UNITED STATES
SECURITIES AND EXCHANGE COMMISSION
Washington, D.C. 20549
FORM N-CSR
CERTIFIED SHAREHOLDER REPORT OF REGISTERED MANAGEMENT
INVESTMENT COMPANIES
Investment Company Act file number 811-22487
DBX ETF Trust
(Exact name of registrant as specified in charter)
60 Wall Street
New York, New York 10005
(Address of principal executive offices) (Zip code)
Alex Depetris
DBX ETF Trust
60 Wall Street
New York, New York 10005
(Name and address of agent for service)
Registrant’s telephone number, including area code: (212) 250-4352
Date of fiscal year end: May 31
Date of reporting period: May 31, 2013
Form N-CSR is to be used by management investment companies to file reports with the Commission not later than 10 days after the transmission to stockholders of any report that is required to be transmitted to stockholders under Rule 30e-1 under the Investment Company Act of 1940 (17 CFR 270.30e-1). The Commission may use the information provided on Form N-CSR in its regulatory, disclosure review, inspection, and policymaking roles.
A registrant is required to disclose the information specified by Form N-CSR, and the Commission will make this information public. A registrant is not required to respond to the collection of information contained in Form N-CSR unless the Form displays a currently valid Office of Management and Budget (“OMB”) control number. Please direct comments concerning the accuracy of the information collection burden estimate and any suggestions for reducing the burden to Secretary, Securities and Exchange Commission, 100 F Street, NE, Washington, DC 20549. The OMB has reviewed this collection of information under the clearance requirements of 44 U.S.C. § 3507.
| Item 1. | Reports to Stockholders. |
The Report to Shareholders is attached herewith.
ANNUAL REPORT
May 31, 2013
DBX ETF Trust
db X-trackers MSCI Brazil Hedged Equity Fund (DBBR)
(formerly known as db-X MSCI Brazil Currency-Hedged Equity Fund)
db X-trackers MSCI EAFE Hedged Equity Fund (DBEF)
(formerly known as db-X MSCI EAFE Currency-Hedged Equity Fund)
db X-trackers MSCI Emerging Markets Hedged Equity Fund (DBEM)
(formerly known as db-X MSCI Emerging Markets Currency-Hedged Equity Fund)
db X-trackers MSCI Germany Hedged Equity Fund (DBGR)
(formerly known as db-X MSCI Canada Currency-Hedged Equity Fund)
db X-trackers MSCI Japan Hedged Equity Fund (DBJP)
(formerly known as db-X MSCI Japan Currency-Hedged Equity Fund)
DBX ETF Trust
| Page | ||||
| 1 | ||||
| 3 | ||||
| 4 | ||||
| 6 | ||||
| 8 | ||||
| 10 | ||||
| 12 | ||||
| 14 | ||||
| 15 | ||||
| 17 | ||||
| 28 | ||||
| 34 | ||||
| 36 | ||||
| 40 | ||||
| 42 | ||||
| 44 | ||||
| 47 | ||||
| 50 | ||||
| 62 | ||||
| 63 | ||||
| 65 | ||||
Board Considerations in Approval of Investment Advisory and Sub-Advisory Contracts (Unaudited) | 68 | |||
Additional Information (Unaudited) | 71 | |||
| 72 | ||||
TO OUR SHAREHOLDERS: (Unaudited)
Dear Shareholder,
We are pleased to present this Annual Report for DBX ETF Trust, which covers the year ended May 31, 2013.
We believe that these funds fill a need in the marketplace by offering investors direct access to global markets with a built-in hedge against currency fluctuations. These ETFs provide investors direct access to some of the world’s most significant international markets with the goal of allowing investors to better manage their portfolios currency risk.
Perhaps no fund better exemplified the impact of currency returns on international investments than the db X-trackers MSCI Japan Hedged Equity Fund (DBJP). Due to an increase in the Bank of Japan’s stated inflation target, the Japanese yen weakened significantly over the period. While the MSCI Japan unhedged index returned 26.32% for the period, the steadily weakening yen contributed to a 60.22% return in the MSCI Japan US Dollar Hedged Index and a 59.04% return for DBJP. Of course, these returns were achieved during market conditions that were favorable to DBJP’s investment strategy, and such returns should not be expected over the long term.
Japan should serve as an example to investors considering international investments. While the yen was an extreme example, the possible effects of currency moves on fund performance are evident.
Deutsche Bank, a leading global banking institution, has managed and operated a successful and growing platform of exchange-traded products since 2006. Our team at Deutsche Bank values the trust that you have placed in us and we look forward to meeting your investment needs by continuing to offer innovative index-driven strategies.
Very truly yours,
Alex Depetris Chairman, President and Chief Executive Officer July 26, 2013 |
*************************
Past performance is no guarantee of future results. Fund performance assumes reinvestment of dividends and capital gains distributions. A Fund’s net asset value (“NAV”) return is based on the changes in the Fund’s NAV per share for the period indicated. A Fund’s NAV per share is calculated by dividing the value of the Fund’s total assets less total liabilities by the number of shares outstanding. Current Fund performance may be higher or lower than the performance quoted. The most recent month end performance may be obtained by visiting www.dbxus.com.
An index is a statistical measure of a specified financial market or sector. An index is unmanaged and one cannot invest directly in an index. An index does not actually hold a portfolio of securities, incur expenses, or pay any transaction costs. Therefore, index returns do not reflect deductions for fees or expenses. In comparison, a Fund’s performance is negatively impacted by these deductions. Fund returns do not reflect brokerage commissions or taxes that a shareholder would pay on Fund distributions or on transactions in Fund shares.
The views expressed in this report reflect those of the portfolio management team only through the end of the period of the report as stated on the cover. The management team’s views are subject to change at any time based on market and other conditions and should not be construed as a recommendation. Current and future portfolio holdings are subject to risk. Investment in the Funds poses investment risk, including possible loss of principal. The investment return and principal value of an investment will fluctuate, so that shares, when sold or redeemed, may be worth more or less than their original cost.
1
This Page is Intentionally Left Blank
2
DBX ETF Trust
MANAGEMENT’S DISCUSSION OF FUND PERFORMANCE (Unaudited)
During the period, global equity markets moved steadily higher as US economic fundamentals continued to improve and fears surrounding eurozone solvency waned. While equities rose, the US dollar overcame a 2012 end of year decline to finish higher for the period as measured by the DXY index, an index measuring the value of the dollar against a basket of currencies including the Euro, Great British pound, Japanese yen, Canadian dollar, Swedish krona and the Swiss franc.
For the year ended May 31, 2013, the db X-trackers MSCI Brazil Hedged Equity Shares returned 1.43%, compared with the Underlying Index return of 2.65%. Fund returns were positively impacted by strength in Brazilian equity markets during the period, specifically in the Financials and Consumer Staples sectors. The fund’s currency hedge had little effect on the period’s return as the Brazilian Real finished mostly unchanged.
For the year ended May 31, 2013, the db X-trackers MSCI EAFE Hedged Equity Shares returned 35.60%, compared with the Underlying Index return of 36.17%. The fund’s returns were positively impacted by strong performance in equities, with all 22 of the countries represented in the index contributing positive returns during the period. Specifically, high allocations and strength in French, British and Japanese securities positively impacted fund performance. Positive performance was enhanced by strong performance in the fund’s currency hedges. Since the currency hedges involve short positions in foreign currencies, the fund benefitted from a significant decline in the Japanese yen.
For the year ended May 31, 2013, the db X-trackers MSCI Emerging Markets Hedged Equity Shares returned 6.54%, compared with the Underlying Index return of 10.96%. The fund’s returns were positively impacted by strong performance in equities, with 17 of the 21 countries represented in the index contributing positive returns during the period. Specifically, high allocations and strength in Chinese, South Korean and Taiwanese securities positively impacted fund performance. Positive performance was partially offset by weak performance in the fund’s currency hedges. Since the currency hedges involve short positions in foreign currencies, the fund was negatively impacted by strength in Chinese remnimbi and Korean won.
For the year ended May 31, 2013, the db X-trackers MSCI Germany Hedged Equity Fund (formerly, db X-trackers MSCI Canada Hedged Equity Fund) returned 11.86%, compared with the Underlying Index return of 12.10%. Prior to May 31, 2013, the Fund sought investment results that corresponded generally to the performance, before fees and expenses, of the MSCI Canada US Dollar Hedged Index. During that period, Fund returns were positively impacted by strength in Canadian equity markets, specifically in the Financials, Energy and Industrials sectors. The positive returns in the equity markets were partially offset by losses on the fund’s currency hedges, with the Canadian dollar appreciating slightly during the period. On May 31, 2013, the Fund adopted its current name and changed its investment objective to seeking investment results that corresponded generally to the performance, before fees and expenses, of the MSCI Germany US Dollar Hedged Index.
For the year ended May 31, 2013, the db X-trackers MSCI Japan Hedged Equity Shares returned 59.04%, compared with the Underlying Index return of 60.22%. The fund’s returns were positively impacted by strength in Japanese equity markets, specifically Financial, Consumer Discretionary and Industrial securities. The fund was also positively impacted by gains in the fund’s currency hedges, with the Japanese yen weakening 22.08% versus the dollar during the period.
*************************
Performance quoted above represents past performance, assumes reinvestment of all dividends and capital gains distributions at net asset value (“NAV”), and does not guarantee future results. A Fund’s NAV return is based on the changes in the Fund’s NAV per share for the period indicated. A Fund’s NAV per share is calculated by dividing the value of the Fund’s total assets less total liabilities by the number of shares outstanding. Current Fund performance may be higher or lower than the performance quoted. Fund performance data current to the most recent month end may be obtained by visiting www.dbxus.com. See pages 4-13 of this report for additional performance information, including performance data based on market value.
An index is a statistical measure of a specified financial market or sector. An index does not actually hold a portfolio of securities, incur expenses, or pay any transaction costs. Therefore, index returns do not reflect deductions for fees or expenses and are not available for direct investment. In comparison, a Fund’s performance is negatively impacted by these deductions. Fund returns do not reflect brokerage commissions or taxes that a shareholder would pay on Fund distributions or on transactions in Fund shares.
The views expressed in this report reflect those of the portfolio management team only through the end of the period of the report as stated on the cover. The management team’s views are subject to change at any time based on market and other conditions and should not be construed as a recommendation. Current and future portfolio holdings are subject to risk. Investment in the Funds poses investment risk, including possible loss of principal. The investment return and principal value of an investment will fluctuate, so that shares, when sold or redeemed, may be worth more or less than their original cost.
3
DBX ETF Trust
db X-trackers MSCI Brazil Fund (DBBR) (Unaudited)
The db X-trackers MSCI Brazil Hedged Equity Fund (formerly known as db-X MSCI Brazil Currency-Hedged Equity Fund) seeks investment results that correspond generally to the performance, before fees and expenses, of the MSCI Brazil US Dollar Hedged Index (the “Underlying Index”). The Underlying Index is designed to provide exposure to Brazilian equity markets, while at the same time mitigating exposure to fluctuations between the value of the U.S. dollar and Brazilian real.
For the year ended May 31, 2013, the db X-trackers MSCI Brazil Hedged Equity Fund ‘s net asset value increase of 1.43%, compared to a increase of 2.65% for the Underlying Index and 2.78% for its benchmark index, the MSCI Brazil Index.
Performance as of 5/31/13
| Average Annual Total Returns | ||||||||
| Net Asset Value | Market Price | MSCI Brazil US Dollar Hedged Index | MSCI Brazil Index | |||||
One Year | 1.43% | -0.44% | 2.65% | 2.78% | ||||
Since Inception1 | -6.83% | -8.00% | -4.43% | -13.03% | ||||
| Cumulative Total Returns | ||||||||
| Net Asset Value | Market Price | MSCI Brazil US Dollar Hedged Index | MSCI Brazil Index | |||||
One Year | 1.43% | -0.44% | 2.65% | 2.78% | ||||
Since Inception1 | -13.06% | -15.22% | -8.59% | -24.16% | ||||
1 Total returns are calculated based on the commencement of trading, 6/9/11 (“Inception”).
Performance quoted represents past performance, assumes reinvestment of all dividends and capital gain distributions, and does not guarantee future results. Current performance may be higher or lower than the performance quoted. Performance data current to the most recent month end may be obtained by visiting www.dbxus.com. Investment in the fund poses investment risk including possible loss of principal. The investment return and principal value of an investment will fluctuate, so that shares, when sold or redeemed, may be worth more or less than their original cost. The estimated operating expense ratio as disclosed in the most recent prospectus dated May 31, 2013, was 0.60%.
The preceding performance chart is provided for comparative purposes and represents the period(s) noted. The net asset value return is based on the changes in the Fund’s net asset value per share (“NAV”). The Fund’s NAV is calculated by dividing the value of the Fund’s total assets less total liabilities by the number of shares outstanding. The market price return is based on the change in the market price on the NYSE Arca of a share of the Fund for the period(s) indicated. The price used to calculate market price returns is the midpoint of the bid/ask spread for Fund shares at 4 p.m. Eastern Time on the NYSE Arca. NAV and market returns assume that dividends and capital gain distributions have been reinvested in the Fund at NAV and market price, respectively. The MSCI Brazil Index is a free float-adjusted market capitalization index that is designed to measure equity performance in Brazil. The MSCI Brazil US Dollar Hedged Index is the index that the Fund seeks to track. It is calculated using the same methodology as its corresponding MSCI Brazil Index, but is designed to mitigate exposure to fluctuations between the value of the U.S. dollar and Brazilian real.
An index is a statistical measure of a specified financial market or sector. An index does not actually hold a portfolio of securities, incur expenses or pay any transaction costs. Therefore index returns do not reflect deductions for fees or expenses and are not available for direct investment. In comparison, the Fund’s performance is negatively impacted by these deductions. Fund returns do not reflect brokerage commissions or taxes that a shareholder would pay on Fund distributions or on transactions in Fund shares.
4
DBX ETF Trust
PERFORMANCE SUMMARY
db X-trackers MSCI Brazil Fund (DBBR) (Unaudited) (Continued)
Growth of a $10,000 Investment in DBBR2 as of 5/31/13
2 Based on Net Asset Value from commencement of trading 6/9/11.
Sector Breakdown* as of 5/31/13
* Weightings are expressed as a percentage of total investments and may change over time. The sector classifications used above are based on company classifications under Bloomberg industry name.
Top Ten Holdings3 as of 5/31/13
| Description | Shares | Value | % of Net Assets | |||||||||
Petroleo Brasileiro SA, Preferred Stock | 70,575 | $660,672 | 8.5% | |||||||||
Itau Unibanco Holding SA, Preferred Stock | 42,165 | 637,849 | 8.3% | |||||||||
Banco Bradesco SA | 35,357 | 566,722 | 7.3% | |||||||||
Petroleo Brasileiro SA | 50,011 | 442,948 | 5.7% | |||||||||
Cia de Bebidas das Americas, Preferred Stock | 11,477 | 439,135 | 5.7% | |||||||||
Vale SA, Preferred Stock | 31,940 | 427,248 | 5.5% | |||||||||
Vale SA | 21,961 | 312,219 | 4.0% | |||||||||
BRF — Brasil Foods SA | 11,080 | 258,246 | 3.3% | |||||||||
Itausa — Investimentos Itau SA, Preferred Stock | 48,076 | 211,446 | 2.7% | |||||||||
BM&FBovespa SA | 31,646 | 207,595 | 2.7% | |||||||||
3 Holdings are subject to change without notice and there is no guarantee that the Fund will remain invested in any particular security. For a complete list of holdings go to www.dbxus.com.
5
DBX ETF Trust
PERFORMANCE SUMMARY
db X-trackers MSCI EAFE Fund (DBEF) (Unaudited)
The db X-trackers MSCI EAFE Hedged Equity Fund (formerly known as db-X MSCI EAFE Currency-Hedged Equity Fund) seeks investment results that correspond generally to the performance, before fees and expenses, of the MSCI EAFE US Dollar Hedged Index (the “Underlying Index”). The Underlying Index is designed provide exposure to equity securities in developed international stock markets, while at the same time mitigating exposure to fluctuations between the value of the U.S. dollar and selected non-U.S. currencies. As of May 31, 2013, the Index included securities from the following 22 countries: Australia, Austria, Belgium, Denmark, Finland, France, Germany, Greece, Hong Kong, Ireland, Israel, Italy, Japan, Netherlands, New Zealand, Norway, Portugal, Singapore, Spain, Sweden, Switzerland and the United Kingdom.
For the year ended May 31, 2013, the db X-trackers MSCI EAFE Hedged Equity Fund’s net asset value increase of 35.60%, compared with a increase of 36.17% for the Underlying Index and 31.62% for its benchmark index, the MSCI EAFE Index.
Performance as of 5/31/13
| Average Annual Total Returns | ||||||||
| Net Asset Value | Market Price | MSCI EAFE US Dollar Hedged Index | MSCI EAFE Index | |||||
One Year | 35.60% | 31.97% | 36.17% | 31.62% | ||||
Since Inception1 | 9.89% | 9.68% | 10.35% | 3.67% | ||||
| Cumulative Total Returns | ||||||||
| Net Asset Value | Market Price | MSCI EAFE US Dollar Hedged Index | MSCI EAFE Index | |||||
One Year | 35.60% | 31.97% | 36.17% | 31.62% | ||||
Since Inception1 | 20.50% | 20.08% | 21.55% | 7.40% | ||||
1 Total returns are calculated based on the commencement of trading, 6/9/11 (“Inception”).
Performance quoted represents past performance, assumes reinvestment of all dividends and capital gain distributions, and does not guarantee future results. Current performance may be higher or lower than the performance quoted. Performance data current to the most recent month end may be obtained by visiting www.dbxus.com. Investment in the fund poses investment risk including possible loss of principal. The investment return and principal value of an investment will fluctuate, so that shares, when sold or redeemed, may be worth more or less than their original cost. The estimated operating expense ratio as disclosed in the most recent prospectus dated May 31, 2013, was 0.35%.
The preceding performance chart is provided for comparative purposes and represents the period(s) noted. The net asset value return is based on the changes in the Fund’s net asset value per share (“NAV”). The Fund’s NAV is calculated by dividing the value of the Fund’s total assets less total liabilities by the number of shares outstanding. The market price return is based on the change in the market price on the NYSE Arca of a share of the Fund for the period(s) indicated. The price used to calculate market price returns is the midpoint of the bid/ask spread for Fund shares at 4 p.m. Eastern Time on the NYSE Arca. NAV and market returns assume that dividends and capital gain distributions have been reinvested in the Fund at NAV and market price, respectively. The MSCI EAFE Index is a free float-adjusted market capitalization index that is designed to measure developed market equity performance, excluding the U.S. and Canada. The MSCI EAFE US Dollar Hedged Index is the index that the Fund seeks to track. It is calculated using the same methodology as its corresponding MSCI EAFE Index, but is designed to mitigate exposure to fluctuations between the value of the U.S. dollar and non-U.S. currencies.
An index is a statistical measure of a specified financial market or sector. An index does not actually hold a portfolio of securities, incur expenses or pay any transaction costs. Therefore index returns do not reflect deductions for fees or expenses and are not available for direct investment. In comparison, the Fund’s performance is negatively impacted by these deductions. Fund returns do not reflect brokerage commissions or taxes that a shareholder would pay on Fund distributions or on transactions in Fund shares.
6
DBX ETF Trust
PERFORMANCE SUMMARY
db X-trackers MSCI EAFE Fund (DBEF) (Unaudited) (Continued)
Growth of a $10,000 Investment in DBEF2 as of 5/31/13
2 Based on Net Asset Value from commencement of trading 6/9/11.
Country Breakdown* as of 5/31/13
* Weightings are expressed as a percentage of total investments and may change over time. The country classifications used above are based on company classifications under Bloomberg country name.
Top Ten Holdings3 as of 5/31/13
| Description | Shares | Value | % of Net Assets | |||||||||
Nestle SA | 19,595 | $1,300,186 | 1.7% | |||||||||
HSBC Holdings PLC | 116,079 | 1,280,282 | 1.7% | |||||||||
Roche Holding AG | 4,409 | 1,102,423 | 1.5% | |||||||||
Toyota Motor Corp. | 17,900 | 1,070,917 | 1.4% | |||||||||
Novartis AG | 14,428 | 1,041,079 | 1.4% | |||||||||
Vodafone Group PLC | 307,252 | 896,103 | 1.2% | |||||||||
BP PLC | 120,160 | 864,389 | 1.1% | |||||||||
Sanofi | 7,496 | 803,887 | 1.1% | |||||||||
GlaxoSmithKline PLC | 30,761 | 800,866 | 1.1% | |||||||||
Royal Dutch Shell PLC, Class A | 23,690 | 792,966 | 1.1% | |||||||||
3 Holdings are subject to change without notice and there is no guarantee that the Fund will remain invested in any particular security. For a complete list of holdings go to www.dbxus.com.
7
DBX ETF Trust
PERFORMANCE SUMMARY
db X-trackers MSCI Emerging Markets Fund (DBEM) (Unaudited)
The db X-trackers MSCI Emerging Markets Hedged Equity Fund (formerly known as db-X MSCI Emerging Markets Currency-Hedged Equity Fund) seeks investment results that correspond generally to the performance, before fees and expenses, of the MSCI EM US Dollar Hedged Index (the “Underlying Index”). The Underlying Index is designed to provide exposure to equity securities in the global emerging markets, while at the same time mitigating exposure to fluctuations between the value of the U.S. dollar and selected emerging market currencies. As of May 31, 2013, the Index included securities from the following 21 countries: Brazil, Chile, China, Colombia, Czech Republic, Egypt, Hungary, India, Indonesia, South Korea, Malaysia, Mexico, Morocco, Peru, Philippines, Poland, Russia, South Africa, Taiwan, Thailand and Turkey.
For the year ended May 31, 2013, the db X-trackers MSCI Emerging Markets Hedged Equity Fund’s net asset value increase of 6.54%, compared with a increase of 10.96% for the Underlying Index and 14.10% for its benchmark index, the MSCI EM Index.
Performance as of 5/31/13
| Average Annual Total Returns | ||||||||
| Net Asset Value | Market Price | MSCI EM US Dollar Hedged Index | MSCI EM Index | |||||
One Year | 6.54% | 6.09% | 10.96% | 14.10% | ||||
Since Inception1 | -3.50% | -3.84% | -0.07% | -3.82% | ||||
| Cumulative Total Returns | ||||||||
| Net Asset Value | Market Price | MSCI EM US Dollar Hedged Index | MSCI EM Index | |||||
One Year | 6.54% | 6.09% | 10.96% | 14.10% | ||||
Since Inception1 | -6.80% | -7.46% | -0.13% | -7.42% | ||||
1 Total returns are calculated based on the commencement of trading, 6/9/11 (“Inception”).
Performance quoted represents past performance, assumes reinvestment of all dividends and capital gain distributions, and does not guarantee future results. Current performance may be higher or lower than the performance quoted. Performance data current to the most recent month end may be obtained by visiting www.dbxus.com. Investment in the fund poses investment risk including possible loss of principal. The investment return and principal value of an investment will fluctuate, so that shares, when sold or redeemed, may be worth more or less than their original cost. The estimated operating expense ratio as disclosed in the most recent prospectus dated May 31, 2013, was 0.65%.
The preceding performance chart is provided for comparative purposes and represents the period(s) noted. The net asset value return is based on the changes in the Fund’s net asset value per share (“NAV”). The Fund’s NAV is calculated by dividing the value of the Fund’s total assets less total liabilities by the number of shares outstanding. The market price return is based on the change in the market price on the NYSE Arca of a share of the Fund for the period(s) indicated. The price used to calculate market price returns is the midpoint of the bid/ask spread for Fund shares at 4 p.m. Eastern Time on the NYSE Arca. NAV and market returns assume that dividends and capital gain distributions have been reinvested in the Fund at NAV and market price, respectively. The MSCI EM Index is a free float-adjusted market capitalization index that is designed to measure equity performance in the global emerging markets. The MSCI EM US Dollar Hedged Index is the index that the Fund seeks to track. It is calculated using the same methodology as its corresponding MSCI EM Index, but is designed to mitigate exposure to fluctuations between the value of the U.S. dollar and non-U.S. currencies.
An index is a statistical measure of a specified financial market or sector. An index does not actually hold a portfolio of securities, incur expenses or pay any transaction costs. Therefore index returns do not reflect deductions for fees or expenses and are not available for direct investment. In comparison, the Fund’s performance is negatively impacted by these deductions. Fund returns do not reflect brokerage commissions or taxes that a shareholder would pay on Fund distributions or on transactions in Fund shares.
8
DBX ETF Trust
PERFORMANCE SUMMARY
db X-trackers MSCI Emerging Markets Fund (DBEM) (Unaudited) (Continued)
Growth of a $10,000 Investment in DBEM2 as of 5/31/13
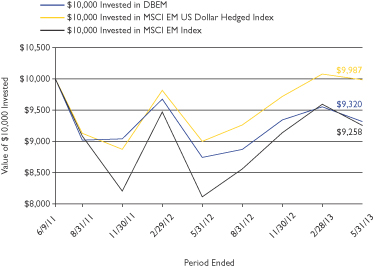
2 Based on Net Asset Value from commencement of trading 6/9/11.
Country Breakdown* as of 5/31/13
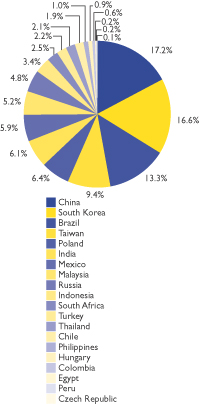
* Weightings are expressed as a percentage of total investments and may change over time. The country classifications used above are based on company classifications under Bloomberg country name.
Top Ten Holdings3 as of 5/31/13
| Description | Shares | Value | % of Net Assets | |||||||||
Samsung Electronics Co. Ltd. | 263 | $358,055 | 4.1% | |||||||||
Taiwan Semiconductor Manufacturing Co. Ltd., ADR | 12,420 | 231,756 | 2.6% | |||||||||
Hon Hai Precision Industry Co. Ltd. GDR | 32,457 | 164,070 | 1.9% | |||||||||
China Construction Bank Corp., Class H | 168,274 | 136,568 | 1.6% | |||||||||
Powszechny Zaklad Ubezpieczen SA | 910 | 127,273 | 1.4% | |||||||||
Advanced Semiconductor Engineering, Inc., ADR | 28,288 | 118,810 | 1.4% | |||||||||
America Movil SAB de CV | 113,048 | 113,684 | 1.3% | |||||||||
Petroleo Brasileiro SA, Preferred Stock | 12,100 | 113,272 | 1.3% | |||||||||
Itau Unibanco Holding SA, Preferred Stock | 7,340 | 111,035 | 1.3% | |||||||||
China Mobile Ltd. | 9,923 | 105,397 | 1.2% | |||||||||
3 Holdings are subject to change without notice and there is no guarantee that the Fund will remain invested in any particular security. For a complete list of holdings go to www.dbxus.com.
9
DBX ETF Trust
PERFORMANCE SUMMARY
db X-trackers MSCI Germany Fund (DBGR) (Unaudited)
The db X-trackers MSCI Germany Hedged Equity Fund (formerly known as db-X MSCI Canada Currency-Hedged Equity Fund) seeks investment results that correspond generally to the performance, before fees and expenses, of the MSCI Germany US Dollar Hedged Index (the “Underlying Index”). The Underlying Index is designed to provide exposure to German equity markets, while at the same time mitigating exposure to fluctuations between the value of the U.S. dollar and Euro.
For the year ended May 31, 2013, the db X-trackers MSCI Germany Hedged Equity Fund’s net asset value increase of 11.86%, compared to a increase of 12.10% for the Underlying Index and 12.89% for its benchmark index, the MSCI Germany Index.
Performance as of 5/31/13
| Average Annual Total Returns | ||||||||
| Net Asset Value | Market Price | MSCI Germany US Dollar Hedged Index2 | MSCI Germany Index3 | |||||
One Year | 11.86% | 11.87% | 12.10% | 12.89% | ||||
Since Inception1 | -0.87% | -1.12% | -0.44% | -3.06% | ||||
| Cumulative Total Returns | ||||||||
| Net Asset Value | Market Price | MSCI Germany US Dollar Hedged Index2 | MSCI Germany Index3 | |||||
One Year | 11.86% | 11.87% | 12.10% | 12.89% | ||||
Since Inception1 | -1.72% | -2.20% | -0.86% | -5.97% | ||||
1 Total returns are calculated based on the commencement of trading, 6/9/11 (“Inception”).
2 Returns reflect the MSCI Canada US Dollar Hedged Index prior to 5/31/2013. Beginning 5/31/2013 the index returns reflect the MSCI Germany US Dollar Hedged Index.
3 Returns reflect the MSCI Canada Index prior to 5/31/2013. Beginning 5/31/2013 the index returns reflect the MSCI Germany Index.
Performance quoted represents past performance, assumes reinvestment of all dividends and capital gain distributions, and does not guarantee future results. Current performance may be higher or lower than the performance quoted. Performance data current to the most recent month end may be obtained by visiting www.dbxus.com. Investment in the fund poses investment risk including possible loss of principal. The investment return and principal value of an investment will fluctuate, so that shares, when sold or redeemed, may be worth more or less than their original cost. The estimated operating expense ratio as disclosed in the most recent prospectus dated May 31, 2013, was 0.50%.
The preceding performance chart is provided for comparative purposes and represents the period(s) noted. The net asset value return is based on the changes in the Fund’s net asset value per share (“NAV”). The Fund’s NAV is calculated by dividing the value of the Fund’s total assets less total liabilities by the number of shares outstanding. The market price return is based on the change in the market price on the NYSE Arca of a share of the Fund for the period(s) indicated. The price used to calculate market price returns is the midpoint of the bid/ask spread for Fund shares at 4 p.m. Eastern Time on the NYSE Arca. NAV and market returns assume that dividends and capital gain distributions have been reinvested in the Fund at NAV and market price, respectively. The MSCI Germany Index is a free float-adjusted market capitalization index that is designed to measure equity performance in Germany. The MSCI Germany US Dollar Hedged Index is the index that the Fund seeks to track. It is calculated using the same methodology as its corresponding MSCI Germany Index, but is designed to mitigate exposure to fluctuations between the value of the U.S. dollar and the Euro.
An index is a statistical measure of a specified financial market or sector. An index does not actually hold a portfolio of securities, incur expenses or pay any transaction costs. Therefore index returns do not reflect deductions for fees or expenses and are not available for direct investment. In comparison, the Fund’s performance is negatively impacted by these deductions. Fund returns do not reflect brokerage commissions or taxes that a shareholder would pay on Fund distributions or on transactions in Fund shares.
10
DBX ETF Trust
PERFORMANCE SUMMARY
db X-trackers MSCI Germany Fund (DBGR) (Unaudited) (Continued)
Growth of a $10,000 Investment in DBGR2 as of 5/31/13
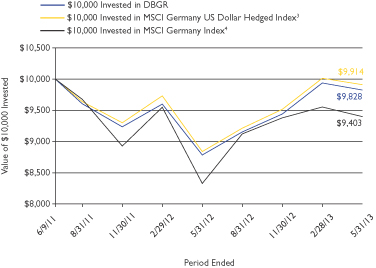
2 Based on Net Asset Value from commencement of trading 6/9/11.
3 Based on MSCI Canada US Dollar Hedged Index prior to 5/31/2013. Beginning 5/31/2013 the growth of a $10,000 investment will be based on the MSCI Germany US Dollar Hedged Index.
4 Based on MSCI Canada Index prior to 5/31/2013. Beginning 5/31/2013 the growth of a $10,000 investment will be based on the MSCI Germany Index.
Sector Breakdown* as of 5/31/13
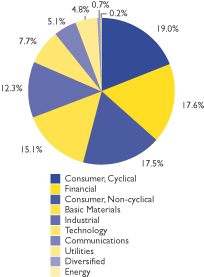
* Weightings are expressed as a percentage of total investments and may change over time. The sector classifications used above are based on company classifications under Bloomberg industry name.
Top Ten Holdings5 as of 5/31/13
| Description | Shares | Value | % of Net Assets | |||||||||
BASF SE | 3,923 | $383,592 | 8.2% | |||||||||
Bayer AG | 3,532 | 380,524 | 8.2% | |||||||||
Siemens AG | 3,387 | 359,267 | 7.7% | |||||||||
Allianz SE | 1,948 | 303,196 | 6.5% | |||||||||
SAP AG | 3,936 | 296,870 | 6.4% | |||||||||
Daimler AG | 4,105 | 263,625 | 5.7% | |||||||||
Deutsche Bank AG | 4,355 | 204,199 | 4.4% | |||||||||
Linde AG | 791 | 152,210 | 3.3% | |||||||||
Muenchener Rueckversicherungs AG | 766 | 144,014 | 3.1% | |||||||||
Deutsche Telekom AG | 11,999 | 137,835 | 3.0% | |||||||||
5 Holdings are subject to change without notice and there is no guarantee that the Fund will remain invested in any particular security. For a complete list of holdings go to www.dbxus.com.
11
DBX ETF Trust
PERFORMANCE SUMMARY
db X-trackers MSCI Japan Fund (DBJP) (Unaudited)
The db X-trackers MSCI Japan Hedged Equity Fund (formerly known as db-X MSCI Japan Currency-Hedged Equity Fund) seeks investment results that correspond generally to the performance, before fees and expenses, of the MSCI Japan US Dollar Hedged Index (the “Underlying Index”). The Underlying Index is designed to provide exposure to Japanese equity markets, while at the same time mitigating exposure to fluctuations between the value of the U.S. dollar and Japanese yen.
For the year ended May 31, 2013, the db X-trackers MSCI Japan Hedged Equity Fund’s net asset value increase of 59.04%, compared to a increase of 60.22% for the Underlying Index and 26.32% for its benchmark index, the MSCI Japan Index.
Performance as of 5/31/13
| Average Annual Total Returns | ||||||||
| Net Asset Value | Market Price | MSCI Japan US Dollar Hedged Index | MSCI Japan Index | |||||
One Year | 59.04% | 55.69% | 60.22% | 26.32% | ||||
Since Inception1 | 18.41% | 17.25% | 19.29% | 7.19% | ||||
| Cumulative Total Returns | ||||||||
| Net Asset Value | Market Price | MSCI Japan US Dollar Hedged Index | MSCI Japan Index | |||||
One Year | 59.04% | 55.69% | 60.22% | 26.32% | ||||
Since Inception1 | 39.70% | 37.07% | 41.82% | 14.75% | ||||
1 Total returns are calculated based on the commencement of trading, 6/9/11 (“Inception”).
Performance quoted represents past performance, assumes reinvestment of all dividends and capital gain distributions, and does not guarantee future results. Current performance may be higher or lower than the performance quoted. Performance data current to the most recent month end may be obtained by visiting www.dbxus.com. Investment in the fund poses investment risk including possible loss of principal. The investment return and principal value of an investment will fluctuate, so that shares, when sold or redeemed, may be worth more or less than their original cost. The estimated operating expense ratio as disclosed in the most recent prospectus dated May 31, 2013, was 0.50%.
The preceding performance chart is provided for comparative purposes and represents the period(s) noted. The net asset value return is based on the changes in the Fund’s net asset value per share (“NAV”). The Fund’s NAV is calculated by dividing the value of the Fund’s total assets less total liabilities by the number of shares outstanding. The market price return is based on the change in the market price on the NYSE Arca of a share of the Fund for the period(s) indicated. The price used to calculate market price returns is the midpoint of the bid/ask spread for Fund shares at 4 p.m. Eastern Time on the NYSE Arca. NAV and market returns assume that dividends and capital gain distributions have been reinvested in the Fund at NAV and market price, respectively. The MSCI Japan Index is a free float-adjusted market capitalization index that is designed to measure equity performance in Japan. The MSCI Japan US Dollar Hedged Index is the index that the Fund seeks to track. It is calculated using the same methodology as its corresponding MSCI Japan Index, but is designed to mitigate exposure to fluctuations between the value of the U.S. dollar and Japanese Yen.
An index is a statistical measure of a specified financial market or sector. An index does not actually hold a portfolio of securities, incur expenses or pay any transaction costs. Therefore index returns do not reflect deductions for fees or expenses and are not available for direct investment. In comparison, the Fund’s performance is negatively impacted by these deductions. Fund returns do not reflect brokerage commissions or taxes that a shareholder would pay on Fund distributions or on transactions in Fund shares.
12
DBX ETF Trust
PERFORMANCE SUMMARY
db X-trackers MSCI Japan Fund (DBJP) (Unaudited) (Continued)
Growth of a $10,000 Investment in DBJP2 as of 5/31/13
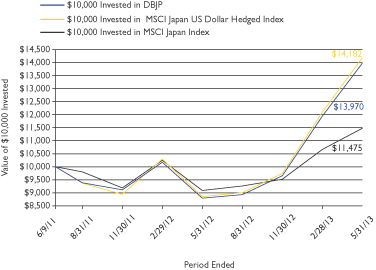
2 Based on Net Asset Value from commencement of trading 6/9/11.
Sector Breakdown* as of 5/31/13
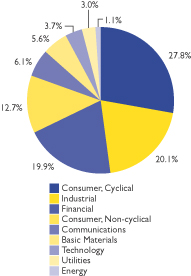
* Weightings are expressed as a percentage of total investments and may change over time. The sector classifications used above are based on company classifications under Bloomberg industry name.
Top Ten Holdings3 as of 5/31/13
| Description | Shares | Value | % of Net Assets | |||||||||
Toyota Motor Corp. | 118,000 | $7,059,677 | 6.5% | |||||||||
Mitsubishi UFJ Financial Group, Inc. | 545,400 | 3,230,431 | 3.0% | |||||||||
Honda Motor Co. Ltd. | 69,700 | 2,657,419 | 2.4% | |||||||||
Sumitomo Mitsui Financial Group, Inc. | 54,400 | 2,195,928 | 2.0% | |||||||||
Softbank Corp. | 40,600 | 2,089,513 | 1.9% | |||||||||
Mizuho Financial Group, Inc. | 980,640 | 1,903,586 | 1.7% | |||||||||
Canon, Inc. | 48,500 | 1,704,296 | 1.6% | |||||||||
Japan Tobacco, Inc. | 47,000 | 1,618,834 | 1.5% | |||||||||
Takeda Pharmaceutical Co. Ltd. | 33,800 | 1,514,112 | 1.4% | |||||||||
Hitachi Ltd. | 207,000 | 1,442,437 | 1.3% | |||||||||
3 Holdings are subject to change without notice and there is no guarantee that the Fund will remain invested in any particular security. For a complete list of holdings go to www.dbxus.com.
13
DBX ETF Trust
As a shareholder of one or more of the funds of the DBX ETF Trust (each, a “Fund” and collectively, the “Funds”), you incur advisory fees and other Fund expenses. The expense examples below are intended to help you understand your ongoing costs (in dollars) of investing in the Funds and to compare these costs with the ongoing costs of investing in other funds.
The examples are based on an investment of $1,000 made at the beginning of the period and held through the six month period ended May 31, 2013.
ACTUAL EXPENSES
The first line in the following tables provides information about actual account values and actual expenses. You may use the information in this line, together with the amount you invested, to estimate the expenses that you paid over the period. Simply divide your account value by $1,000 (for example, an $8,600 account value divided by $1,000 = 8.6), then multiply the result by the number in the first line under the heading “Expenses Paid During the Period” to estimate the expenses you paid on your account during this period.
HYPOTHETICAL EXAMPLE FOR COMPARISON PURPOSES
The second line in the following tables provides information about hypothetical account values and hypothetical expenses based on the Funds’ actual expense ratios and an assumed rate of return of 5% per year before expenses (which is not the Funds’ actual return). The hypothetical account values and expenses may not be used to estimate the actual ending account balance or expenses you paid for the period. You may use this information to compare the ongoing costs of investing in the Fund and other funds. To do so, compare this 5% hypothetical example with the 5% hypothetical examples that appear in the shareholder reports of the other funds.
Please note that the expenses shown in the tables are meant to highlight your ongoing costs only, and do not reflect any transactional costs. Therefore the second line in the table is useful in comparing ongoing costs only, and will not help you determine the relative total costs of owning different funds. In addition, if these transactional costs were included, your costs would have been higher.
| Beginning Account Value December 1, 2012 | Ending Account Value May 31, 2013 | Annualized Expense Ratio(1) based on the number of days in the period | Expenses Paid During the Period(2) December 1, 2012 to May 31, 2013 | |||||||||||||
| db X-trackers MSCI Brazil Hedged Equity Fund | ||||||||||||||||
Actual | $ | 1,000.00 | $ | 991.80 | 0.60 | % | $ | 2.98 | ||||||||
Hypothetical (5% return before expenses) | $ | 1,000.00 | $ | 1,021.94 | 0.60 | % | $ | 3.02 | ||||||||
| db X-trackers MSCI EAFE Hedged Equity Fund | ||||||||||||||||
Actual | $ | 1,000.00 | $ | 1,183.40 | 0.35 | % | $ | 1.91 | ||||||||
Hypothetical (5% return before expenses) | $ | 1,000.00 | $ | 1,023.19 | 0.35 | % | $ | 1.77 | ||||||||
| db X-trackers MSCI Emerging Markets Hedged Equity Fund | ||||||||||||||||
Actual | $ | 1,000.00 | $ | 996.37 | 0.65 | % | $ | 3.24 | ||||||||
Hypothetical (5% return before expenses) | $ | 1,000.00 | $ | 1,021.69 | 0.65 | % | $ | 3.28 | ||||||||
| db X-trackers MSCI Germany Hedged Equity Fund | ||||||||||||||||
Actual | $ | 1,000.00 | $ | 1,040.81 | 0.50 | % | $ | 2.54 | ||||||||
Hypothetical (5% return before expenses) | $ | 1,000.00 | $ | 1,022.44 | 0.50 | % | $ | 2.52 | ||||||||
| db X-trackers MSCI Japan Hedged Equity Fund | ||||||||||||||||
Actual | $ | 1,000.00 | $ | 1,448.59 | 0.50 | % | $ | 3.05 | ||||||||
Hypothetical (5% return before expenses) | $ | 1,000.00 | $ | 1,022.44 | 0.50 | % | $ | 2.52 | ||||||||
(1) DBX Advisors LLC (the “Advisor”), has contractually agreed to reduce its fees and/or pay Fund operating expenses (excluding, among other things, acquired fund fees and expenses, interest, taxes and extraordinary expenses) in order to limit each Fund’s net annual operating expenses for shares of each Fund to 0.65% (with respect to db X-trackers MSCI Emerging Markets Hedged Equity Fund), 0.35% (with respect to db X-trackers MSCI EAFE Hedged Equity Fund), 0.60% (with respect to db X-trackers MSCI Brazil Hedged Equity Fund), 0.50% (with respect to db X-trackers MSCI Germany Hedged Equity Fund) and 0.50% (with respect db X-trackers MSCI Japan Hedged Equity Fund) of its average net assets (the “Expense Cap”). The Expense Cap will remain in effect until September 30, 2013.
(2) Expenses are calculated using the annualized expense ratio, which represents the ongoing expenses as a percentage of net assets for the period December 1, 2012 to May 31, 2013. Expenses are calculated by multiplying the Fund’s annualized expense ratio by the average account value for the period; then multiplying the result by 182 days and then dividing the result by 365.
14
DBX ETF Trust
db X-trackers MSCI Brazil Hedged Equity Fund
May 31, 2013
Number | Value | |||||||
| COMMON STOCKS — 49.8% | ||||||||
| Basic Materials — 6.9% | ||||||||
Cia Siderurgica Nacional SA | 11,578 | $ | 35,732 | |||||
Fibria Celulose SA* | 4,193 | 46,006 | ||||||
Ultrapar Participacoes SA | 5,490 | 138,416 | ||||||
Vale SA | 21,961 | 312,219 | ||||||
|
| |||||||
| 532,373 | ||||||||
|
| |||||||
| Communications — 0.7% | ||||||||
Tim Participacoes SA | 14,217 | 54,099 | ||||||
|
| |||||||
| Consumer, Cyclical — 2.4% | ||||||||
Cia Hering | 2,196 | 39,464 | ||||||
Lojas Americanas SA | 2,196 | 16,364 | ||||||
Lojas Renner SA | 2,097 | 72,942 | ||||||
MRV Engenharia e Participacoes SA | 5,691 | 17,670 | ||||||
Raia Drogasil SA | 3,694 | 39,634 | ||||||
|
| |||||||
| 186,074 | ||||||||
|
| |||||||
| Consumer, Non-cyclical — 14.9% | ||||||||
Anhanguera Educacional Participacoes SA | 6,689 | 41,943 | ||||||
Arteris SA | 1,797 | 17,493 | ||||||
BRF — Brasil Foods SA | 11,080 | 258,246 | ||||||
CCR SA | 14,873 | 135,689 | ||||||
Cia de Bebidas das Americas | 2,396 | 91,788 | ||||||
Cielo SA | 5,945 | 152,664 | ||||||
Cosan SA Industria e Comercio | 2,097 | 46,311 | ||||||
Ecorodovias Infraestrutura e Logistica SA | 2,595 | 20,537 | ||||||
Hypermarcas SA | 5,589 | 44,622 | ||||||
JBS SA | 12,388 | 40,487 | ||||||
Kroton Educacional SA | 2,994 | 43,964 | ||||||
Localiza Rent a Car SA | 2,306 | 35,444 | ||||||
M Dias Branco SA | 600 | 26,336 | ||||||
Multiplus SA | 899 | 15,404 | ||||||
Natura Cosmeticos SA | 2,795 | 66,189 | ||||||
Qualicorp SA* | 3,395 | 30,117 | ||||||
Souza Cruz SA | 6,489 | 88,073 | ||||||
|
| |||||||
| 1,155,307 | ||||||||
|
| |||||||
| Energy — 5.9% | ||||||||
OGX Petroleo e Gas Participacoes SA* | 21,759 | 14,020 | ||||||
Petroleo Brasileiro SA | 50,011 | 442,948 | ||||||
|
| |||||||
| 456,968 | ||||||||
|
| |||||||
| Financial — 12.2% | ||||||||
Banco Bradesco SA | 10,681 | 178,033 | ||||||
Banco do Brasil SA | 9,683 | 114,832 | ||||||
Banco Santander Brasil SA | 15,977 | 113,610 | ||||||
BB Seguridade Participacoes SA* | 10,082 | 86,943 | ||||||
BM&FBovespa SA | 31,646 | 207,595 | ||||||
BR Malls Participacoes SA | 6,888 | 70,752 | ||||||
BR Properties SA | 3,394 | 33,293 | ||||||
CETIP SA — Mercados Organizados | 3,295 | 35,768 | ||||||
Cyrela Brazil Realty SA Empreendimentos e Participacoes | 4,791 | 38,027 | ||||||
Odontoprev SA | 4,392 | 20,609 | ||||||
Porto Seguro SA | 1,996 | 24,575 | ||||||
Sul America SA | 2,415 | 15,617 | ||||||
|
| |||||||
| 939,654 | ||||||||
|
| |||||||
Number | Value | |||||||
| Industrial — 3.1% | ||||||||
All America Latina Logistica SA | 7,487 | $ | 37,229 | |||||
Duratex SA | 4,572 | 31,593 | ||||||
Embraer SA | 9,983 | 91,077 | ||||||
Multiplan Empreendimentos Imobiliarios SA | 1,397 | 36,520 | ||||||
WEG SA | 3,593 | 47,509 | ||||||
|
| |||||||
| 243,928 | ||||||||
|
| |||||||
| Technology — 0.5% | ||||||||
Totvs SA | 2,097 | 36,960 | ||||||
|
| |||||||
| Utilities — 3.2% | ||||||||
Centrais Eletricas Brasileiras SA | 4,991 | 13,189 | ||||||
Cia de Saneamento Basico do Estado de Sao Paulo | 5,790 | 72,666 | ||||||
Cia de Saneamento de Minas Gerais-Copasa | 999 | 20,756 | ||||||
CPFL Energia SA | 3,993 | 41,967 | ||||||
EDP — Energias do Brasil SA | 3,995 | 23,595 | ||||||
MPX Energia SA* | 2,396 | 10,628 | ||||||
Tractebel Energia SA | 2,595 | 44,768 | ||||||
Transmissora Alianca de Energia Eletrica SA | 1,600 | 17,331 | ||||||
|
| |||||||
| 244,900 | ||||||||
|
| |||||||
TOTAL COMMON STOCKS | 3,850,263 | |||||||
|
| |||||||
| PREFERRED STOCKS — 48.5% | ||||||||
| Basic Materials — 8.6% | ||||||||
Braskem SA* | 2,595 | 20,246 | ||||||
Gerdau SA | 14,474 | 88,190 | ||||||
Klabin SA | 8,086 | 48,966 | ||||||
Metalurgica Gerdau SA, Class A | 4,591 | 35,583 | ||||||
Suzano Papel e Celulose SA, Class A | 5,000 | 18,069 | ||||||
Usinas Siderurgicas de Minas Gerais SA* | 6,189 | 25,718 | ||||||
Vale SA | 31,940 | 427,248 | ||||||
|
| |||||||
| 664,020 | ||||||||
|
| |||||||
| Communications — 1.9% | ||||||||
Oi SA | 11,975 | 22,197 | ||||||
Telefonica Brasil SA | 4,991 | 122,806 | ||||||
|
| |||||||
| 145,003 | ||||||||
|
| |||||||
| Consumer, Cyclical — 1.0% | ||||||||
Lojas Americanas SA | 6,634 | 53,430 | ||||||
Marcopolo SA | 3,794 | 24,623 | ||||||
|
| |||||||
| 78,053 | ||||||||
|
| |||||||
| Consumer, Non-cyclical — 6.9% | ||||||||
Cia Brasileira de Distribuicao Grupo Pao de Acucar | 1,996 | 96,725 | ||||||
Cia de Bebidas das Americas | 11,477 | 439,135 | ||||||
|
| |||||||
| 535,860 | ||||||||
|
| |||||||
| Diversified — 2.7% | ||||||||
Itausa — Investimentos Itau SA | 48,076 | 211,446 | ||||||
|
| |||||||
| Energy — 8.6% | ||||||||
Petroleo Brasileiro SA | 70,575 | 660,672 | ||||||
|
| |||||||
| See Notes to Financial Statements. | 15 |
DBX ETF Trust
SCHEDULE OF INVESTMENTS
db X-trackers MSCI Brazil Hedged Equity Fund (Continued)
May 31, 2013
Number | Value | |||||||
| Financial — 16.4% | ||||||||
Banco Bradesco SA | 35,357 | $ | 566,722 | |||||
Banco do Estado do Rio Grande do Sul | 2,795 | 21,937 | ||||||
Bradespar SA | 3,793 | 39,067 | ||||||
Itau Unibanco Holding SA | 42,165 | 637,849 | ||||||
|
| |||||||
| 1,265,575 | ||||||||
|
| |||||||
| Utilities — 2.4% | ||||||||
AES Tiete SA | 1,797 | 19,507 | ||||||
Centrais Eletricas Brasileiras SA | 3,593 | 16,792 | ||||||
Cia Energetica de Minas Gerais | 9,090 | 91,885 | ||||||
Cia Energetica de Sao Paulo | 2,896 | 28,368 | ||||||
Cia Paranaense de Energia | 1,797 | 27,562 | ||||||
|
| |||||||
| 184,114 | ||||||||
|
| |||||||
TOTAL PREFERRED STOCKS | 3,744,743 | |||||||
|
| |||||||
Number | Value | |||||||
| RIGHTS — 0.0% (a) | ||||||||
| Diversified — 0.0% (a) | ||||||||
Itausa — Investimentos Itau SA*, expires 6/30/13 | 568 | $ | 719 | |||||
| �� | |||||||
TOTAL RIGHTS | 719 | |||||||
|
| |||||||
TOTAL INVESTMENTS — 98.3% | $ | 7,595,725 | ||||||
Other assets less liabilities — 1.7% | 131,972 | |||||||
|
| |||||||
NET ASSETS — 100.0% | $ | 7,727,697 | ||||||
|
| |||||||
As of May 31, 2013, the Fund had following forward foreign currency contracts outstanding:
Counterparty | Settlement Date | Currrency To Deliver | Currrency To Receive | Unrealized Appreciation (Depreciation) | ||||||||||||||
Barclays Bank PLC | 6/5/2013 | BRL | 3,841,000 | USD | 1,912,563 | $ | 121,146 | |||||||||||
JP Morgan Chase & Co. | 6/5/2013 | BRL | 3,841,000 | USD | 1,912,849 | 121,431 | ||||||||||||
JP Morgan Chase & Co. | 6/5/2013 | BRL | 73,000 | USD | 36,255 | 2,208 | ||||||||||||
The Bank of New York Mellon | 6/5/2013 | BRL | 7,878,255 | USD | 3,859,052 | 184,687 | ||||||||||||
Barclays Bank PLC | 6/5/2013 | USD | 1,800,581 | BRL | 3,841,000 | (9,164 | ) | |||||||||||
JP Morgan Chase & Co. | 6/5/2013 | USD | 1,834,716 | BRL | 3,914,000 | (9,252 | ) | |||||||||||
The Bank of New York Mellon | 6/5/2013 | USD | 45,206 | BRL | 90,910 | (2,807 | ) | |||||||||||
The Bank of New York Mellon | 6/5/2013 | USD | 117,000 | BRL | 238,657 | (5,692 | ) | |||||||||||
The Bank of New York Mellon | 6/5/2013 | USD | 37,565 | BRL | 77,000 | (1,652 | ) | |||||||||||
The Bank of New York Mellon | 6/5/2013 | USD | 3,501,260 | BRL | 7,471,689 | (16,514 | ) | |||||||||||
Barclays Bank PLC | 7/3/2013 | BRL | 8,085,000 | USD | 3,765,544 | 17,013 | ||||||||||||
JP Morgan Chase & Co. | 7/3/2013 | BRL | 8,085,000 | USD | 3,769,231 | 20,700 | ||||||||||||
The Bank of New York Mellon | 7/3/2013 | USD | 427,000 | BRL | 917,196 | (1,751 | ) | |||||||||||
|
| |||||||||||||||||
| $ | 420,353 | |||||||||||||||||
|
| |||||||||||||||||
Currency Abbreviations
BRL – Brazilian Real
USD – U.S. Dollar
* Non-income producing security.
(a) Less than 0.1%.
| See Notes to Financial Statements. | 16 |
DBX ETF Trust
SCHEDULE OF INVESTMENTS
db X-trackers MSCI EAFE Hedged Equity Fund
May 31, 2013
Number | Value | |||||||
| COMMON STOCKS — 97.2% | ||||||||
| Australia — 7.7% | ||||||||
AGL Energy Ltd | 3,455 | $ | 47,615 | |||||
ALS Ltd | 1,618 | 15,624 | ||||||
Alumina Ltd.* | 19,425 | 19,241 | ||||||
AMP Ltd | 21,372 | 105,952 | ||||||
Asciano Ltd | 4,954 | 23,943 | ||||||
ASX Ltd | 1,153 | 41,270 | ||||||
Australia & New Zealand Banking Group Ltd | 16,916 | 445,857 | ||||||
Bendigo and Adelaide Bank Ltd | 4,609 | 43,581 | ||||||
BHP Billiton Ltd | 19,872 | 663,364 | ||||||
Boral Ltd | 4,912 | 21,437 | ||||||
Brambles Ltd | 9,537 | 83,607 | ||||||
Caltex Australia Ltd | 1,977 | 42,534 | ||||||
Cochlear Ltd | 301 | 18,592 | ||||||
Commonwealth Bank of Australia | 9,955 | 637,003 | ||||||
Computershare Ltd | 2,820 | 30,200 | ||||||
Crown Ltd | 4,499 | 55,329 | ||||||
CSL Ltd | 3,735 | 213,044 | ||||||
Dexus Property Group REIT | 19,559 | 20,591 | ||||||
Federation Centres Ltd. REIT | 10,121 | 24,022 | ||||||
Fortescue Metals Group Ltd | 8,591 | 27,544 | ||||||
Goodman Group REIT | 8,681 | 42,704 | ||||||
GPT Group REIT | 11,107 | 41,350 | ||||||
Harvey Norman Holdings Ltd | 6,631 | 15,929 | ||||||
Iluka Resources Ltd | 3,015 | 32,433 | ||||||
Incitec Pivot Ltd | 7,693 | 21,499 | ||||||
Leighton Holdings Ltd | 3,119 | 52,507 | ||||||
Lend Lease Group | 2,790 | 26,755 | ||||||
Macquarie Group Ltd | 2,593 | 107,132 | ||||||
Mirvac Group REIT | 21,386 | 34,283 | ||||||
National Australia Bank Ltd | 14,670 | 407,157 | ||||||
Newcrest Mining Ltd | 5,771 | 80,140 | ||||||
Orica Ltd | 2,369 | 50,968 | ||||||
Origin Energy Ltd | 8,788 | 113,290 | ||||||
QBE Insurance Group Ltd | 8,203 | 125,689 | ||||||
Ramsay Health Care Ltd | 808 | 26,733 | ||||||
Rio Tinto Ltd | 2,992 | 158,007 | ||||||
Santos Ltd | 7,948 | 99,494 | ||||||
Sonic Healthcare Ltd | 2,197 | 29,920 | ||||||
SP AusNet | 42,329 | 48,816 | ||||||
Stockland REIT | 13,669 | 47,749 | ||||||
Suncorp Group Ltd | 7,887 | 94,126 | ||||||
Sydney Airport | 10,529 | 36,780 | ||||||
Telstra Corp. Ltd | 38,399 | 174,193 | ||||||
Wesfarmers Ltd | 6,060 | 227,581 | ||||||
Westfield Group REIT | 16,046 | 176,910 | ||||||
Westfield Retail Trust REIT | 17,778 | 52,404 | ||||||
Westpac Banking Corp | 19,077 | 519,246 | ||||||
Woodside Petroleum Ltd | 4,018 | 138,397 | ||||||
Woolworths Ltd | 7,805 | 246,502 | ||||||
Worleyparsons Ltd | 1,274 | 25,251 | ||||||
|
| |||||||
| 5,834,295 | ||||||||
|
| |||||||
| Austria — 0.4% | ||||||||
Erste Group Bank AG | 2,175 | 70,843 | ||||||
OMV AG | 703 | 32,666 | ||||||
Raiffeisen Bank International AG | 1,464 | 50,235 | ||||||
Number | Value | |||||||
| Austria (Continued) | ||||||||
Verbund AG | 1,515 | $ | 31,762 | |||||
Vienna Insurance Group AG Wiener Versicherung Gruppe | 1,515 | 74,334 | ||||||
Voestalpine AG | 1,515 | 50,626 | ||||||
|
| |||||||
| 310,466 | ||||||||
|
| |||||||
| Belgium — 1.0% | ||||||||
Anheuser-Busch InBev NV | 5,179 | 478,804 | ||||||
Colruyt SA | 509 | 26,102 | ||||||
Delhaize Group SA | 276 | 17,703 | ||||||
Groupe Bruxelles Lambert SA | 506 | 40,144 | ||||||
Solvay SA | 430 | 62,317 | ||||||
UCB SA | 1,515 | 83,284 | ||||||
Umicore SA | 868 | 41,720 | ||||||
|
| |||||||
| 750,074 | ||||||||
|
| |||||||
| Denmark — 1.1% | ||||||||
AP Moller-Maersk A/S, Class A | 1 | 6,876 | ||||||
AP Moller-Maersk A/S, Class B | 14 | 100,659 | ||||||
Carlsberg A/S, Class B | 1,063 | 101,559 | ||||||
Coloplast A/S, Class B | 420 | 24,018 | ||||||
Danske Bank A/S* | 4,999 | 98,833 | ||||||
DSV A/S | 1,515 | 36,529 | ||||||
Novo Nordisk A/S, Class B | 2,539 | 409,238 | ||||||
Novozymes A/S, Class B | 1,507 | 52,258 | ||||||
TDC A/S | 4,663 | 36,665 | ||||||
|
| |||||||
| 866,635 | ||||||||
|
| |||||||
| Finland — 0.7% | ||||||||
Fortum OYJ | 4,559 | 85,920 | ||||||
Kone OYJ, Class B | 1,033 | 91,501 | ||||||
Metso OYJ | 703 | 27,229 | ||||||
Nokia OYJ* | 25,818 | 88,657 | ||||||
Nokian Renkaat OYJ | 410 | 17,271 | ||||||
Sampo OYJ, Class A | 4,559 | 186,596 | ||||||
Wartsila OYJ Abp | 1,032 | 48,557 | ||||||
|
| |||||||
| 545,731 | ||||||||
|
| |||||||
| France — 9.2% | ||||||||
Aeroports de Paris | 914 | 83,752 | ||||||
Air Liquide SA | 1,845 | 238,245 | ||||||
Alstom SA | 1,995 | 75,521 | ||||||
AXA SA | 10,651 | 216,376 | ||||||
BNP Paribas SA | 6,241 | 367,664 | ||||||
Bouygues SA | 1,289 | 34,471 | ||||||
Bureau Veritas SA | 1,256 | 145,977 | ||||||
Carrefour SA | 3,664 | 108,651 | ||||||
Christian Dior SA | 325 | 59,836 | ||||||
Cie de St-Gobain | 2,519 | 109,812 | ||||||
Cie Generale de Geophysique-Veritas* | 1,485 | 36,885 | ||||||
Cie Generale des Etablissements Michelin | 1,492 | 131,441 | ||||||
Cie Generale d’Optique Essilor International SA | 1,675 | 185,335 | ||||||
CNP Assurances | 3,034 | 45,921 | ||||||
Credit Agricole SA* | 6,524 | 61,875 | ||||||
Danone SA | 3,898 | 287,468 | ||||||
Dassault Systemes SA | 865 | 109,055 | ||||||
EDF SA | 1,455 | 33,265 | ||||||
Eutelsat Communications SA | 1,515 | 47,219 | ||||||
| See Notes to Financial Statements. | 17 |
DBX ETF Trust
SCHEDULE OF INVESTMENTS
db X-trackers MSCI EAFE Hedged Equity Fund (Continued)
May 31, 2013
Number | Value | |||||||
| France (Continued) | ||||||||
France Telecom SA | 12,344 | $ | 125,834 | |||||
GDF Suez | 7,873 | 161,168 | ||||||
Gecina SA REIT | 955 | 117,088 | ||||||
Iliad SA | 105 | 22,027 | ||||||
JCDecaux SA | 1,439 | 37,669 | ||||||
Kering | 673 | 147,130 | ||||||
Klepierre REIT | 1,515 | 65,375 | ||||||
Lafarge SA | 1,299 | 93,451 | ||||||
Lagardere SCA | 1,254 | 32,312 | ||||||
Legrand SA | 1,571 | 77,684 | ||||||
L’Oreal SA | 1,495 | 253,286 | ||||||
LVMH Moet Hennessy Louis Vuitton SA | 1,527 | 271,211 | ||||||
Natixis | 11,983 | 56,693 | ||||||
Pernod-Ricard SA | 1,515 | 182,518 | ||||||
Publicis Groupe SA | 1,075 | 77,225 | ||||||
Renault SA | 1,289 | 100,120 | ||||||
Safran SA | 555 | 29,644 | ||||||
Sanofi | 7,496 | 803,887 | ||||||
Schneider Electric SA | 3,374 | 268,997 | ||||||
Societe BIC SA | 868 | 92,533 | ||||||
Societe Generale SA | 4,390 | 176,084 | ||||||
Sodexo | 627 | 53,509 | ||||||
Suez Environnement Co | 3,634 | 46,916 | ||||||
Technip SA | 657 | 73,379 | ||||||
Total SA | 13,183 | 661,138 | ||||||
Unibail-Rodamco SE REIT | 642 | 157,917 | ||||||
Vallourec SA | 718 | 39,009 | ||||||
Vinci SA | 2,820 | 145,494 | ||||||
Vivendi SA | 8,758 | 172,683 | ||||||
|
| |||||||
| 6,920,750 | ||||||||
|
| |||||||
| Germany — 8.3% | ||||||||
Adidas AG | 1,558 | 170,283 | ||||||
Allianz SE | 2,832 | 440,786 | ||||||
BASF SE | 5,267 | 515,007 | ||||||
Bayer AG | 5,200 | 560,228 | ||||||
Bayerische Motoren Werke AG | 2,025 | 193,951 | ||||||
Beiersdorf AG | 673 | 60,820 | ||||||
Brenntag AG | 316 | 48,260 | ||||||
Celesio AG | 1,515 | 31,408 | ||||||
Commerzbank AG* | 6,075 | 63,800 | ||||||
Continental AG | 687 | 90,766 | ||||||
Daimler AG | 6,034 | 387,507 | ||||||
Deutsche Bank AG (a) | 6,402 | 300,180 | ||||||
Deutsche Boerse AG | 1,931 | 124,964 | ||||||
Deutsche Lufthansa AG* | 2,362 | 51,054 | ||||||
Deutsche Post AG | 6,285 | 159,784 | ||||||
Deutsche Telekom AG | 17,584 | 201,990 | ||||||
E.ON SE | 11,174 | 189,675 | ||||||
Fraport AG Frankfurt Airport Services Worldwide* | 869 | 51,391 | ||||||
Fresenius Medical Care AG & Co. KGaA | 1,665 | 113,398 | ||||||
Fresenius SE & Co. KGaA | 1,060 | 126,035 | ||||||
GEA Group AG | 1,063 | 38,865 | ||||||
Hannover Rueckversicherung SE | 1,234 | 93,539 | ||||||
Heidelbergcement AG | 808 | 61,426 | ||||||
Henkel AG & Co. KGaA | 816 | 66,924 | ||||||
Number | Value | |||||||
| Germany (Continued) | ||||||||
Hochtief AG | 705 | $ | 49,802 | |||||
Infineon Technologies AG | 7,484 | 63,714 | ||||||
K+S AG | 1,732 | 73,185 | ||||||
Kabel Deutschland Holding AG | 869 | 82,226 | ||||||
Lanxess AG | 644 | 48,188 | ||||||
Linde AG | 1,120 | 215,519 | ||||||
MAN SE* | 657 | 73,105 | ||||||
Merck KGaA | 404 | 64,193 | ||||||
Muenchener Rueckversicherungs AG | 1,126 | 211,698 | ||||||
RWE AG | 3,105 | 106,765 | ||||||
SAP AG* | 5,729 | 432,106 | ||||||
Siemens AG | 5,194 | 550,940 | ||||||
Suedzucker AG | 223 | 7,579 | ||||||
ThyssenKrupp AG* | 2,683 | 53,895 | ||||||
Volkswagen AG | 181 | 38,829 | ||||||
|
| |||||||
| 6,213,785 | ||||||||
|
| |||||||
| Hong Kong — 2.9% | ||||||||
AIA Group Ltd | 75,004 | 333,830 | ||||||
Cathay Pacific Airways Ltd | 55,721 | 103,939 | ||||||
Cheung Kong Holdings Ltd | 12,859 | 181,887 | ||||||
CLP Holdings Ltd | 16,076 | 135,751 | ||||||
Galaxy Entertainment Group Ltd.* | 25,933 | 135,635 | ||||||
Hang Lung Properties Ltd | 14,145 | 49,746 | ||||||
Hang Seng Bank Ltd | 5,576 | 89,790 | ||||||
Hong Kong Exchanges & Clearing Ltd | 7,076 | 119,231 | ||||||
Hutchison Whampoa Ltd | 12,859 | 136,995 | ||||||
Kerry Properties Ltd | 7,720 | 31,327 | ||||||
Li & Fung Ltd | 56,577 | 79,006 | ||||||
Link REIT (The) | 15,220 | 78,721 | ||||||
MTR Corp. Ltd | 14,145 | 55,942 | ||||||
New World Development Co. Ltd | 17,145 | 27,388 | ||||||
Power Assets Holdings Ltd | 8,359 | 73,601 | ||||||
Sands China Ltd | 17,576 | 93,285 | ||||||
Shangri-La Asia Ltd | 27,647 | 51,215 | ||||||
Sino Land Co. Ltd | 31,589 | 47,124 | ||||||
Sun Hung KAI Properties Ltd | 12,859 | 170,954 | ||||||
Swire Pacific Ltd., Class A | 4,932 | 62,709 | ||||||
Wheelock & Co. Ltd | 13,288 | 74,463 | ||||||
Wynn Macau Ltd | 12,644 | 37,545 | ||||||
|
| |||||||
| 2,170,084 | ||||||||
|
| |||||||
| Ireland — 0.7% | ||||||||
CRH PLC | 5,714 | 121,056 | ||||||
Elan Corp. PLC* | 2,594 | 31,861 | ||||||
Experian PLC | 10,519 | 195,308 | ||||||
Kerry Group PLC, Class A | 937 | 53,221 | ||||||
Shire PLC | 4,724 | 155,756 | ||||||
|
| |||||||
| 557,202 | ||||||||
|
| |||||||
| Israel — 0.4% | ||||||||
Bank Hapoalim BM* | 6,931 | 32,272 | ||||||
Teva Pharmaceutical Industries Ltd | 6,434 | 247,062 | ||||||
|
| |||||||
| 279,334 | ||||||||
|
| |||||||
| Italy — 1.8% | ||||||||
Assicurazioni Generali SpA | 7,384 | 138,682 | ||||||
Banca Monte dei Paschi di Siena SpA* | 57,131 | 17,859 | ||||||
| See Notes to Financial Statements. | 18 |
DBX ETF Trust
SCHEDULE OF INVESTMENTS
db X-trackers MSCI EAFE Hedged Equity Fund (Continued)
May 31, 2013
Number | Value | |||||||
| Italy (Continued) | ||||||||
Enel SpA | 40,738 | $ | 154,506 | |||||
ENI SpA | 15,781 | 358,948 | ||||||
Fiat Industrial SpA | 5,246 | 60,616 | ||||||
Fiat SpA* | 2,609 | 20,770 | ||||||
Intesa Sanpaolo SpA | 69,499 | 131,793 | ||||||
Luxottica Group SpA | 1,515 | 78,883 | ||||||
Mediobanca SpA | 4,129 | 27,477 | ||||||
Pirelli & C SpA | 3,015 | 35,053 | ||||||
Prysmian SpA | 1,515 | 32,589 | ||||||
Saipem SpA | 2,100 | 56,527 | ||||||
Telecom Italia SpA | 87,645 | 68,236 | ||||||
Unicredit SpA | 25,158 | 143,680 | ||||||
Unione di Banche Italiane SCPA | 6,484 | 29,378 | ||||||
|
| |||||||
| 1,354,997 | ||||||||
|
| |||||||
| Japan — 21.1% | ||||||||
Aisin Seiki Co. Ltd | 1,500 | 55,846 | ||||||
Asahi Glass Co. Ltd | 6,000 | 43,840 | ||||||
Asahi Kasei Corp | 800 | 5,511 | ||||||
Astellas Pharma, Inc | 3,000 | 156,189 | ||||||
Bank of Yokohama Ltd. (The) | 15,000 | 74,959 | ||||||
Bridgestone Corp | 4,500 | 150,963 | ||||||
Canon, Inc | 7,400 | 260,037 | ||||||
Central Japan Railway Co | 1,504 | 167,685 | ||||||
Chiba Bank Ltd. (The) | 2,000 | 12,722 | ||||||
Chubu Electric Power Co., Inc | 4,400 | 57,773 | ||||||
Chugai Pharmaceutical Co. Ltd | 1,500 | 30,536 | ||||||
Chugoku Electric Power Co., (The), Inc | 2,900 | 40,012 | ||||||
Credit Saison Co. Ltd | 1,500 | 36,121 | ||||||
Dai Nippon Printing Co. Ltd | 14,000 | 121,945 | ||||||
Dai-ichi Life Insurance Co. Ltd. (The) | 60 | 83,918 | ||||||
Daiichi Sankyo Co. Ltd | 4,400 | 73,717 | ||||||
Daikin Industries Ltd | 1,500 | 67,194 | ||||||
Daito Trust Construction Co. Ltd | 1,400 | 132,119 | ||||||
Daiwa House Industry Co. Ltd | 3,000 | 57,668 | ||||||
Daiwa Securities Group, Inc | 15,000 | 128,117 | ||||||
Denso Corp | 4,500 | 191,952 | ||||||
Dentsu, Inc | 1,500 | 46,663 | ||||||
East Japan Railway Co | 4,100 | 309,372 | ||||||
Eisai Co. Ltd | 1,500 | 58,235 | ||||||
Electric Power Development Co. Ltd | 1,500 | 47,932 | ||||||
FamilyMart Co. Ltd | 1,400 | 57,210 | ||||||
Fanuc Corp | 1,500 | 227,565 | ||||||
Fast Retailing Co. Ltd | 300 | 104,226 | ||||||
FUJIFILM Holdings Corp | 3,100 | 66,225 | ||||||
Hitachi Ltd | 31,000 | 216,017 | ||||||
Hokkaido Electric Power Co., Inc.* | 3,000 | 39,928 | ||||||
Hokuriku Electric Power Co | 3,000 | 41,302 | ||||||
Honda Motor Co. Ltd | 10,500 | 400,328 | ||||||
Hoya Corp | 3,000 | 61,102 | ||||||
Ibiden Co. Ltd | 100 | 1,609 | ||||||
Inpex Corp | 15 | 65,253 | ||||||
Isetan Mitsukoshi Holdings Ltd | 4,500 | 57,160 | ||||||
Isuzu Motors Ltd | 12,000 | 92,579 | ||||||
ITOCHU Corp | 15,000 | 191,280 | ||||||
Japan Exchange Group, Inc | 300 | 28,341 | ||||||
Japan Real Estate Investment Corp. REIT | 1 | 9,985 | ||||||
Number | Value | |||||||
| Japan (Continued) | ||||||||
Japan Tobacco, Inc | 6,900 | $ | 237,659 | |||||
JFE Holdings, Inc | 1,600 | 34,165 | ||||||
JGC Corp | 1,700 | 57,877 | ||||||
JX Holdings, Inc | 15,100 | 75,158 | ||||||
Kaneka Corp | 14,000 | 86,407 | ||||||
Kansai Electric Power Co., (The), Inc.* | 5,800 | 69,516 | ||||||
Kao Corp | 1,600 | 50,649 | ||||||
KDDI Corp | 4,310 | 197,791 | ||||||
Keikyu Corp | 500 | 4,320 | ||||||
Keio Corp | 800 | 5,399 | ||||||
Keyence Corp | 310 | 96,590 | ||||||
Kirin Holdings Co. Ltd | 5,000 | 82,524 | ||||||
Kobe Steel Ltd.* | 59,000 | 80,464 | ||||||
Komatsu Ltd | 6,000 | 155,950 | ||||||
Konica Minolta, Inc | 300 | 2,204 | ||||||
Kubota Corp | 1,000 | 14,932 | ||||||
Kuraray Co. Ltd | 7,500 | 109,004 | ||||||
Kyocera Corp | 1,500 | 150,814 | ||||||
Kyushu Electric Power Co., Inc.* | 3,000 | 41,780 | ||||||
Lawson, Inc | 400 | 29,227 | ||||||
LIXIL Group Corp | 1,600 | 38,895 | ||||||
Makita Corp | 1,500 | 82,276 | ||||||
Mazda Motor Corp.* | 30,000 | 120,651 | ||||||
McDonald’s Holdings Co. Japan Ltd | 1,500 | 41,810 | ||||||
Miraca Holdings, Inc | 100 | 4,365 | ||||||
Mitsubishi Chemical Holdings Corp | 7,800 | 37,969 | ||||||
Mitsubishi Corp | 9,000 | 160,012 | ||||||
Mitsubishi Electric Corp | 15,000 | 145,886 | ||||||
Mitsubishi Estate Co. Ltd | 14,000 | 354,965 | ||||||
Mitsubishi Gas Chemical Co., Inc | 1,000 | 7,297 | ||||||
Mitsubishi Heavy Industries Ltd | 30,200 | 189,999 | ||||||
Mitsubishi Materials Corp | 29,000 | 94,978 | ||||||
Mitsubishi Tanabe Pharma Corp | 4,500 | 57,966 | ||||||
Mitsubishi UFJ Financial Group, Inc | 80,600 | 477,398 | ||||||
Mitsui & Co. Ltd | 12,000 | 154,218 | ||||||
Mitsui Fudosan Co. Ltd | 5,500 | 156,752 | ||||||
Mitsui O.S.K. Lines Ltd.* | 12,000 | 44,079 | ||||||
Mizuho Financial Group, Inc | 167,500 | 325,146 | ||||||
MS&AD Insurance Group Holdings, Inc | 3,000 | 76,363 | ||||||
Murata Manufacturing Co. Ltd | 1,500 | 115,873 | ||||||
NEC Corp | 13,000 | 30,929 | ||||||
NIDEC Corp | 600 | 41,332 | ||||||
Nikon Corp | 2,600 | 69,986 | ||||||
Nintendo Co. Ltd | 1,400 | 140,341 | ||||||
Nippon Electric Glass Co. Ltd | 14,000 | 72,610 | ||||||
Nippon Steel & Sumitomo Metal Corp | 60,000 | 155,293 | ||||||
Nippon Telegraph and Telephone Corp | 3,000 | 150,814 | ||||||
Nishi-Nippon City Bank Ltd. (The) | 16,000 | 39,341 | ||||||
Nissan Motor Co. Ltd | 16,600 | 184,252 | ||||||
Nissin Foods Holdings Co. Ltd | 1,500 | 58,235 | ||||||
Nitori Holdings Co. Ltd | 50 | 3,957 | ||||||
Nitto Denko Corp | 1,400 | 85,292 | ||||||
Nomura Holdings, Inc | 25,300 | 198,713 | ||||||
NTT Data Corp | 15 | 51,590 | ||||||
NTT DoCoMo, Inc | 105 | 156,578 | ||||||
Odakyu Electric Railway Co. Ltd | 1,000 | 9,855 | ||||||
Oji Holdings Corp | 600 | 2,138 | ||||||
Olympus Corp.* | 1,200 | 36,793 | ||||||
| See Notes to Financial Statements. | 19 |
DBX ETF Trust
SCHEDULE OF INVESTMENTS
db X-trackers MSCI EAFE Hedged Equity Fund (Continued)
May 31, 2013
Number | Value | |||||||
| Japan (Continued) | ||||||||
Omron Corp | 1,400 | $ | 42,228 | |||||
Ono Pharmaceutical Co. Ltd | 500 | 34,941 | ||||||
Oriental Land Co. Ltd | 1,400 | 192,046 | ||||||
ORIX Corp | 7,500 | 102,957 | ||||||
Otsuka Holdings Co. Ltd | 2,700 | 86,949 | ||||||
Panasonic Corp.* | 15,000 | 117,814 | ||||||
Rakuten, Inc | 4,500 | 50,799 | ||||||
Resona Holdings, Inc | 12,000 | 55,189 | ||||||
Ricoh Co. Ltd | 4,000 | 48,181 | ||||||
Rinnai Corp | 1,400 | 112,329 | ||||||
Sankyo Co. Ltd | 1,500 | 66,672 | ||||||
Secom Co. Ltd | 1,500 | 77,199 | ||||||
Sega Sammy Holdings, Inc | 1,500 | 36,404 | ||||||
Sekisui Chemical Co. Ltd | 14,000 | 142,432 | ||||||
Sekisui House Ltd | 3,800 | 50,273 | ||||||
Seven & I Holdings Co. Ltd | 6,000 | 209,347 | ||||||
Sharp Corp.* | 6,000 | 28,431 | ||||||
Shikoku Electric Power Co., Inc.* | 1,500 | 24,877 | ||||||
Shimano, Inc | 100 | 7,814 | ||||||
Shin-Etsu Chemical Co. Ltd | 3,000 | 193,221 | ||||||
Shiseido Co. Ltd | 1,500 | 21,592 | ||||||
SMC Corp | 1,400 | 274,411 | ||||||
Softbank Corp | 6,000 | 308,795 | ||||||
Sony Corp | 7,400 | 150,939 | ||||||
Sumitomo Corp | 12,000 | 153,740 | ||||||
Sumitomo Mitsui Financial Group, Inc | 9,100 | 367,334 | ||||||
Sumitomo Mitsui Trust Holdings, Inc | 20,000 | 85,212 | ||||||
Sumitomo Realty & Development Co. Ltd | 2,100 | 82,679 | ||||||
Suzuki Motor Corp | 2,700 | 67,436 | ||||||
T&D Holdings, Inc | 4,500 | 56,354 | ||||||
Taisho Pharmaceutical Holdings Co. Ltd | 34 | 2,308 | ||||||
Takeda Pharmaceutical Co. Ltd | 5,800 | 259,818 | ||||||
TDK Corp | 600 | 23,533 | ||||||
Terumo Corp | 1,300 | 65,870 | ||||||
Toho Gas Co. Ltd | 14,000 | 74,282 | ||||||
Tohoku Electric Power Co., Inc.* | 3,000 | 35,807 | ||||||
Tokio Marine Holdings, Inc | 4,500 | 134,165 | ||||||
Tokyo Electric Power Co., (The), Inc.* | 13,300 | 81,689 | ||||||
Tokyo Electron Ltd | 1,500 | 76,153 | ||||||
Tokyo Gas Co. Ltd | 3,000 | 16,276 | ||||||
Tokyu Corp | 12,600 | 79,397 | ||||||
Toppan Printing Co. Ltd | 14,000 | 93,236 | ||||||
Toray Industries, Inc | 14,200 | 99,515 | ||||||
Toshiba Corp | 30,000 | 145,737 | ||||||
Toyota Industries Corp | 1,500 | 60,400 | ||||||
Toyota Motor Corp | 17,900 | 1,070,917 | ||||||
Toyota Tsusho Corp | 1,500 | 40,839 | ||||||
Trend Micro, Inc | 100 | 3,116 | ||||||
Unicharm Corp | 1,500 | 84,814 | ||||||
West Japan Railway Co | 1,300 | 54,676 | ||||||
Yahoo Japan Corp | 90 | 41,481 | ||||||
Yakult Honsha Co. Ltd | 1,500 | 64,730 | ||||||
Yamaguchi Financial Group, Inc | 12,400 | 109,243 | ||||||
Yamaha Corp | 1,600 | 17,536 | ||||||
Yamaha Motor Co. Ltd | 1,600 | 25,659 | ||||||
Yamato Holdings Co. Ltd | 1,600 | 29,960 | ||||||
|
| |||||||
| 15,868,265 | ||||||||
|
| |||||||
Number | Value | |||||||
| Luxembourg — 0.1% | ||||||||
Millicom International Cellular SA | 393 | $ | 31,537 | |||||
SES SA | 360 | 10,762 | ||||||
|
| |||||||
| 42,299 | ||||||||
|
| |||||||
| Netherlands — 4.6% | ||||||||
Aegon NV | 7,228 | 49,416 | ||||||
Akzo Nobel NV | 1,822 | 116,714 | ||||||
ASML Holding NV | 1,856 | 155,016 | ||||||
European Aeronautic Defence & Space Co. NV | 3,654 | 211,105 | ||||||
Fugro NV | 955 | 56,844 | ||||||
Gemalto NV | 447 | 37,532 | ||||||
Heineken Holding NV | 1,015 | 60,204 | ||||||
Heineken NV | 2,212 | 154,649 | ||||||
ING Groep NV* | 23,847 | 224,156 | ||||||
Koninklijke Ahold NV | 8,014 | 130,463 | ||||||
Koninklijke DSM NV | 1,063 | 69,938 | ||||||
Koninklijke KPN NV | 20,227 | 39,172 | ||||||
Koninklijke Philips Electronics NV | 6,224 | 177,122 | ||||||
Randstad Holding NV | 1,515 | 64,981 | ||||||
Royal Dutch Shell PLC, Class A | 23,690 | 792,966 | ||||||
Royal Dutch Shell PLC, Class B | 16,452 | 570,064 | ||||||
Tenaris SA | 1,239 | 26,362 | ||||||
TNT Express NV | 3,015 | 23,250 | ||||||
Unilever NV | 10,570 | 433,238 | ||||||
Ziggo NV | 1,068 | 38,729 | ||||||
|
| |||||||
| 3,431,921 | ||||||||
|
| |||||||
| New Zealand — 0.1% | ||||||||
Contact Energy Ltd | 7,601 | 31,173 | ||||||
Fletcher Building Ltd | 2,909 | 19,352 | ||||||
|
| |||||||
| 50,525 | ||||||||
|
| |||||||
| Norway — 0.9% | ||||||||
Arcelormittal | 5,419 | 69,729 | ||||||
DNB ASA | 8,929 | 145,225 | ||||||
Seadrill Ltd | 3,161 | 129,485 | ||||||
Statoil ASA | 6,656 | 151,638 | ||||||
Telenor ASA | 7,077 | 149,290 | ||||||
Yara International ASA | 1,184 | 53,101 | ||||||
|
| |||||||
| 698,468 | ||||||||
|
| |||||||
| Portugal — 0.1% | ||||||||
Galp Energia SGPS SA | 1,375 | 22,608 | ||||||
Jeronimo Martins SGPS SA | 3,015 | 64,326 | ||||||
|
| |||||||
| 86,934 | ||||||||
|
| |||||||
| Singapore — 1.7% | ||||||||
Capitaland Ltd | 15,100 | 41,336 | ||||||
City Developments Ltd | 14,000 | 119,404 | ||||||
DBS Group Holdings Ltd | 15,000 | 203,647 | ||||||
Global Logistic Properties Ltd | 73,000 | 162,870 | ||||||
Golden Agri-Resources Ltd | 10,000 | 4,549 | ||||||
Hutchison Port Holdings Trust, Class U | 119,789 | 94,633 | ||||||
Jardine Cycle & Carriage Ltd | 300 | 11,096 | ||||||
Keppel Corp. Ltd | 2,000 | 16,646 | ||||||
Olam International Ltd | 16,000 | 22,153 | ||||||
Oversea-Chinese Banking Corp. Ltd | 16,000 | 130,765 | ||||||
SembCorp Industries Ltd | 14,100 | 54,327 | ||||||
| See Notes to Financial Statements. | 20 |
DBX ETF Trust
SCHEDULE OF INVESTMENTS
db X-trackers MSCI EAFE Hedged Equity Fund (Continued)
May 31, 2013
Number | Value | |||||||
| Singapore (Continued) | ||||||||
SembCorp Marine Ltd | 14,200 | $ | 48,758 | |||||
Singapore Technologies Engineering Ltd | 14,800 | 47,891 | ||||||
Singapore Telecommunications Ltd | 46,000 | 136,477 | ||||||
United Overseas Bank Ltd | 12,000 | 203,363 | ||||||
|
| |||||||
| 1,297,915 | ||||||||
|
| |||||||
| Spain — 2.8% | ||||||||
Acciona SA | 554 | 34,624 | ||||||
Amadeus It Holding SA, Class A | 2,389 | 72,985 | ||||||
Banco Bilbao Vizcaya Argentaria SA | 33,808 | 318,447 | ||||||
Banco Popular Espanol SA | 39,603 | 33,149 | ||||||
Banco Santander SA | 72,064 | 518,904 | ||||||
Bankia SA* | 220 | 252 | ||||||
Distribuidora Internacional de Alimentacion SA | 3,664 | 28,902 | ||||||
Enagas SA | 1,962 | 49,243 | ||||||
Ferrovial SA | 3,499 | 56,757 | ||||||
Gas Natural SDG SA | 2,113 | 43,914 | ||||||
Grifols SA* | 937 | 34,411 | ||||||
Iberdrola SA | 30,085 | 163,177 | ||||||
Inditex SA | 1,690 | 210,476 | ||||||
Red Electrica Corp. SA | 1,050 | 55,954 | ||||||
Repsol SA | 4,999 | 114,550 | ||||||
Telefonica SA* | 28,075 | 386,798 | ||||||
Zardoya Otis SA | 1,515 | 20,597 | ||||||
|
| |||||||
| 2,143,140 | ||||||||
|
| |||||||
| Sweden — 3.2% | ||||||||
ASSA Abloy AB, Class B | 2,197 | 88,996 | ||||||
Atlas Copco AB, Class A | 5,847 | 156,077 | ||||||
Atlas Copco AB, Class B | 2,396 | 57,120 | ||||||
Boliden AB | 1,515 | 21,879 | ||||||
Electrolux AB | 1,388 | 37,679 | ||||||
Hennes & Mauritz AB, Class B | 6,214 | 213,909 | ||||||
Hexagon AB, Class B | 2,212 | 64,857 | ||||||
Husqvarna AB, Class B | 4,499 | 25,751 | ||||||
Investment AB Kinnevik, Class B | 1,470 | 39,262 | ||||||
Investor AB, Class B | 2,831 | 82,066 | ||||||
Lundin Petroleum AB* | 1,500 | 31,389 | ||||||
Nordea Bank AB | 16,126 | 200,134 | ||||||
Sandvik AB | 8,710 | 123,220 | ||||||
Scania AB, Class B | 1,991 | 44,820 | ||||||
Securitas AB, Class B | 1,635 | 15,033 | ||||||
Skandinaviska Enskilda Banken AB, Class A | 12,544 | 131,816 | ||||||
Skanska AB, Class B | 2,362 | 42,223 | ||||||
SKF AB, Class B | 2,655 | 64,938 | ||||||
Svenska Handelsbanken AB, Class A | 4,184 | 180,983 | ||||||
Swedbank AB, Class A | 7,351 | 176,690 | ||||||
Swedish Match AB | 2,007 | 69,816 | ||||||
Tele2 AB, Class B | 2,673 | 33,496 | ||||||
Telefonaktiebolaget LM Ericsson, Class B | 19,243 | 227,197 | ||||||
Teliasonera AB | 16,375 | 110,191 | ||||||
Volvo AB, Class B | 11,084 | 163,833 | ||||||
|
| |||||||
| 2,403,375 | ||||||||
|
| |||||||
| Switzerland — 9.6% | ||||||||
ABB Ltd.* | 14,473 | 320,411 | ||||||
Adecco SA* | 832 | 46,810 | ||||||
Aryzta AG* | 460 | 26,530 | ||||||
Number | Value | |||||||
| Switzerland (Continued) | ||||||||
Baloise Holding AG | 1,219 | $ | 120,275 | |||||
Cie Financiere Richemont SA | 3,285 | 294,920 | ||||||
Credit Suisse Group AG* | 9,409 | 282,885 | ||||||
Geberit AG | 241 | 60,285 | ||||||
Givaudan SA* | 31 | 40,166 | ||||||
Glencore Xstrata PLC | 62,524 | 306,944 | ||||||
Holcim Ltd.* | 1,545 | 120,692 | ||||||
Julius Baer Group Ltd.* | 1,364 | 54,203 | ||||||
Kuehne + Nagel International AG | 364 | 40,920 | ||||||
Lonza Group AG* | 331 | 24,732 | ||||||
Nestle SA | 19,595 | 1,300,186 | ||||||
Novartis AG | 14,428 | 1,041,079 | ||||||
Pargesa Holding SA | 763 | 53,221 | ||||||
Partners Group Holding AG | 109 | 27,744 | ||||||
Roche Holding AG | 4,409 | 1,102,423 | ||||||
Schindler Holding AG | 660 | 94,005 | ||||||
Schindler Holding AG Participation Certificates | 316 | 46,198 | ||||||
SGS SA | 30 | 67,827 | ||||||
Sika AG | 15 | 37,114 | ||||||
Sonova Holding AG* | 331 | 36,518 | ||||||
STMicroelectronics NV | 3,499 | 33,026 | ||||||
Sulzer AG | 118 | 19,904 | ||||||
Swatch Group AG (The) | 334 | 154,587 | ||||||
Swiss Life Holding AG* | 479 | 80,297 | ||||||
Swiss Re AG* | 2,212 | 163,428 | ||||||
Swisscom AG | 150 | 64,188 | ||||||
Syngenta AG | 629 | 247,324 | ||||||
Transocean Ltd | 2,264 | 115,562 | ||||||
UBS AG* | 22,884 | 407,066 | ||||||
Wolseley PLC | 1,721 | 88,332 | ||||||
Zurich Insurance Group AG* | 1,033 | 274,602 | ||||||
|
| |||||||
| 7,194,404 | ||||||||
|
| |||||||
| United Kingdom — 18.8% | ||||||||
3i Group PLC | 7,258 | 37,583 | ||||||
Aggreko PLC | 1,687 | 45,805 | ||||||
Anglo American PLC | 8,983 | 208,350 | ||||||
Antofagasta PLC | 1,003 | 14,409 | ||||||
ARM Holdings PLC | 9,117 | 136,862 | ||||||
Associated British Foods PLC | 2,237 | 61,589 | ||||||
AstraZeneca PLC | 8,245 | 424,433 | ||||||
Aviva PLC | 22,511 | 114,171 | ||||||
Babcock International Group PLC | 1,922 | 33,876 | ||||||
BAE Systems PLC | 28,378 | 174,670 | ||||||
Barclays PLC | 76,724 | 373,565 | ||||||
BG Group PLC | 21,089 | 388,680 | ||||||
BHP Billiton PLC | 13,126 | 382,023 | ||||||
BP PLC | 120,160 | 864,389 | ||||||
British American Tobacco PLC | 12,355 | 680,121 | ||||||
British Land Co. PLC REIT | 6,751 | 62,468 | ||||||
British Sky Broadcasting Group PLC | 9,163 | 108,664 | ||||||
BT Group PLC | 49,048 | 225,137 | ||||||
Burberry Group PLC | 2,711 | 59,851 | ||||||
Capita PLC | 4,115 | 60,148 | ||||||
Carnival PLC | 778 | 26,538 | ||||||
Centrica PLC | 32,568 | 188,040 | ||||||
Cobham PLC | 6,773 | 29,412 | ||||||
| See Notes to Financial Statements. | 21 |
DBX ETF Trust
SCHEDULE OF INVESTMENTS
db X-trackers MSCI EAFE Hedged Equity Fund (Continued)
May 31, 2013
Number | Value | |||||||
| United Kingdom (Continued) | ||||||||
Compass Group PLC | 14,126 | $ | 185,979 | |||||
Diageo PLC | 16,171 | 479,368 | ||||||
Fresnillo PLC | 1,515 | 26,541 | ||||||
G4S PLC | 3,075 | 11,522 | ||||||
GKN PLC | 10,543 | 47,881 | ||||||
GlaxoSmithKline PLC | 30,761 | 800,866 | ||||||
Hammerson PLC REIT | 3,359 | 26,182 | ||||||
HSBC Holdings PLC | 116,079 | 1,280,282 | ||||||
IMI PLC | 1,065 | 20,923 | ||||||
Imperial Tobacco Group PLC | 5,937 | 213,882 | ||||||
Intercontinental Hotels Group PLC | 1,685 | 48,823 | ||||||
Intertek Group PLC | 415 | 20,272 | ||||||
Invensys PLC | 6,014 | 36,350 | ||||||
Investec PLC | 4,275 | 30,217 | ||||||
ITV PLC | 23,058 | 45,930 | ||||||
J Sainsbury PLC | 7,486 | 42,574 | ||||||
Johnson Matthey PLC | 1,447 | 56,306 | ||||||
Kingfisher PLC | 14,701 | 77,196 | ||||||
Land Securities Group PLC REIT | 6,660 | 94,463 | ||||||
Legal & General Group PLC | 26,837 | 72,990 | ||||||
Lloyds Banking Group PLC* | 287,132 | 270,968 | ||||||
Marks & Spencer Group PLC | 9,979 | 71,399 | ||||||
Meggitt PLC | 4,930 | 39,888 | ||||||
National Grid PLC | 23,500 | 280,115 | ||||||
Next PLC | 1,003 | 70,392 | ||||||
Old Mutual PLC | 30,729 | 95,901 | ||||||
Pearson PLC | 6,494 | 121,266 | ||||||
Prudential PLC | 18,703 | 317,424 | ||||||
Randgold Resources Ltd | 460 | 36,554 | ||||||
Reckitt Benckiser Group PLC | 4,410 | 316,402 | ||||||
Reed Elsevier PLC | 7,360 | 82,809 | ||||||
Rexam PLC | 5,412 | 43,582 | ||||||
Rio Tinto PLC | 8,185 | 355,307 | ||||||
Rolls-Royce Holdings PLC* | 15,958 | 292,173 | ||||||
Royal Bank of Scotland Group PLC* | 14,370 | 73,493 | ||||||
SABMiller PLC | 6,750 | 341,526 | ||||||
Sage Group PLC (The)* | 5,560 | 30,843 | ||||||
Schroders PLC | 704 | 25,330 | ||||||
Segro PLC REIT | 3,059 | 12,986 | ||||||
Serco Group PLC | 1,229 | 11,428 | ||||||
Severn Trent PLC | 1,515 | 47,235 | ||||||
Smith & Nephew PLC | 4,825 | 56,560 | ||||||
Smiths Group PLC | 1,732 | 36,290 | ||||||
SSE PLC | 6,720 | 158,670 | ||||||
Standard Chartered PLC | 16,197 | 378,254 | ||||||
Standard Life PLC | 7,484 | 44,666 | ||||||
Subsea 7 SA | 1,657 | 36,734 | ||||||
Tate & Lyle PLC | 3,840 | 47,639 | ||||||
Tesco PLC | 50,953 | 282,926 | ||||||
TUI Travel PLC | 10,528 | 57,347 | ||||||
Tullow Oil PLC | 6,165 | 97,887 | ||||||
Unilever PLC | 9,766 | 411,770 | ||||||
Number | Value | |||||||
| United Kingdom (Continued) | ||||||||
Vedanta Resources PLC | 1,515 | $ | 29,050 | |||||
Vodafone Group PLC | 307,252 | 896,103 | ||||||
Weir Group PLC (The) | 1,620 | 57,376 | ||||||
Whitbread PLC | 1,515 | 66,364 | ||||||
WM Morrison Supermarkets PLC | 13,909 | 57,864 | ||||||
WPP PLC | 9,751 | 167,122 | ||||||
|
| |||||||
| 14,138,974 | ||||||||
|
| |||||||
TOTAL COMMON STOCKS | 73,159,573 | |||||||
|
| |||||||
| PREFERRED STOCKS — 0.7% | ||||||||
| Germany — 0.7% | ||||||||
Bayerische Motoren Werke AG | 57 | 3,985 | ||||||
Henkel AG & Co. KGaA | 2,128 | 206,333 | ||||||
Porsche Automobil Holding SE | 898 | 75,131 | ||||||
ProSiebenSat.1 Media AG* | 371 | 14,900 | ||||||
RWE AG-Non Vote | 1,423 | 47,006 | ||||||
Volkswagen AG | 899 | 197,414 | ||||||
|
| |||||||
| 544,769 | ||||||||
|
| |||||||
| United Kingdom — 0.0% (a) | ||||||||
Rolls-Royce Holdings PLC, Class C* | 757,078 | 1,151 | ||||||
|
| |||||||
TOTAL PREFERRED STOCKS | 545,920 | |||||||
|
| |||||||
TOTAL INVESTMENTS — 97.9% | $ | 73,705,493 | ||||||
Other assets less liabilities — 2.1% | 1,594,694 | |||||||
|
| |||||||
NET ASSETS — 100.0% | $ | 75,300,187 | ||||||
|
| |||||||
SECTOR BREAKDOWN AS OF MAY 31, 2013
| Value | % of Net Assets | |||||||
Financial | $ | 18,445,422 | 24.5 | % | ||||
Consumer, Non-cyclical | 16,986,781 | 22.6 | ||||||
Consumer, Cyclical | 9,425,205 | 12.5 | ||||||
Industrial | 8,750,262 | 11.6 | ||||||
Basic Materials | 5,350,964 | 7.1 | ||||||
Energy | 5,013,175 | 6.7 | ||||||
Communications | 5,012,741 | 6.6 | ||||||
Utilities | 2,864,751 | 3.8 | ||||||
Technology | 1,560,833 | 2.1 | ||||||
Diversified | 295,359 | 0.4 | ||||||
|
|
|
| |||||
TOTAL INVESTMENTS | 73,705,493 | 97.9 | ||||||
Other assets less liabilities | 1,594,694 | 2.1 | ||||||
|
|
|
| |||||
NET ASSETS | $ | 75,300,187 | 100.0 | % | ||||
|
|
|
| |||||
As of May 31, 2013, the Fund had the following futures contracts open:
Contract Description | Number of Contracts | Contract Value | Expiration Date | Unrealized Depreciation | ||||||||||||
E-mini MSCI Emerging Markets Index Futures | 14 | $ | 1,182,440 | 6/21/2013 | $ | (28,460 | ) | |||||||||
| See Notes to Financial Statements. | 22 |
DBX ETF Trust
SCHEDULE OF INVESTMENTS
db X-trackers MSCI EAFE Hedged Equity Fund (Continued)
May 31, 2013
As of May 31, 2013, the Fund had the following forward foreign currency contracts outstanding:
Counterparty | Settlement Date | Currency To Deliver | Currency To Receive | Unrealized Appreciation (Depreciation) | ||||||||||||||
Barclays Bank PLC | 6/5/2013 | AUD | 1,287,000 | USD | 1,330,822 | $ | 99,561 | |||||||||||
Barclays Bank PLC | 6/5/2013 | AUD | 426,000 | USD | 428,588 | 21,037 | ||||||||||||
Barclays Bank PLC | 6/5/2013 | AUD | 7,867 | USD | 8,000 | 473 | ||||||||||||
Barclays Bank PLC | 6/5/2013 | AUD | 23,252 | USD | 23,000 | 755 | ||||||||||||
Barclays Bank PLC | 6/5/2013 | AUD | 425,000 | USD | 419,452 | 12,859 | ||||||||||||
Barclays Bank PLC | 6/5/2013 | AUD | 423,000 | USD | 414,427 | 9,746 | ||||||||||||
Barclays Bank PLC | 6/5/2013 | AUD | 15,259 | USD | 15,000 | 402 | ||||||||||||
Barclays Bank PLC | 6/5/2013 | AUD | 425,000 | USD | 412,857 | 6,264 | ||||||||||||
JP Morgan & Chase Co. | 6/5/2013 | AUD | 1,287,000 | USD | 1,332,548 | 101,287 | ||||||||||||
JP Morgan & Chase Co. | 6/5/2013 | AUD | 418,000 | USD | 432,231 | 32,334 | ||||||||||||
JP Morgan & Chase Co. | 6/5/2013 | AUD | 425,000 | USD | 419,457 | 12,863 | ||||||||||||
JP Morgan & Chase Co. | 6/5/2013 | AUD | 423,000 | USD | 414,424 | 9,743 | ||||||||||||
JP Morgan & Chase Co. | 6/5/2013 | AUD | 23,645 | USD | 23,000 | 379 | ||||||||||||
JP Morgan & Chase Co. | 6/5/2013 | AUD | 849,000 | USD | 824,752 | 12,521 | ||||||||||||
Barclays Bank PLC | 6/5/2013 | CHF | 1,271,000 | USD | 1,367,130 | 37,915 | ||||||||||||
Barclays Bank PLC | 6/5/2013 | CHF | 428,000 | USD | 451,272 | 3,669 | ||||||||||||
Barclays Bank PLC | 6/5/2013 | CHF | 7,529 | USD | 8,000 | 126 | ||||||||||||
Barclays Bank PLC | 6/5/2013 | CHF | 23,195 | USD | 24,000 | (257 | ) | |||||||||||
Barclays Bank PLC | 6/5/2013 | CHF | 438,000 | USD | 453,441 | (4,621 | ) | |||||||||||
Barclays Bank PLC | 6/5/2013 | CHF | 436,000 | USD | 452,195 | (3,775 | ) | |||||||||||
Barclays Bank PLC | 6/5/2013 | CHF | 15,390 | USD | 16,000 | (95 | ) | |||||||||||
Barclays Bank PLC | 6/5/2013 | CHF | 437,000 | USD | 449,199 | (7,817 | ) | |||||||||||
JP Morgan & Chase Co. | 6/5/2013 | CHF | 1,271,000 | USD | 1,368,620 | 39,404 | ||||||||||||
JP Morgan & Chase Co. | 6/5/2013 | CHF | 426,000 | USD | 458,301 | 12,789 | ||||||||||||
JP Morgan & Chase Co. | 6/5/2013 | CHF | 438,000 | USD | 453,441 | (4,621 | ) | |||||||||||
JP Morgan & Chase Co. | 6/5/2013 | CHF | 436,000 | USD | 452,198 | (3,772 | ) | |||||||||||
JP Morgan & Chase Co. | 6/5/2013 | CHF | 23,338 | USD | 24,000 | (407 | ) | |||||||||||
JP Morgan & Chase Co. | 6/5/2013 | CHF | 874,000 | USD | 898,408 | (15,625 | ) | |||||||||||
The Bank of New York Mellon | 6/5/2013 | CHF | 80,268 | USD | 83,647 | (297 | ) | |||||||||||
Barclays Bank PLC | 6/5/2013 | EUR | 3,206,000 | USD | 4,221,917 | 54,808 | ||||||||||||
Barclays Bank PLC | 6/5/2013 | EUR | 40,000 | USD | 52,270 | 278 | ||||||||||||
Barclays Bank PLC | 6/5/2013 | EUR | 1,072,000 | USD | 1,397,206 | 3,837 | ||||||||||||
Barclays Bank PLC | 6/5/2013 | EUR | 19,084 | USD | 25,000 | 194 | ||||||||||||
Barclays Bank PLC | 6/5/2013 | EUR | 57,501 | USD | 74,000 | (739 | ) | |||||||||||
Barclays Bank PLC | 6/5/2013 | EUR | 1,085,000 | USD | 1,397,467 | (12,799 | ) | |||||||||||
Barclays Bank PLC | 6/5/2013 | EUR | 1,083,000 | USD | 1,394,759 | (12,908 | ) | |||||||||||
Barclays Bank PLC | 6/5/2013 | EUR | 37,960 | USD | 49,000 | (340 | ) | |||||||||||
Barclays Bank PLC | 6/5/2013 | EUR | 1,086,000 | USD | 1,393,183 | (18,384 | ) | |||||||||||
JP Morgan & Chase Co. | 6/5/2013 | EUR | 3,206,000 | USD | 4,227,656 | 60,547 | ||||||||||||
JP Morgan & Chase Co. | 6/5/2013 | EUR | 1,071,000 | USD | 1,410,743 | 18,673 | ||||||||||||
JP Morgan & Chase Co. | 6/5/2013 | EUR | 1,085,000 | USD | 1,397,470 | (12,796 | ) | |||||||||||
JP Morgan & Chase Co. | 6/5/2013 | EUR | 1,083,000 | USD | 1,394,761 | (12,906 | ) | |||||||||||
JP Morgan & Chase Co. | 6/5/2013 | EUR | 57,700 | USD | 74,000 | (998 | ) | |||||||||||
JP Morgan & Chase Co. | 6/5/2013 | EUR | 2,172,000 | USD | 2,786,368 | (36,765 | ) | |||||||||||
The Bank of New York Mellon | 6/5/2013 | EUR | 255,473 | USD | 331,094 | (967 | ) | |||||||||||
Barclays Bank PLC | 6/5/2013 | GBP | 2,095,000 | USD | 3,257,505 | 74,453 | ||||||||||||
Barclays Bank PLC | 6/5/2013 | GBP | 40,000 | USD | 62,100 | 1,326 | ||||||||||||
Barclays Bank PLC | 6/5/2013 | GBP | 701,000 | USD | 1,082,380 | 17,311 | ||||||||||||
Barclays Bank PLC | 6/5/2013 | GBP | 12,253 | USD | 19,000 | 383 | ||||||||||||
Barclays Bank PLC | 6/5/2013 | GBP | 38,060 | USD | 58,000 | 173 | ||||||||||||
Barclays Bank PLC | 6/5/2013 | GBP | 712,000 | USD | 1,083,918 | 2,136 | ||||||||||||
Barclays Bank PLC | 6/5/2013 | GBP | 711,000 | USD | 1,085,541 | 5,278 | ||||||||||||
Barclays Bank PLC | 6/5/2013 | GBP | 24,877 | USD | 38,000 | 203 | ||||||||||||
Barclays Bank PLC | 6/5/2013 | GBP | 715,000 | USD | 1,084,218 | (2,122 | ) | |||||||||||
JP Morgan & Chase Co. | 6/5/2013 | GBP | 2,095,000 | USD | 3,259,923 | 76,871 | ||||||||||||
JP Morgan & Chase Co. | 6/5/2013 | GBP | 698,000 | USD | 1,083,996 | 23,485 | ||||||||||||
| See Notes to Financial Statements. | 23 |
DBX ETF Trust
SCHEDULE OF INVESTMENTS
db X-trackers MSCI EAFE Hedged Equity Fund (Continued)
May 31, 2013
Counterparty | Settlement Date | Currency To Deliver | Currency To Receive | Unrealized Appreciation (Depreciation) | ||||||||||||||
JP Morgan & Chase Co. | 6/5/2013 | GBP | 712,000 | USD | 1,083,920 | $ | 2,138 | |||||||||||
JP Morgan & Chase Co. | 6/5/2013 | GBP | 711,000 | USD | 1,085,506 | 5,243 | ||||||||||||
JP Morgan & Chase Co. | 6/5/2013 | GBP | 38,219 | USD | 58,000 | (68 | ) | |||||||||||
JP Morgan & Chase Co. | 6/5/2013 | GBP | 1,430,000 | USD | 2,168,438 | (4,242 | ) | |||||||||||
The Bank of New York Mellon | 6/5/2013 | GBP | 100,000 | USD | 151,516 | (420 | ) | |||||||||||
Barclays Bank PLC | 6/5/2013 | HKD | 3,637,000 | USD | 468,727 | 188 | ||||||||||||
Barclays Bank PLC | 6/5/2013 | HKD | 1,167,000 | USD | 150,418 | 78 | ||||||||||||
Barclays Bank PLC | 6/5/2013 | HKD | 23,276 | USD | 3,000 | 1 | ||||||||||||
Barclays Bank PLC | 6/5/2013 | HKD | 62,089 | USD | 8,000 | 1 | ||||||||||||
Barclays Bank PLC | 6/5/2013 | HKD | 1,164,000 | USD | 149,974 | 21 | ||||||||||||
Barclays Bank PLC | 6/5/2013 | HKD | 1,164,000 | USD | 149,939 | (14 | ) | |||||||||||
Barclays Bank PLC | 6/5/2013 | HKD | 38,816 | USD | 5,000 | — | ||||||||||||
Barclays Bank PLC | 6/5/2013 | HKD | 1,164,000 | USD | 149,952 | (1 | ) | |||||||||||
JP Morgan & Chase Co. | 6/5/2013 | HKD | 3,637,000 | USD | 468,726 | 187 | ||||||||||||
JP Morgan & Chase Co. | 6/5/2013 | HKD | 1,297,000 | USD | 167,163 | 76 | ||||||||||||
JP Morgan & Chase Co. | 6/5/2013 | HKD | 1,164,000 | USD | 149,974 | 20 | ||||||||||||
JP Morgan & Chase Co. | 6/5/2013 | HKD | 1,164,000 | USD | 149,938 | (15 | ) | |||||||||||
JP Morgan & Chase Co. | 6/5/2013 | HKD | 62,102 | USD | 8,000 | — | ||||||||||||
JP Morgan & Chase Co. | 6/5/2013 | HKD | 2,328,000 | USD | 299,904 | (3 | ) | |||||||||||
The Bank of New York Mellon | 6/5/2013 | HKD | 500,000 | USD | 64,408 | (5 | ) | |||||||||||
Barclays Bank PLC | 6/5/2013 | ILS | 204,000 | USD | 56,795 | 1,483 | ||||||||||||
Barclays Bank PLC | 6/5/2013 | ILS | 66,000 | USD | 18,551 | 656 | ||||||||||||
Barclays Bank PLC | 6/5/2013 | ILS | 3,672 | USD | 1,000 | 4 | ||||||||||||
Barclays Bank PLC | 6/5/2013 | ILS | 67,000 | USD | 18,307 | 140 | ||||||||||||
Barclays Bank PLC | 6/5/2013 | ILS | 70,000 | USD | 19,215 | 235 | ||||||||||||
Barclays Bank PLC | 6/5/2013 | ILS | 3,640 | USD | 1,000 | 13 | ||||||||||||
Barclays Bank PLC | 6/5/2013 | ILS | 70,000 | USD | 19,078 | 99 | ||||||||||||
JP Morgan & Chase Co. | 6/5/2013 | ILS | 204,000 | USD | 56,855 | 1,543 | ||||||||||||
JP Morgan & Chase Co. | 6/5/2013 | ILS | 69,000 | USD | 19,222 | 514 | ||||||||||||
JP Morgan & Chase Co. | 6/5/2013 | ILS | 67,000 | USD | 18,308 | 141 | ||||||||||||
JP Morgan & Chase Co. | 6/5/2013 | ILS | 70,000 | USD | 19,216 | 236 | ||||||||||||
JP Morgan & Chase Co. | 6/5/2013 | ILS | 3,673 | USD | 1,000 | 4 | ||||||||||||
JP Morgan & Chase Co. | 6/5/2013 | ILS | 140,000 | USD | 38,157 | 198 | ||||||||||||
Barclays Bank PLC | 6/5/2013 | JPY | 317,913,000 | USD | 3,262,989 | 98,194 | ||||||||||||
Barclays Bank PLC | 6/5/2013 | JPY | 5,000,000 | USD | 51,002 | 1,227 | ||||||||||||
Barclays Bank PLC | 6/5/2013 | JPY | 103,817,000 | USD | 1,031,459 | (2,029 | ) | |||||||||||
Barclays Bank PLC | 6/5/2013 | JPY | 1,885,942 | USD | 19,000 | 226 | ||||||||||||
Barclays Bank PLC | 6/5/2013 | JPY | 5,923,772 | USD | 58,000 | (971 | ) | |||||||||||
Barclays Bank PLC | 6/5/2013 | JPY | 111,086,000 | USD | 1,085,579 | (20,272 | ) | |||||||||||
Barclays Bank PLC | 6/5/2013 | JPY | 110,647,000 | USD | 1,081,220 | (20,260 | ) | |||||||||||
Barclays Bank PLC | 6/5/2013 | JPY | 3,982,083 | USD | 39,000 | (641 | ) | |||||||||||
Barclays Bank PLC | 6/5/2013 | JPY | 110,904,000 | USD | 1,073,774 | (30,265 | ) | |||||||||||
JP Morgan & Chase Co. | 6/5/2013 | JPY | 317,913,000 | USD | 3,264,155 | 99,360 | ||||||||||||
JP Morgan & Chase Co. | 6/5/2013 | JPY | 105,197,000 | USD | 1,079,272 | 32,046 | ||||||||||||
JP Morgan & Chase Co. | 6/5/2013 | JPY | 111,086,000 | USD | 1,085,577 | (20,274 | ) | |||||||||||
JP Morgan & Chase Co. | 6/5/2013 | JPY | 110,647,000 | USD | 1,081,164 | (20,316 | ) | |||||||||||
JP Morgan & Chase Co. | 6/5/2013 | JPY | 6,073,159 | USD | 59,000 | (1,458 | ) | |||||||||||
JP Morgan & Chase Co. | 6/5/2013 | JPY | 221,807,000 | USD | 2,147,636 | (60,433 | ) | |||||||||||
The Bank of New York Mellon | 6/5/2013 | JPY | 25,374,235 | USD | 251,292 | (1,306 | ) | |||||||||||
Barclays Bank PLC | 6/5/2013 | NOK | 766,000 | USD | 132,514 | 2,014 | ||||||||||||
Barclays Bank PLC | 6/5/2013 | NOK | 258,000 | USD | 44,548 | 594 | ||||||||||||
Barclays Bank PLC | 6/5/2013 | NOK | 5,760 | USD | 1,000 | 19 | ||||||||||||
Barclays Bank PLC | 6/5/2013 | NOK | 11,699 | USD | 2,000 | 7 | ||||||||||||
Barclays Bank PLC | 6/5/2013 | NOK | 254,000 | USD | 43,397 | 124 | ||||||||||||
Barclays Bank PLC | 6/5/2013 | NOK | 250,000 | USD | 42,821 | 230 | ||||||||||||
Barclays Bank PLC | 6/5/2013 | NOK | 5,824 | USD | 1,000 | 8 | ||||||||||||
Barclays Bank PLC | 6/5/2013 | NOK | 250,000 | USD | 42,614 | 23 | ||||||||||||
| See Notes to Financial Statements. | 24 |
DBX ETF Trust
SCHEDULE OF INVESTMENTS
db X-trackers MSCI EAFE Hedged Equity Fund (Continued)
May 31, 2013
Counterparty | Settlement Date | Currency To Deliver | Currency To Receive | Unrealized Appreciation (Depreciation) | ||||||||||||||
JP Morgan & Chase Co. | 6/5/2013 | NOK | 766,000 | USD | 132,882 | $ | 2,382 | |||||||||||
JP Morgan & Chase Co. | 6/5/2013 | NOK | 252,000 | USD | 43,644 | 712 | ||||||||||||
JP Morgan & Chase Co. | 6/5/2013 | NOK | 254,000 | USD | 43,397 | 124 | ||||||||||||
JP Morgan & Chase Co. | 6/5/2013 | NOK | 250,000 | USD | 42,821 | 230 | ||||||||||||
JP Morgan & Chase Co. | 6/5/2013 | NOK | 11,725 | USD | 2,000 | 2 | ||||||||||||
JP Morgan & Chase Co. | 6/5/2013 | NOK | 501,000 | USD | 85,398 | 45 | ||||||||||||
The Bank of New York Mellon | 6/5/2013 | NOK | 37,000 | USD | 6,286 | (17 | ) | |||||||||||
Barclays Bank PLC | 6/5/2013 | NZD | 14,000 | USD | 11,977 | 854 | ||||||||||||
Barclays Bank PLC | 6/5/2013 | NZD | 4,000 | USD | 3,345 | 167 | ||||||||||||
Barclays Bank PLC | 6/5/2013 | NZD | 4,000 | USD | 3,288 | 110 | ||||||||||||
Barclays Bank PLC | 6/5/2013 | NZD | 4,000 | USD | 3,256 | 78 | ||||||||||||
Barclays Bank PLC | 6/5/2013 | NZD | 4,000 | USD | 3,222 | 43 | ||||||||||||
JP Morgan & Chase Co. | 6/5/2013 | NZD | 14,000 | USD | 11,982 | 859 | ||||||||||||
JP Morgan & Chase Co. | 6/5/2013 | NZD | 4,000 | USD | 3,421 | 243 | ||||||||||||
JP Morgan & Chase Co. | 6/5/2013 | NZD | 4,000 | USD | 3,289 | 110 | ||||||||||||
JP Morgan & Chase Co. | 6/5/2013 | NZD | 4,000 | USD | 3,257 | 79 | ||||||||||||
JP Morgan & Chase Co. | 6/5/2013 | NZD | 9,000 | USD | 7,248 | 98 | ||||||||||||
Barclays Bank PLC | 6/5/2013 | SEK | 3,100,000 | USD | 477,882 | 9,898 | ||||||||||||
Barclays Bank PLC | 6/5/2013 | SEK | 1,042,000 | USD | 158,781 | 1,478 | ||||||||||||
Barclays Bank PLC | 6/5/2013 | SEK | 19,531 | USD | 3,000 | 52 | ||||||||||||
Barclays Bank PLC | 6/5/2013 | SEK | 53,334 | USD | 8,000 | (51 | ) | |||||||||||
Barclays Bank PLC | 6/5/2013 | SEK | 1,051,000 | USD | 157,421 | (1,241 | ) | |||||||||||
Barclays Bank PLC | 6/5/2013 | SEK | 1,054,000 | USD | 157,870 | (1,245 | ) | |||||||||||
Barclays Bank PLC | 6/5/2013 | SEK | 33,229 | USD | 5,000 | (16 | ) | |||||||||||
Barclays Bank PLC | 6/5/2013 | SEK | 1,064,000 | USD | 158,702 | (1,922 | ) | |||||||||||
JP Morgan & Chase Co. | 6/5/2013 | SEK | 3,100,000 | USD | 478,534 | 10,549 | ||||||||||||
JP Morgan & Chase Co. | 6/5/2013 | SEK | 1,038,000 | USD | 160,037 | 3,337 | ||||||||||||
JP Morgan & Chase Co. | 6/5/2013 | SEK | 1,051,000 | USD | 157,419 | (1,243 | ) | |||||||||||
JP Morgan & Chase Co. | 6/5/2013 | SEK | 1,054,000 | USD | 157,868 | (1,247 | ) | |||||||||||
JP Morgan & Chase Co. | 6/5/2013 | SEK | 53,612 | USD | 8,000 | (93 | ) | |||||||||||
JP Morgan & Chase Co. | 6/5/2013 | SEK | 2,128,000 | USD | 317,401 | (3,847 | ) | |||||||||||
The Bank of New York Mellon | 6/5/2013 | SEK | 136,000 | USD | 20,460 | (71 | ) | |||||||||||
Barclays Bank PLC | 6/5/2013 | SGD | 333,000 | USD | 270,167 | 6,707 | ||||||||||||
Barclays Bank PLC | 6/5/2013 | SGD | 108,000 | USD | 87,528 | 2,081 | ||||||||||||
Barclays Bank PLC | 6/5/2013 | SGD | 2,459 | USD | 2,000 | 55 | ||||||||||||
Barclays Bank PLC | 6/5/2013 | SGD | 6,227 | USD | 5,000 | 73 | ||||||||||||
Barclays Bank PLC | 6/5/2013 | SGD | 108,000 | USD | 86,636 | 1,189 | ||||||||||||
Barclays Bank PLC | 6/5/2013 | SGD | 108,000 | USD | 86,231 | 784 | ||||||||||||
Barclays Bank PLC | 6/5/2013 | SGD | 3,755 | USD | 3,000 | 29 | ||||||||||||
Barclays Bank PLC | 6/5/2013 | SGD | 109,000 | USD | 86,588 | 351 | ||||||||||||
JP Morgan & Chase Co. | 6/5/2013 | SGD | 333,000 | USD | 270,369 | 6,909 | ||||||||||||
JP Morgan & Chase Co. | 6/5/2013 | SGD | 106,000 | USD | 86,060 | 2,196 | ||||||||||||
JP Morgan & Chase Co. | 6/5/2013 | SGD | 108,000 | USD | 86,637 | 1,191 | ||||||||||||
JP Morgan & Chase Co. | 6/5/2013 | SGD | 108,000 | USD | 86,231 | 784 | ||||||||||||
JP Morgan & Chase Co. | 6/5/2013 | SGD | 6,282 | USD | 5,000 | 29 | ||||||||||||
JP Morgan & Chase Co. | 6/5/2013 | SGD | 217,000 | USD | 172,379 | 694 | ||||||||||||
The Bank of New York Mellon | 6/5/2013 | SGD | 60,000 | USD | 47,444 | (26 | ) | |||||||||||
Barclays Bank PLC | 6/5/2013 | USD | 2,903,891 | AUD | 3,032,379 | (2,840 | ) | |||||||||||
Barclays Bank PLC | 6/5/2013 | USD | 3,177,854 | CHF | 3,056,114 | 18,238 | ||||||||||||
Barclays Bank PLC | 6/5/2013 | USD | 9,952,586 | EUR | 7,686,546 | 38,267 | ||||||||||||
Barclays Bank PLC | 6/5/2013 | USD | 7,647,452 | GBP | 5,049,190 | 24,068 | ||||||||||||
Barclays Bank PLC | 6/5/2013 | USD | 1,084,662 | HKD | 8,420,180 | 74 | ||||||||||||
Barclays Bank PLC | 6/5/2013 | USD | 130,877 | ILS | 484,312 | 438 | ||||||||||||
Barclays Bank PLC | 6/5/2013 | USD | 7,631,480 | JPY | 771,158,797 | 45,335 | ||||||||||||
Barclays Bank PLC | 6/5/2013 | USD | 305,940 | NOK | 1,801,283 | 935 | ||||||||||||
Barclays Bank PLC | 6/5/2013 | USD | 23,862 | NZD | 30,000 | (26 | ) | |||||||||||
Barclays Bank PLC | 6/5/2013 | USD | 1,115,428 | SEK | 7,417,093 | 4,277 | ||||||||||||
| See Notes to Financial Statements. | 25 |
DBX ETF Trust
SCHEDULE OF INVESTMENTS
db X-trackers MSCI EAFE Hedged Equity Fund (Continued)
May 31, 2013
Counterparty | Settlement Date | Currency To Deliver | Currency To Receive | Unrealized Appreciation (Depreciation) | ||||||||||||||
Barclays Bank PLC | 6/5/2013 | USD | 614,790 | SGD | 778,441 | $ | 1,091 | |||||||||||
JP Morgan & Chase Co. | 6/5/2013 | USD | 3,284,091 | AUD | 3,425,645 | (6,806 | ) | |||||||||||
JP Morgan & Chase Co. | 6/5/2013 | USD | 52,000 | CHF | 50,566 | 883 | ||||||||||||
JP Morgan & Chase Co. | 6/5/2013 | USD | 3,561,697 | CHF | 3,417,772 | 12,619 | ||||||||||||
JP Morgan & Chase Co. | 6/5/2013 | USD | 104,000 | EUR | 80,849 | 1,086 | ||||||||||||
JP Morgan & Chase Co. | 6/5/2013 | USD | 149,000 | EUR | 116,180 | 2,009 | ||||||||||||
JP Morgan & Chase Co. | 6/5/2013 | USD | 10,987,121 | EUR | 8,477,671 | 32,024 | ||||||||||||
JP Morgan & Chase Co. | 6/5/2013 | USD | 73,000 | GBP | 47,952 | (144 | ) | |||||||||||
JP Morgan & Chase Co. | 6/5/2013 | USD | 104,000 | GBP | 68,530 | 121 | ||||||||||||
JP Morgan & Chase Co. | 6/5/2013 | USD | 167,946 | GBP | 111,000 | 702 | ||||||||||||
JP Morgan & Chase Co. | 6/5/2013 | USD | 8,272,904 | GBP | 5,456,737 | 17,825 | ||||||||||||
JP Morgan & Chase Co. | 6/5/2013 | USD | 1,243,387 | HKD | 9,652,102 | 53 | ||||||||||||
JP Morgan & Chase Co. | 6/5/2013 | USD | 149,910 | ILS | 553,673 | 211 | ||||||||||||
JP Morgan & Chase Co. | 6/5/2013 | USD | 119,000 | JPY | 12,187,766 | 2,328 | ||||||||||||
JP Morgan & Chase Co. | 6/5/2013 | USD | 237,000 | JPY | 24,395,571 | 5,856 | ||||||||||||
JP Morgan & Chase Co. | 6/5/2013 | USD | 8,280,686 | JPY | 836,139,822 | 43,009 | ||||||||||||
JP Morgan & Chase Co. | 6/5/2013 | USD | 345,711 | NOK | 2,034,725 | 934 | ||||||||||||
JP Morgan & Chase Co. | 6/5/2013 | USD | 27,909 | NZD | 35,000 | (101 | ) | |||||||||||
JP Morgan & Chase Co. | 6/5/2013 | USD | 1,267,405 | SEK | 8,424,612 | 4,397 | ||||||||||||
JP Morgan & Chase Co. | 6/5/2013 | USD | 41,000 | SGD | 51,117 | (558 | ) | |||||||||||
JP Morgan & Chase Co. | 6/5/2013 | USD | 654,076 | SGD | 827,166 | 355 | ||||||||||||
The Bank of New York Mellon | 6/5/2013 | USD | 7,490 | CHF | 7,000 | (169 | ) | |||||||||||
The Bank of New York Mellon | 6/5/2013 | USD | 67,000 | CHF | 64,268 | 211 | ||||||||||||
The Bank of New York Mellon | 6/5/2013 | USD | 9,357 | CHF | 9,000 | 55 | ||||||||||||
The Bank of New York Mellon | 6/5/2013 | USD | 23,518 | EUR | 18,000 | (122 | ) | |||||||||||
The Bank of New York Mellon | 6/5/2013 | USD | 113,000 | EUR | 87,473 | 697 | ||||||||||||
The Bank of New York Mellon | 6/5/2013 | USD | 194,075 | EUR | 150,000 | 893 | ||||||||||||
The Bank of New York Mellon | 6/5/2013 | USD | 86,000 | GBP | 56,186 | (634 | ) | |||||||||||
The Bank of New York Mellon | 6/5/2013 | USD | 30,253 | GBP | 20,000 | 134 | ||||||||||||
The Bank of New York Mellon | 6/5/2013 | USD | 36,105 | GBP | 23,814 | 78 | ||||||||||||
The Bank of New York Mellon | 6/5/2013 | USD | 64,403 | HKD | 500,000 | 10 | ||||||||||||
The Bank of New York Mellon | 6/5/2013 | USD | 217,000 | JPY | 22,124,235 | 3,246 | ||||||||||||
The Bank of New York Mellon | 6/5/2013 | USD | 32,144 | JPY | 3,250,000 | 210 | ||||||||||||
The Bank of New York Mellon | 6/5/2013 | USD | 6,276 | NOK | 37,000 | 28 | ||||||||||||
The Bank of New York Mellon | 6/5/2013 | USD | 12,237 | SEK | 80,000 | (160 | ) | |||||||||||
The Bank of New York Mellon | 6/5/2013 | USD | 8,421 | SEK | 56,000 | 33 | ||||||||||||
The Bank of New York Mellon | 6/5/2013 | USD | 47,401 | SGD | 60,000 | 69 | ||||||||||||
Barclays Bank PLC | 6/6/2013 | DKK | 989,000 | USD | 174,646 | 2,209 | ||||||||||||
Barclays Bank PLC | 6/6/2013 | DKK | 328,000 | USD | 57,362 | 174 | ||||||||||||
Barclays Bank PLC | 6/6/2013 | DKK | 5,689 | USD | 1,000 | 8 | ||||||||||||
Barclays Bank PLC | 6/6/2013 | DKK | 17,378 | USD | 3,000 | (30 | ) | |||||||||||
Barclays Bank PLC | 6/6/2013 | DKK | 333,000 | USD | 57,550 | (510 | ) | |||||||||||
Barclays Bank PLC | 6/6/2013 | DKK | 329,000 | USD | 56,855 | (507 | ) | |||||||||||
Barclays Bank PLC | 6/6/2013 | DKK | 11,546 | USD | 2,000 | (13 | ) | |||||||||||
Barclays Bank PLC | 6/6/2013 | DKK | 329,000 | USD | 56,636 | (727 | ) | |||||||||||
JP Morgan & Chase Co. | 6/6/2013 | DKK | 989,000 | USD | 174,945 | 2,508 | ||||||||||||
JP Morgan & Chase Co. | 6/6/2013 | DKK | 330,000 | USD | 58,310 | 773 | ||||||||||||
JP Morgan & Chase Co. | 6/6/2013 | DKK | 333,000 | USD | 57,550 | (511 | ) | |||||||||||
JP Morgan & Chase Co. | 6/6/2013 | DKK | 329,000 | USD | 56,855 | (508 | ) | |||||||||||
JP Morgan & Chase Co. | 6/6/2013 | DKK | 17,431 | USD | 3,000 | (39 | ) | |||||||||||
JP Morgan & Chase Co. | 6/6/2013 | DKK | 657,000 | USD | 113,099 | (1,451 | ) | |||||||||||
Barclays Bank PLC | 6/6/2013 | USD | 406,826 | DKK | 2,342,613 | 1,619 | ||||||||||||
JP Morgan & Chase Co. | 6/6/2013 | USD | 461,582 | DKK | 2,655,431 | 1,404 | ||||||||||||
Barclays Bank PLC | 7/3/2013 | AUD | 3,117,000 | USD | 2,978,880 | 3,092 | ||||||||||||
JP Morgan & Chase Co. | 7/3/2013 | AUD | 3,117,000 | USD | 2,982,184 | 6,396 | ||||||||||||
Barclays Bank PLC | 7/3/2013 | CHF | 3,326,000 | USD | 3,459,391 | (19,911 | ) | |||||||||||
JP Morgan & Chase Co. | 7/3/2013 | CHF | 3,326,000 | USD | 3,466,989 | (12,313 | ) | |||||||||||
| See Notes to Financial Statements. | 26 |
DBX ETF Trust
SCHEDULE OF INVESTMENTS
db X-trackers MSCI EAFE Hedged Equity Fund (Continued)
May 31, 2013
Counterparty | Settlement Date | Currency To Deliver | Currency To Receive | Unrealized Appreciation (Depreciation) | ||||||||||||||
Barclays Bank PLC | 7/3/2013 | DKK | 2,578,000 | USD | 447,809 | $ | (1,804 | ) | ||||||||||
JP Morgan & Chase Co. | 7/3/2013 | DKK | 2,578,000 | USD | 448,221 | (1,391 | ) | |||||||||||
Barclays Bank PLC | 7/3/2013 | EUR | 8,424,000 | USD | 10,908,970 | (42,155 | ) | |||||||||||
JP Morgan & Chase Co. | 7/3/2013 | EUR | 8,424,000 | USD | 10,919,088 | (32,038 | ) | |||||||||||
Barclays Bank PLC | 7/3/2013 | GBP | 5,501,000 | USD | 8,330,115 | (26,207 | ) | |||||||||||
JP Morgan & Chase Co. | 7/3/2013 | GBP | 5,501,000 | USD | 8,338,383 | (17,939 | ) | |||||||||||
Barclays Bank PLC | 7/3/2013 | HKD | 8,608,000 | USD | 1,108,989 | (86 | ) | |||||||||||
JP Morgan & Chase Co. | 7/3/2013 | HKD | 8,608,000 | USD | 1,109,011 | (64 | ) | |||||||||||
Barclays Bank PLC | 7/3/2013 | ILS | 527,000 | USD | 142,264 | (493 | ) | |||||||||||
JP Morgan & Chase Co. | 7/3/2013 | ILS | 527,000 | USD | 142,551 | (206 | ) | |||||||||||
Barclays Bank PLC | 7/3/2013 | JPY | 813,498,000 | USD | 8,051,319 | (47,922 | ) | |||||||||||
JP Morgan & Chase Co. | 7/3/2013 | JPY | 813,498,000 | USD | 8,057,276 | (41,965 | ) | |||||||||||
Barclays Bank PLC | 7/3/2013 | NOK | 1,987,000 | USD | 337,129 | (1,025 | ) | |||||||||||
JP Morgan & Chase Co. | 7/3/2013 | NOK | 1,987,000 | USD | 337,242 | (912 | ) | |||||||||||
Barclays Bank PLC | 7/3/2013 | NZD | 33,000 | USD | 26,197 | 29 | ||||||||||||
JP Morgan & Chase Co. | 7/3/2013 | NZD | 33,000 | USD | 26,262 | 94 | ||||||||||||
Barclays Bank PLC | 7/3/2013 | SEK | 8,266,000 | USD | 1,242,253 | (4,769 | ) | |||||||||||
JP Morgan & Chase Co. | 7/3/2013 | SEK | 8,266,000 | USD | 1,242,686 | (4,336 | ) | |||||||||||
Barclays Bank PLC | 7/3/2013 | SGD | 821,000 | USD | 648,391 | (1,171 | ) | |||||||||||
JP Morgan & Chase Co. | 7/3/2013 | SGD | 821,000 | USD | 649,188 | (373 | ) | |||||||||||
The Bank of New York Mellon | 7/3/2013 | USD | 56,000 | AUD | 58,467 | (181 | ) | |||||||||||
The Bank of New York Mellon | 7/3/2013 | USD | 167,000 | CHF | 160,106 | 486 | ||||||||||||
The Bank of New York Mellon | 7/3/2013 | USD | 37,000 | DKK | 212,556 | 70 | ||||||||||||
The Bank of New York Mellon | 7/3/2013 | USD | 472,000 | EUR | 363,723 | 837 | ||||||||||||
The Bank of New York Mellon | 7/3/2013 | USD | 282,000 | GBP | 185,855 | 324 | ||||||||||||
The Bank of New York Mellon | 7/3/2013 | USD | 788,000 | JPY | 79,476,892 | 3,278 | ||||||||||||
The Bank of New York Mellon | 7/3/2013 | USD | 19,000 | NOK | 111,817 | 29 | ||||||||||||
The Bank of New York Mellon | 7/3/2013 | USD | 88,000 | SEK | 584,056 | 112 | ||||||||||||
The Bank of New York Mellon | 7/3/2013 | USD | 17,000 | SGD | 21,497 | 8 | ||||||||||||
|
| |||||||||||||||||
| $ | 722,005 | |||||||||||||||||
|
| |||||||||||||||||
Currency Abbreviations
AUD – Australian Dollar
CHF – Swiss Franc
DKK – Danish Krone
EUR – Euro
GBP – Pound Sterling
HKD – Hong Kong Dollar
ILS – Israeli New Sheqel
JPY – Japanese Yen
NOK – Norwegian Krone
NZD – New Zealand Dollar
SEK – Swedish Krona
SGD – Singapore Dollar
USD – U.S. Dollar
* Non-income producing security.
(a) Less than 0.1%.
REIT – Real Estate Investment Trust.
| See Notes to Financial Statements. | 27 |
DBX ETF Trust
SCHEDULE OF INVESTMENTS
db X-trackers MSCI Emerging Markets Hedged Equity Fund
May 31, 2013
Number | Value | |||||||
| COMMON STOCKS — 90.2% | ||||||||
| Brazil — 6.2% | ||||||||
Banco Bradesco SA | 1,323 | $ | 22,052 | |||||
Banco do Brasil SA | 1,400 | 16,603 | ||||||
Banco Santander Brasil SA | 2,300 | 16,355 | ||||||
BM&FBovespa SA | 5,800 | 38,047 | ||||||
BR Malls Participacoes SA | 1,800 | 18,489 | ||||||
BRF SA | 1,800 | 41,953 | ||||||
CCR SA | 3,200 | 29,194 | ||||||
Centrais Eletricas Brasileiras SA | 1,600 | 4,228 | ||||||
Cia Siderurgica Nacional SA | 2,900 | 8,950 | ||||||
Cielo SA | 1,176 | 30,199 | ||||||
Cosan SA Industria e Comercio | 400 | 8,834 | ||||||
CPFL Energia SA | 800 | 8,408 | ||||||
Duratex SA | 1,580 | 10,918 | ||||||
Ecorodovias Infraestrutura e Logistica SA | 800 | 6,331 | ||||||
EDP — Energias do Brasil SA | 600 | 3,544 | ||||||
Embraer SA | 2,600 | 23,720 | ||||||
JBS SA | 3,000 | 9,805 | ||||||
Localiza Rent a Car SA | 420 | 6,456 | ||||||
Lojas Renner SA | 900 | 31,305 | ||||||
Multiplan Empreendimentos Imobiliarios SA | 200 | 5,228 | ||||||
Natura Cosmeticos SA | 800 | 18,945 | ||||||
OGX Petroleo e Gas Participacoes SA* | 3,000 | 1,933 | ||||||
Petroleo Brasileiro SA | 8,800 | 77,943 | ||||||
Souza Cruz SA | 600 | 8,144 | ||||||
Tim Participacoes SA | 2,000 | 7,610 | ||||||
Totvs SA | 400 | 7,050 | ||||||
Tractebel Energia SA | 400 | 6,901 | ||||||
Ultrapar Participacoes SA | 1,200 | 30,255 | ||||||
Vale SA | 3,300 | 46,916 | ||||||
|
| |||||||
| 546,316 | ||||||||
|
| |||||||
| Chile — 1.7% | ||||||||
AES Gener SA | 10,419 | 7,094 | ||||||
Banco de Credito e Inversiones | 207 | 12,481 | ||||||
Banco Santander Chile | 120,964 | 7,411 | ||||||
CAP SA | 201 | 4,985 | ||||||
Cencosud SA | 2,715 | 14,354 | ||||||
Colbun SA | 21,037 | 5,957 | ||||||
Corpbanca | 382,073 | 4,531 | ||||||
E.CL SA | 2,204 | 4,078 | ||||||
Empresa Nacional de Electricidad SA | 10,693 | 17,100 | ||||||
Empresas CMPC SA | 3,907 | 12,820 | ||||||
Empresas COPEC SA | 1,066 | 14,168 | ||||||
Enersis SA | 46,019 | 15,522 | ||||||
ENTEL Chile SA | 401 | 7,362 | ||||||
LATAM Airlines Group SA | 770 | 13,773 | ||||||
SACI Falabella | 922 | 10,562 | ||||||
|
| |||||||
| 152,198 | ||||||||
|
| |||||||
| China — 16.8% | ||||||||
Agile Property Holdings Ltd | 3,800 | 4,602 | ||||||
Agricultural Bank of China Ltd., Class H | 40,000 | 18,757 | ||||||
Air China Ltd., Class H | 7,100 | 5,872 | ||||||
Anhui Conch Cement Co. Ltd., Class H | 5,000 | 16,328 | ||||||
Anta Sports Products Ltd | 10,000 | 9,275 | ||||||
Bank of China Ltd., Class H | 200,325 | 94,968 | ||||||
Number | Value | |||||||
| China (continued) | ||||||||
Bank of Communications Co. Ltd., Class H* | 22,000 | $ | 16,863 | |||||
Beijing Enterprises Holdings Ltd | 1,900 | 15,555 | ||||||
Belle International Holdings Ltd., Class A | 10,000 | 15,433 | ||||||
Brilliance China Automotive Holdings Ltd.* | 3,400 | 3,916 | ||||||
Byd Co. Ltd., Class H* | 3,100 | 13,638 | ||||||
China Citic Bank Corp. Ltd., Class H | 20,000 | 10,795 | ||||||
China Coal Energy Co. Ltd., Class H | 16,000 | 10,430 | ||||||
China Communications Construction Co. Ltd., Class H | 12,000 | 11,285 | ||||||
China Construction Bank Corp., Class H | 168,274 | 136,568 | ||||||
China Life Insurance Co. Ltd., Class H* | 18,030 | 46,570 | ||||||
China Longyuan Power Group Corp., Class H* | 18,000 | 17,971 | ||||||
China Mengniu Dairy Co. Ltd | 4,000 | 13,939 | ||||||
China Merchants Bank Co. Ltd., Class H | 9,000 | 18,179 | ||||||
China Minsheng Banking Corp. Ltd., Class H | 17,000 | 20,827 | ||||||
China Mobile Ltd | 9,923 | 105,397 | ||||||
China National Building Material Co. Ltd., Class H | 12,000 | 12,800 | ||||||
China Overseas Land & Investment Ltd | 12,020 | 35,846 | ||||||
China Pacific Insurance Group Co. Ltd., Class H* | 4,808 | 16,259 | ||||||
China Petroleum & Chemical Corp., Class H | 40,000 | 41,326 | ||||||
China Resources Cement Holdings Ltd | 7,300 | 3,856 | ||||||
China Resources Enterprise Ltd | 4,007 | 13,085 | ||||||
China Resources Power Holdings Co. Ltd | 6,900 | 18,177 | ||||||
China Shanshui Cement Group Ltd | 20,000 | 10,383 | ||||||
China Shenhua Energy Co. Ltd., Class H | 8,000 | 26,228 | ||||||
China State Construction International Holdings Ltd | 6,900 | 11,111 | ||||||
China Telecom Corp. Ltd., Class H | 36,000 | 17,252 | ||||||
CNOOC Ltd | 38,000 | 67,163 | ||||||
Country Garden Holdings Co. Ltd | 38,129 | 21,907 | ||||||
Dongfeng Motor Group Co. Ltd., Class H | 12,020 | 18,953 | ||||||
ENN Energy Holdings Ltd | 900 | 5,072 | ||||||
Fosun International Ltd | 25,000 | 21,030 | ||||||
Guangdong Investment Ltd | 12,100 | 10,615 | ||||||
Hengan International Group Co. Ltd | 1,002 | 11,114 | ||||||
Industrial & Commercial Bank of China Ltd., Class H | 140,228 | 98,813 | ||||||
Intime Department Store Group Co. Ltd | 3,700 | 3,856 | ||||||
Kunlun Energy Co. Ltd | 8,000 | 15,356 | ||||||
Lee & Man Paper Manufacturing Ltd | 34,000 | 22,907 | ||||||
Lenovo Group Ltd | 16,027 | 16,497 | ||||||
Longfor Properties Co. Ltd | 6,700 | 11,393 | ||||||
Nine Dragons Paper Holdings Ltd | 16,000 | 12,305 | ||||||
Parkson Retail Group Ltd | 14,000 | 6,403 | ||||||
PetroChina Co. Ltd., Class H | 60,000 | 69,874 | ||||||
PICC Property & Casualty Co. Ltd., Class H | 12,020 | 14,199 | ||||||
Ping An Insurance Group Co., Class H | 4,007 | 29,836 | ||||||
Poly Property Group Co. Ltd.* | 16,000 | 10,842 | ||||||
Shanghai Industrial Holdings Ltd | 6,000 | 18,434 | ||||||
Shougang Fushan Resources Group Ltd | 10,900 | 4,395 | ||||||
Sinopharm Group Co. Ltd., Class H | 1,803 | 4,878 | ||||||
Soho China Ltd | 24,000 | 20,344 | ||||||
Tencent Holdings Ltd | 1,205 | 47,780 | ||||||
Tingyi Cayman Islands Holding Corp | 8,000 | 20,591 | ||||||
Tsingtao Brewery Co. Ltd., Class H | 800 | 5,570 | ||||||
Uni-President China Holdings Ltd | 11,900 | 13,214 | ||||||
| See Notes to Financial Statements. | 28 |
DBX ETF Trust
SCHEDULE OF INVESTMENTS
db X-trackers MSCI Emerging Markets Hedged Equity Fund (Continued)
May 31, 2013
Number | Value | |||||||
| China (Continued) | ||||||||
Want Want China Holdings Ltd | 22,000 | $ | 32,536 | |||||
Wumart Stores, Inc., Class H | 5,300 | 10,815 | ||||||
Yanzhou Coal Mining Co. Ltd., Class H | 8,000 | 8,203 | ||||||
Zhongsheng Group Holdings Ltd | 6,100 | 7,685 | ||||||
|
| |||||||
| 1,476,071 | ||||||||
|
| |||||||
| Colombia — 0.5% | ||||||||
Almacenes Exito SA | 401 | 6,522 | ||||||
Cementos Argos SA | 1,002 | 4,106 | ||||||
Grupo de Inversiones Suramericana SA | 902 | 18,385 | ||||||
Interconexion Electrica SA ESP | 1,603 | 6,686 | ||||||
Isagen SA ESP* | 7,614 | 10,479 | ||||||
|
| |||||||
| 46,178 | ||||||||
|
| |||||||
| Czech Republic — 0.1% | ||||||||
CEZ AS | 401 | 11,144 | ||||||
Telefonica Czech Republic AS | 100 | 1,460 | ||||||
|
| |||||||
| 12,604 | ||||||||
|
| |||||||
| Egypt — 0.2% | ||||||||
Orascom Construction Industries* | 445 | 14,857 | ||||||
|
| |||||||
| Hungary — 0.9% | ||||||||
MOL Hungarian Oil and Gas PLC | 1,053 | 76,775 | ||||||
|
| |||||||
| India — 5.9% | ||||||||
Axis Bank Ltd. GDR | 3,105 | 80,854 | ||||||
Dr. Reddy’s Laboratories Ltd., ADR | 1,304 | 48,209 | ||||||
HDFC Bank Ltd., ADR | 2,205 | 88,730 | ||||||
ICICI Bank Ltd., ADR | 1,203 | 54,099 | ||||||
Infosys Ltd., ADR | 602 | 25,134 | ||||||
Larsen & Toubro Ltd. GDR | 1,904 | 47,828 | ||||||
Reliance Industries Ltd. GDR, 144A | 3,005 | 86,153 | ||||||
Sterlite Industries India Ltd., ADR | 4,407 | 29,174 | ||||||
Tata Motors Ltd., ADR | 1,202 | 32,971 | ||||||
Wipro Ltd., ADR | 3,640 | 27,773 | ||||||
|
| |||||||
| 520,925 | ||||||||
|
| |||||||
| Indonesia — 3.3% | ||||||||
Adaro Energy Tbk PT | 59,500 | 5,649 | ||||||
Astra Agro Lestari Tbk PT | 2,000 | 3,982 | ||||||
Astra International Tbk PT | 50,082 | 36,047 | ||||||
Bank Central Asia Tbk PT | 29,000 | 30,643 | ||||||
Bank Danamon Indonesia Tbk PT | 28,000 | 16,437 | ||||||
Bank Mandiri Persero Tbk PT | 25,000 | 24,758 | ||||||
Bank Negara Indonesia Persero Tbk PT | 19,000 | 9,456 | ||||||
Bank Rakyat Indonesia Persero Tbk PT | 27,000 | 24,533 | ||||||
Bumi Resources Tbk PT | 40,000 | 2,695 | ||||||
Charoen Pokphand Indonesia Tbk PT | 35,900 | 18,142 | ||||||
Gudang Garam Tbk PT | 1,900 | 10,378 | ||||||
Indo Tambangraya Megah Tbk PT | 2,900 | 8,883 | ||||||
Indosat Tbk PT | 13,000 | 6,901 | ||||||
Perusahaan Gas Negara Persero Tbk PT | 43,000 | 24,145 | ||||||
Semen Indonesia Persero Tbk PT | 8,000 | 14,701 | ||||||
Telekomunikasi Indonesia Persero Tbk PT | 24,039 | 27,119 | ||||||
Unilever Indonesia Tbk PT | 4,007 | 12,477 | ||||||
United Tractors Tbk PT | 8,000 | 13,313 | ||||||
XL Axiata Tbk PT | 8,900 | 4,543 | ||||||
|
| |||||||
| 294,802 | ||||||||
|
| |||||||
Number | Value | |||||||
| Malaysia — 5.1% | ||||||||
AirAsia Bhd | 6,200 | $ | 6,402 | |||||
AMMB Holdings Bhd | 4,400 | 10,407 | ||||||
Axiata Group Bhd | 6,600 | 14,376 | ||||||
British American Tobacco Malaysia Bhd | 1,500 | 30,755 | ||||||
CIMB Group Holdings Bhd | 11,600 | 30,993 | ||||||
DiGi.Com Bhd | 11,000 | 16,860 | ||||||
Genting Malaysia Bhd | 13,200 | 27,852 | ||||||
Hong Leong Bank Bhd | 4,000 | 18,303 | ||||||
IOI Corp. Bhd | 11,400 | 18,761 | ||||||
Kuala Lumpur Kepong Bhd | 1,400 | 9,568 | ||||||
Lafarge Malaysia Bhd | 7,200 | 25,092 | ||||||
Malayan Banking Bhd | 7,800 | 25,622 | ||||||
Maxis Bhd | 9,500 | 20,722 | ||||||
MMC Corp. Bhd | 6,600 | 5,537 | ||||||
Petronas Chemicals Group Bhd | 8,600 | 18,316 | ||||||
Petronas Dagangan Bhd | 3,800 | 30,655 | ||||||
Petronas Gas Bhd | 2,000 | 13,708 | ||||||
Public Bank Bhd | 4,600 | 25,026 | ||||||
RHB Capital Bhd | 1,800 | 5,088 | ||||||
Sime Darby Bhd | 6,600 | 20,062 | ||||||
Telekom Malaysia Bhd | 7,100 | 12,578 | ||||||
Tenaga Nasional Bhd | 8,800 | 23,711 | ||||||
UMW Holdings Bhd | 5,300 | 24,662 | ||||||
YTL Corp. Bhd | 12,593 | 6,868 | ||||||
YTL Power International Bhd | 8,600 | 4,218 | ||||||
|
| |||||||
| 446,142 | ||||||||
|
| |||||||
| Mexico — 5.7% | ||||||||
Alfa SAB de CV, Class A | 8,000 | 18,882 | ||||||
America Movil SAB de CV | 113,048 | 113,684 | ||||||
Arca Continental SAB de CV | 2,000 | 15,802 | ||||||
Cemex SAB de CV* | 49,207 | 57,493 | ||||||
Coca-Cola Femsa SAB de CV | 801 | 11,710 | ||||||
Fomento Economico Mexicano SAB de CV | 4,608 | 50,226 | ||||||
Grupo Bimbo SAB de CV | 4,408 | 13,050 | ||||||
Grupo Carso SAB de CV | 1,800 | 9,456 | ||||||
Grupo Financiero Banorte SAB de CV, Class O | 5,001 | 31,994 | ||||||
Grupo Financiero Inbursa SAB de CV, Class O | 8,400 | 19,274 | ||||||
Grupo Mexico SAB de CV | 9,711 | 32,153 | ||||||
Grupo Modelo SAB de CV | 1,800 | 16,250 | ||||||
Grupo Televisa SAB de CV | 8,409 | 43,999 | ||||||
Industrias Penoles SAB de CV | 540 | 20,508 | ||||||
Minera Frisco SAB de CV* | 1,600 | 5,943 | ||||||
Wal-Mart de Mexico SAB de CV | 15,025 | 44,352 | ||||||
|
| |||||||
| 504,776 | ||||||||
|
| |||||||
| Peru — 0.2% | ||||||||
Cia de Minas Buenaventura SA, Class B, ADR | 301 | 5,403 | ||||||
Southern Copper Corp | 309 | 9,625 | ||||||
|
| |||||||
| 15,028 | ||||||||
|
| |||||||
| Philippines — 1.0% | ||||||||
Aboitiz Power Corp | 9,200 | 7,781 | ||||||
Ayala Land, Inc | 17,500 | 13,973 | ||||||
Bank of the Philippine Islands | 4,610 | 11,179 | ||||||
BDO Unibank, Inc.* | 4,749 | 10,460 | ||||||
Energy Development Corp | 40,500 | 5,940 | ||||||
| See Notes to Financial Statements. | 29 |
DBX ETF Trust
SCHEDULE OF INVESTMENTS
db X-trackers MSCI Emerging Markets Hedged Equity Fund (Continued)
May 31, 2013
Number | Value | |||||||
| Philippines (Continued) | ||||||||
Metropolitan Bank & Trust | 3,810 | $ | 11,384 | |||||
Philippine Long Distance Telephone Co | 200 | 14,658 | ||||||
SM Investments Corp | 400 | 10,589 | ||||||
|
| |||||||
| 85,964 | ||||||||
|
| |||||||
| Poland — 6.3% | ||||||||
Bank Pekao SA | 1,387 | 70,109 | ||||||
Enea SA | 6,534 | 29,422 | ||||||
Grupa Lotos SA* | 401 | 5,239 | ||||||
Kernel Holding SA* | 4,085 | 71,292 | ||||||
KGHM Polska Miedz SA | 992 | 44,729 | ||||||
PGE SA | 10,182 | 56,034 | ||||||
Polski Koncern Naftowy Orlen SA* | 1,785 | 28,764 | ||||||
Powszechna Kasa Oszczednosci Bank Polski SA | 7,383 | 78,139 | ||||||
Powszechny Zaklad Ubezpieczen SA | 910 | 127,273 | ||||||
Synthos SA | 7,578 | 12,373 | ||||||
Tauron Polska Energia SA | 2,605 | 3,437 | ||||||
Telekomunikacja Polska SA | 11,265 | 27,880 | ||||||
|
| |||||||
| 554,691 | ||||||||
|
| |||||||
| Russia — 4.6% | ||||||||
Gazprom OAO, ADR | 5,609 | 42,404 | ||||||
LSR Group OJSC GDR | 3,392 | 12,293 | ||||||
Lukoil OAO, ADR | 1,202 | 71,037 | ||||||
Magnit OJSC GDR | 173 | 9,472 | ||||||
MMC Norilsk Nickel OJSC, ADR | 3,790 | 55,031 | ||||||
Mobile Telesystems OJSC, ADR | 802 | 15,455 | ||||||
NovaTek OAO GDR | 462 | 51,836 | ||||||
Novolipetsk Steel OJSC GDR | 389 | 5,419 | ||||||
Rosneft Oil Co. GDR | 9,818 | 65,241 | ||||||
Severstal OAO GDR | 601 | 4,718 | ||||||
Sistema JSFC GDR | 336 | 6,414 | ||||||
Surgutneftegas OJSC, ADR | 3,006 | 22,755 | ||||||
Tatneft, ADR | 502 | 17,445 | ||||||
VTB Bank OJSC GDR | 10,017 | 29,089 | ||||||
|
| |||||||
| 408,609 | ||||||||
|
| |||||||
| South Africa — 2.4% | ||||||||
AngloGold Ashanti Ltd., ADR | 1,709 | 31,001 | ||||||
Gold Fields Ltd., ADR | 5,420 | 32,900 | ||||||
Harmony Gold Mining Co. Ltd., ADR | 3,212 | 13,426 | ||||||
Impala Platinum Holdings Ltd., ADR | 1,403 | 14,479 | ||||||
MTN Group Ltd., ADR | 4,113 | 74,651 | ||||||
Sasol Ltd., ADR | 1,005 | 44,602 | ||||||
|
| |||||||
| 211,059 | ||||||||
|
| |||||||
| South Korea — 15.8% | ||||||||
Amorepacific Corp | 14 | 11,426 | ||||||
Celltrion, Inc | 164 | 5,458 | ||||||
Cheil Industries, Inc | 317 | 25,760 | ||||||
Coway Co. Ltd | 430 | 21,125 | ||||||
Daewoo Engineering & Construction Co. Ltd.* | 600 | 4,190 | ||||||
Daewoo International Corp | 200 | 6,444 | ||||||
DGB Financial Group, Inc | 400 | 6,002 | ||||||
Doosan Corp | 52 | 6,536 | ||||||
Doosan Heavy Industries & Construction Co. Ltd | 200 | 8,330 | ||||||
Doosan Infracore Co. Ltd.* | 200 | 2,310 | ||||||
Number | Value | |||||||
| South Korea (Continued) | ||||||||
E-Mart Co. Ltd | 63 | $ | 11,070 | |||||
GS Engineering & Construction Corp | 86 | 2,558 | ||||||
Hana Financial Group, Inc | 560 | 18,936 | ||||||
Hankook Tire Co. Ltd | 81 | 3,786 | ||||||
Hanwha Corp | 200 | 5,612 | ||||||
Hanwha Life Insurance Co. Ltd | 800 | 4,950 | ||||||
Hyundai Department Store Co. Ltd | 36 | 5,035 | ||||||
Hyundai Engineering & Construction Co. Ltd | 259 | 14,077 | ||||||
Hyundai Heavy Industries Co. Ltd | 100 | 17,526 | ||||||
Hyundai Merchant Marine Co. Ltd.* | 200 | 2,080 | ||||||
Hyundai Mipo Dockyard | 36 | 4,382 | ||||||
Hyundai Mobis | 163 | 41,121 | ||||||
Hyundai Motor Co | 391 | 73,548 | ||||||
Hyundai Steel Co | 185 | 11,807 | ||||||
Hyundai Wia Corp | 46 | 6,739 | ||||||
Kangwon Land, Inc | 200 | 6,152 | ||||||
KB Financial Group, Inc | 1,012 | 33,100 | ||||||
KIA Motors Corp | 732 | 38,424 | ||||||
Korea Electric Power Corp.* | 740 | 17,555 | ||||||
Korea Gas Corp | 200 | 9,843 | ||||||
Korean Air Lines Co. Ltd.* | 200 | 6,533 | ||||||
KT&G Corp | 595 | 41,924 | ||||||
Kumho Petro Chemical Co. Ltd | 25 | 2,111 | ||||||
LG Chem Ltd | 110 | 26,631 | ||||||
LG Corp | 267 | 16,615 | ||||||
LG Display Co. Ltd.* | 640 | 17,817 | ||||||
LG Electronics, Inc | 235 | 16,891 | ||||||
LG Household & Health Care Ltd | 39 | 21,542 | ||||||
LG Uplus Corp.* | 1,760 | 18,228 | ||||||
Lotte Chemical Corp | 50 | 7,325 | ||||||
Lotte Shopping Co. Ltd | 44 | 14,236 | ||||||
LS Corp | 179 | 11,218 | ||||||
NCSoft Corp | 40 | 5,559 | ||||||
Neo Holdings Co. Ltd.* | 26 | — | ||||||
NHN Corp | 114 | 30,778 | ||||||
OCI Co. Ltd | 52 | 6,812 | ||||||
POSCO | 157 | 44,750 | ||||||
Samsung C&T Corp | 299 | 16,251 | ||||||
Samsung Card Co. Ltd | 200 | 6,648 | ||||||
Samsung Electro-Mechanics Co. Ltd | 207 | 18,103 | ||||||
Samsung Electronics Co. Ltd | 263 | 358,055 | ||||||
Samsung Engineering Co. Ltd | 88 | 7,455 | ||||||
Samsung Fire & Marine Insurance Co. Ltd | 184 | 37,298 | ||||||
Samsung Heavy Industries Co. Ltd | 480 | 14,043 | ||||||
Samsung Life Insurance Co. Ltd | 447 | 41,745 | ||||||
Samsung SDI Co. Ltd | 110 | 13,973 | ||||||
Shinhan Financial Group Co. Ltd | 1,020 | 36,613 | ||||||
SK C&C Co. Ltd | 50 | 4,537 | ||||||
SK Holdings Co. Ltd | 106 | 16,702 | ||||||
SK Hynix, Inc.* | 1,200 | 34,204 | ||||||
SK Innovation Co. Ltd | 199 | 26,335 | ||||||
SK Networks Co. Ltd | 600 | 3,718 | ||||||
SK Telecom Co. Ltd., ADR | 401 | 8,140 | ||||||
S-Oil Corp | 149 | 11,554 | ||||||
Woori Finance Holdings Co. Ltd | 1,530 | 16,184 | ||||||
|
| |||||||
| 1,386,410 | ||||||||
|
| |||||||
| See Notes to Financial Statements. | 30 |
DBX ETF Trust
SCHEDULE OF INVESTMENTS
db X-trackers MSCI Emerging Markets Hedged Equity Fund (Continued)
May 31, 2013
Number | Value | |||||||
| Taiwan — 9.2% | ||||||||
Advanced Semiconductor Engineering, Inc., ADR | 28,288 | $ | 118,810 | |||||
AU Optronics Corp., ADR* | 7,033 | 31,367 | ||||||
Chunghwa Telecom Co. Ltd., ADR | 3,307 | 103,708 | ||||||
Hon Hai Precision Industry Co. Ltd. GDR | 32,457 | 164,070 | ||||||
Siliconware Precision Industries Co., ADR | 14,527 | 83,530 | ||||||
Taiwan Semiconductor Manufacturing Co. Ltd., ADR | 12,420 | 231,756 | ||||||
United Microelectronics Corp., ADR | 33,862 | 73,481 | ||||||
|
| |||||||
| 806,722 | ||||||||
|
| |||||||
| Thailand — 2.1% | ||||||||
Bangkok Bank PCL, NVDR | 3,400 | 23,022 | ||||||
Bank of Ayudhya PCL, NVDR | 12,200 | 13,600 | ||||||
Indorama Ventures PCL, NVDR | 15,200 | 11,045 | ||||||
IRPC PCL, NVDR | 33,900 | 4,143 | ||||||
Kasikornbank PCL, NVDR | 4,600 | 29,628 | ||||||
Krung Thai Bank PCL, NVDR | 29,700 | 21,778 | ||||||
PTT Exploration & Production PCL, NVDR | 3,600 | 18,074 | ||||||
PTT PCL, NVDR | 1,800 | 19,383 | ||||||
Siam Commercial Bank PCL, NVDR | 5,800 | 33,240 | ||||||
Thai Oil PCL, NVDR | 5,300 | 11,204 | ||||||
|
| |||||||
| 185,117 | ||||||||
|
| |||||||
| Turkey — 2.2% | ||||||||
Akbank TAS | 4,371 | 20,869 | ||||||
Arcelik AS | 1,202 | 9,115 | ||||||
Bim Birlesik Magazalar AS | 397 | 18,763 | ||||||
Emlak Konut Gayrimenkul Yatirim Ortakligi AS REIT | 3,406 | 5,621 | ||||||
Enka Insaat ve Sanayi AS | 2,244 | 7,190 | ||||||
Eregli Demir ve Celik Fabrikalari TAS | 3,913 | 4,681 | ||||||
Haci Omer Sabanci Holding AS | 1,403 | 8,991 | ||||||
Turk Hava Yollari | 3,199 | 14,863 | ||||||
Turk Telekomunikasyon AS | 1,202 | 4,660 | ||||||
Turkcell Iletisim Hizmetleri AS* | 3,542 | 21,848 | ||||||
Turkiye Garanti Bankasi AS | 5,025 | 26,031 | ||||||
Turkiye Halk Bankasi AS | 802 | 8,609 | ||||||
Turkiye Is Bankasi, Class C | 6,347 | 23,592 | ||||||
Turkiye Vakiflar Bankasi Tao, Class D | 2,605 | 8,291 | ||||||
Yapi ve Kredi Bankasi AS | 2,404 | 7,190 | ||||||
|
| |||||||
| 190,314 | ||||||||
|
| |||||||
TOTAL COMMON STOCKS | 7,935,558 | |||||||
|
| |||||||
| PREFERRED STOCKS — 7.5% | ||||||||
| Brazil — 6.8% | ||||||||
AES Tiete SA | 400 | 4,342 | ||||||
Banco Bradesco SA | 5,130 | 82,227 | ||||||
Bradespar SA | 1,000 | 10,300 | ||||||
Braskem SA* | 1,200 | 9,362 | ||||||
Cia Brasileira de Distribuicao Grupo Pao de Acucar | 400 | 19,384 | ||||||
Cia de Bebidas das Americas | 1,800 | 68,872 | ||||||
Cia Energetica de Minas Gerais | 1,749 | 17,679 | ||||||
Gerdau SA | 2,400 | 14,623 | ||||||
Itau Unibanco Holding SA | 7,340 | 111,035 | ||||||
Number | Value | |||||||
| Brazil (Continued) | ||||||||
Itausa — Investimentos Itau SA | 7,198 | $ | 31,658 | |||||
Klabin SA | 2,200 | 13,322 | ||||||
Metalurgica Gerdau SA, Class A | 1,200 | 9,301 | ||||||
Oi SA | 800 | 1,483 | ||||||
Petroleo Brasileiro SA | 12,100 | 113,272 | ||||||
Telefonica Brasil SA | 1,000 | 24,605 | ||||||
Vale SA | 5,200 | 69,558 | ||||||
|
| |||||||
| 601,023 | ||||||||
|
| |||||||
| Chile — 0.2% | ||||||||
Sociedad Quimica y Minera de Chile SA, Class B | 331 | 15,402 | ||||||
|
| |||||||
| Colombia — 0.0% (a) | ||||||||
Grupo Argos SA | 155 | 1,637 | ||||||
|
| |||||||
| South Korea — 0.5% | ||||||||
Samsung Electronics Co. Ltd | 50 | 43,817 | ||||||
|
| |||||||
TOTAL PREFERRED STOCKS | 661,879 | |||||||
|
| |||||||
| RIGHTS — 0.0% (a) | ||||||||
| Brazil — 0.0% (a) | ||||||||
Itausa — Investimentos Itau SA*, expires 6/30/13 | 176 | 223 | ||||||
|
| |||||||
| Chile — 0.0% (a) | ||||||||
Empresas CMPC SA*, expires 7/8/13 | 274 | 90 | ||||||
|
| |||||||
| China — 0.0% (a) | ||||||||
PICC Property and Casualty Co. Ltd.*, expires 7/18/13 | 1,322 | 645 | ||||||
|
| |||||||
TOTAL RIGHTS | 958 | |||||||
|
| |||||||
TOTAL INVESTMENTS — 97.7% | $ | 8,598,395 | ||||||
Other assets less liabilities — 2.3% | 201,756 | |||||||
|
| |||||||
NET ASSETS — 100.0% | $ | 8,800,151 | ||||||
|
| |||||||
SECTOR BREAKDOWN AS OF MAY 31, 2013
| Value | % of Net Assets | |||||||
Financial | $ | 2,287,624 | 26.0 | % | ||||
Energy | 1,072,875 | 12.2 | ||||||
Technology | 1,024,643 | 11.6 | ||||||
Communications | 819,682 | 9.3 | ||||||
Consumer, Non-cyclical | 803,499 | 9.1 | ||||||
Basic Materials | 767,792 | 8.7 | ||||||
Industrial | 693,609 | 7.9 | ||||||
Consumer, Cyclical | 633,230 | 7.2 | ||||||
Utilities | 368,377 | 4.2 | ||||||
Diversified | 127,064 | 1.5 | ||||||
|
|
|
| |||||
TOTAL INVESTMENTS | 8,598,395 | 97.7 | ||||||
Other assets less liabilities | 201,756 | 2.3 | ||||||
|
|
|
| |||||
NET ASSETS | $ | 8,800,151 | 100 | % | ||||
|
|
|
| |||||
| See Notes to Financial Statements. | 31 |
DBX ETF Trust
SCHEDULE OF INVESTMENTS
db X-trackers MSCI Emerging Markets Hedged Equity Fund (Continued)
May 31, 2013
As of May 31, 2013, the Fund had the following futures contracts open:
| Number of Contracts | Contract Value | Expiration Date | Unrealized Depreciation | |||||||||||||
E-mini MSCI Emerging Markets Index Futures | 2 | $ | 98,890 | 6/21/2013 | $ | (4,305 | ) | |||||||||
As of May 31, 2013, the Fund had the following forward foreign currency contracts outstanding:
Counterparty | Settlement Date | Currency To Deliver | Currency To Receive | Unrealized Appreciation (Depreciation) | ||||||||||||||
Barclays Bank PLC | 6/5/2013 | BRL | 1,095,000 | USD | 545,237 | $ | 34,536 | |||||||||||
JP Morgan & Chase Co. | 6/5/2013 | BRL | 1,095,000 | USD | 545,319 | 34,618 | ||||||||||||
JP Morgan & Chase Co. | 6/5/2013 | CLP | 87,651,000 | USD | 184,276 | 9,509 | ||||||||||||
JP Morgan & Chase Co. | 6/5/2013 | CZK | 260,000 | USD | 13,291 | 155 | ||||||||||||
JP Morgan & Chase Co. | 6/5/2013 | EGP | 93,000 | USD | 13,408 | 128 | ||||||||||||
Barclays Bank PLC | 6/5/2013 | HKD | 11,749,000 | USD | 1,514,181 | 607 | ||||||||||||
The Bank of New York Mellon | 6/5/2013 | HKD | 816,314 | USD | 105,203 | 41 | ||||||||||||
JP Morgan & Chase Co. | 6/5/2013 | HUF | 2,549,000 | USD | 11,158 | (5 | ) | |||||||||||
Barclays Bank PLC | 6/5/2013 | IDR | 3,082,187,000 | USD | 315,895 | 1,416 | ||||||||||||
Barclays Bank PLC | 6/5/2013 | INR | 35,081,000 | USD | 650,974 | 30,515 | ||||||||||||
Barclays Bank PLC | 6/5/2013 | KRW | 732,683,000 | USD | 663,302 | 14,914 | ||||||||||||
JP Morgan & Chase Co. | 6/5/2013 | KRW | 732,683,000 | USD | 664,414 | 16,027 | ||||||||||||
JP Morgan & Chase Co. | 6/5/2013 | MXN | 5,850,000 | USD | 479,885 | 22,302 | ||||||||||||
The Bank of New York Mellon | 6/5/2013 | MXN | 135,000 | USD | 11,058 | 499 | ||||||||||||
The Bank of New York Mellon | 6/5/2013 | MXN | 20,954 | USD | 1,633 | (6 | ) | |||||||||||
Barclays Bank PLC | 6/5/2013 | MYR | 1,065,000 | USD | 349,192 | 5,659 | ||||||||||||
Barclays Bank PLC | 6/5/2013 | PHP | 4,107,000 | USD | 99,806 | 2,659 | ||||||||||||
JP Morgan & Chase Co. | 6/5/2013 | PLN | 619,000 | USD | 195,478 | 7,347 | ||||||||||||
The Bank of New York Mellon | 6/5/2013 | PLN | 250,000 | USD | 78,732 | 2,750 | ||||||||||||
JP Morgan & Chase Co. | 6/5/2013 | RUB | 12,526,000 | USD | 402,930 | 10,990 | ||||||||||||
Barclays Bank PLC | 6/5/2013 | THB | 4,861,000 | USD | 165,453 | 4,936 | ||||||||||||
Barclays Bank PLC | 6/5/2013 | TRY | 349,000 | USD | 193,928 | 7,670 | ||||||||||||
Barclays Bank PLC | 6/5/2013 | TWD | 28,120,000 | USD | 953,220 | 13,331 | ||||||||||||
Barclays Bank PLC | 6/5/2013 | USD | 513,313 | BRL | 1,095,000 | (2,613 | ) | |||||||||||
JP Morgan & Chase Co. | 6/5/2013 | USD | 513,289 | BRL | 1,095,000 | (2,588 | ) | |||||||||||
JP Morgan & Chase Co. | 6/5/2013 | USD | 175,246 | CLP | 87,651,000 | (479 | ) | |||||||||||
JP Morgan & Chase Co. | 6/5/2013 | USD | 13,095 | CZK | 260,000 | 41 | ||||||||||||
JP Morgan & Chase Co. | 6/5/2013 | USD | 13,317 | EGP | 93,000 | (36 | ) | |||||||||||
Barclays Bank PLC | 6/5/2013 | USD | 1,513,471 | HKD | 11,749,000 | 103 | ||||||||||||
The Bank of New York Mellon | 6/5/2013 | USD | 103,116 | HKD | 800,000 | (55 | ) | |||||||||||
The Bank of New York Mellon | 6/5/2013 | USD | 2,102 | HKD | 16,314 | — | ||||||||||||
JP Morgan & Chase Co. | 6/5/2013 | USD | 11,147 | HUF | 2,549,000 | 16 | ||||||||||||
Barclays Bank PLC | 6/5/2013 | USD | 311,329 | IDR | 3,082,187,000 | 3,150 | ||||||||||||
Barclays Bank PLC | 6/5/2013 | USD | 618,473 | INR | 35,081,000 | 1,987 | ||||||||||||
Barclays Bank PLC | 6/5/2013 | USD | 647,155 | KRW | 732,683,000 | 1,233 | ||||||||||||
JP Morgan & Chase Co. | 6/5/2013 | USD | 646,961 | KRW | 732,683,000 | 1,427 | ||||||||||||
JP Morgan & Chase Co. | 6/5/2013 | USD | 455,892 | MXN | 5,850,000 | 1,691 | ||||||||||||
The Bank of New York Mellon | 6/5/2013 | USD | 12,832 | MXN | 155,954 | (633 | ) | |||||||||||
Barclays Bank PLC | 6/5/2013 | USD | 342,819 | MYR | 1,065,000 | 714 | ||||||||||||
Barclays Bank PLC | 6/5/2013 | USD | 97,010 | PHP | 4,107,000 | 137 | ||||||||||||
JP Morgan & Chase Co. | 6/5/2013 | USD | 187,479 | PLN | 619,000 | 651 | ||||||||||||
The Bank of New York Mellon | 6/5/2013 | USD | 74,156 | PLN | 234,951 | (2,748 | ) | |||||||||||
The Bank of New York Mellon | 6/5/2013 | USD | 4,558 | PLN | 15,049 | 16 | ||||||||||||
JP Morgan & Chase Co. | 6/5/2013 | USD | 392,219 | RUB | 12,526,000 | (279 | ) | |||||||||||
Barclays Bank PLC | 6/5/2013 | USD | 159,639 | THB | 4,861,000 | 878 | ||||||||||||
Barclays Bank PLC | 6/5/2013 | USD | 186,169 | TRY | 349,000 | 89 | ||||||||||||
Barclays Bank PLC | 6/5/2013 | USD | 938,804 | TWD | 28,120,000 | 1,085 | ||||||||||||
JP Morgan & Chase Co. | 6/5/2013 | USD | 468,530 | ZAR | 4,714,000 | (379 | ) | |||||||||||
JP Morgan & Chase Co. | 6/5/2013 | ZAR | 4,714,000 | USD | 522,480 | 54,329 | ||||||||||||
JP Morgan & Chase Co. | 6/6/2013 | COP | 151,095,000 | USD | 82,577 | 3,250 | ||||||||||||
JP Morgan & Chase Co. | 6/6/2013 | USD | 79,228 | COP | 151,095,000 | 99 | ||||||||||||
Barclays Bank PLC | 7/3/2013 | BRL | 1,259,000 | USD | 586,372 | 2,649 | ||||||||||||
JP Morgan & Chase Co. | 7/3/2013 | BRL | 1,259,000 | USD | 586,946 | 3,223 | ||||||||||||
| See Notes to Financial Statements. | 32 |
DBX ETF Trust
SCHEDULE OF INVESTMENTS
db X-trackers MSCI Emerging Markets Hedged Equity Fund (Continued)
May 31, 2013
Counterparty | Settlement Date | Currency To Deliver | Currency To Receive | Unrealized Appreciation (Depreciation) | ||||||||||||||
JP Morgan & Chase Co. | 7/3/2013 | CLP | 84,632,000 | USD | 168,536 | $ | 582 | |||||||||||
JP Morgan & Chase Co. | 7/3/2013 | CZK | 257,000 | USD | 12,945 | (41 | ) | |||||||||||
Barclays Bank PLC | 7/3/2013 | HKD | 11,744,000 | USD | 1,513,008 | (118 | ) | |||||||||||
The Bank of New York Mellon | 7/3/2013 | HKD | 46,572 | USD | 6,000 | – | ||||||||||||
JP Morgan & Chase Co. | 7/3/2013 | HUF | 17,420,000 | USD | 75,951 | (104 | ) | |||||||||||
Barclays Bank PLC | 7/3/2013 | IDR | 3,035,465,000 | USD | 302,024 | (6,591 | ) | |||||||||||
Barclays Bank PLC | 7/3/2013 | INR | 30,648,000 | USD | 536,790 | (2,315 | ) | |||||||||||
Barclays Bank PLC | 7/3/2013 | KRW | 824,579,000 | USD | 726,578 | (2,036 | ) | |||||||||||
JP Morgan & Chase Co. | 7/3/2013 | KRW | 824,579,000 | USD | 727,116 | (1,497 | ) | |||||||||||
JP Morgan & Chase Co. | 7/3/2013 | MXN | 6,285,000 | USD | 488,475 | (1,788 | ) | |||||||||||
Barclays Bank PLC | 7/3/2013 | MYR | 1,414,000 | USD | 455,160 | (15 | ) | |||||||||||
Barclays Bank PLC | 7/3/2013 | PHP | 3,638,000 | USD | 85,614 | (366 | ) | |||||||||||
JP Morgan & Chase Co. | 7/3/2013 | PLN | 1,838,000 | USD | 555,571 | (1,869 | ) | |||||||||||
JP Morgan & Chase Co. | 7/3/2013 | RUB | 10,805,000 | USD | 338,330 | 1,923 | ||||||||||||
Barclays Bank PLC | 7/3/2013 | TRY | 369,000 | USD | 196,009 | (185 | ) | |||||||||||
Barclays Bank PLC | 7/3/2013 | TWD | 25,055,000 | USD | 834,721 | (2,981 | ) | |||||||||||
The Bank of New York Mellon | 7/3/2013 | USD | 131,000 | BRL | 281,388 | (537 | ) | |||||||||||
The Bank of New York Mellon | 7/3/2013 | USD | 65,000 | HUF | 14,847,086 | (179 | ) | |||||||||||
The Bank of New York Mellon | 7/3/2013 | USD | 39,000 | MXN | 499,294 | (52 | ) | |||||||||||
The Bank of New York Mellon | 7/3/2013 | USD | 352,000 | PLN | 1,161,917 | 394 | ||||||||||||
JP Morgan & Chase Co. | 7/3/2013 | ZAR | 2,197,000 | USD | 217,474 | 189 | ||||||||||||
JP Morgan & Chase Co. | 7/5/2013 | COP | 99,422,000 | USD | 51,945 | (108 | ) | |||||||||||
JP Morgan & Chase Co. | 7/5/2013 | EGP | 106,000 | USD | 14,901 | 5 | ||||||||||||
Barclays Bank PLC | 7/5/2013 | THB | 5,820,000 | USD | 190,617 | (1,243 | ) | |||||||||||
|
| |||||||||||||||||
| $ | 268,624 | |||||||||||||||||
|
| |||||||||||||||||
Currency Abbreviations
BRL – Brazilian Real
CLP – Chilean Peso
COP – Colombian Peso
CZK – Czech Kronua
EGP – Egyptian Pound
HKD – Hong Kong Dollar
HUF – Hungarian Forint
IDR – Indonesian Rupiah
INR – Indian Rupee
KRW – South Korean Won
MXN – Mexican Peso
MYR – Malaysian Ringgit
PHP – Philippine Peso
PLN – Polish Zloty
RUB – Russian Ruble
THB – Thai Baht
TRY – Turkish New Lira
TWD – New Taiwan Dollar
USD – U.S. Dollar
ZAR – South African Rand
* Non-income producing security.
144A – Security is exempt from registration under Rule 144A of the securities Act of 1933. This security is considered liquid and may be resold in transactions exempt from registration, normally to qualified institutional buyers. At May 31, 2013 the aggregate market value of this security amounted to $86,153 or 1.0% of net assets.
(a) Less than 0.1%.
ADR – American Depositary Receipt.
GDR – Global Depositary Receipt.
NVDR – Non Voting Depositary Receipt.
REIT – Real Estate Investment Trust.
| See Notes to Financial Statements. | 33 |
DBX ETF Trust
SCHEDULE OF INVESTMENTS
db X-trackers MSCI Germany Hedged Equity Fund
May 31, 2013
Number | Value | |||||||
| COMMON STOCKS — 86.9% | ||||||||
| Basic Materials — 14.2% | ||||||||
BASF SE | 3,923 | $ | 383,592 | |||||
Brenntag AG | 220 | 33,598 | ||||||
K+S AG | 736 | 31,100 | ||||||
Lanxess AG | 355 | 26,563 | ||||||
Linde AG | 791 | 152,210 | ||||||
ThyssenKrupp AG* | 1,648 | 33,104 | ||||||
|
| |||||||
| 660,167 | ||||||||
|
| |||||||
| Communications — 4.4% | ||||||||
Axel Springer AG | 169 | 7,435 | ||||||
Deutsche Telekom AG | 11,999 | 137,835 | ||||||
Kabel Deutschland Holding AG | 378 | 35,767 | ||||||
Telefonica Deutschland Holding AG | 1,200 | 8,907 | ||||||
United Internet AG | 456 | 13,027 | ||||||
|
| |||||||
| 202,971 | ||||||||
|
| |||||||
| Consumer, Cyclical — 13.3% | ||||||||
Adidas AG | 894 | 97,710 | ||||||
Bayerische Motoren Werke AG | 1,414 | 135,431 | ||||||
Continental AG | 470 | 62,096 | ||||||
Daimler AG | 4,105 | 263,625 | ||||||
Deutsche Lufthansa AG* | 982 | 21,226 | ||||||
Hugo Boss AG | 135 | 15,113 | ||||||
Volkswagen AG | 126 | 27,030 | ||||||
|
| |||||||
| 622,231 | ||||||||
|
| |||||||
| Consumer, Non-cyclical — 14.8% | ||||||||
Bayer AG | 3,532 | 380,524 | ||||||
Beiersdorf AG | 431 | 38,950 | ||||||
Celesio AG | 363 | 7,525 | ||||||
Fresenius Medical Care AG & Co. KGaA | 905 | 61,637 | ||||||
Fresenius SE & Co. KGaA | 533 | 63,374 | ||||||
Henkel AG & Co. KGaA | 555 | 45,518 | ||||||
Merck KGaA | 276 | 43,855 | ||||||
Metro AG | 554 | 18,959 | ||||||
QIAGEN NV* | 1,011 | 19,014 | ||||||
Suedzucker AG | 349 | 11,862 | ||||||
|
| |||||||
| 691,218 | ||||||||
|
| |||||||
| Diversified — 0.6% | ||||||||
GEA Group AG | 781 | 28,555 | ||||||
|
| |||||||
| Financial — 16.5% | ||||||||
Allianz SE | 1,948 | 303,196 | ||||||
Commerzbank AG* | 4,133 | 43,405 | ||||||
Deutsche Bank AG | 4,355 | 204,199 | ||||||
Deutsche Boerse AG | 824 | 53,325 | ||||||
Hannover Rueckversicherung SE | 258 | 19,557 | ||||||
Muenchener Rueckversicherungs AG | 766 | 144,014 | ||||||
|
| |||||||
| 767,696 | ||||||||
|
| |||||||
Number | Value | |||||||
| Industrial — 11.6% | ||||||||
Deutsche Post AG | 3,873 | $ | 98,464 | |||||
Fraport AG Frankfurt Airport Services Worldwide | 158 | 9,344 | ||||||
HeidelbergCement AG | 601 | 45,689 | ||||||
Hochtief AG | 132 | 9,325 | ||||||
MAN SE | 151 | 16,802 | ||||||
Siemens AG | 3,387 | 359,267 | ||||||
|
| |||||||
| 538,891 | ||||||||
|
| |||||||
| Technology — 7.2% | ||||||||
Infineon Technologies AG | 4,616 | 39,298 | ||||||
SAP AG | 3,936 | 296,870 | ||||||
|
| |||||||
| 336,168 | ||||||||
|
| |||||||
| Utilities — 4.3% | ||||||||
E.ON SE | 7,693 | 130,587 | ||||||
RWE AG | 2,090 | 71,864 | ||||||
|
| |||||||
| 202,451 | ||||||||
|
| |||||||
TOTAL COMMON STOCKS | 4,050,348 | |||||||
|
| |||||||
| PREFERRED STOCKS — 6.7% | ||||||||
| Communications — 0.4% | ||||||||
ProSiebenSat.1 Media AG | 444 | 17,832 | ||||||
|
| |||||||
| Consumer, Cyclical — 4.4% | ||||||||
Bayerische Motoren Werke AG | 229 | 16,010 | ||||||
Porsche Automobil Holding SE | 654 | 54,717 | ||||||
Volkswagen AG | 618 | 135,708 | ||||||
|
| |||||||
| 206,435 | ||||||||
|
| |||||||
| Consumer, Non-cyclical — 1.6% | ||||||||
Henkel AG & Co. KGaA | 761 | 73,787 | ||||||
|
| |||||||
| Energy — 0.2% | ||||||||
Fuchs Petrolub AG | 100 | 8,651 | ||||||
|
| |||||||
| Utilities — 0.1% | ||||||||
RWE AG — Non Vote | 167 | 5,517 | ||||||
|
| |||||||
TOTAL PREFERRED STOCKS | 312,222 | |||||||
|
| |||||||
TOTAL INVESTMENTS — 93.6% | $ | 4,362,570 | ||||||
Other assets less liabilities — 6.4% | 300,244 | |||||||
|
| |||||||
NET ASSETS — 100.0% | $ | 4,662,814 | ||||||
|
| |||||||
As of May 31,2013, the Fund had the following futures contracts open:
Contract Description | Number of Contracts | Contract Value | Expiration Date | Unrealized Appreciation | ||||||||||||
DAX Index Futures | 1 | $ | 271,859 | 6/21/2013 | $ | 49 | ||||||||||
| See Notes to Financial Statements. | 34 |
DBX ETF Trust
SCHEDULE OF INVESTMENTS
db X-trackers MSCI Germany Hedged Equity Fund (Continued)
May 31, 2013
As of May 31, 2013, the Fund had the following forward foreign currency contracts outstanding:
Counterparty | Settlement Date | Currency To Deliver | Currency To Receive | Unrealized Depreciation | ||||||||||||||
Barclays Bank PLC | 7/2/2013 | EUR | 1,698,868 | USD | 2,200,000 | $ | (8,500 | ) | ||||||||||
JP Morgan & Chase Co. | 7/2/2013 | EUR | 1,697,294 | USD | 2,200,000 | (6,454 | ) | |||||||||||
|
| |||||||||||||||||
| $ | (14,954 | ) | ||||||||||||||||
|
| |||||||||||||||||
As of May 31, 2013, the Fund had the following foreign currency spot contracts outstanding:
Counterparty | Settlement Date | Currency To Deliver | Currency To Receive | Unrealized Appreciation (Depreciation) | ||||||||||||||
Barclays Bank PLC | 6/5/2013 | CAD | 2,211,000 | USD | 2,193,872 | $ | 61,497 | |||||||||||
JP Morgan & Chase Co. | 6/5/2013 | CAD | 2,211,000 | USD | 2,196,359 | 63,983 | ||||||||||||
The Bank of New York Mellon | 6/5/2013 | CAD | 160,646 | USD | 155,423 | 472 | ||||||||||||
The Bank of New York Mellon | 6/5/2013 | USD | 9,661 | CAD | 10,000 | (17 | ) | |||||||||||
Barclays Bank PLC | 6/5/2013 | USD | 2,200,000 | EUR | 1,699,096 | 8,397 | ||||||||||||
JP Morgan & Chase Co. | 6/5/2013 | USD | 2,200,000 | EUR | 1,697,522 | 6,350 | ||||||||||||
|
| |||||||||||||||||
| $ | 140,682 | |||||||||||||||||
|
| |||||||||||||||||
Currency Abbreviations
CAD – Canadian Dollar
EUR – Euro
USD – U.S. Dollar
* Non-income producing security.
| See Notes to Financial Statements. | 35 |
DBX ETF Trust
SCHEDULE OF INVESTMENTS
db X-trackers MSCI Japan Hedged Equity Fund
May 31, 2013
Number | Value | |||||||
| COMMON STOCKS — 98.6% | ||||||||
| Basic Materials — 5.5% | ||||||||
Air Water, Inc. | 6,500 | $ | 92,658 | |||||
Asahi Kasei Corp. | 55,000 | 378,876 | ||||||
Daicel Corp. | 11,900 | 97,138 | ||||||
Daido Steel Co. Ltd. | 12,000 | 66,059 | ||||||
Hitachi Chemical Co. Ltd. | 4,400 | 70,519 | ||||||
Hitachi Metals Ltd. | 7,600 | 80,346 | ||||||
Japan Steel Works Ltd. (The) | 14,000 | 90,727 | ||||||
JFE Holdings, Inc. | 21,100 | 450,545 | ||||||
JSR Corp. | 7,600 | 150,706 | ||||||
Kaneka Corp. | 12,000 | 74,063 | ||||||
Kansai Paint Co. Ltd. | 9,000 | 119,158 | ||||||
Kobe Steel Ltd.* | 107,000 | 145,926 | ||||||
Kuraray Co. Ltd. | 14,800 | 215,101 | ||||||
Mitsubishi Chemical Holdings Corp. | 57,500 | 279,901 | ||||||
Mitsubishi Gas Chemical Co., Inc. | 15,000 | 109,452 | ||||||
Mitsubishi Materials Corp. | 47,000 | 153,930 | ||||||
Mitsui Chemicals, Inc. | 36,000 | 83,142 | ||||||
Nippon Steel Corp. | 326,145 | 844,136 | ||||||
Nitto Denko Corp. | 7,100 | 432,552 | ||||||
OJI Holdings Corp. Ltd. | 34,000 | 121,169 | ||||||
Shin-Etsu Chemical Co. Ltd. | 17,500 | 1,127,123 | ||||||
Showa Denko KK | 64,000 | 100,025 | ||||||
Sumitomo Chemical Co. Ltd. | 64,000 | 208,332 | ||||||
Sumitomo Metal Mining Co. Ltd. | 23,000 | 298,562 | ||||||
Taiyo Nippon Sanso Corp. | 10,000 | 71,276 | ||||||
Ube Industries Ltd. | 43,000 | 84,754 | ||||||
Yamato Kogyo Co. Ltd. | 1,700 | 52,969 | ||||||
|
| |||||||
| 5,999,145 | ||||||||
|
| |||||||
| Communications — 6.0% | ||||||||
Dena Co. Ltd. | 4,613 | 98,179 | ||||||
Dentsu, Inc. | 7,800 | 242,645 | ||||||
Gree, Inc. | 4,600 | 46,021 | ||||||
Hakuhodo DY Holdings, Inc. | 1,010 | 67,565 | ||||||
KDDI Corp. | 22,984 | 1,054,763 | ||||||
M3, Inc. | 31 | 67,675 | ||||||
Nexon Co. Ltd. | 4,600 | 49,913 | ||||||
Nippon Telegraph & Telephone Corp. | 18,600 | 935,046 | ||||||
NTT DoCoMo, Inc. | 653 | 973,763 | ||||||
Rakuten, Inc. | 31,100 | 351,077 | ||||||
SBI Holdings, Inc. | 8,628 | 111,484 | ||||||
Softbank Corp. | 40,600 | 2,089,513 | ||||||
Trend Micro, Inc. | 4,600 | 143,328 | ||||||
Yahoo Japan Corp. | 623 | 287,142 | ||||||
|
| |||||||
| 6,518,114 | ||||||||
|
| |||||||
| Consumer, Cyclical — 27.4% | ||||||||
ABC-Mart, Inc. | 1,100 | 40,132 | ||||||
Aeon Co. Ltd. | 25,700 | 303,933 | ||||||
Aisin Seiki Co. Ltd. | 8,100 | 301,568 | ||||||
ANA Holdings, Inc. | 50,000 | 106,018 | ||||||
Asics Corp. | 6,800 | 106,547 | ||||||
Bridgestone Corp. | 27,800 | 932,617 | ||||||
Citizen Holdings Co. Ltd. | 11,400 | 67,863 | ||||||
Daihatsu Motor Co. Ltd. | 9,000 | 194,774 | ||||||
Daiwa House Industry Co. Ltd. | 22,000 | 422,896 | ||||||
Number | Value | |||||||
| Consumer, Cyclical (Continued) | ||||||||
Denso Corp. | 20,900 | $ | 891,509 | |||||
Don Quijote Co. Ltd. | 2,400 | 109,422 | ||||||
FamilyMart Co. Ltd. | 2,600 | 106,247 | ||||||
Fast Retailing Co. Ltd. | 2,300 | 799,065 | ||||||
Fuji Heavy Industries Ltd. | 25,000 | 584,590 | ||||||
Hino Motors Ltd. | 11,000 | 162,172 | ||||||
Hitachi High-Technologies Corp. | 2,600 | 61,574 | ||||||
Honda Motor Co. Ltd. | 69,700 | 2,657,419 | ||||||
Isetan Mitsukoshi Holdings Ltd. | 15,200 | 193,073 | ||||||
Isuzu Motors Ltd. | 51,000 | 393,460 | ||||||
ITOCHU Corp. | 64,500 | 822,503 | ||||||
J Front Retailing Co. Ltd. | 20,000 | 140,560 | ||||||
Japan Airlines Co. Ltd. | 2,489 | 129,337 | ||||||
JTEKT Corp. | 8,700 | 97,778 | ||||||
Koito Manufacturing Co. Ltd. | 4,800 | 89,688 | ||||||
Lawson, Inc. | 2,700 | 197,282 | ||||||
Marubeni Corp. | 71,000 | 504,644 | ||||||
Marui Group Co. Ltd. | 9,500 | 90,409 | ||||||
Mazda Motor Corp.* | 115,000 | 462,496 | ||||||
McDonald’s Holdings Co. Japan Ltd. | 2,800 | 78,045 | ||||||
Mitsubishi Corp. | 60,100 | 1,068,524 | ||||||
Mitsubishi Logistics Corp. | 6,000 | 83,918 | ||||||
Mitsubishi Motors Corp.* | 181,000 | 286,486 | ||||||
Mitsui & Co. Ltd. | 74,300 | 954,868 | ||||||
Namco Bandai Holdings, Inc. | 7,700 | 126,551 | ||||||
NGK Insulators Ltd. | 11,000 | 142,352 | ||||||
NGK Spark Plug Co. Ltd. | 8,000 | 143,587 | ||||||
NHK Spring Co. Ltd. | 6,700 | 77,701 | ||||||
Nintendo Co. Ltd. | 4,500 | 451,098 | ||||||
Nissan Motor Co. Ltd. | 106,400 | 1,180,987 | ||||||
Nitori Holdings Co. Ltd. | 1,550 | 122,667 | ||||||
NOK Corp. | 4,000 | 65,741 | ||||||
Oriental Land Co. Ltd. | 2,200 | 301,787 | ||||||
Panasonic Corp.* | 94,600 | 743,014 | ||||||
Sankyo Co. Ltd. | 2,200 | 97,785 | ||||||
Sanrio Co. Ltd. | 1,900 | 92,395 | ||||||
Sega Sammy Holdings, Inc. | 7,900 | 191,730 | ||||||
Sekisui Chemical Co. Ltd. | 19,000 | 193,300 | ||||||
Sekisui House Ltd. | 24,000 | 317,515 | ||||||
Sharp Corp.* | 44,000 | 208,491 | ||||||
Shimamura Co. Ltd. | 900 | 104,106 | ||||||
Shimano, Inc. | 3,400 | 265,691 | ||||||
Sojitz Corp. | 53,600 | 94,976 | ||||||
Sony Corp. | 43,300 | 883,199 | ||||||
Stanley Electric Co. Ltd. | 6,200 | 116,155 | ||||||
Sumitomo Corp. | 48,200 | 617,524 | ||||||
Sumitomo Electric Industries Ltd. | 32,200 | �� | 397,151 | |||||
Sumitomo Rubber Industries Ltd. | 7,400 | 119,190 | ||||||
Suzuki Motor Corp. | 15,700 | 392,129 | ||||||
Takashimaya Co. Ltd. | 11,000 | 104,903 | ||||||
Teijin Ltd. | 41,000 | 95,505 | ||||||
Toho Co. Ltd. | 4,600 | 81,418 | ||||||
Toray Industries, Inc. | 62,000 | 434,503 | ||||||
Toyoda Gosei Co. Ltd. | 2,700 | 66,684 | ||||||
Toyota Boshoku Corp. | 2,800 | 40,890 | ||||||
Toyota Industries Corp. | 7,000 | 281,868 | ||||||
Toyota Motor Corp. | 118,000 | 7,059,677 | ||||||
| See Notes to Financial Statements. | 36 |
DBX ETF Trust
SCHEDULE OF INVESTMENTS
db X-trackers MSCI Japan Hedged Equity Fund (Continued)
May 31, 2013
Number | Value | |||||||
| Consumer, Cyclical (Continued) | ||||||||
Toyota Tsusho Corp. | 9,000 | $ | 245,035 | |||||
USS Co. Ltd. | 930 | 108,965 | ||||||
Yamada Denki Co. Ltd. | 3,940 | 151,199 | ||||||
Yamaha Corp. | 6,800 | 74,529 | ||||||
Yamaha Motor Co. Ltd. | 12,000 | 192,444 | ||||||
Yokohama Rubber Co. Ltd. (The) | 9,000 | 92,638 | ||||||
|
| |||||||
| 29,918,497 | ||||||||
|
| |||||||
| Consumer, Non-cyclical — 12.5% | ||||||||
Ajinomoto Co., Inc. | 25,000 | 348,167 | ||||||
Alfresa Holdings Corp. | 1,900 | 100,055 | ||||||
Asahi Group Holdings Ltd. | 16,500 | 401,433 | ||||||
Astellas Pharma, Inc. | 19,100 | 994,405 | ||||||
Benesse Holdings, Inc. | 3,000 | 111,244 | ||||||
Calbee, Inc. | 800 | 77,567 | ||||||
Chugai Pharmaceutical Co. Ltd. | 9,500 | 193,395 | ||||||
Coca-Cola West Co. Ltd. | 2,700 | 48,380 | ||||||
Dai Nippon Printing Co. Ltd. | 24,000 | 209,049 | ||||||
Daiichi Sankyo Co. Ltd. | 28,800 | 482,509 | ||||||
Dainippon Sumitomo Pharma Co. Ltd. | 6,800 | 95,852 | ||||||
Eisai Co. Ltd. | 10,800 | 419,292 | ||||||
Hisamitsu Pharmaceutical Co., Inc. | 2,600 | 128,635 | ||||||
Japan Tobacco, Inc. | 47,000 | 1,618,834 | ||||||
Kao Corp. | 22,600 | 715,425 | ||||||
Kikkoman Corp. | 6,000 | 99,507 | ||||||
Kirin Holdings Co. Ltd. | 38,000 | 627,187 | ||||||
Kyowa Hakko Kirin Co. Ltd. | 9,000 | 102,135 | ||||||
Medipal Holdings Corp. | 5,700 | 76,772 | ||||||
MEIJI Holdings Co. Ltd. | 2,600 | 115,435 | ||||||
Miraca Holdings, Inc. | 2,300 | 100,398 | ||||||
Mitsubishi Tanabe Pharma Corp. | 10,200 | 131,390 | ||||||
Nippon Meat Packers, Inc. | 6,600 | 94,412 | ||||||
Nisshin Seifun Group, Inc. | 7,500 | 85,635 | ||||||
Nissin Foods Holdings Co. Ltd. | 2,600 | 100,941 | ||||||
Ono Pharmaceutical Co. Ltd. | 3,600 | 251,575 | ||||||
Otsuka Holdings Co. Ltd. | 15,600 | 502,374 | ||||||
Park24 Co. Ltd. | 4,200 | 78,393 | ||||||
Santen Pharmaceutical Co. Ltd. | 3,100 | 124,981 | ||||||
Secom Co. Ltd. | 9,000 | 463,193 | ||||||
Seven & I Holdings Co. Ltd. | 32,200 | 1,123,498 | ||||||
Shimadzu Corp. | 11,000 | 91,981 | ||||||
Shionogi & Co. Ltd. | 12,800 | 244,010 | ||||||
Shiseido Co. Ltd. | 15,500 | 223,115 | ||||||
Suzuken Co. Ltd. | 3,000 | 96,162 | ||||||
Sysmex Corp. | 3,000 | 199,194 | ||||||
Taisho Pharmaceutical Holdings Co. Ltd. | 1,200 | 81,469 | ||||||
Takeda Pharmaceutical Co. Ltd. | 33,800 | 1,514,112 | ||||||
Terumo Corp. | 6,600 | 334,418 | ||||||
Toppan Printing Co. Ltd. | 23,000 | 153,173 | ||||||
Toyo Suisan Kaisha Ltd. | 4,000 | 130,008 | ||||||
Tsumura & Co. | 2,500 | 72,022 | ||||||
Unicharm Corp. | 4,800 | 271,405 | ||||||
Yakult Honsha Co. Ltd. | 3,800 | 163,984 | ||||||
Yamazaki Baking Co. Ltd. | 5,400 | 62,894 | ||||||
|
| |||||||
| 13,660,015 | ||||||||
|
| |||||||
Number | Value | |||||||
| Energy — 1.1% | ||||||||
COSMO OIL Co. Ltd.* | 24,000 | $ | 43,960 | |||||
Idemitsu Kosan Co. Ltd. | 900 | 74,003 | ||||||
Inpex Corp. | 93 | 404,569 | ||||||
Japan Petroleum Exploration Co. | 1,200 | 51,426 | ||||||
JX Holdings, Inc. | 96,100 | 478,324 | ||||||
Showa Shell Sekiyu KK | 8,100 | 65,232 | ||||||
TonenGeneral Sekiyu KK | 12,000 | 119,218 | ||||||
|
| |||||||
| 1,236,732 | ||||||||
|
| |||||||
| Financial — 19.6% | ||||||||
Acom Co. Ltd.* | 1,700 | 61,515 | ||||||
AEON Financial Service Co. Ltd. | 2,900 | 78,725 | ||||||
Aeon Mall Co. Ltd. | 3,400 | 91,147 | ||||||
Aozora Bank Ltd. | 45,000 | 132,149 | ||||||
Bank of Kyoto Ltd. (The) | 13,000 | 107,023 | ||||||
Bank of Yokohama Ltd. (The) | 49,000 | 244,866 | ||||||
Chiba Bank Ltd. (The) | 31,000 | 197,193 | ||||||
Chugoku Bank Ltd. (The) | 8,000 | 110,776 | ||||||
Credit Saison Co. Ltd. | 6,800 | 163,747 | ||||||
Dai-ichi Life Insurance Co. Ltd. (The) | 364 | 509,104 | ||||||
Daito Trust Construction Co. Ltd. | 3,200 | 301,986 | ||||||
Daiwa Securities Group, Inc. | 72,000 | 614,962 | ||||||
Fukuoka Financial Group, Inc. | 33,000 | 136,658 | ||||||
Gunma Bank Ltd. (The) | 15,000 | 76,004 | ||||||
Hachijuni Bank Ltd. (The) | 19,000 | 98,920 | ||||||
Hiroshima Bank Ltd. (The) | 22,100 | 91,080 | ||||||
Hokuhoku Financial Group, Inc. | 51,000 | 102,553 | ||||||
Hulic Co. Ltd. | 10,900 | 93,858 | ||||||
Iyo Bank Ltd. (The) | 11,000 | 95,814 | ||||||
Japan Exchange Group, Inc. | 2,204 | 208,212 | ||||||
Japan Prime Realty Investment Corp. REIT | 34 | 106,784 | ||||||
Japan Real Estate Investment Corp. REIT | 25 | 249,615 | ||||||
Japan Retail Fund Investment Corp. REIT | 90 | 172,017 | ||||||
Joyo Bank Ltd. (The) | 29,000 | 146,075 | ||||||
Mitsubishi Estate Co. Ltd. | 54,000 | 1,369,150 | ||||||
Mitsubishi UFJ Financial Group, Inc. | 545,400 | 3,230,431 | ||||||
Mitsubishi UFJ Lease & Finance Co. Ltd. | 26,300 | 123,050 | ||||||
Mitsui Fudosan Co. Ltd. | 36,000 | 1,026,012 | ||||||
Mizuho Financial Group, Inc. | 980,640 | 1,903,586 | ||||||
MS&AD Insurance Group Holdings | 21,700 | 552,355 | ||||||
Nippon Building Fund, Inc. REIT | 29 | 301,678 | ||||||
Nishi — Nippon City Bank Ltd. (The) | 28,000 | 68,847 | ||||||
NKSJ Holdings, Inc. | 14,150 | 326,934 | ||||||
Nomura Holdings, Inc. | 155,400 | 1,220,553 | ||||||
Nomura Real Estate Holdings, Inc. | 5,500 | 125,051 | ||||||
Nomura Real Estate Office Fund, Inc. REIT | 13 | 74,670 | ||||||
NTT Urban Development Corp. | 50 | 58,932 | ||||||
ORIX Corp. | 47,260 | 648,764 | ||||||
Resona Holdings, Inc. | 80,800 | 371,605 | ||||||
Seven Bank Ltd. | 25,400 | 92,037 | ||||||
Shinsei Bank Ltd. | 72,000 | 174,884 | ||||||
Shizuoka Bank Ltd. (The) | 25,000 | 263,800 | ||||||
Sony Financial Holdings, Inc. | 7,400 | 111,308 | ||||||
Sumitomo Mitsui Financial Group, Inc. | 54,400 | 2,195,928 | ||||||
Sumitomo Mitsui Trust Holdings, Inc. | 133,000 | 566,662 | ||||||
Sumitomo Realty & Development Co. Ltd. | 15,000 | 590,563 | ||||||
Suruga Bank Ltd. | 7,000 | 106,894 | ||||||
| See Notes to Financial Statements. | 37 |
DBX ETF Trust
SCHEDULE OF INVESTMENTS
db X-trackers MSCI Japan Hedged Equity Fund (Continued)
May 31, 2013
Number | Value | |||||||
| Financial (Continued) | ||||||||
T&D Holdings, Inc. | 24,800 | $ | 310,571 | |||||
Tokio Marine Holdings, Inc. | 29,600 | 882,504 | ||||||
Tokyo Tatemono Co. Ltd. | 18,000 | 140,481 | ||||||
Tokyu Land Corp. | 19,000 | 178,358 | ||||||
United Urban Investment Corp. REIT | 99 | 128,511 | ||||||
Yamaguchi Financial Group, Inc. | 9,500 | 83,694 | ||||||
|
| |||||||
| 21,418,596 | ||||||||
|
| |||||||
| Industrial — 19.8% | ||||||||
Advantest Corp. | 6,400 | 100,471 | ||||||
Amada Co. Ltd. | 14,000 | 98,671 | ||||||
Asahi Glass Co. Ltd. | 43,000 | 314,190 | ||||||
Brother Industries Ltd. | 10,000 | 117,963 | ||||||
Casio Computer Co. Ltd. | 9,600 | 87,729 | ||||||
Central Japan Railway Co. | 6,098 | 679,883 | ||||||
Chiyoda Corp. | 7,000 | 77,487 | ||||||
Daikin Industries Ltd. | 9,900 | 443,482 | ||||||
East Japan Railway Co. | 14,400 | 1,086,576 | ||||||
FANUC Corp. | 8,300 | 1,259,190 | ||||||
Fuji Electric Co. Ltd. | 24,000 | 80,514 | ||||||
FUJIFILM Holdings Corp. | 19,700 | 420,847 | ||||||
Furukawa Electric Co. Ltd. | 29,000 | 72,749 | ||||||
Hamamatsu Photonics KK | 3,000 | 101,538 | ||||||
Hankyu Hanshin Holdings, Inc. | 48,000 | 258,026 | ||||||
Hirose Electric Co. Ltd. | 1,200 | 158,041 | ||||||
Hitachi Construction Machinery Co. Ltd. | 4,700 | 113,318 | ||||||
Hitachi Ltd. | 207,000 | 1,442,437 | ||||||
Hoya Corp. | 18,800 | 382,906 | ||||||
Ibiden Co. Ltd. | 4,800 | 77,217 | ||||||
IHI Corp. | 57,000 | 215,052 | ||||||
JGC Corp. | 8,000 | 272,361 | ||||||
Kajima Corp. | 36,000 | 107,511 | ||||||
Kamigumi Co. Ltd. | 9,000 | 69,255 | ||||||
Kawasaki Heavy Industries Ltd. | 61,000 | 211,926 | ||||||
Keikyu Corp. | 21,000 | 181,454 | ||||||
Keio Corp. | 24,000 | 161,983 | ||||||
Keisei Electric Railway Co. Ltd. | 11,000 | 94,938 | ||||||
Keyence Corp. | 2,010 | 626,280 | ||||||
Kinden Corp. | 6,000 | 48,977 | ||||||
Kintetsu Corp. | 70,000 | 292,668 | ||||||
Komatsu Ltd. | 39,900 | 1,037,070 | ||||||
Konica Minolta, Inc. | 20,500 | 150,605 | ||||||
Kubota Corp. | 46,000 | 686,875 | ||||||
Kurita Water Industries Ltd. | 4,800 | 105,695 | ||||||
Kyocera Corp. | 7,000 | 703,798 | ||||||
LIXIL Group Corp. | 11,400 | 277,127 | ||||||
Mabuchi Motor Co. Ltd. | 1,100 | 53,765 | ||||||
Makita Corp. | 4,700 | 257,797 | ||||||
Maruichi Steel Tube Ltd. | 2,000 | 50,132 | ||||||
Mitsubishi Electric Corp. | 82,000 | 797,511 | ||||||
Mitsubishi Heavy Industries Ltd. | 129,000 | 811,587 | ||||||
Mitsui OSK Lines Ltd.* | 46,000 | 168,971 | ||||||
Murata Manufacturing Co. Ltd. | 8,700 | 672,062 | ||||||
Nabtesco Corp. | 4,700 | 99,002 | ||||||
NEC Corp. | 106,000 | 252,193 | ||||||
Nidec Corp. | 4,300 | 296,212 | ||||||
Number | Value | |||||||
| Industrial (Continued) | ||||||||
Nikon Corp. | 14,600 | $ | 392,996 | |||||
Nippon Electric Glass Co. Ltd. | 15,000 | 77,796 | ||||||
Nippon Express Co. Ltd. | 34,000 | 154,676 | ||||||
Nippon Yusen KK | 71,000 | 188,005 | ||||||
NSK Ltd. | 21,000 | 201,314 | ||||||
Obayashi Corp. | 27,000 | 132,776 | ||||||
Odakyu Electric Railway Co. Ltd. | 26,000 | 256,234 | ||||||
Olympus Corp.* | 8,800 | 269,812 | ||||||
Omron Corp. | 9,000 | 271,465 | ||||||
Rinnai Corp. | 1,300 | 104,305 | ||||||
Shimizu Corp. | 24,700 | 88,517 | ||||||
SMC Corp. | 2,400 | 470,420 | ||||||
Sumitomo Heavy Industries Ltd. | 23,000 | 99,597 | ||||||
Taiheiyo Cement Corp. | 51,000 | 150,784 | ||||||
Taisei Corp. | 41,000 | 131,014 | ||||||
THK Co. Ltd. | 4,800 | 105,122 | ||||||
Tobu Railway Co. Ltd. | 43,000 | 226,012 | ||||||
Tokyu Corp. | 48,000 | 302,464 | ||||||
Toshiba Corp. | 173,000 | 840,416 | ||||||
TOTO Ltd. | 13,700 | 144,562 | ||||||
Toyo Seikan Group Holdings Ltd. | 7,400 | 107,109 | ||||||
West Japan Railway Co. | 7,300 | 307,028 | ||||||
Yamato Holdings Co. Ltd. | 15,800 | 295,852 | ||||||
Yaskawa Electric Corp. | 9,000 | 112,797 | ||||||
Yokogawa Electric Corp. | 9,100 | 110,789 | ||||||
|
| |||||||
| 21,617,904 | ||||||||
|
| |||||||
| Technology — 3.7% | ||||||||
Canon, Inc. | 48,500 | 1,704,296 | ||||||
Fujitsu Ltd. | 79,000 | 334,229 | ||||||
GungHo Online Entertainment, Inc.* | 15 | 194,117 | ||||||
Itochu Techno — Solutions Corp. | 1,000 | 43,253 | ||||||
Konami Corp. | 4,400 | 108,889 | ||||||
Nomura Research Institute Ltd. | 4,300 | 125,633 | ||||||
NTT Data Corp. | 55 | 189,165 | ||||||
Oracle Corp. | 1,500 | 59,579 | ||||||
OTSUKA Corp. | 700 | 65,432 | ||||||
Ricoh Co. Ltd. | 28,000 | 337,265 | ||||||
Rohm Co. Ltd. | 4,200 | 156,787 | ||||||
Sumco Corp. | 4,900 | 61,119 | ||||||
TDK Corp. | 5,300 | 207,874 | ||||||
Tokyo Electron Ltd. | 7,400 | 375,690 | ||||||
|
| |||||||
| 3,963,328 | ||||||||
|
| |||||||
| Utilities — 3.0% | ||||||||
Chubu Electric Power Co., Inc. | 27,600 | 362,395 | ||||||
Chugoku Electric Power Co., (The), Inc. | 12,800 | 176,604 | ||||||
Electric Power Development Co. Ltd. | 5,000 | 159,773 | ||||||
Hokkaido Electric Power Co., Inc.* | 7,800 | 103,814 | ||||||
Hokuriku Electric Power Co. | 7,200 | 99,125 | ||||||
Kansai Electric Power Co., (The), Inc.* | 30,100 | 360,763 | ||||||
Kyushu Electric Power Co., Inc.* | 18,300 | 254,857 | ||||||
Osaka Gas Co. Ltd. | 80,000 | 326,514 | ||||||
Shikoku Electric Power Co., Inc.* | 7,600 | 126,043 | ||||||
Toho Gas Co. Ltd. | 19,000 | 100,811 | ||||||
Tohoku Electric Power Co., Inc.* | 19,400 | 231,552 | ||||||
| See Notes to Financial Statements. | 38 |
DBX ETF Trust
SCHEDULE OF INVESTMENTS
db X-trackers MSCI Japan Hedged Equity Fund (Continued)
May 31, 2013
Number | Value | |||||||
| Utilities (Continued) | ||||||||
Tokyo Electric Power Co., (The), Inc.* | 62,000 | $ | 380,807 | |||||
Tokyo Gas Co. Ltd. | 105,000 | 569,659 | ||||||
|
| |||||||
| 3,252,717 | ||||||||
|
| |||||||
TOTAL COMMON STOCKS | 107,585,048 | |||||||
|
| |||||||
TOTAL INVESTMENTS — 98.6% | $ | 107,585,048 | ||||||
Other assets less liabilities — 1.4% | 1,486,837 | |||||||
|
| |||||||
NET ASSETS — 100.0% | $ | 109,071,885 | ||||||
|
| |||||||
As of May 31, 2013, the Fund had the following futures contracts open:
Contract Description | Number of Contracts | Contract Value | Expiration Date | Unrealized Depreciation | ||||||||||||
TOPIX Index Futures | 18 | $ | 2,029,267 | 6/13/2013 | $ | (45,165 | ) | |||||||||
As of May 31, 2013, the Fund had the following forward foreign currency contracts outstanding:
Counterparty | Settlement Date | Currency To Deliver | Currency To Receive | Unrealized Appreciation (Depreciation) | ||||||||||||||
Barclays Bank PLC | 6/5/2013 | JPY | 2,642,370,000 | USD | 27,120,702 | $ | 816,152 | |||||||||||
Barclays Bank PLC | 6/5/2013 | JPY | �� | 681,903,000 | USD | 6,891,821 | 103,540 | |||||||||||
Barclays Bank PLC | 6/5/2013 | JPY | 718,482,000 | USD | 7,021,308 | (131,114 | ) | |||||||||||
Barclays Bank PLC | 6/5/2013 | JPY | 728,203,000 | USD | 7,121,859 | (127,335 | ) | |||||||||||
Barclays Bank PLC | 6/5/2013 | JPY | 1,012,879,000 | USD | 10,012,267 | (70,850 | ) | |||||||||||
JP Morgan & Chase Co. | 6/5/2013 | JPY | 2,642,370,000 | USD | 27,130,392 | 825,842 | ||||||||||||
JP Morgan & Chase Co. | 6/5/2013 | JPY | 681,903,000 | USD | 6,891,801 | 103,519 | ||||||||||||
JP Morgan & Chase Co. | 6/5/2013 | JPY | 718,482,000 | USD | 7,021,294 | (131,128 | ) | |||||||||||
JP Morgan & Chase Co. | 6/5/2013 | JPY | 728,202,000 | USD | 7,121,829 | (127,355 | ) | |||||||||||
JP Morgan & Chase Co. | 6/5/2013 | JPY | 1,012,879,000 | USD | 10,012,267 | (70,850 | ) | |||||||||||
The Bank of New York Mellon | 6/5/2013 | JPY | 130,000,000 | USD | 1,326,310 | 32,172 | ||||||||||||
Barclays Bank PLC | 6/5/2013 | USD | 211,521 | JPY | 20,900,000 | (3,463 | ) | |||||||||||
Barclays Bank PLC | 6/5/2013 | USD | 264,434 | JPY | 27,000,000 | 4,348 | ||||||||||||
Barclays Bank PLC | 6/5/2013 | USD | 256,134 | JPY | 26,000,000 | 2,693 | ||||||||||||
Barclays Bank PLC | 6/5/2013 | USD | 57,320,011 | JPY | 5,792,169,947 | 340,508 | ||||||||||||
Barclays Bank PLC | 6/5/2013 | USD | 115,857 | JPY | 11,500,000 | (1,376 | ) | |||||||||||
JP Morgan & Chase Co. | 6/5/2013 | USD | 793,000 | JPY | 81,217,633 | 15,514 | ||||||||||||
JP Morgan & Chase Co. | 6/5/2013 | USD | 985,000 | JPY | 100,921,918 | 19,668 | ||||||||||||
JP Morgan & Chase Co. | 6/5/2013 | USD | 56,399,583 | JPY | 5,694,930,972 | 292,931 | ||||||||||||
The Bank of New York Mellon | 6/5/2013 | USD | 321,128 | JPY | 32,664,000 | 4,039 | ||||||||||||
The Bank of New York Mellon | 6/5/2013 | USD | 346,163 | JPY | 35,000,000 | 2,259 | ||||||||||||
The Bank of New York Mellon | 6/5/2013 | USD | 659,019 | JPY | 66,544,448 | 3,425 | ||||||||||||
Barclays Bank PLC | 7/3/2013 | JPY | 5,646,005,000 | USD | 55,879,407 | (332,597 | ) | |||||||||||
JP Morgan & Chase Co. | 7/3/2013 | JPY | 5,646,005,000 | USD | 55,920,750 | (291,254 | ) | |||||||||||
|
| |||||||||||||||||
| $ | 1,279,288 | |||||||||||||||||
|
| |||||||||||||||||
Currency Abbreviations
JPY – Japanese Yen
USD – U.S. Dollar
* Non-income producing security.
REIT – Real Estate Investment Trust.
| See Notes to Financial Statements. | 39 |
DBX ETF Trust
STATEMENTS OF ASSETS AND LIABILITIES
May 31, 2013
| db X-trackers MSCI Brazil Hedged Equity Fund | db X-trackers MSCI EAFE Hedged Equity Fund | db X-trackers MSCI Emerging Markets Hedged Equity Fund | ||||||||||
Assets | ||||||||||||
Investments at fair value | $ | 7,595,725 | $ | 73,405,313 | $ | 8,598,395 | ||||||
Investment in Affiliates at fair value (See Note 5) | — | 300,180 | — | |||||||||
Cash | 100,875 | 2,503,715 | 58,575 | |||||||||
Foreign currency at value | 11,374 | 83,525 | 48,023 | |||||||||
Unrealized appreciation on futures contracts | — | — | — | |||||||||
Unrealized appreciation on forward foreign currency contracts | 467,185 | 1,342,145 | 300,470 | |||||||||
Receivables: | ||||||||||||
Dividends | 23,790 | 181,924 | 25,106 | |||||||||
Investment securities sold | 82,173 | 52,698 | 663,338 | |||||||||
Foreign tax reclaim | — | 61,421 | — | |||||||||
Reimbursement due from advisor | 2,360 | 14,071 | 3,290 | |||||||||
Shares sold | — | — | — | |||||||||
Prepaid expenses | 2,340 | — | 482 | |||||||||
|
|
|
|
|
| |||||||
Total Assets | $ | 8,285,822 | $ | 77,944,992 | $ | 9,697,679 | ||||||
|
|
|
|
|
| |||||||
Liabilities | ||||||||||||
Unrealized depreciation on futures contracts | $ | — | $ | 28,460 | $ | 4,305 | ||||||
Unrealized depreciation on forward foreign currency contracts | 46,832 | 620,140 | 31,846 | |||||||||
Payables: | ||||||||||||
Investment advisory fees | 2,656 | 15,846 | 4,903 | |||||||||
Investment securities purchased | 506,298 | 1,980,359 | 855,992 | |||||||||
Shares repurchased | — | — | — | |||||||||
Accrued expenses and other liabilities | 2,339 | — | 482 | |||||||||
|
|
|
|
|
| |||||||
Total Liabilities | 558,125 | 2,644,805 | 897,528 | |||||||||
|
|
|
|
|
| |||||||
Net Assets | $ | 7,727,697 | $ | 75,300,187 | $ | 8,800,151 | ||||||
|
|
|
|
|
| |||||||
Net Assets Consist of | ||||||||||||
Paid-in capital | $ | 8,995,304 | $ | 73,122,947 | $ | 9,424,076 | ||||||
Undistributed net investment income | 46,988 | 1,072,603 | 21,001 | |||||||||
Accumulated net realized gain (loss) on investments, futures and foreign currency transactions | (661,898 | ) | (501,724 | ) | (599,327 | ) | ||||||
Net unrealized appreciation (depreciation) on investments, futures and foreign currency translations | (652,697 | ) | 1,606,361 | (45,599 | ) | |||||||
|
|
|
|
|
| |||||||
Net Assets | $ | 7,727,697 | $ | 75,300,187 | $ | 8,800,151 | ||||||
|
|
|
|
|
| |||||||
Number of Common Shares outstanding | 400,800 | 3,000,800 | 400,800 | |||||||||
|
|
|
|
|
| |||||||
Net Assets Value | $ | 19.28 | $ | 25.09 | $ | 21.96 | ||||||
|
|
|
|
|
| |||||||
Investments at cost | $ | 8,666,849 | $ | 72,495,180 | $ | 8,907,827 | ||||||
|
|
|
|
|
| |||||||
Investments in Affiliates at cost | $ | — | $ | 293,015 | $ | — | ||||||
|
|
|
|
|
| |||||||
Foreign currency at cost | $ | 11,844 | $ | 83,498 | $ | 48,147 | ||||||
|
|
|
|
|
| |||||||
| See Notes to Financial Statements. | 40 |
DBX ETF Trust
STATEMENTS OF ASSETS AND LIABILITIES (Continued)
May 31, 2013
| db X-trackers MSCI Germany Hedged Equity Fund | db X-trackers MSCI Japan Hedged Equity Fund | |||||||
Assets | ||||||||
Investments at fair value | $ | 4,158,371 | $ | 107,585,048 | ||||
Investment in Affiliates at fair value (See Note 5) | 204,199 | — | ||||||
Cash | 144,692 | 4,028,781 | ||||||
Foreign currency at value | 9,132 | 116,470 | ||||||
Unrealized appreciation on futures contracts | 49 | — | ||||||
Unrealized appreciation on forward foreign currency and spot contracts | 140,699 | 2,566,610 | ||||||
Receivables: | ||||||||
Dividends | 7,252 | 189,924 | ||||||
Investment securities sold | 4,377,274 | 8,135,407 | ||||||
Foreign tax reclaim | — | — | ||||||
Reimbursement due from advisor | 2,824 | 11,849 | ||||||
Shares sold | — | 20,422,993 | ||||||
Prepaid expenses | — | — | ||||||
|
|
|
| |||||
Total Assets | $ | 9,044,492 | $ | 143,057,082 | ||||
|
|
|
| |||||
Liabilities | ||||||||
Unrealized depreciation on futures contracts | $ | — | $ | 45,165 | ||||
Unrealized depreciation on forward foreign currency and spot contracts | 14,971 | 1,287,322 | ||||||
Payables: | ||||||||
Investment advisory fees | 1,956 | 34,046 | ||||||
Investment securities purchased | 4,364,751 | 25,803,503 | ||||||
Shares repurchased | — | 6,815,161 | ||||||
Accrued expenses and other liabilities | — | — | ||||||
|
|
|
| |||||
Total Liabilities | 4,381,678 | 33,985,197 | ||||||
|
|
|
| |||||
Net Assets | $ | 4,662,814 | $ | 109,071,885 | ||||
|
|
|
| |||||
Net Assets Consist of | ||||||||
Paid-in capital | $ | 5,020,806 | $ | 110,411,018 | ||||
Undistributed net investment income | 60,090 | 986,656 | ||||||
Accumulated net realized gain (loss) on investments, futures and foreign currency transactions | (541,617 | ) | 338,597 | |||||
Net unrealized appreciation (depreciation) on investments, futures and foreign currency translations | 123,535 | (2,664,386 | ) | |||||
|
|
|
| |||||
Net Assets | $ | 4,662,814 | $ | 109,071,885 | ||||
|
|
|
| |||||
Number of Common Shares outstanding | 200,800 | 3,200,800 | ||||||
|
|
|
| |||||
Net Assets Value | $ | 23.22 | $ | 34.08 | ||||
|
|
|
| |||||
Investments at cost | $ | 4,160,450 | $ | 111,469,650 | ||||
|
|
|
| |||||
Investments in Affiliates at cost | $ | 204,301 | $ | — | ||||
|
|
|
| |||||
Foreign currency at cost | $ | 9,140 | $ | 119,369 | ||||
|
|
|
| |||||
| See Notes to Financial Statements. | 41 |
DBX ETF Trust
For the Year Ended May 31, 2013
| db X-trackers MSCI Brazil Hedged Equity Fund | db X-trackers MSCI EAFE Hedged Equity Fund | db X-trackers MSCI Emerging Markets Hedged Equity Fund | ||||||||||
Investment Income | ||||||||||||
Unaffiliated dividend income* | $ | 140,924 | $ | 788,141 | $ | 121,977 | ||||||
Affilifated dividend income | — | 4,572 | — | |||||||||
|
|
|
|
|
| |||||||
Total Investment Income | 140,924 | 792,713 | 121,977 | |||||||||
|
|
|
|
|
| |||||||
Expenses | ||||||||||||
Trustees fees | 13,459 | 60,168 | 14,685 | |||||||||
Advisory fees | 25,271 | 72,513 | 32,495 | |||||||||
|
|
|
|
|
| |||||||
Total Expenses | 38,730 | 132,681 | 47,180 | |||||||||
|
|
|
|
|
| |||||||
Less fees waived and expenses reimbursed: (See Note 3) | ||||||||||||
Waiver | (9,980 | ) | (34,234 | ) | (11,148 | ) | ||||||
|
|
|
|
|
| |||||||
Net Expenses | 28,750 | 98,447 | 36,032 | |||||||||
|
|
|
|
|
| |||||||
Net Investment Income | 112,174 | 694,266 | 85,945 | |||||||||
|
|
|
|
|
| |||||||
Realized and Unrealized Gain (Loss) | ||||||||||||
Net realized gain (loss) from: | ||||||||||||
Investments | (348,049 | ) | (74,774 | ) | (332,055 | ) | ||||||
In-kind redemptions | — | (875,927 | ) | — | ||||||||
Futures contracts | — | (9,600 | ) | (555 | ) | |||||||
Foreign currency transactions | 7,042 | 1,437,063 | (70,729 | ) | ||||||||
|
|
|
|
|
| |||||||
Net realized gain (loss) | (341,007 | ) | 476,762 | (403,339 | ) | |||||||
Net change in unrealized appreciation (depreciation) on: | ||||||||||||
Investments | 51,872 | 3,455,342 | 537,225 | |||||||||
Futures contracts | — | 23,000 | 3,835 | |||||||||
Foreign currency translations | 145,526 | (640,964 | ) | 62,379 | ||||||||
|
|
|
|
|
| |||||||
Net change in unrealized appreciation (depreciation) | 197,398 | 2,837,378 | 603,439 | |||||||||
|
|
|
|
|
| |||||||
Net realized and unrealized gain (loss) on investments, futures and foreign currency transactions | (143,609 | ) | 3,314,140 | 200,100 | ||||||||
|
|
|
|
|
| |||||||
Net Increase (Decrease) in Net Assets Resulting from Operations | $ | (31,435 | ) | $ | 4,008,406 | $ | 286,045 | |||||
|
|
|
|
|
| |||||||
* Foreign taxes withheld | $ | 11,000 | $ | 76,146 | $ | 16,022 | ||||||
| See Notes to Financial Statements. | 42 |
DBX ETF Trust
STATEMENTS OF OPERATIONS (Continued)
For the Year Ended May 31, 2013
| db X-trackers MSCI Germany Hedged Equity Fund | db X-trackers MSCI Japan Hedged Equity Fund | |||||||
Investment Income | ||||||||
Unaffiliated dividend income* | $ | 107,609 | $ | 268,008 | ||||
Affilifated dividend income | 6,869 | — | ||||||
|
|
|
| |||||
Total Investment Income | 114,478 | 268,008 | ||||||
|
|
|
| |||||
Expenses | ||||||||
Trustees fees | 14,551 | 23,628 | ||||||
Advisory fees | 22,776 | 74,777 | ||||||
|
|
|
| |||||
Total Expenses | 37,327 | 98,405 | ||||||
|
|
|
| |||||
Less fees waived and expenses reimbursed: (See Note 3) | ||||||||
Waiver | (10,915 | ) | (19,950 | ) | ||||
|
|
|
| |||||
Net Expenses | 26,412 | 78,455 | ||||||
|
|
|
| |||||
Net Investment Income | 88,066 | 189,553 | ||||||
|
|
|
| |||||
Realized and Unrealized Gain (Loss) | ||||||||
Net realized gain (loss) from: | ||||||||
Investments | (350,104 | ) | (283,676 | ) | ||||
In-kind redemptions | — | 894,412 | ||||||
Futures contracts | 7,044 | 23,250 | ||||||
Foreign currency transactions | 47,106 | 1,488,244 | ||||||
|
|
|
| |||||
Net realized gain (loss) | (295,954 | ) | 2,122,230 | |||||
Net change in unrealized appreciation (depreciation) on: | ||||||||
Investments | 768,333 | (3,369,230 | ) | |||||
Futures contracts | 10,190 | (29,822 | ) | |||||
Foreign currency translations | (63,940 | ) | 1,350,869 | |||||
|
|
|
| |||||
Net change in unrealized appreciation (depreciation) | 714,583 | (2,048,183 | ) | |||||
|
|
|
| |||||
Net realized and unrealized gain (loss) on investments, futures and foreign currency transactions | 418,629 | 74,047 | ||||||
|
|
|
| |||||
Net Increase (Decrease) in Net Assets Resulting from Operations | $ | 506,695 | $ | 263,600 | ||||
|
|
|
| |||||
* Foreign taxes withheld | $ | 20,304 | $ | 20,562 | ||||
| See Notes to Financial Statements. | 43 |
DBX ETF Trust
STATEMENTS OF CHANGES IN NET ASSETS
| db X-trackers MSCI Brazil Hedged Equity Fund | db X-trackers MSCI EAFE Hedged Equity Fund | |||||||||||||||
| Year Ended May 31, 2013 | For the Period Ended June 9, 2011(1) to May 31, 2012 | Year Ended May 31, 2013 | For the Period Ended June 9, 2011(1) to May 31, 2012 | |||||||||||||
Increase (Decrease) in Net Assets from Operations | ||||||||||||||||
Net investment income | $ | 112,174 | $ | 128,400 | $ | 694,266 | $ | 644,207 | ||||||||
Net realized gain (loss) on investments, futures and foreign currency related transactions | (341,007 | ) | 726 | 476,762 | (9,838 | ) | ||||||||||
Net change in unrealized appreciation (depreciation) on investments, futures and foreign currency translations | 197,398 | (850,095 | ) | 2,837,378 | (1,231,017 | ) | ||||||||||
|
|
|
|
|
|
|
| |||||||||
Net increase (decrease) in net assets from operations | (31,435 | ) | (720,969 | ) | 4,008,406 | (596,648 | ) | |||||||||
|
|
|
|
|
|
|
| |||||||||
Distributions to Shareholders from | ||||||||||||||||
Net investment income | (108,682 | ) | (57,834 | ) | (732,399 | ) | (133,281 | ) | ||||||||
Net realized gains on investments, futures and foreign currency transactions | (262,278 | ) | (86,687 | ) | (1,444,717 | ) | — | |||||||||
|
|
|
|
|
|
|
| |||||||||
Total distributions | (370,960 | ) | (144,521 | ) | (2,177,116 | ) | (133,281 | ) | ||||||||
|
|
|
|
|
|
|
| |||||||||
Fund Shares Transactions | ||||||||||||||||
Proceeds from shares sold | 3,964,756 | 5,010,826 | 64,794,798 | 36,042,169 | ||||||||||||
Value of shares redeemed | — | — | (22,304,918 | ) | (4,353,223 | ) | ||||||||||
|
|
|
|
|
|
|
| |||||||||
Net increase in net assets resulting from fund share transactions | 3,964,756 | 5,010,826 | 42,489,880 | 31,688,946 | ||||||||||||
|
|
|
|
|
|
|
| |||||||||
Total Increase in Net Assets | 3,562,361 | 4,145,336 | 44,321,170 | 30,959,017 | ||||||||||||
Net Assets | ||||||||||||||||
Beginning of period | 4,165,336 | 20,000 | 30,979,017 | 20,000 | ||||||||||||
|
|
|
|
|
|
|
| |||||||||
End of period | $ | 7,727,697 | $ | 4,165,336 | $ | 75,300,187 | $ | 30,979,017 | ||||||||
|
|
|
|
|
|
|
| |||||||||
Undistributed net investment income | $ | 46,988 | $ | 62,875 | $ | 1,072,603 | $ | 544,965 | ||||||||
|
|
|
|
|
|
|
| |||||||||
Changes in Shares Outstanding | ||||||||||||||||
Shares outstanding, beginning of period | 200,800 | 800 | 1,400,800 | 800 | ||||||||||||
Shares sold | 200,000 | 200,000 | 2,600,000 | 1,600,000 | ||||||||||||
Shares redeemed | — | — | (1,000,000 | ) | (200,000 | ) | ||||||||||
|
|
|
|
|
|
|
| |||||||||
Shares outstanding, end of period | 400,800 | 200,800 | 3,000,800 | 1,400,800 | ||||||||||||
|
|
|
|
|
|
|
| |||||||||
| (1) | Commencement of investment operations. |
| See Notes to Financial Statements. | 44 |
DBX ETF Trust
STATEMENTS OF CHANGES IN NET ASSETS (Continued)
| db X-trackers MSCI Emerging Markets Hedged Equity Fund | db X-trackers MSCI Germany Hedged Equity Fund | |||||||||||||||
| Year Ended May 31, 2013 | For the Period Ended June 9, 2011(1) to May 31, 2012 | Year Ended May 31, 2013 | For the Period Ended June 9, 2011(1) to May 31, 2012 | |||||||||||||
Increase (Decrease) in Net Assets from Operations | ||||||||||||||||
Net investment income | $ | 85,945 | $ | 43,072 | $ | 88,066 | $ | 54,519 | ||||||||
Net realized gain (loss) on investments, futures and foreign currency related transactions | (403,339 | ) | (44,021 | ) | (295,954 | ) | (72,972 | ) | ||||||||
Net change in unrealized appreciation (depreciation) on investments, futures and foreign currency translations | 603,439 | (649,038 | ) | 714,583 | (591,048 | ) | ||||||||||
|
|
|
|
|
|
|
| |||||||||
Net increase (decrease) in net assets from operations | 286,045 | (649,987 | ) | 506,695 | (609,501 | ) | ||||||||||
|
|
|
|
|
|
|
| |||||||||
Distributions to Shareholders from | ||||||||||||||||
Net investment income | (80,337 | ) | (11,326 | ) | (89,599 | ) | (23,076 | ) | ||||||||
Net realized gains on investments, futures and foreign currency transactions | (50,049 | ) | (118,447 | ) | (85,500 | ) | (57,011 | ) | ||||||||
|
|
|
|
|
|
|
| |||||||||
Total distributions | (130,386 | ) | (129,773 | ) | (175,099 | ) | (80,087 | ) | ||||||||
|
|
|
|
|
|
|
| |||||||||
Fund Shares Transactions | ||||||||||||||||
Proceeds from shares sold | 4,383,685 | 5,020,567 | — | 5,000,806 | ||||||||||||
Value of shares redeemed | — | — | — | — | ||||||||||||
|
|
|
|
|
|
|
| |||||||||
Net increase in net assets resulting from fund share transactions | 4,383,685 | 5,020,567 | — | 5,000,806 | ||||||||||||
|
|
|
|
|
|
|
| |||||||||
Total Increase in Net Assets | 4,539,344 | 4,240,807 | 331,596 | 4,311,218 | ||||||||||||
Net Assets | ||||||||||||||||
Beginning of period | 4,260,807 | 20,000 | 4,331,218 | 20,000 | ||||||||||||
|
|
|
|
|
|
|
| |||||||||
End of period | $ | 8,800,151 | $ | 4,260,807 | $ | 4,662,814 | $ | 4,331,218 | ||||||||
|
|
|
|
|
|
|
| |||||||||
Undistributed net investment income | $ | 21,001 | $ | 31,138 | $ | 60,090 | $ | 23,473 | ||||||||
|
|
|
|
|
|
|
| |||||||||
Changes in Shares Outstanding | ||||||||||||||||
Shares outstanding, beginning of period | 200,800 | 800 | 200,800 | 800 | ||||||||||||
Shares sold | 200,000 | 200,000 | — | 200,000 | ||||||||||||
Shares redeemed | — | — | — | — | ||||||||||||
|
|
|
|
|
|
|
| |||||||||
Shares outstanding, end of period | 400,800 | 200,800 | 200,800 | 200,800 | ||||||||||||
|
|
|
|
|
|
|
| |||||||||
| (1) | Commencement of investment operations. |
| See Notes to Financial Statements. | 45 |
DBX ETF Trust
STATEMENTS OF CHANGES IN NET ASSETS (Continued)
| db X-trackers MSCI Japan Hedged Equity Fund | ||||||||
| Year Ended May 31, 2013 | For the Period Ended June 9, 2011(1) to May 31, 2012 | |||||||
Increase (Decrease) in Net Assets from Operations | ||||||||
Net investment income | $ | 189,553 | $ | 53,253 | ||||
Net realized gain (loss) on investments, futures and foreign currency related transactions | 2,122,230 | (49,599 | ) | |||||
Net change in unrealized appreciation (depreciation) on investments, futures and foreign currency translations | (2,048,183 | ) | (616,203 | ) | ||||
|
|
|
| |||||
Net increase (decrease) in net assets from operations | 263,600 | (612,549 | ) | |||||
|
|
|
| |||||
Distributions to Shareholders from | ||||||||
Net investment income | (81,785 | ) | (34,346 | ) | ||||
Net realized gains on investments, futures and foreign currency transactions | — | — | ||||||
|
|
|
| |||||
Total distributions | (81,785 | ) | (34,346 | ) | ||||
|
|
|
| |||||
Fund Shares Transactions | ||||||||
Proceeds from shares sold | 111,329,490 | 5,002,636 | ||||||
Value of shares redeemed | (6,815,161 | ) | – | |||||
|
|
|
| |||||
Net increase in net assets resulting from fund share transactions | 104,514,329 | 5,002,636 | ||||||
|
|
|
| |||||
Total Increase in Net Assets | 104,696,144 | 4,355,741 | ||||||
Net Assets | ||||||||
Beginning of period | 4,375,741 | 20,000 | ||||||
|
|
|
| |||||
End of period | $ | 109,071,885 | $ | 4,375,741 | ||||
|
|
|
| |||||
Undistributed net investment income | $ | 986,656 | $ | 32,289 | ||||
|
|
|
| |||||
Changes in Shares Outstanding | ||||||||
Shares outstanding, beginning of period | 200,800 | 800 | ||||||
Shares sold | 3,200,000 | 200,000 | ||||||
Shares redeemed | (200,000 | ) | — | |||||
|
|
|
| |||||
Shares outstanding, end of period | 3,200,800 | 200,800 | ||||||
|
|
|
| |||||
| (1) | Commencement of investment operations. |
| See Notes to Financial Statements. | 46 |
DBX ETF Trust
For a Share outstanding throughout each period
| db X-trackers MSCI Brazil Hedged Equity Fund | Year Ended May 31, 2013 | For the Period June 9, 2011* to May 31, 2012 | ||||||
Net Asset Value, beginning of period | $20.74 | $25.00 | ||||||
|
|
|
| |||||
Income from Investment Operations: | ||||||||
Net investment income** | 0.54 | 0.64 | ||||||
Net realized and unrealized gain (loss) on investments and foreign currency transactions | (0.15 | ) | (4.18 | ) | ||||
|
|
|
| |||||
Net increase (decrease) in net asset value from operations | 0.39 | (3.54 | ) | |||||
|
|
|
| |||||
Distributions paid to shareholders from: | ||||||||
Net investment income | (0.54 | ) | (0.29 | ) | ||||
Net realized capital gains | (1.31 | ) | (0.43 | ) | ||||
|
|
|
| |||||
Total distributions | (1.85 | ) | (0.72 | ) | ||||
|
|
|
| |||||
Net Asset Value, end of period | $19.28 | $20.74 | ||||||
|
|
|
| |||||
Total Return*** | 1.43 | % | (14.28 | )% | ||||
Ratios/Supplemental Data | ||||||||
Net Assets, end of period (000’s omitted) | $7,728 | $4,165 | ||||||
Ratios to average net assets: | ||||||||
Expenses, net of fee waiver and expense reimbursements | 0.68 | % | 1.13 | %† | ||||
Expenses, prior to fee waiver and expense reimbursements | 0.92 | % | — | |||||
Net investment income | 2.66 | % | 2.89 | %† | ||||
Portfolio turnover rate†† | 25 | % | 34 | % | ||||
| db X-trackers MSCI EAFE Hedged Equity Fund | Year Ended May 31, 2013 | For the Period June 9, 2011* to May 31, 2012 | ||||||
Net Asset Value, beginning of period | $22.12 | $25.00 | ||||||
|
|
|
| |||||
Income from Investment Operations: | ||||||||
Net investment income** | 0.79 | 0.70 | ||||||
Net realized and unrealized gain (loss) on investments, futures and foreign currency transactions | 6.26 | (3.48 | ) | |||||
|
|
|
| |||||
Net increase (decrease) in net asset value from operations | 7.05 | (2.78 | ) | |||||
|
|
|
| |||||
Distributions paid to shareholders from: | ||||||||
Net investment income | (1.68 | ) | (0.10 | ) | ||||
Net realized capital gains | (2.40 | ) | — | |||||
|
|
|
| |||||
Total distributions | (4.08 | ) | (0.10 | ) | ||||
|
|
|
| |||||
Net Asset Value, end of period | $25.09 | $22.12 | ||||||
|
|
|
| |||||
Total Return*** | 35.60 | % | (11.14 | )% | ||||
Ratios/Supplemental Data | ||||||||
Net Assets, end of period (000’s omitted) | $ | 75,300 | $ | 30,979 | ||||
Ratios to average net assets: | ||||||||
Expenses, net of fee waiver and expense reimbursements | 0.48 | % | 0.57 | %† | ||||
Expenses, prior to fee waiver and expense reimbursements | 0.64 | % | — | |||||
Net investment income | 3.35 | % | 3.04 | %† | ||||
Portfolio turnover rate†† | 14 | % | 14 | % | ||||
| * | Commencement of operations. |
| ** | Based on average shares outstanding. |
| *** | Total Return is calculated assuming an initial investment made at the Net Asset Value at the beginning of the period, reinvestment of all dividend distributions at Net Asset Value during the period, and redemption at Net Asset Value on the last day of the period. Total Return calculated for a period of less than one year is not annualized. |
| † | Annualized. |
| †† | Portfolio turnover rate is not annualized and does not include securities received or delivered from processing creations or redemptions. |
| See Notes to Financial Statements. | 47 |
DBX ETF Trust
FINANCIAL HIGHLIGHTS (Continued)
For a Share outstanding throughout each period
| db X-trackers MSCI Emerging Markets Hedged Equity Fund | Year Ended May 31, 2013 | For the Period June 9, 2011* to May 31, 2012 | ||||||
Net Asset Value, beginning of period | $ | 21.22 | $25.00 | |||||
|
|
|
| |||||
Income from Investment Operations: | ||||||||
Net investment income** | 0.38 | 0.21 | ||||||
Net realized and unrealized gain (loss) on investments, futures and foreign currency transactions | 1.01 | (3.34 | ) | |||||
|
|
|
| |||||
Net increase (decrease) in net asset value from operations | 1.39 | (3.13 | ) | |||||
|
|
|
| |||||
Distributions paid to shareholders from: | ||||||||
Net investment income | (0.40 | ) | (0.06 | ) | ||||
Net realized capital gains | (0.25 | ) | (0.59 | ) | ||||
|
|
|
| |||||
Total distributions | (0.65 | ) | (0.65 | ) | ||||
|
|
|
| |||||
Net Asset Value, end of period | $ | 21.96 | $21.22 | |||||
|
|
|
| |||||
Total Return*** | 6.54 | % | (12.52 | )% | ||||
Ratios/Supplemental Data | ||||||||
Net Assets, end of period (000’s omitted) | $ | 8,800 | $4,261 | |||||
Ratios to average net assets: | ||||||||
Expenses, net of fee waiver and expense reimbursements | 0.72 | % | 1.19 | %† | ||||
Expenses, prior to fee waiver and expense reimbursements | 0.94 | % | — | |||||
Net investment income | 1.72 | % | 0.97 | %† | ||||
Portfolio turnover rate†† | 15 | % | 19 | % | ||||
| db X-trackers MSCI Germany Hedged Equity Fund | Year Ended May 31, 2013 | For the Period June 9, 2011* to May 31, 2012 | ||||||
Net Asset Value, beginning of period | $ | 21.57 | $25.00 | |||||
|
|
|
| |||||
Income from Investment Operations: | ||||||||
Net investment income** | 0.44 | 0.27 | ||||||
Net realized and unrealized gain (loss) on investments, futures and foreign currency transactions | 2.08 | (3.30 | ) | |||||
|
|
|
| |||||
Net increase (decrease) in net asset value from operations | 2.52 | (3.03 | ) | |||||
|
|
|
| |||||
Distributions paid to shareholders from: | ||||||||
Net investment income | (0.44 | ) | (0.12 | ) | ||||
Net realized capital gains | (0.43 | ) | (0.28 | ) | ||||
|
|
|
| |||||
Total distributions | (0.87 | ) | (0.40 | ) | ||||
|
|
|
| |||||
Net Asset Value, end of period | $ | 23.22 | $21.57 | |||||
|
|
|
| |||||
Total Return*** | 11.86 | % | (12.14 | )% | ||||
Ratios/Supplemental Data | ||||||||
Net Assets, end of period (000’s omitted) | $ | 4,663 | $4,331 | |||||
Ratios to average net assets: | ||||||||
Expenses, net of fee waiver and expense reimbursements | 0.58 | % | 1.04 | %† | ||||
Expenses, prior to fee waiver and expense reimbursements | 0.82 | % | — | |||||
Net investment income | 1.93 | % | 1.20 | %† | ||||
Portfolio turnover rate†† | 108 | % | 17 | % | ||||
| * | Commencement of operations. |
| ** | Based on average shares outstanding. |
| *** | Total Return is calculated assuming an initial investment made at the Net Asset Value at the beginning of the period, reinvestment of all dividend distributions at Net Asset Value during the period, and redemption at Net Asset Value on the last day of the period. Total Return calculated for a period of less than one year is not annualized. |
| † | Annualized. |
| †† | Portfolio turnover rate is not annualized and does not include securities received or delivered from processing creations or redemptions. |
| See Notes to Financial Statements. | 48 |
DBX ETF Trust
FINANCIAL HIGHLIGHTS (Continued)
For a Share outstanding throughout each period
| db X-trackers MSCI Japan Hedged Equity Fund | Year Ended May 31, 2013 | For the Period June 9, 2011* to May 31, 2012 | ||||||
Net Asset Value, beginning of period | $21.79 | $25.00 | ||||||
|
|
|
| |||||
Income from Investment Operations: | ||||||||
Net investment income** | 0.39 | 0.27 | ||||||
Net realized and unrealized gain (loss) on investments, futures and foreign currency transactions | 12.31 | (3.31 | ) | |||||
|
|
|
| |||||
Net increase (decrease) in net asset value from operations | 12.70 | (3.04 | ) | |||||
|
|
|
| |||||
Distributions paid to shareholders from: | ||||||||
Net investment income | (0.41 | ) | (0.17 | ) | ||||
Net realized capital gains | — | — | ||||||
|
|
|
| |||||
Total distributions | (0.41 | ) | (0.17 | ) | ||||
|
|
|
| |||||
Net Asset Value, end of period | $34.08 | $21.79 | ||||||
|
|
|
| |||||
Total Return*** | 59.04 | % | (12.16 | )% | ||||
Ratios/Supplemental Data | ||||||||
Net Assets, end of period (000’s omitted) | $ | 109,072 | $4,376 | |||||
Ratios to average net assets: | ||||||||
Expenses, net of fee waiver and expense reimbursements | 0.52 | % | 1.03 | %† | ||||
Expenses, prior to fee waiver and expense reimbursements | 0.66 | % | — | |||||
Net investment income | 1.27 | % | 1.15 | %† | ||||
Portfolio turnover rate†† | 12 | % | 16 | % | ||||
| * | Commencement of operations. |
| ** | Based on average shares outstanding. |
| *** | Total Return is calculated assuming an initial investment made at the Net Asset Value at the beginning of the period, reinvestment of all dividend distributions at Net Asset Value during the period, and redemption at Net Asset Value on the last day of the period. Total Return calculated for a period of less than one year is not annualized. |
| † | Annualized. |
| †† | Portfolio turnover rate is not annualized and does not include securities received or delivered from processing creations or redemptions. |
| See Notes to Financial Statements. | 49 |
DBX ETF Trust
1. Organization
DBX ETF Trust (the “Trust”) was organized as a Delaware statutory trust on October 7, 2010 and commenced operations on June 9, 2011, and is registered under the Investment Company Act of 1940, as amended (the “Act”).
As of May 31, 2013, there were five (5) series of exchange-traded funds (“ETF”) (each, a “Fund,” and collectively, the “Funds”) in operation and trading:
| db X-trackers MSCI Brazil Hedged Equity Fund (formerly known as db-X MSCI Brazil Currency-Hedged Equity Fund) | “db X-trackers MSCI Brazil Fund” | |
| db X-trackers MSCI EAFE Hedged Equity Fund (formerly known as db-X MSCI EAFE Currency-Hedged Equity Fund) | “db X-trackers MSCI EAFE Fund” | |
| db X-trackers MSCI Emerging Markets Hedged Equity Fund (formerly known as db-X MSCI Emerging Markets Currency-Hedged Equity Fund) | “db X-trackers MSCI Emerging Markets Fund” | |
| db X-trackers MSCI Germany Hedged Equity Fund (formerly known as db-X MSCI Canada Currency-Hedged Equity Fund) | “db X-trackers MSCI Germany Fund” | |
| db X-trackers MSCI Japan Hedged Equity Fund (formerly known as db-X MSCI Japan Currency-Hedged Equity Fund) | “db X-trackers MSCI Japan Fund” |
DBX Advisors LLC (“DBX” or the “Advisor”) serves as investment advisor to the Funds and has overall responsibility for the general management and administration of the Funds, subject to the supervision of the Funds’ Board of Trustees.
Each Fund offers shares, known as db-X MSCI shares, that are listed and traded on the NYSE Arca, Inc. (“NYSE Arca”). Unlike conventional mutual funds, each Fund issues and redeems shares on a continuous basis, at net asset value, only in large specified lots consisting of 200,000 shares, (blocks of 50,000 shares for the db X-trackers MSCI Germany Fund) each called a “Creation Unit.” Except when aggregated in Creation Units, shares are not individually redeemable securities of the Funds.
The investment objective of each Fund is to track the performance, before fees and expenses, of a particular index (the “Underlying Index”). MSCI is the creator of each Underlying Index. Each Underlying Index is comprised of securities listed in countries in the MSCI Global Index Series. All listed equity securities and listed securities that exhibit characteristics of equity securities, except mutual funds, exchange traded funds, equity derivatives, limited partnerships and most investment trusts, are eligible for inclusion in the equity universe. REITs in some countries and certain income trusts in Canada are also eligible for inclusion. Each company and its securities (i.e., share classes) are classified in only one country, which allows for a distinctive sorting of each company by its respective country.
The underlying indices for the Funds are:
Fund | Underlying Index | |
| db X-trackers MSCI Brazil Fund | MSCI Brazil US Dollar Hedged Index | |
| db X-trackers MSCI EAFE Fund | MSCI EAFE US Dollar Hedged Index | |
| db X-trackers MSCI Emerging Markets Fund | MSCI EM US Dollar Hedged Index | |
| db X-trackers MSCI Germany Fund | MSCI Germany US Dollar Hedged Index | |
| db X-trackers MSCI Japan Fund | MSCI Japan US Dollar Hedged Index |
The MSCI Hedged Indices are rebalanced monthly on the last trading day of the month, when the index will take into account the effect of rolling into new 1-month forward contracts based on the newly determined weights of currency to be sold for the next month’s index calculation. The currency weights are determined as of the close of two business days before the first calendar day of following month and remain constant intra month. This means that no changes in the weights are made during the month to account for changes in the indexes due to price movement of securities, corporate events, additions, deletions or any other changes. The daily calculation of MSCI Hedged Indices marks to market the one-month forward contracts on a daily basis by using an equal and offsetting forward position.
Each Fund is entitled to use its respective Underlying Index pursuant to a licensing agreement between MSCI and DBX. There is no charge to the Funds in connection with these licensing agreements.
50
DBX ETF Trust
NOTES TO FINANCIAL STATEMENTS (Continued)
Each Fund is non-diversified and will generally hold securities of fewer issuers than diversified funds and may be more susceptible to the risks associated with these particular issuers, or to a single economic, political or regulatory occurrence affecting these issuers.
Each Fund may invest in securities of non-U.S. issuers that may trade in non-U.S. Markets. This may involve certain considerations and risks not typically associated with securities of U.S. issuers. Such risks include, but are not limited to: generally less liquid and less efficient securities markets; generally greater price volatility; exchange rate fluctuations and exchange controls; imposition of restrictions on the expatriation of funds or other assets of the Fund; less publicly available information about issuers; the imposition of withholding or other taxes; higher transaction and custody costs; settlement delays and risk of loss attendant in settlement procedures; difficulties in enforcing contractual obligations; less regulation of securities markets; different accounting, disclosure and reporting requirements; more substantial governmental involvement in the economy; higher inflation rates; greater social, economic and political uncertainties; the risk of nationalization or expropriation of assets and the risk of war.
Pursuant to the Trust’s organizational documents, the Trust’s officers and trustees are indemnified against certain liabilities that may arise out of the performance of their duties to the Funds. Additionally, in the normal course of business the Trust enters into contracts that contain a variety of representations that provide indemnification for certain liabilities. The Trust’s maximum exposure under these arrangements is unknown, as this would involve future claims that may be made against the Funds that have not yet occurred. However, the Trust expects the risk of loss to be remote.
2. Significant Accounting Policies
The financial statements have been prepared in conformity with U.S. generally accepted accounting principles (“U.S. GAAP”), which require management to make certain estimates and assumptions that affect the reported amounts and disclosures in the financial statements. Actual results could differ from those estimates. The following is a summary of significant accounting policies followed by the Funds.
Investment Valuation The Net Asset Value (“NAV”), of each Fund’s shares is calculated each business day as of the close of regular trading on the New York Stock Exchange, generally 4:00 p.m. Eastern Time. NAV per share is calculated by dividing a Fund’s net assets by the number of Fund shares outstanding. Any assets or securities for which market quotations are not readily available are valued at fair-value in accordance with procedures adopted by the Board of Trustees. The Board of Trustees has delegated to the Advisor the responsibility to exercise oversight in the administration of these procedures.
Foreign securities (including foreign exchange contracts) are converted into U.S. dollar amounts using the applicable exchange rates as of the close of the New York Stock Exchange (“NYSE”). If market quotations are available and reliable for foreign exchange traded equity securities, the securities will be valued at the market quotations. Since trading hours for certain foreign securities end before the close of the NYSE, closing market quotations may become unreliable. If between the time trading ends on a particular security and the close of the customary trading session on the NYSE, events occur that are significant and make the closing price unreliable, the Funds may fair value the security. If the event is likely to have affected the closing price of the security, the security will be valued at fair value in good faith using procedures approved by the Board of Trustees. Adjustments to closing prices to reflect fair value may also be based on a screening process of an independent pricing service to indicate the degree of certainty, based on historical data, that the closing price in the principal market where a foreign security trades is not the current value as of the close of the NYSE. Foreign securities meeting the approved degree of certainty that the price is not reflective of current value will be priced at the indication of fair value from the independent pricing service. Multiple factors may be considered by the independent pricing service in determining adjustments to reflect fair value and may include information relating to sector indices, American Depositary Receipts and domestic and foreign index futures. Foreign securities may have additional risks including exchange rate changes, potential for sharply devalued currencies and high inflation, political and economical upheaval, the relative lack of issuer information, relatively low market liquidity and the potential lack of strict financial and accounting controls and standards.
In general, the market value of securities which are readily available and deemed reliable are determined as follows: securities listed on a national securities exchange (other than securities listed on the NASDAQ Stock Market, Inc. (“NASDAQ”)) or on a foreign securities exchange are valued at the last sale price at the close of the exchange or foreign securities exchange. If there has been no sale on such day, the securities are valued at the last traded price from the previous day. Securities listed on more than one exchange are valued by reference to the principal exchange on which the securities are traded; securities listed only on NASDAQ are valued in accordance with the NASDAQ Official Closing Price.
51
DBX ETF Trust
NOTES TO FINANCIAL STATEMENTS (Continued)
Fair Value Measurement The Funds are subject to fair value accounting standards that define fair value, establish the framework for measuring fair value and provide a three-tier hierarchy to maximize the use of observable market data and minimize the use of unobservable inputs. Inputs refer broadly to the assumptions that market participants would use in pricing the asset or liability, including assumptions about risk, for example, the risk inherent in a particular valuation technique used to measure fair value. Inputs may be based on independent market data (“observable inputs”) or they may be internally developed (“unobservable inputs”). The hierarchy gives the highest priority to unadjusted quoted prices in active markets for identical assets or liabilities (level 1 measurement) and the lowest priority to unobservable inputs (level 3 measurements). The three levels of the fair value hierarchy are as follows:
| • | Level 1 — quoted prices in active markets for identical securities |
| • | Level 2 — inputs other than quoted prices included within Level 1 that are observable for the asset or liability either directly or indirectly, including quoted prices for similar assets or liabilities in active markets, quoted prices for identical or similar assets or liabilities in markets that are not considered to be active, inputs other than quoted prices that are observable for the asset or liability, and inputs that are derived principally from or corroborated by observable market data by correlation or other means |
| • | Level 3 — significant unobservable inputs (including a Fund’s own assumption in determining the fair value of investments) |
The level of a value determined for a financial instrument within the fair value hierarchy is based on the lowest level of any input that is significant to the fair value measurement in its entirety. However, the determination of what constitutes an
“observable” input may require significant judgment by the Funds. The Funds consider observable inputs to be market data that is readily available, regularly distributed or updated, reliable and verifiable, and provided by independent sources that are actively involved in the relevant market. The categorization of a value determined for a financial instrument within the hierarchy is based upon the pricing transparency of the instrument and does not necessarily correspond to the Funds’ perceived risk of that instrument.
Level 1 investments consist of active listed equities.
Level 2 investments generally include positions that are not traded in active markets and/or are subject to transfer restrictions, valuations may be adjusted to reflect illiquidity and/or non-transferability, which are generally based on available market information. Forward currency contracts and rights are included in Level 2.
Level 3 investments may include unlisted securities related to corporate actions, securities whose trading have been suspended or which have been de-listed from their primary trading exchange and less liquid corporate debt securities. When observable prices are not available for these securities, the Funds use one or more valuation techniques (e.g., the market approach or the income approach) for which sufficient and reliable data is available. Within Level 3 of the fair value hierarchy, the use of the market approach generally consists of using comparable market transactions, while the use of the income approach generally consists of the net present value of estimated future cash flows, adjusted as appropriate for liquidity, credit, market and/or other risk factors.
The inputs used by the Funds in estimating the value of investments classified as Level 3 may include the original transaction price, quoted prices for similar securities or assets in active markets, completed or pending third-party transactions in the underlying investment or comparable issuers, and changes in financial ratios or cash flows. Level 3 securities may also be adjusted to reflect illiquidity and/or non-transferability, with the amount of such discount estimated by the Funds in the absence of market information. The fair value measurement of Level 3 securities does not include transaction costs that may have been capitalized as part of the security’s cost basis. Assumptions used by the Funds due to the lack of observable inputs may significantly impact the resulting fair value and therefore the Funds’ results of operations. There are no securities classified as Level 3 at May 31, 2013.
Fair value pricing could result in a difference between the prices used to calculate a Fund’s net asset value and the prices used by the Fund’s underlying index, which in turn could result in a difference between the Fund’s performance and the performance of the Fund’s underlying index.
52
DBX ETF Trust
NOTES TO FINANCIAL STATEMENTS (Continued)
The following table summarizes the valuation of each Fund’s investments by the above fair value hierarchy levels as of May 31, 2013 (see the Schedule of Investments for security categories). For the year ended May 31, 2013, there were no transfers between investment levels.
| Level 1 | Level 2 | Level 3 | Fair Value at 5/31/13 | |||||||||||||
| db X-trackers MSCI Brazil Fund | ||||||||||||||||
Investments in Securities* | ||||||||||||||||
Common Stocks | $ | 3,850,263 | $ | — | $ | — | $ | 3,850,263 | ||||||||
Preferred Stocks | 3,744,743 | — | — | 3,744,743 | ||||||||||||
Rights | — | 719 | — | 719 | ||||||||||||
Other Financial Instruments | ||||||||||||||||
Unrealized Appreciation on Forward Foreign Currency Contracts | — | 467,185 | — | 467,185 | ||||||||||||
Unrealized Depreciation on Forward Foreign Currency Contracts | — | (46,832 | ) | — | (46,832 | ) | ||||||||||
|
|
|
|
|
|
|
| |||||||||
Total Investments | $ | 7,595,006 | $ | 421,072 | $ | — | $ | 8,016,078 | ||||||||
|
|
|
|
|
|
|
| |||||||||
| db X-trackers MSCI EAFE Fund | ||||||||||||||||
Investments in Securities* | ||||||||||||||||
Common Stocks | $ | 73,159,573 | $ | — | $ | — | $ | 73,159,573 | ||||||||
Preferred Stocks | 545,920 | — | — | 545,920 | ||||||||||||
Other Financial Instruments | ||||||||||||||||
Unrealized Appreciation on Forward Foreign Currency Contracts | — | 1,342,145 | — | 1,342,145 | ||||||||||||
Unrealized Depreciation on Forward Foreign Currency Contracts | — | (620,140 | ) | — | (620,140 | ) | ||||||||||
Futures Contracts | (28,460 | ) | — | — | (28,460 | ) | ||||||||||
|
|
|
|
|
|
|
| |||||||||
Total Investments | $ | 73,677,033 | $ | 722,005 | $ | — | $ | 74,399,038 | ||||||||
|
|
|
|
|
|
|
| |||||||||
| db X-trackers MSCI Emerging Markets Fund | ||||||||||||||||
Investments in Securities* | ||||||||||||||||
Common Stocks | $ | 7,935,558 | $ | — | $ | — | $ | 7,935,558 | ||||||||
Preferred Stocks | 661,879 | — | — | 661,879 | ||||||||||||
Rights | — | 958 | — | 958 | ||||||||||||
Other Financial Instruments | ||||||||||||||||
Unrealized Appreciation on Forward Foreign Currency Contracts | — | 300,470 | — | 300,470 | ||||||||||||
Unrealized Depreciation on Forward Foreign Currency Contracts | — | (31,846 | ) | — | (31,846 | ) | ||||||||||
Futures Contracts | (4,305 | ) | — | — | (4,305 | ) | ||||||||||
|
|
|
|
|
|
|
| |||||||||
Total Investments | $ | 8,593,132 | $ | 269,582 | $ | — | $ | 8,862,714 | ||||||||
|
|
|
|
|
|
|
| |||||||||
| db X-trackers MSCI Germany Fund | ||||||||||||||||
Investments in Securities* | ||||||||||||||||
Common Stocks | $ | 4,050,348 | $ | — | $ | — | $ | 4,050,348 | ||||||||
Preferred Stocks | 312,222 | — | — | 312,222 | ||||||||||||
Other Financial Instruments | ||||||||||||||||
Unrealized Appreciation on Forward Foreign Currency Contracts | — | — | — | — | ||||||||||||
Unrealized Depreciation on Forward Foreign Currency Contracts | — | (14,954 | ) | — | (14,954 | ) | ||||||||||
Futures Contracts | 49 | — | — | 49 | ||||||||||||
|
|
|
|
|
|
|
| |||||||||
Total Investments | $ | 4,362,619 | $ | (14,954 | ) | $ | — | $ | 4,347,665 | |||||||
|
|
|
|
|
|
|
| |||||||||
53
DBX ETF Trust
NOTES TO FINANCIAL STATEMENTS (Continued)
| Level 1 | Level 2 | Level 3 | Fair Value at 5/31/13 | |||||||||||||
| db X-trackers MSCI Japan Fund | ||||||||||||||||
Investments in Securities* | ||||||||||||||||
Common Stocks | $ | 107,585,048 | $ | — | $ | — | $ | 107,585,048 | ||||||||
Other Financial Instruments | ||||||||||||||||
Unrealized Appreciation on Forward Foreign Currency Contracts | — | 2,566,610 | — | 2,566,610 | ||||||||||||
Unrealized Depreciation on Forward Foreign Currency Contracts | — | (1,287,322 | ) | — | (1,287,322 | ) | ||||||||||
Futures Contracts | (45,165 | ) | — | — | (45,165 | ) | ||||||||||
|
|
|
|
|
|
|
| |||||||||
Total Investments | $ | 107,539,883 | $ | 1,279,288 | $ | — | $ | 108,819,171 | ||||||||
|
|
|
|
|
|
|
| |||||||||
| * | See Schedule of Investments for Industry or Country Classification. |
New Accounting Pronouncements In December 2011, the Financial Accounting Standards Board (the “FASB”) issued Accounting Standards Update (“ASU”) No. 2011-11 related to Disclosures about Offsetting Assets and Liabilities and in January 2013, issued ASU 2013-01, Clarifying the Scope of Disclosures about Offsetting Assets and Liabilities (collectively, the “Update”). The Update requires an entity to disclose information about offsetting and related arrangements to enable users of its financial statements to understand the effect of those arrangements on its financial position. The disclosure requirements are effective for annual reporting periods beginning on or after January 1, 2013, and interim periods within those annual periods. The guidance requires retrospective application for all comparative periods presented. The Advisor is currently evaluating the impact that the Update will have on the financial statement disclosures.
In June 2013, the FASB issued ASU No. 2013-08 which provides guidance that creates a two-tiered approach to assess whether an entity is an investment company. The guidance will also require an investment company to measure non-controlling ownership interests in other investment companies at fair value and will require additional disclosures relating to investment company status, any changes thereto and information about financial support provided or contractually required to be provided to any of the investment company’s investees. The guidance is effective for financial statements with fiscal years beginning on or after December 15, 2013 and interim periods within those fiscal years. Management is evaluating the impact of this guidance on the Funds’ financial statement disclosures.
Forward Currency Contracts Each Fund may enter into forward currency contracts designed to offset a Fund’s exposure to non-U.S. currencies. In addition, the Funds may enter into foreign currency forward and foreign currency futures contracts to facilitate local securities settlements or to protect against currency exposure in connection with distributions to Shareholders.
The db X-trackers MSCI Brazil Fund, db X-trackers MSCI Germany Fund and db X-trackers MSCI Japan Fund each invest in forward foreign currency exchange contracts to hedge against changes in the value of the U.S. dollar against the Brazilian real, Euro dollar and the Japanese yen, respectively. Similarly, the db X-trackers MSCI EAFE Fund and db X-trackers MSCI Emerging Markets Fund invest in forward foreign currency exchange contracts to hedge against changes in the value of the U.S. dollar against specified non-U.S. currencies.
A forward currency exchange contract is a commitment to purchase or sell a foreign currency at a future date at a negotiated forward rate. The gain or loss arising from the difference between the original contract and the closing of such contract would be included in net realized gain or loss on foreign currency transactions. Risks may arise from the potential inability of a counterparty to meet the terms of a contract and from unanticipated movements in the value of a foreign currency relative to the U.S. dollar. The face or contract amount, in U.S. dollars reflects the total exposure the respective Fund has in that particular currency contract.
Forward contracts are valued daily and the respective Fund’s net equity therein, represents unrealized appreciation or depreciation on the contracts as measured by the difference between the contracted price or rate and the forward price or rate at the reporting date which is included in the statement of assets and liabilities. Generally, the key inputs for most forward contracts include notional amount, maturity date, forward rate, and spot rate.
54
DBX ETF Trust
NOTES TO FINANCIAL STATEMENTS (Continued)
Futures Contracts Each Fund may enter into futures contracts. These futures contracts will be used to simulate investment in the respective Underlying Index, to facilitate trading or to reduce transaction costs. Each Fund will enter into futures contracts that are traded on a U.S. or non-U.S. exchange. No Fund will use futures for speculative purposes. Futures contracts provide for the future sale by one party and purchase by another party of a specified amount of a specific instrument or index at a specified future time and at a specified price. Each Fund may enter into futures contracts to purchase securities indexes when the Advisor and/or Sub-Advisor anticipate purchasing the underlying securities and believe prices will rise before the purchase will be made. To the extent required by law, liquid assets committed to futures contracts will be maintained.
Open futures contracts are valued using the closing settlement price or, in the absence of such a price, the most recent quoted bid price. If there are no quotations available for the day of valuation, the last available closing settlement price is used.
At the time each Fund enters into a futures contract, each Fund deposits and maintains as collateral an initial margin with the broker, as required by the exchange on which the transaction is effected. Pursuant to the contract, each Fund agrees to receive from or pay to the broker an amount of cash equal to the daily fluctuation in the value of the contract. Such receipts or payments are known as variation margin and are recorded by each Fund as unrealized gains or losses. Risks may arise from the potential inability of a counterparty to meet the terms of the contract. The credit/counterparty risk for exchange-traded futures contracts is generally less than privately negotiated futures contracts, since the clearinghouse, which is the issuer or counterparty to each exchange-traded future, provides a guarantee of performance. The guarantee is supported by a daily payment system (i.e., margin requirements).
Use of long futures contracts subjects each Fund to risk of loss in excess of the amounts shown on the statement of assets and liabilities, up to the notional value of the futures contracts. Use of short futures contracts subjects each Fund to unlimited risk of loss. Under some circumstances, futures exchanges may establish daily limits on the amount that the price of a futures contract can vary from the previous day’s settlement price, which could effectively prevent liquidation of unfavorable positions.
Cash Cash consists of cash held at banks and are on deposits with major financial institutions.
Investment Transactions and Investment Income Investment transactions are recorded as of the date that the securities are purchased or sold (trade date). Realized gains and losses from the sale or disposition of securities are calculated on the identified cost-method. Dividend income is net of any foreign taxes withheld at source. Interest income is recorded on the accrual basis.
Tax Information and Dividends and Distributions to Shareholders It is each Fund’s policy to comply with all requirements of the Internal Revenue Code of 1986, as amended (“the Code”). Each fund intends to qualify for and to elect treatment as a separate Regulated Investment Company (“RIC”) under Subchapter M of the Code. It is the policy of each Fund to pay out dividends, if any, to investors semi-annually sufficient to relieve it from all, or substantially all, Federal income and excise taxes. Taxable net realized gains from investment transactions, reduced by capital loss carryforwards, if any, are declared and distributed to shareholders at least annually. The capital loss carryforward amount, if any, is available to offset future net capital gains. The Funds may occasionally be required to make supplemental distributions at some other
time during the year. The Funds reserve the right to declare special distributions if, in their reasonable discretion, such action is necessary or advisable to preserve the status of each Fund as a RIC or to avoid imposition of income or excise taxes on undistributed income. Dividends and distributions to shareholders, if any, are recorded on the ex-dividend date. The amount of dividends and distributions from net investment income and net realized capital gains are determined in accordance with Federal income tax regulations which may differ from U.S. GAAP. These “book/tax” differences are either considered temporary or permanent in nature. To the extent these differences are permanent in nature, such amounts are reclassified at the end of the year within the components of net assets based on their federal tax treatment; temporary differences do not require reclassification. Dividends and distributions, which exceed earnings and profits for the full year for tax purposes, are reported as a tax return of capital. Each Fund pays out dividends from its net investment income to investors semi-annually.
In accordance with U.S. GAAP requirements regarding accounting for uncertainties in income taxes, management has analyzed the Funds’ tax positions taken or expected to be taken on foreign, federal and state income tax returns for all open tax years and has concluded that no provision for income tax is required in the Funds’ financial statements. The Advisor does not believe that the unrecognized tax benefits will change significantly in the next 12 months.
The Funds’ recognize interest and penalties, if any, related to uncertain tax provisions as income tax expense on the Statements of Operations. For the year ended May 31, 2013, the Funds did not incur any interest or penalties.
55
DBX ETF Trust
NOTES TO FINANCIAL STATEMENTS (Continued)
Foreign Taxes The Funds may be subject to foreign taxes (a portion of which may be reclaimable) on income, capital gains on investments, certain foreign currency transactions or other corporate events. All foreign taxes are recorded in accordance with the applicable foreign tax regulations and rates that exist in the foreign jurisdictions in which the Funds invest. These foreign taxes, if any, are paid by the Funds and are reflected in their Statements of Operations as follows: foreign taxes withheld at source are presented as a reduction of income, foreign taxes on capital gains from sales of investments and foreign currency transactions are included in their respective net realized gain (loss) categories, and foreign taxes on other corporate events are reflected in “Other foreign taxes.” Foreign taxes payable as of May 31, 2013, if any, are disclosed in the Funds’ Statements of Assets and Liabilities.
Expenses Expenses that are directly related to a specific Fund are charged to that respective Fund. Expenses which are not readily identifiable to a specific Fund are allocated in such a manner as deemed equitable, taking into consideration the nature and type of expense and the relative net assets of each Fund.
Foreign Currency Translation The accounting records of the Funds are maintained in U.S. dollars. Foreign currencies, as well as investment securities and other assets and liabilities denominated in currencies other than the U.S. dollar are translated into U.S. dollars using an exchange rate deemed appropriate by the investment advisor. The effects of changes in foreign currency exchange rates on investments in securities are not segregated in the Statements of Operations from the
effects of changes in market prices of those securities, but are included with the net realized and unrealized gain or loss on investments in securities. Unrealized gains and losses on assets and liabilities, other than investments in securities, which result from changes in foreign currency exchange rates have been included in “Net change in unrealized appreciation (depreciation) on foreign currency translations” on the Statements of Operations. The portion of foreign currency gains and losses related to fluctuations in exchange rates between the initial purchase trade date and subsequent sale trade date is included in “Net realized gain (loss) from foreign currency related transactions” on the Statements of Operations. Certain foreign exchange gains and losses included in realized and unrealized gains or losses are included in or are a reduction of ordinary income in accordance with U.S. Federal income tax regulations.
Derivatives The fair value of derivative instruments as of May 31, 2013 by risk category:
The fair value of derivative instruments as of May 31, 2013 by risk type:
Asset Derivatives | Liability Derivatives | |||||||||||||
Risk Type | Statement of Asset and | Fair Value | Statement of Asset and | Fair Value | ||||||||||
| db X-trackers MSCI Brazil Fund | ||||||||||||||
Foreign exchange contracts | Unrealized appreciation on forward foreign currency contracts | $ | 467,185 | Unrealized depreciation on forward foreign currency contracts | $ | 46,832 | ||||||||
|
|
|
| |||||||||||
Total | $ | 467,185 | $ | 46,832 | ||||||||||
|
|
|
| |||||||||||
| db X-trackers MSCI EAFE Fund | ||||||||||||||
Equity contracts | Unrealized appreciation on futures contracts | $ | — | Unrealized depreciation on futures contracts | $ | 28,460 | ||||||||
Foreign exchange contracts | Unrealized appreciation on forward foreign currency contracts | 1,342,145 | Unrealized depreciation on forward foreign currency contracts | 620,140 | ||||||||||
|
|
|
| |||||||||||
Total | $ | 1,342,145 | $ | 648,600 | ||||||||||
|
|
|
| |||||||||||
| db X-trackers MSCI Emerging Markets Fund | ||||||||||||||
Equity contracts | Unrealized appreciation on futures contracts | $ | — | Unrealized depreciation on futures contracts | $ | 4,305 | ||||||||
Foreign exchange contracts | Unrealized appreciation on forward foreign currency contracts | 300,470 | Unrealized depreciation on forward foreign currency contracts | 31,846 | ||||||||||
|
|
|
| |||||||||||
Total | $ | 300,470 | $ | 36,151 | ||||||||||
|
|
|
| |||||||||||
56
DBX ETF Trust
NOTES TO FINANCIAL STATEMENTS (Continued)
Asset Derivatives | Liability Derivatives | |||||||||||||
Risk Type | Statement of Asset and | Fair Value | Statement of Asset and | Fair Value | ||||||||||
| db X-trackers MSCI Germany Fund | ||||||||||||||
Equity contracts | Unrealized appreciation on futures contracts | $ | 49 | Unrealized depreciation on futures contracts | $ | — | ||||||||
Foreign exchange contracts | Unrealized appreciation on forward foreign currency contracts | — | Unrealized depreciation on forward foreign currency contracts | 14,954 | ||||||||||
|
|
|
| |||||||||||
Total | $ | 49 | $ | 14,954 | ||||||||||
|
|
|
| |||||||||||
| db X-trackers MSCI Japan Fund | ||||||||||||||
Equity contracts | Unrealized appreciation on futures contracts | $ | — | Unrealized depreciation on futures contracts | $ | 45,165 | ||||||||
Foreign exchange contracts | Unrealized appreciation on forward foreign currency contracts | 2,566,610 | Unrealized depreciation on forward foreign currency contracts | 1,287,322 | ||||||||||
|
|
|
| |||||||||||
Total | $ | 2,566,610 | $ | 1,332,487 | ||||||||||
|
|
|
| |||||||||||
The effects of derivative instruments on the Statements of Operations for the year ended May 31, 2013 are as follows:
Amount of Net Realized Gain or (Loss) on Derivatives Recognized in Income | ||||||||||||
| Equity Futures Contracts | Forward Foreign Currency Contracts | Total | ||||||||||
db X-trackers MSCI Brazil Fund | $ | — | $ | 15,405 | $ | 15,405 | ||||||
db X-trackers MSCI EAFE Fund | (9,600 | ) | 1,439,852 | 1,430,252 | ||||||||
db X-trackers MSCI Emerging Markets Fund | (555 | ) | (90,178 | ) | (90,733 | ) | ||||||
db X-trackers MSCI Germany Fund | 7,044 | 47,865 | 54,909 | |||||||||
db X-trackers MSCI Japan Fund | 23,250 | 1,463,381 | 1,486,631 | |||||||||
Net Change in Unrealized Appreciation or (Depreciation) on Derivatives Recognized in Income | ||||||||||||
| Equity Futures Contracts | Forward Foreign Currency Contracts | Total | ||||||||||
db X-trackers MSCI Brazil Fund | $ | — | $ | 146,291 | $ | 146,291 | ||||||
db X-trackers MSCI EAFE Fund | 23,000 | (641,754 | ) | (618,754 | ) | |||||||
db X-trackers MSCI Emerging Markets Fund | 3,835 | 62,481 | 66,316 | |||||||||
db X-trackers MSCI Germany Fund | 10,190 | (204,626 | ) | (194,436 | ) | |||||||
db X-trackers MSCI Japan Fund | (29,822 | ) | 1,369,880 | 1,340,058 | ||||||||
For the year ended May 31, 2013 the average monthly volume of derivatives was as follows:
| Futures Contracts (Contract Value) | Forward Foreign Currency Contracts (Market Value) | |||||||
db X-trackers MSCI Brazil Fund | $ | — | $ | 4,310,396 | ||||
db X-trackers MSCI EAFE Fund | 306,718 | 21,992,324 | ||||||
db X-trackers MSCI Emerging Markets Fund | 58,771 | 5,010,850 | ||||||
db X-trackers MSCI Germany Fund | 151,239 | 4,394,214 | ||||||
db X-trackers MSCI Japan Fund | 367,104 | 18,852,389 | ||||||
3. Investment Advisory and Other Agreements
The Advisor has overall responsibility for the general management and administration of the Funds, subject to the supervision of the Funds’ Board of Trustees. Under an investment advisory agreement between the Trust, on behalf of the
57
DBX ETF Trust
NOTES TO FINANCIAL STATEMENTS (Continued)
Funds, and the Advisor (the “Investment Advisory Agreement”), the Advisor is responsible for arranging sub-advisory, transfer agency, custody, fund administration, and all other non-distribution related services for the Funds to operate. The Advisor is also responsible for employing any sampling strategy for the Funds.
TDAM USA Inc. (“TDAM”) acts as investment sub-advisor to the Funds (“Sub-Advisor”). TDAM is a direct, wholly-owned subsidiary of The Toronto-Dominion Bank. The Sub-Advisor is responsible for the day-to-day management of the Funds, subject to the supervision of the Advisor and the Funds’ Board of Trustees. In this regard, the Sub-Advisor is responsible for implementing the replication strategy for each Fund with regard to its underlying index and for general administration, compliance and management services as may be agreed between the Advisor and Sub Advisor from time to time.
For its investment advisory services to each Fund, the Advisor is entitled to receive a unitary management fee from each Fund at an annual rate equal to 0.60% (with respect to db X-trackers MSCI Brazil Fund), 0.35% (with respect to db X-trackers MSCI EAFE Fund), 0.65% (with respect to db X-trackers MSCI Emerging Markets Fund), 0.50% (with respect db X-trackers MSCI Germany Fund) and 0.50% (with respect db X-trackers MSCI Japan Fund) of its average daily net assets. Out of the unitary management fee, the Advisor pays substantially all expenses of each Fund, including the payments to the Sub-Advisor, the cost of transfer agency, custody, fund administration, legal, audit and other services. Each Fund is responsible for the payment of, interest expense, taxes, brokerage expenses, expenses of the Disinterested Trustees and extraordinary expenses.
Effective September 28, 2012, the Advisor has contractually agreed through September 30, 2013 to waive fees and/or reimburse the Funds’ expenses in order to limit the Funds’ net annual operating expenses to 0.60% (with respect to db X-trackers MSCI Brazil Fund), 0.35% (with respect to db X-trackers MSCI EAFE Fund), 0.65% (with respect to db X-trackers MSCI Emerging Markets Fund), 0.50% (with respect to db X-trackers MSCI Germany Fund) and 0.50% (with respect db X-trackers MSCI Japan Fund) of its average daily net assets, except for interest expense, taxes, brokerage expenses, distribution fees or expenses, litigation expenses and other extraordinary expenses (the “Expense Cap”). In accordance with and as required by the Expense Cap, the Advisor will reimburse the Fund for the Independent Trustee Fees. The Expense Cap will remain in effect until at least September 30, 2013. Prior to September 28, 2012 the Funds did not have an Expense Cap.
The Advisor pays TDAM, out of its own resources, a fee based on a percentage of the average daily net assets of each Fund as set forth below:
db X-trackers MSCI Brazil Fund
| • | 20 basis points (0.20%) of the first $100 million in daily net assets; and |
| • | 12 basis points (0.12%) of the next $400 million in daily net assets; and |
| • | 6 basis points (0.06%) of the daily net assets in excess of $500 million. |
db X-trackers MSCI EAFE Fund
| • | 12 basis points (0.12%) of the first $100 million in daily net assets; and |
| • | 8 basis points (0.08%) of the next $400 million in daily net assets; and |
| • | 4 basis points (0.04%) of the daily net assets in excess of $500 million. |
db X-trackers MSCI Emerging Markets Fund
| • | 20 basis points (0.20%) of the first $100 million in daily net assets; and |
| • | 15 basis points (0.15%) of the next $400 million in daily net assets; and |
| • | 6 basis points (0.06%) of the daily net assets in excess of $500 million. |
db X-trackers MSCI Germany Fund
| • | 15 basis points (0.15%) of the first $100 million in daily net assets; and |
| • | 7 basis points (0.07%) of the next $400 million in daily net assets; and |
| • | 4 basis points (0.04%) of the daily net assets in excess of $500 million. |
db X-trackers MSCI Japan Fund
| • | 15 basis points (0.15%) of the first $100 million in daily net assets; and |
| • | 7 basis points (0.07%) of the next $400 million in daily net assets; and |
| • | 4 basis points (0.04%) of the daily net assets in excess of $500 million. |
58
DBX ETF Trust
NOTES TO FINANCIAL STATEMENTS (Continued)
The total aggregate fees paid by the Advisor to the Sub-Advisor will be at least $300,000 per year.
The Bank of New York Mellon, a wholly-owned subsidiary of The Bank of New York Mellon Corporation, serves as Administrator, Custodian, Accounting Agent and Transfer Agent for each Fund.
ALPS Distributors, Inc. (the “Distributor”) serves as the distributor of Creation Units for each Fund on an agency basis. The Distributor does not maintain a secondary market in shares of the Funds.
The Board of Trustees is currently comprised of four Trustees, of whom three are Independent Trustees. The Trust pays each Independent Trustee an annual fee of $25,000, plus a fee of $2,500 per meeting attended in-person or $1,500 per meeting attended telephonically. Each Independent Trustee also receives $1,500 per Audit Committee meeting. The Audit Committee Chairman receives $2,000 as an annual retainer fee. The Trust reimburses each Trustee for their costs and expenses associated with the performance of their duties hereunder, including the cost and expenses associated with attendance at meetings of the Board. Trustees’ fees and expenses are allocated among the Funds based on each Fund’s relative average daily net assets.
4. Federal Income Taxes
As of May 31, 2013, the components of accumulated earnings (losses) were as follows:
| Undistributed Net Investment Income | Undistributed Long-Term Capital Gains | Net Accumulated Capital and Other Gains (Losses) | Unrealized Appreciation (Depreciation) | Total Accumulated Earnings (Losses) | ||||||||||||||||
db X-trackers MSCI Brazil Fund | $ | 467,341 | $ | — | $ | (511,860 | ) | $ | (1,223,088 | ) | $ | (1,267,607 | ) | |||||||
db X-trackers MSCI EAFE Fund | 1,788,701 | — | (266,746 | ) | 655,285 | 2,177,240 | ||||||||||||||
db X-trackers MSCI Emerging Markets Fund | 256,570 | — | (458,394 | ) | (422,101 | ) | (623,925 | ) | ||||||||||||
db X-trackers MSCI Germany Fund | 170,599 | — | (541,617 | ) | 13,026 | (357,992 | ) | |||||||||||||
db X-trackers MSCI Japan Fund | 2,541,866 | 384,188 | — | (4,265,187 | ) | (1,339,133 | ) | |||||||||||||
The tax character of dividends and distributions declared for the year ended May 31, 2013 and the period June 9, 2011 to May 31, 2012 were as follows:
| Year Ended May 31, 2013 | ||||||||
| Ordinary Income | Long-Term | |||||||
db X-trackers MSCI Brazil Fund | $ | 116,270 | $ | 254,690 | ||||
db X-trackers MSCI EAFE Fund | 1,123,541 | 1,053,575 | ||||||
db X-trackers MSCI Emerging Markets Fund | 80,337 | 50,049 | ||||||
db X-trackers MSCI Germany Fund | 89,599 | 85,500 | ||||||
db X-trackers MSCI Japan Fund | 81,785 | — | ||||||
| June 9, 2011 to May 31, 2012 | ||||||||
| Ordinary Income | Long-Term | |||||||
db X-trackers MSCI Brazil Fund | $ | 93,513 | $ | 51,008 | ||||
db X-trackers MSCI EAFE Fund | 133,281 | — | ||||||
db X-trackers MSCI Emerging Markets Fund | 52,035 | 77,738 | ||||||
db X-trackers MSCI Germany Fund | 38,447 | 41,640 | ||||||
db X-trackers MSCI Japan Fund | 34,346 | — | ||||||
At May 31, 2013, for Federal income tax purposes, the Funds have capital loss carryforwards available as shown in the table below, as provided by regulations, to offset future capital gains. To the extent that these loss carryforwards are used to offset future capital gains, it is probable that the capital gains so offset will not be distributed to shareholders.
| Post-effective-no expiration short-term | Post-effective-no expiration long-term | Total Amount | ||||||||||
db X-trackers MSCI Brazil Fund | $ | 49,375 | $ | 48,579 | $ | 97,954 | ||||||
db X-trackers MSCI EAFE Fund | — | 248,389 | 248,389 | |||||||||
db X-trackers MSCI Emerging Markets Fund | 107,625 | 90,849 | 198,474 | |||||||||
db X-trackers MSCI Germany Fund | 61,269 | 112,729 | 173,998 | |||||||||
db X-trackers MSCI Japan Fund | — | — | — | |||||||||
59
DBX ETF Trust
NOTES TO FINANCIAL STATEMENTS (Continued)
Under the recently enacted Regulated Investment Company Modernization Act of 2010 (the “Act”), the Funds will be permitted to carry forward capital losses incurred in taxable years beginning after December 22, 2010 for an unlimited period.
Capital losses incurred after October 31 (“post-October losses”) within the taxable year are deemed to arise on the first business day of each Fund’s next taxable year.
During the fiscal year ended May 31, 2013, the Funds incurred and elected to defer net capital losses as follows:
| Post-October Losses on Capital | ||||
db X-trackers MSCI Brazil Fund | $ | 413,906 | ||
db X-trackers MSCI EAFE Fund | — | |||
db X-trackers MSCI Emerging Markets Fund | 259,920 | |||
db X-trackers MSCI Germany Fund | 367,619 | |||
db X-trackers MSCI Japan Fund | — | |||
In order to present paid-in capital and accumulated net realized gains or losses on the Statements of Assets and Liabilities that more closely represent their tax character, certain adjustments have been made to additional paid-in capital, undistributed net investment income or loss and accumulated net realized gains or losses on investments. These differences are primarily due to currency gain/(loss), Passive Foreign Investment Companies (“PFICs”) and redemptions-in-kind. For the fiscal year ended May 31, 2013, the adjustments were as follows:
| Undistributed Net Investment Income (Loss) | Undistributed Capital Gains (Accumulated Losses) | Paid-in Capital | ||||||||||
db X-trackers MSCI Brazil Fund | $ | (19,379 | ) | $ | 19,580 | $ | (201 | ) | ||||
db X-trackers MSCI EAFE Fund | 565,771 | 371,926 | (937,697 | ) | ||||||||
db X-trackers MSCI Emerging Markets Fund | (15,745 | ) | 15,844 | (99 | ) | |||||||
db X-trackers MSCI Germany Fund | 38,150 | (38,150 | ) | — | ||||||||
db X-trackers MSCI Japan Fund | 846,599 | (1,720,652 | ) | 874,053 | ||||||||
As of May 31, 2013, the cost of investments for Federal income tax purposes and the aggregated gross unrealized appreciation/depreciation on investments were as follows:
| Cost | Net Unrealized Appreciation (Depreciation) | Gross Unrealized Appreciation | Gross Unrealized (Depreciation) | |||||||||||||
db X-trackers MSCI Brazil Fund | $ | 8,816,887 | $ | (1,221,162 | ) | $ | 131,674 | $ | (1,352,836 | ) | ||||||
db X-trackers MSCI EAFE Fund | 73,069,990 | 635,503 | 2,235,585 | (1,600,082 | ) | |||||||||||
db X-trackers MSCI Emerging Markets Fund | 9,053,065 | (454,670 | ) | 493,538 | (948,208 | ) | ||||||||||
db X-trackers MSCI Germany Fund | 4,364,751 | (2,181 | ) | — | (2,181 | ) | ||||||||||
db X-trackers MSCI Japan Fund | 111,791,163 | (4,206,115 | ) | 1,086,020 | (5,292,135 | ) | ||||||||||
5. Investments in Affiliates
The Advisor is a wholly-owned subsidiary of Deutsche Bank AG. Therefore, Deutsche Bank AG is considered to be affiliated with the Funds. The table below shows the transactions in and earnings from investments in Deutsche Bank AG securities for the year ended May 31, 2013.
| Fair Value 5/31/12 | Purchases at Cost | Proceeds from Sales | Change in Unrealized Appreciation/ (Depreciation) | Realized Gain (Loss) | Fair Value 5/31/13 | Dividend Income | ||||||||||||||||||||||
db X-trackers MSCI EAFE Fund | ||||||||||||||||||||||||||||
Deutsche Bank AG (Common Stock) | $ | 104,799 | $ | 262,248 | $ | (80,963 | ) | $ | 18,604 | $ | (4,508 | ) | $ | 300,180 | $ | 4,572 | ||||||||||||
db X-trackers MSCI Germany Fund | ||||||||||||||||||||||||||||
Deutsche Bank AG (Common Stock) | — | 204,301 | — | (102 | ) | — | 204,199 | — | ||||||||||||||||||||
60
DBX ETF Trust
NOTES TO FINANCIAL STATEMENTS (Continued)
The Sub-Advisor is a wholly-owned subsidiary of The Toronto-Dominion Bank. Therefore, The Toronto-Dominion Bank is considered to be affiliated with the Funds. The table below shows the transactions in and earnings from investments in The Toronto-Dominion Bank securities for the year ended May 31, 2013.
| Fair Value 5/31/12 | Purchases at Cost | Proceeds from Sales | Change in Unrealized Appreciation/ (Depreciation) | Realized Gain (Loss) | Fair Value 5/31/13 | Dividend Income | ||||||||||||||||||||||
db X-trackers MSCI Germany Fund | ||||||||||||||||||||||||||||
Toronto-Dominion Bank (The) | $ | 209,761 | $ | 24,693 | $ | (246,884 | ) | $ | 11,433 | $ | 997 | $ | — | $ | 6,869 | |||||||||||||
6. Investment Portfolio Transactions
For the year ended May 31, 2013, the cost of investments purchased and proceeds from sale of investments (excluding in-kind transactions and short-term investments) were as follows:
| Purchases | Sales | |||||||
db X-trackers MSCI Brazil Fund | $ | 4,814,865 | $ | 1,089,678 | ||||
db X-trackers MSCI EAFE Fund | 3,964,646 | 3,238,838 | ||||||
db X-trackers MSCI Emerging Markets Fund | 2,679,259 | 781,223 | ||||||
db X-trackers MSCI Germany Fund | 4,767,119 | 5,020,848 | ||||||
db X-trackers MSCI Japan Fund | 9,732,300 | 2,217,207 | ||||||
For the year ended May 31, 2013, the cost of in-kind purchases and proceeds from in-kind sales were as follows:
| Purchases | Sales | |||||||
db X-trackers MSCI EAFE Fund | $62,134,060 | $ | 22,035,295 | |||||
db X-trackers MSCI Emerging Markets Fund | 2,849,251 | — | ||||||
db X-trackers MSCI Japan Fund | 105,235,529 | 6,681,606 | ||||||
7. Fund Share Transactions
As of May 31, 2013, there were unlimited Fund shares of $0.0001 par value authorized by the Trust. Fund shares are issued and redeemed by each Fund only in Creation Units or multiples thereof. Except when aggregated in Creation Units, shares of each Fund are not redeemable. Transactions in capital shares for each Fund are disclosed in detail in the Statements of Changes in Net Assets. The consideration for the purchase of Creation Units of a Fund generally consists of the in-kind contribution of a designated portfolio of securities constituting a portfolio sampling representation of the securities included in the respective Fund’s underlying index and an amount of cash. Investors purchasing and redeeming Creation Units pay a purchase transaction fee and a redemption transaction fee to offset transfer and other transaction costs associated with the issuance and redemption of Creation Units.
8. Subsequent Events
The Trust evaluated the need for disclosure and/or adjustment resulting from subsequent events through the date the financial statements were available to be issued. This evaluation did not result in any subsequent events that necessitated disclosure and/or adjustment.
61
DBX ETF Trust
REPORT OF INDEPENDENT REGISTERED PUBLIC ACCOUNTING FIRM
To Board of Trustees and Shareholders of
DBX ETF Trust:
We have audited the accompanying statements of assets and liabilities, including the schedules of investments, of DBX ETF Trust (the “Trust”), consisting of: db X-trackers MSCI Brazil Hedged Equity Fund, db X-trackers MSCI EAFE Hedged Equity Fund, db X-trackers MSCI Emerging Markets Hedged Equity Fund, db X-trackers MSCI Germany Hedged Equity Fund, and db X-trackers MSCI Japan Hedged Equity Fund, as of May 31, 2013, and the related statements of operations for the year then ended and the statements of changes in net assets and financial highlights for the year ended May 31, 2013 and for the period June 9, 2011 (commencement of operations) to May 31, 2012. These financial statements and financial highlights are the responsibility of the Trust’s management. Our responsibility is to express an opinion on these financial statements and financial highlights based on our audits.
We conducted our audits in accordance with the standards of the Public Company Accounting Oversight Board (United States). Those standards require that we plan and perform the audit to obtain reasonable assurance about whether the financial statements and financial highlights are free of material misstatement. We were not engaged to perform an audit of the Trust’s internal control over financial reporting. Our audits included consideration of internal control over financial reporting as a basis for designing audit procedures that are appropriate in the circumstances, but not for the purpose of expressing an opinion on the effectiveness of the Trust’s internal control over financial reporting. Accordingly, we express no such opinion. An audit also includes examining, on a test basis, evidence supporting the amounts and disclosures in the financial statements and the financial highlights, assessing the accounting principles used and significant estimates made by management, and evaluating the overall financial statement presentation. Our procedures included confirmation of securities owned as of May 31, 2013, by correspondence with the custodian and brokers. We believe that our audits provide a reasonable basis for our opinion.
In our opinion, the financial statements and financial highlights referred to above present fairly, in all material respects, the financial position of db X-trackers MSCI Brazil Hedged Equity Fund, db X-trackers MSCI EAFE Hedged Equity Fund, db X-trackers MSCI Emerging Markets Hedged Equity Fund, db X-trackers MSCI Germany Hedged Equity Fund, and db X-trackers MSCI Japan Hedged Equity Fund of DBX ETF Trust at May 31, 2013, the results of their operations for the year then ended and the changes in their net assets and financial highlights for the year ended May 31, 2013 and for the period June 9, 2011 (commencement of operations) to May 31, 2012, in conformity with U.S. generally accepted accounting principles.

New York, New York
July 25, 2013
62
DBX ETF Trust
FREQUENCY DISTRIBUTION OF DISCOUNTS & PREMIUMS (Unaudited)
The tables that follow present information about the differences between the daily market price on secondary markets for shares of a Fund and that Fund’s net asset value (“NAV”). NAV is the price per share at which each Fund issues and redeems shares. It is calculated in accordance with the standard formula for valuing mutual fund shares. The price used to calculate market returns (“Market Price”) of each Fund generally is determined using the midpoint between the highest bid and the lower offer on the national securities exchange on which the shares of such Fund are listed for trading, as of the time that the Fund’s NAV is calculated. Each Fund’s Market Price may be at, above or below its NAV. The NAV of each Fund will fluctuate with changes in the market value of its portfolio holdings. The Market Price of each Fund will fluctuate in accordance with changes in its NAV, as well as market supply and demand. Shareholders may pay more than NAV when they buy Fund shares and receive less than NAV when they sell those shares, because shares are bought and sold at current market prices.
Premiums or discounts are the differences (expressed as a percentage) between the NAV and Market Price of a Fund on a given day, generally at the time NAV is calculated. A premium is the amount that a Fund is trading above the reported NAV, expressed as a percentage of the NAV. A discount is the amount that a Fund is trading below the reported NAV, expressed as a percentage of the NAV.
The following information shows the frequency distributions of premiums and discounts for each Fund included in this report. The information shown for each Fund is for each full calendar quarter completed after the inception date of such Fund, June 9, 2011, through the fiscal year ended May 31, 2013.
Each line in the table shows the number of trading days in which a Fund trades within the premium/discount range indicated. The number of trading days in each premium/discount range is also shown as a percentage of the total number of trading days in the period covered by each table. All data presented here represents past performance, which cannot be used to predict future results.
| MARKET PRICE ABOVE OR EQUAL TO NAV | MARKET PRICE BELOW NAV | |||||||||||
| Basis point Differential* | Number of Days | Percentage of Total Days | Number of Days | Percentage of Total Days | ||||||||
db X-trackers MSCI Brazil Fund June 9, 2011 – May 31, 2013 | 0 — < .25% | 28 | 5.63% | 25 | 5.03% | |||||||
| .25% — < .50% | 20 | 4.02% | 23 | 4.63% | ||||||||
| .50% — < .75% | 30 | 6.04% | 28 | 5.63% | ||||||||
| .75% — < 1.00% | 20 | 4.02% | 23 | 4.63% | ||||||||
| > = 1.00% | 238 | 47.89% | 62 | 12.47% | ||||||||
| Total: | 336 | 67.60% | 161 | 32.39% | ||||||||
db X-trackers MSCI EAFE Fund June 9, 2011 – May 31, 2013 | 0 — < .25% | 53 | 10.66% | 38 | 7.65% | |||||||
| .25% — < .50% | 55 | 11.07% | 47 | 9.46% | ||||||||
| .50% — < .75% | 45 | 9.05% | 20 | 4.02% | ||||||||
| .75% — < 1.00% | 39 | 7.85% | 18 | 3.62% | ||||||||
| > = 1.00% | 153 | 30.78% | 29 | 5.83% | ||||||||
| Total: | 345 | 69.41% | 152 | 30.58% | ||||||||
db X-trackers MSCI Emerging Markets Fund June 9, 2011 – May 31, 2013 | 0 — < .25% | 39 | 7.85% | 27 | 5.43% | |||||||
| .25% — < .50% | 40 | 8.05% | 16 | 3.22% | ||||||||
| .50% — < .75% | 54 | 10.86% | 19 | 3.82% | ||||||||
| .75% — < 1.00% | 44 | 8.85% | 13 | 2.62% | ||||||||
| > = 1.00% | 222 | 44.67% | 23 | 4.63% | ||||||||
| Total: | 399 | 80.28% | 98 | 19.72% | ||||||||
63
DBX ETF Trust
FREQUENCY DISTRIBUTION OF DISCOUNTS & PREMIUMS (Unaudited) (Continued)
| MARKET PRICE ABOVE OR EQUAL TO NAV | MARKET PRICE BELOW NAV | |||||||||||
| Basis point Differential* | Number of Days | Percentage of Total Days | Number of Days | Percentage of Total Days | ||||||||
db X-trackers MSCI Germany Fund June 9, 2011 – May 31, 2013 | 0 — < .25% | 105 | 19.03% | 57 | 4.45% | |||||||
| .25% — < .50% | 107 | 25.51% | 24 | 1.21% | ||||||||
| .50% — < .75% | 89 | 26.32% | 19 | 1.62% | ||||||||
| .75% — < 1.00% | 35 | 10.12% | 12 | 0.00% | ||||||||
| > = 1.00% | 39 | 10.53% | 10 | 1.21% | ||||||||
| Total: | 375 | 91.50% | 122 | 8.50% | ||||||||
db X-trackers MSCI Japan Fund June 9, 2011 – May 31, 2013 | 0 — < .25% | 52 | 10.46% | 40 | 8.05% | |||||||
| .25% — < .50% | 63 | 12.68% | 45 | 9.05% | ||||||||
| .50% — < .75% | 48 | 9.66% | 31 | 6.24% | ||||||||
| .75% — < 1.00% | 34 | 6.84% | 24 | 4.83% | ||||||||
| > = 1.00% | 112 | 22.53% | 48 | 9.66% | ||||||||
| Total: | 309 | 62.17% | 188 | 37.83% | ||||||||
* A basis point equals one-hundredth of one percent (0.01%).
64
DBX ETF Trust
OFFICERS AND TRUSTEES (Unaudited)
| Name, Address, and Age | Position(s) Held with Fund | Term of Office and Length of Time Served | Principal Occupation(s) During Past 5 Years | Number of Portfolios in Fund Complex Overseen by Trustee | Other Directorships held by Trustee | |||||
Independent Trustees: | ||||||||||
J. David Officer Age: 64 60 Wall Street New York, New York 10005 | Trustee, Member of the Audit and Nominating Committees | Since 2011 | Independent Director; Consultant to Pershing LLC (2009-present); Formerly, Consultant, Fidelity (2011), The Dreyfus Corporation (2009-2010); Vice President, The Dreyfus Family of Funds (2010); Vice Chairman, The Dreyfus Corporation (1998-2009); Chief Operating Officer, The Dreyfus Corporation (2006-2009); President, The Dreyfus Family of Funds, Inc. (2006-2009); Chief Executive Officer and Chairman, Laurel Capital Advisors (2005-2009); Executive Vice President, The Bank of New York Mellon (2008-2009); President and Chairman, Dreyfus Founders Funds, Inc. (2007-2009); President, Chairman and Chief Executive Officer, Founders Asset Management (2007-2009); Vice President BNY Mellon Funds Trust (2007-2009); President, MBSC Securities Corporation (2007-2009); Vice President, Dreyfus Service Organization, Inc. (2004-2009); Executive Vice President, Mellon Bank, N.A. (1994-2008). | 7 | GLG Investment Series Trust; The Dreyfus Corporation; MBSC Securities Corporation; Dreyfus Services Corporation; MBSC, LLC; Dreyfus Transfer, Inc.; Dreyfus Service Organization, Inc.; Mellon Residential Funding Corp.; Mellon United National Bank; Laurel Capital Advisors; Mellon United National Bank; Dreyfus Founders Funds, Inc.; Founders Asset Management; Old Westbury Funds LLC. | |||||
65
DBX ETF Trust
OFFICERS AND TRUSTEES (Unaudited) (Continued)
| Name, Address, and Age | Position(s) Held with Fund | Term of Office and Length of Time Served | Principal Occupation(s) During Past 5 Years | Number of Portfolios in Fund Complex Overseen by Trustee | Other Directorships held by Trustee | |||||
Stephen R. Byers Age: 59 60 Wall Street New York, New York 10005 | Trustee, Member and Chairman of the Audit and Nominating Committees | Since 2011 | Retired. Previously, Chief Investment Officer, The Dreyfus Corporation (2000- 2006). | 7 | Sierra Income Corporation; College of William and Mary, Graduate School of Business. | |||||
George O. Elston Age: 48 60 Wall Street New York, New York 10005 | Trustee, Member of the Audit and Nominating Committees | Since 2011 | M&A Advisor, Chief Financial, Operating and Business Officer, Optherion, Inc. (2008-2010); and Vice President, Finance and Government Affairs, Secretary and Treasurer, Elusys Therapeutics, Inc. (2000-2007). | 7 | Celldex Therapeutics. |
66
DBX ETF Trust
OFFICERS AND TRUSTEES (Unaudited) (Continued)
| Name, Address, and Age | Position(s) Held with Fund | Term of Office and Length of Time Served | Principal Occupation(s) During Past 5 Years | Number of Portfolios in Fund Complex Overseen by Trustee | Other Directorships held by Trustee | |||||
Interested Trustee/Officers:* | ||||||||||
Alex Depetris Age: 33 60 Wall Street | Trustee, Chairman of the Board, President, Chief Executive Officer and Secretary | Since 2010 | Director in the DBX Group at Deutsche Bank AG since 2008; Associate, Arnold & Porter, 2006- 2008. | 12 | Director, Chairman of the Board of db-X Exchange Traded Funds Inc. | |||||
| Martin Kremenstein Age: 36 60 Wall Street New York, New York 10005 | Chief Operating Officer | Since 2010 | Director in the DBX Group at Deutsche Bank AG with responsibility for providing investor solutions to the DB sales force in North America since 2006. | N/A | N/A | |||||
| Michael Gilligan Age: 46 60 Wall Street New York, New York 10005 | Treasurer, Chief Financial Officer | Since 2010 | Director in the Finance Group at Deutsche Bank AG with CFO responsibility for DBX Strategic Advisors LLC and DB Commodity Services LLC since 2008; Chief Operating Officer, Americas Credit Trading, Credit Suisse, 2007-2008. | N/A | N/A | |||||
| Frank Gecsedi Age: 45 60 Wall Street New York, New York 10005 | Chief Compliance Officer | Since 2010 | Vice President in Deutsche Bank’s Global Markets Legal, Risk and Capital Division since 2010; Vice President and Compliance Manager at Bank of America Merrill Lynch (formerly Merrill Lynch), (2000 to 2010). | N/A | N/A | |||||
* Officers/Trustee of the Company are “interested persons” as defined in the 1940 Act.
The Funds’ SAI includes additional information about the Funds’ Directors and is available by calling 855-329-3837, or on the Company’s website at www.dbxus.com.
67
DBX ETF Trust
BOARD CONSIDERATIONS IN APPROVAL OF INVESTMENT ADVISORY AND SUB-ADVISORY CONTRACTS (Unaudited)
At a meeting on February 13, 2013, the Board of Trustees, including the Independent Trustees (those not affiliated with the Trust or its service providers), unanimously approved the continuance of the Investment Advisory Agreement and Sub-Advisory Agreements (together, the “Agreements”), on behalf of the Trust’s five (5) underlying portfolios (each, a “Fund”, and together, the “Funds”).
In reaching this decision with respect to the Investment Advisory Agreement (the “Advisory Agreement”), the Board considered all factors it believed relevant, including (1) the nature, extent and quality of the services to be provided to the Funds and their shareholders; (2) the Adviser’s financial resources and its resulting ability to perform its obligations under the Advisory Agreement; (3) the competitiveness of the advisory fee; (4) the total cost of the services to be provided by and the profits that could be realized by the Adviser from its relationship with the Funds; and (5) the extent to which economies of scale would be realized as the Funds grow, and if the fund shareholders would benefit from those economies.
In reaching this decision with respect to the Sub-Advisory Agreement, the Board considered all factors it believed relevant, including (1) the nature, extent and quality of the services to be provided to the Funds and their shareholders (including the investment performance of TDAM’s index fund clients); (2) the performance of TDAM with respect to its management of index funds generally, as well as TDAM’s financial resources and its resulting ability to perform its obligations under the Sub-Advisory Agreement; (3) the competitiveness of the sub-advisory fee; (4) the total cost of the services to be provided by and the profits that could be realized by TDAM from its relationship with the Funds; and (5) the extent to which economies of scale would be realized as the Funds grow, and if the fund shareholders would benefit from those economies.
The Board reached a determination, with the assistance of Trust counsel and through the exercise of its business judgment, that approval of the Agreements and the compensation to be received thereunder is consistent with the Board’s duties under state and federal law. The Board reached this conclusion based on multiple factors.
The Board considered the following in determining whether to approve the Advisory Agreement:
| (i) | Nature, Extent and Quality of Services. |
In considering the nature, extent and quality of services that the Adviser provides to the Funds, the Board reviewed in detail the nature, extent and quality of services provided by the Adviser under the Advisory Agreement. The Board noted that these services include, among other things, furnishing a continuous investment program for the Funds, including arranging for, or implementing, the purchase and sale of portfolio securities, the provision of general corporate services such as portfolio management compliance services and the preparation and filing of certain reports on behalf of the Trust. The Board also considered, among other things, the professional experience and qualifications of the senior management and key professional personnel of the Adviser, including those individuals responsible for portfolio management. The Board considered that the Adviser provides, at its own expense, office facilities and equipment for use by the Funds and supervisory persons responsible for supervising and monitoring the Trust’s service providers. The Board also considered that the Adviser pays for the compensation of officers of the Trust who are also officers or employees of the Adviser, except as may otherwise be determined by the Board. The Board also considered that the Adviser arranges for the provision of transfer agency, custody, fund administration and accounting, and other non-distribution services necessary for the Funds’ operation.
The Board evaluated these factors in consultation with Fund counsel. Based on its review, the Board concluded that the nature, extent, and quality of services provided by the Adviser under the Advisory Agreement were reasonable and appropriate in relation to the fees to be paid to the Adviser, taking special consideration of the fact that the advisory fee is a unitary fee and, as a result, a portion of the unitary advisory fee will be used to compensate the Funds’ service providers. The Board considered the staffing of the Adviser, including the training, qualifications and experience of investment personnel in managing index funds. The Board also considered the expertise of the Adviser in supervising third party service providers to the Fund, such as the administrator and custodian. The Board further considered the compliance program of the Adviser which supports the Fund’s compliance program.
| (ii) | Adviser’s Financial Resources. |
In connection with the assessment of the ability of the Adviser to perform its duties under the Advisory Agreement, the Board considered the Adviser’s financial condition and whether it had the resources necessary to carry out its functions. The Board concluded that the Adviser had the financial resources necessary to perform its obligations under the Advisory Agreement.
68
DBX ETF Trust
BOARD CONSIDERATIONS IN APPROVAL OF INVESTMENT ADVISORY AND SUB-ADVISORY CONTRACTS (Unaudited) (Continued)
| (iii) | Competitiveness of Advisory Fee. |
The Board considered the competitiveness of the Funds’ fees to other exchange-traded funds (ETFs), and noted that each Fund’s fees were equal to or lower than a peer ETF offered by iShares Trust. The Board noted that the proposed fee for each Fund was a unitary fee pursuant to which the Adviser pays all of each Fund’s costs. The Board also noted that, in contrast to other ETFs comparable to the Funds, the Funds offered a currency hedging component. Based on its review, the Board concluded that the advisory fees were reasonable in light of the services provided.
| (iv) | Costs of Services and Profitability. |
The Board considered the expenses of the Adviser in developing and rendering services to the Funds, and the likelihood and level of profits in the early years of the Funds’ operations. The Board considered the asset levels at which the Adviser expected to “break-even” with respect to its operation of the Funds, and noted that since the fee paid by the Adviser to the Sub-Adviser under the Sub-Advisory Agreement contained breakpoints, the Adviser could experience increased profitability as each Fund’s assets increased. The Board considered that there were no material fall-out benefits likely to accrue to the Adviser related to the operation of the Funds, and no affiliates of the Adviser had a contractual relationship with the Trust. The Board noted that the Adviser was taking on considerable entrepreneurial risk.
Given the costs of the services provided by and the profits that could be realized by the Adviser in connection with the management of the Funds, the Board determined that the amount of potential profit was fair.
| (v) | Economies of Scale. |
The Board noted that since each Fund’s fee was a unitary fee, the Funds would not experience economies of scale as a result of asset growth.
Given all the information available to it and considering all material factors, the Board concluded that the Investment Advisory Agreement was fair and reasonable and it was unanimously approved.
The Board considered the following in determining whether to approve the Sub-Advisory Agreement:
| (i) | Nature, Extent and Quality of Services. |
In considering the nature, extent and quality of services that TDAM proposes to provide to the Funds, the Board reviewed in detail the nature, extent and quality of services to be provided by TDAM under the Advisory Agreement. The Board noted that these services include, among other things, furnishing a continuous investment program for the Funds, including arranging for, or implementing, the purchase and sale of portfolio securities.
The Board also considered TDAM’s operational capabilities and resources, and its experience in serving as investment sub-adviser to other funds (including certain other index-based ETFs advised by the Adviser). The Board considered the professional experience and qualifications of TDAM’s senior management and key professional personnel, as well as TDAM’s depth and breadth of experience in managing investment portfolios consisting of U.S. and non-U.S. equity securities. The Board gave special consideration to TDAM’s experience and capabilities in implementing currency hedging strategies, and their techniques for implementing such strategies while minimizing index tracking error. In addition, the Board considered TDAM’s operational capabilities and resources, and TDAM’s experience in managing index funds covering various asset classes. The Board noted that TDAM manages its index-based portfolios using both full replication and sampling techniques and maintains strict discipline in the implementation of its indexing strategies. To that end, the Board noted that when there are changes to a benchmark index, TDAM closely monitors any such changes to devise strategies to realign its portfolios at the lowest possible cost while tracking the respective benchmark index. The Board also noted TDAM’s processes to minimize the cost of trading.
The Board evaluated these factors in consultation with Fund counsel. Based on its review, the Board concluded that the nature, extent, and quality of services to be provided by TDAM under the Sub-Advisory Agreement were reasonable and appropriate in relation to the fees to be paid to TDAM, taking special consideration of the fact that the fees to be paid to TDAM were payable by the Adviser and not the Funds.
69
DBX ETF Trust
BOARD CONSIDERATIONS IN APPROVAL OF INVESTMENT ADVISORY AND SUB-ADVISORY CONTRACTS (Unaudited) (Continued)
| (ii) | Performance of TDAM; TDAM’s Financial Resources. |
The Board considered TDAM’s performance in managing the Funds, as well as other index-based portfolios, and its record at minimizing tracking error. The Board concluded that TDAM had generally been able to keep any such tracking error, as well as the Funds’ tracking error, within acceptable ranges.
The Board also considered TDAM’s financial condition and whether it had the resources necessary to carry out its functions. The Board concluded that TDAM had the financial resources necessary to perform its obligations under the Sub-Advisory Agreement.
| (iii) | Competitiveness of Sub-Advisory Fee. |
The Board noted that the fee to be paid to TDAM in respect of each Fund would be paid by the Adviser and not the Fund. The Board further noted that the proposed fee for each Fund was a unitary fee pursuant to which the Adviser would pay all of each Fund’s costs, and thus was not directly affected by the amount of the sub-advisory fee paid to TDAM. Based on its review, the Board concluded that the sub-advisory fees were reasonable in light of the services provided.
| (iv) | Costs of Services and Profitability. |
The Board considered the asset levels at which TDAM expected to “break-even” with respect to its operation of the Funds, and further noted that the fee paid by the Adviser to the TDAM under the Sub-Advisory Agreement contained breakpoints.
The Board also considered whether TDAM would benefit in other ways from its relationship with the Funds. The Board discussed TDAM’s practices regarding the selection and compensation of brokers and dealers that execute portfolio transactions for the Funds and the brokers’ and dealers’ provision of brokerage services to TDAM. The Board discussed the potential benefits TDAM derives from the Funds’ soft dollar arrangements, whereby brokers provide brokerage services to the Funds or TDAM in return for allocating fund brokerage.
Given the costs of the services provided by and the profits that could be realized by TDAM in connection with the management of the Funds, the Board determined that the amount of potential profit was fair.
| (vi) | Economies of Scale. |
The Board noted that since each Fund’s fee was a unitary fee, the Funds would not experience economies of scale as a result of asset growth.
Given all the information available to it and considering all material factors, the Board concluded that the Sub-Advisory Agreement was fair and reasonable and it was unanimously approved.
70
DBX ETF Trust
ADDITIONAL INFORMATION (Unaudited)
Proxy Voting Policies and Procedures
A description of the policies and procedures that the Company uses to determine how to vote proxies related to each Fund’s portfolio securities, (and information on how the Funds voted proxies during the period ended June 30, 2011 on Form N-PX) is available without charge, upon request, (i) by calling 855-329-3837; (ii) on the Company’s website at www.dbxus.com; and (iii) on the Securities and Exchange Commission’s (“SEC”) website at www.sec.gov.
Quarterly Portfolio Disclosure
The Funds are required to file their complete schedule of portfolio holdings with the SEC for their first and third fiscal quarters on Form N-Q. Copies of the filings are available without charge, upon request on the SEC’s website at www.sec.gov and are available by calling the Company at 855-329-3837. You can also obtain copies of Form N-Q by (i) visiting the SEC’s Public Reference Room in Washington, DC (information on the operation of the Public Reference Room may be obtained by calling 800-SEC-0330); (ii) sending your request and a duplicating fee to the SEC’s Public Reference Room, Washington, DC 20549-0102; or (iii) sending your request electronically to publicinfo@sec.gov.
Information about each Fund’s portfolio holdings is available daily at www.dbxus.com.
Tax Information
Form 1099-DIV, Form 1042-S and other year-end tax information provide shareholders with actual calendar year amounts that should be included in their tax returns. Shareholders should consult their tax advisors.
The following distribution information is being provided as required by the Internal Revenue Code.
Each Fund designates the following amounts or, if subsequently determined to be different, the maximum amount allowable for its fiscal year ended May 31, 2013.
Federal and State Income Tax
| Qualified Divided Income* | Dividends Received Deduction* | |||||||
db X-trackers MSCI Brazil Fund | 10% | 0% | ||||||
db X-trackers MSCI EAFE Fund | 61% | 0% | ||||||
db X-trackers MSCI Emerging Markets Fund | 46% | 0% | ||||||
db X-trackers MSCI Germany Fund | 68% | 0% | ||||||
db X-trackers MSCI Japan Fund | 40% | 0% | ||||||
* The above percentage is based on ordinary income dividends paid to shareholders during each Fund’s fiscal year.
The Funds intend to elect to pass through to shareholders the credit for taxes paid to foreign countries. The gross foreign source income and foreign taxes paid are as follows:
| Gross Foreign Income | Foreign Taxes Paid | |||||||
db X-trackers MSCI Brazil Fund | $151,924 | $11,000 | ||||||
db X-trackers MSCI EAFE Fund | 887,291 | 56,783 | ||||||
db X-trackers MSCI Emerging Markets Fund | 136,914 | 15,787 | ||||||
db X-trackers MSCI Germany Fund | — | — | ||||||
db X-trackers MSCI Japan Fund | 288,601 | 20,436 | ||||||
71
DBX ETF Trust
PRIVACY POLICY NOTICE (Unaudited)
DBX Advisors LLC (“Advisors”) collects non-public information about you from the following sources: (i) information received from you on applications or other forms; and (ii) information about your transactions with the Advisors, Advisors’ affiliates and third-party service providers and vendors. Advisors does not disclose any non-public personal information about you to anyone, other than as set forth below, as permitted by applicable law and regulation. Advisors may disclose non-public personal information about you to the funds in which you invest, to Advisors’ affiliates, and to non-affiliated companies that work with Advisors to service your account(s), or to provide services or process transactions that you have requested. Advisors may disclose non-public personal information in situations that may include, but are not limited to, in response to legal and/or regulatory inquiries and the proposed or actual sale, assignment merger or other transfer of all or a portion of Advisors’ business to another business entity. Advisors may also disclose non-public personal information about you to parties representing you, such as your investment representative, your accountant, your tax adviser, or to other third parties at your direction/consent. Advisors will not sell, rent, license or trade your personal and financial information to or with third parties for their own direct marketing use unless you give us general or specific consent to do so. If you decide to close your account(s) or become an inactive customer, Advisors will adhere to the privacy policies and practices as described in this notice. Advisors restricts access to your personal and account information to those employees who need to know that information to provide products and services to you. Advisors maintains reasonable and customary physical, electronic and procedural safeguards to guard your non-public personal information.
Advisors reserves the right, at their discretion, to change, modify, add, or remove portions of this Privacy Policy Notice, and any of the policies described herein, at any time. Advisors will indicate any such changes to the Privacy Policy Notice at the privacy link which can be found at www.dbxus.com. At all times, you are bound by the then-current version of the Privacy Policy and all applicable laws. Advisors highly recommends that you review this Privacy Policy Notice from time to time to ensure that you are familiar with the most recent version. The examples contained in this Privacy Policy Notice are illustrations; they are not intended to be exclusive.
72
DBX ETF Trust
This report is intended for the shareholders of the DBX ETF Trust. It may not be distributed to prospective Investors unless it is preceded or accompanied by the current prospectus.
An Investor should consider the fund’s investment objective, risks, charges and expenses carefully before investing. For this and more complete information about the fund call 855-329-3837 or visit the website www.dbxus.com. Please read the prospectus carefully before investing.
There are risks involved with investing in exchange-traded funds including possible loss of money. DBX ETF Trust Funds are not actively managed and are subject to risks similar to stocks, including those related to short selling and margin maintenance. Losses from short sales may be unlimited, and losses from purchases on margin may exceed original investment.
Investing involves risk, including possible loss of principal. Investing in funds that invest in specific countries or geographic regions may be more volatile than investing in broadly diversified funds. Securities focusing on a single country may be subject to higher volatility.
In addition to the normal risks associated with investing, international investments may involve risk of capital loss from unfavorable fluctuation in currency values, from differences in generally accepted accounting principles or from economic or political instability in other nations.
Emerging markets involve heightened risks related to the same factors as well as increased volatility and lower trading volume.
Investments in currency involve additional special risks, such as credit risk, interest rate fluctuations, derivative investment risk which can be volatile and may be less liquid than other securities and the effect of varied economic conditions.
The prospectus is not an offer to buy or sell the portfolio shares, nor is the fund soliciting an offer to buy its shares in any jurisdiction where the offer or sale is not permitted.
DBX ETF Trust Funds are distributed by ALPS Distributors, Inc., member of FINRA, which is neither affiliated with DBX ETF Trust or any other affiliate, nor is it affiliated with The Bank of New York Mellon, or TDAM USA Inc.
MSCI and MSCI Index are servicemarks of MSCI Inc. and have been licensed for use by Deutsche Bank AG. DBX ETF Trust Funds are not sponsored, endorsed, issued, sold or promoted by MSCI Inc. Nor does this company make any representation regarding the advisability of investing in db-X Funds. Index data source: MSCI Inc.
DBX ETF Trust
INVESTMENT ADVISOR
DBX Advisors LLC
60 Wall Street
New York, NY 10005
INVESTMENT SUB-ADVISOR
TDAM USA Inc.
161 Bay Street, 35th Floor
TD Canada Trust Tower
Toronto, Ontario Canada M5J 2T2
ADMINISTRATOR, CUSTODIAN, FUND ACCOUNTANT & TRANSFER AGENT
The Bank of New York Mellon
101 Barclay Street
New York, NY 10286
DISTRIBUTOR
ALPS Distributors, Inc.
1290 Broadway
Suite 1100
Denver, CO 80203
INDEPENDENT REGISTERED PUBLIC ACCOUNTING FIRM
Ernst & Young LLP
5 Times Square
New York, NY 10036
LEGAL COUNSEL
Dechert LLP
1095 Avenue of the Americas
New York, NY 10036
| Item 2. | Code of Ethics. |
| (a) | The registrant, as of the end of the period covered by this report, has adopted a code of ethics that applies to the registrant’s principal executive officer, principal financial officer, principal accounting officer or controller, or persons performing similar functions, regardless of whether these individuals are employed by the registrant or a third party. |
| (c) | There have been no amendments, during the period covered by this report, to a provision of the code of ethics that applies to the registrant’s principal executive officer, principal financial officer, principal accounting officer or controller, or persons performing similar functions, regardless of whether these individuals are employed by the registrant or a third party, and that relates to any element of the code of ethics description. |
| (d) | The registrant has not granted any waivers, including an implicit waiver, from a provision of the code of ethics that applies to the registrant’s principal executive officer, principal financial officer, principal accounting officer or controller, or persons performing similar functions, regardless of whether these individuals are employed by the registrant or a third party, that relates to one or more of the items set forth in paragraph (b) of this item’s instructions. |
| Item 3. | Audit Committee Financial Expert. |
Stephen Byers is the designated financial expert on the Audit Committee of DBX ETF Trust with respect to DBX ETF Trust, Stephen Byers is not an “interested person” as such terms are defined by Section 2(a)(19) of the Act (15 U.S.C. 80a-2(a)(19).
| Item 4. | Principal Accountant Fees and Services. |
Audit Fees
| (a) | The aggregate fees billed for each of the last two fiscal years for professional services rendered by the principal accountant for the audit of the registrant’s annual financial statements or services that are normally provided by the accountant in connection with statutory and regulatory filings or engagements for those fiscal years are $90,000 for 2013 and $90,000 for 2012. |
Audit-Related Fees
| (b) | The aggregate fees billed in each of the last two fiscal years for assurance and related services by the principal accountant that are reasonably related to the performance of the audit of the registrant’s financial statements and are not reported under paragraph (a) of this Item are $0 for 2013 and $0 for 2012. |
Tax Fees
| (c) | The aggregate fees billed in each of the last two fiscal years for professional services rendered by the principal accountant for tax compliance, tax advice, and tax planning are $15,000 for 2013 and $15,000 for 2012. |
All Other Fees
| (d) | The aggregate fees billed in each of the last two fiscal years for products and services provided by the principal accountant, other than the services reported in paragraphs (a) through (c) of this Item are $0 for 2013 and $0 for 2012. |
| (e)(1) | In accordance with Rule 2-01(c)(7)(A), the Audit Committee pre-approves all of the audit and permissible non-audit services of the Registrant. |
| (e)(2) | All of the services described in paragraphs (b) through (d) above were approved by the Audit Committee in accordance with paragraph (c) (7) (i) (c) of Rule 2-01 of Regulation S-X. |
| (f) | Not Applicable. |
| (g) | Not Applicable. |
| (h) | The registrant’s audit committee of the board of directors has considered whether the provision of non-audit services that were rendered to the registrant’s investment adviser (not including any sub-adviser whose role is primarily portfolio management and is subcontracted with or overseen by another investment adviser), and any entity controlling, controlled by, or under common control with the investment adviser that provides ongoing services to the registrant that were not pre-approved pursuant to paragraph (c)(7)(ii) of Rule 2-01 of Regulation S-X is compatible with maintaining the principal accountant’s independence. |
| Item 5. | Audit Committee of Listed registrants. |
The Registrant is a listed issuer as defined in Rule 10A-3 under the Exchange Act and has a separately-designated standing audit committee established in accordance with Section 3(a)(58)(A) of the Exchange Act. The Registrant’s audit committee members are Stephen R. Byers, J. David Officer and George O. Elston.
| Item 6. | Investments. |
| (a) | Schedule of Investments in securities of unaffiliated issuers as of the close of the reporting period is included as part of the report to shareholders filed under Item 1 of this form. |
| (b) | Not applicable. |
| Item 7. | Disclosure of Proxy Voting Policies and Procedures for Closed-End Management Investment Companies. |
Not applicable.
| Item 8. | Portfolio Managers of Closed-End Management Investment Companies. |
Not applicable.
| Item 9. | Purchases of Equity Securities by Closed-End Management Investment Company and Affiliated Purchasers. |
Not applicable.
| Item 10. | Submission of Matters to a Vote of Security Holders. |
There have been no material changes to the procedures by which the shareholders may recommend nominees to the registrant’s board of directors, where those changes were implemented after the registrant last provided disclosure in response to the requirements of Item 407(c)(2)(iv) of Regulation S-K (17 CFR 229.407) (as required by Item 22(b)(15) of Schedule 14A (17 CFR 240.14a-101)), or this Item.
| Item 11. | Controls and Procedures. |
| (a) | The registrant’s principal executive and principal financial officers, or persons performing similar functions, have concluded that the registrant’s disclosure controls and procedures (as defined in Rule 30a-3(c) under the Investment Company Act of 1940, as amended (the “1940 Act”) (17 CFR 270.30a-3(c))) are effective, as of a date within 90 days of the filing date of the report that includes the disclosure required by this paragraph, based on their evaluation of these controls and procedures required by Rule 30a-3(b) under the 1940 Act (17 CFR 270.30a-3(b)) and Rules 13a-15(b) or 15d-15(b) under the Securities Exchange Act of 1934, as amended (17 CFR 240.13a-15(b) or 240.15d-15(b)). |
| (b) | There were no changes in the registrant’s internal control over financial reporting (as defined in Rule 30a-3(d) under the 1940 Act (17 CFR 270.30a-3(d)) that occurred during the registrant’s second fiscal quarter of the period covered by this report that has materially affected, or is reasonably likely to materially affect, the registrant’s internal control over financial reporting. |
| Item 12. | Exhibits. |
| (a)(1) | Code of ethics, or any amendment thereto, that is the subject of disclosure required by Item 2 is attached hereto. |
| (a)(2) | Certifications pursuant to Rule 30a-2(a) under the 1940 Act and Section 302 of the Sarbanes-Oxley Act of 2002 are attached hereto. |
| (a)(3) | Not applicable. |
| (b) | Certifications pursuant to Rule 30a-2(b) under the 1940 Act and Section 906 of the Sarbanes- Oxley Act of 2002 are attached hereto. |
(12.other) Not applicable.
SIGNATURES
Pursuant to the requirements of the Securities Exchange Act of 1934 and the Investment Company Act of 1940, the registrant has duly caused this report to be signed on its behalf by the undersigned, thereunto duly authorized.
| (Registrant) | DBX ETF Trust |
| By (Signature and Title)* | /s/ Alex Depetris | |||
| Alex Depetris | ||||
| President and Chief Executive Officer |
| Date | August 2, 2013 |
Pursuant to the requirements of the Securities Exchange Act of 1934 and the Investment Company Act of 1940, this report has been signed below by the following persons on behalf of the registrant and in the capacities and on the dates indicated.
| By (Signature and Title)* | /s/ Alex Depetris | |||
| Alex Depetris | ||||
| President and Chief Executive Officer |
| Date | August 2, 2013 |
| By (Signature and Title)* | /s/ Michael Gilligan | |||
| Michael Gilligan | ||||
| Treasurer, Chief Financial Officer and Controller |
| Date | August 2, 2013 |
| * | Print the name and title of each signing officer under his or her signature. |