UNITED STATES
SECURITIES AND EXCHANGE COMMISSION
Washington, D.C. 20549
FORM N-CSR
CERTIFIED SHAREHOLDER REPORT OF REGISTERED MANAGEMENT
INVESTMENT COMPANIES
Investment Company Act file number 811-22487
DBX ETF Trust
(Exact name of registrant as specified in charter)
60 Wall Street
New York, New York 10005
(Address of principal executive offices) (Zip code)
Alex Depetris
DBX ETF Trust
60 Wall Street
New York, New York 10005
(Name and address of agent for service)
Registrant’s telephone number, including area code: (212) 250-4352
Date of fiscal year end: May 31
Date of reporting period: May 31, 2014
Form N-CSR is to be used by management investment companies to file reports with the Commission not later than 10 days after the transmission to stockholders of any report that is required to be transmitted to stockholders under Rule 30e-1 under the Investment Company Act of 1940 (17 CFR 270.30e-1). The Commission may use the information provided on Form N-CSR in its regulatory, disclosure review, inspection, and policymaking roles.
A registrant is required to disclose the information specified by Form N-CSR, and the Commission will make this information public. A registrant is not required to respond to the collection of information contained in Form N-CSR unless the Form displays a currently valid Office of Management and Budget (“OMB”) control number. Please direct comments concerning the accuracy of the information collection burden estimate and any suggestions for reducing the burden to Secretary, Securities and Exchange Commission, 100 F Street, NE, Washington, DC 20549. The OMB has reviewed this collection of information under the clearance requirements of 44 U.S.C. § 3507.
Item 1. Reports to Stockholders.
The Report to Shareholders is attached herewith.
ANNUAL REPORT
May 31, 2014
DBX ETF Trust
db X-trackers MSCI Brazil Hedged Equity Fund (DBBR)
db X-trackers MSCI EAFE Hedged Equity Fund (DBEF)
db X-trackers MSCI Emerging Markets Hedged Equity Fund (DBEM)
db X-trackers MSCI Germany Hedged Equity Fund (DBGR)
db X-trackers MSCI Japan Hedged Equity Fund (DBJP)
db X-trackers MSCI Asia Pacific ex Japan Hedged Equity Fund (DBAP)
db X-trackers MSCI Europe Hedged Equity Fund (DBEU)
db X-trackers MSCI United Kingdom Hedged Equity Fund (DBUK)
db X-trackers MSCI All World ex US Hedged Equity Fund (DBAW)
db X-trackers MSCI South Korea Hedged Equity Fund (DBKO)
db X-trackers MSCI Mexico Hedged Equity Fund (DBMX)
DBX ETF Trust
| Page | ||||
| 1 | ||||
| 3 | ||||
| 6 | ||||
| 8 | ||||
| 10 | ||||
| 12 | ||||
| 14 | ||||
| 16 | ||||
| 18 | ||||
| 20 | ||||
| 22 | ||||
| 24 | ||||
| 26 | ||||
| 28 | ||||
| 30 | ||||
| 32 | ||||
| 45 | ||||
| 52 | ||||
| 54 | ||||
| 58 | ||||
| 65 | ||||
| 74 | ||||
| 76 | ||||
| 94 | ||||
| 96 | ||||
| 98 | ||||
| 102 | ||||
| 106 | ||||
| 112 | ||||
| 118 | ||||
| 136 | ||||
| 137 | ||||
Board Considerations in Approval of Investment Advisory and Sub-Advisory Contracts (Unaudited) | 139 | |||
| 146 | ||||
| 147 | ||||
TO OUR SHAREHOLDERS: (Unaudited)
Dear Shareholder,
We are pleased to provide this annual report, which covers the 12-month period ended May 31, 2014.
Despite an outlook clouded by mixed economic data, geopolitical tensions and concerns regarding monetary policy/financial system fragility, the global equity markets emerged as a leader during the reporting period. For the fourth consecutive month in May 2014, global equities rallied (+2.2% month-over-month as measured by the MSCI AC World Index1). In the United States, net exports, weak corporate investment and larger inventory reductions than previously reported contributed to disappointing first-quarter GDP growth, while increases in healthcare, rent, food and energy prices contributed to a 2% year-over-year rise in the Consumer Price Index (CPI2) in April 2014, the fastest pace in nine months. Housing data in the U.S including starts, permits, new/existing home sales and prices continued to improve, while consumer confidence levels as reported by the Conference Board remained near a seven-year high. Overall, the U.S. economy has shown less momentum, particularly earlier this year, falling short of the upbeat forecasts that engendered higher interest rate expectations coming into the year. U.S. Treasuries, however, have been supported by events abroad, including concerns about growth in emerging markets (especially China), unrest in the Ukraine and expectations of additional easing from the European Central Bank (ECB). In Europe, weakness in the euro and a “wait and see” attitude by investors regarding the ECB’s actions caused European stocks (+1.2% month-over-month in as measured by the MSCI Europe ex. UK Index3) to underperform U.S. stocks. Meanwhile, in Asia, a +4.1% month-over-month gain in U.S. dollar (USD) as measured by the MSCI Asia ex. Japan Index4 made it the best performing emerging market region. In Japan, positive earnings and attractive valuations contributed to it becoming the best performing developed market in May 2014. The USD/ Japanese Yen (JPY) is near the 101 level, which so far has acted as a key level (corresponding to the 200 day moving average) in the 2014 consolidation of the JPY after its steep weakening in 2013.
Deutsche Bank, a leading global banking institution, has managed a successful and growing platform of exchange-traded products since 2006. Our team appreciates your trust and looks forward to serving your investment needs through innovative index-driven strategies.
Sincerely,
/s/ Alex Depetris
Alex Depetris
Chairman, President and Chief Executive Officer
July 25, 2014
*************************
Past performance is no guarantee of future results. Fund performance assumes reinvestment of dividends and capital gains distributions. A Fund’s net asset value (“NAV”) return is based on the changes in the Fund’s NAV per share for the period indicated. A Fund’s NAV per share is calculated by dividing the value of the Fund’s total assets less total liabilities by the number of shares outstanding. Current Fund performance may be higher or lower than the performance quoted. The most recent month end performance may be obtained by visiting www.dbxus.com.
An index is a statistical measure of a specified financial market or sector. An index is unmanaged and one cannot invest directly in an index. An index does not actually hold a portfolio of securities, incur expenses, or pay any transaction costs. Therefore, index returns do not reflect deductions for fees or expenses. In comparison, a Fund’s performance is negatively impacted by these deductions. Fund returns do not reflect brokerage commissions or taxes that a shareholder would pay on Fund distributions or on transactions in Fund shares.
The views expressed in this report reflect those of the portfolio management team only through the end of the period of the report as stated on the cover. The management team’s views are subject to change at any time based on market and other conditions and should not be construed as a recommendation. Current and future portfolio holdings are subject to risk. Investment in the Funds poses investment risk, including possible loss of principal. The investment return and principal value of an investment will fluctuate, so that shares, when sold or redeemed, may be worth more or less than their original cost.
1 MSCI AC World Index captures large and mid cap representation across 23 Developed Markets (DM) and 23 EmergingMarkets (EM) countries. With 2,446 constituents, the index covers approximately 85% of the global investable equity opportunity set.
2 Consumer Price Index is a measure of the average change over time in the prices paid by urban consumers for a market basket of consumer goods and services.
3 MSCI Europe ex. UK Index captures large and mid cap representation across 14 Developed Markets (DM) countries in Europe. With 329 constituents, the index covers approximately 85% of the free float-adjusted market capitalization across European Developed Markets excluding the UK.
4 MSCI Asia ex Japan Index captures large and mid cap representation across 2 of 3 Developed Markets countries (excluding Japan) and 8 Emerging Markets countries in Asia. With 603 constituents, the index covers approximately 85% of the free float-adjusted market capitalization in each country.
1
This Page is Intentionally Left Blank
DBX ETF Trust
MANAGEMENT’S DISCUSSION OF FUND PERFORMANCE (Unaudited)
db X-trackers MSCI Brazil Hedged Equity Fund
The db X-trackers MSCI Brazil Hedged Equity Fund (“DBBR”) seeks investment results that correspond generally to the performance, before fees and expenses, of the MSCI Brazil U.S. Dollar Hedged Index (the “DBBR Index”). DBBR Index is designed to provide exposure to Brazilian equity markets, while at the same time mitigating exposure to fluctuations between the value of the U.S. dollar and Brazilian real. For the 12-month period ended May 31, 2014, DBBR shares returned -9.83%, compared with the DBBR Index return of -8.85%.
The Energy, Materials and Consumer Staples sectors, which comprised nearly half of the DBBR Index on average, were the main contributors to negative returns for the period. Returns in the Information Technology sector, while positive, were unable to overcome weak returns in other sectors due to a low average weight. Returns of the DBBR Index were dampened further by currency hedging. While the Brazilian real fluctuated between gains and losses during the period, the overall impact of the currency hedge for the period was negative.
db X-trackers MSCI EAFE Hedged Equity Fund
The db X-trackers MSCI EAFE Hedged Equity Fund (“DBEF”) seeks investment results that correspond generally to the performance, before fees and expenses, of the MSCI EAFE U.S. Dollar Hedged Index (the “DBEF Index”). DBEF Index is designed provide exposure to equity securities in developed international stock markets, while at the same time mitigating exposure to fluctuations between the value of the U.S. dollar and selected non-U.S. currencies. As of May 31, 2014, the DBEF Index included securities from the following 21 countries: Australia, Austria, Belgium, Denmark, Finland, France, Germany, Hong Kong, Ireland, Israel, Italy, Japan, Netherlands, New Zealand, Norway, Portugal, Singapore, Spain, Sweden, Switzerland and the United Kingdom. For the 12-month period ended May 31, 2014, DBEF shares returned 12.74%, compared with the DBEF Index return of 13.31%.
All ten sectors represented in the DBEF Index delivered positive returns during the period, with Financials and Industrial stocks being the primary contributors. Financials in particular, averaging more than a quarter of the DBEF Index weight, delivered strong returns, specifically in the United Kingdom, Spain and Australia. Positive contributions from equities were offset somewhat by negative contribution of the monthly currency hedges. In particular, strength in the British pound as well as the euro served to dampen Index returns.
db X-trackers MSCI Emerging Markets Hedged Equity Fund
The db X-trackers MSCI Emerging Markets Hedged Equity Fund (“DBEM”) seeks investment results that correspond generally to the performance, before fees and expenses, of the MSCI EM U.S. Dollar Hedged Index (the “DBEM Index”). DBEM Index is designed to provide exposure to equity securities in the global emerging markets, while at the same time mitigating exposure to fluctuations between the value of the U.S. dollar and selected emerging market currencies. As of May 31, 2014, the DBEM Index included securities from the following 21 countries: Brazil, Chile, China, Colombia, Czech Republic, Egypt, Hungary, India, Indonesia, South Korea, Malaysia, Mexico, Morocco, Peru, Philippines, Poland, Russia, South Africa, Taiwan, Thailand and Turkey. For the 12-month period ended May 31, 2014, DBEM shares returned 1.17%, compared with the DBEM Index return of 2.53%.
Information Technology sector stocks, with an average weight in the DBEM Index of roughly 16% were the primary drivers of return for the period. Positive contributions to return from the sector came primarily in Taiwan, China and South Korea, which outweighed negative contributions from Brazil, Thailand and Indonesia. While the U.S. dollar strengthened in relation to a majority of the currencies in the DBEM Index, the South Korean won strengthened significantly. Given South Korea’s average 15% allocation, the won’s strength meant the currency-hedging strategy detracted from the positive contribution of equity returns.
db X-trackers MSCI Germany Hedged Equity Fund
The db X-trackers MSCI Germany Hedged Equity Fund (“DBGR”) seeks investment results that correspond generally to the performance, before fees and expenses, of the MSCI Germany U.S. Dollar Hedged Index (the “DBGR Index”). DBGR Index is designed to provide exposure to German equity markets, while at the same time mitigating exposure to fluctuations between the value of the U.S. dollar and the euro. For the 12-month period ended May 31, 2014, DBGR shares returned 18.70%, compared with the DBGR Index return of 19.05%.
Positive contributions to returns came from all ten sectors in the DBGR Index. The largest contribution to positive returns came from the Consumer Discretionary sector, which had an average weight of over 20% for the period. Equity returns were dampened by strength in the euro, leading to a negative contribution from the DBGR Index’s currency hedge.
db X-trackers MSCI Japan Hedged Equity Fund
The db X-trackers MSCI Japan Hedged Equity Fund (“DBJP”) seeks investment results that correspond generally to the performance, before fees and expenses, of the MSCI Japan U.S. Dollar Hedged Index (the “Index”). DBJP Index is designed to provide exposure to Japanese equity markets, while at the same time mitigating exposure to fluctuations between the value of the U.S. dollar and Japanese yen. For the 12-month period ended May 31, 2014, DBJP shares returned 6.21%, compared with the DBJP Index return of 6.73%.
3
DBX ETF Trust
MANAGEMENT’S DISCUSSION OF FUND PERFORMANCE (Unaudited) (Continued)
Industrials and Telecommunication Services sectors were the primary contributors to positive returns in the DBJP Index for the period. Japanese Utility sector stocks were the only negative contributor to returns during the period. While the yen fluctuated between strength and weakness against the U.S. dollar during the period, sustained weakening in the 4th quarter of 2013 resulted in a small positive contribution to returns from the DBJP Index’s currency-hedging strategy.
db X-trackers MSCI Asia Pacific ex Japan Hedged Equity Fund
The db X-trackers MSCI Asia Pacific ex. Japan Hedged Equity Fund (“DBAP”) seeks investment results that correspond generally to the performance, before fees and expenses, of the MSCI Asia Pacific ex Japan U.S. Dollar Hedged Index (the “DBAP Index”). DBAP Index is designed to provide exposure to equity securities in developed and emerging stock markets in the Asia-Pacific region (excluding Japan), while at the same time mitigating exposure to fluctuations between the value of the U.S. dollar and selected non-U.S. currencies. DBAP Index consists of issuers from Australia, China, Hong Kong, India, Indonesia, Malaysia, New Zealand, Singapore, South Korea, the Philippines, Taiwan and Thailand. For the period October 1, 2013 (commencement of operations) to May 31, 2014, DBAP returned 5.94%, compared with the DBAP Index return of 5.81%.
Information Technology, particularly in Taiwan, South Korea and China, as well as Financials, particularly in Australia, were the primary contributors to positive returns in the DBAP Index for the period. Allocations to Australian securities in general, as well as to Indian, Taiwanese and South Korean securities, contributed strong positive returns as well. While the U.S. dollar strengthened relative to the Australian dollar, which represents the largest currency exposure in the DBAP Index, negative contributions from the next largest exposures, the Hong Kong dollar and South Korean won, led to an overall negative contribution from the DBAP Index’s currency-hedging strategy.
db X-trackers MSCI Europe Hedged Equity Fund
The db X-trackers MSCI Europe Hedged Equity Fund (“DBEU”) seeks investment results that correspond generally to the performance, before fees and expenses, of the MSCI Europe U.S. Dollar Hedged Index (the “DBEU Index”). DBEU Index is designed to provide exposure to equity securities in 16 developed European stock markets, while at the same time mitigating exposure to fluctuations between the value of the U.S. dollar and selected non-U.S. currencies. The DBEU Index includes securities from Austria, Belgium, Denmark, Finland, France, Germany, Greece, Ireland, Italy, the Netherlands, Norway, Portugal, Spain, Sweden, Switzerland and the United Kingdom. For the period October 1, 2013 (commencement of operations) to May 31, 2014, DBEU returned 12.05%, compared with the DBEU Index return of 12.30%.
The DBEU Index benefited from positive contributions from all ten sectors. Financials, with an average weight of 22% of the DBEU Index, as well as Health Care, with an average weight of 13% contributed more positive return than any other sectors. Returns were also bolstered by a nearly 29% allocation to the United Kingdom as well as a roughly 14% allocation to Germany, both of which contributed positive returns for the period. Overall returns were dampened by strength in both the euro and the Great British pound, which led to a negative contribution from the DBEU Index’s currency-hedging strategy.
db X-trackers MSCI United Kingdom Hedged Equity Fund
The db X-trackers MSCI United Kingdom Hedged Equity Fund (“DBUK”) seeks investment results that correspond generally to the performance, before fees and expenses, of the MSCI United Kingdom U.S. Dollar Hedged Index (the “DBUK Index”). DBUK Index is designed to provide exposure to the equity market of the United Kingdom, while at the same time mitigating exposure to fluctuations between the value of the U.S. dollar and British pound sterling. For the period October 1, 2013 (commencement of operations) to May 31, 2014, DBEU returned 7.90%, compared with the DBUK Index return of 8.31%.
The DBUK Index benefited from positive contributions from all ten sectors. Energy, Consumer Staples, Health Care and Financials were the largest contributors. Overall returns were dampened by negative contributions in the DBUK Index’s currency-hedging strategy as the Great British pound strengthened considerably relative to the U.S. dollar.
db X-trackers MSCI All World ex US Hedged Equity Fund
The db X-trackers MSCI All World ex US Hedged Equity Fund (“DBAW”) seeks investment results that correspond generally to the performance, before fees and expenses, of the MSCI ACWI ex USA US Dollar Hedged Index (the “DBAW Index”). DBAW Index is designed to provide exposure to equity securities in developed and emerging stock markets (excluding the U.S.), while at the same time mitigating exposure to fluctuations between the value of the U.S. dollar and selected non-U.S. currencies. For the period January 23, 2014 (commencement of operations) to May 31, 2014, DBAW returned 2.44%, compared with the DBAW Index return of 2.20%.
The DBAW Index benefited from positive contributions from all ten sectors. Financials, Energy and Consumer Staples were the largest contributors during the period. The DBAW Index also benefited from positive contributions from the majority of countries represented. The United Kingdom, with an average allocation of 14%, contributed more than any other country. The DBAW Index’s currency-hedging strategy contributed negative returns overall, with strength in the Great British pound being the largest contributor.
4
DBX ETF Trust
MANAGEMENT’S DISCUSSION OF FUND PERFORMANCE (Unaudited) (Continued)
db X-trackers MSCI South Korea Hedged Equity Fund
The db X-trackers MSCI South Korea Hedged Equity Fund (“DBKO”) seeks investment results that correspond generally to the performance, before fees and expenses, of the MSCI Korea 25/50 US Dollar Hedged Index (the “DBKO Index”). DBKO Index is designed to provide exposure to South Korean equity markets, while at the same time mitigating exposure to fluctuations between the value of the U.S. dollar and the South Korean won. For the period January 23, 2014 (commencement of operations) to May 31, 2014, DBKO returned 0.32%, compared with the DBKO Index return of 1.48%.
Information technology, comprising a third of the DBKO Index weight, contributed over half of the positive return for the period. The largest contribution was from Samsung Electronics Co, which averaged over 21% of the DBKO Index. Energy was the only sector to contribute negative returns during the period. The strong equity returns were dampened by strength in the Korean won, leading to a negative contribution from the DBKO Index’s currency-hedging strategy.
db X-trackers MSCI Mexico Hedged Equity Fund
The db X-trackers MSCI Mexico Hedged Equity Fund (“DBMX”) seeks investment results that correspond generally to the performance, before fees and expenses, of the MSCI Mexico IMI 25/50 US Dollar Hedged Index (the “DBMX Index”). DBMX Index is designed to provide exposure to the Mexican equity markets, while at the same time mitigating exposure to fluctuations between the value of the U.S. dollar and Mexican peso. For the period January 23, 2014 (commencement of operations) to May 31, 2014, DBMX returned -2.84%, compared with the DBMX Index return of -2.67%.
Negative contribution from the DBMX Index’s currency-hedging strategy was the primary driver of returns for the period. The Mexican peso strengthened relative to the U.S. dollar for the majority of the period. While equity contribution was generally positive, particularly in Financials and Consumer Staples, it was not enough to overcome the negative contribution from hedging.
*************************
Performance quoted above represents past performance, assumes reinvestment of all dividends and capital gains distributions at net asset value (“NAV”), and does not guarantee future results. A Fund’s NAV return is based on the changes in the Fund’s NAV per share for the period indicated. A Fund’s NAV per share is calculated by dividing the value of the Fund’s total assets less total liabilities by the number of shares outstanding. Current Fund performance may be higher or lower than the performance quoted. Fund performance data current to the most recent month end may be obtained by visiting www.dbxus.com. See pages 5-26 of this report for additional performance information, including performance data based on market value.
An index is a statistical measure of a specified financial market or sector. An index does not actually hold a portfolio of securities, incur expenses, or pay any transaction costs. Therefore, index returns do not reflect deductions for fees or expenses and are not available for direct investment. In comparison, a Fund’s performance is negatively impacted by these deductions. Fund returns do not reflect brokerage commissions or taxes that a shareholder would pay on Fund distributions or on transactions in Fund shares.
The views expressed in this report reflect those of the portfolio management team only through the end of the period of the report as stated on the cover. The management team’s views are subject to change at any time based on market and other conditions and should not be construed as a recommendation. Current and future portfolio holdings are subject to risk. Investment in the Funds poses investment risk, including possible loss of principal. The investment return and principal value of an investment will fluctuate, so that shares, when sold or redeemed, may be worth more or less than their original cost.
5
DBX ETF Trust
db X-trackers MSCI Brazil Hedged Equity Fund (DBBR) (Unaudited)
The db X-trackers MSCI Brazil Hedged Equity Fund seeks investment results that correspond generally to the performance, before fees and expenses, of the MSCI Brazil US Dollar Hedged Index (the “Underlying Index”). The Underlying Index is designed to provide exposure to Brazilian equity markets, while at the same time mitigating exposure to fluctuations between the value of the U.S. dollar and Brazilian real.
Performance as of 5/31/14
| Average Annual Total Returns | ||||||||
| Net Asset Value | Market Price | MSCI Brazil US Dollar Hedged Index | MSCI Brazil Index | |||||
One Year | -9.83% | -6.54% | -8.85% | -6.17% | ||||
Since Inception1 | -7.86% | -7.51% | -5.94% | -10.79% | ||||
| Cumulative Total Returns | ||||||||
| Net Asset Value | Market Price | MSCI Brazil US Dollar Hedged Index | MSCI Brazil Index | |||||
One Year | -9.83% | -6.54% | -8.85% | -6.17% | ||||
Since Inception1 | -21.64% | -20.77% | -16.68% | -28.84% | ||||
1 Total returns are calculated based on the commencement of operations, 6/9/11 (“Inception”).
Performance quoted represents past performance, assumes reinvestment of all dividends and capital gain distributions, and does not guarantee future results. Current performance may be higher or lower than the performance quoted. Performance data current to the most recent month end may be obtained by visiting www.dbxus.com. Investment in the fund poses investment risk including possible loss of principal. The investment return and principal value of an investment will fluctuate, so that shares, when sold or redeemed, may be worth more or less than their original cost. The estimated operating expense ratio as disclosed in the most recent prospectus dated October 1, 2013, was 0.60%.
The preceding performance chart is provided for comparative purposes and represents the period(s) noted. The net asset value return is based on the changes in the Fund’s net asset value per share (“NAV”). The Fund’s NAV is calculated by dividing the value of the Fund’s total assets less total liabilities by the number of shares outstanding. The market price return is based on the change in the market price on the NYSE Arca of a share of the Fund for the period(s) indicated. The price used to calculate market price returns is the midpoint of the bid/ask spread for Fund shares at 4 p.m. Eastern Time on the NYSE Arca. NAV and market returns assume that dividends and capital gain distributions have been reinvested in the Fund at NAV and market price, respectively. The MSCI Brazil Index is a free float-adjusted market capitalization index that is designed to measure equity performance in Brazil. The MSCI Brazil US Dollar Hedged Index is the index that the Fund seeks to track. It is calculated using the same methodology as its corresponding MSCI Brazil Index, but is designed to mitigate exposure to fluctuations between the value of the U.S. dollar and Brazilian real.
An index is a statistical measure of a specified financial market or sector. An index does not actually hold a portfolio of securities, incur expenses or pay any transaction costs. Therefore index returns do not reflect deductions for fees or expenses and are not available for direct investment. In comparison, the Fund’s performance is negatively impacted by these deductions. Fund returns do not reflect brokerage commissions or taxes that a shareholder would pay on Fund distributions or on transactions in Fund shares.
6
DBX ETF Trust
PERFORMANCE SUMMARY
db X-trackers MSCI Brazil Hedged Equity Fund (DBBR) (Unaudited) (Continued)
Growth of a $10,000 Investment in DBBR2 as of 5/31/14
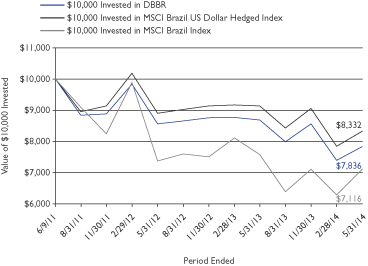
2 Based on Net Asset Value from commencement of operations 6/9/11.
Sector Breakdown* as of 5/31/14
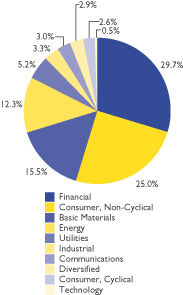
* Weightings are expressed as a percentage of total investments and may change over time. The sector classifications used above are based on company classifications under Bloomberg industry name.
Top Ten Holdings3 as of 5/31/14
| Description | % of Net Assets | |||
Itau Unibanco Holding SA, Preferred Stock | 9.2% | |||
Ambev SA | 7.8% | |||
Petroleo Brasileiro SA, Preferred Stock | 7.3% | |||
Banco Bradesco SA, Preferred Stock | 6.9% | |||
Vale SA, Preferred Stock | 5.2% | |||
Petroleo Brasileiro SA | 5.0% | |||
Vale SA | 3.9% | |||
BRF SA | 3.4% | |||
Cielo SA | 3.0% | |||
Itausa - Investimentos Itau SA, Preferred Stock | 2.9% | |||
3 Holdings are subject to change without notice and there is no guarantee that the Fund will remain invested in any particular security. For a complete list of holdings go to page 29.
7
DBX ETF Trust
PERFORMANCE SUMMARY
db X-trackers MSCI EAFE Hedged Equity Fund (DBEF) (Unaudited)
The db X-trackers MSCI EAFE Hedged Equity Fund seeks investment results that correspond generally to the performance, before fees and expenses, of the MSCI EAFE US Dollar Hedged Index (the “Underlying Index”). The Underlying Index is designed provide exposure to equity securities in developed international stock markets, while at the same time mitigating exposure to fluctuations between the value of the U.S. dollar and selected non-U.S. currencies. As of May 31, 2014, the Index included securities from the following 22 countries: Australia, Austria, Belgium, Denmark, Finland, France, Germany, Greece, Hong Kong, Ireland, Israel, Italy, Japan, Netherlands, New Zealand, Norway, Portugal, Singapore, Spain, Sweden, Switzerland and the United Kingdom.
Performance as of 5/31/14
| Average Annual Total Returns | ||||||||
| Net Asset Value | Market Price | MSCI EAFE US Dollar Hedged Index | MSCI EAFE Index | |||||
One Year | 12.74% | 13.92% | 13.31% | 18.04% | ||||
Since Inception1 | 10.83% | 11.09% | 11.34% | 8.28% | ||||
| Cumulative Total Returns | ||||||||
| Net Asset Value | Market Price | MSCI EAFE US Dollar Hedged Index | MSCI EAFE Index | |||||
One Year | 12.74% | 13.92% | 13.31% | 18.04% | ||||
Since Inception1 | 35.86% | 36.81% | 37.72% | 26.77% | ||||
1 Total returns are calculated based on the commencement of operations, 6/9/11 (“Inception”).
Performance quoted represents past performance, assumes reinvestment of all dividends and capital gain distributions, and does not guarantee future results. Current performance may be higher or lower than the performance quoted. Performance data current to the most recent month end may be obtained by visiting www.dbxus.com. Investment in the fund poses investment risk including possible loss of principal. The investment return and principal value of an investment will fluctuate, so that shares, when sold or redeemed, may be worth more or less than their original cost. The estimated operating expense ratio as disclosed in the most recent prospectus dated October 1, 2013, was 0.35%.
The preceding performance chart is provided for comparative purposes and represents the period(s) noted. The net asset value return is based on the changes in the Fund’s net asset value per share (“NAV”). The Fund’s NAV is calculated by dividing the value of the Fund’s total assets less total liabilities by the number of shares outstanding. The market price return is based on the change in the market price on the NYSE Arca of a share of the Fund for the period(s) indicated. The price used to calculate market price returns is the midpoint of the bid/ask spread for Fund shares at 4 p.m. Eastern Time on the NYSE Arca. NAV and market returns assume that dividends and capital gain distributions have been reinvested in the Fund at NAV and market price, respectively. The MSCI EAFE Index is a free float-adjusted market capitalization index that is designed to measure developed market equity performance, excluding the U.S. and Canada. The MSCI EAFE US Dollar Hedged Index is the index that the Fund seeks to track. It is calculated using the same methodology as its corresponding MSCI EAFE Index, but is designed to mitigate exposure to fluctuations between the value of the U.S. dollar and non-U.S. currencies.
An index is a statistical measure of a specified financial market or sector. An index does not actually hold a portfolio of securities, incur expenses or pay any transaction costs. Therefore index returns do not reflect deductions for fees or expenses and are not available for direct investment. In comparison, the Fund’s performance is negatively impacted by these deductions. Fund returns do not reflect brokerage commissions or taxes that a shareholder would pay on Fund distributions or on transactions in Fund shares.
8
DBX ETF Trust
PERFORMANCE SUMMARY
db X-trackers MSCI EAFE Hedged Equity Fund (DBEF) (Unaudited) (Continued)
Growth of a $10,000 Investment in DBEF2 as of 5/31/14
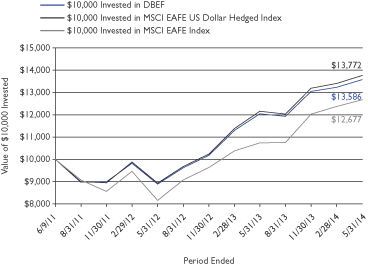
2 Based on Net Asset Value from commencement of operations 6/9/11.
Sector Breakdown* as of 5/31/14
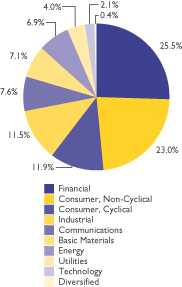
* Weightings are expressed as a percentage of total investments and may change over time. The sector classifications used above are based on company classifications under Bloomberg industry name.
Top Ten Holdings3 as of 5/31/14
| Description | % of Net Assets | |||
Nestle SA | 1.8% | |||
Roche Holding AG | 1.5% | |||
Novartis AG | 1.5% | |||
HSBC Holdings PLC | 1.4% | |||
BP PLC | 1.2% | |||
Royal Dutch Shell PLC, Class A | 1.1% | |||
Total SA | 1.1% | |||
Toyota Motor Corp. | 1.1% | |||
GlaxoSmithKline PLC | 1.0% | |||
Sanofi | 0.9% | |||
3 Holdings are subject to change without notice and there is no guarantee that the Fund will remain invested in any particular security. For a complete list of holdings go to page 31.
Country Breakdown* as of 5/31/14
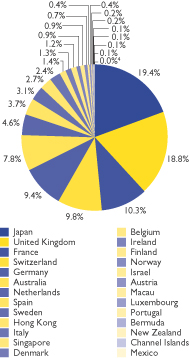
* Weightings are expressed as a percentage of total investments and may change over time. The country classifications used above are based on company classifications under Bloomberg country name.
4 Less than 0.1%.
9
DBX ETF Trust
PERFORMANCE SUMMARY
db X-trackers MSCI Emerging Markets Hedged Equity Fund (DBEM) (Unaudited)
The db X-trackers MSCI Emerging Markets Hedged Equity Fund seeks investment results that correspond generally to the performance, before fees and expenses, of the MSCI EM US Dollar Hedged Index (the “Underlying Index”). The Underlying Index is designed to provide exposure to equity securities in the global emerging markets, while at the same time mitigating exposure to fluctuations between the value of the U.S. dollar and selected emerging market currencies. As of May 31, 2014, the Index included securities from the following 21 countries: Brazil, Chile, China, Colombia, Czech Republic, Egypt, Hungary, India, Indonesia, South Korea, Malaysia, Mexico, Morocco, Peru, Philippines, Poland, Russia, South Africa, Taiwan, Thailand and Turkey.
Performance as of 5/31/14
| Average Annual Total Returns | ||||||||
| Net Asset Value | Market Price | MSCI EM US Dollar Hedged Index | MSCI EM Index | |||||
One Year | 1.17% | 1.92% | 2.53% | 4.27% | ||||
Since Inception1 | -1.97% | -1.94% | 0.80% | -1.18% | ||||
| Cumulative Total Returns | ||||||||
| Net Asset Value | Market Price | MSCI EM US Dollar Hedged Index | MSCI EM Index | |||||
One Year | 1.17% | 1.92% | 2.53% | 4.27% | ||||
Since Inception1 | -5.75% | -5.67% | 2.39% | -3.47% | ||||
1 Total returns are calculated based on the commencement of operations, 6/9/11 (“Inception”).
Performance quoted represents past performance, assumes reinvestment of all dividends and capital gain distributions, and does not guarantee future results. Current performance may be higher or lower than the performance quoted. Performance data current to the most recent month end may be obtained by visiting www.dbxus.com. Investment in the fund poses investment risk including possible loss of principal. The investment return and principal value of an investment will fluctuate, so that shares, when sold or redeemed, may be worth more or less than their original cost. The estimated operating expense ratio as disclosed in the most recent prospectus dated October 1, 2013, was 0.65%.
The preceding performance chart is provided for comparative purposes and represents the period(s) noted. The net asset value return is based on the changes in the Fund’s net asset value per share (“NAV”). The Fund’s NAV is calculated by dividing the value of the Fund’s total assets less total liabilities by the number of shares outstanding. The market price return is based on the change in the market price on the NYSE Arca of a share of the Fund for the period(s) indicated. The price used to calculate market price returns is the midpoint of the bid/ask spread for Fund shares at 4 p.m. Eastern Time on the NYSE Arca. NAV and market returns assume that dividends and capital gain distributions have been reinvested in the Fund at NAV and market price, respectively. The MSCI EM Index is a free float-adjusted market capitalization index that is designed to measure equity performance in the global emerging markets. The MSCI EM US Dollar Hedged Index is the index that the Fund seeks to track. It is calculated using the same methodology as its corresponding MSCI EM Index, but is designed to mitigate exposure to fluctuations between the value of the U.S. dollar and non-U.S. currencies.
An index is a statistical measure of a specified financial market or sector. An index does not actually hold a portfolio of securities, incur expenses or pay any transaction costs. Therefore index returns do not reflect deductions for fees or expenses and are not available for direct investment. In comparison, the Fund’s performance is negatively impacted by these deductions. Fund returns do not reflect brokerage commissions or taxes that a shareholder would pay on Fund distributions or on transactions in Fund shares.
10
DBX ETF Trust
PERFORMANCE SUMMARY
db X-trackers MSCI Emerging Markets Hedged Equity Fund (DBEM) (Unaudited) (Continued)
Growth of a $10,000 Investment in DBEM2 as of 5/31/14
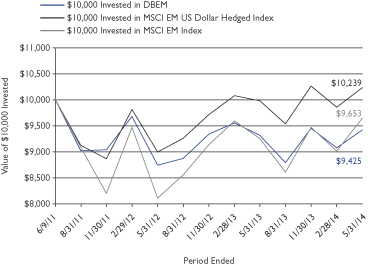
2 Based on Net Asset Value from commencement of operations 6/9/11.
Sector Breakdown* as of 5/31/14
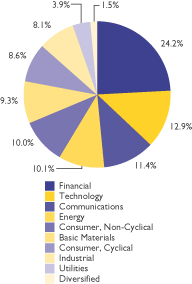
* Weightings are expressed as a percentage of total investments and may change over time. The sector classifications used above are based on company classifications under Bloomberg industry name.
Top Ten Holdings3 as of 5/31/14
| Description | % of Net Assets | |||
Samsung Electronics Co. Ltd. | 3.5% | |||
Taiwan Semiconductor Manufacturing Co. Ltd., ADR | 2.9% | |||
Hon Hai Precision Industry Co. Ltd., GDR | 2.2% | |||
MTN Group Ltd., ADR | 1.7% | |||
Advanced Semiconductor Engineering, Inc., ADR | 1.5% | |||
China Mobile Ltd. | 1.5% | |||
China Construction Bank Corp., Class H | 1.4% | |||
Sasol Ltd., ADR | 1.4% | |||
Itau Unibanco Holding SA, Preferred Stock | 1.3% | |||
Siliconware Precision Industries Co., ADR | 1.3% | |||
3 Holdings are subject to change without notice and there is no guarantee that the Fund will remain invested in any particular security. For a complete list of holdings go to page 44.
Country Breakdown* as of 5/31/14
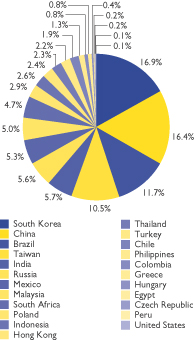
* Weightings are expressed as a percentage of total investments and may change over time. The country classifications used above are based on company classifications under Bloomberg country name.
11
DBX ETF Trust
PERFORMANCE SUMMARY
db X-trackers MSCI Germany Hedged Equity Fund (DBGR) (Unaudited)
The db X-trackers MSCI Germany Hedged Equity Fund seeks investment results that correspond generally to the performance, before fees and expenses, of the MSCI Germany US Dollar Hedged Index (the “Underlying Index”). The Underlying Index is designed to provide exposure to German equity markets, while at the same time mitigating exposure to fluctuations between the value of the U.S. dollar and Euro.
Performance as of 5/31/14
| Average Annual Total Returns | ||||||||
| Net Asset Value | Market Price | MSCI Germany US Dollar Hedged Index2 | MSCI Germany Index2 | |||||
One Year | 18.70% | 19.68% | 19.05% | 24.84% | ||||
Since Inception1 | 5.31% | 5.42% | 5.72% | 5.53% | ||||
| Cumulative Total Returns | ||||||||
| Net Asset Value | Market Price | MSCI Germany US Dollar Hedged Index2 | MSCI Germany Index2 | |||||
One Year | 18.70% | 19.68% | 19.05% | 24.84% | ||||
Since Inception1 | 16.66% | 17.04% | 18.02% | 17.39% | ||||
1 Total returns are calculated based on the commencement of operations, 6/9/11 (“Inception”).
2 Prior to 5/31/13, this fund was known as dbx-trackers MSCI Canada Hedged Equity Fund (DBCN) and had a different investment strategy. Returns reflect performance for DBCN and its underlying hedged and unhedged indicies through 5/31/13.
Performance quoted represents past performance, assumes reinvestment of all dividends and capital gain distributions, and does not guarantee future results. Current performance may be higher or lower than the performance quoted. Performance data current to the most recent month end may be obtained by visiting www.dbxus.com. Investment in the fund poses investment risk including possible loss of principal. The investment return and principal value of an investment will fluctuate, so that shares, when sold or redeemed, may be worth more or less than their original cost. The estimated operating expense ratio as disclosed in the most recent prospectus dated February 7, 2014, was 0.45%.
The preceding performance chart is provided for comparative purposes and represents the period(s) noted. The net asset value return is based on the changes in the Fund’s net asset value per share (“NAV”). The Fund’s NAV is calculated by dividing the value of the Fund’s total assets less total liabilities by the number of shares outstanding. The market price return is based on the change in the market price on the NYSE Arca of a share of the Fund for the period(s) indicated. The price used to calculate market price returns is the midpoint of the bid/ask spread for Fund shares at 4 p.m. Eastern Time on the NYSE Arca. NAV and market returns assume that dividends and capital gain distributions have been reinvested in the Fund at NAV and market price, respectively. The MSCI Germany Index is a free float-adjusted market capitalization index that is designed to measure equity performance in Germany. The MSCI Germany US Dollar Hedged Index is the index that the Fund seeks to track. It is calculated using the same methodology as its corresponding MSCI Germany Index, but is designed to mitigate exposure to fluctuations between the value of the U.S. dollar and the Euro.
An index is a statistical measure of a specified financial market or sector. An index does not actually hold a portfolio of securities, incur expenses or pay any transaction costs. Therefore index returns do not reflect deductions for fees or expenses and are not available for direct investment. In comparison, the Fund’s performance is negatively impacted by these deductions. Fund returns do not reflect brokerage commissions or taxes that a shareholder would pay on Fund distributions or on transactions in Fund shares.
12
DBX ETF Trust
PERFORMANCE SUMMARY
db X-trackers MSCI Germany Hedged Equity Fund (DBGR) (Unaudited) (Continued)
Growth of a $10,000 Investment in DBGR2 as of 5/31/14
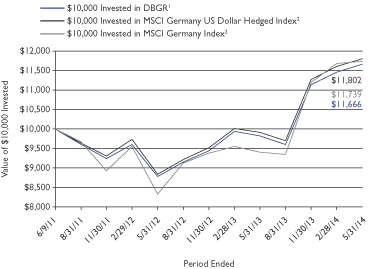
1 Based on Net Asset Value from commencement of operations 6/9/11.
2 Prior to 5/31/13, this fund was known as dbx-trackers MSCI Canada Hedged Equity Fund (DBCN) and had a different investment strategy. Returns reflect performance for DBCN and its underlying hedged and unhedged indicies through 5/31/13.
Sector Breakdown* as of 5/31/14
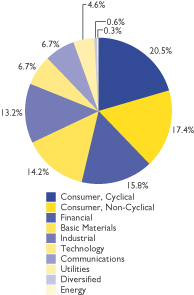
* Weightings are expressed as a percentage of total investments and may change over time. The sector classifications used above are based on company classifications under Bloomberg industry name.
Top Ten Holdings3 as of 5/31/14
| Description | % of Net Assets | |||
Bayer AG | 9.4% | |||
BASF SE | 8.3% | |||
Siemens AG | 8.3% | |||
Daimler AG | 7.2% | |||
Allianz SE | 6.1% | |||
SAP AG | 5.5% | |||
Deutsche Telekom AG | 4.1% | |||
Bayerische Motoren Werke AG | 3.3% | |||
Deutsche Bank AG | 3.2% | |||
Muenchener Rueckversicherungs-Gesellschaft AG | 3.1% | |||
3 Holdings are subject to change without notice and there is no guarantee that the Fund will remain invested in any particular security. For a complete list of holdings go to page 51.
13
DBX ETF Trust
PERFORMANCE SUMMARY
db X-trackers MSCI Japan Hedged Equity Fund (DBJP) (Unaudited)
The db X-trackers MSCI Japan Hedged Equity Fund seeks investment results that correspond generally to the performance, before fees and expenses, of the MSCI Japan US Dollar Hedged Index (the “Underlying Index”). The Underlying Index is designed to provide exposure to Japanese equity markets, while at the same time mitigating exposure to fluctuations between the value of the U.S. dollar and Japanese yen.
Performance as of 5/31/14
| Average Annual Total Returns | ||||||||
| Net Asset Value | Market Price | MSCI Japan US Dollar Hedged Index | MSCI Japan Index | |||||
One Year | 6.21% | 8.85% | 6.73% | 6.21% | ||||
Since Inception1 | 14.15% | 14.36% | 14.92% | 6.86% | ||||
| Cumulative Total Returns | ||||||||
| Net Asset Value | Market Price | MSCI Japan US Dollar Hedged Index | MSCI Japan Index | |||||
One Year | 6.21% | 8.85% | 6.73% | 6.21% | ||||
Since Inception1 | 48.38% | 49.19% | 51.37% | 21.89% | ||||
1 Total returns are calculated based on the commencement of operations, 6/9/11 (“Inception”).
Performance quoted represents past performance, assumes reinvestment of all dividends and capital gain distributions, and does not guarantee future results. Current performance may be higher or lower than the performance quoted. Performance data current to the most recent month end may be obtained by visiting www.dbxus.com. Investment in the fund poses investment risk including possible loss of principal. The investment return and principal value of an investment will fluctuate, so that shares, when sold or redeemed, may be worth more or less than their original cost. The estimated operating expense ratio as disclosed in the most recent prospectus dated October 1, 2013, was 0.50%.
The preceding performance chart is provided for comparative purposes and represents the period(s) noted. The net asset value return is based on the changes in the Fund’s net asset value per share (“NAV”). The Fund’s NAV is calculated by dividing the value of the Fund’s total assets less total liabilities by the number of shares outstanding. The market price return is based on the change in the market price on the NYSE Arca of a share of the Fund for the period(s) indicated. The price used to calculate market price returns is the midpoint of the bid/ask spread for Fund shares at 4 p.m. Eastern Time on the NYSE Arca. NAV and market returns assume that dividends and capital gain distributions have been reinvested in the Fund at NAV and market price, respectively. The MSCI Japan Index is a free float-adjusted market capitalization index that is designed to measure equity performance in Japan. The MSCI Japan US Dollar Hedged Index is the index that the Fund seeks to track. It is calculated using the same methodology as its corresponding MSCI Japan Index, but is designed to mitigate exposure to fluctuations between the value of the U.S. dollar and Japanese Yen.
An index is a statistical measure of a specified financial market or sector. An index does not actually hold a portfolio of securities, incur expenses or pay any transaction costs. Therefore index returns do not reflect deductions for fees or expenses and are not available for direct investment. In comparison, the Fund’s performance is negatively impacted by these deductions. Fund returns do not reflect brokerage commissions or taxes that a shareholder would pay on Fund distributions or on transactions in Fund shares.
14
DBX ETF Trust
PERFORMANCE SUMMARY
db X-trackers MSCI Japan Hedged Equity Fund (DBJP) (Unaudited) (Continued)
Growth of a $10,000 Investment in DBJP2 as of 5/31/14
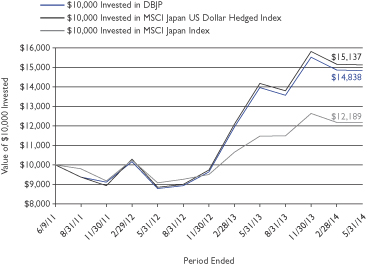
2 Based on Net Asset Value from commencement of operations 6/9/11.
Sector Breakdown* as of 5/31/14
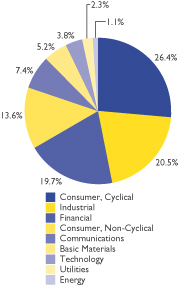
* Weightings are expressed as a percentage of total investments and may change over time. The sector classifications used above are based on company classifications under Bloomberg industry name.
Top Ten Holdings3 as of 5/31/14
| Description | % of Net Assets | |||
Toyota Motor Corp. | 5.9% | |||
Mitsubishi UFJ Financial Group, Inc. | 2.7% | |||
SoftBank Corp. | 2.6% | |||
Honda Motor Co. Ltd. | 2.1% | |||
Sumitomo Mitsui Financial Group, Inc. | 1.9% | |||
Mizuho Financial Group, Inc. | 1.7% | |||
Canon, Inc. | 1.4% | |||
Japan Tobacco, Inc. | 1.4% | |||
Takeda Pharmaceutical Co. Ltd. | 1.3% | |||
KDDI Corp. | 1.3% | |||
3 Holdings are subject to change without notice and there is no guarantee that the Fund will remain invested in any particular security. For a complete list of holdings go to page 53.
15
DBX ETF Trust
PERFORMANCE SUMMARY
db X-trackers MSCI Asia Pacific ex Japan Hedged Equity Fund (DBAP) (Unaudited)
The db X-trackers MSCI Asia Pacific ex Japan Hedged Equity Fund seeks investment results that correspond generally to the performance, before fees and expenses, of the MSCI Asia Pacific ex Japan US Dollar Hedged Index (the “Underlying Index”). The Underlying Index is designed to provide exposure to equity securities in developed and emerging stock markets in the Asia Pacific region (excluding Japan) while at the same time mitigating exposure to fluctuations between the value of the U.S. dollar and selected non-US currencies.
Performance as of 5/31/14
| Cumulative Total Returns | ||||||||||
| Net Asset Value | Market Price | MSCI Asia Pacific ex Hedged Index | MSCI Asia Pacific ex Japan Index | |||||||
Since Inception1 | 5.94% | 6.54% | 5.81% | 7.73% | ||||||
1 Total returns are calculated based on the commencement of operations, 10/1/13 (“Inception”).
Performance quoted represents past performance, assumes reinvestment of all dividends and capital gain distributions, and does not guarantee future results. Current performance may be higher or lower than the performance quoted. Performance data current to the most recent month end may be obtained by visiting www.dbxus.com. Investment in the fund poses investment risk including possible loss of principal. The investment return and principal value of an investment will fluctuate, so that shares, when sold or redeemed, may be worth more or less than their original cost. The estimated operating expense ratio as disclosed in the most recent prospectus dated October 1, 2013, was 0.60%.
The preceding performance chart is provided for comparative purposes and represents the period(s) noted. The net asset value return is based on the changes in the Fund’s net asset value per share (“NAV”). The Fund’s NAV is calculated by dividing the value of the Fund’s total assets less total liabilities by the number of shares outstanding. The market price return is based on the change in the market price on the NYSE Arca of a share of the Fund for the period(s) indicated. The price used to calculate market price returns is the midpoint of the bid/ask spread for Fund shares at 4 p.m. Eastern Time on the NYSE Arca. NAV and market returns assume that dividends and capital gain distributions have been reinvested in the Fund at NAV and market price, respectively.
An index is a statistical measure of a specified financial market or sector. An index does not actually hold a portfolio of securities, incur expenses or pay any transaction costs. Therefore index returns do not reflect deductions for fees or expenses and are not available for direct investment. In comparison, the Fund’s performance is negatively impacted by these deductions. Fund returns do not reflect brokerage commissions or taxes that a shareholder would pay on Fund distributions or on transactions in Fund shares.
16
DBX ETF Trust
PERFORMANCE SUMMARY
db X-trackers MSCI Asia Pacific ex Japan Hedged Equity Fund (DBAP) (Unaudited) (Continued)
Growth of a $10,000 Investment in DBAP2 as of 5/31/14
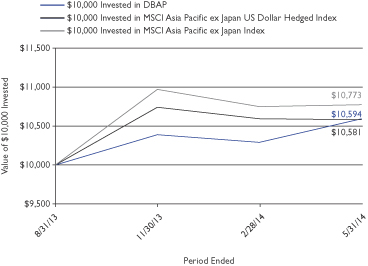
2 Based on Net Asset Value from commencement of operations 10/1/13.
Sector Breakdown* as of 5/31/14
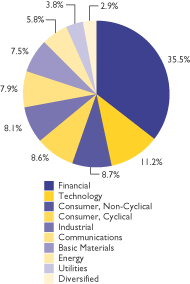
* Weightings are expressed as a percentage of total investments and may change over time. The sector classifications used above are based on company classifications under Bloomberg industry name.
Top Ten Holdings3 as of 5/31/14
| Description | % of Net Assets | |||
Taiwan Semiconductor Manufacturing Co. Ltd., ADR | 3.1% | |||
Samsung Electronics Co. Ltd. | 3.0% | |||
Commonwealth Bank of Australia | 2.9% | |||
BHP Billiton Ltd. | 2.5% | |||
Hon Hai Precision Industry Co. Ltd., GDR | 2.3% | |||
Westpac Banking Corp. | 2.3% | |||
Australia & New Zealand Banking Group Ltd. | 2.0% | |||
Tencent Holdings Ltd. | 1.9% | |||
National Australia Bank Ltd. | 1.7% | |||
AIA Group Ltd. | 1.7% | |||
3 Holdings are subject to change without notice and there is no guarantee that the Fund will remain invested in any particular security. For a complete list of holdings go to page 57.
Country Breakdown* as of 5/31/14
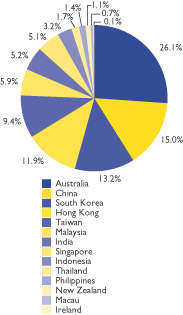
* Weightings are expressed as a percentage of total investments and may change over time. The country classifications used above are based on company classifications under Bloomberg country name.
17
DBX ETF Trust
PERFORMANCE SUMMARY
db X-trackers MSCI Europe Hedged Equity Fund (DBEU) (Unaudited)
The db X-trackers MSCI Europe Hedged Equity Fund seeks investment results that correspond generally to the performance, before fees and expenses, of the MSCI Europe US Dollar Hedged Index (the “Underlying Index”). The Underlying Index is designed to provide exposure to equity securities in developed stock markets in Europe, while at the same time mitigating exposure to fluctuations between the value of the U.S. dollar and selected non-U.S.currencies.
Performance as of 5/31/14
| Cumulative Total Returns | ||||||||
| Net Asset Value | Market Price | MSCI Europe US Dollar Hedged Index | MSCI Europe Index | |||||
Since Inception1 | 12.05% | 12.52% | 12.30% | 13.90% | ||||
1 Total returns are calculated based on the commencement of operations, 10/1/13 (“Inception”).
Performance quoted represents past performance, assumes reinvestment of all dividends and capital gain distributions, and does not guarantee future results. Current performance may be higher or lower than the performance quoted. Performance data current to the most recent month end may be obtained by visiting www.dbxus.com. Investment in the fund poses investment risk including possible loss of principal. The investment return and principal value of an investment will fluctuate, so that shares, when sold or redeemed, may be worth more or less than their original cost. The estimated operating expense ratio as disclosed in the most recent prospectus dated October 1, 2013, was 0.45%.
The preceding performance chart is provided for comparative purposes and represents the period(s) noted. The net asset value return is based on the changes in the Fund’s net asset value per share (“NAV”). The Fund’s NAV is calculated by dividing the value of the Fund’s total assets less total liabilities by the number of shares outstanding. The market price return is based on the change in the market price on the NYSE Arca of a share of the Fund for the period(s) indicated. The price used to calculate market price returns is the midpoint of the bid/ask spread for Fund shares at 4 p.m. Eastern Time on the NYSE Arca. NAV and market returns assume that dividends and capital gain distributions have been reinvested in the Fund at NAV and market price, respectively.
An index is a statistical measure of a specified financial market or sector. An index does not actually hold a portfolio of securities, incur expenses or pay any transaction costs. Therefore index returns do not reflect deductions for fees or expenses and are not available for direct investment. In comparison, the Fund’s performance is negatively impacted by these deductions. Fund returns do not reflect brokerage commissions or taxes that a shareholder would pay on Fund distributions or on transactions in Fund shares.
18
DBX ETF Trust
PERFORMANCE SUMMARY
db X-trackers MSCI Europe Hedged Equity Fund (DBEU) (Unaudited) (Continued)
Growth of a $10,000 Investment in DBEU2 as of 5/31/14
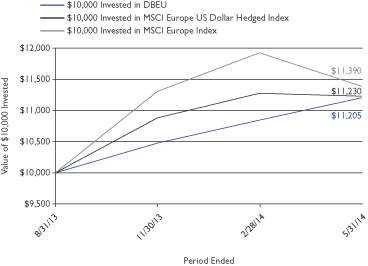
2 Based on Net Asset Value from commencement of operations 10/1/13.
Sector Breakdown* as of 5/31/14
* Weightings are expressed as a percentage of total investments and may change over time. The sector classifications used above are based on company classifications under Bloomberg industry name.
Top Ten Holdings3 as of 5/31/14
| Description | % of Net Assets | |||
Nestle SA | 2.7% | |||
Roche Holding AG | 2.2% | |||
Novartis AG | 2.2% | |||
HSBC Holdings PLC | 2.1% | |||
BP PLC | 1.7% | |||
Royal Dutch Shell PLC, Class A | 1.7% | |||
Total SA | 1.6% | |||
GlaxoSmithKline PLC | 1.4% | |||
Sanofi | 1.4% | |||
Banco Santander SA | 1.3% | |||
3 Holdings are subject to change without notice and there is no guarantee that the Fund will remain invested in any particular security. For a complete list of holdings go to page 64.
Country Breakdown* as of 5/31/14
* Weightings are expressed as a percentage of total investments and may change over time. The country classifications used above are based on company classifications under Bloomberg country name.
(4) Less than 0.1%
19
DBX ETF Trust
PERFORMANCE SUMMARY
db X-trackers MSCI United Kingdom Hedged Equity Fund (DBUK) (Unaudited)
The db X-trackers MSCI United Kingdom Hedged Equity Fund seeks investment results that correspond generally to the performance, before fees and expenses, of the MSCI United Kingdom US Dollar Hedged Index (the “Underlying Index”). The Underlying Index is designed to provide exposure to the United Kingdom equity markets, while at the same time mitigating exposure to fluctuations between the value of the U.S. dollar and British pound sterling.
Performance as of 5/31/14
| Cumulative Total Returns | ||||||||
| Net Asset Value | Market Price | MSCI United Kingdom US Dollar | MSCI United Kingdom Index | |||||
Since Inception1 | 7.90% | 8.37% | 8.31% | 12.25% | ||||
1 Total returns are calculated based on the commencement of operations, 10/1/13 (“Inception”).
Performance quoted represents past performance, assumes reinvestment of all dividends and capital gain distributions, and does not guarantee future results. Current performance may be higher or lower than the performance quoted. Performance data current to the most recent month end may be obtained by visiting www.dbxus.com. Investment in the fund poses investment risk including possible loss of principal. The investment return and principal value of an investment will fluctuate, so that shares, when sold or redeemed, may be worth more or less than their original cost. The estimated operating expense ratio as disclosed in the most recent prospectus dated October 1, 2013, was 0.45%.
The preceding performance chart is provided for comparative purposes and represents the period(s) noted. The net asset value return is based on the changes in the Fund’s net asset value per share (“NAV”). The Fund’s NAV is calculated by dividing the value of the Fund’s total assets less total liabilities by the number of shares outstanding. The market price return is based on the change in the market price on the NYSE Arca of a share of the Fund for the period(s) indicated. The price used to calculate market price returns is the midpoint of the bid/ask spread for Fund shares at 4 p.m. Eastern Time on the NYSE Arca. NAV and market returns assume that dividends and capital gain distributions have been reinvested in the Fund at NAV and market price, respectively.
An index is a statistical measure of a specified financial market or sector. An index does not actually hold a portfolio of securities, incur expenses or pay any transaction costs. Therefore index returns do not reflect deductions for fees or expenses and are not available for direct investment. In comparison, the Fund’s performance is negatively impacted by these deductions. Fund returns do not reflect brokerage commissions or taxes that a shareholder would pay on Fund distributions or on transactions in Fund shares.
20
DBX ETF Trust
PERFORMANCE SUMMARY
db X-trackers MSCI United Kingdom Hedged Equity Fund (DBUK) (Unaudited) (Continued)
Growth of a $10,000 Investment in DBUK2 as of 5/31/14
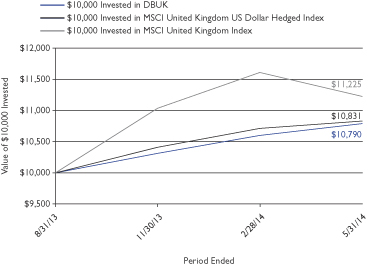
2 Based on Net Asset Value from commencement of operations 10/1/13.
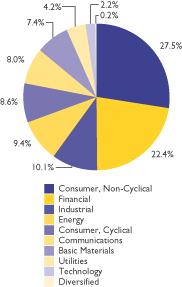
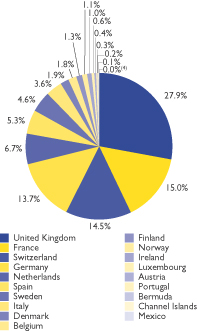
Sector Breakdown* as of 5/31/14
* Weightings are expressed as a percentage of total investments and may change over time. The sector classifications used above are based on company classifications under Bloomberg industry name.
Top Ten Holdings3 as of 5/31/14
| Description | % of Net Assets | |||
HSBC Holdings PLC | 6.7% | |||
BP PLC | 5.3% | |||
Royal Dutch Shell PLC, Class A | 5.2% | |||
GlaxoSmithKline PLC | 4.4% | |||
British American Tobacco PLC | 3.8% | |||
Royal Dutch Shell PLC, Class B | 3.4% | |||
Vodafone Group PLC | 3.1% | |||
AstraZeneca PLC | 3.1% | |||
Diageo PLC | 2.7% | |||
Lloyds Banking Group PLC | 2.5% | |||
3 Holdings are subject to change without notice and there is no guarantee that the Fund will remain invested in any particular security. For a complete list of holdings go to page 73.
21
DBX ETF Trust
PERFORMANCE SUMMARY
db X-trackers MSCI All World ex US Hedged Equity Fund (DBAW) (Unaudited)
The db X-trackers MSCI All World ex US Hedged Equity Fund seeks investment results that correspond generally to the performance, before fees and expenses, of the MSCI ACWI ex USA US Dollar Hedged Index (the “Underlying Index”). The Underlying Index is designed to provide exposure to equity securities in developed and emerging stock markets (excluding the United States), while at the same time mitigating exposure to fluctuations between the value of the U.S. dollar and selected non-U.S. currencies.
Performance as of 5/31/14
| Cumulative Total Returns | ||||||||
| Net Asset Value | Market Price | MSCI ACWI ex USA US Dollar Hedged Index | MSCI ACWI ex USA Index | |||||
Since Inception1 | 2.44% | 3.36% | 2.20% | 4.13% | ||||
1 Total returns are calculated based on the commencement of operations, 1/23/14 (“Inception”).
Performance quoted represents past performance, assumes reinvestment of all dividends and capital gain distributions, and does not guarantee future results. Current performance may be higher or lower than the performance quoted. Performance data current to the most recent month end may be obtained by visiting www.dbxus.com. Investment in the fund poses investment risk including possible loss of principal. The investment return and principal value of an investment will fluctuate, so that shares, when sold or redeemed, may be worth more or less than their original cost. The estimated operating expense ratio as disclosed in the most recent prospectus dated January 3, 2014, was 0.40%.
The preceding performance chart is provided for comparative purposes and represents the period(s) noted. The net asset value return is based on the changes in the Fund’s net asset value per share (“NAV”). The Fund’s NAV is calculated by dividing the value of the Fund’s total assets less total liabilities by the number of shares outstanding. The market price return is based on the change in the market price on the NYSE Arca of a share of the Fund for the period(s) indicated. The price used to calculate market price returns is the midpoint of the bid/ask spread for Fund shares at 4 p.m. Eastern Time on the NYSE Arca. NAV and market returns assume that dividends and capital gain distributions have been reinvested in the Fund at NAV and market price, respectively.
An index is a statistical measure of a specified financial market or sector. An index does not actually hold a portfolio of securities, incur expenses or pay any transaction costs. Therefore index returns do not reflect deductions for fees or expenses and are not available for direct investment. In comparison, the Fund’s performance is negatively impacted by these deductions. Fund returns do not reflect brokerage commissions or taxes that a shareholder would pay on Fund distributions or on transactions in Fund shares.
22
DBX ETF Trust
PERFORMANCE SUMMARY
db X-trackers MSCI All World ex US Hedged Equity Fund (DBAW) (Unaudited) (Continued)
Growth of a $10,000 Investment in DBAW2 as 5/31/14
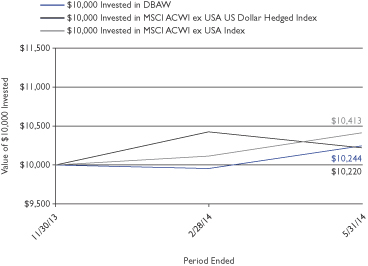
2 Based on Net Asset Value from commencement of operations 1/23/14.
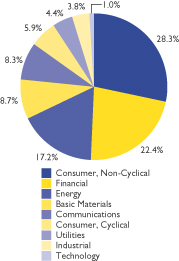
Sector Breakdown* as of 5/31/14
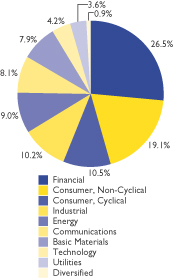
* Weightings are expressed as a percentage of total investments and may change over time. The sector classifications used above are based on company classifications under Bloomberg industry name.
Top Ten Holdings3 as of 5/31/14
| Description | % of Net Assets | |||
Nestle SA | 1.3 | % | ||
Novartis AG | 1.1 | % | ||
Roche Holding AG | 1.1 | % | ||
HSBC Holdings PLC | 1.0 | % | ||
Toyota Motor Corp. | 0.9 | % | ||
BP PLC | 0.8 | % | ||
Total SA | 0.8 | % | ||
Royal Dutch Shell PLC | 0.8 | % | ||
SABMiller PLC | 0.8 | % | ||
Samsung Electronics Co. Ltd. | 0.8 | % | ||
3 Holdings are subject to change without notice and there is no guarantee that the Fund will remain invested in any particular security. For a complete list of holdings go to page 75.
Country Breakdown* as of 5/31/14
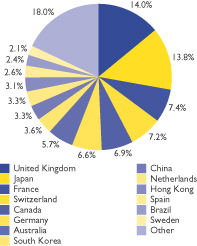
* Weightings are expressed as a percentage of total investments and may change over time. The country classifications used above are based on company classifications under Bloomberg country name.
23
DBX ETF Trust
PERFORMANCE SUMMARY
db X-trackers MSCI South Korea Hedged Equity Fund (DBKO) (Unaudited)
The db X-trackers MSCI South Korea Hedged Equity Fund seeks investment results that correspond generally to the performance, before fees and expenses, of the MSCI Korea 25/50 US Dollar Hedged Index (the “Underlying Index”). The Underlying Index is designed to provide exposure to South Korean equity markets, while at the same time mitigating exposure to fluctuations between the value of the U.S. dollar and the South Korean won.
Performance as of 5/31/14
| Cumulative Total Returns | ||||||||
| Net Asset Value | Market Price | MSCI Korea 25/50 US Dollar Hedged Index | MSCI Korea 25/50 Index | |||||
Since Inception1 | 0.32% | 0.64% | 1.48% | 6.95% | ||||
1 Total returns are calculated based on the commencement of operations, 1/23/14 (“Inception”).
Performance quoted represents past performance, assumes reinvestment of all dividends and capital gain distributions, and does not guarantee future results. Current performance may be higher or lower than the performance quoted. Performance data current to the most recent month end may be obtained by visiting www.dbxus.com. Investment in the fund poses investment risk including possible loss of principal. The investment return and principal value of an investment will fluctuate, so that shares, when sold or redeemed, may be worth more or less than their original cost. The estimated operating expense ratio as disclosed in the most recent prospectus dated January 3, 2014, was 0.58%.
The preceding performance chart is provided for comparative purposes and represents the period(s) noted. The net asset value return is based on the changes in the Fund’s net asset value per share (“NAV”). The Fund’s NAV is calculated by dividing the value of the Fund’s total assets less total liabilities by the number of shares outstanding. The market price return is based on the change in the market price on the NYSE Arca of a share of the Fund for the period(s) indicated. The price used to calculate market price returns is the midpoint of the bid/ask spread for Fund shares at 4 p.m. Eastern Time on the NYSE Arca. NAV and market returns assume that dividends and capital gain distributions have been reinvested in the Fund at NAV and market price, respectively.
An index is a statistical measure of a specified financial market or sector. An index does not actually hold a portfolio of securities, incur expenses or pay any transaction costs. Therefore index returns do not reflect deductions for fees or expenses and are not available for direct investment. In comparison, the Fund’s performance is negatively impacted by these deductions. Fund returns do not reflect brokerage commissions or taxes that a shareholder would pay on Fund distributions or on transactions in Fund shares.
24
DBX ETF Trust
PERFORMANCE SUMMARY
db X-trackers MSCI South Korea Hedged Equity Fund (DBKO) (Unaudited) (Continued)
Growth of a $10,000 Investment in DBKO2 as of 5/31/14
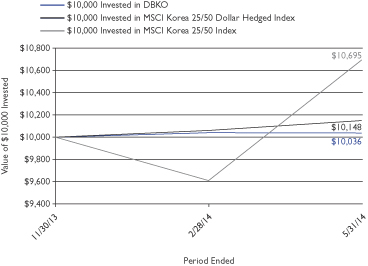
2 Based on Net Asset Value from commencement of operations 1/23/14.
Sector Breakdown* as of 5/31/14
* Weightings are expressed as a percentage of total investments and may change over time. The sector classifications used above are based on company classifications under Bloomberg industry name.
Top Ten Holdings3 as of 5/31/14
| Description | % of Net Assets | |||
Samsung Electronics Co. Ltd. | 22.2% | |||
Hyundai Motor Co. | 5.5% | |||
SK Hynix, Inc. | 3.9% | |||
NAVER Corp. | 3.4% | |||
Hyundai Mobis | 3.2% | |||
Shinhan Financial Group Co. Ltd. | 3.1% | |||
POSCO | 3.1% | |||
Kia Motors Corp. | 2.5% | |||
KB Financial Group, Inc. | 2.2% | |||
LG Chem Ltd. | 2.0% | |||
3 Holdings are subject to change without notice and there is no guarantee that the Fund will remain invested in any particular security. For a complete list of holdings go to page 93.
25
DBX ETF Trust
PERFORMANCE SUMMARY
db X-trackers MSCI Mexico Hedged Equity Fund (DBMX) (Unaudited)
The db X-trackers MSCI Mexico Hedged Equity Fund seeks investment results that correspond generally to the performance, before fees and expenses, of the MSCI Mexico US Dollar Hedged Index (the “Underlying Index”). The Underlying Index is designed to provide exposure to the Mexican equity markets, while at the same time mitigating exposure to fluctuations between the value of the U.S. dollar and Mexican peso.
Performance as of 5/31/13
| Cumulative Total Returns | ||||||||
| Net Asset Value | Market Price | MSCI Mexico IMI 25/50 US Dollar Hedged Index | MSCI Mexico IMI 25/50 Index | |||||
Since Inception | -2.84% | -2.20% | -2.67% | 1.80% | ||||
1 Total returns are calculated based on the commencement of operations, 1/23/14 (“Inception”).
Performance quoted represents past performance, assumes reinvestment of all dividends and capital gain distributions, and does not guarantee future results. Current performance may be higher or lower than the performance quoted. Performance data current to the most recent month end may be obtained by visiting www.dbxus.com. Investment in the fund poses investment risk including possible loss of principal. The investment return and principal value of an investment will fluctuate, so that shares, when sold or redeemed, may be worth more or less than their original cost. The estimated operating expense ratio as disclosed in the most recent prospectus dated January 3, 2014, was 0.50%.
The preceding performance chart is provided for comparative purposes and represents the period(s) noted. The net asset value return is based on the changes in the Fund’s net asset value per share (“NAV”). The Fund’s NAV is calculated by dividing the value of the Fund’s total assets less total liabilities by the number of shares outstanding. The market price return is based on the change in the market price on the NYSE Arca of a share of the Fund for the period(s) indicated. The price used to calculate market price returns is the midpoint of the bid/ask spread for Fund shares at 4 p.m. Eastern Time on the NYSE Arca. NAV and market returns assume that dividends and capital gain distributions have been reinvested in the Fund at NAV and market price, respectively.
An index is a statistical measure of a specified financial market or sector. An index does not actually hold a portfolio of securities, incur expenses or pay any transaction costs. Therefore index returns do not reflect deductions for fees or expenses and are not available for direct investment. In comparison, the Fund’s performance is negatively impacted by these deductions. Fund returns do not reflect brokerage commissions or taxes that a shareholder would pay on Fund distributions or on transactions in Fund shares.
26
DBX ETF Trust
PERFORMANCE SUMMARY
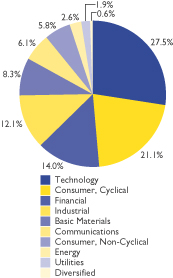
db X-trackers MSCI Mexico Hedged Equity Fund (DBMX) (Unaudited) (Continued)
Growth of a $10,000 Investment in DBMX2 as of 5/31/14
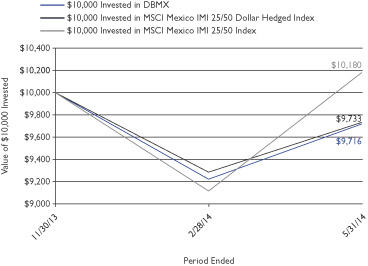
2 Based on Net Asset Value from commencement of operations 1/23/14.
Sector Breakdown* as of 5/31/14
* Weightings are expressed as a percentage of total investments and may change over time. The sector classifications used above are based on company classifications under Bloomberg industry name.
Top Ten Holdings3 as of 5/31/14
| Description | % of Net Assets | |||
America Movil SAB de CV, Series L | 14.7% | |||
Fomento Economico Mexicano SAB de CV | 7.4% | |||
Grupo Financiero Banorte SAB de CV, Class O | 7.2% | |||
Grupo Televisa SAB, Series CPO | 6.8% | |||
Cemex SAB de CV | 5.8% | |||
Wal-Mart de Mexico SAB de CV, Series V | 4.9% | |||
Grupo Mexico SAB de CV, Series B | 4.4% | |||
Alfa SAB de CV, Class A | 4.0% | |||
Grupo Financiero Inbursa SAB de CV, Class O | 3.3% | |||
Grupo Financiero Santander Mexico SAB de CV, Class B | 2.6% | |||
3 Holdings are subject to change without notice and there is no guarantee that the Fund will remain invested in any particular security. For a complete list of holdings go to page 95.
27
DBX ETF Trust
As a shareholder of one or more of the funds, you incur two types of costs: (1) transaction costs, including brokerage commissions paid on purchases and sales of fund shares, and (2) ongoing costs, including management fees and other Fund expenses. The expense examples below are intended to help you understand your ongoing costs (in dollars) of investing in the Funds and to compare these costs with the ongoing costs of investing in other funds.
The examples are based on an investment of $1,000 made at the beginning of the period and held through the six-month period ended May 31, 2014.
ACTUAL EXPENSES
The first line in the following tables provides information about actual account values and actual expenses. You may use the information in this line, together with the amount you invested, to estimate the expenses that you paid over the period. Simply divide your account value by $1,000 (for example, an $8,600 account value divided by $1,000 = 8.6), then multiply the result by the number in the first line under the heading “Expenses Paid During the Period” to estimate the expenses you paid on your account during this period.
HYPOTHETICAL EXAMPLE FOR COMPARISON PURPOSES
The second line in the following tables provides information about hypothetical account values and hypothetical expenses based on the Funds’ actual expense ratios and an assumed rate of return of 5% per year before expenses (which is not the Funds’ actual return). The hypothetical account values and expenses may not be used to estimate the actual ending account balance or expenses you paid for the period. You may use this information to compare the ongoing costs of investing in the Fund and other funds. To do so, compare this 5% hypothetical example with the 5% hypothetical examples that appear in the shareholder reports of the other funds.
Please note that the expenses shown in the tables are meant to highlight your ongoing costs only, and do not reflect any transactional costs. Therefore the second line in the table is useful in comparing ongoing costs only, and will not help you determine the relative total costs of owning different funds. In addition, if these transactional costs were included, your costs would have been higher.
Beginning December 1, 2013 | Ending Account Value May 31, 2014 | Annualized Expense Ratio(1) based on the number of days in the period | Expenses Paid During the Period(2) December 1, 2013 to May 31, 2014 | |||||||||||||
| db X-trackers MSCI Brazil Hedged Equity Fund | ||||||||||||||||
Actual | $ | 1,000.00 | $ | 914.42 | 0.60 | % | $ | 2.86 | ||||||||
Hypothetical (5% return before expenses) | $ | 1,000.00 | $ | 1,021.94 | 0.60 | % | $ | 3.02 | ||||||||
| db X-trackers MSCI EAFE Hedged Equity Fund | ||||||||||||||||
Actual | $ | 1,000.00 | $ | 1,041.20 | 0.35 | % | $ | 1.78 | ||||||||
Hypothetical (5% return before expenses) | $ | 1,000.00 | $ | 1,023.19 | 0.35 | % | $ | 1.77 | ||||||||
| db X-trackers MSCI Emerging Markets Hedged Equity Fund | ||||||||||||||||
Actual | $ | 1,000.00 | $ | 996.61 | 0.65 | % | $ | 3.24 | ||||||||
Hypothetical (5% return before expenses) | $ | 1,000.00 | $ | 1,021.69 | 0.65 | % | $ | 3.28 | ||||||||
| db X-trackers MSCI Germany Hedged Equity Fund | ||||||||||||||||
Actual | $ | 1,000.00 | $ | 1,047.00 | 0.46 | % | $ | 2.35 | ||||||||
Hypothetical (5% return before expenses) | $ | 1,000.00 | $ | 1,022.64 | 0.46 | % | $ | 2.32 | ||||||||
| db X-trackers MSCI Japan Hedged Equity Fund | ||||||||||||||||
Actual | $ | 1,000.00 | $ | 955.50 | 0.47 | % | $ | 2.29 | ||||||||
Hypothetical (5% return before expenses) | $ | 1,000.00 | $ | 1,022.59 | 0.47 | % | $ | 2.37 | ||||||||
| db X-trackers MSCI Asia Pacific ex Japan Hedged Equity Fund | ||||||||||||||||
Actual | $ | 1,000.00 | $ | 1,019.84 | 0.60 | % | $ | 3.02 | ||||||||
Hypothetical (5% return before expenses) | $ | 1,000.00 | $ | 1,021.84 | 0.60 | % | $ | 3.02 | ||||||||
| db X-trackers MSCI Europe Hedged Equity Fund | ||||||||||||||||
Actual | $ | 1,000.00 | $ | 1,069.14 | 0.45 | % | $ | 2.32 | ||||||||
Hypothetical (5% return before expenses) | $ | 1,000.00 | $ | 1,022.69 | 0.45 | % | $ | 2.27 | ||||||||
28
DBX ETF Trust
FEES AND EXPENSES (Unaudited) (Continued)
Beginning December 1, 2013 | Ending Account Value May 31, 2014 | Annualized Expense Ratio based on the number of days in the period | Expenses Paid During the Period(1) December 1, 2013 to May 31, 2014 | |||||||||||||
| db X-trackers MSCI United Kingdom Hedged Equity Fund | ||||||||||||||||
Actual | $ | 1,000.00 | $ | 1,045.91 | 0.45 | % | $ | 2.30 | ||||||||
Hypothetical (5% return before expenses) | $ | 1,000.00 | $ | 1,022.69 | 0.45 | % | $ | 2.27 | ||||||||
| db X-trackers MSCI All World ex US Hedged Equity Fund | ||||||||||||||||
Actual(2) | $ | 1,000.00 | $ | 1,024.40 | 0.40 | % | $ | 1.43 | ||||||||
Hypothetical (5% return before expenses) | $ | 1,000.00 | $ | 1,022.94 | 0.40 | % | $ | 2.02 | ||||||||
| db X-trackers MSCI South Korea Hedged Equity Fund | ||||||||||||||||
Actual(2) | $ | 1,000.00 | $ | 1,003.60 | 0.58 | % | $ | 2.05 | ||||||||
Hypothetical (5% return before expenses) | $ | 1,000.00 | $ | 1,022.04 | 0.58 | % | $ | 2.92 | ||||||||
| db X-trackers MSCI Mexico Hedged Equity Fund | ||||||||||||||||
Actual(2) | $ | 1,000.00 | $ | 971.60 | 0.50 | % | $ | 1.74 | ||||||||
Hypothetical (5% return before expenses) | $ | 1,000.00 | $ | 1,022.44 | 0.50 | % | $ | 2.52 | ||||||||
(1) Expenses are calculated using the annualized expense ratio, which represents the ongoing expenses as a percentage of net assets for the period December 1, 2013 to May 31, 2014. Expenses are calculated by multiplying the Fund’s annualized expense ratio by the average account value for the period; then multiplying the result by 182 days and then dividing the result by 365.
(2) Fund commenced operations on January 23, 2014. Actual expenses are calculated using the Fund’s annualized expense ratio, multiplied by the average account value for the period, multiplied by 129/365 (to reflect the period since commencement of operations).
29
DBX ETF Trust
db X-trackers MSCI Brazil Hedged Equity Fund
May 31, 2014
Number | Value | |||||||
| COMMON STOCKS — 58.7% | ||||||||
| Basic Materials — 7.8% | ||||||||
Cia Siderurgica Nacional SA | 9,768 | $ | 37,454 | |||||
Fibria Celulose SA* | 3,480 | 32,854 | ||||||
Klabin SA | 6,967 | 35,577 | ||||||
Ultrapar Participacoes SA | 4,967 | 119,392 | ||||||
Vale SA | 17,980 | 227,930 | ||||||
|
| |||||||
| 453,207 | ||||||||
|
| |||||||
| Communications — 1.1% | ||||||||
Tim Participacoes SA | 11,598 | 62,952 | ||||||
|
| |||||||
| Consumer, Cyclical — 1.8% | ||||||||
Lojas Americanas SA | 2,379 | 12,053 | ||||||
Lojas Renner SA | 1,692 | 51,138 | ||||||
Raia Drogasil SA | 2,915 | 24,722 | ||||||
Via Varejo SA* | 1,700 | 18,288 | ||||||
|
| |||||||
| 106,201 | ||||||||
|
| |||||||
| Consumer, Non-cyclical — 23.5% | ||||||||
Ambev SA | 63,815 | 451,773 | ||||||
Anhanguera Educacional Participacoes SA | 5,435 | 39,059 | ||||||
BRF SA | 9,117 | 196,192 | ||||||
CCR SA | 12,200 | 95,680 | ||||||
Cielo SA | 9,722 | 173,714 | ||||||
Cosan SA Industria e Comercio | 1,675 | 28,142 | ||||||
EcoRodovias Infraestrutura e Logistica SA | 2,347 | 15,212 | ||||||
Estacio Participacoes SA | 3,584 | 43,018 | ||||||
Hypermarcas SA* | 4,906 | 39,659 | ||||||
JBS SA | 10,267 | 34,372 | ||||||
Kroton Educacional SA | 2,960 | 75,140 | ||||||
Localiza Rent a Car SA | 1,772 | 28,079 | ||||||
M Dias Branco SA | 464 | 19,964 | ||||||
Natura Cosmeticos SA | 2,367 | 40,793 | ||||||
Qualicorp SA* | 2,556 | 26,926 | ||||||
Souza Cruz SA | 5,139 | 52,645 | ||||||
|
| |||||||
| 1,360,368 | ||||||||
|
| |||||||
| Energy — 5.0% | ||||||||
Petroleo Brasileiro SA | 41,064 | 288,510 | ||||||
|
| |||||||
| Financial — 13.0% | ||||||||
Banco Bradesco SA | 8,771 | 125,126 | ||||||
Banco do Brasil SA | 11,879 | 120,736 | ||||||
Banco Santander Brasil SA | 13,199 | 88,728 | ||||||
BB Seguridade Participacoes SA | 9,546 | 121,439 | ||||||
BM&F Bovespa SA | 24,330 | 119,244 | ||||||
BR Malls Participacoes SA | 5,563 | 45,963 | ||||||
BR Properties SA | 2,875 | 22,971 | ||||||
CETIP SA — Mercados Organizados | 2,485 | 32,145 | ||||||
Cyrela Brazil Realty SA Empreendimentos e Participacoes | 4,054 | 23,923 | ||||||
Odontoprev SA | 3,669 | 15,558 | ||||||
Porto Seguro SA | 1,676 | 23,334 | ||||||
Sul America SA | 1,981 | 15,280 | ||||||
|
| |||||||
| 754,447 | ||||||||
|
| |||||||
| Industrial — 3.3% | ||||||||
All America Latina Logistica SA | 6,220 | 22,489 | ||||||
Duratex SA | 4,167 | 17,149 | ||||||
Number | Value | |||||||
| Industrial (Continued) | ||||||||
Embraer SA | 9,137 | $ | 83,160 | |||||
Multiplan Empreendimentos Imobiliarios SA | 1,186 | 25,443 | ||||||
WEG SA | 3,749 | 43,526 | ||||||
|
| |||||||
| 191,767 | ||||||||
|
| |||||||
| Technology — 0.5% | ||||||||
Totvs SA | 1,549 | 27,007 | ||||||
|
| |||||||
| Utilities — 2.7% | ||||||||
Centrais Eletricas Brasileiras SA | 3,758 | 11,054 | ||||||
Cia de Saneamento Basico do Estado de Sao Paulo | 4,554 | 44,273 | ||||||
Cia de Saneamento de Minas Gerais-Copasa | 888 | 15,324 | ||||||
CPFL Energia SA | 3,028 | 24,600 | ||||||
EDP — Energias do Brasil SA | 3,392 | 14,217 | ||||||
Tractebel Energia SA | 2,365 | 35,048 | ||||||
Transmissora Alianca de Energia Eletrica SA | 1,275 | 11,041 | ||||||
|
| |||||||
| 155,557 | ||||||||
|
| |||||||
TOTAL COMMON STOCKS | 3,400,016 | |||||||
|
| |||||||
| PREFERRED STOCKS — 41.2% | ||||||||
| Basic Materials — 7.6% | ||||||||
Braskem SA | 2,166 | 14,154 | ||||||
Gerdau SA | 11,858 | 70,556 | ||||||
Metalurgica Gerdau SA | 3,854 | 28,058 | ||||||
Suzano Papel e Celulose SA, Class A | 4,086 | 14,719 | ||||||
Usinas Siderurgicas de Minas Gerais SA* | 4,908 | 17,285 | ||||||
Vale SA | 26,188 | 299,720 | ||||||
|
| |||||||
| 444,492 | ||||||||
|
| |||||||
| Communications — 2.0% | ||||||||
Oi SA | 37,858 | 32,783 | ||||||
Telefonica Brasil SA | 4,047 | 80,839 | ||||||
|
| |||||||
| 113,622 | ||||||||
|
| |||||||
| Consumer, Cyclical — 0.7% | ||||||||
Lojas Americanas SA | 7,046 | 41,799 | ||||||
|
| |||||||
| Consumer, Non-cyclical — 1.5% | ||||||||
Cia Brasileira de Distribuicao | 1,897 | 86,200 | ||||||
|
| |||||||
| Diversified — 2.9% | ||||||||
Itausa — Investimentos Itau SA | 44,239 | 168,639 | ||||||
|
| |||||||
| Energy — 7.3% | ||||||||
Petroleo Brasileiro SA | 56,888 | 423,810 | ||||||
|
| |||||||
| Financial — 16.7% | ||||||||
Banco Bradesco SA | 28,504 | 397,094 | ||||||
Banco do Estado do Rio Grande do Sul SA, Class B | 2,538 | 12,031 | ||||||
Bradespar SA | 3,158 | 26,219 | ||||||
Itau Unibanco Holding SA | 34,147 | 531,951 | ||||||
|
| |||||||
| 967,295 | ||||||||
|
| |||||||
| Utilities — 2.5% | ||||||||
AES Tiete SA | 1,498 | 11,441 | ||||||
Centrais Eletricas Brasileiras SA | 3,209 | 13,866 | ||||||
Cia Energetica de Minas Gerais | 10,399 | 72,319 | ||||||
| See Notes to Financial Statements. | 30 |
DBX ETF Trust
SCHEDULE OF INVESTMENTS
db X-trackers MSCI Brazil Hedged Equity Fund (Continued)
May 31, 2014
Number | Value | |||||||
| Utilities (Continued) | ||||||||
Cia Energetica de Sao Paulo | 2,092 | $ | 25,100 | |||||
Cia Paranaense de Energia | 1,426 | 20,515 | ||||||
|
| |||||||
| 143,241 | ||||||||
|
| |||||||
TOTAL PREFERRED STOCKS | 2,389,098 | |||||||
|
| |||||||
| RIGHTS — 0.0% (a) | ||||||||
| Financial — 0.0% (a) | ||||||||
CETIP SA — Mercados Organizados*, expires 7/19/14 | 1 | 2 | ||||||
|
| |||||||
TOTAL INVESTMENTS — 99.9% (Cost $5,959,206) | $ | 5,789,116 | ||||||
Other assets less liabilities — 0.1% | 4,650 | |||||||
|
| |||||||
NET ASSETS — 100.0% | $ | 5,793,766 | ||||||
|
| |||||||
As of May 31, 2014, the Fund had the following forward foreign currency contracts outstanding:
Counterparty | Settlement Date | Currency To Deliver | Currency To Receive | Unrealized Appreciation (Depreciation) | ||||||||||||||
Barclays Bank PLC | 6/4/2014 | BRL | 4,960,000 | USD | 2,196,732 | $ | (14,755 | ) | ||||||||||
JP Morgan & Chase Co. | 6/4/2014 | BRL | 4,960,000 | USD | 2,197,851 | (13,636 | ) | |||||||||||
The Bank of New York Mellon | 6/4/2014 | BRL | 91,941 | USD | 40,700 | (293 | ) | |||||||||||
The Bank of New York Mellon | 6/4/2014 | BRL | 84,000 | USD | 37,443 | (10 | ) | |||||||||||
The Bank of New York Mellon | 6/4/2014 | BRL | 3,456,523 | USD | 1,546,543 | 5,402 | ||||||||||||
Barclays Bank PLC | 6/4/2014 | USD | 2,211,324 | BRL | 4,960,000 | 163 | ||||||||||||
JP Morgan & Chase Co. | 6/4/2014 | USD | 2,215,767 | BRL | 4,960,000 | (4,282 | ) | |||||||||||
The Bank of New York Mellon | 6/4/2014 | USD | 37,134 | BRL | 84,000 | 319 | ||||||||||||
The Bank of New York Mellon | 6/4/2014 | USD | 4,041 | BRL | 9,000 | (28 | ) | |||||||||||
The Bank of New York Mellon | 6/4/2014 | USD | 8,072 | BRL | 18,000 | (46 | ) | |||||||||||
The Bank of New York Mellon | 6/4/2014 | USD | 59,762 | BRL | 133,000 | (462 | ) | |||||||||||
The Bank of New York Mellon | 6/4/2014 | USD | 3,580 | BRL | 8,000 | (13 | ) | |||||||||||
The Bank of New York Mellon | 6/4/2014 | USD | 1,508,463 | BRL | 3,380,465 | (1,234 | ) | |||||||||||
Barclays Bank PLC | 7/3/2014 | BRL | 6,568,000 | USD | 2,903,240 | (1,175 | ) | |||||||||||
JP Morgan & Chase Co. | 7/3/2014 | BRL | 6,568,000 | USD | 2,909,155 | 4,741 | ||||||||||||
The Bank of New York Mellon | 7/3/2014 | BRL | 100,937 | USD | 45,000 | 365 | ||||||||||||
|
| |||||||||||||||||
Total net unrealized depreciation | $ | (24,944 | ) | |||||||||||||||
|
| |||||||||||||||||
Currency Abbreviations
BRL – Brazilian Real
USD – U.S. Dollar
* Non-income producing security.
(a) Less than 0.1%.
| See Notes to Financial Statements. | 31 |
DBX ETF Trust
SCHEDULE OF INVESTMENTS
db X-trackers MSCI EAFE Hedged Equity Fund
May 31, 2014
Number | Value | |||||||
| COMMON STOCKS — 98.5% | ||||||||
| Australia — 7.8% | ||||||||
AGL Energy Ltd. | 23,447 | $ | 336,042 | |||||
ALS Ltd. | 11,042 | 91,972 | ||||||
Alumina Ltd.* | 131,476 | 174,360 | ||||||
Amcor Ltd. | 50,211 | 495,792 | ||||||
AMP Ltd. | 141,281 | 695,545 | ||||||
APA Group | 2,387 | 15,528 | ||||||
Asciano Ltd. | 33,591 | 175,063 | ||||||
ASX Ltd. | 7,202 | 241,157 | ||||||
Aurizon Holdings Ltd. | 2,912 | 13,388 | ||||||
Australia & New Zealand Banking Group Ltd. | 111,970 | 3,489,814 | ||||||
Bank of Queensland Ltd. | 1,195 | 13,345 | ||||||
Bendigo and Adelaide Bank Ltd. | 31,193 | 340,518 | ||||||
BHP Billiton Ltd. | 131,173 | 4,518,029 | ||||||
Boral Ltd. | 33,293 | 164,216 | ||||||
Brambles Ltd. | 63,119 | 565,094 | ||||||
Caltex Australia Ltd. | 13,438 | 279,510 | ||||||
CFS Retail Property Trust Group REIT | 7,565 | 14,433 | ||||||
Coca-Cola Amatil Ltd. | 1,192 | 10,494 | ||||||
Cochlear Ltd. | 2,035 | 113,386 | ||||||
Commonwealth Bank of Australia | 66,388 | 5,040,946 | ||||||
Computershare Ltd. | 19,145 | 226,814 | ||||||
Crown Resorts Ltd. | 29,876 | 452,094 | ||||||
CSL Ltd. | 23,780 | 1,562,214 | ||||||
Dexus Property Group REIT | 192,507 | 199,759 | ||||||
Federation Centres Ltd. REIT | 68,490 | 160,625 | ||||||
Flight Centre Travel Group Ltd. | 278 | 12,879 | ||||||
Fortescue Metals Group Ltd. | 58,247 | 239,055 | ||||||
Goodman Group REIT | 70,815 | 335,451 | ||||||
GPT Group REIT | 75,257 | 273,147 | ||||||
Harvey Norman Holdings Ltd. | 44,924 | 133,787 | ||||||
Iluka Resources Ltd. | 20,559 | 166,459 | ||||||
Incitec Pivot Ltd. | 52,174 | 133,528 | ||||||
Insurance Australia Group Ltd. | 95,669 | 529,753 | ||||||
Leighton Holdings Ltd. | 21,159 | 398,361 | ||||||
Lend Lease Group | 18,972 | 236,770 | ||||||
Macquarie Group Ltd. | 16,404 | 916,439 | ||||||
Metcash Ltd. | 4,379 | 11,615 | ||||||
Mirvac Group REIT | 144,640 | 243,642 | ||||||
National Australia Bank Ltd. | 97,191 | 3,029,191 | ||||||
Newcrest Mining Ltd.* | 38,268 | 346,881 | ||||||
Orica Ltd. | 16,136 | 295,233 | ||||||
Origin Energy Ltd. | 58,201 | 817,345 | ||||||
Qantas Airways Ltd.* | 12,927 | 16,903 | ||||||
QBE Insurance Group Ltd. | 52,582 | 556,884 | ||||||
Ramsay Health Care Ltd. | 5,604 | 246,947 | ||||||
REA Group Ltd. | 662 | 28,044 | ||||||
Rio Tinto Ltd. | 19,368 | 1,068,870 | ||||||
Santos Ltd. | 52,604 | 710,838 | ||||||
Seek Ltd. | 8,023 | 126,410 | ||||||
Sonic Healthcare Ltd. | 14,946 | 246,337 | ||||||
SP AusNet | 286,288 | 367,678 | ||||||
Stockland REIT | 92,572 | 335,993 | ||||||
Suncorp Group Ltd. | 52,201 | 648,553 | ||||||
Sydney Airport | 88,564 | 361,833 | ||||||
Tabcorp Holdings Ltd. | 3,996 | 12,942 | ||||||
Tatts Group Ltd. | 4,752 | 13,444 | ||||||
Number | Value | |||||||
| Australia (Continued) | ||||||||
Telstra Corp. Ltd. | 247,747 | $ | 1,231,218 | |||||
Toll Holdings Ltd. | 2,680 | 13,518 | ||||||
TPG Telecom Ltd. | 10,000 | 55,374 | ||||||
Transurban Group | 39,686 | 274,417 | ||||||
Treasury Wine Estates Ltd. | 3,068 | 14,847 | ||||||
Wesfarmers Ltd. | 38,318 | 1,546,242 | ||||||
Westfield Group REIT | 103,644 | 1,032,080 | ||||||
Westfield Retail Trust REIT | 120,290 | 357,113 | ||||||
Westpac Banking Corp. | 127,868 | 4,095,984 | ||||||
Woodside Petroleum Ltd. | 25,854 | 1,014,652 | ||||||
Woolworths Ltd. | 50,022 | 1,747,130 | ||||||
WorleyParsons Ltd. | 8,811 | 131,691 | ||||||
|
| |||||||
| 43,765,616 | ||||||||
|
| |||||||
| Austria — 0.4% | ||||||||
Andritz AG | 353 | 21,026 | ||||||
Erste Group Bank AG | 14,504 | 503,968 | ||||||
Immofinanz AG* | 2,795 | 9,937 | ||||||
OMV AG | 4,826 | 199,924 | ||||||
Raiffeisen Bank International AG | 10,054 | 336,737 | ||||||
Telekom Austria AG | 1,866 | 18,144 | ||||||
Vienna Insurance Group AG Wiener Versicherung Gruppe* | 10,082 | 545,062 | ||||||
Voestalpine AG | 10,082 | 466,519 | ||||||
|
| |||||||
| 2,101,317 | ||||||||
|
| |||||||
| Belgium — 1.2% | ||||||||
Ageas | 275 | 11,561 | ||||||
Anheuser-Busch InBev NV | 34,415 | 3,776,976 | ||||||
Belgacom SA | 301 | 9,973 | ||||||
Colruyt SA | 3,579 | 200,541 | ||||||
Delhaize Group SA | 4,418 | 314,130 | ||||||
Groupe Bruxelles Lambert SA | 3,576 | 372,326 | ||||||
KBC Groep NV* | 5,185 | 308,659 | ||||||
Solvay SA | 2,841 | 459,500 | ||||||
Telenet Group Holding NV* | 259 | 15,517 | ||||||
UCB SA | 10,082 | 803,712 | ||||||
Umicore SA | 6,009 | 288,986 | ||||||
|
| |||||||
| 6,561,881 | ||||||||
|
| |||||||
| Bermuda — 0.1% | ||||||||
Seadrill Ltd. | 20,262 | 763,990 | ||||||
|
| |||||||
| Channel Islands — 0.1% | ||||||||
Friends Life Group Ltd. | 2,321 | 12,189 | ||||||
Randgold Resources Ltd. | 4,166 | 304,250 | ||||||
|
| |||||||
| 316,439 | ||||||||
|
| |||||||
| Denmark — 1.3% | ||||||||
A.P. Moeller — Maersk A/S, Class A | 5 | 12,356 | ||||||
A.P. Moeller — Maersk A/S, Class B | 267 | 695,387 | ||||||
Carlsberg A/S, Class B | 7,201 | 748,344 | ||||||
Coloplast A/S, Class B | 2,836 | 244,481 | ||||||
Danske Bank A/S | 33,142 | 931,565 | ||||||
DSV A/S | 10,433 | 347,560 | ||||||
Novo Nordisk A/S, Class B | 84,525 | 3,578,447 | ||||||
Novozymes A/S, Class B | 10,399 | 508,246 | ||||||
TDC A/S | 31,582 | 306,577 | ||||||
| See Notes to Financial Statements. | 32 |
DBX ETF Trust
SCHEDULE OF INVESTMENTS
db X-trackers MSCI EAFE Hedged Equity Fund (Continued)
May 31, 2014
Number | Value | |||||||
| Denmark (Continued) | ||||||||
Tryg A/S | 304 | $ | 29,011 | |||||
William Demant Holding A/S* | 305 | 27,379 | ||||||
|
| |||||||
| 7,429,353 | ||||||||
|
| |||||||
| Finland — 0.9% | ||||||||
Elisa OYJ | 751 | 22,358 | ||||||
Fortum OYJ | 30,278 | 738,387 | ||||||
Kone OYJ, Class B | 13,730 | 565,229 | ||||||
Metso OYJ | 4,826 | 187,622 | ||||||
Neste Oil OYJ | 1,118 | 22,891 | ||||||
Nokia OYJ* | 170,532 | 1,377,339 | ||||||
Nokian Renkaat OYJ | 2,826 | 119,729 | ||||||
Orion OYJ, Class B | 737 | 23,227 | ||||||
Sampo OYJ, Class A | 29,551 | 1,489,656 | ||||||
Stora Enso OYJ, Class R | 1,463 | 14,987 | ||||||
UPM-Kymmene OYJ | 1,153 | 20,291 | ||||||
Wartsila OYJ Abp | 7,185 | 387,658 | ||||||
|
| |||||||
| 4,969,374 | ||||||||
|
| |||||||
| France — 10.3% | ||||||||
Accor SA | 345 | 18,254 | ||||||
Aeroports de Paris | 6,061 | 789,031 | ||||||
Air Liquide SA | 11,868 | 1,728,616 | ||||||
Airbus Group NV | 23,815 | 1,707,911 | ||||||
Alcatel-Lucent* | 176,666 | 720,304 | ||||||
Alstom SA | 11,450 | 452,637 | ||||||
Arkema SA | 87 | 8,896 | ||||||
AtoS | 124 | 11,139 | ||||||
AXA SA | 69,189 | 1,708,056 | ||||||
BNP Paribas SA | 41,606 | 2,913,480 | ||||||
Bollore | 100 | 64,109 | ||||||
Bouygues SA | 8,844 | 410,560 | ||||||
Bureau Veritas SA | 28,828 | 869,253 | ||||||
Cap Gemini SA | 4,371 | 317,820 | ||||||
Carrefour SA | 24,266 | 882,202 | ||||||
Casino Guichard-Perrachon SA | 71 | 9,142 | ||||||
Christian Dior SA | 2,342 | 490,052 | ||||||
Cie de St-Gobain | 16,727 | 952,991 | ||||||
Cie Generale des Etablissements Michelin | 9,675 | 1,192,247 | ||||||
CNP Assurances | 20,608 | 444,415 | ||||||
Credit Agricole SA | 43,242 | 674,634 | ||||||
Danone SA | 25,443 | 1,894,725 | ||||||
Dassault Systemes SA | 5,692 | 721,907 | ||||||
Edenred | 390 | 12,225 | ||||||
Electricite de France | 10,028 | 352,065 | ||||||
Essilor International SA | 10,901 | 1,145,096 | ||||||
Eurazeo SA | 223 | 19,242 | ||||||
Eutelsat Communications SA | 10,099 | 353,594 | ||||||
Fonciere des Regions REIT | 125 | 12,510 | ||||||
GDF Suez | 50,836 | 1,419,560 | ||||||
Gecina SA REIT | 5,607 | 800,247 | ||||||
Groupe Eurotunnel SA | 1,221 | 16,145 | ||||||
ICADE REIT | 114 | 11,413 | ||||||
Iliad SA | 777 | 248,376 | ||||||
Imerys SA | 195 | 16,340 | ||||||
JCDecaux SA | 9,723 | 387,414 | ||||||
Kering | 3,712 | 820,234 | ||||||
Number | Value | |||||||
| France (Continued) | ||||||||
Klepierre REIT | 10,082 | $ | 489,470 | |||||
Lafarge SA | 8,777 | 758,187 | ||||||
Lagardere SCA | 8,500 | 296,218 | ||||||
Legrand SA | 10,480 | 663,366 | ||||||
L’Oreal SA | 9,670 | 1,687,264 | ||||||
LVMH Moet Hennessy Louis Vuitton SA | 8,431 | 1,677,373 | ||||||
Natixis | 81,041 | 552,359 | ||||||
Orange SA | 78,954 | 1,320,044 | ||||||
Pernod Ricard SA | 9,939 | 1,218,682 | ||||||
Peugeot SA* | 15,717 | 222,389 | ||||||
Publicis Groupe SA | 7,230 | 623,665 | ||||||
Remy Cointreau SA | 198 | 18,354 | ||||||
Renault SA | 8,507 | 800,847 | ||||||
Rexel SA* | 662 | 15,819 | ||||||
Safran SA | 11,274 | 765,109 | ||||||
Sanofi | 49,390 | 5,281,086 | ||||||
Schneider Electric SA | 22,583 | 2,126,575 | ||||||
SCOR SE | 383 | 13,371 | ||||||
Societe BIC SA | 3,130 | 409,005 | ||||||
Societe Generale SA | 28,347 | 1,633,182 | ||||||
Sodexo | 4,387 | 471,478 | ||||||
Suez Environnement Co. | 24,200 | 486,250 | ||||||
Technip SA | 4,419 | 474,555 | ||||||
Thales SA | 309 | 18,496 | ||||||
Total SA | 86,998 | 6,105,122 | ||||||
Unibail-Rodamco SE REIT | 4,310 | 1,205,007 | ||||||
Valeo SA | 3,065 | 411,541 | ||||||
Vallourec SA | 4,859 | 264,281 | ||||||
Veolia Environnement | 7,714 | 147,426 | ||||||
Vinci SA | 19,786 | 1,464,550 | ||||||
Vivendi SA* | 56,644 | 1,485,613 | ||||||
Wendel SA* | 25 | 3,776 | ||||||
Zodiac Aerospace | 228 | 8,106 | ||||||
|
| |||||||
| 57,715,408 | ||||||||
|
| |||||||
| Germany — 8.7% | ||||||||
adidas AG | 10,063 | 1,080,114 | ||||||
Allianz SE | 18,919 | 3,208,227 | ||||||
Axel Springer SE | 348 | 22,414 | ||||||
BASF SE | 37,711 | 4,342,273 | ||||||
Bayer AG | 34,429 | 4,979,508 | ||||||
Bayerische Motoren Werke AG | 13,268 | 1,665,576 | ||||||
Beiersdorf AG | 4,452 | 449,576 | ||||||
Brenntag AG | 2,333 | 435,853 | ||||||
Celesio AG* | 10,119 | 359,880 | ||||||
Commerzbank AG* | 41,127 | 652,850 | ||||||
Continental AG | 4,753 | 1,123,799 | ||||||
Daimler AG | 40,075 | 3,807,613 | ||||||
Deutsche Bank AG (a) | 41,686 | 1,688,545 | ||||||
Deutsche Boerse AG | 12,491 | 953,524 | ||||||
Deutsche Lufthansa AG | 16,128 | 425,410 | ||||||
Deutsche Post AG | 40,551 | 1,504,100 | ||||||
Deutsche Telekom AG | 114,046 | 1,916,080 | ||||||
Deutsche Wohnen AG* | 734 | 16,279 | ||||||
E.ON SE | 68,760 | 1,338,945 | ||||||
Fraport AG Frankfurt Airport Services Worldwide | 5,916 | 453,867 | ||||||
| See Notes to Financial Statements. | 33 |
DBX ETF Trust
SCHEDULE OF INVESTMENTS
db X-trackers MSCI EAFE Hedged Equity Fund (Continued)
May 31, 2014
Number | Value | |||||||
| Germany (Continued) | ||||||||
Fresenius Medical Care AG & Co. KGaA | 6,422 | $ | 425,455 | |||||
Fresenius SE & Co. KGaA | 6,859 | 1,023,348 | ||||||
GEA Group AG | 7,256 | 312,113 | ||||||
Hannover Rueck SE | 2,748 | 244,387 | ||||||
HeidelbergCement AG | 5,520 | 475,407 | ||||||
Henkel AG & Co. KGaA | 5,586 | 566,451 | ||||||
Hochtief AG | 4,792 | 436,028 | ||||||
Hugo Boss AG | 276 | 39,222 | ||||||
Infineon Technologies AG | 49,471 | 613,608 | ||||||
K+S AG | 4,593 | 159,655 | ||||||
Kabel Deutschland Holding AG | 3,803 | 541,220 | ||||||
LANXESS AG | 4,368 | 310,575 | ||||||
Linde AG | 7,283 | 1,521,449 | ||||||
MAN SE | 4,419 | 551,961 | ||||||
Merck KGaA | 2,781 | 477,659 | ||||||
Metro AG* | 392 | 16,362 | ||||||
Muenchener Rueckversicherungs-Gesellschaft AG | 7,292 | 1,616,270 | ||||||
OSRAM Licht AG* | 3,995 | 202,721 | ||||||
ProSiebenSat.1 Media AG | 2,729 | 124,195 | ||||||
RWE AG | 20,599 | 826,948 | ||||||
SAP AG | 38,009 | 2,909,780 | ||||||
Siemens AG | 33,918 | 4,506,125 | ||||||
Sky Deutschland AG* | 1,176 | 10,971 | ||||||
Telefonica Deutschland Holding AG* | 1,579 | 12,260 | ||||||
ThyssenKrupp AG* | 17,782 | 534,001 | ||||||
United Internet AG | 355 | 16,407 | ||||||
Volkswagen AG | 1,217 | 320,595 | ||||||
|
| |||||||
| 49,219,606 | ||||||||
|
| |||||||
| Hong Kong — 2.7% | ||||||||
AIA Group Ltd. | 498,031 | 2,495,631 | ||||||
ASM Pacific Technology Ltd. | 907 | 10,160 | ||||||
Bank of East Asia Ltd. (The) | 3,120 | 12,697 | ||||||
BOC Hong Kong (Holdings) Ltd. | 154,318 | 464,768 | ||||||
Cathay Pacific Airways Ltd. | 368,014 | 670,243 | ||||||
Cheung Kong (Holdings) Ltd. | 80,540 | 1,438,781 | ||||||
Cheung Kong Infrastructure Holdings Ltd. | 3,620 | 24,700 | ||||||
CLP Holdings Ltd. | 89,135 | 733,503 | ||||||
First Pacific Co. Ltd. | 12,880 | 14,570 | ||||||
Galaxy Entertainment Group Ltd. | 88,189 | 704,674 | ||||||
Hang Lung Properties Ltd. | 95,779 | 303,905 | ||||||
Hang Seng Bank Ltd. | 36,858 | 608,520 | ||||||
Henderson Land Development Co. Ltd. | 44,511 | 289,929 | ||||||
HKT Trust and HKT Ltd. | 14,955 | 16,300 | ||||||
Hong Kong and China Gas Co. Ltd. | 137,874 | 333,261 | ||||||
Hong Kong Exchanges & Clearing Ltd. | 46,890 | 872,729 | ||||||
Hutchison Whampoa Ltd. | 80,540 | 1,080,384 | ||||||
Hysan Development Co. Ltd. | 4,365 | 21,366 | ||||||
Kerry Properties Ltd. | 52,247 | 171,844 | ||||||
Li & Fung Ltd. | 373,704 | 542,749 | ||||||
Link REIT (The) | 100,677 | 536,307 | ||||||
MGM China Holdings Ltd. | 3,535 | 12,311 | ||||||
MTR Corp. Ltd. | 95,785 | 362,609 | ||||||
New World Development Co. Ltd. | 32,242 | 37,012 | ||||||
Noble Group Ltd. | 34,000 | 37,543 | ||||||
NWS Holdings Ltd. | 8,730 | 15,201 | ||||||
Number | Value | |||||||
| Hong Kong (Continued) | ||||||||
PCCW Ltd. | 30,071 | $ | 16,445 | |||||
Power Assets Holdings Ltd. | 55,398 | 482,315 | ||||||
Shangri-La Asia Ltd. | 187,020 | 293,329 | ||||||
Sino Land Co. Ltd. | 213,680 | 331,285 | ||||||
SJM Holdings Ltd. | 19,746 | 56,669 | ||||||
Sun Hung Kai Properties Ltd. | 80,540 | 1,101,160 | ||||||
Swire Pacific Ltd., Class A | 32,723 | 388,939 | ||||||
Swire Properties Ltd. | 5,195 | 16,216 | ||||||
Techtronic Industries Co. | 17,800 | 56,135 | ||||||
Wharf Holdings Ltd. (The) | 3,620 | 25,634 | ||||||
Wheelock & Co. Ltd. | 87,850 | 355,232 | ||||||
Yue Yuen Industrial (Holdings) Ltd. | 4,365 | 13,512 | ||||||
|
| |||||||
| 14,948,568 | ||||||||
|
| |||||||
| Ireland — 0.9% | ||||||||
Bank of Ireland* | 1,017,170 | 391,011 | ||||||
CRH PLC | 36,642 | 1,002,974 | ||||||
Experian PLC | 68,086 | 1,183,479 | ||||||
James Hardie Industries PLC CDI | 14,612 | 194,868 | ||||||
Kerry Group PLC, Class A | 6,440 | 490,293 | ||||||
Shire PLC | 30,449 | 1,742,451 | ||||||
|
| |||||||
| 5,005,076 | ||||||||
|
| |||||||
| Israel — 0.4% | ||||||||
Bank Hapoalim BM | 46,948 | 273,658 | ||||||
Bank Leumi Le-Israel BM* | 3,169 | 12,524 | ||||||
Bezeq The Israeli Telecommunication Corp. Ltd. | 7,545 | 13,530 | ||||||
Delek Group Ltd. | 10 | 4,237 | ||||||
Israel Chemicals Ltd. | 1,570 | 13,806 | ||||||
Israel Corp. Ltd. (The)* | 7 | 4,074 | ||||||
Mizrahi Tefahot Bank Ltd. | 1,105 | 14,984 | ||||||
NICE Systems Ltd. | 278 | 10,803 | ||||||
Teva Pharmaceutical Industries Ltd. | 41,264 | 2,067,922 | ||||||
|
| |||||||
| 2,415,538 | ||||||||
|
| |||||||
| Italy — 2.4% | ||||||||
Assicurazioni Generali SpA | 47,381 | 1,072,804 | ||||||
Atlantia SpA | 815 | 22,642 | ||||||
Banca Monte dei Paschi di Siena SpA* | 7,878 | 266,971 | ||||||
Banco Popolare SC* | 20,539 | 396,171 | ||||||
Enel Green Power SpA | 5,181 | 14,535 | ||||||
Enel SpA | 261,188 | 1,478,281 | ||||||
Eni SpA | 104,871 | 2,671,845 | ||||||
EXOR SpA | 531 | 22,801 | ||||||
Fiat SpA* | 24,269 | 253,577 | ||||||
Finmeccanica SpA* | 5,972 | 49,008 | ||||||
Intesa Sanpaolo SpA | 443,539 | 1,486,142 | ||||||
Intesa Sanpaolo SpA-RSP | 51,200 | 146,009 | ||||||
Luxottica Group SpA | 10,082 | 575,847 | ||||||
Mediobanca SpA* | 29,104 | 291,599 | ||||||
Pirelli & C. SpA* | 20,559 | 346,672 | ||||||
Prysmian SpA | 10,433 | 242,198 | ||||||
Saipem SpA* | 14,283 | 372,266 | ||||||
Snam SpA | 84,497 | 495,977 | ||||||
Telecom Italia SpA* | 578,888 | 718,885 | ||||||
Telecom Italia SpA-RSP | 225,041 | 214,890 | ||||||
Terna Rete Elettrica Nazionale SpA | 2,703 | 14,348 | ||||||
| See Notes to Financial Statements. | 34 |
DBX ETF Trust
SCHEDULE OF INVESTMENTS
db X-trackers MSCI EAFE Hedged Equity Fund (Continued)
May 31, 2014
Number | Value | |||||||
| Italy (Continued) | ||||||||
UniCredit SpA | 168,067 | $ | 1,465,108 | |||||
Unione di Banche Italiane SCPA | 54,597 | 502,737 | ||||||
UnipolSai SpA | 45,323 | 155,939 | ||||||
|
| |||||||
| 13,277,252 | ||||||||
|
| |||||||
| Japan — 19.2% | ||||||||
ABC-Mart, Inc. | 2,700 | 137,917 | ||||||
Acom Co. Ltd.* | 1,900 | 7,242 | ||||||
Advantest Corp. | 7,800 | 88,191 | ||||||
Aeon Co. Ltd. | 2,600 | 31,338 | ||||||
AEON Financial Service Co. Ltd. | 300 | 7,535 | ||||||
AEON Mall Co. Ltd. | 2,000 | 50,255 | ||||||
AIR WATER, Inc. | 10,000 | 154,420 | ||||||
AISIN SEIKI Co. Ltd. | 3,200 | 116,149 | ||||||
Ajinomoto Co., Inc. | 1,000 | 15,619 | ||||||
Alfresa Holdings Corp. | 100 | 6,041 | ||||||
Amada Co. Ltd. | 1,000 | 9,450 | ||||||
ANA Holdings, Inc. | 3,000 | 6,542 | ||||||
Aozora Bank Ltd. | 3,000 | 9,195 | ||||||
Asahi Glass Co. Ltd. | 23,000 | 127,878 | ||||||
Asahi Group Holdings Ltd. | 5,600 | 157,823 | ||||||
Asahi Kasei Corp. | 4,800 | 35,835 | ||||||
ASICS Corp. | 400 | 8,613 | ||||||
Astellas Pharma, Inc. | 103,300 | 1,323,214 | ||||||
Bank of Kyoto Ltd. (The) | 1,000 | 8,291 | ||||||
Bank of Yokohama Ltd. (The) | 32,000 | 178,232 | ||||||
Benesse Holdings, Inc. | 900 | 37,706 | ||||||
Bridgestone Corp. | 36,700 | 1,325,237 | ||||||
Brother Industries Ltd. | 2,900 | 45,893 | ||||||
Calbee, Inc. | 3,800 | 106,982 | ||||||
Canon, Inc. | 42,900 | 1,406,682 | ||||||
Casio Computer Co. Ltd. | 500 | 6,655 | ||||||
Central Japan Railway Co. | 3,104 | 411,020 | ||||||
Chiba Bank Ltd. (The) | 2,000 | 12,986 | ||||||
Chiyoda Corp. | 6,000 | 70,904 | ||||||
Chubu Electric Power Co., Inc.* | 26,900 | 323,170 | ||||||
Chugai Pharmaceutical Co. Ltd. | 23,000 | 614,990 | ||||||
Chugoku Bank Ltd. (The) | 500 | 7,087 | ||||||
Chugoku Electric Power Co., (The), Inc. | 20,600 | 273,587 | ||||||
Citizen Holdings Co. Ltd. | 12,800 | 98,075 | ||||||
Credit Saison Co. Ltd. | 30,600 | 550,379 | ||||||
Dai Nippon Printing Co. Ltd. | 30,000 | 300,590 | ||||||
Daicel Corp. | 14,000 | 127,485 | ||||||
Daido Steel Co. Ltd. | 2,000 | 9,823 | ||||||
Daihatsu Motor Co. Ltd. | 400 | 6,896 | ||||||
Dai-ichi Life Insurance Co. Ltd. (The) | 40,204 | 595,556 | ||||||
Daiichi Sankyo Co. Ltd. | 36,800 | 623,214 | ||||||
Daikin Industries Ltd. | 10,800 | 643,438 | ||||||
Dainippon Sumitomo Pharma Co. Ltd. | 400 | 4,377 | ||||||
Daito Trust Construction Co. Ltd. | 3,000 | 324,902 | ||||||
Daiwa House Industry Co. Ltd. | 11,000 | 205,845 | ||||||
Daiwa Securities Group, Inc. | 31,000 | 250,010 | ||||||
DeNa Co. Ltd. | 300 | 3,917 | ||||||
DENSO Corp. | 27,000 | 1,236,748 | ||||||
Dentsu, Inc. | 8,500 | 335,241 | ||||||
Don Quijote Holdings Co. Ltd. | 1,600 | 94,303 | ||||||
East Japan Railway Co. | 9,700 | 739,886 | ||||||
Number | Value | |||||||
| Japan (Continued) | ||||||||
Eisai Co. Ltd. | 3,200 | $ | 130,923 | |||||
Electric Power Development Co. Ltd. | 30,600 | 907,780 | ||||||
FamilyMart Co. Ltd. | 3,100 | 132,770 | ||||||
FANUC Corp. | 7,400 | 1,259,018 | ||||||
Fast Retailing Co. Ltd. | 1,400 | 461,945 | ||||||
Fuji Electric Co. Ltd. | 10,000 | 43,910 | ||||||
Fuji Heavy Industries Ltd. | 30,800 | 815,383 | ||||||
FUJIFILM Holdings Corp. | 33,800 | 872,558 | ||||||
Fujitsu Ltd. | 50,600 | 342,470 | ||||||
Fukuoka Financial Group, Inc. | 2,000 | 8,664 | ||||||
Gree, Inc. | 600 | 5,475 | ||||||
GungHo Online Entertainment, Inc. | 700 | 4,614 | ||||||
Gunma Bank Ltd. (The) | 2,000 | 10,472 | ||||||
Hachijuni Bank Ltd. (The) | 2,000 | 10,963 | ||||||
Hakuhodo DY Holdings, Inc. | 800 | 7,238 | ||||||
Hamamatsu Photonics KK | 3,100 | 149,519 | ||||||
Hankyu Hanshin Holdings, Inc. | 17,700 | 98,237 | ||||||
Hikari Tsushin, Inc. | 900 | 71,788 | ||||||
Hino Motors Ltd. | 500 | 6,292 | ||||||
Hirose Electric Co. Ltd. | 400 | 57,250 | ||||||
Hiroshima Bank Ltd. (The) | 2,000 | 8,978 | ||||||
Hisamitsu Pharmaceutical Co., Inc. | 100 | 4,057 | ||||||
Hitachi Chemical Co. Ltd. | 400 | 6,204 | ||||||
Hitachi Construction Machinery Co. Ltd. | 200 | 3,697 | ||||||
Hitachi High-Technologies Corp. | 200 | 4,519 | ||||||
Hitachi Ltd. | 269,000 | 1,807,425 | ||||||
Hitachi Metals Ltd. | 5,000 | 70,727 | ||||||
Hokuhoku Financial Group, Inc. | 4,000 | 7,898 | ||||||
Hokuriku Electric Power Co. | 24,000 | 308,369 | ||||||
Honda Motor Co. Ltd. | 77,100 | 2,698,500 | ||||||
Hoya Corp. | 33,700 | 1,043,111 | ||||||
Hulic Co. Ltd. | 27,800 | 363,475 | ||||||
IBIDEN Co. Ltd. | 200 | 3,652 | ||||||
Idemitsu Kosan Co. Ltd. | 400 | 8,303 | ||||||
IHI Corp. | 23,000 | 96,473 | ||||||
Iida Group Holdings Co. Ltd. | 300 | 4,515 | ||||||
INPEX Corp. | 40,204 | 579,759 | ||||||
Isetan Mitsukoshi Holdings Ltd. | 36,900 | 482,455 | ||||||
Isuzu Motors Ltd. | 29,000 | 176,906 | ||||||
ITOCHU Corp. | 113,600 | 1,342,444 | ||||||
Itochu Techno-Solutions Corp. | 1,300 | 53,507 | ||||||
Iyo Bank Ltd. (The) | 700 | 6,567 | ||||||
J. Front Retailing Co. Ltd. | 2,000 | 14,361 | ||||||
Japan Airlines Co. Ltd. | 100 | 5,216 | ||||||
Japan Display, Inc.* | 10,400 | 60,377 | ||||||
Japan Exchange Group, Inc. | 24,500 | 585,545 | ||||||
Japan Prime Realty Investment Corp. REIT | 25 | 89,759 | ||||||
Japan Real Estate Investment Corp. REIT | 20 | 116,896 | ||||||
Japan Retail Fund Investment Corp. REIT | 14 | 30,792 | ||||||
Japan Tobacco, Inc. | 42,000 | 1,420,904 | ||||||
JFE Holdings, Inc. | 30,700 | 582,335 | ||||||
JGC Corp. | 2,700 | 77,552 | ||||||
Joyo Bank Ltd. (The) | 2,000 | 9,823 | ||||||
JSR Corp. | 300 | 5,036 | ||||||
JTEKT Corp. | 300 | 4,571 | ||||||
JX Holdings, Inc. | 114,200 | 594,558 | ||||||
Kajima Corp. | 4,000 | 16,582 | ||||||
| See Notes to Financial Statements. | 35 |
DBX ETF Trust
SCHEDULE OF INVESTMENTS
db X-trackers MSCI EAFE Hedged Equity Fund (Continued)
May 31, 2014
Number | Value | |||||||
| Japan (Continued) | ||||||||
Kakaku.com, Inc. | 5,600 | $ | 97,973 | |||||
Kamigumi Co. Ltd. | 7,000 | 63,055 | ||||||
Kaneka Corp. | 31,000 | 193,369 | ||||||
Kansai Electric Power Co., (The), Inc.* | 24,300 | 224,142 | ||||||
Kansai Paint Co. Ltd. | 9,000 | 141,454 | ||||||
Kao Corp. | 30,700 | 1,213,223 | ||||||
Kawasaki Heavy Industries Ltd. | 8,000 | 30,098 | ||||||
KDDI Corp. | 28,310 | 1,683,305 | ||||||
Keikyu Corp. | 24,500 | 196,626 | ||||||
Keio Corp. | 20,800 | 150,585 | ||||||
Keisei Electric Railway Co. Ltd. | 13,000 | 120,167 | ||||||
Keyence Corp. | 910 | 353,497 | ||||||
Kikkoman Corp. | 9,000 | 180,796 | ||||||
Kintetsu Corp. | 47,400 | 166,226 | ||||||
Kirin Holdings Co. Ltd. | 22,100 | 312,396 | ||||||
Kobe Steel Ltd. | 361,000 | 500,010 | ||||||
Koito Manufacturing Co. Ltd. | 1,000 | 23,733 | ||||||
Komatsu Ltd. | 39,900 | 868,942 | ||||||
Konami Corp. | 1,300 | 29,410 | ||||||
Konica Minolta, Inc. | 500 | 4,303 | ||||||
Kubota Corp. | 18,800 | 256,699 | ||||||
Kuraray Co. Ltd. | 43,400 | 520,545 | ||||||
Kurita Water Industries Ltd. | 3,900 | 84,589 | ||||||
Kyocera Corp. | 26,400 | 1,173,995 | ||||||
Kyowa Hakko Kirin Co. Ltd. | 1,000 | 12,112 | ||||||
Kyushu Electric Power Co., Inc.* | 23,800 | 261,847 | ||||||
Lawson, Inc. | 1,000 | 71,807 | ||||||
LIXIL Group Corp. | 30,700 | 794,641 | ||||||
M3, Inc. | 25,710 | 399,540 | ||||||
Mabuchi Motor Co. Ltd. | 700 | 51,847 | ||||||
Makita Corp. | 3,200 | 174,460 | ||||||
Marubeni Corp. | 8,000 | 54,538 | ||||||
Marui Group Co. Ltd. | 600 | 5,664 | ||||||
Maruichi Steel Tube Ltd. | 2,500 | 61,395 | ||||||
Mazda Motor Corp. | 130,000 | 561,886 | ||||||
McDonald’s Holdings Co. Japan Ltd. | 20,500 | 579,558 | ||||||
Medipal Holdings Corp. | 500 | 7,024 | ||||||
MEIJI Holdings Co. Ltd. | 2,200 | 138,527 | ||||||
Miraca Holdings, Inc. | 3,300 | 155,113 | ||||||
Mitsubishi Chemical Holdings Corp. | 110,300 | 456,153 | ||||||
Mitsubishi Corp. | 73,500 | 1,450,506 | ||||||
Mitsubishi Electric Corp. | 80,000 | 928,093 | ||||||
Mitsubishi Estate Co. Ltd. | 50,000 | 1,213,654 | ||||||
Mitsubishi Gas Chemical Co., Inc. | 1,000 | 5,845 | ||||||
Mitsubishi Heavy Industries Ltd. | 230,200 | 1,340,950 | ||||||
Mitsubishi Logistics Corp. | 1,000 | 14,381 | ||||||
Mitsubishi Materials Corp. | 21,000 | 64,155 | ||||||
Mitsubishi Motors Corp. | 600 | 6,106 | ||||||
Mitsubishi Tanabe Pharma Corp. | 36,900 | 536,464 | ||||||
Mitsubishi UFJ Financial Group, Inc. | 529,000 | 2,977,573 | ||||||
Mitsubishi UFJ Lease & Finance Co. Ltd. | 1,000 | 5,393 | ||||||
Mitsui & Co. Ltd. | 79,900 | 1,210,273 | ||||||
Mitsui Chemicals, Inc. | 3,000 | 7,456 | ||||||
Mitsui Fudosan Co. Ltd. | 25,000 | 791,012 | ||||||
Mitsui OSK Lines Ltd. | 29,000 | 103,978 | ||||||
Mizuho Financial Group, Inc. | 1,128,200 | 2,194,338 | ||||||
MS&AD Insurance Group Holdings, Inc. | 33,700 | 797,809 | ||||||
Number | Value | |||||||
| Japan (Continued) | ||||||||
Murata Manufacturing Co. Ltd. | 3,600 | $ | 304,939 | |||||
Nabtesco Corp. | 5,500 | 119,293 | ||||||
Nagoya Railroad Co. Ltd. | 54,700 | 192,901 | ||||||
Namco Bandai Holdings, Inc. | 300 | 6,536 | ||||||
NEC Corp. | 72,000 | 222,083 | ||||||
Nexon Co. Ltd. | 700 | 6,140 | ||||||
NGK Insulators Ltd. | 6,000 | 124,361 | ||||||
NGK Spark Plug Co. Ltd. | 1,000 | 27,525 | ||||||
NHK Spring Co. Ltd. | 600 | 5,564 | ||||||
Nidec Corp. | 6,200 | 360,489 | ||||||
Nikon Corp. | 33,500 | 530,472 | ||||||
Nintendo Co. Ltd. | 3,000 | 346,857 | ||||||
Nippon Building Fund, Inc. REIT | 24 | 140,511 | ||||||
Nippon Electric Glass Co. Ltd. | 31,000 | 155,000 | ||||||
Nippon Express Co. Ltd. | 2,000 | 9,804 | ||||||
Nippon Meat Packers, Inc. | 1,000 | 19,450 | ||||||
Nippon Paint Co. Ltd. | 10,000 | 159,430 | ||||||
Nippon Prologis REIT, Inc. | 41 | 89,733 | ||||||
Nippon Steel & Sumitomo Metal Corp. | 399,000 | 1,124,882 | ||||||
Nippon Telegraph & Telephone Corp. | 23,000 | 1,365,088 | ||||||
Nippon Yusen KK | 2,000 | 5,894 | ||||||
Nissan Motor Co. Ltd. | 116,800 | 1,054,413 | ||||||
Nisshin Seifun Group, Inc. | 4,000 | 46,444 | ||||||
Nissin Foods Holdings Co. Ltd. | 3,200 | 155,599 | ||||||
Nitori Holdings Co. Ltd. | 2,900 | 142,294 | ||||||
Nitto Denko Corp. | 3,100 | 142,941 | ||||||
NKSJ Holdings, Inc. | 300 | 8,334 | ||||||
NOK Corp. | 400 | 7,352 | ||||||
Nomura Holdings, Inc. | 162,800 | 1,069,874 | ||||||
Nomura Real Estate Holdings, Inc. | 2,200 | 42,293 | ||||||
Nomura Research Institute Ltd. | 1,500 | 50,319 | ||||||
NSK Ltd. | 8,000 | 96,660 | ||||||
NTT Data Corp. | 4,100 | 149,018 | ||||||
NTT DOCOMO, Inc. | 76,792 | 1,274,838 | ||||||
NTT Urban Development Corp. | 600 | 6,012 | ||||||
Obayashi Corp. | 2,000 | 13,399 | ||||||
Odakyu Electric Railway Co. Ltd. | 16,500 | 148,306 | ||||||
Oji Holdings Corp. | 1,600 | 6,743 | ||||||
Olympus Corp.* | 3,000 | 96,513 | ||||||
Omron Corp. | 3,400 | 127,584 | ||||||
Ono Pharmaceutical Co. Ltd. | 2,200 | 168,566 | ||||||
Oracle Corp. Japan | 2,000 | 90,177 | ||||||
Oriental Land Co. Ltd. | 500 | 83,251 | ||||||
ORIX Corp. | 68,600 | 1,087,627 | ||||||
Osaka Gas Co. Ltd. | 2,000 | 7,957 | ||||||
OTSUKA Corp. | 700 | 95,786 | ||||||
Otsuka Holdings Co. Ltd. | 30,500 | 860,771 | ||||||
Panasonic Corp. | 113,300 | 1,216,472 | ||||||
Park24 Co. Ltd. | 9,700 | 183,423 | ||||||
Rakuten, Inc. | 36,900 | 478,105 | ||||||
Resona Holdings, Inc. | 80,400 | 420,165 | ||||||
Ricoh Co. Ltd. | 33,500 | 409,700 | ||||||
Rinnai Corp. | 3,100 | 271,631 | ||||||
ROHM Co. Ltd. | 3,000 | 170,923 | ||||||
Sankyo Co. Ltd. | 3,200 | 118,978 | ||||||
Sanrio Co. Ltd. | 200 | 5,387 | ||||||
Santen Pharmaceutical Co. Ltd. | 100 | 5,383 | ||||||
| See Notes to Financial Statements. | 36 |
DBX ETF Trust
SCHEDULE OF INVESTMENTS
db X-trackers MSCI EAFE Hedged Equity Fund (Continued)
May 31, 2014
Number | Value | |||||||
| Japan (Continued) | ||||||||
SBI Holdings, Inc. | 3,600 | $ | 40,986 | |||||
Secom Co. Ltd. | 3,200 | 194,766 | ||||||
Sega Sammy Holdings, Inc. | 30,600 | 587,352 | ||||||
Seiko Epson Corp. | 2,500 | 86,812 | ||||||
Sekisui Chemical Co. Ltd. | 30,000 | 324,460 | ||||||
Sekisui House Ltd. | 26,200 | 344,615 | ||||||
Seven & I Holdings Co. Ltd. | 40,000 | 1,598,429 | ||||||
Seven Bank Ltd. | 35,700 | 132,560 | ||||||
Sharp Corp.* | 24,000 | 67,898 | ||||||
Shikoku Electric Power Co., Inc.* | 14,200 | 182,731 | ||||||
Shimadzu Corp. | 9,000 | 77,004 | ||||||
Shimamura Co. Ltd. | 100 | 9,656 | ||||||
Shimano, Inc. | 100 | 10,314 | ||||||
Shimizu Corp. | 8,000 | 52,967 | ||||||
Shin-Etsu Chemical Co. Ltd. | 24,900 | 1,479,570 | ||||||
Shinsei Bank Ltd. | 3,000 | 6,248 | ||||||
Shionogi & Co. Ltd. | 1,100 | 22,032 | ||||||
Shiseido Co. Ltd. | 30,600 | 514,308 | ||||||
Shizuoka Bank Ltd. (The) | 1,000 | 9,381 | ||||||
Showa Shell Sekiyu KK | 900 | 9,707 | ||||||
SMC Corp. | 900 | 235,167 | ||||||
SoftBank Corp. | 40,000 | 2,886,051 | ||||||
Sony Corp. | 43,000 | 687,239 | ||||||
Sony Financial Holdings, Inc. | 400 | 6,589 | ||||||
Stanley Electric Co. Ltd. | 200 | 4,750 | ||||||
Sumitomo Chemical Co. Ltd. | 29,000 | 107,397 | ||||||
Sumitomo Corp. | 79,900 | 1,045,450 | ||||||
Sumitomo Electric Industries Ltd. | 26,200 | 352,079 | ||||||
Sumitomo Heavy Industries Ltd. | 2,000 | 8,880 | ||||||
Sumitomo Metal Mining Co. Ltd. | 3,000 | 45,354 | ||||||
Sumitomo Mitsui Financial Group, Inc. | 67,500 | 2,721,881 | ||||||
Sumitomo Mitsui Trust Holdings, Inc. | 312,000 | 1,259,646 | ||||||
Sumitomo Realty & Development Co. Ltd. | 6,100 | 261,797 | ||||||
Sumitomo Rubber Industries Ltd. | 500 | 7,412 | ||||||
Suntory Beverage & Food Ltd. | 200 | 7,633 | ||||||
Suruga Bank Ltd. | 7,000 | 120,472 | ||||||
Suzuken Co. Ltd. | 100 | 3,536 | ||||||
Suzuki Motor Corp. | 32,900 | 977,628 | ||||||
Sysmex Corp. | 3,400 | 119,234 | ||||||
T&D Holdings, Inc. | 37,200 | 484,185 | ||||||
Taiheiyo Cement Corp. | 41,000 | 154,656 | ||||||
Taisei Corp. | 20,000 | 102,946 | ||||||
Taisho Pharmaceutical Holdings Co. Ltd. | 134 | 9,662 | ||||||
Taiyo Nippon Sanso Corp. | 12,000 | 105,029 | ||||||
Takashimaya Co. Ltd. | 1,000 | 9,813 | ||||||
Takeda Pharmaceutical Co. Ltd. | 39,600 | 1,792,115 | ||||||
TDK Corp. | 2,400 | 102,436 | ||||||
Teijin Ltd. | 41,000 | 93,035 | ||||||
Terumo Corp. | 6,000 | 127,190 | ||||||
THK Co. Ltd. | 2,000 | 44,028 | ||||||
Tobu Railway Co. Ltd. | 41,000 | 203,792 | ||||||
Toho Co. Ltd. | 300 | 6,436 | ||||||
Toho Gas Co. Ltd. | 31,000 | 155,305 | ||||||
Tohoku Electric Power Co., Inc. | 24,800 | 263,348 | ||||||
Tokio Marine Holdings, Inc. | 36,700 | 1,159,404 | ||||||
Tokyo Electric Power Co., (The), Inc.* | 83,400 | 338,352 | ||||||
Tokyo Electron Ltd. | 5,700 | 342,280 | ||||||
Number | Value | |||||||
| Japan (Continued) | ||||||||
Tokyo Gas Co. Ltd. | 95,400 | $ | 539,787 | |||||
Tokyo Tatemono Co. Ltd. | 7,000 | 63,743 | ||||||
Tokyu Corp. | 29,600 | 201,792 | ||||||
Tokyu Fudosan Holdings Corp. | 32,300 | 254,148 | ||||||
TonenGeneral Sekiyu KK | 1,000 | 9,587 | ||||||
Toppan Printing Co. Ltd. | 31,000 | 229,607 | ||||||
Toray Industries, Inc. | 31,200 | 198,601 | ||||||
Toshiba Corp. | 335,000 | 1,372,249 | ||||||
TOTO Ltd. | 6,000 | 75,855 | ||||||
Toyo Seikan Group Holdings Ltd. | 300 | 4,415 | ||||||
Toyo Suisan Kaisha Ltd. | 4,000 | 121,611 | ||||||
Toyoda Gosei Co. Ltd. | 300 | 5,953 | ||||||
Toyota Industries Corp. | 3,200 | 148,684 | ||||||
Toyota Motor Corp. | 105,800 | 5,987,365 | ||||||
Toyota Tsusho Corp. | 3,800 | 100,599 | ||||||
Trend Micro, Inc. | 4,100 | 126,866 | ||||||
Unicharm Corp. | 3,200 | 193,760 | ||||||
United Urban Investment Corp. REIT | 273 | 436,853 | ||||||
USS Co. Ltd. | 12,400 | 202,931 | ||||||
West Japan Railway Co. | 3,000 | 127,515 | ||||||
Yahoo Japan Corp. | 74,400 | 342,766 | ||||||
Yakult Honsha Co. Ltd. | 3,200 | 160,314 | ||||||
Yamada Denki Co. Ltd. | 1,900 | 6,999 | ||||||
Yamaguchi Financial Group, Inc. | 24,400 | 232,255 | ||||||
Yamaha Corp. | 31,200 | 485,776 | ||||||
Yamaha Motor Co. Ltd. | 29,200 | 458,939 | ||||||
Yamato Holdings Co. Ltd. | 30,700 | 653,204 | ||||||
Yamato Kogyo Co. Ltd. | 2,600 | 73,505 | ||||||
Yamazaki Baking Co. Ltd. | 3,000 | 35,393 | ||||||
Yaskawa Electric Corp. | 2,000 | 24,499 | ||||||
Yokogawa Electric Corp. | 4,400 | 52,688 | ||||||
Yokohama Rubber Co. Ltd. (The) | 1,000 | 8,841 | ||||||
|
| |||||||
| 108,061,010 | ||||||||
|
| |||||||
| Luxembourg — 0.2% | ||||||||
Altice SA* | 800 | 58,125 | ||||||
ArcelorMittal | 34,885 | 532,602 | ||||||
Millicom International Cellular SA SDR | 2,781 | 256,823 | ||||||
RTL Group SA | 282 | 32,867 | ||||||
SES SA FDR | 2,361 | 85,771 | ||||||
Tenaris SA | 8,467 | 189,518 | ||||||
|
| |||||||
| 1,155,706 | ||||||||
|
| |||||||
| Macau — 0.2% | ||||||||
Sands China Ltd. | 115,106 | 838,841 | ||||||
Wynn Macau Ltd. | 85,497 | 355,642 | ||||||
|
| |||||||
| 1,194,483 | ||||||||
|
| |||||||
| Mexico — 0.0% (b) | ||||||||
Fresnillo PLC | 10,433 | 140,951 | ||||||
|
| |||||||
| Netherlands — 4.6% | ||||||||
Aegon NV | 49,476 | 429,211 | ||||||
Akzo Nobel NV | 12,117 | 908,127 | ||||||
ASML Holding NV | 14,830 | 1,272,777 | ||||||
Corio NV REIT | 273 | 13,652 | ||||||
Delta Lloyd NV | 670 | 16,271 | ||||||
Fugro NV | 6,472 | 373,407 | ||||||
| See Notes to Financial Statements. | 37 |
DBX ETF Trust
SCHEDULE OF INVESTMENTS
db X-trackers MSCI EAFE Hedged Equity Fund (Continued)
May 31, 2014
Number | Value | |||||||
| Netherlands (Continued) | ||||||||
Gemalto NV | 3,376 | $ | 366,551 | |||||
Heineken Holding NV | 6,828 | 450,583 | ||||||
Heineken NV | 14,393 | 1,014,548 | ||||||
ING Groep NV* | 152,062 | 2,129,851 | ||||||
Koninklijke Ahold NV | 47,452 | 862,246 | ||||||
Koninklijke Boskalis Westminster NV | 265 | 15,092 | ||||||
Koninklijke DSM NV | 7,201 | 519,272 | ||||||
Koninklijke KPN NV* | 142,348 | 526,051 | ||||||
Koninklijke Philips NV | 40,820 | 1,289,275 | ||||||
Koninklijke Vopak NV | 260 | 13,247 | ||||||
OCI NV* | 1,298 | 49,702 | ||||||
QIAGEN NV* | 683 | 15,669 | ||||||
Randstad Holding NV | 10,082 | 586,567 | ||||||
Reed Elsevier NV | 28,728 | 643,217 | ||||||
Royal Dutch Shell PLC, Class A | 155,927 | 6,128,981 | ||||||
Royal Dutch Shell PLC, Class B | 108,877 | 4,443,847 | ||||||
TNT Express NV | 20,559 | 183,733 | ||||||
Unilever NV | 70,021 | 3,031,485 | ||||||
Wolters Kluwer NV | 305 | 9,130 | ||||||
Ziggo NV | 7,272 | 342,837 | ||||||
|
| |||||||
| 25,635,329 | ||||||||
|
| |||||||
| New Zealand — 0.1% | ||||||||
Auckland International Airport Ltd. | 45,390 | 148,775 | ||||||
Contact Energy Ltd. | 51,438 | 238,048 | ||||||
Fletcher Building Ltd. | 28,294 | 215,031 | ||||||
Ryman Healthcare Ltd. | 11,786 | 83,267 | ||||||
Telecom Corp. of New Zealand Ltd. | 6,749 | 15,416 | ||||||
Xero Ltd.* | 2,100 | 57,063 | ||||||
|
| |||||||
| 757,600 | ||||||||
|
| |||||||
| Norway — 0.7% | ||||||||
Aker Solutions ASA | 3,319 | 58,297 | ||||||
DNB ASA | 57,391 | 1,078,139 | ||||||
Gjensidige Forsikring ASA | 4,326 | 79,893 | ||||||
Norsk Hydro ASA | 3,091 | 16,805 | ||||||
Orkla ASA | 1,635 | 14,469 | ||||||
Statoil ASA | 42,879 | 1,314,079 | ||||||
Telenor ASA | 45,644 | 1,081,944 | ||||||
Yara International ASA | 8,067 | 368,405 | ||||||
|
| |||||||
| 4,012,031 | ||||||||
|
| |||||||
| Portugal — 0.1% | ||||||||
Banco Espirito Santo SA* | 154,650 | 209,759 | ||||||
EDP — Energias de Portugal SA | 9,619 | 45,499 | ||||||
Galp Energia SGPS SA | 9,313 | 165,036 | ||||||
Jeronimo Martins SGPS SA | 20,083 | 343,163 | ||||||
|
| |||||||
| 763,457 | ||||||||
|
| |||||||
| Singapore — 1.3% | ||||||||
Ascendas Real Estate Investment Trust REIT | 4,000 | 7,845 | ||||||
CapitaCommercial Trust REIT | 6,000 | 8,084 | ||||||
CapitaLand Ltd. | 306,100 | 778,489 | ||||||
CapitaMall Trust REIT | 4,000 | 6,601 | ||||||
CapitaMalls Asia Ltd. | 4,000 | 7,494 | ||||||
City Developments Ltd. | 30,000 | 247,788 | ||||||
ComfortDelGro Corp. Ltd. | 95,000 | 176,473 | ||||||
DBS Group Holdings Ltd. | 64,000 | 862,313 | ||||||
Number | Value | |||||||
| Singapore (Continued) | ||||||||
Genting Singapore PLC | 6,000 | $ | 6,434 | |||||
Global Logistic Properties Ltd. | 345,000 | 764,650 | ||||||
Golden Agri-Resources Ltd. | 35,000 | 16,044 | ||||||
Hutchison Port Holdings Trust, Class U | 803,789 | 602,842 | ||||||
Jardine Cycle & Carriage Ltd. | 300 | 10,423 | ||||||
Keppel Corp. Ltd. | 26,000 | 220,346 | ||||||
Keppel Land Ltd. | 69,000 | 191,437 | ||||||
Olam International Ltd. | 305,000 | 569,003 | ||||||
Oversea-Chinese Banking Corp. Ltd. | 106,000 | 823,966 | ||||||
Sembcorp Industries Ltd. | 31,100 | 134,139 | ||||||
Sembcorp Marine Ltd. | 79,200 | 260,148 | ||||||
Singapore Airlines Ltd. | 1,000 | 8,299 | ||||||
Singapore Exchange Ltd. | 18,000 | 98,876 | ||||||
Singapore Press Holdings Ltd. | 2,000 | 6,538 | ||||||
Singapore Technologies Engineering Ltd. | 32,800 | 101,201 | ||||||
Singapore Telecommunications Ltd. | 368,000 | 1,144,224 | ||||||
StarHub Ltd. | 2,000 | 6,697 | ||||||
United Overseas Bank Ltd. | 28,000 | 503,835 | ||||||
UOL Group Ltd. | 2,000 | 10,524 | ||||||
Wilmar International Ltd. | 3,000 | 7,678 | ||||||
Yangzijiang Shipbuilding Holdings Ltd. | 7,000 | 5,637 | ||||||
|
| |||||||
| 7,588,028 | ||||||||
|
| |||||||
| Spain — 3.6% | ||||||||
Abertis Infraestructuras SA | 333 | 7,297 | ||||||
ACS Actividades de Construccion y Servicios SA | 292 | 12,974 | ||||||
Amadeus IT Holding SA, Class A | 15,810 | 694,606 | ||||||
Banco Bilbao Vizcaya Argentaria SA | 236,388 | 3,030,293 | ||||||
Banco de Sabadell SA | 167,391 | 553,110 | ||||||
Banco Popular Espanol SA | 84,596 | 597,462 | ||||||
Banco Santander SA | 488,740 | 5,012,718 | ||||||
Bankia SA* | 200,843 | 408,207 | ||||||
CaixaBank SA | 68,608 | 417,302 | ||||||
Distribuidora Internacional de Alimentacion SA | 24,956 | 230,547 | ||||||
Enagas SA | 13,331 | 392,339 | ||||||
Ferrovial SA | 23,279 | 503,920 | ||||||
Gas Natural SDG SA | 14,482 | 417,430 | ||||||
Grifols SA | 6,440 | 348,955 | ||||||
Iberdrola SA | 194,031 | 1,396,270 | ||||||
Inditex SA | 10,497 | 1,523,917 | ||||||
Mapfre SA | 10,236 | 41,804 | ||||||
Red Electrica Corp. SA | 6,901 | 592,087 | ||||||
Repsol SA | 33,142 | 933,600 | ||||||
Telefonica SA | 186,236 | 3,125,131 | ||||||
Zardoya Otis SA | 10,433 | 188,297 | ||||||
|
| |||||||
| 20,428,266 | ||||||||
|
| |||||||
| Sweden — 3.0% | ||||||||
Alfa Laval AB | 768 | 20,118 | ||||||
Assa Abloy AB, Class B | 14,562 | 735,281 | ||||||
Atlas Copco AB, Class A | 36,332 | 1,065,204 | ||||||
Atlas Copco AB, Class B | 15,997 | 441,041 | ||||||
Boliden AB | 10,433 | 144,989 | ||||||
Electrolux AB, Series B | 2,015 | 50,616 | ||||||
Elekta AB, Class B | 826 | 10,677 | ||||||
| See Notes to Financial Statements. | 38 |
DBX ETF Trust
SCHEDULE OF INVESTMENTS
db X-trackers MSCI EAFE Hedged Equity Fund (Continued)
May 31, 2014
Number | Value | |||||||
| Sweden (Continued) | ||||||||
Getinge AB, Class B | 683 | $ | 17,554 | |||||
Hennes & Mauritz AB, Class B | 40,422 | 1,708,210 | ||||||
Hexagon AB, Class B | 14,792 | 464,847 | ||||||
Husqvarna AB, Class B | 30,573 | 239,622 | ||||||
Industrivarden AB, Class C | 749 | 15,020 | ||||||
Investment AB Kinnevik, Class B | 10,061 | 399,163 | ||||||
Investor AB, Class B | 18,873 | 740,593 | ||||||
Lundin Petroleum AB* | 10,129 | 198,130 | ||||||
Nordea Bank AB | 121,530 | 1,792,441 | ||||||
Sandvik AB | 27,143 | 386,540 | ||||||
Securitas AB, Class B | 11,243 | 129,785 | ||||||
Skandinaviska Enskilda Banken AB, Class A | 80,192 | 1,088,680 | ||||||
Skanska AB, Class B | 16,128 | 373,556 | ||||||
SKF AB, Class B | 17,720 | 454,121 | ||||||
Svenska Cellulosa AB SCA, Class B | 24,268 | 675,239 | ||||||
Svenska Handelsbanken AB, Class A | 26,365 | 1,339,919 | ||||||
Swedbank AB, Class A | 26,830 | 713,649 | ||||||
Swedish Match AB | 13,328 | 465,644 | ||||||
Tele2 AB, Class B | 18,176 | 214,978 | ||||||
Telefonaktiebolaget LM Ericsson, Class B | 119,545 | 1,497,885 | ||||||
TeliaSonera AB | 108,316 | 802,335 | ||||||
Volvo AB, Class B | 61,608 | 895,765 | ||||||
|
| |||||||
| 17,081,602 | ||||||||
|
| |||||||
| Switzerland — 9.7% | ||||||||
ABB Ltd.* | 96,416 | 2,290,082 | ||||||
Actelion Ltd.* | 317 | 31,505 | ||||||
Adecco SA* | 5,662 | 472,624 | ||||||
Aryzta AG* | 3,203 | 298,661 | ||||||
Baloise Holding AG | 1,991 | 239,009 | ||||||
Barry Callebaut AG* | 8 | 10,568 | ||||||
Cie Financiere Richemont SA | 21,414 | 2,256,182 | ||||||
Coca-Cola HBC AG CDI* | 423 | 9,728 | ||||||
Credit Suisse Group AG* | 62,367 | 1,853,947 | ||||||
EMS-Chemie Holding AG | 25 | 9,380 | ||||||
Geberit AG | 1,609 | 532,740 | ||||||
Givaudan SA* | 340 | 557,365 | ||||||
Glencore PLC* | 413,406 | 2,240,648 | ||||||
Holcim Ltd.* | 10,032 | 879,971 | ||||||
Julius Baer Group Ltd.* | 9,208 | 398,551 | ||||||
Kuehne + Nagel International AG | 2,445 | 333,372 | ||||||
Lindt & Spruengli AG | 1 | 59,464 | ||||||
Lindt & Spruengli AG Participation Certificates | 15 | 74,338 | ||||||
Lonza Group AG* | 2,373 | 255,054 | ||||||
Nestle SA | 125,608 | 9,853,671 | ||||||
Novartis AG | 91,922 | 8,242,699 | ||||||
Pargesa Holding SA | 5,231 | 466,146 | ||||||
Partners Group Holding AG | 793 | 210,404 | ||||||
Roche Holding AG | 28,705 | 8,446,418 | ||||||
Schindler Holding AG | 4,422 | 675,522 | ||||||
Schindler Holding AG Participation Certificates | 2,333 | 360,306 | ||||||
SGS SA | 337 | 844,852 | ||||||
Sika AG | 95 | 376,499 | ||||||
Sonova Holding AG* | 2,366 | 360,911 | ||||||
STMicroelectronics NV | 23,814 | 238,273 | ||||||
Number | Value | |||||||
| Switzerland (Continued) | ||||||||
Sulzer AG | 808 | $ | 122,711 | |||||
Swatch Group AG (The) — Bearer | 1,626 | 959,621 | ||||||
Swatch Group AG (The) — Registered | 734 | 80,531 | ||||||
Swiss Life Holding AG* | 3,215 | 772,964 | ||||||
Swiss Prime Site AG* | 2,348 | 188,784 | ||||||
Swiss Re AG* | 14,474 | 1,287,386 | ||||||
Swisscom AG | 1,141 | 679,758 | ||||||
Syngenta AG | 4,040 | 1,554,193 | ||||||
Transocean Ltd. | 14,528 | 612,756 | ||||||
UBS AG* | 151,702 | 3,045,898 | ||||||
Wolseley PLC | 11,186 | 623,434 | ||||||
Zurich Insurance Group AG* | 6,828 | 2,048,781 | ||||||
|
| |||||||
| 54,855,707 | ||||||||
|
| |||||||
| United Kingdom — 18.6% | ||||||||
3i Group PLC | 49,216 | 356,298 | ||||||
Aberdeen Asset Management PLC | 20,127 | 150,162 | ||||||
Admiral Group PLC | 706 | 17,254 | ||||||
Aggreko PLC | 11,066 | 309,208 | ||||||
AMEC PLC | 765 | 15,490 | ||||||
Anglo American PLC | 58,248 | 1,423,029 | ||||||
Antofagasta PLC | 6,852 | 90,561 | ||||||
ARM Holdings PLC | 58,272 | 898,611 | ||||||
ASOS PLC* | 2,121 | 160,944 | ||||||
Associated British Foods PLC | 14,917 | 754,614 | ||||||
AstraZeneca PLC | 54,642 | 3,923,281 | ||||||
Aviva PLC | 143,829 | 1,263,286 | ||||||
Babcock International Group PLC | 13,173 | 268,057 | ||||||
BAE Systems PLC | 183,388 | 1,300,583 | ||||||
Barclays PLC | 631,944 | 2,616,372 | ||||||
BG Group PLC | 139,947 | 2,864,199 | ||||||
BHP Billiton PLC | 87,103 | 2,727,307 | ||||||
BP PLC | 789,050 | 6,652,678 | ||||||
British American Tobacco PLC | 81,662 | 4,928,411 | ||||||
British Land Co. PLC REIT | 44,621 | 534,773 | ||||||
British Sky Broadcasting Group PLC | 58,604 | 866,894 | ||||||
BT Group PLC | 313,355 | 2,085,216 | ||||||
Bunzl PLC | 14,110 | 395,447 | ||||||
Burberry Group PLC | 18,105 | 465,227 | ||||||
Capita PLC | 27,346 | 507,417 | ||||||
Carnival PLC | 5,264 | 213,969 | ||||||
Centrica PLC | 210,599 | 1,184,683 | ||||||
CNH Industrial NV | 38,879 | 425,576 | ||||||
Cobham PLC | 45,942 | 245,577 | ||||||
Compass Group PLC | 91,475 | 1,526,398 | ||||||
Croda International PLC | 279 | 12,313 | ||||||
Diageo PLC | 106,884 | 3,438,047 | ||||||
Direct Line Insurance Group PLC | 3,182 | 13,510 | ||||||
easyJet PLC | 667 | 17,105 | ||||||
G4S PLC | 64,989 | 272,335 | ||||||
GKN PLC | 71,318 | 469,325 | ||||||
GlaxoSmithKline PLC | 202,391 | 5,431,334 | ||||||
Hammerson PLC REIT | 29,460 | 293,321 | ||||||
Hargreaves Lansdown PLC | 6,632 | 135,510 | ||||||
HSBC Holdings PLC | 758,858 | 8,003,376 | ||||||
ICAP PLC | 21,898 | 146,674 | ||||||
IMI PLC | 11,646 | 311,749 | ||||||
| See Notes to Financial Statements. | 39 |
DBX ETF Trust
SCHEDULE OF INVESTMENTS
db X-trackers MSCI EAFE Hedged Equity Fund (Continued)
May 31, 2014
Number | Value | |||||||
| United Kingdom (Continued) | ||||||||
Imperial Tobacco Group PLC | 38,567 | $ | 1,740,263 | |||||
Inmarsat PLC | 1,120 | 13,733 | ||||||
InterContinental Hotels Group PLC | 11,596 | 457,745 | ||||||
International Consolidated Airlines Group SA* | 1,974 | 13,078 | ||||||
Intertek Group PLC | 6,813 | 333,233 | ||||||
Intu Properties PLC REIT | 2,675 | 14,124 | ||||||
Investec PLC | 29,065 | 252,119 | ||||||
ITV PLC | 152,314 | 464,915 | ||||||
J Sainsbury PLC | 50,638 | 293,766 | ||||||
Johnson Matthey PLC | 9,672 | 520,734 | ||||||
Kingfisher PLC | 97,167 | 638,453 | ||||||
Land Securities Group PLC REIT | 44,101 | 789,485 | ||||||
Legal & General Group PLC | 177,325 | 684,226 | ||||||
Lloyds Banking Group PLC* | 1,864,745 | 2,433,649 | ||||||
London Stock Exchange Group PLC | 501 | 16,443 | ||||||
Marks & Spencer Group PLC | 65,995 | 496,907 | ||||||
Meggitt PLC | 33,516 | 272,189 | ||||||
Melrose Industries PLC | 2,268 | 10,645 | ||||||
National Grid PLC | 152,700 | 2,277,997 | ||||||
Next PLC | 6,800 | 756,834 | ||||||
Old Mutual PLC | 203,094 | 687,658 | ||||||
Pearson PLC | 41,633 | 817,182 | ||||||
Persimmon PLC* | 725 | 16,260 | ||||||
Petrofac Ltd. | 733 | 15,506 | ||||||
Prudential PLC | 124,656 | 2,894,968 | ||||||
Reckitt Benckiser Group PLC | 29,501 | 2,521,918 | ||||||
Reed Elsevier PLC | 48,653 | 775,558 | ||||||
Rexam PLC | 36,760 | 327,494 | ||||||
Rio Tinto PLC | 54,485 | 2,791,878 | ||||||
Rolls-Royce Holdings PLC* | 103,740 | 1,808,438 | ||||||
Royal Bank of Scotland Group PLC* | 95,056 | 552,245 | ||||||
Royal Mail PLC* | 14,103 | 121,033 | ||||||
RSA Insurance Group PLC | 1,682 | 13,527 | ||||||
SABMiller PLC | 44,939 | 2,494,058 | ||||||
Sage Group PLC (The) | 36,034 | 247,519 | ||||||
Schroders PLC | 4,827 | 209,233 | ||||||
Segro PLC REIT | 30,671 | 189,962 | ||||||
Severn Trent PLC | 10,433 | 344,158 | ||||||
Smith & Nephew PLC | 31,969 | 560,512 | ||||||
Smiths Group PLC | 16,278 | 360,436 | ||||||
Sports Direct International PLC* | 4,200 | 55,370 | ||||||
SSE PLC | 43,326 | 1,130,010 | ||||||
Standard Chartered PLC | 89,689 | 2,018,262 | ||||||
Standard Life PLC | 50,630 | 339,463 | ||||||
Subsea 7 SA | 11,301 | 225,910 | ||||||
Tate & Lyle PLC | 26,114 | 303,122 | ||||||
Tesco PLC | 326,060 | 1,659,021 | ||||||
Travis Perkins PLC | 10,129 | 285,742 | ||||||
TUI Travel PLC | 69,621 | 478,813 | ||||||
Tullow Oil PLC | 40,833 | 576,983 | ||||||
Unilever PLC | 64,761 | 2,909,192 | ||||||
United Utilities Group PLC | 3,074 | 44,725 | ||||||
Vodafone Group PLC | 1,099,463 | 3,860,901 | ||||||
Weir Group PLC (The) | 10,854 | 476,667 | ||||||
Whitbread PLC | 10,082 | 707,408 | ||||||
William Hill PLC | 1,991 | 11,867 | ||||||
Number | Value | |||||||
| United Kingdom (Continued) | ||||||||
WM Morrison Supermarkets PLC | 91,915 | $ | 310,754 | |||||
WPP PLC | 63,026 | 1,359,635 | ||||||
|
| |||||||
| 104,700,047 | ||||||||
|
| |||||||
TOTAL COMMON STOCKS | 554,863,635 | |||||||
|
| |||||||
| PREFERRED STOCKS — 0.6% | ||||||||
| Germany — 0.6% | ||||||||
Bayerische Motoren Werke AG | 402 | 38,776 | ||||||
Fuchs Petrolub SE | 303 | 28,706 | ||||||
Henkel AG & Co. KGaA | 7,308 | 844,078 | ||||||
Porsche Automobil Holding SE | 6,028 | 643,812 | ||||||
Volkswagen AG | 5,990 | 1,592,237 | ||||||
|
| |||||||
| 3,147,609 | ||||||||
|
| |||||||
| United Kingdom — 0.0% (b) | ||||||||
Rolls-Royce Holdings PLC, Class C* | 12,558,078 | 21,050 | ||||||
|
| |||||||
TOTAL PREFERRED STOCKS | 3,168,659 | |||||||
|
| |||||||
| RIGHTS — 0.0% (b) | ||||||||
| Australia — 0.0% (b) | ||||||||
Transurban Group*, expires 6/23/14 | 439 | 0 | ||||||
|
| |||||||
| France — 0.0% (b) | ||||||||
Eurazeo SA*, expires 6/28/14 | 13 | 56 | ||||||
|
| |||||||
| Portugal — 0.0% (b) | ||||||||
Banco Espirito Santo SA*, expires 7/09/14 | 30,679 | 5,604 | ||||||
|
| |||||||
| Spain — 0.0% (b) | ||||||||
Abertis Infraestructuras SA* | 16 | 351 | ||||||
|
| |||||||
TOTAL RIGHTS | 6,011 | |||||||
|
| |||||||
| WARRANTS — 0.0% (b) | ||||||||
| Hong Kong — 0.0% (b) | ||||||||
Sun Hung Kai Properties Ltd.*, expires 4/22/16 | 4,854 | 5,979 | ||||||
|
| |||||||
TOTAL INVESTMENTS — 99.1% (Cost $527,927,429) | $ | 558,044,284 | ||||||
Other assets less liabilities — 0.9% | 5,089,202 | |||||||
|
| |||||||
NET ASSETS — 100.0% | $ | 563,133,486 | ||||||
|
| |||||||
| See Notes to Financial Statements. | 40 |
DBX ETF Trust
SCHEDULE OF INVESTMENTS
db X-trackers MSCI EAFE Hedged Equity Fund (Continued)
May 31, 2014
As of May 31, 2014, the Fund had the following futures contracts open:
Contract Description | Number of Contracts | Contract Value | Expiration Date | Unrealized Appreciation | ||||||||||||
E-mini MSCI EAFE Index Futures | 20 | $ | 1,958,700 | 6/20/2014 | $ | 81,000 | ||||||||||
As of May 31, 2014, the Fund had the following forward foreign currency contracts outstanding:
Counterparty | Settlement Date | Currency To Deliver | Currency To Receive | Unrealized Appreciation (Depreciation) | ||||||||||||||
Barclays Bank PLC | 6/4/2014 | AUD | 22,780,000 | USD | 21,055,508 | $ | (138,801 | ) | ||||||||||
Barclays Bank PLC | 6/4/2014 | AUD | 463,500 | USD | 433,960 | 2,724 | ||||||||||||
Barclays Bank PLC | 6/4/2014 | AUD | 234,000 | USD | 218,610 | 898 | ||||||||||||
JP Morgan & Chase Co. | 6/4/2014 | AUD | 22,780,000 | USD | 21,058,265 | (136,045 | ) | |||||||||||
JP Morgan & Chase Co. | 6/4/2014 | AUD | 230,000 | USD | 214,266 | 276 | ||||||||||||
JP Morgan & Chase Co. | 6/4/2014 | AUD | 463,500 | USD | 433,960 | 2,724 | ||||||||||||
JP Morgan & Chase Co. | 6/4/2014 | AUD | 234,000 | USD | 218,603 | 891 | ||||||||||||
The Bank of New York Mellon | 6/4/2014 | AUD | 264,000 | USD | 246,854 | 1,231 | ||||||||||||
Barclays Bank PLC | 6/4/2014 | CHF | 22,318,000 | USD | 25,358,511 | 435,007 | ||||||||||||
Barclays Bank PLC | 6/4/2014 | CHF | 468,500 | USD | 532,626 | 9,431 | ||||||||||||
Barclays Bank PLC | 6/4/2014 | CHF | 229,500 | USD | 257,844 | 1,551 | ||||||||||||
JP Morgan & Chase Co. | 6/4/2014 | CHF | 22,318,000 | USD | 25,353,498 | 429,995 | ||||||||||||
JP Morgan & Chase Co. | 6/4/2014 | CHF | 233,000 | USD | 265,984 | 5,783 | ||||||||||||
JP Morgan & Chase Co. | 6/4/2014 | CHF | 468,500 | USD | 532,621 | 9,426 | ||||||||||||
JP Morgan & Chase Co. | 6/4/2014 | CHF | 229,500 | USD | 257,839 | 1,546 | ||||||||||||
The Bank of New York Mellon | 6/4/2014 | CHF | 734,000 | USD | 833,806 | 14,115 | ||||||||||||
The Bank of New York Mellon | 6/4/2014 | CHF | 252,000 | USD | 281,898 | 478 | ||||||||||||
Barclays Bank PLC | 6/4/2014 | DKK | 19,756,000 | USD | 3,670,266 | 61,920 | ||||||||||||
Barclays Bank PLC | 6/4/2014 | DKK | 414,000 | USD | 76,814 | 1,199 | ||||||||||||
Barclays Bank PLC | 6/4/2014 | DKK | 210,000 | USD | 38,552 | 196 | ||||||||||||
JP Morgan & Chase Co. | 6/4/2014 | DKK | 19,756,000 | USD | 3,670,508 | 62,162 | ||||||||||||
JP Morgan & Chase Co. | 6/4/2014 | DKK | 207,000 | USD | 38,591 | 783 | ||||||||||||
JP Morgan & Chase Co. | 6/4/2014 | DKK | 414,000 | USD | 76,817 | 1,202 | ||||||||||||
JP Morgan & Chase Co. | 6/4/2014 | DKK | 210,000 | USD | 38,552 | 197 | ||||||||||||
The Bank of New York Mellon | 6/4/2014 | DKK | 45,000 | USD | 8,228 | 9 | ||||||||||||
Barclays Bank PLC | 6/4/2014 | EUR | 61,569,000 | USD | 85,359,138 | 1,431,395 | ||||||||||||
Barclays Bank PLC | 6/4/2014 | EUR | 1,254,000 | USD | 1,736,370 | 26,981 | ||||||||||||
Barclays Bank PLC | 6/4/2014 | EUR | 630,000 | USD | 863,155 | 4,371 | ||||||||||||
JP Morgan & Chase Co. | 6/4/2014 | EUR | 61,569,000 | USD | 85,360,678 | 1,432,935 | ||||||||||||
JP Morgan & Chase Co. | 6/4/2014 | EUR | 620,000 | USD | 862,555 | 17,402 | ||||||||||||
JP Morgan & Chase Co. | 6/4/2014 | EUR | 1,254,000 | USD | 1,736,374 | 26,984 | ||||||||||||
JP Morgan & Chase Co. | 6/4/2014 | EUR | 630,000 | USD | 863,144 | 4,360 | ||||||||||||
The Bank of New York Mellon | 6/4/2014 | EUR | 1,133,000 | USD | 1,546,027 | 1,579 | ||||||||||||
Barclays Bank PLC | 6/4/2014 | GBP | 34,467,000 | USD | 58,189,395 | 417,728 | ||||||||||||
Barclays Bank PLC | 6/4/2014 | GBP | 709,000 | USD | 1,200,480 | 12,094 | ||||||||||||
Barclays Bank PLC | 6/4/2014 | GBP | 356,500 | USD | 599,719 | 2,173 | ||||||||||||
JP Morgan & Chase Co. | 6/4/2014 | GBP | 34,467,000 | USD | 58,182,812 | 411,145 | ||||||||||||
JP Morgan & Chase Co. | 6/4/2014 | GBP | 352,000 | USD | 596,663 | 6,660 | ||||||||||||
JP Morgan & Chase Co. | 6/4/2014 | GBP | 709,000 | USD | 1,200,482 | 12,096 | ||||||||||||
JP Morgan & Chase Co. | 6/4/2014 | GBP | 356,500 | USD | 599,729 | 2,184 | ||||||||||||
The Bank of New York Mellon | 6/4/2014 | GBP | 185,000 | USD | 310,307 | 220 | ||||||||||||
Barclays Bank PLC | 6/4/2014 | HKD | 61,498,000 | USD | 7,932,442 | 173 | ||||||||||||
Barclays Bank PLC | 6/4/2014 | HKD | 1,196,000 | USD | 154,290 | 25 | ||||||||||||
Barclays Bank PLC | 6/4/2014 | HKD | 617,000 | USD | 79,598 | 15 | ||||||||||||
JP Morgan & Chase Co. | 6/4/2014 | HKD | 61,498,000 | USD | 7,932,752 | 483 | ||||||||||||
JP Morgan & Chase Co. | 6/4/2014 | HKD | 602,000 | USD | 77,656 | 8 | ||||||||||||
JP Morgan & Chase Co. | 6/4/2014 | HKD | 1,196,000 | USD | 154,289 | 24 | ||||||||||||
JP Morgan & Chase Co. | 6/4/2014 | HKD | 617,000 | USD | 79,598 | 14 | ||||||||||||
The Bank of New York Mellon | 6/4/2014 | HKD | 1,358,000 | USD | 175,159 | (1 | ) | |||||||||||
Barclays Bank PLC | 6/4/2014 | JPY | 5,029,199,000 | USD | 49,238,242 | (165,737 | ) | |||||||||||
| See Notes to Financial Statements. | 41 |
DBX ETF Trust
SCHEDULE OF INVESTMENTS
db X-trackers MSCI EAFE Hedged Equity Fund (Continued)
May 31, 2014
Counterparty | Settlement Date | Currency To Deliver | Currency To Receive | Unrealized Appreciation (Depreciation) | ||||||||||||||
Barclays Bank PLC | 6/4/2014 | JPY | 99,999,000 | USD | 984,664 | $ | 2,331 | |||||||||||
Barclays Bank PLC | 6/4/2014 | JPY | 51,961,500 | USD | 508,045 | (2,395 | ) | |||||||||||
JP Morgan & Chase Co. | 6/4/2014 | JPY | 5,029,199,000 | USD | 49,239,351 | (164,628 | ) | |||||||||||
JP Morgan & Chase Co. | 6/4/2014 | JPY | 49,591,000 | USD | 486,714 | (440 | ) | |||||||||||
JP Morgan & Chase Co. | 6/4/2014 | JPY | 99,999,000 | USD | 984,663 | 2,330 | ||||||||||||
JP Morgan & Chase Co. | 6/4/2014 | JPY | 51,961,500 | USD | 508,037 | (2,403 | ) | |||||||||||
The Bank of New York Mellon | 6/4/2014 | JPY | 32,700,000 | USD | 320,211 | (1,015 | ) | |||||||||||
The Bank of New York Mellon | 6/4/2014 | JPY | 50,000,000 | USD | 489,433 | (1,738 | ) | |||||||||||
The Bank of New York Mellon | 6/4/2014 | JPY | 56,600,000 | USD | 559,107 | 3,101 | ||||||||||||
Barclays Bank PLC | 6/4/2014 | NOK | 13,906,000 | USD | 2,331,141 | 5,274 | ||||||||||||
Barclays Bank PLC | 6/4/2014 | NOK | 291,000 | USD | 49,308 | 636 | ||||||||||||
Barclays Bank PLC | 6/4/2014 | NOK | 146,000 | USD | 24,619 | 200 | ||||||||||||
JP Morgan & Chase Co. | 6/4/2014 | NOK | 13,906,000 | USD | 2,331,943 | 6,076 | ||||||||||||
JP Morgan & Chase Co. | 6/4/2014 | NOK | 143,000 | USD | 24,166 | 248 | ||||||||||||
JP Morgan & Chase Co. | 6/4/2014 | NOK | 291,000 | USD | 49,308 | 636 | ||||||||||||
JP Morgan & Chase Co. | 6/4/2014 | NOK | 146,000 | USD | 24,619 | 200 | ||||||||||||
The Bank of New York Mellon | 6/4/2014 | NOK | 674,000 | USD | 112,827 | 96 | ||||||||||||
Barclays Bank PLC | 6/4/2014 | NZD | 301,000 | USD | 257,732 | 2,236 | ||||||||||||
Barclays Bank PLC | 6/4/2014 | NZD | 6,000 | USD | 5,182 | 89 | ||||||||||||
Barclays Bank PLC | 6/4/2014 | NZD | 3,000 | USD | 2,585 | 39 | ||||||||||||
JP Morgan & Chase Co. | 6/4/2014 | NZD | 301,000 | USD | 257,879 | 2,382 | ||||||||||||
JP Morgan & Chase Co. | 6/4/2014 | NZD | 3,000 | USD | 2,596 | 50 | ||||||||||||
JP Morgan & Chase Co. | 6/4/2014 | NZD | 6,000 | USD | 5,183 | 90 | ||||||||||||
JP Morgan & Chase Co. | 6/4/2014 | NZD | 3,000 | USD | 2,585 | 39 | ||||||||||||
The Bank of New York Mellon | 6/4/2014 | NZD | 8,000 | USD | 6,793 | 2 | ||||||||||||
Barclays Bank PLC | 6/4/2014 | SEK | 57,031,000 | USD | 8,745,421 | 223,794 | ||||||||||||
Barclays Bank PLC | 6/4/2014 | SEK | 1,139,500 | USD | 174,728 | 4,462 | ||||||||||||
Barclays Bank PLC | 6/4/2014 | SEK | 578,000 | USD | 88,187 | 1,822 | ||||||||||||
JP Morgan & Chase Co. | 6/4/2014 | SEK | 57,031,000 | USD | 8,745,712 | 224,085 | ||||||||||||
JP Morgan & Chase Co. | 6/4/2014 | SEK | 563,000 | USD | 86,510 | 2,386 | ||||||||||||
JP Morgan & Chase Co. | 6/4/2014 | SEK | 1,139,500 | USD | 174,725 | 4,460 | ||||||||||||
JP Morgan & Chase Co. | 6/4/2014 | SEK | 578,000 | USD | 88,187 | 1,821 | ||||||||||||
The Bank of New York Mellon | 6/4/2014 | SEK | 5,188,000 | USD | 776,666 | 1,470 | ||||||||||||
Barclays Bank PLC | 6/4/2014 | SGD | 3,855,000 | USD | 3,070,147 | (3,280 | ) | |||||||||||
Barclays Bank PLC | 6/4/2014 | SGD | 47,500 | USD | 38,104 | 235 | ||||||||||||
Barclays Bank PLC | 6/4/2014 | SGD | 23,500 | USD | 18,764 | 29 | ||||||||||||
JP Morgan & Chase Co. | 6/4/2014 | SGD | 3,855,000 | USD | 3,070,800 | (2,627 | ) | |||||||||||
JP Morgan & Chase Co. | 6/4/2014 | SGD | 24,000 | USD | 19,220 | 86 | ||||||||||||
JP Morgan & Chase Co. | 6/4/2014 | SGD | 47,500 | USD | 38,105 | 235 | ||||||||||||
JP Morgan & Chase Co. | 6/4/2014 | SGD | 23,500 | USD | 18,764 | 29 | ||||||||||||
The Bank of New York Mellon | 6/4/2014 | SGD | 535,000 | USD | 427,142 | 609 | ||||||||||||
The Bank of New York Mellon | 6/4/2014 | SGD | 167,000 | USD | 133,211 | 69 | ||||||||||||
Barclays Bank PLC | 6/4/2014 | USD | 21,849,007 | AUD | 23,477,500 | (5,749 | ) | |||||||||||
Barclays Bank PLC | 6/4/2014 | USD | 25,746,694 | CHF | 23,016,000 | (43,703 | ) | |||||||||||
Barclays Bank PLC | 6/4/2014 | USD | 3,726,250 | DKK | 20,380,000 | (3,934 | ) | |||||||||||
Barclays Bank PLC | 6/4/2014 | USD | 86,584,537 | EUR | 63,453,000 | (88,622 | ) | |||||||||||
Barclays Bank PLC | 6/4/2014 | USD | 59,600,048 | GBP | 35,532,500 | (42,449 | ) | |||||||||||
Barclays Bank PLC | 6/4/2014 | USD | 8,166,053 | HKD | 63,311,000 | 65 | ||||||||||||
Barclays Bank PLC | 6/4/2014 | USD | 50,923,389 | JPY | 5,181,159,500 | (26,637 | ) | |||||||||||
Barclays Bank PLC | 6/4/2014 | USD | 2,401,018 | NOK | 14,343,000 | (2,060 | ) | |||||||||||
Barclays Bank PLC | 6/4/2014 | USD | 263,221 | NZD | 310,000 | (85 | ) | |||||||||||
Barclays Bank PLC | 6/4/2014 | USD | 8,794,920 | SEK | 58,748,500 | (16,662 | ) | |||||||||||
Barclays Bank PLC | 6/4/2014 | USD | 3,131,681 | SGD | 3,926,000 | (1,648 | ) | |||||||||||
JP Morgan & Chase Co. | 6/4/2014 | USD | 22,064,570 | AUD | 23,707,500 | (7,323 | ) | |||||||||||
JP Morgan & Chase Co. | 6/4/2014 | USD | 26,007,047 | CHF | 23,249,000 | (43,855 | ) | |||||||||||
JP Morgan & Chase Co. | 6/4/2014 | USD | 3,764,067 | DKK | 20,587,000 | (3,943 | ) | |||||||||||
JP Morgan & Chase Co. | 6/4/2014 | USD | 87,430,812 | EUR | 64,073,000 | (89,744 | ) | |||||||||||
| See Notes to Financial Statements. | 42 |
DBX ETF Trust
SCHEDULE OF INVESTMENTS
db X-trackers MSCI EAFE Hedged Equity Fund (Continued)
May 31, 2014
Counterparty | Settlement Date | Currency To Deliver | Currency To Receive | Unrealized Appreciation (Depreciation) | ||||||||||||||
JP Morgan & Chase Co. | 6/4/2014 | USD | 60,190,866 | GBP | 35,884,500 | $ | (43,264 | ) | ||||||||||
JP Morgan & Chase Co. | 6/4/2014 | USD | 8,243,701 | HKD | 63,913,000 | 65 | ||||||||||||
JP Morgan & Chase Co. | 6/4/2014 | USD | 51,410,394 | JPY | 5,230,750,500 | (26,487 | ) | |||||||||||
JP Morgan & Chase Co. | 6/4/2014 | USD | 2,425,044 | NOK | 14,486,000 | (2,168 | ) | |||||||||||
JP Morgan & Chase Co. | 6/4/2014 | USD | 265,768 | NZD | 313,000 | (86 | ) | |||||||||||
JP Morgan & Chase Co. | 6/4/2014 | USD | 8,879,366 | SEK | 59,311,500 | (16,984 | ) | |||||||||||
JP Morgan & Chase Co. | 6/4/2014 | USD | 3,150,800 | SGD | 3,950,000 | (1,633 | ) | |||||||||||
The Bank of New York Mellon | 6/4/2014 | USD | 245,688 | AUD | 264,000 | (64 | ) | |||||||||||
The Bank of New York Mellon | 6/4/2014 | USD | 911,763 | CHF | 800,000 | (18,367 | ) | |||||||||||
The Bank of New York Mellon | 6/4/2014 | USD | 207,016 | CHF | 186,000 | 698 | ||||||||||||
The Bank of New York Mellon | 6/4/2014 | USD | 8,200 | DKK | 45,000 | 19 | ||||||||||||
The Bank of New York Mellon | 6/4/2014 | USD | 550,239 | EUR | 400,000 | (4,979 | ) | |||||||||||
The Bank of New York Mellon | 6/4/2014 | USD | 684,366 | EUR | 500,000 | (2,791 | ) | |||||||||||
The Bank of New York Mellon | 6/4/2014 | USD | 316,868 | EUR | 233,000 | 746 | ||||||||||||
The Bank of New York Mellon | 6/4/2014 | USD | 311,251 | GBP | 185,000 | (1,164 | ) | |||||||||||
The Bank of New York Mellon | 6/4/2014 | USD | 175,170 | HKD | 1,358,000 | (9 | ) | |||||||||||
The Bank of New York Mellon | 6/4/2014 | USD | 16,999 | JPY | 1,730,000 | (4 | ) | |||||||||||
The Bank of New York Mellon | 6/4/2014 | USD | 1,352,118 | JPY | 137,570,000 | (709 | ) | |||||||||||
The Bank of New York Mellon | 6/4/2014 | USD | 113,097 | NOK | 674,000 | (367 | ) | |||||||||||
The Bank of New York Mellon | 6/4/2014 | USD | 6,788 | NZD | 8,000 | 3 | ||||||||||||
The Bank of New York Mellon | 6/4/2014 | USD | 758,918 | SEK | 5,000,000 | (11,813 | ) | |||||||||||
The Bank of New York Mellon | 6/4/2014 | USD | 28,304 | SEK | 188,000 | (212 | ) | |||||||||||
The Bank of New York Mellon | 6/4/2014 | USD | 560,638 | SGD | 702,000 | (964 | ) | |||||||||||
Barclays Bank PLC | 6/5/2014 | ILS | 4,007,000 | USD | 1,157,116 | 3,757 | ||||||||||||
Barclays Bank PLC | 6/5/2014 | ILS | 83,500 | USD | 24,194 | 160 | ||||||||||||
Barclays Bank PLC | 6/5/2014 | ILS | 41,500 | USD | 11,999 | 54 | ||||||||||||
JP Morgan & Chase Co. | 6/5/2014 | ILS | 4,007,000 | USD | 1,157,155 | 3,796 | ||||||||||||
JP Morgan & Chase Co. | 6/5/2014 | ILS | 40,000 | USD | 11,607 | 94 | ||||||||||||
JP Morgan & Chase Co. | 6/5/2014 | ILS | 83,500 | USD | 24,212 | 177 | ||||||||||||
JP Morgan & Chase Co. | 6/5/2014 | ILS | 41,500 | USD | 12,000 | 54 | ||||||||||||
Barclays Bank PLC | 6/5/2014 | USD | 1,189,784 | ILS | 4,132,000 | (445 | ) | |||||||||||
JP Morgan & Chase Co. | 6/5/2014 | USD | 1,201,267 | ILS | 4,172,000 | (415 | ) | |||||||||||
Barclays Bank PLC | 7/3/2014 | AUD | 23,907,000 | USD | 22,203,937 | 6,032 | ||||||||||||
JP Morgan & Chase Co. | 7/3/2014 | AUD | 23,907,000 | USD | 22,204,463 | 6,558 | ||||||||||||
Barclays Bank PLC | 7/3/2014 | CHF | 23,425,000 | USD | 26,211,257 | 43,013 | ||||||||||||
JP Morgan & Chase Co. | 7/3/2014 | CHF | 23,425,000 | USD | 26,209,790 | 41,547 | ||||||||||||
The Bank of New York Mellon | 7/3/2014 | CHF | 837,568 | USD | 937,200 | 1,546 | ||||||||||||
Barclays Bank PLC | 7/3/2014 | DKK | 22,775,000 | USD | 4,164,942 | 4,278 | ||||||||||||
JP Morgan & Chase Co. | 7/3/2014 | DKK | 22,775,000 | USD | 4,164,876 | 4,211 | ||||||||||||
Barclays Bank PLC | 7/3/2014 | EUR | 65,304,000 | USD | 89,104,043 | 89,023 | ||||||||||||
JP Morgan & Chase Co. | 7/3/2014 | EUR | 65,304,000 | USD | 89,104,043 | 89,023 | ||||||||||||
Barclays Bank PLC | 7/3/2014 | GBP | 36,480,000 | USD | 61,175,829 | 43,165 | ||||||||||||
JP Morgan & Chase Co. | 7/3/2014 | GBP | 36,480,000 | USD | 61,175,136 | 42,472 | ||||||||||||
Barclays Bank PLC | 7/3/2014 | HKD | 62,633,000 | USD | 8,078,946 | (175 | ) | |||||||||||
JP Morgan & Chase Co. | 7/3/2014 | HKD | 62,633,000 | USD | 8,078,894 | (227 | ) | |||||||||||
The Bank of New York Mellon | 7/3/2014 | HKD | 3,145,996 | USD | 405,800 | (7 | ) | |||||||||||
Barclays Bank PLC | 7/3/2014 | ILS | 4,334,000 | USD | 1,247,388 | 180 | ||||||||||||
JP Morgan & Chase Co. | 7/3/2014 | ILS | 4,334,000 | USD | 1,247,542 | 334 | ||||||||||||
Barclays Bank PLC | 7/3/2014 | JPY | 5,541,467,000 | USD | 54,474,334 | 28,168 | ||||||||||||
JP Morgan & Chase Co. | 7/3/2014 | JPY | 5,541,467,000 | USD | 54,472,299 | 26,134 | ||||||||||||
Barclays Bank PLC | 7/3/2014 | NOK | 15,095,000 | USD | 2,523,973 | 2,157 | ||||||||||||
JP Morgan & Chase Co. | 7/3/2014 | NOK | 15,095,000 | USD | 2,524,058 | 2,242 | ||||||||||||
Barclays Bank PLC | 7/3/2014 | NZD | 454,000 | USD | 384,527 | 205 | ||||||||||||
JP Morgan & Chase Co. | 7/3/2014 | NZD | 454,000 | USD | 384,497 | 176 | ||||||||||||
Barclays Bank PLC | 7/3/2014 | SEK | 58,047,000 | USD | 8,685,107 | 16,260 | ||||||||||||
JP Morgan & Chase Co. | 7/3/2014 | SEK | 58,047,000 | USD | 8,685,185 | 16,338 | ||||||||||||
Barclays Bank PLC | 7/3/2014 | SGD | 4,675,000 | USD | 3,729,022 | 1,843 | ||||||||||||
| See Notes to Financial Statements. | 43 |
DBX ETF Trust
SCHEDULE OF INVESTMENTS
db X-trackers MSCI EAFE Hedged Equity Fund (Continued)
May 31, 2014
Counterparty | Settlement Date | Currency To Deliver | Currency To Receive | Unrealized Appreciation (Depreciation) | ||||||||||||||
JP Morgan & Chase Co. | 7/3/2014 | SGD | 4,675,000 | USD | 3,729,022 | $ | 1,843 | |||||||||||
The Bank of New York Mellon | 7/3/2014 | USD | 169,000 | AUD | 181,961 | (48 | ) | |||||||||||
The Bank of New York Mellon | 7/3/2014 | USD | 857,500 | DKK | 4,688,819 | (920 | ) | |||||||||||
The Bank of New York Mellon | 7/3/2014 | USD | 1,988,600 | EUR | 1,457,422 | (2,007 | ) | |||||||||||
The Bank of New York Mellon | 7/3/2014 | USD | 827,800 | GBP | 493,627 | (588 | ) | |||||||||||
The Bank of New York Mellon | 7/3/2014 | USD | 60,300 | ILS | 209,461 | (23 | ) | |||||||||||
The Bank of New York Mellon | 7/3/2014 | USD | 2,461,100 | JPY | 250,357,859 | (1,277 | ) | |||||||||||
The Bank of New York Mellon | 7/3/2014 | USD | 48,800 | NOK | 291,849 | (43 | ) | |||||||||||
The Bank of New York Mellon | 7/3/2014 | USD | 288,800 | NZD | 340,975 | (157 | ) | |||||||||||
The Bank of New York Mellon | 7/3/2014 | USD | 677,000 | SGD | 848,718 | (354 | ) | |||||||||||
|
| |||||||||||||||||
Total net unrealized appreciation | $ | 4,688,601 | ||||||||||||||||
|
| |||||||||||||||||
Currency Abbreviations
AUD – Australian Dollar
CHF – Swiss Franc
DKK – Danish Krone
EUR – Euro
GBP – Pound Sterling
HKD – Hong Kong Dollar
ILS – Israeli New Sheqel
JPY – Japanese Yen
NOK – Norwegian Krone
NZD – New Zealand Dollar
SEK – Swedish Krona
SGD – Singapore Dollar
USD – U.S. Dollar
* Non-income producing security.
(a) Affiliated issuer. This security is owned in proportion with its representation in the index.
(b) Less than 0.1%.
CDI – Chess Depositary Interest.
FDR – Fixed Depositary Receipt.
REIT – Real Estate Investment Trust.
RSP – Risparmio (Convertible Savings Shares).
SDR – Swedish Depositary Receipt.
| See Notes to Financial Statements. | 44 |
DBX ETF Trust
SCHEDULE OF INVESTMENTS
db X-trackers MSCI Emerging Markets Hedged Equity Fund
May 31, 2014
Number | Value | |||||||
| COMMON STOCKS — 92.6% | ||||||||
| Brazil — 6.5% | ||||||||
Ambev SA | 27,289 | $ | 193,190 | |||||
Banco Bradesco SA | 4,483 | 63,954 | ||||||
Banco do Brasil SA | 4,943 | 50,240 | ||||||
Banco Santander Brasil SA | 7,794 | 52,394 | ||||||
BB Seguridade Participacoes SA | 3,017 | 38,381 | ||||||
BM&F Bovespa SA | 19,651 | 96,312 | ||||||
BR Malls Participacoes SA | 6,101 | 50,408 | ||||||
BRF SA | 7,829 | 168,476 | ||||||
CCR SA | 9,941 | 77,964 | ||||||
Centrais Eletricas Brasileiras SA | 3,220 | 9,472 | ||||||
Cia Siderurgica Nacional SA | 9,822 | 37,661 | ||||||
Cielo SA | 9,320 | 166,531 | ||||||
Cosan SA Industria e Comercio | 1,357 | 22,799 | ||||||
CPFL Energia SA | 2,709 | 22,008 | ||||||
Duratex SA | 1,888 | 7,768 | ||||||
EcoRodovias Infraestrutura e Logistica SA | 1,109 | 7,188 | ||||||
EDP — Energias do Brasil SA | 2,033 | 8,521 | ||||||
Embraer SA | 8,813 | 80,211 | ||||||
JBS SA | 10,165 | 34,030 | ||||||
Klabin SA | 3,454 | 17,638 | ||||||
Kroton Educacional SA | 400 | 10,154 | ||||||
Localiza Rent a Car SA | 1,425 | 22,581 | ||||||
Lojas Renner SA | 2,852 | 86,198 | ||||||
Multiplan Empreendimentos Imobiliarios SA | 676 | 14,502 | ||||||
Natura Cosmeticos SA | 2,709 | 46,688 | ||||||
Petroleo Brasileiro SA | 21,829 | 153,366 | ||||||
Souza Cruz SA | 2,033 | 20,826 | ||||||
Tim Participacoes SA | 6,777 | 36,785 | ||||||
Totvs SA | 2,033 | 35,446 | ||||||
Tractebel Energia SA | 1,357 | 20,110 | ||||||
Ultrapar Participacoes SA | 4,066 | 97,734 | ||||||
Vale SA | 12,038 | 152,604 | ||||||
|
| |||||||
| 1,902,140 | ||||||||
|
| |||||||
| Chile — 1.7% | ||||||||
AES Gener SA | 46,951 | 24,716 | ||||||
Banco de Credito e Inversiones | 711 | 40,946 | ||||||
Banco Santander Chile | 409,785 | 25,589 | ||||||
CAP SA | 677 | 9,759 | ||||||
Cencosud SA | 9,197 | 32,522 | ||||||
Colbun SA | 71,270 | 17,688 | ||||||
Corpbanca SA | 1,294,340 | 15,463 | ||||||
Empresa Nacional de Electricidad SA | 36,225 | 53,300 | ||||||
Empresas CMPC SA | 13,237 | 28,927 | ||||||
Empresas Copec SA | 3,616 | 48,191 | ||||||
Enersis SA | 155,897 | 50,613 | ||||||
ENTEL Chile SA | 1,358 | 17,103 | ||||||
LATAM Airlines Group SA* | 2,608 | 37,758 | ||||||
SACI Falabella | 11,319 | 105,944 | ||||||
|
| |||||||
| 508,519 | ||||||||
|
| |||||||
| China — 16.2% | ||||||||
AAC Technologies Holdings, Inc. | 2,700 | 15,933 | ||||||
Agile Property Holdings Ltd. | 8,582 | 6,642 | ||||||
Agricultural Bank of China Ltd., Class H | 135,503 | 60,473 | ||||||
Air China Ltd., Class H | 38,549 | 22,027 | ||||||
Number | Value | |||||||
| China (Continued) | ||||||||
Anhui Conch Cement Co. Ltd., Class H | 16,941 | $ | 60,964 | |||||
Anta Sports Products Ltd. | 33,876 | 49,811 | ||||||
Bank of China Ltd., Class H | 668,983 | 318,401 | ||||||
Bank of Communications Co. Ltd., Class H | 74,526 | 49,889 | ||||||
BBMG Corp., Class H | 6,640 | 4,479 | ||||||
Belle International Holdings Ltd. | 33,876 | 33,601 | ||||||
Biostime International Holdings Ltd. | 1,370 | 9,242 | ||||||
Byd Co. Ltd., Class H* | 10,386 | 50,906 | ||||||
China BlueChemical Ltd., Class H | 28,000 | 14,988 | ||||||
China CITIC Bank Corp. Ltd., Class H | 67,757 | 39,415 | ||||||
China Communications Construction Co. Ltd., Class H | 40,652 | 27,161 | ||||||
China Communications Services Corp. Ltd., Class H | 54,080 | 25,670 | ||||||
China Construction Bank Corp., Class H | 563,030 | 413,215 | ||||||
China Gas Holdings Ltd. | 61,180 | 98,955 | ||||||
China Life Insurance Co. Ltd., Class H | 59,044 | 162,214 | ||||||
China Longyuan Power Group Corp., Class H | 60,977 | 67,796 | ||||||
China Mengniu Dairy Co. Ltd. | 22,586 | 110,849 | ||||||
China Merchants Bank Co. Ltd., Class H | 30,490 | 56,159 | ||||||
China Minsheng Banking Corp. Ltd., Class H | 57,592 | 59,130 | ||||||
China National Building Material Co. Ltd., Class H | 1,558 | 1,409 | ||||||
China Pacific Insurance Group Co. Ltd., Class H | 16,280 | 54,386 | ||||||
China Petroleum & Chemical Corp., Class H | 176,152 | 159,726 | ||||||
China Resources Cement Holdings Ltd. | 21,002 | 13,247 | ||||||
China Resources Enterprise Ltd. | 13,567 | 38,061 | ||||||
China Resources Power Holdings Co. Ltd. | 20,104 | 52,769 | ||||||
China Shenhua Energy Co. Ltd., Class H. | 27,106 | 74,295 | ||||||
China Shipping Container Lines Co. Ltd., Class H* | 31,960 | 7,709 | ||||||
China State Construction International Holdings Ltd. | 20,104 | 34,799 | ||||||
China Telecom Corp. Ltd., Class H | 121,958 | 61,349 | ||||||
CNOOC Ltd. | 124,728 | 213,968 | ||||||
Country Garden Holdings Co. Ltd. | 129,020 | 54,251 | ||||||
Dongfeng Motor Group Co. Ltd., Class H | 40,700 | 62,470 | ||||||
ENN Energy Holdings Ltd.* | 2,033 | 14,383 | ||||||
Fosun International Ltd. | 60,691 | 71,628 | ||||||
GOME Electrical Appliances Holding Ltd. | 52,855 | 8,863 | ||||||
Great Wall Motor Co. Ltd., Class H | 29,136 | 119,506 | ||||||
Guangdong Investment Ltd. | 40,876 | 45,342 | ||||||
Guangzhou R&F Properties Co. Ltd., Class H | 1,230 | 1,691 | ||||||
Haitian International Holdings Ltd. | 1,282 | 2,811 | ||||||
Hengan International Group Co. Ltd. | 4,523 | 47,984 | ||||||
Industrial & Commercial Bank of China Ltd., Class H | 466,361 | 303,170 | ||||||
Intime Retail Group Co. Ltd. | 11,745 | 11,407 | ||||||
Lee & Man Paper Manufacturing Ltd. | 115,178 | 57,344 | ||||||
Lenovo Group Ltd. | 54,260 | 67,187 | ||||||
Longfor Properties Co. Ltd. | 21,909 | 27,722 | ||||||
Nine Dragons Paper Holdings Ltd. | 48,193 | 31,329 | ||||||
PetroChina Co. Ltd., Class H | 191,254 | 228,183 | ||||||
PICC Property & Casualty Co. Ltd., Class H | 40,700 | 59,951 | ||||||
Ping An Insurance Group Co. of China Ltd., Class H | 13,567 | 104,907 | ||||||
Poly Property Group Co. Ltd. | 36,177 | 16,472 | ||||||
| See Notes to Financial Statements. | 45 |
DBX ETF Trust
SCHEDULE OF INVESTMENTS
db X-trackers MSCI Emerging Markets Hedged Equity Fund (Continued)
May 31, 2014
Number | Value | |||||||
| China (Continued) | ||||||||
Shandong Weigao Group Medical Polymer Co. Ltd., Class H | 6,900 | $ | 6,710 | |||||
Shanghai Industrial Holdings Ltd. | 20,326 | 62,790 | ||||||
Shenzhou International Group Holdings Ltd.* | 3,380 | 11,793 | ||||||
Sihuan Pharmaceutical Holdings Group Ltd. | 6,483 | 7,726 | ||||||
Sino Biopharmaceutical Ltd. | 143,091 | 116,644 | ||||||
Sinopec Engineering Group Co. Ltd., Class H | 4,600 | 5,304 | ||||||
Sinopharm Group Co. Ltd., Class H | 5,879 | 15,962 | ||||||
Soho China Ltd. | 81,303 | 63,864 | ||||||
Tencent Holdings Ltd. | 20,220 | 285,059 | ||||||
Tingyi Cayman Islands Holding Corp. | 27,106 | 77,266 | ||||||
Tsingtao Brewery Co. Ltd., Class H | 8,571 | 67,436 | ||||||
Uni-President China Holdings Ltd. | 56,235 | 43,665 | ||||||
Want Want China Holdings Ltd. | 74,526 | 104,008 | ||||||
Weichai Power Co. Ltd., Class H | 2,000 | 7,468 | ||||||
Yanzhou Coal Mining Co. Ltd., Class H | 32,000 | 25,219 | ||||||
Zhongsheng Group Holdings Ltd. | 20,548 | 25,761 | ||||||
Zhuzhou CSR Times Electric Co. Ltd., Class H | 700 | 2,059 | ||||||
Zijin Mining Group Co. Ltd., Class H | 4,918 | 1,135 | ||||||
Zoomlion Heavy Industry Science and Technology Co. Ltd., Class H | 26,100 | 17,371 | ||||||
|
| |||||||
| 4,753,479 | ||||||||
|
| |||||||
| Colombia — 0.7% | ||||||||
Almacenes Exito SA | 1,358 | 21,822 | ||||||
Cementos Argos SA | 3,400 | 19,346 | ||||||
Cemex Latam Holdings SA* | 4,134 | 37,985 | ||||||
Grupo de Inversiones Suramericana SA | 3,056 | 61,666 | ||||||
Interconexion Electrica SA ESP* | 5,434 | 25,766 | ||||||
Isagen SA ESP | 25,794 | 39,003 | ||||||
|
| |||||||
| 205,588 | ||||||||
|
| |||||||
| Czech Republic — 0.2% | ||||||||
CEZ AS | 1,358 | 39,749 | ||||||
Telefonica Czech Republic AS | 344 | 4,985 | ||||||
|
| |||||||
| 44,734 | ||||||||
|
| |||||||
| Egypt — 0.2% | ||||||||
Commercial International Bank Egypt SAE | 6,029 | 30,430 | ||||||
Talaat Moustafa Group | 352 | 450 | ||||||
Telecom Egypt Co. | 16,602 | 31,763 | ||||||
|
| |||||||
| 62,643 | ||||||||
|
| |||||||
| Greece — 0.7% | ||||||||
Alpha Bank AE* | 645 | 607 | ||||||
Eurobank Ergasias SA* | 5,700 | 3,186 | ||||||
Hellenic Telecommunications Organization SA* | 3,282 | 47,021 | ||||||
National Bank of Greece SA* | 10,062 | 35,936 | ||||||
OPAP SA | 1,872 | 31,796 | ||||||
Piraeus Bank SA* | 17,700 | 43,430 | ||||||
Public Power Corp. SA | 2,631 | 39,451 | ||||||
Titan Cement Co. SA* | 600 | 18,165 | ||||||
|
| |||||||
| 219,592 | ||||||||
|
| |||||||
| Hong Kong — 2.4% | ||||||||
Beijing Enterprises Holdings Ltd. | 5,420 | 46,315 | ||||||
Beijing Enterprises Water Group Ltd. | 27,611 | 17,664 | ||||||
Brilliance China Automotive Holdings Ltd. | 7,681 | 12,741 | ||||||
Number | Value | |||||||
| Hong Kong (Continued) | ||||||||
China Everbright International Ltd. | 30,859 | $ | 39,285 | |||||
China Mobile Ltd. | 44,070 | 431,153 | ||||||
China Overseas Land & Investment Ltd. | 40,700 | 106,042 | ||||||
China Taiping Insurance Holdings Co. Ltd.* | 245 | 427 | ||||||
CITIC 21CN Co. Ltd.* | 10,000 | 7,984 | ||||||
Hanergy Solar Group Ltd.* | 2,000 | 292 | ||||||
Kunlun Energy Co. Ltd.* | 24,527 | 39,988 | ||||||
|
| |||||||
| 701,891 | ||||||||
|
| |||||||
| Hungary — 0.4% | ||||||||
MOL Hungarian Oil and Gas PLC | 2,192 | 126,368 | ||||||
|
| |||||||
| India — 5.6% | ||||||||
Dr. Reddy’s Laboratories Ltd., ADR | 3,717 | 152,806 | ||||||
HDFC Bank Ltd., ADR | 5,876 | 264,595 | ||||||
ICICI Bank Ltd., ADR* | 4,467 | 221,876 | ||||||
Infosys Ltd., ADR | 2,037 | 104,763 | ||||||
Larsen & Toubro Ltd., GDR | 8,297 | 216,303 | ||||||
Reliance Industries Ltd., GDR, 144A | 9,981 | 357,020 | ||||||
Tata Motors Ltd., ADR | 5,203 | 193,760 | ||||||
Wipro Ltd., ADR | 12,226 | 136,198 | ||||||
|
| |||||||
| 1,647,321 | ||||||||
|
| |||||||
| Indonesia — 2.6% | ||||||||
PT Astra Agro Lestari Tbk | 6,777 | 15,861 | ||||||
PT Astra International Tbk | 168,663 | 102,209 | ||||||
PT Bank Central Asia Tbk | 98,238 | 90,665 | ||||||
PT Bank Danamon Indonesia Tbk* | 41,829 | 14,904 | ||||||
PT Bank Mandiri Persero Tbk | 84,691 | 73,810 | ||||||
PT Bank Negara Indonesia Persero Tbk | 64,366 | 26,325 | ||||||
PT Bank Rakyat Indonesia Persero Tbk | 91,468 | 79,912 | ||||||
PT Charoen Pokphand Indonesia Tbk | 110,801 | 35,827 | ||||||
PT Gudang Garam Tbk | 5,420 | 24,164 | ||||||
PT Indo Tambangraya Megah Tbk | 831 | 2,039 | ||||||
PT Lippo Karawaci Tbk | 6,700 | 594 | ||||||
PT Matahari Department Store Tbk* | 3,690 | 4,591 | ||||||
PT Perusahaan Gas Negara Persero Tbk | 145,668 | 67,687 | ||||||
PT Semen Indonesia Persero Tbk | 27,106 | 34,187 | ||||||
PT Telekomunikasi Indonesia Persero Tbk | 406,949 | 89,756 | ||||||
PT Unilever Indonesia Tbk | 13,567 | 33,845 | ||||||
PT United Tractors Tbk | 23,350 | 43,350 | ||||||
PT XL Axiata Tbk | 29,138 | 13,664 | ||||||
|
| |||||||
| 753,390 | ||||||||
|
| |||||||
| Malaysia — 5.0% | ||||||||
AirAsia Bhd* | 21,200 | 16,495 | ||||||
AMMB Holdings Bhd | 14,800 | 33,810 | ||||||
Axiata Group Bhd | 3,500 | 7,549 | ||||||
British American Tobacco Malaysia Bhd | 5,300 | 103,757 | ||||||
CIMB Group Holdings Bhd | 39,800 | 90,923 | ||||||
DiGi.Com Bhd | 37,500 | 63,259 | ||||||
Genting Bhd | 18,900 | 57,236 | ||||||
Genting Malaysia Bhd | 26,200 | 33,188 | ||||||
Hong Leong Bank Bhd | 13,500 | 58,319 | ||||||
IOI Corp. Bhd | 38,300 | 58,767 | ||||||
IOI Properties Group Bhd* | 12,466 | 9,622 | ||||||
Kuala Lumpur Kepong Bhd | 5,000 | 37,224 | ||||||
Lafarge Malaysia Bhd | 24,300 | 74,723 | ||||||
| See Notes to Financial Statements. | 46 |
DBX ETF Trust
SCHEDULE OF INVESTMENTS
db X-trackers MSCI Emerging Markets Hedged Equity Fund (Continued)
May 31, 2014
Number | Value | |||||||
| Malaysia (Continued) | ||||||||
Malayan Banking Bhd | 26,600 | $ | 81,795 | |||||
Maxis Bhd | 32,300 | 66,047 | ||||||
MMC Corp. Bhd | 22,000 | 18,556 | ||||||
Petronas Chemicals Group Bhd | 29,400 | 61,673 | ||||||
Petronas Dagangan Bhd | 13,100 | 102,908 | ||||||
Petronas Gas Bhd | 6,200 | 47,277 | ||||||
Public Bank Bhd | 15,800 | 106,219 | ||||||
RHB Capital Bhd | 5,800 | 15,163 | ||||||
Sime Darby Bhd | 22,000 | 65,390 | ||||||
Telekom Malaysia Bhd | 24,200 | 46,547 | ||||||
Tenaga Nasional Bhd | 26,800 | 100,594 | ||||||
UMW Holdings Bhd | 18,400 | 61,849 | ||||||
YTL Corp. Bhd | 42,893 | 21,760 | ||||||
YTL Power International Bhd* | 30,870 | 14,508 | ||||||
|
| |||||||
| 1,455,158 | ||||||||
|
| |||||||
| Mexico — 5.2% | ||||||||
Alfa SAB de CV, Class A | 27,106 | 75,859 | ||||||
America Movil SAB de CV, Series L | 306,372 | 296,207 | ||||||
Arca Continental SAB de CV | 6,777 | 44,126 | ||||||
Cemex SAB de CV* | 128,147 | 165,062 | ||||||
Coca-Cola Femsa SAB de CV, Series L | 2,710 | 31,180 | ||||||
Fomento Economico Mexicano SAB de CV | 15,611 | 148,187 | ||||||
Grupo Bimbo SAB de CV | 14,934 | 43,211 | ||||||
Grupo Carso SAB de CV, Series A1 | 6,099 | 31,656 | ||||||
Grupo Financiero Banorte SAB de CV, Class O | 16,942 | 122,527 | ||||||
Grupo Financiero Inbursa SAB de CV, Class O | 28,457 | 77,979 | ||||||
Grupo Financiero Santander Mexico SAB de CV, Class B | 9,054 | 24,078 | ||||||
Grupo Mexico SAB de CV, Series B | 32,899 | 108,345 | ||||||
Grupo Televisa SAB, Series CPO | 27,586 | 186,353 | ||||||
Industrias Penoles SAB de CV | 1,131 | 27,366 | ||||||
Minera Frisco SAB de CV, Class A1* | 5,421 | 10,432 | ||||||
Wal-Mart de Mexico SAB de CV, Series V | 50,899 | 129,658 | ||||||
|
| |||||||
| 1,522,226 | ||||||||
|
| |||||||
| Peru — 0.1% | ||||||||
Cia de Minas Buenaventura SA, Class B, ADR | 1,021 | 10,914 | ||||||
Credicorp Ltd. | 140 | 21,875 | ||||||
|
| |||||||
| 32,789 | ||||||||
|
| |||||||
| Philippines — 1.3% | ||||||||
Aboitiz Power Corp. | 31,700 | 26,081 | ||||||
Ayala Land, Inc. | 77,500 | 53,137 | ||||||
Bank of the Philippine Islands | 16,660 | 32,174 | ||||||
BDO Unibank, Inc. | 16,429 | 33,192 | ||||||
Energy Development Corp. | 137,000 | 18,724 | ||||||
Metropolitan Bank & Trust Company | 16,789 | 32,039 | ||||||
Philippine Long Distance Telephone Co. | 675 | 43,504 | ||||||
SM Investments Corp. | 1,660 | 29,820 | ||||||
Universal Robina Corp. | 30,040 | 102,296 | ||||||
|
| |||||||
| 370,967 | ||||||||
|
| |||||||
| Poland — 2.9% | ||||||||
Bank Pekao SA | 2,489 | 152,181 | ||||||
Enea SA | 4,819 | 25,414 | ||||||
Orange Polska SA | 16,680 | 57,452 | ||||||
PGE SA | 14,966 | 103,343 | ||||||
Number | Value | |||||||
| Poland (Continued) | ||||||||
Powszechna Kasa Oszczednosci Bank Polski SA | 11,266 | $ | 150,760 | |||||
Powszechny Zaklad Ubezpieczen SA | 2,118 | 311,631 | ||||||
Synthos SA | 25,672 | 37,316 | ||||||
|
| |||||||
| 838,097 | ||||||||
|
| |||||||
| Russia — 5.5% | ||||||||
Gazprom OAO, ADR* | 12,677 | 103,330 | ||||||
Lukoil OAO, ADR | 3,876 | 219,304 | ||||||
Magnit OJSC, GDR | 3,328 | 193,690 | ||||||
MegaFon OAO, GDR* | 3,566 | 107,087 | ||||||
MMC Norilsk Nickel OJSC, ADR | 12,639 | 243,806 | ||||||
Mobile Telesystems OJSC, ADR | 2,716 | 50,219 | ||||||
NovaTek OAO, GDR | 1,510 | 175,160 | ||||||
Rosneft Oil Co. OJSC, GDR* | 32,759 | 213,654 | ||||||
Sistema JSFC, GDR* | 2,697 | 77,269 | ||||||
Surgutneftegas OJSC, ADR* | 10,185 | 74,707 | ||||||
Tatneft, ADR* | 1,704 | 60,918 | ||||||
VTB Bank OJSC, GDR* | 33,931 | 91,139 | ||||||
|
| |||||||
| 1,610,283 | ||||||||
|
| |||||||
| South Africa — 4.6% | ||||||||
AngloGold Ashanti Ltd., ADR* | 7,117 | 112,378 | ||||||
Gold Fields Ltd., ADR | 29,573 | 104,688 | ||||||
Harmony Gold Mining Co. Ltd., ADR* | 33,259 | 88,136 | ||||||
Impala Platinum Holdings Ltd., ADR | 12,329 | 127,729 | ||||||
MTN Group Ltd., ADR | 23,906 | 509,197 | ||||||
Sasol Ltd., ADR | 7,196 | 405,063 | ||||||
|
| |||||||
| 1,347,191 | ||||||||
|
| |||||||
| South Korea — 16.0% | ||||||||
Amorepacific Corp. | 50 | 71,015 | ||||||
Celltrion, Inc.* | 426 | 20,315 | ||||||
Cheil Industries, Inc. | 1,492 | 97,107 | ||||||
Coway Co. Ltd. | 1,456 | 122,451 | ||||||
Daewoo Engineering & Construction Co. Ltd.* | 2,080 | 17,024 | ||||||
Daewoo International Corp. | 620 | 19,569 | ||||||
DGB Financial Group, Inc. | 1,350 | 20,643 | ||||||
Doosan Corp. | 181 | 22,621 | ||||||
Doosan Heavy Industries & Construction Co. Ltd. | 620 | 20,389 | ||||||
Doosan Infracore Co. Ltd.* | 680 | 8,165 | ||||||
E-Mart Co. Ltd. | 458 | 105,050 | ||||||
Hana Financial Group, Inc. | 1,890 | 68,638 | ||||||
Hankook Tire Co. Ltd. | 273 | 16,189 | ||||||
Hanwha Corp. | 620 | 16,469 | ||||||
Hanwha Life Insurance Co. Ltd. | 5,480 | 34,807 | ||||||
Hyundai Department Store Co. Ltd. | 116 | 15,009 | ||||||
Hyundai Engineering & Construction Co. Ltd. | 876 | 45,852 | ||||||
Hyundai Heavy Industries Co. Ltd. | 344 | 62,380 | ||||||
Hyundai Merchant Marine Co. Ltd.* | 680 | 6,339 | ||||||
Hyundai Mipo Dockyard Co. Ltd. | 121 | 19,155 | ||||||
Hyundai Mobis | 532 | 150,183 | ||||||
Hyundai Motor Co. | 1,274 | 280,350 | ||||||
Hyundai Steel Co. | 577 | 38,912 | ||||||
Hyundai Wia Corp. | 158 | 27,877 | ||||||
Kangwon Land, Inc. | 620 | 18,505 | ||||||
KB Financial Group, Inc. | 3,232 | 110,088 | ||||||
Kia Motors Corp. | 2,485 | 143,225 | ||||||
| See Notes to Financial Statements. | 47 |
DBX ETF Trust
SCHEDULE OF INVESTMENTS
db X-trackers MSCI Emerging Markets Hedged Equity Fund (Continued)
May 31, 2014
Number | Value | |||||||
| South Korea (Continued) | ||||||||
Korea Electric Power Corp. | 250 | $ | 9,581 | |||||
Korea Gas Corp.* | 594 | 33,945 | ||||||
Korean Air Lines Co. Ltd.* | 261 | 8,532 | ||||||
KT&G Corp. | 2,082 | 169,384 | ||||||
Kumho Petro Chemical Co. Ltd. | 84 | 6,686 | ||||||
LG Chem Ltd. | 375 | 95,570 | ||||||
LG Corp. | 903 | 53,727 | ||||||
LG Display Co. Ltd.* | 1,080 | 28,741 | ||||||
LG Electronics, Inc. | 795 | 56,808 | ||||||
LG Household & Health Care Ltd. | 134 | 66,987 | ||||||
LG Uplus Corp. | 6,690 | 62,887 | ||||||
Lotte Shopping Co. Ltd. | 154 | 44,983 | ||||||
LS Corp. | 605 | 42,638 | ||||||
NAVER Corp. | 128 | 95,103 | ||||||
NCSoft Corp. | 135 | 22,297 | ||||||
Neo Holdings Co. Ltd.* | 26 | — | ||||||
OCI Co. Ltd.* | 181 | 31,048 | ||||||
POSCO | 499 | 141,355 | ||||||
Samsung C&T Corp. | 1,011 | 72,341 | ||||||
Samsung Card Co. Ltd. | 620 | 22,820 | ||||||
Samsung Electro-Mechanics Co. Ltd. | 282 | 17,387 | ||||||
Samsung Electronics Co. Ltd. | 717 | 1,014,146 | ||||||
Samsung Fire & Marine Insurance Co. Ltd. | 675 | 172,025 | ||||||
Samsung Heavy Industries Co. Ltd. | 1,620 | 44,700 | ||||||
Samsung Life Insurance Co. Ltd. | 2,135 | 209,064 | ||||||
Samsung SDI Co. Ltd. | 375 | 55,688 | ||||||
Shinhan Financial Group Co. Ltd. | 3,250 | 141,284 | ||||||
SK C&C Co. Ltd. | 166 | 26,929 | ||||||
SK Holdings Co. Ltd. | 356 | 64,206 | ||||||
SK Hynix, Inc.* | 4,690 | 202,964 | ||||||
SK Innovation Co. Ltd. | 273 | 28,499 | ||||||
SK Networks Co. Ltd.* | 2,080 | 19,328 | ||||||
S-Oil Corp. | 484 | 26,140 | ||||||
Woori Finance Holdings Co. Ltd.* | 4,077 | 47,955 | ||||||
|
| |||||||
| 4,714,075 | ||||||||
|
| |||||||
| Taiwan — 10.3% | ||||||||
Advanced Semiconductor Engineering, Inc., ADR | 69,615 | 448,321 | ||||||
AU Optronics Corp., ADR* | 25,295 | 94,603 | ||||||
Chunghwa Telecom Co. Ltd., ADR | 11,134 | 354,618 | ||||||
Hon Hai Precision Industry Co. Ltd., GDR | 101,523 | 632,489 | ||||||
Siliconware Precision Industries Co., ADR | 48,673 | 384,517 | ||||||
Taiwan Semiconductor Manufacturing Co. Ltd., ADR | 41,728 | 857,927 | ||||||
United Microelectronics Corp., ADR | 112,024 | 257,655 | ||||||
|
| |||||||
| 3,030,130 | ||||||||
|
| |||||||
| Thailand — 2.3% | ||||||||
Bangkok Bank PCL, NVDR | 13,000 | 73,256 | ||||||
Indorama Ventures PCL, NVDR | 135,700 | 103,335 | ||||||
IRPC PCL, NVDR | 654,708 | 70,596 | ||||||
Kasikornbank PCL, NVDR | 15,800 | 90,238 | ||||||
Krung Thai Bank PCL, NVDR | 163,100 | 93,896 | ||||||
PTT Exploration & Production PCL, NVDR | 11,600 | 54,237 | ||||||
PTT PCL, NVDR | 5,800 | 51,940 | ||||||
Siam Commercial Bank PCL, NVDR | 19,300 | 93,472 | ||||||
Number | Value | |||||||
| Thailand (Continued) | ||||||||
Thai Oil PCL, NVDR | 32,300 | $ | 48,947 | |||||
|
| |||||||
| 679,917 | ||||||||
|
| |||||||
| Turkey—2.1% | ||||||||
Akbank TAS | 14,806 | 57,744 | ||||||
Arcelik AS | 5,924 | 37,283 | ||||||
BIM Birlesik Magazalar AS | 2,684 | 58,929 | ||||||
Emlak Konut Gayrimenkul Yatirim Ortakligi AS REIT | 11,537 | 14,742 | ||||||
Enka Insaat ve Sanayi AS | 9,771 | 27,160 | ||||||
Eregli Demir ve Celik Fabrikalari TAS | 13,262 | 19,728 | ||||||
Ford Otomotiv Sanayi AS* | 3,504 | 46,444 | ||||||
Haci Omer Sabanci Holding AS | 4,754 | 23,119 | ||||||
TAV Havalimanlari Holding AS | 593 | 4,722 | ||||||
Tofas Turk Otomobil Fabrikasi AS | 2,687 | 16,654 | ||||||
Turk Hava Yollari* | 12,462 | 42,363 | ||||||
Turk Telekomunikasyon AS | 4,076 | 11,796 | ||||||
Turkcell Iletisim Hizmetleri AS* | 11,999 | 75,230 | ||||||
Turkiye Garanti Bankasi AS | 17,023 | 69,393 | ||||||
Turkiye Halk Bankasi AS | 2,723 | 21,162 | ||||||
Turkiye Is Bankasi, Class C | 21,503 | 61,206 | ||||||
Turkiye Vakiflar Bankasi TAO, Class D | 8,823 | 21,286 | ||||||
Yapi ve Kredi Bankasi AS | 8,145 | 18,990 | ||||||
|
| |||||||
| 627,951 | ||||||||
|
| |||||||
| United States — 0.1% | ||||||||
Southern Copper Corp. | 1,048 | 31,147 | ||||||
|
| |||||||
TOTAL COMMON STOCKS | 27,185,596 | |||||||
|
| |||||||
| PREFERRED STOCKS — 5.9% | ||||||||
| Brazil — 5.1% | ||||||||
AES Tiete SA | 557 | 4,254 | ||||||
Banco Bradesco SA | 16,378 | 228,165 | ||||||
Bradespar SA | 2,341 | 19,436 | ||||||
Braskem SA | 4,066 | 26,571 | ||||||
Cia Brasileira de Distribuicao. | 1,357 | 61,663 | ||||||
Cia Energetica de Minas Gerais | 7,747 | 53,876 | ||||||
Gerdau SA | 8,129 | 48,368 | ||||||
Itau Unibanco Holding SA | 24,709 | 384,923 | ||||||
Itausa — Investimentos Itau SA | 26,821 | 102,241 | ||||||
Metalurgica Gerdau SA | 4,067 | 29,609 | ||||||
Oi SA | 2,709 | 2,346 | ||||||
Petroleo Brasileiro SA | 34,175 | 254,600 | ||||||
Telefonica Brasil SA | 3,385 | 67,615 | ||||||
Vale SA | 18,423 | 210,849 | ||||||
|
| |||||||
| 1,494,516 | ||||||||
|
| |||||||
| Chile — 0.1% | ||||||||
Sociedad Quimica y Minera de Chile SA, Class B | 1,510 | 45,690 | ||||||
|
| |||||||
| Colombia — 0.1% | ||||||||
Bancolombia SA | 810 | 11,318 | ||||||
Grupo Argos SA | 524 | 5,720 | ||||||
|
| |||||||
| 17,038 | ||||||||
|
| |||||||
| See Notes to Financial Statements. | 48 |
DBX ETF Trust
SCHEDULE OF INVESTMENTS
db X-trackers MSCI Emerging Markets Hedged Equity Fund (Continued)
May 31, 2014
Number | Value | |||||||
| South Korea — 0.6% | ||||||||
Samsung Electronics Co. Ltd. | 160 | $ | 173,613 | |||||
|
| |||||||
TOTAL PREFERRED STOCKS | 1,730,857 | |||||||
|
| |||||||
| RIGHTS — 0.0% (a) | ||||||||
| China — 0.0% (a) | ||||||||
Uni-President China Holdings Ltd.*, expires 7/17/14 | 11,247 | 2,118 | ||||||
|
| |||||||
TOTAL INVESTMENTS — 98.5% (Cost $27,358,937) | $ | 28,918,571 | ||||||
Other assets less liabilities — 1.5% | 454,275 | |||||||
|
| |||||||
NET ASSETS — 100.0% | $ | 29,372,846 | ||||||
|
| |||||||
As of May 31, 2014, the Fund had the following futures contracts open:
Contract Description | Number of Contracts | Contract Value | Expiration Date | Unrealized Appreciation | ||||||||||||
E-mini MSCI Emerging Markets Index Futures | 4 | $ | 204,920 | 6/20/2014 | $ | 15,820 | ||||||||||
As of May 31, 2014, the Fund had the following forward foreign currency contracts outstanding:
Counterparty | Settlement Date | Currency To Deliver | Currency To Receive | Unrealized Appreciation (Depreciation) | ||||||||||||||
Barclays Bank PLC | 6/4/2014 | BRL | 3,910,000 | USD | 1,731,698 | $ | (11,632 | ) | ||||||||||
JP Morgan & Chase Co. | 6/4/2014 | BRL | 3,910,000 | USD | 1,732,580 | (10,750 | ) | |||||||||||
The Bank of New York Mellon | 6/4/2014 | BRL | 32,000 | USD | 14,279 | 12 | ||||||||||||
JP Morgan & Chase Co. | 6/4/2014 | CLP | 309,297,000 | USD | 545,839 | (16,846 | ) | |||||||||||
JP Morgan & Chase Co. | 6/4/2014 | CZK | 913,000 | USD | 46,095 | 799 | ||||||||||||
JP Morgan & Chase Co. | 6/4/2014 | EGP | 472,000 | USD | 66,525 | 698 | ||||||||||||
JP Morgan & Chase Co. | 6/4/2014 | EUR | 111,000 | USD | 153,893 | 2,583 | ||||||||||||
Barclays Bank PLC | 6/4/2014 | HKD | 42,076,000 | USD | 5,427,257 | 118 | ||||||||||||
The Bank of New York Mellon | 6/4/2014 | HKD | 408,000 | USD | 52,628 | 2 | ||||||||||||
The Bank of New York Mellon | 6/4/2014 | HKD | 46,000 | USD | 5,933 | — | ||||||||||||
JP Morgan & Chase Co. | 6/4/2014 | HUF | 40,726,000 | USD | 183,463 | 143 | ||||||||||||
The Bank of New York Mellon | 6/4/2014 | HUF | 1,800,000 | USD | 8,110 | 8 | ||||||||||||
Barclays Bank PLC | 6/4/2014 | IDR | 8,737,259,000 | USD | 753,992 | 6,126 | ||||||||||||
Barclays Bank PLC | 6/4/2014 | INR | 93,135,000 | USD | 1,535,108 | (39,642 | ) | |||||||||||
The Bank of New York Mellon | 6/4/2014 | INR | 2,688,300 | USD | 45,000 | (454 | ) | |||||||||||
The Bank of New York Mellon | 6/4/2014 | INR | 1,969,700 | USD | 33,328 | 24 | ||||||||||||
JP Morgan & Chase Co. | 6/4/2014 | MXN | 19,508,000 | USD | 1,486,695 | (30,187 | ) | |||||||||||
The Bank of New York Mellon | 6/4/2014 | MXN | 60,000 | USD | 4,662 | (3 | ) | |||||||||||
Barclays Bank PLC | 6/4/2014 | MYR | 4,733,000 | USD | 1,446,825 | (25,820 | ) | |||||||||||
Barclays Bank PLC | 6/4/2014 | PHP | 16,073,000 | USD | 361,232 | (6,090 | ) | |||||||||||
JP Morgan & Chase Co. | 6/4/2014 | PLN | 3,391,000 | USD | 1,117,904 | 505 | ||||||||||||
The Bank of New York Mellon | 6/4/2014 | PLN | 12,000 | USD | 3,954 | — | ||||||||||||
The Bank of New York Mellon | 6/4/2014 | PLN | 82,000 | USD | 27,058 | 38 | ||||||||||||
JP Morgan & Chase Co. | 6/4/2014 | RUB | 43,667,000 | USD | 1,215,566 | (34,895 | ) | |||||||||||
Barclays Bank PLC | 6/4/2014 | THB | 22,526,000 | USD | 694,561 | 8,542 | ||||||||||||
Barclays Bank PLC | 6/4/2014 | TRY | 1,072,000 | USD | 502,082 | (8,544 | ) | |||||||||||
The Bank of New York Mellon | 6/4/2014 | TRY | 14,000 | USD | 6,682 | 13 | ||||||||||||
Barclays Bank PLC | 6/4/2014 | USD | 1,743,201 | BRL | 3,910,000 | 129 | ||||||||||||
Barclays Bank PLC | 6/4/2014 | USD | 5,427,095 | HKD | 42,076,000 | 43 | ||||||||||||
Barclays Bank PLC | 6/4/2014 | USD | 744,864 | IDR | 8,737,259,000 | 3,001 | ||||||||||||
| See Notes to Financial Statements. | 49 |
DBX ETF Trust
SCHEDULE OF INVESTMENTS
db X-trackers MSCI Emerging Markets Hedged Equity Fund (Continued)
May 31, 2014
Counterparty | Settlement Date | Currency To Deliver | Currency To Receive | Unrealized Appreciation (Depreciation) | ||||||||||||||
Barclays Bank PLC | 6/4/2014 | USD | 1,573,492 | INR | 93,135,000 | $ | 1,259 | |||||||||||
Barclays Bank PLC | 6/4/2014 | USD | 1,471,704 | MYR | 4,733,000 | 941 | ||||||||||||
Barclays Bank PLC | 6/4/2014 | USD | 366,378 | PHP | 16,073,000 | 943 | ||||||||||||
Barclays Bank PLC | 6/4/2014 | USD | 685,744 | THB | 22,526,000 | 274 | ||||||||||||
Barclays Bank PLC | 6/4/2014 | USD | 511,653 | TRY | 1,072,000 | (1,028 | ) | |||||||||||
JP Morgan & Chase Co. | 6/4/2014 | USD | 1,746,705 | BRL | 3,910,000 | (3,376 | ) | |||||||||||
JP Morgan & Chase Co. | 6/4/2014 | USD | 561,399 | CLP | 309,297,000 | 1,286 | ||||||||||||
JP Morgan & Chase Co. | 6/4/2014 | USD | 45,306 | CZK | 913,000 | (10 | ) | |||||||||||
JP Morgan & Chase Co. | 6/4/2014 | USD | 66,011 | EGP | 472,000 | (184 | ) | |||||||||||
JP Morgan & Chase Co. | 6/4/2014 | USD | 151,465 | EUR | 111,000 | (155 | ) | |||||||||||
JP Morgan & Chase Co. | 6/4/2014 | USD | 183,511 | HUF | 40,726,000 | (191 | ) | |||||||||||
JP Morgan & Chase Co. | 6/4/2014 | USD | 1,515,950 | MXN | 19,508,000 | 932 | ||||||||||||
JP Morgan & Chase Co. | 6/4/2014 | USD | 1,119,031 | PLN | 3,391,000 | (1,632 | ) | |||||||||||
JP Morgan & Chase Co. | 6/4/2014 | USD | 1,252,792 | RUB | 43,667,000 | (2,331 | ) | |||||||||||
JP Morgan & Chase Co. | 6/4/2014 | USD | 1,261,840 | ZAR | 13,355,000 | (777 | ) | |||||||||||
The Bank of New York Mellon | 6/4/2014 | USD | 14,267 | BRL | 32,000 | 1 | ||||||||||||
The Bank of New York Mellon | 6/4/2014 | USD | 58,562 | HKD | 454,000 | (3 | ) | |||||||||||
The Bank of New York Mellon | 6/4/2014 | USD | 8,044 | HUF | 1,800,000 | 58 | ||||||||||||
The Bank of New York Mellon | 6/4/2014 | USD | 79,706 | INR | 4,658,000 | (947 | ) | |||||||||||
The Bank of New York Mellon | 6/4/2014 | USD | 4,660 | MXN | 60,000 | 6 | ||||||||||||
The Bank of New York Mellon | 6/4/2014 | USD | 30,755 | PLN | 94,000 | 220 | ||||||||||||
The Bank of New York Mellon | 6/4/2014 | USD | 6,649 | TRY | 14,000 | 20 | ||||||||||||
JP Morgan & Chase Co. | 6/4/2014 | ZAR | 13,355,000 | USD | 1,262,158 | 1,095 | ||||||||||||
JP Morgan & Chase Co. | 6/5/2014 | COP | 404,622,000 | USD | 208,600 | (4,499 | ) | |||||||||||
Barclays Bank PLC | 6/5/2014 | KRW | 2,570,372,000 | USD | 2,484,315 | (34,526 | ) | |||||||||||
JP Morgan & Chase Co. | 6/5/2014 | KRW | 2,570,372,000 | USD | 2,483,379 | (35,462 | ) | |||||||||||
The Bank of New York Mellon | 6/5/2014 | KRW | 35,889,350 | USD | 35,000 | (170 | ) | |||||||||||
Barclays Bank PLC | 6/5/2014 | TWD | 89,148,000 | USD | 2,956,326 | (16,968 | ) | |||||||||||
The Bank of New York Mellon | 6/5/2014 | TWD | 1,434,000 | USD | 47,610 | (218 | ) | |||||||||||
Barclays Bank PLC | 6/5/2014 | USD | 2,516,642 | KRW | 2,570,372,000 | 2,200 | ||||||||||||
Barclays Bank PLC | 6/5/2014 | USD | 2,971,600 | TWD | 89,148,000 | 1,693 | ||||||||||||
JP Morgan & Chase Co. | 6/5/2014 | USD | 212,893 | COP | 404,622,000 | 207 | ||||||||||||
JP Morgan & Chase Co. | 6/5/2014 | USD | 2,519,479 | KRW | 2,570,372,000 | (637 | ) | |||||||||||
The Bank of New York Mellon | 6/5/2014 | USD | 35,178 | KRW | 35,889,350 | (8 | ) | |||||||||||
The Bank of New York Mellon | 6/5/2014 | USD | 47,775 | TWD | 1,434,000 | 52 | ||||||||||||
Barclays Bank PLC | 7/3/2014 | BRL | 3,903,000 | USD | 1,725,235 | (698 | ) | |||||||||||
JP Morgan & Chase Co. | 7/3/2014 | BRL | 3,903,000 | USD | 1,728,751 | 2,817 | ||||||||||||
JP Morgan & Chase Co. | 7/3/2014 | CLP | 308,156,000 | USD | 557,305 | (1,525 | ) | |||||||||||
JP Morgan & Chase Co. | 7/3/2014 | COP | 428,948,000 | USD | 225,062 | (377 | ) | |||||||||||
JP Morgan & Chase Co. | 7/3/2014 | CZK | 905,000 | USD | 44,918 | 9 | ||||||||||||
JP Morgan & Chase Co. | 7/3/2014 | EUR | 182,000 | USD | 248,330 | 248 | ||||||||||||
Barclays Bank PLC | 7/3/2014 | HKD | 42,408,000 | USD | 5,470,151 | (119 | ) | |||||||||||
The Bank of New York Mellon | 7/3/2014 | HKD | 645,790 | USD | 83,300 | (1 | ) | |||||||||||
JP Morgan & Chase Co. | 7/3/2014 | HUF | 28,238,000 | USD | 127,063 | 122 | ||||||||||||
The Bank of New York Mellon | 7/3/2014 | HUF | 13,467,844 | USD | 60,600 | 57 | ||||||||||||
Barclays Bank PLC | 7/3/2014 | IDR | 9,149,596,000 | USD | 776,706 | (2,510 | ) | |||||||||||
Barclays Bank PLC | 7/3/2014 | KRW | 2,532,393,000 | USD | 2,475,748 | (2,325 | ) | |||||||||||
JP Morgan & Chase Co. | 7/3/2014 | KRW | 2,532,393,000 | USD | 2,478,365 | 291 | ||||||||||||
JP Morgan & Chase Co. | 7/3/2014 | MXN | 19,988,000 | USD | 1,549,686 | (912 | ) | |||||||||||
Barclays Bank PLC | 7/3/2014 | MYR | 4,693,000 | USD | 1,456,549 | (528 | ) | |||||||||||
Barclays Bank PLC | 7/3/2014 | PHP | 16,525,000 | USD | 376,681 | (824 | ) | |||||||||||
JP Morgan & Chase Co. | 7/3/2014 | PLN | 2,584,000 | USD | 851,092 | 1,202 | ||||||||||||
The Bank of New York Mellon | 7/3/2014 | PLN | 835,306 | USD | 275,100 | 364 | ||||||||||||
JP Morgan & Chase Co. | 7/3/2014 | RUB | 47,339,000 | USD | 1,348,853 | 2,477 | ||||||||||||
Barclays Bank PLC | 7/3/2014 | TRY | 1,310,000 | USD | 620,880 | 1,190 | ||||||||||||
Barclays Bank PLC | 7/3/2014 | TWD | 91,482,000 | USD | 3,050,925 | (1,710 | ) | |||||||||||
The Bank of New York Mellon | 7/3/2014 | USD | 10,900 | BRL | 24,449 | (88 | ) | |||||||||||
| See Notes to Financial Statements. | 50 |
DBX ETF Trust
SCHEDULE OF INVESTMENTS
db X-trackers MSCI Emerging Markets Hedged Equity Fund (Continued)
May 31, 2014
Counterparty | Settlement Date | Currency To Deliver | Currency To Receive | Unrealized Appreciation (Depreciation) | ||||||||||||||
The Bank of New York Mellon | 7/3/2014 | USD | 65,900 | EUR | 48,297 | $ | (66 | ) | ||||||||||
The Bank of New York Mellon | 7/3/2014 | USD | 73,400 | TRY | 154,835 | (156 | ) | |||||||||||
JP Morgan & Chase Co. | 7/3/2014 | ZAR | 14,511,000 | USD | 1,364,746 | 873 | ||||||||||||
JP Morgan & Chase Co. | 7/7/2014 | EGP | 550,000 | USD | 75,442 | 378 | ||||||||||||
Barclays Bank PLC | 7/7/2014 | INR | 96,973,000 | USD | 1,630,196 | 2,832 | ||||||||||||
Barclays Bank PLC | 7/7/2014 | THB | 22,554,000 | USD | 684,949 | (916 | ) | |||||||||||
|
| |||||||||||||||||
Total net unrealized depreciation | $ | (253,909 | ) | |||||||||||||||
|
| |||||||||||||||||
Currency Abbreviations
BRL – Brazilian Real
CLP – Chilean Peso
COP – Colombian Peso
CZK – Czech Kronua
EGP – Egyptian Pound
EUR – Euro
HKD – Hong Kong Dollar
HUF – Hungarian Forint
IDR – Indonesian Rupiah
INR – Indian Rupee
KRW – South Korean Won
MXN – Mexican Peso
MYR – Malaysian Ringgit
PHP – Philippine Peso
PLN – Polish Zloty
RUB – Russian Ruble
THB – Thai Baht
TRY – Turkish New Lira
TWD – New Taiwan Dollar
USD – U.S. Dollar
ZAR – South African Rand
* Non-income producing security.
144A – Security is exempt from registration under Rule 144A of the securities Act of 1933. This security is considered liquid and may be resold in transactions exempt from registration, normally to qualified institutional buyers. At May 31, 2014, the aggregate market value of this security amounted to $357,020 or 1.2% of net assets.
(a) Less than 0.1%.
ADR – American Depositary Receipt.
CPO – Ordinary Participation Certificates.
GDR – Global Depositary Receipt.
NVDR – Non Voting Depositary Receipt.
REIT – Real Estate Investment Trust.
| See Notes to Financial Statements. | 51 |
DBX ETF Trust
SCHEDULE OF INVESTMENTS
db X-trackers MSCI Germany Hedged Equity Fund
May 31, 2014
Number | Value | |||||||
| COMMON STOCKS — 92.6% | ||||||||
| Basic Materials — 14.0% | ||||||||
BASF SE | 32,464 | $ | 3,738,101 | |||||
Brenntag AG | 1,839 | 343,564 | ||||||
K+S AG | 6,005 | 208,737 | ||||||
LANXESS AG | 2,940 | 209,041 | ||||||
Linde AG | 6,562 | 1,370,829 | ||||||
ThyssenKrupp AG* | 16,127 | 484,300 | ||||||
|
| |||||||
| 6,354,572 | ||||||||
|
| |||||||
| Communications — 6.6% | ||||||||
Axel Springer SE | 1,380 | 88,885 | ||||||
Deutsche Telekom AG | 110,130 | 1,850,288 | ||||||
Kabel Deutschland Holding AG | 768 | 109,297 | ||||||
ProSiebenSat.1 Media AG | 7,806 | 355,244 | ||||||
RTL Group SA (Luxembourg) | 1,348 | 157,110 | ||||||
Sky Deutschland AG* | 15,313 | 142,862 | ||||||
Telefonica Deutschland Holding AG* | 9,869 | 76,628 | ||||||
United Internet AG | 4,115 | 190,187 | ||||||
|
| |||||||
| 2,970,501 | ||||||||
|
| |||||||
| Consumer, Cyclical — 15.7% | ||||||||
adidas AG | 7,395 | 793,744 | ||||||
Bayerische Motoren Werke AG | 11,703 | 1,469,117 | ||||||
Continental AG | 3,888 | 919,279 | ||||||
Daimler AG | 34,031 | 3,233,360 | ||||||
Deutsche Lufthansa AG | 8,037 | 211,993 | ||||||
Hugo Boss AG | 1,118 | 158,878 | ||||||
Volkswagen AG | 1,029 | 271,070 | ||||||
|
| |||||||
| 7,057,441 | ||||||||
|
| |||||||
| Consumer, Non-cyclical — 15.7% | ||||||||
Bayer AG | 29,229 | 4,227,426 | ||||||
Beiersdorf AG | 3,540 | 357,479 | ||||||
Celesio AG* | 1,805 | 64,195 | ||||||
Fresenius Medical Care AG & Co. KGaA | 7,685 | 509,128 | ||||||
Fresenius SE & Co. KGaA | 4,450 | 663,929 | ||||||
Henkel AG & Co. KGaA | 4,132 | 419,007 | ||||||
Merck KGaA | 2,268 | 389,547 | ||||||
Metro AG* | 5,728 | 239,086 | ||||||
QIAGEN NV (Netherlands)* | 8,503 | 195,076 | ||||||
|
| |||||||
| 7,064,873 | ||||||||
|
| |||||||
| Diversified — 0.6% | ||||||||
GEA Group AG | 6,556 | 282,003 | ||||||
|
| |||||||
| Financial — 15.7% | ||||||||
Allianz SE | 16,135 | 2,736,126 | ||||||
Commerzbank AG* | 34,388 | 545,875 | ||||||
Deutsche Bank AG (a) | 36,035 | 1,459,644 | ||||||
Deutsche Boerse AG | 6,869 | 524,358 | ||||||
Number | Value | |||||||
| Financial (Continued) | ||||||||
Deutsche Wohnen AG* | 9,977 | $ | 221,276 | |||||
Hannover Rueck SE | 2,102 | 186,936 | ||||||
Muenchener Rueckversicherungs-Gesellschaft AG | 6,339 | 1,405,037 | ||||||
|
| |||||||
| 7,079,252 | ||||||||
|
| |||||||
| Industrial — 13.1% | ||||||||
Deutsche Post AG | 34,187 | 1,268,049 | ||||||
Fraport AG Frankfurt Airport Services Worldwide | 1,281 | 98,277 | ||||||
HeidelbergCement AG | 5,026 | 432,861 | ||||||
Hochtief AG | 816 | 74,249 | ||||||
MAN SE | 1,224 | 152,885 | ||||||
OSRAM Licht AG* | 3,146 | 159,639 | ||||||
Siemens AG | 28,026 | 3,723,352 | ||||||
|
| |||||||
| 5,909,312 | ||||||||
|
| |||||||
| Technology — 6.6% | ||||||||
Infineon Technologies AG | 39,852 | 494,300 | ||||||
SAP AG | 32,567 | 2,493,167 | ||||||
|
| |||||||
| 2,987,467 | ||||||||
|
| |||||||
| Utilities — 4.6% | ||||||||
E.ON SE | 70,726 | 1,377,228 | ||||||
RWE AG | 17,324 | 695,473 | ||||||
|
| |||||||
| 2,072,701 | ||||||||
|
| |||||||
TOTAL COMMON STOCKS | 41,778,122 | |||||||
|
| |||||||
| PREFERRED STOCKS — 6.6% | ||||||||
| Consumer, Cyclical — 4.7% | ||||||||
Bayerische Motoren Werke AG | 1,883 | 181,629 | ||||||
Porsche Automobil Holding SE | 5,436 | 580,584 | ||||||
Volkswagen AG | 5,112 | 1,358,851 | ||||||
|
| |||||||
| 2,121,064 | ||||||||
|
| |||||||
| Consumer, Non-cyclical — 1.6% | ||||||||
Henkel AG & Co. KGaA | 6,303 | 728,000 | ||||||
|
| |||||||
| Energy — 0.3% | ||||||||
Fuchs Petrolub SE | 1,254 | 118,803 | ||||||
|
| |||||||
TOTAL PREFERRED STOCKS | 2,967,867 | |||||||
|
| |||||||
TOTAL INVESTMENTS — 99.2% (Cost $41,974,407) | $ | 44,745,989 | ||||||
Other assets less liabilities — 0.8% | 349,014 | |||||||
|
| |||||||
NET ASSETS — 100.0% | $ | 45,095,003 | ||||||
|
| |||||||
As of May 31, 2014, the Fund had the following futures contracts open:
Contract Description | Number of Contracts | Contract Value | Expiration Date | Unrealized Appreciation | ||||||||||||
DAX Index Futures | 1 | $ | 338,711 | 6/20/2014 | $ | 23,088 | ||||||||||
| See Notes to Financial Statements. | 52 |
DBX ETF Trust
SCHEDULE OF INVESTMENTS
db X-trackers MSCI Germany Hedged Equity Fund (Continued)
May 31, 2014
As of May 31, 2014, the Fund had the following forward foreign currency contracts outstanding:
Counterparty | Settlement Date | Currency To Deliver | Currency To Receive | Unrealized Appreciation (Depreciation) | ||||||||||||||
The Bank of New York Mellon | 6/3/2014 | USD | 76,555 | EUR | 55,000 | $ | (1,581 | ) | ||||||||||
The Bank of New York Mellon | 6/3/2014 | USD | 123,456 | EUR | 90,474 | (127 | ) | |||||||||||
Barclays Bank PLC | 6/3/2014 | USD | 21,728,918 | EUR | 15,923,871 | (22,264 | ) | |||||||||||
JP Morgan & Chase Co. | 6/3/2014 | USD | 21,729,604 | EUR | 15,924,373 | (22,265 | ) | |||||||||||
Barclays Bank PLC | 6/3/2014 | EUR | 15,219,000 | USD | 21,099,622 | 353,814 | ||||||||||||
JP Morgan & Chase Co. | 6/3/2014 | EUR | 15,219,000 | USD | 21,100,306 | 354,499 | ||||||||||||
Barclays Bank PLC | 6/3/2014 | EUR | 457,500 | USD | 629,297 | 5,655 | ||||||||||||
JP Morgan & Chase Co. | 6/3/2014 | EUR | 457,500 | USD | 629,297 | 5,655 | ||||||||||||
The Bank of New York Mellon | 6/3/2014 | EUR | 91,000 | USD | 125,178 | 1,131 | ||||||||||||
The Bank of New York Mellon | 6/3/2014 | EUR | 4,000 | USD | 5,440 | (13 | ) | |||||||||||
The Bank of New York Mellon | 6/3/2014 | EUR | 51,000 | USD | 69,393 | (128 | ) | |||||||||||
JP Morgan & Chase Co. | 7/2/2014 | �� | EUR | 16,485,000 | USD | 22,492,958 | 22,483 | |||||||||||
Barclays Bank PLC | 7/2/2014 | EUR | 16,485,000 | USD | 22,493,123 | 22,648 | ||||||||||||
|
| |||||||||||||||||
Total net unrealized appreciation | $ | 719,507 | ||||||||||||||||
|
| |||||||||||||||||
Currency Abbreviations
EUR – Euro
USD – U.S. Dollar
* Non-income producing security.
(a) Affiliated issuer. This security is owned in proportion with its representation in the index.
| See Notes to Financial Statements. | 53 |
DBX ETF Trust
SCHEDULE OF INVESTMENTS
db X-trackers MSCI Japan Hedged Equity Fund
May 31, 2014
Number | Value | |||||||
| COMMON STOCKS — 98.9% | ||||||||
| Basic Materials — 5.1% | ||||||||
AIR WATER, Inc. | 24,500 | $ | 378,330 | |||||
Asahi Kasei Corp. | 230,000 | 1,717,092 | ||||||
Daicel Corp. | 44,900 | 408,863 | ||||||
Daido Steel Co. Ltd. | 20,000 | 98,232 | ||||||
Hitachi Chemical Co. Ltd. | 22,300 | 345,891 | ||||||
Hitachi Metals Ltd. | 35,600 | 503,576 | ||||||
JFE Holdings, Inc. | 76,400 | 1,449,198 | ||||||
JSR Corp. | 26,600 | 446,556 | ||||||
Kaneka Corp. | 17,000 | 106,041 | ||||||
Kansai Paint Co. Ltd. | 38,000 | 597,250 | ||||||
Kobe Steel Ltd. | 460,000 | 637,132 | ||||||
Kuraray Co. Ltd. | 52,100 | 624,893 | ||||||
Mitsubishi Chemical Holdings Corp. | 238,000 | 984,263 | ||||||
Mitsubishi Gas Chemical Co., Inc. | 35,000 | 204,568 | ||||||
Mitsubishi Materials Corp. | 226,000 | 690,432 | ||||||
Mitsui Chemicals, Inc. | 207,000 | 514,450 | ||||||
Nippon Paint Co. Ltd. | 15,000 | 239,145 | ||||||
Nippon Steel & Sumitomo Metal Corp. | 1,292,145 | 3,642,884 | ||||||
Nitto Denko Corp. | 25,400 | 1,171,195 | ||||||
Oji Holdings Corp. | 130,000 | 547,839 | ||||||
Shin-Etsu Chemical Co. Ltd. | 71,700 | 4,260,445 | ||||||
Sumitomo Chemical Co. Ltd. | 247,000 | 914,725 | ||||||
Sumitomo Metal Mining Co. Ltd. | 91,000 | 1,375,727 | ||||||
Taiyo Nippon Sanso Corp. | 15,000 | 131,287 | ||||||
Teijin Ltd. | 210,000 | 476,523 | ||||||
Yamato Kogyo Co. Ltd. | 2,500 | 70,678 | ||||||
|
| |||||||
| 22,537,215 | ||||||||
|
| |||||||
| Communications — 7.3% | ||||||||
DeNa Co. Ltd. | 22,513 | 293,907 | ||||||
Dentsu, Inc. | 35,200 | 1,388,291 | ||||||
Gree, Inc. | 22,500 | 205,329 | ||||||
Hakuhodo DY Holdings, Inc. | 45,900 | 415,264 | ||||||
Hikari Tsushin, Inc. | 2,800 | 223,340 | ||||||
Kakaku.com, Inc. | 24,400 | 426,880 | ||||||
KDDI Corp. | 93,084 | 5,534,749 | ||||||
M3, Inc. | 40,400 | 627,827 | ||||||
Nexon Co. Ltd. | 22,500 | 197,372 | ||||||
Nippon Telegraph & Telephone Corp. | 62,500 | 3,709,479 | ||||||
NTT DOCOMO, Inc. | 253,900 | 4,215,039 | ||||||
Rakuten, Inc. | 121,600 | 1,575,544 | ||||||
SBI Holdings, Inc. | 28,128 | 320,239 | ||||||
SoftBank Corp. | 158,100 | 11,407,117 | ||||||
Trend Micro, Inc. | 22,100 | 683,841 | ||||||
Yahoo Japan Corp. | 229,700 | 1,058,245 | ||||||
|
| |||||||
| 32,282,463 | ||||||||
|
| |||||||
| Consumer, Cyclical — 26.1% | ||||||||
ABC-Mart, Inc. | 1,900 | 97,053 | ||||||
Aeon Co. Ltd. | 98,500 | 1,187,225 | ||||||
AISIN SEIKI Co. Ltd. | 27,200 | 987,269 | ||||||
ANA Holdings, Inc. | 229,000 | 499,391 | ||||||
ASICS Corp. | 25,500 | 549,077 | ||||||
Bridgestone Corp. | 105,100 | 3,795,164 | ||||||
Citizen Holdings Co. Ltd. | 48,000 | 367,780 | ||||||
Daihatsu Motor Co. Ltd. | 26,500 | 456,852 | ||||||
Number | Value | |||||||
| Consumer, Cyclical (Continued) | ||||||||
Daiwa House Industry Co. Ltd. | 87,000 | $ | 1,628,045 | |||||
DENSO Corp. | 78,700 | 3,604,893 | ||||||
Don Quijote Holdings Co. Ltd. | 9,700 | 571,709 | ||||||
FamilyMart Co. Ltd. | 5,100 | 218,428 | ||||||
Fast Retailing Co. Ltd. | 8,900 | 2,936,649 | ||||||
Fuji Heavy Industries Ltd. | 98,000 | 2,594,401 | ||||||
Hino Motors Ltd. | 37,200 | 468,106 | ||||||
Hitachi High-Technologies Corp. | 19,700 | 445,088 | ||||||
Honda Motor Co. Ltd. | 270,600 | 9,471,000 | ||||||
Iida Group Holdings Co. Ltd. | 23,400 | 352,149 | ||||||
Isetan Mitsukoshi Holdings Ltd. | 52,700 | 689,034 | ||||||
Isuzu Motors Ltd. | 228,000 | 1,390,845 | ||||||
ITOCHU Corp. | 246,800 | 2,916,507 | ||||||
J. Front Retailing Co. Ltd. | 80,000 | 574,460 | ||||||
Japan Airlines Co. Ltd. | 8,089 | 421,931 | ||||||
JTEKT Corp. | 28,200 | 429,648 | ||||||
Koito Manufacturing Co. Ltd. | 16,000 | 379,725 | ||||||
Lawson, Inc. | 11,100 | 797,063 | ||||||
Marubeni Corp. | 254,000 | 1,731,591 | ||||||
Marui Group Co. Ltd. | 45,300 | 427,636 | ||||||
Mazda Motor Corp. | 475,000 | 2,053,045 | ||||||
McDonald’s Holdings Co. Japan Ltd. | 10,900 | 308,155 | ||||||
Mitsubishi Corp. | 242,300 | 4,781,736 | ||||||
Mitsubishi Logistics Corp. | 7,000 | 100,668 | ||||||
Mitsubishi Motors Corp. | 105,400 | 1,072,637 | ||||||
Mitsui & Co. Ltd. | 295,800 | 4,480,585 | ||||||
Namco Bandai Holdings, Inc. | 26,400 | 575,198 | ||||||
NGK Insulators Ltd. | 34,000 | 704,715 | ||||||
NGK Spark Plug Co. Ltd. | 31,000 | 853,261 | ||||||
NHK Spring Co. Ltd. | 25,400 | 235,536 | ||||||
Nintendo Co. Ltd. | 17,800 | 2,058,016 | ||||||
Nissan Motor Co. Ltd. | 421,300 | 3,803,288 | ||||||
Nitori Holdings Co. Ltd. | 11,600 | 569,175 | ||||||
NOK Corp. | 21,100 | 387,801 | ||||||
Oriental Land Co. Ltd. | 8,700 | 1,448,576 | ||||||
Panasonic Corp. | 373,000 | 4,004,804 | ||||||
Sankyo Co. Ltd. | 5,000 | 185,904 | ||||||
Sanrio Co. Ltd. | 2,700 | 72,725 | ||||||
Sega Sammy Holdings, Inc. | 27,000 | 518,251 | ||||||
Sekisui Chemical Co. Ltd. | 54,000 | 584,028 | ||||||
Sekisui House Ltd. | 95,400 | 1,254,819 | ||||||
Sharp Corp.* | 220,000 | 622,397 | ||||||
Shimamura Co. Ltd. | 3,700 | 357,279 | ||||||
Shimano, Inc. | 12,600 | 1,299,608 | ||||||
Sony Corp. | 170,100 | 2,718,592 | ||||||
Stanley Electric Co. Ltd. | 24,400 | 579,560 | ||||||
Sumitomo Corp. | 177,400 | 2,321,187 | ||||||
Sumitomo Electric Industries Ltd. | 123,400 | 1,658,263 | ||||||
Sumitomo Rubber Industries Ltd. | 25,700 | 380,956 | ||||||
Suzuki Motor Corp. | 65,900 | 1,958,227 | ||||||
Takashimaya Co. Ltd. | 44,000 | 431,788 | ||||||
Toho Co. Ltd. | 22,500 | 482,711 | ||||||
Toray Industries, Inc. | 246,000 | 1,565,894 | ||||||
Toyoda Gosei Co. Ltd. | 19,800 | 392,888 | ||||||
Toyota Industries Corp. | 25,300 | 1,175,530 | ||||||
Toyota Motor Corp. | 458,300 | 25,935,818 | ||||||
Toyota Tsusho Corp. | 28,200 | 746,552 | ||||||
| See Notes to Financial Statements. | 54 |
DBX ETF Trust
SCHEDULE OF INVESTMENTS
db X-trackers MSCI Japan Hedged Equity Fund (Continued)
May 31, 2014
Number | Value | |||||||
| Consumer, Cyclical (Continued) | ||||||||
USS Co. Ltd. | 45,100 | $ | 738,081 | |||||
Yamada Denki Co. Ltd. | 149,900 | 552,186 | ||||||
Yamaha Corp. | 25,500 | 397,028 | ||||||
Yamaha Motor Co. Ltd. | 48,000 | 754,420 | ||||||
Yokohama Rubber Co. Ltd. (The) | 12,000 | 106,090 | ||||||
|
| |||||||
| 115,216,697 | ||||||||
|
| |||||||
| Consumer, Non-cyclical — 13.4% | ||||||||
Ajinomoto Co., Inc. | 111,000 | 1,733,693 | ||||||
Alfresa Holdings Corp. | 7,200 | 434,971 | ||||||
Asahi Group Holdings Ltd. | 70,200 | 1,978,426 | ||||||
Astellas Pharma, Inc. | 364,500 | 4,669,037 | ||||||
Benesse Holdings, Inc. | 11,400 | 477,613 | ||||||
Calbee, Inc. | 19,500 | 548,988 | ||||||
Chugai Pharmaceutical Co. Ltd. | 44,800 | 1,197,894 | ||||||
Dai Nippon Printing Co. Ltd. | 71,000 | 711,395 | ||||||
Daiichi Sankyo Co. Ltd. | 117,500 | 1,989,882 | ||||||
Dainippon Sumitomo Pharma Co. Ltd. | 25,500 | 279,047 | ||||||
Eisai Co. Ltd. | 46,100 | 1,886,115 | ||||||
Hisamitsu Pharmaceutical Co., Inc. | 10,500 | 425,982 | ||||||
Japan Tobacco, Inc. | 181,400 | 6,136,951 | ||||||
Kao Corp. | 85,300 | 3,370,942 | ||||||
Kikkoman Corp. | 15,000 | 301,326 | ||||||
Kirin Holdings Co. Ltd. | 149,600 | 2,114,680 | ||||||
Kyowa Hakko Kirin Co. Ltd. | 38,000 | 460,255 | ||||||
Medipal Holdings Corp. | 24,400 | 342,750 | ||||||
MEIJI Holdings Co. Ltd. | 9,500 | 598,183 | ||||||
Miraca Holdings, Inc. | 8,600 | 404,234 | ||||||
Mitsubishi Tanabe Pharma Corp. | 45,100 | 655,678 | ||||||
Nippon Meat Packers, Inc. | 15,600 | 303,418 | ||||||
Nisshin Seifun Group, Inc. | 28,150 | 326,850 | ||||||
Nissin Foods Holdings Co. Ltd. | 14,300 | 695,334 | ||||||
Olympus Corp.* | 45,700 | 1,470,212 | ||||||
Ono Pharmaceutical Co. Ltd. | 13,900 | 1,065,029 | ||||||
Otsuka Holdings Co. Ltd. | 65,700 | 1,854,186 | ||||||
Park24 Co. Ltd. | 22,100 | 417,903 | ||||||
Santen Pharmaceutical Co. Ltd. | 12,100 | 651,356 | ||||||
Secom Co. Ltd. | 33,500 | 2,038,958 | ||||||
Seven & I Holdings Co. Ltd. | 125,900 | 5,031,053 | ||||||
Shimadzu Corp. | 16,000 | 136,896 | ||||||
Shionogi & Co. Ltd. | 49,300 | 987,453 | ||||||
Shiseido Co. Ltd. | 53,300 | 895,838 | ||||||
Suntory Beverage & Food Ltd. | 22,900 | 873,934 | ||||||
Suzuken Co. Ltd. | 11,200 | 396,071 | ||||||
Sysmex Corp. | 24,900 | 873,212 | ||||||
Taisho Pharmaceutical Holdings Co. Ltd. | 5,200 | 374,931 | ||||||
Takeda Pharmaceutical Co. Ltd. | 130,200 | 5,892,254 | ||||||
Terumo Corp. | 50,000 | 1,059,921 | ||||||
Toppan Printing Co. Ltd. | 66,000 | 488,841 | ||||||
Toyo Suisan Kaisha Ltd. | 15,900 | 483,404 | ||||||
Unicharm Corp. | 22,500 | 1,362,377 | ||||||
Yakult Honsha Co. Ltd. | 14,200 | 711,395 | ||||||
Yamazaki Baking Co. Ltd. | 7,400 | 87,303 | ||||||
|
| |||||||
| 59,196,171 | ||||||||
|
| |||||||
| Energy — 1.2% | ||||||||
Idemitsu Kosan Co. Ltd. | 12,400 | 257,379 | ||||||
INPEX Corp. | 147,000 | 2,119,804 | ||||||
Number | Value | |||||||
| Energy (Continued) | ||||||||
JX Holdings, Inc. | 367,300 | $ | 1,912,269 | |||||
Showa Shell Sekiyu KK | 27,600 | 297,690 | ||||||
TonenGeneral Sekiyu KK | 47,000 | 450,609 | ||||||
|
| |||||||
| 5,037,751 | ||||||||
|
| |||||||
| Financial — 19.5% | ||||||||
Acom Co. Ltd.* | 72,300 | 275,564 | ||||||
AEON Financial Service Co. Ltd. | 20,000 | 502,357 | ||||||
AEON Mall Co. Ltd. | 22,450 | 564,117 | ||||||
Aozora Bank Ltd. | 224,000 | 686,523 | ||||||
Bank of Kyoto Ltd. (The) | 41,000 | 339,921 | ||||||
Bank of Yokohama Ltd. (The) | 228,000 | 1,269,902 | ||||||
Chiba Bank Ltd. (The) | 126,000 | 818,134 | ||||||
Chugoku Bank Ltd. (The) | 23,500 | 333,109 | ||||||
Credit Saison Co. Ltd. | 25,100 | 451,455 | ||||||
Dai-ichi Life Insurance Co. Ltd. (The) | 145,100 | 2,149,418 | ||||||
Daito Trust Construction Co. Ltd. | 12,300 | 1,332,097 | ||||||
Daiwa Securities Group, Inc. | 266,000 | 2,145,246 | ||||||
Fukuoka Financial Group, Inc. | 152,000 | 658,468 | ||||||
Gunma Bank Ltd. (The) | 23,000 | 120,422 | ||||||
Hachijuni Bank Ltd. (The) | 55,000 | 301,473 | ||||||
Hiroshima Bank Ltd. (The) | 83,100 | 373,052 | ||||||
Hokuhoku Financial Group, Inc. | 230,000 | 454,126 | ||||||
Hulic Co. Ltd. | 47,500 | 621,046 | ||||||
Iyo Bank Ltd. (The) | 44,000 | 412,770 | ||||||
Japan Exchange Group, Inc. | 46,020 | 1,099,869 | ||||||
Japan Prime Realty Investment Corp. REIT | 129 | 463,158 | ||||||
Japan Real Estate Investment Corp. REIT | 197 | 1,151,424 | ||||||
Japan Retail Fund Investment Corp. REIT | 444 | 976,538 | ||||||
Joyo Bank Ltd. (The) | 113,000 | 555,010 | ||||||
Mitsubishi Estate Co. Ltd. | 207,900 | 5,046,375 | ||||||
Mitsubishi UFJ Financial Group, Inc. | 2,111,600 | 11,885,527 | ||||||
Mitsubishi UFJ Lease & Finance Co. Ltd. | 98,400 | 530,664 | ||||||
Mitsui Fudosan Co. Ltd. | 140,900 | 4,458,143 | ||||||
Mizuho Financial Group, Inc. | 3,796,340 | 7,383,844 | ||||||
MS&AD Insurance Group Holdings, Inc. | 90,500 | 2,142,485 | ||||||
Nippon Building Fund, Inc. REIT | 230 | 1,346,562 | ||||||
Nippon Prologis REIT, Inc | 220 | 481,493 | ||||||
NKSJ Holdings, Inc. | 51,150 | 1,420,945 | ||||||
Nomura Holdings, Inc. | 606,600 | 3,986,399 | ||||||
Nomura Real Estate Holdings, Inc. | 22,900 | 440,229 | ||||||
NTT Urban Development Corp. | 22,900 | 229,450 | ||||||
ORIX Corp. | 218,560 | 3,465,185 | ||||||
Resona Holdings, Inc. | 367,900 | 1,922,621 | ||||||
Seven Bank Ltd. | 101,800 | 378,000 | ||||||
Shinsei Bank Ltd. | 254,000 | 528,959 | ||||||
Shizuoka Bank Ltd. (The) | 71,000 | 666,061 | ||||||
Sony Financial Holdings, Inc. | 26,900 | 443,137 | ||||||
Sumitomo Mitsui Financial Group, Inc. | 210,300 | 8,480,172 | ||||||
Sumitomo Mitsui Trust Holdings, Inc. | 531,900 | 2,147,455 | ||||||
Sumitomo Realty & Development Co. Ltd. | 60,000 | 2,575,049 | ||||||
Suruga Bank Ltd. | 17,000 | 292,574 | ||||||
T&D Holdings, Inc. | 97,500 | 1,269,032 | ||||||
Tokio Marine Holdings, Inc. | 119,700 | 3,781,486 | ||||||
Tokyo Tatemono Co. Ltd. | 68,000 | 619,214 | ||||||
Tokyu Fudosan Holdings Corp. | 92,300 | 726,250 | ||||||
United Urban Investment Corp. REIT | 451 | 721,689 | ||||||
| See Notes to Financial Statements. | 55 |
DBX ETF Trust
SCHEDULE OF INVESTMENTS
db X-trackers MSCI Japan Hedged Equity Fund (Continued)
May 31, 2014
Number | Value | |||||||
| Financial (Continued) | ||||||||
Yamaguchi Financial Group, Inc. | 34,500 | $ | 328,394 | |||||
|
| |||||||
| 85,752,593 | ||||||||
|
| |||||||
| Industrial — 20.3% | ||||||||
Advantest Corp. | 25,100 | 283,793 | ||||||
Amada Co. Ltd. | 59,300 | 560,379 | ||||||
Asahi Glass Co. Ltd. | 163,000 | 906,267 | ||||||
Brother Industries Ltd. | 45,800 | 724,792 | ||||||
Casio Computer Co. Ltd. | 45,400 | 604,293 | ||||||
Central Japan Railway Co. | 24,298 | 3,217,456 | ||||||
Chiyoda Corp. | 10,000 | 118,173 | ||||||
Daikin Industries Ltd. | 38,700 | 2,305,654 | ||||||
East Japan Railway Co. | 55,700 | 4,248,630 | ||||||
FANUC Corp. | 30,800 | 5,240,237 | ||||||
Fuji Electric Co. Ltd. | 93,000 | 408,360 | ||||||
FUJIFILM Holdings Corp. | 74,900 | 1,933,568 | ||||||
Hamamatsu Photonics KK | 11,600 | 559,489 | ||||||
Hankyu Hanshin Holdings, Inc. | 225,000 | 1,248,772 | ||||||
Hirose Electric Co. Ltd. | 5,200 | 744,244 | ||||||
Hitachi Construction Machinery Co. Ltd. | 22,600 | 417,811 | ||||||
Hitachi Ltd. | 810,000 | 5,442,436 | ||||||
Hoya Corp. | 73,000 | 2,259,558 | ||||||
IBIDEN Co. Ltd. | 22,700 | 414,531 | ||||||
IHI Corp. | 235,000 | 985,707 | ||||||
Japan Display, Inc.* | 59,700 | 346,588 | ||||||
JGC Corp. | 36,000 | 1,034,028 | ||||||
Kajima Corp. | 139,000 | 576,208 | ||||||
Kamigumi Co. Ltd. | 15,000 | 135,118 | ||||||
Kawasaki Heavy Industries Ltd. | 244,000 | 917,996 | ||||||
Keikyu Corp. | 81,000 | 650,069 | ||||||
Keio Corp. | 94,000 | 680,530 | ||||||
Keisei Electric Railway Co. Ltd. | 35,000 | 323,527 | ||||||
Keyence Corp. | 7,610 | 2,956,164 | ||||||
Kintetsu Corp. | 265,000 | 929,322 | ||||||
Komatsu Ltd. | 163,800 | 3,567,236 | ||||||
Konica Minolta, Inc. | 79,100 | 680,664 | ||||||
Kubota Corp. | 196,000 | 2,676,228 | ||||||
Kurita Water Industries Ltd. | 22,700 | 492,354 | ||||||
Kyocera Corp. | 52,600 | 2,339,098 | ||||||
LIXIL Group Corp. | 47,300 | 1,224,317 | ||||||
Mabuchi Motor Co. Ltd. | 1,600 | 118,507 | ||||||
Makita Corp. | 22,400 | 1,221,218 | ||||||
Maruichi Steel Tube Ltd. | 2,800 | 68,762 | ||||||
Mitsubishi Electric Corp. | 311,000 | 3,607,966 | ||||||
Mitsubishi Heavy Industries Ltd. | 497,000 | 2,895,098 | ||||||
Mitsui OSK Lines Ltd. | 222,000 | 795,972 | ||||||
Murata Manufacturing Co. Ltd. | 32,200 | 2,727,511 | ||||||
Nabtesco Corp. | 22,600 | 490,185 | ||||||
Nagoya Railroad Co. Ltd. | 138,600 | 488,776 | ||||||
NEC Corp. | 380,000 | 1,172,102 | ||||||
Nidec Corp. | 35,400 | 2,058,277 | ||||||
Nikon Corp. | 52,000 | 823,419 | ||||||
Nippon Electric Glass Co. Ltd. | 23,000 | 115,000 | ||||||
Nippon Express Co. Ltd. | 128,000 | 627,426 | ||||||
Nippon Yusen KK | 254,000 | 748,527 | ||||||
NSK Ltd. | 59,000 | 712,868 | ||||||
Obayashi Corp. | 111,000 | 743,635 | ||||||
Odakyu Electric Railway Co. Ltd. | 107,000 | 961,739 | ||||||
Omron Corp. | 39,000 | 1,463,458 | ||||||
Number | Value | |||||||
| Industrial (Continued) | ||||||||
Rinnai Corp. | 5,900 | $ | 516,974 | |||||
Shimizu Corp. | 97,700 | 646,855 | ||||||
SMC Corp. | 8,700 | 2,273,281 | ||||||
Sumitomo Heavy Industries Ltd. | 50,000 | 222,004 | ||||||
Taiheiyo Cement Corp. | 226,000 | 852,495 | ||||||
Taisei Corp. | 211,000 | 1,086,089 | ||||||
THK Co. Ltd. | 22,700 | 499,712 | ||||||
Tobu Railway Co. Ltd. | 169,000 | 840,020 | ||||||
Tokyu Corp. | 188,000 | 1,281,650 | ||||||
Toshiba Corp. | 709,000 | 2,904,254 | ||||||
TOTO Ltd. | 49,700 | 628,329 | ||||||
Toyo Seikan Group Holdings Ltd. | 25,600 | 376,707 | ||||||
West Japan Railway Co. | 25,800 | 1,096,627 | ||||||
Yamato Holdings Co. Ltd. | 58,700 | 1,248,961 | ||||||
Yaskawa Electric Corp. | 25,700 | 314,812 | ||||||
Yokogawa Electric Corp. | 44,900 | 537,653 | ||||||
|
| |||||||
| 89,320,466 | ||||||||
|
| |||||||
| Technology — 3.7% | ||||||||
Canon, Inc. | 187,500 | 6,148,084 | ||||||
Fujitsu Ltd. | 303,000 | 2,050,756 | ||||||
GungHo Online Entertainment, Inc. | 52,400 | 345,387 | ||||||
Itochu Techno-Solutions Corp. | 1,800 | 74,086 | ||||||
Konami Corp. | 21,900 | 495,439 | ||||||
Nomura Research Institute Ltd. | 21,700 | 727,952 | ||||||
NTT Data Corp. | 23,000 | 835,953 | ||||||
Oracle Corp. Japan | 2,300 | 103,703 | ||||||
OTSUKA Corp. | 1,000 | 136,837 | ||||||
Ricoh Co. Ltd. | 111,600 | 1,364,853 | ||||||
ROHM Co. Ltd. | 15,900 | 905,894 | ||||||
Seiko Epson Corp. | 21,500 | 746,586 | ||||||
TDK Corp. | 22,900 | 977,412 | ||||||
Tokyo Electron Ltd. | 25,800 | 1,549,267 | ||||||
|
| |||||||
| 16,462,209 | ||||||||
|
| |||||||
| Utilities — 2.3% | ||||||||
Chubu Electric Power Co., Inc.* | 101,200 | 1,215,791 | ||||||
Chugoku Electric Power Co., (The), Inc. | 49,300 | 654,750 | ||||||
Electric Power Development Co. Ltd. | 22,600 | 670,452 | ||||||
Hokuriku Electric Power Co. | 25,900 | 332,782 | ||||||
Kansai Electric Power Co., (The), Inc.* | 120,600 | 1,112,410 | ||||||
Kyushu Electric Power Co., Inc.* | 72,600 | 798,743 | ||||||
Osaka Gas Co. Ltd. | 271,000 | 1,078,143 | ||||||
Shikoku Electric Power Co., Inc.* | 27,100 | 348,733 | ||||||
Toho Gas Co. Ltd. | 25,000 | 125,246 | ||||||
Tohoku Electric Power Co., Inc. | 74,100 | 786,858 | ||||||
Tokyo Electric Power Co., (The), Inc.* | 229,500 | 931,076 | ||||||
Tokyo Gas Co. Ltd. | 393,000 | 2,223,654 | ||||||
|
| |||||||
| 10,278,638 | ||||||||
|
| |||||||
TOTAL COMMON STOCKS | 436,084,203 | |||||||
|
| |||||||
TOTAL INVESTMENTS — 98.9% (Cost $445,425,573) | $ | 436,084,203 | ||||||
Other assets less liabilities — 1.1% | 5,070,297 | |||||||
|
| |||||||
NET ASSETS — 100.0% | $ | 441,154,500 | ||||||
|
| |||||||
| See Notes to Financial Statements. | 56 |
DBX ETF Trust
SCHEDULE OF INVESTMENTS
db X-trackers MSCI Japan Hedged Equity Fund (Continued)
May 31, 2014
As of May 31, 2014, the Fund had the following futures contracts open:
Contract Description | Number of Contracts | Contract Value | Expiration Date | Unrealized Depreciation | ||||||||||||
TOPIX Index Futures | 17 | $ | 2,006,434 | 6/12/2014 | $ | (33,065 | ) | |||||||||
As of May 31, 2014, the Fund had the following forward foreign currency contracts outstanding:
Counterparty | Settlement Date | Currency To Deliver | Currency To Receive | Unrealized Appreciation (Depreciation) | ||||||||||||||
Barclays Bank PLC | 6/4/2014 | JPY | 22,489,202,000 | USD | 220,179,949 | $ | (741,130 | ) | ||||||||||
JP Morgan & Chase Co. | 6/4/2014 | JPY | 22,489,202,000 | USD | 220,184,907 | (736,172 | ) | |||||||||||
The Bank of New York Mellon | 6/4/2014 | JPY | 169,000,000 | USD | 1,655,503 | (4,657 | ) | |||||||||||
The Bank of New York Mellon | 6/4/2014 | JPY | 41,095,916 | USD | 403,914 | 212 | ||||||||||||
Barclays Bank PLC | 6/4/2014 | USD | 220,179,949 | JPY | 22,402,032,758 | (115,171 | ) | |||||||||||
JP Morgan & Chase Co. | 6/4/2014 | USD | 15,462,864 | JPY | 1,579,980,000 | 57,957 | ||||||||||||
JP Morgan & Chase Co. | 6/4/2014 | USD | 204,722,043 | JPY | 20,829,444,252 | (105,476 | ) | |||||||||||
The Bank of New York Mellon | 6/4/2014 | USD | 2,059,417 | JPY | 209,591,000 | (515 | ) | |||||||||||
Barclays Bank PLC | 7/3/2014 | JPY | 22,269,732,000 | USD | 218,918,351 | 113,202 | ||||||||||||
JP Morgan & Chase Co. | 7/3/2014 | JPY | 22,269,732,000 | USD | 218,910,174 | 105,024 | ||||||||||||
|
| |||||||||||||||||
Total net unrealized depreciation | $ | (1,426,726 | ) | |||||||||||||||
|
| |||||||||||||||||
Currency Abbreviations
JPY – Japanese Yen
USD – U.S. Dollar
* Non-income producing security.
REIT — Real Estate Investment Trust.
| See Notes to Financial Statements. | 57 |
DBX ETF Trust
SCHEDULE OF INVESTMENTS
db X-trackers MSCI Asia Pacific ex Japan Hedged Equity Fund
May 31, 2014
Number | Value | |||||||
| COMMON STOCKS — 99.5% | ||||||||
| Australia — 26.0% | ||||||||
AGL Energy Ltd. | 1,279 | $ | 18,331 | |||||
ALS Ltd. | 733 | 6,105 | ||||||
Alumina Ltd.* | 4,711 | 6,248 | ||||||
Amcor Ltd. | 2,060 | 20,341 | ||||||
AMP Ltd. | 5,520 | 27,176 | ||||||
APA Group | 1,539 | 10,012 | ||||||
Asciano Ltd. | 976 | 5,087 | ||||||
ASX Ltd. | 353 | 11,820 | ||||||
Aurizon Holdings Ltd. | 3,042 | 13,985 | ||||||
Australia & New Zealand Banking Group Ltd. | 4,268 | 133,022 | ||||||
Bank of Queensland Ltd. | 326 | 3,641 | ||||||
Bendigo and Adelaide Bank Ltd. | 450 | 4,912 | ||||||
BHP Billiton Ltd. | 4,897 | 168,668 | ||||||
Boral Ltd. | 1,112 | 5,485 | ||||||
Brambles Ltd. | 2,798 | 25,050 | ||||||
Caltex Australia Ltd. | 231 | 4,805 | ||||||
CFS Retail Property Trust Group REIT | 4,823 | 9,201 | ||||||
Coca-Cola Amatil Ltd. | 966 | 8,505 | ||||||
Cochlear Ltd. | 73 | 4,067 | ||||||
Commonwealth Bank of Australia | 2,507 | 190,360 | ||||||
Computershare Ltd. | 551 | 6,528 | ||||||
Crown Resorts Ltd. | 675 | 10,214 | ||||||
CSL Ltd. | 814 | 53,475 | ||||||
Dexus Property Group REIT | 7,431 | 7,711 | ||||||
Federation Centres Ltd. REIT | 2,583 | 6,058 | ||||||
Flight Centre Travel Group Ltd. | 76 | 3,521 | ||||||
Fortescue Metals Group Ltd. | 3,464 | 14,217 | ||||||
Goodman Group REIT | 1,980 | 9,379 | ||||||
GPT Group REIT | 2,504 | 9,088 | ||||||
Harvey Norman Holdings Ltd. | 1,250 | 3,723 | ||||||
Iluka Resources Ltd. | 677 | 5,481 | ||||||
Incitec Pivot Ltd. | 1,556 | 3,982 | ||||||
Insurance Australia Group Ltd. | 4,272 | 23,656 | ||||||
Leighton Holdings Ltd. | 308 | 5,799 | ||||||
Lend Lease Group | 697 | 8,699 | ||||||
Macquarie Group Ltd. | 481 | 26,872 | ||||||
Metcash Ltd. | 1,232 | 3,268 | ||||||
Mirvac Group REIT | 4,868 | 8,200 | ||||||
National Australia Bank Ltd. | 3,690 | 115,008 | ||||||
Newcrest Mining Ltd.* | 2,288 | 20,740 | ||||||
Orica Ltd. | 459 | 8,398 | ||||||
Origin Energy Ltd. | 2,031 | 28,522 | ||||||
Qantas Airways Ltd.* | 4,069 | 5,320 | ||||||
QBE Insurance Group Ltd. | 2,205 | 23,353 | ||||||
Ramsay Health Care Ltd. | 276 | 12,162 | ||||||
REA Group Ltd. | 74 | 3,135 | ||||||
Rio Tinto Ltd. | 693 | 38,245 | ||||||
Santos Ltd. | 1,637 | 22,121 | ||||||
Seek Ltd. | 623 | 9,816 | ||||||
Sonic Healthcare Ltd. | 509 | 8,389 | ||||||
SP AusNet | 5,702 | 7,323 | ||||||
Stockland REIT | 3,965 | 14,391 | ||||||
Suncorp Group Ltd. | 2,686 | 33,370 | ||||||
Sydney Airport | 1,090 | 4,453 | ||||||
Tabcorp Holdings Ltd. | 903 | 2,925 | ||||||
Tatts Group Ltd. | 2,469 | 6,985 | ||||||
Number | Value | |||||||
| Australia (Continued) | ||||||||
Telstra Corp. Ltd. | 7,648 | $ | 38,008 | |||||
Toll Holdings Ltd. | 1,067 | 5,382 | ||||||
Transurban Group | 2,023 | 13,989 | ||||||
Treasury Wine Estates Ltd. | 2,195 | 10,622 | ||||||
Wesfarmers Ltd. | 1,665 | 67,188 | ||||||
Westfield Group REIT | 3,887 | 38,707 | ||||||
Westfield Retail Trust REIT | 6,060 | 17,991 | ||||||
Westpac Banking Corp. | 4,748 | 152,092 | ||||||
Woodside Petroleum Ltd. | 1,062 | 41,679 | ||||||
Woolworths Ltd. | 2,240 | 78,236 | ||||||
WorleyParsons Ltd. | 340 | 5,082 | ||||||
|
| |||||||
| 1,720,324 | ||||||||
|
| |||||||
| China — 14.9% | ||||||||
AAC Technologies Holdings, Inc. | 700 | 4,131 | ||||||
Agricultural Bank of China Ltd., Class H | 13,753 | 6,138 | ||||||
Anhui Conch Cement Co. Ltd., Class H | 1,375 | 4,948 | ||||||
Anta Sports Products Ltd. | 3,750 | 5,514 | ||||||
AviChina Industry & Technology Co. Ltd., Class H | 5,500 | 2,972 | ||||||
Bank of China Ltd., Class H | 97,524 | 46,416 | ||||||
Beijing Capital International Airport Co. Ltd., Class H | 12,503 | 8,579 | ||||||
Belle International Holdings Ltd. | 18,754 | 18,602 | ||||||
Biostime International Holdings Ltd. | 1,400 | 9,444 | ||||||
Byd Co. Ltd., Class H* | 1,000 | 4,901 | ||||||
China BlueChemical Ltd., Class H | 12,503 | 6,693 | ||||||
China Cinda Asset Management Co. Ltd., Class H* | 2,000 | 954 | ||||||
China Communications Construction Co. Ltd., Class H | 7,501 | 5,012 | ||||||
China Communications Services Corp. Ltd., Class H | 2,000 | 949 | ||||||
China Construction Bank Corp., Class H | 51,262 | 37,622 | ||||||
China COSCO Holdings Co. Ltd., Class H* | 12,628 | 4,919 | ||||||
China Everbright Bank Co. Ltd., Class H* | 4,300 | 1,902 | ||||||
China Gas Holdings Ltd. | 10,002 | 16,178 | ||||||
China International Marine Containers (Group) Co. Ltd., Class H | 1,250 | 2,222 | ||||||
China Life Insurance Co. Ltd., Class H | 11,252 | 30,913 | ||||||
China Longyuan Power Group Corp., Class H | 7,501 | 8,340 | ||||||
China Mengniu Dairy Co. Ltd. | 2,500 | 12,270 | ||||||
China Merchants Bank Co. Ltd., Class H | 5,001 | 9,211 | ||||||
China Minsheng Banking Corp. Ltd., Class H | 9,127 | 9,371 | ||||||
China Oilfield Services Ltd., Class H | 2,500 | 6,165 | ||||||
China Pacific Insurance Group Co. Ltd., Class H | 5,626 | 18,795 | ||||||
China Petroleum & Chemical Corp., Class H | 45,011 | 40,814 | ||||||
China Railway Construction Corp. Ltd., Class H | 3,625 | 3,067 | ||||||
China Railway Group Ltd., Class H | 1,250 | 582 | ||||||
China Resources Power Holdings Co. Ltd. | 2,500 | 6,562 | ||||||
China Shenhua Energy Co. Ltd., Class H | 5,751 | 15,763 | ||||||
China Shipping Container Lines Co. Ltd., Class H* | 5,000 | 1,206 | ||||||
China State Construction International Holdings Ltd. | 5,001 | 8,656 | ||||||
China Telecom Corp. Ltd., Class H | 12,503 | 6,290 | ||||||
CITIC Securities Co. Ltd., Class H | 1,250 | 2,696 | ||||||
| See Notes to Financial Statements. | 58 |
DBX ETF Trust
SCHEDULE OF INVESTMENTS
db X-trackers MSCI Asia Pacific ex Japan Hedged Equity Fund (Continued)
May 31, 2014
Number | Value | |||||||
| China (Continued) | ||||||||
CNOOC Ltd. | 20,005 | $ | 34,318 | |||||
Country Garden Holdings Co. Ltd. | 10,001 | 4,205 | ||||||
CSR Corp. Ltd., Class H | 2,500 | 1,851 | ||||||
Dongfeng Motor Group Co. Ltd., Class H | 5,001 | 7,676 | ||||||
ENN Energy Holdings Ltd.* | 2,500 | 17,687 | ||||||
Golden Eagle Retail Group Ltd. | 11,252 | 13,744 | ||||||
GOME Electrical Appliances Holding Ltd. | 16,000 | 2,683 | ||||||
Great Wall Motor Co. Ltd., Class H | 3,350 | 13,741 | ||||||
Guangdong Investment Ltd. | 10,002 | 11,095 | ||||||
Guangzhou Automobile Group Co. Ltd., Class H | 5,001 | 5,270 | ||||||
Guangzhou R&F Properties Co. Ltd., Class H | 1,700 | 2,337 | ||||||
Haitong Securities Co. Ltd., Class H | 2,500 | 3,734 | ||||||
Hengan International Group Co. Ltd. | 2,250 | 23,870 | ||||||
Huaneng Power International, Inc., Class H | 5,001 | 5,283 | ||||||
Industrial & Commercial Bank of China Ltd., Class H | 103,777 | 67,463 | ||||||
Intime Retail Group Co. Ltd. | 2,500 | 2,428 | ||||||
Jiangsu Expressway Co. Ltd., Class H | 12,503 | 15,014 | ||||||
Lenovo Group Ltd. | 16,505 | 20,437 | ||||||
Longfor Properties Co. Ltd. | 4,751 | 6,012 | ||||||
New China Life Insurance Co. Ltd., Class H | 1,125 | 3,519 | ||||||
People’s Insurance Co. (Group) of China Ltd., Class H | 22,505 | 9,057 | ||||||
PetroChina Co. Ltd., Class H | 20,005 | 23,868 | ||||||
PICC Property & Casualty Co. Ltd., Class H | 5,001 | 7,366 | ||||||
Ping An Insurance Group Co. of China Ltd., Class H | 2,000 | 15,465 | ||||||
Shandong Weigao Group Medical Polymer Co. Ltd., Class H | 3,625 | 3,525 | ||||||
Shanghai Electric Group Co. Ltd., Class H | 10,002 | 3,612 | ||||||
Shanghai Pharmaceuticals Holding Co. Ltd., Class H | 1,625 | 3,056 | ||||||
Shenzhou International Group Holdings Ltd.* | 5,001 | 17,448 | ||||||
Sihuan Pharmaceutical Holdings Group Ltd. | 2,254 | 2,686 | ||||||
Sino Biopharmaceutical Ltd. | 16,254 | 13,250 | ||||||
Sino-Ocean Land Holdings Ltd. | 2,700 | 1,421 | ||||||
Sinopec Engineering Group Co. Ltd., Class H | 1,900 | 2,191 | ||||||
Sinopharm Group Co. Ltd., Class H | 1,750 | 4,751 | ||||||
Soho China Ltd. | 18,504 | 14,535 | ||||||
Sun Art Retail Group Ltd. | 7,001 | 8,226 | ||||||
Tencent Holdings Ltd. | 9,000 | 126,881 | ||||||
Tingyi Cayman Islands Holding Corp. | 2,500 | 7,126 | ||||||
Tsingtao Brewery Co. Ltd., Class H | 2,500 | 19,670 | ||||||
Uni-President China Holdings Ltd. | 2,500 | 1,941 | ||||||
Want Want China Holdings Ltd. | 17,504 | 24,429 | ||||||
Weichai Power Co. Ltd., Class H | 1,250 | 4,667 | ||||||
Zhejiang Expressway Co. Ltd., Class H | 15,003 | 14,862 | ||||||
Zhongsheng Group Holdings Ltd. | 5,100 | 6,394 | ||||||
Zhuzhou CSR Times Electric Co. Ltd., Class H | 1,950 | 5,735 | ||||||
Zijin Mining Group Co. Ltd., Class H | 23,003 | 5,311 | ||||||
Zoomlion Heavy Industry Science and Technology Co. Ltd., Class H | 5,376 | 3,578 | ||||||
ZTE Corp., Class H* | 2,700 | 5,210 | ||||||
|
| |||||||
| 987,425 | ||||||||
|
| |||||||
| Hong Kong — 11.9% | ||||||||
AIA Group Ltd. | 22,780 | 114,150 | ||||||
ASM Pacific Technology Ltd. | 650 | 7,281 | ||||||
Number | Value | |||||||
| Hong Kong (Continued) | ||||||||
Bank of East Asia Ltd. (The) | 625 | $ | 2,543 | |||||
Beijing Enterprises Holdings Ltd. | 2,750 | 23,499 | ||||||
Beijing Enterprises Water Group Ltd. | 10,000 | 6,398 | ||||||
BOC Hong Kong (Holdings) Ltd. | 3,625 | 10,918 | ||||||
Brilliance China Automotive Holdings Ltd. | 5,001 | 8,295 | ||||||
Cheung Kong (Holdings) Ltd. | 2,500 | 44,659 | ||||||
China Everbright International Ltd. | 15,504 | 19,738 | ||||||
China Merchants Holdings International Co. Ltd. | 5,001 | 14,772 | ||||||
China Mobile Ltd. | 9,202 | 90,027 | ||||||
China Overseas Land & Investment Ltd. | 7,501 | 19,544 | ||||||
China Resources Gas Group Ltd. | 2,500 | 7,658 | ||||||
China Resources Land Ltd. | 2,500 | 5,063 | ||||||
China Taiping Insurance Holdings Co. Ltd.* | 1,500 | 2,616 | ||||||
China Unicom (Hong Kong) Ltd. | 2,500 | 3,740 | ||||||
CITIC 21CN Co. Ltd.* | 2,000 | 1,597 | ||||||
CLP Holdings Ltd. | 1,625 | 13,372 | ||||||
Far East Horizon Ltd. | 3,750 | 2,549 | ||||||
First Pacific Co. Ltd. | 2,500 | 2,828 | ||||||
Galaxy Entertainment Group Ltd. | 3,750 | 29,965 | ||||||
GCL-Poly Energy Holdings Ltd.* | 6,501 | 2,021 | ||||||
Geely Automobile Holdings Ltd.* | 10,000 | 3,741 | ||||||
Haier Electronics Group Co. Ltd. | 2,500 | 5,849 | ||||||
Hanergy Solar Group Ltd.* | 13,900 | 2,026 | ||||||
Hang Lung Properties Ltd. | 3,750 | 11,899 | ||||||
Hang Seng Bank Ltd. | 250 | 4,127 | ||||||
Henderson Land Development Co. Ltd. | 2,500 | 16,284 | ||||||
Hong Kong and China Gas Co. Ltd. | 7,501 | 18,131 | ||||||
Hong Kong Exchanges & Clearing Ltd. | 1,875 | 34,898 | ||||||
Hutchison Whampoa Ltd. | 3,750 | 50,304 | ||||||
Hysan Development Co. Ltd. | 1,250 | 6,119 | ||||||
Kerry Properties Ltd. | 1,250 | 4,111 | ||||||
Kunlun Energy Co. Ltd.* | 10,002 | 16,307 | ||||||
Li & Fung Ltd. | 7,501 | 10,894 | ||||||
Link REIT (The) | 1,000 | 5,327 | ||||||
MGM China Holdings Ltd. | 2,000 | 6,965 | ||||||
New World Development Co. Ltd. | 7,501 | 8,611 | ||||||
Noble Group Ltd. | 8,752 | 9,664 | ||||||
Power Assets Holdings Ltd. | 1,250 | 10,883 | ||||||
Shangri-La Asia Ltd. | 2,500 | 3,921 | ||||||
Sino Land Co. Ltd. | 5,001 | 7,753 | ||||||
SJM Holdings Ltd. | 8,752 | 25,117 | ||||||
Sun Hung Kai Properties Ltd. | 2,500 | 34,181 | ||||||
Swire Pacific Ltd., Class A | 750 | 8,914 | ||||||
Wharf Holdings Ltd. (The) | 3,750 | 26,554 | ||||||
Wheelock & Co. Ltd. | 2,500 | 10,109 | ||||||
Yingde Gases Group Co. Ltd. | 8,002 | 8,752 | ||||||
Yuexiu Property Co. Ltd. | 12,000 | 2,384 | ||||||
|
| |||||||
| 787,058 | ||||||||
|
| |||||||
| India — 5.2% | ||||||||
Dr. Reddy’s Laboratories Ltd., ADR | 625 | 25,694 | ||||||
HDFC Bank Ltd., ADR | 1,125 | 50,658 | ||||||
ICICI Bank Ltd., ADR* | 975 | 48,428 | ||||||
Infosys Ltd., ADR | 500 | 25,715 | ||||||
Larsen & Toubro Ltd., GDR | 2,175 | 56,702 | ||||||
Reliance Industries Ltd., GDR, 144A | 1,775 | 63,492 | ||||||
Tata Motors Ltd., ADR | 1,100 | 40,964 | ||||||
Wipro Ltd., ADR | 2,625 | 29,243 | ||||||
|
| |||||||
| 340,896 | ||||||||
|
| |||||||
| See Notes to Financial Statements. | 59 |
DBX ETF Trust
SCHEDULE OF INVESTMENTS
db X-trackers MSCI Asia Pacific ex Japan Hedged Equity Fund (Continued)
May 31, 2014
Number | Value | |||||||
| Indonesia — 3.2% | ||||||||
PT Adaro Energy Tbk | 40,635 | $ | 4,264 | |||||
PT Astra Agro Lestari Tbk | 1,875 | 4,388 | ||||||
PT Astra International Tbk | 20,308 | 12,307 | ||||||
PT Bank Central Asia Tbk | 28,307 | 26,124 | ||||||
PT Bank Danamon Indonesia Tbk* | 3,875 | 1,381 | ||||||
PT Bank Mandiri Persero Tbk | 12,128 | 10,570 | ||||||
PT Bank Negara Indonesia Persero Tbk | 3,625 | 1,483 | ||||||
PT Bank Rakyat Indonesia Persero Tbk | 19,379 | 16,931 | ||||||
PT Bumi Serpong Damai Tbk | 6,501 | 897 | ||||||
PT Charoen Pokphand Indonesia Tbk | 10,002 | 3,234 | ||||||
PT Global Mediacom Tbk | 17,504 | 3,074 | ||||||
PT Gudang Garam Tbk | 750 | 3,344 | ||||||
PT Indo Tambangraya Megah Tbk | 500 | 1,227 | ||||||
PT Indocement Tunggal Prakarsa Tbk | 3,375 | 6,548 | ||||||
PT Indofood CBP Sukses Makmur Tbk | 7,552 | 6,598 | ||||||
PT Indofood Sukses Makmur Tbk | 4,276 | 2,500 | ||||||
PT Jasa Marga Persero Tbk | 21,006 | 10,570 | ||||||
PT Kalbe Farma Tbk | 7,668 | 1,011 | ||||||
PT Lippo Karawaci Tbk | 72,643 | 6,439 | ||||||
PT Matahari Department Store Tbk* | 3,925 | 4,883 | ||||||
PT Media Nusantara Citra Tbk | 19,254 | 4,667 | ||||||
PT Perusahaan Gas Negara Persero Tbk | 23,130 | 10,748 | ||||||
PT Semen Indonesia Persero Tbk | 8,752 | 11,038 | ||||||
PT Tambang Batubara Bukit Asam Persero Tbk | 4,251 | 3,896 | ||||||
PT Telekomunikasi Indonesia Persero Tbk | 97,274 | 21,454 | ||||||
PT Tower Bersama Infrastructure Tbk | 7,251 | 4,767 | ||||||
PT Unilever Indonesia Tbk | 7,751 | 19,336 | ||||||
PT XL Axiata Tbk | 15,878 | 7,446 | ||||||
|
| |||||||
| 211,125 | ||||||||
|
| |||||||
| Ireland — 0.1% | ||||||||
James Hardie Industries PLC CDI† | 612 | 8,162 | ||||||
|
| |||||||
| Macau — 0.7% | ||||||||
Sands China Ltd. | 4,501 | 32,802 | ||||||
Wynn Macau Ltd. | 2,500 | 10,399 | ||||||
|
| |||||||
| 43,201 | ||||||||
|
| |||||||
| Malaysia — 5.9% | ||||||||
AirAsia Bhd* | 8,377 | 6,518 | ||||||
Alliance Financial Group Bhd | 5,876 | 8,943 | ||||||
AMMB Holdings Bhd | 3,000 | 6,853 | ||||||
Astro Malaysia Holdings Bhd | 19,531 | 20,668 | ||||||
Berjaya Sports Toto Bhd | 16,247 | 19,317 | ||||||
British American Tobacco Malaysia Bhd | 750 | 14,683 | ||||||
Bumi Armada Bhd | 2,125 | 2,328 | ||||||
CIMB Group Holdings Bhd | 1,250 | 2,856 | ||||||
DiGi.Com Bhd | 9,502 | 16,029 | ||||||
Felda Global Ventures Holdings Bhd | 11,127 | 14,683 | ||||||
Gamuda Bhd | 500 | 685 | ||||||
Genting Malaysia Bhd | 13,753 | 17,421 | ||||||
Hong Leong Bank Bhd | 4,251 | 18,364 | ||||||
Hong Leong Financial Group Bhd | 3,625 | 17,375 | ||||||
IHH Healthcare Bhd* | 6,376 | 8,156 | ||||||
Kuala Lumpur Kepong Bhd | 1,000 | 7,445 | ||||||
Lafarge Malaysia Bhd | 1,500 | 4,613 | ||||||
Malayan Banking Bhd | 8,127 | 24,990 | ||||||
Malaysia Airports Holdings Bhd | 3,125 | 7,353 | ||||||
Number | Value | |||||||
| Malaysia (Continued) | ||||||||
Maxis Bhd | 7,501 | $ | 15,338 | |||||
MISC Bhd | 2,125 | 4,087 | ||||||
MMC Corp. Bhd | 7,751 | 6,538 | ||||||
Petronas Dagangan Bhd | 2,500 | 19,639 | ||||||
Petronas Gas Bhd | 2,375 | 18,110 | ||||||
Public Bank Bhd | 5,626 | 37,821 | ||||||
SapuraKencana Petroleum Bhd* | 5,051 | 6,555 | ||||||
Sime Darby Bhd | 12,128 | 36,048 | ||||||
Telekom Malaysia Bhd | 5,251 | 10,100 | ||||||
UMW Holdings Bhd | 5,376 | 18,071 | ||||||
YTL Power International Bhd* | 2,231 | 1,048 | ||||||
|
| |||||||
| 392,635 | ||||||||
|
| |||||||
| New Zealand — 1.1% | ||||||||
Auckland International Airport Ltd. | 5,295 | 17,356 | ||||||
Contact Energy Ltd. | 4,976 | 23,027 | ||||||
Fletcher Building Ltd. | 1,848 | 14,045 | ||||||
Ryman Healthcare Ltd. | 1,711 | 12,088 | ||||||
Telecom Corp. of New Zealand Ltd. | 3,184 | 7,273 | ||||||
|
| |||||||
| 73,789 | ||||||||
|
| |||||||
| Philippines — 1.4% | ||||||||
Aboitiz Equity Ventures, Inc. | 10,727 | 13,288 | ||||||
Aboitiz Power Corp. | 1,750 | 1,440 | ||||||
Ayala Corp. | 325 | 4,590 | ||||||
Ayala Land, Inc. | 6,626 | 4,543 | ||||||
Bank of the Philippine Islands | 3,588 | 6,929 | ||||||
Globe Telecom, Inc. | 250 | 9,657 | ||||||
International Container Terminal Services, Inc. | 2,913 | 7,190 | ||||||
Jollibee Foods Corp. | 3,068 | 12,558 | ||||||
Philippine Long Distance Telephone Co. | 125 | 8,056 | ||||||
SM Investments Corp. | 75 | 1,347 | ||||||
SM Prime Holdings, Inc. | 30,257 | 11,590 | ||||||
Universal Robina Corp. | 2,700 | 9,194 | ||||||
|
| |||||||
| 90,382 | ||||||||
|
| |||||||
| Singapore — 5.1% | ||||||||
Ascendas Real Estate Investment Trust REIT | 3,750 | 7,355 | ||||||
CapitaCommercial Trust REIT | 3,750 | 5,053 | ||||||
CapitaLand Ltd. | 6,251 | 15,898 | ||||||
CapitaMall Trust REIT | 5,001 | 8,253 | ||||||
CapitaMalls Asia Ltd. | 3,750 | 7,026 | ||||||
City Developments Ltd. | 1,250 | 10,324 | ||||||
DBS Group Holdings Ltd. | 2,500 | 33,684 | ||||||
Genting Singapore PLC | 12,503 | 13,407 | ||||||
Global Logistic Properties Ltd. | 7,501 | 16,626 | ||||||
Golden Agri-Resources Ltd. | 15,003 | 6,878 | ||||||
Hutchison Port Holdings Trust, Class U | 8,752 | 6,564 | ||||||
Keppel Corp. Ltd. | 2,500 | 21,188 | ||||||
Keppel Land Ltd. | 3,250 | 9,017 | ||||||
Olam International Ltd. | 2,500 | 4,664 | ||||||
Oversea-Chinese Banking Corp. Ltd. | 3,750 | 29,150 | ||||||
Sembcorp Industries Ltd. | 1,250 | 5,391 | ||||||
Sembcorp Marine Ltd. | 1,250 | 4,106 | ||||||
Singapore Exchange Ltd. | 1,250 | 6,866 | ||||||
Singapore Press Holdings Ltd. | 1,250 | 4,086 | ||||||
Singapore Technologies Engineering Ltd. | 3,750 | 11,570 | ||||||
Singapore Telecommunications Ltd. | 12,503 | 38,876 | ||||||
| See Notes to Financial Statements. | 60 |
DBX ETF Trust
SCHEDULE OF INVESTMENTS
db X-trackers MSCI Asia Pacific ex Japan Hedged Equity Fund (Continued)
May 31, 2014
Number | Value | |||||||
| Singapore (Continued) | ||||||||
United Overseas Bank Ltd. | 2,500 | $ | 44,984 | |||||
UOL Group Ltd. | 1,250 | 6,577 | ||||||
Wilmar International Ltd. | 4,750 | 12,156 | ||||||
Yangzijiang Shipbuilding Holdings Ltd. | 10,002 | 8,054 | ||||||
|
| |||||||
| 337,753 | ||||||||
|
| |||||||
| South Korea — 13.0% | ||||||||
BS Financial Group, Inc. | 70 | 1,067 | ||||||
Celltrion, Inc.* | 118 | 5,627 | ||||||
Cheil Industries, Inc. | 74 | 4,816 | ||||||
Daelim Industrial Co. Ltd. | 1 | 79 | ||||||
Daewoo Securities Co. Ltd.* | 520 | 4,429 | ||||||
Daewoo Shipbuilding & Marine Engineering Co. Ltd. | 20 | 526 | ||||||
DGB Financial Group, Inc. | 240 | 3,670 | ||||||
E-Mart Co. Ltd. | 1 | 229 | ||||||
GS Engineering & Construction Corp.* | 50 | 1,625 | ||||||
Hana Financial Group, Inc. | 750 | 27,237 | ||||||
Hanwha Chemical Corp. | 150 | 2,764 | ||||||
Hanwha Corp. | 260 | 6,906 | ||||||
Hite Jinro Co. Ltd. | 30 | 635 | ||||||
Hyundai Department Store Co. Ltd. | 2 | 259 | ||||||
Hyundai Heavy Industries Co. Ltd. | 77 | 13,964 | ||||||
Hyundai Marine & Fire Insurance Co. Ltd. | 30 | 851 | ||||||
Hyundai Mipo Dockyard | 8 | 1,266 | ||||||
Hyundai Mobis | 51 | 14,397 | ||||||
Hyundai Motor Co. | 131 | 28,828 | ||||||
Hyundai Steel Co. | 472 | 31,831 | ||||||
Industrial Bank of Korea | 2,880 | 39,522 | ||||||
Kangwon Land, Inc. | 50 | 1,492 | ||||||
KB Financial Group, Inc. | 1,920 | 65,399 | ||||||
Kia Motors Corp. | 147 | 8,472 | ||||||
Korea Electric Power Corp. | 190 | 7,282 | ||||||
Korea Zinc Co. Ltd. | 14 | 5,098 | ||||||
KT Corp. | 100 | 2,980 | ||||||
KT&G Corp. | 29 | 2,359 | ||||||
Kumho Petro Chemical Co. Ltd. | 20 | 1,592 | ||||||
LG Chem Ltd. | 139 | 35,425 | ||||||
LG Display Co. Ltd.* | 30 | 798 | ||||||
LG Electronics, Inc. | 10 | 715 | ||||||
LG Household & Health Care Ltd. | 17 | 8,498 | ||||||
LG Uplus Corp. | 1,140 | 10,716 | ||||||
Lotte Chemical Corp. | 67 | 10,574 | ||||||
Mirae Asset Securities Co. Ltd. | 80 | 3,337 | ||||||
NAVER Corp. | 30 | 22,290 | ||||||
NCSoft Corp. | 5 | 826 | ||||||
OCI Co. Ltd.* | 21 | 3,602 | ||||||
Orion Corp. | 8 | 6,579 | ||||||
POSCO | 392 | 111,045 | ||||||
Samsung C&T Corp. | 9 | 644 | ||||||
Samsung Card Co. Ltd. | 80 | 2,945 | ||||||
Samsung Electro-Mechanics Co. Ltd. | 29 | 1,788 | ||||||
Samsung Electronics Co. Ltd. | 139 | 196,605 | ||||||
Samsung Engineering Co. Ltd.* | 48 | 3,834 | ||||||
Samsung Fire & Marine Insurance Co. Ltd. | 24 | 6,116 | ||||||
Samsung Heavy Industries Co. Ltd. | 10 | 276 | ||||||
Samsung Life Insurance Co. Ltd. | 82 | 8,030 | ||||||
Samsung Securities Co. Ltd. | 150 | 6,036 | ||||||
Number | Value | |||||||
| South Korea (Continued) | ||||||||
Shinhan Financial Group Co. Ltd. | 1,220 | $ | 53,036 | |||||
SK Holdings Co. Ltd. | 19 | 3,427 | ||||||
SK Hynix, Inc.* | 420 | 18,176 | ||||||
SK Innovation Co. Ltd. | 34 | 3,549 | ||||||
SK Telecom Co. Ltd. | 29 | 6,239 | ||||||
Woori Finance Holdings Co. Ltd.* | 3,515 | 41,345 | ||||||
Woori Investment & Securities Co. Ltd. | 630 | 5,323 | ||||||
|
| |||||||
| 856,976 | ||||||||
|
| |||||||
| Taiwan — 9.4% | ||||||||
Advanced Semiconductor Engineering, Inc., ADR | 13,654 | 87,932 | ||||||
AU Optronics Corp., ADR* | 6,951 | 25,997 | ||||||
Chunghwa Telecom Co. Ltd., ADR | 750 | 23,888 | ||||||
Hon Hai Precision Industry Co. Ltd., GDR | 24,881 | 155,008 | ||||||
Siliconware Precision Industries Co., ADR | 8,277 | 65,388 | ||||||
Taiwan Semiconductor Manufacturing Co. Ltd., ADR | 9,927 | 204,099 | ||||||
United Microelectronics Corp., ADR | 25,954 | 59,694 | ||||||
|
| |||||||
| 622,006 | ||||||||
|
| |||||||
| Thailand — 1.6% | ||||||||
Bangkok Bank PCL, NVDR | 2,125 | 11,975 | ||||||
Indorama Ventures PCL, NVDR | 8,326 | 6,340 | ||||||
IRPC PCL, NVDR | 37,384 | 4,031 | ||||||
Kasikornbank PCL, NVDR | 3,000 | 17,134 | ||||||
Krung Thai Bank PCL, NVDR | 20,304 | 11,689 | ||||||
PTT Exploration & Production PCL, NVDR | 3,500 | 16,365 | ||||||
PTT PCL, NVDR | 2,125 | 19,030 | ||||||
Siam Commercial Bank PCL, NVDR | 3,000 | 14,529 | ||||||
Thai Oil PCL, NVDR | 5,251 | 7,957 | ||||||
|
| |||||||
| 109,050 | ||||||||
|
| |||||||
TOTAL COMMON STOCKS | 6,580,782 | |||||||
|
| |||||||
| PREFERRED STOCKS — 0.2% | ||||||||
| South Korea — 0.2% | ||||||||
Samsung Electronics Co. Ltd. | 16 | 17,361 | ||||||
|
| |||||||
| RIGHTS — 0.0% (a) | ||||||||
| Australia — 0.0% (a) | ||||||||
Transurban Group*, expires 6/23/14 | 470 | 0 | ||||||
|
| |||||||
| China — 0.0% (a) | ||||||||
Uni-President China Holdings Ltd.*, expires 7/17/14 | 500 | 94 | ||||||
|
| |||||||
| Hong Kong — 0.0% (a) | ||||||||
China Merchants Holdings International Co. Ltd.*, expires 7/05/14 | 1,000 | 0 | ||||||
|
| |||||||
| South Korea — 0.0% (a) | ||||||||
BS Financial Group, Inc.*, expires 8/04/14 | 11 | 21 | ||||||
|
| |||||||
TOTAL RIGHTS | 115 | |||||||
|
| |||||||
| See Notes to Financial Statements. | 61 |
DBX ETF Trust
SCHEDULE OF INVESTMENTS
db X-trackers MSCI Asia Pacific ex Japan Hedged Equity Fund (Continued)
May 31, 2014
Number | Value | |||||||
| WARRANTS — 0.0% (a) | ||||||||
| Hong Kong — 0.0% (a) | ||||||||
Sun Hung KAI Properties Ltd.*, expires 4/22/16 (Cost $208) | 208 | $ | 256 | |||||
|
| |||||||
TOTAL INVESTMENTS — 99.7% (Cost $6,203,261) | $ | 6,598,514 | ||||||
Other assets less liabilities — 0.3% | 17,783 | |||||||
|
| |||||||
NET ASSETS — 100.0% | $ | 6,616,297 | ||||||
|
| |||||||
As of May 31, 2014, the Fund had the following forward foreign currency contracts outstanding:
Counterparty | Settlement Date | Currency To Deliver | Currency To Receive | Unrealized Appreciation (Depreciation) | ||||||||||||||
Barclays Bank PLC | 6/4/2014 | AUD | 934,000 | USD | 863,294 | $ | (5,692 | ) | ||||||||||
JP Morgan & Chase Co. | 6/4/2014 | AUD | 934,000 | USD | 863,407 | (5,578 | ) | |||||||||||
Barclays Bank PLC | 6/4/2014 | HKD | 6,888,000 | USD | 888,462 | 19 | ||||||||||||
JP Morgan & Chase Co. | 6/4/2014 | HKD | 6,888,000 | USD | 888,497 | 54 | ||||||||||||
The Bank of New York Mellon | 6/4/2014 | HKD | 80,008 | USD | 10,320 | — | ||||||||||||
Barclays Bank PLC | 6/4/2014 | IDR | 1,311,436,000 | USD | 113,172 | 921 | ||||||||||||
JP Morgan & Chase Co. | 6/4/2014 | IDR | 1,311,436,000 | USD | 112,826 | 574 | ||||||||||||
Barclays Bank PLC | 6/4/2014 | INR | 9,570,000 | USD | 157,739 | (4,073 | ) | |||||||||||
JP Morgan & Chase Co. | 6/4/2014 | INR | 9,570,000 | USD | 157,658 | (4,154 | ) | |||||||||||
The Bank of New York Mellon | 6/4/2014 | INR | 418,180 | USD | 7,000 | (71 | ) | |||||||||||
The Bank of New York Mellon | 6/4/2014 | INR | 526,820 | USD | 8,914 | 6 | ||||||||||||
Barclays Bank PLC | 6/4/2014 | MYR | 640,000 | USD | 195,641 | (3,491 | ) | |||||||||||
JP Morgan & Chase Co. | 6/4/2014 | MYR | 640,000 | USD | 195,599 | (3,533 | ) | |||||||||||
Barclays Bank PLC | 6/4/2014 | NZD | 47,000 | USD | 40,244 | 349 | ||||||||||||
JP Morgan & Chase Co. | 6/4/2014 | NZD | 47,000 | USD | 40,267 | 372 | ||||||||||||
The Bank of New York Mellon | 6/4/2014 | NZD | 3,000 | USD | 2,547 | 1 | ||||||||||||
Barclays Bank PLC | 6/4/2014 | PHP | 2,027,000 | USD | 45,556 | (768 | ) | |||||||||||
JP Morgan & Chase Co. | 6/4/2014 | PHP | 2,027,000 | USD | 45,448 | (875 | ) | |||||||||||
Barclays Bank PLC | 6/4/2014 | SGD | 210,000 | USD | 167,245 | (179 | ) | |||||||||||
JP Morgan & Chase Co. | 6/4/2014 | SGD | 210,000 | USD | 167,281 | (143 | ) | |||||||||||
The Bank of New York Mellon | 6/4/2014 | SGD | 2,000 | USD | 1,595 | 1 | ||||||||||||
Barclays Bank PLC | 6/4/2014 | THB | 1,822,000 | USD | 56,179 | 692 | ||||||||||||
JP Morgan & Chase Co. | 6/4/2014 | THB | 1,822,000 | USD | 56,181 | 694 | ||||||||||||
Barclays Bank PLC | 6/4/2014 | USD | 869,214 | AUD | 934,000 | (229 | ) | |||||||||||
Barclays Bank PLC | 6/4/2014 | USD | 888,436 | HKD | 6,888,000 | 7 | ||||||||||||
Barclays Bank PLC | 6/4/2014 | USD | 111,802 | IDR | 1,311,436,000 | 450 | ||||||||||||
Barclays Bank PLC | 6/4/2014 | USD | 161,683 | INR | 9,570,000 | 129 | ||||||||||||
Barclays Bank PLC | 6/4/2014 | USD | 199,005 | MYR | 640,000 | 127 | ||||||||||||
Barclays Bank PLC | 6/4/2014 | USD | 39,908 | NZD | 47,000 | (13 | ) | |||||||||||
Barclays Bank PLC | 6/4/2014 | USD | 46,205 | PHP | 2,027,000 | 119 | ||||||||||||
Barclays Bank PLC | 6/4/2014 | USD | 167,512 | SGD | 210,000 | (88 | ) | |||||||||||
Barclays Bank PLC | 6/4/2014 | USD | 55,466 | THB | 1,822,000 | 22 | ||||||||||||
JP Morgan & Chase Co. | 6/4/2014 | USD | 869,274 | AUD | 934,000 | (288 | ) | |||||||||||
JP Morgan & Chase Co. | 6/4/2014 | USD | 888,436 | HKD | 6,888,000 | 7 | ||||||||||||
JP Morgan & Chase Co. | 6/4/2014 | USD | 112,329 | IDR | 1,311,436,000 | (76 | ) | |||||||||||
JP Morgan & Chase Co. | 6/4/2014 | USD | 161,956 | INR | 9,570,000 | (144 | ) | |||||||||||
JP Morgan & Chase Co. | 6/4/2014 | USD | 199,191 | MYR | 640,000 | (59 | ) | |||||||||||
JP Morgan & Chase Co. | 6/4/2014 | USD | 39,908 | NZD | 47,000 | (13 | ) | |||||||||||
JP Morgan & Chase Co. | 6/4/2014 | USD | 46,326 | PHP | 2,027,000 | (2 | ) | |||||||||||
JP Morgan & Chase Co | 6/4/2014 | USD | 167,511 | SGD | 210,000 | (87 | ) | |||||||||||
| See Notes to Financial Statements. | 62 |
DBX ETF Trust
SCHEDULE OF INVESTMENTS
db X-trackers MSCI Asia Pacific ex Japan Hedged Equity Fund (Continued)
May 31, 2014
Counterparty | Settlement Date | Currency To Deliver | Currency To Receive | Unrealized Appreciation (Depreciation) | ||||||||||||||
JP Morgan & Chase Co | 6/4/2014 | USD | 55,464 | THB | 1,822,000 | $ | 24 | |||||||||||
The Bank of New York Mellon | 6/4/2014 | USD | 6,579 | HKD | 51,000 | (1 | ) | |||||||||||
The Bank of New York Mellon | 6/4/2014 | USD | 646 | HKD | 5,008 | — | ||||||||||||
The Bank of New York Mellon | 6/4/2014 | USD | 3,096 | HKD | 24,000 | — | ||||||||||||
The Bank of New York Mellon | 6/4/2014 | USD | 16,170 | INR | 945,000 | (192 | ) | |||||||||||
The Bank of New York Mellon | 6/4/2014 | USD | 2,570 | NZD | 3,000 | (23 | ) | |||||||||||
The Bank of New York Mellon | 6/4/2014 | USD | 1,597 | SGD | 2,000 | (2 | ) | |||||||||||
Barclays Bank PLC | 6/5/2014 | KRW | 417,635,000 | USD | 403,652 | (5,611 | ) | |||||||||||
JP Morgan & Chase Co. | 6/5/2014 | KRW | 417,635,000 | USD | 403,500 | (5,763 | ) | |||||||||||
Barclays Bank PLC | 6/5/2014 | TWD | 9,105,000 | USD | 301,940 | (1,733 | ) | |||||||||||
JP Morgan & Chase Co. | 6/5/2014 | TWD | 9,105,000 | USD | 301,420 | (2,253 | ) | |||||||||||
The Bank of New York Mellon | 6/5/2014 | TWD | 368,000 | USD | 12,218 | (56 | ) | |||||||||||
Barclays Bank PLC | 6/5/2014 | USD | 408,905 | KRW | 417,635,000 | 357 | ||||||||||||
Barclays Bank PLC | 6/5/2014 | USD | 303,500 | TWD | 9,105,000 | 173 | ||||||||||||
JP Morgan & Chase Co. | 6/5/2014 | USD | 409,366 | KRW | 417,635,000 | (104 | ) | |||||||||||
JP Morgan & Chase Co. | 6/5/2014 | USD | 303,647 | TWD | 9,105,000 | 26 | ||||||||||||
The Bank of New York Mellon | 6/5/2014 | USD | 12,260 | TWD | 368,000 | 13 | ||||||||||||
Barclays Bank PLC | 7/3/2014 | AUD | 937,000 | USD | 870,251 | 236 | ||||||||||||
JP Morgan & Chase Co. | 7/3/2014 | AUD | 937,000 | USD | 870,272 | 257 | ||||||||||||
The Bank of New York Mellon | 7/3/2014 | AUD | 10,229 | USD | 9,500 | 3 | ||||||||||||
Barclays Bank PLC | 7/3/2014 | HKD | 7,018,000 | USD | 905,242 | (20 | ) | |||||||||||
JP Morgan & Chase Co. | 7/3/2014 | HKD | 7,018,000 | USD | 905,237 | (25 | ) | |||||||||||
The Bank of New York Mellon | 7/3/2014 | HKD | 51,942 | USD | 6,700 | — | ||||||||||||
Barclays Bank PLC | 7/3/2014 | IDR | 1,273,404,000 | USD | 108,099 | (349 | ) | |||||||||||
JP Morgan & Chase Co. | 7/3/2014 | IDR | 1,273,404,000 | USD | 108,857 | 408 | ||||||||||||
Barclays Bank PLC | 7/3/2014 | KRW | 454,259,000 | USD | 444,098 | (417 | ) | |||||||||||
JP Morgan & Chase Co. | 7/3/2014 | KRW | 454,259,000 | USD | 444,567 | 52 | ||||||||||||
Barclays Bank PLC | 7/3/2014 | MYR | 636,000 | USD | 197,393 | (71 | ) | |||||||||||
JP Morgan & Chase Co. | 7/3/2014 | MYR | 636,000 | USD | 197,663 | 198 | ||||||||||||
Barclays Bank PLC | 7/3/2014 | NZD | 44,000 | USD | 37,267 | 20 | ||||||||||||
JP Morgan & Chase Co. | 7/3/2014 | NZD | 44,000 | USD | 37,264 | 17 | ||||||||||||
The Bank of New York Mellon | 7/3/2014 | NZD | 4,368 | USD | 3,700 | 2 | ||||||||||||
Barclays Bank PLC | 7/3/2014 | PHP | 2,022,000 | USD | 46,091 | (101 | ) | |||||||||||
JP Morgan & Chase Co. | 7/3/2014 | PHP | 2,022,000 | USD | 46,212 | 20 | ||||||||||||
Barclays Bank PLC | 7/3/2014 | SGD | 214,000 | USD | 170,697 | 84 | ||||||||||||
JP Morgan & Chase Co. | 7/3/2014 | SGD | 214,000 | USD | 170,697 | 84 | ||||||||||||
Barclays Bank PLC | 7/3/2014 | TWD | 9,388,000 | USD | 313,090 | (175 | ) | |||||||||||
JP Morgan & Chase Co. | 7/3/2014 | TWD | 9,388,000 | USD | 313,356 | 91 | ||||||||||||
Barclays Bank PLC | 7/7/2014 | INR | 10,016,000 | USD | 168,377 | 293 | ||||||||||||
JP Morgan & Chase Co. | 7/7/2014 | INR | 10,016,000 | USD | 168,756 | 671 | ||||||||||||
Barclays Bank PLC | 7/7/2014 | THB | 1,809,000 | USD | 54,938 | (73 | ) | |||||||||||
JP Morgan & Chase Co. | 7/7/2014 | THB | 1,809,000 | USD | 54,926 | (85 | ) | |||||||||||
|
| |||||||||||||||||
Total net unrealized depreciation | $ | (39,037 | ) | |||||||||||||||
|
| |||||||||||||||||
Currency Abbreviations
AUD – Australian Dollar
HKD – Hong Kong Dollar
IDR – Indonesian Rupiah
INR – Indian Rupee
KRW – South Korean Won
MYR – Malaysian Ringgit
NZD – New Zealand Dollar
PHP – Phillippine Peso
SGD – Singapore Dollar
THB – Thai Baht
TWD – New Taiwan Dollar
USD – U.S. Dollar
| See Notes to Financial Statements. | 63 |
DBX ETF Trust
SCHEDULE OF INVESTMENTS
db X-trackers MSCI Asia Pacific ex Japan Hedged Equity Fund (Continued)
May 31, 2014
* Non-income producing security.
144A – Security is exempt from registration under Rule 144A of the securities Act of 1933. This security is considered liquid and may be resold in transactions exempt from registration, normally to qualified institutional buyers. At May 31, 2014 the aggregate market value of this security amounted to $63,492 or 1.0% of net assets.
† Security is listed in country of domicile. Significant business activities of company are in Australia, New Zealand and the United States.
(a) Less than 0.1%.
ADR – American Depositary Receipt.
CDI – Chess Depositary Interest.
GDR – Global Depositary Receipt.
NVDR – Non Voting Depositary Receipt.
REIT – Real Estate Investment Trust.
| See Notes to Financial Statements. | 64 |
DBX ETF Trust
SCHEDULE OF INVESTMENTS
db X-trackers MSCI Europe Hedged Equity Fund
May 31, 2014
Number | Value | |||||||
| COMMON STOCKS — 98.2% | ||||||||
| Austria — 0.4% | ||||||||
Andritz AG | 1,297 | $ | 77,254 | |||||
Erste Group Bank AG | 4,907 | 170,503 | ||||||
Immofinanz AG* | 17,266 | 61,383 | ||||||
OMV AG | 2,596 | 107,543 | ||||||
Raiffeisen Bank International AG | 2,017 | 67,555 | ||||||
Telekom Austria AG | 3,895 | 37,873 | ||||||
Vienna Insurance Group AG Wiener Versicherung Gruppe* | 659 | 35,627 | ||||||
Voestalpine AG | 2,005 | 92,776 | ||||||
|
| |||||||
| 650,514 | ||||||||
|
| |||||||
| Belgium — 1.8% | ||||||||
Ageas | 3,899 | 163,913 | ||||||
Anheuser-Busch InBev NV | 14,219 | 1,560,506 | ||||||
Belgacom SA | 2,713 | 89,886 | ||||||
Colruyt SA | 1,345 | 75,364 | ||||||
Delhaize Group SA | 1,806 | 128,411 | ||||||
Groupe Bruxelles Lambert SA | 1,418 | 147,639 | ||||||
KBC Groep NV* | 4,378 | 260,619 | ||||||
Solvay SA | 1,043 | 168,694 | ||||||
Telenet Group Holding NV* | 890 | 53,321 | ||||||
UCB SA | 2,025 | 161,428 | ||||||
Umicore SA | 2,008 | 96,569 | ||||||
|
| |||||||
| 2,906,350 | ||||||||
|
| |||||||
| Bermuda — 0.1% | ||||||||
Seadrill Ltd | 6,610 | 249,234 | ||||||
|
| |||||||
| Channel Islands — 0.1% | ||||||||
Friends Life Group Ltd. | 25,018 | 131,382 | ||||||
Randgold Resources Ltd. | 1,536 | 112,177 | ||||||
|
| |||||||
| 243,559 | ||||||||
|
| |||||||
| Denmark — 1.9% | ||||||||
A.P. Moeller — Maersk A/S, Class A | 44 | 108,729 | ||||||
A.P. Moeller — Maersk A/S, Class B | 106 | 276,072 | ||||||
Carlsberg A/S, Class B | 1,890 | 196,413 | ||||||
Coloplast A/S, Class B | 1,936 | 166,895 | ||||||
Danske Bank A/S | 11,564 | 325,044 | ||||||
DSV A/S | 3,186 | 106,137 | ||||||
Novo Nordisk A/S, Class B | 35,247 | 1,492,216 | ||||||
Novozymes A/S, Class B | 4,012 | 196,084 | ||||||
TDC A/S | 14,517 | 140,921 | ||||||
Tryg A/S | 407 | 38,840 | ||||||
William Demant Holding A/S* | 415 | 37,254 | ||||||
|
| |||||||
| 3,084,605 | ||||||||
|
| |||||||
| Finland — 1.3% | ||||||||
Elisa OYJ | 2,481 | 73,863 | ||||||
Fortum OYJ | 7,799 | 190,194 | ||||||
Kone OYJ, Class B | 5,507 | 226,708 | ||||||
Metso OYJ | 2,244 | 87,241 | ||||||
Neste Oil OYJ | 2,244 | 45,945 | ||||||
Nokia OYJ* | 66,099 | 533,863 | ||||||
Nokian Renkaat OYJ | 2,005 | 84,946 | ||||||
Orion OYJ, Class B | 1,769 | 55,752 | ||||||
Sampo OYJ, Class A | 7,856 | 396,018 | ||||||
Number | Value | |||||||
| Finland (Continued) | ||||||||
Stora Enso OYJ, Class R | 9,795 | $ | 100,341 | |||||
UPM-Kymmene OYJ | 9,325 | 164,105 | ||||||
Wartsila OYJ Abp | 3,126 | 168,660 | ||||||
|
| |||||||
| 2,127,636 | ||||||||
|
| |||||||
| France — 14.9% | ||||||||
Accor SA | 3,013 | 159,421 | ||||||
Aeroports de Paris | 505 | 65,742 | ||||||
Air Liquide SA | 5,522 | 804,299 | ||||||
Airbus Group NV | 10,338 | 741,398 | ||||||
Alcatel-Lucent* | 49,093 | 200,162 | ||||||
Alstom SA | 3,459 | 136,740 | ||||||
Arkema SA | 1,093 | 111,760 | ||||||
AtoS | 1,372 | 123,250 | ||||||
AXA SA | 32,085 | 792,077 | ||||||
BNP Paribas SA | 18,656 | 1,306,395 | ||||||
Bollore SA | 88 | 56,416 | ||||||
Bouygues SA | 3,377 | 156,768 | ||||||
Bureau Veritas SA | 3,895 | 117,446 | ||||||
Cap Gemini SA | 2,524 | 183,522 | ||||||
Carrefour SA | 10,813 | 393,111 | ||||||
Casino Guichard-Perrachon SA | 976 | 125,674 | ||||||
CGG* | 264 | 3,563 | ||||||
Christian Dior SA | 959 | 200,666 | ||||||
Cie de St-Gobain | 7,819 | 445,474 | ||||||
Cie Generale des Etablissements Michelin | 3,303 | 407,027 | ||||||
CNP Assurances | 3,067 | 66,140 | ||||||
Credit Agricole SA | 17,598 | 274,553 | ||||||
Danone SA | 10,028 | 746,779 | ||||||
Dassault Systemes SA | 1,093 | 138,623 | ||||||
Edenred | 3,550 | 111,278 | ||||||
Electricite de France | 4,249 | 149,175 | ||||||
Essilor International SA | 3,587 | 376,797 | ||||||
Eurazeo SA | 711 | 61,351 | ||||||
Eutelsat Communications SA | 2,714 | 95,025 | ||||||
Fonciere des Regions REIT | 499 | 49,941 | ||||||
GDF Suez | 25,439 | 710,366 | ||||||
Gecina SA REIT | 377 | 53,806 | ||||||
Groupe Eurotunnel SA | 8,895 | 117,615 | ||||||
ICADE REIT | 621 | 62,169 | ||||||
Iliad SA | 460 | 147,044 | ||||||
Imerys SA | 591 | 49,522 | ||||||
JCDecaux SA | 1,181 | 47,057 | ||||||
Kering | 1,325 | 292,783 | ||||||
Klepierre REIT | 1,769 | 85,883 | ||||||
Lafarge SA | 3,304 | 285,411 | ||||||
Lagardere SCA | 2,131 | 74,264 | ||||||
Legrand SA | 4,657 | 294,780 | ||||||
L’Oreal SA | 4,264 | 744,001 | ||||||
LVMH Moet Hennessy Louis Vuitton SA | 4,905 | 975,865 | ||||||
Natixis | 16,300 | 111,097 | ||||||
Orange SA | 32,693 | 546,599 | ||||||
Pernod Ricard SA | 3,754 | 460,302 | ||||||
Peugeot SA* | 6,856 | 97,010 | ||||||
Publicis Groupe SA | 3,185 | 274,740 | ||||||
Remy Cointreau SA | 408 | 37,819 | ||||||
Renault SA | 3,424 | 322,334 | ||||||
| See Notes to Financial Statements. | 65 |
DBX ETF Trust
SCHEDULE OF INVESTMENTS
db X-trackers MSCI Europe Hedged Equity Fund (Continued)
May 31, 2014
Number | Value | |||||||
| France (Continued) | ||||||||
Rexel SA* | 4,722 | $ | 112,838 | |||||
Safran SA | 4,774 | 323,987 | ||||||
Sanofi | 21,110 | 2,257,212 | ||||||
Schneider Electric SA | 9,689 | 912,385 | ||||||
SCOR SE | 2,714 | 94,747 | ||||||
Societe BIC SA | 497 | 64,944 | ||||||
Societe Generale SA | 12,734 | 733,656 | ||||||
Sodexo | 1,654 | 177,758 | ||||||
Suez Environnement Co. | 4,957 | 99,601 | ||||||
Technip SA | 1,796 | 192,872 | ||||||
Thales SA | 1,590 | 95,172 | ||||||
Total SA | 37,904 | 2,659,929 | ||||||
Unibail-Rodamco SE REIT | 1,711 | 478,369 | ||||||
Valeo SA | 1,324 | 177,775 | ||||||
Vallourec SA | 1,887 | 102,634 | ||||||
Veolia Environnement | 7,198 | 137,565 | ||||||
Vinci SA | 8,498 | 629,019 | ||||||
Vivendi SA* | 21,406 | 561,419 | ||||||
Wendel SA* | 570 | 86,091 | ||||||
Zodiac Aerospace | 3,297 | 117,212 | ||||||
|
| |||||||
| 24,406,225 | ||||||||
|
| |||||||
| Germany — 12.7% | ||||||||
adidas AG | 3,689 | 395,959 | ||||||
Allianz SE | 8,075 | 1,369,335 | ||||||
Axel Springer SE | 709 | 45,666 | ||||||
BASF SE | 16,234 | 1,869,282 | ||||||
Bayer AG | 14,655 | 2,119,571 | ||||||
Bayerische Motoren Werke AG | 5,820 | 730,604 | ||||||
Beiersdorf AG | 1,772 | 178,942 | ||||||
Brenntag AG | 908 | 169,633 | ||||||
Celesio AG* | 755 | 26,851 | ||||||
Commerzbank AG* | 17,019 | 270,159 | ||||||
Continental AG | 1,967 | 465,077 | ||||||
Daimler AG | 17,013 | 1,616,444 | ||||||
Deutsche Bank AG (a) | 17,991 | 728,748 | ||||||
Deutsche Boerse AG | 3,449 | 263,286 | ||||||
Deutsche Lufthansa AG | 4,032 | 106,353 | ||||||
Deutsche Post AG | 17,037 | 631,929 | ||||||
Deutsche Telekom AG | 54,827 | 921,145 | ||||||
Deutsche Wohnen AG* | 4,975 | 110,339 | ||||||
E.ON SE | 35,133 | 684,135 | ||||||
Fraport AG Frankfurt Airport Services Worldwide | 631 | 48,409 | ||||||
Fresenius Medical Care AG & Co. KGaA | 3,779 | 250,357 | ||||||
Fresenius SE & Co. KGaA | 2,266 | 338,083 | ||||||
GEA Group AG | 3,195 | 137,431 | ||||||
Hannover Rueck SE | 1,063 | 94,535 | ||||||
HeidelbergCement AG | 2,480 | 213,589 | ||||||
Henkel AG & Co. KGaA | 2,275 | 230,697 | ||||||
Hochtief AG | 517 | 47,042 | ||||||
Hugo Boss AG | 567 | 80,576 | ||||||
Infineon Technologies AG | 19,888 | 246,679 | ||||||
K+S AG | 3,067 | 106,611 | ||||||
Kabel Deutschland Holding AG | 377 | 53,652 | ||||||
LANXESS AG | 1,582 | 112,484 | ||||||
Linde AG | 3,277 | 684,579 | ||||||
Number | Value | |||||||
| Germany (Continued) | ||||||||
MAN SE | 612 | $ | 76,443 | |||||
Merck KGaA | 1,143 | 196,319 | ||||||
Metro AG* | 2,813 | 117,414 | ||||||
Muenchener Rueckversicherungs-Gesellschaft AG | 3,162 | 700,856 | ||||||
OSRAM Licht AG* | 1,466 | 74,390 | ||||||
ProSiebenSat.1 Media AG | 3,851 | 175,255 | ||||||
RWE AG | 8,617 | 345,930 | ||||||
SAP AG | 16,312 | 1,248,766 | ||||||
Siemens AG | 14,004 | 1,860,480 | ||||||
Sky Deutschland AG* | 7,690 | 71,744 | ||||||
Suedzucker AG | 132 | 2,681 | ||||||
Telefonica Deutschland Holding AG* | 4,956 | 38,481 | ||||||
ThyssenKrupp AG* | 7,939 | 238,411 | ||||||
United Internet AG | 2,061 | 95,255 | ||||||
Volkswagen AG | 525 | 138,301 | ||||||
|
| |||||||
| 20,728,908 | ||||||||
|
| |||||||
| Ireland — 1.0% | ||||||||
Bank of Ireland* | 427,137 | 164,196 | ||||||
CRH PLC | 12,878 | 352,500 | ||||||
Experian PLC | 17,598 | 305,891 | ||||||
Kerry Group PLC, Class A | 2,784 | 211,953 | ||||||
Shire PLC | 10,332 | 591,250 | ||||||
|
| |||||||
| 1,625,790 | ||||||||
|
| |||||||
| Italy — 3.6% | ||||||||
Assicurazioni Generali SpA | 20,546 | 465,204 | ||||||
Atlantia SpA | 6,635 | 184,328 | ||||||
Banca Monte dei Paschi di Siena SpA* | 2,035 | 68,968 | ||||||
Banco Popolare SC* | 6,138 | 118,394 | ||||||
Enel Green Power SpA | 31,383 | 88,041 | ||||||
Enel SpA | 116,088 | 657,039 | ||||||
Eni SpA | 44,874 | 1,143,275 | ||||||
EXOR SpA | 1,733 | 74,414 | ||||||
Fiat SpA* | 15,456 | 161,494 | ||||||
Finmeccanica SpA* | 7,198 | 59,068 | ||||||
Intesa Sanpaolo SpA | 206,541 | 692,047 | ||||||
Intesa Sanpaolo SpA-RSP | 15,000 | 42,776 | ||||||
Luxottica Group SpA | 2,950 | 168,493 | ||||||
Mediobanca SpA* | 10,544 | 105,643 | ||||||
Pirelli & C. SpA* | 4,247 | 71,614 | ||||||
Prysmian SpA | 3,560 | 82,644 | ||||||
Saipem SpA* | 4,719 | 122,994 | ||||||
Snam SpA | 35,777 | 210,003 | ||||||
Telecom Italia SpA* | 177,838 | 220,846 | ||||||
Telecom Italia SpA-RSP | 108,070 | 103,195 | ||||||
Terna Rete Elettrica Nazionale SpA | 26,560 | 140,984 | ||||||
UniCredit SpA | 77,689 | 677,247 | ||||||
Unione di Banche Italiane SCPA | 15,106 | 139,098 | ||||||
UnipolSai SpA | 15,694 | 53,997 | ||||||
|
| |||||||
| 5,851,806 | ||||||||
|
| |||||||
| Luxembourg — 0.6% | ||||||||
Altice SA* | 1,000 | 72,656 | ||||||
ArcelorMittal | 17,592 | 268,584 | ||||||
Millicom International Cellular SA SDR | 1,181 | 109,064 | ||||||
RTL Group SA | 685 | 79,837 | ||||||
| See Notes to Financial Statements. | 66 |
DBX ETF Trust
SCHEDULE OF INVESTMENTS
db X-trackers MSCI Europe Hedged Equity Fund (Continued)
May 31, 2014
Number | Value | |||||||
| Luxembourg (Continued) | ||||||||
SES SA FDR | 5,321 | $ | 193,302 | |||||
Tenaris SA | 8,379 | 187,548 | ||||||
|
| |||||||
| 910,991 | ||||||||
|
| |||||||
| Mexico — 0.0% (b) | ||||||||
Fresnillo PLC | 3,850 | 52,014 | ||||||
|
| |||||||
| Netherlands — 6.7% | ||||||||
Aegon NV | 31,857 | 276,364 | ||||||
Akzo Nobel NV | 4,273 | 320,246 | ||||||
ASML Holding NV | 6,294 | 540,179 | ||||||
Corio NV REIT | 1,181 | 59,059 | ||||||
Delta Lloyd NV | 3,439 | 83,515 | ||||||
Fugro NV | 1,244 | 71,773 | ||||||
Gemalto NV | 1,424 | 154,612 | ||||||
Heineken Holding NV | 1,772 | 116,935 | ||||||
Heineken NV | 4,058 | 286,044 | ||||||
ING Groep NV* | 67,817 | 949,877 | ||||||
Koninklijke Ahold NV | 16,405 | 298,094 | ||||||
Koninklijke Boskalis Westminster NV | 1,522 | 86,682 | ||||||
Koninklijke DSM NV | 3,023 | 217,992 | ||||||
Koninklijke KPN NV* | 56,535 | 208,926 | ||||||
Koninklijke Philips NV | 17,241 | 544,547 | ||||||
Koninklijke Vopak NV | 1,233 | 62,819 | ||||||
OCI NV* | 1,660 | 63,563 | ||||||
QIAGEN NV* | 4,130 | 94,750 | ||||||
Randstad Holding NV | 2,184 | 127,064 | ||||||
Reed Elsevier NV | 12,184 | 272,798 | ||||||
Royal Dutch Shell PLC, Class A | 68,990 | 2,711,772 | ||||||
Royal Dutch Shell PLC, Class B | 43,833 | 1,789,057 | ||||||
TNT Express NV | 7,670 | 68,546 | ||||||
Unilever NV | 28,858 | 1,249,377 | ||||||
Wolters Kluwer NV | 5,312 | 159,015 | ||||||
Ziggo NV | 2,607 | 122,907 | ||||||
|
| |||||||
| 10,936,513 | ||||||||
|
| |||||||
| Norway — 1.1% | ||||||||
Aker Solutions ASA | 2,852 | 50,095 | ||||||
DNB ASA | 17,231 | 323,699 | ||||||
Gjensidige Forsikring ASA | 3,540 | 65,377 | ||||||
Norsk Hydro ASA | 23,723 | 128,975 | ||||||
Orkla ASA | 14,605 | 129,243 | ||||||
Statoil ASA | 19,717 | 604,251 | ||||||
Telenor ASA | 13,307 | 315,429 | ||||||
Yara International ASA | 3,186 | 145,499 | ||||||
|
| |||||||
| 1,762,568 | ||||||||
|
| |||||||
| Portugal — 0.3% | ||||||||
Banco Espirito Santo SA* | 54,587 | 74,039 | ||||||
EDP — Energias de Portugal SA | 40,510 | 191,619 | ||||||
Galp Energia SGPS SA | 6,768 | 119,936 | ||||||
Jeronimo Martins SGPS SA | 4,483 | 76,602 | ||||||
Portugal Telecom SGPS SA | 1,045 | 3,755 | ||||||
|
| |||||||
| 465,951 | ||||||||
|
| |||||||
| Spain — 5.3% | ||||||||
Abertis Infraestructuras SA | 7,100 | 155,581 | ||||||
ACS Actividades de Construccion y Servicios SA | 3,074 | 136,585 | ||||||
Number | Value | |||||||
| Spain (Continued) | ||||||||
Amadeus IT Holding SA, Class A | 6,721 | $ | 295,285 | |||||
Banco Bilbao Vizcaya Argentaria SA | 104,601 | 1,340,896 | ||||||
Banco de Sabadell SA | 60,544 | 200,055 | ||||||
Banco Popular Espanol SA | 30,833 | 217,759 | ||||||
Banco Santander SA | 209,443 | 2,148,134 | ||||||
Bankia SA* | 80,656 | 163,931 | ||||||
CaixaBank SA | 30,936 | 188,166 | ||||||
Distribuidora Internacional de Alimentacion SA | 11,160 | 103,098 | ||||||
Enagas SA | 3,421 | 100,682 | ||||||
Ferrovial SA | 7,089 | 153,455 | ||||||
Gas Natural SDG SA | 6,146 | 177,152 | ||||||
Grifols SA | 2,599 | 140,828 | ||||||
Iberdrola SA | 89,901 | 646,938 | ||||||
Inditex SA | 3,856 | 559,800 | ||||||
Mapfre SA | 19,117 | 78,074 | ||||||
Red Electrica Corp. SA | 1,890 | 162,157 | ||||||
Repsol SA | 15,375 | 433,109 | ||||||
Telefonica SA | 72,292 | 1,213,095 | ||||||
Zardoya Otis SA | 3,006 | 54,253 | ||||||
|
| |||||||
| 8,669,033 | ||||||||
|
| |||||||
| Sweden — 4.5% | ||||||||
Alfa Laval AB | 5,546 | 145,280 | ||||||
Assa Abloy AB, Class B | 5,898 | 297,808 | ||||||
Atlas Copco AB, Class A | 11,811 | 346,282 | ||||||
Atlas Copco AB, Class B | 6,853 | 188,939 | ||||||
Boliden AB | 4,839 | 67,249 | ||||||
Electrolux AB, Series B | 4,249 | 106,733 | ||||||
Elekta AB, Class B | 6,510 | 84,147 | ||||||
Getinge AB, Class B | 3,540 | 90,987 | ||||||
Hennes & Mauritz AB, Class B | 16,766 | 708,521 | ||||||
Hexagon AB, Class B | 4,474 | 140,598 | ||||||
Husqvarna AB, Class B | 7,198 | 56,416 | ||||||
Industrivarden AB, Class C | 2,127 | 42,654 | ||||||
Investment AB Kinnevik, Class B | 4,146 | 164,489 | ||||||
Investor AB, Class B | 8,026 | 314,948 | ||||||
Lundin Petroleum AB* | 3,914 | 76,560 | ||||||
Nordea Bank AB | 53,671 | 791,591 | ||||||
Sandvik AB | 18,772 | 267,330 | ||||||
Securitas AB, Class B | 5,547 | 64,033 | ||||||
Skandinaviska Enskilda Banken AB, Class A | 26,790 | 363,699 | ||||||
Skanska AB, Class B | 6,727 | 155,811 | ||||||
SKF AB, Class B | 6,963 | 178,445 | ||||||
Svenska Cellulosa AB SCA, Class B | 10,385 | 288,955 | ||||||
Svenska Handelsbanken AB, Class A | 8,798 | 447,131 | ||||||
Swedbank AB, Class A | 15,939 | 423,960 | ||||||
Swedish Match AB | 3,543 | 123,783 | ||||||
Tele2 AB, Class B | 5,664 | 66,991 | ||||||
Telefonaktiebolaget LM Ericsson, Class B | 54,029 | 676,977 | ||||||
TeliaSonera AB | 42,016 | 311,227 | ||||||
Volvo AB, Class B | 26,910 | 391,264 | ||||||
|
| |||||||
| 7,382,808 | ||||||||
|
| |||||||
| Switzerland — 14.3% | ||||||||
ABB Ltd.* | 38,827 | 922,223 | ||||||
Actelion Ltd.* | 1,804 | 179,292 | ||||||
Adecco SA* | 2,957 | 246,830 | ||||||
| See Notes to Financial Statements. | 67 |
DBX ETF Trust
SCHEDULE OF INVESTMENTS
db X-trackers MSCI Europe Hedged Equity Fund (Continued)
May 31, 2014
Number | Value | |||||||
| Switzerland (Continued) | ||||||||
Aryzta AG* | 1,536 | $ | 143,223 | |||||
Baloise Holding AG | 827 | 99,277 | ||||||
Barry Callebaut AG* | 36 | 47,558 | ||||||
Cie Financiere Richemont SA | 9,211 | 970,472 | ||||||
Coca-Cola HBC AG CDI* | 3,558 | 81,825 | ||||||
Credit Suisse Group AG* | 26,782 | 796,133 | ||||||
EMS-Chemie Holding AG | 150 | 56,281 | ||||||
Geberit AG | 655 | 216,870 | ||||||
Givaudan SA* | 159 | 260,650 | ||||||
Glencore PLC* | 188,157 | 1,019,805 | ||||||
Holcim Ltd.* | 4,018 | 352,444 | ||||||
Julius Baer Group Ltd.* | 3,906 | 169,064 | ||||||
Kuehne + Nagel International AG | 945 | 128,849 | ||||||
Lindt & Spruengli AG | 2 | 118,928 | ||||||
Lindt & Spruengli AG Participation Certificates | 14 | 69,382 | ||||||
Lonza Group AG* | 945 | 101,570 | ||||||
Nestle SA | 57,134 | 4,482,036 | ||||||
Novartis AG | 40,702 | 3,649,772 | ||||||
Pargesa Holding SA | 563 | 50,170 | ||||||
Partners Group Holding AG | 303 | 80,394 | ||||||
Roche Holding AG | 12,454 | 3,664,578 | ||||||
Schindler Holding AG | 373 | 56,981 | ||||||
Schindler Holding AG Participation Certificates | 812 | 125,404 | ||||||
SGS SA | 88 | 220,614 | ||||||
Sika AG | 35 | 138,710 | ||||||
Sonova Holding AG* | 955 | 145,676 | ||||||
STMicroelectronics NV* | 11,348 | 113,543 | ||||||
Sulzer AG | 435 | 66,064 | ||||||
Swatch Group AG (The) — Bearer | 538 | 317,513 | ||||||
Swatch Group AG (The) — Registered | 864 | 94,794 | ||||||
Swiss Life Holding AG* | 555 | 133,436 | ||||||
Swiss Prime Site AG* | 1,044 | 83,940 | ||||||
Swiss Re AG* | 6,185 | 550,123 | ||||||
Swisscom AG | 407 | 242,473 | ||||||
Syngenta AG | 1,638 | 630,141 | ||||||
Transocean Ltd. | 6,373 | 268,798 | ||||||
UBS AG* | 64,634 | 1,297,732 | ||||||
Wolseley PLC | 4,667 | 260,108 | ||||||
Zurich Insurance Group AG* | 2,631 | 789,446 | ||||||
|
| |||||||
| 23,443,122 | ||||||||
|
| |||||||
| United Kingdom — 27.6% | ||||||||
3i Group PLC | 17,347 | 125,583 | ||||||
Aberdeen Asset Management PLC | 17,111 | 127,661 | ||||||
Admiral Group PLC | 3,421 | 83,605 | ||||||
Aggreko PLC | 4,792 | 133,899 | ||||||
AMEC PLC | 5,309 | 107,499 | ||||||
Anglo American PLC | 24,763 | 604,973 | ||||||
Antofagasta PLC | 6,982 | 92,280 | ||||||
ARM Holdings PLC | 24,671 | 380,451 | ||||||
ASOS PLC* | 947 | 71,860 | ||||||
Associated British Foods PLC | 6,261 | 316,728 | ||||||
AstraZeneca PLC | 22,329 | 1,603,216 | ||||||
Aviva PLC | 52,036 | 457,045 | ||||||
Babcock International Group PLC | 8,798 | 179,030 | ||||||
Number | Value | |||||||
| United Kingdom (Continued) | ||||||||
BAE Systems PLC | 56,862 | $ | 403,264 | |||||
Barclays PLC | 287,922 | 1,192,054 | ||||||
BG Group PLC | 60,438 | 1,236,943 | ||||||
BHP Billiton PLC | 37,402 | 1,171,104 | ||||||
BP PLC | 329,575 | 2,778,729 | ||||||
British American Tobacco PLC | 33,401 | 2,015,794 | ||||||
British Land Co. PLC REIT | 16,868 | 202,159 | ||||||
British Sky Broadcasting Group PLC | 18,175 | 268,852 | ||||||
BT Group PLC | 140,355 | 933,990 | ||||||
Bunzl PLC | 5,901 | 165,381 | ||||||
Burberry Group PLC | 7,796 | 200,326 | ||||||
Capita PLC | 11,578 | 214,835 | ||||||
Carnival PLC | 3,198 | 129,991 | ||||||
Centrica PLC | 90,076 | 506,705 | ||||||
CNH Industrial NV | 16,642 | 182,166 | ||||||
Cobham PLC | 19,345 | 103,406 | ||||||
Compass Group PLC | 31,737 | 529,580 | ||||||
Croda International PLC | 2,363 | 104,289 | ||||||
Diageo PLC | 44,456 | 1,429,978 | ||||||
Direct Line Insurance Group PLC | 25,961 | 110,225 | ||||||
easyJet PLC | 2,831 | 72,603 | ||||||
G4S PLC | 27,731 | 116,206 | ||||||
GKN PLC | 28,916 | 190,289 | ||||||
GlaxoSmithKline PLC | 85,950 | 2,306,541 | ||||||
Hammerson PLC REIT | 12,523 | 124,686 | ||||||
Hargreaves Lansdown PLC | 4,170 | 85,205 | ||||||
HSBC Holdings PLC | 333,538 | 3,517,693 | ||||||
ICAP PLC | 9,794 | 65,601 | ||||||
IMI PLC | 4,764 | 127,527 | ||||||
Imperial Tobacco Group PLC | 17,053 | 769,485 | ||||||
Inmarsat PLC | 8,023 | 98,373 | ||||||
InterContinental Hotels Group PLC | 4,603 | 181,700 | ||||||
International Consolidated Airlines Group SA* | 17,871 | 118,395 | ||||||
Intertek Group PLC | 2,835 | 138,664 | ||||||
Intu Properties PLC REIT | 15,368 | 81,143 | ||||||
Investec PLC | 10,266 | 89,050 | ||||||
ITV PLC | 66,919 | 204,260 | ||||||
J Sainsbury PLC | 22,067 | 128,017 | ||||||
Johnson Matthey PLC | 3,602 | 193,929 | ||||||
Kingfisher PLC | 41,888 | 275,233 | ||||||
Land Securities Group PLC REIT | 13,822 | 247,439 | ||||||
Legal & General Group PLC | 104,589 | 403,567 | ||||||
Lloyds Banking Group PLC* | 1,000,039 | 1,305,135 | ||||||
London Stock Exchange Group PLC | 3,077 | 100,987 | ||||||
Marks & Spencer Group PLC | 28,548 | 214,951 | ||||||
Meggitt PLC | 14,071 | 114,273 | ||||||
Melrose Industries PLC | 19,124 | 89,755 | ||||||
National Grid PLC | 65,855 | 982,433 | ||||||
Next PLC | 2,719 | 302,623 | ||||||
Old Mutual PLC | 86,498 | 292,874 | ||||||
Pearson PLC | 14,404 | 282,725 | ||||||
Persimmon PLC* | 5,427 | 121,714 | ||||||
Petrofac Ltd. | 4,602 | 97,349 | ||||||
Prudential PLC | 45,181 | 1,049,269 | ||||||
Reckitt Benckiser Group PLC | 11,496 | 982,745 | ||||||
Reed Elsevier PLC | 20,560 | 327,739 | ||||||
| See Notes to Financial Statements. | 68 |
DBX ETF Trust
SCHEDULE OF INVESTMENTS
db X-trackers MSCI Europe Hedged Equity Fund (Continued)
May 31, 2014
Number | Value | |||||||
| United Kingdom (Continued) | ||||||||
Rexam PLC | 13,935 | $ | 124,146 | |||||
Rio Tinto PLC | 22,537 | 1,154,823 | ||||||
Rolls-Royce Holdings PLC* | 33,149 | 577,867 | ||||||
Royal Bank of Scotland Group PLC* | 43,453 | 252,448 | ||||||
Royal Mail PLC* | 11,798 | 101,252 | ||||||
RSA Insurance Group PLC | 17,816 | 143,283 | ||||||
SABMiller PLC | 16,993 | 943,090 | ||||||
Sage Group PLC (The) | 19,352 | 132,930 | ||||||
Schroders PLC | 2,163 | 93,758 | ||||||
Segro PLC REIT | 13,245 | 82,033 | ||||||
Serco Group PLC | 891 | 5,550 | ||||||
Severn Trent PLC | 4,248 | 140,131 | ||||||
Smith & Nephew PLC | 15,711 | 275,461 | ||||||
Smiths Group PLC | 6,960 | 154,112 | ||||||
Sports Direct International PLC* | 4,400 | 58,006 | ||||||
SSE PLC | 17,003 | 443,465 | ||||||
Standard Chartered PLC | 43,028 | 968,254 | ||||||
Standard Life PLC | 41,913 | 281,017 | ||||||
Subsea 7 SA | 4,719 | 94,334 | ||||||
Tate & Lyle PLC | 8,280 | 96,111 | ||||||
Tesco PLC | 142,932 | 727,251 | ||||||
Travis Perkins PLC | 4,365 | 123,138 | ||||||
TUI Travel PLC | 9,089 | 62,509 | ||||||
Tullow Oil PLC | 16,049 | 226,777 | ||||||
Unilever PLC | 22,650 | 1,017,483 | ||||||
United Utilities Group PLC | 12,035 | 175,101 | ||||||
Vodafone Group PLC | 467,889 | 1,643,050 | ||||||
Weir Group PLC (The) | 3,776 | 165,828 | ||||||
Whitbread PLC | 3,185 | 223,477 | ||||||
William Hill PLC | 15,459 | 92,144 | ||||||
WM Morrison Supermarkets PLC | 39,527 | 133,636 | ||||||
WPP PLC | 23,704 | 511,357 | ||||||
|
| |||||||
| 45,187,601 | ||||||||
|
| |||||||
TOTAL COMMON STOCKS | 160,685,228 | |||||||
|
| |||||||
Number | Value | |||||||
| PREFERRED STOCKS — 0.9% | ||||||||
| Germany — 0.9% | ||||||||
Bayerische Motoren Werke AG | 945 | $ | 91,152 | |||||
Fuchs Petrolub SE | 618 | 58,549 | ||||||
Henkel AG & Co. KGaA | 3,160 | 364,982 | ||||||
Porsche Automobil Holding SE | 2,721 | 290,612 | ||||||
Volkswagen AG | 2,552 | 678,362 | ||||||
|
| |||||||
| 1,483,657 | ||||||||
|
| |||||||
| United Kingdom — 0.0% (b) | ||||||||
Rolls-Royce Holdings PLC, Class C* | 865,372 | 1,451 | ||||||
|
| |||||||
TOTAL PREFERRED STOCKS | 1,485,108 | |||||||
|
| |||||||
| RIGHTS — 0.0% (b) | ||||||||
| France — 0.0% (b) | ||||||||
Eurazeo SA*, expires 6/28/14 | 1 | 4 | ||||||
|
| |||||||
| Portugal — 0.0% (b) | ||||||||
Banco Espirito Santo SA*, expires 7/09/14 | 23,291 | 4,254 | ||||||
|
| |||||||
| Spain — 0.0% (b) | ||||||||
Abertis Infraestructuras SA* | 228 | 4,997 | ||||||
|
| |||||||
TOTAL RIGHTS | 9,255 | |||||||
|
| |||||||
TOTAL INVESTMENTS — 99.1% (Cost $159,912,804) | $ | 162,179,591 | ||||||
Other assets less liabilities — 0.9% | 1,551,327 | |||||||
|
| |||||||
NET ASSETS — 100.0% | $ | 163,730,918 | ||||||
|
| |||||||
As of May 31, 2014, the Fund had the following forward foreign currency contracts outstanding:
Counterparty | Settlement Date | Currency To Deliver | Currency To Receive | Unrealized Appreciation (Depreciation) | ||||||||||||||
Barclays Bank PLC | 6/4/2014 | CHF | 2,026,000 | USD | 2,302,014 | $ | 39,489 | |||||||||||
Barclays Bank PLC | 6/4/2014 | CHF | 613,000 | USD | 699,784 | 15,220 | ||||||||||||
Barclays Bank PLC | 6/4/2014 | CHF | 3,327,000 | USD | 3,753,562 | 38,153 | ||||||||||||
Barclays Bank PLC | 6/4/2014 | CHF | 155,500 | USD | 175,179 | 1,525 | ||||||||||||
Barclays Bank PLC | 6/4/2014 | CHF | 155,500 | USD | 174,705 | 1,051 | ||||||||||||
Barclays Bank PLC | 6/4/2014 | CHF | 238,000 | USD | 266,814 | 1,029 | ||||||||||||
Barclays Bank PLC | 6/4/2014 | CHF | 236,000 | USD | 264,598 | 1,046 | ||||||||||||
Barclays Bank PLC | 6/4/2014 | CHF | 1,749,500 | USD | 1,953,461 | (284 | ) | |||||||||||
Barclays Bank PLC | 6/4/2014 | CHF | 877,000 | USD | 976,738 | (2,647 | ) | |||||||||||
JP Morgan & Chase Co. | 6/4/2014 | CHF | 2,026,000 | USD | 2,301,559 | 39,034 | ||||||||||||
JP Morgan & Chase Co. | 6/4/2014 | CHF | 461,000 | USD | 525,137 | 10,318 | ||||||||||||
JP Morgan & Chase Co. | 6/4/2014 | CHF | 3,327,000 | USD | 3,753,736 | 38,327 | ||||||||||||
JP Morgan & Chase Co. | 6/4/2014 | CHF | 155,500 | USD | 175,176 | 1,522 | ||||||||||||
JP Morgan & Chase Co. | 6/4/2014 | CHF | 155,500 | USD | 174,701 | 1,048 | ||||||||||||
JP Morgan & Chase Co. | 6/4/2014 | CHF | 238,000 | USD | 266,813 | 1,027 | ||||||||||||
| See Notes to Financial Statements. | 69 |
DBX ETF Trust
SCHEDULE OF INVESTMENTS
db X-trackers MSCI Europe Hedged Equity Fund (Continued)
May 31, 2014
Counterparty | Settlement Date | Currency To Deliver | Currency To Receive | Unrealized Appreciation (Depreciation) | ||||||||||||||
JP Morgan & Chase Co. | 6/4/2014 | CHF | 236,000 | USD | 264,598 | $ | 1,046 | |||||||||||
JP Morgan & Chase Co. | 6/4/2014 | CHF | 1,749,500 | USD | 1,953,450 | (295 | ) | |||||||||||
JP Morgan & Chase Co. | 6/4/2014 | CHF | 877,000 | USD | 976,794 | (2,591 | ) | |||||||||||
The Bank of New York Mellon | 6/4/2014 | CHF | 7,000 | USD | 7,952 | 135 | ||||||||||||
The Bank of New York Mellon | 6/4/2014 | CHF | 22,000 | USD | 25,024 | 456 | ||||||||||||
The Bank of New York Mellon | 6/4/2014 | CHF | 48,300 | USD | 54,421 | 483 | ||||||||||||
The Bank of New York Mellon | 6/4/2014 | CHF | 356,000 | USD | 399,866 | 2,305 | ||||||||||||
The Bank of New York Mellon | 6/4/2014 | CHF | 41,100 | USD | 46,104 | 206 | ||||||||||||
The Bank of New York Mellon | 6/4/2014 | CHF | 75,000 | USD | 83,739 | (17 | ) | |||||||||||
The Bank of New York Mellon | 6/4/2014 | CHF | 159,000 | USD | 176,965 | (597 | ) | |||||||||||
Barclays Bank PLC | 6/4/2014 | DKK | 1,792,000 | USD | 332,917 | 5,617 | ||||||||||||
Barclays Bank PLC | 6/4/2014 | DKK | 492,000 | USD | 91,723 | 1,861 | ||||||||||||
Barclays Bank PLC | 6/4/2014 | DKK | 2,658,000 | USD | 489,925 | 4,453 | ||||||||||||
Barclays Bank PLC | 6/4/2014 | DKK | 124,500 | USD | 22,951 | 212 | ||||||||||||
Barclays Bank PLC | 6/4/2014 | DKK | 123,500 | USD | 22,672 | 116 | ||||||||||||
Barclays Bank PLC | 6/4/2014 | DKK | 184,500 | USD | 33,860 | 162 | ||||||||||||
Barclays Bank PLC | 6/4/2014 | DKK | 184,000 | USD | 33,794 | 188 | ||||||||||||
Barclays Bank PLC | 6/4/2014 | DKK | 1,366,000 | USD | 249,445 | (49 | ) | |||||||||||
Barclays Bank PLC | 6/4/2014 | DKK | 685,500 | USD | 124,932 | (271 | ) | |||||||||||
JP Morgan & Chase Co. | 6/4/2014 | DKK | 1,792,000 | USD | 332,939 | 5,638 | ||||||||||||
JP Morgan & Chase Co. | 6/4/2014 | DKK | 372,000 | USD | 69,148 | 1,204 | ||||||||||||
JP Morgan & Chase Co. | 6/4/2014 | DKK | 2,658,000 | USD | 489,932 | 4,460 | ||||||||||||
JP Morgan & Chase Co. | 6/4/2014 | DKK | 124,500 | USD | 22,952 | 212 | ||||||||||||
JP Morgan & Chase Co. | 6/4/2014 | DKK | 123,500 | USD | 22,672 | 116 | ||||||||||||
JP Morgan & Chase Co. | 6/4/2014 | DKK | 184,500 | USD | 33,860 | 162 | ||||||||||||
JP Morgan & Chase Co. | 6/4/2014 | DKK | 184,000 | USD | 33,795 | 188 | ||||||||||||
JP Morgan & Chase Co. | 6/4/2014 | DKK | 1,366,000 | USD | 249,444 | (50 | ) | |||||||||||
JP Morgan & Chase Co. | 6/4/2014 | DKK | 685,500 | USD | 124,933 | (270 | ) | |||||||||||
The Bank of New York Mellon | 6/4/2014 | DKK | 39,000 | USD | 7,247 | 123 | ||||||||||||
The Bank of New York Mellon | 6/4/2014 | DKK | 87,300 | USD | 16,204 | 260 | ||||||||||||
The Bank of New York Mellon | 6/4/2014 | DKK | 99,000 | USD | 18,250 | 168 | ||||||||||||
The Bank of New York Mellon | 6/4/2014 | DKK | 806,000 | USD | 148,066 | 853 | ||||||||||||
The Bank of New York Mellon | 6/4/2014 | DKK | 77,600 | USD | 14,263 | 90 | ||||||||||||
The Bank of New York Mellon | 6/4/2014 | DKK | 44,800 | USD | 8,217 | 34 | ||||||||||||
The Bank of New York Mellon | 6/4/2014 | DKK | 154,000 | USD | 28,122 | (5 | ) | |||||||||||
The Bank of New York Mellon | 6/4/2014 | DKK | 419,000 | USD | 76,349 | (180 | ) | |||||||||||
Barclays Bank PLC | 6/4/2014 | EUR | 5,734,000 | USD | 7,949,606 | 133,307 | ||||||||||||
Barclays Bank PLC | 6/4/2014 | EUR | 1,781,000 | USD | 2,477,774 | 50,005 | ||||||||||||
Barclays Bank PLC | 6/4/2014 | EUR | 9,641,500 | USD | 13,261,970 | 119,166 | ||||||||||||
Barclays Bank PLC | 6/4/2014 | EUR | 451,500 | USD | 621,157 | 5,695 | ||||||||||||
Barclays Bank PLC | 6/4/2014 | EUR | 451,000 | USD | 617,909 | 3,129 | ||||||||||||
Barclays Bank PLC | 6/4/2014 | EUR | 670,500 | USD | 918,411 | 4,419 | ||||||||||||
Barclays Bank PLC | 6/4/2014 | EUR | 671,500 | USD | 920,512 | 5,158 | ||||||||||||
Barclays Bank PLC | 6/4/2014 | EUR | 4,983,500 | USD | 6,792,286 | (969 | ) | |||||||||||
Barclays Bank PLC | 6/4/2014 | EUR | 2,534,500 | USD | 3,447,528 | (7,374 | ) | |||||||||||
JP Morgan & Chase Co. | 6/4/2014 | EUR | 5,734,000 | USD | 7,949,749 | 133,450 | ||||||||||||
JP Morgan & Chase Co. | 6/4/2014 | EUR | 1,347,000 | USD | 1,868,471 | 32,309 | ||||||||||||
JP Morgan & Chase Co. | 6/4/2014 | EUR | 9,641,500 | USD | 13,261,960 | 119,156 | ||||||||||||
JP Morgan & Chase Co. | 6/4/2014 | EUR | 451,500 | USD | 621,151 | 5,689 | ||||||||||||
JP Morgan & Chase Co. | 6/4/2014 | EUR | 451,000 | USD | 617,902 | 3,121 | ||||||||||||
JP Morgan & Chase Co. | 6/4/2014 | EUR | 670,500 | USD | 918,411 | 4,420 | ||||||||||||
JP Morgan & Chase Co. | 6/4/2014 | EUR | 671,500 | USD | 920,518 | 5,163 | ||||||||||||
JP Morgan & Chase Co. | 6/4/2014 | EUR | 4,983,500 | USD | 6,791,803 | (1,452 | ) | |||||||||||
JP Morgan & Chase Co. | 6/4/2014 | EUR | 2,534,500 | USD | 3,447,531 | (7,371 | ) | |||||||||||
The Bank of New York Mellon | 6/4/2014 | EUR | 2,000 | USD | 2,773 | 47 | ||||||||||||
The Bank of New York Mellon | 6/4/2014 | EUR | 48,000 | USD | 66,026 | 595 | ||||||||||||
The Bank of New York Mellon | 6/4/2014 | EUR | 19,200 | USD | 26,411 | 239 | ||||||||||||
| See Notes to Financial Statements. | 70 |
DBX ETF Trust
SCHEDULE OF INVESTMENTS
db X-trackers MSCI Europe Hedged Equity Fund (Continued)
May 31, 2014
Counterparty | Settlement Date | Currency To Deliver | Currency To Receive | Unrealized Appreciation (Depreciation) | ||||||||||||||
The Bank of New York Mellon | 6/4/2014 | EUR | 140,000 | USD | 192,556 | $ | 1,715 | |||||||||||
The Bank of New York Mellon | 6/4/2014 | EUR | 262,000 | USD | 359,173 | 2,028 | ||||||||||||
The Bank of New York Mellon | 6/4/2014 | EUR | 203,200 | USD | 278,759 | 1,767 | ||||||||||||
The Bank of New York Mellon | 6/4/2014 | EUR | 248,000 | USD | 337,267 | (794 | ) | |||||||||||
The Bank of New York Mellon | 6/4/2014 | EUR | 10,000 | USD | 13,606 | (25 | ) | |||||||||||
Barclays Bank PLC | 6/4/2014 | GBP | 3,208,000 | USD | 5,415,951 | 38,880 | ||||||||||||
Barclays Bank PLC | 6/4/2014 | GBP | 1,022,000 | USD | 1,732,357 | 19,338 | ||||||||||||
Barclays Bank PLC | 6/4/2014 | GBP | 5,513,500 | USD | 9,289,509 | 48,087 | ||||||||||||
Barclays Bank PLC | 6/4/2014 | GBP | 258,000 | USD | 435,124 | 2,679 | ||||||||||||
Barclays Bank PLC | 6/4/2014 | GBP | 258,500 | USD | 434,859 | 1,576 | ||||||||||||
Barclays Bank PLC | 6/4/2014 | GBP | 389,500 | USD | 655,041 | 2,183 | ||||||||||||
Barclays Bank PLC | 6/4/2014 | GBP | 388,500 | USD | 653,383 | 2,201 | ||||||||||||
Barclays Bank PLC | 6/4/2014 | GBP | 2,842,000 | USD | 4,781,685 | 18,083 | ||||||||||||
Barclays Bank PLC | 6/4/2014 | GBP | 1,432,000 | USD | 2,394,052 | (6,187 | ) | |||||||||||
JP Morgan & Chase Co. | 6/4/2014 | GBP | 3,208,000 | USD | 5,415,338 | 38,267 | ||||||||||||
JP Morgan & Chase Co. | 6/4/2014 | GBP | 772,000 | USD | 1,302,552 | 8,569 | ||||||||||||
JP Morgan & Chase Co. | 6/4/2014 | GBP | 5,513,500 | USD | 9,289,503 | 48,081 | ||||||||||||
JP Morgan & Chase Co. | 6/4/2014 | GBP | 258,000 | USD | 435,117 | 2,672 | ||||||||||||
JP Morgan & Chase Co. | 6/4/2014 | GBP | 258,500 | USD | 434,867 | 1,583 | ||||||||||||
JP Morgan & Chase Co. | 6/4/2014 | GBP | 389,500 | USD | 655,041 | 2,183 | ||||||||||||
JP Morgan & Chase Co. | 6/4/2014 | GBP | 388,500 | USD | 653,385 | 2,203 | ||||||||||||
JP Morgan & Chase Co. | 6/4/2014 | GBP | 2,842,000 | USD | 4,781,685 | 18,083 | ||||||||||||
JP Morgan & Chase Co. | 6/4/2014 | GBP | 1,432,000 | USD | 2,394,052 | (6,187 | ) | |||||||||||
The Bank of New York Mellon | 6/4/2014 | GBP | 6,000 | USD | 10,122 | 66 | ||||||||||||
The Bank of New York Mellon | 6/4/2014 | GBP | 32,000 | USD | 53,966 | 329 | ||||||||||||
The Bank of New York Mellon | 6/4/2014 | GBP | 42,000 | USD | 70,526 | 128 | ||||||||||||
The Bank of New York Mellon | 6/4/2014 | GBP | 57,000 | USD | 95,909 | 369 | ||||||||||||
The Bank of New York Mellon | 6/4/2014 | GBP | 41,000 | USD | 68,980 | 258 | ||||||||||||
Barclays Bank PLC | 6/4/2014 | NOK | 1,272,000 | USD | 213,233 | 482 | ||||||||||||
Barclays Bank PLC | 6/4/2014 | NOK | 408,000 | USD | 68,948 | 707 | ||||||||||||
Barclays Bank PLC | 6/4/2014 | NOK | 2,223,500 | USD | 375,751 | 3,856 | ||||||||||||
Barclays Bank PLC | 6/4/2014 | NOK | 103,000 | USD | 17,368 | 141 | ||||||||||||
Barclays Bank PLC | 6/4/2014 | NOK | 104,500 | USD | 17,631 | 153 | ||||||||||||
Barclays Bank PLC | 6/4/2014 | NOK | 154,000 | USD | 25,944 | 187 | ||||||||||||
Barclays Bank PLC | 6/4/2014 | NOK | 154,500 | USD | 26,021 | 180 | ||||||||||||
Barclays Bank PLC | 6/4/2014 | NOK | 1,144,000 | USD | 191,855 | 513 | ||||||||||||
Barclays Bank PLC | 6/4/2014 | NOK | 577,000 | USD | 96,692 | 185 | ||||||||||||
JP Morgan & Chase Co. | 6/4/2014 | NOK | 1,272,000 | USD | 213,306 | 556 | ||||||||||||
JP Morgan & Chase Co. | 6/4/2014 | NOK | 305,000 | USD | 51,319 | 306 | ||||||||||||
JP Morgan & Chase Co. | 6/4/2014 | NOK | 2,223,500 | USD | 375,752 | 3,858 | ||||||||||||
JP Morgan & Chase Co. | 6/4/2014 | NOK | 104,500 | USD | 17,631 | 153 | ||||||||||||
JP Morgan & Chase Co. | 6/4/2014 | NOK | 103,000 | USD | 17,368 | 141 | ||||||||||||
JP Morgan & Chase Co. | 6/4/2014 | NOK | 154,000 | USD | 25,944 | 187 | ||||||||||||
JP Morgan & Chase Co. | 6/4/2014 | NOK | 154,500 | USD | 26,021 | 180 | ||||||||||||
JP Morgan & Chase Co. | 6/4/2014 | NOK | 1,144,000 | USD | 191,855 | 513 | ||||||||||||
JP Morgan & Chase Co. | 6/4/2014 | NOK | 577,000 | USD | 96,693 | 186 | ||||||||||||
The Bank of New York Mellon | 6/4/2014 | NOK | 125,000 | USD | 20,925 | 18 | ||||||||||||
Barclays Bank PLC | 6/4/2014 | SEK | 5,310,000 | USD | 814,262 | 20,837 | ||||||||||||
Barclays Bank PLC | 6/4/2014 | SEK | 1,651,000 | USD | 253,694 | 7,000 | ||||||||||||
Barclays Bank PLC | 6/4/2014 | SEK | 8,964,500 | USD | 1,363,040 | 23,556 | ||||||||||||
Barclays Bank PLC | 6/4/2014 | SEK | 420,500 | USD | 63,988 | 1,156 | ||||||||||||
Barclays Bank PLC | 6/4/2014 | SEK | 420,500 | USD | 64,157 | 1,325 | ||||||||||||
Barclays Bank PLC | 6/4/2014 | SEK | 625,000 | USD | 95,255 | 1,867 | ||||||||||||
Barclays Bank PLC | 6/4/2014 | SEK | 625,500 | USD | 94,895 | 1,432 | ||||||||||||
Barclays Bank PLC | 6/4/2014 | SEK | 4,625,500 | USD | 696,464 | 5,317 | ||||||||||||
Barclays Bank PLC | 6/4/2014 | SEK | 2,313,000 | USD | 347,920 | 2,309 | ||||||||||||
JP Morgan & Chase Co. | 6/4/2014 | SEK | 5,310,000 | USD | 814,289 | 20,864 | ||||||||||||
| See Notes to Financial Statements. | 71 |
DBX ETF Trust
SCHEDULE OF INVESTMENTS
db X-trackers MSCI Europe Hedged Equity Fund (Continued)
May 31, 2014
Counterparty | Settlement Date | Currency To Deliver | Currency To Receive | Unrealized Appreciation (Depreciation) | ||||||||||||||
JP Morgan & Chase Co. | 6/4/2014 | SEK | 1,255,000 | USD | 192,783 | $ | 5,260 | |||||||||||
JP Morgan & Chase Co. | 6/4/2014 | SEK | 8,964,500 | USD | 1,363,018 | 23,534 | ||||||||||||
JP Morgan & Chase Co. | 6/4/2014 | SEK | 420,500 | USD | 63,987 | 1,155 | ||||||||||||
JP Morgan & Chase Co. | 6/4/2014 | SEK | 420,500 | USD | 64,157 | 1,325 | ||||||||||||
JP Morgan & Chase Co. | 6/4/2014 | SEK | 625,000 | USD | 95,254 | 1,866 | ||||||||||||
JP Morgan & Chase Co. | 6/4/2014 | SEK | 625,500 | USD | 94,895 | 1,432 | ||||||||||||
JP Morgan & Chase Co. | 6/4/2014 | SEK | 4,625,500 | USD | 696,463 | 5,317 | ||||||||||||
JP Morgan & Chase Co. | 6/4/2014 | SEK | 2,313,000 | USD | 347,920 | 2,309 | ||||||||||||
The Bank of New York Mellon | 6/4/2014 | SEK | 27,000 | USD | 4,109 | 75 | ||||||||||||
The Bank of New York Mellon | 6/4/2014 | SEK | 43,000 | USD | 6,474 | 49 | ||||||||||||
The Bank of New York Mellon | 6/4/2014 | SEK | 696,000 | USD | 104,194 | 197 | ||||||||||||
Barclays Bank PLC | 6/4/2014 | USD | 10,490,078 | CHF | 9,377,500 | (17,806 | ) | |||||||||||
Barclays Bank PLC | 6/4/2014 | USD | 1,391,402 | DKK | 7,610,000 | (1,469 | ) | |||||||||||
Barclays Bank PLC | 6/4/2014 | USD | 36,732,214 | EUR | 26,919,000 | (37,595 | ) | |||||||||||
Barclays Bank PLC | 6/4/2014 | USD | 25,683,415 | GBP | 15,312,000 | (18,293 | ) | |||||||||||
Barclays Bank PLC | 6/4/2014 | USD | 1,027,920 | NOK | 6,140,500 | (882 | ) | |||||||||||
Barclays Bank PLC | 6/4/2014 | USD | 3,735,953 | SEK | 24,955,500 | (7,078 | ) | |||||||||||
JP Morgan & Chase Co. | 6/4/2014 | USD | 10,319,928 | CHF | 9,225,500 | (17,402 | ) | |||||||||||
JP Morgan & Chase Co. | 6/4/2014 | USD | 1,369,450 | DKK | 7,490,000 | (1,434 | ) | |||||||||||
JP Morgan & Chase Co. | 6/4/2014 | USD | 36,140,107 | EUR | 26,485,000 | (37,095 | ) | |||||||||||
JP Morgan & Chase Co. | 6/4/2014 | USD | 25,264,246 | GBP | 15,062,000 | (18,160 | ) | |||||||||||
JP Morgan & Chase Co. | 6/4/2014 | USD | 1,010,714 | NOK | 6,037,500 | (903 | ) | |||||||||||
JP Morgan & Chase Co. | 6/4/2014 | USD | 3,676,737 | SEK | 24,559,500 | (7,033 | ) | |||||||||||
The Bank of New York Mellon | 6/4/2014 | USD | 15,944 | CHF | 14,000 | (309 | ) | |||||||||||
The Bank of New York Mellon | 6/4/2014 | USD | 231,000 | CHF | 206,800 | (58 | ) | |||||||||||
The Bank of New York Mellon | 6/4/2014 | USD | 545,450 | CHF | 487,600 | (925 | ) | |||||||||||
The Bank of New York Mellon | 6/4/2014 | USD | 7,247 | DKK | 39,000 | (124 | ) | |||||||||||
The Bank of New York Mellon | 6/4/2014 | USD | 308,576 | DKK | 1,687,700 | (325 | ) | |||||||||||
The Bank of New York Mellon | 6/4/2014 | USD | 40,214 | EUR | 29,000 | (683 | ) | |||||||||||
The Bank of New York Mellon | 6/4/2014 | USD | 161,701 | EUR | 118,000 | (850 | ) | |||||||||||
The Bank of New York Mellon | 6/4/2014 | USD | 1,071,712 | EUR | 785,400 | (1,095 | ) | |||||||||||
The Bank of New York Mellon | 6/4/2014 | USD | 37,102 | GBP | 22,000 | (227 | ) | |||||||||||
The Bank of New York Mellon | 6/4/2014 | USD | 119,658 | GBP | 71,000 | (652 | ) | |||||||||||
The Bank of New York Mellon | 6/4/2014 | USD | 142,574 | GBP | 85,000 | (101 | ) | |||||||||||
The Bank of New York Mellon | 6/4/2014 | USD | 20,975 | NOK | 125,000 | (68 | ) | |||||||||||
The Bank of New York Mellon | 6/4/2014 | USD | 116,207 | SEK | 766,000 | (1,750 | ) | |||||||||||
Barclays Bank PLC | 7/3/2014 | CHF | 9,972,000 | USD | 11,158,107 | 18,311 | ||||||||||||
JP Morgan & Chase Co. | 7/3/2014 | CHF | 9,972,000 | USD | 11,157,483 | 17,686 | ||||||||||||
Barclays Bank PLC | 7/3/2014 | DKK | 9,659,000 | USD | 1,766,374 | 1,814 | ||||||||||||
JP Morgan & Chase Co. | 7/3/2014 | DKK | 9,659,000 | USD | 1,766,346 | 1,786 | ||||||||||||
Barclays Bank PLC | 7/3/2014 | EUR | 27,979,000 | USD | 38,175,947 | 38,141 | ||||||||||||
JP Morgan & Chase Co. | 7/3/2014 | EUR | 27,979,000 | USD | 38,175,947 | 38,141 | ||||||||||||
Barclays Bank PLC | 7/3/2014 | GBP | 15,625,000 | USD | 26,202,641 | 18,488 | ||||||||||||
JP Morgan & Chase Co. | 7/3/2014 | GBP | 15,625,000 | USD | 26,202,344 | 18,191 | ||||||||||||
Barclays Bank PLC | 7/3/2014 | NOK | 6,353,000 | USD | 1,062,259 | 908 | ||||||||||||
JP Morgan & Chase Co. | 7/3/2014 | NOK | 6,353,000 | USD | 1,062,295 | 943 | ||||||||||||
Barclays Bank PLC | 7/3/2014 | SEK | 25,054,000 | USD | 3,748,629 | 7,018 | ||||||||||||
JP Morgan & Chase Co. | 7/3/2014 | SEK | 25,054,000 | USD | 3,748,663 | 7,052 | ||||||||||||
The Bank of New York Mellon | 7/3/2014 | USD | 110,500 | CHF | 98,753 | (182 | ) | |||||||||||
The Bank of New York Mellon | 7/3/2014 | USD | 361,400 | DKK | 1,976,139 | (388 | ) | |||||||||||
The Bank of New York Mellon | 7/3/2014 | USD | 896,400 | EUR | 656,961 | (905 | ) | |||||||||||
The Bank of New York Mellon | 7/3/2014 | USD | 431,000 | GBP | 257,010 | (306 | ) | |||||||||||
The Bank of New York Mellon | 7/3/2014 | USD | 41,500 | NOK | 248,191 | (36 | ) | |||||||||||
The Bank of New York Mellon | 7/3/2014 | USD | 21,600 | SEK | 144,361 | (41 | ) | |||||||||||
|
| |||||||||||||||||
Total net unrealized appreciation | $ | 1,203,306 | ||||||||||||||||
|
| |||||||||||||||||
| See Notes to Financial Statements. | 72 |
DBX ETF Trust
SCHEDULE OF INVESTMENTS
db X-trackers MSCI Europe Hedged Equity Fund (Continued)
May 31, 2014
Currency Abbreviations
CHF – Swiss Franc
DKK – Danish Krone
EUR – Euro
GBP – Pound Sterling
NOK – Norwegian Krone
SEK – Swedish Krona
USD – U.S. Dollar
* Non-income producing security.
(a) Affiliated issuer. This security is owned in proportion with its representation in the index.
(b) Less than 0.1%.
CDI – Chess Depositary Interest.
FDR – Fiduciary Depositary Receipt.
REIT – Real Estate Investment Trust.
RSP – Risparmio (Convertible Savings Shares).
SDR – Swedish Depositary Receipt.
| See Notes to Financial Statements. | 73 |
DBX ETF Trust
SCHEDULE OF INVESTMENTS
db X-trackers MSCI United Kingdom Hedged Equity Fund
May 31, 2014
| Number of Shares | Value | |||||||
| COMMON STOCKS — 99.0% | ||||||||
| Basic Materials — 8.6% | ||||||||
Anglo American PLC | 2,463 | $ | 60,172 | |||||
Antofagasta PLC | 720 | 9,516 | ||||||
BHP Billiton PLC | 3,793 | 118,764 | ||||||
Croda International PLC | 248 | 10,945 | ||||||
Fresnillo PLC (Mexico) | 336 | 4,539 | ||||||
Glencore PLC (Switzerland)* | 19,026 | 103,120 | ||||||
Johnson Matthey PLC | 374 | 20,136 | ||||||
Randgold Resources Ltd. (Channel Islands) | 160 | 11,685 | ||||||
Rio Tinto PLC | 2,283 | 116,984 | ||||||
|
| |||||||
| 455,861 | ||||||||
|
| |||||||
| Communications — 8.3% | ||||||||
ASOS PLC* | 100 | 7,588 | ||||||
British Sky Broadcasting Group PLC | 1,892 | 27,987 | ||||||
BT Group PLC | 14,156 | 94,201 | ||||||
Inmarsat PLC | 819 | 10,042 | ||||||
ITV PLC | 6,815 | 20,802 | ||||||
Pearson PLC | 1,390 | 27,283 | ||||||
Reed Elsevier PLC | 2,096 | 33,411 | ||||||
Vodafone Group PLC | 47,170 | 165,643 | ||||||
WPP PLC | 2,410 | 51,991 | ||||||
|
| |||||||
| 438,948 | ||||||||
|
| |||||||
| Consumer, Cyclical — 5.9% | ||||||||
Burberry Group PLC | 808 | 20,762 | ||||||
Carnival PLC | 335 | 13,617 | ||||||
Compass Group PLC | 3,164 | 52,796 | ||||||
easyJet PLC | 290 | 7,437 | ||||||
GKN PLC | 2,989 | 19,670 | ||||||
InterContinental Hotels Group PLC | 487 | 19,224 | ||||||
Kingfisher PLC | 4,334 | 28,477 | ||||||
Marks & Spencer Group PLC | 2,950 | 22,212 | ||||||
Next PLC | 264 | 29,383 | ||||||
Persimmon PLC* | 555 | 12,447 | ||||||
Sports Direct International PLC* | 500 | 6,592 | ||||||
Travis Perkins PLC | 448 | 12,638 | ||||||
TUI Travel PLC | 817 | 5,619 | ||||||
Whitbread PLC | 327 | 22,944 | ||||||
William Hill PLC | 1,581 | 9,424 | ||||||
Wolseley PLC (Switzerland) | 484 | 26,975 | ||||||
|
| |||||||
| 310,217 | ||||||||
|
| |||||||
| Consumer, Non-cyclical — 28.0% | ||||||||
Aggreko PLC | 467 | 13,049 | ||||||
Associated British Foods PLC | 651 | 32,932 | ||||||
AstraZeneca PLC | 2,256 | 161,980 | ||||||
Babcock International Group PLC | 902 | 18,355 | ||||||
British American Tobacco PLC | 3,367 | 203,203 | ||||||
Bunzl PLC | 607 | 17,012 | ||||||
Capita PLC | 1,201 | 22,285 | ||||||
Coca-Cola HBC AG (Switzerland)* | 351 | 8,072 | ||||||
Diageo PLC | 4,519 | 145,359 | ||||||
Experian PLC (Ireland) | 1,797 | 31,236 | ||||||
G4S PLC | 2,834 | 11,876 | ||||||
GlaxoSmithKline PLC | 8,692 | 233,257 | ||||||
Imperial Tobacco Group PLC | 1,723 | 77,747 | ||||||
| Number of Shares | Value | |||||||
| Consumer, Non-cyclical (Continued) | ||||||||
Intertek Group PLC | 295 | $ | 14,429 | |||||
J Sainsbury PLC | 2,255 | 13,082 | ||||||
Reckitt Benckiser Group PLC | 1,157 | 98,907 | ||||||
SABMiller PLC | 1,719 | 95,402 | ||||||
Shire PLC (Ireland) | 1,062 | 60,773 | ||||||
Smith & Nephew PLC | 1,604 | 28,123 | ||||||
Tate & Lyle PLC | 852 | 9,890 | ||||||
Tesco PLC | 14,378 | 73,156 | ||||||
Unilever PLC | 2,297 | 103,186 | ||||||
WM Morrison Supermarkets PLC | 4,032 | 13,632 | ||||||
|
| |||||||
| 1,486,943 | ||||||||
|
| |||||||
| Energy — 17.0% | ||||||||
AMEC PLC | 543 | 10,995 | ||||||
BG Group PLC | 6,115 | 125,152 | ||||||
BP PLC | 33,087 | 278,965 | ||||||
Petrofac Ltd. | 474 | 10,027 | ||||||
Royal Dutch Shell PLC, Class A (Netherlands) | 6,994 | 274,911 | ||||||
Royal Dutch Shell PLC, Class B (Netherlands) | 4,387 | 179,057 | ||||||
Tullow Oil PLC | 1,659 | 23,442 | ||||||
|
| |||||||
| 902,549 | ||||||||
|
| |||||||
| Financial — 22.2% | ||||||||
3i Group PLC | 1,774 | 12,843 | ||||||
Aberdeen Asset Management PLC | 1,752 | 13,071 | ||||||
Admiral Group PLC | 350 | 8,554 | ||||||
Aviva PLC | 5,337 | 46,876 | ||||||
Barclays PLC | 29,340 | 121,473 | ||||||
British Land Co. PLC REIT | 1,722 | 20,638 | ||||||
Direct Line Insurance Group PLC | 2,733 | 11,604 | ||||||
Friends Life Group Ltd. (Channel Islands) | 2,590 | 13,601 | ||||||
Hammerson PLC REIT | 1,302 | 12,963 | ||||||
Hargreaves Lansdown PLC | 390 | 7,969 | ||||||
HSBC Holdings PLC | 33,590 | 354,261 | ||||||
ICAP PLC | 1,003 | 6,718 | ||||||
Intu Properties PLC REIT | 1,589 | 8,390 | ||||||
Investec PLC | 1,050 | 9,108 | ||||||
Land Securities Group PLC REIT | 1,431 | 25,618 | ||||||
Legal & General Group PLC | 10,224 | 39,450 | ||||||
Lloyds Banking Group PLC* | 102,453 | 133,710 | ||||||
London Stock Exchange Group PLC | 322 | 10,568 | ||||||
Old Mutual PLC | 9,020 | 30,541 | ||||||
Prudential PLC | 4,589 | 106,574 | ||||||
Royal Bank of Scotland Group PLC* | 4,453 | 25,871 | ||||||
RSA Insurance Group PLC | 1,841 | 14,806 | ||||||
Schroders PLC | 186 | 8,062 | ||||||
Segro PLC REIT | 1,356 | 8,398 | ||||||
Standard Chartered PLC | 4,399 | 98,990 | ||||||
Standard Life PLC | 4,307 | 28,877 | ||||||
|
| |||||||
| 1,179,534 | ||||||||
|
| |||||||
| Industrial — 3.7% | ||||||||
BAE Systems PLC | 5,560 | 39,431 | ||||||
Cobham PLC | 1,970 | 10,530 | ||||||
IMI PLC | 508 | 13,599 | ||||||
Meggitt PLC | 1,441 | 11,703 | ||||||
Melrose Industries PLC | 1,957 | 9,185 | ||||||
Rexam PLC | 1,446 | 12,882 | ||||||
| See Notes to Financial Statements. | 74 |
DBX ETF Trust
SCHEDULE OF INVESTMENTS
db X-trackers MSCI United Kingdom Hedged Equity Fund (Continued)
May 31, 2014
| Number of Shares | Value | |||||||
| Industrial (Continued) | ||||||||
Rolls-Royce Holdings PLC* | 3,297 | $ | 57,475 | |||||
Royal Mail PLC* | 1,200 | 10,299 | ||||||
Smiths Group PLC | 719 | 15,920 | ||||||
Weir Group PLC (The) | 389 | 17,083 | ||||||
|
| |||||||
| 198,107 | ||||||||
|
| |||||||
| Technology — 1.0% | ||||||||
ARM Holdings PLC | 2,410 | 37,165 | ||||||
Sage Group PLC (The) | 2,027 | 13,924 | ||||||
|
| |||||||
| 51,089 | ||||||||
|
| |||||||
| Utilities — 4.3% | ||||||||
Centrica PLC | 9,242 | 51,989 | ||||||
National Grid PLC | 6,699 | 99,937 | ||||||
Severn Trent PLC | 436 | 14,383 | ||||||
SSE PLC | 1,734 | 45,225 | ||||||
United Utilities Group PLC | 1,245 | 18,113 | ||||||
|
| |||||||
| 229,647 | ||||||||
|
| |||||||
TOTAL COMMON STOCKS | 5,252,895 | |||||||
|
| |||||||
| Number of Shares | Value | |||||||
| PREFERRED STOCKS — 0.0% (a) | ||||||||
| Industrial — 0.0% (a) | ||||||||
Rolls-Royce Holdings PLC, Class C* | 461,362 | $ | 773 | |||||
|
| |||||||
TOTAL INVESTMENTS — 99.0% (Cost $4,965,941) | $ | 5,253,668 | ||||||
Other assets less liabilities — 1.0% | 51,546 | |||||||
|
| |||||||
NET ASSETS — 100.0% | $ | 5,305,214 | ||||||
|
| |||||||
As of May 31, 2014, the Fund had the following forward foreign currency contracts outstanding:
Counterparty | Settlement Date | Currency To Deliver | Currency To Receive | Unrealized Appreciation (Depreciation) | ||||||||||||||
Barclays Bank PLC | 6/4/2014 | GBP | 1,548,000 | USD | 2,613,433 | $ | 18,761 | |||||||||||
JP Morgan & Chase Co. | 6/4/2014 | GBP | 1,548,000 | USD | 2,613,137 | 18,466 | ||||||||||||
The Bank of New York Mellon | 6/4/2014 | GBP | 600 | USD | 1,008 | 2 | ||||||||||||
The Bank of New York Mellon | 6/4/2014 | GBP | 2,700 | USD | 4,543 | 18 | ||||||||||||
Barclays Bank PLC | 6/4/2014 | USD | 2,613,433 | GBP | 1,558,083 | (1,861 | ) | |||||||||||
JP Morgan & Chase Co. | 6/4/2014 | USD | 2,613,137 | GBP | 1,557,896 | (1,878 | ) | |||||||||||
The Bank of New York Mellon | 6/4/2014 | USD | 3,365 | GBP | 2,000 | (13 | ) | |||||||||||
The Bank of New York Mellon | 6/4/2014 | USD | 2,186 | GBP | 1,303 | (2 | ) | |||||||||||
Barclays Bank PLC | 7/3/2014 | GBP | 1,590,000 | USD | 2,666,381 | 1,881 | ||||||||||||
JP Morgan & Chase Co. | 7/3/2014 | GBP | 1,590,000 | USD | 2,666,351 | 1,851 | ||||||||||||
|
| |||||||||||||||||
Total net unrealized appreciation | $ | 37,225 | ||||||||||||||||
|
| |||||||||||||||||
Currency Abbreviations
GBP – Pound Sterling
USD – U.S. Dollar
* Non-income producing security.
(a) Less than 0.1%.
REIT – Real Estate Investment Trust.
| See Notes to Financial Statements. | 75 |
DBX ETF Trust
SCHEDULE OF INVESTMENTS
db X-trackers MSCI All World ex US Hedged Equity Fund
May 31, 2014
Number | Value | |||||||
| COMMON STOCKS — 97.5% | ||||||||
| Australia — 5.6% | ||||||||
AGL Energy Ltd. | 123 | $ | 1,763 | |||||
ALS Ltd. | 103 | 858 | ||||||
Alumina Ltd.* | 672 | 891 | ||||||
Amcor Ltd. | 361 | 3,565 | ||||||
AMP Ltd. | 665 | 3,274 | ||||||
APA Group | 264 | 1,717 | ||||||
Asciano Ltd. | 174 | 907 | ||||||
ASX Ltd. | 54 | 1,808 | ||||||
Aurizon Holdings Ltd. | 581 | 2,671 | ||||||
Australia & New Zealand Banking Group Ltd. | 730 | 22,752 | ||||||
Bank of Queensland Ltd. | 69 | 771 | ||||||
Bendigo and Adelaide Bank Ltd. | 85 | 928 | ||||||
BHP Billiton Ltd. | 881 | 30,345 | ||||||
Boral Ltd. | 178 | 878 | ||||||
Brambles Ltd. | 425 | 3,805 | ||||||
Caltex Australia Ltd. | 44 | 915 | ||||||
CFS Retail Property Trust Group REIT | 904 | 1,725 | ||||||
Coca-Cola Amatil Ltd. | 182 | 1,602 | ||||||
Cochlear Ltd. | 18 | 1,003 | ||||||
Commonwealth Bank of Australia | 440 | 33,410 | ||||||
Computershare Ltd. | 117 | 1,386 | ||||||
Crown Resorts Ltd. | 111 | 1,680 | ||||||
CSL Ltd. | 135 | 8,869 | ||||||
Dexus Property Group REIT | 1,685 | 1,748 | ||||||
Federation Centres Ltd. REIT | 455 | 1,067 | ||||||
Flight Centre Travel Group Ltd. | 11 | 510 | ||||||
Fortescue Metals Group Ltd. | 382 | 1,568 | ||||||
Goodman Group REIT | 359 | 1,701 | ||||||
GPT Group REIT | 469 | 1,702 | ||||||
Harvey Norman Holdings Ltd. | 99 | 295 | ||||||
Iluka Resources Ltd. | 147 | 1,190 | ||||||
Incitec Pivot Ltd. | 526 | 1,346 | ||||||
Insurance Australia Group Ltd. | 584 | 3,234 | ||||||
Leighton Holdings Ltd. | 40 | 753 | ||||||
Lend Lease Group | 123 | 1,535 | ||||||
Macquarie Group Ltd. | 67 | 3,743 | ||||||
Metcash Ltd. | 323 | 857 | ||||||
Mirvac Group REIT | 821 | 1,383 | ||||||
National Australia Bank Ltd. | 627 | 19,542 | ||||||
Newcrest Mining Ltd.* | 268 | 2,429 | ||||||
Orica Ltd. | 112 | 2,049 | ||||||
Origin Energy Ltd. | 314 | 4,410 | ||||||
Qantas Airways Ltd.* | 40 | 52 | ||||||
QBE Insurance Group Ltd. | 317 | 3,357 | ||||||
Ramsay Health Care Ltd. | 48 | 2,115 | ||||||
REA Group Ltd. | 10 | 424 | ||||||
Rio Tinto Ltd. | 119 | 6,567 | ||||||
Santos Ltd. | 271 | 3,662 | ||||||
Seek Ltd. | 86 | 1,355 | ||||||
Sonic Healthcare Ltd. | 123 | 2,027 | ||||||
SP AusNet | 725 | 931 | ||||||
Stockland REIT | 589 | 2,138 | ||||||
Suncorp Group Ltd. | 293 | 3,640 | ||||||
Sydney Airport | 281 | 1,148 | ||||||
Tabcorp Holdings Ltd. | 207 | 670 | ||||||
Tatts Group Ltd. | 478 | 1,352 | ||||||
Number | Value | |||||||
| Australia (Continued) | ||||||||
Telstra Corp. Ltd. | 1,231 | $ | 6,118 | |||||
Toll Holdings Ltd. | 168 | 847 | ||||||
Transurban Group | 437 | 3,022 | ||||||
Treasury Wine Estates Ltd. | 281 | 1,360 | ||||||
Wesfarmers Ltd. | 271 | 10,936 | ||||||
Westfield Group REIT | 700 | 6,971 | ||||||
Westfield Retail Trust REIT | 984 | 2,921 | ||||||
Westpac Banking Corp. | 833 | 26,683 | ||||||
Woodside Petroleum Ltd. | 181 | 7,103 | ||||||
Woolworths Ltd. | 366 | 12,783 | ||||||
WorleyParsons Ltd. | 58 | 867 | ||||||
|
| |||||||
| 287,634 | ||||||||
|
| |||||||
| Austria — 0.2% | ||||||||
Andritz AG | 21 | 1,251 | ||||||
Erste Group Bank AG | 80 | 2,780 | ||||||
Immofinanz AG* | 397 | 1,411 | ||||||
OMV AG | 47 | 1,947 | ||||||
Raiffeisen Bank International AG | 19 | 636 | ||||||
Telekom Austria AG | 69 | 671 | ||||||
Vienna Insurance Group AG Wiener Versicherung Gruppe* | 19 | 1,027 | ||||||
Voestalpine AG | 36 | 1,666 | ||||||
|
| |||||||
| 11,389 | ||||||||
|
| |||||||
| Belgium — 0.9% | ||||||||
Ageas | 75 | 3,153 | ||||||
Anheuser-Busch InBev NV | 218 | 23,925 | ||||||
Belgacom SA | 47 | 1,557 | ||||||
Colruyt SA | 13 | 728 | ||||||
Delhaize Group SA | 25 | 1,778 | ||||||
Groupe Bruxelles Lambert SA | 25 | 2,603 | ||||||
KBC Groep NV* | 70 | 4,167 | ||||||
Solvay SA | 18 | 2,911 | ||||||
Telenet Group Holding NV* | 18 | 1,078 | ||||||
UCB SA | 29 | 2,312 | ||||||
Umicore SA | 34 | 1,635 | ||||||
|
| |||||||
| 45,847 | ||||||||
|
| |||||||
| Bermuda — 0.1% | ||||||||
Seadrill Ltd. | 107 | 4,035 | ||||||
|
| |||||||
| Brazil — 1.5% | ||||||||
All America Latina Logistica SA | 100 | 362 | ||||||
Ambev SA | 1,300 | 9,203 | ||||||
Anhanguera Educacional Participacoes SA | 100 | 719 | ||||||
Banco Bradesco SA | 200 | 2,853 | ||||||
Banco do Brasil SA | 200 | 2,033 | ||||||
Banco Santander Brasil SA | 400 | 2,689 | ||||||
BB Seguridade Participacoes SA | 300 | 3,816 | ||||||
BM&F Bovespa SA | 600 | 2,941 | ||||||
BR Malls Participacoes SA | 200 | 1,652 | ||||||
BR Properties SA | 100 | 799 | ||||||
BRF SA | 200 | 4,304 | ||||||
CCR SA | 200 | 1,569 | ||||||
CETIP SA-Mercados Organizados | 100 | 1,294 | ||||||
Cia de Saneamento Basico do Estado de Sao Paulo | 100 | 972 | ||||||
| See Notes to Financial Statements. | 76 |
DBX ETF Trust
SCHEDULE OF INVESTMENTS
db X-trackers MSCI All World ex US Hedged Equity Fund (Continued)
May 31, 2014
Number | Value | |||||||
| Brazil (Continued) | ||||||||
Cia Siderurgica Nacional SA | 200 | $ | 767 | |||||
Cielo SA | 200 | 3,574 | ||||||
Cosan SA Industria e Comercio | 100 | 1,680 | ||||||
Cyrela Brazil Realty SA Empreendimentos e Participacoes | 100 | 590 | ||||||
Duratex SA | 110 | 453 | ||||||
Embraer SA | 200 | 1,820 | ||||||
Estacio Participacoes SA | 100 | 1,200 | ||||||
Fibria Celulose SA* | 100 | 944 | ||||||
Hypermarcas SA* | 100 | 808 | ||||||
JBS SA | 200 | 670 | ||||||
Klabin SA | 100 | 511 | ||||||
Lojas Americanas SA | 125 | 633 | ||||||
Lojas Renner SA | 100 | 3,022 | ||||||
Odontoprev SA | 200 | 848 | ||||||
Petroleo Brasileiro SA | 900 | 6,323 | ||||||
Qualicorp SA* | 100 | 1,053 | ||||||
Raia Drogasil SA | 100 | 848 | ||||||
Souza Cruz SA | 100 | 1,024 | ||||||
Sul America SA | 100 | 771 | ||||||
Tim Participacoes SA | 300 | 1,628 | ||||||
Totvs SA | 100 | 1,744 | ||||||
Ultrapar Participacoes SA | 100 | 2,404 | ||||||
Vale SA | 400 | 5,071 | ||||||
WEG SA | 130 | 1,509 | ||||||
|
| |||||||
| 75,101 | ||||||||
|
| |||||||
| Canada — 6.8% | ||||||||
Agnico Eagle Mines Ltd. | 100 | 3,042 | ||||||
Alimentation Couche Tard, Inc., Class B | 200 | 5,430 | ||||||
ARC Resources Ltd. | 100 | 2,882 | ||||||
Athabasca Oil Corp.* | 100 | 696 | ||||||
Bank of Montreal | 200 | 14,070 | ||||||
Bank of Nova Scotia | 400 | 25,687 | ||||||
Barrick Gold Corp. | 300 | 4,869 | ||||||
BCE, Inc. | 100 | 4,597 | ||||||
BlackBerry Ltd.* | 100 | 763 | ||||||
Bombardier, Inc., Class B | 400 | 1,361 | ||||||
Brookfield Asset Management, Inc., Class A | 200 | 8,595 | ||||||
CAE, Inc. | 100 | 1,356 | ||||||
Cameco Corp. | 100 | 1,999 | ||||||
Canadian Imperial Bank of Commerce | 100 | 8,822 | ||||||
Canadian National Railway Co. | 200 | 12,130 | ||||||
Canadian Natural Resources Ltd. | 300 | 12,210 | ||||||
Canadian Oil Sands Ltd. | 100 | 2,104 | ||||||
Catamaran Corp.* | 100 | 4,406 | ||||||
Cenovus Energy, Inc. | 200 | 5,952 | ||||||
CGI Group, Inc., Class A* | 100 | 3,403 | ||||||
CI Financial Corp. | 100 | 3,206 | ||||||
Crescent Point Energy Corp. | 100 | 4,099 | ||||||
Eldorado Gold Corp. | 200 | 1,147 | ||||||
Enbridge, Inc. | 200 | 9,505 | ||||||
Encana Corp. | 200 | 4,657 | ||||||
Enerplus Corp. | 100 | 2,276 | ||||||
Finning International, Inc. | 100 | 2,689 | ||||||
First Quantum Minerals Ltd. | 200 | 4,218 | ||||||
Fortis, Inc. | 100 | 3,001 | ||||||
Number | Value | |||||||
| Canada (Continued) | ||||||||
Franco-Nevada Corp. | 100 | $ | 4,640 | |||||
Goldcorp, Inc. | 200 | 4,707 | ||||||
Great-West Lifeco, Inc. | 100 | 2,679 | ||||||
Husky Energy, Inc. | 100 | 3,373 | ||||||
Imperial Oil Ltd. | 100 | 4,924 | ||||||
Kinross Gold Corp.* | 300 | 1,129 | ||||||
Loblaw Cos. Ltd. | 25 | 1,054 | ||||||
Manulife Financial Corp. | 500 | 9,153 | ||||||
MEG Energy Corp.* | 100 | 3,490 | ||||||
New Gold, Inc.* | 100 | 536 | ||||||
Pacific Rubiales Energy Corp. | 100 | 1,954 | ||||||
Pembina Pipeline Corp. | 100 | 3,948 | ||||||
Pengrowth Energy Corp. | 200 | 1,264 | ||||||
Penn West Petroleum Ltd. | 200 | 1,857 | ||||||
Peyto Exploration & Development Corp. | 100 | 3,549 | ||||||
Potash Corp. of Saskatchewan, Inc. | 200 | 7,258 | ||||||
Power Corp. of Canada | 100 | 2,691 | ||||||
Power Financial Corp. | 100 | 3,011 | ||||||
Rogers Communications, Inc., Class B | 100 | 4,041 | ||||||
Royal Bank of Canada | 500 | 34,419 | ||||||
Shaw Communications, Inc., Class B | 100 | 2,489 | ||||||
Silver Wheaton Corp. | 100 | 2,077 | ||||||
SNC-Lavalin Group, Inc. | 100 | 4,831 | ||||||
Sun Life Financial, Inc. | 200 | 6,769 | ||||||
Suncor Energy, Inc. | 400 | 15,394 | ||||||
Talisman Energy, Inc. | 300 | 3,099 | ||||||
Teck Resources Ltd., Class B | 200 | 4,458 | ||||||
TELUS Corp. | 100 | 3,777 | ||||||
Tim Hortons, Inc. | 100 | 5,415 | ||||||
Toronto-Dominion Bank (The) | 480 | 23,799 | ||||||
Tourmaline Oil Corp.* | 100 | 4,980 | ||||||
TransAlta Corp. | 100 | 1,199 | ||||||
TransCanada Corp. | 200 | 9,311 | ||||||
Turquoise Hill Resources Ltd.* | 500 | 1,780 | ||||||
Yamana Gold, Inc. | 200 | 1,492 | ||||||
|
| |||||||
| 349,719 | ||||||||
|
| |||||||
| Channel Islands — 0.1% | ||||||||
Friends Life Group Ltd. | 386 | 2,027 | ||||||
Randgold Resources Ltd. | 25 | 1,826 | ||||||
|
| |||||||
| 3,853 | ||||||||
|
| |||||||
| Chile — 0.4% | ||||||||
AES Gener SA | 161 | 85 | ||||||
Aguas Andinas SA, Class A | 391 | 253 | ||||||
Banco de Chile | 25,641 | 3,423 | ||||||
Banco de Credito e Inversiones | 16 | 921 | ||||||
Banco Santander Chile | 40,759 | 2,545 | ||||||
CAP SA | 21 | 303 | ||||||
Cencosud SA | 288 | 1,018 | ||||||
Cia Cervecerias Unidas SA | 54 | 639 | ||||||
Colbun SA | 1,881 | 467 | ||||||
Corpbanca SA | 72,281 | 864 | ||||||
Empresa Nacional de Electricidad SA | 662 | 974 | ||||||
Empresas CMPC SA | 475 | 1,038 | ||||||
Empresas Copec SA | 164 | 2,186 | ||||||
Enersis SA | 4,418 | 1,434 | ||||||
| See Notes to Financial Statements. | 77 |
DBX ETF Trust
SCHEDULE OF INVESTMENTS
db X-trackers MSCI All World ex US Hedged Equity Fund (Continued)
May 31, 2014
Number | Value | |||||||
| Chile (Continued) | ||||||||
ENTEL Chile SA | 84 | $ | 1,058 | |||||
LATAM Airlines Group SA* | 100 | 1,448 | ||||||
SACI Falabella | 321 | 3,005 | ||||||
Vina Concha y Toro SA | 37 | 76 | ||||||
|
| |||||||
| 21,737 | ||||||||
|
| |||||||
| China — 3.3% | ||||||||
AAC Technologies Holdings, Inc. | 200 | 1,180 | ||||||
Agricultural Bank of China Ltd., Class H | 3,000 | 1,339 | ||||||
Air China Ltd., Class H | 2,000 | 1,143 | ||||||
Anhui Conch Cement Co. Ltd., Class H | 400 | 1,439 | ||||||
AviChina Industry & Technology Co. Ltd., Class H | 800 | 432 | ||||||
Bank of China Ltd., Class H | 23,000 | 10,947 | ||||||
Bank of Communications Co. Ltd., Class H | 3,000 | 2,008 | ||||||
BBMG Corp., Class H | 400 | 270 | ||||||
Beijing Capital International Airport Co. Ltd., Class H | 2,000 | 1,372 | ||||||
Belle International Holdings Ltd. | 1,267 | 1,257 | ||||||
Biostime International Holdings Ltd. | 100 | 675 | ||||||
Byd Co. Ltd., Class H* | 200 | 980 | ||||||
China BlueChemical Ltd., Class H | 2,000 | 1,071 | ||||||
China CITIC Bank Corp. Ltd., Class H | 2,000 | 1,163 | ||||||
China Communications Construction Co. Ltd., Class H | 1,000 | 668 | ||||||
China Communications Services Corp. Ltd., Class H | 2,000 | 949 | ||||||
China Construction Bank Corp., Class H | 24,000 | 17,614 | ||||||
China International Marine Containers (Group) Co. Ltd., Class H | 200 | 355 | ||||||
China Life Insurance Co. Ltd., Class H | 2,000 | 5,495 | ||||||
China Longyuan Power Group Corp., Class H | 1,000 | 1,112 | ||||||
China Mengniu Dairy Co. Ltd. | 1,000 | 4,908 | ||||||
China Merchants Bank Co. Ltd., Class H | 1,100 | 2,026 | ||||||
China Minsheng Banking Corp. Ltd., Class H | 1,600 | 1,643 | ||||||
China Pacific Insurance Group Co. Ltd., Class H | 900 | 3,007 | ||||||
China Petroleum & Chemical Corp., Class H | 8,000 | 7,254 | ||||||
China Railway Construction Corp. Ltd., Class H | 600 | 508 | ||||||
China Resources Cement Holdings Ltd. | 2,000 | 1,261 | ||||||
China Shenhua Energy Co. Ltd., Class H | 800 | 2,193 | ||||||
China Shipping Container Lines Co. Ltd., Class H* | 1,000 | 241 | ||||||
China Telecom Corp. Ltd., Class H | 4,000 | 2,012 | ||||||
Chongqing Rural Commercial Bank, Class H* | 1,000 | 462 | ||||||
CITIC Securities Co. Ltd., Class H | 400 | 863 | ||||||
CNOOC Ltd. | 4,000 | 6,862 | ||||||
Country Garden Holdings Co. Ltd. | 1,000 | 420 | ||||||
Datang International Power Generation Co. Ltd., Class H | 2,000 | 776 | ||||||
Fosun International Ltd. | 500 | 590 | ||||||
GOME Electrical Appliances Holding Ltd. | 4,000 | 671 | ||||||
Great Wall Motor Co. Ltd., Class H | 300 | 1,231 | ||||||
Guangdong Investment Ltd. | 2,000 | 2,218 | ||||||
Guangzhou Automobile Group Co. Ltd., Class H | 2,000 | 2,108 | ||||||
Guangzhou R&F Properties Co. Ltd., Class H | 481 | 661 | ||||||
Haitong Securities Co. Ltd., Class H | 500 | 747 | ||||||
Number | Value | |||||||
| China (Continued) | ||||||||
Hengan International Group Co. Ltd. | 300 | $ | 3,183 | |||||
Huaneng Power International, Inc., Class H | 2,000 | 2,113 | ||||||
Industrial and Commercial Bank of China Ltd., Class H | 18,000 | 11,701 | ||||||
Intime Retail Group Co. Ltd. | 200 | 194 | ||||||
Lee & Man Paper Manufacturing Ltd. | 1,000 | 498 | ||||||
Lenovo Group Ltd. | 2,000 | 2,476 | ||||||
Longfor Properties Co. Ltd. | 820 | 1,038 | ||||||
New China Life Insurance Co. Ltd., Class H | 200 | 626 | ||||||
People’s Insurance Co. (Group) of China Ltd., Class H | 2,000 | 805 | ||||||
PetroChina Co. Ltd., Class H | 6,000 | 7,159 | ||||||
PICC Property & Casualty Co. Ltd., Class H | 2,000 | 2,946 | ||||||
Ping An Insurance Group Co. of China Ltd., Class H | 500 | 3,866 | ||||||
Shandong Weigao Group Medical Polymer Co. Ltd., Class H | 600 | 584 | ||||||
Shanghai Pharmaceuticals Holding Co. Ltd., Class H | 300 | 564 | ||||||
Shimao Property Holdings Ltd. | 200 | 403 | ||||||
Sihuan Pharmaceutical Holdings Group Ltd. | 449 | 535 | ||||||
Sino Biopharmaceutical Ltd. | 1,200 | 978 | ||||||
Sino-Ocean Land Holdings Ltd. | 500 | 263 | ||||||
Sinopec Engineering Group Co. Ltd., Class H | 600 | 692 | ||||||
Sinopec Shanghai Petrochemical Co. Ltd., Class H | 2,000 | 493 | ||||||
Sinopharm Group Co. Ltd., Class H | 300 | 815 | ||||||
Soho China Ltd. | 1,700 | 1,335 | ||||||
Sun Art Retail Group Ltd. | 1,100 | 1,293 | ||||||
Tencent Holdings Ltd. | 1,330 | 18,750 | ||||||
Uni-President China Holdings Ltd. | 1,000 | 776 | ||||||
Want Want China Holdings Ltd. | 3,000 | 4,187 | ||||||
Zhejiang Expressway Co. Ltd., Class H | 2,000 | 1,981 | ||||||
Zhongsheng Group Holdings Ltd. | 300 | 376 | ||||||
Zhuzhou CSR Times Electric Co. Ltd., Class H | 200 | 588 | ||||||
Zijin Mining Group Co. Ltd., Class H | 4,296 | 992 | ||||||
Zoomlion Heavy Industry Science and Technology Co. Ltd., Class H | 500 | 333 | ||||||
ZTE Corp., Class H* | 300 | 579 | ||||||
|
| |||||||
| 167,253 | ||||||||
|
| |||||||
| Colombia — 0.0% (a) | ||||||||
Almacenes Exito SA | 7 | 112 | ||||||
Cementos Argos SA | 3 | 17 | ||||||
Corp. Financiera Colombiana SA | 2 | 39 | ||||||
Grupo Argos SA/Colombia | 21 | 238 | ||||||
Grupo de Inversiones Suramericana SA | 68 | 1,372 | ||||||
Interconexion Electrica SA ESP* | 2 | 9 | ||||||
|
| |||||||
| 1,787 | ||||||||
|
| |||||||
| Czech Republic — 0.1% | ||||||||
CEZ AS | 25 | 732 | ||||||
Komercni Banka AS | 9 | 2,074 | ||||||
Telefonica Czech Republic AS | 26 | 377 | ||||||
|
| |||||||
| 3,183 | ||||||||
|
| |||||||
| See Notes to Financial Statements. | 78 |
DBX ETF Trust
SCHEDULE OF INVESTMENTS
db X-trackers MSCI All World ex US Hedged Equity Fund (Continued)
May 31, 2014
Number | Value | |||||||
| Denmark — 0.8% | ||||||||
Carlsberg A/S, Class B | 27 | $ | 2,806 | |||||
Coloplast A/S, Class B | 30 | 2,586 | ||||||
Danske Bank A/S | 230 | 6,465 | ||||||
DSV A/S | 50 | 1,666 | ||||||
Novo Nordisk A/S, Class B | 532 | 22,523 | ||||||
Novozymes A/S, Class B | 56 | 2,737 | ||||||
TDC A/S | 219 | 2,126 | ||||||
Tryg A/S | 7 | 668 | ||||||
William Demant Holding A/S* | 7 | 628 | ||||||
|
| |||||||
| 42,205 | ||||||||
|
| |||||||
| Egypt — 0.1% | ||||||||
Commercial International Bank Egypt SAE | 547 | 2,761 | ||||||
Global Telecom Holding* | 475 | 349 | ||||||
Talaat Moustafa Group | 1,505 | 1,926 | ||||||
|
| |||||||
| 5,036 | ||||||||
|
| |||||||
| Finland — 0.7% | ||||||||
Elisa OYJ | 41 | 1,221 | ||||||
Fortum OYJ | 133 | 3,243 | ||||||
Kone OYJ, Class B | 86 | 3,540 | ||||||
Metso OYJ | 37 | 1,438 | ||||||
Neste Oil OYJ | 39 | 799 | ||||||
Nokia OYJ* | 1,057 | 8,537 | ||||||
Nokian Renkaat OYJ | 33 | 1,398 | ||||||
Orion OYJ, Class B | 25 | 788 | ||||||
Sampo OYJ, Class A | 124 | 6,251 | ||||||
Stora Enso OYJ, Class R | 164 | 1,680 | ||||||
UPM-Kymmene OYJ | 150 | 2,640 | ||||||
Wartsila OYJ Abp | 51 | 2,752 | ||||||
|
| |||||||
| 34,287 | ||||||||
|
| |||||||
| France — 7.3% | ||||||||
Accor SA | 43 | 2,275 | ||||||
Aeroports de Paris | 11 | 1,432 | ||||||
Air Liquide SA | 85 | 12,381 | ||||||
Airbus Group NV | 160 | 11,475 | ||||||
Alcatel-Lucent* | 812 | 3,311 | ||||||
Alstom SA | 68 | 2,688 | ||||||
Arkema SA | 18 | 1,840 | ||||||
AtoS | 19 | 1,707 | ||||||
AXA SA | 531 | 13,109 | ||||||
BNP Paribas SA | 275 | 19,257 | ||||||
Bouygues SA | 53 | 2,460 | ||||||
Bureau Veritas SA | 66 | 1,990 | ||||||
Cap Gemini SA | 39 | 2,836 | ||||||
Carrefour SA | 156 | 5,671 | ||||||
Casino Guichard-Perrachon SA | 12 | 1,545 | ||||||
Christian Dior SA | 15 | 3,139 | ||||||
Cie de St-Gobain | 115 | 6,552 | ||||||
Cie Generale des Etablissements Michelin | 53 | 6,531 | ||||||
CNP Assurances | 58 | 1,251 | ||||||
Credit Agricole SA | 271 | 4,228 | ||||||
Danone SA | 148 | 11,021 | ||||||
Dassault Systemes SA | 16 | 2,029 | ||||||
Edenred | 60 | 1,881 | ||||||
Electricite de France | 76 | 2,668 | ||||||
Essilor International SA | 57 | 5,988 | ||||||
Number | Value | |||||||
| France (Continued) | ||||||||
Eurazeo SA | 10 | $ | 863 | |||||
Eutelsat Communications SA | 44 | 1,541 | ||||||
Fonciere des Regions REIT | 6 | 600 | ||||||
GDF Suez | 367 | 10,248 | ||||||
Gecina SA REIT | 6 | 856 | ||||||
Groupe Eurotunnel SA | 163 | 2,155 | ||||||
ICADE REIT | 7 | 701 | ||||||
Iliad SA | 7 | 2,238 | ||||||
Imerys SA | 11 | 922 | ||||||
JCDecaux SA | 24 | 956 | ||||||
Kering | 21 | 4,640 | ||||||
Klepierre REIT | 25 | 1,214 | ||||||
Lafarge SA | 53 | 4,578 | ||||||
Lagardere SCA | 36 | 1,255 | ||||||
Legrand SA | 72 | 4,557 | ||||||
L’Oreal SA | 66 | 11,516 | ||||||
LVMH Moet Hennessy Louis Vuitton SA | 70 | 13,927 | ||||||
Natixis | 262 | 1,786 | ||||||
Orange SA | 505 | 8,443 | ||||||
Pernod Ricard SA | 56 | 6,866 | ||||||
Peugeot SA* | 83 | 1,174 | ||||||
Publicis Groupe SA | 53 | 4,572 | ||||||
Remy Cointreau SA | 7 | 649 | ||||||
Renault SA | 54 | 5,084 | ||||||
Rexel SA | 63 | 1,505 | ||||||
Safran SA | 74 | 5,022 | ||||||
Sanofi | 320 | 34,216 | ||||||
Schneider Electric SA | 150 | 14,125 | ||||||
SCOR SE | 46 | 1,606 | ||||||
Societe BIC SA | 9 | 1,176 | ||||||
Societe Generale SA | 197 | 11,350 | ||||||
Sodexo | 23 | 2,472 | ||||||
Suez Environnement Co. | 85 | 1,708 | ||||||
Technip SA | 29 | 3,114 | ||||||
Thales SA | 24 | 1,437 | ||||||
Total SA | 587 | 41,193 | ||||||
Unibail-Rodamco SE REIT | 25 | 6,990 | ||||||
Valeo SA | 22 | 2,954 | ||||||
Vallourec SA | 32 | 1,740 | ||||||
Veolia Environnement | 105 | 2,007 | ||||||
Vinci SA | 133 | 9,845 | ||||||
Vivendi SA* | 332 | 8,707 | ||||||
Wendel SA* | 11 | 1,661 | ||||||
Zodiac Aerospace | 45 | 1,600 | ||||||
|
| |||||||
| 375,034 | ||||||||
|
| |||||||
| Germany — 6.1% | ||||||||
adidas AG | 56 | 6,011 | ||||||
Allianz SE | 125 | 21,197 | ||||||
Axel Springer SE | 13 | 837 | ||||||
BASF SE | 250 | 28,786 | ||||||
Bayer AG | 220 | 31,819 | ||||||
Bayerische Motoren Werke AG | 90 | 11,298 | ||||||
Beiersdorf AG | 27 | 2,727 | ||||||
Brenntag AG | 13 | 2,429 | ||||||
Celesio AG* | 23 | 818 | ||||||
Commerzbank AG* | 252 | 4,000 | ||||||
| See Notes to Financial Statements. | 79 |
DBX ETF Trust
SCHEDULE OF INVESTMENTS
db X-trackers MSCI All World ex US Hedged Equity Fund (Continued)
May 31, 2014
Number | Value | |||||||
| Germany (Continued) | ||||||||
Continental AG | 30 | $ | 7,093 | |||||
Daimler AG | 261 | 24,798 | ||||||
Deutsche Bank AG (b) | 276 | 11,180 | ||||||
Deutsche Boerse AG | 53 | 4,046 | ||||||
Deutsche Lufthansa AG | 68 | 1,794 | ||||||
Deutsche Post AG | 256 | 9,495 | ||||||
Deutsche Telekom AG | 783 | 13,155 | ||||||
Deutsche Wohnen AG* | 70 | 1,552 | ||||||
E.ON SE | 492 | 9,581 | ||||||
Fraport AG Frankfurt Airport Services Worldwide | 12 | 921 | ||||||
Fresenius Medical Care AG & Co. KGaA | 59 | 3,909 | ||||||
Fresenius SE & Co. KGaA | 34 | 5,073 | ||||||
GEA Group AG | 49 | 2,108 | ||||||
Hannover Rueck SE | 17 | 1,512 | ||||||
HeidelbergCement AG | 38 | 3,273 | ||||||
Henkel AG & Co. KGaA | 35 | 3,549 | ||||||
Hochtief AG | 8 | 728 | ||||||
Hugo Boss AG | 9 | 1,279 | ||||||
Infineon Technologies AG | 264 | 3,274 | ||||||
K+S AG | 48 | 1,668 | ||||||
Kabel Deutschland Holding AG | 7 | 996 | ||||||
LANXESS AG | 24 | 1,706 | ||||||
Linde AG | 50 | 10,445 | ||||||
MAN SE | 9 | 1,124 | ||||||
Merck KGaA | 16 | 2,748 | ||||||
Metro AG* | 25 | 1,043 | ||||||
Muenchener Rueckversicherungs-Gesellschaft AG | 49 | 10,861 | ||||||
OSRAM Licht AG* | 25 | 1,269 | ||||||
ProSiebenSat.1 Media AG | 55 | 2,503 | ||||||
RWE AG | 136 | 5,460 | ||||||
SAP AG | 247 | 18,909 | ||||||
Siemens AG | 212 | 28,165 | ||||||
Sky Deutschland AG* | 130 | 1,213 | ||||||
Telefonica Deutschland Holding AG* | 74 | 575 | ||||||
ThyssenKrupp AG* | 123 | 3,694 | ||||||
United Internet AG | 24 | 1,109 | ||||||
Volkswagen AG | 9 | 2,371 | ||||||
|
| |||||||
| 314,101 | ||||||||
|
| |||||||
| Greece — 0.1% | ||||||||
Alpha Bank AE* | 210 | 198 | ||||||
Folli Follie SA* | 15 | 589 | ||||||
Hellenic Telecommunications Organization SA* | 62 | 888 | ||||||
JUMBO SA* | 43 | 641 | ||||||
National Bank of Greece SA* | 334 | 1,193 | ||||||
OPAP SA | 53 | 900 | ||||||
Piraeus Bank SA* | 519 | 1,273 | ||||||
Public Power Corp. SA | 43 | 645 | ||||||
Titan Cement Co. SA* | 12 | 363 | ||||||
|
| |||||||
| 6,690 | ||||||||
|
| |||||||
| Hong Kong — 3.1% | ||||||||
AIA Group Ltd. | 3,000 | 15,033 | ||||||
ASM Pacific Technology Ltd. | 100 | 1,120 | ||||||
Bank of East Asia Ltd. (The) | 300 | 1,221 | ||||||
Beijing Enterprises Holdings Ltd. | 300 | 2,563 | ||||||
Number | Value | |||||||
| Hong Kong (Continued) | ||||||||
Beijing Enterprises Water Group Ltd. | 1,497 | $ | 958 | |||||
BOC Hong Kong (Holdings) Ltd. | 900 | 2,711 | ||||||
Brilliance China Automotive Holdings Ltd. | 2,000 | 3,317 | ||||||
Cheung Kong (Holdings) Ltd. | 1,000 | 17,864 | ||||||
China Everbright International Ltd. | 1,000 | 1,273 | ||||||
China Mobile Ltd. | 1,800 | 17,610 | ||||||
China Overseas Land & Investment Ltd. | 2,000 | 5,211 | ||||||
China Taiping Insurance Holdings Co. Ltd.* | 300 | 523 | ||||||
China Unicom (Hong Kong) Ltd. | 2,000 | 2,992 | ||||||
CLP Holdings Ltd. | 500 | 4,115 | ||||||
Far East Horizon Ltd. | 1,000 | 680 | ||||||
Franshion Properties China Ltd. | 2,000 | 598 | ||||||
Galaxy Entertainment Group Ltd. | 1,000 | 7,991 | ||||||
GCL-Poly Energy Holdings Ltd.* | 2,000 | 622 | ||||||
Hanergy Solar Group Ltd.* | 2,000 | 291 | ||||||
Hang Lung Properties Ltd. | 1,000 | 3,173 | ||||||
Hang Seng Bank Ltd. | 200 | 3,302 | ||||||
Hong Kong and China Gas Co. Ltd. | 2,000 | 4,834 | ||||||
Hong Kong Exchanges & Clearing Ltd. | 300 | 5,584 | ||||||
Hutchison Whampoa Ltd. | 886 | 11,885 | ||||||
Kerry Properties Ltd. | 200 | 658 | ||||||
Kingboard Chemical Holdings Ltd. | 100 | 188 | ||||||
Kunlun Energy Co. Ltd.* | 2,000 | 3,261 | ||||||
Li & Fung Ltd. | 2,000 | 2,905 | ||||||
Link REIT (The) | 600 | 3,196 | ||||||
MGM China Holdings Ltd. | 300 | 1,045 | ||||||
MTR Corp. Ltd. | 200 | 757 | ||||||
Noble Group Ltd. | 1,000 | 1,104 | ||||||
PCCW Ltd. | 1,000 | 547 | ||||||
Power Assets Holdings Ltd. | 400 | 3,483 | ||||||
Sino Land Co. Ltd. | 2,000 | 3,101 | ||||||
SJM Holdings Ltd. | 1,000 | 2,870 | ||||||
Sun Hung Kai Properties Ltd. | 1,000 | 13,672 | ||||||
Swire Pacific Ltd., Class A | 200 | 2,377 | ||||||
Swire Properties Ltd. | 200 | 624 | ||||||
Yingde Gases Group Co. Ltd. | 1,000 | 1,094 | ||||||
Yue Yuen Industrial (Holdings) Ltd. | 100 | 310 | ||||||
|
| |||||||
| 156,663 | ||||||||
|
| |||||||
| Hungary — 0.1% | ||||||||
MOL Hungarian Oil and Gas PLC | 21 | 1,211 | ||||||
OTP Bank PLC | 71 | 1,551 | ||||||
Richter Gedeon Nyrt | 135 | 2,534 | ||||||
|
| |||||||
| 5,296 | ||||||||
|
| |||||||
| India — 0.9% | ||||||||
Dr. Reddy’s Laboratories Ltd., ADR | 100 | 4,111 | ||||||
ICICI Bank Ltd., ADR* | 200 | 9,934 | ||||||
Infosys Ltd., ADR | 100 | 5,143 | ||||||
Larsen & Toubro Ltd., GDR | 300 | 7,821 | ||||||
Reliance Industries Ltd., GDR, 144A | 300 | 10,731 | ||||||
Tata Motors Ltd., ADR | 200 | 7,448 | ||||||
Wipro Ltd., ADR | 300 | 3,342 | ||||||
|
| |||||||
| 48,530 | ||||||||
|
| |||||||
| Indonesia — 0.6% | ||||||||
PT Adaro Energy Tbk | 6,400 | 672 | ||||||
PT Astra Agro Lestari Tbk | 400 | 936 | ||||||
| See Notes to Financial Statements. | 80 |
DBX ETF Trust
SCHEDULE OF INVESTMENTS
db X-trackers MSCI All World ex US Hedged Equity Fund (Continued)
May 31, 2014
Number | Value | |||||||
| Indonesia (Continued) | ||||||||
PT Astra International Tbk | 5,000 | $ | 3,030 | |||||
PT Bank Central Asia Tbk | 3,600 | 3,322 | ||||||
PT Bank Danamon Indonesia Tbk* | 1,200 | 428 | ||||||
PT Bank Mandiri Persero Tbk | 1,900 | 1,656 | ||||||
PT Bank Negara Indonesia Persero Tbk | 1,800 | 736 | ||||||
PT Bank Rakyat Indonesia Persero Tbk | 2,900 | 2,534 | ||||||
PT Bumi Serpong Damai Tbk | 1,500 | 207 | ||||||
PT Charoen Pokphand Indonesia Tbk | 1,700 | 550 | ||||||
PT Global Mediacom Tbk | 2,500 | 439 | ||||||
PT Gudang Garam Tbk | 200 | 892 | ||||||
PT Indo Tambangraya Megah Tbk | 100 | 245 | ||||||
PT Indocement Tunggal Prakarsa Tbk | 500 | 970 | ||||||
PT Indofood CBP Sukses Makmur Tbk | 500 | 437 | ||||||
PT Indofood Sukses Makmur Tbk | 1,000 | 585 | ||||||
PT Jasa Marga Persero Tbk | 1,000 | 503 | ||||||
PT Kalbe Farma Tbk | 6,400 | 844 | ||||||
PT Lippo Karawaci Tbk | 9,000 | 798 | ||||||
PT Matahari Department Store Tbk* | 600 | 746 | ||||||
PT Media Nusantara Citra Tbk | 1,700 | 412 | ||||||
PT Perusahaan Gas Negara Persero Tbk | 3,000 | 1,394 | ||||||
PT Semen Indonesia Persero Tbk | 1,000 | 1,261 | ||||||
PT Surya Citra Media Tbk | 2,100 | 570 | ||||||
PT Tambang Batubara Bukit Asam Persero Tbk | 903 | 828 | ||||||
PT Telekomunikasi Indonesia Persero Tbk | 13,600 | 3,000 | ||||||
PT Tower Bersama Infrastructure Tbk | 1,100 | 723 | ||||||
PT Unilever Indonesia Tbk | 800 | 1,996 | ||||||
PT United Tractors Tbk | 400 | 743 | ||||||
PT XL Axiata Tbk | 1,700 | 797 | ||||||
|
| |||||||
| 32,254 | ||||||||
|
| |||||||
| Ireland — 0.5% | ||||||||
Bank of Ireland* | 6,112 | 2,349 | ||||||
CRH PLC | 182 | 4,982 | ||||||
Experian PLC | 282 | 4,902 | ||||||
James Hardie Industries PLC CDI | 121 | 1,614 | ||||||
Kerry Group PLC, Class A | 36 | 2,741 | ||||||
Shire PLC | 147 | 8,412 | ||||||
|
| |||||||
| 25,000 | ||||||||
|
| |||||||
| Israel — 0.4% | ||||||||
Bank Hapoalim BM | 326 | 1,900 | ||||||
Bank Leumi Le-Israel BM* | 335 | 1,324 | ||||||
Bezeq The Israeli Telecommunication Corp. Ltd. | 620 | 1,112 | ||||||
Delek Group Ltd. | 1 | 424 | ||||||
Israel Chemicals Ltd. | 141 | 1,240 | ||||||
Israel Corp. Ltd. (The)* | 1 | 582 | ||||||
Mizrahi Tefahot Bank Ltd. | 63 | 854 | ||||||
NICE Systems Ltd. | 19 | 738 | ||||||
Teva Pharmaceutical Industries Ltd. | 221 | 11,075 | ||||||
|
| |||||||
| 19,249 | ||||||||
|
| |||||||
| Italy — 1.8% | ||||||||
Assicurazioni Generali SpA | 320 | 7,245 | ||||||
Atlantia SpA | 109 | 3,028 | ||||||
Banca Monte dei Paschi di Siena SpA* | 28 | 949 | ||||||
Banco Popolare SC* | 83 | 1,601 | ||||||
Enel Green Power SpA | 511 | 1,434 | ||||||
Enel SpA | 1,805 | 10,216 | ||||||
Number | Value | |||||||
| Italy (Continued) | ||||||||
Eni SpA | 692 | $ | 17,630 | |||||
EXOR SpA | 27 | 1,159 | ||||||
Fiat SpA* | 285 | 2,978 | ||||||
Finmeccanica SpA* | 127 | 1,042 | ||||||
Intesa Sanpaolo SpA | 3,145 | 10,538 | ||||||
Intesa Sanpaolo SpA-RSP | 200 | 570 | ||||||
Luxottica Group SpA | 43 | 2,456 | ||||||
Mediobanca SpA* | 168 | 1,683 | ||||||
Pirelli & C. SpA* | 66 | 1,113 | ||||||
Prysmian SpA | 54 | 1,254 | ||||||
Saipem SpA* | 89 | 2,320 | ||||||
Snam SpA | 577 | 3,387 | ||||||
Telecom Italia SpA* | 2,737 | 3,399 | ||||||
Telecom Italia SpA-RSP | 1,715 | 1,638 | ||||||
Terna Rete Elettrica Nazionale SpA | 434 | 2,304 | ||||||
UniCredit SpA | 1,187 | 10,348 | ||||||
Unione di Banche Italiane SCpA | 231 | 2,127 | ||||||
UnipolSai SpA | 288 | 991 | ||||||
|
| |||||||
| 91,410 | ||||||||
|
| |||||||
| Japan — 13.7% | ||||||||
Acom Co. Ltd.* | 200 | 762 | ||||||
Aeon Co. Ltd. | 300 | 3,616 | ||||||
AISIN SEIKI Co. Ltd. | 100 | 3,630 | ||||||
Asahi Group Holdings Ltd. | 200 | 5,637 | ||||||
Astellas Pharma, Inc. | 500 | 6,405 | ||||||
Bridgestone Corp. | 200 | 7,222 | ||||||
Brother Industries Ltd. | 100 | 1,583 | ||||||
Canon, Inc. | 300 | 9,837 | ||||||
Casio Computer Co. Ltd. | 100 | 1,331 | ||||||
Central Japan Railway Co. | 100 | 13,242 | ||||||
Chubu Electric Power Co., Inc.* | 200 | 2,403 | ||||||
Chugai Pharmaceutical Co. Ltd. | 100 | 2,674 | ||||||
Chugoku Electric Power Co., (The), Inc. | 100 | 1,328 | ||||||
Citizen Holdings Co. Ltd. | 200 | 1,532 | ||||||
Credit Saison Co. Ltd. | 100 | 1,799 | ||||||
Daihatsu Motor Co. Ltd. | 100 | 1,724 | ||||||
Dai-ichi Life Insurance Co. Ltd. (The) | 300 | 4,444 | ||||||
Daiichi Sankyo Co. Ltd. | 200 | 3,387 | ||||||
Daikin Industries Ltd. | 100 | 5,958 | ||||||
Dainippon Sumitomo Pharma Co. Ltd. | 100 | 1,094 | ||||||
Daiwa Securities Group, Inc. | 1,000 | 8,065 | ||||||
DENSO Corp. | 100 | 4,581 | ||||||
Dentsu, Inc. | 100 | 3,944 | ||||||
East Japan Railway Co. | 100 | 7,628 | ||||||
Eisai Co. Ltd. | 100 | 4,091 | ||||||
FANUC Corp. | 100 | 17,014 | ||||||
Fuji Heavy Industries Ltd. | 200 | 5,295 | ||||||
FUJIFILM Holdings Corp. | 100 | 2,582 | ||||||
Fujitsu Ltd. | 1,000 | 6,768 | ||||||
GungHo Online Entertainment, Inc. | 100 | 659 | ||||||
Hino Motors Ltd. | 100 | 1,258 | ||||||
Hitachi Ltd. | 1,100 | 7,391 | ||||||
Hokuhoku Financial Group, Inc. | 1,400 | 2,764 | ||||||
Hokuriku Electric Power Co. | 100 | 1,285 | ||||||
Honda Motor Co. Ltd. | 500 | 17,500 | ||||||
Hoya Corp. | 100 | 3,095 | ||||||
| See Notes to Financial Statements. | 81 |
DBX ETF Trust
SCHEDULE OF INVESTMENTS
db X-trackers MSCI All World ex US Hedged Equity Fund (Continued)
May 31, 2014
Number | Value | |||||||
| Japan (Continued) | ||||||||
Hulic Co. Ltd. | 100 | $ | 1,307 | |||||
INPEX Corp. | 300 | 4,326 | ||||||
Isetan Mitsukoshi Holdings Ltd. | 100 | 1,307 | ||||||
ITOCHU Corp. | 400 | 4,727 | ||||||
Iyo Bank Ltd. (The) | 500 | 4,691 | ||||||
Japan Exchange Group, Inc. | 100 | 2,390 | ||||||
Japan Retail Fund Investment Corp. REIT | 1 | 2,199 | ||||||
Japan Tobacco, Inc. | 300 | 10,149 | ||||||
JFE Holdings, Inc. | 200 | 3,794 | ||||||
JSR Corp. | 100 | 1,679 | ||||||
JTEKT Corp. | 100 | 1,524 | ||||||
JX Holdings, Inc. | 700 | 3,644 | ||||||
Kakaku.com, Inc. | 100 | 1,750 | ||||||
Kansai Electric Power Co., (The), Inc.* | 200 | 1,845 | ||||||
Kao Corp. | 200 | 7,904 | ||||||
Kawasaki Heavy Industries Ltd. | 1,000 | 3,762 | ||||||
KDDI Corp. | 200 | 11,892 | ||||||
Kintetsu Corp. | 1,000 | 3,507 | ||||||
Kobe Steel Ltd. | 1,000 | 1,385 | ||||||
Komatsu Ltd. | 300 | 6,533 | ||||||
Konica Minolta, Inc. | 200 | 1,721 | ||||||
Kuraray Co. Ltd. | 200 | 2,399 | ||||||
Kyocera Corp. | 100 | 4,447 | ||||||
Kyushu Electric Power Co., Inc.* | 100 | 1,100 | ||||||
LIXIL Group Corp. | 100 | 2,588 | ||||||
Marubeni Corp. | 1,000 | 6,817 | ||||||
Marui Group Co. Ltd. | 200 | 1,888 | ||||||
Mazda Motor Corp. | 1,000 | 4,322 | ||||||
Medipal Holdings Corp. | 100 | 1,405 | ||||||
MEIJI Holdings Co. Ltd. | 100 | 6,297 | ||||||
Mitsubishi Chemical Holdings Corp. | 500 | 2,068 | ||||||
Mitsubishi Corp. | 400 | 7,894 | ||||||
Mitsubishi Electric Corp. | 1,000 | 11,601 | ||||||
Mitsubishi Heavy Industries Ltd. | 1,000 | 5,825 | ||||||
Mitsubishi Motors Corp. | 100 | 1,018 | ||||||
Mitsubishi Tanabe Pharma Corp. | 100 | 1,454 | ||||||
Mitsubishi UFJ Financial Group, Inc. | 3,500 | 19,700 | ||||||
Mitsubishi UFJ Lease & Finance Co. Ltd. | 500 | 2,696 | ||||||
Mitsui & Co. Ltd. | 500 | 7,574 | ||||||
Mizuho Financial Group, Inc. | 6,400 | 12,448 | ||||||
MS&AD Insurance Group Holdings, Inc. | 100 | 2,367 | ||||||
Murata Manufacturing Co. Ltd. | 100 | 8,471 | ||||||
Namco Bandai Holdings, Inc. | 100 | 2,179 | ||||||
NEC Corp. | 1,000 | 3,084 | ||||||
Nidec Corp. | 100 | 5,814 | ||||||
Nikon Corp. | 100 | 1,584 | ||||||
Nippon Building Fund, Inc. REIT | 1 | 5,855 | ||||||
Nippon Steel & Sumitomo Metal Corp. | 2,000 | 5,638 | ||||||
Nippon Telegraph & Telephone Corp. | 100 | 5,935 | ||||||
Nippon Yusen KK | 1,000 | 2,947 | ||||||
Nissan Motor Co. Ltd. | 700 | 6,319 | ||||||
Nisshin Seifun Group, Inc. | 500 | 5,805 | ||||||
Nitto Denko Corp. | 100 | 4,611 | ||||||
NKSJ Holdings, Inc. | 100 | 2,778 | ||||||
Nomura Holdings, Inc. | 900 | 5,915 | ||||||
Nomura Research Institute Ltd. | 100 | 3,355 | ||||||
NTT DOCOMO, Inc. | 400 | 6,640 | ||||||
Number | Value | |||||||
| Japan (Continued) | ||||||||
NTT Urban Development Corp. | 500 | $ | 5,010 | |||||
Olympus Corp.* | 100 | 3,217 | ||||||
Omron Corp. | 100 | 3,752 | ||||||
ORIX Corp. | 400 | 6,342 | ||||||
Osaka Gas Co. Ltd. | 1,000 | 3,978 | ||||||
Otsuka Holdings Co. Ltd. | 100 | 2,822 | ||||||
Panasonic Corp. | 600 | 6,442 | ||||||
Rakuten, Inc. | 200 | 2,591 | ||||||
Resona Holdings, Inc. | 500 | 2,613 | ||||||
Ricoh Co. Ltd. | 200 | 2,446 | ||||||
SBI Holdings, Inc. | 100 | 1,138 | ||||||
Secom Co. Ltd. | 100 | 6,086 | ||||||
Sega Sammy Holdings, Inc. | 100 | 1,919 | ||||||
Sekisui House Ltd. | 100 | 1,315 | ||||||
Seven & I Holdings Co. Ltd. | 200 | 7,992 | ||||||
Seven Bank Ltd. | 500 | 1,857 | ||||||
Shikoku Electric Power Co., Inc.* | 100 | 1,287 | ||||||
Shin-Etsu Chemical Co. Ltd. | 100 | 5,942 | ||||||
Shinsei Bank Ltd. | 1,000 | 2,082 | ||||||
Shionogi & Co. Ltd. | 100 | 2,003 | ||||||
Shiseido Co. Ltd. | 200 | 3,361 | ||||||
Showa Shell Sekiyu KK | 100 | 1,079 | ||||||
SoftBank Corp. | 300 | 21,645 | ||||||
Sony Corp. | 300 | 4,795 | ||||||
Sumitomo Chemical Co. Ltd. | 1,000 | 3,703 | ||||||
Sumitomo Corp. | 300 | 3,925 | ||||||
Sumitomo Electric Industries Ltd. | 200 | 2,688 | ||||||
Sumitomo Mitsui Financial Group, Inc. | 400 | 16,130 | ||||||
Sumitomo Mitsui Trust Holdings, Inc. | 1,000 | 4,037 | ||||||
Sumitomo Rubber Industries Ltd. | 100 | 1,482 | ||||||
Suzuki Motor Corp. | 100 | 2,972 | ||||||
T&D Holdings, Inc. | 200 | 2,603 | ||||||
Takeda Pharmaceutical Co. Ltd. | 200 | 9,051 | ||||||
TDK Corp. | 100 | 4,268 | ||||||
Terumo Corp. | 200 | 4,240 | ||||||
Tohoku Electric Power Co., Inc. | 100 | 1,062 | ||||||
Tokio Marine Holdings, Inc. | 200 | 6,318 | ||||||
Tokyo Electric Power Co., (The), Inc.* | 600 | 2,434 | ||||||
Tokyo Gas Co. Ltd. | 1,000 | 5,658 | ||||||
Tokyu Fudosan Holdings Corp. | 300 | 2,361 | ||||||
Toray Industries, Inc. | 1,000 | 6,365 | ||||||
Toshiba Corp. | 1,000 | 4,096 | ||||||
Toyo Seikan Group Holdings Ltd. | 100 | 1,472 | ||||||
Toyota Industries Corp. | 100 | 4,646 | ||||||
Toyota Motor Corp. | 800 | 45,273 | ||||||
Toyota Tsusho Corp. | 100 | 2,647 | ||||||
Trend Micro, Inc. | 100 | 3,094 | ||||||
United Urban Investment Corp. REIT | 2 | 3,200 | ||||||
USS Co. Ltd. | 100 | 1,637 | ||||||
West Japan Railway Co. | 100 | 4,251 | ||||||
Yahoo Japan Corp. | 400 | 1,843 | ||||||
Yamada Denki Co. Ltd. | 400 | 1,473 | ||||||
Yamaha Corp. | 100 | 1,557 | ||||||
Yamaha Motor Co. Ltd. | 100 | 1,572 | ||||||
Yamato Holdings Co. Ltd. | 100 | 2,128 | ||||||
Yokogawa Electric Corp. | 100 | 1,197 | ||||||
|
| |||||||
| 699,499 | ||||||||
|
| |||||||
| See Notes to Financial Statements. | 82 |
DBX ETF Trust
SCHEDULE OF INVESTMENTS
db X-trackers MSCI All World ex US Hedged Equity Fund (Continued)
May 31, 2014
Number | Value | |||||||
| Luxembourg — 0.3% | ||||||||
ArcelorMittal | 271 | $ | 4,137 | |||||
Millicom International Cellular SA SDR | 16 | 1,478 | ||||||
RTL Group SA | 12 | 1,399 | ||||||
SES SA FDR | 87 | 3,161 | ||||||
Tenaris SA | 130 | 2,910 | ||||||
|
| |||||||
| 13,085 | ||||||||
|
| |||||||
| Macau — 0.1% | ||||||||
Sands China Ltd. | 700 | 5,101 | ||||||
Wynn Macau Ltd. | 400 | 1,664 | ||||||
|
| |||||||
| 6,765 | ||||||||
|
| |||||||
| Malaysia — 1.1% | ||||||||
Alliance Financial Group Bhd | 800 | 1,218 | ||||||
AMMB Holdings Bhd | 700 | 1,599 | ||||||
Astro Malaysia Holdings Bhd | 1,000 | 1,058 | ||||||
Axiata Group Bhd | 100 | 216 | ||||||
Berjaya Sports Toto Bhd | 1,318 | 1,567 | ||||||
British American Tobacco Malaysia Bhd | 100 | 1,958 | ||||||
Bumi Armada Bhd | 100 | 110 | ||||||
CIMB Group Holdings Bhd | 700 | 1,599 | ||||||
Dialog Group Bhd | 700 | 797 | ||||||
DiGi.Com Bhd | 1,400 | 2,362 | ||||||
Felda Global Ventures Holdings Bhd | 1,100 | 1,452 | ||||||
Genting Malaysia Bhd | 1,300 | 1,647 | ||||||
Genting Plantations Bhd | 200 | 700 | ||||||
Hong Leong Bank Bhd | 500 | 2,160 | ||||||
Hong Leong Financial Group Bhd | 400 | 1,917 | ||||||
IHH Healthcare Bhd* | 1,000 | 1,279 | ||||||
IJM Corp. Bhd | 300 | 625 | ||||||
IOI Corp. Bhd | 900 | 1,381 | ||||||
Kuala Lumpur Kepong Bhd | 200 | 1,489 | ||||||
Lafarge Malaysia Bhd | 400 | 1,230 | ||||||
Malayan Banking Bhd | 1,800 | 5,535 | ||||||
Malaysia Airports Holdings Bhd | 300 | 706 | ||||||
Maxis Bhd | 1,000 | 2,045 | ||||||
MISC Bhd | 500 | 962 | ||||||
MMC Corp. Bhd | 200 | 169 | ||||||
Petronas Chemicals Group Bhd | 700 | 1,468 | ||||||
Petronas Dagangan Bhd | 200 | 1,571 | ||||||
Petronas Gas Bhd | 300 | 2,288 | ||||||
PPB Group Bhd | 100 | 488 | ||||||
Public Bank Bhd | 600 | 4,034 | ||||||
RHB Capital Bhd | 100 | 261 | ||||||
SapuraKencana Petroleum Bhd* | 900 | 1,168 | ||||||
Sime Darby Bhd | 600 | 1,783 | ||||||
Telekom Malaysia Bhd | 600 | 1,154 | ||||||
Tenaga Nasional Bhd | 500 | 1,877 | ||||||
UMW Holdings Bhd | 400 | 1,345 | ||||||
YTL Corp. Bhd | 1,300 | 659 | ||||||
YTL Power International Bhd* | 1,365 | 641 | ||||||
|
| |||||||
| 54,518 | ||||||||
|
| |||||||
| Mexico — 1.2% | ||||||||
Alfa SAB de CV, Class A | 800 | 2,239 | ||||||
America Movil SAB de CV, Series L | 10,100 | 9,765 | ||||||
Arca Continental SAB de CV | 100 | 651 | ||||||
Cemex SAB de CV* | 3,028 | 3,900 | ||||||
Number | Value | |||||||
| Mexico (Continued) | ||||||||
Coca-Cola Femsa SAB de CV, Series L | 100 | $ | 1,151 | |||||
Compartamos SAB de CV | 300 | 532 | ||||||
Controladora Comercial Mexicana SAB de CV | 100 | 389 | ||||||
El Puerto de Liverpool SAB de CV, Series C1 | 100 | 1,130 | ||||||
Fibra Uno Administracion SA de CV REIT | 600 | 1,835 | ||||||
Fomento Economico Mexicano SAB de CV | 600 | 5,695 | ||||||
Fresnillo PLC | 54 | 730 | ||||||
Genomma Lab Internacional SAB de CV, Class B* | 200 | 510 | ||||||
Grupo Aeroportuario del Pacifico SAB de CV, Class B | 200 | 1,230 | ||||||
Grupo Aeroportuario del Sureste SAB de CV, Class B | 100 | 1,289 | ||||||
Grupo Bimbo SAB de CV | 400 | 1,157 | ||||||
Grupo Carso SAB de CV, Series A1 | 200 | 1,038 | ||||||
Grupo Comercial Chedraui SA de CV | 100 | 341 | ||||||
Grupo Financiero Banorte SAB de CV, Class O | 700 | 5,062 | ||||||
Grupo Financiero Inbursa SAB de CV, Class O | 900 | 2,466 | ||||||
Grupo Financiero Santander Mexico SAB de CV, Class B | 500 | 1,330 | ||||||
Grupo Mexico SAB de CV, Series B | 1,100 | 3,623 | ||||||
Grupo Televisa SAB, Series CPO | 800 | 5,404 | ||||||
Industrias Penoles SAB de CV | 91 | 2,202 | ||||||
Kimberly-Clark de Mexico SAB de CV, Class A | 400 | 1,069 | ||||||
Mexichem SAB de CV | 300 | 1,192 | ||||||
Minera Frisco SAB de CV, Class A1* | 200 | 385 | ||||||
OHL Mexico SAB de CV* | 300 | 833 | ||||||
Wal-Mart de Mexico SAB de CV, Series V | 1,500 | 3,821 | ||||||
|
| |||||||
| 60,969 | ||||||||
|
| |||||||
| Netherlands — 3.2% | ||||||||
Aegon NV | 738 | 6,402 | ||||||
Akzo Nobel NV | 63 | 4,722 | ||||||
ASML Holding NV | 90 | 7,724 | ||||||
Corio NV REIT | 8 | 400 | ||||||
Delta Lloyd NV | 48 | 1,166 | ||||||
Fugro NV. | 19 | 1,096 | ||||||
Gemalto NV | 26 | 2,823 | ||||||
Heineken Holding NV | 21 | 1,386 | ||||||
Heineken NV | 57 | 4,018 | ||||||
ING Groep NV* | 1,033 | 14,469 | ||||||
Koninklijke Ahold NV | 213 | 3,870 | ||||||
Koninklijke Boskalis Westminster NV | 18 | 1,025 | ||||||
Koninklijke DSM NV | 40 | 2,884 | ||||||
Koninklijke KPN NV* | 881 | 3,256 | ||||||
Koninklijke Philips NV | 254 | 8,022 | ||||||
Koninklijke Vopak NV | 19 | 968 | ||||||
OCI NV* | 29 | 1,110 | ||||||
QIAGEN NV* | 58 | 1,331 | ||||||
Randstad Holding NV | 33 | 1,920 | ||||||
Reed Elsevier NV | 197 | 4,411 | ||||||
Royal Dutch Shell PLC, Class A | 1,041 | 40,918 | ||||||
Royal Dutch Shell PLC, Class B | 686 | 27,999 | ||||||
TNT Express NV | 137 | 1,224 | ||||||
Unilever NV | 424 | 18,357 | ||||||
Wolters Kluwer NV | 87 | 2,604 | ||||||
Ziggo NV | 40 | 1,886 | ||||||
|
| |||||||
| 165,991 | ||||||||
|
| |||||||
| See Notes to Financial Statements. | 83 |
DBX ETF Trust
SCHEDULE OF INVESTMENTS
db X-trackers MSCI All World ex US Hedged Equity Fund (Continued)
May 31, 2014
Number | Value | |||||||
| New Zealand — 0.1% | ||||||||
Auckland International Airport Ltd. | 515 | $ | 1,688 | |||||
Contact Energy Ltd. | 363 | 1,680 | ||||||
Fletcher Building Ltd. | 202 | 1,535 | ||||||
Ryman Healthcare Ltd. | 214 | 1,512 | ||||||
Telecom Corp. of New Zealand Ltd. | 401 | 916 | ||||||
|
| |||||||
| 7,331 | ||||||||
|
| |||||||
| Norway — 0.5% | ||||||||
Aker Solutions ASA | 49 | 861 | ||||||
DNB ASA | 271 | 5,091 | ||||||
Gjensidige Forsikring ASA | 53 | 979 | ||||||
Norsk Hydro ASA | 380 | 2,066 | ||||||
Orkla ASA | 186 | 1,646 | ||||||
Statoil ASA | 302 | 9,255 | ||||||
Telenor ASA | 190 | 4,504 | ||||||
Yara International ASA | 52 | 2,375 | ||||||
|
| |||||||
| 26,777 | ||||||||
|
| |||||||
| Peru — 0.0% (a) | ||||||||
Cia de Minas Buenaventura SA, Class B, ADR | 100 | 1,069 | ||||||
|
| |||||||
| Philippines — 0.3% | ||||||||
Aboitiz Equity Ventures, Inc. | 1,010 | 1,251 | ||||||
Aboitiz Power Corp. | 1,000 | 823 | ||||||
Alliance Global Group, Inc. | 500 | 339 | ||||||
Ayala Corp. | 80 | 1,130 | ||||||
Ayala Land, Inc. | 2,000 | 1,371 | ||||||
Bank of the Philippine Islands | 490 | 946 | ||||||
BDO Unibank, Inc. | 520 | 1,051 | ||||||
DMCI Holdings Inc. | 100 | 163 | ||||||
Energy Development Corp. | 900 | 123 | ||||||
International Container Terminal Services, Inc. | 390 | 963 | ||||||
JG Summit Holdings, Inc. | 200 | 225 | ||||||
Jollibee Foods Corp. | 290 | 1,187 | ||||||
Metro Pacific Investments Corp. | 2,000 | 229 | ||||||
Metropolitan Bank & Trust Company | 320 | 611 | ||||||
SM Investments Corp. | 50 | 898 | ||||||
SM Prime Holdings, Inc. | 3,000 | 1,149 | ||||||
Universal Robina Corp. | 380 | 1,294 | ||||||
|
| |||||||
| 13,753 | ||||||||
|
| |||||||
| Poland — 0.5% | ||||||||
Alior Bank SA* | 80 | 2,201 | ||||||
Bank Handlowy w Warszawie SA | 16 | 632 | ||||||
Bank Millennium SA | 78 | 212 | ||||||
Bank Pekao SA | 34 | 2,079 | ||||||
Bank Zachodni WBK SA | 15 | 1,810 | ||||||
Cyfrowy Polsat SA | 283 | 2,032 | ||||||
Enea SA | 79 | 417 | ||||||
Grupa Azoty SA* | 47 | 1,233 | ||||||
KGHM Polska Miedz SA | 31 | 1,184 | ||||||
mBank | 5 | 817 | ||||||
Orange Polska SA | 190 | 654 | ||||||
PGE SA | 209 | 1,443 | ||||||
Polski Koncern Naftowy Orlen SA | 51 | 709 | ||||||
Polskie Gornictwo Naftowe i Gazownictwo SA | 650 | 996 | ||||||
Powszechna Kasa Oszczednosci Bank Polski SA | 237 | 3,171 | ||||||
Powszechny Zaklad Ubezpieczen SA | 22 | 3,237 | ||||||
Number | Value | |||||||
| Poland (Continued) | ||||||||
Synthos SA | 290 | $ | 422 | |||||
Tauron Polska Energia SA* | 129 | 227 | ||||||
|
| |||||||
| 23,476 | ||||||||
|
| |||||||
| Portugal — 0.1% | ||||||||
Banco Espirito Santo SA* | 534 | 724 | ||||||
EDP — Energias de Portugal SA | 616 | 2,914 | ||||||
Galp Energia SGPS SA | 104 | 1,843 | ||||||
Jeronimo Martins SGPS SA | 64 | 1,094 | ||||||
|
| |||||||
| 6,575 | ||||||||
|
| |||||||
| Russia — 1.0% | ||||||||
Gazprom OAO, ADR* | 400 | 3,260 | ||||||
Lukoil OAO, ADR | 100 | 5,658 | ||||||
Magnit OJSC, GDR | 137 | 7,973 | ||||||
MegaFon OAO, GDR* | 128 | 3,844 | ||||||
MMC Norilsk Nickel OJSC, ADR | 200 | 3,858 | ||||||
Mobile TeleSystems OJSC, ADR | 300 | 5,547 | ||||||
NovaTek OAO, GDR | 46 | 5,336 | ||||||
Rosneft Oil Co. OJSC, GDR* | 600 | 3,913 | ||||||
Severstal OAO, GDR | 200 | 1,707 | ||||||
Sistema JSFC, GDR* | 119 | 3,409 | ||||||
Surgutneftegas OJSC, ADR* | 400 | 2,934 | ||||||
VTB Bank OJSC, GDR* | 1,200 | 3,223 | ||||||
|
| |||||||
| 50,662 | ||||||||
|
| |||||||
| Singapore — 1.2% | ||||||||
Ascendas Real Estate Investment Trust REIT | 1,000 | 1,961 | ||||||
CapitaCommercial Trust REIT | 1,000 | 1,347 | ||||||
CapitaLand Ltd. | 1,000 | 2,543 | ||||||
CapitaMall Trust REIT | 1,000 | 1,650 | ||||||
CapitaMalls Asia Ltd. | 1,000 | 1,874 | ||||||
ComfortDelGro Corp. Ltd. | 1,000 | 1,858 | ||||||
DBS Group Holdings Ltd. | 1,000 | 13,474 | ||||||
Genting Singapore PLC | 2,000 | 2,145 | ||||||
Global Logistic Properties Ltd. | 1,000 | 2,216 | ||||||
Golden Agri-Resources Ltd. | 2,000 | 917 | ||||||
Hutchison Port Holdings Trust, Class U | 1,000 | 750 | ||||||
Keppel Corp. Ltd. | 1,000 | 8,475 | ||||||
Oversea-Chinese Banking Corp. Ltd. | 1,000 | 7,773 | ||||||
Singapore Technologies Engineering Ltd. | 1,000 | 3,085 | ||||||
Singapore Telecommunications Ltd. | 2,000 | 6,219 | ||||||
Wilmar International Ltd. | 1,000 | 2,559 | ||||||
|
| |||||||
| 58,846 | ||||||||
|
| |||||||
| South Africa — 0.6% | ||||||||
AngloGold Ashanti Ltd., ADR* | 200 | 3,158 | ||||||
Gold Fields Ltd., ADR | 900 | 3,186 | ||||||
Harmony Gold Mining Co. Ltd., ADR* | 700 | 1,855 | ||||||
Impala Platinum Holdings Ltd., ADR | 300 | 3,108 | ||||||
MTN Group Ltd., ADR | 400 | 8,520 | ||||||
Sasol Ltd., ADR | 200 | 11,258 | �� | |||||
|
| |||||||
| 31,085 | ||||||||
|
| |||||||
| South Korea — 3.3% | ||||||||
Amorepacific Corp. | 1 | 1,420 | ||||||
AMOREPACIFIC Group | 1 | 672 | ||||||
BS Financial Group, Inc. | 70 | 1,067 | ||||||
| See Notes to Financial Statements. | 84 |
DBX ETF Trust
SCHEDULE OF INVESTMENTS
db X-trackers MSCI All World ex US Hedged Equity Fund (Continued)
May 31, 2014
Number | Value | |||||||
| South Korea (Continued) | ||||||||
Celltrion, Inc.* | 18 | $ | 858 | |||||
Cheil Industries, Inc. | 28 | 1,822 | ||||||
Cheil Worldwide, Inc.* | 40 | 923 | ||||||
CJ CheilJedang Corp. | 2 | 647 | ||||||
CJ Corp. | 4 | 559 | ||||||
Coway Co. Ltd. | 24 | 2,018 | ||||||
Daelim Industrial Co. Ltd. | 7 | 553 | ||||||
Daewoo International Corp. | 10 | 316 | ||||||
Daewoo Securities Co. Ltd.* | 10 | 85 | ||||||
Daewoo Shipbuilding & Marine Engineering Co. Ltd. | 30 | 790 | ||||||
DGB Financial Group, Inc. | 60 | 917 | ||||||
Dongbu Insurance Co. Ltd. | 30 | 1,697 | ||||||
Doosan Corp. | 1 | 125 | ||||||
Doosan Infracore Co. Ltd.* | 10 | 120 | ||||||
E-Mart Co. Ltd. | 8 | 1,835 | ||||||
GS Holdings | 8 | 340 | ||||||
Halla Visteon Climate Control Corp. | 30 | 1,397 | ||||||
Hana Financial Group, Inc. | 80 | 2,905 | ||||||
Hankook Tire Co. Ltd. | 28 | 1,660 | ||||||
Hanwha Chemical Corp. | 30 | 553 | ||||||
Hanwha Corp. | 10 | 266 | ||||||
Hanwha Life Insurance Co. Ltd. | 160 | 1,016 | ||||||
Hite Jinro Co. Ltd. | 10 | 212 | ||||||
Hyosung Corp. | 16 | 1,071 | ||||||
Hyundai Department Store Co. Ltd. | 6 | 776 | ||||||
Hyundai Development Co.-Engineering & Construction | 10 | 280 | ||||||
Hyundai Engineering & Construction Co. Ltd. | 14 | 733 | ||||||
Hyundai Glovis Co. Ltd. | 6 | 1,550 | ||||||
Hyundai Heavy Industries Co. Ltd. | 8 | 1,451 | ||||||
Hyundai Marine & Fire Insurance Co. Ltd. | 50 | 1,419 | ||||||
Hyundai Merchant Marine Co. Ltd.* | 20 | 186 | ||||||
Hyundai Mipo Dockyard Co. Ltd. | 2 | 317 | ||||||
Hyundai Mobis | 20 | 5,646 | ||||||
Hyundai Motor Co. | 40 | 8,802 | ||||||
Hyundai Steel Co. | 20 | 1,349 | ||||||
Hyundai Wia Corp. | 7 | 1,235 | ||||||
Industrial Bank of Korea | 20 | 274 | ||||||
Kangwon Land, Inc. | 40 | 1,194 | ||||||
KB Financial Group, Inc. | 90 | 3,066 | ||||||
KCC Corp. | 3 | 1,723 | ||||||
Kia Motors Corp. | 68 | 3,919 | ||||||
Korea Aerospace Industries Ltd. | 30 | 938 | ||||||
Korea Electric Power Corp. | 40 | 1,533 | ||||||
Korea Gas Corp.* | 5 | 286 | ||||||
Korea Investment Holdings Co. Ltd. | 20 | 759 | ||||||
Korea Zinc Co. Ltd. | 4 | 1,457 | ||||||
KT Corp. | 10 | 298 | ||||||
KT&G Corp. | 42 | 3,417 | ||||||
Kumho Petro Chemical Co. Ltd. | 5 | 398 | ||||||
LG Chem Ltd. | 14 | 3,568 | ||||||
LG Corp. | 15 | 892 | ||||||
LG Display Co. Ltd.* | 50 | 1,331 | ||||||
LG Electronics, Inc. | 25 | 1,786 | ||||||
LG Household & Health Care Ltd. | 3 | 1,500 | ||||||
LG Innotek Co. Ltd.* | 3 | 375 | ||||||
Number | Value | |||||||
| South Korea (Continued) | ||||||||
LG Uplus Corp. | 80 | $ | 752 | |||||
Lotte Chemical Corp. | 5 | 789 | ||||||
Lotte Shopping Co. Ltd. | 4 | 1,168 | ||||||
LS Corp. | 3 | 211 | ||||||
LS Industrial Systems Co. Ltd. | 7 | 443 | ||||||
Mirae Asset Securities Co. Ltd. | 10 | 417 | ||||||
NAVER Corp. | 6 | 4,458 | ||||||
NCSoft Corp. | 6 | 991 | ||||||
OCI Co. Ltd.* | 7 | 1,201 | ||||||
Orion Corp. | 2 | 1,645 | ||||||
POSCO | 27 | 7,648 | ||||||
S-1 Corp. | 10 | 779 | ||||||
Samsung C&T Corp. | 23 | 1,646 | ||||||
Samsung Card Co. Ltd. | 30 | 1,104 | ||||||
Samsung Electro-Mechanics Co. Ltd. | 16 | 986 | ||||||
Samsung Electronics Co. Ltd. | 28 | 39,604 | ||||||
Samsung Engineering Co. Ltd.* | 6 | 479 | ||||||
Samsung Fire & Marine Insurance Co. Ltd. | 16 | 4,078 | ||||||
Samsung Heavy Industries Co. Ltd. | 30 | 828 | ||||||
Samsung Life Insurance Co. Ltd. | 31 | 3,036 | ||||||
Samsung SDI Co. Ltd. | 10 | 1,485 | ||||||
Samsung Securities Co. Ltd. | 20 | 805 | ||||||
Samsung Techwin Co. Ltd. | 11 | 617 | ||||||
Shinhan Financial Group Co. Ltd. | 130 | 5,651 | ||||||
Shinsegae Co. Ltd. | 4 | 819 | ||||||
SK C&C Co. Ltd. | 8 | 1,298 | ||||||
SK Holdings Co. Ltd. | 4 | 721 | ||||||
SK Hynix, Inc.* | 140 | 6,059 | ||||||
SK Innovation Co. Ltd. | 4 | 418 | ||||||
SK Telecom Co. Ltd. | 6 | 1,291 | ||||||
S-Oil Corp. | 7 | 378 | ||||||
Woori Finance Holdings Co. Ltd.* | 33 | 388 | ||||||
Yuhan Corp. | 3 | 519 | ||||||
|
| |||||||
| 171,014 | ||||||||
|
| |||||||
| Spain — 2.6% | ||||||||
Abertis Infraestructuras SA | 113 | 2,476 | ||||||
ACS Actividades de Construccion y Servicios SA | 40 | 1,777 | ||||||
Amadeus IT Holding SA, Class A | 99 | 4,350 | ||||||
Banco Bilbao Vizcaya Argentaria SA | 1,673 | 21,446 | ||||||
Banco de Sabadell SA | 928 | 3,066 | ||||||
Banco Popular Espanol SA | 386 | 2,726 | ||||||
Banco Santander SA | 3,281 | 33,651 | ||||||
Bankia SA* | 872 | 1,772 | ||||||
CaixaBank SA | 471 | 2,865 | ||||||
Distribuidora Internacional de Alimentacion SA | 130 | 1,201 | ||||||
Enagas SA | 57 | 1,678 | ||||||
Ferrovial SA | 109 | 2,360 | ||||||
Gas Natural SDG SA | 100 | 2,882 | ||||||
Grifols SA | 39 | 2,113 | ||||||
Iberdrola SA | 1,423 | 10,240 | ||||||
Inditex SA | 60 | 8,711 | ||||||
Mapfre SA | 305 | 1,246 | ||||||
Red Electrica Corp. SA | 31 | 2,660 | ||||||
Repsol SA | 237 | 6,676 | ||||||
Telefonica SA | 1,116 | 18,727 | ||||||
Zardoya Otis SA | 42 | 758 | ||||||
|
| |||||||
| 133,381 | ||||||||
|
| |||||||
| See Notes to Financial Statements. | 85 |
DBX ETF Trust
SCHEDULE OF INVESTMENTS
db X-trackers MSCI All World ex US Hedged Equity Fund (Continued)
May 31, 2014
Number | Value | |||||||
| Sweden — 2.1% | ||||||||
Alfa Laval AB | 68 | $ | 1,781 | |||||
Assa Abloy AB, Class B | 76 | 3,838 | ||||||
Atlas Copco AB, Class A | 168 | 4,926 | ||||||
Atlas Copco AB, Class B | 94 | 2,592 | ||||||
Boliden AB | 74 | 1,028 | ||||||
Electrolux AB, Series B | 66 | 1,658 | ||||||
Elekta AB, Class B | 67 | 866 | ||||||
Getinge AB, Class B | 44 | 1,131 | ||||||
Hennes & Mauritz AB, Class B | 242 | 10,227 | ||||||
Hexagon AB, Class B | 92 | 2,891 | ||||||
Husqvarna AB, Class B | 88 | 690 | ||||||
Industrivarden AB, Class C | 35 | 702 | ||||||
Investment AB Kinnevik, Class B | 49 | 1,944 | ||||||
Investor AB, Class B | 110 | 4,316 | ||||||
Lundin Petroleum AB* | 48 | 939 | ||||||
Nordea Bank AB | 787 | 11,607 | ||||||
Sandvik AB | 280 | 3,987 | ||||||
Securitas AB, Class B | 56 | 646 | ||||||
Skandinaviska Enskilda Banken AB, Class A | 378 | 5,132 | ||||||
Skanska AB, Class B | 82 | 1,899 | ||||||
SKF AB, Class B | 98 | 2,512 | ||||||
Svenska Cellulosa AB SCA, Class B | 147 | 4,090 | ||||||
Svenska Handelsbanken AB, Class A | 115 | 5,845 | ||||||
Swedbank AB, Class A | 273 | 7,261 | ||||||
Swedish Match AB | 37 | 1,293 | ||||||
Tele2 AB, Class B | 65 | 769 | ||||||
Telefonaktiebolaget LM Ericsson, Class B | 839 | 10,513 | ||||||
TeliaSonera AB | 553 | 4,096 | ||||||
Volvo AB, Class B | 412 | 5,990 | ||||||
|
| |||||||
| 105,169 | ||||||||
|
| |||||||
| Switzerland — 7.2% | ||||||||
ABB Ltd.* | 599 | 14,228 | ||||||
Actelion Ltd.* | 27 | 2,683 | ||||||
Adecco SA* | 42 | 3,506 | ||||||
Aryzta AG* | 21 | 1,958 | ||||||
Baloise Holding AG | 16 | 1,921 | ||||||
Barry Callebaut AG* | 1 | 1,321 | ||||||
Cie Financiere Richemont SA | 143 | 15,067 | ||||||
Coca-Cola HBC AG CDI* | 53 | 1,219 | ||||||
Credit Suisse Group AG* | 411 | 12,218 | ||||||
EMS-Chemie Holding AG | 3 | 1,126 | ||||||
Geberit AG | 11 | 3,642 | ||||||
Givaudan SA* | 3 | 4,918 | ||||||
Glencore PLC* | 2,881 | 15,615 | ||||||
Holcim Ltd.* | 61 | 5,351 | ||||||
Julius Baer Group Ltd.* | 62 | 2,684 | ||||||
Kuehne + Nagel International AG | 18 | 2,454 | ||||||
Lonza Group AG* | 14 | 1,505 | ||||||
Nestle SA | 878 | 68,877 | ||||||
Novartis AG | 643 | 57,658 | ||||||
Pargesa Holding SA | 9 | 802 | ||||||
Partners Group Holding AG | 6 | 1,592 | ||||||
Roche Holding AG | 190 | 55,907 | ||||||
Schindler Holding AG | 8 | 1,222 | ||||||
Schindler Holding AG Participation Certificates | 15 | 2,317 | ||||||
SGS SA | 2 | 5,014 | ||||||
Number | Value | |||||||
| Switzerland (Continued) | ||||||||
Sika AG | 1 | $ | 3,963 | |||||
Sonova Holding AG* | 17 | 2,593 | ||||||
STMicroelectronics NV* | 158 | 1,581 | ||||||
Sulzer AG | 7 | 1,063 | ||||||
Swatch Group AG (The) — Bearer | 9 | 5,312 | ||||||
Swatch Group AG (The) — Registered | 12 | 1,317 | ||||||
Swiss Life Holding AG* | 11 | 2,645 | ||||||
Swiss Prime Site AG* | 19 | 1,528 | ||||||
Swiss Re AG* | 81 | 7,205 | ||||||
Swisscom AG | 7 | 4,170 | ||||||
Syngenta AG | 27 | 10,387 | ||||||
Transocean Ltd. | 101 | 4,260 | ||||||
UBS AG* | 980 | 19,677 | ||||||
Wolseley PLC | 70 | 3,901 | ||||||
Zurich Insurance Group AG* | 44 | 13,202 | ||||||
|
| |||||||
| 367,609 | ||||||||
|
| |||||||
| Taiwan — 1.8% | ||||||||
Advanced Semiconductor Engineering, Inc., ADR | 1,700 | 10,948 | ||||||
AU Optronics Corp., ADR* | 1,400 | 5,236 | ||||||
Chunghwa Telecom Co. Ltd., ADR | 100 | 3,185 | ||||||
Hon Hai Precision Industry Co. Ltd., GDR | 4,200 | 26,166 | ||||||
Siliconware Precision Industries Co., ADR | 1,100 | 8,690 | ||||||
Taiwan Semiconductor Manufacturing Co. Ltd., ADR | 1,300 | 26,728 | ||||||
United Microelectronics Corp., ADR | 5,200 | 11,960 | ||||||
|
| |||||||
| 92,913 | ||||||||
|
| |||||||
| Thailand — 0.4% | ||||||||
Bangkok Bank PCL, NVDR | 500 | 2,818 | ||||||
Indorama Ventures PCL, NVDR | 2,400 | 1,828 | ||||||
IRPC PCL, NVDR | 10,300 | 1,111 | ||||||
Kasikornbank PCL, NVDR | 500 | 2,856 | ||||||
Krung Thai Bank PCL, NVDR | 4,000 | 2,303 | ||||||
PTT Exploration & Production PCL, NVDR | 600 | 2,805 | ||||||
PTT PCL, NVDR | 500 | 4,478 | ||||||
Siam Commercial Bank PCL, NVDR | 600 | 2,906 | ||||||
Thai Oil PCL, NVDR | 800 | 1,212 | ||||||
|
| |||||||
| 22,317 | ||||||||
|
| |||||||
| Turkey — 0.4% | ||||||||
Akbank TAS | 521 | 2,032 | ||||||
Arcelik AS | 229 | 1,441 | ||||||
BIM Birlesik Magazalar AS | 2 | 44 | ||||||
Emlak Konut Gayrimenkul Yatirim Ortakligi AS REIT | 815 | 1,041 | ||||||
Enka Insaat ve Sanayi AS | 232 | 645 | ||||||
Eregli Demir ve Celik Fabrikalari TAS | 839 | 1,248 | ||||||
Ford Otomotiv Sanayi AS* | 127 | 1,683 | ||||||
Haci Omer Sabanci Holding AS | 257 | 1,250 | ||||||
KOC Holding AS | 123 | 607 | ||||||
Koza Altin Isletmeleri AS | 29 | 289 | ||||||
TAV Havalimanlari Holding AS | 175 | 1,393 | ||||||
Tofas Turk Otomobil Fabrikasi AS | 166 | 1,029 | ||||||
Tupras Turkiye Petrol Rafinerileri AS | 46 | 1,119 | ||||||
Turk Hava Yollari* | 211 | 717 | ||||||
Turk Telekomunikasyon AS | 119 | 344 | ||||||
| See Notes to Financial Statements. | 86 |
DBX ETF Trust
SCHEDULE OF INVESTMENTS
db X-trackers MSCI All World ex US Hedged Equity Fund (Continued)
May 31, 2014
Number | Value | |||||||
| Turkey (Continued) | ||||||||
Turkcell Iletisim Hizmetleri AS* | 176 | $ | 1,103 | |||||
Turkiye Garanti Bankasi AS | 590 | 2,405 | ||||||
Turkiye Halk Bankasi AS | 157 | 1,220 | ||||||
Turkiye Is Bankasi, Class C | 451 | 1,284 | ||||||
Turkiye Sise ve Cam Fabrikalari AS | 152 | 211 | ||||||
Turkiye Vakiflar Bankasi TAO, Class D | 131 | 316 | ||||||
Ulker Biskuvi Sanayi AS | 24 | 203 | ||||||
Yapi ve Kredi Bankasi AS | 218 | 508 | ||||||
|
| |||||||
| 22,132 | ||||||||
|
| |||||||
| United Kingdom — 13.9% | ||||||||
3i Group PLC | 263 | 1,904 | ||||||
Aberdeen Asset Management PLC | 268 | 1,999 | ||||||
Admiral Group PLC | 57 | 1,393 | ||||||
Aggreko PLC | 74 | 2,068 | ||||||
AMEC PLC | 84 | 1,701 | ||||||
Anglo American PLC | 377 | 9,210 | ||||||
Antofagasta PLC | 106 | 1,401 | ||||||
ARM Holdings PLC | 373 | 5,752 | ||||||
ASOS PLC* | 15 | 1,138 | ||||||
Associated British Foods PLC | 91 | 4,603 | ||||||
AstraZeneca PLC | 336 | 24,125 | ||||||
Aviva PLC | 794 | 6,974 | ||||||
Babcock International Group PLC | 109 | 2,218 | ||||||
BAE Systems PLC | 874 | 6,198 | ||||||
Barclays PLC | 4,106 | 17,000 | ||||||
BG Group PLC | 927 | 18,972 | ||||||
BHP Billiton PLC | 574 | 17,973 | ||||||
BP PLC | 5,108 | 43,067 | ||||||
British American Tobacco PLC | 511 | 30,840 | ||||||
British Land Co. PLC REIT | 227 | 2,721 | ||||||
British Sky Broadcasting Group PLC | 301 | 4,453 | ||||||
BT Group PLC | 2,150 | 14,307 | ||||||
Bunzl PLC | 90 | 2,522 | ||||||
Burberry Group PLC | 121 | 3,109 | ||||||
Capita PLC | 188 | 3,488 | ||||||
Carnival PLC | 47 | 1,910 | ||||||
Centrica PLC | 1,462 | 8,224 | ||||||
CNH Industrial NV | 253 | 2,769 | ||||||
Cobham PLC | 290 | 1,550 | ||||||
Compass Group PLC | 472 | 7,876 | ||||||
Croda International PLC | 39 | 1,721 | ||||||
Diageo PLC | 671 | 21,583 | ||||||
Direct Line Insurance Group PLC | 339 | 1,439 | ||||||
easyJet PLC | 49 | 1,257 | ||||||
G4S PLC | 453 | 1,898 | ||||||
GKN PLC | 440 | 2,896 | ||||||
GlaxoSmithKline PLC | 1,317 | 35,343 | ||||||
Hammerson PLC REIT | 158 | 1,573 | ||||||
Hargreaves Lansdown PLC | 59 | 1,206 | ||||||
HSBC Holdings PLC | 4,992 | 52,649 | ||||||
ICAP PLC | 153 | 1,025 | ||||||
IMI PLC | 73 | 1,954 | ||||||
Imperial Tobacco Group PLC | 258 | 11,642 | ||||||
Inmarsat PLC | 125 | 1,533 | ||||||
InterContinental Hotels Group PLC | 67 | 2,645 | ||||||
International Consolidated Airlines Group SA* | 264 | 1,749 | ||||||
Number | Value | |||||||
| United Kingdom (Continued) | ||||||||
Intertek Group PLC | 48 | $ | 2,348 | |||||
Intu Properties PLC REIT | 146 | 771 | ||||||
Investec PLC | 159 | 1,379 | ||||||
ITV PLC | 1,056 | 3,223 | ||||||
J Sainsbury PLC | 279 | 1,619 | ||||||
Johnson Matthey PLC | 56 | 3,015 | ||||||
Kingfisher PLC | 662 | 4,350 | ||||||
Land Securities Group PLC REIT | 185 | 3,312 | ||||||
Legal & General Group PLC | 1,606 | 6,197 | ||||||
Lloyds Banking Group PLC* | 13,351 | 17,424 | ||||||
London Stock Exchange Group PLC | 49 | 1,608 | ||||||
Marks & Spencer Group PLC | 455 | 3,426 | ||||||
Meggitt PLC | 209 | 1,697 | ||||||
Melrose Industries PLC | 280 | 1,314 | ||||||
National Grid PLC | 1,047 | 15,619 | ||||||
Next PLC | 45 | 5,008 | ||||||
Old Mutual PLC | 1,369 | 4,635 | ||||||
Pearson PLC | 232 | 4,554 | ||||||
Persimmon PLC* | 82 | 1,839 | ||||||
Petrofac Ltd. | 75 | 1,587 | ||||||
Prudential PLC | 697 | 16,187 | ||||||
Reckitt Benckiser Group PLC | 176 | 15,046 | ||||||
Reed Elsevier PLC | 336 | 5,356 | ||||||
Rexam PLC | 219 | 1,951 | ||||||
Rio Tinto PLC | 353 | 18,088 | ||||||
Rolls-Royce Holdings PLC* | 508 | 8,856 | ||||||
Royal Bank of Scotland Group PLC* | 569 | 3,306 | ||||||
Royal Mail PLC* | 128 | 1,099 | ||||||
RSA Insurance Group PLC | 211 | 1,697 | ||||||
SABMiller PLC | 730 | 40,514 | ||||||
Sage Group PLC (The) | 290 | 1,992 | ||||||
Schroders PLC | 28 | 1,214 | ||||||
Segro PLC REIT | 108 | 669 | ||||||
Severn Trent PLC | 71 | 2,342 | ||||||
Smith & Nephew PLC | 260 | 4,559 | ||||||
Smiths Group PLC | 106 | 2,347 | ||||||
SSE PLC | 274 | 7,146 | ||||||
Standard Chartered PLC | 647 | 14,559 | ||||||
Standard Life PLC | 661 | 4,432 | ||||||
Subsea 7 SA | 77 | 1,539 | ||||||
Tate & Lyle PLC | 116 | 1,346 | ||||||
Tesco PLC | 2,121 | 10,792 | ||||||
Travis Perkins PLC | 64 | 1,805 | ||||||
TUI Travel PLC | 103 | 708 | ||||||
Tullow Oil PLC | 252 | 3,561 | ||||||
Unilever PLC | 341 | 15,318 | ||||||
United Utilities Group PLC | 203 | 2,953 | ||||||
Vodafone Group PLC | 7,166 | 25,164 | ||||||
Weir Group PLC (The) | 58 | 2,547 | ||||||
Whitbread PLC | 45 | 3,157 | ||||||
William Hill PLC | 225 | 1,341 | ||||||
WM Morrison Supermarkets PLC | 536 | 1,812 | ||||||
WPP PLC | 374 | 8,068 | ||||||
|
| |||||||
| 709,974 | ||||||||
|
| |||||||
| See Notes to Financial Statements. | 87 |
DBX ETF Trust
SCHEDULE OF INVESTMENTS
db X-trackers MSCI All World ex US Hedged Equity Fund (Continued)
May 31, 2014
Number | Value | |||||||
| United States — 0.4% | ||||||||
Southern Copper Corp. | 100 | $ | 2,972 | |||||
Thomson Reuters Corp. | 100 | 3,467 | ||||||
Valeant Pharmaceuticals International, Inc.* | 100 | 13,127 | ||||||
|
| |||||||
| 19,566 | ||||||||
|
| |||||||
TOTAL COMMON STOCKS | 4,991,769 | |||||||
|
| |||||||
| PREFERRED STOCKS — 1.7% | ||||||||
| Brazil — 0.9% | ||||||||
Banco Bradesco SA | 600 | 8,359 | ||||||
Banco do Estado do Rio Grande do Sul SA, Class B | 100 | 474 | ||||||
Bradespar SA | 100 | 830 | ||||||
Centrais Eletricas Brasileiras SA, Class B | 100 | 432 | ||||||
Cia Energetica de Minas Gerais | 200 | 1,391 | ||||||
Gerdau SA | 300 | 1,785 | ||||||
Itau Unibanco Holding SA | 700 | 10,905 | ||||||
Itausa — Investimentos Itau SA | 880 | 3,355 | ||||||
Lojas Americanas SA | 125 | 742 | ||||||
Metalurgica Gerdau SA | 100 | 728 | ||||||
Oi SA | 427 | 370 | ||||||
Petroleo Brasileiro SA | 1,200 | 8,940 | ||||||
Suzano Papel e Celulose SA, Class A | 100 | 360 | ||||||
Telefonica Brasil SA | 100 | 1,997 | ||||||
Usinas Siderurgicas de Minas Gerais SA, Class A* | 200 | 705 | ||||||
Vale SA | 600 | 6,867 | ||||||
|
| |||||||
| 48,240 | ||||||||
|
| |||||||
| Chile — 0.0% (a) | ||||||||
Embotelladora Andina SA, Class B | 80 | 337 | ||||||
Sociedad Quimica y Minera de Chile SA, Class B | 30 | 908 | ||||||
|
| |||||||
| 1,245 | ||||||||
|
| |||||||
| Colombia — 0.1% | ||||||||
Bancolombia SA | 141 | 1,970 | ||||||
Grupo de Inversiones Suramericana SA | 16 | 324 | ||||||
|
| |||||||
| 2,294 | ||||||||
|
| |||||||
| Germany — 0.5% | ||||||||
Bayerische Motoren Werke AG | 14 | 1,350 | ||||||
Fuchs Petrolub SE | 10 | 947 | ||||||
Henkel AG & Co. KGaA | 48 | 5,544 | ||||||
Porsche Automobil Holding SE | 42 | 4,486 | ||||||
Volkswagen AG | 40 | 10,633 | ||||||
|
| |||||||
| 22,960 | ||||||||
|
| |||||||
Number | Value | |||||||
| South Korea — 0.2% | ||||||||
Hyundai Motor Co. | 15 | $ | 2,220 | |||||
Hyundai Motor Co. | 14 | 1,976 | ||||||
LG Chem Ltd. | 7 | 1,125 | ||||||
Samsung Electronics Co. Ltd. | 6 | 6,510 | ||||||
|
| |||||||
| 11,831 | ||||||||
|
| |||||||
| United Kingdom — 0.0% (a) | ||||||||
Rolls-Royce Holdings PLC, Class C* | 68,072 | 114 | ||||||
|
| |||||||
TOTAL PREFERRED STOCKS | 86,684 | |||||||
|
| |||||||
| RIGHTS — 0.0% (a) | ||||||||
| Australia — 0.0% (a) | ||||||||
Transurban Group*, expiring 6/23/14 | 101 | — | ||||||
|
| |||||||
| China — 0.0% (a) | ||||||||
Uni-President China Holdings Ltd.*, expiring 7/17/14 | 200 | 38 | ||||||
|
| |||||||
| France — 0.0% (a) | ||||||||
Eurazeo SA*, expiring 6/28/14 | 10 | 43 | ||||||
|
| |||||||
| Portugal — 0.0% (a) | ||||||||
Banco Espirito Santo SA*, expiring 7/09/14 | 534 | 98 | ||||||
|
| |||||||
| South Korea — 0.0% (a) | ||||||||
BS Financial Group, Inc.*, expiring 8/04/14 | 11 | 21 | ||||||
|
| |||||||
| Spain — 0.0% (a) | ||||||||
Abertis Infraestructuras SA* | 5 | 109 | ||||||
|
| |||||||
TOTAL RIGHTS | 309 | |||||||
|
| |||||||
| WARRANTS — 0.0% (a) | ||||||||
| Hong Kong — 0.0% (a) | ||||||||
Sun Hung Kai Properties Ltd.*, expiring 4/22/16 | 83 | 102 | ||||||
|
| |||||||
TOTAL INVESTMENTS — 99.2% (Cost $4,963,713) | $ | 5,078,864 | ||||||
Other assets less liabilities — 0.8% | 42,693 | |||||||
|
| |||||||
NET ASSETS — 100.0% | $ | 5,121,557 | ||||||
|
| |||||||
As of May 31, 2014, the Fund had the following forward foreign currency contracts outstanding:
Counterparty | Settlement Date | Currency To Deliver | Currency To Receive | Unrealized Appreciation (Depreciation) | ||||||||||||||
Barclays Bank PLC | 6/4/14 | USD | 146,110 | AUD | 157,000 | $ | (38 | ) | ||||||||||
The Bank of New York Mellon | 6/4/14 | USD | 931 | AUD | 1,000 | — | ||||||||||||
JP Morgan & Chase Co. | 6/4/14 | USD | 146,120 | AUD | 157,000 | (49 | ) | |||||||||||
Barclays Bank PLC | 6/4/14 | USD | 63,308 | BRL | 142,000 | 5 | ||||||||||||
| See Notes to Financial Statements. | 88 |
DBX ETF Trust
SCHEDULE OF INVESTMENTS
db X-trackers MSCI All World ex US Hedged Equity Fund (Continued)
May 31, 2014
Counterparty | Settlement Date | Currency To Deliver | Currency To Receive | Unrealized Appreciation (Depreciation) | ||||||||||||||
JP Morgan & Chase Co. | 6/4/14 | USD | 63,435 | BRL | 142,000 | $ | (123 | ) | ||||||||||
Barclays Bank PLC | 6/4/14 | USD | 184,179 | CAD | 200,000 | 254 | ||||||||||||
The Bank of New York Mellon | 6/4/14 | USD | 5,474 | CAD | 6,000 | 59 | ||||||||||||
JP Morgan & Chase Co. | 6/4/14 | USD | 184,188 | CAD | 200,000 | 245 | ||||||||||||
Barclays Bank PLC | 6/4/14 | USD | 171,152 | CHF | 153,000 | (291 | ) | |||||||||||
JP Morgan & Chase Co. | 6/4/14 | USD | 171,151 | CHF | 153,000 | (289 | ) | |||||||||||
Barclays Bank PLC | 6/4/14 | USD | 11,379 | CLP | 6,267,000 | 22 | ||||||||||||
JP Morgan & Chase Co. | 6/4/14 | USD | 11,375 | CLP | 6,267,000 | 26 | ||||||||||||
Barclays Bank PLC | 6/4/14 | USD | 1,538 | CZK | 31,000 | — | ||||||||||||
JP Morgan & Chase Co. | 6/4/14 | USD | 1,538 | CZK | 31,000 | — | ||||||||||||
Barclays Bank PLC | 6/4/14 | USD | 21,392 | DKK | 117,000 | (23 | ) | |||||||||||
The Bank of New York Mellon | 7/3/14 | USD | 8,600 | DKK | 47,025 | (9 | ) | |||||||||||
JP Morgan & Chase Co. | 6/4/14 | USD | 21,392 | DKK | 117,000 | (22 | ) | |||||||||||
Barclays Bank PLC | 6/4/14 | USD | 2,521 | EGP | 18,000 | (11 | ) | |||||||||||
JP Morgan & Chase Co. | 6/4/14 | USD | 2,517 | EGP | 18,000 | (7 | ) | |||||||||||
Barclays Bank PLC | 6/4/14 | USD | 574,474 | EUR | 421,000 | (588 | ) | |||||||||||
The Bank of New York Mellon | 6/4/14 | USD | 5,547 | EUR | 4,000 | (94 | ) | |||||||||||
The Bank of New York Mellon | 6/4/14 | USD | 3,331 | EUR | 2,400 | (59 | ) | |||||||||||
The Bank of New York Mellon | 6/4/14 | USD | 2,720 | EUR | 2,000 | 6 | ||||||||||||
The Bank of New York Mellon | 7/3/14 | USD | 3,800 | EUR | 2,785 | (4 | ) | |||||||||||
JP Morgan & Chase Co. | 6/4/14 | USD | 574,476 | EUR | 421,000 | (590 | ) | |||||||||||
Barclays Bank PLC | 6/4/14 | USD | 402,561 | GBP | 240,000 | (287 | ) | |||||||||||
The Bank of New York Mellon | 6/4/14 | USD | 2,867 | GBP | 1,700 | (18 | ) | |||||||||||
The Bank of New York Mellon | 6/4/14 | USD | 2,805 | GBP | 1,667 | (10 | ) | |||||||||||
The Bank of New York Mellon | 7/3/14 | USD | 1,400 | GBP | 835 | (1 | ) | |||||||||||
JP Morgan & Chase Co. | 6/4/14 | USD | 402,564 | GBP | 240,000 | (289 | ) | |||||||||||
Barclays Bank PLC | 6/4/14 | USD | 159,036 | HKD | 1,233,000 | 1 | ||||||||||||
The Bank of New York Mellon | 6/4/14 | USD | 3,354 | HKD | 26,000 | (1 | ) | |||||||||||
The Bank of New York Mellon | 6/4/14 | USD | 1,935 | HKD | 15,000 | — | ||||||||||||
The Bank of New York Mellon | 7/3/14 | USD | 6,000 | HKD | 46,515 | — | ||||||||||||
JP Morgan & Chase Co. | 6/4/14 | USD | 159,036 | HKD | 1,233,000 | 1 | ||||||||||||
Barclays Bank PLC | 6/4/14 | USD | 3,114 | HUF | 691,000 | (3 | ) | |||||||||||
The Bank of New York Mellon | 6/4/14 | USD | 1,415 | HUF | 314,000 | (1 | ) | |||||||||||
JP Morgan & Chase Co. | 6/4/14 | USD | 3,114 | HUF | 691,000 | (3 | ) | |||||||||||
Barclays Bank PLC | 6/4/14 | USD | 15,872 | IDR | 186,182,000 | 64 | ||||||||||||
JP Morgan & Chase Co. | 6/4/14 | USD | 15,947 | IDR | 186,182,000 | (11 | ) | |||||||||||
Barclays Bank PLC | 6/5/14 | USD | 9,502 | ILS | 33,000 | (4 | ) | |||||||||||
JP Morgan & Chase Co. | 6/5/14 | USD | 9,502 | ILS | 33,000 | (3 | ) | |||||||||||
Barclays Bank PLC | 6/4/14 | USD | 23,230 | INR | 1,375,000 | 19 | ||||||||||||
JP Morgan & Chase Co. | 6/4/14 | USD | 23,270 | INR | 1,375,000 | (21 | ) | |||||||||||
Barclays Bank PLC | 6/4/14 | USD | 337,641 | JPY | 34,353,000 | (177 | ) | |||||||||||
The Bank of New York Mellon | 6/4/14 | USD | 6,831 | JPY | 695,000 | (4 | ) | |||||||||||
JP Morgan & Chase Co. | 6/4/14 | USD | 337,638 | JPY | 34,353,000 | (174 | ) | |||||||||||
Barclays Bank PLC | 6/5/14 | USD | 89,617 | KRW | 91,530,000 | 78 | ||||||||||||
JP Morgan & Chase Co. | 6/5/14 | USD | 89,718 | KRW | 91,530,000 | (23 | ) | |||||||||||
Barclays Bank PLC | 6/4/14 | USD | 30,382 | MXN | 391,000 | 21 | ||||||||||||
The Bank of New York Mellon | 6/4/14 | USD | 233 | MXN | 3,000 | — | ||||||||||||
JP Morgan & Chase Co. | 6/4/14 | USD | 30,384 | MXN | 391,000 | 19 | ||||||||||||
Barclays Bank PLC | 6/4/14 | USD | 27,363 | MYR | 88,000 | 18 | ||||||||||||
JP Morgan & Chase Co. | 6/4/14 | USD | 27,389 | MYR | 88,000 | (8 | ) | |||||||||||
Barclays Bank PLC | 6/4/14 | USD | 15,736 | NOK | 94,000 | (14 | ) | |||||||||||
JP Morgan & Chase Co. | 6/4/14 | USD | 15,736 | NOK | 94,000 | (14 | ) | |||||||||||
Barclays Bank PLC | 6/4/14 | USD | 3,396 | NZD | 4,000 | (1 | ) | |||||||||||
JP Morgan & Chase Co. | 6/4/14 | USD | 3,396 | NZD | 4,000 | (1 | ) | |||||||||||
Barclays Bank PLC | 6/4/14 | USD | 6,588 | PHP | 289,000 | 17 | ||||||||||||
JP Morgan & Chase Co. | 6/4/14 | USD | 6,605 | PHP | 289,000 | — | ||||||||||||
Barclays Bank PLC | 6/4/14 | USD | 11,549 | PLN | 35,000 | (16 | ) | |||||||||||
| See Notes to Financial Statements. | 89 |
DBX ETF Trust
SCHEDULE OF INVESTMENTS
db X-trackers MSCI All World ex US Hedged Equity Fund (Continued)
May 31, 2014
Counterparty | Settlement Date | Currency To Deliver | Currency To Receive | Unrealized Appreciation (Depreciation) | ||||||||||||||
JP Morgan & Chase Co. | 6/4/14 | USD | 11,550 | PLN | 35,000 | $ | (17 | ) | ||||||||||
Barclays Bank PLC | 6/4/14 | USD | 20,881 | RUB | 728,000 | (34 | ) | |||||||||||
JP Morgan & Chase Co. | 6/4/14 | USD | 20,886 | RUB | 728,000 | (39 | ) | |||||||||||
Barclays Bank PLC | 6/4/14 | USD | 53,445 | SEK | 357,000 | (101 | ) | |||||||||||
The Bank of New York Mellon | 6/4/14 | USD | 2,409 | SEK | 16,000 | (18 | ) | |||||||||||
JP Morgan & Chase Co. | 6/4/14 | USD | 53,446 | SEK | 357,000 | (102 | ) | |||||||||||
Barclays Bank PLC | 6/4/14 | USD | 28,716 | SGD | 36,000 | (15 | ) | |||||||||||
JP Morgan & Chase Co. | 6/4/14 | USD | 28,716 | SGD | 36,000 | (15 | ) | |||||||||||
Barclays Bank PLC | 6/4/14 | USD | 11,355 | THB | 373,000 | 5 | ||||||||||||
JP Morgan & Chase Co. | 6/4/14 | USD | 11,355 | THB | 373,000 | 5 | ||||||||||||
Barclays Bank PLC | 6/4/14 | USD | 10,023 | TRY | 21,000 | (20 | ) | |||||||||||
JP Morgan & Chase Co. | 6/4/14 | USD | 10,028 | TRY | 21,000 | (25 | ) | |||||||||||
Barclays Bank PLC | 6/5/14 | USD | 44,600 | TWD | 1,338,000 | 25 | ||||||||||||
JP Morgan & Chase Co. | 6/5/14 | USD | 44,622 | TWD | 1,338,000 | 4 | ||||||||||||
Barclays Bank PLC | 6/4/14 | AUD | 157,000 | USD | 145,115 | (957 | ) | |||||||||||
Barclays Bank PLC | 7/3/14 | AUD | 157,000 | USD | 145,816 | 40 | ||||||||||||
Barclays Bank PLC | 6/4/14 | BRL | 142,000 | USD | 62,890 | (422 | ) | |||||||||||
Barclays Bank PLC | 7/3/14 | BRL | 141,000 | USD | 62,326 | (25 | ) | |||||||||||
Barclays Bank PLC | 6/4/14 | CAD | 200,000 | USD | 182,079 | (2,353 | ) | |||||||||||
Barclays Bank PLC | 7/3/14 | CAD | 199,000 | USD | 183,128 | (252 | ) | |||||||||||
Barclays Bank PLC | 6/4/14 | CHF | 153,000 | USD | 173,844 | 2,981 | ||||||||||||
Barclays Bank PLC | 7/3/14 | CHF | 156,000 | USD | 174,555 | 286 | ||||||||||||
Barclays Bank PLC | 6/4/14 | CLP | 6,267,000 | USD | 11,053 | (348 | ) | |||||||||||
Barclays Bank PLC | 7/3/14 | CLP | 6,387,000 | USD | 11,558 | (25 | ) | |||||||||||
Barclays Bank PLC | 7/3/14 | COP | 3,899,000 | USD | 2,049 | — | ||||||||||||
Barclays Bank PLC | 6/4/14 | CZK | 31,000 | USD | 1,565 | 27 | ||||||||||||
Barclays Bank PLC | 7/3/14 | CZK | 32,000 | USD | 1,588 | — | ||||||||||||
Barclays Bank PLC | 6/4/14 | DKK | 117,000 | USD | 21,736 | 367 | ||||||||||||
Barclays Bank PLC | 7/3/14 | DKK | 138,000 | USD | 25,237 | 26 | ||||||||||||
Barclays Bank PLC | 6/4/14 | EGP | 18,000 | USD | 2,546 | 36 | ||||||||||||
Barclays Bank PLC | 7/7/14 | EGP | 19,000 | USD | 2,610 | 17 | ||||||||||||
Barclays Bank PLC | 6/4/14 | EUR | 421,000 | USD | 583,674 | 9,787 | ||||||||||||
Barclays Bank PLC | 7/3/14 | EUR | 430,000 | USD | 586,714 | 586 | ||||||||||||
Barclays Bank PLC | 6/4/14 | GBP | 240,000 | USD | 405,183 | 2,909 | ||||||||||||
Barclays Bank PLC | 7/3/14 | GBP | 244,000 | USD | 409,180 | 289 | ||||||||||||
Barclays Bank PLC | 6/4/14 | HKD | 1,233,000 | USD | 159,041 | 3 | ||||||||||||
Barclays Bank PLC | 7/3/14 | HKD | 1,276,000 | USD | 164,590 | (4 | ) | |||||||||||
Barclays Bank PLC | 6/4/14 | HUF | 691,000 | USD | 3,111 | 1 | ||||||||||||
Barclays Bank PLC | 7/3/14 | HUF | 588,000 | USD | 2,646 | 3 | ||||||||||||
Barclays Bank PLC | 6/4/14 | IDR | 186,182,000 | USD | 16,067 | 131 | ||||||||||||
Barclays Bank PLC | 7/3/14 | IDR | 194,792,000 | USD | 16,536 | (53 | ) | |||||||||||
Barclays Bank PLC | 6/5/14 | ILS | 33,000 | USD | 9,530 | 31 | ||||||||||||
Barclays Bank PLC | 7/3/14 | ILS | 34,000 | USD | 9,786 | 1 | ||||||||||||
Barclays Bank PLC | 6/4/14 | INR | 1,375,000 | USD | 22,664 | (585 | ) | |||||||||||
Barclays Bank PLC | 7/7/14 | INR | 1,416,000 | USD | 23,804 | 41 | ||||||||||||
Barclays Bank PLC | 6/4/14 | JPY | 34,353,000 | USD | 336,332 | (1,131 | ) | |||||||||||
Barclays Bank PLC | 7/3/14 | JPY | 35,734,000 | USD | 351,276 | 182 | ||||||||||||
Barclays Bank PLC | 6/5/14 | KRW | 91,530,000 | USD | 88,466 | (1,228 | ) | |||||||||||
Barclays Bank PLC | 7/3/14 | KRW | 94,691,000 | USD | 92,573 | (87 | ) | |||||||||||
Barclays Bank PLC | 6/4/14 | MXN | 391,000 | USD | 29,786 | (617 | ) | |||||||||||
Barclays Bank PLC | 7/3/14 | MXN | 395,000 | USD | 30,620 | (23 | ) | |||||||||||
Barclays Bank PLC | 6/4/14 | MYR | 88,000 | USD | 26,901 | (480 | ) | |||||||||||
Barclays Bank PLC | 7/3/14 | MYR | 88,000 | USD | 27,312 | (10 | ) | |||||||||||
Barclays Bank PLC | 6/4/14 | NOK | 94,000 | USD | 15,758 | 36 | ||||||||||||
Barclays Bank PLC | 7/3/14 | NOK | 97,000 | USD | 16,219 | 14 | ||||||||||||
Barclays Bank PLC | 6/4/14 | NZD | 4,000 | USD | 3,425 | �� | 30 | |||||||||||
Barclays Bank PLC | 7/3/14 | NZD | 4,000 | USD | 3,388 | 2 | ||||||||||||
| See Notes to Financial Statements. | 90 |
DBX ETF Trust
SCHEDULE OF INVESTMENTS
db X-trackers MSCI All World ex US Hedged Equity Fund (Continued)
May 31, 2014
Counterparty | Settlement Date | Currency To Deliver | Currency To Receive | Unrealized Appreciation (Depreciation) | ||||||||||||||
Barclays Bank PLC | 6/4/14 | PHP | 289,000 | USD | 6,495 | $ | (110 | ) | ||||||||||
Barclays Bank PLC | 7/3/14 | PHP | 308,000 | USD | 7,021 | (15 | ) | |||||||||||
Barclays Bank PLC | 6/4/14 | PLN | 35,000 | USD | 11,532 | (2 | ) | |||||||||||
Barclays Bank PLC | 7/3/14 | PLN | 36,000 | USD | 11,857 | 16 | ||||||||||||
Barclays Bank PLC | 6/4/14 | RUB | 728,000 | USD | 20,263 | (584 | ) | |||||||||||
Barclays Bank PLC | 7/3/14 | RUB | 720,000 | USD | 20,499 | 21 | ||||||||||||
Barclays Bank PLC | 6/4/14 | SEK | 357,000 | USD | 54,744 | 1,401 | ||||||||||||
Barclays Bank PLC | 7/3/14 | SEK | 356,000 | USD | 53,265 | 100 | ||||||||||||
Barclays Bank PLC | 6/4/14 | SGD | 36,000 | USD | 28,671 | (31 | ) | |||||||||||
Barclays Bank PLC | 7/3/14 | SGD | 37,000 | USD | 29,513 | 15 | ||||||||||||
Barclays Bank PLC | 6/4/14 | THB | 373,000 | USD | 11,501 | 141 | ||||||||||||
Barclays Bank PLC | 7/7/14 | THB | 370,000 | USD | 11,237 | (15 | ) | |||||||||||
Barclays Bank PLC | 6/4/14 | TRY | 21,000 | USD | 9,836 | (167 | ) | |||||||||||
Barclays Bank PLC | 7/3/14 | TRY | 23,000 | USD | 10,901 | 21 | ||||||||||||
Barclays Bank PLC | 6/5/14 | TWD | 1,338,000 | USD | 44,371 | (255 | ) | |||||||||||
Barclays Bank PLC | 7/3/14 | TWD | 1,399,000 | USD | 46,657 | (26 | ) | |||||||||||
Barclays Bank PLC | 6/4/14 | ZAR | 171,000 | USD | 16,160 | 13 | ||||||||||||
Barclays Bank PLC | 7/3/14 | ZAR | 168,000 | USD | 15,797 | 7 | ||||||||||||
The Bank of New York Mellon | 6/4/14 | AUD | 1,000 | USD | 923 | (8 | ) | |||||||||||
The Bank of New York Mellon | 7/3/14 | AUD | 3,230 | USD | 3,000 | 1 | ||||||||||||
The Bank of New York Mellon | 7/3/14 | BRL | 2,019 | USD | 900 | 7 | ||||||||||||
The Bank of New York Mellon | 6/4/14 | CAD | 2,000 | USD | 1,823 | (21 | ) | |||||||||||
The Bank of New York Mellon | 6/4/14 | CAD | 2,000 | USD | 1,842 | (2 | ) | |||||||||||
The Bank of New York Mellon | 6/4/14 | CAD | 2,000 | USD | 1,842 | (3 | ) | |||||||||||
The Bank of New York Mellon | 7/3/14 | CHF | 3,932 | USD | 4,400 | 7 | ||||||||||||
The Bank of New York Mellon | 6/4/14 | EUR | 4,000 | USD | 5,502 | 49 | ||||||||||||
The Bank of New York Mellon | 6/4/14 | EUR | 4,400 | USD | 6,004 | 6 | ||||||||||||
The Bank of New York Mellon | 6/4/14 | GBP | 3,367 | USD | 5,648 | 4 | ||||||||||||
The Bank of New York Mellon | 6/4/14 | HKD | 27,000 | USD | 3,483 | — | ||||||||||||
The Bank of New York Mellon | 6/4/14 | HKD | 14,000 | USD | 1,806 | — | ||||||||||||
The Bank of New York Mellon | 6/4/14 | HUF | 314,000 | USD | 1,415 | 2 | ||||||||||||
The Bank of New York Mellon | 7/3/14 | HUF | 111,121 | USD | 500 | — | ||||||||||||
The Bank of New York Mellon | 6/4/14 | JPY | 580,000 | USD | 5,689 | (9 | ) | |||||||||||
The Bank of New York Mellon | 6/4/14 | JPY | 115,000 | USD | 1,130 | — | ||||||||||||
The Bank of New York Mellon | 7/3/14 | JPY | 264,488 | USD | 2,600 | 1 | ||||||||||||
The Bank of New York Mellon | 6/4/14 | MXN | 3,000 | USD | 229 | (5 | ) | |||||||||||
The Bank of New York Mellon | 7/3/14 | MXN | 12,900 | USD | 1,000 | (1 | ) | |||||||||||
The Bank of New York Mellon | 6/4/14 | SEK | 16,000 | USD | 2,395 | 5 | ||||||||||||
JP Morgan & Chase Co. | 6/4/14 | AUD | 157,000 | USD | 145,134 | (938 | ) | |||||||||||
JP Morgan & Chase Co. | 7/3/14 | AUD | 157,000 | USD | 145,819 | 43 | ||||||||||||
JP Morgan & Chase Co. | 6/4/14 | BRL | 142,000 | USD | 62,922 | (390 | ) | |||||||||||
JP Morgan & Chase Co. | 7/3/14 | BRL | 141,000 | USD | 62,453 | 102 | ||||||||||||
JP Morgan & Chase Co. | 6/4/14 | CAD | 200,000 | USD | 182,095 | (2,337 | ) | |||||||||||
JP Morgan & Chase Co. | 7/3/14 | CAD | 199,000 | USD | 183,132 | (249 | ) | |||||||||||
JP Morgan & Chase Co. | 6/4/14 | CHF | 153,000 | USD | 173,810 | 2,948 | ||||||||||||
JP Morgan & Chase Co. | 7/3/14 | CHF | 156,000 | USD | 174,545 | 277 | ||||||||||||
JP Morgan & Chase Co. | 6/4/14 | CLP | 6,267,000 | USD | 11,060 | (341 | ) | |||||||||||
JP Morgan & Chase Co. | 7/3/14 | CLP | 6,387,000 | USD | 11,551 | (32 | ) | |||||||||||
JP Morgan & Chase Co. | 7/3/14 | COP | 3,899,000 | USD | 2,046 | (3 | ) | |||||||||||
JP Morgan & Chase Co. | 6/4/14 | CZK | 31,000 | USD | 1,565 | 27 | ||||||||||||
JP Morgan & Chase Co. | 7/3/14 | CZK | 32,000 | USD | 1,588 | — | ||||||||||||
JP Morgan & Chase Co. | 6/4/14 | DKK | 117,000 | USD | 21,738 | 368 | ||||||||||||
JP Morgan & Chase Co. | 7/3/14 | DKK | 138,000 | USD | 25,236 | 26 | ||||||||||||
JP Morgan & Chase Co. | 6/4/14 | EGP | 18,000 | USD | 2,537 | 27 | ||||||||||||
JP Morgan & Chase Co. | 7/7/14 | EGP | 19,000 | USD | 2,606 | 13 | ||||||||||||
JP Morgan & Chase Co. | 6/4/14 | EUR | 421,000 | USD | 583,684 | 9,797 | ||||||||||||
JP Morgan & Chase Co. | 7/3/14 | EUR | 430,000 | USD | 586,714 | 586 | ||||||||||||
| See Notes to Financial Statements. | 91 |
DBX ETF Trust
SCHEDULE OF INVESTMENTS
db X-trackers MSCI All World ex US Hedged Equity Fund (Continued)
May 31, 2014
Counterparty | Settlement Date | Currency To Deliver | Currency To Receive | Unrealized Appreciation (Depreciation) | ||||||||||||||
JP Morgan & Chase Co. | 6/4/14 | GBP | 240,000 | USD | 405,138 | $ | 2,863 | |||||||||||
JP Morgan & Chase Co. | 7/3/14 | GBP | 244,000 | USD | 409,176 | 284 | ||||||||||||
JP Morgan & Chase Co. | 6/4/14 | HKD | 1,233,000 | USD | 159,047 | 10 | ||||||||||||
JP Morgan & Chase Co. | 7/3/14 | HKD | 1,276,000 | USD | 164,588 | (5 | ) | |||||||||||
JP Morgan & Chase Co. | 6/4/14 | HUF | 691,000 | USD | 3,113 | 2 | ||||||||||||
JP Morgan & Chase Co. | 7/3/14 | HUF | 588,000 | USD | 2,646 | 3 | ||||||||||||
JP Morgan & Chase Co. | 6/4/14 | IDR | 186,182,000 | USD | 16,018 | 81 | ||||||||||||
JP Morgan & Chase Co. | 7/3/14 | IDR | 194,792,000 | USD | 16,652 | 62 | ||||||||||||
JP Morgan & Chase Co. | 6/5/14 | ILS | 33,000 | USD | 9,530 | 31 | ||||||||||||
JP Morgan & Chase Co. | 7/3/14 | ILS | 34,000 | USD | 9,787 | 3 | ||||||||||||
JP Morgan & Chase Co. | 6/4/14 | INR | 1,375,000 | USD | 22,652 | (597 | ) | |||||||||||
JP Morgan & Chase Co. | 7/7/14 | INR | 1,416,000 | USD | 23,858 | 95 | ||||||||||||
JP Morgan & Chase Co. | 6/4/14 | JPY | 34,353,000 | USD | 336,340 | (1,125 | ) | |||||||||||
JP Morgan & Chase Co. | 7/3/14 | JPY | 35,734,000 | USD | 351,263 | 169 | ||||||||||||
JP Morgan & Chase Co. | 6/5/14 | KRW | 91,530,000 | USD | 88,432 | (1,262 | ) | |||||||||||
JP Morgan & Chase Co. | 7/3/14 | KRW | 94,691,000 | USD | 92,671 | 11 | ||||||||||||
JP Morgan & Chase Co. | 6/4/14 | MXN | 391,000 | USD | 29,798 | (605 | ) | |||||||||||
JP Morgan & Chase Co. | 7/3/14 | MXN | 395,000 | USD | 30,625 | (18 | ) | |||||||||||
JP Morgan & Chase Co. | 6/4/14 | MYR | 88,000 | USD | 26,895 | (486 | ) | |||||||||||
JP Morgan & Chase Co. | 7/3/14 | MYR | 88,000 | USD | 27,350 | 27 | ||||||||||||
JP Morgan & Chase Co. | 6/4/14 | NOK | 94,000 | USD | 15,763 | 41 | ||||||||||||
JP Morgan & Chase Co. | 7/3/14 | NOK | 97,000 | USD | 16,220 | 14 | ||||||||||||
JP Morgan & Chase Co. | 6/4/14 | NZD | 4,000 | USD | 3,427 | 32 | ||||||||||||
JP Morgan & Chase Co. | 7/3/14 | NZD | 4,000 | USD | 3,388 | 2 | ||||||||||||
JP Morgan & Chase Co. | 6/4/14 | PHP | 289,000 | USD | 6,480 | (125 | ) | |||||||||||
JP Morgan & Chase Co. | 7/3/14 | PHP | 308,000 | USD | 7,039 | 3 | ||||||||||||
JP Morgan & Chase Co. | 6/4/14 | PLN | 35,000 | USD | 11,538 | 5 | ||||||||||||
JP Morgan & Chase Co. | 7/3/14 | PLN | 36,000 | USD | 11,857 | 17 | ||||||||||||
JP Morgan & Chase Co. | 6/4/14 | RUB | 728,000 | USD | 20,265 | (582 | ) | |||||||||||
JP Morgan & Chase Co. | 7/3/14 | RUB | 720,000 | USD | 20,515 | 38 | ||||||||||||
JP Morgan & Chase Co. | 6/4/14 | SEK | 357,000 | USD | 54,746 | 1,403 | ||||||||||||
JP Morgan & Chase Co. | 7/3/14 | SEK | 356,000 | USD | 53,266 | 100 | ||||||||||||
JP Morgan & Chase Co. | 6/4/14 | SGD | 36,000 | USD | 28,677 | (25 | ) | |||||||||||
JP Morgan & Chase Co. | 7/3/14 | SGD | 37,000 | USD | 29,513 | 15 | ||||||||||||
JP Morgan & Chase Co. | 6/4/14 | THB | 373,000 | USD | 11,501 | 142 | ||||||||||||
JP Morgan & Chase Co. | 7/7/14 | THB | 370,000 | USD | 11,234 | (17 | ) | |||||||||||
JP Morgan & Chase Co. | 6/4/14 | TRY | 21,000 | USD | 9,832 | (171 | ) | |||||||||||
JP Morgan & Chase Co. | 7/3/14 | TRY | 23,000 | USD | 10,906 | 26 | ||||||||||||
JP Morgan & Chase Co. | 6/5/14 | TWD | 1,338,000 | USD | 44,294 | (331 | ) | |||||||||||
JP Morgan & Chase Co. | 7/3/14 | TWD | 1,399,000 | USD | 46,696 | 14 | ||||||||||||
JP Morgan & Chase Co. | 6/4/14 | ZAR | 171,000 | USD | 16,161 | 14 | ||||||||||||
JP Morgan & Chase Co. | 7/3/14 | ZAR | 168,000 | USD | 15,800 | 10 | ||||||||||||
Barclays Bank PLC | 6/4/14 | USD | 16,154 | ZAR | 171,000 | (8 | ) | |||||||||||
JP Morgan & Chase Co. | 6/4/14 | USD | 16,157 | ZAR | 171,000 | (10 | ) | |||||||||||
|
| |||||||||||||||||
Total net unrealized appreciation | $ | 17,090 | ||||||||||||||||
|
| |||||||||||||||||
Currency Abbreviations
AUD – Australian Dollar
BRL – Brazilian Real
CAD – Canadian Dollar
CHF – Swiss Franc
CLP – Chilean Peso
COP – Colombian Peso
CZK – Czech Kornua
DKK – Danish Krone
EGP – Egyptian Pound
| See Notes to Financial Statements. | 92 |
DBX ETF Trust
SCHEDULE OF INVESTMENTS
db X-trackers MSCI All World ex US Hedged Equity Fund (Continued)
May 31, 2014
EUR – Euro
GBP – Great British Pound
HKD – Hong Kong Dollar
HUF – Hungarian Forint
IDR – Indonesian Rupiah
ILS – Israeli New Shekel
INR – Indian Rupee
JPY – Japanese Yen
KRW – South Korean Won
MXN – Mexican Peso
MYR – Malaysian Ringgit
NOK – Norwegian Krone
NZD – New Zealand Dollar
PHP – Philippine Peso
PLN – Polish Zloty
RUB – Russian Ruble
SEK – Swedish Krona
SGD – Singapore Dollar
THB – Thai Baht
TRY – Turkish New Lira
TWD – New Taiwan Dollar
USD – U.S. Dollar
ZAR – South African Rand
ADR – American Depositary Receipt.
CDI – Chess Depositary Interest.
CPO – Ordinary Participation Certificates.
FDR – Fiduciary Depositary Receipt.
GDR – Global Depositary Receipt.
NVDR – Non Voting Depositary Receipt.
REIT – Real Estate Investment Trust.
SDR – Swedish Depositary Receipt.
* Non-income producing security.
144A – Security is exempt from registration under Rule 144A of the securities Act of 1933. This security is considered liquid and may be resold in transactions exempt from registration, normally to qualified institutional buyers. At May 31, 2014 the aggregate market value of this security amounted to $10,731 or 0.2% of net assets.
(a) Less than 0.1%.
(b) Affiliated issuer. This security is owned in proportion with its representation in the index.
| See Notes to Financial Statements. | 93 |
DBX ETF Trust
SCHEDULE OF INVESTMENTS
db X-trackers MSCI South Korea Hedged Equity Fund
May 31, 2014
Number | Value | |||||||
| COMMON STOCKS — 97.6% | ||||||||
| Basic Materials — 8.1% | ||||||||
Hanwha Chemical Corp. | 850 | $ | 15,664 | |||||
Hyundai Steel Co. | 590 | 39,788 | ||||||
KCC Corp. | 44 | 25,273 | ||||||
Korea Zinc Co. Ltd. | 74 | 26,947 | ||||||
LG Chem Ltd. | 387 | 98,628 | ||||||
Lotte Chemical Corp. | 144 | 22,725 | ||||||
OCI Co. Ltd.* | 142 | 24,358 | ||||||
POSCO | 540 | 152,970 | ||||||
|
| |||||||
| 406,353 | ||||||||
|
| |||||||
| Communications — 6.1% | ||||||||
Cheil Worldwide, Inc.* | 790 | 18,236 | ||||||
KT Corp. | 510 | 15,197 | ||||||
LG Uplus Corp. | 1,840 | 17,296 | ||||||
NAVER Corp. | 231 | 171,631 | ||||||
NCSoft Corp. | 131 | 21,636 | ||||||
Samsung SDI Co. Ltd. | 289 | 42,917 | ||||||
SK Telecom Co. Ltd. | 83 | 17,858 | ||||||
|
| |||||||
| 304,771 | ||||||||
|
| |||||||
| Consumer, Cyclical — 19.6% | ||||||||
Daewoo International Corp. | 400 | 12,625 | ||||||
E-Mart Co. Ltd. | 176 | 40,369 | ||||||
Halla Visteon Climate Control Corp. | 370 | 17,227 | ||||||
Hankook Tire Co. Ltd. | 630 | 37,360 | ||||||
Hanwha Corp. | 460 | 12,219 | ||||||
Hotel Shilla Co. Ltd. | 300 | 27,201 | ||||||
Hyundai Department Store Co. Ltd. | 147 | 19,020 | ||||||
Hyundai Development Co.-Engineering & Construction | 510 | 14,297 | ||||||
Hyundai Mobis | 562 | 158,651 | ||||||
Hyundai Motor Co. | 1,247 | 274,408 | ||||||
Hyundai Wia Corp. | 130 | 22,937 | ||||||
Kangwon Land, Inc. | 910 | 27,161 | ||||||
Kia Motors Corp. | 2,190 | 126,222 | ||||||
Korean Air Lines Co. Ltd.* | 270 | 8,826 | ||||||
LG Corp. | 803 | 47,777 | ||||||
Lotte Shopping Co. Ltd. | 92 | 26,873 | ||||||
Paradise Co. Ltd. | 200 | 7,371 | ||||||
Samsung C&T Corp. | 1,056 | 75,562 | ||||||
Shinsegae Co. Ltd. | 71 | 14,545 | ||||||
SK Networks Co. Ltd.* | 1,180 | 10,965 | ||||||
|
| |||||||
| 981,616 | ||||||||
|
| |||||||
| Consumer, Non-cyclical — 5.8% | ||||||||
Amorepacific Corp. | 28 | 39,769 | ||||||
AMOREPACIFIC Group | 25 | 16,810 | ||||||
Celltrion, Inc.* | 540 | 25,751 | ||||||
CJ CheilJedang Corp. | 69 | 22,319 | ||||||
Hite Jinro Co. Ltd. | 360 | 7,622 | ||||||
KT&G Corp. | 925 | 75,255 | ||||||
LG Household & Health Care Ltd. | 79 | 39,492 | ||||||
Lotte Confectionery Co. Ltd. | 8 | 13,809 | ||||||
Orion Corp. | 31 | 25,494 | ||||||
S-1 Corp. | 153 | 11,923 | ||||||
Yuhan Corp. | 69 | 11,937 | ||||||
|
| |||||||
| 290,181 | ||||||||
|
| |||||||
Number | Value | |||||||
| Diversified — 0.6% | ||||||||
CJ Corp. | 129 | $ | 18,018 | |||||
LS Corp. | 188 | 13,250 | ||||||
|
| |||||||
| 31,268 | ||||||||
|
| |||||||
| Energy — 2.7% | ||||||||
GS Holdings | 425 | 18,059 | ||||||
SK Holdings Co. Ltd. | 220 | 39,678 | ||||||
SK Innovation Co. Ltd. | 506 | 52,822 | ||||||
S-Oil Corp. | 421 | 22,738 | ||||||
|
| |||||||
| 133,297 | ||||||||
|
| |||||||
| Financial — 14.0% | ||||||||
BS Financial Group, Inc. | 1,710 | 26,064 | ||||||
Daewoo Securities Co. Ltd.* | 1,720 | 14,651 | ||||||
DGB Financial Group, Inc. | 1,130 | 17,279 | ||||||
Dongbu Insurance Co. Ltd. | 368 | 20,813 | ||||||
Hana Financial Group, Inc. | 2,270 | 82,438 | ||||||
Hanwha Life Insurance Co. Ltd. | 2,260 | 14,355 | ||||||
Hyundai Marine & Fire Insurance Co. Ltd. | 540 | 15,323 | ||||||
Industrial Bank of Korea | 1,650 | 22,643 | ||||||
KB Financial Group, Inc. | 3,220 | 109,679 | ||||||
Korea Investment Holdings Co. Ltd. | 410 | 15,553 | ||||||
Mirae Asset Securities Co. Ltd. | 230 | 9,593 | ||||||
Samsung Card Co. Ltd. | 300 | 11,042 | ||||||
Samsung Fire & Marine Insurance Co. Ltd. | 299 | 76,201 | ||||||
Samsung Life Insurance Co. Ltd. | 504 | 49,353 | ||||||
Samsung Securities Co. Ltd. | 520 | 20,923 | ||||||
Shinhan Financial Group Co. Ltd. | 3,520 | 153,021 | ||||||
Woori Finance Holdings Co. Ltd.* | 2,768 | 32,558 | ||||||
Woori Investment & Securities Co. Ltd. | 1,300 | 10,984 | ||||||
|
| |||||||
| 702,473 | ||||||||
|
| |||||||
| Industrial — 12.1% | ||||||||
Cheil Industries, Inc. | 430 | 27,987 | ||||||
Coway Co. Ltd. | 489 | 41,125 | ||||||
Daelim Industrial Co. Ltd. | 235 | 18,566 | ||||||
Daewoo Engineering & Construction Co. Ltd.* | 1,250 | 10,231 | ||||||
Daewoo Shipbuilding & Marine Engineering Co. Ltd. | 800 | 21,055 | ||||||
Doosan Corp. | 93 | 11,623 | ||||||
Doosan Heavy Industries & Construction Co. Ltd. | 480 | 15,785 | ||||||
Doosan Infracore Co. Ltd.* | 1,240 | 14,889 | ||||||
GS Engineering & Construction Corp.* | 470 | 15,272 | ||||||
Hyosung Corp. | 248 | 16,603 | ||||||
Hyundai Engineering & Construction Co. Ltd. | 660 | 34,546 | ||||||
Hyundai Glovis Co. Ltd. | 113 | 29,186 | ||||||
Hyundai Heavy Industries Co. Ltd. | 350 | 63,468 | ||||||
Hyundai Merchant Marine Co. Ltd.* | 650 | 6,059 | ||||||
Hyundai Mipo Dockyard Co. Ltd. | 93 | 14,722 | ||||||
Korea Aerospace Industries Ltd. | 350 | 10,944 | ||||||
Kumho Petro Chemical Co. Ltd. | 144 | 11,461 | ||||||
LG Display Co. Ltd.* | 1,880 | 50,031 | ||||||
LG Electronics, Inc. | 902 | 64,454 | ||||||
LG Innotek Co. Ltd.* | 104 | 12,997 | ||||||
LS Industrial Systems Co. Ltd. | 173 | 10,938 | ||||||
Samsung Electro-Mechanics Co. Ltd. | 505 | 31,136 | ||||||
Samsung Engineering Co. Ltd.* | 266 | 21,250 | ||||||
Samsung Heavy Industries Co. Ltd. | 1,340 | 36,974 | ||||||
| See Notes to Financial Statements. | 94 |
DBX ETF Trust
SCHEDULE OF INVESTMENTS
db X-trackers MSCI South Korea Hedged Equity Fund (Continued)
May 31, 2014
Number | Value | |||||||
| Industrial (Continued) | ||||||||
Samsung Techwin Co. Ltd. | 323 | $ | 18,110 | |||||
|
| |||||||
| 609,412 | ||||||||
|
| |||||||
| Technology — 26.7% | ||||||||
Samsung Electronics Co. Ltd. | 786 | 1,111,741 | ||||||
SK C&C Co. Ltd. | 197 | 31,958 | ||||||
SK Hynix, Inc.* | 4,520 | 195,607 | ||||||
|
| |||||||
| 1,339,306 | ||||||||
|
| |||||||
| Utilities — 1.9% | ||||||||
Korea Electric Power Corp. | 2,180 | 83,550 | ||||||
Korea Gas Corp.* | 236 | 13,487 | ||||||
|
| |||||||
| 97,037 | ||||||||
|
| |||||||
TOTAL COMMON STOCKS | 4,895,714 | |||||||
|
| |||||||
Number | Value | |||||||
| PREFERRED STOCKS — 2.7% | ||||||||
| Basic Materials — 0.2% | ||||||||
LG Chem Ltd. | 67 | $ | 10,770 | |||||
|
| |||||||
| Consumer, Cyclical — 1.6% | ||||||||
Hyundai Motor Co. | 225 | 31,759 | ||||||
Hyundai Motor Co. — 2nd Preferred | 322 | 47,659 | ||||||
|
| |||||||
| 79,418 | ||||||||
|
| |||||||
| Technology — 0.9% | ||||||||
Samsung Electronics Co. Ltd. | 41 | 44,488 | ||||||
|
| |||||||
TOTAL PREFERRED STOCKS | 134,676 | |||||||
|
| |||||||
| RIGHTS — 0.0% (a) | ||||||||
| Financial — 0.0% (a) | ||||||||
BS Financial Group, Inc.*, expires 8/04/14 | 239 | 457 | ||||||
|
| |||||||
TOTAL INVESTMENTS — 100.3% (Cost $4,756,386) | $ | 5,030,847 | ||||||
Liabilities in excess of other assets — (0.3%) | (15,510 | ) | ||||||
|
| |||||||
NET ASSETS — 100.0% | $ | 5,015,337 | ||||||
|
| |||||||
As of May 31, 2014, the Fund had the following forward foreign currency contracts outstanding:
Counterparty | Settlement Date | Currency To Deliver | Currency To Receive | Unrealized Appreciation (Depreciation) | ||||||||||||||
Barclays Bank PLC | 6/5/2014 | KRW | 2,544,368,000 | USD | 2,459,182 | $ | (34,177 | ) | ||||||||||
JP Morgan & Chase Co. | 6/5/2014 | KRW | 2,544,368,000 | USD | 2,458,255 | (35,103 | ) | |||||||||||
The Bank of New York Mellon | 6/5/2014 | KRW | 121,095,000 | USD | 117,000 | (1,667 | ) | |||||||||||
The Bank of New York Mellon | 6/5/2014 | KRW | 10,271,100 | USD | 10,067 | 2 | ||||||||||||
Barclays Bank PLC | 6/5/2014 | USD | 2,491,181 | KRW | 2,544,368,000 | 2,177 | ||||||||||||
JP Morgan & Chase Co. | 6/5/2014 | USD | 2,493,989 | KRW | 2,544,368,000 | (631 | ) | |||||||||||
The Bank of New York Mellon | 6/5/2014 | USD | 100,000 | KRW | 102,680,000 | 621 | ||||||||||||
The Bank of New York Mellon | 6/5/2014 | USD | 10,000 | KRW | 10,254,100 | 49 | ||||||||||||
The Bank of New York Mellon | 6/5/2014 | USD | 18,000 | KRW | 18,432,000 | 63 | ||||||||||||
Barclays Bank PLC | 7/3/2014 | KRW | 2,587,286,000 | USD | 2,529,413 | (2,376 | ) | |||||||||||
JP Morgan & Chase Co. | 7/3/2014 | KRW | 2,587,286,000 | USD | 2,532,087 | 298 | ||||||||||||
The Bank of New York Mellon | 7/3/2014 | KRW | 70,477,810 | USD | 68,900 | (66 | ) | |||||||||||
|
| |||||||||||||||||
Total net unrealized depreciation | $ | (70,810 | ) | |||||||||||||||
|
| |||||||||||||||||
Currency Abbreviations
KRW – South Korean Won
USD – U.S. Dollar
* Non-income producing security.
(a) Less than 0.1%.
| See Notes to Financial Statements. | 95 |
DBX ETF Trust
SCHEDULE OF INVESTMENTS
db X-trackers MSCI Mexico Hedged Equity Fund
May 31, 2014
Number | Value | |||||||
| COMMON STOCKS — 100.1% | ||||||||
| Basic Materials — 10.2% | ||||||||
Bio Pappel SAB de CV* | 7,300 | $ | 15,677 | |||||
Grupo Mexico SAB de CV, Series B | 65,137 | 214,514 | ||||||
Grupo Simec SAB de CV, Series B* | 6,000 | 26,555 | ||||||
Industrias Penoles SAB de CV | 3,723 | 90,083 | ||||||
Mexichem SAB de CV | 27,247 | 108,276 | ||||||
Minera Frisco SAB de CV, Class A1* | 21,189 | 40,774 | ||||||
|
| |||||||
| 495,879 | ||||||||
|
| |||||||
| Communications — 22.5% | ||||||||
America Movil SAB de CV, Series L | 738,825 | 714,315 | ||||||
Axtel SAB de CV* | 60,200 | 20,837 | ||||||
Grupo Televisa SAB, Series CPO | 48,974 | 330,836 | ||||||
TV Azteca SAB de CV | 50,300 | 29,109 | ||||||
|
| |||||||
| 1,095,097 | ||||||||
|
| |||||||
| Consumer, Cyclical — 10.5% | ||||||||
Alsea SAB de CV* | 13,700 | 46,706 | ||||||
Consorcio ARA SAB de CV* | 47,600 | 21,770 | ||||||
Controladora Comercial Mexicana SAB de CV | 12,774 | 49,669 | ||||||
Controladora Vuela Cia de Aviacion SAB de CV, Class A* | 3,900 | 3,452 | ||||||
El Puerto de Liverpool SAB de CV, Series C1 | 5,715 | 64,593 | ||||||
Grupo Aeromexico SAB de CV* | 12,800 | 22,710 | ||||||
Grupo Comercial Chedraui SA de CV | 12,226 | 41,652 | ||||||
Grupo Famsa SAB de CV, Class A* | 11,200 | 15,054 | ||||||
Hoteles City Express SAB de CV* | 2,700 | 5,202 | ||||||
Wal-Mart de Mexico SAB de CV, Series V | 93,811 | 238,969 | ||||||
|
| |||||||
| 509,777 | ||||||||
|
| |||||||
| Consumer, Non-cyclical — 18.0% | ||||||||
Arca Continental SAB de CV | 9,491 | 61,797 | ||||||
Coca-Cola Femsa SAB de CV, Series L | 4,474 | 51,475 | ||||||
Fomento Economico Mexicano SAB de CV | 38,053 | 361,217 | ||||||
Genomma Lab Internacional SAB de CV, | 23,612 | 60,258 | ||||||
Gruma SAB de CV, Class B* | 1,200 | 12,631 | ||||||
Grupo Bimbo SAB de CV, Series A | 42,547 | 123,109 | ||||||
Grupo Herdez SAB de CV | 6,800 | 21,104 | ||||||
Grupo Lala SAB de CV | 4,100 | 10,323 | ||||||
Industrias Bachoco SAB de CV, Series B | 1,100 | 4,775 | ||||||
Kimberly-Clark de Mexico SAB de CV, Class A | 40,220 | 107,522 | ||||||
OHL Mexico SAB de CV* | 20,939 | 58,127 | ||||||
Organizacion Cultiba SAB de CV* | 2,000 | 3,832 | ||||||
|
| |||||||
| 876,170 | ||||||||
|
| |||||||
| Diversified — 5.8% | ||||||||
Alfa SAB de CV, Class A | 69,700 | 195,061 | ||||||
Grupo Carso SAB de CV, Series A1 | 15,488 | 80,389 | ||||||
Grupo Financiero Interacciones SA de CV, Class O | 600 | 4,046 | ||||||
|
| |||||||
| 279,496 | ||||||||
|
| |||||||
Number | Value | |||||||
| Financial — 20.5% | ||||||||
Banregio Grupo Financiero SAB de CV | 6,500 | $ | 37,878 | |||||
Bolsa Mexicana de Valores SAB de CV | 14,600 | 30,389 | ||||||
Compartamos SAB de CV | 32,550 | 57,674 | ||||||
Concentradora Fibra Hotelera Mexicana SA de CV REIT | 18,100 | 30,945 | ||||||
Corp. Inmobiliaria Vesta SAB de CV | 15,800 | 32,407 | ||||||
Credito Real SAB de CV | 1,300 | 2,764 | ||||||
Fibra Shop Portafolios Inmobiliarios SAPI de CV REIT | 3,700 | 5,091 | ||||||
Fibra Uno Administracion SA de CV REIT | 35,492 | 108,520 | ||||||
Grupo Financiero Banorte SAB de CV, Class O | 48,170 | 348,372 | ||||||
Grupo Financiero Inbursa SAB de CV, Class O | 58,702 | 160,858 | ||||||
Grupo Financiero Santander Mexico SAB de CV, Class B | 47,800 | 127,117 | ||||||
Mexico Real Estate Management SA de CV | 19,900 | 37,443 | ||||||
Qualitas Controladora SAB de CV | 1,500 | 4,430 | ||||||
TF Administradora Industrial S de RL de CV REIT | 6,500 | 13,342 | ||||||
|
| |||||||
| 997,230 | ||||||||
|
| |||||||
| Industrial — 12.6% | ||||||||
Cemex SAB de CV* | 217,477 | 280,124 | ||||||
Empresas ICA SAB de CV* | 19,800 | 40,135 | ||||||
Grupo Aeroportuario del Centro Norte SAB de CV* | 8,600 | 32,282 | ||||||
Grupo Aeroportuario del Pacifico SAB de CV, Class B | 10,059 | 61,849 | ||||||
Grupo Aeroportuario del Sureste SAB de CV, Class B | 6,015 | 77,529 | ||||||
Industrias CH SAB de CV, Series B* | 6,638 | 37,717 | ||||||
Promotora y Operadora de Infraestructura SAB de CV* | 5,815 | 81,319 | ||||||
|
| |||||||
| 610,955 | ||||||||
|
| |||||||
TOTAL COMMON STOCKS | 4,864,604 | |||||||
|
| |||||||
TOTAL INVESTMENTS — 100.1% (Cost $4,799,499) | $ | 4,864,604 | ||||||
Liabilities in excess of other assets — (0.1%) | (6,877 | ) | ||||||
|
| |||||||
NET ASSETS — 100.0% | $ | 4,857,727 | ||||||
|
| |||||||
| See Notes to Financial Statements. | 96 |
DBX ETF Trust
SCHEDULE OF INVESTMENTS
db X-trackers MSCI Mexico Hedged Equity Fund (Continued)
May 31, 2014
As of May 31, 2014, the Fund had the following forward foreign currency contracts outstanding:
Counterparty | Settlement Date | Currency To Deliver | Currency To Receive | Unrealized Appreciation (Depreciation) | ||||||||||||||
Barclays Bank PLC | 6/4/2014 | MXN | 31,431,000 | USD | 2,394,351 | $ | (49,627 | ) | ||||||||||
JP Morgan & Chase Co. | 6/4/2014 | MXN | 31,431,000 | USD | 2,395,341 | (48,637 | ) | |||||||||||
The Bank of New York Mellon | 6/4/2014 | MXN | 96,600 | USD | 7,404 | (107 | ) | |||||||||||
Barclays Bank PLC | 6/4/2014 | USD | 2,394,351 | MXN | 30,813,904 | 1,644 | ||||||||||||
JP Morgan & Chase Co. | 6/4/2014 | USD | 2,395,341 | MXN | 30,824,447 | 1,473 | ||||||||||||
The Bank of New York Mellon | 6/4/2014 | USD | 2,143 | MXN | 28,000 | 34 | ||||||||||||
The Bank of New York Mellon | 6/4/2014 | USD | 4,504 | MXN | 58,000 | 5 | ||||||||||||
The Bank of New York Mellon | 6/4/2014 | USD | 757 | MXN | 9,739 | 1 | ||||||||||||
Barclays Bank PLC | 7/3/2014 | MXN | 31,625,000 | USD | 2,451,550 | (1,804 | ) | |||||||||||
JP Morgan & Chase Co. | 7/3/2014 | MXN | 31,625,000 | USD | 2,451,912 | (1,442 | ) | |||||||||||
|
| |||||||||||||||||
Total net unrealized depreciation | $ | (98,460 | ) | |||||||||||||||
|
| |||||||||||||||||
Currency Abbreviations
MXN – Mexican Peso
USD – U.S. Dollar
* Non-income producing security.
REIT – Real Estate Investment Trust.
| See Notes to Financial Statements. | 97 |
DBX ETF Trust
STATEMENTS OF ASSETS AND LIABILITIES
May 31, 2014
| db X-trackers MSCI Brazil Hedged Equity Fund | db X-trackers MSCI EAFE Hedged Equity Fund | db X-trackers MSCI Emerging Markets Hedged Equity Fund | ||||||||||
Assets | ||||||||||||
Investments in non-affiliated securities at fair value | $ | 5,789,116 | $ | 556,355,739 | $ | 28,918,571 | ||||||
Investment in affiliated securities at fair value (See Note 5) | — | 1,688,545 | — | |||||||||
Cash | — | 2,314,136 | 196,850 | |||||||||
Foreign currency at value | 7,514 | 191,226 | 22,490 | |||||||||
Deposit with broker for futures contracts | — | 27,712 | 329 | |||||||||
Unrealized appreciation on forward foreign currency contracts | 10,990 | 5,822,876 | 46,831 | |||||||||
Receivable for variation margin on futures contracts | — | 81,000 | 15,820 | |||||||||
Receivables: | ||||||||||||
Dividends | 12,847 | 2,066,173 | 60,209 | |||||||||
Investment securities sold | 88,701 | 5,333,048 | 805,649 | |||||||||
Foreign tax reclaim | — | 605,307 | 239 | |||||||||
|
|
|
|
|
| |||||||
Total Assets | $ | 5,909,168 | $ | 574,485,762 | $ | 30,066,988 | ||||||
|
|
|
|
|
| |||||||
Liabilities | ||||||||||||
Unrealized depreciation on forward foreign currency contracts | $ | 35,934 | $ | 1,134,275 | $ | 300,740 | ||||||
Payables: | ||||||||||||
Due to custodian | 6,742 | — | — | |||||||||
Investment advisory fees | 2,703 | 162,789 | 16,143 | |||||||||
Investment securities purchased | 69,735 | 10,055,212 | 377,172 | |||||||||
Accrued expenses and other liabilities | 288 | — | 87 | |||||||||
|
|
|
|
|
| |||||||
Total Liabilities | 115,402 | 11,352,276 | 694,142 | |||||||||
|
|
|
|
|
| |||||||
Net Assets | $ | 5,793,766 | $ | 563,133,486 | $ | 29,372,846 | ||||||
|
|
|
|
|
| |||||||
Net Assets Consist of | ||||||||||||
Paid-in capital | $ | 8,826,051 | $ | 527,766,411 | $ | 29,341,930 | ||||||
Undistributed net investment income (loss) | (121,580 | ) | 2,792,739 | (159,178 | ) | |||||||
Accumulated net realized gain (loss) on investments, futures and foreign currency transactions | (2,715,591 | ) | (2,303,307 | ) | (1,131,593 | ) | ||||||
Net unrealized appreciation (depreciation) on investments, futures and foreign currency translations | (195,114 | ) | 34,877,643 | 1,321,687 | ||||||||
|
|
|
|
|
| |||||||
Net Assets | $ | 5,793,766 | $ | 563,133,486 | $ | 29,372,846 | ||||||
|
|
|
|
|
| |||||||
Number of Common Shares outstanding | 400,800 | 20,250,800 | 1,350,800 | |||||||||
|
|
|
|
|
| |||||||
Net Assets Value | $ | 14.46 | $ | 27.81 | $ | 21.74 | ||||||
|
|
|
|
|
| |||||||
Investments in non-affiliated securities at cost | $ | 5,959,206 | $ | 525,996,585 | $ | 27,358,937 | ||||||
|
|
|
|
|
| |||||||
Investments in affiliated securities at cost | $ | — | $ | 1,930,844 | $ | — | ||||||
|
|
|
|
|
| |||||||
Foreign currency at cost | $ | 7,514 | $ | 191,115 | $ | 22,280 | ||||||
|
|
|
|
|
| |||||||
| See Notes to Financial Statements. | 98 |
DBX ETF Trust
STATEMENTS OF ASSETS AND LIABILITIES (Continued)
May 31, 2014
| db X-trackers MSCI Germany Hedged Equity Fund | db X-trackers MSCI Japan Hedged Equity Fund | db X-trackers MSCI Asia Pacific ex Japan Hedged Equity Fund | ||||||||||
Assets | ||||||||||||
Investments in non-affiliated securities at fair value | $ | 43,286,345 | $ | 436,084,203 | $ | 6,598,514 | ||||||
Investment in affiliated securities at fair value (See Note 5) | 1,459,644 | — | — | |||||||||
Cash | 213,200 | 2,199,088 | — | |||||||||
Foreign currency at value | 1,149 | 52,843 | 14,879 | |||||||||
Deposit with broker for futures contracts | 6,243 | 97,878 | — | |||||||||
Unrealized appreciation on forward foreign currency contracts | 765,885 | 276,395 | 7,573 | |||||||||
Receivable for variation margin on futures contracts | 23,088 | — | — | |||||||||
Receivables: | ||||||||||||
Investment securities sold | 142,185 | 5,699,029 | 92,619 | |||||||||
Foreign tax reclaim | 109,883 | 263,941 | — | |||||||||
Dividends | 68,456 | 3,711,664 | 27,177 | |||||||||
Capital shares | — | — | — | |||||||||
|
|
|
|
|
| |||||||
Total Assets | $ | 46,076,078 | $ | 448,385,041 | $ | 6,740,762 | ||||||
|
|
|
|
|
| |||||||
Liabilities | ||||||||||||
Unrealized depreciation on forward foreign currency contracts | $ | 46,378 | $ | 1,703,121 | $ | 46,610 | ||||||
Variation margin on futures contracts | — | 33,065 | — | |||||||||
Payables: | ||||||||||||
Investment securities purchased | 918,073 | 5,329,630 | 74,085 | |||||||||
Investment advisory fees | 16,624 | 164,725 | 3,334 | |||||||||
Due to custodian | — | — | 436 | |||||||||
|
|
|
|
|
| |||||||
Total Liabilities | 981,075 | 7,230,541 | 124,465 | |||||||||
|
|
|
|
|
| |||||||
Net Assets | $ | 45,095,003 | $ | 441,154,500 | $ | 6,616,297 | ||||||
|
|
|
|
|
| |||||||
Net Assets Consist of | ||||||||||||
Paid-in capital | $ | 42,165,815 | $ | 449,105,878 | $ | 6,268,352 | ||||||
Undistributed net investment income (loss) | (41,236 | ) | 8,012,581 | 29,596 | ||||||||
Accumulated net realized gain (loss) on investments, futures and foreign currency transactions | (542,291 | ) | (5,176,622 | ) | (37,888 | ) | ||||||
Net unrealized appreciation (depreciation) on investments, futures and foreign currency translations | 3,512,715 | (10,787,337 | ) | 356,237 | ||||||||
|
|
|
|
|
| |||||||
Net Assets | $ | 45,095,003 | $ | 441,154,500 | $ | 6,616,297 | ||||||
|
|
|
|
|
| |||||||
Number of Common Shares outstanding | 1,700,800 | 12,450,800 | 250,001 | |||||||||
|
|
|
|
|
| |||||||
Net Assets Value | $ | 26.51 | $ | 35.43 | $ | 26.47 | ||||||
|
|
|
|
|
| |||||||
Investments in non-affiliated securities at cost | $ | 40,242,167 | $ | 445,425,573 | $ | 6,203,261 | ||||||
|
|
|
|
|
| |||||||
Investments in affiliated securities at cost | $ | 1,732,240 | $ | — | $ | — | ||||||
|
|
|
|
|
| |||||||
Foreign currency at cost | $ | 1,149 | $ | 52,856 | $ | 14,775 | ||||||
|
|
|
|
|
| |||||||
| See Notes to Financial Statements. | 99 |
DBX ETF Trust
STATEMENTS OF ASSETS AND LIABILITIES (Continued)
May 31, 2014
| db X-trackers MSCI Europe Hedged Equity Fund | db X-trackers MSCI United Kingdom Hedged Equity Fund | db X-trackers MSCI All World ex US Hedged Equity Fund | ||||||||||
Assets | ||||||||||||
Investments in non-affiliated securities at fair value | $ | 161,450,843 | $ | 5,253,668 | $ | 5,067,684 | ||||||
Investment in affiliated securities at fair value (See Note 5) | 728,748 | — | 11,180 | |||||||||
Cash | 1,571,438 | 9,646 | — | |||||||||
Foreign currency at value | — | 6,489 | 10,879 | |||||||||
Unrealized appreciation on forward foreign currency contracts | 1,415,096 | 40,979 | 40,268 | |||||||||
Receivables: | ||||||||||||
Capital shares | 14,798,170 | — | — | |||||||||
Dividends | 226,885 | 28,062 | 18,287 | |||||||||
Investment securities sold | 151,759 | 11,730 | 25,614 | |||||||||
Foreign tax reclaim | 83,312 | — | 1,877 | |||||||||
|
|
|
|
|
| |||||||
Total Assets | $ | 180,426,251 | $ | 5,350,574 | $ | 5,175,789 | ||||||
|
|
|
|
|
| |||||||
Liabilities | ||||||||||||
Unrealized depreciation on forward foreign currency contracts | $ | 211,790 | $ | 3,754 | $ | 23,178 | ||||||
Payables: | ||||||||||||
Due to custodian | — | — | 1,386 | |||||||||
Due to foreign custodian | 22,915 | — | — | |||||||||
Investment advisory fees | 33,653 | 2,020 | 1,719 | |||||||||
Investment securities purchased | 16,426,960 | 39,586 | 27,949 | |||||||||
Capital shares | 15 | — | — | |||||||||
|
|
|
|
|
| |||||||
Total Liabilities | 16,695,333 | 45,360 | 54,232 | |||||||||
|
|
|
|
|
| |||||||
Net Assets | $ | 163,730,918 | $ | 5,305,214 | $ | 5,121,557 | ||||||
|
|
|
|
|
| |||||||
Net Assets Consist of | ||||||||||||
Paid-in capital | $ | 159,677,733 | $ | 5,025,321 | $ | 5,009,449 | ||||||
Undistributed net investment income (loss) | 652,157 | (37,225 | ) | (14,814 | ) | |||||||
Accumulated net realized gain (loss) on investments and foreign currency transactions | (67,746 | ) | (7,699 | ) | (5,275 | ) | ||||||
Net unrealized appreciation (depreciation) on investments and foreign currency translations | 3,468,774 | 324,817 | 132,197 | |||||||||
|
|
|
|
|
| |||||||
Net Assets | $ | 163,730,918 | $ | 5,305,214 | $ | 5,121,557 | ||||||
|
|
|
|
|
| |||||||
Number of Common Shares outstanding | 5,900,001 | 200,001 | 200,001 | |||||||||
|
|
|
|
|
| |||||||
Net Assets Value | $ | 27.75 | $ | 26.53 | $ | 25.61 | ||||||
|
|
|
|
|
| |||||||
Investments in non-affiliated securities at cost | $ | 159,133,717 | $ | 4,965,941 | $ | 4,949,714 | ||||||
|
|
|
|
|
| |||||||
Investments in affiliated securities at cost | $ | 779,087 | $ | — | $ | 13,999 | ||||||
|
|
|
|
|
| |||||||
Foreign currency at cost | $ | (23,095 | ) | $ | 6,483 | $ | 10,868 | |||||
|
|
|
|
|
| |||||||
| See Notes to Financial Statements. | 100 |
DBX ETF Trust
STATEMENTS OF ASSETS AND LIABILITIES (Continued)
May 31, 2014
| db X-trackers MSCI South Korea Hedged Equity Fund | db X-trackers MSCI Mexico Hedged Equity Fund | |||||||
Assets | ||||||||
Investments in non-affiliated securities at fair value | $ | 5,030,847 | $ | 4,864,604 | ||||
Cash | 1,019 | 6,143 | ||||||
Foreign currency at value | — | 1,058 | ||||||
Unrealized appreciation on forward foreign currency contracts | 3,210 | 3,157 | ||||||
Receivables: | ||||||||
Investment securities sold | 105,993 | 132,691 | ||||||
Capital shares | — | — | ||||||
|
|
|
| |||||
Total Assets | $ | 5,141,069 | $ | 5,007,653 | ||||
|
|
|
| |||||
Liabilities | ||||||||
Unrealized depreciation on forward foreign currency contracts | $ | 74,020 | $ | 101,617 | ||||
Payables: | ||||||||
Investment securities purchased | 49,249 | 46,229 | ||||||
Investment advisory fees | 2,463 | 2,080 | ||||||
|
|
|
| |||||
Total Liabilities | 125,732 | 149,926 | ||||||
|
|
|
| |||||
Net Assets | $ | 5,015,337 | $ | 4,857,727 | ||||
|
|
|
| |||||
Net Assets Consist of | ||||||||
Paid-in capital | $ | 5,045,847 | $ | 5,003,920 | ||||
Undistributed net investment income (loss) | (209,158 | ) | (98,801 | ) | ||||
Accumulated net realized gain (loss) on investments and foreign currency transactions | (25,003 | ) | (14,037 | ) | ||||
Net unrealized appreciation (depreciation) on investments and foreign currency translations | 203,651 | (33,355 | ) | |||||
|
|
|
| |||||
Net Assets | $ | 5,015,337 | $ | 4,857,727 | ||||
|
|
|
| |||||
Number of Common Shares outstanding | 200,001 | 200,001 | ||||||
|
|
|
| |||||
Net Assets Value | $ | 25.08 | $ | 24.29 | ||||
|
|
|
| |||||
Investments in non-affiliated securities at cost | $ | 4,756,386 | $ | 4,799,499 | ||||
|
|
|
| |||||
Foreign currency at cost | $ | — | $ | 1,058 | ||||
|
|
|
| |||||
| See Notes to Financial Statements. | 101 |
DBX ETF Trust
For the Year Ended May 31, 2014
| db X-trackers MSCI Brazil Hedged Equity Fund | db X-trackers MSCI EAFE Hedged Equity Fund | db X-trackers MSCI Emerging Markets Hedged Equity Fund | ||||||||||
Investment Income | ||||||||||||
Unaffiliated dividend income* | $ | 166,228 | $ | 12,505,867 | $ | 501,724 | ||||||
Affiliated dividend income** | — | 36,220 | — | |||||||||
|
|
|
|
|
| |||||||
Total Investment Income | 166,228 | 12,542,087 | 501,724 | |||||||||
|
|
|
|
|
| |||||||
Expenses | ||||||||||||
Trustees fees | 1,247 | 15,766 | 2,169 | |||||||||
Advisory fees | 28,222 | 908,847 | 132,723 | |||||||||
|
|
|
|
|
| |||||||
Total Expenses | 29,469 | 924,613 | 134,892 | |||||||||
Less fees waived and expenses reimbursed (See Note 3): | ||||||||||||
Waiver | (1,247 | ) | (15,766 | ) | (2,169 | ) | ||||||
|
|
|
|
|
| |||||||
Net Expenses | 28,222 | 908,847 | 132,723 | |||||||||
|
|
|
|
|
| |||||||
Net Investment Income | 138,006 | 11,633,240 | 369,001 | |||||||||
|
|
|
|
|
| |||||||
Realized and Unrealized Gain (Loss) | ||||||||||||
Net realized gain (loss) from: | ||||||||||||
Investments | (2,053,584 | ) | (1,191,767 | ) | (503,102 | ) | ||||||
Futures contracts | — | 177,675 | (5,675 | ) | ||||||||
Foreign currency transactions | 606,402 | (8,911,924 | ) | (290,679 | ) | |||||||
|
|
|
|
|
| |||||||
Net realized gain (loss) | (1,447,182 | ) | (9,926,016 | ) | (799,456 | ) | ||||||
Net change in unrealized appreciation (depreciation) on: | ||||||||||||
Investments | 901,034 | 29,199,557 | 1,869,066 | |||||||||
Futures contracts | — | 109,460 | 20,125 | |||||||||
Foreign currency translations | (443,451 | ) | 3,962,265 | (521,905 | ) | |||||||
|
|
|
|
|
| |||||||
Net change in unrealized appreciation (depreciation) | 457,583 | 33,271,282 | 1,367,286 | |||||||||
|
|
|
|
|
| |||||||
Net realized and unrealized gain (loss) on investments, futures, and foreign currency transactions | (989,599 | ) | 23,345,266 | 567,830 | ||||||||
|
|
|
|
|
| |||||||
Net Increase (Decrease) in Net Assets Resulting from Operations | $ | (851,593 | ) | $ | 34,978,506 | $ | 936,831 | |||||
|
|
|
|
|
| |||||||
* Unaffiliated foreign tax withheld | $ | 18,031 | $ | 964,981 | $ | 66,422 | ||||||
** Affiliated foreign tax withheld | $ | — | $ | 6,392 | $ | — | ||||||
| See Notes to Financial Statements. | 102 |
DBX ETF Trust
STATEMENTS OF OPERATIONS (Continued)
For the Year Ended May 31, 2014
| db X-trackers MSCI Germany Hedged Equity Fund | db X-trackers MSCI Japan Hedged Equity Fund | db X-trackers MSCI Asia Pacific ex Japan Hedged Equity Fund(1) | ||||||||||
Investment Income | ||||||||||||
Unaffiliated dividend income* | $ | 929,812 | $ | 5,779,657 | $ | 116,058 | ||||||
Affiliated dividend income** | 30,879 | — | — | |||||||||
|
|
|
|
|
| |||||||
Total Investment Income | 960,691 | 5,779,657 | 116,058 | |||||||||
|
|
|
|
|
| |||||||
Expenses | ||||||||||||
Trustees fees | 1,041 | 19,744 | — | |||||||||
Advisory fees | 97,421 | 1,352,302 | 23,772 | |||||||||
|
|
|
|
|
| |||||||
Total Expenses | 98,462 | 1,372,046 | 23,772 | |||||||||
Less fees waived and expenses reimbursed (See Note 3): | ||||||||||||
Waiver | (1,041 | ) | (19,744 | ) | — | |||||||
|
|
|
|
|
| |||||||
Net Expenses | 97,421 | 1,352,302 | 23,772 | |||||||||
|
|
|
|
|
| |||||||
Net Investment Income | 863,270 | 4,427,355 | 92,286 | |||||||||
|
|
|
|
|
| |||||||
Realized and Unrealized Gain (Loss) | ||||||||||||
Net realized gain (loss) from: | ||||||||||||
Investments | (28,688 | ) | (3,713,979 | ) | (23,477 | ) | ||||||
In-kind redemptions | — | 2,657,201 | — | |||||||||
Futures contracts | 28,014 | 129,885 | — | |||||||||
Foreign currency transactions | (793,996 | ) | 3,371,668 | (88,846 | ) | |||||||
|
|
|
|
|
| |||||||
Net realized gain (loss) | (794,670 | ) | 2,444,775 | (112,323 | ) | |||||||
Net change in unrealized appreciation (depreciation) on: | ||||||||||||
Investments | 2,773,763 | (5,456,768 | ) | 395,253 | ||||||||
Futures contracts | 23,039 | 12,100 | — | |||||||||
Foreign currency translations | 592,378 | (2,678,283 | ) | (39,016 | ) | |||||||
|
|
|
|
|
| |||||||
Net change in unrealized appreciation (depreciation) | 3,389,180 | (8,122,951 | ) | 356,237 | ||||||||
|
|
|
|
|
| |||||||
Net realized and unrealized gain (loss) on investments, futures and foreign currency transactions | 2,594,510 | (5,678,176 | ) | 243,914 | ||||||||
|
|
|
|
|
| |||||||
Net Increase (Decrease) in Net Assets Resulting from Operations | $ | 3,457,780 | $ | (1,250,821 | ) | $ | 336,200 | |||||
|
|
|
|
|
| |||||||
* Unaffiliated foreign tax withheld | $ | 142,733 | $ | 601,418 | $ | 4,322 | ||||||
** Affiliated foreign tax withheld | $ | 5,449 | $ | — | $ | — | ||||||
| (1) | For the period October 1, 2013 (commencement of operations) through May 31, 2014. |
| See Notes to Financial Statements. | 103 |
DBX ETF Trust
STATEMENTS OF OPERATIONS (Continued)
For the Year Ended May 31, 2014
| db X-trackers MSCI Europe Hedged Equity Fund(1) | db X-trackers MSCI United Kingdom Hedged Equity Fund(1) | db X-trackers MSCI All World ex US Hedged Equity Fund(2) | ||||||||||
Investment Income | ||||||||||||
Unaffiliated dividend income* | $ | 1,331,930 | $ | 278,676 | $ | 97,505 | ||||||
Affiliated dividend income** | 11,274 | — | 208 | |||||||||
|
|
|
|
|
| |||||||
Total Investment Income | 1,343,204 | 278,676 | 97,713 | |||||||||
|
|
|
|
|
| |||||||
Expenses | ||||||||||||
Advisory fees | 77,946 | 15,380 | 7,003 | |||||||||
|
|
|
|
|
| |||||||
Total Expenses | 77,946 | 15,380 | 7,003 | |||||||||
|
|
|
|
|
| |||||||
Net Investment Income | 1,265,258 | 263,296 | 90,710 | |||||||||
|
|
|
|
|
| |||||||
Realized and Unrealized Gain (Loss) | ||||||||||||
Net realized gain (loss) from: | ||||||||||||
Investments | (25,394 | ) | (1,129 | ) | 1,964 | |||||||
Foreign currency transactions | (582,820 | ) | (223,328 | ) | (112,763 | ) | ||||||
|
|
|
|
|
| |||||||
Net realized gain (loss) | (608,214 | ) | (224,457 | ) | (110,799 | ) | ||||||
Net change in unrealized appreciation (depreciation) on: | ||||||||||||
Investments | 2,266,787 | 287,727 | 115,151 | |||||||||
Foreign currency translations | 1,201,987 | 37,090 | 17,046 | |||||||||
|
|
|
|
|
| |||||||
Net change in unrealized appreciation (depreciation) | 3,468,774 | 324,817 | 132,197 | |||||||||
|
|
|
|
|
| |||||||
Net realized and unrealized gain on investments and foreign currency transactions | 2,860,560 | 100,360 | 21,398 | |||||||||
|
|
|
|
|
| |||||||
Net Increase (Decrease) in Net Assets Resulting from Operations | $ | 4,125,818 | $ | 363,656 | $ | 112,108 | ||||||
|
|
|
|
|
| |||||||
* Unaffiliated foreign tax withheld | $ | 128,485 | $ | 2,332 | $ | 10,754 | ||||||
** Affiliated foreign tax withheld | 1,989 | — | 74 | |||||||||
| (1) | For the period October 1, 2013 (commencement of operations) through May 31, 2014. |
| (2) | For the period January 23, 2014 (commencement of operations) through May 31, 2014. |
| See Notes to Financial Statements. | 104 |
DBX ETF Trust
STATEMENTS OF OPERATIONS (Continued)
For the Year Ended May 31, 2014
| db X-trackers MSCI South Korea Hedged Equity Fund(1) | db X-trackers MSCI Mexico Hedged Equity Fund(1) | |||||||
Investment Income | ||||||||
Unaffiliated dividend income* | $ | 5,651 | $ | 21,746 | ||||
|
|
|
| |||||
Total Investment Income | 5,651 | 21,746 | ||||||
|
|
|
| |||||
Expenses | ||||||||
Advisory fees | 10,164 | 8,456 | ||||||
|
|
|
| |||||
Total Expenses | 10,164 | 8,456 | ||||||
|
|
|
| |||||
Net Investment Income (Loss) | (4,513 | ) | 13,290 | |||||
|
|
|
| |||||
Realized and Unrealized Gain (Loss) | ||||||||
Net realized gain (loss) from: | ||||||||
Investments | 13,117 | (11,746 | ) | |||||
Foreign currency transactions | (244,916 | ) | (114,382 | ) | ||||
|
|
|
| |||||
Net realized gain (loss) | (231,799 | ) | (126,128 | ) | ||||
Net change in unrealized appreciation (depreciation) on: | ||||||||
Investments | 274,461 | 65,105 | ||||||
Foreign currency translations | (70,810 | ) | (98,460 | ) | ||||
|
|
|
| |||||
Net change in unrealized appreciation (depreciation) | 203,651 | (33,355 | ) | |||||
|
|
|
| |||||
Net realized and unrealized loss on investments and foreign currency transactions | (28,148 | ) | (159,483 | ) | ||||
|
|
|
| |||||
Net Decrease in Net Assets Resulting from Operations | $ | (32,661 | ) | $ | (146,193 | ) | ||
|
|
|
| |||||
* Unaffiliated foreign tax withheld | $ | — | $ | 480 | ||||
| (1) | For the period January 23, 2014 (commencement of operations) through May 31, 2014. |
| See Notes to Financial Statements. | 105 |
DBX ETF Trust
STATEMENTS OF CHANGES IN NET ASSETS
| db X-trackers MSCI Brazil Hedged Equity Fund | db X-trackers MSCI EAFE Hedged Equity Fund | |||||||||||||||
| Year Ended May 31, | Year Ended May 31, | |||||||||||||||
| 2014 | 2013 | 2014 | 2013 | |||||||||||||
Increase (Decrease) in Net Assets from Operations | ||||||||||||||||
Net investment income | $ | 138,006 | $ | 112,174 | $ | 11,633,240 | $ | 694,266 | ||||||||
Net realized gain (loss) on investments, futures and foreign currency related transactions | (1,447,182 | ) | (341,007 | ) | (9,926,016 | ) | 476,762 | |||||||||
Net change in unrealized appreciation (depreciation) on investments, futures and foreign currency translations | 457,583 | 197,398 | 33,271,282 | 2,837,378 | ||||||||||||
|
|
|
|
|
|
|
| |||||||||
Net increase (decrease) in net assets resulting from operations | (851,593 | ) | (31,435 | ) | 34,978,506 | 4,008,406 | ||||||||||
|
|
|
|
|
|
|
| |||||||||
Distributions to Shareholders from |
| |||||||||||||||
Net investment income | (913,085 | ) | (108,682 | ) | (1,788,671 | ) | (732,399 | ) | ||||||||
Net realized gains on investments, futures and foreign currency transactions | — | (262,278 | ) | — | (1,444,717 | ) | ||||||||||
Return of capital | (10,791 | ) | — | — | — | |||||||||||
|
|
|
|
|
|
|
| |||||||||
Total distributions | (923,876 | ) | (370,960 | ) | (1,788,671 | ) | (2,177,116 | ) | ||||||||
|
|
|
|
|
|
|
| |||||||||
Fund Shares Transactions | ||||||||||||||||
Proceeds from shares sold | 3,145,520 | 3,964,756 | 454,643,464 | 64,794,798 | ||||||||||||
Value of shares redeemed | (3,303,982 | ) | — | — | (22,304,918 | ) | ||||||||||
|
|
|
|
|
|
|
| |||||||||
Net increase (decrease) in net assets resulting from fund share transactions | (158,462 | ) | 3,964,756 | 454,643,464 | 42,489,880 | |||||||||||
|
|
|
|
|
|
|
| |||||||||
Total Increase (Decrease) in Net Assets | (1,933,931 | ) | 3,562,361 | 487,833,299 | 44,321,170 | |||||||||||
Net Assets | ||||||||||||||||
Beginning of year | 7,727,697 | 4,165,336 | 75,300,187 | 30,979,017 | ||||||||||||
|
|
|
|
|
|
|
| |||||||||
End of year | $ | 5,793,766 | $ | 7,727,697 | $ | 563,133,486 | $ | 75,300,187 | ||||||||
|
|
|
|
|
|
|
| |||||||||
Undistributed net investment income (loss) | $ | (121,580 | ) | $ | 46,988 | $ | 2,792,739 | $ | 1,072,603 | |||||||
|
|
|
|
|
|
|
| |||||||||
Changes in Shares Outstanding | ||||||||||||||||
Shares outstanding, beginning of year | 400,800 | 200,800 | 3,000,800 | 1,400,800 | ||||||||||||
Shares sold | 200,000 | 200,000 | 17,250,000 | 2,600,000 | ||||||||||||
Shares redeemed | (200,000 | ) | — | — | (1,000,000 | ) | ||||||||||
|
|
|
|
|
|
|
| |||||||||
Shares outstanding, end of year | 400,800 | 400,800 | 20,250,800 | 3,000,800 | ||||||||||||
|
|
|
|
|
|
|
| |||||||||
| See Notes to Financial Statements. | 106 |
DBX ETF Trust
STATEMENTS OF CHANGES IN NET ASSETS (Continued)
| db X-trackers MSCI Emerging Markets Hedged Equity Fund | db X-trackers MSCI Germany Hedged Equity Fund | |||||||||||||||
| Year Ended May 31, | Year Ended May 31, | |||||||||||||||
| 2014 | 2013 | 2014 | 2013 | |||||||||||||
Increase (Decrease) in Net Assets from Operations | ||||||||||||||||
Net investment income | $ | 369,001 | $ | 85,945 | $ | 863,270 | $ | 88,066 | ||||||||
Net realized loss on investments, futures and foreign currency related transactions | (799,456 | ) | (403,339 | ) | (794,670 | ) | (295,954 | ) | ||||||||
Net change in unrealized appreciation (depreciation) on investments, futures and foreign currency translations | 1,367,286 | 603,439 | 3,389,180 | 714,583 | ||||||||||||
|
|
|
|
|
|
|
| |||||||||
Net increase in net assets resulting from operations | 936,831 | 286,045 | 3,457,780 | 506,695 | ||||||||||||
|
|
|
|
|
|
|
| |||||||||
Distributions to Shareholders from |
| |||||||||||||||
Net investment income | (283,194 | ) | (80,337 | ) | (170,600 | ) | (89,599 | ) | ||||||||
Net realized gains on investments, futures and foreign currency transactions | — | (50,049 | ) | — | (85,500 | ) | ||||||||||
|
|
|
|
|
|
|
| |||||||||
Total distributions | (283,194 | ) | (130,386 | ) | (170,600 | ) | (175,099 | ) | ||||||||
|
|
|
|
|
|
|
| |||||||||
Fund Shares Transactions | ||||||||||||||||
Proceeds from shares sold | 19,919,058 | 4,383,685 | 37,145,009 | — | ||||||||||||
Value of shares redeemed | — | — | — | — | ||||||||||||
|
|
|
|
|
|
|
| |||||||||
Net increase in net assets resulting from fund share transactions | 19,919,058 | 4,383,685 | 37,145,009 | — | ||||||||||||
|
|
|
|
|
|
|
| |||||||||
Total Increase in Net Assets | 20,572,695 | 4,539,344 | 40,432,189 | 331,596 | ||||||||||||
Net Assets | ||||||||||||||||
Beginning of year | 8,800,151 | 4,260,807 | 4,662,814 | 4,331,218 | ||||||||||||
|
|
|
|
|
|
|
| |||||||||
End of year | $ | 29,372,846 | $ | 8,800,151 | $ | 45,095,003 | $ | 4,662,814 | ||||||||
|
|
|
|
|
|
|
| |||||||||
Undistributed net investment income (loss) | $ | (159,178 | ) | $ | 21,001 | $ | (41,236 | ) | $ | 60,090 | ||||||
|
|
|
|
|
|
|
| |||||||||
Changes in Shares Outstanding | ||||||||||||||||
Shares outstanding, beginning of year | 400,800 | 200,800 | 200,800 | 200,800 | ||||||||||||
Shares sold | 950,000 | 200,000 | 1,500,000 | — | ||||||||||||
Shares redeemed | — | — | — | — | ||||||||||||
|
|
|
|
|
|
|
| |||||||||
Shares outstanding, end of year | 1,350,800 | 400,800 | 1,700,800 | 200,800 | ||||||||||||
|
|
|
|
|
|
|
| |||||||||
| See Notes to Financial Statements. | 107 |
DBX ETF Trust
STATEMENTS OF CHANGES IN NET ASSETS (Continued)
| db X-trackers MSCI Japan Hedged Equity Fund | db X-trackers MSCI Asia Pacific ex Japan Hedged Equity Fund | |||||||||||
| Year Ended May 31, | For the Period October 1, 2013(1) to May 31, 2014 | |||||||||||
| 2014 | 2013 | |||||||||||
Increase (Decrease) in Net Assets from Operations | ||||||||||||
Net investment income | $ | 4,427,355 | $ | 189,553 | $ | 92,286 | ||||||
Net realized gain (loss) on investments, futures and foreign currency related transactions | 2,444,775 | 2,122,230 | (112,323 | ) | ||||||||
Net change in unrealized appreciation (depreciation) on investments, futures and foreign currency translations | (8,122,951 | ) | (2,048,183 | ) | 356,237 | |||||||
|
|
|
|
|
| |||||||
Net increase (decrease) in net assets resulting from operations | (1,250,821 | ) | 263,600 | 336,200 | ||||||||
|
|
|
|
|
| |||||||
Distributions to Shareholders from |
| |||||||||||
Net investment income | (2,980,876 | ) | (81,785 | ) | (2,908 | ) | ||||||
Net realized gains on investments, futures and foreign currency transactions | — | — | — | |||||||||
|
|
|
|
|
| |||||||
Total distributions to shareholders | (2,980,876 | ) | (81,785 | ) | (2,908 | ) | ||||||
|
|
|
|
|
| |||||||
Fund Shares Transactions | ||||||||||||
Proceeds from shares sold | 362,208,513 | 111,329,490 | 6,283,005 | |||||||||
Value of shares redeemed | (25,894,201 | ) | (6,815,161 | ) | — | |||||||
|
|
|
|
|
| |||||||
Net increase in net assets resulting from fund share transactions | 336,314,312 | 104,514,329 | 6,283,005 | |||||||||
|
|
|
|
|
| |||||||
Total Increase in Net Assets | 332,082,615 | 104,696,144 | 6,616,297 | |||||||||
Net Assets | ||||||||||||
Beginning of period | 109,071,885 | 4,375,741 | — | |||||||||
|
|
|
|
|
| |||||||
End of period | $ | 441,154,500 | $ | 109,071,885 | $ | 6,616,297 | ||||||
|
|
|
|
|
| |||||||
Undistributed net investment income (loss) | $ | 8,012,581 | $ | 986,656 | $ | 29,596 | ||||||
|
|
|
|
|
| |||||||
Changes in Shares Outstanding | ||||||||||||
Shares outstanding, beginning of period | 3,200,800 | 200,800 | 1 | |||||||||
Shares sold | 10,000,000 | 3,200,000 | 250,000 | |||||||||
Shares redeemed | (750,000 | ) | (200,000 | ) | — | |||||||
|
|
|
|
|
| |||||||
Shares outstanding, end of period | 12,450,800 | 3,200,800 | 250,001 | |||||||||
|
|
|
|
|
| |||||||
| (1) | Commencement of operations. |
| See Notes to Financial Statements. | 108 |
DBX ETF Trust
STATEMENTS OF CHANGES IN NET ASSETS (Continued)
| db X-trackers MSCI Europe Hedged Equity Fund | db X-trackers MSCI United Kingdom Hedged Equity Fund | |||||||
| For the Period October 1, 2013(1) to May 31, 2014 | For the Period October 1, 2013(1) to May 31, 2014 | |||||||
Increase (Decrease) in Net Assets from Operations | ||||||||
Net investment income | $ | 1,265,258 | $ | 263,296 | ||||
Net realized loss on investments, futures and foreign currency related transactions | (608,214 | ) | (224,457 | ) | ||||
Net change in unrealized appreciation (depreciation) on investments, futures and foreign currency translation | 3,468,774 | 324,817 | ||||||
|
|
|
| |||||
Net increase in net assets resulting from operations | 4,125,818 | 363,656 | ||||||
|
|
|
| |||||
Distributions to Shareholders from |
| |||||||
Net investment income | (72,633 | ) | (84,384 | ) | ||||
|
|
|
| |||||
Fund Shares Transactions | ||||||||
Proceeds from shares sold | 159,677,733 | 5,025,942 | ||||||
Value of shares redeemed | — | — | ||||||
|
|
|
| |||||
Net increase in net assets resulting from fund share transactions | 159,677,733 | 5,025,942 | ||||||
|
|
|
| |||||
Total Increase in Net Assets | 163,730,918 | 5,305,214 | ||||||
Net Assets | ||||||||
Beginning of period | — | — | ||||||
|
|
|
| |||||
End of period | $ | 163,730,918 | $ | 5,305,214 | ||||
|
|
|
| |||||
Undistributed net investment income (loss) | $ | 652,157 | $ | (37,225 | ) | |||
|
|
|
| |||||
Changes in Shares Outstanding | ||||||||
Shares outstanding, beginning of period | 1 | 1 | ||||||
Shares sold | 5,900,000 | 200,000 | ||||||
Shares redeemed | — | — | ||||||
|
|
|
| |||||
Shares outstanding, end of period | 5,900,001 | 200,001 | ||||||
|
|
|
| |||||
| (1) | Commencement of operations. |
| See Notes to Financial Statements. | 109 |
DBX ETF Trust
STATEMENTS OF CHANGES IN NET ASSETS (Continued)
| db X-trackers MSCI All World ex US Hedged Equity Fund | db X-trackers MSCI South Korea Hedged Equity Fund | |||||||
| For the Period January 23, 2014(1) to May 31, 2014 | For the Period January 23, 2014(1) to May 31, 2014 | |||||||
Increase (Decrease) in Net Assets from Operations | ||||||||
Net investment income (loss) | $ | 90,710 | $ | (4,513 | ) | |||
Net realized loss on investments, futures and foreign currency related transactions | (110,799 | ) | (231,799 | ) | ||||
Net change in unrealized appreciation (depreciation) on investments, futures and foreign currency translation | 132,197 | 203,651 | ||||||
|
|
|
| |||||
Net increase (decrease) in net assets resulting from operations | 112,108 | (32,661 | ) | |||||
|
|
|
| |||||
Fund Shares Transactions | ||||||||
Proceeds from shares sold | 5,009,449 | 5,047,998 | ||||||
Value of shares redeemed | — | — | ||||||
|
|
|
| |||||
Net increase in net assets resulting from fund share transactions | 5,009,449 | 5,047,998 | ||||||
|
|
|
| |||||
Total Increase in Net Assets | 5,121,557 | 5,015,337 | ||||||
Net Assets | ||||||||
Beginning of period | — | — | ||||||
|
|
|
| |||||
End of period | $ | 5,121,557 | $ | 5,015,337 | ||||
|
|
|
| |||||
Undistributed net investment income (loss) | $ | (14,814 | ) | $ | (209,158 | ) | ||
|
|
|
| |||||
Changes in Shares Outstanding | ||||||||
Shares outstanding, beginning of period | 1 | 1 | ||||||
Shares sold | 200,000 | 200,000 | ||||||
Shares redeemed | — | — | ||||||
|
|
|
| |||||
Shares outstanding, end of period | 200,001 | 200,001 | ||||||
|
|
|
| |||||
| (1) | Commencement of operations. |
| See Notes to Financial Statements. | 110 |
DBX ETF Trust
STATEMENTS OF CHANGES IN NET ASSETS (Continued)
| db X-trackers MSCI Mexico Hedged Equity Fund | ||||
| For the Period January 23, 2014(1) to May 31, 2014 | ||||
Increase (Decrease) in Net Assets from Operations | ||||
Net investment income | $ | 13,290 | ||
Net realized (loss) on investments and foreign currency related transactions | (126,128 | ) | ||
Net change in unrealized appreciation (depreciation) on investments and foreign currency translation | (33,355 | ) | ||
|
| |||
Net decrease in net assets resulting from operations | (146,193 | ) | ||
|
| |||
Fund Shares Transactions: | ||||
Proceeds from shares sold | 5,003,920 | |||
Value of shares redeemed | — | |||
|
| |||
Net increase in net assets resulting from fund share transactions | 5,003,920 | |||
|
| |||
Total Increase in Net Assets | 4,857,727 | |||
Net Assets | ||||
Beginning of period | — | |||
|
| |||
End of period | $ | 4,857,727 | ||
|
| |||
Undistributed net investment income (loss) | $ | (98,801 | ) | |
|
| |||
Changes in Shares Outstanding | ||||
Shares outstanding, beginning of period | 1 | |||
Shares sold | 200,000 | |||
Shares redeemed | — | |||
|
| |||
Shares outstanding, end of period | 200,001 | |||
|
| |||
| (1) | Commencement of operations. |
| See Notes to Financial Statements. | 111 |
DBX ETF Trust
For a Share outstanding throughout each period
| db X-trackers MSCI Brazil Hedged Equity Fund | Year Ended May 31, 2014 | Year Ended May 31, 2013 | For the Period June 9, 2011* to May 31, 2012 | |||||||||
Net Asset Value, beginning of period | $ | 19.28 | $ | 20.74 | $ | 25.00 | ||||||
|
|
|
|
|
| |||||||
Income from Investment Operations: | ||||||||||||
Net investment income** | 0.47 | 0.54 | 0.64 | |||||||||
Net realized and unrealized loss on investment and foreign currency transactions | (2.30 | ) | (0.15 | ) | (4.18 | ) | ||||||
|
|
|
|
|
| |||||||
Net increase (decrease) in net asset value from operations | (1.83 | ) | 0.39 | (3.54 | ) | |||||||
|
|
|
|
|
| |||||||
Distributions paid to shareholders from: | ||||||||||||
Net investment income | (2.95 | ) | (0.54 | ) | (0.29 | ) | ||||||
Net realized capital gains | — | (1.31 | ) | (0.43 | ) | |||||||
Return of capital | (0.04 | ) | — | — | ||||||||
|
|
|
|
|
| |||||||
Total distributions | (2.99 | ) | (1.85 | ) | (0.72 | ) | ||||||
|
|
|
|
|
| |||||||
Net Asset Value, end of period | $ | 14.46 | $ | 19.28 | $ | 20.74 | ||||||
|
|
|
|
|
| |||||||
Total Return*** | (9.83 | )%††† | 1.43 | %††† | (14.28 | )% | ||||||
Ratios/Supplemental Data: | ||||||||||||
Net assets, end of period (000’s omitted) | $ | 5,794 | $ | 7,728 | $ | 4,165 | ||||||
Ratios to average net assets: | ||||||||||||
Expenses, net of fee waiver and expense reimbursements | 0.60 | % | 0.68 | % | 1.13 | %† | ||||||
Expenses, prior to fee waiver and expense reimbursements | 0.63 | % | 0.92 | % | — | |||||||
Net investment income | 2.93 | % | 2.66 | % | 2.89 | %† | ||||||
Portfolio turnover rate | 89 | % | 25 | % | 34 | %†† | ||||||
| db X-trackers MSCI EAFE Hedged Equity Fund | Year Ended May 31, 2014 | Year Ended May 31, 2013 | For the Period June 9, 2011* to May 31, 2012 | |||||||||
Net Asset Value, beginning of period | $ | 25.09 | $ | 22.12 | $ | 25.00 | ||||||
|
|
|
|
|
| |||||||
Income from Investment Operations: | ||||||||||||
Net investment income** | 1.18 | 0.79 | 0.70 | |||||||||
Net realized and unrealized gain (loss) on investments, futures and foreign currency transactions | 1.95 | 6.26 | (3.48 | ) | ||||||||
|
|
|
|
|
| |||||||
Net increase (decrease) in net asset value from operations | 3.13 | 7.05 | (2.78 | ) | ||||||||
|
|
|
|
|
| |||||||
Distributions paid to shareholders from: | ||||||||||||
Net investment income | (0.41 | ) | (1.68 | ) | (0.10 | ) | ||||||
Net realized capital gains | — | (2.40 | ) | — | ||||||||
|
|
|
|
|
| |||||||
Total distributions | (0.41 | ) | (4.08 | ) | (0.10 | ) | ||||||
|
|
|
|
|
| |||||||
Net Asset Value, end of period | $ | 27.81 | $ | 25.09 | $ | 22.12 | ||||||
|
|
|
|
|
| |||||||
Total Return*** | 12.74 | %††† | 35.60 | %††† | (11.14 | )% | ||||||
Ratios/Supplemental Data | ||||||||||||
Net assets, end of period (000’s omitted) | $ | 563,133 | $ | 75,300 | $ | 30,979 | ||||||
Ratios to average net assets: | ||||||||||||
Expenses, net of fee waiver and expense reimbursements | 0.35 | % | 0.48 | % | 0.57 | %† | ||||||
Expenses, prior to fee waiver and expense reimbursements | 0.36 | % | 0.64 | % | — | |||||||
Net investment income | 4.48 | % | 3.35 | % | 3.04 | %† | ||||||
Portfolio turnover rate | 10 | % | 14 | % | 14 | %†† | ||||||
| * | Commencement of Operations. |
| ** | Based on average shares outstanding. |
| *** | Total Return is calculated assuming an initial investment made at the Net Asset Value at the beginning of the period, reinvestment of all dividend distributions at Net Asset Value during the period, and redemption at Net Asset Value on the last day of the period. Total Return calculated for a period of less than one year is not annualized. |
| † | Annualized. |
| †† | Portfolio turnover rate is not annualized and does not include securities received or delivered from processing creations or redemptions. |
| ††† | The Total Return would have been lower if certain fees had not been reimbursed by the Advisor. |
| See Notes to Financial Statements. | 112 |
DBX ETF Trust
FINANCIAL HIGHLIGHTS (Continued)
For a Share outstanding throughout each period
| db X-trackers MSCI Emerging Markets Hedged Equity Fund | Year Ended May 31, 2014 | Year Ended May 31, 2013 | For the Period June 9, 2011* to May 31, 2012 | |||||||||
Net Asset Value, beginning of period | $ | 21.96 | $ | 21.22 | $ | 25.00 | ||||||
|
|
|
|
|
| |||||||
Income from Investment Operations: | ||||||||||||
Net investment income** | 0.38 | 0.38 | 0.21 | |||||||||
Net realized and unrealized gain (loss) on investments, futures and foreign currency transactions | (0.17 | )(a) | 1.01 | (3.34 | ) | |||||||
|
|
|
|
|
| |||||||
Net increase (decrease) in net asset value from operations | 0.21 | 1.39 | (3.13 | ) | ||||||||
|
|
|
|
|
| |||||||
Distributions paid to shareholders from: | ||||||||||||
Net investment income | (0.43 | ) | (0.40 | ) | (0.06 | ) | ||||||
Net realized capital gains | — | (0.25 | ) | (0.59 | ) | |||||||
|
|
|
|
|
| |||||||
Total distributions | (0.43 | ) | (0.65 | ) | (0.65 | ) | ||||||
|
|
|
|
|
| |||||||
Net Asset Value, end of period | $ | 21.74 | $ | 21.96 | $ | 21.22 | ||||||
|
|
|
|
|
| |||||||
Total Return*** | 1.17 | %††† | 6.54 | %††† | (12.52 | )% | ||||||
Ratios/Supplemental Data | ||||||||||||
Net assets, end of period (000’s omitted) | $ | 29,373 | $ | 8,800 | $ | 4,261 | ||||||
Ratios to average net assets: | ||||||||||||
Expenses, net of fee waiver and expense reimbursements | 0.65 | % | 0.72 | % | 1.19 | %† | ||||||
Expenses, prior to fee waiver and expense reimbursements | 0.66 | % | 0.94 | % | — | |||||||
Net investment income | 1.81 | % | 1.72 | % | 0.97 | %† | ||||||
Portfolio turnover rate | 16 | % | 15 | % | 19 | %†† | ||||||
| db X-trackers MSCI Germany Hedged Equity Fund | Year Ended May 31, 2014 | Year Ended May 31, 2013 | For the Period June 9, 2011* to May 31, 2012 | |||||||||
Net Asset Value, beginning of period | $ | 23.22 | $ | 21.57 | $ | 25.00 | ||||||
|
|
|
|
|
| |||||||
Income from Investment Operations: | ||||||||||||
Net investment income** | 1.03 | 0.44 | 0.27 | |||||||||
Net realized and unrealized gain (loss) on investments, futures and foreign currency transactions | 3.11 | 2.08 | (3.30 | ) | ||||||||
|
|
|
|
|
| |||||||
Net increase (decrease) in net asset value from operations | 4.14 | 2.52 | (3.03 | ) | ||||||||
|
|
|
|
|
| |||||||
Distributions paid to shareholders from: | ||||||||||||
Net investment income | (0.85 | ) | (0.44 | ) | (0.12 | ) | ||||||
Net realized capital gains | — | (0.43 | ) | (0.28 | ) | |||||||
|
|
|
|
|
| |||||||
Total distributions | (0.85 | ) | (0.87 | ) | (0.40 | ) | ||||||
|
|
|
|
|
| |||||||
Net Asset Value, end of period | $ | 26.51 | $ | 23.22 | $ | 21.57 | ||||||
|
|
|
|
|
| |||||||
Total Return*** | 18.70 | %††† | 11.86 | %††† | (12.14 | )% | ||||||
Ratios/Supplemental Data | ||||||||||||
Net assets, end of period (000’s omitted) | $ | 45,095 | $ | 4,663 | $ | 4,331 | ||||||
Ratios to average net assets: | ||||||||||||
Expenses, net of fee waiver and expense reimbursements | 0.47 | % | 0.58 | % | 1.04 | %† | ||||||
Expenses, prior to fee waiver and expense reimbursements | 0.47 | % | 0.82 | % | — | |||||||
Net investment income | 4.15 | % | 1.93 | % | 1.20 | %† | ||||||
Portfolio turnover rate | 12 | % | 108 | % | 17 | %†† | ||||||
| * | Commencement of Operations. |
| ** | Based on average shares outstanding. |
| *** | Total Return is calculated assuming an initial investment made at the Net Asset Value at the beginning of the period, reinvestment of all dividend distributions at Net Asset Value during the period, and redemption at Net Asset Value on the last day of the period. Total Return calculated for a period of less than one year is not annualized. |
| † | Annualized. |
| †† | Portfolio turnover rate is not annualized and does not include securities received or delivered from processing creations or redemptions. |
| ††† | The Total Return would have been lower if certain fees had not been reimbursed by the Advisor. |
| (a) | Because of the timing of subscriptions and redemptions in relation to fluctuating markets at value, the amount shown may not agree with the change in aggregate gains and losses. |
| See Notes to Financial Statements. | 113 |
DBX ETF Trust
FINANCIAL HIGHLIGHTS (Continued)
For a Share outstanding throughout each period
| db X-trackers MSCI Japan Hedged Equity Fund | Year Ended May 31, 2014 | Year Ended May 31, 2013 | For the Period June 9, 2011* to May 31, 2012 | |||||||||
Net Asset Value, beginning of period | $ | 34.08 | $ | 21.79 | $ | 25.00 | ||||||
|
|
|
|
|
| |||||||
Income from Investment Operations: | ||||||||||||
Net investment income** | 0.55 | 0.39 | 0.27 | |||||||||
Net realized and unrealized gain (loss) on investment, futures and foreign currency transactions | 1.51 | (a) | 12.31 | (3.31 | ) | |||||||
|
|
|
|
|
| |||||||
Net increase (decrease) in net asset value from operations | 2.06 | 12.70 | (3.04 | ) | ||||||||
|
|
|
|
|
| |||||||
Distributions paid to shareholders from: | ||||||||||||
Net investment income | (0.71 | ) | (0.41 | ) | (0.17 | ) | ||||||
Net realized capital gains | — | — | — | |||||||||
|
|
|
|
|
| |||||||
Total distributions | (0.71 | ) | (0.41 | ) | (0.17 | ) | ||||||
|
|
|
|
|
| |||||||
Net Asset Value, end of period | $ | 35.43 | $ | 34.08 | $ | 21.79 | ||||||
|
|
|
|
|
| |||||||
Total Return*** | 6.21 | %††† | 59.04 | %††† | (12.16 | )% | ||||||
Ratios/Supplemental Data | ||||||||||||
Net assets, end of period (000’s omitted) | $ | 441,155 | $ | 109,072 | $ | 4,376 | ||||||
Ratios to average net assets: | ||||||||||||
Expenses, net of fee waiver and expense reimbursements | 0.48 | % | 0.52 | % | 1.03 | %† | ||||||
Expenses, prior to fee waiver and expense reimbursements | 0.48 | % | 0.66 | % | — | |||||||
Net investment income | 1.56 | % | 1.27 | % | 1.15 | %† | ||||||
Portfolio turnover rate | 13 | % | 12 | % | 16 | %†† | ||||||
| db X-trackers MSCI Asia Pacific ex Japan Hedged Equity Fund | For the Period October 1, 2013* to May 31, 2014 | |||||||||||
Net Asset Value, beginning of period | $ | 25.00 | ||||||||||
|
| |||||||||||
Income from Investment Operations: | ||||||||||||
Net investment income** | 0.40 | |||||||||||
Net realized and unrealized gain on investments and foreign currency transactions | 1.08 | |||||||||||
|
| |||||||||||
Net increase (decrease) in net asset value from operations | 1.48 | |||||||||||
|
| |||||||||||
Distributions paid to shareholders from: | ||||||||||||
Net investment income | (0.01 | ) | ||||||||||
|
| |||||||||||
Net Asset Value, end of period | $ | 26.47 | ||||||||||
|
| |||||||||||
Total Return*** | 5.94 | % | ||||||||||
Ratios/Supplemental Data | ||||||||||||
Net assets, end of period (000’s omitted) | $ | 6,616 | ||||||||||
Ratios to average net assets: | ||||||||||||
Expenses | 0.60 | %† | ||||||||||
Net investment income | 2.33 | %† | ||||||||||
Portfolio turnover rate | 20 | %†† | ||||||||||
| * | Commencement of Operations. |
| ** | Based on average shares outstanding. |
| *** | Total Return is calculated assuming an initial investment made at the Net Asset Value at the beginning of the period, reinvestment of all dividend distributions at Net Asset Value during the period, and redemption at Net Asset Value on the last day of the period. Total Return calculated for a period of less than one year is not annualized. |
| † | Annualized. |
| †† | Portfolio turnover rate is not annualized and does not include securities received or delivered from processing creations or redemptions. |
| ††† | The Total Return would have been lower if certain fees had not been reimbursed by the Advisor. |
| (a) | Because of the timing of subscriptions and redemptions in relation to fluctuating markets at value, the amount shown may not agree with the change in aggregate gains and losses. |
| See Notes to Financial Statements. | 114 |
DBX ETF Trust
FINANCIAL HIGHLIGHTS (Continued)
For a Share outstanding throughout each period
| db X-trackers MSCI Europe Hedged Equity Fund | For the Period October 1, 2013* to May 31, 2014 | |||
Net Asset Value, beginning of period | $ | 25.00 | ||
|
| |||
Income from Investment Operations: | ||||
Net investment income** | 1.27 | |||
Net realized and unrealized gain on investment and foreign currency transactions | 1.72 | |||
|
| |||
Net increase in net asset value from operations | 2.99 | |||
|
| |||
Distributions paid to shareholders from: | ||||
Net investment income | (0.24 | ) | ||
|
| |||
Net Asset Value, end of period | $ | 27.75 | ||
|
| |||
Total Return*** | 12.05 | % | ||
Ratios/Supplemental Data | ||||
Net assets, end of period (000’s omitted) | $ | 163,731 | ||
Ratios to average net assets: | ||||
Expenses | 0.45 | %† | ||
Net investment income | 7.30 | %† | ||
Portfolio turnover rate | 4 | %†† | ||
| db X-trackers MSCI United Kingdom Hedged Equity Fund | For the Period October 1, 2013* to May 31, 2014 | |||
Net Asset Value, beginning of period | $ | 25.00 | ||
|
| |||
Income from Investment Operations: | ||||
Net investment income** | 1.32 | |||
Net realized and unrealized gain on investment and foreign currency transactions | 0.63 | |||
|
| |||
Net increase in net asset value from operations | 1.95 | |||
|
| |||
Distributions paid to shareholders from: | ||||
Net investment income | (0.42 | ) | ||
|
| |||
Net Asset Value, end of period | $ | 26.53 | ||
|
| |||
Total Return*** | 7.90 | % | ||
Ratios/Supplemental Data: | ||||
Net assets, end of period (000’s omitted) | $ | 5,305 | ||
Ratios to average net assets: | ||||
Expenses | 0.45 | %† | ||
Net investment income | 7.70 | %† | ||
Portfolio turnover rate | 11 | %†† | ||
| * | Commencement of Operations. |
| ** | Based on average shares outstanding. |
| *** | Total Return is calculated assuming an initial investment made at the Net Asset Value at the beginning of the period, reinvestment of all dividend distributions at Net Asset Value during the period, and redemption at Net Asset Value on the last day of the period. Total Return calculated for a period of less than one year is not annualized. |
| † | Annualized. |
| †† | Portfolio turnover rate is not annualized and does not include securities received or delivered from processing creations or redemptions. |
| See Notes to Financial Statements. | 115 |
DBX ETF Trust
FINANCIAL HIGHLIGHTS (Continued)
For a Share outstanding throughout each period
| db X-trackers MSCI All World ex US Hedged Equity Fund | For the Period January 23, 2014* to May 31, 2014 | |||
Net Asset Value, beginning of period | $ | 25.00 | ||
|
| |||
Income from Investment Operations: | ||||
Net investment income** | 0.45 | |||
Net realized and unrealized gain on investment and foreign currency transactions | 0.16 | |||
|
| |||
Net increase in net asset value from operations | 0.61 | |||
|
| |||
Net Asset Value, end of period | $ | 25.61 | ||
|
| |||
Total Return*** | 2.44 | % | ||
Ratios/Supplemental Data | ||||
Net assets, end of period (000’s omitted) | $ | 5,122 | ||
Ratios to average net assets: | ||||
Expenses | 0.40 | %† | ||
Net investment income | 5.18 | %† | ||
Portfolio turnover rate | 3 | %†† | ||
| db X-trackers MSCI South Korea Hedged Equity Fund | For the Period January 23, 2014* to May 31, 2014 | |||
Net Asset Value, beginning of period | $ | 25.00 | ||
|
| |||
Income from Investment Operations: | ||||
Net investment loss** | (0.02 | ) | ||
Net realized and unrealized gain on investment and foreign currency transactions | 0.10 | (a) | ||
|
| |||
Net increase in net asset value from operations | 0.08 | |||
|
| |||
Net Asset Value, end of period | $ | 25.08 | ||
|
| |||
Total Return*** | 0.32 | % | ||
Ratios/Supplemental Data | ||||
Net assets, end of period (000’s omitted) | $ | 5,015 | ||
Ratios to average net assets: | ||||
Expenses | 0.58 | %† | ||
Net investment loss | (0.26 | )%† | ||
Portfolio turnover rate | 8 | %†† | ||
| * | Commencement of Operations. |
| ** | Based on average shares outstanding. |
| *** | Total Return is calculated assuming an initial investment made at the Net Asset Value at the beginning of the period, reinvestment of all dividend distributions at Net Asset Value during the period, and redemption at Net Asset Value on the last day of the period. Total Return calculated for a period of less than one year is not annualized. |
| † | Annualized. |
| †† | Portfolio turnover rate is not annualized and does not include securities received or delivered from processing creations or redemptions. |
| (a) | Because of the timing of subscriptions and redemptions in relation to fluctuating markets at value, the amount shown may not agree with the change in aggregate gains and losses. |
| See Notes to Financial Statements. | 116 |
DBX ETF Trust
FINANCIAL HIGHLIGHTS (Continued)
For a Share outstanding throughout each period
| db X-trackers MSCI Mexico Hedged Equity Fund | For the Period January 23, 2014* to May 31, 2014 | |||
Net Asset Value, beginning of period | $ | 25.00 | ||
|
| |||
Income from Investment Operations: | ||||
Net investment income** | 0.07 | |||
Net realized and unrealized loss on investment and foreign currency transactions | (0.78 | ) | ||
|
| |||
Net decrease in net asset value from operations | (0.71 | ) | ||
|
| |||
Net Asset Value, end of period | $ | 24.29 | ||
|
| |||
Total Return*** | (2.84 | )% | ||
Ratios/Supplemental Data | ||||
Net assets, end of period (000’s omitted) | $ | 4,858 | ||
Ratios to average net assets: | ||||
Expenses | 0.50 | %† | ||
Net investment income | 0.79 | %† | ||
Portfolio turnover rate | 7 | %†† | ||
| * | Commencement of Operations. |
| ** | Based on average shares outstanding. |
| *** | Total Return is calculated assuming an initial investment made at the Net Asset Value at the beginning of the period, reinvestment of all dividend distributions at Net Asset Value during the period, and redemption at Net Asset Value on the last day of the period. Total Return calculated for a period of less than one year is not annualized. |
| † | Annualized. |
| †† | Portfolio turnover rate is not annualized and does not include securities received or delivered from processing creations or redemptions. |
| See Notes to Financial Statements. | 117 |
DBX ETF Trust
1. Organization
DBX ETF Trust (the “Trust”) is registered under the Investment Company Act of 1940, as amended (the “Act”), as an open end registered management investment company organized as a Delaware statutory trust.
As of May 31, 2014, the Trust consists of seventeen non-diversified series of exchange-traded funds (“ETF”) (each a “Fund” and collectively, the “Funds”) in operation and trading. These financial statements report on the Funds listed below:
| db X-trackers MSCI Brazil Hedged Equity Fund |
| db X-trackers MSCI EAFE Hedged Equity Fund |
| db X-trackers MSCI Emerging Markets Hedged Equity Fund |
| db X-trackers MSCI Germany Hedged Equity Fund |
| db X-trackers MSCI Japan Hedged Equity Fund |
| db X-trackers MSCI Asia Pacific ex Japan Hedged Equity Fund |
| db X-trackers MSCI Europe Hedged Equity Fund |
| db X-trackers MSCI United Kingdom Hedged Equity Fund |
| db X-trackers MSCI All World ex US Hedged Equity Fund |
| db X-trackers MSCI South Korea Hedged Equity Fund |
| db X-trackers MSCI Mexico Hedged Equity Fund |
DBX Advisors LLC (“DBX” or the “Advisor”), an indirect wholly owned subsidiary of Deutsche Bank AG, serves as investment advisor to the Funds and has overall responsibility for the general management and administration of the Funds, subject to the supervision of the Funds’ Board of Trustees.
Each Fund offers shares that are listed and traded on the NYSE Arca, Inc. (“NYSE Arca”). Unlike conventional mutual funds, each Fund issues and redeems shares on a continuous basis, at net asset value, only in large specified lots consisting of 50,000 shares each called a “Creation Unit”, to authorized participants who have entered into agreements with the Funds’ distributor. Except when aggregated in Creation Units, shares are not individually redeemable securities of the Funds.
The investment objective of each Fund is to track the performance, before fees and expenses, of a particular index (the “Underlying Index”). The underlying indices for the Funds are:
Fund | Underlying Index | |
| db X-trackers MSCI Brazil Hedged Equity Fund | MSCI Brazil US Dollar Hedged Index | |
| db X-trackers MSCI EAFE Hedged Equity Fund | MSCI EAFE US Dollar Hedged Index | |
db X-trackers MSCI Emerging Markets Hedged Equity Fund | MSCI EM US Dollar Hedged Index | |
| db X-trackers MSCI Germany Hedged Equity Fund | MSCI Germany US Dollar Hedged Index | |
| db X-trackers MSCI Japan Hedged Equity Fund | MSCI Japan US Dollar Hedged Index | |
| db X-trackers MSCI Asia Pacific ex Japan Hedged Equity Fund | MSCI Asia Pacific ex Japan US Dollar Hedged Index | |
| db X-trackers MSCI Europe Hedged Equity Fund | MSCI Europe US Dollar Hedged Index | |
| db X-trackers MSCI United Kingdom Hedged Equity Fund | MSCI United Kingdom US Dollar Hedged Index | |
| db X-trackers MSCI All World ex US Hedged Equity Fund | MSCI ACWI ex USA US Dollar Hedged Index | |
| db X-trackers MSCI South Korea Hedged Equity Fund | MSCI Korea 25/50 US Dollar Hedged Index | |
| db X-trackers MSCI Mexico Hedged Equity Fund | MSCI Mexico IMI 25/50 US Dollar Hedged Index |
MSCI, Inc. (“MSCI”) is the creator of each MSCI Hedged Underlying Index. Each MSCI Hedged Underlying Index is comprised of securities listed in countries in the MSCI Global Index Series. All listed equity securities and listed securities that exhibit characteristics of equity securities, except mutual funds, exchange traded funds, equity derivatives, limited partnerships and most investment trusts, are eligible for inclusion in the equity universe. REITs in some countries and certain income trusts in Canada are also eligible for inclusion. Each company and its securities (i.e., share classes) are classified in only one country, which allows for a distinctive sorting of each company by its respective country.
The MSCI Hedged Indices are rebalanced monthly on the last trading day of the month, when the index will take into account the effect of rolling into new 1-month forward contracts based on the newly determined weights of currency to be sold for the next month’s index calculation. The currency weights are determined as of the close of two business days before the first calendar day of following month and remain constant intra month. This means that no changes in the weights are made during the month to account for changes in the indexes due to price movement of securities, corporate events, additions, deletions or any other changes. The daily calculation of MSCI Hedged Indices marks to market the one-month forward contracts on a daily basis by using an equal and offsetting forward position.
118
DBX ETF Trust
NOTES TO FINANCIAL STATEMENTS (Continued)
Each Fund is entitled to use its respective Underlying Index pursuant to a licensing agreement between MSCI and DBX. There is no charge to the Funds in connection with these licensing agreements.
Each Fund is non-diversified and is not limited by the Act with regard to the percentage of its assets that may be invested in the securities of a single issuer. The securities of a particular issuer (or securities of issuers in particular industries) may dominate the underlying index of such a Fund and, consequently, the Fund’s investment portfolio. This may adversely affect the Fund’s performance or subject the Fund’s shares to greater price volatility than that experienced by more diversified investment companies.
The funds invest in securities of non-U.S. issuers that trade in non-U.S. Markets, this involves certain considerations and risks not typically associated with securities of U.S. issuers. Such risks include, but are not limited to: generally less liquid and less efficient securities markets; generally greater price volatility; exchange rate fluctuations and exchange controls; imposition of restrictions on the expatriation of funds or other assets of the Fund; less publicly available information about issuers; the imposition of withholding or other taxes; higher transaction and custody costs; settlement delays and risk of loss attendant in settlement procedures; difficulties in enforcing contractual obligations; less regulation of securities markets; different accounting, disclosure and reporting requirements; more substantial governmental involvement in the economy; higher inflation rates; greater social, economic and political uncertainties; the risk of nationalization or expropriation of assets and the risk of war.
Pursuant to the Trust’s organizational documents, the Trust’s officers and trustees are indemnified against certain liabilities that may arise out of the performance of their duties to the Funds. Additionally, in the normal course of business the Trust enters into contracts that contain a variety of representations that provide indemnification for certain liabilities. The Trust’s maximum exposure under these arrangements is unknown, as this would involve future claims that may be made against the Funds that have not yet occurred. However, the Trust expects the risk of loss to be remote.
2. Significant Accounting Policies
The financial statements have been prepared in conformity with U.S. generally accepted accounting principles (“U.S. GAAP”), which require management to make certain estimates and assumptions that affect the reported amounts and disclosures in the financial statements. Actual results could differ from those estimates. The following is a summary of significant accounting policies followed by the Funds.
Security Valuation The Net Asset Value (“NAV”), of each Fund’s shares is calculated each business day as of the close of regular trading on the New York Stock Exchange, generally 4:00 p.m. Eastern Time. NAV per share is calculated by dividing a Fund’s net assets by the number of Fund shares outstanding.
Various inputs are used in determining the value of the Funds’ investments. These inputs are summarized in three broad levels. Level 1 includes quoted prices in active markets for identical securities. Level 2 includes other significant observable inputs (including quoted prices for similar securities, interest rates, prepayment speeds, and credit risk). Level 3 includes significant unobservable inputs (including the Fund’s own assumptions in determining the fair value of investments). The level assigned to the securities valuations may not be an indication of the risk or liquidity associated with investing in those securities.
Equity securities are valued at the most recent sale price or official closing price reported on the exchange (U.S. or foreign) or over-the-counter market on which they trade. Securities for which no sales are reported are valued at the calculated mean between the most recent bid and asked quotations on the relevant market or, if a mean cannot be determined, at the most recent bid quotation. Equity securities are generally categorized as Level 1.
Futures contracts are generally valued at the settlement prices established each day on the exchange on which they are traded and are categorized as Level 1.
Forward currency contracts are valued at the prevailing forward exchange rate of the underlying currencies and are categorized as Level 2.
Securities and other assets for which market quotations are not readily available or for which the above valuation procedures are deemed not to reflect fair value are valued in a manner that is intended to reflect their fair value as determined in accordance with procedures approved by the Board and are generally categorized as Level 3. In accordance with the Fund’s valuation procedures, factors considered in determining value may include, but are not limited to, the type
119
DBX ETF Trust
NOTES TO FINANCIAL STATEMENTS (Continued)
of the security; the size of the holding; the initial cost of the security; the existence of any contractual restrictions on the security’s disposition; the price and extent of public trading in similar securities of the issuer or of comparable companies; quotations or evaluated prices from broker-dealers and/or pricing services; information obtained from the issuer, analysts, and/or the appropriate stock exchange (for exchange-traded securities); an analysis of the company’s or issuer’s financial statements; an evaluation of the forces that influence the issuer and the market(s) in which the security is purchased and sold; and with respect to debt securities, the maturity, coupon, creditworthiness, currency denomination and the movement of the market in which the security is normally traded. The value determined under these procedures may differ from published values for the same securities.
Fair value pricing could result in a difference between the prices used to calculate a Fund’s net asset value and the prices used by the Fund’s underlying index, which in turn could result in a difference between the Fund’s performance and the performance of the Fund’s underlying index.
The following table summarizes the valuation of each Fund’s investments by the above fair value hierarchy levels as of May 31, 2014 (see the Schedule of Investments for security categories). For the year ended May 31, 2014, there were no transfers between investment levels.
| Level 1 | Level 2 | Level 3 | Fair Value at 5/31/2014 | |||||||||||||
| db X-trackers MSCI Brazil Hedged Equity Fund | ||||||||||||||||
Investments in Securities* | ||||||||||||||||
Common Stocks | $ | 3,400,016 | $ | — | $ | — | $ | 3,400,016 | ||||||||
Preferred Stocks | 2,389,098 | — | — | 2,389,098 | ||||||||||||
Rights | 2 | — | — | 2 | ||||||||||||
Other Financial Instruments | ||||||||||||||||
Unrealized Appreciation on Forward Foreign Currency Contracts | — | 10,990 | — | 10,990 | ||||||||||||
Unrealized Depreciation on Forward Foreign Currency Contracts | — | (35,934 | ) | — | (35,934 | ) | ||||||||||
|
|
|
|
|
|
|
| |||||||||
Total Investments | $ | 5,789,116 | $ | (24,944 | ) | $ | — | $ | 5,764,172 | |||||||
|
|
|
|
|
|
|
| |||||||||
| db X-trackers MSCI EAFE Hedged Equity Fund | ||||||||||||||||
Investments in Securities* | ||||||||||||||||
Common Stocks | $ | 554,863,635 | $ | — | $ | — | $ | 554,863,635 | ||||||||
Preferred Stocks | 3,168,659 | — | — | 3,168,659 | ||||||||||||
Rights | 6,011 | — | — | 6,011 | ||||||||||||
Warrants | 5,979 | — | — | 5,979 | ||||||||||||
Other Financial Instruments | ||||||||||||||||
Unrealized Appreciation on Forward Foreign Currency Contracts | — | 5,822,876 | — | 5,822,876 | ||||||||||||
Unrealized Depreciation on Forward Foreign Currency Contracts | — | (1,134,275 | ) | — | (1,134,275 | ) | ||||||||||
Futures Contracts | 81,000 | — | — | 81,000 | ||||||||||||
|
|
|
|
|
|
|
| |||||||||
Total Investments | $ | 558,125,284 | $ | 4,688,601 | $ | — | $ | 562,813,885 | ||||||||
|
|
|
|
|
|
|
| |||||||||
db X-trackers MSCI Emerging Markets Hedged Equity Fund | ||||||||||||||||
Investments in Securities* | ||||||||||||||||
Common Stocks | $ | 27,185,596 | $ | — | $ | — | $ | 27,185,596 | ||||||||
Preferred Stocks | 1,730,857 | — | — | 1,730,857 | ||||||||||||
Rights | 2,118 | — | — | 2,118 | ||||||||||||
Other Financial Instruments | ||||||||||||||||
Unrealized Appreciation on Forward Foreign Currency Contracts | — | 46,831 | — | 46,831 | ||||||||||||
Unrealized Depreciation on Forward Foreign Currency Contracts | — | (300,740 | ) | — | (300,740 | ) | ||||||||||
Futures Contracts | 15,820 | — | — | 15,820 | ||||||||||||
|
|
|
|
|
|
|
| |||||||||
Total Investments | $ | 28,934,391 | $ | (253,909 | ) | $ | — | $ | 28,680,482 | |||||||
|
|
|
|
|
|
|
| |||||||||
120
DBX ETF Trust
NOTES TO FINANCIAL STATEMENTS (Continued)
| Level 1 | Level 2 | Level 3 | Fair Value at 5/31/2014 | |||||||||||||
| db X-trackers MSCI Germany Hedged Equity Fund | ||||||||||||||||
Investments in Securities* | ||||||||||||||||
Common Stocks | $ | 41,778,122 | $ | — | $ | — | $ | 41,778,122 | ||||||||
Preferred Stocks | 2,967,867 | — | — | 2,967,867 | ||||||||||||
Other Financial Instruments | ||||||||||||||||
Unrealized Appreciation on Forward Foreign Currency Contracts | — | 765,885 | — | 765,885 | ||||||||||||
Unrealized Depreciation on Forward Foreign Currency Contracts | — | (46,378 | ) | — | (46,378 | ) | ||||||||||
Futures Contracts | 23,088 | — | — | 23,088 | ||||||||||||
|
|
|
|
|
|
|
| |||||||||
Total Investments | $ | 44,769,077 | $ | 719,507 | $ | — | $ | 45,488,584 | ||||||||
|
|
|
|
|
|
|
| |||||||||
| db X-trackers MSCI Japan Hedged Equity Fund | ||||||||||||||||
Investments in Securities* | ||||||||||||||||
Common Stocks | $ | 436,084,203 | $ | — | $ | — | $ | 436,084,203 | ||||||||
Other Financial Instruments | ||||||||||||||||
Unrealized Appreciation on Forward Foreign Currency Contracts | — | 276,395 | — | 276,395 | ||||||||||||
Unrealized Depreciation on Forward Foreign Currency Contracts | — | (1,703,121 | ) | — | (1,703,121 | ) | ||||||||||
Futures Contracts | (33,065 | ) | — | — | (33,065 | ) | ||||||||||
|
|
|
|
|
|
|
| |||||||||
Total Investments | $ | 436,051,138 | $ | (1,426,726 | ) | $ | — | $ | 434,624,412 | |||||||
|
|
|
|
|
|
|
| |||||||||
| db X-trackers MSCI Asia Pacific ex Japan Hedged Equity Fund | ||||||||||||||||
Investments in Securities* | ||||||||||||||||
Common Stocks | $ | 6,580,782 | $ | — | $ | — | $ | 6,580,782 | ||||||||
Preferred Stocks | 17,361 | — | — | 17,361 | ||||||||||||
Rights | 115 | — | — | 115 | ||||||||||||
Warrants | 256 | — | — | 256 | ||||||||||||
Other Financial Instruments | ||||||||||||||||
Unrealized Appreciation on Forward Foreign Currency Contracts | — | 7,573 | — | 7,573 | ||||||||||||
Unrealized Depreciation on Forward Foreign Currency Contracts | — | (46,610 | ) | — | (46,610 | ) | ||||||||||
|
|
|
|
|
|
|
| |||||||||
Total Investments | $ | 6,598,514 | $ | (39,037 | ) | $ | — | $ | 6,559,477 | |||||||
|
|
|
|
|
|
|
| |||||||||
| db X-trackers MSCI Europe Hedged Equity Fund | ||||||||||||||||
Investments in Securities* | ||||||||||||||||
Common Stocks | $ | 160,685,228 | $ | — | $ | — | $ | 160,685,228 | ||||||||
Preferred Stocks | 1,485,108 | — | — | 1,485,108 | ||||||||||||
Rights | 9,255 | — | — | 9,255 | ||||||||||||
Other Financial Instruments | ||||||||||||||||
Unrealized Appreciation on Forward Foreign Currency Contracts | — | 1,415,096 | — | 1,415,096 | ||||||||||||
Unrealized Depreciation on Forward Foreign Currency Contracts | — | (211,790 | ) | — | (211,790 | ) | ||||||||||
|
|
|
|
|
|
|
| |||||||||
Total Investments | $ | 162,179,591 | $ | 1,203,306 | $ | — | $ | 163,382,897 | ||||||||
|
|
|
|
|
|
|
| |||||||||
121
DBX ETF Trust
NOTES TO FINANCIAL STATEMENTS (Continued)
| Level 1 | Level 2 | Level 3 | Fair Value at 5/31/2014 | |||||||||||||
| db X-trackers MSCI United Kingdom Hedged Equity Fund | ||||||||||||||||
Investments in Securities* | ||||||||||||||||
Common Stocks | $ | 5,252,895 | $ | — | $ | — | $ | 5,252,895 | ||||||||
Preferred Stocks | 773 | — | — | 773 | ||||||||||||
Other Financial Instruments | ||||||||||||||||
Unrealized Appreciation on Forward Foreign Currency Contracts | — | 40,979 | — | 40,979 | ||||||||||||
Unrealized Depreciation on Forward Foreign Currency Contracts | — | (3,754 | ) | — | (3,754 | ) | ||||||||||
|
|
|
|
|
|
|
| |||||||||
Total Investments | $ | 5,253,668 | $ | 37,225 | $ | — | $ | 5,290,893 | ||||||||
|
|
|
|
|
|
|
| |||||||||
| db X-trackers MSCI All World ex US Hedged Equity Fund | ||||||||||||||||
Investments in Securities* | ||||||||||||||||
Common Stocks | $ | 4,991,769 | $ | — | $ | — | $ | 4,991,769 | ||||||||
Preferred Stocks | 86,684 | — | — | 86,684 | ||||||||||||
Rights | 309 | — | — | 309 | ||||||||||||
Warrants | 102 | — | — | 102 | ||||||||||||
Other Financial Instruments | ||||||||||||||||
Unrealized Appreciation on Forward Foreign Currency Contracts | — | 40,268 | — | 40,268 | ||||||||||||
Unrealized Depreciation on Forward Foreign Currency Contracts | — | (23,178 | ) | — | (23,178 | ) | ||||||||||
|
|
|
|
|
|
|
| |||||||||
Total Investments | $ | 5,078,864 | $ | 17,090 | $ | — | $ | 5,095,954 | ||||||||
|
|
|
|
|
|
|
| |||||||||
| db X-trackers MSCI South Korea Hedged Equity Fund | ||||||||||||||||
Investments in Securities* | ||||||||||||||||
Common Stocks | $ | 4,895,714 | $ | — | $ | — | $ | 4,895,714 | ||||||||
Preferred Stocks | 134,676 | — | — | 134,676 | ||||||||||||
Rights | 457 | — | — | 457 | ||||||||||||
Other Financial Instruments | ||||||||||||||||
Unrealized Appreciation on Forward Foreign Currency Contracts | — | 3,210 | — | 3,210 | ||||||||||||
Unrealized Depreciation on Forward Foreign Currency Contracts | — | (74,020 | ) | — | (74,020 | ) | ||||||||||
|
|
|
|
|
|
|
| |||||||||
Total Investments | $ | 5,030,847 | $ | (70,810 | ) | $ | — | $ | 4,960,037 | |||||||
|
|
|
|
|
|
|
| |||||||||
| db X-trackers MSCI Mexico Hedged Equity Fund | ||||||||||||||||
Investments in Securities* | ||||||||||||||||
Common Stocks | $ | 4,864,604 | $ | — | $ | — | $ | 4,864,604 | ||||||||
Other Financial Instruments | ||||||||||||||||
Unrealized Appreciation on Forward Foreign Currency Contracts | — | 3,157 | — | 3,157 | ||||||||||||
Unrealized Depreciation on Forward Foreign Currency Contracts | — | (101,617 | ) | — | (101,617 | ) | ||||||||||
|
|
|
|
|
|
|
| |||||||||
Total Investments | $ | 4,864,604 | $ | (98,460 | ) | $ | — | $ | 4,766,144 | |||||||
|
|
|
|
|
|
|
| |||||||||
| * | See Schedule of Investments for Industry or Country Classification. |
Cash Cash consists of cash held at banks and are on deposits with major financial institutions.
Investment Transactions and Investment Income Investment transactions are recorded as of the date that the securities are purchased or sold (trade date). Realized gains and losses from the sale or disposition of securities are calculated
122
DBX ETF Trust
NOTES TO FINANCIAL STATEMENTS (Continued)
on the identified cost-method. Dividend income is net of any foreign taxes withheld at source. Certain dividends from foreign securities may be recorded subsequent to the ex-dividend date as soon as the fund is informed of such dividends. Interest income is recorded on the accrual basis.
Tax Information and Dividends and Distributions to Shareholders It is each Fund’s policy to comply with all requirements of the Internal Revenue Code of 1986, as amended (“the Code”). Each fund intends to qualify for and to elect treatment as a separate Regulated Investment Company (“RIC”) under Subchapter M of the Code. It is the policy of each Fund to pay out dividends from its net investment income, if any, to investors semi-annually sufficient to relieve it from all, or substantially all, Federal income and excise taxes. Taxable net realized gains from investment transactions, reduced by capital loss carryforwards, if any, are declared and distributed to shareholders at least annually. The capital loss carryforward amount, if any, is available to offset future net capital gains. The Funds may occasionally be required to make supplemental distributions at some other time during the year. The Funds reserve the right to declare special distributions if, in their reasonable discretion, such action is necessary or advisable to preserve the status of each Fund as a RIC or to avoid imposition of income or excise taxes on undistributed income. Dividends and distributions to shareholders, if any, are recorded on the ex-dividend date. The amount of dividends and distributions from net investment income and net realized capital gains are determined in accordance with Federal income tax regulations which may differ from U.S. GAAP. These “book/tax” differences are either considered temporary or permanent in nature. To the extent these differences are permanent in nature, such amounts are reclassified at the end of the year within the components of net assets based on their federal tax treatment; temporary differences do not require reclassification. Dividends and distributions, which exceed earnings and profits for the full year for tax purposes, are reported as a tax return of capital.
In accordance with U.S. GAAP requirements regarding accounting for uncertainties in income taxes, management has analyzed the Funds’ tax positions taken or expected to be taken on foreign, federal and state income tax returns for all open tax years and has concluded that no provision for income tax is required in the Funds’ financial statements. The Advisor does not believe that the unrecognized tax benefits will change significantly in the next 12 months.
The Funds’ recognize interest and penalties, if any, related to uncertain tax provisions as income tax expense on the Statements of Operations. For the year ended May 31, 2014, the Funds did not incur any interest or penalties.
Foreign Taxes The Funds may be subject to foreign taxes (a portion of which may be reclaimable) on income, capital gains on investments, certain foreign currency transactions or other corporate events. All foreign taxes are recorded in accordance with the applicable foreign tax regulations and rates that exist in the foreign jurisdictions in which the Funds invest. These foreign taxes, if any, are paid by the Funds and are reflected in their Statements of Operations as follows: foreign taxes withheld at source are presented as a reduction of income and foreign taxes on capital gains from sales of investments and foreign currency transactions are included in their respective net realized gain (loss) categories. Foreign taxes payable as of May 31, 2014, if any, are disclosed in the Funds’ Statements of Assets and Liabilities.
Foreign Currency Translations The books and records of the Funds are maintained in U.S. dollars. Investment securities and other assets and liabilities denominated in a foreign currency are translated into U.S. dollars at the prevailing exchange rates at period end. Purchases and sales of investment securities, income and expenses are translated into U.S. dollars at the prevailing exchange rates on the respective dates of the transactions.
Net realized and unrealized gains and losses on foreign currency transactions represent net gains and losses between trade and settlement dates on securities transactions, the acquisition and disposition of foreign currencies, and the difference between the amount of net investment income accrued and the U.S. dollar amount actually received. That portion of both realized and unrealized gains and losses on investments that results from fluctuations in foreign currency exchange rates is not separately disclosed, but is included with net realized and unrealized gain/appreciation and loss/depreciation on investments.
Derivatives
Forward Currency Contracts Each Fund may enter into forward currency contracts designed to offset a Fund’s exposure to non-U.S. currencies. In addition, the Funds may enter into foreign currency forward and foreign currency futures contracts to facilitate local securities settlements or to protect against currency exposure in connection with distributions to Shareholders.
123
DBX ETF Trust
NOTES TO FINANCIAL STATEMENTS (Continued)
The db X-trackers MSCI EAFE Hedged Equity Fund, db X-trackers MSCI Emerging Markets Hedged Equity Fund, db X-trackers Asia Pacific ex Japan Fund, db X-trackers Europe Fund, and db X-trackers MSCI All World ex US Hedged Equity Fund invest in forward foreign currency exchange contracts to hedge against changes in the value of the U.S. dollar against specified non-U.S. currencies. Similarly, the db X-trackers MSCI Brazil Hedged Equity Fund, db X-trackers MSCI Germany Hedged Equity Fund, db X-trackers MSCI Japan Hedged Equity Fund, db X-trackers MSCI South Korea Hedged Equity Fund db X-trackers United Kingdom Fund, and db X-trackers MSCI Mexico Hedged Equity Fund each invest in forward foreign currency exchange contracts to hedge against changes in the value of the U.S. dollar against the Brazilian real, Euro, the Japanese yen, the South Korean won, the British Pound Sterling and the Mexican peso respectively.
A forward currency exchange contract is a commitment to purchase or sell a foreign currency at a future date at a negotiated forward rate. The gain or loss arising from the difference between the original contract and the closing of such contract would be included in net realized gain or loss on foreign currency transactions. Risks may arise from the potential inability of a counterparty to meet the terms of a contract and from unanticipated movements in the value of a foreign currency relative to the U.S. dollar. The face or contract amount, in U.S. dollars reflects the total exposure the respective Fund has in that particular currency contract.
A summary of the open forward currency exchange contracts as of May 31, 2014 is included in a table following the Funds’ Schedule of Investments. The investment in forward foreign currency exchange contracts short vs. U.S. dollars had a contract value generally indicative of a range of the total exposure the respective Fund had to the value of non U.S currencies during the year ended May 31, 2014.
Futures Contracts Each Fund may enter into futures contracts. These futures contracts will be used to simulate investment in the respective Underlying Index, to facilitate trading or to reduce transaction costs. Each Fund will enter into futures contracts that are traded on a U.S. or non-U.S. exchange. No Fund will use futures for speculative purposes. Futures contracts provide for the future sale by one party and purchase by another party of a specified amount of a specific instrument or index at a specified future time and at a specified price. Each Fund may enter into futures contracts in seeking performance that corresponds to its Underlying Index. To the extent required by law, liquid assets committed to futures contracts will be maintained.
Open futures contracts are valued using the closing price or, in the absence of such a price, the most recent quoted bid price. If there are no quotations available for the day of valuation, the last available closing settlement price is used.
At the time each Fund enters into a futures contract, each Fund deposits and maintains as collateral an initial margin with the broker, as required by the exchange on which the transaction is affected. Pursuant to the contract, each Fund agrees to receive from or pay to the broker an amount of cash equal to the daily fluctuation in the value of the contract. Such receipts or payments are known as variation margin and are recorded by each Fund as unrealized gains or losses. Risks may arise from the potential inability of a counterparty to meet the terms of the contract. The credit/counterparty risk for exchange-traded futures contracts is generally less than privately negotiated futures contracts, since the clearinghouse, which is the issuer or counterparty to each exchange-traded future, provides a guarantee of performance. The guarantee is supported by a daily payment system (i.e., margin requirements).
Use of long futures contracts subjects each Fund to risk of loss in excess of the amounts shown on the statement of assets and liabilities, up to the notional value of the futures contracts. Use of short futures contracts subjects each Fund to unlimited risk of loss. Under some circumstances, futures exchanges may establish daily limits on the amount that the price of a futures contract can vary from the previous day’s settlement price, which could effectively prevent liquidation of unfavorable positions.
124
DBX ETF Trust
NOTES TO FINANCIAL STATEMENTS (Continued)
A summary of the open futures contracts as of May 31, 2014 is included in a table following the Funds’ Schedule of Investments.
The following tables summarize the value of the Funds’ derivative instruments held as of May 31, 2014 and the related location in the accompanying Statement of Assets and Liabilities, presented by primary underlying risk exposure:
Asset Derivatives | Liability Derivatives | |||||||||||||
Risk Type | Statement of Asset and | Fair Value | Statement of Asset and | Fair Value | ||||||||||
| db X-trackers MSCI Brazil Hedged Equity Fund | ||||||||||||||
| Foreign exchange contracts | Unrealized appreciation on forward foreign currency contracts | $ | 10,990 | Unrealized depreciation on forward foreign currency contracts | $ | 35,934 | ||||||||
|
|
|
| |||||||||||
| Total | $ | 10,990 | Total | $ | 35,934 | |||||||||
|
|
|
| |||||||||||
| db X-trackers MSCI EAFE Hedged Equity Fund | ||||||||||||||
| Equity contracts | Unrealized appreciation on futures contracts(a) | $ | 81,000 | Unrealized depreciation on futures contracts(a) | $ | — | ||||||||
| Foreign exchange contracts | Unrealized appreciation on forward foreign currency contracts | 5,822,876 | Unrealized depreciation on forward foreign currency contracts | 1,134,275 | ||||||||||
|
|
|
| |||||||||||
| Total | $ | 5,903,876 | Total | $ | 1,134,275 | |||||||||
|
|
|
| |||||||||||
| db X-trackers MSCI Emerging Markets Hedged Equity Fund | ||||||||||||||
| Equity contracts | Unrealized appreciation on futures contracts(a) | $ | 15,820 | Unrealized depreciation on futures contracts(a) | $ | — | ||||||||
| Foreign exchange contracts | Unrealized appreciation on forward foreign currency contracts | 46,831 | Unrealized depreciation on forward foreign currency contracts | 300,740 | ||||||||||
|
|
|
| |||||||||||
| Total | $ | 62,651 | Total | $ | 300,740 | |||||||||
|
|
|
| |||||||||||
| db X-trackers MSCI Germany Hedged Equity Fund | ||||||||||||||
| Equity contracts | Unrealized appreciation on futures contracts(a) | $ | 23,088 | Unrealized depreciation on futures contracts(a) | $ | — | ||||||||
| Foreign exchange contracts | Unrealized appreciation on forward foreign currency contracts | 765,885 | Unrealized depreciation on forward foreign currency contracts | 46,378 | ||||||||||
|
|
|
| |||||||||||
| Total | $ | 788,973 | Total | $ | 46,378 | |||||||||
|
|
|
| |||||||||||
| db X-trackers MSCI Japan Hedged Equity Fund | ||||||||||||||
| Equity contracts | Unrealized appreciation on futures contracts(a) | $ | — | Unrealized depreciation on futures contracts(a) | $ | 33,065 | ||||||||
| Foreign exchange contracts | Unrealized appreciation on forward foreign currency contracts | 276,395 | Unrealized depreciation on forward foreign currency contracts | 1,703,121 | ||||||||||
|
|
|
| |||||||||||
| Total | $ | 276,395 | Total | $ | 1,736,186 | |||||||||
|
|
|
| |||||||||||
| db X-trackers MSCI Asia Pacific ex Japan Hedged Equity Fund | ||||||||||||||
| Foreign exchange contracts | Unrealized appreciation on forward foreign currency contracts | $ | 7,573 | Unrealized depreciation on forward foreign currency contracts | $ | 46,610 | ||||||||
|
|
|
| |||||||||||
| Total | $ | 7,573 | Total | $ | 46,610 | |||||||||
|
|
|
| |||||||||||
125
DBX ETF Trust
NOTES TO FINANCIAL STATEMENTS (Continued)
Asset Derivatives | Liability Derivatives | |||||||||||||
Risk Type | Statement of Asset and | Fair Value | Statement of Asset and | Fair Value | ||||||||||
| db X-trackers MSCI Europe Hedged Equity Fund | ||||||||||||||
| Foreign exchange contracts | Unrealized appreciation on forward foreign currency contracts(a) | $ | 1,415,096 | Unrealized depreciation on forward foreign currency contracts(a) | $ | 211,790 | ||||||||
|
|
|
| |||||||||||
| Total | $ | 1,415,096 | Total | $ | 211,790 | |||||||||
|
|
|
| |||||||||||
| db X-trackers MSCI United Kingdom Hedged Equity Fund | ||||||||||||||
| Foreign exchange contracts | Unrealized appreciation on forward foreign currency contracts(a) | $ | 40,979 | Unrealized depreciation on forward foreign currency contracts(a) | $ | 3,754 | ||||||||
|
|
|
| |||||||||||
| Total | $ | 40,979 | Total | $ | 3,754 | |||||||||
|
|
|
| |||||||||||
| db X-trackers All World Fund | ||||||||||||||
| Foreign exchange contracts | Unrealized appreciation on forward foreign currency contracts | $ | 40,268 | Unrealized depreciation on forward foreign currency contracts | $ | 23,178 | ||||||||
|
|
|
| |||||||||||
| Total | $ | 40,268 | Total | $ | 23,178 | |||||||||
|
|
|
| |||||||||||
| db X-trackers South Korea Hedged Equity Fund | ||||||||||||||
| Foreign exchange contracts | Unrealized appreciation on forward foreign currency contracts | $ | 3,210 | Unrealized depreciation on forward foreign currency contracts | $ | 74,020 | ||||||||
|
|
|
| |||||||||||
| Total | $ | 3,210 | Total | $ | 74,020 | |||||||||
|
|
|
| |||||||||||
| db X-trackers Mexico Hedged Equity Fund | ||||||||||||||
| Foreign exchange contracts | Unrealized appreciation on forward foreign currency contracts | $ | 3,157 | Unrealized depreciation on forward foreign currency contracts | $ | 101,617 | ||||||||
|
|
|
| |||||||||||
| Total | $ | 3,157 | Total | $ | 101,617 | |||||||||
|
|
|
| |||||||||||
| (a) | Includes cumulative appreciation of futures contracts as disclosed in the Investment Portfolio. Unsettled variation margin is disclosed separately within the Statement of Assets and Liabilities. |
Additionally, the amount of unrealized and realized gains and losses on derivative instruments recognized in the Funds’ earnings during the year ended May 31, 2014 and the related location in the accompanying Statement of Operations is summarized in the following tables by primary underlying risk exposure:
Amount of Net Realized Gain or (Loss) on Derivatives Recognized in Income | ||||||||||||
| Equity Futures Contracts | Forward Foreign Currency Contracts | Total | ||||||||||
db X-trackers MSCI Brazil Hedged Equity Fund | $ | — | $ | 435,630 | $ | 435,630 | ||||||
db X-trackers MSCI EAFE Hedged Equity Fund | 177,675 | (9,107,764 | ) | (8,930,089 | ) | |||||||
db X-trackers MSCI Emerging Markets Hedged Equity Fund | (5,675 | ) | (303,795 | ) | (309,470 | ) | ||||||
db X-trackers MSCI Germany Hedged Equity Fund | 28,014 | (741,914 | ) | (713,900 | ) | |||||||
db X-trackers MSCI Japan Hedged Equity Fund | 129,885 | 3,417,055 | 3,546,940 | |||||||||
db X-trackers MSCI Asia Pacific ex Japan Hedged Equity Fund | — | (85,417 | ) | (85,417 | ) | |||||||
db X-trackers MSCI Europe Hedged Equity Fund | — | (584,463 | ) | (584,463 | ) | |||||||
db X-trackers MSCI United Kingdom Hedged Equity Fund | — | (224,326 | ) | (224,326 | ) | |||||||
db X-trackers MSCI All World ex US Hedged Equity Fund | — | (91,131 | ) | (91,131 | ) | |||||||
db X-trackers MSCI South Korea Hedged Equity Fund | — | (250,811 | ) | (250,811 | ) | |||||||
db X-trackers MSCI Mexico Hedged Equity Fund | — | (136,249 | ) | (136,249 | ) | |||||||
126
DBX ETF Trust
NOTES TO FINANCIAL STATEMENTS (Continued)
Net Change in Unrealized Appreciation or (Depreciation) on Derivatives Recognized in Income | ||||||||||||
| Equity Futures Contracts | Forward Foreign Currency Contracts | Total | ||||||||||
db X-trackers MSCI Brazil Hedged Equity Fund | $ | — | $ | (445,297 | ) | $ | (445,297 | ) | ||||
db X-trackers MSCI EAFE Hedged EquityFund | 109,460 | 3,966,596 | 4,076,056 | |||||||||
db X-trackers MSCI Emerging Markets Hedged Equity Fund | 20,125 | (522,533 | ) | (502,408 | ) | |||||||
db X-trackers MSCI Germany Hedged Equity Fund | 23,039 | 578,825 | 601,864 | |||||||||
db X-trackers MSCI Japan Hedged Equity Fund | 12,100 | (2,706,014 | ) | (2,693,914 | ) | |||||||
db X-trackers MSCI Asia Pacific ex Japan Hedged Equity Fund | — | (39,037 | ) | (39,037 | ) | |||||||
db X-trackers MSCI Europe Hedged Equity Fund | — | 1,203,306 | 1,203,306 | |||||||||
db X-trackers MSCI United Kingdom Hedged Equity Fund | — | 37,225 | 37,225 | |||||||||
db X-trackers MSCI All World ex US Hedged Equity Fund | — | 17,090 | 17,090 | |||||||||
db X-trackers MSCI South Korea Hedged Equity Fund | — | (70,810 | ) | (70,810 | ) | |||||||
db X-trackers MSCI Mexico Hedged Equity Fund | — | (98,460 | ) | (98,460 | ) | |||||||
For the year ended May 31, 2014 the average monthly volume of derivatives was as follows:
| Futures Contracts (Contract Value) | Forward Foreign Currency Contracts (Market Value) | |||||||
db X-trackers MSCI Brazil Hedged Equity Fund | $ | — | $ | 4,764,539 | ||||
db X-trackers MSCI EAFE Hedged Equity Fund | 1,502,732 | 265,098,928 | ||||||
db X-trackers MSCI Emerging Markets Hedged Equity Fund | 180,633 | 20,116,737 | ||||||
db X-trackers MSCI Germany Hedged Equity Fund | 305,483 | 21,693,624 | ||||||
db X-trackers MSCI Japan Hedged Equity Fund | 2,100,325 | 285,917,109 | ||||||
db X-trackers MSCI Asia Pacific ex Japan Hedged Equity Fund | — | 6,115,147 | ||||||
db X-trackers MSCI Europe Hedged Equity Fund | — | 37,992,264 | ||||||
db X-trackers MSCI United Kingdom Hedged Equity Fund | — | 5,171,226 | ||||||
db X-trackers MSCI All World ex US Hedged Equity Fund | — | 3,108,576 | ||||||
db X-trackers MSCI South Korea Hedged Equity Fund | — | 3,164,913 | ||||||
db X-trackers MSCI Mexico Hedged Equity Fund | — | 4,829,918 | ||||||
As of May 31, 2014, the Fund has transactions subject to enforceable master netting agreements. A reconciliation of the gross amounts on the Statement of Assets and Liabilities to the net amounts by derivative type, including any collateral exposure, is included in the following tables:
Fund | Gross Amounts of Assets Presented in the Statement of Assets and Liabilities | Financial Instruments and Derivatives Available for Offset | Net Amount of Derivatives Assets | Gross Amounts of Liabilities Presented in the Statement of Assets and Liabilities | Financial Instruments and Derivatives Available for Offset | Net Amount of Derivatives Liabilities | ||||||||||||||||||
| db X-trackers MSCI Brazil Hedged Equity Fund | ||||||||||||||||||||||||
Barclays Bank PLC | $ | 163 | $ | (163 | ) | $ | — | $ | 15,930 | $ | (163 | ) | $ | 15,767 | ||||||||||
JP Morgan & Chase Co. | 4,741 | (4,741 | ) | — | 17,918 | (4,741 | ) | 13,177 | ||||||||||||||||
The Bank of New York Mellon | 6,086 | (2,086 | ) | 4,000 | 2,086 | (2,086 | ) | — | ||||||||||||||||
|
|
|
|
|
|
|
|
|
|
|
| |||||||||||||
| $ | 10,990 | $ | (6,990 | ) | $ | 4,000 | $ | 35,934 | $ | (6,990 | ) | $ | 28,944 | |||||||||||
|
|
|
|
|
|
|
|
|
|
|
| |||||||||||||
| db X-trackers MSCI EAFE Hedged Equity Fund | ||||||||||||||||||||||||
Barclays Bank PLC | $ | 2,887,388 | $ | (542,382 | ) | $ | 2,345,006 | $ | 542,382 | $ | (542,382 | ) | $ | — | ||||||||||
JP Morgan & Chase Co. | 2,909,497 | (542,272 | ) | 2,367,225 | 542,272 | (542,272 | ) | — | ||||||||||||||||
The Bank of New York Mellon | 25,991 | (25,991 | ) | — | 49,621 | (25,991 | ) | 23,630 | ||||||||||||||||
|
|
|
|
|
|
|
|
|
|
|
| |||||||||||||
| $ | 5,822,876 | $ | (1,110,645 | ) | $ | 4,712,231 | $ | 1,134,275 | $ | (1,110,645 | ) | $ | 23,630 | |||||||||||
|
|
|
|
|
|
|
|
|
|
|
| |||||||||||||
127
DBX ETF Trust
NOTES TO FINANCIAL STATEMENTS (Continued)
Fund | Gross Amounts of Assets Presented in the Statement of Assets and Liabilities | Financial Instruments and Derivatives Available for Offset | Net Amount of Derivatives Assets | Gross Amounts of Liabilities Presented in the Statement of Assets and Liabilities | Financial Instruments and Derivatives Available for Offset | Net Amount of Derivatives Liabilities | ||||||||||||||||||
| db X-trackers MSCI Emerging Markets Hedged Equity Fund | ||||||||||||||||||||||||
Barclays Bank PLC | $ | 29,291 | $ | (29,291 | ) | $ | — | $ | 153,880 | $ | (29,291 | ) | $ | 124,589 | ||||||||||
JP Morgan & Chase Co. | 16,665 | (16,665 | ) | — | 144,746 | (16,665 | ) | 128,081 | ||||||||||||||||
The Bank of New York Mellon | 875 | (875 | ) | — | 2,114 | (875 | ) | 1,239 | ||||||||||||||||
|
|
|
|
|
|
|
|
|
|
|
| |||||||||||||
| $ | 46,831 | $ | (46,831 | ) | $ | — | $ | 300,740 | $ | (46,831 | ) | $ | 253,909 | |||||||||||
|
|
|
|
|
|
|
|
|
|
|
| |||||||||||||
| db X-trackers MSCI Germany Hedged Equity Fund | ||||||||||||||||||||||||
Barclays Bank PLC | $ | 382,117 | $ | (22,264 | ) | $ | 359,853 | $ | 22,264 | $ | (22,264 | ) | $ | — | ||||||||||
JP Morgan & Chase Co. | 382,637 | (22,265 | ) | 360,372 | 22,265 | (22,265 | ) | — | ||||||||||||||||
The Bank of New York Mellon | 1,131 | (1,131 | ) | — | 1,849 | (1,131 | ) | 718 | ||||||||||||||||
|
|
|
|
|
|
|
|
|
|
|
| |||||||||||||
| $ | 765,885 | $ | (45,660 | ) | $ | 720,225 | $ | 46,378 | $ | (45,660 | ) | $ | 718 | |||||||||||
|
|
|
|
|
|
|
|
|
|
|
| |||||||||||||
| db X-trackers MSCI Japan Hedged Equity Fund | ||||||||||||||||||||||||
Barclays Bank PLC | $ | 113,202 | $ | (113,202 | ) | $ | — | $ | 856,301 | $ | (113,202 | ) | $ | 743,099 | ||||||||||
JP Morgan & Chase Co. | 162,981 | (162,981 | ) | — | 841,648 | (162,981 | ) | 678,667 | ||||||||||||||||
The Bank of New York Mellon | 212 | (212 | ) | — | 5,172 | (212 | ) | 4,960 | ||||||||||||||||
|
|
|
|
|
|
|
|
|
|
|
| |||||||||||||
| $ | 276,395 | $ | (276,395 | ) | $ | — | $ | 1,703,121 | $ | (276,395 | ) | $ | 1,426,726 | |||||||||||
|
|
|
|
|
|
|
|
|
|
|
| |||||||||||||
| db X-trackers MSCI Asia Pacific ex Japan Hedged Equity Fund | ||||||||||||||||||||||||
Barclays Bank PLC | $ | 3,998 | $ | (3,998 | ) | $ | — | $ | 23,083 | $ | (3,998 | ) | $ | 19,085 | ||||||||||
JP Morgan & Chase Co. | 3,549 | (3,549 | ) | — | 23,182 | (3,549 | ) | 19,633 | ||||||||||||||||
The Bank of New York Mellon | 26 | (26 | ) | — | 345 | (26 | ) | 319 | ||||||||||||||||
|
|
|
|
|
|
|
|
|
|
|
| |||||||||||||
| $ | 7,573 | $ | (7,573 | ) | $ | — | $ | 46,610 | $ | (7,573 | ) | $ | 39,037 | |||||||||||
|
|
|
|
|
|
|
|
|
|
|
| |||||||||||||
| db X-trackers MSCI Europe Hedged Equity Fund | ||||||||||||||||||||||||
Barclays Bank PLC | $ | 719,911 | $ | (100,904 | ) | $ | 619,007 | $ | 100,904 | $ | (100,904 | ) | $ | — | ||||||||||
JP Morgan & Chase Co. | 682,192 | (100,243 | ) | 581,949 | 100,243 | (100,243 | ) | — | ||||||||||||||||
The Bank of New York Mellon | 12,993 | (10,643 | ) | 2,350 | 10,643 | (10,643 | ) | — | ||||||||||||||||
|
|
|
|
|
|
|
|
|
|
|
| |||||||||||||
| $ | 1,415,096 | $ | (211,790 | ) | $ | 1,203,306 | $ | 211,790 | $ | (211,790 | ) | $ | — | |||||||||||
|
|
|
|
|
|
|
|
|
|
|
| |||||||||||||
| db X-trackers MSCI United Kingdom Hedged Equity Fund | ||||||||||||||||||||||||
Barclays Bank PLC | $ | 20,642 | $ | (1,861 | ) | $ | 18,781 | $ | 1,861 | $ | (1,861 | ) | $ | — | ||||||||||
JP Morgan & Chase Co. | 20,317 | (1,878 | ) | 18,439 | 1,878 | (1,878 | ) | — | ||||||||||||||||
The Bank of New York Mellon | 20 | (15 | ) | 5 | 15 | (15 | ) | — | ||||||||||||||||
|
|
|
|
|
|
|
|
|
|
|
| |||||||||||||
| $ | 40,979 | $ | (3,754 | ) | $ | 37,225 | $ | 3,754 | $ | (3,754 | ) | $ | — | |||||||||||
|
|
|
|
|
|
|
|
|
|
|
| |||||||||||||
| db X-trackers MSCI All World ex US Hedged Equity Fund | ||||||||||||||||||||||||
Barclays Bank PLC | $ | 20,090 | $ | (11,436 | ) | $ | 8,654 | $ | 11,436 | $ | (11,436 | ) | $ | — | ||||||||||
JP Morgan & Chase Co. | 20,031 | (11,474 | ) | 8,557 | 11,474 | (11,474 | ) | — | ||||||||||||||||
The Bank of New York Mellon | 147 | (147 | ) | — | 268 | (147 | ) | 121 | ||||||||||||||||
|
|
|
|
|
|
|
|
|
|
|
| |||||||||||||
| $ | 40,268 | $ | (23,057 | ) | $ | 17,211 | $ | 23,178 | $ | (23,057 | ) | $ | 121 | |||||||||||
|
|
|
|
|
|
|
|
|
|
|
| |||||||||||||
128
DBX ETF Trust
NOTES TO FINANCIAL STATEMENTS (Continued)
Fund | Gross Amounts of Assets Presented in the Statement of Assets and Liabilities | Financial Instruments and Derivatives Available for Offset | Net Amount of Derivatives Assets | Gross Amounts of Liabilities Presented in the Statement of Assets and Liabilities | Financial Instruments and Derivatives Available for Offset | Net Amount of Derivatives Liabilities | ||||||||||||||||||
| db X-trackers MSCI South Korea Hedged Equity Fund | ||||||||||||||||||||||||
Barclays Bank PLC | $ | 2,177 | $ | (2,177 | ) | $ | — | $ | 36,553 | $ | (2,177 | ) | $ | 34,376 | ||||||||||
JP Morgan & Chase Co. | 298 | (298 | ) | — | 35,734 | (298 | ) | 35,436 | ||||||||||||||||
The Bank of New York Mellon | 735 | (735 | ) | — | 1,733 | (735 | ) | 998 | ||||||||||||||||
|
|
|
|
|
|
|
|
|
|
|
| |||||||||||||
| $ | 3,210 | $ | (3,210 | ) | $ | — | $ | 74,020 | $ | (3,210 | ) | $ | 70,810 | |||||||||||
|
|
|
|
|
|
|
|
|
|
|
| |||||||||||||
| db X-trackers MSCI Mexico Hedged Equity Fund | ||||||||||||||||||||||||
Barclays Bank PLC | $ | 1,644 | $ | (1,644 | ) | $ | — | $ | 51,431 | $ | (1,644 | ) | $ | 49,787 | ||||||||||
JP Morgan & Chase Co. | 1,473 | (1,473 | ) | — | 50,079 | (1,473 | ) | 48,606 | ||||||||||||||||
The Bank of New York Mellon | 40 | (40 | ) | — | 107 | (40 | ) | 67 | ||||||||||||||||
|
|
|
|
|
|
|
|
|
|
|
| |||||||||||||
| $ | 3,157 | $ | (3,157 | ) | $ | — | $ | 101,617 | $ | (3,157 | ) | $ | 98,460 | |||||||||||
|
|
|
|
|
|
|
|
|
|
|
| |||||||||||||
3. Investment Advisory and Other Agreements
The Advisor has overall responsibility for the general management and administration of the Funds, subject to the supervision of the Funds’ Board of Trustees. Under an investment advisory agreement between the Trust, on behalf of the Funds, and the Advisor (the “Investment Advisory Agreement”), the Advisor is responsible for arranging sub-advisory, transfer agency, custody, fund administration, and all other non-distribution related services for the Funds to operate. The Advisor is also responsible for employing any sampling strategy for the Funds.
TDAM USA Inc. (“TDAM”) acts as investment sub-advisor to each Fund. TDAM is responsible for day-to-day management of the Funds, subject to the replication strategy for each Fund with regard to its underlying index and for general administration, compliance and management services as may be agreed between the Advisor and TDAM from time to time.
For its investment advisory services to the Funds below, the Advisor is entitled to receive a unitary management fee from each Fund at an annual rate equal to:
Fund | Management Fee | |||
db X-trackers MSCI Brazil Hedged Equity Fund | 0.60 | % | ||
db X-trackers MSCI EAFE Hedged Equity Fund | 0.35 | % | ||
db X-trackers MSCI Emerging Markets Hedged Equity Fund | 0.65 | % | ||
db X-trackers MSCI Germany Hedged Equity Fund | 0.50 | % | ||
db X-trackers MSCI Japan Hedged Equity Fund | 0.50 | % | ||
db X-trackers MSCI Asia Pacific ex Japan Hedged Equity Fund | 0.60 | % | ||
db X-trackers MSCI Europe Hedged Equity Fund | 0.45 | % | ||
db X-trackers MSCI United Kingdom Hedged Equity Fund | 0.45 | % | ||
db X-trackers MSCI All World ex US Hedged Equity Fund | 0.40 | % | ||
db X-trackers MSCI South Korea Hedged Equity Fund | 0.58 | % | ||
db X-trackers MSCI Mexico Hedged Equity Fund | 0.50 | % | ||
Effective January 7, 2014, for its investment advisory services to the Funds below, the Advisor is entitled to receive a unitary management fee from each Fund at an annual rate equal to:
Fund | Management Fee | |||
db X-trackers MSCI Germany Hedged Equity Fund | 0.45 | % | ||
db X-trackers MSCI Japan Hedged Equity Fund | 0.45 | % | ||
Out of the unitary management fee, the Advisor pays substantially all expenses of each Fund, including the payments to the sub-advisor, the cost of transfer agency, custody, fund administration, legal, audit and other services and effective October 1, 2013, expenses of the Independent Trustees. Each Fund is responsible for the payment of, interest expense, taxes, brokerage expenses, expenses of the Independent Trustees through September 30, 2013, and extraordinary expenses.
129
DBX ETF Trust
NOTES TO FINANCIAL STATEMENTS (Continued)
For the period from June 1, 2013 through September 30, 2013, the Advisor contractually agreed to waive fees and/or reimburse expenses in order to limit net annual operating expenses to the following amounts of its average daily net assets, except for interest expense, brokerage expenses, distribution fees or expenses, litigation expenses and any other extraordinary expenses (the “Expense Cap”):
db X-trackers MSCI Brazil Hedged Equity Fund | 0.60 | % | ||
db X-trackers MSCI EAFE Hedged Equity Fund | 0.35 | % | ||
db X-trackers MSCI Emerging Markets Hedged Equity Fund | 0.65 | % | ||
db X-trackers MSCI Germany Hedged Equity Fund | 0.50 | % | ||
db X-trackers MSCI Japan Hedged Equity Fund | 0.50 | % |
The Advisor pays TDAM a fee based on a percentage of daily net assets for each of the Funds listed below:
Fund
db X-trackers MSCI Brazil Hedged Equity Fund
| • | 0.20% on the first $100 million in daily net assets |
| • | 0.12% on the next $400 million in daily net assets |
| • | 0.06% in excess of $500 million in daily net assets |
db X-trackers MSCI EAFE Hedged Equity Fund
| • | 0.12% on the first $100 million in daily net assets |
| • | 0.08% on the next $400 million in daily net assets |
| • | 0.04% in excess of $500 million in daily net assets |
db X-trackers MSCI Emerging Markets Hedged Equity Fund
| • | 0.20% on the first $100 million in daily net assets |
| • | 0.15% on the next $400 million in daily net assets |
| • | 0.06% in excess of $500 million in daily net assets |
db X-trackers MSCI Germany Hedged Equity Fund
| • | 0.15% on the first $100 million in daily net assets |
| • | 0.07% on the next $400 million in daily net assets |
| • | 0.04% in excess of $500 million in daily net assets |
db X-trackers MSCI Japan Hedged Equity Fund
| • | 0.15% on the first $100 million in daily net assets |
| • | 0.07% on the next $400 million in daily net assets |
| • | 0.04% in excess of $500 million in daily net assets |
db X-trackers MSCI Asia Pacific ex Japan Hedged Equity Fund
| • | 0.20% on the first $100 million in daily net assets |
| • | 0.12% on the next $400 million in daily net assets |
| • | 0.06% in excess of $500 million in daily net assets |
db X-trackers MSCI Europe Hedged Equity Fund
| • | 0.15% on the first $100 million in daily net assets |
| • | 0.07% on the next $400 million in daily net assets |
| • | 0.04% in excess of $500 million in daily net assets |
130
DBX ETF Trust
NOTES TO FINANCIAL STATEMENTS (Continued)
Fund
db X-trackers MSCI United Kingdom Hedged Equity Fund
| • | 0.15% on the first $100 million in daily net assets |
| • | 0.07% on the next $400 million in daily net assets |
| • | 0.04% in excess of $500 million in daily net assets |
db X-trackers MSCI All World ex US Hedged Equity Fund
| • | 0.15% on the first $100 million in daily net assets |
| • | 0.08% on the next $400 million in daily net assets |
| • | 0.04% in excess of $500 million in daily net assets |
db X-trackers MSCI South Korea Hedged Equity Fund
| • | 0.20% on the first $100 million in daily net assets |
| • | 0.12% on the next $400 million in daily net assets |
| • | 0.06% in excess of $500 million in daily net assets |
db X-trackers MSCI Mexico Hedged Equity Fund
| • | 0.20% on the first $100 million in daily net assets |
| • | 0.12% on the next $400 million in daily net assets |
| • | 0.06% in excess of $500 million in daily net assets |
The total aggregate fees paid by the Advisor to TDAM will be at least $650,000 per year.
The Bank of New York Mellon, a wholly-owned subsidiary of The Bank of New York Mellon Corporation, serves as Administrator, Custodian, Accounting Agent and Transfer Agent for each Fund.
ALPS Distributors, Inc. (the “Distributor”) serves as the distributor of Creation Units for each Fund on an agency basis. The Distributor does not maintain a secondary market in shares of the Funds.
The Board of Trustees is currently comprised of four Trustees, of whom three are Independent Trustees. The Fund paid retainer fees to each Trustee not affiliated with the Advisor, plus a specified amount to the Audit Committee. Prior to October 1, 2013, Trustees’ fees and expenses were allocated among the Funds based on each Fund’s relative average daily net assets. Effective October 1, 2013, the Advisor pays the fees and expenses of the Independent Trustees for each Fund.
4. Federal Income Taxes
As of May 31, 2014, the components of accumulated earnings (losses) were as follows:
Fund | Undistributed Net Investment Income | Undistributed Long-Term Capital Gains | Net Accumulated Capital and Other Gains (Losses) | Unrealized Appreciation (Depreciation) | Total Accumulated Earnings (Losses) | |||||||||||||||
db X-trackers MSCI Brazil Hedged Equity Fund | $ | — | $ | — | $ | (2,451,589 | ) | $ | (580,696 | ) | $ | (3,032,285 | ) | |||||||
db X-trackers MSCI EAFE Hedged Equity Fund | 7,359,037 | — | (95,145 | ) | 28,103,183 | 35,367,075 | ||||||||||||||
db X-trackers MSCI Emerging Markets Hedged Equity Fund | — | — | (1,151,430 | ) | 1,182,346 | 30,916 | ||||||||||||||
db X-trackers MSCI Germany Hedged Equity Fund | 678,271 | — | (496,409 | ) | 2,747,326 | 2,929,188 | ||||||||||||||
db X-trackers MSCI Japan Hedged Equity Fund | 6,585,855 | — | (1,262,084 | ) | (13,275,149 | ) | (7,951,378 | ) | ||||||||||||
db X-trackers MSCI Asia Pacific ex Japan Hedged Equity Fund | — | — | (27,028 | ) | 374,973 | 347,945 | ||||||||||||||
db X-trackers MSCI Europe Hedged Equity Fund | 1,842,992 | — | — | 2,210,193 | 4,053,185 | |||||||||||||||
db X-trackers MSCI United Kingdom Hedged Equity Fund | — | — | — | 279,893 | 279,893 | |||||||||||||||
db X-trackers MSCI All World ex US Hedged Equity Fund | 5,506 | — | — | 106,602 | 112,108 | |||||||||||||||
db X-trackers MSCI South Korea Hedged Equity Fund | — | — | (279,968 | ) | 249,458 | (30,510 | ) | |||||||||||||
db X-trackers MSCI Mexico Hedged Equity Fund | — | — | (204,009 | ) | 57,816 | (146,193 | ) | |||||||||||||
131
DBX ETF Trust
NOTES TO FINANCIAL STATEMENTS (Continued)
The tax character of dividends and distributions declared for the years ended May 31, 2014 and May 31, 2013 were as follows:
| Year Ended May 31, 2014 | ||||||||
Fund | Ordinary Income | Return of Capital | ||||||
db X-trackers MSCI Brazil Hedged Equity Fund | $ | 913,085 | $ | 10,791 | ||||
db X-trackers MSCI EAFE Hedged Equity Fund | 1,788,671 | — | ||||||
db X-trackers MSCI Emerging Markets Hedged Equity Fund | 283,194 | — | ||||||
db X-trackers MSCI Germany Hedged Equity Fund | 170,600 | — | ||||||
db X-trackers MSCI Japan Hedged Equity Fund | 2,980,876 | — | ||||||
db X-trackers MSCI Asia Pacific ex Japan Hedged Equity Fund | 2,908 | — | ||||||
db X-trackers MSCI Europe Hedged Equity Fund | 72,633 | — | ||||||
db X-trackers MSCI United Kingdom Hedged Equity Fund | 84,384 | — | ||||||
| Year Ended May 31, 2013 | ||||||||
Fund | Ordinary Income | Long-Term | ||||||
db X-trackers MSCI Brazil Hedged Equity Fund | $ | 116,270 | $ | 254,690 | ||||
db X-trackers MSCI EAFE Hedged Equity Fund | 1,123,541 | 1,053,575 | ||||||
db X-trackers MSCI Emerging Markets Hedged Equity Fund | 80,337 | 50,049 | ||||||
db X-trackers MSCI Germany Hedged Equity Fund | 89,599 | 85,500 | ||||||
db X-trackers MSCI Japan Hedged Equity Fund | 81,785 | — | ||||||
At May 31, 2014, for Federal income tax purposes, the Funds have capital loss carryforwards available as shown in the table below, as provided by regulations, to offset future capital gains. To the extent that these loss carryforwards are used to offset future capital gains, it is probable that the capital gains so offset will not be distributed to shareholders.
| Post-effective-no expiration short-term | Post-effective-no expiration long-term | Total Amount | ||||||||||
db X-trackers MSCI Brazil Hedged Equity Fund | $ | 847,129 | $ | 1,385,419 | $ | 2,232,548 | ||||||
db X-trackers MSCI EAFE Hedged Equity Fund | — | 6,337 | 6,337 | |||||||||
db X-trackers MSCI Emerging Markets Hedged Equity Fund | 252,765 | 495,350 | 748,115 | |||||||||
db X-trackers MSCI Germany Hedged Equity Fund | 20,778 | 474,496 | 495,274 | |||||||||
db X-trackers MSCI Japan Hedged Equity Fund | — | 10,110 | 10,110 | |||||||||
Under the Regulated Investment Company Modernization Act of 2010 (the “Act”), the Funds will be permitted to carry forward capital losses for an unlimited period.
Capital losses incurred after October 31 (“post-October losses”) within the taxable year are deemed to arise on the first business day of each Fund’s next taxable year.
During the fiscal year ended May 31, 2014, the Funds incurred and elected to defer net capital losses as follows:
| Late Year Ordinary Losses | Post-October Losses on Capital | |||||||
db X-trackers MSCI Brazil Hedged Equity Fund | $ | 146,525 | $ | 72,516 | ||||
db X-trackers MSCI EAFE Hedged Equity Fund | — | 88,808 | ||||||
db X-trackers MSCI Emerging Markets Hedged Equity Fund | 358,257 | 45,058 | ||||||
db X-trackers MSCI Germany Hedged Equity Fund | — | 1,135 | ||||||
db X-trackers MSCI Japan Hedged Equity Fund | — | 1,251,974 | ||||||
db X-trackers MSCI Asia-Pacific Fund | — | 27,028 | ||||||
db X-trackers MSCI South Korea Hedged Equity Fund | 279,968 | — | ||||||
db X-trackers MSCI Mexico Hedged Equity Fund | 197,261 | 6,748 | ||||||
In order to present paid-in capital and accumulated net realized gains or losses on the Statements of Assets and Liabilities that more closely represent their tax character, certain adjustments have been made to additional paid-in capital,
132
DBX ETF Trust
NOTES TO FINANCIAL STATEMENTS (Continued)
undistributed net investment income or loss and accumulated net realized gains or losses on investments. These differences are primarily due to currency gain/(loss), Passive Foreign Investment Companies (“PFICs”) and redemptions-in-kind. For the fiscal year ended May 31, 2014, the adjustments were as follows:
Fund | Undistributed Net Investment Income (Loss) | Undistributed Capital Gains (Accumulated Losses) | Paid-in Capital | |||||||||
db X-trackers MSCI Brazil Hedged Equity Fund | $ | 606,511 | $ | (606,511 | ) | $ | — | |||||
db X-trackers MSCI EAFE Hedged Equity Fund | (8,124,433 | ) | 8,124,433 | — | ||||||||
db X-trackers MSCI Emerging Markets Hedged Equity Fund | (265,986 | ) | 267,190 | (1,204 | ) | |||||||
db X-trackers MSCI Germany Hedged Equity Fund | (793,996 | ) | 793,996 | — | ||||||||
db X-trackers MSCI Japan Hedged Equity Fund | 5,579,446 | (7,959,994 | ) | 2,380,548 | ||||||||
db X-trackers MSCI Asia Pacific ex Japan Hedged Equity Fund | (59,782 | ) | 74,435 | (14,653 | ) | |||||||
db X-trackers MSCI Europe Hedged Equity Fund | (540,468 | ) | 540,468 | — | ||||||||
db X-trackers MSCI United Kingdom Hedged Equity Fund | (216,137 | ) | 216,758 | (621 | ) | |||||||
db X-trackers MSCI All World ex US Hedged Equity Fund | (105,524 | ) | 105,524 | — | ||||||||
db X-trackers MSCI South Korea Hedged Equity Fund | (204,645 | ) | 206,796 | (2,151 | ) | |||||||
db X-trackers MSCI Mexico Hedged Equity Fund | (112,091 | ) | 112,091 | — | ||||||||
As of May 31, 2014, the cost of investments for Federal income tax purposes and the aggregated gross unrealized appreciation/depreciation on investments were as follows:
| Cost | Net Unrealized Appreciation (Depreciation) | Gross Unrealized Appreciation | Gross Unrealized (Depreciation) | |||||||||||||
db X-trackers MSCI Brazil Hedged Equity Fund | $ | 6,369,733 | $ | (580,617 | ) | $ | 210,494 | $ | (791,111 | ) | ||||||
db X-trackers MSCI EAFE Hedged Equity Fund | 530,054,591 | 27,989,693 | 35,750,443 | (7,760,750 | ) | |||||||||||
db X-trackers MSCI Emerging Markets Hedged Equity Fund | 27,681,537 | 1,237,034 | 2,429,605 | (1,192,571 | ) | |||||||||||
db X-trackers MSCI Germany Hedged Equity Fund | 42,020,289 | 2,725,700 | 3,159,097 | (433,397 | ) | |||||||||||
db X-trackers MSCI Japan Hedged Equity Fund | 449,340,111 | (13,255,908 | ) | 11,731,437 | (24,987,345 | ) | ||||||||||
db X-trackers MSCI Asia Pacific ex Japan Hedged Equity Fund | 6,214,121 | 384,393 | 538,792 | (154,399 | ) | |||||||||||
db X-trackers MSCI Europe Hedged Equity Fund | 159,993,231 | 2,186,360 | 3,325,835 | (1,139,475 | ) | |||||||||||
db X-trackers MSCI United Kingdom Hedged Equity Fund | 4,973,640 | 280,028 | 495,827 | (215,799 | ) | |||||||||||
db X-trackers MSCI All World ex US Hedged Equity Fund | 4,971,071 | 107,793 | 276,051 | (168,258 | ) | |||||||||||
db X-trackers MSCI South Korea Hedged Equity Fund | 4,781,389 | 249,458 | 383,462 | (134,004 | ) | |||||||||||
db X-trackers MSCI Mexico Hedged Equity Fund | 4,806,788 | 57,816 | 191,972 | (134,156 | ) | |||||||||||
5. Investments in Affiliates
The Advisor is a wholly-owned subsidiary of Deutsche Bank AG. Therefore, Deutsche Bank AG is considered to be affiliated with the Funds. The table below shows the transactions in and earnings from investments in Deutsche Bank AG securities for the year ended May 31, 2014.
| Fair Value 5/31/13 | Purchases at Cost | Proceeds from Sales | Change in Unrealized Appreciation/ (Depreciation) | Realized Gain (Loss) | Fair Value 05/31/14 | Dividend Income | ||||||||||||||||||||||
db X-trackers MSCI EAFE Hedged Equity Fund | ||||||||||||||||||||||||||||
Deutsche Bank AG (Common Stock) | $ | 300,180 | $ | 1,667,694 | $ | (26,193 | ) | $ | (249,464 | ) | $ | (3,672 | ) | $ | 1,688,545 | $ | 42,612 | |||||||||||
db X-trackers MSCI Germany Hedged Equity Fund | ||||||||||||||||||||||||||||
Deutsche Bank AG (Common Stock) | $ | 204,199 | $ | 1,621,506 | $ | (86,398 | ) | $ | (272,494 | ) | $ | (7,169 | ) | $ | 1,459,644 | $ | 36,328 | |||||||||||
db X-trackers MSCI Europe Hedged Equity Fund | ||||||||||||||||||||||||||||
Deutsche Bank AG (Common Stock) | $ | — | $ | 784,586 | $ | (5,053 | ) | $ | (50,338 | ) | $ | (447 | ) | $ | 728,748 | $ | 13,263 | |||||||||||
db X-trackers MSCI All World ex US Hedged Equity Fund | ||||||||||||||||||||||||||||
Deutsche Bank AG (Common Stock) | $ | — | $ | 13,999 | $ | — | $ | (2,819 | ) | $ | — | $ | 11,180 | $ | 282 | |||||||||||||
133
DBX ETF Trust
NOTES TO FINANCIAL STATEMENTS (Continued)
6. Investment Portfolio Transactions
For the year ended May 31, 2014, the cost of investments purchased and proceeds from sale of investments (excluding in-kind transactions and short-term investments) were as follows:
| Purchases | Sales | |||||||
db X-trackers MSCI Brazil Hedged Equity Fund | $ | 4,230,035 | $ | 4,883,919 | ||||
db X-trackers MSCI EAFE Hedged Equity Fund | 30,989,734 | 27,421,394 | ||||||
db X-trackers MSCI Emerging Markets Hedged Equity Fund | 12,454,771 | 3,161,159 | ||||||
db X-trackers MSCI Germany Hedged Equity Fund | 3,780,486 | 2,557,673 | ||||||
db X-trackers MSCI Japan Hedged Equity Fund | 38,705,201 | 36,007,064 | ||||||
db X-trackers MSCI Asia Pacific ex Japan Hedged Equity Fund1 | 6,263,829 | 1,219,801 | ||||||
db X-trackers MSCI Europe Hedged Equity Fund1 | 11,218,663 | 1,499,490 | ||||||
db X-trackers MSCI United Kingdom Hedged Equity Fund1 | 5,543,560 | 570,773 | ||||||
db X-trackers MSCI All World ex US Hedged Equity Fund2 | 5,123,616 | 160,815 | ||||||
db X-trackers MSCI South Korea Hedged Equity Fund2 | 5,152,799 | 408,716 | ||||||
db X-trackers MSCI Mexico Hedged Equity Fund2 | 5,126,467 | 312,399 | ||||||
| 1 | For the period October 1, 2013 through May 31, 2014. |
| 2 | For the period January 23, 2014 through May 31, 2014. |
For the year ended May 31, 2014, the cost of in-kind purchases and proceeds from in-kind sales were as follows:
| Purchases | Sales | |||||||
db X-trackers MSCI Brazil Hedged Equity Fund | $ | — | $ | — | ||||
db X-trackers MSCI EAFE Hedged Equity Fund | 452,896,954 | — | ||||||
db X-trackers MSCI Emerging Markets Hedged Equity Fund | 9,662,700 | — | ||||||
db X-trackers MSCI Germany Hedged Equity Fund | 36,415,531 | — | ||||||
db X-trackers MSCI Japan Hedged Equity Fund | 357,848,042 | 25,533,478 | ||||||
db X-trackers MSCI Asia Pacific ex Japan Hedged Equity Fund1 | 1,183,387 | — | ||||||
db X-trackers MSCI Europe Hedged Equity Fund1 | 150,531,367 | — | ||||||
db X-trackers MSCI United Kingdom Hedged Equity Fund1 | — | — | ||||||
db X-trackers MSCI All World ex US Hedged Equity Fund2 | — | — | ||||||
db X-trackers MSCI South Korea Hedged Equity Fund2 | — | — | ||||||
db X-trackers MSCI Mexico Hedged Equity Fund2 | — | — | ||||||
| 1 | For the period October 1, 2013 through May 31, 2014. |
| 2 | For the period January 23, 2014 through May 31, 2014. |
7. Fund Share Transactions
As of May 31, 2014, there were unlimited Fund shares of $0.0001 par value authorized by the Trust. Fund shares are issued and redeemed by each Fund only in Creation Units or multiples thereof. Except when aggregated in Creation Units, shares of each Fund are not redeemable. Transactions in capital shares for each Fund are disclosed in detail in the Statements of Changes in Net Assets. The consideration for the purchase of Creation Units of a Fund generally consists of the in-kind contribution of a designated portfolio of securities constituting a portfolio sampling representation of the securities included in the respective Fund’s Underlying Index and an amount of cash, which under certain circumstances may include cash in lieu of portfolio securities. The purchase of Creation Units for db X-trackers Brazil Hedged Equity Fund are generally issued in exchange for a specific amount of cash totaling the NAV of the Creation Units. Investors purchasing and redeeming Creation Units pay a purchase transaction fee and a redemption transaction fee to offset transfer and other transaction costs associated with the issuance and redemption of Creation Units.
8. Investing in Emerging Markets
Investment in emerging markets subjects a Fund to a greater risk of loss than investments in a developed market. This is due to, among other things, (i) greater market volatility, (ii) lower trading volume, (iii) political and economic instability, (iv) high levels of inflations, deflation or currency devaluation, (v) greater risk of market shut down, (vi) more governmental limitations on foreign investments and limitations on repatriation of invested capital than those typically found in a developed market, and (vii) the risk that companies may be held to lower disclosure, corporate governance, auditing and financial reporting standards than companies in more developed markets.
134
DBX ETF Trust
NOTES TO FINANCIAL STATEMENTS (Continued)
The financial stability of issuers (including governments) in emerging market countries may be more precarious than in other countries. As a result, there will tend to be an increased risk of price volatility in a Fund’s investments in emerging market countries, which may be magnified by currency fluctuations relative to the U.S. dollar.
Settlement practices for transactions in foreign markets may differ from those in U.S. markets. Such differences include delays beyond periods customary in the United States and practices, such as delivery of securities prior to receipt of payment, which increase the likelihood of a “failed settlement.” Failed settlements can result in losses to a Fund. Low trading volumes and volatile prices in less developed markets make trades harder to complete and settle, and governments or trade groups may compel local agents to hold securities in designated depositories that are not subject to independent evaluation. Local agents are held only to the standards of care of their local markets.
9. Line of Credit
Effective October 24, 2013 the Trust entered into a senior unsecured credit facility with a commercial bank which allows the db X-trackers MSCI Emerging Markets Hedged Equity Fund, and certain other funds managed by the Advisor, to borrow up to $100 million.
The Fund may borrow money under this credit facility to the extent necessary for temporary or emergency purposes, including the funding of shareholder redemption requests, trade settlements, and as necessary to distribute to shareholders any income necessary to maintain the Fund’s status as a regulated investment company. Borrowings are charged an interest rate of 1.25% per annum plus the greater of the Federal Funds Effective Rate or the one-month LIBOR Rate. The Fund had no loans outstanding at May 31, 2014.
10. Concentration of Ownership
From time to time, the Funds may have a concentration of several shareholder accounts holding a significant percentage of shares outstanding. Investment activities of these shareholders could have a material impact on the Fund. At May 31, 2014, there was one affiliated shareholder account for each of the funds listed below holding a significant percentage of the shares outstanding:
Fund Name | Approximate Percent of Outstanding Shares Held | |||
db X-trackers MSCI United Kingdom Hedged Equity Fund | 88 | % | ||
db X-trackers MSCI Asia Pacific ex-Japan Hedged Equity Fund | 66 | % | ||
db X-trackers MSCI All World ex US Hedged Equity Fund | 50 | % | ||
db X-trackers MSCI South Korea Hedged Equity Fund | 50 | % | ||
db X-trackers MSCI Mexico Hedged Equity Fund | 50 | % | ||
11. Fund Name Change
Effective August 11, 2014, the “db X-trackers Funds” will be rebranded “Deutsche X-trackers ETFs.” As a result the Funds will be renamed as follows:
Current Fund Name | New Fund Name | |
| db X-trackers MSCI Brazil Hedged Equity Fund | Deutsche X-trackers MSCI Brazil Hedged Equity ETF | |
| db X-trackers MSCI EAFE Hedged Equity Fund | Deutsche X-trackers MSCI EAFE Hedged Equity ETF | |
| db X-trackers MSCI Emerging Markets Hedged Equity Fund | Deutsche X-trackers MSCI Emerging Markets Hedged Equity ETF | |
| db X-trackers MSCI Germany Hedged Equity Fund | Deutsche X-trackers MSCI Germany Hedged Equity ETF | |
| db X-trackers MSCI Japan Hedged Equity Fund | Deutsche X-trackers MSCI Japan Hedged Equity ETF | |
| db X-trackers MSCI Asia Pacific ex Japan Hedged Equity Fund | Deutsche X-trackers MSCI Asia Pacific ex Japan Hedged Equity ETF | |
| db X-trackers MSCI Europe Hedged Equity Fund | Deutsche X-trackers MSCI Europe Hedged Equity ETF | |
| db X-trackers MSCI United Kingdom Hedged Equity Fund | Deutsche X-trackers MSCI United Kingdom Hedged Equity ETF | |
| db X-trackers MSCI All World ex US Hedged Equity Fund | Deutsche X-trackers MSCI All World ex US Hedged Equity ETF | |
| db X-trackers MSCI South Korea Hedged Equity Fund | Deutsche X-trackers MSCI South Korea Hedged Equity ETF | |
| db X-trackers MSCI Mexico Hedged Equity Fund | Deutsche X-trackers MSCI Mexico Hedged Equity ETF |
135
DBX ETF Trust
REPORT OF INDEPENDENT REGISTERED PUBLIC ACCOUNTING FIRM
To Board of Trustees and Shareholders of
DBX ETF Trust:
We have audited the accompanying statements of assets and liabilities, including the schedules of investments, of db X-trackers MSCI Brazil Hedged Equity Fund, db X-trackers MSCI EAFE Hedged Equity Fund, db X-trackers MSCI Emerging Markets Hedged Equity Fund, db X-trackers MSCI Germany Hedged Equity Fund, db X-trackers MSCI Japan Hedged Equity Fund, db X-trackers MSCI Asia Pacific ex Japan Hedged Equity Fund, db X-trackers MSCI Europe Hedged Equity Fund, db X-trackers MSCI United Kingdom Hedged Equity Fund, db X-trackers MSCI All World ex US Hedged Equity Fund, db X-trackers MSCI South Korea Hedged Equity Fund and db X-trackers MSCI Mexico Hedged Equity Fund (the “Funds” within DBX ETF Trust), as of May 31, 2014, and the related statements of operations and changes in net assets and the financial highlights for each of the periods indicated therein. These financial statements and financial highlights are the responsibility of the Funds’ management. Our responsibility is to express an opinion on these financial statements and financial highlights based on our audits.
We conducted our audits in accordance with the standards of the Public Company Accounting Oversight Board (United States). Those standards require that we plan and perform the audit to obtain reasonable assurance about whether the financial statements and financial highlights are free of material misstatement. We were not engaged to perform an audit of the Funds’ internal control over financial reporting. Our audits included consideration of internal control over financial reporting as a basis for designing audit procedures that are appropriate in the circumstances, but not for the purpose of expressing an opinion on the effectiveness of the Funds’ internal control over financial reporting. Accordingly, we express no such opinion. An audit also includes examining, on a test basis, evidence supporting the amounts and disclosures in the financial statements and the financial highlights, assessing the accounting principles used and significant estimates made by management, and evaluating the overall financial statement presentation. Our procedures included confirmation of securities owned as of May 31, 2014, by correspondence with the custodian and brokers or by other appropriate auditing procedures where replies from brokers were not received. We believe that our audits provide a reasonable basis for our opinion.
In our opinion, the financial statements and financial highlights referred to above present fairly, in all material respects, the financial positions of db X-trackers MSCI Brazil Hedged Equity Fund, db X-trackers MSCI EAFE Hedged Equity Fund, db X-trackers MSCI Emerging Markets Hedged Equity Fund, db X-trackers MSCI Germany Hedged Equity Fund, db X-trackers MSCI Japan Hedged Equity Fund, db X-trackers MSCI Asia Pacific ex Japan Hedged Equity Fund, db X-trackers MSCI Europe Hedged Equity Fund, db X-trackers MSCI United Kingdom Hedged Equity Fund, db X-trackers MSCI All World ex US Hedged Equity Fund, db X-trackers MSCI South Korea Hedged Equity Fund and db X-trackers MSCI Mexico Hedged Equity Fund at May 31, 2014, the results of their operations, changes in their net assets and financial highlights for each of the periods therein in conformity with U.S. generally accepted accounting principles.

New York, New York
July 24, 2014
136
DBX ETF Trust
OFFICERS AND TRUSTEES (Unaudited)
| Name, Address, and Age | Position(s) Held with Fund | Term of Office and Length of Time Served | Principal Occupation(s) During Past 5 Years | Number of Portfolios in Fund Complex Overseen by Trustee | Other Directorships held by Trustee | |||||
Independent Trustees: | ||||||||||
J. David Officer Age: 65 60 Wall Street New York, New York 10005 | Trustee, Member of the Audit and Nominating Committees | Since 2011 | Independent Director; Formerly, Vice Chairman, The Dreyfus Corporation (1998-2009); Chief Operating Officer, The Dreyfus Corporation (2006-2009); President, The Dreyfus Family of Funds, Inc. (2006-2009). | 17 | Ilex Partners (Asia), LLC; Old Westbury Funds: & MAN Long/Short Fund; GLG Investment Series Trust; The Dreyfus Corporation; MBSC Securities Corporation; Dreyfus Services Corporation; MBSC, LLC; Dreyfus Transfer, Inc.; Dreyfus Service Organization, Inc.; Mellon Residential Funding Corp.; Mellon United National Bank; Laurel Capital Advisors; Mellon United National Bank; Dreyfus Founders Funds, Inc.; Founders Asset Management. | |||||
Stephen R. Byers Age: 60 60 Wall Street New York, New York 10005 | Trustee, Member and Chairman of the Audit and Nominating Committees | Since 2011 | Retired. Previously, Chief Investment Officer, The Dreyfus Corporation (2000-2006). | 17 | Sierra Income Corporation; College of William and Mary, Graduate School of Business. | |||||
George O. Elston Age: 49 60 Wall Street New York, New York 10005 | Trustee, Member of the Audit and Nominating Committees | Since 2011 | M&A Advisor, Chief Financial, Operating and Business Officer, Optherion, Inc. (2008-2010); and Vice President, Finance and Government Affairs, Secretary and Treasurer, Elusys Therapeutics, Inc. (2000-2007). | 17 | Celldex Therapeutics. | |||||
137
DBX ETF Trust
OFFICERS AND TRUSTEES (Unaudited) (Continued)
| Name, Address, and Age | Position(s) Held with Fund | Term of Office and Length of Time Served | Principal Occupation(s) During Past 5 Years | Number of Portfolios in Fund Complex Overseen by Trustee | Other Directorships held by Trustee | |||||
Interested Trustee/Officers:* | ||||||||||
Alex Depetris Age: 34 60 Wall Street New York, New York 10005 | Trustee, Chairman of the Board, President, Chief Executive Officer and Secretary | Since 2010 | Director in the Deutsche Asset and Wealth Management Passive Asset Management Group at Deutsche Bank AG since 2008; Associate, Arnold & Porter, 2006-2008. | 22 | Director, Chairman of the Board of db-X Exchange Traded Funds Inc. and DBX ETF Trust. | |||||
Martin Kremenstein Age: 37 60 Wall Street New York, New York 10005 | Chief Operating Officer | Since 2010 | Managing Director in the DBX Group at Deutsche Bank AG with responsibility for providing investor solutions to the DB sales force in North America since 2006. | N/A | N/A | |||||
Michael Gilligan Age: 47 60 Wall Street New York, New York 10005 | Treasurer, Chief Financial Officer and Controller. | Since 2010 | Director in the Finance Group at Deutsche Bank AG with CFO responsibility for DBX Advisors LLC, DBX Strategic Advisors LLC and DB Commodity Services LLC since 2008; Chief Operating Officer, Americas Credit Trading, Credit Suisse, 2007-2008. | N/A | N/A | |||||
Frank Gecsedi Age: 46 60 Wall Street New York, New York 10005 | Chief Compliance Officer | Since 2010 | Vice President in Deutsche Bank’s Global Markets Legal, Risk and Capital Division since 2010; Vice President and Compliance Manager at Bank of America Merrill Lynch (formerly Merrill Lynch), (2000 to 2010). | N/A | N/A | |||||
* Officers/Trustee of the Company are “interested persons” as defined in the 1940 Act.
The Funds’ SAI includes additional information about the Funds’ Directors and is available by calling 855-329-3837, or on the Company’s website at www.dbxus.com.
138
DBX ETF Trust
BOARD CONSIDERATIONS IN APPROVAL OF INVESTMENT ADVISORY AND SUB-ADVISORY CONTRACTS (Unaudited)
db X-trackers MSCI Emerging Markets Hedged Equity Fund, db X-trackers MSCI EAFE Hedged Equity Fund, db X-trackers MSCI Brazil Hedged Equity Fund, db X-trackers MSCI Germany Hedged Equity Fund and db X-trackers MSCI Japan Hedged Equity Fund:
At a meeting held on February 25, 2014, the Board of Trustees, including the Independent Trustees (those not affiliated with the Trust or its service providers), unanimously approved the continuance of the Investment Advisory Agreement and the Sub-Advisory Agreements (together, the “Agreements”) with respect to db X-trackers MSCI Emerging Markets Hedged Equity Fund, db X-trackers MSCI EAFE Hedged Equity Fund, db X-trackers MSCI Brazil Hedged Equity Fund, db X-trackers MSCI Germany Hedged Equity Fund and db X-trackers MSCI Japan Hedged Equity Fund (the “Funds”).
In reaching this decision with respect to the Investment Advisory Agreement (the “Advisory Agreement”), the Board considered all factors it believed relevant, including (1) the nature, extent and quality of the services to be provided to the Funds and their shareholders; (2) the Adviser’s financial resources and its resulting ability to perform its obligations under the Advisory Agreement; (3) the competitiveness of the advisory fee; (4) the total cost of the services to be provided by and the profits that could be realized by the Adviser from its relationship with the Funds; and (5) the extent to which economies of scale would be realized as the Funds grow, and if the Funds’ shareholders would benefit from those economies.
In reaching this decision with respect to the Sub-Advisory agreement, the Board considered all factors it believed relevant, including (1) the nature, extent and quality of the services to be provided to the Funds and their shareholders; (2) the performance of TDAM with respect to its management of other funds of the Trust, as well as TDAM’s financial resources and its resulting ability to perform its obligations under the Sub-Advisory Agreement; (3) the total cost of the services to be provided by and the profits that could be realized by TDAM from its relationship with the Funds; and (4) the extent to which economies of scale would be realized as the Funds grow, and if the Funds’ shareholders would benefit from those economies.
The Board reached a determination, with the assistance of Trust Counsel and through the exercise of its business judgment, that approval of the Agreements and the compensation to be received thereunder is consistent with the Board’s duties under state and federal law. The Board reached this conclusion based on multiple factors.
The Board considered the following in determining whether to approve the Advisory Agreement:
Nature, Extent and Quality of Services. The Board reviewed in detail the nature, extent and quality of services to be provided by the Adviser under the Advisory Agreement. The Board noted that these services include, among other things, furnishing a continuous investment program for the Funds, including arranging for, or implementing, the purchase and sale of portfolio securities, the provision of general corporate services such as portfolio management compliance services and the preparation and filing of certain reports on behalf of the Trust.
The Board also considered, among other things, the professional experience and qualifications of the senior management and key professional personnel of the Adviser, including those individuals responsible for portfolio management. The Board considered that the Adviser provides, at its own expense, office facilities and equipment for use by the Funds and supervisory persons responsible for supervising and monitoring the Trust’s service providers. The Board also considered that the Adviser pays for the compensation of officers of the Trust who are also officers or employees of the Adviser, except as may otherwise be determined by the Board. The Board also considered that the Adviser arranges for the provision of transfer agency, custody, fund administration and accounting, and other non-distribution services necessary for each Fund’s operation.
The Board also considered the role to be played by the Adviser in working with the Sub-Adviser to manage the Funds’ portfolios, noting that the Adviser would provide oversight of day-to-day operations, including monitoring tracking error, providing services in connection with creation and redemption units and assistance in meeting legal and regulatory requirements applicable to the Funds.
The Board evaluated these factors in consultation with Trust Counsel. Based on its review, the Board concluded that the nature, extent, and quality of services to be provided by the Adviser under the Advisory Agreement are reasonable and appropriate in relation to the fees to be paid to the Adviser, taking special consideration of the fact that the advisory fee is a unitary fee and, as a result, a portion of the unitary advisory fee will be used to compensate the Funds’ service providers.
139
DBX ETF Trust
BOARD CONSIDERATIONS IN APPROVAL OF INVESTMENT ADVISORY AND SUB-ADVISORY CONTRACTS (Unaudited) (Continued)
The Board considered the staffing of the Adviser, including the training, qualifications and experience of investment personnel in managing the Funds. The Board also considered the expertise of the Adviser in supervising third party service providers to the Funds, such as the administrator and custodian. The Board further considered the compliance program of the Adviser which supports each Fund’s compliance program.
Adviser’s Financial Resources. In connection with the assessment of the ability of the Adviser to perform its duties under the Advisory Agreement, the Board considered the Adviser’s financial condition and whether it had the resources necessary to carry out its functions. The Board concluded that the Adviser had the financial resources necessary to perform its obligations under the Advisory Agreement.
Reasonableness of Advisory Fee. The Board compared each Fund’s proposed advisory fee to that of other exchange-traded funds (“ETFs”), and noted that each Fund’s fee is competitive with the fees of its respective peer group. The Board noted that the proposed fee for the Funds is a unitary fee pursuant to which the Adviser pays all of each Fund’s costs. The Board also noted that the Funds’ portfolios would be managed on a day-to-day basis by the Sub-Adviser, which will receive a fee from the Adviser. The Board considered the allocation of responsibilities between the Adviser and Sub-Adviser and noted that the Adviser would provide oversight of day-to-day operations, including monitoring tracking error, providing services in connection with creation and redemption units and assistance in meeting legal and regulatory requirements applicable to the Funds. Based on its review, the Board concluded that the advisory fee is reasonable in light of the services provided.
Costs of Services and Profitability. The Board considered the expenses of the Adviser in developing and rendering services to the Funds, and the likelihood and level of profits in the early years of the Funds’ operations. The Board considered the asset levels at which the Adviser expected to “break-even” with respect to its operation of the Funds and noted that since the fee paid by the Adviser to the Sub-Adviser under the Sub-Advisory Agreement contained breakpoints, the Adviser could experience increased profitability as each Fund’s assets increased. The Board considered whether the Adviser would benefit in other ways from its relationships with the Funds, and concluded that there were no material fall-out benefits likely to accrue to the Adviser related to the operation of the Funds.
Economies of Scale. The Board noted that since each Fund’s fee was a unitary fee, the Funds would not experience economies of scale as a result of asset growth.
Given all the information available to it and considering all material factors, the Board concluded that the Investment Advisory Agreement was fair and reasonable and it was unanimously approved.
The Board considered the following in determining whether to approve the Sub-Advisory Agreement:
Nature, Extent and Quality of Services. In considering the nature, extent and quality of services that TDAM proposes to provide to the Funds, the Board reviewed in detail the nature, extent and quality of services to be provided by TDAM under the Sub-Advisory Agreement. The Board noted that these services include, among other things, furnishing a continuous investment program for the Funds, including arranging for, or implementing, the purchase and sale of portfolio securities.
The Board also considered TDAM’s operational capabilities and resources, and its experience in serving as investment sub-adviser to other funds, (including certain other index-based ETFs advised by the Adviser). The Board considered the professional experience and qualifications of TDAM’s senior management and key professional personnel, as well as TDAM’s depth and breadth of experience in managing investment portfolios consisting of U.S. and non-U.S. equity securities. The Board gave special consideration to TDAM’s experience and capabilities in implementing currency hedging strategies, and their techniques for implementing such strategies while minimizing index tracking error. In addition, the Board considered TDAM’s operational capabilities and resources, and TDAM’s experience in managing index funds covering various asset classes. The Board noted that TDAM manages its index-based portfolios using both full replication and sampling techniques and maintains strict discipline in the implementation of its indexing strategies. To that end, the Board noted that when there are changes to a benchmark index, TDAM closely monitors any such changes to devise strategies to realign its portfolios at the lowest possible cost while tracking the respective benchmark index. The Board also noted TDAM’s processes to minimize the cost of trading.
140
DBX ETF Trust
BOARD CONSIDERATIONS IN APPROVAL OF INVESTMENT ADVISORY AND SUB-ADVISORY CONTRACTS (Unaudited) (Continued)
The Board evaluated these factors in consultation with Trust Counsel. Based on its review, the Board concluded that the nature, extent, and quality of services to be provided by TDAM under the Sub-Advisory Agreement are reasonable and appropriate in relation to the fees to be paid to TDAM, taking special consideration of the fact that the fees to be paid to TDAM are payable by the Adviser and not the Funds.
Performance of TDAM; TDAM’s Financial Resources. The Board considered TDAM’s performance in managing the Funds, as well as other index based portfolios, and its record at minimizing tracking error. The Board concluded that TDAM had generally been able to keep any such tracking error, as well as the Funds’ tracking error, within acceptable ranges.
The Board also considered TDAM’s financial condition and whether it had the resources necessary to carry out its functions. The Board concluded that TDAM had the financial resources necessary to perform its obligations under the Sub-Advisory Agreement.
Reasonableness of Sub-Advisory Fee. The Board noted that the fee to be paid to TDAM in respect of the Funds would be paid by the Adviser and not the Funds. The Board further noted that the proposed fee for each Fund was a unitary fee pursuant to which the Adviser would pay all of each Fund’s costs, and thus was not directly affected by the amount of the sub-advisory fee paid to TDAM. Based on its review, the Board concluded that the sub-advisory fees were reasonable in light of the services provided.
Costs of Services and Profitability. The Board considered the asset levels at which TDAM expected to “break-even” with respect to its operation of the Funds, and further noted that the fee paid by the Adviser to TDAM under the Sub-Advisory Agreement contained breakpoints.
The Board noted that since the fee paid by the Adviser to the Sub-Adviser under the Sub-Advisory Agreement contained breakpoints, the Adviser could experience increased profitability as each Fund’s assets increased.
The Board also considered whether TDAM would benefit in other ways from its relationship with the Funds. The Board discussed TDAM’s practices regarding the selection and compensation of brokers and dealers that would execute portfolio transactions for the Funds and the brokers’ and dealers’ provision of brokerage services to TDAM. The Board discussed the possible potential benefits TDAM might derive from the Funds’ soft dollar arrangements, whereby brokers provide brokerage services to the Funds or TDAM in return for allocating fund brokerage.
Economies of Scale. The Board noted that since each Fund’s fee was a unitary fee, the Funds would not experience economies of scale as a result of asset growth.
Given all the information available to it and considering all material factors, the Board concluded that the Sub-Advisory Agreement was fair and reasonable and it was unanimously approved.
db X-trackers MSCI All World ex-US Hedged Equity Fund, db X-trackers MSCI South Korea Hedged Equity Fund and db X-trackers MSCI Mexico Hedged Equity Fund:
At a meeting held on November 18, 2013, the Board of Trustees, including the Independent Trustees (those not affiliated with the Trust or its service providers), unanimously approved the continuance of the Agreements with respect to db X-trackers MSCI All World ex-US Hedged Equity Fund, db X-trackers MSCI South Korea Hedged Equity Fund and db X-trackers MSCI Mexico Hedged Equity Fund (the “Funds”).
In reaching this decision with respect to the Investment Advisory Agreement (the “Advisory Agreement”), the Board considered all factors it believed relevant, including (1) the nature, extent and quality of the services to be provided to the Funds and their shareholders; (2) the Adviser financial resources and its resulting ability to perform its obligations under the Advisory Agreement; (3) the competitiveness of the advisory fee; (4) the total cost of the services to be provided by and the profits that could be realized by the Adviser from its relationship with the Funds; and (5) the extent to which economies of scale would be realized as the Funds grow, and if the Funds’ shareholders would benefit from those economies.
In reaching this decision with respect to the Sub-Advisory agreement, the Board considered all factors it believed relevant, including (1) the nature, extent and quality of the services to be provided to the Funds and their shareholders; (2) the performance of TDAM with respect to its management of other funds of the Trust, as well as TDAM’s financial resources and its resulting ability to perform its obligations under the Sub-Advisory Agreement; (3) the total cost of the services to be
141
DBX ETF Trust
BOARD CONSIDERATIONS IN APPROVAL OF INVESTMENT ADVISORY AND SUB-ADVISORY CONTRACTS (Unaudited) (Continued)
provided by and the profits that could be realized by TDAM from its relationship with the Funds; and (4) the extent to which economies of scale would be realized as the Funds grow, and if the Funds’ shareholders would benefit from those economies.
The Board reached a determination, with the assistance of Trust Counsel and through the exercise of its business judgment, that approval of the Agreements and the compensation to be received thereunder is consistent with the Board’s duties under state and federal law. The Board reached this conclusion based on multiple factors.
The Board considered the following in determining whether to approve the Advisory Agreement:
Nature, Extent and Quality of Services. The Board reviewed in detail the nature, extent and quality of services to be provided by the Adviser under the Advisory Agreement. The Board noted that these services include, among other things, furnishing a continuous investment program for the Funds, including arranging for, or implementing, the purchase and sale of portfolio securities, the provision of general corporate services such as portfolio management compliance services and the preparation and filing of certain reports on behalf of the Trust. The Board also considered, among other things, the professional experience and qualifications of the senior management and key professional personnel of the Adviser, including those individuals responsible for portfolio management. The Board considered that the Adviser provides, at its own expense, office facilities and equipment for use by the Funds and supervisory persons responsible for supervising and monitoring the Trust’s service providers. The Board also considered that the Adviser pays for the compensation of officers of the Trust who are also officers or employees of the Adviser, except as may otherwise be determined by the Board. The Board also considered that the Adviser arranges for the provision of transfer agency, custody, fund administration and accounting, and other non-distribution services necessary for each Fund’s operation. The Board also considered the role to be played by the Adviser in working with TDAM to manage the Funds’ portfolios, noting that the Adviser would provide oversight of day-to-day operations, including monitoring tracking error, providing services in connection with creation and redemption units and assistance in meeting legal and regulatory requirements applicable to the Funds.
The Board evaluated these factors in consultation with Trust Counsel. Based on its review, the Board concluded that the nature, extent, and quality of services to be provided by the Adviser under the Advisory Agreement are reasonable and appropriate in relation to the fees to be paid to the Adviser, taking special consideration of the fact that the advisory fee is a unitary fee and, as a result, a portion of the unitary advisory fee will be used to compensate the Funds’ service providers. The Board considered the staffing of the Adviser, including the training, qualifications and experience of investment personnel in managing the Funds. The Board also considered the expertise of the Adviser in supervising third party service providers to the Funds, such as the administrator and custodian. The Board further considered the compliance program of the Adviser which supports each Fund’s compliance program.
Adviser’s Financial Resources. In connection with the assessment of the ability of the Adviser to perform its duties under the Advisory Agreement, the Board considered the Adviser’s financial condition and whether it had the resources necessary to carry out its functions. The Board concluded that the Adviser had the financial resources necessary to perform its obligations under the Advisory Agreement.
Reasonableness of Advisory Fee. The Board compared each Fund’s proposed advisory fee to that of other exchange-traded funds (“ETFs”), and noted that each Fund’s fee is competitive with the fees of its respective peer group. The Board noted that the proposed fee for the Funds is a unitary fee pursuant to which the Adviser pays all of each Fund’s costs. The Board also noted that the Funds’ portfolios would be managed on a day-to-day basis by the Sub-Adviser, which will receive a fee from the Adviser. The Board considered the allocation of responsibilities between the Adviser and Sub-Adviser and noted that the Adviser would provide oversight of day-to-day operations, including monitoring tracking error, providing services in connection with creation and redemption units and assistance in meeting legal and regulatory requirements applicable to the Funds. Based on its review, the Board concluded that the advisory fee is reasonable in light of the services provided.
Costs of Services and Profitability. The Board considered the expenses of the Adviser in developing and rendering services to be provided to the Funds, and the likelihood and level of profits in the early years of the Funds’ operations. The Board noted that since each Fund was new, it was difficult to estimate the profitability of the Funds to the Adviser at this time, and noted that since the fee paid by the Adviser to the Sub-Adviser under the Sub-Advisory Agreement contained breakpoints, the Adviser could experience increased profitability as each Fund’s assets increased. The Board considered
142
DBX ETF Trust
BOARD CONSIDERATIONS IN APPROVAL OF INVESTMENT ADVISORY AND SUB-ADVISORY CONTRACTS (Unaudited) (Continued)
whether the Adviser would benefit in other ways from its relationships with the Funds, and concluded that there were no material fall-out benefits likely to accrue to the Adviser related to the operation of the Funds.
Economies of Scale. The Board noted that since the Funds were new, it was difficult to estimate whether the Funds would experience economies of scale. The Board determined to evaluate economies of scale on an ongoing basis as a result of asset growth of the Funds.
Given all the information available to it and considering all material factors, the Board concluded that the Investment Advisory Agreement was fair and reasonable and it was unanimously approved.
The Board considered the following in determining whether to approve the Sub-Advisory Agreement:
Nature, Extent and Quality of Services. In considering the nature, extent and quality of services that TDAM proposes to provide to the Funds, the Board reviewed in detail the nature, extent and quality of services to be provided by TDAM under the Sub-Advisory Agreement. The Board noted that these services include, among other things, furnishing a continuous investment program for the Funds, including arranging for, or implementing, the purchase and sale of portfolio securities.
The Board also considered TDAM’s operational capabilities and resources, and its experience in serving as investment sub-adviser to other funds, (including certain other index-based ETFs advised by the Adviser). The Board considered the professional experience and qualifications of TDAM’s senior management and key professional personnel, as well as TDAM’s depth and breadth of experience in managing investment portfolios consisting of U.S. and non-U.S. equity securities. The Board gave special consideration to TDAM’s experience and capabilities in implementing currency hedging strategies, and their techniques for implementing such strategies while minimizing index tracking error. In addition, the Board considered TDAM’s operational capabilities and resources, and TDAM’s experience in managing index funds covering various asset classes. The Board noted that TDAM manages its index-based portfolios using both full replication and sampling techniques and maintains strict discipline in the implementation of its indexing strategies. To that end, the Board noted that when there are changes to a benchmark index, TDAM closely monitors any such changes to devise strategies to realign its portfolios at the lowest possible cost while tracking the respective benchmark index. The Board also noted TDAM’s processes to minimize the cost of trading.
The Board evaluated these factors in consultation with Trust Counsel. Based on its review, the Board concluded that the nature, extent, and quality of services to be provided by TDAM under the Sub-Advisory Agreement are reasonable and appropriate in relation to the fees to be paid to TDAM, taking special consideration of the fact that the fees to be paid to TDAM are payable by the Adviser and not the Funds.
Performance of TDAM; TDAM’s Financial Resources. The Board noted that the Funds have not commenced operations and have no performance history, but the Board considered TDAM’s performance in managing other equity based portfolios of the Trust and its ability to minimize tracking error. The Board concluded that, given TDAM’s capabilities and experience in managing other portfolios of the Trust, TDAM should be able to keep each Fund’s tracking error within acceptable ranges. The Board also considered TDAM’s financial condition and whether it had the resources necessary to carry out its functions. The Board concluded that TDAM had the financial resources necessary to perform its obligations under the Sub-Advisory Agreement.
Reasonableness of Sub-Advisory Fee. The Board noted that the fee to be paid to TDAM in respect of the Funds would be paid by the Adviser and not the Funds. The Board further noted that the proposed fee for each Fund was a unitary fee pursuant to which the Adviser would pay all of each Fund’s costs, and thus was not directly affected by the amount of the sub-advisory fee paid to TDAM. Based on its review, the Board concluded that the sub-advisory fees were reasonable in light of the services provided.
Costs of Services and Profitability. The Board noted that since each Fund was new, it was difficult to estimate the profitability of the Funds to the Sub-Adviser at this time, and further noted that the fees to be paid by the Adviser to TDAM under the Sub-Advisory Agreement contain breakpoints.
The Board noted that since the fee paid by the Adviser to the Sub-Adviser under the Sub-Advisory Agreement contained breakpoints, the Adviser could experience increased profitability as each Fund’s assets increased.
143
DBX ETF Trust
BOARD CONSIDERATIONS IN APPROVAL OF INVESTMENT ADVISORY AND SUB-ADVISORY CONTRACTS (Unaudited) (Continued)
The Board also considered whether TDAM would benefit in other ways from its relationship with the Funds. The Board discussed TDAM’s practices regarding the selection and compensation of brokers and dealers that would execute portfolio transactions for the Funds and the brokers’ and dealers’ provision of brokerage services to TDAM. The Board discussed the possible potential benefits TDAM might derive from the Funds’ soft dollar arrangements, whereby brokers provide brokerage services to the Funds or TDAM in return for allocating fund brokerage.
Economies of Scale. The Board noted that since each Funds were new, it was difficult to estimate whether the Fund would experience economies of scale. The Board determined to evaluate economies of scale on an ongoing basis as a result of asset growth of the Funds.
Given all the information available to it and considering all material factors, the Board concluded that the Sub-Advisory Agreement was fair and reasonable and it was unanimously approved.
db X-trackers MSCI Asia Pacific ex-Japan Hedged Equity Fund, db X-trackers MSCI Europe Hedged Equity Fund and db X-trackers MSCI United Kingdom Hedged Equity Fund:
At a special meeting held on July 25, 2013, the Board of Trustees, including the Independent Trustees (those not affiliated with the Trust or its service providers), unanimously approved the Investment Advisory Agreement and the Sub-Investment Advisory Agreements relating to db X-trackers MSCI Asia Pacific ex-Japan Hedged Equity Fund, db X-trackers MSCI Europe Hedged Equity Fund, and db X-trackers MSCI United Kingdom Hedged Equity Fund.
In reaching these decisions with respect to each Fund, the Board considered all factors it believed relevant, including (1) the nature, extent and quality of the services to be provided to the Fund and its shareholders (including the investment performance of the Sub-Adviser’s fund clients); (2) the performance of the Sub-Adviser with respect to its management of other comparable funds generally, as well as the Sub-Adviser’s financial resources and its resulting ability to perform its obligations under the Sub-Advisory Agreement; (3) the Adviser’s financial resources and its resulting ability to perform its obligations under the Advisory Agreement; (4) the competitiveness of the advisory fee and the sub-advisory fee; (5) the total cost of the services to be provided by and the profits that could be realized by the Adviser and the Sub-Adviser from their relationships with the Fund; and (6) the extent to which economies of scale would be realized as the Fund grows, and if the fund shareholders would benefit from those economies.
The Board reached a determination, with the assistance of Trust counsel and through the exercise of its business judgment, that approval of the Investment Advisory Agreements and the Sub-Investment Advisory Agreements (together, the “Agreements”) and the compensation to be received thereunder is consistent with the Board’s duties under state and federal law. The Board reached this conclusion based on multiple factors.
Nature, Extent and Quality of Services. The Board reviewed in detail the nature, extent and quality of services to be provided by the Adviser and the Sub-Adviser under the Agreements. The Board noted that these services include, among other things, furnishing a continuous investment program for the Fund, including arranging for, or implementing, the purchase and sale of portfolio securities, the provision of general corporate services such as portfolio management compliance services and the preparation and filing of certain reports on behalf of the Trust. The Board also considered, among other things, the professional experience and qualifications of the senior management and key professional personnel of the Adviser, including those individuals responsible for portfolio management. The Board considered that the Adviser provides, at its own expense, office facilities and equipment for use by the Fund and supervisory persons responsible for supervising and monitoring the Trust’s service providers. The Board also considered that the Adviser pays for the compensation of officers of the Trust who are also officers or employees of the Adviser, except as may otherwise be determined by the Board. The Board also considered that the Adviser arranges for the provision of transfer agency, custody, fund administration and accounting, and other non-distribution services necessary for the Fund’s operation. The Board also considered the role to be played by the Adviser in working with the Sub-Adviser to manage the Fund’s portfolio, noting that the Adviser would provide oversight of day-to-day operations, including monitoring tracking error, providing services in connection with creation and redemption units and assistance in meeting legal and regulatory requirements applicable to the Fund.
The Board also considered the Sub-Adviser’s operational capabilities and resources, and its experience in serving as investment sub-adviser to other funds, including those with comparable investment strategies. The Board considered the professional experience and qualifications of the Sub-Adviser’s senior management and key professional personnel, as well as the Sub-Adviser’s depth and breadth of experience in managing investment portfolios consisting of index-based portfolios
144
DBX ETF Trust
BOARD CONSIDERATIONS IN APPROVAL OF INVESTMENT ADVISORY AND SUB-ADVISORY CONTRACTS (Unaudited) (Continued)
and the type of securities in which the Fund invests. The Board gave special consideration to the Sub-Adviser’s experience and capabilities in managing portfolios comprised of non-U.S. equity securities, and their techniques for tracking an index while minimizing index tracking error. In addition, the Board considered the Sub-Adviser’s operational capabilities and resources.
The Board evaluated these factors in consultation with Fund counsel. Based on its review, the Board concluded that the nature, extent, and quality of services to be provided by the Adviser under the Investment Advisory Agreements are reasonable and appropriate in relation to the fees to be paid to the Adviser. The Board considered the staffing of the Adviser, including the training, qualifications and experience of investment personnel in managing the Fund. The Board also considered the expertise of the Adviser in supervising third party service providers to the Fund, such as the administrator and custodian. The Board further considered the compliance program of the Adviser which supports the Fund’s compliance program. Additionally, based on its review, the Board concluded that the nature, extent, and quality of services to be provided by the Sub-Advisers under the Sub-Advisory Agreements are reasonable and appropriate in relation to the fees to be paid to each Sub-Adviser, taking special consideration of the fact that the fees to be paid to each Sub-Adviser are payable by the Adviser and not the Fund.
Performance of the Sub-Advisers; the Sub-Advisers’ Financial Resources. With respect to each Fund, the Board noted that operations had not commenced and there is no performance history. The Board considered each Sub-Adviser’s performance in managing other similar index-based portfolios and its ability to minimize tracking error for such portfolios. The Board concluded that, given each Sub-Adviser’s capabilities and experience managing other index-based portfolios, each Sub-Adviser should be able to keep the Fund’s tracking error within acceptable ranges.
The Board also considered each Sub-Adviser’s financial condition and whether it had the resources necessary to carry out its functions. The Board concluded that each Sub-Adviser had the financial resources necessary to perform its obligations under the respective Sub-Investment Advisory Agreement.
Adviser’s Financial Resources. In connection with the assessment of the ability of the Adviser to perform its duties under the Investment Advisory Agreements, the Board considered the Adviser’s financial condition and whether it had the resources necessary to carry out its functions. The Board concluded that the Adviser had the financial resources necessary to perform its obligations under the Advisory Agreements.
Competitiveness of Fees. The Board considered the competitiveness of each of the Fund’s fee to other comparable exchange-traded funds (ETFs), and noted that each Fund’s fee is competitive with the fees of its respective peer group. The Board noted that the proposed fee for each Fund is a unitary fee pursuant to which the Adviser pays all of the Funds’ costs, including the Sub-Adviser’s fee. Based on its review, the Board concluded that each advisory fee and sub-advisory fee is reasonable in light of the services provided.
Costs of Services and Profitability. The Board considered the expenses of the Adviser in developing and rendering services to be provided to the Funds, and the likelihood and level of profits in the early years of the Funds’ operations. The Board considered the asset levels at which the Adviser expects to “break-even” with respect to its operation of the Funds and noted that the fee paid by the Adviser to the Sub-Adviser under the Sub-Advisory Agreement contained breakpoints, and accordingly, the Adviser could experience increased profitability as each Fund’s assets increased. Given the costs of the services to be provided by and the profits that could be realized by the Adviser in connection with the management of the Funds, the Board determined that the amount of potential profit was fair.
Economies of Scale. The Board noted that at the current fee rate the Fund would not experience economies of scale. The Board determined to review economies of scale on an ongoing basis as a result of asset growth of the Fund.
Given all the information available to it and considering all material factors, the Board concluded that each Investment Advisory Agreement and Sub-Advisory Agreement was fair and reasonable and they were unanimously approved.
145
DBX ETF Trust
ADDITIONAL INFORMATION (Unaudited)
Proxy Voting Policies and Procedures
The Funds’ policies and procedures for voting proxies for portfolio securities and information about how each Fund voted proxies related to its portfolio securities during the 12-month period ended June 30 are available on our Web site —www.dbxus.com (click on “proxy voting” at the bottom of the page) — or on the SEC’s Web site — www.sec.gov. To obtain a written copy of the Funds’ policies and procedures without charge, upon request, call us toll free at (855) 329-3837.
Quarterly Portfolio Disclosure
The Funds are required to file their complete schedule of portfolio holdings with the SEC for their first and third fiscal quarters on Form N-Q. Copies of the filings are available without charge, upon request on the SEC’s website at www.sec.gov and are available by calling the Company at 855-329-3837. You can also obtain copies of Form N-Q by (i) visiting the SEC’s Public Reference Room in Washington, DC (information on the operation of the Public Reference Room may be obtained by calling 800-SEC-0330); (ii) sending your request and a duplicating fee to the SEC’s Public Reference Room, Washington, DC 20549-0102; or (iii) sending your request electronically to publicinfo@sec.gov.
Information about each Fund’s portfolio holdings is available daily at www.dbxus.com.
Discount & Premium Information
Information regarding how often shares of each Fund traded on NYSE Arca at a price above (i.e., at a premium) or below (i.e., at a discount) the Net Asset Value of the Fund can be found at www.dbxus.com.
Tax Information
Form 1099-DIV, Form 1042-S and other year-end tax information provide shareholders with actual calendar year amounts that should be included in their tax returns. Shareholders should consult their tax advisors.
Each Fund designates the following amounts or, if subsequently determined to be different, the maximum amount allowable for its fiscal year ended May 31, 2013.
| Qualified Divided Income* | ||||
db X-trackers MSCI Brazil Hedged Equity Fund | 2% | |||
db X-trackers MSCI EAFE Hedged Equity Fund | 40% | |||
db X-trackers MSCI Emerging Markets Hedged Equity Fund | 27% | |||
db X-trackers MSCI Germany Hedged Equity Fund | 56% | |||
db X-trackers MSCI Japan Hedged Equity Fund | 12% | |||
db X-trackers MSCI Europe Hedged Equity Fund | 75% | |||
db X-trackers MSCI United Kingdom Hedged Equity Fund | 100% | |||
* The above percentage is based on ordinary income dividends paid to shareholders during each Fund’s fiscal year.
Each Fund intends to elect to pass through to shareholders the credit for taxes paid to foreign countries. The gross foreign source income and foreign taxes paid are as follows:
| Gross Foreign Income | Foreign Taxes Paid | |||||||
db X-trackers MSCI Brazil Hedged Equity Fund | 184,259 | 18,031 | ||||||
db X-trackers MSCI EAFE Hedged Equity Fund | 13,513,478 | 961,196 | ||||||
db X-trackers MSCI Emerging Markets Hedged Equity Fund | 567,859 | 66,422 | ||||||
db X-trackers MSCI Germany Hedged Equity Fund | 1,108,873 | 148,090 | ||||||
db X-trackers MSCI Japan Hedged Equity Fund | 6,381,278 | 601,330 | ||||||
db X-trackers MSCI Europe Hedged Equity Fund | 1,473,695 | 124,352 | ||||||
db X-trackers MSCI United Kingdom Hedged Equity Fund | 280,759 | 925 | ||||||
db X-trackers MSCI All World ex US Hedged Equity Fund | 108,542 | 10,572 | ||||||
146
DBX ETF Trust
PRIVACY POLICY NOTICE (Unaudited)
DBX Advisors LLC (“Advisors”) collects non-public information about you from the following sources: (i) information received from you on applications or other forms; and (ii) information about your transactions with the Advisors, Advisors’ affiliates and third-party service providers and vendors. Advisors does not disclose any non-public personal information about you to anyone, other than as set forth below, as permitted by applicable law and regulation. Advisors may disclose non-public personal information about you to the funds in which you invest, to Advisors’ affiliates, and to non-affiliated companies that work with Advisors to service your account(s), or to provide services or process transactions that you have requested. Advisors may disclose non-public personal information in situations that may include, but are not limited to, in response to legal and/or regulatory inquiries and the proposed or actual sale, assignment merger or other transfer of all or a portion of Advisors’ business to another business entity. Advisors may also disclose non-public personal information about you to parties representing you, such as your investment representative, your accountant, your tax adviser, or to other third parties at your direction/consent. Advisors will not sell, rent, license or trade your personal and financial information to or with third parties for their own direct marketing use unless you give us general or specific consent to do so. If you decide to close your account(s) or become an inactive customer, Advisors will adhere to the privacy policies and practices as described in this notice. Advisors restricts access to your personal and account information to those employees who need to know that information to provide products and services to you. Advisors maintains reasonable and customary physical, electronic and procedural safeguards to guard your non-public personal information.
Advisors reserves the right, at their discretion, to change, modify, add, or remove portions of this Privacy Policy Notice, and any of the policies described herein, at any time. Advisors will indicate any such changes to the Privacy Policy Notice at the privacy link which can be found at www.dbxus.com. At all times, you are bound by the then-current version of the Privacy Policy and all applicable laws. Advisors highly recommends that you review this Privacy Policy Notice from time to time to ensure that you are familiar with the most recent version. The examples contained in this Privacy Policy Notice are illustrations; they are not intended to be exclusive.
147
DBX ETF Trust
This report is intended for the shareholders of the DBX ETF Trust.
Carefully consider a Fund’s investment objectives, risk factors and charges and expenses before investing. This and other information can be found in the Fund’s prospectus, which may be obtained by calling 1-855-DBX-ETFS (1-855-329-3837), or by viewing or downloading a prospectus at WWW.DBXUS.COM. Read the prospectus carefully before investing.
Investing involves risk, including possible loss of principal.
Stocks may decline in value. Investing in foreign companies, particularly those in emerging markets, presents certain risks, such as currency fluctuations, less liquidity, less developed or less efficient trading markets, lack of comprehensive company information, political instability and differing auditing and legal standards. Emerging markets tend to be more volatile than the markets of more mature economies, and generally have less diverse and less mature economic structures and less stable political systems than those of developed countries. Funds investing in a single industry, country or in a limited geographic region generally are more volatile than more diversified funds and may be subject to enhanced risks. The funds may use derivatives to hedge its investments or to seek to enhance returns. Derivatives entail risks relating to liquidity, leverage and credit that may reduce returns and increase volatility. Please read the prospectus for more information. An investment in any Fund should be considered only as a supplement to a complete investment program for those investors willing to accept the risks associated with that fund.
Shares of the Funds are bought and sold at market price (not NAV) throughout the day on the New York Stock Exchange. Transactions in Fund shares may result in brokerage commissions and may generate tax consequences. There can be no assurance that an active trading market for shares of a fund will develop or be maintained.
DBX ETF Trust Funds are distributed by ALPS Distributors, Inc. The Funds are managed by DBX Advisors LLC which is not affiliated with ALPS.
Deutsche Asset & Wealth Management is the brand name for the asset and wealth management activities conducted by Deutsche Bank AG or any of its subsidiaries. Clients will be provided Deutsche Asset & Wealth Management products or services by one or more legal entities that will be identified to clients pursuant to the contracts, agreements, offering materials or other documentation relevant to such products or services.
MSCI and MSCI Index are servicemarks of MSCI Inc. and have been licensed for use by Deutsche Bank AG. DBX ETF Trust Funds are not sponsored, endorsed, issued, sold or promoted by MSCI Inc. Nor does this company make any representation regarding the advisability of investing in db-X Funds. Index data source: MSCI Inc.
Copyright © 2013 Deutsche Bank AG. All rights reserved. db-X® is a registered trademark of Deutsche Bank AG. All other trademarks, servicemarks or registered trademarks are the property of their respective owners.
Not FDIC Insured — No Bank Guarantee — May Lose Value
DBX ETF Trust
INVESTMENT ADVISOR
DBX Advisors LLC
60 Wall Street
New York, NY 10005
INVESTMENT SUB-ADVISOR
TDAM USA Inc.
161 Bay Street, 35th Floor
TD Canada Trust Tower
Toronto, Ontario Canada M5J 2T2
ADMINISTRATOR, CUSTODIAN, FUND ACCOUNTANT & TRANSFER AGENT
The Bank of New York Mellon
101 Barclay Street
New York, NY 10286
DISTRIBUTOR
ALPS Distributors, Inc.
1290 Broadway
Suite 1100
Denver, CO 80203
INDEPENDENT REGISTERED PUBLIC ACCOUNTING FIRM
Ernst & Young LLP
5 Times Square
New York, NY 10036
LEGAL COUNSEL
Dechert LLP
1095 Avenue of the Americas
New York, NY 10036
R-35361-1 (8/14) DBX972 (8/15)
ANNUAL REPORT
May 31, 2014
DBX ETF Trust
db X-trackers Harvest CSI 300 China A-Shares Fund (ASHR)
db X-trackers Harvest CSI 500 China A-Shares Small Cap Fund (ASHS)
db X-trackers Harvest MSCI All China Equity Fund (CN)
DBX ETF Trust
| Page | ||||
| 1 | ||||
| 3 | ||||
| 4 | ||||
| 6 | ||||
| 8 | ||||
| 10 | ||||
| 11 | ||||
| 16 | ||||
| 22 | ||||
| 24 | ||||
| 25 | ||||
| 26 | ||||
| 27 | ||||
| 29 | ||||
| 37 | ||||
| 38 | ||||
Board Considerations in Approval of Investment Advisory and Sub-Advisory Contracts (Unaudited) | 40 | |||
| 44 | ||||
| 45 | ||||
TO OUR SHAREHOLDERS: (Unaudited)
Dear Shareholder,
We are pleased to provide this annual report, which covers the period ended May 31, 2014.
As the financial crisis started to drag down developed economies’ import demand, the contribution of foreign trade to China’s economic growth shrunk, prompting the Chinese government to increase investment. Of late, China has been pursuing an evolutionary shift from being an export-driven economy to one with meaningfully more balance. Consumption today accounts for roughly half of China’s GDP, which is low compared to other countries, both developed and emerging, but historically high for China. A growing middle class and the increase in wages as more Chinese are taking advantage of urbanization and moving to the bigger cities, may be driving some of this growth in consumption. The net result is a more balanced economy which is not entirely dependent on the global economy. With recent reforms to support private companies, the Chinese government has signaled its intent to boost the market economy and strengthen the drivers of economic growth.
Deutsche Bank, a leading global banking institution, has managed a successful and growing platform of exchange-traded products since 2006. Our team appreciates your trust and looks forward to serving your investment needs through innovative index-driven strategies.
Sincerely,
/s/ Alex Depetris
Alex Depetris
Chairman, President and Chief Executive Officer
July 25, 2014
*************************
Past performance is no guarantee of future results. Fund performance assumes reinvestment of dividends and capital gains distributions. A Fund’s net asset value (“NAV”) return is based on the changes in the Fund’s NAV per share for the period indicated. A Fund’s NAV per share is calculated by dividing the value of the Fund’s total assets less total liabilities by the number of shares outstanding. Current Fund performance may be higher or lower than the performance quoted. The most recent month end performance may be obtained by visiting www.dbxus.com.
An index is a statistical measure of a specified financial market or sector. An index is unmanaged and one cannot invest directly in an index. An index does not actually hold a portfolio of securities, incur expenses, or pay any transaction costs. Therefore, index returns do not reflect deductions for fees or expenses. In comparison, a Fund’s performance is negatively impacted by these deductions. Fund returns do not reflect brokerage commissions or taxes that a shareholder would pay on Fund distributions or on transactions in Fund shares.
The views expressed in this report reflect those of the portfolio management team only through the end of the period of the report as stated on the cover. The management team’s views are subject to change at any time based on market and other conditions and should not be construed as a recommendation. Current and future portfolio holdings are subject to risk. Investment in the Funds poses investment risk, including possible loss of principal. The investment return and principal value of an investment will fluctuate, so that shares, when sold or redeemed, may be worth more or less than their original cost.
1
This Page is Intentionally Left Blank
DBX ETF Trust
MANAGEMENT’S DISCUSSION OF FUND PERFORMANCE (Unaudited)
The db X-trackers Harvest CSI 300 China A-Shares Fund
The db X-trackers Harvest CSI 300 China A-Shares Fund (“ASHR”) seeks investment results that correspond generally to the performance, before fees and expenses, of the CSI 300 Index (“ASHR Index”). The ASHR Index is designed to reflect the price fluctuation and performance of the China A-Share market and is composed of the 300 largest and most liquid stocks in the China A-Share market. For the period November 6, 2013 (commencement of operations) to May 31, 2014, ASHR returned -12.08%, compared with the ASHR Index return of -11.34%.
Weakness in the financials sector, which averaged over a third of the ASHR Index weight, contributed more than any other sector to negative returns during the period. Energy, while representing less than 5% of the ASHR Index weight, was the second largest contributor to negative returns as nearly the entire sector experienced significant weakness during the period.
The db X-trackers Harvest CSI 500 China A-Shares Small Cap Fund
The db X-trackers Harvest CSI 500 China A-Shares Small Cap Fund (“ASHS”) seeks investment results that correspond generally to the performance, before fees and expenses, of the CSI 500 Index (“ASHS Index”). The ASHS Index aims to track 500 small cap companies listed on the Shanghai and Shenzhen stock exchanges. For the period May 21, 2014 (commencement of operations) to May 31, 2014, ASHS returned 2.80%, compared with the ASHS Index return of 3.09%.
Information Technology and Health Care, averaging almost a quarter of the ASHS Index weight, were the largest contributors to positive performance during the period. All ten sectors contributed positive returns during the period.
The db X-trackers Harvest MSCI All China Equity Fund
The db X-trackers Harvest MSCI All China Equity Fund (“CN”) seeks investment results that correspond generally to the performance, before fees and expenses, of the MSCI All China Index (“CN Index”). The CN Index is designed to capture large and mid cap representation across all China securities listed in China and Hong Kong as well as in the U.S. and Singapore. The CN Index includes: A-shares, H-shares, B-shares, Red chips, and P chips share classes as well as securities of Chinese companies listed in the U.S. and Singapore. CN, using a passive approach or indexing approach, attempts to approximate the performance of the CN Index. CN expects to gain exposure to the China A-share components of the CN Index by investing in the db X-trackers Harvest CSI 300 China A-Shares Fund (ASHR). For the period April 30, 2014 (commencement of operations) to May 31, 2014, CN returned 2.04%, compared with the CN Index return of 2.24%.
All six share classes delivered positive returns during the period. H-shares, which averaged almost a quarter of the CN Index during the period, were the largest contributor of positive returns. ASHR, which averaged half the weight of CN, made a small positive contribution to returns, in line with the small positive contribution from A-shares in the CN Index. Irrespective of share class, financial sector stocks, which averaged a third of the weight of the CN Index, were the largest contributors to positive returns for the period.
*************************
Performance quoted above represents past performance, assumes reinvestment of all dividends and capital gains distributions at net asset value (“NAV”), and does not guarantee future results. A Fund’s NAV return is based on the changes in the Fund’s NAV per share for the period indicated. A Fund’s NAV per share is calculated by dividing the value of the Fund’s total assets less total liabilities by the number of shares outstanding. Current Fund performance may be higher or lower than the performance quoted. Fund performance data current to the most recent month end may be obtained by visiting www.dbxus.com. See pages 3-8 of this report for additional performance information, including performance data based on market value.
An index is a statistical measure of a specified financial market or sector. An index does not actually hold a portfolio of securities, incur expenses, or pay any transaction costs. Therefore, index returns do not reflect deductions for fees or expenses and are not available for direct investment. In comparison, a Fund’s performance is negatively impacted by these deductions. Fund returns do not reflect brokerage commissions or taxes that a shareholder would pay on Fund distributions or on transactions in Fund shares.
The views expressed in this report reflect those of the portfolio management team only through the end of the period of the report as stated on the cover. The management team’s views are subject to change at any time based on market and other conditions and should not be construed as a recommendation. Current and future portfolio holdings are subject to risk. Investment in the Funds poses investment risk, including possible loss of principal. The investment return and principal value of an investment will fluctuate, so that shares, when sold or redeemed, may be worth more or less than their original cost.
3
DBX ETF Trust
db X-trackers Harvest CSI 300 China A-Shares Fund (ASHR) (Unaudited)
The db X-trackers Harvest CSI 300 China A-Shares Fund (ASHR) seeks investment results that correspond generally to the performance, before fees and expenses, of the CSI 300 Index (the “Underlying Index”). The Underlying Index is designed to reflect the price fluctuation and performance of the China A-Share market and is composed of the 300 largest and most liquid stocks in the China A-Share market.
For the period November 6, 2013 (commencement of operations) to May 31, 2014, the db X-trackers Harvest CSI 300 China A-Shares Fund returned (12.08)%, compared with the Underlying Index return of (11.34)%.
Performance as of 5/31/14
| Cumulative Total Returns | ||||||
| Net Asset Value | Market Price | CSI 300 Index | ||||
Since Inception1 | (12.08)% | (11.36)% | (11.34)% | |||
1 Total returns are calculated based on the commencement of operations, 11/06/13 (“Inception”).
Performance quoted represents past performance, assumes reinvestment of all dividends and capital gain distributions, and does not guarantee future results. Current performance may be higher or lower than the performance quoted. Performance data current to the most recent month end may be obtained by visiting www.dbxus.com. Investment in the fund poses investment risk including possible loss of principal. The investment return and principal value of an investment will fluctuate, so that shares, when sold or redeemed, may be worth more or less than their original cost. The estimated operating expense ratio as disclosed in the most recent prospectus dated February 7, 2014, was 0.82%.
The preceding performance chart is provided for comparative purposes and represents the period(s) noted. The net asset value return is based on the changes in the Fund’s net asset value per share (“NAV”). The Fund’s NAV is calculated by dividing the value of the Fund’s total assets less total liabilities by the number of shares outstanding. The market price return is based on the change in the market price on the NYSE Arca of a share of the Fund for the period(s) indicated. The price used to calculate market price returns is the midpoint of the bid/ask spread for Fund shares at 4 p.m. Eastern Time on the NYSE Arca. NAV and market returns assume that dividends and capital gain distributions have been reinvested in the Fund at NAV and market price, respectively.
An index is a statistical measure of a specified financial market or sector. An index does not actually hold a portfolio of securities, incur expenses or pay any transaction costs. Therefore index returns do not reflect deductions for fees or expenses and are not available for direct investment. In comparison, the Fund’s performance is negatively impacted by these deductions. Fund returns do not reflect brokerage commissions or taxes that a shareholder would pay on Fund distributions or on transactions in Fund shares.
4
DBX ETF Trust
PERFORMANCE SUMMARY
db X-trackers Harvest CSI 300 China A-Shares Fund (ASHR) (Unaudited) (Continued)
Growth of a $10,000 Investment in ASHR2 as of 5/31/14
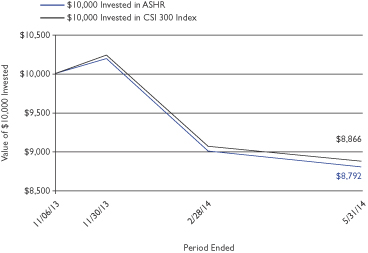
2 Based on Net Asset Value from commencement of operations 11/06/13.
Sector Breakdown* as of 5/31/14
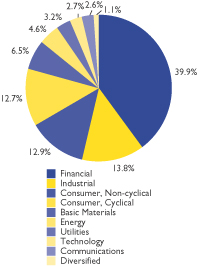
* Weightings are expressed as a percentage of total investments and may change over time. The sector classifications used above are based on company classifications under Bloomberg industry name.
Top Ten Holdings3 as of 5/31/14
| Description | % of Net Assets | |||
Ping An Insurance Group Co. of China Ltd., Class A | 4.0% | |||
China Minsheng Banking Corp. Ltd., Class A | 3.5% | |||
China Merchants Bank Co. Ltd., Class A | 3.5% | |||
Industrial Bank Co. Ltd., Class A | 2.3% | |||
Shanghai Pudong Development Bank, Class A | 2.2% | |||
China Vanke Co. Ltd., Class A | 1.7% | |||
CITIC Securities Co. Ltd., Class A | 1.6% | |||
Haitong Securities Co. Ltd., Class A | 1.6% | |||
Gree Electric Appliances, Inc., Class A | 1.5% | |||
Agricultural Bank of China Ltd., Class A | 1.3% | |||
3 Holdings are subject to change without notice and there is no guarantee that the Fund will remain invested in any particular security. For a complete list of holdings go to page 10.
5
DBX ETF Trust
PERFORMANCE SUMMARY
db X-trackers Harvest CSI 500 China A-Shares Small Cap Fund (ASHS) (Unaudited)
The db X-trackers Harvest CSI 500 China A-Shares Small Cap Fund (ASHS) seeks investment results that correspond generally to the performance, before fees and expenses, of the China Securities 500 Index (CSI 500 Index). The index aims to track 500 small cap companies listed on the Shanghai and Shenzhen stock exchanges.
For the period May 21, 2014 (commencement of operations) to May 31, 2014, the db X-trackers Harvest CSI 500 China A-Shares Small Cap Fund returned 2.80%, compared with the Underlying Index return of 3.09%.
Performance as of 5/31/14
| Cumulative Total Returns | ||||||
| Net Asset Value | Market Price | CSI 500 Index | ||||
Since Inception1 | 2.80% | 2.28% | 3.09% | |||
1 Total returns are calculated based on the commencement of operations, 5/21/14 (“Inception”).
Performance quoted represents past performance, assumes reinvestment of all dividends and capital gain distributions, and does not guarantee future results. Current performance may be higher or lower than the performance quoted. Performance data current to the most recent month end may be obtained by visiting www.dbxus.com. Investment in the fund poses investment risk including possible loss of principal. The investment return and principal value of an investment will fluctuate, so that shares, when sold or redeemed, may be worth more or less than their original cost. The estimated operating expense ratio as disclosed in the most recent prospectus dated May 13, 2014, was 0.82%.
The preceding performance chart is provided for comparative purposes and represents the period(s) noted. The net asset value return is based on the changes in the Fund’s net asset value per share (“NAV”). The Fund’s NAV is calculated by dividing the value of the Fund’s total assets less total liabilities by the number of shares outstanding. The market price return is based on the change in the market price on the NYSE Arca of a share of the Fund for the period(s) indicated. The price used to calculate market price returns is the midpoint of the bid/ask spread for Fund shares at 4 p.m. Eastern Time on the NYSE Arca. NAV and market returns assume that dividends and capital gain distributions have been reinvested in the Fund at NAV and market price, respectively.
An index is a statistical measure of a specified financial market or sector. An index does not actually hold a portfolio of securities, incur expenses or pay any transaction costs. Therefore index returns do not reflect deductions for fees or expenses and are not available for direct investment. In comparison, the Fund’s performance is negatively impacted by these deductions. Fund returns do not reflect brokerage commissions or taxes that a shareholder would pay on Fund distributions or on transactions in Fund shares.
6
DBX ETF Trust
PERFORMANCE SUMMARY
db X-trackers Harvest CSI 500 China A-Shares Small Cap Fund (ASHS) (Unaudited) (Continued)
Growth of a $10,000 Investment in ASHS2 as of 5/31/14
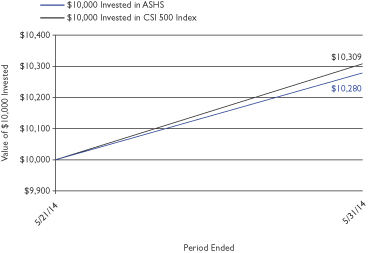
2 Based on Net Asset Value from commencement of operations 5/21/14.
Sector Breakdown* as of 5/31/2014
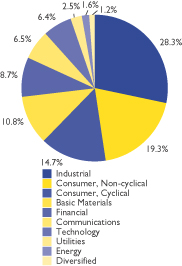
* Weightings are expressed as a percentage of total investments and may change over time. The sector classifications used above are based on company classifications under Bloomberg industry name.
Top Ten Holdings3 as of 5/31/14
| Description | % of Net Assets | |||
Hundsun Technologies, Inc., Class A | 0.8% | |||
Han’s Laser Technology Co. Ltd., Class A | 0.7% | |||
Shanghai RAAS Blood Products Co. Ltd., Class A | 0.6% | |||
Guizhou Yibai Pharmaceutical Co. Ltd., Class A | 0.6% | |||
Guangzhou Haige Communications Group, Inc. Co., Class A | 0.6% | |||
Jishi Media Co. Ltd., Class A | 0.6% | |||
Guangdong Advertising Co. Ltd., Class A | 0.6% | |||
Shinva Medical Instrument Co. Ltd., Class A | 0.6% | |||
Keda Clean Energy Co. Ltd., Class A | 0.5% | |||
Jiangsu Kanion Pharmaceutical Co. Ltd., Class A | 0.5% | |||
3 Holdings are subject to change without notice and there is no guarantee that the Fund will remain invested in any particular security. For a complete list of holdings go to page 15.
7
DBX ETF Trust
PERFORMANCE SUMMARY
db X-trackers Harvest MSCI All China Equity Fund (CN) (Unaudited)
The db X-trackers Harvest MSCI All China Equity Fund (CN) seeks investment results that correspond generally to the performance, before fees and expenses, of the MSCI All China Index. The Index is designed to capture large and mid cap representation across all China securities listed in China and Hong Kong as well as in the U.S. and Singapore. The index includes: A-shares, H-shares, B-shares, Red chips, and P chips share classes as well as securities of Chinese Companies listed in the U.S. and Singapore. The fund, using a passive approach or indexing approach, attempts to approximate the performance of the Index. CN expects to gain exposure to the China A-share components of the Index by investing in the db X-trackers Harvest CSI 300 China A-Shares Fund (ASHR), an affiliated fund subadvised by Harvest Global Investments Limited.
For the period April 30, 2014 (commencement of operations) to May 31, 2014, the db X-trackers Harvest MSCI All China Equity Fund returned 2.04%, compared with the Underlying Index return of 2.24%.
Performance as of 5/31/14
| Cumulative Total Returns | ||||||
| Net Asset Value | Market Price | MSCI All China Index | ||||
Since Inception1 | 2.04% | 1.92% | 2.24% | |||
1 Total returns are calculated based on the commencement of operations, 4/30/14 (“Inception”).
Performance quoted represents past performance, assumes reinvestment of all dividends and capital gain distributions, and does not guarantee future results. Current performance may be higher or lower than the performance quoted. Performance data current to the most recent month end may be obtained by visiting www.dbxus.com. Investment in the fund poses investment risk including possible loss of principal. The investment return and principal value of an investment will fluctuate, so that shares, when sold or redeemed, may be worth more or less than their original cost. The estimated operating expense ratio as disclosed in the most recent prospectus dated April 30, 2014, was 0.71%.
The preceding performance chart is provided for comparative purposes and represents the period(s) noted. The net asset value return is based on the changes in the Fund’s net asset value per share (“NAV”). The Fund’s NAV is calculated by dividing the value of the Fund’s total assets less total liabilities by the number of shares outstanding. The market price return is based on the change in the market price on the NYSE Arca of a share of the Fund for the period(s) indicated. The price used to calculate market price returns is the midpoint of the bid/ask spread for Fund shares at 4 p.m. Eastern Time on the NYSE Arca. NAV and market returns assume that dividends and capital gain distributions have been reinvested in the Fund at NAV and market price, respectively.
An index is a statistical measure of a specified financial market or sector. An index does not actually hold a portfolio of securities, incur expenses or pay any transaction costs. Therefore index returns do not reflect deductions for fees or expenses and are not available for direct investment. In comparison, the Fund’s performance is negatively impacted by these deductions. Fund returns do not reflect brokerage commissions or taxes that a shareholder would pay on Fund distributions or on transactions in Fund shares.
8
DBX ETF Trust
PERFORMANCE SUMMARY
db X-trackers Harvest MSCI All China Equity Fund (CN) (Unaudited) (Continued)
Growth of a $10,000 Investment in CN2 as of 5/31/14
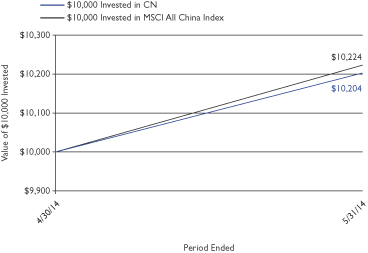
2 Based on Net Asset Value from commencement of operations 4/30/14.
Sector Breakdown* as of 5/31/14
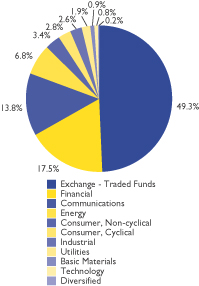
* Weightings are expressed as a percentage of total investments and may change over time. The sector classifications used above are based on company classifications under Bloomberg industry name.
Top Ten Holdings3 as of 5/31/14
| Description | % of Net Assets | |||
db X-trackers Harvest CSI 300 China A-Shares Fund | 49.3% | |||
Tencent Holdings Ltd. | 4.5% | |||
China Mobile Ltd. | 3.7% | |||
China Construction Bank Corp., Class H | 3.3% | |||
Industrial & Commercial Bank of China Ltd., Class H | 3.0% | |||
Baidu, Inc., ADR | 2.9% | |||
Bank of China Ltd., Class H | 2.4% | |||
CNOOC Ltd. | 1.9% | |||
PetroChina Co. Ltd., Class H | 1.6% | |||
China Petroleum & Chemical Corp., Class H | 1.4% | |||
3 Holdings are subject to change without notice and there is no guarantee that the Fund will remain invested in any particular security. For a complete list of holdings go to page 21.
9
DBX ETF Trust
As a shareholder of one or more of the funds, you incur two types of costs: (1) transaction costs, including brokerage commissions paid on purchases and sales of fund shares, and (2) ongoing costs, including management fees and other Fund expenses. The expense examples below are intended to help you understand your ongoing costs (in dollars) of investing in the Funds and to compare these costs with the ongoing costs of investing in other funds. In the most recent six-month period, db X-trackers Harvest CSI 300 China A-Shares Fund and db X-trackers Harvest MSCI All China Equity Fund limited these expenses; had they not done so, expenses would have been higher.
The examples are based on an investment of $1,000 made at the beginning of the period and held through the six-month period ended May 31, 2014.
ACTUAL EXPENSES
The first line in the following tables provides information about actual account values and actual expenses. You may use the information in this line, together with the amount you invested, to estimate the expenses that you paid over the period. Simply divide your account value by $1,000 (for example, an $8,600 account value divided by $1,000 = 8.6), then multiply the result by the number in the first line under the heading “Expenses Paid During the Period” to estimate the expenses you paid on your account during this period.
HYPOTHETICAL EXAMPLE FOR COMPARISON PURPOSES
The second line in the following tables provides information about hypothetical account values and hypothetical expenses based on the Funds’ actual expense ratios and an assumed rate of return of 5% per year before expenses (which is not the Funds’ actual return). The hypothetical account values and expenses may not be used to estimate the actual ending account balance or expenses you paid for the period. You may use this information to compare the ongoing costs of investing in the Fund and other funds. To do so, compare this 5% hypothetical example with the 5% hypothetical examples that appear in the shareholder reports of the other funds.
Please note that the expenses shown in the tables are meant to highlight your ongoing costs only, and do not reflect any transactional costs. Therefore the second line in the table is useful in comparing ongoing costs only, and will not help you determine the relative total costs of owning different funds. In addition, if these transactional costs were included, your costs would have been higher.
| Beginning Account Value | Ending Account Value May 31, 2014 | Annualized Expense Ratio based on the number of days in the period | Expenses Paid During the Period(1) December 1, 2013 to May 31, 2014 | |||||||||||||
db X-trackers Harvest CSI 300 China | ||||||||||||||||
Actual | $ | 1,000.00 | $ | 862.30 | 0.88 | % | $ | 4.09 | ||||||||
Hypothetical (5% return before expenses) | $ | 1,000.00 | $ | 1,020.54 | 0.88 | % | $ | 4.43 | ||||||||
db X-trackers Harvest CSI 500 China | ||||||||||||||||
Actual(2) | $ | 1,000.00 | $ | 1,028.00 | 0.80 | % | $ | 0.24 | ||||||||
Hypothetical (5% return before expenses) | $ | 1,000.00 | $ | 1,020.94 | 0.80 | % | $ | 4.03 | ||||||||
db X-trackers Harvest MSCI All China Equity Fund | ||||||||||||||||
Actual(3) | $ | 1,000.00 | $ | 1,020.40 | 0.30 | % | $ | 0.27 | ||||||||
Hypothetical (5% return before expenses) | $ | 1,000.00 | $ | 1,023.44 | 0.30 | % | $ | 1.51 | ||||||||
(1) Expenses are calculated using the Fund’s annualized expense ratio, multiplied by the average account value for the period, multiplied by 182/365.
(2) Fund commenced operations on May 21, 2014. Actual expenses are calculated using the Fund’s annualized expense ratio, multiplied by the average account value for the period, multiplied by 11/365 (to reflect the period since commencement of operations).
(3) Fund commenced operations on April 30, 2014. Actual expenses are calculated using the Fund’s annualized expense ratio, multiplied by the average account value for the period, multiplied by 32/365 (to reflect the period since commencement of operations).
10
DBX ETF Trust
db X-trackers Harvest CSI 300 China A-Shares Fund
May 31, 2014
Number of Shares | Value | |||||||||
| COMMON STOCKS — 99.5% | ||||||||||
| Basic Materials — 6.5% | ||||||||||
Aluminum Corp. of China Ltd., Class A* | 570,460 | $ | 275,765 | |||||||
Baoshan Iron & Steel Co. Ltd., Class A | 986,069 | 621,888 | ||||||||
Chenzhou Mining Group Co. Ltd., Class A* | 137,600 | 160,786 | ||||||||
China Hainan Rubber Industry Group Co. Ltd., Class A | 233,900 | 215,281 | ||||||||
China Minmetals Rare Earth Co. Ltd., Class A* | 97,489 | 322,711 | ||||||||
China Molybdenum Co. Ltd., Class A | 41,715 | 42,000 | ||||||||
China Nonferrous Metal Industry’s Foreign Engineering and Construction Co. Ltd., Class A | 118,657 | 179,677 | ||||||||
Gansu Yasheng Industrial Group Co., Class A | 289,500 | 271,089 | ||||||||
Hebei Iron & Steel Co. Ltd., Class A* | 844,700 | 244,731 | ||||||||
Hengyi Petrochemical Co. Ltd., Class A | 72,925 | 71,789 | ||||||||
Inner Mongolia Baotou Steel Rare-Earth Hi-Tech Co. Ltd., Class A | 287,519 | 887,783 | ||||||||
Inner Mongolian Baotou Steel Union Co. Ltd., Class A | 642,900 | 380,761 | ||||||||
Jiangxi Copper Co. Ltd., Class A | 164,136 | 321,057 | ||||||||
Jinduicheng Molybdenum Co. Ltd., Class A | 191,400 | 204,963 | ||||||||
Kingfa Sci & Tech Co. Ltd., Class A | 316,557 | 231,060 | ||||||||
Pangang Group Vanadium Titanium & Resources Co. Ltd., Class A* | 853,400 | 285,500 | ||||||||
Qinghai Salt Lake Industry Co. Ltd., Class A | 126,735 | 320,525 | ||||||||
Rising Nonferrous Metals Share Co. Ltd., Class A* | 23,991 | 131,143 | ||||||||
Shandong Gold Mining Co. Ltd., Class A | 141,700 | 350,661 | ||||||||
Shandong Nanshan Aluminum Co. Ltd., Class A | 230,500 | 180,421 | ||||||||
Shenzhen Zhongjin Lingnan Nonfemet Co. Ltd., Class A | 288,489 | 259,521 | ||||||||
Sinopec Shanghai Petrochemical Co. Ltd., Class A | 436,403 | 221,439 | ||||||||
Tongling Nonferrous Metals Group Co. Ltd., Class A | 141,543 | 213,199 | ||||||||
Wanhua Chemical Group Co. Ltd., Class A* | 216,308 | 583,418 | ||||||||
Wasu Media Holding Co. Ltd., Class A* | 15,600 | 69,619 | ||||||||
Western Mining Co. Ltd., Class A | 379,900 | 318,646 | ||||||||
Xiamen Tungsten Co. Ltd., Class A | 53,882 | 213,551 | ||||||||
Yunnan Chihong Zinc & Germanium Co. Ltd., Class A | 165,163 | 226,834 | ||||||||
Yunnan Copper Industry Co. Ltd., Class A* | 132,849 | 161,827 | ||||||||
Yunnan Tin Co. Ltd., Class A | 86,900 | 173,041 | ||||||||
Yunnan Yuntianhua Co. Ltd., Class A* | 91,203 | 104,673 | ||||||||
Zhejiang Juhua Co. Ltd., Class A* | 180,061 | 155,928 | ||||||||
Number of Shares | Value | |||||||||
| Basic Materials (Continued) | ||||||||||
Zhejiang Longsheng Group Co. Ltd., Class A* | 220,607 | $ | 557,229 | |||||||
Zhongjin Gold Co. Ltd., Class A | 292,433 | 359,497 | ||||||||
Zijin Mining Group Co. Ltd., Class A | 1,580,100 | 553,906 | ||||||||
|
| |||||||||
| 9,871,919 | ||||||||||
|
| |||||||||
| Communications — 2.6% | ||||||||||
China South Publishing & Media Group Co. Ltd., Class A | 105,148 | 221,327 | ||||||||
China Spacesat Co. Ltd., Class A* | 119,046 | 336,141 | ||||||||
China United Network Communications Ltd., Class A | 1,686,401 | 869,209 | ||||||||
CITIC Guoan Information Industry Co. Ltd., Class A | 187,485 | 192,968 | ||||||||
Dr Peng Telcom & Media Group Co. Ltd., Class A | 218,681 | 489,007 | ||||||||
Fiberhome Telecommunication Technologies Co. Ltd., Class A | 97,372 | 187,658 | ||||||||
Huawen Media Investment Group Corp., Class A* | 221,744 | 441,195 | ||||||||
Jiangsu Phoenix Publishing & Media Corp. Ltd., Class A | 151,260 | 211,129 | ||||||||
People.cn Co. Ltd., Class A | 17,320 | 203,827 | ||||||||
ZTE Corp., Class A* | 390,212 | 821,361 | ||||||||
|
| |||||||||
| 3,973,822 | ||||||||||
|
| |||||||||
| Consumer, Cyclical — 12.6% | ||||||||||
Air China Ltd., Class A | 339,373 | 178,180 | ||||||||
Beijing Wangfujing Department Store Group Co. Ltd., Class A | 44,824 | 121,256 | ||||||||
Beiqi Foton Motor Co. Ltd., Class A | 286,200 | 227,685 | ||||||||
BesTV New Media Co. Ltd., Class A | 128,622 | 659,447 | ||||||||
Byd Co. Ltd., Class A* | 92,024 | 687,606 | ||||||||
China Avic Electronics Co. Ltd., Class A | 69,568 | 219,819 | ||||||||
China Eastern Airlines Corp. Ltd., Class A* | 506,300 | 188,830 | ||||||||
China International Travel Service Corp. Ltd., Class A* | 55,787 | 283,788 | ||||||||
China Southern Airlines Co. Ltd., Class A | 697,000 | 261,070 | ||||||||
Chongqing Changan Automobile Co. Ltd., Class A | 372,979 | 694,339 | ||||||||
Dashang Group Co. Ltd., Class A | 55,663 | 237,539 | ||||||||
FAW CAR Co. Ltd., Class A* | 161,300 | 258,966 | ||||||||
Fuyao Glass Industry Group Co. Ltd., Class A | 278,280 | 363,479 | ||||||||
Great Wall Motor Co. Ltd., Class A | 78,922 | 361,935 | ||||||||
Gree Electric Appliances, Inc., Class A | 473,760 | 2,347,832 | ||||||||
Guangzhou Automobile Group Co. Ltd., Class A | 167,721 | 195,714 | ||||||||
Hainan Airlines Co. Ltd., Class A | 1,173,900 | 319,439 | ||||||||
Haining China Leather Market Co. Ltd., Class A | 90,922 | 182,941 | ||||||||
Hisense Electric Co. Ltd., Class A* | 156,500 | 262,032 | ||||||||
Huayu Automotive Systems Co. Ltd., Class A | 204,100 | 313,306 | ||||||||
| See Notes to Financial Statements. | 11 |
DBX ETF Trust
SCHEDULE OF INVESTMENTS
db X-trackers Harvest CSI 300 China A-Shares Fund (Continued)
May 31, 2014
Number of Shares | Value | |||||||||
| Consumer, Cyclical (Continued) | ||||||||||
Liaoning Cheng Da Co. Ltd., Class A* | 272,991 | $ | 625,310 | |||||||
Midea Group Co. Ltd., Class A | 330,476 | 921,501 | ||||||||
Minmetals Development Co. Ltd., Class A* | 84,200 | 149,604 | ||||||||
Pang Da Automobile Trade Co. Ltd., Class A* | 157,001 | 119,121 | ||||||||
Qingdao Haier Co. Ltd., Class A | 325,081 | 783,133 | ||||||||
SAIC Motor Corp. Ltd., Class A | 654,207 | 1,528,888 | ||||||||
Shanghai Friendship Group, Inc. Co., Class A | 153,086 | 316,351 | ||||||||
Shanghai Jahwa United Co. Ltd., Class A | 92,529 | 479,878 | ||||||||
Shanghai Metersbonwe Fashion & Accessories Co. Ltd., Class A* | 41,760 | 57,955 | ||||||||
Shanghai Oriental Pearl Group Co. Ltd., Class A | 311,000 | 546,601 | ||||||||
Shanghai Pharmaceuticals Holding Co. Ltd., Class A | 189,974 | 377,680 | ||||||||
Shanghai Waigaoqiao Free Trade Zone Development Co. Ltd., Class A | 40,052 | 179,831 | ||||||||
Shanghai Yuyuan Tourist Mart Co. Ltd., Class A | 200,951 | 239,315 | ||||||||
Shenzhen Overseas Chinese Town Co. Ltd., Class A | 721,100 | 547,119 | ||||||||
Sichuan Changhong Electric Co. Ltd., Class A | 738,600 | 373,598 | ||||||||
Suning Commerce Group Co. Ltd., Class A* | 879,806 | 977,360 | ||||||||
TCL Corp., Class A | 1,504,800 | 566,049 | ||||||||
Weichai Power Co. Ltd., Class A | 210,656 | 587,394 | ||||||||
Weifu High-Technology Group Co. Ltd., Class A | 119,920 | 476,049 | ||||||||
Xiamen C & D, Inc., Class A | 338,911 | 303,795 | ||||||||
Youngor Group Co. Ltd., Class A | 311,900 | 334,002 | ||||||||
Zhengzhou Yutong Bus Co. Ltd., Class A | 167,101 | 414,857 | ||||||||
|
| |||||||||
| 19,270,594 | ||||||||||
|
| |||||||||
| Consumer, Non-cyclical — 12.8% | ||||||||||
Anhui Gujing Distillery Co. Ltd., Class A | 21,600 | 62,719 | ||||||||
Beijing Dabeinong Technology Group Co. Ltd., Class A | 160,687 | 288,590 | ||||||||
Beijing SL Pharmaceutical Co. Ltd., Class A* | 53,634 | 348,557 | ||||||||
Beijing Tongrentang Co. Ltd., Class A | 130,740 | 353,046 | ||||||||
Beijing Yanjing Brewery Co. Ltd., Class A | 278,817 | 304,823 | ||||||||
Beingmate Baby & Child Food Co. Ltd., Class A | 125,120 | 272,579 | ||||||||
Bright Dairy & Food Co. Ltd., Class A | 121,641 | 339,768 | ||||||||
China Resources Double Crane Pharmaceutical Co. Ltd., Class A | 69,532 | 189,320 | ||||||||
China Resources Sanjiu Medical & Pharmaceutical Co. Ltd., Class A | 79,100 | 244,366 | ||||||||
Number of Shares | Value | |||||||||
| Consumer, Non-cyclical (Continued) | ||||||||||
Fujian Sunner Development Co. Ltd., Class A* | 92,130 | $ | 150,569 | |||||||
Guangxi Wuzhou Zhongheng Group Co. Ltd., Class A | 175,829 | 337,456 | ||||||||
Guangzhou Baiyunshan Pharmaceutical Holdings Co. Ltd., Class A | 104,239 | 418,137 | ||||||||
Harbin Pharmaceutical Group Co. Ltd., Class A* | 194,600 | 191,881 | ||||||||
Heilongjiang Agriculture Co. Ltd., Class A* | 141,299 | 156,288 | ||||||||
Henan Shuanghui Investment & Development Co. Ltd., Class A | 132,462 | 726,630 | ||||||||
Huadong Medicine Co. Ltd., Class A* | 41,754 | 328,629 | ||||||||
Hualan Biological Engineering, Inc., Class A | 55,600 | 220,360 | ||||||||
Inner Mongolia Yili Industrial Group Co. Ltd., Class A | 284,127 | 1,544,045 | ||||||||
Jiangsu Hengrui Medicine Co. Ltd., Class A | 147,547 | 764,978 | ||||||||
Jiangsu Yanghe Brewery Joint-Stock Co. Ltd., Class A | 63,160 | 559,283 | ||||||||
Jilin Aodong Medicine Industry Groups Co. Ltd., Class A | 142,573 | 351,680 | ||||||||
Kangmei Pharmaceutical Co. Ltd., Class A | 305,087 | 746,199 | ||||||||
Kweichow Moutai Co. Ltd., Class A | 81,517 | 1,999,268 | ||||||||
Luzhou Laojiao Co. Ltd., Class A | 138,686 | 351,194 | ||||||||
MeiHua Holdings Group Co., Class A | 186,048 | 145,031 | ||||||||
New Hope Liuhe Co. Ltd., Class A | 139,000 | 268,330 | ||||||||
Shandong Dong-E E-Jiao, Class A | 105,379 | 531,171 | ||||||||
Shanghai Fosun Pharmaceutical Group Co. Ltd., Class A | 227,795 | 721,602 | ||||||||
Shanghai International Port Group Co. Ltd., Class A | 905,200 | 650,576 | ||||||||
Shanxi Xinghuacun Fen Wine Factory Co. Ltd., Class A | 50,050 | 110,879 | ||||||||
Shenzhen Agricultural Products Co. Ltd., Class A | 203,513 | 315,011 | ||||||||
Shenzhen Hepalink Pharmaceutical Co. Ltd., Class A | 48,600 | 146,330 | ||||||||
Shenzhen Salubris Pharmaceuticals Co. Ltd., Class A | 38,291 | 178,912 | ||||||||
Shijiazhuang Yiling Pharmaceutical Co. Ltd., Class A | 21,000 | 103,197 | ||||||||
Sichuan Kelun Pharmaceutical Co. Ltd., Class A* | 47,245 | 292,970 | ||||||||
Tasly Pharmaceutical Group Co. Ltd., Class A* | 122,414 | 734,605 | ||||||||
Tsingtao Brewery Co. Ltd., Class A | 69,517 | 472,920 | ||||||||
Wuliangye Yibin Co. Ltd., Class A | 376,877 | 1,012,277 | ||||||||
Xizang Haisco Pharmaceutical Group Co. Ltd., Class A | 43,355 | 125,263 | ||||||||
Yantai Changyu Pioneer Wine Co. Ltd., Class A | 27,888 | 112,538 | ||||||||
Yonghui Superstores Co. Ltd., Class A | 260,470 | 264,752 | ||||||||
Yunnan Baiyao Group Co. Ltd., Class A | 102,350 | 942,517 | ||||||||
| See Notes to Financial Statements. | 12 |
DBX ETF Trust
SCHEDULE OF INVESTMENTS
db X-trackers Harvest CSI 300 China A-Shares Fund (Continued)
May 31, 2014
Number of Shares | Value | |||||||||
| Consumer, Non-cyclical (Continued) | ||||||||||
Zhangzhou Pientzehuang Pharmaceutical Co. Ltd., Class A | 16,616 | $ | 205,170 | |||||||
Zhangzidao Group Co. Ltd., Class A | 55,600 | 126,823 | ||||||||
Zhejiang Hisun Pharmaceutical Co. Ltd., Class A | 100,661 | 230,895 | ||||||||
Zhejiang Medicine Co. Ltd., Class A | 130,997 | 192,492 | ||||||||
Zhejiang NHU Co. Ltd., Class A | 104,389 | 213,547 | ||||||||
Zhejiang Yasha Decoration Co. Ltd., Class A | 66,397 | 234,456 | ||||||||
|
| |||||||||
| 19,582,629 | ||||||||||
|
| |||||||||
| Diversified — 1.0% | ||||||||||
AVIC Capital Co. Ltd., Class A | 150,900 | 376,568 | ||||||||
China Baoan Group Co. Ltd., Class A | 245,000 | 400,405 | ||||||||
Humanwell Healthcare Group Co. Ltd., Class A | 84,127 | 359,007 | ||||||||
Orient Group, Inc., Class A* | 264,688 | 231,755 | ||||||||
Zhejiang China Commodities City Group Co. Ltd., Class A | 271,409 | 224,607 | ||||||||
|
| |||||||||
| 1,592,342 | ||||||||||
|
| |||||||||
| Energy — 4.6% | ||||||||||
Anhui Hengyuan Coal-Electricity Group Co. Ltd., Class A | 99,198 | 86,220 | ||||||||
Beijing Haohua Energy Resource Co. Ltd., Class A | 97,300 | 86,440 | ||||||||
China Coal Energy Co. Ltd., Class A | 363,700 | 236,944 | ||||||||
China Oilfield Services Ltd., Class A | 118,706 | 320,930 | ||||||||
China Petroleum & Chemical Corp., Class A | 1,098,715 | 896,938 | ||||||||
China Shenhua Energy Co. Ltd., Class A | 654,669 | 1,500,625 | ||||||||
Datong Coal Industry Co. Ltd., Class A | 122,000 | 116,780 | ||||||||
Guizhou Panjiang Refined Coal Co. Ltd., Class A | 98,870 | 106,193 | ||||||||
Henan Dayou Energy Co. Ltd., Class A | 97,392 | 83,871 | ||||||||
Henan Shenhuo Coal & Power Co. Ltd., Class A | 190,800 | 112,086 | ||||||||
Jizhong Energy Resources Co. Ltd., Class A | 139,000 | 130,383 | ||||||||
Kailuan Energy Chemical Co. Ltd., Class A* | 125,100 | 89,710 | ||||||||
Offshore Oil Engineering Co. Ltd., Class A* | 351,700 | 412,652 | ||||||||
PetroChina Co. Ltd., Class A | 695,506 | 846,101 | ||||||||
Pingdingshan Tianan Coal Mining Co. Ltd., Class A | 232,296 | 149,106 | ||||||||
SDIC Xinji Energy Co. Ltd., Class A | 227,459 | 105,587 | ||||||||
Shanxi Coal International Energy Group Co. Ltd., Class A | 196,100 | 120,536 | ||||||||
Shanxi Lanhua Sci-Tech Venture Co. Ltd., Class A | 139,000 | 171,100 | ||||||||
Shanxi Lu’an Environmental Energy Development Co. Ltd., Class A | 183,361 | 227,759 | ||||||||
Shanxi Xishan Coal & Electricity Power Co. Ltd., Class A | 315,200 | 266,396 | ||||||||
Number of Shares | Value | |||||||||
| Energy (Continued) | ||||||||||
Wintime Energy Co. Ltd., Class A | 395,640 | $ | 150,408 | |||||||
Yang Quan Coal Industry Group Co. Ltd., Class A | 239,209 | 219,402 | ||||||||
Yantai Jereh Oilfield Services Group Co. Ltd., Class A* | 46,400 | 449,272 | ||||||||
Yanzhou Coal Mining Co. Ltd., Class A | 118,630 | 129,125 | ||||||||
|
| |||||||||
| 7,014,564 | ||||||||||
|
| |||||||||
| Financial — 39.7% | ||||||||||
Agricultural Bank of China Ltd., Class A | 5,131,552 | 2,045,294 | ||||||||
Bank of Beijing Co. Ltd., Class A | 1,049,499 | 1,318,740 | ||||||||
Bank of China Ltd., Class A | 1,262,500 | 539,573 | ||||||||
Bank of Communications Co. Ltd., Class A | 3,089,332 | 1,884,071 | ||||||||
Bank of Nanjing Co. Ltd., Class A | 414,515 | 525,500 | ||||||||
Bank of Ningbo Co. Ltd., Class A | 289,949 | 420,492 | ||||||||
Beijing Capital Development Co. Ltd., Class A | 221,755 | 158,668 | ||||||||
Beijing Urban Construction Investment & Development Co. Ltd., Class A | 107,867 | 129,151 | ||||||||
Changjiang Securities Co. Ltd., Class A | 328,646 | 496,601 | ||||||||
China CITIC Bank Corp. Ltd., Class A | 577,300 | 389,961 | ||||||||
China Construction Bank Corp., Class A | 1,880,100 | 1,212,812 | ||||||||
China Everbright Bank Co. Ltd., Class A | 3,213,500 | 1,270,524 | ||||||||
China Fortune Land Development Co. Ltd., Class A | 106,312 | 455,042 | ||||||||
China Life Insurance Co. Ltd., Class A | 299,045 | 670,150 | ||||||||
China Merchants Bank Co. Ltd., Class A | 3,251,104 | 5,282,075 | ||||||||
China Merchants Property Development Co. Ltd., Class A* | 135,175 | 382,548 | ||||||||
China Merchants Securities Co. Ltd., Class A | 463,357 | 769,134 | ||||||||
China Minsheng Banking Corp. Ltd., Class A | 4,469,943 | 5,330,475 | ||||||||
China Pacific Insurance Group Co. Ltd., Class A | 619,605 | 1,664,234 | ||||||||
China Vanke Co. Ltd., Class A | 1,914,082 | 2,619,597 | ||||||||
CITIC Securities Co. Ltd., Class A | 1,359,695 | 2,463,743 | ||||||||
Financial Street Holdings Co. Ltd., Class A | 483,600 | 486,131 | ||||||||
Founder Securities Co. Ltd., Class A | 719,400 | 648,316 | ||||||||
Gemdale Corp., Class A | �� | 889,928 | 1,136,751 | |||||||
GF Securities Co. Ltd., Class A | 586,870 | 950,671 | ||||||||
Guanghui Energy Co. Ltd., Class A | 625,689 | 718,101 | ||||||||
Guoyuan Securities Co. Ltd., Class A | 195,000 | 308,077 | ||||||||
Haitong Securities Co. Ltd., Class A | 1,600,200 | 2,366,757 | ||||||||
Huatai Securities Co. Ltd., Class A | 556,237 | 696,265 | ||||||||
Huaxia Bank Co. Ltd., Class A | 880,800 | 1,164,568 | ||||||||
| See Notes to Financial Statements. | 13 |
DBX ETF Trust
SCHEDULE OF INVESTMENTS
db X-trackers Harvest CSI 300 China A-Shares Fund (Continued)
May 31, 2014
Number of Shares | Value | |||||||||
| Financial (Continued) | ||||||||||
Industrial & Commercial Bank of China Ltd., Class A | 3,222,403 | $ | 1,836,274 | |||||||
Industrial Bank Co. Ltd., Class A | 2,260,240 | 3,556,442 | ||||||||
Industrial Securities Co. Ltd., Class A* | 310,506 | 424,956 | ||||||||
Jiangsu Zhongnan Construction Group Co. Ltd., Class A | 69,553 | 77,154 | ||||||||
Jinke Properties Group Co. Ltd., Class A | 53,703 | 62,236 | ||||||||
Luxin Venture Capital Group Co. Ltd., Class A | 41,707 | 101,943 | ||||||||
New China Life Insurance Co. Ltd., Class A* | 165,153 | 535,063 | ||||||||
Northeast Securities Co. Ltd., Class A | 194,172 | 231,242 | ||||||||
Oceanwide Real Estate Group Co. Ltd., Class A | 274,128 | 203,601 | ||||||||
Pacific Securities Co. Ltd., Class A | 209,852 | 208,263 | ||||||||
Ping An Bank Co. Ltd., Class A | 939,093 | 1,728,678 | ||||||||
Ping An Insurance Group Co. of China Ltd., Class A | 942,806 | 6,018,457 | ||||||||
Poly Real Estate Group Co. Ltd., Class A | 1,275,475 | 1,024,904 | ||||||||
RiseSun Real Estate Development Co. Ltd., Class A* | 146,600 | 250,853 | ||||||||
Sealand Securities Co. Ltd., Class A* | 137,380 | 215,285 | ||||||||
Shanghai Chengtou Holding Co. Ltd., Class A | 297,484 | 314,755 | ||||||||
Shanghai Lujiazui Finance & Trade Zone Development Co. Ltd., Class A* | 80,200 | 214,515 | ||||||||
Shanghai Pudong Development Bank, Class A | 2,211,000 | 3,386,946 | ||||||||
Shanghai Zhangjiang High-Tech Park Development Co. Ltd., Class A | 153,830 | 161,037 | ||||||||
Shanxi Securities Co. Ltd., Class A | 197,700 | 212,659 | ||||||||
Sinolink Securities Co. Ltd., Class A | 103,567 | 323,932 | ||||||||
SooChow Securities Co. Ltd., Class A | 238,602 | 273,461 | ||||||||
Southwest Securities Co. Ltd., Class A | 232,500 | 324,524 | ||||||||
Suning Universal Co. Ltd., Class A | 166,800 | 110,536 | ||||||||
Western Securities Co. Ltd., Class A | 71,604 | 127,224 | ||||||||
Xinhu Zhongbao Co. Ltd., Class A | 496,900 | 234,638 | ||||||||
|
| |||||||||
| 60,663,600 | ||||||||||
|
| |||||||||
| Industrial — 13.8% | ||||||||||
Anhui Conch Cement Co. Ltd., Class A | 399,398 | 1,042,720 | ||||||||
AVIC Aircraft Co. Ltd., Class A | 263,100 | 387,450 | ||||||||
BBMG Corp., Class A | 213,600 | 191,810 | ||||||||
Beijing Capital Co. Ltd., Class A | 216,800 | 211,341 | ||||||||
Beijing Kangde Xin Composite Material Co. Ltd., Class A | 147,316 | 474,445 | ||||||||
Beijing Orient Landscape Co. Ltd., Class A* | 46,300 | 181,426 | ||||||||
Beijing Zhongke Sanhuan High-Tech Co. Ltd., Class A | 169,563 | 327,602 | ||||||||
China CAMC Engineering Co. Ltd., Class A | 43,535 | 111,498 | ||||||||
China CNR Corp. Ltd., Class A | 818,907 | 572,827 | ||||||||
Number of Shares | Value | |||||||||
| Industrial (Continued) | ||||||||||
China Communications Construction Co. Ltd., Class A | 466,000 | $ | 277,483 | |||||||
China CSSC Holdings Ltd., Class A | 108,213 | 336,385 | ||||||||
China First Heavy Industries Co. Ltd., Class A | 517,700 | 159,106 | ||||||||
China Gezhouba Group Co. Ltd., Class A | 417,153 | 256,410 | ||||||||
China International Marine Containers Group Co. Ltd., Class A | 172,162 | 347,780 | ||||||||
China National Chemical Engineering Co. Ltd., Class A | 392,080 | 351,456 | ||||||||
China Railway Construction Corp. Ltd., Class A | 612,100 | 436,982 | ||||||||
China Railway Erju Co. Ltd., Class A | 154,800 | 115,717 | ||||||||
China Railway Group Ltd., Class A | 1,018,100 | 417,193 | ||||||||
China Shipbuilding Industry Co. Ltd., Class A | 1,038,500 | 738,070 | ||||||||
China Shipping Container Lines Co. Ltd., Class A* | 469,100 | 158,437 | ||||||||
China State Construction Engineering Corp. Ltd., Class A | 2,965,100 | 1,433,355 | ||||||||
CPT Technology Group Co. Ltd., Class A* | 27,379 | 101,237 | ||||||||
CSG Holding Co. Ltd., Class A | 259,600 | 297,526 | ||||||||
CSR Corp. Ltd., Class A | 935,701 | 632,058 | ||||||||
Daqin Railway Co. Ltd., Class A | 1,183,559 | 1,271,218 | ||||||||
Dongfang Electric Corp. Ltd., Class A | 134,661 | 250,039 | ||||||||
Fangda Carbon New Material Co. Ltd., Class A | 170,800 | 202,041 | ||||||||
GoerTek, Inc., Class A | 151,142 | 644,022 | ||||||||
Guangshen Railway Co. Ltd., Class A | 588,000 | 238,125 | ||||||||
Guangxi Liugong Machinery Co. Ltd., Class A | 156,800 | 152,852 | ||||||||
Hangzhou Hikvision Digital Technology Co. Ltd., Class A | 239,903 | 691,986 | ||||||||
Jiangxi Hongdu Aviation Industry Corp. Ltd., Class A | 85,918 | 217,707 | ||||||||
Metallurgical Corp. of China Ltd., Class A* | 969,400 | 263,791 | ||||||||
NARI Technology Development Co. Ltd., Class A | 286,581 | 603,686 | ||||||||
Ningbo Port Co. Ltd., Class A | 764,100 | 278,864 | ||||||||
Palm Landscape Architecture Co. Ltd., Class A | 35,418 | 100,120 | ||||||||
Power Construction Corp. of China Ltd., Class A | 720,300 | 321,681 | ||||||||
Sany Heavy Industry Co. Ltd., Class A | 608,123 | 507,150 | ||||||||
Shanghai Construction Co. Ltd., Class A | 164,886 | 155,984 | ||||||||
Shanghai International Airport Co. Ltd., Class A | 190,310 | 406,069 | ||||||||
Shenzhen Laibao Hi-tech Co. Ltd., Class A | 83,400 | 140,173 | ||||||||
Shenzhen O-film Tech Co. Ltd., Class A | 73,168 | 248,879 | ||||||||
| See Notes to Financial Statements. | 14 |
DBX ETF Trust
SCHEDULE OF INVESTMENTS
db X-trackers Harvest CSI 300 China A-Shares Fund (Continued)
May 31, 2014
Number of Shares | Value | |||||||||
| Industrial (Continued) | ||||||||||
Sinoma International Engineering Co., Class A | 87,500 | $ | 99,723 | |||||||
Sound Environmental Resources Co. Ltd., Class A | 103,412 | 362,347 | ||||||||
Suzhou Gold Mantis Construction Decoration Co. Ltd., Class A* | 117,712 | 329,171 | ||||||||
Tangshan Jidong Cement Co. Ltd., Class A | 111,200 | 138,482 | ||||||||
TBEA Co. Ltd., Class A | 628,954 | 894,003 | ||||||||
Tian Di Science & Technology Co. Ltd., Class A | 97,340 | 142,256 | ||||||||
Tianjin Zhonghuan Semiconductor Joint-Stock Co. Ltd., Class A* | 69,900 | 210,238 | ||||||||
XCMG Construction Machinery Co. Ltd., Class A | 244,400 | 267,196 | ||||||||
Xi’ An Aero-Engine PLC, Class A | 106,627 | 372,588 | ||||||||
Xi’an Shaangu Power Co. Ltd., Class A | 143,500 | 130,699 | ||||||||
Xinjiang Goldwind Science & Technology Co. Ltd., Class A | 304,548 | 463,113 | ||||||||
Xinxing Ductile Iron Pipes, Class A | 288,600 | 253,616 | ||||||||
XJ Electric Co. Ltd., Class A* | 76,835 | 348,551 | ||||||||
Zhengzhou Coal Mining Machinery Group Co. Ltd., Class A | 166,802 | 135,101 | ||||||||
Zoomlion Heavy Industry Science and Technology Co. Ltd., Class A | 875,600 | 634,909 | ||||||||
|
| |||||||||
| 21,036,694 | ||||||||||
|
| |||||||||
| Technology — 2.7% | ||||||||||
Aisino Co. Ltd., Class A | 111,306 | 356,511 | ||||||||
Anhui USTC iFlytek Co. Ltd., Class A | 108,512 | 411,656 | ||||||||
BOE Technology Group Co. Ltd., Class A* | 1,924,500 | 665,395 | ||||||||
DHC Software Co. Ltd., Class A | 68,685 | 440,654 | ||||||||
Neusoft Corp., Class A | 171,680 | 356,424 | ||||||||
Sanan Optoelectronics Co. Ltd., Class A | 140,153 | 511,724 | ||||||||
Tsinghua Tongfang Co. Ltd., Class A | 300,700 | 413,942 | ||||||||
Universal Scientific Industrial Shanghai Co. Ltd., Class A | 39,800 | 178,763 | ||||||||
Yonyou Software Co. Ltd., Class A | 112,474 | 277,256 | ||||||||
Zhejiang Dahua Technology Co. Ltd., Class A | 114,312 | 490,565 | ||||||||
|
| |||||||||
| 4,102,890 | ||||||||||
|
| |||||||||
| Utilities — 3.2% | ||||||||||
Chengdu Xingrong Investment Co. Ltd., Class A | 359,300 | 259,383 | ||||||||
China Yangtze Power Co. Ltd., Class A | 985,532 | 951,253 | ||||||||
Chongqing Water Group Co. Ltd., Class A | 189,000 | 152,173 | ||||||||
Datang International Power Generation Co. Ltd., Class A | 594,327 | 340,578 | ||||||||
GD Power Development Co. Ltd., Class A* | 1,713,200 | 627,988 | ||||||||
Number of Shares | Value | |||||||||||
| Utilities (Continued) | ||||||||||||
Huadian Power International Corp. Ltd., Class A | 468,576 | $ | 242,265 | |||||||||
Huaneng Power International, Inc., Class A | 833,169 | 741,507 | ||||||||||
Inner Mongolia MengDian Huaneng Thermal Power Co. Ltd., Class A | 386,000 | 226,139 | ||||||||||
SDIC Power Holdings Co. Ltd., Class A* | 675,429 | 538,414 | ||||||||||
Shenergy Co. Ltd., Class A | 454,322 | 316,345 | ||||||||||
Shenzhen Gas Corp. Ltd., Class A | 83,479 | 93,136 | ||||||||||
Sichuan Chuantou Energy Co. Ltd., Class A | 197,075 | 368,769 | ||||||||||
|
| |||||||||||
| 4,857,950 | ||||||||||||
|
| |||||||||||
TOTAL COMMON STOCKS | 151,967,004 | |||||||||||
|
| |||||||||||
Principal | Value | |||||||||||
| CONVERTIBLE BONDS — 0.0% (a) | ||||||||||||
| Financial — 0.0% (a) | ||||||||||||
Sinolink Securities Co. Ltd. | RMB | 189,000 | $ | 30,253 | ||||||||
|
| |||||||||||
TOTAL INVESTMENTS — 99.5% (Cost $169,453,537) | $ | 151,997,257 | ||||||||||
Other assets less liabilities — 0.5% | 795,280 | |||||||||||
|
| |||||||||||
NET ASSETS — 100.0% | $ | 152,792,537 | ||||||||||
|
| |||||||||||
RMB – Renminbi
* Non-income producing security.
(a) Less than 0.1%.
| See Notes to Financial Statements. | 15 |
DBX ETF Trust
SCHEDULE OF INVESTMENTS
db X-trackers Harvest CSI 500 China A-Shares Small Cap Fund
May 31, 2014
Number | Value | |||||||
| COMMON STOCKS — 94.5% | ||||||||
| Basic Materials — 10.2% | ||||||||
Anhui Liuguo Chemical Co. Ltd., Class A | 10,820 | $ | 9,786 | |||||
Anhui Wanwei Updated High-Tech Material Industry Co. Ltd., Class A* | 27,600 | 10,559 | ||||||
Baoji Titanium Industry Co. Ltd., Class A* | 6,000 | 13,148 | ||||||
Befar Group Co. Ltd., Class A | 9,000 | 10,632 | ||||||
Chongyi Zhangyuan Tungsten Co. Ltd., Class A | 2,408 | 6,225 | ||||||
Cofco Biochemical Co. Ltd., Class A* | 20,400 | 12,180 | ||||||
Danhua Chemical Technology Co. Ltd., Class A* | 12,600 | 11,456 | ||||||
FSPG Hi-Tech Co. Ltd., Class A | 18,000 | 13,513 | ||||||
Goldleaf Jewelry Co. Ltd., Class A* | 9,000 | 15,357 | ||||||
Guangdong Hec Technology Holding Co. Ltd., Class A* | 7,800 | 15,944 | ||||||
Guangdong Highsun Group Co. Ltd., Class A | 5,400 | 7,788 | ||||||
Guangdong Rongtai Industry Co. Ltd., Class A | 11,400 | 9,252 | ||||||
Guangzhou Guangri Stock Co. Ltd., Class A* | 8,400 | 14,360 | ||||||
Henan Billions Chemicals Co. Ltd., Class A | 2,400 | 6,293 | ||||||
Henan Yinge Industrial Investment Holding Co. Ltd., Class A* | 15,600 | 8,840 | ||||||
Henan Yuguang Gold & Lead Co. Ltd., Class A | 4,800 | 6,777 | ||||||
Henan Zhongfu Industry Co. Ltd., Class A | 22,800 | 12,883 | ||||||
Hubei Biocause Pharmaceutical Co. Ltd., Class A* | 28,800 | 12,032 | ||||||
Hubei Fuxing Science And Technology Co. Ltd., Class A | 15,000 | 15,631 | ||||||
Hubei Xingfa Chemicals Group Co. Ltd., Class A | 7,800 | 12,473 | ||||||
Hubei Yihua Chemical Industry Co. Ltd., Class A | 24,000 | 19,439 | ||||||
Ingenious Ene-Carbon New Materials Co. Ltd., Class A* | 30,600 | 29,242 | ||||||
Inner Mongolia Junzheng Energy & Chemical Industry Co. Ltd., Class A | 10,200 | 18,188 | ||||||
Inner Mongolia Xingye Mining Co. Ltd., Class A | 7,800 | 10,762 | ||||||
Inner Mongolia Yili Energy Co. Ltd., Class A | 10,812 | 11,578 | ||||||
Inner Mongolia Yuan Xing Energy Co. Ltd., Class A | 20,400 | 11,853 | ||||||
Jiangsu Chengxing Phosph-Chemicals Co. Ltd., Class A | 10,800 | 9,888 | ||||||
Juli Sling Co. Ltd., Class A | 10,200 | 8,327 | ||||||
Kingenta Ecological Engineering Group Co. Ltd., Class A* | 5,400 | 16,051 | ||||||
Lianhe Chemical Technology Co. Ltd., Class A* | 8,450 | 27,850 | ||||||
Luxi Chemical Group Co. Ltd., Class A* | 27,000 | 15,170 | ||||||
Nanjing Redsun Co. Ltd., Class A | 5,400 | 11,531 | ||||||
Ningxia Orient Tantalum Industry Co. Ltd., | 7,200 | 10,718 | ||||||
PetroChina Jinhong Energy Investment Co. Ltd., Class A* | 2,400 | 10,292 | ||||||
Rongsheng Petro Chemical Co. Ltd., Class A | 6,000 | 7,558 | ||||||
Shaanxi Ligeance Mineral Resources Co. Ltd., Class A | 7,200 | 13,565 | ||||||
Shandong Chenming Paper Holdings Ltd., Class A | 23,400 | 15,993 | ||||||
Shandong Haihua Co. Ltd., Class A* | 14,400 | 6,961 | ||||||
Shandong Hualu Hengsheng Chemical Co. Ltd., Class A | 17,400 | 19,162 | ||||||
Shandong Huatai Paper Co. Ltd., Class A | 21,600 | 9,266 | ||||||
Number | Value | |||||||
| Basic Materials (Continued) | ||||||||
Shandong Humon Smelting Co. Ltd., Class A* | 6,000 | $ | 12,101 | |||||
Shandong Jinling Mining Co. Ltd., Class A | 7,800 | 8,577 | ||||||
Shandong Sun Paper Industry JSC Ltd., Class A | 18,000 | 8,903 | ||||||
Shanghai 3F New Materials Co., Class A | 7,200 | 15,190 | ||||||
Shanghai Chlor-Alkali Chemical Co. Ltd., | 6,000 | 7,683 | ||||||
Shanxi Antai Group Co. Ltd., Class A* | 18,600 | 7,533 | ||||||
Shanxi Coking Co. Ltd., Class A* | 10,200 | 8,947 | ||||||
Shengda Mining Co. Ltd., Class A | 2,400 | 4,068 | ||||||
Sichuan EM Technology Co. Ltd., Class A* | 6,600 | 7,152 | ||||||
Sichuan Hebang Corp. Ltd., Class A* | 4,200 | 8,283 | ||||||
Sichuan Jinlu Group Co. Ltd., Class A* | 16,200 | 17,192 | ||||||
Sichuan Western Resources Holding Co. Ltd., Class A* | 10,800 | 19,569 | ||||||
Stanley Fertilizer Co. Ltd., Class A | 3,000 | 9,897 | ||||||
Tangshan Sanyou Chemical Industries Co. Ltd., Class A | 24,600 | 17,641 | ||||||
Xining Special Steel Co., Class A | 12,000 | 6,031 | ||||||
Xinjiang Ba Yi Iron & Steel Co. Ltd., Class A | 10,200 | 6,612 | ||||||
Xinjiang Joinworld Co. Ltd., Class A | 10,200 | 8,931 | ||||||
Yueyang Forest & Paper Co. Ltd., Class A* | 19,200 | 8,790 | ||||||
Yunnan Lincang Xinyuan Germanium Industrial Co. Ltd., Class A | 10,200 | 18,841 | ||||||
Zhejiang Runtu Co. Ltd., Class A | 10,200 | 32,018 | ||||||
Zhejiang Satellite Petrochemical Co. Ltd., | 6,600 | 13,987 | ||||||
Zhejiang Xinan Chemical Industrial Group Co. Ltd., Class A | 14,400 | 20,699 | ||||||
Zibo Qixiang Tengda Chemical Co. Ltd., Class A | 6,000 | 12,879 | ||||||
|
| |||||||
| 790,047 | ||||||||
|
| |||||||
| Communications — 6.2% | ||||||||
Anhui Xinhua Media Co. Ltd., Class A | 4,800 | 9,404 | ||||||
Beijing Gehua CATV Network Co. Ltd., Class A | 16,800 | 27,403 | ||||||
Central China Land Media Co. Ltd.* | 2,400 | 4,575 | ||||||
Changjiang Publishing & Media Co. Ltd., | 9,600 | 13,123 | ||||||
Chengdu B-Ray Media Co. Ltd., Class A | 17,400 | 29,607 | ||||||
Dalian Daxian Enterprises Holdings Co. Ltd., Class A* | 28,200 | 25,729 | ||||||
Datang Telecom Technology Co. Ltd., Class A* | 9,000 | 21,811 | ||||||
Eastern Communications Co. Ltd., Class A | 10,200 | 20,425 | ||||||
Focus Technology Co. Ltd., Class A* | 1,200 | 7,639 | ||||||
Fujian Star-net Communication Co. Ltd., Class A | 4,800 | 19,585 | ||||||
Guangdong Advertising Co. Ltd., Class A | 10,800 | 40,850 | ||||||
Guangdong Guangzhou Daily Media Co. Ltd., Class A | 7,200 | 17,691 | ||||||
Guangzhou Haige Communications Group, Inc. Co., Class A | 18,600 | �� | 44,869 | |||||
Guomai Technologies, Inc., Class A* | 9,000 | 6,973 | ||||||
Hengtong Optic-electric Co. Ltd., Class A | 5,400 | 11,963 | ||||||
Insigma Technology Co. Ltd., Class A* | 22,200 | 24,519 | ||||||
Jiangsu Zhongtian Technologies Co. Ltd., Class A | 15,000 | 30,661 | ||||||
Jishi Media Co. Ltd., Class A | 23,400 | 42,213 | ||||||
| See Notes to Financial Statements. | 16 |
DBX ETF Trust
SCHEDULE OF INVESTMENTS
db X-trackers Harvest CSI 500 China A-Shares Small Cap Fund (Continued)
May 31, 2014
Number | Value | |||||||
| Communications (Continued) | ||||||||
Northern United Publishing & Media Group Co. Ltd., Class A | 6,000 | $ | 6,214 | |||||
Shaanxi Broadcast & TV Network Intermediary Co. Ltd., Class A | 10,200 | 12,409 | ||||||
Shanghai Xinhua Media Co. Ltd., Class A | 13,800 | 17,981 | ||||||
Shenzhen Aisidi Co. Ltd., Class A* | 5,400 | 12,110 | ||||||
Shenzhen Topway Video Communication Co. Ltd., Class A | 3,600 | 7,122 | ||||||
Time Publishing and Media Co. Ltd., Class A | 5,400 | 13,588 | ||||||
Wuhan Fingu Electronic Technology Co. Ltd., Class A | 4,200 | 7,657 | ||||||
|
| |||||||
| 476,121 | ||||||||
|
| |||||||
| Consumer, Cyclical — 13.9% | ||||||||
Aeolus Tyre Co. Ltd., Class A | 6,000 | 8,384 | ||||||
Anhui Huamao Textile Co., Class A | 15,000 | 10,445 | ||||||
AVIC Aero-Engine Controls Co. Ltd., Class A | 6,000 | 11,006 | ||||||
Beijing Capital Retailing Group Co. Ltd., Class A | 9,000 | 8,989 | ||||||
Beijing WKW Automotive Parts Co. Ltd., | 4,800 | 6,262 | ||||||
Besttone Holdings Co. Ltd., Class A* | 5,400 | 14,962 | ||||||
Better Life Commercial Chain Share Co. Ltd., Class A | 6,600 | 14,664 | ||||||
Bros Eastern Co. Ltd., Class A | 6,000 | 7,722 | ||||||
China Automotive Engineering Research Institute Co. Ltd., Class A | 4,800 | 9,082 | ||||||
China CYTS Tours Holding Co. Ltd., Class A | 9,000 | 30,715 | ||||||
China Meheco Co. Ltd., Class A* | 5,400 | 17,676 | ||||||
China Television Media Ltd., Class A | 4,200 | 9,587 | ||||||
Chongqing Department Store, Class A* | 4,200 | 13,735 | ||||||
CMST Development Co. Ltd., Class A | 12,600 | 24,990 | ||||||
CNHTC Jinan Truck Co. Ltd., Class A* | 4,200 | 8,027 | ||||||
Dongfeng Automobile Co. Ltd., Class A | 21,000 | 10,118 | ||||||
Dongguan Souyute Fashion Co. Ltd., Class A | 4,320 | 5,532 | ||||||
Eastern Gold Jade Co. Ltd., Class A* | 5,400 | 15,057 | ||||||
Elec-Tech International Co. Ltd., Class A* | 18,600 | 24,176 | ||||||
Fangda Special Steel Technology Co. Ltd., Class A | 13,800 | 7,223 | ||||||
Fengfan Stock Ltd. Co., Class A | 8,400 | 13,580 | ||||||
Fujian Septwolves Industry Co. Ltd., Class A | 12,000 | 14,176 | ||||||
Guangdong Alpha Animation and Culture Co. Ltd., Class A | 4,800 | 24,218 | ||||||
Guangdong Chj Industry Co. Ltd., Class A | 4,200 | 10,360 | ||||||
Guangdong Yihua Timber Industry Co. Ltd., Class A* | 31,800 | 24,993 | ||||||
Guangzhou Friendship Group Co. Ltd., Class A | 4,800 | 7,122 | ||||||
Guangzhou Pearl River Piano Group Co. Ltd., Class A | 4,800 | 5,824 | ||||||
Haima Automobile Group Co. Ltd., Class A* | 26,400 | 15,044 | ||||||
Hangzhou Robam Appliances Co. Ltd., Class A | 3,677 | 17,645 | ||||||
Hefei Department Store Group Co. Ltd., Class A | 14,400 | 12,885 | ||||||
Hefei Rongshida Sanyo Electric Co. Ltd., Class A | 5,400 | 11,686 | ||||||
Hisense Kelon Electrical Holdings Co. Ltd., | 9,699 | 13,569 | ||||||
Huangshan Tourism Development Co. Ltd., Class A | 3,600 | 6,857 | ||||||
Number | Value | |||||||
| Consumer, Cyclical (Continued) | ||||||||
Hunan Friendship & Apollo Commercial Co. Ltd., Class A | 9,000 | $ | 15,286 | |||||
Jiangling Motors Corp. Ltd., Class A | 5,400 | 24,531 | ||||||
Jiangsu Guotai International Group Guomao Co. Ltd., Class A | 4,800 | 9,666 | ||||||
Jiangsu Sunshine Co. Ltd., Class A* | 37,800 | 17,910 | ||||||
Jiangsu Yueda Investment Co. Ltd., Class A | 18,000 | 25,873 | ||||||
Joeone Co. Ltd., Class A | 4,800 | 8,336 | ||||||
Lancy Co. Ltd., Class A | 1,800 | 5,786 | ||||||
Lao Feng Xiang Co. Ltd., Class A | 3,600 | 12,868 | ||||||
Lifan Industry Group Co. Ltd., Class A | 7,800 | 8,415 | ||||||
Loncin Motor Co. Ltd., Class A | 6,600 | 9,212 | ||||||
Luolai Home Textile Co. Ltd., Class A | 3,000 | 9,916 | ||||||
Luthai Textile Co. Ltd., Class A | 12,000 | 17,115 | ||||||
Markor International Furniture Co. Ltd., Class A | 10,200 | 9,682 | ||||||
Nanjing Central Emporium, Class A | 4,800 | 7,038 | ||||||
Ningbo Huaxiang Electronic Co. Ltd., Class A | 11,400 | 23,631 | ||||||
Ningbo Joyson Electronic Corp., Class A* | 4,800 | 17,641 | ||||||
Ningbo Shanshan Co. Ltd., Class A | 7,800 | 18,678 | ||||||
Ningbo Yunsheng Group Co. Ltd., Class A | 9,600 | 21,375 | ||||||
Rainbow Department Store Co. Ltd., Class A | 4,200 | 6,864 | ||||||
Shanghai Haixin Group Co., Class A* | 15,600 | 16,930 | ||||||
Shanghai Jinjiang International Hotels Development Co. Ltd., Class A | 4,800 | 12,316 | ||||||
Shanghai Lansheng Corp., Class A* | 5,400 | 13,441 | ||||||
Shanghai New World Co. Ltd., Class A | 11,400 | 14,598 | ||||||
Shenzhen MTC Co. Ltd., Class A | 11,400 | 19,781 | ||||||
Shunfa Hengye Corp., Class A* | 8,400 | 6,293 | ||||||
Sinochem International Corp., Class A | 22,200 | 23,382 | ||||||
Sinomach Automobile Co. Ltd., Class A | 4,200 | 9,708 | ||||||
Sunny Loan Top Co. Ltd., Class A | 8,400 | 11,200 | ||||||
Sunvim Group Co. Ltd., Class A* | 19,800 | 13,343 | ||||||
Suofeiya Home Collection Co. Ltd., Class A | 3,600 | 9,358 | ||||||
Tianjin Faw Xiali Automobile Co. Ltd., Class A | 12,600 | 7,120 | ||||||
Tianrun Crankshaft Co. Ltd., Class A | 9,000 | 9,191 | ||||||
TongKun Group Co. Ltd., Class A* | 7,800 | 6,755 | ||||||
Vtron Technologies Ltd., Class A* | 10,800 | 11,583 | ||||||
Wanxiang Qianchao Co. Ltd., Class A | 21,000 | 30,926 | ||||||
Wenfeng Great World Chain Development Corp., Class A | 6,000 | 6,550 | ||||||
Wuhan Department Store Group Co. Ltd., | 6,600 | 12,572 | ||||||
Xiamen ITG Group Corp. Ltd., Class A | 24,600 | 19,767 | ||||||
Yantai Tayho Advanced Materials Co. Ltd., Class A* | 9,600 | 13,323 | ||||||
Yotrio Group Co. Ltd., Class A | 3,600 | 5,699 | ||||||
Zhejiang Aokang Shoes Co. Ltd., Class A | 3,000 | 6,521 | ||||||
Zhejiang Baoxiniao Garment Co. Ltd., Class A | 7,800 | 7,316 | ||||||
Zhejiang Haiyue Co. Ltd., Class A | 8,400 | 19,000 | ||||||
Zhejiang Huafeng Spandex Co. Ltd., Class A | 12,000 | 16,500 | ||||||
Zhejiang Material Industrial Zhongda Yuantong Group Co. Ltd., Class A | 14,400 | 17,265 | ||||||
Zhejiang Ming Jewelry Co. Ltd., Class A | 2,422 | 9,091 | ||||||
Zhejiang Orient Holdings Co., Class A | 7,800 | 13,559 | ||||||
|
| |||||||
| 1,069,222 | ||||||||
|
| |||||||
| See Notes to Financial Statements. | 17 |
DBX ETF Trust
SCHEDULE OF INVESTMENTS
db X-trackers Harvest CSI 500 China A-Shares Small Cap Fund (Continued)
May 31, 2014
Number | Value | |||||||
| Consumer, Non-cyclical — 18.2% | ||||||||
Angel Yeast Co. Ltd., Class A | 5,400 | $ | 12,412 | |||||
Anhui Golden Seed Winery Co. Ltd., Class A | 10,200 | 11,984 | ||||||
Beijing Sanyuan Foods Co. Ltd., Class A* | 9,600 | 10,849 | ||||||
Beijing Shunxin Agriculture Co. Ltd., Class A | 7,200 | 17,057 | ||||||
Beijing Tiantan Biological Products Co., Class A* | 6,600 | 19,312 | ||||||
Chacha Food Co. Ltd., Class A* | 2,400 | 6,385 | ||||||
China Animal Husbandry Industry Co. Ltd., Class A | 4,800 | 9,919 | ||||||
China National Accord Medicines Corp. Ltd., Class A | 3,000 | 18,536 | ||||||
China National Medicines Corp. Ltd., Class A | 7,800 | 24,971 | ||||||
Chongqing Brewery Co., Class A | 7,800 | 18,053 | ||||||
Chongqing Road & Bridge Co., Class A* | 19,200 | 11,279 | ||||||
Chuying Agro-pastoral Group Co. Ltd., Class A | 10,200 | 14,694 | ||||||
COFCO Tunhe Co. Ltd., Class A* | 10,800 | 8,955 | ||||||
Dalian Port PDA Co. Ltd., Class A | 27,000 | 10,502 | ||||||
Dalian Yi Qiao Marine Seeds Co. Ltd., Class A | 3,600 | 11,064 | ||||||
Eternal Asia Supply Chain Management Ltd., Class A | 10,200 | 12,245 | ||||||
Gansu Ronghua Industry Group Co. Ltd., | 17,400 | 12,868 | ||||||
Guangdong Zhongsheng Pharmaceutical Co. Ltd., Class A | 6,600 | 20,844 | ||||||
Guangzhou Zhujiang Brewery Co. Ltd., Class A | 5,400 | 13,087 | ||||||
Guilin Sanjin Pharmaceutical Co. Ltd., Class A | 4,879 | 11,762 | ||||||
Guizhou Bailing Group Pharmaceutical Co. Ltd., Class A* | 3,600 | 13,041 | ||||||
Guizhou Yibai Pharmaceutical Co. Ltd., Class A | 7,200 | 46,087 | ||||||
Hainan Haiyao Co. Ltd., Class A | 10,800 | 18,290 | ||||||
Harbin Pharm Group Sanjing Pharmaceutical Shareholding Co. Ltd., Class A* | 4,800 | 5,048 | ||||||
Hebei Chengde Lolo Co., Class A | 6,600 | 23,929 | ||||||
Henan Rebecca Hair Products Co. Ltd., Class A | 17,400 | 11,670 | ||||||
Hengkang Medical Group Co. Ltd., Class A | 8,400 | 28,277 | ||||||
Huapont-Nutrichem Co. Ltd., Class A | 7,200 | 20,399 | ||||||
Jiangsu Kanion Pharmaceutical Co. Ltd., | 7,800 | 38,830 | ||||||
Jiangsu Nhwa Pharmaceutical Co. Ltd., Class A | 4,320 | 14,708 | ||||||
Jiangsu Sihuan Bioengineering Co. Ltd., | 27,000 | 14,003 | ||||||
Jiangsu Yuyue Medical Equipment & Supply Co. Ltd., Class A | 5,400 | 22,050 | ||||||
Jiangxi Ganyue Expressway Co. Ltd., Class A | 31,200 | 13,834 | ||||||
Jiangzhong Pharmaceutical Co. Ltd., Class A* | 4,800 | 12,132 | ||||||
Jianxin Mining Co. Ltd., Class A* | 9,000 | 7,088 | ||||||
Jilin Zixin Pharmaceutical Industrial Co. Ltd., Class A* | 6,600 | 15,097 | ||||||
Jinling Pharmaceutical Co. Ltd., Class A | 6,600 | 13,406 | ||||||
Jiugui Liquor Co. Ltd., Class A* | 6,000 | 10,421 | ||||||
Joincare Pharmaceutical Group Industry Co. Ltd., Class A | 16,200 | 13,562 | ||||||
Kunming Pharmaceutical Corp., Class A* | 7,296 | 25,716 | ||||||
Livzon Pharmaceutical Group, Inc., Class A | 3,000 | 21,797 | ||||||
Luoniushan Co. Ltd., Class A* | 23,400 | 21,912 | ||||||
Mayinglong Pharmaceutical Group Co. Ltd., | 5,400 | 13,510 | ||||||
North China Pharmaceutical Co. Ltd., Class A | 21,600 | 15,870 | ||||||
Number | Value | |||||||
| Consumer, Non-cyclical (Continued) | ||||||||
Pubang Landscape Architecture Co. Ltd., Class A | 7,200 | $ | 13,945 | |||||
Qinghai Huzhu Barley Wine Co. Ltd., Class A | 4,800 | 11,448 | ||||||
Renhe Pharmacy Co. Ltd., Class A* | 15,600 | 11,986 | ||||||
Rizhao Port Co. Ltd., Class A | 40,800 | 16,262 | ||||||
Sanquan Food Co. Ltd., Class A* | 5,400 | 15,913 | ||||||
Shandong Denghai Seeds Co. Ltd., Class A | 3,600 | 19,529 | ||||||
Shandong Homey Aquatic Development Co. Ltd., Class A* | 11,446 | 9,436 | ||||||
Shanghai Jinfeng Wine Co. Ltd., Class A | 8,400 | 10,918 | ||||||
Shanghai Kehua Bio-Engineering Co. Ltd., Class A | 10,200 | 35,805 | ||||||
Shanghai Maling Aquarius Co. Ltd., Class A | 13,200 | 17,030 | ||||||
Shanghai RAAS Blood Products Co. Ltd., Class A | 4,800 | 48,636 | ||||||
Shantou Dongfeng Printing Co. Ltd., Class A | 3,000 | 11,381 | ||||||
Shenzhen Fuanna Bedding and Furnishing Co. Ltd., Class A | 4,200 | 7,523 | ||||||
Shenzhen Grandland Decoration Group Co. Ltd., Class A | 5,400 | 10,571 | ||||||
Shenzhen Jinjia Color Printing Group Co. Ltd., Class A | 8,400 | 19,025 | ||||||
Shenzhen Neptunus Bioengineering Co. Ltd., Class A* | 13,800 | 16,368 | ||||||
Shinva Medical Instrument Co. Ltd., Class A | 3,600 | 40,603 | ||||||
Sichuan Tuopai Shede Wine Co. Ltd., Class A | 7,200 | 12,435 | ||||||
Tangshan Port Group Co. Ltd., Class A | 21,600 | 15,144 | ||||||
Tianjin Lisheng Pharmaceutical Co. Ltd., Class A | 2,400 | 11,141 | ||||||
Tianjin Port Co. Ltd., Class A | 22,200 | 27,859 | ||||||
Tianjin Tianyao Pharmaceutical Co. Ltd., Class A | 12,600 | 8,451 | ||||||
Tianjin ZhongXin Pharmaceutical Group Corp. Ltd., Class A | 6,000 | 13,628 | ||||||
Tieling Newcity Investment Holding Ltd., | 9,000 | 16,495 | ||||||
Tongwei Co. Ltd., Class A* | 8,400 | 11,926 | ||||||
V V Food & Beverage Co. Ltd., Class A | 22,200 | 14,001 | ||||||
Wuhu Port Storage & Transportation Co. Ltd., Class A* | 25,800 | 15,074 | ||||||
Xiandai Investment Co. Ltd., Class A | 14,400 | 14,660 | ||||||
Xinjiang Guannong Fruit & Antler Group Co. Ltd., Class A | 6,000 | 15,588 | ||||||
Xinjiang Yilite Industry Co. Ltd., Class A | 6,000 | 9,249 | ||||||
Yabao Pharmaceutical Group Co. Ltd., Class A | 14,480 | 21,301 | ||||||
Yuan Longping High-tech Agriculture Co. Ltd., Class A | 9,000 | 37,701 | ||||||
Zhejiang Conba Pharmaceutical Co. Ltd., | 10,800 | 24,081 | ||||||
Zhejiang Guyuelongshan Shaoxing Wine Co. Ltd., Class A | 10,200 | 13,062 | ||||||
Zhejiang Huahai Pharmaceutical Co. Ltd., Class A | 12,600 | 20,713 | ||||||
Zhejiang Xianju Pharmaceutical Co. Ltd., Class A | 9,600 | 12,478 | ||||||
Zhongbai Holdings Group Co. Ltd., Class A | 14,400 | 18,970 | ||||||
| See Notes to Financial Statements. | 18 |
DBX ETF Trust
SCHEDULE OF INVESTMENTS
db X-trackers Harvest CSI 500 China A-Shares Small Cap Fund (Continued)
May 31, 2014
Number | Value | |||||||
| Consumer, Non-cyclical (Continued) | ||||||||
Zhongyuan Union Stem Cell Bioengineering Co. Ltd., Class A* | 7,200 | $ | 26,323 | |||||
Zhuzhou Qianjin Pharmaceutical Co. Ltd., | 5,400 | 9,949 | ||||||
|
| |||||||
| 1,404,063 | ||||||||
|
| |||||||
| Diversified — 1.1% | ||||||||
Anyuan Coal Industry Group Co. Ltd., Class A* | 10,200 | 6,694 | ||||||
Jilin Yatai Group Co. Ltd., Class A | 50,400 | 29,446 | ||||||
Metro Land Corp. Ltd., Class A | 9,600 | 6,930 | ||||||
Nanjing Gaoke Co. Ltd., Class A | 9,600 | 15,582 | ||||||
Silver Plaza Group Co. Ltd., Class A | 9,600 | 11,848 | ||||||
Tianjin TEDA Co. Ltd., Class A* | 27,600 | 16,876 | ||||||
|
| |||||||
| 87,376 | ||||||||
|
| |||||||
| Energy — 1.6% | ||||||||
Changchun Gas Co. Ltd., Class A* | 7,200 | 8,125 | ||||||
Gansu Jingyuan Coal Industry and Electricity Power Co. Ltd., Class A* | 6,000 | 7,722 | ||||||
Hareon Solar Technology Co. Ltd., Class A* | 8,400 | 10,313 | ||||||
Inner Mongolia Pingzhuang Energy Co. Ltd., Class A | 10,800 | 6,673 | ||||||
Jiangsu Zongyi Co. Ltd., Class A | 20,400 | 35,135 | ||||||
Kingdream PLC, Class A* | 4,200 | 10,623 | ||||||
Oriental Energy Co. Ltd., Class A | 6,000 | 10,670 | ||||||
Qitaihe Baotailong Coal & Coal Chemicals PCL, Class A* | 4,200 | 7,099 | ||||||
Shaan Xi Provincial Natural Gas Co. Ltd., Class A | 5,400 | 7,952 | ||||||
Shanghai Datun Energy Resources Co. Ltd., Class A | 7,800 | 9,776 | ||||||
Zhengzhou Coal Industry & Electric Power Co. Ltd., Class A* | 7,800 | 5,169 | ||||||
|
| |||||||
| 119,257 | ||||||||
|
| |||||||
| Financial — 8.3% | ||||||||
Anxin Trust Co. Ltd., Class A | 8,441 | 19,984 | ||||||
Beijing Huaye Realestate Co. Ltd., Class A* | 22,800 | 15,292 | ||||||
Beijing North Star Co. Ltd., Class A | 42,000 | 17,278 | ||||||
Black Peony Group Co. Ltd., Class A | 8,400 | 7,099 | ||||||
Bohai Leasing Co. Ltd., Class A* | 14,400 | 18,325 | ||||||
China Enterprise Co. Ltd., Class A | 28,800 | 26,185 | ||||||
China Sports Industry Group Co. Ltd., Class A | 18,000 | 29,821 | ||||||
Cinda Real Estate Co. Ltd., Class A | 16,200 | 8,505 | ||||||
COFCO Property Group Co. Ltd., Class A | 24,000 | 12,639 | ||||||
Deluxe Family Co. Ltd., Class A | 30,000 | 19,352 | ||||||
FAWER Automotive Parts Ltd. Co., Class A* | 6,600 | 6,677 | ||||||
Greattown Holdings Ltd., Class A* | 7,200 | 6,823 | ||||||
Hainan Expressway Co. Ltd., Class A* | 21,000 | 12,202 | ||||||
Hainan Zhenghe Industrial Group Co. Ltd., Class A | 16,200 | 29,121 | ||||||
Huafa Industrial Co. Ltd. Zhuhai, Class A | 17,400 | 18,243 | ||||||
Huayuan Property Co. Ltd., Class A | 14,400 | 6,638 | ||||||
Lushang Property Co. Ltd., Class A* | 10,800 | 5,843 | ||||||
Macrolink Real Estate Co. Ltd., Class A | 8,400 | 8,054 | ||||||
Myhome Real Estate Development Group Co. Ltd., Class A | 48,000 | 13,215 | ||||||
Nanjing Chixia Development Co. Ltd., Class A | 16,800 | 8,363 | ||||||
Number | Value | |||||||
| Financial (Continued) | ||||||||
Ningbo Fuda Co. Ltd., Class A | 11,400 | $ | 7,555 | |||||
Rongan Property Co. Ltd., Class A* | 5,400 | 3,976 | ||||||
Shaanxi International Trust Co. Ltd., Class A | 12,600 | 13,896 | ||||||
Shanghai AJ Corp., Class A* | 20,400 | 31,218 | ||||||
Shanghai Dingli Technology Development Group Co. Ltd., Class A | 6,000 | 9,268 | ||||||
Shanghai DZH Ltd., Class A* | 15,600 | 17,954 | ||||||
Shanghai Industrial Development Co. Ltd., Class A | 11,400 | 13,230 | ||||||
Shanghai Jinqiao Export Processing Zone Development Co. Ltd., Class A | 7,200 | 12,620 | ||||||
Shenzhen Centralcon Investment Holding Co. Ltd., Class A* | 2,450 | 8,785 | ||||||
Shenzhen Heungkong Holding Co. Ltd., Class A | 10,200 | 8,049 | ||||||
Shenzhen World Union Properties Consultancy, Inc., Class A | 8,640 | 11,479 | ||||||
Shenzhen Zhenye Group Co. Ltd., Class A | 25,200 | 18,999 | ||||||
Sunshine City Group Co. Ltd., Class A* | 16,200 | 22,975 | ||||||
Suzhou New District Hi-Tech Industrial Co. Ltd., Class A* | 16,800 | 9,869 | ||||||
Thaihot Group Co. Ltd., Class A* | 7,800 | 11,149 | ||||||
Tianjin Jinbin Development Co., Class A* | 34,200 | 26,824 | ||||||
Tianjin Reality Development Group Co. Ltd., Class A | 23,400 | 12,548 | ||||||
Tibet Urban Development and Investment Co. Ltd., Class A | 6,000 | 9,066 | ||||||
Wuhan Langold Real Estate Co. Ltd., Class A* | 7,800 | 8,877 | ||||||
Yangguang Co. Ltd., Class A | 12,000 | 7,414 | ||||||
Yeland Investment Group Co. Ltd., Class A | 37,800 | 19,483 | ||||||
YunNan Metropolitan Real Estate Development Co. Ltd., Class A | 15,000 | 10,709 | ||||||
Zhejiang China Light & Textile Industrial City Group Co. Ltd., Class A | 12,600 | 12,807 | ||||||
Zhonghong Holding Co. Ltd., Class A | 35,400 | 17,056 | ||||||
Zhongrun Resources Investment Corp., Class A* | 9,600 | 5,762 | ||||||
Zhongtian Urban Development Group Co. Ltd., Class A | 20,400 | 17,078 | ||||||
|
| |||||||
| 638,305 | ||||||||
|
| |||||||
| Industrial — 26.7% | ||||||||
Advanced Technology & Materials Co. Ltd., Class A* | 13,840 | 19,407 | ||||||
Anhui Heli Co. Ltd.-A, Class A | 9,600 | 18,471 | ||||||
Anhui Jiangnan Chemical Industry Co. Ltd., Class A* | 4,200 | 7,321 | ||||||
Anhui Zhongding Sealing Parts Co. Ltd., Class A | 14,400 | 20,307 | ||||||
AVIC Electromechanical Co. Ltd., Class A | 5,400 | 12,170 | ||||||
Avic Heavy Machinery Co. Ltd., Class A | 12,600 | 23,678 | ||||||
Beijing Jingyuntong Technology Co. Ltd., Class A | 6,600 | 7,913 | ||||||
Beijing Lier High-temperature Materials Co. Ltd.* | 6,600 | 9,064 | ||||||
Beijing New Building Material PLC, Class A | 7,800 | 18,042 | ||||||
Beijing Oriental Yuhong Waterproof Technology Co. Ltd., Class A | 4,800 | 18,325 | ||||||
Beijing Sevenstar Electronics Co. Ltd., Class A* | 3,600 | 11,243 | ||||||
Beijing Sifang Automation Co. Ltd., Class A* | 3,000 | 6,617 | ||||||
Camel Group Co. Ltd., Class A* | 9,000 | 14,968 | ||||||
| See Notes to Financial Statements. | 19 |
DBX ETF Trust
SCHEDULE OF INVESTMENTS
db X-trackers Harvest CSI 500 China A-Shares Small Cap Fund (Continued)
May 31, 2014
Number | Value | |||||||
| Industrial (Continued) | ||||||||
CCS Supply Chain Management Co. Ltd., | 7,200 | $ | 12,585 | |||||
Changjiang & Jingong Steel Building Group Co. Ltd., Class A* | 10,800 | 11,306 | ||||||
Changyuan Group Ltd., Class A | 16,200 | 23,701 | ||||||
Chengdu Xinzhu Road&Bridge Machinery Co. Ltd., Class A* | 9,000 | 10,070 | ||||||
China Aerospace Times Electronics Co. Ltd., Class A* | 22,200 | 37,170 | ||||||
China Aviation Optical-Electrical Technology Co. Ltd., Class A | 4,800 | 11,932 | ||||||
China Fiberglass Co. Ltd., Class A | 9,000 | 10,372 | ||||||
China Railway Tielong Container Logistics Co. Ltd., Class A | 24,000 | 18,900 | ||||||
China Shipping Development Co. Ltd., Class A* | 16,800 | 10,783 | ||||||
China-Kinwa High Technology Co. Ltd., | 30,600 | 24,833 | ||||||
Chongqing Zongshen Power Machinery Co. Ltd., Class A | 18,000 | 14,637 | ||||||
CITIC Heavy Industries Co. Ltd., Class A | 21,600 | 10,684 | ||||||
Citic Offshore Helicopter Co. Ltd., Class A | 9,001 | 11,829 | ||||||
Citychamp Dartong Co. Ltd., Class A | 22,200 | 18,763 | ||||||
COSCO Shipping Co. Ltd., Class A* | 22,200 | 10,590 | ||||||
CPI Yuanda Environmental-Protection Group Co. Ltd., Class A | 5,400 | 15,697 | ||||||
Dazhong Transportation Group Co. Ltd., Class A | 16,800 | 16,996 | ||||||
Dongguan Kingsun Optoelectronic Co. Ltd., Class A | 7,200 | 15,904 | ||||||
Dongjiang Environmental Co. Ltd., Class A | 1,800 | 10,787 | ||||||
Dongxu Optoelectronic Technology Co. Ltd., Class A* | 19,800 | 25,544 | ||||||
East China Engineering Science and Technology Co. Ltd., Class A | 4,800 | 12,601 | ||||||
Far East Cable Co. Ltd., Class A* | 7,800 | 10,226 | ||||||
Feilo Acoustics Co. Ltd., Class A | 19,800 | 19,713 | ||||||
Fenghua Advanced Technology Holding Co. Ltd., Class A | 14,400 | 13,669 | ||||||
Foshan Electrical and Lighting Co. Ltd., Class A | 13,800 | 20,389 | ||||||
Fujian Longking Co. Ltd., Class A | 9,000 | 34,013 | ||||||
Gansu Qilianshan Cement Group Co. Ltd., Class A | 16,200 | 16,259 | ||||||
Gem-Year Industrial Co. Ltd., Class A* | 8,400 | 10,394 | ||||||
Guangdong Goworld Co. Ltd., Class A | 8,400 | 15,342 | ||||||
Guangdong Tapai Group Co. Ltd., Class A | 9,600 | 9,420 | ||||||
Guangzhou Baiyun International Airport Co. Ltd., Class A | 12,000 | 13,407 | ||||||
Guizhou Changzheng Tiacheng Holding Co. Ltd., Class A* | 9,600 | 20,392 | ||||||
Guizhou Space Appliance Co. Ltd., Class A | 5,400 | 12,603 | ||||||
Guodian Nanjing Automation Co. Ltd., Class A | 8,400 | 6,777 | ||||||
Hafei Aviation Industry Co. Ltd., Class A | 4,800 | 19,462 | ||||||
Hainan Strait Shipping Co. Ltd., Class A | 4,800 | 6,523 | ||||||
Hang Zhou Great Star Industrial Co. Ltd., Class A | 7,800 | 11,037 | ||||||
Hangzhou Boiler Group Co. Ltd., Class A | 2,400 | 4,245 | ||||||
Hangzhou Hangyang Co. Ltd., Class A | 6,600 | 6,677 | ||||||
Number | Value | |||||||
| Industrial (Continued) | ||||||||
Han’s Laser Technology Co. Ltd., Class A* | 19,200 | $ | 53,690 | |||||
Harbin Boshi Automation Co. Ltd., Class A | 3,000 | 11,563 | ||||||
Hefei Meiya Optoelectronic Technology, Inc., Class A | 3,600 | 20,002 | ||||||
Henan Pinggao Electric Co. Ltd., Class A* | 18,000 | 35,957 | ||||||
Hengdian Group DMEGC Magnetics Co. Ltd., Class A* | 5,400 | 15,559 | ||||||
Hongfa Technology Co. Ltd., Class A* | 4,200 | 13,876 | ||||||
Huagong Tech Co. Ltd., Class A | 16,800 | 22,885 | ||||||
Huaxin Cement Co. Ltd., Class A | 7,800 | 14,108 | ||||||
Hunan Corun New Energy Co. Ltd., Class A* | 6,546 | 25,462 | ||||||
Jiangsu Hengli Highpressure Oil Cylinder Co. Ltd., Class A | 4,800 | 6,969 | ||||||
Jiangsu Jianghuai Engine Co. Ltd., Class A | 22,800 | 15,511 | ||||||
Jiangsu Shagang Co. Ltd., Class A* | 12,600 | 8,088 | ||||||
Jiangsu Sunrain Solar Energy Co. Ltd., Class A | 4,200 | 8,847 | ||||||
Jiangsu Wuzhong Industrial Co., Class A* | 16,800 | 27,940 | ||||||
Jihua Group Corp. Ltd., Class A | 40,800 | 16,262 | ||||||
Jonjee High-Tech Industrial and Commercial Holding Co. Ltd., Class A | 21,000 | 35,766 | ||||||
Kaile Science & Technology Co. Ltd. Hubei, Class A* | 11,400 | 12,244 | ||||||
Keda Clean Energy Co. Ltd., Class A | 14,441 | 39,758 | ||||||
Long Yuan Construction Group Co. Ltd., Class A | 15,000 | 7,851 | ||||||
Ningxia Building Materials Group Co. Ltd., Class A | 7,800 | 9,302 | ||||||
North Electro-Optic Co. Ltd., Class A* | 1,800 | 5,956 | ||||||
North Navigation Control Technology Co. Ltd., Class A | 9,600 | 17,964 | ||||||
ORG Packaging Co. Ltd., Class A | 4,800 | 16,581 | ||||||
Qingdao Hanhe Cable Co. Ltd., Class A | 5,400 | 5,705 | ||||||
Rongxin Power Electronic Co. Ltd., Class A | 9,600 | 11,264 | ||||||
Shandong Jinjing Science & Technology Co. Ltd., Class A* | 26,400 | 12,593 | ||||||
Shandong Molong Petroleum Machinery Co. Ltd., Class A | 4,200 | 5,499 | ||||||
Shanghai Aerospace Automobile Electromechanical Co., Class A* | 19,800 | 22,186 | ||||||
Shanghai Diesel Engine Co. Ltd., Class A | 4,200 | 6,857 | ||||||
Shanghai Feilo Co. Ltd., Class A | 19,800 | 25,291 | ||||||
Shanghai Guangdian Electric Group Co. Ltd., Class A | 15,000 | 8,668 | ||||||
Shanghai Mechanical and Electrical Industry Co. Ltd., Class A | 8,400 | 21,231 | ||||||
Shanghai Pudong Road & Bridge Construction Co. Ltd., Class A | 10,899 | 17,428 | ||||||
Shanghai Tunnel Engineering Co. Ltd., Class A* | 13,800 | 22,665 | ||||||
Shanghai Zhenhua Heavy Industries Co. Ltd., Class A* | 43,800 | 22,786 | ||||||
Shanghai Zhixin Electric Co. Ltd., Class A* | 10,800 | 28,870 | ||||||
Shantui Construction Machinery Co. Ltd., | 26,400 | 12,086 | ||||||
Shengyi Technology Co. Ltd., Class A | 22,800 | 19,744 | ||||||
Shenzhen Desay Battery Technology Co., | 3,000 | 20,029 | ||||||
| See Notes to Financial Statements. | 20 |
DBX ETF Trust
SCHEDULE OF INVESTMENTS
db X-trackers Harvest CSI 500 China A-Shares Small Cap Fund (Continued)
May 31, 2014
Number | Value | |||||||
| Industrial (Continued) | ||||||||
Shenzhen Green Eco-manufacture Hi-Tech Co. Ltd., Class A | 13,800 | $ | 25,337 | |||||
Shenzhen Hifuture Electric Co. Ltd., Class A* | 10,200 | 11,511 | ||||||
Shenzhen Hongtao Decoration Co. Ltd., Class A | 9,600 | 12,247 | ||||||
Shenzhen Tagen Group Co. Ltd., Class A | 10,200 | 12,229 | ||||||
Shenzhen Yantian Port Holding Co. Ltd., | 20,400 | 17,405 | ||||||
Shuangliang Eco-Energy Systems Co. Ltd., Class A | 8,400 | 13,365 | ||||||
Sichuan Road & Bridge Co. Ltd., Class A | 12,000 | 10,238 | ||||||
Sichuan Shuangma Cement Co. Ltd., Class A* | 4,800 | 4,041 | ||||||
Sieyuan Electric Co. Ltd., Class A | 9,600 | 15,136 | ||||||
Sinotrans Air Transportation Development Co. Ltd., Class A | 9,600 | 18,686 | ||||||
SUFA Technology Industry Co.Ltd. CNNC, Class A* | 3,600 | 10,701 | ||||||
Suzhou Anjie Technology Co. Ltd., Class A | 1,800 | 10,790 | ||||||
Suzhou Dongshan Precision Manufacturing Co. Ltd., Class A* | 4,200 | 13,876 | ||||||
Telling Telecommunication Holding Co. Ltd., Class A* | 15,000 | 20,889 | ||||||
Tianjin Benefo Tejing Electric Co. Ltd., Class A | 4,800 | 7,845 | ||||||
Tianjin Capital Environmental Protection Group Co. Ltd., Class A | 11,400 | 13,832 | ||||||
Tianma Bearing Group Co. Ltd., Class A | 15,600 | 10,762 | ||||||
Tianma Microelectronics Co. Ltd., Class A | 7,800 | 15,519 | ||||||
Tongfang Guoxin Electronics Co. Ltd., Class A | 3,000 | 23,103 | ||||||
Wolong Electric Group Co. Ltd., Class A* | 15,000 | 16,543 | ||||||
Wuhan Kaidi Electric Power Co. Ltd., Class A* | 19,800 | 18,129 | ||||||
WUS Printed Circuit Kunshan Co. Ltd., Class A* | 15,000 | 8,692 | ||||||
Xiamen Faratronic Co. Ltd., Class A | 3,000 | 14,421 | ||||||
Xiamen XGMA Machinery Co. Ltd., Class A | 15,000 | 8,668 | ||||||
Xiangtan Electric Manufacturing Co. Ltd., | 11,400 | 16,606 | ||||||
Xinjiang Qingsong Building Materials and Chemicals Group Co Ltd., Class A | 18,000 | 16,049 | ||||||
Xinjiang Tianshan Cement Co. Ltd., Class A* | 16,200 | 17,037 | ||||||
Xinjiang Urban Construction Group Co. Ltd., Class A | 14,400 | 21,344 | ||||||
Yechiu Metal Recycling China Ltd., Class A | 4,200 | 6,293 | ||||||
Yintai Resources Co. Ltd., Class A | 11,400 | 13,978 | ||||||
Zhejiang Crystal-Optech Co. Ltd., Class A | 7,800 | 22,723 | ||||||
Zhejiang Dun’an Artificial Environment Co. Ltd., Class A* | 11,400 | 14,270 | ||||||
Zhejiang Hailiang Co. Ltd., Class A | 6,000 | 11,919 | ||||||
Zhejiang Sanhua Co. Ltd., Class A* | 7,800 | 16,169 | ||||||
Zhejiang Wanma Co. Ltd., Class A* | 10,200 | 11,364 | ||||||
Zhejiang Yankon Group Co. Ltd., Class A | 8,460 | 21,369 | ||||||
Zhongli Science and Technology Group Co. Ltd., Class A | 7,800 | 22,137 | ||||||
Zhongshan Broad Ocean Motor Co. Ltd., Class A | 7,800 | 15,831 | ||||||
Zhuzhou Kibing Group Co. Ltd., Class A | 6,600 | 7,247 | ||||||
Zhuzhou Times New Material Technology Co. Ltd., Class A* | 10,800 | 14,729 | ||||||
|
| |||||||
| 2,061,831 | ||||||||
|
| |||||||
Number | Value | |||||||
| Technology — 6.0% | ||||||||
Accelink Technologies Co. Ltd., Class A | 1,800 | $ | 8,897 | |||||
Beijing Shiji Information Technology Co. Ltd., Class A | 3,000 | 21,931 | ||||||
Beijing Teamsun Technology Co. Ltd., Class A | 13,800 | 20,189 | ||||||
Bright Oceans Inter-Telecom Corp., Class A | 12,000 | 17,230 | ||||||
China Greatwall Computer Shenzhen Co. Ltd., Class A* | 17,400 | 11,921 | ||||||
EGing Photovoltaic Technology Co. Ltd., Class A | 6,600 | 11,241 | ||||||
Fujian Newland Computer Co. Ltd., Class A | 9,600 | 25,678 | ||||||
Glodon Software Co. Ltd., Class A | 5,400 | 30,945 | ||||||
GRG Banking Equipment Co. Ltd., Class A | 12,240 | 31,211 | ||||||
Hangzhou Silan Microelectronics Co. Ltd., Class A* | 16,380 | 14,919 | ||||||
Hundsun Technologies, Inc., Class A | 13,200 | 58,569 | ||||||
Inspur Electronic Information Industry Co. Ltd., Class A | 6,300 | 37,040 | ||||||
Invengo Information Technology Co. Ltd., Class A | 13,800 | 14,778 | ||||||
Jiangsu Changjiang Electronics Technology Co. Ltd., Class A* | 22,800 | 30,692 | ||||||
Jiangsu Hongtu High Technology Co. Ltd., Class A | 24,000 | 19,669 | ||||||
Mesnac Co. Ltd., Class A | 15,600 | 21,150 | ||||||
Shangdong Geo-Mineral Co. Ltd., Class A* | 4,800 | 7,307 | ||||||
Shanghai Belling Co. Ltd., Class A* | 14,400 | 23,050 | ||||||
Shenghe Resources, Class A* | 4,200 | 11,315 | ||||||
Shenzhen Kaifa Technology Co. Ltd., Class A | 15,600 | 13,384 | ||||||
Taiji Computer Corp. Ltd., Class A | 3,600 | 19,224 | ||||||
Wuhan Guide Infrared Co. Ltd., Class A | 4,800 | 12,739 | ||||||
|
| |||||||
| 463,079 | ||||||||
|
| |||||||
| Utilities — 2.3% | ||||||||
An Hui Wenergy Co. Ltd., Class A | 8,400 | 8,726 | ||||||
Beijing SPC Environmental Protection Tech Co. Ltd., Class A | 7,200 | 19,592 | ||||||
Guangdong Baolihua New Energy Stock Co. Ltd., Class A | 31,800 | 21,329 | ||||||
Guangdong Golden Dragon Development, Inc., Class A | 12,000 | 25,912 | ||||||
Guangxi Guiguan Electric Power Co. Ltd., Class A | 24,000 | 10,641 | ||||||
Shanghai Dazhong Public Utilities Group Co. Ltd., Class A | 34,800 | 27,295 | ||||||
Shanghai Electric Power Co. Ltd., Class A | 16,800 | 11,644 | ||||||
Xinjiang Tianfu Thermoelectric Co. Ltd., Class A | 9,600 | 13,031 | ||||||
Zhefu Holding Group Co. Ltd., Class A | 19,200 | 19,854 | ||||||
Zhejiang Fuchunjiang Environmental Thermoelectric Co. Ltd., Class A* | 7,800 | 9,027 | ||||||
Zhongshan Public Utilities Group Co. Ltd., Class A | 8,400 | 13,405 | ||||||
|
| |||||||
| 180,456 | ||||||||
|
| |||||||
TOTAL COMMON STOCKS | 7,289,757 | |||||||
|
| |||||||
TOTAL INVESTMENTS — 94.5% (Cost $7,093,606) | $ | 7,289,757 | ||||||
Other assets less liabilities — 5.5% | 420,583 | |||||||
|
| |||||||
NET ASSETS — 100.0% | $ | 7,710,340 | ||||||
|
| |||||||
* Non-income producing security.
| See Notes to Financial Statements. | 21 |
DBX ETF TRUST
SCHEDULE OF INVESTMENTS
db X-trackers Harvest MSCI All China Equity Fund
May 31, 2014
Number | Value | |||||||
| COMMON STOCKS — 50.6% | ||||||||
| Basic Materials — 0.9% | ||||||||
Aluminum Corp. of China Ltd., Class H* | 12,562 | $ | 4,488 | |||||
China BlueChemical Ltd., Class H | 5,643 | 3,021 | ||||||
CITIC Pacific Ltd. | 5,232 | 9,137 | ||||||
Jiangxi Copper Co. Ltd., Class H | 4,200 | 6,956 | ||||||
Kingboard Chemical Holdings Ltd. | 2,124 | 3,983 | ||||||
Lee & Man Paper Manufacturing Ltd. | 4,396 | 2,189 | ||||||
Nine Dragons Paper Holdings Ltd. | 5,203 | 3,382 | ||||||
Sinopec Shanghai Petrochemical Co. Ltd., Class H | 11,131 | 2,742 | ||||||
Yingde Gases Group Co. Ltd. | 3,497 | 3,825 | ||||||
Zijin Mining Group Co. Ltd., Class H | 19,141 | 4,419 | ||||||
|
| |||||||
| 44,142 | ||||||||
|
| |||||||
| Communications — 13.7% | ||||||||
Baidu, Inc., ADR* | 876 | 145,416 | ||||||
China Communications Services Corp. Ltd., Class H | 7,618 | 3,616 | ||||||
China Mobile Ltd. | 19,276 | 188,585 | ||||||
China Telecom Corp. Ltd., Class H | 44,218 | 22,243 | ||||||
China Unicom (Hong Kong) Ltd. | 15,156 | 22,677 | ||||||
Ctrip.com International, Ltd., ADR* | 423 | 23,443 | ||||||
NetEase, Inc., ADR | 256 | 18,217 | ||||||
Qihoo 360 Technology Co. Ltd., ADR* | 208 | 19,101 | ||||||
SINA Corp.* | 220 | 9,858 | ||||||
Sohu.com, Inc.* | 98 | 5,660 | ||||||
Tencent Holdings Ltd. | 16,333 | 230,260 | ||||||
Youku Tudou, Inc., ADR* | 416 | 8,112 | ||||||
ZTE Corp., Class H* | 2,005 | 3,869 | ||||||
|
| |||||||
| 701,057 | ||||||||
|
| |||||||
| Consumer, Cyclical — 2.8% | ||||||||
Air China Ltd., Class H | 5,815 | 3,323 | ||||||
Anta Sports Products Ltd. | 3,180 | 4,676 | ||||||
Belle International Holdings Ltd. | 14,781 | 14,661 | ||||||
Brilliance China Automotive Holdings Ltd. | 9,608 | 15,937 | ||||||
Byd Co. Ltd., Class H* | 1,642 | 8,048 | ||||||
China Resources Enterprise Ltd. | 3,829 | 10,742 | ||||||
Dongfeng Motor Group Co. Ltd., Class H | 8,644 | 13,268 | ||||||
Geely Automobile Holdings Ltd.* | 16,820 | 6,292 | ||||||
Golden Eagle Retail Group Ltd. | 1,747 | 2,134 | ||||||
GOME Electrical Appliances Holding Ltd. | 32,213 | 5,401 | ||||||
Great Wall Motor Co. Ltd., Class H | 3,292 | 13,503 | ||||||
Guangzhou Automobile Group Co. Ltd., Class H | 7,052 | 7,431 | ||||||
Haier Electronics Group Co. Ltd. | 3,288 | 7,693 | ||||||
Intime Retail Group Co. Ltd. | 3,836 | 3,726 | ||||||
Shanghai Pharmaceuticals Holding Co. Ltd., Class H | 2,196 | 4,130 | ||||||
Shenzhou International Group Holdings Ltd. | 1,782 | 6,217 | ||||||
Sun Art Retail Group Ltd. | 7,599 | 8,929 | ||||||
Weichai Power Co. Ltd., Class H | 1,548 | 5,779 | ||||||
Zhongsheng Group Holdings Ltd. | 2,052 | 2,573 | ||||||
|
| |||||||
| 144,463 | ||||||||
|
| |||||||
| Consumer, Non-cyclical — 3.4% | ||||||||
Biostime International Holdings Ltd. | 575 | 3,879 | ||||||
China Agri-Industries Holdings Ltd. | 6,687 | 2,760 | ||||||
China Huishan Dairy Holdings Co. Ltd.* | 18,363 | 4,358 | ||||||
China Mengniu Dairy Co. Ltd. | 4,365 | 21,423 | ||||||
Number | Value | |||||||
| Consumer, Non-cyclical (Continued) | ||||||||
CSPC Pharmaceutical Group Ltd. | 4,705 | $ | 3,708 | |||||
Hengan International Group Co. Ltd. | 2,354 | 24,973 | ||||||
Jiangsu Expressway Co. Ltd., Class H | 3,893 | 4,675 | ||||||
New Oriental Education & Technology Group, Inc., ADR | 439 | 11,335 | ||||||
Shandong Weigao Group Medical Polymer Co. Ltd., Class H | 6,002 | 5,837 | ||||||
Shanghai Fosun Pharmaceutical Group Co. Ltd., Class H | 1,285 | 4,773 | ||||||
Sihuan Pharmaceutical Holdings Group Ltd. | 6,605 | 7,872 | ||||||
Sino Biopharmaceutical Ltd. | 9,447 | 7,701 | ||||||
Sinopharm Group Co. Ltd., Class H | 3,167 | 8,598 | ||||||
Tingyi Cayman Islands Holding Corp. | 6,240 | 17,787 | ||||||
Tsingtao Brewery Co. Ltd., Class H | 1,147 | 9,025 | ||||||
Uni-President China Holdings Ltd. | 4,129 | 3,206 | ||||||
Want Want China Holdings Ltd. | 18,944 | 26,438 | ||||||
Zhejiang Expressway Co. Ltd., Class H | 4,568 | 4,525 | ||||||
|
| |||||||
| 172,873 | ||||||||
|
| |||||||
| Diversified — 0.2% | ||||||||
China Merchants Holdings International Co. Ltd. | 3,623 | 10,701 | ||||||
|
| |||||||
| Energy — 6.9% | ||||||||
China Coal Energy Co. Ltd., Class H | 13,085 | 7,460 | ||||||
China Longyuan Power Group Corp., Class H | 9,578 | 10,649 | ||||||
China Oilfield Services Ltd., Class H | 5,771 | 14,232 | ||||||
China Petroleum & Chemical Corp., Class H | 81,297 | 73,716 | ||||||
China Shenhua Energy Co. Ltd., Class H | 10,829 | 29,681 | ||||||
CNOOC Ltd. | 56,906 | 97,621 | ||||||
GCL-Poly Energy Holdings Ltd.* | 32,068 | 9,969 | ||||||
Kunlun Energy Co. Ltd.* | 10,275 | 16,752 | ||||||
PetroChina Co. Ltd., Class H | 67,230 | 80,212 | ||||||
Sinopec Engineering Group Co. Ltd., Class H | 3,724 | 4,294 | ||||||
Yanzhou Coal Mining Co. Ltd., Class H | 5,928 | 4,672 | ||||||
|
| |||||||
| 349,258 | ||||||||
|
| |||||||
| Financial — 17.4% | ||||||||
Agile Property Holdings Ltd. | 4,438 | 3,435 | ||||||
Agricultural Bank of China Ltd., Class H | 68,558 | 30,596 | ||||||
Bank of China Ltd., Class H | 253,133 | 120,478 | ||||||
Bank of Communications Co. Ltd., Class H | 27,890 | 18,670 | ||||||
China Cinda Asset Management Co. Ltd., | 13,002 | 6,205 | ||||||
China CITIC Bank Corp. Ltd., Class H | 26,081 | 15,172 | ||||||
China Construction Bank Corp., Class H | 229,822 | 168,670 | ||||||
China Everbright Bank Co. Ltd., Class H* | 8,754 | 3,873 | ||||||
China Everbright Ltd. | 2,684 | 3,801 | ||||||
China Life Insurance Co. Ltd., Class H | 23,710 | 65,139 | ||||||
China Merchants Bank Co. Ltd., Class H | 14,628 | 26,943 | ||||||
China Minsheng Banking Corp. Ltd., Class H | 16,569 | 17,011 | ||||||
China Overseas Land & Investment Ltd. | 13,020 | 33,923 | ||||||
China Pacific Insurance Group Co. Ltd., Class H | 8,401 | 28,065 | ||||||
China Resources Land Ltd. | 6,502 | 13,167 | ||||||
China Taiping Insurance Holdings Co. Ltd.* | 2,709 | 4,724 | ||||||
Chongqing Rural Commercial Bank, Class H* | 8,009 | 3,698 | ||||||
CITIC Securities Co. Ltd., Class H | 3,378 | 7,285 | ||||||
COSCO Pacific Ltd. | 5,568 | 7,354 | ||||||
| See Notes to Financial Statements. | 22 |
DBX ETF TRUST
SCHEDULE OF INVESTMENTS
db X-trackers Harvest MSCI All China Equity Fund (Continued)
May 31, 2014
Number | Value | |||||||
| Financial (Continued) | ||||||||
Country Garden Holdings Co. Ltd. | 14,702 | $ | 6,181 | |||||
Evergrande Real Estate Group Ltd. | 18,559 | 8,210 | ||||||
Far East Horizon Ltd. | 4,196 | 2,852 | ||||||
Franshion Properties China Ltd. | 11,673 | 3,493 | ||||||
Guangzhou R&F Properties Co. Ltd., Class H | 3,235 | 4,448 | ||||||
Haitong Securities Co. Ltd., Class H | 4,280 | 6,393 | ||||||
Industrial & Commercial Bank of China Ltd., Class H | 235,078 | 152,818 | ||||||
Longfor Properties Co. Ltd. | 4,334 | 5,484 | ||||||
New China Life Insurance Co. Ltd., Class H | 2,636 | 8,245 | ||||||
New World China Land Ltd. | 8,290 | 6,897 | ||||||
People’s Insurance Co. (Group) of China Ltd., Class H | 20,854 | 8,392 | ||||||
PICC Property & Casualty Co. Ltd., Class H | 10,084 | 14,854 | ||||||
Ping An Insurance Group Co. of China Ltd., Class H | 6,481 | 50,115 | ||||||
Poly Property Group Co. Ltd. | 6,384 | 2,907 | ||||||
Shanghai Industrial Holdings Ltd. | 1,553 | 4,797 | ||||||
Shimao Property Holdings Ltd. | 4,426 | 8,917 | ||||||
Shui On Land Ltd. | 11,468 | 2,988 | ||||||
Sino-Ocean Land Holdings Ltd. | 10,443 | 5,496 | ||||||
Soho China Ltd. | 5,885 | 4,623 | ||||||
Yuexiu Property Co. Ltd. | 16,334 | 3,244 | ||||||
|
| |||||||
| 889,563 | ||||||||
|
| |||||||
| Industrial — 2.6% | ||||||||
AAC Technologies Holdings, Inc. | 2,347 | 13,849 | ||||||
Anhui Conch Cement Co. Ltd., Class H | 3,934 | 14,158 | ||||||
AviChina Industry & Technology Co. Ltd., Class H | 6,757 | 3,652 | ||||||
BBMG Corp., Class H | 3,726 | 2,513 | ||||||
Beijing Capital International Airport Co. Ltd., Class H | 4,790 | 3,287 | ||||||
China Communications Construction Co. Ltd., Class H | 14,107 | 9,425 | ||||||
China COSCO Holdings Co. Ltd., Class H* | 8,210 | 3,198 | ||||||
China Everbright International Ltd. | 7,857 | 10,002 | ||||||
China International Marine Containers Group Co. Ltd., Class H | 1,595 | 2,835 | ||||||
China National Building Material Co. Ltd., | 9,173 | 8,294 | ||||||
China Railway Construction Corp. Ltd., Class H | 6,284 | 5,317 | ||||||
China Railway Group Ltd., Class H | 12,734 | 5,929 | ||||||
China Resources Cement Holdings Ltd. | 6,244 | 3,938 | ||||||
China Shipping Container Lines Co. Ltd., Class H* | 11,945 | 2,881 | ||||||
China State Construction International Holdings Ltd. | 5,575 | 9,651 | ||||||
CSR Corp. Ltd., Class H | 6,449 | 4,775 | ||||||
Fosun International Ltd. | 5,514 | 6,508 | ||||||
Haitian International Holdings Ltd. | 2,033 | 4,458 | ||||||
Shanghai Electric Group Co. Ltd., Class H | 8,998 | 3,250 | ||||||
Yangzijiang Shipbuilding Holdings Ltd. | 6,113 | 4,922 | ||||||
Zhuzhou CSR Times Electric Co. Ltd., Class H | 1,656 | 4,870 | ||||||
Zoomlion Heavy Industry Science and Technology Co. Ltd., Class H | 4,328 | 2,881 | ||||||
|
| |||||||
| 130,593 | ||||||||
|
| |||||||
Number | Value | |||||||
| Technology — 0.8% | ||||||||
CITIC 21CN Co. Ltd.* | 7,812 | $ | 6,237 | |||||
Hanergy Solar Group Ltd.* | 36,270 | 5,286 | ||||||
Kingsoft Corp. Ltd. | 2,072 | 6,267 | ||||||
Lenovo Group Ltd. | 19,890 | 24,629 | ||||||
|
| |||||||
| 42,419 | ||||||||
|
| |||||||
| Utilities — 1.9% | ||||||||
Beijing Enterprises Holdings Ltd. | 1,621 | 13,852 | ||||||
Beijing Enterprises Water Group Ltd. | 13,790 | 8,822 | ||||||
China Gas Holdings Ltd. | 6,363 | 10,292 | ||||||
China Resources Gas Group Ltd. | 2,834 | 8,682 | ||||||
China Resources Power Holdings Co. Ltd. | 6,107 | 16,030 | ||||||
Datang International Power Generation Co. Ltd., Class H | 8,451 | 3,281 | ||||||
ENN Energy Holdings Ltd.* | 2,415 | 17,085 | ||||||
Guangdong Investment Ltd. | 7,953 | 8,822 | ||||||
Huaneng Power International, Inc., Class H | 10,196 | 10,771 | ||||||
|
| |||||||
| 97,637 | ||||||||
|
| |||||||
TOTAL COMMON STOCKS | 2,582,706 | |||||||
|
| |||||||
| EXCHANGE—TRADED FUNDS — 49.2% | ||||||||
db X-trackers Harvest CSI 300 China A-Shares | 114,107 | 2,508,528 | ||||||
|
| |||||||
| RIGHTS — 0.0% (b) | ||||||||
| Consumer, Non-cyclical — 0.0% (b) | ||||||||
Uni-President China Holdings Ltd.*, expires 7/17/2014 | 707 | 133 | ||||||
|
| |||||||
| Diversified — 0.0% (b) | ||||||||
China Merchants Holdings International Co. Ltd.*, expires 7/05/2014 | 1,115 | 0 | ||||||
|
| |||||||
| 133 | ||||||||
|
| |||||||
TOTAL INVESTMENTS — 99.8% (Cost $5,014,159) | $ | 5,091,367 | ||||||
Other assets less liabilities — 0.2% | 11,287 | |||||||
|
| |||||||
NET ASSETS — 100.0% | $ | 5,102,654 | ||||||
|
| |||||||
ADR – American Depositary Receipt.
* Non-income producing security.
(a) Affiliated fund advised by DBX Advisors LLC.
(b) Less than 0.1%.
| See Notes to Financial Statements. | 23 |
DBX ETF Trust
STATEMENTS OF ASSETS AND LIABILITIES
May 31, 2014
| db X-trackers Harvest CSI 300 China A-Shares Fund | db X-trackers Harvest CSI 500 China A-Shares Small Cap Fund | db X-trackers Harvest MSCI All China Equity Fund | ||||||||||
Assets | ||||||||||||
Investments in non-affiliated securities at fair value | $ | 151,997,257 | $ | 7,289,757 | $ | 2,582,839 | ||||||
Investments in affiliated securities at fair value (See Note 5) | — | — | 2,508,528 | |||||||||
Cash | 31,544 | 1,205 | — | |||||||||
Foreign currency at value | 1,101,762 | † | 423,555 | 2,155 | ||||||||
Receivables: | ||||||||||||
Dividends and interest | 390 | — | 13,554 | |||||||||
Investment securities sold | — | — | 76,873 | |||||||||
|
|
|
|
|
| |||||||
Total Assets | $ | 153,130,953 | $ | 7,714,517 | $ | 5,183,949 | ||||||
|
|
|
|
|
| |||||||
Liabilities | ||||||||||||
Deferred foreign taxes payable | $ | 59,294 | $ | 2,340 | $ | — | ||||||
Payables: | ||||||||||||
Due to authorized participants | 179,823 | — | — | |||||||||
Due to custodian | — | — | 31,307 | |||||||||
Investment advisory fees | 99,299 | 1,837 | 1,498 | |||||||||
Investment securities purchased | — | — | 48,490 | |||||||||
|
|
|
|
|
| |||||||
Total Liabilities | 338,416 | 4,177 | 81,295 | |||||||||
|
|
|
|
|
| |||||||
Net Assets | $ | 152,792,537 | $ | 7,710,340 | $ | 5,102,654 | ||||||
|
|
|
|
|
| |||||||
Net Assets Consist of | ||||||||||||
Paid-in capital | $ | 178,828,842 | $ | 7,514,273 | $ | 5,011,536 | ||||||
Undistributed net investment income (loss) | (652,661 | ) | 4,766 | 14,305 | ||||||||
Accumulated net realized gain (loss) on investments and foreign currency transactions | (7,870,070 | ) | (1,919 | ) | (390 | ) | ||||||
Net unrealized appreciation (depreciation) on investments and foreign currency translations (net of deferred foreign taxes of $55,586, $2,340 and $0 respectively) | (17,513,574 | ) | 193,220 | 77,203 | ||||||||
|
|
|
|
|
| |||||||
Net Assets | $ | 152,792,537 | $ | 7,710,340 | $ | 5,102,654 | ||||||
|
|
|
|
|
| |||||||
Number of Common Shares outstanding | 6,950,001 | 300,001 | 200,001 | |||||||||
|
|
|
|
|
| |||||||
Net Assets Value | $ | 21.98 | $ | 25.70 | $ | 25.51 | ||||||
|
|
|
|
|
| |||||||
Investments in non-affiliated securities at cost | $ | 169,453,537 | $ | 7,093,606 | $ | 2,509,649 | ||||||
|
|
|
|
|
| |||||||
Investments in affiliated securities at cost | $ | — | $ | — | $ | 2,504,510 | ||||||
|
|
|
|
|
| |||||||
Foreign currency at cost | $ | 1,103,470 | $ | 424,146 | $ | 2,155 | ||||||
|
|
|
|
|
| |||||||
| † | Included in foreign currency at value is $89,639 which represents foreign investor minimum settlement reserve funds required by China Securities Depository and Clearing Corporation Limited. |
| See Notes to Financial Statements. | 24 |
DBX ETF Trust
For the Period Ended May 31, 2014
| db X-trackers Harvest CSI 300 China A-Shares Fund1 | db X-trackers Harvest CSI 500 China A-Shares Small Cap Fund2 | db X-trackers Harvest MSCI All China Equity Fund3 | ||||||||||
Investment Income | ||||||||||||
Unaffiliated interest income | $ | 7,327 | $ | — | $ | — | ||||||
Unaffiliated dividend income* | 503,305 | 7,738 | 15,716 | |||||||||
|
|
|
|
|
| |||||||
Total Investment Income | 510,632 | 7,738 | 15,716 | |||||||||
|
|
|
|
|
| |||||||
Expenses | ||||||||||||
Advisory fees | 769,829 | 1,837 | 3,110 | |||||||||
Trustee fees | 5,379 | — | — | |||||||||
Interest expense | 144,400 | — | — | |||||||||
|
|
|
|
|
| |||||||
Total Expenses | 919,608 | 1,837 | 3,110 | |||||||||
|
|
|
|
|
| |||||||
Less fees waived (See Note 3): | ||||||||||||
Waiver | (38,532 | ) | — | (1,561 | ) | |||||||
|
|
|
|
|
| |||||||
Net Expenses | 881,076 | 1,837 | 1,549 | |||||||||
|
|
|
|
|
| |||||||
Net Investment Income (Loss) | (370,444 | ) | 5,901 | 14,167 | ||||||||
|
|
|
|
|
| |||||||
Realized and Unrealized Gain (Loss) | ||||||||||||
Net realized gain (loss) from: | ||||||||||||
Investments | (7,855,796 | )** | 601 | (261 | ) | |||||||
Investments in affiliates | — | — | (222 | ) | ||||||||
In-kind redemptions | — | — | 30,049 | |||||||||
In-kind redemptions in affiliates | — | — | 18,244 | |||||||||
Foreign currency transactions | (606,425 | ) | (3,655 | ) | (47 | ) | ||||||
|
|
|
|
|
| |||||||
Net realized gain (loss) | (8,462,221 | ) | (3,054 | ) | 47,763 | |||||||
Net change in unrealized appreciation (depreciation) on: | ||||||||||||
Investments | (17,511,866 | )*** | 193,809 | *** | 77,208 | |||||||
Foreign currency translations | (1,708 | ) | (589 | ) | (5 | ) | ||||||
|
|
|
|
|
| |||||||
Net change in unrealized appreciation (depreciation) | (17,513,574 | ) | 193,220 | 77,203 | ||||||||
|
|
|
|
|
| |||||||
Net realized and unrealized gain (loss) on investments and foreign currency transactions | (25,975,795 | ) | 190,166 | 124,966 | ||||||||
|
|
|
|
|
| |||||||
Net Increase (Decrease) in Net Assets Resulting from Operations | $ | (26,346,239 | ) | $ | 196,067 | $ | 139,133 | |||||
|
|
|
|
|
| |||||||
* Foreign tax withheld | $ | 56,270 | $ | 860 | $ | 710 | ||||||
|
|
|
|
|
| |||||||
** Net of deferred foreign taxes | $ | 3,708 | $ | — | $ | — | ||||||
|
|
|
|
|
| |||||||
*** Net of deferred foreign taxes | $ | 55,586 | $ | 2,340 | $ | — | ||||||
|
|
|
|
|
| |||||||
| 1 | For the period November 6, 2013 (commencement of operations) through May 31, 2014. |
| 2 | For the period May 21, 2014 (commencement of operations) through May 31, 2014. |
| 3 | For the period April 30, 2014 (commencement of operations) through May 31, 2014. |
| See Notes to Financial Statements. | 25 |
DBX ETF Trust
STATEMENTS OF CHANGES IN NET ASSETS
| db X-trackers Harvest CSI 300 China A-Shares Fund | db X-trackers Harvest CSI 500 China A-Shares Small Cap Fund | db X-trackers Harvest MSCI All China Equity Fund | ||||||||||
| For the Period November 6, 2013(1) to May 31, 2014 | For the Period May 21, 2014(1) to May 31, 2014 | For the Period April 30, 2014(1) to May 31, 2014 | ||||||||||
Increase (Decrease) in Net Assets from Operations | ||||||||||||
Net investment income (loss) | $ | (370,444 | ) | $ | 5,901 | $ | 14,167 | |||||
Net realized gain (loss) on investments and foreign currency related transactions | (8,462,221 | ) | (3,054 | ) | 47,763 | |||||||
Net change in unrealized appreciation (depreciation) on investments and foreign currency translations | (17,513,574 | ) | 193,220 | 77,203 | ||||||||
|
|
|
|
|
| |||||||
Net increase (decrease) in net assets resulting from operations | (26,346,239 | ) | 196,067 | 139,133 | ||||||||
|
|
|
|
|
| |||||||
Fund Shares Transactions | ||||||||||||
Proceeds from shares sold | 237,857,414 | 7,514,273 | 7,493,477 | |||||||||
Value of shares redeemed | (58,718,638 | ) | — | (2,529,956 | ) | |||||||
|
|
|
|
|
| |||||||
Net increase (decrease) in net assets resulting from fund share transactions | 179,138,776 | 7,514,273 | 4,963,521 | |||||||||
|
|
|
|
|
| |||||||
Total Increase (decrease) in Net Assets | 152,792,537 | 7,710,340 | 5,102,654 | |||||||||
Net Assets | ||||||||||||
Beginning of period | — | — | — | |||||||||
|
|
|
|
|
| |||||||
End of period | $ | 152,792,537 | $ | 7,710,340 | $ | 5,102,654 | ||||||
|
|
|
|
|
| |||||||
Undistributed net investment income (loss) | $ | (652,661 | ) | $ | 4,766 | $ | 14,305 | |||||
|
|
|
|
|
| |||||||
Changes in Shares Outstanding | ||||||||||||
Shares outstanding, beginning of period | 1 | 1 | 1 | |||||||||
Shares sold | 9,500,000 | 300,000 | 300,000 | |||||||||
Shares redeemed | (2,550,000 | ) | — | (100,000 | ) | |||||||
|
|
|
|
|
| |||||||
Shares outstanding, end of period | 6,950,001 | 300,001 | 200,001 | |||||||||
|
|
|
|
|
| |||||||
| (1) | Commencement of operations. |
| See Notes to Financial Statements. | 26 |
DBX ETF Trust
For a Share outstanding throughout each period
| db X-trackers Harvest CSI 300 China A-Shares Fund | For the Period November 6, 2013* to May 31, 2014 | |||
Net Asset Value, beginning of period | $ | 25.00 | ||
|
| |||
Income from Investment Operations: | ||||
Net investment loss** | (0.05 | ) | ||
Net realized and unrealized loss on investments and foreign currency transactions | (2.97 | ) | ||
|
| |||
Net decrease in net asset value from operations | (3.02 | ) | ||
|
| |||
Net Asset Value, end of period | $ | 21.98 | ||
|
| |||
Total Return*** | (12.08 | )%† | ||
Ratios/Supplemental Data: | ||||
Net assets, end of period (000’s omitted) | $ | 152,793 | ||
Ratios to average net assets: | ||||
Expenses, net of fee waiver and expense reimbursements | 0.92 | %†† | ||
Expenses, prior to fee waiver and expense reimbursements | 0.96 | %†† | ||
Net investment loss | (0.38 | )%†† | ||
Portfolio turnover rate | 42 | %††† | ||
| db X-trackers Harvest CSI 500 China A-Shares Small Cap Fund | For the Period May 21, 2014* to May 31, 2014 | |||
Net Asset Value, beginning of period | $ | 25.00 | ||
|
| |||
Income from Investment Operations: | ||||
Net investment income** | 0.02 | |||
Net realized and unrealized gain on investments and foreign currency transactions | 0.68 | |||
|
| |||
Net increase in net asset value from operations | 0.70 | |||
|
| |||
Net Asset Value, end of period | $ | 25.70 | ||
|
| |||
Total Return*** | 2.80 | % | ||
Ratios/Supplemental Data | ||||
Net assets, end of period (000’s omitted) | $ | 7,710 | ||
Ratios to average net assets: | ||||
Expenses | 0.80 | %†† | ||
Net investment income | 2.57 | %†† | ||
Portfolio turnover rate | 0 | %††† | ||
| * | Commencement of Operations. |
| ** | Based on average shares outstanding. |
| *** | Total Return is calculated assuming an initial investment made at the Net Asset Value at the beginning of the period, reinvestment of all dividend distributions at Net Asset Value during the period, and redemption at Net Asset Value on the last day of the period. Total Return calculated for a period of less than one year is not annualized. |
| † | The Total Return would have been lower if certain fees had not been reimbursed by the Advisor. |
| †† | Annualized. |
| ††† | Portfolio turnover rate is not annualized and does not include securities received or delivered from processing creations or redemptions. |
| See Notes to Financial Statements. | 27 |
DBX ETF Trust
FINANCIAL HIGHLIGHTS (Continued)
For a Share outstanding throughout each period
| db X-trackers Harvest MSCI All China Equity Fund | For the Period April 30, 2014* to May 31, 2014 | |||
Net Asset Value, beginning of period | $ | 25.00 | ||
|
| |||
Income from Investment Operations: | ||||
Net investment income** | 0.06 | |||
Net realized and unrealized gain on investments and foreign currency transactions | 0.45 | |||
|
| |||
Net increase in net asset value from operations | 0.51 | |||
|
| |||
Net Asset Value, end of period | $ | 25.51 | ||
|
| |||
Total Return*** | 2.04 | %† | ||
Ratios/Supplemental Data: | ||||
Net assets, end of period (000’s omitted) | $ | 5,103 | ||
Ratios to average net assets: | ||||
Expenses, net of fee waiver and expense reimbursements | 0.30 | %†† | ||
Expenses, prior to fee waiver and expense reimbursements | 0.60 | %†† | ||
Net investment income | 2.73 | %†† | ||
Portfolio turnover rate | 2 | %††† | ||
| * | Commencement of Operations. |
| ** | Based on average shares outstanding. |
| *** | Total Return is calculated assuming an initial investment made at the Net Asset Value at the beginning of the period, reinvestment of all dividend distributions at Net Asset Value during the period, and redemption at Net Asset Value on the last day of the period. Total Return calculated for a period of less than one year is not annualized. |
| † | Total Return would have been lower if certain fees had not been reimbursed by the Advisor. |
| †† | Annualized. |
| ††† | Portfolio turnover rate is not annualized and does not include securities received or delivered from processing creations or redemptions. |
| See Notes to Financial Statements. | 28 |
DBX ETF Trust
1. Organization
DBX ETF Trust (the “Trust”) is registered under the Investment Company Act of 1940, as amended (the “Act”), as an open end registered management investment company organized as a Delaware statutory trust.
As of May 31, 2014, the Trust consists of seventeen non-diversified series of exchange-traded funds (“ETF”) (each a “Fund” and collectively, the “Funds”) in operation and trading. These financial statements report on the Funds listed below:
| db X-trackers Harvest CSI 300 China A-Shares Fund | ||
| db X-trackers Harvest CSI 500 China A-Shares Small Cap Fund | ||
| db X-trackers Harvest MSCI All China Equity Fund |
DBX Advisors LLC (“DBX” or the “Advisor”), an indirect, wholly owned subsidiary of Deutsche Bank AG, serves as investment advisor to the Funds and has overall responsibility for the general management and administration of the Funds, subject to the supervision of the Funds’ Board of Trustees.
Each Fund offers shares that are listed and traded on the NYSE Arca, Inc. (“NYSE Arca”). Unlike conventional mutual funds, each Fund issues and redeems shares on a continuous basis, at net asset value, only in large specified lots consisting of 50,000 shares each called a “Creation Unit”, to authorized participants who have entered into agreements with the Funds’ distributor. Except when aggregated in Creation Units, shares are not individually redeemable securities of the Funds.
The investment objective of each Fund is to track the performance, before fees and expenses, of a particular index (the “Underlying Index”). The underlying indices for the Funds are:
Fund | Underlying Index | |
| db X-trackers Harvest CSI 300 China A-Shares Fund | CSI 300 Index | |
db X-trackers Harvest CSI 500 China A-Shares Small Cap Fund | CSI 500 Index | |
| db X-trackers Harvest MSCI All China Equity Fund | MSCI All China Index |
CSI 300 Index is calculated and maintained by China Securities Index Co., Ltd. It is a modified free-float market capitalization weighted index composed of the largest and most liquid stocks in the Chinese A-Share market. Constituent stocks for the Underlying Index must have been listed on either the Shanghai Stock Exchange or the Shenzhen Stock Exchange. The composition of the Underlying Index is rebalanced every six months.
CSI 500 Index is calculated and maintained by China Securities Index Co., Ltd. It is a modified free-float market capitalization weighted index composed of the 500 smallest and most liquid stocks in the Chinese A-Share market. Constituent stocks for the Underlying Index must have been listed on either the Shanghai Stock Exchange or the Shenzhen Stock Exchange. The composition of the Underlying Index is rebalanced every six months.
MSCI is the creator of the MSCI All China Index. The MSCI All China Index captures large and mid-cap representation across all China securities listed in China and Hong Kong as well as in the U.S. and Singapore. The Underlying Index includes: A shares, B shares, H shares, Red chips and P chips share classes as well as securities of Chinese Companies listed in the U.S. and Singapore. With over 600 constituents, the Underlying index is comprehensive, aiming to cover the global large and mid-cap China equity opportunity set. The MSCI All China Index is rebalanced on a quarterly basis.
Each Fund is entitled to use its respective Underlying Index pursuant to a licensing agreement between MSCI, CSI and DBX. There is no charge to the Funds in connection with these licensing agreements.
Each Fund is non-diversified and is not limited by the Act with regard to the percentage of its assets that may be invested in the securities of a single issuer. The securities of a particular issuer (or securities of issuers in particular industries) may dominate the underlying index of such a fund and, consequently, the fund’s investment portfolio. This may adversely affect the fund’s performance or subject the fund’s Shares to greater price volatility than that experienced by more diversified investment companies.
The Funds invest in securities of non-U.S. issuers that trade in non-U.S. Markets, this involves certain considerations and risks not typically associated with securities of U.S. issuers. Such risks include, but are not limited to: generally less liquid and less efficient securities markets; generally greater price volatility; exchange rate fluctuations and exchange controls; imposition of restrictions on the expatriation of funds or other assets of the Fund; less publicly available information about issuers; the imposition of withholding or other taxes; higher transaction and custody costs; settlement delays and risk of loss attendant in settlement procedures; difficulties in enforcing contractual obligations; less regulation of securities markets;
29
DBX ETF Trust
NOTES TO FINANCIAL STATEMENTS (Continued)
different accounting, disclosure and reporting requirements; more substantial governmental involvement in the economy; higher inflation rates; greater social, economic and political uncertainties; the risk of nationalization or expropriation of assets and the risk of war.
Pursuant to the Trust’s organizational documents, the Trust’s officers and trustees are indemnified against certain liabilities that may arise out of the performance of their duties to the Funds. Additionally, in the normal course of business the Trust enters into contracts that contain a variety of representations that provide indemnification for certain liabilities. The Trust’s maximum exposure under these arrangements is unknown, as this would involve future claims that may be made against the Funds that have not yet occurred. However, the Trust expects the risk of loss to be remote.
2. Significant Accounting Policies
The financial statements have been prepared in conformity with U.S. generally accepted accounting principles (“U.S. GAAP”), which require management to make certain estimates and assumptions that affect the reported amounts and disclosures in the financial statements. Actual results could differ from those estimates. The following is a summary of significant accounting policies followed by the Funds.
Security Valuation The Net Asset Value (“NAV”), of each Fund’s shares is calculated each business day as of the close of regular trading on the New York Stock Exchange, generally 4:00 p.m. Eastern Time. NAV per share is calculated by dividing a Fund’s net assets by the number of Fund shares outstanding.
Various inputs are used in determining the value of the Funds’ investments. These inputs are summarized in three broad levels. Level 1 includes quoted prices in active markets for identical securities. Level 2 includes other significant observable inputs (including quoted prices for similar securities, interest rates, prepayment speeds, and credit risk). Level 3 includes significant unobservable inputs (including the Fund’s own assumptions in determining the fair value of investments). The level assigned to the securities valuations may not be an indication of the risk or liquidity associated with investing in those securities.
Equity securities and ETFs are valued at the most recent sale price or official closing price reported on the exchange (U.S. or foreign) or over-the-counter market on which they trade. Securities or ETFs for which no sales are reported are valued at the calculated mean between the most recent bid and asked quotations on the relevant market or, if a mean cannot be determined, at the most recent bid quotation. Equity securities and ETFs are generally categorized as Level 1.
Securities and other assets for which market quotations are not readily available or for which the above valuation procedures are deemed not to reflect fair value are valued in a manner that is intended to reflect their fair value as determined in accordance with procedures approved by the Board and are generally categorized as Level 3. In accordance with the Fund’s valuation procedures, factors considered in determining value may include, but are not limited to, the type of the security; the size of the holding; the initial cost of the security; the existence of any contractual restrictions on the security’s disposition; the price and extent of public trading in similar securities of the issuer or of comparable companies; quotations or evaluated prices from broker-dealers and/or pricing services; information obtained from the issuer, analysts, and/or the appropriate stock exchange (for exchange-traded securities); an analysis of the company’s or issuer’s financial statements; an evaluation of the forces that influence the issuer and the market(s) in which the security is purchased and sold; and with respect to debt securities, the maturity, coupon, creditworthiness, currency denomination and the movement of the market in which the security is normally traded. The value determined under these procedures may differ from published values for the same securities.
Fair value pricing could result in a difference between the prices used to calculate a Fund’s net asset value and the prices used by the Fund’s underlying index, which in turn could result in a difference between the Fund’s performance and the performance of the Fund’s underlying index.
30
DBX ETF Trust
NOTES TO FINANCIAL STATEMENTS (Continued)
The following table summarizes the valuation of each Fund’s investments by the above fair value hierarchy levels as of May 31, 2014. For the period ended May 31, 2014, there were no transfers between investment levels.
| Level 1 | Level 2 | Level 3 | Fair Value at 5/31/2014 | |||||||||||||
| db X-trackers Harvest CSI 300 China A-Shares Fund | ||||||||||||||||
Investments in Securities* | ||||||||||||||||
Common Stocks | $ | 151,967,004 | $ | — | $ | — | $ | 151,967,004 | ||||||||
Convertible Bonds | — | — | 30,253 | 30,253 | ||||||||||||
|
|
|
|
|
|
|
| |||||||||
Total Investments | $ | 151,967,004 | $ | — | $ | 30,253 | $ | 151,997,257 | ||||||||
|
|
|
|
|
|
|
| |||||||||
db X-trackers Harvest CSI 500 China A-Shares Small Cap Fund | ||||||||||||||||
Investments in Securities* | ||||||||||||||||
Common Stocks | $ | 7,289,757 | $ | — | $ | — | $ | 7,289,757 | ||||||||
|
|
|
|
|
|
|
| |||||||||
Total Investments | $ | 7,289,757 | $ | — | $ | — | $ | 7,289,757 | ||||||||
|
|
|
|
|
|
|
| |||||||||
db X-trackers Harvest MSCI All China Equity Fund | ||||||||||||||||
Investments in Securities* | ||||||||||||||||
Common Stocks | $ | 2,582,706 | $ | — | $ | — | $ | 2,582,706 | ||||||||
Exchange-Traded Funds | 2,508,528 | — | — | 2,508,528 | ||||||||||||
Rights | 133 | 0 | — | 133 | ||||||||||||
|
|
|
|
|
|
|
| |||||||||
Total Investments | $ | 5,091,367 | $ | 0 | $ | — | $ | 5,091,367 | ||||||||
|
|
|
|
|
|
|
| |||||||||
| * | See Schedule of Investments for Industry Classification. |
Cash Cash consists of cash held at banks and are on deposit with major financial institutions.
Investment Transactions and Investment Income Investment transactions are recorded as of the date that the securities are purchased or sold (trade date). Realized gains and losses from the sale or disposition of securities are calculated on the identified cost-method. Dividend income is net of any foreign taxes withheld at source. Certain dividends from foreign securities may be recorded subsequent to the ex-dividend date as soon as the fund is informed of such dividends. Interest income is recorded on the accrual basis.
Tax Information and Dividends and Distributions to Shareholders It is each Fund’s policy to comply with all requirements of the Internal Revenue Code of 1986, as amended (“the Code”). Each fund intends to qualify for and to elect treatment as a separate Regulated Investment Company (“RIC”) under Subchapter M of the Code. It is the policy of each Fund to pay out dividends from its net investment income, if any, to investors annually sufficient to relieve it from all, or substantially all, Federal income and excise taxes. Taxable net realized gains from investment transactions, reduced by capital loss carryforwards, if any, are declared and distributed to shareholders at least annually. The capital loss carryforward amount, if any, is available to offset future net capital gains. The Funds may occasionally be required to make supplemental distributions at some other time during the year. The Funds reserve the right to declare special distributions if, in their reasonable discretion, such action is necessary or advisable to preserve the status of each Fund as a RIC or to avoid imposition of income or excise taxes on undistributed income. Dividends and distributions to shareholders, if any, are recorded on the ex-dividend date. The amount of dividends and distributions from net investment income and net realized capital gains are determined in accordance with Federal income tax regulations which may differ from U.S. GAAP. These “book/tax” differences are either considered temporary or permanent in nature. To the extent these differences are permanent in nature, such amounts are reclassified at the end of the year within the components of net assets based on their federal tax treatment; temporary differences do not require reclassification. Dividends and distributions, which exceed earnings and profits for the full year for tax purposes, are reported as a tax return of capital.
In accordance with U.S. GAAP requirements regarding accounting for uncertainties in income taxes, management has analyzed the Funds’ tax positions taken or expected to be taken on foreign, federal and state income tax returns for the current tax year and has concluded that no provision for income tax is required in the Funds’ financial statements. The Advisor does not believe that the unrecognized tax benefits will change significantly in the next 12 months.
The Funds’ recognize interest and penalties, if any, related to uncertain tax provisions as income tax expense on the Statements of Operations. For the period ended May 31, 2014, the Funds did not incur any interest or penalties.
31
DBX ETF Trust
NOTES TO FINANCIAL STATEMENTS (Continued)
Foreign Taxes The Funds may be subject to foreign taxes (a portion of which may be reclaimable) on income, capital gains on investments, certain foreign currency transactions or other corporate events. All foreign taxes are recorded in accordance with the applicable foreign tax regulations and rates that exist in the foreign jurisdictions in which the Funds invest. These foreign taxes, if any, are paid by the Funds and are reflected in their Statements of Operations as follows: foreign taxes withheld at source are presented as a reduction of income, and foreign taxes on capital gains from sales of investments and foreign currency transactions are included in their respective net realized gain (loss) categories. Foreign taxes payable as of May 31, 2014, if any, are disclosed in the Funds’ Statements of Assets and Liabilities.
The Funds’ investments in China A-Shares (including the db X-trackers Harvest MSCI All China Equity Fund though its investment in db X-trackers Harvest CSI 300 China A-Shares Fund) will be subject to a number of Chinese tax rules and the application of many of those rules is at present uncertain. Chinese taxes that may apply to the Funds’ investments include withholding taxes on dividends and interest earned by the Funds, withholding taxes on capital gains, business tax and stamp tax.
China generally imposes withholding tax at a rate of 10% on dividends and interest derived by Qualified Foreign Institutional Investors (“QFII”) from issuers resident in China, subject to any lower rate provided by an applicable tax treaty. There is no direct authority on the application of this tax to an Renminbi Qualified Foreign Institutional Investor (“RQFII”), but it is expected that the authorities requiring such withholding with respect to QFIIs and nonresident enterprises generally would be followed in the case of an RQFII that is not a PRC resident for tax purposes and does not have a place of business, an establishment or a permanent establishment in the People’s Republic of China (“PRC”). It is generally expected that such taxes will be withheld by the payor.
China also generally imposes withholding tax at a rate of 10% on capital gains derived by nonresident enterprises from investments in an issuer resident in China, subject to any lower rate provided by an applicable tax treaty. There is no direct authority on the application of this tax to an RQFII, nor on the methodology for calculating and collecting the tax. The Chinese tax authorities are not currently enforcing the collection of withholding tax on capital gains, and at present such taxes likely will not be collected through withholding. However, the tax authorities may at any time begin to seek collection of such taxes, including, potentially, on a retrospective basis without prior warning. The imposition of such taxes, particularly on a retrospective basis, could have a material adverse effect on the Funds’ returns.
db X-trackers Harvest CSI 300 China A-Shares Fund and db X-trackers Harvest CSI 500 China A-Shares Small Cap Fund intend to reserve a portion of realized and/or unrealized gains from investments in A-Shares of “land-rich” enterprises to meet certain tax liabilities that may be imposed by the PRC. Land-rich enterprises are companies that have greater than 50% of their assets in land or real properties in the PRC. The Fund’s withholding provision with respect to such investments may be excessive or inadequate to meet liabilities for those withholding taxes. In addition, if the PRC begins applying tax rules regarding the taxation of income from A-Shares investments to RQFIIs and/or begins collecting capital gains taxes on such investments, the Funds could be subject to withholding tax liability in excess of the amount reserved. The impact of any such tax liability on the Funds’ return could be substantial.
In the absence of specific guidance, RQFIIs such as the Sub-Adviser may be potentially subject to PRC business tax at a rate of 5% in respect of capital gains derived from the trading of A-Shares. Existing guidance provides a business tax exemption for QFIIs in respect of their gains derived from the trading of PRC securities, but does not explicitly apply to RQFIIs. In practice, the Chinese tax authorities have not actively enforced the collection of business tax on such gains.
The PRC rules for taxation of RQFIIs (and QFIIs) are evolving and the tax regulations to be issued by the PRC State Administration of Taxation and/or PRC Ministry of Finance to clarify the subject matter may adversely affect the Fund and its shareholders. The applicability of reduced treaty rates of withholding in the case of an RQFII acting for a foreign investor such as the Funds is also uncertain.
Foreign Currency Translations The books and records of the Funds are maintained in U.S. dollars. Investment securities and other assets and liabilities denominated in a foreign currency are translated into U.S. dollars at the prevailing exchange rates at period end. Purchases and sales of investment securities, income and expenses are translated into U.S. dollars at the prevailing exchange rates on the respective dates of the transactions.
Net realized and unrealized gains and losses on foreign currency transactions represent net gains and losses between trade and settlement dates on securities transactions, the acquisition and disposition of foreign currencies, and the difference between the amount of net investment income accrued and the U.S. dollar amount actually received. That portion of both realized and unrealized gains and losses on investments that results from fluctuations in foreign currency exchange rates is not separately disclosed, but is included with net realized and unrealized gain/appreciation and loss/depreciation on investments.
32
DBX ETF Trust
NOTES TO FINANCIAL STATEMENTS (Continued)
3. Investment Advisory and Other Agreements
The Advisor has overall responsibility for the general management and administration of the Funds, subject to the supervision of the Funds’ Board of Trustees. Under an investment advisory agreement between the Trust, on behalf of the Funds, and the Advisor (the “Investment Advisory Agreement”), the Advisor is responsible for arranging sub-advisory, transfer agency, custody, fund administration, and all other non-distribution related services for the Funds to operate. The Advisor is also responsible for employing any sampling strategy for the Funds.
Harvest Global Investments Ltd. acts as investment sub-advisor (the “Sub-Advisor”) to the db X-trackers Harvest CSI 300 China A-Shares Fund and the db X-trackers Harvest CSI 500 China A-Shares Small Cap Fund. The Sub-Advisor is responsible for day-to-day management of each Fund, subject to the replication strategy for each Fund with regard to its underlying index and for general administration, compliance and management services as may be agreed between the Advisor and Sub-Advisor from time to time.
For its investment advisory services to the Funds below, the Advisor is entitled to receive a unitary management fee from each Fund at an annual rate equal to:
Fund | Management Fee | |||
db X-trackers Harvest CSI 300 China A-Shares Fund | 0.80 | % | ||
db X-trackers Harvest CSI 500 China A-Shares Small Cap Fund | 0.80 | % | ||
db X-trackers Harvest MSCI All China Equity Fund | 0.60 | % | ||
Out of the unitary management fee, the Advisor pays substantially all expenses of each Fund, including the payments to the Sub-Advisor, the cost of transfer agency, custody, fund administration, legal, audit and other services and expenses of the Independent Trustees. Each Fund is responsible for the payment of, interest expense, taxes, brokerage expenses, extraordinary expenses and for the db X-trackers Harvest CSI 300 China A-Shares Fund, expenses of the Independent Trustees through February 6, 2014.
For the period November 6, 2013 (commencement of operations) through January 12, 2014, the Advisor had contractually agreed to waive fees for the db X-trackers Harvest CSI 300 China A-Shares Fund in order to limit the Fund’s net annual operating expenses to 0.90% of the Fund’s average daily net assets, except for interest expense, brokerage expenses, distribution fees or expenses, litigation expenses and any other extraordinary expenses.
Effective January 13, 2014 through January 12, 2015, the Advisor has contractually agreed to waive fees for the db X-trackers Harvest CSI 300 China A-Shares Fund in order to limit the Fund’s net annual operating expenses to 0.80% of the Funds average daily net assets, except for interest expense, brokerage expenses, distribution fees or expenses, litigation expenses and any other extraordinary expenses.
The Advisor for the db X-trackers Harvest MSCI All China Equity Fund has contractually agreed to waive fees and/or reimburse the Fund’s expenses in order to limit the Fund’s net annual operating expenses by an amount equal to the Fund’s management fee attributable to the Fund’s assets invested in an affiliated fund, if any (the “Expense Limit”). For the period ended May 31, 2014, the Advisor reimbursed $1,561 of expenses to the Fund. The Expense Limit will remain in effect until at least May 1, 2016.
The Advisor pays the Sub-Advisor a fee based on a percentage of the average daily net assets for each of the Funds listed below:
Fund | Sub-Advisor Fee | |||
db X-trackers Harvest CSI 300 China A-Shares Fund (through May 19, 2014) | 0.40 | % | ||
db X-trackers Harvest CSI 500 China A-Shares Small Cap Fund | 0.30 | % | ||
Effective May 20, 2014, for the db X-trackers Harvest CSI 300 China A-Shares Fund, the Advisor pays the Sub-Advisor a fee based on 0.30% of the average daily net assets.
The Bank of New York Mellon, a wholly-owned subsidiary of The Bank of New York Mellon Corporation, serves as Administrator, Custodian, Accounting Agent and Transfer Agent for each Fund.
ALPS Distributors, Inc. (the “Distributor”) serves as the distributor of Creation Units for each Fund on an agency basis. The Distributor does not maintain a secondary market in shares of the Funds.
33
DBX ETF Trust
NOTES TO FINANCIAL STATEMENTS (Continued)
The Board of Trustees is currently comprised of four Trustees, of whom three are Independent Trustees. The Advisor pays retainer fees to each Trustee not affiliated with the Advisor, plus a specified amount to the Audit Committee. For the period November 6, 2013 (commencement of operations) through February 6, 2014, the db X-trackers Harvest CSI 300 China A-Shares Fund paid the fees and expenses of the Independent Trustees.
4. Federal Income Taxes
Capital losses incurred after October 31 (“post-October losses”) within the taxable year are deemed to arise on the first business day of each Fund’s next taxable year. During the period ended May 31, 2014, the Funds incurred and elected to defer net capital losses as follows:
| Post-October Losses on Capital | Late Year Ordinary Losses | |||||||
db X-trackers Harvest CSI 300 China A-Shares Fund | $ | 6,941,534 | $ | 652,661 | ||||
db X-trackers Harvest MSCI All China Equity Fund | 210 | — | ||||||
As of May 31, 2014, the components of accumulated earnings (losses) were as follows:
| Undistributed Net Investment Income (Loss) | Net Accumulated Capital and Other Gains (Losses) | Unrealized Appreciation (Depreciation) | Total Accumulated Earnings (Losses) | |||||||||||||
db X-trackers Harvest CSI 300 China A-Shares Fund | $ | (652,661 | ) | $ | (6,941,534 | ) | $ | (18,442,110 | ) | $ | (26,036,305 | ) | ||||
db X-trackers Harvest CSI 500 China A-Shares Small Cap Fund | 5,367 | — | 190,700 | 196,067 | ||||||||||||
db X-trackers Harvest MSCI All China Equity Fund | 14,305 | (210 | ) | 77,023 | 91,118 | |||||||||||
In order to present paid-in capital and accumulated net realized gains or losses on the Statement of Assets and Liabilities that more closely represent their tax character, certain adjustments have been made to additional paid-in capital, undistributed net investment income or loss and accumulated net realized gains or losses on investments. These differences are primarily due to currency gain/(loss), Passive Foreign Investment Companies (“PFICs”), net operating losses and redemptions-in-kind. For the period ended May 31, 2014, the adjustments were as follows:
| Undistributed Net Investment Income (Loss) | Undistributed Capital Gains (Accumulated Losses) | Paid-in Capital | ||||||||||
db X-trackers Harvest CSI 300 China A-Shares Fund | $ | (282,217 | ) | $ | 592,151 | $ | (309,934 | ) | ||||
db X-trackers Harvest CSI 500 China A-Shares Small Cap Fund | (1,135 | ) | 1,135 | — | ||||||||
db X-trackers Harvest MSCI All China Equity Fund | 138 | (48,153 | ) | 48,015 | ||||||||
As of May 31, 2014, the cost of investments for Federal income tax purposes and the aggregated gross unrealized appreciation/depreciation on investments were as follows:
| Cost | Net Unrealized Appreciation (Depreciation) | Gross Unrealized Appreciation | Gross Unrealized (Depreciation) | |||||||||||||
db X-trackers Harvest CSI 300 China A-Shares Fund | $ | 170,373,861 | $ | (18,376,604 | ) | $ | 2,075,037 | $ | (20,451,641 | ) | ||||||
db X-trackers Harvest CSI 500 China A-Shares Small Cap Fund | 7,096,126 | 193,631 | 243,254 | (49,623 | ) | |||||||||||
db X-trackers Harvest MSCI All China Equity Fund | 5,014,339 | 77,028 | 100,809 | (23,781 | ) | |||||||||||
34
DBX ETF Trust
NOTES TO FINANCIAL STATEMENTS (Continued)
5. Investments in Affiliates
The db X-trackers Harvest CSI 300 China A-Shares Fund in which the db X-trackers Harvest MSCI All China Equity Fund invests is considered to be an affiliate investment. The table below shows the transactions in and earnings from the Fund’s investments in db X-trackers Harvest CSI 300 China A-Shares Fund for the period ended May 31, 2014.
| Purchases at Cost | Proceeds from Sales | Change in Unrealized Appreciation/ (Depreciation) | Realized Gain (Loss) | Fair Value 5/31/14 | Dividend Income | |||||||||||||||||||
db X-trackers Harvest CSI 300 China A-Shares Fund | $ | 3,796,733 | $ | (1,310,106 | ) | $ | 3,879 | $ | 18,022 | $ | 2,508,528 | $ | — | |||||||||||
6. Investment Portfolio Transactions
For the period ended May 31, 2014, the cost of investments purchased and proceeds from sale of investments (excluding in-kind transactions and short-term investments) were as follows:
| Purchases | Sales | |||||||
db X-trackers Harvest CSI 300 China A-Shares Fund1 | $ | 250,107,616 | $ | 72,806,304 | ||||
db X-trackers Harvest CSI 500 China A-Shares Small Cap Fund2 | 7,094,733 | 1,728 | ||||||
db X-trackers Harvest MSCI All China Equity Fund3 | 6,384,730 | 118,433 | ||||||
For the period ended May 31, 2014, the cost of in-kind purchases and proceeds from in-kind sales were as follows:
| Purchases | Sales | |||||||
db X-trackers Harvest MSCI All China Equity Fund3 | $ | 1,230,063 | $ | 2,529,911 | ||||
| 1 | For the period November 6, 2013 through May 31, 2014. |
| 2 | For the period May 21, 2014 through May 31, 2014. |
| 3 | For the period April 30, 2014 through May 31, 2014. |
7. Fund Share Transactions
As of May 31, 2014, there were unlimited Fund shares of $0.0001 par value authorized by the Trust. Fund shares are issued and redeemed by each Fund only in Creation Units or multiples thereof. Except when aggregated in Creation Units, shares of each Fund are not redeemable. Transactions in capital shares for each Fund are disclosed in detail in the Statements of Changes in Net Assets. The consideration for the purchase of Creation Units of db X-trackers Harvest MSCI All China Equity Fund generally consists of the in-kind contribution of a designated portfolio of securities constituting a portfolio sampling representation of the securities included in the respective Fund’s underlying index and an amount of cash, which under certain circumstances may include cash in lieu of portfolio securities. The purchase of Creation Units for db X-trackers Harvest CSI 300 China A-Shares Fund and db X-trackers CSI 500 China A-Shares Small Cap Fund are generally issued in exchange for a specific amount of cash totaling the NAV of the Creation Units. Investors purchasing and redeeming Creation Units pay a purchase transaction fee and a redemption transaction fee to offset transfer and other transaction costs associated with the issuance and redemption of Creation Units.
8. Line of Credit
Effective October 24, 2013 the Trust entered into a senior unsecured credit facility with a commercial bank which allows the db X-trackers Harvest CSI 300 China A-Shares Fund, db X-trackers Harvest CSI 500 China A-Shares Small Cap Fund and certain other funds managed by the Advisor to borrow up to $100 million. Each Fund may borrow money under this credit facility to the extent necessary for temporary or emergency purposes, including the funding of shareholder redemption requests, trade settlements, and as necessary to distribute to shareholders any income necessary to maintain each Fund’s status as a regulated investment company. Borrowings are charged an interest rate of 1.25% per annum plus the greater of the Federal Funds Effective Rate or the one-month LIBOR Rate. In addition, upfront commitment fees, including arrangement, administrative and legal fees, were paid by the db X-trackers Harvest CSI 300 China A-Shares Fund and are also included with “interest expense” in the Statement of Operations. The Funds had no outstanding loans at May 31, 2014.
35
DBX ETF Trust
NOTES TO FINANCIAL STATEMENTS (Continued)
9. Fund Name Change
Effective August 11, 2014, the “db X-trackers Funds” will be rebranded “Deutsche X-trackers ETFs.” As a result the Funds will be renamed as follows:
Current Fund Name | New Fund Name | |
| db X-trackers Harvest CSI 300 China A-Shares Fund | Deutsche X-trackers Harvest CSI 300 China A-Shares ETF | |
db X-trackers Harvest CSI 500 China A-Shares Small Cap Fund db X-trackers Harvest MSCI All China Equity Fund | Deutsche X-trackers Harvest CSI 500 China A-Shares Small Cap ETF Deutsche X-trackers Harvest MSCI All China Equity ETF |
36
DBX ETF Trust
REPORT OF INDEPENDENT REGISTERED PUBLIC ACCOUNTING FIRM
To Board of Trustees and Shareholders of
DBX ETF Trust:
We have audited the accompanying statements of assets and liabilities, including the schedules of investments, of db X-trackers Harvest CSI 300 China A-Shares Fund, db X-trackers Harvest CSI 500 China A-Shares Small Cap Fund and db X-trackers Harvest MSCI All China Equity Fund (the “Funds” within DBX ETF Trust), as of May 31, 2014, and the related statements of operations and changes in net assets and the financial highlights for each of the periods indicated therein. These financial statements and financial highlights are the responsibility of the Funds’ management. Our responsibility is to express an opinion on these financial statements and financial highlights based on our audits.
We conducted our audits in accordance with the standards of the Public Company Accounting Oversight Board (United States). Those standards require that we plan and perform the audit to obtain reasonable assurance about whether the financial statements and financial highlights are free of material misstatement. We were not engaged to perform an audit of the Funds’ internal control over financial reporting. Our audits included consideration of internal control over financial reporting as a basis for designing audit procedures that are appropriate in the circumstances, but not for the purpose of expressing an opinion on the effectiveness of the Funds’ internal control over financial reporting. Accordingly, we express no such opinion. An audit also includes examining, on a test basis, evidence supporting the amounts and disclosures in the financial statements and the financial highlights, assessing the accounting principles used and significant estimates made by management, and evaluating the overall financial statement presentation. Our procedures included confirmation of securities owned as of May 31, 2014, by correspondence with the custodian and brokers or by other appropriate auditing procedures where replies from brokers were not received. We believe that our audits provide a reasonable basis for our opinion.
In our opinion, the financial statements and financial highlights referred to above present fairly, in all material respects, the financial position of db X-trackers Harvest CSI 300 China A-Shares Fund, db X-trackers Harvest CSI 500 China A-Shares Small Cap Fund and db X-trackers Harvest MSCI All China Equity Fund at May 31, 2014, the results of their operations, changes in their net assets and financial highlights for each of the periods therein in conformity with U.S. generally accepted accounting principles.

New York, New York
July 24, 2014
37
DBX ETF Trust
OFFICERS AND TRUSTEES (Unaudited)
Name, Address, and Age | Position(s) Held with Fund | Term of Office and Length of Time Served | Principal Occupation(s) During Past 5 Years | Number of Portfolios in Fund Complex Overseen by Trustee | Other Directorships held by Trustee | |||||
Independent Trustees: | ||||||||||
J. David Officer Age: 65 60 Wall Street New York, New York 10005 | Trustee, Member of the Audit and Nominating Committees | Since 2011 | Independent Director; Formerly, Vice Chairman, The Dreyfus Corporation (1998-2009); Chief Operating Officer, The Dreyfus Corporation (2006-2009); President, The Dreyfus Family of Funds, Inc. (2006-2009). | 17 | Ilex Partners (Asia), LLC; Old Westbury Funds: & MAN Long/Short Fund; GLG Investment Series Trust; The Dreyfus Corporation; MBSC Securities Corporation; Dreyfus Services Corporation; MBSC, LLC; Dreyfus Transfer, Inc.; Dreyfus Service Organization, Inc.; Mellon Residential Funding Corp.; Mellon United National Bank; Laurel Capital Advisors; Mellon United National Bank; Dreyfus Founders Funds, Inc.; Founders Asset Management. | |||||
Stephen R. Byers Age: 60 60 Wall Street New York, New York 10005 | Trustee, Member and Chairman of the Audit and Nominating Committees | Since 2011 | Retired. Previously, Chief Investment Officer, The Dreyfus Corporation (2000-2006). | 17 | Sierra Income Corporation; College of William and Mary, Graduate School of Business. | |||||
George O. Elston Age: 49 60 Wall Street New York, New York 10005 | Trustee, Member of the Audit and Nominating Committees | Since 2011 | M&A Advisor, Chief Financial, Operating and Business Officer, Optherion, Inc. (2008-2010); and Vice President, Finance and Government Affairs, Secretary and Treasurer, Elusys Therapeutics, Inc. (2000-2007). | 17 | Celldex Therapeutics. | |||||
38
DBX ETF Trust
OFFICERS AND TRUSTEES (Unaudited) (Continued)
Name, Address, and Age | Position(s) Held with Fund | Term of Office and Length of Time Served | Principal Occupation(s) During Past 5 Years | Number of Portfolios in Fund Complex Overseen by Trustee | Other Directorships held by Trustee | |||||
Interested Trustee/Officers:* | ||||||||||
Alex Depetris Age: 34 60 Wall Street New York, New York 10005 | Trustee, Chairman of the Board, President, Chief Executive Officer and Secretary | Since 2010 | Director in the Deutsche Asset and Wealth Management Passive Asset Management Group at Deutsche Bank AG since 2008; Associate, Arnold & Porter, 2006-2008. | 22 | Director, Chairman of the Board of db-X Exchange Traded Funds Inc. and DBX ETF Trust. | |||||
Martin Kremenstein Age: 37 60 Wall Street New York, New York 10005 | Chief Operating Officer | Since 2010 | Managing Director in the DBX Group at Deutsche Bank AG with responsibility for providing investor solutions to the DB sales force in North America since 2006. | N/A | N/A | |||||
Michael Gilligan Age: 47 60 Wall Street New York, New York 10005 | Treasurer, Chief Financial Officer and Controller | Since 2010 | Director in the Finance Group at Deutsche Bank AG with CFO responsibility for DBX Advisors LLC, DBX Strategic Advisors LLC and DB Commodity Services LLC since 2008; Chief Operating Officer, Americas Credit Trading, Credit Suisse, 2007-2008. | N/A | N/A | |||||
Frank Gecsedi Age: 46 60 Wall Street New York, New York 10005 | Chief Compliance Officer | Since 2010 | Vice President in Deutsche Bank’s Global Markets Legal, Risk and Capital Division since 2010; Vice President and Compliance Manager at Bank of America Merrill Lynch (formerly Merrill Lynch), (2000 to 2010). | N/A | N/A | |||||
* Officers/Trustee of the Company are “interested persons” as defined in the 1940 Act.
The Funds’ SAI includes additional information about the Funds’ Directors and is available by calling 855-329-3837, or on the Company’s website at www.dbxus.com
39
DBX ETF Trust
BOARD CONSIDERATIONS IN APPROVAL OF INVESTMENT
ADVISORY AND SUB-ADVISORY CONTRACTS (Unaudited)
db X-trackers Harvest CSI 300 China A-Shares Fund
At a special meeting held on July 25, 2013, the Board of Trustees, including the Independent Trustees (those not affiliated with the Trust or its service providers), unanimously approved the Investment Advisory Agreement and the Sub-Investment Advisory Agreements relating to db X-trackers Harvest CSI 300 China A-Shares Fund.
In reaching these decisions with, the Board considered all factors it believed relevant, including (1) the nature, extent and quality of the services to be provided to the Fund and its shareholders (including the investment performance of the Sub-Adviser’s fund clients); (2) the performance of the Sub-Adviser with respect to its management of other comparable funds generally, as well as the Sub-Adviser’s financial resources and its resulting ability to perform its obligations under the Sub-Advisory Agreement; (3) the Adviser’s financial resources and its resulting ability to perform its obligations under the Advisory Agreement; (4) the competitiveness of the advisory fee and the sub-advisory fee; (5) the total cost of the services to be provided by and the profits that could be realized by the Adviser and the Sub-Adviser from their relationships with the Fund; and (6) the extent to which economies of scale would be realized as the Fund grows, and if the fund shareholders would benefit from those economies.
The Board reached a determination, with the assistance of Trust counsel and through the exercise of its business judgment, that approval of the Investment Advisory Agreements and the Sub-Investment Advisory Agreements (together, the “Agreements”) and the compensation to be received thereunder is consistent with the Board’s duties under state and federal law. The Board reached this conclusion based on multiple factors.
Nature, Extent and Quality of Services. The Board reviewed in detail the nature, extent and quality of services to be provided by the Adviser and the Sub-Adviser under the Agreements. The Board noted that these services include, among other things, furnishing a continuous investment program for the Fund, including arranging for, or implementing, the purchase and sale of portfolio securities, the provision of general corporate services such as portfolio management compliance services and the preparation and filing of certain reports on behalf of the Trust. The Board also considered, among other things, the professional experience and qualifications of the senior management and key professional personnel of the Adviser, including those individuals responsible for portfolio management. The Board considered that the Adviser provides, at its own expense, office facilities and equipment for use by the Fund and supervisory persons responsible for supervising and monitoring the Trust’s service providers. The Board also considered that the Adviser pays for the compensation of officers of the Trust who are also officers or employees of the Adviser, except as may otherwise be determined by the Board. The Board also considered that the Adviser arranges for the provision of transfer agency, custody, fund administration and accounting, and other non-distribution services necessary for the Fund’s operation. The Board also considered the role to be played by the Adviser in working with the Sub-Adviser to manage the Fund’s portfolio, noting that the Adviser would provide oversight of day-to-day operations, including monitoring tracking error, providing services in connection with creation and redemption units and assistance in meeting legal and regulatory requirements applicable to the Fund.
The Board also considered the Sub-Adviser’s operational capabilities and resources, and its experience in serving as investment sub-adviser to other funds, including those with comparable investment strategies. The Board considered the professional experience and qualifications of the Sub-Adviser’s senior management and key professional personnel, as well as the Sub-Adviser’s depth and breadth of experience in managing investment portfolios consisting of index-based portfolios and the type of securities in which the Fund invests. The Board gave special consideration to the Sub-Adviser’s experience and capabilities in managing portfolios comprised of non-U.S. equity securities, and their techniques for tracking an index while minimizing index tracking error. In addition, the Board considered the Sub-Adviser’s operational capabilities and resources.
The Board evaluated these factors in consultation with Fund counsel. Based on its review, the Board concluded that the nature, extent, and quality of services to be provided by the Adviser under the Investment Advisory Agreements are reasonable and appropriate in relation to the fees to be paid to the Adviser. The Board considered the staffing of the Adviser, including the training, qualifications and experience of investment personnel in managing the Fund. The Board also considered the expertise of the Adviser in supervising third party service providers to the Fund, such as the administrator and custodian. The Board further considered the compliance program of the Adviser which supports the Fund’s compliance program. Additionally, based on its review, the Board concluded that the nature, extent, and quality of services to be provided by the Sub-Advisers under the Sub-Advisory Agreements are reasonable and appropriate in relation to the fees to be paid to each Sub-Adviser, taking special consideration of the fact that the fees to be paid to each Sub-Adviser are payable by the Adviser and not the Fund.
40
DBX ETF Trust
BOARD CONSIDERATIONS IN APPROVAL OF INVESTMENT
ADVISORY AND SUB-ADVISORY CONTRACTS (Continued)
Performance of the Sub-Advisers; the Sub-Advisers’ Financial Resources. The Board noted that operations had not commenced and there is no performance history. The Board considered each Sub-Adviser’s performance in managing other similar index-based portfolios and its ability to minimize tracking error for such portfolios. The Board concluded that, given each Sub-Adviser’s capabilities and experience managing other index-based portfolios, each Sub-Adviser should be able to keep the Fund’s tracking error within acceptable ranges.
The Board also considered each Sub-Adviser’s financial condition and whether it had the resources necessary to carry out its functions. The Board concluded that the Sub-Adviser had the financial resources necessary to perform its obligations under the respective Sub-Investment Advisory Agreement.
Adviser’s Financial Resources. In connection with the assessment of the ability of the Adviser to perform its duties under the Investment Advisory Agreements, the Board considered the Adviser’s financial condition and whether it had the resources necessary to carry out its functions. The Board concluded that the Adviser had the financial resources necessary to perform its obligations under the Advisory Agreements.
Competitiveness of Fees. The Board considered the competitiveness of the Fund’s fee to other comparable exchange-traded funds (ETFs), and noted that the Fund’s fee is competitive with the fees of its respective peer group. Based on its review, the Board concluded that each advisory fee and sub-advisory fee is reasonable in light of the services provided.
Costs of Services and Profitability. The Board considered the expenses of the Adviser in developing and rendering services to be provided to the Fund, and the likelihood and level of profits in the early years of the Fund’s operations. The Board noted that the Adviser, not the Fund, paid the Sub-Adviser a flat fee of 0.40%.
Given the costs of the services to be provided by and the profits that could be realized by the Adviser in connection with the management of the Fund, the Board determined that the amount of potential profit was fair.
Economies of Scale. The Board noted that at the current fee rate the Fund would not experience economies of scale. The Board determined to review economies of scale on an ongoing basis as a result of asset growth of the Fund.
Given all the information available to it and considering all material factors, the Board concluded that each Investment Advisory Agreement and Sub-Advisory Agreement was fair and reasonable and they were unanimously approved.
db X-trackers Harvest MSCI All China Equity Fund and
db X-trackers Harvest CSI 500 China A-Shares Small Cap Fund
At a special meeting held on July 25, 2013, the Board of Trustees, including the Independent Trustees (those not affiliated with the Trust or its service providers), unanimously approved the Investment Advisory Agreement, pursuant to which the Adviser provides investment advisory and management services to the db X-trackers Harvest MSCI All China Equity Fund (“CN”) and db X-trackers Harvest CSI 500 China A-Shares Small Cap Fund (“ASHS”) (together, the “Funds”), and the Sub-Advisory Agreement (together, the “Agreements”), pursuant to which the Sub-Adviser provides day-to-day management of ASHS’s investments. In reaching this decision, the Board considered all factors it believed relevant, including (1) the nature, extent and quality of the services to be provided to the Funds and their shareholders (including, with respect to ASHS, the investment performance of the Sub-Adviser’s fund clients); (2) with respect to ASHS, the performance of the Sub-Adviser with respect to its management of China A share ETFs generally, as well as the Sub-Adviser’s financial resources and its resulting ability to perform its obligations under the Sub-Advisory Agreement; (3) the Adviser’s financial resources and its resulting ability to perform its obligations under the Advisory Agreement; (4) the competitiveness of the advisory fees and the sub-advisory fees; (5) the total cost of the services to be provided by and the profits that could be realized by the Adviser and the Sub-Adviser from their relationships with each Fund; and (6) the extent to which economies of scale would be realized as each Fund grows, and if the fund shareholders would benefit from those economies.
The Board reached a determination, with the assistance of Trust counsel and through the exercise of its business judgment, that approval of the Agreements and the compensation to be received thereunder is consistent with the Board’s duties under state and federal law. The Board reached this conclusion based on multiple factors.
Nature, Extent and Quality of Services. The Board reviewed in detail the nature, extent and quality of services to be provided by the Adviser and the Sub-Adviser under the Agreements. The Board noted that these services include, among
41
DBX ETF Trust
BOARD CONSIDERATIONS IN APPROVAL OF INVESTMENT
ADVISORY AND SUB-ADVISORY CONTRACTS (Continued)
other things, furnishing a continuous investment program for each Fund, including arranging for, or implementing, the purchase and sale of portfolio securities, the provision of general corporate services such as portfolio management compliance services and the preparation and filing of certain reports on behalf of the Trust. The Board also considered, among other things, the professional experience and qualifications of the senior management and key professional personnel of the Adviser, including those individuals responsible for portfolio management. The Board considered that the Adviser provides, at its own expense, office facilities and equipment for use by each Fund and supervisory persons responsible for supervising and monitoring the Trust’s service providers. The Board also considered that the Adviser pays for the compensation of officers of the Trust who are also officers or employees of the Adviser, except as may otherwise be determined by the Board. The Board also considered that the Adviser arranges for the provision of transfer agency, custody, fund administration and accounting, and other non-distribution services necessary for each Fund’s operation. The Board also considered the role to be played by the Adviser in working with the Sub-Adviser to manage each Fund’s portfolio, noting that the Adviser would provide oversight of day-to-day operations, including monitoring tracking error, providing services in connection with creation and redemption units and assistance in meeting legal and regulatory requirements applicable to each Fund.
With respect to ASHS, the Board also considered the Sub-Adviser’s operational capabilities and resources, and its experience in serving as investment sub-adviser to other funds, including those which invest in China A shares. The Board considered the professional experience and qualifications of the Sub-Adviser’s senior management and key professional personnel, as well as the Sub-Adviser’s depth and breadth of experience in managing investment portfolios consisting of China A shares. The Board gave special consideration to the Sub-Adviser’s experience and capabilities in managing portfolios comprised of China A shares, and their techniques for tracking an index while minimizing index tracking error. In addition, the Board considered the Sub-Adviser’s operational capabilities and resources.
The Board evaluated these factors in consultation with Fund counsel. Based on its review, the Board concluded that the nature, extent, and quality of services to be provided by the Adviser under the Investment Advisory Agreement are reasonable and appropriate in relation to the fees to be paid to the Adviser. The Board considered the staffing of the Adviser, including the training, qualifications and experience of investment personnel in managing the Fund. The Board also considered the expertise of the Adviser in supervising third party service providers to the Fund, such as the administrator and custodian. The Board further considered the compliance program of the Adviser which supports the Funds’ compliance program. Additionally, based on its review, the Board concluded that the nature, extent, and quality of services to be provided by the Sub-Adviser to ASHS under the Sub-Advisory Agreement are reasonable and appropriate in relation to the fees to be paid to the Sub-Adviser, taking special consideration of the fact that the fees to be paid to the Sub-Adviser are payable by the Adviser and not the ASHS.
Performance of the Sub-Adviser; the Sub-Adviser’s Financial Resources. With respect to ASHS, the Board noted that the Fund has not commenced operations and has no performance history, but the Board considered the Sub-Adviser’s performance in managing other similar China A share based portfolios and its ability to minimize tracking error for such portfolios. The Board concluded that, given the Sub-Adviser’s capabilities and experience managing China A share based portfolios, the Sub-Adviser should be able to keep the Fund’s tracking error within acceptable ranges.
The Board also considered the Sub-Adviser’s financial condition and whether it had the resources necessary to carry out its functions. The Board concluded that the Sub-Adviser had the financial resources necessary to perform its obligations under the Sub-Advisory Agreement.
Adviser’s Financial Resources. In connection with the assessment of the ability of the Adviser to perform its duties under the Advisory Agreement, the Board considered the Adviser’s financial condition and whether it had the resources necessary to carry out its functions. The Board concluded that the Adviser had the financial resources necessary to perform its obligations under the Advisory Agreement.
Competitiveness of Fees. The Board considered the competitiveness of each Fund’s fee to other U.S. exchange-traded funds (ETFs) with exposure to Chinese equities and other Harvest China A share ETFs and noted that the Fund’s fee was comparable to other funds that invested primarily in China. The Board also noted that the fee to be paid to the Sub-Adviser in respect of the ASHS would be paid by the Adviser and not the Fund.
Based on its review, the Board concluded that the advisory fees and the sub-advisory fee are reasonable in light of the services provided.
42
DBX ETF Trust
BOARD CONSIDERATIONS IN APPROVAL OF INVESTMENT
ADVISORY AND SUB-ADVISORY CONTRACTS (Unaudited) (Continued)
Costs of Services and Profitability. The Board considered the expenses of the Adviser in developing and rendering services to be provided to the Funds, and the likelihood and level of profits in the early years of each Fund’s operations. The Board considered the asset levels at which the Adviser and the Sub-Adviser expect to “break-even” with respect to its operation of the Funds. The Board also noted that the Sub-Adviser was an affiliate of the Adviser and would be paid a fee of one-half the management fee, which currently amounts to 0.40%.
The Board considered that there were no material fall-out benefits likely to accrue to the Adviser related to the operation of each Fund. The Board also considered whether the Sub-Adviser would benefit in other ways from its relationship with the Funds. The Board discussed the Sub-Adviser’s practices regarding the selection and compensation of brokers and dealers that would execute portfolio transactions for the Funds and, with respect to ASHS, the brokers’ and dealers’ provision of brokerage services to the Sub-Adviser. The Board discussed the possible potential benefits the Sub-Adviser might derive from each Fund’s soft dollar arrangements, whereby brokers provide brokerage services to the Fund or the Sub-Adviser in return for allocating fund brokerage.
Given the costs of the services to be provided by and the profits that could be realized by the Adviser and the Sub-Adviser in connection with the management of each Fund, the Board determined that the amount of potential profit for each was fair.
Economies of Scale. The Board noted that at current asset levels the Funds would not experience economies of scale. The Board determined to review economies of scale on an ongoing basis as fund assets grow.
Given all the information available to it and considering all material factors, the Board concluded that the Investment Advisory Agreement and, with respect to ASHS, the Sub-Advisory Agreement were fair and reasonable and they were unanimously approved.
43
DBX ETF Trust
ADDITIONAL INFORMATION (Unaudited)
Proxy Voting Policies and Procedures
The Funds’ policies and procedures for voting proxies for portfolio securities and information about how each Fund voted proxies related to its portfolio securities during the 12-month period ended June 30 are available on our Web site — www.dbxus.com (click on “proxy voting” at the bottom of the page) — or on the SEC’s Web site — www.sec.gov. To obtain a written copy of the Funds’ policies and procedures without charge, upon request, call us toll free at (855) 329-3837.
Quarterly Portfolio Disclosure
The Funds are required to file their complete schedule of portfolio holdings with the SEC for their first and third fiscal quarters on Form N-Q. Copies of the filings are available without charge, upon request on the SEC’s website at www.sec.gov and are available by calling the Company at 855-329-3837. You can also obtain copies of Form N-Q by (i) visiting the SEC’s Public Reference Room in Washington, DC (information on the operation of the Public Reference Room may be obtained by calling 800-SEC-0330); (ii) sending your request and a duplicating fee to the SEC’s Public Reference Room, Washington, DC 20549-0102; or (iii) sending your request electronically to publicinfo@sec.gov.
Information about each Fund’s portfolio holdings is available daily at www.dbxus.com.
Discount & Premium Information
Information regarding how often shares of each Fund traded on NYSE Arca at a price above (i.e., at a premium) or below (i.e., at a discount) the Net Asset Value of the Fund can be found at www.dbxus.com.
Tax Information
Form 1099-DIV, Form 1042-S and other year-end tax information provide shareholders with actual calendar year amounts that should be included in their tax returns. Shareholders should consult their tax advisors.
44
DBX ETF Trust
PRIVACY POLICY NOTICE (Unaudited)
DBX Advisors LLC (“Advisors”) collects non-public information about you from the following sources: (i) information received from you on applications or other forms; and (ii) information about your transactions with the Advisors, Advisors’ affiliates and third-party service providers and vendors. Advisors does not disclose any non-public personal information about you to anyone, other than as set forth below, as permitted by applicable law and regulation. Advisors may disclose non-public personal information about you to the funds in which you invest, to Advisors’ affiliates, and to non-affiliated companies that work with Advisors to service your account(s), or to provide services or process transactions that you have requested. Advisors may disclose non-public personal information in situations that may include, but are not limited to, in response to legal and/or regulatory inquiries and the proposed or actual sale, assignment merger or other transfer of all or a portion of Advisors’ business to another business entity. Advisors may also disclose non-public personal information about you to parties representing you, such as your investment representative, your accountant, your tax adviser, or to other third parties at your direction/consent. Advisors will not sell, rent, license or trade your personal and financial information to or with third parties for their own direct marketing use unless you give us general or specific consent to do so. If you decide to close your account(s) or become an inactive customer, Advisors will adhere to the privacy policies and practices as described in this notice. Advisors restricts access to your personal and account information to those employees who need to know that information to provide products and services to you. Advisors maintains reasonable and customary physical, electronic and procedural safeguards to guard your non-public personal information.
Advisors reserves the right, at their discretion, to change, modify, add, or remove portions of this Privacy Policy Notice, and any of the policies described herein, at any time. Advisors will indicate any such changes to the Privacy Policy Notice at the privacy link which can be found at www.dbxus.com. At all times, you are bound by the then-current version of the Privacy Policy and all applicable laws. Advisors highly recommends that you review this Privacy Policy Notice from time to time to ensure that you are familiar with the most recent version. The examples contained in this Privacy Policy Notice are illustrations; they are not intended to be exclusive.
45
DBX ETF Trust
This report is intended for the shareholders of DBX ETF Trust.
Carefully consider a Fund’s investment objectives, risk factors and charges and expenses before investing. This and other information can be found in the Fund’s prospectus, which may be obtained by calling 1-855-DBX-ETFS (1-855-329-3837), or by viewing or downloading a prospectus at WWW.DBXUS.COM. Read the prospectus carefully before investing.
Investing involves risk, including possible loss of principal.
Stocks may decline in value. Funds investing in a single industry, country or in a limited geographic region generally are more volatile than more diversified funds and may be subject to enhanced risks. Emerging markets, such as China, tend to be more volatile than the markets of more mature economies, and generally have less diverse and less mature economic structures and less stable political systems than those of developed countries. Special risks associated with investments in Chinese companies include exposure to currency fluctuations, less liquidity, less developed or less efficient trading markets, lack of comprehensive company information, political instability, differing auditing and legal standards, the nature and extent of intervention by the Chinese government in the Chinese securities markets; and the potential unavailability of A shares. Any reduction or elimination of access to A shares will have a material adverse effect on the ability of the Funds to achieve its investment objective. Uncertainties in the Chinese tax rules governing taxation of income and gains from investments in A-shares could result in unexpected tax liabilities for the Fund which may reduce Fund returns. Please read the prospectus for more information. An investment in any Fund should be considered only as a supplement to a complete investment program for those investors willing to accept the risks associated with that fund.
Shares of the Funds are bought and sold at market price (not NAV) throughout the day on the New York Stock Exchange. Transactions in Fund shares may result in brokerage commissions and may generate tax consequences. There can be no assurance that an active trading market for shares of a fund will develop or be maintained.
DBX ETF Trust Funds are distributed by ALPS Distributors, Inc. The Funds are managed by DBX Advisors LLC which is not affiliated with ALPS.
Deutsche Asset & Wealth Management is the brand name for the asset and wealth management activities conducted by Deutsche Bank AG or any of its subsidiaries. Clients will be provided Deutsche Asset & Wealth Management products or services by one or more legal entities that will be identified to clients pursuant to the contracts, agreements, offering materials or other documentation relevant to such products or services.
MSCI and MSCI Index are servicemarks of MSCI Inc. and have been licensed for use by Deutsche Bank AG. The Funds are not sponsored, endorsed, issued, sold or promoted by MSCI Inc. nor does this company make any representation regarding the advisability of investing in the Funds. Index data source: MSCI Inc.
Copyright © 2013 Deutsche Bank AG. All rights reserved. db-X® is a registered trademark of Deutsche Bank AG. All other trademarks, servicemarks or registered trademarks are the property of their respective owners.
Not FDIC Insured — No Bank Guarantee — May Lose Value
DBX ETF Trust
INVESTMENT ADVISOR
DBX Advisors LLC
60 Wall Street
New York, NY 10005
INVESTMENT SUB-ADVISOR
Harvest Global investments
31/F, One Exchange Square
8 Connaught Place
Central, Hong Kong
ADMINISTRATOR, CUSTODIAN, FUND ACCOUNTANT & TRANSFER AGENT
The Bank of New York Mellon
101 Barclay Street
New York, NY 10286
DISTRIBUTOR
ALPS Distributors, Inc.
1290 Broadway
Suite 1100
Denver, CO 80203
INDEPENDENT REGISTERED PUBLIC ACCOUNTING FIRM
Ernst & Young LLP
5 Times Square
New York, NY 10036
LEGAL COUNSEL
Dechert LLP
1095 Avenue of the Americas
New York, NY 10036
R-35360-1 (8/14) DBX974 (8/15)
ANNUAL REPORT
May 31, 2014
DBX ETF Trust
db X-trackers Municipal Infrastructure Revenue Bond Fund (RVNU)
db X-trackers Regulated Utilities Fund (UTLT)
db X-trackers Solactive Investment Grade Subordinated Debt Fund (SUBD)
DBX ETF Trust
TO OUR SHAREHOLDERS: (Unaudited)
Dear Shareholder,
We are pleased to provide this annual report for db X-trackers Municipal Infrastructure Revenue Bond Fund, db X-trackers Regulated Utilities Fund and db X-trackers Solactive Investment Grade Subordinated Debt Fund, which covers the period ended May 31, 2014.
Market Overview
In the past year, market interest rates reacted strongly to expectations regarding the economy and the potential for the U.S. Federal Reserve Board (Fed) to begin unwinding its extremely accommodative monetary policy.
For example, early in the period, municipal-bond funds began to experience significant outflows as investors found the historically low yields on offer unappealing and sought to minimize exposure to rising interest rates. The negative sentiment intensified when Fed chair Janet Yellen made comments to the effect that the economy had stabilized sufficiently to consider a tapering of long-term bond purchases under the Fed’s quantitative easing program. Overall bond market sentiment soon stabilized to a degree on weaker data, including a downward revision in gross domestic product (GDP) growth that suggested the Fed had ample justification to keep its foot on the monetary pedal. Entering 2014, markets appeared to have become more comfortable with the likely pace of Fed tightening, and bond market rates generally began to drift downward. But, this “stop and go” dynamic with respect to expectations for the Fed repeated itself throughout much of the 12 months ending June 30, 2014.
The municipal bond market faced additional challenges, including negative sentiment from Detroit’s July 2013 bankruptcy filing and ongoing concerns over Puerto Rico’s economic and fiscal outlook. But, as the period progressed, municipals found some support as favorable yields relative to U.S. Treasuries drew demand from both retail institutional investors. Municipal prices were also supported to a degree by a drop-off in new issuance. The result was a strong recovery in municipals over the first few months of 2014, and this continued in the second quarter.
Looking ahead at the outlook for both taxable and tax-free income, it’s important to note that the recent interest-rate declines that have supported bond prices may have been influenced in part by the extreme weather of this past winter, so the markets will closely monitor economic data and the direction and effectiveness of monetary policy.
In the second quarter of 2014, global equities rallied as investors anticipated a snapback in the U.S. economy from its weather-related malaise in the first quarter, while the accommodative monetary policies of global central banks overshadowed geopolitical risk in Iraq and Ukraine. As discussed early, although a revising down of first-quarter U.S. GDP caused the Fed to reduce their 2014 GDP forecast, relatively strong U.S. manufacturing data, improving consumer confidence and a better employment picture had many forecasters looking for an acceleration in economic growth going forward. In addition, the European Central Bank (ECB) stepped up monetary easing by lowering its three main interest rates, and the ECB became the first major central bank in the world to cut a key policy rate to a level below zero.
Deutsche Bank, a leading global banking institution, has managed a successful and growing platform of exchange-traded products since 2006. Our team appreciates your trust and looks forward to serving your investment needs through innovative index-driven strategies.
Sincerely,
/s/ Alex Depetris
Alex Depetris
Chairman, President and Chief Executive Officer
July 25, 2014
1
*************************
Past performance is no guarantee of future results. Fund performance assumes reinvestment of dividends and capital gains distributions. A Fund’s net asset value (“NAV”) return is based on the changes in the Fund’s NAV per share for the period indicated. A Fund’s NAV per share is calculated by dividing the value of the Fund’s total assets less total liabilities by the number of shares outstanding. Current Fund performance may be higher or lower than the performance quoted. The most recent month end performance may be obtained by visiting www.dbxus.com.
An index is a statistical measure of a specified financial market or sector. An index is unmanaged and one cannot invest directly in an index. An index does not actually hold a portfolio of securities, incur expenses, or pay any transaction costs. Therefore, index returns do not reflect deductions for fees or expenses. In comparison, a Fund’s performance is negatively impacted by these deductions. Fund returns do not reflect brokerage commissions or taxes that a shareholder would pay on Fund distributions or on transactions in Fund shares.
The views expressed in this report reflect those of the portfolio management team only through the end of the period of the report as stated on the cover. The management team’s views are subject to change at any time based on market and other conditions and should not be construed as a recommendation. Current and future portfolio holdings are subject to risk. Investment in the Funds poses investment risk, including possible loss of principal. The investment return and principal value of an investment will fluctuate, so that shares, when sold or redeemed, may be worth more or less than their original cost.
2
DBX ETF Trust
MANAGEMENT’S DISCUSSION OF FUND PERFORMANCE (Unaudited)
db X-trackers Municipal Infrastructure Revenue Bond Fund
The db X-trackers Municipal Infrastructure Revenue Bond Fund (“RVNU”) seeks investment results that correspond generally to the performance, before fees and expenses, of the DBIQ Municipal Infrastructure Revenue Bond Index (“RVNU Index”). RVNU Index is designed to track the returns of the segment of the U.S. long term tax-exempt bond market, consisting of infrastructure revenue bonds. For the period June 4, 2013 (commencement of operations) to May 31, 2014, RVNU returned 3.46%, compared with the RVNU Index return of 3.10%.
Revenue bonds issued in Massachusetts, California and Texas, which averaged nearly half of the RVNU’s weight during the period had the largest positive contribution to returns for the period. Of the 17 U.S. states represented in RVNU during the period, only one, Michigan, contributed negative return. Overall, General revenue-backed as well as Transportation-backed bonds were the largest contributors to positive return from a sector standpoint.
db X-trackers Regulated Utilities Fund
The db X-trackers Regulated Utilities Fund (“UTLT”) seeks investment results that correspond generally to the performance, before fees and expenses, of the DBIQ Regulated Utilities Index (“UTLT Index”). UTLT Index is designed to track the price movements in shares of companies whose main business operations are in the regulated utilities sector. A company is considered to be in the regulated utilities sector if its ancillary, non-utility businesses are, or unregulated utilities business does not, represent more than 25% of the company’s earnings before interest, taxes, depreciation and amortization (“EBITDA”). For the period June 4, 2013 (commencement of operations) to May 31, 2014, UTLT returned 15.68%, compared with the UTLT Index return of 15.23%.
The UTLT Index benefitted from positive contributions from overall positive returns in the utility sector during the period. Only five of the 65 securities represented during the period contributed negative returns. The largest positive contributions of returns were provided by Dominion Resources, Inc. and National Grid PLC, which together averaged over ten percent of the UTLT Index weight during the period.
db X-trackers Solactive Investment Grade Subordinated Debt Fund
The db X-trackers Solactive Investment Grade Subordinated Debt Fund (“SUBD”) seeks investment results that correspond generally to the performance, before fees and expenses, of the Solactive Subordinated Bond Index (“SUBD Index”). SUBD Index is designed to track the subordinated corporate bond market denominated in U.S. dollars. SUBD Index is comprised of corporate securities which are classified as subordinated or junior subordinated. Subordinated securities are subordinated or “junior” to more senior securities of the issuer and are entitled to payment after other, more senior holders of debt in that issuer. For the period May 1, 2014 (commencement of operations) to May 31, 2014, SUBD returned 1.92%, compared with the SUBD Index return of 1.86%.
With an average weight in SUBD of 77%, United States based corporate bonds were the largest contributor to positive returns during the period. Examining issue characteristics, the largest positive contributions to returns came from issues with higher credit ratings, with issues whose Fitch Rating was A or better providing more positive return contribution than any other segment.
*************************
Performance quoted above represents past performance, assumes reinvestment of all dividends and capital gains distributions at net asset value (“NAV”), and does not guarantee future results. A Fund’s NAV return is based on the changes in the Fund’s NAV per share for the period indicated. A Fund’s NAV per share is calculated by dividing the value of the Fund’s total assets less total liabilities by the number of shares outstanding. Current Fund performance may be higher or lower than the performance quoted. Fund performance data current to the most recent month end may be obtained by visiting www.dbxus.com. See pages 5-10 of this report for additional performance information, including performance data based on market value.
An index is a statistical measure of a specified financial market or sector. An index does not actually hold a portfolio of securities, incur expenses, or pay any transaction costs. Therefore, index returns do not reflect deductions for fees or expenses and are not available for direct investment. In comparison, a Fund’s performance is negatively impacted by these deductions. Fund returns do not reflect brokerage commissions or taxes that a shareholder would pay on Fund distributions or on transactions in Fund shares.
3
DBX ETF Trust
MANAGEMENT’S DISCUSSION OF FUND PERFORMANCE (Unaudited) (Continued)
The views expressed in this report reflect those of the portfolio management team only through the end of the period of the report as stated on the cover. The management team’s views are subject to change at any time based on market and other conditions and should not be construed as a recommendation. Current and future portfolio holdings are subject to risk. Investment in the Funds poses investment risk, including possible loss of principal. The investment return and principal value of an investment will fluctuate, so that shares, when sold or redeemed, may be worth more or less than their original cost.
4
This Page is Intentionally Left Blank
5
DBX ETF Trust
db X-trackers Municipal Infrastructure Revenue Bond Fund (RVNU) (Unaudited)
The db X-trackers Municipal Infrastructure Revenue Bond Fund (the “Fund”) seeks investment results that correspond generally to the performance, before fees and expenses, of the DBIQ Municipal Infrastructure Revenue Bond Index (the “Index”). The Index is designed to track the returns of the segment of the U.S. long term tax-exempt bond market, consisting of infrastructure revenue bonds.
For the period June 4, 2013 (commencement of operations) to May 31, 2014, the db X-trackers Municipal Infrastructure Revenue Bond Fund returned 3.46%, compared with the Index return of 3.10%.
Performance as of 5/31/14
| Cumulative Total Returns | ||||||
| Net Asset Value | Market Price | DBIQ Municipal Infrastructure Bond Index | ||||
Since Inception1 | 3.46% | 3.18% | 3.10% | |||
1 Total returns are calculated based on the commencement of operations 6/4/13 (“Inception”).
Performance quoted represents past performance, assumes reinvestment of all dividends and capital gain distributions, and does not guarantee future results. Current performance may be higher or lower than the performance quoted. Performance data current to the most recent month end may be obtained by visiting www.dbxus.com. Investment in the fund poses investment risk including possible loss of principal. The investment return and principal value of an investment will fluctuate, so that shares, when sold or redeemed, may be worth more or less than their original cost. The estimated operating expense ratio as disclosed in the most recent prospectus dated October 1, 2013, was 0.30%.
The preceding performance chart is provided for comparative purposes and represents the period(s) noted. The net asset value return is based on the changes in the Fund’s net asset value per share (“NAV”). The Fund’s NAV is calculated by dividing the value of the Fund’s total assets less total liabilities by the number of shares outstanding. The market price return is based on the change in the market price on the NYSE Arca of a share of the Fund for the period(s) indicated. The price used to calculate market price returns is the midpoint of the bid/ask spread for Fund shares at 4 p.m. Eastern Time on the NYSE Arca. NAV and market returns assume that dividends and capital gain distributions have been reinvested in the Fund at NAV and market price, respectively.
An index is a statistical measure of a specified financial market or sector. An index does not actually hold a portfolio of securities, incur expenses or pay any transaction costs. Therefore index returns do not reflect deductions for fees or expenses and are not available for direct investment. In comparison, the Fund’s performance is negatively impacted by these deductions. Fund returns do not reflect brokerage commissions or taxes that a shareholder would pay on Fund distributions or on transactions in Fund shares.
6
DBX ETF Trust
PERFORMANCE SUMMARY
db X-trackers Municipal Infrastructure Revenue Bond Fund (RVNU) (Unaudited) (Continued)
Growth of a $10,000 Investment in RVNU2 as of 5/31/14
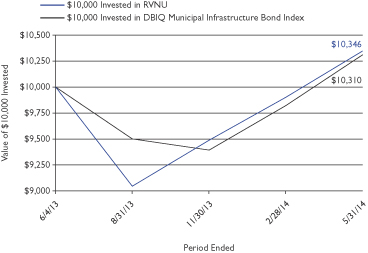
2 Based on Net Asset Value from commencement of operations 6/4/13.
Sector Breakdown* as of 5/31/14
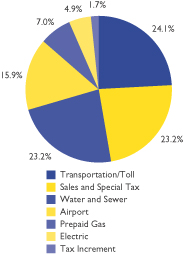
* Weightings are expressed as a percentage of total investments and may change over time. The sector classifications used above are based on company classifications under Bloomberg industry name. Holdings are subject to change without notice and there is no guarantee that the Fund will remain invested in any particular security. For complete list of holding go to page 15.
Modified duration: 6.9 years
Modified duration is an approximate measure of a fund’s sensitivity to movements in interest rates based on the current interest rate environment.
Credit Quality Diversification
| % of Municipal Bonds | ||||
AAA | 8.3% | |||
AA+ | 23.2% | |||
AA | 9.6% | |||
AA- | 6.8% | |||
A+ | 25.0% | |||
A | 5.3% | |||
A- | 13.1% | |||
BBB- | 8.7% | |||
| 100% | ||||
The quality ratings represents the higher of Moody’s Investor Services, Inc. (“Moody’s”) or Standard & Poor’s Corporation (S&P) credit ratings. The ratings of Moody’s and S&P represent their opinions as to the quality of the securities they rate. Credit quality measures a bond issuer’s ability to repay interest and principal in a timely manner. Ratings are relative and subjective and are not absolute standards of quality. Credit quality does not remove market risk and is subject to change.
7
DBX ETF Trust
PERFORMANCE SUMMARY
db X-trackers Regulated Utilities Fund (UTLT) (Unaudited)
The db X-trackers Regulated Utilities Fund (the “Fund”) seeks investment results that correspond generally to the performance, before fees and expenses, of the DBIQ Regulated Utilities Index (the “Index”). The Index is designed to track the price movements in shares of companies whose main business operations are in the regulated utilities sector. A company is considered to be in the regulated utilities sector if its ancillary, non-utility businesses are, or unregulated utilities business does not, represent more than 25% of the company’s earnings before interest, taxes, depreciation and amortization (“EBITDA”).
For the period June 4, 2013 (commencement of operations) to May 31, 2014, the db X-trackers Regulated Utilities Fund returned 15.68%, compared with the Index return of 15.23%.
Performance as of 5/31/14
| Cumulative Total Returns | ||||||
| Net Asset Value | Market Price | DBIQ Regulated Utilities Index | ||||
Since Inception1 | 15.68% | 15.22% | 15.23% | |||
1 Total returns are calculated based on the commencement of operations, 6/4/13 (“Inception”).
Performance quoted represents past performance, assumes reinvestment of all dividends and capital gain distributions, and does not guarantee future results. Current performance may be higher or lower than the performance quoted. Performance data current to the most recent month end may be obtained by visiting www.dbxus.com. Investment in the fund poses investment risk including possible loss of principal. The investment return and principal value of an investment will fluctuate, so that shares, when sold or redeemed, may be worth more or less than their original cost. The estimated operating expense ratio as disclosed in the most recent prospectus dated October 1, 2013, was 0.45%.
The preceding performance chart is provided for comparative purposes and represents the period(s) noted. The net asset value return is based on the changes in the Fund’s net asset value per share (“NAV”). The Fund’s NAV is calculated by dividing the value of the Fund’s total assets less total liabilities by the number of shares outstanding. The market price return is based on the change in the market price on the NYSE Arca of a share of the Fund for the period(s) indicated. The price used to calculate market price returns is the midpoint of the bid/ask spread for Fund shares at 4 p.m. Eastern Time on the NYSE Arca. NAV and market returns assume that dividends and capital gain distributions have been reinvested in the Fund at NAV and market price, respectively.
An index is a statistical measure of a specified financial market or sector. An index does not actually hold a portfolio of securities, incur expenses or pay any transaction costs. Therefore index returns do not reflect deductions for fees or expenses and are not available for direct investment. In comparison, the Fund’s performance is negatively impacted by these deductions. Fund returns do not reflect brokerage commissions or taxes that a shareholder would pay on Fund distributions or on transactions in Fund shares.
8
DBX ETF Trust
PERFORMANCE SUMMARY
db X-trackers Regulated Utilities Fund (UTLT) (Unaudited) (Continued)
Growth of a $10,000 Investment in UTLT2 as of 5/31/14
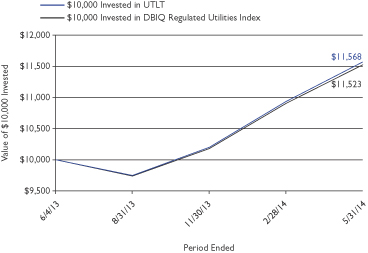
2 Based on Net Asset Value from commencement of operations 6/4/13.
Sector Breakdown* as of 5/31/14
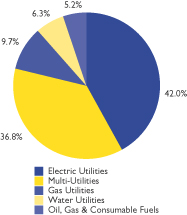
* Weightings are expressed as a percentage of total investments and may change over time. The sector classifications used above are based on company classifications under Bloomberg industry name.
Top Ten Holdings3 as of 5/31/14
| Description | % of Net Assets | |||
National Grid PLC (United Kingdom) | 5.5% | |||
Enbridge, Inc. (Canada) | 5.2% | |||
American Electric Power Co., Inc. | 5.1% | |||
Dominion Resources, Inc. | 5.0% | |||
Duke Energy Corp. | 4.8% | |||
Southern Co. (The) | 4.7% | |||
Sempra Energy | 4.5% | |||
PG&E Corp. | 4.0% | |||
Edison International | 3.5% | |||
Consolidated Edison, Inc. | 3.1% | |||
3 Holdings are subject to change without notice and there is no guarantee that the Fund will remain invested in any particular security. For a complete list of holdings go to page 14.
Country Breakdown
as of May 31, 2014
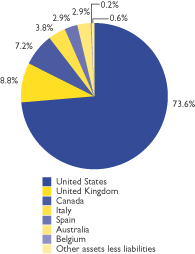
9
DBX ETF Trust
PERFORMANCE SUMMARY
db X-trackers Solactive Investment Grade Subordinated Debt Fund (SUBD) (Unaudited)
The db X-trackers Solactive Investment Grade Subordinated Debt Fund (SUBD) seeks investment results that correspond generally to the performance, before fees and expenses, of the Solactive Subordinated Bond Index (the “Index”). The Index is designed to track the subordinated corporate bond market denominated in U.S. dollars. The Index is comprised of corporate securities which are classified as subordinated or junior subordinated. Subordinated securities are subordinated or “junior” to more senior securities of the issuer and are entitled to payment after other, more senior holders of debt in that issuer. Junior subordinated securities generally rank slightly higher in terms of payment priority than both common and preferred stock of an issuer, but rank below other subordinated securities and debt securities. In order to be added to the index, a bond must have an amount outstanding of at least $500 million and a remaining maturity of at least one year. The index may include U.S. dollar-denominated bonds issued by issuers located outside the U.S. (including emerging markets). Additionally, the index may include a substantial number of bonds offered pursuant to Rule 144A under the Securities Act of 1933, as amended. As of May 31, 2014, the index was substantially comprised of issuers in the financial services sector.
For the period May 1, 2014 (commencement of operations) to May 31, 2014, the db X-trackers Solactive Investment Grade Subordinated Debt Fund returned 1.92%, compared with the Underlying Index return of 1.86%.
Performance as of 5/31/14
| Cumulative Total Returns | ||||||
| Net Asset Value | Market Price | Solactive Subordinated Bond Index | ||||
Since Inception1 | 1.92% | 1.80% | 1.86% | |||
1 Total returns are calculated based on the commencement of operations, 5/1/14 (“Inception”).
Performance quoted represents past performance, assumes reinvestment of all dividends and capital gain distributions, and does not guarantee future results. Current performance may be higher or lower than the performance quoted. Performance data current to the most recent month end may be obtained by visiting www.dbxus.com. Investment in the fund poses investment risk including possible loss of principal. The investment return and principal value of an investment will fluctuate, so that shares, when sold or redeemed, may be worth more or less than their original cost. The estimated operating expense ratio as disclosed in the most recent prospectus dated March 21, 2014, was 0.45%.
The preceding performance chart is provided for comparative purposes and represents the period(s) noted. The net asset value return is based on the changes in the Fund’s net asset value per share (“NAV”). The Fund’s NAV is calculated by dividing the value of the Fund’s total assets less total liabilities by the number of shares outstanding. The market price return is based on the change in the market price on the NYSE Arca of a share of the Fund for the period(s) indicated. The price used to calculate market price returns is the midpoint of the bid/ask spread for Fund shares at 4 p.m. Eastern Time on the NYSE Arca. NAV and market returns assume that dividends and capital gain distributions have been reinvested in the Fund at NAV and market price, respectively.
An index is a statistical measure of a specified financial market or sector. An index does not actually hold a portfolio of securities, incur expenses or pay any transaction costs. Therefore index returns do not reflect deductions for fees or expenses and are not available for direct investment. In comparison, the Fund’s performance is negatively impacted by these deductions. Fund returns do not reflect brokerage commissions or taxes that a shareholder would pay on Fund distributions or on transactions in Fund shares.
10
DBX ETF Trust
PERFORMANCE SUMMARY
db X-trackers Solactive Investment Grade Subordinated Debt Fund (SUBD) (Unaudited) (Continued)
Growth of a $10,000 Investment in SUBD2 as of 5/31/14
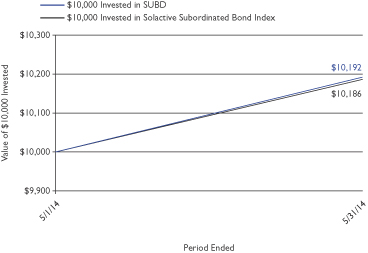
2 Based on Net Asset Value from commencement of operations 5/1/14.
Sector Breakdown* as of 5/31/14
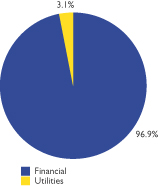
* Weightings are expressed as a percentage of total investments and may change over time. The sector classifications used above are based on company classifications under Bloomberg industry name. Holdings are subject to change without notice and there is no guarantee that the Fund will remain invested in any particular security. For complete list of holding go to page 15.
Modified duration: 9.3 years
Modified duration is an approximate measure of a fund’s sensitivity to movements in interest rates based on the current interest rate environment.
Credit Quality Diversification
| Market Value (%) | ||||
AAA | 1.5 | |||
AA | 4.6 | |||
A | 47.2 | |||
BBB | 46.7 | |||
Total | 100.0 | |||
The quality ratings represents the higher of Moody’s Investor Services, Inc. (“Moody’s”) or Standard & Poor’s Corporation (S&P) credit ratings. The ratings of Moody’s and S&P represent their opinions as to the quality of the securities they rate. Credit quality measures a bond issuer’s ability to repay interest and principal in a timely manner. Ratings are relative and subjective and are not absolute standards of quality. Credit quality does not remove market risk and is subject to change.
Country Breakdown as of 5/31/14
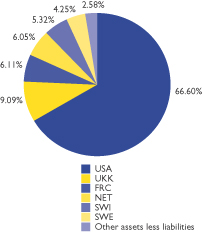
11
DBX ETF Trust
As a shareholder of one or more of the funds, you incur two types of costs: (1) transaction costs, including brokerage commissions paid on purchases and sales of fund shares, and (2) ongoing costs, including management fees and other Fund expenses. The expense examples below are intended to help you understand your ongoing costs (in dollars) of investing in the Funds and to compare these costs with the ongoing costs of investing in other funds.
The examples are based on an investment of $1,000 made at the beginning of the period and held through the six-month period ended May 31, 2014.
ACTUAL EXPENSES
The first line in the following tables provides information about actual account values and actual expenses. You may use the information in this line, together with the amount you invested, to estimate the expenses that you paid over the period. Simply divide your account value by $1,000 (for example, an $8,600 account value divided by $1,000 = 8.6), then multiply the result by the number in the first line under the heading “Expenses Paid During the Period” to estimate the expenses you paid on your account during this period.
HYPOTHETICAL EXAMPLE FOR COMPARISON PURPOSES
The second line in the following tables provides information about hypothetical account values and hypothetical expenses based on the Funds’ actual expense ratios and an assumed rate of return of 5% per year before expenses (which is not the Funds’ actual return). The hypothetical account values and expenses may not be used to estimate the actual ending account balance or expenses you paid for the period. You may use this information to compare the ongoing costs of investing in the Fund and other funds. To do so, compare this 5% hypothetical example with the 5% hypothetical examples that appear in the shareholder reports of the other funds.
Please note that the expenses shown in the tables are meant to highlight your ongoing costs only, and do not reflect any transactional costs. Therefore the second line in the table is useful in comparing ongoing costs only, and will not help you determine the relative total costs of owning different funds. In addition, if these transactional costs were included, your costs would have been higher.
| Beginning Account Value | Ending Account Value May 31, 2014 | Annualized Expense Ratio based on the number of days in the period | Expenses Paid(1) During the Period December 1, 2013 to May 31, 2014 | |||||||||||||
| db X-trackers Municipal Infrastructure Revenue Bond Fund | ||||||||||||||||
Actual | $ | 1,000.00 | $ | 1,090.42 | 0.30 | % | $ | 1.56 | ||||||||
Hypothetical (5% return before expenses) | $ | 1,000.00 | $ | 1,023.44 | 0.30 | % | $ | 1.51 | ||||||||
| db X-trackers Regulated Utilities Fund | ||||||||||||||||
Actual | $ | 1,000.00 | $ | 1,134.15 | 0.45 | % | $ | 2.39 | ||||||||
Hypothetical (5% return before expenses) | $ | 1,000.00 | $ | 1,022.69 | 0.45 | % | $ | 2.27 | ||||||||
| db X-trackers Solactive Investment Grade Subordinated Debt Fund | ||||||||||||||||
Actual(2) | $ | 1,000.00 | $ | 1,019.20 | 0.45 | % | $ | 0.39 | ||||||||
Hypothetical (5% return before expenses) | $ | 1,000.00 | $ | 1,022.69 | 0.45 | % | $ | 2.27 | ||||||||
(1) Actual expenses are calculated using the Fund’s annualized expense ratio, multiplied by the average account value for the period, multiplied by 182/365.
(2) Fund commenced operations on May 1, 2014. Actual expenses are calculated using the Fund’s annualized expense ratio, multiplied by the average account value for the period, multiplied by 31/365 (to reflect the period since commencement of operations).
12
DBX ETF Trust
db X-trackers Municipal Infrastructure Revenue Bond Fund
May 31, 2014
Principal | Value | |||||||
| MUNICIPAL BONDS — 97.9% | ||||||||
| Arizona — 0.7% | ||||||||
Arizona Department of Transportation State Highway Fund, Fuel Sales Tax Revenue, Sub-Series A, | $ | 100,000 | $ | 117,800 | ||||
|
| |||||||
| California — 13.6% | ||||||||
City of Los Angeles Department of Airports, Private Airport & Marina Revenue, Series A, | 85,000 | 93,384 | ||||||
City of San Francisco Public Utilities Commission, Water Revenue, | 100,000 | 111,649 | ||||||
M-S-R Energy Authority, Natural Gas Revenue, | 100,000 | 123,490 | ||||||
Series A, | 500,000 | 660,605 | ||||||
San Diego County Regional Airport Authority, Private Airport & Marina Revenue, Series B, | 600,000 | 646,260 | ||||||
San Francisco City & County Airports Commission, Private Airport & Marina Revenue, San Francisco International Airport, Series E, | 220,000 | 252,217 | ||||||
Southern California Public Power Authority, Natural Gas Revenue, Project No. 1, Series A, | 300,000 | 328,281 | ||||||
|
| |||||||
| 2,215,886 | ||||||||
|
| |||||||
| Colorado — 1.0% | ||||||||
City & County of Denver Airport System, Private Airport & Marina Revenue, Series B, | 100,000 | 110,860 | ||||||
Regional Transportation District, Sales Tax Revenue, Fastracks Project, Series A, | 50,000 | 59,103 | ||||||
|
| |||||||
| 169,963 | ||||||||
|
| |||||||
| Florida — 7.6% | ||||||||
City of Cape Coral, Water & Sewer Revenue, | 80,000 | 85,959 | ||||||
County of Miami-Dade Aviation, Private Airport & Marina Revenue, | 250,000 | 285,783 | ||||||
Series A, AMT, | 50,000 | 54,831 | ||||||
County of Miami-Dade Transit System, Sales Tax Revenue, | 50,000 | 54,707 | ||||||
County of Miami-Dade Water & Sewer System, Water Revenue, | 500,000 | 537,120 | ||||||
Principal | Value | |||||||
| Florida (Continued) | ||||||||
Orlando-Orange County Expressway Authority, Highway Tolls Revenue, | $ | 200,000 | $ | 220,632 | ||||
|
| |||||||
| 1,239,032 | ||||||||
|
| |||||||
| Georgia — 2.8% | ||||||||
County of DeKalb Water & Sewerage, Water Revenue, Series A, | 110,000 | 123,071 | ||||||
Metropolitan Atlanta Rapid Transit Authority, Sales Tax Revenue, 3rd Series, | 300,000 | 331,917 | ||||||
|
| |||||||
| 454,988 | ||||||||
|
| |||||||
| Illinois — 3.7% | ||||||||
City of Chicago Waterworks, Water Revenue, | 575,000 | 605,446 | ||||||
|
| |||||||
| Indiana — 4.7% | ||||||||
Indiana Finance Authority, Sewer Revenue, | 700,000 | 761,012 | ||||||
|
| |||||||
| Massachusetts — 15.6% | ||||||||
Massachusetts Bay Transportation Authority, Sales Tax Revenue, Series A, | 750,000 | 940,072 | ||||||
Massachusetts School Building Authority, Sales Tax Revenue, | 750,000 | 894,803 | ||||||
Series A, | 200,000 | 236,876 | ||||||
Series B, | 400,000 | 468,560 | ||||||
|
| |||||||
| 2,540,311 | ||||||||
|
| |||||||
| Nevada — 0.7% | ||||||||
County of Clark, Private Airport & Marina Revenue, Las Vegas-McCarran International Airport, Series A, | 100,000 | 108,839 | ||||||
|
| |||||||
| New Jersey — 6.3% | ||||||||
New Jersey State Turnpike Authority, Highway Tolls Revenue, | 250,000 | 275,050 | ||||||
Series A, | 700,000 | 760,270 | ||||||
|
| |||||||
| 1,035,320 | ||||||||
|
| |||||||
| New York — 14.1% | ||||||||
Hudson Yards Infrastructure Corp., Miscellaneous Tax Revenue, | 200,000 | 215,084 | ||||||
Series A, | 55,000 | 62,912 | ||||||
| See Notes to Financial Statements. | 13 |
DBX ETF Trust
SCHEDULE OF INVESTMENTS
db X-trackers Municipal Infrastructure Revenue Bond Fund (Continued)
May 31, 2014
Principal | Value | |||||||
| New York (Continued) | ||||||||
Long Island Power Authority, Electric Power & Light Revenue, Series A, | $ | 200,000 | $ | 234,628 | ||||
Metropolitan Transportation Authority, Transit Revenue, Series A, | 100,000 | 109,236 | ||||||
New York City Transitional Finance Authority, Future Tax Secured Revenue, Series F-1, | 350,000 | 387,177 | ||||||
New York City Water & Sewer System, Water Revenue, | 110,000 | 123,566 | ||||||
Series GG, | 100,000 | 108,606 | ||||||
Series FF, | 300,000 | 327,018 | ||||||
Series BB, | 450,000 | 490,608 | ||||||
Triborough Bridge & Tunnel Authority, Highway Tolls Revenue, Series B, | 200,000 | 237,698 | ||||||
|
| |||||||
| 2,296,533 | ||||||||
|
| |||||||
| Pennsylvania — 3.3% | ||||||||
Pennsylvania Turnpike Commission, Highway Tolls Revenue, Series A, | 100,000 | 108,612 | ||||||
Westmoreland County Municipal Authority, Water Revenue, | 400,000 | 432,616 | ||||||
|
| |||||||
| 541,228 | ||||||||
|
| |||||||
| Texas — 16.3% | ||||||||
City Public Service Board of San Antonio, Electric Power & Light Revenue, | 435,000 | 546,812 | ||||||
Dallas/Fort Worth International Airport, Private Airport & Marina Revenue, | 200,000 | 211,624 | ||||||
Series H, AMT, | 300,000 | 316,620 | ||||||
Texas Private Activity Bond Surface Transportation Corp., Highway Tolls Revenue, LBJ Infrastructure, | 700,000 | 835,289 | ||||||
Texas Transportation Commission, Highway Tolls Revenue, Series A, | 700,000 | 740,243 | ||||||
|
| |||||||
| 2,650,588 | ||||||||
|
| |||||||
| Utah — 1.3% | ||||||||
Utah Transit Authority, Sales Tax Revenue, | 200,000 | 216,132 | ||||||
|
| |||||||
Principal | Value | |||||||
| Virginia — 3.4% | ||||||||
Virginia Small Business Financing Authority, Highway Tolls Revenue, Elizabeth River Crossings, AMT, | $ | 500,000 | $ | 553,915 | ||||
|
| |||||||
| Washington — 2.8% | ||||||||
Port of Seattle, Private Airport & Marina Revenue, Series A, | 400,000 | 448,784 | ||||||
|
| |||||||
TOTAL MUNICIPAL BONDS | 15,955,777 | |||||||
|
| |||||||
TOTAL INVESTMENTS — 97.9% (Cost $15,630,419) | $ | 15,955,777 | ||||||
Other assets less liabilities — 2.1% | 339,978 | |||||||
|
| |||||||
NET ASSETS — 100.0% | $ | 16,295,755 | ||||||
|
| |||||||
AGM – Assured Guaranty Corp
AMT – Alternative Minimum Tax
INS – Insured
| See Notes to Financial Statements. | 14 |
DBX ETF Trust
SCHEDULE OF INVESTMENTS
db X-trackers Regulated Utilities Fund
May 31, 2014
Number | Value | |||||||
| COMMON STOCKS — 99.4% | ||||||||
| Electric Utilities — 41.7% | ||||||||
ALLETE, Inc. | 642 | $ | 31,888 | |||||
American Electric Power Co., Inc. | 7,929 | 423,013 | ||||||
Cleco Corp. | 963 | 50,105 | ||||||
Duke Energy Corp. | 5,571 | 395,987 | ||||||
Edison International | 5,316 | 293,124 | ||||||
El Paso Electric Co. | 642 | 24,467 | ||||||
Elia System Operator SA (Belgium) | 428 | 22,109 | ||||||
Emera, Inc. (Canada) | 2,143 | 67,257 | ||||||
Empire District Electric (The) Co. | 684 | 16,423 | ||||||
FirstEnergy Corp. | 6,790 | 229,638 | ||||||
Fortis, Inc. (Canada) | 3,424 | 102,755 | ||||||
Great Plains Energy, Inc. | 2,485 | 63,243 | ||||||
IDACORP, Inc. | 803 | 44,028 | ||||||
ITC Holdings Corp. | 2,513 | 91,976 | ||||||
Northeast Utilities | 5,081 | 230,677 | ||||||
Pepco Holdings, Inc. | 4,030 | 111,631 | ||||||
Pinnacle West Capital Corp. | 1,771 | 98,149 | ||||||
PNM Resources, Inc. | 1,288 | 36,656 | ||||||
Portland General Electric Co. | 1,243 | 41,106 | ||||||
Red Electrica Corp. SA (Spain) | 1,685 | 144,568 | ||||||
Southern (The) Co. | 9,039 | 395,727 | ||||||
SP AusNet (Australia) | 26,297 | 33,773 | ||||||
Spark Infrastructure Group (Australia) | 17,957 | 30,081 | ||||||
Terna Rete Elettrica Nazionale SpA (Italy) | 22,843 | 121,254 | ||||||
UIL Holdings Corp. | 887 | 32,792 | ||||||
UNS Energy Corp. | 634 | 38,401 | ||||||
Westar Energy, Inc. | 2,187 | 78,841 | ||||||
Xcel Energy, Inc. | 8,075 | 248,387 | ||||||
|
| |||||||
| 3,498,056 | ||||||||
|
| |||||||
| Gas Utilities — 9.7% | ||||||||
AGL Resources, Inc. | 1,919 | 102,436 | ||||||
APA Group (Australia) | 13,489 | 87,749 | ||||||
Atmos Energy Corp. | 1,449 | 72,595 | ||||||
Enagas SA (Spain) | 3,310 | 97,415 | ||||||
Envestra Ltd. (Australia) | 15,243 | 19,364 | ||||||
Northwest Natural Gas Co. | 432 | 19,557 | ||||||
Piedmont Natural Gas Co., Inc. | 1,216 | 43,521 | ||||||
Questar Corp. | 2,804 | 67,492 | ||||||
Snam SpA (Italy) | 33,829 | 198,568 | ||||||
South Jersey Industries, Inc. | 508 | 29,220 | ||||||
Southwest Gas Corp. | 736 | 38,537 | ||||||
WGL Holdings, Inc. | 830 | 33,657 | ||||||
|
| |||||||
| 810,111 | ||||||||
|
| |||||||
| Multi-Utilities — 36.6% | ||||||||
Alliant Energy Corp. | 1,797 | 104,765 | ||||||
Avista Corp. | 955 | 29,901 | ||||||
CenterPoint Energy, Inc. | 6,938 | 167,345 | ||||||
CMS Energy Corp. | 4,309 | 128,193 | ||||||
Consolidated Edison, Inc. | 4,748 | 261,187 | ||||||
Dominion Resources, Inc. | 6,011 | 414,519 | ||||||
DTE Energy Co. | 2,844 | 216,485 | ||||||
DUET Group (Australia) | 30,778 | 69,031 | ||||||
Integrys Energy Group, Inc. | 1,294 | 75,039 | ||||||
National Grid PLC (United Kingdom) | 30,943 | 461,612 | ||||||
NiSource, Inc. | 5,045 | 188,532 | ||||||
Number | Value | |||||||
| Multi-Utilities (Continued) | ||||||||
NorthWestern Corp. | 614 | $ | 29,472 | |||||
PG&E Corp. | 7,236 | 331,915 | ||||||
SCANA Corp. | 2,043 | 106,236 | ||||||
Sempra Energy | 3,715 | 372,800 | ||||||
TECO Energy, Inc. | 3,483 | 60,151 | ||||||
Vectren Corp. | 1,334 | 53,200 | ||||||
|
| |||||||
| 3,070,383 | ||||||||
|
| |||||||
| Oil, Gas & Consumable Fuels — 5.1% | ||||||||
Enbridge, Inc. (Canada) | 9,064 | 430,449 | ||||||
|
| |||||||
| Water Utilities — 6.3% | ||||||||
American States Water Co. | 626 | 18,955 | ||||||
American Water Works Co., Inc. | 2,893 | 140,629 | ||||||
Aqua America, Inc. | 2,846 | 72,231 | ||||||
California Water Service Group | 736 | 16,236 | ||||||
Severn Trent PLC (United Kingdom) | 3,613 | 119,184 | ||||||
United Utilities Group PLC (United Kingdom) | 10,730 | 156,115 | ||||||
|
| |||||||
| 523,350 | ||||||||
|
| |||||||
TOTAL COMMON STOCKS | 8,332,349 | |||||||
|
| |||||||
TOTAL INVESTMENTS — 99.4% (Cost $7,454,801) | $ | 8,332,349 | ||||||
Other assets less liabilities — 0.6% | 47,866 | |||||||
|
| |||||||
NET ASSETS — 100.0% | $ | 8,380,215 | ||||||
|
| |||||||
| See Notes to Financial Statements. | 15 |
DBX ETF Trust
SCHEDULE OF INVESTMENTS
db X-trackers Solactive Investment Grade Subordinated Debt Fund
May 31, 2014
Principal | Value | |||||||
| CORPORATE BONDS — 97.4% | ||||||||
| Financial — 94.4% | ||||||||
| Banks — 63.2% | ||||||||
Bank of America Corp. | $ | 200,000 | $ | 231,733 | ||||
7.75%, 5/14/38 | 100,000 | 137,823 | ||||||
BPCE SA, 144A (France) | 300,000 | 313,418 | ||||||
Citigroup, Inc. | 184,000 | 186,273 | ||||||
5.50%, 9/13/25 | 100,000 | 110,794 | ||||||
6.125%, 8/25/36 | 100,000 | 114,573 | ||||||
Fifth Third Bancorp | 150,000 | 221,907 | ||||||
Goldman Sachs Group, (The), Inc. | 150,000 | 173,090 | ||||||
6.75%, 10/01/37 | 150,000 | 180,552 | ||||||
HSBC Holdings PLC (United Kingdom) | 250,000 | 265,325 | ||||||
ING Bank NV, 144A (Netherlands) | 550,000 | 616,185 | ||||||
JPMorgan Chase & Co. | 257,000 | 260,357 | ||||||
3.375%, 5/01/23 | 450,000 | 440,577 | ||||||
Morgan Stanley | 300,000 | 321,850 | ||||||
MTN, | 250,000 | 252,199 | ||||||
5.00%, 11/24/25 | 250,000 | 265,895 | ||||||
Nordea Bank AB, 144A (Sweden) | 400,000 | 432,802 | ||||||
Santander UK PLC, 144A (United Kingdom) | 200,000 | 215,209 | ||||||
Standard Chartered PLC, 144A (United Kingdom) | 450,000 | 446,261 | ||||||
US Bancorp, MTN | 400,000 | 394,806 | ||||||
US Bank NA | 394,000 | 409,479 | ||||||
Wells Fargo & Co. | 200,000 | 219,086 | ||||||
5.606%, 1/15/44 | 200,000 | 227,817 | ||||||
|
| |||||||
| 6,438,011 | ||||||||
|
| |||||||
| Diversified Financial Services — 13.3% | ||||||||
General Electric Capital Corp., Series A | 250,000 | 295,463 | ||||||
Series G, MTN, | 150,000 | 167,640 | ||||||
HSBC Finance Corp. | 750,000 | 899,204 | ||||||
|
| |||||||
| 1,362,307 | ||||||||
|
| |||||||
Principal | Value | |||||||
| Insurance — 17.9% | ||||||||
Allstate (The) Corp. | $ | 250,000 | $ | 267,656 | ||||
Chubb (The) Corp. | 200,000 | 223,000 | ||||||
MetLife, Inc. | 300,000 | 336,165 | ||||||
Prudential Financial, Inc. | 425,000 | 449,438 | ||||||
ZFS Finance USA Trust II, 144A | 500,000 | 542,500 | ||||||
|
| |||||||
| 1,818,759 | ||||||||
|
| |||||||
| Utilities — 3.0% | ||||||||
| Electric — 3.0% | ||||||||
Electricite de France, 144A (France) | 300,000 | 309,150 | ||||||
|
| |||||||
TOTAL CORPORATE BONDS | 9,928,227 | |||||||
|
| |||||||
TOTAL INVESTMENTS — 97.4% (Cost $9,772,998) | 9,928,227 | |||||||
Other assets less liabilities — 2.6% | 262,733 | |||||||
|
| |||||||
NET ASSETS — 100.0% | $ | 10,190,960 | ||||||
|
| |||||||
MTN – Medium Term Note.
(a) Variable Rate Coupon. Stated interest rate was in effect at May 31, 2014.
144A – Security is exempt from registration under Rule 144A of the Securities Act of 1933. This security is considered liquid and may be resold in transactions exempt from registration, normally to qualified institutional buyers.
| See Notes to Financial Statements. | 16 |
This Page is Intentionally Left Blank
17
DBX ETF Trust
STATEMENTS OF ASSETS AND LIABILITIES
May 31, 2014
| db X-trackers Municipal Infrastructure Revenue Bond Fund | db X-trackers Regulated Utilities Fund | db X-trackers Solactive Investment Grade Subordinated Debt Fund | ||||||||||
Assets | ||||||||||||
Investments in non-affiliated securities at fair value | $ | 15,955,777 | $ | 8,332,349 | $ | 9,928,227 | ||||||
Cash | 135,621 | 2,583 | 92,169 | |||||||||
Foreign currency at value | — | 6,519 | — | |||||||||
Receivables: | ||||||||||||
Dividends and Interest | 208,477 | 38,052 | 131,113 | |||||||||
Investment securities sold | — | — | 364,274 | |||||||||
Foreign tax reclaim | — | 3,886 | — | |||||||||
|
|
|
|
|
| |||||||
Total Assets | $ | 16,299,875 | $ | 8,383,389 | $ | 10,515,783 | ||||||
|
|
|
|
|
| |||||||
Liabilities | ||||||||||||
Payables: | ||||||||||||
Investment advisory fees | $ | 4,120 | $ | 3,174 | $ | 3,859 | ||||||
Investment securities purchased | — | — | 320,964 | |||||||||
|
|
|
|
|
| |||||||
Total Liabilities | 4,120 | 3,174 | 324,823 | |||||||||
|
|
|
|
|
| |||||||
Net Assets | $ | 16,295,755 | $ | 8,380,215 | $ | 10,190,960 | ||||||
|
|
|
|
|
| |||||||
Net Assets Consist of | ||||||||||||
Paid-in capital | $ | 15,986,437 | $ | 7,437,895 | $ | 10,000,000 | ||||||
Undistributed net investment income | 46,054 | 57,469 | 38,669 | |||||||||
Accumulated net realized gain (loss) on investments and foreign currency transactions | (62,094 | ) | 7,281 | (2,938 | ) | |||||||
Net unrealized appreciation (depreciation) on investments and foreign currency translations | 325,358 | 877,570 | 155,229 | |||||||||
|
|
|
|
|
| |||||||
Net Assets | $ | 16,295,755 | $ | 8,380,215 | $ | 10,190,960 | ||||||
|
|
|
|
|
| |||||||
Number of Common Shares outstanding | 650,001 | 300,001 | 400,000 | |||||||||
|
|
|
|
|
| |||||||
Net Assets Value | $ | 25.07 | $ | 27.93 | $ | 25.48 | ||||||
|
|
|
|
|
| |||||||
Investments in non-affiliated securities at cost | $ | 15,630,419 | $ | 7,454,801 | $ | 9,772,998 | ||||||
|
|
|
|
|
| |||||||
Foreign currency at cost | $ | — | $ | 6,526 | $ | — | ||||||
|
|
|
|
|
| |||||||
| See Notes to Financial Statements. | 18 |
DBX ETF Trust
For the Period Ended May 31, 2014
| db X-trackers Municipal Infrastructure Revenue Bond Fund(1) | db X-trackers Regulated Utilities Fund(1) | db X-trackers Solactive Investment Grade Subordinated Debt Fund(2) | ||||||||||
Investment Income | ||||||||||||
Interest income | $ | 582,035 | $ | — | $ | 32,911 | ||||||
Dividend income* | — | 457,965 | — | |||||||||
|
|
|
|
|
| |||||||
Total Investment Income | 582,035 | 457,965 | 32,911 | |||||||||
|
|
|
|
|
| |||||||
Expenses | ||||||||||||
Advisory fees | 46,168 | 52,098 | 3,859 | |||||||||
Trustee fees | 2,916 | 2,407 | — | |||||||||
|
|
|
|
|
| |||||||
Total Expenses | 49,084 | 54,505 | 3,859 | |||||||||
Less fees waived (See Note 3): | ||||||||||||
Waiver | (2,916 | ) | (2,407 | ) | — | |||||||
|
|
|
|
|
| |||||||
Net Expenses | 46,168 | 52,098 | 3,859 | |||||||||
|
|
|
|
|
| |||||||
Net Investment Income | 535,867 | 405,867 | 29,052 | |||||||||
|
|
|
|
|
| |||||||
Realized and Unrealized Gain (Loss) | ||||||||||||
Net realized gain (loss) from: | ||||||||||||
Investments | (62,094 | ) | (28,180 | ) | 6,679 | |||||||
In-kind redemptions | (73,822 | ) | 189,135 | — | ||||||||
Foreign currency transactions | — | 1,270 | — | |||||||||
|
|
|
|
|
| |||||||
Net realized gain (loss) | (135,916 | ) | 162,225 | 6,679 | ||||||||
Net change in unrealized appreciation (depreciation) on: | ||||||||||||
Investments | 325,358 | 877,548 | 155,229 | |||||||||
Foreign currency translations | — | 22 | — | |||||||||
|
|
|
|
|
| |||||||
Net change in unrealized appreciation (depreciation) | 325,358 | 877,570 | 155,229 | |||||||||
|
|
|
|
|
| |||||||
Net realized and unrealized gain on investments and foreign currency transactions | 189,442 | 1,039,795 | 161,908 | |||||||||
|
|
|
|
|
| |||||||
Net Increase in Net Assets Resulting from Operations | $ | 725,309 | $ | 1,445,662 | $ | 190,960 | ||||||
|
|
|
|
|
| |||||||
* Foreign tax withheld | $ | — | $ | 15,351 | $ | — | ||||||
| (1) | For the period June 4, 2013 (commencement of operations) through May 31, 2014. |
| (2) | For the period May 1, 2014 (commencement of operations) through May 31, 2014. |
| See Notes to Financial Statements. | 19 |
DBX ETF Trust
STATEMENTS OF CHANGES IN NET ASSETS
| db X-trackers Municipal Infrastructure Revenue Bond Fund | db X-trackers Regulated Utilities Fund | |||||||
| For the Period June 4, 2013(1) to May 31, 2014 | For the Period June 4, 2013(1) to May 31, 2014 | |||||||
Increase (Decrease) in Net Assets from Operations | ||||||||
Net investment income | $ | 535,867 | $ | 405,867 | ||||
Net realized gain (loss) on investments and foreign currency related transactions | (135,916 | ) | 162,225 | |||||
Net change in unrealized appreciation (depreciation) on investments and foreign currency translations | 325,358 | 877,570 | ||||||
|
|
|
| |||||
Net increase (decrease) in net assets resulting from operations | 725,309 | 1,445,662 | ||||||
|
|
|
| |||||
Distributions to Shareholders from | ||||||||
Net investment income | (489,813 | ) | (349,668 | ) | ||||
|
|
|
| |||||
Fund Shares Transactions | ||||||||
Proceeds from shares sold | 17,235,994 | 16,232,245 | ||||||
Value of shares redeemed | (1,175,735 | ) | (8,948,024 | ) | ||||
|
|
|
| |||||
Net increase (decrease) in net assets resulting from fund share transactions | 16,060,259 | 7,284,221 | ||||||
|
|
|
| |||||
Total Increase (decrease) in Net Assets | 16,295,755 | 8,380,215 | ||||||
Net Assets | ||||||||
Beginning of period | — | — | ||||||
|
|
|
| |||||
End of period | $ | 16,295,755 | $ | 8,380,215 | ||||
|
|
|
| |||||
Undistributed net investment income | $ | 46,054 | $ | 57,469 | ||||
|
|
|
| |||||
Changes in Shares Outstanding | ||||||||
Shares outstanding, beginning of period | 1 | 1 | ||||||
Shares sold | 700,000 | 650,000 | ||||||
Shares redeemed | (50,000 | ) | (350,000 | ) | ||||
|
|
|
| |||||
Shares outstanding, end of period | 650,001 | 300,001 | ||||||
|
|
|
| |||||
| (1) | Commencement of operations. |
| See Notes to Financial Statements. | 20 |
DBX ETF Trust
STATEMENTS OF CHANGES IN NET ASSETS (Continued)
| db X-trackers Solactive Investment Grade Subordinated Debt Fund | ||||
| For the Period May 1, 2014(1) to May 31, 2014 | ||||
Increase (Decrease) in Net Assets from Operations | ||||
Net investment income | $ | 29,052 | ||
Net realized gain (loss) on investments and foreign currency transactions | 6,679 | |||
Net change in unrealized appreciation (depreciation) on investments and foreign currency translations | 155,229 | |||
|
| |||
Net increase (decrease) in net assets resulting from operations | 190,960 | |||
|
| |||
Fund Shares Transactions: | ||||
Proceeds from shares sold | 10,000,000 | |||
Value of shares redeemed | — | |||
|
| |||
Net increase (decrease) in net assets resulting from fund share transactions | 10,000,000 | |||
|
| |||
Total Increase (decrease) in Net Assets | 10,190,960 | |||
Net Assets | ||||
Beginning of period | — | |||
|
| |||
End of period | $ | 10,190,960 | ||
|
| |||
Undistributed net investment income | $ | 38,669 | ||
|
| |||
Changes in Shares Outstanding | ||||
Shares outstanding, beginning of period | — | |||
Shares sold | 400,000 | |||
Shares redeemed | — | |||
|
| |||
Shares outstanding, end of period | 400,000 | |||
|
| |||
| (1) | Commencement of operations. |
| See Notes to Financial Statements. | 21 |
DBX ETF Trust
For a Share outstanding throughout each period
| db X-trackers Municipal Infrastructure Revenue Bond Fund | For the Period June 4, 2013* to May 31, 2014 | |||
Net Asset Value, beginning of period | $ | 25.00 | ||
|
| |||
Income from Investment Operations: | ||||
Net investment income** | 0.81 | |||
Net realized and unrealized gain on investment transactions | 0.00 | ‡ | ||
|
| |||
Net increase (decrease) in net asset value from operations | 0.81 | |||
|
| |||
Distributions paid to shareholders from: | ||||
Net investment income | (0.74 | ) | ||
|
| |||
Total distributions | (0.74 | ) | ||
|
| |||
Net Asset Value, end of period | $ | 25.07 | ||
|
| |||
Total Return*** | 3.46 | %††† | ||
Ratios/Supplemental Data | ||||
Net assets, end of period (000’s omitted) | $ | 16,296 | ||
Ratios to average net assets: | ||||
Expenses, net of fee waiver | 0.30 | %† | ||
Expenses, prior to fee waiver | 0.32 | %† | ||
Net investment income | 3.48 | %† | ||
Portfolio turnover rate | 5 | %†† | ||
| db X-trackers Regulated Utilities Fund | For the Period June 4, 2013* to May 31, 2014 | |||
Net Asset Value, beginning of period | $ | 25.00 | ||
|
| |||
Income from Investment Operations: | ||||
Net investment income** | 0.88 | |||
Net realized and unrealized gain on investment and foreign currency transactions | 2.81 | |||
|
| |||
Net increase (decrease) in net asset value from operations | 3.69 | |||
|
| |||
Distributions paid to shareholders from: | ||||
Net investment income | (0.76 | ) | ||
|
| |||
Total distributions | (0.76 | ) | ||
|
| |||
Net Asset Value, end of period | $ | 27.93 | ||
|
| |||
Total Return*** | 15.68 | %††† | ||
Ratios/Supplemental Data: | ||||
Net assets, end of period (000’s omitted) | $ | 8,380 | ||
Ratios to average net assets: | ||||
Expenses, net of fee waiver | 0.45 | %† | ||
Expenses, prior to fee waiver | 0.47 | %† | ||
Net investment income | 3.51 | %† | ||
Portfolio turnover rate | 59 | %†† | ||
| * | Commencement of operations. |
| ** | Based on average shares outstanding. |
| *** | Total Return is calculated assuming an initial investment made at the Net Asset Value at the beginning of the period, reinvestment of all dividend distributions at Net Asset Value during the period, and redemption at Net Asset Value on the last day of the period. Total Return calculated for a period of less than one year is not annualized. |
| † | Annualized. |
| †† | Portfolio turnover rate is not annualized and does not include securities received or delivered from processing creations or redemptions. |
| ††† | The Total Return would have been lower if certain fees had not been reimbursed by the Advisor. |
| ‡ | Less than 0.005. |
| See Notes to Financial Statements. | 22 |
DBX ETF Trust
FINANCIAL HIGHLIGHTS (Continued)
For a Share outstanding throughout each period
| db X-trackers Solactive Investment Grade Subordinated Debt Fund | For the Period May 1, 2014* to May 31, 2014 | |||
Net Asset Value, beginning of period | $ | 25.00 | ||
|
| |||
Income from Investment Operations: | ||||
Net investment income** | 0.07 | |||
Net realized and unrealized gain on investment transactions | 0.41 | |||
|
| |||
Net increase in net asset value from operations | 0.48 | |||
|
| |||
Net Asset Value, end of period | $ | 25.48 | ||
|
| |||
Total Return*** | 1.92 | % | ||
Ratios/Supplemental Data | ||||
Net assets, end of period (000’s omitted) | $ | 10,191 | ||
Ratios to average net assets: | ||||
Expenses | 0.45 | %† | ||
Net investment income | 3.39 | %† | ||
Portfolio turnover rate | 4 | %†† | ||
| * | Commencement of operations. |
| ** | Based on average shares outstanding. |
| *** | Total Return is calculated assuming an initial investment made at the Net Asset Value at the beginning of the period, reinvestment of all dividend distributions at Net Asset Value during the period, and redemption at Net Asset Value on the last day of the period. Total Return calculated for a period of less than one year is not annualized. |
| † | Annualized. |
| †† | Portfolio turnover rate is not annualized and does not include securities received or delivered from processing creations or redemptions. |
| See Notes to Financial Statements. | 23 |
DBX ETF Trust
1. Organization
DBX ETF Trust (the “Trust”) is registered under the Investment Company Act of 1940, as amended (the “Act”), as an open end registered management investment company organized as a Delaware statutory trust.
As of May 31, 2014, the Trust consists of seventeen non-diversified series of exchange-traded funds (“ETF”) (each a “Fund” and collectively, the “Funds”) in operation and trading. These financial statements report on the Funds listed below:
| db X-trackers Municipal Infrastructure Revenue Bond Fund |
| db X-trackers Regulated Utilities Fund |
| db X-trackers Solactive Investment Grade Subordinated Debt Fund |
DBX Advisors LLC (“DBX” or the “Advisor”), an indirect, wholly owned subsidiary of Deutsche Bank AG, serves as investment advisor to the Funds and has overall responsibility for the general management and administration of the Funds, subject to the supervision of the Funds’ Board of Trustees.
Each Fund offers shares that are listed and traded on the NYSE Arca, Inc. (“NYSE Arca”). Unlike conventional mutual funds, each Fund issues and redeems shares on a continuous basis, at net asset value, only in large specified lots consisting of 50,000 shares each called a “Creation Unit”, to authorized participants who have entered into agreements with the Funds’ distributor. Except when aggregated in Creation Units, shares are not individually redeemable securities of the Funds.
The investment objective of each Fund is to track the performance, before fees and expenses, of a particular index (the “Underlying Index”). The underlying indices for the Funds are:
Fund | Underlying Index | |
| db X-trackers Municipal Infrastructure Revenue Bond Fund | DBIQ Municipal Infrastructure Revenue Bond Index | |
| db X-trackers Regulated Utilities Fund | DBIQ Regulated Utilities Index | |
| db X-trackers Solactive Investment Grade Subordinated Debt Fund | Solactive Subordinated Bond Index |
Deutsche Bank Securities Inc. is the creator of each DBIQ Underlying Index. The DBIQ Municipal Infrastructure Revenue Bond Index is designed to track the returns of the segment of the U.S. long term tax-exempt bond market, consisting of infrastructure revenue bonds. It is comprised of tax-exempt municipal securities issued by states, cities, counties, districts, their respective agencies and other tax-exempt issuers. The Underlying Index is intended to track bonds that have been issued with the intention of funding federal, state and local infrastructure projects such as water and sewer systems, public power systems, toll roads, bridges, tunnels and many other public use projects. It is designed to only hold bonds issued by state and local municipalities where the interest and principal repayments are generated from dedicated revenue streams or double-barreled entities. The DBIQ Municipal Infrastructure Revenue Bond Index is rebalanced monthly on the last business day of each month. The DBIQ Regulated Utilities Index is designed to track the price movements in shares of companies whose main business operations are in the regulated utilities sector. It consist of issuers of large, medium or small market capitalization from the following seven developed market countries: Australia, Belguim, Canada, Italy, Spain, the United Kingdom and the United States. The Underlying Index is a total return index, which tracks capital gains and assumes that any cash distributions are reinvested back into the Underlying Index. The composition of the DBIQ Regulated Utilities Index is ordinarily adjusted annually on the fifth business day of October.
Solactive AG maintains and calculates the Solactive Subordinated Bond Index. It is designed to track the subordinated corporate bond market denominated in U.S. dollars. It is comprised of corporate securities which are classified as subordinated or junior subordinated. The Underlying Index is a total return index, which assumes that any cash distributions are reinvested. Financial instruments must meet certain requirements in order for it to be included in the Underlying Index. The Solactive Subordinated Bond Index is reconstituted on a monthly basis and the composition is determined five business days prior to the last business day of each month.
Each Fund is entitled to use its respective Underlying Index pursuant to a licensing agreement between DBIQ, Solactive and DBX. There is no charge to the Funds in connection with these licensing agreements.
Each Fund is non-diversified and is not limited by the Act with regard to the percentage of its assets that may be invested in the securities of a single issuer. The securities of a particular issuer (or securities of issuers in particular industries) may dominate the underlying index of such a fund and, consequently, the fund’s investment portfolio. This may adversely affect the fund’s performance or subject the fund’s shares to greater price volatility than that experienced by more diversified investment companies.
24
DBX ETF Trust
NOTES TO FINANCIAL STATEMENTS (Continued)
The db X-trackers Regulated Utilities Fund and the db X-trackers Solactive Investment Grade Subordinated Debt Fund may invest in securities of non-U.S. issuers that may trade in non-U.S. Markets. This may involve certain considerations and risks not typically associated with securities of U.S. issuers. Such risks include, but are not limited to: generally less liquid and less efficient securities markets; generally greater price volatility; exchange rate fluctuations and exchange controls; imposition of restrictions on the expatriation of funds or other assets of the Fund; less publicly available information about issuers; the imposition of withholding or other taxes; higher transaction and custody costs; settlement delays and risk of loss attendant in settlement procedures; difficulties in enforcing contractual obligations; less regulation of securities markets; different accounting, disclosure and reporting requirements; more substantial governmental involvement in the economy; higher inflation rates; greater social, economic and political uncertainties; the risk of nationalization or expropriation of assets and the risk of war.
Pursuant to the Trust’s organizational documents, the Trust’s officers and trustees are indemnified against certain liabilities that may arise out of the performance of their duties to the Funds. Additionally, in the normal course of business the Trust enters into contracts that contain a variety of representations that provide indemnification for certain liabilities. The Trust’s maximum exposure under these arrangements is unknown, as this would involve future claims that may be made against the Funds that have not yet occurred. However, the Trust expects the risk of loss to be remote.
2. Significant Accounting Policies
The financial statements have been prepared in conformity with U.S. generally accepted accounting principles (“U.S. GAAP”), which require management to make certain estimates and assumptions that affect the reported amounts and disclosures in the financial statements. Actual results could differ from those estimates. The following is a summary of significant accounting policies followed by the Funds.
Security Valuation The Net Asset Value (“NAV”), of each Fund’s shares is calculated each business day as of the close of regular trading on the New York Stock Exchange, generally 4:00 p.m. Eastern Time. NAV per share is calculated by dividing a Fund’s net assets by the number of Fund shares outstanding.
Various inputs are used in determining the value of the Funds’ investments. These inputs are summarized in three broad levels. Level 1 includes quoted prices in active markets for identical securities. Level 2 includes other significant observable inputs (including quoted prices for similar securities, interest rates, prepayment speeds, and credit risk). Level 3 includes significant unobservable inputs (including the Fund’s own assumptions in determining the fair value of investments). The level assigned to the securities valuations may not be an indication of the risk or liquidity associated with investing in those securities.
Equity securities are valued at the most recent sale price or official closing price reported on the exchange (U.S. or foreign) or over-the-counter market on which they trade. Securities for which no sales are reported are valued at the calculated mean between the most recent bid and asked quotations on the relevant market or, if a mean cannot be determined, at the most recent bid quotation. Equity securities are generally categorized as Level 1.
Municipal debt securities are valued at prices supplied by independent pricing services approved by the Funds’ Board, whose valuations are intended to reflect the mean between the bid and asked prices. Such services may use various pricing techniques which take into account appropriate factors such as yield, quality, coupon rate, maturity, type of issue, trading characteristics, prepayment speeds and other data, as well as broker quotes. If the pricing services are unable to provide valuations, the securities are valued at the mean of the most recent bid and asked quotations or evaluated prices, as applicable, obtained from broker-dealers. These securities are generally categorized as Level 2.
Corporate debt securities are valued at prices supplied by independent pricing services approved by the Funds’ Board, whose valuations are intended to reflect the mean between the bid and asked prices. Such services may use various pricing techniques which take into account appropriate factors such as yield, quality, coupon rate, maturity, type of issue, trading characteristics, prepayment speeds and other data, as well as broker quotes. If the pricing services are unable to provide valuations, the securities are valued at the mean of the most recent bid and asked quotations or evaluated prices, as applicable, obtained from broker-dealers. These securities are generally categorized as Level 2.
Securities and other assets for which market quotations are not readily available or for which the above valuation procedures are deemed not to reflect fair value are valued in a manner that is intended to reflect their fair value as determined in accordance with procedures approved by the Board and are generally categorized as Level 3. In accordance with the Fund’s valuation procedures, factors considered in determining value may include, but are not limited to, the type
25
DBX ETF Trust
NOTES TO FINANCIAL STATEMENTS (Continued)
of the security; the size of the holding; the initial cost of the security; the existence of any contractual restrictions on the security’s disposition; the price and extent of public trading in similar securities of the issuer or of comparable companies; quotations or evaluated prices from broker-dealers and/or pricing services; information obtained from the issuer, analysts, and/or the appropriate stock exchange (for exchange-traded securities); an analysis of the company’s or issuer’s financial statements; an evaluation of the forces that influence the issuer and the market(s) in which the security is purchased and sold; and with respect to debt securities, the maturity, coupon, creditworthiness, currency denomination and the movement of the market in which the security is normally traded. The value determined under these procedures may differ from published values for the same securities.
Fair value pricing could result in a difference between the prices used to calculate a Fund’s net asset value and the prices used by the Fund’s underlying index, which in turn could result in a difference between the Fund’s performance and the performance of the Fund’s underlying index.
The following table summarizes the valuation of each Fund’s investments by the above fair value hierarchy levels as of May 31, 2014. For the period ended May 31, 2014, there were no transfers between investment levels.
| Level 1 | Level 2 | Level 3 | Fair Value at 5/31/2014 | |||||||||||||
| db X-trackers Municipal Infrastructure Revenue Bond Fund | ||||||||||||||||
Investments in Securities* | ||||||||||||||||
Municipal Bonds | $ | — | $ | 15,955,777 | $ | — | $ | 15,955,777 | ||||||||
|
|
|
|
|
|
|
| |||||||||
Total Investments | $ | — | $ | 15,955,777 | $ | — | $ | 15,955,777 | ||||||||
|
|
|
|
|
|
|
| |||||||||
| db X-trackers Regulated Utilities Fund | ||||||||||||||||
Investments in Securities* | ||||||||||||||||
Common Stocks | $ | 8,332,349 | $ | — | $ | — | $ | 8,332,349 | ||||||||
|
|
|
|
|
|
|
| |||||||||
Total Investments | $ | 8,332,349 | $ | — | $ | — | $ | 8,332,349 | ||||||||
|
|
|
|
|
|
|
| |||||||||
| db X-trackers Solactive Investment Grade Subordinated Debt Fund | ||||||||||||||||
Investments in Securities* | ||||||||||||||||
Corporate Bonds | $ | — | $ | 9,928,227 | $ | — | $ | 9,928,227 | ||||||||
|
|
|
|
|
|
|
| |||||||||
Total Investments | $ | — | $ | 9,928,227 | $ | — | $ | 9,928,227 | ||||||||
|
|
|
|
|
|
|
| |||||||||
| * | See Schedule of Investments for Industry or Country Classification. |
Cash Cash consists of cash held at banks and are on deposit with major financial institutions.
Investment Transactions and Investment Income Investment transactions are recorded as of the date that the securities are purchased or sold (trade date). Realized gains and losses from the sale or disposition of securities are calculated on the identified cost-method. Dividend income is net of any foreign taxes withheld at source. Certain dividends from foreign securities may be recorded subsequent to the ex-dividend date as soon as the fund is informed of such dividends. Interest income is recorded on the accrual basis. Discounts and premiums on securities purchased are accreted/amortized over the lives of the respective securities.
Tax Information and Dividends and Distributions to Shareholders It is each Fund’s policy to comply with all requirements of the Internal Revenue Code of 1986, as amended (“the Code”). Each fund intends to qualify for and to elect treatment as a separate Regulated Investment Company (“RIC”) under Subchapter M of the Code. It is the policy of each Fund to pay out dividends from net investment income, monthly or quarterly, depending on the fund, sufficient to relieve it from all or substantially all Federal income and excise taxes. Taxable net realized gains from investment transactions, reduced by capital loss carryforwards, if any, are declared and distributed to shareholders at least annually. The capital loss carryforward amount, if any, is available to offset future net capital gains. The Funds may occasionally be required to make supplemental distributions at some other time during the year. The Funds reserve the right to declare special distributions if, in their reasonable discretion, such action is necessary or advisable to preserve the status of each Fund as a RIC or to avoid imposition of income or excise taxes on undistributed income. Dividends and distributions to shareholders, if any, are
26
DBX ETF Trust
NOTES TO FINANCIAL STATEMENTS (Continued)
recorded on the ex-dividend date. The amount of dividends and distributions from net investment income and net realized capital gains are determined in accordance with Federal income tax regulations which may differ from U.S. GAAP. These “book/tax” differences are either considered temporary or permanent in nature. To the extent these differences are permanent in nature, such amounts are reclassified at the end of the year within the components of net assets based on their federal tax treatment; temporary differences do not require reclassification. Dividends and distributions, which exceed earnings and profits for the full year for tax purposes, are reported as a tax return of capital. db X-trackers Regulated Utilities Fund pays out dividends from net investment income to investors quarterly, and db X-trackers Municipal Infrastructure Revenue Bond Fund and db X-trackers Solactive Investment Grade Subordinated Debt Fund pay monthly.
In accordance with U.S. GAAP requirements regarding accounting for uncertainties in income taxes, management has analyzed the Funds’ tax positions taken or expected to be taken on foreign, federal and state income tax returns for the current tax year and has concluded that no provision for income tax is required in the Funds’ financial statements. The Advisor does not believe that the unrecognized tax benefits will change significantly in the next 12 months.
The Funds’ recognize interest and penalties, if any, related to uncertain tax provisions as income tax expense on the Statements of Operations. For the period ended May 31, 2014, the Funds did not incur any interest or penalties.
Foreign Taxes The db X-trackers Regulated Utilities Fund and the db X-trackers Solactive Investment Grade Subordinated Debt Fund may be subject to foreign taxes (a portion of which may be reclaimable) on income, capital gains on investments, certain foreign currency transactions or other corporate events. All foreign taxes are recorded in accordance with the applicable foreign tax regulations and rates that exist in the foreign jurisdictions in which the Funds invest. These foreign taxes, if any, are paid by the Funds and are reflected in their Statements of Operations as follows: foreign taxes withheld at source are presented as a reduction of income, and foreign taxes on capital gains from sales of investments and foreign currency transactions are included in their respective net realized gain (loss) categories. Foreign taxes payable as of May 31, 2014, if any, are disclosed in the Funds’ Statements of Assets and Liabilities.
Foreign Currency Translation The books and records of the Funds are maintained in U.S. dollars. Investment securities and other assets and liabilities denominated in a foreign currency are translated into U.S. dollars at the prevailing exchange rates at period end. Purchases and sales of investment securities, income and expenses are translated into U.S. dollars at the prevailing exchange rates on the respective dates of the transactions.
Net realized and unrealized gains and losses on foreign currency transactions represent net gains and losses between trade and settlement dates on securities transactions, the acquisition and disposition of foreign currencies, and the difference between the amount of net investment income accrued and the U.S. dollar amount actually received. That portion of both realized and unrealized gains and losses on investments that results from fluctuations in foreign currency exchange rates is not separately disclosed, but is included with net realized and unrealized gain/appreciation and loss/depreciation on investments.
3. Investment Advisory and Other Agreements
The Advisor has overall responsibility for the general management and administration of the Funds, subject to the supervision of the Funds’ Board of Trustees. Under an investment advisory agreement between the Trust, on behalf of the Funds, and the Advisor (the “Investment Advisory Agreement”), the Advisor is responsible for arranging sub-advisory, transfer agency, custody, fund administration, and all other non-distribution related services for the Funds to operate. The Advisor is also responsible for employing any sampling strategy for the Funds.
Prior to April 28, 2014, RREEF America L.L.C (“RREEF”) served as investment sub-advisor to the db X-trackers Regulated Utilities Fund. Effective April 28, 2014, RREEF no longer serves as sub-advisor to the db X-trackers Regulated Utilities Fund and the day-to-day portfolio management transitioned to the Advisor. The db X-trackers Municipal Infrastructure Revenue Bond Fund and the db X-trackers Solactive Investment Grade Subordinated Debt Fund are sub-advised by Deutsche Investment Management Americas Inc. (“DIMA”). The sub-advisors are responsible for day-to-day management of the Funds, subject to the replication strategy for each Fund with regard to its underlying index and for general administration, compliance and management services as may be agreed between the Advisor and sub-advisor from time to time.
27
DBX ETF Trust
NOTES TO FINANCIAL STATEMENTS (Continued)
For its investment advisory services to the Funds below, the Advisor is entitled to receive a unitary management fee from each Fund at an annual rate equal to:
Fund | Unitary Management Fee | |||
db X-trackers Municipal Infrastructure Revenue Bond Fund | 0.30 | % | ||
db X-trackers Regulated Utilities Fund | 0.45 | % | ||
db X-trackers Solactive Investment Grade Subordinated Debt Fund | 0.45 | % | ||
Out of the unitary management fee, the Advisor pays substantially all expenses of each Fund, including the payments to the sub-advisors, the cost of transfer agency, custody, fund administration, legal, audit and other services and expenses of the Independent Trustees. Prior to October 1, 2013, Trustees’ fees and expenses were allocated among the Funds based on each Fund’s relative average daily net assets. Effective October 1, 2013, the Advisor pays the fees and expenses of the Independent Trustees for each Fund. Each Fund is responsible for the payment of, interest expense, taxes, brokerage expenses, expenses of the Independent Trustees through September 30, 2013, and extraordinary expenses.
For the period from June 4, 2013 through September 30, 2014, the Advisor contractually agreed to waive fees and/or reimburse expenses in order to limit net annual operating expenses to 0.45% (with respect to the db X-trackers Regulated Utilities Fund) and 0.30% (with respect to the db X-trackers Municipal Infrastructure Revenue Bond Fund) of its average daily net assets, except for interest expense, brokerage expenses, distribution fees or expenses, litigation expenses and any other extraordinary expenses.
The Advisor pays DIMA a fee based on a percentage of the average daily net assets for each of the Funds listed below:
Fund | Sub-Advisor | |
db X-trackers Municipal Infrastructure Revenue Bond Fund | Deutsche Investment Management Americas Inc. | |
0.05% on the average daily net assets | ||
db X-trackers Regulated Utilities Fund | RREEF America L.L.C. (prior to April 28, 2014) | |
0.05% on the average daily net assets | ||
db X-trackers Solactive Investment Grade Subordinated Debt Fund | Deutsche Investment Management Americas Inc. | |
0.09% on the average daily net assets |
Prior to April 28, 2014, the Advisor paid RREEF a fee based on 0.05% of the average daily net assets of the db X-trackers Regulated Utilities Fund.
The Bank of New York Mellon, a wholly-owned subsidiary of The Bank of New York Mellon Corporation, serves as Administrator, Custodian, Accounting Agent and Transfer Agent for each Fund.
ALPS Distributors, Inc. (the “Distributor”) serves as the distributor of Creation Units for each Fund on an agency basis. The Distributor does not maintain a secondary market in shares of the Funds.
The Board of Trustees is currently comprised of four Trustees, of whom three are Independent Trustees. The Trust paid retainer fees to each Trustee not affiliated with Advisor, plus a specified amount to the audit committee.
4. Federal Income Taxes
As of May 31, 2014, the components of accumulated earnings (losses) were as follows:
| Undistributed Net Investment Income (Loss) | Net Accumulated Capital and Other Gains (Losses) | Unrealized Appreciation (Depreciation) | Total Accumulated Earnings (Losses) | |||||||||||||
db X-trackers Municipal Infrastructure Revenue Bond Fund | $ | 46,054 | $ | (62,094 | ) | $ | 325,358 | $ | 309,318 | |||||||
db X-trackers Regulated Utilities Fund | 66,773 | — | 875,547 | 942,320 | ||||||||||||
db X-trackers Solactive Investment Grade Subordinated Debt Fund | 45,089 | — | 145,871 | 190,960 | ||||||||||||
28
DBX ETF Trust
NOTES TO FINANCIAL STATEMENTS (Continued)
The tax characteristics of dividends and distributions declared for the period ended May 31, 2014 were as follows:
| Period Ended May 31, 2014 | ||||||||
Fund | Ordinary Income | Tax exempt | ||||||
db X-trackers Municipal Infrastructure Revenue Bond Fund | $ | — | $ | 489,813 | ||||
db X-trackers Regulated Utilities Fund | 349,668 | — | ||||||
At May 31, 2014, for Federal income tax purposes, the Funds have capital loss carryforwards available as shown in the table below, to the extent provided by regulations, to offset future capital gains. To the extent that these loss carryforwards are used to offset future capital gains, it is probable that the capital gains so offset will not be distributed to shareholders.
| Short-term | Long-term | Total Amount | ||||||||||
db X-trackers Municipal Infrastructure Revenue Bond Fund | $ | 38,192 | $ | — | �� | $ | 38,192 | |||||
Capital losses incurred after October 31 (“post-October losses”) within the taxable year are deemed to arise on the first business day of each Fund’s next taxable year.
During the period ended May 31, 2014, the db X-trackers Municipal Infrastructure Revenue Bond Fund incurred and elected to defer net capital losses as follows:
| Post-October Losses on Capital | ||||
db X-trackers Municipal Infrastructure Revenue Bond Fund | $ | 23,902 | ||
In order to present paid-in capital accumulated net realized gains or losses on the Statements of Assets and Liabilities that more closely represent their tax character, certain adjustments have been made to additional paid-in capital, undistributed net investment income or loss and accumulated net realized gains or losses on investments. These differences are primarily due to currency gain/(loss), certain securities sold at loss, market discount and redemptions-in-kind. For the period ended May 31, 2014, the adjustments were as follows:
| Undistributed Net Investment Income (Loss) | Undistributed Capital Gains (Accumulated Losses) | Paid-in Capital | ||||||||||
db X-trackers Municipal Infrastructure Revenue Bond Fund | $ | — | $ | 73,822 | $ | (73,822 | ) | |||||
db X-trackers Regulated Utilities Fund | 1,270 | (154,944 | ) | 153,674 | ||||||||
db X-trackers Solactive Investment Grade Subordinated Debt Fund | 9,617 | (9,617 | ) | — | ||||||||
As of May 31, 2014, the cost of investments for Federal income tax purposes and the aggregated gross unrealized appreciation/depreciation on investments were as follows:
| Cost | Net Unrealized Appreciation (Depreciation) | Gross Unrealized Appreciation | Gross Unrealized (Depreciation) | |||||||||||||
db X-trackers Municipal Infrastructure Revenue Bond Fund | $ | 15,630,419 | $ | 325,358 | $ | 336,316 | $ | (10,958 | ) | |||||||
db X-trackers Regulated Utilities Fund | $ | 7,456,824 | $ | 875,525 | $ | 943,623 | $ | (68,098 | ) | |||||||
db X-trackers Solactive Investment Grade Subordinated Debt Fund | $ | 9,782,356 | $ | 145,871 | $ | 149,421 | $ | (3,550 | ) | |||||||
5. Investment Portfolio Transactions
For the period ended May 31, 2014, the cost of investments purchased and proceeds from sale of investments (excluding in-kind transactions and short-term investments) were as follows:
| Purchases | Sales | |||||||
db X-trackers Municipal Infrastructure Revenue Bond Fund(1) | $ | 15,558,607 | $ | 817,165 | ||||
db X-trackers Regulated Utilities Fund(1) | $ | 11,694,665 | $ | 6,799,156 | ||||
db X-trackers Solactive Investment Grade Subordinated Debt Fund(2) | $ | 318,476 | $ | 434,006 | ||||
29
DBX ETF Trust
NOTES TO FINANCIAL STATEMENTS (Continued)
For the period ended May 31, 2014, the cost of in-kind purchases and proceeds from in-kind sales were as follows:
| Purchases | Sales | |||||||
db X-trackers Municipal Infrastructure Revenue Bond Fund(1) | $ | 2,330,607 | $ | 1,153,767 | ||||
db X-trackers Regulated Utilities Fund(1) | $ | 6,260,444 | $ | 3,862,094 | ||||
db X-trackers Solactive Investment Grade Subordinated Debt Fund(2) | $ | 9,032,079 | $ | — | ||||
| (1) | For the period June 4, 2013 through May 31, 2014. |
| (2) | For the period May 1, 2014 through May 31, 2014. |
6. Fund Share Transactions
As of May 31, 2014, there were unlimited Fund shares of $0.0001 par value authorized by the Trust. Fund shares are issued and redeemed by each Fund only in Creation Units or multiples thereof. Except when aggregated in Creation Units, shares of each Fund are not redeemable. Transactions in capital shares for each Fund are disclosed in detail in the Statements of Changes in Net Assets. The consideration for the purchase of Creation Units of a Fund generally consists of the in-kind contribution of a designated portfolio of securities constituting a portfolio sampling representation of the securities included in the respective Fund’s underlying index and an amount of cash, which under certain circumstances may include cash in lieu of portfolio securities. Investors purchasing and redeeming Creation Units pay a purchase transaction fee and a redemption transaction fee to offset transfer and other transaction costs associated with the issuance and redemption of Creation Units.
7. Concentration of Ownership
From time to time, the Funds may have a concentration of several shareholder accounts holding a significant percentage of shares outstanding. Investment activities of these shareholders could have a material impact on the Fund. At May 31, 2014, there was one affiliated shareholder account for each of the funds listed below holding a significant percentage of the shares outstanding:
Fund Name | Approximate Percent of Outstanding Shares Held | |||
db X-trackers Municipal Infrastructure Revenue Bond Fund | 54 | % | ||
db X-trackers Regulated Utilities Fund | 67 | % | ||
8. Fund Name Change
Effective August 11, 2014, the “db X-trackers Funds” will be rebranded “Deutsche X-trackers ETFs.” As a result the Funds will be renamed as follows:
Current Fund Name | New Fund Name | |
db X-trackers Municipal Infrastructure Revenue Bond Fund | Deutsche X-trackers Municipal Infrastructure Revenue Bond ETF | |
db X-trackers Regulated Utilities Fund | Deutsche X-trackers Regulated Utilities ETF | |
db X-trackers Solactive Investment Grade Subordinated Debt Fund | Deutsche X-trackers Solactive Investment Grade Subordinated Debt ETF |
30
DBX ETF Trust
REPORT OF INDEPENDENT REGISTERED PUBLIC ACCOUNTING FIRM
To Board of Trustees and Shareholders of
DBX ETF Trust:
We have audited the accompanying statements of assets and liabilities, including the schedules of investments, of db X-trackers Municipal Infrastructure Revenue Bond Fund, db X-trackers Regulated Utilities Fund and db X-trackers Solactive Investment Grade Subordinated Debt Fund (the “Funds” within DBX ETF Trust), as of May 31, 2014, and the related statements of operations and changes in net assets and the financial highlights for each of the periods therein. These financial statements and financial highlights are the responsibility of the Funds’ management. Our responsibility is to express an opinion on these financial statements and financial highlights based on our audits.
We conducted our audits in accordance with the standards of the Public Company Accounting Oversight Board (United States). Those standards require that we plan and perform the audit to obtain reasonable assurance about whether the financial statements and financial highlights are free of material misstatement. We were not engaged to perform an audit of the Funds’ internal control over financial reporting. Our audits included consideration of internal control over financial reporting as a basis for designing audit procedures that are appropriate in the circumstances, but not for the purpose of expressing an opinion on the effectiveness of the Funds’ internal control over financial reporting. Accordingly, we express no such opinion. An audit also includes examining, on a test basis, evidence supporting the amounts and disclosures in the financial statements and the financial highlights, assessing the accounting principles used and significant estimates made by management, and evaluating the overall financial statement presentation. Our procedures included confirmation of securities owned as of May 31, 2014, by correspondence with the custodian and brokers or by other appropriate auditing procedures where replies from brokers were not received. We believe that our audits provide a reasonable basis for our opinion.
In our opinion, the financial statements and financial highlights referred to above present fairly, in all material respects, the financial position of db X-trackers Municipal Infrastructure Revenue Bond Fund, db X-trackers Regulated Utilities Fund and db X-trackers Solactive Investment Grade Subordinated Debt Fund at May 31, 2014, the results of their operations, changes in their net assets and financial highlights for each of the periods therein in conformity with U.S. generally accepted accounting principles.

New York, New York
July 24, 2014
31
DBX ETF Trust
OFFICERS AND TRUSTEES (Unaudited)
| Name, Address, and Age | Position(s) Held with Fund | Term of Office and Length of Time Served | Principal Occupation(s) During Past 5 Years | Number of Portfolios in Fund Complex Overseen by Trustee | Other Directorships held by Trustee | |||||
Independent Trustees: | ||||||||||
J. David Officer Age: 65 60 Wall Street New York, New York 10005 | Trustee, Member of the Audit and Nominating Committees | Since 2011 | Independent Director; Formerly, Vice Chairman, The Dreyfus Corporation (1998-2009); Chief Operating Officer, The Dreyfus Corporation (2006-2009); President, The Dreyfus Family of Funds, Inc. (2006-2009). | 17 | Ilex Partners (Asia), LLC; Old Westbury Funds: & MAN Long/Short Fund; GLG Investment Series Trust; The Dreyfus Corporation; MBSC Securities Corporation; Dreyfus Services Corporation; MBSC, LLC; Dreyfus Transfer, Inc.; Dreyfus Service Organization, Inc.; Mellon Residential Funding Corp.; Mellon United National Bank; Laurel Capital Advisors; Mellon United National Bank; Dreyfus Founders Funds, Inc.; Founders Asset Management. | |||||
Stephen R. Byers Age: 60 60 Wall Street New York, New York 10005 | Trustee, Member and Chairman of the Audit and Nominating Committees | Since 2011 | Retired. Previously, Chief Investment Officer, The Dreyfus Corporation (2000-2006). | 17 | Sierra Income Corporation; College of William and Mary, Graduate School of Business. | |||||
George O. Elston Age: 49 60 Wall Street New York, New York 10005 | Trustee, Member of the Audit and Nominating Committees | Since 2011 | M&A Advisor, Chief Financial, Operating and Business Officer, Optherion, Inc. (2008-2010); and Vice President, Finance and Government Affairs, Secretary and Treasurer, Elusys Therapeutics, Inc. (2000-2007). | 17 | Celldex Therapeutics. | |||||
32
DBX ETF Trust
OFFICERS AND TRUSTEES (Unaudited) (Continued)
| Name, Address, and Age | Position(s) Held with Fund | Term of Office and Length of Time Served | Principal Occupation(s) During Past 5 Years | Number of Portfolios in Fund Complex Overseen by Trustee | Other Directorships held by Trustee | |||||
Interested Trustee/Officers:* | ||||||||||
Alex Depetris Age: 34 60 Wall Street | Trustee, Chairman of the Board, President, Chief Executive Officer and Secretary | Since 2010 | Director in the Deutsche Asset and Wealth Management Passive Asset Management Group at Deutsche Bank AG since 2008; Associate, Arnold & Porter, 2006-2008. | 22 | Director, Chairman of the Board of db-X Exchange Traded Funds Inc. and DBX ETF Trust. | |||||
| Martin Kremenstein Age: 37 60 Wall Street New York, New York 10005 | Chief Operating Officer | Since 2010 | Managing Director in the DBX Group at Deutsche Bank AG with responsibility for providing investor solutions to the DB sales force in North America since 2006. | N/A | N/A | |||||
| Michael Gilligan Age: 47 60 Wall Street New York, New York 10005 | Treasurer, Chief Financial Officer and Controller | Since 2010 | Director in the Finance Group at Deutsche Bank AG with CFO responsibility for DBX Advisors LLC, DBX Strategic Advisors LLC and DB Commodity Services LLC since 2008; Chief Operating Officer, Americas Credit Trading, Credit Suisse, 2007-2008. | N/A | N/A | |||||
| Frank Gecsedi Age: 46 60 Wall Street New York, New York 10005 | Chief Compliance Officer | Since 2010 | Vice President in Deutsche Bank’s Global Markets Legal, Risk and Capital Division since 2010; Vice President and Compliance Manager at Bank of America Merrill Lynch (formerly Merrill Lynch), (2000 to 2010). | N/A | N/A | |||||
* Officers/Trustee of the Company are “interested persons” as defined in the 1940 Act.
The Funds’ SAI includes additional information about the Funds’ Directors and is available by calling 855-329-3837, or on the Company’s website at www.dbxus.com.
33
DBX ETF Trust
BOARD CONSIDERATIONS IN APPROVAL OF INVESTMENT
ADVISORY AND SUB-ADVISORY CONTRACTS (Unaudited)
db X-trackers Solactive Investment Grade Subordinated Debt Fund
At a special meeting held on July 25, 2013, the Board of Trustees, including the Independent Trustees (those not affiliated with the Trust or its service providers), unanimously approved the Investment Advisory Agreement with respect to db X-trackers Solactive Investment Grade Subordinated Debt Fund. In reaching this decision, the Board considered all factors it believed relevant, including (1) the nature, extent and quality of the services to be provided to the Fund and its shareholders; (2) the Adviser’s financial resources and its resulting ability to perform its obligations under the Advisory Agreement; (3) the competitiveness of the advisory fee; (4) the total cost of the services to be provided by and the profits that could be realized by the Adviser from its relationship with the Fund; and (5) the extent to which economies of scale would be realized as the Fund grows, and if the fund shareholders would benefit from those economies.
The Board reached a determination, with the assistance of Trust counsel and through the exercise of its business judgment, that approval of the Agreement and the compensation to be received thereunder is consistent with the Board’s duties under state and federal law. The Board reached this conclusion based on multiple factors.
Nature, Extent and Quality of Services. The Board reviewed in detail the nature, extent and quality of services to be provided by the Adviser under the Advisory Agreement. The Board noted that these services include, among other things, furnishing a continuous investment program for the Fund, including arranging for, or implementing, the purchase and sale of portfolio securities, the provision of general corporate services such as portfolio management compliance services and the preparation and filing of certain reports on behalf of the Trust. The Board also considered, among other things, the professional experience and qualifications of the senior management and key professional personnel of the Adviser, including those individuals responsible for portfolio management. The Board considered that the Adviser provides, at its own expense, office facilities and equipment for use by the Fund and supervisory persons responsible for supervising and monitoring the Trust’s service providers. The Board also considered that the Adviser pays for the compensation of officers of the Trust who are also officers or employees of the Adviser, except as may otherwise be determined by the Board. The Board also considered that the Adviser arranges for the provision of transfer agency, custody, fund administration and accounting, and other non-distribution services necessary for the Fund’s operation. The Board also considered the role to be played by the Adviser in working with the Sub-Adviser to manage the Fund’s portfolio, noting that the Adviser would provide oversight of day-to-day operations, including monitoring tracking error, providing services in connection with creation and redemption units and assistance in meeting legal and regulatory requirements applicable to the Fund.
The Board evaluated these factors in consultation with Fund counsel. Based on its review, the Board concluded that the nature, extent, and quality of services to be provided by the Adviser under the Advisory Agreement are reasonable and appropriate in relation to the fees to be paid to the Adviser, taking special consideration of the fact that the advisory fee is a unitary fee and, as a result, a portion of the unitary advisory fee will be used to compensate the Fund’s service providers. The Board considered the staffing of the Adviser, including the training, qualifications and experience of investment personnel in managing the Fund. The Board also considered the expertise of the Adviser in supervising third party service providers to the Fund, such as the administrator and custodian. The Board further considered the compliance program of the Adviser which supports the Fund’s compliance program.
Adviser’s Financial Resources. In connection with the assessment of the ability of the Adviser to perform its duties under the Advisory Agreement, the Board considered the Adviser’s financial condition and whether it had the resources necessary to carry out its functions. The Board concluded that the Adviser had the financial resources necessary to perform its obligations under the Advisory Agreement.
Competitiveness of Advisory Fee. The Board considered the competitiveness of the Fund’s fee to other exchange-traded funds (ETFs), and noted that the Fund’s fee is competitive with the fees of the peer group, particularly noting that the Fund’s fee is lower than that of several other ETFs that provide exposure to investment grade securities. The Board noted that the proposed fee for the Fund is a unitary fee pursuant to which the Adviser pays all of the Fund’s costs. Based on its review, the Board concluded that the advisory fee is reasonable in light of the services provided.
Costs of Services and Profitability. The Board considered the expenses of the Adviser in developing and rendering services to be provided to the Fund, and the likelihood and level of profits in the early years of the Fund’s operations. The Board considered the asset levels at which the Adviser expects to “break-even” with respect to its operation of the Fund. The Board also noted that the Sub-Adviser was an affiliate of the Adviser and would be paid a fee of 0.09%
34
DBX ETF Trust
BOARD CONSIDERATIONS IN APPROVAL OF INVESTMENT
ADVISORY AND SUB-ADVISORY CONTRACTS (Unaudited) (Continued)
from the advisory fee. The Board considered that there were no material fall-out benefits likely to accrue to the Adviser related to the operation of the Fund.
Given the costs of the services to be provided by and the profits that could be realized by the Adviser in connection with the management of the Fund, the Board determined that the amount of potential profit was fair.
Economies of Scale. The Board noted that since the Fund’s fee was a unitary fee, the Fund would not experience economies of scale as a result of asset growth.
Given all the information available to it and considering all material factors, the Board concluded that the Investment Advisory Agreement was fair and reasonable and it was unanimously approved.
At a special meeting held on July 25, 2013, the Board of Trustees, including the Independent Trustees (those not affiliated with the Trust or its service providers), unanimously approved the Sub-Advisory Agreement with respect to the Fund. In reaching this decision, the Board considered all factors it believed relevant, including (1) the nature, extent and quality of the services to be provided to the Fund and its shareholders (including the investment performance of DIMA’s fund clients); (2) the performance of DIMA with respect to its management of subordinate debt funds generally, as well as DIMA’s financial resources and its resulting ability to perform its obligations under the Sub-Advisory Agreement; (3) the competitiveness of the sub-advisory fee; (4) the total cost of the services to be provided by and the profits that could be realized by DIMA from its relationship with the Fund; and (5) the extent to which economies of scale would be realized as the Fund grows, and if the fund shareholders would benefit from those economies.
The Board reached a determination, with the assistance of Trust counsel and through the exercise of its business judgment, that approval of the Agreement and the compensation to be received thereunder is consistent with the Board’s duties under state and federal law. The Board reached this conclusion based on multiple factors.
Nature, Extent and Quality of Services. In considering the nature, extent and quality of services that DIMA proposes to provide to the Funds, the Board reviewed in detail the nature, extent and quality of services to be provided by DIMA under the Sub-Advisory Agreement. The Board noted that these services include, among other things, furnishing a continuous investment program for the Fund, including arranging for, or implementing, the purchase and sale of portfolio securities.
The Board also considered DIMA’s operational capabilities and resources, and its experience in serving as investment sub-adviser to other funds, including those which invest in subordinated debt. The Board considered the professional experience and qualifications of DIMA’s senior management and key professional personnel, as well as DIMA’s depth and breadth of experience in managing investment portfolios consisting of subordinated debt. The Board gave special consideration to DIMA’s experience and capabilities in managing portfolios comprised of subordinated debt, and their techniques for tracking an index while minimizing index tracking error. In addition, the Board considered DIMA’s operational capabilities and resources.
The Board evaluated these factors in consultation with Fund counsel. Based on its review, the Board concluded that the nature, extent, and quality of services to be provided by DIMA under the Sub-Advisory Agreement are reasonable and appropriate in relation to the fees to be paid to DIMA, taking special consideration of the fact that the fees to be paid to DIMA are payable by the Adviser and not the Fund.
Performance of DIMA; DIMA’s Financial Resources. The Board noted that the Fund has not commenced operations and has no performance history, but the Board considered DIMA’s performance in managing other subordinated debt based portfolios and ability to minimize tracking error for index-based portfolios. The Board concluded that, given DIMA’s capabilities and experience in managing subordinated debt funds, DIMA should be able to keep the Fund’s tracking error within acceptable ranges.
The Board also considered DIMA’s financial condition and whether it had the resources necessary to carry out its functions. The Board concluded that DIMA had the financial resources necessary to perform its obligations under the Sub-Advisory Agreement.
Competitiveness of Sub-Advisory Fee. The Board noted that the fee to be paid to DIMA in respect of the Fund would be paid by the Adviser and not the Fund. The Board further noted that the proposed fee for the Fund was a unitary fee pursuant to which the Adviser would pay all of the Fund’s costs, and thus was not directly affected by the
35
DBX ETF Trust
BOARD CONSIDERATIONS IN APPROVAL OF INVESTMENT
ADVISORY AND SUB-ADVISORY CONTRACTS (Unaudited) (Continued)
amount of the sub-advisory fee paid to DIMA. Based on its review, the Board concluded that the sub-advisory fees were reasonable in light of the services provided.
Costs of Services and Profitability. The Board considered the asset levels at which DIMA expects to “break-even” with respect to its operation of the Fund, and further noted that the fee to be paid by the Adviser to DIMA under the Sub-Advisory Agreement was a flat fee of 0.09% and did not contain breakpoints.
The Board also considered whether DIMA would benefit in other ways from its relationship with the Funds. The Board discussed DIMA’s practices regarding the selection and compensation of brokers and dealers that would execute portfolio transactions for the Fund and the brokers’ and dealers’ provision of brokerage services to DIMA. The Board discussed the possible potential benefits DIMA might derive from the Fund’s soft dollar arrangements, whereby brokers provide brokerage services to the Fund or DIMA in return for allocating fund brokerage.
Given the costs of the services provided by and the profits that could be realized by DIMA in connection with the management of the Fund, the Board determined that the amount of potential profit was fair.
Economies of Scale. The Board noted that since the Fund’s fee was a unitary fee, the Funds would not experience economies of scale as a result of asset growth.
Given all the information available to it and considering all material factors, the Board concluded that the Sub-Advisory Agreement was fair and reasonable and it was unanimously approved.
db X-trackers Municipal Infrastructure Revenue Bond Fund and db X-trackers Regulated Utilities Fund
At a special meeting held on March 25, 2013, the Board of Trustees, including the Independent, unanimously approved the Investment Advisory Agreement and the Sub-Investment Advisory Agreements relating to db X-trackers Municipal Infrastructure Revenue Bond Fund and db X-trackers Regulated Utilities Fund.
In reaching these decisions with respect to each Fund, the Board considered all factors it believed relevant, including (1) the nature, extent and quality of the services to be provided to the Fund and its shareholders (including the investment performance of the Sub-Adviser’s fund clients); (2) the performance of the Sub-Adviser with respect to its management of other comparable funds generally, as well as the Sub-Adviser’s financial resources and its resulting ability to perform its obligations under the Sub-Advisory Agreement; (3) the Adviser’s financial resources and its resulting ability to perform its obligations under the Advisory Agreement; (4) the competitiveness of the advisory fee and the sub-advisory fee; (5) the total cost of the services to be provided by and the profits that could be realized by the Adviser and the Sub-Adviser from their relationships with the Fund; and (6) the extent to which economies of scale would be realized as the Fund grows, and if the fund shareholders would benefit from those economies.
The Board reached a determination, with the assistance of Trust counsel and through the exercise of its business judgment, that approval of the Investment Advisory Agreements and the Sub-Investment Advisory Agreements (together, the “Agreements”) and the compensation to be received thereunder is consistent with the Board’s duties under state and federal law. The Board reached this conclusion based on multiple factors.
Nature, Extent and Quality of Services. The Board reviewed in detail the nature, extent and quality of services to be provided by the Adviser and the Sub-Adviser under the Agreements. The Board noted that these services include, among other things, furnishing a continuous investment program for the Fund, including arranging for, or implementing, the purchase and sale of portfolio securities, the provision of general corporate services such as portfolio management compliance services and the preparation and filing of certain reports on behalf of the Trust. The Board also considered, among other things, the professional experience and qualifications of the senior management and key professional personnel of the Adviser, including those individuals responsible for portfolio management. The Board considered that the Adviser provides, at its own expense, office facilities and equipment for use by the Fund and supervisory persons responsible for supervising and monitoring the Trust’s service providers. The Board also considered that the Adviser pays for the compensation of officers of the Trust who are also officers or employees of the Adviser, except as may otherwise be determined by the Board. The Board also considered that the Adviser arranges for the provision of transfer agency, custody, fund administration and accounting, and other non-distribution services necessary for the Fund’s operation. The Board also considered the role to be played by the Adviser in working with the Sub-Adviser to manage the Fund’s portfolio, noting that the Adviser would provide oversight of day-to-day operations, including monitoring tracking error,
36
DBX ETF Trust
BOARD CONSIDERATIONS IN APPROVAL OF INVESTMENT
ADVISORY AND SUB-ADVISORY CONTRACTS (Unaudited) (Continued)
providing services in connection with creation and redemption units and assistance in meeting legal and regulatory requirements applicable to the Fund.
The Board also considered the Sub-Adviser’s operational capabilities and resources, and its experience in serving as investment sub-adviser to other funds, including those with comparable investment strategies. The Board considered the professional experience and qualifications of the Sub-Adviser’s senior management and key professional personnel, as well as the Sub-Adviser’s depth and breadth of experience in managing investment portfolios consisting of index-based portfolios and the type of securities in which the Fund invests. The Board gave special consideration to the Sub-Adviser’s experience and capabilities in managing portfolios comprised of non-U.S. equity securities, and their techniques for tracking an index while minimizing index tracking error. In addition, the Board considered the Sub-Adviser’s operational capabilities and resources.
The Board evaluated these factors in consultation with Fund counsel. Based on its review, the Board concluded that the nature, extent, and quality of services to be provided by the Adviser under the Investment Advisory Agreements are reasonable and appropriate in relation to the fees to be paid to the Adviser. The Board considered the staffing of the Adviser, including the training, qualifications and experience of investment personnel in managing the Fund. The Board also considered the expertise of the Adviser in supervising third party service providers to the Fund, such as the administrator and custodian. The Board further considered the compliance program of the Adviser which supports the Fund’s compliance program. Additionally, based on its review, the Board concluded that the nature, extent, and quality of services to be provided by the Sub-Advisers under the Sub-Advisory Agreements are reasonable and appropriate in relation to the fees to be paid to each Sub-Adviser, taking special consideration of the fact that the fees to be paid to each Sub-Adviser are payable by the Adviser and not the Fund.
Performance of the Sub-Advisers; the Sub-Advisers’ Financial Resources. With respect to each Fund, the Board noted that operations had not commenced and there is no performance history. The Board considered each Sub-Adviser’s performance in managing other similar index-based portfolios and its ability to minimize tracking error for such portfolios. The Board concluded that, given each Sub-Adviser’s capabilities and experience managing other index-based portfolios, each Sub-Adviser should be able to keep the Fund’s tracking error within acceptable ranges.
The Board also considered each Sub-Adviser’s financial condition and whether it had the resources necessary to carry out its functions. The Board concluded that each Sub-Adviser had the financial resources necessary to perform its obligations under the respective Sub-Investment Advisory Agreement.
Adviser’s Financial Resources. In connection with the assessment of the ability of the Adviser to perform its duties under the Investment Advisory Agreements, the Board considered the Adviser’s financial condition and whether it had the resources necessary to carry out its functions. The Board concluded that the Adviser had the financial resources necessary to perform its obligations under the Advisory Agreements.
Competitiveness of Fees. The Board considered the competitiveness of each of the Fund’s fee to other comparable exchange-traded funds (ETFs), and noted that each Fund’s fee is competitive with the fees of its respective peer group. The Board noted that the proposed fee for each Fund is a unitary fee pursuant to which the Adviser pays all of the Funds’ costs, including the Sub-Adviser’s fee. Based on its review, the Board concluded that each advisory fee and sub-advisory fee is reasonable in light of the services provided.
Costs of Services and Profitability. The Board considered the expenses of the Adviser in developing and rendering services to be provided to the Funds, and the likelihood and level of profits in the early years of the Funds’ operations. The Board considered the asset levels at which the Adviser expects to “break-even” with respect to its operation of the Funds and noted that the fee paid by the Adviser to the Sub-Adviser under the Sub-Advisory Agreement contained breakpoints, and accordingly, the Adviser could experience increased profitability as each Fund’s assets increased. Given the costs of the services to be provided by and the profits that could be realized by the Adviser in connection with the management of the Funds, the Board determined that the amount of potential profit was fair.
Economies of Scale. The Board noted that at the current fee rate the Fund would not experience economies of scale. The Board determined to review economies of scale on an ongoing basis as a result of asset growth of the Fund.
Given all the information available to it and considering all material factors, the Board concluded that each Investment Advisory Agreement and Sub-Advisory Agreement was fair and reasonable and they were unanimously approved.
37
DBX ETF Trust
ADDITIONAL INFORMATION (Unaudited)
Proxy Voting Policies and Procedures
The Funds’ policies and procedures for voting proxies for portfolio securities and information about how each Fund voted proxies related to its portfolio securities during the 12-month period ended June 30 are available on our Web site — www.dbxus.com (click on “proxy voting” at the bottom of the page) — or on the SEC’s Web site — www.sec.gov. To obtain a written copy of the Funds’ policies and procedures without charge, upon request, call us toll free at (855) 329-3837.
Quarterly Portfolio Disclosure
The Funds are required to file their complete schedule of portfolio holdings with the SEC for their first and third fiscal quarters on Form N-Q. Copies of the filings are available without charge, upon request on the SEC’s website at www.sec.gov and are available by calling the Company at 855-329-3837. You can also obtain copies of Form N-Q by (i) visiting the SEC’s Public Reference Room in Washington, DC (information on the operation of the Public Reference Room may be obtained by calling 800-SEC-0330); (ii) sending your request and a duplicating fee to the SEC’s Public Reference Room, Washington, DC 20549-0102; or (iii) sending your request electronically to publicinfo@sec.gov.
Information about each Fund’s portfolio holdings is available daily at www.dbxus.com.
Discount & Premium Information
Information regarding how often shares of each Fund traded on NYSE Arca at a price above (i.e., at a premium) or below (i.e., at a discount) the Net Asset Value of the Fund can be found at www.dbxus.com.
Tax Information
Form 1099-DIV, Form 1042-S and other year-end tax information provide shareholders with actual calendar year amounts that should be included in their tax returns. Shareholders should consult their tax advisors.
db X-trackers Regulated Utilities Fund designates the following amounts or, if subsequently determined to be different, the maximum amount allowable for its fiscal year ended May 31, 2014.
| Qualified Divided Income* | Dividends Received Deduction* | |||||||
db X-trackers Regulated Utilities Fund | 100% | 79% | ||||||
* The above percentage is based on ordinary income dividends paid to shareholders during the Fund’s fiscal year.
Of the dividends paid from net investment income for the fiscal year ended May 31, 2014 for db X-trackers Municipal Infrastructure Revenue Bond Fund, 100% are designated as exempt interest dividends for federal income tax purposes.
38
DBX ETF Trust
PRIVACY POLICY NOTICE (Unaudited)
DBX Advisors LLC (“Advisors”) collects non-public information about you from the following sources: (i) information received from you on applications or other forms; and (ii) information about your transactions with the Advisors, Advisors’ affiliates and third-party service providers and vendors. Advisors does not disclose any non-public personal information about you to anyone, other than as set forth below, as permitted by applicable law and regulation. Advisors may disclose non-public personal information about you to the funds in which you invest, to Advisors’ affiliates, and to non-affiliated companies that work with Advisors to service your account(s), or to provide services or process transactions that you have requested. Advisors may disclose non-public personal information in situations that may include, but are not limited to, in response to legal and/or regulatory inquiries and the proposed or actual sale, assignment merger or other transfer of all or a portion of Advisors’ business to another business entity. Advisors may also disclose non-public personal information about you to parties representing you, such as your investment representative, your accountant, your tax adviser, or to other third parties at your direction/consent. Advisors will not sell, rent, license or trade your personal and financial information to or with third parties for their own direct marketing use unless you give us general or specific consent to do so. If you decide to close your account(s) or become an inactive customer, Advisors will adhere to the privacy policies and practices as described in this notice. Advisors restricts access to your personal and account information to those employees who need to know that information to provide products and services to you. Advisors maintains reasonable and customary physical, electronic and procedural safeguards to guard your non-public personal information.
Advisors reserves the right, at their discretion, to change, modify, add, or remove portions of this Privacy Policy Notice, and any of the policies described herein, at any time. Advisors will indicate any such changes to the Privacy Policy Notice at the privacy link which can be found at www.dbxus.com. At all times, you are bound by the then-current version of the Privacy Policy and all applicable laws. Advisors highly recommends that you review this Privacy Policy Notice from time to time to ensure that you are familiar with the most recent version. The examples contained in this Privacy Policy Notice are illustrations; they are not intended to be exclusive.
39
DBX ETF Trust
This report is intended for the shareholders of DBX ETF Trust.
Carefully consider a Fund’s investment objectives, risk factors and charges and expenses before investing. This and other information can be found in the Fund’s prospectus, which may be obtained by calling 1-855-DBX-ETFS (1-855-329-3837), or by viewing or downloading a prospectus at WWW.DBXUS.COM. Read the prospectus carefully before investing.
Investing involves risk, including possible loss of principal.
Stocks may decline in value. Investments in bonds and bond funds are subject to interest rate, credit, liquidity and market risks to varying degrees. Generally, all other factors being equal, bond prices are inversely related to interest-rate changes and rate increases can cause price declines. Credit risk refers to the possibility that the bond issuer will not be able to make principal and interest payments. High yield bonds involve increased credit and liquidity risk, and are considered speculative in terms of the issuer’s ability to pay interest and repay principal in a timely manner. Subordinated securities are more likely to suffer a credit loss than non-subordinated securities of the same issuer. Income from municipal bonds may be subject to state and local taxes and at times the alternative minimum tax. Funds that concentrate in a particular segment of the market will generally be more volatile than a fund that invests more broadly. Please read the prospectus for more information. An investment in any Fund should be considered only as a supplement to a complete investment program for those investors willing to accept the risks associated with that fund.
Shares of the Funds are bought and sold at market price (not NAV) throughout the day on the New York Stock Exchange. Transactions in Fund shares may result in brokerage commissions and may generate tax consequences. There can be no assurance that an active trading market for shares of a fund will develop or be maintained.
DBX ETF Trust Funds are distributed by ALPS Distributors, Inc. The Funds are managed by DBX Advisors LLC which is not affiliated with ALPS.
Deutsche Asset & Wealth Management is the brand name for the asset and wealth management activities conducted by Deutsche Bank AG or any of its subsidiaries. Clients will be provided Deutsche Asset & Wealth Management products or services by one or more legal entities that will be identified to clients pursuant to the contracts, agreements, offering materials or other documentation relevant to such products or services.
Copyright © 2013 Deutsche Bank AG. All rights reserved. db-X® is a registered trademark of Deutsche Bank AG. All other trademarks, servicemarks or registered trademarks are the property of their respective owners.
Not FDIC Insured — No Bank Guarantee — May Lose Value
DBX ETF Trust
INVESTMENT ADVISOR
DBX Advisors LLC
60 Wall Street
New York, NY 10005
INVESTMENT SUB-ADVISOR
Deutsche Investment Management Americas Inc.
245 Park Avenue
New York, NY 10154
ADMINISTRATOR, CUSTODIAN, FUND ACCOUNTANT & TRANSFER AGENT
The Bank of New York Mellon
101 Barclay Street
New York, NY 10286
DISTRIBUTOR
ALPS Distributors, Inc.
1290 Broadway
Suite 1100
Denver, CO 80203
INDEPENDENT REGISTERED PUBLIC ACCOUNTING FIRM
Ernst & Young LLP
5 Times Square
New York, NY 10036
LEGAL COUNSEL
Dechert LLP
1095 Avenue of the Americas
New York, NY 10036
R-35362-1 (8/14) DBX973 (8/15)
| Item 2. | Code of Ethics. |
| (a) | The registrant, as of the end of the period covered by this report, has adopted a code of ethics that applies to the registrant’s principal executive officer, principal financial officer, principal accounting officer or controller, or persons performing similar functions, regardless of whether these individuals are employed by the registrant or a third party. |
| (c) | There have been no amendments, during the period covered by this report, to a provision of the code of ethics that applies to the registrant’s principal executive officer, principal financial officer, principal accounting officer or controller, or persons performing similar functions, regardless of whether these individuals are employed by the registrant or a third party, and that relates to any element of the code of ethics description. |
| (d) | The registrant has not granted any waivers, including an implicit waiver, from a provision of the code of ethics that applies to the registrant’s principal executive officer, principal financial officer, principal accounting officer or controller, or persons performing similar functions, regardless of whether these individuals are employed by the registrant or a third party, that relates to one or more of the items set forth in paragraph (b) of this item’s instructions. |
| Item 3. | Audit Committee Financial Expert. |
Stephen Byers is the designated financial expert on the Audit Committee of DBX ETF Trust with respect to DBX ETF Trust, Stephen Byers is not an “interested person” as such terms are defined by Section 2(a)(19) of the Act (15 U.S.C. 80a-2(a)(19).
| Item 4. | Principal Accountant Fees and Services. |
Audit Fees
| (a) | The aggregate fees billed for each of the last two fiscal years for professional services rendered by the principal accountant for the audit of the registrant’s annual financial statements or services that are normally provided by the accountant in connection with statutory and regulatory filings or engagements for those fiscal years are $323,000 for 2014 and $90,000 for 2013. |
Audit-Related Fees
| (b) | The aggregate fees billed in each of the last two fiscal years for assurance and related services by the principal accountant that are reasonably related to the performance of the audit of the registrant’s financial statements and are not reported under paragraph (a) of this Item are $50,000 for 2014 and $0 for 2013. |
Tax Fees
| (c) | The aggregate fees billed in each of the last two fiscal years for professional services rendered by the principal accountant for tax compliance, tax advice, and tax planning are $122,400 for 2014 and $15,000 for 2013. |
All Other Fees
| (d) | The aggregate fees billed in each of the last two fiscal years for products and services provided by the principal accountant, other than the services reported in paragraphs (a) through (c) of this Item are $0 for 2014 and $0 for 2013. |
| (e)(1) | In accordance with Rule 2-01(c)(7)(A), the Audit Committee pre-approves all of the audit and permissible non-audit services of the Registrant. |
| (e)(2) | All of the services described in paragraphs (b) through (d) above were approved by the Audit Committee in accordance with paragraph (c) (7) (i) (c) of Rule 2-01 of Regulation S-X. |
| (f) | Not Applicable. |
| (g) | The aggregate non-audit fees billed by the registrant’s accountant for services rendered to the registrant, and rendered to the registrant’s investment adviser (not including any sub-adviser whose role is primarily portfolio management and is subcontracted with or overseen by another investment adviser), and any entity controlling, controlled by, or under common control with the adviser that provides ongoing services to the registrant for each of the last two fiscal years of the registrant was $4,524,752 for 2014 and $0 for 2013. |
| (h) | The registrant’s audit committee of the board of directors has considered whether the provision of non-audit services that were rendered to the registrant’s investment adviser (not including any sub-adviser whose role is primarily portfolio management and is subcontracted with or overseen by another investment adviser), and any entity controlling, controlled by, or under common control with the investment adviser that provides ongoing services to the registrant that were not pre-approved pursuant to paragraph (c)(7)(ii) of Rule 2-01 of Regulation S-X is compatible with maintaining the principal accountant’s independence. |
| Item 5. | Audit Committee of Listed registrants. |
The Registrant is a listed issuer as defined in Rule 10A-3 under the Exchange Act and has a separately-designated standing audit committee established in accordance with Section 3(a)(58)(A) of the Exchange Act. The Registrant’s audit committee members are Stephen R. Byers, J. David Officer and George O. Elston.
| Item 6. | Investments. |
| (a) | Schedule of Investments in securities of unaffiliated issuers as of the close of the reporting period is included as part of the report to shareholders filed under Item 1 of this form. |
| (b) | Not applicable. |
| Item 7. | Disclosure of Proxy Voting Policies and Procedures for Closed-End Management Investment Companies. |
Not applicable.
| Item 8. | Portfolio Managers of Closed-End Management Investment Companies. |
Not applicable.
| Item 9. | Purchases of Equity Securities by Closed-End Management Investment Company and Affiliated Purchasers. |
Not applicable.
| Item 10. | Submission of Matters to a Vote of Security Holders. |
There were no material changes to the procedures by which shareholders may recommend nominees to the Registrant’s Board of Trustees.
| Item 11. | Controls and Procedures. |
| (a) | The Chief Executive and Financial Officers concluded that the Registrant’s Disclosure Controls and Procedures are effective based on the evaluation of the Disclosure Controls and Procedures as of a date within 90 days of the filing date of this report. |
| (b) | There have been no changes in the registrant’s internal control over financial reporting that occurred during the second fiscal quarter of the period covered by this report that has materially affected, or is reasonably likely to materially affect, the registrant’s internal controls over financial reporting. |
| Item 12. | Exhibits. |
| (a)(1) | Code of ethics, or any amendment thereto, that is the subject of disclosure required by Item 2 is attached hereto. |
| (a)(2) | Certifications pursuant to Rule 30a-2(a) under the 1940 Act and Section 302 of the Sarbanes-Oxley Act of 2002 are attached hereto. |
| (a)(3) | Not applicable. |
| (b) | Certifications pursuant to Rule 30a-2(b) under the 1940 Act and Section 906 of the Sarbanes-Oxley Act of 2002 are attached hereto. |
(12.other) Not applicable.
SIGNATURES
Pursuant to the requirements of the Securities Exchange Act of 1934 and the Investment Company Act of 1940, the registrant has duly caused this report to be signed on its behalf by the undersigned, thereunto duly authorized.
| (Registrant) DBX ETF Trust | ||||
| By (Signature and Title)* | /s/ Alex Depetris | |||
| Alex Depetris | ||||
| President and Chief Executive Officer | ||||
Date August 7, 2014
Pursuant to the requirements of the Securities Exchange Act of 1934 and the Investment Company Act of 1940, this report has been signed below by the following persons on behalf of the registrant and in the capacities and on the dates indicated.
| By (Signature and Title)* | /s/ Alex Depetris | |||
| Alex Depetris | ||||
| President and Chief Executive Officer | ||||
| Date August 7, 2014 | ||||
| By (Signature and Title)* | /s/ Michael Gilligan | |||
| Michael Gilligan | ||||
| Treasurer, Chief Financial Officer and Controller | ||||
Date August 7, 2014
* Print the name and title of each signing officer under his or her signature.