UNITED STATES
SECURITIES AND EXCHANGE COMMISSION
Washington, D.C. 20549
FORM N-CSR
CERTIFIED SHAREHOLDER REPORT OF REGISTERED
MANAGEMENT INVESTMENT COMPANIES
Investment Company Act file number 811-22487
DBX ETF Trust
(Exact name of registrant as specified in charter)
875 Third Avenue
New York, New York 10022
(Address of principal executive offices) (Zip code)
Diane Kenneally
100 Summer Street
Boston, MA 02110
(Name and address of agent for service)
Registrant’s telephone number, including area code: (212) 454-4500
Date of fiscal year end: August 31
Date of reporting period: August 31, 2022
Form N-CSR is to be used by management investment companies to file reports with the Commission not later than 10 days after the transmission to stockholders of any report that is required to be transmitted to stockholders under Rule 30e-1 under the Investment Company Act of 1940 (17 CFR 270.30e-1). The Commission may use the information provided on Form N-CSR in its regulatory, disclosure review, inspection, and policymaking roles.
A registrant is required to disclose the information specified by Form N-CSR, and the Commission will make this information public. A registrant is not required to respond to the collection of information contained in Form N-CSR unless the Form displays a currently valid Office of Management and Budget (“OMB”) control number. Please direct comments concerning the accuracy of the information collection burden estimate and any suggestions for reducing the burden to Secretary, Securities and Exchange Commission, 450 Fifth Street, NW, Washington, DC 20549-0609. The OMB has reviewed this collection of information under the clearance requirements of 44 U.S.C. § 3507.
Item 1. Reports to Stockholders.
| (a) | The Report to Shareholders is attached herewith. |

August 31, 2022
Annual Report
DBX ETF Trust
Xtrackers FTSE Developed ex US Multifactor ETF (DEEF)
Xtrackers MSCI Kokusai Equity ETF (KOKU)
Xtrackers Russell 1000 US Quality at a Reasonable Price ETF (QARP)
Xtrackers Russell US Multifactor ETF (DEUS)

DBX ETF Trust
| Page | ||||
| 1 | ||||
| 3 | ||||
Performance Summary | ||||
| 5 | ||||
| 7 | ||||
| 9 | ||||
| 11 | ||||
| 13 | ||||
Schedule of Investments | ||||
| 14 | ||||
| 32 | ||||
| 42 | ||||
| 47 | ||||
| 57 | ||||
| 58 | ||||
| 59 | ||||
| 61 | ||||
| 63 | ||||
| 72 | ||||
| 74 | ||||
| 77 | ||||
To our Shareholders: (Unaudited)
Dear shareholder,
We are pleased to provide this annual report for four of our equity ETFs for the period ended August 31, 2022.
The global economy slowed down as high inflation with soaring energy and food prices, fueled by Russia’s military invasion on Ukraine, rising interest rates, supply chain disruptions and COVID-19-led lockdowns took a heavy toll on the markets. Higher-than-expected inflation in most parts of the world was pronounced particularly in developed economies like the US and Europe. The global output contracted in the second quarter of the year, with major economies reeling under inflationary pressure. China’s slowdown was spurred by a resurgence in COVID-19 cases, strict lockdowns, and negative spillovers from the Russia-Ukraine conflict. Amid fears of a global economic recession, central banks implemented aggressive monetary policies as a measure to curb high inflation.
U.S. equities witnessed heightened volatility in 2022 amid a slowdown in economic growth, weakness in consumer confidence and a less favorable long-term economic outlook. High inflation readings, tepid personal consumption expenditure, supply chain disruptions, the Federal Reserve’s aggressive monetary policy and impacts of the Russia-Ukraine war weighed on market sentiments. Central bank officials incrementally raised rates in each of their meetings from 25 to 75 basis points1 (bps) as inflation jumped to its highest level in 40 years. The 75-bps rate hike in July 2022 for a second successive month marked the fastest pace of policy tightening in the past four decades. However, healthy corporate earnings results, a robust job market and strong labor force participation were some of the positives during the reporting period.
The Eurozone was mired in high inflation, rising interest rates and supply chain disruptions, fueled by the Russia-Ukraine war. However, the region sustained its growth in Q2 2022, supported by the easing out of COVID-19 restrictions and the summer tourism season in southern countries. Italy and Spain, the Eurozone’s third and fourth largest economies, respectively, were the major contributors to growth, while the bloc’s largest economy, Germany stalled. France, Eurozone’s second-largest economy posted growth, backed by a positive contribution from net trade, as exports grew. The import reduction of oil and gas from Russia raised gas and commodity prices in Europe, leading to higher inflation and a bearing on the overall demand environment. Although the labor market remained robust, consumer confidence dipped significantly. In line with many central banks, the European Central Bank (ECB) raised interest rates by 50 bps in July 2022 — its first-rate hike in more than a decade — to prevent high inflation. Furthermore, the ECB approved the Transmission Protection Instrument mechanism for the smooth transmission of its monetary policy across all euro area countries.
The UK economy witnessed a slowdown in GDP growth, as household spending and business activity were hit by rising inflation levels. The Bank of England raised the interest rate in a similar move with the central banks of other countries. The employment market remains strong with the unemployment rate falling to pre-pandemic levels. Japan’s economy faced a resurgence in COVID-19 cases amid persistent supply chain disruptions and inflationary pressure.
The war in Ukraine is expected to contribute to a significant slowdown in global economic growth in 2022 and add to inflation. Central banks across the world are likely to maintain a hawkish stance, as controlling high inflation has become the primary objective. Consumer confidence has remained weak owing to a less favorable long-term economic outlook and as a fragmented recovery is anticipated. Investors would need to keep an eye on potential sanctions on Russian energy by the European Union, as any further supply crunch on oil and gas could sustain the record-high inflation rates.
Our team appreciates your trust and looks forward to serving your investment needs through innovative index-driven strategies.
Sincerely,
/s/ Freddi Klassen
Freddi Klassen
President and Chief Executive Officer
1 Basis points are a unit of measurement equal to 1/100th of 1 percent and a standard measure for interest rates.
Assumptions, estimates and opinions contained in this document constitute our judgment as of the date of the document and are subject to change without notice. Any projections are based on a number of assumptions as to market conditions and there can be no guarantee that any projected results will be achieved. Past performance is not a guarantee of future results.
1
This Page is Intentionally Left Blank
2
DBX ETF Trust
Xtrackers FTSE Developed ex-US Multifactor Factor ETF
The Xtrackers FTSE Developed ex-US Multifactor Factor ETF (DEEF) seeks investment results that correspond generally to the performance, before fees and expenses, of the FTSE Developed ex-US Comprehensive Factor Index (the DEEF Index). The DEEF Index is designed to track the equity market performance of companies in developed countries (except the United States) selected on the investment style criteria (“factors”) of value, momentum, quality, low volatility and size. The companies eligible for the DEEF Index are derived from its starting universe, the FTSE Developed ex US Index, which is comprised of large- and mid-capitalization equity securities from developed markets (except the United States). For the 12-month period ended August 31, 2022, DEEF shares returned -19.75%, compared to the DEEF Index return of -19.42%.
All sectors contributed negatively to performance during the period with the Industrials, Materials, and Real Estate sectors detracting the most from performance. From a geographical perspective, Israel, Singapore, and Canada were the major positive contributors, while Japan, Great Britain, and Sweden contributed negatively to performance.
Xtrackers MSCI Kokusai Equity ETF
The Xtrackers MSCI Kokusai Equity ETF (KOKU) seeks investment results that correspond generally to the performance, before fees and expenses, of the MSCI Kokusai Index (the KOKU Index). The KOKU Index is also known as the MSCI World ex-Japan Index. The KOKU Index is designed to track the performance of equity markets in developed markets (excluding Japan). The MSCI World Index is a free float-adjusted market capitalization index that is designed to measure developed-market equity performance throughout the world. For the 12-month period ended August 31, 2022, KOKU shares returned -14.55%, compared to the KOKU Index return of -14.80%.
The majority of sectors contributed negatively to performance during the period with the greatest negative contributions coming from Information Technology, Communication Services, and Consumer Discretionary. The Energy and Utilities sectors were the positive contributors to performance. From a geographical perspective, Singapore, Israel, and Norway were the major positive contributors, while the US, Germany and France contributed negatively to performance.
Xtrackers Russell 1000 US Quality at a Reasonable Price ETF
The Xtrackers Russell 1000 US Quality at a Reasonable Price ETF (QARP) seeks investment results that correspond generally to the performance, before fees and expenses, of the Russell 1000 2Qual/Val 5% Capped Factor Index (the QARP Index). The QARP Index is designed to track the equity market performance of companies in the United States selected on the investment style criteria (“factors”) of quality and value. The companies eligible for the QARP Index are derived from its starting universe, the Russell 1000 Index, which is comprised of large-cap equity securities from issuers in the United States. For the 12-month period ended August 31, 2022, QARP shares returned -9.84%, compared to the QARP Index return of -9.65%.
The majority of sectors contributed negatively to performance during the period with the greatest negative contributions coming from Communication Services, Information Technology and Consumer Discretionary. The Energy, Health Care and Materials sectors were the positive contributors to performance.
Xtrackers Russell US Multifactor ETF
The Xtrackers Russell US Multifactor ETF (DEUS) seeks investment results that correspond generally to the performance, before fees and expenses, of the Russell 1000 Comprehensive Factor Index (the DEUS Index). The DEUS Index is designed to track the equity market performance of companies in the United States selected on the investment style criteria (“factors”) of value, momentum, quality, low volatility and size. The companies eligible for the DEUS Index are derived from its starting universe, the Russell 1000 Index, which is comprised of large-cap equity securities from issuers in the United States. For the 12-month period ended August 31, 2022, DEUS shares returned -8.80%, compared to the DEUS Index return of -8.64%.
The majority of sectors contributed negatively to performance during the period with the greatest negative contributions coming from Information Technology, Industrials, and Consumer Discretionary. The Energy, Utilities, and Consumer Staples sectors contributed positively to performance.
*************************
3
DBX ETF Trust
Management’s Discussion of Fund Performance (Unaudited) (Continued)
Performance data quoted represents past performance and does not guarantee future results. Investment returns and principal value of an investment will fluctuate so that an investor’s shares, when sold or redeemed, may be worth more or less than their original cost. Current performance may be lower or higher than the performance data quoted. To obtain the most recent month-end performance data visit www.Xtrackers.com. Returns assume that dividends and capital gains distributions have been reinvested. See pages 5-11 of this report for additional performance information, including performance data based on market value.
The views expressed in this report reflect those of the portfolio management team only through the end of the period of the report as stated on the cover. The management team’s views are subject to change at any time based on market and other conditions and should not be construed as a recommendation. Current and future portfolio holdings are subject to risk.
4
DBX ETF Trust
Performance Summary (Unaudited)
Xtrackers FTSE Developed ex US Multifactor ETF (DEEF)
Xtrackers FTSE Developed ex US Multifactor ETF (the “Fund”), using a “passive” or indexing investment approach, seeks investment results that correspond generally to the performance, before fees and expenses, of the FTSE Developed ex US Comprehensive Factor Index (the “Underlying Index”). The Underlying Index is designed to track the equity market performance of companies in developed countries (except the United States) selected on the investment style criteria (“factors”) of value, momentum, quality, low volatility and size. The companies eligible for the Underlying Index are derived from its starting universe, the FTSE Developed ex US Index, which is comprised of large- and mid-capitalization equity securities from developed markets (except the United States). It is not possible to invest directly into an index.
| Performance as of August 31, 2022 |
| Average Annual Total Returns | ||||||||
| Net Asset Value | Market Value | FTSE Developed ex US Comprehensive Factor Index | FTSE Developed ex US Net Tax (US RIC) Index | |||||
One Year | -19.75% | -20.05% | -19.42% | -19.24% | ||||
Five Year | 1.26% | 1.01% | 1.65% | 2.28% | ||||
Since Inception1 | 3.53% | 3.43% | 4.05% | 4.26% | ||||
| Cumulative Total Returns | ||||||||
| Net Asset Value | Market Value | FTSE Developed ex US Comprehensive Factor Index | FTSE Developed ex US Net Tax (US RIC) Index | |||||
One Year | -19.75% | -20.05% | -19.42% | -19.24% | ||||
Five Year | 6.44% | 5.15% | 8.52% | 11.95% | ||||
Since Inception1 | 26.51% | 25.66% | 30.89% | 32.70% | ||||
1 Total returns are calculated based on the commencement of operations, November 24, 2015 (“Inception”).
Past performance is no guarantee of future results. Current performance may be lower or higher than the performance data quoted. Performance data current to the most recent month-end is available at www.Xtrackers.com. Performance results assume reinvestment of all dividends and capital gain distributions and do not reflect the deduction of taxes that a shareholder would pay on fund distributions or on the sale of fund shares or redemption of fund creation units. The investment return and principal value of shares will vary with changes in market conditions. Shares may be worth more or less than their original cost when they are sold in the market or redeemed. Performance for certain funds may reflect a waiver of a portion of the unitary advisory fee. Without such waiver, performance would have been lower. The gross expense ratio of the Fund, as stated in the fee table of the prospectus dated December 17, 2021, was 0.35%, and may differ from the expense ratio disclosed in the Financial Highlights table in this report.
The Fund’s net asset value or “NAV” is calculated by dividing the value of the Fund’s total assets less total liabilities by the number of shares outstanding. The price used to calculate market return (“Market Price”) is determined by using the midpoint between the highest bid and the lowest offer on the primary stock exchange on which shares of a fund are listed for trading, as of the time that such fund’s NAV is calculated. Since shares of a fund may not have traded in the secondary market until after the fund’s inception, for the period from inception to the first day of secondary trading, the NAV of the fund is used as a proxy for the Market Price to calculate market returns. Market and NAV returns assume that dividends and capital gain distributions have been reinvested at Market Price and NAV, respectively.
An index is a statistical composite that tracks a specified financial market or sector. Unlike a fund, an index does not actually hold a portfolio of securities and therefore does not incur the expenses incurred by a fund. These expenses negatively impact fund performance. Also, market returns do not include brokerage commissions that may be payable on secondary market transactions. If brokerage commissions were included, market returns would be lower.
Generally accepted accounting principles require adjustments to be made to the net assets of the Fund at period end for financial reporting purposes only, and as such, the total return based on the unadjusted net asset value per share may differ from the total return reported in the financial highlights.
5
DBX ETF Trust
Performance Summary (Unaudited)
Xtrackers FTSE Developed ex US Multifactor ETF (DEEF) (Continued)
| Growth of an Assumed $10,000 Investment |
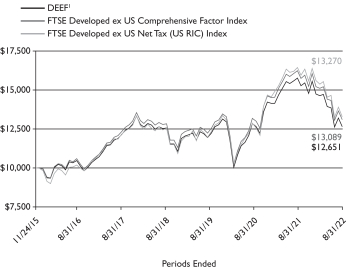
1 Based on Net Asset Value from commencement of operations, November 24, 2015.
| Sector Diversification* as of August 31, 2022 |
Industrials | 19.6% | |||
Consumer Staples | 13.1% | |||
Materials | 11.8% | |||
Financials | 11.5% | |||
Utilities | 8.3% | |||
Real Estate | 8.1% | |||
Consumer Discretionary | 7.7% | |||
Communication Services | 6.9% | |||
Information Technology | 4.9% | |||
Health Care | 4.6% | |||
Energy | 3.5% | |||
|
| |||
Total | 100.0% |
| Ten Largest Equity Holdings as of August 31, 2022 (6.0% of Net Assets) |
| Description | % of Net Assets | |||
Segro PLC (United Kingdom) | 0.7% | |||
Imperial Brands PLC (United Kingdom) | 0.7% | |||
Ampol Ltd. (Australia) | 0.7% | |||
Sonic Healthcare Ltd. (Australia) | 0.6% | |||
Tesco PLC (United Kingdom) | 0.6% | |||
Rio Tinto Ltd. (Australia) | 0.6% | |||
Medibank Pvt Ltd. (Australia) | 0.6% | |||
Woodside Energy Group Ltd. (Australia) | 0.5% | |||
Metro, Inc. (Canada) | 0.5% | |||
Elia Group SA/NV (Belgium) | 0.5% | |||
| Country Diversification* as of August 31, 2022 |
Japan | 25.4% | |||
Australia | 13.7% | |||
United Kingdom | 10.5% | |||
Canada | 5.6% | |||
Sweden | 4.8% | |||
South Korea | 4.2% | |||
Switzerland | 3.9% | |||
France | 3.6% | |||
Germany | 3.5% | |||
Singapore | 3.4% | |||
Israel | 3.0% | |||
Netherlands | 2.3% | |||
Hong Kong | 2.3% | |||
Finland | 2.1% | |||
Other | 11.7% | |||
|
| |||
Total | 100.0% |
* As a percent of total investments excluding securities lending collateral and cash equivalents.
Portfolio holdings and characteristics are subject to change. For more complete details about the Fund’s investment portfolio see page 14.
6
DBX ETF Trust
Performance Summary (Unaudited)
Xtrackers MSCI Kokusai Equity ETF (KOKU)
Xtrackers MSCI Kokusai Equity ETF (the “Fund”), using a “passive” or indexing investment approach, seeks investment results that correspond generally to the performance, before fees and expenses, of the MSCI Kokusai Index (the “Underlying Index”). The MSCI Kokusai Index is also known as the MSCI World ex Japan Index. The Underlying Index is designed to track the performance of equity markets in developed markets (excluding Japan). The MSCI World Index is a free float-adjusted market capitalization index that is designed to measure developed-market equity performance throughout the world. It is not possible to invest directly into an index.
| Performance as of August 31, 2022 | ||||||||
| Average Annual Total Returns | ||||||||
| Net Asset Value | Market Value | MSCI Kokusai Index | MSCI World Index | |||||
One Year | -14.55% | -14.53% | -14.80% | -15.08% | ||||
Since Inception1 | 17.49% | 17.44% | 17.15% | 16.32% | ||||
| Cumulative Total Returns | ||||||||
| Net Asset Value | Market Value | MSCI Kokusai Index | MSCI World Index | |||||
One Year | -14.55% | -14.53% | -14.80% | -15.08% | ||||
Since Inception1 | 47.24% | 47.07% | 46.20% | 43.74% | ||||
1 Total returns are calculated based on the commencement of operations, April 8, 2020 (“Inception”).
Past performance is no guarantee of future results. Current performance may be lower or higher than the performance data quoted. Performance data current to the most recent month-end is available at www.Xtrackers.com. Performance results assume reinvestment of all dividends and capital gain distributions and do not reflect the deduction of taxes that a shareholder would pay on fund distributions or on the sale of fund shares or redemption of fund creation units. The investment return and principal value of shares will vary with changes in market conditions. Shares may be worth more or less than their original cost when they are sold in the market or redeemed. Performance for certain funds may reflect a waiver of a portion of the unitary advisory fee. Without such waiver, performance would have been lower. The gross expense ratio of the Fund, as stated in the fee table of the prospectus dated December 17, 2021, was 0.09%, and may differ from the expense ratio disclosed in the Financial Highlights table in this report.
The Fund’s net asset value or “NAV” is calculated by dividing the value of the Fund’s total assets less total liabilities by the number of shares outstanding. The price used to calculate market return (“Market Price”) is determined by using the midpoint between the highest bid and the lowest offer on the primary stock exchange on which shares of a fund are listed for trading, as of the time that such fund’s NAV is calculated. Since shares of a fund may not have traded in the secondary market until after the fund’s inception, for the period from inception to the first day of secondary trading, the NAV of the fund is used as a proxy for the Market Price to calculate market returns. Market and NAV returns assume that dividends and capital gain distributions have been reinvested at Market Price and NAV, respectively.
An index is a statistical composite that tracks a specified financial market or sector. Unlike a fund, an index does not actually hold a portfolio of securities and therefore does not incur the expenses incurred by a fund. These expenses negatively impact fund performance. Also, market returns do not include brokerage commissions that may be payable on secondary market transactions. If brokerage commissions were included, market returns would be lower.
Generally accepted accounting principles require adjustments to be made to the net assets of the Fund at period end for financial reporting purposes only, and as such, the total return based on the unadjusted net asset value per share may differ from the total return reported in the financial highlights.
7
DBX ETF Trust
Performance Summary (Unaudited)
Xtrackers MSCI Kokusai Equity ETF (KOKU) (Continued)
| Growth of an Assumed $10,000 Investment |
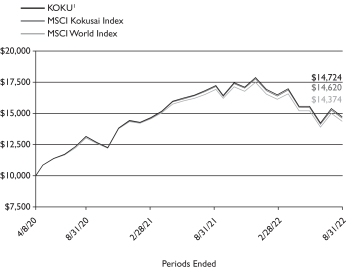
1 Based on Net Asset Value from commencement of operations, April 8, 2020.
| Sector Diversification* as of August 31, 2022 |
Information Technology | 22.2% | |||
Financials | 13.6% | |||
Health Care | 13.5% | |||
Consumer Discretionary | 10.7% | |||
Industrials | 9.3% | |||
Consumer Staples | 7.7% | |||
Communication Services | 7.2% | |||
Energy | 5.5% | |||
Materials | 4.2% | |||
Utilities | 3.3% | |||
Real Estate | 2.8% | |||
|
| |||
Total | 100.0% |
| Ten Largest Equity Holdings as of August 31, 2022 (20.2% of Net Assets) |
| Description | % of Net Assets | |||
Apple, Inc. (United States) | 5.3% | |||
Microsoft Corp. (United States) | 3.9% | |||
Alphabet, Inc. (United States) | 2.7% | |||
Amazon.com, Inc. (United States) | 2.4% | |||
Tesla, Inc. (United States) | 1.5% | |||
UnitedHealth Group, Inc. (United States) | 1.0% | |||
Johnson & Johnson (United States) | 0.9% | |||
Exxon Mobil Corp. (United States) | 0.9% | |||
Meta Platforms, Inc. (United States) | 0.8% | |||
NVIDIA Corp. (United States) | 0.8% | |||
| Country Diversification* as of August 31, 2022 |
United States | 72.5% | |||
United Kingdom | 4.7% | |||
Canada | 3.8% | |||
Switzerland | 3.3% | |||
France | 3.1% | |||
Australia | 2.3% | |||
Germany | 2.1% | |||
Other | 8.2% | |||
|
| |||
Total | 100.0% |
* As a percent of total investments excluding securities lending collateral and cash equivalents.
Portfolio holdings and characteristics are subject to change. For more complete details about the Fund’s investment portfolio see page 32.
8
DBX ETF Trust
Performance Summary (Unaudited)
Xtrackers Russell 1000 US Quality at a Reasonable Price ETF (QARP)
Xtrackers Russell 1000 US Quality at a Reasonable Price ETF (the “Fund”), using a “passive” or indexing investment approach, seeks investment results that correspond generally to the performance, before fees and expenses, of the Russell 1000 2Qual/Val 5% Capped Factor Index (the “Underlying Index”). The Underlying Index is designed to track the equity market performance of companies in the United States selected on the investment style criteria (“factors”) of quality and value. The companies eligible for the Underlying Index are derived from its starting universe, the Russell 1000 Index, which is comprised of large-cap equity securities from issuers in the United States. It is not possible to invest directly into an index.
| Performance as of August 31, 2022 |
| Average Annual Total Returns | ||||||||
| Net Asset Value | Market Value | Russell 1000 2Qual/Val 5% Capped Factor Index | Russell 1000 Index Total Return | |||||
One Year | -9.84% | -9.81% | -9.65% | -12.96% | ||||
Since Inception1 | 11.28% | 11.27% | 11.53% | 11.24% | ||||
| Cumulative Total Returns | ||||||||
| Net Asset Value | Market Value | Russell 1000 2Qual/Val 5% Capped Factor Index | Russell 1000 Index Total Return | |||||
One Year | -9.84% | -9.81% | -9.65% | -12.96% | ||||
Since Inception1 | 60.19% | 60.19% | 61.84% | 60.00% | ||||
1 Total returns are calculated based on the commencement of operations, April 5, 2018 (“Inception”).
Past performance is no guarantee of future results. Current performance may be lower or higher than the performance data quoted. Performance data current to the most recent month-end is available at www.Xtrackers.com. Performance results assume reinvestment of all dividends and capital gain distributions and do not reflect the deduction of taxes that a shareholder would pay on fund distributions or on the sale of fund shares or redemption of fund creation units. The investment return and principal value of shares will vary with changes in market conditions. Shares may be worth more or less than their original cost when they are sold in the market or redeemed. Performance for certain funds may reflect a waiver of a portion of the unitary advisory fee. Without such waiver, performance would have been lower. The gross expense ratio of the Fund, as stated in the fee table of the prospectus dated December 17, 2021, was 0.19%, and may differ from the expense ratio disclosed in the Financial Highlights table in this report.
The Fund’s net asset value or “NAV” is calculated by dividing the value of the Fund’s total assets less total liabilities by the number of shares outstanding. The price used to calculate market return (“Market Price”) is determined by using the midpoint between the highest bid and the lowest offer on the primary stock exchange on which shares of a fund are listed for trading, as of the time that such fund’s NAV is calculated. Since shares of a fund may not have traded in the secondary market until after the fund’s inception, for the period from inception to the first day of secondary trading, the NAV of the fund is used as a proxy for the Market Price to calculate market returns. Market and NAV returns assume that dividends and capital gain distributions have been reinvested at Market Price and NAV, respectively.
An index is a statistical composite that tracks a specified financial market or sector. Unlike a fund, an index does not actually hold a portfolio of securities and therefore does not incur the expenses incurred by a fund. These expenses negatively impact fund performance. Also, market returns do not include brokerage commissions that may be payable on secondary market transactions. If brokerage commissions were included, market returns would be lower.
Generally accepted accounting principles require adjustments to be made to the net assets of the Fund at period end for financial reporting purposes only, and as such, the total return based on the unadjusted net asset value per share may differ from the total return reported in the financial highlights.
9
DBX ETF Trust
Performance Summary (Unaudited)
Xtrackers Russell 1000 US Quality at a Reasonable Price ETF (QARP) (Continued)
| Growth of an Assumed $10,000 Investment |
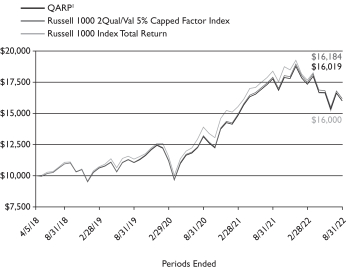
1 Based on Net Asset Value from commencement of operations, April 5, 2018.
| Sector Diversification as of August 31, 2022 |
Information Technology | 16.4% | |||
Industrials | 15.9% | |||
Financials | 13.4% | |||
Health Care | 11.4% | |||
Consumer Discretionary | 9.0% | |||
Materials | 8.2% | |||
Consumer Staples | 7.9% | |||
Utilities | 7.0% | |||
Real Estate | 4.7% | |||
Energy | 3.8% | |||
Communication Services | 2.3% | |||
|
| |||
Total | 100.0% |
| Ten Largest Equity Holdings as of August 31, 2022 (8.3% of Net Assets) |
| Description | % of Net Assets | |||
HP, Inc. | 1.3% | |||
McKesson Corp. | 1.2% | |||
Archer-Daniels-Midland Co. | 1.0% | |||
Nucor Corp. | 0.9% | |||
Molina Healthcare, Inc. | 0.7% | |||
Cognizant Technology Solutions Corp. | 0.7% | |||
Quest Diagnostics, Inc. | 0.7% | |||
Reliance Steel & Aluminum Co. | 0.6% | |||
Kroger Co. | 0.6% | |||
AutoZone, Inc. | 0.6% | |||
* As a percent of total investments excluding exchange-traded funds, securities lending collateral and cash equivalents.
Portfolio holdings and characteristics are subject to change. For more complete details about the Fund’s investment portfolio see page 42.
10
DBX ETF Trust
Performance Summary (Unaudited)
Xtrackers Russell US Multifactor ETF (DEUS)
Xtrackers Russell US Multifactor ETF (the “Fund”), using a “passive” or indexing investment approach, seeks investment results that correspond generally to the performance, before fees and expenses, of the Russell 1000 Comprehensive Factor Index (the “Underlying Index”). The Underlying Index is designed to track the equity market performance of companies in the United States selected on the investment style criteria (“factors”) of value, momentum, quality, low volatility and size. The companies eligible for the Underlying Index are derived from its starting universe, the Russell 1000 Index, which is comprised of large-cap equity securities from issuers in the United States. It is not possible to invest directly into an index.
| Performance as of August 31, 2022 | ||||||||
| Average Annual Total Returns | ||||||||
| Net Asset Value | Market Value | Russell 1000 Comprehensive Factor Index | Russell 1000 Index Total Return | |||||
One Year | -8.80% | -8.86% | -8.64% | -12.96% | ||||
Five Year | 8.92% | 8.91% | 9.05% | 11.61% | ||||
Since Inception1 | 9.66% | 9.65% | 9.83% | 11.78% | ||||
| Cumulative Total Returns | ||||||||
| Net Asset Value | Market Value | Russell 1000 Comprehensive Factor Index | Russell 1000 Index Total Return | |||||
One Year | -8.80% | -8.86% | -8.64% | -12.96% | ||||
Five Year | 53.27% | 53.19% | 54.19% | 73.16% | ||||
Since Inception1 | 86.74% | 86.64% | 88.73% | 112.62% | ||||
1 Total returns are calculated based on the commencement of operations, November 24, 2015 (“Inception”).
Past performance is no guarantee of future results. Current performance may be lower or higher than the performance data quoted. Performance data current to the most recent month-end is available at www.Xtrackers.com. Performance results assume reinvestment of all dividends and capital gain distributions and do not reflect the deduction of taxes that a shareholder would pay on fund distributions or on the sale of fund shares or redemption of fund creation units. The investment return and principal value of shares will vary with changes in market conditions. Shares may be worth more or less than their original cost when they are sold in the market or redeemed. Performance for certain funds may reflect a waiver of a portion of investment management fees. Without such waiver, performance would have been lower. The estimated operating expense ratio as disclosed in the most recent prospectus dated December 17, 2021, was 0.17%, and may differ from the expense ratio disclosed in the Financial Highlights table in this report.
The Fund’s net asset value or “NAV” is calculated by dividing the value of the Fund’s total assets less total liabilities by the number of shares outstanding. The price used to calculate market return (“Market Price”) is determined by using the midpoint between the highest bid and the lowest offer on the primary stock exchange on which shares of a fund are listed for trading, as of the time that such fund’s NAV is calculated. Since shares of a fund may not have traded in the secondary market until after the fund’s inception, for the period from inception to the first day of secondary trading, the NAV of the fund is used as a proxy for the Market Price to calculate market returns. Market and NAV returns assume that dividends and capital gain distributions have been reinvested at Market Price and NAV, respectively.
An index is a statistical composite that tracks a specified financial market or sector. Unlike a fund, an index does not actually hold a portfolio of securities and therefore does not incur the expenses incurred by a fund. These expenses negatively impact fund performance. Also, market returns do not include brokerage commissions that may be payable on secondary market transactions. If brokerage commissions were included, market returns would be lower.
Generally accepted accounting principles require adjustments to be made to the net assets of the Fund at period end for financial reporting purposes only, and as such, the total return based on the unadjusted net asset value per share may differ from the total return reported in the financial highlights.
11
DBX ETF Trust
Performance Summary (Unaudited)
Xtrackers Russell US Multifactor ETF (DEUS) (Continued)
| Growth of an Assumed $10,000 Investment |
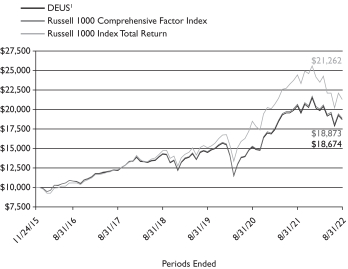
1 Based on Net Asset Value from commencement of operations, November 24, 2015.
| Sector Diversification* as of August 31, 2022 | ||
Information Technology | 24.9% | |||
Health Care | 14.7% | |||
Consumer Discretionary | 12.3% | |||
Communication Services | 10.6% | |||
Energy | 9.9% | |||
Financials | 8.7% | |||
Consumer Staples | 8.4% | |||
Industrials | 5.9% | |||
Materials | 3.3% | |||
Real Estate | 0.9% | |||
Utilities | 0.4% | |||
|
| |||
Total | 100.0% |
| Ten Largest Equity Holdings as of August 31, 2022 (35.3% of Net Assets) | ||
| Description | % of Net Assets | |||
Apple, Inc. | 5.6% | |||
Microsoft Corp. | 5.1% | |||
Alphabet, Inc. | 4.9% | |||
Berkshire Hathaway, Inc. | 4.3% | |||
Exxon Mobil Corp. | 3.6% | |||
Meta Platforms, Inc. | 3.3% | |||
Costco Wholesale Corp. | 2.2% | |||
Chevron Corp. | 2.1% | |||
UnitedHealth Group, Inc. | 2.1% | |||
Home Depot, Inc. | 2.1% | |||
* As a percent of total investments excluding exchange-traded funds, securities lending collateral and cash equivalents.
Portfolio holdings and characteristics are subject to change. For more complete details about the Fund’s investment portfolio see page 47.
12
DBX ETF Trust
As a shareholder of one or more of the Funds, you incur two types of costs: (1) transaction costs, including brokerage commissions paid on purchases and sales of fund shares, and (2) ongoing costs, including management fees and other Fund expenses. In the most recent six-month period the Funds limited these expenses; had they not done so, expenses would have been higher. The expense examples below are intended to help you understand your ongoing costs (in dollars) of investing in the Funds and to compare these costs with the ongoing costs of investing in other funds.
The examples in the tables are based on an investment of $1,000 invested at the beginning of the period and held for the entire period (March 1, 2022 to August 31, 2022).
Actual expenses
The first line in the following tables provides information about actual account values and actual expenses. You may use the information in this line, together with the amount you invested, to estimate the expenses that you paid over the period. Simply divide your account value by $1,000 (for example, an $8,600 account value divided by $1,000 = 8.6), then multiply the result by the number in the first line under the heading “Expenses Paid During the Period” to estimate the expenses you paid on your account during this period.
Hypothetical example for comparison purposes
The second line in the following tables provides information about hypothetical account values and hypothetical expenses based on the Funds’ actual expense ratios and an assumed rate of return of 5% per year before expenses (which is not the Funds’ actual return). The hypothetical account values and expenses may not be used to estimate the actual ending account balance or expenses you paid for the period. You may use this information to compare the ongoing costs of investing in the Fund and other funds. To do so, compare this 5% hypothetical example with the 5% hypothetical examples that appear in the shareholder reports of the other funds.
Please note that the expenses shown in the tables are meant to highlight your ongoing costs only, and do not reflect any transactional costs. Therefore the second line in the table is useful in comparing ongoing costs only, and will not help you determine the relative total costs of owning different funds. In addition, if these transactional costs were included, your costs would have been higher.
| Beginning Account Value March 1, 2022 | Ending Account Value August 31, 2022 | Annualized Expense Ratio | Expenses Paid During the Period Per $1,000(1) | |||||||||||||
| Xtrackers FTSE Developed ex US Multifactor ETF |
| |||||||||||||||
Actual | $ | 1,000.00 | $ | 864.70 | 0.24 | % | $ | 1.13 | ||||||||
Hypothetical (5% return before expenses) | $ | 1,000.00 | $ | 1,024.00 | 0.24 | % | $ | 1.22 | ||||||||
| Xtrackers MSCI Kokusai Equity ETF |
| |||||||||||||||
Actual | $ | 1,000.00 | $ | 893.30 | 0.09 | % | $ | 0.43 | ||||||||
Hypothetical (5% return before expenses) | $ | 1,000.00 | $ | 1,024.75 | 0.09 | % | $ | 0.46 | ||||||||
| Xtrackers Russell 1000 US Quality at a Reasonable Price ETF |
| |||||||||||||||
Actual | $ | 1,000.00 | $ | 923.80 | 0.19 | % | $ | 0.92 | ||||||||
Hypothetical (5% return before expenses) | $ | 1,000.00 | $ | 1,024.25 | 0.19 | % | $ | 0.97 | ||||||||
| Xtrackers Russell US Multifactor ETF |
| |||||||||||||||
Actual | $ | 1,000.00 | $ | 940.30 | 0.17 | % | $ | 0.83 | ||||||||
Hypothetical (5% return before expenses) | $ | 1,000.00 | $ | 1,024.35 | 0.17 | % | $ | 0.87 | ||||||||
(1) Expenses are equal to each Fund’s annualized expense ratio, multiplied by the average account value over the period, multiplied by 184 (the number of days in the most recent six-month period), then divided by 365.
13
DBX ETF Trust
Schedule of Investments
Xtrackers FTSE Developed ex US Multifactor ETF
August 31, 2022
Number | Value | |||||||
| COMMON STOCKS — 98.9% | ||||||||
| Australia — 13.5% | ||||||||
Adbri Ltd. | 4,457 | $ | 6,753 | |||||
AGL Energy Ltd. | 4,288 | 22,576 | ||||||
ALS Ltd. | 7,233 | 59,007 | ||||||
Altium Ltd. | 515 | 12,978 | ||||||
Alumina Ltd. | 74,751 | 77,637 | ||||||
Ampol Ltd. | 18,471 | 437,880 | ||||||
Ansell Ltd. | 1,179 | 21,492 | ||||||
APA Group (a) | 9,801 | 74,515 | ||||||
Aristocrat Leisure Ltd. | 4,706 | 115,175 | ||||||
ASX Ltd. | 5,505 | 296,067 | ||||||
Atlas Arteria Ltd. (a) | 10,220 | 56,051 | ||||||
Aurizon Holdings Ltd. | 82,587 | 211,183 | ||||||
Australia & New Zealand Banking Group Ltd. | 2,436 | 38,126 | ||||||
Bank of Queensland Ltd. | 3,094 | 14,911 | ||||||
Beach Energy Ltd. | 4,401 | 5,159 | ||||||
Bendigo & Adelaide Bank Ltd. | 7,290 | 45,179 | ||||||
BHP Group Ltd. | 1,084 | 30,171 | ||||||
BlueScope Steel Ltd. | 11,220 | 128,608 | ||||||
Boral Ltd. | 8,896 | 17,991 | ||||||
Brambles Ltd. | 39,408 | 334,460 | ||||||
carsales.com Ltd. | 4,573 | 70,851 | ||||||
Challenger Ltd. | 4,433 | 19,450 | ||||||
Charter Hall Group REIT | 10,345 | 95,813 | ||||||
Cleanaway Waste Management Ltd. | 31,154 | 59,801 | ||||||
Cochlear Ltd. | 525 | 77,130 | ||||||
Coles Group Ltd. | 23,541 | 283,393 | ||||||
Commonwealth Bank of Australia | 677 | 45,238 | ||||||
Computershare Ltd. | 8,796 | 148,943 | ||||||
CSL Ltd. | 291 | 58,560 | ||||||
CSR Ltd. | 23,213 | 72,089 | ||||||
Deterra Royalties Ltd. | 15,227 | 43,739 | ||||||
Dexus REIT | 41,894 | 250,729 | ||||||
Domino’s Pizza Enterprises Ltd. | 744 | 32,414 | ||||||
Downer EDI Ltd. | 20,763 | 71,882 | ||||||
EBOS Group Ltd. | 6,716 | 159,103 | ||||||
Endeavour Group Ltd. | 17,910 | 89,263 | ||||||
Evolution Mining Ltd. | 15,276 | 25,029 | ||||||
Fortescue Metals Group Ltd. | 5,406 | 68,266 | ||||||
Goodman Group REIT | 15,069 | 203,202 | ||||||
GPT Group REIT | 95,442 | 275,461 | ||||||
Harvey Norman Holdings Ltd. | 13,378 | 38,795 | ||||||
IDP Education Ltd. | 496 | 9,864 | ||||||
IGO Ltd. | 1,216 | 11,204 | ||||||
Iluka Resources Ltd. | 20,803 | 150,316 | ||||||
Incitec Pivot Ltd. | 31,032 | 83,394 | ||||||
Insurance Australia Group Ltd. | 6,069 | 19,347 | ||||||
JB Hi-Fi Ltd. | 4,717 | 131,581 | ||||||
Lendlease Corp. Ltd. (a) | 2,504 | 17,630 | ||||||
Lottery Corp. Ltd.* | 30,323 | 91,883 | ||||||
Macquarie Group Ltd. | 447 | 54,320 | ||||||
Medibank Pvt Ltd. | 146,664 | 373,024 | ||||||
Metcash Ltd. | 74,601 | 210,708 | ||||||
Mineral Resources Ltd.* | 2,651 | 116,259 | ||||||
Mirvac Group REIT | 98,532 | 141,852 | ||||||
National Australia Bank Ltd. | 410 | 8,598 | ||||||
Number | Value | |||||||
| Australia (Continued) | ||||||||
Newcrest Mining Ltd. | 10,459 | $ | 127,127 | |||||
NEXTDC Ltd.* | 290 | 2,086 | ||||||
Northern Star Resources Ltd. | 2,018 | 10,902 | ||||||
Nufarm Ltd/Australia | 2,266 | 8,295 | ||||||
Orica Ltd. | 4,305 | 45,657 | ||||||
Origin Energy Ltd. | 4,623 | 19,998 | ||||||
Orora Ltd. | 67,457 | 153,534 | ||||||
OZ Minerals Ltd. | 3,145 | 55,454 | ||||||
Perpetual Ltd. (b) | 1,529 | 28,742 | ||||||
QBE Insurance Group Ltd. | 23,757 | 196,579 | ||||||
Qube Holdings Ltd. | 13,708 | 27,159 | ||||||
Ramsay Health Care Ltd. | 1,551 | 76,248 | ||||||
REA Group Ltd. | 306 | 26,757 | ||||||
Reece Ltd. | 3,367 | 36,955 | ||||||
Rio Tinto Ltd. | 6,162 | 399,202 | ||||||
Santos Ltd. | 1,495 | 8,086 | ||||||
SEEK Ltd. | 675 | 9,653 | ||||||
Seven Group Holdings Ltd. | 1,012 | 12,890 | ||||||
Shopping Centres Australasia Property Group REIT | 87,120 | 163,050 | ||||||
Sierra Rutile Holdings Ltd.*(b) | 20,803 | 4,278 | ||||||
Sims Ltd. | 2,794 | 29,478 | ||||||
Sonic Healthcare Ltd. | 18,163 | 423,356 | ||||||
South32 Ltd. | 43,657 | 124,206 | ||||||
Star Entertainment Group Ltd.* | 2,517 | 4,797 | ||||||
Stockland REIT | 38,122 | 94,607 | ||||||
Suncorp Group Ltd. | 30,573 | 228,457 | ||||||
Tabcorp Holdings Ltd. (b) | 30,323 | 19,956 | ||||||
Telstra Corp. Ltd. | 29,801 | 81,107 | ||||||
TPG Telecom Ltd. | 1,630 | 5,978 | ||||||
Transurban Group (a) | 3,984 | 38,128 | ||||||
Treasury Wine Estates Ltd. | 6,003 | 54,282 | ||||||
Vicinity Centres REIT | 4,047 | 5,369 | ||||||
Washington H Soul Pattinson & Co. Ltd. | 2,006 | 35,343 | ||||||
Wesfarmers Ltd. | 4,745 | 152,920 | ||||||
Westpac Banking Corp. | 3,834 | 56,800 | ||||||
Woodside Energy Group Ltd. | 15,019 | 352,648 | ||||||
Woolworths Group Ltd. | 7,658 | 189,470 | ||||||
Worley Ltd. | 585 | 5,827 | ||||||
|
| |||||||
(Cost $9,394,214) | 8,930,431 | |||||||
|
| |||||||
| Austria — 0.3% | ||||||||
ANDRITZ AG | 2,040 | 94,320 | ||||||
Erste Group Bank AG | 357 | 8,070 | ||||||
OMV AG | 621 | 25,153 | ||||||
Raiffeisen Bank International AG | 558 | 7,092 | ||||||
Telekom Austria AG* | 8,951 | 55,984 | ||||||
Verbund AG | 148 | 14,190 | ||||||
voestalpine AG | 732 | 14,810 | ||||||
|
| |||||||
(Cost $235,642) | 219,619 | |||||||
|
| |||||||
| Belgium — 1.6% | ||||||||
Ackermans & van Haaren NV | 438 | 64,215 | ||||||
Ageas SA/NV | 410 | 16,693 | ||||||
Anheuser-Busch InBev SA/NV | 91 | 4,424 | ||||||
D’ieteren Group | 172 | 26,064 | ||||||
Elia Group SA/NV | 2,373 | 345,756 | ||||||
Etablissements Franz Colruyt NV | 559 | 15,559 | ||||||
| See Notes to Financial Statements. | 14 |
DBX ETF Trust
Schedule of Investments
Xtrackers FTSE Developed ex US Multifactor ETF (Continued)
August 31, 2022
Number | Value | |||||||
| Belgium (Continued) | ||||||||
Groupe Bruxelles Lambert SA | 259 | $ | 19,663 | |||||
KBC Group NV | 154 | 7,337 | ||||||
Proximus SADP | 4,452 | 56,765 | ||||||
Sofina SA | 424 | 85,356 | ||||||
Solvay SA | 517 | 41,922 | ||||||
Telenet Group Holding NV | 1,575 | 22,442 | ||||||
UCB SA | 921 | 64,920 | ||||||
Umicore SA (b) | 2,279 | 72,760 | ||||||
Warehouses De Pauw CVA REIT | 6,800 | 207,730 | ||||||
|
| |||||||
(Cost $1,313,835) | 1,051,606 | |||||||
|
| |||||||
| Bermuda — 0.0% | ||||||||
Hiscox Ltd. | 934 | 9,757 | ||||||
|
| |||||||
| Canada — 5.6% | ||||||||
Agnico Eagle Mines Ltd. | 460 | 19,024 | ||||||
Alimentation Couche-Tard, Inc. | 2,172 | 93,607 | ||||||
Bank of Montreal | 188 | 17,406 | ||||||
Bank of Nova Scotia (b) | 87 | 4,824 | ||||||
Barrick Gold Corp. | 2,588 | 38,535 | ||||||
BCE, Inc. (b) | 1,078 | 52,171 | ||||||
Brookfield Asset Management, Inc., Class A | 200 | 9,649 | ||||||
Canadian Imperial Bank of Commerce | 510 | 24,188 | ||||||
Canadian National Railway Co. | 532 | 63,449 | ||||||
Canadian Pacific Railway Ltd. | 113 | 8,484 | ||||||
Canadian Tire Corp. Ltd., Class A | 1,157 | 136,471 | ||||||
Canadian Utilities Ltd., Class A | 3,303 | 101,340 | ||||||
CGI, Inc.* | 2,172 | 172,486 | ||||||
Constellation Software, Inc. | 50 | 75,482 | ||||||
Dollarama, Inc. | 2,306 | 140,832 | ||||||
Enbridge, Inc. | 1,581 | 65,384 | ||||||
Fairfax Financial Holdings Ltd. | 187 | 93,491 | ||||||
Fortis, Inc. | 3,641 | 161,087 | ||||||
Franco-Nevada Corp. | 764 | 92,116 | ||||||
George Weston Ltd. | 2,228 | 255,448 | ||||||
Great-West Lifeco, Inc. | 912 | 21,484 | ||||||
Hydro One Ltd., 144A | 4,067 | 110,433 | ||||||
IGM Financial, Inc. | 2,690 | 73,433 | ||||||
Imperial Oil Ltd. | 464 | 22,839 | ||||||
Intact Financial Corp. | 1,300 | 188,855 | ||||||
Loblaw Cos. Ltd. | 2,697 | 239,035 | ||||||
Magna International, Inc. | 652 | 37,773 | ||||||
Manulife Financial Corp. | 2,065 | 35,825 | ||||||
Metro, Inc. | 6,601 | 348,196 | ||||||
National Bank of Canada | 1,023 | 67,874 | ||||||
Nutrien Ltd. | 863 | 79,453 | ||||||
Power Corp. of Canada | 2,882 | 74,317 | ||||||
Restaurant Brands International, Inc. | 299 | 17,701 | ||||||
Rogers Communications, Inc., Class B | 2,657 | 114,732 | ||||||
Royal Bank of Canada | 133 | 12,403 | ||||||
Saputo, Inc. | 1,906 | 48,538 | ||||||
Shaw Communications, Inc., Class B | 4,675 | 120,231 | ||||||
Sun Life Financial, Inc. | 1,452 | 64,151 | ||||||
Suncor Energy, Inc. | 2,350 | 76,246 | ||||||
TC Energy Corp. | 1,502 | 72,588 | ||||||
Teck Resources Ltd., Class B | 523 | 17,763 | ||||||
Number | Value | |||||||
| Canada (Continued) | ||||||||
TELUS Corp. | 1,976 | $ | 44,632 | |||||
Thomson Reuters Corp. | 954 | 105,351 | ||||||
Toronto-Dominion Bank | 226 | 14,581 | ||||||
Wheaton Precious Metals Corp. | 1,747 | 53,480 | ||||||
|
| |||||||
(Cost $3,318,102) | 3,687,388 | |||||||
|
| |||||||
| Chile — 0.0% | ||||||||
Antofagasta PLC | 1,071 | 13,721 | ||||||
|
| |||||||
| China — 0.3% | ||||||||
Lenovo Group Ltd. | 51,620 | 42,749 | ||||||
Tingyi Cayman Islands Holding Corp. | 29,809 | 53,019 | ||||||
Uni-President China Holdings Ltd. | 12,678 | 10,935 | ||||||
Want Want China Holdings Ltd. | 108,513 | 76,592 | ||||||
|
| |||||||
(Cost $197,413) | 183,295 | |||||||
|
| |||||||
| Czech Republic — 0.1% | ||||||||
Avast PLC, 144A | 4,060 | 33,400 | ||||||
|
| |||||||
| Denmark — 1.1% | ||||||||
A.P. Moller — Maersk A/S, Class A | 25 | 58,678 | ||||||
A.P. Moller — Maersk A/S, Class B | 23 | 55,212 | ||||||
Carlsberg A/S, Class B | 1,202 | 156,956 | ||||||
Chr Hansen Holding A/S | 173 | 10,109 | ||||||
Coloplast A/S, Class B | 453 | 51,950 | ||||||
Danske Bank A/S | 1,179 | 15,810 | ||||||
Demant A/S* | 824 | 25,456 | ||||||
DSV A/S | 170 | 25,202 | ||||||
Genmab A/S* | 110 | 39,263 | ||||||
GN Store Nord AS | 172 | 4,890 | ||||||
Novo Nordisk A/S, Class B | 316 | 33,859 | ||||||
Novozymes A/S, Class B | 1,339 | 77,049 | ||||||
Pandora A/S | 215 | 12,997 | ||||||
ROCKWOOL A/S, Class B | 83 | 17,175 | ||||||
Royal Unibrew A/S | 1,160 | 87,294 | ||||||
SimCorp A/S | 206 | 15,129 | ||||||
Tryg A/S | 1,654 | 37,491 | ||||||
Vestas Wind Systems A/S | 176 | 4,436 | ||||||
|
| |||||||
(Cost $800,234) | 728,956 | |||||||
|
| |||||||
| Finland — 2.1% | ||||||||
Elisa OYJ | 2,631 | 140,905 | ||||||
Fortum OYJ | 7,123 | 73,380 | ||||||
Huhtamaki OYJ | 413 | 14,502 | ||||||
Kesko OYJ, Class B | 8,481 | 178,919 | ||||||
Kojamo OYJ | 15,228 | 255,872 | ||||||
Kone OYJ, Class B | 960 | 38,536 | ||||||
Metso Outotec OYJ | 634 | 4,985 | ||||||
Neste OYJ | 190 | 9,409 | ||||||
Nokia OYJ | 7,714 | 38,877 | ||||||
Nokian Renkaat OYJ | 3,984 | 41,543 | ||||||
Nordea Bank Abp | 2,185 | 20,363 | ||||||
Orion OYJ, Class B | 2,319 | 105,331 | ||||||
Sampo OYJ, Class A | 3,048 | 138,228 | ||||||
Stora Enso OYJ, Class R | 5,306 | 79,365 | ||||||
UPM-Kymmene OYJ | 3,234 | 110,209 | ||||||
| See Notes to Financial Statements. | 15 |
DBX ETF Trust
Schedule of Investments
Xtrackers FTSE Developed ex US Multifactor ETF (Continued)
August 31, 2022
Number | Value | |||||||
| Finland (Continued) | ||||||||
Valmet OYJ (b) | 3,318 | $ | 84,411 | |||||
Wartsila OYJ Abp | 4,618 | 38,236 | ||||||
|
| |||||||
(Cost $1,838,507) | 1,373,071 | |||||||
|
| |||||||
| France — 3.6% | ||||||||
Air Liquide SA | 298 | 37,517 | ||||||
Airbus SE | 45 | 4,430 | ||||||
ALD SA, 144A | 1,205 | 13,159 | ||||||
Amundi SA, 144A | 361 | 18,404 | ||||||
Arkema SA | 1,395 | 118,363 | ||||||
AXA SA | 507 | 11,993 | ||||||
BioMerieux | 223 | 20,464 | ||||||
BNP Paribas SA | 153 | 7,152 | ||||||
Bollore SE | 12,105 | 58,134 | ||||||
Bouygues SA | 2,500 | 73,657 | ||||||
Bureau Veritas SA | 2,134 | 53,153 | ||||||
Capgemini SE | 252 | 43,838 | ||||||
Carrefour SA | 14,015 | 234,504 | ||||||
Cie de L’Odet SE | 14 | 16,077 | ||||||
Cie de Saint-Gobain | 2,616 | 106,141 | ||||||
Cie Generale des Etablissements Michelin SCA | 5,244 | 128,163 | ||||||
Credit Agricole SA | 478 | 4,417 | ||||||
Danone SA | 1,316 | 69,487 | ||||||
Dassault Systemes SE | 407 | 15,787 | ||||||
Edenred | 549 | 27,878 | ||||||
Eiffage SA | 1,422 | 125,630 | ||||||
Engie SA | 7,279 | 86,867 | ||||||
EssilorLuxottica SA | 134 | 20,111 | ||||||
Euroapi SA* | 13 | 203 | ||||||
Gecina SA REIT | 193 | 17,263 | ||||||
Getlink SE | 663 | 12,527 | ||||||
Hermes International | 6 | 7,738 | ||||||
ICADE REIT | 131 | 5,791 | ||||||
Ipsen SA | 413 | 39,681 | ||||||
JCDecaux SA* | 375 | 5,215 | ||||||
Kering SA | 27 | 13,656 | ||||||
La Francaise des Jeux SAEM, 144A | 207 | 6,738 | ||||||
Legrand SA | 1,163 | 84,528 | ||||||
L’Oreal SA | 25 | 8,629 | ||||||
LVMH Moet Hennessy Louis Vuitton SE | 10 | 6,511 | ||||||
Orange SA | 17,867 | 181,422 | ||||||
Pernod Ricard SA | 230 | 42,451 | ||||||
Publicis Groupe SA | 1,875 | 91,914 | ||||||
Remy Cointreau SA | 130 | 24,223 | ||||||
Renault SA* | 331 | 9,522 | ||||||
Rexel SA* | 1,504 | 24,500 | ||||||
Sanofi | 302 | 24,956 | ||||||
Sartorius Stedim Biotech | 14 | 5,148 | ||||||
Schneider Electric SE | 221 | 26,396 | ||||||
SCOR SE | 421 | 6,989 | ||||||
SEB SA | 356 | 26,490 | ||||||
Societe Generale SA | 548 | 12,167 | ||||||
Sodexo SA | 286 | 21,983 | ||||||
Somfy SA | 125 | 13,851 | ||||||
Teleperformance | 225 | 64,323 | ||||||
Thales SA | 241 | 29,117 | ||||||
TotalEnergies SE (b) | 685 | 34,915 | ||||||
Number | Value | |||||||
| France (Continued) | ||||||||
Ubisoft Entertainment SA* | 241 | $ | 11,150 | |||||
Veolia Environnement SA | 3,800 | 85,134 | ||||||
Vinci SA | 642 | 59,553 | ||||||
Vivendi SE | 4,496 | 40,933 | ||||||
|
| |||||||
(Cost $2,697,722) | 2,340,943 | |||||||
|
| |||||||
| Germany — 3.4% | ||||||||
1&1 AG | 255 | 4,103 | ||||||
adidas AG | 51 | 7,604 | ||||||
Allianz SE | 38 | 6,442 | ||||||
BASF SE | 1,344 | 56,856 | ||||||
Bayer AG | 446 | 23,590 | ||||||
Bayerische Motoren Werke AG | 488 | 36,052 | ||||||
Bechtle AG | 603 | 23,181 | ||||||
Beiersdorf AG | 657 | 66,461 | ||||||
Brenntag SE | 2,504 | 164,721 | ||||||
Carl Zeiss Meditec AG | 146 | 18,234 | ||||||
Continental AG | 115 | 6,647 | ||||||
Covestro AG, 144A | 3,321 | 100,584 | ||||||
Daimler Truck Holding AG* | 1,049 | 26,924 | ||||||
Deutsche Bank AG (c) | 490 | 4,101 | ||||||
Deutsche Boerse AG | 94 | 15,922 | ||||||
Deutsche Post AG | 2,037 | 74,548 | ||||||
Deutsche Telekom AG | 3,420 | 64,612 | ||||||
Deutsche Wohnen SE | 179 | 4,075 | ||||||
E.ON SE | 31,127 | 266,361 | ||||||
Evonik Industries AG | 1,750 | 32,722 | ||||||
Fielmann AG | 79 | 2,941 | ||||||
Fresenius Medical Care AG & Co. KGaA | 1,540 | 52,945 | ||||||
Fresenius SE & Co. KGaA | 2,016 | 49,990 | ||||||
FUCHS PETROLUB SE | 574 | 13,391 | ||||||
GEA Group AG | 3,205 | 111,798 | ||||||
Hannover Rueck SE | 134 | 19,794 | ||||||
HeidelbergCement AG | 1,420 | 64,397 | ||||||
Hella GmbH & Co. KGaA | 191 | 13,502 | ||||||
Henkel AG & Co. KGaA | 269 | 16,852 | ||||||
HOCHTIEF AG | 84 | 4,162 | ||||||
Infineon Technologies AG | 138 | 3,372 | ||||||
KION Group AG | 111 | 4,446 | ||||||
Knorr-Bremse AG | 274 | 13,321 | ||||||
LANXESS AG | 1,032 | 34,920 | ||||||
LEG Immobilien SE | 1,730 | 131,027 | ||||||
Mercedes-Benz Group AG | 491 | 27,708 | ||||||
Merck KGaA | 614 | 105,824 | ||||||
METRO AG* | 2,639 | 21,070 | ||||||
MTU Aero Engines AG | 94 | 16,631 | ||||||
Muenchener Rueckversicherungs-Gesellschaft AG in Muenchen | 78 | 18,683 | ||||||
Nemetschek SE | 100 | 5,923 | ||||||
Puma SE | 191 | 11,719 | ||||||
Rational AG | 13 | 7,039 | ||||||
Rheinmetall AG | 435 | 69,286 | ||||||
RWE AG | 4,269 | 163,466 | ||||||
SAP SE | 79 | 6,747 | ||||||
Scout24 SE, 144A | 114 | 6,596 | ||||||
Siemens AG | 100 | 10,164 | ||||||
Siemens Healthineers AG, 144A | 193 | 9,457 | ||||||
| See Notes to Financial Statements. | 16 |
DBX ETF Trust
Schedule of Investments
Xtrackers FTSE Developed ex US Multifactor ETF (Continued)
August 31, 2022
Number | Value | |||||||
| Germany (Continued) | ||||||||
Symrise AG | 224 | $ | 23,504 | |||||
Talanx AG | 237 | 8,412 | ||||||
Telefonica Deutschland Holding AG | 28,841 | 74,968 | ||||||
Uniper SE (b) | 3,943 | 21,351 | ||||||
United Internet AG | 1,202 | 27,255 | ||||||
Vantage Towers AG | 157 | 4,076 | ||||||
Vonovia SE | 848 | 23,023 | ||||||
Wacker Chemie AG | 73 | 10,427 | ||||||
Zalando SE, 144A* | 64 | 1,487 | ||||||
|
| |||||||
(Cost $2,926,324) | 2,215,414 | |||||||
|
| |||||||
| Hong Kong — 2.3% | ||||||||
AIA Group Ltd. | 1,932 | 18,695 | ||||||
ASMPT Ltd. | 1,600 | 12,445 | ||||||
Bank of East Asia Ltd. | 7,585 | 9,567 | ||||||
BOC Hong Kong Holdings Ltd. | 8,121 | 28,040 | ||||||
Cafe de Coral Holdings Ltd. | 1,846 | 2,648 | ||||||
Chow Tai Fook Jewellery Group Ltd. | 12,864 | 25,994 | ||||||
CK Asset Holdings Ltd. | 12,942 | 87,557 | ||||||
CK Hutchison Holdings Ltd. | 23,641 | 152,861 | ||||||
CK Infrastructure Holdings Ltd. | 6,589 | 40,127 | ||||||
CLP Holdings Ltd. | 11,173 | 96,372 | ||||||
Dah Sing Financial Holdings Ltd. | 1,898 | 5,066 | ||||||
ESR Group Ltd., 144A* | 1,724 | 4,843 | ||||||
First Pacific Co. Ltd. | 33,838 | 13,063 | ||||||
Haitong International Securities Group Ltd. | 9,084 | 1,007 | ||||||
Hang Lung Group Ltd. | 6,039 | 10,233 | ||||||
Hang Seng Bank Ltd. | 1,383 | 21,673 | ||||||
Henderson Land Development Co. Ltd. | 6,439 | 21,576 | ||||||
Hong Kong & China Gas Co. Ltd. | 39,836 | 39,334 | ||||||
Hong Kong Exchanges & Clearing Ltd. | 514 | 20,812 | ||||||
Hutchison Port Holdings Trust, Class U | 240,600 | 51,729 | ||||||
Hutchison Telecommunications Hong Kong Holdings Ltd. | 92,544 | 13,677 | ||||||
Jardine Matheson Holdings Ltd. | 400 | 21,240 | ||||||
Kerry Logistics Network Ltd. | 14,502 | 31,928 | ||||||
Kerry Properties Ltd. | 27,641 | 63,813 | ||||||
Link REIT | 3,075 | 23,840 | ||||||
MTR Corp. Ltd. | 1,551 | 7,954 | ||||||
New World Development Co. Ltd. | 3,521 | 11,507 | ||||||
NWS Holdings Ltd. | 10,783 | 10,386 | ||||||
PCCW Ltd. | 100,964 | 50,554 | ||||||
Power Assets Holdings Ltd. | 33,400 | 200,004 | ||||||
Sino Land Co. Ltd. | 70,505 | 103,303 | ||||||
SITC International Holdings Co. Ltd. | 9,461 | 24,108 | ||||||
Sun Hung Kai Properties Ltd. | 2,772 | 32,598 | ||||||
Swire Pacific Ltd., Class A | 1,908 | 13,212 | ||||||
Swire Pacific Ltd., Class B | 2,738 | 3,181 | ||||||
Swire Properties Ltd. | 1,769 | 4,089 | ||||||
Techtronic Industries Co. Ltd. | 2,522 | 29,947 | ||||||
Towngas Smart Energy Co. Ltd.* | 47,385 | 20,828 | ||||||
Vinda International Holdings Ltd. | 1,877 | 5,249 | ||||||
VTech Holdings Ltd. | 9,227 | 62,835 | ||||||
WH Group Ltd., 144A | 62,212 | 42,485 | ||||||
Wharf Holdings Ltd. | 10,591 | 39,941 | ||||||
Number | Value | |||||||
| Hong Kong (Continued) | ||||||||
Xinyi Glass Holdings Ltd. | 12,562 | $ | 23,303 | |||||
Yue Yuen Industrial Holdings Ltd. | 3,191 | 4,765 | ||||||
|
| |||||||
(Cost $1,591,059) | 1,508,389 | |||||||
|
| |||||||
| Ireland — 0.9% | ||||||||
CRH PLC | 2,003 | 74,011 | ||||||
DCC PLC | 1,067 | 61,619 | ||||||
Experian PLC | 2,128 | 64,949 | ||||||
Glanbia PLC | 5,235 | 66,696 | ||||||
James Hardie Industries PLC CDI | 4,577 | 105,146 | ||||||
Kerry Group PLC, Class A | 601 | 62,156 | ||||||
Kingspan Group PLC | 560 | 31,895 | ||||||
Smurfit Kappa Group PLC | 3,632 | 122,306 | ||||||
|
| |||||||
(Cost $662,828) | 588,778 | |||||||
|
| |||||||
| Israel — 3.0% | ||||||||
Airport City Ltd.* | 1,161 | 24,428 | ||||||
Alony Hetz Properties & Investments Ltd. | 1,915 | 31,081 | ||||||
Amot Investments Ltd. | 3,370 | 24,213 | ||||||
Ashtrom Group Ltd. | 197 | 5,034 | ||||||
Azrieli Group Ltd. | 182 | 15,183 | ||||||
Bank Hapoalim BM | 11,700 | 122,049 | ||||||
Bank Leumi Le-Israel BM | 15,683 | 166,710 | ||||||
Bezeq The Israeli Telecommunication Corp. Ltd. | 101,543 | 171,861 | ||||||
Big Shopping Centers Ltd. | 45 | 6,464 | ||||||
Elbit Systems Ltd. | 514 | 110,188 | ||||||
Elco Ltd. (b) | 494 | 34,899 | ||||||
Electra Ltd. | 81 | 51,623 | ||||||
Energix-Renewable Energies Ltd. | 1,349 | 6,193 | ||||||
Enlight Renewable Energy Ltd.* | 2,635 | 6,465 | ||||||
First International Bank Of Israel Ltd. | 1,362 | 63,710 | ||||||
Fox Wizel Ltd. | 65 | 9,473 | ||||||
Gav-Yam Lands Corp. Ltd. | 7,330 | 75,075 | ||||||
Harel Insurance Investments & Financial Services Ltd. | 3,457 | 39,491 | ||||||
ICL Group Ltd. | 15,905 | 153,004 | ||||||
Israel Corp. Ltd.* | 30 | 14,610 | ||||||
Israel Discount Bank Ltd., Class A | 30,924 | 190,111 | ||||||
Maytronics Ltd. | 1,059 | 15,300 | ||||||
Mivne Real Estate KD Ltd. | 23,051 | 85,096 | ||||||
Mizrahi Tefahot Bank Ltd. | 3,691 | 150,904 | ||||||
Nice Ltd.* | 435 | 94,455 | ||||||
Nova Ltd.* | 246 | 24,286 | ||||||
Paz Oil Co. Ltd.* | 48 | 6,307 | ||||||
Phoenix Holdings Ltd. | 5,385 | 65,239 | ||||||
Sapiens International Corp NV | 195 | 4,425 | ||||||
Shapir Engineering and Industry Ltd. | 2,632 | 25,232 | ||||||
Shufersal Ltd. | 9,503 | 65,221 | ||||||
Strauss Group Ltd. | 2,035 | 53,438 | ||||||
Tower Semiconductor Ltd.* | 1,258 | 59,223 | ||||||
|
| |||||||
(Cost $1,651,884) | 1,970,991 | |||||||
|
| |||||||
| Italy — 1.7% | ||||||||
A2A SpA | 47,011 | 52,921 | ||||||
Amplifon SpA | 550 | 14,407 | ||||||
Assicurazioni Generali SpA | 2,109 | 31,047 | ||||||
| See Notes to Financial Statements. | 17 |
DBX ETF Trust
Schedule of Investments
Xtrackers FTSE Developed ex US Multifactor ETF (Continued)
August 31, 2022
Number | Value | |||||||
| Italy (Continued) | ||||||||
Atlantia SpA | 412 | $ | 9,458 | |||||
Banca Mediolanum SpA | 986 | 6,324 | ||||||
Buzzi Unicem SpA | 1,287 | 21,645 | ||||||
Davide Campari-Milano NV | 3,981 | 39,262 | ||||||
De’ Longhi SpA | 650 | 11,418 | ||||||
DiaSorin SpA | 94 | 12,378 | ||||||
Enel SpA | 3,091 | 14,594 | ||||||
Eni SpA | 10,446 | 124,031 | ||||||
Ferrari NV | 216 | 41,963 | ||||||
FinecoBank Banca Fineco SpA | 1,440 | 15,660 | ||||||
Hera SpA | 32,594 | 81,937 | ||||||
Infrastrutture Wireless Italiane SpA, 144A | 1,356 | 12,626 | ||||||
Interpump Group SpA | 905 | 32,160 | ||||||
Intesa Sanpaolo SpA | 7,935 | 13,748 | ||||||
Italgas SpA | 17,988 | 92,881 | ||||||
Leonardo SpA | 505 | 4,147 | ||||||
Mediobanca Banca di Credito Finanziario SpA | 968 | 7,697 | ||||||
Moncler SpA | 966 | 43,362 | ||||||
Pirelli & C SpA, 144A | 8,421 | 32,008 | ||||||
Poste Italiane SpA, 144A | 1,173 | 9,427 | ||||||
Prysmian SpA | 4,348 | 133,831 | ||||||
Recordati Industria Chimica e Farmaceutica SpA | 1,085 | 44,448 | ||||||
Reply SpA | 267 | 31,627 | ||||||
Snam SpA | 12,906 | 61,462 | ||||||
Telecom Italia SpA* | 73,984 | 15,325 | ||||||
Telecom Italia SpA-RSP* | 55,952 | 11,129 | ||||||
Terna — Rete Elettrica Nazionale | 14,424 | 102,979 | ||||||
UniCredit SpA | 508 | 5,005 | ||||||
UnipolSai Assicurazioni SpA (b) | 3,792 | 8,450 | ||||||
|
| |||||||
(Cost $1,451,351) | 1,139,357 | |||||||
|
| |||||||
| Japan — 25.2% | ||||||||
ABC-Mart, Inc. (b) | 263 | 10,643 | ||||||
Acom Co. Ltd. | 2,000 | 4,790 | ||||||
Activia Properties, Inc. REIT | 4 | 12,480 | ||||||
Advance Residence Investment Corp. REIT | 9 | 23,892 | ||||||
Advantest Corp. | 100 | 5,771 | ||||||
Aeon Co. Ltd. (b) | 1,049 | 20,602 | ||||||
AEON REIT Investment Corp. REIT | 15 | 17,010 | ||||||
AGC, Inc. | 8,954 | 306,810 | ||||||
Aica Kogyo Co. Ltd. | 914 | 20,340 | ||||||
Ain Holdings, Inc. | 500 | 28,747 | ||||||
Air Water, Inc. | 3,600 | 45,446 | ||||||
Aisin Corp. | 3,193 | 95,704 | ||||||
Ajinomoto Co., Inc. | 3,300 | 91,912 | ||||||
Alfresa Holdings Corp. | 300 | 3,612 | ||||||
Amada Co. Ltd. | 4,243 | 33,577 | ||||||
Amano Corp. | 1,000 | 18,676 | ||||||
Anritsu Corp. | 200 | 2,381 | ||||||
Aozora Bank Ltd. | 1,000 | 19,398 | ||||||
Ariake Japan Co. Ltd. | 200 | 6,839 | ||||||
As One Corp. | 200 | 9,277 | ||||||
Asahi Group Holdings Ltd. | 1,592 | 53,666 | ||||||
Asahi Intecc Co. Ltd. | 216 | 3,903 | ||||||
Asahi Kasei Corp. | 5,419 | 39,990 | ||||||
Number | Value | |||||||
| Japan (Continued) | ||||||||
Asics Corp. | 400 | $ | 7,393 | |||||
ASKUL Corp. | 400 | 5,330 | ||||||
Astellas Pharma, Inc. | 6,983 | 99,966 | ||||||
Azbil Corp. | 1,113 | 32,035 | ||||||
Bandai Namco Holdings, Inc. | 800 | 60,509 | ||||||
Benesse Holdings, Inc. | 1,000 | 15,805 | ||||||
Bic Camera, Inc. | 1,700 | 13,980 | ||||||
BIPROGY, Inc. | 600 | 13,418 | ||||||
Bridgestone Corp. | 3,824 | 147,664 | ||||||
Brother Industries Ltd. | 2,042 | 39,419 | ||||||
Calbee, Inc. | 1,080 | 21,510 | ||||||
Canon Marketing Japan, Inc. | 1,400 | 31,964 | ||||||
Canon, Inc. | 13,422 | 322,903 | ||||||
Capcom Co. Ltd. | 408 | 11,214 | ||||||
Chiba Bank Ltd. | 3,700 | 20,071 | ||||||
Chubu Electric Power Co., Inc. | 11,831 | 120,678 | ||||||
Chugai Pharmaceutical Co. Ltd. | 400 | 10,414 | ||||||
Chugoku Bank Ltd. | 800 | 5,390 | ||||||
Chugoku Electric Power Co., Inc. | 3,283 | 19,751 | ||||||
Coca-Cola Bottlers Japan Holdings, Inc. | 400 | 4,123 | ||||||
COMSYS Holdings Corp. | 2,734 | 51,160 | ||||||
Concordia Financial Group Ltd. | 2,900 | 9,247 | ||||||
Cosmo Energy Holdings Co. Ltd. | 200 | 5,980 | ||||||
Cosmos Pharmaceutical Corp. | 190 | 20,134 | ||||||
Credit Saison Co. Ltd. | 2,000 | 25,277 | ||||||
CyberAgent, Inc. | 800 | 7,900 | ||||||
Dai Nippon Printing Co. Ltd. | 5,407 | 114,556 | ||||||
Daicel Corp. | 12,527 | 79,341 | ||||||
Daido Steel Co. Ltd. | 255 | 7,211 | ||||||
Daifuku Co. Ltd. | 126 | 7,444 | ||||||
Dai-ichi Life Holdings, Inc. | 2,800 | 48,617 | ||||||
Daiichi Sankyo Co. Ltd. | 200 | 6,055 | ||||||
Daikin Industries Ltd. | 184 | 32,499 | ||||||
Daio Paper Corp. | 2,600 | 24,495 | ||||||
Daito Trust Construction Co. Ltd. | 2,285 | 226,481 | ||||||
Daiwa House Industry Co. Ltd. | 5,602 | 126,729 | ||||||
Daiwa House REIT Investment Corp. REIT (b) | 15 | 34,842 | ||||||
Daiwa Office Investment Corp. REIT | 1 | 5,078 | ||||||
Daiwa Securities Group, Inc. | 17,145 | 75,271 | ||||||
DeNA Co. Ltd. | 500 | 6,882 | ||||||
Denka Co. Ltd. | 600 | 14,478 | ||||||
Denso Corp. | 344 | 18,986 | ||||||
Dentsu Group, Inc. | 2,800 | 91,196 | ||||||
DIC Corp. | 1,600 | 28,913 | ||||||
Disco Corp. | 133 | 32,812 | ||||||
DMG Mori Co. Ltd. | 700 | 9,210 | ||||||
Dowa Holdings Co. Ltd. | 700 | 26,611 | ||||||
Ebara Corp. | 3,000 | 115,131 | ||||||
Electric Power Development Co. Ltd. | 8,976 | 138,824 | ||||||
ENEOS Holdings, Inc. | 21,320 | 80,528 | ||||||
EXEO Group, Inc. | 1,372 | 21,200 | ||||||
Ezaki Glico Co. Ltd. | 900 | 23,535 | ||||||
Fancl Corp. | 200 | 4,083 | ||||||
FANUC Corp. | 96 | 15,606 | ||||||
Food & Life Cos. Ltd. | 184 | 2,935 | ||||||
FP Corp. | 400 | 9,479 | ||||||
| See Notes to Financial Statements. | 18 |
DBX ETF Trust
Schedule of Investments
Xtrackers FTSE Developed ex US Multifactor ETF (Continued)
August 31, 2022
Number | Value | |||||||
| Japan (Continued) | ||||||||
Fuji Electric Co. Ltd. | 888 | $ | 38,883 | |||||
Fuji Media Holdings, Inc. | 800 | 6,377 | ||||||
FUJIFILM Holdings Corp. | 2,151 | 110,339 | ||||||
Fujitsu General Ltd. | 700 | 14,957 | ||||||
Fujitsu Ltd. | 642 | 76,716 | ||||||
Fukuoka Financial Group, Inc. | 900 | 16,140 | ||||||
Fukuyama Transporting Co. Ltd. | 600 | 13,764 | ||||||
Fuyo General Lease Co. Ltd. | 200 | 11,888 | ||||||
GLP J REIT | 18 | 22,061 | ||||||
GS Yuasa Corp. | 638 | 11,704 | ||||||
GungHo Online Entertainment, Inc. | 800 | 13,354 | ||||||
H.U. Group Holdings, Inc. | 700 | 14,316 | ||||||
Hachijuni Bank Ltd. | 4,500 | 15,517 | ||||||
Hakuhodo DY Holdings, Inc. | 569 | 5,135 | ||||||
Hamamatsu Photonics KK | 850 | 36,483 | ||||||
Hankyu Hanshin Holdings, Inc. | 167 | 5,042 | ||||||
Haseko Corp. | 5,797 | 66,909 | ||||||
Heiwa Corp. | 400 | 6,117 | ||||||
Hino Motors Ltd. | 3,059 | 14,079 | ||||||
Hirogin Holdings, Inc. | 1,600 | 7,075 | ||||||
Hirose Electric Co. Ltd. | 340 | 48,685 | ||||||
Hitachi Construction Machinery Co. Ltd. | 200 | 4,154 | ||||||
Hitachi Ltd. | 2,546 | 128,489 | ||||||
Hitachi Metals Ltd.* | 1,100 | 16,608 | ||||||
Hitachi Transport System Ltd. | 1,680 | 106,405 | ||||||
Honda Motor Co. Ltd. | 2,445 | 65,682 | ||||||
Horiba Ltd. | 600 | 27,657 | ||||||
Hoshizaki Corp. | 426 | 12,753 | ||||||
House Foods Group, Inc. | 857 | 18,287 | ||||||
Hoya Corp. | 500 | 51,398 | ||||||
Hulic Co. Ltd. | 3,548 | 27,130 | ||||||
Idemitsu Kosan Co. Ltd. | 1,225 | 32,254 | ||||||
IHI Corp. | 300 | 8,083 | ||||||
Iida Group Holdings Co. Ltd. | 3,400 | 52,070 | ||||||
Industrial & Infrastructure Fund Investment Corp. REIT | 15 | 19,888 | ||||||
INFRONEER Holdings, Inc.* | 10,284 | 73,963 | ||||||
Inpex Corp. | 17,399 | 201,320 | ||||||
Internet Initiative Japan, Inc. | 1,300 | 47,546 | ||||||
Isetan Mitsukoshi Holdings Ltd. | 700 | 5,565 | ||||||
Isuzu Motors Ltd. | 7,800 | 97,398 | ||||||
Ito En Ltd. | 100 | 4,429 | ||||||
ITOCHU Corp. | 4,536 | 125,748 | ||||||
Itochu Techno-Solutions Corp. | 500 | 12,750 | ||||||
Itoham Yonekyu Holdings, Inc. | 7,000 | 34,034 | ||||||
Iwatani Corp. | 1,000 | 41,118 | ||||||
Iyo Bank Ltd. | 1,000 | 4,674 | ||||||
Izumi Co. Ltd. | 300 | 6,514 | ||||||
J. Front Retailing Co. Ltd. (b) | 1,065 | 8,497 | ||||||
Japan Aviation Electronics Industry Ltd. | 600 | 10,128 | ||||||
Japan Exchange Group, Inc. | 500 | 7,519 | ||||||
Japan Logistics Fund, Inc. REIT | 6 | 14,305 | ||||||
Japan Metropolitan Fund Invest REIT (b) | 18 | 14,361 | ||||||
Japan Post Holdings Co. Ltd. | 3,500 | 24,271 | ||||||
Japan Post Insurance Co. Ltd. | 700 | 10,766 | ||||||
Japan Prime Realty Investment Corp. REIT | 7 | 20,830 | ||||||
Number | Value | |||||||
| Japan (Continued) | ||||||||
Japan Real Estate Investment Corp. REIT | 6 | $ | 27,917 | |||||
Japan Steel Works Ltd. | 200 | 4,318 | ||||||
Japan Tobacco, Inc. | 9,564 | 162,821 | ||||||
JFE Holdings, Inc. (b) | 4,200 | 45,446 | ||||||
JSR Corp. | 1,032 | 23,301 | ||||||
JTEKT Corp. | 700 | 4,974 | ||||||
Kadokawa Corp. | 400 | 8,772 | ||||||
Kagome Co. Ltd. | 365 | 8,096 | ||||||
Kajima Corp. | 15,600 | 165,312 | ||||||
Kakaku.com, Inc. | 386 | 7,209 | ||||||
Kaken Pharmaceutical Co. Ltd. | 647 | 18,062 | ||||||
Kamigumi Co. Ltd. | 5,632 | 110,791 | ||||||
Kandenko Co. Ltd. | 5,292 | 32,029 | ||||||
Kaneka Corp. | 1,122 | 30,352 | ||||||
Kansai Electric Power Co., Inc. | 18,411 | 178,764 | ||||||
Kansai Paint Co. Ltd. | 1,088 | 16,859 | ||||||
Kao Corp. | 553 | 24,154 | ||||||
Kawasaki Heavy Industries Ltd. | 243 | 4,756 | ||||||
KDDI Corp. | 4,129 | 127,392 | ||||||
Keisei Electric Railway Co. Ltd. | 100 | 2,813 | ||||||
Kenedix Office Investment Corp. REIT | 3 | 15,582 | ||||||
Kewpie Corp. | 3,759 | 62,124 | ||||||
Keyence Corp. | 28 | 10,673 | ||||||
Kikkoman Corp. | 773 | 47,732 | ||||||
Kinden Corp. | 4,800 | 50,969 | ||||||
Kirin Holdings Co. Ltd. | 3,712 | 61,440 | ||||||
Kobayashi Pharmaceutical Co. Ltd. | 426 | 24,369 | ||||||
Kobe Bussan Co. Ltd. | 600 | 15,452 | ||||||
Kobe Steel Ltd. | 1,300 | 5,964 | ||||||
Koei Tecmo Holdings Co. Ltd. | 162 | 5,487 | ||||||
Koito Manufacturing Co. Ltd. | 300 | 10,355 | ||||||
Kokuyo Co. Ltd. | 4,400 | 57,133 | ||||||
Komatsu Ltd. | 1,170 | 24,729 | ||||||
Konami Group Corp. | 682 | 34,832 | ||||||
Kose Corp. | 100 | 9,551 | ||||||
K’s Holdings Corp. | 6,211 | 57,574 | ||||||
Kubota Corp. | 1,900 | 29,818 | ||||||
Kuraray Co. Ltd. | 6,981 | 53,431 | ||||||
Kurita Water Industries Ltd. | 1,828 | 71,999 | ||||||
Kyocera Corp. | 972 | 54,537 | ||||||
Kyowa Kirin Co. Ltd. | 1,100 | 24,876 | ||||||
Kyudenko Corp. | 499 | 10,119 | ||||||
Kyushu Electric Power Co., Inc. | 10,564 | 63,708 | ||||||
LaSalle Logiport REIT (b) | 16 | 19,864 | ||||||
Lawson, Inc. (b) | 1,100 | 36,581 | ||||||
Lintec Corp. | 3,713 | 62,354 | ||||||
Lion Corp. | 906 | 10,653 | ||||||
Lixil Corp. | 1,411 | 24,825 | ||||||
Mabuchi Motor Co. Ltd. | 400 | 11,455 | ||||||
Makita Corp. | 1,218 | 29,004 | ||||||
Marubeni Corp. | 19,791 | 207,297 | ||||||
Marui Group Co. Ltd. | 779 | 14,094 | ||||||
Maruichi Steel Tube Ltd. | 3,450 | 74,139 | ||||||
MatsukiyoCocokara & Co. | 697 | 27,855 | ||||||
Mazda Motor Corp. | 3,800 | 33,744 | ||||||
Mebuki Financial Group, Inc. | 5,900 | 11,364 | ||||||
Medipal Holdings Corp. | 4,851 | 66,733 | ||||||
| See Notes to Financial Statements. | 19 |
DBX ETF Trust
Schedule of Investments
Xtrackers FTSE Developed ex US Multifactor ETF (Continued)
August 31, 2022
Number | Value | |||||||
| Japan (Continued) | ||||||||
MEIJI Holdings Co. Ltd. | 2,669 | $ | 127,650 | |||||
MINEBEA MITSUMI, Inc. | 1,471 | 25,658 | ||||||
MISUMI Group, Inc. | 2,140 | 53,259 | ||||||
Mitsubishi Chemical Group Corp. | 22,402 | 118,454 | ||||||
Mitsubishi Corp. | 3,436 | 113,125 | ||||||
Mitsubishi Electric Corp. | 9,374 | 95,921 | ||||||
Mitsubishi Estate Co. Ltd. | 1,900 | 25,767 | ||||||
Mitsubishi Gas Chemical Co., Inc. | 1,067 | 16,018 | ||||||
Mitsubishi HC Capital, Inc. | 2,950 | 14,386 | ||||||
Mitsubishi Heavy Industries Ltd. | 1,213 | 47,024 | ||||||
Mitsubishi Logistics Corp. | 1,100 | 28,804 | ||||||
Mitsubishi Materials Corp. | 1,600 | 24,019 | ||||||
Mitsubishi UFJ Financial Group, Inc. | 1,200 | 6,242 | ||||||
Mitsui & Co. Ltd. | 10,225 | 240,901 | ||||||
Mitsui Chemicals, Inc. | 2,800 | 63,524 | ||||||
Mitsui Fudosan Co. Ltd. | 1,100 | 22,405 | ||||||
Mitsui Fudosan Logistics Park, Inc. REIT | 3 | 11,794 | ||||||
Mitsui Mining & Smelting Co. Ltd. | 300 | 7,142 | ||||||
Mitsui OSK Lines Ltd. (b) | 1,274 | 33,590 | ||||||
Mizuho Financial Group, Inc. | 1,980 | 22,760 | ||||||
Mori Hills REIT Investment Corp. REIT | 11 | 12,410 | ||||||
Morinaga & Co. Ltd. | 500 | 14,355 | ||||||
Morinaga Milk Industry Co. Ltd. | 800 | 24,613 | ||||||
MS&AD Insurance Group Holdings, Inc. (b) | 1,300 | 39,021 | ||||||
Murata Manufacturing Co. Ltd. | 317 | 17,274 | ||||||
Nabtesco Corp. | 400 | 9,594 | ||||||
Nagase & Co. Ltd. | 5,465 | 79,082 | ||||||
Nagoya Railroad Co. Ltd. | 300 | 4,670 | ||||||
Nankai Electric Railway Co. Ltd. | 718 | 14,378 | ||||||
NEC Corp. | 200 | 7,358 | ||||||
NEC Networks & System Integration Corp. | 1,900 | 23,903 | ||||||
NGK Insulators Ltd. | 3,477 | 50,139 | ||||||
NGK Spark Plug Co. Ltd. | 3,402 | 70,335 | ||||||
NH Foods Ltd. | 800 | 23,026 | ||||||
NHK Spring Co. Ltd. | 3,800 | 25,904 | ||||||
Nichirei Corp. | 1,400 | 25,157 | ||||||
Nifco, Inc. | 861 | 19,627 | ||||||
Nihon Kohden Corp. | 1,700 | 39,181 | ||||||
Nikon Corp. | 600 | 6,895 | ||||||
Nintendo Co. Ltd. | 150 | 61,666 | ||||||
Nippon Accommodations Fund, Inc. REIT (b) | 4 | 19,708 | ||||||
Nippon Building Fund, Inc. REIT | 11 | 55,069 | ||||||
Nippon Electric Glass Co. Ltd. | 4,600 | 87,338 | ||||||
NIPPON EXPRESS HOLDINGS, Inc. | 1,136 | 63,018 | ||||||
Nippon Kayaku Co. Ltd. | 7,800 | 68,364 | ||||||
Nippon Prologis REIT, Inc. REIT | 9 | 22,756 | ||||||
Nippon Sanso Holdings Corp. | 1,259 | 23,105 | ||||||
Nippon Shinyaku Co. Ltd. | 400 | 22,074 | ||||||
Nippon Shokubai Co. Ltd. | 300 | 11,989 | ||||||
Nippon Steel Corp. | 2,913 | 46,408 | ||||||
Nippon Telegraph & Telephone Corp. | 1,891 | 51,413 | ||||||
Nippon Television Holdings, Inc. | 700 | 5,989 | ||||||
Nippon Yusen KK (b) | 500 | 38,557 | ||||||
Nipro Corp. | 600 | 4,917 | ||||||
Number | Value | |||||||
| Japan (Continued) | ||||||||
Nissan Chemical Corp. | 1,283 | $ | 65,434 | |||||
Nissan Motor Co. Ltd. | 8,100 | 32,131 | ||||||
Nisshin Seifun Group, Inc. | 2,578 | 29,197 | ||||||
Nissin Foods Holdings Co. Ltd. | 1,384 | 99,438 | ||||||
Nitori Holdings Co. Ltd. | 232 | 22,409 | ||||||
Nitto Denko Corp. | 1,243 | 77,292 | ||||||
Noevir Holdings Co. Ltd. | 300 | 12,509 | ||||||
NOF Corp. | 1,107 | 42,324 | ||||||
NOK Corp. | 500 | 4,483 | ||||||
Nomura Holdings, Inc. | 3,800 | 13,810 | ||||||
Nomura Real Estate Holdings, Inc. | 586 | 14,478 | ||||||
Nomura Real Estate Master Fund, Inc. REIT (b) | 15 | 18,417 | ||||||
Nomura Research Institute Ltd. | 430 | 11,756 | ||||||
NS Solutions Corp. | 300 | 8,234 | ||||||
NTT Data Corp. | 1,417 | 20,178 | ||||||
Obayashi Corp. | 7,362 | 51,302 | ||||||
Obic Co. Ltd. | 200 | 29,966 | ||||||
Oji Holdings Corp. | 12,088 | 48,570 | ||||||
Olympus Corp. | 200 | 4,343 | ||||||
Omron Corp. | 300 | 15,993 | ||||||
Ono Pharmaceutical Co. Ltd. | 2,377 | 57,065 | ||||||
Open House Group Co. Ltd. | 680 | 26,832 | ||||||
ORIX Corp. | 7,036 | 116,535 | ||||||
Orix JREIT, Inc. REIT (b) | 13 | 17,959 | ||||||
Osaka Gas Co. Ltd. | 14,929 | 252,433 | ||||||
OSG Corp. | 2,000 | 27,845 | ||||||
Otsuka Corp. | 808 | 26,404 | ||||||
Otsuka Holdings Co. Ltd. | 1,534 | 50,471 | ||||||
PALTAC Corp. | 382 | 11,091 | ||||||
Pan Pacific International Holdings Corp. | 699 | 12,631 | ||||||
Panasonic Holdings Corp. | 3,772 | 30,829 | ||||||
Penta-Ocean Construction Co. Ltd. | 1,720 | 9,144 | ||||||
Persol Holdings Co. Ltd. | 1,229 | 25,001 | ||||||
Recruit Holdings Co. Ltd. | 326 | 10,543 | ||||||
Relo Group, Inc. | 200 | 3,252 | ||||||
Rengo Co. Ltd. | 6,212 | 36,835 | ||||||
Resona Holdings, Inc. | 10,500 | 38,804 | ||||||
Resorttrust, Inc. | 500 | 8,083 | ||||||
Ricoh Co. Ltd. | 4,000 | 31,654 | ||||||
Rinnai Corp. | 517 | 39,980 | ||||||
Rohm Co. Ltd. | 114 | 8,651 | ||||||
Rohto Pharmaceutical Co. Ltd. | 1,911 | 57,968 | ||||||
Ryohin Keikaku Co. Ltd. | 500 | 4,689 | ||||||
Sankyo Co. Ltd. | 1,209 | 35,670 | ||||||
Sankyu, Inc. | 700 | 21,688 | ||||||
Santen Pharmaceutical Co. Ltd. | 1,600 | 11,611 | ||||||
Sanwa Holdings Corp. | 5,500 | 54,950 | ||||||
Sapporo Holdings Ltd. | 1,100 | 24,242 | ||||||
Sawai Group Holdings Co. Ltd. | 300 | 8,905 | ||||||
SCREEN Holdings Co. Ltd. | 100 | 6,766 | ||||||
SCSK Corp. | 600 | 9,868 | ||||||
Secom Co. Ltd. | 1,735 | 111,666 | ||||||
Sega Sammy Holdings, Inc. | 600 | 8,972 | ||||||
Seiko Epson Corp. | 2,351 | 37,243 | ||||||
Seino Holdings Co. Ltd. | 2,700 | 21,619 | ||||||
Sekisui Chemical Co. Ltd. | 3,901 | 53,636 | ||||||
| See Notes to Financial Statements. | 20 |
DBX ETF Trust
Schedule of Investments
Xtrackers FTSE Developed ex US Multifactor ETF (Continued)
August 31, 2022
Number | Value | |||||||
| Japan (Continued) | ||||||||
Sekisui House Ltd. | 10,736 | $ | 183,858 | |||||
Sekisui House Reit, Inc. REIT | 23 | 14,003 | ||||||
Seven & i Holdings Co. Ltd. (b) | 2,500 | 99,784 | ||||||
Seven Bank Ltd. | 7,800 | 14,854 | ||||||
SG Holdings Co. Ltd. | 4,260 | 71,264 | ||||||
Shikoku Electric Power Co., Inc. | 5,500 | 32,216 | ||||||
Shimadzu Corp. | 2,496 | 73,642 | ||||||
Shimamura Co. Ltd. | 500 | 45,591 | ||||||
Shimano, Inc. | 400 | 71,618 | ||||||
Shimizu Corp. | 4,746 | 26,225 | ||||||
Shin-Etsu Chemical Co. Ltd. | 300 | 35,307 | ||||||
Shinko Electric Industries Co. Ltd. | 300 | 8,505 | ||||||
Shionogi & Co. Ltd. | 1,800 | 88,348 | ||||||
Shiseido Co. Ltd. | 400 | 15,279 | ||||||
Shizuoka Bank Ltd. | 2,100 | 12,210 | ||||||
SHO-BOND Holdings Co. Ltd. | 1,149 | 49,980 | ||||||
Showa Denko KK | 500 | 7,773 | ||||||
Skylark Holdings Co. Ltd.* | 2,100 | 23,238 | ||||||
SMC Corp. | 67 | 32,189 | ||||||
SMS Co. Ltd. | 300 | 6,958 | ||||||
SoftBank Corp. | 4,405 | 48,602 | ||||||
Sohgo Security Services Co. Ltd. | 887 | 23,131 | ||||||
Sojitz Corp. | 10,220 | 173,252 | ||||||
Sompo Holdings, Inc. | 2,700 | 116,336 | ||||||
Sony Group Corp. | 408 | 32,772 | ||||||
Square Enix Holdings Co. Ltd. | 400 | 17,515 | ||||||
Stanley Electric Co. Ltd. | 1,331 | 24,839 | ||||||
Subaru Corp. | 5,264 | 96,280 | ||||||
Sugi Holdings Co. Ltd. | 335 | 14,306 | ||||||
Sumitomo Bakelite Co. Ltd. | 600 | 19,131 | ||||||
Sumitomo Chemical Co. Ltd. | 32,500 | 128,945 | ||||||
Sumitomo Corp. | 6,632 | 94,008 | ||||||
Sumitomo Electric Industries Ltd. | 4,426 | 51,164 | ||||||
Sumitomo Forestry Co. Ltd. | 4,183 | 71,545 | ||||||
Sumitomo Heavy Industries Ltd. | 2,449 | 51,921 | ||||||
Sumitomo Metal Mining Co. Ltd. | 1,169 | 37,147 | ||||||
Sumitomo Mitsui Financial Group, Inc. | 500 | 15,127 | ||||||
Sumitomo Mitsui Trust Holdings, Inc. | 800 | 25,023 | ||||||
Sumitomo Realty & Development Co. Ltd. | 771 | 19,021 | ||||||
Sumitomo Rubber Industries Ltd. | 6,600 | 57,133 | ||||||
Sundrug Co. Ltd. | 788 | 19,384 | ||||||
Suntory Beverage & Food Ltd. | 2,574 | 94,697 | ||||||
Suzuken Co. Ltd. | 1,584 | 38,107 | ||||||
Suzuki Motor Corp. | 2,242 | 78,909 | ||||||
Sysmex Corp. | 127 | 7,882 | ||||||
T&D Holdings, Inc. | 3,741 | 41,046 | ||||||
Taiheiyo Cement Corp. | 1,700 | 25,618 | ||||||
Taisei Corp. | 2,134 | 65,194 | ||||||
Taisho Pharmaceutical Holdings Co. Ltd. | 200 | 7,488 | ||||||
Taiyo Yuden Co. Ltd. | 100 | 3,138 | ||||||
Takara Bio, Inc. | 300 | 4,233 | ||||||
Takara Holdings, Inc. | 500 | 3,823 | ||||||
Takashimaya Co. Ltd. | 1,300 | 14,470 | ||||||
Takeda Pharmaceutical Co. Ltd. | 500 | 13,886 | ||||||
TDK Corp. | 330 | 11,700 | ||||||
TechnoPro Holdings, Inc. | 1,087 | 24,779 | ||||||
Teijin Ltd. | 2,720 | 28,941 | ||||||
Number | Value | |||||||
| Japan (Continued) | ||||||||
Terumo Corp. | 416 | $ | 13,522 | |||||
TIS, Inc. | 1,300 | 37,417 | ||||||
Tobu Railway Co. Ltd. | 700 | 16,638 | ||||||
Toda Corp. | 900 | 4,467 | ||||||
Toho Co. Ltd. | 1,359 | 52,056 | ||||||
Tohoku Electric Power Co., Inc. | 5,919 | 29,547 | ||||||
Tokio Marine Holdings, Inc. | 1,100 | 61,830 | ||||||
Tokyo Electric Power Co. Holdings, Inc.* | 35,604 | 139,719 | ||||||
Tokyo Electron Ltd. | 50 | 15,928 | ||||||
Tokyo Gas Co. Ltd. | 9,159 | 172,576 | ||||||
Tokyo Ohka Kogyo Co. Ltd. | 900 | 44,667 | ||||||
Tokyo Tatemono Co. Ltd. | 2,000 | 30,225 | ||||||
Tokyu Corp. | 1,900 | 22,738 | ||||||
Tokyu Fudosan Holdings Corp. | 2,222 | 12,038 | ||||||
TOPPAN, Inc. | 11,165 | 176,465 | ||||||
Toray Industries, Inc. | 10,500 | 60,512 | ||||||
Toshiba Corp. | 2,000 | 74,546 | ||||||
Toshiba TEC Corp. | 391 | 11,748 | ||||||
Tosoh Corp. | 5,141 | 67,014 | ||||||
TOTO Ltd. | 380 | 13,254 | ||||||
Toyo Seikan Group Holdings Ltd. | 6,121 | 73,165 | ||||||
Toyo Suisan Kaisha Ltd. | 3,100 | 127,690 | ||||||
Toyo Tire Corp. | 1,000 | 12,220 | ||||||
Toyoda Gosei Co. Ltd. | 584 | 10,241 | ||||||
Toyota Boshoku Corp. | 1,900 | 27,906 | ||||||
Toyota Industries Corp. | 298 | 16,811 | ||||||
Toyota Motor Corp. | 500 | 7,580 | ||||||
Toyota Tsusho Corp. | 1,123 | 39,735 | ||||||
Trend Micro, Inc. | 1,539 | 95,698 | ||||||
TS Tech Co. Ltd. | 3,358 | 37,886 | ||||||
Tsumura & Co. | 300 | 6,914 | ||||||
Tsuruha Holdings, Inc. | 128 | 7,156 | ||||||
UBE Corp. | 3,293 | 48,816 | ||||||
Ulvac, Inc. | 400 | 15,784 | ||||||
Unicharm Corp. | 1,077 | 37,688 | ||||||
United Urban Investment Corp. REIT | 14 | 14,967 | ||||||
Ushio, Inc. | 1,701 | 20,897 | ||||||
USS Co. Ltd. | 3,000 | 53,324 | ||||||
Welcia Holdings Co. Ltd. | 842 | 17,754 | ||||||
Yakult Honsha Co. Ltd. | 1,100 | 65,306 | ||||||
Yamada Holdings Co. Ltd. | 8,857 | 30,796 | ||||||
Yamaguchi Financial Group, Inc. | 1,800 | 9,920 | ||||||
Yamaha Corp. | 481 | 18,945 | ||||||
Yamaha Motor Co. Ltd. | 5,100 | 106,654 | ||||||
Yamato Holdings Co. Ltd. | 2,400 | 37,742 | ||||||
Yamato Kogyo Co. Ltd. | 1,600 | 57,017 | ||||||
Yamazaki Baking Co. Ltd. | 1,753 | 20,714 | ||||||
Yaoko Co. Ltd. | 500 | 23,300 | ||||||
Yaskawa Electric Corp. | 300 | 9,912 | ||||||
Yokogawa Electric Corp. | 1,200 | 21,165 | ||||||
Yokohama Rubber Co. Ltd. | 2,900 | 47,885 | ||||||
Zenkoku Hosho Co. Ltd. | 838 | 27,898 | ||||||
Zensho Holdings Co. Ltd. | 400 | 10,546 | ||||||
Zeon Corp. | 1,459 | 14,135 | ||||||
|
| |||||||
(Cost $18,396,334) | 16,622,362 | |||||||
|
| |||||||
| See Notes to Financial Statements. | 21 |
DBX ETF Trust
Schedule of Investments
Xtrackers FTSE Developed ex US Multifactor ETF (Continued)
August 31, 2022
Number | Value | |||||||
| Jordan — 0.0% | ||||||||
Hikma Pharmaceuticals PLC | 1,547 | $ | 23,635 | |||||
|
| |||||||
| Luxembourg — 0.2% | ||||||||
ArcelorMittal SA | 409 | 9,770 | ||||||
Aroundtown SA | 1,862 | 5,445 | ||||||
Eurofins Scientific SE | 542 | 37,660 | ||||||
L’Occitane International SA | 11,326 | 35,714 | ||||||
RTL Group SA | 848 | 31,550 | ||||||
Tenaris SA | 1,392 | 19,246 | ||||||
|
| |||||||
(Cost $163,880) | 139,385 | |||||||
|
| |||||||
| Netherlands — 2.3% | ||||||||
Aalberts NV | 1,768 | 64,997 | ||||||
Akzo Nobel NV | 965 | 61,171 | ||||||
ASM International NV | 61 | 16,629 | ||||||
ASML Holding NV | 19 | 9,259 | ||||||
ASR Nederland NV | 1,021 | 41,755 | ||||||
BE Semiconductor Industries NV | 304 | 14,487 | ||||||
CTP NV, 144A | 314 | 4,281 | ||||||
Euronext NV, 144A | 96 | 7,124 | ||||||
EXOR NV | 129 | 7,817 | ||||||
Heineken Holding NV | 550 | 39,156 | ||||||
Heineken NV | 263 | 23,733 | ||||||
IMCD NV | 463 | 64,155 | ||||||
ING Groep NV | 511 | 4,504 | ||||||
JDE Peet’s NV | 471 | 14,549 | ||||||
Koninklijke Ahold Delhaize NV | 7,848 | 216,229 | ||||||
Koninklijke DSM NV | 923 | 118,196 | ||||||
Koninklijke KPN NV | 70,999 | 226,316 | ||||||
Koninklijke Philips NV | 714 | 11,953 | ||||||
Koninklijke Vopak NV | 377 | 8,317 | ||||||
NN Group NV | 880 | 36,254 | ||||||
QIAGEN NV* | 1,590 | 72,347 | ||||||
Randstad NV | 3,667 | 171,425 | ||||||
Signify NV, 144A | 1,678 | 47,869 | ||||||
Stellantis NV | 3,403 | 45,696 | ||||||
Universal Music Group NV | 666 | 13,264 | ||||||
Wolters Kluwer NV | 1,773 | 173,720 | ||||||
|
| |||||||
(Cost $1,694,298) | 1,515,203 | |||||||
|
| |||||||
| New Zealand — 1.1% | ||||||||
Auckland International Airport Ltd.* | 3,549 | 16,450 | ||||||
Contact Energy Ltd. | 29,156 | 140,859 | ||||||
Fisher & Paykel Healthcare Corp. Ltd. | 5,028 | 60,605 | ||||||
Fletcher Building Ltd. | 27,573 | 94,668 | ||||||
Infratil Ltd. | 2,340 | 12,984 | ||||||
Kiwi Property Group Ltd. | 56,095 | 35,080 | ||||||
Mainfreight Ltd. | 2,700 | 123,325 | ||||||
Mercury NZ Ltd. | 4,670 | 16,606 | ||||||
Meridian Energy Ltd. | 8,708 | 26,721 | ||||||
Ryman Healthcare Ltd. | 791 | 4,457 | ||||||
SKYCITY Entertainment Group Ltd. | 8,900 | 15,551 | ||||||
Spark New Zealand Ltd. | 58,464 | 194,276 | ||||||
Xero Ltd.* | 92 | 5,535 | ||||||
|
| |||||||
(Cost $825,242) | 747,117 | |||||||
|
| |||||||
Number | Value | |||||||
| Norway — 1.2% | ||||||||
Aker BP ASA | 1,091 | $ | 38,224 | |||||
DNB Bank ASA | 255 | 4,882 | ||||||
Equinor ASA | 1,839 | 70,916 | ||||||
Gjensidige Forsikring ASA | 2,636 | 53,654 | ||||||
Leroy Seafood Group ASA | 6,456 | 43,326 | ||||||
Mowi ASA | 6,117 | 125,926 | ||||||
Nordic Semiconductor ASA* | 648 | 9,990 | ||||||
Norsk Hydro ASA | 7,967 | 54,991 | ||||||
Orkla ASA | 13,803 | 116,025 | ||||||
Salmar ASA | 528 | 35,088 | ||||||
Telenor ASA | 5,249 | 57,651 | ||||||
TOMRA Systems ASA | 3,322 | 76,103 | ||||||
Yara International ASA | 2,885 | 122,503 | ||||||
|
| |||||||
(Cost $849,633) | 809,279 | |||||||
|
| |||||||
| Poland — 0.6% | ||||||||
Cyfrowy Polsat SA | 14,914 | 61,658 | ||||||
Dino Polska SA, 144A* | 393 | 28,785 | ||||||
KGHM Polska Miedz SA | 617 | 11,637 | ||||||
Polski Koncern Naftowy ORLEN SA | 13,779 | 179,061 | ||||||
Polskie Gornictwo Naftowe i Gazownictwo SA* | 54,130 | 64,483 | ||||||
Powszechna Kasa Oszczednosci Bank Polski SA | 2,367 | 11,864 | ||||||
Powszechny Zaklad Ubezpieczen SA | 3,807 | 22,846 | ||||||
Santander Bank Polska SA | 117 | 5,341 | ||||||
|
| |||||||
(Cost $555,620) | 385,675 | |||||||
|
| |||||||
| Portugal — 0.3% | ||||||||
EDP — Energias de Portugal SA | 4,387 | 21,007 | ||||||
Galp Energia SGPS SA | 1,366 | 14,828 | ||||||
Jeronimo Martins SGPS SA | 7,972 | 177,159 | ||||||
|
| |||||||
(Cost $207,184) | 212,994 | |||||||
|
| |||||||
| Singapore — 3.4% | ||||||||
Ascendas Real Estate Investment Trust REIT | 65,336 | 132,068 | ||||||
Ascott Residence Trust (a) | 45,200 | 35,315 | ||||||
BOC Aviation Ltd., 144A | 1,544 | 12,403 | ||||||
CapitaLand Integrated Commercial Trust REIT | 78,174 | 115,992 | ||||||
Capitaland Investment Ltd. | 17,800 | 47,080 | ||||||
City Developments Ltd. | 2,800 | 16,317 | ||||||
ComfortDelGro Corp. Ltd. | 109,244 | 110,411 | ||||||
DBS Group Holdings Ltd. | 2,826 | 66,036 | ||||||
Frasers Logistics & Commercial Trust REIT | 124,500 | 121,368 | ||||||
Genting Singapore Ltd. | 48,600 | 26,998 | ||||||
Golden Agri-Resources Ltd. | 331,800 | 66,593 | ||||||
Jardine Cycle & Carriage Ltd. | 5,605 | 132,019 | ||||||
Kenon Holdings Ltd. | 241 | 9,846 | ||||||
Keppel REIT | 35,000 | 27,095 | ||||||
Keppel Corp. Ltd. | 11,662 | 60,772 | �� | |||||
Keppel DC REIT | 21,800 | 30,315 | ||||||
Mapletree Industrial Trust REIT | 19,378 | 35,142 | ||||||
Mapletree Logistics Trust REIT | 46,767 | 55,982 | ||||||
Mapletree Pan Asia Commercial Trust REIT | 13,791 | 18,189 | ||||||
| See Notes to Financial Statements. | 22 |
DBX ETF Trust
Schedule of Investments
Xtrackers FTSE Developed ex US Multifactor ETF (Continued)
August 31, 2022
Number | Value | |||||||
| Singapore (Continued) | ||||||||
NETLINK NBN MANAGEMENT PTE Ltd. | 87,600 | $ | 58,710 | |||||
Olam Group Ltd. | 44,964 | 47,378 | ||||||
Oversea-Chinese Banking Corp. Ltd. | 11,362 | 98,464 | ||||||
SATS Ltd.* | 2,065 | 5,980 | ||||||
Sembcorp Industries Ltd. | 70,153 | 170,467 | ||||||
SIA Engineering Co. Ltd.* | 8,100 | 14,399 | ||||||
Singapore Exchange Ltd. | 21,880 | 148,836 | ||||||
Singapore Post Ltd. | 56,800 | 23,614 | ||||||
Singapore Technologies Engineering Ltd. | 45,928 | 122,795 | ||||||
Singapore Telecommunications Ltd. | 38,666 | 72,615 | ||||||
StarHub Ltd. | 42,400 | 37,382 | ||||||
Suntec Real Estate Investment Trust REIT | 77,100 | 87,318 | ||||||
United Overseas Bank Ltd. | 4,300 | 84,237 | ||||||
UOL Group Ltd. | 6,229 | 30,897 | ||||||
Venture Corp. Ltd. | 4,562 | 59,809 | ||||||
Wilmar International Ltd. | 13,900 | 40,252 | ||||||
Wing Tai Holdings Ltd. | 6,900 | 8,260 | ||||||
|
| |||||||
(Cost $2,227,250) | 2,231,354 | |||||||
|
| |||||||
| South Korea — 4.1% | ||||||||
AMOREPACIFIC Group | 96 | 2,505 | ||||||
BGF retail Co. Ltd. | 107 | 12,840 | ||||||
BNK Financial Group, Inc. | 9,818 | 49,253 | ||||||
Cheil Worldwide, Inc. | 2,991 | 48,972 | ||||||
CJ CheilJedang Corp. | 165 | 50,269 | ||||||
CJ Corp. | 328 | 19,177 | ||||||
CJ ENM Co. Ltd. | 51 | 3,748 | ||||||
CJ Logistics Corp.* | 91 | 8,062 | ||||||
Coway Co. Ltd. | 991 | 47,196 | ||||||
Daewoo Engineering & Construction Co. Ltd.* | 1,453 | 5,649 | ||||||
DB Insurance Co. Ltd. | 1,438 | 64,183 | ||||||
DGB Financial Group, Inc. | 5,218 | 29,064 | ||||||
DL E&C Co. Ltd. | 516 | 15,798 | ||||||
Doosan Bobcat, Inc. | 370 | 9,599 | ||||||
E-MART, Inc. | 209 | 15,282 | ||||||
F&F Co. Ltd. / New | 200 | 21,308 | ||||||
GS Engineering & Construction Corp. | 877 | 19,769 | ||||||
GS Holdings Corp. | 2,188 | 75,330 | ||||||
GS Retail Co. Ltd. | 174 | 3,304 | ||||||
Hana Financial Group, Inc. | 3,481 | 102,149 | ||||||
Hankook Tire & Technology Co. Ltd. | 933 | 26,472 | ||||||
Hanwha Aerospace Co. Ltd. | 200 | 12,172 | ||||||
Hanwha Corp. | 908 | 21,621 | ||||||
HD Hyundai Co. Ltd. | 107 | 5,056 | ||||||
Hite Jinro Co. Ltd. | 417 | 9,509 | ||||||
Hotel Shilla Co. Ltd. | 112 | 6,180 | ||||||
Hyundai Department Store Co. Ltd. | 146 | 6,757 | ||||||
Hyundai Engineering & Construction Co. Ltd. | 1,197 | 43,135 | ||||||
Hyundai Glovis Co. Ltd. | 157 | 20,717 | ||||||
Hyundai Marine & Fire Insurance Co. Ltd. | 2,000 | 47,101 | ||||||
Hyundai Mobis Co. Ltd. | 162 | 26,040 | ||||||
Hyundai Steel Co. | 126 | 3,099 | ||||||
Industrial Bank of Korea | 5,760 | 41,212 | ||||||
Kakao Corp. | 37 | 2,030 | ||||||
KB Financial Group, Inc. | 3,007 | 111,171 | ||||||
Number | Value | |||||||
| South Korea (Continued) | ||||||||
KCC Corp. | 89 | $ | 19,596 | |||||
KEPCO Plant Service & Engineering Co. Ltd. | 744 | 23,001 | ||||||
Kia Corp. | 818 | 49,415 | ||||||
Korea Aerospace Industries Ltd. | 407 | 18,562 | ||||||
Korea Electric Power Corp.* | 3,868 | 60,584 | ||||||
Korea Gas Corp. | 424 | 13,789 | ||||||
Korea Investment Holdings Co. Ltd. | 342 | 14,523 | ||||||
Korea Zinc Co. Ltd. | 236 | 118,569 | ||||||
Krafton, Inc.* | 141 | 25,985 | ||||||
KT&G Corp. | 4,072 | 253,292 | ||||||
LG Corp. | 743 | 45,550 | ||||||
LG Display Co. Ltd. | 1,035 | 12,071 | ||||||
LG Electronics, Inc. | 321 | 24,239 | ||||||
LG H&H Co. Ltd. | 9 | 4,791 | ||||||
LG Innotek Co. Ltd. | 118 | 30,348 | ||||||
LG Uplus Corp. | 10,652 | 91,584 | ||||||
Lotte Chemical Corp. | 28 | 3,663 | ||||||
Lotte Chilsung Beverage Co. Ltd. | 42 | 4,851 | ||||||
LOTTE Fine Chemical Co. Ltd. | 249 | 13,124 | ||||||
Meritz Financial Group, Inc. | 411 | 9,464 | ||||||
Mirae Asset Securities Co. Ltd. | 2,210 | 10,839 | ||||||
NH Investment & Securities Co. Ltd. | 3,804 | 28,298 | ||||||
NHN Corp.* | 266 | 5,041 | ||||||
NongShim Co. Ltd. | 245 | 54,951 | ||||||
Orion Corp. | 153 | 11,256 | ||||||
Ottogi Corp. | 15 | 5,372 | ||||||
Pan Ocean Co. Ltd. | 820 | 3,157 | ||||||
POSCO Holdings, Inc. | 413 | 78,737 | ||||||
Posco International Corp. | 542 | 10,880 | ||||||
S-1 Corp. | 550 | 23,932 | ||||||
Samsung C&T Corp. | 335 | 30,180 | ||||||
Samsung Card Co. Ltd. | 1,105 | 25,899 | ||||||
Samsung Electro-Mechanics Co. Ltd. | 215 | 22,504 | ||||||
Samsung Electronics Co. Ltd. | 200 | 8,927 | ||||||
Samsung Engineering Co. Ltd.* | 760 | 13,324 | ||||||
Samsung Fire & Marine Insurance Co. Ltd. | 810 | 118,089 | ||||||
Samsung Life Insurance Co. Ltd. | 216 | 10,012 | ||||||
Samsung SDS Co. Ltd. | 107 | 10,280 | ||||||
Samsung Securities Co. Ltd. | 193 | 4,892 | ||||||
SD Biosensor, Inc. | 739 | 19,420 | ||||||
Shinhan Financial Group Co. Ltd. | 1,590 | 43,508 | ||||||
Shinsegae, Inc. | 38 | 6,350 | ||||||
SK Bioscience Co. Ltd.* | 43 | 3,633 | ||||||
SK Hynix, Inc. | 220 | 15,658 | ||||||
SK Square Co. Ltd.* | 1,152 | 34,882 | ||||||
SK Telecom Co. Ltd. | 2,957 | 115,181 | ||||||
SK, Inc. | 56 | 9,755 | ||||||
S-Oil Corp. | 70 | 5,312 | ||||||
SSANGYONG C&E Co. Ltd. | 771 | 3,937 | ||||||
Woori Financial Group, Inc. | 12,924 | 117,882 | ||||||
Yuhan Corp. | 187 | 7,941 | ||||||
|
| |||||||
(Cost $2,959,951) | 2,682,759 | |||||||
|
| |||||||
| See Notes to Financial Statements. | 23 |
DBX ETF Trust
Schedule of Investments
Xtrackers FTSE Developed ex US Multifactor ETF (Continued)
August 31, 2022
Number | Value | |||||||
| Spain — 1.8% | ||||||||
Acciona SA | 164 | $ | 32,174 | |||||
ACS Actividades de Construccion y Servicios SA (b) | 480 | 10,720 | ||||||
Aena SME SA, 144A* | 72 | 8,858 | ||||||
Amadeus IT Group SA* | 89 | 4,709 | ||||||
Banco Bilbao Vizcaya Argentaria SA | 1,939 | 8,757 | ||||||
Banco Santander SA | 2,751 | 6,686 | ||||||
Bankinter SA | 2,075 | 10,650 | ||||||
CaixaBank SA | 4,039 | 12,200 | ||||||
Corp ACCIONA Energias Renovables SA | 164 | 6,834 | ||||||
EDP Renovaveis SA | 324 | 7,875 | ||||||
Enagas SA | 5,085 | 93,010 | ||||||
Endesa SA | 1,964 | 33,771 | ||||||
Ferrovial SA | 4,007 | 100,650 | ||||||
Fluidra SA | 1,066 | 17,097 | ||||||
Iberdrola SA | 2,913 | 30,419 | ||||||
Industria de Diseno Textil SA | 201 | 4,356 | ||||||
Mapfre SA (b) | 10,852 | 18,038 | ||||||
Merlin Properties Socimi SA REIT | 3,906 | 35,820 | ||||||
Naturgy Energy Group SA | 1,522 | 42,057 | ||||||
Red Electrica Corp. SA | 14,424 | 264,481 | ||||||
Repsol SA | 15,626 | 204,030 | ||||||
Telefonica SA (b) | 63,456 | 262,635 | ||||||
|
| |||||||
(Cost $1,341,353) | 1,215,827 | |||||||
|
| |||||||
| Sweden — 4.7% | ||||||||
Alfa Laval AB | 2,405 | 64,574 | ||||||
Alleima AB* | 451 | 1,815 | ||||||
Assa Abloy AB, Class B | 4,961 | 101,103 | ||||||
Atlas Copco AB, Class A | 3,088 | 31,579 | ||||||
Atlas Copco AB, Class B | 1,696 | 15,554 | ||||||
Beijer Ref AB | 524 | 6,820 | ||||||
Boliden AB | 7,193 | 232,399 | ||||||
Castellum AB | 6,505 | 91,856 | ||||||
Electrolux AB, Class B | 2,316 | 29,456 | ||||||
Elekta AB, Class B (b) | 1,263 | 7,276 | ||||||
Epiroc AB, Class A | 3,828 | 58,914 | ||||||
Epiroc AB, Class B | 2,286 | 31,280 | ||||||
Essity AB, Class B | 3,939 | 87,832 | ||||||
Fastighets AB Balder, Class B* | 12,480 | 69,411 | ||||||
Getinge AB, Class B | 3,278 | 61,085 | ||||||
H & M Hennes & Mauritz AB, Class B (b) | 1,205 | 12,586 | ||||||
Hexagon AB, Class B | 2,135 | 21,976 | ||||||
Holmen AB, Class B | 2,393 | 103,207 | ||||||
Husqvarna AB, Class B | 3,095 | 20,957 | ||||||
Industrivarden AB, Class A | 5,793 | 129,227 | ||||||
Industrivarden AB, Class C | 4,648 | 102,636 | ||||||
Indutrade AB | 2,077 | 38,715 | ||||||
Investment AB Latour, Class B (b) | 1,603 | 31,809 | ||||||
Investor AB, Class A | 3,485 | 58,273 | ||||||
Investor AB, Class B | 10,413 | 165,206 | ||||||
Kinnevik AB, Class B* | 5,880 | 84,302 | ||||||
L E Lundbergforetagen AB, Class B | 1,579 | 65,635 | ||||||
Lifco AB, Class B | 1,383 | 21,649 | ||||||
Nibe Industrier AB, Class B | 4,171 | 39,324 | ||||||
Orron Energy ab | 999 | 1,909 | ||||||
Sagax AB, Class B | 2,987 | 64,666 | ||||||
Number | Value | |||||||
| Sweden (Continued) | ||||||||
Sagax AB, Class D | 5,932 | $ | 15,509 | |||||
Samhallsbyggnadsbolaget i Norden AB (b) | 12,170 | 19,692 | ||||||
Sandvik AB | 2,256 | 35,421 | ||||||
Securitas AB, Class B (b) | 3,879 | 34,145 | ||||||
Skandinaviska Enskilda Banken AB, Class A | 2,345 | 23,520 | ||||||
Skanska AB, Class B | 3,723 | 55,373 | ||||||
SKF AB, Class B | 964 | 14,555 | ||||||
Svenska Cellulosa AB SCA, Class B | 4,732 | 71,359 | ||||||
Svenska Handelsbanken AB, Class A | 1,378 | 11,350 | ||||||
Sweco AB, Class B | 1,814 | 17,179 | ||||||
Swedbank AB, Class A | 1,952 | 25,388 | ||||||
Swedish Match AB | 30,051 | 302,679 | ||||||
Swedish Orphan Biovitrum AB* | 1,942 | 43,029 | ||||||
Tele2 AB, Class B | 15,389 | 164,408 | ||||||
Telefonaktiebolaget LM Ericsson, Class B | 7,346 | 55,254 | ||||||
Telia Co. AB | 42,699 | 150,907 | ||||||
Thule Group AB, 144A | 2,394 | 58,830 | ||||||
Trelleborg AB, Class B | 4,760 | 99,558 | ||||||
Volvo AB, Class A | 718 | 12,013 | ||||||
Volvo AB, Class B | 3,267 | 52,010 | ||||||
|
| |||||||
(Cost $3,533,964) | 3,115,210 | |||||||
|
| |||||||
| Switzerland — 3.9% | ||||||||
ABB Ltd. | 3,106 | 85,833 | ||||||
Adecco Group AG | 1,194 | 37,987 | ||||||
Alcon, Inc. | 578 | 38,235 | ||||||
Baloise Holding AG | 134 | 19,414 | ||||||
Barry Callebaut AG | 32 | 65,708 | ||||||
Belimo Holding AG | 224 | 85,381 | ||||||
BKW AG | 444 | 53,956 | ||||||
Chocoladefabriken Lindt & Spruengli AG Participation Certificates | 10 | 105,948 | ||||||
Cie Financiere Richemont SA, Class A | 330 | 37,144 | ||||||
Clariant AG* | 2,067 | 38,356 | ||||||
Coca-Cola HBC AG* | 3,261 | 74,752 | ||||||
DKSH Holding AG | 1,726 | 128,661 | ||||||
Emmi AG | 77 | 68,010 | ||||||
EMS-Chemie Holding AG | 62 | 43,739 | ||||||
Flughafen Zurich AG* | 57 | 9,637 | ||||||
Geberit AG | 256 | 118,800 | ||||||
Georg Fischer AG | 1,360 | 74,135 | ||||||
Givaudan SA | 15 | 48,092 | ||||||
Glencore PLC* | 17,660 | 97,259 | ||||||
Helvetia Holding AG | 122 | 13,513 | ||||||
Holcim AG* | 2,198 | 98,059 | ||||||
Julius Baer Group Ltd. | 182 | 8,849 | ||||||
Kuehne + Nagel International AG | 331 | 76,649 | ||||||
Logitech International SA | 557 | 27,886 | ||||||
Lonza Group AG | 58 | 31,105 | ||||||
Nestle SA | 196 | 23,011 | ||||||
Novartis AG | 335 | 27,162 | ||||||
Partners Group Holding AG | 79 | 76,608 | ||||||
PSP Swiss Property AG | 963 | 109,330 | ||||||
Roche Holding AG | 66 | 21,329 | ||||||
Schindler Holding AG | 56 | 9,479 | ||||||
| See Notes to Financial Statements. | 24 |
DBX ETF Trust
Schedule of Investments
Xtrackers FTSE Developed ex US Multifactor ETF (Continued)
August 31, 2022
Number | Value | |||||||
| Switzerland (Continued) | ||||||||
Schindler Holding AG Participation Certificates | 111 | $ | 19,415 | |||||
SGS SA | 33 | 72,901 | ||||||
SIG Group AG* | 1,370 | 32,258 | ||||||
Sika AG | 176 | 39,746 | ||||||
Sonova Holding AG | 254 | 67,329 | ||||||
STMicroelectronics NV | 295 | 10,307 | ||||||
Straumann Holding AG | 520 | 57,384 | ||||||
Swatch Group AG — Bearer | 329 | 80,333 | ||||||
Swatch Group AG — Registered | 579 | 26,495 | ||||||
Swiss Life Holding AG | 62 | 32,552 | ||||||
Swiss Prime Site AG | 763 | 65,906 | ||||||
Swiss Re AG | 365 | 28,491 | ||||||
Swisscom AG | 252 | 130,706 | ||||||
Tecan Group AG | 134 | 49,566 | ||||||
Temenos AG | 84 | 6,901 | ||||||
UBS Group AG | 1,261 | 20,066 | ||||||
VAT Group AG, 144A | 193 | 46,394 | ||||||
Zurich Insurance Group AG | 82 | 36,473 | ||||||
|
| |||||||
(Cost $2,764,567) | 2,577,250 | |||||||
|
| |||||||
| United Kingdom — 10.4% | ||||||||
3i Group PLC | 12,488 | 176,625 | ||||||
abrdn PLC | 31,717 | 54,196 | ||||||
Admiral Group PLC | 4,981 | 122,989 | ||||||
Amcor PLC CDI (b) | 22,699 | 277,302 | ||||||
Anglo American PLC | 2,108 | 68,263 | ||||||
Ashtead Group PLC | 695 | 34,370 | ||||||
Associated British Foods PLC | 813 | 14,427 | ||||||
Auto Trader Group PLC, 144A | 7,493 | 56,830 | ||||||
Aviva PLC | 6,903 | 33,631 | ||||||
B&M European Value Retail SA | 37,139 | 159,852 | ||||||
BAE Systems PLC | 26,671 | 240,889 | ||||||
Barclays PLC | 2,137 | 4,091 | ||||||
Barratt Developments PLC | 6,668 | 33,154 | ||||||
Bellway PLC | 1,842 | 43,789 | ||||||
Berkeley Group Holdings PLC | 1,960 | 83,358 | ||||||
BP PLC | 5,029 | 25,835 | ||||||
British American Tobacco PLC | 1,489 | 59,801 | ||||||
BT Group PLC | 87,005 | 152,567 | ||||||
Bunzl PLC | 4,518 | 150,407 | ||||||
Burberry Group PLC | 1,686 | 34,293 | ||||||
Centrica PLC* | 101,552 | 89,499 | ||||||
CNH Industrial NV | 1,741 | 21,323 | ||||||
Compass Group PLC | 1,477 | 31,950 | ||||||
ConvaTec Group PLC, 144A | 5,810 | 14,711 | ||||||
Croda International PLC | 1,357 | 106,204 | ||||||
Dechra Pharmaceuticals PLC | 699 | 28,386 | ||||||
Derwent London PLC REIT | 842 | 23,867 | ||||||
Diageo PLC | 820 | 35,914 | ||||||
Direct Line Insurance Group PLC | 33,105 | 79,315 | ||||||
DS Smith PLC | 15,660 | 48,780 | ||||||
Evraz PLC (d) | 4,559 | 0 | ||||||
Ferguson PLC | 1,279 | 148,616 | ||||||
GSK PLC | 2,957 | 47,462 | ||||||
Haleon PLC* | 3,697 | 11,135 | ||||||
Halma PLC | 3,659 | 88,346 | ||||||
Number | Value | |||||||
| United Kingdom (Continued) | ||||||||
Hargreaves Lansdown PLC | 2,489 | $ | 23,679 | |||||
Howden Joinery Group PLC | 12,289 | 81,679 | ||||||
HSBC Holdings PLC | 1,176 | 7,236 | ||||||
IMI PLC | 5,194 | 69,443 | ||||||
Imperial Brands PLC | 20,643 | 455,543 | ||||||
InterContinental Hotels Group PLC | 343 | 18,722 | ||||||
Intermediate Capital Group PLC | 151 | 2,402 | ||||||
Intertek Group PLC | 1,032 | 47,541 | ||||||
ITV PLC | 14,706 | 11,003 | ||||||
J Sainsbury PLC | 80,712 | 191,026 | ||||||
Johnson Matthey PLC | 719 | 16,858 | ||||||
Kingfisher PLC | 27,363 | 73,900 | ||||||
Legal & General Group PLC | 3,732 | 10,965 | ||||||
Lloyds Banking Group PLC | 53,733 | 27,435 | ||||||
Mondi PLC | 9,877 | 168,486 | ||||||
National Grid PLC | 8,385 | 105,178 | ||||||
Next PLC | 304 | 20,559 | ||||||
Pearson PLC | 2,327 | 23,362 | ||||||
Pennon Group PLC | 5,850 | 63,578 | ||||||
Pepco Group NV, 144A* | 1,312 | 9,909 | ||||||
Persimmon PLC | 1,619 | 27,806 | ||||||
Phoenix Group Holdings PLC | 2,499 | 17,517 | ||||||
Reckitt Benckiser Group PLC | 374 | 28,931 | ||||||
RELX PLC | 2,766 | 72,803 | ||||||
Renishaw PLC | 62 | 2,666 | ||||||
Rentokil Initial PLC | 8,754 | 53,070 | ||||||
Rightmove PLC | 13,330 | 94,244 | ||||||
Rio Tinto PLC | 1,894 | 105,146 | ||||||
Royal Mail PLC | 11,328 | 36,314 | ||||||
RS GROUP PLC | 4,770 | 60,277 | ||||||
Sage Group PLC | 21,190 | 176,345 | ||||||
Schroders PLC | 703 | 21,988 | ||||||
Segro PLC REIT | 44,538 | 488,704 | ||||||
Severn Trent PLC | 4,481 | 145,317 | ||||||
Shell PLC | 442 | 11,778 | ||||||
Smith & Nephew PLC | 1,994 | 23,562 | ||||||
Smiths Group PLC | 3,235 | 56,125 | ||||||
Spirax-Sarco Engineering PLC | 699 | 85,687 | ||||||
SSE PLC | 14,435 | 277,563 | ||||||
St James’s Place PLC | 2,108 | 27,153 | ||||||
Standard Chartered PLC | 653 | 4,545 | ||||||
Tate & Lyle PLC | 14,549 | 129,373 | ||||||
Tesco PLC | 139,165 | 402,726 | ||||||
Travis Perkins PLC | 1,489 | 14,710 | ||||||
Unilever PLC | 526 | 24,026 | ||||||
United Utilities Group PLC | 14,926 | 183,492 | ||||||
Vodafone Group PLC | 94,093 | 126,654 | ||||||
Weir Group PLC | 596 | 10,108 | ||||||
Wise PLC, Class A* | 12,677 | 71,808 | ||||||
WPP PLC | 5,056 | 43,794 | ||||||
|
| |||||||
(Cost $8,350,911) | 6,854,913 | |||||||
|
| |||||||
| United States — 0.2% | ||||||||
Waste Connections, Inc. | 1,051 | 146,752 | ||||||
|
| |||||||
TOTAL COMMON STOCKS | 65,274,831 | |||||||
|
| |||||||
| See Notes to Financial Statements. | 25 |
DBX ETF Trust
Schedule of Investments
Xtrackers FTSE Developed ex US Multifactor ETF (Continued)
August 31, 2022
Number | Value | |||||||
| PREFERRED STOCKS — 0.2% | ||||||||
| Germany — 0.1% | ||||||||
Bayerische Motoren Werke AG | 91 | $ | 6,337 | |||||
FUCHS PETROLUB SE | 993 | 26,940 | ||||||
Henkel AG & Co. KGaA | 286 | 18,475 | ||||||
Porsche Automobil Holding SE | 397 | 28,136 | ||||||
Sartorius AG | 11 | 4,600 | ||||||
Sixt SE | 69 | 4,135 | ||||||
|
| |||||||
(Cost $111,081) | 88,623 | |||||||
|
| |||||||
| South Korea — 0.1% | ||||||||
Hanwha Corp. | 1,820 | 21,703 | ||||||
Hyundai Motor Co. | 98 | 6,836 | ||||||
LG H&H Co. Ltd. | 15 | 4,110 | ||||||
Mirae Asset Securities Co. Ltd. | 3,814 | 11,021 | ||||||
Samsung Fire & Marine Insurance Co. Ltd. | 86 | 10,255 | ||||||
|
| |||||||
(Cost $62,378) | 53,925 | |||||||
|
| |||||||
TOTAL PREFERRED STOCKS | 142,548 | |||||||
|
| |||||||
Number | Value | |||||||
| WARRANTS — 0.0% | ||||||||
| Switzerland — 0.0% | ||||||||
Cie Financiere Richemont SA*, expires 11/22/23 | 826 | $ | 533 | |||||
|
| |||||||
| SECURITIES LENDING COLLATERAL — 1.1% | ||||||||
DWS Government & Agency Securities Portfolio “DWS Government Cash Institutional Shares”, 2.00% (e)(f) | 731,962 | 731,962 | ||||||
|
| |||||||
| CASH EQUIVALENTS — 0.2% | ||||||||
DWS Government Money Market Series “Institutional Shares”, 2.24% (e) | 101,059 | 101,059 | ||||||
|
| |||||||
TOTAL INVESTMENTS — 100.4% (Cost $73,175,378) | $ | 66,250,933 | ||||||
Other assets and liabilities, net — (0.4%) | (247,826 | ) | ||||||
|
| |||||||
NET ASSETS — 100.0% | $ | 66,003,107 | ||||||
|
| |||||||
A summary of the Fund’s transactions with affiliated investments during the year ended August 31, 2022 is as follows:
| Value ($) at 8/31/2021 | Purchases Cost ($) | Sales Proceeds ($) | Net Realized Gain/(Loss) ($) | Net Change in Unrealized Appreciation (Depreciation) ($) | Income ($) | Capital Gain Distributions ($) | Number of Shares at 8/31/2022 | Value ($) at 8/31/2022 | ||||||||||||||||||||||||||||
COMMON STOCKS — 0.0% |
| |||||||||||||||||||||||||||||||||||
Germany — 0.0% |
| |||||||||||||||||||||||||||||||||||
Deutsche Bank AG (c) |
| |||||||||||||||||||||||||||||||||||
| — | 5,968 | — | — | (1,867 | ) | 103 | — | 490 | 4,101 | |||||||||||||||||||||||||||
SECURITIES LENDING COLLATERAL — 1.1% |
| |||||||||||||||||||||||||||||||||||
DWS Government & Agency Securities Portfolio “DWS Government Cash Institutional Shares”, 2.00% (e)(f) |
| |||||||||||||||||||||||||||||||||||
| 990,427 | — | (258,465 | ) (g) | — | — | 5,818 | — | 731,962 | 731,962 | |||||||||||||||||||||||||||
CASH EQUIVALENTS — 0.2% |
| |||||||||||||||||||||||||||||||||||
DWS Government Money Market Series “Institutional Shares”, 2.24% (e) |
| |||||||||||||||||||||||||||||||||||
| 6,186 | 3,315,646 | (3,220,773 | ) | — | — | 514 | — | 101,059 | 101,059 | |||||||||||||||||||||||||||
|
|
|
|
|
|
|
|
|
|
|
|
|
|
|
|
|
| |||||||||||||||||||
| 996,613 | 3,321,614 | (3,479,238 | ) | — | (1,867 | ) | 6,435 | — | 833,511 | 837,122 | ||||||||||||||||||||||||||
|
|
|
|
|
|
|
|
|
|
|
|
|
|
|
|
|
| |||||||||||||||||||
| * | Non-income producing security. |
| (a) | Stapled Security — A security contractually bound to one or more other securities to form a single saleable unit which cannot be sold separately. |
| (b) | All or a portion of these securities were on loan. In addition, “Other assets and liabilities, net” may include pending sales that are also on loan. The value of securities loaned at August 31, 2022 amounted to $1,102,919, which is 1.7% of net assets. |
| (c) | Affiliated issuer. This security is owned in proportion with its representation in the index. |
| (d) | Investment was valued using significant unobservable inputs. |
| (e) | Affiliated fund managed by DWS Investment Management Americas, Inc. The rate shown is the annualized seven-day yield at period end. |
| (f) | Represents cash collateral held in connection with securities lending. Income earned by the Fund is net of borrower rebates. In addition, the Fund held non-cash U.S. Treasury securities collateral having a value of $444,256. |
| (g) | Represents the net increase (purchase cost) or decrease (sales proceeds) in the amount invested in cash collateral for the year ended August 31, 2022. |
| See Notes to Financial Statements. | 26 |
DBX ETF Trust
Schedule of Investments
Xtrackers FTSE Developed ex US Multifactor ETF (Continued)
August 31, 2022
| CDI: | Chess Depositary Interest |
| CVA: | Credit Valuation Adjustment |
| REIT: | Real Estate Investment Trust |
| RSP: | Risparmio (Convertible Savings Shares) |
| 144A: | Security exempt from registration under Rule 144A of the Securities Act of 1933. These securities may be resold in transactions exempt from registration, normally to qualified institutional buyers. |
Securities are listed in country of domicile.
At August 31, 2022, open futures contracts purchased were as follows:
Contract Description | Currency | Number of Contracts | Notional Amount | Contract Value | Expiration Date | Unrealized Depreciation | ||||||||||||
MSCI EAFE Futures | USD | 5 | $ | 461,475 | $456,775 | 9/16/2022 | $ | (4,700 | ) | |||||||||
For information on the Fund’s policy and additional disclosures regarding open futures contracts, please refer to the Derivatives section of Note 2 in the accompanying Notes to Financial Statements.
Currency Abbreviations
| USD | U.S. Dollar |
Fair Value Measurements
Various inputs are used in determining the value of the Fund’s investments. These inputs are summarized in three broad levels. Level 1 includes quoted prices in active markets for identical securities. Level 2 includes other significant observable inputs (including quoted prices for similar securities, interest rates, prepayment speeds and credit risk). Level 3 includes significant unobservable inputs (including the Fund’s own assumptions in determining the fair value of investments). The level assigned to the securities valuations may not be an indication of the risk or liquidity associated with investing in those securities.
The following is a summary of the inputs used as of August 31, 2022 in valuing the Fund’s investments. For information on the Fund’s policy regarding the valuation of investments, please refer to the Security Valuation section of Note 2 in the accompanying Notes to Financial Statements.
Assets | Level 1 | Level 2 | Level 3 | Total | ||||||||||||
Common Stocks (a) | $ | 65,274,831 | $ | — | $ | 0 | $ | 65,274,831 | ||||||||
Preferred Stocks (a) | 142,548 | — | — | 142,548 | ||||||||||||
Warrants | 533 | — | — | 533 | ||||||||||||
Short-Term Investments (a) | 833,021 | — | — | 833,021 | ||||||||||||
|
|
|
|
|
|
|
| |||||||||
TOTAL | $ | 66,250,933 | $ | — | $ | 0 | $ | 66,250,933 | ||||||||
|
|
|
|
|
|
|
| |||||||||
Liabilities | Level 1 | Level 2 | Level 3 | Total | ||||||||||||
Derivatives (b) | ||||||||||||||||
Futures Contracts | $ | (4,700 | ) | $ | — | $ | — | $ | (4,700 | ) | ||||||
|
|
|
|
|
|
|
| |||||||||
TOTAL | $ | (4,700 | ) | $ | — | $ | — | $ | (4,700 | ) | ||||||
|
|
|
|
|
|
|
| |||||||||
| (a) | See Schedule of Investments for additional detailed categorizations. |
| (b) | Derivatives include unrealized appreciation (depreciation) on open futures contracts. |
During the year ended August 31, 2022, the amount of transfers from Level 1 to Level 3 was $3,185. The investment was transferred from Level 1 to Level 3 due to the lack of observable market data due to a decrease in market activity.
| See Notes to Financial Statements. | 27 |
DBX ETF Trust
Schedule of Investments
Xtrackers MSCI Kokusai Equity ETF
August 31, 2022
Number | Value | |||||||
| COMMON STOCKS — 99.2% | ||||||||
| Australia — 2.3% | ||||||||
Ampol Ltd. | 2,507 | $ | 59,432 | |||||
APA Group (a) | 11,384 | 86,550 | ||||||
Aristocrat Leisure Ltd. | 6,908 | 169,067 | ||||||
ASX Ltd. | 2,193 | 117,943 | ||||||
Aurizon Holdings Ltd. | 16,325 | 41,745 | ||||||
Australia & New Zealand Banking Group Ltd. | 31,385 | 491,210 | ||||||
BHP Group Ltd. | 53,049 | 1,476,531 | ||||||
BlueScope Steel Ltd. | 5,167 | 59,226 | ||||||
Brambles Ltd. | 14,991 | 127,230 | ||||||
Cochlear Ltd. | 587 | 86,238 | ||||||
Coles Group Ltd. | 13,331 | 160,482 | ||||||
Commonwealth Bank of Australia | 17,969 | 1,200,699 | ||||||
Computershare Ltd. | 5,724 | 96,925 | ||||||
CSL Ltd. | 4,993 | 1,004,773 | ||||||
Dexus REIT | 12,041 | 72,064 | ||||||
Domino’s Pizza Enterprises Ltd. | 657 | 28,623 | ||||||
Endeavour Group Ltd. | 13,936 | 69,456 | ||||||
Evolution Mining Ltd. | 18,351 | 30,067 | ||||||
Fortescue Metals Group Ltd. | 18,157 | 229,284 | ||||||
Goodman Group REIT | 17,542 | 236,550 | ||||||
GPT Group REIT | 22,387 | 64,613 | ||||||
IDP Education Ltd. | 2,287 | 45,483 | ||||||
Insurance Australia Group Ltd. | 24,577 | 78,347 | ||||||
Lendlease Corp. Ltd. (a) | 7,597 | 53,487 | ||||||
Lottery Corp. Ltd.* | 28,184 | 85,401 | ||||||
Macquarie Group Ltd. | 3,843 | 467,004 | ||||||
Medibank Pvt Ltd. | 31,226 | 79,420 | ||||||
Mineral Resources Ltd.* | 1,958 | 85,867 | ||||||
Mirvac Group REIT | 44,321 | 63,807 | ||||||
National Australia Bank Ltd. | 34,061 | 714,292 | ||||||
Newcrest Mining Ltd. | 8,480 | 103,073 | ||||||
Northern Star Resources Ltd. | 11,866 | 64,102 | ||||||
Orica Ltd. | 2,719 | 28,836 | ||||||
Origin Energy Ltd. | 19,925 | 86,192 | ||||||
Qantas Airways Ltd.* | 8,405 | 30,654 | ||||||
QBE Insurance Group Ltd. | 16,050 | 132,807 | ||||||
Ramsay Health Care Ltd. | 2,068 | 101,665 | ||||||
REA Group Ltd. | 644 | 56,313 | ||||||
Reece Ltd. | 1,325 | 14,543 | ||||||
Rio Tinto Ltd. | 4,032 | 261,211 | ||||||
Santos Ltd. | 35,456 | 191,781 | ||||||
Scentre Group REIT | 53,099 | 107,022 | ||||||
SEEK Ltd. | 3,640 | 52,054 | ||||||
Sonic Healthcare Ltd. | 4,957 | 115,541 | ||||||
South32 Ltd. | 43,804 | 124,624 | ||||||
Stockland REIT | 18,901 | 46,906 | ||||||
Suncorp Group Ltd. | 13,301 | 99,392 | ||||||
Telstra Corp. Ltd. | 38,195 | 103,953 | ||||||
Transurban Group (a) | 33,729 | 322,796 | ||||||
Treasury Wine Estates Ltd. | 9,025 | 81,608 | ||||||
Vicinity Centres REIT | 51,676 | 68,550 | ||||||
Washington H Soul Pattinson & Co. Ltd. | 2,244 | 39,536 | ||||||
Wesfarmers Ltd. | 11,948 | 385,057 | ||||||
Westpac Banking Corp. | 36,877 | 546,323 | ||||||
WiseTech Global Ltd. | 1,441 | 58,058 | ||||||
Number | Value | |||||||
| Australia (Continued) | ||||||||
Woodside Energy Group Ltd. | 19,299 | $ | 453,142 | |||||
Woolworths Group Ltd. | 12,766 | 315,850 | ||||||
|
| |||||||
(Cost $12,230,034) | 11,573,405 | |||||||
|
| |||||||
| Austria — 0.0% | ||||||||
Erste Group Bank AG | 3,594 | 81,242 | ||||||
OMV AG | 1,252 | 50,710 | ||||||
Verbund AG | 609 | 58,390 | ||||||
voestalpine AG | 1,178 | 23,833 | ||||||
|
| |||||||
(Cost $269,602) | 214,175 | |||||||
|
| |||||||
| Belgium — 0.2% | ||||||||
Ageas SA/NV | 1,537 | 62,578 | ||||||
Anheuser-Busch InBev SA/NV | 9,274 | 450,840 | ||||||
D’ieteren Group | 265 | 40,157 | ||||||
Elia Group SA/NV | 344 | 50,122 | ||||||
Groupe Bruxelles Lambert SA | 1,191 | 90,420 | ||||||
KBC Group NV | 2,684 | 127,874 | ||||||
Proximus SADP | 1,542 | 19,661 | ||||||
Sofina SA | 121 | 24,359 | ||||||
Solvay SA | 812 | 65,843 | ||||||
UCB SA | 1,433 | 101,011 | ||||||
Umicore SA | 2,207 | 70,461 | ||||||
Warehouses De Pauw CVA REIT | 1,569 | 47,931 | ||||||
|
| |||||||
(Cost $1,509,073) | 1,151,257 | |||||||
|
| |||||||
| Bermuda — 0.1% | ||||||||
Arch Capital Group Ltd.* | 3,649 | 166,832 | ||||||
Everest Re Group Ltd. | 411 | 110,580 | ||||||
|
| |||||||
(Cost $240,884) | 277,412 | |||||||
|
| |||||||
| Canada — 3.8% | ||||||||
Agnico Eagle Mines Ltd. | 4,906 | 202,893 | ||||||
Air Canada* | 1,527 | 20,627 | ||||||
Algonquin Power & Utilities Corp. | 7,231 | 99,608 | ||||||
Alimentation Couche-Tard, Inc. | 9,104 | 392,356 | ||||||
AltaGas Ltd. | 2,275 | 49,197 | ||||||
ARC Resources Ltd. | 7,237 | 100,188 | ||||||
Bank of Montreal | 6,897 | 638,562 | ||||||
Bank of Nova Scotia (b) | 12,806 | 710,119 | ||||||
Barrick Gold Corp. | 19,388 | 288,688 | ||||||
BCE, Inc. (b) | 766 | 37,072 | ||||||
BlackBerry Ltd.* | 6,132 | 36,522 | ||||||
Brookfield Asset Management, Inc., Class A | 14,914 | 719,507 | ||||||
BRP, Inc. | 398 | 27,683 | ||||||
CAE, Inc.* | 2,955 | 54,109 | ||||||
Cameco Corp. | 4,331 | 126,596 | ||||||
Canadian Apartment Properties REIT | 844 | 28,789 | ||||||
Canadian Imperial Bank of Commerce | 9,592 | 454,917 | ||||||
Canadian National Railway Co. | 6,264 | 747,079 | ||||||
Canadian Natural Resources Ltd. | 12,701 | 698,283 | ||||||
Canadian Pacific Railway Ltd. | 9,832 | 738,151 | ||||||
Canadian Tire Corp. Ltd., Class A | 654 | 77,141 | ||||||
Canadian Utilities Ltd., Class A | 1,372 | 42,095 | ||||||
CCL Industries, Inc., Class B | 1,547 | 76,098 | ||||||
Cenovus Energy, Inc. | 14,713 | 276,824 | ||||||
CGI, Inc.* | 2,305 | 183,048 | ||||||
| See Notes to Financial Statements. | 28 |
Schedule of Investments
Xtrackers MSCI Kokusai Equity ETF (Continued)
August 31, 2022
Number | Value | |||||||
| Canada (Continued) | ||||||||
Constellation Software, Inc. | 214 | $ | 323,062 | |||||
Dollarama, Inc. | 2,830 | 172,834 | ||||||
Emera, Inc. | 2,853 | 132,389 | ||||||
Empire Co. Ltd., Class A | 1,417 | 40,478 | ||||||
Enbridge, Inc. | 21,343 | 882,664 | ||||||
Fairfax Financial Holdings Ltd. | 266 | 132,988 | ||||||
First Quantum Minerals Ltd. | 6,186 | 109,776 | ||||||
FirstService Corp. | 473 | 59,338 | ||||||
Fortis, Inc. | 4,785 | 211,700 | ||||||
Franco-Nevada Corp. | 2,038 | 245,724 | ||||||
George Weston Ltd. | 818 | 93,786 | ||||||
GFL Environmental, Inc. | 1,905 | 53,822 | ||||||
Gildan Activewear, Inc. | 2,243 | 66,523 | ||||||
Great-West Lifeco, Inc. (b) | 2,608 | 61,436 | ||||||
Hydro One Ltd., 144A | 3,660 | 99,381 | ||||||
iA Financial Corp., Inc. | 1,131 | 60,929 | ||||||
IGM Financial, Inc. | 1,249 | 34,096 | ||||||
Imperial Oil Ltd. | 2,807 | 138,164 | ||||||
Intact Financial Corp. | 1,882 | 273,404 | ||||||
Ivanhoe Mines Ltd., Class A* | 6,379 | 41,111 | ||||||
Keyera Corp. | 2,155 | 53,250 | ||||||
Kinross Gold Corp. | 14,211 | 46,770 | ||||||
Lightspeed Commerce, Inc.* | 1,344 | 25,790 | ||||||
Loblaw Cos. Ltd. | 1,753 | 155,369 | ||||||
Lululemon Athletica, Inc.* | 1,182 | 354,553 | ||||||
Lundin Mining Corp. | 6,394 | 33,347 | ||||||
Magna International, Inc. | 2,866 | 166,038 | ||||||
Manulife Financial Corp. | 20,455 | 354,870 | ||||||
Metro, Inc. | 2,248 | 118,580 | ||||||
National Bank of Canada | 3,570 | 236,864 | ||||||
Northland Power, Inc. | 2,762 | 94,822 | ||||||
Nutrien Ltd. | 5,808 | 534,721 | ||||||
Nuvei Corp., 144A* | 663 | 20,347 | ||||||
Onex Corp. | 727 | 36,056 | ||||||
Open Text Corp. | 2,596 | 82,007 | ||||||
Pan American Silver Corp. | 2,017 | 30,095 | ||||||
Parkland Corp. | 1,889 | 46,504 | ||||||
Pembina Pipeline Corp. | 5,419 | 191,916 | ||||||
Power Corp. of Canada | 6,251 | 161,191 | ||||||
Quebecor, Inc., Class B | 1,565 | 33,903 | ||||||
Restaurant Brands International, Inc. | 2,754 | 163,040 | ||||||
RioCan Real Estate Investment Trust REIT | 1,558 | 23,948 | ||||||
Ritchie Bros Auctioneers, Inc. | 1,163 | 80,795 | ||||||
Rogers Communications, Inc., Class B | 3,414 | 147,420 | ||||||
Royal Bank of Canada | 14,836 | 1,383,568 | ||||||
Saputo, Inc. | 2,472 | 62,951 | ||||||
Shaw Communications, Inc., Class B | 4,810 | 123,703 | ||||||
Shopify, Inc., Class A* | 12,001 | 381,034 | ||||||
Sun Life Financial, Inc. | 6,191 | 273,527 | ||||||
Suncor Energy, Inc. | 15,494 | 502,703 | ||||||
TC Energy Corp. | 9,998 | 483,181 | ||||||
Teck Resources Ltd., Class B | 5,134 | 174,374 | ||||||
TELUS Corp. | 4,782 | 108,011 | ||||||
TFI International, Inc. | 831 | 83,144 | ||||||
Thomson Reuters Corp. | 1,636 | 180,665 | ||||||
TMX Group Ltd. | 650 | 65,467 | ||||||
Number | Value | |||||||
| Canada (Continued) | ||||||||
Toromont Industries Ltd. | 870 | $ | 67,535 | |||||
Toronto-Dominion Bank | 19,063 | 1,229,866 | ||||||
Tourmaline Oil Corp. | 3,360 | 199,224 | ||||||
West Fraser Timber Co. Ltd. | 468 | 41,990 | ||||||
Wheaton Precious Metals Corp. | 4,741 | 145,133 | ||||||
WSP Global, Inc. | 1,379 | 164,804 | ||||||
|
| |||||||
(Cost $19,298,752) | 18,922,833 | |||||||
|
| |||||||
| Chile — 0.0% | ||||||||
Antofagasta PLC | 4,186 | 53,628 | ||||||
|
| |||||||
| Denmark — 0.8% | ||||||||
A.P. Moller — Maersk A/S, Class A | 33 | 77,455 | ||||||
A.P. Moller — Maersk A/S, Class B | 55 | 132,029 | ||||||
Carlsberg A/S, Class B | 958 | 125,094 | ||||||
Chr Hansen Holding A/S | 1,273 | 74,387 | ||||||
Coloplast A/S, Class B | 1,263 | 144,840 | ||||||
Danske Bank A/S | 6,419 | 86,075 | ||||||
Demant A/S* | 883 | 27,279 | ||||||
DSV A/S | 2,021 | 299,613 | ||||||
Genmab A/S* | 659 | 235,220 | ||||||
GN Store Nord AS | 1,350 | 38,385 | ||||||
Novo Nordisk A/S, Class B | 17,745 | 1,901,344 | ||||||
Novozymes A/S, Class B | 2,102 | 120,954 | ||||||
Orsted AS, 144A | 2,061 | 202,553 | ||||||
Pandora A/S | 1,202 | 72,660 | ||||||
ROCKWOOL A/S, Class B | 34 | 7,036 | ||||||
Tryg A/S | 3,795 | 86,020 | ||||||
Vestas Wind Systems A/S | 10,782 | 271,755 | ||||||
|
| |||||||
(Cost $3,987,719) | 3,902,699 | |||||||
|
| |||||||
| Finland — 0.3% | ||||||||
Elisa OYJ | 1,275 | 68,284 | ||||||
Fortum OYJ | 4,980 | 51,303 | ||||||
Kesko OYJ, Class B | 2,459 | 51,876 | ||||||
Kone OYJ, Class B | 3,570 | 143,305 | ||||||
Neste OYJ | 4,438 | 219,785 | ||||||
Nokia OYJ | 59,302 | 298,871 | ||||||
Nordea Bank Abp | 33,848 | 315,617 | ||||||
Orion OYJ, Class B | 1,258 | 57,139 | ||||||
Sampo OYJ, Class A | 5,561 | 252,193 | ||||||
Stora Enso OYJ, Class R | 5,413 | 80,965 | ||||||
UPM-Kymmene OYJ | 5,952 | 202,833 | ||||||
Wartsila OYJ Abp | 5,034 | 41,680 | ||||||
|
| |||||||
(Cost $2,042,782) | 1,783,851 | |||||||
|
| |||||||
| France — 3.1% | ||||||||
Accor SA* | 2,048 | 49,157 | ||||||
Aeroports de Paris* | 316 | 43,485 | ||||||
Air Liquide SA | 5,490 | 691,163 | ||||||
Airbus SE | 6,183 | 608,613 | ||||||
Alstom SA (b) | 2,783 | 57,536 | ||||||
Amundi SA, 144A | 514 | 26,204 | ||||||
Arkema SA | 656 | 55,660 | ||||||
AXA SA | 20,981 | 496,317 | ||||||
BioMerieux | 554 | 50,839 | ||||||
BNP Paribas SA | 11,828 | 552,876 | ||||||
| See Notes to Financial Statements. | 29 |
Schedule of Investments
Xtrackers MSCI Kokusai Equity ETF (Continued)
August 31, 2022
Number | Value | |||||||
| France (Continued) | ||||||||
Bollore SE | 12,487 | $ | 59,969 | |||||
Bouygues SA | 2,769 | 81,582 | ||||||
Bureau Veritas SA | 3,469 | 86,404 | ||||||
Capgemini SE | 1,728 | 300,603 | ||||||
Carrefour SA | 7,249 | 121,293 | ||||||
Cie de Saint-Gobain | 5,246 | 212,851 | ||||||
Cie Generale des Etablissements Michelin SCA | 7,667 | 187,381 | ||||||
Covivio REIT | 651 | 36,527 | ||||||
Credit Agricole SA | 12,106 | 111,872 | ||||||
Danone SA | 6,998 | 369,504 | ||||||
Dassault Aviation SA | 202 | 27,828 | ||||||
Dassault Systemes SE | 6,978 | 270,670 | ||||||
Edenred | 2,625 | 133,298 | ||||||
Eiffage SA | 859 | 75,891 | ||||||
Electricite de France SA | 4,962 | 59,550 | ||||||
Engie SA | 19,135 | 228,355 | ||||||
EssilorLuxottica SA | 3,077 | 461,791 | ||||||
Eurazeo SE | 503 | 30,170 | ||||||
Gecina SA REIT | 567 | 50,715 | ||||||
Getlink SE | 5,071 | 95,813 | ||||||
Hermes International | 328 | 422,995 | ||||||
Ipsen SA | 394 | 37,856 | ||||||
Kering SA | 789 | 399,070 | ||||||
Klepierre SA REIT* | 1,889 | 38,939 | ||||||
La Francaise des Jeux SAEM, 144A | 1,190 | 38,734 | ||||||
Legrand SA | 2,751 | 199,946 | ||||||
L’Oreal SA | 2,535 | 874,968 | ||||||
LVMH Moet Hennessy Louis Vuitton SE | 2,925 | 1,904,449 | ||||||
Orange SA | 21,011 | 213,347 | ||||||
Pernod Ricard SA | 2,165 | 399,591 | ||||||
Publicis Groupe SA | 2,238 | 109,708 | ||||||
Remy Cointreau SA | 245 | 45,650 | ||||||
Renault SA* | 2,024 | 58,228 | ||||||
Safran SA | 3,450 | 353,506 | ||||||
Sanofi | 11,746 | 970,644 | ||||||
Sartorius Stedim Biotech | 294 | 108,113 | ||||||
Schneider Electric SE | 5,600 | 668,860 | ||||||
SEB SA | 129 | 9,599 | ||||||
Societe Generale SA | 8,328 | 184,903 | ||||||
Sodexo SA | 717 | 55,112 | ||||||
Teleperformance | 655 | 187,250 | ||||||
Thales SA | 1,121 | 135,436 | ||||||
TotalEnergies SE (b) | 26,113 | 1,331,014 | ||||||
Ubisoft Entertainment SA* | 719 | 33,265 | ||||||
Unibail-Rodamco-Westfield REIT* | 1,274 | 65,847 | ||||||
Valeo | 2,248 | 43,265 | ||||||
Veolia Environnement SA | 6,433 | 144,123 | ||||||
Vinci SA | 5,574 | 517,055 | ||||||
Vivendi SE | 7,528 | 68,537 | ||||||
Wendel SE | 286 | 22,576 | ||||||
Worldline SA, 144A* | 2,587 | 111,312 | ||||||
|
| |||||||
(Cost $16,952,384) | 15,387,815 | |||||||
|
| |||||||
| Germany — 1.9% | ||||||||
adidas AG | 1,818 | 271,069 | ||||||
Allianz SE | 4,222 | 715,695 | ||||||
Number | Value | |||||||
| Germany (Continued) | ||||||||
BASF SE | 9,722 | $ | 411,275 | |||||
Bayer AG | 10,496 | 555,154 | ||||||
Bayerische Motoren Werke AG | 3,545 | 261,897 | ||||||
Bechtle AG | 752 | 28,908 | ||||||
Beiersdorf AG | 1,058 | 107,026 | ||||||
Brenntag SE | 1,409 | 92,688 | ||||||
Carl Zeiss Meditec AG | 471 | 58,823 | ||||||
Commerzbank AG* | 11,245 | 74,968 | ||||||
Continental AG | 1,156 | 66,816 | ||||||
Covestro AG, 144A | 2,058 | 62,331 | ||||||
Daimler Truck Holding AG* | 4,426 | 113,601 | ||||||
Delivery Hero SE, 144A* | 1,558 | 65,016 | ||||||
Deutsche Bank AG (c) | 21,324 | 178,464 | ||||||
Deutsche Boerse AG | 2,011 | 340,633 | ||||||
Deutsche Lufthansa AG* | 5,569 | 33,235 | ||||||
Deutsche Post AG | 10,618 | 388,587 | ||||||
Deutsche Telekom AG | 34,133 | 644,850 | ||||||
E.ON SE | 22,476 | 192,332 | ||||||
Evonik Industries AG | 2,210 | 41,323 | ||||||
Fresenius Medical Care AG & Co. KGaA | 2,069 | 71,132 | ||||||
Fresenius SE & Co. KGaA | 4,251 | 105,411 | ||||||
GEA Group AG | 1,618 | 56,440 | ||||||
Hannover Rueck SE | 737 | 108,866 | ||||||
HeidelbergCement AG | 1,542 | 69,930 | ||||||
HelloFresh SE* | 1,540 | 36,948 | ||||||
Henkel AG & Co. KGaA | 1,178 | 73,797 | ||||||
Infineon Technologies AG | 13,990 | 341,844 | ||||||
KION Group AG | 824 | 33,002 | ||||||
Knorr-Bremse AG | 647 | 31,456 | ||||||
LEG Immobilien SE | 676 | 51,199 | ||||||
Mercedes-Benz Group AG | 8,451 | 476,902 | ||||||
Merck KGaA | 1,361 | 234,570 | ||||||
MTU Aero Engines AG | 643 | 113,764 | ||||||
Muenchener Rueckversicherungs-Gesellschaft AG in Muenchen | 1,435 | 343,714 | ||||||
Nemetschek SE | 589 | 34,885 | ||||||
Puma SE | 1,179 | 72,342 | ||||||
Rational AG | 34 | 18,411 | ||||||
Rheinmetall AG | 456 | 72,631 | ||||||
RWE AG | 6,870 | 263,062 | ||||||
SAP SE | 10,998 | 939,355 | ||||||
Scout24 SE, 144A | 586 | 33,906 | ||||||
Siemens AG | 7,950 | 808,046 | ||||||
Siemens Energy AG | 4,186 | 61,770 | ||||||
Siemens Healthineers AG, 144A | 2,957 | 144,894 | ||||||
Symrise AG | 1,433 | 150,363 | ||||||
Telefonica Deutschland Holding AG | 10,718 | 27,860 | ||||||
Uniper SE (b) | 806 | 4,364 | ||||||
United Internet AG | 1,437 | 32,584 | ||||||
Volkswagen AG | 314 | 58,160 | ||||||
Vonovia SE | 8,233 | 223,525 | ||||||
Zalando SE, 144A* | 2,162 | 50,241 | ||||||
|
| |||||||
(Cost $13,530,962) | 9,850,065 | |||||||
|
| |||||||
| Hong Kong — 0.9% | ||||||||
AIA Group Ltd. | 127,444 | 1,233,222 | ||||||
BOC Hong Kong Holdings Ltd. | 35,779 | 123,535 | ||||||
| See Notes to Financial Statements. | 30 |
Schedule of Investments
Xtrackers MSCI Kokusai Equity ETF (Continued)
August 31, 2022
Number | Value | |||||||
| Hong Kong (Continued) | ||||||||
Budweiser Brewing Co. APAC Ltd., 144A | 20,536 | $ | 60,570 | |||||
Chow Tai Fook Jewellery Group Ltd. | 22,047 | 44,550 | ||||||
CK Asset Holdings Ltd. | 21,324 | 144,264 | ||||||
CK Hutchison Holdings Ltd. | 27,551 | 178,142 | ||||||
CK Infrastructure Holdings Ltd. | 6,637 | 40,420 | ||||||
CLP Holdings Ltd. | 16,859 | 145,417 | ||||||
ESR Group Ltd., 144A* | 26,986 | 75,813 | ||||||
Futu Holdings Ltd., ADR* | 662 | 32,498 | ||||||
Galaxy Entertainment Group Ltd. | 21,091 | 118,503 | ||||||
Hang Lung Properties Ltd. | 28,377 | 47,290 | ||||||
Hang Seng Bank Ltd. | 7,093 | 111,155 | ||||||
Henderson Land Development Co. Ltd. | 17,717 | 59,366 | ||||||
HK Electric Investments & HK Electric Investments Ltd. (a) | 43,878 | 36,617 | ||||||
HKT Trust & HKT Ltd. (a) | 32,397 | 43,505 | ||||||
Hong Kong & China Gas Co. Ltd. | 102,306 | 101,017 | ||||||
Hong Kong Exchanges & Clearing Ltd. | 12,866 | 520,944 | ||||||
Hongkong Land Holdings Ltd. | 12,100 | 58,564 | ||||||
Jardine Matheson Holdings Ltd. | 2,251 | 119,528 | ||||||
Link REIT | 20,921 | 162,195 | ||||||
MTR Corp. Ltd. | 17,543 | 89,963 | ||||||
New World Development Co. Ltd. | 15,905 | 51,977 | ||||||
Power Assets Holdings Ltd. | 14,613 | 87,505 | ||||||
Sino Land Co. Ltd. | 36,093 | 52,883 | ||||||
SITC International Holdings Co. Ltd. | 15,433 | 39,325 | ||||||
Sun Hung Kai Properties Ltd. | 14,824 | 174,326 | ||||||
Swire Pacific Ltd., Class A | 3,327 | 23,038 | ||||||
Swire Properties Ltd. | 13,400 | 30,970 | ||||||
Techtronic Industries Co. Ltd. | 14,647 | 173,924 | ||||||
WH Group Ltd., 144A | 110,032 | 75,141 | ||||||
Wharf Real Estate Investment Co. Ltd. | 14,195 | 64,746 | ||||||
Xinyi Glass Holdings Ltd. | 17,012 | 31,558 | ||||||
|
| |||||||
(Cost $4,923,527) | 4,352,471 | |||||||
|
| |||||||
| Ireland — 1.1% | ||||||||
Accenture PLC, Class A | 6,660 | 1,921,143 | ||||||
AerCap Holdings NV* | 1,414 | 62,287 | ||||||
Allegion PLC | 931 | 88,538 | ||||||
Aptiv PLC* | 2,891 | 270,106 | ||||||
CRH PLC | 8,071 | 298,621 | ||||||
DCC PLC | 1,183 | 68,318 | ||||||
Experian PLC | 9,365 | 285,831 | ||||||
Flutter Entertainment PLC* | 1,754 | 220,908 | ||||||
James Hardie Industries PLC CDI | 4,349 | 99,909 | ||||||
Jazz Pharmaceuticals PLC* | 646 | 100,272 | ||||||
Kerry Group PLC, Class A | 1,507 | 155,855 | ||||||
Kingspan Group PLC | 1,626 | 92,608 | ||||||
Medtronic PLC | 14,022 | 1,232,814 | ||||||
Smurfit Kappa Group PLC | 2,152 | 72,600 | ||||||
Trane Technologies PLC | 2,456 | 378,396 | ||||||
|
| |||||||
(Cost $5,969,318) | 5,348,206 | |||||||
|
| |||||||
| Israel — 0.3% | ||||||||
Azrieli Group Ltd. | 561 | 46,800 | ||||||
Bank Hapoalim BM | 13,376 | 139,532 | ||||||
Bank Leumi Le-Israel BM | 14,706 | 156,324 | ||||||
Check Point Software Technologies Ltd.* | 1,084 | 130,340 | ||||||
Number | Value | |||||||
| Israel (Continued) | ||||||||
CyberArk Software Ltd.* | 496 | $ | 71,563 | |||||
Elbit Systems Ltd. | 283 | 60,667 | ||||||
ICL Group Ltd. | 7,695 | 74,025 | ||||||
Israel Discount Bank Ltd., Class A | 12,524 | 76,994 | ||||||
Mizrahi Tefahot Bank Ltd. | 1,093 | 44,687 | ||||||
Nice Ltd.* | 720 | 156,339 | ||||||
SolarEdge Technologies, Inc.* | 567 | 156,475 | ||||||
Teva Pharmaceutical Industries Ltd., ADR* | 12,191 | 110,207 | ||||||
Tower Semiconductor Ltd.* | 1,147 | 53,997 | ||||||
Wix.com Ltd.* | 644 | 40,759 | ||||||
ZIM Integrated Shipping Services Ltd. (b) | 885 | 31,940 | ||||||
|
| |||||||
(Cost $1,347,690) | 1,350,649 | |||||||
|
| |||||||
| Italy — 0.5% | ||||||||
Amplifon SpA | 1,275 | 33,398 | ||||||
Assicurazioni Generali SpA | 11,653 | 171,547 | ||||||
Atlantia SpA | 5,223 | 119,903 | ||||||
Davide Campari-Milano NV | 5,568 | 54,914 | ||||||
DiaSorin SpA | 193 | 25,414 | ||||||
Enel SpA | 85,958 | 405,856 | ||||||
Eni SpA | 26,787 | 318,056 | ||||||
Ferrari NV | 1,274 | 247,503 | ||||||
FinecoBank Banca Fineco SpA | 5,423 | 58,975 | ||||||
Infrastrutture Wireless Italiane SpA, 144A | 2,866 | 26,687 | ||||||
Intesa Sanpaolo SpA | 174,275 | 301,942 | ||||||
Mediobanca Banca di Credito Finanziario SpA | 5,650 | 44,928 | ||||||
Moncler SpA | 2,153 | 96,643 | ||||||
Nexi SpA, 144A* | 4,006 | 33,040 | ||||||
Poste Italiane SpA, 144A | 7,246 | 58,232 | ||||||
Prysmian SpA | 2,956 | 90,985 | ||||||
Recordati Industria Chimica e Farmaceutica SpA | 1,343 | 55,018 | ||||||
Snam SpA | 21,239 | 101,146 | ||||||
Telecom Italia SpA* | 53,264 | 11,033 | ||||||
Terna — Rete Elettrica Nazionale | 12,869 | 91,877 | ||||||
UniCredit SpA | 23,945 | 235,915 | ||||||
|
| |||||||
(Cost $3,221,131) | 2,583,012 | |||||||
|
| |||||||
| Jersey — 0.0% | ||||||||
Novocure Ltd.* | 834 | 68,496 | ||||||
|
| |||||||
| Jordan — 0.0% | ||||||||
Hikma Pharmaceuticals PLC | 2,053 | 31,366 | ||||||
|
| |||||||
| Luxembourg — 0.1% | ||||||||
ArcelorMittal SA | 6,421 | 153,377 | ||||||
Aroundtown SA | 10,721 | 31,350 | ||||||
Eurofins Scientific SE | 1,443 | 100,265 | ||||||
Tenaris SA | 4,952 | 68,468 | ||||||
|
| |||||||
(Cost $407,506) | 353,460 | |||||||
|
| |||||||
| See Notes to Financial Statements. | 31 |
Schedule of Investments
Xtrackers MSCI Kokusai Equity ETF (Continued)
August 31, 2022
Number | Value | |||||||
| Macau — 0.0% | ||||||||
Sands China Ltd.* | 26,189 | $ | 59,059 | |||||
|
| |||||||
| Netherlands — 1.4% | ||||||||
ABN AMRO Bank NV, 144A | 2,867 | 27,601 | ||||||
Adyen NV, 144A* | 231 | 358,876 | ||||||
Aegon NV | 19,260 | 86,531 | ||||||
Akzo Nobel NV | 1,979 | 125,449 | ||||||
Argenx SE* | 508 | 190,791 | ||||||
ASM International NV | 491 | 133,849 | ||||||
ASML Holding NV | 4,251 | 2,071,682 | ||||||
Euronext NV, 144A | 904 | 67,085 | ||||||
EXOR NV | 1,359 | 82,348 | ||||||
Heineken Holding NV | 875 | 62,294 | ||||||
Heineken NV | 2,564 | 231,370 | ||||||
IMCD NV | 668 | 92,561 | ||||||
ING Groep NV | 40,168 | 354,067 | ||||||
JDE Peet’s NV | 740 | 22,859 | ||||||
Just Eat Takeaway.com NV, 144A* | 1,974 | 33,113 | ||||||
Koninklijke Ahold Delhaize NV | 11,432 | 314,975 | ||||||
Koninklijke DSM NV | 1,858 | 237,930 | ||||||
Koninklijke KPN NV | 37,552 | 119,701 | ||||||
Koninklijke Philips NV | 9,820 | 164,391 | ||||||
NN Group NV | 3,131 | 128,989 | ||||||
NXP Semiconductors NV | 2,819 | 463,951 | ||||||
OCI NV | 1,107 | 41,676 | ||||||
Prosus NV* | 8,739 | 542,628 | ||||||
QIAGEN NV* | 2,434 | 110,750 | ||||||
Randstad NV | 1,441 | 67,364 | ||||||
Stellantis NV | 23,100 | 310,189 | ||||||
Universal Music Group NV | 7,528 | 149,927 | ||||||
Wolters Kluwer NV | 2,773 | 271,701 | ||||||
|
| |||||||
(Cost $7,853,883) | 6,864,648 | |||||||
|
| |||||||
| New Zealand — 0.1% | ||||||||
Auckland International Airport Ltd.* | 12,828 | 59,458 | ||||||
Fisher & Paykel Healthcare Corp. Ltd. | 5,532 | 66,680 | ||||||
Mercury NZ Ltd. | 7,206 | 25,625 | ||||||
Meridian Energy Ltd. | 13,566 | 41,628 | ||||||
Spark New Zealand Ltd. | 22,480 | 74,701 | ||||||
Xero Ltd.* | 1,525 | 91,740 | ||||||
|
| |||||||
(Cost $461,970) | 359,832 | |||||||
|
| |||||||
| Norway — 0.2% | ||||||||
Adevinta ASA* | 1,886 | 15,422 | ||||||
Aker BP ASA | 3,267 | 114,462 | ||||||
DNB Bank ASA | 9,727 | 186,226 | ||||||
Equinor ASA | 9,916 | 382,386 | ||||||
Gjensidige Forsikring ASA | 1,901 | 38,694 | ||||||
Kongsberg Gruppen ASA | 944 | 32,341 | ||||||
Mowi ASA | 4,276 | 88,026 | ||||||
Norsk Hydro ASA | 16,424 | 113,364 | ||||||
Orkla ASA | 8,653 | 72,735 | ||||||
Salmar ASA | 620 | 41,201 | ||||||
Telenor ASA | 7,867 | 86,406 | ||||||
Yara International ASA | 1,433 | 60,848 | ||||||
|
| |||||||
(Cost $1,181,972) | 1,232,111 | |||||||
|
| |||||||
Number | Value | |||||||
| Portugal — 0.0% | ||||||||
EDP — Energias de Portugal SA | 31,046 | $ | 148,661 | |||||
Galp Energia SGPS SA | 4,007 | 43,496 | ||||||
Jeronimo Martins SGPS SA | 3,502 | 77,824 | ||||||
|
| |||||||
(Cost $277,907) | 269,981 | |||||||
|
| |||||||
| Singapore — 0.4% | ||||||||
Ascendas Real Estate Investment Trust REIT | 34,979 | 70,705 | ||||||
CapitaLand Integrated Commercial Trust REIT | 48,156 | 71,452 | ||||||
Capitaland Investment Ltd. | 27,702 | 73,271 | ||||||
City Developments Ltd. | 3,300 | 19,231 | ||||||
DBS Group Holdings Ltd. | 19,307 | 451,156 | ||||||
Genting Singapore Ltd. | 88,400 | 49,108 | ||||||
Grab Holdings Ltd., Class A*(b) | 12,634 | 36,007 | ||||||
Keppel Corp. Ltd. | 15,500 | 80,772 | ||||||
Mapletree Logistics Trust REIT | 34,128 | 40,853 | ||||||
Mapletree Pan Asia Commercial Trust REIT | 14,100 | 18,597 | ||||||
Oversea-Chinese Banking Corp. Ltd. | 35,285 | 305,781 | ||||||
Sea Ltd., ADR* | 3,780 | 234,360 | ||||||
Singapore Airlines Ltd.* | 14,250 | 54,340 | ||||||
Singapore Exchange Ltd. | 9,131 | 62,113 | ||||||
Singapore Technologies Engineering Ltd. | 10,502 | 28,079 | ||||||
Singapore Telecommunications Ltd. | 87,200 | 163,762 | ||||||
United Overseas Bank Ltd. | 12,601 | 246,853 | ||||||
UOL Group Ltd. | 2,801 | 13,894 | ||||||
Venture Corp. Ltd. | 2,056 | 26,954 | ||||||
Wilmar International Ltd. | 20,400 | 59,075 | ||||||
|
| |||||||
(Cost $2,428,049) | 2,106,363 | |||||||
|
| |||||||
| Spain — 0.7% | ||||||||
Acciona SA | 263 | 51,596 | ||||||
ACS Actividades de Construccion y Servicios SA | 2,320 | 51,813 | ||||||
Aena SME SA, 144A* | 738 | 90,795 | ||||||
Amadeus IT Group SA* | 4,744 | 251,015 | ||||||
Banco Bilbao Vizcaya Argentaria SA | 70,244 | 317,252 | ||||||
Banco Santander SA | 186,688 | 453,729 | ||||||
CaixaBank SA | 46,707 | 141,087 | ||||||
Cellnex Telecom SA, 144A* | 5,726 | 223,229 | ||||||
EDP Renovaveis SA | 2,883 | 70,069 | ||||||
Enagas SA | 2,776 | 50,776 | ||||||
Endesa SA | 3,394 | 58,360 | ||||||
Ferrovial SA | 5,148 | 129,311 | ||||||
Grifols SA*(b) | 3,570 | 43,239 | ||||||
Iberdrola SA | 62,187 | 649,396 | ||||||
Industria de Diseno Textil SA | 11,424 | 247,554 | ||||||
Naturgy Energy Group SA | 1,079 | 29,815 | ||||||
Red Electrica Corp. SA | 4,174 | 76,535 | ||||||
Repsol SA | 15,683 | 204,774 | ||||||
Siemens Gamesa Renewable | 2,068 | 37,275 | ||||||
Telefonica SA | 57,332 | 237,288 | ||||||
|
| |||||||
(Cost $4,010,983) | 3,414,908 | |||||||
|
| |||||||
| See Notes to Financial Statements. | 32 |
DBX ETF Trust
Schedule of Investments
Xtrackers MSCI Kokusai Equity ETF (Continued)
August 31, 2022
Number | Value | |||||||
| Sweden — 0.9% | ||||||||
Alfa Laval AB | 3,477 | $ | 93,357 | |||||
Alleima AB* | 2,265 | 9,117 | ||||||
Assa Abloy AB, Class B | 10,448 | 212,925 | ||||||
Atlas Copco AB, Class A | 28,529 | 291,749 | ||||||
Atlas Copco AB, Class B | 16,708 | 153,233 | ||||||
Boliden AB | 2,882 | 93,115 | ||||||
Electrolux AB, Class B | 2,248 | 28,591 | ||||||
Embracer Group AB*(b) | 6,727 | 42,089 | ||||||
Epiroc AB, Class A | 7,164 | 110,257 | ||||||
Epiroc AB, Class B | 4,774 | 65,325 | ||||||
EQT AB | 3,300 | 74,576 | ||||||
Essity AB, Class B | 5,908 | 131,737 | ||||||
Evolution AB, 144A | 1,887 | 152,351 | ||||||
Fastighets AB Balder, Class B* | 8,274 | 46,018 | ||||||
Getinge AB, Class B | 2,631 | 49,029 | ||||||
H & M Hennes & Mauritz AB, Class B (b) | 8,596 | 89,782 | ||||||
Hexagon AB, Class B | 20,253 | 208,468 | ||||||
Holmen AB, Class B | 991 | 42,741 | ||||||
Husqvarna AB, Class B | 3,522 | 23,848 | ||||||
Industrivarden AB, Class A | 1,509 | 33,662 | ||||||
Industrivarden AB, Class C | 1,886 | 41,646 | ||||||
Indutrade AB | 2,878 | 53,645 | ||||||
Investment AB Latour, Class B (b) | 1,355 | 26,888 | ||||||
Investor AB, Class A | 5,453 | 91,180 | ||||||
Investor AB, Class B | 19,580 | 310,643 | ||||||
Kinnevik AB, Class B* | 2,684 | 38,481 | ||||||
L E Lundbergforetagen AB, Class B | 661 | 27,476 | ||||||
Lifco AB, Class B | 2,760 | 43,204 | ||||||
Nibe Industrier AB, Class B | 16,347 | 154,119 | ||||||
Sagax AB, Class B | 2,014 | 43,601 | ||||||
Sandvik AB | 11,326 | 177,827 | ||||||
Securitas AB, Class B (b) | 2,144 | 18,873 | ||||||
Skandinaviska Enskilda Banken AB, Class A | 17,148 | 171,992 | ||||||
Skanska AB, Class B | 2,861 | 42,552 | ||||||
SKF AB, Class B | 3,392 | 51,215 | ||||||
Svenska Cellulosa AB SCA, Class B | 6,139 | 92,576 | ||||||
Svenska Handelsbanken AB, Class A | 14,293 | 117,723 | ||||||
Swedbank AB, Class A | 9,802 | 127,488 | ||||||
Swedish Match AB | 14,697 | 148,031 | ||||||
Swedish Orphan Biovitrum AB* | 1,776 | 39,351 | ||||||
Tele2 AB, Class B | 5,661 | 60,479 | ||||||
Telefonaktiebolaget LM Ericsson, Class B | 31,875 | 239,754 | ||||||
Telia Co. AB | 26,262 | 92,815 | ||||||
Volvo AB, Class A | 1,612 | 26,970 | ||||||
Volvo AB, Class B | 15,895 | 253,046 | ||||||
Volvo Car AB, Class B*(b) | 6,277 | 38,371 | ||||||
|
| |||||||
(Cost $5,846,107) | 4,481,916 | |||||||
|
| |||||||
| Switzerland — 3.3% | ||||||||
ABB Ltd. | 17,067 | 471,640 | ||||||
Adecco Group AG | 1,447 | 46,037 | ||||||
Alcon, Inc. | 5,259 | 347,888 | ||||||
Bachem Holding AG | 205 | 14,273 | ||||||
Baloise Holding AG | 556 | 80,556 | ||||||
Barry Callebaut AG | 38 | 78,029 | ||||||
Number | Value | |||||||
| Switzerland (Continued) | ||||||||
Chocoladefabriken Lindt & Spruengli AG | 1 | $ | 109,124 | |||||
Chocoladefabriken Lindt & Spruengli AG Participation Certificates | 11 | 116,543 | ||||||
Chubb Ltd. | 4,434 | 838,248 | ||||||
Cie Financiere Richemont SA, Class A | 5,583 | 628,406 | ||||||
Clariant AG* | 1,604 | 29,764 | ||||||
Coca-Cola HBC AG* | 1,538 | 35,255 | ||||||
Credit Suisse Group AG | 27,395 | 142,035 | ||||||
EMS-Chemie Holding AG | 75 | 52,910 | ||||||
Garmin Ltd. | 1,596 | 141,230 | ||||||
Geberit AG | 375 | 174,023 | ||||||
Givaudan SA | 100 | 320,611 | ||||||
Glencore PLC* | 104,149 | 573,582 | ||||||
Holcim AG* | 5,842 | 260,629 | ||||||
Julius Baer Group Ltd. | 2,083 | 101,274 | ||||||
Kuehne + Nagel International AG | 571 | 132,226 | ||||||
Logitech International SA | 1,615 | 80,853 | ||||||
Lonza Group AG | 785 | 420,994 | ||||||
Nestle SA | 29,752 | 3,492,991 | ||||||
Novartis AG | 22,837 | 1,851,623 | ||||||
Partners Group Holding AG | 241 | 233,703 | ||||||
Roche Holding AG | 7,396 | 2,390,182 | ||||||
Roche Holding AG | 284 | 108,892 | ||||||
Schindler Holding AG | 250 | 42,318 | ||||||
Schindler Holding AG Participation Certificates | 530 | 92,700 | ||||||
SGS SA | 68 | 150,221 | ||||||
SIG Group AG* | 3,217 | 75,748 | ||||||
Sika AG | 1,502 | 339,199 | ||||||
Sonova Holding AG | 564 | 149,502 | ||||||
STMicroelectronics NV | 7,096 | 247,919 | ||||||
Straumann Holding AG | 1,172 | 129,335 | ||||||
Swatch Group AG — Bearer | 308 | 75,205 | ||||||
Swatch Group AG — Registered | 751 | 34,366 | ||||||
Swiss Life Holding AG | 328 | 172,209 | ||||||
Swiss Prime Site AG | 727 | 62,796 | ||||||
Swiss Re AG | 3,304 | 257,901 | ||||||
Swisscom AG | 276 | 143,154 | ||||||
Temenos AG | 650 | 53,401 | ||||||
UBS Group AG | 37,042 | 589,438 | ||||||
VAT Group AG, 144A | 287 | 68,989 | ||||||
Zurich Insurance Group AG | 1,578 | 701,890 | ||||||
|
| |||||||
(Cost $18,235,208) | 16,659,812 | |||||||
|
| |||||||
| United Kingdom — 4.6% | ||||||||
3i Group PLC | 9,322 | 131,846 | ||||||
abrdn PLC | 17,635 | 30,134 | ||||||
Admiral Group PLC | 2,151 | 53,112 | ||||||
Amcor PLC | 14,698 | 176,523 | ||||||
Anglo American PLC | 13,312 | 431,082 | ||||||
Ashtead Group PLC | 4,944 | 244,496 | ||||||
Associated British Foods PLC | 4,276 | 75,877 | ||||||
AstraZeneca PLC | 16,327 | 2,022,158 | ||||||
Auto Trader Group PLC, 144A | 10,678 | 80,986 | ||||||
AVEVA Group PLC | 1,176 | 38,315 | ||||||
Aviva PLC | 29,313 | 142,813 | ||||||
BAE Systems PLC | 33,139 | 299,307 | ||||||
| See Notes to Financial Statements. | 33 |
DBX ETF Trust
Schedule of Investments
Xtrackers MSCI Kokusai Equity ETF (Continued)
August 31, 2022
Number | Value | |||||||
| United Kingdom (Continued) | ||||||||
Barclays PLC | 176,480 | $ | 337,804 | |||||
Barratt Developments PLC | 9,916 | 49,303 | ||||||
Berkeley Group Holdings PLC | 1,274 | 54,183 | ||||||
BP PLC | 204,482 | 1,050,485 | ||||||
British American Tobacco PLC | 22,689 | 911,228 | ||||||
British Land Co. PLC REIT | 9,639 | 48,318 | ||||||
BT Group PLC | 73,182 | 128,328 | ||||||
Bunzl PLC | 3,554 | 118,315 | ||||||
Burberry Group PLC | 3,660 | 74,443 | ||||||
Clarivate PLC* | 3,643 | 42,514 | ||||||
CNH Industrial NV | 9,923 | 121,533 | ||||||
Coca-Cola Europacific Partners PLC | 2,074 | 101,979 | ||||||
Compass Group PLC | 18,348 | 396,892 | ||||||
Croda International PLC | 1,456 | 113,952 | ||||||
Diageo PLC | 24,384 | 1,067,968 | ||||||
Entain PLC | 6,324 | 93,675 | ||||||
Ferguson PLC | 2,247 | 261,095 | ||||||
GSK PLC | 42,376 | 680,165 | ||||||
Haleon PLC* | 52,971 | 159,548 | ||||||
Halma PLC | 3,663 | 88,442 | ||||||
Hargreaves Lansdown PLC | 3,549 | 33,764 | ||||||
HSBC Holdings PLC | 212,263 | 1,306,080 | ||||||
Imperial Brands PLC | 9,506 | 209,775 | ||||||
Informa PLC | 13,469 | 85,697 | ||||||
InterContinental Hotels Group PLC | 2,068 | 112,881 | ||||||
Intertek Group PLC | 1,703 | 78,452 | ||||||
J Sainsbury PLC | 18,958 | 44,869 | ||||||
JD Sports Fashion PLC | 33,261 | 43,714 | ||||||
Johnson Matthey PLC | 1,972 | 46,237 | ||||||
Kingfisher PLC | 18,156 | 49,034 | ||||||
Land Securities Group PLC REIT | 7,418 | 56,157 | ||||||
Legal & General Group PLC | 59,923 | 176,059 | ||||||
Liberty Global PLC, Class A* | 2,784 | 56,237 | ||||||
Liberty Global PLC, Class C* | 2,879 | 61,351 | ||||||
Linde PLC | 5,396 | 1,526,313 | ||||||
Lloyds Banking Group PLC | 768,678 | 392,478 | ||||||
London Stock Exchange Group PLC | 3,360 | 316,764 | ||||||
M&G PLC | 29,478 | 67,143 | ||||||
Melrose Industries PLC | 45,027 | 71,517 | ||||||
Mondi PLC | 5,709 | 97,386 | ||||||
National Grid PLC | 39,344 | 493,516 | ||||||
NatWest Group PLC | 54,956 | 157,597 | ||||||
Next PLC | 1,212 | 81,966 | ||||||
Ocado Group PLC* | 5,273 | 44,545 | ||||||
Pearson PLC | 5,387 | 54,083 | ||||||
Pentair PLC | 1,879 | 83,615 | ||||||
Persimmon PLC | 3,391 | 58,240 | ||||||
Phoenix Group Holdings PLC | 7,899 | 55,368 | ||||||
Prudential PLC | 28,934 | 304,221 | ||||||
Reckitt Benckiser Group PLC | 7,649 | 591,697 | ||||||
RELX PLC | 19,860 | 522,728 | ||||||
Rentokil Initial PLC | 21,948 | 133,057 | ||||||
Rio Tinto PLC | 11,830 | 656,747 | ||||||
Rolls-Royce Holdings PLC* | 90,971 | 81,507 | ||||||
Sage Group PLC | 9,649 | 80,300 | ||||||
Schroders PLC | 790 | 24,709 | ||||||
Segro PLC REIT | 12,781 | 140,243 | ||||||
Number | Value | |||||||
| United Kingdom (Continued) | ||||||||
Severn Trent PLC | 2,864 | $ | 92,878 | |||||
Shell PLC | 78,366 | 2,088,176 | ||||||
Smith & Nephew PLC | 9,265 | 109,479 | ||||||
Smiths Group PLC | 4,783 | 82,982 | ||||||
Spirax-Sarco Engineering PLC | 683 | 83,726 | ||||||
SSE PLC | 10,504 | 201,976 | ||||||
St James’s Place PLC | 5,716 | 73,628 | ||||||
Standard Chartered PLC | 25,489 | 177,420 | ||||||
Taylor Wimpey PLC | 33,857 | 42,666 | ||||||
Tesco PLC | 84,807 | 245,421 | ||||||
Unilever PLC | 26,975 | 1,232,141 | ||||||
United Utilities Group PLC | 6,895 | 84,763 | ||||||
Vodafone Group PLC | 283,731 | 381,917 | ||||||
Whitbread PLC | 2,149 | 62,614 | ||||||
Willis Towers Watson PLC | 1,238 | 256,055 | ||||||
WPP PLC | 12,837 | 111,192 | ||||||
|
| |||||||
(Cost $24,782,254) | 23,349,900 | |||||||
|
| |||||||
| United States — 72.1% | ||||||||
3M Co. | 6,012 | 747,592 | ||||||
A O Smith Corp. | 1,384 | 78,127 | ||||||
Abbott Laboratories | 18,296 | 1,878,084 | ||||||
AbbVie, Inc. | 18,637 | 2,505,931 | ||||||
ABIOMED, Inc.* | 549 | 142,345 | ||||||
Activision Blizzard, Inc. | 8,322 | 653,194 | ||||||
Adobe, Inc.* | 4,923 | 1,838,445 | ||||||
Advance Auto Parts, Inc. | 643 | 108,436 | ||||||
Advanced Micro Devices, Inc.* | 17,221 | 1,461,546 | ||||||
AES Corp. | 7,163 | 182,298 | ||||||
Affirm Holdings, Inc.*(b) | 2,003 | 46,930 | ||||||
Aflac, Inc. | 6,504 | 386,468 | ||||||
Agilent Technologies, Inc. | 3,161 | 405,398 | ||||||
Air Products and Chemicals, Inc. | 2,338 | 590,228 | ||||||
Airbnb, Inc., Class A* | 3,951 | 446,937 | ||||||
Akamai Technologies, Inc.* | 1,692 | 152,754 | ||||||
Albemarle Corp. | 1,231 | 329,859 | ||||||
Alcoa Corp. | 1,941 | 96,041 | ||||||
Alexandria Real Estate Equities, Inc. REIT | 1,603 | 245,900 | ||||||
Align Technology, Inc.* | 747 | 182,044 | ||||||
Alleghany Corp.* | 144 | 121,130 | ||||||
Alliant Energy Corp. | 2,758 | 168,348 | ||||||
Allstate Corp. | 2,856 | 344,148 | ||||||
Ally Financial, Inc. | 3,394 | 112,681 | ||||||
Alnylam Pharmaceuticals, Inc.* | 1,250 | 258,337 | ||||||
Alphabet, Inc., Class A* | 62,940 | 6,811,367 | ||||||
Alphabet, Inc., Class C* | 59,428 | 6,486,566 | ||||||
Altria Group, Inc. | 19,142 | 863,687 | ||||||
Amazon.com, Inc.* | 96,461 | 12,228,361 | ||||||
AMC Entertainment Holdings, Inc., Class A*(b) | 5,444 | 49,649 | ||||||
AMERCO | 104 | 54,670 | ||||||
Ameren Corp. | 2,841 | 263,133 | ||||||
American Electric Power Co., Inc. | 5,309 | 531,962 | ||||||
American Express Co. | 6,796 | 1,032,992 | ||||||
American Financial Group, Inc. | 747 | 95,377 | ||||||
American Homes 4 Rent, Class A REIT | 3,294 | 117,135 | ||||||
American International Group, Inc. | 8,582 | 444,118 | ||||||
| See Notes to Financial Statements. | 34 |
DBX ETF Trust
Schedule of Investments
Xtrackers MSCI Kokusai Equity ETF (Continued)
August 31, 2022
Number | Value | |||||||
| United States (Continued) | ||||||||
American Tower Corp. REIT | 4,725 | $ | 1,200,386 | |||||
American Water Works Co., Inc. | 1,912 | 283,836 | ||||||
Ameriprise Financial, Inc. | 1,164 | 311,964 | ||||||
AmerisourceBergen Corp. | 1,655 | 242,557 | ||||||
AMETEK, Inc. | 2,437 | 292,830 | ||||||
Amgen, Inc. | 5,794 | 1,392,298 | ||||||
Amphenol Corp., Class A | 6,448 | 474,121 | ||||||
Analog Devices, Inc. | 5,510 | 834,930 | ||||||
Annaly Capital Management, Inc. REIT | 15,443 | 99,607 | ||||||
ANSYS, Inc.* | 921 | 228,684 | ||||||
Aon PLC, Class A | 2,220 | 619,957 | ||||||
APA Corp. | 3,656 | 142,986 | ||||||
Apollo Global Management, Inc. | 4,210 | 233,992 | ||||||
Apple, Inc. | 170,455 | 26,798,935 | ||||||
Applied Materials, Inc. | 9,339 | 878,520 | ||||||
AppLovin Corp., Class A* | 1,251 | 30,812 | ||||||
Aramark | 2,229 | 79,598 | ||||||
Archer-Daniels-Midland Co. | 5,765 | 506,686 | ||||||
Arista Networks, Inc.* | 2,592 | 310,729 | ||||||
Arrow Electronics, Inc.* | 839 | 87,936 | ||||||
Arthur J Gallagher & Co. | 2,164 | 392,917 | ||||||
Assurant, Inc. | 648 | 102,702 | ||||||
AT&T, Inc. | 75,404 | 1,322,586 | ||||||
Atmos Energy Corp. | 1,564 | 177,326 | ||||||
Autodesk, Inc.* | 2,294 | 462,792 | ||||||
Automatic Data Processing, Inc. | 4,427 | 1,082,003 | ||||||
AutoZone, Inc.* | 220 | 466,226 | ||||||
Avalara, Inc.* | 850 | 77,851 | ||||||
AvalonBay Communities, Inc. REIT | 1,427 | 286,699 | ||||||
Avantor, Inc.* | 6,427 | 160,097 | ||||||
Avery Dennison Corp. | 858 | 157,546 | ||||||
Baker Hughes Co. | 10,045 | 253,737 | ||||||
Ball Corp. | 3,386 | 188,973 | ||||||
Bank of America Corp. | 76,491 | 2,570,863 | ||||||
Bank of New York Mellon Corp. | 8,245 | 342,415 | ||||||
Bath & Body Works, Inc. | 2,944 | 109,900 | ||||||
Bausch Health Cos., Inc.* | 3,665 | 22,053 | ||||||
Baxter International, Inc. | 5,145 | 295,632 | ||||||
Becton Dickinson and Co. | 3,002 | 757,765 | ||||||
Bentley Systems, Inc., Class B | 1,975 | 72,621 | ||||||
Berkshire Hathaway, Inc., Class B* | 13,601 | 3,819,161 | ||||||
Best Buy Co., Inc. | 2,321 | 164,071 | ||||||
Bill.com Holdings, Inc.* | 985 | 159,452 | ||||||
Biogen, Inc.* | 1,529 | 298,736 | ||||||
BioMarin Pharmaceutical, Inc.* | 1,937 | 172,780 | ||||||
Bio-Rad Laboratories, Inc., Class A* | 238 | 115,440 | ||||||
Bio-Techne Corp. | 411 | 136,374 | ||||||
Black Knight, Inc.* | 1,638 | 108,370 | ||||||
BlackRock, Inc. | 1,579 | 1,052,230 | ||||||
Blackstone, Inc. | 7,375 | 692,807 | ||||||
Block, Inc.* | 5,458 | 376,111 | ||||||
Boeing Co.* | 5,774 | 925,283 | ||||||
Booking Holdings, Inc.* | 429 | 804,722 | ||||||
Booz Allen Hamilton Holding Corp. | 1,547 | 148,048 | ||||||
BorgWarner, Inc. | 2,137 | 80,565 | ||||||
Boston Properties, Inc. REIT | 1,446 | 114,856 | ||||||
Boston Scientific Corp.* | 15,337 | 618,234 | ||||||
Number | Value | |||||||
| United States (Continued) | ||||||||
Bristol-Myers Squibb Co. | 22,999 | $ | 1,550,363 | |||||
Broadcom, Inc. | 4,315 | 2,153,660 | ||||||
Broadridge Financial Solutions, Inc. | 1,261 | 215,845 | ||||||
Brookfield Renewable Corp., Class A | 1,360 | 52,412 | ||||||
Brown & Brown, Inc. | 2,740 | 172,730 | ||||||
Brown-Forman Corp., Class B | 3,261 | 237,075 | ||||||
Bunge Ltd. | 1,539 | 152,623 | ||||||
Burlington Stores, Inc.* | 648 | 90,843 | ||||||
C.H. Robinson Worldwide, Inc. | 1,351 | 154,217 | ||||||
Cable One, Inc. (b) | 58 | 65,830 | ||||||
Cadence Design Systems, Inc.* | 2,968 | 515,749 | ||||||
Caesars Entertainment, Inc.* | 2,164 | 93,312 | ||||||
Camden Property Trust REIT | 1,046 | 134,421 | ||||||
Campbell Soup Co. | 1,961 | 98,795 | ||||||
Capital One Financial Corp. | 4,358 | 461,164 | ||||||
Cardinal Health, Inc. | 2,919 | 206,432 | ||||||
Carlisle Cos., Inc. | 544 | 160,839 | ||||||
Carlyle Group, Inc. | 2,012 | 65,450 | ||||||
CarMax, Inc.*(b) | 1,543 | 136,463 | ||||||
Carnival Corp.* | 8,578 | 81,148 | ||||||
Carrier Global Corp. | 9,011 | 352,510 | ||||||
Catalent, Inc.* | 1,790 | 157,520 | ||||||
Caterpillar, Inc. | 5,586 | 1,031,790 | ||||||
Cboe Global Markets, Inc. | 1,003 | 118,324 | ||||||
CBRE Group, Inc., Class A* | 3,647 | 287,967 | ||||||
CDW Corp. | 1,400 | 238,980 | ||||||
Celanese Corp. | 1,236 | 137,023 | ||||||
Centene Corp.* | 5,840 | 524,082 | ||||||
CenterPoint Energy, Inc. | 6,629 | 209,012 | ||||||
Ceridian HCM Holding, Inc.* | 1,364 | 81,349 | ||||||
CF Industries Holdings, Inc. | 2,142 | 221,611 | ||||||
Charles River Laboratories International, Inc.* | 572 | 117,403 | ||||||
Charles Schwab Corp. | 15,263 | 1,082,910 | ||||||
Charter Communications, Inc., Class A* | 1,272 | 524,865 | ||||||
Cheniere Energy, Inc. | 2,418 | 387,315 | ||||||
Chevron Corp. | 19,665 | 3,108,250 | ||||||
Chewy, Inc., Class A* | 729 | 25,027 | ||||||
Chipotle Mexican Grill, Inc.* | 298 | 475,846 | ||||||
Church & Dwight Co., Inc. | 2,554 | 213,795 | ||||||
Cigna Corp. | 3,384 | 959,195 | ||||||
Cincinnati Financial Corp. | 1,607 | 155,815 | ||||||
Cintas Corp. | 986 | 401,144 | ||||||
Cisco Systems, Inc. | 43,753 | 1,956,634 | ||||||
Citigroup, Inc. | 20,942 | 1,022,179 | ||||||
Citizens Financial Group, Inc. | 5,144 | 188,682 | ||||||
Citrix Systems, Inc. | 1,435 | 147,475 | ||||||
Cleveland-Cliffs, Inc.* | 5,524 | 95,399 | ||||||
Clorox Co. | 1,295 | 186,920 | ||||||
Cloudflare, Inc., Class A* | 2,816 | 176,197 | ||||||
CME Group, Inc. | 3,698 | 723,366 | ||||||
CMS Energy Corp. | 2,829 | 191,071 | ||||||
Coca-Cola Co. | 43,180 | 2,664,638 | ||||||
Cognex Corp. | 1,507 | 63,460 | ||||||
Cognizant Technology Solutions Corp., Class A | 5,279 | 333,474 | ||||||
Coinbase Global, Inc., Class A* | 1,261 | 84,235 | ||||||
| See Notes to Financial Statements. | 35 |
DBX ETF Trust
Schedule of Investments
Xtrackers MSCI Kokusai Equity ETF (Continued)
August 31, 2022
Number | Value | |||||||
| United States (Continued) | ||||||||
Colgate-Palmolive Co. | 8,319 | $ | 650,629 | |||||
Comcast Corp., Class A | 47,643 | 1,724,200 | ||||||
Conagra Brands, Inc. | 5,234 | 179,945 | ||||||
ConocoPhillips | 13,690 | 1,498,370 | ||||||
Consolidated Edison, Inc. | 3,731 | 364,668 | ||||||
Constellation Brands, Inc., Class A | 1,735 | 426,897 | ||||||
Constellation Energy Corp. | 3,530 | 288,013 | ||||||
Cooper Cos., Inc. | 542 | 155,792 | ||||||
Copart, Inc.* | 2,181 | 260,957 | ||||||
Corning, Inc. | 8,586 | 294,672 | ||||||
Corteva, Inc. | 7,658 | 470,431 | ||||||
CoStar Group, Inc.* | 4,323 | 301,054 | ||||||
Costco Wholesale Corp. | 4,668 | 2,437,163 | ||||||
Coterra Energy, Inc. | 8,572 | 264,961 | ||||||
Coupa Software, Inc.* | 731 | 42,690 | ||||||
Crowdstrike Holdings, Inc., Class A* | 2,058 | 375,811 | ||||||
Crown Castle, Inc. REIT | 4,550 | 777,276 | ||||||
Crown Holdings, Inc. | 1,390 | 125,920 | ||||||
CSX Corp. | 23,100 | 731,115 | ||||||
Cummins, Inc. | 1,427 | 307,333 | ||||||
CVS Health Corp. | 13,617 | 1,336,509 | ||||||
D.R. Horton, Inc. | 3,557 | 253,081 | ||||||
Danaher Corp. | 7,161 | 1,932,826 | ||||||
Darden Restaurants, Inc. | 1,350 | 167,008 | ||||||
Datadog, Inc., Class A* | 2,638 | 276,858 | ||||||
DaVita, Inc.* | 690 | 58,850 | ||||||
Deere & Co. | 3,072 | 1,122,048 | ||||||
Dell Technologies, Inc., Class C | 2,718 | 104,072 | ||||||
Delta Air Lines, Inc.* | 1,356 | 42,131 | ||||||
DENTSPLY SIRONA, Inc. | 2,179 | 71,406 | ||||||
Devon Energy Corp. | 6,464 | 456,488 | ||||||
Dexcom, Inc.* | 4,086 | 335,910 | ||||||
Diamondback Energy, Inc. | 1,773 | 236,305 | ||||||
Digital Realty Trust, Inc. REIT | 2,998 | 370,643 | ||||||
Discover Financial Services | 3,002 | 301,671 | ||||||
DISH Network Corp., Class A* | 2,762 | 47,921 | ||||||
DocuSign, Inc.* | 2,070 | 120,515 | ||||||
Dollar General Corp. | 2,437 | 578,593 | ||||||
Dollar Tree, Inc.* | 2,323 | 315,185 | ||||||
Dominion Energy, Inc. | 8,537 | 698,327 | ||||||
Domino’s Pizza, Inc. | 416 | 154,694 | ||||||
DoorDash, Inc., Class A* | 2,002 | 119,920 | ||||||
Dover Corp. | 1,520 | 189,939 | ||||||
Dow, Inc. | 7,658 | 390,558 | ||||||
Dropbox, Inc., Class A* | 2,758 | 58,994 | ||||||
DTE Energy Co. | 2,143 | 279,319 | ||||||
Duke Energy Corp. | 8,100 | 865,971 | ||||||
Duke Realty Corp. REIT | 3,810 | 224,218 | ||||||
DuPont de Nemours, Inc. | 5,495 | 305,742 | ||||||
Dynatrace, Inc.* | 2,229 | 85,103 | ||||||
Eastman Chemical Co. | 1,452 | 132,132 | ||||||
Eaton Corp. PLC | 4,101 | 560,361 | ||||||
eBay, Inc. | 6,186 | 272,988 | ||||||
Ecolab, Inc. | 2,762 | 452,498 | ||||||
Edison International | 4,097 | 277,654 | ||||||
Edwards Lifesciences Corp.* | 6,566 | 591,597 | ||||||
Elanco Animal Health, Inc.* | 4,180 | 63,243 | ||||||
Number | Value | |||||||
| United States (Continued) | ||||||||
Electronic Arts, Inc. | 2,942 | $ | 373,252 | |||||
Elevance Health, Inc. | 2,539 | 1,231,694 | ||||||
Eli Lilly & Co. | 8,483 | 2,555,334 | ||||||
Emerson Electric Co. | 6,248 | 510,712 | ||||||
Enphase Energy, Inc.* | 1,430 | 409,609 | ||||||
Entegris, Inc. | 1,378 | 130,745 | ||||||
Entergy Corp. | 2,137 | 246,396 | ||||||
EOG Resources, Inc. | 6,164 | 747,693 | ||||||
EPAM Systems, Inc.* | 544 | 232,016 | ||||||
EQT Corp. | 3,570 | 170,646 | ||||||
Equifax, Inc. | 1,312 | 247,640 | ||||||
Equinix, Inc. REIT | 958 | 629,760 | ||||||
Equitable Holdings, Inc. | 4,184 | 124,474 | ||||||
Equity LifeStyle Properties, Inc. REIT | 2,055 | 144,055 | ||||||
Equity Residential REIT | 3,674 | 268,863 | ||||||
Erie Indemnity Co., Class A | 270 | 58,031 | ||||||
Essential Utilities, Inc. | 2,229 | 109,555 | ||||||
Essex Property Trust, Inc. REIT | 712 | 188,723 | ||||||
Estee Lauder Cos., Inc., Class A | 2,445 | 621,959 | ||||||
Etsy, Inc.* | 1,340 | 141,517 | ||||||
Evergy, Inc. | 2,419 | 165,774 | ||||||
Eversource Energy | 3,480 | 312,121 | ||||||
Exact Sciences Corp.* | 1,889 | 67,154 | ||||||
Exelon Corp. | 9,896 | 434,533 | ||||||
Expedia Group, Inc.* | 1,440 | 147,816 | ||||||
Expeditors International of Washington, Inc. | 1,781 | 183,247 | ||||||
Extra Space Storage, Inc. REIT | 1,379 | 274,049 | ||||||
Exxon Mobil Corp. | 44,269 | 4,231,674 | ||||||
F5, Inc.* | 645 | 101,304 | ||||||
FactSet Research Systems, Inc. | 395 | 171,169 | ||||||
Fair Isaac Corp.* | 280 | 125,832 | ||||||
Fastenal Co. | 6,061 | 305,050 | ||||||
FedEx Corp. | 2,650 | 558,646 | ||||||
Fidelity National Financial, Inc. | 2,642 | 103,302 | ||||||
Fidelity National Information Services, Inc. | 6,459 | 590,159 | ||||||
Fifth Third Bancorp | 7,202 | 245,948 | ||||||
First Citizens BancShares, Inc., Class A | 127 | 103,119 | ||||||
First Republic Bank | 1,771 | 268,891 | ||||||
FirstEnergy Corp. | 5,707 | 225,712 | ||||||
Fiserv, Inc.* | 6,378 | 645,390 | ||||||
FleetCor Technologies, Inc.* | 838 | 178,100 | ||||||
FMC Corp. | 1,323 | 142,990 | ||||||
Ford Motor Co. | 40,300 | 614,172 | ||||||
Fortinet, Inc.* | 7,280 | 354,463 | ||||||
Fortive Corp. | 3,695 | 234,004 | ||||||
Fortune Brands Home & Security, Inc. | 1,453 | 89,258 | ||||||
Fox Corp., Class A | 2,858 | 97,686 | ||||||
Fox Corp., Class B | 1,563 | 49,422 | ||||||
Franklin Resources, Inc. | 3,384 | 88,221 | ||||||
Freeport-McMoRan, Inc. | 14,789 | 437,754 | ||||||
Gaming and Leisure Properties, Inc. REIT | 2,688 | 129,750 | ||||||
Gartner, Inc.* | 797 | 227,400 | ||||||
Generac Holdings, Inc.* | 656 | 144,589 | ||||||
General Dynamics Corp. | 2,457 | 562,481 | ||||||
General Electric Co. | 11,459 | 841,549 | ||||||
| See Notes to Financial Statements. | 36 |
DBX ETF Trust
Schedule of Investments
Xtrackers MSCI Kokusai Equity ETF (Continued)
August 31, 2022
Number | Value | |||||||
| United States (Continued) | ||||||||
General Mills, Inc. | 6,222 | $ | 477,850 | |||||
General Motors Co. | 14,540 | 555,573 | ||||||
Genuine Parts Co. | 1,546 | 241,191 | ||||||
Gilead Sciences, Inc. | 13,234 | 839,962 | ||||||
Global Payments, Inc. | 2,971 | 369,087 | ||||||
Globe Life, Inc. | 997 | 96,898 | ||||||
GoDaddy, Inc., Class A* | 1,757 | 133,216 | ||||||
Goldman Sachs Group, Inc. | 3,512 | 1,168,337 | ||||||
Guidewire Software, Inc.* | 820 | 58,802 | ||||||
Halliburton Co. | 9,317 | 280,721 | ||||||
Hartford Financial Services Group, Inc. | 3,435 | 220,905 | ||||||
Hasbro, Inc. | 1,356 | 106,880 | ||||||
HCA Healthcare, Inc. | 2,555 | 505,558 | ||||||
Healthcare Realty Trust, Inc. REIT | 3,990 | 97,037 | ||||||
Healthpeak Properties, Inc. REIT | 6,159 | 161,674 | ||||||
HEICO Corp. (b) | 474 | 72,190 | ||||||
HEICO Corp., Class A | 814 | 99,780 | ||||||
Henry Schein, Inc.* | 1,355 | 99,471 | ||||||
Hershey Co. | 1,539 | 345,767 | ||||||
Hess Corp. | 2,852 | 344,465 | ||||||
Hewlett Packard Enterprise Co. | 13,698 | 186,293 | ||||||
Hilton Worldwide Holdings, Inc. | 2,833 | 360,811 | ||||||
Hologic, Inc.* | 2,418 | 163,360 | ||||||
Home Depot, Inc. | 10,828 | 3,123,012 | ||||||
Honeywell International, Inc. | 7,248 | 1,372,409 | ||||||
Horizon Therapeutics PLC* | 2,211 | 130,913 | ||||||
Hormel Foods Corp. | 3,380 | 169,946 | ||||||
Host Hotels & Resorts, Inc. REIT | 7,189 | 127,749 | ||||||
Howmet Aerospace, Inc. | 4,250 | 150,577 | ||||||
HP, Inc. | 11,114 | 319,083 | ||||||
HubSpot, Inc.* | 474 | 159,757 | ||||||
Humana, Inc. | 1,333 | 642,213 | ||||||
Huntington Bancshares, Inc. | 15,700 | 210,380 | ||||||
Huntington Ingalls Industries, Inc. | 418 | 96,249 | ||||||
IAC, Inc.* | 816 | 52,444 | ||||||
IDEX Corp. | 833 | 167,608 | ||||||
IDEXX Laboratories, Inc.* | 889 | 309,034 | ||||||
Illinois Tool Works, Inc. | 3,294 | 641,770 | ||||||
Illumina, Inc.* | 1,656 | 333,916 | ||||||
Incyte Corp.* | 2,048 | 144,241 | ||||||
Ingersoll Rand, Inc. | 4,270 | 202,270 | ||||||
Insulet Corp.* | 737 | 188,281 | ||||||
Intel Corp. | 42,898 | 1,369,304 | ||||||
Intercontinental Exchange, Inc. | 5,764 | 581,299 | ||||||
International Business Machines Corp. | 9,475 | 1,217,064 | ||||||
International Flavors & Fragrances, Inc. | 2,713 | 299,732 | ||||||
International Paper Co. | 4,004 | 166,646 | ||||||
Interpublic Group of Cos., Inc. | 4,148 | 114,651 | ||||||
Intuit, Inc. | 2,851 | 1,231,005 | ||||||
Intuitive Surgical, Inc.* | 3,771 | 775,846 | ||||||
Invesco Ltd. | 4,276 | 70,426 | ||||||
Invitation Homes, Inc. REIT | 6,448 | 233,933 | ||||||
IQVIA Holdings, Inc.* | 1,919 | 408,095 | ||||||
Iron Mountain, Inc. REIT | 2,730 | 143,625 | ||||||
J M Smucker Co. | 1,183 | 165,608 | ||||||
Jack Henry & Associates, Inc. | 695 | 133,579 | ||||||
Jacobs Solutions, Inc. | 1,444 | 179,894 | ||||||
Number | Value | |||||||
| United States (Continued) | ||||||||
JB Hunt Transport Services, Inc. | 800 | $ | 139,216 | |||||
Johnson & Johnson | 27,656 | 4,462,019 | ||||||
Johnson Controls International PLC | 7,690 | 416,337 | ||||||
JPMorgan Chase & Co. | 30,943 | 3,519,147 | ||||||
Juniper Networks, Inc. | 2,860 | 81,281 | ||||||
Kellogg Co. | 2,591 | 188,469 | ||||||
Keurig Dr Pepper, Inc. | 7,798 | 297,260 | ||||||
KeyCorp | 10,641 | 188,239 | ||||||
Keysight Technologies, Inc.* | 1,923 | 315,160 | ||||||
Kimberly-Clark Corp. | 3,570 | 455,246 | ||||||
Kimco Realty Corp. REIT | 7,106 | 149,794 | ||||||
Kinder Morgan, Inc. | 21,920 | 401,574 | ||||||
KKR & Co., Inc. | 5,662 | 286,271 | ||||||
KLA Corp. | 1,542 | 530,648 | ||||||
Knight-Swift Transportation Holdings, Inc. | 1,544 | 77,987 | ||||||
Kraft Heinz Co. | 7,735 | 289,289 | ||||||
Kroger Co. | 7,083 | 339,559 | ||||||
L3Harris Technologies, Inc. | 2,033 | 463,910 | ||||||
Laboratory Corp. of America Holdings | 986 | 222,116 | ||||||
Lam Research Corp. | 1,478 | 647,231 | ||||||
Las Vegas Sands Corp.* | 4,006 | 150,746 | ||||||
Lear Corp. | 642 | 89,007 | ||||||
Leidos Holdings, Inc. | 1,260 | 119,763 | ||||||
Lennar Corp., Class A | 2,857 | 221,275 | ||||||
Lennox International, Inc. | 344 | 82,601 | ||||||
Liberty Broadband Corp., Class C* | 1,479 | 150,414 | ||||||
Liberty Media Corp.-Liberty Formula One, Class C* | 2,225 | 141,688 | ||||||
Liberty Media Corp-Liberty SiriusXM, Class A*(b) | 832 | 34,561 | ||||||
Liberty Media Corp-Liberty SiriusXM, Class C* | 1,979 | 81,851 | ||||||
Lincoln National Corp. | 1,729 | 79,638 | ||||||
Live Nation Entertainment, Inc.* | 1,893 | 171,051 | ||||||
LKQ Corp. | 2,563 | 136,403 | ||||||
Lockheed Martin Corp. | 2,579 | 1,083,464 | ||||||
Loews Corp. | 2,121 | 117,313 | ||||||
Lowe’s Cos., Inc. | 6,733 | 1,307,145 | ||||||
LPL Financial Holdings, Inc. | 845 | 187,024 | ||||||
Lucid Group, Inc.*(b) | 4,242 | 65,072 | ||||||
Lumen Technologies, Inc. | 8,490 | 84,560 | ||||||
Lyft, Inc., Class A* | 2,844 | 41,892 | ||||||
LyondellBasell Industries NV, Class A | 2,890 | 239,870 | ||||||
M&T Bank Corp. | 1,796 | 326,477 | ||||||
Marathon Oil Corp. | 7,568 | 193,665 | ||||||
Marathon Petroleum Corp. | 5,961 | 600,571 | ||||||
Markel Corp.* | 145 | 173,146 | ||||||
MarketAxess Holdings, Inc. | 395 | 98,193 | ||||||
Marriott International, Inc., Class A | 2,923 | 449,382 | ||||||
Marsh & McLennan Cos., Inc. | 5,292 | 853,970 | ||||||
Martin Marietta Materials, Inc. | 711 | 247,222 | ||||||
Marvell Technology, Inc. | 8,573 | 401,388 | ||||||
Masco Corp. | 2,287 | 116,340 | ||||||
Masimo Corp.* | 621 | 91,219 | ||||||
Mastercard, Inc., Class A | 9,099 | 2,951,443 | ||||||
Match Group, Inc.* | 2,861 | 161,732 | ||||||
| See Notes to Financial Statements. | 37 |
DBX ETF Trust
Schedule of Investments
Xtrackers MSCI Kokusai Equity ETF (Continued)
August 31, 2022
Number | Value | |||||||
| United States (Continued) | ||||||||
McCormick & Co., Inc. | 2,715 | $ | 228,250 | |||||
McDonald’s Corp. | 7,854 | 1,981,407 | ||||||
McKesson Corp. | 1,580 | 579,860 | ||||||
Medical Properties Trust, Inc. REIT | 6,367 | 93,022 | ||||||
Merck & Co., Inc. | 26,628 | 2,272,966 | ||||||
Meta Platforms, Inc., Class A* | 24,316 | 3,961,806 | ||||||
MetLife, Inc. | 7,383 | 474,948 | ||||||
Mettler-Toledo International, Inc.* | 243 | 294,628 | ||||||
MGM Resorts International | 3,720 | 121,421 | ||||||
Microchip Technology, Inc. | 5,612 | 366,183 | ||||||
Micron Technology, Inc. | 11,492 | 649,643 | ||||||
Microsoft Corp. | 74,825 | 19,564,493 | ||||||
Mid-America Apartment Communities, Inc. REIT | 1,266 | 209,738 | ||||||
Moderna, Inc.* | 3,570 | 472,204 | ||||||
Mohawk Industries, Inc.* | 416 | 45,910 | ||||||
Molina Healthcare, Inc.* | 655 | 220,977 | ||||||
Molson Coors Beverage Co., Class B | 1,967 | 101,635 | ||||||
Mondelez International, Inc., Class A | 14,822 | 916,889 | ||||||
MongoDB, Inc.* | 656 | 211,796 | ||||||
Monolithic Power Systems, Inc. | 463 | 209,822 | ||||||
Monster Beverage Corp.* | 4,116 | 365,624 | ||||||
Moody’s Corp. | 1,751 | 498,195 | ||||||
Morgan Stanley | 14,071 | 1,199,131 | ||||||
Mosaic Co. | 3,536 | 190,484 | ||||||
Motorola Solutions, Inc. | 1,768 | 430,349 | ||||||
MSCI, Inc. | 858 | 385,448 | ||||||
Nasdaq, Inc. | 3,630 | 216,094 | ||||||
NetApp, Inc. | 2,318 | 167,197 | ||||||
Netflix, Inc.* | 4,587 | 1,025,470 | ||||||
Neurocrine Biosciences, Inc.* | 1,190 | 124,510 | ||||||
Newell Brands, Inc. | 4,259 | 76,023 | ||||||
Newmont Corp. | 8,140 | 336,670 | ||||||
News Corp., Class A | 4,251 | 71,927 | ||||||
NextEra Energy, Inc. | 20,560 | 1,748,834 | ||||||
NIKE, Inc., Class B | 13,423 | 1,428,878 | ||||||
NiSource, Inc. | 4,271 | 126,037 | ||||||
Nordson Corp. | 633 | 143,799 | ||||||
Norfolk Southern Corp. | 2,522 | 613,174 | ||||||
Northern Trust Corp. | 2,200 | 209,198 | ||||||
Northrop Grumman Corp. | 1,542 | 737,061 | ||||||
NortonLifeLock, Inc. | 5,685 | 128,424 | ||||||
NRG Energy, Inc. | 2,670 | 110,218 | ||||||
Nucor Corp. | 2,702 | 359,204 | ||||||
NVIDIA Corp. | 26,237 | 3,960,213 | ||||||
NVR, Inc.* | 22 | 91,081 | ||||||
Occidental Petroleum Corp. | 9,840 | 698,640 | ||||||
Okta, Inc.* | 1,582 | 144,595 | ||||||
Old Dominion Freight Line, Inc. | 1,025 | 278,195 | ||||||
Omnicom Group, Inc. | 2,139 | 143,099 | ||||||
ON Semiconductor Corp.* | 4,796 | 329,821 | ||||||
ONEOK, Inc. | 4,712 | 288,516 | ||||||
Oracle Corp. | 16,875 | 1,251,281 | ||||||
O’Reilly Automotive, Inc.* | 702 | 489,378 | ||||||
Otis Worldwide Corp. | 4,286 | 309,535 | ||||||
Owens Corning | 1,040 | 84,999 | ||||||
PACCAR, Inc. | 3,570 | 312,411 | ||||||
Number | Value | |||||||
| United States (Continued) | ||||||||
Packaging Corp. of America | 988 | $ | 135,277 | |||||
Palantir Technologies, Inc., Class A* | 15,054 | 116,217 | ||||||
Palo Alto Networks, Inc.* | 1,034 | 575,742 | ||||||
Paramount Global, Class B | 6,550 | 153,205 | ||||||
Parker-Hannifin Corp. | 1,390 | 368,350 | ||||||
Paychex, Inc. | 3,475 | 428,606 | ||||||
Paycom Software, Inc.* | 579 | 203,345 | ||||||
PayPal Holdings, Inc.* | 11,492 | 1,073,812 | ||||||
PepsiCo, Inc. | 14,497 | 2,497,398 | ||||||
PerkinElmer, Inc. | 1,281 | 173,012 | ||||||
Pfizer, Inc. | 59,263 | 2,680,465 | ||||||
PG&E Corp.*(b) | 16,078 | 198,242 | ||||||
Philip Morris International, Inc. | 16,241 | 1,550,853 | ||||||
Phillips 66 | 5,045 | 451,326 | ||||||
Pinterest, Inc., Class A* | 5,608 | 129,208 | ||||||
Pioneer Natural Resources Co. | 2,434 | 616,337 | ||||||
Plug Power, Inc.*(b) | 5,060 | 141,882 | ||||||
PNC Financial Services Group, Inc. | 4,328 | 683,824 | ||||||
Pool Corp. | 420 | 142,460 | ||||||
PPG Industries, Inc. | 2,483 | 315,291 | ||||||
PPL Corp. | 7,747 | 225,283 | ||||||
Principal Financial Group, Inc. (b) | 2,775 | 207,459 | ||||||
Procter & Gamble Co. | 25,028 | 3,452,362 | ||||||
Progressive Corp. | 6,012 | 737,372 | ||||||
Prologis, Inc. REIT | 7,699 | 958,602 | ||||||
Prudential Financial, Inc. | 3,959 | 379,074 | ||||||
PTC, Inc.* | 1,168 | 134,192 | ||||||
Public Service Enterprise Group, Inc. | 5,033 | 323,924 | ||||||
Public Storage REIT | 1,613 | 533,629 | ||||||
PulteGroup, Inc. | 2,851 | 115,922 | ||||||
Qorvo, Inc.* | 1,140 | 102,349 | ||||||
QUALCOMM, Inc. | 11,974 | 1,583,801 | ||||||
Quanta Services, Inc. | 1,516 | 214,211 | ||||||
Quest Diagnostics, Inc. | 1,142 | 143,104 | ||||||
Raymond James Financial, Inc. | 2,065 | 215,524 | ||||||
Raytheon Technologies Corp. | 15,710 | 1,409,973 | ||||||
Realty Income Corp. REIT | 6,245 | 426,409 | ||||||
Regency Centers Corp. REIT | 1,627 | 98,987 | ||||||
Regeneron Pharmaceuticals, Inc.* | 1,113 | 646,720 | ||||||
Regions Financial Corp. | 9,121 | 197,652 | ||||||
Republic Services, Inc. | 2,228 | 317,980 | ||||||
ResMed, Inc. | 1,542 | 339,117 | ||||||
RingCentral, Inc., Class A* | 833 | 35,852 | ||||||
Rivian Automotive, Inc., Class A* | 1,926 | 62,999 | ||||||
Robert Half International, Inc. | 991 | 76,277 | ||||||
ROBLOX Corp., Class A* | 3,704 | 144,863 | ||||||
Rockwell Automation, Inc. | 1,222 | 289,541 | ||||||
Roku, Inc.* | 1,279 | 86,972 | ||||||
Rollins, Inc. | 2,250 | 75,960 | ||||||
Roper Technologies, Inc. | 1,109 | 446,461 | ||||||
Ross Stores, Inc. | 3,723 | 321,183 | ||||||
Royal Caribbean Cruises Ltd.* | 2,320 | 94,772 | ||||||
Royalty Pharma PLC, Class A | 3,547 | 148,300 | ||||||
RPM International, Inc. | 1,356 | 126,325 | ||||||
S&P Global, Inc. | 3,733 | 1,314,688 | ||||||
Salesforce, Inc.* | 10,428 | 1,628,019 | ||||||
SBA Communications Corp. REIT | 1,143 | 371,761 | ||||||
| See Notes to Financial Statements. | 38 |
DBX ETF Trust
Schedule of Investments
Xtrackers MSCI Kokusai Equity ETF (Continued)
August 31, 2022
Number | Value | |||||||
| United States (Continued) | ||||||||
Schlumberger N.V. | 14,658 | $ | 559,203 | |||||
Seagate Technology Holdings PLC | 2,047 | 137,067 | ||||||
Seagen, Inc.* | 1,502 | 231,744 | ||||||
Sealed Air Corp. | 1,562 | 84,051 | ||||||
SEI Investments Co. | 1,281 | 70,071 | ||||||
Sempra Energy | 3,323 | 548,195 | ||||||
Sensata Technologies Holding PLC | 1,547 | 62,313 | ||||||
ServiceNow, Inc.* | 2,108 | 916,179 | ||||||
Sherwin-Williams Co. | 2,546 | 590,927 | ||||||
Signature Bank | 664 | 115,775 | ||||||
Simon Property Group, Inc. REIT | 3,404 | 347,140 | ||||||
Sirius XM Holdings, Inc. (b) | 7,954 | 48,440 | ||||||
Skyworks Solutions, Inc. | 1,724 | 169,900 | ||||||
Snap, Inc., Class A* | 11,247 | 122,367 | ||||||
Snap-on, Inc. | 561 | 122,219 | ||||||
Snowflake, Inc., Class A* | 2,186 | 395,557 | ||||||
Southern Co. | 11,291 | 870,197 | ||||||
Southwest Airlines Co.* | 1,546 | 56,738 | ||||||
Splunk, Inc.* | 1,675 | 150,800 | ||||||
SS&C Technologies Holdings, Inc. | 2,677 | 149,270 | ||||||
Stanley Black & Decker, Inc. | 1,724 | 151,884 | ||||||
Starbucks Corp. | 12,117 | 1,018,676 | ||||||
State Street Corp. | 4,104 | 280,508 | ||||||
Steel Dynamics, Inc. | 1,986 | 160,310 | ||||||
STERIS PLC | 1,051 | 211,650 | ||||||
Stryker Corp. | 3,570 | 732,564 | ||||||
Sun Communities, Inc. REIT | 1,273 | 195,673 | ||||||
SVB Financial Group* | 638 | 259,360 | ||||||
Synchrony Financial | 5,657 | 185,267 | ||||||
Synopsys, Inc.* | 1,615 | 558,822 | ||||||
Sysco Corp. | 5,342 | 439,219 | ||||||
T. Rowe Price Group, Inc. | 2,324 | 278,880 | ||||||
Take-Two Interactive Software, Inc.* | 1,705 | 208,965 | ||||||
Targa Resources Corp. | 2,286 | 155,974 | ||||||
Target Corp. | 5,073 | 813,405 | ||||||
TE Connectivity Ltd. | 3,398 | 428,862 | ||||||
Teladoc Health, Inc.*(b) | 1,501 | 46,621 | ||||||
Teledyne Technologies, Inc.* | 469 | 172,761 | ||||||
Teleflex, Inc. | 549 | 124,217 | ||||||
Teradyne, Inc. | 1,714 | 145,073 | ||||||
Tesla, Inc.* | 27,804 | 7,663,060 | ||||||
Texas Instruments, Inc. | 9,533 | 1,574,947 | ||||||
Texas Pacific Land Corp. | 65 | 119,630 | ||||||
Textron, Inc. | 2,237 | 139,544 | ||||||
Thermo Fisher Scientific, Inc. | 4,119 | 2,246,173 | ||||||
TJX Cos., Inc. | 12,299 | 766,843 | ||||||
T-Mobile US, Inc.* | 6,536 | 940,923 | ||||||
Tractor Supply Co. | 1,125 | 208,294 | ||||||
Trade Desk, Inc., Class A* | 4,734 | 296,822 | ||||||
Tradeweb Markets, Inc., Class A | 1,177 | 81,907 | ||||||
TransDigm Group, Inc. | 583 | 350,027 | ||||||
TransUnion | 2,164 | 159,855 | ||||||
Travelers Cos., Inc. | 2,449 | 395,856 | ||||||
Trimble, Inc.* | 2,760 | 174,570 | ||||||
Truist Financial Corp. | 14,118 | 661,287 | ||||||
Twilio, Inc., Class A* | 1,806 | 125,661 | ||||||
Twitter, Inc.* | 8,432 | 326,740 | ||||||
Number | Value | |||||||
| United States (Continued) | ||||||||
Tyler Technologies, Inc.* | 433 | $ | 160,864 | |||||
Tyson Foods, Inc., Class A | 2,930 | 220,863 | ||||||
Uber Technologies, Inc.* | 15,618 | 449,174 | ||||||
UDR, Inc. REIT | 3,351 | 150,359 | ||||||
UGI Corp. | 2,049 | 80,936 | ||||||
Ulta Beauty, Inc.* | 578 | 242,685 | ||||||
Union Pacific Corp. | 6,705 | 1,505,340 | ||||||
United Parcel Service, Inc., Class B | 7,691 | 1,495,976 | ||||||
United Rentals, Inc.* | 744 | 217,278 | ||||||
UnitedHealth Group, Inc. | 9,900 | 5,141,367 | ||||||
Unity Software, Inc.* | 2,013 | 85,995 | ||||||
Universal Health Services, Inc., Class B | 779 | 76,217 | ||||||
US Bancorp | 14,902 | 679,680 | ||||||
Vail Resorts, Inc. | 423 | 95,040 | ||||||
Valero Energy Corp. | 4,087 | 478,669 | ||||||
Veeva Systems, Inc., Class A* | 1,443 | 287,619 | ||||||
Ventas, Inc. REIT | 4,207 | 201,347 | ||||||
VeriSign, Inc.* | 1,041 | 189,691 | ||||||
Verisk Analytics, Inc. | 1,702 | 318,546 | ||||||
Verizon Communications, Inc. | 44,222 | 1,848,922 | ||||||
Vertex Pharmaceuticals, Inc.* | 2,680 | 755,117 | ||||||
VF Corp. | 3,578 | 148,308 | ||||||
Viatris, Inc. | 12,635 | 120,664 | ||||||
VICI Properties, Inc. REIT | 10,150 | 334,849 | ||||||
Visa, Inc., Class A | 17,416 | 3,460,733 | ||||||
Vistra Corp. | 4,718 | 116,771 | ||||||
VMware, Inc., Class A | 2,156 | 250,161 | ||||||
Vornado Realty Trust REIT (b) | 1,886 | 49,451 | ||||||
Vulcan Materials Co. | 1,343 | 223,596 | ||||||
W.R. Berkley Corp. | 2,019 | 130,831 | ||||||
W.W. Grainger, Inc. | 482 | 267,481 | ||||||
Walgreens Boots Alliance, Inc. | 7,593 | 266,211 | ||||||
Walmart, Inc. | 16,061 | 2,128,886 | ||||||
Walt Disney Co.* | 19,135 | 2,144,651 | ||||||
Warner Bros Discovery, Inc.* | 23,176 | 306,850 | ||||||
Waste Connections, Inc. | 2,709 | 377,039 | ||||||
Waste Management, Inc. | 4,364 | 737,647 | ||||||
Waters Corp.* | 659 | 196,777 | ||||||
Wayfair, Inc., Class A* | 731 | 38,531 | ||||||
Webster Financial Corp. | 1,974 | 92,877 | ||||||
WEC Energy Group, Inc. | 3,321 | 342,528 | ||||||
Wells Fargo & Co. | 40,176 | 1,756,093 | ||||||
Welltower, Inc. REIT | 4,710 | 361,022 | ||||||
West Pharmaceutical Services, Inc. | 763 | 226,374 | ||||||
Western Digital Corp.* | 3,546 | 149,854 | ||||||
Western Union Co. | 5,106 | 75,671 | ||||||
Westinghouse Air Brake Technologies Corp. | 1,894 | 166,009 | ||||||
Westlake Corp. | 402 | 39,649 | ||||||
Westrock Co. | 2,772 | 112,515 | ||||||
Weyerhaeuser Co. REIT | 7,864 | 268,634 | ||||||
Whirlpool Corp. | 645 | 101,007 | ||||||
Williams Cos., Inc. | 11,932 | 406,046 | ||||||
Workday, Inc., Class A* | 2,081 | 342,449 | ||||||
WP Carey, Inc. REIT | 2,007 | 168,648 | ||||||
Wynn Resorts Ltd.*(b) | 1,183 | 71,678 | ||||||
Xcel Energy, Inc. | 5,797 | 430,427 | ||||||
| See Notes to Financial Statements. | 39 |
DBX ETF Trust
Schedule of Investments
Xtrackers MSCI Kokusai Equity ETF (Continued)
August 31, 2022
Number | Value | |||||||
| United States (Continued) | ||||||||
Xylem, Inc. | 2,048 | $ | 186,573 | |||||
Yum! Brands, Inc. | 2,954 | 328,603 | ||||||
Zebra Technologies Corp., Class A* | 599 | 180,682 | ||||||
Zendesk, Inc.* | 1,276 | 97,959 | ||||||
Zillow Group, Inc., Class C* | 1,452 | 48,584 | ||||||
Zimmer Biomet Holdings, Inc. | 2,143 | 227,844 | ||||||
Zoetis, Inc. | 4,903 | 767,467 | ||||||
Zoom Video Communications, Inc., Class A* | 2,314 | 186,046 | ||||||
ZoomInfo Technologies, Inc.* | 2,760 | 125,359 | ||||||
Zscaler, Inc.*(b) | 798 | 127,074 | ||||||
|
| |||||||
(Cost $366,285,731) | 362,103,723 | |||||||
|
| |||||||
| Uruguay — 0.1% | ||||||||
MercadoLibre, Inc.* | 443 | 378,924 | ||||||
|
| |||||||
TOTAL COMMON STOCKS | 498,485,977 | |||||||
|
| |||||||
| PREFERRED STOCKS — 0.1% | ||||||||
| Germany — 0.1% | ||||||||
Bayerische Motoren Werke AG | 558 | 38,856 | ||||||
Henkel AG & Co. KGaA | 1,875 | 121,118 | ||||||
Porsche Automobil Holding SE | 1,615 | 114,457 | ||||||
Sartorius AG | 259 | 108,316 | ||||||
Volkswagen AG | 1,973 | 281,999 | ||||||
|
| |||||||
(Cost $799,320) | 664,746 | |||||||
|
| |||||||
Number | Value | |||||||
| United States — 0.0% | ||||||||
AMC Entertainment Holdings, Inc.* | 5,444 | $ | 26,676 | |||||
|
| |||||||
TOTAL PREFERRED STOCKS | 691,422 | |||||||
|
| |||||||
| WARRANTS — 0.0% | ||||||||
| Switzerland — 0.0% | ||||||||
Cie Financiere Richemont SA*, expires 11/22/23 | 19,824 | 12,797 | ||||||
|
| |||||||
| SECURITIES LENDING COLLATERAL — 0.1% | ||||||||
DWS Government & Agency Securities Portfolio “DWS Government Cash Institutional Shares”, 2.00% (d)(e) | 339,649 | 339,649 | ||||||
|
| |||||||
| CASH EQUIVALENTS — 0.2% | ||||||||
DWS Government Money Market Series “Institutional Shares”, 2.24% (d) | 995,448 | 995,448 | ||||||
|
| |||||||
TOTAL INVESTMENTS — 99.6% (Cost $520,337,389) | $ | 500,525,293 | ||||||
Other assets and liabilities, net — 0.4% | 1,849,676 | |||||||
|
| |||||||
NET ASSETS — 100.0% | $ | 502,374,969 | ||||||
|
| |||||||
A summary of the Fund’s transactions with affiliated investments during the year ended August 31, 2022 is as follows:
| Value ($) at 8/31/2021 | Purchases Cost ($) | Sales Proceeds ($) | Net Realized Gain/ (Loss) ($) | Net Change in Unrealized Appreciation (Depreciation) ($) | Income ($) | Capital Gain Distributions ($) | Number of Shares at 8/31/2022 | Value ($) at 8/31/2022 | ||||||||||||||||||||||||||||
COMMON STOCKS — 0.0% |
| |||||||||||||||||||||||||||||||||||
Germany — 0.0% |
| |||||||||||||||||||||||||||||||||||
Deutsche Bank AG (c) |
| |||||||||||||||||||||||||||||||||||
| 356,205 | 98,321 | (200,802 | ) | 58,255 | (133,515 | ) | 4,547 | — | 21,324 | 178,464 | ||||||||||||||||||||||||||
SECURITIES LENDING COLLATERAL — 0.1% |
| |||||||||||||||||||||||||||||||||||
DWS Government & Agency Securities Portfolio “DWS Government Cash Institutional Shares”, 2.00% (d)(e) |
| |||||||||||||||||||||||||||||||||||
| 430,881 | — | (91,232 | ) (f) | — | — | 8,998 | — | 339,649 | 339,649 | |||||||||||||||||||||||||||
CASH EQUIVALENTS — 0.2% |
| |||||||||||||||||||||||||||||||||||
DWS Government Money Market Series “Institutional Shares”, 2.24% (d) |
| |||||||||||||||||||||||||||||||||||
| 985,575 | 16,206,538 | (16,196,665 | ) | — | — | 3,673 | — | 995,448 | 995,448 | |||||||||||||||||||||||||||
|
|
|
|
|
|
|
|
|
|
|
|
|
|
|
|
|
| |||||||||||||||||||
| 1,772,661 | 16,304,859 | (16,488,699 | ) | 58,255 | (133,515 | ) | 17,218 | — | 1,356,421 | 1,513,561 | ||||||||||||||||||||||||||
|
|
|
|
|
|
|
|
|
|
|
|
|
|
|
|
|
| |||||||||||||||||||
| * | Non-income producing security. |
| (a) | Stapled Security — A security contractually bound to one or more other securities to form a single saleable unit which cannot be sold separately. |
| (b) | All or a portion of these securities were on loan. In addition, “Other assets and liabilities, net” may include pending sales that are also on loan. The value of securities loaned at August 31, 2022 amounted to $2,565,387, which is 0.5% of net assets. |
| (c) | Affiliated issuer. This security is owned in proportion with its representation in the index. |
| (d) | Affiliated fund managed by DWS Investment Management Americas, Inc. The rate shown is the annualized seven-day yield at period end. |
| (e) | Represents cash collateral held in connection with securities lending. Income earned by the Fund is net of borrower rebates. In addition, the Fund held non-cash U.S. Treasury securities collateral having a value of $2,415,063. |
| See Notes to Financial Statements. | 40 |
DBX ETF Trust
Schedule of Investments
Xtrackers MSCI Kokusai Equity ETF (Continued)
August 31, 2022
| (f) | Represents the net increase (purchase cost) or decrease (sales proceeds) in the amount invested in cash collateral for the year ended August 31, 2022. |
| ADR: | American Depositary Receipt |
| CDI: | Chess Depositary Interest |
| CVA: | Credit Valuation Adjustment |
| REIT: | Real Estate Investment Trust |
| 144A: | Security exempt from registration under Rule 144A of the Securities Act of 1933. These securities may be resold in transactions exempt from registration, normally to qualified institutional buyers. |
Securities are listed in country of domicile.
At August 31, 2022, open futures contracts purchased were as follows:
Contract Description | Currency | Number of Contracts | Notional Amount | Contract Value | Expiration Date | Unrealized Appreciation (Depreciation) | ||||||||||||||
E-Mini S&P 500 Futures | USD | 8 | $ | 1,577,610 | $1,582,600 | 9/16/2022 | $ | 4,990 | ||||||||||||
MINI S&P/TSX 60 Futures | CAD | 1 | 46,408 | 44,479 | 9/15/2022 | (1,929 | ) | |||||||||||||
MSCI EAFE Futures | USD | 12 | 1,140,875 | 1,096,260 | 9/16/2022 | (44,615 | ) | |||||||||||||
S&P MidCap 400 E-Mini Futures | USD | 1 | 229,035 | 243,030 | 9/16/2022 | 13,995 | ||||||||||||||
|
| |||||||||||||||||||
Total net unrealized depreciation | $ | (27,559 | ) | |||||||||||||||||
|
| |||||||||||||||||||
For information on the Fund’s policy and additional disclosures regarding open futures contracts, please refer to the Derivatives section of Note 2 in the accompanying Notes to Financial Statements.
Currency Abbreviations
| CAD | Canadian Dollar |
| USD | U.S. Dollar |
Fair Value Measurements
Various inputs are used in determining the value of the Fund’s investments. These inputs are summarized in three broad levels. Level 1 includes quoted prices in active markets for identical securities. Level 2 includes other significant observable inputs (including quoted prices for similar securities, interest rates, prepayment speeds and credit risk). Level 3 includes significant unobservable inputs (including the Fund’s own assumptions in determining the fair value of investments). The level assigned to the securities valuations may not be an indication of the risk or liquidity associated with investing in those securities.
The following is a summary of the inputs used as of August 31, 2022 in valuing the Fund’s investments. For information on the Fund’s policy regarding the valuation of investments, please refer to the Security Valuation section of Note 2 in the accompanying Notes to Financial Statements.
Assets | Level 1 | Level 2 | Level 3 | Total | ||||||||||||
Common Stocks (a) | $ | 498,485,977 | $ | — | $ | — | $ | 498,485,977 | ||||||||
Preferred Stocks (a) | 691,422 | — | — | 691,422 | ||||||||||||
Warrants | 12,797 | — | — | 12,797 | ||||||||||||
Short-Term Investments (a) | 1,335,097 | — | — | 1,335,097 | ||||||||||||
Derivatives (b) | ||||||||||||||||
Futures Contracts | 18,985 | — | — | 18,985 | ||||||||||||
|
|
|
|
|
|
|
| |||||||||
TOTAL | $ | 500,544,278 | $ | — | $ | — | $ | 500,544,278 | ||||||||
|
|
|
|
|
|
|
| |||||||||
Liabilities | Level 1 | Level 2 | Level 3 | Total | ||||||||||||
Derivatives (b) | ||||||||||||||||
Futures Contracts | $ | (46,544 | ) | $ | — | $ | — | $ | (46,544 | ) | ||||||
|
|
|
|
|
|
|
| |||||||||
TOTAL | $ | (46,544 | ) | $ | — | $ | — | $ | (46,544 | ) | ||||||
|
|
|
|
|
|
|
| |||||||||
| (a) | See Schedule of Investments for additional detailed categorizations. |
| (b) | Derivatives include unrealized appreciation (depreciation) on open futures contracts. |
| See Notes to Financial Statements. | 41 |
DBX ETF Trust
Schedule of Investments
Xtrackers Russell 1000 US Quality at a Reasonable Price ETF
August 31, 2022
Number | Value | |||||||
| COMMON STOCKS — 99.7% | ||||||||
| Communication Services — 10.6% | ||||||||
Activision Blizzard, Inc. | 300 | $ | 23,547 | |||||
Alphabet, Inc., Class A* | 2,596 | 280,939 | ||||||
Alphabet, Inc., Class C* | 2,427 | 264,907 | ||||||
AT&T, Inc. | 3,116 | 54,655 | ||||||
Charter Communications, Inc., Class A* | 49 | 20,219 | ||||||
Comcast Corp., Class A | 1,420 | 51,390 | ||||||
Electronic Arts, Inc. | 152 | 19,284 | ||||||
Fox Corp., Class A | 211 | 7,212 | ||||||
Fox Corp., Class B | 101 | 3,193 | ||||||
Interpublic Group of Cos., Inc. | 378 | 10,448 | ||||||
Lumen Technologies, Inc. | 353 | 3,516 | ||||||
Meta Platforms, Inc., Class A* | 2,275 | 370,666 | ||||||
New York Times Co., Class A | 98 | 2,988 | ||||||
News Corp., Class A | 129 | 2,183 | ||||||
Omnicom Group, Inc. | 103 | 6,891 | ||||||
Pinterest, Inc., Class A* | 223 | 5,138 | ||||||
Spotify Technology SA* | 41 | 4,434 | ||||||
Take-Two Interactive Software, Inc.* | 22 | 2,696 | ||||||
Verizon Communications, Inc. | 826 | 34,535 | ||||||
Walt Disney Co.* | 28 | 3,138 | ||||||
Warner Bros Discovery, Inc.* | 299 | 3,959 | ||||||
|
| |||||||
(Cost $1,305,488) | 1,175,938 | |||||||
|
| |||||||
| Consumer Discretionary — 12.3% | ||||||||
Advance Auto Parts, Inc. | 77 | 12,985 | ||||||
Amazon.com, Inc.* | 950 | 120,432 | ||||||
AutoNation, Inc.*(a) | 69 | 8,597 | ||||||
AutoZone, Inc.* | 17 | 36,027 | ||||||
Bath & Body Works, Inc. | 209 | 7,802 | ||||||
Best Buy Co., Inc. | 404 | 28,559 | ||||||
Booking Holdings, Inc.* | 6 | 11,255 | ||||||
BorgWarner, Inc. | 185 | 6,975 | ||||||
Burlington Stores, Inc.*(a) | 47 | 6,589 | ||||||
Capri Holdings Ltd.* | 123 | 5,803 | ||||||
Chipotle Mexican Grill, Inc.* | 12 | 19,162 | ||||||
Columbia Sportswear Co. | 38 | 2,707 | ||||||
D.R. Horton, Inc. | 156 | 11,099 | ||||||
Darden Restaurants, Inc. | 71 | 8,783 | ||||||
Deckers Outdoor Corp.* | 21 | 6,753 | ||||||
Dick’s Sporting Goods, Inc. | 110 | 11,701 | ||||||
Dollar General Corp. | 177 | 42,023 | ||||||
Dollar Tree, Inc.* | 67 | 9,091 | ||||||
Domino’s Pizza, Inc. | 21 | 7,809 | ||||||
eBay, Inc. | 244 | 10,768 | ||||||
Expedia Group, Inc.* | 74 | 7,596 | ||||||
Five Below, Inc.*(a) | 30 | 3,836 | ||||||
Floor & Decor Holdings, Inc., Class A*(a) | 55 | 4,475 | ||||||
Garmin Ltd. | 115 | 10,176 | ||||||
Gentex Corp. | 194 | 5,294 | ||||||
Genuine Parts Co. | 94 | 14,665 | ||||||
Grand Canyon Education, Inc.* | 48 | 3,906 | ||||||
Home Depot, Inc. | 805 | 232,178 | ||||||
Kohl’s Corp. | 151 | 4,291 | ||||||
Lear Corp. | 33 | 4,575 | ||||||
Number | Value | |||||||
| Consumer Discretionary (Continued) | ||||||||
Lennar Corp., Class A | 228 | $ | 17,659 | |||||
Lithia Motors, Inc. | 24 | 6,371 | ||||||
LKQ Corp. | 204 | 10,857 | ||||||
Lowe’s Cos., Inc. | 728 | 141,334 | ||||||
Lululemon Athletica, Inc.* | 54 | 16,198 | ||||||
Macy’s, Inc. | 398 | 6,893 | ||||||
Mohawk Industries, Inc.* | 58 | 6,401 | ||||||
NIKE, Inc., Class B | 476 | 50,670 | ||||||
NVR, Inc.* | 4 | 16,560 | ||||||
O’Reilly Automotive, Inc.* | 57 | 39,736 | ||||||
Penske Automotive Group, Inc. | 26 | 3,066 | ||||||
Polaris, Inc. (a) | 37 | 4,191 | ||||||
PulteGroup, Inc. | 243 | 9,880 | ||||||
PVH Corp. | 53 | 2,981 | ||||||
Ralph Lauren Corp. (a) | 35 | 3,197 | ||||||
Ross Stores, Inc. | 319 | 27,520 | ||||||
Skechers U.S.A., Inc., Class A* | 89 | 3,364 | ||||||
Starbucks Corp. | 613 | 51,535 | ||||||
Tapestry, Inc. | 260 | 9,030 | ||||||
Target Corp. | 710 | 113,841 | ||||||
Tempur Sealy International, Inc. | 180 | 4,502 | ||||||
Thor Industries, Inc. (a) | 64 | 5,185 | ||||||
TJX Cos., Inc. | 927 | 57,798 | ||||||
Toll Brothers, Inc. | 71 | 3,109 | ||||||
Tractor Supply Co. | 114 | 21,107 | ||||||
Ulta Beauty, Inc.* | 41 | 17,215 | ||||||
VF Corp. | 120 | 4,974 | ||||||
Victoria’s Secret & Co.* | 130 | 4,347 | ||||||
Whirlpool Corp. | 54 | 8,456 | ||||||
Williams-Sonoma, Inc. (a) | 124 | 18,445 | ||||||
Yum! Brands, Inc. | 116 | 12,904 | ||||||
|
| |||||||
(Cost $1,420,912) | 1,365,238 | |||||||
|
| |||||||
| Consumer Staples — 8.3% | ||||||||
Altria Group, Inc. | 765 | 34,517 | ||||||
Archer-Daniels-Midland Co. | 558 | 49,043 | ||||||
BJ’s Wholesale Club Holdings, Inc.* | 154 | 11,472 | ||||||
Clorox Co. | 66 | 9,526 | ||||||
Colgate-Palmolive Co. | 391 | 30,580 | ||||||
Costco Wholesale Corp. | 463 | 241,732 | ||||||
Darling Ingredients, Inc.* | 66 | 5,020 | ||||||
Estee Lauder Cos., Inc., Class A | 23 | 5,851 | ||||||
General Mills, Inc. | 68 | 5,222 | ||||||
Hershey Co. | 21 | 4,718 | ||||||
Hormel Foods Corp. | 67 | 3,369 | ||||||
Kimberly-Clark Corp. | 62 | 7,906 | ||||||
Kroger Co. | 543 | 26,031 | ||||||
Monster Beverage Corp.* | 172 | 15,279 | ||||||
PepsiCo, Inc. | 22 | 3,790 | ||||||
Performance Food Group Co.* | 63 | 3,149 | ||||||
Philip Morris International, Inc. | 921 | 87,946 | ||||||
Procter & Gamble Co. | 1,041 | 143,596 | ||||||
Sysco Corp. | 69 | 5,673 | ||||||
Tyson Foods, Inc., Class A | 182 | 13,719 | ||||||
US Foods Holding Corp.* | 119 | 3,644 | ||||||
| See Notes to Financial Statements. | 42 |
DBX ETF Trust
Schedule of Investments
Xtrackers Russell 1000 US Quality at a Reasonable Price ETF (Continued)
August 31, 2022
Number | Value | |||||||
| Consumer Staples (Continued) | ||||||||
Walgreens Boots Alliance, Inc. | 531 | $ | 18,617 | |||||
Walmart, Inc. | 1,506 | 199,620 | ||||||
|
| |||||||
(Cost $884,835) | 930,020 | |||||||
|
| |||||||
| Energy — 9.9% | ||||||||
Antero Resources Corp.* | 125 | 5,010 | ||||||
APA Corp. | 242 | 9,465 | ||||||
Chesapeake Energy Corp. (a) | 75 | 7,537 | ||||||
Chevron Corp. | 1,501 | 237,248 | ||||||
ConocoPhillips | 950 | 103,977 | ||||||
Coterra Energy, Inc. | 120 | 3,709 | ||||||
Devon Energy Corp. | 272 | 19,209 | ||||||
Diamondback Energy, Inc. | 93 | 12,395 | ||||||
EOG Resources, Inc. | 589 | 71,446 | ||||||
Exxon Mobil Corp. | 4,145 | 396,220 | ||||||
HF Sinclair Corp. | 59 | 3,105 | ||||||
Marathon Oil Corp. | 483 | 12,360 | ||||||
Marathon Petroleum Corp. | 650 | 65,487 | ||||||
Occidental Petroleum Corp. (a) | 205 | 14,555 | ||||||
ONEOK, Inc. | 159 | 9,735 | ||||||
Ovintiv, Inc. | 255 | 13,551 | ||||||
PDC Energy, Inc. | 92 | 6,248 | ||||||
Phillips 66 | 492 | 44,014 | ||||||
Pioneer Natural Resources Co. | 31 | 7,850 | ||||||
Targa Resources Corp. | 146 | 9,962 | ||||||
Texas Pacific Land Corp. | 2 | 3,681 | ||||||
Valero Energy Corp. | 399 | 46,731 | ||||||
|
| |||||||
(Cost $930,875) | 1,103,495 | |||||||
|
| |||||||
| Financials — 8.7% | ||||||||
Affiliated Managers Group, Inc. | 20 | 2,547 | ||||||
Aflac, Inc. | 60 | 3,565 | ||||||
Allstate Corp. | 149 | 17,954 | ||||||
Aon PLC, Class A | 24 | 6,702 | ||||||
Apollo Global Management, Inc. | 160 | 8,893 | ||||||
Arch Capital Group Ltd.* | 160 | 7,315 | ||||||
Berkshire Hathaway, Inc., Class B* | 1,712 | 480,730 | ||||||
Blackstone, Inc. | 430 | 40,394 | ||||||
Capital One Financial Corp. | 46 | 4,868 | ||||||
Carlyle Group, Inc. | 288 | 9,369 | ||||||
Cboe Global Markets, Inc. | 58 | 6,842 | ||||||
Cincinnati Financial Corp. | 175 | 16,968 | ||||||
Coinbase Global, Inc., Class A* | 233 | 15,564 | ||||||
Credit Acceptance Corp.* | 10 | 5,321 | ||||||
Discover Financial Services | 82 | 8,240 | ||||||
Erie Indemnity Co., Class A | 21 | 4,513 | ||||||
Evercore, Inc., Class A | 86 | 8,057 | ||||||
FactSet Research Systems, Inc. | 23 | 9,967 | ||||||
Fidelity National Financial, Inc. | 172 | 6,725 | ||||||
First American Financial Corp. | 124 | 6,634 | ||||||
Franklin Resources, Inc. | 237 | 6,179 | ||||||
Janus Henderson Group PLC | 109 | 2,551 | ||||||
Lazard Ltd., Class A (a) | 143 | 5,198 | ||||||
LPL Financial Holdings, Inc. | 32 | 7,083 | ||||||
Markel Corp.* | 5 | 5,971 | ||||||
MarketAxess Holdings, Inc. | 18 | 4,475 | ||||||
Marsh & McLennan Cos., Inc. | 239 | 38,567 | ||||||
Number | Value | |||||||
| Financials (Continued) | ||||||||
MGIC Investment Corp. | 413 | $ | 5,902 | |||||
Moody’s Corp. | 104 | 29,590 | ||||||
MSCI, Inc. | 38 | 17,071 | ||||||
Old Republic International Corp. | 192 | 4,193 | ||||||
Progressive Corp. | 273 | 33,483 | ||||||
S&P Global, Inc. | 176 | 61,984 | ||||||
SEI Investments Co. | 121 | 6,619 | ||||||
Synchrony Financial | 245 | 8,024 | ||||||
T. Rowe Price Group, Inc. (a) | 305 | 36,600 | ||||||
Travelers Cos., Inc. | 17 | 2,748 | ||||||
Willis Towers Watson PLC | 112 | 23,165 | ||||||
|
| |||||||
(Cost $911,036) | 970,571 | |||||||
|
| |||||||
| Health Care — 14.6% | ||||||||
Abbott Laboratories | 545 | 55,944 | ||||||
AbbVie, Inc. | 158 | 21,245 | ||||||
Align Technology, Inc.* | 42 | 10,235 | ||||||
AmerisourceBergen Corp. | 27 | 3,957 | ||||||
Amgen, Inc. | 115 | 27,635 | ||||||
Biogen, Inc.* | 117 | 22,860 | ||||||
Bio-Rad Laboratories, Inc., Class A* | 27 | 13,096 | ||||||
Bristol-Myers Squibb Co. | 607 | 40,918 | ||||||
Cardinal Health, Inc. | 77 | 5,445 | ||||||
Chemed Corp. | 12 | 5,714 | ||||||
Cigna Corp. | 144 | 40,817 | ||||||
Cooper Cos., Inc. | 16 | 4,599 | ||||||
CVS Health Corp. | 842 | 82,642 | ||||||
DaVita, Inc.* | 36 | 3,070 | ||||||
Edwards Lifesciences Corp.* | 246 | 22,165 | ||||||
Elevance Health, Inc. | 86 | 41,720 | ||||||
Eli Lilly & Co. | 58 | 17,471 | ||||||
Exelixis, Inc.* | 210 | 3,725 | ||||||
Gilead Sciences, Inc. | 459 | 29,133 | ||||||
HCA Healthcare, Inc. | 163 | 32,253 | ||||||
Henry Schein, Inc.* | 150 | 11,012 | ||||||
Hologic, Inc.* | 229 | 15,471 | ||||||
Humana, Inc. | 67 | 32,279 | ||||||
IDEXX Laboratories, Inc.* | 31 | 10,776 | ||||||
Incyte Corp.* | 87 | 6,127 | ||||||
Intuitive Surgical, Inc.* | 17 | 3,498 | ||||||
Johnson & Johnson | 1,363 | 219,906 | ||||||
Laboratory Corp. of America Holdings | 78 | 17,571 | ||||||
Masimo Corp.* | 21 | 3,085 | ||||||
McKesson Corp. | 235 | 86,245 | ||||||
Merck & Co., Inc. | 188 | 16,048 | ||||||
Mettler-Toledo International, Inc.* | 10 | 12,125 | ||||||
Moderna, Inc.* | 492 | 65,077 | ||||||
Molina Healthcare, Inc.* | 74 | 24,965 | ||||||
Organon & Co. | 274 | 7,817 | ||||||
Pfizer, Inc. | 4,494 | 203,264 | ||||||
Premier, Inc., Class A | 92 | 3,242 | ||||||
Quest Diagnostics, Inc. | 123 | 15,413 | ||||||
QuidelOrtho Corp.* | 55 | 4,359 | ||||||
Regeneron Pharmaceuticals, Inc.* | 116 | 67,403 | ||||||
Thermo Fisher Scientific, Inc. | 36 | 19,632 | ||||||
United Therapeutics Corp.* | 22 | 4,986 | ||||||
UnitedHealth Group, Inc. | 449 | 233,179 | ||||||
| See Notes to Financial Statements. | 43 |
DBX ETF Trust
Schedule of Investments
Xtrackers Russell 1000 US Quality at a Reasonable Price ETF (Continued)
August 31, 2022
Number | Value | |||||||
| Health Care (Continued) | ||||||||
Universal Health Services, Inc., Class B | 41 | $ | 4,011 | |||||
Vertex Pharmaceuticals, Inc.* | 143 | 40,292 | ||||||
Waters Corp.* | 29 | 8,659 | ||||||
West Pharmaceutical Services, Inc. | 35 | 10,384 | ||||||
|
| |||||||
(Cost $1,513,972) | 1,631,470 | |||||||
|
| |||||||
| Industrials — 5.9% | ||||||||
3M Co. | 290 | 36,061 | ||||||
A O Smith Corp. | 137 | 7,734 | ||||||
Acuity Brands, Inc. | 33 | 5,410 | ||||||
AECOM | 43 | 3,145 | ||||||
AGCO Corp. | 49 | 5,327 | ||||||
Alaska Air Group, Inc.* | 92 | 4,008 | ||||||
Allegion PLC | 26 | 2,473 | ||||||
C.H. Robinson Worldwide, Inc. | 63 | 7,191 | ||||||
Carrier Global Corp. | 282 | 11,032 | ||||||
Caterpillar, Inc. | 32 | 5,911 | ||||||
Cintas Corp. | 7 | 2,848 | ||||||
Copart, Inc.* | 108 | 12,922 | ||||||
Cummins, Inc. | 128 | 27,567 | ||||||
Delta Air Lines, Inc.* | 159 | 4,940 | ||||||
Donaldson Co., Inc. | 77 | 3,954 | ||||||
Eaton Corp. PLC | 32 | 4,372 | ||||||
Emerson Electric Co. | 110 | 8,991 | ||||||
Expeditors International of Washington, Inc. | 200 | 20,578 | ||||||
Fastenal Co. | 314 | 15,804 | ||||||
FedEx Corp. | 153 | 32,254 | ||||||
Fortune Brands Home & Security, Inc. | 60 | 3,686 | ||||||
FTI Consulting, Inc.* | 29 | 4,657 | ||||||
General Dynamics Corp. | 17 | 3,892 | ||||||
Graco, Inc. | 96 | 6,129 | ||||||
GXO Logistics, Inc.* | 59 | 2,618 | ||||||
Huntington Ingalls Industries, Inc. | 14 | 3,224 | ||||||
Illinois Tool Works, Inc. | 25 | 4,871 | ||||||
JB Hunt Transport Services, Inc. | 84 | 14,618 | ||||||
JetBlue Airways Corp.* | 270 | 2,103 | ||||||
Johnson Controls International PLC | 73 | 3,952 | ||||||
Knight-Swift Transportation Holdings, Inc. | 137 | 6,920 | ||||||
L3Harris Technologies, Inc. | 18 | 4,107 | ||||||
Landstar System, Inc. | 48 | 7,038 | ||||||
Lennox International, Inc. | 25 | 6,003 | ||||||
Lincoln Electric Holdings, Inc. | 26 | 3,554 | ||||||
Lockheed Martin Corp. | 208 | 87,383 | ||||||
ManpowerGroup, Inc. | 53 | 3,886 | ||||||
Masco Corp. | 154 | 7,834 | ||||||
Nordson Corp. | 15 | 3,408 | ||||||
Northrop Grumman Corp. | 15 | 7,170 | ||||||
Old Dominion Freight Line, Inc. | 64 | 17,370 | ||||||
Otis Worldwide Corp. | 100 | 7,222 | ||||||
Owens Corning | 87 | 7,111 | ||||||
PACCAR, Inc. | 29 | 2,538 | ||||||
Parker-Hannifin Corp. | 9 | 2,385 | ||||||
Pentair PLC | 103 | 4,584 | ||||||
Quanta Services, Inc. | 25 | 3,532 | ||||||
Robert Half International, Inc. | 118 | 9,082 | ||||||
Rockwell Automation, Inc. | 12 | 2,843 | ||||||
Number | Value | |||||||
| Industrials (Continued) | ||||||||
Snap-on, Inc. | 45 | $ | 9,804 | |||||
Southwest Airlines Co.* | 155 | 5,688 | ||||||
Tetra Tech, Inc. | 21 | 2,852 | ||||||
Textron, Inc. | 74 | 4,616 | ||||||
Toro Co. | 73 | 6,054 | ||||||
Trex Co., Inc.* | 58 | 2,714 | ||||||
United Parcel Service, Inc., Class B | 555 | 107,953 | ||||||
W.W. Grainger, Inc. | 24 | 13,319 | ||||||
Waste Management, Inc. | 116 | 19,607 | ||||||
Watsco, Inc. | 27 | 7,345 | ||||||
WESCO International, Inc.* | 20 | 2,634 | ||||||
XPO Logistics, Inc.* | 89 | 4,665 | ||||||
|
| |||||||
(Cost $643,907) | 653,493 | |||||||
|
| |||||||
| Information Technology — 24.9% | ||||||||
Accenture PLC, Class A | 374 | 107,884 | ||||||
Adobe, Inc.* | 217 | 81,036 | ||||||
Advanced Micro Devices, Inc.* | 655 | 55,590 | ||||||
Akamai Technologies, Inc.* | 63 | 5,688 | ||||||
Amdocs Ltd. | 110 | 9,402 | ||||||
Apple, Inc. | 3,976 | 625,107 | ||||||
Applied Materials, Inc. | 629 | 59,170 | ||||||
Arista Networks, Inc.* | 113 | 13,546 | ||||||
Autodesk, Inc.* | 17 | 3,430 | ||||||
Automatic Data Processing, Inc. | 231 | 56,459 | ||||||
Broadridge Financial Solutions, Inc. | 59 | 10,099 | ||||||
Cadence Design Systems, Inc.* | 113 | 19,636 | ||||||
Ciena Corp.* | 110 | 5,581 | ||||||
Cirrus Logic, Inc.* | 47 | 3,604 | ||||||
Cisco Systems, Inc. | 3,760 | 168,147 | ||||||
Citrix Systems, Inc. | 29 | 2,980 | ||||||
Cognex Corp. | 74 | 3,116 | ||||||
Cognizant Technology Solutions Corp., Class A | 466 | 29,437 | ||||||
Concentrix Corp. | 21 | 2,641 | ||||||
Corning, Inc. | 202 | 6,933 | ||||||
Dell Technologies, Inc., Class C | 249 | 9,534 | ||||||
Dolby Laboratories, Inc., Class A | 39 | 2,856 | ||||||
Dropbox, Inc., Class A* | 127 | 2,717 | ||||||
EPAM Systems, Inc.* | 21 | 8,956 | ||||||
F5, Inc.* | 33 | 5,183 | ||||||
Fair Isaac Corp.* | 10 | 4,494 | ||||||
First Solar, Inc.* | 43 | 5,485 | ||||||
Fortinet, Inc.* | 105 | 5,112 | ||||||
Gartner, Inc.* | 27 | 7,704 | ||||||
Genpact Ltd. | 60 | 2,819 | ||||||
HP, Inc. | 1,871 | 53,716 | ||||||
Intel Corp. | 4,193 | 133,841 | ||||||
International Business Machines Corp. | 67 | 8,606 | ||||||
Intuit, Inc. | 34 | 14,681 | ||||||
Jack Henry & Associates, Inc. | 39 | 7,496 | ||||||
Keysight Technologies, Inc.* | 79 | 12,947 | ||||||
KLA Corp. | 61 | 20,992 | ||||||
Lam Research Corp. | 89 | 38,974 | ||||||
Lumentum Holdings, Inc.*(a) | 44 | 3,676 | ||||||
Mastercard, Inc., Class A | 359 | 116,449 | ||||||
Micron Technology, Inc. | 1,243 | 70,267 | ||||||
| See Notes to Financial Statements. | 44 |
DBX ETF Trust
Schedule of Investments
Xtrackers Russell 1000 US Quality at a Reasonable Price ETF (Continued)
August 31, 2022
Number | Value | |||||||
| Information Technology (Continued) | ||||||||
Microsoft Corp. | 2,176 | $ | 568,959 | |||||
MKS Instruments, Inc. | 43 | 4,283 | ||||||
NetApp, Inc. | 66 | 4,761 | ||||||
NVIDIA Corp. | 151 | 22,792 | ||||||
ON Semiconductor Corp.* | 112 | 7,702 | ||||||
Oracle Corp. | 313 | 23,209 | ||||||
Paychex, Inc. | 160 | 19,734 | ||||||
PayPal Holdings, Inc.* | 387 | 36,161 | ||||||
Qorvo, Inc.* | 59 | 5,297 | ||||||
QUALCOMM, Inc. | 591 | 78,172 | ||||||
Salesforce, Inc.* | 63 | 9,836 | ||||||
Skyworks Solutions, Inc. | 130 | 12,812 | ||||||
Synopsys, Inc.* | 18 | 6,228 | ||||||
Teradyne, Inc. | 136 | 11,511 | ||||||
Texas Instruments, Inc. | 650 | 107,387 | ||||||
VeriSign, Inc.* | 15 | 2,733 | ||||||
Visa, Inc., Class A (a) | 151 | 30,005 | ||||||
Western Union Co. | 265 | 3,927 | ||||||
Zebra Technologies Corp., Class A* | 31 | 9,351 | ||||||
|
| |||||||
(Cost $2,764,702) | 2,770,851 | |||||||
|
| |||||||
| Materials — 3.2% | ||||||||
Air Products and Chemicals, Inc. | 31 | 7,826 | ||||||
Alcoa Corp. | 66 | 3,266 | ||||||
Amcor PLC | 277 | 3,327 | ||||||
Celanese Corp. | 85 | 9,423 | ||||||
CF Industries Holdings, Inc. | 179 | 18,519 | ||||||
Cleveland-Cliffs, Inc.* | 579 | 9,999 | ||||||
Corteva, Inc. | 519 | 31,882 | ||||||
Dow, Inc. | 571 | 29,121 | ||||||
DuPont de Nemours, Inc. | 364 | 20,253 | ||||||
Eagle Materials, Inc. | 32 | 3,828 | ||||||
Eastman Chemical Co. | 40 | 3,640 | ||||||
Freeport-McMoRan, Inc. | 1,086 | 32,146 | ||||||
Huntsman Corp. | 135 | 3,783 | ||||||
International Paper Co. | 201 | 8,366 | ||||||
Louisiana-Pacific Corp. | 151 | 8,189 | ||||||
LyondellBasell Industries NV, Class A | 336 | 27,888 | ||||||
Mosaic Co. | 169 | 9,104 | ||||||
Newmont Corp. | 134 | 5,542 | ||||||
Nucor Corp. | 438 | 58,228 | ||||||
Olin Corp. | 146 | 7,980 | ||||||
Packaging Corp. of America | 49 | 6,709 | ||||||
Reliance Steel & Aluminum Co. | 74 | 13,911 | ||||||
Sherwin-Williams Co. | 21 | 4,874 | ||||||
Southern Copper Corp. | 50 | 2,353 | ||||||
Steel Dynamics, Inc. | 271 | 21,875 | ||||||
United States Steel Corp. | 354 | 8,096 | ||||||
|
| |||||||
(Cost $331,841) | 360,128 | |||||||
|
| |||||||
| Real Estate — 0.9% | ||||||||
CBRE Group, Inc., Class A* | 358 | 28,268 | ||||||
Jones Lang LaSalle, Inc.* | 32 | 5,536 | ||||||
Public Storage REIT | 94 | 31,098 | ||||||
Simon Property Group, Inc. REIT | 127 | 12,951 | ||||||
Weyerhaeuser Co. REIT | 757 | 25,859 | ||||||
|
| |||||||
(Cost $99,960) | 103,712 | |||||||
|
| |||||||
Number | Value | |||||||
| Utilities — 0.4% | ||||||||
Constellation Energy Corp. | 44 | $ | 3,590 | |||||
DTE Energy Co. | 91 | 11,861 | ||||||
Exelon Corp. | 131 | 5,752 | ||||||
NRG Energy, Inc. | 253 | 10,444 | ||||||
Public Service Enterprise Group, Inc. | 66 | 4,248 | ||||||
Sempra Energy | 25 | 4,124 | ||||||
UGI Corp. | 87 | 3,437 | ||||||
Vistra Corp. | 135 | 3,341 | ||||||
|
| |||||||
(Cost $40,533) | 46,797 | |||||||
|
| |||||||
TOTAL COMMON STOCKS | 11,111,713 | |||||||
|
| |||||||
| EXCHANGE-TRADED FUNDS — 0.1% | ||||||||
iShares Russell 1000 ETF | 43 | 9,387 | ||||||
|
| |||||||
| SECURITIES LENDING COLLATERAL — 0.0% | ||||||||
DWS Government & Agency Securities Portfolio “DWS Government Cash Institutional Shares”, 2.00% (b)(c) (Cost $4,995) | 4,995 | 4,995 | ||||||
|
| |||||||
| CASH EQUIVALENTS — 0.0% | ||||||||
DWS Government Money Market Series “Institutional Shares”, 2.24% (b) (Cost $4,206) | 4,206 | $ | 4,206 | |||||
|
| |||||||
TOTAL INVESTMENTS — 99.8% (Cost $10,867,036) | $ | 11,130,301 | ||||||
Other assets and liabilities, net — 0.2% | 18,155 | |||||||
|
| |||||||
NET ASSETS — 100.0% | $ | 11,148,456 | ||||||
|
| |||||||
| See Notes to Financial Statements. | 45 |
DBX ETF Trust
Schedule of Investments
Xtrackers Russell 1000 US Quality at a Reasonable Price ETF (Continued)
August 31, 2022
A summary of the Fund’s transactions with affiliated investments during the year ended August 31, 2022 is as follows:
| Value ($) at 8/31/2021 | Purchases Cost ($) | Sales Proceeds ($) | Net Realized Gain/(Loss) ($) | Net Change in Unrealized Appreciation (Depreciation) ($) | Income ($) | Capital Gain Distributions ($) | Number of Shares at 8/31/2022 | Value ($) at 8/31/2022 | ||||||||||||||||||||||||||||
SECURITIES LENDING COLLATERAL — 0.0% |
| |||||||||||||||||||||||||||||||||||
DWS Government & Agency Securities Portfolio “DWS Government Cash Institutional Shares”, 2.00%(b)(c) |
| |||||||||||||||||||||||||||||||||||
| 18,629 | — | (13,634 | ) (d) | — | — | 166 | — | 4,995 | 4,995 | |||||||||||||||||||||||||||
CASH EQUIVALENTS — 0.0% |
| |||||||||||||||||||||||||||||||||||
DWS Government Money Market Series “Institutional Shares”, 2.24%(b) |
| |||||||||||||||||||||||||||||||||||
| 187,481 | 661,785 | (845,060 | ) | — | — | 368 | — | 4,206 | 4,206 | |||||||||||||||||||||||||||
|
|
|
|
|
|
|
|
|
|
|
|
|
|
|
|
|
| |||||||||||||||||||
| 206,110 | 661,785 | (858,694 | ) | — | — | 534 | — | 9,201 | 9,201 | |||||||||||||||||||||||||||
|
|
|
|
|
|
|
|
|
|
|
|
|
|
|
|
|
| |||||||||||||||||||
| * | Non-income producing security. |
| (a) | All or a portion of these securities were on loan. In addition, “Other assets and liabilities, net” may include pending sales that are also on loan. The value of securities loaned at August 31, 2022 amounted to $135,859, which is 1.2% of net assets. |
| (b) | Affiliated fund managed by DWS Investment Management Americas, Inc. The rate shown is the annualized seven-day yield at period end. |
| (c) | Represents cash collateral held in connection with securities lending. Income earned by the Fund is net of borrower rebates. In addition, the Fund held non-cash U.S. Treasury securities collateral having a value of $135,137. |
| (d) | Represents the net increase (purchase cost) or decrease (sales proceeds) in the amount invested in cash collateral for the year ended August 31, 2022. |
| REIT: | Real Estate Investment Trust |
Fair Value Measurements
Various inputs are used in determining the value of the Fund’s investments. These inputs are summarized in three broad levels. Level 1 includes quoted prices in active markets for identical securities. Level 2 includes other significant observable inputs (including quoted prices for similar securities, interest rates, prepayment speeds and credit risk). Level 3 includes significant unobservable inputs (including the Fund’s own assumptions in determining the fair value of investments). The level assigned to the securities valuations may not be an indication of the risk or liquidity associated with investing in those securities.
The following is a summary of the inputs used as of August 31, 2022 in valuing the Fund’s investments. For information on the Fund’s policy regarding the valuation of investments, please refer to the Security Valuation section of Note 2 in the accompanying Notes to Financial Statements.
Assets | Level 1 | Level 2 | Level 3 | Total | ||||||||||||
Common Stocks (a) | $ | 11,111,713 | $ | — | $ | — | $ | 11,111,713 | ||||||||
Exchange-Traded Funds | 9,387 | — | — | 9,387 | ||||||||||||
Short-Term Investments (a) | 9,201 | — | — | 9,201 | ||||||||||||
|
|
|
|
|
|
|
| |||||||||
TOTAL | $ | 11,130,301 | $ | — | $ | — | $ | 11,130,301 | ||||||||
|
|
|
|
|
|
|
| |||||||||
| (a) | See Schedule of Investments for additional detailed categorizations. |
| See Notes to Financial Statements. | 46 |
DBX ETF Trust
Schedule of Investments
Xtrackers Russell US Multifactor ETF
August 31, 2022
Number | Value | |||||||
| COMMON STOCKS — 99.1% | ||||||||
| Communication Services — 2.3% | ||||||||
Activision Blizzard, Inc. | 1,818 | $ | 142,695 | |||||
Alphabet, Inc., Class A* | 720 | 77,918 | ||||||
Alphabet, Inc., Class C* | 640 | 69,856 | ||||||
AT&T, Inc. | 11,951 | 209,621 | ||||||
Cable One, Inc. | 24 | 27,240 | ||||||
Charter Communications, Inc., Class A* | 167 | 68,909 | ||||||
Comcast Corp., Class A | 1,831 | 66,264 | ||||||
DISH Network Corp., Class A*(a) | 492 | 8,536 | ||||||
Electronic Arts, Inc. | 1,604 | 203,500 | ||||||
Fox Corp., Class A | 4,916 | 168,029 | ||||||
Fox Corp., Class B | 2,170 | 68,615 | ||||||
Frontier Communications Parent, Inc.* | 4,216 | 108,604 | ||||||
IAC, Inc.* | 100 | 6,427 | ||||||
Interpublic Group of Cos., Inc. | 17,002 | 469,935 | ||||||
Liberty Broadband Corp., Class C* | 290 | 29,493 | ||||||
Liberty Media Corp.-Liberty Formula One, Class C* | 1,158 | 73,741 | ||||||
Liberty Media Corp-Liberty SiriusXM, Class A*(a) | 975 | 40,502 | ||||||
Liberty Media Corp-Liberty SiriusXM, Class C* | 2,233 | 92,357 | ||||||
Live Nation Entertainment, Inc.* | 546 | 49,337 | ||||||
Lumen Technologies, Inc. (a) | 10,831 | 107,877 | ||||||
Meta Platforms, Inc., Class A* | 85 | 13,849 | ||||||
New York Times Co., Class A | 3,274 | 99,824 | ||||||
News Corp., Class A | 3,787 | 64,076 | ||||||
News Corp., Class B | 1,826 | 31,480 | ||||||
Nexstar Media Group, Inc. | 1,125 | 215,235 | ||||||
Omnicom Group, Inc. | 5,907 | 395,178 | ||||||
Paramount Global, Class B (a) | 1,679 | 39,272 | ||||||
Sirius XM Holdings, Inc. (a) | 11,435 | 69,639 | ||||||
Take-Two Interactive Software, Inc.* | 421 | 51,598 | ||||||
T-Mobile US, Inc.* | 203 | 29,224 | ||||||
Verizon Communications, Inc. | 2,206 | 92,233 | ||||||
Warner Bros Discovery, Inc.* | 1,159 | 15,345 | ||||||
World Wrestling Entertainment, Inc., Class A | 642 | 43,662 | ||||||
|
| |||||||
(Cost $3,509,845) | 3,250,071 | |||||||
|
| |||||||
| Consumer Discretionary — 8.9% | ||||||||
Advance Auto Parts, Inc. | 2,653 | 447,402 | ||||||
Airbnb, Inc., Class A* | 78 | 8,823 | ||||||
Amazon.com, Inc.* | 43 | 5,451 | ||||||
Aptiv PLC* | 179 | 16,724 | ||||||
Aramark | 701 | 25,033 | ||||||
AutoNation, Inc.*(a) | 2,686 | 334,676 | ||||||
AutoZone, Inc.* | 400 | 847,684 | ||||||
Bath & Body Works, Inc. | 246 | 9,183 | ||||||
Best Buy Co., Inc. | 3,118 | 220,411 | ||||||
Booking Holdings, Inc.* | 32 | 60,026 | ||||||
BorgWarner, Inc. | 5,567 | 209,876 | ||||||
Boyd Gaming Corp. | 146 | 7,947 | ||||||
Bright Horizons Family Solutions, Inc.* | 104 | 7,093 | ||||||
Brunswick Corp. | 806 | 60,216 | ||||||
Burlington Stores, Inc.*(a) | 149 | 20,888 | ||||||
CarMax, Inc.*(a) | 997 | 88,175 | ||||||
Number | Value | |||||||
| Consumer Discretionary (Continued) | ||||||||
Carter’s, Inc. | 1,075 | $ | 79,389 | |||||
Chipotle Mexican Grill, Inc.* | 95 | 151,696 | ||||||
Choice Hotels International, Inc. | 786 | 90,162 | ||||||
Churchill Downs, Inc. | 231 | 45,528 | ||||||
Columbia Sportswear Co. | 1,231 | 87,696 | ||||||
D.R. Horton, Inc. | 1,678 | 119,390 | ||||||
Darden Restaurants, Inc. | 498 | 61,608 | ||||||
Deckers Outdoor Corp.* | 218 | 70,102 | ||||||
Dick’s Sporting Goods, Inc. | 1,140 | 121,262 | ||||||
Dollar General Corp. | 1,685 | 400,053 | ||||||
Dollar Tree, Inc.* | 2,069 | 280,722 | ||||||
Domino’s Pizza, Inc. | 424 | 157,669 | ||||||
eBay, Inc. | 2,910 | 128,418 | ||||||
Expedia Group, Inc.* | 523 | 53,686 | ||||||
Five Below, Inc.*(a) | 191 | 24,425 | ||||||
Floor & Decor Holdings, Inc., Class A*(a) | 369 | 30,022 | ||||||
Ford Motor Co. | 13,626 | 207,660 | ||||||
Garmin Ltd. | 1,407 | 124,505 | ||||||
General Motors Co. | 949 | 36,261 | ||||||
Gentex Corp. | 8,446 | 230,491 | ||||||
Genuine Parts Co. | 4,577 | 714,058 | ||||||
Grand Canyon Education, Inc.* | 2,460 | 200,195 | ||||||
H&R Block, Inc. | 2,658 | 119,610 | ||||||
Hanesbrands, Inc. | 2,206 | 19,214 | ||||||
Harley-Davidson, Inc. | 1,023 | 39,457 | ||||||
Hasbro, Inc. | 1,584 | 124,851 | ||||||
Hilton Worldwide Holdings, Inc. | 212 | 27,000 | ||||||
Home Depot, Inc. | 270 | 77,873 | ||||||
Hyatt Hotels Corp., Class A* | 113 | 10,127 | ||||||
Kohl’s Corp. | 938 | 26,658 | ||||||
Lear Corp. | 853 | 118,260 | ||||||
Leggett & Platt, Inc. | 1,510 | 57,712 | ||||||
Lennar Corp., Class A | 1,704 | 131,975 | ||||||
Lithia Motors, Inc. | 641 | 170,147 | ||||||
LKQ Corp. | 7,510 | 399,682 | ||||||
Lowe’s Cos., Inc. | 1,570 | 304,800 | ||||||
Lululemon Athletica, Inc.* | 273 | 81,889 | ||||||
Macy’s, Inc. | 1,397 | 24,196 | ||||||
Marriott International, Inc., Class A | 251 | 38,589 | ||||||
Marriott Vacations Worldwide Corp. | 57 | 8,118 | ||||||
Mattel, Inc.* | 4,680 | 103,522 | ||||||
McDonald’s Corp. | 396 | 99,903 | ||||||
MGM Resorts International | 249 | 8,127 | ||||||
Mohawk Industries, Inc.* | 604 | 66,657 | ||||||
Newell Brands, Inc. (a) | 3,902 | 69,651 | ||||||
NIKE, Inc., Class B | 689 | 73,344 | ||||||
NVR, Inc.* | 84 | 347,765 | ||||||
O’Reilly Automotive, Inc.* | 961 | 669,932 | ||||||
Penske Automotive Group, Inc. | 1,826 | 215,304 | ||||||
Petco Health & Wellness Co., Inc.* | 581 | 8,669 | ||||||
Polaris, Inc. | 646 | 73,172 | ||||||
Pool Corp. | 187 | 63,429 | ||||||
PulteGroup, Inc. | 3,799 | 154,467 | ||||||
PVH Corp. | 271 | 15,244 | ||||||
Ralph Lauren Corp. (a) | 1,256 | 114,710 | ||||||
Ross Stores, Inc. | 1,200 | 103,524 | ||||||
Service Corp. International | 5,747 | 354,647 | ||||||
| See Notes to Financial Statements. | 47 |
DBX ETF Trust
Schedule of Investments
Xtrackers Russell US Multifactor ETF (Continued)
August 31, 2022
Number | Value | |||||||
| Consumer Discretionary (Continued) | ||||||||
Skechers U.S.A., Inc., Class A* | 1,897 | $ | 71,707 | |||||
Starbucks Corp. | 1,158 | 97,353 | ||||||
Tapestry, Inc. | 2,530 | 87,867 | ||||||
Target Corp. | 1,282 | 205,556 | ||||||
Terminix Global Holdings, Inc.* | 1,020 | 43,503 | ||||||
Thor Industries, Inc. (a) | 456 | 36,941 | ||||||
TJX Cos., Inc. | 5,372 | 334,944 | ||||||
Toll Brothers, Inc. | 1,599 | 70,020 | ||||||
TopBuild Corp.* | 164 | 30,137 | ||||||
Tractor Supply Co. | 3,417 | 632,658 | ||||||
Travel + Leisure Co. | 651 | 27,602 | ||||||
Ulta Beauty, Inc.* | 446 | 187,262 | ||||||
Vail Resorts, Inc. | 145 | 32,579 | ||||||
VF Corp. | 1,551 | 64,289 | ||||||
Victoria’s Secret & Co.* | 5,844 | 195,423 | ||||||
Whirlpool Corp. | 1,797 | 281,410 | ||||||
Williams-Sonoma, Inc. (a) | 803 | 119,446 | ||||||
Wyndham Hotels & Resorts, Inc. | 399 | 26,071 | ||||||
Yum! Brands, Inc. | 3,138 | 349,071 | ||||||
|
| |||||||
(Cost $12,099,865) | 13,000,670 | |||||||
|
| |||||||
| Consumer Staples — 7.8% | ||||||||
Albertsons Cos., Inc., Class A | 5,181 | 142,529 | ||||||
Altria Group, Inc. | 5,434 | 245,182 | ||||||
Archer-Daniels-Midland Co. | 16,926 | 1,487,626 | ||||||
BJ’s Wholesale Club Holdings, Inc.* | 7,555 | 562,772 | ||||||
Brown-Forman Corp., Class A | 225 | 15,878 | ||||||
Brown-Forman Corp., Class B | 777 | 56,488 | ||||||
Bunge Ltd. | 3,707 | 367,623 | ||||||
Campbell Soup Co. | 3,587 | 180,713 | ||||||
Casey’s General Stores, Inc. | 1,391 | 297,354 | ||||||
Church & Dwight Co., Inc. | 3,550 | 297,170 | ||||||
Clorox Co. | 1,667 | 240,615 | ||||||
Coca-Cola Co. | 900 | 55,539 | ||||||
Colgate-Palmolive Co. | 3,635 | 284,293 | ||||||
Conagra Brands, Inc. | 6,802 | 233,853 | ||||||
Constellation Brands, Inc., Class A | 663 | 163,131 | ||||||
Costco Wholesale Corp. | 551 | 287,677 | ||||||
Darling Ingredients, Inc.* | 3,491 | 265,525 | ||||||
Estee Lauder Cos., Inc., Class A | 573 | 145,760 | ||||||
Flowers Foods, Inc. | 8,240 | 224,952 | ||||||
General Mills, Inc. | 5,097 | 391,450 | ||||||
Grocery Outlet Holding Corp.*(a) | 1,430 | 57,372 | ||||||
Hershey Co. | 1,721 | 386,657 | ||||||
Hormel Foods Corp. | 1,876 | 94,325 | ||||||
Ingredion, Inc. | 1,984 | 172,747 | ||||||
J M Smucker Co. | 2,678 | 374,893 | ||||||
Kellogg Co. | 4,680 | 340,423 | ||||||
Keurig Dr Pepper, Inc. | 3,348 | 127,626 | ||||||
Kimberly-Clark Corp. | 2,696 | 343,794 | ||||||
Kraft Heinz Co. | 3,449 | 128,993 | ||||||
Kroger Co. | 17,973 | 861,626 | ||||||
Lamb Weston Holdings, Inc. | 713 | 56,705 | ||||||
McCormick & Co., Inc. | 1,905 | 160,153 | ||||||
Molson Coors Beverage Co., Class B | 3,737 | 193,091 | ||||||
Mondelez International, Inc., Class A | 2,912 | 180,136 | ||||||
Monster Beverage Corp.* | 1,817 | 161,404 | ||||||
Number | Value | |||||||
| Consumer Staples (Continued) | ||||||||
Olaplex Holdings, Inc.*(a) | 1,027 | $ | 13,680 | |||||
PepsiCo, Inc. | 606 | 104,396 | ||||||
Philip Morris International, Inc. | 1,802 | 172,073 | ||||||
Pilgrim’s Pride Corp.* | 1,490 | 42,420 | ||||||
Post Holdings, Inc.* | 1,851 | 164,295 | ||||||
Procter & Gamble Co. | 422 | 58,211 | ||||||
Reynolds Consumer Products, Inc. (a) | 1,159 | 32,371 | ||||||
Seaboard Corp. | 13 | 50,210 | ||||||
Spectrum Brands Holdings, Inc. | 125 | 7,874 | ||||||
Sysco Corp. | 1,490 | 122,508 | ||||||
Tyson Foods, Inc., Class A | 8,390 | 632,438 | ||||||
US Foods Holding Corp.* | 1,259 | 38,550 | ||||||
Walgreens Boots Alliance, Inc. | 8,065 | 282,759 | ||||||
Walmart, Inc. | 354 | 46,923 | ||||||
|
| |||||||
(Cost $10,294,135) | 11,354,783 | |||||||
|
| |||||||
| Energy — 3.8% | ||||||||
Antero Midstream Corp. | 2,213 | 22,285 | ||||||
Baker Hughes Co. | 3,861 | 97,529 | ||||||
Cheniere Energy, Inc. | 887 | 142,080 | ||||||
Chesapeake Energy Corp. (a) | 6,650 | 668,258 | ||||||
Chevron Corp. | 663 | 104,794 | ||||||
ConocoPhillips | 1,955 | 213,975 | ||||||
Coterra Energy, Inc. | 2,181 | 67,415 | ||||||
Devon Energy Corp. | 995 | 70,267 | ||||||
Diamondback Energy, Inc. | 361 | 48,114 | ||||||
DT Midstream, Inc. | 2,176 | 120,137 | ||||||
Enviva, Inc. (a) | 1,011 | 70,285 | ||||||
EOG Resources, Inc. | 2,221 | 269,407 | ||||||
EQT Corp. | 656 | 31,357 | ||||||
Exxon Mobil Corp. | 1,374 | 131,341 | ||||||
Halliburton Co. | 710 | 21,392 | ||||||
Hess Corp. | 1,024 | 123,679 | ||||||
HF Sinclair Corp. | 5,031 | 264,781 | ||||||
Kinder Morgan, Inc. | 12,326 | 225,812 | ||||||
Marathon Oil Corp. | 6,241 | 159,707 | ||||||
Marathon Petroleum Corp. | 6,012 | 605,709 | ||||||
NOV, Inc. | 914 | 16,150 | ||||||
Occidental Petroleum Corp. | 793 | 56,303 | ||||||
ONEOK, Inc. | 2,290 | 140,217 | ||||||
Ovintiv, Inc. | 844 | 44,850 | ||||||
PDC Energy, Inc. | 308 | 20,916 | ||||||
Phillips 66 | 7,544 | 674,886 | ||||||
Pioneer Natural Resources Co. | 724 | 183,331 | ||||||
Schlumberger N.V. | 1,718 | 65,542 | ||||||
Targa Resources Corp. | 369 | 25,177 | ||||||
Texas Pacific Land Corp. | 23 | 42,331 | ||||||
Valero Energy Corp. | 5,290 | 619,565 | ||||||
Williams Cos., Inc. | 6,170 | 209,965 | ||||||
|
| |||||||
(Cost $4,541,111) | 5,557,557 | |||||||
|
| |||||||
| Financials — 13.3% | ||||||||
Affiliated Managers Group, Inc. | 1,257 | 160,092 | ||||||
Aflac, Inc. | 4,182 | 248,494 | ||||||
AGNC Investment Corp. REIT | 3,377 | 40,355 | ||||||
Alleghany Corp.* | 524 | 440,778 | ||||||
Allstate Corp. | 4,535 | 546,467 | ||||||
| See Notes to Financial Statements. | 48 |
DBX ETF Trust
Schedule of Investments
Xtrackers Russell US Multifactor ETF (Continued)
August 31, 2022
Number | Value | |||||||
| Financials (Continued) | ||||||||
Ally Financial, Inc. | 1,385 | $ | 45,982 | |||||
American Express Co. | 590 | 89,680 | ||||||
American Financial Group, Inc. | 1,125 | 143,640 | ||||||
American International Group, Inc. | 2,993 | 154,888 | ||||||
Ameriprise Financial, Inc. | 640 | 171,526 | ||||||
Annaly Capital Management, Inc. REIT | 19,058 | 122,924 | ||||||
Aon PLC, Class A | 562 | 156,944 | ||||||
Apollo Global Management, Inc. | 3,867 | 214,928 | ||||||
Arch Capital Group Ltd.* | 13,434 | 614,202 | ||||||
Ares Management Corp., Class A | 244 | 18,090 | ||||||
Arthur J Gallagher & Co. | 1,173 | 212,982 | ||||||
Assurant, Inc. | 2,105 | 333,621 | ||||||
Assured Guaranty Ltd. | 1,467 | 74,920 | ||||||
Axis Capital Holdings Ltd. | 3,165 | 168,220 | ||||||
Bank of America Corp. | 217 | 7,293 | ||||||
Bank of Hawaii Corp. | 423 | 33,002 | ||||||
Bank of New York Mellon Corp. | 1,913 | 79,447 | ||||||
Bank OZK | 1,398 | 56,661 | ||||||
Berkshire Hathaway, Inc., Class B* | 451 | 126,641 | ||||||
BlackRock, Inc. | 60 | 39,983 | ||||||
Blackstone, Inc. | 3,076 | 288,959 | ||||||
Brighthouse Financial, Inc.* | 360 | 17,118 | ||||||
Brown & Brown, Inc. | 4,090 | 257,834 | ||||||
Capital One Financial Corp. | 722 | 76,402 | ||||||
Carlyle Group, Inc. | 6,917 | 225,010 | ||||||
Cboe Global Markets, Inc. | 2,332 | 275,106 | ||||||
Charles Schwab Corp. | 217 | 15,396 | ||||||
Chubb Ltd. | 1,888 | 356,926 | ||||||
Cincinnati Financial Corp. | 7,023 | 680,950 | ||||||
Citigroup, Inc. | 790 | 38,560 | ||||||
Citizens Financial Group, Inc. | 1,527 | 56,010 | ||||||
CME Group, Inc. | 237 | 46,360 | ||||||
CNA Financial Corp. | 634 | 24,384 | ||||||
Comerica, Inc. | 841 | 67,532 | ||||||
Commerce Bancshares, Inc. | 991 | 68,151 | ||||||
Credit Acceptance Corp.* | 467 | 248,481 | ||||||
Cullen/Frost Bankers, Inc. | 435 | 56,533 | ||||||
Discover Financial Services | 1,356 | 136,264 | ||||||
East West Bancorp, Inc. | 1,170 | 84,439 | ||||||
Equitable Holdings, Inc. | 247 | 7,348 | ||||||
Erie Indemnity Co., Class A | 718 | 154,320 | ||||||
Evercore, Inc., Class A | 2,113 | 197,967 | ||||||
Everest Re Group Ltd. | 1,750 | 470,837 | ||||||
FactSet Research Systems, Inc. | 1,054 | 456,740 | ||||||
Fidelity National Financial, Inc. | 6,661 | 260,445 | ||||||
Fifth Third Bancorp | 2,111 | 72,091 | ||||||
First American Financial Corp. | 6,631 | 354,759 | ||||||
First Citizens BancShares, Inc., Class A | 14 | 11,367 | ||||||
First Hawaiian, Inc. | 1,404 | 36,097 | ||||||
First Horizon Corp. | 3,704 | 83,784 | ||||||
First Republic Bank | 256 | 38,868 | ||||||
FNB Corp. | 3,756 | 44,772 | ||||||
Franklin Resources, Inc. | 7,066 | 184,211 | ||||||
Globe Life, Inc. | 1,873 | 182,037 | ||||||
Goldman Sachs Group, Inc. | 216 | 71,857 | ||||||
Hanover Insurance Group, Inc. | 1,483 | 191,885 | ||||||
Hartford Financial Services Group, Inc. | 4,645 | 298,720 | ||||||
Number | Value | |||||||
| Financials (Continued) | ||||||||
Huntington Bancshares, Inc. | 5,914 | $ | 79,248 | |||||
Interactive Brokers Group, Inc., Class A | 889 | 54,754 | ||||||
Intercontinental Exchange, Inc. | 907 | 91,471 | ||||||
Invesco Ltd. | 4,389 | 72,287 | ||||||
Janus Henderson Group PLC | 4,364 | 102,118 | ||||||
Jefferies Financial Group, Inc. | 5,998 | 192,476 | ||||||
JPMorgan Chase & Co. | 105 | 11,942 | ||||||
Kemper Corp. | 150 | 6,900 | ||||||
KeyCorp | 4,152 | 73,449 | ||||||
KKR & Co., Inc. | 991 | 50,105 | ||||||
Lazard Ltd., Class A (a) | 4,599 | 167,174 | ||||||
Lincoln National Corp. | 567 | 26,116 | ||||||
Loews Corp. | 4,114 | 227,545 | ||||||
LPL Financial Holdings, Inc. | 944 | 208,936 | ||||||
M&T Bank Corp. | 644 | 117,066 | ||||||
Markel Corp.* | 513 | 612,578 | ||||||
MarketAxess Holdings, Inc. | 154 | 38,283 | ||||||
Marsh & McLennan Cos., Inc. | 2,303 | 371,635 | ||||||
MetLife, Inc. | 2,363 | 152,012 | ||||||
MGIC Investment Corp. | 11,858 | 169,451 | ||||||
Moody’s Corp. | 564 | 160,469 | ||||||
Morgan Stanley | 600 | 51,132 | ||||||
Morningstar, Inc. | 390 | 88,916 | ||||||
MSCI, Inc. | 335 | 150,495 | ||||||
Nasdaq, Inc. | 2,364 | 140,729 | ||||||
New York Community Bancorp, Inc. (a) | 4,616 | 45,191 | ||||||
Northern Trust Corp. | 693 | 65,897 | ||||||
Old Republic International Corp. | 18,263 | 398,864 | ||||||
OneMain Holdings, Inc. | 746 | 26,058 | ||||||
PacWest Bancorp | 614 | 16,167 | ||||||
Pinnacle Financial Partners, Inc. | 586 | 47,296 | ||||||
PNC Financial Services Group, Inc. | 398 | 62,884 | ||||||
Popular, Inc. | 1,081 | 83,475 | ||||||
Primerica, Inc. | 519 | 65,783 | ||||||
Principal Financial Group, Inc. (a) | 2,213 | 165,444 | ||||||
Progressive Corp. | 3,942 | 483,486 | ||||||
Prosperity Bancshares, Inc. | 1,021 | 72,368 | ||||||
Prudential Financial, Inc. | 1,629 | 155,977 | ||||||
Raymond James Financial, Inc. | 3,106 | 324,173 | ||||||
Regions Financial Corp. | 5,939 | 128,698 | ||||||
Reinsurance Group of America, Inc. | 955 | 119,719 | ||||||
RenaissanceRe Holdings Ltd. | 431 | 58,297 | ||||||
Rithm Capital Corp. REIT | 8,602 | 81,117 | ||||||
Ryan Specialty Holdings, Inc.*(a) | 369 | 15,631 | ||||||
S&P Global, Inc. | 332 | 116,924 | ||||||
SEI Investments Co. | 4,399 | 240,625 | ||||||
Signature Bank | 108 | 18,831 | ||||||
SLM Corp. | 5,004 | 76,461 | ||||||
Starwood Property Trust, Inc. REIT | 545 | 12,497 | ||||||
State Street Corp. | 253 | 17,293 | ||||||
Stifel Financial Corp. | 1,823 | 108,122 | ||||||
SVB Financial Group* | 56 | 22,765 | ||||||
Synchrony Financial | 2,972 | 97,333 | ||||||
Synovus Financial Corp. | 861 | 34,578 | ||||||
T. Rowe Price Group, Inc. (a) | 1,998 | 239,760 | ||||||
Tradeweb Markets, Inc., Class A | 484 | 33,682 | ||||||
Travelers Cos., Inc. | 2,482 | 401,190 | ||||||
| See Notes to Financial Statements. | 49 |
DBX ETF Trust
Schedule of Investments
Xtrackers Russell US Multifactor ETF (Continued)
August 31, 2022
Number | Value | |||||||
| Financials (Continued) | ||||||||
Truist Financial Corp. | 1,578 | $ | 73,914 | |||||
Umpqua Holdings Corp. | 3,278 | 58,152 | ||||||
Unum Group | 2,727 | 103,217 | ||||||
US Bancorp | 1,664 | 75,895 | ||||||
Virtu Financial, Inc., Class A | 2,613 | 59,994 | ||||||
Voya Financial, Inc. | 1,850 | 113,831 | ||||||
W.R. Berkley Corp. | 4,578 | 296,654 | ||||||
Webster Financial Corp. | 514 | 24,184 | ||||||
Wells Fargo & Co. | 550 | 24,041 | ||||||
Willis Towers Watson PLC | 3,577 | 739,831 | ||||||
Wintrust Financial Corp. | 509 | 42,929 | ||||||
Zions Bancorp NA | 1,709 | 94,046 | ||||||
|
| |||||||
(Cost $18,545,730) | 19,400,841 | |||||||
|
| |||||||
| Health Care — 11.3% | ||||||||
Abbott Laboratories | 1,003 | 102,958 | ||||||
AbbVie, Inc. | 674 | 90,626 | ||||||
ABIOMED, Inc.* | 116 | 30,076 | ||||||
Acadia Healthcare Co., Inc.* | 603 | 49,404 | ||||||
Agilent Technologies, Inc. | 1,364 | 174,933 | ||||||
Align Technology, Inc.* | 27 | 6,580 | ||||||
AmerisourceBergen Corp. | 1,230 | 180,269 | ||||||
Amgen, Inc. | 674 | 161,962 | ||||||
Avantor, Inc.* | 668 | 16,640 | ||||||
Azenta, Inc. | 199 | 10,489 | ||||||
Baxter International, Inc. | 788 | 45,278 | ||||||
Becton Dickinson and Co. | 834 | 210,518 | ||||||
Biogen, Inc.* | 94 | 18,366 | ||||||
BioMarin Pharmaceutical, Inc.* | 510 | 45,492 | ||||||
Bio-Rad Laboratories, Inc., Class A* | 676 | 327,887 | ||||||
Bio-Techne Corp. | 288 | 95,561 | ||||||
Boston Scientific Corp.* | 2,124 | 85,618 | ||||||
Bristol-Myers Squibb Co. | 2,799 | 188,681 | ||||||
Bruker Corp. | 941 | 52,696 | ||||||
Cardinal Health, Inc. | 7,072 | 500,132 | ||||||
Catalent, Inc.* | 482 | 42,416 | ||||||
Centene Corp.* | 3,411 | 306,103 | ||||||
Change Healthcare, Inc.* | 1,560 | 38,329 | ||||||
Charles River Laboratories International, Inc.* | 115 | 23,604 | ||||||
Chemed Corp. | 642 | 305,714 | ||||||
Cigna Corp. | 1,319 | 373,871 | ||||||
Cooper Cos., Inc. | 995 | 286,003 | ||||||
CVS Health Corp. | 4,777 | 468,863 | ||||||
Danaher Corp. | 208 | 56,141 | ||||||
DaVita, Inc.* | 1,032 | 88,019 | ||||||
DENTSPLY SIRONA, Inc. | 1,298 | �� | 42,535 | |||||
Dexcom, Inc.* | 143 | 11,756 | ||||||
Doximity, Inc., Class A*(a) | 1,139 | 37,803 | ||||||
Edwards Lifesciences Corp.* | 1,572 | 141,637 | ||||||
Elanco Animal Health, Inc.* | 560 | 8,473 | ||||||
Elevance Health, Inc. | 581 | 281,849 | ||||||
Eli Lilly & Co. | 134 | 40,365 | ||||||
Encompass Health Corp. | 1,476 | 71,689 | ||||||
Enhabit, Inc.* | 738 | 12,251 | ||||||
Enovis Corp.* | 383 | 19,399 | ||||||
Envista Holdings Corp.* | 1,486 | 55,116 | ||||||
Number | Value | |||||||
| Health Care (Continued) | ||||||||
Exelixis, Inc.* | 2,921 | $ | 51,819 | |||||
Gilead Sciences, Inc. | 5,877 | 373,013 | ||||||
Globus Medical, Inc., Class A* | 1,271 | 75,230 | ||||||
HCA Healthcare, Inc. | 1,215 | 240,412 | ||||||
Henry Schein, Inc.* | 8,447 | 620,094 | ||||||
Hologic, Inc.* | 12,339 | 833,623 | ||||||
Horizon Therapeutics PLC* | 841 | 49,796 | ||||||
Humana, Inc. | 90 | 43,360 | ||||||
ICU Medical, Inc.* | 497 | 79,023 | ||||||
IDEXX Laboratories, Inc.* | 139 | 48,319 | ||||||
Incyte Corp.* | 2,464 | 173,540 | ||||||
Integra LifeSciences Holdings Corp.* | 695 | 33,158 | ||||||
Intuitive Surgical, Inc.* | 246 | 50,612 | ||||||
Ionis Pharmaceuticals, Inc.* | 635 | 27,000 | ||||||
IQVIA Holdings, Inc.* | 536 | 113,986 | ||||||
Jazz Pharmaceuticals PLC* | 115 | 17,850 | ||||||
Johnson & Johnson | 263 | 42,432 | ||||||
Laboratory Corp. of America Holdings | 2,606 | 587,054 | ||||||
Masimo Corp.* | 202 | 29,672 | ||||||
McKesson Corp. | 4,815 | 1,767,105 | ||||||
Medtronic PLC | 715 | 62,863 | ||||||
Merck & Co., Inc. | 1,118 | 95,432 | ||||||
Mettler-Toledo International, Inc.* | 174 | 210,968 | ||||||
Molina Healthcare, Inc.* | 3,104 | 1,047,196 | ||||||
Neurocrine Biosciences, Inc.* | 483 | 50,536 | ||||||
Organon & Co. | 14,322 | 408,607 | ||||||
PerkinElmer, Inc. | 445 | 60,102 | ||||||
Perrigo Co. PLC | 941 | 35,212 | ||||||
Pfizer, Inc. | 3,715 | 168,029 | ||||||
Premier, Inc., Class A | 7,819 | 275,542 | ||||||
QIAGEN NV* | 3,841 | 174,497 | ||||||
Quest Diagnostics, Inc. | 7,568 | 948,346 | ||||||
QuidelOrtho Corp.* | 325 | 25,760 | ||||||
Regeneron Pharmaceuticals, Inc.* | 1,027 | 596,749 | ||||||
Repligen Corp.* | 151 | 33,125 | ||||||
ResMed, Inc. | 676 | 148,666 | ||||||
Royalty Pharma PLC, Class A | 2,293 | 95,870 | ||||||
Seagen, Inc.* | 135 | 20,829 | ||||||
Sotera Health Co.* | 602 | 10,180 | ||||||
STERIS PLC | 174 | 35,040 | ||||||
Stryker Corp. | 353 | 72,436 | ||||||
Syneos Health, Inc.* | 451 | 27,110 | ||||||
Teleflex, Inc. | 224 | 50,682 | ||||||
Thermo Fisher Scientific, Inc. | 74 | 40,354 | ||||||
United Therapeutics Corp.* | 995 | 225,487 | ||||||
UnitedHealth Group, Inc. | 95 | 49,336 | ||||||
Universal Health Services, Inc., Class B | 1,096 | 107,233 | ||||||
Veeva Systems, Inc., Class A* | 129 | 25,712 | ||||||
Vertex Pharmaceuticals, Inc.* | 1,321 | 372,205 | ||||||
Viatris, Inc. | 11,014 | 105,184 | ||||||
Waters Corp.* | 743 | 221,860 | ||||||
West Pharmaceutical Services, Inc. | 626 | 185,728 | ||||||
Zimmer Biomet Holdings, Inc. | 507 | 53,904 | ||||||
Zoetis, Inc. | 594 | 92,979 | ||||||
|
| |||||||
(Cost $15,501,995) | 16,496,959 | |||||||
|
| |||||||
| See Notes to Financial Statements. | 50 |
DBX ETF Trust
Schedule of Investments
Xtrackers Russell US Multifactor ETF (Continued)
August 31, 2022
Number | Value | |||||||
| Industrials — 15.8% | ||||||||
3M Co. | 1,257 | $ | 156,308 | |||||
A O Smith Corp. | 5,173 | 292,016 | ||||||
Acuity Brands, Inc. | 889 | 145,734 | ||||||
Advanced Drainage Systems, Inc. | 736 | 99,875 | ||||||
AECOM | 4,542 | 332,247 | ||||||
AGCO Corp. | 1,989 | 216,224 | ||||||
Alaska Air Group, Inc.* | 1,141 | 49,702 | ||||||
Allegion PLC | 1,400 | 133,140 | ||||||
Allison Transmission Holdings, Inc. | 5,609 | 203,382 | ||||||
AMERCO | 467 | 245,488 | ||||||
AMETEK, Inc. | 1,304 | 156,689 | ||||||
Armstrong World Industries, Inc. | 574 | 48,210 | ||||||
Booz Allen Hamilton Holding Corp. | 2,196 | 210,157 | ||||||
Builders FirstSource, Inc.* | 1,322 | 77,482 | ||||||
BWX Technologies, Inc. | 2,039 | 106,293 | ||||||
C.H. Robinson Worldwide, Inc. | 5,736 | 654,764 | ||||||
CACI International, Inc., Class A* | 1,600 | 449,392 | ||||||
Carlisle Cos., Inc. | 540 | 159,656 | ||||||
Carrier Global Corp. | 4,646 | 181,752 | ||||||
Caterpillar, Inc. | 628 | 115,998 | ||||||
Cintas Corp. | 461 | 187,553 | ||||||
Clean Harbors, Inc.* | 711 | 83,486 | ||||||
Copa Holdings SA, Class A* | 147 | 10,466 | ||||||
Copart, Inc.* | 1,602 | 191,679 | ||||||
CoStar Group, Inc.* | 356 | 24,792 | ||||||
Crane Holdings Co. | 2,289 | 215,990 | ||||||
CSX Corp. | 6,952 | 220,031 | ||||||
Cummins, Inc. | 2,207 | 475,322 | ||||||
Curtiss-Wright Corp. | 1,379 | 202,975 | ||||||
Deere & Co. | 282 | 103,001 | ||||||
Delta Air Lines, Inc.* | 2,496 | 77,551 | ||||||
Donaldson Co., Inc. | 3,281 | 168,479 | ||||||
Dover Corp. | 1,785 | 223,054 | ||||||
Driven Brands Holdings, Inc.* | 369 | 11,598 | ||||||
Dun & Bradstreet Holdings, Inc. | 1,720 | 24,510 | ||||||
Eaton Corp. PLC | 1,198 | 163,695 | ||||||
Emerson Electric Co. | 2,494 | 203,860 | ||||||
Equifax, Inc. | 330 | 62,288 | ||||||
Esab Corp. | 2,368 | 97,301 | ||||||
Expeditors International of Washington, Inc. | 5,539 | 569,908 | ||||||
Fastenal Co. | 6,254 | 314,764 | ||||||
FedEx Corp. | 823 | 173,497 | ||||||
Flowserve Corp. | 1,087 | 33,121 | ||||||
Fortive Corp. | 1,307 | 82,772 | ||||||
Fortune Brands Home & Security, Inc. | 1,506 | 92,514 | ||||||
FTI Consulting, Inc.* | 2,200 | 353,320 | ||||||
Gates Industrial Corp. PLC* | 700 | 7,504 | ||||||
Generac Holdings, Inc.* | 44 | 9,698 | ||||||
General Dynamics Corp. | 1,626 | 372,240 | ||||||
General Electric Co. | 165 | 12,118 | ||||||
Graco, Inc. | 3,334 | 212,843 | ||||||
GXO Logistics, Inc.* | 3,214 | 142,637 | ||||||
HEICO Corp. (a) | 326 | 49,650 | ||||||
HEICO Corp., Class A | 418 | 51,238 | ||||||
Hertz Global Holdings, Inc.*(a) | 2,940 | 54,272 | ||||||
Hexcel Corp. | 156 | 9,153 | ||||||
Number | Value | |||||||
| Industrials (Continued) | ||||||||
Honeywell International, Inc. | 468 | $ | 88,616 | |||||
Howmet Aerospace, Inc. | 1,007 | 35,678 | ||||||
Hubbell, Inc. | 1,241 | 256,018 | ||||||
Huntington Ingalls Industries, Inc. | 429 | 98,782 | ||||||
IAA, Inc.* | 640 | 23,846 | ||||||
IDEX Corp. | 810 | 162,980 | ||||||
Illinois Tool Works, Inc. | 1,009 | 196,583 | ||||||
Ingersoll Rand, Inc. | 1,985 | 94,029 | ||||||
ITT, Inc. | 553 | 40,109 | ||||||
Jacobs Solutions, Inc. | 1,067 | 132,927 | ||||||
JB Hunt Transport Services, Inc. | 3,155 | 549,033 | ||||||
JetBlue Airways Corp.* | 1,127 | 8,779 | ||||||
Johnson Controls International PLC | 2,991 | 161,933 | ||||||
KBR, Inc. | 3,444 | 166,345 | ||||||
Kirby Corp.* | 608 | 40,773 | ||||||
Knight-Swift Transportation Holdings, Inc. | 8,390 | 423,779 | ||||||
L3Harris Technologies, Inc. | 1,369 | 312,392 | ||||||
Landstar System, Inc. | 2,884 | 422,881 | ||||||
Leidos Holdings, Inc. | 5,530 | 525,627 | ||||||
Lennox International, Inc. | 492 | 118,139 | ||||||
Lincoln Electric Holdings, Inc. | 1,864 | 254,790 | ||||||
Lockheed Martin Corp. | 867 | 364,235 | ||||||
ManpowerGroup, Inc. | 2,144 | 157,198 | ||||||
Masco Corp. | 6,267 | 318,802 | ||||||
MasTec, Inc.* | 425 | 34,213 | ||||||
MDU Resources Group, Inc. | 3,622 | 109,203 | ||||||
Mercury Systems, Inc.* | 341 | 16,412 | ||||||
Middleby Corp.* | 355 | 51,056 | ||||||
MSA Safety, Inc. | 195 | 23,178 | ||||||
MSC Industrial Direct Co., Inc., Class A | 1,434 | 113,587 | ||||||
Nielsen Holdings PLC | 1,839 | 51,198 | ||||||
Nordson Corp. | 991 | 225,125 | ||||||
Norfolk Southern Corp. | 819 | 199,123 | ||||||
Northrop Grumman Corp. | 892 | 426,367 | ||||||
nVent Electric PLC | 3,368 | 111,009 | ||||||
Old Dominion Freight Line, Inc. | 1,118 | 303,436 | ||||||
Oshkosh Corp. | 135 | 10,768 | ||||||
Otis Worldwide Corp. | 3,904 | 281,947 | ||||||
Owens Corning | 3,537 | 289,079 | ||||||
PACCAR, Inc. | 4,442 | 388,719 | ||||||
Parker-Hannifin Corp. | 606 | 160,590 | ||||||
Pentair PLC | 3,346 | 148,897 | ||||||
Quanta Services, Inc. | 524 | 74,041 | ||||||
Raytheon Technologies Corp. | 930 | 83,468 | ||||||
Republic Services, Inc. | 2,210 | 315,411 | ||||||
Robert Half International, Inc. | 5,574 | 429,031 | ||||||
Rockwell Automation, Inc. | 224 | 53,075 | ||||||
Rollins, Inc. | 4,146 | 139,969 | ||||||
Ryder System, Inc. | 2,309 | 176,500 | ||||||
Schneider National, Inc., Class B | 4,285 | 97,955 | ||||||
Science Applications International Corp. | 2,803 | 255,269 | ||||||
Sensata Technologies Holding PLC | 868 | 34,963 | ||||||
SiteOne Landscape Supply, Inc.* | 413 | 51,691 | ||||||
Snap-on, Inc. | 2,186 | 476,242 | ||||||
Southwest Airlines Co.* | 2,769 | 101,622 | ||||||
Stanley Black & Decker, Inc. | 206 | 18,149 | ||||||
| See Notes to Financial Statements. | 51 |
DBX ETF Trust
Schedule of Investments
Xtrackers Russell US Multifactor ETF (Continued)
August 31, 2022
Number | Value | |||||||
| Industrials (Continued) | ||||||||
Stericycle, Inc.* | 621 | $ | 31,106 | |||||
Tetra Tech, Inc. | 1,865 | 253,286 | ||||||
Textron, Inc. | 4,258 | 265,614 | ||||||
Timken Co. | 559 | 35,211 | ||||||
Toro Co. | 2,032 | 168,514 | ||||||
Trane Technologies PLC | 789 | 121,561 | ||||||
TransDigm Group, Inc. | 30 | 18,012 | ||||||
TransUnion | 823 | 60,795 | ||||||
Trex Co., Inc.* | 336 | 15,721 | ||||||
Union Pacific Corp. | 631 | 141,666 | ||||||
United Parcel Service, Inc., Class B | 1,289 | 250,723 | ||||||
United Rentals, Inc.* | 422 | 123,241 | ||||||
Univar Solutions, Inc.* | 1,492 | 37,628 | ||||||
Valmont Industries, Inc. | 294 | 81,385 | ||||||
Verisk Analytics, Inc. | 1,158 | 216,731 | ||||||
W.W. Grainger, Inc. | 755 | 418,980 | ||||||
Waste Management, Inc. | 2,554 | 431,703 | ||||||
Watsco, Inc. | 1,181 | 321,267 | ||||||
WESCO International, Inc.* | 603 | 79,403 | ||||||
Westinghouse Air Brake Technologies Corp. | 1,918 | 168,113 | ||||||
WillScot Mobile Mini Holdings Corp.* | 2,307 | 92,603 | ||||||
Woodward, Inc. (a) | 656 | 61,054 | ||||||
XPO Logistics, Inc.* | 770 | 40,363 | ||||||
Xylem, Inc. | 676 | 61,584 | ||||||
|
| |||||||
(Cost $21,101,057) | 23,025,220 | |||||||
|
| |||||||
| Information Technology — 16.2% | ||||||||
Accenture PLC, Class A | 429 | 123,749 | ||||||
Adobe, Inc.* | 154 | 57,510 | ||||||
Advanced Micro Devices, Inc.* | 655 | 55,590 | ||||||
Akamai Technologies, Inc.* | 4,670 | 421,608 | ||||||
Allegro MicroSystems, Inc.* | 1,017 | 23,716 | ||||||
Amdocs Ltd. | 9,615 | 821,794 | ||||||
Amphenol Corp., Class A | 5,946 | 437,209 | ||||||
Analog Devices, Inc. | 116 | 17,578 | ||||||
ANSYS, Inc.* | 589 | 146,249 | ||||||
Apple, Inc. | 2,261 | 355,474 | ||||||
Applied Materials, Inc. | 1,903 | 179,015 | ||||||
Arista Networks, Inc.* | 1,557 | 186,653 | ||||||
Arrow Electronics, Inc.* | 5,168 | 541,658 | ||||||
Aspen Technology, Inc.* | 1,015 | 213,759 | ||||||
Atlassian Corp. PLC, Class A* | 159 | 39,378 | ||||||
Autodesk, Inc.* | 350 | 70,609 | ||||||
Automatic Data Processing, Inc. | 1,166 | 284,982 | ||||||
Avnet, Inc. | 4,226 | 185,479 | ||||||
Black Knight, Inc.* | 2,411 | 159,512 | ||||||
Broadcom, Inc. | 210 | 104,813 | ||||||
Broadridge Financial Solutions, Inc. | 1,582 | 270,791 | ||||||
Cadence Design Systems, Inc.* | 3,654 | 634,956 | ||||||
CDW Corp. | 558 | 95,251 | ||||||
Ciena Corp.* | 3,556 | 180,431 | ||||||
Cirrus Logic, Inc.* | 4,147 | 318,033 | ||||||
Cisco Systems, Inc. | 2,766 | 123,696 | ||||||
Citrix Systems, Inc. | 614 | 63,101 | ||||||
Cognex Corp. | 628 | 26,445 | ||||||
Number | Value | |||||||
| Information Technology (Continued) | ||||||||
Cognizant Technology Solutions Corp., Class A | 16,546 | $ | 1,045,211 | |||||
Concentrix Corp. | 874 | 109,932 | ||||||
Corning, Inc. | 14,507 | 497,880 | ||||||
Datadog, Inc., Class A* | 70 | 7,347 | ||||||
Dell Technologies, Inc., Class C | 11,730 | 449,142 | ||||||
Dolby Laboratories, Inc., Class A | 2,530 | 185,297 | ||||||
Dropbox, Inc., Class A* | 5,898 | 126,158 | ||||||
DXC Technology Co.* | 1,307 | 32,387 | ||||||
Entegris, Inc. | 1,459 | 138,430 | ||||||
EPAM Systems, Inc.* | 197 | 84,021 | ||||||
Euronet Worldwide, Inc.* | 358 | 31,740 | ||||||
F5, Inc.* | 2,215 | 347,888 | ||||||
Fair Isaac Corp.* | 239 | 107,407 | ||||||
Fidelity National Information Services, Inc. | 418 | 38,193 | ||||||
First Solar, Inc.* | 1,137 | 145,024 | ||||||
Fiserv, Inc.* | 861 | 87,125 | ||||||
FleetCor Technologies, Inc.* | 552 | 117,317 | ||||||
Fortinet, Inc.* | 6,197 | 301,732 | ||||||
Gartner, Inc.* | 2,812 | 802,320 | ||||||
Genpact Ltd. | 5,456 | 256,323 | ||||||
Global Payments, Inc. | 336 | 41,741 | ||||||
GLOBALFOUNDRIES, Inc.*(a) | 289 | 17,288 | ||||||
Globant SA* | 449 | 94,636 | ||||||
GoDaddy, Inc., Class A* | 1,589 | 120,478 | ||||||
Guidewire Software, Inc.* | 294 | 21,083 | ||||||
Hewlett Packard Enterprise Co. | 58,909 | 801,162 | ||||||
HP, Inc. | 64,237 | 1,844,244 | ||||||
HubSpot, Inc.* | 26 | 8,763 | ||||||
II-VI, Inc.* | 1,401 | 66,169 | ||||||
Intel Corp. | 4,659 | 148,715 | ||||||
International Business Machines Corp. | 1,601 | 205,648 | ||||||
Intuit, Inc. | 158 | 68,221 | ||||||
IPG Photonics Corp.* | 148 | 13,407 | ||||||
Jabil, Inc. | 7,511 | 452,913 | ||||||
Jack Henry & Associates, Inc. | 1,912 | 367,486 | ||||||
Juniper Networks, Inc. | 9,554 | 271,525 | ||||||
Keysight Technologies, Inc.* | 1,949 | 319,422 | ||||||
KLA Corp. | 1,385 | 476,620 | ||||||
Lam Research Corp. | 383 | 167,720 | ||||||
Lattice Semiconductor Corp.* | 2,286 | 123,215 | ||||||
Littelfuse, Inc. | 645 | 153,007 | ||||||
Lumentum Holdings, Inc.*(a) | 1,747 | 145,962 | ||||||
Mandiant, Inc.* | 3,830 | 87,554 | ||||||
Manhattan Associates, Inc.* | 787 | 111,172 | ||||||
Mastercard, Inc., Class A | 80 | 25,950 | ||||||
Microchip Technology, Inc. | 3,193 | 208,343 | ||||||
Micron Technology, Inc. | 4,529 | 256,024 | ||||||
Microsoft Corp. | 809 | 211,529 | ||||||
MKS Instruments, Inc. | 552 | 54,985 | ||||||
Monolithic Power Systems, Inc. | 730 | 330,821 | ||||||
Motorola Solutions, Inc. | 1,288 | 313,512 | ||||||
National Instruments Corp. | 2,113 | 84,013 | ||||||
NCR Corp.* | 506 | 15,711 | ||||||
NetApp, Inc. | 4,888 | 352,571 | ||||||
NortonLifeLock, Inc. | 14,345 | 324,054 | ||||||
| See Notes to Financial Statements. | 52 |
DBX ETF Trust
Schedule of Investments
Xtrackers Russell US Multifactor ETF (Continued)
August 31, 2022
Number | Value | |||||||
| Information Technology (Continued) | ||||||||
NVIDIA Corp. | 67 | $ | 10,113 | |||||
ON Semiconductor Corp.* | 1,579 | 108,588 | ||||||
Oracle Corp. | 1,180 | 87,497 | ||||||
Palo Alto Networks, Inc.* | 259 | 144,214 | ||||||
Paychex, Inc. | 2,745 | 338,568 | ||||||
Paycom Software, Inc.* | 291 | 102,199 | ||||||
Paycor HCM, Inc.* | 395 | 11,704 | ||||||
Paylocity Holding Corp.* | 173 | 41,693 | ||||||
PTC, Inc.* | 708 | 81,342 | ||||||
Pure Storage, Inc., Class A* | 3,023 | 87,576 | ||||||
Qorvo, Inc.* | 1,241 | 111,417 | ||||||
QUALCOMM, Inc. | 1,783 | 235,837 | ||||||
Roper Technologies, Inc. | 474 | 190,823 | ||||||
Salesforce, Inc.* | 79 | 12,334 | ||||||
ServiceNow, Inc.* | 178 | 77,362 | ||||||
Skyworks Solutions, Inc. | 1,859 | 183,204 | ||||||
SS&C Technologies Holdings, Inc. | 3,371 | 187,967 | ||||||
Switch, Inc., Class A | 1,891 | 64,199 | ||||||
Synopsys, Inc.* | 1,826 | 631,833 | ||||||
Teradata Corp.* | 1,900 | 62,510 | ||||||
Teradyne, Inc. | 3,190 | 270,002 | ||||||
Texas Instruments, Inc. | 1,824 | 301,343 | ||||||
Trimble, Inc.* | 1,559 | 98,607 | ||||||
Tyler Technologies, Inc.* | 111 | 41,238 | ||||||
Universal Display Corp. | 99 | 11,061 | ||||||
VeriSign, Inc.* | 1,265 | 230,508 | ||||||
Viasat, Inc.* | 596 | 22,636 | ||||||
Visa, Inc., Class A | 130 | 25,832 | ||||||
VMware, Inc., Class A | 498 | 57,783 | ||||||
Vontier Corp. | 2,325 | 50,964 | ||||||
Western Digital Corp.* | 1,105 | 46,697 | ||||||
Western Union Co. | 10,335 | 153,165 | ||||||
WEX, Inc.* | 54 | 8,330 | ||||||
Workday, Inc., Class A* | 505 | 83,103 | ||||||
Zebra Technologies Corp., Class A* | 276 | 83,253 | ||||||
Zendesk, Inc.* | 111 | 8,521 | ||||||
|
| |||||||
(Cost $22,522,674) | 23,619,600 | |||||||
|
| |||||||
| Materials — 8.1% | ||||||||
Air Products and Chemicals, Inc. | 477 | 120,419 | ||||||
Albemarle Corp. | 90 | 24,116 | ||||||
Alcoa Corp. | 1,392 | 68,876 | ||||||
Amcor PLC | 25,251 | 303,265 | ||||||
AptarGroup, Inc. | 590 | 60,658 | ||||||
Ashland, Inc. | 1,240 | 126,182 | ||||||
Avery Dennison Corp. | 629 | 115,497 | ||||||
Axalta Coating Systems Ltd.* | 2,502 | 64,427 | ||||||
Ball Corp. | 2,567 | 143,264 | ||||||
Berry Global Group, Inc.* | 3,420 | 185,809 | ||||||
Celanese Corp. | 3,406 | 377,589 | ||||||
CF Industries Holdings, Inc. | 5,427 | 561,477 | ||||||
Chemours Co. | 2,148 | 72,452 | ||||||
Cleveland-Cliffs, Inc.* | 3,405 | 58,804 | ||||||
Corteva, Inc. | 7,653 | 470,124 | ||||||
Crown Holdings, Inc. | 1,229 | 111,335 | ||||||
Dow, Inc. | 6,979 | 355,929 | ||||||
DuPont de Nemours, Inc. | 5,876 | 326,941 | ||||||
Number | Value | |||||||
| Materials (Continued) | ||||||||
Eagle Materials, Inc. | 1,341 | $ | 160,410 | |||||
Eastman Chemical Co. | 2,400 | 218,400 | ||||||
Ecolab, Inc. | 228 | 37,353 | ||||||
Element Solutions, Inc. | 1,858 | 34,689 | ||||||
FMC Corp. | 1,492 | 161,255 | ||||||
Freeport-McMoRan, Inc. | 3,943 | 116,713 | ||||||
Graphic Packaging Holding Co. | 5,665 | 126,160 | ||||||
Huntsman Corp. | 15,569 | 436,243 | ||||||
International Paper Co. | 7,452 | 310,152 | ||||||
Linde PLC | 512 | 144,824 | ||||||
Louisiana-Pacific Corp. | 4,594 | 249,133 | ||||||
LyondellBasell Industries NV, Class A | 5,648 | 468,784 | ||||||
Martin Marietta Materials, Inc. | 305 | 106,052 | ||||||
Mosaic Co. | 2,777 | 149,597 | ||||||
NewMarket Corp. | 108 | 31,019 | ||||||
Newmont Corp. | 4,233 | 175,077 | ||||||
Nucor Corp. | 9,492 | 1,261,867 | ||||||
Olin Corp. | 5,403 | 295,328 | ||||||
Packaging Corp. of America | 3,247 | 444,579 | ||||||
PPG Industries, Inc. | 806 | 102,346 | ||||||
Reliance Steel & Aluminum Co. | 4,828 | 907,567 | ||||||
Royal Gold, Inc. | 1,404 | 129,028 | ||||||
RPM International, Inc. | 2,658 | 247,619 | ||||||
Sealed Air Corp. | 3,565 | 191,833 | ||||||
Sherwin-Williams Co. | 609 | 141,349 | ||||||
Silgan Holdings, Inc. | 3,713 | 169,127 | ||||||
Sonoco Products Co. | 1,481 | 93,333 | ||||||
Southern Copper Corp. | 834 | 39,256 | ||||||
SSR Mining, Inc. | 451 | 6,084 | ||||||
Steel Dynamics, Inc. | 10,267 | 828,752 | ||||||
United States Steel Corp. | 3,908 | 89,376 | ||||||
Valvoline, Inc. | 2,204 | 64,070 | ||||||
Vulcan Materials Co. | 551 | 91,736 | ||||||
Westlake Corp. | 1,011 | 99,715 | ||||||
Westrock Co. | 4,166 | 169,098 | ||||||
|
| |||||||
(Cost $10,708,628) | 11,845,088 | |||||||
|
| |||||||
| Real Estate — 4.7% | ||||||||
Alexandria Real Estate Equities, Inc. REIT | 365 | 55,991 | ||||||
American Homes 4 Rent, Class A REIT | 1,420 | 50,495 | ||||||
American Tower Corp. REIT | 235 | 59,702 | ||||||
Americold Realty Trust, Inc. REIT | 253 | 7,443 | ||||||
Apartment Income REIT Corp. REIT | 4,061 | 165,892 | ||||||
AvalonBay Communities, Inc. REIT | 886 | 178,006 | ||||||
Boston Properties, Inc. REIT | 668 | 53,059 | ||||||
Brixmor Property Group, Inc. REIT | 2,302 | 49,447 | ||||||
Camden Property Trust REIT | 906 | 116,430 | ||||||
CBRE Group, Inc., Class A* | 5,586 | 441,071 | ||||||
Cousins Properties, Inc. REIT | 2,124 | 57,029 | ||||||
Crown Castle, Inc. REIT | 307 | 52,445 | ||||||
CubeSmart REIT | 1,889 | 86,988 | ||||||
Digital Realty Trust, Inc. REIT | 893 | 110,402 | ||||||
Douglas Emmett, Inc. REIT | 628 | 12,259 | ||||||
Duke Realty Corp. REIT | 6,552 | 385,585 | ||||||
EastGroup Properties, Inc. REIT | 533 | 87,961 | ||||||
Equinix, Inc. REIT | 43 | 28,267 | ||||||
Equity LifeStyle Properties, Inc. REIT | 1,749 | 122,605 | ||||||
| See Notes to Financial Statements. | 53 |
DBX ETF Trust
Schedule of Investments
Xtrackers Russell US Multifactor ETF (Continued)
August 31, 2022
Number | Value | |||||||
| Real Estate (Continued) | ||||||||
Equity Residential REIT | 3,231 | $ | 236,445 | |||||
Essex Property Trust, Inc. REIT | 421 | 111,590 | ||||||
Extra Space Storage, Inc. REIT | 1,895 | 376,593 | ||||||
Federal Realty Investment Trust REIT | 554 | 56,104 | ||||||
First Industrial Realty Trust, Inc. REIT | 2,928 | 148,391 | ||||||
Gaming and Leisure Properties, Inc. REIT | 1,343 | 64,827 | ||||||
Healthcare Realty Trust, Inc. REIT (a) | 1,663 | 40,444 | ||||||
Healthpeak Properties, Inc. REIT | 2,881 | 75,626 | ||||||
Highwoods Properties, Inc. REIT | 2,707 | 82,320 | ||||||
Host Hotels & Resorts, Inc. REIT | 960 | 17,059 | ||||||
Invitation Homes, Inc. REIT | 1,617 | 58,665 | ||||||
Iron Mountain, Inc. REIT | 2,717 | 142,941 | ||||||
Jones Lang LaSalle, Inc.* | 1,438 | 248,774 | ||||||
Kilroy Realty Corp. REIT | 2,423 | 118,170 | ||||||
Kimco Realty Corp. REIT | 5,079 | 107,065 | ||||||
Lamar Advertising Co., Class A REIT | 1,438 | 135,014 | ||||||
Life Storage, Inc. REIT | 1,097 | 139,593 | ||||||
Medical Properties Trust, Inc. REIT | 6,227 | 90,976 | ||||||
Mid-America Apartment Communities, Inc. REIT | 1,014 | 167,989 | ||||||
National Retail Properties, Inc. REIT | 1,710 | 76,779 | ||||||
National Storage Affiliates Trust REIT | 809 | 40,871 | ||||||
Omega Healthcare Investors, Inc. REIT (a) | 920 | 30,047 | ||||||
Prologis, Inc. REIT | 801 | 99,732 | ||||||
Public Storage REIT | 961 | 317,928 | ||||||
Rayonier, Inc. REIT | 2,677 | 95,087 | ||||||
Realty Income Corp. REIT (a) | 654 | 44,655 | ||||||
Regency Centers Corp. REIT | 1,199 | 72,947 | ||||||
Rexford Industrial Realty, Inc. REIT | 922 | 57,358 | ||||||
SBA Communications Corp. REIT | 202 | 65,700 | ||||||
Simon Property Group, Inc. REIT | 660 | 67,307 | ||||||
SL Green Realty Corp. REIT | 727 | 32,112 | ||||||
Spirit Realty Capital, Inc. REIT | 701 | 28,636 | ||||||
STORE Capital Corp. REIT | 884 | 23,850 | ||||||
Sun Communities, Inc. REIT | 522 | 80,237 | ||||||
UDR, Inc. REIT | 1,162 | 52,139 | ||||||
Ventas, Inc. REIT | 143 | 6,844 | ||||||
VICI Properties, Inc. REIT (a) | 3,319 | 109,494 | ||||||
Vornado Realty Trust REIT (a) | 521 | 13,661 | ||||||
Welltower, Inc. REIT | 231 | 17,706 | ||||||
Weyerhaeuser Co. REIT | 22,597 | 771,914 | ||||||
WP Carey, Inc. REIT | 1,470 | 123,524 | ||||||
|
| |||||||
(Cost $6,518,619) | 6,768,191 | |||||||
|
| |||||||
| Utilities — 6.9% | ||||||||
AES Corp. | 5,494 | 139,822 | ||||||
Alliant Energy Corp. | 3,328 | 203,141 | ||||||
Ameren Corp. | 3,382 | 313,241 | ||||||
American Electric Power Co., Inc. | 3,532 | 353,906 | ||||||
American Water Works Co., Inc. | 1,194 | 177,249 | ||||||
Atmos Energy Corp. | 521 | 59,071 | ||||||
Avangrid, Inc. (a) | 840 | 41,496 | ||||||
Brookfield Renewable Corp., Class A | 1,041 | 39,964 | ||||||
Number | Value | |||||||
| Utilities (Continued) | ||||||||
CenterPoint Energy, Inc. | 6,179 | $ | 194,824 | |||||
CMS Energy Corp. | 7,577 | 511,751 | ||||||
Consolidated Edison, Inc. | 4,282 | 418,523 | ||||||
Constellation Energy Corp. | 755 | 61,601 | ||||||
Dominion Energy, Inc. | 2,786 | 227,895 | ||||||
DTE Energy Co. | 5,495 | 716,218 | ||||||
Duke Energy Corp. | 2,451 | 262,036 | ||||||
Edison International | 2,926 | 198,295 | ||||||
Entergy Corp. | 3,506 | 404,242 | ||||||
Essential Utilities, Inc. | 3,202 | 157,378 | ||||||
Evergy, Inc. | 4,970 | 340,594 | ||||||
Eversource Energy | 3,431 | 307,726 | ||||||
Exelon Corp. | 9,519 | 417,979 | ||||||
FirstEnergy Corp. | 9,255 | 366,035 | ||||||
Hawaiian Electric Industries, Inc. | 3,913 | 153,077 | ||||||
IDACORP, Inc. | 1,691 | 184,725 | ||||||
National Fuel Gas Co. | 6,099 | 434,676 | ||||||
NextEra Energy, Inc. | 937 | 79,701 | ||||||
NiSource, Inc. | 11,253 | 332,076 | ||||||
NRG Energy, Inc. | 15,587 | 643,431 | ||||||
OGE Energy Corp. | 5,134 | 208,132 | ||||||
Pinnacle West Capital Corp. | 2,888 | 217,611 | ||||||
PPL Corp. | 6,793 | 197,541 | ||||||
Public Service Enterprise Group, Inc. | 2,640 | 169,910 | ||||||
Sempra Energy | 1,495 | 246,630 | ||||||
Southern Co. | 3,638 | 280,381 | ||||||
UGI Corp. | 8,609 | 340,056 | ||||||
Vistra Corp. | 1,916 | 47,421 | ||||||
WEC Energy Group, Inc. | 3,273 | 337,577 | ||||||
Xcel Energy, Inc. | 4,005 | 297,371 | ||||||
|
| |||||||
(Cost $8,893,987) | 10,083,303 | |||||||
|
| |||||||
TOTAL COMMON STOCKS | 144,402,283 | |||||||
|
| |||||||
| EXCHANGE-TRADED FUNDS — 0.2% | ||||||||
iShares Russell 1000 ETF | 1,750 | 382,042 | ||||||
|
| |||||||
| SECURITIES LENDING COLLATERAL — 0.2% | ||||||||
DWS Government & Agency Securities Portfolio “DWS Government Cash Institutional Shares”, 2.00% (b)(c) | 304,334 | 304,334 | ||||||
|
| |||||||
| CASH EQUIVALENTS — 0.5% | ||||||||
DWS Government Money Market Series “Institutional Shares”, 2.24% (b) | 657,286 | $ | 657,286 | |||||
|
| |||||||
TOTAL INVESTMENTS — 100.0% (Cost $135,595,948) | $ | 145,745,945 | ||||||
Other assets and liabilities, net — (0.0)% | (45,700 | ) | ||||||
|
| |||||||
NET ASSETS — 100.0% | $ | 145,700,245 | ||||||
|
| |||||||
| See Notes to Financial Statements. | 54 |
DBX ETF Trust
Schedule of Investments
Xtrackers Russell US Multifactor ETF (Continued)
August 31, 2022
A summary of the Fund’s transactions with affiliated investments during the year ended August 31, 2022 is as follows:
| Value ($) at 8/31/2021 | Purchases Cost ($) | Sales Proceeds ($) | Net Realized Gain/(Loss) ($) | Net Change in Unrealized Appreciation (Depreciation) ($) | Income ($) | Capital Gain Distributions ($) | Number of Shares at 8/31/2022 | Value ($) at 8/31/2022 | ||||||||||||||||||||||||||||
SECURITIES LENDING COLLATERAL — 0.2% |
| |||||||||||||||||||||||||||||||||||
DWS Government & Agency Securities Portfolio “DWS Government Cash Institutional Shares”, 2.00%(b)(c) |
| |||||||||||||||||||||||||||||||||||
| 639,018 | — | (334,684 | ) (d) | — | — | 2,184 | — | 304,334 | 304,334 | |||||||||||||||||||||||||||
CASH EQUIVALENTS — 0.5% |
| |||||||||||||||||||||||||||||||||||
DWS Government Money Market Series “Institutional Shares”, 2.24% (b) |
| |||||||||||||||||||||||||||||||||||
| 426,619 | 5,540,402 | (5,309,735 | ) | — | — | 3,367 | — | 657,286 | 657,286 | |||||||||||||||||||||||||||
|
|
|
|
|
|
|
|
|
|
|
|
|
|
|
|
|
| |||||||||||||||||||
| 1,065,637 | 5,540,402 | (5,644,419 | ) | — | — | 5,551 | — | 961,620 | 961,620 | |||||||||||||||||||||||||||
|
|
|
|
|
|
|
|
|
|
|
|
|
|
|
|
|
| |||||||||||||||||||
| * | Non-income producing security. |
| (a) | All or a portion of these securities were on loan. In addition, “Other assets and liabilities, net” may include pending sales that are also on loan. The value of securities loaned at August 31, 2022 amounted to $2,839,336, which is 1.9% of net assets. |
| (b) | Affiliated fund managed by DWS Investment Management Americas, Inc. The rate shown is the annualized seven-day yield at period end. |
| (c) | Represents cash collateral held in connection with securities lending. Income earned by the Fund is net of borrower rebates. In addition, the Fund held non-cash U.S. Treasury securities collateral having a value of $2,601,213. |
| (d) | Represents the net increase (purchase cost) or decrease (sales proceeds) in the amount invested in cash collateral for the year ended August 31, 2022. |
| REIT: | Real Estate Investment Trust |
At August 31, 2022, open futures contracts purchased were as follows:
Contract Description | Currency | Number of Contracts | Notional Amount | Contract Value | Expiration Date | Unrealized Appreciation | ||||||||||||
S&P Mid 400 E-Mini Futures | USD | 1 | $ | 229,040 | $ | 243,030 | 9/16/2022 | $ | 13,990 | |||||||||
S&P 500 E-Mini Futures | USD | 3 | 586,695 | 593,475 | 9/16/2022 | 6,780 | ||||||||||||
|
| |||||||||||||||||
Total unrealized appreciation | $ | 20,770 | ||||||||||||||||
|
| |||||||||||||||||
For information on the Fund’s policy and additional disclosures regarding open futures contracts, please refer to the Derivatives section of Note 2 in the accompanying Notes to Financial Statements.
Currency Abbreviations
| USD | U.S. Dollar |
Fair Value Measurements
Various inputs are used in determining the value of the Fund’s investments. These inputs are summarized in three broad levels. Level 1 includes quoted prices in active markets for identical securities. Level 2 includes other significant observable inputs (including quoted prices for similar securities, interest rates, prepayment speeds and credit risk). Level 3 includes significant unobservable inputs (including the Fund’s own assumptions in determining the fair value of investments). The level assigned to the securities valuations may not be an indication of the risk or liquidity associated with investing in those securities.
The following is a summary of the inputs used as of August 31, 2022 in valuing the Fund’s investments. For information on the Fund’s policy regarding the valuation of investments, please refer to the Security Valuation section of Note 2 in the accompanying Notes to Financial Statements.
Assets | Level 1 | Level 2 | Level 3 | Total | ||||||||||||
Common Stocks (a) | $ | 144,402,283 | $ | — | $ | — | $ | 144,402,283 | ||||||||
Exchange-Traded Funds | 382,042 | — | — | 382,042 | ||||||||||||
Short-Term Investments (a) | 961,620 | — | — | 961,620 | ||||||||||||
Derivatives (b) | ||||||||||||||||
Futures Contracts | 20,770 | — | — | 20,770 | ||||||||||||
|
|
|
|
|
|
|
| |||||||||
TOTAL | $ | 145,766,715 | $ | — | $ | — | $ | 145,766,715 | ||||||||
|
|
|
|
|
|
|
| |||||||||
| (a) | See Schedule of Investments for additional detailed categorizations. |
| (b) | Derivatives include unrealized appreciation (depreciation) on open futures contracts and forward foreign currency contracts. |
| See Notes to Financial Statements. | 55 |
This Page is Intentionally Left Blank
56
DBX ETF Trust
August 31, 2022
| Xtrackers FTSE Developed ex US Multifactor ETF | Xtrackers MSCI Kokusai Equity ETF | Xtrackers Russell 1000 US Quality at a Reasonable Price ETF | Xtrackers Russell US Multifactor ETF | |||||||||||||
Assets | ||||||||||||||||
Investment in non-affiliated securities at value | $ | 65,413,811 | $ | 499,011,732 | $ | 11,121,100 | $ | 144,784,325 | ||||||||
Investment in affiliated securities at value | 4,101 | 178,464 | — | — | ||||||||||||
Investment in DWS Government Money Market Series | 101,059 | 995,448 | 4,206 | 657,286 | ||||||||||||
Investment in DWS Government & Agency Securities Portfolio* | 731,962 | 339,649 | 4,995 | 304,334 | ||||||||||||
Cash | — | — | — | 26 | ||||||||||||
Foreign currency at value | 188,813 | 849,132 | — | — | ||||||||||||
Deposit with broker for futures contracts | 23,368 | 161,487 | — | 47,850 | ||||||||||||
| Receivables: | ||||||||||||||||
Investment securities sold | — | 647,058 | — | — | ||||||||||||
Dividends | 219,853 | 950,596 | 24,989 | 291,552 | ||||||||||||
Interest | 215 | 1,836 | 7 | 1,265 | ||||||||||||
Securities lending income | 654 | 2,815 | 44 | 1,004 | ||||||||||||
Foreign tax reclaim | 68,381 | 273,171 | — | — | ||||||||||||
|
|
|
|
|
|
|
| |||||||||
Total assets | $ | 66,752,217 | $ | 503,411,388 | $ | 11,155,341 | $ | 146,087,642 | ||||||||
|
|
|
|
|
|
|
| |||||||||
Liabilities | ||||||||||||||||
Payable upon return of securities loaned | $ | 731,962 | $ | 339,649 | $ | 4,995 | $ | 304,334 | ||||||||
| Payables: | ||||||||||||||||
Investment securities purchased | — | 623,948 | — | 54,831 | ||||||||||||
Investment advisory fees | 13,996 | 40,411 | 1,890 | 21,862 | ||||||||||||
Variation margin on futures contracts | 3,152 | 32,411 | — | 6,370 | ||||||||||||
|
|
|
|
|
|
|
| |||||||||
Total liabilities | 749,110 | 1,036,419 | 6,885 | 387,397 | ||||||||||||
|
|
|
|
|
|
|
| |||||||||
Net Assets, at value | $ | 66,003,107 | $ | 502,374,969 | $ | 11,148,456 | $ | 145,700,245 | ||||||||
|
|
|
|
|
|
|
| |||||||||
Net Assets Consist of | ||||||||||||||||
Paid-in capital | $ | 87,160,256 | $ | 523,874,317 | $ | 14,499,833 | $ | 167,492,360 | ||||||||
Distributable earnings (loss) | (21,157,149 | ) | (21,499,348 | ) | (3,351,377 | ) | (21,792,115 | ) | ||||||||
|
|
|
|
|
|
|
| |||||||||
Net Assets, at value | $ | 66,003,107 | $ | 502,374,969 | $ | 11,148,456 | $ | 145,700,245 | ||||||||
|
|
|
|
|
|
|
| |||||||||
Number of Common Shares outstanding | 2,600,001 | 7,070,001 | 300,001 | 3,500,001 | ||||||||||||
|
|
|
|
|
|
|
| |||||||||
Net Asset Value | $ | 25.39 | $ | 71.06 | $ | 37.16 | $ | 41.63 | ||||||||
|
|
|
|
|
|
|
| |||||||||
Investment in non-affiliated securities at cost | $ | 72,336,389 | $ | 518,761,597 | $ | 10,857,835 | $ | 134,634,328 | ||||||||
|
|
|
|
|
|
|
| |||||||||
Investment in affiliated securities at cost | $ | 5,968 | $ | 240,695 | $ | – | $ | – | ||||||||
|
|
|
|
|
|
|
| |||||||||
Value of securities loaned | $ | 1,102,919 | $ | 2,565,387 | $ | 135,859 | $ | 2,839,336 | ||||||||
|
|
|
|
|
|
|
| |||||||||
Investment in DWS Government Money Market Series at cost | $ | 101,059 | $ | 995,448 | $ | 4,206 | $ | 657,286 | ||||||||
|
|
|
|
|
|
|
| |||||||||
Investment in DWS Government & Agency Securities Portfolio at cost* | $ | 731,962 | $ | 339,649 | $ | 4,995 | $ | 304,334 | ||||||||
|
|
|
|
|
|
|
| |||||||||
Non-cash collateral for securities on loan | $ | 444,256 | $ | 2,415,063 | $ | 135,137 | $ | 2,601,213 | ||||||||
|
|
|
|
|
|
|
| |||||||||
Foreign currency at cost | $ | 190,923 | $ | 864,288 | $ | — | $ | — | ||||||||
|
|
|
|
|
|
|
| |||||||||
| * | Represents collateral on securities loaned. |
| See Notes to Financial Statements. | 57 |
DBX ETF Trust
For the Year Ended August 31, 2022
| Xtrackers FTSE Developed ex US Multifactor ETF | Xtrackers MSCI Kokusai Equity ETF | Xtrackers Russell 1000 US Quality at a Reasonable Price ETF | Xtrackers Russell US Multifactor ETF | |||||||||||||
Investment Income | ||||||||||||||||
Unaffiliated dividend income* | $ | 2,251,068 | $ | 9,378,928 | $ | 303,245 | $ | 3,035,890 | ||||||||
Income distributions from affiliated funds | 617 | 8,220 | 368 | 3,367 | ||||||||||||
Affiliated securities lending income | 5,818 | 8,998 | 166 | 2,184 | ||||||||||||
Unaffiliated non-cash dividend income | 276,144 | 843,881 | — | — | ||||||||||||
Unaffiliated securities lending income, net of borrower rebates | 10,199 | 48,672 | 506 | 5,944 | ||||||||||||
|
|
|
|
|
|
|
| |||||||||
Total investment income | 2,543,846 | 10,288,699 | 304,285 | 3,047,385 | ||||||||||||
|
|
|
|
|
|
|
| |||||||||
Expenses | ||||||||||||||||
Investment advisory fees | 241,198 | 458,442 | 39,201 | 292,724 | ||||||||||||
Other expenses | 57 | 57 | 57 | 57 | ||||||||||||
|
|
|
|
|
|
|
| |||||||||
Total expenses | 241,255 | 458,499 | 39,258 | 292,781 | ||||||||||||
|
|
|
|
|
|
|
| |||||||||
Less fees waived (see note 3): | ||||||||||||||||
Waiver | (76,236 | ) | (218 | ) | (138 | ) | (272 | ) | ||||||||
|
|
|
|
|
|
|
| |||||||||
Net expenses | 165,019 | 458,281 | 39,120 | 292,509 | ||||||||||||
|
|
|
|
|
|
|
| |||||||||
Net investment income (loss) | 2,378,827 | 9,830,418 | 265,165 | 2,754,876 | ||||||||||||
|
|
|
|
|
|
|
| |||||||||
Realized and Unrealized Gain (Loss) | ||||||||||||||||
Net realized gain (loss) from: | ||||||||||||||||
Investments | (2,454,272 | ) | (3,013,193 | ) | (189,649 | ) | (8,705,202 | ) | ||||||||
In-kind redemptions | 6,641,271 | 111,298,658 | 6,110,820 | 27,894,641 | ||||||||||||
In-kind redemptions in affiliates | — | 58,255 | — | — | ||||||||||||
Futures contracts | (111,556 | ) | (101,001 | ) | (15,142 | ) | (88,792 | ) | ||||||||
Foreign currency transactions | (63,006 | ) | (66,094 | ) | — | — | ||||||||||
|
|
|
|
|
|
|
| |||||||||
Net realized gain (loss) | 4,012,437 | 108,176,625 | 5,906,029 | 19,100,647 | ||||||||||||
|
|
|
|
|
|
|
| |||||||||
Net change in unrealized appreciation (depreciation) on: | ||||||||||||||||
Investments | (21,713,611 | ) | (190,420,606 | ) | (6,969,646 | ) | (35,600,006 | ) | ||||||||
Investments in affiliates | (1,867 | ) | (133,515 | ) | — | — | ||||||||||
Futures contracts | (2,009 | ) | (73,643 | ) | (13,743 | ) | (4,635 | ) | ||||||||
Foreign currency translations | (13,477 | ) | (50,456 | ) | — | — | ||||||||||
|
|
|
|
|
|
|
| |||||||||
Net change in unrealized appreciation (depreciation) | (21,730,964 | ) | (190,678,220 | ) | (6,983,389 | ) | (35,604,641 | ) | ||||||||
|
|
|
|
|
|
|
| |||||||||
Net realized and unrealized gain (loss) on investments, futures and foreign currency transactions | (17,718,527 | ) | (82,501,595 | ) | (1,077,360 | ) | (16,503,994 | ) | ||||||||
|
|
|
|
|
|
|
| |||||||||
Net Increase (Decrease) in Net Assets Resulting from Operations | $ | (15,339,700 | ) | $ | (72,671,177 | ) | $ | (812,195 | ) | $ | (13,749,118 | ) | ||||
|
|
|
|
|
|
|
| |||||||||
* Unaffiliated foreign tax withheld | $ | 248,554 | $ | 474,123 | $ | — | $ | 1,072 | ||||||||
| See Notes to Financial Statements. | 58 |
DBX ETF Trust
| Xtrackers FTSE Developed ex US Multifactor ETF | Xtrackers MSCI Kokusai Equity ETF | |||||||||||||||
| Year Ended August 31, 2022 | Year Ended August 31, 2021 | Year Ended August 31, 2022 | Year Ended August 31, 2021 | |||||||||||||
Increase (Decrease) in Net Assets from Operations | ||||||||||||||||
Net investment income (loss) | $ | 2,378,827 | $ | 1,995,225 | $ | 9,830,418 | $ | 12,961,318 | ||||||||
Net realized gain (loss) | 4,012,437 | 5,545,507 | 108,176,625 | 66,852,582 | ||||||||||||
Net change in net unrealized appreciation (depreciation) | (21,730,964 | ) | 7,471,727 | (190,678,220 | ) | 147,646,826 | ||||||||||
|
|
|
|
|
|
|
| |||||||||
Net increase (decrease) in net assets resulting from operations | (15,339,700 | ) | 15,012,459 | (72,671,177 | ) | 227,460,726 | ||||||||||
|
|
|
|
|
|
|
| |||||||||
Distributions to Shareholders | (2,665,644 | ) | (2,769,501 | ) | (10,748,298 | ) | (11,461,571 | ) | ||||||||
|
|
|
|
|
|
|
| |||||||||
Fund Shares Transactions | ||||||||||||||||
Proceeds from shares sold | 34,320,381 | 3,122,218 | 219,667,883 | 738,181,720 | ||||||||||||
Value of shares redeemed | (21,000,774 | ) | (17,052,937 | ) | (436,629,998 | ) | (283,087,229 | ) | ||||||||
|
|
|
|
|
|
|
| |||||||||
Net increase (decrease) in net assets resulting from fund share transactions | 13,319,607 | (13,930,719 | ) | (216,962,115 | ) | 455,094,491 | ||||||||||
|
|
|
|
|
|
|
| |||||||||
Total net increase (decrease) in Net Assets | (4,685,737 | ) | (1,687,761 | ) | (300,381,590 | ) | 671,093,646 | |||||||||
Net Assets | ||||||||||||||||
Beginning of year | 70,688,844 | 72,376,605 | 802,756,559 | 131,662,913 | ||||||||||||
|
|
|
|
|
|
|
| |||||||||
End of year | $ | 66,003,107 | $ | 70,688,844 | $ | 502,374,969 | $ | 802,756,559 | ||||||||
|
|
|
|
|
|
|
| |||||||||
Changes in Shares Outstanding | ||||||||||||||||
Shares outstanding, beginning of year | 2,150,001 | 2,600,001 | 9,450,001 | 2,000,001 | ||||||||||||
Shares sold | 1,100,000 | 100,000 | 2,700,000 | 11,250,000 | ||||||||||||
Shares redeemed | (650,000 | ) | (550,000 | ) | (5,080,000 | ) | (3,800,000 | ) | ||||||||
|
|
|
|
|
|
|
| |||||||||
Shares outstanding, end of year | 2,600,001 | 2,150,001 | 7,070,001 | 9,450,001 | ||||||||||||
|
|
|
|
|
|
|
| |||||||||
| See Notes to Financial Statements. | 59 |
DBX ETF Trust
Statements of Changes in Net Assets (Continued)
| Xtrackers Russell 1000 US Quality at a Reasonable Price ETF | Xtrackers Russell US Multifactor ETF | |||||||||||||||
| Year Ended August 31, 2022 | Year Ended August 31, 2021 | Year Ended August 31, 2022 | Year Ended August 31, 2021 | |||||||||||||
Increase (Decrease) in Net Assets from Operations | ||||||||||||||||
Net investment income (loss) | $ | 265,165 | $ | 1,069,129 | $ | 2,754,876 | $ | 2,521,312 | ||||||||
Net realized gain (loss) | 5,906,029 | 28,616,974 | 19,100,647 | 23,394,468 | ||||||||||||
Net change in net unrealized appreciation (depreciation) | (6,983,389 | ) | (7,514,529 | ) | (35,604,641 | ) | 28,283,557 | |||||||||
|
|
|
|
|
|
|
| |||||||||
Net increase (decrease) in net assets resulting from operations | (812,195 | ) | 22,171,574 | (13,749,118 | ) | 54,199,337 | ||||||||||
|
|
|
|
|
|
|
| |||||||||
Distributions to Shareholders | (319,266 | ) | (1,304,404 | ) | (2,701,417 | ) | (2,600,903 | ) | ||||||||
|
|
|
|
|
|
|
| |||||||||
Fund Shares Transactions | ||||||||||||||||
Proceeds from shares sold | 1,772,590 | 22,826,382 | 38,220,376 | 79,876,610 | ||||||||||||
Value of shares redeemed | (29,229,939 | ) | (104,524,407 | ) | (82,229,358 | ) | (75,144,279 | ) | ||||||||
|
|
|
|
|
|
|
| |||||||||
Net increase (decrease) in net assets resulting from fund share transactions | (27,457,349 | ) | (81,698,025 | ) | (44,008,982 | ) | 4,732,331 | |||||||||
|
|
|
|
|
|
|
| |||||||||
Total net increase (decrease) in Net Assets | (28,588,810 | ) | (60,830,855 | ) | (60,459,517 | ) | 56,330,765 | |||||||||
Net Assets | ||||||||||||||||
Beginning of year | 39,737,266 | 100,568,121 | 206,159,762 | 149,828,997 | ||||||||||||
|
|
|
|
|
|
|
| |||||||||
End of year | $ | 11,148,456 | $ | 39,737,266 | $ | 145,700,245 | $ | 206,159,762 | ||||||||
|
|
|
|
|
|
|
| |||||||||
Changes in Shares Outstanding | ||||||||||||||||
Shares outstanding, beginning of year | 950,001 | 3,200,001 | 4,450,001 | 4,300,001 | ||||||||||||
Shares sold | 50,000 | 700,000 | 850,000 | 1,950,000 | ||||||||||||
Shares redeemed | (700,000 | ) | (2,950,000 | ) | (1,800,000 | ) | (1,800,000 | ) | ||||||||
|
|
|
|
|
|
|
| |||||||||
Shares outstanding, end of year | 300,001 | 950,001 | 3,500,001 | 4,450,001 | ||||||||||||
|
|
|
|
|
|
|
| |||||||||
| See Notes to Financial Statements. | 60 |
DBX ETF Trust
| Xtrackers FTSE Developed ex US Multifactor ETF Selected Per Share Data | Years Ended August 31, | |||||||||||||||||||
| 2022 | 2021 | 2020 | 2019 | 2018 | ||||||||||||||||
Net Asset Value, beginning of year | $ | 32.88 | $ | 27.84 | $ | 26.80 | $ | 28.84 | $ | 28.17 | ||||||||||
|
|
|
|
|
|
|
|
|
| |||||||||||
| Income (loss) from investment operations: | ||||||||||||||||||||
Net investment income (loss)(a) | 1.01 | 0.84 | 0.62 | 0.83 | 0.77 | |||||||||||||||
Net realized and unrealized gain (loss) | (7.37 | ) | 5.35 | 1.32 | (2.11 | ) | 0.72 | |||||||||||||
|
|
|
|
|
|
|
|
|
| |||||||||||
Total from investment operations | (6.36 | ) | 6.19 | 1.94 | (1.28 | ) | 1.49 | |||||||||||||
|
|
|
|
|
|
|
|
|
| |||||||||||
| Less distributions from: |
| |||||||||||||||||||
Net investment income | (1.13 | ) | (1.15 | ) | (0.90 | ) | (0.76 | ) | (0.82 | ) | ||||||||||
|
|
|
|
|
|
|
|
|
| |||||||||||
Total distributions | (1.13 | ) | (1.15 | ) | (0.90 | ) | (0.76 | ) | (0.82 | ) | ||||||||||
|
|
|
|
|
|
|
|
|
| |||||||||||
Net Asset Value, end of year | $ | 25.39 | $ | 32.88 | $ | 27.84 | $ | 26.80 | $ | 28.84 | ||||||||||
|
|
|
|
|
|
|
|
|
| |||||||||||
Total Return (%) | (19.75 | )(b) | 22.69 | (b) | 7.49 | (b) | (4.51 | )(b) | 5.32 | |||||||||||
Ratios to Average Net Assets and Supplemental Data | ||||||||||||||||||||
Net Assets, end of year ($ millions) | 66 | 71 | 72 | 72 | 59 | |||||||||||||||
Ratio of expenses before fee waiver (%) | 0.35 | 0.35 | 0.35 | 0.35 | 0.35 | |||||||||||||||
Ratio of expenses after fee waiver (%) | 0.24 | 0.24 | 0.24 | 0.29 | 0.35 | |||||||||||||||
Ratio of net investment income (loss) (%) | 3.45 | 2.75 | 2.37 | 3.05 | 2.62 | |||||||||||||||
Portfolio turnover rate (%)(c) | 56 | 53 | 43 | 51 | 45 | |||||||||||||||
| Xtrackers MSCI Kokusai Equity ETF Selected Per Share Data | Years Ended August 31, | Period Ended 8/31/2020(d) | ||||||||||||||||||
| 2022 | 2021 | |||||||||||||||||||
Net Asset Value, beginning of period | $ | 84.95 | $ | 65.83 | $ | 50.00 | ||||||||||||||
|
|
|
|
|
| |||||||||||||||
| Income (loss) from investment operations: | ||||||||||||||||||||
Net investment income (loss)(a) | 1.53 | 1.28 | 0.49 | |||||||||||||||||
Net realized and unrealized gain (loss) | (13.73 | ) | 18.91 | 15.34 | ||||||||||||||||
|
|
|
|
|
| |||||||||||||||
Total from investment operations | (12.20 | ) | 20.19 | 15.83 | ||||||||||||||||
|
|
|
|
|
| |||||||||||||||
| Less distributions from: |
| |||||||||||||||||||
Net investment income | (1.69 | ) | (1.06 | ) | — | |||||||||||||||
Net realized gains | — | (0.01 | ) | — | ||||||||||||||||
|
|
|
|
|
| |||||||||||||||
Total distributions | (1.69 | ) | (1.07 | ) | — | |||||||||||||||
|
|
|
|
|
| |||||||||||||||
Net Asset Value, end of period | $ | 71.06 | $ | 84.95 | $ | 65.83 | ||||||||||||||
|
|
|
|
|
| |||||||||||||||
Total Return (%)(b) | (14.55 | ) | 30.87 | 31.66 | ** | |||||||||||||||
Ratios to Average Net Assets and Supplemental Data | ||||||||||||||||||||
Net Assets, end of period ($ millions) | 502 | 803 | 132 | |||||||||||||||||
Ratio of expenses before fee waiver (%) | 0.09 | 0.09 | 0.09 | * | ||||||||||||||||
Ratio of expenses after fee waiver (%) | 0.09 | 0.09 | 0.09 | * | ||||||||||||||||
Ratio of net investment income (loss) (%) | 1.93 | 1.73 | 2.08 | * | ||||||||||||||||
Portfolio turnover rate (%)(c) | 4 | 6 | 7 | ** | ||||||||||||||||
| (a) | Based on average shares outstanding during the period. |
| (b) | Total Return would have been lower if certain expenses had not been reimbursed by the Advisor. |
| (c) | Portfolio turnover rate does not include securities received or delivered from processing creations or redemptions. |
| (d) | For the period April 8, 2020 (commencement of operations) through August 31, 2020. |
| * | Annualized. |
| ** | Not Annualized. |
| See Notes to Financial Statements. | 61 |
DBX ETF Trust
Financial Highlights (Continued)
| Xtrackers Russell 1000 US Quality at a Reasonable Price ETF Selected Per Share Data | Years Ended August 31, | Period Ended 8/31/2018(a) | ||||||||||||||||||
| 2022 | 2021 | 2020 | 2019 | |||||||||||||||||
Net Asset Value, beginning of period | $ | 41.83 | $ | 31.43 | $ | 27.08 | $ | 27.29 | $ | 25.00 | ||||||||||
|
|
|
|
|
|
|
|
|
| |||||||||||
| Income (loss) from investment operations: | ||||||||||||||||||||
Net investment income (loss)(b) | 0.53 | 0.52 | 0.52 | 0.51 | 0.21 | |||||||||||||||
Net realized and unrealized gain (loss) | (4.60 | ) | 10.44 | 4.42 | (0.25 | ) | 2.16 | |||||||||||||
|
|
|
|
|
|
|
|
|
| |||||||||||
Total from investment operations | (4.07 | ) | 10.96 | 4.94 | 0.26 | 2.37 | ||||||||||||||
|
|
|
|
|
|
|
|
|
| |||||||||||
| Less distributions from: |
| |||||||||||||||||||
Net investment income | (0.60 | ) | (0.56 | ) | (0.59 | ) | (0.47 | ) | (0.08 | ) | ||||||||||
|
|
|
|
|
|
|
|
|
| |||||||||||
Total distributions | (0.60 | ) | (0.56 | ) | (0.59 | ) | (0.47 | ) | (0.08 | ) | ||||||||||
|
|
|
|
|
|
|
|
|
| |||||||||||
Net Asset Value, end of period | $ | 37.16 | $ | 41.83 | $ | 31.43 | $ | 27.08 | $ | 27.29 | ||||||||||
|
|
|
|
|
|
|
|
|
| |||||||||||
Total Return (%) | (9.84 | )(c) | 35.25 | (c) | 18.72 | (c) | 1.03 | (c) | 9.52 | ** | ||||||||||
Ratios to Average Net Assets and Supplemental Data | ||||||||||||||||||||
Net Assets, end of period ($ millions) | 11 | 40 | 101 | 111 | 61 | |||||||||||||||
Ratio of expenses before fee waiver (%) | 0.19 | 0.19 | 0.19 | 0.19 | 0.19 | * | ||||||||||||||
Ratio of expenses after fee waiver (%) | 0.19 | 0.19 | 0.19 | 0.19 | 0.19 | * | ||||||||||||||
Ratio of net investment income (loss) (%) | 1.29 | 1.51 | 1.85 | 1.93 | 2.00 | * | ||||||||||||||
Portfolio turnover rate (%)(d) | 14 | 13 | 22 | 31 | 26 | ** | ||||||||||||||
| Xtrackers Russell US Multifactor ETF Selected Per Share Data | Years Ended August 31, | |||||||||||||||||||
| 2022 | 2021 | 2020 | 2019 | 2018 | ||||||||||||||||
Net Asset Value, beginning of year | $ | 46.33 | $ | 34.84 | $ | 33.88 | $ | 33.93 | $ | 29.47 | ||||||||||
|
|
|
|
|
|
|
|
|
| |||||||||||
| Income (loss) from investment operations: | ||||||||||||||||||||
Net investment income (loss)(b) | 0.72 | 0.56 | 0.62 | 0.57 | 0.52 | |||||||||||||||
Net realized and unrealized gain (loss) | (4.76 | ) | 11.47 | 0.96 | (0.09 | ) | 4.44 | |||||||||||||
|
|
|
|
|
|
|
|
|
| |||||||||||
Total from investment operations | (4.04 | ) | 12.03 | 1.58 | 0.48 | 4.96 | ||||||||||||||
|
|
|
|
|
|
|
|
|
| |||||||||||
| Less distributions from: |
| |||||||||||||||||||
Net investment income | (0.66 | ) | (0.54 | ) | (0.62 | ) | (0.53 | ) | (0.50 | ) | ||||||||||
|
|
|
|
|
|
|
|
|
| |||||||||||
Total distributions | (0.66 | ) | (0.54 | ) | (0.62 | ) | (0.53 | ) | (0.50 | ) | ||||||||||
|
|
|
|
|
|
|
|
|
| |||||||||||
Net Asset Value, end of year | $ | 41.63 | $ | 46.33 | $ | 34.84 | $ | 33.88 | $ | 33.93 | ||||||||||
|
|
|
|
|
|
|
|
|
| |||||||||||
Total Return (%)(c) | (8.80 | ) | 34.85 | 4.93 | 1.53 | 16.97 | ||||||||||||||
Ratios to Average Net Assets and Supplemental Data | ||||||||||||||||||||
Net Assets, end of year ($ millions) | 146 | 206 | 150 | 203 | 171 | |||||||||||||||
Ratio of expenses before fee waiver (%) | 0.17 | 0.17 | 0.17 | 0.17 | 0.19 | |||||||||||||||
Ratio of expenses after fee waiver (%) | 0.17 | 0.17 | 0.17 | 0.17 | 0.18 | |||||||||||||||
Ratio of net investment income (loss) (%) | 1.60 | 1.40 | 1.85 | 1.77 | 1.62 | |||||||||||||||
Portfolio turnover rate (%)(d) | 38 | 39 | 47 | 48 | 45 | |||||||||||||||
| (a) | For the period April 5, 2018 (commencement of operations) through August 31, 2018. |
| (b) | Based on average shares outstanding during the period. |
| (c) | Total Return would have been lower if certain expenses had not been reimbursed by the Advisor. |
| (d) | Portfolio turnover rate does not include securities received or delivered from processing creations or redemptions. |
| * | Annualized. |
| ** | Not Annualized. |
| See Notes to Financial Statements. | 62 |
DBX ETF Trust
1. Organization
DBX ETF Trust (the “Trust”) is registered under the Investment Company Act of 1940, as amended (the “Act”), as an open-end registered management investment company organized as a Delaware statutory trust.
As of August 31, 2022, the Trust consists of thirty-five investment series of exchange-traded funds (“ETFs”) (each a “Fund” and collectively, the “Funds”) in operation and trading. These financial statements report on the Funds listed below:
| Xtrackers FTSE Developed ex US Multifactor ETF |
| Xtrackers MSCI Kokusai Equity ETF |
Xtrackers Russell 1000 US Quality at a Reasonable Price ETF |
| Xtrackers Russell US Multifactor ETF |
DBX Advisors LLC (“DBX” or the “Advisor”), an indirect, wholly-owned subsidiary of DWS Group GmbH & Co. KGaA (“DWS Group”), serves as investment advisor to the Funds and has overall responsibility for the general management and administration of the Funds, subject to the supervision of the Funds’ Board of Trustees (“Board”).
Each Fund offers shares that are listed and traded on the NYSE Arca, Inc. (“NYSE Arca”). Unlike conventional mutual funds, each Fund issues and redeems shares on a continuous basis, at net asset value (“NAV”), only in large specified lots consisting of 50,000 shares, except for Xtrackers MSCI Kokusai Equity ETF which lots consist of 10,000 shares effective February 24, 2022, each called a “Creation Unit”, to authorized participants who have entered into agreements with the Funds’ distributor. Shares are not individually redeemable securities of the Funds, and owners of the shares may acquire those shares from the Funds, or tender such shares for redemption to the Funds, in Creation Units only.
The investment objective of each Fund is to track the performance, before fees and expenses, of a particular index (the “Underlying Index”). The underlying indices for the Funds are:
Fund | Underlying Index | |
| Xtrackers FTSE Developed ex US Multifactor ETF | FTSE Developed ex US Comprehensive Factor Index | |
| Xtrackers MSCI Kokusai Equity ETF | MSCI Kokusai Index | |
Xtrackers Russell 1000 US Quality at a Reasonable Price ETF | Russell 1000 2Qual/Val 5% Capped Factor Index | |
| Xtrackers Russell US Multifactor ETF | Russell 1000 Comprehensive Factor Index |
The FTSE Developed ex US Comprehensive Factor is designed to track the equity market performance of companies in developed countries (except the United States) selected on the investment style criteria (“factors”) of value, momentum, quality, low volatility and size. The companies eligible for the Underlying Index are derived from its starting universe, the FTSE Developed ex US Index, which is comprised of large- and mid-capitalization equity securities from developed markets (except the United States). The Underlying Index is rebalanced semiannually in March and September after the close of business on the third Friday of the review month.
The MSCI Kokusai Index, also known as the MSCI World ex Japan Index, is designed to track the performance of equity markets in developed markets (excluding Japan). The index is reviewed quarterly in February, May, August and November, with the objective of reflecting change in the underlying equity markets in a timely manner, while limiting undue index turnover. During the May and November semi-annual index reviews, the index is rebalanced and the large and mid capitalization cutoff points are recalculated.
The Russell 1000 2Qual/Val 5% Capped Factor Index is designed to track the equity market performance of companies in the United States selected on the investment style criteria (“factors”) of quality and value. The companies eligible for the Underlying Index are derived from its starting universe, the Russell 1000 Index, which is comprised of large-cap equity securities from issuers in the United States. The Underlying Index is rebalanced annually in June after the close of business on the third Friday of the review month. Upon a rebalancing, no issuer in the Underlying Index may represent more than 5% of the Underlying Index. In the event an issuer represents more than 5% of the Underlying Index at a rebalancing, such amount in excess of 5% shall be reallocated pro-rata to the other issuers in the Underlying Index.
The Russell 1000 Comprehensive Factor Index is designed to track the equity market performance of companies in the United States selected on the investment style criteria (“factors”) of value, momentum, quality, low volatility and size.
63
DBX ETF Trust
Notes to Financial Statements (Continued)
The companies eligible for the Underlying Index are derived from its starting universe, the Russell 1000 Index, which is comprised of large-cap equity securities from issuers in the United States. The Underlying Index is rebalanced semiannually in June and December after the close of business on the third Friday of the review month.
Each Fund is entitled to use its respective Underlying Index pursuant to a licensing agreement between the Index Provider and DBX. There is no charge to the Funds in connection with these licensing agreements.
Each Fund, except Xtrackers MSCI Kokusai Equity ETF is diversified. Xtrackers MSCI Kokusai Equity ETF is non-diversified and is not limited by the Act with regard to the percentage of its assets that may be invested in the securities of a single issuer. This means the securities of a particular issuer (or securities of issuers in particular industries) may dominate the Underlying Index of the Fund and, consequently, the Fund’s investment portfolio. This may adversely affect the Fund’s performance or subject the Fund’s shares to greater price volatility than that experienced by more diversified investment companies. Each Fund may change its diversification status over time and then change it back again, without shareholder approval, solely as a result of a change in relative market capitalization or index weighting of one or more constituents of the index each Fund tracks.
Pursuant to the Trust’s organizational documents, the Trust’s officers and trustees are indemnified against certain liabilities that may arise out of the performance of their duties to the Funds. Additionally, in the normal course of business the Trust enters into contracts that contain a variety of representations that provide indemnification for certain liabilities. The Trust’s maximum exposure under these arrangements is unknown, as this would involve future claims that may be made against the Funds that have not yet occurred. However, the Trust expects the risk of loss to be remote.
2. Significant Accounting Policies
The financial statements have been prepared in conformity with U.S. generally accepted accounting principles (“U.S. GAAP”), which require management to make certain estimates and assumptions that affect the reported amounts and disclosures in the financial statements. Actual results could differ from those estimates. Each Fund qualifies as an investment company under Topic 946 of the Accounting Standards Codification of U.S. GAAP. The following is a summary of significant accounting policies followed by the Funds.
Security Valuation The NAV of each Fund’s shares is calculated each business day as of the close of regular trading on the New York Stock Exchange, generally 4:00 p.m. Eastern Time. NAV per share is calculated by dividing a Fund’s net assets by the number of Fund shares outstanding.
The Funds’ Board has designated the Advisor as the valuation designee for the Funds pursuant to Rule 2a-5 under the 1940 Act. The Advisor’s Pricing Committee (the “Pricing Committee”) typically values securities using readily available market quotations or prices supplied by independent pricing services (which are considered fair values under Rule 2a-5). The Advisor has adopted fair valuation procedures that provide methodologies for fair valuing securities.
Various inputs are used in determining the value of the Funds’ investments. These inputs are summarized in three broad levels. Level 1 includes quoted prices in active markets for identical securities. Level 2 includes other significant observable inputs (including quoted prices for similar securities, interest rates, prepayment speeds, and credit risk). Level 3 includes significant unobservable inputs (including the Funds’ own assumptions in determining the fair value of investments). The level assigned to the securities valuations may not be an indication of the risk or liquidity associated with investing in those securities.
Equity securities and ETFs are valued at the most recent sale price or official closing price reported on the exchange (U.S. or foreign) or over-the-counter market on which they trade. Securities or ETFs for which no sales are reported are valued at the calculated mean between the most recent bid and asked quotations on the relevant market or, if a mean cannot be determined, at the most recent bid quotation. Equity securities and ETFs are generally categorized as Level 1.
Corporate and sovereign debt securities are valued at prices supplied by independent pricing services approved by the Pricing Committee. Such services may use various pricing techniques which take into account appropriate factors such as yield, quality, coupon rate, maturity, type of issue, trading characteristics and other data, as well as broker quotes. If the pricing services are unable to provide valuations, securities are valued at the mean between the bid and ask quotations or evaluated prices, as applicable, obtained from broker-dealers. These securities are generally categorized as Level 2.
64
DBX ETF Trust
Notes to Financial Statements (Continued)
Investments in open-end investment companies are valued at their NAV each business day and are categorized as Level 1.
Futures contracts are generally valued at the settlement prices established each day on the exchange on which they are traded and are categorized as Level 1.
Securities and other assets for which market quotations are not readily available or for which the above valuation procedures are deemed not to reflect fair value are valued in a manner that is intended to reflect their fair value as determined in accordance with procedures approved by the Pricing Committee and are generally categorized as Level 3. In accordance with the Funds’ valuation procedures, factors considered in determining value may include, but are not limited to, the type of the security; the size of the holding; the initial cost of the security; the existence of any contractual restrictions on the security’s disposition; the price and extent of public trading in similar securities of the issuer or of comparable companies; quotations or evaluated prices from broker-dealers and/or pricing services; information obtained from the issuer, analysts, and/or the appropriate stock exchange (for exchange-traded securities); an analysis of the company’s or issuer’s financial statements; an evaluation of the forces that influence the issuer and the market(s) in which the security is purchased and sold; and with respect to debt securities, the maturity, coupon, creditworthiness, currency denomination and the movement of the market in which the security is normally traded. The value determined under these procedures may differ from published values for the same securities.
Fair value pricing could result in a difference between the prices used to calculate a Fund’s NAV and the prices used by the Fund’s Underlying Index, which in turn could result in a difference between the Fund’s performance and the performance of the Fund’s Underlying Index.
Disclosure about the classification of the fair value measurements is included in a table following the Fund’s Schedule of Investments.
Cash Cash consists of cash held at banks and is on deposit with major financial institutions.
Investment Transactions and Investment Income Investment transactions are recorded as of the date that the securities are purchased or sold (trade date). Realized gains and losses from the sale or disposition of securities are calculated on the identified cost-method. Dividend income is net of any foreign taxes withheld at source. Certain dividends from foreign securities may be recorded subsequent to the ex-dividend date as soon as the Fund is informed of such dividends. Interest income is recorded on the accrual basis. Distributions received from foreign domiciled corporations, generally determined to be passive foreign investment companies for tax reporting purposes, are included in dividend income.
Tax Information and Dividends and Distributions to Shareholders It is each Fund’s policy to comply with all requirements of the Internal Revenue Code of 1986, as amended (“the Code”). Each Fund intends to qualify for and to elect treatment as a separate Regulated Investment Company (“RIC”) under Subchapter M of the Code. It is the policy of each Fund to pay out dividends from its net investment income, if any, to investors quarterly. Taxable net realized gains from investment transactions, reduced by capital loss carryforwards, if any, are declared and distributed to shareholders at least annually. The capital loss carryforward amount, if any, is available to offset future net capital gains. The Funds may occasionally be required to make supplemental distributions at some other time during the year. The Funds reserve the right to declare special distributions if, in their reasonable discretion, such action is necessary or advisable to preserve the status of each Fund as a RIC or to avoid imposition of income or excise taxes on undistributed income. Dividends and distributions to shareholders, if any, are recorded on the ex-dividend date. The amount of dividends and distributions from net investment income and net realized capital gains are determined in accordance with Federal income tax regulations which may differ from U.S. GAAP. These “book/tax” differences are either considered temporary or permanent in nature. To the extent these differences are permanent in nature, such amounts are reclassified at the end of the year within the components of net assets based on their federal tax treatment; temporary differences do not require reclassification. Dividends and distributions, which exceed earnings and profits for the full year for tax purposes, are reported as a tax return of capital.
In accordance with U.S. GAAP requirements regarding accounting for uncertainties in income taxes, management has analyzed the Funds’ tax positions taken or expected to be taken on foreign, federal and state income tax returns for all open tax years and has concluded that no provision for income tax is required in the Funds’ financial statements.
65
DBX ETF Trust
Notes to Financial Statements (Continued)
The Funds recognize interest and penalties, if any, related to uncertain tax positions as income tax expense on the Statements of Operations. For the year ended August 31, 2022, the Funds did not incur any interest or penalties.
As of August 31, 2022, the components of accumulated earnings (losses) on a tax basis were as follows:
| Undistributed Ordinary Income* | Capital and Other Gains (Losses) | Unrealized Appreciation (Depreciation) | Total Accumulated Earnings (Losses) | |||||||||||||
Xtrackers FTSE Developed ex US Multifactor ETF | $ | 286,270 | $ | (13,935,004 | ) | $ | (7,508,415 | ) | $ | (21,157,149 | ) | |||||
Xtrackers MSCI Kokusai Equity ETF | 1,746,836 | (3,097,875 | ) | (20,148,309 | ) | (21,499,348 | ) | |||||||||
Xtrackers Russell 1000 US Quality at a Reasonable Price ETF | 40,276 | (3,526,764 | ) | 135,111 | (3,351,377 | ) | ||||||||||
Xtrackers Russell US Multifactor ETF | 535,643 | (30,869,101 | ) | 8,541,343 | (21,792,115 | ) | ||||||||||
The tax character of dividends and distributions declared for the years ended August 31, 2022 and August 31, 2021 were as follows:
| Year Ended August 31, 2022 | ||||||||
| Ordinary Income* | Long Term Capital Gains | |||||||
Xtrackers FTSE Developed ex US Multifactor ETF | $ | 2,665,644 | $ | — | ||||
Xtrackers MSCI Kokusai Equity ETF | 10,748,298 | — | ||||||
Xtrackers Russell 1000 US Quality at a Reasonable Price ETF | 319,266 | — | ||||||
Xtrackers Russell US Multifactor ETF | 2,701,417 | — | �� | |||||
| Year Ended August 31, 2021 | ||||||||
| Ordinary Income* | Long Term Capital Gains | |||||||
Xtrackers FTSE Developed ex US Multifactor ETF | $ | 2,769,501 | $ | — | ||||
Xtrackers MSCI Kokusai Equity ETF | 11,426,407 | 35,164 | ||||||
Xtrackers Russell 1000 US Quality at a Reasonable Price ETF | 1,304,404 | — | ||||||
Xtrackers Russell US Multifactor ETF | 2,600,903 | — | ||||||
| * | For tax purposes short-term capital gain distributions are considered ordinary income distributions. |
At August 31, 2022, for Federal income tax purposes, the Funds have capital loss carryforwards available as shown in the table below, to the extent provided by regulations, to offset future capital gains for an unlimited period. To the extent that these loss carryforwards are used to offset future capital gains, it is probable that the capital gains so offset will not be distributed to shareholders.
| Short-Term | Long-Term | Total Amount | ||||||||||
Xtrackers FTSE Developed ex US Multifactor ETF | $ | 6,499,149 | $ | 7,435,855 | $ | 13,935,004 | ||||||
Xtrackers MSCI Kokusai Equity ETF | 1,443,212 | 1,654,663 | 3,097,875 | |||||||||
Xtrackers Russell 1000 US Quality at a Reasonable Price ETF | 544,474 | 2,982,290 | 3,526,764 | |||||||||
Xtrackers Russell US Multifactor ETF | 21,569,550 | 9,299,551 | 30,869,101 | |||||||||
For the fiscal year ended August 31, 2022, the effect of permanent “book/tax” reclassifications to the components of net assets are included below. These differences are primarily due to redemptions-in-kind and equalization.
| Distributable earnings (loss) | Paid-In Capital | |||||||
Xtrackers FTSE Developed ex US Multifactor ETF | $ | (6,181,374 | ) | $ | 6,181,374 | |||
Xtrackers MSCI Kokusai Equity ETF | (110,870,877 | ) | 110,870,877 | |||||
Xtrackers Russell 1000 US Quality at a Reasonable Price ETF | (5,955,479 | ) | 5,955,479 | |||||
Xtrackers Russell US Multifactor ETF | (26,542,934 | ) | 26,542,934 | |||||
66
DBX ETF Trust
Notes to Financial Statements (Continued)
As of August 31, 2022, the aggregate cost of investments for federal income tax purposes, the net unrealized appreciation or (depreciation) and the aggregated gross unrealized appreciation (depreciation) on investments were as follows:
| Aggregate Tax Cost | Net Unrealized Appreciation (Depreciation) | Aggregate Gross Unrealized Appreciation | Aggregate Gross Unrealized (Depreciation) | |||||||||||||
Xtrackers FTSE Developed ex US Multifactor ETF | $ | 73,747,260 | $ | (7,496,327 | ) | $ | 2,838,740 | $ | (10,335,067 | ) | ||||||
Xtrackers MSCI Kokusai Equity ETF | 520,620,894 | (20,097,530 | ) | 30,497,765 | (50,595,295 | ) | ||||||||||
Xtrackers Russell 1000 US Quality at a Reasonable Price ETF | 10,995,190 | 135,111 | 939,496 | (804,385 | ) | |||||||||||
Xtrackers Russell US Multifactor ETF | 137,204,602 | 8,541,343 | 15,009,670 | (6,468,327 | ) | |||||||||||
Foreign Taxes The Funds may be subject to foreign taxes (a portion of which may be reclaimable) on income, capital gains on investments, certain foreign currency transactions or other corporate events. All foreign taxes are recorded in accordance with the applicable foreign tax regulations and rates that exist in the foreign jurisdictions in which the Funds invest. These foreign taxes, if any, are paid by the Funds and are reflected in their Statements of Operations as follows: foreign taxes withheld at source are presented as a reduction of income, foreign taxes on capital gains from sales of investments and foreign currency transactions are included in their respective net realized gain (loss) categories, and deferred foreign taxes on unrealized gains are included in net change in unrealized appreciation (depreciation). Receivables and payables related to foreign taxes as of August 31, 2022, if any, are disclosed in the Funds’ Statements of Assets and Liabilities.
Foreign Currency Translations The books and records of the Funds are maintained in U.S. dollars. Investment securities and other assets and liabilities denominated in a foreign currency are translated into U.S. dollars at the prevailing exchange rates at period end. Purchases and sales of investment securities, income and expenses are translated into U.S. dollars at the prevailing exchange rates on the respective dates of the transactions.
Net realized and unrealized gains and losses on foreign currency transactions represent net gains and losses between trade and settlement dates on securities transactions, the acquisition and disposition of foreign currencies, and the difference between the amount of net investment income accrued and the U.S. dollar amount actually received. The portion of both realized and unrealized gains and losses on investments that results from fluctuations in foreign currency exchange rates is not separately disclosed, but is included with net realized and unrealized gain/appreciation and loss/depreciation on investments.
Securities Lending The Funds may lend securities to certain financial institutions under the terms of their securities lending agreement. During the term of the loans, the Funds continue to receive interest and dividends generated by the securities and to participate in any changes in their market value. The Funds require the borrowers of the securities to maintain collateral with the Funds consisting of cash and/or securities issued or guaranteed by the U.S. Government, its agencies or instrumentalities having a value at least equal to the value of the securities loaned. When the collateral falls below specified amounts, the lending agent will use its best effort to obtain additional collateral on the next business day to meet required amounts under the securities lending agreement. During the year ended August 31, 2022, the Funds invested the cash collateral into a joint trading account in DWS Government & Agency Securities Portfolio, an affiliated money market fund managed by DWS Investment Management Americas, Inc. DWS Investment Management Americas, Inc. receives a management/administration fee (0.06% annualized effective rate as of August 31, 2022) on the cash collateral invested in DWS Government & Agency Securities Portfolio. The Funds receive compensation for lending their securities either in the form of fees or by earning interest on invested cash collateral, net of borrower rebates and fees paid to a lending agent. Either the Fund or the borrower may terminate the loan at any time and the borrower, after notice, is required to return borrowed securities within a standard time period. There may be risks of delay and costs in recovery of securities or even loss of rights in the collateral should the borrower of the securities fail financially. If the Funds are not able to recover securities lent, the Funds may sell the collateral and purchase a replacement investment in the market, incurring the risk that the value of the replacement security is greater than the value of the collateral. The Funds are also subject to all investment risks associated with the reinvestment of any cash collateral received, including, but not limited to, interest rate, credit and liquidity risk associated with such investments.
67
DBX ETF Trust
Notes to Financial Statements (Continued)
As of August 31, 2022, the Funds listed below had securities on loan. The value of the related collateral exceeded the value of the securities loaned at period end.
Remaining Contractual Maturity of the Agreements, as of August 31, 2022 | ||||||||||||||||||||
| Securities Lending Transactions | Overnight and Continuous | <30 Days | Between 30 & 90 days | >90 days | Total | |||||||||||||||
Xtrackers FTSE Developed ex US Multifactor ETF |
| |||||||||||||||||||
Common Stocks | $ | 731,962 | $ | — | $ | 830 | $ | 443,426 | $ | 1,176,218 | ||||||||||
|
|
|
|
|
|
|
|
|
| |||||||||||
Gross amount of recognized liabilities and non-cash collateral for securities lending transactions |
| $ | 1,176,218 | |||||||||||||||||
Xtrackers MSCI Kokusai Equity ETF | ||||||||||||||||||||
Common Stocks | $ | 339,649 | $ | 2,538 | $ | 18,969 | $ | 2,393,556 | $ | 2,754,712 | ||||||||||
|
|
|
|
|
|
|
|
|
| |||||||||||
Gross amount of recognized liabilities and non-cash collateral for securities lending transactions |
| $ | 2,754,712 | |||||||||||||||||
Xtrackers Russell 1000 US Quality at a Reasonable Price ETF |
| |||||||||||||||||||
Common Stocks | $ | 4,995 | $ | 7 | $ | 164 | $ | 134,966 | $ | 140,132 | ||||||||||
|
|
|
|
|
|
|
|
|
| |||||||||||
Gross amount of recognized liabilities and non-cash collateral for securities lending transactions |
| $ | 140,132 | |||||||||||||||||
Xtrackers Russell US Multifactor ETF | ||||||||||||||||||||
Common Stocks | $ | 304,334 | $ | 1,483 | $ | 9,782 | $ | 2,589,948 | $ | 2,905,547 | ||||||||||
|
|
|
|
|
|
|
|
|
| |||||||||||
Gross amount of recognized liabilities and non-cash collateral for securities lending transactions |
| $ | 2,905,547 | |||||||||||||||||
Derivatives
Futures Contracts Each Fund may enter into futures contracts. These futures contracts will be used to simulate investment in the respective Underlying Index, to facilitate trading or to reduce transaction costs. Each Fund will enter into futures contracts that are traded on a U.S. or non-U.S. exchange. No Fund will use futures for speculative purposes. Futures contracts provide for the future sale by one party and purchase by another party of a specified amount of a specific instrument or index at a specified future time and at a specified price. For the year ended August 31, 2022, Xtrackers FTSE Developed ex US Multifactor ETF, Xtrackers MSCI Kokusai Equity ETF, Xtrackers Russell 1000 US Quality at a Reasonable Price ETF and Xtrackers Russell US Multifactor ETF utilized futures in order to simulate investment in the Underlying Index. To the extent required by law, liquid assets committed to futures contracts will be maintained.
At the time each Fund enters into a futures contract, each Fund deposits and maintains as collateral an initial margin with the broker, as required by the exchange on which the transaction is affected. Pursuant to the contract, each Fund agrees to receive from or pay to the broker an amount of cash equal to the daily fluctuation in the value of the contract. Such receipts or payments are known as variation margin and are recorded by each Fund as unrealized gains or losses. Risks may arise from the potential inability of a counterparty to meet the terms of the contract. The credit/counterparty risk for exchange-traded futures contracts is generally less than privately negotiated futures contracts, since the clearinghouse, which is the issuer or counterparty to each exchange-traded future, provides a guarantee of performance. The guarantee is supported by a daily payment system (i.e., margin requirements).
Use of long futures contracts subjects each Fund to risk of loss in excess of the amounts shown on the Statement of Assets and Liabilities, up to the notional value of the futures contracts. Use of short futures contracts subjects each Fund to unlimited risk of loss. Under some circumstances, futures exchanges may establish daily limits on the amount that the price of a futures contract can vary from the previous day’s settlement price, which could effectively prevent liquidation of unfavorable positions.
A summary of the open futures contracts as of August 31, 2022 is included in a table following the Funds’ Schedule of Investments.
68
DBX ETF Trust
Notes to Financial Statements (Continued)
The following tables summarize the value of the Funds’ derivative instruments held as of August 31, 2022 and the related location in the accompanying Statement of Assets and Liabilities, presented by primary underlying risk exposure:
Asset Derivatives | Liability Derivatives | |||||||||||||
| Xtrackers FTSE Developed ex US Multifactor ETF |
| |||||||||||||
| Equity contracts | Unrealized appreciation on futures contracts* | $ | — | Unrealized depreciation on futures contracts* | $ | 4,700 | ||||||||
| Xtrackers MSCI Kokusai Equity ETF |
| |||||||||||||
| Equity contracts | Unrealized appreciation on futures contracts* | $ | 18,985 | Unrealized depreciation on futures contracts* | $ | 46,544 | ||||||||
| Xtrackers Russell US Multifactor ETF |
| |||||||||||||
| Equity contracts | Unrealized appreciation on futures contracts* | $ | 20,770 | Unrealized depreciation on futures contracts* | $ | — | ||||||||
| * | Includes cumulative appreciation or cumulative depreciation of futures contracts as disclosed in the Schedule of Investments. Unsettled variation margin is disclosed separately within the Statement of Assets and Liabilities. |
Additionally, the amount of realized and unrealized gains and losses on derivative instruments recognized in the Funds’ earnings during the year ended August 31, 2022 and the related location in the accompanying Statement of Operations is summarized in the following tables by primary underlying risk exposure:
Net Realized Gain (Loss) from: | ||||
| Futures Contracts -Equity Contracts | ||||
Xtrackers FTSE Developed ex US Multifactor ETF | $ | (111,556 | ) | |
Xtrackers MSCI Kokusai Equity ETF | (101,001 | ) | ||
Xtrackers Russell 1000 US Quality at a Reasonable Price ETF | (15,142 | ) | ||
Xtrackers Russell US Multifactor ETF | (88,792 | ) | ||
Net Change in Unrealized Appreciation (Depreciation) on: | ||||
| Futures Contracts -Equity Contracts | ||||
Xtrackers FTSE Developed ex US Multifactor ETF | $ | (2,009 | ) | |
Xtrackers MSCI Kokusai Equity ETF | (73,643 | ) | ||
Xtrackers Russell 1000 US Quality at a Reasonable Price ETF | (13,743 | ) | ||
Xtrackers Russell US Multifactor ETF | (4,635 | ) | ||
For the year ended August 31, 2022 the average monthly volume of derivatives was as follows:
| Futures Contracts (Contract Value) | ||||
Xtrackers FTSE Developed ex US Multifactor ETF | $ | 443,130 | ||
Xtrackers MSCI Kokusai Equity ETF | 1,613,969 | |||
Xtrackers Russell 1000 US Quality at a Reasonable Price ETF | 170,776 | |||
Xtrackers Russell US Multifactor ETF | 592,953 | |||
Affiliated Cash Management Vehicles The Funds may invest uninvested cash balances in DWS Government Money Market Series and DWS ESG Liquidity Fund, affiliated money market funds which are managed by DWS Investment Management Americas, Inc. (“DIMA”), also an indirect, wholly owned subsidiary of DWS Group GmbH & Co. KGaA. Each affiliated money market fund is managed in accordance with Rule 2a-7 under the 1940 Act, which governs the quality, maturity, diversity and liquidity of instruments in which a money market fund may invest. DWS Government Money Market Series seeks to maintain a stable NAV, and DWS ESG Liquidity Fund maintains a floating NAV. The Funds indirectly bear their proportionate share of the expenses of each affiliated
69
DBX ETF Trust
Notes to Financial Statements (Continued)
money market fund in which they invest. The Advisor will waive an amount of the unitary advisory fee payable to the Advisor by the Funds equal to such acquired fund’s fees and expenses on the Funds’ assets invested in the affiliated money market funds.
3. Investment Advisory and Other Agreements
The Advisor has overall responsibility for the general management and administration of the Funds, subject to the supervision of the Funds’ Board of Trustees. Under an investment advisory agreement between the Trust, on behalf of the Funds, and the Advisor (the “Investment Advisory Agreement”), the Advisor is responsible for arranging sub-advisory, transfer agency, custody, fund administration, and all other non-distribution related services for the Funds to operate.
For its investment advisory services to the Funds below, the Advisor is entitled to receive a unitary advisory fee from each Fund based on each Fund’s average daily net assets, computed and accrued daily and payable monthly, at an annual rate equal to:
| Unitary Advisory Fee | ||||
Xtrackers FTSE Developed ex US Multifactor ETF | 0.35 | % | ||
Xtrackers MSCI Kokusai Equity ETF | 0.09 | % | ||
Xtrackers Russell 1000 US Quality at a Reasonable Price ETF | 0.19 | % | ||
Xtrackers Russell US Multifactor ETF | 0.17 | % | ||
The Advisor for Xtrackers FTSE Developed ex US Multifactor ETF has contractually agreed, until December 16, 2022, to waive a portion of its unitary advisory fee to the extent necessary to prevent the operating expenses of the Fund (excluding interest expense, taxes, brokerage expenses, distribution fees or expenses, litigation expenses and other extraordinary expenses) from exceeding 0.24% of the Fund’s average daily net assets. For the year ended August 31, 2022, the Advisor waived $75,805 of expenses to the Fund.
The Advisor for the Funds below has contractually agreed to waive a portion of its unitary advisory fee in an amount equal to the acquired fund’s fees and expenses attributable to the Funds’ investments in affiliated Funds. For the year ended August 31, 2022, the Advisor waived expenses of the Funds as follows:
| Expenses Waived | ||||
Xtrackers FTSE Developed ex US Multifactor ETF | $ | 431 | ||
Xtrackers MSCI Kokusai Equity ETF | 218 | |||
Xtrackers Russell 1000 US Quality at a Reasonable Price ETF | 138 | |||
Xtrackers Russell US Multifactor ETF | 272 | |||
Out of the unitary advisory fee, the Advisor pays substantially all expenses of each Fund, including the cost of transfer agency, custody, fund administration, legal, audit and other services, and expenses of the Independent Trustees. Each Fund is responsible for the payment of interest expense, acquired fund fees and expenses, taxes, brokerage expenses, distribution fees or expenses, if any, litigation expenses and extraordinary expenses.
The Bank of New York Mellon, a wholly-owned subsidiary of The Bank of New York Mellon Corporation, serves as Administrator, Custodian, Accounting Agent, Lending Agent and Transfer Agent for each Fund.
ALPS Distributors, Inc. (the “Distributor”) serves as the distributor of Creation Units for each Fund on an agency basis. The Distributor does not maintain a secondary market in shares of the Funds.
The Board of Trustees is currently comprised of three Independent Trustees. The Advisor paid retainer fees and attendance fees to each Independent Trustee; retainer fees to the Chairman of the Board of Trustees and Chairman of the Audit Committee; and attendance fees to each member of the Audit Committee (which is comprised of all of the Funds’ Independent Trustees).
70
DBX ETF Trust
Notes to Financial Statements (Continued)
4. Investment Portfolio Transactions
For the year ended August 31, 2022, the cost of investments purchased and proceeds from sale of investments (excluding in-kind transactions and short-term investments) were as follows:
| Purchases | Sales | |||||||
Xtrackers FTSE Developed ex US Multifactor ETF | $ | 39,550,136 | $ | 38,687,220 | ||||
Xtrackers MSCI Kokusai Equity ETF | 23,092,735 | 25,508,089 | ||||||
Xtrackers Russell 1000 US Quality at a Reasonable Price ETF | 3,000,410 | 2,867,520 | ||||||
Xtrackers Russell US Multifactor ETF | 64,169,427 | 64,633,855 | ||||||
For the year ended August 31, 2022, the cost of in-kind purchases and proceeds from in-kind sales were as follows:
| Purchases | Sales | |||||||
Xtrackers FTSE Developed ex US Multifactor ETF | $ | 31,775,769 | $ | 20,030,052 | ||||
Xtrackers MSCI Kokusai Equity ETF | 219,413,951 | 436,454,435 | ||||||
Xtrackers Russell 1000 US Quality at a Reasonable Price ETF | 1,772,604 | 29,226,549 | ||||||
Xtrackers Russell US Multifactor ETF | 38,209,936 | 82,124,881 | ||||||
5. Fund Share Transactions
As of August 31, 2022 there were unlimited Fund shares, no par value, authorized by the Trust. Fund shares are issued and redeemed by each Fund only in Creation Units or multiples thereof. Except when aggregated in Creation Units, shares of each Fund are not redeemable. Transactions in capital shares for each Fund are disclosed in detail in the Statements of Changes in Net Assets. The consideration for the purchase of Creation Units of a Fund generally consists of the in-kind contribution of a designated portfolio of securities constituting a portfolio sampling representation of the securities included in the respective Fund’s Underlying Index and an amount of cash, which under certain circumstances may include cash in lieu of portfolio securities. Investors purchasing and redeeming Creation Units pay a purchase transaction fee and a redemption transaction fee to offset transfer and other transaction costs associated with the issuance and redemption of Creation Units.
6. Other — COVID-19 Pandemic
A novel coronavirus known as COVID-19, declared a pandemic by the World Health Organization, has caused significant uncertainty, market volatility, decreased economic and other activity, increased government activity, including economic stimulus measures, and supply chain interruptions. The full effects, duration and costs of the COVID-19 pandemic are impossible to predict, and the circumstances surrounding the COVID-19 pandemic will continue to evolve, including the risk of future increased rates of infection due to significant portions of the population remaining unvaccinated and/or the lack of effectiveness of current vaccines against new variants. The pandemic has affected and may continue to affect certain countries, industries, economic sectors, companies and investment products more than others, may exacerbate existing economic, political, or social tensions and may increase the probability of an economic recession or depression. The Funds’ and their investments may be adversely affected by the effects of the COVID-19 pandemic, and the pandemic may result in the Funds and their service providers experiencing operational difficulties in coordinating a remote workforce and implementing their business continuity plans, among others. Management will continue to monitor the impact COVID-19 has on the Funds and reflect the consequences as appropriate in the Funds’ accounting and financial reporting.
71
DBX ETF Trust
To the Shareholders of
Xtrackers FTSE Developed ex US Multifactor ETF, Xtrackers MSCI Kokusai Equity ETF, Xtrackers Russell 1000 US Quality at a Reasonable Price ETF and Xtrackers Russell US Multifactor ETF and the Board of Trustees of DBX ETF Trust
Opinion on the Financial Statements
We have audited the accompanying statements of assets and liabilities of Xtrackers FTSE Developed ex US Multifactor ETF, Xtrackers MSCI Kokusai Equity ETF, Xtrackers Russell 1000 US Quality at a Reasonable Price ETF and Xtrackers Russell US Multifactor ETF (collectively referred to as the “Funds”), (four of the funds constituting DBX ETF Trust (the “Trust”)), including the schedules of investments, as of August 31, 2022, and the related statements of operations and changes in net assets, and the financial highlights for each of the periods indicated in the table below and the related notes (collectively referred to as the “financial statements”). In our opinion, the financial statements present fairly, in all material respects, the financial position of each of the Funds (four of the funds constituting DBX ETF Trust) at August 31, 2022, and the results of their operations, changes in net assets and financial highlights for each of the periods indicated in the table below, in conformity with U.S. generally accepted accounting principles.
| Individual fund constituting the DBX ETF Trust | Statement of operations | Statements of changes in net assets | Financial highlights | |||
Xtrackers FTSE Developed ex US Multifactor ETF
Xtrackers Russell US Multifactor ETF | For the year ended August 31, 2022 | For each of the two years in the period ended August 31, 2022 | For each of the five years in the period ended August 31, 2022 | |||
| Xtrackers Russell 1000 US Quality at a Reasonable Price ETF | For the year ended August 31, 2022 | For each of the two years in the period ended August 31, 2022 | For each of the four years in the period ended August 31, 2022 and the period from April 5, 2018 (commencement of operations) through August 31, 2018 | |||
| Xtrackers MSCI Kokusai Equity ETF | For the year ended August 31, 2022 | For each of the two years in the period ended August 31, 2022 | For each of the two years in the period ended August 31, 2022 and the period from April 8, 2020 (commencement of operations) through August 31, 2020 |
Basis for Opinion
These financial statements are the responsibility of the Trust’s management. Our responsibility is to express an opinion on each of the Funds’ financial statements based on our audits. We are a public accounting firm registered with the Public Company Accounting Oversight Board (United States) (“PCAOB”) and are required to be independent with respect to the Trust in accordance with the U.S. federal securities laws and the applicable rules and regulations of the Securities and Exchange Commission and the PCAOB.
We conducted our audits in accordance with the standards of the PCAOB. Those standards require that we plan and perform the audit to obtain reasonable assurance about whether the financial statements are free of material misstatement, whether due to error or fraud. The Trust is not required to have, nor were we engaged to perform, an audit of the Trust’s internal control over financial reporting. As part of our audits we are required to obtain an understanding of internal control over financial reporting but not for the purpose of expressing an opinion on the effectiveness of the Trust’s internal control over financial reporting. Accordingly, we express no such opinion.
72
DBX ETF Trust
Report of Independent Registered Public Accounting Firm (Continued)
Our audits included performing procedures to assess the risks of material misstatement of the financial statements, whether due to error or fraud, and performing procedures that respond to those risks. Such procedures included examining, on a test basis, evidence regarding the amounts and disclosures in the financial statements. Our procedures included confirmation of securities owned as of August 31, 2022, by correspondence with the custodian, brokers and others; when replies were not received from brokers, we performed other auditing procedures. Our audits also included evaluating the accounting principles used and significant estimates made by management, as well as evaluating the overall presentation of the financial statements. We believe that our audits provide a reasonable basis for our opinion.

We have served as the auditor of one or more investment companies in the DWS family of funds since at least 1979, but we are unable to determine the specific year.
New York, New York
October 25, 2022
73
DBX ETF Trust
Identification and Background
The Board has responsibility for the overall management and operations of the funds, including general supervision of the duties performed by the Advisor and other service providers. Each Board Member serves until his or her successor is duly elected or appointed and qualified. Each officer serves until he or she resigns, is removed, dies, retires or becomes disqualified.
The Trust currently has three Board Members. The three Independent Board Members have no affiliation or business connection with the Advisor or any of its affiliated persons and do not own any stock or other securities issued by the Advisor.
The Independent Board Members of the Trust, their term of office and length of time served, their principal business occupations during the past five years, the number of portfolios in the fund complex (defined below) overseen by each Independent Board Member, and other directorships, if any, held by the Board Members are shown below. The fund complex includes all registered open- and closed-end funds (including all of their portfolios) advised by the Advisor and any registered funds that have an investment advisor that is an affiliated person of the Advisor. As of the date of this shareholder report, the fund complex consists of the funds in the Trust, as well as the registered funds advised by affiliates of the Advisor.
Shareholder Communications to the Board. Shareholders may send communications to the Trust’s Board by addressing the communications directly to the Board (or individual Board Members) and/or otherwise clearly indicating in the salutation that the communication is for the Board (or individual Board Members). The shareholder may send the communication to either the Trust’s office or directly to such Board members c/o 875 Third Avenue, New York, NY 10022. Other shareholder communications received by the Trust not directly addressed and sent to the Board will be reviewed and generally responded to by management. Such communications will be forwarded to the Board at management’s discretion based on the matters contained therein.
Independent Board Members
| Name, Year of Birth, Position with the Trust and Length of Time Served(1) | Business Experience and Directorships During the Past 5 Years | Number of Portfolios in Fund Complex Overseen | Other Directorships Held by Board Member | |||
Stephen R. Byers (1953) Chairperson since 2016, and Board Member since 2011 (formerly, Lead Independent Board Member, 2015-2016) | Independent Director (2011-present); Independent Consultant (2014-present); Director of Investment Management, the Dreyfus Corporation (2000-2006) and Vice Chairman and Chief Investment Officer, the Dreyfus Corporation (2002-2006). | 35 | The Arbitrage Funds, Sierra Income Corporation, Mutual Fund Directors Forum | |||
George O. Elston (1964) Board Member since 2011, Chairperson of the Audit Committee since 2015 | Chief Financial Officer, EyePoint Pharmaceuticals, Inc. (2019-present); Chief Financial Officer, Enzyvant (2018-2019); Chief Executive Officer, 2X Oncology, Inc. (2017-2018); Senior Vice President and Chief Financial Officer, Juniper Pharmaceuticals, Inc. (2014-2016); Senior Vice President and Chief Financial Officer, KBI BioPharma Inc. (2013-2014); Managing Partner, Chatham Street Partners (2010-2013). | 35 | — | |||
J. David Officer (1948) Board Member since 2011, Chairperson of the Nominating Committee since 2015 | Independent Director (2010-present); Vice Chairman, the Dreyfus Corporation (2006-2009); President, The Dreyfus Family of Funds, Inc. (2006-2009). | 35 | (Chairman of) Ilex Management Ltd; Old Westbury Funds |
74
DBX ETF Trust
Board Members and Officers (Unaudited) (Continued)
Officers(2)
| Name, Year of Birth, Position with the Trust and Length of Time Served(3) | Business Experience and Directorships During the Past 5 Years | |
Freddi Klassen(4) (1975) President and Chief Executive Officer, 2016-present | Programmes (Head since 2021), of DWS Investment Management Americas, Inc. and Manager and Chief Operating Officer of the Advisor (2016-present). Formerly: Chief Operating Officer in the Americas for the Traditional Asset Classes Department (2014 -2020); Manager and Chief Operating Officer of DWS Investment Management Americas, Inc. (2018- 2020); Global Chief Operating Officer for Equities Technology in the Investment Bank Division at Deutsche Bank AG (2013- 2014); Chief Operating Officer for Exchange Traded Funds and Systematic Funds in Europe (2008-2013). | |
Diane Kenneally(5) (1966) Treasurer, Chief Financial Officer and Controller, 2019-present | Fund Administration Treasurer’s Office (Co-Head since 2018), of DWS Investment Management Americas, Inc.; Chief Financial Officer and Treasurer for DWS US registered investment companies advised by DWS Investment Management Americas, Inc. (2018- present); Treasurer and Chief Financial Officer, The European Equity Fund, Inc., The New Germany Fund, Inc. and The Central and Eastern Europe Fund, Inc. (2018-present); formerly: Assistant Treasurer for the DWS funds (2007- 2018). | |
Frank Gecsedi(4) (1967) Chief Compliance Officer, 2010-present | AFC Compliance US (Senior Team Lead), of DWS Investment Management Americas, Inc.; Compliance Department (2016-present), Vice President in the Deutsche Asset Management Compliance Department at Deutsche Bank AG (2013-2016) and Chief Compliance Officer of the Advisor (2010-present); Chief Compliance Officer of DWS Distributors, Inc. (2019-2022); Vice President in Deutsche Bank’s Global Markets Legal, Risk and Capital Division (2010- 2012). | |
| Bryan Richards(4) (1978) Vice President, 2016-present | Portfolio Engineering, Systematic Investments Solutions (Head), of DWS Investment Management Americas, Inc. (2018-present); Portfolio Manager in the Passive Asset Management Department at DWS (2011- present); Primary Portfolio Manager for the PowerShares DB Commodity ETFs (2011-2015). | |
| John Millette(5) (1962) Secretary, 2020-present | Legal (Associate General Counsel), DWS US Retail Legal (2003-present), of DWS Investment Management Americas, Inc.; Vice President and Secretary of DWS US registered investment companies advised by DWS Investment Management Americas, Inc. (1999-present); Chief Legal Officer, DWS Investment Management Americas, Inc. (2015- present); Director and Vice President of DWS Trust Company (2016-present); Vice President, DBX Advisors LLC (2021-present); Secretary, The European Equity Fund, Inc., The New Germany Fund, Inc. and The Central and Eastern Europe Fund, Inc. (2011- present); formerly: Secretary of Deutsche Investment Management Americas Inc. (2015-2017); and Assistant Secretary of DBX ETF Trust (2019-2020). |
75
DBX ETF Trust
Board Members and Officers (Unaudited) (Continued)
| Name, Year of Birth, Position with the Trust and Length of Time Served(3) | Business Experience and Directorships During the Past 5 Years | |
| Caroline Pearson(5) (1962) Assistant Secretary, 2020-present | Legal (Senior Team Lead), DWS US Retail Legal, of DWS Investment Management Americas, Inc.; Chief Legal Officer of DWS US registered investment companies advised by DWS Investment Management Americas, Inc. (2010-present); Chief Legal Officer, DBX Advisors LLC (2020-present); Chief Legal Officer, The European Equity Fund, Inc., The New Germany Fund, Inc. and The Central and Eastern Europe Fund, Inc. (2012-present); formerly: Secretary, Deutsche AM Distributors, Inc. (2002-2017); and Secretary, Deutsche AM Service Company (2010-2017); and Chief Legal Officer, DBX Strategic Advisors LLC (2020-2021). | |
| Paul Antosca(5) (1957) Assistant Treasurer, 2019-present | Fund Administration Tax (Head), of DWS Investment Management Americas, Inc.; Assistant Treasurer for DWS US registered investment companies advised by DWS Investment Management Americas, Inc. (2007-present). | |
| Jeffrey Berry(5) (1959) Assistant Treasurer, 2019-present | Fund Administration (Senior Specialist), of DWS Investment Management Americas, Inc. | |
| Sheila Cadogan(5) (1966) Assistant Treasurer, 2019-present | Fund Administration Treasurer’s Office (Co-Head since 2018), of DWS Investment Management Americas, Inc.; Assistant Treasurer for DWS US registered investment companies advised by DWS Investment Management Americas, Inc. (2017-present); Director and Vice President, DWS Trust Company (2018- present); Assistant Treasurer, The European Equity Fund, Inc., The New Germany Fund, Inc. and The Central and Eastern Europe Fund, Inc. (2018-present). | |
| Christina A. Morse(6) (1964) Assistant Secretary, 2017-present | Vice President at BNY Mellon Asset Servicing (2014- present); Vice President and Counsel at Lord Abbett & Co. LLC (2013-2014). | |
| Christian Rijs(4) (1980) Anti-Money Laundering Compliance Officer, since October 21, 2021 | Senior Team Lead Anti-Financial Crime and Compliance, DWS Investment Management Americas, Inc.; AML Officer, DWS Trust Company (since November 2, 2021); AML Officer, DWS US registered investment companies advised by DWS Investment Management Americas, Inc. (since October 6, 2021); AML Officer, The European Equity Fund, Inc., The New Germany Fund, Inc. and The Central and Eastern Europe Fund, Inc. (since November 12, 2021); formerly: DWS UK & Ireland Head of Anti-Financial Crime and MLRO. |
| (1) | The length of time served is represented by the year in which the Board Member joined the Board. |
| (2) | As a result of their respective positions held with the Advisor and its affiliates, these individuals are considered “interested persons” of the Advisor within the meaning of the 1940 Act. Interested persons receive no compensation from the Funds. |
| (3) | The length of time served is represented by the year in which the officer was first elected to the Trust in such capacity. |
| (4) | Address: 875 Third Avenue, New York, New York 10022. |
| (5) | Address: 100 Summer Street, Boston, MA 02110. |
| (6) | Address: BNY Mellon Asset Servicing, 240 Greenwich Street, New York, NY 10286. |
The Funds’ Statement of Additional Information (“SAI”) includes additional information about the Funds’ Board Members. The SAI is available by calling 855-329-3837, or on the Company’s website at www.Xtrackers.com.
76
DBX ETF Trust
Proxy Voting Policies and Procedures
The Funds’ policies and procedures for voting proxies for portfolio securities and information about how each Fund voted proxies related to its portfolio securities during the most recent 12-month period ended June 30 are available on our Web site — www.Xtrackers.com (click on “Resources” and “Proxy Voting” at the top of the page) — or on the SEC’s Web site — www.sec.gov. To obtain a written copy of the Funds’ policies and procedures without charge, upon request, call us toll free at (855) 329-3837.
Portfolio Holdings Information
The Funds are required to file their complete schedule of portfolio holdings with the SEC for their first and third fiscal quarters on Form N-PORT. Copies of the filings are available without charge, upon request on the SEC’s website at www.sec.gov and are available by calling the Trust at 855-329-3837.
Information about each Fund’s portfolio holdings is available daily at www.Xtrackers.com.
Discount & Premium Information
Information regarding how often shares of each Fund traded on NYSE Arca at a price above (i.e., at a premium) or below (i.e., at a discount) the NAV of the Fund can be found at www.Xtrackers.com.
Tax Information
Form 1099-DIV and other year-end tax information provide shareholders with actual calendar year amounts that should be included in their tax returns. Shareholders should consult their tax advisors.
Each Fund designates the following amounts or, if subsequently determined to be different, the maximum allowable for its year ended August 31, 2022.
| Qualified Dividend Income* | Dividends Received Deduction* | |||||||
Xtrackers FTSE Developed ex US Multifactor ETF | 100 | % | 0 | % | ||||
Xtrackers MSCI Kokusai Equity ETF | 94 | % | 39 | % | ||||
Xtrackers Russell 1000 US Quality at a Reasonable Price ETF | 100 | % | 100 | % | ||||
Xtrackers Russell US Multifactor ETF | 100 | % | 93 | % | ||||
* The above percentage is based on ordinary income dividends paid to shareholders during each Fund’s fiscal year.
Each Fund intends to elect to pass through to shareholders the credit for taxes paid to foreign countries. The gross foreign source income and foreign taxes paid are as follows:
| Gross Foreign Income | Foreign Taxes Income | |||||||
Xtrackers FTSE Developed ex US Multifactor ETF | $ | 2,775,998 | $ | 199,275 | ||||
77
DBX ETF Trust
This report is intended for the shareholders of the DBX ETF Trust.
This report must be preceded or accompanied by a prospectus.
Investing involves risk, including the possible loss of principal. Stocks may decline in value. Foreign investing involves greater and different risks than investing in U.S. companies, including currency fluctuations, less liquidity, less developed or less efficient trading markets, lack of comprehensive company information, political instability and differing auditing and legal standards. Funds investing in a single industry, country or in a limited geographic region, generally are more volatile than more diversified funds. Investing in derivatives entails special risks relating to liquidity, leverage and credit that may reduce returns and/or increase volatility. Because the Funds seek to provide exposure to stocks based on the following multifactors — value, momentum, quality, low volatility and size — it is expected, exposure to such investment factors will detract from performance in some market environments, as more fully explained in the Funds’ prospectus. KOKU is currently non-diversified and can take larger positions in fewer issues, increasing its potential risk. Performance of a Fund may diverge from that of its Underlying Index due to operating expenses, transaction costs, cash flows, use of sampling strategies or operational inefficiencies. An investment in any Fund should be considered only as a supplement to a complete investment program for those investors willing to accept the risks associated with that Fund. Please read the prospectus for more information.
War, terrorism, sanctions, economic uncertainty, trade disputes, public health crises and related geopolitical events have led, and, in the future, may lead to significant disruptions in U.S. and world economies and markets, which may lead to increased market volatility and may have significant adverse effects on the Funds and their investments.
Shares of the Funds are bought and sold at market price (not NAV) throughout the day on the NYSE Arca, Inc. Transactions in Fund shares may result in brokerage commissions and may generate tax consequences. There can be no assurance that an active trading market for shares of a Fund will develop or be maintained.
DBX ETF Trust Funds are distributed by ALPS Distributors, Inc. (“ALPS”). The Funds are managed by DBX Advisors LLC which is not affiliated with ALPS.
The brand DWS represents DWS Group GmbH & Co. KGaA and any of its subsidiaries such as DWS Distributors, Inc. which offers investment products or DWS Investment Management Americas, Inc. and RREEF America L.L.C. which offer advisory services.
DEEF, DEUS and QARP have been developed solely by DBX Advisors LLC. The Funds are not in any way connected to or sponsored, endorsed, issued, sold or promoted by the London Stock Exchange Group plc and its group undertakings (collectively, the “LSE Group”). FTSE Russell is a trading name of certain of the LSE Group companies.
All rights in the FTSE Developed ex US Comprehensive Factor Index, Russell 1000 Comprehensive Factor Index and Russell 1000 2Qual/Val 5% Capped Factor Index vest in the relevant LSE Group company which owns the Indexes. “FTSE®” “Russell®” and “FTSE Russell®” are a trademarks of the relevant LSE Group company and are used by any other LSE Group company under license.
The Index is calculated by or on behalf of FTSE International Limited or its affiliate, agent or partner. The LSE Group does not accept any liability whatsoever to any person arising out of (a) the use of, reliance on or any error in the Index or (b) investment in or operation of the Funds. The LSE Group makes no claim, prediction, warranty or representation either as to the results to be obtained from the Funds or the suitability of the Indexes for the purpose to which it is being put by DBX Advisors LLC.
KOKU is not sponsored, endorsed, issued, sold or promoted by MSCI, and MSCI bears no liability with respect to any such funds or securities or any index on which such funds or securities are based. The Prospectus contains a more detailed description of the limited relationship MSCI has with DBX Advisors LLC and any related funds.
Copyright © 2022 DWS Group. All rights reserved. XtrackersTM is a trademark of DWS Investment GmbH. All other trademarks, servicemarks or registered trademarks are the property of their respective owners.
Not FDIC Insured | No Bank Guarantee | May Lose Value
DBX ETF Trust
Investment advisor DBX Advisors LLC 875 Third Avenue New York, NY 10022 | Administrator, custodian, fund accounting agent, lending agent & transfer agent The Bank of New York Mellon 240 Greenwich Street New York, NY 10286 | Distributor ALPS Distributors, Inc. 1290 Broadway Suite 1000 Denver, CO 80203 | ||
Independent registered public accounting firm Ernst & Young LLP One Manhattan West New York, NY 10001 | Legal counsel Vedder Price P.C. 1633 Broadway New York, NY | |||
R-047731-7 (10/22) DBX005325 (10/23)
August 31, 2022
Annual Report
DBX ETF Trust
Xtrackers Emerging Markets Carbon Reduction and Climate Improvers ETF (EMCR)
Xtrackers MSCI EAFE ESG Leaders Equity ETF (EASG)
Xtrackers MSCI Emerging Markets ESG Leaders Equity ETF (EMSG)
Xtrackers MSCI USA ESG Leaders Equity ETF (USSG)
Xtrackers Net Zero Pathway Paris Aligned US Equity ETF (USNZ)
Xtrackers S&P 500 ESG ETF (SNPE)
Xtrackers S&P MidCap 400 ESG ETF (MIDE)
Xtrackers S&P SmallCap 600 ESG ETF (SMLE)

DBX ETF Trust
| Page | ||||
| 1 | ||||
| 3 | ||||
Xtrackers Emerging Markets Carbon Reduction and Climate Improvers ETF | 6 | |||
| 8 | ||||
| 10 | ||||
| 12 | ||||
| 14 | ||||
| 16 | ||||
| 18 | ||||
| 20 | ||||
| 22 | ||||
Xtrackers Emerging Markets Carbon Reduction and Climate Improvers ETF | 24 | |||
| 40 | ||||
| 46 | ||||
| 54 | ||||
| 59 | ||||
| 64 | ||||
| 69 | ||||
| 73 | ||||
| 78 | ||||
| 80 | ||||
| 82 | ||||
| 86 | ||||
| 90 | ||||
| 103 | ||||
Board Considerations in Approval of Investment Advisory Contracts | 105 | |||
| 107 | ||||
| 110 | ||||
To our Shareholders: (Unaudited)
Dear shareholder,
We are pleased to provide this annual report for eight of our equity ETFs tracking the environmental, social and governance (ESG) market for the period ended August 31, 2022.
The global economy’s recovery, supported by accommodative fiscal and monetary policies and rapid vaccination rollouts, was stalled by the emergence of the highly infectious Omicron variant of the coronavirus towards the end of 2021. Global equity markets started 2022 on a rough note as central banks shifted to a more hawkish stance in the face of rising inflation. The U.S. Federal Reserve emphasized on multiple rate hikes and mentioned the possibility of shrinking its balance sheet as a next step. The European Central Bank maintained its accommodative stance initially, but it has pivoted to a more hawkish tone lately as it made its first-rate hike since 2011 in July 2022. The sanctions placed on Russia following the ongoing Russia-Ukraine crisis pushed fuel prices to record levels.
ESG-focused funds’ flows and assets fell globally in 2022; meanwhile, global sustainable fund assets, which had expanded in Q4 2021, fell in the subsequent two quarters. Europe accounted for the lion’s share of the sustainable fund landscape, with 82% of global sustainable fund assets1. U.S.-domiciled sustainable funds bled USD1.6bn, their first quarter of outflows in more than five years. In the U.S., the Department of Labor proposed rules to permit fiduciaries of retirement plans to make allowances on ESG matters in their investment mandates. The Securities and Exchange Commission’s (SEC’s) semiannual regulatory agenda published in December 2021 included disclosure requirements on climate change, human capital management and corporate board diversity. The SEC also considered policies on cybersecurity governance, strategy and risk management.
The UK introduced a series of ESG-related rules and regulations, where all companies are currently required to include climate-related disclosures on a ‘comply or explain’ basis. In the European Union (EU), the sustainable finance disclosure regulation hastened the mainstreaming of ESG more than any other catalyst in the past year, designating funds that promote ESG characteristics, along with a sustainable investment objective. The EU started its implementation of the EU Taxonomy Regulation, which covers environmentally sustainable economic activities. Once fully implemented, it will cover 80% of all greenhouse gas emissions in the EU2. European authorities drafted a new Corporate Sustainability Reporting Directive (CSRD), which emphasizes on ‘double materiality,’ requiring companies to detail both their environmental impact and climate-related risks. To end the use of Russian natural gas by 2027, the EU acknowledged the need to burn more coal over the next decade3. However, EU officials believe that the block will achieve its targets to cut emissions by 55% by 20302.
We believe 2022 will be viewed as year of sudden and pivotal change, in both macroeconomic and financial conditions, affecting the global investment landscape, including ESG and the green transition. The positive ESG investment spree of the last decade might have taken a pause, as we can see by looking at global macroeconomic dynamics and the slowing down of institutional and retail investment flows observable in the market. Meanwhile, global record-high inflation levels and subsequent aggressive rate hikes by central banks have made investors jittery as expectations of a global slowdown and impending recession are on the rise.
Our team appreciates your trust and looks forward to serving your investment needs through innovative index-driven strategies.
Sincerely,
/s/ Freddi Klassen
Freddi Klassen
President and Chief Executive Officer
1 Source: Morningstar
2 Source: CNBC
3 Source: Conventus Law
Assumptions, estimates and opinions contained in this document constitute our judgment as of the date of the document and are subject to change without notice. Any projections are based on a number of assumptions as to market conditions and there can be no guarantee that any projected results will be achieved. Past performance is not a guarantee of future results.
1
This Page is Intentionally Left Blank
2
DBX ETF Trust
Xtrackers Emerging Markets Carbon Reduction and Climate Improvers ETF
The Xtrackers Emerging Markets Carbon Reduction and Climate Improvers ETF (EMCR) seeks investment results that correspond generally to the performance, before fees and expenses, of the Solactive ISS Emerging Markets Carbon Reduction & Climate Improvers Index NTR (the EMCR Index). The EMCR Index is comprised of large and mid-capitalization companies in emerging markets countries that meet certain environmental, social and governance (“ESG”) criteria and/or have committed to greenhouse gas emissions reduction targets. For the period ended August 31, 2022, EMCR shares returned -20.81%, compared to the EMCR Index return of -20.65%.
The majority of sectors contributed negatively to performance during the period with the greatest negative contributions coming from Information Technology, Consumer Discretionary and Communication Services. The Utilities and Energy sectors were the positive contributors to performance. From a geographical perspective, United Arab Emirates, South Africa and Qatar were the major positive contributors, while Hong Kong, the United States and South Korea contributed negatively to performance.
Xtrackers MSCI EAFE ESG Leaders Equity ETF
Xtrackers MSCI EAFE ESG Leaders Equity ETF (EASG) seeks investment results that correspond generally to the performance, before fees and expenses, of the MSCI EAFE ESG Leaders Index. (the EASG Index). The EASG Index is a capitalization weighted index that provides exposure to companies with high environmental, social and governance (“ESG”) performance relative to their sector peers and consists of large- and medium-capitalization companies across developed markets countries, excluding Canada and the United States. For the period ended August 31, 2022 EASG shares returned -21.40%, compared to the EASG Index return of -21.50%.
The majority of the sectors contributed negatively to performance during the period with the greatest contribution coming from Industrials, Information Technology and Consumer Discretionary. The Energy sector was the only positive contributor to performance. From a geographical perspective, Norway, Singapore, and Israel were the major positive contributors, while Japan, Germany and Netherlands contributed negatively to performance.
Xtrackers MSCI Emerging Markets ESG Leaders Equity ETF
Xtrackers MSCI Emerging Markets ESG Leaders Equity ETF (EMSG), seeks investment results that correspond generally to the performance, before fees and expenses, of the MSCI Emerging Markets ESG Leaders Index (the EMSG Index). The EMSG Index is a capitalization weighted index that provides exposure to companies with high environmental, social and governance (“ESG”) performance relative to their sector peers and consists of large- and medium-capitalization companies across emerging markets countries. For the period ended August 31, 2022, EMSG shares returned -25.55%, compared to the EMSG Index return of -25.29%.
All sectors contributed negatively to performance during the period with the Consumer Discretionary, Information Technology and Communication Services sectors detracting the most from performance. From a geographical perspective, Indonesia, United Arab Emirates and Chile were the major positive contributors, while Hong Kong, Taiwan and South Korea contributed negatively to performance.
Xtrackers MSCI USA ESG Leaders Equity ETF
Xtrackers MSCI USA ESG Leaders Equity ETF (USSG) seeks investment results that correspond generally to the performance, before fees and expenses, of the MSCI USA ESG Leaders Index (the USSG Index). The USSG Index is a capitalization weighted index that provides exposure to companies with high environmental, social and governance (“ESG”) performance relative to their sector peers and consists of large- and medium-capitalization companies in the U.S. market. For the period ended August 31, 2022, USSG shares returned -13.29%, compared to the USSG Index return of -13.22%.
The Majority of sectors contributed negatively to performance during the period with the greatest negative contributions coming from Information Technology, Communication Services and Consumer Discretionary. The Energy, Consumer Staples and Utilities sectors contributed positively to performance.
Xtrackers Net Zero Pathway Paris Aligned US Equity ETF
Xtrackers Net Zero Pathway Paris Aligned US Equity ETF (USNZ) seeks investment results that correspond generally to the performance, before fees and expenses, of the Solactive ISS ESG United States Net Zero Pathway Enhanced Index (the “USNZ Index”) .The USNZ Index which is comprised of large and mid-capitalization companies in the United States that meet certain environmental, social and governance (“ESG “) criteria. The
3
DBX ETF Trust
Management’s Discussion of Fund Performance (Unaudited) (Continued)
constituents of the USNZ Index are weighted in such a manner seeking to comply with the European Union Paris-aligned Benchmark standards, while incorporating recommendations of the Net Zero Investment Framework published, from time to time, by the Institutional Investors Group on Climate Change. For the period June 28, 2022, to August 31, 2022, USNZ shares returned 0.84%, compared to the USNZ Index return of 0.84%.
The majority of sectors contributed positively to performance during the period with the greatest positive contributions coming from Information Technology, Consumer Discretionary and Financials. The Health Care, Communication Services and Real Estate sectors detracted most from the performance.
Xtrackers S&P 500 ESG ETF
Xtrackers S&P 500 ESG ETF (SNPE), seeks investment results that correspond generally to the performance, before fees and expenses, of the S&P 500 ESG Index (the SNPE Index). The SNPE Index is a broadbased, market capitalization weighted index that provides exposure to companies with high environmental, social and governance (“ESG”) performance relative to their sector peers, while maintaining similar overall industry group weights as the S&P 500 Index. For the period ended August 31, 2022 SNPE shares returned -9.59%, compared to the SNPE Index return of -9.50%.
The majority of sectors contributed negatively to performance during the period with the greatest negative contributions coming from Information Technology, Communication Services and Consumer Discretionary. The Energy, Consumer Staples and Utilities sectors contributed positively to performance.
Xtrackers S&P MidCap 400 ESG ETF
Xtrackers S&P MidCap 400 ESG ETF (MIDE), seeks investment results that correspond generally to the performance, before fees and expenses, of the S&P MidCap 400 ESG Index (the MIDE Index). The MIDE Index is a broad-based, market capitalization weighted index that provides exposure to companies with high environmental, social and governance (“ESG”) performance relative to their sector peers, while maintaining similar overall industry group weights as the S&P MidCap 400 Index. For the period ending August 31, 2022 MIDE shares returned -9.64%, compared to the MIDE Index return of -9.52%.
The majority of sectors contributed negatively to performance during the period with the greatest negative contributions coming from Consumer Discretionary, Information Technology and Health Care. The Energy, Utilities and Consumer Staples sectors contributed positively to performance.
Xtrackers S&P SmallCap 600 ESG ETF
Xtrackers S&P SmallCap 600 ESG ETF (SMLE), seeks investment results that correspond generally to the performance, before fees and expenses, of the S&P SmallCap 600 ESG Index (the SMLE Index). The SMLE Index is a broad-based, market capitalization weighted index that provides exposure to companies with high environmental, social and governance (“ESG”) performance relative to their sector peers, while maintaining similar overall industry group weights as the S&P SmallCap 600 Index. For the period ending August 31, 2022 MIDE shares returned -10.43%, compared to the MIDE Index return of -10.28%.
The majority of sectors contributed negatively to performance during the period with the greatest negative contributions coming from Consumer Discretionary, Health Care and Information Technology. The Energy, Consumer Staples, and Utilities sectors contributed positively to performance.
*************************
Performance data quoted represents past performance and does not guarantee future results. Investment returns and principal value of an investment will fluctuate so that an investor’s shares, when sold or redeemed, may be worth more or less than their original cost. Current performance may be lower or higher than the performance data quoted. To obtain the most recent month-end performance data visit www.Xtrackers.com. Returns assume that dividends and capital gains distributions have been reinvested. See pages 6-21 of this report for additional performance information, including performance data based on market value.
The views expressed in this report reflect those of the portfolio management team only through the end of the period of the report as stated on the cover. The management team’s views are subject to change at any time based on market and other conditions and should not be construed as a recommendation. Current and future portfolio holdings are subject to risk.
4
This Page is Intentionally Left Blank
5
DBX ETF Trust
Xtrackers Emerging Markets Carbon Reduction and Climate Improvers ETF (EMCR)
The Xtrackers Emerging Markets Carbon Reduction and Climate Improvers ETF (the “Fund”), using a “passive” or indexing investment approach, seeks investment results that correspond generally to the performance, before fees and expenses, of the Solactive ISS Emerging Markets Carbon Reduction & Climate Improvers Index NTR (the “Underlying Index”). The Underlying Index is comprised of large and mid-capitalization companies in emerging markets countries that meet certain environmental, social and governance (“ESG”) criteria and/or have committed to greenhouse gas emissions reduction targets. The Underlying Index is then weighted in such a manner seeking to align its constituent companies’ greenhouse gas emissions with the long-term global warming target of the Paris Climate Agreement. It is not possible to invest directly into an index.
| Performance as of August 31, 2022 |
| Average Annual Total Return | ||||||||
| Net Asset Value | Market Value | Solactive ISS Emerging Markets Carbon Reduction & Climate Improvers Index NTR2 | MSCI Emerging Markets Index | |||||
One Year | -20.81% | -21.11% | -20.65% | -21.80% | ||||
Since Inception1 | 4.31% | 4.18% | 4.54% | 1.97% | ||||
| Cumulative Total Returns | ||||||||
| Net Asset Value | Market Value | Solactive ISS Emerging Markets Carbon Reduction & Climate Improvers Index NTR2 | MSCI Emerging Markets Index | |||||
One Year | -20.81% | -21.11% | -20.65% | -21.80% | ||||
Since Inception1 | 17.10% | 16.56% | 18.06% | 7.56% | ||||
1 Total returns are calculated based on the commencement of operations, December 6, 2018 (“Inception”).
2 On August 18, 2021, the Fund changed its Underlying Index from MSCI ACWI ex USA ESG Leaders Index to the Solactive ISS Emerging Markets Carbon Reduction & Climate Improvers Index NTR. Returns reflect performance for the MSCI ACWI ex USA ESG Leaders Index through August 17, 2021.
Prior to August 18, 2021, the Fund was known as Xtrackers MSCI ACWI ex USA ESG Leaders Equity ETF (ASCG) and had a different investment strategy. Past performance may have been different if the Fund’s current investment strategy had been in effect.
Past performance is no guarantee of future results. Current performance may be lower or higher than the performance data quoted. Performance data current to the most recent month-end is available at www.Xtrackers.com. Performance results assume reinvestment of all dividends and capital gain distributions and do not reflect the deduction of taxes that a shareholder would pay on fund distributions or on the sale of fund shares or redemption of fund creation units. The investment return and principal value of shares will vary with changes in market conditions. Shares may be worth more or less than their original cost when they are sold in the market or redeemed. Performance for certain funds may reflect a waiver of a portion of the unitary advisory fee. Without such waiver, performance would have been lower. The gross expense ratio of the Fund, as stated in the fee table of the prospectus dated December 17, 2021, was 0.15%, and may differ from the expense ratio disclosed in the Financial Highlights table in this report.
The Fund’s net asset value or “NAV” is calculated by dividing the value of the Fund’s total assets less total liabilities by the number of shares outstanding. The price used to calculate market return (“Market Price”) is determined by using the midpoint between the highest bid and the lowest offer on the primary stock exchange on which shares of a fund are listed for trading, as of the time that such fund’s NAV is calculated. Since shares of a fund may not have traded in the secondary market until after the fund’s inception, for the period from inception to the first day of secondary trading, the NAV of the fund is used as a proxy for the Market Price to calculate market returns. Market and NAV returns assume that dividends and capital gain distributions have been reinvested at Market Price and NAV, respectively.
An index is a statistical composite that tracks a specified financial market or sector. Unlike a fund, an index does not actually hold a portfolio of securities and therefore does not incur the expenses incurred by a fund. These expenses negatively impact fund performance. Also, market returns do not include brokerage commissions that may be payable on secondary market transactions. If brokerage commissions were included, market returns would be lower.
Generally accepted accounting principles require adjustments to be made to the net assets of the Fund at period end for financial reporting purposes only, and as such, the total return based on the unadjusted net asset value per share may differ from the total return reported in the financial highlights.
6
DBX ETF Trust
Performance Summary (Unaudited)
Xtrackers Emerging Markets Carbon Reduction and Climate Improvers ETF (EMCR) (Continued)
| Growth of an Assumed $10,000 Investment |
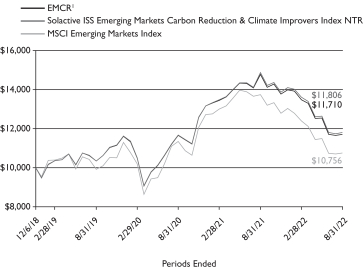
1 Based on Net Asset Value from commencement of operations, December 6, 2018.
| Sector Diversification* as of August 31, 2022 |
Financials | 26.1% | |||
Information Technology | 24.1% | |||
Consumer Discretionary | 13.3% | |||
Communication Services | 12.6% | |||
Materials | 6.1% | |||
Industrials | 5.6% | |||
Consumer Staples | 4.6% | |||
Health Care | 4.0% | |||
Utilities | 1.8% | |||
Real Estate | 1.6% | |||
Energy | 0.2% | |||
|
| |||
Total | 100.0% |
| Ten Largest Equity Holdings as of August 31, 2022 (27.6% of Net Assets) |
| Description | % of Net Assets | |||
Taiwan Semiconductor Manufacturing Co. Ltd. (Taiwan) | 8.9% | |||
Tencent Holdings Ltd. (China) | 5.5% | |||
Samsung Electronics Co. Ltd. (South Korea) | 2.8% | |||
Alibaba Group Holding Ltd. (China) | 2.4% | |||
Meituan (China) | 2.3% | |||
Infosys Ltd. (India) | 1.6% | |||
China Construction Bank Corp. (China) | 1.3% | |||
JD.com, Inc. (China) | 1.0% | |||
Tata Consultancy Services Ltd. (India) | 0.9% | |||
Hon Hai Precision Industry Co. Ltd. (Taiwan) | 0.9% | |||
| Country Diversification* as of August 31, 2022 |
China | 30.4% | |||
Taiwan | 18.9% | |||
India | 14.6% | |||
South Korea | 10.5% | |||
Brazil | 4.3% | |||
Saudi Arabia | 3.3% | |||
South Africa | 3.1% | |||
Mexico | 2.3% | |||
Indonesia | 2.1% | |||
United Arab Emirates | 2.1% | |||
Other | 8.4% | |||
|
| |||
Total | 100.0% |
* As a percent of total investments excluding securities lending collateral and cash equivalents.
Portfolio holdings and characteristics are subject to change. For more complete details about the Fund’s investment portfolio see page 24.
7
DBX ETF Trust
Performance Summary (Unaudited)
Xtrackers MSCI EAFE ESG Leaders Equity ETF (EASG)
The Xtrackers MSCI EAFE ESG Leaders Equity ETF (the “Fund”), using a “passive” or indexing investment approach, seeks investment results that correspond generally to the performance, before fees and expenses, of the MSCI EAFE ESG Leaders Index (the “Underlying Index”). The Underlying Index is a capitalization weighted index that provides exposure to companies with high environmental, social and governance (“ESG”) performance relative to their sector peers and consists of large- and medium-capitalization companies across developed markets countries, excluding Canada and the United States. It is not possible to invest directly into an index.
| Performance as of August 31, 2022 |
| Average Annual Total Return | ||||||||
| Net Asset Value | Market Value | MSCI EAFE ESG Leaders Index | MSCI EAFE Index | |||||
One Year | -21.40% | -21.92% | -21.50% | -19.80% | ||||
Since Inception1 | 1.82% | 1.72% | 1.78% | 1.45% | ||||
| Cumulative Total Returns | ||||||||
| Net Asset Value | Market Value | MSCI EAFE ESG Leaders Index | MSCI EAFE Index | |||||
One Year | -21.40% | -21.92% | -21.50% | -19.80% | ||||
Since Inception1 | 7.46% | 7.04% | 7.31% | 5.92% | ||||
1 Total returns are calculated based on the commencement of operations, September 6, 2018 (“Inception”).
Past performance is no guarantee of future results. Current performance may be lower or higher than the performance data quoted. Performance data current to the most recent month-end is available at www.Xtrackers.com. Performance results assume reinvestment of all dividends and capital gain distributions and do not reflect the deduction of taxes that a shareholder would pay on fund distributions or on the sale of fund shares or redemption of fund creation units. The investment return and principal value of shares will vary with changes in market conditions. Shares may be worth more or less than their original cost when they are sold in the market or redeemed. Performance for certain funds may reflect a waiver of a portion of the unitary advisory fee. Without such waiver, performance would have been lower. The gross expense ratio of the Fund, as stated in the fee table of the prospectus dated December 17, 2021, was 0.14%, and may differ from the expense ratio disclosed in the Financial Highlights table in this report.
The Fund’s net asset value or “NAV” is calculated by dividing the value of the Fund’s total assets less total liabilities by the number of shares outstanding. The price used to calculate market return (“Market Price”) is determined by using the midpoint between the highest bid and the lowest offer on the primary stock exchange on which shares of a fund are listed for trading, as of the time that such fund’s NAV is calculated. Since shares of a fund may not have traded in the secondary market until after the fund’s inception, for the period from inception to the first day of secondary trading, the NAV of the fund is used as a proxy for the Market Price to calculate market returns. Market and NAV returns assume that dividends and capital gain distributions have been reinvested at Market Price and NAV, respectively.
An index is a statistical composite that tracks a specified financial market or sector. Unlike a fund, an index does not actually hold a portfolio of securities and therefore does not incur the expenses incurred by a fund. These expenses negatively impact fund performance. Also, market returns do not include brokerage commissions that may be payable on secondary market transactions. If brokerage commissions were included, market returns would be lower.
Generally accepted accounting principles require adjustments to be made to the net assets of the Fund at period end for financial reporting purposes only, and as such, the total return based on the unadjusted net asset value per share may differ from the total return reported in the financial highlights.
8
DBX ETF Trust
Performance Summary (Unaudited)
Xtrackers MSCI EAFE ESG Leaders Equity ETF (EASG) (Continued)
| Growth of an Assumed $10,000 Investment |
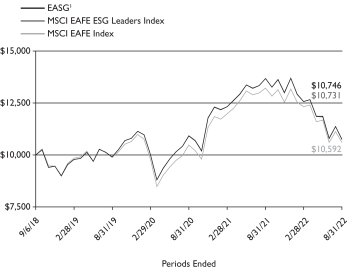
1 Based on Net Asset Value from commencement of operations, September 6, 2018.
| Sector Diversification* as of August 31, 2022 | ||
Financials | 17.4% | |||
Industrials | 15.3% | |||
Health Care | 15.2% | |||
Consumer Discretionary | 11.2% | |||
Consumer Staples | 9.5% | |||
Materials | 8.0% | |||
Information Technology | 7.9% | |||
Communication Services | 4.7% | |||
Energy | 4.5% | |||
Utilities | 3.3% | |||
Real Estate | 3.0% | |||
|
| |||
Total | 100.0% |
| Ten Largest Equity Holdings as of August 31, 2022 (21.8% of Net Assets) | ||
| Description | % of Net Assets | |||
Roche Holding AG (Switzerland) | 3.3% | |||
ASML Holding NV (Netherlands) | 2.9% | |||
AstraZeneca PLC (United Kingdom) | 2.8% | |||
Novo Nordisk A/S (Denmark) | 2.6% | |||
TotalEnergies SE (France) | 1.8% | |||
HSBC Holdings PLC (United Kingdom) | 1.8% | |||
Unilever PLC (United Kingdom) | 1.7% | |||
AIA Group Ltd. (Hong Kong) | 1.7% | |||
Commonwealth Bank of Australia (Australia) | 1.7% | |||
Sony Group Corp. (Japan) | 1.5% | |||
| Country Diversification* as of August 31, 2022 | ||
Japan | 23.5% | |||
United Kingdom | 16.2% | |||
France | 10.5% | |||
Switzerland | 8.7% | |||
Australia | 8.5% | |||
Netherlands | 6.0% | |||
Germany | 5.6% | |||
Denmark | 4.5% | |||
Sweden | 3.2% | |||
Hong Kong | 2.8% | |||
Spain | 2.1% | |||
Other | 8.4% | |||
|
| |||
Total | 100.0% |
* As a percent of total investments excluding exchange-traded funds, securities lending collateral and cash equivalents.
Portfolio holdings and characteristics are subject to change. For more complete details about the Fund’s investment portfolio see page 40.
9
DBX ETF Trust
Performance Summary (Unaudited)
Xtrackers MSCI Emerging Markets ESG Leaders Equity ETF (EMSG)
The Xtrackers MSCI Emerging Markets ESG Leaders Equity ETF (the “Fund”), using a “passive” or indexing investment approach, seeks investment results that correspond generally to the performance, before fees and expenses, of the MSCI Emerging Markets ESG Leaders Index (the “Underlying Index”). The Underlying Index is a capitalization weighted index that provides exposure to companies with high environmental, social and governance (“ESG”) performance relative to their sector peers and consists of large- and medium-capitalization companies across emerging markets countries. It is not possible to invest directly into an index.
| Performance as of August 31, 2022 | ||||||||
| Average Annual Total Return | ||||||||
| Net Asset Value | Market Value | MSCI Emerging Markets ESG Leaders Index | MSCI Emerging Markets Index | |||||
One Year | -25.55% | -26.42% | -25.29% | -21.80% | ||||
Since Inception1 | 1.55% | 1.23% | 1.88% | 1.97% | ||||
| Cumulative Total Returns | ||||||||
| Net Asset Value | Market Value | MSCI Emerging Markets ESG Leaders Index | MSCI Emerging Markets Index | |||||
One Year | -25.55% | -26.42% | -25.29% | -21.80% | ||||
Since Inception1 | 5.90% | 4.67% | 7.23% | 7.56% | ||||
1 Total returns are calculated based on the commencement of operations, December 6, 2018 (“Inception”).
Past performance is no guarantee of future results. Current performance may be lower or higher than the performance data quoted. Performance data current to the most recent month-end is available at www.Xtrackers.com. Performance results assume reinvestment of all dividends and capital gain distributions and do not reflect the deduction of taxes that a shareholder would pay on fund distributions or on the sale of fund shares or redemption of fund creation units. The investment return and principal value of shares will vary with changes in market conditions. Shares may be worth more or less than their original cost when they are sold in the market or redeemed. Performance for certain funds may reflect a waiver of a portion of the unitary advisory fee. Without such waiver, performance would have been lower. The gross expense ratio of the Fund, as stated in the fee table of the prospectus dated December 17, 2021, was 0.20%, and may differ from the expense ratio disclosed in the Financial Highlights table in this report.
The Fund’s net asset value or “NAV” is calculated by dividing the value of the Fund’s total assets less total liabilities by the number of shares outstanding. The price used to calculate market return (“Market Price”) is determined by using the midpoint between the highest bid and the lowest offer on the primary stock exchange on which shares of a fund are listed for trading, as of the time that such fund’s NAV is calculated. Since shares of a fund may not have traded in the secondary market until after the fund’s inception, for the period from inception to the first day of secondary trading, the NAV of the fund is used as a proxy for the Market Price to calculate market returns. Market and NAV returns assume that dividends and capital gain distributions have been reinvested at Market Price and NAV, respectively.
An index is a statistical composite that tracks a specified financial market or sector. Unlike a fund, an index does not actually hold a portfolio of securities and therefore does not incur the expenses incurred by a fund. These expenses negatively impact fund performance. Also, market returns do not include brokerage commissions that may be payable on secondary market transactions. If brokerage commissions were included, market returns would be lower.
Generally accepted accounting principles require adjustments to be made to the net assets of the Fund at period end for financial reporting purposes only, and as such, the total return based on the unadjusted net asset value per share may differ from the total return reported in the financial highlights.
10
DBX ETF Trust
Performance Summary (Unaudited)
Xtrackers MSCI Emerging Markets ESG Leaders Equity ETF (EMSG) (Continued)
| Growth of an Assumed $10,000 Investment |
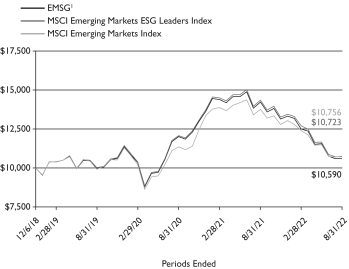
1 Based on Net Asset Value from commencement of operations, December 6, 2018.
| Sector Diversification* as of August 31, 2022 | ||
Financials | 20.7% | |||
Information Technology | 19.0% | |||
Communication Services | 14.9% | |||
Consumer Discretionary | 14.0% | |||
Materials | 7.3% | |||
Consumer Staples | 5.7% | |||
Industrials | 5.4% | |||
Energy | 4.9% | |||
Health Care | 3.9% | |||
Utilities | 2.5% | |||
Real Estate | 1.7% | |||
|
| |||
Total | 100.0% |
| Ten Largest Equity Holdings as of August 31, 2022 (37.6% of Net Assets) | ||
| Description | % of Net Assets | |||
Taiwan Semiconductor Manufacturing Co. Ltd. (Taiwan) | 11.9% | |||
Tencent Holdings Ltd. (China) | 7.6% | |||
Alibaba Group Holding Ltd. (China) | 5.3% | |||
Meituan (China) | 3.1% | |||
Reliance Industries Ltd. (India) | 2.6% | |||
Infosys Ltd. (India) | 1.7% | |||
China Construction Bank Corp. (China) | 1.7% | |||
Housing Development Finance Corp. Ltd. (India) | 1.4% | |||
Baidu, Inc. (China) | 1.2% | |||
NetEase, Inc. (China) | 1.1% | |||
| Country Diversification* as of August 31, 2022 | ||
China | 30.2% | |||
Taiwan | 20.9% | |||
India | 12.9% | |||
South Korea | 7.1% | |||
South Africa | 5.6% | |||
Brazil | 4.2% | |||
Thailand | 2.7% | |||
United Arab Emirates | 2.1% | |||
Saudi Arabia | 2.0% | |||
Other | 12.3% | |||
|
| |||
Total | 100.0% |
* As a percent of total investments excluding exchange-traded funds and securities lending collateral.
Portfolio holdings and characteristics are subject to change. For more complete details about the Fund’s investment portfolio see page 46.
11
DBX ETF Trust
Performance Summary (Unaudited)
Xtrackers MSCI USA ESG Leaders Equity ETF (USSG)
Xtrackers MSCI USA ESG Leaders Equity ETF (the “Fund”), using a “passive” or indexing investment approach, seeks investment results that correspond generally to the performance, before fees and expenses, of the MSCI USA ESG Leaders Index (the “Underlying Index”). The Underlying Index is a capitalization weighted index that provides exposure to companies with high environmental, social and governance (“ESG”) performance relative to their sector peers and consists of large- and medium-capitalization companies in the U.S. market. The S&P 500 Index or the Standard & Poor’s 500 Index is a market-capitalization-weighted index of the 500 largest U.S. publicly traded companies. It is not possible to invest directly into an index.
| Performance as of August 31, 2022 | ||||||||||
| Average Annual Total Return | ||||||||||
| Net Asset Value | Market Value | MSCI USA ESG Leaders Index | MSCI USA Index2 | S&P 500 Index | ||||||
One Year | -13.29% | -13.33% | -13.22% | -13.08% | -11.23% | |||||
Since Inception1 | 12.48% | 12.46% | 12.56% | 12.55% | 12.88% | |||||
| Cumulative Total Returns | ||||||||||
| Net Asset Value | Market Value | MSCI USA ESG Leaders Index | MSCI USA Index2 | S&P 500 Index | ||||||
One Year | -13.29% | -13.33% | -13.22% | -13.08% | -11.23% | |||||
Since Inception1 | 50.70% | 50.66% | 51.14% | 52.30% | 52.61% | |||||
1 Total returns are calculated based on the commencement of operations, March 7, 2019 (“Inception”).
2 Effective June 30, 2022, the MSCI USA Index replaces the S&P 500 Index as the fund’s broad-based securities market benchmark index because the Advisor believes the MSCI USA Index more accurately reflects the fund’s current invest-ment strategies.
Past performance is no guarantee of future results. Current performance may be lower or higher than the performance data quoted. Performance data current to the most recent month-end is available at www.Xtrackers.com. Performance results assume reinvestment of all dividends and capital gain distributions and do not reflect the deduction of taxes that a shareholder would pay on fund distributions or on the sale of fund shares or redemption of fund creation units. The investment return and principal value of shares will vary with changes in market conditions. Shares may be worth more or less than their original cost when they are sold in the market or redeemed. Performance for certain funds may reflect a waiver of a portion of the unitary advisory fee. Without such waiver, performance would have been lower. The gross expense ratio of the Fund, as stated in the fee table of the prospectus dated December 17, 2021, was 0.10%, and may differ from the expense ratio disclosed in the Financial Highlights table in this report.
The Fund’s net asset value or “NAV” is calculated by dividing the value of the Fund’s total assets less total liabilities by the number of shares outstanding. The price used to calculate market return (“Market Price”) is determined by using the midpoint between the highest bid and the lowest offer on the primary stock exchange on which shares of a fund are listed for trading, as of the time that such fund’s NAV is calculated. Since shares of a fund may not have traded in the secondary market until after the fund’s inception, for the period from inception to the first day of secondary trading, the NAV of the fund is used as a proxy for the Market Price to calculate market returns. Market and NAV returns assume that dividends and capital gain distributions have been reinvested at Market Price and NAV, respectively.
An index is a statistical composite that tracks a specified financial market or sector. Unlike a fund, an index does not actually hold a portfolio of securities and therefore does not incur the expenses incurred by a fund. These expenses negatively impact fund performance. Also, market returns do not include brokerage commissions that may be payable on secondary market transactions. If brokerage commissions were included, market returns would be lower.
Generally accepted accounting principles require adjustments to be made to the net assets of the Fund at period end for financial reporting purposes only, and as such, the total return based on the unadjusted net asset value per share may differ from the total return reported in the financial highlights.
12
DBX ETF Trust
Performance Summary (Unaudited)
Xtrackers MSCI USA ESG Leaders Equity ETF (USSG) (Continued)
| Growth of an Assumed $10,000 Investment |
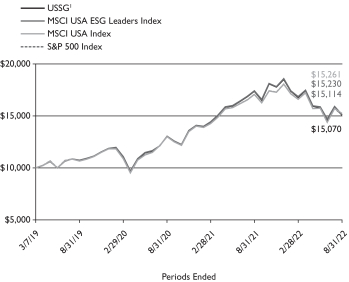
1 Based on Net Asset Value from commencement of operations, March 7, 2019.
| Sector Diversification* as of August 31, 2022 |
Information Technology | 28.0% | |||
Health Care | 14.5% | |||
Consumer Discretionary | 11.5% | |||
Financials | 11.1% | |||
Communication Services | 10.2% | |||
Industrials | 8.3% | |||
Consumer Staples | 7.0% | |||
Real Estate | 2.9% | |||
Materials | 2.9% | |||
Energy | 2.4% | |||
Utilities | 1.2% | |||
|
| |||
Total | 100.0% |
| Ten Largest Equity Holdings as of August 31, 2022 (35.4% of Net Assets) | ||
| Description | % of Net Assets | |||
Microsoft Corp. | 10.7% | |||
Alphabet, Inc. | 7.3% | |||
Tesla, Inc. | 4.2% | |||
Johnson & Johnson | 2.4% | |||
NVIDIA Corp. | 2.2% | |||
Procter & Gamble Co. | 1.9% | |||
Visa, Inc. | 1.9% | |||
Home Depot, Inc. | 1.7% | |||
Mastercard, Inc. | 1.6% | |||
Coca-Cola Co. | 1.5% | |||
* As a percent of total investments excluding securities lending collateral and cash equivalents.
Portfolio holdings and characteristics are subject to change. For more complete details about the Fund’s investment portfolio see page 54.
13
DBX ETF Trust
Performance Summary (Unaudited)
Xtrackers Net Zero Pathway Paris Aligned US Equity ETF (USNZ)
Xtrackers Net Zero Pathway Paris Aligned US Equity ETF , (the “Fund”), using a “passive” or indexing investment approach, seeks investment results that correspond generally to the performance, before fees and expenses, of the Solactive ISS ESG United States Net Zero Pathway Enhanced Index (the “Underlying Index”), which is comprised of large and mid-capitalization companies in the United States that meet certain environmental, social and governance (“ ESG “) criteria.The constituents of the Underlying Index are weighted in such a manner seeking to comply with the European Union Paris-aligned Benchmark standards, while incorporating recommendations of the Net Zero Investment Framework published, from time to time, by the Institutional Investors Group on Climate Change. It is not possible to invest directly into an index.
| Performance as of August 31, 2022 | ||||||||
| Cumulative Total Returns | ||||||||
| Net Asset Value | Market Value | Solactive ISS ESG United States Net Zero Pathway Enhanced Index | S&P 500 Index | |||||
Since Inception1 | 0.84% | 1.00% | 0.84% | 1.71% | ||||
1 Total returns are calculated based on the commencement of operations, June 28, 2022 (“Inception”).
Past performance is no guarantee of future results. Current performance may be lower or higher than the performance data quoted. Performance data current to the most recent month-end is available at www.Xtrackers.com. Performance results assume reinvestment of all dividends and capital gain distributions and do not reflect the deduction of taxes that a shareholder would pay on fund distributions or on the sale of fund shares or redemption of fund creation units. The investment return and principal value of shares will vary with changes in market conditions. Shares may be worth more or less than their original cost when they are sold in the market or redeemed. Performance for certain funds may reflect a waiver of a portion of the unitary advisory fee. Without such waiver, performance would have been lower. The gross expense ratio of the Fund, as stated in the fee table of the prospectus dated June 22, 2022, was 0.10%, and may differ from the expense ratio disclosed in the Financial Highlights table in this report.
The Fund’s net asset value or “NAV” is calculated by dividing the value of the Fund’s total assets less total liabilities by the number of shares outstanding. The price used to calculate market return (“Market Price”) is determined by using the midpoint between the highest bid and the lowest offer on the primary stock exchange on which shares of a fund are listed for trading, as of the time that such fund’s NAV is calculated. Since shares of a fund may not have traded in the secondary market until after the fund’s inception, for the period from inception to the first day of secondary trading, the NAV of the fund is used as a proxy for the Market Price to calculate market returns. Market and NAV returns assume that dividends and capital gain distributions have been reinvested at Market Price and NAV, respectively.
An index is a statistical composite that tracks a specified financial market or sector. Unlike a fund, an index does not actually hold a portfolio of securities and therefore does not incur the expenses incurred by a fund. These expenses negatively impact fund performance. Also, market returns do not include brokerage commissions that may be payable on secondary market transactions. If brokerage commissions were included, market returns would be lower.
Generally accepted accounting principles require adjustments to be made to the net assets of the Fund at period end for financial reporting purposes only, and as such, the total return based on the unadjusted net asset value per share may differ from the total return reported in the financial highlights.
14
DBX ETF Trust
Performance Summary (Unaudited)
Xtrackers Net Zero Pathway Paris Aligned US Equity ETF (USNZ) (Continued)
| Growth of an Assumed $10,000 Investment |
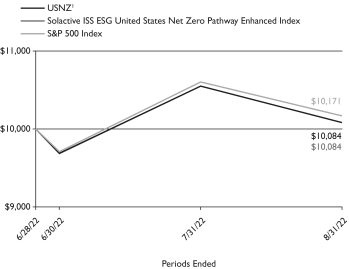
1 Based on Net Asset Value from commencement of operations, June 28, 2022.
| Sector Diversification* as of August 31, 2022 |
Information Technology | 34.3% | |||
Health Care | 19.6% | |||
Communication Services | 9.3% | |||
Financials | 9.2% | |||
Consumer Discretionary | 7.5% | |||
Consumer Staples | 6.3% | |||
Industrials | 5.3% | |||
Real Estate | 5.2% | |||
Materials | 2.1% | |||
Utilities | 1.2% | |||
|
| |||
Total | 100.0% |
| Ten Largest Equity Holdings as of August 31, 2022 (30.5% of Net Assets) | ||
| Description | % of Net Assets | |||
Apple, Inc. | 9.8% | |||
Microsoft Corp. | 7.7% | |||
Alphabet, Inc. | 4.6% | |||
Johnson & Johnson | 1.5% | |||
UnitedHealth Group, Inc. | 1.5% | |||
NVIDIA Corp. | 1.2% | |||
Meta Platforms, Inc. | 1.1% | |||
Procter & Gamble Co. | 1.1% | |||
JPMorgan Chase & Co. | 1.0% | |||
Home Depot, Inc. | 1.0% | |||
* As a percent of total investments excluding cash equivalents.
Portfolio holdings and characteristics are subject to change. For more complete details about the Fund’s investment portfolio see page 59.
15
DBX ETF Trust
Performance Summary (Unaudited)
Xtrackers S&P 500 ESG ETF (SNPE)
Xtrackers S&P 500 ESG ETF (the “Fund”), using a “passive” or indexing investment approach, seeks investment results that correspond generally to the performance, before fees and expenses, of the S&P 500 ESG Index (the “Underlying Index”). The Underlying Index is a broad-based, market capitalization weighted index that provides exposure to companies with high environmental, social and governance (“ESG”) performance relative to their sector peers, while maintaining similar overall industry group weights as the S&P 500 Index. It is not possible to invest directly into an index.
| Performance as of August 31, 2022 | ||||||||
| Average Annual Total Return | ||||||||
| Net Asset Value | Market Value | S&P 500 ESG Index | S&P 500 Index | |||||
One Year | -9.59% | -9.59% | -9.50% | -11.23% | ||||
Since Inception1 | 13.51% | 13.50% | 13.63% | 11.87% | ||||
| Cumulative Total Returns | ||||||||
| Net Asset Value | Market Value | S&P 500 ESG Index | S&P 500 Index | |||||
One Year | -9.59% | -9.59% | -9.50% | -11.23% | ||||
Since Inception1 | 49.71% | 49.71% | 50.24% | 42.95% | ||||
1 Total returns are calculated based on the commencement of operations, June 26, 2019 (“Inception”).
Past performance is no guarantee of future results. Current performance may be lower or higher than the performance data quoted. Performance data current to the most recent month-end is available at www.Xtrackers.com. Performance results assume reinvestment of all dividends and capital gain distributions and do not reflect the deduction of taxes that a shareholder would pay on fund distributions or on the sale of fund shares or redemption of fund creation units. The investment return and principal value of shares will vary with changes in market conditions. Shares may be worth more or less than their original cost when they are sold in the market or redeemed. Performance for certain funds may reflect a waiver of a portion of the unitary advisory fee. Without such waiver, performance would have been lower. The gross expense ratio of the Fund, as stated in the fee table of the prospectus dated December 17, 2021, was 0.11%, and may differ from the expense ratio disclosed in the Financial Highlights table in this report.
The Fund’s net asset value or “NAV” is calculated by dividing the value of the Fund’s total assets less total liabilities by the number of shares outstanding. The price used to calculate market return (“Market Price”) is determined by using the midpoint between the highest bid and the lowest offer on the primary stock exchange on which shares of a fund are listed for trading, as of the time that such fund’s NAV is calculated. Since shares of a fund may not have traded in the secondary market until after the fund’s inception, for the period from inception to the first day of secondary trading, the NAV of the fund is used as a proxy for the Market Price to calculate market returns. Market and NAV returns assume that dividends and capital gain distributions have been reinvested at Market Price and NAV, respectively.
An index is a statistical composite that tracks a specified financial market or sector. Unlike a fund, an index does not actually hold a portfolio of securities and therefore does not incur the expenses incurred by a fund. These expenses negatively impact fund performance. Also, market returns do not include brokerage commissions that may be payable on secondary market transactions. If brokerage commissions were included, market returns would be lower.
Generally accepted accounting principles require adjustments to be made to the net assets of the Fund at period end for financial reporting purposes only, and as such, the total return based on the unadjusted net asset value per share may differ from the total return reported in the financial highlights.
16
DBX ETF Trust
Performance Summary (Unaudited)
Xtrackers S&P 500 ESG ETF (SNPE) (Continued)
| Growth of an Assumed $10,000 Investment |
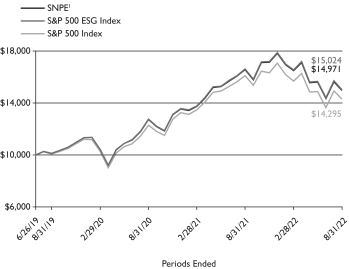
1 Based on Net Asset Value from commencement of operations, June 26, 2019.
| Sector Diversification* as of August 31, 2022 |
Information Technology | 30.4% | |||
Health Care | 15.2% | |||
Financials | 10.8% | |||
Consumer Discretionary | 9.5% | |||
Communication Services | 8.8% | |||
Consumer Staples | 6.8% | |||
Industrials | 6.3% | |||
Energy | 5.0% | |||
Real Estate | 2.8% | |||
Materials | 2.6% | |||
Utilities | 1.8% | |||
|
| |||
Total | 100.0% |
| Ten Largest Equity Holdings as of August 31, 2022 (37.4% of Net Assets) | ||
| Description | % of Net Assets | |||
Apple, Inc. | 10.0% | |||
Microsoft Corp. | 8.1% | |||
Alphabet, Inc. | 5.2% | |||
Amazon.com, Inc. | 4.6% | |||
UnitedHealth Group, Inc. | 2.0% | |||
Exxon Mobil Corp. | 1.7% | |||
NVIDIA Corp. | 1.6% | |||
JPMorgan Chase & Co. | 1.4% | |||
Procter & Gamble Co. | 1.4% | |||
Visa, Inc. | 1.4% | |||
* As a percent of total investments excluding cash equivalents.
Portfolio holdings and characteristics are subject to change. For more complete details about the Fund’s investment portfolio see page 64.
17
DBX ETF Trust
Performance Summary (Unaudited)
Xtrackers S&P MidCap 400 ESG ETF (MIDE)
Xtrackers S&P MidCap 400 ESG ETF (the “Fund”), using a “passive” or indexing investment approach, seeks investment results that correspond generally to the performance, before fees and expenses, of the S&P MidCap 400 ESG Index (the “Underlying Index”). The Underlying Index is a broad-based, market capitalization weighted index that provides exposure to companies with high environmental, social and governance (“ESG”) performance relative to their sector peers, while maintaining similar overall industry group weights as the S&P MidCap 400 Index. It is not possible to invest directly into an index.
| Performance as of August 31, 2021 | ||||||||
| Average Annual Total Return | ||||||||
| Net Asset Value | Market Value | S&P MidCap 400 ESG Index | S&P MidCap 400 Index | |||||
One Year | -9.64% | -9.64% | -9.52% | -10.37% | ||||
Since Inception1 | -0.45% | -0.45% | -0.31% | -1.24% | ||||
| Cumulative Total Returns | ||||||||
| Net Asset Value | Market Value | S&P MidCap 400 ESG Index | S&P MidCap 400 Index | |||||
One Year | -9.64% | -9.64% | -9.52% | -10.37% | ||||
Since Inception1 | -0.68% | -0.68% | -0.46% | -1.87% | ||||
1 Total returns are calculated based on the commencement of operations, February 24, 2021 (“Inception”).
Past performance is no guarantee of future results. Current performance may be lower or higher than the performance data quoted. Performance data current to the most recent month-end is available at www.Xtrackers.com. Performance results assume reinvestment of all dividends and capital gain distributions and do not reflect the deduction of taxes that a shareholder would pay on fund distributions or on the sale of fund shares or redemption of fund creation units. The investment return and principal value of shares will vary with changes in market conditions. Shares may be worth more or less than their original cost when they are sold in the market or redeemed. Performance for certain funds may reflect a waiver of a portion of the unitary advisory fee. Without such waiver, performance would have been lower. The gross expense ratio of the Fund, as stated in the fee table of the prospectus dated December 17, 2021, was 0.15%, and may differ from the expense ratio disclosed in the Financial Highlights table in this report.
The Fund’s net asset value or “NAV” is calculated by dividing the value of the Fund’s total assets less total liabilities by the number of shares outstanding. The price used to calculate market return (“Market Price”) is determined by using the midpoint between the highest bid and the lowest offer on the primary stock exchange on which shares of a fund are listed for trading, as of the time that such fund’s NAV is calculated. Since shares of a fund may not have traded in the secondary market until after the fund’s inception, for the period from inception to the first day of secondary trading, the NAV of the fund is used as a proxy for the Market Price to calculate market returns. Market and NAV returns assume that dividends and capital gain distributions have been reinvested at Market Price and NAV, respectively.
An index is a statistical composite that tracks a specified financial market or sector. Unlike a fund, an index does not actually hold a portfolio of securities and therefore does not incur the expenses incurred by a fund. These expenses negatively impact fund performance. Also, market returns do not include brokerage commissions that may be payable on secondary market transactions. If brokerage commissions were included, market returns would be lower.
Generally accepted accounting principles require adjustments to be made to the net assets of the Fund at period end for financial reporting purposes only, and as such, the total return based on the unadjusted net asset value per share may differ from the total return reported in the financial highlights.
18
DBX ETF Trust
Performance Summary (Unaudited)
Xtrackers S&P MidCap 400 ESG ETF (MIDE) (Continued)
| Growth of an Assumed $10,000 Investment |
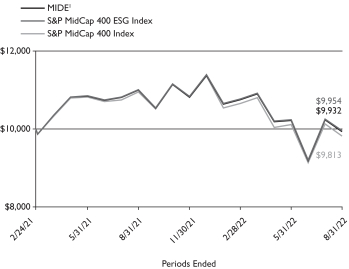
1 Based on Net Asset Value from commencement of operations, February 24, 2021.
| Sector Diversification* as of August 31, 2022 | ||
Industrials | 19.2% | |||
Financials | 16.0% | |||
Consumer Discretionary | 15.0% | |||
Information Technology | 12.6% | |||
Health Care | 9.8% | |||
Real Estate | 8.6% | |||
Materials | 7.0% | |||
Energy | 4.6% | |||
Consumer Staples | 3.4% | |||
Utilities | 2.2% | |||
Communication Services | 1.6% | |||
|
| |||
Total | 100.0% |
| Ten Largest Equity Holdings as of August 31, 2022 (9.4% of Net Assets) | ||
| Description | % of Net Assets | |||
Targa Resources Corp. | 1.1% | |||
Carlisle Cos., Inc. | 1.1% | |||
Steel Dynamics, Inc. | 1.0% | |||
EQT Corp. | 1.0% | |||
Wolfspeed, Inc. | 1.0% | |||
First Solar, Inc. | 0.9% | |||
Darling Ingredients, Inc. | 0.9% | |||
First Horizon Corp. | 0.8% | |||
Fair Isaac Corp. | 0.8% | |||
Alleghany Corp. | 0.8% | |||
* As a percent of total investments excluding exchange traded funds and cash equivalents.
Portfolio holdings and characteristics are subject to change. For more complete details about the Fund’s investment portfolio see page 69.
19
DBX ETF Trust
Performance Summary (Unaudited)
Xtrackers S&P SmallCap 600 ESG ETF (SMLE)
Xtrackers S&P SmallCap 600 ESG ETF (the “Fund”), using a “passive” or indexing investment approach, seeks investment results that correspond generally to the performance, before fees and expenses, of the S&P SmallCap 600 ESG Index (the “Underlying Index”). The Underlying Index is a broad-based, market capitalization weighted index that provides exposure to companies with high environmental, social and governance (“ESG”) performance relative to their sector peers, while maintaining similar overall industry group weights as the S&P SmallCap 600 Index. It is not possible to invest directly into an index.
| Performance as of August 31, 2021 | ||||||||
| Average Annual Total Return | ||||||||
| Net Asset Value | Market Value | S&P SmallCap 600 ESG Index | S&P SmallCap 600 Index | |||||
One Year | -10.43% | -10.39% | -10.28% | -12.12% | ||||
Since Inception1 | -2.76% | -2.73% | -2.60% | -4.14% | ||||
| Cumulative Total Returns | ||||||||
| Net Asset Value | Market Value | S&P SmallCap 600 ESG Index | S&P SmallCap 600 Index | |||||
One Year | -10.43% | -10.39% | -10.28% | -12.12% | ||||
Since Inception1 | -4.15% | -4.11% | -3.92% | -6.21% | ||||
1 Total returns are calculated based on the commencement of operations, February 24, 2021 (“Inception”).
Past performance is no guarantee of future results. Current performance may be lower or higher than the performance data quoted. Performance data current to the most recent month-end is available at www.Xtrackers.com. Performance results assume reinvestment of all dividends and capital gain distributions and do not reflect the deduction of taxes that a shareholder would pay on fund distributions or on the sale of fund shares or redemption of fund creation units. The investment return and principal value of shares will vary with changes in market conditions. Shares may be worth more or less than their original cost when they are sold in the market or redeemed. Performance for certain funds may reflect a waiver of a portion of the unitary advisory fee. Without such waiver, performance would have been lower. The gross expense ratio of the Fund, as stated in the fee table of the prospectus dated December 17, 2021, was 0.15%, and may differ from the expense ratio disclosed in the Financial Highlights table in this report.
The Fund’s net asset value or “NAV” is calculated by dividing the value of the Fund’s total assets less total liabilities by the number of shares outstanding. The price used to calculate market return (“Market Price”) is determined by using the midpoint between the highest bid and the lowest offer on the primary stock exchange on which shares of a fund are listed for trading, as of the time that such fund’s NAV is calculated. Since shares of a fund may not have traded in the secondary market until after the fund’s inception, for the period from inception to the first day of secondary trading, the NAV of the fund is used as a proxy for the Market Price to calculate market returns. Market and NAV returns assume that dividends and capital gain distributions have been reinvested at Market Price and NAV, respectively.
An index is a statistical composite that tracks a specified financial market or sector. Unlike a fund, an index does not actually hold a portfolio of securities and therefore does not incur the expenses incurred by a fund. These expenses negatively impact fund performance. Also, market returns do not include brokerage commissions that may be payable on secondary market transactions. If brokerage commissions were included, market returns would be lower.
Generally accepted accounting principles require adjustments to be made to the net assets of the Fund at period end for financial reporting purposes only, and as such, the total return based on the unadjusted net asset value per share may differ from the total return reported in the financial highlights.
20
DBX ETF Trust
Performance Summary (Unaudited)
Xtrackers S&P SmallCap 600 ESG ETF (SMLE) (Continued)
| Growth of an Assumed $10,000 Investment |
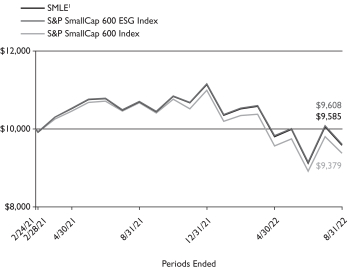
1 Based on Net Asset Value from commencement of operations, February 24, 2021.
| Sector Diversification* as of August 31, 2022 | ||
Financials | 19.8% | |||
Industrials | 16.0% | |||
Information Technology | 14.5% | |||
Consumer Discretionary | 12.1% | |||
Health Care | 11.2% | |||
Real Estate | 8.2% | |||
Materials | 5.8% | |||
Consumer Staples | 4.6% | |||
Energy | 4.0% | |||
Utilities | 2.5% | |||
Communication Services | 1.3% | |||
|
| |||
Total | 100.0% |
| Ten Largest Equity Holdings as of August 31, 2022 (8.1% of Net Assets) | ||
| Description | % of Net Assets | |||
Agree Realty Corp. | 0.9% | |||
ExlService Holdings, Inc. | 0.9% | |||
SM Energy Co. | 0.9% | |||
Livent Corp. | 0.9% | |||
UFP Industries, Inc. | 0.8% | |||
Rogers Corp. | 0.8% | |||
AMN Healthcare Services, Inc. | 0.8% | |||
Cytokinetics, Inc. | 0.7% | |||
Helmerich & Payne, Inc. | 0.7% | |||
Ensign Group, Inc. | 0.7% | |||
* As a percent of total investments excluding exchange traded funds, securities lending collateral, and cash equivalents.
Portfolio holdings and characteristics are subject to change. For more complete details about the Fund’s investment portfolio see page 73.
21
DBX ETF Trust
As a shareholder of one or more of the Funds, you incur two types of costs: (1) transaction costs, including brokerage commissions paid on purchases and sales of fund shares, and (2) ongoing costs, including management fees and other Fund expenses. In the most recent six-month period the Funds limited these expenses; had they not done so, expenses would have been higher. The expense examples below are intended to help you understand your ongoing costs (in dollars) of investing in the Funds and to compare these costs with the ongoing costs of investing in other funds.
The examples in the tables are based on an investment of $1,000 invested at the beginning of the period and held for the entire period (March 1, 2022 to August 31, 2022) except Xtrackers Net Zero Pathway Paris Aligned US Equity ETF which is based on an investment of $1,000 invested at the beginning of the period and held for the entire period (commencement of operations, as noted below, to August 31, 2022).
Actual expenses
The first line in the following tables provides information about actual account values and actual expenses. You may use the information in this line, together with the amount you invested, to estimate the expenses that you paid over the period. Simply divide your account value by $1,000 (for example, an $8,600 account value divided by $1,000 = 8.6), then multiply the result by the number in the first line under the heading “Expenses Paid During the Period” to estimate the expenses you paid on your account during this period.
Hypothetical example for comparison purposes
The second line in the following tables provides information about hypothetical account values and hypothetical expenses based on the Funds’ actual expense ratios and an assumed rate of return of 5% per year before expenses (which is not the Funds’ actual return). The hypothetical account values and expenses may not be used to estimate the actual ending account balance or expenses you paid for the period. You may use this information to compare the ongoing costs of investing in the Fund and other funds. To do so, compare this 5% hypothetical example with the 5% hypothetical examples that appear in the shareholder reports of the other funds.
Please note that the expenses shown in the tables are meant to highlight your ongoing costs only, and do not reflect any transactional costs. Therefore the second line in the table is useful in comparing ongoing costs only, and will not help you determine the relative total costs of owning different funds. In addition, if these transactional costs were included, your costs would have been higher.
| Beginning Account Value March 1, 2022 | Ending Account Value August 31, 2022 | Annualized Expense Ratio | Expenses Paid During the Period Per $1,000(1) | |||||||||||||
| Xtrackers Emerging Markets Carbon Reduction and Climate Improvers ETF |
| |||||||||||||||
Actual | $ | 1,000.00 | $ | 868.70 | 0.15 | % | $ | 0.71 | ||||||||
Hypothetical (5% return before expenses) | $ | 1,000.00 | $ | 1,024.45 | 0.15 | % | $ | 0.77 | ||||||||
| Xtrackers MSCI EAFE ESG Leaders Equity ETF |
| |||||||||||||||
Actual | $ | 1,000.00 | $ | 855.00 | 0.14 | % | $ | 0.65 | ||||||||
Hypothetical (5% return before expenses) | $ | 1,000.00 | $ | 1,024.50 | 0.14 | % | $ | 0.71 | ||||||||
| Xtrackers MSCI Emerging Markets ESG Leaders Equity ETF |
| |||||||||||||||
Actual | $ | 1,000.00 | $ | 846.70 | 0.20 | % | $ | 0.93 | ||||||||
Hypothetical (5% return before expenses) | $ | 1,000.00 | $ | 1,024.20 | 0.20 | % | $ | 1.02 | ||||||||
| Xtrackers MSCI USA ESG Leaders Equity ETF |
| |||||||||||||||
Actual | $ | 1,000.00 | $ | 897.50 | 0.09 | % | $ | 0.43 | ||||||||
Hypothetical (5% return before expenses) | $ | 1,000.00 | $ | 1,024.75 | 0.09 | % | $ | 0.46 | ||||||||
| Xtrackers Net Zero Pathway Paris Aligned US Equity ETF |
| |||||||||||||||
Actual (2) | $ | 1,000.00 | $ | 1,008.40 | 0.10 | % | $ | 0.18 | ||||||||
Hypothetical (5% return before expenses) | $ | 1,000.00 | $ | 1,008.73 | 0.10 | % | $ | 0.51 | ||||||||
| Xtrackers S&P 500 ESG ETF |
| |||||||||||||||
Actual | $ | 1,000.00 | $ | 907.70 | 0.10 | % | $ | 0.48 | ||||||||
Hypothetical (5% return before expenses) | $ | 1,000.00 | $ | 1,024.70 | 0.10 | % | $ | 0.51 | ||||||||
22
DBX ETF Trust
Fees and Expenses (Unaudited) (Continued)
| Beginning Account Value March 1, 2022 | Ending Account Value August 31, 2022 | Annualized Expense Ratio | Expenses Paid During the Period Per $1,000(1) | |||||||||||||
| Xtrackers S&P MidCap 400 ESG ETF |
| |||||||||||||||
Actual | $ | 1,000.00 | $ | 923.60 | 0.15 | % | $ | 0.73 | ||||||||
Hypothetical (5% return before expenses) | $ | 1,000.00 | $ | 1,024.45 | 0.15 | % | $ | 0.77 | ||||||||
| Xtrackers S&P SmallCap 600 ESG ETF |
| |||||||||||||||
Actual | $ | 1,000.00 | $ | 911.40 | 0.15 | % | $ | 0.72 | ||||||||
Hypothetical (5% return before expenses) | $ | 1,000.00 | $ | 1,024.45 | 0.15 | % | $ | 0.77 | ||||||||
(1) Expenses are equal to each Fund’s annualized expense ratio, multiplied by the average account value over the period, multiplied by 184 (the number of days in the most recent six-month period), then divided by 365.
(2) Expenses are equal to each Fund’s annualized expense ratio, multiplied by the average account value over the period, multiplied by 65 (the number of days in the period June 28, 2022 (commencement of operations) to August 31, 2022), then divided by 365.
23
DBX ETF Trust
Xtrackers Emerging Markets Carbon Reduction and Climate Improvers ETF
August 31, 2022
Number | Value | |||||||
| COMMON STOCKS — 97.2% | ||||||||
| Brazil — 2.9% | ||||||||
Ambev SA | 290,410 | $ | 855,928 | |||||
Americanas SA | 69,115 | 217,977 | ||||||
Atacadao SA | 56,149 | 214,040 | ||||||
B3 SA — Brasil Bolsa Balcao | 663,893 | 1,518,458 | ||||||
Banco Bradesco SA | 158,213 | 483,709 | ||||||
Banco BTG Pactual SA | 158,615 | 779,145 | ||||||
Banco do Brasil SA | 93,804 | 754,813 | ||||||
Banco Santander Brasil SA | 43,374 | 245,878 | ||||||
BB Seguridade Participacoes SA | 74,320 | 405,669 | ||||||
BRF SA* | 42,849 | 131,086 | ||||||
CCR SA | 119,806 | 318,881 | ||||||
Centrais Eletricas Brasileiras SA | 63,494 | 565,086 | ||||||
Cia de Saneamento Basico do Estado de Sao Paulo | 21,059 | 199,778 | ||||||
Cia Energetica de Minas Gerais, Class A | 25,731 | 91,084 | ||||||
Cia Siderurgica Nacional SA | 29,795 | 79,361 | ||||||
CPFL Energia SA | 11,601 | 78,303 | ||||||
Energisa SA | 23,093 | 188,497 | ||||||
Engie Brasil Energia SA | 18,815 | 147,077 | ||||||
Equatorial Energia SA | 40,610 | 189,529 | ||||||
Hapvida Participacoes e Investimentos SA, 144A | 301,047 | 423,011 | ||||||
Hypera SA | 28,527 | 237,147 | ||||||
Itau Unibanco Holding SA | 46,529 | 198,833 | ||||||
Klabin SA | 50,093 | 182,060 | ||||||
Localiza Rent a Car SA | 39,183 | 459,971 | ||||||
Lojas Renner SA | 102,598 | 524,179 | ||||||
Magazine Luiza SA* | 205,832 | 169,640 | ||||||
Multiplan Empreendimentos Imobiliarios SA | 17,634 | 82,026 | ||||||
Natura & Co. Holding SA | 92,809 | 258,310 | ||||||
Neoenergia SA | 20,444 | 65,227 | ||||||
Pagseguro Digital Ltd., Class A* | 15,542 | 241,523 | ||||||
Porto Seguro SA | 19,374 | 78,939 | ||||||
Raia Drogasil SA | 127,371 | 534,953 | ||||||
Rede D’Or Sao Luiz SA, 144A | 47,481 | 305,451 | ||||||
Rumo SA | 136,429 | 532,181 | ||||||
Sendas Distribuidora SA | 66,496 | 236,028 | ||||||
StoneCo Ltd., Class A* | 24,741 | 234,545 | ||||||
Suzano SA | 51,259 | 437,893 | ||||||
Telefonica Brasil SA | 45,178 | 358,738 | ||||||
TIM SA | 85,684 | 195,646 | ||||||
TOTVS SA | 45,231 | 249,246 | ||||||
WEG SA | 97,183 | 530,652 | ||||||
XP, Inc.* | 7,107 | 136,420 | ||||||
XP, Inc., Class A* (a) | 15,694 | 301,953 | ||||||
|
| |||||||
(Cost $16,192,798) | 14,438,871 | |||||||
|
| |||||||
| Chile — 0.3% | ||||||||
Banco de Chile | 2,903,192 | 276,561 | ||||||
Banco de Credito e Inversiones SA | 7,264 | 214,844 | ||||||
Banco Santander Chile | 6,993,460 | 282,058 | ||||||
Cencosud SA | 139,513 | 195,843 | ||||||
Cencosud Shopping SA | 36,524 | 51,967 | ||||||
Cia Sud Americana de Vapores SA | 1,454,900 | 137,487 | ||||||
Empresas CMPC SA | 80,465 | 153,249 | ||||||
Number | Value | |||||||
| Chile (Continued) | ||||||||
Enel Americas SA | 1,233,149 | $ | 134,146 | |||||
Falabella SA | 45,611 | 107,921 | ||||||
|
| |||||||
(Cost $1,703,296) | 1,554,076 | |||||||
|
| |||||||
| China — 30.2% | ||||||||
360 Security Technology, Inc., Class A | 33,054 | 35,099 | ||||||
37 Interactive Entertainment Network Technology Group Co. Ltd., Class A | 17,936 | 53,000 | ||||||
AAC Technologies Holdings, Inc. | 32,826 | 61,145 | ||||||
Agricultural Bank of China Ltd., Class A | 620,639 | 256,591 | ||||||
Agricultural Bank of China Ltd., Class H | 3,335,888 | 1,092,291 | ||||||
Aier Eye Hospital Group Co. Ltd., Class A | 31,520 | 134,520 | ||||||
Air China Ltd., Class A* | 17,096 | 25,569 | ||||||
Air China Ltd., Class H* | 69,821 | 56,132 | ||||||
Airtac International Group* | 7,969 | 215,736 | ||||||
Alibaba Group Holding Ltd., ADR* | 122,629 | 11,700,033 | ||||||
Aluminum Corp. of China Ltd., Class A | 57,672 | 37,731 | ||||||
Aluminum Corp. of China Ltd., Class H | 197,031 | 72,799 | ||||||
Angang Steel Co. Ltd., Class A | 34,600 | 14,556 | ||||||
Angang Steel Co. Ltd., Class H | 113,112 | 35,452 | ||||||
Angel Yeast Co. Ltd., Class A | 6,112 | 43,055 | ||||||
Anhui Conch Cement Co. Ltd., Class A | 12,732 | 58,954 | ||||||
Anhui Conch Cement Co. Ltd., Class H | 45,325 | 173,242 | ||||||
Anjoy Foods Group Co. Ltd., Class A | 1,900 | 42,754 | ||||||
ANTA Sports Products Ltd. | 79,797 | 964,821 | ||||||
Apeloa Pharmaceutical Co. Ltd., Class A | 6,900 | 18,057 | ||||||
Asymchem Laboratories Tianjin Co. Ltd., Class A | 2,452 | 61,019 | ||||||
Autohome, Inc., ADR | 7,755 | 276,156 | ||||||
Avary Holding Shenzhen Co. Ltd., Class A | 4,836 | 20,807 | ||||||
Baidu, Inc., ADR* | 29,949 | 4,311,758 | ||||||
Bank of Beijing Co. Ltd., Class A | 91,802 | 55,000 | ||||||
Bank of China Ltd., Class A | 149,013 | 65,714 | ||||||
Bank of China Ltd., Class H | 5,467,752 | 1,922,701 | ||||||
Bank of Communications Co. Ltd., Class A | 224,214 | 148,965 | ||||||
Bank of Communications Co. Ltd., Class H | 838,680 | 478,705 | ||||||
Bank of Hangzhou Co. Ltd., Class A | 35,743 | 74,301 | ||||||
Bank of Jiangsu Co. Ltd., Class A | 62,276 | 65,496 | ||||||
Bank of Nanjing Co. Ltd., Class A | 52,895 | 81,488 | ||||||
Bank of Ningbo Co. Ltd., Class A | 31,455 | 136,113 | ||||||
Bank of Shanghai Co. Ltd., Class A | 65,639 | 56,274 | ||||||
Bank of Zhengzhou Co. Ltd., Class A* | 73,100 | 27,147 | ||||||
Baoshan Iron & Steel Co. Ltd., Class A | 64,956 | 50,223 | ||||||
BBMG Corp., Class A | 45,480 | 17,285 | ||||||
BeiGene Ltd., ADR* (a) | 5,173 | 887,997 | ||||||
Beijing Dabeinong Technology Group Co. Ltd., Class A* | 19,038 | 23,889 | ||||||
Beijing New Building Materials PLC, Class A | 8,000 | 30,510 | ||||||
Beijing Shiji Information Technology Co. Ltd., Class A | 8,680 | 16,407 | ||||||
Beijing United Information Technology Co. Ltd., Class A | 4,990 | 71,721 | ||||||
| See Notes to Financial Statements. | 24 |
DBX ETF Trust
Schedule of Investments
Xtrackers Emerging Markets Carbon Reduction and Climate Improvers ETF (Continued)
August 31, 2022
Number | Value | |||||||
| China (Continued) | ||||||||
Beijing Wantai Biological Pharmacy Enterprise Co. Ltd., Class A | 2,684 | $ | 49,700 | |||||
Beijing-Shanghai High Speed Railway Co. Ltd., Class A | 198,928 | 133,608 | ||||||
BGI Genomics Co. Ltd., Class A | 3,200 | 28,029 | ||||||
Bilibili, Inc., ADR* (a) | 25,521 | 637,004 | ||||||
Bloomage Biotechnology Corp. Ltd., Class A | 2,107 | 43,723 | ||||||
Blue Moon Group Holdings Ltd., 144A | 121,938 | 93,215 | ||||||
BOC International China Co. Ltd., Class A | 14,455 | 26,232 | ||||||
BOE Technology Group Co. Ltd., Class A | 123,687 | 66,387 | ||||||
BYD Co. Ltd., Class A | 6,878 | 287,330 | ||||||
BYD Co. Ltd., Class H | 57,115 | 1,762,456 | ||||||
By-health Co. Ltd., Class A | 4,800 | 12,986 | ||||||
CanSino Biologics, Inc., Class H, 144A | 4,744 | 29,768 | ||||||
CGN Power Co. Ltd., Class A | 122,190 | 49,808 | ||||||
CGN Power Co. Ltd., Class H, 144A | 1,178,547 | 280,791 | ||||||
Changchun High & New Technology Industry Group, Inc., Class A | 1,512 | 38,840 | ||||||
Changzhou Xingyu Automotive Lighting Systems Co. Ltd., Class A | 1,412 | 28,733 | ||||||
Chaozhou Three-Circle Group Co. Ltd., Class A | 11,300 | 44,423 | ||||||
Chengxin Lithium Group Co. Ltd., Class A | 5,100 | 39,344 | ||||||
China Baoan Group Co. Ltd., Class A | 13,549 | 29,010 | ||||||
China Bohai Bank Co. Ltd., Class H, 144A (a) | 245,802 | 40,712 | ||||||
China Cinda Asset Management Co. Ltd., Class H | 529,076 | 72,801 | ||||||
China CITIC Bank Corp. Ltd., Class H | 641,557 | 275,460 | ||||||
China Conch Venture Holdings Ltd. | 94,009 | 192,357 | ||||||
China Construction Bank Corp., Class A | 59,021 | 47,261 | ||||||
China Construction Bank Corp., Class H | 10,092,383 | 6,262,052 | ||||||
China CSSC Holdings Ltd., Class A | 8,613 | 31,286 | ||||||
China Eastern Airlines Corp. Ltd., Class A* | 56,408 | 40,177 | ||||||
China Eastern Airlines Corp. Ltd., Class H* (a) | 105,864 | 36,552 | ||||||
China Everbright Bank Co. Ltd., Class A | 169,415 | 70,533 | ||||||
China Everbright Bank Co. Ltd., Class H | 466,999 | 143,393 | ||||||
China Evergrande Group* (b) | 185,090 | 38,910 | ||||||
China Feihe Ltd., 144A* | 112,982 | 93,710 | ||||||
China Galaxy Securities Co. Ltd., Class H | 297,996 | 163,257 | ||||||
China Great Wall Securities Co. Ltd., Class A | 33,500 | 45,146 | ||||||
China Greatwall Technology Group Co. Ltd., Class A | 13,749 | 18,110 | ||||||
China Hongqiao Group Ltd. | 175,112 | 170,899 | ||||||
China International Capital Corp. Ltd., Class A | 10,188 | 61,629 | ||||||
China International Capital Corp. Ltd., Class H, 144A | 174,169 | 307,559 | ||||||
China International Marine Containers Group Co. Ltd., Class H | 25,316 | 21,062 | ||||||
Number | Value | |||||||
| China (Continued) | ||||||||
China Jushi Co. Ltd., Class A | 19,600 | $ | 40,971 | |||||
China Lesso Group Holdings Ltd. | 71,198 | 84,906 | ||||||
China Life Insurance Co. Ltd., Class A | 6,829 | 30,413 | ||||||
China Life Insurance Co. Ltd., Class H | 496,331 | 713,304 | ||||||
China Literature Ltd., 144A* | 32,996 | 134,526 | ||||||
China Meidong Auto Holdings Ltd. | 50,698 | 103,865 | ||||||
China Merchants Bank Co. Ltd., Class A | 78,760 | 400,452 | ||||||
China Merchants Bank Co. Ltd., Class H | 268,985 | 1,381,106 | ||||||
China Merchants Securities Co. Ltd., Class A | 55,344 | 106,376 | ||||||
China Merchants Securities Co. Ltd., Class H, 144A | 25,675 | 23,552 | ||||||
China Merchants Shekou Industrial Zone Holdings Co. Ltd., Class A | 34,643 | 73,472 | ||||||
China Minsheng Banking Corp. Ltd., Class A | 143,963 | 75,181 | ||||||
China Minsheng Banking Corp. Ltd., Class H | 449,954 | 143,318 | ||||||
China National Building Material Co. Ltd., Class H | 233,957 | 221,770 | ||||||
China National Chemical Engineering Co. Ltd., Class A | 52,701 | 65,900 | ||||||
China National Nuclear Power Co. Ltd., Class A | 109,672 | 101,343 | ||||||
China Northern Rare Earth Group High-Tech Co. Ltd., Class A | 13,154 | 57,512 | ||||||
China Pacific Insurance Group Co. Ltd., Class A | 29,460 | 89,617 | ||||||
China Pacific Insurance Group Co. Ltd., Class H | 156,129 | 331,400 | ||||||
China Railway Group Ltd., Class A | 73,124 | 60,994 | ||||||
China Railway Group Ltd., Class H | 267,460 | 153,343 | ||||||
China Railway Signal & Communication Corp. Ltd., Class H, 144A | 194,842 | 61,316 | ||||||
China Reinsurance Group Corp., Class H | 663,791 | 49,052 | ||||||
China Resources Mixc Lifestyle Services Ltd., 144A | 45,989 | 209,178 | ||||||
China Resources Sanjiu Medical & Pharmaceutical Co. Ltd., Class A | 7,800 | 44,683 | ||||||
China Southern Airlines Co. Ltd., Class H* | 116,493 | 63,079 | ||||||
China State Construction Engineering Corp. Ltd., Class A | 142,259 | 106,072 | ||||||
China Tower Corp. Ltd., Class H, 144A | 2,780,741 | 347,201 | ||||||
China United Network Communications Ltd., Class A | 141,167 | 72,697 | ||||||
China Vanke Co. Ltd., Class A | 33,752 | 81,423 | ||||||
China Vanke Co. Ltd., Class H | 119,922 | 234,684 | ||||||
China Yangtze Power Co. Ltd., Class A | 177,818 | 618,560 | ||||||
China Zhenhua Group Science & Technology Co. Ltd., Class A | 3,284 | 53,446 | ||||||
China Zheshang Bank Co. Ltd., Class A* | 90,700 | 42,761 | ||||||
Chongqing Brewery Co. Ltd., Class A | 3,100 | 50,231 | ||||||
Chongqing Changan Automobile Co. Ltd., Class A | 25,670 | 54,069 | ||||||
Chongqing Rural Commercial Bank Co. Ltd., Class H | 250,913 | 86,953 | ||||||
| See Notes to Financial Statements. | 25 |
DBX ETF Trust
Schedule of Investments
Xtrackers Emerging Markets Carbon Reduction and Climate Improvers ETF (Continued)
August 31, 2022
Number | Value | |||||||
| China (Continued) | ||||||||
Chongqing Zhifei Biological Products Co. Ltd., Class A | 7,540 | $ | 102,870 | |||||
CIFI Holdings Group Co. Ltd. (a) | 300,749 | 76,635 | ||||||
CITIC Securities Co. Ltd., Class A | 46,746 | 132,367 | ||||||
CITIC Securities Co. Ltd., Class H | 151,543 | 308,150 | ||||||
CMOC Group Ltd., Class H | 169,141 | 75,855 | ||||||
Contemporary Amperex Technology Co. Ltd., Class A* | 15,756 | 1,103,952 | ||||||
COSCO SHIPPING Development Co. Ltd., Class H | 219,713 | 33,312 | ||||||
COSCO SHIPPING Holdings Co. Ltd., Class A | 36,076 | 74,313 | ||||||
COSCO SHIPPING Holdings Co. Ltd., Class H | 222,523 | 333,975 | ||||||
Country Garden Holdings Co. Ltd. | 617,482 | 183,305 | ||||||
Country Garden Services Holdings Co. Ltd. | 206,295 | 408,971 | ||||||
CRRC Corp. Ltd., Class A | 110,900 | 80,598 | ||||||
CRRC Corp. Ltd., Class H | 204,213 | 76,494 | ||||||
CSC Financial Co. Ltd., Class A | 14,300 | 55,262 | ||||||
CSC Financial Co. Ltd., Class H, 144A | 57,366 | 54,012 | ||||||
Dali Foods Group Co. Ltd., 144A | 140,667 | 64,340 | ||||||
DaShenLin Pharmaceutical Group Co. Ltd., Class A | 5,739 | 27,789 | ||||||
Dong-E-E-Jiao Co. Ltd., Class A | 5,400 | 26,837 | ||||||
Dongfang Electric Corp. Ltd., Class A | 10,172 | 29,069 | ||||||
Dongfang Electric Corp. Ltd., Class H | 25,040 | 33,370 | ||||||
Dongfeng Motor Group Co. Ltd., Class H | 122,828 | 78,089 | ||||||
East Money Information Co. Ltd., Class A | 59,756 | 192,438 | ||||||
Ecovacs Robotics Co. Ltd., Class A | 1,965 | 23,260 | ||||||
Eve Energy Co. Ltd., Class A | 6,482 | 89,319 | ||||||
Everbright Securities Co. Ltd., Class A | 43,488 | 101,188 | ||||||
Evergrande Property Services Group Ltd., 144A* (b) | 362,957 | 106,360 | ||||||
Fangda Carbon New Material Co. Ltd., Class A* | 29,300 | 29,625 | ||||||
Flat Glass Group Co. Ltd., Class A* | 9,482 | 55,061 | ||||||
Flat Glass Group Co. Ltd., Class H* | 59,696 | 197,368 | ||||||
Focus Media Information Technology Co. Ltd., Class A | 28,042 | 24,651 | ||||||
Foshan Haitian Flavouring & Food Co. Ltd., Class A | 9,259 | 108,203 | ||||||
Founder Securities Co. Ltd., Class A | 44,118 | 44,479 | ||||||
Foxconn Industrial Internet Co. Ltd., Class A | 26,457 | 35,654 | ||||||
Fujian Sunner Development Co. Ltd., Class A | 8,260 | 26,744 | ||||||
Fuyao Glass Industry Group Co. Ltd., Class A | 12,131 | 68,736 | ||||||
Fuyao Glass Industry Group Co. Ltd., Class H, 144A | 36,813 | 175,884 | ||||||
Gan & Lee Pharmaceuticals Co. Ltd., Class A | 5,100 | 27,151 | ||||||
Ganfeng Lithium Co. Ltd., Class A | 7,847 | 97,553 | ||||||
Ganfeng Lithium Co. Ltd., Class H, 144A (a) | 22,995 | 203,177 | ||||||
GDS Holdings Ltd., ADR* (a) | 19,702 | 536,682 | ||||||
Number | Value | |||||||
| China (Continued) | ||||||||
GEM Co. Ltd., Class A | 26,341 | $ | 31,906 | |||||
Gemdale Corp., Class A | 13,396 | 22,658 | ||||||
Genscript Biotech Corp.* | 108,205 | 350,856 | ||||||
GF Securities Co. Ltd., Class A | 40,163 | 95,782 | ||||||
GF Securities Co. Ltd., Class H | 140,265 | 183,712 | ||||||
GigaDevice Semiconductor, Inc., Class A | 1,804 | 30,349 | ||||||
GoerTek, Inc., Class A | 10,488 | 49,416 | ||||||
Gotion High-tech Co. Ltd., Class A | 9,419 | 46,948 | ||||||
Great Wall Motor Co. Ltd., Class A | 7,101 | 34,467 | ||||||
Great Wall Motor Co. Ltd., Class H | 126,094 | 190,856 | ||||||
Gree Electric Appliances, Inc. of Zhuhai, Class A | 22,370 | 103,615 | ||||||
Greentown China Holdings Ltd. | 38,013 | 72,066 | ||||||
Guangdong Haid Group Co. Ltd., Class A | 6,070 | 53,713 | ||||||
Guangdong Kinlong Hardware Products Co. Ltd., Class A | 1,171 | 16,217 | ||||||
Guangzhou Automobile Group Co. Ltd., Class H | 122,828 | 106,101 | ||||||
Guangzhou Baiyunshan Pharmaceutical Holdings Co. Ltd., Class A | 7,832 | 30,903 | ||||||
Guangzhou Baiyunshan Pharmaceutical Holdings Co. Ltd., Class H | 27,363 | 65,960 | ||||||
Guangzhou Kingmed Diagnostics Group Co. Ltd., Class A | 2,871 | 27,766 | ||||||
Guangzhou Shiyuan Electronic Technology Co. Ltd., Class A | 4,300 | 42,167 | ||||||
Guangzhou Tinci Materials Technology Co. Ltd., Class A | 11,210 | 77,324 | ||||||
Guosen Securities Co. Ltd., Class A | 21,556 | 28,925 | ||||||
Guotai Junan Securities Co. Ltd., Class A | 21,291 | 45,680 | ||||||
Guotai Junan Securities Co. Ltd., Class H, 144A | 61,314 | 72,885 | ||||||
Guoyuan Securities Co. Ltd., Class A | 46,400 | 49,270 | ||||||
H World Group Ltd., ADR | 6,224 | 234,209 | ||||||
Haidilao International Holding Ltd., 144A* | 94,340 | 223,564 | ||||||
Haier Smart Home Co. Ltd., Class A | 23,907 | 89,718 | ||||||
Haier Smart Home Co. Ltd., Class H | 149,827 | 492,497 | ||||||
Haitong Securities Co. Ltd., Class A | 49,036 | 67,434 | ||||||
Haitong Securities Co. Ltd., Class H | 197,837 | 129,810 | ||||||
Hangzhou First Applied Material Co. Ltd., Class A | 11,644 | 109,590 | ||||||
Hangzhou Robam Appliances Co. Ltd., Class A | 10,200 | 37,213 | ||||||
Hangzhou Silan Microelectronics Co. Ltd., Class A | 9,789 | 56,318 | ||||||
Hangzhou Tigermed Consulting Co. Ltd., Class A | 2,805 | 44,088 | ||||||
Hangzhou Tigermed Consulting Co. Ltd., Class H, 144A | 7,661 | 76,231 | ||||||
Hansoh Pharmaceutical Group Co. Ltd., 144A | 77,868 | 155,759 | ||||||
Hengan International Group Co. Ltd. | 36,388 | 174,317 | ||||||
Hithink RoyalFlush Information Network Co. Ltd., Class A | 3,742 | 46,211 | ||||||
Hongfa Technology Co. Ltd., Class A | 7,890 | 43,127 | ||||||
Hua Hong Semiconductor Ltd., 144A* | 60,442 | 178,657 | ||||||
| See Notes to Financial Statements. | 26 |
DBX ETF Trust
Schedule of Investments
Xtrackers Emerging Markets Carbon Reduction and Climate Improvers ETF (Continued)
August 31, 2022
Number | Value | |||||||
| China (Continued) | ||||||||
Huadong Medicine Co. Ltd., Class A | 6,850 | $ | 41,904 | |||||
Huafon Chemical Co. Ltd., Class A | 39,300 | 42,871 | ||||||
Huaneng Lancang River Hydropower, Inc., Class A | 63,742 | 67,223 | ||||||
Huatai Securities Co. Ltd., Class A | 35,679 | 68,009 | ||||||
Huatai Securities Co. Ltd., Class H, 144A | 65,814 | 88,212 | ||||||
Huaxia Bank Co. Ltd., Class A | 87,452 | 65,206 | ||||||
Huayu Automotive Systems Co. Ltd., Class A | 21,406 | 57,974 | ||||||
Huizhou Desay Sv Automotive Co. Ltd., Class A | 3,670 | 81,454 | ||||||
Hunan Valin Steel Co. Ltd., Class A | 35,305 | 22,842 | ||||||
Hundsun Technologies, Inc., Class A | 8,183 | 39,932 | ||||||
Iflytek Co. Ltd., Class A | 12,131 | 65,973 | ||||||
Industrial & Commercial Bank of China Ltd., Class A | 449,792 | 285,787 | ||||||
Industrial & Commercial Bank of China Ltd., Class H | 8,465,025 | 4,314,021 | ||||||
Industrial Bank Co. Ltd., Class A | 80,490 | 199,779 | ||||||
Industrial Securities Co. Ltd., Class A* | 68,416 | 61,632 | ||||||
Ingenic Semiconductor Co. Ltd., Class A | 3,880 | 45,900 | ||||||
Inner Mongolia BaoTou Steel Union Co. Ltd., Class A | 147,163 | 42,909 | ||||||
Inner Mongolia Yili Industrial Group Co. Ltd., Class A | 27,518 | 142,669 | ||||||
Innovent Biologics, Inc., 144A* | 50,178 | 213,847 | ||||||
Inspur Electronic Information Industry Co. Ltd., Class A | 7,671 | 25,828 | ||||||
Intco Medical Technology Co. Ltd., Class A | 5,196 | 16,552 | ||||||
iQIYI, Inc., ADR* | 23,415 | 85,699 | ||||||
JA Solar Technology Co. Ltd., Class A | 18,294 | 174,009 | ||||||
Jafron Biomedical Co. Ltd., Class A | 5,198 | 35,410 | ||||||
Jason Furniture Hangzhou Co. Ltd., Class A | 4,100 | 28,786 | ||||||
JCET Group Co. Ltd., Class A | 8,792 | 31,617 | ||||||
JD Health International, Inc., 144A* (a) | 44,285 | 308,348 | ||||||
JD.com, Inc., ADR | 63,281 | 4,017,711 | ||||||
JD.com, Inc., Class A | 25,217 | 792,926 | ||||||
Jiangsu Eastern Shenghong Co. Ltd., Class A | 23,742 | 66,333 | ||||||
Jiangsu Hengrui Medicine Co. Ltd., Class A | 30,512 | 153,411 | ||||||
Jiangsu Yangnong Chemical Co. Ltd., Class A | 2,600 | 42,925 | ||||||
Jiangsu Yuyue Medical Equipment & Supply Co. Ltd., Class A | 11,000 | 43,531 | ||||||
Jiangsu Zhongtian Technology Co. Ltd., Class A | 15,525 | 50,132 | ||||||
Jiangxi Copper Co. Ltd., Class A | 9,112 | 21,651 | ||||||
Jiangxi Copper Co. Ltd., Class H | 59,850 | 73,889 | ||||||
Jiangxi Zhengbang Technology Co. Ltd., Class A* | 21,900 | 18,998 | ||||||
Joinn Laboratories China Co. Ltd., Class H, 144A | 11,628 | 62,223 | ||||||
Jonjee Hi-Tech Industrial And Commercial Holding Co. Ltd., Class A | 5,489 | 27,391 | ||||||
Number | Value | |||||||
| China (Continued) | ||||||||
KE Holdings, Inc., ADR* | 37,964 | $ | 684,871 | |||||
Kingdee International Software Group Co. Ltd.* | 301,997 | 589,461 | ||||||
Kingfa Sci & Tech Co. Ltd., Class A | 4,300 | 6,706 | ||||||
Kingsoft Corp. Ltd. | 88,406 | 270,325 | ||||||
Kuaishou Technology, 144A* | 77,417 | 678,608 | ||||||
Kuang-Chi Technologies Co. Ltd., Class A* | 9,700 | 25,581 | ||||||
LB Group Co. Ltd., Class A | 7,201 | 18,364 | ||||||
Legend Holdings Corp., Class H, 144A | 111,158 | 126,611 | ||||||
Lenovo Group Ltd. | 753,219 | 623,776 | ||||||
Lens Technology Co. Ltd., Class A | 11,938 | 18,842 | ||||||
Li Auto, Inc., ADR* | 59,671 | 1,716,735 | ||||||
Li Ning Co. Ltd. | 152,196 | 1,396,142 | ||||||
Lingyi iTech Guangdong Co., Class A* | 39,435 | 31,463 | ||||||
Livzon Pharmaceutical Group, Inc., Class H | 20,431 | 57,788 | ||||||
Logan Group Co. Ltd. (a) | 162,655 | 17,822 | ||||||
Longfor Group Holdings Ltd., 144A | 137,016 | 446,895 | ||||||
LONGi Green Energy Technology Co. Ltd., Class A | 59,333 | 440,680 | ||||||
Lufax Holding Ltd., ADR | 198,886 | 869,132 | ||||||
Luxshare Precision Industry Co. Ltd., Class A | 29,353 | 159,762 | ||||||
Mango Excellent Media Co. Ltd., Class A | 7,960 | 32,101 | ||||||
Maxscend Microelectronics Co. Ltd., Class A | 2,174 | 32,085 | ||||||
Meituan, Class B, 144A* | 456,299 | 11,034,171 | ||||||
Metallurgical Corp. of China Ltd., Class A | 56,242 | 26,189 | ||||||
Metallurgical Corp. of China Ltd., Class H | 220,909 | 41,937 | ||||||
Microport Scientific Corp.* | 72,502 | 145,210 | ||||||
Ming Yang Smart Energy Group Ltd., Class A | 11,834 | 46,058 | ||||||
Ming Yuan Cloud Group Holdings Ltd. | 34,205 | 28,370 | ||||||
Montage Technology Co. Ltd., Class A | 3,022 | 24,330 | ||||||
Muyuan Foods Co. Ltd., Class A | 15,550 | 132,231 | ||||||
Nanjing King-Friend Biochemical Pharmaceutical Co. Ltd., Class A | 15,500 | 40,338 | ||||||
NARI Technology Co. Ltd., Class A | 26,736 | 106,462 | ||||||
NAURA Technology Group Co. Ltd., Class A | 2,163 | 88,484 | ||||||
NavInfo Co. Ltd., Class A | 11,031 | 20,930 | ||||||
NetEase, Inc., ADR (a) | 26,773 | 2,369,678 | ||||||
New China Life Insurance Co. Ltd., Class A | 4,480 | 18,723 | ||||||
New China Life Insurance Co. Ltd., Class H | 71,713 | 169,030 | ||||||
New Hope Liuhe Co. Ltd., Class A* | 10,878 | 24,790 | ||||||
Ninestar Corp., Class A | 7,759 | 49,794 | ||||||
Ningbo Tuopu Group Co. Ltd., Class A | 3,500 | 40,140 | ||||||
NIO, Inc., ADR* | 162,258 | 3,230,557 | ||||||
Nongfu Spring Co. Ltd., Class H, 144A (a) | 114,619 | 684,164 | ||||||
Offcn Education Technology Co. Ltd., Class A* | 26,339 | 17,499 | ||||||
Oppein Home Group, Inc., Class A | 2,766 | 52,362 | ||||||
Orient Securities Co. Ltd., Class A | 23,380 | 29,371 | ||||||
Ovctek China, Inc., Class A | 3,677 | 22,771 | ||||||
| See Notes to Financial Statements. | 27 |
DBX ETF Trust
Schedule of Investments
Xtrackers Emerging Markets Carbon Reduction and Climate Improvers ETF (Continued)
August 31, 2022
Number | Value | |||||||
| China (Continued) | ||||||||
Pangang Group Vanadium Titanium & Resources Co. Ltd., Class A* | 47,342 | $ | 39,351 | |||||
People’s Insurance Co. Group of China Ltd., Class A | 39,304 | 28,451 | ||||||
People’s Insurance Co. Group of China Ltd., Class H | 584,409 | 180,933 | ||||||
Pharmaron Beijing Co. Ltd., Class A | 5,505 | 54,343 | ||||||
Pharmaron Beijing Co. Ltd., Class H, 144A | 10,945 | 72,722 | ||||||
PICC Property & Casualty Co. Ltd., Class H | 443,475 | 480,266 | ||||||
Pinduoduo, Inc., ADR* | 50,063 | 3,569,492 | ||||||
Ping An Bank Co. Ltd., Class A | 93,433 | 172,809 | ||||||
Ping An Healthcare and Technology Co. Ltd., 144A* | 35,301 | 96,249 | ||||||
Ping An Insurance Group Co. of China Ltd., Class A | 69,167 | 439,872 | ||||||
Ping An Insurance Group Co. of China Ltd., Class H | 676,497 | 3,994,934 | ||||||
Poly Developments and Holdings Group Co. Ltd., Class A | 43,488 | 109,137 | ||||||
Poly Property Services Co. Ltd., Class H | 10,741 | 63,155 | ||||||
Pop Mart International Group Ltd., 144A (a) | 18,980 | 49,452 | ||||||
Postal Savings Bank of China Co. Ltd., Class A | 100,873 | 65,995 | ||||||
Postal Savings Bank of China Co. Ltd., Class H, 144A (a) | 828,114 | 495,886 | ||||||
Qinghai Salt Lake Industry Co. Ltd., Class A* | 28,100 | 113,320 | ||||||
Rongsheng Petrochemical Co. Ltd., Class A | 23,842 | 48,974 | ||||||
SAIC Motor Corp. Ltd., Class A | 18,888 | 42,387 | ||||||
Sangfor Technologies, Inc., Class A | 3,812 | 53,401 | ||||||
Sany Heavy Industry Co. Ltd., Class A | 30,512 | 69,712 | ||||||
Satellite Chemical Co. Ltd., Class A | 19,821 | 63,055 | ||||||
Seazen Group Ltd.* | 145,728 | 48,645 | ||||||
Seazen Holdings Co. Ltd., Class A* | 10,115 | 30,549 | ||||||
SF Holding Co. Ltd., Class A | 17,931 | 128,574 | ||||||
SG Micro Corp., Class A | 1,209 | 28,096 | ||||||
Shandong Gold Mining Co. Ltd., Class H, 144A | 49,319 | 83,949 | ||||||
Shandong Hualu Hengsheng Chemical Co. Ltd., Class A | 18,550 | 78,494 | ||||||
Shandong Linglong Tyre Co. Ltd., Class A | 4,844 | 15,986 | ||||||
Shandong Nanshan Aluminum Co. Ltd., Class A | 107,584 | 52,906 | ||||||
Shandong Weigao Group Medical Polymer Co. Ltd., Class H | 149,410 | 203,684 | ||||||
Shanghai Baosight Software Co. Ltd., Class A | 3,947 | 21,763 | ||||||
Shanghai Baosight Software Co. Ltd., Class B | 31,434 | 95,496 | ||||||
Shanghai Electric Group Co. Ltd., Class H* | 303,875 | 72,786 | ||||||
Number | Value | |||||||
| China (Continued) | ||||||||
Shanghai Fosun Pharmaceutical Group Co. Ltd., Class A | 13,471 | $ | 78,869 | |||||
Shanghai Fosun Pharmaceutical Group Co. Ltd., Class H | 48,230 | 155,772 | ||||||
Shanghai Fudan Microelectronics Group Co. Ltd., Class H | 25,376 | 118,816 | ||||||
Shanghai International Airport Co. Ltd., Class A* | 7,184 | 58,797 | ||||||
Shanghai International Port Group Co. Ltd., Class A | 42,100 | 33,040 | ||||||
Shanghai Jinjiang International Hotels Co. Ltd., Class A | 5,632 | 47,157 | ||||||
Shanghai Junshi Biosciences Co. Ltd., Class A* | 4,474 | 34,320 | ||||||
Shanghai Junshi Biosciences Co. Ltd., Class H, 144A* (a) | 6,944 | 25,480 | ||||||
Shanghai Lujiazui Finance & Trade Zone Development Co. Ltd., Class B | 65,381 | 54,528 | ||||||
Shanghai M&G Stationery, Inc., Class A | 4,400 | 28,327 | ||||||
Shanghai MicroPort MedBot Group Co. Ltd.* (a) | 19,404 | 61,434 | ||||||
Shanghai Pharmaceuticals Holding Co. Ltd., Class A | 17,000 | 42,614 | ||||||
Shanghai Pharmaceuticals Holding Co. Ltd., Class H | 47,085 | 68,628 | ||||||
Shanghai Pudong Development Bank Co. Ltd., Class A | 112,261 | 118,391 | ||||||
Shanghai Putailai New Energy Technology Co. Ltd., Class A | 3,732 | 34,312 | ||||||
Shanghai Yuyuan Tourist Mart Group Co. Ltd., Class A | 18,885 | 21,971 | ||||||
Shanxi Taigang Stainless Steel Co. Ltd., Class A | 44,671 | 31,753 | ||||||
Shenwan Hongyuan Group Co. Ltd., Class A | 74,927 | 45,433 | ||||||
Shenzhen Capchem Technology Co. Ltd., Class A | 3,357 | 20,477 | ||||||
Shenzhen Dynanonic Co. Ltd., Class A | 900 | 41,843 | ||||||
Shenzhen Inovance Technology Co. Ltd., Class A | 8,818 | 76,712 | ||||||
Shenzhen Kangtai Biological Products Co. Ltd., Class A | 3,624 | 17,711 | ||||||
Shenzhen Mindray Bio-Medical Electronics Co. Ltd., Class A | 7,791 | 337,361 | ||||||
Shenzhen Overseas Chinese Town Co. Ltd., Class A | 36,464 | 28,299 | ||||||
Shenzhou International Group Holdings Ltd. | 51,631 | 541,712 | ||||||
Sichuan Chuantou Energy Co. Ltd., Class A | 27,600 | 52,809 | ||||||
Sichuan Kelun Pharmaceutical Co. Ltd., Class A | 5,800 | 18,064 | ||||||
Sichuan Road & Bridge Co. Ltd., Class A | 41,752 | 64,625 | ||||||
Sichuan Swellfun Co. Ltd., Class A | 3,800 | 40,229 | ||||||
Sinoma Science & Technology Co. Ltd., Class A | 5,182 | 17,425 | ||||||
Sinopharm Group Co. Ltd., Class H | 90,678 | 201,947 | ||||||
| See Notes to Financial Statements. | 28 |
DBX ETF Trust
Schedule of Investments
Xtrackers Emerging Markets Carbon Reduction and Climate Improvers ETF (Continued)
August 31, 2022
Number | Value | |||||||
| China (Continued) | ||||||||
Sinotrans Ltd., Class H | 140,207 | $ | 40,193 | |||||
Sinotruk Hong Kong Ltd. | 43,975 | 44,093 | ||||||
Sunac China Holdings Ltd.* (b) | 230,518 | 0 | ||||||
Sungrow Power Supply Co. Ltd., Class A | 8,089 | 130,719 | ||||||
Sunny Optical Technology Group Co. Ltd. | 43,884 | 603,284 | ||||||
Sunwoda Electronic Co. Ltd., Class A | 10,172 | 40,283 | ||||||
Suzhou Dongshan Precision Manufacturing Co. Ltd., Class A | 8,700 | 32,637 | ||||||
Suzhou Maxwell Technologies Co. Ltd., Class A | 1,290 | 87,578 | ||||||
TCL Technology Group Corp., Class A | 94,768 | 57,051 | ||||||
TCL Zhonghuan Renewable Energy Technology Co. Ltd., Class A | 24,262 | 169,324 | ||||||
Tencent Holdings Ltd. | 653,961 | 27,262,088 | ||||||
Tencent Music Entertainment Group, ADR* | 64,633 | 330,275 | ||||||
Thunder Software Technology Co. Ltd., Class A | 2,871 | 51,214 | ||||||
Tingyi Cayman Islands Holding Corp. | 68,291 | 121,463 | ||||||
Tongcheng Travel Holdings Ltd.* | 101,331 | 208,889 | ||||||
Tongwei Co. Ltd., Class A | 18,550 | 142,296 | ||||||
Topchoice Medical Corp., Class A* | 1,965 | 33,177 | ||||||
Topsports International Holdings Ltd., 144A | 135,291 | 107,042 | ||||||
TravelSky Technology Ltd., Class H | 98,588 | 172,586 | ||||||
Trina Solar Co. Ltd., Class A | 11,239 | 116,555 | ||||||
Trip.com Group Ltd., ADR* | 69,652 | 1,791,449 | ||||||
Unigroup Guoxin Microelectronics Co. Ltd., Class A | 3,428 | 77,580 | ||||||
Uni-President China Holdings Ltd. | 78,694 | 67,877 | ||||||
Universal Scientific Industrial Shanghai Co. Ltd., Class A | 18,400 | 44,388 | ||||||
Vipshop Holdings Ltd., ADR* | 35,685 | 414,303 | ||||||
Walvax Biotechnology Co. Ltd., Class A | 6,070 | 38,435 | ||||||
Wanhua Chemical Group Co. Ltd., Class A | 12,131 | 155,862 | ||||||
Want Want China Holdings Ltd. | 261,042 | 184,253 | ||||||
Weibo Corp., ADR* | 6,593 | 136,409 | ||||||
Weichai Power Co. Ltd., Class A | 13,688 | 23,093 | ||||||
Weichai Power Co. Ltd., Class H | 147,188 | 197,280 | ||||||
Wens Foodstuffs Group Co. Ltd., Class A* | 15,686 | 53,974 | ||||||
Western Securities Co. Ltd., Class A | 44,956 | 42,259 | ||||||
Will Semiconductor Co. Ltd., Class A | 4,218 | 57,357 | ||||||
Wingtech Technology Co. Ltd., Class A | 6,070 | 56,882 | ||||||
WuXi AppTec Co. Ltd., Class A | 16,850 | 219,133 | ||||||
WuXi AppTec Co. Ltd., Class H, 144A | 37,321 | 424,856 | ||||||
Wuxi Biologics Cayman, Inc., 144A* | 387,505 | 3,441,154 | ||||||
Wuxi Shangji Automation Co. Ltd., Class A | 1,900 | 37,173 | ||||||
XCMG Construction Machinery Co. Ltd., Class A* | 133,389 | 100,813 | ||||||
Xiamen C & D, Inc., Class A | 24,800 | 42,235 | ||||||
Xiaomi Corp., Class B, 144A* | 960,913 | 1,415,259 | ||||||
Xinjiang Goldwind Science & Technology Co. Ltd., Class A | 27,287 | 50,785 | ||||||
Number | Value | |||||||
| China (Continued) | ||||||||
Xinjiang Goldwind Science & Technology Co. Ltd., Class H | 100,138 | $ | 149,782 | |||||
Xinyi Solar Holdings Ltd. | 547,680 | 756,398 | ||||||
XPeng, Inc., ADR* | 64,654 | 1,197,392 | ||||||
Yealink Network Technology Corp. Ltd., Class A | 4,533 | 47,003 | ||||||
Yifeng Pharmacy Chain Co. Ltd., Class A | 495 | 3,834 | ||||||
Yihai International Holding Ltd.* | 33,109 | 83,607 | ||||||
Yihai Kerry Arawana Holdings Co. Ltd., Class A | 7,184 | 47,605 | ||||||
Yonyou Network Technology Co. Ltd., Class A | 20,100 | 58,578 | ||||||
YTO Express Group Co. Ltd., Class A | 14,655 | 41,710 | ||||||
Yunda Holding Co. Ltd., Class A | 8,618 | 21,053 | ||||||
Yunnan Aluminium Co. Ltd., Class A | 18,868 | 27,617 | ||||||
Yunnan Baiyao Group Co. Ltd., Class A | 7,847 | 59,602 | ||||||
Yunnan Energy New Material Co. Ltd., Class A | 4,177 | 116,944 | ||||||
Yunnan Tin Co. Ltd., Class A | 19,600 | 39,464 | ||||||
Zai Lab Ltd., ADR* | 5,333 | 246,438 | ||||||
Zhangzhou Pientzehuang Pharmaceutical Co. Ltd., Class A | 3,056 | 133,433 | ||||||
Zhejiang Century Huatong Group Co. Ltd., Class A* | 78,886 | 52,411 | ||||||
Zhejiang Chint Electrics Co. Ltd., Class A | 7,554 | 34,660 | ||||||
Zhejiang Dahua Technology Co. Ltd., Class A | 33,468 | 71,562 | ||||||
Zhejiang Dingli Machinery Co. Ltd., Class A | 2,700 | 15,361 | ||||||
Zhejiang Expressway Co. Ltd., Class H | 70,040 | 53,363 | ||||||
Zhejiang Huayou Cobalt Co. Ltd., Class A | 3,273 | 35,486 | ||||||
Zhejiang Jingsheng Mechanical & Electrical Co. Ltd., Class A | 9,175 | 101,153 | ||||||
Zhejiang Jiuzhou Pharmaceutical Co. Ltd., Class A | 4,030 | 23,998 | ||||||
Zhejiang Juhua Co. Ltd., Class A | 18,500 | 42,134 | ||||||
Zhejiang NHU Co. Ltd., Class A | 13,516 | 44,056 | ||||||
Zhejiang Supor Co. Ltd., Class A | 6,300 | 41,902 | ||||||
Zhejiang Weiming Environment Protection Co. Ltd., Class A | 9,700 | 35,825 | ||||||
Zheshang Securities Co. Ltd., Class A | 16,722 | 26,513 | ||||||
ZhongAn Online P&C Insurance Co. Ltd., Class H, 144A* | 85,669 | 252,679 | ||||||
Zhongji Innolight Co. Ltd., Class A | 8,800 | 37,429 | ||||||
Zhongsheng Group Holdings Ltd. | 26,588 | 126,184 | ||||||
Zhuzhou CRRC Times Electric Co. Ltd. | 30,023 | 145,738 | ||||||
Zhuzhou CRRC Times Electric Co. Ltd., Class A | 2,832 | 25,380 | ||||||
Zhuzhou Kibing Group Co. Ltd., Class A | 23,980 | 39,413 | ||||||
Zijin Mining Group Co. Ltd., Class A | 87,452 | 111,637 | ||||||
Zijin Mining Group Co. Ltd., Class H | 366,661 | 417,634 | ||||||
Zoomlion Heavy Industry Science and Technology Co. Ltd., Class A | 34,900 | 29,212 | ||||||
Zoomlion Heavy Industry Science and Technology Co. Ltd., Class H | 73,661 | 33,317 | ||||||
ZTE Corp., Class A | 18,512 | 65,793 | ||||||
ZTE Corp., Class H | 40,095 | 85,004 | ||||||
| See Notes to Financial Statements. | 29 |
DBX ETF Trust
Schedule of Investments
Xtrackers Emerging Markets Carbon Reduction and Climate Improvers ETF (Continued)
August 31, 2022
Number | Value | |||||||
| China (Continued) | ||||||||
ZTO Express Cayman, Inc., ADR (a) | 31,117 | $ | 810,598 | |||||
|
| |||||||
(Cost $198,527,763) | 148,854,566 | |||||||
|
| |||||||
| Colombia — 0.1% | ||||||||
Bancolombia SA | 24,943 | 192,857 | ||||||
Ecopetrol SA | 160,799 | 82,050 | ||||||
Interconexion Electrica SA ESP | 32,351 | 140,207 | ||||||
|
| |||||||
(Cost $480,123) | 415,114 | |||||||
|
| |||||||
| Cyprus — 0.0% | ||||||||
Polymetal International PLC (b) (Cost $548,412) | 28,889 | 0 | ||||||
|
| |||||||
| Czech Republic — 0.2% | ||||||||
CEZ AS | 10,205 | 413,272 | ||||||
Komercni Banka AS | 8,419 | 198,452 | ||||||
Moneta Money Bank AS, 144A (a) | 38,464 | 121,994 | ||||||
|
| |||||||
(Cost $948,185) | 733,718 | |||||||
|
| |||||||
| Egypt — 0.1% | ||||||||
Commercial International Bank Egypt SAE | 179,216 | 355,913 | ||||||
Egyptian Financial Group-Hermes Holding Co.* | 72,041 | 48,040 | ||||||
|
| |||||||
(Cost $580,780) | 403,953 | |||||||
|
| |||||||
| Greece — 0.3% | ||||||||
Alpha Services and Holdings SA* | 226,654 | 210,636 | ||||||
Eurobank Ergasias Services and Holdings SA* | 267,923 | 250,551 | ||||||
Hellenic Telecommunications Organization SA | 23,668 | 377,458 | ||||||
JUMBO SA | 6,968 | 99,775 | ||||||
Mytilineos SA | 8,644 | 135,769 | ||||||
National Bank of Greece SA* | 55,185 | 178,904 | ||||||
Piraeus Financial Holdings SA* | 72,432 | 76,330 | ||||||
Star Bulk Carriers Corp. | 5,762 | 112,647 | ||||||
Terna Energy SA | 4,772 | 85,077 | ||||||
|
| |||||||
(Cost $1,818,161) | 1,527,147 | |||||||
|
| |||||||
| Hong Kong — 0.7% | ||||||||
Beijing Enterprises Water Group Ltd. | 245,438 | 63,167 | ||||||
BOC Hong Kong Holdings Ltd. | 389,217 | 1,343,863 | ||||||
China Everbright Environment Group Ltd. | 255,131 | 126,447 | ||||||
China Jinmao Holdings Group Ltd. | 498,520 | 105,435 | ||||||
China Merchants Port Holdings Co. Ltd. | 80,561 | 121,116 | ||||||
China Overseas Land & Investment Ltd. | 314,986 | 850,787 | ||||||
China Resources Cement Holdings Ltd. | 58,571 | 36,192 | ||||||
China Resources Land Ltd. | 126,066 | 517,990 | ||||||
China State Construction International Holdings Ltd. | 100,213 | 115,932 | ||||||
China Taiping Insurance Holdings Co. Ltd. | 100,681 | 103,133 | ||||||
Guangdong Investment Ltd. | 127,454 | 116,918 | ||||||
Orient Overseas International Ltd. | 6,394 | 179,058 | ||||||
|
| |||||||
(Cost $3,875,096) | 3,680,038 | |||||||
|
| |||||||
Number | Value | |||||||
| Hungary — 0.1% | ||||||||
OTP Bank Nyrt | 23,371 | $ | 496,345 | |||||
Richter Gedeon Nyrt | 8,891 | 178,885 | ||||||
|
| |||||||
(Cost $1,639,461) | 675,230 | |||||||
|
| |||||||
| India — 14.5% | ||||||||
Aarti Industries Ltd. | 16,436 | 171,831 | ||||||
ABB India Ltd. | 3,116 | 127,951 | ||||||
ACC Ltd. | 6,089 | 176,230 | ||||||
Adani Green Energy Ltd.* | 61,057 | 1,872,018 | ||||||
Adani Ports & Special Economic Zone Ltd. | 76,389 | 809,621 | ||||||
Adani Transmission Ltd.* | 25,064 | 1,249,349 | ||||||
Alkem Laboratories Ltd. | 1,851 | 69,295 | ||||||
Ambuja Cements Ltd. | 41,360 | 214,066 | ||||||
Apollo Hospitals Enterprise Ltd. | 7,754 | 421,854 | ||||||
Ashok Leyland Ltd. | 118,617 | 229,895 | ||||||
Asian Paints Ltd. | 40,735 | 1,738,737 | ||||||
Astral Ltd. | 6,452 | 169,903 | ||||||
AU Small Finance Bank Ltd., 144A | 25,346 | 202,205 | ||||||
Aurobindo Pharma Ltd. | 21,631 | 148,475 | ||||||
Avenue Supermarts Ltd., 144A* | 14,980 | 854,281 | ||||||
Axis Bank Ltd. | 202,118 | 1,911,593 | ||||||
Axis Bank Ltd., GDR | 8,874 | 421,515 | ||||||
Bajaj Auto Ltd. | 3,500 | 179,931 | ||||||
Bajaj Finance Ltd. | 16,073 | 1,477,927 | ||||||
Bajaj Finserv Ltd. | 2,395 | 511,267 | ||||||
Bajaj Holdings & Investment Ltd. | 2,609 | 179,453 | ||||||
Balkrishna Industries Ltd. | 6,765 | 174,199 | ||||||
Bandhan Bank Ltd., 144A* | 69,084 | 242,139 | ||||||
Bank of Baroda | 84,525 | 139,194 | ||||||
Berger Paints India Ltd. | 27,192 | 230,552 | ||||||
Bharat Forge Ltd. | 25,335 | 236,218 | ||||||
Bharti Airtel Ltd. | 230,304 | 2,106,000 | ||||||
Biocon Ltd. | 35,317 | 137,742 | ||||||
Bosch Ltd. | 255 | 56,290 | ||||||
Britannia Industries Ltd. | 4,327 | 204,089 | ||||||
Canara Bank | 30,287 | 91,900 | ||||||
Cholamandalam Investment and Finance Co. Ltd. | 37,973 | 377,708 | ||||||
Cipla Ltd. | 49,572 | 647,864 | ||||||
Colgate-Palmolive India Ltd. | 10,482 | 220,957 | ||||||
Container Corp. Of India Ltd. | 19,022 | 166,752 | ||||||
Dabur India Ltd. | 46,634 | 342,515 | ||||||
Dalmia Bharat Ltd. | 8,311 | 160,696 | ||||||
Deepak Nitrite Ltd. | 7,381 | 183,837 | ||||||
Divi’s Laboratories Ltd. | 12,422 | 566,999 | ||||||
DLF Ltd. | 39,961 | 196,138 | ||||||
Dr. Reddy’s Laboratories Ltd. | 12,728 | 679,993 | ||||||
Eicher Motors Ltd. | 5,119 | 216,384 | ||||||
Embassy Office Parks REIT | 83,442 | 381,347 | ||||||
Gland Pharma Ltd., 144A* | 5,501 | 163,943 | ||||||
Godrej Consumer Products Ltd.* | 39,921 | 464,357 | ||||||
Godrej Properties Ltd.* | 7,592 | 134,502 | ||||||
Grasim Industries Ltd. | 22,477 | 474,854 | ||||||
Havells India Ltd. | 14,828 | 259,673 | ||||||
HCL Technologies Ltd. | 104,660 | 1,236,758 | ||||||
HDFC Asset Management Co. Ltd., 144A | 2,651 | 69,226 | ||||||
| See Notes to Financial Statements. | 30 |
DBX ETF Trust
Schedule of Investments
Xtrackers Emerging Markets Carbon Reduction and Climate Improvers ETF (Continued)
August 31, 2022
Number | Value | |||||||
| India (Continued) | ||||||||
HDFC Life Insurance Co. Ltd., 144A | 80,730 | $ | 584,407 | |||||
Hero MotoCorp Ltd. | 8,649 | 308,883 | ||||||
Hindalco Industries Ltd. | 80,210 | 443,154 | ||||||
Hindustan Unilever Ltd. | 84,068 | 2,814,164 | ||||||
Honeywell Automation India Ltd. | 156 | 84,815 | ||||||
Housing Development Finance Corp. Ltd. | 108,320 | 3,335,014 | ||||||
ICICI Bank Ltd. | 335,790 | 3,749,728 | ||||||
ICICI Lombard General Insurance Co. Ltd., 144A | 20,537 | 332,978 | ||||||
ICICI Prudential Life Insurance Co. Ltd., 144A | 31,501 | 235,728 | ||||||
IDFC First Bank Ltd.* | 271,652 | 168,034 | ||||||
Indian Railway Catering & Tourism Corp. Ltd. | 21,352 | 190,993 | ||||||
Indus Towers Ltd. | 52,599 | 132,262 | ||||||
IndusInd Bank Ltd. | 48,277 | 672,862 | ||||||
Info Edge India Ltd. | 5,921 | 323,725 | ||||||
Infosys Ltd., ADR | 145,546 | 2,663,492 | ||||||
Infosys Ltd. | 281,313 | 5,285,628 | ||||||
InterGlobe Aviation Ltd., 144A* | 4,009 | 101,756 | ||||||
JSW Energy Ltd. | 44,367 | 190,432 | ||||||
JSW Steel Ltd. | 57,633 | 483,719 | ||||||
Jubilant Foodworks Ltd. | 35,352 | 274,200 | ||||||
Kansai Nerolac Paints Ltd. | 11,187 | 71,142 | ||||||
Kotak Mahindra Bank Ltd. | 71,343 | 1,719,823 | ||||||
L&T Technology Services Ltd., 144A | 2,360 | 110,310 | ||||||
Larsen & Toubro Infotech Ltd., 144A | 3,665 | 214,098 | ||||||
Laurus Labs Ltd., 144A | 30,967 | 225,672 | ||||||
Linde India Ltd. | 2,038 | 87,952 | ||||||
Lupin Ltd. | 15,662 | 131,886 | ||||||
Macrotech Developers Ltd., 144A* | 6,261 | 86,439 | ||||||
Mahindra & Mahindra Ltd. | 65,107 | 1,072,332 | ||||||
Marico Ltd. | 54,315 | 359,283 | ||||||
Maruti Suzuki India Ltd. | 7,586 | 867,097 | ||||||
Max Financial Services Ltd.* | 22,969 | 238,281 | ||||||
Max Healthcare Institute Ltd.* | 29,603 | 144,647 | ||||||
Mindtree Ltd. | 5,223 | 217,345 | ||||||
Mphasis Ltd. | 5,326 | 142,835 | ||||||
MRF Ltd. | 254 | 272,882 | ||||||
Muthoot Finance Ltd. | 11,564 | 153,555 | ||||||
Nestle India Ltd. | 2,217 | 555,961 | ||||||
NHPC Ltd. | 230,042 | 111,173 | ||||||
NMDC Ltd. | 52,600 | 80,928 | ||||||
Oberoi Realty Ltd. | 9,399 | 119,099 | ||||||
Oracle Financial Services Software Ltd. | 2,341 | 93,390 | ||||||
Page Industries Ltd. | 374 | 240,254 | ||||||
Persistent Systems Ltd. | 3,389 | 150,045 | ||||||
PI Industries Ltd. | 6,519 | 281,917 | ||||||
Pidilite Industries Ltd. | 9,910 | 341,271 | ||||||
Piramal Enterprises Ltd. | 8,258 | 110,534 | ||||||
Piramal Pharma Ltd.* (b) | 33,032 | 91,094 | ||||||
Polycab India Ltd. | 3,340 | 103,832 | ||||||
Power Finance Corp. Ltd. | 67,521 | 101,632 | ||||||
Power Grid Corp. of India Ltd. | 174,065 | 502,973 | ||||||
Punjab National Bank | 164,143 | 74,058 | ||||||
REC Ltd. | 90,522 | 123,892 | ||||||
Samvardhana Motherson International Ltd. | 56,750 | 87,777 | ||||||
Number | Value | |||||||
| India (Continued) | ||||||||
SBI Cards & Payment Services Ltd. | 17,072 | $ | 198,140 | |||||
SBI Life Insurance Co. Ltd., 144A | 34,441 | 576,096 | ||||||
Shree Cement Ltd. | 616 | 171,122 | ||||||
Shriram Transport Finance Co. Ltd. | 11,601 | 197,781 | ||||||
Siemens Ltd. | 4,477 | 162,474 | ||||||
SRF Ltd. | 11,293 | 361,481 | ||||||
State Bank of India | 193,503 | 1,293,744 | ||||||
Steel Authority of India Ltd. | 96,449 | 98,685 | ||||||
Sun Pharmaceutical Industries Ltd. | 64,255 | 722,178 | ||||||
Tata Communications Ltd. | 9,401 | 142,243 | ||||||
Tata Consultancy Services Ltd. | 114,135 | 4,612,549 | ||||||
Tata Consumer Products Ltd. | 51,391 | 523,656 | ||||||
Tata Elxsi Ltd. | 3,075 | 349,042 | ||||||
Tata Motors Ltd.* | 107,230 | 635,757 | ||||||
Tata Motors Ltd., Class A* | 21,074 | 62,102 | ||||||
Tata Power Co. Ltd. | 88,674 | 264,432 | ||||||
Tata Steel Ltd. | 443,690 | 604,741 | ||||||
Tech Mahindra Ltd. | 59,529 | 806,200 | ||||||
Titan Co. Ltd. | 23,628 | 774,529 | ||||||
Torrent Pharmaceuticals Ltd. | 8,064 | 157,361 | ||||||
Trent Ltd. | 15,318 | 271,291 | ||||||
UltraTech Cement Ltd. | 7,106 | 597,205 | ||||||
United Spirits Ltd.* | 18,570 | 189,736 | ||||||
UPL Ltd. | 27,331 | 264,597 | ||||||
Varun Beverages Ltd. | 19,654 | 255,797 | ||||||
Vedanta Ltd. | 47,386 | 161,167 | ||||||
Voltas Ltd. | 18,068 | 227,663 | ||||||
Wipro Ltd. | 167,532 | 871,941 | ||||||
Yes Bank Ltd.* | 1,736,925 | 359,591 | ||||||
Zydus Lifesciences Ltd. | 16,885 | 80,368 | ||||||
|
| |||||||
(Cost $74,522,762) | 71,355,275 | |||||||
|
| |||||||
| Indonesia — 2.1% | ||||||||
Aneka Tambang Tbk | 377,938 | 50,672 | ||||||
PT Bank Central Asia Tbk | 6,021,917 | 3,326,914 | ||||||
PT Bank Jago Tbk* | 526,609 | 298,917 | ||||||
PT Bank Mandiri Persero Tbk | 1,934,520 | 1,153,478 | ||||||
PT Bank Negara Indonesia Persero Tbk | 467,346 | 268,427 | ||||||
PT Bank Rakyat Indonesia Persero Tbk | 7,577,515 | 2,215,692 | ||||||
PT Barito Pacific Tbk | 2,007,064 | 110,884 | ||||||
PT Chandra Asri Petrochemical Tbk | 1,428,337 | 234,808 | ||||||
PT Charoen Pokphand Indonesia Tbk | 468,846 | 185,580 | ||||||
PT Elang Mahkota Teknologi Tbk* | 1,714,556 | 220,637 | ||||||
PT Indah Kiat Pulp & Paper Tbk | 193,631 | 108,606 | ||||||
PT Indocement Tunggal Prakarsa Tbk | 113,471 | 72,245 | ||||||
PT Indofood CBP Sukses Makmur Tbk | 73,522 | 41,114 | ||||||
PT Indofood Sukses Makmur Tbk | 276,048 | 115,776 | ||||||
PT Kalbe Farma Tbk | 1,440,897 | 163,093 | ||||||
PT Merdeka Copper Gold Tbk* | 1,059,411 | 305,493 | ||||||
PT Sarana Menara Nusantara Tbk | 2,263,248 | 189,081 | ||||||
PT Semen Indonesia Persero Tbk | 148,797 | 66,165 | ||||||
PT Telkom Indonesia Persero Tbk | 3,120,898 | 958,821 | ||||||
PT Tower Bersama Infrastructure Tbk | 151,700 | 28,822 | ||||||
PT Unilever Indonesia Tbk | 567,860 | 175,609 | ||||||
PT Vale Indonesia Tbk* | 164,188 | 67,478 | ||||||
|
| |||||||
(Cost $10,027,831) | 10,358,312 | |||||||
|
| |||||||
| See Notes to Financial Statements. | 31 |
DBX ETF Trust
Schedule of Investments
Xtrackers Emerging Markets Carbon Reduction and Climate Improvers ETF (Continued)
August 31, 2022
Number | Value | |||||||
| Kuwait — 0.8% | ||||||||
Agility Public Warehousing Co. KSC | 116,136 | $ | 317,540 | |||||
Boubyan Bank KSCP | 94,771 | 256,970 | ||||||
Gulf Bank KSCP | 154,371 | 175,450 | ||||||
Kuwait Finance House KSCP | 332,054 | 970,445 | ||||||
Mabanee Co KPSC | 40,423 | 108,819 | ||||||
Mobile Telecommunications Co. KSCP | 217,049 | 426,415 | ||||||
National Bank of Kuwait SAKP | 467,942 | 1,601,594 | ||||||
|
| |||||||
(Cost $3,461,420) | 3,857,233 | |||||||
|
| |||||||
| Malaysia — 0.9% | ||||||||
AMMB Holdings Bhd | 162,900 | 152,144 | ||||||
Axiata Group Bhd | 151,452 | 102,874 | ||||||
CIMB Group Holdings Bhd | 442,458 | 530,890 | ||||||
DiGi.Com Bhd | 88,800 | 74,405 | ||||||
Gamuda Bhd | 72,322 | 61,729 | ||||||
Greatech Technology Bhd* | 24,600 | 19,953 | ||||||
Hartalega Holdings Bhd | 74,400 | 27,596 | ||||||
Hong Leong Bank Bhd | 44,000 | 205,474 | ||||||
Hong Leong Financial Group Bhd | 10,300 | 44,694 | ||||||
IHH Healthcare Bhd | 74,700 | 103,483 | ||||||
Inari Amertron Bhd | 223,700 | 135,455 | ||||||
IOI Corp. Bhd | 87,400 | 82,606 | ||||||
Kuala Lumpur Kepong Bhd | 15,700 | 81,175 | ||||||
Malayan Banking Bhd | 275,257 | 551,683 | ||||||
Malaysia Airports Holdings Bhd* | 40,700 | 53,381 | ||||||
Malaysian Pacific Industries Bhd | 8,000 | 54,984 | ||||||
Maxis Bhd | 87,200 | 75,013 | ||||||
MISC Bhd | 67,700 | 107,400 | ||||||
MR DIY Group M Bhd, 144A | 189,350 | 91,809 | ||||||
Nestle Malaysia Bhd | 2,419 | 71,886 | ||||||
Petronas Chemicals Group Bhd | 89,000 | 174,997 | ||||||
PPB Group Bhd | 25,300 | 99,493 | ||||||
Press Metal Aluminium Holdings Bhd | 205,500 | 219,482 | ||||||
Public Bank Bhd | 701,200 | 737,940 | ||||||
QL Resources Bhd | 53,600 | 61,079 | ||||||
RHB Bank Bhd | 154,378 | 197,996 | ||||||
Sime Darby Bhd | 121,400 | 62,117 | ||||||
Sime Darby Plantation Bhd | 74,900 | 74,641 | ||||||
Telekom Malaysia Bhd | 76,800 | 102,446 | ||||||
TIME dotCom Bhd | 74,700 | 79,615 | ||||||
Top Glove Corp. Bhd | 254,400 | 45,758 | ||||||
Westports Holdings Bhd | 19,900 | 15,474 | ||||||
|
| |||||||
(Cost $4,830,903) | 4,499,672 | |||||||
|
| |||||||
| Mexico — 2.3% | ||||||||
Alfa SAB de CV, Class A | 308,902 | 196,904 | ||||||
America Movil SAB de CV, Series L | 2,991,763 | 2,554,125 | ||||||
Arca Continental SAB de CV | 32,107 | 218,948 | ||||||
Cemex SAB de CV, Series CPO* | 912,082 | 338,766 | ||||||
Coca-Cola Femsa SAB de CV | 59,429 | 363,985 | ||||||
El Puerto de Liverpool SAB de CV, Class C1 | 12,703 | 56,744 | ||||||
Fibra Uno Administracion SA de CV REIT | 189,921 | 199,156 | ||||||
Fomento Economico Mexicano SAB de CV | 143,164 | 898,832 | ||||||
Gruma SAB de CV, Class B | 6,359 | 69,411 | ||||||
Grupo Aeroportuario del Pacifico SAB de CV, Class B | 24,440 | 348,567 | ||||||
Number | Value | |||||||
| Mexico (Continued) | ||||||||
Grupo Aeroportuario del Sureste SAB de CV, Class B | 7,158 | $ | 151,869 | |||||
Grupo Bimbo SAB de CV, Series A | 80,272 | 264,301 | ||||||
Grupo Elektra SAB DE CV | 5,492 | 285,228 | ||||||
Grupo Financiero Banorte SAB de CV, Class O | 315,653 | 1,867,362 | ||||||
Grupo Financiero Inbursa SAB de CV, Class O* | 106,781 | 168,518 | ||||||
Grupo Mexico SAB de CV, Series B | 209,205 | 793,464 | ||||||
Grupo Televisa SAB, Series CPO | 283,642 | 358,078 | ||||||
Industrias Penoles SAB de CV | 9,514 | 78,332 | ||||||
Kimberly-Clark de Mexico SAB de CV, Class A | 176,864 | 239,987 | ||||||
Orbia Advance Corp. SAB de CV | 77,359 | 146,241 | ||||||
Wal-Mart de Mexico SAB de CV | 564,196 | 1,846,990 | ||||||
|
| |||||||
(Cost $13,300,123) | 11,445,808 | |||||||
|
| |||||||
| Peru — 0.2% | ||||||||
Credicorp Ltd. (c) | 2,738 | 352,901 | ||||||
Credicorp Ltd. | 1,733 | 224,129 | ||||||
InRetail Peru Corp., 144A | 4,448 | 137,710 | ||||||
Intercorp Financial Services, Inc. | 3,220 | 69,423 | ||||||
|
| |||||||
(Cost $739,095) | 784,163 | |||||||
|
| |||||||
| Philippines — 0.6% | ||||||||
ACEN Corp. | 59,410 | 7,935 | ||||||
Ayala Land, Inc. | 419,100 | 213,823 | ||||||
Bank of the Philippine Islands | 204,310 | 345,459 | ||||||
BDO Unibank, Inc. | 204,290 | 468,570 | ||||||
Globe Telecom, Inc. | 3,035 | 113,390 | ||||||
International Container Terminal Services, Inc. | 58,370 | 188,347 | ||||||
JG Summit Holdings, Inc. | 130,540 | 119,021 | ||||||
Jollibee Foods Corp. | 32,860 | 140,206 | ||||||
Metropolitan Bank & Trust Co. | 109,300 | 102,381 | ||||||
PLDT, Inc. | 8,645 | 258,480 | ||||||
SM Investments Corp. | 29,490 | 436,403 | ||||||
SM Prime Holdings, Inc. | 700,500 | 472,156 | ||||||
Universal Robina Corp. | 58,400 | 126,877 | ||||||
|
| |||||||
(Cost $3,388,533) | 2,993,048 | |||||||
|
| |||||||
| Qatar — 1.3% | ||||||||
Commercial Bank PSQC | 263,842 | 531,053 | ||||||
Industries Qatar QSC | 198,080 | 987,205 | ||||||
Masraf Al Rayan QSC | 491,221 | 609,820 | ||||||
Mesaieed Petrochemical Holding Co. | 411,067 | 293,478 | ||||||
Ooredoo QPSC | 72,339 | 180,363 | ||||||
Qatar International Islamic Bank QSC | 64,615 | 211,317 | ||||||
Qatar Islamic Bank SAQ | 143,788 | 1,011,165 | ||||||
Qatar National Bank QPSC | 481,841 | 2,730,884 | ||||||
|
| |||||||
(Cost $5,834,245) | 6,555,285 | |||||||
|
| |||||||
| Russia — 0.0% | ||||||||
Alrosa PJSC (b) | 246,725 | 0 | ||||||
MMC Norilsk Nickel PJSC (b) | 5,593 | 0 | ||||||
Mobile TeleSystems PJSC, ADR (b) | 25,457 | 0 | ||||||
Mobile TeleSystems PJSC (b) | 32,151 | 0 | ||||||
Novolipetsk Steel PJSC (b) | 121,611 | 0 | ||||||
| See Notes to Financial Statements. | 32 |
DBX ETF Trust
Schedule of Investments
Xtrackers Emerging Markets Carbon Reduction and Climate Improvers ETF (Continued)
August 31, 2022
Number | Value | |||||||
| Russia (Continued) | ||||||||
PIK Group PJSC* (b) | 21,692 | $ | 0 | |||||
Polyus PJSC (b) | 2,793 | 0 | ||||||
Sberbank of Russia PJSC* (b) | 989,954 | 0 | ||||||
United Co RUSAL International PJSC* (b) | 255,320 | 0 | ||||||
Yandex NV, Class A* (b) | 28,401 | 0 | ||||||
|
| |||||||
(Cost $9,710,782) | 0 | |||||||
|
| |||||||
| Saudi Arabia — 3.3% | ||||||||
Advanced Petrochemical Co. | 12,976 | 172,599 | ||||||
Al Rajhi Bank* | 127,324 | 3,055,234 | ||||||
Alinma Bank | 84,098 | 850,153 | ||||||
Almarai Co. JSC | 34,317 | 483,852 | ||||||
Arab National Bank | 56,331 | 449,569 | ||||||
Bank AlBilad* | 43,962 | 591,774 | ||||||
Banque Saudi Fransi | 52,328 | 692,556 | ||||||
Bupa Arabia for Cooperative Insurance Co. | 5,594 | 244,654 | ||||||
Dr Sulaiman Al Habib Medical Services Group Co. | 7,223 | 384,304 | ||||||
Etihad Etisalat Co. | 32,021 | 311,777 | ||||||
Jarir Marketing Co. | 5,195 | 237,707 | ||||||
Mouwasat Medical Services Co. | 4,203 | 270,361 | ||||||
National Industrialization Co.* | 34,215 | 145,088 | ||||||
Riyad Bank | 97,193 | 917,891 | ||||||
Sahara International Petrochemical Co. | 31,068 | 394,652 | ||||||
Saudi Basic Industries Corp. | 57,475 | 1,532,055 | ||||||
Saudi British Bank | 62,407 | 663,251 | ||||||
Saudi Industrial Investment Group | 30,403 | 207,054 | ||||||
Saudi Kayan Petrochemical Co.* | 62,131 | 242,970 | ||||||
Saudi National Bank | 143,258 | 2,663,936 | ||||||
Saudi Telecom Co. | 116,842 | 1,299,280 | ||||||
Savola Group | 21,441 | 186,233 | ||||||
Yanbu National Petrochemical Co. | 17,305 | 230,641 | ||||||
|
| |||||||
(Cost $14,600,336) | 16,227,591 | |||||||
|
| |||||||
| Singapore — 0.0% | ||||||||
BOC Aviation Ltd., 144A (Cost $87,313) | 10,949 | 87,954 | ||||||
|
| |||||||
| South Africa — 3.0% | ||||||||
Absa Group Ltd. | 65,364 | 682,693 | ||||||
Anglo American Platinum Ltd. | 3,027 | 212,890 | ||||||
AngloGold Ashanti Ltd. (a) | 39,314 | 529,656 | ||||||
Aspen Pharmacare Holdings Ltd. | 38,794 | 335,718 | ||||||
Bid Corp. Ltd. | 35,691 | 680,655 | ||||||
Bidvest Group Ltd. | 15,002 | 189,193 | ||||||
Capitec Bank Holdings Ltd. | 4,029 | 483,060 | ||||||
Clicks Group Ltd. | 15,285 | 267,257 | ||||||
Discovery Ltd.* | 39,315 | 283,346 | ||||||
FirstRand Ltd. | 407,398 | 1,533,802 | ||||||
Gold Fields Ltd. | 76,339 | 621,348 | ||||||
Harmony Gold Mining Co. Ltd. | 45,394 | 114,947 | ||||||
Impala Platinum Holdings Ltd. | 53,020 | 561,108 | ||||||
Investec Ltd. | 18,164 | 85,852 | ||||||
Kumba Iron Ore Ltd. (a) | 2,409 | 53,780 | ||||||
MTN Group Ltd. | 148,878 | 1,085,288 | ||||||
MultiChoice Group | 30,304 | 205,548 | ||||||
Naspers Ltd., Class N | 14,336 | 2,040,309 | ||||||
Number | Value | |||||||
| South Africa (Continued) | ||||||||
Nedbank Group Ltd. (a) | 42,752 | $ | 508,678 | |||||
Northam Platinum Holdings Ltd.* | 22,803 | 215,663 | ||||||
Old Mutual Ltd. | 500,456 | 298,611 | ||||||
Pepkor Holdings Ltd., 144A | 83,264 | 98,240 | ||||||
Rand Merchant Investment Holdings Ltd. | 72,599 | 115,217 | ||||||
Sanlam Ltd. | 183,541 | 574,171 | ||||||
Shoprite Holdings Ltd. | 44,376 | 605,899 | ||||||
Sibanye Stillwater Ltd. | 295,724 | 667,810 | ||||||
Standard Bank Group Ltd. | 115,780 | 1,040,868 | ||||||
Vodacom Group Ltd. | 62,462 | 462,297 | ||||||
Woolworths Holdings Ltd. | 114,580 | 376,457 | ||||||
|
| |||||||
(Cost $17,946,436) | 14,930,361 | |||||||
|
| |||||||
| South Korea — 10.0% | ||||||||
Alteogen, Inc.* | 2,238 | 106,583 | ||||||
Amorepacific Corp. | 1,867 | 171,688 | ||||||
AMOREPACIFIC Group | 1,617 | 42,192 | ||||||
BNK Financial Group, Inc. | 19,948 | 100,072 | ||||||
Celltrion Healthcare Co. Ltd. | 5,633 | 303,644 | ||||||
Celltrion Pharm, Inc.* | 829 | 48,592 | ||||||
Celltrion, Inc. | 5,798 | 821,443 | ||||||
Cheil Worldwide, Inc. | 5,593 | 91,575 | ||||||
Chong Kun Dang Pharmaceutical Corp. | 856 | 54,974 | ||||||
Chunbo Co. Ltd. | 379 | 64,350 | ||||||
CJ CheilJedang Corp. | 421 | 128,262 | ||||||
CJ Corp. | 808 | 47,240 | ||||||
CJ ENM Co. Ltd. | 544 | 39,980 | ||||||
Coway Co. Ltd. | 3,295 | 156,922 | ||||||
CS Wind Corp. | 1,866 | 95,843 | ||||||
Daewoo Engineering & Construction Co. Ltd.* | 13,124 | 51,022 | ||||||
DB HiTek Co. Ltd. | 2,758 | 95,882 | ||||||
DB Insurance Co. Ltd. | 3,889 | 173,581 | ||||||
DL E&C Co. Ltd. | 2,302 | 70,477 | ||||||
Dongsuh Cos., Inc. | 2,983 | 54,528 | ||||||
Doosan Bobcat, Inc. | 2,609 | 67,685 | ||||||
Doosan Fuel Cell Co. Ltd.* | 3,358 | 96,154 | ||||||
Douzone Bizon Co. Ltd. | 588 | 15,914 | ||||||
Ecopro BM Co. Ltd. | 3,124 | 262,056 | ||||||
E-MART, Inc. | 1,120 | 81,893 | ||||||
F&F Co. Ltd. / New | 1,002 | 106,751 | ||||||
Fila Holdings Corp. | 3,728 | 86,960 | ||||||
Genexine, Inc.* | 2,018 | 45,941 | ||||||
Green Cross Corp. | 405 | 49,658 | ||||||
GS Engineering & Construction Corp. | 2,982 | 67,218 | ||||||
Hana Financial Group, Inc. | 27,263 | 800,025 | ||||||
Hanjin Kal Corp.* | 1,293 | 51,041 | ||||||
Hankook Tire & Technology Co. Ltd. | 3,897 | 110,569 | ||||||
Hanmi Pharm. Co. Ltd. | 381 | 87,734 | ||||||
Hanmi Science Co. Ltd. | 1,892 | 61,249 | ||||||
Hanon Systems | 11,187 | 86,147 | ||||||
Hansol Chemical Co. Ltd. | 747 | 122,029 | ||||||
Hanssem Co. Ltd. | 940 | 37,809 | ||||||
Hanwha Life Insurance Co. Ltd.* | 28,391 | 49,032 | ||||||
Hanwha Solutions Corp.* | 7,086 | 278,661 | ||||||
Helixmith Co. Ltd.* | 1,045 | 12,930 | ||||||
HLB, Inc.* | 4,850 | 178,763 | ||||||
| See Notes to Financial Statements. | 33 |
DBX ETF Trust
Schedule of Investments
Xtrackers Emerging Markets Carbon Reduction and Climate Improvers ETF (Continued)
August 31, 2022
Number | Value | |||||||
| South Korea (Continued) | ||||||||
HMM Co. Ltd. | 15,910 | $ | 264,661 | |||||
Hugel, Inc.* | 306 | 27,934 | ||||||
HYBE Co. Ltd.* | 860 | 116,698 | ||||||
Hyosung Advanced Materials Corp. | 152 | 48,184 | ||||||
Hyosung TNC Corp. | 182 | 42,658 | ||||||
Hyundai Autoever Corp. | 542 | 48,829 | ||||||
Hyundai Department Store Co. Ltd. | 968 | 44,798 | ||||||
Hyundai Doosan Infracore Co. Ltd.* | 11,988 | 55,300 | ||||||
Hyundai Elevator Co. Ltd. | 2,611 | 57,196 | ||||||
Hyundai Engineering & Construction Co. Ltd. | 6,315 | 227,568 | ||||||
Hyundai Glovis Co. Ltd. | 1,121 | 147,925 | ||||||
Hyundai Marine & Fire Insurance Co. Ltd. | 3,346 | 78,800 | ||||||
Hyundai Mipo Dockyard Co. Ltd.* | 1,214 | 97,116 | ||||||
Hyundai Mobis Co. Ltd. | 3,609 | 580,117 | ||||||
Hyundai Motor Co. | 7,382 | 1,081,733 | ||||||
Hyundai Steel Co. | 4,263 | 104,858 | ||||||
Iljin Materials Co. Ltd. | 736 | 40,829 | ||||||
Industrial Bank of Korea | 16,782 | 120,073 | ||||||
Kakao Corp. | 17,554 | 963,301 | ||||||
Kakao Games Corp.* | 2,226 | 87,872 | ||||||
KakaoBank Corp.* | 10,271 | 209,636 | ||||||
Kakaopay Corp.* | 1,811 | 84,217 | ||||||
KB Financial Group, Inc. | 33,955 | 1,255,336 | ||||||
KCC Corp. | 267 | 58,788 | ||||||
KEPCO Engineering & Construction Co., Inc. | 906 | 49,854 | ||||||
KEPCO Plant Service & Engineering Co. Ltd. | 1,770 | 54,719 | ||||||
Kia Corp. | 14,295 | 863,546 | ||||||
KIWOOM Securities Co. Ltd. | 1,489 | 95,292 | ||||||
KMW Co. Ltd.* | 2,610 | 62,638 | ||||||
Korea Gas Corp. | 2,008 | 65,304 | ||||||
Korea Investment Holdings Co. Ltd. | 2,240 | 95,123 | ||||||
Korea Zinc Co. Ltd. | 554 | 278,336 | ||||||
Korean Air Lines Co. Ltd.* | 11,271 | 226,254 | ||||||
Krafton, Inc.* | 1,666 | 307,031 | ||||||
KT Corp. | 6,627 | 184,310 | ||||||
KT&G Corp. | 10,049 | 625,081 | ||||||
Kumho Petrochemical Co. Ltd. | 1,118 | 108,661 | ||||||
L&F Co. Ltd.* | 1,969 | 339,318 | ||||||
LEENO Industrial, Inc. | 687 | 73,757 | ||||||
LG Chem Ltd. | 2,769 | 1,308,368 | ||||||
LG Corp. | 6,572 | 402,904 | ||||||
LG Display Co. Ltd. | 21,947 | 255,970 | ||||||
LG Electronics, Inc. | 6,194 | 467,716 | ||||||
LG Energy Solution Ltd.* | 1,928 | 666,667 | ||||||
LG H&H Co. Ltd. | 908 | 483,343 | ||||||
LG Innotek Co. Ltd. | 1,250 | 321,483 | ||||||
LG Uplus Corp. | 22,570 | 194,053 | ||||||
Lotte Chemical Corp. | 895 | 117,098 | ||||||
Lotte Shopping Co. Ltd. | 917 | 67,736 | ||||||
LS Corp. | 1,201 | 60,250 | ||||||
Mando Corp. | 1,971 | 79,574 | ||||||
Meritz Financial Group, Inc. | 813 | 18,721 | ||||||
Meritz Fire & Marine Insurance Co. Ltd. | 3,187 | 91,377 | ||||||
Meritz Securities Co. Ltd. | 17,585 | 63,632 | ||||||
Number | Value | |||||||
| South Korea (Continued) | ||||||||
Mirae Asset Securities Co. Ltd. | 28,445 | $ | 139,508 | |||||
NAVER Corp. | 13,877 | 2,489,985 | ||||||
NCSoft Corp. | 813 | 230,063 | ||||||
Netmarble Corp., 144A | 1,489 | 70,690 | ||||||
NH Investment & Securities Co. Ltd. | 16,098 | 119,753 | ||||||
Orion Corp. | 1,121 | 82,469 | ||||||
Pan Ocean Co. Ltd. | 4,830 | 18,597 | ||||||
Pearl Abyss Corp.* | 2,239 | 95,081 | ||||||
S-1 Corp. | 961 | 41,815 | ||||||
Samsung Biologics Co. Ltd., 144A* | 1,126 | 702,934 | ||||||
Samsung C&T Corp. | 4,626 | 416,757 | ||||||
Samsung Electro-Mechanics Co. Ltd. | 5,225 | 546,895 | ||||||
Samsung Electronics Co. Ltd. | 310,052 | 13,838,813 | ||||||
Samsung Engineering Co. Ltd.* | 7,907 | 138,626 | ||||||
Samsung Fire & Marine Insurance Co. Ltd. | 3,247 | 473,377 | ||||||
Samsung Life Insurance Co. Ltd. | 7,072 | 327,811 | ||||||
Samsung SDI Co. Ltd. | 5,106 | 2,282,822 | ||||||
Samsung SDS Co. Ltd. | 3,237 | 310,982 | ||||||
Samsung Securities Co. Ltd. | 6,713 | 170,140 | ||||||
Seegene, Inc. | 2,986 | 70,433 | ||||||
Shin Poong Pharmaceutical Co. Ltd.* | 2,983 | 62,334 | ||||||
Shinhan Financial Group Co. Ltd. | 47,658 | 1,304,088 | ||||||
Shinsegae, Inc. | 375 | 62,661 | ||||||
SK Biopharmaceuticals Co. Ltd.* | 2,240 | 119,909 | ||||||
SK Bioscience Co. Ltd.* | 1,963 | 165,840 | ||||||
SK Chemicals Co. Ltd. | 1,119 | 81,820 | ||||||
SK Hynix, Inc. | 51,342 | 3,654,262 | ||||||
SK IE Technology Co. Ltd., 144A* | 1,555 | 96,726 | ||||||
SK Innovation Co. Ltd.* | 2,767 | 393,054 | ||||||
SK Square Co. Ltd.* | 9,185 | 278,115 | ||||||
SK Telecom Co. Ltd. | 5,747 | 223,856 | ||||||
SKC Co. Ltd. | 766 | 69,582 | ||||||
Solus Advanced Materials Co. Ltd. | 1,344 | 42,002 | ||||||
Soulbrain Co. Ltd. | 376 | 60,945 | ||||||
SSANGYONG C&E Co. Ltd. | 5,733 | 29,275 | ||||||
Studio Dragon Corp.* | 733 | 41,594 | ||||||
Wemade Co. Ltd. | 1,492 | 69,271 | ||||||
WONIK IPS Co. Ltd. | 2,298 | 48,106 | ||||||
Woori Financial Group, Inc. | 34,227 | 312,190 | ||||||
Yuhan Corp. | 1,937 | 82,256 | ||||||
|
| |||||||
(Cost $65,862,876) | 49,113,049 | |||||||
|
| |||||||
| Taiwan — 18.8% | ||||||||
Accton Technology Corp. | 40,554 | 377,727 | ||||||
Acer, Inc. | 310,579 | 224,484 | ||||||
Advantech Co. Ltd. | 24,556 | 264,217 | ||||||
ASE Technology Holding Co. Ltd. | 351,138 | 985,205 | ||||||
Asia Cement Corp. | 134,498 | 191,114 | ||||||
ASMedia Technology, Inc. | 2,611 | 80,206 | ||||||
ASPEED Technology, Inc. | 2,006 | 134,118 | ||||||
Asustek Computer, Inc. | 69,533 | 582,535 | ||||||
AUO Corp. | 863,056 | 474,947 | ||||||
Catcher Technology Co. Ltd.* | 43,107 | 262,714 | ||||||
Cathay Financial Holding Co. Ltd. | 805,689 | 1,179,251 | ||||||
Chailease Holding Co. Ltd. | 147,113 | 952,156 | ||||||
Chang Hwa Commercial Bank Ltd. | 575,246 | 333,572 | ||||||
| See Notes to Financial Statements. | 34 |
DBX ETF Trust
Schedule of Investments
Xtrackers Emerging Markets Carbon Reduction and Climate Improvers ETF (Continued)
August 31, 2022
Number | Value | |||||||
| Taiwan (Continued) | ||||||||
Cheng Shin Rubber Industry Co. Ltd. | 87,184 | $ | 101,542 | |||||
Chicony Electronics Co. Ltd. | 49,244 | 132,018 | ||||||
China Airlines Ltd. | 200,772 | 150,393 | ||||||
China Development Financial Holding Corp. | 1,792,524 | 789,152 | ||||||
China Development Financial Holding Corp. | 207,773 | 57,886 | ||||||
China Steel Corp. | 727,259 | 691,717 | ||||||
Chroma ATE, Inc. | 30,496 | 188,862 | ||||||
Chunghwa Telecom Co. Ltd. | 407,631 | 1,620,480 | ||||||
Compal Electronics, Inc. | 422,992 | 316,158 | ||||||
CTBC Financial Holding Co. Ltd. | 1,963,193 | 1,515,730 | ||||||
Delta Electronics, Inc. | 201,521 | 1,741,274 | ||||||
E Ink Holdings, Inc. | 69,000 | 542,932 | ||||||
E.Sun Financial Holding Co. Ltd. | 1,364,764 | 1,264,438 | ||||||
Eclat Textile Co. Ltd. | 19,253 | 281,797 | ||||||
eMemory Technology, Inc. | 5,605 | 255,045 | ||||||
Eva Airways Corp. | 170,224 | 188,749 | ||||||
Evergreen Marine Corp. Taiwan Ltd. | 177,421 | 514,703 | ||||||
Far Eastern New Century Corp. | 192,409 | 207,027 | ||||||
Far EasTone Telecommunications Co. Ltd. | 175,364 | 430,956 | ||||||
Feng TAY Enterprise Co. Ltd. | 43,856 | 247,827 | ||||||
First Financial Holding Co. Ltd. | 1,114,168 | 971,866 | ||||||
Formosa Chemicals & Fibre Corp. | 214,640 | 484,461 | ||||||
Formosa Plastics Corp. | 300,962 | 900,785 | ||||||
Formosa Sumco Technology Corp. | 6,070 | 36,495 | ||||||
Foxconn Technology Co. Ltd. | 60,613 | 100,764 | ||||||
Fubon Financial Holding Co. Ltd. | 727,124 | 1,371,233 | ||||||
Giant Manufacturing Co. Ltd. | 17,090 | 134,474 | ||||||
Globalwafers Co. Ltd. | 12,663 | 202,192 | ||||||
Highwealth Construction Corp. | 79,731 | 126,784 | ||||||
Hiwin Technologies Corp. | 16,964 | 115,648 | ||||||
Hon Hai Precision Industry Co. Ltd. | 1,237,105 | 4,430,208 | ||||||
Hotai Motor Co. Ltd. | 18,609 | 375,390 | ||||||
Hua Nan Financial Holdings Co. Ltd. | 1,045,595 | 798,689 | ||||||
Innolux Corp. | 977,635 | 388,645 | ||||||
Inventec Corp. | 269,515 | 204,986 | ||||||
Largan Precision Co. Ltd. | 5,568 | 357,633 | ||||||
Lite-On Technology Corp. | 219,169 | 473,801 | ||||||
Macronix International Co. Ltd. | 151,937 | 164,479 | ||||||
MediaTek, Inc. | 95,354 | 2,089,564 | ||||||
Mega Financial Holding Co. Ltd. | 1,109,860 | 1,309,042 | ||||||
Merida Industry Co. Ltd. | 20,073 | 147,065 | ||||||
Micro-Star International Co. Ltd. | 71,482 | 270,076 | ||||||
momo.com, Inc. | 7,162 | 171,770 | ||||||
Nan Ya Plastics Corp. | 308,138 | 695,493 | ||||||
Nan Ya Printed Circuit Board Corp. | 13,944 | 123,921 | ||||||
Nanya Technology Corp. | 116,457 | 204,314 | ||||||
Nien Made Enterprise Co. Ltd. | 11,562 | 107,500 | ||||||
Novatek Microelectronics Corp. | 34,386 | 297,683 | ||||||
Oneness Biotech Co. Ltd.* | 22,720 | 220,949 | ||||||
Pegatron Corp. | 174,548 | 364,723 | ||||||
Phison Electronics Corp. | 8,051 | 82,659 | ||||||
Pou Chen Corp. | 167,283 | 159,383 | ||||||
Powerchip Semiconductor Manufacturing Corp. | 218,897 | 247,754 | ||||||
Number | Value | |||||||
| Taiwan (Continued) | ||||||||
Powertech Technology, Inc. | 68,856 | $ | 193,193 | |||||
Quanta Computer, Inc. | 278,331 | 725,147 | ||||||
Realtek Semiconductor Corp. | 26,578 | 302,127 | ||||||
Ruentex Development Co. Ltd. | 51,742 | 107,266 | ||||||
Ruentex Industries Ltd. | 41,222 | 88,572 | ||||||
Shanghai Commercial & Savings Bank Ltd. | 347,521 | 568,593 | ||||||
Shin Kong Financial Holding Co. Ltd. | 1,501,777 | 433,696 | ||||||
Silicon Motion Technology Corp., ADR | 2,806 | 216,371 | ||||||
Sino-American Silicon Products, Inc. | 40,611 | 223,486 | ||||||
SinoPac Financial Holdings Co. Ltd. | 1,080,839 | 616,100 | ||||||
Standard Foods Corp. | 37,567 | 50,665 | ||||||
Synnex Technology International Corp. | 68,635 | 125,826 | ||||||
TA Chen Stainless Pipe | 134,000 | 174,117 | ||||||
Taishin Financial Holding Co. Ltd. | 1,194,497 | 596,513 | ||||||
Taiwan Business Bank | 343,682 | 145,094 | ||||||
Taiwan Cement Corp. | 241,828 | 312,241 | ||||||
Taiwan Cooperative Financial Holding Co. Ltd. | 624,093 | 566,938 | ||||||
Taiwan Fertilizer Co. Ltd. | 50,080 | 103,492 | ||||||
Taiwan High Speed Rail Corp. | 229,877 | 220,531 | ||||||
Taiwan Mobile Co. Ltd. | 192,984 | 631,498 | ||||||
Taiwan Semiconductor Manufacturing Co. Ltd. | 2,639,453 | 43,792,157 | ||||||
Tatung Co. Ltd.* | 123,942 | 140,485 | ||||||
Teco Electric and Machinery Co. Ltd. | 107,051 | 104,105 | ||||||
Tripod Technology Corp. | 49,616 | 163,824 | ||||||
Unimicron Technology Corp. | 104,796 | 521,613 | ||||||
Uni-President Enterprises Corp. | 291,953 | 633,064 | ||||||
United Microelectronics Corp.* | 1,230,588 | 1,661,673 | ||||||
Vanguard International Semiconductor Corp. | 91,426 | 223,477 | ||||||
Voltronic Power Technology Corp. | 5,343 | 304,562 | ||||||
Walsin Lihwa Corp. | 227,624 | 296,893 | ||||||
Walsin Technology Corp. | 27,937 | 85,360 | ||||||
Wan Hai Lines Ltd. | 57,509 | 164,001 | ||||||
Win Semiconductors Corp. | 32,837 | 192,572 | ||||||
Winbond Electronics Corp. | 285,514 | 208,243 | ||||||
Wistron Corp. | 276,505 | 251,637 | ||||||
Wiwynn Corp. | 7,697 | 194,717 | ||||||
WPG Holdings Ltd. | 87,190 | 147,238 | ||||||
Yageo Corp. | 27,332 | 294,984 | ||||||
Yang Ming Marine Transport Corp. | 149,850 | 388,441 | ||||||
Yuanta Financial Holding Co. Ltd. | 1,267,318 | 845,226 | ||||||
Zhen Ding Technology Holding Ltd. | 71,962 | 269,525 | ||||||
|
| |||||||
(Cost $113,574,655) | 92,696,624 | |||||||
|
| |||||||
| Thailand — 1.8% | ||||||||
Advanced Info Service PCL, NVDR | 106,000 | 558,162 | ||||||
Airports of Thailand PCL, NVDR* | 262,200 | 523,142 | ||||||
Asset World Corp. PCL, NVDR | 815,900 | 125,308 | ||||||
Bangkok Bank PCL | 54,100 | 203,269 | ||||||
Bangkok Bank PCL, NVDR | 52,800 | 198,385 | ||||||
Bangkok Commercial Asset Management PCL, NVDR | 196,200 | 99,008 | ||||||
Bangkok Dusit Medical Services PCL, NVDR | 384,900 | 308,764 | ||||||
| See Notes to Financial Statements. | 35 |
DBX ETF Trust
Schedule of Investments
Xtrackers Emerging Markets Carbon Reduction and Climate Improvers ETF (Continued)
August 31, 2022
Number | Value | |||||||
| Thailand (Continued) | ||||||||
Bangkok Expressway & Metro PCL | 75,100 | $ | 18,022 | |||||
Bangkok Expressway & Metro PCL, NVDR | 728,600 | 174,844 | ||||||
Bangkok Life Assurance PCL, NVDR | 43,200 | 42,060 | ||||||
Berli Jucker PCL, NVDR | 83,500 | 76,716 | ||||||
BTS Group Holdings PCL, NVDR | 773,900 | 178,286 | ||||||
Bumrungrad Hospital PCL, NVDR | 36,600 | 216,815 | ||||||
Carabao Group PCL, NVDR | 36,500 | 101,104 | ||||||
Central Pattana PCL, NVDR | 106,500 | 202,266 | ||||||
Central Retail Corp. PCL | 95,500 | 106,075 | ||||||
Central Retail Corp. PCL, NVDR | 182,800 | 203,041 | ||||||
Charoen Pokphand Foods PCL, NVDR | 256,300 | 182,758 | ||||||
Com7 PCL, NVDR | 98,000 | 92,725 | ||||||
Dohome PCL, NVDR | 105,300 | 43,896 | ||||||
Energy Absolute PCL, NVDR | 172,700 | 403,776 | ||||||
Fabrinet* | 2,368 | 243,525 | ||||||
Hana Microelectronics PCL, NVDR | 52,100 | 61,084 | ||||||
Home Product Center PCL, NVDR | 320,200 | 122,065 | ||||||
Indorama Ventures PCL, NVDR | 109,700 | 130,121 | ||||||
Intouch Holdings PCL, Class F | 15,900 | 31,724 | ||||||
Intouch Holdings PCL, NVDR | 83,000 | 165,602 | ||||||
Jay Mart PCL, NVDR | 44,100 | 62,892 | ||||||
JMT Network Services PCL, NVDR | 64,300 | 137,550 | ||||||
Kasikornbank PCL, NVDR | 171,900 | 723,665 | ||||||
KCE Electronics PCL, NVDR | 65,200 | 97,007 | ||||||
Kerry Express Thailand PCL, NVDR* | 70,800 | 42,135 | ||||||
Krung Thai Bank PCL, NVDR | 291,500 | 135,107 | ||||||
Krungthai Card PCL | 36,900 | 60,973 | ||||||
Krungthai Card PCL, NVDR | 36,900 | 60,973 | ||||||
Land & Houses PCL, NVDR | 247,900 | 60,509 | ||||||
Minor International PCL, NVDR* | 196,083 | 176,118 | ||||||
Muangthai Capital PCL | 600 | 699 | ||||||
Muangthai Capital PCL, NVDR | 33,400 | 38,930 | ||||||
Osotspa PCL | 30,500 | 26,140 | ||||||
Osotspa PCL, NVDR | 109,700 | 94,018 | ||||||
PTT Exploration & Production PCL, NVDR | 56,500 | 261,097 | ||||||
PTT Global Chemical PCL, NVDR | 219,700 | 286,205 | ||||||
SCB X PCL, NVDR | 115,100 | 348,812 | ||||||
SCG Packaging PCL | 53,300 | 82,956 | ||||||
SCG Packaging PCL, NVDR | 73,000 | 113,617 | ||||||
Siam Cement PCL, NVDR | 26,000 | 255,276 | ||||||
Siam Global House PCL, NVDR | 108,513 | 58,330 | ||||||
Siam Makro PCL, NVDR | 125,600 | 118,840 | ||||||
Sri Trang Agro-Industry PCL, NVDR | 62,480 | 38,726 | ||||||
Sri Trang Gloves Thailand PCL | 73,500 | 28,624 | ||||||
Srisawad Corp. PCL, NVDR | 70,700 | 94,525 | ||||||
Thai Union Group PCL, NVDR | 209,800 | 100,692 | ||||||
Thonburi Healthcare Group PCL, NVDR | 28,100 | 52,597 | ||||||
Tisco Financial Group PCL, NVDR | 49,700 | 127,785 | ||||||
TMBThanachart Bank PCL, NVDR | 2,811,377 | 97,921 | ||||||
Total Access Communication PCL, NVDR | 37,700 | 44,459 | ||||||
True Corp. PCL, NVDR | 1,202,700 | 150,410 | ||||||
VGI PCL, NVDR | 510,900 | 61,371 | ||||||
|
| |||||||
(Cost $9,320,981) | 8,851,502 | |||||||
|
| |||||||
| Turkey — 0.6% | ||||||||
Akbank TAS | 325,103 | 209,415 | ||||||
Aksa Akrilik Kimya Sanayii AS | 16,142 | 49,017 | ||||||
Number | Value | |||||||
| Turkey (Continued) | ||||||||
Anadolu Efes Biracilik Ve Malt Sanayii AS | 26,867 | $ | 61,015 | |||||
Arcelik AS | 17,536 | 67,707 | ||||||
Aselsan Elektronik Sanayi Ve Ticaret AS | 44,655 | 63,959 | ||||||
BIM Birlesik Magazalar AS | 53,562 | 322,058 | ||||||
Borusan Yatirim ve Pazarlama AS | 935 | 22,072 | ||||||
Coca-Cola Icecek AS | 8,156 | 71,723 | ||||||
Emlak Konut Gayrimenkul Yatirim Ortakligi AS REIT | 272,232 | 59,999 | ||||||
Eregli Demir ve Celik Fabrikalari TAS | 115,435 | 182,595 | ||||||
Ford Otomotiv Sanayi AS | 3,485 | 63,573 | ||||||
Hektas Ticaret TAS* | 33,902 | 76,470 | ||||||
Is Gayrimenkul Yatirim Ortakligi AS REIT* | 53,335 | 52,999 | ||||||
Kardemir Karabuk Demir Celik Sanayi ve Ticaret AS, Class D | 77,854 | 50,578 | ||||||
KOC Holding AS | 33,699 | 84,495 | ||||||
Koza Altin Isletmeleri AS | 4,957 | 43,128 | ||||||
Koza Anadolu Metal Madencilik Isletmeleri AS* | 34,269 | 51,080 | ||||||
Petkim Petrokimya Holding AS* | 67,645 | 53,612 | ||||||
Sasa Polyester Sanayi AS* | 41,792 | 122,887 | ||||||
Tekfen Holding AS | 30,454 | 49,846 | ||||||
Tofas Turk Otomobil Fabrikasi AS | 7,121 | 34,579 | ||||||
Turk Hava Yollari AO* | 52,692 | 211,701 | ||||||
Turk Telekomunikasyon AS | 59,180 | 34,120 | ||||||
Turkcell Iletisim Hizmetleri AS | 145,391 | 172,604 | ||||||
Turkiye Halk Bankasi AS* | 86,760 | 41,104 | ||||||
Turkiye Is Bankasi AS, Class C | 359,859 | 156,645 | ||||||
Turkiye Sise ve Cam Fabrikalari AS | 150,325 | 204,735 | ||||||
Turkiye Vakiflar Bankasi TAO, Class D* | 208,124 | 83,618 | ||||||
Ulker Biskuvi Sanayi AS* | 26,328 | 26,047 | ||||||
Yapi ve Kredi Bankasi AS | 392,626 | 151,919 | ||||||
|
| |||||||
(Cost $2,728,228) | 2,875,300 | |||||||
|
| |||||||
| United Arab Emirates — 2.1% | ||||||||
Abu Dhabi Commercial Bank PJSC | 188,240 | 464,828 | ||||||
Aldar Properties PJSC | 233,601 | 306,546 | ||||||
Dubai Islamic Bank PJSC | 195,547 | 311,444 | ||||||
Emaar Properties PJSC | 257,843 | 439,443 | ||||||
Emirates NBD Bank PJSC | 162,914 | 592,124 | ||||||
Emirates Telecommunications Group Co. PJSC | 376,849 | 2,638,831 | ||||||
First Abu Dhabi Bank PJSC | 289,562 | 1,505,733 | ||||||
International Holding Co. PJSC* | 41,613 | 3,840,625 | ||||||
|
| |||||||
(Cost $7,783,720) | 10,099,574 | |||||||
|
| |||||||
TOTAL COMMON STOCKS | 479,013,464 | |||||||
|
| |||||||
| PREFERRED STOCKS — 2.1% | ||||||||
| Brazil — 1.3% | ||||||||
Alpargatas SA | 19,396 | 77,270 | ||||||
Banco Bradesco SA | 572,424 | 2,094,800 | ||||||
Bradespar SA | 25,703 | 108,597 | ||||||
Braskem SA, Class A | 12,468 | 73,277 | ||||||
Centrais Eletricas Brasileiras SA, Class B | 28,530 | 263,769 | ||||||
Cia Energetica de Minas Gerais | 154,707 | 361,311 | ||||||
| See Notes to Financial Statements. | 36 |
DBX ETF Trust
Schedule of Investments
Xtrackers Emerging Markets Carbon Reduction and Climate Improvers ETF (Continued)
August 31, 2022
Number | Value | |||||||
| Brazil (Continued) | ||||||||
Gerdau SA | 74,121 | $ | 333,623 | |||||
Itau Unibanco Holding SA | 528,148 | 2,631,056 | ||||||
Itausa SA | 312,590 | 552,055 | ||||||
Usinas Siderurgicas de Minas Gerais SA Usiminas, Class A | 38,948 | 60,290 | ||||||
|
| |||||||
(Cost $6,794,363) | 6,556,048 | |||||||
|
| |||||||
| Chile — 0.2% | ||||||||
Sociedad Quimica y Minera de Chile SA, Class B (Cost $489,969) | 9,389 | 942,497 | ||||||
|
| |||||||
| Colombia — 0.1% | ||||||||
Bancolombia SA | 48,465 | 335,063 | ||||||
Grupo Aval Acciones y Valores SA | 109,752 | 16,501 | ||||||
|
| |||||||
(Cost $426,029) | 351,564 | |||||||
|
| |||||||
| Russia — 0.0% | ||||||||
Sberbank of Russia PJSC (b) (Cost $275,893) | 71,636 | 0 | ||||||
|
| |||||||
| South Korea — 0.5% | ||||||||
Hyundai Motor Co. | 1,493 | 101,799 | ||||||
Hyundai Motor Co. — 2nd Preferred | 2,627 | 183,245 | ||||||
LG Chem Ltd. | 411 | 92,491 | ||||||
LG Electronics, Inc. | 997 | 35,257 | ||||||
Samsung Electronics Co. Ltd. | 54,244 | 2,210,234 | ||||||
|
| |||||||
(Cost $3,756,204) | 2,623,026 | |||||||
|
| |||||||
TOTAL PREFERRED STOCKS | 10,473,135 | |||||||
|
| |||||||
Principal | ||||||||
| CORPORATE BONDS — 0.0% | ||||||||
| India — 0.0% | ||||||||
Britannia Industries Ltd. Series N3, | INR | 2,494 | 30 | |||||
|
| |||||||
Number | Value | |||||||
| WARRANTS — 0.0% | ||||||||
| Switzerland — 0.0% | ||||||||
Cie Financiere Richemont SA*, expires 11/22/23 | 746 | $ | 481 | |||||
|
| |||||||
| Thailand — 0.0% | ||||||||
BTS Group Holdings PCL*, expires 11/7/24 | 400 | 3 | ||||||
BTS Group Holdings PCL*, expires 11/20/26 | 800 | 5 | ||||||
|
| |||||||
(Cost $0) | 8 | |||||||
|
| |||||||
TOTAL WARRANTS | 489 | |||||||
|
| |||||||
| SECURITIES LENDING COLLATERAL — 0.3% | ||||||||
DWS Government & Agency Securities Portfolio “DWS Government Cash Institutional Shares”, 2.00% (d)(e) | 1,366,731 | 1,366,731 | ||||||
|
| |||||||
| CASH EQUIVALENTS — 0.4% | ||||||||
DWS Government Money Market Series “Institutional Shares”, 2.24% (d) | 1,859,521 | 1,859,521 | ||||||
|
| |||||||
TOTAL INVESTMENTS — 100.0% | ||||||||
(Cost $599,003,024) | $ | 492,713,370 | ||||||
Other assets and liabilities, net — 0.0% | 67,842 | |||||||
|
| |||||||
NET ASSETS — 100.0% | $ | 492,781,212 | ||||||
|
| |||||||
A summary of the Fund’s transactions with affiliated investments during the year ended August 31, 2022 is as follows:
| Value ($) at 8/31/2021 | Purchases Cost ($) | Sales Proceeds ($) | Net Realized Gain/(Loss) ($) | Net Change in Unrealized Appreciation (Depreciation) ($) | Income ($) | Capital Gain Distributions ($) | Number of Shares at 8/31/2022 | Value ($) at 8/31/2022 | ||||||||||||||||||||||||||||
EXCHANGE-TRADED FUNDS — 0.0% |
| |||||||||||||||||||||||||||||||||||
Xtrackers MSCI EAFE ESG Leaders Equity ETF (f) |
| |||||||||||||||||||||||||||||||||||
| 3,087 | — | (3,141 | ) | 297 | (243 | ) | — | — | — | — | ||||||||||||||||||||||||||
SECURITIES LENDING COLLATERAL — 0.3% |
| |||||||||||||||||||||||||||||||||||
DWS Government & Agency Securities Portfolio “DWS Government Cash Institutional Shares”, 2.00% (d)(e) |
| |||||||||||||||||||||||||||||||||||
| 1,768,050 | — | (401,319 | )(g) | — | — | 8,092 | — | 1,366,731 | 1,366,731 | |||||||||||||||||||||||||||
CASH EQUIVALENTS — 0.4% |
| |||||||||||||||||||||||||||||||||||
DWS Government Money Market Series “Institutional Shares”, 2.24% (d) |
| |||||||||||||||||||||||||||||||||||
| 3,753,775 | 33,109,751 | (35,004,005 | ) | — | — | 5,632 | — | 1,859,521 | 1,859,521 | |||||||||||||||||||||||||||
|
|
|
|
|
|
|
|
|
|
|
|
|
|
|
|
|
| |||||||||||||||||||
| 5,524,912 | 33,109,751 | (35,408,465 | ) | 297 | (243 | ) | 13,724 | — | 3,226,252 | 3,226,252 | ||||||||||||||||||||||||||
|
|
|
|
|
|
|
|
|
|
|
|
|
|
|
|
|
| |||||||||||||||||||
| See Notes to Financial Statements. | 37 |
DBX ETF Trust
Schedule of Investments
Xtrackers Emerging Markets Carbon Reduction and Climate Improvers ETF (Continued)
August 31, 2022
| * | Non-income producing security. |
| (a) | All or a portion of these securities were on loan. In addition, “Other assets and liabilities, net” may include pending sales that are also on loan. The value of securities loaned at August 31, 2022 amounted to $5,511,559, which is 1.1% of net assets. |
| (b) | Investment was valued using significant unobservable inputs. |
| (c) | Listed on the New York Stock Exchange. |
| (d) | Affiliated fund managed by DWS Investment Management Americas, Inc. The rate shown is the annualized seven-day yield at period end. |
| (e) | Represents cash collateral held in connection with securities lending. Income earned by the Fund is net of borrower rebates. In addition, the Fund held non-cash U.S. Treasury securities collateral having a value of $4,316,668. |
| (f) | Affiliated fund advised by DBX Advisors LLC. |
| (g) | Represents the net increase (purchase cost) or decrease (sales proceeds) in the amount invested in cash collateral for the year ended August 31, 2022. |
| ADR: | American Depositary Receipt |
| CPO: | Ordinary Participation Certificates |
| GDR: | Global Depositary Receipt |
| JSC: | Joint Stock Company |
| KSC: | Kuwait Shareholding Company |
| KSCP: | Kuwait Shareholding Company Public |
| NVDR: | Non Voting Depositary Receipt |
| PJSC: | Public Joint Stock Company |
| PSQC: | Public Shareholders Qatari Company |
| QPSC: | Qatari Public Shareholders Company |
| QSC: | Qatari Shareholders Company |
| REIT: | Real Estate Investment Trust |
| SAE: | Societe Anonyme Egyptienne |
| SAQ: | Societe Anonyme Qatar |
| 144A: | Security exempt from registration under Rule 144A of the Securities Act of 1933. These securities may be resold in transactions exempt from registration, normally to qualified institutional buyers. |
Securities are listed in country of domicile.
At August 31, 2022, open futures contracts purchased were as follows:
Contract Description | Currency | Number of Contracts | Notional Amount | Contract Value | Expiration Date | Unrealized Depreciation | ||||||||||||
MSCI Emerging Markets Index Future | USD | 65 | $ | 3,233,320 | $ | 3,191,175 | 9/16/2022 | $ | (42,145 | ) | ||||||||
For information on the Fund’s policy and additional disclosures regarding open futures contracts, please refer to the Derivatives section of Note 2 in the accompanying Notes to Financial Statements.
Currency Abbreviations
| INR | Indian Rupee |
| USD | U.S. Dollar |
Fair Value Measurements
Various inputs are used in determining the value of the Fund’s investments. These inputs are summarized in three broad levels. Level 1 includes quoted prices in active markets for identical securities. Level 2 includes other significant observable inputs (including quoted prices for similar securities, interest rates, prepayment speeds and credit risk). Level 3 includes significant unobservable inputs (including the Fund’s own assumptions in determining the fair value of investments). The level assigned to the securities valuations may not be an indication of the risk or liquidity associated with investing in those securities.
The following is a summary of the inputs used as of August 31, 2022 in valuing the Fund’s investments. For information on the Fund’s policy regarding the valuation of investments, please refer to the Security Valuation section of Note 2 in the accompanying Notes to Financial Statements.
Assets | Level 1 | Level 2 | Level 3 | Total | ||||||||||||
Common Stocks (a) | $ | 478,777,100 | $ | — | $ | 236,364 | $ | 479,013,464 | ||||||||
Preferred Stocks (a) | 10,473,135 | — | 0 | 10,473,135 | ||||||||||||
Corporate Bonds | — | 30 | — | 30 | ||||||||||||
Warrants (a) | 489 | — | — | 489 | ||||||||||||
Short-Term Investments (a) | 3,226,252 | — | — | 3,226,252 | ||||||||||||
|
|
|
|
|
|
|
| |||||||||
TOTAL | $ | 492,476,976 | $ | 30 | $ | 236,364 | $ | 492,713,370 | ||||||||
|
|
|
|
|
|
|
| |||||||||
| See Notes to Financial Statements. | 38 |
DBX ETF Trust
Schedule of Investments
Xtrackers Emerging Markets Carbon Reduction and Climate Improvers ETF (Continued)
August 31, 2022
Liabilities | Level 1 | Level 2 | Level 3 | Total | ||||||||||||
Derivatives (b) | ||||||||||||||||
Futures Contracts | $ | (42,145 | ) | $ | — | $ | — | $ | (42,145 | ) | ||||||
|
|
|
|
|
|
|
| |||||||||
TOTAL | $ | (42,145 | ) | $ | — | $ | — | $ | (42,145 | ) | ||||||
|
|
|
|
|
|
|
| |||||||||
| (a) | See Schedule of Investments for additional detailed categorizations. |
| (b) | Derivatives include unrealized appreciation (depreciation) on open futures contracts. |
During the year ended August 31, 2022, the amount of transfers from Level 1 to Level 3 was $7,635,815 and between Level 3 and Level 1 was $26. The investments were transferred from Level 1 to Level 3 due to the lack of observable market data due to a decrease in market activity. The investments were transferred from Level 3 to Level 1 due to the availability of a pricing source supported by observable inputs. Transfers between price levels are recognized at the beginning of the reporting period.
| See Notes to Financial Statements. | 39 |
DBX ETF Trust
Schedule of Investments
Xtrackers MSCI EAFE ESG Leaders Equity ETF
August 31, 2022
Number | Value | |||||||
| COMMON STOCKS — 98.7% | ||||||||
| Australia — 8.4% | ||||||||
APA Group (a) | 5,106 | $ | 38,820 | |||||
Aristocrat Leisure Ltd. | 2,558 | 62,605 | ||||||
ASX Ltd. | 787 | 42,326 | ||||||
Aurizon Holdings Ltd. | 7,763 | 19,851 | ||||||
Australia & New Zealand Banking Group Ltd. | 12,552 | 196,453 | ||||||
BlueScope Steel Ltd. | 1,973 | 22,615 | ||||||
Brambles Ltd. | 5,883 | 49,930 | ||||||
Cochlear Ltd. | 280 | 41,136 | ||||||
Coles Group Ltd. | 5,717 | 68,823 | ||||||
Commonwealth Bank of Australia | 7,211 | 481,843 | ||||||
Computershare Ltd. | 2,326 | 39,386 | ||||||
Dexus REIT | 4,620 | 27,650 | ||||||
Domino’s Pizza Enterprises Ltd. | 257 | 11,197 | ||||||
Endeavour Group Ltd. | 5,763 | 28,722 | ||||||
Evolution Mining Ltd. | 7,728 | 12,662 | ||||||
Fortescue Metals Group Ltd. | 7,049 | 89,013 | ||||||
Goodman Group REIT | 7,003 | 94,434 | ||||||
GPT Group REIT | 8,269 | 23,866 | ||||||
IDP Education Ltd. | 891 | 17,720 | ||||||
Lendlease Corp. Ltd. (a) | 2,856 | 20,108 | ||||||
Macquarie Group Ltd. | 1,521 | 184,833 | ||||||
Mineral Resources Ltd.* | 716 | 31,400 | ||||||
Mirvac Group REIT | 16,665 | 23,992 | ||||||
Newcrest Mining Ltd. | 3,757 | 45,666 | ||||||
Northern Star Resources Ltd. | 4,966 | 26,827 | ||||||
Orica Ltd. | 1,756 | 18,623 | ||||||
QBE Insurance Group Ltd. | 6,252 | 51,733 | ||||||
Ramsay Health Care Ltd. | 784 | 38,542 | ||||||
REA Group Ltd. | 213 | 18,625 | ||||||
Santos Ltd. | 13,312 | 72,004 | ||||||
Scentre Group REIT | 22,273 | 44,892 | ||||||
SEEK Ltd. | 1,385 | 19,806 | ||||||
Sonic Healthcare Ltd. | 1,850 | 43,121 | ||||||
Stockland REIT | 10,026 | 24,881 | ||||||
Suncorp Group Ltd. | 5,419 | 40,493 | ||||||
Telstra Corp. Ltd. | 16,899 | 45,993 | ||||||
Transurban Group (a) | 12,804 | 122,538 | ||||||
Vicinity Centres REIT | 15,305 | 20,303 | ||||||
Woodside Energy Group Ltd. | 7,905 | 185,610 | ||||||
|
| |||||||
(Cost $2,504,616) | 2,449,042 | |||||||
|
| |||||||
| Austria — 0.2% | ||||||||
OMV AG | 625 | 25,315 | ||||||
Verbund AG | 291 | 27,901 | ||||||
voestalpine AG | 455 | 9,205 | ||||||
|
| |||||||
(Cost $75,813) | 62,421 | |||||||
|
| |||||||
| Belgium — 0.4% | ||||||||
D’ieteren Group | 107 | 16,214 | ||||||
KBC Group NV | 1,031 | 49,120 | ||||||
Solvay SA | 300 | 24,326 | ||||||
Umicore SA (b) | 898 | 28,670 | ||||||
|
| |||||||
(Cost $166,554) | 118,330 | |||||||
|
| |||||||
Number | Value | |||||||
| Chile — 0.1% | ||||||||
Antofagasta PLC (Cost $34,939) | 1,693 | $ | 21,689 | |||||
|
| |||||||
| Denmark — 4.5% | ||||||||
A.P. Moller — Maersk A/S, Class A | 14 | 32,860 | ||||||
A.P. Moller — Maersk A/S, Class B | 22 | 52,811 | ||||||
Chr Hansen Holding A/S | 435 | 25,419 | ||||||
Coloplast A/S, Class B | 506 | 58,028 | ||||||
Demant A/S* | 411 | 12,697 | ||||||
Genmab A/S* | 274 | 97,800 | ||||||
GN Store Nord AS | 544 | 15,468 | ||||||
Novo Nordisk A/S, Class B | 6,973 | 747,144 | ||||||
Novozymes A/S, Class B | 855 | 49,199 | ||||||
Orsted AS, 144A | 784 | 77,051 | ||||||
Pandora A/S | 406 | 24,542 | ||||||
Vestas Wind Systems A/S | 4,212 | 106,161 | ||||||
|
| |||||||
(Cost $1,157,164) | 1,299,180 | |||||||
|
| |||||||
| Finland — 1.8% | ||||||||
Elisa OYJ | 595 | 31,866 | ||||||
Kesko OYJ, Class B | 1,179 | 24,873 | ||||||
Neste OYJ | 1,762 | 87,260 | ||||||
Nordea Bank Abp | 13,924 | 129,835 | ||||||
Orion OYJ, Class B | 409 | 18,577 | ||||||
Sampo OYJ, Class A | 2,090 | 94,782 | ||||||
Stora Enso OYJ, Class R | 2,358 | 35,270 | ||||||
UPM-Kymmene OYJ | 2,272 | 77,425 | ||||||
Wartsila OYJ Abp | 1,893 | 15,673 | ||||||
|
| |||||||
(Cost $552,978) | 515,561 | |||||||
|
| |||||||
| France — 10.4% | ||||||||
Accor SA* | 740 | 17,762 | ||||||
Air Liquide SA | 2,190 | 275,710 | ||||||
Alstom SA | 1,373 | 28,386 | ||||||
AXA SA | 7,873 | 186,240 | ||||||
BioMerieux | 177 | 16,243 | ||||||
BNP Paribas SA | 4,653 | 217,495 | ||||||
Bouygues SA | 950 | 27,990 | ||||||
Bureau Veritas SA | 1,225 | 30,512 | ||||||
Carrefour SA | 2,633 | 44,056 | ||||||
Cie Generale des Etablissements Michelin SCA | 2,828 | 69,116 | ||||||
Covivio REIT | 202 | 11,334 | ||||||
Danone SA | 2,717 | 143,462 | ||||||
Eiffage SA | 357 | 31,540 | ||||||
EssilorLuxottica SA | 1,218 | 182,795 | ||||||
Gecina SA REIT | 185 | 16,547 | ||||||
Kering SA | 313 | 158,313 | ||||||
Klepierre SA REIT* | 857 | 17,666 | ||||||
L’Oreal SA | 1,015 | 350,332 | ||||||
Orange SA | 8,305 | 84,329 | ||||||
Publicis Groupe SA | 953 | 46,717 | ||||||
Schneider Electric SE | 2,261 | 270,052 | ||||||
SEB SA | 106 | 7,888 | ||||||
Societe Generale SA | 3,309 | 73,468 | ||||||
Teleperformance | 243 | 69,468 | ||||||
TotalEnergies SE | 10,504 | 535,403 | ||||||
Unibail-Rodamco-Westfield REIT* | 504 | 26,049 | ||||||
| See Notes to Financial Statements. | 40 |
DBX ETF Trust
Schedule of Investments
Xtrackers MSCI EAFE ESG Leaders Equity ETF (Continued)
August 31, 2022
Number | Value | |||||||
| France (Continued) | ||||||||
Valeo | 883 | $ | 16,994 | |||||
Vivendi SE | 3,078 | 28,023 | ||||||
Worldline SA, 144A* | 1,021 | 43,931 | ||||||
|
| |||||||
(Cost $3,484,346) | 3,027,821 | |||||||
|
| |||||||
| Germany — 5.4% | ||||||||
adidas AG | 718 | 107,056 | ||||||
Allianz SE | 1,709 | 289,702 | ||||||
Bayerische Motoren Werke AG | 1,377 | 101,730 | ||||||
Beiersdorf AG | 427 | 43,195 | ||||||
Brenntag SE | 645 | 42,430 | ||||||
Carl Zeiss Meditec AG | 172 | 21,481 | ||||||
Commerzbank AG* | 4,473 | 29,821 | ||||||
Delivery Hero SE, 144A* (b) | 664 | 27,709 | ||||||
Deutsche Boerse AG | 799 | 135,338 | ||||||
Evonik Industries AG | 901 | 16,847 | ||||||
GEA Group AG | 658 | 22,953 | ||||||
HeidelbergCement AG | 620 | 28,117 | ||||||
HelloFresh SE* | 676 | 16,219 | ||||||
Henkel AG & Co. KGaA | 446 | 27,940 | ||||||
LEG Immobilien SE | 319 | 24,160 | ||||||
Merck KGaA | 536 | 92,380 | ||||||
MTU Aero Engines AG | 229 | 40,516 | ||||||
Puma SE | 451 | 27,673 | ||||||
SAP SE | 4,377 | 373,846 | ||||||
Symrise AG | 547 | 57,396 | ||||||
Telefonica Deutschland Holding AG | 4,475 | 11,632 | ||||||
Zalando SE, 144A* | 951 | 22,100 | ||||||
|
| |||||||
(Cost $2,088,032) | 1,560,241 | |||||||
|
| |||||||
| Hong Kong — 2.8% | ||||||||
AIA Group Ltd. | 50,702 | 490,622 | ||||||
BOC Hong Kong Holdings Ltd. | 15,829 | 54,653 | ||||||
Chow Tai Fook Jewellery Group Ltd. | 8,210 | 16,590 | ||||||
CK Infrastructure Holdings Ltd. | 2,432 | 14,811 | ||||||
Hang Seng Bank Ltd. | 3,208 | 50,273 | ||||||
HKT Trust & HKT Ltd. (a) | 16,794 | 22,552 | ||||||
Hong Kong & China Gas Co. Ltd. | 47,155 | 46,561 | ||||||
MTR Corp. Ltd. | 6,511 | 33,389 | ||||||
Sino Land Co. Ltd. | 14,020 | 20,542 | ||||||
Swire Pacific Ltd., Class A | 2,043 | 14,147 | ||||||
Swire Properties Ltd. | 4,791 | 11,073 | ||||||
WH Group Ltd., 144A | 35,724 | 24,396 | ||||||
|
| |||||||
(Cost $881,641) | 799,609 | |||||||
|
| |||||||
| Ireland — 1.1% | ||||||||
CRH PLC | 3,211 | 118,805 | ||||||
DCC PLC | 402 | 23,215 | ||||||
James Hardie Industries PLC CDI | 1,878 | 43,143 | ||||||
Kerry Group PLC, Class A | 682 | 70,533 | ||||||
Kingspan Group PLC | 629 | 35,824 | ||||||
Smurfit Kappa Group PLC | 1,052 | 35,490 | ||||||
|
| |||||||
(Cost $392,213) | 327,010 | |||||||
|
| |||||||
| Israel — 0.2% | ||||||||
Bank Leumi Le-Israel BM (Cost $51,511) | 6,224 | 66,161 | ||||||
|
| |||||||
Number | Value | |||||||
| Italy — 1.2% | ||||||||
Amplifon SpA | 519 | $ | 13,595 | |||||
Enel SpA | 34,118 | 161,090 | ||||||
Intesa Sanpaolo SpA | 69,366 | 120,181 | ||||||
Nexi SpA, 144A* | 2,247 | 18,532 | ||||||
Prysmian SpA | 1,091 | 33,581 | ||||||
|
| |||||||
(Cost $508,902) | 346,979 | |||||||
|
| |||||||
| Japan — 23.2% | ||||||||
Aeon Co. Ltd. | 2,800 | 54,990 | ||||||
Ajinomoto Co., Inc. | 2,000 | 55,704 | ||||||
ANA Holdings, Inc.* | 600 | 11,632 | ||||||
Asahi Kasei Corp. | 5,300 | 39,112 | ||||||
Astellas Pharma, Inc. | 7,700 | 110,230 | ||||||
Azbil Corp. | 500 | 14,391 | ||||||
Bridgestone Corp. | 2,400 | 92,676 | ||||||
Chugai Pharmaceutical Co. Ltd. | 2,798 | 72,844 | ||||||
Dai Nippon Printing Co. Ltd. | 965 | 20,445 | ||||||
Daifuku Co. Ltd. | 416 | 24,577 | ||||||
Dai-ichi Life Holdings, Inc. | 4,100 | 71,190 | ||||||
Daiichi Sankyo Co. Ltd. | 7,400 | 224,042 | ||||||
Daikin Industries Ltd. | 1,121 | 198,000 | ||||||
Daiwa House Industry Co. Ltd. | 2,500 | 56,555 | ||||||
Denso Corp. | 1,860 | 102,657 | ||||||
Eisai Co. Ltd. | 1,058 | 43,480 | ||||||
FANUC Corp. | 771 | 125,334 | ||||||
Fast Retailing Co. Ltd. | 239 | 141,288 | ||||||
FUJIFILM Holdings Corp. | 1,550 | 79,510 | ||||||
Fujitsu Ltd. | 800 | 95,596 | ||||||
Hankyu Hanshin Holdings, Inc. | 1,000 | 30,189 | ||||||
Hikari Tsushin, Inc. | 90 | 11,459 | ||||||
Hirose Electric Co. Ltd. | 121 | 17,326 | ||||||
Hitachi Construction Machinery Co. Ltd. | 400 | 8,307 | ||||||
Hitachi Metals Ltd.* | 1,000 | 15,098 | ||||||
Hoshizaki Corp. | 400 | 11,975 | ||||||
Hoya Corp. | 1,550 | 159,333 | ||||||
Hulic Co. Ltd. | 1,700 | 12,999 | ||||||
Ibiden Co. Ltd. | 500 | 16,159 | ||||||
Inpex Corp. | 4,400 | 50,911 | ||||||
Isuzu Motors Ltd. | 2,400 | 29,969 | ||||||
Ito En Ltd. | 200 | 8,858 | ||||||
ITOCHU Corp. | 5,000 | 138,611 | ||||||
Japan Real Estate Investment Corp. REIT | 5 | 23,264 | ||||||
JFE Holdings, Inc. (b) | 2,100 | 22,723 | ||||||
JSR Corp. | 700 | 15,805 | ||||||
Kajima Corp. | 1,800 | 19,075 | ||||||
Kao Corp. | 1,984 | 86,659 | ||||||
KDDI Corp. | 6,800 | 209,801 | ||||||
Keio Corp. | 439 | 16,847 | ||||||
Kikkoman Corp. | 600 | 37,050 | ||||||
Komatsu Ltd. | 3,900 | 82,431 | ||||||
Kubota Corp. | 4,400 | 69,051 | ||||||
Kurita Water Industries Ltd. | 400 | 15,755 | ||||||
Lixil Corp. | 1,300 | 22,873 | ||||||
Marubeni Corp. | 6,700 | 70,178 | ||||||
Mazda Motor Corp. | 2,400 | 21,312 | ||||||
McDonald’s Holdings Co. Japan Ltd. | 400 | 14,341 | ||||||
MEIJI Holdings Co. Ltd. | 400 | 19,131 | ||||||
| See Notes to Financial Statements. | 41 |
DBX ETF Trust
Schedule of Investments
Xtrackers MSCI EAFE ESG Leaders Equity ETF (Continued)
August 31, 2022
Number | Value | |||||||
| Japan (Continued) | ||||||||
Mitsubishi Chemical Group Corp. | 5,100 | $ | 26,967 | |||||
Mitsubishi Estate Co. Ltd. | 4,900 | 66,453 | ||||||
Mitsui & Co. Ltd. | 5,900 | 139,004 | ||||||
Mitsui Chemicals, Inc. | 800 | 18,150 | ||||||
MS&AD Insurance Group Holdings, Inc. (b) | 1,900 | 57,031 | ||||||
Murata Manufacturing Co. Ltd. | 2,400 | 130,782 | ||||||
Nintendo Co. Ltd. | 452 | 185,821 | ||||||
Nippon Building Fund, Inc. REIT | 6 | 30,038 | ||||||
NIPPON EXPRESS HOLDINGS, Inc. | 350 | 19,416 | ||||||
Nippon Paint Holdings Co. Ltd. | 3,650 | 28,594 | ||||||
Nippon Prologis REIT, Inc. REIT | 10 | 25,284 | ||||||
Nippon Steel Corp. | 3,200 | 50,981 | ||||||
Nippon Yusen KK (b) | 670 | 51,667 | ||||||
Nissin Foods Holdings Co. Ltd. | 250 | 17,962 | ||||||
Nitori Holdings Co. Ltd. | 394 | 38,057 | ||||||
Nitto Denko Corp. | 550 | 34,200 | ||||||
Nomura Holdings, Inc. | 12,400 | 45,065 | ||||||
Nomura Real Estate Holdings, Inc. | 500 | 12,353 | ||||||
Nomura Research Institute Ltd. | 1,400 | 38,276 | ||||||
NTT Data Corp. | 2,700 | 38,448 | ||||||
Obayashi Corp. | 2,500 | 17,421 | ||||||
Odakyu Electric Railway Co. Ltd. | 1,300 | 17,921 | ||||||
Omron Corp. | 813 | 43,340 | ||||||
Open House Group Co. Ltd. | 300 | 11,838 | ||||||
Oriental Land Co. Ltd. | 835 | 125,589 | ||||||
ORIX Corp. | 4,900 | 81,157 | ||||||
Osaka Gas Co. Ltd. | 1,600 | 27,054 | ||||||
Pan Pacific International Holdings Corp. | 1,500 | 27,106 | ||||||
Panasonic Holdings Corp. | 9,400 | 76,827 | ||||||
Rakuten Group, Inc. | 3,800 | 18,531 | ||||||
Recruit Holdings Co. Ltd. | 6,100 | 197,268 | ||||||
Rohm Co. Ltd. | 390 | 29,596 | ||||||
SCSK Corp. | 700 | 11,513 | ||||||
Sekisui Chemical Co. Ltd. | 1,600 | 21,999 | ||||||
Sekisui House Ltd. | 2,600 | 44,526 | ||||||
Seven & i Holdings Co. Ltd. (b) | 3,100 | 123,732 | ||||||
SG Holdings Co. Ltd. | 1,300 | 21,747 | ||||||
Sharp Corp. | 1,100 | 7,959 | ||||||
Shimadzu Corp. | 1,040 | 30,684 | ||||||
Shimizu Corp. | 2,400 | 13,262 | ||||||
Shin-Etsu Chemical Co. Ltd. | 1,635 | 192,426 | ||||||
Shionogi & Co. Ltd. | 1,200 | 58,898 | ||||||
SoftBank Corp. | 12,000 | 132,400 | ||||||
Sompo Holdings, Inc. | 1,340 | 57,737 | ||||||
Sony Group Corp. | 5,305 | 426,122 | ||||||
Sumitomo Chemical Co. Ltd. | 6,400 | 25,392 | ||||||
Sumitomo Electric Industries Ltd. | 2,800 | 32,368 | ||||||
Sumitomo Metal Mining Co. Ltd. | 1,053 | 33,461 | ||||||
Sumitomo Mitsui Trust Holdings, Inc. | 1,500 | 46,918 | ||||||
Sumitomo Realty & Development Co. Ltd. | 1,300 | 32,072 | ||||||
Suntory Beverage & Food Ltd. | 500 | 18,395 | ||||||
Sysmex Corp. | 650 | 40,339 | ||||||
Taisei Corp. | 774 | 23,646 | ||||||
TDK Corp. | 1,625 | 57,615 | ||||||
Terumo Corp. | 2,650 | 86,138 | ||||||
Tobu Railway Co. Ltd. | 800 | 19,015 | ||||||
Number | Value | |||||||
| Japan (Continued) | ||||||||
Tokyo Electron Ltd. | 611 | $ | 194,639 | |||||
Tokyo Gas Co. Ltd. | 1,700 | 32,032 | ||||||
Tokyu Corp. | 2,100 | 25,132 | ||||||
Toray Industries, Inc. | 6,000 | 34,578 | ||||||
Tosoh Corp. | 1,000 | 13,035 | ||||||
TOTO Ltd. | 500 | 17,439 | ||||||
Unicharm Corp. | 1,700 | 59,489 | ||||||
USS Co. Ltd. | 1,000 | 17,775 | ||||||
West Japan Railway Co. | 950 | 37,226 | ||||||
Yamaha Corp. | 519 | 20,442 | ||||||
Yamaha Motor Co. Ltd. | 1,300 | 27,186 | ||||||
Yaskawa Electric Corp. | 1,001 | 33,072 | ||||||
Yokogawa Electric Corp. | 1,000 | 17,638 | ||||||
Z Holdings Corp. | 11,400 | 34,128 | ||||||
ZOZO, Inc. | 500 | 11,217 | ||||||
|
| |||||||
(Cost $7,249,098) | 6,753,332 | |||||||
|
| |||||||
| Luxembourg — 0.1% | ||||||||
Tenaris SA (Cost $24,760) | 2,019 | 27,915 | ||||||
|
| |||||||
| Netherlands — 5.9% | ||||||||
Akzo Nobel NV | 745 | 47,226 | ||||||
ASML Holding NV | 1,716 | 836,275 | ||||||
IMCD NV | 244 | 33,810 | ||||||
ING Groep NV | 16,383 | 144,411 | ||||||
JDE Peet’s NV | 435 | 13,437 | ||||||
Koninklijke Ahold Delhaize NV | 4,345 | 119,714 | ||||||
Koninklijke DSM NV | 729 | 93,353 | ||||||
Koninklijke KPN NV | 14,165 | 45,152 | ||||||
NN Group NV | 1,193 | 49,149 | ||||||
Prosus NV* (b) | 3,479 | 216,020 | ||||||
Randstad NV | 499 | 23,327 | ||||||
Wolters Kluwer NV | 1,109 | 108,661 | ||||||
|
| |||||||
(Cost $1,831,199) | 1,730,535 | |||||||
|
| |||||||
| New Zealand — 0.5% | ||||||||
Auckland International Airport Ltd.* | 5,384 | 24,955 | ||||||
Fisher & Paykel Healthcare Corp. Ltd. | 2,431 | 29,302 | ||||||
Mercury NZ Ltd. | 2,937 | 10,444 | ||||||
Meridian Energy Ltd. | 5,310 | 16,294 | ||||||
Spark New Zealand Ltd. | 7,735 | 25,703 | ||||||
Xero Ltd.* | 577 | 34,711 | ||||||
|
| |||||||
(Cost $177,314) | 141,409 | |||||||
|
| |||||||
| Norway — 1.5% | ||||||||
Aker BP ASA | 1,349 | 47,263 | ||||||
DNB Bank ASA | 3,859 | 73,881 | ||||||
Equinor ASA | 4,093 | 157,836 | ||||||
Gjensidige Forsikring ASA | 862 | 17,546 | ||||||
Mowi ASA | 1,771 | 36,458 | ||||||
Norsk Hydro ASA | 5,631 | 38,867 | ||||||
Orkla ASA | 3,103 | 26,083 | ||||||
Salmar ASA | 252 | 16,747 | ||||||
Telenor ASA | 2,936 | 32,247 | ||||||
|
| |||||||
(Cost $434,960) | 446,928 | |||||||
|
| |||||||
| See Notes to Financial Statements. | 42 |
DBX ETF Trust
Schedule of Investments
Xtrackers MSCI EAFE ESG Leaders Equity ETF (Continued)
August 31, 2022
Number | Value | |||||||
| Portugal — 0.2% | ||||||||
Galp Energia SGPS SA | 2,121 | $ | 23,023 | |||||
Jeronimo Martins SGPS SA | 1,214 | 26,979 | ||||||
|
| |||||||
(Cost $51,705) | 50,002 | |||||||
|
| |||||||
| Singapore — 0.9% | ||||||||
CapitaLand Integrated Commercial Trust REIT | 23,065 | 34,223 | ||||||
Capitaland Investment Ltd. | 11,300 | 29,888 | ||||||
City Developments Ltd. | 1,800 | 10,490 | ||||||
Grab Holdings Ltd., Class A* | 4,641 | 13,227 | ||||||
Keppel Corp. Ltd. | 6,300 | 32,830 | ||||||
Singapore Airlines Ltd.* | 5,750 | 21,927 | ||||||
Singapore Exchange Ltd. | 3,700 | 25,169 | ||||||
United Overseas Bank Ltd. | 5,000 | 97,950 | ||||||
UOL Group Ltd. | 2,000 | 9,920 | ||||||
|
| |||||||
(Cost $273,339) | 275,624 | |||||||
|
| |||||||
| Spain — 2.1% | ||||||||
Banco Bilbao Vizcaya Argentaria SA | 27,956 | 126,261 | ||||||
Iberdrola SA | 25,212 | 263,280 | ||||||
Industria de Diseno Textil SA | 4,573 | 99,095 | ||||||
Naturgy Energy Group SA | 623 | 17,215 | ||||||
Red Electrica Corp. SA | 1,751 | 32,107 | ||||||
Repsol SA | 6,053 | 79,034 | ||||||
|
| |||||||
(Cost $672,740) | 616,992 | |||||||
|
| |||||||
| Sweden — 3.1% | ||||||||
Alfa Laval AB | 1,256 | 33,723 | ||||||
Alleima AB* | 887 | 3,570 | ||||||
Assa Abloy AB, Class B | 4,163 | 84,840 | ||||||
Atlas Copco AB, Class A | 11,275 | 115,303 | ||||||
Atlas Copco AB, Class B | 6,399 | 58,687 | ||||||
Boliden AB | 1,165 | 37,640 | ||||||
Electrolux AB, Class B | 975 | 12,401 | ||||||
Epiroc AB, Class A | 2,675 | 41,169 | ||||||
Epiroc AB, Class B | 1,680 | 22,988 | ||||||
EQT AB | 1,265 | 28,588 | ||||||
Essity AB, Class B | 2,505 | 55,856 | ||||||
H & M Hennes & Mauritz AB, Class B (b) | 2,970 | 31,020 | ||||||
Holmen AB, Class B | 402 | 17,338 | ||||||
Husqvarna AB, Class B | 1,790 | 12,121 | ||||||
Nibe Industrier AB, Class B | 6,489 | 61,178 | ||||||
Sandvik AB | 4,435 | 69,633 | ||||||
SKF AB, Class B | 1,604 | 24,219 | ||||||
Svenska Cellulosa AB SCA, Class B | 2,447 | 36,901 | ||||||
Tele2 AB, Class B | 2,432 | 25,982 | ||||||
Telefonaktiebolaget LM Ericsson, Class B | 12,431 | 93,502 | ||||||
Telia Co. AB | 11,122 | 39,307 | ||||||
|
| |||||||
(Cost $1,122,876) | 905,966 | |||||||
|
| |||||||
| Switzerland — 8.6% | ||||||||
ABB Ltd. | 7,024 | 194,106 | ||||||
Adecco Group AG | 660 | 20,998 | ||||||
Chocoladefabriken Lindt & Spruengli AG Participation Certificates | 10 | 105,948 | ||||||
Cie Financiere Richemont SA, Class A | 2,234 | 251,452 | ||||||
Clariant AG* | 930 | 17,257 | ||||||
Coca-Cola HBC AG* | 882 | 20,218 | ||||||
Number | Value | |||||||
| Switzerland (Continued) | ||||||||
Geberit AG | 154 | $ | 71,465 | |||||
Givaudan SA | 40 | 128,244 | ||||||
Kuehne + Nagel International AG | 233 | 53,956 | ||||||
Lonza Group AG | 319 | 171,079 | ||||||
Roche Holding AG | 2,962 | 957,236 | ||||||
SGS SA | 27 | 59,647 | ||||||
Sika AG | 622 | 140,467 | ||||||
Sonova Holding AG | 230 | 60,967 | ||||||
Straumann Holding AG | 477 | 52,639 | ||||||
Swiss Life Holding AG | 136 | 71,404 | ||||||
Swiss Re AG | 1,289 | 100,616 | ||||||
Temenos AG | 273 | 22,429 | ||||||
|
| |||||||
(Cost $2,656,545) | 2,500,128 | |||||||
|
| |||||||
| United Kingdom — 16.1% | ||||||||
abrdn PLC | 9,181 | 15,688 | ||||||
Ashtead Group PLC | 1,883 | 93,120 | ||||||
Associated British Foods PLC | 1,455 | 25,819 | ||||||
AstraZeneca PLC | 6,532 | 809,012 | ||||||
Barratt Developments PLC | 4,105 | 20,410 | ||||||
Berkeley Group Holdings PLC | 486 | 20,669 | ||||||
British Land Co. PLC REIT | 3,785 | 18,973 | ||||||
BT Group PLC | 28,732 | 50,383 | ||||||
Bunzl PLC | 1,447 | 48,172 | ||||||
Burberry Group PLC | 1,693 | 34,435 | ||||||
CNH Industrial NV | 4,192 | 51,342 | ||||||
Coca-Cola Europacific Partners PLC | 882 | 43,368 | ||||||
Compass Group PLC | 7,576 | 163,879 | ||||||
Croda International PLC | 570 | 44,610 | ||||||
Ferguson PLC | 911 | 105,856 | ||||||
GSK PLC | 17,069 | 273,970 | ||||||
HSBC Holdings PLC | 85,014 | 523,101 | ||||||
Informa PLC | 6,326 | 40,250 | ||||||
InterContinental Hotels Group PLC | 784 | 42,794 | ||||||
Intertek Group PLC | 687 | 31,648 | ||||||
J Sainsbury PLC | 7,320 | 17,325 | ||||||
Johnson Matthey PLC | 811 | 19,015 | ||||||
Kingfisher PLC | 8,809 | 23,791 | ||||||
Land Securities Group PLC REIT | 2,968 | 22,469 | ||||||
Legal & General Group PLC | 24,746 | 72,706 | ||||||
Lloyds Banking Group PLC | 296,688 | 151,485 | ||||||
Mondi PLC | 2,030 | 34,629 | ||||||
National Grid PLC | 15,274 | 191,591 | ||||||
Next PLC | 537 | 36,316 | ||||||
Ocado Group PLC* | 2,422 | 20,460 | ||||||
Pearson PLC | 2,918 | 29,295 | ||||||
Persimmon PLC | 1,362 | 23,392 | ||||||
Prudential PLC | 11,485 | 120,757 | ||||||
Reckitt Benckiser Group PLC | 3,011 | 232,919 | ||||||
RELX PLC | 8,058 | 212,092 | ||||||
Rentokil Initial PLC | 7,869 | 47,705 | ||||||
Schroders PLC | 525 | 16,421 | ||||||
Segro PLC REIT | 5,134 | 56,334 | ||||||
Spirax-Sarco Engineering PLC | 312 | 38,247 | ||||||
St James’s Place PLC | 2,221 | 28,609 | ||||||
Taylor Wimpey PLC | 15,575 | 19,627 | ||||||
Tesco PLC | 31,619 | 91,501 | ||||||
| See Notes to Financial Statements. | 43 |
DBX ETF Trust
Schedule of Investments
Xtrackers MSCI EAFE ESG Leaders Equity ETF (Continued)
August 31, 2022
Number | Value | |||||||
| United Kingdom (Continued) | ||||||||
Unilever PLC | 10,776 | $ | 492,217 | |||||
Vodafone Group PLC | 113,134 | 152,284 | ||||||
Whitbread PLC | 816 | 23,775 | ||||||
WPP PLC | 4,653 | 40,304 | ||||||
|
| |||||||
(Cost $5,349,887) | 4,672,765 | |||||||
|
| |||||||
TOTAL COMMON STOCKS | 28,715,640 | |||||||
|
| |||||||
| PREFERRED STOCKS — 0.2% | ||||||||
| Germany — 0.2% | ||||||||
Bayerische Motoren Werke AG | 249 | 17,339 | ||||||
Henkel AG & Co. KGaA | 749 | 48,383 | ||||||
|
| |||||||
(Cost $89,826) | 65,722 | |||||||
|
| |||||||
| WARRANTS — 0.0% | ||||||||
| Switzerland — 0.0% | ||||||||
Cie Financiere Richemont SA*, | 1,880 | 1,214 | ||||||
|
| |||||||
Number | Value | |||||||
| EXCHANGE-TRADED FUNDS — 0.2% | ||||||||
iShares Trust iShares ESG Aware MSCI EAFE ETF (b) | 850 | $ | 52,742 | |||||
|
| |||||||
| SECURITIES LENDING COLLATERAL — 0.4% | ||||||||
DWS Government & Agency Securities Portfolio “DWS Government Cash Institutional Shares”, 2.00% (c)(d) | 112,126 | 112,126 | ||||||
|
| |||||||
| CASH EQUIVALENTS — 0.1% | ||||||||
DWS Government Money Market Series “Institutional Shares”, 2.24% (c) | 29,931 | 29,931 | ||||||
|
| |||||||
TOTAL INVESTMENTS — 99.6% (Cost $32,030,096) | $ | 28,977,375 | ||||||
Other assets and liabilities, net — 0.4% | 128,817 | |||||||
|
| |||||||
NET ASSETS — 100.0% | $ | 29,106,192 | ||||||
|
| |||||||
A summary of the Fund’s transactions with affiliated investments during the year ended August 31, 2022 is as follows:
| Value ($) at 8/31/2021 | Purchases Cost ($) | Sales Proceeds ($) | Net Realized Gain/(Loss) ($) | Net Change in Unrealized Appreciation (Depreciation) ($) | Income ($) | Capital Gain Distributions ($) | Number of Shares at 8/31/2022 | Value ($) at 8/31/2022 | ||||||||||||||||||||||||||||
SECURITIES LENDING COLLATERAL — 0.4% |
| |||||||||||||||||||||||||||||||||||
DWS Government & Agency Securities Portfolio “DWS Government Cash Institutional Shares”, 2.00% (c)(d) |
| |||||||||||||||||||||||||||||||||||
| 61,137 | 50,989 | (e) | — | — | — | 1,603 | — | 112,126 | 112,126 | |||||||||||||||||||||||||||
CASH EQUIVALENTS — 0.1% |
| |||||||||||||||||||||||||||||||||||
DWS Government Money Market Series “Institutional Shares”, 2.24% (c) |
| |||||||||||||||||||||||||||||||||||
| 2,532 | 1,930,135 | (1,902,736 | ) | — | — | 211 | — | 29,931 | 29,931 | |||||||||||||||||||||||||||
|
|
|
|
|
|
|
|
|
|
|
|
|
|
|
|
|
| |||||||||||||||||||
| 63,669 | 1,981,124 | (1,902,736 | ) | — | — | 1,814 | — | 142,057 | 142,057 | |||||||||||||||||||||||||||
|
|
|
|
|
|
|
|
|
|
|
|
|
|
|
|
|
| |||||||||||||||||||
| * | Non-income producing security. |
| (a) | Stapled Security — A security contractually bound to one or more other securities to form a single saleable unit which cannot be sold separately. |
| (b) | All or a portion of these securities were on loan. In addition, “Other assets and liabilities, net” may include pending sales that are also on loan. The value of securities loaned at August 31, 2022 amounted to $534,846, which is 1.8% of net assets. |
| (c) | Affiliated fund managed by DWS Investment Management Americas, Inc. The rate shown is the annualized seven-day yield at period end. |
| (d) | Represents cash collateral held in connection with securities lending. Income earned by the Fund is net of borrower rebates. In addition, the Fund held non-cash U.S. Treasury securities collateral having a value of $460,188. |
| (e) | Represents the net increase (purchase cost) or decrease (sales proceeds) in the amount invested in cash collateral for the year ended August 31, 2022. |
| CDI: | Chess Depositary Interest |
| REIT: | Real Estate Investment Trust |
| 144A: | Security exempt from registration under Rule 144A of the Securities Act of 1933. These securities may be resold in transactions exempt from registration, normally to qualified institutional buyers. |
Securities are listed in country of domicile.
| See Notes to Financial Statements. | 44 |
DBX ETF Trust
Schedule of Investments
Xtrackers MSCI EAFE ESG Leaders Equity ETF (Continued)
August 31, 2022
At August 31, 2022, open futures contracts purchased were as follows:
Contract Description | Currency | Number of Contracts | Notional Amount | Contract Value | Expiration Date | Unrealized Appreciation (Depreciation) | ||||||||||||
EURO STOXX 50 Futures | EUR | 5 | $ | 180,665 | $ | 176,977 | 9/16/2022 | $ | (3,688 | ) | ||||||||
MINI TOPIX Index Futures | JPY | 5 | 69,666 | 70,766 | 9/08/2022 | 1,100 | ||||||||||||
|
| |||||||||||||||||
Total net unrealized depreciation | $ | (2,588 | ) | |||||||||||||||
|
| |||||||||||||||||
For information on the Fund’s policy and additional disclosures regarding open futures contracts, please refer to the Derivatives section of Note 2 in the accompanying Notes to Financial Statements.
Currency Abbreviations
| EUR | Euro |
| JPY | Japanese Yen |
Fair Value Measurements
Various inputs are used in determining the value of the Fund’s investments. These inputs are summarized in three broad levels. Level 1 includes quoted prices in active markets for identical securities. Level 2 includes other significant observable inputs (including quoted prices for similar securities, interest rates, prepayment speeds and credit risk). Level 3 includes significant unobservable inputs (including the Fund’s own assumptions in determining the fair value of investments). The level assigned to the securities valuations may not be an indication of the risk or liquidity associated with investing in those securities.
The following is a summary of the inputs used as of August 31, 2022 in valuing the Fund’s investments. For information on the Fund’s policy regarding the valuation of investments, please refer to the Security Valuation section of Note 2 in the accompanying Notes to Financial Statements.
Assets | Level 1 | Level 2 | Level 3 | Total | ||||||||||||
Common Stocks (a) | $ | 28,715,640 | $ | — | $ | — | $ | 28,715,640 | ||||||||
Preferred Stocks | 65,722 | — | — | 65,722 | ||||||||||||
Warrants | 1,214 | — | — | 1,214 | ||||||||||||
Exchange-Traded Funds | 52,742 | — | — | 52,742 | ||||||||||||
Short-Term Investments (a) | 142,057 | — | — | 142,057 | ||||||||||||
Derivatives (b) | ||||||||||||||||
Futures Contracts | 1,100 | — | — | 1,100 | ||||||||||||
|
|
|
|
|
|
|
| |||||||||
TOTAL | $ | 28,978,475 | $ | — | $ | — | $ | 28,978,475 | ||||||||
|
|
|
|
|
|
|
| |||||||||
Liabilities | Level 1 | Level 2 | Level 3 | Total | ||||||||||||
Derivatives (b) | ||||||||||||||||
Futures Contracts | $ | (3,688 | ) | $ | — | $ | — | $ | (3,688 | ) | ||||||
|
|
|
|
|
|
|
| |||||||||
TOTAL | $ | (3,688 | ) | $ | — | $ | — | $ | (3,688 | ) | ||||||
|
|
|
|
|
|
|
| |||||||||
| (a) | See Schedule of Investments for additional detailed categorizations. |
| (b) | Derivatives include unrealized appreciation (depreciation) on open futures contracts. |
| See Notes to Financial Statements. | 45 |
DBX ETF Trust
Schedule of Investments
Xtrackers MSCI Emerging Markets ESG Leaders Equity ETF
August 31, 2022
Number | Value | |||||||
| COMMON STOCKS — 95.9% | ||||||||
| Brazil — 2.7% | ||||||||
Americanas SA | 4,518 | $ | 14,249 | |||||
Atacadao SA | 2,632 | 10,033 | ||||||
Banco Bradesco SA | 10,069 | 30,784 | ||||||
Banco Santander Brasil SA | 2,249 | 12,749 | ||||||
CCR SA | 8,443 | 22,472 | ||||||
Cia de Saneamento Basico do Estado de Sao Paulo | 2,209 | 20,956 | ||||||
Cosan SA | 8,300 | 32,008 | ||||||
Energisa SA | 877 | 7,159 | ||||||
Equatorial Energia SA | 7,020 | 32,763 | ||||||
Hapvida Participacoes e Investimentos SA, 144A | 29,558 | 41,533 | ||||||
Hypera SA | 2,668 | 22,179 | ||||||
Klabin SA | 4,950 | 17,990 | ||||||
Localiza Rent a Car SA | 4,999 | 58,683 | ||||||
Lojas Renner SA | 6,882 | 35,161 | ||||||
Natura & Co. Holding SA | 6,235 | 17,354 | ||||||
Petro Rio SA* | 4,841 | 25,518 | ||||||
Raia Drogasil SA | 7,258 | 30,483 | ||||||
Rede D’Or Sao Luiz SA, 144A | 2,789 | 17,942 | ||||||
Rumo SA | 8,918 | 34,787 | ||||||
Telefonica Brasil SA | 3,601 | 28,594 | ||||||
TIM SA | 5,681 | 12,972 | ||||||
TOTVS SA | 3,549 | 19,557 | ||||||
Ultrapar Participacoes SA | 5,137 | 13,415 | ||||||
WEG SA | 11,502 | 62,805 | ||||||
|
| |||||||
(Cost $682,198) | 622,146 | |||||||
|
| |||||||
| Chile — 0.3% | ||||||||
Cencosud SA | 10,134 | 14,226 | ||||||
Empresas CMPC SA | 7,215 | 13,741 | ||||||
Empresas Copec SA | 2,620 | 22,692 | ||||||
Enel Americas SA | 159,735 | 17,377 | ||||||
Falabella SA | 5,178 | 12,252 | ||||||
|
| |||||||
(Cost $94,138) | 80,288 | |||||||
|
| |||||||
| China — 29.6% | ||||||||
37 Interactive Entertainment Network Technology Group Co. Ltd., Class A | 700 | 2,068 | ||||||
3SBio, Inc., 144A | 7,850 | 5,231 | ||||||
AAC Technologies Holdings, Inc. | 4,413 | 8,220 | ||||||
Air China Ltd., Class A* | 2,300 | 3,440 | ||||||
Air China Ltd., Class H* | 12,626 | 10,151 | ||||||
Airtac International Group* | 1,000 | 27,072 | ||||||
Alibaba Group Holding Ltd.* | 102,561 | 1,232,219 | ||||||
A-Living Smart City Services Co. Ltd., 144A | 2,520 | 2,607 | ||||||
Angel Yeast Co. Ltd., Class A | 200 | 1,409 | ||||||
Anjoy Foods Group Co. Ltd., Class A | 100 | 2,250 | ||||||
Baidu, Inc., Class A* | 14,880 | 268,258 | ||||||
Baoshan Iron & Steel Co. Ltd., Class A | 9,400 | 7,268 | ||||||
BBMG Corp., Class A | 2,500 | 950 | ||||||
Beijing Capital International Airport Co. Ltd., Class H* | 11,410 | 7,181 | ||||||
Beijing Easpring Material Technology Co. Ltd., Class A | 200 | 2,281 | ||||||
Number | Value | |||||||
| China (Continued) | ||||||||
BYD Co. Ltd., Class A | 657 | $ | 27,446 | |||||
BYD Co. Ltd., Class H | 5,567 | 171,787 | ||||||
By-health Co. Ltd., Class A | 300 | 812 | ||||||
CanSino Biologics, Inc., Class A | 26 | 474 | ||||||
CanSino Biologics, Inc., Class H, 144A | 334 | 2,096 | ||||||
CECEP Solar Energy Co. Ltd., Class A* | 3,400 | 3,985 | ||||||
Chengxin Lithium Group Co. Ltd., Class A | 300 | 2,314 | ||||||
China Baoan Group Co. Ltd., Class A | 2,000 | 4,282 | ||||||
China Communications Services Corp. Ltd., Class H | 14,512 | 6,231 | ||||||
China Conch Venture Holdings Ltd. | 11,502 | 23,535 | ||||||
China Construction Bank Corp., Class H | 646,551 | 401,167 | ||||||
China Eastern Airlines Corp. Ltd., Class A* | 4,800 | 3,419 | ||||||
China Feihe Ltd., 144A* | 24,846 | 20,608 | ||||||
China Jushi Co. Ltd., Class A | 1,028 | 2,149 | ||||||
China Lesso Group Holdings Ltd. | 8,459 | 10,088 | ||||||
China Medical System Holdings Ltd. | 9,010 | 13,362 | ||||||
China Merchants Bank Co. Ltd., Class A | 8,200 | 41,693 | ||||||
China Merchants Bank Co. Ltd., Class H | 26,250 | 134,781 | ||||||
China Resources Mixc Lifestyle Services Ltd., 144A | 4,724 | 21,487 | ||||||
China Resources Sanjiu Medical & Pharmaceutical Co. Ltd., Class A | 400 | 2,291 | ||||||
China Southern Airlines Co. Ltd., Class A* | 3,674 | 3,432 | ||||||
China Southern Airlines Co. Ltd., Class H* | 11,673 | 6,321 | ||||||
China Suntien Green Energy Corp. Ltd., Class H | 10,166 | 4,572 | ||||||
China Three Gorges Renewables Group Co. Ltd., Class A | 11,638 | 10,298 | ||||||
China Vanke Co. Ltd., Class A | 3,479 | 8,393 | ||||||
China Vanke Co. Ltd., Class H | 11,501 | 22,507 | ||||||
CIFI Holdings Group Co. Ltd. (a) | 24,957 | 6,359 | ||||||
CITIC Ltd. | 40,325 | 41,667 | ||||||
CMOC Group Ltd., Class A | 7,024 | 5,013 | ||||||
CMOC Group Ltd., Class H | 23,186 | 10,398 | ||||||
Contemporary Amperex Technology Co. Ltd., Class A* | 953 | 66,772 | ||||||
Country Garden Services Holdings Co. Ltd. | 14,362 | 28,472 | ||||||
CSPC Pharmaceutical Group Ltd. | 58,811 | 59,869 | ||||||
Dali Foods Group Co. Ltd., 144A | 14,303 | 6,542 | ||||||
ENN Energy Holdings Ltd. | 5,474 | 79,786 | ||||||
ENN Natural Gas Co. Ltd., Class A | 800 | 2,384 | ||||||
Eve Energy Co. Ltd., Class A | 694 | 9,563 | ||||||
Fosun International Ltd. | 17,779 | 13,115 | ||||||
Ganfeng Lithium Co. Ltd., Class A | 630 | 7,832 | ||||||
Ganfeng Lithium Co. Ltd., Class H, 144A | 2,530 | 22,354 | ||||||
GEM Co. Ltd., Class A | 1,200 | 1,454 | ||||||
Genscript Biotech Corp.* | 8,042 | 26,076 | ||||||
Gotion High-tech Co. Ltd., Class A | 500 | 2,492 | ||||||
Greentown Service Group Co. Ltd. | 8,956 | 6,504 | ||||||
Guangzhou Baiyunshan Pharmaceutical Holdings Co. Ltd., Class A | 300 | 1,184 | ||||||
Guangzhou Kingmed Diagnostics Group Co. Ltd., Class A | 200 | 1,934 | ||||||
| See Notes to Financial Statements. | 46 |
DBX ETF Trust
Schedule of Investments
Xtrackers MSCI Emerging Markets ESG Leaders Equity ETF (Continued)
August 31, 2022
Number | Value | |||||||
| China (Continued) | ||||||||
Hansoh Pharmaceutical Group Co. Ltd., 144A | 8,369 | $ | 16,740 | |||||
Henan Shuanghui Investment & Development Co. Ltd., Class A | 1,500 | 5,834 | ||||||
Huadong Medicine Co. Ltd., Class A | 600 | 3,670 | ||||||
Huatai Securities Co. Ltd., Class A | 4,200 | 8,006 | ||||||
Huatai Securities Co. Ltd., Class H, 144A | 7,940 | 10,642 | ||||||
Inner Mongolia Yili Industrial Group Co. Ltd., Class A | 2,404 | 12,464 | ||||||
Jafron Biomedical Co. Ltd., Class A | 200 | 1,362 | ||||||
Jiangsu Eastern Shenghong Co. Ltd., Class A | 1,600 | 4,470 | ||||||
Jiangsu Zhongtian Technology Co. Ltd., Class A | 1,100 | 3,552 | ||||||
Jinke Properties Group Co. Ltd., Class A* | 1,400 | 508 | ||||||
Jinxin Fertility Group Ltd., 144A | 8,531 | 5,576 | ||||||
Jonjee Hi-Tech Industrial And Commercial Holding Co. Ltd., Class A | 800 | 3,992 | ||||||
Kingdee International Software Group Co. Ltd.* | 18,044 | 35,220 | ||||||
Kingfa Sci & Tech Co. Ltd., Class A | 2,600 | 4,055 | ||||||
Lenovo Group Ltd. | 49,138 | 40,693 | ||||||
Li Auto, Inc., ADR* | 3,727 | 107,226 | ||||||
Logan Group Co. Ltd. (a) | 7,124 | 781 | ||||||
Longfor Group Holdings Ltd., 144A | 12,662 | 41,299 | ||||||
Meituan, Class B, 144A* | 29,530 | 714,091 | ||||||
Microport Scientific Corp.* | 4,479 | 8,971 | ||||||
Ming Yang Smart Energy Group Ltd., Class A | 600 | 2,335 | ||||||
NetEase, Inc. | 13,965 | 252,296 | ||||||
Orient Securities Co. Ltd., Class A | 3,500 | 4,397 | ||||||
Ovctek China, Inc., Class A | 340 | 2,106 | ||||||
Pharmaron Beijing Co. Ltd., Class A | 300 | 2,961 | ||||||
Pharmaron Beijing Co. Ltd., Class H, 144A | 1,282 | 8,518 | ||||||
Ping An Healthcare and Technology Co. Ltd., 144A* | 3,757 | 10,243 | ||||||
Pop Mart International Group Ltd., 144A | 3,903 | 10,169 | ||||||
Postal Savings Bank of China Co. Ltd., Class A | 15,300 | 10,010 | ||||||
Postal Savings Bank of China Co. Ltd., Class H, 144A (a) | 49,813 | 29,829 | ||||||
SF Holding Co. Ltd., Class A | 2,000 | 14,341 | ||||||
Shandong Weigao Group Medical Polymer Co. Ltd., Class H | 18,251 | 24,881 | ||||||
Shanghai Construction Group Co. Ltd., Class A | 3,400 | 1,337 | ||||||
Shanghai Electric Group Co. Ltd., Class A* | 4,200 | 2,583 | ||||||
Shanghai Fosun Pharmaceutical Group Co. Ltd., Class A | 524 | 3,068 | ||||||
Shanghai Fosun Pharmaceutical Group Co. Ltd., Class H | 3,455 | 11,159 | ||||||
Shanghai M&G Stationery, Inc., Class A | 200 | 1,288 | ||||||
Shanghai Pharmaceuticals Holding Co. Ltd., Class A | 2,100 | 5,264 | ||||||
Shanghai Pharmaceuticals Holding Co. Ltd., Class H | 4,605 | 6,712 | ||||||
Number | Value | |||||||
| China (Continued) | ||||||||
Shanghai Putailai New Energy Technology Co. Ltd., Class A | 400 | $ | 3,678 | |||||
Shenzhen Inovance Technology Co. Ltd., Class A | 944 | 8,212 | ||||||
Shenzhen Mindray Bio-Medical Electronics Co. Ltd., Class A | 500 | 21,651 | ||||||
Sinopharm Group Co. Ltd., Class H | 9,431 | 21,004 | ||||||
Sinotrans Ltd., Class A | 1,400 | 766 | ||||||
Sinotruk Hong Kong Ltd. | 4,169 | 4,180 | ||||||
Skshu Paint Co. Ltd., Class A* | 140 | 1,893 | ||||||
Sungrow Power Supply Co. Ltd., Class A | 538 | 8,694 | ||||||
Suzhou TA&A Ultra Clean Technology Co. Ltd., Class A | 200 | 2,263 | ||||||
Tencent Holdings Ltd. | 42,205 | 1,759,427 | ||||||
Tongcheng Travel Holdings Ltd.* | 8,075 | 16,646 | ||||||
Topchoice Medical Corp., Class A* | 100 | 1,688 | ||||||
Uni-President China Holdings Ltd. | 9,012 | 7,773 | ||||||
Unisplendour Corp. Ltd., Class A | 1,040 | 2,610 | ||||||
Vipshop Holdings Ltd., ADR* | 3,102 | 36,014 | ||||||
Want Want China Holdings Ltd. | 33,007 | 23,298 | ||||||
WuXi AppTec Co. Ltd., Class A | 994 | 12,927 | ||||||
WuXi AppTec Co. Ltd., Class H, 144A | 2,500 | 28,460 | ||||||
Wuxi Biologics Cayman, Inc., 144A* | 24,325 | 216,013 | ||||||
Xinjiang Goldwind Science & Technology Co. Ltd., Class A | 1,700 | 3,164 | ||||||
Xinjiang Goldwind Science & Technology Co. Ltd., Class H | 4,510 | 6,746 | ||||||
Xinyi Solar Holdings Ltd. | 33,919 | 46,845 | ||||||
XPeng, Inc., ADR* | 2,768 | 51,263 | ||||||
Yadea Group Holdings Ltd., 144A | 7,646 | 14,632 | ||||||
Yihai International Holding Ltd.* | 2,841 | 7,174 | ||||||
Yum China Holdings, Inc. | 2,873 | 143,966 | ||||||
Yunnan Baiyao Group Co. Ltd., Class A | 490 | 3,722 | ||||||
Yunnan Energy New Material Co. Ltd., Class A | 300 | 8,399 | ||||||
Zhejiang Chint Electrics Co. Ltd., Class A | 612 | 2,808 | ||||||
Zhejiang Expressway Co. Ltd., Class H | 4,092 | 3,118 | ||||||
Zhejiang Huayou Cobalt Co. Ltd., Class A | 669 | 7,253 | ||||||
Zhejiang Jiuzhou Pharmaceutical Co. Ltd., Class A | 300 | 1,786 | ||||||
Zhejiang Weixing New Building Materials Co. Ltd., Class A | 300 | 908 | ||||||
Zoomlion Heavy Industry Science and Technology Co. Ltd., Class A | 3,800 | 3,181 | ||||||
Zoomlion Heavy Industry Science and Technology Co. Ltd., Class H | 8,722 | 3,945 | ||||||
|
| |||||||
(Cost $9,039,524) | 6,848,661 | |||||||
|
| |||||||
| Colombia — 0.1% | ||||||||
Bancolombia SA | 1,715 | 13,260 | ||||||
Interconexion Electrica SA ESP | 3,235 | 14,020 | ||||||
|
| |||||||
(Cost $37,461) | 27,280 | |||||||
|
| |||||||
| Cyprus — 0.0% | ||||||||
Polymetal International PLC (b) (Cost $40,174) | 2,070 | 0 | ||||||
|
| |||||||
| See Notes to Financial Statements. | 47 |
DBX ETF Trust
Schedule of Investments
Xtrackers MSCI Emerging Markets ESG Leaders Equity ETF (Continued)
August 31, 2022
Number | Value | |||||||
| Czech Republic — 0.1% | ||||||||
Komercni Banka AS | 530 | $ | 12,493 | |||||
Moneta Money Bank AS, 144A | 2,669 | 8,465 | ||||||
|
| |||||||
(Cost $27,033) | 20,958 | |||||||
|
| |||||||
| Egypt — 0.1% | ||||||||
Commercial International Bank Egypt SAE | ||||||||
(Cost $26,671) | 11,257 | 22,356 | ||||||
|
| |||||||
| Greece — 0.2% | ||||||||
Alpha Services and Holdings SA* | 13,105 | 12,179 | ||||||
Eurobank Ergasias Services and Holdings SA* | 18,123 | 16,948 | ||||||
Mytilineos SA | 669 | 10,508 | ||||||
Public Power Corp. SA* | 1,442 | 7,547 | ||||||
|
| |||||||
(Cost $52,859) | 47,182 | |||||||
|
| |||||||
| Hong Kong — 1.7% | ||||||||
Alibaba Health Information Technology Ltd.* | 26,938 | 15,616 | ||||||
Beijing Enterprises Water Group Ltd. | 26,028 | 6,699 | ||||||
China Everbright Environment Group Ltd. | 27,807 | 13,781 | ||||||
China Gas Holdings Ltd. | 21,160 | 30,033 | ||||||
China Mengniu Dairy Co. Ltd.* | 21,047 | 95,597 | ||||||
China Overseas Land & Investment Ltd. | 25,305 | 68,350 | ||||||
China Resources Cement Holdings Ltd. | 15,951 | 9,856 | ||||||
China Resources Gas Group Ltd. | 6,368 | 24,867 | ||||||
China Ruyi Holdings Ltd.* | 27,897 | 7,109 | ||||||
Far East Horizon Ltd. | 9,292 | 7,044 | ||||||
Hopson Development Holdings Ltd. | 4,456 | 6,131 | ||||||
Kunlun Energy Co. Ltd. | 26,668 | 23,274 | ||||||
Shenzhen International Holdings Ltd. | 8,077 | 6,977 | ||||||
Shimao Group Holdings Ltd. (a)(b) | 7,398 | 0 | ||||||
Sino Biopharmaceutical Ltd. | 72,524 | 38,254 | ||||||
Vinda International Holdings Ltd. | 1,423 | 3,980 | ||||||
Wharf Holdings Ltd. | 8,522 | 32,139 | ||||||
|
| |||||||
(Cost $537,655) | 389,707 | |||||||
|
| |||||||
| Hungary — 0.2% | ||||||||
MOL Hungarian Oil & Gas PLC | 2,896 | 19,917 | ||||||
OTP Bank Nyrt | 1,514 | 32,154 | ||||||
|
| |||||||
(Cost $87,062) | 52,071 | |||||||
|
| |||||||
| India — 12.6% | ||||||||
Adani Green Energy Ltd.* | 1,902 | 58,316 | ||||||
Adani Total Gas Ltd. | 1,705 | 80,359 | ||||||
Asian Paints Ltd. | 2,286 | 97,576 | ||||||
Axis Bank Ltd. | 13,816 | 130,669 | ||||||
Berger Paints India Ltd. | 1,452 | 12,311 | ||||||
Britannia Industries Ltd. | 659 | 31,083 | ||||||
Colgate-Palmolive India Ltd. | 743 | 15,662 | ||||||
Dabur India Ltd. | 3,761 | 27,624 | ||||||
Eicher Motors Ltd. | 847 | 35,803 | ||||||
GAIL India Ltd. | 7,891 | 13,516 | ||||||
Grasim Industries Ltd. | 1,651 | 34,879 | ||||||
Havells India Ltd. | 1,634 | 28,615 | ||||||
HCL Technologies Ltd. | 6,386 | 75,463 | ||||||
Hero MotoCorp Ltd. | 668 | 23,856 | ||||||
Hindalco Industries Ltd. | 8,026 | 44,343 | ||||||
Number | Value | |||||||
| India (Continued) | ||||||||
Hindustan Unilever Ltd. | 5,000 | $ | 167,374 | |||||
Housing Development Finance Corp. Ltd. | 10,472 | 322,418 | ||||||
ICICI Prudential Life Insurance Co. Ltd., 144A | 1,856 | 13,889 | ||||||
Indraprastha Gas Ltd. | 1,856 | 9,789 | ||||||
Info Edge India Ltd. | 431 | 23,565 | ||||||
Infosys Ltd. | 9,953 | 187,008 | ||||||
Infosys Ltd., ADR | 11,851 | 216,873 | ||||||
Kotak Mahindra Bank Ltd. | 3,468 | 83,601 | ||||||
Lupin Ltd. | 934 | 7,865 | ||||||
Mahindra & Mahindra Ltd. | 5,179 | 85,300 | ||||||
Marico Ltd. | 3,203 | 21,187 | ||||||
Nestle India Ltd. | 213 | 53,414 | ||||||
PI Industries Ltd. | 428 | 18,509 | ||||||
Piramal Pharma Ltd.* (b) | 2,760 | 7,611 | ||||||
Reliance Industries Ltd. | 18,341 | 608,907 | ||||||
Shree Cement Ltd. | 70 | 19,446 | ||||||
Shriram Transport Finance Co. Ltd. | 1,067 | 18,191 | ||||||
Siemens Ltd. | 422 | 15,315 | ||||||
State Bank of India | 10,518 | 70,322 | ||||||
Tata Consultancy Services Ltd. | 5,517 | 222,959 | ||||||
UPL Ltd. | 3,018 | 29,218 | ||||||
Zomato Ltd.* | 14,261 | 10,401 | ||||||
|
| |||||||
(Cost $2,513,181) | 2,923,237 | |||||||
|
| |||||||
| Indonesia — 1.9% | ||||||||
Aneka Tambang Tbk | 57,998 | 7,776 | ||||||
PT Bank Central Asia Tbk | 371,990 | 205,512 | ||||||
PT Bank Negara Indonesia Persero Tbk | 49,925 | 28,675 | ||||||
PT Barito Pacific Tbk | 182,178 | 10,065 | ||||||
PT Indah Kiat Pulp & Paper Tbk | 18,998 | 10,656 | ||||||
PT Kalbe Farma Tbk | 153,108 | 17,330 | ||||||
PT Merdeka Copper Gold Tbk* | 84,325 | 24,316 | ||||||
PT Telkom Indonesia Persero Tbk | 329,926 | 101,362 | ||||||
PT Tower Bersama Infrastructure Tbk | 33,080 | 6,285 | ||||||
PT Unilever Indonesia Tbk | 54,803 | 16,948 | ||||||
|
| |||||||
(Cost $398,127) | 428,925 | |||||||
|
| |||||||
| Kuwait — 0.4% | ||||||||
Kuwait Finance House KSCP (Cost $86,084) | 35,085 | 102,538 | ||||||
|
| |||||||
| Malaysia — 1.9% | ||||||||
AMMB Holdings Bhd | 11,700 | 10,927 | ||||||
Axiata Group Bhd | 16,983 | 11,536 | ||||||
CIMB Group Holdings Bhd | 41,950 | 50,334 | ||||||
DiGi.Com Bhd | 20,100 | 16,842 | ||||||
HAP Seng Consolidated Bhd | 4,500 | 6,988 | ||||||
Hartalega Holdings Bhd | 11,800 | 4,377 | ||||||
IHH Healthcare Bhd | 10,500 | 14,546 | ||||||
Kuala Lumpur Kepong Bhd | 2,700 | 13,960 | ||||||
Malayan Banking Bhd | 29,775 | 59,676 | ||||||
Malaysia Airports Holdings Bhd* | 1,900 | 2,492 | ||||||
Maxis Bhd | 13,800 | 11,871 | ||||||
MISC Bhd | 8,200 | 13,009 | ||||||
Nestle Malaysia Bhd | 500 | 14,859 | ||||||
Petronas Dagangan Bhd | 1,700 | 8,926 | ||||||
Petronas Gas Bhd | 4,100 | 15,885 | ||||||
| See Notes to Financial Statements. | 48 |
DBX ETF Trust
Schedule of Investments
Xtrackers MSCI Emerging Markets ESG Leaders Equity ETF (Continued)
August 31, 2022
Number | Value | |||||||
| Malaysia (Continued) | ||||||||
PPB Group Bhd | 3,900 | $ | 15,337 | |||||
Press Metal Aluminium Holdings Bhd | 20,600 | 22,002 | ||||||
Public Bank Bhd | 88,475 | 93,111 | ||||||
QL Resources Bhd | 6,400 | 7,293 | ||||||
RHB Bank Bhd | 8,843 | 11,341 | ||||||
Sime Darby Bhd | 16,200 | 8,289 | ||||||
Telekom Malaysia Bhd | 6,900 | 9,204 | ||||||
Top Glove Corp. Bhd | 32,400 | 5,828 | ||||||
|
| |||||||
(Cost $447,287) | 428,633 | |||||||
|
| |||||||
| Mexico — 1.6% | ||||||||
Arca Continental SAB de CV | 3,070 | 20,935 | ||||||
Cemex SAB de CV, Series CPO* | 103,105 | 38,295 | ||||||
Coca-Cola Femsa SAB de CV | 3,768 | 23,078 | ||||||
Fomento Economico Mexicano SAB de CV | 12,617 | 79,214 | ||||||
Gruma SAB de CV, Class B | 1,626 | 17,748 | ||||||
Grupo Aeroportuario del Sureste SAB de CV, Class B | 1,170 | 24,824 | ||||||
Grupo Bimbo SAB de CV, Series A | 8,611 | 28,352 | ||||||
Grupo Financiero Banorte SAB de CV, Class O | 17,174 | 101,599 | ||||||
Grupo Televisa SAB, Series CPO | 16,229 | 20,488 | ||||||
Industrias Penoles SAB de CV | 960 | 7,904 | ||||||
Kimberly-Clark de Mexico SAB de CV, Class A | 11,002 | 14,929 | ||||||
|
| |||||||
(Cost $435,235) | 377,366 | |||||||
|
| |||||||
| Peru — 0.3% | ||||||||
Credicorp Ltd. (Cost $66,159) | 487 | 62,769 | ||||||
|
| |||||||
| Philippines — 0.6% | ||||||||
Globe Telecom, Inc. | 165 | 6,164 | ||||||
GT Capital Holdings, Inc. | 490 | 4,206 | ||||||
JG Summit Holdings, Inc. | 21,320 | 19,439 | ||||||
Monde Nissin Corp., 144A* | 41,800 | 12,282 | ||||||
SM Investments Corp. | 1,472 | 21,783 | ||||||
SM Prime Holdings, Inc. | 76,900 | 51,833 | ||||||
Universal Robina Corp. | 6,700 | 14,556 | ||||||
|
| |||||||
(Cost $144,021) | 130,263 | |||||||
|
| |||||||
| Poland — 0.7% | ||||||||
Bank Polska Kasa Opieki SA | 1,260 | 17,507 | ||||||
CD Projekt SA | 489 | 8,766 | ||||||
KGHM Polska Miedz SA | 962 | 18,143 | ||||||
Polski Koncern Naftowy ORLEN SA | 2,749 | 35,724 | ||||||
Polskie Gornictwo Naftowe i Gazownictwo SA* | 11,785 | 14,039 | ||||||
Powszechna Kasa Oszczednosci Bank Polski SA | 6,043 | 30,289 | ||||||
Powszechny Zaklad Ubezpieczen SA | 4,074 | 24,449 | ||||||
Santander Bank Polska SA | 258 | 11,777 | ||||||
|
| |||||||
(Cost $262,527) | 160,694 | |||||||
|
| |||||||
| Qatar — 1.1% | ||||||||
Commercial Bank PSQC | 21,282 | 42,836 | ||||||
Qatar Fuel QSC | 3,263 | 17,033 | ||||||
Number | Value | |||||||
| Qatar (Continued) | ||||||||
Qatar Gas Transport Co. Ltd. | 17,752 | $ | 19,498 | |||||
Qatar National Bank QPSC | 31,062 | 176,047 | ||||||
|
| |||||||
(Cost $231,616) | 255,414 | |||||||
|
| |||||||
| Romania — 0.1% | ||||||||
NEPI Rockcastle S.A. (Cost $19,919) | 2,953 | 15,721 | ||||||
|
| |||||||
| Russia — 0.0% | ||||||||
Gazprom PJSC* (b) | 68,905 | 0 | ||||||
LUKOIL PJSC (b) | 2,409 | 0 | ||||||
Mobile TeleSystems PJSC, ADR (b) | 2,662 | 0 | ||||||
Moscow Exchange MICEX-RTS PJSC* (b) | 8,602 | 0 | ||||||
Novatek PJSC, GDR (b) | 530 | 0 | ||||||
Novolipetsk Steel PJSC (b) | 8,462 | 0 | ||||||
PhosAgro PJSC, GDR (b) | 804 | 0 | ||||||
PhosAgro PJSC, GDR* (b) | 4 | 0 | ||||||
Polyus PJSC (b) | 193 | 0 | ||||||
|
| |||||||
(Cost $644,209) | 0 | |||||||
|
| |||||||
| Saudi Arabia — 2.0% | ||||||||
ACWA Power Co. | 488 | 22,719 | ||||||
Bank AlBilad* | 3,216 | 43,290 | ||||||
Dr Sulaiman Al Habib Medical Services Group Co. | 621 | 33,041 | ||||||
Saudi Arabian Oil Co., 144A | 16,440 | 164,006 | ||||||
Saudi Basic Industries Corp. | 6,027 | 160,656 | ||||||
Saudi Electricity Co. | 4,926 | 33,089 | ||||||
|
| |||||||
(Cost $463,810) | 456,801 | |||||||
|
| |||||||
| Singapore — 0.0% | ||||||||
BOC Aviation Ltd., 144A (Cost $10,636) | 1,317 | 10,579 | ||||||
|
| |||||||
| South Africa — 5.5% | ||||||||
Absa Group Ltd. | 5,567 | 58,144 | ||||||
Anglo American Platinum Ltd. | 378 | 26,585 | ||||||
Aspen Pharmacare Holdings Ltd. | 2,731 | 23,634 | ||||||
Bid Corp. Ltd. | 2,311 | 44,073 | ||||||
Bidvest Group Ltd. | 1,915 | 24,150 | ||||||
Capitec Bank Holdings Ltd. | 566 | 67,861 | ||||||
Clicks Group Ltd. | 1,698 | 29,689 | ||||||
Discovery Ltd.* | 3,014 | 21,722 | ||||||
FirstRand Ltd. | 33,726 | 126,974 | ||||||
Gold Fields Ltd. | 6,170 | 50,220 | ||||||
Growthpoint Properties Ltd. REIT | 19,266 | 14,401 | ||||||
Impala Platinum Holdings Ltd. | 5,657 | 59,868 | ||||||
Kumba Iron Ore Ltd. (a) | 452 | 10,091 | ||||||
Mr Price Group Ltd. | 1,587 | 17,339 | ||||||
MTN Group Ltd. | 11,666 | 85,043 | ||||||
MultiChoice Group | 2,612 | 17,717 | ||||||
Naspers Ltd., Class N | 1,470 | 209,211 | ||||||
Nedbank Group Ltd. (a) | 3,128 | 37,218 | ||||||
Northam Platinum Holdings Ltd.* | 2,481 | 23,464 | ||||||
Old Mutual Ltd. | 32,121 | 19,166 | ||||||
Remgro Ltd. | 3,563 | 26,624 | ||||||
Sanlam Ltd. | 11,249 | 35,190 | ||||||
Sasol Ltd.* | 3,866 | 75,265 | ||||||
Shoprite Holdings Ltd. | 3,493 | 47,693 | ||||||
| See Notes to Financial Statements. | 49 |
DBX ETF Trust
Schedule of Investments
Xtrackers MSCI Emerging Markets ESG Leaders Equity ETF (Continued)
August 31, 2022
Number | Value | |||||||
| South Africa (Continued) | ||||||||
SPAR Group Ltd. | 1,273 | $ | 11,694 | |||||
Standard Bank Group Ltd. | 9,206 | 82,762 | ||||||
Vodacom Group Ltd. | 4,291 | 31,759 | ||||||
|
| |||||||
(Cost $1,435,168) | 1,277,557 | |||||||
|
| |||||||
| South Korea — 6.9% | ||||||||
Amorepacific Corp. | 182 | 16,737 | ||||||
AMOREPACIFIC Group | 145 | 3,783 | ||||||
BGF retail Co. Ltd. | 49 | 5,880 | ||||||
Celltrion Healthcare Co. Ltd. | 591 | 31,858 | ||||||
CJ CheilJedang Corp. | 58 | 17,670 | ||||||
CJ Corp. | 82 | 4,794 | ||||||
CJ Logistics Corp.* | 41 | 3,632 | ||||||
Coway Co. Ltd. | 371 | 17,669 | ||||||
Doosan Bobcat, Inc. | 283 | 7,342 | ||||||
GS Engineering & Construction Corp. | 387 | 8,723 | ||||||
Hana Financial Group, Inc. | 2,005 | 58,836 | ||||||
Hanwha Solutions Corp.* | 810 | 31,854 | ||||||
HMM Co. Ltd. | 1,845 | 30,691 | ||||||
Hyundai Engineering & Construction Co. Ltd. | 548 | 19,748 | ||||||
Hyundai Glovis Co. Ltd. | 130 | 17,155 | ||||||
Kakao Corp. | 2,088 | 114,582 | ||||||
KB Financial Group, Inc. | 2,623 | 96,974 | ||||||
Korea Zinc Co. Ltd. | 60 | 30,145 | ||||||
Korean Air Lines Co. Ltd.* | 1,203 | 24,149 | ||||||
LG Chem Ltd. | 329 | 155,454 | ||||||
LG Corp. | 654 | 40,094 | ||||||
LG Display Co. Ltd. | 1,582 | 18,451 | ||||||
LG Electronics, Inc. | 737 | 55,652 | ||||||
LG H&H Co. Ltd. | 61 | 32,471 | ||||||
Lotte Chemical Corp. | 117 | 15,308 | ||||||
NAVER Corp. | 895 | 160,592 | ||||||
NCSoft Corp. | 113 | 31,977 | ||||||
Netmarble Corp., 144A | 95 | 4,510 | ||||||
POSCO Chemical Co. Ltd. | 177 | 22,232 | ||||||
S-1 Corp. | 104 | 4,525 | ||||||
Samsung Engineering Co. Ltd.* | 1,060 | 18,584 | ||||||
Samsung Life Insurance Co. Ltd. | 562 | 26,051 | ||||||
Samsung SDI Co. Ltd. | 370 | 165,422 | ||||||
Samsung SDS Co. Ltd. | 241 | 23,153 | ||||||
Samsung Securities Co. Ltd. | 431 | 10,924 | ||||||
Shinhan Financial Group Co. Ltd. | 3,016 | 82,528 | ||||||
SK Biopharmaceuticals Co. Ltd.* | 191 | 10,224 | ||||||
SK Chemicals Co. Ltd. | 68 | 4,972 | ||||||
SK IE Technology Co. Ltd., 144A* | 182 | 11,321 | ||||||
SK Innovation Co. Ltd.* | 379 | 53,837 | ||||||
SK, Inc. | 251 | 43,724 | ||||||
SKC Co. Ltd. | 148 | 13,444 | ||||||
Woori Financial Group, Inc. | 3,488 | 31,815 | ||||||
Yuhan Corp. | 357 | 15,160 | ||||||
|
| |||||||
(Cost $1,948,444) | 1,594,647 | |||||||
|
| |||||||
| Taiwan — 20.4% | ||||||||
Acer, Inc. | 19,849 | 14,347 | ||||||
AUO Corp. | 57,387 | 31,580 | ||||||
Cathay Financial Holding Co. Ltd. | 53,605 | 78,459 | ||||||
Number | Value | |||||||
| Taiwan (Continued) | ||||||||
Chailease Holding Co. Ltd. | 9,614 | $ | 62,224 | |||||
China Airlines Ltd. | 19,018 | 14,246 | ||||||
China Steel Corp. | 81,348 | 77,372 | ||||||
Chunghwa Telecom Co. Ltd. | 25,389 | 100,930 | ||||||
CTBC Financial Holding Co. Ltd. | 117,963 | 91,076 | ||||||
Delta Electronics, Inc. | 13,007 | 112,389 | ||||||
E.Sun Financial Holding Co. Ltd. | 87,881 | 81,421 | ||||||
Eva Airways Corp. | 17,898 | 19,846 | ||||||
Evergreen Marine Corp. Taiwan Ltd. | 18,068 | 52,416 | ||||||
Far Eastern New Century Corp. | 19,040 | 20,487 | ||||||
Far EasTone Telecommunications Co. Ltd. | 10,233 | 25,148 | ||||||
First Financial Holding Co. Ltd. | 68,572 | 59,814 | ||||||
Fubon Financial Holding Co. Ltd. | 48,113 | 90,733 | ||||||
Hotai Motor Co. Ltd. | 1,899 | 38,308 | ||||||
Hua Nan Financial Holdings Co. Ltd. | 61,573 | 47,033 | ||||||
MediaTek, Inc. | 10,285 | 225,383 | ||||||
Mega Financial Holding Co. Ltd. | 73,523 | 86,718 | ||||||
momo.com, Inc. | 383 | 9,186 | ||||||
Nan Ya Plastics Corp. | 32,594 | 73,567 | ||||||
President Chain Store Corp. | 3,988 | 35,114 | ||||||
Shanghai Commercial & Savings Bank Ltd. | 24,544 | 40,157 | ||||||
SinoPac Financial Holdings Co. Ltd. | 70,102 | 39,960 | ||||||
Taishin Financial Holding Co. Ltd. | 71,840 | 35,876 | ||||||
Taiwan Cement Corp. | 38,278 | 49,423 | ||||||
Taiwan Cooperative Financial Holding Co. Ltd. | 66,830 | 60,710 | ||||||
Taiwan High Speed Rail Corp. | 15,039 | 14,428 | ||||||
Taiwan Mobile Co. Ltd. | 12,687 | 41,515 | ||||||
Taiwan Semiconductor Manufacturing Co. Ltd. | 166,192 | 2,757,354 | ||||||
Uni-President Enterprises Corp. | 33,242 | 72,081 | ||||||
United Microelectronics Corp.* | 81,295 | 109,773 | ||||||
Voltronic Power Technology Corp. | 385 | 21,946 | ||||||
Wan Hai Lines Ltd. | 4,995 | 14,244 | ||||||
Yang Ming Marine Transport Corp. | 12,703 | 32,929 | ||||||
|
| |||||||
(Cost $4,365,217) | 4,738,193 | |||||||
|
| |||||||
| Thailand — 2.6% | ||||||||
Advanced Info Service PCL, NVDR | 8,100 | 42,652 | ||||||
Airports of Thailand PCL, NVDR* | 30,000 | 59,856 | ||||||
Asset World Corp. PCL, NVDR | 65,800 | 10,106 | ||||||
B Grimm Power PCL, NVDR | 5,600 | 5,682 | ||||||
Bangkok Dusit Medical Services PCL, NVDR | 70,600 | 56,635 | ||||||
Berli Jucker PCL, NVDR | 9,600 | 8,820 | ||||||
BTS Group Holdings PCL, NVDR | 58,400 | 13,454 | ||||||
Bumrungrad Hospital PCL, NVDR | 3,700 | 21,918 | ||||||
Central Pattana PCL, NVDR | 13,500 | 25,639 | ||||||
Charoen Pokphand Foods PCL, NVDR | 21,300 | 15,188 | ||||||
CP ALL PCL, NVDR | 39,900 | 67,298 | ||||||
Energy Absolute PCL, NVDR | 10,000 | 23,380 | ||||||
Home Product Center PCL, NVDR | 39,800 | 15,172 | ||||||
Indorama Ventures PCL, NVDR | 11,300 | 13,403 | ||||||
Intouch Holdings PCL, NVDR | 7,700 | 15,363 | ||||||
Krungthai Card PCL | 400 | 661 | ||||||
| See Notes to Financial Statements. | 50 |
DBX ETF Trust
Schedule of Investments
Xtrackers MSCI Emerging Markets ESG Leaders Equity ETF (Continued)
August 31, 2022
Number | Value | |||||||
| Thailand (Continued) | ||||||||
Krungthai Card PCL, NVDR | 5,500 | $ | 9,088 | |||||
Minor International PCL, NVDR* | 22,554 | 20,258 | ||||||
Osotspa PCL | 2,400 | 2,057 | ||||||
Osotspa PCL, NVDR | 5,600 | 4,799 | ||||||
PTT Exploration & Production PCL, NVDR | 9,100 | 42,053 | ||||||
PTT Global Chemical PCL, NVDR | 15,400 | 20,062 | ||||||
PTT Oil & Retail Business PCL, NVDR | 18,200 | 13,602 | ||||||
SCB X PCL, NVDR | 5,700 | 17,274 | ||||||
SCG Packaging PCL | 400 | 623 | ||||||
SCG Packaging PCL, NVDR | 10,000 | 15,564 | ||||||
Siam Cement PCL, NVDR | 5,500 | 54,001 | ||||||
Thai Union Group PCL, NVDR | 18,700 | 8,975 | ||||||
True Corp. PCL, NVDR | 79,200 | 9,905 | ||||||
|
| |||||||
(Cost $643,348) | 613,488 | |||||||
|
| |||||||
| Turkey — 0.3% | ||||||||
KOC Holding AS | 5,449 | 13,663 | ||||||
Turk Hava Yollari AO* | 3,500 | 14,062 | ||||||
Turkiye Is Bankasi AS, Class C | 20,927 | 9,110 | ||||||
Turkiye Petrol Rafinerileri AS* | 930 | 18,365 | ||||||
Turkiye Sise ve Cam Fabrikalari AS | 9,472 | 12,900 | ||||||
|
| |||||||
(Cost $59,890) | 68,100 | |||||||
|
| |||||||
| United Arab Emirates — 2.0% | ||||||||
Abu Dhabi Commercial Bank PJSC | 19,166 | 47,327 | ||||||
Abu Dhabi Islamic Bank PJSC | 9,714 | 23,405 | ||||||
Aldar Properties PJSC | 24,519 | 32,175 | ||||||
Emirates NBD Bank PJSC | 12,976 | 47,162 | ||||||
Emirates Telecommunications Group Co. PJSC | 23,671 | 165,753 | ||||||
First Abu Dhabi Bank PJSC | 29,896 | 155,461 | ||||||
|
| |||||||
(Cost $410,875) | 471,283 | |||||||
|
| |||||||
TOTAL COMMON STOCKS | 22,226,857 | |||||||
|
| |||||||
| PREFERRED STOCKS — 2.1% | ||||||||
| Brazil — 1.5% | ||||||||
Banco Bradesco SA | 36,587 | 133,891 | ||||||
Cia Energetica de Minas Gerais | 9,940 | 23,214 | ||||||
Gerdau SA | 7,857 | 35,365 | ||||||
Itau Unibanco Holding SA | 32,480 | 161,805 | ||||||
|
| |||||||
(Cost $376,071) | 354,275 | |||||||
|
| |||||||
| Chile — 0.4% | ||||||||
Sociedad Quimica y Minera de Chile SA, Class B (Cost $58,748) | 939 | 94,260 | ||||||
|
| |||||||
Number | Value | |||||||
| Colombia — 0.1% | ||||||||
Bancolombia SA (Cost $23,543) | 3,223 | $ | 22,282 | |||||
|
| |||||||
| South Korea — 0.1% | ||||||||
LG Chem Ltd. | 56 | 12,602 | ||||||
LG H&H Co. Ltd. | 11 | 3,014 | ||||||
|
| |||||||
(Cost $20,321) | 15,616 | |||||||
|
| |||||||
TOTAL PREFERRED STOCKS | 486,433 | |||||||
|
| |||||||
| EXCHANGE TRADED FUNDS — 0.1% | ||||||||
iShares ESG Aware MSCI EM ETF (Cost $35,334) | 1,100 | 34,529 | ||||||
|
| |||||||
Principal | ||||||||
| CORPORATE BONDS — 0.0% | ||||||||
| India — 0.0% | ||||||||
Britannia Industries Ltd. Series N3, | INR | 12,383 | 152 | |||||
|
| |||||||
Number | ||||||||
| WARRANTS — 0.0% | ||||||||
| Thailand — 0.0% | ||||||||
BTS Group Holdings PCL*, | 3,050 | 20 | ||||||
BTS Group Holdings PCL*, | 6,100 | 39 | ||||||
|
| |||||||
TOTAL WARRANTS | 59 | |||||||
|
| |||||||
| SECURITIES LENDING COLLATERAL — 0.2% | ||||||||
DWS Government & Agency Securities Portfolio “DWS Government Cash Institutional Shares”, 2.00% (c)(d) | 43,257 | 43,257 | ||||||
|
| |||||||
TOTAL INVESTMENTS — 98.3% (Cost $25,767,802) | $ | 22,791,287 | ||||||
Other assets and liabilities, net — 1.7% | 383,166 | |||||||
|
| |||||||
NET ASSETS — 100.0% | $ | 23,174,453 | ||||||
|
| |||||||
| See Notes to Financial Statements. | 51 |
DBX ETF Trust
Schedule of Investments
Xtrackers MSCI Emerging Markets ESG Leaders Equity ETF (Continued)
August 31, 2022
A summary of the Fund’s transactions with affiliated investments during the year ended August 31, 2022 is as follows:
Value ($) at | Purchases Cost ($) | Sales Proceeds ($) | Net Realized Gain/(Loss) ($) | Net Change in Unrealized Appreciation (Depreciation) ($) | Income ($) | Capital Gain Distributions ($) | Number of Shares at 8/31/2022 | Value ($) at 8/31/2022 | ||||||||||||||||||||||||
SECURITIES LENDING COLLATERAL — 0.2% |
| |||||||||||||||||||||||||||||||
DWS Government & Agency Securities Portfolio “DWS Government Cash Institutional Shares”, 2.00% (c)(d) |
| |||||||||||||||||||||||||||||||
| 79,911 | — | (36,654 | )(e) | — | — | 224 | — | 43,257 | 43,257 | |||||||||||||||||||||||
CASH EQUIVALENTS — 0.0% |
| |||||||||||||||||||||||||||||||
DWS Government Money Market Series “Institutional Shares”, 2.24% (c) |
| |||||||||||||||||||||||||||||||
| 149,313 | 4,412,121 | (4,561,434 | ) | — | — | 228 | — | — | — | |||||||||||||||||||||||
|
|
|
|
|
|
|
|
|
|
|
|
|
|
|
| |||||||||||||||||
| 229,224 | 4,412,121 | (4,598,088 | ) | — | — | 452 | — | 43,257 | 43,257 | |||||||||||||||||||||||
|
|
|
|
|
|
|
|
|
|
|
|
|
|
|
| |||||||||||||||||
| * | Non-income producing security. |
| (a) | All or a portion of these securities were on loan. In addition, “Other assets and liabilities, net” may include pending sales that are also on loan. The value of securities loaned at August 31, 2022 amounted to $63,480, which is 0.3% of net assets. |
| (b) | Investment was valued using significant unobservable inputs. |
| (c) | Affiliated fund managed by DWS Investment Management Americas, Inc. The rate shown is the annualized seven-day yield at period end. |
| (d) | Represents cash collateral held in connection with securities lending. Income earned by the Fund is net of borrower rebates. In addition, the Fund held non-cash U.S. Treasury securities collateral having a value of $33,792. |
| (e) | Represents the net increase (purchase cost) or decrease (sales proceeds) in the amount invested in cash collateral for the year ended August 31, 2022. |
| ADR: | American Depositary Receipt |
| CPO: | Ordinary Participation Certificates |
| GDR: | Global Depositary Receipt |
| KSCP: | Kuwait Shareholding Company Public |
| NVDR: | Non Voting Depositary Receipt |
| PJSC: | Public Joint Stock Company |
| PSQC: | Public Shareholders Qatari Company |
| QPSC: | Qatari Public Shareholders Company |
| QSC: | Qatari Shareholders Company |
| REIT: | Real Estate Investment Trust |
| SAE: | Societe Anonyme Egyptienne |
| 144A: | Security exempt from registration under Rule 144A of the Securities Act of 1933. These securities may be resold in transactions exempt from registration, normally to qualified institutional buyers. |
Securities are listed in country of domicile.
At August 31, 2022, open futures contracts purchased were as follows:
Contract Description | Currency | Number of Contracts | Notional Amount | Contract Value | Expiration Date | Unrealized Depreciation | ||||||||||||
MSCI Emerging Markets Index Future | USD | 2 | $ | 100,625 | $ | 98,190 | 9/16/2022 | $ | (2,435 | ) | ||||||||
For information on the Fund’s policy and additional disclosures regarding open futures contracts, please refer to the Derivatives section of Note 2 in the accompanying Notes to Financial Statements.
Currency Abbreviations
| USD | U.S. Dollar |
| See Notes to Financial Statements. | 52 |
DBX ETF Trust
Schedule of Investments
Xtrackers MSCI Emerging Markets ESG Leaders Equity ETF (Continued)
August 31, 2022
Fair Value Measurements
Various inputs are used in determining the value of the Fund’s investments. These inputs are summarized in three broad levels. Level 1 includes quoted prices in active markets for identical securities. Level 2 includes other significant observable inputs (including quoted prices for similar securities, interest rates, prepayment speeds and credit risk). Level 3 includes significant unobservable inputs (including the Fund’s own assumptions in determining the fair value of investments). The level assigned to the securities valuations may not be an indication of the risk or liquidity associated with investing in those securities.
The following is a summary of the inputs used as of August 31, 2022 in valuing the Fund’s investments. For information on the Fund’s policy regarding the valuation of investments, please refer to the Security Valuation section of Note 2 in the accompanying Notes to Financial Statements.
Assets | Level 1 | Level 2 | Level 3 | Total | ||||||||||||
Common Stocks (a) | $ | 22,219,246 | $ | — | $ | 7,611 | $ | 22,226,857 | ||||||||
Preferred Stocks (a) | 486,433 | — | — | 486,433 | ||||||||||||
Exchange Traded Funds | 34,529 | — | — | 34,529 | ||||||||||||
Corporate Bonds | — | 152 | — | 152 | ||||||||||||
Warrants | 59 | — | — | 59 | ||||||||||||
Short-Term Investments (a) | 43,257 | — | — | 43,257 | ||||||||||||
|
|
|
|
|
|
|
| |||||||||
TOTAL | $ | 22,783,524 | $ | 152 | $ | 7,611 | $ | 22,791,287 | ||||||||
|
|
|
|
|
|
|
| |||||||||
Liabilities | Level 1 | Level 2 | Level 3 | Total | ||||||||||||
Derivatives (b) | ||||||||||||||||
Futures Contracts | $ | (2,435 | ) | $ | — | $ | — | $ | (2,435 | ) | ||||||
|
|
|
|
|
|
|
| |||||||||
TOTAL | $ | (2,435 | ) | $ | — | $ | — | $ | (2,435 | ) | ||||||
|
|
|
|
|
|
|
| |||||||||
| (a) | See Schedule of Investments for additional detailed categorizations. |
| (b) | Derivatives include unrealized appreciation (depreciation) on open futures contracts. |
During the year ended August 31, 2022, the amount of transfers from Level 1 to Level 3 was $741,871, and between Level 3 to Level 1 was $200. The investments were transferred from Level 1 to Level 3 due to the lack of observable market data due to a decrease in market activity. The investments were transferred from Level 3 to Level 1 due to the availability of a pricing source supported by observable inputs.
| See Notes to Financial Statements. | 53 |
DBX ETF Trust
Schedule of Investments
Xtrackers MSCI USA ESG Leaders Equity ETF
August 31, 2022
Number | Value | |||||||
| COMMON STOCKS — 99.6% | ||||||||
| Communication Services — 10.2% | ||||||||
Alphabet, Inc., Class A* | 1,057,520 | $ | 114,444,814 | |||||
Alphabet, Inc., Class C* | 995,146 | 108,620,186 | ||||||
Cable One, Inc. (a) | 1,022 | 1,159,970 | ||||||
Electronic Arts, Inc. | 49,329 | 6,258,370 | ||||||
Interpublic Group of Cos., Inc. | 69,109 | 1,910,173 | ||||||
Lumen Technologies, Inc. (a) | 160,875 | 1,602,315 | ||||||
Sirius XM Holdings, Inc. (a) | 137,065 | 834,726 | ||||||
Take-Two Interactive Software, Inc.* | 28,344 | 3,473,841 | ||||||
Verizon Communications, Inc. | 735,739 | 30,761,248 | ||||||
Walt Disney Co.* | 319,194 | 35,775,263 | ||||||
Warner Bros Discovery, Inc.* | 392,404 | 5,195,429 | ||||||
ZoomInfo Technologies, Inc.* | 45,877 | 2,083,733 | ||||||
|
| |||||||
(Cost $282,721,999) | 312,120,068 | |||||||
|
| |||||||
| Consumer Discretionary — 11.4% | ||||||||
Advance Auto Parts, Inc. | 10,944 | 1,845,596 | ||||||
Aptiv PLC* | 45,896 | 4,288,063 | ||||||
Best Buy Co., Inc. | 37,568 | 2,655,682 | ||||||
BorgWarner, Inc. | 42,102 | 1,587,246 | ||||||
Burlington Stores, Inc.* (a) | 12,106 | 1,697,140 | ||||||
CarMax, Inc.* (a) | 27,839 | 2,462,081 | ||||||
eBay, Inc. | 98,310 | 4,338,420 | ||||||
Genuine Parts Co. | 24,884 | 3,882,153 | ||||||
Hasbro, Inc. | 22,483 | 1,772,110 | ||||||
Hilton Worldwide Holdings, Inc. | 48,800 | 6,215,168 | ||||||
Home Depot, Inc. | 180,859 | 52,163,353 | ||||||
Lear Corp. | 10,295 | 1,427,299 | ||||||
LKQ Corp. | 47,578 | 2,532,101 | ||||||
Lowe’s Cos., Inc. | 112,471 | 21,835,120 | ||||||
Lululemon Athletica, Inc.* | 20,652 | 6,194,774 | ||||||
McDonald’s Corp. | 130,430 | 32,904,880 | ||||||
MercadoLibre, Inc.* | 8,006 | 6,848,012 | ||||||
Newell Brands, Inc. (a) | 71,189 | 1,270,724 | ||||||
NIKE, Inc., Class B | 223,859 | 23,829,791 | ||||||
Pool Corp. | 6,960 | 2,360,762 | ||||||
Rivian Automotive, Inc., Class A* | 54,938 | 1,797,022 | ||||||
Target Corp. | 81,925 | 13,135,855 | ||||||
Tesla, Inc.* | 464,448 | 128,006,513 | ||||||
TJX Cos., Inc. | 206,146 | 12,853,203 | ||||||
Tractor Supply Co. | 19,668 | 3,641,530 | ||||||
Ulta Beauty, Inc.* | 9,149 | 3,841,391 | ||||||
Vail Resorts, Inc. | 6,928 | 1,556,583 | ||||||
VF Corp. | 57,924 | 2,400,950 | ||||||
|
| |||||||
(Cost $276,680,562) | 349,343,522 | |||||||
|
| |||||||
| Consumer Staples — 7.0% | ||||||||
Bunge Ltd. | 26,667 | 2,644,566 | ||||||
Campbell Soup Co. | 37,051 | 1,866,629 | ||||||
Clorox Co. | 20,692 | 2,986,683 | ||||||
Coca-Cola Co. | 724,940 | 44,736,048 | ||||||
Colgate-Palmolive Co. | 141,920 | 11,099,563 | ||||||
Conagra Brands, Inc. | 84,070 | 2,890,327 | ||||||
Estee Lauder Cos., Inc., Class A | 40,734 | 10,361,915 | ||||||
General Mills, Inc. | 105,761 | 8,122,445 | ||||||
Hormel Foods Corp. | 50,816 | 2,555,029 | ||||||
Kellogg Co. | 44,473 | 3,234,966 | ||||||
Number | Value | |||||||
| Consumer Staples (Continued) | ||||||||
Keurig Dr Pepper, Inc. | 136,724 | $ | 5,211,919 | |||||
Kimberly-Clark Corp. | 59,120 | 7,538,983 | ||||||
Kroger Co. | 123,911 | 5,940,293 | ||||||
McCormick & Co., Inc. | 44,332 | 3,726,991 | ||||||
PepsiCo, Inc. | 242,564 | 41,786,500 | ||||||
Procter & Gamble Co. | 421,902 | 58,197,162 | ||||||
|
| |||||||
(Cost $187,830,106) | 212,900,019 | |||||||
|
| |||||||
| Energy — 2.3% | ||||||||
Baker Hughes Co. | 176,948 | 4,469,706 | ||||||
Cheniere Energy, Inc. | 40,633 | 6,508,594 | ||||||
Halliburton Co. | 156,922 | 4,728,060 | ||||||
Kinder Morgan, Inc. | 355,470 | 6,512,210 | ||||||
Marathon Petroleum Corp. | 95,202 | 9,591,602 | ||||||
ONEOK, Inc. | 77,958 | 4,773,368 | ||||||
Phillips 66 | 84,091 | 7,522,781 | ||||||
Schlumberger N.V. | 248,139 | 9,466,503 | ||||||
Targa Resources Corp. | 37,891 | 2,585,303 | ||||||
Valero Energy Corp. | 71,849 | 8,414,955 | ||||||
Williams Cos., Inc. | 214,236 | 7,290,451 | ||||||
|
| |||||||
(Cost $63,127,720) | 71,863,533 | |||||||
|
| |||||||
| Financials — 11.1% | ||||||||
Aflac, Inc. | 108,624 | 6,454,438 | ||||||
Allstate Corp. | 49,220 | 5,931,010 | ||||||
Ally Financial, Inc. | 58,518 | 1,942,798 | ||||||
American Express Co. | 113,268 | 17,216,736 | ||||||
American International Group, Inc. | 142,991 | 7,399,784 | ||||||
Ameriprise Financial, Inc. | 19,391 | 5,196,982 | ||||||
Annaly Capital Management, Inc. REIT | 280,969 | 1,812,250 | ||||||
Arch Capital Group Ltd.* | 66,426 | 3,036,997 | ||||||
Arthur J Gallagher & Co. | 36,478 | 6,623,310 | ||||||
Assurant, Inc. | 9,509 | 1,507,081 | ||||||
Bank of New York Mellon Corp. | 134,015 | 5,565,643 | ||||||
BlackRock, Inc. | 26,692 | 17,787,282 | ||||||
Carlyle Group, Inc. | 34,368 | 1,117,991 | ||||||
Cboe Global Markets, Inc. | 17,427 | 2,055,863 | ||||||
Charles Schwab Corp. | 253,938 | 18,016,901 | ||||||
Chubb Ltd. | 74,739 | 14,129,408 | ||||||
Citizens Financial Group, Inc. | 86,174 | 3,160,862 | ||||||
CME Group, Inc. | 63,005 | 12,324,408 | ||||||
Discover Financial Services | 50,001 | 5,024,601 | ||||||
Equitable Holdings, Inc. | 68,244 | 2,030,259 | ||||||
FactSet Research Systems, Inc. | 6,498 | 2,815,843 | ||||||
First Republic Bank | 30,840 | 4,682,437 | ||||||
Franklin Resources, Inc. (a) | 55,006 | 1,434,006 | ||||||
Hartford Financial Services Group, Inc. | 58,237 | 3,745,221 | ||||||
Huntington Bancshares, Inc. | 253,262 | 3,393,711 | ||||||
Intercontinental Exchange, Inc. | 98,546 | 9,938,364 | ||||||
Invesco Ltd. | 59,816 | 985,170 | ||||||
KeyCorp | 161,677 | 2,860,066 | ||||||
Lincoln National Corp. | 28,260 | 1,301,656 | ||||||
Loews Corp. | 37,234 | 2,059,413 | ||||||
LPL Financial Holdings, Inc. | 13,951 | 3,087,775 | ||||||
MarketAxess Holdings, Inc. | 6,622 | 1,646,163 | ||||||
Marsh & McLennan Cos., Inc. | 88,234 | 14,238,321 | ||||||
Moody’s Corp. | 29,222 | 8,314,243 | ||||||
| See Notes to Financial Statements. | 54 |
DBX ETF Trust
Schedule of Investments
Xtrackers MSCI USA ESG Leaders Equity ETF (Continued)
August 31, 2022
Number | Value | |||||||
| Financials (Continued) | ||||||||
Morgan Stanley | 234,212 | $ | 19,959,547 | |||||
Nasdaq, Inc. | 60,717 | 3,614,483 | ||||||
Northern Trust Corp. | 34,589 | 3,289,068 | ||||||
PNC Financial Services Group, Inc. | 73,436 | 11,602,888 | ||||||
Principal Financial Group, Inc. (a) | 46,074 | 3,444,492 | ||||||
Progressive Corp. | 102,571 | 12,580,333 | ||||||
Prudential Financial, Inc. | 66,137 | 6,332,618 | ||||||
Raymond James Financial, Inc. | 33,355 | 3,481,261 | ||||||
Regions Financial Corp. | 162,562 | 3,522,719 | ||||||
S&P Global, Inc. | 61,081 | 21,511,507 | ||||||
State Street Corp. | 64,224 | 4,389,710 | ||||||
SVB Financial Group* | 10,288 | 4,182,278 | ||||||
Synchrony Financial | 91,055 | 2,982,051 | ||||||
T. Rowe Price Group, Inc. (a) | 39,719 | 4,766,280 | ||||||
Travelers Cos., Inc. | 42,369 | 6,848,525 | ||||||
Truist Financial Corp. | 233,092 | 10,918,029 | ||||||
US Bancorp | 247,419 | 11,284,781 | ||||||
Webster Financial Corp. | 31,267 | 1,471,112 | ||||||
Willis Towers Watson PLC | 20,642 | 4,269,385 | ||||||
|
| |||||||
(Cost $308,364,585) | 339,288,060 | |||||||
|
| |||||||
| Health Care — 14.4% | ||||||||
ABIOMED, Inc.* | 8,088 | 2,097,057 | ||||||
Agilent Technologies, Inc. | 52,605 | 6,746,591 | ||||||
Align Technology, Inc.* | 13,445 | 3,276,547 | ||||||
AmerisourceBergen Corp. | 27,083 | 3,969,285 | ||||||
Amgen, Inc. | 94,006 | 22,589,642 | ||||||
Baxter International, Inc. | 88,188 | 5,067,282 | ||||||
Biogen, Inc.* | 25,735 | 5,028,104 | ||||||
BioMarin Pharmaceutical, Inc.* | 32,459 | 2,895,343 | ||||||
Bio-Techne Corp. | 6,769 | 2,246,022 | ||||||
Bristol-Myers Squibb Co. | 374,663 | 25,256,033 | ||||||
Cardinal Health, Inc. | 46,454 | 3,285,227 | ||||||
Catalent, Inc.* | 28,811 | 2,535,368 | ||||||
Cigna Corp. | 56,449 | 16,000,469 | ||||||
DaVita, Inc.* | 10,247 | 873,967 | ||||||
DENTSPLY SIRONA, Inc. | 38,961 | 1,276,752 | ||||||
Dexcom, Inc.* | 68,044 | 5,593,897 | ||||||
Edwards Lifesciences Corp.* | 109,278 | 9,845,948 | ||||||
Elanco Animal Health, Inc.* | 74,219 | 1,122,933 | ||||||
Elevance Health, Inc. | 42,228 | 20,485,225 | ||||||
Eli Lilly & Co. | 142,197 | 42,834,002 | ||||||
Gilead Sciences, Inc. | 219,672 | 13,942,582 | ||||||
HCA Healthcare, Inc. | 42,606 | 8,430,449 | ||||||
Hologic, Inc.* | 43,154 | 2,915,484 | ||||||
Humana, Inc. | 22,196 | 10,693,589 | ||||||
IDEXX Laboratories, Inc.* | 14,837 | 5,157,638 | ||||||
Illumina, Inc.* | 27,482 | 5,541,470 | ||||||
Insulet Corp.* (a) | 12,227 | 3,123,632 | ||||||
Jazz Pharmaceuticals PLC* | 10,793 | 1,675,289 | ||||||
Johnson & Johnson | 463,179 | 74,729,300 | ||||||
Laboratory Corp. of America Holdings | 16,325 | 3,677,533 | ||||||
Merck & Co., Inc. | 443,091 | 37,822,248 | ||||||
Mettler-Toledo International, Inc.* | 3,952 | 4,791,642 | ||||||
Novocure Ltd.* (a) | 16,619 | 1,364,918 | ||||||
Quest Diagnostics, Inc. | 20,679 | 2,591,286 | ||||||
ResMed, Inc. | 25,457 | 5,598,503 | ||||||
Number | Value | |||||||
| Health Care (Continued) | ||||||||
STERIS PLC | 18,081 | $ | 3,641,152 | |||||
Teladoc Health, Inc.* (a) | 28,152 | 874,401 | ||||||
Teleflex, Inc. | 8,238 | 1,863,930 | ||||||
Thermo Fisher Scientific, Inc. | 69,040 | 37,648,893 | ||||||
Vertex Pharmaceuticals, Inc.* | 44,590 | 12,563,678 | ||||||
Waters Corp.* | 10,567 | 3,155,306 | ||||||
West Pharmaceutical Services, Inc. | 12,976 | 3,849,849 | ||||||
Zoetis, Inc. | 82,803 | 12,961,154 | ||||||
|
| |||||||
(Cost $413,473,606) | 441,639,620 | |||||||
|
| |||||||
| Industrials — 8.3% | ||||||||
3M Co. (a) | 100,178 | 12,457,134 | ||||||
A O Smith Corp. | 23,133 | 1,305,858 | ||||||
Allegion PLC | 15,609 | 1,484,416 | ||||||
AMERCO | 1,873 | 984,580 | ||||||
C.H. Robinson Worldwide, Inc. (a) | 22,311 | 2,546,801 | ||||||
Carrier Global Corp. | 149,632 | 5,853,604 | ||||||
Caterpillar, Inc. | 93,943 | 17,352,212 | ||||||
Copart, Inc.* | 37,553 | 4,493,216 | ||||||
CSX Corp. | 384,669 | 12,174,774 | ||||||
Cummins, Inc. | 25,015 | 5,387,481 | ||||||
Deere & Co. | 51,103 | 18,665,371 | ||||||
Delta Air Lines, Inc.* | 27,987 | 869,556 | ||||||
Dover Corp. | 25,312 | 3,162,987 | ||||||
Eaton Corp. PLC | 70,019 | 9,567,396 | ||||||
Expeditors International of Washington, Inc. | 29,648 | 3,050,483 | ||||||
Fastenal Co. | 100,840 | 5,075,277 | ||||||
Fortive Corp. | 59,408 | 3,762,309 | ||||||
Fortune Brands Home & Security, Inc. | 23,145 | 1,421,797 | ||||||
Generac Holdings, Inc.* | 11,298 | 2,490,192 | ||||||
IDEX Corp. | 13,151 | 2,646,113 | ||||||
Illinois Tool Works, Inc. | 54,904 | 10,696,946 | ||||||
Ingersoll Rand, Inc. | 71,116 | 3,368,765 | ||||||
JB Hunt Transport Services, Inc. | 14,691 | 2,556,528 | ||||||
Johnson Controls International PLC | 123,675 | 6,695,764 | ||||||
Knight-Swift Transportation Holdings, Inc. | 27,406 | 1,384,277 | ||||||
Lennox International, Inc. | 5,559 | 1,334,827 | ||||||
Masco Corp. | 41,156 | 2,093,606 | ||||||
Norfolk Southern Corp. | 42,095 | 10,234,557 | ||||||
Old Dominion Freight Line, Inc. | 17,042 | 4,625,369 | ||||||
Otis Worldwide Corp. | 74,262 | 5,363,202 | ||||||
Owens Corning | 17,195 | 1,405,347 | ||||||
Pentair PLC | 25,514 | 1,135,373 | ||||||
Plug Power, Inc.* | 90,714 | 2,543,621 | ||||||
Quanta Services, Inc. | 25,189 | 3,559,206 | ||||||
Republic Services, Inc. | 38,751 | 5,530,543 | ||||||
Robert Half International, Inc. | 19,288 | 1,484,597 | ||||||
Rockwell Automation, Inc. | 20,370 | 4,826,468 | ||||||
Rollins, Inc. | 38,769 | 1,308,841 | ||||||
Snap-on, Inc. | 9,674 | 2,107,578 | ||||||
Trane Technologies PLC | 41,125 | 6,336,129 | ||||||
Union Pacific Corp. | 110,213 | 24,743,921 | ||||||
United Parcel Service, Inc., Class B | 129,077 | 25,106,767 | ||||||
United Rentals, Inc.* | 12,484 | 3,645,827 | ||||||
| See Notes to Financial Statements. | 55 |
DBX ETF Trust
Schedule of Investments
Xtrackers MSCI USA ESG Leaders Equity ETF (Continued)
August 31, 2022
Number | Value | |||||||
| Industrials (Continued) | ||||||||
W.W. Grainger, Inc. | 8,101 | $ | 4,495,569 | |||||
Xylem, Inc. | 32,165 | 2,930,231 | ||||||
|
| |||||||
(Cost $222,934,860) | 254,265,416 | |||||||
|
| |||||||
| Information Technology — 27.9% | ||||||||
Accenture PLC, Class A | 110,788 | 31,957,907 | ||||||
Adobe, Inc.* | 82,744 | 30,899,919 | ||||||
ANSYS, Inc.* | 15,284 | 3,795,017 | ||||||
Applied Materials, Inc. | 154,924 | 14,573,701 | ||||||
Autodesk, Inc.* | 38,633 | 7,793,821 | ||||||
Automatic Data Processing, Inc. | 73,614 | 17,991,998 | ||||||
Cadence Design Systems, Inc.* | 48,991 | 8,513,166 | ||||||
Cisco Systems, Inc. | 728,088 | 32,560,095 | ||||||
Citrix Systems, Inc. | 21,969 | 2,257,754 | ||||||
Cognex Corp. | 30,053 | 1,265,532 | ||||||
Guidewire Software, Inc.* | 13,730 | 984,578 | ||||||
Hewlett Packard Enterprise Co. | 229,217 | 3,117,351 | ||||||
HP, Inc. | 186,564 | 5,356,252 | ||||||
HubSpot, Inc.* | 7,952 | 2,680,142 | ||||||
Intel Corp. | 713,756 | 22,783,092 | ||||||
International Business Machines Corp. | 157,703 | 20,256,950 | ||||||
Intuit, Inc. | 47,220 | 20,388,652 | ||||||
Keysight Technologies, Inc.* | 32,250 | 5,285,453 | ||||||
Lam Research Corp. | 24,397 | 10,683,690 | ||||||
Mastercard, Inc., Class A | 152,920 | 49,602,660 | ||||||
Microsoft Corp. | 1,249,653 | 326,746,770 | ||||||
Motorola Solutions, Inc. | 29,350 | 7,144,084 | ||||||
NortonLifeLock, Inc. | 101,817 | 2,300,046 | ||||||
NVIDIA Corp. | 440,078 | 66,425,373 | ||||||
NXP Semiconductors NV | 45,881 | 7,551,095 | ||||||
Roper Technologies, Inc. | 18,512 | 7,452,561 | ||||||
Salesforce, Inc.* | 174,680 | 27,271,042 | ||||||
ServiceNow, Inc.* | 35,043 | 15,230,389 | ||||||
Splunk, Inc.* | 27,724 | 2,495,992 | ||||||
Texas Instruments, Inc. | 161,862 | 26,741,221 | ||||||
Trimble, Inc.* | 44,202 | 2,795,777 | ||||||
Visa, Inc., Class A | 290,760 | 57,776,920 | ||||||
VMware, Inc., Class A | 36,770 | 4,266,423 | ||||||
Western Union Co. | 64,609 | 957,505 | ||||||
Zebra Technologies Corp., Class A* | 9,230 | 2,784,137 | ||||||
Zendesk, Inc.* | 21,390 | 1,642,110 | ||||||
|
| |||||||
(Cost $750,804,545) | 852,329,175 | |||||||
|
| |||||||
| Materials — 2.9% | ||||||||
Amcor PLC | 266,108 | 3,195,957 | ||||||
Ball Corp. | 56,324 | 3,143,442 | ||||||
Celanese Corp. | 18,867 | 2,091,596 | ||||||
Ecolab, Inc. | 44,346 | 7,265,205 | ||||||
International Flavors & Fragrances, Inc. | 44,483 | 4,914,482 | ||||||
International Paper Co. | 63,000 | 2,622,060 | ||||||
Linde PLC | 89,016 | 25,179,066 | ||||||
Martin Marietta Materials, Inc. | 10,839 | 3,768,829 | ||||||
Number | Value | |||||||
| Materials (Continued) | ||||||||
Mosaic Co. | 64,549 | $ | 3,477,255 | |||||
Newmont Corp. | 139,869 | 5,784,982 | ||||||
Nucor Corp. | 47,181 | 6,272,242 | ||||||
PPG Industries, Inc. | 41,104 | 5,219,386 | ||||||
Sherwin-Williams Co. | 43,303 | 10,050,626 | ||||||
Steel Dynamics, Inc. | 33,688 | 2,719,295 | ||||||
Westrock Co. | 45,922 | 1,863,974 | ||||||
|
| |||||||
(Cost $85,418,724) | 87,568,397 | |||||||
|
| |||||||
| Real Estate — 2.9% | ||||||||
American Tower Corp. REIT | 79,917 | 20,302,914 | ||||||
Boston Properties, Inc. REIT | 25,491 | 2,024,750 | ||||||
CBRE Group, Inc., Class A* | 58,291 | 4,602,657 | ||||||
Crown Castle, Inc. REIT | 75,849 | 12,957,285 | ||||||
Equinix, Inc. REIT | 15,852 | 10,420,629 | ||||||
Healthpeak Properties, Inc. REIT | 95,145 | 2,497,556 | ||||||
Prologis, Inc. REIT | 129,708 | 16,149,943 | ||||||
SBA Communications Corp. REIT | 18,977 | 6,172,269 | ||||||
Ventas, Inc. REIT | 69,789 | 3,340,102 | ||||||
Welltower, Inc. REIT | 78,436 | 6,012,120 | ||||||
Weyerhaeuser Co. REIT | 131,065 | 4,477,180 | ||||||
|
| |||||||
(Cost $85,816,118) | 88,957,405 | |||||||
|
| |||||||
| Utilities — 1.2% | ||||||||
American Water Works Co., Inc. | 31,736 | 4,711,209 | ||||||
Atmos Energy Corp. | 23,970 | 2,717,719 | ||||||
Consolidated Edison, Inc. | 62,185 | 6,077,962 | ||||||
Edison International | 66,943 | 4,536,727 | ||||||
Essential Utilities, Inc. | 40,808 | 2,005,713 | ||||||
Eversource Energy | 60,244 | 5,403,284 | ||||||
Sempra Energy | 55,517 | 9,158,639 | ||||||
UGI Corp. | 35,767 | 1,412,797 | ||||||
|
| |||||||
(Cost $31,749,002) | 36,024,050 | |||||||
|
| |||||||
TOTAL COMMON STOCKS | 3,046,299,265 | |||||||
|
| |||||||
| SECURITIES LENDING COLLATERAL — 0.0% |
| |||||||
DWS Government & Agency Securities Portfolio “DWS Government Cash Institutional Shares”, 2.00% (b)(c) | 804,200 | 804,200 | ||||||
|
| |||||||
| CASH EQUIVALENTS — 0.3% | ||||||||
DWS Government Money Market Series “Institutional Shares”, 2.24% (b) | 8,312,422 | 8,312,422 | ||||||
|
| |||||||
TOTAL INVESTMENTS — 99.9% (Cost $2,718,038,449) | $ | 3,055,415,887 | ||||||
Other assets and liabilities, net — 0.1% | 4,275,917 | |||||||
|
| |||||||
NET ASSETS — 100.0% | $ | 3,059,691,804 | ||||||
|
| |||||||
| See Notes to Financial Statements. | 56 |
DBX ETF Trust
Schedule of Investments
Xtrackers MSCI USA ESG Leaders Equity ETF (Continued)
August 31, 2022
A summary of the Fund’s transactions with affiliated investments during the year ended August 31, 2022 is as follows:
Value ($) at | Purchases Cost ($) | Sales Proceeds ($) | Net Realized Gain/(Loss) ($) | Net Change in Unrealized Appreciation (Depreciation) ($) | Income ($) | Capital Gain Distributions ($) | Number of Shares at 8/31/2022 | Value ($) at 8/31/2022 | ||||||||||||||||||||||||
SECURITIES LENDING COLLATERAL — 0.0% |
| |||||||||||||||||||||||||||||||
DWS Government & Agency Securities Portfolio “DWS Government Cash Institutional Shares”, 2.00% (b)(c) |
| |||||||||||||||||||||||||||||||
| 852,902 | — | (48,702 | )(d) | — | — | 5,475 | — | 804,200 | 804,200 | |||||||||||||||||||||||
CASH EQUIVALENTS — 0.3% |
| |||||||||||||||||||||||||||||||
DWS Government Money Market Series “Institutional Shares”, 2.24% (b) |
| |||||||||||||||||||||||||||||||
| 3,332,190 | 76,346,140 | (71,365,908 | ) | — | — | 32,091 | — | 8,312,422 | 8,312,422 | |||||||||||||||||||||||
|
|
|
|
|
|
|
|
|
|
|
|
|
|
|
| |||||||||||||||||
| 4,185,092 | 76,346,140 | (71,414,610 | ) | — | — | 37,566 | — | 9,116,622 | 9,116,622 | |||||||||||||||||||||||
|
|
|
|
|
|
|
|
|
|
|
|
|
|
|
| |||||||||||||||||
| * | Non-income producing security. |
| (a) | All or a portion of these securities were on loan. In addition, “Other assets and liabilities, net” may include pending sales that are also on loan. The value of securities loaned at August 31, 2022 amounted to $28,634,670, which is 0.9% of net assets. |
| (b) | Affiliated fund managed by DWS Investment Management Americas, Inc. The rate shown is the annualized seven-day yield at period end. |
| (c) | Represents cash collateral held in connection with securities lending. Income earned by the Fund is net of borrower rebates. In addition, the Fund held non-cash U.S. Treasury securities collateral having a value of $29,094,935. |
| (d) | Represents the net increase (purchase cost) or decrease (sales proceeds) in the amount invested in cash collateral for the year ended August 31, 2022. |
| REIT: | Real Estate Investment Trust |
At August 31, 2022, open futures contracts purchased were as follows:
Contract Description | Currency | Number of Contracts | Notional Amount | Contract Value | Expiration Date | Unrealized Appreciation (Depreciation) | ||||||||||||
S&P 500 E-Mini Futures | USD | 2 | $ | 401,650 | $ | 395,650 | 9/16/2022 | $ | (6,000 | ) | ||||||||
MSCI USA ESG Leaders GTR Index Futures | USD | 40 | 1,646,400 | 1,702,800 | 9/16/2022 | 56,400 | ||||||||||||
E-Mini S&P 500 ESG Futures | USD | 62 | 10,802,109 | 10,696,240 | 9/16/2022 | (105,869 | ) | |||||||||||
|
| |||||||||||||||||
Total net unrealized depreciation | $ | (55,469 | ) | |||||||||||||||
|
| |||||||||||||||||
For information on the Fund’s policy and additional disclosures regarding open futures contracts, please refer to the Derivatives section of Note 2 in the accompanying Notes to Financial Statements.
Currency Abbreviations
| USD | U.S. Dollar |
| See Notes to Financial Statements. | 57 |
DBX ETF Trust
Schedule of Investments
Xtrackers MSCI USA ESG Leaders Equity ETF (Continued)
August 31, 2022
Fair Value Measurements
Various inputs are used in determining the value of the Fund’s investments. These inputs are summarized in three broad levels. Level 1 includes quoted prices in active markets for identical securities. Level 2 includes other significant observable inputs (including quoted prices for similar securities, interest rates, prepayment speeds and credit risk). Level 3 includes significant unobservable inputs (including the Fund’s own assumptions in determining the fair value of investments). The level assigned to the securities valuations may not be an indication of the risk or liquidity associated with investing in those securities.
The following is a summary of the inputs used as of August 31, 2022 in valuing the Fund’s investments. For information on the Fund’s policy regarding the valuation of investments, please refer to the Security Valuation section of Note 2 in the accompanying Notes to Financial Statements.
Assets | Level 1 | Level 2 | Level 3 | Total | ||||||||||||
Common Stocks (a) | $ | 3,046,299,265 | $ | — | $ | — | $ | 3,046,299,265 | ||||||||
Short-Term Investments (a) | 9,116,622 | — | — | 9,116,622 | ||||||||||||
Derivatives (b) | ||||||||||||||||
Futures Contracts | 56,400 | — | — | 56,400 | ||||||||||||
|
|
|
|
|
|
|
| |||||||||
TOTAL | $ | 3,055,472,287 | $ | — | $ | — | $ | 3,055,472,287 | ||||||||
|
|
|
|
|
|
|
| |||||||||
Liabilities | Level 1 | Level 2 | Level 3 | Total | ||||||||||||
Derivatives (b) | ||||||||||||||||
Futures Contracts | $ | (111,869 | ) | $ | — | $ | — | $ | (111,869 | ) | ||||||
|
|
|
|
|
|
|
| |||||||||
TOTAL | $ | (111,869 | ) | $ | — | $ | — | $ | (111,869 | ) | ||||||
|
|
|
|
|
|
|
| |||||||||
| (a) | See Schedule of Investments for additional detailed categorizations. |
| (b) | Derivatives include unrealized appreciation (depreciation) on open futures contracts and forward foreign currency contracts. |
| See Notes to Financial Statements. | 58 |
DBX ETF Trust
Schedule of Investments
Xtrackers Net Zero Pathway Paris Aligned US Equity ETF
August 31, 2022
Number | Value | |||||||
| COMMON STOCKS — 99.4% | ||||||||
| Communication Services — 9.3% | ||||||||
Activision Blizzard, Inc. | 1,593 | $ | 125,035 | |||||
Alphabet, Inc., Class A* | 17,084 | 1,848,830 | ||||||
Alphabet, Inc., Class C* | 14,937 | 1,630,374 | ||||||
AT&T, Inc. | 16,231 | 284,692 | ||||||
Charter Communications, Inc., Class A* | 200 | 82,526 | ||||||
Comcast Corp., Class A | 9,850 | 356,471 | ||||||
DISH Network Corp., Class A* | 630 | 10,930 | ||||||
Electronic Arts, Inc. | 636 | 80,689 | ||||||
Fox Corp., Class A | 644 | 22,012 | ||||||
Fox Corp., Class B | 269 | 8,506 | ||||||
IAC, Inc.* | 210 | 13,497 | ||||||
Liberty Broadband Corp., Class A* | 20 | 2,016 | ||||||
Liberty Broadband Corp., Class C* | 85 | 8,644 | ||||||
Liberty Media Corp-Liberty SiriusXM, Class A* | 189 | 7,851 | ||||||
Liberty Media Corp-Liberty SiriusXM, Class C* | 245 | 10,133 | ||||||
Live Nation Entertainment, Inc.* | 383 | 34,608 | ||||||
Lumen Technologies, Inc. | 633 | 6,305 | ||||||
Match Group, Inc.* | 492 | 27,813 | ||||||
Meta Platforms, Inc., Class A* | 5,163 | 841,208 | ||||||
Netflix, Inc.* | 979 | 218,865 | ||||||
Omnicom Group, Inc. | 393 | 26,292 | ||||||
Paramount Global, Class A | 139 | 3,672 | ||||||
Paramount Global, Class B | 1,208 | 28,255 | ||||||
Pinterest, Inc., Class A* | 1,235 | 28,454 | ||||||
Sirius XM Holdings, Inc. | 1,446 | 8,806 | ||||||
Snap, Inc., Class A* | 1,753 | 19,073 | ||||||
Spotify Technology SA* | 240 | 25,956 | ||||||
Take-Two Interactive Software, Inc.* | 373 | 45,715 | ||||||
T-Mobile US, Inc.* | 1,402 | 201,832 | ||||||
Twitter, Inc.* | 1,412 | 54,715 | ||||||
Verizon Communications, Inc. | 9,500 | 397,195 | ||||||
Walt Disney Co.* | 4,078 | 457,062 | ||||||
Warner Bros Discovery, Inc.* | 4,911 | 65,022 | ||||||
Warner Music Group Corp., Class A | 299 | 8,004 | ||||||
ZoomInfo Technologies, Inc.* | 692 | 31,431 | ||||||
|
| |||||||
(Cost $7,134,716) | 7,022,489 | |||||||
|
| |||||||
| Consumer Discretionary — 7.5% | ||||||||
Advance Auto Parts, Inc. | 536 | 90,391 | ||||||
Airbnb, Inc., Class A* | 768 | 86,876 | ||||||
Aptiv PLC* | 1,436 | 134,165 | ||||||
AutoZone, Inc.* | 79 | 167,418 | ||||||
Best Buy Co., Inc. | 1,401 | 99,037 | ||||||
Booking Holdings, Inc.* | 92 | 172,575 | ||||||
Chipotle Mexican Grill, Inc.* | 62 | 99,002 | ||||||
D.R. Horton, Inc. | 1,766 | 125,651 | ||||||
Domino’s Pizza, Inc. | 81 | 30,121 | ||||||
DoorDash, Inc., Class A* | 103 | 6,170 | ||||||
eBay, Inc. | 3,036 | 133,979 | ||||||
Etsy, Inc.* | 1,146 | 121,029 | ||||||
Expedia Group, Inc.* | 329 | 33,772 | ||||||
Ford Motor Co. | 14,150 | 215,646 | ||||||
Garmin Ltd. | 1,080 | 95,569 | ||||||
General Motors Co. | 5,018 | 191,738 | ||||||
Number | Value | |||||||
| Consumer Discretionary (Continued) | ||||||||
Genuine Parts Co. | 848 | $ | 132,296 | |||||
Hasbro, Inc. | 1,165 | 91,825 | ||||||
Home Depot, Inc. | 2,575 | 742,682 | ||||||
Lennar Corp., Class A | 1,512 | 117,104 | ||||||
Lennar Corp., Class B | 611 | 37,686 | ||||||
LKQ Corp. | 2,014 | 107,185 | ||||||
Lowe’s Cos., Inc. | 1,842 | 357,606 | ||||||
Lululemon Athletica, Inc.* | 543 | 162,878 | ||||||
McDonald’s Corp. | 1,651 | 416,514 | ||||||
MercadoLibre, Inc.* | 216 | 184,758 | ||||||
Newell Brands, Inc. | 4,420 | 78,897 | ||||||
NIKE, Inc., Class B | 3,554 | 378,323 | ||||||
NVR, Inc.* | 24 | 99,361 | ||||||
PulteGroup, Inc. | 2,140 | 87,012 | ||||||
Starbucks Corp. | 2,507 | 210,763 | ||||||
Target Corp. | 1,533 | 245,801 | ||||||
Tractor Supply Co. | 605 | 112,016 | ||||||
Vail Resorts, Inc. | 85 | 19,098 | ||||||
VF Corp. | 2,498 | 103,542 | ||||||
Whirlpool Corp. | 401 | 62,797 | ||||||
Yum China Holdings, Inc. | 1,008 | 50,511 | ||||||
Yum! Brands, Inc. | 573 | 63,741 | ||||||
|
| |||||||
(Cost $5,370,730) | 5,665,535 | |||||||
|
| |||||||
| Consumer Staples — 6.2% | ||||||||
Archer-Daniels-Midland Co. | 2,173 | 190,985 | ||||||
Campbell Soup Co. | 1,922 | 96,830 | ||||||
Church & Dwight Co., Inc. | 1,223 | 102,377 | ||||||
Clorox Co. | 771 | 111,286 | ||||||
Coca-Cola Co. | 9,963 | 614,817 | ||||||
Colgate-Palmolive Co. | 2,726 | 213,201 | ||||||
Conagra Brands, Inc. | 3,051 | 104,893 | ||||||
Estee Lauder Cos., Inc., Class A | 777 | 197,653 | ||||||
General Mills, Inc. | 2,270 | 174,336 | ||||||
Hershey Co. | 656 | 147,384 | ||||||
J M Smucker Co. | 780 | 109,192 | ||||||
Kellogg Co. | 1,567 | 113,984 | ||||||
Keurig Dr Pepper, Inc. | 4,018 | 153,166 | ||||||
Kimberly-Clark Corp. | 1,278 | 162,971 | ||||||
Kraft Heinz Co. | 3,653 | 136,622 | ||||||
McCormick & Co., Inc. | 1,461 | 122,826 | ||||||
Mondelez International, Inc., Class A | 4,244 | 262,534 | ||||||
PepsiCo, Inc. | 3,549 | 611,386 | ||||||
Procter & Gamble Co. | 5,938 | 819,088 | ||||||
Sysco Corp. | 1,893 | 155,643 | ||||||
Tyson Foods, Inc., Class A | 1,235 | 93,094 | ||||||
|
| |||||||
(Cost $4,674,937) | 4,694,268 | |||||||
|
| |||||||
| Financials — 9.1% | ||||||||
Aflac, Inc. | 1,293 | 76,830 | ||||||
Alleghany Corp.* | 28 | 23,553 | ||||||
Allstate Corp. | 589 | 70,974 | ||||||
Ally Financial, Inc. | 660 | 21,912 | ||||||
American Express Co. | 1,238 | 188,176 | ||||||
American International Group, Inc. | 1,736 | 89,838 | ||||||
Ameriprise Financial, Inc. | 252 | 67,539 | ||||||
Annaly Capital Management, Inc. REIT | 15,756 | 101,626 | ||||||
| See Notes to Financial Statements. | 59 |
DBX ETF Trust
Schedule of Investments
Xtrackers Net Zero Pathway Paris Aligned US Equity ETF (Continued)
August 31, 2022
Number | Value | |||||||
| Financials (Continued) | ||||||||
Aon PLC, Class A | 451 | $ | 125,946 | |||||
Apollo Global Management, Inc. | 948 | 52,690 | ||||||
Arch Capital Group Ltd.* | 785 | 35,890 | ||||||
Bank of America Corp. | 15,879 | 533,693 | ||||||
Bank of New York Mellon Corp. | 1,607 | 66,739 | ||||||
BlackRock, Inc. | 321 | 213,911 | ||||||
Capital One Financial Corp. | 858 | 90,794 | ||||||
Cboe Global Markets, Inc. | 252 | 29,728 | ||||||
Charles Schwab Corp. | 3,397 | 241,017 | ||||||
Chubb Ltd. | 782 | 147,837 | ||||||
Cincinnati Financial Corp. | 229 | 22,204 | ||||||
Citigroup, Inc. | 4,333 | 211,494 | ||||||
Citizens Financial Group, Inc. | 1,071 | 39,284 | ||||||
CME Group, Inc. | 748 | 146,316 | ||||||
Discover Financial Services | 614 | 61,701 | ||||||
Everest Re Group Ltd. | 82 | 22,062 | ||||||
Fidelity National Financial, Inc. | 528 | 20,645 | ||||||
Fifth Third Bancorp | 1,494 | 51,020 | ||||||
First Republic Bank | 393 | 59,669 | ||||||
Franklin Resources, Inc. | 515 | 13,426 | ||||||
Globe Life, Inc. | 229 | 22,257 | ||||||
Goldman Sachs Group, Inc. | 764 | 254,160 | ||||||
Hartford Financial Services Group, Inc. | 706 | 45,403 | ||||||
Huntington Bancshares, Inc. | 3,082 | 41,299 | ||||||
Interactive Brokers Group, Inc., Class A | 190 | 11,702 | ||||||
Intercontinental Exchange, Inc. | 1,231 | 124,146 | ||||||
JPMorgan Chase & Co. | 6,581 | 748,457 | ||||||
KeyCorp | 2,019 | 35,716 | ||||||
KKR & Co., Inc. | 1,903 | 96,216 | ||||||
M&T Bank Corp. | 384 | 69,804 | ||||||
Markel Corp.* | 29 | 34,629 | ||||||
Marsh & McLennan Cos., Inc. | 1,119 | 180,573 | ||||||
MetLife, Inc. | 1,332 | 85,688 | ||||||
Moody’s Corp. | 358 | 101,858 | ||||||
Morgan Stanley | 3,036 | 258,728 | ||||||
MSCI, Inc. | 178 | 79,965 | ||||||
Nasdaq, Inc. | 786 | 46,791 | ||||||
Northern Trust Corp. | 434 | 41,269 | ||||||
PNC Financial Services Group, Inc. | 916 | 144,728 | ||||||
Principal Financial Group, Inc. | 533 | 39,847 | ||||||
Progressive Corp. | 1,295 | 158,832 | ||||||
Prudential Financial, Inc. | 821 | 78,611 | ||||||
Raymond James Financial, Inc. | 430 | 44,879 | ||||||
Regions Financial Corp. | 2,030 | 43,990 | ||||||
Rocket Cos., Inc., Class A | 471 | 3,721 | ||||||
S&P Global, Inc. | 766 | 269,770 | ||||||
State Street Corp. | 770 | 52,630 | ||||||
SVB Financial Group* | 137 | 55,693 | ||||||
Synchrony Financial | 1,121 | 36,713 | ||||||
T. Rowe Price Group, Inc. | 490 | 58,800 | ||||||
Travelers Cos., Inc. | 525 | 84,861 | ||||||
Truist Financial Corp. | 2,942 | 137,803 | ||||||
US Bancorp | 2,968 | 135,370 | ||||||
W.R. Berkley Corp. | 418 | 27,086 | ||||||
Wells Fargo & Co. | 8,502 | 371,622 | ||||||
Willis Towers Watson PLC | 242 | 50,053 | ||||||
|
| |||||||
(Cost $6,675,852) | 6,900,184 | |||||||
|
| |||||||
Number | Value | |||||||
| Health Care — 19.4% | ||||||||
Abbott Laboratories | 4,626 | $ | 474,859 | |||||
AbbVie, Inc. | 4,491 | 603,860 | ||||||
ABIOMED, Inc.* | 407 | 105,527 | ||||||
Agilent Technologies, Inc. | 1,273 | 163,262 | ||||||
Align Technology, Inc.* | 463 | 112,833 | ||||||
Alnylam Pharmaceuticals, Inc.* | 765 | 158,103 | ||||||
AmerisourceBergen Corp. | 832 | 121,938 | ||||||
Amgen, Inc. | 1,515 | 364,055 | ||||||
Avantor, Inc.* | 3,839 | 95,630 | ||||||
Baxter International, Inc. | 2,327 | 133,709 | ||||||
Becton Dickinson and Co. | 951 | 240,051 | ||||||
Biogen, Inc.* | 682 | 133,249 | ||||||
BioMarin Pharmaceutical, Inc.* | 1,323 | 118,012 | ||||||
Boston Scientific Corp.* | 5,166 | 208,241 | ||||||
Bristol-Myers Squibb Co. | 5,662 | 381,675 | ||||||
Cardinal Health, Inc. | 1,764 | 124,750 | ||||||
Catalent, Inc.* | 970 | 85,360 | ||||||
Centene Corp.* | 1,234 | 110,739 | ||||||
Cigna Corp. | 694 | 196,714 | ||||||
Cooper Cos., Inc. | 344 | 98,879 | ||||||
CVS Health Corp. | 3,769 | 369,927 | ||||||
Danaher Corp. | 1,787 | 482,329 | ||||||
DaVita, Inc.* | 126 | 10,747 | ||||||
DENTSPLY SIRONA, Inc. | 2,498 | 81,859 | ||||||
Dexcom, Inc.* | 1,850 | 152,089 | ||||||
Edwards Lifesciences Corp.* | 2,189 | 197,229 | ||||||
Elanco Animal Health, Inc.* | 4,845 | 73,305 | ||||||
Elevance Health, Inc. | 538 | 260,989 | ||||||
Eli Lilly & Co. | 2,139 | 644,331 | ||||||
Exact Sciences Corp.* | 2,100 | 74,655 | ||||||
Gilead Sciences, Inc. | 4,047 | 256,863 | ||||||
HCA Healthcare, Inc. | 490 | 96,956 | ||||||
Henry Schein, Inc.* | 1,160 | 85,156 | ||||||
Hologic, Inc.* | 1,493 | 100,867 | ||||||
Horizon Therapeutics PLC* | 1,468 | 86,920 | ||||||
Humana, Inc. | 279 | 134,417 | ||||||
IDEXX Laboratories, Inc.* | 384 | 133,486 | ||||||
Illumina, Inc.* | 732 | 147,600 | ||||||
Incyte Corp.* | 1,242 | 87,474 | ||||||
Intuitive Surgical, Inc.* | 1,178 | 242,362 | ||||||
IQVIA Holdings, Inc.* | 409 | 86,978 | ||||||
Jazz Pharmaceuticals PLC* | 598 | 92,822 | ||||||
Johnson & Johnson | 6,841 | 1,103,727 | ||||||
Laboratory Corp. of America Holdings | 105 | 23,653 | ||||||
McKesson Corp. | 518 | 190,106 | ||||||
Medtronic PLC | 3,843 | 337,877 | ||||||
Merck & Co., Inc. | 6,508 | 555,523 | ||||||
Mettler-Toledo International, Inc.* | 114 | 138,220 | ||||||
Moderna, Inc.* | 1,246 | 164,808 | ||||||
Organon & Co. | 2,652 | 75,662 | ||||||
Pfizer, Inc. | 14,123 | 638,783 | ||||||
Quest Diagnostics, Inc. | 45 | 5,639 | ||||||
Regeneron Pharmaceuticals, Inc.* | 369 | 214,411 | ||||||
ResMed, Inc. | 688 | 151,305 | ||||||
Royalty Pharma PLC, Class A | 2,592 | 108,372 | ||||||
Seagen, Inc.* | 727 | 112,169 | ||||||
STERIS PLC | 595 | 119,821 | ||||||
| See Notes to Financial Statements. | 60 |
DBX ETF Trust
Schedule of Investments
Xtrackers Net Zero Pathway Paris Aligned US Equity ETF (Continued)
August 31, 2022
Number | Value | |||||||
| Health Care (Continued) | ||||||||
Stryker Corp. | 1,110 | $ | 227,772 | |||||
Teladoc Health, Inc.* | 77 | 2,392 | ||||||
Teleflex, Inc. | 414 | 93,672 | ||||||
Thermo Fisher Scientific, Inc. | 1,020 | 556,226 | ||||||
UnitedHealth Group, Inc. | 2,110 | 1,095,786 | ||||||
Universal Health Services, Inc., Class B | 155 | 15,165 | ||||||
Veeva Systems, Inc., Class A* | 310 | 61,789 | ||||||
Vertex Pharmaceuticals, Inc.* | 830 | 233,861 | ||||||
Viatris, Inc. | 10,191 | 97,324 | ||||||
Waters Corp.* | 301 | 89,879 | ||||||
Zimmer Biomet Holdings, Inc. | 1,205 | 128,116 | ||||||
Zoetis, Inc. | 1,505 | 235,578 | ||||||
|
| |||||||
(Cost $15,213,232) | 14,708,443 | |||||||
|
| |||||||
| Industrials — 5.3% | ||||||||
A O Smith Corp. | 1,202 | 67,853 | ||||||
C.H. Robinson Worldwide, Inc. | 992 | 113,237 | ||||||
Carrier Global Corp. | 3,943 | 154,250 | ||||||
Copart, Inc.* | 1,141 | 136,521 | ||||||
CoStar Group, Inc.* | 896 | 62,397 | ||||||
Deere & Co. | 838 | 306,079 | ||||||
Delta Air Lines, Inc.* | 3,805 | 118,221 | ||||||
Dover Corp. | 875 | 109,340 | ||||||
Equifax, Inc. | 269 | 50,774 | ||||||
Expeditors International of Washington, Inc. | 1,107 | 113,899 | ||||||
Fastenal Co. | 2,803 | 141,075 | ||||||
FedEx Corp. | 763 | 160,848 | ||||||
JB Hunt Transport Services, Inc. | 657 | 114,331 | ||||||
Johnson Controls International PLC | 2,658 | 143,904 | ||||||
Lyft, Inc., Class A* | 6,371 | 93,845 | ||||||
Masco Corp. | 1,936 | 98,484 | ||||||
Old Dominion Freight Line, Inc. | 514 | 139,505 | ||||||
Otis Worldwide Corp. | 1,945 | 140,468 | ||||||
PACCAR, Inc. | 1,478 | 129,340 | ||||||
Rollins, Inc. | 508 | 17,150 | ||||||
Southwest Airlines Co.* | 3,360 | 123,312 | ||||||
Stanley Black & Decker, Inc. | 1,025 | 90,303 | ||||||
Trane Technologies PLC | 764 | 117,709 | ||||||
TransUnion | 418 | 30,878 | ||||||
Uber Technologies, Inc.* | 7,516 | 216,160 | ||||||
United Airlines Holdings, Inc.* | 2,597 | 90,921 | ||||||
United Parcel Service, Inc., Class B | 2,063 | 401,274 | ||||||
Verisk Analytics, Inc. | 346 | 64,757 | ||||||
W.W. Grainger, Inc. | 245 | 135,960 | ||||||
Waste Management, Inc. | 1,392 | 235,290 | ||||||
Westinghouse Air Brake Technologies Corp. | 992 | 86,949 | ||||||
|
| |||||||
(Cost $3,817,742) | 4,005,034 | |||||||
|
| |||||||
| Information Technology — 34.1% | ||||||||
Accenture PLC, Class A | 1,488 | 429,228 | ||||||
Adobe, Inc.* | 1,061 | 396,220 | ||||||
Advanced Micro Devices, Inc.* | 4,608 | 391,081 | ||||||
Akamai Technologies, Inc.* | 363 | 32,772 | ||||||
Amdocs Ltd. | 315 | 26,923 | ||||||
Analog Devices, Inc. | 1,664 | 252,146 | ||||||
Number | Value | |||||||
| Information Technology (Continued) | ||||||||
Apple, Inc. | 47,021 | $ | 7,392,642 | |||||
Applied Materials, Inc. | 2,800 | 263,396 | ||||||
Arista Networks, Inc.* | 1,307 | 156,683 | ||||||
Atlassian Corp. PLC, Class A* | 317 | 78,508 | ||||||
Autodesk, Inc.* | 481 | 97,037 | ||||||
Automatic Data Processing, Inc. | 933 | 228,035 | ||||||
Bill.com Holdings, Inc.* | 244 | 39,499 | ||||||
Block, Inc.* | 1,192 | 82,141 | ||||||
Broadcom, Inc. | 1,035 | 516,579 | ||||||
Broadridge Financial Solutions, Inc. | 253 | 43,306 | ||||||
Cadence Design Systems, Inc.* | 609 | 105,826 | ||||||
CDW Corp. | 247 | 42,163 | ||||||
Cisco Systems, Inc. | 8,536 | 381,730 | ||||||
Citrix Systems, Inc. | 271 | 27,851 | ||||||
Cloudflare, Inc., Class A* | 545 | 34,101 | ||||||
Cognizant Technology Solutions Corp., Class A | 1,053 | 66,518 | ||||||
Corning, Inc. | 4,058 | 139,271 | ||||||
Crowdstrike Holdings, Inc., Class A* | 462 | 84,366 | ||||||
Datadog, Inc., Class A* | 566 | 59,402 | ||||||
DocuSign, Inc.* | 427 | 24,860 | ||||||
Enphase Energy, Inc.* | 679 | 194,493 | ||||||
EPAM Systems, Inc.* | 125 | 53,313 | ||||||
Fidelity National Information Services, Inc. | 1,349 | 123,258 | ||||||
Fiserv, Inc.* | 1,335 | 135,089 | ||||||
FleetCor Technologies, Inc.* | 165 | 35,067 | ||||||
Fortinet, Inc.* | 1,599 | 77,855 | ||||||
Gartner, Inc.* | 171 | 48,790 | ||||||
Global Payments, Inc. | 618 | 76,774 | ||||||
GLOBALFOUNDRIES, Inc.* | 1,920 | 114,854 | ||||||
HP, Inc. | 4,464 | 128,161 | ||||||
HubSpot, Inc.* | 100 | 33,704 | ||||||
Intel Corp. | 11,286 | 360,249 | ||||||
Intuit, Inc. | 620 | 267,704 | ||||||
Keysight Technologies, Inc.* | 941 | 154,220 | ||||||
Lam Research Corp. | 500 | 218,955 | ||||||
Marvell Technology, Inc. | 3,591 | 168,131 | ||||||
Mastercard, Inc., Class A | 1,934 | 627,332 | ||||||
Microchip Technology, Inc. | 2,510 | 163,778 | ||||||
Micron Technology, Inc. | 3,770 | 213,118 | ||||||
Microsoft Corp. | 22,271 | 5,823,198 | ||||||
MongoDB, Inc.* | 145 | 46,815 | ||||||
Motorola Solutions, Inc. | 726 | 176,716 | ||||||
NetApp, Inc. | 1,644 | 118,582 | ||||||
NortonLifeLock, Inc. | 1,027 | 23,200 | ||||||
NVIDIA Corp. | 5,929 | 894,923 | ||||||
Okta, Inc.* | 373 | 34,092 | ||||||
Oracle Corp. | 3,387 | 251,146 | ||||||
Palantir Technologies, Inc., Class A* | 3,614 | 27,900 | ||||||
Palo Alto Networks, Inc.* | 221 | 123,055 | ||||||
Paychex, Inc. | 718 | 88,558 | ||||||
Paycom Software, Inc.* | 112 | 39,334 | ||||||
PayPal Holdings, Inc.* | 2,580 | 241,075 | ||||||
QUALCOMM, Inc. | 3,123 | 413,079 | ||||||
Salesforce, Inc.* | 2,174 | 339,405 | ||||||
Seagate Technology Holdings PLC | 1,438 | 96,288 | ||||||
| See Notes to Financial Statements. | 61 |
DBX ETF Trust
Schedule of Investments
Xtrackers Net Zero Pathway Paris Aligned US Equity ETF (Continued)
August 31, 2022
Number | Value | |||||||
| Information Technology (Continued) | ||||||||
ServiceNow, Inc.* | 423 | $ | 183,844 | |||||
Skyworks Solutions, Inc. | 1,169 | 115,205 | ||||||
Snowflake, Inc., Class A* | 595 | 107,665 | ||||||
Splunk, Inc.* | 322 | 28,990 | ||||||
SS&C Technologies Holdings, Inc. | 519 | 28,939 | ||||||
Synopsys, Inc.* | 340 | 117,647 | ||||||
TE Connectivity Ltd. | 1,395 | 176,063 | ||||||
Teradyne, Inc. | 1,238 | 104,784 | ||||||
Texas Instruments, Inc. | 2,583 | 426,737 | ||||||
Trade Desk, Inc., Class A* | 962 | 60,317 | ||||||
Twilio, Inc., Class A* | 269 | 18,717 | ||||||
VeriSign, Inc.* | 210 | 38,266 | ||||||
Visa, Inc., Class A | 3,702 | 735,624 | ||||||
VMware, Inc., Class A | 509 | 59,059 | ||||||
Western Digital Corp.* | 2,276 | 96,184 | ||||||
Workday, Inc., Class A* | 447 | 73,558 | ||||||
Zoom Video Communications, Inc., Class A* | 404 | 32,482 | ||||||
Zscaler, Inc.* | 189 | 30,096 | ||||||
|
| |||||||
(Cost $24,382,690) | 25,758,672 | |||||||
|
| |||||||
| Materials — 2.1% | ||||||||
Ball Corp. | 1,699 | 94,821 | ||||||
Corteva, Inc. | 3,008 | 184,781 | ||||||
Ecolab, Inc. | 1,045 | 171,202 | ||||||
FMC Corp. | 1,007 | 108,837 | ||||||
International Flavors & Fragrances, Inc. | 1,223 | 135,117 | ||||||
International Paper Co. | 2,267 | 94,353 | ||||||
Mosaic Co. | 2,326 | 125,302 | ||||||
Nucor Corp. | 1,197 | 159,129 | ||||||
Packaging Corp. of America | 723 | 98,993 | ||||||
PPG Industries, Inc. | 1,160 | 147,297 | ||||||
Sherwin-Williams Co. | 846 | 196,357 | ||||||
Southern Copper Corp. | 1,674 | 78,795 | ||||||
|
| |||||||
(Cost $1,565,577) | 1,594,984 | |||||||
|
| |||||||
| Real Estate — 5.2% | ||||||||
Alexandria Real Estate Equities, Inc. REIT | 857 | 131,464 | ||||||
American Tower Corp. REIT | 1,344 | 341,443 | ||||||
AvalonBay Communities, Inc. REIT | 684 | 137,422 | ||||||
Boston Properties, Inc. REIT | 1,189 | 94,442 | ||||||
CBRE Group, Inc., Class A* | 596 | 47,060 | ||||||
Crown Castle, Inc. REIT | 1,409 | 240,699 | ||||||
Number | Value | |||||||
| Real Estate (Continued) | ||||||||
Digital Realty Trust, Inc. REIT | 1,231 | $ | 152,189 | |||||
Duke Realty Corp. REIT | 2,207 | 129,882 | ||||||
Equinix, Inc. REIT | 316 | 207,729 | ||||||
Equity Residential REIT | 1,833 | 134,139 | ||||||
Essex Property Trust, Inc. REIT | 421 | 111,590 | ||||||
Extra Space Storage, Inc. REIT | 735 | 146,067 | ||||||
Healthpeak Properties, Inc. REIT | 3,974 | 104,317 | ||||||
Invitation Homes, Inc. REIT | 3,384 | 122,771 | ||||||
Iron Mountain, Inc. REIT | 2,164 | 113,848 | ||||||
Mid-America Apartment Communities, Inc. REIT | 684 | 113,318 | ||||||
Prologis, Inc. REIT | 2,292 | 285,377 | ||||||
Public Storage REIT | 583 | 192,874 | ||||||
Realty Income Corp. REIT | 2,486 | 169,744 | ||||||
SBA Communications Corp. REIT | 473 | 153,843 | ||||||
Simon Property Group, Inc. REIT | 1,540 | 157,049 | ||||||
UDR, Inc. REIT | 2,310 | 103,650 | ||||||
Ventas, Inc. REIT | 2,194 | 105,005 | ||||||
Welltower, Inc. REIT | 1,975 | 151,384 | ||||||
Weyerhaeuser Co. REIT | 3,885 | 132,712 | ||||||
WP Carey, Inc. REIT | 1,386 | 116,466 | ||||||
Zillow Group, Inc., Class A* | 62 | 2,071 | ||||||
Zillow Group, Inc., Class C* | 404 | 13,518 | ||||||
|
| |||||||
(Cost $3,903,371) | 3,912,073 | |||||||
|
| |||||||
| Utilities — 1.2% | ||||||||
American Water Works Co., Inc. | 3,067 | 455,296 | ||||||
Edison International | 6,791 | 460,226 | ||||||
|
| |||||||
(Cost $873,674) | 915,522 | |||||||
|
| |||||||
TOTAL COMMON STOCKS | 75,177,204 | |||||||
|
| |||||||
| CASH EQUIVALENTS — 0.5% | ||||||||
DWS Government Money Market Series “Institutional Shares”, 2.24% (a) | 349,061 | 349,061 | ||||||
|
| |||||||
TOTAL INVESTMENTS — 99.9% (Cost $73,961,582) | $ | 75,526,265 | ||||||
Other assets and liabilities, net — 0.1% | 111,171 | |||||||
|
| |||||||
NET ASSETS — 100.0% | $ | 75,637,436 | ||||||
|
| |||||||
A summary of the Fund’s transactions with affiliated investments during the period ended August 31, 2022 is as follows:
| Value ($) at 6/28/2022 (Commencement of Operations) | Purchases Cost ($) | Sales Proceeds ($) | Net Realized Gain/(Loss) ($) | Net Change in Unrealized Appreciation (Depreciation) ($) | Income ($) | Capital Gain Distributions ($) | Number of Shares at 8/31/2022 | Value ($) at 8/31/2022 | ||||||||||||||||||||||||||||
CASH EQUIVALENTS — 0.5% | ||||||||||||||||||||||||||||||||||||
DWS Government Money Market Series “Institutional Shares”, 2.24% (a) | ||||||||||||||||||||||||||||||||||||
| — | 3,399,892 | (3,050,831 | ) | — | — | 492 | — | 349,061 | 349,061 | |||||||||||||||||||||||||||
| * | Non-income producing security. |
| (a) | Affiliated fund managed by DWS Investment Management Americas, Inc. The rate shown is the annualized seven-day yield at period end. |
| REIT: | Real Estate Investment Trust |
| See Notes to Financial Statements. | 62 |
DBX ETF Trust
Schedule of Investments
Xtrackers Net Zero Pathway Paris Aligned US Equity ETF (Continued)
August 31, 2022
At August 31, 2022, open futures contracts purchased were as follows:
Contract Description | Currency | Number of Contracts | Notional Amount | Contract Value | Expiration Date | Unrealized Depreciation | ||||||||||||
E-Mini S&P 500 ESG Futures | USD | 2 | $ | 357,770 | $345,040 | 9/16/2022 | $ | (12,730 | ) | |||||||||
For information on the Fund’s policy and additional disclosures regarding open futures contracts, please refer to the Derivatives section of Note 2 in the accompanying Notes to Financial Statements.
Currency Abbreviations
| USD | U.S. Dollar |
Fair Value Measurements
Various inputs are used in determining the value of the Fund’s investments. These inputs are summarized in three broad levels. Level 1 includes quoted prices in active markets for identical securities. Level 2 includes other significant observable inputs (including quoted prices for similar securities, interest rates, prepayment speeds and credit risk). Level 3 includes significant unobservable inputs (including the Fund’s own assumptions in determining the fair value of investments). The level assigned to the securities valuations may not be an indication of the risk or liquidity associated with investing in those securities.
The following is a summary of the inputs used as of August 31, 2022 in valuing the Fund’s investments. For information on the Fund’s policy regarding the valuation of investments, please refer to the Security Valuation section of Note 2 in the accompanying Notes to Financial Statements.
Assets | Level 1 | Level 2 | Level 3 | Total | ||||||||||||
Common Stocks (a) | $ | 75,177,204 | $ | — | $ | — | $ | 75,177,204 | ||||||||
Short-Term Investments (a) | 349,061 | — | — | 349,061 | ||||||||||||
|
|
|
|
|
|
|
| |||||||||
TOTAL | $ | 75,526,265 | $ | — | $ | — | $ | 75,526,265 | ||||||||
|
|
|
|
|
|
|
| |||||||||
Liabilities | Level 1 | Level 2 | Level 3 | Total | ||||||||||||
Derivatives (b) | ||||||||||||||||
Futures Contracts | $ | (12,730 | ) | $ | — | $ | — | $ | (12,730 | ) | ||||||
|
|
|
|
|
|
|
| |||||||||
TOTAL | $ | (12,730 | ) | $ | — | $ | — | $ | (12,730 | ) | ||||||
|
|
|
|
|
|
|
| |||||||||
| (a) | See Schedule of Investments for additional detailed categorizations. |
| (b) | Derivatives include unrealized appreciation (depreciation) on open futures contracts. |
| See Notes to Financial Statements. | 63 |
DBX ETF Trust
Schedule of Investments
August 31, 2022
Number | Value | |||||||
| COMMON STOCKS — 99.6% | ||||||||
| Communication Services — 8.7% | ||||||||
Alphabet, Inc., Class A* | 186,520 | $ | 20,185,194 | |||||
Alphabet, Inc., Class C* | 171,012 | 18,665,960 | ||||||
AT&T, Inc. | 220,178 | 3,861,922 | ||||||
Charter Communications, Inc., Class A* | 3,609 | 1,489,182 | ||||||
Comcast Corp., Class A | 138,666 | 5,018,323 | ||||||
Electronic Arts, Inc. | 8,675 | 1,100,597 | ||||||
Interpublic Group of Cos., Inc. | 12,143 | 335,632 | ||||||
Omnicom Group, Inc. | 6,684 | 447,160 | ||||||
Take-Two Interactive Software, Inc.* | 4,873 | 597,235 | ||||||
Twitter, Inc.* | 24,819 | 961,736 | ||||||
Verizon Communications, Inc. | 129,660 | 5,421,085 | ||||||
Walt Disney Co.* | 56,175 | 6,296,094 | ||||||
Warner Bros Discovery, Inc.* | 68,234 | 903,418 | ||||||
|
| |||||||
(Cost $79,264,320) | 65,283,538 | |||||||
|
| |||||||
| Consumer Discretionary — 9.5% | ||||||||
Amazon.com, Inc.* | 271,623 | 34,433,648 | ||||||
Aptiv PLC* | 8,452 | 789,670 | ||||||
Best Buy Co., Inc. | 6,282 | 444,075 | ||||||
BorgWarner, Inc. | 7,460 | 281,242 | ||||||
Caesars Entertainment, Inc.* | 6,629 | 285,843 | ||||||
Darden Restaurants, Inc. | 3,936 | 486,923 | ||||||
Dollar Tree, Inc.* | 6,914 | 938,092 | ||||||
eBay, Inc. | 17,351 | 765,700 | ||||||
Etsy, Inc.* | 3,952 | 417,371 | ||||||
Expedia Group, Inc.* | 4,663 | 478,657 | ||||||
Ford Motor Co. | 121,380 | 1,849,831 | ||||||
General Motors Co. | 44,816 | 1,712,419 | ||||||
Hasbro, Inc. | 4,042 | 318,590 | ||||||
Hilton Worldwide Holdings, Inc. | 8,610 | 1,096,570 | ||||||
Las Vegas Sands Corp.* | 10,276 | 386,686 | ||||||
Lowe’s Cos., Inc. | 20,519 | 3,983,559 | ||||||
Marriott International, Inc., Class A | 8,511 | 1,308,481 | ||||||
McDonald’s Corp. | 23,055 | 5,816,315 | ||||||
MGM Resorts International | 11,386 | 371,639 | ||||||
Mohawk Industries, Inc.* | 1,723 | 190,150 | ||||||
Newell Brands, Inc. | 11,739 | 209,541 | ||||||
NIKE, Inc., Class B | 39,387 | 4,192,746 | ||||||
PulteGroup, Inc. | 7,676 | 312,106 | ||||||
PVH Corp. | 2,128 | 119,700 | ||||||
Ralph Lauren Corp. | 1,482 | 135,351 | ||||||
Royal Caribbean Cruises Ltd.* | 6,804 | 277,943 | ||||||
Starbucks Corp. | 35,488 | 2,983,476 | ||||||
Tapestry, Inc. | 8,137 | 282,598 | ||||||
Target Corp. | 14,345 | 2,300,077 | ||||||
TJX Cos., Inc. | 36,793 | 2,294,044 | ||||||
VF Corp. | 9,940 | 412,013 | ||||||
Whirlpool Corp. | 1,825 | 285,795 | ||||||
Yum! Brands, Inc. | 8,983 | 999,269 | ||||||
|
| |||||||
(Cost $85,084,794) | 71,160,120 | |||||||
|
| |||||||
| Consumer Staples — 6.8% | ||||||||
Archer-Daniels-Midland Co. | 17,272 | 1,518,036 | ||||||
Brown-Forman Corp., Class B | 5,722 | 415,989 | ||||||
Campbell Soup Co. | 6,257 | 315,228 | ||||||
Coca-Cola Co. | 120,932 | 7,462,714 | ||||||
Number | Value | |||||||
| Consumer Staples (Continued) | ||||||||
Colgate-Palmolive Co. | 25,939 | $ | 2,028,689 | |||||
Conagra Brands, Inc. | 14,721 | 506,108 | ||||||
Constellation Brands, Inc., Class A | 5,059 | 1,244,767 | ||||||
Estee Lauder Cos., Inc., Class A | 7,216 | 1,835,606 | ||||||
General Mills, Inc. | 18,585 | 1,427,328 | ||||||
Hershey Co. | 4,474 | 1,005,174 | ||||||
Hormel Foods Corp. | 8,535 | 429,140 | ||||||
J M Smucker Co. | 3,384 | 473,726 | ||||||
Kellogg Co. | 7,729 | 562,208 | ||||||
Kraft Heinz Co. | 22,128 | 827,587 | ||||||
Kroger Co. | 20,642 | 989,578 | ||||||
McCormick & Co., Inc. | 7,722 | 649,189 | ||||||
Molson Coors Beverage Co., Class B | 5,872 | 303,406 | ||||||
Mondelez International, Inc., Class A | 42,754 | 2,644,762 | ||||||
PepsiCo, Inc. | 42,638 | 7,345,248 | ||||||
Procter & Gamble Co. | 74,459 | 10,270,874 | ||||||
Sysco Corp. | 15,651 | 1,286,825 | ||||||
Tyson Foods, Inc., Class A | 9,074 | 683,998 | ||||||
Walgreens Boots Alliance, Inc. | 22,212 | 778,753 | ||||||
Walmart, Inc. | 43,623 | 5,782,229 | ||||||
|
| |||||||
(Cost $49,933,905) | 50,787,162 | |||||||
|
| |||||||
| Energy — 5.0% | ||||||||
APA Corp. | 10,490 | 410,264 | ||||||
Baker Hughes Co. | 28,108 | 710,008 | ||||||
ConocoPhillips | 40,279 | 4,408,536 | ||||||
Devon Energy Corp. | 19,297 | 1,362,754 | ||||||
EOG Resources, Inc. | 18,163 | 2,203,172 | ||||||
Exxon Mobil Corp. | 130,678 | 12,491,510 | ||||||
Halliburton Co. | 27,581 | 831,015 | ||||||
Hess Corp. | 8,474 | 1,023,490 | ||||||
Kinder Morgan, Inc. | 60,178 | 1,102,461 | ||||||
Marathon Oil Corp. | 21,925 | 561,061 | ||||||
Marathon Petroleum Corp. | 16,799 | 1,692,499 | ||||||
Occidental Petroleum Corp. | 27,243 | 1,934,253 | ||||||
ONEOK, Inc. | 13,595 | 832,422 | ||||||
Phillips 66 | 14,514 | 1,298,422 | ||||||
Pioneer Natural Resources Co. | 7,036 | 1,781,656 | ||||||
Schlumberger N.V. | 43,344 | 1,653,574 | ||||||
Valero Energy Corp. | 12,692 | 1,486,487 | ||||||
Williams Cos., Inc. | 37,722 | 1,283,680 | ||||||
|
| |||||||
(Cost $28,403,384) | 37,067,264 | |||||||
|
| |||||||
| Financials — 10.8% | ||||||||
Aflac, Inc. | 18,722 | 1,112,461 | ||||||
Allstate Corp. | 8,616 | 1,038,228 | ||||||
American Express Co. | 18,983 | 2,885,416 | ||||||
American International Group, Inc. | 24,575 | 1,271,756 | ||||||
Ameriprise Financial, Inc. | 3,438 | 921,418 | ||||||
Assurant, Inc. | 1,763 | 279,418 | ||||||
Bank of America Corp. | 219,154 | 7,365,766 | ||||||
Bank of New York Mellon Corp. | 22,859 | 949,334 | ||||||
BlackRock, Inc. | 4,374 | 2,914,790 | ||||||
Capital One Financial Corp. | 12,193 | 1,290,263 | ||||||
Cboe Global Markets, Inc. | 3,263 | 384,936 | ||||||
Charles Schwab Corp. | 46,384 | 3,290,945 | ||||||
Chubb Ltd. | 13,290 | 2,512,475 | ||||||
| See Notes to Financial Statements. | 64 |
DBX ETF Trust
Schedule of Investments
Xtrackers S&P 500 ESG ETF (Continued)
August 31, 2022
Number | Value | |||||||
| Financials (Continued) | ||||||||
Cincinnati Financial Corp. | 4,651 | $ | 450,961 | |||||
Citigroup, Inc. | 60,264 | 2,941,486 | ||||||
CME Group, Inc. | 11,174 | 2,185,746 | ||||||
Comerica, Inc. | 3,995 | 320,799 | ||||||
Discover Financial Services | 8,959 | 900,290 | ||||||
FactSet Research Systems, Inc. | 1,177 | 510,041 | ||||||
Fifth Third Bancorp | 21,338 | 728,693 | ||||||
Franklin Resources, Inc. | 8,617 | 224,645 | ||||||
Globe Life, Inc. | 2,788 | 270,966 | ||||||
Goldman Sachs Group, Inc. | 10,623 | 3,533,953 | ||||||
Hartford Financial Services Group, Inc. | 10,444 | 671,654 | ||||||
Intercontinental Exchange, Inc. | 17,447 | 1,759,530 | ||||||
Invesco Ltd. | 10,623 | 174,961 | ||||||
JPMorgan Chase & Co. | 91,290 | 10,382,412 | ||||||
KeyCorp | 28,533 | 504,749 | ||||||
Lincoln National Corp. | 5,114 | 235,551 | ||||||
MarketAxess Holdings, Inc. | 1,166 | 289,856 | ||||||
Marsh & McLennan Cos., Inc. | 15,596 | 2,516,727 | ||||||
MetLife, Inc. | 21,537 | 1,385,475 | ||||||
Moody’s Corp. | 5,008 | 1,424,876 | ||||||
Morgan Stanley | 43,701 | 3,724,199 | ||||||
MSCI, Inc. | 2,501 | 1,123,549 | ||||||
Nasdaq, Inc. | 10,549 | 627,982 | ||||||
Northern Trust Corp. | 6,424 | 610,858 | ||||||
PNC Financial Services Group, Inc. | 12,937 | 2,044,046 | ||||||
Principal Financial Group, Inc. (a) | 7,725 | 577,521 | ||||||
Prudential Financial, Inc. | 11,569 | 1,107,732 | ||||||
Raymond James Financial, Inc. | 5,631 | 587,707 | ||||||
Regions Financial Corp. | 29,778 | 645,289 | ||||||
S&P Global, Inc. | 10,782 | 3,797,205 | ||||||
State Street Corp. | 11,340 | 775,089 | ||||||
Synchrony Financial | 16,038 | 525,245 | ||||||
T. Rowe Price Group, Inc. | 7,110 | 853,200 | ||||||
Travelers Cos., Inc. | 7,432 | 1,201,308 | ||||||
Truist Financial Corp. | 41,425 | 1,940,347 | ||||||
US Bancorp | 41,910 | 1,911,515 | ||||||
W.R. Berkley Corp. | 6,468 | 419,126 | ||||||
Willis Towers Watson PLC | 3,459 | 715,425 | ||||||
|
| |||||||
(Cost $87,724,684) | 80,817,920 | |||||||
|
| |||||||
| Health Care — 15.1% | ||||||||
Abbott Laboratories | 54,539 | 5,598,428 | ||||||
AbbVie, Inc. | 54,562 | 7,336,407 | ||||||
Agilent Technologies, Inc. | 9,268 | 1,188,621 | ||||||
AmerisourceBergen Corp. | 4,689 | 687,220 | ||||||
Amgen, Inc. | 16,587 | 3,985,856 | ||||||
Baxter International, Inc. | 15,700 | 902,122 | ||||||
Becton Dickinson and Co. | 8,777 | 2,215,490 | ||||||
Biogen, Inc.* | 4,498 | 878,819 | ||||||
Bio-Rad Laboratories, Inc., Class A* | 617 | 299,270 | ||||||
Boston Scientific Corp.* | 43,918 | 1,770,335 | ||||||
Bristol-Myers Squibb Co. | 66,107 | 4,456,273 | ||||||
Cardinal Health, Inc. | 8,536 | 603,666 | ||||||
Catalent, Inc.* | 5,561 | 489,368 | ||||||
Centene Corp.* | 18,112 | 1,625,371 | ||||||
Charles River Laboratories International, Inc.* | 1,580 | 324,295 | ||||||
Number | Value | |||||||
| Health Care (Continued) | ||||||||
Cigna Corp. | 9,825 | $ | 2,784,896 | |||||
CVS Health Corp. | 40,496 | 3,974,682 | ||||||
DaVita, Inc.* | 1,855 | 158,213 | ||||||
Edwards Lifesciences Corp.* | 19,399 | 1,747,850 | ||||||
Elevance Health, Inc. | 7,490 | 3,633,474 | ||||||
Eli Lilly & Co. | 24,501 | 7,380,436 | ||||||
Gilead Sciences, Inc. | 38,680 | 2,455,020 | ||||||
Henry Schein, Inc.* | 4,163 | 305,606 | ||||||
Hologic, Inc.* | 7,709 | 520,820 | ||||||
Humana, Inc. | 4,003 | 1,928,565 | ||||||
IDEXX Laboratories, Inc.* | 2,620 | 910,764 | ||||||
Illumina, Inc.* | 4,779 | 963,638 | ||||||
Laboratory Corp. of America Holdings | 2,831 | 637,739 | ||||||
McKesson Corp. | 4,518 | 1,658,106 | ||||||
Medtronic PLC | 41,475 | 3,646,482 | ||||||
Merck & Co., Inc. | 78,460 | 6,697,346 | ||||||
Mettler-Toledo International, Inc.* | 701 | 849,934 | ||||||
Moderna, Inc.* | 10,949 | 1,448,224 | ||||||
Organon & Co. | 7,969 | 227,356 | ||||||
PerkinElmer, Inc. | 3,973 | 536,593 | ||||||
Pfizer, Inc. | 174,168 | 7,877,619 | ||||||
Quest Diagnostics, Inc. | 3,761 | 471,291 | ||||||
Regeneron Pharmaceuticals, Inc.* | 3,318 | 1,927,957 | ||||||
Thermo Fisher Scientific, Inc. | 12,159 | 6,630,546 | ||||||
UnitedHealth Group, Inc. | 29,059 | 15,091,210 | ||||||
Vertex Pharmaceuticals, Inc.* | 7,851 | 2,212,098 | ||||||
Viatris, Inc. | 37,379 | 356,969 | ||||||
Waters Corp.* | 1,858 | 554,799 | ||||||
West Pharmaceutical Services, Inc. | 2,276 | 675,266 | ||||||
Zoetis, Inc. | 14,684 | 2,298,487 | ||||||
|
| |||||||
(Cost $109,996,998) | 112,923,527 | |||||||
|
| |||||||
| Industrials — 6.3% | ||||||||
American Airlines Group, Inc.* | 20,198 | 262,372 | ||||||
Carrier Global Corp. | 26,547 | 1,038,519 | ||||||
Caterpillar, Inc. | 16,689 | 3,082,625 | ||||||
Cintas Corp. | 2,745 | 1,116,776 | ||||||
CSX Corp. | 68,389 | 2,164,512 | ||||||
Cummins, Inc. | 4,375 | 942,244 | ||||||
Deere & Co. | 8,647 | 3,158,317 | ||||||
Dover Corp. | 4,430 | 553,573 | ||||||
Eaton Corp. PLC | 12,320 | 1,683,405 | ||||||
Emerson Electric Co. | 18,344 | 1,499,439 | ||||||
Fastenal Co. | 17,747 | 893,206 | ||||||
FedEx Corp. | 7,516 | 1,584,448 | ||||||
Fortive Corp. | 10,862 | 687,890 | ||||||
Generac Holdings, Inc.* | 1,952 | 430,240 | ||||||
General Electric Co. | 33,921 | 2,491,158 | ||||||
IDEX Corp. | 2,324 | 467,612 | ||||||
Illinois Tool Works, Inc. | 8,848 | 1,723,856 | ||||||
Ingersoll Rand, Inc. | 12,588 | 596,294 | ||||||
JB Hunt Transport Services, Inc. | 2,610 | 454,192 | ||||||
Johnson Controls International PLC | 21,640 | 1,171,590 | ||||||
Nielsen Holdings PLC | 10,765 | 299,698 | ||||||
Nordson Corp. | 1,701 | 386,416 | ||||||
Otis Worldwide Corp. | 13,175 | 951,498 | ||||||
PACCAR, Inc. | 10,598 | 927,431 | ||||||
| See Notes to Financial Statements. | 65 |
DBX ETF Trust
Schedule of Investments
Xtrackers S&P 500 ESG ETF (Continued)
August 31, 2022
Number | Value | |||||||
| Industrials (Continued) | ||||||||
Parker-Hannifin Corp. | 3,941 | $ | 1,044,365 | |||||
Pentair PLC | 5,060 | 225,170 | ||||||
Republic Services, Inc. | 6,378 | 910,268 | ||||||
Robert Half International, Inc. | 3,383 | 260,390 | ||||||
Rockwell Automation, Inc. | 3,583 | 848,956 | ||||||
Snap-on, Inc. | 1,614 | 351,626 | ||||||
Stanley Black & Decker, Inc. | 4,975 | 438,297 | ||||||
Trane Technologies PLC | 7,309 | 1,126,098 | ||||||
Union Pacific Corp. | 19,653 | 4,412,295 | ||||||
United Parcel Service, Inc., Class B | 22,769 | 4,428,798 | ||||||
United Rentals, Inc.* | 2,252 | 657,674 | ||||||
Verisk Analytics, Inc. | 4,951 | 926,629 | ||||||
Waste Management, Inc. | 11,903 | 2,011,964 | ||||||
Westinghouse Air Brake Technologies Corp. | 5,868 | 514,330 | ||||||
Xylem, Inc. | 5,483 | 499,501 | ||||||
|
| |||||||
(Cost $49,198,253) | 47,223,672 | |||||||
|
| |||||||
| Information Technology — 30.3% | ||||||||
Adobe, Inc.* | 14,552 | 5,434,299 | ||||||
Advanced Micro Devices, Inc.* | 50,425 | 4,279,570 | ||||||
ANSYS, Inc.* | 2,739 | 680,094 | ||||||
Apple, Inc. | 476,911 | 74,979,947 | ||||||
Applied Materials, Inc. | 27,372 | 2,574,884 | ||||||
Arista Networks, Inc.* | 6,891 | 826,093 | ||||||
Autodesk, Inc.* | 6,814 | 1,374,656 | ||||||
CDW Corp. | 4,212 | 718,988 | ||||||
Cisco Systems, Inc. | 128,852 | 5,762,261 | ||||||
Corning, Inc. | 23,048 | 791,007 | ||||||
Hewlett Packard Enterprise Co. | 40,454 | 550,174 | ||||||
HP, Inc. | 33,342 | 957,249 | ||||||
Intel Corp. | 126,915 | 4,051,127 | ||||||
Intuit, Inc. | 8,733 | 3,770,735 | ||||||
Juniper Networks, Inc. | 10,011 | 284,513 | ||||||
Keysight Technologies, Inc.* | 5,633 | 923,192 | ||||||
Lam Research Corp. | 4,306 | 1,885,640 | ||||||
Mastercard, Inc., Class A | 26,625 | 8,636,351 | ||||||
Micron Technology, Inc. | 34,712 | 1,962,269 | ||||||
Microsoft Corp. | 231,978 | 60,655,288 | ||||||
Motorola Solutions, Inc. | 5,251 | 1,278,146 | ||||||
NortonLifeLock, Inc. | 17,711 | 400,092 | ||||||
NVIDIA Corp. | 77,685 | 11,725,774 | ||||||
Oracle Corp. | 48,631 | 3,605,989 | ||||||
QUALCOMM, Inc. | 34,781 | 4,600,483 | ||||||
Roper Technologies, Inc. | 3,248 | 1,307,580 | ||||||
Salesforce, Inc.* | 30,768 | 4,803,500 | ||||||
Seagate Technology Holdings PLC | 6,223 | 416,692 | ||||||
TE Connectivity Ltd. | 10,050 | 1,268,411 | ||||||
Texas Instruments, Inc. | 28,494 | 4,707,494 | ||||||
Trimble, Inc.* | 7,722 | 488,417 | ||||||
Tyler Technologies, Inc.* | 1,272 | 472,561 | ||||||
Visa, Inc., Class A (a) | 51,178 | 10,169,580 | ||||||
Zebra Technologies Corp., Class A* | 1,635 | 493,181 | ||||||
|
| |||||||
(Cost $239,436,286) | 226,836,237 | |||||||
|
| |||||||
| Materials — 2.6% | ||||||||
Air Products and Chemicals, Inc. | 6,850 | 1,729,282 | ||||||
Albemarle Corp. | 3,610 | 967,336 | ||||||
Number | Value | |||||||
| Materials (Continued) | ||||||||
Amcor PLC | 47,267 | $ | 567,677 | |||||
Ball Corp. | 10,234 | 571,160 | ||||||
CF Industries Holdings, Inc. | 6,529 | 675,490 | ||||||
Corteva, Inc. | 22,425 | 1,377,568 | ||||||
Dow, Inc. | 22,719 | 1,158,669 | ||||||
Ecolab, Inc. | 7,691 | 1,260,016 | ||||||
FMC Corp. | 3,906 | 422,160 | ||||||
Freeport-McMoRan, Inc. | 45,361 | 1,342,686 | ||||||
International Flavors & Fragrances, Inc. | 7,815 | 863,401 | ||||||
International Paper Co. | 11,817 | 491,824 | ||||||
Linde PLC | 15,613 | 4,416,293 | ||||||
LyondellBasell Industries NV, Class A | 8,043 | 667,569 | ||||||
Mosaic Co. | 11,547 | 622,037 | ||||||
Newmont Corp. | 24,603 | 1,017,580 | ||||||
PPG Industries, Inc. | 7,307 | 927,843 | ||||||
Westrock Co. | 8,158 | 331,133 | ||||||
|
| |||||||
(Cost $21,054,106) | 19,409,724 | |||||||
|
| |||||||
| Real Estate — 2.7% | ||||||||
Alexandria Real Estate Equities, Inc. REIT | 4,532 | 695,209 | ||||||
American Tower Corp. REIT | 14,407 | 3,660,098 | ||||||
AvalonBay Communities, Inc. REIT | 4,301 | 864,114 | ||||||
Boston Properties, Inc. REIT | 4,325 | 343,535 | ||||||
CBRE Group, Inc., Class A* | 10,307 | 813,841 | ||||||
Digital Realty Trust, Inc. REIT | 8,762 | 1,083,246 | ||||||
Equinix, Inc. REIT | 2,837 | 1,864,959 | ||||||
Equity Residential REIT | 10,696 | 782,733 | ||||||
Essex Property Trust, Inc. REIT | 2,007 | 531,975 | ||||||
Extra Space Storage, Inc. REIT | 4,083 | 811,415 | ||||||
Federal Realty Investment Trust REIT | 2,199 | 222,693 | ||||||
Healthpeak Properties, Inc. REIT | 16,455 | 431,944 | ||||||
Host Hotels & Resorts, Inc. REIT | 22,056 | 391,935 | ||||||
Iron Mountain, Inc. REIT | 9,026 | 474,858 | ||||||
Kimco Realty Corp. REIT | 18,580 | 391,666 | ||||||
Prologis, Inc. REIT | 23,052 | 2,870,205 | ||||||
Regency Centers Corp. REIT | 4,625 | 281,385 | ||||||
Simon Property Group, Inc. REIT | 10,150 | 1,035,097 | ||||||
UDR, Inc. REIT | 9,304 | 417,470 | ||||||
Ventas, Inc. REIT | 12,213 | 584,514 | ||||||
Vornado Realty Trust REIT (a) | 4,953 | 129,868 | ||||||
Welltower, Inc. REIT | 14,156 | 1,085,057 | ||||||
Weyerhaeuser Co. REIT | 22,934 | 783,425 | ||||||
|
| |||||||
(Cost $22,328,035) | 20,551,242 | |||||||
|
| |||||||
| Utilities — 1.8% | ||||||||
American Water Works Co., Inc. | 5,690 | 844,681 | ||||||
Consolidated Edison, Inc. | 10,944 | 1,069,667 | ||||||
Edison International | 11,751 | 796,365 | ||||||
Entergy Corp. | 6,227 | 717,973 | ||||||
Eversource Energy | 10,667 | 956,723 | ||||||
Exelon Corp. | 30,546 | 1,341,275 | ||||||
NextEra Energy, Inc. | 60,456 | 5,142,387 | ||||||
Public Service Enterprise Group, Inc. | 15,658 | 1,007,749 | ||||||
Sempra Energy | 9,952 | 1,641,781 | ||||||
|
| |||||||
(Cost $12,450,999) | 13,518,601 | |||||||
|
| |||||||
TOTAL COMMON STOCKS | 745,579,007 | |||||||
|
| |||||||
| See Notes to Financial Statements. | 66 |
DBX ETF Trust
Schedule of Investments
Xtrackers S&P 500 ESG ETF (Continued)
August 31, 2022
Number | Value | |||||||
| CASH EQUIVALENTS — 0.2% | ||||||||
DWS Government Money Market Series “Institutional Shares”, 2.24% (b) | 1,156,171 | $ | 1,156,171 | |||||
|
| |||||||
TOTAL INVESTMENTS — 99.8% (Cost $786,031,935) | $ | 746,735,178 | ||||||
Other assets and liabilities, net — 0.2% | 1,129,970 | |||||||
|
| |||||||
NET ASSETS — 100.0% | $ | 747,865,148 | ||||||
|
| |||||||
A summary of the Fund’s transactions with affiliated investments during the year ended August 31, 2022 is as follows:
| Value ($) at 8/31/2021 | Purchases Cost ($) | Sales Proceeds ($) | Net Realized Gain/(Loss) ($) | Net Change in Unrealized Appreciation (Depreciation) ($) | Income ($) | Capital Gain Distributions ($) | Number of Shares at 8/31/2022 | Value ($) at 8/31/2022 | ||||||||||||||||||||||||||||
SECURITIES LENDING COLLATERAL — 0.0% |
| |||||||||||||||||||||||||||||||||||
DWS Government & Agency Securities Portfolio “DWS Government Cash Institutional Shares”, 2.00% (b)(c) |
| |||||||||||||||||||||||||||||||||||
| 107,727 | — | (107,727 | )(d) | — | — | 23 | — | — | — | |||||||||||||||||||||||||||
CASH EQUIVALENTS — 0.2% |
| |||||||||||||||||||||||||||||||||||
DWS Government Money Market Series “Institutional Shares”, 2.24% (b) |
| |||||||||||||||||||||||||||||||||||
| 1,353,973 | 15,370,028 | (15,567,830 | ) | — | — | 4,262 | — | 1,156,171 | 1,156,171 | |||||||||||||||||||||||||||
|
|
|
|
|
|
|
|
|
|
|
|
|
|
|
|
|
| |||||||||||||||||||
| 1,461,700 | 15,370,028 | (15,675,557 | ) | — | — | 4,285 | — | 1,156,171 | 1,156,171 | |||||||||||||||||||||||||||
|
|
|
|
|
|
|
|
|
|
|
|
|
|
|
|
|
| |||||||||||||||||||
| * | Non-income producing security. |
| (a) | All or a portion of these securities were on loan. In addition, “Other assets and liabilities, net” may include pending sales that are also on loan. The value of securities loaned at August 31, 2022 amounted to $9,620,118, which is 1.3% of net assets. |
| (b) | Affiliated fund managed by DWS Investment Management Americas, Inc. The rate shown is the annualized seven-day yield at period end. |
| (c) | Represents collateral held in connection with securities lending. Income earned by the Fund is net of borrower rebates. In addition, the Fund held non-cash U.S. Treasury securities collateral having a value of $9,947,642. |
| (d) | Represents the net increase (purchase cost) or decrease (sales proceeds) in the amount invested in cash collateral for the year ended August 31, 2022. |
| REIT: | Real Estate Investment Trust |
At August 31, 2022, open futures contracts purchased were as follows:
Contract Description | Currency | Number of Contracts | Notional Amount | Contract Value | Expiration Date | Unrealized Appreciation (Depreciation) | ||||||||||||
E-Mini S&P 500 ESG Futures | USD | 9 | $ | 1,612,467 | $ | 1,552,680 | 9/16/2022 | $ | (59,787 | ) | ||||||||
S&P 500 E-Mini Futures | USD | 3 | 571,507 | 593,475 | 9/16/2022 | 21,968 | ||||||||||||
|
| |||||||||||||||||
Total net unrealized depreciation | $ | (37,819 | ) | |||||||||||||||
|
| |||||||||||||||||
For information on the Fund’s policy and additional disclosures regarding open futures contracts, please refer to the Derivatives section of Note 2 in the accompanying Notes to Financial Statements.
Currency Abbreviations
| USD | U.S. Dollar |
| See Notes to Financial Statements. | 67 |
DBX ETF Trust
Schedule of Investments
Xtrackers S&P 500 ESG ETF (Continued)
August 31, 2022
Fair Value Measurements
Various inputs are used in determining the value of the Fund’s investments. These inputs are summarized in three broad levels. Level 1 includes quoted prices in active markets for identical securities. Level 2 includes other significant observable inputs (including quoted prices for similar securities, interest rates, prepayment speeds and credit risk). Level 3 includes significant unobservable inputs (including the Fund’s own assumptions in determining the fair value of investments). The level assigned to the securities valuations may not be an indication of the risk or liquidity associated with investing in those securities.
The following is a summary of the inputs used as of August 31, 2022 in valuing the Fund’s investments. For information on the Fund’s policy regarding the valuation of investments, please refer to the Security Valuation section of Note 2 in the accompanying Notes to Financial Statements.
Assets | Level 1 | Level 2 | Level 3 | Total | ||||||||||||
Common Stocks (a) | $ | 745,579,007 | $ | — | $ | — | $ | 745,579,007 | ||||||||
Short-Term Investments (a) | 1,156,171 | — | — | 1,156,171 | ||||||||||||
Derivatives (b) | ||||||||||||||||
Futures Contracts | 21,968 | — | — | 21,968 | ||||||||||||
|
|
|
|
|
|
|
| |||||||||
TOTAL | $ | 746,757,146 | $ | — | $ | — | $ | 746,757,146 | ||||||||
|
|
|
|
|
|
|
| |||||||||
Liabilities | Level 1 | Level 2 | Level 3 | Total | ||||||||||||
Derivatives (b) | ||||||||||||||||
Futures Contracts | $ | (59,787 | ) | $ | — | $ | — | $ | (59,787 | ) | ||||||
|
|
|
|
|
|
|
| |||||||||
TOTAL | $ | (59,787 | ) | $ | — | $ | — | $ | (59,787 | ) | ||||||
|
|
|
|
|
|
|
| |||||||||
| (a) | See Schedule of Investments for additional detailed categorizations. |
| (b) | Derivatives include unrealized appreciation (depreciation) on open futures contracts and forward foreign currency contracts. |
| See Notes to Financial Statements. | 68 |
DBX ETF Trust
Schedule of Investments
Xtrackers S&P MidCap 400 ESG ETF
August 31, 2022
Number | Value | |||||||
| COMMON STOCKS — 99.4% | ||||||||
| Communication Services — 1.6% | ||||||||
Cable One, Inc. | 38 | $ | 43,130 | |||||
John Wiley & Sons, Inc., Class A | 319 | 14,683 | ||||||
New York Times Co., Class A | 1,285 | 39,180 | ||||||
TEGNA, Inc. | 1,717 | 36,744 | ||||||
TripAdvisor, Inc.* | 785 | 18,683 | ||||||
Ziff Davis, Inc.* | 353 | 27,280 | ||||||
|
| |||||||
(Cost $233,377) | 179,700 | |||||||
|
| |||||||
| Consumer Discretionary — 14.9% | ||||||||
Adient PLC* | 743 | 24,668 | ||||||
American Eagle Outfitters, Inc. | 1,200 | 13,512 | ||||||
AutoNation, Inc.* (a) | 276 | 34,390 | ||||||
Boyd Gaming Corp. | 625 | 34,019 | ||||||
Brunswick Corp. | 585 | 43,705 | ||||||
Capri Holdings Ltd.* | 1,126 | 53,125 | ||||||
Carter’s, Inc. | 309 | 22,820 | ||||||
Columbia Sportswear Co. | 252 | 17,952 | ||||||
Cracker Barrel Old Country Store, Inc. | 172 | 18,566 | ||||||
Crocs, Inc.* | 462 | 34,049 | ||||||
Dana, Inc. | 1,055 | 16,321 | ||||||
Deckers Outdoor Corp.* | 210 | 67,530 | ||||||
Dick’s Sporting Goods, Inc. | 446 | 47,441 | ||||||
Five Below, Inc.* (a) | 425 | 54,349 | ||||||
Foot Locker, Inc. | 639 | 23,541 | ||||||
Gap, Inc. | 1,557 | 14,231 | ||||||
Goodyear Tire & Rubber Co.* | 2,107 | 29,561 | ||||||
Graham Holdings Co., Class B | 32 | 18,094 | ||||||
Grand Canyon Education, Inc.* | 241 | 19,613 | ||||||
H&R Block, Inc. | 1,203 | 54,135 | ||||||
Hanesbrands, Inc. (a) | 2,675 | 23,299 | ||||||
Harley-Davidson, Inc. | 1,135 | 43,777 | ||||||
KB Home | 653 | 18,708 | ||||||
Kohl’s Corp. | 1,020 | 28,988 | ||||||
Lear Corp. | 458 | 63,497 | ||||||
Leggett & Platt, Inc. | 1,002 | 38,296 | ||||||
Lithia Motors, Inc. | 225 | 59,724 | ||||||
Macy’s, Inc. | 2,199 | 38,087 | ||||||
Marriott Vacations Worldwide Corp. | 312 | 44,435 | ||||||
Nordstrom, Inc. | 872 | 14,920 | ||||||
Papa John’s International, Inc. | 250 | 20,208 | ||||||
Polaris, Inc. (a) | 430 | 48,706 | ||||||
RH* (a) | 132 | 33,780 | ||||||
Service Corp. International | 1,204 | 74,299 | ||||||
Taylor Morrison Home Corp.* | 899 | 22,574 | ||||||
Tempur Sealy International, Inc. | 1,354 | 33,864 | ||||||
Texas Roadhouse, Inc. | 524 | 46,510 | ||||||
Thor Industries, Inc. (a) | 425 | 34,429 | ||||||
Toll Brothers, Inc. | 860 | 37,659 | ||||||
Callaway Golf Co.* | 857 | 18,965 | ||||||
Travel + Leisure Co. | 662 | 28,069 | ||||||
Visteon Corp.* | 225 | 26,962 | ||||||
Wendy’s Co. | 1,292 | 24,781 | ||||||
Williams-Sonoma, Inc. (a) | 532 | 79,135 | ||||||
Wingstop, Inc. (a) | 235 | 26,757 | ||||||
Wyndham Hotels & Resorts, Inc. | 701 | 45,803 | ||||||
Number | Value | |||||||
| Consumer Discretionary (Continued) | ||||||||
YETI Holdings, Inc.* | 641 | $ | 23,646 | |||||
|
| |||||||
(Cost $1,841,179) | 1,641,500 | |||||||
|
| |||||||
| Consumer Staples — 3.4% | ||||||||
BJ’s Wholesale Club Holdings, Inc.* | 1,025 | 76,352 | ||||||
Coty, Inc., Class A* | 2,670 | 20,052 | ||||||
Darling Ingredients, Inc.* | 1,232 | 93,706 | ||||||
Flowers Foods, Inc. | 1,559 | 42,561 | ||||||
Grocery Outlet Holding Corp.* (a) | 680 | 27,281 | ||||||
Hain Celestial Group, Inc.* | 668 | 13,534 | ||||||
Ingredion, Inc. | 510 | 44,406 | ||||||
Nu Skin Enterprises, Inc., Class A | 396 | 16,212 | ||||||
Pilgrim’s Pride Corp.* | 356 | 10,135 | ||||||
Sprouts Farmers Market, Inc.* | 821 | 23,727 | ||||||
|
| |||||||
(Cost $334,335) | 367,966 | |||||||
|
| |||||||
| Energy — 4.6% | ||||||||
CNX Resources Corp.* (a) | 1,481 | 26,169 | ||||||
EQT Corp. | 2,250 | 107,550 | ||||||
Equitrans Midstream Corp. | 3,174 | 29,423 | ||||||
HF Sinclair Corp. | 1,145 | 60,262 | ||||||
Murphy Oil Corp. | 1,130 | 44,036 | ||||||
NOV, Inc. | 2,990 | 52,833 | ||||||
Range Resources Corp.* | 1,977 | 64,964 | ||||||
Targa Resources Corp. | 1,748 | 119,266 | ||||||
|
| |||||||
(Cost $403,927) | 504,503 | |||||||
|
| |||||||
| Financials — 15.9% | ||||||||
Affiliated Managers Group, Inc. | 298 | 37,953 | ||||||
Alleghany Corp.* | 105 | 88,324 | ||||||
Associated Banc-Corp. | 1,170 | 23,447 | ||||||
Bank of Hawaii Corp. | 310 | 24,186 | ||||||
Bank OZK | 870 | 35,261 | ||||||
Bread Financial Holdings, Inc. | 400 | 15,372 | ||||||
Brighthouse Financial, Inc.* | 570 | 27,104 | ||||||
Cadence Bank | 1,378 | 35,111 | ||||||
CNO Financial Group, Inc. | 880 | 16,201 | ||||||
Commerce Bancshares, Inc. | 863 | 59,349 | ||||||
East West Bancorp, Inc. | 1,080 | 77,944 | ||||||
Evercore, Inc., Class A | 306 | 28,669 | ||||||
First American Financial Corp. | 827 | 44,245 | ||||||
First Horizon Corp. | 4,119 | 93,172 | ||||||
FNB Corp. | 2,600 | 30,992 | ||||||
Fulton Financial Corp. | 1,278 | 20,742 | ||||||
Hancock Whitney Corp. | 655 | 31,591 | ||||||
Hanover Insurance Group, Inc. | 267 | 34,547 | ||||||
Janus Henderson Group PLC | 1,287 | 30,116 | ||||||
Jefferies Financial Group, Inc. | 1,480 | 47,493 | ||||||
Kemper Corp. | 478 | 21,988 | ||||||
Kinsale Capital Group, Inc. | 166 | 42,094 | ||||||
MGIC Investment Corp. | 2,343 | 33,482 | ||||||
Navient Corp. | 1,126 | 17,329 | ||||||
Old National Bancorp. | 2,244 | 37,452 | ||||||
PacWest Bancorp | 875 | 23,039 | ||||||
Pinnacle Financial Partners, Inc. | 575 | 46,408 | ||||||
Primerica, Inc. | 288 | 36,504 | ||||||
Prosperity Bancshares, Inc. | 697 | 49,403 | ||||||
Reinsurance Group of America, Inc. | 511 | 64,059 | ||||||
| See Notes to Financial Statements. | 69 |
DBX ETF Trust
Schedule of Investments
Xtrackers S&P MidCap 400 ESG ETF (Continued)
August 31, 2022
Number | Value | |||||||
| Financials (Continued) | ||||||||
RenaissanceRe Holdings Ltd. | 342 | $ | 46,259 | |||||
SEI Investments Co. | 795 | 43,487 | ||||||
Selective Insurance Group, Inc. | 452 | 35,898 | ||||||
SLM Corp. | 2,040 | 31,171 | ||||||
Stifel Financial Corp. | 823 | 48,812 | ||||||
Synovus Financial Corp. | 1,095 | 43,975 | ||||||
Texas Capital Bancshares, Inc.* | 400 | 23,612 | ||||||
UMB Financial Corp. | 330 | 29,525 | ||||||
Umpqua Holdings Corp. | 1,685 | 29,892 | ||||||
Unum Group | 1,532 | 57,986 | ||||||
Valley National Bancorp | 3,157 | 36,684 | ||||||
Voya Financial, Inc. | 780 | 47,993 | ||||||
Webster Financial Corp. | 1,346 | 63,329 | ||||||
Wintrust Financial Corp. | 465 | 39,218 | ||||||
|
| |||||||
(Cost $1,787,904) | 1,751,418 | |||||||
|
| |||||||
| Health Care — 9.7% | ||||||||
Acadia Healthcare Co., Inc.* | 700 | 57,351 | ||||||
Amedisys, Inc.* | 249 | 29,494 | ||||||
Arrowhead Pharmaceuticals, Inc.* | 816 | 32,403 | ||||||
Azenta, Inc. | 565 | 29,781 | ||||||
Encompass Health Corp. | 749 | 36,379 | ||||||
Enovis Corp.* | 360 | 18,234 | ||||||
Envista Holdings Corp.* | 1,250 | 46,362 | ||||||
Exelixis, Inc.* | 2,461 | 43,658 | ||||||
Haemonetics Corp.* | 390 | 29,262 | ||||||
Halozyme Therapeutics, Inc.* (a) | 1,050 | 42,767 | ||||||
HealthEquity, Inc.* | 653 | 43,150 | ||||||
ICU Medical, Inc.* | 152 | 24,168 | ||||||
Integra LifeSciences Holdings Corp.* | 550 | 26,241 | ||||||
Jazz Pharmaceuticals PLC* | 474 | 73,574 | ||||||
LHC Group, Inc.* | 232 | 37,461 | ||||||
LivaNova PLC* | 410 | 23,063 | ||||||
Neurocrine Biosciences, Inc.* | 730 | 76,380 | ||||||
NuVasive, Inc.* | 400 | 17,004 | ||||||
Patterson Cos., Inc. | 684 | 19,077 | ||||||
Penumbra, Inc.* | 267 | 43,833 | ||||||
Perrigo Co. PLC | 1,050 | 39,291 | ||||||
Progyny, Inc.* | 539 | 21,673 | ||||||
QuidelOrtho Corp.* | 388 | 30,753 | ||||||
R1 RCM, Inc.* | 1,040 | 22,724 | ||||||
STAAR Surgical Co.* | 371 | 35,093 | ||||||
Syneos Health, Inc.* | 782 | 47,006 | ||||||
Tenet Healthcare Corp.* | 820 | 46,330 | ||||||
United Therapeutics Corp.* | 348 | 78,864 | ||||||
|
| |||||||
(Cost $1,164,581) | 1,071,376 | |||||||
|
| |||||||
| Industrials — 19.1% | ||||||||
Acuity Brands, Inc. | 270 | 44,261 | ||||||
AECOM | 1,075 | 78,636 | ||||||
AGCO Corp. | 469 | 50,985 | ||||||
Avis Budget Group, Inc.* | 265 | 44,356 | ||||||
Axon Enterprise, Inc.* | 545 | 63,591 | ||||||
Brink’s Co. | 359 | 19,846 | ||||||
Carlisle Cos., Inc. | 396 | 117,081 | ||||||
Chart Industries, Inc.* | 273 | 52,924 | ||||||
Clean Harbors, Inc.* | 385 | 45,207 | ||||||
Number | Value | |||||||
| Industrials (Continued) | ||||||||
Donaldson Co., Inc. | 952 | $ | 48,885 | |||||
EMCOR Group, Inc. | 395 | 46,973 | ||||||
EnerSys | 302 | 18,836 | ||||||
Flowserve Corp. | 1,000 | 30,470 | ||||||
FTI Consulting, Inc.* | 260 | 41,756 | ||||||
Graco, Inc. | 1,290 | 82,354 | ||||||
Hubbell, Inc. | 408 | 84,170 | ||||||
IAA, Inc.* | 1,023 | 38,117 | ||||||
Insperity, Inc. | 273 | 29,762 | ||||||
ITT, Inc. | 645 | 46,782 | ||||||
Kennametal, Inc. | 608 | 14,252 | ||||||
Kirby Corp.* | 453 | 30,378 | ||||||
Knight-Swift Transportation Holdings, Inc. | 1,240 | 62,632 | ||||||
Lennox International, Inc. | 252 | 60,510 | ||||||
Lincoln Electric Holdings, Inc. | 445 | 60,827 | ||||||
ManpowerGroup, Inc. | 396 | 29,035 | ||||||
MasTec, Inc.* (a) | 430 | 34,615 | ||||||
Middleby Corp.* | 420 | 60,404 | ||||||
MillerKnoll, Inc. | 597 | 16,525 | ||||||
MSA Safety, Inc. | 280 | 33,281 | ||||||
nVent Electric PLC | 1,270 | 41,859 | ||||||
Owens Corning | 745 | 60,889 | ||||||
Regal Rexnord Corp. | 510 | 70,171 | ||||||
Ryder System, Inc. | 398 | 30,423 | ||||||
Saia, Inc.* | 205 | 42,400 | ||||||
Stericycle, Inc.* | 712 | 35,664 | ||||||
Sunrun, Inc.* (a) | 1,625 | 53,674 | ||||||
Terex Corp. | 510 | 16,942 | ||||||
Tetra Tech, Inc. | 420 | 57,040 | ||||||
Timken Co. | 505 | 31,810 | ||||||
Toro Co. | 800 | 66,344 | ||||||
Trex Co., Inc.* | 864 | 40,427 | ||||||
Univar Solutions, Inc.* | 1,325 | 33,417 | ||||||
Valmont Industries, Inc. | 164 | 45,398 | ||||||
Watts Water Technologies, Inc., Class A | 215 | 29,782 | ||||||
Werner Enterprises, Inc. | 438 | 17,428 | ||||||
XPO Logistics, Inc.* | 764 | 40,049 | ||||||
|
| |||||||
(Cost $2,054,556) | 2,101,168 | |||||||
|
| |||||||
| Information Technology — 12.5% | ||||||||
ACI Worldwide, Inc.* | 859 | 20,358 | ||||||
Amkor Technology, Inc. | 794 | 15,983 | ||||||
Arrow Electronics, Inc.* | 498 | 52,195 | ||||||
Avnet, Inc. | 755 | 33,137 | ||||||
Belden, Inc. | 328 | 21,477 | ||||||
Calix, Inc.* | 430 | 25,305 | ||||||
Ciena Corp.* | 1,185 | 60,127 | ||||||
Cirrus Logic, Inc.* | 440 | 33,744 | ||||||
CommVault Systems, Inc.* | 326 | 17,699 | ||||||
Envestnet, Inc.* | 417 | 21,838 | ||||||
Fair Isaac Corp.* | 200 | 89,880 | ||||||
First Solar, Inc.* | 760 | 96,938 | ||||||
Genpact Ltd. | 1,298 | 60,980 | ||||||
Jabil, Inc. | 1,073 | 64,702 | ||||||
Littelfuse, Inc. | 195 | 46,258 | ||||||
Lumentum Holdings, Inc.* (a) | 530 | 44,281 | ||||||
| See Notes to Financial Statements. | 70 |
DBX ETF Trust
Schedule of Investments
Xtrackers S&P MidCap 400 ESG ETF (Continued)
August 31, 2022
Number | Value | |||||||
| Information Technology (Continued) | ||||||||
Manhattan Associates, Inc.* | 485 | $ | 68,511 | |||||
Maximus, Inc. | 475 | 28,780 | ||||||
National Instruments Corp. | 1,004 | 39,919 | ||||||
Paylocity Holding Corp.* | 305 | 73,505 | ||||||
Power Integrations, Inc. | 450 | 32,189 | ||||||
Semtech Corp.* | 490 | 22,633 | ||||||
Silicon Laboratories, Inc.* | 280 | 35,092 | ||||||
Synaptics, Inc.* | 305 | 35,261 | ||||||
TD SYNNEX Corp. | 317 | 30,521 | ||||||
Teradata Corp.* | 794 | 26,123 | ||||||
Universal Display Corp. | 335 | 37,430 | ||||||
Vishay Intertechnology, Inc. | 971 | 19,100 | ||||||
Western Union Co. | 2,945 | 43,645 | ||||||
WEX, Inc.* | 344 | 53,062 | ||||||
Wolfspeed, Inc.* | 940 | 106,662 | ||||||
Xerox Holdings Corp. | 898 | 14,925 | ||||||
|
| |||||||
(Cost $1,398,083) | 1,372,260 | |||||||
|
| |||||||
| Materials — 6.9% | ||||||||
Alcoa Corp. | 1,405 | 69,519 | ||||||
AptarGroup, Inc. | 505 | 51,919 | ||||||
Ashland, Inc. | 387 | 39,381 | ||||||
Avient Corp. | 710 | 31,119 | ||||||
Cabot Corp. | 440 | 31,667 | ||||||
Chemours Co. | 1,170 | 39,464 | ||||||
Cleveland-Cliffs, Inc.* | 3,658 | 63,174 | ||||||
Commercial Metals Co. | 940 | 38,079 | ||||||
Greif, Inc., Class A | 199 | 13,343 | ||||||
Ingevity Corp.* | 287 | 20,130 | ||||||
Louisiana-Pacific Corp. | 630 | 34,165 | ||||||
Minerals Technologies, Inc. | 243 | 14,157 | ||||||
NewMarket Corp. | 50 | 14,360 | ||||||
Scotts Miracle-Gro Co. (a) | 310 | 20,755 | ||||||
Sensient Technologies Corp. | 330 | 26,291 | ||||||
Sonoco Products Co. | 750 | 47,265 | ||||||
Steel Dynamics, Inc. | 1,376 | 111,071 | ||||||
United States Steel Corp. | 2,000 | 45,740 | ||||||
Valvoline, Inc. | 1,370 | 39,826 | ||||||
Worthington Industries, Inc. | 239 | 12,187 | ||||||
|
| |||||||
(Cost $773,134) | 763,612 | |||||||
|
| |||||||
| Real Estate — 8.6% | ||||||||
Brixmor Property Group, Inc. REIT | 2,297 | 49,339 | ||||||
Corporate Office Properties Trust REIT | 865 | 22,351 | ||||||
Cousins Properties, Inc. REIT | 1,130 | 30,340 | ||||||
Douglas Emmett, Inc. REIT | 1,334 | 26,040 | ||||||
EastGroup Properties, Inc. REIT | 318 | 52,479 | ||||||
First Industrial Realty Trust, Inc. REIT | 1,013 | 51,339 | ||||||
Highwoods Properties, Inc. REIT | 807 | 24,541 | ||||||
Hudson Pacific Properties, Inc. REIT | 1,115 | 14,729 | ||||||
JBG SMITH Properties REIT | 835 | 18,345 | ||||||
Jones Lang LaSalle, Inc.* | 380 | 65,740 | ||||||
Kilroy Realty Corp. REIT | 795 | 38,772 | ||||||
Lamar Advertising Co., Class A REIT | 665 | 62,437 | ||||||
Life Storage, Inc. REIT | 640 | 81,440 | ||||||
Macerich Co. REIT | 1,759 | 16,834 | ||||||
Medical Properties Trust, Inc. REIT | 4,568 | 66,738 | ||||||
Number | Value | |||||||
| Real Estate (Continued) | ||||||||
National Storage Affiliates Trust REIT | 634 | $ | 32,030 | |||||
Park Hotels & Resorts, Inc. REIT | 1,830 | 25,620 | ||||||
Pebblebrook Hotel Trust REIT | 961 | 16,933 | ||||||
Physicians Realty Trust REIT | 1,753 | 29,205 | ||||||
PotlatchDeltic Corp. REIT | 540 | 25,067 | ||||||
Rayonier, Inc. REIT | 1,129 | 40,102 | ||||||
Rexford Industrial Realty, Inc. REIT | 1,260 | 78,385 | ||||||
SL Green Realty Corp. REIT | 493 | 21,776 | ||||||
STORE Capital Corp. REIT | 1,910 | 51,532 | ||||||
|
| |||||||
(Cost $1,097,368) | 942,114 | |||||||
|
| |||||||
| Utilities — 2.2% | ||||||||
Essential Utilities, Inc. | 1,751 | 86,062 | ||||||
Hawaiian Electric Industries, Inc. | 849 | 33,213 | ||||||
ONE Gas, Inc. | 405 | 31,699 | ||||||
Spire, Inc. | 415 | 29,004 | ||||||
UGI Corp. | 1,597 | 63,082 | ||||||
|
| |||||||
(Cost $228,387) | 243,060 | |||||||
|
| |||||||
TOTAL COMMON STOCKS | 10,938,677 | |||||||
|
| |||||||
| EXCHANGE-TRADED FUNDS — 0.5% | ||||||||
iShares ESG Screened S&P Mid-Cap ETF | 1,850 | 60,634 | ||||||
|
| |||||||
| CASH EQUIVALENTS — 0.1% | ||||||||
DWS Government Money Market Series “Institutional Shares”, 2.24% (b) | 5,679 | 5,679 | ||||||
|
| |||||||
TOTAL INVESTMENTS — 100.0% (Cost $11,383,475) | $ | 11,004,990 | ||||||
Other assets and liabilities, net — 0.0% | 2,574 | |||||||
|
| |||||||
NET ASSETS — 100.0% | $ | 11,007,564 | ||||||
|
| |||||||
| See Notes to Financial Statements. | 71 |
DBX ETF Trust
Schedule of Investments
Xtrackers S&P MidCap 400 ESG ETF (Continued)
August 31, 2022
A summary of the Fund’s transactions with affiliated investments during the year ended August 31, 2022 is as follows:
| Value ($) at 8/31/2021 | Purchases Cost ($) | Sales Proceeds ($) | Net Realized Gain/(Loss) ($) | Net Change in Unrealized Appreciation (Depreciation) ($) | Income ($) | Capital Gain Distributions ($) | Number of Shares at 8/31/2022 | Value ($) at 8/31/2022 | ||||||||||||||||||||||||||||
SECURITIES LENDING COLLATERAL — 0.0% |
| |||||||||||||||||||||||||||||||||||
DWS Government & Agency Securities Portfolio “DWS Government Cash Institutional Shares, 2.00% (b)(c) |
| |||||||||||||||||||||||||||||||||||
| 1,305 | — | (1,305 | )(d) | — | — | 86 | — | — | — | |||||||||||||||||||||||||||
CASH EQUIVALENTS — 0.1% |
| |||||||||||||||||||||||||||||||||||
DWS Government Money Market Series “Institutional Shares”, 2.24% (b) |
| |||||||||||||||||||||||||||||||||||
| 10,177 | 513,480 | (517,978 | ) | — | — | 41 | — | 5,679 | 5,679 | |||||||||||||||||||||||||||
|
|
|
|
|
|
|
|
|
|
|
|
|
|
|
|
|
| |||||||||||||||||||
| 11,482 | 513,480 | (519,283 | ) | — | — | 127 | — | 5,679 | 5,679 | |||||||||||||||||||||||||||
|
|
|
|
|
|
|
|
|
|
|
|
|
|
|
|
|
| |||||||||||||||||||
| * | Non-income producing security. |
| (a) | All or a portion of these securities were on loan. In addition, “Other assets and liabilities, net” may include pending sales that are also on loan. The value of securities loaned at August 31, 2022 amounted to $526,958, which is 4.8% of net assets. |
| (b) | Affiliated fund managed by DWS Investment Management Americas, Inc. The rate shown is the annualized seven-day yield at period end. |
| (c) | Represents collateral held in connection with securities lending. Income earned by the Fund is net of borrower rebates. In addition, the Fund held non-cash U.S. Treasury securities collateral having a value of $542,542. |
| (d) | Represents the net increase (purchase cost) or decrease (sales proceeds) in the amount invested in cash collateral for the year ended August 31, 2022. |
| REIT: | Real Estate Investment Trust |
Fair Value Measurements
Various inputs are used in determining the value of the Fund’s investments. These inputs are summarized in three broad levels. Level 1 includes quoted prices in active markets for identical securities. Level 2 includes other significant observable inputs (including quoted prices for similar securities, interest rates, prepayment speeds and credit risk). Level 3 includes significant unobservable inputs (including the Fund’s own assumptions in determining the fair value of investments). The level assigned to the securities valuations may not be an indication of the risk or liquidity associated with investing in those securities.
The following is a summary of the inputs used as of August 31, 2022 in valuing the Fund’s investments. For information on the Fund’s policy regarding the valuation of investments, please refer to the Security Valuation section of Note 2 in the accompanying Notes to Financial Statements.
Assets | Level 1 | Level 2 | Level 3 | Total | ||||||||||||
Common Stocks (a) | $ | 10,938,677 | $ | — | $ | — | $ | 10,938,677 | ||||||||
Exchange-Traded Funds | 60,634 | — | — | 60,634 | ||||||||||||
Short-Term Investments (a) | 5,679 | — | — | 5,679 | ||||||||||||
|
|
|
|
|
|
|
| |||||||||
TOTAL | $ | 11,004,990 | $ | — | $ | — | $ | 11,004,990 | ||||||||
|
|
|
|
|
|
|
| |||||||||
| (a) | See Schedule of Investments for additional detailed categorizations. |
| See Notes to Financial Statements. | 72 |
DBX ETF Trust
Schedule of Investments
Xtrackers S&P SmallCap 600 ESG ETF
August 31, 2022
Number | Value | |||||||
| COMMON STOCKS — 99.5% | ||||||||
| Communication Services — 1.3% | ||||||||
Cars.com, Inc.* | 1,038 | $ | 13,234 | |||||
Cinemark Holdings, Inc.* | 1,658 | 23,345 | ||||||
Consolidated Communications Holdings, Inc.* | 1,126 | 6,463 | ||||||
EW Scripps Co., Class A* | 897 | 13,410 | ||||||
QuinStreet, Inc.* | 789 | 9,476 | ||||||
Scholastic Corp. | 466 | 21,394 | ||||||
TechTarget, Inc.* | 410 | 26,609 | ||||||
Thryv Holdings, Inc.* | 281 | 7,188 | ||||||
|
| |||||||
(Cost $130,347) | 121,119 | |||||||
|
| |||||||
| Consumer Discretionary — 12.1% | ||||||||
Aaron’s Co., Inc. | 449 | 5,343 | ||||||
Abercrombie & Fitch Co., Class A* | 787 | 11,325 | ||||||
Adtalem Global Education, Inc.* | 693 | 26,119 | ||||||
American Axle & Manufacturing Holdings, Inc.* | 1,770 | 18,320 | ||||||
American Public Education, Inc.* | 272 | 2,810 | ||||||
America’s Car-Mart, Inc.* | 89 | 7,174 | ||||||
Asbury Automotive Group, Inc.* | 341 | 59,498 | ||||||
Bed Bath & Beyond, Inc.* | 1,182 | 11,264 | ||||||
Big Lots, Inc. (a) | 444 | 9,133 | ||||||
BJ’s Restaurants, Inc.* | 368 | 9,229 | ||||||
Bloomin’ Brands, Inc. | 1,232 | 24,911 | ||||||
Boot Barn Holdings, Inc.* | 456 | 30,379 | ||||||
Brinker International, Inc.* | 688 | 16,863 | ||||||
Buckle, Inc. (a) | 459 | 14,817 | ||||||
Caleres, Inc. | 587 | 14,980 | ||||||
Cavco Industries, Inc.* | 132 | 30,889 | ||||||
Century Communities, Inc. | 450 | 21,011 | ||||||
Cheesecake Factory, Inc. (a) | 764 | 23,394 | ||||||
Chico’s FAS, Inc.* | 1,977 | 11,229 | ||||||
Children’s Place, Inc.* | 198 | 8,352 | ||||||
Dine Brands Global, Inc. (a) | 262 | 17,449 | ||||||
Ethan Allen Interiors, Inc. | 354 | 8,415 | ||||||
Fossil Group, Inc.* | 689 | 2,915 | ||||||
Gentherm, Inc.* | 509 | 30,489 | ||||||
Group 1 Automotive, Inc. | 257 | 45,898 | ||||||
Guess?, Inc. (a) | 569 | 9,940 | ||||||
Hibbett, Inc. | 187 | 10,958 | ||||||
Installed Building Products, Inc. | 359 | 32,511 | ||||||
iRobot Corp.* | 414 | 24,376 | ||||||
Jack in the Box, Inc. | 319 | 25,475 | ||||||
Kontoor Brands, Inc. (a) | 718 | 26,731 | ||||||
La-Z-Boy, Inc. | 675 | 17,813 | ||||||
LCI Industries | 393 | 45,537 | ||||||
LGI Homes, Inc.* (a) | 319 | 30,276 | ||||||
Liquidity Services, Inc.* | 423 | 7,398 | ||||||
MarineMax, Inc.* | 338 | 12,283 | ||||||
MDC Holdings, Inc. | 873 | 27,133 | ||||||
Monro, Inc. | 522 | 24,174 | ||||||
Motorcar Parts of America, Inc.* | 281 | 4,176 | ||||||
Movado Group, Inc. | 239 | 7,622 | ||||||
ODP Corp.* | 671 | 23,988 | ||||||
Patrick Industries, Inc. | 341 | 18,063 | ||||||
PetMed Express, Inc. | 307 | 6,315 | ||||||
Number | Value | |||||||
| Consumer Discretionary (Continued) | ||||||||
Rent-A-Center, Inc. | 831 | $ | 21,473 | |||||
Ruth’s Hospitality Group, Inc. | 461 | 8,399 | ||||||
Sally Beauty Holdings, Inc.* (a) | 1,657 | 24,656 | ||||||
Shake Shack, Inc., Class A* (a) | 607 | 28,930 | ||||||
Signet Jewelers Ltd. | 733 | 47,916 | ||||||
Sleep Number Corp.* | 346 | 14,335 | ||||||
Sonos, Inc.* (a) | 1,980 | 29,779 | ||||||
Standard Motor Products, Inc. | 295 | 10,827 | ||||||
Steven Madden Ltd. | 1,164 | 33,884 | ||||||
Strategic Education, Inc. | 355 | 22,969 | ||||||
Tupperware Brands Corp.* | 710 | 7,980 | ||||||
Unifi, Inc.* | 223 | 2,533 | ||||||
Universal Electronics, Inc.* | 187 | 4,157 | ||||||
Winnebago Industries, Inc. (a) | 502 | 28,905 | ||||||
Wolverine World Wide, Inc. | 1,241 | 24,249 | ||||||
WW International, Inc.* | 853 | 4,453 | ||||||
|
| |||||||
(Cost $1,453,419) | 1,132,420 | |||||||
|
| |||||||
| Consumer Staples — 4.6% | ||||||||
Calavo Growers, Inc. | 279 | 11,729 | ||||||
Cal-Maine Foods, Inc. | 581 | 31,147 | ||||||
Edgewell Personal Care Co. | 812 | 31,636 | ||||||
elf Beauty, Inc.* | 746 | 28,445 | ||||||
Fresh Del Monte Produce, Inc. | 514 | 14,053 | ||||||
Hostess Brands, Inc.* | 2,134 | 49,466 | ||||||
J & J Snack Foods Corp. | 231 | 34,426 | ||||||
John B Sanfilippo & Son, Inc. | 143 | 11,544 | ||||||
Medifast, Inc. | 179 | 22,461 | ||||||
MGP Ingredients, Inc. | 191 | 20,907 | ||||||
PriceSmart, Inc. | 366 | 23,157 | ||||||
Seneca Foods Corp., Class A* | 88 | 4,649 | ||||||
Simply Good Foods Co.* | 1,366 | 41,731 | ||||||
SpartanNash Co. | 556 | 16,919 | ||||||
TreeHouse Foods, Inc.* | 866 | 40,356 | ||||||
United Natural Foods, Inc.* | 903 | 39,804 | ||||||
USANA Health Sciences, Inc.* | 182 | 11,743 | ||||||
|
| |||||||
(Cost $425,760) | 434,173 | |||||||
|
| |||||||
| Energy — 4.0% | ||||||||
Archrock, Inc. | 2,070 | 15,297 | ||||||
Bristow Group, Inc.* | 369 | 10,705 | ||||||
Core Laboratories NV | 716 | 11,563 | ||||||
DMC Global, Inc.* | 310 | 6,919 | ||||||
Green Plains, Inc.* | 828 | 30,330 | ||||||
Helix Energy Solutions Group, Inc.* | 2,216 | 9,573 | ||||||
Helmerich & Payne, Inc. | 1,622 | 69,341 | ||||||
Laredo Petroleum, Inc.* | 226 | 17,540 | ||||||
Nabors Industries Ltd.* | 138 | 18,286 | ||||||
Par Pacific Holdings, Inc.* | 720 | 13,536 | ||||||
Patterson-UTI Energy, Inc. | 3,339 | 49,751 | ||||||
SM Energy Co. | 1,874 | 82,587 | ||||||
Talos Energy, Inc.* | 650 | 13,475 | ||||||
World Fuel Services Corp. | 980 | 25,284 | ||||||
|
| |||||||
(Cost $310,928) | 374,187 | |||||||
|
| |||||||
| Financials — 19.7% | ||||||||
Ambac Financial Group, Inc.* | 671 | 10,125 | ||||||
| See Notes to Financial Statements. | 73 |
DBX ETF Trust
Schedule of Investments
Xtrackers S&P SmallCap 600 ESG ETF (Continued)
August 31, 2022
Number | Value | |||||||
| Financials (Continued) | ||||||||
American Equity Investment Life Holding Co. | 1,194 | $ | 45,372 | |||||
Ameris Bancorp | 1,020 | 47,614 | ||||||
AMERISAFE, Inc. | 299 | 14,298 | ||||||
Assured Guaranty Ltd. | 986 | 50,355 | ||||||
Banc of California, Inc. | 832 | 14,044 | ||||||
Bancorp, Inc.* | 870 | 20,636 | ||||||
BankUnited, Inc. | 1,265 | 46,868 | ||||||
Banner Corp. | 528 | 32,081 | ||||||
Berkshire Hills Bancorp, Inc. | 735 | 20,734 | ||||||
Blucora, Inc.* | 737 | 14,799 | ||||||
Brightsphere Investment Group, Inc. | 508 | 8,682 | ||||||
Central Pacific Financial Corp. | 434 | 9,457 | ||||||
City Holding Co. | 232 | 19,722 | ||||||
Community Bank System, Inc. | 828 | 54,135 | ||||||
Customers Bancorp, Inc.* | 466 | 16,166 | ||||||
Donnelley Financial Solutions, Inc.* | 423 | 17,956 | ||||||
Eagle Bancorp, Inc. | 500 | 24,265 | ||||||
eHealth, Inc.* | 401 | 2,566 | ||||||
Ellington Financial, Inc. REIT | 847 | 12,434 | ||||||
Encore Capital Group, Inc.* | 373 | 20,396 | ||||||
Enova International, Inc.* | 496 | 17,330 | ||||||
FB Financial Corp. | 541 | 21,434 | ||||||
First BanCorp | 3,056 | 43,701 | ||||||
First Financial Bancorp | 1,451 | 31,313 | ||||||
First Hawaiian, Inc. | 1,978 | 50,854 | ||||||
Franklin BSP Realty Trust, Inc. REIT (a) | 1,304 | 16,822 | ||||||
Genworth Financial, Inc., Class A* | 7,865 | 33,190 | ||||||
Green Dot Corp., Class A* | 830 | 16,841 | ||||||
Hanmi Financial Corp. | 483 | 11,940 | ||||||
Heritage Financial Corp. | 546 | 14,191 | ||||||
Hilltop Holdings, Inc. | 760 | 20,064 | ||||||
HomeStreet, Inc. | 292 | 10,165 | ||||||
Hope Bancorp, Inc. | 1,860 | 26,914 | ||||||
Horace Mann Educators Corp. | 646 | 23,107 | ||||||
Independent Bank Corp. | 721 | 56,404 | ||||||
Independent Bank Group, Inc. | 560 | 37,722 | ||||||
Invesco Mortgage Capital, Inc. REIT | 516 | 8,199 | ||||||
Lakeland Financial Corp. | 394 | 29,684 | ||||||
Mr Cooper Group, Inc.* | 1,141 | 48,264 | ||||||
National Bank Holdings Corp., Class A | 459 | 18,420 | ||||||
NBT Bancorp, Inc. | 667 | 25,866 | ||||||
New York Mortgage Trust, Inc. REIT | 5,843 | 16,360 | ||||||
Northfield Bancorp, Inc. | 671 | 9,891 | ||||||
Northwest Bancshares, Inc. | 1,958 | 27,549 | ||||||
OFG Bancorp | 757 | 20,590 | ||||||
Pacific Premier Bancorp, Inc. | 1,468 | 48,092 | ||||||
Park National Corp. (a) | 224 | 29,530 | ||||||
Pathward Financial, Inc. | 457 | 15,063 | ||||||
PennyMac Mortgage Investment Trust REIT (a) | 1,429 | 21,221 | ||||||
Piper Sandler Cos. | 220 | 25,205 | ||||||
PRA Group, Inc.* | 612 | 22,607 | ||||||
ProAssurance Corp. | 825 | 17,647 | ||||||
Provident Financial Services, Inc. | 1,150 | 26,715 | ||||||
Redwood Trust, Inc. REIT | 1,869 | 14,485 | ||||||
S&T Bancorp, Inc. | 605 | 17,932 | ||||||
Number | Value | |||||||
| Financials (Continued) | ||||||||
Seacoast Banking Corp. of Florida | 938 | $ | 30,316 | |||||
ServisFirst Bancshares, Inc. | 751 | 63,354 | ||||||
Simmons First National Corp., Class A | 1,962 | 46,284 | ||||||
Southside Bancshares, Inc. | 495 | 18,652 | ||||||
Stewart Information Services Corp. | 421 | 21,319 | ||||||
StoneX Group, Inc.* | 263 | 24,417 | ||||||
Tompkins Financial Corp. | 185 | 13,253 | ||||||
Triumph Bancorp, Inc.* | 366 | 22,659 | ||||||
Trupanion, Inc.* (a) | 531 | 37,478 | ||||||
Trustmark Corp. | 941 | 29,679 | ||||||
Two Harbors Investment Corp. REIT (a) | 5,287 | 25,642 | ||||||
United Fire Group, Inc. | 341 | 10,036 | ||||||
Veritex Holdings, Inc. | 836 | 25,172 | ||||||
Virtus Investment Partners, Inc. | 109 | 20,846 | ||||||
Westamerica BanCorp | 411 | 22,996 | ||||||
WisdomTree Investments, Inc. | 1,736 | 8,697 | ||||||
World Acceptance Corp.* | 54 | 6,277 | ||||||
WSFS Financial Corp. | 992 | 47,963 | ||||||
|
| |||||||
(Cost $1,923,024) | 1,853,057 | |||||||
|
| |||||||
| Health Care — 11.1% | ||||||||
Addus HomeCare Corp.* | 250 | 22,305 | ||||||
Allscripts Healthcare Solutions, Inc.* | 1,773 | 30,141 | ||||||
AMN Healthcare Services, Inc.* | 686 | 70,411 | ||||||
Amphastar Pharmaceuticals, Inc.* | 582 | 17,227 | ||||||
AngioDynamics, Inc.* | 610 | 13,505 | ||||||
Anika Therapeutics, Inc.* | 238 | 5,379 | ||||||
Avanos Medical, Inc.* | 733 | 18,054 | ||||||
Avid Bioservices, Inc.* | 954 | 16,428 | ||||||
Cara Therapeutics, Inc.* | 673 | 6,945 | ||||||
Coherus Biosciences, Inc.* (a) | 1,014 | 11,336 | ||||||
Collegium Pharmaceutical, Inc.* | 536 | 9,423 | ||||||
Community Health Systems, Inc.* (a) | 2,029 | 5,397 | ||||||
Computer Programs and Systems, Inc.* | 237 | 7,231 | ||||||
CONMED Corp. | 457 | 40,476 | ||||||
CorVel Corp.* | 143 | 22,219 | ||||||
Covetrus, Inc.* | 1,602 | 33,434 | ||||||
Cross Country Healthcare, Inc.* (a) | 557 | 14,137 | ||||||
Cytokinetics, Inc.* | 1,321 | 69,960 | ||||||
Eagle Pharmaceuticals, Inc.* | 166 | 5,440 | ||||||
Emergent BioSolutions, Inc.* | 694 | 16,670 | ||||||
Enanta Pharmaceuticals, Inc.* | 285 | 17,351 | ||||||
Ensign Group, Inc. | 810 | 69,093 | ||||||
Fulgent Genetics, Inc.* | 306 | 13,302 | ||||||
Glaukos Corp.* | 725 | 35,199 | ||||||
Hanger, Inc.* | 585 | 10,899 | ||||||
Innoviva, Inc.* | 956 | 12,581 | ||||||
Inogen, Inc.* | 325 | 9,305 | ||||||
iTeos Therapeutics, Inc.* | 322 | 7,142 | ||||||
Ligand Pharmaceuticals, Inc.* | 262 | 24,206 | ||||||
Merit Medical Systems, Inc.* | 788 | 46,673 | ||||||
ModivCare, Inc.* | 187 | 20,256 | ||||||
Myriad Genetics, Inc.* | 1,245 | 27,813 | ||||||
Nektar Therapeutics* (a) | 2,907 | 11,454 | ||||||
NextGen Healthcare, Inc.* | 868 | 14,877 | ||||||
OraSure Technologies, Inc.* | 1,045 | 4,274 | ||||||
Organogenesis Holdings, Inc.* | 916 | 3,288 | ||||||
| See Notes to Financial Statements. | 74 |
DBX ETF Trust
Schedule of Investments
Xtrackers S&P SmallCap 600 ESG ETF (Continued)
August 31, 2022
Number | Value | |||||||
| Health Care (Continued) | ||||||||
Orthofix Medical, Inc.* | 311 | $ | 6,189 | |||||
Owens & Minor, Inc. (a) | 1,180 | 34,822 | ||||||
Pediatrix Medical Group, Inc.* | 1,323 | 23,576 | ||||||
Phibro Animal Health Corp., Class A | 296 | 4,384 | ||||||
Prestige Consumer Healthcare, Inc.* | 775 | 39,199 | ||||||
RadNet, Inc.* | 728 | 14,625 | ||||||
REGENXBIO, Inc.* | 584 | 17,228 | ||||||
Select Medical Holdings Corp. | 1,597 | 40,947 | ||||||
Surmodics, Inc.* | 204 | 6,873 | ||||||
uniQure NV* | 573 | 11,196 | ||||||
US Physical Therapy, Inc. | 201 | 16,605 | ||||||
Vanda Pharmaceuticals, Inc.* | 893 | 9,448 | ||||||
Varex Imaging Corp.* (a) | 610 | 12,865 | ||||||
Vericel Corp.* | 719 | 17,939 | ||||||
Xencor, Inc.* | 922 | 24,332 | ||||||
|
| |||||||
(Cost $1,106,006) | 1,044,059 | |||||||
|
| |||||||
| Industrials — 15.9% | ||||||||
AAON, Inc. | 643 | 36,960 | ||||||
ABM Industries, Inc. | 1,035 | 48,024 | ||||||
Alamo Group, Inc. | 152 | 19,875 | ||||||
Allegiant Travel Co.* | 236 | 22,774 | ||||||
Applied Industrial Technologies, Inc. | 592 | 62,764 | ||||||
ArcBest Corp. | 374 | 30,118 | ||||||
Astec Industries, Inc. | 354 | 13,516 | ||||||
Atlas Air Worldwide Holdings, Inc.* | 402 | 40,168 | ||||||
AZZ, Inc. | 381 | 16,234 | ||||||
Boise Cascade Co. | 611 | 38,084 | ||||||
Brady Corp., Class A | 741 | 34,486 | ||||||
Comfort Systems USA, Inc. | 555 | 55,689 | ||||||
CoreCivic, Inc.* | 1,901 | 18,116 | ||||||
Deluxe Corp. | 661 | 12,718 | ||||||
Encore Wire Corp. | 305 | 39,680 | ||||||
Enerpac Tool Group Corp. | 925 | 17,945 | ||||||
EnPro Industries, Inc. | 321 | 29,070 | ||||||
Federal Signal Corp. | 933 | 37,199 | ||||||
Forrester Research, Inc.* | 162 | 6,738 | ||||||
Forward Air Corp. | 412 | 39,980 | ||||||
Franklin Electric Co., Inc. | 601 | 52,197 | ||||||
GEO Group, Inc.* | 1,951 | 15,959 | ||||||
Granite Construction, Inc. | 697 | 20,896 | ||||||
Greenbrier Cos., Inc. | 497 | 14,169 | ||||||
Harsco Corp.* | 1,262 | 7,156 | ||||||
Healthcare Services Group, Inc. | 1,128 | 15,871 | ||||||
Heartland Express, Inc. | 729 | 11,044 | ||||||
Heidrick & Struggles International, Inc. | 313 | 8,908 | ||||||
Hillenbrand, Inc. | 1,105 | 46,045 | ||||||
HNI Corp. | 653 | 20,896 | ||||||
Interface, Inc. | 932 | 10,410 | ||||||
John Bean Technologies Corp. | 491 | 50,701 | ||||||
KAR Auction Services, Inc.* | 1,861 | 27,171 | ||||||
Kelly Services, Inc., Class A | 523 | 8,425 | ||||||
Korn Ferry | 831 | 50,624 | ||||||
Lindsay Corp. | 171 | 27,422 | ||||||
Matson, Inc. | 625 | 46,037 | ||||||
Matthews International Corp., Class A | 494 | 12,355 | ||||||
MYR Group, Inc.* | 264 | 24,536 | ||||||
Number | Value | |||||||
| Industrials (Continued) | ||||||||
NOW, Inc.* | 1,681 | $ | 20,374 | |||||
NV5 Global, Inc.* | 185 | 26,041 | ||||||
PGT Innovations, Inc.* | 936 | 19,581 | ||||||
Pitney Bowes, Inc. | 2,404 | 6,948 | ||||||
Powell Industries, Inc. | 154 | 3,798 | ||||||
Proto Labs, Inc.* | 420 | 16,128 | ||||||
Quanex Building Products Corp. | 524 | 11,685 | ||||||
Resideo Technologies, Inc.* | 2,248 | 46,803 | ||||||
SkyWest, Inc.* | 762 | 16,223 | ||||||
SPX Technologies, Inc.* | 709 | 40,456 | ||||||
Standex International Corp. | 187 | 16,907 | ||||||
Tennant Co. | 285 | 17,200 | ||||||
Titan International, Inc.* | 804 | 11,280 | ||||||
Triumph Group, Inc.* | 1,008 | 13,094 | ||||||
TrueBlue, Inc.* | 523 | 10,742 | ||||||
UFP Industries, Inc. | 962 | 76,373 | ||||||
Veritiv Corp.* | 216 | 25,745 | ||||||
Viad Corp.* | 322 | 12,294 | ||||||
Wabash National Corp. | 779 | 12,815 | ||||||
|
| |||||||
(Cost $1,522,197) | 1,495,447 | |||||||
|
| |||||||
| Information Technology — 14.4% | ||||||||
8x8, Inc.* (a) | 1,888 | 9,836 | ||||||
ADTRAN Holdings, Inc. | 1,197 | 27,818 | ||||||
Agilysys, Inc.* | 305 | 15,790 | ||||||
Alarm.com Holdings, Inc.* | 708 | 47,153 | ||||||
Arlo Technologies, Inc.* | 1,362 | 8,295 | ||||||
Axcelis Technologies, Inc.* | 507 | 33,939 | ||||||
Badger Meter, Inc. | 450 | 42,610 | ||||||
CalAmp Corp.* (a) | 522 | 3,226 | ||||||
Cerence, Inc.* | 612 | 12,246 | ||||||
CEVA, Inc.* | 360 | 10,537 | ||||||
Cohu, Inc.* | 740 | 19,854 | ||||||
CTS Corp. | 495 | 20,948 | ||||||
Digi International, Inc.* | 543 | 17,979 | ||||||
Diodes, Inc.* | 698 | 49,677 | ||||||
Ebix, Inc. (a) | 381 | 9,914 | ||||||
EVERTEC, Inc. | 1,003 | 33,701 | ||||||
ExlService Holdings, Inc.* | 511 | 85,700 | ||||||
Extreme Networks, Inc.* | 2,021 | 28,961 | ||||||
Fabrinet* | 568 | 58,413 | ||||||
FARO Technologies, Inc.* | 289 | 9,696 | ||||||
FormFactor, Inc.* | 1,209 | 35,400 | ||||||
Harmonic, Inc.* | 1,633 | 18,388 | ||||||
Ichor Holdings Ltd.* | 448 | 13,763 | ||||||
Insight Enterprises, Inc.* | 542 | 49,387 | ||||||
InterDigital, Inc. | 475 | 23,826 | ||||||
Itron, Inc.* | 692 | 32,925 | ||||||
Knowles Corp.* | 1,424 | 21,574 | ||||||
Kulicke & Soffa Industries, Inc. | 915 | 38,467 | ||||||
LivePerson, Inc.* | 1,052 | 12,203 | ||||||
Methode Electronics, Inc. | 566 | 22,900 | ||||||
NETGEAR, Inc.* | 457 | 10,781 | ||||||
NetScout Systems, Inc.* | 1,141 | 36,215 | ||||||
OneSpan, Inc.* | 499 | 5,743 | ||||||
Onto Innovation, Inc.* | 762 | 54,094 | ||||||
OSI Systems, Inc.* | 246 | 20,497 | ||||||
| See Notes to Financial Statements. | 75 |
DBX ETF Trust
Schedule of Investments
Xtrackers S&P SmallCap 600 ESG ETF (Continued)
August 31, 2022
Number | Value | |||||||
| Information Technology (Continued) | ||||||||
PDF Solutions, Inc.* | 464 | $ | 12,240 | |||||
Perficient, Inc.* | 534 | 41,705 | ||||||
Plexus Corp.* | 429 | 40,210 | ||||||
Progress Software Corp. | 680 | 32,728 | ||||||
Rambus, Inc.* | 1,706 | 43,998 | ||||||
Rogers Corp.* | 287 | 71,899 | ||||||
ScanSource, Inc.* | 396 | 11,472 | ||||||
SPS Commerce, Inc.* | 555 | 67,777 | ||||||
TTEC Holdings, Inc. | 280 | 14,658 | ||||||
Unisys Corp.* | 1,052 | 9,794 | ||||||
Veeco Instruments, Inc.* | 779 | 16,468 | ||||||
Viavi Solutions, Inc.* | 3,514 | 49,477 | ||||||
|
| |||||||
(Cost $1,451,802) | 1,354,882 | |||||||
|
| |||||||
| Materials — 5.8% | ||||||||
AdvanSix, Inc. | 426 | 15,447 | ||||||
American Vanguard Corp. | 426 | 8,490 | ||||||
Arconic Corp.* | 1,636 | 41,244 | ||||||
Balchem Corp. | 495 | 65,251 | ||||||
Century Aluminum Co.* | 811 | 6,261 | ||||||
Clearwater Paper Corp.* | 264 | 11,231 | ||||||
Compass Minerals International, Inc. | 535 | 21,662 | ||||||
GCP Applied Technologies, Inc.* | 841 | 26,424 | ||||||
Glatfelter Corp. | 647 | 3,151 | ||||||
Hawkins, Inc. | 294 | 11,266 | ||||||
Haynes International, Inc. | 181 | 7,184 | ||||||
HB Fuller Co. | 820 | 53,185 | ||||||
Innospec, Inc. | 385 | 35,982 | ||||||
Kaiser Aluminum Corp. | 241 | 17,294 | ||||||
Koppers Holdings, Inc. | 310 | 7,077 | ||||||
Livent Corp.* (a) | 2,493 | 80,225 | ||||||
Olympic Steel, Inc. | 135 | 3,553 | ||||||
Quaker Chemical Corp. (a) | 206 | 35,910 | ||||||
Stepan Co. | 328 | 34,187 | ||||||
SunCoke Energy, Inc. | 1,336 | 8,804 | ||||||
TimkenSteel Corp.* | 652 | 10,002 | ||||||
Trinseo PLC | 558 | 14,804 | ||||||
Warrior Met Coal, Inc. | 800 | 26,040 | ||||||
|
| |||||||
(Cost $540,234) | 544,674 | |||||||
|
| |||||||
| Real Estate — 8.1% | ||||||||
Acadia Realty Trust REIT | 1,468 | 23,385 | ||||||
Agree Realty Corp. REIT | 1,152 | 86,769 | ||||||
American Assets Trust, Inc. REIT | 821 | 22,791 | ||||||
Anywhere Real Estate, Inc.* | 1,785 | 17,439 | ||||||
Armada Hoffler Properties, Inc. REIT | 1,049 | 13,773 | ||||||
Brandywine Realty Trust REIT | 2,665 | 21,400 | ||||||
CareTrust REIT, Inc. REIT | 1,500 | 32,310 | ||||||
Centerspace REIT | 240 | 18,091 | ||||||
Chatham Lodging Trust REIT* | 796 | 9,679 | ||||||
Community Healthcare Trust, Inc. REIT | 367 | 13,539 | ||||||
DiamondRock Hospitality Co. REIT* | 3,243 | 28,311 | ||||||
Diversified Healthcare Trust REIT | 3,917 | 5,719 | ||||||
Easterly Government Properties, Inc. REIT | 1,391 | 24,969 | ||||||
Essential Properties Realty Trust, Inc. REIT | 2,130 | 48,223 | ||||||
Getty Realty Corp. REIT | 630 | 18,950 | ||||||
Hersha Hospitality Trust REIT* | 496 | 4,811 | ||||||
Number | Value | |||||||
| Real Estate (Continued) | ||||||||
Innovative Industrial Properties, Inc. REIT | 433 | $ | 39,715 | |||||
iStar, Inc. REIT (a) | 1,283 | 17,667 | ||||||
LTC Properties, Inc. REIT | 602 | 27,024 | ||||||
Office Properties Income Trust REIT | 748 | 13,142 | ||||||
Retail Opportunity Investments Corp. REIT | 1,919 | 32,143 | ||||||
RPT Realty REIT | 1,314 | 12,654 | ||||||
Safehold, Inc. REIT | 242 | 9,203 | ||||||
SITE Centers Corp. REIT | 2,777 | 35,990 | ||||||
Summit Hotel Properties, Inc. REIT | 1,672 | 13,142 | ||||||
Tanger Factory Outlet Centers, Inc. REIT | 1,616 | 24,919 | ||||||
Uniti Group, Inc. REIT | 3,628 | 34,067 | ||||||
Universal Health Realty Income Trust REIT | 202 | 10,280 | ||||||
Urban Edge Properties REIT | 1,719 | 27,040 | ||||||
Veris Residential, Inc. REIT* | 1,213 | 16,303 | ||||||
Washington Real Estate Investment Trust REIT | 1,339 | 26,258 | ||||||
Whitestone REIT | 731 | 7,193 | ||||||
Xenia Hotels & Resorts, Inc. REIT* | 1,763 | 27,961 | ||||||
|
| |||||||
(Cost $863,822) | 764,860 | |||||||
|
| |||||||
| Utilities — 2.5% | ||||||||
American States Water Co. | 571 | 47,376 | ||||||
Avista Corp. | 1,121 | 45,546 | ||||||
California Water Service Group | 830 | 48,580 | ||||||
Northwest Natural Holding Co. | 527 | 25,090 | ||||||
South Jersey Industries, Inc. | 1,883 | 63,740 | ||||||
|
| |||||||
(Cost $216,191) | 230,332 | |||||||
|
| |||||||
TOTAL COMMON STOCKS | 9,349,210 | |||||||
|
| |||||||
| EXCHANGE-TRADED FUNDS — 0.4% | ||||||||
SPDR Portfolio S&P 600 Small Cap ETF | 970 | 36,753 | ||||||
|
| |||||||
| SECURITIES LENDING COLLATERAL — 0.2% | ||||||||
DWS Government & Agency Securities Portfolio “DWS Government Cash Institutional Shares”, 2.00% (b)(c) | 22,525 | 22,525 | ||||||
|
| |||||||
| CASH EQUIVALENTS — 0.4% | ||||||||
DWS Government Money Market Series “Institutional Shares”, 2.24% (b) | 33,982 | 33,982 | ||||||
|
| |||||||
TOTAL INVESTMENTS — 100.5% (Cost $10,036,918) | $ | 9,442,470 | ||||||
Other assets and liabilities, net — (0.5%) | (49,886 | ) | ||||||
|
| |||||||
NET ASSETS — 100.0% | $ | 9,392,584 | ||||||
|
| |||||||
| See Notes to Financial Statements. | 76 |
DBX ETF Trust
Schedule of Investments
Xtrackers S&P SmallCap 600 ESG ETF (Continued)
August 31, 2022
A summary of the Fund’s transactions with affiliated investments during the year ended August 31, 2022 is as follows:
| Value ($) at 8/31/2021 | Purchases Cost ($) | Sales Proceeds ($) | Net Realized Gain/(Loss) ($) | Net Change in Unrealized Appreciation (Depreciation) ($) | Income ($) | Capital Gain Distributions ($) | Number of Shares at 8/31/2022 | Value ($) at 8/31/2022 | ||||||||||||||||||||||||||||
SECURITIES LENDING COLLATERAL — 0.2% |
| |||||||||||||||||||||||||||||||||||
DWS Government & Agency Securities Portfolio “DWS Government Cash Institutional Shares”, 2.00% (b)(c) |
| |||||||||||||||||||||||||||||||||||
| 50,397 | — | (27,872 | )(d) | — | — | 121 | — | 22,525 | 22,525 | |||||||||||||||||||||||||||
CASH EQUIVALENTS — 0.4% |
| |||||||||||||||||||||||||||||||||||
DWS Government Money Market Series “Institutional Shares”, 2.24% (b) |
| |||||||||||||||||||||||||||||||||||
| 12,273 | 678,572 | (656,863 | ) | — | — | 36 | — | 33,982 | 33,982 | |||||||||||||||||||||||||||
|
|
|
|
|
|
|
|
|
|
|
|
|
|
|
|
|
| |||||||||||||||||||
| 62,670 | 678,572 | (684,735 | ) | — | — | 157 | — | 56,507 | 56,507 | |||||||||||||||||||||||||||
|
|
|
|
|
|
|
|
|
|
|
|
|
|
|
|
|
| |||||||||||||||||||
| * | Non-income producing security. |
| (a) | All or a portion of these securities were on loan. In addition, “Other assets and liabilities, net” may include pending sales that are also on loan. The value of securities loaned at August 31, 2022 amounted to $576,899, which is 6.1% of net assets. |
| (b) | Affiliated fund managed by DWS Investment Management Americas, Inc. The rate shown is the annualized seven-day yield at period end. |
| (c) | Represents cash collateral held in connection with securities lending. Income earned by the Fund is net of borrower rebates. In addition, the Fund held non-cash U.S. Treasury securities collateral having a value of $572,865. |
| (d) | Represents the net increase (purchase cost) or decrease (sales proceeds) in the amount invested in cash collateral for the period ended August 31, 2022. |
| REIT: | Real Estate Investment Trust |
Fair Value Measurements
Various inputs are used in determining the value of the Fund’s investments. These inputs are summarized in three broad levels. Level 1 includes quoted prices in active markets for identical securities. Level 2 includes other significant observable inputs (including quoted prices for similar securities, interest rates, prepayment speeds and credit risk). Level 3 includes significant unobservable inputs (including the Fund’s own assumptions in determining the fair value of investments). The level assigned to the securities valuations may not be an indication of the risk or liquidity associated with investing in those securities.
The following is a summary of the inputs used as of August 31, 2022 in valuing the Fund’s investments. For information on the Fund’s policy regarding the valuation of investments, please refer to the Security Valuation section of Note 2 in the accompanying Notes to Financial Statements.
Assets | Level 1 | Level 2 | Level 3 | Total | ||||||||||||
Common Stocks (a) | $ | 9,349,210 | $ | — | $ | — | $ | 9,349,210 | ||||||||
Exchange-Traded Funds | 36,753 | — | — | 36,753 | ||||||||||||
Short-Term Investments (a) | 56,507 | — | — | 56,507 | ||||||||||||
|
|
|
|
|
|
|
| |||||||||
TOTAL | $ | 9,442,470 | $ | — | $ | — | $ | 9,442,470 | ||||||||
|
|
|
|
|
|
|
| |||||||||
| (a) | See Schedule of Investments for additional detailed categorizations. |
| See Notes to Financial Statements. | 77 |
DBX ETF Trust
August 31, 2022
| Xtrackers Emerging Markets Carbon Reduction and Climate Improvers ETF | Xtrackers MSCI EAFE ESG Leaders Equity ETF | Xtrackers MSCI Emerging Markets ESG Leaders Equity ETF | Xtrackers MSCI USA ESG Leaders Equity ETF | |||||||||||||
Assets | ||||||||||||||||
Investment in non-affiliated securities at value | $ | 489,487,118 | $ | 28,835,318 | $ | 22,748,030 | $ | 3,046,299,265 | ||||||||
Investment in DWS Government Money Market Series | 1,859,521 | 29,931 | — | 8,312,422 | ||||||||||||
Investment in DWS Government & Agency Securities Portfolio* | 1,366,731 | 112,126 | 43,257 | 804,200 | ||||||||||||
Foreign currency at value | 814,018 | 125,996 | 79,498 | — | ||||||||||||
Due from broker | — | — | 4,148 | — | ||||||||||||
Deposit with broker for futures contracts | 151,562 | 21,158 | 4,664 | 873,968 | ||||||||||||
| Receivables: | ||||||||||||||||
Investment securities sold | — | 53,264 | 129,660 | 4,986,772 | ||||||||||||
Capital shares | — | — | 2,439,996 | — | ||||||||||||
Variation margin on futures contracts | 9,870 | — | 3,191 | — | ||||||||||||
Dividends | 508,887 | 69,463 | 28,577 | 4,971,506 | ||||||||||||
Interest | 1,543 | 74 | 79 | 15,206 | ||||||||||||
Securities lending income | 2,814 | 88 | 145 | 8,421 | ||||||||||||
Foreign tax reclaim | 10,112 | 32,708 | 56 | — | ||||||||||||
|
|
|
|
|
|
|
| |||||||||
Total assets | $ | 494,212,176 | $ | 29,280,126 | $ | 25,481,301 | $ | 3,066,271,760 | ||||||||
|
|
|
|
|
|
|
| |||||||||
Liabilities | ||||||||||||||||
Due to custodian | $ | — | $ | — | $ | 11,896 | $ | — | ||||||||
Payable upon return of securities loaned | 1,366,731 | 112,126 | 43,257 | 804,200 | ||||||||||||
| Payables: | ||||||||||||||||
Investment securities purchased | 952 | 56,231 | 2,194,062 | 5,409,175 | ||||||||||||
Capital shares | — | — | 5,132 | — | ||||||||||||
Investment advisory fees | 62,989 | 3,636 | 3,556 | 247,041 | ||||||||||||
Variation margin on futures contracts | — | 1,941 | — | 119,540 | ||||||||||||
Deferred foreign tax payable | 292 | — | 48,945 | — | ||||||||||||
|
|
|
|
|
|
|
| |||||||||
Total liabilities | 1,430,964 | 173,934 | 2,306,848 | 6,579,956 | ||||||||||||
|
|
|
|
|
|
|
| |||||||||
Net Assets, at value | $ | 492,781,212 | $ | 29,106,192 | $ | 23,174,453 | $ | 3,059,691,804 | ||||||||
|
|
|
|
|
|
|
| |||||||||
Net Assets Consist of | ||||||||||||||||
Paid-in capital | $ | 633,908,970 | $ | 33,273,415 | $ | 27,516,650 | $ | 2,773,461,745 | ||||||||
Distributable earnings (loss) | (141,127,758 | ) | (4,167,223 | ) | (4,342,197 | ) | 286,230,059 | |||||||||
|
|
|
|
|
|
|
| |||||||||
Net Assets, at value | $ | 492,781,212 | $ | 29,106,192 | $ | 23,174,453 | $ | 3,059,691,804 | ||||||||
|
|
|
|
|
|
|
| |||||||||
Number of Common Shares outstanding | 18,300,001 | 1,200,001 | 950,001 | 85,300,001 | ||||||||||||
|
|
|
|
|
|
|
| |||||||||
Net Asset Value | $ | 26.93 | $ | 24.26 | $ | 24.39 | $ | 35.87 | ||||||||
|
|
|
|
|
|
|
| |||||||||
Investment in non-affiliated securities at cost | $ | 595,776,772 | $ | 31,888,039 | $ | 25,724,545 | $ | 2,708,921,827 | ||||||||
|
|
|
|
|
|
|
| |||||||||
Value of securities loaned | $ | 5,511,559 | $ | 534,846 | $ | 63,480 | $ | 28,634,670 | ||||||||
|
|
|
|
|
|
|
| |||||||||
Investment in DWS Government Money Market Series at cost | $ | 1,859,521 | $ | 29,931 | $ | — | $ | 8,312,422 | ||||||||
|
|
|
|
|
|
|
| |||||||||
Investment in DWS Government & Agency Securities Portfolio at cost* | $ | 1,366,731 | $ | 112,126 | $ | 43,257 | $ | 804,200 | ||||||||
|
|
|
|
|
|
|
| |||||||||
Non-cash collateral for securities on loan | $ | 4,316,668 | $ | 460,188 | $ | 33,792 | $ | 29,094,935 | ||||||||
|
|
|
|
|
|
|
| |||||||||
Foreign currency at cost | $ | 864,267 | $ | 128,544 | $ | 80,863 | $ | — | ||||||||
|
|
|
|
|
|
|
| |||||||||
| * | Represents collateral on securities loaned. |
| See Notes to Financial Statements. | 78 |
DBX ETF Trust
Statements of Assets and Liabilities (Continued)
August 31, 2022
| Xtrackers Net Zero Pathway Paris Aligned US Equity ETF | Xtrackers S&P 500 ESG ETF | Xtrackers S&P MidCap 400 ESG ETF | Xtrackers S&P SmallCap 600 ESG ETF | |||||||||||||
Assets | ||||||||||||||||
Investment in non-affiliated securities at value | $ | 75,177,204 | $ | 745,579,007 | $ | 10,999,311 | $ | 9,385,963 | ||||||||
Investment in DWS Government Money Market Series | 349,061 | 1,156,171 | 5,679 | 33,982 | ||||||||||||
Investment in DWS Government & Agency Securities Portfolio* | — | — | — | 22,525 | ||||||||||||
Deposit with broker for futures contracts | 24,200 | 141,898 | — | — | ||||||||||||
| Receivables: | ||||||||||||||||
Dividends | 96,778 | 1,083,568 | 10,547 | 7,878 | ||||||||||||
Interest | 384 | 1,904 | 10 | 11 | ||||||||||||
Securities lending income | — | 1,138 | 62 | 126 | ||||||||||||
|
|
|
|
|
|
|
| |||||||||
Total assets | $ | 75,647,627 | $ | 747,963,686 | $ | 11,015,609 | $ | 9,450,485 | ||||||||
|
|
|
|
|
|
|
| |||||||||
Liabilities | ||||||||||||||||
Payable upon return of securities loaned | $ | — | $ | — | $ | — | $ | 22,525 | ||||||||
| Payables: | ||||||||||||||||
Investment securities purchased | — | — | 6,580 | 34,110 | ||||||||||||
Investment advisory fees | 6,831 | 65,745 | 1,465 | 1,266 | ||||||||||||
Variation margin on futures contracts | 3,360 | 32,793 | — | — | ||||||||||||
|
|
|
|
|
|
|
| |||||||||
Total liabilities | 10,191 | 98,538 | 8,045 | 57,901 | ||||||||||||
|
|
|
|
|
|
|
| |||||||||
Net Assets, at value | $ | 75,637,436 | $ | 747,865,148 | $ | 11,007,564 | $ | 9,392,584 | ||||||||
|
|
|
|
|
|
|
| |||||||||
Net Assets Consist of | ||||||||||||||||
Paid-in capital | $ | 73,911,518 | $ | 792,466,336 | $ | 11,668,515 | $ | 10,410,524 | ||||||||
Distributable earnings (loss) | 1,725,918 | (44,601,188 | ) | (660,951 | ) | (1,017,940 | ) | |||||||||
|
|
|
|
|
|
|
| |||||||||
Net Assets, at value | $ | 75,637,436 | $ | 747,865,148 | $ | 11,007,564 | $ | 9,392,584 | ||||||||
|
|
|
|
|
|
|
| |||||||||
Number of Common Shares outstanding | 3,000,001 | 21,000,001 | 450,001 | 400,001 | ||||||||||||
|
|
|
|
|
|
|
| |||||||||
Net Asset Value | $ | 25.21 | $ | 35.61 | $ | 24.46 | $ | 23.48 | ||||||||
|
|
|
|
|
|
|
| |||||||||
Investment in non-affiliated securities at cost | $ | 73,612,521 | $ | 784,875,764 | $ | 11,377,796 | $ | 9,980,411 | ||||||||
|
|
|
|
|
|
|
| |||||||||
Value of securities loaned | $ | — | $ | 9,620,118 | $ | 526,958 | $ | 576,899 | ||||||||
|
|
|
|
|
|
|
| |||||||||
Investment in DWS Government Money Market Series at cost | $ | 349,061 | $ | 1,156,171 | $ | 5,679 | $ | 33,982 | ||||||||
|
|
|
|
|
|
|
| |||||||||
Investment in DWS Government & Agency Securities Portfolio at cost* | $ | — | $ | — | $ | — | $ | 22,525 | ||||||||
|
|
|
|
|
|
|
| |||||||||
Non-cash collateral for securities on loan | $ | — | $ | 9,947,642 | $ | 542,542 | $ | 572,865 | ||||||||
|
|
|
|
|
|
|
| |||||||||
| * | Represents collateral on securities loaned. |
| See Notes to Financial Statements. | 79 |
DBX ETF Trust
For the Year Ended August 31, 2022
| Xtrackers Emerging Markets Carbon Reduction and Climate Improvers ETF | Xtrackers MSCI EAFE ESG Leaders Equity ETF | Xtrackers MSCI Emerging Markets ESG Leaders Equity ETF | Xtrackers MSCI USA ESG Leaders Equity ETF | |||||||||||||
Investment Income | ||||||||||||||||
Unaffiliated dividend income* | $ | 12,541,304 | $ | 753,566 | $ | 452,503 | $ | 48,504,071 | ||||||||
Income distributions from affiliated funds | 5,632 | 211 | 228 | 32,091 | ||||||||||||
Affiliated securities lending income | 8,092 | 1,603 | 224 | 5,475 | ||||||||||||
Unaffiliated non-cash dividend income | 1,144,489 | 49,455 | 84,481 | — | ||||||||||||
Unaffiliated securities lending income, net of borrower rebates | 47,380 | 6,217 | 1,541 | 44,841 | ||||||||||||
|
|
|
|
|
|
|
| |||||||||
Total investment income | 13,746,897 | 811,052 | 538,977 | 48,586,478 | ||||||||||||
|
|
|
|
|
|
|
| |||||||||
Expenses | ||||||||||||||||
Investment advisory fees | 840,435 | 35,722 | 44,685 | 3,443,079 | ||||||||||||
Other expenses | 57 | 57 | 57 | 172 | ||||||||||||
|
|
|
|
|
|
|
| |||||||||
Total expenses | 840,492 | 35,779 | 44,742 | 3,443,251 | ||||||||||||
|
|
|
|
|
|
|
| |||||||||
Less fees waived (see note 3): | ||||||||||||||||
Waiver | (360 | ) | (13 | ) | (24 | ) | (346,227 | ) | ||||||||
|
|
|
|
|
|
|
| |||||||||
Net expenses | 840,132 | 35,766 | 44,718 | 3,097,024 | ||||||||||||
|
|
|
|
|
|
|
| |||||||||
Net investment income (loss) | 12,906,765 | 775,286 | 494,259 | 45,489,454 | ||||||||||||
|
|
|
|
|
|
|
| |||||||||
Realized and Unrealized Gain (Loss) | ||||||||||||||||
Net realized gain (loss) from: | ||||||||||||||||
Investments** | (38,405,661 | ) | (805,015 | ) | (1,002,555 | ) | (26,570,794 | ) | ||||||||
Investments in affiliates | 297 | — | — | — | ||||||||||||
In-kind redemptions | (8,532,963 | ) | — | 158,777 | 530,262,417 | |||||||||||
Futures contracts | (426,163 | ) | (9,218 | ) | (19,061 | ) | (744,318 | ) | ||||||||
Foreign currency transactions | (190,236 | ) | (14,107 | ) | (16,996 | ) | — | |||||||||
Payments by Affiliates (see note 7) | 2,700 | — | — | — | ||||||||||||
|
|
|
|
|
|
|
| |||||||||
Net realized gain (loss) | (47,552,026 | ) | (828,340 | ) | (879,835 | ) | 502,947,305 | |||||||||
|
|
|
|
|
|
|
| |||||||||
Net change in unrealized appreciation (depreciation) on: | ||||||||||||||||
Investments*** | (122,743,467 | ) | (6,744,390 | ) | (6,106,513 | ) | (947,383,161 | ) | ||||||||
Investments in affiliates | (243 | ) | — | — | — | |||||||||||
Futures contracts | �� | (41,689 | ) | (2,671 | ) | (6,500 | ) | (351,594 | ) | |||||||
Foreign currency translations | (53,246 | ) | (7,301 | ) | (1,657 | ) | — | |||||||||
|
|
|
|
|
|
|
| |||||||||
Net change in unrealized appreciation (depreciation) | (122,838,645 | ) | (6,754,362 | ) | (6,114,670 | ) | (947,734,755 | ) | ||||||||
|
|
|
|
|
|
|
| |||||||||
Net realized and unrealized gain (loss) on investments, futures and foreign currency transactions | (170,390,671 | ) | (7,582,702 | ) | (6,994,505 | ) | (444,787,450 | ) | ||||||||
|
|
|
|
|
|
|
| |||||||||
Net Increase (Decrease) in Net Assets Resulting from Operations | $ | (157,483,906 | ) | $ | (6,807,416 | ) | $ | (6,500,246 | ) | $ | (399,297,996 | ) | ||||
|
|
|
|
|
|
|
| |||||||||
* Unaffiliated foreign tax withheld | $ | 1,893,396 | $ | 96,932 | $ | 71,375 | $ | — | ||||||||
** Including foreign taxes | $ | 77,936 | $ | — | $ | 24,017 | $ | — | ||||||||
*** Net of change in deferred foreign taxes | $ | (333,375 | ) | $ | — | $ | (19,159 | ) | $ | — | ||||||
| See Notes to Financial Statements. | 80 |
DBX ETF Trust
Statements of Operations (Continued)
For the Year Ended August 31, 2022
| Xtrackers Net Zero Pathway Paris Aligned US Equity ETF(1) | Xtrackers S&P 500 ESG ETF | Xtrackers S&P MidCap 400 ESG ETF | Xtrackers S&P SmallCap 600 ESG ETF | |||||||||||||
Investment Income | ||||||||||||||||
Unaffiliated dividend income* | $ | 209,340 | $ | 11,797,303 | $ | 150,279 | $ | 139,143 | ||||||||
Income distributions from affiliated funds | 492 | 4,262 | 41 | 36 | ||||||||||||
Affiliated securities lending income | — | 23 | 86 | 121 | ||||||||||||
Unaffiliated securities lending income, net of borrower rebates | — | 12,405 | 473 | 1,196 | ||||||||||||
|
|
|
|
|
|
|
| |||||||||
Total investment income | 209,832 | 11,813,993 | 150,879 | 140,496 | ||||||||||||
|
|
|
|
|
|
|
| |||||||||
Expenses | ||||||||||||||||
Investment advisory fees | 13,106 | 885,218 | 16,300 | 15,325 | ||||||||||||
Other expenses | — | 57 | 44 | 44 | ||||||||||||
|
|
|
|
|
|
|
| |||||||||
Total expenses | 13,106 | 885,275 | 16,344 | 15,369 | ||||||||||||
|
|
|
|
|
|
|
| |||||||||
Less fees waived (see note 3): | ||||||||||||||||
Waiver | (12 | ) | (80,908 | ) | (2 | ) | (2 | ) | ||||||||
|
|
|
|
|
|
|
| |||||||||
Net expenses | 13,094 | 804,367 | 16,342 | 15,367 | ||||||||||||
|
|
|
|
|
|
|
| |||||||||
Net investment income (loss) | 196,738 | 11,009,626 | 134,537 | 125,129 | ||||||||||||
|
|
|
|
|
|
|
| |||||||||
Realized and Unrealized Gain (Loss) | ||||||||||||||||
Net realized gain (loss) from: | ||||||||||||||||
Investments | (17,820 | ) | (6,222,310 | ) | (316,841 | ) | (414,098 | ) | ||||||||
In-kind redemptions | 850,765 | 89,097,458 | 197,733 | 268,748 | ||||||||||||
Futures contracts | (2,559 | ) | (46,565 | ) | — | — | ||||||||||
|
|
|
|
|
|
|
| |||||||||
Net realized gain (loss) | 830,386 | 82,828,583 | (119,108 | ) | (145,350 | ) | ||||||||||
|
|
|
|
|
|
|
| |||||||||
Net change in unrealized appreciation (depreciation) on: | ||||||||||||||||
Investments | 1,564,683 | (185,870,376 | ) | (1,161,848 | ) | (1,080,165 | ) | |||||||||
Futures contracts | (12,730 | ) | (110,379 | ) | — | — | ||||||||||
|
|
|
|
|
|
|
| |||||||||
Net change in unrealized appreciation (depreciation) | 1,551,953 | (185,980,755 | ) | (1,161,848 | ) | (1,080,165 | ) | |||||||||
|
|
|
|
|
|
|
| |||||||||
Net realized and unrealized gain (loss) on investments and futures | 2,382,339 | (103,152,172 | ) | (1,280,956 | ) | (1,225,515 | ) | |||||||||
|
|
|
|
|
|
|
| |||||||||
Net Increase (Decrease) in Net Assets Resulting from Operations | $ | 2,579,077 | $ | (92,142,546 | ) | $ | (1,146,419 | ) | $ | (1,100,386 | ) | |||||
|
|
|
|
|
|
|
| |||||||||
* Unaffiliated foreign tax withheld | $ | 404 | $ | — | $ | — | $ | 156 | ||||||||
| (1) | For the period June 28, 2022 (commencement of operations) through August 31, 2022. |
| See Notes to Financial Statements. | 81 |
DBX ETF Trust
| Xtrackers Emerging Markets Carbon Reduction and Climate Improvers ETF | Xtrackers MSCI EAFE ESG Leaders Equity ETF | |||||||||||||||
| Year Ended August 31, 2022 | Year Ended August 31, 2021 | Year Ended August 31, 2022 | Year Ended August 31, 2021 | |||||||||||||
Increase (Decrease) in Net Assets from Operations | ||||||||||||||||
Net investment income (loss) | $ | 12,906,765 | $ | 297,064 | $ | 775,286 | $ | 408,101 | ||||||||
Net realized gain (loss) | (47,552,026 | ) | 1,511,757 | (828,340 | ) | 264,176 | ||||||||||
Net change in net unrealized appreciation (depreciation) | (122,838,645 | ) | 15,562,693 | (6,754,362 | ) | 2,955,505 | ||||||||||
|
|
|
|
|
|
|
| |||||||||
Net increase (decrease) in net assets resulting from operations | (157,483,906 | ) | 17,371,514 | (6,807,416 | ) | 3,627,782 | ||||||||||
|
|
|
|
|
|
|
| |||||||||
Distributions to Shareholders | (9,660,140 | ) | (192,472 | ) | (738,856 | ) | (404,392 | ) | ||||||||
|
|
|
|
|
|
|
| |||||||||
Fund Shares Transactions | ||||||||||||||||
Proceeds from shares sold | 304,205,924 | 475,859,618 | 17,576,378 | 5,739,352 | ||||||||||||
Value of shares redeemed | (140,382,770 | ) | (5,307,482 | ) | — | (1,567,175 | ) | |||||||||
|
|
|
|
|
|
|
| |||||||||
Net increase (decrease) in net assets resulting from fund share transactions | 163,823,154 | 470,552,136 | 17,576,378 | 4,172,177 | ||||||||||||
|
|
|
|
|
|
|
| |||||||||
Total net increase (decrease) in Net Assets | (3,320,892 | ) | 487,731,178 | 10,030,106 | 7,395,567 | |||||||||||
Net Assets | ||||||||||||||||
Beginning of year | 496,102,104 | 8,370,926 | 19,076,086 | 11,680,519 | ||||||||||||
|
|
|
|
|
|
|
| |||||||||
End of year | $ | 492,781,212 | $ | 496,102,104 | $ | 29,106,192 | $ | 19,076,086 | ||||||||
|
|
|
|
|
|
|
| |||||||||
Changes in Shares Outstanding | ||||||||||||||||
Shares outstanding, beginning of year | 14,300,001 | 300,001 | 600,001 | 450,001 | ||||||||||||
Shares sold | 9,050,000 | 14,150,000 | 600,000 | 200,000 | ||||||||||||
Shares redeemed | (5,050,000 | ) | (150,000 | ) | — | (50,000 | ) | |||||||||
|
|
|
|
|
|
|
| |||||||||
Shares outstanding, end of year | 18,300,001 | 14,300,001 | 1,200,001 | 600,001 | ||||||||||||
|
|
|
|
|
|
|
| |||||||||
| See Notes to Financial Statements. | 82 |
DBX ETF Trust
Statements of Changes in Net Assets (Continued)
| Xtrackers MSCI Emerging Markets ESG Leaders Equity ETF | Xtrackers MSCI USA ESG Leaders Equity ETF | |||||||||||||||
| Year Ended August 31, 2022 | Year Ended August 31, 2021 | Year Ended August 31, 2022 | Year Ended August 31, 2021 | |||||||||||||
Increase (Decrease) in Net Assets from Operations | ||||||||||||||||
Net investment income (loss) | $ | 494,259 | $ | 200,440 | $ | 45,489,454 | $ | 44,760,180 | ||||||||
Net realized gain (loss) | (879,835 | ) | (263,400 | ) | 502,947,305 | 79,672,605 | ||||||||||
Net change in net unrealized appreciation (depreciation) | (6,114,670 | ) | 1,853,650 | (947,734,755 | ) | 828,704,550 | ||||||||||
|
|
|
|
|
|
|
| |||||||||
Net increase (decrease) in net assets resulting from operations | (6,500,246 | ) | 1,790,690 | (399,297,996 | ) | 953,137,335 | ||||||||||
|
|
|
|
|
|
|
| |||||||||
Distributions to Shareholders | (519,666 | ) | (82,138 | ) | (45,094,920 | ) | (44,278,620 | ) | ||||||||
|
|
|
|
|
|
|
| |||||||||
Fund Shares Transactions | ||||||||||||||||
Proceeds from shares sold | 9,159,408 | 14,924,326 | 858,929,738 | 610,533,251 | ||||||||||||
Value of shares redeemed | (4,168,383 | ) | — | (1,244,247,484 | ) | (296,434,378 | ) | |||||||||
|
|
|
|
|
|
|
| |||||||||
Net increase (decrease) in net assets resulting from fund share transactions | 4,991,025 | 14,924,326 | (385,317,746 | ) | 314,098,873 | |||||||||||
|
|
|
|
|
|
|
| |||||||||
Total net increase (decrease) in Net Assets | (2,028,887 | ) | 16,632,878 | (829,710,662 | ) | 1,222,957,588 | ||||||||||
Net Assets | ||||||||||||||||
Beginning of year | 25,203,340 | 8,570,462 | 3,889,402,466 | 2,666,444,878 | ||||||||||||
|
|
|
|
|
|
|
| |||||||||
End of year | $ | 23,174,453 | $ | 25,203,340 | $ | 3,059,691,804 | $ | 3,889,402,466 | ||||||||
|
|
|
|
|
|
|
| |||||||||
Changes in Shares Outstanding | ||||||||||||||||
Shares outstanding, beginning of year | 750,001 | 300,001 | 92,850,001 | 83,750,001 | ||||||||||||
Shares sold | 350,000 | 450,000 | 21,800,000 | 17,200,000 | ||||||||||||
Shares redeemed | (150,000 | ) | — | (29,350,000 | ) | (8,100,000 | ) | |||||||||
|
|
|
|
|
|
|
| |||||||||
Shares outstanding, end of year | 950,001 | 750,001 | 85,300,001 | 92,850,001 | ||||||||||||
|
|
|
|
|
|
|
| |||||||||
| See Notes to Financial Statements. | 83 |
DBX ETF Trust
Statements of Changes in Net Assets (Continued)
| Xtrackers Net Zero Pathway Paris Aligned US Equity ETF | Xtrackers S&P 500 ESG ETF | |||||||||||
| For the Period June 28, 2022(1) to August 31, 2022 (Unaudited) | Year Ended August 31, 2022 | Year Ended August 31, 2021 | ||||||||||
Increase (Decrease) in Net Assets from Operations | ||||||||||||
Net investment income (loss) | $ | 196,738 | $ | 11,009,626 | $ | 6,793,362 | ||||||
Net realized gain (loss) | 830,386 | 82,828,583 | 22,972,189 | |||||||||
Net change in net unrealized appreciation (depreciation) | 1,551,953 | (185,980,755 | ) | 109,454,795 | ||||||||
|
|
|
|
|
| |||||||
Net increase (decrease) in net assets resulting from operations | 2,579,077 | (92,142,546 | ) | 139,220,346 | ||||||||
|
|
|
|
|
| |||||||
Distributions to Shareholders | — | (10,676,805 | ) | (5,646,092 | ) | |||||||
|
|
|
|
|
| |||||||
Fund Shares Transactions | ||||||||||||
Proceeds from shares sold | 77,058,253 | 454,290,442 | 428,551,169 | |||||||||
Value of shares redeemed | (3,999,919 | ) | (348,358,077 | ) | (87,808,140 | ) | ||||||
|
|
|
|
|
| |||||||
Net increase (decrease) in net assets resulting from fund share transactions | 73,058,334 | 105,932,365 | 340,743,029 | |||||||||
|
|
|
|
|
| |||||||
Total net increase (decrease) in Net Assets | 75,637,411 | 3,113,014 | 474,317,283 | |||||||||
Net Assets | ||||||||||||
Beginning of period | 25 | 744,752,134 | 270,434,851 | |||||||||
|
|
|
|
|
| |||||||
End of period | $ | 75,637,436 | $ | 747,865,148 | $ | 744,752,134 | ||||||
|
|
|
|
|
| |||||||
Changes in Shares Outstanding | ||||||||||||
Shares outstanding, beginning of period | 1 | 18,650,001 | 8,700,001 | |||||||||
Shares sold | 3,150,000 | 11,650,000 | 12,450,000 | |||||||||
Shares redeemed | (150,000 | ) | (9,300,000 | ) | (2,500,000 | ) | ||||||
|
|
|
|
|
| |||||||
Shares outstanding, end of period | 3,000,001 | 21,000,001 | 18,650,001 | |||||||||
|
|
|
|
|
| |||||||
| (1) | Commencement of Operations. |
| See Notes to Financial Statements. | 84 |
DBX ETF Trust
Statements of Changes in Net Assets (Continued)
| Xtrackers S&P MidCap 400 ESG ETF | Xtrackers S&P SmallCap 600 ESG ETF | |||||||||||||||
| Year Ended August 31, 2022 | For the Period February 24, 2021(1) to August 31, 2021 (Unaudited) | Year Ended August 31, 2022 | For the Period February 24, 2021(1) to August 31, 2021 (Unaudited) | |||||||||||||
Increase (Decrease) in Net Assets from Operations | ||||||||||||||||
Net investment income (loss) | $ | 134,537 | $ | 54,903 | $ | 125,129 | $ | 65,069 | ||||||||
Net realized gain (loss) | (119,108 | ) | 132,093 | (145,350 | ) | 128,496 | ||||||||||
Net change in net unrealized appreciation (depreciation) | (1,161,848 | ) | 783,363 | (1,080,165 | ) | 485,717 | ||||||||||
|
|
|
|
|
|
|
| |||||||||
Net increase (decrease) in net assets resulting from operations | (1,146,419 | ) | 970,359 | (1,100,386 | ) | 679,282 | ||||||||||
|
|
|
|
|
|
|
| |||||||||
Distributions to Shareholders | (125,672 | ) | (33,536 | ) | (182,588 | ) | (27,800 | ) | ||||||||
|
|
|
|
|
|
|
| |||||||||
Fund Shares Transactions | ||||||||||||||||
Proceeds from shares sold | 2,580,181 | 11,371,328 | 1,210,311 | 11,335,683 | ||||||||||||
Value of shares redeemed | (1,257,281 | ) | (1,351,421 | ) | (1,205,460 | ) | (1,316,483 | ) | ||||||||
|
|
|
|
|
|
|
| |||||||||
Net increase (decrease) in net assets resulting from fund share transactions | 1,322,900 | 10,019,907 | 4,851 | 10,019,200 | ||||||||||||
|
|
|
|
|
|
|
| |||||||||
Total net increase (decrease) in Net Assets | 50,809 | 10,956,730 | (1,278,123 | ) | 10,670,682 | |||||||||||
Net Assets | ||||||||||||||||
Beginning of period | 10,956,755 | 25 | 10,670,707 | 25 | ||||||||||||
|
|
|
|
|
|
|
| |||||||||
End of period | $ | 11,007,564 | $ | 10,956,755 | $ | 9,392,584 | $ | 10,670,707 | ||||||||
|
|
|
|
|
|
|
| |||||||||
Changes in Shares Outstanding | ||||||||||||||||
Shares outstanding, beginning of period | 400,001 | 1 | 400,001 | 1 | ||||||||||||
Shares sold | 100,000 | 450,000 | 50,000 | 450,000 | ||||||||||||
Shares redeemed | (50,000 | ) | (50,000 | ) | (50,000 | ) | (50,000 | ) | ||||||||
|
|
|
|
|
|
|
| |||||||||
Shares outstanding, end of period | 450,001 | 400,001 | 400,001 | 400,001 | ||||||||||||
|
|
|
|
|
|
|
| |||||||||
| (1) | Commencement of Operations. |
| See Notes to Financial Statements. | 85 |
DBX ETF Trust
| Xtrackers Emerging Markets Carbon Reduction and Climate Improvers ETF Selected Per Share Data | Years Ended August 31, | Period Ended 8/31/2019(a) | ||||||||||||||
| 2022 | 2021 | 2020 | ||||||||||||||
Net Asset Value, beginning of period | $ | 34.69 | $ | 27.90 | $ | 25.42 | $ | 25.00 | ||||||||
|
|
|
|
|
|
|
| |||||||||
| Income (loss) from investment operations: | ||||||||||||||||
Net investment income (loss)(b) | 0.70 | 0.57 | 0.68 | 0.60 | ||||||||||||
Net realized and unrealized gain (loss) | (7.88 | ) | 6.86 | 2.53 | 0.27 | |||||||||||
|
|
|
|
|
|
|
| |||||||||
Total from investment operations | (7.18 | ) | 7.43 | 3.21 | 0.87 | |||||||||||
|
|
|
|
|
|
|
| |||||||||
| Less distributions from: |
| |||||||||||||||
Net investment income | (0.58 | ) | (0.64 | ) | (0.73 | ) | (0.45 | ) | ||||||||
|
|
|
|
|
|
|
| |||||||||
Total distributions | (0.58 | ) | (0.64 | ) | (0.73 | ) | (0.45 | ) | ||||||||
|
|
|
|
|
|
|
| |||||||||
Net Asset Value, end of period | $ | 26.93 | $ | 34.69 | $ | 27.90 | $ | 25.42 | ||||||||
|
|
|
|
|
|
|
| |||||||||
Total Return (%)(c) | (20.81 | ) | 26.80 | 12.74 | 3.44 | ** | ||||||||||
Ratios to Average Net Assets and Supplemental Data | ||||||||||||||||
Net Assets, end of period ($ millions) | 493 | 496 | 8 | 8 | ||||||||||||
Ratio of expenses before fee waiver (%) | 0.15 | 0.16 | 0.16 | 0.16 | * | |||||||||||
Ratio of expenses after fee waiver (%) | 0.15 | 0.16 | 0.16 | 0.16 | * | |||||||||||
Ratio of net investment income (loss) (%) | 2.30 | 1.97 | 2.61 | 3.17 | * | |||||||||||
Portfolio turnover rate (%)(d) | 33 | 17 | 13 | 10 | ** | |||||||||||
| Xtrackers MSCI EAFE ESG Leaders Equity ETF Selected Per Share Data | Years Ended August 31, | Period Ended 8/31/2019(e) | ||||||||||||||
| 2022 | 2021 | 2020 | ||||||||||||||
Net Asset Value, beginning of period | $ | 31.79 | $ | 25.96 | $ | 24.10 | $ | 25.00 | ||||||||
|
|
|
|
|
|
|
| |||||||||
| Income (loss) from investment operations: | ||||||||||||||||
Net investment income (loss)(b) | 0.85 | 0.72 | 0.59 | 0.78 | ||||||||||||
Net realized and unrealized gain (loss) | (7.57 | ) | 5.80 | 1.83 | (1.01 | ) | ||||||||||
|
|
|
|
|
|
|
| |||||||||
Total from investment operations | (6.72 | ) | 6.52 | 2.42 | (0.23 | ) | ||||||||||
|
|
|
|
|
|
|
| |||||||||
| Less distributions from: |
| |||||||||||||||
Net investment income | (0.81 | ) | (0.69 | ) | (0.56 | ) | (0.66 | ) | ||||||||
Net realized gains | — | — | — | (0.01 | ) | |||||||||||
|
|
|
|
|
|
|
| |||||||||
Total distributions | (0.81 | ) | (0.69 | ) | (0.56 | ) | (0.67 | ) | ||||||||
|
|
|
|
|
|
|
| |||||||||
Net Asset Value, end of period | $ | 24.26 | $ | 31.79 | $ | 25.96 | $ | 24.10 | ||||||||
|
|
|
|
|
|
|
| |||||||||
Total Return (%)(c) | (21.40 | ) | 25.28 | 10.12 | (0.91 | )** | ||||||||||
Ratios to Average Net Assets and Supplemental Data | ||||||||||||||||
Net Assets, end of period ($ millions) | 29 | 19 | 12 | 7 | ||||||||||||
Ratio of expenses before fee waiver (%) | 0.14 | 0.14 | 0.14 | 0.14 | * | |||||||||||
Ratio of expenses after fee waiver (%) | 0.14 | 0.14 | 0.14 | 0.14 | * | |||||||||||
Ratio of net investment income (loss) (%) | 3.04 | 2.45 | 2.39 | 3.25 | * | |||||||||||
Portfolio turnover rate (%)(d) | 22 | 22 | 16 | 10 | ** | |||||||||||
| (a) | For the period December 6, 2018 (commencement of operations) through August 31, 2019. |
| (b) | Based on average shares outstanding during the period. |
| (c) | Total Return would have been lower if certain expenses had not been reimbursed by the Advisor. |
| (d) | Portfolio turnover rate does not include securities received or delivered from processing creations or redemptions. |
| (e) | For the period September 6, 2018 (commencement of operations) through August 31, 2019. |
| * | Annualized. |
| ** | Not Annualized. |
| See Notes to Financial Statements. | 86 |
DBX ETF Trust
Financial Highlights (Continued)
| Xtrackers MSCI Emerging Markets ESG Leaders Equity ETF Selected Per Share Data | Years Ended August 31, | Period Ended 8/31/2019(a) | ||||||||||||||
| 2022 | 2021 | 2020 | ||||||||||||||
Net Asset Value, beginning of period | $ | 33.60 | $ | 28.57 | $ | 24.70 | $ | 25.00 | ||||||||
|
|
|
|
|
|
|
| |||||||||
| Income (loss) from investment operations: | ||||||||||||||||
Net investment income (loss)(b) | 0.64 | 0.49 | 0.86 | 0.50 | ||||||||||||
Net realized and unrealized gain (loss) | (9.14 | ) | 4.77 | 4.07 | (0.53 | ) | ||||||||||
|
|
|
|
|
|
|
| |||||||||
Total from investment operations | (8.50 | ) | 5.26 | 4.93 | (0.03 | ) | ||||||||||
|
|
|
|
|
|
|
| |||||||||
| Less distributions from: |
| |||||||||||||||
Net investment income | (0.71 | ) | (0.23 | ) | (1.06 | ) | (0.27 | ) | ||||||||
Net realized gains | — | — | (0.00 | )(c) | — | |||||||||||
|
|
|
|
|
|
|
| |||||||||
Total distributions | (0.71 | ) | (0.23 | ) | (1.06 | ) | (0.27 | ) | ||||||||
|
|
|
|
|
|
|
| |||||||||
Net Asset Value, end of period | $ | 24.39 | $ | 33.60 | $ | 28.57 | $ | 24.70 | ||||||||
|
|
|
|
|
|
|
| |||||||||
Total Return (%)(d) | (25.55 | ) | 18.43 | 20.32 | (0.17 | )** | ||||||||||
Ratios to Average Net Assets and Supplemental Data | ||||||||||||||||
Net Assets, end of period ($ millions) | 23 | 25 | 9 | 7 | ||||||||||||
Ratio of expenses before fee waiver (%) | 0.20 | 0.20 | 0.20 | 0.20 | * | |||||||||||
Ratio of expenses after fee waiver (%) | 0.20 | 0.20 | 0.20 | 0.20 | * | |||||||||||
Ratio of net investment income (loss) (%) | 2.22 | 1.48 | 3.38 | 2.68 | * | |||||||||||
Portfolio turnover rate (%)(e) | 24 | 26 | 17 | 16 | ** | |||||||||||
| Xtrackers MSCI USA ESG Leaders Equity ETF Selected Per Share Data | Years Ended August 31, | Period Ended 8/31/2019(f) | ||||||||||||||
| 2022 | 2021 | 2020 | ||||||||||||||
Net Asset Value, beginning of period | $ | 41.89 | $ | 31.84 | $ | 26.69 | $ | 25.00 | ||||||||
|
|
|
|
|
|
|
| |||||||||
| Income (loss) from investment operations: | ||||||||||||||||
Net investment income (loss)(b) | 0.53 | 0.50 | 0.51 | 0.24 | ||||||||||||
Net realized and unrealized gain (loss) | (6.04 | ) | 10.05 | 5.10 | 1.57 | |||||||||||
|
|
|
|
|
|
|
| |||||||||
Total from investment operations | (5.51 | ) | 10.55 | 5.61 | 1.81 | |||||||||||
|
|
|
|
|
|
|
| |||||||||
| Less distributions from: |
| |||||||||||||||
Net investment income | (0.51 | ) | (0.50 | ) | (0.46 | ) | (0.12 | ) | ||||||||
|
|
|
|
|
|
|
| |||||||||
Total distributions | (0.51 | ) | (0.50 | ) | (0.46 | ) | (0.12 | ) | ||||||||
|
|
|
|
|
|
|
| |||||||||
Net Asset Value, end of period | $ | 35.87 | $ | 41.89 | $ | 31.84 | $ | 26.69 | ||||||||
|
|
|
|
|
|
|
| |||||||||
Total Return (%)(d) | (13.29 | ) | 33.48 | 21.42 | 7.23 | ** | ||||||||||
Ratios to Average Net Assets and Supplemental Data | ||||||||||||||||
Net Assets, end of period ($ millions) | 3,060 | 3,889 | 2,666 | 1,341 | ||||||||||||
Ratio of expenses before fee waiver (%) | 0.10 | 0.10 | 0.10 | 0.10 | * | |||||||||||
Ratio of expenses after fee waiver (%) | 0.09 | 0.09 | 0.09 | 0.10 | * | |||||||||||
Ratio of net investment income (loss) (%) | 1.32 | 1.39 | 1.83 | 1.89 | * | |||||||||||
Portfolio turnover rate (%)(e) | 6 | 12 | 9 | 5 | ** | |||||||||||
| (a) | For the period December 6, 2018 (commencement of operations) through August 31, 2019. |
| (b) | Based on average shares outstanding during the period. |
| (c) | Amount represents less than $0.005. |
| (d) | Total Return would have been lower if certain expenses had not been reimbursed by the Advisor. |
| (e) | Portfolio turnover rate does not include securities received or delivered from processing creations or redemptions. |
| (f) | For the period March 7, 2019 (commencement of operations) through August 31, 2019. |
| * | Annualized. |
| ** | Not Annualized. |
| See Notes to Financial Statements. | 87 |
DBX ETF Trust
Financial Highlights (Continued)
| Xtrackers Net Zero Pathway Paris Aligned US Equity ETF Selected Per Share Data | Period Ended 8/31/2022(a) | |||||||||||||||
Net Asset Value, beginning of period | $ | 25.00 | ||||||||||||||
|
| |||||||||||||||
| Income (loss) from investment operations: | ||||||||||||||||
Net investment income (loss)(b) | 0.07 | |||||||||||||||
Net realized and unrealized gain (loss) | 0.14 | |||||||||||||||
|
| |||||||||||||||
Total from investment operations | 0.21 | |||||||||||||||
|
| |||||||||||||||
Net Asset Value, end of period | $ | 25.21 | ||||||||||||||
|
| |||||||||||||||
Total Return (%)(c) | 0.84 | ** | ||||||||||||||
Ratios to Average Net Assets and Supplemental Data | ||||||||||||||||
Net Assets, end of period ($ millions) | 76 | |||||||||||||||
Ratio of expenses before fee waiver (%) | 0.10 | * | ||||||||||||||
Ratio of expenses after fee waiver (%) | 0.10 | * | ||||||||||||||
Ratio of net investment income (loss) (%) | 1.50 | * | ||||||||||||||
Portfolio turnover rate (%)(d) | 11 | ** | ||||||||||||||
| Xtrackers S&P 500 ESG ETF Selected Per Share Data | Years Ended August 31, | Period Ended 8/31/2019(e) | ||||||||||||||
| 2022 | 2021 | 2020 | ||||||||||||||
Net Asset Value, beginning of period | $ | 39.93 | $ | 31.08 | $ | 25.30 | $ | 25.00 | ||||||||
|
|
|
|
|
|
|
| |||||||||
| Income (loss) from investment operations: | ||||||||||||||||
Net investment income (loss)(b) | 0.53 | 0.49 | 0.50 | 0.10 | ||||||||||||
Net realized and unrealized gain (loss) | (4.32 | ) | 8.79 | 5.85 | 0.20 | |||||||||||
|
|
|
|
|
|
|
| |||||||||
Total from investment operations | (3.79 | ) | 9.28 | 6.35 | 0.30 | |||||||||||
|
|
|
|
|
|
|
| |||||||||
| Less distributions from: |
| |||||||||||||||
Net investment income | (0.53 | ) | (0.43 | ) | (0.57 | ) | — | |||||||||
|
|
|
|
|
|
|
| |||||||||
Total distributions | (0.53 | ) | (0.43 | ) | (0.57 | ) | — | |||||||||
|
|
|
|
|
|
|
| |||||||||
Net Asset Value, end of period | $ | 35.61 | $ | 39.93 | $ | 31.08 | $ | 25.30 | ||||||||
|
|
|
|
|
|
|
| |||||||||
Total Return (%)(c) | (9.59 | ) | 30.16 | 25.71 | 1.20 | ** | ||||||||||
Ratios to Average Net Assets and Supplemental Data | ||||||||||||||||
Net Assets, end of period ($ millions) | 748 | 745 | 270 | 11 | ||||||||||||
Ratio of expenses before fee waiver (%) | 0.11 | 0.11 | 0.11 | 0.11 | * | |||||||||||
Ratio of expenses after fee waiver (%) | 0.10 | 0.10 | 0.11 | 0.11 | * | |||||||||||
Ratio of net investment income (loss) (%) | 1.37 | 1.41 | 1.86 | 2.08 | * | |||||||||||
Portfolio turnover rate (%)(d) | 6 | 13 | 11 | 0 | ** | |||||||||||
| (a) | For the period June 28, 2022 (commencement of operations) through August 31, 2022. |
| (b) | Based on average shares outstanding during the period. |
| (c) | Total Return would have been lower if certain expenses had not been reimbursed by the Advisor. |
| (d) | Portfolio turnover rate does not include securities received or delivered from processing creations or redemptions. |
| (e) | For the period June 26, 2019 (commencement of operations) through August 31, 2019. |
| * | Annualized. |
| ** | Not Annualized. |
| See Notes to Financial Statements. | 88 |
DBX ETF Trust
Financial Highlights (Continued)
| Xtrackers S&P MidCap 400 ESG ETF Selected Per Share Data | Year Ended 8/31/2022 | Period Ended 8/31/2021(a) | ||||||
Net Asset Value, beginning of period | $ | 27.39 | $ | 25.00 | ||||
|
|
|
| |||||
| Income (loss) from investment operations: | ||||||||
Net investment income (loss)(b) | 0.32 | 0.14 | ||||||
Net realized and unrealized gain (loss) | (2.94 | ) | 2.33 | |||||
|
|
|
| |||||
Total from investment operations | (2.62 | ) | 2.47 | |||||
|
|
|
| |||||
| Less distributions from: |
| |||||||
Net investment income | (0.31 | ) | (0.08 | ) | ||||
|
|
|
| |||||
Total distributions | (0.31 | ) | (0.08 | ) | ||||
|
|
|
| |||||
Net Asset Value, end of period | $ | 24.46 | $ | 27.39 | ||||
|
|
|
| |||||
Total Return (%)(c) | (9.64 | ) | 9.92 | ** | ||||
Ratios to Average Net Assets and Supplemental Data | ||||||||
Net Assets, end of period ($ millions) | 11 | 11 | ||||||
Ratio of expenses before fee waiver (%) | 0.15 | 0.15 | * | |||||
Ratio of expenses after fee waiver (%) | 0.15 | 0.15 | * | |||||
Ratio of net investment income (loss) (%) | 1.24 | 1.00 | * | |||||
Portfolio turnover rate (%)(d) | 41 | 27 | ** | |||||
| Xtrackers S&P SmallCap 600 ESG ETF Selected Per Share Data | Year Ended 8/31/2022 | Period Ended 8/31/2021(a) | ||||||
Net Asset Value, beginning of period | $ | 26.68 | $ | 25.00 | ||||
|
|
|
| |||||
| Income (loss) from investment operations: | ||||||||
Net investment income (loss)(b) | 0.31 | 0.16 | ||||||
Net realized and unrealized gain (loss) | (3.05 | ) | 1.59 | |||||
|
|
|
| |||||
Total from investment operations | (2.74 | ) | 1.75 | |||||
|
|
|
| |||||
| Less distributions from: |
| |||||||
Net investment income | (0.34 | ) | (0.07 | ) | ||||
Net realized gains | (0.12 | ) | — | |||||
|
|
|
| |||||
Total distributions | (0.46 | ) | (0.07 | ) | ||||
|
|
|
| |||||
Net Asset Value, end of period | $ | 23.48 | $ | 26.68 | ||||
|
|
|
| |||||
Total Return (%)(c) | (10.43 | ) | 7.01 | ** | ||||
Ratios to Average Net Assets and Supplemental Data | ||||||||
Net Assets, end of period ($ millions) | 9 | 11 | ||||||
Ratio of expenses before fee waiver (%) | 0.15 | 0.15 | * | |||||
Ratio of expenses after fee waiver (%) | 0.15 | 0.15 | * | |||||
Ratio of net investment income (loss) (%) | 1.22 | 1.19 | * | |||||
Portfolio turnover rate (%)(d) | 43 | 25 | ** | |||||
| (a) | For the period February 24, 2021 (commencement of operations) through August 31, 2021. |
| (b) | Based on average shares outstanding during the period. |
| (c) | Total Return would have been lower if certain expenses had not been reimbursed by the Advisor. |
| (d) | Portfolio turnover rate does not include securities received or delivered from processing creations or redemptions. |
| * | Annualized. |
| ** | Not Annualized. |
| See Notes to Financial Statements. | 89 |
DBX ETF Trust
1. Organization
DBX ETF Trust (the “Trust”) is registered under the Investment Company Act of 1940, as amended (the “Act”), as an open-end registered management investment company organized as a Delaware statutory trust.
As of August 31, 2022, the Trust consists of thirty-five investment series of exchange-traded funds (“ETFs”) (each a “Fund” and collectively, the “Funds”) in operation and trading. These financial statements report on the Funds listed below:
| Xtrackers Emerging Markets Carbon Reduction and Climate Improvers ETF | ||
| Xtrackers MSCI EAFE ESG Leaders Equity ETF | ||
| Xtrackers MSCI Emerging Markets ESG Leaders Equity ETF | ||
| Xtrackers MSCI USA ESG Leaders Equity ETF | ||
| Xtrackers Net Zero Pathway Paris Aligned US Equity ETF | ||
| Xtrackers S&P 500 ESG ETF | ||
| Xtrackers S&P MidCap 400 ESG ETF | ||
| Xtrackers S&P SmallCap 600 ESG ETF |
DBX Advisors LLC (“DBX” or the “Advisor”), an indirect, wholly-owned subsidiary of DWS Group GmbH & Co. KGaA (“DWS Group”), serves as investment advisor to the Funds and has overall responsibility for the general management and administration of the Funds, subject to the supervision of the Funds’ Board of Trustees (“Board”).
Each Fund offers shares that are listed and traded on the NYSE Arca, Inc. (“NYSE Arca”). Unlike conventional mutual funds, each Fund issues and redeems shares on a continuous basis, at net asset value (“NAV”), only in large specified lots consisting of 50,000 shares, each called a “Creation Unit”, to authorized participants who have entered into agreements with the Funds’ distributor. Shares are not individually redeemable securities of the Funds, and owners of the shares may acquire those shares from the Funds, or tender such shares for redemption to the Funds, in Creation Units only.
The investment objective of each Fund is to track the performance, before fees and expenses, of a particular index (the “Underlying Index”). The underlying indices for the Funds are:
Fund | Underlying Index | |
| Xtrackers Emerging Markets Carbon Reduction and Climate Improvers ETF | Solactive ISS Emerging Markets Carbon Reduction & Climate Improvers Index NTR | |
| Xtrackers MSCI EAFE ESG Leaders Equity ETF | MSCI EAFE ESG Leaders Index | |
| Xtrackers MSCI Emerging Markets ESG Leaders Equity ETF | MSCI Emerging Markets ESG Leaders Index | |
| Xtrackers MSCI USA ESG Leaders Equity ETF | MSCI USA ESG Leaders Index | |
| Xtrackers Net Zero Pathway Paris Aligned US Equity ETF | Solactive ISS ESG United States Net Zero Pathway Enhanced Index | |
| Xtrackers S&P 500 ESG ETF | S&P 500 ESG Index | |
| Xtrackers S&P MidCap 400 ESG ETF | S&P MidCap 400 ESG Index | |
| Xtrackers S&P SmallCap 600 ESG ETF | S&P SmallCap 600 ESG Index |
The Solactive ISS Emerging Markets Carbon Reduction & Climate Improvers Index NTR is comprised of large and mid-capitalization companies in emerging markets countries that meet certain environmental, social and governance (“ESG”) criteria and/or have committed to greenhouse gas emissions reduction targets. The Under-lying Index is then weighted in such a manner seeking to align its constituent companies’ greenhouse gas emissions with the long-term global warming target of the Paris Climate Agreement. Under normal circumstances, the Underlying Index is rebalanced semi-annually in February and August, and thus the Fund updates and rebalances its portfolio in a corresponding fashion.
The MSCI EAFE ESG Leaders Index is a capitalization weighted index that provides exposure to companies with high ESG performance relative to their sector peers. The Underlying Index consists of large- and medium-capitalization companies across developed markets countries, excluding Canada and the United States. The annual review of the Underlying Index takes place in May and it is rebalanced in August, November and February, and thus the Fund updates and rebalances its portfolio in a corresponding fashion.
90
DBX ETF Trust
Notes to Financial Statements (Continued)
The MSCI Emerging Markets ESG Leaders Index is a capitalization weighted index that provides exposure to companies with high ESG performance relative to their sector peers. The Underlying Index consists of large- and medium-capitalization companies across emerging markets countries. The annual review of the Underlying Index takes place in May and it is rebalanced in August, November and February, and thus the Fund updates and rebalances its portfolio in a corresponding fashion.
MSCI USA ESG Leaders Index is a capitalization weighted index that provides exposure to companies with high ESG performance relative to their sector peers. The Underlying Index consists of large- and medium-capitalization companies in the U.S market. The annual review of the Underlying Index takes place in May and it is rebalanced in August, November and February, and thus the Fund updates and rebalances its portfolio in a corresponding fashion.
Solactive ISS ESG United States Net Zero Pathway Enhanced Index is comprised of large and mid-capitalization companies in the United States that meet certain environmental, social and governance (“ ESG ”) criteria. The constituents of the Underlying Index are weighted in such a manner seeking to comply with the European Union Paris-aligned Benchmark standards, while incorporating recommendations of the Net Zero Investment Framework published, from time to time, by the Institutional Investors Group on Climate Change. Under normal circumstances, the Underlying Index is rebalanced semi-annually in February and August. The fund rebalances its portfolio in accordance with the Underlying Index, and, therefore, any changes to the Underlying Index’s rebalance schedule will result in corresponding changes to the fund’s rebalance schedule.
S&P 500 ESG Index is a broad-based, market capitalization weighted index that provides exposure to companies with high ESG performance relative to their sector peers, while maintaining similar overall industry group weights as the S&P 500 Index. Under normal circumstances, the Underlying Index is rebalanced annually, effective after the close of the last business day of April. The Fund rebalances its portfolio in accordance with the Underlying Index, and therefore, any changes to the Underlying Index’s rebalance schedule will result in corresponding changes to the Fund’s rebalance schedule.
S&P MidCap 400 ESG Index is a broad-based, market capitalization weighted index that provides exposure to companies with high ESG performance relative to their sector peers, while maintaining similar overall industry group weights as the S&P MidCap 400 Index. Under normal circumstances, the Underlying Index is rebalanced annually, effective after the close of the last business day of April. The Fund rebalances its portfolio in accordance with the Underlying Index, and, therefore, any changes to the Underlying Index’s rebalance schedule will result in corresponding changes to the Fund’s rebalance schedule.
S&P SmallCap 600 ESG is a broad-based, market capitalization weighted index that provides exposure to companies with high ESG performance relative to their sector peers, while maintaining similar overall industry group weights as the S&P SmallCap 600 Index. Under normal circumstances, the Underlying Index is rebalanced annually, effective after the close of the last business day of April. The Fund rebalances its portfolio in accordance with the Underlying Index, and, therefore, any changes to the Underlying Index’s rebalance schedule will result in corresponding changes to the Fund’s rebalance schedule.
Each Fund is entitled to use its respective Underlying Index pursuant to a licensing agreement between the Index Provider and DBX. There is no charge to the Funds in connection with these licensing agreements.
Each Fund, except Xtrackers MSCI EAFE ESG Leaders Equity ETF, Xtrackers Emerging Markets Carbon Reduction and Climate Improvers ETF and Xtrackers MSCI USA ESG Leaders Equity ETF, is non-diversified and is not limited by the Act with regard to the percentage of its assets that may be invested in the securities of a single issuer. This means the securities of a particular issuer (or securities of issuers in particular industries) may dominate the Underlying Index of the Fund and, consequently, the Fund’s investment portfolio. This may adversely affect the Fund’s performance or subject the Fund’s shares to greater price volatility than that experienced by more diversified investment companies. Each Fund may change its diversification status over time and then change it back again, without shareholder approval, solely as a result of a change in relative market capitalization or index weighting of one or more constituents of the index each Fund tracks.
Pursuant to the Trust’s organizational documents, the Trust’s officers and trustees are indemnified against certain liabilities that may arise out of the performance of their duties to the Funds. Additionally, in the normal course of business the Trust enters into contracts that contain a variety of representations that provide indemnification for
91
DBX ETF Trust
Notes to Financial Statements (Continued)
certain liabilities. The Trust’s maximum exposure under these arrangements is unknown, as this would involve future claims that may be made against the Funds that have not yet occurred. However, the Trust expects the risk of loss to be remote.
2. Significant Accounting Policies
The financial statements have been prepared in conformity with U.S. generally accepted accounting principles (“U.S. GAAP”), which require management to make certain estimates and assumptions that affect the reported amounts and disclosures in the financial statements. Actual results could differ from those estimates. Each Fund qualifies as an investment company under Topic 946 of Accounting Standards Codification of U.S. GAAP. The following is a summary of significant accounting policies followed by the Funds.
Security Valuation The NAV of each Fund’s shares is calculated each business day as of the close of regular trading on the New York Stock Exchange, generally 4:00 p.m. Eastern Time. NAV per share is calculated by dividing a Fund’s net assets by the number of Fund shares outstanding.
The Funds’ Board has designated the Advisor as the valuation designee for the Funds pursuant to Rule 2a-5 under the 1940 Act. The Advisor’s Pricing Committee (the “Pricing Committee”) typically values securities using readily available market quotations or prices supplied by independent pricing services (which are considered fair values under Rule 2a-5). The Advisor has adopted fair valuation procedures that provide methodologies for fair valuing securities.
Various inputs are used in determining the value of the Funds’ investments. These inputs are summarized in three broad levels. Level 1 includes quoted prices in active markets for identical securities. Level 2 includes other significant observable inputs (including quoted prices for similar securities, interest rates, prepayment speeds, and credit risk). Level 3 includes significant unobservable inputs (including the Funds’ own assumptions in determining the fair value of investments). The level assigned to the securities valuations may not be an indication of the risk or liquidity associated with investing in those securities.
Equity securities and ETFs are valued at the most recent sale price or official closing price reported on the exchange (U.S. or foreign) or over-the-counter market on which they trade. Securities or ETFs for which no sales are reported are valued at the calculated mean between the most recent bid and asked quotations on the relevant market or, if a mean cannot be determined, at the most recent bid quotation. Equity securities and ETFs are generally categorized as Level 1.
Corporate and sovereign debt securities are valued at prices supplied by independent pricing services approved by the Pricing Committee. Such services may use various pricing techniques which take into account appropriate factors such as yield, quality, coupon rate, maturity, type of issue, trading characteristics and other data, as well as broker quotes. If the pricing services are unable to provide valuations, securities are valued at the mean between the bid and ask quotations or evaluated prices, as applicable, obtained from broker-dealers. These securities are generally categorized as Level 2
Investments in open-end investment companies are valued at their NAV each business day and are categorized as Level 1.
Futures contracts are generally valued at the settlement prices established each day on the exchange on which they are traded and are categorized as Level 1.
Securities and other assets for which market quotations are not readily available or for which the above valuation procedures are deemed not to reflect fair value are valued in a manner that is intended to reflect their fair value as determined in accordance with procedures approved by the Pricing Committee and are generally categorized as Level 3. In accordance with the Funds’ valuation procedures, factors considered in determining value may include, but are not limited to, the type of the security; the size of the holding; the initial cost of the security; the existence of any contractual restrictions on the security’s disposition; the price and extent of public trading in similar securities of the issuer or of comparable companies; quotations or evaluated prices from broker-dealers and/or pricing services; information obtained from the issuer, analysts, and/or the appropriate stock exchange (for exchange-traded securities); an analysis of the company’s or issuer’s financial statements; an evaluation of the forces that influence the issuer and the market(s) in which the security is purchased and sold; and with respect to
92
DBX ETF Trust
Notes to Financial Statements (Continued)
debt securities, the maturity, coupon, creditworthiness, currency denomination and the movement of the market in which the security is normally traded. The value determined under these procedures may differ from published values for the same securities.
Fair value pricing could result in a difference between the prices used to calculate a Fund’s NAV and the prices used by the Fund’s Underlying Index, which in turn could result in a difference between the Fund’s performance and the performance of the Fund’s Underlying Index.
Disclosure about the classification of the fair value measurements is included in a table following the Fund’s Schedule of Investments.
Cash Cash consists of cash held at banks and is on deposit with major financial institutions.
Investment Transactions and Investment Income Investment transactions are recorded as of the date that the securities are purchased or sold (trade date). Realized gains and losses from the sale or disposition of securities are calculated on the identified cost-method. Dividend income is net of any foreign taxes withheld at source. Certain dividends from foreign securities may be recorded subsequent to the ex-dividend date as soon as the fund is informed of such dividends. Interest income is recorded on the accrual basis. Distributions received from foreign domiciled corporations, generally determined to be passive foreign investment companies for tax reporting purposes, are included in dividend income.
Tax Information and Dividends and Distributions to Shareholders It is each Fund’s policy to comply with all requirements of the Internal Revenue Code of 1986, as amended (“the Code”). Each Fund intends to qualify for and to elect treatment as a separate Regulated Investment Company (“RIC”) under Subchapter M of the Code. It is the policy of Xtrackers Emerging Markets Carbon Reduction and Climate Improvers ETF, Xtrackers MSCI EAFE ESG Leaders Equity ETF and Xtrackers MSCI Emerging Markets ESG Leaders Equity ETF to pay out dividends from its net investment income, if any, to investors semi-annually. It is the policy of Xtrackers MSCI USA ESG Leaders Equity ETF, Xtrackers Net Zero Pathway Paris Aligned US Equity ETF, Xtrackers S&P 500 ESG ETF, Xtrackers S&P MidCap 400 ESG ETF and Xtrackers S&P SmallCap 600 ESG ETF to pay out dividends from its net investment income, if any, to investors quarterly. Taxable net realized gains from investment transactions, reduced by capital loss carryforwards, if any, are declared and distributed to shareholders at least annually. The capital loss carryforward amount, if any, is available to offset future net capital gains. The Funds may occasionally be required to make supplemental distributions at some other time during the year. The Funds reserve the right to declare special distributions if, in their reasonable discretion, such action is necessary or advisable to preserve the status of each Fund as a RIC or to avoid imposition of income or excise taxes on undistributed income. Dividends and distributions to shareholders, if any, are recorded on the ex-dividend date. The amount of dividends and distributions from net investment income and net realized capital gains are determined in accordance with Federal income tax regulations which may differ from U.S. GAAP. These “book/tax” differences are either considered temporary or permanent in nature. To the extent these differences are permanent in nature, such amounts are reclassified at the end of the year within the components of net assets based on their federal tax treatment; temporary differences do not require reclassification. Dividends and distributions, which exceed earnings and profits for the full year for tax purposes, are reported as a tax return of capital.
In accordance with U.S. GAAP requirements regarding accounting for uncertainties in income taxes, management has analyzed the Funds’ tax positions taken or expected to be taken on foreign, federal and state income tax returns for all open tax years and has concluded that no provision for income tax is required in the Funds’ financial statements.
The Funds recognize interest and penalties, if any, related to uncertain tax positions as income tax expense on the Statements of Operations. For the year ended August 31, 2022, the Funds did not incur any interest or penalties.
93
DBX ETF Trust
Notes to Financial Statements (Continued)
As of August 31, 2022, the components of accumulated earnings (losses) on a tax basis were as follows:
| Undistributed Ordinary Income* | Capital and Other Gains (Losses) | Unrealized Appreciation (Depreciation) | Total Accumulated Earnings (Losses) | |||||||||||||
Xtrackers Emerging Markets Carbon Reduction and Climate Improvers ETF | $ | 4,688,050 | $ | (36,339,119 | ) | $ | (109,476,689 | ) | $ | (141,127,758 | ) | |||||
Xtrackers MSCI EAFE ESG Leaders Equity ETF | 85,856 | (722,959 | ) | (3,530,120 | ) | (4,167,223 | ) | |||||||||
Xtrackers MSCI Emerging Markets ESG Leaders Equity ETF | 92,653 | (1,101,308 | ) | (3,333,542 | ) | (4,342,197 | ) | |||||||||
Xtrackers MSCI USA ESG Leaders Equity ETF | 8,712,676 | (33,067,012 | ) | 310,584,395 | 286,230,059 | |||||||||||
Xtrackers Net Zero Pathway Paris Aligned US Equity ETF | 205,910 | — | 1,520,008 | 1,725,918 | ||||||||||||
Xtrackers S&P 500 ESG ETF | 2,224,417 | (3,207,022 | ) | (43,618,583 | ) | (44,601,188 | ) | |||||||||
Xtrackers S&P MidCap 400 ESG ETF | 30,444 | (3,522 | ) | (687,873 | ) | (660,951 | ) | |||||||||
Xtrackers S&P SmallCap 600 ESG ETF | 27,842 | (216,916 | ) | (828,866 | ) | (1,017,940 | ) | |||||||||
The tax character of dividends and distributions declared for the period ended August 31, 2022 and year ended August 31, 2021 were as follows:
| Period Ended August 31, 2022 | ||||
| Ordinary Income* | ||||
Xtrackers Emerging Markets Carbon Reduction and Climate Improvers ETF | $ | 9,660,140 | ||
Xtrackers MSCI EAFE ESG Leaders Equity ETF | 738,856 | |||
Xtrackers MSCI Emerging Markets ESG Leaders Equity ETF | 519,666 | |||
Xtrackers MSCI USA ESG Leaders Equity ETF | 45,094,920 | |||
Xtrackers Net Zero Pathway Paris Aligned US Equity ETF | — | |||
Xtrackers S&P 500 ESG ETF | 10,676,805 | |||
Xtrackers S&P MidCap 400 ESG ETF | 125,672 | |||
Xtrackers S&P SmallCap 600 ESG ETF | 182,588 | |||
| Year Ended August 31, 2021 | ||||
| Ordinary Income* | ||||
Xtrackers Emerging Markets Carbon Reduction and Climate Improvers ETF | $ | 192,472 | ||
Xtrackers MSCI EAFE ESG Leaders Equity ETF | 404,392 | |||
Xtrackers MSCI Emerging Markets ESG Leaders Equity ETF | 82,138 | |||
Xtrackers MSCI USA ESG Leaders Equity ETF | 44,278,620 | |||
Xtrackers S&P 500 ESG ETF | 5,646,092 | |||
Xtrackers S&P MidCap 400 ESG ETF | 33,536 | |||
Xtrackers S&P SmallCap 600 ESG ETF | 27,800 | |||
| * | For tax purposes short-term capital gain distributions are considered ordinary income distributions. |
At August 31, 2022, for Federal income tax purposes, the Funds have capital loss carryforwards available as shown in the table below, to the extent provided by regulations, to offset future capital gains for an unlimited period. To the extent that these loss carryforwards are used to offset future capital gains, it is probable that the capital gains so offset will not be distributed to shareholders.
| Short-Term | Long-Term | Total Amount | ||||||||||
Xtrackers Emerging Markets Carbon Reduction and Climate Improvers ETF | $ | 35,935,999 | $ | 403,120 | $ | 36,339,119 | ||||||
Xtrackers MSCI EAFE ESG Leaders Equity ETF | 313,618 | 409,341 | 722,959 | |||||||||
Xtrackers MSCI Emerging Markets ESG Leaders Equity ETF | 483,759 | 617,549 | 1,101,308 | |||||||||
Xtrackers MSCI USA ESG Leaders Equity ETF | 9,242,769 | 23,824,243 | 33,067,012 | |||||||||
Xtrackers S&P 500 ESG ETF | 3,129,116 | 77,906 | 3,207,022 | |||||||||
Xtrackers S&P MidCap 400 ESG ETF | — | 3,522 | 3,522 | |||||||||
Xtrackers S&P SmallCap 600 ESG ETF | 49,959 | 166,957 | 216,916 | |||||||||
94
DBX ETF Trust
Notes to Financial Statements (Continued)
For the period ended August 31, 2022, the effect of permanent “book/tax” reclassifications to the components of net assets are included below. These differences are primarily due to redemptions-in-kind and equalization.
| Distributable earnings (loss) | Paid-In Capital | |||||||
Xtrackers Emerging Markets Carbon Reduction and Climate Improvers ETF | $ | 9,789,387 | $ | (9,789,387 | ) | |||
Xtrackers MSCI EAFE ESG Leaders Equity ETF | 120 | (120 | ) | |||||
Xtrackers MSCI Emerging Markets ESG Leaders Equity ETF | (115,440 | ) | 115,440 | |||||
Xtrackers MSCI USA ESG Leaders Equity ETF | (527,093,924 | ) | 527,093,924 | |||||
Xtrackers Net Zero Pathway Paris Aligned US Equity ETF | (853,159 | ) | 853,159 | |||||
Xtrackers S&P 500 ESG ETF | (87,409,035 | ) | 87,409,035 | |||||
Xtrackers S&P MidCap 400 ESG ETF | (173,474 | ) | 173,474 | |||||
Xtrackers S&P SmallCap 600 ESG ETF | (263,413 | ) | 263,413 | |||||
As of August 31, 2022, the aggregate cost of investments for federal income tax purposes, the net unrealized appreciation or (depreciation) and the aggregated gross unrealized appreciation (depreciation) on investments were as follows:
| Aggregate Tax Cost | Net Unrealized Appreciation (Depreciation) | Aggregate Gross Unrealized Appreciation | Aggregate Gross Unrealized (Depreciation) | |||||||||||||
Xtrackers Emerging Markets Carbon Reduction and Climate Improvers ETF | $ | 602,132,890 | $ | (109,419,520 | ) | $ | 16,251,105 | $ | (125,670,625 | ) | ||||||
Xtrackers MSCI EAFE ESG Leaders Equity ETF | 32,501,513 | (3,523,038 | ) | 671,408 | (4,194,446 | ) | ||||||||||
Xtrackers MSCI Emerging Markets ESG Leaders Equity ETF | 26,074,692 | (3,283,405 | ) | 1,207,289 | (4,490,694 | ) | ||||||||||
Xtrackers MSCI USA ESG Leaders Equity ETF | 2,744,831,492 | 310,584,395 | 436,242,789 | (125,658,394 | ) | |||||||||||
Xtrackers Net Zero Pathway Paris Aligned US Equity ETF | 74,006,257 | 1,520,008 | 3,249,343 | (1,729,335 | ) | |||||||||||
Xtrackers S&P 500 ESG ETF | 790,353,761 | (43,618,583 | ) | 30,515,577 | (74,134,160 | ) | ||||||||||
Xtrackers S&P MidCap 400 ESG ETF | 11,692,863 | (687,873 | ) | 775,499 | (1,463,372 | ) | ||||||||||
Xtrackers S&P SmallCap 600 ESG ETF | 10,271,336 | (828,866 | ) | 723,545 | (1,552,411 | ) | ||||||||||
Foreign Taxes The Funds may be subject to foreign taxes (a portion of which may be reclaimable) on income, capital gains on investments, certain foreign currency transactions or other corporate events. All foreign taxes are recorded in accordance with the applicable foreign tax regulations and rates that exist in the foreign jurisdictions in which the Funds invest. These foreign taxes, if any, are paid by the Funds and are reflected in their Statements of Operations as follows: foreign taxes withheld at source are presented as a reduction of income, foreign taxes on capital gains from sales of investments and foreign currency transactions are included in their respective net realized gain (loss) categories, and deferred foreign taxes on unrealized gains are included in net change in unrealized appreciation (depreciation). Receivables and payables related to foreign taxes as of August 31, 2022, if any, are disclosed in the Funds’ Statements of Assets and Liabilities.
Foreign Currency Translations The books and records of the Funds are maintained in U.S. dollars. Investment securities and other assets and liabilities denominated in a foreign currency are translated into U.S. dollars at the prevailing exchange rates at period end. Purchases and sales of investment securities, income and expenses are translated into U.S. dollars at the prevailing exchange rates on the respective dates of the transactions.
Net realized and unrealized gains and losses on foreign currency transactions represent net gains and losses between trade and settlement dates on securities transactions, the acquisition and disposition of foreign currencies, and the difference between the amount of net investment income accrued and the U.S. dollar amount actually received. The portion of both realized and unrealized gains and losses on investments that results from fluctuations in foreign currency exchange rates is not separately disclosed, but is included with net realized and unrealized gain/appreciation and loss/depreciation on investments.
95
DBX ETF Trust
Notes to Financial Statements (Continued)
Securities Lending The Funds may lend securities to certain financial institutions under the terms of their securities lending agreement. During the term of the loans, the Funds continue to receive interest and dividends generated by the securities and to participate in any changes in their market value. The Funds require the borrowers of the securities to maintain collateral with the Funds consisting of cash and/or securities issued or guaranteed by the U.S. Government, its agencies or instrumentalities having a value at least equal to the value of the securities loaned. When the collateral falls below specified amounts, the lending agent will use its best effort to obtain additional collateral on the next business day to meet required amounts under the securities lending agreement. During the year ended August 31, 2022, the Funds invested the cash collateral into a joint trading account in DWS Government & Agency Securities Portfolio, an affiliated money market fund managed by DWS Investment Management Americas, Inc. DWS Investment Management Americas, Inc. receives a management/administration fee (0.06% annualized effective rate as of August 31, 2022) on the cash collateral invested in DWS Government & Agency Securities Portfolio. The Funds receive compensation for lending their securities either in the form of fees or by earning interest on invested cash collateral, net of borrower rebates and fees paid to a lending agent. Either the Fund or the borrower may terminate the loan at any time and the borrower, after notice, is required to return borrowed securities within a standard time period. There may be risks of delay and costs in recovery of securities or even loss of rights in the collateral should the borrower of the securities fail financially. If the Funds are not able to recover securities lent, the Funds may sell the collateral and purchase a replacement investment in the market, incurring the risk that the value of the replacement security is greater than the value of the collateral. The Funds are also subject to all investment risks associated with the reinvestment of any cash collateral received, including, but not limited to, interest rate, credit and liquidity risk associated with such investments.
As of August 31, 2022, the Funds listed below had securities on loan. The value of the related collateral exceeded the value of the securities loaned at period end.
Remaining Contractual Maturity of the Agreements, as of August 31, 2022 | ||||||||||||||||||||
| Securities Lending Transactions | Overnight and Continuous | <30 Days | Between 30 & 90 days | >90 days | Total | |||||||||||||||
Xtrackers Emerging Markets Carbon Reduction and Climate Improvers ETF |
| |||||||||||||||||||
Common Stocks | $ | 1,366,731 | $ | — | $ | — | $ | 4,316,668 | $ | 5,683,399 | ||||||||||
|
|
|
|
|
|
|
|
|
| |||||||||||
Gross amount of recognized liabilities and non-cash collateral for securities lending transactions |
| $ | 5,683,399 | |||||||||||||||||
Xtrackers MSCI EAFE ESG Leaders Equity ETF |
| |||||||||||||||||||
Common Stocks | $ | 75,746 | $ | — | $ | 42 | $ | 460,146 | $ | 535,934 | ||||||||||
Exchange-Trade Funds | 36,380 | — | — | — | 36,380 | |||||||||||||||
|
|
|
|
|
|
|
|
|
| |||||||||||
Total Borrowings | $ | 112,126 | $ | — | $ | 42 | $ | 460,146 | $ | 572,314 | ||||||||||
|
|
|
|
|
|
|
|
|
| |||||||||||
Gross amount of recognized liabilities and non-cash collateral for securities lending transactions |
| $ | 572,314 | |||||||||||||||||
Xtrackers MSCI Emerging Markets ESG Leaders Equity ETF |
| |||||||||||||||||||
Common Stocks | $ | 43,257 | $ | — | $ | — | $ | 33,792 | $ | 77,049 | ||||||||||
|
|
|
|
|
|
|
|
|
| |||||||||||
Gross amount of recognized liabilities and non-cash collateral for securities lending transactions |
| $ | 77,049 | |||||||||||||||||
Xtrackers MSCI USA ESG Leaders Equity ETF |
| |||||||||||||||||||
Common Stocks | $ | 804,200 | $ | 629,197 | $ | 4,150,935 | $ | 24,314,803 | $ | 29,899,135 | ||||||||||
|
|
|
|
|
|
|
|
|
| |||||||||||
Gross amount of recognized liabilities and non-cash collateral for securities lending transactions |
| $ | 29,899,135 | |||||||||||||||||
Xtrackers S&P 500 ESG ETF |
| |||||||||||||||||||
Common Stocks | $ | — | $ | 1,578 | $ | 35,228 | $ | 9,910,836 | $ | 9,947,642 | ||||||||||
|
|
|
|
|
|
|
|
|
| |||||||||||
Gross amount of recognized liabilities and non-cash collateral for securities lending transactions |
| $ | 9,947,642 | |||||||||||||||||
Xtrackers S&P MidCap 400 ESG ETF |
| |||||||||||||||||||
Common Stocks | $ | — | $ | 20 | $ | 458 | $ | 542,064 | $ | 542,542 | ||||||||||
|
|
|
|
|
|
|
|
|
| |||||||||||
Gross amount of recognized liabilities and non-cash collateral for securities lending transactions |
| $ | 542,542 | |||||||||||||||||
Xtrackers S&P SmallCap 600 ESG ETF |
| |||||||||||||||||||
Common Stocks | $ | 22,525 | $ | 4 | $ | 85 | $ | 572,776 | $ | 595,390 | ||||||||||
|
|
|
|
|
|
|
|
|
| |||||||||||
Gross amount of recognized liabilities and non-cash collateral for securities lending transactions |
| $ | 595,390 | |||||||||||||||||
As of August 31, 2022, Xtrackers Net Zero Pathway Paris Aligned US Equity ETF had no securities on loan.
96
DBX ETF Trust
Notes to Financial Statements (Continued)
Derivatives
Futures Contracts Each Fund may enter into futures contracts. These futures contracts will be used to simulate investment in the respective Underlying Index, to facilitate trading or to reduce transaction costs. Each Fund will enter into futures contracts that are traded on a U.S. or non-U.S. exchange. No Fund will use futures for speculative purposes. Futures contracts provide for the future sale by one party and purchase by another party of a specified amount of a specific instrument or index at a specified future time and at a specified price. For the year ended August 31, 2022, Xtrackers Emerging Markets Carbon Reduction and Climate Improvers ETF, Xtrackers MSCI EAFE ESG Leaders Equity ETF, Xtrackers MSCI Emerging Markets ESG Leaders Equity ETF, Xtrackers MSCI USA ESG Leaders Equity ETF, Xtrackers Net Zero Pathway Paris Aligned US Equity ETF and Xtrackers S&P 500 ESG ETF utilized futures in order to simulate investment in the Funds’ Underlying Index. To the extent required by law, liquid assets committed to futures contracts will be maintained.
At the time each Fund enters into a futures contract, each Fund deposits and maintains as collateral an initial margin with the broker, as required by the exchange on which the transaction is affected. Pursuant to the contract, each Fund agrees to receive from or pay to the broker an amount of cash equal to the daily fluctuation in the value of the contract. Such receipts or payments are known as variation margin and are recorded by each Fund as unrealized gains or losses. Risks may arise from the potential inability of a counterparty to meet the terms of the contract. The credit/counterparty risk for exchange-traded futures contracts is generally less than privately negotiated futures contracts, since the clearinghouse, which is the issuer or counterparty to each exchange-traded future, provides a guarantee of performance. The guarantee is supported by a daily payment system (i.e., margin requirements).
Use of long futures contracts subjects each Fund to risk of loss in excess of the amounts shown on the Statement of Assets and Liabilities, up to the notional value of the futures contracts. Use of short futures contracts subjects each Fund to unlimited risk of loss. Under some circumstances, futures exchanges may establish daily limits on the amount that the price of a futures contract can vary from the previous day’s settlement price, which could effectively prevent liquidation of unfavorable positions.
A summary of the open futures contracts as of August 31, 2022 is included in a table following the Funds’ Schedule of Investments.
The following tables summarize the value of the Funds’ derivative instruments held as of August 31, 2022 and the related location in the accompanying Statement of Assets and Liabilities, presented by primary underlying risk exposure:
Asset Derivatives | Liability Derivatives | |||||||||||||
| Xtrackers Emerging Markets Carbon Reduction and Climate Improvers ETF |
| |||||||||||||
| Equity contracts | Unrealized appreciation on futures contracts* | $ | — | Unrealized depreciation on futures contracts* | $ | 42,145 | ||||||||
| Xtrackers MSCI EAFE ESG Leaders Equity ETF |
| |||||||||||||
| Equity contracts | Unrealized appreciation on futures contracts* | $ | 1,100 | Unrealized depreciation on futures contracts* | $ | 3,688 | ||||||||
| Xtrackers MSCI Emerging Markets ESG Leaders Equity ETF |
| |||||||||||||
| Equity contracts | Unrealized appreciation on futures contracts* | $ | — | Unrealized depreciation on futures contracts* | $ | 2,435 | ||||||||
| Xtrackers MSCI USA ESG Leaders Equity ETF |
| |||||||||||||
| Equity contracts | Unrealized appreciation on futures contracts* | $ | 56,400 | Unrealized depreciation on futures contracts* | $ | 111,869 | ||||||||
| Xtrackers Net Zero Pathway Paris Aligned US Equity ETF |
| |||||||||||||
| Equity contracts | Unrealized appreciation on futures contracts* | $ | — | Unrealized depreciation on futures contracts* | $ | 12,730 | ||||||||
| Xtrackers S&P 500 ESG ETF |
| |||||||||||||
| Equity contracts | Unrealized appreciation on futures contracts* | $ | 21,968 | Unrealized depreciation on futures contracts* | $ | 59,787 | ||||||||
| * | Includes cumulative appreciation or cumulative depreciation of futures contracts as disclosed in the Schedule of Investments. Unsettled variation margin is disclosed separately within the Statement of Assets and Liabilities. |
97
DBX ETF Trust
Notes to Financial Statements (Continued)
Additionally, the amount of realized and unrealized gains and losses on derivative instruments recognized in the Funds’ earnings during the period ended August 31, 2022 and the related location in the accompanying Statement of Operations is summarized in the following tables by primary underlying risk exposure:
Net Realized Gain (Loss) from: | ||||
| Futures Contracts — Equity Contracts | ||||
Xtrackers Emerging Markets Carbon Reduction and Climate Improvers ETF | $ | (426,163 | ) | |
Xtrackers MSCI EAFE ESG Leaders Equity ETF | (9,218 | ) | ||
Xtrackers MSCI Emerging Markets ESG Leaders Equity ETF | (19,061 | ) | ||
Xtrackers MSCI USA ESG Leaders Equity ETF | (744,318 | ) | ||
Xtrackers Net Zero Pathway Paris Aligned US Equity ETF | (2,559 | ) | ||
Xtrackers S&P 500 ESG ETF | (46,565 | ) | ||
Net Change in Unrealized Appreciation (Depreciation) on: | ||||
| Futures Contracts — Equity Contracts | ||||
Xtrackers Emerging Markets Carbon Reduction and Climate Improvers ETF | $ | (41,689 | ) | |
Xtrackers MSCI EAFE ESG Leaders Equity ETF | (2,671 | ) | ||
Xtrackers MSCI Emerging Markets ESG Leaders Equity ETF | (6,500 | ) | ||
Xtrackers MSCI USA ESG Leaders Equity ETF | (351,594 | ) | ||
Xtrackers Net Zero Pathway Paris Aligned US Equity ETF | (12,730 | ) | ||
Xtrackers S&P 500 ESG ETF | (110,379 | ) | ||
For the period ended August 31, 2022 the average monthly volume of derivatives was as follows:
| Futures Contracts (Contract Value) | ||||
Xtrackers Emerging Markets Carbon Reduction and Climate Improvers ETF | $ | 1,776,619 | ||
Xtrackers MSCI EAFE ESG Leaders Equity ETF | 114,095 | |||
Xtrackers MSCI Emerging Markets ESG Leaders Equity ETF | 92,164 | |||
Xtrackers MSCI USA ESG Leaders Equity ETF | 5,672,160 | |||
Xtrackers Net Zero Pathway Paris Aligned US Equity ETF | 172,520 | |||
Xtrackers S&P 500 ESG ETF | 1,299,852 | |||
Affiliated Cash Management Vehicles The Funds may invest uninvested cash balances in DWS Government Money Market Series and DWS ESG Liquidity Fund, affiliated money market funds which are managed by DWS Investment Management Americas, Inc. (“DIMA”), also an indirect, wholly owned subsidiary of DWS Group GmbH & Co. KGaA. Each affiliated money market fund is managed in accordance with Rule 2a-7 under the 1940 Act, which governs the quality, maturity, diversity and liquidity of instruments in which a money market fund may invest. DWS Government Money Market Series seeks to maintain a stable NAV, and DWS ESG Liquidity Fund maintains a floating NAV. The Funds indirectly bear their proportionate share of the expenses of each affiliated money market fund in which they invest. The Advisor will waive an amount of the unitary advisory fee payable to the Advisor by the Funds equal to such acquired fund’s fees and expenses on the Funds’ assets invested in the affiliated money market funds.
3. Investment Advisory and Other Agreements
The Advisor has overall responsibility for the general management and administration of the Funds, subject to the supervision of the Funds’ Board of Trustees. Under an investment advisory agreement between the Trust, on behalf of the Funds, and the Advisor (the “Investment Advisory Agreement”), the Advisor is responsible for arranging sub-advisory, transfer agency, custody, fund administration, and all other non-distribution related services for the Funds to operate.
98
DBX ETF Trust
Notes to Financial Statements (Continued)
For its investment advisory services to the Funds below, the Advisor was entitled to receive a unitary advisory fee based on each Fund’s average daily net assets, computed and accrued daily and payable monthly, at an annual rate equal to:
| Unitary Advisory Fee | ||||
Xtrackers Emerging Markets Carbon Reduction and Climate Improvers ETF | 0.15 | % | ||
Xtrackers MSCI EAFE ESG Leaders Equity ETF | 0.14 | % | ||
Xtrackers MSCI Emerging Markets ESG Leaders Equity ETF | 0.20 | % | ||
Xtrackers MSCI USA ESG Leaders Equity ETF | 0.10 | % | ||
Xtrackers Net Zero Pathway Paris Aligned US Equity ETF | 0.10 | % | ||
Xtrackers S&P 500 ESG ETF | 0.11 | % | ||
Xtrackers S&P MidCap 400 ESG ETF | 0.15 | % | ||
Xtrackers S&P SmallCap 600 ESG ETF | 0.15 | % | ||
The Advisor for the Xtrackers MSCI USA ESG Leaders Equity ETF has voluntarily elected to waive its fees and/or reimburse Fund expenses to the extent necessary to maintain the Fund’s total annual operating expenses (excluding certain expenses such as extraordinary expenses, taxes, brokerage, interest expense and acquired fund fees and expenses) at nine basis points of the Fund’s average daily net assets. Any voluntary waiver or reimbursement implemented by the Advisor may be eliminated by the Advisor at any time. For the year ended August 31, 2022, the Advisor waived $344,308 of expenses to the Fund.
The Advisor for the Xtrackers S&P 500 ESG ETF has contractually agreed through December 16, 2022 to waive its fees and/or reimburse fund expenses to the extent necessary to prevent the operating expenses of the fund (excluding interest expense, taxes, brokerage expenses, distribution fees or expenses, litigation expenses and other extraordinary expenses) from exceeding 0.10% of the fund’s average daily net assets. This agreement may only be terminated by the Fund’s Board (and may not be terminated by the Advisor) prior to that time. For the year ended August 31, 2022, the Advisor waived $80,475 of expenses to the Fund.
The Advisor for the Funds below has contractually agreed to waive a portion of its unitary advisory fee in an amount equal to the acquired fund’s fees and expenses attributable to the Funds’ investments in affiliated Funds. For the year ended August 31, 2022, the Advisor waived expenses of the Funds as follows:
| Expenses Waived | ||||
Xtrackers Emerging Markets Carbon Reduction and Climate Improvers ETF | $ | 360 | ||
Xtrackers MSCI EAFE ESG Leaders Equity ETF | 13 | |||
Xtrackers MSCI Emerging Markets ESG Leaders Equity ETF | 24 | |||
Xtrackers MSCI USA ESG Leaders Equity ETF | 1,919 | |||
Xtrackers Net Zero Pathway Paris Aligned US Equity ETF | 12 | |||
Xtrackers S&P 500 ESG ETF | 433 | |||
Xtrackers S&P MidCap 400 ESG ETF | 2 | |||
Xtrackers S&P SmallCap 600 ESG ETF | 2 | |||
Out of the unitary advisory fee, the Advisor pays substantially all expenses of each Fund, including the cost of transfer agency, custody, fund administration, legal, audit and other services, and expenses of the Independent Trustees. Each Fund is responsible for the payment of interest expense, acquired fund fees and expenses, taxes, brokerage expenses, distribution fees or expenses, if any, litigation expenses and extraordinary expenses.
The Bank of New York Mellon, a wholly-owned subsidiary of The Bank of New York Mellon Corporation, serves as Administrator, Custodian, Accounting Agent, Lending Agent and Transfer Agent for each Fund.
ALPS Distributors, Inc. (the “Distributor”) serves as the distributor of Creation Units for each Fund on an agency basis. The Distributor does not maintain a secondary market in shares of the Funds.
The Board of Trustees is currently comprised of three Independent Trustees. The Advisor paid retainer fees and attendance fees to each Independent Trustee; retainer fees to the Chairman of the Board of Trustees and Chairman of the Audit Committee; and attendance fees to each member of the Audit Committee (which is comprised of all of the Funds’ Independent Trustees).
99
DBX ETF Trust
Notes to Financial Statements (Continued)
4. Investment Portfolio Transactions
For the year ended August 31, 2022, the cost of investments purchased and proceeds from sale of investments (excluding in-kind transactions and short-term investments) were as follows:
| Purchases | Sales | |||||||
Xtrackers Emerging Markets Carbon Reduction and Climate Improvers ETF | $ | 342,266,102 | $ | 184,924,404 | ||||
Xtrackers MSCI EAFE ESG Leaders Equity ETF | 5,799,884 | 5,660,465 | ||||||
Xtrackers MSCI Emerging Markets ESG Leaders Equity ETF | 10,290,657 | 5,372,888 | ||||||
Xtrackers MSCI USA ESG Leaders Equity ETF | 189,740,715 | 201,576,885 | ||||||
Xtrackers Net Zero Pathway Paris Aligned US Equity ETF | 8,072,400 | 5,496,486 | ||||||
Xtrackers S&P 500 ESG ETF | 44,708,096 | 43,941,898 | ||||||
Xtrackers S&P MidCap 400 ESG ETF | 4,504,799 | 4,477,678 | ||||||
Xtrackers S&P SmallCap 600 ESG ETF | 4,408,019 | 4,464,607 | ||||||
For the year ended August 31, 2022, the cost of in-kind purchases and proceeds from in-kind sales were as follows:
| Purchases | Sales | |||||||
Xtrackers Emerging Markets Carbon Reduction and Climate Improvers ETF | $ | 59,048,573 | $ | 50,858,508 | ||||
Xtrackers MSCI EAFE ESG Leaders Equity ETF | 17,228,336 | — | ||||||
Xtrackers MSCI Emerging Markets ESG Leaders Equity ETF | 1,537,319 | 1,820,839 | ||||||
Xtrackers MSCI USA ESG Leaders Equity ETF | 858,549,113 | 1,238,727,575 | ||||||
Xtrackers Net Zero Pathway Paris Aligned US Equity ETF | 74,473,310 | 4,264,213 | ||||||
Xtrackers S&P 500 ESG ETF | 453,803,949 | 348,267,598 | ||||||
Xtrackers S&P MidCap 400 ESG ETF | 2,580,265 | 1,250,558 | ||||||
Xtrackers S&P SmallCap 600 ESG ETF | 1,210,286 | 1,204,031 | ||||||
5. Fund Share Transactions
As of August 31, 2022, there were unlimited Fund shares, no par value, authorized by the Trust. Fund shares are issued and redeemed by each Fund only in Creation Units or multiples thereof. Except when aggregated in Creation Units, shares of each Fund are not redeemable. Transactions in capital shares for each Fund are disclosed in detail in the Statements of Changes in Net Assets. The consideration for the purchase of Creation Units of a Fund generally consists of the in-kind contribution of a designated portfolio of securities constituting a portfolio sampling representation of the securities included in the respective Fund’s Underlying Index and an amount of cash, which under certain circumstances may include cash in lieu of portfolio securities. Investors purchasing and redeeming Creation Units pay a purchase transaction fee and a redemption transaction fee to offset transfer and other transaction costs associated with the issuance and redemption of Creation Units.
6. Concentration of Ownership
From time to time, the Funds may have a concentration of several shareholder accounts holding a significant percentage of shares outstanding. Investment activities of these shareholders could have a material impact on the Fund. At August 31, 2022, there was one affiliated shareholder account for each of the funds listed below holding a significant percentage of the shares outstanding:
| Approximate Percent of Outstanding Shares Held | ||||
Xtrackers S&P MidCap 400 ESG ETF | 67 | % | ||
Xtrackers S&P SmallCap 600 ESG ETF | 93 | % | ||
7. Payments by Affiliates
During the year ended August 31, 2022, the Advisor agreed to reimburse Xtrackers Emerging Markets Carbon Reduction and Climate Improvers ETF $2,700 for a loss due to a foreign currency trade executed incorrectly. The amount compensated was less than 0.01% of the Fund’s average net assets, thus having no impact on the Fund’s total return.
100
DBX ETF Trust
Notes to Financial Statements (Continued)
8. Investing in Emerging Markets
Investing in emerging markets may involve special risks and considerations not typically associated with investing in developed markets. These risks include revaluation of currencies, high rates of inflation or deflation, repatriation restrictions on income and capital, and future adverse political, social and economic developments. Moreover, securities issued in these markets may be less liquid, subject to government ownership controls or delayed settlements, and may have prices that are more volatile or less easily assessed than those of comparable securities of issuers in developed markets. There is also substantially less publicly available information about emerging market issuers than there is about issuers in developed countries. Therefore, disclosure of certain material information may not be made, and less information may be available to the Funds and other investors than would be the case if the Funds’ investments were restricted to securities of issuers in developed countries. Investments in emerging markets are often considered speculative.
Russia’s recent military incursions in Ukraine have led to, and may lead to additional sanctions being levied by the United States, European Union and other countries against Russia. Russia’s military incursion and the resulting sanctions could adversely affect global energy and financial markets and thus could affect the value of the Funds’ investments, even beyond any direct exposure the Funds may have to Russian issuers or the adjoining geographic regions. The extent and duration of the military action, sanctions and resulting market disruptions are impossible to predict, but could be substantial.
Investing in securities of Chinese issuers involves certain risks and considerations not typically associated with investing in securities of U.S. issuers, including, among others; more frequent (and potentially widespread) trading suspensions and government interventions with respect to Chinese issuers, resulting in lack of liquidity and in price volatility; currency revaluations and other currency exchange rate fluctuations or blockage; the nature and extent of intervention by the Chinese government in the Chinese securities markets (including both direct and indirect market stabilization efforts, which may affect valuations of Chinese issuers), whether such intervention will continue and the impact of such intervention or its discontinuation; the risk of nationalization or expropriation of assets; the risk that the Chinese government may decide not to continue to support economic reform programs; limitations on the use of brokers (or action by the Chinese government that discourages brokers from serving international clients); higher rates of inflation; greater political, economic and social uncertainty; higher market volatility caused by any potential regional territorial conflicts or natural disasters; the risk of increased trade tariffs, embargoes and other trade limitations; restrictions on foreign ownership; custody risks associated with investing through Shanghai — Hong Kong and Shenzhen — Hong Kong Stock Connect programs, Renminbi Qualified Foreign Institutional Investor program or other programs to access the Chinese securities markets, both interim and permanent market regulations which may affect the ability of certain stockholders to sell Chinese securities when it would otherwise be advisable; and different and less stringent financial reporting standards. In addition, in June 2021, President Biden issued an executive order (“CMIC Order”) prohibiting U.S. persons, including the Funds, from purchasing or selling publicly traded securities (including publicly traded securities that are derivative of, or designed to provide exposure to, such securities) of any Chinese company identified as a “Chinese Military-Industrial Complex Company” (“CMIC”). This prohibition, effective August 2, 2021, expands on similar sanctions imposed by the prior administration on certain designated Chinese military companies (“CCMCs”) that took effect in January 2021. To the extent that any company in an Underlying Index is identified as a CMIC at any time (or was previously designated as a CCMC), it may have material adverse effect on a fund’s ability to track its Underlying Index.
9. Line of Credit
The Trust has entered into a senior unsecured credit facility with a syndication of banks which allows the Xtrackers Emerging Markets Carbon Reduction and Climate Improvers ETF, Xtrackers MSCI Emerging Markets ESG Leaders Equity ETF and certain other funds managed by the Advisor to borrow up to $105 million. Each Fund may borrow money under this credit facility to the extent necessary for temporary or emergency purposes, including the funding of shareholder redemption requests, trade settlements, and as necessary to distribute to shareholders any income necessary to maintain each Funds’ status as a regulated investment company. Borrowings are charged an interest rate of 1.25% per annum plus the greater of the Federal Funds Effective Rate or the one-month LIBOR Rate. Each Fund may borrow up to the lesser of 33 percent of its net assets as permitted by the Act or 25 percent of adjusted total net assets. The Funds had no outstanding loans at August 31, 2022.
101
DBX ETF Trust
Notes to Financial Statements (Continued)
10. Other — COVID-19 Pandemic
A novel coronavirus known as COVID-19, declared a pandemic by the World Health Organization, has caused significant uncertainty, market volatility, decreased economic and other activity, increased government activity, including economic stimulus measures, and supply chain interruptions. The full effects, duration and costs of the COVID-19 pandemic are impossible to predict, and the circumstances surrounding the COVID-19 pandemic will continue to evolve, including the risk of future increased rates of infection due to significant portions of the population remaining unvaccinated and/or the lack of effectiveness of current vaccines against new variants. The pandemic has affected and may continue to affect certain countries, industries, economic sectors, companies and investment products more than others, may exacerbate existing economic, political, or social tensions and may increase the probability of an economic recession or depression. The Funds’ and their investments may be adversely affected by the effects of the COVID-19 pandemic, and the pandemic may result in the Funds and their service providers experiencing operational difficulties in coordinating a remote workforce and implementing their business continuity plans, among others. Management will continue to monitor the impact COVID-19 has on the Funds and reflect the consequences as appropriate in the Funds’ accounting and financial reporting.
102
DBX ETF Trust
To the Shareholders of
Xtrackers Emerging Markets Carbon Reduction and Climate Improvers ETF, Xtrackers MSCI EAFE ESG Leaders Equity ETF, Xtrackers MSCI Emerging Markets ESG Leaders Equity ETF, Xtrackers MSCI USA ESG Leaders Equity ETF, Xtrackers S&P 500 ESG ETF, Xtrackers S&P MidCap 400 ESG ETF, Xtrackers S&P SmallCap 600 ESG ETF and Xtrackers Net Zero Pathway Paris Aligned US Equity ETF and the Board of Trustees of DBX ETF Trust
Opinion on the Financial Statements
We have audited the accompanying statements of assets and liabilities of Xtrackers Emerging Markets Carbon Reduction and Climate Improvers ETF, Xtrackers MSCI EAFE ESG Leaders Equity ETF, Xtrackers MSCI Emerging Markets ESG Leaders Equity ETF, Xtrackers MSCI USA ESG Leaders Equity ETF, Xtrackers S&P 500 ESG ETF, Xtrackers S&P MidCap 400 ESG ETF, Xtrackers S&P SmallCap 600 ESG ETF and Xtrackers Net Zero Pathway Paris Aligned US Equity ETF (collectively referred to as the “Funds”), (eight of the funds constituting DBX ETF Trust (the “Trust”)), including the schedules of investments, as of August 31, 2022, and the related statements of operations and changes in net assets, and the financial highlights for each of the periods indicated in the table below and the related notes (collectively referred to as the “financial statements”). In our opinion, the financial statements present fairly, in all material respects, the financial position of each of the Funds (eight of the funds constituting DBX ETF Trust) at August 31, 2022, and the results of their operations, changes in net assets and financial highlights for each of the periods indicated in the table below, in conformity with U.S. generally accepted accounting principles.
Individual fund constituting the DBX ETF Trust | Statement of operations | Statements of changes in net assets | Financial highlights | |||
Xtrackers Emerging Markets Carbon Reduction and Climate Improvers ETF
Xtrackers MSCI Emerging Markets ESG Leaders Equity ETF | For the year ended August 31, 2022 | For each of the two years in the period ended August 31, 2022 | For each of the three years in the period ended August 31, 2022 and the period from December 6, 2018 (commencement of operations) through August 31, 2019 | |||
| Xtrackers MSCI EAFE ESG Leaders Equity ETF | For the year ended August 31, 2022 | For each of the two years in the period ended August 31, 2022 | For each of the three years in the period ended August 31, 2022 and the period from September 6, 2018 (commencement of operations) through August 31, 2019 | |||
| Xtrackers MSCI USA ESG Leaders Equity ETF | For the year ended August 31, 2022 | For each of the two years in the period ended August 31, 2022 | For each of the three years in the period ended August 31, 2022 and the period from March 7, 2019 (commencement of operations) through August 31, 2019 | |||
| Xtrackers S&P 500 ESG ETF | For the year ended August 31, 2022 | For each of the two years in the period ended August 31, 2022 | For each of the three years in the period ended August 31, 2022 and the period from June 26, 2019 (commencement of operations) through August 31, 2019 |
103
DBX ETF Trust
Report of Independent Registered Public Accounting Firm (Continued)
Individual fund constituting the DBX ETF Trust | Statement of operations | Statements of changes in net assets | Financial highlights | |||
Xtrackers S&P MidCap 400 ESG ETF
Xtrackers S&P SmallCap 600 ESG ETF | For the year ended August 31, 2022 | For the year ended August 31, 2022 and the period from February 24, 2021 (commencement of operations) through August 31, 2021 | ||||
| Xtrackers Net Zero Pathway Paris Aligned US Equity ETF | For the period from June 28, 2022 (commencement of operations) through August 31, 2022 | |||||
Basis for Opinion
These financial statements are the responsibility of the Trust’s management. Our responsibility is to express an opinion on each of the Funds’ financial statements based on our audits. We are a public accounting firm registered with the Public Company Accounting Oversight Board (United States) (“PCAOB”) and are required to be independent with respect to the Trust in accordance with the U.S. federal securities laws and the applicable rules and regulations of the Securities and Exchange Commission and the PCAOB.
We conducted our audits in accordance with the standards of the PCAOB. Those standards require that we plan and perform the audit to obtain reasonable assurance about whether the financial statements are free of material misstatement, whether due to error or fraud. The Trust is not required to have, nor were we engaged to perform, an audit of the Trust’s internal control over financial reporting. As part of our audits we are required to obtain an understanding of internal control over financial reporting but not for the purpose of expressing an opinion on the effectiveness of the Trust’s internal control over financial reporting. Accordingly, we express no such opinion.
Our audits included performing procedures to assess the risks of material misstatement of the financial statements, whether due to error or fraud, and performing procedures that respond to those risks. Such procedures included examining, on a test basis, evidence regarding the amounts and disclosures in the financial statements. Our procedures included confirmation of securities owned as of August 31, 2022, by correspondence with the custodian, brokers and others; when replies were not received from brokers, we performed other auditing procedures. Our audits also included evaluating the accounting principles used and significant estimates made by management, as well as evaluating the overall presentation of the financial statements. We believe that our audits provide a reasonable basis for our opinion.

We have served as the auditor of one or more investment companies in the DWS family of funds since at least 1979, but we are unable to determine the specific year.
New York, New York
October 25, 2022
104
DBX ETF Trust
Xtrackers Net Zero Paris Aligned US Equity ETF
Board Approval of Investment Advisory Agreement with DBX Advisors LLC
After discussions at the meeting of the Board of Trustees (“Board” or “Trustees”) held on May 10, 2022, the Trustees, all of who are not “interested persons,” as defined by the Investment Company Act of 1940, as amended (the “1940 Act”) of DBX ETF Trust (the “Trust”) or its service providers), unanimously approved the Investment Advisory Agreement between DBX Advisors LLC (“DBX” or the “Adviser”) and the Trust, with respect to Xtrackers Net Zero Paris Aligned US Equity ETF (subsequently renamed as Xtrackers Net Zero Pathway Paris Aligned US Equity ETF) (the “Fund”). The Independent Trustees were advised throughout the review and meeting by K&L Gates LLP (“Independent Trustee Counsel”).
In reaching this decision, the Board considered all factors it believed relevant, including (1) the nature, extent and quality of the services to be provided to the Fund and its shareholders; (2) the financial resources of the Adviser and its resulting ability to perform its obligations under the Investment Advisory Agreement; (3) the competitiveness of the Fund’s advisory fee; (4) the total cost of the services to be provided by, and the anticipated profits to be realized, by the Adviser from its relationship with the Fund; and (5) the extent to which economies of scale would be realized, and if the Fund’s shareholders would benefit from those economies.
The Board reached a determination, with the assistance of Vedder Price P.C. (“Trust Counsel”) and through the exercise of its business judgment, that approval of the Investment Advisory Agreement and the compensation to be received thereunder is in the best interests of the Fund and its shareholders as well as consistent with the Board’s duties under state and federal law. The Board reached this conclusion based on multiple factors.
The Board considered the following in determining whether to approve the Investment Advisory Agreement:
Nature, Extent and Quality of Services. The Board reviewed in detail the nature, extent and quality of services to be provided by the Adviser under the Investment Advisory Agreement. The Board considered that these services include, among other things, furnishing a continuous investment program for the Fund, including arranging for, or implementing, the purchase and sale of portfolio securities, the provision of general corporate services, such as portfolio management compliance services and the preparation and filing of certain reports on behalf of the Trust. The Board also considered, among other things, the professional experience, qualifications and performance of the senior management and key professional personnel of the Adviser, including portfolio management.
The Board considered that the Adviser will provide, at its own expense, office facilities and equipment for use by the Fund and supervisory persons responsible for supervising and monitoring the Trust’s service providers. The Board also considered that the Adviser will pay or arrange for the compensation of officers of the Trust who are also officers or employees of the Adviser or one of its DWS Group affiliates, except as may otherwise be determined by the Board. In addition, the Board considered that the Adviser arranges for the provision of transfer agency, custody, fund administration and accounting, and other non-distribution services necessary for the Fund’s operations. The Board also considered that in addition to managing the Fund’s portfolio directly, the Adviser will provide oversight of day-to-day operations, including monitoring tracking error, providing services in connection with the creation and redemption of creation units and assistance in meeting legal, compliance and regulatory requirements applicable to the Fund.
Based on its review, the Board concluded that the nature, extent, and quality of services to be provided by the Adviser under the Investment Advisory Agreement are reasonable and appropriate in relation to the fee to be paid to the Adviser, taking special consideration of the fact that the advisory fee is a unitary fee and, as a result, a portion of the unitary advisory fee will be used to compensate the Fund’s service providers. The Board considered the staffing of the Adviser, including the training, qualifications and experience of investment personnel in managing the Fund. The Board also considered the expertise of the Adviser in supervising third party service providers to its currently managed funds, such as the administrator and the custodian (which would also provide those services to the Fund), noting the Adviser’s extensive work with these service providers (including onsite and virtual due diligence sessions) to conduct such supervision (which would cover the Fund as well). The Board
105
DBX ETF Trust
Board Considerations in Approval of Investment Advisory
Contracts (Unaudited) (Continued)
further considered the compliance program of the Adviser, which supports the compliance program of the Adviser’s currently managed funds (which would also cover the Fund).
Adviser’s Financial Resources. In connection with the assessment of the ability of the Adviser to perform its duties under the Investment Advisory Agreement, the Board considered the Adviser’s financial condition and whether it has the resources necessary to carry out its functions. The Board concluded that the Adviser has the financial resources necessary to perform its obligations under the Investment Advisory Agreement.
Reasonableness of Advisory Fee. The Board compared the Fund’s advisory fee to those of other pertinent exchange-traded funds (“ETFs”) and noted that the Fund’s fee is below the average and median fee of the ETFs in the Fund’s peer group. The Board accordingly noted that the Fund’s fees are competitive with the fees of its peer group. The Board agreed that it was familiar with the Adviser’s methodology for selecting the Fund’s peer group and believed that the Fund’s peer group was appropriate. The Board considered that the proposed fees for the Fund is a unitary fee pursuant to which the Adviser pays all of the Fund’s costs (subject to certain specified exceptions). The Board also considered that the Fund’s portfolio will be managed on a day-to-day basis by the Adviser and that the Adviser will also provide oversight of day-to-day operations, including monitoring tracking error, providing services in connection with creation and redemption units and assistance in meeting legal and regulatory requirements applicable to the Fund. Based on its review, the Board concluded that the advisory fee for the Fund is reasonable in light of the services to be provided.
Costs of Services and Profitability. The Board considered the anticipated expenses of the Adviser in developing and rendering services to be provided to the Fund and the likelihood and level of profits in the early years of the Fund’s operations. The Board noted that because the Fund is new, it is difficult to estimate the profitability of the Fund to the Adviser at this time. The Board considered whether the Adviser would benefit in other ways from its relationships with the Fund and concluded that there were no material fall-out benefits likely to accrue to the Adviser related to the operation of the Fund.
Economies of Scale. The Board noted that the Fund’s advisory fee was set at a competitive level that was designed to reflect scale in assets from the Fund’s commencement of operations. The Board noted that because the Fund is new, it is difficult to estimate whether the Fund would experience economies of scale beyond those already reflected in the advisory fees. The Board determined to evaluate economies of scale on an ongoing basis as a result of asset growth of the Fund.
Given all the information available to it and considering all material factors, the Board concluded that the Investment Advisory Agreement was fair and reasonable and it was unanimously approved.
106
DBX ETF Trust
Identification and Background
The Board has responsibility for the overall management and operations of the funds, including general supervision of the duties performed by the Advisor and other service providers. Each Board Member serves until his or her successor is duly elected or appointed and qualified. Each officer serves until he or she resigns, is removed, dies, retires or becomes disqualified.
The Trust currently has three Board Members. The three Independent Board Members have no affiliation or business connection with the Advisor or any of its affiliated persons and do not own any stock or other securities issued by the Advisor.
The Independent Board Members of the Trust, their term of office and length of time served, their principal business occupations during the past five years, the number of portfolios in the fund complex (defined below) overseen by each Independent Board Member, and other directorships, if any, held by the Board Members are shown below. The fund complex includes all registered open- and closed-end funds (including all of their portfolios) advised by the Advisor and any registered funds that have an investment advisor that is an affiliated person of the Advisor. As of the date of this shareholder report, the fund complex consists of the funds in the Trust, as well as the registered funds advised by affiliates of the Advisor.
Shareholder Communications to the Board. Shareholders may send communications to the Trust’s Board by addressing the communications directly to the Board (or individual Board Members) and/or otherwise clearly indicating in the salutation that the communication is for the Board (or individual Board Members). The shareholder may send the communication to either the Trust’s office or directly to such Board members c/o 875 Third Avenue, New York, NY 10022. Other shareholder communications received by the Trust not directly addressed and sent to the Board will be reviewed and generally responded to by management. Such communications will be forwarded to the Board at management’s discretion based on the matters contained therein.
Independent Board Members | ||||||
| Name, Year of Birth, Position with the Trust and Length of Time Served(1) | Business Experience and Directorships During the Past 5 Years | Number of Portfolios in Fund Complex Overseen | Other Directorships Held by Board Member | |||
Stephen R. Byers (1953) Chairperson since 2016, and Board Member since 2011 (formerly, Lead Independent Board Member, 2015-2016) | Independent Director (2011-present); Independent Consultant (2014-present); Director of Investment Management, the Dreyfus Corporation (2000-2006) and Vice Chairman and Chief Investment Officer, the Dreyfus Corporation (2002-2006). | 35 | The Arbitrage Funds, Sierra Income Corporation, Mutual Fund Directors Forum | |||
George O. Elston (1964) Board Member since 2011, Chairperson of the Audit Committee since 2015 | Chief Financial Officer, EyePoint Pharmaceuticals, Inc. (2019-present); Chief Financial Officer, Enzyvant (2018-2019); Chief Executive Officer, 2X Oncology, Inc. (2017-2018); Senior Vice President and Chief Financial Officer, Juniper Pharmaceuticals, Inc. (2014-2016); Senior Vice President and Chief Financial Officer, KBI BioPharma Inc. (2013-2014); Managing Partner, Chatham Street Partners (2010-2013). | 35 | — | |||
J. David Officer (1948) Board Member since 2011, Chairperson of the Nominating Committee since 2015 | Independent Director (2010-present); Vice Chairman, the Dreyfus Corporation (2006-2009); President, The Dreyfus Family of Funds, Inc. (2006-2009). | 35 | (Chairman of) Ilex Management Ltd; Old Westbury Funds | |||
107
DBX ETF Trust
Board Members and Officers (Unaudited) (Continued)
Officers(2) | ||||||
| Name, Year of Birth, Position with the Trust and Length of Time Served(3) | Business Experience and Directorships During the Past 5 Years | |||||
| Freddi Klassen(4) (1975) President and Chief Executive Officer, 2016-present | Programmes (Head since 2021), of DWS Investment Management Americas, Inc. and Manager and Chief Operating Officer of the Advisor (2016-present). Formerly: Chief Operating Officer in the Americas for the Traditional Asset Classes Department (2014-2020); Manager and Chief Operating Officer of DWS Investment Management Americas, Inc. (2018-2020); Global Chief Operating Officer for Equities Technology in the Investment Bank Division at Deutsche Bank AG (2013-2014); Chief Operating Officer for Exchange Traded Funds and Systematic Funds in Europe (2008-2013). | |||||
| Diane Kenneally(5) (1966) Treasurer, Chief Financial Officer and Controller, 2019-present | Fund Administration Treasurer’s Office (Co-Head since 2018), of DWS Investment Management Americas, Inc.; Chief Financial Officer and Treasurer for DWS US registered investment companies advised by DWS Investment Management Americas, Inc. (2018-present); Treasurer and Chief Financial Officer, The European Equity Fund, Inc., The New Germany Fund, Inc. and The Central and Eastern Europe Fund, Inc. (2018-present); formerly: Assistant Treasurer for the DWS funds (2007-2018). | |||||
| Frank Gecsedi(4) (1967) Chief Compliance Officer, 2010-present | AFC Compliance US (Senior Team Lead), of DWS Investment Management Americas, Inc.; Compliance Department (2016-present), Vice President in the Deutsche Asset Management Compliance Department at Deutsche Bank AG (2013-2016) and Chief Compliance Officer of the Advisor (2010-present); Chief Compliance Officer of DWS Distributors, Inc. (2019-2022); Vice President in Deutsche Bank’s Global Markets Legal, Risk and Capital Division (2010-2012). | |||||
| Bryan Richards(4) (1978) Vice President, 2016-present | Portfolio Engineering, Systematic Investments Solutions (Head), of DWS Investment Management Americas, Inc.(2018-present); Portfolio Manager in the Passive Asset Management Department at DWS (2011-present); Primary Portfolio Manager for the PowerShares DB Commodity ETFs (2011-2015). | |||||
| John Millette(5) (1962) Secretary, 2020-present | Legal (Associate General Counsel), DWS US Retail Legal (2003-present), of DWS Investment Management Americas, Inc.; Vice President and Secretary of DWS US registered investment companies advised by DWS Investment Management Americas, Inc. (1999-present); Chief Legal Officer, DWS Investment Management Americas, Inc. (2015-present); Director and Vice President of DWS Trust Company (2016-present); Vice President, DBX Advisors LLC (2021-present); Secretary, The European Equity Fund, Inc., The New Germany Fund, Inc. and The Central and Eastern Europe Fund, Inc. (2011-present); formerly: Secretary of Deutsche Investment Management Americas Inc. (2015-2017); and Assistant Secretary of DBX ETF Trust (2019-2020). | |||||
108
DBX ETF Trust
Board Members and Officers (Unaudited) (Continued)
| Name, Year of Birth, Position with the Trust and Length of Time Served(3) | Business Experience and Directorships During the Past 5 Years | |||||
| Caroline Pearson(5) (1962) Assistant Secretary, 2020-present | Legal (Senior Team Lead), DWS US Retail Legal, of DWS Investment Management Americas, Inc.; Chief Legal Officer of DWS US registered investment companies advised by DWS Investment Management Americas, Inc. (2010-present); Chief Legal Officer, DBX Advisors LLC (2020-present); Chief Legal Officer, The European Equity Fund, Inc., The New Germany Fund, Inc. and The Central and Eastern Europe Fund, Inc. (2012-present); formerly: Secretary, Deutsche AM Distributors, Inc. (2002-2017); and Secretary, Deutsche AM Service Company (2010-2017); and Chief Legal Officer, DBX Strategic Advisors LLC (2020-2021). | |||||
| Paul Antosca(5) (1957) Assistant Treasurer, 2019-present | Fund Administration Tax (Head), of DWS Investment Management Americas, Inc.; Assistant Treasurer for DWS US registered investment companies advised by DWS Investment Management Americas, Inc. (2007-present). | |||||
| Jeffrey Berry(5) (1959) Assistant Treasurer, 2019-present | Fund Administration (Senior Specialist), of DWS Investment Management Americas, Inc. | |||||
| Sheila Cadogan(5) (1966) Assistant Treasurer, 2019-present | Fund Administration Treasurer’s Office (Co-Head since 2018), of DWS Investment Management Americas, Inc.; Assistant Treasurer for DWS US registered investment companies advised by DWS Investment Management Americas, Inc. (2017-present); Director and Vice President, DWS Trust Company (2018-present); Assistant Treasurer, The European Equity Fund, Inc., The New Germany Fund, Inc. and The Central and Eastern Europe Fund, Inc. (2018-present). | |||||
| Christina A. Morse(6) (1964) Assistant Secretary, 2017-present | Vice President at BNY Mellon Asset Servicing (2014-present); Vice President and Counsel at Lord Abbett & Co. LLC (2013-2014). | |||||
| Christian Rijs(4) (1980) Anti-Money Laundering Compliance Officer, since October 21, 2021 | Senior Team Lead Anti-Financial Crime and Compliance, DWS Investment Management Americas, Inc.; AML Officer, DWS Trust Company (since November 2, 2021); AML Officer, DWS US registered investment companies advised by DWS Investment Management Americas, Inc. (since October 6, 2021); AML Officer, The European Equity Fund, Inc., The New Germany Fund, Inc. and The Central and Eastern Europe Fund, Inc. (since November 12, 2021); formerly: DWS UK & Ireland Head of Anti-Financial Crime and MLRO. | |||||
| (1) | The length of time served is represented by the year in which the Board Member joined the Board. |
| (2) | As a result of their respective positions held with the Advisor and its affiliates, these individuals are considered “interested persons” of the Advisor within the meaning of the 1940 Act. Interested persons receive no compensation from the Funds. |
| (3) | The length of time served is represented by the year in which the officer was first elected to the Trust in such capacity. |
| (4) | Address: 875 Third Avenue, New York, New York 10022. |
| (5) | Address: 100 Summer Street, Boston, MA 02110. |
| (6) | Address: BNY Mellon Asset Servicing, 240 Greenwich Street, New York, NY 10286. |
The Funds’ Statement of Additional Information (“SAI”) includes additional information about the Funds’ Board Members. The SAI is available by calling 855-329-3837, or on the Company’s website at www.Xtrackers.com.
109
DBX ETF Trust
Proxy Voting Policies and Procedures
The Funds’ policies and procedures for voting proxies for portfolio securities and information about how each Fund voted proxies related to its portfolio securities during the most recent 12-month period ended June 30 are available on our Web site — www.Xtrackers.com (click on “Resources” and “Proxy Voting” at the top of the page) — or on the SEC’s Web site — www.sec.gov. To obtain a written copy of the Funds’ policies and procedures without charge, upon request, call us toll free at (855) 329-3837.
Portfolio Holdings Information
The Funds are required to file their complete schedule of portfolio holdings with the SEC for their first and third fiscal quarters on Form N-PORT. Copies of the filings are available without charge, upon request on the SEC’s website at www.sec.gov and are available by calling the Trust at 855-329-3837.
Information about each Fund’s portfolio holdings is available daily at www.Xtrackers.com.
Discount & Premium Information
Information regarding how often shares of each Fund traded on NYSE Arca at a price above (i.e.,at a premium) or below (i.e., at a discount) the NAV of the Fund can be found at www.Xtrackers.com.
Tax Information
Form 1099-DIV and other year-end tax information provide shareholders with actual calendar year amounts that should be included in their tax returns. Shareholders should consult their tax advisors.
Each Fund designates the following amounts or, if subsequently determined to be different, the maximum allowable for its period ended August 31, 2022.
| Qualified Dividend Income* | Dividends Received Deduction* | |||||||
Xtrackers Emerging Markets Carbon Reduction and Climate Improvers ETF | 78 | % | 0 | % | ||||
Xtrackers MSCI EAFE ESG Leaders Equity ETF | 93 | % | 0 | % | ||||
Xtrackers MSCI Emerging Markets ESG Leaders Equity ETF | 71 | % | 0 | % | ||||
Xtrackers MSCI USA ESG Leaders Equity ETF | 100 | % | 98 | % | ||||
Xtrackers Net Zero Pathway Paris Aligned US Equity ETF | 0 | % | 0 | % | ||||
Xtrackers S&P 500 ESG ETF | 100 | % | 98 | % | ||||
Xtrackers S&P MidCap 400 ESG ETF | 90 | % | 87 | % | ||||
Xtrackers S&P SmallCap 600 ESG ETF | 73 | % | 70 | % | ||||
| * | The above percentage is based on ordinary income dividends paid to shareholders during each Fund’s fiscal year. |
Each Fund intends to elect to pass through to shareholders the credit for taxes paid to foreign countries. The gross foreign source income and foreign taxes paid are as follows:
| Gross Foreign Income | Foreign Taxes Income | |||||||
Xtrackers Emerging Markets Carbon Reduction and Climate Improvers ETF | $ | 17,177,960 | $ | 1,817,739 | ||||
Xtrackers MSCI EAFE ESG Leaders Equity ETF | 898,857 | 72,448 | ||||||
Xtrackers MSCI Emerging Markets ESG Leaders Equity ETF | 606,492 | 67,200 | ||||||
110
DBX ETF Trust
This report is intended for the shareholders of the DBX ETF Trust.
This report must be preceded or accompanied by a prospectus.
Investing involves risk, including the possible loss of principal. ESG criteria in a Fund’s investment strategy does not guarantee a return or protect against loss, limits the types and number of investment opportunities available to the Fund and, as a result, the Fund may underperform other funds that do not have an ESG focus. Regulatory changes or interpretations regarding the definitions and/or use of ESG criteria could have a material adverse effect on the fund’s ability to invest in accordance with its investment policies and/or achieve its investment objective, as well as the ability of certain classes of investors to invest in funds following an ESG strategy such as the fund. The Underlying Index’s methodology for identifying companies attempting to reduce their carbon footprint limits the types and number of investment opportunities available to the fund and, as a result, the fund may underperform other funds that do not follow a carbon reduction strategy. Stocks may decline in value. Foreign investing involves greater and different risks than investing in US companies, including currency fluctuations, less liquidity, less developed or less efficient trading markets, lack of comprehensive company information, political instability and differing auditing and legal standards. Emerging markets tend to be more volatile and less liquid than the markets of more mature economies, and generally have less diverse and less mature economic structures and less stable political systems than those of developed countries. Stocks of medium-sized companies involve greater risk than securities of larger, more established companies. Small company stocks tend to be more volatile than medium-sized or large company stocks. Each Fund, except EASG, EMCR and USSG is currently non-diversified and can take larger positions in fewer issues, increasing its potential risk. Funds investing in a single industry, country or in a limited geographic region generally are more volatile than more diversified funds. Performance of a Fund may diverge from that of its Underlying Index due to operating expenses, transaction costs, cash flows, use of sampling strategies or operational inefficiencies. In certain situations, it may be difficult or impossible to sell an investment at an acceptable price. Any fund that focuses in a particular segment of the market or region of the world will generally be more volatile than a fund that invests more broadly. An investment in any Fund should be considered only as a supplement to a complete investment program for those investors willing to accept the risks associated with the Fund. Please read the prospectus for more information.
The U.S. government has imposed restrictions on the ability of U.S. investors to hold and/or acquire securities of certain Chinese companies. To the extent that an Underlying Index includes such a security and the Fund excludes it, the Fund’s tracking error may increase and the performance of the Fund and Underlying Index may diverge.
Environmental, social and governance (ESG) criteria are a set of standards for a company’s operations that socially conscious investors use to screen potential investments: Environmental (how a company performs as a steward of nature); Social (how a company manages relationships with employee, suppliers, customers and communities); Governance (company’s leadership, executive pay, shareholder rights, etc).
War, terrorism, sanctions, economic uncertainty, trade disputes, public health crises and related geopolitical events have led, and, in the future, may lead to significant disruptions in U.S. and world economies and markets, which may lead to increased market volatility and may have significant adverse effects on the Funds and their investments.
Shares of the Funds are bought and sold at market price (not NAV) throughout the day on the NYSE Arca, Inc. Transactions in Fund shares may result in brokerage commissions and may generate tax consequences. There can be no assurance that an active trading market for shares of a Fund will develop or be maintained.
DBX ETF Trust Funds are distributed by ALPS Distributors, Inc. (“ALPS”). The Funds are managed by DBX Advisors LLC which is not affiliated with ALPS.
The brand DWS represents DWS Group GmbH & Co. KGaA and any of its subsidiaries such as DWS Distributors, Inc. which offers investment products or DWS Investment Management Americas, Inc. and RREEF America L.L.C. which offer advisory services.
The Funds or securities referred to herein are not sponsored, endorsed, issued, sold or promoted by MSCI, and MSCI bears no liability with respect to any such Funds or securities or any index on which such Funds or securities are based. The prospectus contains a more detailed description of the limited relationship MSCI has with DBX Advisors LLC and any related funds.
The S&P 400 ESG Index, S&P 500 ESG Index and S&P 600 ESG Index are products of S&P Dow Jones Indices LLC or its affiliates (“SPDJI”), and have been licensed for use by DBX Advisors. S&P®, S&P 400®, S&P 500® and S&P 600®, are registered trademarks of Standard & Poor’s Financial Services LLC (“S&P”); Dow Jones® is a registered trademark of Dow Jones Trademark Holdings LLC (“Dow Jones”); and these trademarks have been licensed for use by SPDJI and sublicensed for certain purposes by DBX Advisors. The ESG Scores used in the Indexes are calculated by SAM. DBX Advisors LLC. Xtrackers ETFs are not sponsored, endorsed, sold or promoted by SPDJI, Dow Jones, S&P, their respective affiliates or SAM, and none of such parties make any representation regarding the advisability of investing in such ETFs, nor do they have any liability for any errors, omissions, or interruptions of the S&P 400 ESG Index, S&P 500 ESG Index and S&P 600 ESG Index.
EMCR and USNZ (the “Funds”) are not sponsored, endorsed, sold or promoted by Solactive. Neither Solactive nor any other party makes any representation or warranty, express or implied, to the owners of the Funds or any member of the public regarding advisability of investing in funds generally or in these Funds particularly or the ability of the Underlying Indexes to track general stock market performance. Neither Solactive nor any other party makes any express or implied warranties, and Solactive hereby expressly disclaims all warranties of merchantability or fitness for a particular purpose with respect to the Underlying Indexes or any data included therein. The prospectus contains a more detailed description of the limited relationship Solactive has with DBX Advisors LLC and any related funds.
Copyright © 2022 DWS Group. All rights reserved. XtrackersTM is a trademark of DWS Investment GmbH. All other trademarks, servicemarks or registered trademarks are the property of their respective owners.
Not FDIC Insured | No Bank Guarantee | May Lose Value
DBX ETF Trust
Investment advisor DBX Advisors LLC 875 Third Avenue New York, NY 10022 | Administrator, custodian, fund accounting agent, lending agent & transfer agent The Bank of New York Mellon 240 Greenwich Street New York, NY 10286 | Distributor ALPS Distributors, Inc. 1290 Broadway Suite 1000 Denver, CO 80203 | ||
Independent registered public accounting firm Ernst & Young LLP One Manhattan West New York, NY 10001 | Legal counsel Vedder Price P.C. 1633 Broadway New York, NY 10019 | |||
R-070013-4 (10/22) DBX005327 (10/23)
August 31, 2022
Annual Report
DBX ETF Trust
Xtrackers High Beta High Yield Bond ETF (HYUP)
Xtrackers Low Beta High Yield Bond ETF (HYDW)
Xtrackers Risk Managed USD High Yield Strategy ETF (HYRM)
Xtrackers Short Duration High Yield Bond ETF (SHYL)
Xtrackers USD High Yield Corporate Bond ETF (HYLB)

DBX ETF Trust
| Page | ||||
| 1 | ||||
| 3 | ||||
| 6 | ||||
| 8 | ||||
| 10 | ||||
| 12 | ||||
| 14 | ||||
| 16 | ||||
| 17 | ||||
| 29 | ||||
| 39 | ||||
| 40 | ||||
| 50 | ||||
| 68 | ||||
| 70 | ||||
| 72 | ||||
| 75 | ||||
| 78 | ||||
| 87 | ||||
| 89 | ||||
| 92 | ||||
To our Shareholders: (Unaudited)
Dear shareholder,
We are pleased to provide this annual report for five of our ETFs tracking the fixed income market for the period ended August 31, 2022
The global economic recovery in 2021, after the pandemic-induced uncertainty, was followed by geopolitical developments in 2022 that have led to soaring energy prices, high interest rates and supply chain disruptions. Markets across the world, especially those in developed parts, such as the U.S. and the Eurozone, continued to suffer from the effects of the Russia-Ukraine war, which saw various central banks taking hawkish measures to curb rising inflation. The second quarter of 2022 also witnessed global output contracting due to a worse-than-forecasted slowdown in China caused by the country’s strict zero-COVID policy.
Policymakers across the globe continued to face the twin challenges of handling the post-pandemic recovery while fighting multi-year-high inflation rates. The Federal Reserve, in the wake of impending recession, has taken the most rigorous interest rate hikes (75 basis points1 (bps) each in June and July 2022) since the monetary policy tool was introduced in the 1990s. The European Central Bank on its part tightened its stance with a 50bps increase in rates and announced that it would stop its asset purchase program in the third quarter of 2022, forecasting a further hike in September. In the far east, the Bank of Japan has refrained from taking a hawkish view and continues to hold rates at around 0%.
Bond markets were volatile during the reporting period, driven by various macroeconomic and geopolitical events. Yields fell initially in Q4 2021, as economic recovery moderated, followed by heightened inflation worries and the ensuing hawkish central bank policies. Spreads widened the most in the U.S. market, followed by the European and UK markets, during the last quarter of 2021 following fears of the Omicron variant impacting global growth. However, yield spreads tightened again in December 2021 on evidence of the lower-than-expected impact of the virus and diminished supply of new bond issues. The Federal Reserve continued to tread on its hawkish path as its chairman, Jerome Powell, in his address at the Jackson Hole symposium, signaled at further rate hikes until inflation cools down. Overall, 1H22 caused record-breaking losses, as bond markets were adjusting to the central bank’s policy of higher interest rates.
The Eurozone’s economy remained most vulnerable to the changing dynamics of the Russian war, with energy and food commodity prices staying elevated as inflation climbed higher. Although the labor market remained a bright spot during the final quarter of 2021, consumer confidence dropped significantly amid prevalent uncertainties. The Eurozone’s third and fourth largest economies, Italy and Spain, were the major contributors to growth in 2022, sustaining their path to recovery from COVID-19, while the bloc’s largest economy, Germany stalled. France, Eurozone’s second-largest economy posted positive growth, backed by a positive contribution from net trade as exports grew.
All macroeconomic indicators point towards a significant slowdown in 2022, as central banks across the globe are at a crossroads of high inflation and economic recovery. Consumer confidence has remained weak owing to a less favorable long-term economic outlook, as a fragmented recovery is anticipated. Investors would need to keep an eye on potential sanctions on Russian energy by the European Union, as any further supply crunch on oil and gas could sustain the record-high inflation rates.
Our team appreciates your trust and looks forward to serving your investment needs through innovative index-driven strategies.
Sincerely,
/s/ Freddi Klassen
Freddi Klassen
President and Chief Executive Officer
1 Basis points are a unit of measurement equal to 1/100th of 1 percent and a standard measure for interest rates.
Assumptions, estimates and opinions contained in this document constitute our judgment as of the date of the document and are subject to change without notice. Any projections are based on a number of assumptions as to market conditions and there can be no guarantee that any projected results will be achieved. Past performance is not a guarantee of future results.
1
This Page is Intentionally Left Blank
2
DBX ETF Trust
Xtrackers High Beta High Yield Bond ETF
The Xtrackers High Beta High Yield Bond ETF (HYUP) seeks investment results that correspond generally to the performance, before fees and expenses, of the Solactive USD High Yield Corporates Total Market High Beta Index (the HYUP Index). The HYUP Index is designed to track the performance of the segment of the US dollar-denominated high yield corporate bond market that exhibits higher overall beta to the broader high yield corporate fixed income market. For the 12-month period ended August 31, 2022, HYUP shares returned -12.56%, compared to the HYUP Index return of -12.55%.
All sectors contributed negatively to performance during the period with the Communications, Consumer Non-Cyclical and Consumer Cyclical sectors detracting the most from performance.
Xtrackers Low Beta High Yield Bond ETF
The Xtrackers Low Beta High Yield Bond ETF (HYDW) seeks investment results that correspond generally to the performance, before fees and expenses, of the Solactive USD High Yield Corporates Total Market Low Beta Index (the HYDW Index). The HYDW Index is designed to track the performance of the segment of the U.S. dollar denominated high yield corporate bond market that exhibits lower overall beta to the broader high yield corporate fixed income market. For the 12-month period ended August 31, 2022, HYDW shares returned -8.36%, compared to the HYDW Index return of -8.37%.
All sectors contributed negatively to performance during the period with the Communications, Consumer Cyclical and Financial Institutions sectors detracting the most from performance.
Xtrackers Risk Managed USD High Yield Strategy ETF
Xtrackers Risk Managed USD High Yield Strategy ETF (HYRM) seeks investment results that correspond generally to the performance, before fees and expenses, of the Adaptive Wealth Strategies Risk Managed High Yield Index (the HYRM Index). The HYRM Index is designed to track the performance of the US dollar-denominated high yield corporate bond market during normal market conditions, and the performance of a USD cash position accruing interest at the Effective Federal Funds Rate (the interest rate depository institutions such as banks charge each other for overnight loans to meet their reserve requirements) during periods of adverse market conditions. For the period from February 10, 2022, to August 31, 2022, HYRM shares returned -9.12%, compared to the HYRM Index return of -8.48%.
All sectors contributed negatively to performance during the period with the Communications, Consumer Non-Cyclical and Consumer Cyclical sectors detracting the most from performance.
Xtrackers Short Duration High Yield Bond ETF
The Xtrackers Short Duration High Yield Bond ETF (SHYL) seeks investment results that correspond generally to the performance, before fees and expenses, of the Solactive USD High Yield Corporates Total Market 0-5 Year Index (the SHYL Index). The SHYL Index is designed to track the performance of short-term publicly issued US dollar denominated below investment grade corporate debt. For the 12-month period ended August 31, 2022, SHYL shares returned -5.84%, compared to the SHYL Index return of -5.76%.
All sectors contributed negatively to performance during the period with the Communications, Consumer Non-Cyclical and Consumer Cyclical sectors detracting the most from performance.
Xtrackers USD High Yield Corporate Bond ETF
The Xtrackers USD High Yield Corporate Bond ETF (HYLB) seeks investment results that correspond generally to the performance, before fees and expenses, of the Solactive USD High Yield Corporates Total Market Index (the HYLB Index). The HYLB Index is designed to track the performance of a basket of U.S. dollar-denominated high yield liquid corporate bonds. For the 12-month period ended August 31, 2022, HYLB shares returned -10.67%, compared to the HYLB Index return of -10.54%.
All sectors contributed negatively to performance during the period with the Communications, Consumer Non-Cyclical and Consumer Cyclical sectors detracting the most from performance.
*************************
3
DBX ETF Trust
Management’s Discussion of Fund Performance (Unaudited) (Continued)
Performance data quoted represents past performance and does not guarantee future results. Investment returns and principal value of an investment will fluctuate so that an investor’s shares, when sold or redeemed, may be worth more or less than their original cost. Current performance may be lower or higher than the performance data quoted. To obtain the most recent month-end performance data visit www.Xtrackers.com. Returns assume that dividends and capital gains distributions have been reinvested. See pages 6-15 of this report for additional performance information, including performance data based on market value.
The views expressed in this report reflect those of the portfolio management team only through the end of the period of the report as stated on the cover. The management team’s views are subject to change at any time based on market and other conditions and should not be construed as a recommendation. Current and future portfolio holdings are subject to risk.
4
This Page is Intentionally Left Blank
5
DBX ETF Trust
Xtrackers High Beta High Yield Bond ETF (HYUP)
The Xtrackers High Beta High Yield Bond ETF (the “Fund”), using a “passive” or indexing investment approach, seeks investment results that correspond generally to the performance, before fees and expenses, of the Solactive USD High Yield Corporates Total Market High Beta Index (the “Underlying Index”). The Underlying Index is designed to track the performance of the segment of the US dollar-denominated high yield corporate bond market that exhibits higher overall beta to the broader high yield corporate fixed income market. It is not possible to invest directly into an index.
| Performance as of August 31, 2022 |
| Average Annual Total Returns | ||||||||
| Net Asset Value | Market Value | Solactive USD High Yield Corporates Total Market High Beta Index | Solactive USD High Yield Corporates Total Market Index | |||||
One Year | -12.56% | -13.30% | -12.55% | -10.54% | ||||
Since Inception1 | 1.69% | 1.52% | 1.68% | 1.88% | ||||
| Cumulative Total Returns | ||||||||
| Net Asset Value | Market Value | Solactive USD High Yield Corporates Total Market High Beta Index | Solactive USD High Yield Corporates Total Market Index | |||||
One Year | -12.56% | -13.30% | -12.55% | -10.54% | ||||
Since Inception1 | 8.07% | 7.26% | 8.02% | 9.04% | ||||
1 Total returns are calculated based on the commencement of operations, January 11, 2018 (“Inception”).
Past performance is no guarantee of future results. Current performance may be lower or higher than the performance data quoted. Performance data current to the most recent month-end is available at www.Xtrackers.com. Performance results assume reinvestment of all dividends and capital gain distributions and do not reflect the deduction of taxes that a shareholder would pay on fund distributions or on the sale of fund shares or redemption of fund creation units. The investment return and principal value of shares will vary with changes in market conditions. Shares may be worth more or less than their original cost when they are sold in the market or redeemed. Performance for certain funds may reflect a waiver of a portion of the unitary advisory fee. Without such waiver, performance would have been lower. The gross expense ratio of the Fund, as stated in the fee table of the prospectus dated December 17, 2021, was 0.35%, and may differ from the expense ratio disclosed in the Financial Highlights table in this report.
The Fund’s net asset value or “NAV” is calculated by dividing the value of the Fund’s total assets less total liabilities by the number of shares outstanding. The price used to calculate market return (“Market Price”) is determined by using the midpoint between the highest bid and the lowest offer on the primary stock exchange on which shares of a fund are listed for trading, as of the time that such fund’s NAV is calculated. Since shares of a fund may not have traded in the secondary market until after the fund’s inception, for the period from inception to the first day of secondary trading, the NAV of the fund is used as a proxy for the Market Price to calculate market returns. Market and NAV returns assume that dividends and capital gain distributions have been reinvested at Market Price and NAV, respectively.
An index is a statistical composite that tracks a specified financial market or sector. Unlike a fund, an index does not actually hold a portfolio of securities and therefore does not incur the expenses incurred by a fund. These expenses negatively impact fund performance. Also, market returns do not include brokerage commissions that may be payable on secondary market transactions. If brokerage commissions were included, market returns would be lower.
Generally accepted accounting principles require adjustments to be made to the net assets of the Fund at period end for financial reporting purposes only, and as such, the total return based on the unadjusted net asset value per share may differ from the total return reported in the financial highlights.
6
DBX ETF Trust
Performance Summary (Unaudited)
Xtrackers High Beta High Yield Bond ETF (HYUP) (Continued)
| Growth of an Assumed $10,000 Investment |
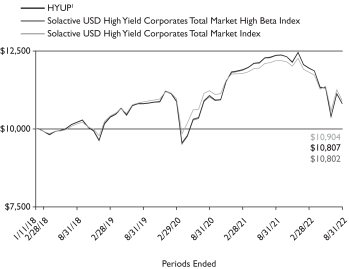
1 Based on Net Asset Value from commencement of operations, January 11, 2018.
| Sector Diversification* as of August 31, 2022 |
Communications | 20.1% | |||
Consumer, Cyclical | 20.0% | |||
Consumer, Non-cyclical | 16.5% | |||
Energy | 12.8% | |||
Industrial | 10.6% | |||
Financial | 9.1% | |||
Technology | 4.6% | |||
Basic Materials | 4.0% | |||
Utilities | 2.3% | |||
|
| |||
Total | 100.0% |
Modified duration to worst as of August 31, 2022: 4.3 years
Modified duration to worst is the measure of sensitivity of the price of a bond to a change in interest rates, assuming worst case scenario.
| Quality* as of August 31, 2022 |
| Description | % of Market Value | |||
BBB | 1.7% | |||
BB | 45.1% | |||
B | 37.5% | |||
CCC | 15.4% | |||
NR | 0.3% | |||
|
| |||
Total | 100.0% | |||
The quality ratings represent the higher of Moody’s Investor Services, Inc. (“Moody’s”), S&P Global Ratings (S&P) or Fitch Ratings Inc. (Fitch) credit ratings. The ratings of Moody’s, S&P and Fitch represent their opinions as to the quality of the securities they rate. Credit quality measures a bond issuer’s ability to repay interest and principal in a timely manner and is measured on a scale that ranges from AAA (highest) to D (lowest). Ratings are relative and subjective and are not absolute standards of quality. Credit quality does not remove market risk and is subject to change.
| Country Diversification* as of August 31, 2022 |
United States | 83.1% | |||
Canada | 4.0% | |||
Luxembourg | 3.1% | |||
Netherlands | 2.4% | |||
France | 2.2% | |||
Other | 5.2% | |||
|
| |||
Total | 100.0% |
* As a percent of total investments excluding securities lending collateral and cash equivalents.
Portfolio holdings and characteristics are subject to change. For more complete details about the Fund’s investment portfolio see page 17.
7
DBX ETF Trust
Performance Summary (Unaudited)
Xtrackers Low Beta High Yield Bond ETF (HYDW)
The Xtrackers Low Beta High Yield Bond ETF (the “Fund”), using a “passive” or indexing investment approach, seeks investment results that correspond generally to the performance, before fees and expenses, of the Solactive USD High Yield Corporates Total Market Low Beta Index (the “Underlying Index”). The Underlying Index is designed to track the performance of the segment of the U.S. dollar denominated high yield corporate bond market that exhibits lower overall beta to the broader high yield corporate fixed income market. It is not possible to invest directly into an index.
| Performance as of August 31, 2022 |
| Average Annual Total Returns | ||||||||
| Net Asset Value | Market Value | Solactive USD High Yield Corporates Total Market Low Beta Index | Solactive USD High Yield Corporates Total Market Index | |||||
One Year | -8.36% | -8.85% | -8.37% | -10.54% | ||||
Since Inception1 | 1.92% | 1.81% | 1.92% | 1.88% | ||||
| Cumulative Total Returns | ||||||||
| Net Asset Value | Market Value | Solactive USD High Yield Corporates Total Market Low Beta Index | Solactive USD High Yield Corporates Total Market Index | |||||
One Year | -8.36% | -8.85% | -8.37% | -10.54% | ||||
Since Inception1 | 9.22% | 8.66% | 9.22% | 9.04% | ||||
1 Total returns are calculated based on the commencement of operations, January 11, 2018 (“Inception”).
Past performance is no guarantee of future results. Current performance may be lower or higher than the performance data quoted. Performance data current to the most recent month-end is available at www.Xtrackers.com. Performance results assume reinvestment of all dividends and capital gain distributions and do not reflect the deduction of taxes that a shareholder would pay on fund distributions or on the sale of fund shares or redemption of fund creation units. The investment return and principal value of shares will vary with changes in market conditions. Shares may be worth more or less than their original cost when they are sold in the market or redeemed. Performance for certain funds may reflect a waiver of a portion of the unitary advisory fee. Without such waiver, performance would have been lower. The gross expense ratio of the Fund, as stated in the fee table of the prospectus dated December 17, 2021, was 0.25%, and may differ from the expense ratio disclosed in the Financial Highlights table in this report.
The Fund’s net asset value or “NAV” is calculated by dividing the value of the Fund’s total assets less total liabilities by the number of shares outstanding. The price used to calculate market return (“Market Price”) is determined by using the midpoint between the highest bid and the lowest offer on the primary stock exchange on which shares of a fund are listed for trading, as of the time that such fund’s NAV is calculated. Since shares of a fund may not have traded in the secondary market until after the fund’s inception, for the period from inception to the first day of secondary trading, the NAV of the fund is used as a proxy for the Market Price to calculate market returns. Market and NAV returns assume that dividends and capital gain distributions have been reinvested at Market Price and NAV, respectively.
An index is a statistical composite that tracks a specified financial market or sector. Unlike a fund, an index does not actually hold a portfolio of securities and therefore does not incur the expenses incurred by a fund. These expenses negatively impact fund performance. Also, market returns do not include brokerage commissions that may be payable on secondary market transactions. If brokerage commissions were included, market returns would be lower.
Generally accepted accounting principles require adjustments to be made to the net assets of the Fund at period end for financial reporting purposes only, and as such, the total return based on the unadjusted net asset value per share may differ from the total return reported in the financial highlights.
8
DBX ETF Trust
Performance Summary (Unaudited)
Xtrackers Low Beta High Yield Bond ETF (HYDW) (Continued)
| Growth of an Assumed $10,000 Investment |
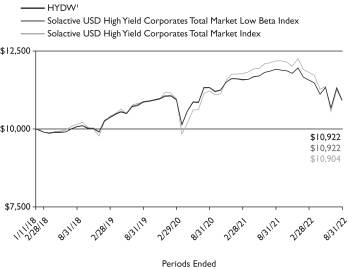
1 Based on Net Asset Value from commencement of operations, January 11, 2018.
| Sector Diversification* as of August 31, 2022 |
Consumer, Cyclical | 23.2% | |||
Consumer, Non-cyclical | 18.9% | |||
Communications | 17.4% | |||
Financial | 11.3% | |||
Energy | 11.3% | |||
Industrial | 7.8% | |||
Technology | 3.7% | |||
Basic Materials | 3.4% | |||
Utilities | 3.0% | |||
|
| |||
Total | 100.0% |
Modified duration to worst as of August 31, 2022: 4.4 years
Modified duration to worst is the measure of sensitivity of the price of a bond to a change in interest rates, assuming worst case scenario
| Quality* as of August 31, 2022 |
| Description | % of Market Value | |||
BBB | 14.4% | |||
BB | 74.0% | |||
B | 11.5% | |||
CCC | 0.1% | |||
|
| |||
Total | 100.0% | |||
The quality ratings represent the higher of Moody’s Investor Services, Inc. (“Moody’s”), S&P Global Ratings (S&P) or Fitch Ratings Inc. (Fitch) credit ratings. The ratings of Moody’s, S&P and Fitch represent their opinions as to the quality of the securities they rate. Credit quality measures a bond issuer’s ability to repay interest and principal in a timely manner and is measured on a scale that ranges from AAA (highest) to D (lowest). Ratings are relative and subjective and are not absolute standards of quality. Credit quality does not remove market risk and is subject to change.
| Country Diversification* as of August 31, 2022 |
United States | 90.6% | |||
Canada | 3.5% | |||
Other | 5.9% | |||
|
| |||
Total | 100.0% |
* As a percent of total investments excluding securities lending collateral and cash equivalents.
Portfolio holdings and characteristics are subject to change. For more complete details about the Fund’s investment portfolio see page 29.
9
DBX ETF Trust
Performance Summary (Unaudited)
Xtrackers Risk Managed USD High Yield Strategy ETF (HYRM)
The Xtrackers Risk Managed USD High Yield Strategy ETF (the “Fund”), using a “passive” or indexing investment approach, seeks investment results that correspond generally to the performance, before fees and expenses, of the Adaptive Wealth Strategies Risk Managed High Yield Index (the “Underlying Index”). The Underlying Index is designed to track the performance of the US dollar-denominated high yield corporate bond market during normal market conditions, and the performance of a USD cash position accruing interest at the Effective Federal Funds Rate (the interest rate depository institutions such as banks charge each other for overnight loans to meet their reserve requirements) during periods of adverse market conditions. It is not possible to invest directly into an index.
| Performance as of August 31, 2022 |
| Average Annual Total Returns | ||||||||
| Net Asset Value | Market Value | Adaptive Wealth Strategies Risk Managed High Yield Index | Solactive USD High Yield Corporates Total Market Index | |||||
Since Inception1 | -9.12% | -9.16% | -8.48% | -8.48% | ||||
| Cumulative Total Returns | ||||||||
| Net Asset Value | Market Value | Adaptive Wealth Strategies Risk Managed High Yield Index | Solactive USD High Yield Corporates Total Market Index | |||||
Since Inception1 | -9.12% | -9.16% | -8.48% | -8.48% | ||||
1 Total returns are calculated based on the commencement of operations, February 10, 2022 (“Inception”).
Past performance is no guarantee of future results. Current performance may be lower or higher than the performance data quoted. Performance data current to the most recent month-end is available at www.Xtrackers.com. Performance results assume reinvestment of all dividends and capital gain distributions and do not reflect the deduction of taxes that a shareholder would pay on fund distributions or on the sale of fund shares or redemption of fund creation units. The investment return and principal value of shares will vary with changes in market conditions. Shares may be worth more or less than their original cost when they are sold in the market or redeemed. Performance for certain funds may reflect a waiver of a portion of the unitary advisory fee. Without such waiver, performance would have been lower. The gross expense ratio of the Fund, as stated in the fee table of the prospectus dated December 21, 2021, was 0.45%, and may differ from the expense ratio disclosed in the Financial Highlights table in this report.
The Fund’s net asset value or “NAV” is calculated by dividing the value of the Fund’s total assets less total liabilities by the number of shares outstanding. The price used to calculate market return (“Market Price”) is determined by using the midpoint between the highest bid and the lowest offer on the primary stock exchange on which shares of a fund are listed for trading, as of the time that such fund’s NAV is calculated. Since shares of a fund may not have traded in the secondary market until after the fund’s inception, for the period from inception to the first day of secondary trading, the NAV of the fund is used as a proxy for the Market Price to calculate market returns. Market and NAV returns assume that dividends and capital gain distributions have been reinvested at Market Price and NAV, respectively.
An index is a statistical composite that tracks a specified financial market or sector. Unlike a fund, an index does not actually hold a portfolio of securities and therefore does not incur the expenses incurred by a fund. These expenses negatively impact fund performance. Also, market returns do not include brokerage commissions that may be payable on secondary market transactions. If brokerage commissions were included, market returns would be lower.
Generally accepted accounting principles require adjustments to be made to the net assets of the Fund at period end for financial reporting purposes only, and as such, the total return based on the unadjusted net asset value per share may differ from the total return reported in the financial highlights.
10
DBX ETF Trust
Performance Summary (Unaudited)
Xtrackers Risk Managed USD High Yield Strategy ETF (HYRM) (Continued)
| Growth of an Assumed $10,000 Investment |
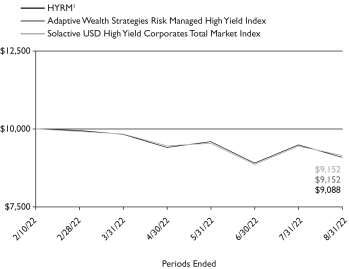
1 Based on Net Asset Value from commencement of operations, February 10, 2022.
| Sector Diversification* as of August 31, 2022 |
Consumer, Cyclical | 22.1% | |||
Communications | 19.4% | |||
Consumer, Non-cyclical | 17.6% | |||
Energy | 11.7% | |||
Financial | 10.0% | |||
Industrial | 9.0% | |||
Technology | 4.1% | |||
Basic Materials | 3.6% | |||
Utilities | 2.5% | |||
|
| |||
Total | 100.0% |
Modified duration to worst as of August 31, 2022: 4.3 years
Modified duration to worst is the measure of sensitivity of the price of a bond to a change in interest rates, assuming worst case scenario
| Quality* as of August 31, 2022 |
| Description | % of Market Value | |||
BBB | 7.6% | |||
BB | 59.9% | |||
B | 24.4% | |||
CCC | 8.0% | |||
NR | 0.1% | |||
|
| |||
| 100.0% | ||||
The quality ratings represent the higher of Moody’s Investor Services, Inc. (“Moody’s”), S&P Global Ratings (S&P) or Fitch Ratings Inc. (Fitch) credit ratings. The ratings of Moody’s, S&P and Fitch represent their opinions as to the quality of the securities they rate. Credit quality measures a bond issuer’s ability to repay interest and principal in a timely manner and is measured on a scale that ranges from AAA (highest) to D (lowest). Ratings are relative and subjective and are not absolute standards of quality. Credit quality does not remove market risk and is subject to change.
* As a percentage of total investments excluding cash equivalents. Sector percentages include the sector allocations of the Underlying Funds in which the Fund invests.
Portfolio holdings and characteristics are subject to change. For more complete details about the Fund’s investment portfolio see page 39.
11
DBX ETF Trust
Performance Summary (Unaudited)
Xtrackers Short Duration High Yield Bond ETF (SHYL)
The Xtrackers Short Duration High Yield Bond ETF (the “Fund”), using a “passive” or indexing investment approach, seeks investment results that correspond generally to the performance, before fees and expenses, of the Solactive USD High Yield Corporates Total Market 0-5 Year Index (the “Underlying Index”). The Underlying Index is designed to track the performance of short-term publicly issued US dollar-denominated below investment grade corporate debt. It is not possible to invest directly into an index.
| Performance as of August 31, 2022 |
| Average Annual Total Returns | ||||||||
| Net Asset Value | Market Value | Solactive USD High Yield Corporates Total Market 0-5 Year Index | Solactive USD High Yield Corporates Total Market Index | |||||
One Year | -5.84% | -6.34% | -5.76% | -10.54% | ||||
Since Inception1 | 2.21% | 2.11% | 2.36% | 1.82% | ||||
| Cumulative Total Returns | ||||||||
| Net Asset Value | Market Value | Solactive USD High Yield Corporates Total Market 0-5 Year Index | Solactive USD High Yield Corporates Total Market Index | |||||
One Year | -5.84% | -6.34% | -5.76% | -10.54% | ||||
Since Inception1 | 10.67% | 10.16% | 11.43% | 8.71% | ||||
1 Total returns are calculated based on the commencement of operations, January 10, 2018 (“Inception”).
Past performance is no guarantee of future results. Current performance may be lower or higher than the performance data quoted. Performance data current to the most recent month-end is available at www.Xtrackers.com. Performance results assume reinvestment of all dividends and capital gain distributions and do not reflect the deduction of taxes that a shareholder would pay on fund distributions or on the sale of fund shares or redemption of fund creation units. The investment return and principal value of shares will vary with changes in market conditions. Shares may be worth more or less than their original cost when they are sold in the market or redeemed. Performance for certain funds may reflect a waiver of a portion of the unitary advisory fee. Without such waiver, performance would have been lower. The gross expense ratio of the Fund, as stated in the fee table of the prospectus dated December 17, 2021, was 0.20%, and may differ from the expense ratio disclosed in the Financial Highlights table in this report.
The Fund’s net asset value or “NAV” is calculated by dividing the value of the Fund’s total assets less total liabilities by the number of shares outstanding. The price used to calculate market return (“Market Price”) is determined by using the midpoint between the highest bid and the lowest offer on the primary stock exchange on which shares of a fund are listed for trading, as of the time that such fund’s NAV is calculated. Since shares of a fund may not have traded in the secondary market until after the fund’s inception, for the period from inception to the first day of secondary trading, the NAV of the fund is used as a proxy for the Market Price to calculate market returns. Market and NAV returns assume that dividends and capital gain distributions have been reinvested at Market Price and NAV, respectively.
An index is a statistical composite that tracks a specified financial market or sector. Unlike a fund, an index does not actually hold a portfolio of securities and therefore does not incur the expenses incurred by a fund. These expenses negatively impact fund performance. Also, market returns do not include brokerage commissions that may be payable on secondary market transactions. If brokerage commissions were included, market returns would be lower.
Generally accepted accounting principles require adjustments to be made to the net assets of the Fund at period end for financial reporting purposes only, and as such, the total return based on the unadjusted net asset value per share may differ from the total return reported in the financial highlights.
12
DBX ETF Trust
Performance Summary (Unaudited)
Xtrackers Short Duration High Yield Bond ETF (SHYL) (Continued)
| Growth of an Assumed $10,000 Investment |
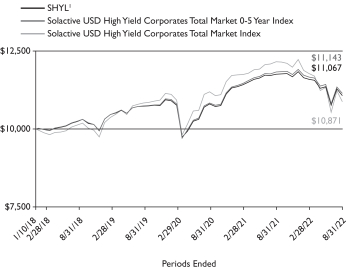
1 Based on Net Asset Value from commencement of operations, January 10, 2018.
| Sector Diversification* as of August 31, 2022 |
Consumer, Cyclical | 26.1% | |||
Communications | 18.9% | |||
Consumer, Non-cyclical | 13.3% | |||
Energy | 12.0% | |||
Financial | 11.4% | |||
Industrial | 10.6% | |||
Technology | 2.8% | |||
Basic Materials | 2.7% | |||
Utilities | 2.2% | |||
|
| |||
Total | 100.0% |
Modified duration to worst as of August 31, 2022: 2.7 years
Modified duration to worst is the measure of sensitivity of the price of a bond to a change in interest rates, assuming worst case scenario.
| Quality* as of August 31, 2022 |
| Description | % of Market Value | |||
BBB | 9.7% | |||
BB | 52.1% | |||
B | 30.1% | |||
CCC | 7.8% | |||
NR | 0.3% | |||
|
| |||
| 100.0% | ||||
The quality ratings represent the higher of Moody’s Investor Services, Inc. (“Moody’s”), S&P Global Ratings (S&P) or Fitch Ratings Inc. (Fitch) credit ratings. The ratings of Moody’s, S&P and Fitch represent their opinions as to the quality of the securities they rate. Credit quality measures a bond issuer’s ability to repay interest and principal in a timely manner and is measured on a scale that ranges from AAA (highest) to D (lowest). Ratings are relative and subjective and are not absolute standards of quality. Credit quality does not remove market risk and is subject to change.
| Country Diversification* as of August 31, 2022 |
United States | 84.1% | |||
Canada | 4.3% | |||
Netherlands | 2.8% | |||
Other | 8.8% | |||
|
| |||
Total | 100.0% |
* As a percent of total investments excluding securities lending collateral and cash equivalents.
Portfolio holdings and characteristics are subject to change. For more complete details about the Fund’s investment portfolio see page 40.
13
DBX ETF Trust
Performance Summary (Unaudited)
Xtrackers USD High Yield Corporate Bond ETF (HYLB)
The Xtrackers USD High Yield Corporate Bond ETF (the “Fund”), using a “passive” or indexing investment approach, seeks investment results that correspond generally to the performance, before fees and expenses, of the Solactive USD High Yield Corporates Total Market Index (the “Underlying Index”). The Underlying Index is designed to track the performance of a basket of U.S. dollar-denominated high yield liquid corporate bonds. It is not possible to invest directly into an index.
| Performance as of August 31, 2022 |
| Average Annual Total Returns | ||||||||
| Net Asset Value | Market Value | Solactive USD High Yield Corporates Total Market Index | iBoxx USD Liquid High Yield Index | |||||
One Year | -10.67% | -11.39% | -10.54% | -10.62% | ||||
Five Year | 1.80% | 1.65% | 2.02% | 2.06% | ||||
Since Inception1 | 2.68% | 2.56% | 2.94% | 2.89% | ||||
| Cumulative Total Returns | ||||||||
| Net Asset Value | Market Value | Solactive USD High Yield Corporates Total Market Index | iBoxx USD Liquid High Yield Index | |||||
One Year | -10.67% | -11.39% | -10.54% | -10.62% | ||||
Five Year | 9.34% | 8.55% | 10.52% | 10.75% | ||||
Since Inception1 | 16.37% | 15.63% | 18.08% | 17.72% | ||||
1 Total returns are calculated based on the commencement of operations, December 7, 2016 (“Inception”).
Past performance is no guarantee of future results. Current performance may be lower or higher than the performance data quoted. Performance data current to the most recent month-end is available at www.Xtrackers.com. Performance results assume reinvestment of all dividends and capital gain distributions and do not reflect the deduction of taxes that a shareholder would pay on fund distributions or on the sale of fund shares or redemption of fund creation units. The investment return and principal value of shares will vary with changes in market conditions. Shares may be worth more or less than their original cost when they are sold in the market or redeemed. Performance for certain funds may reflect a waiver of a portion of the unitary advisory fee. Without such waiver, performance would have been lower. The gross expense ratio of the Fund, as stated in the fee table of the prospectus dated December 17, 2021, was 0.20%, and may differ from the expense ratio disclosed in the Financial Highlights table in this report.
The Fund’s net asset value or “NAV” is calculated by dividing the value of the Fund’s total assets less total liabilities by the number of shares outstanding. The price used to calculate market return (“Market Price”) is determined by using the midpoint between the highest bid and the lowest offer on the primary stock exchange on which shares of a fund are listed for trading, as of the time that such fund’s NAV is calculated. Since shares of a fund may not have traded in the secondary market until after the fund’s inception, for the period from inception to the first day of secondary trading, the NAV of the fund is used as a proxy for the Market Price to calculate market returns. Market and NAV returns assume that dividends and capital gain distributions have been reinvested at Market Price and NAV, respectively.
An index is a statistical composite that tracks a specified financial market or sector. Unlike a fund, an index does not actually hold a portfolio of securities and therefore does not incur the expenses incurred by a fund. These expenses negatively impact fund performance. Also, market returns do not include brokerage commissions that may be payable on secondary market transactions. If brokerage commissions were included, market returns would be lower.
Generally accepted accounting principles require adjustments to be made to the net assets of the Fund at period end for financial reporting purposes only, and as such, the total return based on the unadjusted net asset value per share may differ from the total return reported in the financial highlights.
14
DBX ETF Trust
Xtrackers USD High Yield Corporate Bond ETF (HYLB) (Continued)
| Growth of an Assumed $10,000 Investment |
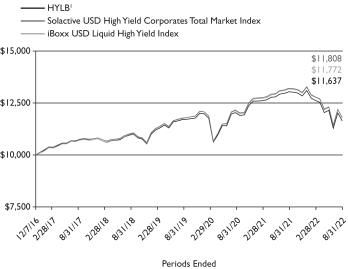
1 Based on Net Asset Value from commencement of operations, December 7, 2016.
| Sector Diversification* as of August 31, 2022 |
Consumer, Cyclical | 22.1% | |||
Communications | 19.4% | |||
Consumer, Non-cyclical | 17.6% | |||
Energy | 11.7% | |||
Financial | 10.0% | |||
Industrial | 9.0% | |||
Technology | 4.1% | |||
Basic Materials | 3.6% | |||
Utilities | 2.5% | |||
|
| |||
Total | 100.0% |
Modified duration to worst as of August 31, 2022: 4.4 years
Modified duration to worst is the measure of sensitivity of the price of a bond to a change in interest rates, assuming worst case scenario.
| Quality* as of August 31, 2022 |
| Description | % of Market Value | |||
BBB | 7.7% | |||
BB | 60.3% | |||
B | 24.1% | |||
CCC | 7.8% | |||
NR | 0.1% | |||
|
| |||
Total | 100.0% | |||
The quality ratings represent the higher of Moody’s Investor Services, Inc. (“Moody’s”), S&P Global Ratings (S&P) or Fitch Ratings Inc. (Fitch) credit ratings. The ratings of Moody’s, S&P and Fitch represent their opinions as to the quality of the securities they rate. Credit quality measures a bond issuer’s ability to repay interest and principal in a timely manner and is measured on a scale that ranges from AAA (highest) to D (lowest). Ratings are relative and subjective and are not absolute standards of quality. Credit quality does not remove market risk and is subject to change.
| Country Diversification* as of August 31, 2022 |
United States | 87.1% | |||
Canada | 3.7% | |||
Other | 9.2% | |||
|
| |||
Total | 100.0% |
* As a percent of total investments excluding securities lending collateral and cash equivalents.
Portfolio holdings and characteristics are subject to change. For more complete details about the Fund’s investment portfolio see page 50.
15
DBX ETF Trust
As a shareholder of one or more of the Funds, you incur two types of costs: (1) transaction costs, including brokerage commissions paid on purchases and sales of fund shares, and (2) ongoing costs, including unitary advisory fees and other fund expenses. In the most recent six-month period the Funds limited these expenses; had they not done so, expenses would have been higher. In addition to the ongoing expenses which each Fund bears directly, the Xtrackers Risk Managed USD High Yield Strategy ETF shareholders indirectly bear the expenses of Xtrackers High Beta High Yield Bond ETF and Xtrackers USD High Yield Corporate Bond ETF (the “Underlying Funds”) in which the Xtrackers Risk Managed USD High Yield Strategy ETF invests. The Underlying Funds’ expenses are not included in Xtrackers Risk Managed USD High Yield Strategy ETF’s annualized expense ratios used to calculate the expense estimate in the tables. The expense examples below are intended to help you understand your ongoing costs (in dollars) of investing in the Funds and to compare these costs with the ongoing costs of investing in other funds.
The examples in the tables are based on an investment of $1,000 invested at the beginning of the six-month period and held for the entire period (March 1, 2022 to August 31, 2022).
Actual expenses
The first line in the following tables provides information about actual account values and actual expenses. You may use the information in this line, together with the amount you invested, to estimate the expenses that you paid over the period. Simply divide your account value by $1,000 (for example, an $8,600 account value divided by $1,000 = 8.6), then multiply the result by the number in the first line under the heading “Expenses Paid During the Period” to estimate the expenses you paid on your account during this period.
Hypothetical example for comparison purposes
The second line in the following tables provides information about hypothetical account values and hypothetical expenses based on the Funds’ actual expense ratios and an assumed rate of return of 5% per year before expenses (which is not the Funds’ actual return). The hypothetical account values and expenses may not be used to estimate the actual ending account balance or expenses you paid for the period. You may use this information to compare the ongoing costs of investing in the Fund and other funds. To do so, compare this 5% hypothetical example with the 5% hypothetical examples that appear in the shareholder reports of the other funds.
Please note that the expenses shown in the tables are meant to highlight your ongoing costs only, and do not reflect any transactional costs. Therefore the second line in the table is useful in comparing ongoing costs only, and will not help you determine the relative total costs of owning different funds. In addition, if these transactional costs were included, your costs would have been higher.
| Beginning Account Value March 1, 2022 | Ending Account Value August 31, 2022 | Annualized Expense Ratio | Expenses Paid During the Period Per $1,000(1) | |||||||||||||
| Xtrackers High Beta High Yield Bond ETF |
| |||||||||||||||
Actual | $ | 1,000.00 | $ | 904.50 | 0.20 | % | $ | 0.96 | ||||||||
Hypothetical (5% return before expenses) | $ | 1,000.00 | $ | 1,024.20 | 0.20 | % | $ | 1.02 | ||||||||
| Xtrackers Low Beta High Yield Bond ETF |
| |||||||||||||||
Actual | $ | 1,000.00 | $ | 944.10 | 0.20 | % | $ | 0.98 | ||||||||
Hypothetical (5% return before expenses) | $ | 1,000.00 | $ | 1,024.20 | 0.20 | % | $ | 1.02 | ||||||||
| Xtrackers Risk Managed USD High Yield Strategy ETF(2) |
| |||||||||||||||
Actual | $ | 1,000.00 | $ | 913.60 | 0.15 | % | $ | 0.72 | ||||||||
Hypothetical (5% return before expenses) | $ | 1,000.00 | $ | 1,024.45 | 0.15 | % | $ | 0.77 | ||||||||
| Xtrackers Short Duration High Yield Bond ETF |
| |||||||||||||||
Actual | $ | 1,000.00 | $ | 955.20 | 0.20 | % | $ | 0.99 | ||||||||
Hypothetical (5% return before expenses) | $ | 1,000.00 | $ | 1,024.20 | 0.20 | % | $ | 1.02 | ||||||||
| Xtrackers USD High Yield Corporate Bond ETF |
| |||||||||||||||
Actual | $ | 1,000.00 | $ | 921.80 | 0.15 | % | $ | 0.73 | ||||||||
Hypothetical (5% return before expenses) | $ | 1,000.00 | $ | 1,024.45 | 0.15 | % | $ | 0.77 | ||||||||
(1) Expenses are equal to each Fund’s annualized expense ratio, multiplied by the average account value over the period, multiplied by 184 (the number of days in the most recent six-month period), then divided by 365.
(2) The Fund invests in other ETFs and indirectly bears its proportionate share of fees and expenses incurred by the Underlying Funds in which the Fund is invested. This ratio does not include these indirect fees and expenses.
16
DBX ETF Trust
Xtrackers High Beta High Yield Bond ETF
August 31, 2022
Principal | Value | |||||||
| CORPORATE BONDS — 98.1% | ||||||||
| Basic Materials — 3.9% | ||||||||
| Chemicals — 2.2% | ||||||||
ASP Unifrax Holdings, Inc. | $ | 21,000 | $ | 16,877 | ||||
144A, 7.50%, 9/30/29 (a) | 10,000 | 7,330 | ||||||
Chemours Co. | 13,000 | 12,072 | ||||||
144A, 5.75%, 11/15/28 | 25,000 | 22,415 | ||||||
144A, 4.625%, 11/15/29 | 15,000 | 12,396 | ||||||
Consolidated Energy Finance SA | 10,000 | 9,147 | ||||||
144A, 5.625%, 10/15/28 | 13,000 | 10,726 | ||||||
INEOS Quattro Finance 2 PLC, 144A, | 13,000 | 11,268 | ||||||
Methanex Corp., | 18,000 | 15,142 | ||||||
NOVA Chemicals Corp. | 28,000 | 24,763 | ||||||
144A, 4.25%, 5/15/29 (a) | 13,000 | 10,710 | ||||||
Olympus Water US Holding Corp. | 22,000 | 17,918 | ||||||
144A, 6.25%, 10/1/29 | 10,000 | 7,563 | ||||||
SCIH Salt Holdings, Inc. | 28,000 | 24,029 | ||||||
144A, 6.625%, 5/1/29 | 19,000 | 15,671 | ||||||
Tronox, Inc., 144A, | 27,000 | 22,493 | ||||||
WR Grace Holdings LLC, 144A, | 29,000 | 22,982 | ||||||
|
| |||||||
(Cost $314,445) | 263,502 | |||||||
|
| |||||||
| Forest Products & Paper — 0.1% | ||||||||
Mercer International, Inc., | ||||||||
(Cost $22,515) | 22,000 | 19,240 | ||||||
|
| |||||||
| Iron/Steel — 0.6% | ||||||||
Mineral Resources Ltd. | 18,000 | 18,065 | ||||||
144A, 8.00%, 11/1/27 | 17,000 | 16,985 | ||||||
144A, 8.50%, 5/1/30 | 16,000 | 16,145 | ||||||
United States Steel Corp., | 19,000 | 18,644 | ||||||
|
| |||||||
(Cost $71,363) | 69,839 | |||||||
|
| |||||||
| Mining — 1.0% | ||||||||
Arconic Corp., 144A, | 24,000 | 22,570 | ||||||
Constellium SE, 144A, | 13,000 | 10,777 | ||||||
FMG Resources August 2006 Pty Ltd. | 19,000 | 17,556 | ||||||
144A, 6.125%, 4/15/32 | 18,000 | 16,662 | ||||||
Hudbay Minerals, Inc. | 15,000 | 13,635 | ||||||
144A, 6.125%, 4/1/29 | 15,000 | 13,227 | ||||||
Principal | Value | |||||||
| Mining (Continued) | ||||||||
Kaiser Aluminum Corp. | $ | 15,000 | $ | 12,940 | ||||
144A, 4.50%, 6/1/31 | 15,000 | 11,830 | ||||||
|
| |||||||
(Cost $134,731) | 119,197 | |||||||
|
| |||||||
| Communications — 19.7% | ||||||||
| Advertising — 1.3% | ||||||||
Clear Channel Outdoor Holdings, Inc. | 32,000 | 28,701 | ||||||
144A, 7.75%, 4/15/28 | 25,000 | 20,380 | ||||||
144A, 7.50%, 6/1/29 | 27,000 | 21,836 | ||||||
CMG Media Corp., 144A, | 26,000 | 22,402 | ||||||
Outfront Media Capital LLC / Outfront Media Capital Corp. | 17,000 | 15,584 | ||||||
144A, 4.25%, 1/15/29 | 11,000 | 9,258 | ||||||
144A, 4.625%, 3/15/30 | 13,000 | 10,863 | ||||||
Stagwell Global LLC, 144A, | 29,000 | 24,640 | ||||||
|
| |||||||
(Cost $179,038) | 153,664 | |||||||
|
| |||||||
| Internet — 0.7% | ||||||||
Arches Buyer, Inc. | 30,000 | 24,160 | ||||||
144A, 6.125%, 12/1/28 | 13,000 | 10,209 | ||||||
Photo Holdings Merger Sub, Inc., 144A, | 20,000 | 14,965 | ||||||
Uber Technologies, Inc., 144A, | 38,000 | 32,846 | ||||||
|
| |||||||
(Cost $96,172) | 82,180 | |||||||
|
| |||||||
| Media — 8.6% | ||||||||
Altice Financing SA | 32,000 | 25,874 | ||||||
144A, 5.75%, 8/15/29 | 54,000 | 43,624 | ||||||
AMC Networks, Inc., | 26,000 | 21,258 | ||||||
Audacy Capital Corp. | 11,000 | 3,618 | ||||||
144A, 6.75%, 3/31/29 | 14,000 | 4,232 | ||||||
CSC Holdings LLC | 25,000 | 22,709 | ||||||
144A, 7.50%, 4/1/28 | 27,000 | 24,047 | ||||||
144A, 6.50%, 2/1/29 | 46,000 | 42,716 | ||||||
144A, 5.75%, 1/15/30 | 62,000 | 48,091 | ||||||
144A, 4.125%, 12/1/30 | 29,000 | 23,228 | ||||||
144A, 4.625%, 12/1/30 | 59,000 | 43,026 | ||||||
144A, 4.50%, 11/15/31 | 40,000 | 31,404 | ||||||
144A, 5.00%, 11/15/31 | 8,000 | 5,713 | ||||||
Diamond Sports Group LLC / Diamond Sports Finance Co. | 78,000 | 14,918 | ||||||
144A, 6.625%, 8/15/27 | 44,000 | 4,126 | ||||||
Directv Financing LLC / Directv Financing Co.-Obligor, Inc., 144A, | 94,000 | 86,845 | ||||||
| See Notes to Financial Statements. | 17 |
DBX ETF Trust
Schedule of Investments
Xtrackers High Beta High Yield Bond ETF (Continued)
August 31, 2022
Principal | Value | |||||||
| Media (Continued) | ||||||||
DISH DBS Corp. | $ | 51,000 | $ | 46,217 | ||||
7.75%, 7/1/26 | 51,000 | 40,209 | ||||||
144A, 5.25%, 12/1/26 | 70,000 | 57,925 | ||||||
7.375%, 7/1/28 | 30,000 | 19,700 | ||||||
144A, 5.75%, 12/1/28 | 64,000 | 49,265 | ||||||
5.125%, 6/1/29 | 38,000 | 22,572 | ||||||
Gray Escrow II, Inc., 144A, | 33,000 | 27,931 | ||||||
Gray Television, Inc., 144A, | 20,000 | 16,480 | ||||||
iHeartCommunications, Inc. | 22,000 | 20,816 | ||||||
8.375%, 5/1/27 | 38,000 | 33,394 | ||||||
144A, 5.25%, 8/15/27 | 19,000 | 17,078 | ||||||
144A, 4.75%, 1/15/28 | 11,000 | 9,459 | ||||||
LCPR Senior Secured Financing DAC | 30,000 | 28,365 | ||||||
144A, 5.125%, 7/15/29 | 22,000 | 18,953 | ||||||
McGraw-Hill Education, Inc. | 23,000 | 20,274 | ||||||
144A, 8.00%, 8/1/29 | 18,000 | 15,643 | ||||||
Radiate Holdco LLC / Radiate Finance, Inc. | 23,000 | 19,866 | ||||||
144A, 6.50%, 9/15/28 | 26,000 | 19,409 | ||||||
Scripps Escrow II, Inc., 144A, | 13,000 | 10,656 | ||||||
Sinclair Television Group, Inc., 144A, | 13,000 | 10,213 | ||||||
Univision Communications, Inc., 144A, | 23,000 | 22,856 | ||||||
UPC Holding BV, 144A, | 12,000 | 10,292 | ||||||
Virgin Media Finance PLC, 144A, | 25,000 | 19,792 | ||||||
Ziggo Bond Co. BV | 16,000 | 14,435 | ||||||
144A, 5.125%, 2/28/30 | 13,000 | 10,425 | ||||||
|
| |||||||
(Cost $1,326,710) | 1,027,654 | |||||||
|
| |||||||
| Telecommunications — 9.1% | ||||||||
Altice France Holding SA | 40,000 | 34,587 | ||||||
144A, 6.00%, 2/15/28 | 31,000 | 21,226 | ||||||
Altice France SA | 46,000 | 43,585 | ||||||
144A, 5.50%, 1/15/28 | 29,000 | 23,646 | ||||||
144A, 5.125%, 1/15/29 | 15,000 | 11,670 | ||||||
144A, 5.125%, 7/15/29 | 64,000 | 48,698 | ||||||
144A, 5.50%, 10/15/29 | 52,000 | 41,129 | ||||||
Avaya, Inc., 144A, | 26,000 | 14,258 | ||||||
C&W Senior Financing DAC, 144A, | 32,000 | 28,449 | ||||||
CommScope Technologies LLC | 33,000 | 29,990 | ||||||
144A, 5.00%, 3/15/27 | 19,000 | 15,024 | ||||||
Principal | Value | |||||||
| Telecommunications (Continued) | ||||||||
CommScope, Inc. | $ | 38,000 | $ | 35,959 | ||||
144A, 8.25%, 3/1/27 | 25,000 | 21,469 | ||||||
144A, 7.125%, 7/1/28 | 18,000 | 14,723 | ||||||
144A, 4.75%, 9/1/29 | 33,000 | 28,140 | ||||||
Connect Finco SARL / Connect US Finco LLC, 144A, | 53,000 | 48,600 | ||||||
Consolidated Communications, Inc. | 12,000 | 9,260 | ||||||
144A, 6.50%, 10/1/28 | 20,000 | 16,144 | ||||||
Frontier Communications Holdings LLC | 30,000 | 28,039 | ||||||
144A, 5.00%, 5/1/28 | 40,000 | 35,109 | ||||||
144A, 6.75%, 5/1/29 | 25,000 | 21,594 | ||||||
5.875%, 11/1/29 | 20,000 | 16,354 | ||||||
144A, 6.00%, 1/15/30 | 25,000 | 20,644 | ||||||
144A, 8.75%, 5/15/30 | 31,000 | 32,008 | ||||||
Hughes Satellite Systems Corp., | 19,000 | 18,010 | ||||||
Iliad Holding SASU | 31,000 | 28,368 | ||||||
144A, 7.00%, 10/15/28 | 23,000 | 21,140 | ||||||
Intelsat Jackson Holdings SA, 144A, | 76,000 | 69,082 | ||||||
Level 3 Financing, Inc. | 25,000 | 22,123 | ||||||
144A, 4.25%, 7/1/28 | 32,000 | 26,639 | ||||||
144A, 3.625%, 1/15/29 | 22,000 | 17,690 | ||||||
144A, 3.75%, 7/15/29 | 23,000 | 18,508 | ||||||
Lumen Technologies, Inc. | 32,000 | 27,692 | ||||||
144A, 4.50%, 1/15/29 | 25,000 | 18,687 | ||||||
144A, 5.375%, 6/15/29 | 25,000 | 19,522 | ||||||
Telesat Canada / Telesat LLC | 13,000 | 7,612 | ||||||
144A, 4.875%, 6/1/27 | 10,000 | 5,438 | ||||||
VEON Holdings BV | 17,000 | 12,539 | ||||||
144A, 4.00%, 4/9/25 | 31,000 | 19,453 | ||||||
Viasat, Inc. | 18,000 | 15,916 | ||||||
144A, 5.625%, 4/15/27 | 16,000 | 14,743 | ||||||
144A, 6.50%, 7/15/28 | 10,000 | 7,734 | ||||||
Windstream Escrow LLC / Windstream Escrow Finance Corp., 144A, | 35,000 | 30,514 | ||||||
Zayo Group Holdings, Inc. | 38,000 | 32,445 | ||||||
144A, 6.125%, 3/1/28 | 28,000 | 21,821 | ||||||
|
| |||||||
(Cost $1,300,065) | 1,095,981 | |||||||
|
| |||||||
| Consumer, Cyclical — 19.6% | ||||||||
| Airlines — 0.9% | ||||||||
American Airlines Group, Inc., 144A, | 16,000 | 13,467 | ||||||
| See Notes to Financial Statements. | 18 |
DBX ETF Trust
Schedule of Investments
Xtrackers High Beta High Yield Bond ETF (Continued)
August 31, 2022
Principal | Value | |||||||
| Airlines (Continued) | ||||||||
American Airlines, Inc., 144A, | $ | 64,000 | $ | 70,802 | ||||
Hawaiian Brand Intellectual Property Ltd. / HawaiianMiles Loyalty Ltd., 144A, | 31,000 | 28,339 | ||||||
|
| |||||||
(Cost $119,526) | 112,608 | |||||||
|
| |||||||
| Auto Manufacturers — 0.4% | ||||||||
Jaguar Land Rover Automotive PLC | 17,000 | 15,598 | ||||||
144A, 4.50%, 10/1/27 (a) | 13,000 | 9,567 | ||||||
144A, 5.875%, 1/15/28 | 13,000 | 9,908 | ||||||
144A, 5.50%, 7/15/29 | 16,000 | 11,276 | ||||||
|
| |||||||
(Cost $59,149) | 46,349 | |||||||
|
| |||||||
| Auto Parts & Equipment — 1.7% | ||||||||
Adient Global Holdings Ltd., 144A, | 20,000 | 18,534 | ||||||
American Axle & Manufacturing, Inc. | 13,000 | 12,176 | ||||||
6.875%, 7/1/28 | 10,000 | 9,510 | ||||||
5.00%, 10/1/29 (a) | 14,000 | 11,895 | ||||||
Clarios Global LP / Clarios US Finance Co., 144A, | 52,000 | 50,801 | ||||||
Dana, Inc. | 10,000 | 8,929 | ||||||
5.625%, 6/15/28 | 10,000 | 8,989 | ||||||
4.25%, 9/1/30 | 10,000 | 8,088 | ||||||
Goodyear Tire & Rubber Co. | 23,000 | 20,647 | ||||||
5.25%, 4/30/31 (a) | 14,000 | 12,227 | ||||||
5.25%, 7/15/31 (a) | 16,000 | 13,815 | ||||||
5.625%, 4/30/33 | 11,000 | 9,531 | ||||||
Tenneco, Inc., 144A, | 19,000 | 18,934 | ||||||
|
| |||||||
(Cost $225,832) | 204,076 | |||||||
|
| |||||||
| Distribution/Wholesale — 0.0% | ||||||||
Wesco Aircraft Holdings, Inc., 144A, | ||||||||
(Cost $13,319) | 15,000 | 4,988 | ||||||
|
| |||||||
| Entertainment — 2.9% | ||||||||
AMC Entertainment Holdings, Inc. | 36,000 | 28,939 | ||||||
144A, 7.50%, 2/15/29 | 25,000 | 21,531 | ||||||
Banijay Entertainment SASU, 144A, | 25,000 | 23,604 | ||||||
Caesars Entertainment, Inc. | 46,000 | 45,319 | ||||||
144A, 4.625%, 10/15/29 | 31,000 | 25,071 | ||||||
Cinemark USA, Inc. | 10,000 | 8,887 | ||||||
144A, 5.25%, 7/15/28 | 20,000 | 16,189 | ||||||
Mohegan Gaming & Entertainment, 144A, | 31,000 | 27,130 | ||||||
Principal | Value | |||||||
| Entertainment (Continued) | ||||||||
Penn Entertainment, Inc. | $ | 10,000 | $ | 9,161 | ||||
144A, 4.125%, 7/1/29 | 10,000 | 8,091 | ||||||
Premier Entertainment Sub LLC / Premier Entertainment Finance Corp. | 19,000 | 14,109 | ||||||
144A, 5.875%, 9/1/31 | 18,000 | 12,606 | ||||||
Resorts World Las Vegas LLC / RWLV Capital, Inc., 144A, | 32,000 | 26,267 | ||||||
Scientific Games International, Inc. | 19,000 | 18,622 | ||||||
144A, 7.25%, 11/15/29 | 11,000 | 10,835 | ||||||
Six Flags Entertainment Corp., 144A, | 13,000 | 11,935 | ||||||
Wynn Resorts Finance LLC / Wynn Resorts Capital Corp. | 16,000 | 15,974 | ||||||
144A, 5.125%, 10/1/29 | 19,000 | 15,972 | ||||||
|
| |||||||
(Cost $396,636) | 340,242 | |||||||
|
| |||||||
| Food Service — 0.2% | ||||||||
TKC Holdings, Inc. | 11,000 | 9,284 | ||||||
144A, 10.50%, 5/15/29 | 16,000 | 12,844 | ||||||
|
| |||||||
(Cost $28,140) | 22,128 | |||||||
|
| |||||||
| Home Builders — 0.7% | ||||||||
Ashton Woods USA LLC / Ashton Woods Finance Co., 144A, | 10,000 | 7,902 | ||||||
Brookfield Residential Properties, Inc. / Brookfield Residential US LLC | 15,000 | 13,352 | ||||||
144A, 4.875%, 2/15/30 | 15,000 | 11,569 | ||||||
Century Communities, Inc., 144A, | 13,000 | 10,515 | ||||||
Mattamy Group Corp. | 13,000 | 11,466 | ||||||
144A, 4.625%, 3/1/30 | 16,000 | 12,979 | ||||||
Taylor Morrison Communities, Inc., 144A, | 13,000 | 11,173 | ||||||
|
| |||||||
(Cost $94,017) | 78,956 | |||||||
|
| |||||||
| Home Furnishings — 0.1% | ||||||||
Tempur Sealy International, Inc., 144A, | ||||||||
(Cost $21,048) | 21,000 | 16,195 | ||||||
|
| |||||||
| Housewares — 0.2% | ||||||||
Scotts Miracle-Gro Co. | 10,000 | 8,025 | ||||||
4.00%, 4/1/31 | 12,000 | 9,030 | ||||||
4.375%, 2/1/32 | 10,000 | 7,563 | ||||||
|
| |||||||
(Cost $30,085) | 24,618 | |||||||
|
| |||||||
| Leisure Time — 4.4% | ||||||||
Carnival Corp. | 20,000 | 20,626 | ||||||
| See Notes to Financial Statements. | 19 |
DBX ETF Trust
Schedule of Investments
Xtrackers High Beta High Yield Bond ETF (Continued)
August 31, 2022
Principal | Value | |||||||
| Leisure Time (Continued) | ||||||||
144A, 7.625%, 3/1/26 (a) | $ | 37,000 | $ | 31,500 | ||||
144A, 5.75%, 3/1/27 | 95,000 | 74,176 | ||||||
144A, 9.875%, 8/1/27 | 23,000 | 23,117 | ||||||
144A, 6.00%, 5/1/29 | 51,000 | 38,585 | ||||||
144A, 10.50%, 6/1/30 | 25,000 | 22,906 | ||||||
Life Time, Inc. | 24,000 | 21,659 | ||||||
144A, 8.00%, 4/15/26 | 10,000 | 8,844 | ||||||
NCL Corp. Ltd. | 14,000 | 12,153 | ||||||
144A, 5.875%, 3/15/26 | 36,000 | 29,160 | ||||||
144A, 5.875%, 2/15/27 | 26,000 | 23,600 | ||||||
144A, 7.75%, 2/15/29 | 15,000 | 12,211 | ||||||
Royal Caribbean Cruises Ltd. | 35,000 | 37,146 | ||||||
144A, 4.25%, 7/1/26 | 18,000 | 13,856 | ||||||
144A, 5.50%, 8/31/26 (a) | 26,000 | 21,160 | ||||||
144A, 5.375%, 7/15/27 | 25,000 | 19,436 | ||||||
144A, 11.625%, 8/15/27 | 35,000 | 34,441 | ||||||
3.70%, 3/15/28 | 22,000 | 14,989 | ||||||
144A, 5.50%, 4/1/28 | 28,000 | 21,570 | ||||||
Viking Cruises Ltd. | 17,000 | 17,866 | ||||||
144A, 5.875%, 9/15/27 | 22,000 | 17,743 | ||||||
144A, 7.00%, 2/15/29 | 13,000 | 10,445 | ||||||
|
| |||||||
(Cost $620,883) | 527,189 | |||||||
|
| |||||||
| Lodging — 2.1% | ||||||||
Hilton Grand Vacations Borrower Escrow LLC / Hilton Grand Vacations Borrower Esc | 22,000 | 19,499 | ||||||
144A, 4.875%, 7/1/31 | 12,000 | 9,922 | ||||||
Marriott Ownership Resorts, Inc., 144A, | 13,000 | 10,980 | ||||||
Melco Resorts Finance Ltd. | 26,000 | 19,865 | ||||||
144A, 5.25%, 4/26/26 | 10,000 | 7,371 | ||||||
144A, 5.625%, 7/17/27 | 16,000 | 11,374 | ||||||
144A, 5.75%, 7/21/28 | 23,000 | 15,651 | ||||||
144A, 5.375%, 12/4/29 | 29,000 | 18,932 | ||||||
MGM Resorts International | 18,000 | 16,689 | ||||||
4.75%, 10/15/28 | 19,000 | 16,724 | ||||||
Station Casinos LLC | 19,000 | 16,395 | ||||||
144A, 4.625%, 12/1/31 | 13,000 | 10,779 | ||||||
Travel + Leisure Co., 144A, | 17,000 | 13,846 | ||||||
Wynn Las Vegas LLC / Wynn Las Vegas Capital Corp. | 47,000 | 45,067 | ||||||
144A, 5.25%, 5/15/27 | 23,000 | 20,785 | ||||||
|
| |||||||
(Cost $312,208) | 253,879 | |||||||
|
| |||||||
| Retail — 6.0% | ||||||||
Asbury Automotive Group, Inc. | 21,000 | 18,033 | ||||||
Principal | Value | |||||||
| Retail (Continued) | ||||||||
4.75%, 3/1/30 | $ | 8,000 | $ | 6,831 | ||||
144A, 5.00%, 2/15/32 | 16,000 | 13,389 | ||||||
Bath & Body Works, Inc. | 13,000 | 11,667 | ||||||
7.50%, 6/15/29 (a) | 14,000 | 13,479 | ||||||
144A, 6.625%, 10/1/30 | 26,000 | 23,652 | ||||||
Carvana Co. | 13,000 | 9,759 | ||||||
144A, 5.50%, 4/15/27 | 15,000 | 9,746 | ||||||
144A, 5.875%, 10/1/28 (a) | 15,000 | 9,021 | ||||||
144A, 4.875%, 9/1/29 | 19,000 | 10,830 | ||||||
144A, 10.25%, 5/1/30 | 84,000 | 66,886 | ||||||
eG Global Finance PLC | 18,000 | 17,034 | ||||||
144A, 8.50%, 10/30/25 | 16,000 | 14,964 | ||||||
Ferrellgas LP / Ferrellgas Finance Corp. | 17,000 | 14,816 | ||||||
144A, 5.875%, 4/1/29 | 22,000 | 17,963 | ||||||
Fertitta Entertainment LLC / Fertitta Entertainment Finance Co., Inc., 144A, | 33,000 | 26,968 | ||||||
Gap, Inc. | 19,000 | 13,233 | ||||||
144A, 3.875%, 10/1/31 | 19,000 | 13,205 | ||||||
Guitar Center, Inc., 144A, | 14,000 | 12,971 | ||||||
LBM Acquisition LLC, 144A, | 20,000 | 14,975 | ||||||
LCM Investments Holdings II LLC, 144A, | 26,000 | 21,744 | ||||||
Macy’s Retail Holdings LLC | 13,000 | 11,266 | ||||||
144A, 5.875%, 3/15/30 | 11,000 | 9,420 | ||||||
144A, 6.125%, 3/15/32 | 11,000 | 9,287 | ||||||
Michaels Cos., Inc. | 22,000 | 16,959 | ||||||
144A, 7.875%, 5/1/29 | 33,000 | 21,995 | ||||||
NMG Holding Co, Inc. / Neiman Marcus Group LLC, 144A, | 29,000 | 27,182 | ||||||
Nordstrom, Inc. | 13,000 | 10,038 | ||||||
4.25%, 8/1/31 | 11,000 | 8,081 | ||||||
Party City Holdings, Inc., 144A, | 19,000 | 12,475 | ||||||
PetSmart, Inc. / PetSmart Finance Corp., 144A, | 29,000 | 27,296 | ||||||
QVC, Inc. | 15,000 | 13,798 | ||||||
4.75%, 2/15/27 | 15,000 | 12,412 | ||||||
4.375%, 9/1/28 | 13,000 | 9,943 | ||||||
Rite Aid Corp. | 12,000 | 10,236 | ||||||
144A, 8.00%, 11/15/26 | 23,000 | 18,785 | ||||||
Sonic Automotive, Inc. | 17,000 | 14,529 | ||||||
144A, 4.875%, 11/15/31 | 17,000 | 14,198 | ||||||
| See Notes to Financial Statements. | 20 |
DBX ETF Trust
Schedule of Investments
Xtrackers High Beta High Yield Bond ETF (Continued)
August 31, 2022
Principal | Value | |||||||
| Retail (Continued) | ||||||||
SRS Distribution, Inc. | $ | 12,000 | $ | 9,971 | ||||
144A, 6.00%, 12/1/29 | 21,000 | 17,129 | ||||||
Staples, Inc. | 51,000 | 43,160 | ||||||
144A, 10.75%, 4/15/27 (a) | 26,000 | 19,149 | ||||||
Suburban Propane Partners LP/Suburban Energy Finance Corp., 144A, | 17,000 | 15,040 | ||||||
|
| |||||||
(Cost $873,929) | 713,515 | |||||||
|
| |||||||
| Consumer, Non-cyclical — 16.2% | ||||||||
| Agriculture — 0.3% | ||||||||
Vector Group Ltd. | 14,000 | 13,573 | ||||||
144A, 5.75%, 2/1/29 | 22,000 | 19,106 | ||||||
|
| |||||||
(Cost $37,115) | 32,679 | |||||||
|
| |||||||
| Beverages — 0.1% | ||||||||
Primo Water Holdings, Inc., 144A, | ||||||||
(Cost $18,988) | 19,000 | 16,274 | ||||||
|
| |||||||
| Biotechnology — 0.1% | ||||||||
Grifols Escrow Issuer SA, 144A, | ||||||||
(Cost $18,005) | 19,000 | 15,863 | ||||||
|
| |||||||
| Commercial Services — 3.6% | ||||||||
Allied Universal Holdco LLC / Allied Universal Finance Corp. | 49,000 | 45,938 | ||||||
144A, 9.75%, 7/15/27 | 28,000 | 25,297 | ||||||
144A, 6.00%, 6/1/29 | 25,000 | 18,653 | ||||||
Allied Universal Holdco LLC / Allied Universal Finance Corp. / Atlas Luxco 4 SARL, 144A, | 31,000 | 26,278 | ||||||
APX Group, Inc. | 15,000 | 14,712 | ||||||
144A, 5.75%, 7/15/29 | 20,000 | 16,381 | ||||||
Avis Budget Car Rental LLC / Avis Budget Finance, Inc. | 10,000 | 9,489 | ||||||
144A, 4.75%, 4/1/28 | 13,000 | 11,370 | ||||||
144A, 5.375%, 3/1/29 (a) | 14,000 | 12,343 | ||||||
CoreCivic, Inc., | 18,000 | 17,968 | ||||||
Garda World Security Corp. | 14,000 | 12,325 | ||||||
144A, 9.50%, 11/1/27 | 16,000 | 14,606 | ||||||
144A, 6.00%, 6/1/29 | 11,000 | 8,543 | ||||||
Hertz Corp. | 13,000 | 11,084 | ||||||
144A, 5.00%, 12/1/29 | 26,000 | 20,960 | ||||||
MPH Acquisition Holdings LLC | 27,000 | 23,061 | ||||||
144A, 5.75%, 11/1/28 (a) | 33,000 | 26,299 | ||||||
Principal | Value | |||||||
| Commercial Services (Continued) | ||||||||
Prime Security Services Borrower LLC / Prime Finance, Inc., 144A, | $ | 33,000 | $ | 29,281 | ||||
Sabre GLBL, Inc. | 20,000 | 19,783 | ||||||
144A, 7.375%, 9/1/25 | 23,000 | 21,821 | ||||||
Sotheby’s, 144A, | 20,000 | 18,886 | ||||||
Verscend Escrow Corp., 144A, | 29,000 | 29,328 | ||||||
|
| |||||||
(Cost $496,566) | 434,406 | |||||||
|
| |||||||
| Cosmetics/Personal Care — 0.4% | ||||||||
Coty, Inc. | 24,000 | 22,773 | ||||||
144A, 6.50%, 4/15/26 (a) | 14,000 | 13,375 | ||||||
Edgewell Personal Care Co., 144A, | 13,000 | 11,191 | ||||||
|
| |||||||
(Cost $51,418) | 47,339 | |||||||
|
| |||||||
| Food — 2.0% | ||||||||
Albertsons Cos., Inc. / Safeway, Inc. / New Albertsons LP / Albertsons LLC, 144A, | 19,000 | 18,127 | ||||||
B&G Foods, Inc. | 24,000 | 21,386 | ||||||
5.25%, 9/15/27 | 14,000 | 11,690 | ||||||
Performance Food Group, Inc., 144A, | 26,000 | 22,360 | ||||||
Post Holdings, Inc. | 25,000 | 23,777 | ||||||
144A, 5.50%, 12/15/29 | 32,000 | 29,360 | ||||||
144A, 4.625%, 4/15/30 | 42,000 | 36,527 | ||||||
144A, 4.50%, 9/15/31 | 35,000 | 29,804 | ||||||
Sigma Holdco BV, 144A, | 12,000 | 8,581 | ||||||
US Foods, Inc. | 24,000 | 21,420 | ||||||
144A, 4.625%, 6/1/30 | 11,000 | 9,502 | ||||||
|
| |||||||
(Cost $263,676) | 232,534 | |||||||
|
| |||||||
| Healthcare-Products — 0.5% | ||||||||
Medline Borrower LP, 144A, | ||||||||
(Cost $64,941) | 64,000 | 53,865 | ||||||
|
| |||||||
| Healthcare-Services — 4.6% | ||||||||
CHS/Community Health Systems, Inc. | 56,000 | 52,430 | ||||||
144A, 5.625%, 3/15/27 | 50,000 | 42,494 | ||||||
144A, 8.00%, 12/15/27 | 16,000 | 14,089 | ||||||
144A, 6.875%, 4/1/28 | 20,000 | 10,450 | ||||||
144A, 6.00%, 1/15/29 | 23,000 | 18,915 | ||||||
144A, 6.875%, 4/15/29 | 45,000 | 28,195 | ||||||
144A, 6.125%, 4/1/30 | 37,000 | 22,996 | ||||||
144A, 5.25%, 5/15/30 | 41,000 | 31,109 | ||||||
144A, 4.75%, 2/15/31 | 28,000 | 20,712 | ||||||
| See Notes to Financial Statements. | 21 |
DBX ETF Trust
Schedule of Investments
Xtrackers High Beta High Yield Bond ETF (Continued)
August 31, 2022
Principal | Value | |||||||
| Healthcare-Services (Continued) | ||||||||
DaVita, Inc. | $ | 70,000 | $ | 56,439 | ||||
144A, 3.75%, 2/15/31 | 38,000 | 28,027 | ||||||
Encompass Health Corp. | 21,000 | 17,995 | ||||||
4.625%, 4/1/31 | 10,000 | 8,273 | ||||||
Legacy LifePoint Health LLC | 25,000 | 24,582 | ||||||
144A, 4.375%, 2/15/27 | 16,000 | 13,931 | ||||||
LifePoint Health, Inc., 144A, | 13,000 | 9,872 | ||||||
ModivCare, Inc., 144A, | 13,000 | 12,261 | ||||||
Radiology Partners, Inc., 144A, | 19,000 | 14,586 | ||||||
RegionalCare Hospital Partners Holdings, Inc. / LifePoint Health, Inc., 144A, | 36,000 | 34,414 | ||||||
Select Medical Corp., 144A, | 32,000 | 30,651 | ||||||
Tenet Healthcare Corp., 144A, | 64,000 | 58,801 | ||||||
|
| |||||||
(Cost $682,341) | 551,222 | |||||||
|
| |||||||
| Household Products/Wares — 0.3% | ||||||||
Central Garden & Pet Co., 144A, | 10,000 | 8,204 | ||||||
Kronos Acquisition Holdings, Inc. / KIK Custom Products, Inc. | 13,000 | 11,795 | ||||||
144A, 7.00%, 12/31/27 | 13,000 | 10,745 | ||||||
Spectrum Brands, Inc., 144A, | 13,000 | 10,102 | ||||||
|
| |||||||
(Cost $48,749) | 40,846 | |||||||
|
| |||||||
| Pharmaceuticals — 4.3% | ||||||||
AdaptHealth LLC | 11,000 | 9,175 | ||||||
144A, 5.125%, 3/1/30 | 16,000 | 13,682 | ||||||
Bausch Health Americas, Inc. | 38,000 | 22,388 | ||||||
144A, 8.50%, 1/31/27 | 45,000 | 21,228 | ||||||
Bausch Health Cos., Inc. | 46,000 | 38,236 | ||||||
144A, 9.00%, 12/15/25 | 38,000 | 24,106 | ||||||
144A, 6.125%, 2/1/27 | 26,000 | 19,449 | ||||||
144A, 5.75%, 8/15/27 (a) | 13,000 | 9,501 | ||||||
144A, 7.00%, 1/15/28 | 19,000 | 7,191 | ||||||
144A, 5.00%, 1/30/28 | 32,000 | 12,132 | ||||||
144A, 4.875%, 6/1/28 | 42,000 | 29,033 | ||||||
144A, 5.00%, 2/15/29 | 25,000 | 9,787 | ||||||
144A, 6.25%, 2/15/29 | 37,000 | 14,027 | ||||||
144A, 7.25%, 5/30/29 | 23,000 | 9,005 | ||||||
144A, 5.25%, 1/30/30 | 32,000 | 12,208 | ||||||
144A, 5.25%, 2/15/31 | 26,000 | 10,310 | ||||||
Cheplapharm Arzneimittel GmbH, 144A, | 13,000 | 11,174 | ||||||
Principal | Value | |||||||
| Pharmaceuticals (Continued) | ||||||||
HLF Financing Sarl LLC / Herbalife International, Inc., 144A, | $ | 15,000 | $ | 11,851 | ||||
Mallinckrodt International Finance SA / Mallinckrodt CB LLC | 11,000 | 9,913 | ||||||
144A, 11.50%, 12/15/28 | 17,000 | 15,321 | ||||||
Owens & Minor, Inc. | 11,000 | 9,390 | ||||||
144A, 6.625%, 4/1/30 | 16,000 | 14,745 | ||||||
Teva Pharmaceutical Finance Netherlands III BV | 26,000 | 25,775 | ||||||
3.15%, 10/1/26 | 89,000 | 74,875 | ||||||
4.75%, 5/9/27 | 26,000 | 22,775 | ||||||
6.75%, 3/1/28 | 32,000 | 30,637 | ||||||
5.125%, 5/9/29 (a) | 25,000 | 21,894 | ||||||
|
| |||||||
(Cost $739,896) | 509,808 | |||||||
|
| |||||||
| Energy — 12.6% | ||||||||
| Energy-Alternate Sources — 0.3% | ||||||||
TerraForm Power Operating LLC | 19,000 | 17,412 | ||||||
144A, 4.75%, 1/15/30 | 19,000 | 16,804 | ||||||
|
| |||||||
(Cost $39,906) | 34,216 | |||||||
|
| |||||||
| Oil & Gas — 6.5% | ||||||||
Ascent Resources Utica Holdings LLC / ARU Finance Corp. | 16,000 | 15,583 | ||||||
144A, 5.875%, 6/30/29 | 10,000 | 9,021 | ||||||
Callon Petroleum Co. | 17,000 | 16,334 | ||||||
144A, 7.50%, 6/15/30 | 15,000 | 13,892 | ||||||
Calumet Specialty Products Partners LP / Calumet Finance Corp., 144A, | 14,000 | 14,684 | ||||||
Citgo Holding, Inc., 144A, | 36,000 | 36,041 | ||||||
CITGO Petroleum Corp. | 29,000 | 28,238 | ||||||
144A, 6.375%, 6/15/26 | 17,000 | 16,204 | ||||||
CNX Resources Corp. | 20,000 | 19,869 | ||||||
144A, 6.00%, 1/15/29 | 13,000 | 12,240 | ||||||
Colgate Energy Partners III LLC, 144A, | 19,000 | 17,636 | ||||||
Comstock Resources, Inc. | 32,000 | 30,600 | ||||||
144A, 5.875%, 1/15/30 | 25,000 | 22,916 | ||||||
CVR Energy, Inc. | 15,000 | 14,172 | ||||||
144A, 5.75%, 2/15/28 | 11,000 | 10,025 | ||||||
Hilcorp Energy I LP / Hilcorp Finance Co. 144A, 6.25%, 11/1/28 | 15,000 | 14,195 | ||||||
144A, 5.75%, 2/1/29 | 15,000 | 13,643 | ||||||
144A, 6.00%, 4/15/30 | 13,000 | 11,986 | ||||||
144A, 6.00%, 2/1/31 | 15,000 | 13,618 | ||||||
144A, 6.25%, 4/15/32 | 12,000 | 10,782 | ||||||
| See Notes to Financial Statements. | 22 |
DBX ETF Trust
Schedule of Investments
Xtrackers High Beta High Yield Bond ETF (Continued)
August 31, 2022
Principal | Value | |||||||
| Oil & Gas (Continued) | ||||||||
Laredo Petroleum, Inc. | $ | 15,000 | $ | 15,072 | ||||
144A, 7.75%, 7/31/29 (a) | 10,000 | 9,592 | ||||||
Leviathan Bond Ltd. | 16,000 | 15,760 | ||||||
144A, REGS, 6.50%, 6/30/27 | 15,000 | 14,625 | ||||||
144A, REGS, 6.75%, 6/30/30 | 14,000 | 13,370 | ||||||
MEG Energy Corp., 144A, | 16,000 | 14,902 | ||||||
Moss Creek Resources Holdings, Inc. | 18,000 | 16,398 | ||||||
144A, 10.50%, 5/15/27 | 10,000 | 9,674 | ||||||
Murphy Oil Corp. | 14,000 | 13,636 | ||||||
6.375%, 7/15/28 | 14,000 | 13,790 | ||||||
Nabors Industries Ltd., 144A, | 14,000 | 12,750 | ||||||
Nabors Industries, Inc. | 15,000 | 13,852 | ||||||
144A, 7.375%, 5/15/27 | 19,000 | 18,367 | ||||||
Parkland Corp. | 11,000 | 10,642 | ||||||
144A, 4.50%, 10/1/29 | 21,000 | 17,819 | ||||||
144A, 4.625%, 5/1/30 | 21,000 | 18,063 | ||||||
PBF Holding Co. LLC / PBF Finance Corp. | 18,000 | 17,505 | ||||||
6.00%, 2/15/28 | 19,000 | 17,118 | ||||||
Puma International Financing SA, 144A, | 50,000 | 46,725 | ||||||
Range Resources Corp., | 16,000 | 16,815 | ||||||
SM Energy Co. | 12,000 | 11,818 | ||||||
6.625%, 1/15/27 (a) | 11,000 | 10,740 | ||||||
6.50%, 7/15/28 | 11,000 | 10,610 | ||||||
Sunoco LP / Sunoco Finance Corp. | 20,000 | 17,036 | ||||||
4.50%, 4/30/30 | 20,000 | 17,093 | ||||||
Transocean, Inc. | 10,000 | 7,986 | ||||||
144A, 7.50%, 1/15/26 | 15,000 | 11,581 | ||||||
144A, 11.50%, 1/30/27 | 18,000 | 17,374 | ||||||
144A, 8.00%, 2/1/27 | 14,000 | 10,416 | ||||||
|
| |||||||
(Cost $829,932) | 782,808 | |||||||
|
| |||||||
| Oil & Gas Services — 1.1% | ||||||||
Archrock Partners LP / Archrock Partners Finance Corp. | 16,000 | 15,022 | ||||||
144A, 6.25%, 4/1/28 | 21,000 | 19,143 | ||||||
CGG SA, 144A, | 13,000 | 11,604 | ||||||
USA Compression Partners LP / USA Compression Finance Corp. | 19,000 | 17,852 | ||||||
6.875%, 9/1/27 | 19,000 | 17,594 | ||||||
Principal | Value | |||||||
| Oil & Gas Services (Continued) | ||||||||
Weatherford International Ltd. | $ | 13,000 | $ | 12,272 | ||||
144A, 8.625%, 4/30/30 | 41,000 | 37,127 | ||||||
|
| |||||||
(Cost $145,462) | 130,614 | |||||||
|
| |||||||
| Pipelines — 4.7% | ||||||||
Antero Midstream Partners LP / Antero Midstream Finance Corp. | 18,000 | 17,084 | ||||||
144A, 5.75%, 1/15/28 | 17,000 | 16,186 | ||||||
Buckeye Partners LP, 144A, | 13,000 | 11,527 | ||||||
CQP Holdco LP / BIP-V Chinook Holdco LLC, 144A, | 37,000 | 32,785 | ||||||
Crestwood Midstream Partners LP / Crestwood Midstream Finance Corp. | 15,000 | 14,009 | ||||||
144A, 6.00%, 2/1/29 | 19,000 | 17,583 | ||||||
144A, 8.00%, 4/1/29 | 11,000 | 10,921 | ||||||
EnLink Midstream LLC, | 13,000 | 12,168 | ||||||
EQM Midstream Partners LP | 13,000 | 12,850 | ||||||
144A, 6.50%, 7/1/27 | 24,000 | 23,210 | ||||||
5.50%, 7/15/28 | 18,000 | 16,487 | ||||||
144A, 4.50%, 1/15/29 | 21,000 | 18,116 | ||||||
144A, 7.50%, 6/1/30 | 13,000 | 12,856 | ||||||
144A, 4.75%, 1/15/31 | 29,000 | 25,133 | ||||||
Genesis Energy LP / Genesis Energy Finance Corp. | 14,000 | 13,139 | ||||||
8.00%, 1/15/27 | 25,000 | 23,542 | ||||||
7.75%, 2/1/28 (a) | 18,000 | 16,713 | ||||||
ITT Holdings LLC, 144A, | 31,000 | 26,229 | ||||||
New Fortress Energy, Inc. | 32,000 | 30,889 | ||||||
144A, 6.50%, 9/30/26 | 38,000 | 35,849 | ||||||
NGL Energy Operating LLC / NGL Energy Finance Corp., 144A, | 52,000 | 47,077 | ||||||
NGL Energy Partners LP / NGL Energy Finance Corp., | 12,000 | 11,372 | ||||||
NuStar Logistics LP | 15,000 | 13,680 | ||||||
6.375%, 10/1/30 | 15,000 | 13,672 | ||||||
Rockies Express Pipeline LLC, 144A, | 14,000 | 12,641 | ||||||
Tallgrass Energy Partners LP / Tallgrass Energy Finance Corp. | 15,000 | 15,041 | ||||||
144A, 6.00%, 3/1/27 | 11,000 | 10,055 | ||||||
144A, 5.50%, 1/15/28 | 22,000 | 19,075 | ||||||
144A, 6.00%, 12/31/30 | 19,000 | 16,681 | ||||||
144A, 6.00%, 9/1/31 | 13,000 | 11,392 | ||||||
|
| |||||||
(Cost $617,864) | 557,962 | |||||||
|
| |||||||
| See Notes to Financial Statements. | 23 |
DBX ETF Trust
Schedule of Investments
Xtrackers High Beta High Yield Bond ETF (Continued)
August 31, 2022
Principal | Value | |||||||
| Financial — 9.0% | ||||||||
| Banks — 0.5% | ||||||||
Freedom Mortgage Corp. | $ | 11,000 | $ | 9,888 | ||||
144A, 8.25%, 4/15/25 | 14,000 | 12,133 | ||||||
144A, 7.625%, 5/1/26 | 15,000 | 12,304 | ||||||
144A, 6.625%, 1/15/27 | 14,000 | 10,828 | ||||||
Intesa Sanpaolo SpA, 144A, | 21,000 | 15,272 | ||||||
|
| |||||||
(Cost $74,383) | 60,425 | |||||||
|
| |||||||
| Diversified Financial Services — 4.2% | ||||||||
Coinbase Global, Inc. | 25,000 | 16,246 | ||||||
144A, 3.625%, 10/1/31 | 25,000 | 15,259 | ||||||
Curo Group Holdings Corp., 144A, | 25,000 | 15,192 | ||||||
Jefferies Finance LLC / JFIN Co.-Issuer Corp., 144A, | 26,000 | 22,258 | ||||||
LD Holdings Group LLC | 11,000 | 6,330 | ||||||
144A, 6.125%, 4/1/28 | 14,000 | 7,457 | ||||||
Midcap Financial Issuer Trust | 26,000 | 22,337 | ||||||
144A, 5.625%, 1/15/30 | 10,000 | 7,643 | ||||||
Nationstar Mortgage Holdings, Inc. | 15,000 | 13,381 | ||||||
144A, 5.50%, 8/15/28 | 22,000 | 18,386 | ||||||
144A, 5.125%, 12/15/30 | 15,000 | 11,852 | ||||||
144A, 5.75%, 11/15/31 | 16,000 | 12,718 | ||||||
Navient Corp. | 13,000 | 12,564 | ||||||
6.75%, 6/15/26 | 13,000 | 12,350 | ||||||
5.00%, 3/15/27 | 19,000 | 16,302 | ||||||
4.875%, 3/15/28 | 13,000 | 10,637 | ||||||
5.50%, 3/15/29 | 19,000 | 15,419 | ||||||
NFP Corp., 144A, | 53,000 | 43,664 | ||||||
OneMain Finance Corp. | 45,000 | 42,387 | ||||||
6.625%, 1/15/28 | 20,000 | 18,308 | ||||||
3.875%, 9/15/28 | 15,000 | 11,720 | ||||||
5.375%, 11/15/29 | 19,000 | 15,767 | ||||||
4.00%, 9/15/30 (a) | 22,000 | 16,432 | ||||||
PennyMac Financial Services, Inc. | 17,000 | 15,296 | ||||||
144A, 4.25%, 2/15/29 | 17,000 | 13,318 | ||||||
144A, 5.75%, 9/15/31 | 13,000 | 10,558 | ||||||
United Wholesale Mortgage LLC | 21,000 | 18,372 | ||||||
144A, 5.75%, 6/15/27 | 11,000 | 9,076 | ||||||
144A, 5.50%, 4/15/29 | 19,000 | 14,814 | ||||||
VistaJet Malta Finance PLC / XO Management Holding, Inc. | 13,000 | 11,931 | ||||||
144A, 6.375%, 2/1/30 | 26,000 | 22,406 | ||||||
|
| |||||||
(Cost $618,768) | 500,380 | |||||||
|
| |||||||
Principal | Value | |||||||
| Insurance — 1.4% | ||||||||
Acrisure LLC / Acrisure Finance, Inc. | $ | 24,000 | $ | 22,651 | ||||
144A, 10.125%, 8/1/26 | 10,000 | 10,022 | ||||||
144A, 6.00%, 8/1/29 | 13,000 | 10,562 | ||||||
Alliant Holdings Intermediate LLC / Alliant Holdings Co.-Issuer, 144A, | 11,000 | 9,476 | ||||||
Alliant Holdings Intermediate LLC / Alliant Holdings Co-Issuer, 144A, | 34,000 | 30,941 | ||||||
AssuredPartners, Inc. | 13,000 | 12,610 | ||||||
144A, 5.625%, 1/15/29 | 14,000 | 11,656 | ||||||
HUB International Ltd. | 44,000 | 43,162 | ||||||
144A, 5.625%, 12/1/29 | 14,000 | 12,264 | ||||||
|
| |||||||
(Cost $178,621) | 163,344 | |||||||
|
| |||||||
| Real Estate — 0.6% | ||||||||
Kennedy-Wilson, Inc. | 15,000 | 12,115 | ||||||
5.00%, 3/1/31 | 15,000 | 12,357 | ||||||
Realogy Group LLC / Realogy Co.-Issuer Corp. 144A, 5.75%, 1/15/29 | 24,000 | 18,840 | ||||||
144A, 5.25%, 4/15/30 | 25,000 | 18,875 | ||||||
WeWork Cos., Inc., 144A, | 18,000 | 13,456 | ||||||
|
| |||||||
(Cost $97,059) | 75,643 | |||||||
|
| |||||||
| Real Estate Investment Trusts — 2.1% | ||||||||
Brookfield Property REIT, Inc. / BPR Cumulus LLC / BPR Nimbus LLC / GGSI Sellco LL, 144A, | 19,000 | 16,307 | ||||||
Diversified Healthcare Trust | 13,000 | 12,795 | ||||||
4.75%, 2/15/28 | 13,000 | 9,630 | ||||||
4.375%, 3/1/31 | 12,000 | 8,252 | ||||||
Ladder Capital Finance Holdings LLLP / Ladder Capital Finance Corp., 144A, | 16,000 | 13,584 | ||||||
Service Properties Trust | 26,000 | 24,961 | ||||||
4.75%, 10/1/26 | 15,000 | 12,222 | ||||||
5.50%, 12/15/27 | 16,000 | 13,862 | ||||||
3.95%, 1/15/28 | 7,000 | 5,221 | ||||||
4.95%, 10/1/29 | 22,000 | 16,627 | ||||||
4.375%, 2/15/30 | 10,000 | 7,341 | ||||||
Uniti Group LP / Uniti Fiber Holdings, Inc. / CSL Capital LLC 144A, | 62,000 | 61,330 | ||||||
144A, 6.00%, 1/15/30 | 19,000 | 13,427 | ||||||
Uniti Group LP / Uniti Group Finance, Inc. / CSL Capital LLC | 15,000 | 12,556 | ||||||
144A, 6.50%, 2/15/29 | 28,000 | 21,376 | ||||||
|
| |||||||
(Cost $290,374) | 249,491 | |||||||
|
| |||||||
| See Notes to Financial Statements. | 24 |
DBX ETF Trust
Schedule of Investments
Xtrackers High Beta High Yield Bond ETF (Continued)
August 31, 2022
Principal | Value | |||||||
| Venture Capital — 0.2% | ||||||||
Compass Group Diversified Holdings LLC, 144A, | ||||||||
(Cost $26,984) | $ | 26,000 | $ | 22,166 | ||||
|
| |||||||
| Industrial — 10.4% | ||||||||
| Aerospace/Defense — 3.3% | ||||||||
Bombardier, Inc. | 18,000 | 17,863 | ||||||
144A, 7.50%, 3/15/25 | 33,000 | 32,336 | ||||||
144A, 7.125%, 6/15/26 | 31,000 | 29,581 | ||||||
144A, 7.875%, 4/15/27 | 49,000 | 46,980 | ||||||
144A, 6.00%, 2/15/28 | 20,000 | 17,715 | ||||||
Rolls-Royce PLC, 144A, | 25,000 | 22,655 | ||||||
Spirit AeroSystems, Inc. | 31,000 | 30,371 | ||||||
4.60%, 6/15/28 | 19,000 | 15,132 | ||||||
TransDigm, Inc. | 22,000 | 21,146 | ||||||
7.50%, 3/15/27 | 16,000 | 15,622 | ||||||
5.50%, 11/15/27 | 74,000 | 66,690 | ||||||
4.625%, 1/15/29 | 25,000 | 21,332 | ||||||
4.875%, 5/1/29 | 19,000 | 16,147 | ||||||
Triumph Group, Inc. | 15,000 | 15,210 | ||||||
144A, 6.25%, 9/15/24 | 13,000 | 11,928 | ||||||
7.75%, 8/15/25 | 11,000 | 9,279 | ||||||
|
| |||||||
(Cost $420,855) | 389,987 | |||||||
|
| |||||||
| Building Materials — 1.6% | ||||||||
Builders FirstSource, Inc., 144A, | 18,000 | 16,717 | ||||||
Cornerstone Building Brands, Inc., 144A, | 14,000 | 9,563 | ||||||
Griffon Corp., | 26,000 | 24,094 | ||||||
JELD-WEN, Inc. | 10,000 | 8,614 | ||||||
144A, 4.875%, 12/15/27 | 10,000 | 7,759 | ||||||
SRM Escrow Issuer LLC, 144A, | 28,000 | 25,441 | ||||||
Standard Industries, Inc. | 26,000 | 22,775 | ||||||
144A, 4.375%, 7/15/30 | 41,000 | 32,877 | ||||||
144A, 3.375%, 1/15/31 | 29,000 | 21,592 | ||||||
Summit Materials LLC / Summit Materials Finance Corp., 144A, | 19,000 | 17,124 | ||||||
|
| |||||||
(Cost $216,930) | 186,556 | |||||||
|
| |||||||
| Electrical Components & Equipment — 0.2% | ||||||||
Energizer Holdings, Inc. | 15,000 | 12,499 | ||||||
144A, 4.375%, 3/31/29 | 21,000 | 17,082 | ||||||
|
| |||||||
(Cost $36,437) | 29,581 | |||||||
|
| |||||||
Principal | Value | |||||||
| Electronics — 0.6% | ||||||||
II-VI, Inc., 144A, | $ | 26,000 | $ | 23,181 | ||||
Imola Merger Corp., 144A, | 51,000 | 43,362 | ||||||
|
| |||||||
(Cost $78,874) | 66,543 | |||||||
|
| |||||||
| Engineering & Construction — 0.2% | ||||||||
Brand Industrial Services, Inc., 144A, | ||||||||
(Cost $25,464) | 25,000 | 20,281 | ||||||
|
| |||||||
| Environmental Control — 0.9% | ||||||||
Covanta Holding Corp. | 20,000 | 16,910 | ||||||
5.00%, 9/1/30 | 10,000 | 8,450 | ||||||
GFL Environmental, Inc. | 19,000 | 16,089 | ||||||
144A, 4.75%, 6/15/29 | 19,000 | 16,515 | ||||||
144A, 4.375%, 8/15/29 | 15,000 | 12,735 | ||||||
Madison IAQ LLC | 18,000 | 15,461 | ||||||
144A, 5.875%, 6/30/29 | 26,000 | 21,434 | ||||||
|
| |||||||
(Cost $128,331) | 107,594 | |||||||
|
| |||||||
| Machinery-Diversified — 0.4% | ||||||||
TK Elevator Holdco GmbH, 144A, | 10,000 | 8,966 | ||||||
TK Elevator US Newco, Inc., 144A, | 41,000 | 37,462 | ||||||
|
| |||||||
(Cost $53,086) | 46,428 | |||||||
|
| |||||||
| Miscellaneous Manufacturing — 0.2% | ||||||||
FXI Holdings, Inc. | 13,000 | 10,799 | ||||||
144A, 12.25%, 11/15/26 | 19,000 | 15,884 | ||||||
|
| |||||||
(Cost $33,322) | 26,683 | |||||||
|
| |||||||
| Packaging & Containers — 2.5% | ||||||||
Ardagh Metal Packaging Finance USA LLC / Ardagh Metal Packaging Finance PLC, 144A, | 28,000 | 22,731 | ||||||
Ardagh Packaging Finance PLC / Ardagh Holdings USA, Inc. | 18,000 | 17,064 | ||||||
144A, 4.125%, 8/15/26 | 31,000 | 26,781 | ||||||
144A, 5.25%, 8/15/27 (a) | 25,000 | 18,118 | ||||||
144A, 5.25%, 8/15/27 | 21,000 | 15,220 | ||||||
Clydesdale Acquisition Holdings, Inc. | 13,000 | 12,492 | ||||||
144A, 8.75%, 4/15/30 | 28,000 | 24,378 | ||||||
LABL, Inc. | 18,000 | 17,127 | ||||||
144A, 10.50%, 7/15/27 | 18,000 | 17,037 | ||||||
144A, 5.875%, 11/1/28 | 13,000 | 11,334 | ||||||
144A, 8.25%, 11/1/29 | 11,000 | 8,917 | ||||||
Mauser Packaging Solutions Holding Co. | 30,000 | 29,080 | ||||||
144A, 7.25%, 4/15/25 | 39,000 | 35,558 | ||||||
| See Notes to Financial Statements. | 25 |
DBX ETF Trust
Schedule of Investments
Xtrackers High Beta High Yield Bond ETF (Continued)
August 31, 2022
Principal | Value | |||||||
| Packaging & Containers (Continued) | ||||||||
OI European Group BV, 144A, | $ | 12,000 | $ | 9,732 | ||||
Owens-Brockway Glass Container, Inc., 144A, | 16,000 | 14,884 | ||||||
Trivium Packaging Finance BV, 144A, | 19,000 | 18,074 | ||||||
|
| |||||||
(Cost $334,527) | 298,527 | |||||||
|
| |||||||
| Transportation — 0.1% | ||||||||
Seaspan Corp., 144A, | ||||||||
(Cost $19,098) | 19,000 | 15,675 | ||||||
|
| |||||||
| Trucking & Leasing — 0.4% | ||||||||
Fortress Transportation and Infrastructure Investors LLC | 17,000 | 15,867 | ||||||
144A, 9.75%, 8/1/27 | 12,000 | 12,060 | ||||||
144A, 5.50%, 5/1/28 | 25,000 | 21,422 | ||||||
|
| |||||||
(Cost $54,966) | 49,349 | |||||||
|
| |||||||
| Technology — 4.5% | ||||||||
| Computers — 1.8% | ||||||||
Condor Merger Sub, Inc., 144A, | 52,000 | 43,480 | ||||||
Diebold Nixdorf, Inc. | 8,000 | 4,876 | ||||||
144A, 9.375%, 7/15/25 | 19,000 | 15,623 | ||||||
Exela Intermediate LLC / Exela Finance, Inc., 144A, | 30,000 | 9,775 | ||||||
NCR Corp. | 13,000 | 12,565 | ||||||
144A, 5.00%, 10/1/28 | 17,000 | 16,028 | ||||||
144A, 5.125%, 4/15/29 | 32,000 | 29,926 | ||||||
144A, 6.125%, 9/1/29 | 13,000 | 12,432 | ||||||
144A, 5.25%, 10/1/30 | 11,000 | 10,175 | ||||||
Presidio Holdings, Inc. | 11,000 | 10,308 | ||||||
144A, 8.25%, 2/1/28 | 15,000 | 13,564 | ||||||
Seagate HDD Cayman, | 12,000 | 9,944 | ||||||
Vericast Corp., 144A, | 31,894 | 31,979 | ||||||
|
| |||||||
(Cost $261,507) | 220,675 | |||||||
|
| |||||||
| Office/Business Equipment — 0.4% | ||||||||
Pitney Bowes, Inc., 144A, | 10,000 | 7,580 | ||||||
Xerox Holdings Corp. | 19,000 | 17,641 | ||||||
144A, 5.50%, 8/15/28 | 19,000 | 16,647 | ||||||
|
| |||||||
(Cost $48,322) | 41,868 | |||||||
|
| |||||||
| Semiconductors — 0.3% | ||||||||
ams-OSRAM AG, 144A, | 11,000 | 10,511 | ||||||
Principal | Value | |||||||
| Semiconductors (Continued) | ||||||||
Entegris Escrow Corp., 144A, | $ | 22,000 | $ | 20,904 | ||||
|
| |||||||
(Cost $32,430) | 31,415 | |||||||
|
| |||||||
| Software — 2.0% | ||||||||
Boxer Parent Co., Inc., 144A, | 16,000 | 15,842 | ||||||
Change Healthcare Holdings LLC / Change Healthcare Finance, Inc., 144A, | 32,000 | 31,620 | ||||||
Clarivate Science Holdings Corp. | 23,000 | 19,717 | ||||||
144A, 4.875%, 7/1/29 | 23,000 | 19,052 | ||||||
MicroStrategy, Inc., 144A, | 16,000 | 13,381 | ||||||
Minerva Merger Sub, Inc., 144A, | 60,000 | 51,016 | ||||||
Rackspace Technology Global, Inc. | 14,000 | 10,000 | ||||||
144A, 5.375%, 12/1/28 | 15,000 | 8,331 | ||||||
ROBLOX Corp., 144A, | 26,000 | 21,734 | ||||||
Veritas US, Inc. / Veritas Bermuda Ltd., 144A, | 46,000 | 35,454 | ||||||
Ziff Davis, Inc., 144A, | 15,000 | 12,821 | ||||||
|
| |||||||
(Cost $284,640) | 238,968 | |||||||
|
| |||||||
| Utilities — 2.2% | ||||||||
| Electric — 1.8% | ||||||||
Calpine Corp. | 37,000 | 32,973 | ||||||
144A, 4.625%, 2/1/29 | 13,000 | 11,081 | ||||||
144A, 5.00%, 2/1/31 | 23,000 | 19,285 | ||||||
NRG Energy, Inc. | 21,000 | 19,819 | ||||||
144A, 5.25%, 6/15/29 | 20,000 | 18,057 | ||||||
144A, 3.625%, 2/15/31 | 26,000 | 20,684 | ||||||
144A, 3.875%, 2/15/32 | 28,000 | 22,239 | ||||||
PG&E Corp. | 25,000 | 22,220 | ||||||
5.25%, 7/1/30 | 25,000 | 21,655 | ||||||
Vistra Operations Co. LLC, 144A, | 33,000 | 28,828 | ||||||
|
| |||||||
(Cost $252,522) | 216,841 | |||||||
|
| |||||||
| Gas — 0.4% | ||||||||
AmeriGas Partners LP / AmeriGas Finance Corp. | 18,000 | 17,106 | ||||||
5.875%, 8/20/26 | 18,000 | 17,160 | ||||||
5.75%, 5/20/27 | 13,000 | 12,270 | ||||||
|
| |||||||
(Cost $49,096) | 46,536 | |||||||
|
| |||||||
TOTAL CORPORATE BONDS | 11,721,392 | |||||||
|
| |||||||
| See Notes to Financial Statements. | 26 |
DBX ETF Trust
Schedule of Investments
Xtrackers High Beta High Yield Bond ETF (Continued)
August 31, 2022
Number | Value | |||||||
| SECURITIES LENDING COLLATERAL — 2.2% | ||||||||
DWS Government & Agency Securities Portfolio “DWS Government Cash Institutional Shares”, 2.00% (b)(c) | 263,774 | $ | 263,774 | |||||
|
| |||||||
| CASH EQUIVALENTS — 0.3% | ||||||||
DWS Government Money Market Series “Institutional Shares”, 2.24% (b) | 35,828 | 35,828 | ||||||
|
| |||||||
TOTAL INVESTMENTS — 100.6% (Cost $14,210,868) | $ | 12,020,994 | ||||||
Other assets and liabilities, net — (0.6%) | (68,538 | ) | ||||||
|
| |||||||
NET ASSETS — 100.0% | $ | 11,952,456 | ||||||
|
| |||||||
A summary of the Fund’s transactions with affiliated investments during the year ended August 31, 2022 is as follows:
| Value ($) at 8/31/2021 | Purchases Cost ($) | Sales Proceeds ($) | Net Realized Gain/(Loss) ($) | Net Change in Unrealized Appreciation (Depreciation) ($) | Income ($) | Capital Gain Distributions ($) | Number of Shares at 8/31/2022 | Value ($) at 8/31/2022 | ||||||||||||||||||||||||||||
SECURITIES LENDING COLLATERAL — 2.2% |
| |||||||||||||||||||||||||||||||||||
DWS Government & Agency Securities Portfolio “DWS Government Cash Institutional Shares”, 2.00% (b)(c) |
| |||||||||||||||||||||||||||||||||||
| 1,444,823 | — | (1,181,049 | )(d) | — | — | 2,166 | — | 263,774 | 263,774 | |||||||||||||||||||||||||||
CASH EQUIVALENTS — 0.3% |
| |||||||||||||||||||||||||||||||||||
DWS Government Money Market Series “Institutional Shares”, 2.24% (b) |
| |||||||||||||||||||||||||||||||||||
| 171,850 | 1,764,389 | (1,900,411 | ) | — | — | 375 | — | 35,828 | 35,828 | |||||||||||||||||||||||||||
|
|
|
|
|
|
|
|
|
|
|
|
|
|
|
|
|
| |||||||||||||||||||
| 1,616,673 | 1,764,389 | (3,081,460 | ) | — | — | 2,541 | — | 299,602 | 299,602 | |||||||||||||||||||||||||||
|
|
|
|
|
|
|
|
|
|
|
|
|
|
|
|
|
| |||||||||||||||||||
| (a) | All or a portion of these securities were on loan. In addition, “Other assets and liabilities, net” may include pending sales that are also on loan. The value of securities loaned at August 31, 2022 amounted to $395,224, which is 3.3% of net assets. |
| (b) | Affiliated fund managed by DWS Investment Management Americas, Inc. The rate shown is the annualized seven-day yield at period end. |
| (c) | Represents cash collateral held in connection with securities lending. Income earned by the Fund is net of borrower rebates. In addition, the Fund held non-cash U.S. Treasury securities collateral having a value of $151,718. |
| (d) | Represents the net increase (purchase cost) or decrease (sales proceeds) in the amount invested in cash collateral for the year ended August 31, 2022. |
| REIT: | Real Estate Investment Trust |
| REGS: | Securities sold under Regulation S may not be offered, sold or delivered within the United States or to, or for the account or benefit of, U.S. persons, except pursuant to an exemption from, or in a transaction not subject to, the registration requirements of the Securities Act of 1933. |
| 144A: | Security exempt from registration under Rule 144A of the Securities Act of 1933. These securities may be resold in transactions exempt from registration, normally to qualified institutional buyers. |
| See Notes to Financial Statements. | 27 |
DBX ETF Trust
Schedule of Investments
Xtrackers High Beta High Yield Bond ETF (Continued)
August 31, 2022
Fair Value Measurements
Various inputs are used in determining the value of the Fund’s investments. These inputs are summarized in three broad levels. Level 1 includes quoted prices in active markets for identical securities. Level 2 includes other significant observable inputs (including quoted prices for similar securities, interest rates, prepayment speeds and credit risk). Level 3 includes significant unobservable inputs (including the Fund’s own assumptions in determining the fair value of investments). The level assigned to the securities valuations may not be an indication of the risk or liquidity associated with investing in those securities.
The following is a summary of the inputs used as of August 31, 2022 in valuing the Fund’s investments. For information on the Fund’s policy regarding the valuation of investments, please refer to the Security Valuation section of Note 2 in the accompanying Notes to Financial Statements.
Assets | Level 1 | Level 2 | Level 3 | Total | ||||||||||||
Corporate Bonds (a) | $ | — | $ | 11,721,392 | $ | — | $ | 11,721,392 | ||||||||
Short-Term Investments (a) | 299,602 | — | — | 299,602 | ||||||||||||
|
|
|
|
|
|
|
| |||||||||
TOTAL | $ | 299,602 | $ | 11,721,392 | $ | — | $ | 12,020,994 | ||||||||
|
|
|
|
|
|
|
| |||||||||
| (a) | See Schedule of Investments for additional detailed categorizations. |
| See Notes to Financial Statements. | 28 |
DBX ETF Trust
Xtrackers Low Beta High Yield Bond ETF
August 31, 2022
Principal | Value | |||||||
| CORPORATE BONDS — 98.2% | ||||||||
| Basic Materials — 3.4% | ||||||||
| Chemicals — 1.8% | ||||||||
Ashland LLC, 144A, | $ | 1,521,000 | $ | 1,247,581 | ||||
Avient Corp. | 1,922,000 | 1,897,946 | ||||||
144A, 7.125%, 8/1/30 | 2,500,000 | 2,473,369 | ||||||
Axalta Coating Systems LLC, 144A, | 2,192,000 | 1,821,142 | ||||||
Methanex Corp., | 2,211,000 | 2,016,565 | ||||||
NOVA Chemicals Corp. | 3,566,000 | 3,418,820 | ||||||
144A, 5.00%, 5/1/25 | 1,628,000 | 1,533,422 | ||||||
Olin Corp. | 1,603,000 | 1,523,459 | ||||||
5.625%, 8/1/29 | 2,520,000 | 2,403,790 | ||||||
5.00%, 2/1/30 (a) | 1,395,000 | 1,267,696 | ||||||
Valvoline, Inc. | 1,977,000 | 1,929,947 | ||||||
144A, 3.625%, 6/15/31 | 1,747,000 | 1,409,646 | ||||||
WR Grace Holdings LLC, 144A, | 2,419,000 | 2,240,308 | ||||||
|
| |||||||
(Cost $26,283,995) | 25,183,691 | |||||||
|
| |||||||
| Iron/Steel — 0.3% | ||||||||
Cleveland-Cliffs, Inc. | 2,728,000 | 2,762,346 | ||||||
5.875%, 6/1/27 | 1,785,000 | 1,710,565 | ||||||
|
| |||||||
(Cost $4,641,755) | 4,472,911 | |||||||
|
| |||||||
| Mining — 1.3% | ||||||||
Arconic Corp., 144A, | 2,284,000 | 2,247,175 | ||||||
FMG Resources August 2006 Pty Ltd. | 2,185,000 | 2,165,859 | ||||||
144A, 4.50%, 9/15/27 | 2,019,000 | 1,847,385 | ||||||
144A, 4.375%, 4/1/31 | 4,900,000 | 4,003,055 | ||||||
Novelis Corp. | 2,291,000 | 2,043,332 | ||||||
144A, 4.75%, 1/30/30 | 5,311,000 | 4,626,943 | ||||||
144A, 3.875%, 8/15/31 | 2,427,000 | 1,963,176 | ||||||
|
| |||||||
(Cost $20,224,523) | 18,896,925 | |||||||
|
| |||||||
| Communications — 17.1% | ||||||||
| Advertising — 0.4% | ||||||||
Lamar Media Corp. | 1,917,000 | 1,722,300 | ||||||
4.00%, 2/15/30 | 1,739,000 | 1,530,311 | ||||||
3.625%, 1/15/31 | 1,868,000 | 1,567,962 | ||||||
Outfront Media Capital LLC / Outfront Media Capital Corp., 144A, | 1,325,000 | 1,314,894 | ||||||
|
| |||||||
(Cost $6,678,580) | 6,135,467 | |||||||
|
| |||||||
Principal | Value | |||||||
| Internet — 2.2% | ||||||||
Go Daddy Operating Co. LLC / GD Finance Co., Inc. | $ | 1,965,000 | $ | 1,849,733 | ||||
144A, 3.50%, 3/1/29 | 2,519,000 | 2,136,163 | ||||||
Match Group Holdings II LLC | 1,360,000 | 1,249,738 | ||||||
144A, 4.625%, 6/1/28 | 1,760,000 | 1,569,251 | ||||||
144A, 4.125%, 8/1/30 | 1,518,000 | 1,258,189 | ||||||
144A, 3.625%, 10/1/31 | 1,721,000 | 1,353,206 | ||||||
NortonLifeLock, Inc., 144A, | 3,581,000 | 3,534,447 | ||||||
Twitter, Inc. | 2,703,000 | 2,518,350 | ||||||
144A, 5.00%, 3/1/30 | 2,934,000 | 2,758,403 | ||||||
Uber Technologies, Inc. | 3,254,000 | 3,281,340 | ||||||
144A, 8.00%, 11/1/26 | 4,826,000 | 4,881,314 | ||||||
144A, 7.50%, 9/15/27 | 3,981,000 | 3,990,913 | ||||||
144A, 6.25%, 1/15/28 (a) | 1,609,000 | 1,538,791 | ||||||
|
| |||||||
(Cost $33,957,532) | 31,919,838 | |||||||
|
| |||||||
| Media — 10.1% | ||||||||
AMC Networks, Inc. | 1,876,000 | 1,831,745 | ||||||
4.75%, 8/1/25 (a) | 2,397,000 | 2,223,316 | ||||||
Cable One, Inc., 144A, | 2,102,000 | 1,753,730 | ||||||
CCO Holdings LLC / CCO Holdings Capital Corp. | 1,226,000 | 1,215,297 | ||||||
144A, 5.125%, 5/1/27 | 6,063,000 | 5,762,881 | ||||||
144A, 5.00%, 2/1/28 | 4,884,000 | 4,481,497 | ||||||
144A, 5.375%, 6/1/29 | 2,652,000 | 2,425,784 | ||||||
144A, 6.375%, 9/1/29 | 1,300,000 | 1,260,025 | ||||||
144A, 4.75%, 3/1/30 | 5,959,000 | 5,128,852 | ||||||
144A, 4.50%, 8/15/30 | 5,373,000 | 4,525,141 | ||||||
144A, 4.25%, 2/1/31 | 5,861,000 | �� | 4,789,609 | |||||
144A, 4.75%, 2/1/32 | 2,312,000 | 1,916,579 | ||||||
4.50%, 5/1/32 | 5,653,000 | 4,587,268 | ||||||
144A, 4.50%, 6/1/33 | 3,419,000 | 2,688,343 | ||||||
144A, 4.25%, 1/15/34 | 3,769,000 | 2,874,277 | ||||||
CSC Holdings LLC | 2,655,000 | 2,591,758 | ||||||
144A, 5.50%, 4/15/27 | 4,190,000 | 3,978,468 | ||||||
144A, 3.375%, 2/15/31 | 3,225,000 | 2,421,104 | ||||||
Gray Television, Inc. | 2,405,000 | 2,324,649 | ||||||
144A, 7.00%, 5/15/27 (a) | 2,240,000 | 2,212,246 | ||||||
News Corp. | 3,284,000 | 2,863,467 | ||||||
144A, 5.125%, 2/15/32 | 1,617,000 | 1,490,090 | ||||||
Nexstar Media, Inc. | 5,428,000 | 5,174,947 | ||||||
144A, 4.75%, 11/1/28 | 3,420,000 | 3,099,324 | ||||||
Scripps Escrow II, Inc., 144A, | 1,836,000 | 1,559,168 | ||||||
Sinclair Television Group, Inc., 144A, | 2,440,000 | 1,995,334 | ||||||
| See Notes to Financial Statements. | 29 |
DBX ETF Trust
Schedule of Investments
Xtrackers Low Beta High Yield Bond ETF (Continued)
August 31, 2022
Principal | Value | |||||||
| Media (Continued) | ||||||||
Sirius XM Radio, Inc. | $ | 3,234,000 | $ | 2,884,340 | ||||
144A, 5.00%, 8/1/27 | 5,251,000 | 4,949,960 | ||||||
144A, 4.00%, 7/15/28 | 6,241,000 | 5,445,272 | ||||||
144A, 5.50%, 7/1/29 | 4,022,000 | 3,765,296 | ||||||
144A, 4.125%, 7/1/30 | 4,699,000 | 3,987,008 | ||||||
144A, 3.875%, 9/1/31 | 5,108,000 | 4,130,942 | ||||||
TEGNA, Inc. | 2,231,000 | 2,189,519 | ||||||
4.625%, 3/15/28 | 3,040,000 | 2,918,628 | ||||||
5.00%, 9/15/29 | 3,429,000 | 3,288,051 | ||||||
Univision Communications, Inc. | 4,560,000 | 4,410,432 | ||||||
144A, 6.625%, 6/1/27 | 5,130,000 | 4,957,043 | ||||||
144A, 4.50%, 5/1/29 | 3,401,000 | 2,980,977 | ||||||
UPC Broadband Finco BV, 144A, | 4,053,000 | 3,510,850 | ||||||
Videotron Ltd. | 2,230,000 | 2,217,824 | ||||||
144A, 5.125%, 4/15/27 | 1,820,000 | 1,709,353 | ||||||
144A, 3.625%, 6/15/29 | 1,646,000 | 1,368,416 | ||||||
Virgin Media Secured Finance PLC | 4,544,000 | 4,083,329 | ||||||
144A, 4.50%, 8/15/30 | 3,009,000 | 2,510,860 | ||||||
VZ Secured Financing BV, 144A, | 5,006,000 | 4,087,825 | ||||||
Ziggo BV, 144A, | 3,208,000 | 2,712,824 | ||||||
|
| |||||||
(Cost $155,043,859) | 145,283,648 | |||||||
|
| |||||||
| Telecommunications — 4.4% | ||||||||
Hughes Satellite Systems Corp., | 2,493,000 | 2,378,297 | ||||||
Lumen Technologies, Inc. | 2,463,000 | 2,494,255 | ||||||
Series Y, 7.50%, 4/1/24 | 3,245,000 | 3,275,178 | ||||||
5.625%, 4/1/25 | 1,388,000 | 1,348,327 | ||||||
144A, 4.00%, 2/15/27 | 4,153,000 | 3,617,637 | ||||||
Nokia OYJ, | 1,610,000 | 1,537,172 | ||||||
Sprint Corp. | 13,134,000 | 13,561,446 | ||||||
7.125%, 6/15/24 | 8,375,000 | 8,657,489 | ||||||
7.625%, 2/15/25 | 4,922,000 | 5,155,844 | ||||||
7.625%, 3/1/26 | 4,989,000 | 5,283,850 | ||||||
Switch Ltd. | 1,690,000 | 1,677,796 | ||||||
144A, 4.125%, 6/15/29 | 1,753,000 | 1,751,245 | ||||||
Telecom Italia SpA, 144A, | 4,897,000 | 4,719,778 | ||||||
Vmed O2 UK Financing I PLC | 4,393,000 | 3,550,510 | ||||||
144A, 4.75%, 7/15/31 | 4,559,000 | 3,766,874 | ||||||
|
| |||||||
(Cost $65,764,800) | 62,775,698 | |||||||
|
| |||||||
Principal | Value | |||||||
| Consumer, Cyclical — 22.8% | ||||||||
| Airlines — 1.6% | ||||||||
Air Canada, 144A, | $ | 3,864,000 | $ | 3,453,180 | ||||
Delta Air Lines, Inc. | 2,596,000 | 2,437,644 | ||||||
7.375%, 1/15/26 (a) | 2,876,000 | 2,933,261 | ||||||
4.375%, 4/19/28 | 1,337,000 | 1,177,095 | ||||||
3.75%, 10/28/29 | 1,589,000 | 1,292,890 | ||||||
United Airlines, Inc. | 6,505,000 | 5,939,650 | ||||||
144A, 4.625%, 4/15/29 | 6,545,000 | 5,751,419 | ||||||
|
| |||||||
(Cost $24,477,580) | 22,985,139 | |||||||
|
| |||||||
| Apparel — 0.4% | ||||||||
Hanesbrands, Inc. | 2,770,000 | 2,671,665 | ||||||
144A, 4.875%, 5/15/26 | 3,042,000 | 2,802,564 | ||||||
|
| |||||||
(Cost $5,929,349) | 5,474,229 | |||||||
|
| |||||||
| Auto Manufacturers — 4.8% | ||||||||
Allison Transmission, Inc. | 1,454,000 | 1,354,663 | ||||||
144A, 5.875%, 6/1/29 | 1,617,000 | 1,522,595 | ||||||
144A, 3.75%, 1/30/31 | 3,201,000 | 2,593,850 | ||||||
Ford Motor Co. | 3,331,000 | 3,729,781 | ||||||
4.346%, 12/8/26 | 4,759,000 | 4,570,491 | ||||||
9.625%, 4/22/30 | 1,488,000 | 1,742,555 | ||||||
3.25%, 2/12/32 | 8,031,000 | 6,298,954 | ||||||
6.10%, 8/19/32 | 5,900,000 | 5,753,503 | ||||||
Ford Motor Credit Co. LLC | 1,787,000 | 1,743,772 | ||||||
3.81%, 1/9/24 | 1,341,000 | 1,312,430 | ||||||
5.584%, 3/18/24 | 2,836,000 | 2,824,434 | ||||||
3.664%, 9/8/24 | 1,313,000 | 1,260,086 | ||||||
4.063%, 11/1/24 | 2,625,000 | 2,551,539 | ||||||
2.30%, 2/10/25 | 2,069,000 | 1,888,997 | ||||||
4.687%, 6/9/25 | 828,000 | 796,126 | ||||||
5.125%, 6/16/25 | 2,863,000 | 2,796,679 | ||||||
4.134%, 8/4/25 | 2,716,000 | 2,569,309 | ||||||
3.375%, 11/13/25 | 3,677,000 | 3,362,028 | ||||||
GMTN, 4.389%, 1/8/26 | 2,128,000 | 1,998,958 | ||||||
4.542%, 8/1/26 | 1,051,000 | 981,829 | ||||||
2.70%, 8/10/26 | 2,502,000 | 2,180,117 | ||||||
4.271%, 1/9/27 | 1,576,000 | 1,446,174 | ||||||
4.95%, 5/28/27 | 2,902,000 | 2,728,518 | ||||||
4.125%, 8/17/27 | 2,299,000 | 2,074,848 | ||||||
3.815%, 11/2/27 | 1,566,000 | 1,380,586 | ||||||
2.90%, 2/16/28 | 1,313,000 | 1,100,557 | ||||||
2.90%, 2/10/29 | 1,429,000 | 1,159,112 | ||||||
5.113%, 5/3/29 | 2,627,000 | 2,447,037 | ||||||
4.00%, 11/13/30 | 2,889,000 | 2,417,024 | ||||||
3.625%, 6/17/31 | 1,677,000 | 1,360,005 | ||||||
|
| |||||||
(Cost $76,081,955) | 69,946,557 | |||||||
|
| |||||||
| See Notes to Financial Statements. | 30 |
DBX ETF Trust
Schedule of Investments
Xtrackers Low Beta High Yield Bond ETF (Continued)
August 31, 2022
Principal | Value | |||||||
| Auto Parts & Equipment — 1.4% | ||||||||
Clarios Global LP, 144A, | $ | 1,635,000 | $ | 1,628,661 | ||||
Clarios Global LP / Clarios US Finance Co., 144A, | 2,748,000 | 2,720,712 | ||||||
Dana Financing Luxembourg SARL, 144A, | 1,465,000 | 1,444,183 | ||||||
Goodyear Tire & Rubber Co. | 2,198,000 | 2,299,636 | ||||||
5.00%, 5/31/26 (a) | 3,068,000 | 2,964,348 | ||||||
4.875%, 3/15/27 | 2,295,000 | 2,158,046 | ||||||
Tenneco, Inc. | 1,610,000 | 1,539,854 | ||||||
144A, 5.125%, 4/15/29 | 2,107,000 | 2,056,215 | ||||||
ZF North America Capital, Inc., 144A, | 3,462,000 | 3,211,002 | ||||||
|
| |||||||
(Cost $20,684,465) | 20,022,657 | |||||||
|
| |||||||
| Distribution/Wholesale — 0.5% | ||||||||
American Builders & Contractors Supply Co., Inc. | 2,512,000 | 2,276,199 | ||||||
144A, 3.875%, 11/15/29 | 1,166,000 | 956,948 | ||||||
H&E Equipment Services, Inc., 144A, | 4,058,000 | 3,433,636 | ||||||
|
| |||||||
(Cost $7,103,406) | 6,666,783 | |||||||
|
| |||||||
| Entertainment — 4.3% | ||||||||
Caesars Entertainment, Inc., 144A, | 10,973,000 | 10,728,302 | ||||||
Caesars Resort Collection LLC / CRC Finco, Inc., 144A, | 3,384,000 | 3,320,584 | ||||||
CDI Escrow Issuer, Inc., 144A, | 3,909,000 | 3,626,340 | ||||||
Cedar Fair LP, | 1,765,000 | 1,616,630 | ||||||
Cedar Fair LP / Canada’s Wonderland Co. / Magnum Management Corp. / Millennium Op | 2,658,000 | 2,610,714 | ||||||
5.375%, 4/15/27 | 1,673,000 | 1,580,801 | ||||||
Churchill Downs, Inc. | 1,993,000 | 1,913,356 | ||||||
144A, 4.75%, 1/15/28 | 2,274,000 | 2,072,126 | ||||||
International Game Technology PLC | 3,397,000 | 3,375,786 | ||||||
144A, 4.125%, 4/15/26 | 2,485,000 | 2,281,230 | ||||||
144A, 6.25%, 1/15/27 | 2,465,000 | 2,416,982 | ||||||
144A, 5.25%, 1/15/29 | 2,495,000 | 2,333,087 | ||||||
Live Nation Entertainment, Inc. | 2,207,000 | 2,139,157 | ||||||
144A, 6.50%, 5/15/27 | 3,911,000 | 3,909,787 | ||||||
144A, 4.75%, 10/15/27 | 2,946,000 | 2,685,765 | ||||||
144A, 3.75%, 1/15/28 | 1,667,000 | 1,463,159 | ||||||
Principal | Value | |||||||
| Entertainment (Continued) | ||||||||
Mohegan Gaming & Entertainment, 144A, | $ | 1,110,000 | $ | 1,134,492 | ||||
Scientific Games International, Inc., 144A, | 1,948,000 | 2,005,164 | ||||||
Six Flags Entertainment Corp., 144A, | 3,172,000 | 3,048,094 | ||||||
Vail Resorts, Inc., 144A, | 2,073,000 | 2,078,638 | ||||||
WMG Acquisition Corp. | 1,741,000 | 1,490,731 | ||||||
144A,3.875%, 7/15/30 | 1,493,000 | 1,276,049 | ||||||
144A,3.00%, 2/15/31 | 2,877,000 | 2,288,812 | ||||||
|
| |||||||
(Cost $64,983,176) | 61,395,786 | |||||||
|
| |||||||
| Food Service — 0.7% | ||||||||
Aramark Services, Inc. | 1,980,000 | 1,936,242 | ||||||
144A, 6.375%, 5/1/25 | 4,630,000 | 4,595,321 | ||||||
144A, 5.00%, 2/1/28 | 3,959,000 | 3,648,041 | ||||||
|
| |||||||
(Cost $10,363,785) | 10,179,604 | |||||||
|
| |||||||
| Home Builders — 0.5% | ||||||||
Century Communities, Inc., | 1,637,000 | 1,607,993 | ||||||
Meritage Homes Corp. | 1,254,000 | 1,254,859 | ||||||
144A, 3.875%, 4/15/29 | 1,487,000 | 1,265,578 | ||||||
Taylor Morrison Communities, Inc. | 1,737,000 | 1,680,599 | ||||||
144A, 5.75%, 1/15/28 | 1,401,000 | 1,285,058 | ||||||
|
| |||||||
(Cost $7,781,298) | 7,094,087 | |||||||
|
| |||||||
| Home Furnishings — 0.1% | ||||||||
Tempur Sealy International, Inc., 144A, | ||||||||
(Cost $2,479,664) | 2,551,000 | 2,099,743 | ||||||
|
| |||||||
| Housewares — 0.5% | ||||||||
Newell Brands, Inc. | 2,452,000 | 2,407,386 | ||||||
4.45%, 4/1/26 | 5,870,000 | 5,528,190 | ||||||
|
| |||||||
(Cost $8,660,479) | 7,935,576 | |||||||
|
| |||||||
| Leisure Time — 0.4% | ||||||||
Carnival Corp., 144A, | ||||||||
(Cost $7,013,931) | 7,797,000 | 6,500,671 | ||||||
|
| |||||||
| Lodging — 3.1% | ||||||||
Boyd Gaming Corp. | 3,620,000 | 3,384,266 | ||||||
144A, 4.75%, 6/15/31 | 2,728,000 | 2,378,134 | ||||||
Hilton Domestic Operating Co., Inc. | 2,017,000 | 2,004,353 | ||||||
144A, 5.75%, 5/1/28 | 1,397,000 | 1,367,572 | ||||||
144A, 3.75%, 5/1/29 | 2,627,000 | 2,271,541 | ||||||
4.875%, 1/15/30 | 3,194,000 | 2,922,861 | ||||||
| See Notes to Financial Statements. | 31 |
DBX ETF Trust
Schedule of Investments
Xtrackers Low Beta High Yield Bond ETF (Continued)
August 31, 2022
Principal | Value | |||||||
| Lodging (Continued) | ||||||||
144A, 4.00%, 5/1/31 | $ | 3,697,000 | $ | 3,129,834 | ||||
144A, 3.625%, 2/15/32 | 4,813,000 | 3,892,514 | ||||||
Hilton Worldwide Finance LLC / Hilton Worldwide Finance Corp., | 1,930,000 | 1,845,572 | ||||||
Las Vegas Sands Corp. | 5,730,000 | 5,427,111 | ||||||
2.90%, 6/25/25 | 1,500,000 | 1,384,356 | ||||||
3.50%, 8/18/26 | 3,394,000 | 3,052,612 | ||||||
3.90%, 8/8/29 | 2,407,000 | 2,055,651 | ||||||
MGM Resorts International | 2,375,000 | 2,376,627 | ||||||
5.75%, 6/15/25 | 2,156,000 | 2,094,877 | ||||||
4.625%, 9/1/26 | 1,254,000 | 1,142,613 | ||||||
Travel + Leisure Co. | 2,090,000 | 2,029,077 | ||||||
6.00%, 4/1/27 | 1,334,000 | 1,268,554 | ||||||
|
| |||||||
(Cost $46,369,586) | 44,028,125 | |||||||
|
| |||||||
| Retail — 4.1% | ||||||||
1011778 BC ULC / New Red Finance, Inc. | 1,733,000 | 1,744,715 | ||||||
144A, 3.875%, 1/15/28 | 5,234,000 | 4,660,040 | ||||||
144A, 4.375%, 1/15/28 | 2,335,000 | 2,091,257 | ||||||
144A, 3.50%, 2/15/29 | 2,375,000 | 2,046,336 | ||||||
144A, 4.00%, 10/15/30 | 9,450,000 | 7,739,597 | ||||||
Asbury Automotive Group, Inc., | 1,317,000 | 1,177,971 | ||||||
Fertitta Entertainment LLC / Fertitta Entertainment Finance Co., Inc., 144A, | 3,264,000 | 2,876,914 | ||||||
FirstCash, Inc. | 1,573,000 | 1,364,127 | ||||||
144A, 5.625%, 1/1/30 | 1,780,000 | 1,595,467 | ||||||
IRB Holding Corp., 144A, | 2,335,000 | 2,348,531 | ||||||
KFC Holding Co./Pizza Hut Holdings LLC/Taco Bell of America LLC, 144A, | 2,175,000 | 2,091,241 | ||||||
Lithia Motors, Inc. | 1,118,000 | 1,036,923 | ||||||
144A, 3.875%, 6/1/29 | 2,770,000 | 2,360,317 | ||||||
144A, 4.375%, 1/15/31 | 1,770,000 | 1,560,051 | ||||||
Murphy Oil USA, Inc. | 1,529,000 | 1,404,106 | ||||||
144A, 3.75%, 2/15/31 | 1,694,000 | 1,426,670 | ||||||
Penske Automotive Group, Inc. | 1,449,000 | 1,362,607 | ||||||
3.75%, 6/15/29 | 1,728,000 | 1,463,962 | ||||||
PetSmart, Inc. / PetSmart Finance Corp., 144A, | 3,898,000 | 3,480,672 | ||||||
QVC, Inc., | 2,068,000 | 1,992,601 | ||||||
SRS Distribution, Inc., 144A, | 2,157,000 | 1,912,820 | ||||||
Yum! Brands, Inc. | 2,757,000 | 2,515,997 | ||||||
Principal | Value | |||||||
| Retail (Continued) | ||||||||
3.625%, 3/15/31 | $ | 3,557,000 | $ | 3,000,721 | ||||
4.625%, 1/31/32 | 3,617,000 | 3,200,683 | ||||||
5.375%, 4/1/32 | 3,064,000 | 2,834,522 | ||||||
|
| |||||||
(Cost $63,915,434) | 59,288,848 | |||||||
|
| |||||||
| Toys/Games/Hobbies — 0.4% | ||||||||
Mattel, Inc. | 1,930,000 | 1,756,918 | ||||||
144A, 5.875%, 12/15/27 | 1,880,000 | 1,875,300 | ||||||
144A, 3.75%, 4/1/29 (a) | 1,915,000 | 1,709,865 | ||||||
|
| |||||||
(Cost $5,801,884) | 5,342,083 | |||||||
|
| |||||||
| Consumer, Non-cyclical — 18.5% | ||||||||
| Agriculture — 0.3% | ||||||||
Darling Ingredients, Inc. | 1,473,000 | 1,447,237 | ||||||
144A, 6.00%, 6/15/30 | 3,413,000 | 3,422,079 | ||||||
|
| |||||||
(Cost $4,927,191) | 4,869,316 | |||||||
|
| |||||||
| Commercial Services — 4.1% | ||||||||
ADT Security Corp., 144A, | 3,226,000 | 2,774,296 | ||||||
Block, Inc. | 3,236,000 | 2,878,147 | ||||||
3.50%, 6/1/31 | 3,314,000 | 2,731,183 | ||||||
Brink’s Co. | 1,404,000 | 1,375,204 | ||||||
144A, 4.625%, 10/15/27 | 1,940,000 | 1,748,629 | ||||||
Gartner, Inc. | 2,596,000 | 2,400,846 | ||||||
144A, 3.625%, 6/15/29 | 1,995,000 | 1,718,363 | ||||||
144A, 3.75%, 10/1/30 | 2,608,000 | 2,239,985 | ||||||
Grand Canyon University, | 1,582,000 | 1,504,102 | ||||||
Herc Holdings, Inc., 144A, | 3,902,000 | 3,693,574 | ||||||
Prime Security Services Borrower LLC / Prime Finance, Inc. | 2,405,000 | 2,386,211 | ||||||
144A, 5.75%, 4/15/26 | 4,535,000 | 4,370,332 | ||||||
144A, 3.375%, 8/31/27 | 3,262,000 | 2,811,387 | ||||||
Service Corp. International | 1,549,000 | 1,456,370 | ||||||
5.125%, 6/1/29 | 2,205,000 | 2,091,895 | ||||||
3.375%, 8/15/30 | 2,889,000 | 2,385,808 | ||||||
4.00%, 5/15/31 | 2,758,000 | 2,362,422 | ||||||
United Rentals North America, Inc. | 1,617,000 | 1,607,694 | ||||||
4.875%, 1/15/28 | 5,437,000 | 5,090,269 | ||||||
5.25%, 1/15/30 | 2,668,000 | 2,528,730 | ||||||
4.00%, 7/15/30 | 2,275,000 | 1,982,519 | ||||||
3.875%, 2/15/31 | 3,600,000 | 3,117,870 | ||||||
3.75%, 1/15/32 | 2,413,000 | 2,010,150 | ||||||
Williams Scotsman International, Inc., 144A, | 1,627,000 | 1,464,837 | ||||||
|
| |||||||
(Cost $63,497,310) | 58,730,823 | |||||||
|
| |||||||
| See Notes to Financial Statements. | 32 |
DBX ETF Trust
Schedule of Investments
Xtrackers Low Beta High Yield Bond ETF (Continued)
August 31, 2022
Principal | Value | |||||||
| Cosmetics/Personal Care — 0.1% | ||||||||
Edgewell Personal Care Co., 144A, | ||||||||
(Cost $2,555,379) | $ | 2,515,000 | $ | 2,325,583 | ||||
|
| |||||||
| Food — 2.6% | ||||||||
Albertsons Cos., Inc. / Safeway, Inc. / New Albertsons LP / Albertsons LLC | 2,425,000 | 2,189,654 | ||||||
144A, 7.50%, 3/15/26 | 1,588,000 | 1,620,419 | ||||||
144A, 4.625%, 1/15/27 | 4,986,000 | 4,556,104 | ||||||
144A, 3.50%, 3/15/29 | 4,576,000 | 3,766,277 | ||||||
144A, 4.875%, 2/15/30 | 2,864,000 | 2,513,160 | ||||||
Lamb Weston Holdings, Inc. | 1,667,000 | 1,591,452 | ||||||
144A, 4.125%, 1/31/30 | 3,396,000 | 3,067,199 | ||||||
144A, 4.375%, 1/31/32 | 2,079,000 | 1,843,561 | ||||||
Performance Food Group, Inc., 144A, | 3,317,000 | 3,121,401 | ||||||
Pilgrim’s Pride Corp. | 2,891,000 | 2,851,639 | ||||||
144A, 4.25%, 4/15/31 | 3,222,000 | 2,779,716 | ||||||
144A, 3.50%, 3/1/32 | 2,893,000 | 2,352,125 | ||||||
Post Holdings, Inc., 144A, | 1,258,000 | 1,231,028 | ||||||
US Foods, Inc., 144A, | 3,474,000 | 3,495,487 | ||||||
|
| |||||||
(Cost $40,208,650) | 36,979,222 | |||||||
|
| |||||||
| Healthcare-Products — 1.8% | ||||||||
Avantor Funding, Inc. | 5,022,000 | 4,576,549 | ||||||
144A, 3.875%, 11/1/29 | 2,636,000 | 2,285,390 | ||||||
Hologic, Inc. | 1,287,000 | 1,201,788 | ||||||
144A, 3.25%, 2/15/29 | 2,976,000 | 2,542,635 | ||||||
Medline Borrower LP, 144A, | 14,623,000 | 12,411,271 | ||||||
Teleflex, Inc. | 1,741,000 | 1,632,274 | ||||||
144A, 4.25%, 6/1/28 | 1,623,000 | 1,477,046 | ||||||
|
| |||||||
(Cost $28,473,967) | 26,126,953 | |||||||
|
| |||||||
| Healthcare-Services — 7.2% | ||||||||
Catalent Pharma Solutions, Inc. | 1,741,000 | 1,645,349 | ||||||
144A, 3.125%, 2/15/29 | 1,783,000 | 1,481,870 | ||||||
144A, 3.50%, 4/1/30 | 2,091,000 | 1,725,075 | ||||||
Centene Corp. | 7,856,000 | 7,471,685 | ||||||
2.45%, 7/15/28 | 6,628,000 | 5,599,467 | ||||||
4.625%, 12/15/29 | 10,343,000 | 9,758,103 | ||||||
3.375%, 2/15/30 | 6,224,000 | 5,350,711 | ||||||
3.00%, 10/15/30 | 6,863,000 | 5,736,095 | ||||||
2.50%, 3/1/31 | 6,779,000 | 5,418,997 | ||||||
2.625%, 8/1/31 | 3,996,000 | 3,202,754 | ||||||
Charles River Laboratories International, Inc. | 1,587,000 | 1,457,239 | ||||||
Principal | Value | |||||||
| Healthcare-Services (Continued) | ||||||||
144A, 3.75%, 3/15/29 | $ | 1,696,000 | $ | 1,464,386 | ||||
144A, 4.00%, 3/15/31 | 1,626,000 | 1,382,696 | ||||||
Encompass Health Corp., | 2,662,000 | 2,332,721 | ||||||
IQVIA, Inc. | 3,440,000 | 3,336,972 | ||||||
144A, 5.00%, 5/15/27 | 3,617,000 | 3,501,961 | ||||||
Molina Healthcare, Inc. | 2,687,000 | 2,483,151 | ||||||
144A, 3.875%, 11/15/30 | 2,102,000 | 1,822,739 | ||||||
144A, 3.875%, 5/15/32 | 2,416,000 | 2,083,039 | ||||||
Tenet Healthcare Corp. | 2,672,000 | 2,619,896 | ||||||
144A, 4.625%, 9/1/24 | 1,751,000 | 1,704,762 | ||||||
144A, 4.875%, 1/1/26 | 6,895,000 | 6,580,071 | ||||||
144A, 6.25%, 2/1/27 | 4,885,000 | 4,716,468 | ||||||
144A, 5.125%, 11/1/27 | 4,830,000 | 4,480,429 | ||||||
144A, 4.625%, 6/15/28 | 1,930,000 | 1,757,033 | ||||||
144A, 4.25%, 6/1/29 | 4,518,000 | 3,921,127 | ||||||
144A, 4.375%, 1/15/30 | 4,794,000 | 4,194,750 | ||||||
144A, 6.125%, 6/15/30 | 6,435,000 | 6,210,097 | ||||||
|
| |||||||
(Cost $112,847,625) | 103,439,643 | |||||||
|
| |||||||
| Household Products/Wares — 0.2% | ||||||||
Central Garden & Pet Co., | 1,669,000 | 1,392,021 | ||||||
Spectrum Brands, Inc., | 1,337,000 | 1,306,050 | ||||||
|
| |||||||
(Cost $2,842,341) | 2,698,071 | |||||||
|
| |||||||
| Pharmaceuticals — 2.2% | ||||||||
Elanco Animal Health, Inc., | 2,417,000 | 2,262,771 | ||||||
Jazz Securities DAC, 144A, | 4,878,000 | 4,405,761 | ||||||
Organon & Co. / Organon Foreign Debt Co.-Issuer BV | 6,729,000 | 6,046,646 | ||||||
144A, 5.125%, 4/30/31 | 6,591,000 | 5,775,430 | ||||||
Perrigo Finance Unlimited Co. | 2,166,000 | 2,067,981 | ||||||
4.375%, 3/15/26 | 2,535,000 | 2,414,575 | ||||||
4.40%, 6/15/30 | 2,283,000 | 1,981,142 | ||||||
Prestige Brands, Inc. | 1,348,000 | 1,245,235 | ||||||
144A, 3.75%, 4/1/31 | 1,960,000 | 1,571,263 | ||||||
Teva Pharmaceutical Finance Netherlands III BV, | 4,188,000 | 4,074,296 | ||||||
|
| |||||||
(Cost $34,059,239) | 31,845,100 | |||||||
|
| |||||||
| Energy — 11.1% | ||||||||
| Oil & Gas — 5.7% | ||||||||
Antero Resources Corp. | 917,000 | 933,873 | ||||||
144A, 5.375%, 3/1/30 | 2,292,000 | 2,160,325 | ||||||
Apache Corp., | 1,940,000 | 1,753,159 | ||||||
| See Notes to Financial Statements. | 33 |
DBX ETF Trust
Schedule of Investments
Xtrackers Low Beta High Yield Bond ETF (Continued)
August 31, 2022
Principal | Value | |||||||
| Oil & Gas (Continued) | ||||||||
Chesapeake Energy Corp. | $ | 1,317,000 | $ | 1,270,958 | ||||
144A, 5.875%, 2/1/29 | 1,704,000 | 1,628,981 | ||||||
144A, 6.75%, 4/15/29 | 3,013,000 | 2,947,005 | ||||||
CrownRock LP / CrownRock Finance, Inc. | 3,851,000 | 3,798,819 | ||||||
144A, 5.00%, 5/1/29 | 1,324,000 | 1,217,802 | ||||||
Endeavor Energy Resources LP / EER Finance, Inc., 144A, | 3,104,000 | 3,075,133 | ||||||
Matador Resources Co., | 3,440,000 | 3,371,338 | ||||||
MEG Energy Corp., 144A, | 4,050,000 | 4,097,587 | ||||||
Murphy Oil Corp., | 1,521,000 | 1,509,136 | ||||||
Occidental Petroleum Corp. | 1,834,000 | 1,916,530 | ||||||
2.90%, 8/15/24 | 2,130,000 | 2,077,911 | ||||||
8.00%, 7/15/25 | 1,643,000 | 1,786,795 | ||||||
5.875%, 9/1/25 | 2,739,000 | 2,811,255 | ||||||
5.50%, 12/1/25 | 2,157,000 | 2,217,892 | ||||||
5.55%, 3/15/26 | 3,677,000 | 3,770,763 | ||||||
8.50%, 7/15/27 | 1,567,000 | 1,756,960 | ||||||
6.375%, 9/1/28 | 1,880,000 | 1,966,082 | ||||||
8.875%, 7/15/30 | 3,342,000 | 3,913,031 | ||||||
6.625%, 9/1/30 | 4,887,000 | 5,227,624 | ||||||
6.125%, 1/1/31 | 4,182,000 | 4,351,378 | ||||||
7.50%, 5/1/31 | 2,840,000 | 3,202,640 | ||||||
7.875%, 9/15/31 | 1,457,000 | 1,681,480 | ||||||
Range Resources Corp. | 2,055,000 | 1,997,080 | ||||||
144A, 4.75%, 2/15/30 (a) | 1,813,000 | 1,682,065 | ||||||
Southwestern Energy Co. | 2,205,000 | 2,288,636 | ||||||
5.375%, 2/1/29 | 2,764,000 | 2,617,549 | ||||||
5.375%, 3/15/30 | 3,619,000 | 3,397,010 | ||||||
4.75%, 2/1/32 | 3,415,000 | 3,048,782 | ||||||
Sunoco LP / Sunoco Finance Corp., | 1,816,000 | 1,759,993 | ||||||
|
| |||||||
(Cost $85,510,550) | 81,235,572 | |||||||
|
| |||||||
| Pipelines — 5.4% | ||||||||
Antero Midstream Partners LP / Antero Midstream Finance Corp. | 1,449,000 | 1,476,915 | ||||||
144A, 5.375%, 6/15/29 | 2,600,000 | 2,387,047 | ||||||
Buckeye Partners LP | 1,202,000 | 1,125,642 | ||||||
3.95%, 12/1/26 | 2,210,000 | 1,965,569 | ||||||
4.125%, 12/1/27 | 1,252,000 | 1,109,175 | ||||||
Cheniere Energy Partners LP | 4,687,000 | 4,306,767 | ||||||
4.00%, 3/1/31 | 5,127,000 | 4,499,276 | ||||||
3.25%, 1/31/32 | 3,845,000 | 3,082,767 | ||||||
Cheniere Energy, Inc., | 6,266,000 | 6,037,667 | ||||||
Principal | Value | |||||||
| Pipelines (Continued) | ||||||||
Crestwood Midstream Partners LP / Crestwood Midstream Finance Corp., | $ | 1,647,000 | $ | 1,589,668 | ||||
DT Midstream, Inc. | 3,719,000 | 3,272,348 | ||||||
144A, 4.375%, 6/15/31 | 3,146,000 | 2,695,351 | ||||||
EnLink Midstream LLC | 1,600,000 | 1,540,480 | ||||||
144A, 6.50%, 9/1/30 | 2,280,000 | 2,271,062 | ||||||
EnLink Midstream Partners LP | 1,170,000 | 1,142,038 | ||||||
4.85%, 7/15/26 | 1,542,000 | 1,519,109 | ||||||
EQM Midstream Partners LP | 1,648,000 | 1,593,525 | ||||||
4.125%, 12/1/26 | 1,397,000 | 1,261,163 | ||||||
Hess Midstream Operations LP | 2,174,000 | 2,123,791 | ||||||
144A, 5.125%, 6/15/28 | 2,089,000 | 1,943,344 | ||||||
144A, 4.25%, 2/15/30 | 2,672,000 | 2,296,612 | ||||||
144A, 5.50%, 10/15/30 | 1,054,000 | 961,728 | ||||||
Kinetik Holdings LP, 144A, | 3,310,000 | 3,148,820 | ||||||
NuStar Logistics LP | 2,006,000 | 1,917,445 | ||||||
6.00%, 6/1/26 | 1,554,000 | 1,468,981 | ||||||
Rockies Express Pipeline LLC, 144A, | 1,193,000 | 1,097,894 | ||||||
Venture Global Calcasieu Pass LLC 144A, 3.875%, 8/15/29 | 4,022,000 | 3,514,826 | ||||||
144A, 4.125%, 8/15/31 | 4,172,000 | 3,628,443 | ||||||
144A, 3.875%, 11/1/33 | 4,022,000 | 3,361,728 | ||||||
Western Midstream Operating LP | 2,125,000 | 2,008,890 | ||||||
4.65%, 7/1/26 | 1,799,000 | 1,715,068 | ||||||
4.50%, 3/1/28 | 1,289,000 | 1,198,461 | ||||||
4.75%, 8/15/28 | 1,301,000 | 1,226,687 | ||||||
4.30%, 2/1/30 | 3,907,000 | 3,517,042 | ||||||
|
| |||||||
(Cost $84,933,087) | 78,005,329 | |||||||
|
| |||||||
| Financial — 11.1% | ||||||||
| Banks — 1.5% | ||||||||
Commerzbank AG, 144A, | 3,034,000 | 3,100,828 | ||||||
Deutsche Bank AG | 1,777,000 | 1,552,065 | ||||||
3.729%, 1/14/32 (b) | 4,118,000 | 3,038,749 | ||||||
3.742%, 1/7/33 (b) | 3,920,000 | 2,794,732 | ||||||
Intesa Sanpaolo SpA | 6,498,000 | 6,220,602 | ||||||
144A, 5.71%, 1/15/26 | 4,852,000 | 4,559,811 | ||||||
|
| |||||||
(Cost $24,255,399) | 21,266,787 | |||||||
|
| |||||||
| Diversified Financial Services — 2.6% | ||||||||
Ally Financial, Inc., | 3,446,000 | 3,487,258 | ||||||
LPL Holdings, Inc. | 1,384,000 | 1,304,382 | ||||||
| See Notes to Financial Statements. | 34 |
DBX ETF Trust
Schedule of Investments
Xtrackers Low Beta High Yield Bond ETF (Continued)
August 31, 2022
Principal | Value | |||||||
| Diversified Financial Services (Continued) | ||||||||
144A, 4.00%, 3/15/29 | $ | 3,052,000 | $ | 2,732,105 | ||||
144A, 4.375%, 5/15/31 | 1,142,000 | 1,006,742 | ||||||
Navient Corp. | ||||||||
MTN, 6.125%, 3/25/24 | 2,639,000 | 2,577,986 | ||||||
5.875%, 10/25/24 | 1,737,000 | 1,670,373 | ||||||
NFP Corp., 144A, | 1,751,000 | 1,556,087 | ||||||
OneMain Finance Corp. | 4,203,000 | 4,108,811 | ||||||
6.875%, 3/15/25 | 4,031,000 | 3,924,014 | ||||||
3.50%, 1/15/27 | 2,506,000 | 2,073,065 | ||||||
Rocket Mortgage LLC / Rocket Mortgage Co.-Issuer, Inc. | 3,678,000 | 3,096,361 | ||||||
144A, 3.625%, 3/1/29 | 2,427,000 | 1,957,315 | ||||||
144A, 3.875%, 3/1/31 | 4,182,000 | 3,281,072 | ||||||
144A, 4.00%, 10/15/33 | 2,744,000 | 2,048,691 | ||||||
SLM Corp. | 1,597,000 | 1,464,349 | ||||||
3.125%, 11/2/26 | 1,637,000 | 1,376,951 | ||||||
|
| |||||||
(Cost $41,657,451) | 37,665,562 | |||||||
|
| |||||||
| Insurance — 0.3% | ||||||||
Acrisure LLC / Acrisure Finance, Inc., 144A, | 2,250,000 | 1,911,937 | ||||||
Alliant Holdings Intermediate LLC / Alliant Holdings Co-Issuer, 144A, | 2,535,000 | 2,287,583 | ||||||
|
| |||||||
(Cost $4,425,094) | 4,199,520 | |||||||
|
| |||||||
| Real Estate — 0.5% | ||||||||
Howard Hughes Corp. | 2,145,000 | 1,912,182 | ||||||
144A, 4.125%, 2/1/29 | 2,316,000 | 1,914,710 | ||||||
144A, 4.375%, 2/1/31 | 2,172,000 | 1,739,989 | ||||||
Kennedy-Wilson, Inc., | 1,990,000 | 1,663,212 | ||||||
|
| |||||||
(Cost $8,160,161) | 7,230,093 | |||||||
|
| |||||||
| Real Estate Investment Trusts — 5.1% | ||||||||
Blackstone Mortgage Trust, Inc., 144A, | 1,225,000 | 1,067,685 | ||||||
Brookfield Property REIT, Inc. / BPR Cumulus LLC / BPR Nimbus LLC / GGSI Sellco LL, 144A, | 3,074,000 | 2,871,520 | ||||||
HAT Holdings I LLC / HAT Holdings II LLC | 1,304,000 | 1,265,725 | ||||||
144A, 3.375%, 6/15/26 | 3,267,000 | 2,840,264 | ||||||
Iron Mountain, Inc. | 3,084,000 | 2,836,077 | ||||||
144A, 5.25%, 3/15/28 | 2,613,000 | 2,401,465 | ||||||
144A, 5.00%, 7/15/28 | 2,107,000 | 1,925,577 | ||||||
144A, 4.875%, 9/15/29 | 3,180,000 | 2,763,102 | ||||||
144A, 5.25%, 7/15/30 | 3,883,000 | 3,441,018 | ||||||
Principal | Value | |||||||
| Real Estate Investment Trusts (Continued) | ||||||||
144A, 4.50%, 2/15/31 | $ | 3,753,000 | $ | 3,122,440 | ||||
144A, 5.625%, 7/15/32 | 1,991,000 | 1,752,856 | ||||||
iStar, Inc. | 2,493,000 | 2,497,213 | ||||||
4.25%, 8/1/25 | 1,799,000 | 1,797,723 | ||||||
Ladder Capital Finance Holdings LLLP / Ladder Capital Finance Corp., 144A, | 2,187,000 | 1,909,909 | ||||||
MPT Operating Partnership LP / MPT Finance Corp. | 1,663,000 | 1,596,983 | ||||||
5.00%, 10/15/27 | 4,238,000 | 3,812,511 | ||||||
4.625%, 8/1/29 | 3,055,000 | 2,606,333 | ||||||
3.50%, 3/15/31 | 4,318,000 | 3,244,891 | ||||||
Park Intermediate Holdings LLC / PK Domestic Property LLC / PK Finance Co.-Issuer | 2,232,000 | 2,255,659 | ||||||
144A, 5.875%, 10/1/28 | 2,489,000 | 2,290,676 | ||||||
144A, 4.875%, 5/15/29 | 2,337,000 | 2,058,834 | ||||||
RHP Hotel Properties LP / RHP Finance Corp. | 2,262,000 | 2,059,890 | ||||||
144A, 4.50%, 2/15/29 | 1,969,000 | 1,703,976 | ||||||
RLJ Lodging Trust LP | 1,337,000 | 1,201,388 | ||||||
144A, 4.00%, 9/15/29 | 1,787,000 | 1,511,143 | ||||||
SBA Communications Corp. | 4,890,000 | 4,465,151 | ||||||
3.125%, 2/1/29 | 4,847,000 | 4,000,326 | ||||||
Starwood Property Trust, Inc. | 1,092,000 | 1,019,688 | ||||||
4.75%, 3/15/25 | 1,388,000 | 1,323,611 | ||||||
144A, 3.625%, 7/15/26 | 1,309,000 | 1,160,330 | ||||||
144A, 4.375%, 1/15/27 | 1,821,000 | 1,622,939 | ||||||
XHR LP | 1,612,000 | 1,566,875 | ||||||
144A, 4.875%, 6/1/29 | 1,641,000 | 1,450,056 | ||||||
|
| |||||||
(Cost $78,500,571) | 73,443,834 | |||||||
|
| |||||||
| Venture Capital — 1.1% | ||||||||
Icahn Enterprises LP / Icahn Enterprises Finance Corp. | 3,912,000 | 3,726,571 | ||||||
6.375%, 12/15/25 | 2,636,000 | 2,576,690 | ||||||
6.25%, 5/15/26 | 3,450,000 | 3,313,311 | ||||||
5.25%, 5/15/27 | 4,581,000 | 4,172,728 | ||||||
4.375%, 2/1/29 | 2,712,000 | 2,310,543 | ||||||
|
| |||||||
(Cost $16,386,526) | 16,099,843 | |||||||
|
| |||||||
| Industrial — 7.7% | ||||||||
| Aerospace/Defense — 2.1% | ||||||||
Howmet Aerospace, Inc. | 4,009,000 | 3,989,757 | ||||||
6.875%, 5/1/25 | 2,220,000 | 2,282,582 | ||||||
3.00%, 1/15/29 | 2,104,000 | 1,779,858 | ||||||
Rolls-Royce PLC, 144A, | 3,284,000 | 2,975,140 | ||||||
| See Notes to Financial Statements. | 35 |
DBX ETF Trust
Schedule of Investments
Xtrackers Low Beta High Yield Bond ETF (Continued)
August 31, 2022
Principal | Value | |||||||
| Aerospace/Defense (Continued) | ||||||||
Spirit AeroSystems, Inc., 144A, | $ | 1,467,000 | $ | 1,438,481 | ||||
TransDigm, Inc. | 3,821,000 | 3,918,282 | ||||||
144A, 6.25%, 3/15/26 | 14,052,000 | 13,823,304 | ||||||
|
| |||||||
(Cost $31,527,355) | 30,207,404 | |||||||
|
| |||||||
| Building Materials — 0.5% | ||||||||
Builders FirstSource, Inc. | 1,769,000 | 1,570,208 | ||||||
144A, 4.25%, 2/1/32 | 4,231,000 | 3,382,600 | ||||||
Standard Industries, Inc., 144A, | 2,759,000 | 2,530,544 | ||||||
|
| |||||||
(Cost $8,422,710) | 7,483,352 | |||||||
|
| |||||||
| Electrical Components & Equipment — 0.7% | ||||||||
WESCO Distribution, Inc. | 4,981,000 | 4,987,894 | ||||||
144A, 7.25%, 6/15/28 | 4,280,000 | 4,330,333 | ||||||
|
| |||||||
(Cost $9,642,110) | 9,318,227 | |||||||
|
| |||||||
| Electronics — 0.9% | ||||||||
Sensata Technologies BV | 1,937,000 | 1,956,516 | ||||||
144A, 5.625%, 11/1/24 | 1,424,000 | 1,433,324 | ||||||
144A, 5.00%, 10/1/25 | 2,314,000 | 2,269,859 | ||||||
144A, 4.00%, 4/15/29 | 3,423,000 | 2,963,942 | ||||||
144A, 5.875%, 9/1/30 | 1,000,000 | 978,740 | ||||||
Sensata Technologies, Inc. | 1,717,000 | 1,532,423 | ||||||
144A, 3.75%, 2/15/31 | 2,475,000 | 2,048,675 | ||||||
|
| |||||||
(Cost $14,255,791) | 13,183,479 | |||||||
|
| |||||||
| Engineering & Construction — 0.1% | ||||||||
Fluor Corp., | ||||||||
(Cost $1,930,692) | 1,941,000 | 1,757,515 | ||||||
|
| |||||||
| Environmental Control — 0.7% | ||||||||
GFL Environmental, Inc. | 1,460,000 | 1,395,893 | ||||||
144A, 3.75%, 8/1/25 | 2,440,000 | 2,308,521 | ||||||
144A, 5.125%, 12/15/26 | 1,460,000 | 1,414,074 | ||||||
144A, 3.50%, 9/1/28 | 2,593,000 | 2,257,362 | ||||||
Stericycle, Inc. | 1,630,000 | 1,597,351 | ||||||
144A, 3.875%, 1/15/29 | 1,727,000 | 1,498,656 | ||||||
|
| |||||||
(Cost $11,125,664) | 10,471,857 | |||||||
|
| |||||||
| Miscellaneous Manufacturing — 0.1% | ||||||||
Hillenbrand, Inc., | ||||||||
(Cost $1,265,121) | 1,234,000 | 1,237,492 | ||||||
|
| |||||||
| Packaging & Containers — 2.6% | ||||||||
Ardagh Metal Packaging Finance USA LLC / Ardagh Metal Packaging Finance PLC | 2,202,000 | 2,160,949 | ||||||
144A, 3.25%, 9/1/28 | 1,745,000 | 1,507,820 | ||||||
Principal | Value | |||||||
| Packaging & Containers (Continued) | ||||||||
Ball Corp. | $ | 3,084,000 | $ | 3,055,503 | ||||
5.25%, 7/1/25 | 3,217,000 | 3,212,995 | ||||||
4.875%, 3/15/26 | 2,725,000 | 2,641,888 | ||||||
2.875%, 8/15/30 | 4,182,000 | 3,397,833 | ||||||
3.125%, 9/15/31 | 2,724,000 | 2,210,142 | ||||||
Berry Global, Inc., 144A, | 1,717,000 | 1,678,711 | ||||||
Crown Americas LLC, 144A, | 1,681,000 | 1,616,298 | ||||||
Graphic Packaging International LLC | 1,515,000 | 1,350,636 | ||||||
144A, 3.75%, 2/1/30 | 1,284,000 | 1,105,517 | ||||||
Pactiv Evergreen Group Issuer, Inc. /Pactiv Evergreen Group Issuer LLC, 144A, | 3,326,000 | 2,907,772 | ||||||
Sealed Air Corp. | 1,119,000 | 1,109,455 | ||||||
144A, 5.50%, 9/15/25 | 1,204,000 | 1,199,756 | ||||||
144A, 4.00%, 12/1/27 | 1,438,000 | 1,311,046 | ||||||
144A, 5.00%, 4/15/29 | 1,367,000 | 1,301,097 | ||||||
Silgan Holdings, Inc., | 1,921,000 | 1,761,096 | ||||||
Trivium Packaging Finance BV, 144A, | 3,276,000 | 3,150,496 | ||||||
|
| |||||||
(Cost $39,238,613) | 36,679,010 | |||||||
|
| |||||||
| Technology — 3.6% | ||||||||
| Computers — 0.8% | ||||||||
Booz Allen Hamilton, Inc. | 2,360,000 | 2,103,114 | ||||||
144A, 4.00%, 7/1/29 | 1,618,000 | 1,429,177 | ||||||
Seagate HDD Cayman | 1,410,000 | 1,384,210 | ||||||
4.75%, 1/1/25 | 1,282,000 | 1,254,325 | ||||||
4.875%, 6/1/27 | 1,820,000 | 1,719,563 | ||||||
4.091%, 6/1/29 | 1,317,000 | 1,127,793 | ||||||
3.125%, 7/15/29 | 1,747,000 | 1,399,478 | ||||||
3.375%, 7/15/31 | 1,797,000 | 1,407,743 | ||||||
|
| |||||||
(Cost $13,115,551) | 11,825,403 | |||||||
|
| |||||||
| Semiconductors — 0.3% | ||||||||
Entegris, Inc. | 1,252,000 | 1,107,043 | ||||||
144A, 3.625%, 5/1/29 | 1,317,000 | 1,111,291 | ||||||
ON Semiconductor Corp., 144A, | 2,286,000 | 2,043,010 | ||||||
|
| |||||||
(Cost $4,595,717) | 4,261,344 | |||||||
|
| |||||||
| Software — 2.5% | ||||||||
Fair Isaac Corp. | 1,305,000 | 1,264,343 | ||||||
144A, 4.00%, 6/15/28 | 2,918,000 | 2,581,708 | ||||||
MSCI, Inc. | 3,329,000 | 2,969,351 | ||||||
144A, 3.625%, 9/1/30 | 2,961,000 | 2,516,789 | ||||||
144A, 3.875%, 2/15/31 | 3,083,000 | 2,666,810 | ||||||
| See Notes to Financial Statements. | 36 |
DBX ETF Trust
Schedule of Investments
Xtrackers Low Beta High Yield Bond ETF (Continued)
August 31, 2022
Principal | Value | |||||||
| Software (Continued) | ||||||||
144A, 3.625%, 11/1/31 | $ | 1,986,000 | $ | 1,657,699 | ||||
144A, 3.25%, 8/15/33 | 2,337,000 | 1,875,408 | ||||||
Open Text Corp. | 3,018,000 | 2,578,172 | ||||||
144A, 3.875%, 12/1/29 | 2,399,000 | 1,939,405 | ||||||
Open Text Holdings, Inc. | 2,908,000 | 2,359,951 | ||||||
144A, 4.125%, 12/1/31 | 2,352,000 | 1,861,996 | ||||||
PTC, Inc. | 1,503,000 | 1,414,266 | ||||||
144A, 4.00%, 2/15/28 | 1,660,000 | 1,520,510 | ||||||
SS&C Technologies, Inc., 144A, | 6,529,000 | 6,179,430 | ||||||
Twilio, Inc. | 1,637,000 | 1,369,146 | ||||||
3.875%, 3/15/31 | 1,599,000 | 1,292,919 | ||||||
|
| |||||||
(Cost $40,273,394) | 36,047,903 | |||||||
|
| |||||||
| Utilities — 2.9% | ||||||||
| Electric — 2.7% | ||||||||
Calpine Corp. | 1,836,000 | 1,784,684 | ||||||
144A, 4.50%, 2/15/28 | 4,285,000 | 3,925,553 | ||||||
144A, 3.75%, 3/1/31 | 2,573,000 | 2,138,047 | ||||||
Clearway Energy Operating LLC | 3,034,000 | 2,846,271 | ||||||
144A, 3.75%, 2/15/31 | 2,785,000 | 2,333,069 | ||||||
DPL, Inc., | 1,380,000 | 1,304,100 | ||||||
FirstEnergy Corp. | ||||||||
Series B, 4.40%, 7/15/27 | 4,894,000 | 4,643,476 | ||||||
2.65%, 3/1/30 | 1,958,000 | 1,673,503 | ||||||
Series B, 2.25%, 9/1/30 | 1,465,000 | 1,202,423 | ||||||
NextEra Energy Operating Partners LP 144A, 4.25%, 7/15/24 | 2,114,000 | 2,041,329 | ||||||
144A, 3.875%, 10/15/26 | 1,552,000 | 1,449,145 | ||||||
144A, 4.50%, 9/15/27 | 1,936,000 | 1,793,685 | ||||||
NRG Energy, Inc., 144A, | 1,641,000 | 1,350,952 | ||||||
Vistra Operations Co. LLC | 3,385,000 | 3,272,686 | ||||||
144A, 5.625%, 2/15/27 | 4,212,000 | 4,064,959 | ||||||
144A, 5.00%, 7/31/27 | 4,198,000 | 3,912,116 | ||||||
|
| |||||||
(Cost $42,654,476) | 39,735,998 | |||||||
|
| |||||||
| Gas — 0.2% | ||||||||
AmeriGas Partners LP / AmeriGas Finance Corp., | ||||||||
(Cost $2,570,629) | 2,489,000 | 2,454,876 | ||||||
|
| |||||||
TOTAL CORPORATE BONDS | 1,414,453,177 | |||||||
|
| |||||||
Number | Value | |||||||
| SECURITIES LENDING COLLATERAL — 0.6% | ||||||||
DWS Government & Agency Securities Portfolio “DWS Government Cash Institutional Shares”, 2.00% (c)(d) | 9,125,075 | $ | 9,125,075 | |||||
|
| |||||||
| CASH EQUIVALENTS — 0.7% | ||||||||
DWS Government Money Market Series “Institutional Shares”, 2.24% (c) | ||||||||
(Cost $10,573,885) | 10,573,885 | 10,573,885 | ||||||
|
| |||||||
TOTAL INVESTMENTS — 99.5% (Cost $1,537,798,360) | $ | 1,434,152,137 | ||||||
Other assets and liabilities, net — 0.5% | 6,514,568 | |||||||
|
| |||||||
NET ASSETS — 100.0% | $ | 1,440,666,705 | ||||||
|
| |||||||
| See Notes to Financial Statements. | 37 |
DBX ETF Trust
Schedule of Investments
Xtrackers Low Beta High Yield Bond ETF (Continued)
August 31, 2022
A summary of the Fund’s transactions with affiliated investments during the year ended August 31, 2022 is as follows:
Value ($) at | Purchases Cost ($) | Sales Proceeds ($) | Net Realized Gain/(Loss) ($) | Net Change in Unrealized Appreciation (Depreciation) ($) | Income ($) | Capital Gain Distributions ($) | Number of Shares at 8/31/2022 | Value ($) at 8/31/2022 | ||||||||||||||||||||||||||
CORPORATE BONDS — 0.5% |
| |||||||||||||||||||||||||||||||||
Financial — 0.5% |
| |||||||||||||||||||||||||||||||||
Deutsche Bank AG, 5.882%, 7/08/31 (b) |
| |||||||||||||||||||||||||||||||||
| — | 2,355,617 | (455,955 | ) | (34,378 | ) | (313,219 | ) | 49,377 | — | 1,777,000 | 1,552,065 | |||||||||||||||||||||||
Deutsche Bank AG, 3.729%, 1/14/32 (b) |
| |||||||||||||||||||||||||||||||||
| 1,672,217 | 3,276,634 | (935,924 | ) | (93,462 | ) | (880,716 | ) | 108,897 | — | 4,118,000 | 3,038,749 | |||||||||||||||||||||||
Deutsche Bank AG, 3.742%, 1/07/33 (b) |
| |||||||||||||||||||||||||||||||||
| — | 4,798,248 | (1,096,046 | ) | (140,976 | ) | (766,494 | ) | 76,648 | — | 3,920,000 | 2,794,732 | |||||||||||||||||||||||
SECURITIES LENDING COLLATERAL — 0.6% |
| |||||||||||||||||||||||||||||||||
DWS Government & Agency Securities Portfolio “DWS Government Cash Institutional Shares”, 2.00% (c)(d) |
| |||||||||||||||||||||||||||||||||
| 4,866,433 | 4,258,642 | (e) | — | — | — | 50,464 | — | 9,125,075 | 9,125,075 | |||||||||||||||||||||||||
CASH EQUIVALENTS — 0.7% |
| |||||||||||||||||||||||||||||||||
DWS Government Money Market Series “Institutional Shares”, 2.24% (c) |
| |||||||||||||||||||||||||||||||||
| 29,654,545 | 216,856,435 | (235,937,095 | ) | — | — | 44,686 | — | 10,573,885 | 10,573,885 | |||||||||||||||||||||||||
|
|
|
|
|
|
|
|
|
|
|
|
|
|
|
| |||||||||||||||||||
| 36,193,195 | 231,545,576 | (238,425,020 | ) | (268,816 | ) | (1,960,429 | ) | 330,072 | — | 29,513,960 | 27,084,506 | |||||||||||||||||||||||
|
|
|
|
|
|
|
|
|
|
|
|
|
|
|
| |||||||||||||||||||
| (a) | All or a portion of these securities were on loan. In addition, “Other assets and liabilities, net” may include pending sales that are also on loan. The value of securities loaned at August 31, 2022 amounted to $11,651,353, which is 0.8% of net assets. |
| (b) | Affiliated issuer. This security is owned in proportion with its representation in the index. |
| (c) | Affiliated fund managed by DWS Investment Management Americas, Inc. The rate shown is the annualized seven-day yield at period end. |
| (d) | Represents cash collateral held in connection with securities lending. Income earned by the Fund is net of borrower rebates. In addition, the Fund held non-cash U.S. Treasury securities collateral having a value of $2,986,781. |
| (e) | Represents the net increase (purchase cost) or decrease (sales proceeds) in the amount invested in cash collateral for the year ended August 31, 2022. |
| GMTN: | Global Medium Term Note |
| MTN: | Medium Term Note |
| REIT: | Real Estate Investment Trust |
| 144A: | Security exempt from registration under Rule 144A of the Securities Act of 1933. These securities may be resold in transactions exempt from registration, normally to qualified institutional buyers. |
Fair Value Measurements
Various inputs are used in determining the value of the Fund’s investments. These inputs are summarized in three broad levels. Level 1 includes quoted prices in active markets for identical securities. Level 2 includes other significant observable inputs (including quoted prices for similar securities, interest rates, prepayment speeds and credit risk). Level 3 includes significant unobservable inputs (including the Fund’s own assumptions in determining the fair value of investments). The level assigned to the securities valuations may not be an indication of the risk or liquidity associated with investing in those securities.
The following is a summary of the inputs used as of August 31, 2022 in valuing the Fund’s investments. For information on the Fund’s policy regarding the valuation of investments, please refer to the Security Valuation section of Note 2 in the accompanying Notes to Financial Statements.
Assets | Level 1 | Level 2 | Level 3 | Total | ||||||||||||
Corporate Bonds (a) | $ | — | $ | 1,414,453,177 | $ | — | $ | 1,414,453,177 | ||||||||
Short-Term Investments (a) | 19,698,960 | — | — | 19,698,960 | ||||||||||||
|
|
|
|
|
|
|
| |||||||||
TOTAL | $ | 19,698,960 | $ | 1,414,453,177 | $ | — | $ | 1,434,152,137 | ||||||||
|
|
|
|
|
|
|
| |||||||||
| (a) | See Schedule of Investments for additional detailed categorizations. |
| See Notes to Financial Statements. | 38 |
DBX ETF Trust
Xtrackers Risk Managed USD High Yield Strategy ETF
August 31, 2022
Number | Value | |||||||
| EXCHANGE-TRADED FUNDS — 99.2% | ||||||||
Xtrackers High Beta High Yield Bond ETF (a) | 27,598 | $ | 1,090,918 | |||||
Xtrackers USD High Yield Corporate Bond ETF (a) | 1,409,763 | 48,129,309 | ||||||
|
| |||||||
TOTAL EXCHANGE-TRADED FUNDS | 49,220,227 | |||||||
|
| |||||||
Number | Value | |||||||
| CASH EQUIVALENTS — 0.8% | ||||||||
DWS Government Money Market Series “Institutional Shares”, 2.24% (b) | 374,305 | $ | 374,305 | |||||
|
| |||||||
TOTAL INVESTMENTS — 100.0% | $ | 49,594,532 | ||||||
Other assets and liabilities, net — (0.0)% | (5,926 | ) | ||||||
|
| |||||||
NET ASSETS — 100.0% | $ | 49,588,606 | ||||||
|
| |||||||
A summary of the Fund’s transactions with affiliated investments during the period ended August 31, 2022 is as follows:
| Value ($) at 2/10/2022 (Commencement of Operations) | Purchases Cost ($) | Sales Proceeds ($) | Net Realized Gain/(Loss) ($) | Net Change in Unrealized Appreciation (Depreciation) ($) | Income ($) | Capital Gain Distributions ($) | Number of Shares at 8/31/2022 | Value ($) at 8/31/2022 | ||||||||||||||||||||||||||||
EXCHANGE-TRADED FUNDS — 99.2% |
| |||||||||||||||||||||||||||||||||||
Xtrackers High Beta High Yield Bond ETF (a) |
| |||||||||||||||||||||||||||||||||||
| — | 1,306,956 | (85,490 | ) | 1,195 | (131,743 | ) | 30,137 | — | 27,598 | 1,090,918 | ||||||||||||||||||||||||||
Xtrackers USD High Yield Corporate Bond ETF (a) |
| |||||||||||||||||||||||||||||||||||
| — | 55,436,916 | (2,805,684 | ) | 127,353 | (4,629,276 | ) | 1,017,341 | — | 1,409,763 | 48,129,309 | ||||||||||||||||||||||||||
SECURITIES LENDING COLLATERAL — 0.0% |
| |||||||||||||||||||||||||||||||||||
DWS Government & Agency Securities Portfolio “DWS Government Cash Institutional Shares”, 2.00% (b)(c) |
| |||||||||||||||||||||||||||||||||||
| — | 0 | (d) | — | — | — | 6,861 | — | — | — | |||||||||||||||||||||||||||
CASH EQUIVALENTS — 0.8% |
| |||||||||||||||||||||||||||||||||||
DWS Government Money Market Series “Institutional Shares”, 2.24% (b) |
| |||||||||||||||||||||||||||||||||||
| — | 747,530 | (373,225 | ) | — | — | 1,388 | — | 374,305 | 374,305 | |||||||||||||||||||||||||||
|
|
|
|
|
|
|
|
|
|
|
|
|
|
|
|
|
| |||||||||||||||||||
| — | 57,491,402 | (3,264,399 | ) | 128,548 | (4,761,019 | ) | 1,055,727 | — | 1,811,666 | 49,594,532 | ||||||||||||||||||||||||||
|
|
|
|
|
|
|
|
|
|
|
|
|
|
|
|
|
| |||||||||||||||||||
| (a) | Affiliated fund advised by DBX Advisors LLC. |
| (b) | Affiliated fund managed by DWS Investment Management Americas, Inc. The rate shown is the annualized seven-day yield at period end. |
| (c) | Represents collateral held in connection with securities lending. Income earned by the Fund is net of borrower rebates. |
| (d) | Represents the net increase (purchase cost) or decrease (sales proceeds) in the amount invested in cash collateral for the period ended August 31, 2022. |
Fair Value Measurements
Various inputs are used in determining the value of the Fund’s investments. These inputs are summarized in three broad levels. Level 1 includes quoted prices in active markets for identical securities. Level 2 includes other significant observable inputs (including quoted prices for similar securities, interest rates, prepayment speeds and credit risk). Level 3 includes significant unobservable inputs (including the Fund’s own assumptions in determining the fair value of investments). The level assigned to the securities valuations may not be an indication of the risk or liquidity associated with investing in those securities.
The following is a summary of the inputs used as of August 31, 2022 in valuing the Fund’s investments. For information on the Fund’s policy regarding the valuation of investments, please refer to the Security Valuation section of Note 2 in the accompanying Notes to Financial Statements.
Assets | Level 1 | Level 2 | Level 3 | Total | ||||||||||||
Exchange-Traded Funds | $ | 49,220,227 | $ | — | $ | — | $ | 49,220,227 | ||||||||
Short-Term Investments (a) | 374,305 | — | — | 374,305 | ||||||||||||
|
|
|
|
|
|
|
| |||||||||
TOTAL | $ | 49,594,532 | $ | — | $ | — | $ | 49,594,532 | ||||||||
|
|
|
|
|
|
|
| |||||||||
| (a) | See Schedule of Investments for additional detailed categorizations. |
| See Notes to Financial Statements. | 39 |
DBX ETF Trust
Xtrackers Short Duration High Yield Bond ETF
August 31, 2022
Principal | Value | |||||||
| CORPORATE BONDS — 98.1% | ||||||||
| Basic Materials — 2.7% | ||||||||
| Chemicals — 1.5% | ||||||||
Avient Corp. | $ | 67,000 | $ | 67,087 | ||||
144A, 5.75%, 5/15/25 | 161,000 | 158,985 | ||||||
Chemours Co., | 75,000 | 69,646 | ||||||
Consolidated Energy Finance SA, 144A, | 150,000 | 137,205 | ||||||
INEOS Quattro Finance 2 PLC, 144A, | 115,000 | 99,677 | ||||||
NOVA Chemicals Corp. | 244,000 | 233,929 | ||||||
144A, 5.00%, 5/1/25 | 150,000 | 141,286 | ||||||
144A, 5.25%, 6/1/27 | 250,000 | 221,095 | ||||||
WR Grace Holdings LLC, 144A, | 150,000 | 138,920 | ||||||
|
| |||||||
(Cost $1,328,255) | 1,267,830 | |||||||
|
| |||||||
| Iron/Steel — 0.5% | ||||||||
Cleveland-Cliffs, Inc. | 174,000 | 176,190 | ||||||
5.875%, 6/1/27 | 100,000 | 95,830 | ||||||
Mineral Resources Ltd., 144A, | 150,000 | 150,544 | ||||||
|
| |||||||
(Cost $430,922) | 422,564 | |||||||
|
| |||||||
| Mining — 0.7% | ||||||||
Arconic Corp., | 200,000 | 196,775 | ||||||
FMG Resources August 2006 Pty Ltd., 144A, | 170,000 | 168,511 | ||||||
Hudbay Minerals, Inc., 144A, | 85,000 | 77,265 | ||||||
Novelis Corp., 144A, | 200,000 | 178,379 | ||||||
|
| |||||||
(Cost $667,575) | 620,930 | |||||||
|
| |||||||
| Communications — 18.6% | ||||||||
| Advertising — 0.5% | ||||||||
Clear Channel Outdoor Holdings, Inc., 144A, | 400,000 | 358,756 | ||||||
Outfront Media Capital LLC / Outfront Media Capital Corp., 144A, | 65,000 | 64,504 | ||||||
|
| |||||||
(Cost $425,664) | 423,260 | |||||||
|
| |||||||
| Internet — 1.0% | ||||||||
NortonLifeLock, Inc., 144A, | 130,000 | 128,310 | ||||||
Photo Holdings Merger Sub, Inc., 144A, | 150,000 | 112,241 | ||||||
Uber Technologies, Inc. | 175,000 | 176,470 | ||||||
144A, 8.00%, 11/1/26 | 450,000 | 455,158 | ||||||
|
| |||||||
(Cost $934,782) | 872,179 | |||||||
|
| |||||||
Principal | Value | |||||||
| Media — 8.1% | ||||||||
AMC Networks, Inc. | $ | 111,000 | $ | 108,382 | ||||
4.75%, 8/1/25 | 155,000 | 143,769 | ||||||
Audacy Capital Corp., 144A, | 101,000 | 33,220 | ||||||
CCO Holdings LLC / CCO Holdings Capital Corp. | 133,000 | 132,628 | ||||||
144A, 5.50%, 5/1/26 | 100,000 | 99,127 | ||||||
144A, 5.125%, 5/1/27 | 740,000 | 703,370 | ||||||
CSC Holdings LLC | 219,000 | 218,781 | ||||||
5.25%, 6/1/24 | 154,000 | 150,332 | ||||||
144A, 5.50%, 4/15/27 | 300,000 | 284,854 | ||||||
Diamond Sports Group LLC / Diamond Sports Finance Co., 144A, | 626,000 | 119,722 | ||||||
Directv Financing LLC / Directv Financing Co.-Obligor, Inc., 144A, | 775,000 | 716,007 | ||||||
DISH DBS Corp. | 278,000 | 272,409 | ||||||
5.875%, 11/15/24 | 427,000 | 386,952 | ||||||
7.75%, 7/1/26 | 507,000 | 399,729 | ||||||
144A, 5.25%, 12/1/26 | 590,000 | 488,225 | ||||||
Gray Television, Inc. | 160,000 | 154,654 | ||||||
144A, 7.00%, 5/15/27 | 161,000 | 159,005 | ||||||
iHeartCommunications, Inc. | 230,000 | 217,626 | ||||||
8.375%, 5/1/27 | 312,000 | 274,179 | ||||||
Nexstar Media, Inc., 144A, | 400,000 | 381,352 | ||||||
Radiate Holdco LLC / Radiate Finance, Inc., 144A, | 174,000 | 150,292 | ||||||
Sirius XM Radio, Inc., 144A, | 270,000 | 240,808 | ||||||
TEGNA, Inc., 144A, | 102,000 | 100,104 | ||||||
Univision Communications, Inc. | 337,000 | 325,946 | ||||||
144A, 6.625%, 6/1/27 | 300,000 | 289,886 | ||||||
Videotron Ltd., 144A, | 261,000 | 259,575 | ||||||
Ziggo Bond Co. BV, 144A, | 135,000 | 121,797 | ||||||
|
| |||||||
(Cost $7,764,742) | 6,932,731 | |||||||
|
| |||||||
| Telecommunications — 9.0% | ||||||||
Altice France Holding SA, 144A, | 325,000 | 281,017 | ||||||
Altice France SA, 144A, | 400,000 | 379,000 | ||||||
CommScope Technologies LLC | 266,000 | 241,735 | ||||||
144A, 5.00%, 3/15/27 | 150,000 | 118,609 | ||||||
| See Notes to Financial Statements. | 40 |
DBX ETF Trust
Schedule of Investments
Xtrackers Short Duration High Yield Bond ETF (Continued)
August 31, 2022
Principal | Value | |||||||
| Telecommunications (Continued) | ||||||||
CommScope, Inc. | $ | 355,000 | $ | 335,937 | ||||
144A, 8.25%, 3/1/27 | 212,000 | 182,055 | ||||||
Connect Finco SARL / Connect US Finco LLC, 144A, | 400,000 | 366,793 | ||||||
DKT Finance ApS, 144A, | 88,000 | 85,052 | ||||||
Hughes Satellite Systems Corp. | 125,000 | 119,249 | ||||||
6.625%, 8/1/26 | 160,000 | 151,662 | ||||||
Iliad Holding SASU, 144A, | 250,000 | 228,778 | ||||||
Lumen Technologies, Inc. | 245,000 | 248,109 | ||||||
Series Y, 7.50%, 4/1/24 | 194,000 | 195,804 | ||||||
5.625%, 4/1/25 | 97,000 | 94,227 | ||||||
144A, 5.125%, 12/15/26 | 318,000 | 275,194 | ||||||
144A, 4.00%, 2/15/27 | 250,000 | 217,772 | ||||||
Nokia OYJ, | 100,000 | 95,477 | ||||||
Quebecor Media, Inc., | 157,000 | 157,198 | ||||||
Sprint Communications LLC, | 457,000 | 458,526 | ||||||
Sprint Corp. | 993,000 | 1,025,317 | ||||||
7.125%, 6/15/24 | 595,000 | 615,069 | ||||||
7.625%, 2/15/25 | 478,000 | 500,710 | ||||||
7.625%, 3/1/26 | 265,000 | 280,662 | ||||||
Telecom Italia SpA, 144A, | 259,000 | 249,627 | ||||||
Telesat Canada / Telesat LLC | 130,000 | 76,120 | ||||||
144A, 4.875%, 6/1/27 | 100,000 | 54,375 | ||||||
VEON Holdings BV | 113,000 | 83,344 | ||||||
144A, 4.00%, 4/9/25 | 239,000 | 149,980 | ||||||
Viasat, Inc., 144A, | 236,000 | 208,680 | ||||||
Zayo Group Holdings, Inc., 144A, | 318,000 | 271,513 | ||||||
|
| |||||||
(Cost $8,420,258) | 7,747,591 | |||||||
|
| |||||||
| Consumer, Cyclical — 25.6% | ||||||||
| Airlines — 2.3% | ||||||||
Air Canada, 144A, | 282,000 | 252,018 | ||||||
American Airlines Group, Inc., 144A, | 117,000 | 98,478 | ||||||
American Airlines, Inc., 144A, | 484,000 | 535,444 | ||||||
Delta Air Lines, Inc. | 245,000 | 230,055 | ||||||
7.375%, 1/15/26 | 284,000 | 289,655 | ||||||
Principal | Value | |||||||
| Airlines (Continued) | ||||||||
Hawaiian Brand Intellectual Property Ltd. / HawaiianMiles Loyalty Ltd., 144A, | $ | 237,252 | $ | 216,884 | ||||
United Airlines, Inc., 144A, | 370,000 | 337,843 | ||||||
|
| |||||||
(Cost $2,132,827) | 1,960,377 | |||||||
|
| |||||||
| Apparel — 0.3% | ||||||||
Hanesbrands, Inc. | 137,000 | 132,136 | ||||||
144A, 4.875%, 5/15/26 | 172,000 | 158,462 | ||||||
|
| |||||||
(Cost $322,103) | 290,598 | |||||||
|
| |||||||
| Auto Manufacturers — 3.2% | ||||||||
Ford Motor Co. | 260,000 | 291,127 | ||||||
4.346%, 12/8/26 (a) | 300,000 | 288,117 | ||||||
Ford Motor Credit Co. LLC | 115,000 | 114,531 | ||||||
3.664%, 9/8/24 | 122,000 | 117,083 | ||||||
4.063%, 11/1/24 | 200,000 | 194,403 | ||||||
4.687%, 6/9/25 | 200,000 | 192,301 | ||||||
5.125%, 6/16/25 | 200,000 | 195,367 | ||||||
4.134%, 8/4/25 | 125,000 | 118,249 | ||||||
3.375%, 11/13/25 | 330,000 | 301,732 | ||||||
GMTN, 4.389%, 1/8/26 | 200,000 | 187,872 | ||||||
4.542%, 8/1/26 | 82,000 | 76,603 | ||||||
2.70%, 8/10/26 | 200,000 | 174,270 | ||||||
4.271%, 1/9/27 | 98,000 | 89,927 | ||||||
4.95%, 5/28/27 | 200,000 | 188,044 | ||||||
Jaguar Land Rover Automotive PLC | 108,000 | 105,501 | ||||||
144A, 7.75%, 10/15/25 | 156,000 | 143,139 | ||||||
|
| |||||||
(Cost $2,958,047) | 2,778,266 | |||||||
|
| |||||||
| Auto Parts & Equipment — 2.0% | ||||||||
Adient Global Holdings Ltd., 144A, | 250,000 | 231,671 | ||||||
American Axle & Manufacturing, Inc., | 75,000 | 70,247 | ||||||
Clarios Global LP, 144A, | 134,000 | 133,480 | ||||||
Clarios Global LP / Clarios US Finance Co. | 265,000 | 262,369 | ||||||
144A,8.50%, 5/15/27 | 365,000 | 356,587 | ||||||
Goodyear Tire & Rubber Co. | 196,000 | 189,378 | ||||||
4.875%, 3/15/27 | 150,000 | 141,049 | ||||||
Tenneco, Inc., | 97,000 | 92,774 | ||||||
ZF North America Capital, Inc., 144A, | 266,000 | 246,715 | ||||||
|
| |||||||
(Cost $1,815,352) | 1,724,270 | |||||||
|
| |||||||
| Entertainment — 4.4% | ||||||||
AMC Entertainment Holdings, Inc., 144A,, | 330,000 | 265,279 | ||||||
| See Notes to Financial Statements. | 41 |
DBX ETF Trust
Schedule of Investments
Xtrackers Short Duration High Yield Bond ETF (Continued)
August 31, 2022
Principal | Value | |||||||
| Entertainment (Continued) | ||||||||
Banijay Entertainment SASU, 144A, | $ | 125,000 | $ | 118,022 | ||||
Caesars Entertainment, Inc. | 709,000 | 693,189 | ||||||
144A,8.125%, 7/1/27 | 400,000 | 394,076 | ||||||
Caesars Resort Collection LLC / CRC Finco, Inc., 144A, | 218,000 | 213,915 | ||||||
Cedar Fair LP / Canada’s Wonderland Co. / Magnum Management Corp. / Millennium Op 144A, | 192,000 | 188,584 | ||||||
5.375%, 4/15/27 | 200,000 | 188,978 | ||||||
Cinemark USA, Inc., 144A, | 78,000 | 69,316 | ||||||
International Game Technology PLC | 175,000 | 173,907 | ||||||
144A, 4.125%, 4/15/26 | 220,000 | 201,960 | ||||||
144A, 6.25%, 1/15/27 | 200,000 | 196,104 | ||||||
Live Nation Entertainment, Inc. | 126,000 | 122,127 | ||||||
144A, 6.50%, 5/15/27 | 258,000 | 257,920 | ||||||
Mohegan Gaming & Entertainment, 144A, | 261,000 | 228,421 | ||||||
Penn Entertainment, Inc., 144A, | 100,000 | 91,609 | ||||||
Scientific Games International, Inc., 144A, | 52,000 | 53,526 | ||||||
Six Flags Entertainment Corp., 144A, | 315,000 | 302,695 | ||||||
Vail Resorts, Inc., 144A, | 50,000 | 50,136 | ||||||
|
| |||||||
(Cost $4,064,751) | 3,809,764 | |||||||
|
| |||||||
| Food Service — 0.5% | ||||||||
Aramark Services, Inc., 144A, | ||||||||
(Cost $420,920) | 410,000 | 406,929 | ||||||
|
| |||||||
| Home Builders — 0.4% | ||||||||
Century Communities, Inc., | 100,000 | 98,228 | ||||||
Meritage Homes Corp., | 164,000 | 164,112 | ||||||
Taylor Morrison Communities, Inc., 144A, | 100,000 | 96,753 | ||||||
|
| |||||||
(Cost $362,554) | 359,093 | |||||||
|
| |||||||
| Housewares — 0.9% | ||||||||
Newell Brands, Inc. | 189,000 | 188,537 | ||||||
4.875%, 6/1/25 | 68,000 | 66,763 | ||||||
4.45%, 4/1/26 | 505,000 | 475,594 | ||||||
|
| |||||||
(Cost $803,896) | 730,894 | |||||||
|
| |||||||
| Leisure Time — 4.3% | ||||||||
Carnival Corp. 144A, | 150,000 | 154,695 | ||||||
Principal | Value | |||||||
| Leisure Time (Continued) | ||||||||
144A, 7.625%, 3/1/26 (a) | $ | 329,000 | $ | 280,094 | ||||
144A, 5.75%, 3/1/27 | 740,000 | 577,788 | ||||||
Life Time, Inc. | 179,000 | 161,544 | ||||||
144A,8.00%, 4/15/26 | 100,000 | 88,436 | ||||||
NCL Corp. Ltd. | 300,000 | 260,421 | ||||||
144A, 5.875%, 3/15/26 | 200,000 | 162,000 | ||||||
144A, 5.875%, 2/15/27 | 200,000 | 181,538 | ||||||
Royal Caribbean Cruises Ltd. | 155,000 | 155,153 | ||||||
144A, 10.875%, 6/1/23 | 194,000 | 197,766 | ||||||
144A, 9.125%, 6/15/23 | 185,000 | 187,078 | ||||||
144A, 11.50%, 6/1/25 | 358,000 | 379,949 | ||||||
144A, 4.25%, 7/1/26 | 110,000 | 84,674 | ||||||
144A, 5.50%, 8/31/26 | 250,000 | 203,463 | ||||||
144A, 5.375%, 7/15/27 | 200,000 | 155,487 | ||||||
144A, 11.625%, 8/15/27 | 300,000 | 295,212 | ||||||
Viking Cruises Ltd., 144A, | 152,000 | 159,741 | ||||||
|
| |||||||
(Cost $4,094,040) | 3,685,039 | |||||||
|
| |||||||
| Lodging — 3.9% | ||||||||
Hilton Domestic Operating Co., Inc., 144A, | 81,000 | 80,492 | ||||||
Hilton Worldwide Finance LLC / Hilton Worldwide Finance Corp., | 129,000 | 123,357 | ||||||
Las Vegas Sands Corp. | 400,000 | 378,856 | ||||||
2.90%, 6/25/25 | 100,000 | 92,290 | ||||||
3.50%, 8/18/26 | 200,000 | 179,883 | ||||||
Melco Resorts Finance Ltd. | 200,000 | 152,804 | ||||||
144A, 5.25%, 4/26/26 | 185,000 | 136,366 | ||||||
144A, 5.625%, 7/17/27 | 100,000 | 71,086 | ||||||
MGM Resorts International | 252,000 | 252,343 | ||||||
6.75%, 5/1/25 | 91,000 | 91,062 | ||||||
5.75%, 6/15/25 (a) | 192,000 | 186,557 | ||||||
4.625%, 9/1/26 | 120,000 | 109,341 | ||||||
5.50%, 4/15/27 | 175,000 | 162,256 | ||||||
Travel + Leisure Co. | 177,000 | 175,548 | ||||||
144A, 6.625%, 7/31/26 | 126,000 | 122,327 | ||||||
6.00%, 4/1/27 | 86,000 | 81,781 | ||||||
Wynn Las Vegas LLC / Wynn Las Vegas Capital Corp. | 423,000 | 416,329 | ||||||
144A, 5.50%, 3/1/25 | 394,000 | 377,797 | ||||||
144A, 5.25%, 5/15/27 | 194,000 | 175,316 | ||||||
|
| |||||||
(Cost $3,555,176) | 3,365,791 | |||||||
|
| |||||||
| Retail — 3.2% | ||||||||
1011778 BC ULC / New Red Finance, Inc., 144A, | 147,000 | 147,994 | ||||||
| See Notes to Financial Statements. | 42 |
DBX ETF Trust
Schedule of Investments
Xtrackers Short Duration High Yield Bond ETF (Continued)
August 31, 2022
Principal | Value | |||||||
| Retail (Continued) | ||||||||
Carvana Co. | $ | 165,000 | $ | 123,863 | ||||
144A, 5.50%, 4/15/27 | 100,000 | 64,971 | ||||||
eG Global Finance PLC | 200,000 | 189,263 | ||||||
144A,8.50%, 10/30/25 | 90,000 | 84,171 | ||||||
Ferrellgas LP / Ferrellgas Finance Corp., 144A, | 126,000 | 109,809 | ||||||
Guitar Center, Inc., 144A, | 120,000 | 111,176 | ||||||
IRB Holding Corp., 144A, | 161,000 | 161,933 | ||||||
KFC Holding Co./Pizza Hut Holdings LLC/Taco Bell of America LLC, 144A, | 150,000 | 144,223 | ||||||
NMG Holding Co, Inc. / Neiman Marcus Group LLC, 144A, | 204,000 | 191,209 | ||||||
Party City Holdings, Inc., 144A, | 130,000 | 85,358 | ||||||
Penske Automotive Group, Inc., | 150,000 | 141,057 | ||||||
QVC, Inc. | 116,000 | 111,771 | ||||||
4.45%, 2/15/25 | 166,000 | 152,696 | ||||||
4.75%, 2/15/27 | 50,000 | 41,372 | ||||||
Rite Aid Corp. | 165,000 | 140,747 | ||||||
144A,8.00%, 11/15/26 | 185,000 | 151,097 | ||||||
Staples, Inc. | 500,000 | 423,140 | ||||||
144A, 10.75%, 4/15/27 (a) | 200,000 | 147,301 | ||||||
|
| |||||||
(Cost $3,114,744) | 2,723,151 | |||||||
|
| |||||||
| Toys/Games/Hobbies — 0.2% | ||||||||
Mattel, Inc., 144A, | ||||||||
(Cost $217,241) | 218,000 | 198,450 | ||||||
|
| |||||||
| Consumer, Non-cyclical — 13.0% | ||||||||
| Agriculture — 0.1% | ||||||||
Vector Group Ltd., 144A, | ||||||||
(Cost $113,090) | 110,000 | 106,641 | ||||||
|
| |||||||
| Commercial Services — 3.5% | ||||||||
ADT Security Corp., | 218,000 | 215,556 | ||||||
Allied Universal Holdco LLC / Allied Universal Finance Corp. | 359,000 | 336,562 | ||||||
144A, 9.75%, 7/15/27 | 200,000 | 180,694 | ||||||
APX Group, Inc., 144A, | 214,000 | 209,892 | ||||||
Block, Inc., | 230,000 | 204,565 | ||||||
CoreCivic, Inc., | 140,000 | 139,749 | ||||||
Principal | Value | |||||||
| Commercial Services (Continued) | ||||||||
Garda World Security Corp., 144A, | $ | 125,000 | $ | 110,048 | ||||
Grand Canyon University, | 108,000 | 102,682 | ||||||
Herc Holdings, Inc., 144A, | 300,000 | 283,975 | ||||||
Hertz Corp., 144A, | 100,000 | 85,260 | ||||||
Nielsen Co. Luxembourg SARL, 144A, | 132,000 | 132,762 | ||||||
Prime Security Services Borrower LLC / Prime Finance, Inc. | 112,000 | 111,125 | ||||||
144A, 5.75%, 4/15/26 | 243,000 | 234,177 | ||||||
Sabre GLBL, Inc. | 209,000 | 206,733 | ||||||
144A, 7.375%, 9/1/25 | 167,000 | 158,441 | ||||||
United Rentals North America, Inc., | 100,000 | 99,425 | ||||||
Verscend Escrow Corp., 144A, | 200,000 | 202,260 | ||||||
|
| |||||||
(Cost $3,210,215) | 3,013,906 | |||||||
|
| |||||||
| Cosmetics/Personal Care — 0.3% | ||||||||
Coty, Inc. | 174,000 | 165,105 | ||||||
144A, 6.50%, 4/15/26 | 127,000 | 121,333 | ||||||
|
| |||||||
(Cost $304,436) | 286,438 | |||||||
|
| |||||||
| Food — 1.5% | ||||||||
Albertsons Cos., Inc. / Safeway, Inc. / New Albertsons LP / Albertsons LLC | 137,000 | 135,812 | ||||||
144A, 3.25%, 3/15/26 | 145,000 | 130,928 | ||||||
144A, 7.50%, 3/15/26 | 150,000 | 153,062 | ||||||
144A, 4.625%, 1/15/27 | 280,000 | 255,858 | ||||||
B&G Foods, Inc., | 220,000 | 196,036 | ||||||
Post Holdings, Inc., 144A, | 100,000 | 97,856 | ||||||
Sigma Holdco BV, 144A, | 105,000 | 75,085 | ||||||
US Foods, Inc., 144A, | 269,000 | 270,664 | ||||||
|
| |||||||
(Cost $1,418,125) | 1,315,301 | |||||||
|
| |||||||
| Healthcare-Services — 3.7% | ||||||||
CHS/Community Health Systems, Inc. | 457,000 | 427,866 | ||||||
144A, 5.625%, 3/15/27 | 400,000 | 339,956 | ||||||
IQVIA, Inc. | 225,000 | 218,261 | ||||||
144A, 5.00%, 5/15/27 | 237,000 | 229,462 | ||||||
Legacy LifePoint Health LLC | 136,000 | 133,728 | ||||||
144A, 4.375%, 2/15/27 | 170,000 | 148,018 | ||||||
ModivCare, Inc., 144A, | 120,000 | 113,177 | ||||||
| See Notes to Financial Statements. | 43 |
DBX ETF Trust
Schedule of Investments
Xtrackers Short Duration High Yield Bond ETF (Continued)
August 31, 2022
Principal | Value | |||||||
| Healthcare-Services (Continued) | ||||||||
RegionalCare Hospital Partners Holdings, Inc. / LifePoint Health, Inc., 144A, | $ | 260,000 | $ | 248,547 | ||||
Select Medical Corp., 144A, | 277,000 | 265,325 | ||||||
Tenet Healthcare Corp. | 90,000 | 88,245 | ||||||
144A, 4.625%, 9/1/24 | 131,000 | 127,541 | ||||||
144A, 4.875%, 1/1/26 | 539,000 | 514,381 | ||||||
144A, 6.25%, 2/1/27 | 300,000 | 289,650 | ||||||
|
| |||||||
(Cost $3,392,504) | 3,144,157 | |||||||
|
| |||||||
| Household Products/Wares — 0.1% | ||||||||
Kronos Acquisition Holdings, Inc. / KIK Custom Products, Inc., 144A, (Cost $99,112) | 101,000 | 91,637 | ||||||
|
| |||||||
| Pharmaceuticals — 3.8% | ||||||||
Bausch Health Americas, Inc. | 300,000 | 176,745 | ||||||
144A, 8.50%, 1/31/27 | 400,000 | 188,692 | ||||||
Bausch Health Cos., Inc. | 328,000 | 272,637 | ||||||
144A, 9.00%, 12/15/25 | 291,000 | 184,603 | ||||||
144A, 6.125%, 2/1/27 | 297,000 | 222,168 | ||||||
Mallinckrodt International Finance SA / Mallinckrodt CB LLC, 144A, | 100,000 | 90,117 | ||||||
Perrigo Finance Unlimited Co. | 120,000 | 114,570 | ||||||
4.375%, 3/15/26 | 200,000 | 190,499 | ||||||
Teva Pharmaceutical Finance Co. BV, | 209,000 | 207,815 | ||||||
Teva Pharmaceutical Finance Netherlands III BV | 297,000 | 285,254 | ||||||
6.00%, 4/15/24 | 190,000 | 184,841 | ||||||
7.125%, 1/31/25 | 386,000 | 382,655 | ||||||
3.15%, 10/1/26 | 779,000 | 655,365 | ||||||
4.75%, 5/9/27 | 115,000 | 100,738 | ||||||
|
| |||||||
(Cost $4,019,095) | 3,256,699 | |||||||
|
| |||||||
| Energy — 11.7% | ||||||||
| Oil & Gas — 6.8% | ||||||||
Ascent Resources Utica Holdings LLC / ARU Finance Corp., 144A, | 120,000 | 116,870 | ||||||
Calumet Specialty Products Partners LP / Calumet Finance Corp., 144A, | 118,000 | 123,769 | ||||||
Chesapeake Energy Corp., 144A, | 130,000 | 125,455 | ||||||
Citgo Holding, Inc., 144A, | 251,000 | 251,283 | ||||||
CITGO Petroleum Corp., 144A, | 418,000 | 407,021 | ||||||
Principal | Value | |||||||
| Oil & Gas (Continued) | ||||||||
CNX Resources Corp., 144A, | $ | 100,000 | $ | 99,345 | ||||
CrownRock LP / CrownRock Finance, Inc., 144A, | 230,000 | 226,883 | ||||||
CVR Energy, Inc., 144A, | 27,000 | 25,510 | ||||||
Laredo Petroleum, Inc., | 169,000 | 169,810 | ||||||
Leviathan Bond Ltd. | 107,000 | 106,961 | ||||||
144A, REGS, 6.125%, 6/30/25 | 208,000 | 204,880 | ||||||
144A, REGS, 6.50%, 6/30/27 | 150,000 | 146,250 | ||||||
Matador Resources Co., | 226,000 | 221,489 | ||||||
MEG Energy Corp., 144A, | 250,000 | 252,937 | ||||||
Moss Creek Resources Holdings, Inc., 144A, | 256,000 | 233,215 | ||||||
Murphy Oil Corp., | 100,000 | 99,220 | ||||||
Nabors Industries Ltd., 144A, | 110,000 | 100,176 | ||||||
Nabors Industries, Inc. | 119,000 | 109,894 | ||||||
144A, 7.375%, 5/15/27 | 150,000 | 145,004 | ||||||
Occidental Petroleum Corp. | 150,000 | 156,750 | ||||||
2.90%, 8/15/24 | 276,000 | 269,250 | ||||||
8.00%, 7/15/25 | 50,000 | 54,376 | ||||||
5.875%, 9/1/25 | 264,000 | 270,964 | ||||||
5.50%, 12/1/25 | 100,000 | 102,823 | ||||||
5.55%, 3/15/26 | 194,000 | 198,947 | ||||||
Parkland Corp., 144A, | 100,000 | 96,741 | ||||||
PBF Holding Co. LLC / PBF Finance Corp., | 130,000 | 126,425 | ||||||
Puma International Financing SA | 200,000 | 186,901 | ||||||
144A, 5.00%, 1/24/26 | 200,000 | 176,761 | ||||||
Range Resources Corp. | 217,000 | 217,008 | ||||||
4.875%, 5/15/25 | 151,000 | 146,744 | ||||||
SM Energy Co., | 100,000 | 97,639 | ||||||
Sunoco LP / Sunoco Finance Corp., | 129,000 | 125,022 | ||||||
Transocean, Inc. | 162,000 | 129,372 | ||||||
144A, 7.50%, 1/15/26 | 111,000 | 85,698 | ||||||
144A, 11.50%, 1/30/27 | 140,000 | 135,132 | ||||||
144A, 8.00%, 2/1/27 | 100,000 | 74,399 | ||||||
|
| |||||||
(Cost $5,880,036) | 5,816,924 | |||||||
|
| |||||||
| See Notes to Financial Statements. | 44 |
DBX ETF Trust
Schedule of Investments
Xtrackers Short Duration High Yield Bond ETF (Continued)
August 31, 2022
Principal | Value | |||||||
| Oil & Gas Services — 0.4% | ||||||||
Archrock Partners LP / Archrock Partners Finance Corp., 144A, | $ | 100,000 | $ | 93,889 | ||||
CGG SA, 144A, | 100,000 | 89,261 | ||||||
USA Compression Partners LP / USA Compression Finance Corp., | 212,000 | 199,189 | ||||||
|
| |||||||
(Cost $416,190) | 382,339 | |||||||
|
| |||||||
| Pipelines — 4.5% | ||||||||
Antero Midstream Partners LP / Antero Midstream Finance Corp. | 75,000 | 76,445 | ||||||
144A, 5.75%, 3/1/27 | 140,000 | 132,874 | ||||||
Buckeye Partners LP | 68,000 | 66,896 | ||||||
144A, 4.125%, 3/1/25 | 98,000 | 91,774 | ||||||
3.95%, 12/1/26 | 203,000 | 180,548 | ||||||
Crestwood Midstream Partners LP / Crestwood Midstream Finance Corp. | 50,000 | 48,259 | ||||||
144A, 5.625%, 5/1/27 | 129,000 | 120,478 | ||||||
DCP Midstream Operating LP, | 73,000 | 72,908 | ||||||
EnLink Midstream Partners LP | 20,000 | 19,522 | ||||||
4.85%, 7/15/26 | 166,000 | 163,536 | ||||||
EQM Midstream Partners LP | 63,000 | 60,917 | ||||||
4.125%, 12/1/26 | 120,000 | 108,332 | ||||||
144A, 7.50%, 6/1/27 | 100,000 | 98,844 | ||||||
144A, 6.50%, 7/1/27 | 200,000 | 193,414 | ||||||
Genesis Energy LP / Genesis Energy Finance Corp. | 110,000 | 103,233 | ||||||
8.00%, 1/15/27 | 210,000 | 197,749 | ||||||
Hess Midstream Operations LP, 144A, | 147,000 | 143,605 | ||||||
New Fortress Energy, Inc. | 282,000 | 272,206 | ||||||
144A, 6.50%, 9/30/26 | 310,000 | 292,451 | ||||||
NGL Energy Operating LLC / NGL Energy Finance Corp., 144A, | 420,000 | 380,241 | ||||||
NGL Energy Partners LP / NGL Energy Finance Corp., | 116,000 | 109,932 | ||||||
NuStar Logistics LP | 131,000 | 125,217 | ||||||
6.00%, 6/1/26 | 150,000 | 141,794 | ||||||
5.625%, 4/28/27 | 200,000 | 182,399 | ||||||
Rockies Express Pipeline LLC, 144A, | 54,000 | 49,695 | ||||||
Tallgrass Energy Partners LP / Tallgrass Energy Finance Corp. | 113,000 | 113,308 | ||||||
144A, 6.00%, 3/1/27 | 90,000 | 82,266 | ||||||
Principal | Value | |||||||
| Pipelines (Continued) | ||||||||
Western Midstream Operating LP | $ | 200,000 | $ | 189,072 | ||||
4.65%, 7/1/26 | 83,000 | 79,128 | ||||||
|
| |||||||
(Cost $4,131,054) | 3,897,043 | |||||||
|
| |||||||
| Financial — 11.2% | ||||||||
| Banks — 1.6% | ||||||||
Commerzbank AG, 144A, | 286,000 | 292,300 | ||||||
Freedom Mortgage Corp. | 112,000 | 100,678 | ||||||
144A, 8.25%, 4/15/25 | 61,000 | 52,863 | ||||||
144A, 7.625%, 5/1/26 | 142,000 | 116,479 | ||||||
144A, 6.625%, 1/15/27 | 142,000 | 109,832 | ||||||
Intesa Sanpaolo SpA | 400,000 | 382,924 | ||||||
144A, 5.71%, 1/15/26 | 340,000 | 319,525 | ||||||
|
| |||||||
(Cost $1,526,367) | 1,374,601 | |||||||
|
| |||||||
| Diversified Financial Services — 3.7% | ||||||||
Ally Financial, Inc., | 180,000 | 182,155 | ||||||
LD Holdings Group LLC, 144A, | 95,000 | 54,669 | ||||||
Nationstar Mortgage Holdings, Inc., 144A, | 120,000 | 107,048 | ||||||
Navient Corp. | 181,000 | 180,307 | ||||||
MTN, 6.125%, 3/25/24 | 165,000 | 161,185 | ||||||
5.875%, 10/25/24 | 91,000 | 87,510 | ||||||
6.75%, 6/25/25 | 110,000 | 106,306 | ||||||
6.75%, 6/15/26 | 140,000 | 133,000 | ||||||
5.00%, 3/15/27 | 150,000 | 128,703 | ||||||
OneMain Finance Corp. | 217,000 | 215,357 | ||||||
6.125%, 3/15/24 | 241,000 | 235,599 | ||||||
6.875%, 3/15/25 | 265,000 | 257,967 | ||||||
7.125%, 3/15/26 | 296,000 | 278,810 | ||||||
3.50%, 1/15/27 | 150,000 | 124,086 | ||||||
PennyMac Financial Services, Inc., 144A, | 146,000 | 131,368 | ||||||
Rocket Mortgage LLC / Rocket Mortgage Co.-Issuer, Inc., 144A, | 248,000 | 208,781 | ||||||
SLM Corp. | 200,000 | 183,388 | ||||||
3.125%, 11/2/26 | 100,000 | 84,114 | ||||||
United Wholesale Mortgage LLC | 165,000 | 144,354 | ||||||
144A, 5.75%, 6/15/27 | 100,000 | 82,509 | ||||||
VistaJet Malta Finance PLC / XO Management Holding, Inc., 144A, | 100,000 | 91,780 | ||||||
|
| |||||||
(Cost $3,523,473) | 3,178,996 | |||||||
|
| |||||||
| See Notes to Financial Statements. | 45 |
DBX ETF Trust
Schedule of Investments
Xtrackers Short Duration High Yield Bond ETF (Continued)
August 31, 2022
Principal | Value | |||||||
| Insurance — 0.9% | ||||||||
Acrisure LLC / Acrisure Finance, Inc. | $ | 209,000 | $ | 197,253 | ||||
144A, 10.125%, 8/1/26 | 50,000 | 50,109 | ||||||
AssuredPartners, Inc., 144A, | 226,000 | 219,220 | ||||||
HUB International Ltd., 144A, | 350,000 | 343,333 | ||||||
|
| |||||||
(Cost $836,648) | 809,915 | |||||||
|
| |||||||
| Real Estate — 0.1% | ||||||||
WeWork Cos., Inc., 144A, (Cost $141,338) | 150,000 | 112,133 | ||||||
|
| |||||||
| Real Estate Investment Trusts — 3.8% | ||||||||
Blackstone Mortgage Trust, Inc., 144A, | 129,000 | 112,434 | ||||||
Brookfield Property REIT, Inc. / BPR Cumulus LLC / BPR Nimbus LLC / GGSI Sellco LL | 218,000 | 203,641 | ||||||
144A, 4.50%, 4/1/27 | 150,000 | 128,742 | ||||||
Diversified Healthcare Trust, | 131,000 | 128,936 | ||||||
HAT Holdings I LLC / HAT Holdings II LLC, 144A, | 270,000 | 234,733 | ||||||
iStar, Inc. | 179,000 | 179,302 | ||||||
4.25%, 8/1/25 | 107,000 | 106,924 | ||||||
Ladder Capital Finance Holdings LLLP / Ladder Capital Finance Corp., 144A, | 125,000 | 109,163 | ||||||
MPT Operating Partnership LP / MPT Finance Corp., 5.25%, 8/1/26 | 50,000 | 48,015 | ||||||
Park Intermediate Holdings LLC / PK Domestic Property LLC / PK Finance Co.-Issuer, 144A, | 100,000 | 101,060 | ||||||
RLJ Lodging Trust LP, 144A, | 115,000 | 103,336 | ||||||
SBA Communications Corp., | 250,000 | 228,280 | ||||||
Service Properties Trust | 295,000 | 264,847 | ||||||
7.50%, 9/15/25 | 211,000 | 202,564 | ||||||
4.75%, 10/1/26 | 100,000 | 81,480 | ||||||
Starwood Property Trust, Inc. 144A, | 90,000 | 84,040 | ||||||
4.75%, 3/15/25 | 70,000 | 66,753 | ||||||
144A, 3.625%, 7/15/26 | 150,000 | 132,964 | ||||||
144A, 4.375%, 1/15/27 | 100,000 | 89,123 | ||||||
Uniti Group LP / Uniti Fiber Holdings, Inc. / CSL Capital LLC, 144A, | 522,000 | 516,357 | ||||||
XHR LP, 144A, | 117,000 | 113,725 | ||||||
|
| |||||||
(Cost $3,491,088) | 3,236,419 | |||||||
|
| |||||||
Principal | Value | |||||||
| Venture Capital — 1.1% | ||||||||
Icahn Enterprises LP / Icahn Enterprises Finance Corp. | $ | 313,000 | $ | 298,164 | ||||
6.375%, 12/15/25 | 195,000 | 190,612 | ||||||
6.25%, 5/15/26 | 255,000 | 244,897 | ||||||
5.25%, 5/15/27 | 250,000 | 227,719 | ||||||
|
| |||||||
(Cost $1,013,710) | 961,392 | |||||||
|
| |||||||
| Industrial — 10.4% | ||||||||
| Aerospace/Defense — 4.2% | ||||||||
Bombardier, Inc. | 85,000 | 84,351 | ||||||
144A, 7.50%, 3/15/25 | 249,000 | 243,993 | ||||||
144A, 7.125%, 6/15/26 | 282,000 | 269,087 | ||||||
144A, 7.875%, 4/15/27 | 400,000 | 383,514 | ||||||
Howmet Aerospace, Inc. | 248,000 | 246,810 | ||||||
6.875%, 5/1/25 | 129,000 | 132,636 | ||||||
Rolls-Royce PLC, 144A, | 186,000 | 168,507 | ||||||
Spirit AeroSystems, Inc. | 130,000 | 127,473 | ||||||
144A, 7.50%, 4/15/25 | 145,000 | 142,056 | ||||||
TransDigm, Inc. | 195,000 | 199,965 | ||||||
144A, 6.25%, 3/15/26 | 1,015,000 | 998,481 | ||||||
6.375%, 6/15/26 | 205,000 | 197,045 | ||||||
7.50%, 3/15/27 | 125,000 | 122,049 | ||||||
Triumph Group, Inc. | 138,000 | 139,930 | ||||||
144A, 6.25%, 9/15/24 | 71,000 | 65,142 | ||||||
7.75%, 8/15/25 | 118,000 | 99,544 | ||||||
|
| |||||||
(Cost $3,721,401) | 3,620,583 | |||||||
|
| |||||||
| Building Materials — 0.2% | ||||||||
JELD-WEN, Inc., 144A, | 95,000 | 81,835 | ||||||
Standard Industries, Inc., 144A, | 100,000 | 91,720 | ||||||
|
| |||||||
(Cost $192,762) | 173,555 | |||||||
|
| |||||||
| Electrical Components & Equipment — 0.4% | ||||||||
WESCO Distribution, Inc., 144A, (Cost $335,370) | 325,000 | 325,450 | ||||||
|
| |||||||
| Electronics — 0.3% | ||||||||
Sensata Technologies BV | 76,000 | 76,766 | ||||||
144A, 5.625%, 11/1/24 | 66,000 | 66,432 | ||||||
144A, 5.00%, 10/1/25 | 156,000 | 153,024 | ||||||
|
| |||||||
(Cost $312,245) | 296,222 | |||||||
|
| |||||||
| Engineering & Construction — 0.2% | ||||||||
Brand Industrial Services, Inc., 144A, (Cost $200,896) | 203,000 | 164,678 | ||||||
|
| |||||||
| See Notes to Financial Statements. | 46 |
DBX ETF Trust
Schedule of Investments
Xtrackers Short Duration High Yield Bond ETF (Continued)
August 31, 2022
Principal | Value | |||||||
| Environmental Control — 0.7% | ||||||||
GFL Environmental, Inc. | $ | 282,000 | $ | 269,618 | ||||
144A, 3.75%, 8/1/25 | 130,000 | 122,995 | ||||||
Stericycle, Inc., 144A, | 199,000 | 195,014 | ||||||
|
| |||||||
(Cost $618,209) | 587,627 | |||||||
|
| |||||||
| Machinery-Diversified — 0.4% | ||||||||
TK Elevator US Newco, Inc., 144A, (Cost $337,092) | 350,000 | 319,793 | ||||||
|
| |||||||
| Miscellaneous Manufacturing — 0.4% | ||||||||
FXI Holdings, Inc. | 140,000 | 116,298 | ||||||
144A, 12.25%, 11/15/26 | 185,000 | 154,656 | ||||||
Hillenbrand, Inc., | 94,000 | 94,266 | ||||||
|
| |||||||
(Cost $434,290) | 365,220 | |||||||
|
| |||||||
| Packaging & Containers — 3.4% | ||||||||
Ardagh Packaging Finance PLC / Ardagh Holdings USA, Inc. | 215,000 | 203,816 | ||||||
144A, 4.125%, 8/15/26 | 265,000 | 228,936 | ||||||
144A, 5.25%, 8/15/27 | 210,000 | 152,195 | ||||||
144A, 5.25%, 8/15/27 | 200,000 | 144,948 | ||||||
Ball Corp. | 185,000 | 183,291 | ||||||
5.25%, 7/1/25 | 250,000 | 249,689 | ||||||
4.875%, 3/15/26 | 139,000 | 134,760 | ||||||
LABL, Inc. | 185,000 | 176,025 | ||||||
144A, 10.50%, 7/15/27 | 150,000 | 141,976 | ||||||
Mauser Packaging Solutions Holding Co. | 425,000 | 411,964 | ||||||
144A, 7.25%, 4/15/25 | 250,000 | 227,935 | ||||||
Owens-Brockway Glass Container, Inc. | 136,000 | 135,347 | ||||||
144A, 6.625%, 5/13/27 (a) | 100,000 | 93,027 | ||||||
Sealed Air Corp. | 50,000 | 49,573 | ||||||
144A, 5.50%, 9/15/25 | 100,000 | 99,648 | ||||||
Trivium Packaging Finance BV | 200,000 | 192,338 | ||||||
144A, 8.50%, 8/15/27 | 150,000 | 142,693 | ||||||
|
| |||||||
(Cost $3,128,133) | 2,968,161 | |||||||
|
| |||||||
| Trucking & Leasing — 0.2% | ||||||||
Fortress Transportation and Infrastructure Investors LLC, 144A, (Cost $142,240) | 141,000 | 131,599 | ||||||
|
| |||||||
| Technology — 2.7% | ||||||||
| Computers — 1.2% | ||||||||
Diebold Nixdorf, Inc. | 89,000 | 54,250 | ||||||
144A, 9.375%, 7/15/25 | 165,000 | 135,672 | ||||||
Principal | Value | |||||||
| Computers (Continued) | ||||||||
Exela Intermediate LLC / Exela Finance, Inc., 144A, | $ | 236,000 | $ | 76,896 | ||||
Presidio Holdings, Inc., 144A, | 100,000 | 93,712 | ||||||
Seagate HDD Cayman | 110,000 | 109,301 | ||||||
4.875%, 3/1/24 | 97,000 | 95,226 | ||||||
4.75%, 1/1/25 | 133,000 | 130,129 | ||||||
4.875%, 6/1/27 | 100,000 | 94,482 | ||||||
Vericast Corp., 144A, | 277,000 | 277,734 | ||||||
|
| |||||||
(Cost $1,235,853) | 1,067,402 | |||||||
|
| |||||||
| Office/Business Equipment — 0.3% | ||||||||
Pitney Bowes, Inc., 144A, | 80,000 | 60,637 | ||||||
Xerox Corp., | 36,000 | 35,835 | ||||||
Xerox Holdings Corp., 144A, | 161,000 | 149,485 | ||||||
|
| |||||||
(Cost $270,894) | 245,957 | |||||||
|
| |||||||
| Semiconductors — 0.1% | ||||||||
ams-OSRAM AG, 144A, (Cost $130,857) | 125,000 | 119,443 | ||||||
|
| |||||||
| Software — 1.1% | ||||||||
Boxer Parent Co., Inc., 144A, | 137,000 | 135,643 | ||||||
Change Healthcare Holdings LLC / Change Healthcare Finance, Inc., 144A, | 232,000 | 229,246 | ||||||
Fair Isaac Corp., 144A, | 80,000 | 77,508 | ||||||
PTC, Inc., 144A, | 162,000 | 152,436 | ||||||
Veritas US, Inc. / Veritas Bermuda Ltd., 144A, | 403,000 | 310,612 | ||||||
|
| |||||||
(Cost $1,024,654) | 905,445 | |||||||
|
| |||||||
| Utilities — 2.2% | ||||||||
| Electric — 1.6% | ||||||||
Calpine Corp., 144A, | 134,000 | 130,255 | ||||||
DPL, Inc., | 80,000 | 75,600 | ||||||
FirstEnergy Corp., | 350,000 | 332,083 | ||||||
NextEra Energy Operating Partners LP, 144A, | 350,000 | 337,968 | ||||||
TransAlta Corp., | 89,000 | 88,897 | ||||||
| See Notes to Financial Statements. | 47 |
DBX ETF Trust
Schedule of Investments
Xtrackers Short Duration High Yield Bond ETF (Continued)
August 31, 2022
Principal | Value | |||||||
| Electric (Continued) | ||||||||
Vistra Operations Co. LLC | $ | 230,000 | $ | 222,369 | ||||
144A, 5.625%, 2/15/27 | 200,000 | 193,018 | ||||||
|
| |||||||
(Cost $1,448,909) | 1,380,190 | |||||||
|
| |||||||
| Gas — 0.6% | ||||||||
AmeriGas Partners LP / AmeriGas Finance Corp. | 121,000 | 119,341 | ||||||
5.50%, 5/20/25 | 107,000 | 101,685 | ||||||
5.875%, 8/20/26 | 175,000 | 166,828 | ||||||
5.75%, 5/20/27 | 113,000 | 106,659 | ||||||
|
| |||||||
(Cost $542,250) | 494,513 | |||||||
|
| |||||||
TOTAL CORPORATE BONDS | 84,470,086 | |||||||
|
| |||||||
Number | Value | |||||||
| SECURITIES LENDING COLLATERAL — 1.0% | ||||||||
DWS Government & Agency Securities Portfolio “DWS Government Cash Institutional Shares”, 2.00% (b)(c) | 821,382 | $ | 821,382 | |||||
|
| |||||||
| CASH EQUIVALENTS — 0.7% | ||||||||
DWS Government Money Market Series “Institutional Shares”, 2.24% (b) | 589,978 | 589,978 | ||||||
|
| |||||||
TOTAL INVESTMENTS — 99.8% (Cost $92,837,745) | $ | 85,881,446 | ||||||
Other assets and liabilities, net — 0.2% | 197,728 | |||||||
|
| |||||||
NET ASSETS — 100.0% | $ | 86,079,174 | ||||||
|
| |||||||
A summary of the Fund’s transactions with affiliated investments during the year ended August 31, 2022 is as follows:
| Value ($) at 8/31/2021 | Purchases Cost ($) | Sales Proceeds ($) | Net Realized Gain/(Loss) ($) | Net Change in Unrealized Appreciation (Depreciation) ($) | Income ($) | Capital Gain Distributions ($) | Number of Shares at 8/31/2022 | Value ($) at 8/31/2022 | ||||||||||||||||||||||||||||
SECURITIES LENDING COLLATERAL — 1.0% |
| |||||||||||||||||||||||||||||||||||
DWS Government & Agency Securities Portfolio “DWS Government Cash Institutional Shares”, 2.00% (b)(c) |
| |||||||||||||||||||||||||||||||||||
| 1,323,612 | — | (502,230 | )(d) | — | — | 6,595 | — | 821,382 | 821,382 | |||||||||||||||||||||||||||
CASH EQUIVALENTS — 0.7% |
| |||||||||||||||||||||||||||||||||||
DWS Government Money Market Series “Institutional Shares”, 2.24% (b) |
| |||||||||||||||||||||||||||||||||||
| 5,311,866 | 23,071,063 | (27,792,951 | ) | — | — | 4,079 | — | 589,978 | 589,978 | |||||||||||||||||||||||||||
|
|
|
|
|
|
|
|
|
|
|
|
|
|
|
|
|
| |||||||||||||||||||
| 6,635,478 | 23,071,063 | (28,295,181 | ) | — | — | 10,674 | — | 1,411,360 | 1,411,360 | |||||||||||||||||||||||||||
|
|
|
|
|
|
|
|
|
|
|
|
|
|
|
|
|
| |||||||||||||||||||
| (a) | All or a portion of these securities were on loan. In addition, “Other assets and liabilities, net” may include pending sales that are also on loan. The value of securities loaned at August 31, 2022 amounted to $1,743,621, which is 2.0% of net assets. |
| (b) | Affiliated fund managed by DWS Investment Management Americas, Inc. The rate shown is the annualized seven-day yield at period end. |
| (c) | Represents cash collateral held in connection with securities lending. Income earned by the Fund is net of borrower rebates. In addition, the Fund held non-cash U.S. Treasury securities collateral having a value of $1,002,868. |
| (d) | Represents the net increase (purchase cost) or decrease (sales proceeds) in the amount invested in cash collateral for the year ended August 31, 2022. |
| GMTN: | Global Medium Term Note |
| MTN: | Medium Term Note |
| REIT: | Real Estate Investment Trust |
| REGS: | Securities sold under Regulation S may not be offered, sold or delivered within the United States or to, or for the account or benefit of, U.S. persons, except pursuant to an exemption from, or in a transaction not subject to, the registration requirements of the Securities Act of 1933. |
| 144A: | Security exempt from registration under Rule 144A of the Securities Act of 1933. These securities may be resold in transactions exempt from registration, normally to qualified institutional buyers. |
| See Notes to Financial Statements. | 48 |
DBX ETF Trust
Schedule of Investments
Xtrackers Short Duration High Yield Bond ETF (Continued)
August 31, 2022
Fair Value Measurements
Various inputs are used in determining the value of the Fund’s investments. These inputs are summarized in three broad levels. Level 1 includes quoted prices in active markets for identical securities. Level 2 includes other significant observable inputs (including quoted prices for similar securities, interest rates, prepayment speeds and credit risk). Level 3 includes significant unobservable inputs (including the Fund’s own assumptions in determining the fair value of investments). The level assigned to the securities valuations may not be an indication of the risk or liquidity associated with investing in those securities.
The following is a summary of the inputs used as of August 31, 2022 in valuing the Fund’s investments. For information on the Fund’s policy regarding the valuation of investments, please refer to the Security Valuation section of Note 2 in the accompanying Notes to Financial Statements.
Assets | Level 1 | Level 2 | Level 3 | Total | ||||||||||||
Corporate Bonds (a) | $ | — | $ | 84,470,086 | $ | — | $ | 84,470,086 | ||||||||
Short-Term Investments (a) | 1,411,360 | — | — | 1,411,360 | ||||||||||||
|
|
|
|
|
|
|
| |||||||||
TOTAL | $ | 1,411,360 | $ | 84,470,086 | $ | — | $ | 85,881,446 | ||||||||
|
|
|
|
|
|
|
| |||||||||
| (a) | See Schedule of Investments for additional detailed categorizations. |
| See Notes to Financial Statements. | 49 |
DBX ETF Trust
Xtrackers USD High Yield Corporate Bond ETF
August 31, 2022
Principal | Value | |||||||
| CORPORATE BONDS — 98.5% |
| |||||||
| Basic Materials — 3.6% |
| |||||||
| Chemicals — 1.9% | ||||||||
Ashland LLC, 144A, | $ | 1,763,000 | $ | 1,446,079 | ||||
ASP Unifrax Holdings, Inc. | 3,117,000 | 2,505,085 | ||||||
144A, 7.50%, 9/30/29 (a) | 1,567,000 | 1,148,545 | ||||||
Avient Corp. | 2,532,000 | 2,500,312 | ||||||
144A, 7.125%, 8/1/30 | 2,824,000 | 2,793,917 | ||||||
Axalta Coating Systems LLC, 144A, | 2,727,000 | 2,265,626 | ||||||
Chemours Co. | 1,948,000 | 1,808,932 | ||||||
144A, 5.75%, 11/15/28 | 3,117,000 | 2,794,718 | ||||||
144A, 4.625%, 11/15/29 | 2,532,000 | 2,092,407 | ||||||
Consolidated Energy Finance SA | 1,567,000 | 1,433,335 | ||||||
144A, 5.625%, 10/15/28 | 2,045,000 | 1,687,278 | ||||||
INEOS Quattro Finance 2 PLC, 144A, | 1,959,000 | 1,697,983 | ||||||
Methanex Corp. | 2,727,000 | 2,487,188 | ||||||
5.25%, 12/15/29 | 2,727,000 | 2,293,952 | ||||||
NOVA Chemicals Corp. | 4,091,000 | 3,922,151 | ||||||
144A, 5.00%, 5/1/25 | 1,948,000 | 1,834,832 | ||||||
144A, 5.25%, 6/1/27 | 4,091,000 | 3,617,999 | ||||||
144A, 4.25%, 5/15/29 (a) | 2,240,000 | 1,845,491 | ||||||
Olin Corp. | 1,948,000 | 1,851,340 | ||||||
5.625%, 8/1/29 | 2,607,000 | 2,486,778 | ||||||
5.00%, 2/1/30 (a) | 2,008,000 | 1,824,755 | ||||||
Olympus Water US Holding Corp. | 3,175,000 | 2,585,879 | ||||||
144A, 6.25%, 10/1/29 | 1,569,000 | 1,186,705 | ||||||
SCIH Salt Holdings, Inc. | 4,285,000 | 3,677,239 | ||||||
144A, 6.625%, 5/1/29 | 2,727,000 | 2,249,161 | ||||||
Tronox, Inc., 144A, | 4,188,000 | 3,488,981 | ||||||
Valvoline, Inc. | 2,331,000 | 2,275,522 | ||||||
144A, 3.625%, 6/15/31 | 2,086,000 | 1,683,183 | ||||||
WR Grace Holdings LLC | 2,893,000 | 2,679,294 | ||||||
144A, 5.625%, 8/15/29 | 4,500,000 | 3,566,250 | ||||||
|
| |||||||
(Cost $81,242,391) | 69,730,917 | |||||||
|
| |||||||
| Forest Products & Paper — 0.1% | ||||||||
Mercer International, Inc., (Cost $3,476,524) | 3,397,000 | 2,970,761 | ||||||
|
| |||||||
| Iron/Steel — 0.5% | ||||||||
Cleveland-Cliffs, Inc. | 3,229,000 | 3,269,653 | ||||||
5.875%, 6/1/27 | 2,162,000 | 2,071,845 | ||||||
Principal | Value | |||||||
| Iron/Steel (Continued) | ||||||||
Mineral Resources Ltd. | $ | 2,727,000 | $ | 2,736,884 | ||||
144A, 8.00%, 11/1/27 | 2,435,000 | 2,432,820 | ||||||
144A, 8.50%, 5/1/30 | 2,435,000 | 2,457,121 | ||||||
United States Steel Corp., | 2,727,000 | 2,675,910 | ||||||
|
| |||||||
(Cost $16,253,398) | 15,644,233 | |||||||
|
| |||||||
| Mining — 1.1% | ||||||||
Arconic Corp. | 2,727,000 | 2,683,032 | ||||||
144A, 6.125%, 2/15/28 | 3,506,000 | 3,297,091 | ||||||
Constellium SE, 144A, | 1,959,000 | 1,623,962 | ||||||
FMG Resources August 2006 Pty Ltd. | 2,922,000 | 2,896,403 | ||||||
144A, 4.50%, 9/15/27 | 2,337,000 | 2,138,355 | ||||||
144A, 5.875%, 4/15/30 | 2,727,000 | 2,519,721 | ||||||
144A, 4.375%, 4/1/31 | 5,844,000 | 4,774,256 | ||||||
144A, 6.125%, 4/15/32 | 3,117,000 | 2,885,376 | ||||||
Hudbay Minerals, Inc. | 2,337,000 | 2,124,333 | ||||||
144A, 6.125%, 4/1/29 | 2,337,000 | 2,060,699 | ||||||
Kaiser Aluminum Corp. | 1,959,000 | 1,690,030 | ||||||
144A, 4.50%, 6/1/31 | 2,155,000 | 1,699,573 | ||||||
Novelis Corp. | 2,922,000 | 2,606,117 | ||||||
144A, 4.75%, 1/30/30 | 6,233,000 | 5,430,190 | ||||||
144A, 3.875%, 8/15/31 | 2,922,000 | 2,363,577 | ||||||
|
| |||||||
(Cost $47,055,110) | 40,792,715 | |||||||
|
| |||||||
| Communications — 19.1% |
| |||||||
| Advertising — 0.9% | ||||||||
Clear Channel Outdoor Holdings, Inc. | 4,870,000 | 4,367,854 | ||||||
144A, 7.75%, 4/15/28 | 3,896,000 | 3,176,019 | ||||||
144A, 7.50%, 6/1/29 | 4,091,000 | 3,308,494 | ||||||
CMG Media Corp., 144A, | 3,954,000 | 3,406,886 | ||||||
Lamar Media Corp. | 2,318,000 | 2,082,572 | ||||||
4.00%, 2/15/30 | 2,143,000 | 1,885,829 | ||||||
3.625%, 1/15/31 | 2,143,000 | 1,798,791 | ||||||
Outfront Media Capital LLC / Outfront Media Capital Corp. | 1,567,000 | 1,555,049 | ||||||
144A, 5.00%, 8/15/27 | 2,532,000 | 2,321,072 | ||||||
144A, 4.25%, 1/15/29 | 1,959,000 | 1,648,775 | ||||||
144A, 4.625%, 3/15/30 | 1,959,000 | 1,636,999 | ||||||
Stagwell Global LLC, 144A, | 4,285,000 | 3,640,793 | ||||||
|
| |||||||
(Cost $36,325,497) | 30,829,133 | |||||||
|
| |||||||
| Internet — 1.4% | ||||||||
Arches Buyer, Inc. | 3,692,000 | 2,973,241 | ||||||
144A, 6.125%, 12/1/28 | 1,959,000 | 1,538,403 | ||||||
| See Notes to Financial Statements. | 50 |
DBX ETF Trust
Schedule of Investments
Xtrackers USD High Yield Corporate Bond ETF (Continued)
August 31, 2022
Principal | Value | |||||||
| Internet (Continued) | ||||||||
Go Daddy Operating Co. LLC / GD Finance Co., Inc. | $ | 2,337,000 | $ | 2,199,912 | ||||
144A, 3.50%, 3/1/29 | 3,117,000 | 2,643,278 | ||||||
Match Group Holdings II LLC | 1,755,000 | 1,612,713 | ||||||
144A, 4.625%, 6/1/28 | 1,934,000 | 1,724,393 | ||||||
144A, 4.125%, 8/1/30 | 1,948,000 | 1,614,593 | ||||||
144A, 3.625%, 10/1/31 | 1,959,000 | 1,540,343 | ||||||
NortonLifeLock, Inc., 144A, | 4,285,000 | 4,229,295 | ||||||
Photo Holdings Merger Sub, Inc., 144A, | 3,058,000 | 2,288,212 | ||||||
Twitter, Inc. | 2,727,000 | 2,540,711 | ||||||
144A, 5.00%, 3/1/30 | 3,896,000 | 3,662,828 | ||||||
Uber Technologies, Inc. | 3,896,000 | 3,928,734 | ||||||
144A, 8.00%, 11/1/26 | 5,844,000 | 5,910,982 | ||||||
144A, 7.50%, 9/15/27 | 4,675,000 | 4,686,641 | ||||||
144A, 6.25%, 1/15/28 (a) | 1,948,000 | 1,862,999 | ||||||
144A, 4.50%, 8/15/29 | 5,844,000 | 5,051,408 | ||||||
|
| |||||||
(Cost $55,906,823) | 50,008,686 | |||||||
|
| |||||||
| Media — 10.2% | ||||||||
Altice Financing SA | 4,675,000 | 3,780,010 | ||||||
144A, 5.75%, 8/15/29 | 7,986,000 | 6,451,450 | ||||||
AMC Networks, Inc. | 1,567,000 | 1,530,034 | ||||||
4.75%, 8/1/25 | 3,117,000 | 2,891,146 | ||||||
4.25%, 2/15/29 | 3,896,000 | 3,185,370 | ||||||
Audacy Capital Corp. | 1,803,000 | 593,025 | ||||||
144A, 6.75%, 3/31/29 | 2,116,000 | 639,685 | ||||||
Cable One, Inc., 144A, | 2,532,000 | 2,112,486 | ||||||
CCO Holdings LLC / CCO Holdings Capital Corp. | 2,922,000 | 2,896,491 | ||||||
144A, 5.125%, 5/1/27 | 12,661,000 | 12,034,280 | ||||||
144A, 5.00%, 2/1/28 | 9,739,000 | 8,936,385 | ||||||
144A, 5.375%, 6/1/29 | 5,844,000 | 5,345,507 | ||||||
144A, 6.375%, 9/1/29 | 5,844,000 | 5,664,297 | ||||||
144A, 4.75%, 3/1/30 | 11,882,000 | 10,226,719 | ||||||
144A, 4.50%, 8/15/30 | 10,713,000 | 9,022,489 | ||||||
144A, 4.25%, 2/1/31 | 11,687,000 | 9,550,616 | ||||||
144A, 4.75%, 2/1/32 | 4,675,000 | 3,875,435 | ||||||
4.50%, 5/1/32 | 11,273,000 | 9,147,758 | ||||||
144A, 4.50%, 6/1/33 | 6,818,000 | 5,360,959 | ||||||
144A, 4.25%, 1/15/34 | 7,791,000 | 5,941,494 | ||||||
CSC Holdings LLC | 2,922,000 | 2,852,398 | ||||||
144A, 5.50%, 4/15/27 | 5,103,000 | 4,845,375 | ||||||
144A, 5.375%, 2/1/28 | 3,896,000 | 3,538,951 | ||||||
144A, 7.50%, 4/1/28 | 4,074,000 | 3,628,406 | ||||||
144A, 6.50%, 2/1/29 | 6,818,000 | 6,331,297 | ||||||
Principal | Value | |||||||
| Media (Continued) | ||||||||
144A, 5.75%, 1/15/30 | $ | 8,765,000 | $ | 6,798,704 | ||||
144A, 4.125%, 12/1/30 | 4,285,000 | 3,432,178 | ||||||
144A, 4.625%, 12/1/30 | 9,058,000 | 6,605,592 | ||||||
144A, 3.375%, 2/15/31 | 3,896,000 | 2,924,844 | ||||||
144A, 4.50%, 11/15/31 | 5,844,000 | 4,588,066 | ||||||
144A, 5.00%, 11/15/31 | 1,959,000 | 1,399,063 | ||||||
Diamond Sports Group LLC / Diamond Sports Finance Co. | 11,842,000 | 2,264,782 | ||||||
144A, 6.625%, 8/15/27 | 6,833,000 | 640,662 | ||||||
Directv Financing LLC / Directv Financing Co.-Obligor, Inc., 144A, | 14,414,000 | 13,316,806 | ||||||
DISH DBS Corp. | 7,790,000 | 7,059,376 | ||||||
7.75%, 7/1/26 | 7,774,000 | 6,129,177 | ||||||
144A, 5.25%, 12/1/26 | 10,713,000 | 8,865,007 | ||||||
7.375%, 7/1/28 | 3,892,000 | 2,555,799 | ||||||
144A, 5.75%, 12/1/28 | 9,739,000 | 7,496,723 | ||||||
5.125%, 6/1/29 | 5,843,000 | 3,470,800 | ||||||
Gray Escrow II, Inc., 144A, | 5,064,000 | 4,286,119 | ||||||
Gray Television, Inc. | 2,727,000 | 2,635,891 | ||||||
144A, 7.00%, 5/15/27 (a) | 2,922,000 | 2,885,796 | ||||||
144A, 4.75%, 10/15/30 | 3,117,000 | 2,568,408 | ||||||
iHeartCommunications, Inc. | 3,115,157 | 2,947,562 | ||||||
8.375%, 5/1/27 | 5,206,113 | 4,575,028 | ||||||
144A, 5.25%, 8/15/27 | 2,922,000 | 2,626,464 | ||||||
144A, 4.75%, 1/15/28 | 1,959,000 | 1,684,538 | ||||||
LCPR Senior Secured Financing DAC | 4,523,000 | 4,276,496 | ||||||
144A, 5.125%, 7/15/29 | 3,194,000 | 2,751,615 | ||||||
McGraw-Hill Education, Inc. | 3,506,000 | 3,090,471 | ||||||
144A, 8.00%, 8/1/29 | 2,824,000 | 2,454,141 | ||||||
News Corp. | 3,896,000 | 3,397,098 | ||||||
144A, 5.125%, 2/15/32 | 1,948,000 | 1,795,111 | ||||||
Nexstar Media, Inc. | 6,954,000 | 6,629,805 | ||||||
144A, 4.75%, 11/1/28 | 3,896,000 | 3,530,692 | ||||||
Radiate Holdco LLC / Radiate Finance, Inc. | 3,506,000 | 3,028,307 | ||||||
144A, 6.50%, 9/15/28 | 3,896,000 | 2,908,403 | ||||||
Scripps Escrow II, Inc. | 2,039,000 | 1,731,560 | ||||||
144A, 5.375%, 1/15/31 (a) | 1,659,000 | 1,359,882 | ||||||
Sinclair Television Group, Inc. | 1,959,000 | 1,538,995 | ||||||
144A, 4.125%, 12/1/30 | 2,922,000 | 2,389,495 | ||||||
Sirius XM Radio, Inc. | 3,896,000 | 3,474,764 | ||||||
144A, 5.00%, 8/1/27 | 5,844,000 | 5,508,963 | ||||||
144A, 4.00%, 7/15/28 | 7,791,000 | 6,797,647 | ||||||
| See Notes to Financial Statements. | 51 |
DBX ETF Trust
Schedule of Investments
Xtrackers USD High Yield Corporate Bond ETF (Continued)
August 31, 2022
Principal | Value | |||||||
| Media (Continued) | ||||||||
144A, 5.50%, 7/1/29 | $ | 4,870,000 | $ | 4,559,172 | ||||
144A, 4.125%, 7/1/30 | 5,844,000 | 4,958,517 | ||||||
144A, 3.875%, 9/1/31 | 5,844,000 | 4,726,160 | ||||||
TEGNA, Inc. | 2,143,000 | 2,103,155 | ||||||
4.625%, 3/15/28 | 3,896,000 | 3,740,452 | ||||||
5.00%, 9/15/29 | 4,285,000 | 4,108,865 | ||||||
Telenet Finance Luxembourg Notes SARL, 144A, | 3,800,000 | 3,488,400 | ||||||
Univision Communications, Inc. | 5,763,000 | 5,573,974 | ||||||
144A, 6.625%, 6/1/27 | 5,844,000 | 5,646,971 | ||||||
144A, 4.50%, 5/1/29 | 4,091,000 | 3,585,761 | ||||||
144A, 7.375%, 6/30/30 | 3,506,000 | 3,484,087 | ||||||
UPC Broadband Finco BV, 144A, | 4,870,000 | 4,218,564 | ||||||
UPC Holding BV, 144A, | 1,772,000 | 1,519,827 | ||||||
Videotron Ltd. | 2,344,000 | 2,331,202 | ||||||
144A, 5.125%, 4/15/27 | 2,337,500 | 2,195,392 | ||||||
144A, 3.625%, 6/15/29 | 1,959,000 | 1,628,631 | ||||||
Virgin Media Finance PLC, 144A, | 3,604,000 | 2,853,251 | ||||||
Virgin Media Secured Finance PLC | 5,551,000 | 4,988,240 | ||||||
144A, 4.50%, 8/15/30 | 3,565,000 | 2,974,814 | ||||||
VZ Secured Financing BV, 144A, | 5,945,000 | 4,854,598 | ||||||
Ziggo Bond Co. BV | 2,435,000 | 2,196,857 | ||||||
144A, 5.125%, 2/28/30 | 1,948,000 | 1,562,082 | ||||||
Ziggo BV, 144A, | 3,861,000 | 3,265,029 | ||||||
|
| |||||||
(Cost $453,206,061) | 369,366,894 | |||||||
|
| |||||||
| Telecommunications — 6.6% | ||||||||
Altice France Holding SA | 6,085,000 | 5,261,498 | ||||||
144A, 6.00%, 2/15/28 | 4,772,000 | 3,267,388 | ||||||
Altice France SA | 6,818,000 | 6,460,055 | ||||||
144A, 5.50%, 1/15/28 | 4,285,000 | 3,493,946 | ||||||
144A, 5.125%, 1/15/29 | 1,861,000 | 1,447,836 | ||||||
144A, 5.125%, 7/15/29 | 9,739,000 | 7,410,503 | ||||||
144A, 5.50%, 10/15/29 | 7,791,000 | 6,162,175 | ||||||
Avaya, Inc., 144A, | 3,896,000 | 2,136,527 | ||||||
C&W Senior Financing DAC, 144A, | 4,753,000 | 4,225,536 | ||||||
CommScope Technologies LLC | 5,064,000 | 4,602,062 | ||||||
144A, 5.00%, 3/15/27 | 2,922,000 | 2,310,513 | ||||||
CommScope, Inc. | 5,844,000 | 5,530,177 | ||||||
144A, 8.25%, 3/1/27 | 3,896,000 | 3,345,690 | ||||||
Principal | Value | |||||||
| Telecommunications (Continued) | ||||||||
144A, 7.125%, 7/1/28 (a) | $ | 2,727,000 | $ | 2,230,536 | ||||
144A, 4.75%, 9/1/29 | 4,870,000 | 4,152,771 | ||||||
Connect Finco SARL / Connect US Finco LLC, 144A, | 8,084,000 | 7,412,882 | ||||||
Consolidated Communications, Inc. | 1,567,000 | 1,209,235 | ||||||
144A, 6.50%, 10/1/28 | 2,922,000 | 2,358,638 | ||||||
Frontier Communications Holdings LLC | 4,480,000 | 4,187,098 | ||||||
144A, 5.00%, 5/1/28 | 6,038,000 | 5,299,734 | ||||||
144A, 6.75%, 5/1/29 | 3,896,000 | 3,365,151 | ||||||
5.875%, 11/1/29 | 2,922,685 | 2,389,938 | ||||||
144A, 6.00%, 1/15/30 | 3,896,000 | 3,217,161 | ||||||
144A, 8.75%, 5/15/30 | 4,675,000 | 4,826,938 | ||||||
Hughes Satellite Systems Corp. | 2,914,000 | 2,779,927 | ||||||
6.625%, 8/1/26 | 2,917,500 | 2,765,469 | ||||||
Iliad Holding SASU | 4,675,000 | 4,278,139 | ||||||
144A, 7.00%, 10/15/28 | 3,506,000 | 3,222,406 | ||||||
Intelsat Jackson Holdings SA, 144A, | 11,687,000 | 10,623,249 | ||||||
Level 3 Financing, Inc. | 3,896,000 | 3,447,707 | ||||||
144A, 4.25%, 7/1/28 | 4,675,000 | 3,891,821 | ||||||
144A, 3.625%, 1/15/29 | 3,272,000 | 2,630,950 | ||||||
144A, 3.75%, 7/15/29 | 3,506,000 | 2,821,278 | ||||||
Lumen Technologies, Inc. | 2,922,000 | 2,959,080 | ||||||
Series Y, 7.50%, 4/1/24 | 3,896,000 | 3,932,233 | ||||||
5.625%, 4/1/25 | 1,948,000 | 1,892,320 | ||||||
144A, 5.125%, 12/15/26 (a) | 4,825,000 | 4,175,507 | ||||||
144A, 4.00%, 2/15/27 | 4,870,000 | 4,242,208 | ||||||
144A, 4.50%, 1/15/29 | 3,896,000 | 2,912,260 | ||||||
144A, 5.375%, 6/15/29 | 3,896,000 | 3,042,308 | ||||||
Nokia OYJ, | 1,948,000 | 1,859,882 | ||||||
Sprint Corp. | 16,557,000 | 17,095,848 | ||||||
7.125%, 6/15/24 | 9,739,000 | 10,067,496 | ||||||
7.625%, 2/15/25 | 5,844,000 | 6,121,648 | ||||||
7.625%, 3/1/26 | 5,844,000 | 6,189,380 | ||||||
Switch Ltd. | 2,337,000 | 2,320,124 | ||||||
144A, 4.125%, 6/15/29 | 1,948,000 | 1,946,049 | ||||||
Telecom Italia SpA, 144A, | 5,844,000 | 5,632,506 | ||||||
Telesat Canada / Telesat LLC | 1,959,000 | 1,147,065 | ||||||
144A, 4.875%, 6/1/27 | 1,558,000 | 847,163 | ||||||
VEON Holdings BV | 2,120,000 | 1,563,627 | ||||||
144A, 4.00%, 4/9/25 | 2,226,000 | 1,396,882 | ||||||
Viasat, Inc. | 2,727,000 | 2,411,318 | ||||||
144A, 5.625%, 4/15/27 | 2,337,000 | 2,153,405 | ||||||
144A, 6.50%, 7/15/28 | 1,567,000 | 1,211,918 | ||||||
| See Notes to Financial Statements. | 52 |
DBX ETF Trust
Schedule of Investments
Xtrackers USD High Yield Corporate Bond ETF (Continued)
August 31, 2022
Principal | Value | |||||||
| Telecommunications (Continued) | ||||||||
Vmed O2 UK Financing I PLC | $ | 5,261,000 | $ | 4,252,045 | ||||
144A, 4.75%, 7/15/31 | 5,454,000 | 4,506,368 | ||||||
Windstream Escrow LLC / Windstream Escrow Finance Corp., 144A, | 5,454,000 | 4,755,015 | ||||||
Zayo Group Holdings, Inc. | 5,756,000 | 4,914,559 | ||||||
144A, 6.125%, 3/1/28 | 4,207,000 | 3,278,557 | ||||||
|
| |||||||
(Cost $279,381,150) | 239,591,705 | |||||||
|
| |||||||
| Consumer, Cyclical — 21.8% |
| |||||||
| Airlines — 1.2% | ||||||||
Air Canada, 144A, | 4,675,000 | 4,177,954 | ||||||
American Airlines Group, Inc., 144A, | 1,959,000 | 1,648,871 | ||||||
American Airlines, Inc., 144A, | 9,739,000 | 10,774,158 | ||||||
Delta Air Lines, Inc. | 3,506,000 | 3,292,134 | ||||||
7.375%, 1/15/26 (a) | 3,339,000 | 3,405,480 | ||||||
4.375%, 4/19/28 | 1,608,000 | 1,415,683 | ||||||
3.75%, 10/28/29 (a) | 1,857,000 | 1,510,948 | ||||||
Hawaiian Brand Intellectual Property Ltd. / HawaiianMiles Loyalty Ltd., 144A, | 4,675,542 | 4,274,147 | ||||||
United Airlines, Inc. | 7,791,000 | 7,113,884 | ||||||
144A, 4.625%, 4/15/29 | 7,791,000 | 6,846,341 | ||||||
|
| |||||||
(Cost $49,748,618) | 44,459,600 | |||||||
|
| |||||||
| Apparel — 0.2% | ||||||||
Hanesbrands, Inc. | 3,506,000 | 3,381,537 | ||||||
144A, 4.875%, 5/15/26 | 3,506,000 | 3,230,043 | ||||||
|
| |||||||
(Cost $7,300,981) | 6,611,580 | |||||||
|
| |||||||
| Auto Manufacturers — 3.7% | ||||||||
Allison Transmission, Inc. | 1,567,000 | 1,459,943 | ||||||
144A, 5.875%, 6/1/29 | 1,948,000 | 1,834,270 | ||||||
144A, 3.75%, 1/30/31 | 3,896,000 | 3,157,026 | ||||||
Ford Motor Co. | 4,239,000 | 4,746,486 | ||||||
4.346%, 12/8/26 | 5,844,000 | 5,612,513 | ||||||
9.625%, 4/22/30 | 1,683,000 | 1,970,914 | ||||||
3.25%, 2/12/32 | 9,796,000 | 7,683,297 | ||||||
6.10%, 8/19/32 | 6,600,000 | 6,436,122 | ||||||
Ford Motor Credit Co. LLC | 3,896,000 | 3,801,756 | ||||||
3.81%, 1/9/24 | 2,922,000 | 2,859,747 | ||||||
5.584%, 3/18/24 | 5,844,000 | 5,820,167 | ||||||
3.664%, 9/8/24 | 2,922,000 | 2,804,243 | ||||||
4.063%, 11/1/24 | 5,844,000 | 5,680,456 | ||||||
2.30%, 2/10/25 | 4,870,000 | 4,446,310 | ||||||
4.687%, 6/9/25 | 2,337,000 | 2,247,037 | ||||||
Principal | Value | |||||||
| Auto Manufacturers (Continued) | ||||||||
5.125%, 6/16/25 | $ | 6,818,000 | $ | 6,660,061 | ||||
4.134%, 8/4/25 | 5,454,000 | 5,159,429 | ||||||
3.375%, 11/13/25 | 8,181,000 | 7,480,215 | ||||||
GMTN, 4.389%, 1/8/26 | 4,675,000 | 4,391,508 | ||||||
4.542%, 8/1/26 | 2,922,000 | 2,729,691 | ||||||
2.70%, 8/10/26 | 5,844,000 | 5,092,168 | ||||||
4.271%, 1/9/27 | 3,506,000 | 3,217,186 | ||||||
4.95%, 5/28/27 | 5,844,000 | 5,494,646 | ||||||
4.125%, 8/17/27 | 4,870,000 | 4,395,175 | ||||||
3.815%, 11/2/27 | 2,922,000 | 2,576,035 | ||||||
2.90%, 2/16/28 | 2,922,000 | 2,449,220 | ||||||
2.90%, 2/10/29 | 3,130,000 | 2,538,852 | ||||||
5.113%, 5/3/29 | 5,793,000 | 5,396,150 | ||||||
4.00%, 11/13/30 | 6,465,000 | 5,408,813 | ||||||
3.625%, 6/17/31 | 3,903,000 | 3,165,235 | ||||||
Jaguar Land Rover Automotive PLC | 2,727,000 | 2,502,175 | ||||||
144A, 4.50%, 10/1/27 (a) | 1,959,000 | 1,441,689 | ||||||
144A, 5.875%, 1/15/28 | 2,522,000 | 1,922,054 | ||||||
144A, 5.50%, 7/15/29 | 1,944,000 | 1,370,084 | ||||||
|
| |||||||
(Cost $151,327,025) | 133,950,673 | |||||||
|
| |||||||
| Auto Parts & Equipment — 1.5% | ||||||||
Adient Global Holdings Ltd., 144A, | 3,095,000 | 2,868,090 | ||||||
American Axle & Manufacturing, Inc. | 1,932,000 | 1,809,569 | ||||||
6.875%, 7/1/28 (a) | 1,567,000 | 1,490,131 | ||||||
5.00%, 10/1/29 (a) | 2,337,000 | 1,985,632 | ||||||
Clarios Global LP, 144A, | 1,753,000 | 1,746,204 | ||||||
Clarios Global LP / Clarios US Finance Co. | 3,506,000 | 3,471,185 | ||||||
144A, 8.50%, 5/15/27 | 7,597,000 | 7,421,889 | ||||||
Dana Financing Luxembourg SARL, 144A, | 1,517,000 | 1,495,444 | ||||||
Dana, Inc. | 1,567,000 | 1,399,159 | ||||||
5.625%, 6/15/28 | 1,567,000 | 1,408,559 | ||||||
4.25%, 9/1/30 | 1,567,000 | 1,267,332 | ||||||
Goodyear Tire & Rubber Co. | 3,117,000 | 3,261,130 | ||||||
5.00%, 5/31/26 (a) | 3,506,000 | 3,387,550 | ||||||
4.875%, 3/15/27 (a) | 2,727,000 | 2,564,266 | ||||||
5.00%, 7/15/29 (a) | 3,290,000 | 2,953,433 | ||||||
5.25%, 4/30/31 (a) | 2,143,000 | 1,871,617 | ||||||
5.25%, 7/15/31 (a) | 2,337,000 | 2,017,813 | ||||||
5.625%, 4/30/33 | 1,763,000 | 1,527,613 | ||||||
Tenneco, Inc. | 1,909,000 | 1,825,827 | ||||||
144A, 7.875%, 1/15/29 | 2,010,000 | 2,003,061 | ||||||
144A, 5.125%, 4/15/29 | 2,948,000 | 2,876,945 | ||||||
ZF North America Capital, Inc., 144A, | 4,197,000 | 3,892,714 | ||||||
|
| |||||||
(Cost $59,739,407) | 54,545,163 | |||||||
|
| |||||||
| See Notes to Financial Statements. | 53 |
DBX ETF Trust
Schedule of Investments
Xtrackers USD High Yield Corporate Bond ETF (Continued)
August 31, 2022
Principal | Value | |||||||
| Distribution/Wholesale — 0.2% | ||||||||
American Builders & Contractors Supply Co., Inc. | $ | 2,718,000 | $ | 2,462,862 | ||||
144A, 3.875%, 11/15/29 | 1,567,000 | 1,286,053 | ||||||
H&E Equipment Services, Inc., 144A, | 4,870,000 | 4,120,702 | ||||||
Wesco Aircraft Holdings, Inc., 144A, | 2,057,000 | 683,952 | ||||||
|
| |||||||
(Cost $11,103,770) | 8,553,569 | |||||||
|
| |||||||
| Entertainment — 3.4% | ||||||||
AMC Entertainment Holdings, Inc. | 5,592,730 | 4,495,856 | ||||||
144A, 7.50%, 2/15/29 | 3,701,000 | 3,187,523 | ||||||
Banijay Entertainment SASU, 144A, | 1,579,000 | 1,490,856 | ||||||
Caesars Entertainment, Inc. | 13,245,000 | 12,949,637 | ||||||
144A, 8.125%, 7/1/27 | 7,012,000 | 6,908,152 | ||||||
144A, 4.625%, 10/15/29 | 4,675,000 | 3,780,883 | ||||||
Caesars Resort Collection LLC / CRC Finco, Inc., 144A, | 3,896,000 | 3,822,989 | ||||||
CDI Escrow Issuer, Inc., 144A, | 4,675,000 | 4,336,951 | ||||||
Cedar Fair LP, | 1,948,000 | 1,784,246 | ||||||
Cedar Fair LP / Canada’s Wonderland Co. / Magnum Management Corp. / Millennium Op | 3,896,000 | 3,826,690 | ||||||
5.375%, 4/15/27 | 1,948,000 | 1,840,646 | ||||||
Churchill Downs, Inc. | 2,337,000 | 2,243,609 | ||||||
144A, 4.75%, 1/15/28 | 2,727,000 | 2,484,911 | ||||||
Cinemark USA, Inc. | 1,587,000 | 1,410,311 | ||||||
144A, 5.25%, 7/15/28 | 2,980,000 | 2,412,105 | ||||||
International Game Technology PLC | 4,285,000 | 4,258,240 | ||||||
144A, 4.125%, 4/15/26 | 2,922,000 | 2,682,396 | ||||||
144A, 6.25%, 1/15/27 | 2,922,000 | 2,865,079 | ||||||
144A, 5.25%, 1/15/29 | 2,906,000 | 2,717,415 | ||||||
Live Nation Entertainment, Inc. | 2,240,000 | 2,171,142 | ||||||
144A, 6.50%, 5/15/27 | 4,675,000 | 4,673,551 | ||||||
144A, 4.75%, 10/15/27 (a) | 3,701,000 | 3,374,072 | ||||||
144A, 3.75%, 1/15/28 | 1,959,000 | 1,719,453 | ||||||
Mohegan Gaming & Entertainment | 1,504,000 | 1,537,186 | ||||||
144A, 8.00%, 2/1/26 | 4,577,000 | 4,005,676 | ||||||
Penn Entertainment, Inc. | 1,558,000 | 1,427,268 | ||||||
144A, 4.125%, 7/1/29 | 1,564,000 | 1,265,393 | ||||||
Premier Entertainment Sub LLC / Premier Entertainment Finance Corp. | 2,922,000 | 2,169,877 | ||||||
144A, 5.875%, 9/1/31 | 2,922,000 | 2,046,335 | ||||||
Principal | Value | |||||||
| Entertainment (Continued) | ||||||||
Resorts World Las Vegas LLC / RWLV Capital, Inc., 144A, | $ | 3,895,000 | $ | 3,197,136 | ||||
Scientific Games International, Inc. | 2,143,000 | 2,205,886 | ||||||
144A, 7.00%, 5/15/28 | 2,727,000 | 2,672,705 | ||||||
144A, 7.25%, 11/15/29 | 1,948,000 | 1,918,780 | ||||||
Six Flags Entertainment Corp. | 3,896,000 | 3,743,813 | ||||||
144A, 5.50%, 4/15/27 (a) | 1,948,000 | 1,788,459 | ||||||
Vail Resorts, Inc., 144A, | 2,337,000 | 2,343,357 | ||||||
WMG Acquisition Corp. | 2,104,000 | 1,801,550 | ||||||
144A, 3.875%, 7/15/30 | 2,084,000 | 1,781,169 | ||||||
144A, 3.00%, 2/15/31 | 3,117,000 | 2,479,745 | ||||||
Wynn Resorts Finance LLC / Wynn Resorts Capital Corp. | 2,337,000 | 2,333,191 | ||||||
144A, 5.125%, 10/1/29 | 2,922,000 | 2,456,350 | ||||||
|
| |||||||
(Cost $137,037,958) | 122,610,589 | |||||||
|
| |||||||
| Food Service — 0.4% | ||||||||
Aramark Services, Inc. | 2,337,000 | 2,285,352 | ||||||
144A, 6.375%, 5/1/25 | 5,844,000 | 5,800,229 | ||||||
144A, 5.00%, 2/1/28 | 4,480,000 | 4,128,118 | ||||||
TKC Holdings, Inc. | 1,665,000 | 1,405,243 | ||||||
144A, 10.50%, 5/15/29 | 2,630,000 | 2,111,166 | ||||||
|
| |||||||
(Cost $17,384,503) | 15,730,108 | |||||||
|
| |||||||
| Home Builders — 0.6% | ||||||||
Ashton Woods USA LLC / Ashton Woods Finance Co., 144A, | 1,547,000 | 1,222,471 | ||||||
Brookfield Residential Properties, Inc. / Brookfield Residential US LLC | 2,326,000 | 2,070,349 | ||||||
144A, 4.875%, 2/15/30 | 1,959,000 | 1,510,927 | ||||||
Century Communities, Inc. | 1,948,000 | 1,913,482 | ||||||
144A, 3.875%, 8/15/29 | 1,959,000 | 1,584,508 | ||||||
Mattamy Group Corp. | 1,959,000 | 1,727,813 | ||||||
144A, 4.625%, 3/1/30 | 2,326,000 | 1,886,841 | ||||||
Meritage Homes Corp. | 1,547,000 | 1,548,060 | ||||||
144A, 3.875%, 4/15/29 | 1,763,000 | 1,500,480 | ||||||
Taylor Morrison Communities, Inc. | 1,924,000 | 1,861,528 | ||||||
144A, 5.75%, 1/15/28 | 1,763,000 | 1,617,100 | ||||||
144A, 5.125%, 8/1/30 | 1,959,000 | 1,683,702 | ||||||
|
| |||||||
(Cost $23,853,418) | 20,127,261 | |||||||
|
| |||||||
| See Notes to Financial Statements. | 54 |
DBX ETF Trust
Schedule of Investments
Xtrackers USD High Yield Corporate Bond ETF (Continued)
August 31, 2022
Principal | Value | |||||||
| Home Furnishings — 0.1% | ||||||||
Tempur Sealy International, Inc. | $ | 3,117,000 | $ | 2,565,621 | ||||
144A, 3.875%, 10/15/31 | 3,117,000 | 2,403,869 | ||||||
|
| |||||||
(Cost $6,245,403) | 4,969,490 | |||||||
|
| |||||||
| Housewares — 0.4% | ||||||||
Newell Brands, Inc. | 1,948,000 | 1,912,556 | ||||||
4.45%, 4/1/26 | 7,791,000 | 7,337,330 | ||||||
Scotts Miracle-Gro Co. | 1,611,000 | 1,292,827 | ||||||
4.00%, 4/1/31 | 1,861,000 | 1,400,403 | ||||||
4.375%, 2/1/32 | 1,537,000 | 1,162,495 | ||||||
|
| |||||||
(Cost $15,549,941) | 13,105,611 | |||||||
|
| |||||||
| Leisure Time — 2.4% | ||||||||
Carnival Corp. | 3,019,000 | 3,113,495 | ||||||
144A, 7.625%, 3/1/26 (a) | 5,649,000 | 4,809,276 | ||||||
144A, 5.75%, 3/1/27 | 13,635,000 | 10,646,140 | ||||||
144A, 9.875%, 8/1/27 | 3,506,000 | 3,523,837 | ||||||
144A, 4.00%, 8/1/28 | 9,371,000 | 7,812,978 | ||||||
144A, 6.00%, 5/1/29 | 7,791,000 | 5,894,482 | ||||||
144A, 10.50%, 6/1/30 | 3,896,000 | 3,569,613 | ||||||
Life Time, Inc. | 3,604,000 | 3,252,538 | ||||||
144A, 8.00%, 4/15/26 | 1,850,000 | 1,636,057 | ||||||
NCL Corp. Ltd. | 2,201,000 | 1,910,623 | ||||||
144A, 5.875%, 3/15/26 | 5,551,000 | 4,496,310 | ||||||
144A, 5.875%, 2/15/27 | 3,896,000 | 3,536,360 | ||||||
144A, 7.75%, 2/15/29 | 2,337,000 | 1,902,550 | ||||||
Royal Caribbean Cruises Ltd. | 5,423,000 | 5,755,484 | ||||||
144A, 4.25%, 7/1/26 | 2,532,000 | 1,949,042 | ||||||
144A, 5.50%, 8/31/26 | 3,896,000 | 3,170,760 | ||||||
144A, 5.375%, 7/15/27 | 3,896,000 | 3,028,890 | ||||||
144A, 11.625%, 8/15/27 | 4,870,000 | 4,792,275 | ||||||
3.70%, 3/15/28 (a) | 1,948,000 | 1,327,250 | ||||||
144A, 5.50%, 4/1/28 (a) | 5,844,000 | 4,501,867 | ||||||
Viking Cruises Ltd. | 2,630,000 | 2,763,943 | ||||||
144A, 5.875%, 9/15/27 | 3,214,000 | 2,592,139 | ||||||
144A, 7.00%, 2/15/29 | 1,959,000 | 1,573,951 | ||||||
|
| |||||||
(Cost $103,833,563) | 87,559,860 | |||||||
|
| |||||||
| Lodging — 2.5% | ||||||||
Boyd Gaming Corp. | 3,895,000 | 3,641,358 | ||||||
144A, 4.75%, 6/15/31 | 3,506,000 | 3,056,355 | ||||||
Hilton Domestic Operating Co., Inc. | 1,948,000 | 1,935,785 | ||||||
144A, 5.75%, 5/1/28 | 1,948,000 | 1,906,965 | ||||||
144A, 3.75%, 5/1/29 | 3,117,000 | 2,695,239 | ||||||
4.875%, 1/15/30 | 3,896,000 | 3,565,269 | ||||||
144A, 4.00%, 5/1/31 | 4,285,000 | 3,627,628 | ||||||
144A, 3.625%, 2/15/32 | 5,844,000 | 4,726,335 | ||||||
Principal | Value | |||||||
| Lodging (Continued) | ||||||||
Hilton Grand Vacations Borrower Escrow LLC / Hilton Grand Vacations Borrower Esc | $ | 3,311,000 | $ | 2,934,539 | ||||
144A, 4.875%, 7/1/31 | 1,959,000 | 1,619,780 | ||||||
Hilton Worldwide Finance LLC / Hilton Worldwide Finance Corp., | 2,337,000 | 2,234,768 | ||||||
Las Vegas Sands Corp. | 6,818,000 | 6,457,599 | ||||||
2.90%, 6/25/25 | 1,948,000 | 1,797,817 | ||||||
3.50%, 8/18/26 | 3,896,000 | 3,504,117 | ||||||
3.90%, 8/8/29 | 2,922,000 | 2,495,477 | ||||||
Marriott Ownership Resorts, Inc., 144A, | 1,959,000 | 1,654,542 | ||||||
Melco Resorts Finance Ltd. | 3,896,000 | 2,976,622 | ||||||
144A, 5.25%, 4/26/26 (a) | 1,959,000 | 1,444,008 | ||||||
144A, 5.625%, 7/17/27 | 2,337,000 | 1,661,273 | ||||||
144A, 5.75%, 7/21/28 | 3,311,000 | 2,253,135 | ||||||
144A, 5.375%, 12/4/29 | 4,480,000 | 2,924,745 | ||||||
MGM Resorts International | 2,922,000 | 2,924,002 | ||||||
5.75%, 6/15/25 (a) | 2,630,000 | 2,555,439 | ||||||
4.625%, 9/1/26 | 1,567,000 | 1,427,811 | ||||||
5.50%, 4/15/27 | 2,630,000 | 2,438,477 | ||||||
4.75%, 10/15/28 | 2,922,000 | 2,572,054 | ||||||
Station Casinos LLC | 2,682,000 | 2,314,264 | ||||||
144A, 4.625%, 12/1/31 | 1,959,000 | 1,624,246 | ||||||
Travel + Leisure Co. | 2,532,000 | 2,458,192 | ||||||
6.00%, 4/1/27 | 1,567,000 | 1,490,123 | ||||||
144A, 4.50%, 12/1/29 | 2,532,000 | 2,062,211 | ||||||
Wynn Las Vegas LLC / Wynn Las Vegas Capital Corp. | 7,012,000 | 6,723,632 | ||||||
144A, 5.25%, 5/15/27 | 3,506,000 | 3,168,337 | ||||||
|
| |||||||
(Cost $104,736,089) | 90,872,144 | |||||||
|
| |||||||
| Retail — 5.0% | ||||||||
1011778 BC ULC / New Red Finance, Inc. | 1,948,000 | 1,961,168 | ||||||
144A, 3.875%, 1/15/28 | 6,038,000 | 5,375,873 | ||||||
144A, 4.375%, 1/15/28 | 2,922,000 | 2,616,983 | ||||||
144A, 3.50%, 2/15/29 | 2,922,000 | 2,517,639 | ||||||
144A, 4.00%, 10/15/30 | 11,298,000 | 9,253,119 | ||||||
Asbury Automotive Group, Inc. | 1,587,000 | 1,419,468 | ||||||
144A, 4.625%, 11/15/29 | 3,110,000 | 2,670,619 | ||||||
4.75%, 3/1/30 | 1,744,000 | 1,489,158 | ||||||
144A, 5.00%, 2/15/32 | 2,331,000 | 1,950,604 | ||||||
Bath & Body Works, Inc. | 1,959,000 | 1,758,095 | ||||||
7.50%, 6/15/29 (a) | 1,948,000 | 1,875,544 | ||||||
144A, 6.625%, 10/1/30 | 3,883,000 | 3,532,365 | ||||||
| See Notes to Financial Statements. | 55 |
DBX ETF Trust
Schedule of Investments
Xtrackers USD High Yield Corporate Bond ETF (Continued)
August 31, 2022
Principal | Value | |||||||
| Retail (Continued) | ||||||||
Carvana Co. | $ | 1,934,000 | $ | 1,451,822 | ||||
144A, 5.50%, 4/15/27 | 2,351,000 | 1,527,462 | ||||||
144A, 5.875%, 10/1/28 (a) | 2,331,000 | 1,401,898 | ||||||
144A, 4.875%, 9/1/29 | 2,922,000 | 1,665,540 | ||||||
144A, 10.25%, 5/1/30 | 12,759,000 | 10,159,545 | ||||||
eG Global Finance PLC | 2,922,000 | 2,765,132 | ||||||
144A, 8.50%, 10/30/25 | 2,474,000 | 2,313,784 | ||||||
Ferrellgas LP / Ferrellgas Finance Corp. | 2,532,000 | 2,206,638 | ||||||
144A, 5.875%, 4/1/29 | 3,214,000 | 2,624,215 | ||||||
Fertitta Entertainment LLC / Fertitta Entertainment Finance Co., Inc. | 3,896,000 | 3,433,964 | ||||||
144A, 6.75%, 1/15/30 | 4,870,000 | 3,979,764 | ||||||
FirstCash, Inc. | 1,959,000 | 1,698,871 | ||||||
144A, 5.625%, 1/1/30 | 2,143,000 | 1,920,835 | ||||||
Gap, Inc. | 2,922,000 | 2,035,129 | ||||||
144A, 3.875%, 10/1/31 (a) | 2,922,000 | 2,030,790 | ||||||
Guitar Center, Inc., 144A, | 2,143,000 | 1,985,425 | ||||||
IRB Holding Corp., 144A, | 2,922,000 | 2,938,933 | ||||||
KFC Holding Co./Pizza Hut Holdings LLC/Taco Bell of America LLC, 144A, | 2,922,000 | 2,809,474 | ||||||
LBM Acquisition LLC, 144A, | 3,194,000 | 2,391,510 | ||||||
LCM Investments Holdings II LLC, 144A, | 3,896,000 | 3,258,183 | ||||||
Lithia Motors, Inc. | 1,567,000 | 1,453,361 | ||||||
144A, 3.875%, 6/1/29 | 3,117,000 | 2,655,996 | ||||||
144A, 4.375%, 1/15/31 | 2,143,000 | 1,888,808 | ||||||
Macy’s Retail Holdings LLC | 1,959,000 | 1,697,699 | ||||||
144A, 5.875%, 3/15/30 | 1,665,000 | 1,425,839 | ||||||
144A, 6.125%, 3/15/32 | 1,642,000 | 1,386,324 | ||||||
Michaels Cos., Inc. | 3,311,000 | 2,552,351 | ||||||
144A, 7.875%, 5/1/29 | 5,064,000 | 3,375,283 | ||||||
Murphy Oil USA, Inc. | 1,934,000 | 1,776,025 | ||||||
144A, 3.75%, 2/15/31 (a) | 1,959,000 | 1,649,850 | ||||||
NMG Holding Co, Inc. / Neiman Marcus Group LLC, 144A, | 4,285,000 | 4,016,326 | ||||||
Nordstrom, Inc. | 1,959,000 | 1,512,632 | ||||||
4.25%, 8/1/31 | 1,644,000 | 1,207,761 | ||||||
Party City Holdings, Inc., 144A, | 2,922,000 | 1,918,585 | ||||||
Principal | Value | |||||||
| Retail (Continued) | ||||||||
Penske Automotive Group, Inc. | $ | 2,135,000 | $ | 2,007,706 | ||||
3.75%, 6/15/29 | 1,959,000 | 1,659,665 | ||||||
PetSmart, Inc. / PetSmart Finance Corp. | 4,675,000 | 4,174,485 | ||||||
144A, 7.75%, 2/15/29 | 4,480,000 | 4,216,800 | ||||||
QVC, Inc. | 2,321,000 | 2,236,376 | ||||||
4.45%, 2/15/25 | 2,337,000 | 2,149,701 | ||||||
4.75%, 2/15/27 | 2,240,000 | 1,853,466 | ||||||
4.375%, 9/1/28 | 1,959,000 | 1,498,371 | ||||||
Rite Aid Corp. | 1,901,000 | 1,621,582 | ||||||
144A, 8.00%, 11/15/26 | 3,300,000 | 2,695,242 | ||||||
Sonic Automotive, Inc. | 2,522,000 | 2,155,465 | ||||||
144A, 4.875%, 11/15/31 | 1,959,000 | 1,636,157 | ||||||
SRS Distribution, Inc. | 2,532,000 | 2,245,369 | ||||||
144A, 6.125%, 7/1/29 | 1,763,000 | 1,464,930 | ||||||
144A, 6.00%, 12/1/29 | 3,301,000 | 2,692,551 | ||||||
Staples, Inc. | 7,791,000 | 6,593,367 | ||||||
144A, 10.75%, 4/15/27 (a) | 3,896,000 | 2,869,423 | ||||||
Suburban Propane Partners LP/Suburban Energy Finance Corp., 144A, | 2,532,000 | 2,240,049 | ||||||
Yum! Brands, Inc. | 3,117,000 | 2,844,527 | ||||||
3.625%, 3/15/31 | 4,091,000 | 3,451,209 | ||||||
4.625%, 1/31/32 | 4,285,000 | 3,791,797 | ||||||
5.375%, 4/1/32 | 3,896,000 | 3,604,209 | ||||||
|
| |||||||
(Cost $214,436,860) | 179,238,836 | |||||||
|
| |||||||
| Toys/Games/Hobbies — 0.2% | ||||||||
Mattel, Inc. | 2,337,000 | 2,127,418 | ||||||
144A, 5.875%, 12/15/27 | 2,337,000 | 2,331,157 | ||||||
144A, 3.75%, 4/1/29 | 2,337,000 | 2,086,661 | ||||||
|
| |||||||
(Cost $7,226,920) | 6,545,236 | |||||||
|
| |||||||
| Consumer, Non-cyclical — 17.4% | ||||||||
| Agriculture — 0.3% | ||||||||
Darling Ingredients, Inc. | 1,948,000 | 1,913,930 | ||||||
144A, 6.00%, 6/15/30 | 3,896,000 | 3,906,363 | ||||||
Vector Group Ltd. | 2,162,000 | 2,095,979 | ||||||
144A, 5.75%, 2/1/29 | 3,409,000 | 2,960,631 | ||||||
|
| |||||||
(Cost $11,607,062) | 10,876,903 | |||||||
|
| |||||||
| Beverages — 0.1% | ||||||||
Primo Water Holdings, Inc., 144A, (Cost $2,894,417) | 2,922,000 | 2,502,754 | ||||||
|
| |||||||
| See Notes to Financial Statements. | 56 |
DBX ETF Trust
Schedule of Investments
Xtrackers USD High Yield Corporate Bond ETF (Continued)
August 31, 2022
Principal | Value | |||||||
| Biotechnology — 0.1% | ||||||||
Grifols Escrow Issuer SA, 144A, (Cost $2,591,897) | $ | 2,746,000 | $ | 2,292,568 | ||||
|
| |||||||
| Commercial Services — 4.1% | ||||||||
ADT Security Corp., 144A, | 3,896,000 | 3,350,482 | ||||||
Allied Universal Holdco LLC / Allied Universal Finance Corp. | 7,558,000 | 7,085,625 | ||||||
144A, 9.75%, 7/15/27 | 4,091,000 | 3,696,104 | ||||||
144A, 6.00%, 6/1/29 | 3,740,000 | 2,790,553 | ||||||
Allied Universal Holdco LLC / Allied Universal Finance Corp. / Atlas Luxco 4 SARL, 144A, | 4,772,000 | 4,045,170 | ||||||
APX Group, Inc. | 2,337,000 | 2,292,135 | ||||||
144A, 5.75%, 7/15/29 (a) | 3,117,000 | 2,553,016 | ||||||
Avis Budget Car Rental LLC / Avis Budget Finance, Inc. | 1,567,000 | 1,486,911 | ||||||
144A, 4.75%, 4/1/28 (a) | 1,959,000 | 1,713,312 | ||||||
144A, 5.375%, 3/1/29 (a) | 2,337,000 | 2,060,451 | ||||||
Block, Inc. | 3,896,000 | 3,465,161 | ||||||
3.50%, 6/1/31 (a) | 3,896,000 | 3,210,830 | ||||||
Brink’s Co. | 1,567,000 | 1,534,861 | ||||||
144A, 4.625%, 10/15/27 | 2,337,000 | 2,106,467 | ||||||
CoreCivic, Inc., | 2,630,000 | 2,625,281 | ||||||
Garda World Security Corp. | 2,221,000 | 1,955,324 | ||||||
144A, 9.50%, 11/1/27 | 2,354,000 | 2,148,919 | ||||||
144A, 6.00%, 6/1/29 | 1,944,000 | 1,509,691 | ||||||
Gartner, Inc. | 3,117,000 | 2,882,680 | ||||||
144A, 3.625%, 6/15/29 | 2,337,000 | 2,012,940 | ||||||
144A, 3.75%, 10/1/30 | 3,117,000 | 2,677,160 | ||||||
Grand Canyon University, | 1,948,000 | 1,852,080 | ||||||
Herc Holdings, Inc., 144A, | 4,675,000 | 4,425,284 | ||||||
Hertz Corp. | ||||||||
144A, 4.625%, 12/1/26 | 1,959,000 | 1,670,234 | ||||||
144A, 5.00%, 12/1/29 | 3,896,000 | 3,140,840 | ||||||
MPH Acquisition Holdings LLC | 4,091,000 | 3,494,225 | ||||||
144A, 5.75%, 11/1/28 (a) | 5,064,000 | 4,035,641 | ||||||
Nielsen Co. Luxembourg SARL, 144A, | 1,874,000 | 1,884,813 | ||||||
Nielsen Finance LLC / Nielsen Finance Co. | 4,030,000 | 4,044,669 | ||||||
144A, 4.50%, 7/15/29 | 2,519,000 | 2,526,355 | ||||||
144A, 5.875%, 10/1/30 | 3,102,000 | 3,106,734 | ||||||
144A, 4.75%, 7/15/31 | 2,530,000 | 2,517,375 | ||||||
Principal | Value | |||||||
| Commercial Services (Continued) | ||||||||
Prime Security Services Borrower LLC / Prime Finance, Inc. | $ | 2,922,000 | $ | 2,899,172 | ||||
144A, 5.75%, 4/15/26 | 5,259,000 | 5,068,043 | ||||||
144A, 3.375%, 8/31/27 | 3,896,000 | 3,357,807 | ||||||
144A, 6.25%, 1/15/28 (a) | 5,064,000 | 4,493,338 | ||||||
Sabre GLBL, Inc. | 3,019,000 | 2,986,259 | ||||||
144A, 7.375%, 9/1/25 | 3,311,000 | 3,141,311 | ||||||
Service Corp. International | 2,143,000 | 2,014,849 | ||||||
5.125%, 6/1/29 | 2,922,000 | 2,772,116 | ||||||
3.375%, 8/15/30 | 3,311,000 | 2,734,307 | ||||||
4.00%, 5/15/31 | 3,117,000 | 2,669,930 | ||||||
Sotheby’s, 144A, | 2,980,000 | 2,813,939 | ||||||
United Rentals North America, Inc. | 1,948,000 | 1,936,789 | ||||||
4.875%, 1/15/28 | 6,503,000 | 6,088,288 | ||||||
5.25%, 1/15/30 | 2,922,000 | 2,769,472 | ||||||
4.00%, 7/15/30 | 2,922,000 | 2,546,339 | ||||||
3.875%, 2/15/31 | 4,285,000 | 3,711,131 | ||||||
3.75%, 1/15/32 | 2,922,000 | 2,434,173 | ||||||
Verscend Escrow Corp., 144A, | 4,285,000 | 4,333,420 | ||||||
Williams Scotsman International, Inc., 144A, | 1,959,000 | 1,763,746 | ||||||
|
| |||||||
(Cost $169,837,624) | 150,435,752 | |||||||
|
| |||||||
| Cosmetics/Personal Care — 0.3% | ||||||||
Coty, Inc. | 3,506,000 | 3,326,773 | ||||||
144A, 6.50%, 4/15/26 (a) | 2,143,000 | 2,047,379 | ||||||
Edgewell Personal Care Co. | 2,909,000 | 2,689,909 | ||||||
144A, 4.125%, 4/1/29 | 1,959,000 | 1,686,396 | ||||||
|
| |||||||
(Cost $10,719,129) | 9,750,457 | |||||||
|
| |||||||
| Food — 2.2% | ||||||||
Albertsons Cos., Inc. / Safeway, Inc. / New Albertsons LP / Albertsons LLC | 2,922,000 | 2,638,420 | ||||||
144A, 7.50%, 3/15/26 | 2,337,000 | 2,384,710 | ||||||
144A, 4.625%, 1/15/27 | 5,259,000 | 4,805,566 | ||||||
144A, 5.875%, 2/15/28 | 2,922,000 | 2,787,771 | ||||||
144A, 3.50%, 3/15/29 | 5,259,000 | 4,328,420 | ||||||
144A, 4.875%, 2/15/30 | 3,896,000 | 3,418,740 | ||||||
B&G Foods, Inc. | 3,506,000 | 3,124,109 | ||||||
5.25%, 9/15/27 | 2,143,000 | 1,789,405 | ||||||
Lamb Weston Holdings, Inc. | 1,948,000 | 1,859,717 | ||||||
144A, 4.125%, 1/31/30 | 3,779,000 | 3,413,117 | ||||||
144A, 4.375%, 1/31/32 | 2,727,000 | 2,418,177 | ||||||
Performance Food Group, Inc. | 4,129,000 | 3,885,519 | ||||||
144A, 4.25%, 8/1/29 | 3,896,000 | 3,350,501 | ||||||
| See Notes to Financial Statements. | 57 |
DBX ETF Trust
Schedule of Investments
Xtrackers USD High Yield Corporate Bond ETF (Continued)
August 31, 2022
Principal | Value | |||||||
| Food (Continued) | ||||||||
Pilgrim’s Pride Corp. | $ | 3,311,000 | $ | 3,265,921 | ||||
144A, 4.25%, 4/15/31 | 3,896,000 | 3,361,196 | ||||||
144A, 3.50%, 3/1/32 | 3,506,000 | 2,850,518 | ||||||
Post Holdings, Inc. | 1,789,000 | 1,750,644 | ||||||
144A, 5.625%, 1/15/28 | 3,666,000 | 3,486,714 | ||||||
144A, 5.50%, 12/15/29 | 4,870,000 | 4,468,274 | ||||||
144A, 4.625%, 4/15/30 | 5,883,000 | 5,116,386 | ||||||
144A, 4.50%, 9/15/31 | 5,295,000 | 4,508,904 | ||||||
Sigma Holdco BV, 144A, | 1,910,000 | 1,365,834 | ||||||
US Foods, Inc. | 3,896,000 | 3,920,097 | ||||||
144A, 4.75%, 2/15/29 | 3,506,000 | 3,129,070 | ||||||
144A, 4.625%, 6/1/30 | 1,959,000 | 1,692,272 | ||||||
|
| |||||||
(Cost $90,127,981) | 79,120,002 | |||||||
|
| |||||||
| Healthcare-Products — 1.1% | ||||||||
Avantor Funding, Inc. | 6,038,000 | 5,502,429 | ||||||
144A, 3.875%, 11/1/29 | 3,117,000 | 2,702,413 | ||||||
Hologic, Inc. | 1,558,000 | 1,454,845 | ||||||
144A, 3.25%, 2/15/29 | 3,701,000 | 3,162,060 | ||||||
Medline Borrower LP | 17,531,000 | 14,879,436 | ||||||
144A, 5.25%, 10/1/29 (a) | 9,739,000 | 8,196,732 | ||||||
Teleflex, Inc. | 1,948,000 | 1,826,347 | ||||||
144A, 4.25%, 6/1/28 | 1,948,000 | 1,772,820 | ||||||
|
| |||||||
(Cost $45,861,595) | 39,497,082 | |||||||
|
| |||||||
| Healthcare-Services — 5.8% | ||||||||
Catalent Pharma Solutions, Inc. | 1,948,000 | 1,840,977 | ||||||
144A, 3.125%, 2/15/29 | 2,155,000 | 1,791,044 | ||||||
144A, 3.50%, 4/1/30 | 2,532,000 | 2,088,900 | ||||||
Centene Corp. | 9,730,000 | 9,254,008 | ||||||
2.45%, 7/15/28 | 8,960,000 | 7,569,587 | ||||||
4.625%, 12/15/29 | 13,635,000 | 12,863,941 | ||||||
3.375%, 2/15/30 | 7,781,000 | 6,689,248 | ||||||
3.00%, 10/15/30 | 8,571,000 | 7,163,642 | ||||||
2.50%, 3/1/31 | 8,571,000 | 6,851,486 | ||||||
2.625%, 8/1/31 | 5,064,000 | 4,058,745 | ||||||
Charles River Laboratories International, Inc. | 1,948,000 | 1,788,722 | ||||||
144A, 3.75%, 3/15/29 | 1,959,000 | 1,691,469 | ||||||
144A, 4.00%, 3/15/31 | 1,959,000 | 1,665,868 | ||||||
CHS/Community Health Systems, Inc. | 8,184,000 | 7,662,270 | ||||||
144A, 5.625%, 3/15/27 | 7,402,000 | 6,290,886 | ||||||
144A, 8.00%, 12/15/27 | 2,727,000 | 2,401,261 | ||||||
144A, 6.875%, 4/1/28 | 2,988,000 | 1,561,277 | ||||||
144A, 6.00%, 1/15/29 | 3,506,000 | 2,883,343 | ||||||
Principal | Value | |||||||
| Healthcare-Services (Continued) | ||||||||
144A, 6.875%, 4/15/29 (a) | $ | 6,915,000 | $ | 4,332,559 | ||||
144A, 6.125%, 4/1/30 | 5,610,000 | 3,486,671 | ||||||
144A, 5.25%, 5/15/30 | 5,980,000 | 4,537,415 | ||||||
144A, 4.75%, 2/15/31 (a) | 4,266,000 | 3,155,560 | ||||||
DaVita, Inc. | 10,713,000 | 8,637,570 | ||||||
144A, 3.75%, 2/15/31 | 5,844,000 | 4,310,242 | ||||||
Encompass Health Corp. | 3,117,000 | 2,731,439 | ||||||
4.75%, 2/1/30 | 3,117,000 | 2,670,947 | ||||||
4.625%, 4/1/31 | 1,567,000 | 1,296,373 | ||||||
IQVIA, Inc. | 4,091,000 | 3,968,475 | ||||||
144A, 5.00%, 5/15/27 | 4,285,000 | 4,148,716 | ||||||
Legacy LifePoint Health LLC | 2,284,000 | 2,245,846 | ||||||
144A, 4.375%, 2/15/27 | 2,337,000 | 2,034,802 | ||||||
LifePoint Health, Inc., 144A, | 1,948,000 | 1,479,272 | ||||||
ModivCare, Inc., 144A, | 1,948,000 | 1,837,238 | ||||||
Molina Healthcare, Inc. | 3,117,000 | 2,880,529 | ||||||
144A, 3.875%, 11/15/30 | 2,532,000 | 2,195,611 | ||||||
144A, 3.875%, 5/15/32 | 2,922,000 | 2,519,305 | ||||||
Radiology Partners, Inc., 144A, | 2,766,000 | 2,123,377 | ||||||
RegionalCare Hospital Partners Holdings, Inc. / LifePoint Health, Inc., 144A, | 5,551,000 | 5,306,481 | ||||||
Select Medical Corp., 144A, | 4,772,000 | 4,570,860 | ||||||
Tenet Healthcare Corp. | 3,000,000 | 2,941,500 | ||||||
144A, 4.625%, 9/1/24 | 2,337,000 | 2,275,288 | ||||||
144A, 4.875%, 1/1/26 | 8,181,000 | 7,807,333 | ||||||
144A, 6.25%, 2/1/27 | 5,844,000 | 5,642,382 | ||||||
144A, 5.125%, 11/1/27 | 5,844,000 | 5,421,040 | ||||||
144A, 4.625%, 6/15/28 | 2,337,000 | 2,127,558 | ||||||
144A, 6.125%, 10/1/28 | 9,739,000 | 8,947,852 | ||||||
144A, 4.25%, 6/1/29 | 5,454,000 | 4,733,472 | ||||||
144A, 4.375%, 1/15/30 | 5,649,000 | 4,942,875 | ||||||
144A, 6.125%, 6/15/30 | 7,791,000 | 7,518,705 | ||||||
|
| |||||||
(Cost $245,123,719) | 208,943,967 | |||||||
|
| |||||||
| Household Products/Wares — 0.2% | ||||||||
Central Garden & Pet Co. | 1,939,000 | 1,617,213 | ||||||
144A, 4.125%, 4/30/31 | 1,567,000 | 1,285,578 | ||||||
Kronos Acquisition Holdings, Inc. / KIK Custom Products, Inc. | 1,850,000 | 1,678,505 | ||||||
144A, 7.00%, 12/31/27 | 2,045,000 | 1,690,162 | ||||||
Spectrum Brands, Inc. | 1,743,000 | 1,702,652 | ||||||
144A, 3.875%, 3/15/31 | 1,959,000 | 1,522,319 | ||||||
|
| |||||||
(Cost $11,198,046) | 9,496,429 | |||||||
|
| |||||||
| See Notes to Financial Statements. | 58 |
DBX ETF Trust
Schedule of Investments
Xtrackers USD High Yield Corporate Bond ETF (Continued)
August 31, 2022
Principal | Value | |||||||
| Pharmaceuticals — 3.2% | ||||||||
AdaptHealth LLC | $ | 1,959,000 | $ | 1,634,002 | ||||
144A, 5.125%, 3/1/30 | 2,337,000 | 1,998,462 | ||||||
Bausch Health Americas, Inc. | ||||||||
144A, 9.25%, 4/1/26 | 5,844,000 | 3,442,993 | ||||||
144A, 8.50%, 1/31/27 | 6,818,000 | 3,216,255 | ||||||
Bausch Health Cos., Inc. | 6,818,000 | 5,667,190 | ||||||
144A, 9.00%, 12/15/25 | 5,844,000 | 3,707,288 | ||||||
144A, 6.125%, 2/1/27 | 3,896,000 | 2,914,364 | ||||||
144A, 5.75%, 8/15/27 (a) | 1,959,000 | 1,431,745 | ||||||
144A, 7.00%, 1/15/28 | 2,919,000 | 1,104,769 | ||||||
144A, 5.00%, 1/30/28 | 4,870,000 | 1,846,266 | ||||||
144A, 4.875%, 6/1/28 | 6,233,000 | 4,308,624 | ||||||
144A, 5.00%, 2/15/29 | 3,893,000 | 1,524,109 | ||||||
144A, 6.25%, 2/15/29 | 5,844,000 | 2,215,460 | ||||||
144A, 7.25%, 5/30/29 | 2,919,000 | 1,142,905 | ||||||
144A, 5.25%, 1/30/30 | 4,870,000 | 1,857,978 | ||||||
144A, 5.25%, 2/15/31 | 3,893,000 | 1,543,672 | ||||||
Cheplapharm Arzneimittel GmbH, 144A, 5.50%, 1/15/28 | 1,959,000 | 1,683,806 | ||||||
Elanco Animal Health, Inc., | 2,850,000 | 2,668,141 | ||||||
HLF Financing Sarl LLC / Herbalife International, Inc., 144A, | 2,337,000 | 1,846,419 | ||||||
Jazz Securities DAC, 144A, | 5,844,000 | 5,278,242 | ||||||
Mallinckrodt International Finance SA / Mallinckrodt CB LLC | 1,940,000 | 1,748,270 | ||||||
144A, 11.50%, 12/15/28 | 2,522,000 | 2,272,952 | ||||||
Organon & Co. / Organon Foreign Debt Co.-Issuer BV | 8,181,000 | 7,351,406 | ||||||
144A, 5.125%, 4/30/31 | 7,791,000 | 6,826,942 | ||||||
Owens & Minor, Inc. | 1,959,000 | 1,672,281 | ||||||
144A, 6.625%, 4/1/30 | 2,337,000 | 2,153,697 | ||||||
Perrigo Finance Unlimited Co. | 2,727,000 | 2,603,594 | ||||||
4.375%, 3/15/26 (a) | 2,727,000 | 2,597,454 | ||||||
4.40%, 6/15/30 | 2,922,000 | 2,535,653 | ||||||
Prestige Brands, Inc. | 1,567,000 | 1,447,540 | ||||||
144A, 3.75%, 4/1/31 | 2,337,000 | 1,873,491 | ||||||
Teva Pharmaceutical Finance Netherlands III BV | 4,863,000 | 4,730,970 | ||||||
7.125%, 1/31/25 | 3,889,000 | 3,855,302 | ||||||
3.15%, 10/1/26 | 13,635,000 | 11,470,989 | ||||||
4.75%, 5/9/27 | 3,896,000 | 3,412,818 | ||||||
6.75%, 3/1/28 (a) | 4,869,000 | 4,661,629 | ||||||
5.125%, 5/9/29 (a) | 3,896,000 | 3,411,898 | ||||||
|
| |||||||
(Cost $158,029,818) | 115,659,576 | |||||||
|
| |||||||
Principal | Value | |||||||
| Energy — 11.5% | ||||||||
| Energy-Alternate Sources — 0.2% | ||||||||
TerraForm Power Operating LLC | ||||||||
144A, 5.00%, 1/31/28 | $ | 2,727,000 | $ | 2,499,153 | ||||
144A, 4.75%, 1/15/30 | 2,727,000 | 2,411,796 | ||||||
|
| |||||||
(Cost $5,799,208) | 4,910,949 | |||||||
|
| |||||||
| Oil & Gas — 5.9% | ||||||||
Antero Resources Corp. | 1,481,000 | 1,508,250 | ||||||
144A, 5.375%, 3/1/30 (a) | 2,417,000 | 2,278,143 | ||||||
Apache Corp., | 2,258,000 | 2,040,532 | ||||||
Ascent Resources Utica Holdings LLC / ARU Finance Corp. | 2,337,000 | 2,276,051 | ||||||
144A, 5.875%, 6/30/29 | 1,567,000 | 1,413,583 | ||||||
Callon Petroleum Co. | 2,532,000 | 2,432,860 | ||||||
144A, 7.50%, 6/15/30 | 2,337,000 | 2,164,354 | ||||||
Calumet Specialty Products Partners LP / Calumet Finance Corp., 144A, | 2,143,000 | 2,247,771 | ||||||
Chesapeake Energy Corp. | 1,948,000 | 1,879,898 | ||||||
144A, 5.875%, 2/1/29 | 1,948,000 | 1,862,239 | ||||||
144A, 6.75%, 4/15/29 | 3,701,000 | 3,619,935 | ||||||
Citgo Holding, Inc., 144A, | 5,337,000 | 5,343,024 | ||||||
CITGO Petroleum Corp. | 4,383,000 | 4,267,881 | ||||||
144A, 6.375%, 6/15/26 | 2,532,000 | 2,413,482 | ||||||
CNX Resources Corp. | 2,727,000 | 2,709,138 | ||||||
144A, 6.00%, 1/15/29 | 1,948,000 | 1,834,164 | ||||||
Colgate Energy Partners III LLC, 144A, | 2,727,000 | 2,531,229 | ||||||
Comstock Resources, Inc. | 4,768,000 | 4,559,400 | ||||||
144A, 5.875%, 1/15/30 | 3,759,000 | 3,445,642 | ||||||
CrownRock LP / CrownRock Finance, Inc. | 4,616,000 | 4,553,453 | ||||||
144A, 5.00%, 5/1/29 | 1,567,000 | 1,441,311 | ||||||
CVR Energy, Inc. | 2,337,000 | 2,208,047 | ||||||
144A, 5.75%, 2/15/28 | 1,567,000 | 1,428,078 | ||||||
Endeavor Energy Resources LP / EER Finance, Inc., 144A, | 3,896,000 | 3,859,767 | ||||||
Hilcorp Energy I LP / Hilcorp Finance Co. | 2,337,000 | 2,211,503 | ||||||
144A, 5.75%, 2/1/29 | 2,337,000 | 2,125,653 | ||||||
144A, 6.00%, 4/15/30 | 1,948,000 | 1,796,037 | ||||||
144A, 6.00%, 2/1/31 | 2,337,000 | 2,121,707 | ||||||
144A, 6.25%, 4/15/32 | 1,948,000 | 1,750,231 | ||||||
Laredo Petroleum, Inc. | 2,251,000 | 2,261,782 | ||||||
144A, 7.75%, 7/31/29 (a) | 1,567,000 | 1,503,035 | ||||||
| See Notes to Financial Statements. | 59 |
DBX ETF Trust
Schedule of Investments
Xtrackers USD High Yield Corporate Bond ETF (Continued)
August 31, 2022
Principal | Value | |||||||
| Oil & Gas (Continued) | ||||||||
Leviathan Bond Ltd. | $ | 2,337,509 | $ | 2,302,446 | ||||
144A, REGS, 6.50%, 6/30/27 | 2,337,379 | 2,278,945 | ||||||
144A, REGS, 6.75%, 6/30/30 | 2,152,668 | 2,055,798 | ||||||
Matador Resources Co., | 4,090,000 | 4,008,364 | ||||||
MEG Energy Corp. | 4,675,000 | 4,729,931 | ||||||
144A, 5.875%, 2/1/29 | 2,337,000 | 2,176,670 | ||||||
Moss Creek Resources Holdings, Inc. | 2,727,000 | 2,484,283 | ||||||
144A, 10.50%, 5/15/27 | 1,948,000 | 1,884,511 | ||||||
Murphy Oil Corp. | 1,758,000 | 1,744,288 | ||||||
5.875%, 12/1/27 | 2,116,000 | 2,060,963 | ||||||
6.375%, 7/15/28 | 1,771,000 | 1,744,435 | ||||||
Nabors Industries Ltd., 144A, | 2,173,000 | 1,978,929 | ||||||
Nabors Industries, Inc. | 2,018,000 | 1,863,573 | ||||||
144A, 7.375%, 5/15/27 | 2,727,000 | 2,636,177 | ||||||
Occidental Petroleum Corp. | 2,269,000 | 2,371,105 | ||||||
2.90%, 8/15/24 | 2,540,000 | 2,477,884 | ||||||
8.00%, 7/15/25 | 1,948,000 | 2,118,489 | ||||||
5.875%, 9/1/25 | 3,246,000 | 3,331,629 | ||||||
5.50%, 12/1/25 | 2,643,000 | 2,717,612 | ||||||
5.55%, 3/15/26 | 4,212,000 | 4,319,406 | ||||||
8.50%, 7/15/27 | 1,954,000 | 2,190,874 | ||||||
6.375%, 9/1/28 | 2,337,000 | 2,444,008 | ||||||
8.875%, 7/15/30 | 3,896,000 | 4,561,690 | ||||||
6.625%, 9/1/30 | 5,844,000 | 6,251,327 | ||||||
6.125%, 1/1/31 | 4,870,000 | 5,067,243 | ||||||
7.50%, 5/1/31 | 3,388,000 | 3,820,614 | ||||||
7.875%, 9/15/31 | 1,888,000 | 2,178,884 | ||||||
Parkland Corp. | 1,948,000 | 1,884,515 | ||||||
144A, 4.50%, 10/1/29 | 3,117,000 | 2,644,817 | ||||||
144A, 4.625%, 5/1/30 | 3,117,000 | 2,681,080 | ||||||
PBF Holding Co. LLC / PBF Finance Corp. | 2,584,000 | 2,512,940 | ||||||
6.00%, 2/15/28 | 3,123,000 | 2,813,698 | ||||||
Puma International Financing SA | 2,514,000 | 2,349,346 | ||||||
144A, 5.00%, 1/24/26 (a) | 2,880,000 | 2,545,358 | ||||||
Range Resources Corp. | 2,922,000 | 2,839,643 | ||||||
8.25%, 1/15/29 | 2,337,000 | 2,456,058 | ||||||
144A, 4.75%, 2/15/30 (a) | 1,948,000 | 1,807,315 | ||||||
SM Energy Co. | 1,633,000 | 1,608,227 | ||||||
6.625%, 1/15/27 (a) | 1,633,000 | 1,594,445 | ||||||
6.50%, 7/15/28 (a) | 1,567,000 | 1,511,505 | ||||||
Southwestern Energy Co. | 1,640,000 | 1,702,205 | ||||||
5.375%, 2/1/29 | 2,710,000 | 2,566,411 | ||||||
Principal | Value | |||||||
| Oil & Gas (Continued) | ||||||||
5.375%, 3/15/30 | $ | 4,675,000 | $ | 4,388,236 | ||||
4.75%, 2/1/32 | 4,480,000 | 3,999,574 | ||||||
Sunoco LP / Sunoco Finance Corp. | 2,337,000 | 2,264,925 | ||||||
4.50%, 5/15/29 | 3,117,000 | 2,655,067 | ||||||
4.50%, 4/30/30 | 3,115,000 | 2,662,157 | ||||||
Transocean, Inc. | 1,612,000 | 1,287,327 | ||||||
144A, 7.50%, 1/15/26 | 2,217,000 | 1,711,652 | ||||||
144A, 11.50%, 1/30/27 | 2,678,000 | 2,584,886 | ||||||
144A, 8.00%, 2/1/27 | 2,385,000 | 1,774,404 | ||||||
|
| |||||||
(Cost $229,009,348) | 212,734,049 | |||||||
|
| |||||||
| Oil & Gas Services — 0.5% | ||||||||
Archrock Partners LP / Archrock Partners Finance Corp. | 1,948,000 | 1,828,958 | ||||||
144A, 6.25%, 4/1/28 | 3,117,000 | 2,841,410 | ||||||
CGG SA, 144A, | 1,948,000 | 1,738,801 | ||||||
USA Compression Partners LP / USA Compression Finance Corp. | 2,824,000 | 2,653,346 | ||||||
6.875%, 9/1/27 | 2,922,000 | 2,705,772 | ||||||
Weatherford International Ltd. | 1,948,000 | 1,838,863 | ||||||
144A, 8.625%, 4/30/30 | 6,233,000 | 5,644,187 | ||||||
|
| |||||||
(Cost $21,514,090) | 19,251,337 | |||||||
|
| |||||||
| Pipelines — 4.9% | ||||||||
Antero Midstream Partners LP / Antero Midstream Finance Corp. | 2,143,000 | 2,184,285 | ||||||
144A, 5.75%, 3/1/27 | 2,532,000 | 2,403,121 | ||||||
144A, 5.75%, 1/15/28 | 2,532,000 | 2,410,793 | ||||||
144A, 5.375%, 6/15/29 | 2,922,000 | 2,682,674 | ||||||
Buckeye Partners LP | 1,948,000 | 1,824,251 | ||||||
3.95%, 12/1/26 | 2,337,000 | 2,078,522 | ||||||
4.125%, 12/1/27 | 1,567,000 | 1,388,241 | ||||||
144A, 4.50%, 3/1/28 | 1,948,000 | 1,727,340 | ||||||
Cheniere Energy Partners LP | 5,843,000 | 5,368,987 | ||||||
4.00%, 3/1/31 | 5,839,000 | 5,124,102 | ||||||
3.25%, 1/31/32 | 4,656,000 | 3,732,995 | ||||||
Cheniere Energy, Inc., | 7,790,000 | 7,506,132 | ||||||
CQP Holdco LP / BIP-V Chinook Holdco LLC, 144A, | 5,454,000 | 4,832,735 | ||||||
Crestwood Midstream Partners LP / Crestwood Midstream Finance Corp. | 1,948,000 | 1,880,190 | ||||||
144A, 5.625%, 5/1/27 | 2,337,000 | 2,182,618 | ||||||
144A, 6.00%, 2/1/29 | 2,727,000 | 2,523,579 | ||||||
144A, 8.00%, 4/1/29 | 1,753,000 | 1,740,416 | ||||||
| See Notes to Financial Statements. | 60 |
DBX ETF Trust
Schedule of Investments
Xtrackers USD High Yield Corporate Bond ETF (Continued)
August 31, 2022
Principal | Value | |||||||
| Pipelines (Continued) | ||||||||
DT Midstream, Inc. | $ | 4,285,000 | $ | 3,770,372 | ||||
144A, 4.375%, 6/15/31 | 3,896,000 | 3,337,918 | ||||||
EnLink Midstream LLC | 1,948,000 | 1,875,534 | ||||||
5.375%, 6/1/29 | 1,943,000 | 1,818,667 | ||||||
144A,6.50%, 9/1/30 | 2,727,000 | 2,716,310 | ||||||
EnLink Midstream Partners LP | 1,160,000 | 1,132,277 | ||||||
4.85%, 7/15/26 | 2,088,000 | 2,057,004 | ||||||
EQM Midstream Partners LP | 1,567,000 | 1,515,203 | ||||||
4.125%, 12/1/26 | 1,948,000 | 1,758,586 | ||||||
144A, 7.50%, 6/1/27 | 1,948,000 | 1,925,481 | ||||||
144A, 6.50%, 7/1/27 | 3,506,000 | 3,390,542 | ||||||
5.50%, 7/15/28 | 3,311,000 | 3,032,595 | ||||||
144A, 4.50%, 1/15/29 | 3,117,000 | 2,688,943 | ||||||
144A, 7.50%, 6/1/30 | 1,948,000 | 1,926,445 | ||||||
144A, 4.75%, 1/15/31 | 4,285,000 | 3,713,638 | ||||||
Genesis Energy LP / Genesis Energy Finance Corp. | 2,084,000 | 1,955,804 | ||||||
8.00%, 1/15/27 | 3,823,000 | 3,599,966 | ||||||
7.75%, 2/1/28 | 2,647,000 | 2,457,790 | ||||||
Hess Midstream Operations LP | 3,097,000 | 3,025,475 | ||||||
144A, 5.125%, 6/15/28 | 2,143,000 | 1,993,579 | ||||||
144A, 4.25%, 2/15/30 | 2,922,000 | 2,511,490 | ||||||
144A, 5.50%, 10/15/30 | 1,567,000 | 1,429,817 | ||||||
ITT Holdings LLC, 144A, | 4,753,000 | 4,021,513 | ||||||
Kinetik Holdings LP, 144A, | 3,896,000 | 3,706,284 | ||||||
New Fortress Energy, Inc. | 4,870,000 | 4,700,867 | ||||||
144A, 6.50%, 9/30/26 | 5,844,000 | 5,513,171 | ||||||
NGL Energy Operating LLC / NGL Energy Finance Corp., 144A, | 7,986,000 | 7,230,005 | ||||||
NGL Energy Partners LP / NGL Energy Finance Corp., | 1,717,000 | 1,627,184 | ||||||
NuStar Logistics LP | 2,337,000 | 2,233,833 | ||||||
6.00%, 6/1/26 | 1,948,000 | 1,841,426 | ||||||
5.625%, 4/28/27 | 2,143,000 | 1,954,402 | ||||||
6.375%, 10/1/30 | 2,337,000 | 2,130,024 | ||||||
Rockies Express Pipeline LLC | 1,567,000 | 1,442,079 | ||||||
144A, 4.95%, 7/15/29 | 2,143,000 | 1,934,974 | ||||||
Tallgrass Energy Partners LP / Tallgrass Energy Finance Corp. | 2,337,000 | 2,343,380 | ||||||
144A, 6.00%, 3/1/27 | 1,685,000 | 1,540,208 | ||||||
144A, 5.50%, 1/15/28 | 2,922,000 | 2,533,520 | ||||||
144A, 6.00%, 12/31/30 | 2,922,000 | 2,565,372 | ||||||
144A, 6.00%, 9/1/31 | 1,959,000 | 1,716,730 | ||||||
Principal | Value | |||||||
| Pipelines (Continued) | ||||||||
Venture Global Calcasieu Pass LLC 144A, 3.875%, 8/15/29 | $ | 4,870,000 | $ | 4,255,893 | ||||
144A, 4.125%, 8/15/31 | 4,870,000 | 4,235,503 | ||||||
144A, 3.875%, 11/1/33 | 4,870,000 | 4,070,516 | ||||||
Western Midstream Operating LP | 2,847,000 | 2,691,440 | ||||||
4.65%, 7/1/26 | 1,858,000 | 1,771,315 | ||||||
4.50%, 3/1/28 | 1,567,000 | 1,456,934 | ||||||
4.75%, 8/15/28 | 1,558,000 | 1,469,007 | ||||||
4.30%, 2/1/30 | 4,675,000 | 4,208,388 | ||||||
|
| |||||||
(Cost $199,723,691) | 178,418,385 | |||||||
|
| |||||||
| Financial — 9.8% | ||||||||
| Banks — 0.9% | ||||||||
Commerzbank AG, 144A, | 3,896,000 | 3,981,815 | ||||||
Deutsche Bank AG | 1,959,000 | 1,711,027 | ||||||
3.729%, 1/14/32 (b) | 4,870,000 | 3,593,664 | ||||||
3.742%, 1/7/33 (b) | 4,870,000 | 3,472,027 | ||||||
Freedom Mortgage Corp. | 1,634,000 | 1,468,819 | ||||||
144A, 8.25%, 4/15/25 | 2,101,000 | 1,820,748 | ||||||
144A, 7.625%, 5/1/26 | 2,337,000 | 1,916,981 | ||||||
144A, 6.625%, 1/15/27 | 2,268,000 | 1,754,213 | ||||||
Intesa Sanpaolo SpA | 7,791,000 | 7,458,404 | ||||||
144A, 5.71%, 1/15/26 | 5,844,000 | 5,492,072 | ||||||
144A, 4.198%, 6/1/32 | 2,922,000 | 2,125,021 | ||||||
|
| |||||||
(Cost $41,521,528) | 34,794,791 | |||||||
|
| |||||||
| Diversified Financial Services — 3.4% | ||||||||
Ally Financial, Inc., | 4,091,000 | 4,139,981 | ||||||
Coinbase Global, Inc. | 3,896,000 | 2,531,836 | ||||||
144A, 3.625%, 10/1/31 | 3,896,000 | 2,377,924 | ||||||
Curo Group Holdings Corp., 144A, | 3,896,000 | 2,367,560 | ||||||
Jefferies Finance LLC / JFIN Co.-Issuer Corp., 144A, | 3,896,000 | 3,335,229 | ||||||
LD Holdings Group LLC | 1,959,000 | 1,127,331 | ||||||
144A, 6.125%, 4/1/28 | 1,969,000 | 1,048,751 | ||||||
LPL Holdings, Inc. | 1,558,000 | 1,468,372 | ||||||
144A, 4.00%, 3/15/29 | 3,506,000 | 3,138,519 | ||||||
144A, 4.375%, 5/15/31 | 1,567,000 | 1,381,405 | ||||||
Midcap Financial Issuer Trust | 3,896,000 | 3,347,170 | ||||||
144A, 5.625%, 1/15/30 | 1,567,000 | 1,197,697 | ||||||
Nationstar Mortgage Holdings, Inc. | 2,337,000 | 2,084,755 | ||||||
144A, 5.50%, 8/15/28 | 3,311,000 | 2,767,135 | ||||||
144A, 5.125%, 12/15/30 | 2,532,000 | 2,000,640 | ||||||
144A, 5.75%, 11/15/31 | 2,337,000 | 1,857,576 | ||||||
| See Notes to Financial Statements. | 61 |
DBX ETF Trust
Schedule of Investments
Xtrackers USD High Yield Corporate Bond ETF (Continued)
August 31, 2022
Principal | Value | |||||||
| Diversified Financial Services (Continued) | ||||||||
Navient Corp. | ||||||||
MTN, 6.125%, 3/25/24 | $ | 3,311,000 | $ | 3,234,450 | ||||
5.875%, 10/25/24 | 1,948,000 | 1,873,280 | ||||||
6.75%, 6/25/25 | 1,948,000 | 1,882,576 | ||||||
6.75%, 6/15/26 | 1,948,000 | 1,850,600 | ||||||
5.00%, 3/15/27 | 2,727,000 | 2,339,820 | ||||||
4.875%, 3/15/28 | 1,959,000 | 1,602,902 | ||||||
5.50%, 3/15/29 | 2,922,000 | 2,371,225 | ||||||
NFP Corp. | 2,143,000 | 1,904,452 | ||||||
144A, 6.875%, 8/15/28 | 8,084,000 | 6,659,923 | ||||||
OneMain Finance Corp. | 5,064,000 | 4,950,516 | ||||||
6.875%, 3/15/25 | 4,870,000 | 4,740,747 | ||||||
7.125%, 3/15/26 | 6,233,000 | 5,871,019 | ||||||
3.50%, 1/15/27 | 2,922,000 | 2,417,197 | ||||||
6.625%, 1/15/28 | 3,117,000 | 2,853,271 | ||||||
3.875%, 9/15/28 | 2,337,000 | 1,826,038 | ||||||
5.375%, 11/15/29 | 2,922,000 | 2,424,836 | ||||||
4.00%, 9/15/30 | 3,311,000 | 2,472,944 | ||||||
PennyMac Financial Services, Inc. | 2,532,000 | 2,278,252 | ||||||
144A, 4.25%, 2/15/29 | 2,532,000 | 1,983,581 | ||||||
144A, 5.75%, 9/15/31 | 1,959,000 | 1,591,021 | ||||||
Rocket Mortgage LLC / Rocket Mortgage Co.-Issuer, Inc. | 4,480,000 | 3,771,533 | ||||||
144A, 3.625%, 3/1/29 | 2,922,000 | 2,356,520 | ||||||
144A, 3.875%, 3/1/31 | 4,870,000 | 3,820,856 | ||||||
144A, 4.00%, 10/15/33 | 3,311,000 | 2,472,017 | ||||||
SLM Corp. | 1,948,000 | 1,786,195 | ||||||
3.125%, 11/2/26 | 1,959,000 | 1,647,799 | ||||||
United Wholesale Mortgage LLC | 3,117,000 | 2,726,973 | ||||||
144A, 5.75%, 6/15/27 | 1,959,000 | 1,616,361 | ||||||
144A, 5.50%, 4/15/29 | 2,727,000 | 2,126,214 | ||||||
VistaJet Malta Finance PLC / XO Management Holding, Inc. | 1,948,000 | 1,787,874 | ||||||
144A, 6.375%, 2/1/30 | 3,896,000 | 3,357,378 | ||||||
|
| |||||||
(Cost $146,757,032) | 120,770,251 | |||||||
|
| |||||||
| Insurance — 0.8% | ||||||||
Acrisure LLC / Acrisure Finance, Inc. | 3,604,000 | 3,401,437 | ||||||
144A, 10.125%, 8/1/26 | 1,567,000 | 1,570,415 | ||||||
144A, 4.25%, 2/15/29 | 2,727,000 | 2,317,267 | ||||||
144A, 6.00%, 8/1/29 | 1,959,000 | 1,591,575 | ||||||
Alliant Holdings Intermediate LLC / Alliant Holdings Co.-Issuer, 144A, | 1,763,000 | 1,518,797 | ||||||
Alliant Holdings Intermediate LLC / Alliant Holdings Co-Issuer | 2,922,000 | 2,636,812 | ||||||
144A, 6.75%, 10/15/27 | 5,220,000 | 4,750,409 | ||||||
Principal | Value | |||||||
| Insurance (Continued) | ||||||||
AssuredPartners, Inc. | $ | 1,948,000 | $ | 1,889,560 | ||||
144A, 5.625%, 1/15/29 | 2,143,000 | 1,784,200 | ||||||
HUB International Ltd. | 6,506,000 | 6,382,061 | ||||||
144A, 5.625%, 12/1/29 | 2,143,000 | 1,877,239 | ||||||
|
| |||||||
(Cost $32,795,560) | 29,719,772 | |||||||
|
| |||||||
| Real Estate — 0.6% | ||||||||
Howard Hughes Corp. | 2,922,000 | 2,604,846 | ||||||
144A, 4.125%, 2/1/29 | 2,532,000 | 2,093,284 | ||||||
144A, 4.375%, 2/1/31 | 2,532,000 | 2,028,385 | ||||||
Kennedy-Wilson, Inc. | 2,337,000 | 1,953,230 | ||||||
4.75%, 2/1/30 | 2,337,000 | 1,887,572 | ||||||
5.00%, 3/1/31 | 2,337,000 | 1,925,162 | ||||||
Realogy Group LLC / Realogy Co.-Issuer Corp. | 3,506,000 | 2,752,210 | ||||||
144A, 5.25%, 4/15/30 | 3,896,000 | 2,941,480 | ||||||
WeWork Cos., Inc., 144A, | 2,606,000 | 1,948,128 | ||||||
|
| |||||||
(Cost $24,969,396) | 20,134,297 | |||||||
|
| |||||||
| Real Estate Investment Trusts — 3.5% | ||||||||
Blackstone Mortgage Trust, Inc., 144A, | 1,567,000 | 1,365,766 | ||||||
Brookfield Property REIT, Inc. / BPR Cumulus LLC / BPR Nimbus LLC / GGSI Sellco LL | 3,683,000 | 3,440,406 | ||||||
144A, 4.50%, 4/1/27 | 2,922,000 | 2,507,891 | ||||||
Diversified Healthcare Trust | 1,948,000 | 1,917,309 | ||||||
4.75%, 2/15/28 | 1,959,000 | 1,451,106 | ||||||
4.375%, 3/1/31 | 1,939,000 | 1,333,334 | ||||||
HAT Holdings I LLC / HAT Holdings II LLC | 1,567,000 | 1,521,005 | ||||||
144A, 3.375%, 6/15/26 | 3,896,000 | 3,387,104 | ||||||
Iron Mountain, Inc. | 3,896,000 | 3,582,801 | ||||||
144A, 5.25%, 3/15/28 | 3,214,000 | 2,953,811 | ||||||
144A, 5.00%, 7/15/28 | 1,948,000 | 1,780,267 | ||||||
144A, 4.875%, 9/15/29 | 3,896,000 | 3,385,234 | ||||||
144A, 5.25%, 7/15/30 | 5,064,000 | 4,487,590 | ||||||
144A, 4.50%, 2/15/31 | 4,285,000 | 3,565,056 | ||||||
144A, 5.625%, 7/15/32 | 2,337,000 | 2,057,471 | ||||||
iStar, Inc. | 2,992,000 | 2,997,056 | ||||||
4.25%, 8/1/25 | 2,143,000 | 2,141,478 | ||||||
Ladder Capital Finance Holdings LLLP / Ladder Capital Finance Corp. | 2,539,000 | 2,217,311 | ||||||
144A, 4.75%, 6/15/29 | 2,532,000 | 2,149,661 | ||||||
| See Notes to Financial Statements. | 62 |
DBX ETF Trust
Schedule of Investments
Xtrackers USD High Yield Corporate Bond ETF (Continued)
August 31, 2022
Principal | Value | |||||||
| Real Estate Investment Trusts (Continued) | ||||||||
MPT Operating Partnership LP / MPT Finance Corp. | $ | 1,948,000 | $ | 1,870,670 | ||||
5.00%, 10/15/27 | 5,454,000 | 4,906,426 | ||||||
4.625%, 8/1/29 | 3,506,000 | 2,991,098 | ||||||
3.50%, 3/15/31 | 5,064,000 | 3,805,495 | ||||||
Park Intermediate Holdings LLC / PK Domestic Property LLC / PK Finance Co.-Issuer | 2,532,000 | 2,558,839 | ||||||
144A, 5.875%, 10/1/28 | 2,824,000 | 2,598,984 | ||||||
144A, 4.875%, 5/15/29 | 2,922,000 | 2,574,203 | ||||||
RHP Hotel Properties LP / RHP Finance Corp. | 2,725,500 | 2,481,977 | ||||||
144A, 4.50%, 2/15/29 | 2,337,000 | 2,022,444 | ||||||
RLJ Lodging Trust LP | 1,959,000 | 1,760,299 | ||||||
144A, 4.00%, 9/15/29 | 1,939,000 | 1,639,679 | ||||||
SBA Communications Corp. | 5,827,000 | 5,320,744 | ||||||
3.125%, 2/1/29 | 5,838,000 | 4,818,218 | ||||||
Service Properties Trust | 3,203,000 | 2,875,613 | ||||||
7.50%, 9/15/25 | 3,117,000 | 2,992,382 | ||||||
4.75%, 10/1/26 | 1,763,000 | 1,436,501 | ||||||
4.95%, 2/15/27 | 1,567,000 | 1,271,587 | ||||||
5.50%, 12/15/27 | 1,763,000 | 1,527,446 | ||||||
3.95%, 1/15/28 | 1,558,000 | 1,162,143 | ||||||
4.95%, 10/1/29 | 1,645,000 | 1,243,244 | ||||||
4.375%, 2/15/30 | 1,547,000 | 1,135,668 | ||||||
Starwood Property Trust, Inc. | 1,567,000 | 1,463,233 | ||||||
4.75%, 3/15/25 | 1,948,000 | 1,857,632 | ||||||
144A, 3.625%, 7/15/26 | 1,567,000 | 1,389,028 | ||||||
144A, 4.375%, 1/15/27 | 1,948,000 | 1,736,126 | ||||||
Uniti Group LP / Uniti Fiber Holdings, Inc. / CSL Capital LLC | 8,765,000 | 8,670,250 | ||||||
144A, 6.00%, 1/15/30 | 2,727,000 | 1,927,178 | ||||||
Uniti Group LP / Uniti Group Finance, Inc. / CSL Capital LLC | 2,221,000 | 1,859,060 | ||||||
144A, 6.50%, 2/15/29 | 4,324,000 | 3,301,115 | ||||||
XHR LP | 1,948,000 | 1,893,469 | ||||||
144A, 4.875%, 6/1/29 | 1,959,000 | 1,731,054 | ||||||
|
| |||||||
(Cost $146,392,892) | 127,063,462 | |||||||
|
| |||||||
| Venture Capital — 0.6% | ||||||||
Compass Group Diversified Holdings LLC, 144A, | 3,896,000 | 3,321,496 | ||||||
Icahn Enterprises LP / Icahn Enterprises Finance Corp. | 4,278,000 | 4,075,223 | ||||||
6.375%, 12/15/25 | 2,908,000 | 2,842,570 | ||||||
Principal | Value | |||||||
| Venture Capital (Continued) | ||||||||
6.25%, 5/15/26 | $ | 4,862,000 | $ | 4,669,368 | ||||
5.25%, 5/15/27 | 5,654,000 | 5,150,099 | ||||||
4.375%, 2/1/29 | 2,921,000 | 2,488,604 | ||||||
|
| |||||||
(Cost $25,069,916) | 22,547,360 | |||||||
|
| |||||||
| Industrial — 8.8% | ||||||||
| Aerospace/Defense — 2.6% | ||||||||
Bombardier, Inc. | 1,987,000 | 1,971,840 | ||||||
144A, 7.50%, 3/15/25 | 5,043,000 | 4,941,585 | ||||||
144A, 7.125%, 6/15/26 | 4,675,000 | 4,460,932 | ||||||
144A, 7.875%, 4/15/27 | 7,489,000 | 7,180,341 | ||||||
144A, 6.00%, 2/15/28 | 2,922,000 | 2,588,099 | ||||||
Howmet Aerospace, Inc. | 4,246,000 | 4,225,619 | ||||||
6.875%, 5/1/25 | 2,337,000 | 2,402,880 | ||||||
3.00%, 1/15/29 | 2,727,000 | 2,306,878 | ||||||
Rolls-Royce PLC | 3,896,000 | 3,529,581 | ||||||
144A, 5.75%, 10/15/27 | 3,896,000 | 3,530,516 | ||||||
Spirit AeroSystems, Inc. | 1,948,000 | 1,910,131 | ||||||
144A, 7.50%, 4/15/25 | 4,675,000 | 4,580,097 | ||||||
4.60%, 6/15/28 (a) | 2,727,000 | 2,171,892 | ||||||
TransDigm, Inc. | 4,285,000 | 4,394,096 | ||||||
144A, 6.25%, 3/15/26 | 17,141,000 | 16,862,030 | ||||||
6.375%, 6/15/26 | 3,701,000 | 3,557,383 | ||||||
7.50%, 3/15/27 | 2,143,000 | 2,092,404 | ||||||
5.50%, 11/15/27 | 10,319,000 | 9,299,638 | ||||||
4.625%, 1/15/29 | 4,675,000 | 3,989,178 | ||||||
4.875%, 5/1/29 | 2,920,000 | 2,481,538 | ||||||
Triumph Group, Inc. | 2,194,000 | 2,224,683 | ||||||
144A, 6.25%, 9/15/24 | 2,045,000 | 1,876,288 | ||||||
7.75%, 8/15/25 | 1,959,000 | 1,652,593 | ||||||
|
| |||||||
(Cost $102,227,860) | 94,230,222 | |||||||
|
| |||||||
| Building Materials — 1.0% | ||||||||
Builders FirstSource, Inc. | 2,143,000 | 1,902,180 | ||||||
144A, 4.25%, 2/1/32 | 5,064,000 | 4,048,567 | ||||||
144A, 6.375%, 6/15/32 | 2,727,000 | 2,532,579 | ||||||
Cornerstone Building Brands, Inc., 144A, | 1,949,000 | 1,331,266 | ||||||
Griffon Corp., | 3,893,000 | 3,607,643 | ||||||
JELD-WEN, Inc. | 1,547,000 | 1,332,624 | ||||||
144A, 4.875%, 12/15/27 | 1,567,000 | 1,215,827 | ||||||
SRM Escrow Issuer LLC, 144A, | 4,285,000 | 3,893,458 | ||||||
Standard Industries, Inc. | 3,311,000 | 3,036,836 | ||||||
144A, 4.75%, 1/15/28 | 3,896,000 | 3,412,774 | ||||||
144A, 4.375%, 7/15/30 | 6,233,000 | 4,998,087 | ||||||
144A, 3.375%, 1/15/31 | 4,285,000 | 3,190,371 | ||||||
| See Notes to Financial Statements. | 63 |
DBX ETF Trust
Schedule of Investments
Xtrackers USD High Yield Corporate Bond ETF (Continued)
August 31, 2022
Principal | Value | |||||||
| Building Materials (Continued) | ||||||||
Summit Materials LLC / Summit Materials Finance Corp., 144A, | $ | 2,727,000 | $ | 2,457,752 | ||||
|
| |||||||
(Cost $43,678,681) | 36,959,964 | |||||||
|
| |||||||
| Electrical Components & Equipment — 0.4% | ||||||||
Energizer Holdings, Inc. | 2,337,000 | 1,947,399 | ||||||
144A, 4.375%, 3/31/29 | 3,117,000 | 2,535,415 | ||||||
WESCO Distribution, Inc. | 5,844,000 | 5,852,088 | ||||||
144A, 7.25%, 6/15/28 | 5,162,000 | 5,222,705 | ||||||
|
| |||||||
(Cost $17,027,239) | 15,557,607 | |||||||
|
| |||||||
| Electronics — 0.7% | ||||||||
II-VI, Inc., 144A, | 3,857,000 | 3,438,843 | ||||||
Imola Merger Corp., 144A, | 7,791,000 | 6,624,176 | ||||||
Sensata Technologies BV | 1,948,000 | 1,967,627 | ||||||
144A, 5.625%, 11/1/24 | 1,558,000 | 1,568,202 | ||||||
144A, 5.00%, 10/1/25 | 2,727,000 | 2,674,981 | ||||||
144A, 4.00%, 4/15/29 | 3,896,000 | 3,373,507 | ||||||
144A, 5.875%, 9/1/30 | 1,948,000 | 1,906,586 | ||||||
Sensata Technologies, Inc. | 1,763,000 | 1,573,477 | ||||||
144A, 3.75%, 2/15/31 | 2,914,000 | 2,412,057 | ||||||
|
| |||||||
(Cost $29,193,565) | 25,539,456 | |||||||
|
| |||||||
| Engineering & Construction — 0.1% | ||||||||
Brand Industrial Services, Inc., 144A, | 3,896,000 | 3,160,513 | ||||||
Fluor Corp., | 2,337,000 | 2,116,081 | ||||||
|
| |||||||
(Cost $6,312,268) | 5,276,594 | |||||||
|
| |||||||
| Environmental Control — 0.8% | ||||||||
Covanta Holding Corp. | 2,980,000 | 2,519,590 | ||||||
5.00%, 9/1/30 | 1,567,000 | 1,324,115 | ||||||
GFL Environmental, Inc. | 1,948,000 | 1,862,465 | ||||||
144A, 3.75%, 8/1/25 | 2,922,000 | 2,764,548 | ||||||
144A, 5.125%, 12/15/26 | 1,948,000 | 1,886,724 | ||||||
144A, 4.00%, 8/1/28 | 2,922,000 | 2,474,262 | ||||||
144A, 3.50%, 9/1/28 | 2,922,000 | 2,543,776 | ||||||
144A, 4.75%, 6/15/29 | 2,922,000 | 2,539,919 | ||||||
144A, 4.375%, 8/15/29 | 2,143,000 | 1,819,418 | ||||||
Madison IAQ LLC | 2,727,000 | 2,342,343 | ||||||
144A, 5.875%, 6/30/29 | 4,032,000 | 3,323,900 | ||||||
Stericycle, Inc. | 2,337,000 | 2,290,190 | ||||||
144A, 3.875%, 1/15/29 | 1,959,000 | 1,699,981 | ||||||
|
| |||||||
(Cost $33,603,826) | 29,391,231 | |||||||
|
| |||||||
Principal | Value | |||||||
| Machinery-Diversified — 0.2% | ||||||||
TK Elevator Holdco GmbH, 144A, | $ | 1,569,000 | $ | 1,406,820 | ||||
TK Elevator US Newco, Inc., 144A, | 6,077,000 | 5,552,525 | ||||||
|
| |||||||
(Cost $7,921,647) | 6,959,345 | |||||||
|
| |||||||
| Miscellaneous Manufacturing — 0.2% | ||||||||
FXI Holdings, Inc. | 1,966,000 | 1,633,156 | ||||||
144A, 12.25%, 11/15/26 | 2,968,000 | 2,481,189 | ||||||
Hillenbrand, Inc., | 1,567,000 | 1,571,434 | ||||||
|
| |||||||
(Cost $6,712,442) | 5,685,779 | |||||||
|
| |||||||
| Packaging & Containers — 2.5% | ||||||||
Ardagh Metal Packaging Finance USA LLC / Ardagh Metal Packaging Finance PLC | 2,337,000 | 2,293,432 | ||||||
144A, 3.25%, 9/1/28 | 2,337,000 | 2,019,355 | ||||||
144A, 4.00%, 9/1/29 | 4,091,000 | 3,321,094 | ||||||
Ardagh Packaging Finance PLC / Ardagh Holdings USA, Inc. | 2,727,000 | 2,585,143 | ||||||
144A, 4.125%, 8/15/26 | 4,733,000 | 4,088,886 | ||||||
144A, 5.25%, 8/15/27 | 3,896,000 | 2,823,585 | ||||||
144A, 5.25%, 8/15/27 | 3,117,000 | 2,259,013 | ||||||
Ball Corp. | 3,896,000 | 3,860,000 | ||||||
5.25%, 7/1/25 | 3,896,000 | 3,891,150 | ||||||
4.875%, 3/15/26 | 2,922,000 | 2,832,879 | ||||||
2.875%, 8/15/30 | 5,064,000 | 4,114,449 | ||||||
3.125%, 9/15/31 (a) | 3,311,000 | 2,686,410 | ||||||
Berry Global, Inc., 144A, | 1,948,000 | 1,904,560 | ||||||
Clydesdale Acquisition Holdings, Inc. | 1,948,000 | 1,871,854 | ||||||
144A, 8.75%, 4/15/30 | 4,324,000 | 3,764,604 | ||||||
Crown Americas LLC, 144A, | 1,948,000 | 1,873,021 | ||||||
Graphic Packaging International LLC 144A, 3.50%, 3/15/28 | 1,763,000 | 1,571,730 | ||||||
144A, 3.75%, 2/1/30 | 1,558,000 | 1,341,430 | ||||||
LABL, Inc. | 2,718,000 | 2,586,136 | ||||||
144A, 10.50%, 7/15/27 | 2,688,000 | 2,544,205 | ||||||
144A, 5.875%, 11/1/28 | 1,948,000 | 1,698,413 | ||||||
144A, 8.25%, 11/1/29 | 1,802,000 | 1,460,746 | ||||||
Mauser Packaging Solutions Holding Co. | 5,766,000 | 5,589,144 | ||||||
144A, 7.25%, 4/15/25 | 5,259,000 | 4,794,841 | ||||||
OI European Group BV, 144A, | 1,567,000 | 1,270,900 | ||||||
Owens-Brockway Glass Container, Inc., 144A, | 2,383,000 | 2,216,840 | ||||||
| See Notes to Financial Statements. | 64 |
DBX ETF Trust
Schedule of Investments
Xtrackers USD High Yield Corporate Bond ETF (Continued)
August 31, 2022
Principal | Value | |||||||
| Packaging & Containers (Continued) | ||||||||
Pactiv Evergreen Group Issuer, Inc. /Pactiv Evergreen Group Issuer LLC, 144A, | $ | 3,896,000 | $ | 3,406,097 | ||||
Sealed Air Corp. | 1,665,000 | 1,650,798 | ||||||
144A, 5.50%, 9/15/25 | 1,547,000 | 1,541,547 | ||||||
144A, 4.00%, 12/1/27 | 1,650,000 | 1,504,330 | ||||||
144A, 5.00%, 4/15/29 | 1,665,000 | 1,584,730 | ||||||
Silgan Holdings, Inc., | 2,221,000 | 2,036,124 | ||||||
Trivium Packaging Finance BV | 4,091,000 | 3,934,274 | ||||||
144A, 8.50%, 8/15/27 | 2,727,000 | 2,594,154 | ||||||
|
| |||||||
(Cost $100,507,891) | 89,515,874 | |||||||
|
| |||||||
| Transportation — 0.1% | ||||||||
Seaspan Corp., 144A, (Cost $2,914,236) | 2,922,000 | 2,410,650 | ||||||
|
| |||||||
| Trucking & Leasing — 0.2% | ||||||||
Fortress Transportation and Infrastructure Investors LLC | 2,466,000 | 2,301,592 | ||||||
144A, 9.75%, 8/1/27 | 1,558,000 | 1,565,801 | ||||||
144A, 5.50%, 5/1/28 | 3,896,000 | 3,338,404 | ||||||
|
| |||||||
(Cost $8,179,073) | 7,205,797 | |||||||
|
| |||||||
| Technology — 4.0% | ||||||||
| Computers — 1.3% | ||||||||
Booz Allen Hamilton, Inc. | 2,727,000 | 2,430,166 | ||||||
144A, 4.00%, 7/1/29 | 1,959,000 | 1,730,382 | ||||||
Condor Merger Sub, Inc., 144A, | 7,869,000 | 6,579,664 | ||||||
Diebold Nixdorf, Inc. | 1,567,000 | 955,159 | ||||||
144A, 9.375%, 7/15/25 | 2,727,000 | 2,242,284 | ||||||
Exela Intermediate LLC / Exela Finance, Inc., 144A, | 4,628,000 | 1,507,950 | ||||||
NCR Corp. | 1,948,000 | 1,882,860 | ||||||
144A, 5.00%, 10/1/28 | 2,532,000 | 2,387,207 | ||||||
144A, 5.125%, 4/15/29 | 4,675,000 | 4,372,060 | ||||||
144A, 6.125%, 9/1/29 | 1,948,000 | 1,862,915 | ||||||
144A, 5.25%, 10/1/30 | 1,763,000 | 1,630,772 | ||||||
Presidio Holdings, Inc. | 2,045,000 | 1,916,421 | ||||||
144A, 8.25%, 2/1/28 | 2,143,000 | 1,937,862 | ||||||
Seagate HDD Cayman | 1,948,000 | 1,912,369 | ||||||
4.75%, 1/1/25 | 1,867,000 | 1,826,696 | ||||||
4.875%, 6/1/27 | 1,967,000 | 1,858,451 | ||||||
4.091%, 6/1/29 | 1,919,000 | 1,643,307 | ||||||
3.125%, 7/15/29 | 1,959,000 | 1,569,306 | ||||||
4.125%, 1/15/31 | 1,959,000 | 1,623,296 | ||||||
3.375%, 7/15/31 | 1,959,000 | 1,534,651 | ||||||
Principal | Value | |||||||
| Computers (Continued) | ||||||||
Vericast Corp., 144A, | $ | 4,817,578 | $ | 4,830,345 | ||||
|
| |||||||
(Cost $56,478,616) | 48,234,123 | |||||||
|
| |||||||
| Office/Business Equipment — 0.2% | ||||||||
Pitney Bowes, Inc., 144A, | 1,567,000 | 1,187,719 | ||||||
Xerox Holdings Corp. | 2,922,000 | 2,713,017 | ||||||
144A, 5.50%, 8/15/28 | 2,922,000 | 2,560,125 | ||||||
|
| |||||||
(Cost $7,690,726) | 6,460,861 | |||||||
|
| |||||||
| Semiconductors — 0.3% | ||||||||
ams-OSRAM AG, 144A, | 1,763,000 | 1,684,626 | ||||||
Entegris Escrow Corp., 144A, | 3,487,000 | 3,313,278 | ||||||
Entegris, Inc. | 1,547,000 | 1,367,888 | ||||||
144A, 3.625%, 5/1/29 | 1,567,000 | 1,322,242 | ||||||
ON Semiconductor Corp., 144A, | 2,727,000 | 2,437,134 | ||||||
|
| |||||||
(Cost $10,825,974) | 10,125,168 | |||||||
|
| |||||||
| Software — 2.2% | ||||||||
Black Knight InfoServ LLC, 144A, | 3,896,000 | 3,418,117 | ||||||
Boxer Parent Co., Inc., 144A, | 2,337,000 | 2,313,858 | ||||||
Change Healthcare Holdings LLC / Change Healthcare Finance, Inc., 144A, | 4,577,000 | 4,522,671 | ||||||
Clarivate Science Holdings Corp. | 3,589,000 | 3,076,666 | ||||||
144A, 4.875%, 7/1/29 | 3,590,000 | 2,973,830 | ||||||
Fair Isaac Corp. | 1,567,000 | 1,518,180 | ||||||
144A, 4.00%, 6/15/28 | 3,506,000 | 3,101,943 | ||||||
MicroStrategy, Inc., 144A, | 1,944,000 | 1,625,808 | ||||||
Minerva Merger Sub, Inc., 144A, | 9,155,000 | 7,784,130 | ||||||
MSCI, Inc. | 3,896,000 | 3,475,096 | ||||||
144A, 3.625%, 9/1/30 | 3,506,000 | 2,980,027 | ||||||
144A, 3.875%, 2/15/31 | 3,896,000 | 3,370,059 | ||||||
144A, 3.625%, 11/1/31 | 2,337,000 | 1,950,676 | ||||||
144A, 3.25%, 8/15/33 | 2,727,000 | 2,188,377 | ||||||
Open Text Corp. | ||||||||
144A, 3.875%, 2/15/28 | 3,506,000 | 2,995,053 | ||||||
144A, 3.875%, 12/1/29 | 3,311,000 | 2,676,686 | ||||||
Open Text Holdings, Inc. | 3,506,000 | 2,845,250 | ||||||
144A, 4.125%, 12/1/31 | 2,532,000 | 2,004,496 | ||||||
PTC, Inc. | 1,948,000 | 1,832,994 | ||||||
144A, 4.00%, 2/15/28 | 1,948,000 | 1,784,310 | ||||||
| See Notes to Financial Statements. | 65 |
DBX ETF Trust
Schedule of Investments
Xtrackers USD High Yield Corporate Bond ETF (Continued)
August 31, 2022
Principal | Value | |||||||
| Software (Continued) | ||||||||
Rackspace Technology Global, Inc. | $ | 2,130,000 | $ | 1,521,421 | ||||
144A, 5.375%, 12/1/28 | 2,155,000 | 1,196,880 | ||||||
ROBLOX Corp., 144A, | 3,896,000 | 3,256,708 | ||||||
SS&C Technologies, Inc., 144A, | 7,791,000 | 7,373,861 | ||||||
Twilio, Inc. | 1,959,000 | 1,638,459 | ||||||
3.875%, 3/15/31 (a) | 1,939,000 | 1,567,837 | ||||||
Veritas US, Inc. / Veritas Bermuda Ltd., 144A, | 6,818,000 | 5,254,973 | ||||||
Ziff Davis, Inc., 144A, | 1,885,000 | 1,611,241 | ||||||
|
| |||||||
(Cost $96,691,953) | 81,859,607 | |||||||
|
| |||||||
| Utilities — 2.5% | ||||||||
| Electric — 2.2% | ||||||||
Calpine Corp. | 1,646,000 | 1,599,994 | ||||||
144A, 4.50%, 2/15/28 | 4,870,000 | 4,461,480 | ||||||
144A, 5.125%, 3/15/28 (a) | 5,454,000 | 4,860,433 | ||||||
144A, 4.625%, 2/1/29 | 2,532,000 | 2,158,269 | ||||||
144A, 5.00%, 2/1/31 | 3,311,000 | 2,776,191 | ||||||
144A, 3.75%, 3/1/31 | 3,506,000 | 2,913,328 | ||||||
Clearway Energy Operating LLC | ||||||||
144A, 4.75%, 3/15/28 | 3,311,000 | 3,106,132 | ||||||
144A, 3.75%, 2/15/31 | 3,604,000 | 3,019,167 | ||||||
DPL, Inc., | 1,622,000 | 1,532,790 | ||||||
FirstEnergy Corp. | ||||||||
Series B, 4.40%, 7/15/27 | 5,844,000 | 5,544,846 | ||||||
2.65%, 3/1/30 | 2,337,000 | 1,997,434 | ||||||
Series B, 2.25%, 9/1/30 | 1,763,000 | 1,447,011 | ||||||
NextEra Energy Operating Partners LP 144A, 4.25%, 7/15/24 | 2,727,000 | 2,633,257 | ||||||
144A, 3.875%, 10/15/26 | 1,948,000 | 1,818,902 | ||||||
144A, 4.50%, 9/15/27 | 2,143,000 | 1,985,468 | ||||||
NRG Energy, Inc. | 3,199,000 | 3,019,072 | ||||||
144A, 3.375%, 2/15/29 | 1,959,000 | 1,612,745 | ||||||
144A, 5.25%, 6/15/29 | 2,856,000 | 2,578,539 | ||||||
144A, 3.625%, 2/15/31 | 4,013,000 | 3,192,542 | ||||||
144A, 3.875%, 2/15/32 | 4,285,000 | 3,403,404 | ||||||
PG&E Corp. | 3,896,000 | 3,462,784 | ||||||
5.25%, 7/1/30 | 3,896,000 | 3,374,696 | ||||||
Vistra Operations Co. LLC | 3,896,000 | 3,766,731 | ||||||
144A, 5.625%, 2/15/27 | 5,064,000 | 4,887,216 | ||||||
144A, 5.00%, 7/31/27 | 5,064,000 | 4,719,142 | ||||||
144A, 4.375%, 5/1/29 | 4,870,000 | 4,254,213 | ||||||
|
| |||||||
(Cost $91,756,179) | 80,125,786 | |||||||
|
| |||||||
Principal | Value | |||||||
| Gas — 0.3% | ||||||||
AmeriGas Partners LP / AmeriGas Finance Corp. | $ | 2,630,000 | $ | 2,593,943 | ||||
5.50%, 5/20/25 | 2,727,000 | 2,591,536 | ||||||
5.875%, 8/20/26 | 2,630,000 | 2,507,192 | ||||||
5.75%, 5/20/27 | 2,045,000 | 1,930,235 | ||||||
|
| |||||||
(Cost $10,762,414) | 9,622,906 | |||||||
|
| |||||||
TOTAL CORPORATE BONDS | 3,561,895,877 | |||||||
|
| |||||||
Number | ||||||||
| SECURITIES LENDING COLLATERAL — 2.2% | ||||||||
DWS Government & Agency Securities Portfolio “DWS Government Cash Institutional Shares”, 2.00% (c)(d) | 78,245,816 | 78,245,816 | ||||||
|
| |||||||
| CASH EQUIVALENTS — 0.6% | ||||||||
DWS Government Money Market Series “Institutional Shares”, 2.24% (c) | 21,909,142 | 21,909,142 | ||||||
|
| |||||||
TOTAL INVESTMENTS — 101.3% (Cost $4,236,554,907) | $ | 3,662,050,835 | ||||||
Other assets and liabilities, net — (1.3%) | (46,799,644 | ) | ||||||
|
| |||||||
NET ASSETS — 100.0% | $ | 3,615,251,191 | ||||||
|
| |||||||
| See Notes to Financial Statements. | 66 |
DBX ETF Trust
Schedule of Investments
Xtrackers USD High Yield Corporate Bond ETF (Continued)
August 31, 2022
A summary of the Fund’s transactions with affiliated investments during the year ended August 31, 2022 is as follows:
| Value ($) at 8/31/2021 | Purchases Cost ($) | Sales Proceeds ($) | Net Realized Gain/(Loss) ($) | Net Change in Unrealized Appreciation (Depreciation) ($) | Income ($) | Capital Gain Distributions ($) | Number of Shares at 8/31/2022 | Value ($) at 8/31/2022 | ||||||||||||||||||||||||||||
CORPORATE BONDS — 0.2% |
| |||||||||||||||||||||||||||||||||||
Financial — 0.2% |
| |||||||||||||||||||||||||||||||||||
Deutsche Bank AG, 5.882%, 7/08/31 (b) |
| |||||||||||||||||||||||||||||||||||
| — | 4,148,743 | (1,915,802 | ) | (80,935 | ) | (440,979 | ) | 72,341 | — | 1,959,000 | 1,711,027 | |||||||||||||||||||||||||
Deutsche Bank AG, 3.729%, 1/14/32 (b) |
| |||||||||||||||||||||||||||||||||||
| 7,207,371 | 4,946,486 | (6,873,516 | ) | (204,563 | ) | (1,482,114 | ) | 221,213 | — | 4,870,000 | 3,593,664 | |||||||||||||||||||||||||
Deutsche Bank AG, 3.742%, 1/07/33 (b) |
| |||||||||||||||||||||||||||||||||||
| — | 9,267,202 | (4,415,441 | ) | (200,068 | ) | (1,179,666 | ) | 113,412 | — | 4,870,000 | 3,472,027 | |||||||||||||||||||||||||
SECURITIES LENDING COLLATERAL — 2.2% |
| |||||||||||||||||||||||||||||||||||
DWS Government & Agency Securities Portfolio “DWS Government Cash Institutional Shares”, 2.00% (c)(d) |
| |||||||||||||||||||||||||||||||||||
| 219,083,931 | — | (140,838,115 | )(e) | — | — | 407,279 | — | 78,245,816 | 78,245,816 | |||||||||||||||||||||||||||
CASH EQUIVALENTS — 0.6% |
| |||||||||||||||||||||||||||||||||||
DWS Government Money Market Series “Institutional Shares”, 2.24% (c) |
| |||||||||||||||||||||||||||||||||||
| 168,443,173 | 789,507,693 | (936,041,724 | ) | — | — | 94,910 | — | 21,909,142 | 21,909,142 | |||||||||||||||||||||||||||
|
|
|
|
|
|
|
|
|
|
|
|
|
|
|
|
|
| |||||||||||||||||||
| 394,734,475 | 807,870,124 | (1,090,084,598 | ) | (485,566 | ) | (3,102,759 | ) | 909,155 | — | 111,853,958 | 108,931,676 | |||||||||||||||||||||||||
|
|
|
|
|
|
|
|
|
|
|
|
|
|
|
|
|
| |||||||||||||||||||
| (a) | All or a portion of these securities were on loan. In addition, “Other assets and liabilities, net” may include pending sales that are also on loan. The value of securities loaned at August 31, 2022 amounted to $105,290,151, which is 2.9% of net assets. |
| (b) | Affiliated issuer. This security is owned in proportion with its representation in the index. |
| (c) | Affiliated fund managed by DWS Investment Management Americas, Inc. The rate shown is the annualized seven-day yield at period end. |
| (d) | Represents cash collateral held in connection with securities lending. Income earned by the Fund is net of borrower rebates. In addition, the Fund held non-cash U.S. Treasury securities collateral having a value of $32,090,970. |
| (e) | Represents the net increase (purchase cost) or decrease (sales proceeds) in the amount invested in cash collateral for the year ended August 31, 2022. |
| CDI: | Chess Depositary Interest |
| GMTN: | Global Medium Term Note |
| MTN: | Medium Term Note |
| REIT: | Real Estate Investment Trust |
| REGS: | Securities sold under Regulation S may not be offered, sold or delivered within the United States or to, or for the account or benefit of, U.S. persons, except pursuant to an exemption from, or in a transaction not subject to, the registration requirements of the Securities Act of 1933. |
| 144A: | Security exempt from registration under Rule 144A of the Securities Act of 1933. These securities may be resold in transactions exempt from registration, normally to qualified institutional buyers. |
Fair Value Measurements
Various inputs are used in determining the value of the Fund’s investments. These inputs are summarized in three broad levels. Level 1 includes quoted prices in active markets for identical securities. Level 2 includes other significant observable inputs (including quoted prices for similar securities, interest rates, prepayment speeds and credit risk). Level 3 includes significant unobservable inputs (including the Fund’s own assumptions in determining the fair value of investments). The level assigned to the securities valuations may not be an indication of the risk or liquidity associated with investing in those securities.
The following is a summary of the inputs used as of August 31, 2022 in valuing the Fund’s investments. For information on the Fund’s policy regarding the valuation of investments, please refer to the Security Valuation section of Note 2 in the accompanying Notes to Financial Statements.
Assets | Level 1 | Level 2 | Level 3 | Total | ||||||||||||
Corporate Bonds (a) | $ | — | $ | 3,561,895,877 | $ | — | $ | 3,561,895,877 | ||||||||
Short-Term Investments (a) | 100,154,958 | — | — | 100,154,958 | ||||||||||||
|
|
|
|
|
|
|
| |||||||||
TOTAL | $ | 100,154,958 | $ | 3,561,895,877 | $ | — | $ | 3,662,050,835 | ||||||||
|
|
|
|
|
|
|
| |||||||||
| (a) | See Schedule of Investments for additional detailed categorizations. |
| See Notes to Financial Statements. | 67 |
DBX ETF Trust
August 31, 2022
| Xtrackers High Beta High Yield Bond ETF | Xtrackers Low Beta High Yield Bond ETF | Xtrackers Risk Managed USD High Yield Strategy ETF | Xtrackers Short Duration High Yield Bond ETF | |||||||||||||
Assets | ||||||||||||||||
Investment in non-affiliated securities at value | $ | 11,721,392 | $ | 1,407,067,631 | $ | — | $ | 84,470,086 | ||||||||
Investment in affiliated securities at value | — | 7,385,546 | 49,220,227 | — | ||||||||||||
Investment in DWS Government Money Market Series | 35,828 | 10,573,885 | 374,305 | 589,978 | ||||||||||||
Investment in DWS Government & Agency Securities Portfolio* | 263,774 | 9,125,075 | — | 821,382 | ||||||||||||
Foreign currency at value | — | 358 | — | 25 | ||||||||||||
| Receivables: | ||||||||||||||||
Investment securities sold | 295,431 | 50,176,485 | — | 1,368,959 | ||||||||||||
Interest | 220,491 | 19,596,072 | 545 | 1,485,727 | ||||||||||||
Securities lending income | 680 | 13,987 | 3 | 2,313 | ||||||||||||
|
|
|
|
|
|
|
| |||||||||
Total assets | $ | 12,537,596 | $ | 1,503,939,039 | $ | 49,595,080 | $ | 88,738,470 | ||||||||
|
|
|
|
|
|
|
| |||||||||
Liabilities | ||||||||||||||||
Payable upon return of securities loaned | $ | 263,774 | $ | 9,125,075 | $ | — | $ | 821,382 | ||||||||
| Payables: | ||||||||||||||||
Investment securities purchased | 318,924 | 53,923,231 | — | 1,822,996 | ||||||||||||
Investment advisory fees | 2,442 | 224,028 | 6,474 | 14,918 | ||||||||||||
|
|
|
|
|
|
|
| |||||||||
Total liabilities | 585,140 | 63,272,334 | 6,474 | 2,659,296 | ||||||||||||
|
|
|
|
|
|
|
| |||||||||
Net Assets, at value | $ | 11,952,456 | $ | 1,440,666,705 | $ | 49,588,606 | $ | 86,079,174 | ||||||||
|
|
|
|
|
|
|
| |||||||||
Net Assets Consist of | ||||||||||||||||
Paid-in capital | $ | 25,048,069 | $ | 1,576,982,155 | $ | 54,167,825 | $ | 93,959,442 | ||||||||
Distributable earnings (loss) | (13,095,613 | ) | (136,315,450 | ) | (4,579,219 | ) | (7,880,268 | ) | ||||||||
|
|
|
|
|
|
|
| |||||||||
Net Assets, at value | $ | 11,952,456 | $ | 1,440,666,705 | $ | 49,588,606 | $ | 86,079,174 | ||||||||
|
|
|
|
|
|
|
| |||||||||
Number of Common Shares outstanding | 300,001 | 31,950,001 | 2,225,001 | 2,000,001 | ||||||||||||
|
|
|
|
|
|
|
| |||||||||
Net Asset Value | $ | 39.84 | $ | 45.09 | $ | 22.29 | $ | 43.04 | ||||||||
|
|
|
|
|
|
|
| |||||||||
Investment in non-affiliated securities at cost | $ | 13,911,266 | $ | 1,508,815,620 | $ | — | $ | 91,426,385 | ||||||||
|
|
|
|
|
|
|
| |||||||||
Investment in affiliated securities at cost | $ | — | $ | 9,283,780 | $ | 53,981,246 | $ | — | ||||||||
|
|
|
|
|
|
|
| |||||||||
Value of securities loaned | $ | 395,224 | $ | 11,651,353 | $ | — | $ | 1,743,621 | ||||||||
|
|
|
|
|
|
|
| |||||||||
Investment in DWS Government Money Market Series at cost | $ | 35,828 | $ | 10,573,885 | $ | 374,305 | $ | 589,978 | ||||||||
|
|
|
|
|
|
|
| |||||||||
Investment in DWS Government & Agency Securities Portfolio at cost* | $ | 263,774 | $ | 9,125,075 | $ | — | $ | 821,382 | ||||||||
|
|
|
|
|
|
|
| |||||||||
Non-cash collateral for securities on loan | $ | 151,718 | $ | 2,986,781 | $ | — | $ | 1,002,868 | ||||||||
|
|
|
|
|
|
|
| |||||||||
Foreign currency at cost | $ | — | $ | 358 | $ | — | $ | 25 | ||||||||
|
|
|
|
|
|
|
| |||||||||
| * | Represents collateral on securities loaned. |
| See Notes to Financial Statements. | 68 |
DBX ETF Trust
Statements of Assets and Liabilities (Continued)
August 31, 2022
| Xtrackers USD High Yield Corporate Bond ETF | ||||
Assets | ||||
Investment in non-affiliated securities at value | $ | 3,553,119,159 | ||
Investment in affiliated securities at value | 8,776,718 | |||
Investment in DWS Government Money Market Series | 21,909,142 | |||
Investment in DWS Government & Agency Securities Portfolio* | 78,245,816 | |||
Foreign currency at value | 625 | |||
| Receivables: | ||||
Investment securities sold | 199,779,224 | |||
Capital shares | 13,814,597 | |||
Interest | 57,709,326 | |||
Securities lending income | 156,125 | |||
|
| |||
Total assets | $ | 3,933,510,732 | ||
|
| |||
Liabilities | ||||
Payable upon return of securities loaned | $ | 78,245,816 | ||
| Payables: | ||||
Investment securities purchased | 56,870,445 | |||
Capital shares | 182,614,827 | |||
Investment advisory fees | 528,453 | |||
|
| |||
Total liabilities | 318,259,541 | |||
|
| |||
Net Assets, at value | $ | 3,615,251,191 | ||
|
| |||
Net Assets Consist of | ||||
Paid-in capital | $ | 4,323,444,166 | ||
Distributable earnings (loss) | (708,192,975 | ) | ||
|
| |||
Net Assets, at value | $ | 3,615,251,191 | ||
|
| |||
Number of Common Shares outstanding | 105,187,501 | |||
|
| |||
Net Asset Value | $ | 34.37 | ||
|
| |||
Investment in non-affiliated securities at cost | $ | 4,124,732,350 | ||
|
| |||
Investment in affiliated securities at cost | $ | 11,667,599 | ||
|
| |||
Value of securities loaned | $ | 105,290,151 | ||
|
| |||
Investment in DWS Government Money Market Series at cost | $ | 21,909,142 | ||
|
| |||
Investment in DWS Government & Agency Securities Portfolio at cost* | $ | 78,245,816 | ||
|
| |||
Non-cash collateral for securities on loan | $ | 32,090,970 | ||
|
| |||
Foreign currency at cost | $ | 623 | ||
|
| |||
| * | Represents collateral on securities loaned. |
| See Notes to Financial Statements. | 69 |
DBX ETF Trust
For the Year Ended August 31, 2022
| Xtrackers High Beta High Yield Bond ETF | Xtrackers Low Beta High Yield Bond ETF | Xtrackers Risk Managed USD High Yield Strategy ETF(1) | Xtrackers Short Duration High Yield Bond ETF | |||||||||||||
Investment Income | ||||||||||||||||
Unaffiliated interest income | $ | 1,107,804 | $ | 43,019,571 | $ | — | $ | 3,934,299 | ||||||||
Affiliated interest income | — | 234,922 | — | — | ||||||||||||
Affiliated dividend income | — | — | 1,047,478 | — | ||||||||||||
Income distributions from affiliated funds | 375 | 44,686 | 1,388 | 4,079 | ||||||||||||
Affiliated securities lending income | 2,166 | 50,464 | 6,861 | 6,595 | ||||||||||||
Unaffiliated securities lending income, net of borrower rebates | 9,174 | 11,381 | 6,576 | 19,839 | ||||||||||||
|
|
|
|
|
|
|
| |||||||||
Total investment income | 1,119,519 | 43,361,024 | 1,062,303 | 3,964,812 | ||||||||||||
|
|
|
|
|
|
|
| |||||||||
Expenses | ||||||||||||||||
Investment advisory fees | 67,427 | 2,903,725 | 67,987 | 169,479 | ||||||||||||
Other expenses | 57 | 1,147 | — | 172 | ||||||||||||
|
|
|
|
|
|
|
| |||||||||
Total expenses | 67,484 | 2,904,872 | 67,987 | 169,651 | ||||||||||||
|
|
|
|
|
|
|
| |||||||||
Less fees waived (see note 3): | ||||||||||||||||
Waiver | (29,068 | ) | (585,439 | ) | (34,121 | ) | (521 | ) | ||||||||
|
|
|
|
|
|
|
| |||||||||
Net expenses | 38,416 | 2,319,433 | 33,866 | 169,130 | ||||||||||||
|
|
|
|
|
|
|
| |||||||||
Net investment income (loss) | 1,081,103 | 41,041,591 | 1,028,437 | 3,795,682 | ||||||||||||
|
|
|
|
|
|
|
| |||||||||
Realized and Unrealized Gain (Loss) | ||||||||||||||||
Net realized gain (loss) from: | ||||||||||||||||
Investments | (465,605 | ) | (28,314,352 | ) | — | (455,688 | ) | |||||||||
Investments in affiliates | — | (35,888 | ) | (2,635 | ) | — | ||||||||||
In-kind redemptions | (743,489 | ) | (14,143,859 | ) | — | 59,151 | ||||||||||
In-kind redemptions in affiliates | — | (232,928 | ) | 131,183 | — | |||||||||||
|
|
|
|
|
|
|
| |||||||||
Net realized gain (loss) | (1,209,094 | ) | (42,727,027 | ) | 128,548 | (396,537 | ) | |||||||||
|
|
|
|
|
|
|
| |||||||||
Net change in unrealized appreciation (depreciation) on: | ||||||||||||||||
Investments | (2,372,970 | ) | (112,586,428 | ) | — | (8,681,574 | ) | |||||||||
Investments in affiliates | — | (1,960,429 | ) | (4,761,019 | ) | — | ||||||||||
|
|
|
|
|
|
|
| |||||||||
Net change in unrealized appreciation (depreciation) | (2,372,970 | ) | (114,546,857 | ) | (4,761,019 | ) | (8,681,574 | ) | ||||||||
|
|
|
|
|
|
|
| |||||||||
Net realized and unrealized gain (loss) on investments | (3,582,064 | ) | (157,273,884 | ) | (4,632,471 | ) | (9,078,111 | ) | ||||||||
|
|
|
|
|
|
|
| |||||||||
Net Increase (Decrease) in Net Assets Resulting from Operations | $ | (2,500,961 | ) | $ | (116,232,293 | ) | $ | (3,604,034 | ) | $ | (5,282,429 | ) | ||||
|
|
|
|
|
|
|
| |||||||||
| (1) | For the period February 10, 2022 (commencement of operations) through August 31, 2022. |
| See Notes to Financial Statements. | 70 |
DBX ETF Trust
Statements of Operations (Continued)
For the Year Ended August 31, 2022
| Xtrackers USD High Yield Corporate Bond ETF | ||||
Investment Income | ||||
Unaffiliated interest income | $ | 228,221,896 | ||
Affiliated interest income | 406,966 | |||
Income distributions from affiliated funds | 94,910 | |||
Affiliated securities lending income | 407,279 | |||
Unaffiliated securities lending income, net of borrower rebates | 1,261,182 | |||
|
| |||
Total investment income | 230,392,233 | |||
|
| |||
Expenses | ||||
Investment advisory fees | 10,504,345 | |||
Other expenses | 4,147 | |||
|
| |||
Total expenses | 10,508,492 | |||
|
| |||
Less fees waived (see note 3): | ||||
Waiver | (2,638,477 | ) | ||
|
| |||
Net expenses | 7,870,015 | |||
|
| |||
Net investment income (loss) | 222,522,218 | |||
|
| |||
Realized and Unrealized Gain (Loss) | ||||
Net realized gain (loss) from: | ||||
Investments | (31,975,873 | ) | ||
Investments in affiliates | (20,008 | ) | ||
In-kind redemptions | (150,215,836 | ) | ||
In-kind redemptions in affiliates | (465,558 | ) | ||
Foreign currency transactions | — | |||
|
| |||
Net realized gain (loss) | (182,677,275 | ) | ||
|
| |||
Net change in unrealized appreciation (depreciation) on: | ||||
Investments | (599,849,890 | ) | ||
Investments in affiliates | (3,102,759 | ) | ||
Foreign currency translations | 2 | |||
|
| |||
Net change in unrealized appreciation (depreciation) | (602,952,647 | ) | ||
|
| |||
Net realized and unrealized gain (loss) on investments and foreign currency transactions | (785,629,922 | ) | ||
|
| |||
Net Increase (Decrease) in Net Assets Resulting from Operations | $ | (563,107,704 | ) | |
|
| |||
| See Notes to Financial Statements. | 71 |
DBX ETF Trust
| Xtrackers High Beta High Yield Bond ETF | Xtrackers Low Beta High Yield Bond ETF | |||||||||||||||
| Year Ended August 31, 2022 | Year Ended August 31, 2021 | Year Ended August 31, 2022 | Year Ended August 31, 2021 | |||||||||||||
Increase (Decrease) in Net Assets from Operations | ||||||||||||||||
Net investment income (loss) | $ | 1,081,103 | $ | 680,195 | $ | 41,041,591 | $ | 8,011,095 | ||||||||
Net realized gain (loss) | (1,209,094 | ) | 331,044 | (42,727,027 | ) | 2,106,618 | ||||||||||
Net change in net unrealized appreciation (depreciation) | (2,372,970 | ) | 178,690 | (114,546,857 | ) | 10,048,247 | ||||||||||
|
|
|
|
|
|
|
| |||||||||
Net increase (decrease) in net assets resulting from operations | (2,500,961 | ) | 1,189,929 | (116,232,293 | ) | 20,165,960 | ||||||||||
|
|
|
|
|
|
|
| |||||||||
Distributions to Shareholders | (1,152,992 | ) | (825,490 | ) | (42,567,833 | ) | (8,258,522 | ) | ||||||||
|
|
|
|
|
|
|
| |||||||||
Fund Shares Transactions | ||||||||||||||||
Proceeds from shares sold | 6,992,436 | 11,992,336 | 1,268,329,518 | 715,759,317 | ||||||||||||
Value of shares redeemed | (10,724,660 | ) | — | (419,246,955 | ) | (15,156,196 | ) | |||||||||
|
|
|
|
|
|
|
| |||||||||
Net increase (decrease) in net assets resulting from fund share transactions | (3,732,224 | ) | 11,992,336 | 849,082,563 | 700,603,121 | |||||||||||
|
|
|
|
|
|
|
| |||||||||
Total net increase (decrease) in Net Assets | (7,386,177 | ) | 12,356,775 | 690,282,437 | 712,510,559 | |||||||||||
Net Assets | ||||||||||||||||
Beginning of year | 19,338,633 | 6,981,858 | 750,384,268 | 37,873,709 | ||||||||||||
|
|
|
|
|
|
|
| |||||||||
End of year | $ | 11,952,456 | $ | 19,338,633 | $ | 1,440,666,705 | $ | 750,384,268 | ||||||||
|
|
|
|
|
|
|
| |||||||||
Changes in Shares Outstanding | ||||||||||||||||
Shares outstanding, beginning of year | 400,001 | 150,001 | 14,700,001 | 750,001 | ||||||||||||
Shares sold | 150,000 | 250,000 | 26,250,000 | 14,250,000 | ||||||||||||
Shares redeemed | (250,000 | ) | — | (9,000,000 | ) | (300,000 | ) | |||||||||
|
|
|
|
|
|
|
| |||||||||
Shares outstanding, end of year | 300,001 | 400,001 | 31,950,001 | 14,700,001 | ||||||||||||
|
|
|
|
|
|
|
| |||||||||
| See Notes to Financial Statements. | 72 |
DBX ETF Trust
Statements of Changes in Net Assets (Continued)
| Xtrackers Risk Managed USD High Yield Strategy ETF | Xtrackers Short Duration High Yield Bond ETF | |||||||||||
| For the Period February 10, 2022(1) to August 31, 2022 | Year Ended August 31, 2022 | Year Ended August 31, 2021 | ||||||||||
Increase (Decrease) in Net Assets from Operations | ||||||||||||
Net investment income (loss) | $ | 1,028,437 | $ | 3,795,682 | $ | 2,489,447 | ||||||
Net realized gain (loss) | 128,548 | (396,537 | ) | 1,271,532 | ||||||||
Net change in net unrealized appreciation (depreciation) | (4,761,019 | ) | (8,681,574 | ) | 185,876 | |||||||
|
|
|
|
|
| |||||||
Net increase (decrease) in net assets resulting from operations | (3,604,034 | ) | (5,282,429 | ) | 3,946,855 | |||||||
|
|
|
|
|
| |||||||
Distributions to Shareholders | (844,002 | ) | (3,956,845 | ) | (2,657,928 | ) | ||||||
|
|
|
|
|
| |||||||
Fund Shares Transactions | ||||||||||||
Proceeds from shares sold | 56,938,197 | 23,388,169 | 45,259,188 | |||||||||
Value of shares redeemed | (2,901,580 | ) | (4,697,674 | ) | (7,179,887 | ) | ||||||
|
|
|
|
|
| |||||||
Net increase (decrease) in net assets resulting from fund share transactions | 54,036,617 | 18,690,495 | 38,079,301 | |||||||||
|
|
|
|
|
| |||||||
Total net increase (decrease) in Net Assets | 49,588,581 | 9,451,221 | 39,368,228 | |||||||||
Net Assets | ||||||||||||
Beginning of period | 25 | 76,627,953 | 37,259,725 | |||||||||
|
|
|
|
|
| |||||||
End of period | $ | 49,588,606 | $ | 86,079,174 | $ | 76,627,953 | ||||||
|
|
|
|
|
| |||||||
Changes in Shares Outstanding | ||||||||||||
Shares outstanding, beginning of period | 1 | 1,600,001 | 800,001 | |||||||||
Shares sold | 2,350,000 | 500,000 | 950,000 | |||||||||
Shares redeemed | (125,000 | ) | (100,000 | ) | (150,000 | ) | ||||||
|
|
|
|
|
| |||||||
Shares outstanding, end of period | 2,225,001 | 2,000,001 | 1,600,001 | |||||||||
|
|
|
|
|
| |||||||
| (1) | Commencement of Operations. |
| See Notes to Financial Statements. | 73 |
DBX ETF Trust
Statements of Changes in Net Assets (Continued)
| Xtrackers USD High Yield Corporate Bond ETF | ||||||||
| Year Ended August 31, 2022 | Year Ended August 31, 2021 | |||||||
Increase (Decrease) in Net Assets from Operations | ||||||||
Net investment income (loss) | $ | 222,522,218 | $ | 294,840,227 | ||||
Net realized gain (loss) | (182,677,275 | ) | 261,534,954 | |||||
Net change in net unrealized appreciation (depreciation) | (602,952,647 | ) | (13,795,630 | ) | ||||
|
|
|
| |||||
Net increase (decrease) in net assets resulting from operations | (563,107,704 | ) | 542,579,551 | |||||
|
|
|
| |||||
Distributions to Shareholders | (242,753,834 | ) | (328,072,536 | ) | ||||
|
|
|
| |||||
Fund Shares Transactions | ||||||||
Proceeds from shares sold | 4,826,710,036 | 8,910,076,826 | ||||||
Value of shares redeemed | (7,072,094,189 | ) | (8,666,637,450 | ) | ||||
|
|
|
| |||||
Net increase (decrease) in net assets resulting from fund share transactions | (2,245,384,153 | ) | 243,439,376 | |||||
|
|
|
| |||||
Total net increase (decrease) in Net Assets | (3,051,245,691 | ) | 457,946,391 | |||||
Net Assets | ||||||||
Beginning of period | 6,666,496,882 | 6,208,550,491 | ||||||
|
|
|
| |||||
End of period | $ | 3,615,251,191 | $ | 6,666,496,882 | ||||
|
|
|
| |||||
Changes in Shares Outstanding | ||||||||
Shares outstanding, beginning of period | 165,387,501 | 158,937,501 | * | |||||
Shares sold | 129,000,000 | 224,750,000 | * | |||||
Shares redeemed | (189,200,000 | ) | (218,300,000 | )* | ||||
|
|
|
| |||||
Shares outstanding, end of period | 105,187,501 | 165,387,501 | * | |||||
|
|
|
| |||||
| * | Shares through April 12, 2021 have been adjusted to reflect the effects of a stock split effective April 13, 2021. See Note 9. |
| See Notes to Financial Statements. | 74 |
DBX ETF Trust
| Xtrackers High Beta High Yield Bond ETF Selected Per Share Data | Years Ended August 31, | Period Ended 8/31/2018(a) | ||||||||||||||||||
| 2022 | 2021 | 2020 | 2019 | |||||||||||||||||
Net Asset Value, beginning of period | $ | 48.35 | $ | 46.55 | $ | 48.61 | $ | 49.17 | $ | 50.00 | ||||||||||
|
|
|
|
|
|
|
|
|
| |||||||||||
| Income (loss) from investment operations: | ||||||||||||||||||||
Net investment income (loss)(b) | 2.51 | 2.60 | 3.01 | (c) | 3.32 | 2.07 | ||||||||||||||
Net realized and unrealized gain (loss) | (8.37 | ) | 2.65 | (1.95 | )(c) | (0.58 | ) | (1.11 | ) | |||||||||||
|
|
|
|
|
|
|
|
|
| |||||||||||
Total from investment operations | (5.86 | ) | 5.25 | 1.06 | 2.74 | 0.96 | ||||||||||||||
|
|
|
|
|
|
|
|
|
| |||||||||||
| Less distributions from: |
| |||||||||||||||||||
Net investment income | (2.65 | ) | (3.45 | ) | (3.12 | ) | (3.30 | ) | (1.79 | ) | ||||||||||
|
|
|
|
|
|
|
|
|
| |||||||||||
Total distributions | (2.65 | ) | (3.45 | ) | (3.12 | ) | (3.30 | ) | (1.79 | ) | ||||||||||
|
|
|
|
|
|
|
|
|
| |||||||||||
Net Asset Value, end of period | $ | 39.84 | $ | 48.35 | $ | 46.55 | $ | 48.61 | $ | 49.17 | ||||||||||
|
|
|
|
|
|
|
|
|
| |||||||||||
Total Return (%) | (12.56 | )(d) | 11.67 | (d) | 2.46 | (d) | 5.90 | (d) | 2.01 | ** | ||||||||||
Ratios to Average Net Assets and Supplemental Data | ||||||||||||||||||||
Net Assets, end of period ($ millions) | 12 | 19 | 7 | 151 | 148 | |||||||||||||||
Ratio of expenses before fee waiver (%) | 0.35 | 0.35 | 0.35 | 0.35 | 0.35 | * | ||||||||||||||
Ratio of expenses after fee waiver (%) | 0.20 | 0.20 | 0.20 | 0.31 | 0.35 | * | ||||||||||||||
Ratio of net investment income (loss) (%) | 5.61 | 5.45 | 6.50 | (c) | 6.91 | 6.71 | * | |||||||||||||
Portfolio turnover rate (%)(e) | 55 | 98 | 98 | 51 | 34 | ** | ||||||||||||||
| Xtrackers Low Beta High Yield Bond ETF Selected Per Share Data | Years Ended August 31, | Period Ended 8/31/2018(a) | ||||||||||||||||||
| 2022 | 2021 | 2020 | 2019 | |||||||||||||||||
Net Asset Value, beginning of period | $ | 51.05 | $ | 50.50 | $ | 50.62 | $ | 49.16 | $ | 50.00 | ||||||||||
|
|
|
|
|
|
|
|
|
| |||||||||||
| Income (loss) from investment operations: | ||||||||||||||||||||
Net investment income (loss)(b) | 1.69 | 1.45 | 2.02 | (c) | 2.29 | 1.37 | ||||||||||||||
Net realized and unrealized gain (loss) | (5.87 | ) | 1.07 | 0.12 | (c) | 1.44 | (1.05 | ) | ||||||||||||
|
|
|
|
|
|
|
|
|
| |||||||||||
Total from investment operations | (4.18 | ) | 2.52 | 2.14 | 3.73 | 0.32 | ||||||||||||||
|
|
|
|
|
|
|
|
|
| |||||||||||
| Less distributions from: |
| |||||||||||||||||||
Net investment income | (1.78 | ) | (1.97 | ) | (2.26 | ) | (2.27 | ) | (1.16 | ) | ||||||||||
|
|
|
|
|
|
|
|
|
| |||||||||||
Total distributions | (1.78 | ) | (1.97 | ) | (2.26 | ) | (2.27 | ) | (1.16 | ) | ||||||||||
|
|
|
|
|
|
|
|
|
| |||||||||||
Net Asset Value, end of period | $ | 45.09 | $ | 51.05 | $ | 50.50 | $ | 50.62 | $ | 49.16 | ||||||||||
|
|
|
|
|
|
|
|
|
| |||||||||||
Total Return (%) | (8.36 | )(d) | 5.12 | (d) | 4.42 | (d) | 7.84 | (d) | 0.68 | ** | ||||||||||
Ratios to Average Net Assets and Supplemental Data | ||||||||||||||||||||
Net Assets, end of period ($ millions) | 1,441 | 750 | 38 | 144 | 138 | |||||||||||||||
Ratio of expenses before fee waiver (%) | 0.25 | 0.25 | 0.25 | 0.25 | 0.25 | * | ||||||||||||||
Ratio of expenses after fee waiver (%) | 0.20 | 0.20 | 0.20 | 0.24 | 0.25 | * | ||||||||||||||
Ratio of net investment income (loss) (%) | 3.53 | 2.89 | 4.09 | (c) | 4.66 | 4.44 | * | |||||||||||||
Portfolio turnover rate (%)(e) | 68 | 88 | 111 | 55 | 52 | ** | ||||||||||||||
| (a) | For the period January 11, 2018 (commencement of operations) through August 31, 2018. |
| (b) | Based on average shares outstanding during the period. |
| (c) | The Financial Accounting Standards Board issued Accounting Standards Update (ASU) 2017-08 to amend the amortization period to the earliest call date for purchased callable debt securities held at a premium. Effective September 1, 2019, the Fund adopted ASU 2017-08 and the effect of this change for the year ended August 31, 2020 was a decrease to net investment income per share by $0.04 and $0.23, increase to net realized and unrealized gain (loss) from investments per share by $0.04 and $0.23, and decrease to the ratio of net investment income to average net assets of 0.08% and 0.47%, for Xtrackers High Beta High Yield Bond ETF and Xtrackers Low Beta High Yield Bond ETF respectively. Per share data and ratios for years prior to August 31, 2020 have not been restated to reflect this change in presentation. |
| (d) | Total Return would have been lower if certain expenses had not been reimbursed by the Advisor. |
| (e) | Portfolio turnover rate does not include securities received or delivered from processing creations or redemptions. |
| * | Annualized. |
| ** | Not Annualized. |
| See Notes to Financial Statements. | 75 |
DBX ETF Trust
Financial Highlights (Continued)
| Xtrackers Risk Managed USD High Yield Strategy ETF Selected Per Share Data | Period Ended 8/31/2022(a) | |||
Net Asset Value, beginning of period | $ | 25.00 | ||
|
| |||
| Income (loss) from investment operations: | ||||
Net investment income (loss)(b) | 0.58 | |||
Net realized and unrealized gain (loss) | (2.84 | ) | ||
|
| |||
Total from investment operations | (2.26 | ) | ||
|
| |||
| Less distributions from: |
| |||
Net investment income | (0.45 | ) | ||
|
| |||
Total distributions | (0.45 | ) | ||
|
| |||
Net Asset Value, end of period | $ | 22.29 | ||
|
| |||
Total Return (%)(c) | (9.12 | )** | ||
Ratios to Average Net Assets and Supplemental Data | ||||
Net Assets, end of period ($ millions) | 50 | |||
Ratio of expenses before fee waiver (%)(d) | 0.30 | * | ||
Ratio of expenses after fee waiver (%)(d) | 0.15 | * | ||
Ratio of net investment income (loss) (%) | 4.54 | * | ||
Portfolio turnover rate (%)(e) | 0 | ** | ||
| Xtrackers Short Duration High Yield Bond ETF Selected Per Share Data | Years Ended August 31, | Period Ended 8/31/2018(f) | ||||||||||||||||||
| 2022 | 2021 | 2020 | 2019 | |||||||||||||||||
Net Asset Value, beginning of period | $ | 47.89 | $ | 46.57 | $ | 49.13 | $ | 49.69 | $ | 50.00 | ||||||||||
|
|
|
|
|
|
|
|
|
| |||||||||||
| Income (loss) from investment operations: | ||||||||||||||||||||
Net investment income (loss)(b) | 2.04 | 2.34 | 2.69 | (g) | 2.83 | 1.76 | ||||||||||||||
Net realized and unrealized gain (loss) | (4.76 | ) | 1.67 | (2.47 | )(g) | (0.54 | ) | (0.59 | ) | |||||||||||
|
|
|
|
|
|
|
|
|
| |||||||||||
Total from investment operations | (2.72 | ) | 4.01 | 0.22 | 2.29 | 1.17 | ||||||||||||||
|
|
|
|
|
|
|
|
|
| |||||||||||
| Less distributions from: |
| |||||||||||||||||||
Net investment income | (2.13 | ) | (2.69 | ) | (2.78 | ) | (2.85 | ) | (1.48 | ) | ||||||||||
|
|
|
|
|
|
|
|
|
| |||||||||||
Total distributions | (2.13 | ) | (2.69 | ) | (2.78 | ) | (2.85 | ) | (1.48 | ) | ||||||||||
|
|
|
|
|
|
|
|
|
| |||||||||||
Net Asset Value, end of period | $ | 43.04 | $ | 47.89 | $ | 46.57 | $ | 49.13 | $ | 49.69 | ||||||||||
|
|
|
|
|
|
|
|
|
| |||||||||||
Total Return (%) | (5.84 | )(c) | 8.86 | (c) | 0.61 | (c) | 4.79 | (c) | 2.41 | ** | ||||||||||
Ratios to Average Net Assets and Supplemental Data | ||||||||||||||||||||
Net Assets, end of period ($ millions) | 86 | 77 | 37 | 22 | 40 | |||||||||||||||
Ratio of expenses before fee waiver (%) | 0.20 | 0.20 | 0.20 | 0.20 | 0.20 | * | ||||||||||||||
Ratio of expenses after fee waiver (%) | 0.20 | 0.20 | 0.20 | 0.20 | 0.20 | * | ||||||||||||||
Ratio of net investment income (loss) (%) | 4.48 | 4.95 | 6.13 | (g) | 5.78 | 5.56 | * | |||||||||||||
Portfolio turnover rate (%)(e) | 46 | 52 | 150 | 45 | 37 | ** | ||||||||||||||
| (a) | For the period February 10, 2022 (commencement of operations) through August 31, 2022. |
| (b) | Based on average shares outstanding during the period. |
| (c) | Total Return would have been lower if certain expenses had not been reimbursed by the Advisor. |
| (d) | The Fund invests in other ETFs and indirectly bears its proportionate shares of fees and expenses incurred by the Underlying Funds in which the Fund is invested. This ratio does not included these indirect fees and expenses. |
| (e) | Portfolio turnover rate does not include securities received or delivered from processing creations or redemptions. |
| (f) | For the period January 10, 2018 (commencement of operations) through August 31, 2018. |
| (g) | The Financial Accounting Standards Board issued Accounting Standards Update (ASU) 2017-08 to amend the amortization period to the earliest call date for purchased callable debt securities held at a premium. Effective September 1, 2019, the Fund adopted ASU 2017-08 and the effect of this change for the year ended August 31, 2020 was a decrease to net investment income per share by $0.10, increase to net realized and unrealized gain (loss) from investments per share by $0.10 and decrease to the ratio of net investment income to average net assets of 0.22% for Xtrackers Short Duration High Yield Bond ETF. Per share data and ratios for years prior to August 31, 2020 have not been restated to reflect this change in presentation. |
| * | Annualized. |
| ** | Not Annualized. |
| See Notes to Financial Statements. | 76 |
DBX ETF Trust
Financial Highlights (Continued)
| Xtrackers USD High Yield Corporate Bond ETF Selected Per Share Data | Years Ended August 31, | |||||||||||||||||||
| 2022 | 2021 | 2020(a) | 2019(a) | 2018(a) | ||||||||||||||||
Net Asset Value, beginning of year | $ | 40.31 | $ | 39.06 | (a) | $ | 40.19 | $ | 39.90 | $ | 40.97 | |||||||||
|
|
|
|
|
|
|
|
|
| |||||||||||
| Income (loss) from investment operations: | ||||||||||||||||||||
Net investment income (loss)(b) | 1.61 | 1.70 | 2.03 | (c) | 2.39 | 2.32 | ||||||||||||||
Net realized and unrealized gain (loss) | (5.80 | ) | 1.79 | (0.95 | )(c) | 0.24 | (1.24 | ) | ||||||||||||
|
|
|
|
|
|
|
|
|
| |||||||||||
Total from investment operations | (4.19 | ) | 3.49 | 1.08 | 2.63 | 1.08 | ||||||||||||||
|
|
|
|
|
|
|
|
|
| |||||||||||
| Less distributions from: |
| |||||||||||||||||||
Net investment income | (1.75 | ) | (2.24 | ) | (2.21 | ) | (2.34 | ) | (2.15 | ) | ||||||||||
|
|
|
|
|
|
|
|
|
| |||||||||||
Total distributions | (1.75 | ) | (2.24 | ) | (2.21 | ) | (2.34 | ) | (2.15 | ) | ||||||||||
|
|
|
|
|
|
|
|
|
| |||||||||||
Net Asset Value, end of year | $ | 34.37 | $ | 40.31 | $ | 39.06 | $ | 40.19 | $ | 39.90 | ||||||||||
|
|
|
|
|
|
|
|
|
| |||||||||||
Total Return (%)(d) | (10.67 | ) | 8.31 | 2.91 | 6.87 | 2.76 | ||||||||||||||
Ratios to Average Net Assets and Supplemental Data | ||||||||||||||||||||
Net Assets, end of year ($ millions) | 3,615 | 6,666 | 6,209 | 3,062 | 1,796 | |||||||||||||||
Ratio of expenses before fee waiver (%) | 0.20 | 0.20 | 0.20 | 0.20 | 0.20 | |||||||||||||||
Ratio of expenses after fee waiver (%) | 0.15 | 0.15 | 0.15 | 0.17 | 0.20 | |||||||||||||||
Ratio of net investment income (loss) (%) | 4.24 | 4.27 | 5.27 | (c) | 6.06 | 5.86 | ||||||||||||||
Portfolio turnover rate (%)(e) | 24 | 37 | 54 | 29 | 32 | |||||||||||||||
| (a) | On April 13, 2021, the Xtrackers USD High Yield Corporate Bond ETF implemented a 5 for 4 stock split. Net asset value and per share information through April 12, 2021 have been updated to reflect the effect of the split. Shareholders received 5 shares for every 4 shares owned and net asset value per share decreased correspondingly. |
| (b) | Based on average shares outstanding during the period. |
| (c) | The Financial Accounting Standards Board issued Accounting Standards Update (ASU) 2017-08 to amend the amortization period to the earliest call date for purchased callable debt securities held at a premium. Effective September 1, 2019, the Fund adopted ASU 2017-08 and the effect of this change for the year ended August 31, 2020 was a decrease to net investment income per share by $0.12, increase to net realized and unrealized gain (loss) from investments per share by $0.12 and decrease to the ratio of net investment income to average net assets of 0.32% for Xtrackers USD High Yield Corporate Bond ETF. Per share data and ratios for years prior to August 31, 2020 have not been restated to reflect this change in presentation. |
| (d) | Total Return would have been lower if certain expenses had not been reimbursed by the Advisor. |
| (e) | Portfolio turnover rate does not include securities received or delivered from processing creations or redemptions. |
| See Notes to Financial Statements. | 77 |
DBX ETF Trust
1. Organization
DBX ETF Trust (the “Trust”) is registered under the Investment Company Act of 1940, as amended (the “Act”), as an open-end registered management investment company organized as a Delaware statutory trust.
As of August 31, 2022, the Trust consists of thirty-five investment series of exchange-traded funds (“ETFs”) (each a “Fund” and collectively, the “Funds”) in operation and trading. These financial statements report on the Funds listed below:
Xtrackers High Beta High Yield Bond ETF
Xtrackers Low Beta High Yield Bond ETF
Xtrackers Risk Managed USD High Yield Strategy ETF
Xtrackers Short Duration High Yield Bond ETF
Xtrackers USD High Yield Corporate Bond ETF
DBX Advisors LLC (“DBX” or the “Advisor”), an indirect, wholly-owned subsidiary of DWS Group GmbH & Co. KGaA (“DWS Group”), serves as investment advisor to the Funds and has overall responsibility for the general management and administration of the Funds, subject to the supervision of the Funds’ Board of Trustees (“Board”).
Each Fund offers shares that are listed and traded on the NYSE Arca, Inc. (“NYSE Arca”). Unlike conventional mutual funds, each Fund issues and redeems shares on a continuous basis, at net asset value (“NAV”), only in large specified lots consisting of 50,000 shares, except for Xtrackers Risk Managed USD High Yield Strategy ETF which lots consist of 25,000 shares and Xtrackers USD High Yield Corporate Bond ETF which lots consist of 100,000 shares, each called a “Creation Unit”, to authorized participants who have entered into agreements with the Funds’ distributor. Shares are not individually redeemable securities of the Funds, and owners of the shares may acquire those shares from the Funds, or tender such shares for redemption to the Funds, in Creation Units only.
The investment objective of each Fund is to track the performance, before fees and expenses, of a particular index (the “Underlying Index”). The underlying indices for the Funds are:
Fund | Underlying Index | |
| Xtrackers High Beta High Yield Bond ETF | Solactive USD High Yield Corporates Total Market High Beta Index | |
Xtrackers Low Beta High Yield Bond ETF Xtrackers Risk Managed USD High Yield Strategy ETF | Solactive USD High Yield Corporates Total Market Low Beta Index Adaptive Wealth Strategies Risk Managed High Yield Index | |
| Xtrackers Short Duration High Yield Bond ETF | Solactive USD High Yield Corporates Total Market 0-5 Year Index | |
| Xtrackers USD High Yield Corporate Bond ETF | Solactive USD High Yield Corporates Total Market Index |
The Solactive USD High Yield Corporates Total Market High Beta Index is designed to track the performance of the segment of the US dollar-denominated high yield corporate bond market that exhibits higher overall beta to the broader high yield corporate fixed income market. The Solactive USD High Yield Corporates Total Market Low Beta Index is designed to track the performance of the segment of the US dollar-denominated high yield corporate bond market that exhibits lower overall beta to the broader high yield corporate fixed income market. The Adaptive Wealth Strategies Risk Managed High Yield Index is designed to track the performance of the US dollar-denominated high yield corporate bond market during normal market conditions, and the performance of a USD cash position accruing interest at the Effective Federal Funds Rate (the interest rate depository institutions such as banks charge each other for overnight loans to meet their reserve requirements) during periods of adverse market conditions. The Solactive USD High Yield Corporates Total Market 0-5 Year Index is designed to track the performance of short-term publicly issued US dollar-denominated below investment grade corporate debt. The Solactive USD High Yield Corporates Total Market Index is designed to track the performance of a basket of U.S. dollar-denominated high yield liquid corporate bonds. Under normal circumstances, the Solactive Indexes are reconstituted monthly on the last day of each month. The Funds reconstitute and rebalance their portfolios in accordance with their respective underlying indexes, and therefore any changes to the underlying indexes reconstitution and rebalance schedules will result in corresponding changes to a Fund’s reconstitution and rebalance schedule.
Each Fund is entitled to use its respective Underlying Index pursuant to a licensing agreement between the Index Provider and DBX. There is no charge to the Funds in connection with these licensing agreements.
78
DBX ETF Trust
Notes to Financial Statements (Continued)
Xtrackers Risk Managed USD High Yield Strategy ETF is non-diversified and is not limited by the Act with regard to the percentage of its assets that may be invested in the securities of a single issuer. This means the securities of a particular issuer (or securities of issuers in particular industries) may dominate the Underlying Index of the Fund and, consequently, the Fund’s investment portfolio. This may adversely affect the Fund’s performance or subject the Fund’s shares to greater price volatility than that experienced by more diversified investment companies.
Pursuant to the Trust’s organizational documents, the Trust’s officers and trustees are indemnified against certain liabilities that may arise out of the performance of their duties to the Funds. Additionally, in the normal course of business the Trust enters into contracts that contain a variety of representations that provide indemnification for certain liabilities. The Trust’s maximum exposure under these arrangements is unknown, as this would involve future claims that may be made against the Funds that have not yet occurred. However, the Trust expects the risk of loss to be remote.
2. Significant Accounting Policies
The financial statements have been prepared in conformity with U.S. generally accepted accounting principles (“U.S. GAAP”), which require management to make certain estimates and assumptions that affect the reported amounts and disclosures in the financial statements. Actual results could differ from those estimates. Each Fund qualifies as an investment company under Topic 946 of the Accounting Standards Codification of U.S. GAAP. The following is a summary of significant accounting policies followed by the Funds.
Security Valuation The NAV of each Fund’s shares is calculated each business day as of the close of regular trading on the New York Stock Exchange, generally 4:00 p.m. Eastern Time. NAV per share is calculated by dividing a Fund’s net assets by the number of Fund shares outstanding.
The Funds’ Board has designated the Advisor as the valuation designee for the Funds pursuant to Rule 2a-5 under the 1940 Act. The Advisor’s Pricing Committee (the “Pricing Committee”) typically values securities using readily available market quotations or prices supplied by independent pricing services (which are considered fair values under Rule 2a-5). The Advisor has adopted fair valuation procedures that provide methodologies for fair valuing securities.
Various inputs are used in determining the value of the Funds’ investments. These inputs are summarized in three broad levels. Level 1 includes quoted prices in active markets for identical securities. Level 2 includes other significant observable inputs (including quoted prices for similar securities, interest rates, prepayment speeds, and credit risk). Level 3 includes significant unobservable inputs (including the Funds’ own assumptions in determining the fair value of investments). The level assigned to the securities valuations may not be an indication of the risk or liquidity associated with investing in those securities.
Corporate and sovereign debt securities are valued at prices supplied by independent pricing services approved by the Pricing Committee. Such services may use various pricing techniques which take into account appropriate factors such as yield, quality, coupon rate, maturity, type of issue, trading characteristics and other data, as well as broker quotes. If the pricing services are unable to provide valuations, securities are valued at the mean between the bid and ask quotations or evaluated prices, as applicable, obtained from broker-dealers. These securities are generally categorized as Level 2.
ETFs are valued at the most recent sale price or official closing price reported on the exchange (U.S. or foreign) or over-the-counter market on which they trade. ETFs for which no sales are reported are valued at the calculated mean between the most recent bid and asked quotations on the relevant market or, if a mean cannot be determined, at the most recent bid quotation. ETFs are generally categorized as Level 1.
Investments in open-end investment companies are valued at their NAV each business day and are categorized as Level 1.
Securities and other assets for which market quotations are not readily available or for which the above valuation procedures are deemed not to reflect fair value are valued in a manner that is intended to reflect their fair value as determined in accordance with procedures approved by the Pricing Committee and are generally categorized as Level 3. In accordance with the Funds’ valuation procedures, factors considered in determining value may include, but are not limited to, the type of the security; the size of the holding; the initial cost of the security; the existence of any contractual restrictions on the security’s disposition; the price and extent of public trading in similar securities of the issuer or of comparable companies; quotations or evaluated prices from broker-dealers and/or
79
DBX ETF Trust
Notes to Financial Statements (Continued)
pricing services; information obtained from the issuer, analysts, and/or the appropriate stock exchange (for exchange-traded securities); an analysis of the company’s or issuer’s financial statements; an evaluation of the forces that influence the issuer and the market(s) in which the security is purchased and sold; length of time of a halt in trading of the security; movement in the security’s proxy index; and with respect to debt securities, the maturity, coupon, creditworthiness, currency denomination and the movement of the market in which the security is normally traded. The value determined under these procedures may differ from published values for the same securities.
Fair value pricing could result in a difference between the prices used to calculate a Fund’s NAV and the prices used by the Fund’s Underlying Index, which in turn could result in a difference between the Fund’s performance and the performance of the Fund’s Underlying Index
Disclosure about the classification of the fair value measurements is included in a table following the Fund’s Schedule of Investments.
Cash Cash consists of cash held at banks and is on deposit with major financial institutions.
Investment Transactions and Investment Income Investment transactions are recorded as of the date that the securities are purchased or sold (trade date). Realized gains and losses from the sale or disposition of securities are calculated on the identified cost-method. Interest income is recorded on the accrual basis. All premiums and discounts are amortized/accreted for both tax and financial reporting purposes. Distributions of income and capital gains from investments in affiliated funds are recorded on the ex-dividend date.
Tax Information and Dividends and Distributions to Shareholders It is each Fund’s policy to comply with all requirements of the Internal Revenue Code of 1986, as amended (“the Code”). Each Fund intends to qualify for and to elect treatment as a separate Regulated Investment Company (“RIC”) under Subchapter M of the Code. It is the policy of each Fund to pay out dividends from its net investment income, if any, to investors monthly. Taxable net realized gains from investment transactions, reduced by capital loss carryforwards, if any, are declared and distributed to shareholders at least annually. The capital loss carryforward amount, if any, is available to offset future net capital gains. The Funds may occasionally be required to make supplemental distributions at some other time during the year. The Funds reserve the right to declare special distributions if, in their reasonable discretion, such action is necessary or advisable to preserve the status of each Fund as a RIC or to avoid imposition of income or excise taxes on undistributed income. Dividends and distributions to shareholders, if any, are recorded on the ex-dividend date. The amount of dividends and distributions from net investment income and net realized capital gains are determined in accordance with Federal income tax regulations which may differ from U.S. GAAP. These “book/tax” differences are either considered temporary or permanent in nature. To the extent these differences are permanent in nature, such amounts are reclassified at the end of the year within the components of net assets based on their federal tax treatment; temporary differences do not require reclassification. Dividends and distributions, which exceed earnings and profits for the full year for tax purposes, are reported as a tax return of capital.
In accordance with U.S. GAAP requirements regarding accounting for uncertainties in income taxes, management has analyzed the Funds’ tax positions taken or expected to be taken on foreign, federal and state income tax returns for all open tax years and has concluded that no provision for income tax is required in the Funds’ financial statements.
The Funds recognize interest and penalties, if any, related to uncertain tax positions as income tax expense on the Statements of Operations. For the year ended August 31, 2022, the Funds did not incur any interest or penalties.
As of August 31, 2022, the components of accumulated earnings (losses) on a tax basis were as follows:
| Undistributed Ordinary Income | Capital and Other Gains (Losses) | Unrealized Appreciation (Depreciation) | Total Accumulated Earnings (Losses) | |||||||||||||
Xtrackers High Beta High Yield Bond ETF | $ | 73,969 | $ | (10,948,893 | ) | $ | (2,220,689 | ) | $ | (13,095,613 | ) | |||||
Xtrackers Low Beta High Yield Bond ETF | 4,944,933 | (31,980,876 | ) | (109,279,507 | ) | (136,315,450 | ) | |||||||||
Xtrackers Risk Managed USD High Yield Strategy ETF | 184,435 | — | (4,763,654 | ) | (4,579,219 | ) | ||||||||||
Xtrackers Short Duration High Yield Bond ETF | 389,542 | (996,238 | ) | (7,273,572 | ) | (7,880,268 | ) | |||||||||
Xtrackers USD High Yield Corporate Bond ETF | 15,829,564 | (120,650,633 | ) | (603,371,906 | ) | (708,192,975 | ) | |||||||||
80
DBX ETF Trust
Notes to Financial Statements (Continued)
The tax character of dividends and distributions declared for the years ended August 31, 2022 and August 31, 2021 were as follows:
| Year Ended August 31, 2022 | ||||
| Ordinary Income* | ||||
Xtrackers High Beta High Yield Bond ETF | $ | 1,152,992 | ||
Xtrackers Low Beta High Yield Bond ETF | 42,567,833 | |||
Xtrackers Risk Managed USD High Yield Strategy ETF | 844,002 | |||
Xtrackers Short Duration High Yield Bond ETF | 3,956,845 | |||
Xtrackers USD High Yield Corporate Bond ETF | 242,753,834 | |||
| Year Ended August 31, 2021 | ||||
| Ordinary Income* | ||||
Xtrackers High Beta High Yield Bond ETF | $ | 825,490 | ||
Xtrackers Low Beta High Yield Bond ETF | 8,258,522 | |||
Xtrackers Short Duration High Yield Bond ETF | 2,657,928 | |||
Xtrackers USD High Yield Corporate Bond ETF | 328,072,536 | |||
| * | For tax purposes short-term capital gain distributions are considered ordinary income distributions. |
At August 31, 2022, for Federal income tax purposes, the Funds have capital loss carryforwards available as shown in the table below, to the extent provided by regulations, to offset future capital gains for an unlimited period. To the extent that these loss carryforwards are used to offset future capital gains, it is probable that the capital gains so offset will not be distributed to shareholders.
| Short-Term | Long-Term | Total Amount | ||||||||||
Xtrackers High Beta High Yield Bond ETF | $ | 2,899,789 | $ | 8,049,104 | $ | 10,948,893 | ||||||
Xtrackers Low Beta High Yield Bond ETF | 24,251,180 | 7,729,696 | 31,980,876 | |||||||||
Xtrackers Short Duration High Yield Bond ETF | 618,223 | 378,015 | 996,238 | |||||||||
Xtrackers USD High Yield Corporate Bond ETF | 27,135,091 | 93,515,542 | 120,650,633 | |||||||||
For the fiscal year ended August 31, 2022, the effect of permanent “book/tax” reclassifications to the components of net assets are included below. These differences are primarily due to redemptions-in-kind.
| Distributable earnings (loss) | Paid-In Capital | |||||||
Xtrackers High Beta High Yield Bond ETF | $ | 783,491 | $ | (783,491 | ) | |||
Xtrackers Low Beta High Yield Bond ETF | 14,394,103 | (14,394,103 | ) | |||||
Xtrackers Risk Managed USD High Yield Strategy ETF | (131,183 | ) | 131,183 | |||||
Xtrackers Short Duration High Yield Bond ETF | (58,782 | ) | 58,782 | |||||
Xtrackers USD High Yield Corporate Bond ETF | 158,252,797 | (158,252,797 | ) | |||||
As of August 31, 2022, the aggregate cost of investments for federal income tax purposes, the net unrealized appreciation or (depreciation) and the aggregated gross unrealized appreciation (depreciation) on investments were as follows:
| Aggregate Tax Cost | Net Unrealized Appreciation (Depreciation) | Aggregate Gross Unrealized Appreciation | Aggregate Gross Unrealized (Depreciation) | |||||||||||||
Xtrackers High Beta High Yield Bond ETF | $ | 14,241,683 | $ | (2,220,689 | ) | $ | 12,415 | $ | (2,233,104 | ) | ||||||
Xtrackers Low Beta High Yield Bond ETF | 1,543,431,644 | (109,279,507 | ) | 889,790 | (110,169,297 | ) | ||||||||||
Xtrackers Risk Managed USD High Yield Strategy ETF | 54,358,186 | (4,763,654 | ) | — | (4,763,654 | ) | ||||||||||
Xtrackers Short Duration High Yield Bond ETF | 93,155,018 | (7,273,572 | ) | 176,333 | (7,449,905 | ) | ||||||||||
Xtrackers USD High Yield Corporate Bond ETF | 4,265,422,743 | (603,371,908 | ) | 153,306 | (603,525,214 | ) | ||||||||||
81
DBX ETF Trust
Notes to Financial Statements (Continued)
Foreign Taxes The Funds may be subject to foreign taxes (a portion of which may be reclaimable) on income, capital gains on investments, certain foreign currency transactions or other corporate events. All foreign taxes are recorded in accordance with the applicable foreign tax regulations and rates that exist in the foreign jurisdictions in which the Funds invest. These foreign taxes, if any, are paid by the Funds and are reflected in their Statements of Operations as follows: foreign taxes withheld at source are presented as a reduction of income, and foreign taxes on capital gains from sales of investments and foreign currency transactions are included in their respective net realized gain (loss) categories. Receivables and payables related to foreign taxes as of August 31, 2022, if any, are disclosed in the Funds’ Statements of Assets and Liabilities.
Foreign Currency Translations The books and records of the Funds are maintained in U.S. dollars. Investment securities and other assets and liabilities denominated in a foreign currency are translated into U.S. dollars at the prevailing exchange rates at period end. Purchases and sales of investment securities, income and expenses are translated into U.S. dollars at the prevailing exchange rates on the respective dates of the transactions.
Net realized and unrealized gains and losses on foreign currency transactions represent net gains and losses between trade and settlement dates on securities transactions, the acquisition and disposition of foreign currencies, and the difference between the amount of net investment income accrued and the U.S. dollar amount actually received. The portion of both realized and unrealized gains and losses on investments that results from fluctuations in foreign currency exchange rates is not separately disclosed, but is included with net realized and unrealized gain/appreciation and loss/depreciation on investments.
Securities Lending The Funds may lend securities to certain financial institutions under the terms of their securities lending agreement. During the term of the loans the Funds continue to receive interest and dividends generated by the securities and to participate in any changes in their market value. The Funds require the borrowers of the securities to maintain collateral with the Funds consisting of cash and/or securities issued or guaranteed by the U.S. Government, its agencies or instrumentalities having a value at least equal to the value of the securities loaned. When the collateral falls below specified amounts, the lending agent will use its best effort to obtain additional collateral on the next business day to meet required amounts under the securities lending agreement. During the year ended August 31, 2022, the Funds invested the cash collateral into a joint trading account in DWS Government & Agency Securities Portfolio, an affiliated money market fund managed by DWS Investment Management Americas, Inc. DWS Investment Management Americas, Inc. receives a management/administration fee (0.06% annualized effective rate as of August 31, 2022) on the cash collateral invested in DWS Government & Agency Securities Portfolio. The Funds receive compensation for lending their securities either in the form of fees or by earning interest on invested cash collateral, net of borrower rebates and fees paid to a lending agent. Either the Fund or the borrower may terminate the loan at any time and the borrower, after notice, is required to return borrowed securities within a standard time period. There may be risks of delay and costs in recovery of securities or even loss of rights in the collateral should the borrower of the securities fail financially. If the Funds are not able to recover securities lent, the Funds may sell the collateral and purchase a replacement investment in the market, incurring the risk that the value of the replacement security is greater than the value of the collateral. The Funds are also subject to all investment risks associated with the reinvestment of any cash collateral received, including, but not limited to, interest rate, credit and liquidity risk associated with such investments.
82
DBX ETF Trust
Notes to Financial Statements (Continued)
As of August 31, 2022, the Funds listed below had securities on loan. The value of the related collateral exceeded the value of the securities loaned at period end.
Remaining Contractual Maturity of the Agreements, as of August 31, 2022 | ||||||||||||||||||||
| Securities Lending Transactions | Overnight and Continuous | <30 Days | Between 30 & 90 days | >90 days | Total | |||||||||||||||
Xtrackers High Beta High Yield Bond ETF |
| |||||||||||||||||||
Corporate Bonds | $ | 263,774 | $ | — | $ | 120 | $ | 151,598 | $ | 415,492 | ||||||||||
|
|
|
|
|
|
|
|
|
| |||||||||||
Gross amount of recognized liabilities and non-cash collateral for securities lending transactions |
| $ | 415,492 | |||||||||||||||||
Xtrackers Low Beta High Yield Bond ETF |
| |||||||||||||||||||
Corporate Bonds | $ | 9,125,075 | $ | — | $ | 2,555 | $ | 2,984,226 | $ | 12,111,856 | ||||||||||
|
|
|
|
|
|
|
|
|
| |||||||||||
Gross amount of recognized liabilities and non-cash collateral for securities lending transactions |
| $ | 12,111,856 | |||||||||||||||||
Xtrackers Short Duration High Yield Bond ETF |
| |||||||||||||||||||
Corporate Bonds | $ | 821,382 | $ | — | $ | 778 | $ | 1,002,090 | $ | 1,824,250 | ||||||||||
|
|
|
|
|
|
|
|
|
| |||||||||||
Gross amount of recognized liabilities and non-cash collateral for securities lending transactions |
| $ | 1,824,250 | |||||||||||||||||
Xtrackers USD High Yield Corporate Bond ETF |
| |||||||||||||||||||
Corporate Bonds | $ | 78,245,816 | $ | — | $ | 26,617 | $ | 32,064,353 | $ | 110,336,786 | ||||||||||
|
|
|
|
|
|
|
|
|
| |||||||||||
Gross amount of recognized liabilities and non-cash collateral for securities lending transactions |
| $ | 110,336,786 | |||||||||||||||||
As of August 31, 2022, Xtrackers Risk Managed USD High Yield Strategy ETF had no securities on loan.
Affiliated Cash Management Vehicles The Funds may invest uninvested cash balances in DWS Government Money Market Series and DWS ESG Liquidity Fund, affiliated money market funds which are managed by DWS Investment Management Americas, Inc. (“DIMA”), also an indirect, wholly owned subsidiary of DWS Group GmbH & Co. KGaA. Each affiliated money market fund is managed in accordance with Rule 2a-7 under the 1940 Act, which governs the quality, maturity, diversity and liquidity of instruments in which a money market fund may invest. DWS Government Money Market Series seeks to maintain a stable NAV, and DWS ESG Liquidity Fund maintains a floating NAV. The Funds indirectly bear their proportionate share of the expenses of each affiliated money market fund in which they invest. The Advisor will waive an amount of the unitary advisory fee payable to the Advisor by the Funds equal to such acquired fund’s fees and expenses on the Funds’ assets invested in the affiliated money market funds.
3. Investment Advisory and Other Agreements
The Advisor has overall responsibility for the general management and administration of the Funds, subject to the supervision of the Funds’ Board of Trustees. Under an investment advisory agreement between the Trust, on behalf of the Funds, and the Advisor (the “Investment Advisory Agreement”), the Advisor is responsible for arranging sub-advisory, transfer agency, custody, fund administration, and all other non-distribution related services for the Funds to operate.
For its investment advisory services to the Funds below, the Advisor was entitled to receive a unitary advisory fee based on each Fund’s average daily net assets, computed and accrued daily and payable monthly, at an annual rate equal to:
| Unitary Advisory Fee | ||||
Xtrackers High Beta High Yield Bond ETF | 0.35 | % | ||
Xtrackers Low Beta High Yield Bond ETF | 0.25 | % | ||
Xtrackers Risk Managed USD High Yield Strategy ETF | 0.30 | % | ||
Xtrackers Short Duration High Yield Bond ETF | 0.20 | % | ||
Xtrackers USD High Yield Corporate Bond ETF | 0.20 | % | ||
The Advisor for Xtrackers High Beta High Yield Bond ETF has contractually agreed, until December 16, 2022, to waive a portion of its unitary advisory fee to the extent necessary to prevent the operating expenses (except for interest expense, taxes, brokerage expenses, distribution fees or expenses, litigation expenses and other
83
DBX ETF Trust
Notes to Financial Statements (Continued)
extraordinary expenses) of the fund from exceeding 0.20% of the fund’s average daily net assets. For the year ended August 31, 2022, the Advisor waived $28,897 of expenses to the Fund.
The Advisor for Xtrackers Low Beta High Yield Bond ETF has contractually agreed, until December 16, 2022, to waive a portion of its unitary advisory fee to the extent necessary to prevent the operating expenses (except for interest expense, taxes, brokerage expenses, distribution fees or expenses, litigation expenses and other extraordinary expenses) of the fund from exceeding 0.20% of the fund’s average daily net assets. For the year ended August 31, 2022, the Advisor waived $580,745 of expenses to the Fund.
The Advisor for Xtrackers Risk Managed USD High Yield Strategy ETF has contractually agreed, until November 14, 2024, to waive a portion of its management fees in an amount equal to the acquired fund’s fees and expenses attributable to the Fund’s investments in affiliated funds. For the year ended August 31, 2022, the Advisor waived $34,054 of the expenses of the Fund which were attributable to the Fund’s investments in affiliated funds.
The Advisor for Xtrackers USD High Yield Corporate Bond ETF has contractually agreed, until December 16, 2022, to waive a portion of its unitary advisory fee to the extent necessary to prevent the operating expenses (except for interest expense, taxes, brokerage expenses, distribution fees or expenses, litigation expenses and other extraordinary expenses) of the fund from exceeding 0.15% of the fund’s average daily net assets. For the year ended August 31, 2022, the Advisor waived $2,626,086 of expenses to the Fund.
The Advisor for the Funds below has contractually agreed to waive a portion of its unitary advisory fee in an amount equal to the acquired fund’s fees and expenses attributable to the Funds’ investments in affiliated cash management vehicles. For the year ended August 31, 2022, the Advisor waived expenses of the Funds as follows:
| Expenses Waived | ||||
Xtrackers High Beta High Yield Bond ETF | $ | 171 | ||
Xtrackers Low Beta High Yield Bond ETF | 4,694 | |||
Xtrackers Risk Managed USD High Yield Strategy ETF | 67 | |||
Xtrackers Short Duration High Yield Bond ETF | 521 | |||
Xtrackers USD High Yield Corporate Bond ETF | 12,391 | |||
Out of the unitary advisory fee, the Advisor pays substantially all expenses of each Fund, including the cost of transfer agency, custody, fund administration, legal, audit and other services, and expenses of the Independent Trustees. Each Fund is responsible for the payment of interest expense, acquired fund fees and expenses, taxes, brokerage expenses, distribution fees or expenses, if any, litigation expenses and extraordinary expenses.
The Bank of New York Mellon, a wholly-owned subsidiary of The Bank of New York Mellon Corporation, serves as Administrator, Custodian, Accounting Agent, Lending Agent and Transfer Agent for each Fund.
ALPS Distributors, Inc. (the “Distributor”) serves as the distributor of Creation Units for each Fund on an agency basis. The Distributor does not maintain a secondary market in shares of the Funds.
The Board of Trustees is currently comprised of three Independent Trustees. The Advisor paid retainer fees and attendance fees to each Independent Trustee; retainer fees to the Chairman of the Board of Trustees and the Chairman of the Audit Committee; and attendance fees to each member of the Audit Committee (which is comprised of all of the Funds’ Independent Trustees).
4. Investment Portfolio Transactions
For the year ended August 31, 2022, the cost of investments purchased and proceeds from sale of investments (excluding in-kind transactions and short-term investments) were as follows:
| Purchases | Sales | |||||||
Xtrackers High Beta High Yield Bond ETF | $ | 10,272,911 | $ | 10,336,663 | ||||
Xtrackers Low Beta High Yield Bond ETF | 775,867,311 | 768,549,219 | ||||||
Xtrackers Risk Managed USD High Yield Strategy ETF | 626,404 | 20,322 | ||||||
Xtrackers Short Duration High Yield Bond ETF | 41,113,262 | 36,839,443 | ||||||
Xtrackers USD High Yield Corporate Bond ETF | 1,233,346,510 | 1,272,538,276 | ||||||
84
DBX ETF Trust
Notes to Financial Statements (Continued)
For the year ended August 31, 2022, the cost of in-kind purchases and proceeds from in-kind sales were as follows:
| Purchases | Sales | |||||||
Xtrackers High Beta High Yield Bond ETF | $ | 6,850,243 | $ | 10,372,480 | ||||
Xtrackers Low Beta High Yield Bond ETF | 1,250,185,235 | 409,568,287 | ||||||
Xtrackers Risk Managed USD High Yield Strategy ETF | 56,117,468 | 2,870,852 | ||||||
Xtrackers Short Duration High Yield Bond ETF | 23,379,318 | 4,410,318 | ||||||
Xtrackers USD High Yield Corporate Bond ETF | 4,769,272,515 | 6,916,621,234 | ||||||
Transactions with Affiliates. The Funds may purchase securities from, or sell securities to, an affiliated fund provided the affiliation is solely due to having a common investment advisor, common officers, or common trustees. During the year ended August 31, 2022, the Funds engaged in securities purchases and securities sales with an affiliated fund in compliance with Rule 17a-7 under the 1940 Act as follows:
| Securities Purchased | Securities Sold | Net Realized Gain (Loss) on Securities Sold | ||||||||||
Xtrackers High Beta High Yield Bond ETF | $ | 3,504,209 | $ | 7,043,810 | $ | (324,570 | ) | |||||
Xtrackers Low Beta High Yield Bond ETF | 8,396,996 | 6,048,995 | (563,215 | ) | ||||||||
Xtrackers USD High Yield Corporate Bond ETF | 2,544,786 | 1,353,186 | 4,134 | |||||||||
5. Fund Share Transactions
As of August 31, 2022, there were unlimited Fund shares, no par value, authorized by the Trust. Fund shares are issued and redeemed by each Fund only in Creation Units or multiples thereof. Except when aggregated in Creation Units, shares of each Fund are not redeemable. Transactions in capital shares for each Fund are disclosed in detail in the Statements of Changes in Net Assets. The consideration for the purchase of Creation Units of a Fund generally consists of the in-kind contribution of a designated portfolio of securities constituting a portfolio sampling representation of the securities included in the respective Fund’s Underlying Index and an amount of cash, which under certain circumstances may include cash in lieu of portfolio securities. Investors purchasing and redeeming Creation Units pay a purchase transaction fee and a redemption transaction fee to offset transfer and other transaction costs associated with the issuance and redemption of Creation Units.
6. Investing in High-Yield Debt Securities
High-yield debt securities or junk bonds are generally regarded as speculative with respect to the issuer’s continuing ability to meet principal and interest payments. A Fund’s performance could be hurt if an issuer of a debt security suffers an adverse change in financial condition that results in the issuer not making timely payments of interest or principal, a security downgrade or an inability to meet a financial obligation. High-yield debt securities’ total return and yield may generally be expected to fluctuate more than the total return and yield of investment-grade debt securities. A real or perceived economic downturn or an increase in market interest rates could cause a decline in the value of high-yield debt securities, result in increased redemptions and/or result in increased portfolio turnover, which could result in a decline in NAV of a Fund, reduce liquidity for certain investments and/or increase costs. High-yield debt securities are often thinly traded and can be more difficult to sell and value accurately than investment-grade debt securities as there may be no established secondary market. Investments in high-yield debt securities could increase liquidity risk for a Fund. In addition, the market for high-yield debt securities can experience sudden and sharp volatility which is generally associated more with investments in stocks.
7. Line of Credit
The Trust has entered into a senior unsecured credit facility with a syndication of banks which allows the Xtrackers USD High Yield Corporate Bond ETF and certain other funds managed by the Advisor to borrow up to $105 million. The Fund may borrow money under this credit facility to the extent necessary for temporary or emergency purposes, including the funding of shareholder redemption requests, trade settlements, and as necessary to distribute to shareholders any income necessary to maintain the Fund’s status as a regulated
85
DBX ETF Trust
Notes to Financial Statements (Continued)
investment company. Borrowings are charged an interest rate of 1.25% per annum plus the greater of the Federal Funds Effective Rate or the one-month LIBOR Rate. The Fund may borrow up to the lesser of 33 percent of its net assets as permitted by the Act or 25 percent of adjusted total net assets. The Fund had no outstanding loans at August 31, 2022.
8. Other — COVID-19 Pandemic
A novel coronavirus known as COVID-19, declared a pandemic by the World Health Organization, has caused significant uncertainty, market volatility, decreased economic and other activity, increased government activity, including economic stimulus measures, and supply chain interruptions. The full effects, duration and costs of the COVID-19 pandemic are impossible to predict, and the circumstances surrounding the COVID-19 pandemic will continue to evolve, including the risk of future increased rates of infection due to significant portions of the population remaining unvaccinated and/or the lack of effectiveness of current vaccines against new variants. The pandemic has affected and may continue to affect certain countries, industries, economic sectors, companies and investment products more than others, may exacerbate existing economic, political, or social tensions and may increase the probability of an economic recession or depression. The Funds’ and their investments may be adversely affected by the effects of the COVID-19 pandemic, and the pandemic may result in the Funds and their service providers experiencing operational difficulties in coordinating a remote workforce and implementing their business continuity plans, among others. Management will continue to monitor the impact COVID-19 has on the Funds and reflect the consequences as appropriate in the Funds’ accounting and financial reporting.
9. Stock Split
On April 13, 2021, the Xtrackers USD High Yield Corporate Bond ETF implemented a 5 for 4 stock split of its outstanding shares. The net effect of the stock split was to increase the number of outstanding shares and decrease the net asset value per share by a proportionate amount for the shares of the Fund. The stock split had no impact on the overall value of a shareholder’s investment in the Fund. Capital share activity referenced in the Statement of Changes in Net Assets, and per share and net asset value data in the Financial Highlights tables have been restated to reflect the stock split.
86
DBX ETF Trust
To the Shareholders of
Xtrackers High Beta High Yield Bond ETF, Xtrackers Low Beta High Yield Bond ETF, Xtrackers Risk Managed USD High Yield Strategy ETF, Xtrackers Short Duration High Yield Bond ETF and Xtrackers USD High Yield Corporate Bond ETF and the Board of Trustees of DBX ETF Trust
Opinion on the Financial Statements
We have audited the accompanying statements of assets and liabilities of Xtrackers High Beta High Yield Bond ETF, Xtrackers Low Beta High Yield Bond ETF, Xtrackers Risk Managed USD High Yield Strategy ETF, Xtrackers Short Duration High Yield Bond ETF, and Xtrackers USD High Yield Corporate Bond ETF (collectively referred to as the “Funds”), (five of the funds constituting DBX ETF Trust (the “Trust”)), including the schedules of investments, as of August 31, 2022, and the related statements of operations and changes in net assets, and the financial highlights for each of the periods indicated in the table below and the related notes (collectively referred to as the “financial statements”). In our opinion, the financial statements present fairly, in all material respects, the financial position of each of the Funds (five of the funds constituting DBX ETF Trust) at August 31, 2022, and the results of their operations, changes in net assets and financial highlights for each of the periods indicated in the table below, in conformity with U.S. generally accepted accounting principles.
| Individual fund constituting the DBX ETF Trust | Statement of operations | Statements of changes in net assets | Financial highlights | |||
Xtrackers High Beta High Yield Bond ETF
Xtrackers Low Beta High Yield Bond ETF | For the year ended August 31, 2022 | For each of the two years in the period ended August 31, 2022 | For each of the four years in the period ended August 31, 2022 and the period from January 11, 2018 (commencement of operations) through August 31, 2018 | |||
| Xtrackers Short Duration High Yield Bond ETF | For the year ended August 31, 2022 | For each of the two years in the period ended August 31, 2022 | For each of the four years in the period ended August 31, 2022 and the period from January 10, 2018 (commencement of operations) through August 31, 2018 | |||
| Xtrackers USD High Yield Corporate Bond ETF | For the year ended August 31, 2022 | For each of the two years in the period ended August 31, 2022 | For each of the five years in the period ended August 31, 2022 | |||
| Xtrackers Risk Managed USD High Yield Strategy | For the period from February 10, 2022 (commencement of operations) through August 31, 2022 | |||||
Basis for Opinion
These financial statements are the responsibility of the Trust’s management. Our responsibility is to express an opinion on each of the Funds’ financial statements based on our audits. We are a public accounting firm registered with the Public Company Accounting Oversight Board (United States) (“PCAOB”) and are required to be independent with respect to the Trust in accordance with the U.S. federal securities laws and the applicable rules and regulations of the Securities and Exchange Commission and the PCAOB.
We conducted our audits in accordance with the standards of the PCAOB. Those standards require that we plan and perform the audit to obtain reasonable assurance about whether the financial statements are free of material misstatement, whether due to error or fraud. The Trust is not required to have, nor were we engaged to perform, an audit of the Trust’s internal control over financial reporting. As part of our audits we are required to obtain an understanding of internal control over financial reporting but not for the purpose of expressing an opinion on the effectiveness of the Trust’s internal control over financial reporting. Accordingly, we express no such opinion.
87
DBX ETF Trust
Report of Independent Registered Public Accounting Firm (Continued)
Our audits included performing procedures to assess the risks of material misstatement of the financial statements, whether due to error or fraud, and performing procedures that respond to those risks. Such procedures included examining, on a test basis, evidence regarding the amounts and disclosures in the financial statements. Our procedures included confirmation of securities owned as of August 31, 2022, by correspondence with the custodian, brokers and others; when replies were not received from brokers, we performed other auditing procedures. Our audits also included evaluating the accounting principles used and significant estimates made by management, as well as evaluating the overall presentation of the financial statements. We believe that our audits provide a reasonable basis for our opinion.

We have served as the auditor of one or more investment companies in the DWS family of funds since at least 1979, but we are unable to determine the specific year.
New York, New York
October 25, 2022
88
DBX ETF Trust
Identification and Background
The Board has responsibility for the overall management and operations of the funds, including general supervision of the duties performed by the Advisor and other service providers. Each Board Member serves until his or her successor is duly elected or appointed and qualified. Each officer serves until he or she resigns, is removed, dies, retires or becomes disqualified.
The Trust currently has three Board Members. The three Independent Board Members have no affiliation or business connection with the Advisor or any of its affiliated persons and do not own any stock or other securities issued by the Advisor.
The Independent Board Members of the Trust, their term of office and length of time served, their principal business occupations during the past five years, the number of portfolios in the fund complex (defined below) overseen by each Independent Board Member, and other directorships, if any, held by the Board Members are shown below. The fund complex includes all registered open- and closed-end funds (including all of their portfolios) advised by the Advisor and any registered funds that have an investment advisor that is an affiliated person of the Advisor. As of the date of this shareholder report, the fund complex consists of the funds in the Trust, as well as the registered funds advised by affiliates of the Advisor.
Shareholder Communications to the Board. Shareholders may send communications to the Trust’s Board by addressing the communications directly to the Board (or individual Board Members) and/or otherwise clearly indicating in the salutation that the communication is for the Board (or individual Board Members). The shareholder may send the communication to either the Trust’s office or directly to such Board members c/o 875 Third Avenue, New York, NY 10022. Other shareholder communications received by the Trust not directly addressed and sent to the Board will be reviewed and generally responded to by management. Such communications will be forwarded to the Board at management’s discretion based on the matters contained therein.
Independent Board Members | ||||||
| Name, Year of Birth, Position with the Trust and Length of Time Served(1) | Business Experience and Directorships During the Past 5 Years | Number of Portfolios in Fund Complex Overseen | Other Directorships Held by Board Member | |||
Stephen R. Byers (1953) Chairperson since 2016, and Board Member since 2011 (formerly, Lead Independent Board Member, 2015-2016) | Independent Director (2011-present); Independent Consultant (2014-present); Director of Investment Management, the Dreyfus Corporation (2000-2006) and Vice Chairman and Chief Investment Officer, the Dreyfus Corporation (2002-2006). | 35 | The Arbitrage Funds, Sierra Income Corporation, Mutual Fund Directors Forum | |||
George O. Elston (1964) Board Member since 2011, Chairperson of the Audit Committee since 2015 | Chief Financial Officer, EyePoint Pharmaceuticals, Inc. (2019-present); Chief Financial Officer, Enzyvant (2018-2019); Chief Executive Officer, 2X Oncology, Inc. (2017-2018); Senior Vice President and Chief Financial Officer, Juniper Pharmaceuticals, Inc. (2014-2016); Senior Vice President and Chief Financial Officer, KBI BioPharma Inc. (2013-2014); Managing Partner, Chatham Street Partners (2010-2013). | 35 | — | |||
J. David Officer (1948) Board Member since 2011, Chairperson of the Nominating Committee since 2015 | Independent Director (2010-present); Vice Chairman, the Dreyfus Corporation (2006-2009); President, The Dreyfus Family of Funds, Inc. (2006-2009). | 35 | (Chairman of) Ilex Management Ltd; Old Westbury Funds | |||
89
DBX ETF Trust
Board Members and Officers (Unaudited) (Continued)
Officers(2) | ||
| Name, Year of Birth, Position with the Trust and Length of Time Served(3) | Business Experience and Directorships During the Past 5 Years | |
Freddi Klassen(4) (1975) President and Chief Executive Officer, 2016-present | Programmes (Head since 2021), of DWS Investment Management Americas, Inc. and Manager and Chief Operating Officer of the Advisor (2016-present). Formerly: Chief Operating Officer in the Americas for the Traditional Asset Classes Department (2014-2020); Manager and Chief Operating Officer of DWS Investment Management Americas, Inc. (2018-2020); Global Chief Operating Officer for Equities Technology in the Investment Bank Division at Deutsche Bank AG (2013-2014); Chief Operating Officer for Exchange Traded Funds and Systematic Funds in Europe (2008-2013). | |
Diane Kenneally(5) (1966) Treasurer, Chief Financial Officer and Controller, 2019-present | Fund Administration Treasurer’s Office (Co-Head since 2018), of DWS Investment Management Americas, Inc.; Chief Financial Officer and Treasurer for DWS US registered investment companies advised by DWS Investment Management Americas, Inc. (2018-present); Treasurer and Chief Financial Officer, The European Equity Fund, Inc., The New Germany Fund, Inc. and The Central and Eastern Europe Fund, Inc. (2018-present); formerly: Assistant Treasurer for the DWS funds (2007-2018). | |
Frank Gecsedi(4) (1967) Chief Compliance Officer, 2010-present | AFC Compliance US (Senior Team Lead), of DWS Investment Management Americas, Inc.; Compliance Department (2016-present), Vice President in the Deutsche Asset Management Compliance Department at Deutsche Bank AG (2013-2016) and Chief Compliance Officer of the Advisor (2010-present); Chief Compliance Officer of DWS Distributors, Inc. (2019-2022); Vice President in Deutsche Bank’s Global Markets Legal, Risk and Capital Division (2010-2012). | |
| Bryan Richards(4) (1978) Vice President, 2016-present | Portfolio Engineering, Systematic Investments Solutions (Head), of DWS Investment Management Americas, Inc. (2018-present); Portfolio Manager in the Passive Asset Management Department at DWS (2011-present); Primary Portfolio Manager for the PowerShares DB Commodity ETFs (2011-2015). | |
| John Millette(5) (1962) Secretary, 2020-present | Legal (Associate General Counsel), DWS US Retail Legal (2003-present), of DWS Investment Management Americas, Inc.; Vice President and Secretary of DWS US registered investment companies advised by DWS Investment Management Americas, Inc. (1999-present); Chief Legal Officer, DWS Investment Management Americas, Inc. (2015- present); Director and Vice President of DWS Trust Company (2016-present); Vice President, DBX Advisors LLC (2021-present); Secretary, The European Equity Fund, Inc., The New Germany Fund, Inc. and The Central and Eastern Europe Fund, Inc. (2011- present); formerly: Secretary of Deutsche Investment Management Americas Inc. (2015-2017); and Assistant Secretary of DBX ETF Trust (2019-2020). | |
90
DBX ETF Trust
Board Members and Officers (Unaudited) (Continued)
| Name, Year of Birth, Position with the Trust and Length of Time Served(3) | Business Experience and Directorships During the Past 5 Years | |
| Caroline Pearson(5) (1962) Assistant Secretary, 2020-present | Legal (Senior Team Lead), DWS US Retail Legal, of DWS Investment Management Americas, Inc.; Chief Legal Officer of DWS US registered investment companies advised by DWS Investment Management Americas, Inc. (2010-present); Chief Legal Officer, DBX Advisors LLC (2020-present); Chief Legal Officer, The European Equity Fund, Inc., The New Germany Fund, Inc. and The Central and Eastern Europe Fund, Inc. (2012-present); formerly: Secretary, Deutsche AM Distributors, Inc. (2002-2017); and Secretary, Deutsche AM Service Company (2010-2017); and Chief Legal Officer, DBX Strategic Advisors LLC (2020-2021). | |
| Paul Antosca(5) (1957) Assistant Treasurer, 2019-present | Fund Administration Tax (Head), of DWS Investment Management Americas, Inc.; Assistant Treasurer for DWS US registered investment companies advised by DWS Investment Management Americas, Inc. (2007-present). | |
| Jeffrey Berry(5) (1959) Assistant Treasurer, 2019-present | Fund Administration (Senior Specialist), of DWS Investment Management Americas, Inc. | |
| Sheila Cadogan(5) (1966) Assistant Treasurer, 2019-present | Fund Administration Treasurer’s Office (Co-Head since 2018), of DWS Investment Management Americas, Inc.; Assistant Treasurer for DWS US registered investment companies advised by DWS Investment Management Americas, Inc. (2017-present); Director and Vice President, DWS Trust Company (2018-present); Assistant Treasurer, The European Equity Fund, Inc., The New Germany Fund, Inc. and The Central and Eastern Europe Fund, Inc. (2018-present). | |
| Christina A. Morse(6) (1964) Assistant Secretary, 2017-present | Vice President at BNY Mellon Asset Servicing (2014- present); Vice President and Counsel at Lord Abbett & Co. LLC (2013-2014). | |
| Christian Rijs(4) (1980) Anti-Money Laundering Compliance Officer, since October 21, 2021 | Senior Team Lead Anti-Financial Crime and Compliance, DWS Investment Management Americas, Inc.; AML Officer, DWS Trust Company (since November 2, 2021); AML Officer, DWS US registered investment companies advised by DWS Investment Management Americas, Inc. (since October 6, 2021); AML Officer, The European Equity Fund, Inc., The New Germany Fund, Inc. and The Central and Eastern Europe Fund, Inc. (since November 12, 2021); formerly: DWS UK & Ireland Head of Anti-Financial Crime and MLRO. |
| (1) | The length of time served is represented by the year in which the Board Member joined the Board. |
| (2) | As a result of their respective positions held with the Advisor and its affiliates, these individuals are considered “interested persons” of the Advisor within the meaning of the 1940 Act. Interested persons receive no compensation from the Funds. |
| (3) | The length of time served is represented by the year in which the officer was first elected to the Trust in such capacity. |
| (4) | Address: 875 Third Avenue, New York, New York 10022. |
| (5) | Address: 100 Summer Street, Boston, MA 02110. |
| (6) | Address: BNY Mellon Asset Servicing, 240 Greenwich Street, New York, NY 10286. |
The Funds’ Statement of Additional Information (“SAI”) includes additional information about the Funds’ Board Members. The SAI is available by calling 855-329-3837, or on the Company’s website at www.Xtrackers.com.
91
DBX ETF Trust
Proxy Voting Policies and Procedures
The Funds’ policies and procedures for voting proxies for portfolio securities and information about how each Fund voted proxies related to its portfolio securities during the most recent 12-month period ended June 30 are available on our Web site — www.Xtrackers.com (click on “Resources” and “Proxy Voting” at the top of the page) — or on the SEC’s Web site — www.sec.gov. To obtain a written copy of the Funds’ policies and procedures without charge, upon request, call us toll free at 855-329-3837.
Portfolio Holdings Information
The Funds are required to file their complete schedule of portfolio holdings with the SEC for their first and third fiscal quarters on Form N-PORT. Copies of the filings are available without charge, upon request on the SEC’s website at www.sec.gov and are available by calling the Trust at 855-329-3837.
Information about each Fund’s portfolio holdings is available daily at www.Xtrackers.com.
Discount/Premium Information
Information regarding how often shares of each Fund traded on NYSE Arca or Cboe, as applicable, at a price above (i.e., at a premium) or below (i.e., at a discount) the NAV of the Fund can be found at www.Xtrackers.com.
92
DBX ETF Trust
This report is intended for the shareholders of the DBX ETF Trust.
This report must be preceded or accompanied by a prospectus.
Investing involves risk, including the possible loss of principal. Bond investments are subject to interest rate, credit, liquidity and market risks to varying degrees. When interest rates rise, bond prices generally fall. Foreign investing involves greater and different risks than investing in U.S. companies, including currency fluctuations, less liquidity, less developed or less efficient trading markets, lack of comprehensive company information, political instability and differing auditing and legal standards. Investing in a single industry, or group of industries, country or in a limited geographic region generally are more volatile than more diversified funds. Investments in lower-quality (“junk bonds”) and non-rated securities present greater risk of loss than investments in higher-quality securities. Distressed securities are speculative and involve substantial risks beyond the risks of investing in junk bonds, such as no interest payments or repayment of principal, or the loss of the entire investment in the distressed security. Credit risk refers to the ability of an issuer to make timely payments of principal and interest. Investing in derivatives entails special risks relating to liquidity, leverage and credit that may reduce returns and/or increase volatility. HYRM is currently non-diversified and can take larger positions in fewer issues, increasing its potential risk. Performance of the Funds may diverge from that of the Underlying Index due to operating expenses, transaction costs, cash flows, use of sampling strategies or operational inefficiencies. An investment in these Funds should be considered only as a supplement to a complete investment program for those investors willing to accept the risks associated with the Funds. Please read the prospectus for more information.
War, terrorism, sanctions, economic uncertainty, trade disputes, public health crises and related geopolitical events have led, and, in the future, may lead to significant disruptions in U.S. and world economies and markets, which may lead to increased market volatility and may have significant adverse effects on the Funds and their investments.
Shares of the Funds are bought and sold at market price (not NAV) throughout the day on the NYSE Arca, Inc. or Cboe BZX Exchange, Inc., as applicable. Transactions in Fund shares may result in brokerage commissions and may generate tax consequences. There can be no assurance that an active trading market for shares of a Fund will develop or be maintained.
DBX ETF Trust Funds are distributed by ALPS Distributors, Inc. (“ALPS”) The Funds are managed by DBX Advisors LLC which is not affiliated with ALPS.
The brand DWS represents DWS Group GmbH & Co. KGaA and any of its subsidiaries such as DWS Distributors, Inc. which offers investment products or DWS Investment Management Americas, Inc. and RREEF America L.L.C. which offer advisory services.
HYUP, HYDW, SHYL and HYLB (the “Funds”) are not sponsored, endorsed, sold or promoted by Solactive. Neither Solactive nor any other party makes any representation or warranty, express or implied, to the owners of the Funds or any member of the public regarding advisability of investing in funds generally or in these Funds particularly or the ability of the Underlying Indexes to track general stock market performance. Neither Solactive nor any other party makes any express or implied warranties, and Solactive hereby expressly disclaims all warranties of merchantability or fitness for a particular purpose with respect to the Underlying Indexes or any data included therein. The prospectus contains a more detailed description of the limited relationship Solactive has with DBX Advisors LLC and any related funds.
The Index Marks, trademarks and trade names, the Index and the Intellectual Property are licensed under an Agreement for use by DBX Advisors LLC (“Licensee”) and the Xtrackers Risk Managed USD High Yield Strategy ETF (the “Fund”). Such Index Marks, trademarks, trade names, Index and Intellectual Property have been created and developed by NorthCrest Asset Management LLC without regard to Licensee or the Fund, their business, and/or any prospective investor in the Fund.
Copyright © 2022 DWS Group. All rights reserved. XtrackersTM is a trademark of DWS Investment GmbH. All other trademarks, servicemarks or registered trademarks are the property of their respective owners.
Not FDIC Insured | No Bank Guarantee | May Lose Value
DBX ETF Trust
Investment advisor DBX Advisors LLC 875 Third Avenue New York, NY 10022 | Administrator, custodian, fund accounting agent, lending agent & transfer agent The Bank of New York Mellon 240 Greenwich Street New York, NY 10286 | Distributor ALPS Distributors, Inc. 1290 Broadway Suite 1000 Denver, CO 80203 | ||
Independent registered public accounting firm Ernst & Young LLP One Manhattan West New York, NY, 10001 | Legal counsel Vedder Price P.C. 1633 Broadway New York, NY 10019 | |||
R-052201-6 (10/22) DBX005326 (10/23)
| (b) | Not applicable |
Item 2. Code of Ethics.
| (a) | The registrant, as of the end of the period covered by this report, has adopted a code of ethics that applies to the registrant’s principal executive officer, principal financial officer, principal accounting officer or controller, or persons performing similar functions, regardless of whether these individuals are employed by the registrant or a third party. |
| (b) | There have been no amendments, during the period covered by this report, to a provision of the code of ethics that applies to the registrant’s principal executive officer, principal financial officer, principal accounting officer or controller, or persons performing similar functions, regardless of whether these individuals are employed by the registrant or a third party, and that relates to any element of the code of ethics description. |
| (c) | The registrant has not granted any waivers, including an implicit waiver, from a provision of the code of ethics that applies to the registrant’s principal executive officer, principal financial officer, principal accounting officer or controller, or persons performing similar functions, regardless of whether these individuals are employed by the registrant or a third party, that relates to one or more of the items set forth in paragraph (b) of this item’s instructions. |
Item 3. Audit Committee Financial Expert.
Stephen R. Byers, George O. Elston, and J. David Officer are the designated financial experts on the Audit Committee of DBX ETF Trust. With respect to DBX ETF Trust, Stephen Byers, George O. Elston, and J. David Officer are not “interested persons” as such terms are defined by Section 2(a)(19) of the Act (15 U.S.C. 80a-2(a)(19)).
Item 4. Principal Accountant Fees and Services.
Audit Fees
| (a) | The aggregate fees billed for each of the last two fiscal years for professional services rendered by the principal accountant for the audit of the registrant’s annual financial statements or services that are normally provided by the accountant in connection with statutory and regulatory filings or engagements for those fiscal years are $376,343 for 2022 and $325,955 for 2021. |
Audit-Related Fees
| (b) | The aggregate fees billed in each of the last two fiscal years for assurance and related services by the principal accountant that are reasonably related to the performance of the audit of the registrant’s financial statements and are not reported under paragraph (a) of this Item are $0 for 2022 and $0 for 2021. |
Tax Fees
| (c) | The aggregate fees billed in each of the last two fiscal years for professional services rendered by the principal accountant for tax compliance, tax advice, and tax planning are $160,644 for 2022 and $153,258 for 2021. |
All Other Fees
| (d) | The aggregate fees billed in each of the last two fiscal years for products and services provided by the principal accountant, other than the services reported in paragraphs (a) through (c) of this Item are $0 for 2022 and $0 for 2021. |
| (e)(1) | Disclose the audit committee’s pre-approval policies and procedures described in paragraph (c)(7) of Rule 2-01 of Regulation S-X. |
In accordance with Rule 2-01(c)(7)(A), the Audit Committee pre-approves all of the audit and permissible non-audit services of the Registrant.
| (e)(2) | All of the services described in paragraphs (b) through (d) above were approved by the Audit Committee in accordance with paragraph (c) (7) (i) (c) of Rule 2-01 of Regulation S-X. |
| (f) | Not Applicable. |
| (g) | The aggregate non-audit fees billed by the registrant’s accountant for services rendered to the registrant, and rendered to the registrant’s investment adviser (not including any sub-adviser whose role is primarily portfolio management and is subcontracted with or overseen by another investment adviser), and any entity controlling, controlled by, or under common control with the adviser that provides ongoing services to the registrant for each of the last two fiscal years of the registrant was $0 for 2022 and $0 for 2021. |
| (h) | The registrant’s audit committee of the board of directors has considered whether the provision of non-audit services that were rendered to the registrant’s investment adviser (not including any sub-adviser whose role is primarily portfolio management and is subcontracted with or overseen by another investment adviser), and any entity controlling, controlled by, or under common control with the investment adviser that provides ongoing services to the registrant that were not pre-approved pursuant to paragraph (c)(7)(ii) of Rule 2-01 of Regulation S-X is compatible with maintaining the principal accountant’s independence. |
| (i) | Not applicable. |
| (j) | Not applicable. |
Pursuant to PCAOB Rule 3526, EY is required to describe in writing to the Funds’ Audit Committee, on at least an annual basis, all relationships between EY, or any of its affiliates, and the Xtrackers ETFs, or persons in financial reporting oversight roles at DWS that, as of the date of the communication, may reasonably be thought to bear on EY’s independence. Pursuant to PCAOB Rule 3526, EY has reported the matters set forth below that may reasonably be thought to bear on EY’s independence. With respect to each reported matter in the aggregate, EY advised the Audit Committee that, after careful consideration of the facts and circumstances and the applicable independence rules, it concluded that the matters do not and will not impair EY’s ability to exercise objective and impartial judgement in connection with the audits of the financial statements for the Funds and a reasonable investor with knowledge of all relevant facts and circumstances would conclude that EY has been and is capable of exercising objective and impartial judgment on all issues encompassed within EY’s audit engagements. EY also confirmed to the Audit Committee that it can continue to act as the Independent Registered Public Accounting Firm for the Funds.
| • | EY advised the Funds’ Audit Committee that various covered persons within EY and EY’s affiliates held investments in, or had other financial relationships with, entities within the Xtrackers ETFs “investment company complex” (as defined in Regulation S-X). EY informed the Audit Committee that these investments and financial relationships were inconsistent with Rule 2-01(c)(1) of Regulation S-X. EY reported that all breaches have been resolved and that none of the breaches involved any professionals who were part of the audit engagement team for the Funds ETFs or in the position to influence the audit engagement team for the Funds. |
Item 5. Audit Committee of Listed Registrants.
The Registrant is a listed issuer as defined in Rule 10A-3 under the Exchange Act and has a separately-designated standing audit committee established in accordance with Section 3(a)(58)(A) of the Exchange Act. The Registrant’s audit committee members are Stephen R. Byers, George O. Elston, and J. David Officer.
Item 6. Investments.
| (a) | Schedule of Investments in securities of unaffiliated issuers as of the close of the reporting period is included as part of the report to shareholders filed under Item 1(a) of this Form. |
| (b) | Not applicable. |
Item 7. Disclosure of Proxy Voting Policies and Procedures for Closed-End Management Investment Companies.
Not applicable.
Item 8. Portfolio Managers of Closed-End Management Investment Companies.
Not applicable.
Item 9. Purchases of Equity Securities by Closed-End Management Investment Company and Affiliated Purchasers.
Not applicable.
Item 10. Submission of Matters to a Vote of Security Holders.
There were no material changes to the procedures by which shareholders may recommend nominees to the Registrant’s Board of Trustees.
Item 11. Controls and Procedures.
| (a) | The Chief Executive and Financial Officers concluded that the Registrant’s Disclosure Controls and Procedures are effective based on the evaluation of the Disclosure Controls and Procedures as of a date within 90 days of the filing date of this report. |
| (b) | There have been no changes in the registrant’s internal control over financial reporting that occurred during the period covered by this report that has materially affected, or is reasonably likely to materially affect, the registrant’s internal controls over financial reporting. |
Item 12. Disclosure of Securities Lending Activities for Closed-End Management Investment Companies
Not applicable.
Item 13. Exhibits.
SIGNATURES
Pursuant to the requirements of the Securities Exchange Act of 1934 and the Investment Company Act of 1940, the registrant has duly caused this report to be signed on its behalf by the undersigned, thereunto duly authorized.
| (Registrant) | DBX ETF Trust | |
| By (Signature and Title) | /s/ Freddi Klassen | |
| Freddi Klassen | ||
| President and Chief Executive Officer | ||
| Date November 3, 2022 | ||
Pursuant to the requirements of the Securities Exchange Act of 1934 and the Investment Company Act of 1940, this report has been signed below by the following persons on behalf of the registrant and in the capacities and on the dates indicated.
| By (Signature and Title) | /s/ Freddi Klassen | |
| Freddi Klassen | ||
| President and Chief Executive Officer | ||
| Date November 3, 2022 | ||
| By (Signature and Title) | /s/ Diane Kenneally | |
| Diane Kenneally | ||
| Treasurer and Chief Financial Officer | ||
| Date November 3, 2022 | ||