UNITED STATES
SECURITIES AND EXCHANGE COMMISSION
Washington, D.C. 20549
FORM N-CSR
CERTIFIED SHAREHOLDER REPORT OF REGISTERED
MANAGEMENT INVESTMENT COMPANIES
Investment Company Act file number 811-22487
DBX ETF Trust
(Exact name of registrant as specified in charter)
875 Third Avenue
New York, New York 10022
(Address of principal executive offices) (Zip code)
Diane Kenneally
100 Summer Street
Boston, MA 02110
(Name and address of agent for service)
Registrant’s telephone number, including area code: (212) 454-4500
Date of fiscal year end: August 31
Date of reporting period: August 31, 2021
Form N-CSR is to be used by management investment companies to file reports with the Commission not later than 10 days after the transmission to stockholders of any report that is required to be transmitted to stockholders under Rule 30e-1 under the Investment Company Act of 1940 (17 CFR 270.30e-1). The Commission may use the information provided on Form N-CSR in its regulatory, disclosure review, inspection, and policymaking roles.
A registrant is required to disclose the information specified by Form N-CSR, and the Commission will make this information public. A registrant is not required to respond to the collection of information contained in Form N-CSR unless the Form displays a currently valid Office of Management and Budget (“OMB”) control number. Please direct comments concerning the accuracy of the information collection burden estimate and any suggestions for reducing the burden to Secretary, Securities and Exchange Commission, 450 Fifth Street, NW, Washington, DC 20549-0609. The OMB has reviewed this collection of information under the clearance requirements of 44 U.S.C. § 3507.
| Item 1. | Reports to Stockholders. |
| (a) | The Report to Shareholders is attached herewith. |

August 31, 2021
Annual Report
DBX ETF Trust
Xtrackers FTSE Developed ex US Multifactor ETF (DEEF)
Xtrackers MSCI Kokusai Equity ETF (KOKU)
Xtrackers Russell 1000 US Quality at a Reasonable Price ETF (QARP)
Xtrackers Russell US Multifactor ETF (DEUS)

DBX ETF Trust
| Page | ||||
| 1 | ||||
| 3 | ||||
Performance Summary | ||||
| 4 | ||||
| 6 | ||||
| 8 | ||||
| 10 | ||||
| 12 | ||||
Schedule of Investments | ||||
| 13 | ||||
| 27 | ||||
| 41 | ||||
| 46 | ||||
| 56 | ||||
| 57 | ||||
| 58 | ||||
| 60 | ||||
| 62 | ||||
| 71 | ||||
| 73 | ||||
| 76 | ||||
| 77 | ||||
To our Shareholders: (Unaudited)
Dear Shareholder,
We are pleased to provide this annual report for four of our equity ETFs for the period ended August 31, 2021.
The global economy staged a comeback from its post-pandemic recession, supported by accommodative fiscal and monetary policies, rapid vaccination rollouts, favorable economic data, and healthy corporate earnings results. The economic recovery was more pronounced in major economies, such as the U.S. and China, while most emerging countries continued to grapple with COVID-19, owing to slower vaccination numbers. The U.S. economy recovered strongly as unprecedented government aid and successful vaccination rollouts fueled consumption of goods and services. The Eurozone economy also posted positive growth in Q2 2021, after contracting for two consecutive quarters, driven mainly by increased household spending.
The U.S. economy sustained its robust recovery, driven by continued fiscal and monetary stimulus, and easing restrictions by many state and local governments. Markets also benefited from reduced political uncertainty after Joe Biden was elected as the new president. Stocks continued their gains into early 2021 due to positive developments surrounding the pandemic and the eventual accelerated rollout of approved coronavirus vaccines. Favorable data on unemployment rates and labor force participation as well as healthy corporate earnings results drove the surge in markets for H1 2021. On the flip side of this accelerated growth, high inflation readings and expectations of a Federal Reserve Board (Fed) tapering cautioned investors, while potential supply chain disruptions and a surge in the Delta variant of the virus also weighed on market sentiment. Although Fed officials maintained a dovish stance throughout the period, the Fed chair also acknowledged the initiation of discussions on slowing bond purchases, the first step towards eventually raising interest rates.
After a brief recession, the Eurozone economy started recovering as easing of lockdown restrictions supported economic activity. Increased household spending and healthy export numbers were major drivers of growth for the euro area. Eurozone’s third and fourth largest economies, Italy and Spain, were the major contributors to growth, while the bloc’s largest economy, Germany, grew at a rate below expectations. France, Eurozone’s second largest economy posted positive growth on the back of easing lockdown restrictions. Economic sentiment reached an all-time high in July 2021 and the composite Purchasing Managers Index1 posted its strongest numbers in over 15 years on the back of robust demand. In light of the rapid spread of the Delta variant posing a risk to the economy, the European Central Bank (ECB) decided to defer increasing interest rates until inflation is maintained below its target of 2%. Furthermore, the ECB announced its intention to purchase EUR1.85tn of bonds until March 2022 as part of its Pandemic Emergency Purchase Program.
The UK economy started to recover after contracting significantly in 2020, as a fast pace of vaccination allowed the policy makers to withdraw many of the lockdown restrictions. Healthcare sector contributed the most to the recovery followed by food and beverages services as restaurants started to open back up or increase capacity due to easing COVID-19 precautions. Elsewhere, Japan’s economic recovery remained weak, compared with other developed economies. This was mainly due to the government’s inability to contain the pandemic and the slow rollout of vaccinations, which hurt overall consumption in the economy.
The global economy is expected to continue its recovery over the coming quarters, supported by rapid rollout of vaccination drives and reopening of economies. Despite a positive outlook, the spread of the Delta variant, U.S.-China conflict, and a sudden rise in inflation pose threats to the recovery. Nonetheless, central banks across the world are likely to maintain an accommodative
1
stance even if inflation targets are exceeded for a longer period, as a high employment rate has become the primary objective.
Sincerely,
/s/ Freddi Klassen
Freddi Klassen
President and Chief Executive Officer
1 Purchasing Managers’ Index (PMI) are economic indicators derived from monthly surveys of private sector companies.
Assumptions, estimates and opinions contained in this document constitute our judgment as of the date of the document and are subject to change without notice. Any projections are based on a number of assumptions as to market conditions and there can be no guarantee that any projected results will be achieved. Past performance is not a guarantee of future results.
2
DBX ETF Trust
Xtrackers FTSE Developed ex-US Multifactor Factor ETF (DEEF)
The Xtrackers FTSE Developed ex-US Multifactor Factor ETF (DEEF) seeks investment results that correspond generally to the performance, before fees and expenses, of the FTSE Developed ex-US Comprehensive Factor Index (the DEEF Index). The DEEF index is designed to provide exposure to developed international equities (except the United States) based on five factors — value, momentum, quality, low volatility and size. For the 12-month period ended August 31, 2021, DEEF shares returned 22.69%, compared to the DEEF Index return of 23.19%.
All sectors contributed positively to the performance during the period with the greatest contributions coming from Industrials, Materials and Financials. From a geographical perspective, all contributed positively to performance during the period with the greatest contributions coming from Japan, Sweden, and the United Kingdom.
Xtrackers MSCI Kokusai Equity ETF (KOKU)
The Xtrackers MSCI Kokusai Equity ETF (KOKU) seeks investment results that correspond generally to the performance, before fees and expenses, of the MSCI Kokusai Index (the KOKU Index). The KOKU Index is a market capitalization weighted index designed to provide exposure to the large- and mid-cap equity securities in 22 of the 23 developed stock market across the world, excluding Japan. For the 12-month period ended August 31, 2021, KOKU shares returned 30.87%, compared to the KOKU Index return of 30.52%.
All sectors contributed positively to performance during the period with the greatest contributions coming from Information Technology, Financials and Health Care. From a geographical perspective, a majority of countries contributed positively to performance during the period with the greatest contributions coming from the United States, the United Kingdom, and France. New Zealand was the only negative contributor to performance.
Xtrackers Russell 1000 US Quality at a Reasonable Price ETF (QARP)
The Xtrackers Russell 1000 US Quality at a Reasonable Price ETF (QARP) seeks investment results that correspond generally to the performance, before fees and expenses, of the Russell 1000 2Qual/Val 5% Capped Factor Index (the QARP Index). The QARP Index is a multifactor index designed to capture exposure to large-cap U.S. equities that exhibit strong quality and value factor characteristics. For the 12-month period ended August 31, 2021, QARP shares returned 35.25%, compared to the QARP Index return of 35.55%.
All sectors contributed positively to performance during the period with the greatest contributions coming from Information Technology, Communication Services and Consumer Discretionary.
Xtrackers Russell US Multifactor ETF (DEUS)
The Xtrackers Russell US Multifactor ETF (DEUS) seeks investment results that correspond generally to the performance, before fees and expenses, of the Russell 1000 Comprehensive Factor Index (the DEUS Index). The DEUS index is designed to provide exposure to large-cap United States equities based on five factors — value, momentum, quality, low volatility and size. For the 12-month period ended August 31, 2021, DEUS shares returned 34.85%, compared to the DEUS Index return of 35.03%.
All sectors contributed positively to performance during the period with the greatest contributions coming from Information Technology, Industrials and Financials.
*************************
Performance data quoted represents past performance and does not guarantee future results. Investment returns and principal value of an investment will fluctuate so that an investor’s shares, when sold or redeemed, may be worth more or less than their original cost. Current performance may be lower or higher than the performance data quoted. To obtain the most recent month-end performance data visit www.Xtrackers.com. Returns assume that dividends and capital gains distributions have been reinvested. See pages 4-11 of this report for additional performance information, including performance data based on market value.
The views expressed in this report reflect those of the portfolio management team only through the end of the period of the report as stated on the cover. The management team’s views are subject to change at any time based on market and other conditions and should not be construed as a recommendation. Current and future portfolio holdings are subject to risk.
3
DBX ETF Trust
Performance Summary (Unaudited)
Xtrackers FTSE Developed ex US Multifactor ETF (DEEF)
Xtrackers FTSE Developed ex US Multifactor ETF (the “Fund”), using a “passive” or indexing investment approach, seeks investment results that correspond generally to the performance, before fees and expenses, of the FTSE Developed ex US Comprehensive Factor Index (the “Underlying Index”). The Underlying Index is designed to track the equity market performance of companies in developed countries (except the United States) selected on the investment style criteria (“factors”) of value, momentum, quality, low volatility and size. The companies eligible for the Underlying Index are derived from its starting universe, the FTSE Developed ex US Index, which is comprised of large- and mid-capitalization equity securities from developed markets (except the United States). It is not possible to invest directly into an index.
| Performance as of August 31, 2021 |
| Average Annual Total Returns | ||||||||
| Net Asset Value | Market Value | FTSE Developed ex US Comprehensive Factor Index | FTSE Developed ex US Net Tax (US RIC) Index | |||||
One Year | 22.69% | 23.17% | 23.19% | 27.73% | ||||
Five Year | 8.84% | 8.69% | 9.33% | 10.31% | ||||
Since Inception1 | 8.20% | 8.14% | 8.76% | 8.98% | ||||
| Cumulative Total Returns | ||||||||
| Net Asset Value | Market Value | FTSE Developed ex US Comprehensive Factor Index | FTSE Developed ex US Net Tax (US RIC) Index | |||||
One Year | 22.69% | 23.17% | 23.19% | 27.73% | ||||
Five Year | 52.73% | 51.68% | 56.21% | 63.36% | ||||
Since Inception1 | 57.63% | 57.16% | 62.43% | 64.31% | ||||
1 Total returns are calculated based on the commencement of operations, November 24, 2015 (“Inception”).
Past performance is no guarantee of future results. Current performance may be lower or higher than the performance data quoted. Performance data current to the most recent month-end is available at www.Xtrackers.com. Performance results assume reinvestment of all dividends and capital gain distributions and do not reflect the deduction of taxes that a shareholder would pay on fund distributions or on the sale of fund shares or redemption of fund creation units. The investment return and principal value of shares will vary with changes in market conditions. Shares may be worth more or less than their original cost when they are sold in the market or redeemed. Performance for certain funds may reflect a waiver of a portion of the unitary advisory fee. Without such waiver, performance would have been lower. The gross expense ratio of the Fund, as stated in the fee table of the prospectus dated December 18, 2020, was 0.35%, and may differ from the expense ratio disclosed in the Financial Highlights table in this report.
The Fund’s net asset value or “NAV” is calculated by dividing the value of the Fund’s total assets less total liabilities by the number of shares outstanding. The price used to calculate market return (“Market Price”) is determined by using the midpoint between the highest bid and the lowest offer on the primary stock exchange on which shares of a fund are listed for trading, as of the time that such fund’s NAV is calculated. Since shares of a fund may not have traded in the secondary market until after the fund’s inception, for the period from inception to the first day of secondary trading, the NAV of the fund is used as a proxy for the Market Price to calculate market returns. Market and NAV returns assume that dividends and capital gain distributions have been reinvested at Market Price and NAV, respectively.
An index is a statistical composite that tracks a specified financial market or sector. Unlike a fund, an index does not actually hold a portfolio of securities and therefore does not incur the expenses incurred by a fund. These expenses negatively impact fund performance. Also, market returns do not include brokerage commissions that may be payable on secondary market transactions. If brokerage commissions were included, market returns would be lower.
4
DBX ETF Trust
Performance Summary (Unaudited)
Xtrackers FTSE Developed ex US Multifactor ETF (DEEF) (Continued)
| Growth of an Assumed $10,000 Investment |
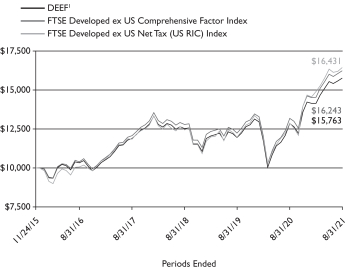
1 Based on Net Asset Value from commencement of operations, November 24, 2015.
| Sector Diversification* as of August 31, 2021 |
Industrials | 23.4% | |||
Materials | 14.4% | |||
Consumer Discretionary | 13.2% | |||
Financials | 10.2% | |||
Consumer Staples | 8.2% | |||
Real Estate | 7.3% | |||
Information Technology | 6.6% | |||
Communication Services | 5.5% | |||
Health Care | 5.4% | |||
Utilities | 4.4% | |||
Energy | 1.4% | |||
|
| |||
Total | 100.0% |
| Ten Largest Equity Holdings as of August 31, 2021 (6.1% of Net Assets) |
| Description | % of Net Assets | |||
Kesko OYJ (Finland) | 1.0% | |||
Kinnevik AB (Sweden) | 0.9% | |||
Segro PLC (United Kingdom) | 0.6% | |||
Canadian Tire Corp. Ltd. (Canada) | 0.6% | |||
Boliden AB (Sweden) | 0.6% | |||
Electrolux AB (Sweden) | 0.5% | |||
Zalando SE (Germany) | 0.5% | |||
Koninklijke Ahold Delhaize NV (Netherlands) | 0.5% | |||
Porsche Automobil Holding SE (Germany) | 0.5% | |||
Publicis Groupe SA (France) | 0.4% | |||
| Country Diversification* as of August 31, 2021 |
Japan | 30.1% | |||
United Kingdom | 8.0% | |||
Sweden | 7.9% | |||
Australia | 7.5% | |||
South Korea | 5.9% | |||
Switzerland | 5.2% | |||
Germany | 4.8% | |||
Canada | 4.8% | |||
France | 3.8% | |||
Netherlands | 3.0% | |||
Hong Kong | 2.6% | |||
Finland | 2.4% | |||
Denmark | 2.0% | |||
Singapore | 2.0% | |||
Other | 10.0% | |||
|
| |||
Total | 100.0% |
* As a percent of total investments excluding securities lending collateral and cash equivalents.
Portfolio holdings and characteristics are subject to change. For more complete details about the Fund’s investment portfolio see page 13.
5
DBX ETF Trust
Performance Summary (Unaudited)
Xtrackers MSCI Kokusai Equity ETF (KOKU)
Xtrackers MSCI Kokusai Equity ETF (the “Fund”), using a “passive” or indexing investment approach, seeks investment results that correspond generally to the performance, before fees and expenses, of the MSCI Kokusai Index (the “Underlying Index”). The MSCI Kokusai Index is also known as the MSCI World ex Japan Index. The Underlying Index is designed to track the performance of equity markets in developed markets (excluding Japan). The MSCI World Index is a free float-adjusted market capitalization index that is designed to measure developed-market equity performance throughout the world. It is not possible to invest directly into an index.
| Performance as of August 31, 2021 | ||||||||
| Average Annual Total Returns | ||||||||
| Net Asset Value | Market Value | MSCI Kokusai Index | MSCI World Index | |||||
One Year | 30.87% | 30.89% | 30.52% | 29.76% | ||||
Since Inception1 | 47.50% | 47.35% | 47.07% | 45.62% | ||||
| Cumulative Total Returns | ||||||||
| Net Asset Value | Market Value | MSCI Kokusai Index | MSCI World Index | |||||
One Year | 30.87% | 30.89% | 30.52% | 29.76% | ||||
Since Inception1 | 72.31% | 72.07% | 71.60% | 69.25% | ||||
1 Total returns are calculated based on the commencement of operations, April 8, 2020 (“Inception”).
Past performance is no guarantee of future results. Current performance may be lower or higher than the performance data quoted. Performance data current to the most recent month-end is available at www.Xtrackers.com. Performance results assume reinvestment of all dividends and capital gain distributions and do not reflect the deduction of taxes that a shareholder would pay on fund distributions or on the sale of fund shares or redemption of fund creation units. The investment return and principal value of shares will vary with changes in market conditions. Shares may be worth more or less than their original cost when they are sold in the market or redeemed. Performance for certain funds may reflect a waiver of a portion of the unitary advisory fee. Without such waiver, performance would have been lower. The gross expense ratio of the Fund, as stated in the fee table of the prospectus dated December 18, 2020, was 0.09%, and may differ from the expense ratio disclosed in the Financial Highlights table in this report.
The Fund’s net asset value or “NAV” is calculated by dividing the value of the Fund’s total assets less total liabilities by the number of shares outstanding. The price used to calculate market return (“Market Price”) is determined by using the midpoint between the highest bid and the lowest offer on the primary stock exchange on which shares of a fund are listed for trading, as of the time that such fund’s NAV is calculated. Since shares of a fund may not have traded in the secondary market until after the fund’s inception, for the period from inception to the first day of secondary trading, the NAV of the fund is used as a proxy for the Market Price to calculate market returns. Market and NAV returns assume that dividends and capital gain distributions have been reinvested at Market Price and NAV, respectively.
An index is a statistical composite that tracks a specified financial market or sector. Unlike a fund, an index does not actually hold a portfolio of securities and therefore does not incur the expenses incurred by a fund. These expenses negatively impact fund performance. Also, market returns do not include brokerage commissions that may be payable on secondary market transactions. If brokerage commissions were included, market returns would be lower.
6
DBX ETF Trust
Performance Summary (Unaudited)
Xtrackers MSCI Kokusai Equity ETF (KOKU) (Continued)
| Growth of an Assumed $10,000 Investment |
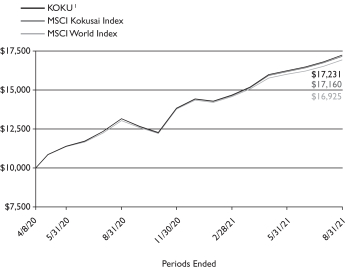
1 Based on Net Asset Value from commencement of operations, April 8, 2020.
| Sector Diversification* as of August 31, 2021 |
Information Technology | 23.5% | |||
Financials | 13.6% | |||
Health Care | 12.9% | |||
Consumer Discretionary | 11.4% | |||
Industrials | 9.5% | |||
Communication Services | 9.4% | |||
Consumer Staples | 6.9% | |||
Materials | 4.3% | |||
Energy | 2.9% | |||
Utilities | 2.9% | |||
Real Estate | 2.7% | |||
|
| |||
Total | 100.0% |
| Ten Largest Equity Holdings as of August 31, 2021 (20.2% of Net Assets) |
| Description | % of Net Assets | |||
Apple, Inc. (United States) | 4.5% | |||
Microsoft Corp. (United States) | 3.8% | |||
Alphabet, Inc. (United States) | 3.0% | |||
Amazon.com, Inc. (United States) | 2.8% | |||
Facebook, Inc. (United States) | 1.6% | |||
Tesla, Inc. (United States) | 1.1% | |||
NVIDIA Corp. (United States) | 1.0% | |||
JPMorgan Chase & Co. (United States) | 0.9% | |||
Johnson & Johnson (United States) | 0.8% | |||
UnitedHealth Group, Inc. (United States) | 0.7% | |||
| Country Diversification* as of August 31, 2021 |
United States | 70.7% | |||
United Kingdom | 4.4% | |||
Canada | 3.5% | |||
Switzerland | 3.5% | |||
France | 3.4% | |||
Germany | 2.9% | |||
Australia | 2.2% | |||
Netherlands | 2.0% | |||
Other | 7.4% | |||
|
| |||
Total | 100.0% |
* As a percent of total investments excluding securities lending collateral and cash equivalents.
Portfolio holdings and characteristics are subject to change. For more complete details about the Fund’s investment portfolio see page 27.
7
DBX ETF Trust
Performance Summary (Unaudited)
Xtrackers Russell 1000 US Quality at a Reasonable Price ETF (QARP)
Xtrackers Russell 1000 US Quality at a Reasonable Price ETF (the “Fund”), using a “passive” or indexing investment approach, seeks investment results that correspond generally to the performance, before fees and expenses, of the Russell 1000 2Qual/Val 5% Capped Factor Index (the “Underlying Index”). The Underlying Index is designed to track the equity market performance of companies in the United States selected on the investment style criteria (“factors”) of quality and value. The companies eligible for the Underlying Index are derived from its starting universe, the Russell 1000 Index, which is comprised of large-cap equity securities from issuers in the United States. It is not possible to invest directly into an index.
| Performance as of August 31, 2021 |
| Average Annual Total Returns | ||||||||
| Net Asset Value | Market Value | Russell 1000 2Qual/Val 5% Capped Factor Index | Russell 1000 Index Total Return | |||||
One Year | 35.25% | 35.27% | 35.55% | 32.25% | ||||
Since Inception1 | 18.37% | 18.34% | 18.64% | 19.54% | ||||
| Cumulative Total Returns | ||||||||
| Net Asset Value | Market Value | Russell 1000 2Qual/Val 5% Capped Factor Index | Russell 1000 Index Total Return | |||||
One Year | 35.25% | 35.27% | 35.55% | 32.25% | ||||
Since Inception1 | 77.66% | 77.62% | 79.14% | 83.84% | ||||
1 Total returns are calculated based on the commencement of operations, April 5, 2018 (“Inception”).
Past performance is no guarantee of future results. Current performance may be lower or higher than the performance data quoted. Performance data current to the most recent month-end is available at www.Xtrackers.com. Performance results assume reinvestment of all dividends and capital gain distributions and do not reflect the deduction of taxes that a shareholder would pay on fund distributions or on the sale of fund shares or redemption of fund creation units. The investment return and principal value of shares will vary with changes in market conditions. Shares may be worth more or less than their original cost when they are sold in the market or redeemed. Performance for certain funds may reflect a waiver of a portion of the unitary advisory fee. Without such waiver, performance would have been lower. The gross expense ratio of the Fund, as stated in the fee table of the prospectus dated December 18, 2020, was 0.19%, and may differ from the expense ratio disclosed in the Financial Highlights table in this report.
The Fund’s net asset value or “NAV” is calculated by dividing the value of the Fund’s total assets less total liabilities by the number of shares outstanding. The price used to calculate market return (“Market Price”) is determined by using the midpoint between the highest bid and the lowest offer on the primary stock exchange on which shares of a fund are listed for trading, as of the time that such fund’s NAV is calculated. Since shares of a fund may not have traded in the secondary market until after the fund’s inception, for the period from inception to the first day of secondary trading, the NAV of the fund is used as a proxy for the Market Price to calculate market returns. Market and NAV returns assume that dividends and capital gain distributions have been reinvested at Market Price and NAV, respectively.
An index is a statistical composite that tracks a specified financial market or sector. Unlike a fund, an index does not actually hold a portfolio of securities and therefore does not incur the expenses incurred by a fund. These expenses negatively impact fund performance. Also, market returns do not include brokerage commissions that may be payable on secondary market transactions. If brokerage commissions were included, market returns would be lower.
8
DBX ETF Trust
Performance Summary (Unaudited)
Xtrackers Russell 1000 US Quality at a Reasonable Price ETF (QARP) (Continued)
| Growth of an Assumed $10,000 Investment |
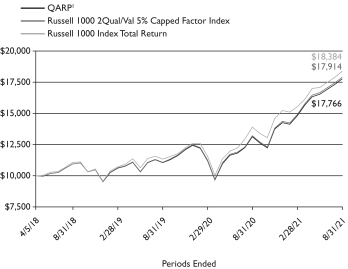
1 Based on Net Asset Value from commencement of operations, April 5, 2018.
| Sector Diversification as of August 31, 2021 |
Information Technology | 29.5% | |||
Consumer Discretionary | 14.4% | |||
Health Care | 14.2% | |||
Communication Services | 12.9% | |||
Financials | 8.1% | |||
Consumer Staples | 7.7% | |||
Industrials | 7.1% | |||
Energy | 2.4% | |||
Materials | 1.9% | |||
Real Estate | 1.1% | |||
Utilities | 0.7% | |||
|
| |||
Total | 100.0% |
| Ten Largest Equity Holdings as of August 31, 2021 (36.4% of Net Assets) |
| Description | % of Net Assets | |||
Apple, Inc. | 5.6% | |||
Alphabet, Inc. | 5.6% | |||
Microsoft Corp. | 5.1% | |||
Facebook, Inc. | 4.2% | |||
Amazon.com, Inc. | 4.0% | |||
Berkshire Hathaway, Inc. | 3.4% | |||
Intel Corp. | 2.5% | |||
Johnson & Johnson | 2.2% | |||
UnitedHealth Group, Inc. | 1.9% | |||
Cisco Systems, Inc. | 1.9% | |||
* As a percent of total investments excluding securities lending collateral and cash equivalents.
Portfolio holdings and characteristics are subject to change. For more complete details about the Fund’s investment portfolio see page 41.
9
DBX ETF Trust
Performance Summary (Unaudited)
Xtrackers Russell US Multifactor ETF (DEUS)
Xtrackers Russell US Multifactor ETF (the “Fund”), using a “passive” or indexing investment approach, seeks investment results that correspond generally to the performance, before fees and expenses, of the Russell 1000 Comprehensive Factor Index (the “Underlying Index”). The Underlying Index is designed to track the equity market performance of companies in the United States selected on the investment style criteria (“factors”) of value, momentum, quality, low volatility and size. The companies eligible for the Underlying Index are derived from its starting universe, the Russell 1000 Index, which is comprised of large-cap equity securities from issuers in the United States. It is not possible to invest directly into an index.
| Performance as of August 31, 2021 | ||||||||
| Average Annual Total Returns | ||||||||
| Net Asset Value | Market Value | Russell 1000 Comprehensive Factor Index | Russell 1000 Index Total Return | |||||
One Year | 34.85% | 34.88% | 35.03% | 32.25% | ||||
Five Year | 13.64% | 13.62% | 13.80% | 18.24% | ||||
Since Inception1 | 13.22% | 13.21% | 13.39% | 16.73% | ||||
| Cumulative Total Returns | ||||||||
| Net Asset Value | Market Value | Russell 1000 Comprehensive Factor Index | Russell 1000 Index Total Return | |||||
One Year | 34.85% | 34.88% | 35.03% | 32.25% | ||||
Five Year | 89.48% | 89.37% | 90.83% | 131.10% | ||||
Since Inception1 | 104.74% | 104.78% | 106.59% | 144.30% | ||||
1 Total returns are calculated based on the commencement of operations, November 24, 2015 (“Inception”).
Past performance is no guarantee of future results. Current performance may be lower or higher than the performance data quoted. Performance data current to the most recent month-end is available at www.Xtrackers.com. Performance results assume reinvestment of all dividends and capital gain distributions and do not reflect the deduction of taxes that a shareholder would pay on fund distributions or on the sale of fund shares or redemption of fund creation units. The investment return and principal value of shares will vary with changes in market conditions. Shares may be worth more or less than their original cost when they are sold in the market or redeemed. Performance for certain funds may reflect a waiver of a portion of investment management fees. Without such waiver, performance would have been lower. The estimated operating expense ratio as disclosed in the most recent prospectus dated December 18, 2020, was 0.17%, and may differ from the expense ratio disclosed in the Financial Highlights table in this report.
The Fund’s net asset value or “NAV” is calculated by dividing the value of the Fund’s total assets less total liabilities by the number of shares outstanding. The price used to calculate market return (“Market Price”) is determined by using the midpoint between the highest bid and the lowest offer on the primary stock exchange on which shares of a fund are listed for trading, as of the time that such fund’s NAV is calculated. Since shares of a fund may not have traded in the secondary market until after the fund’s inception, for the period from inception to the first day of secondary trading, the NAV of the fund is used as a proxy for the Market Price to calculate market returns. Market and NAV returns assume that dividends and capital gain distributions have been reinvested at Market Price and NAV, respectively.
An index is a statistical composite that tracks a specified financial market or sector. Unlike a fund, an index does not actually hold a portfolio of securities and therefore does not incur the expenses incurred by a fund. These expenses negatively impact fund performance. Also, market returns do not include brokerage commissions that may be payable on secondary market transactions. If brokerage commissions were included, market returns would be lower.
10
DBX ETF Trust
Performance Summary (Unaudited)
Xtrackers Russell US Multifactor ETF (DEUS) (Continued)
| Growth of an Assumed $10,000 Investment |
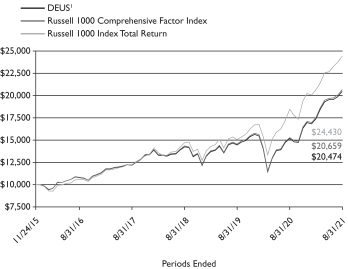
1 Based on Net Asset Value from commencement of operations, November 24, 2015.
| Sector Diversification* as of August 31, 2021 | ||
Information Technology | 19.0% | |||
Industrials | 17.3% | |||
Financials | 17.1% | |||
Consumer Discretionary | 11.4% | |||
Health Care | 9.6% | |||
Materials | 7.9% | |||
Real Estate | 5.2% | |||
Utilities | 4.4% | |||
Consumer Staples | 4.3% | |||
Communication Services | 2.9% | |||
Energy | 0.9% | |||
|
| |||
Total | 100.0% |
| Ten Largest Equity Holdings as of August 31, 2021 (6.9% of Net Assets) | ||
| Description | % of Net Assets | |||
HP, Inc. | 1.3% | |||
NetApp, Inc. | 0.7% | |||
Interpublic Group of Cos., Inc. | 0.7% | |||
Quanta Services, Inc. | 0.7% | |||
EPAM Systems, Inc. | 0.6% | |||
Analog Devices, Inc. | 0.6% | |||
Cognizant Technology Solutions Corp. | 0.6% | |||
Dell Technologies, Inc. | 0.6% | |||
Cincinnati Financial Corp. | 0.6% | |||
International Paper Co. | 0.5% | |||
* As a percent of total investments excluding securities lending collateral and cash equivalents.
Portfolio holdings and characteristics are subject to change. For more complete details about the Fund’s investment portfolio see page 46.
11
DBX ETF Trust
As a shareholder of one or more of the Funds, you incur two types of costs: (1) transaction costs, including brokerage commissions paid on purchases and sales of fund shares, and (2) ongoing costs, including management fees and other Fund expenses. In the most recent six-month period the Funds limited these expenses; had they not done so, expenses would have been higher. The expense examples below are intended to help you understand your ongoing costs (in dollars) of investing in the Funds and to compare these costs with the ongoing costs of investing in other funds.
The examples in the tables are based on an investment of $1,000 invested at the beginning of the period and held for the entire period (March 1, 2021 to August 31, 2021).
Actual expenses
The first line in the following tables provides information about actual account values and actual expenses. You may use the information in this line, together with the amount you invested, to estimate the expenses that you paid over the period. Simply divide your account value by $1,000 (for example, an $8,600 account value divided by $1,000 = 8.6), then multiply the result by the number in the first line under the heading “Expenses Paid During the Period” to estimate the expenses you paid on your account during this period.
Hypothetical example for comparison purposes
The second line in the following tables provides information about hypothetical account values and hypothetical expenses based on the Funds’ actual expense ratios and an assumed rate of return of 5% per year before expenses (which is not the Funds’ actual return). The hypothetical account values and expenses may not be used to estimate the actual ending account balance or expenses you paid for the period. You may use this information to compare the ongoing costs of investing in the Fund and other funds. To do so, compare this 5% hypothetical example with the 5% hypothetical examples that appear in the shareholder reports of the other funds.
Please note that the expenses shown in the tables are meant to highlight your ongoing costs only, and do not reflect any transactional costs. Therefore the second line in the table is useful in comparing ongoing costs only, and will not help you determine the relative total costs of owning different funds. In addition, if these transactional costs were included, your costs would have been higher.
| Beginning Account Value March 1, 2021 | Ending Account Value August 31, 2021 | Annualized Expense Ratio | Expenses Paid During the Period Per $1,000(1) | |||||||||||||
| Xtrackers FTSE Developed ex US Multifactor ETF |
| |||||||||||||||
Actual | $ | 1,000.00 | $ | 1,114.70 | 0.24 | % | $ | 1.28 | ||||||||
Hypothetical (5% return before expenses) | $ | 1,000.00 | $ | 1,024.00 | 0.24 | % | $ | 1.22 | ||||||||
| Xtrackers MSCI Kokusai Equity ETF |
| |||||||||||||||
Actual | $ | 1,000.00 | $ | 1,174.30 | 0.09 | % | $ | 0.49 | ||||||||
Hypothetical (5% return before expenses) | $ | 1,000.00 | $ | 1,024.75 | 0.09 | % | $ | 0.46 | ||||||||
| Xtrackers Russell 1000 US Quality at a Reasonable Price ETF |
| |||||||||||||||
Actual | $ | 1,000.00 | $ | 1,198.80 | 0.19 | % | $ | 1.05 | ||||||||
Hypothetical (5% return before expenses) | $ | 1,000.00 | $ | 1,024.25 | 0.19 | % | $ | 0.97 | ||||||||
| Xtrackers Russell US Multifactor ETF |
| |||||||||||||||
Actual | $ | 1,000.00 | $ | 1,177.20 | 0.17 | % | $ | 0.93 | ||||||||
Hypothetical (5% return before expenses) | $ | 1,000.00 | $ | 1,024.35 | 0.17 | % | $ | 0.87 | ||||||||
(1) Expenses are equal to each Fund’s annualized expense ratio, multiplied by the average account value over the period, multiplied by 184 (the number of days in the most recent six-month period), then divided by 365.
12
DBX ETF Trust
Schedule of Investments
Xtrackers FTSE Developed ex US Multifactor ETF
August 31, 2021
Number | Value | |||||||
| COMMON STOCKS — 98.8% | ||||||||
| Australia — 7.4% | ||||||||
Adbri Ltd. | 4,782 | $ | 11,988 | |||||
AGL Energy Ltd. | 5,291 | 24,942 | ||||||
ALS Ltd. | 4,480 | 41,779 | ||||||
Altium Ltd. | 399 | 8,719 | ||||||
Alumina Ltd. | 32,336 | 42,066 | ||||||
Ampol Ltd. | 356 | 7,171 | ||||||
Ansell Ltd. | 7,648 | 201,168 | ||||||
APA Group (a) | 5,914 | 39,678 | ||||||
Aristocrat Leisure Ltd. | 3,359 | 112,116 | ||||||
ASX Ltd. | 825 | 52,921 | ||||||
Aurizon Holdings Ltd. | 33,481 | 92,495 | ||||||
AusNet Services Ltd. | 14,542 | 20,565 | ||||||
Australia & New Zealand Banking Group Ltd. | 906 | 18,441 | ||||||
Bank of Queensland Ltd. | 2,041 | 14,111 | ||||||
Beach Energy Ltd. | 7,388 | 5,670 | ||||||
Bendigo & Adelaide Bank Ltd. | 3,423 | 25,117 | ||||||
BHP Group Ltd. | 1,650 | 55,001 | ||||||
BHP Group PLC | 4,560 | 141,674 | ||||||
BlueScope Steel Ltd. | 5,036 | 92,750 | ||||||
Boral Ltd.* | 3,301 | 14,717 | ||||||
Brambles Ltd. | 12,216 | 108,119 | ||||||
carsales.com Ltd. | 5,737 | 105,241 | ||||||
Charter Hall Group REIT | 18,519 | 241,728 | ||||||
Cleanaway Waste Management Ltd. | 12,267 | 23,758 | ||||||
Coles Group Ltd. | 2,527 | 33,391 | ||||||
Commonwealth Bank of Australia | 388 | 28,391 | ||||||
Computershare Ltd. | 17,231 | 207,789 | ||||||
Crown Resorts Ltd.* | 3,264 | 22,209 | ||||||
CSL Ltd. | 64 | 14,591 | ||||||
CSR Ltd. | 15,565 | 61,998 | ||||||
Deterra Royalties Ltd. | 8,689 | 27,624 | ||||||
Dexus REIT | 12,543 | 97,537 | ||||||
Domino’s Pizza Enterprises Ltd. | 720 | 82,479 | ||||||
Downer EDI Ltd. | 7,185 | 34,185 | ||||||
Endeavour Group Ltd.* | 845 | 4,508 | ||||||
Evolution Mining Ltd. | 4,156 | 11,876 | ||||||
Fortescue Metals Group Ltd. | 1,712 | 26,276 | ||||||
Goodman Group REIT | 16,066 | 271,589 | ||||||
Harvey Norman Holdings Ltd. | 38,487 | 151,330 | ||||||
IDP Education Ltd. | 350 | 7,372 | ||||||
IGO Ltd. | 2,318 | 16,348 | ||||||
Iluka Resources Ltd. | 20,578 | 150,394 | ||||||
Incitec Pivot Ltd. | 13,134 | 25,917 | ||||||
Insurance Australia Group Ltd. | 6,098 | 23,353 | ||||||
JB Hi-Fi Ltd. | 6,799 | 227,533 | ||||||
Macquarie Group Ltd. | 858 | 104,558 | ||||||
Magellan Financial Group Ltd. | 1,411 | 44,694 | ||||||
Medibank Pvt Ltd. | 46,906 | 121,699 | ||||||
Mineral Resources Ltd. | 3,338 | 133,957 | ||||||
Mirvac Group REIT | 38,474 | 87,730 | ||||||
National Australia Bank Ltd. | 735 | 14,896 | ||||||
Newcrest Mining Ltd. | 2,060 | 37,247 | ||||||
Oil Search Ltd. | 3,016 | 8,244 | ||||||
Orica Ltd. | 1,510 | 14,534 | ||||||
Origin Energy Ltd. | 4,887 | 15,894 | ||||||
Number | Value | |||||||
| Australia (Continued) | ||||||||
Orora Ltd. | 19,110 | $ | 47,626 | |||||
OZ Minerals Ltd. | 6,860 | 118,171 | ||||||
Perpetual Ltd. | 1,048 | 32,376 | ||||||
Platinum Asset Management Ltd. | 3,809 | 11,080 | ||||||
Qube Holdings Ltd. | 12,519 | 28,912 | ||||||
Ramsay Health Care Ltd. | 311 | 15,661 | ||||||
REA Group Ltd. | 621 | 69,667 | ||||||
Reece Ltd. | 2,864 | 43,705 | ||||||
Rio Tinto Ltd. | 2,522 | 206,549 | ||||||
Santos Ltd. | 3,068 | 13,566 | ||||||
SEEK Ltd. | 4,069 | 96,768 | ||||||
Seven Group Holdings Ltd. | 1,036 | 16,090 | ||||||
Shopping Centres Australasia Property Group REIT | 9,718 | 19,034 | ||||||
Sonic Healthcare Ltd. | 8,060 | 255,654 | ||||||
South32 Ltd. | 40,174 | 92,194 | ||||||
Star Entertainment Group Ltd.* | 1,782 | 5,314 | ||||||
Stockland REIT | 9,371 | 31,641 | ||||||
Suncorp Group Ltd. | 7,285 | 66,447 | ||||||
Tabcorp Holdings Ltd. | 8,728 | 30,555 | ||||||
Telstra Corp. Ltd. | 10,288 | 28,873 | ||||||
Transurban Group (a) | 2,471 | 25,662 | ||||||
Treasury Wine Estates Ltd. | 1,157 | 10,680 | ||||||
Washington H Soul Pattinson & Co. Ltd. (b) | 4,163 | 108,983 | ||||||
Wesfarmers Ltd. | 4,367 | 191,338 | ||||||
Westpac Banking Corp. | 1,296 | 24,456 | ||||||
Woodside Petroleum Ltd. | 806 | 11,481 | ||||||
Woolworths Group Ltd. | 845 | 25,784 | ||||||
Worley Ltd. | 645 | 4,940 | ||||||
|
| |||||||
(Cost $3,918,568) | 5,245,285 | |||||||
|
| |||||||
| Austria — 0.4% | ||||||||
ANDRITZ AG | 1,638 | 94,088 | ||||||
Raiffeisen Bank International AG | 200 | 4,802 | ||||||
Telekom Austria AG* | 3,814 | 33,857 | ||||||
Verbund AG | 349 | 38,211 | ||||||
voestalpine AG | 1,848 | 83,768 | ||||||
|
| |||||||
(Cost $161,167) | 254,726 | |||||||
|
| |||||||
| Belgium — 1.1% | ||||||||
Ackermans & van Haaren NV | 101 | 18,599 | ||||||
Ageas SA/NV | 1,302 | 65,090 | ||||||
Elia Group SA/NV | 165 | 20,724 | ||||||
Etablissements Franz Colruyt NV | 624 | 34,908 | ||||||
Groupe Bruxelles Lambert SA | 430 | 49,287 | ||||||
KBC Group NV | 106 | 8,927 | ||||||
Proximus SADP | 2,237 | 43,848 | ||||||
Sofina SA | 599 | 264,734 | ||||||
Solvay SA | 118 | 15,455 | ||||||
Telenet Group Holding NV | 806 | 30,656 | ||||||
UCB SA | 346 | 39,569 | ||||||
Umicore SA | 837 | 55,073 | ||||||
Warehouses De Pauw CVA REIT | 3,133 | 144,014 | ||||||
|
| |||||||
(Cost $594,673) | 790,884 | |||||||
|
| |||||||
| See Notes to Financial Statements. | 13 |
DBX ETF Trust
Schedule of Investments
Xtrackers FTSE Developed ex US Multifactor ETF (Continued)
August 31, 2021
Number | Value | |||||||
| Cambodia — 0.0% | ||||||||
NagaCorp Ltd. | 11,877 | $ | 9,544 | |||||
|
| |||||||
| Canada — 4.7% | ||||||||
Agnico Eagle Mines Ltd. | 659 | 37,861 | ||||||
Alimentation Couche-Tard, Inc., Class B | 2,203 | 88,877 | ||||||
Bank of Montreal | 255 | 25,337 | ||||||
Bank of Nova Scotia | 775 | 47,930 | ||||||
Barrick Gold Corp. | 1,247 | 25,026 | ||||||
BCE, Inc. | 471 | 24,526 | ||||||
Brookfield Asset Management Reinsurance Partners Ltd., Class A* | 3 | 183 | ||||||
Brookfield Asset Management, Inc., Class A | 511 | 28,384 | ||||||
Canadian Imperial Bank of Commerce | 326 | 37,444 | ||||||
Canadian National Railway Co. | 454 | 53,317 | ||||||
Canadian Natural Resources Ltd. | 626 | 20,682 | ||||||
Canadian Pacific Railway Ltd. | 1,646 | 112,920 | ||||||
Canadian Tire Corp. Ltd., Class A | 2,704 | 410,848 | ||||||
Canadian Utilities Ltd., Class A | 1,489 | 42,078 | ||||||
CGI, Inc.* | 1,501 | 133,939 | ||||||
Constellation Software, Inc. | 69 | 116,753 | ||||||
Dollarama, Inc. | 744 | 33,872 | ||||||
Enbridge, Inc. | 925 | 36,344 | ||||||
Fairfax Financial Holdings Ltd. | 301 | 133,027 | ||||||
Fortis, Inc. | 1,824 | 83,431 | ||||||
Franco-Nevada Corp. | 299 | 43,549 | ||||||
George Weston Ltd. | 780 | 83,947 | ||||||
Great-West Lifeco, Inc. | 1,157 | 35,736 | ||||||
Hydro One Ltd., 144A | 3,815 | 94,798 | ||||||
IGM Financial, Inc. | 3,082 | 112,217 | ||||||
Intact Financial Corp. | 1,195 | 162,495 | ||||||
Loblaw Cos. Ltd. | 1,235 | 86,875 | ||||||
Magna International, Inc. | 1,913 | 150,827 | ||||||
Manulife Financial Corp. | 4,325 | 84,094 | ||||||
Metro, Inc. | 1,252 | 63,677 | ||||||
National Bank of Canada | 1,311 | 103,892 | ||||||
Nutrien Ltd. | 1,347 | 81,759 | ||||||
Power Corp. of Canada | 4,230 | 145,748 | ||||||
Restaurant Brands International, Inc. | 322 | 20,655 | ||||||
Rogers Communications, Inc., Class B | 1,559 | 79,304 | ||||||
Royal Bank of Canada | 199 | 20,409 | ||||||
Saputo, Inc. | 476 | 13,369 | ||||||
Shaw Communications, Inc., Class B | 5,668 | 166,544 | ||||||
Sun Life Financial, Inc. | 2,928 | 150,519 | ||||||
TC Energy Corp. | 1,370 | 64,941 | ||||||
TELUS Corp. | 1,524 | 35,059 | ||||||
Thomson Reuters Corp. | 296 | 34,532 | ||||||
Toronto-Dominion Bank | 93 | 6,030 | ||||||
Wheaton Precious Metals Corp. | 407 | 18,314 | ||||||
|
| |||||||
(Cost $2,573,114) | 3,352,069 | |||||||
|
| |||||||
| Chile — 0.1% | ||||||||
Antofagasta PLC | 2,250 | 45,086 | ||||||
|
| |||||||
| China — 0.3% | ||||||||
Lenovo Group Ltd. | 86,143 | 95,476 | ||||||
Minth Group Ltd. | 2,487 | 10,329 | ||||||
Number | Value | |||||||
| China (Continued) | ||||||||
Tingyi Cayman Islands Holding Corp. | 11,660 | $ | 20,749 | |||||
Uni-President China Holdings Ltd. | 13,891 | 13,163 | ||||||
Want Want China Holdings Ltd. | 79,455 | 54,044 | ||||||
|
| |||||||
(Cost $172,120) | 193,761 | |||||||
|
| |||||||
| Czech Republic — 0.0% | ||||||||
Avast PLC, 144A | 704 | 5,792 | ||||||
|
| |||||||
| Denmark — 2.0% | ||||||||
A.P. Moller — Maersk A/S, Class A | 27 | 73,073 | ||||||
A.P. Moller — Maersk A/S, Class B | 25 | 70,914 | ||||||
Carlsberg A/S, Class B | 914 | 159,519 | ||||||
Chr Hansen Holding A/S | 224 | 20,665 | ||||||
Coloplast A/S, Class B | 208 | 36,021 | ||||||
Demant A/S* | 829 | 46,978 | ||||||
DSV PANALPINA A/S | 848 | 216,043 | ||||||
Genmab A/S* | 274 | 129,696 | ||||||
GN Store Nord AS | 1,661 | 124,947 | ||||||
H Lundbeck A/S | 269 | 7,944 | ||||||
Novo Nordisk A/S, Class B | 397 | 39,556 | ||||||
Novozymes A/S, Class B | 1,773 | 143,194 | ||||||
Orsted AS, 144A | 150 | 23,834 | ||||||
Pandora A/S | 337 | 40,334 | ||||||
ROCKWOOL International A/S, Class B | 145 | 76,714 | ||||||
SimCorp A/S | 800 | 109,057 | ||||||
Tryg A/S | 1,652 | 40,895 | ||||||
Vestas Wind Systems A/S | 2,106 | 85,011 | ||||||
|
| |||||||
(Cost $908,680) | 1,444,395 | |||||||
|
| |||||||
| Finland — 2.4% | ||||||||
Elisa OYJ | 929 | 59,482 | ||||||
Fortum OYJ | 4,780 | 145,127 | ||||||
Huhtamaki OYJ | 2,133 | 113,834 | ||||||
Kesko OYJ, Class B | 17,680 | 729,628 | ||||||
Kojamo OYJ | 1,283 | 31,199 | ||||||
Kone OYJ, Class B | 1,300 | 107,789 | ||||||
Neste OYJ | 399 | 24,275 | ||||||
Nokian Renkaat OYJ | 4,759 | 180,948 | ||||||
Nordea Bank Abp | 1,561 | 18,311 | ||||||
Orion OYJ, Class B | 998 | 40,680 | ||||||
Sampo OYJ, Class A | 185 | 9,552 | ||||||
Stora Enso OYJ, Class R | 2,448 | 47,898 | ||||||
UPM-Kymmene OYJ | 2,545 | 103,436 | ||||||
Wartsila OYJ Abp | 4,408 | 62,467 | ||||||
|
| |||||||
(Cost $1,153,173) | 1,674,626 | |||||||
|
| |||||||
| France — 3.8% | ||||||||
Air Liquide SA | 282 | 50,539 | ||||||
Alstom SA (b) | 429 | 18,433 | ||||||
Amundi SA, 144A | 241 | 22,802 | ||||||
Arkema SA | 633 | 83,988 | ||||||
Atos SE | 595 | 30,876 | ||||||
AXA SA | 417 | 11,706 | ||||||
BioMerieux | 236 | 28,931 | ||||||
Bollore SA | 9,639 | 57,006 | ||||||
Bouygues SA | 1,065 | 44,542 | ||||||
Bureau Veritas SA | 1,155 | 38,326 | ||||||
| See Notes to Financial Statements. | 14 |
DBX ETF Trust
Schedule of Investments
Xtrackers FTSE Developed ex US Multifactor ETF (Continued)
August 31, 2021
Number | Value | |||||||
| France (Continued) | ||||||||
Capgemini SE | 657 | $ | 147,472 | |||||
Carrefour SA | 4,205 | 83,640 | ||||||
Cie de Saint-Gobain | 1,510 | 109,426 | ||||||
Cie Generale des Etablissements Michelin SCA | 1,673 | 270,659 | ||||||
Cie Plastic Omnium SA | 237 | 7,140 | ||||||
Credit Agricole SA | 470 | 6,774 | ||||||
Danone SA | 377 | 27,534 | ||||||
Dassault Aviation SA | 12 | 13,528 | ||||||
Dassault Systemes SE | 386 | 22,010 | ||||||
Edenred | 708 | 40,116 | ||||||
Eiffage SA | 394 | 40,938 | ||||||
Electricite de France SA | 510 | 6,908 | ||||||
Engie SA | 3,180 | 45,542 | ||||||
EssilorLuxottica SA | 115 | 22,570 | ||||||
Eurazeo SE | 155 | 15,937 | ||||||
Getlink SE | 469 | 7,538 | ||||||
Hermes International | 6 | 8,814 | ||||||
Iliad SA | 154 | 33,086 | ||||||
Imerys SA | 609 | 28,181 | ||||||
Ipsen SA | 442 | 44,183 | ||||||
Kering SA | 15 | 11,934 | ||||||
Legrand SA | 1,030 | 117,842 | ||||||
L’Oreal SA | 13 | 6,082 | ||||||
Orange SA | 4,282 | 48,626 | ||||||
Orpea SA | 106 | 13,339 | ||||||
Pernod Ricard SA | 128 | 26,888 | ||||||
Publicis Groupe SA | 4,751 | 311,374 | ||||||
Remy Cointreau SA* | 141 | 27,763 | ||||||
Renault SA* | 553 | 20,530 | ||||||
Rexel SA* | 792 | 16,562 | ||||||
Rubis SCA | 415 | 16,073 | ||||||
Sanofi | 191 | 19,755 | ||||||
Sartorius Stedim Biotech | 46 | 27,889 | ||||||
Schneider Electric SE | 275 | 49,116 | ||||||
SCOR SE | 277 | 8,498 | ||||||
SEB SA | 357 | 56,133 | ||||||
Sodexo SA* | 197 | 16,283 | ||||||
Suez SA | 4,529 | 105,054 | ||||||
Technip Energies NV* | 5,999 | 78,357 | ||||||
Teleperformance | 333 | 147,173 | ||||||
Thales SA | 150 | 15,217 | ||||||
Veolia Environnement SA | 2,537 | 86,999 | ||||||
Vinci SA | 213 | 22,853 | ||||||
Vivendi SE (b) | 1,019 | 38,877 | ||||||
Wendel SE | 381 | 55,274 | ||||||
|
| |||||||
(Cost $2,065,136) | 2,713,636 | |||||||
|
| |||||||
| Germany — 4.2% | ||||||||
1&1 Drillisch AG | 317 | 10,006 | ||||||
adidas AG | 77 | 27,309 | ||||||
Allianz SE | 16 | 3,758 | ||||||
BASF SE | 656 | 50,737 | ||||||
Bayerische Motoren Werke AG | 543 | 51,516 | ||||||
Bechtle AG | 1,073 | 77,543 | ||||||
Beiersdorf AG | 207 | 25,107 | ||||||
Brenntag SE | 2,386 | 240,647 | ||||||
Number | Value | |||||||
| Germany (Continued) | ||||||||
Carl Zeiss Meditec AG | 187 | $ | 41,301 | |||||
Continental AG* | 421 | 56,565 | ||||||
Covestro AG, 144A | 929 | 60,206 | ||||||
CTS Eventim AG & Co. KGaA* | 262 | 16,893 | ||||||
Daimler AG (b) | 545 | 45,948 | ||||||
Delivery Hero SE, 144A*(b) | 32 | 4,631 | ||||||
Deutsche Boerse AG | 50 | 8,623 | ||||||
Deutsche Lufthansa AG*(b) | 742 | 7,432 | ||||||
Deutsche Post AG | 2,126 | 149,524 | ||||||
Deutsche Telekom AG | 1,085 | 23,064 | ||||||
Deutsche Wohnen SE | 3,112 | 193,082 | ||||||
E.ON SE | 2,088 | 27,551 | ||||||
Evonik Industries AG | 1,614 | 54,490 | ||||||
Fielmann AG | 131 | 10,067 | ||||||
Fraport AG Frankfurt Airport Services Worldwide* | 159 | 10,259 | ||||||
Fresenius Medical Care AG & Co. KGaA | 195 | 14,971 | ||||||
Fresenius SE & Co. KGaA | 1,630 | 84,758 | ||||||
FUCHS PETROLUB SE | 267 | 10,527 | ||||||
GEA Group AG | 1,300 | 60,018 | ||||||
Hannover Rueck SE | 118 | 21,723 | ||||||
HeidelbergCement AG | 1,135 | 98,610 | ||||||
Hella GmbH & Co. KGaA* | 178 | 12,721 | ||||||
Henkel AG & Co. KGaA | 303 | 27,255 | ||||||
HOCHTIEF AG | 227 | 18,168 | ||||||
Infineon Technologies AG | 170 | 7,237 | ||||||
KION Group AG | 186 | 19,897 | ||||||
Knorr-Bremse AG | 216 | 25,918 | ||||||
LANXESS AG | 792 | 57,722 | ||||||
LEG Immobilien SE | 1,166 | 185,815 | ||||||
Merck KGaA | 321 | 76,240 | ||||||
METRO AG | 3,036 | 40,426 | ||||||
MTU Aero Engines AG | 62 | 14,224 | ||||||
Muenchener Rueckversicherungs-Gesellschaft AG in Muenchen | 81 | 23,660 | ||||||
ProSiebenSat.1 Media SE | 2,750 | 52,475 | ||||||
Puma SE | 197 | 23,906 | ||||||
Rational AG | 14 | 16,007 | ||||||
Rheinmetall AG | 617 | 60,336 | ||||||
RWE AG | 1,530 | 59,764 | ||||||
SAP SE | 83 | 12,488 | ||||||
Scout24 AG, 144A | 117 | 9,834 | ||||||
Siemens AG | 133 | 22,112 | ||||||
Siemens Energy AG* | 533 | 15,465 | ||||||
Siemens Healthineers AG, 144A | 132 | 9,178 | ||||||
Symrise AG | 58 | 8,257 | ||||||
Telefonica Deutschland Holding AG | 11,225 | 31,497 | ||||||
Uniper SE | 1,914 | 75,983 | ||||||
United Internet AG | 1,084 | 46,847 | ||||||
Vonovia SE | 1,589 | 107,217 | ||||||
Wacker Chemie AG | 139 | 24,506 | ||||||
Zalando SE, 144A*(b) | 3,340 | 369,826 | ||||||
|
| |||||||
(Cost $2,235,178) | 2,941,847 | |||||||
|
| |||||||
| Hong Kong — 2.6% | ||||||||
AIA Group Ltd. | 2,736 | 32,699 | ||||||
ASM Pacific Technology Ltd. | 2,006 | 23,884 | ||||||
| See Notes to Financial Statements. | 15 |
DBX ETF Trust
Schedule of Investments
Xtrackers FTSE Developed ex US Multifactor ETF (Continued)
August 31, 2021
Number | Value | |||||||
| Hong Kong (Continued) | ||||||||
Bank of East Asia Ltd. | 5,446 | $ | 9,131 | |||||
BOC Hong Kong Holdings Ltd. | 5,600 | 16,993 | ||||||
Cafe de Coral Holdings Ltd. | 5,730 | 10,433 | ||||||
Cathay Pacific Airways Ltd.*(b) | 8,147 | 6,840 | ||||||
China Travel International Investment Hong Kong Ltd.* | 67,581 | 9,472 | ||||||
Chow Tai Fook Jewellery Group Ltd. | 14,569 | 29,523 | ||||||
CK Asset Holdings Ltd. | 18,378 | 119,805 | ||||||
CK Hutchison Holdings Ltd. | 12,198 | 89,007 | ||||||
CK Infrastructure Holdings Ltd. | 4,489 | 27,272 | ||||||
CLP Holdings Ltd. | 4,585 | 45,836 | ||||||
Dah Sing Banking Group Ltd. | 8,620 | 8,290 | ||||||
Dairy Farm International Holdings Ltd. | 1,965 | 6,936 | ||||||
ESR Cayman Ltd., 144A* | 851 | 2,593 | ||||||
First Pacific Co. Ltd. | 65,319 | 24,356 | ||||||
Galaxy Entertainment Group Ltd.* | 1,089 | 6,980 | ||||||
Hang Lung Group Ltd. | 4,134 | 10,355 | ||||||
Hang Lung Properties Ltd. | 8,252 | 19,820 | ||||||
Hang Seng Bank Ltd. | 931 | 16,663 | ||||||
Henderson Land Development Co. Ltd. | 6,347 | 28,726 | ||||||
Hong Kong & China Gas Co. Ltd. | 8,389 | 13,505 | ||||||
Hong Kong Exchanges & Clearing Ltd. | 1,292 | 81,533 | ||||||
Hongkong Land Holdings Ltd. | 1,544 | 6,485 | ||||||
Hutchison Port Holdings Trust, Class U | 278,600 | 57,113 | ||||||
Hutchison Telecommunications Hong Kong Holdings Ltd. | 44,567 | 7,048 | ||||||
Hysan Development Co. Ltd. | 1,068 | 3,811 | ||||||
Jardine Matheson Holdings Ltd. | 300 | 16,296 | ||||||
Johnson Electric Holdings Ltd. | 3,671 | 8,421 | ||||||
Kerry Logistics Network Ltd. (b) | 26,649 | 84,806 | ||||||
Kerry Properties Ltd. | 23,350 | 79,561 | ||||||
Lee & Man Paper Manufacturing Ltd. | 33,382 | 29,316 | ||||||
Man Wah Holdings Ltd. | 2,915 | 5,450 | ||||||
MTR Corp. Ltd. | 1,997 | 11,247 | ||||||
New World Development Co. Ltd. | 584 | 2,748 | ||||||
PCCW Ltd. | 25,980 | 13,562 | ||||||
Power Assets Holdings Ltd. | 9,103 | 57,177 | ||||||
Shangri-La Asia Ltd.* | 4,795 | 4,217 | ||||||
Shun Tak Holdings Ltd.* | 21,191 | 6,076 | ||||||
Sino Land Co. Ltd. | 15,718 | 23,161 | ||||||
SITC International Holdings Co. Ltd. | 30,920 | 134,774 | ||||||
Sun Hung Kai Properties Ltd. | 2,150 | 30,298 | ||||||
Swire Pacific Ltd., Class A | 5,845 | 39,606 | ||||||
Swire Pacific Ltd., Class B | 13,201 | 14,343 | ||||||
Swire Properties Ltd. | 6,414 | 17,360 | ||||||
Techtronic Industries Co. Ltd. | 6,421 | 142,416 | ||||||
Towngas China Co. Ltd.* | 8,277 | 6,034 | ||||||
Vinda International Holdings Ltd. (b) | 3,518 | 10,359 | ||||||
Vitasoy International Holdings Ltd. (b) | 7,014 | 18,127 | ||||||
VTech Holdings Ltd. | 5,958 | 57,877 | ||||||
WH Group Ltd., 144A | 30,540 | 26,506 | ||||||
Wharf Holdings Ltd. | 8,952 | 30,272 | ||||||
Wharf Real Estate Investment Co. Ltd. | 920 | 4,560 | ||||||
Xinyi Glass Holdings Ltd. | 46,289 | 194,623 | ||||||
Yue Yuen Industrial Holdings Ltd.* | 23,625 | 47,934 | ||||||
|
| |||||||
(Cost $1,441,871) | 1,832,236 | |||||||
|
| |||||||
Number | Value | |||||||
| Ireland — 1.0% | ||||||||
CRH PLC | 2,026 | $ | 107,823 | |||||
DCC PLC | 737 | 62,683 | ||||||
Experian PLC | 1,304 | 57,500 | ||||||
Glanbia PLC | 3,097 | 55,240 | ||||||
James Hardie Industries PLC CDI | 4,816 | 186,689 | ||||||
Kerry Group PLC, Class A | 229 | 33,574 | ||||||
Kingspan Group PLC | 606 | 69,232 | ||||||
Smurfit Kappa Group PLC | 2,643 | 151,608 | ||||||
|
| |||||||
(Cost $409,799) | 724,349 | |||||||
|
| |||||||
| Israel — 1.4% | ||||||||
Airport City Ltd.* | 1,079 | 19,776 | ||||||
Alony Hetz Properties & Investments Ltd. | 1,651 | 24,375 | ||||||
Amot Investments Ltd. | 2,850 | 20,247 | ||||||
Azrieli Group Ltd. | 270 | 25,266 | ||||||
Bank Hapoalim BM | 2,677 | 23,054 | ||||||
Bank Leumi Le-Israel BM | 6,510 | 53,848 | ||||||
Bezeq The Israeli Telecommunication Corp. Ltd.* | 25,144 | 29,902 | ||||||
Big Shopping Centers Ltd.* | 217 | 31,909 | ||||||
Elbit Systems Ltd. | 133 | 19,366 | ||||||
Electra Ltd. | 28 | 16,754 | ||||||
Enlight Renewable Energy Ltd.*(b) | 4,009 | 8,684 | ||||||
First International Bank Of Israel Ltd. | 264 | 9,551 | ||||||
Harel Insurance Investments & Financial Services Ltd. | 1,063 | 10,452 | ||||||
ICL Group Ltd. | 12,318 | 87,240 | ||||||
Israel Discount Bank Ltd., Class A* | 9,824 | 50,810 | ||||||
Maytronics Ltd. | 1,148 | 26,355 | ||||||
Melisron Ltd.*(b) | 488 | 39,451 | ||||||
Mivne Real Estate KD Ltd. | 9,755 | 33,037 | ||||||
Mizrahi Tefahot Bank Ltd. | 675 | 22,481 | ||||||
Nice Ltd.* | 735 | 214,690 | ||||||
Nova Ltd.* | 420 | 42,200 | ||||||
Paz Oil Co. Ltd.* | 410 | 41,323 | ||||||
Phoenix Holdings Ltd. | 1,222 | 13,060 | ||||||
Sapiens International Corp NV | 304 | 8,748 | ||||||
Shapir Engineering and Industry Ltd. | 660 | 5,272 | ||||||
Shufersal Ltd. | 4,694 | 38,768 | ||||||
Strauss Group Ltd. | 588 | 17,016 | ||||||
Tower Semiconductor Ltd.* | 952 | 28,057 | ||||||
|
| |||||||
(Cost $621,278) | 961,692 | |||||||
|
| |||||||
| Italy — 1.7% | ||||||||
A2A SpA | 69,528 | 152,658 | ||||||
Amplifon SpA | 1,095 | 57,236 | ||||||
Assicurazioni Generali SpA | 1,151 | 23,465 | ||||||
Atlantia SpA* | 987 | 18,496 | ||||||
Banca Mediolanum SpA | 1,036 | 10,750 | ||||||
Buzzi Unicem SpA | 1,023 | 27,147 | ||||||
Davide Campari-Milano NV | 2,977 | 41,151 | ||||||
DiaSorin SpA | 168 | 38,325 | ||||||
Enel SpA | 3,516 | 32,029 | ||||||
Ferrari NV | 83 | 17,998 | ||||||
FinecoBank Banca Fineco SpA* | 1,947 | 35,889 | ||||||
Hera SpA | 8,981 | 38,834 | ||||||
Infrastrutture Wireless Italiane SpA, 144A | 484 | 5,753 | ||||||
| See Notes to Financial Statements. | 16 |
DBX ETF Trust
Schedule of Investments
Xtrackers FTSE Developed ex US Multifactor ETF (Continued)
August 31, 2021
Number | Value | |||||||
| Italy (Continued) | ||||||||
Intesa Sanpaolo SpA | 2,584 | $ | 7,313 | |||||
Italgas SpA | 8,403 | 55,687 | ||||||
Leonardo SpA* | 833 | 6,783 | ||||||
Mediobanca Banca di Credito Finanziario SpA* | 865 | 10,190 | ||||||
Moncler SpA | 1,507 | 96,418 | ||||||
Pirelli & C SpA, 144A | 5,146 | 30,823 | ||||||
Poste Italiane SpA, 144A | 1,205 | 16,337 | ||||||
Prysmian SpA | 6,469 | 243,370 | ||||||
Recordati Industria Chimica e Farmaceutica SpA | 616 | 40,401 | ||||||
Snam SpA | 11,162 | 65,934 | ||||||
Telecom Italia SpA | 59,700 | 27,012 | ||||||
Telecom Italia SpA-RSP | 45,019 | 21,730 | ||||||
Terna - Rete Elettrica Nazionale | 6,436 | 50,872 | ||||||
UnipolSai Assicurazioni SpA | 2,299 | 6,611 | ||||||
|
| |||||||
(Cost $923,522) | 1,179,212 | |||||||
|
| |||||||
| Japan — 29.9% | ||||||||
ABC-Mart, Inc. | 363 | 19,462 | ||||||
Acom Co. Ltd. | 1,500 | 5,803 | ||||||
Activia Properties, Inc. REIT | 10 | 42,008 | ||||||
Advance Residence Investment Corp. REIT | 12 | 40,907 | ||||||
Advantest Corp. | 200 | 17,331 | ||||||
Aeon Co. Ltd. (b) | 2,849 | 75,711 | ||||||
Aeon Mall Co. Ltd. | 2,500 | 38,185 | ||||||
AGC, Inc. | 3,300 | 159,803 | ||||||
Aica Kogyo Co. Ltd. | 914 | 30,700 | ||||||
Ain Holdings, Inc. | 400 | 27,053 | ||||||
Air Water, Inc. | 2,000 | 32,296 | ||||||
Aisin Corp. | 2,693 | 103,077 | ||||||
Ajinomoto Co., Inc. | 2,600 | 76,774 | ||||||
Alfresa Holdings Corp. | 1,870 | 29,635 | ||||||
Alps Alpine Co. Ltd. | 1,500 | 15,756 | ||||||
Amada Co. Ltd. | 7,643 | 77,640 | ||||||
Amano Corp. | 1,100 | 27,976 | ||||||
ANA Holdings, Inc.* | 243 | 5,763 | ||||||
Anritsu Corp. (b) | 900 | 15,647 | ||||||
Ariake Japan Co. Ltd. | 112 | 6,351 | ||||||
As One Corp. | 200 | 29,765 | ||||||
Asahi Group Holdings Ltd. | 192 | 8,938 | ||||||
Asahi Intecc Co. Ltd. | 216 | 6,547 | ||||||
Asahi Kasei Corp. | 9,919 | 102,567 | ||||||
ASKUL Corp. | 618 | 9,698 | ||||||
Astellas Pharma, Inc. | 1,483 | 25,068 | ||||||
Azbil Corp. | 4,013 | 174,423 | ||||||
Bandai Namco Holdings, Inc. | 1,500 | 104,328 | ||||||
Bank of Kyoto Ltd. | 200 | 8,866 | ||||||
Benesse Holdings, Inc. | 700 | 15,152 | ||||||
Bic Camera, Inc. | 3,100 | 30,221 | ||||||
Bridgestone Corp. | 1,624 | 74,858 | ||||||
Brother Industries Ltd. | 2,042 | 41,970 | ||||||
Calbee, Inc. | 1,280 | 31,761 | ||||||
Canon Marketing Japan, Inc. | 700 | 16,012 | ||||||
Canon, Inc. | 1,922 | 45,688 | ||||||
Capcom Co. Ltd. | 1,308 | 36,552 | ||||||
Number | Value | |||||||
| Japan (Continued) | ||||||||
Casio Computer Co. Ltd. | 1,398 | $ | 21,620 | |||||
Central Japan Railway Co. | 156 | 22,897 | ||||||
Chubu Electric Power Co., Inc. | 4,031 | 48,764 | ||||||
Chugai Pharmaceutical Co. Ltd. | 300 | 11,764 | ||||||
Chugoku Electric Power Co., Inc. | 3,083 | 28,793 | ||||||
COMSYS Holdings Corp. | 4,534 | 122,079 | ||||||
Concordia Financial Group Ltd. | 2,600 | 10,106 | ||||||
Cosmo Energy Holdings Co. Ltd. | 600 | 11,950 | ||||||
Cosmos Pharmaceutical Corp. | 390 | 69,153 | ||||||
Credit Saison Co. Ltd. | 500 | 5,698 | ||||||
CyberAgent, Inc. | 700 | 12,877 | ||||||
Dai Nippon Printing Co. Ltd. | 4,907 | 116,846 | ||||||
Daicel Corp. | 3,927 | 31,670 | ||||||
Daido Steel Co. Ltd. | 755 | 34,499 | ||||||
Daifuku Co. Ltd. | 226 | 19,996 | ||||||
Dai-ichi Life Holdings, Inc. | 1,000 | 19,748 | ||||||
Daiichi Sankyo Co. Ltd. | 500 | 11,899 | ||||||
Daiichikosho Co. Ltd. | 1,416 | 47,948 | ||||||
Daikin Industries Ltd. | 284 | 70,845 | ||||||
Daio Paper Corp. | 2,600 | 48,800 | ||||||
Daito Trust Construction Co. Ltd. | 2,085 | 229,263 | ||||||
Daiwa House Industry Co. Ltd. | 3,602 | 110,034 | ||||||
Daiwa House REIT Investment Corp. REIT (b) | 10 | 29,629 | ||||||
Daiwa Office Investment Corp. REIT | 2 | 14,418 | ||||||
Daiwa Securities Group, Inc. | 2,845 | 16,121 | ||||||
Denka Co. Ltd. | 2,400 | 84,325 | ||||||
Denso Corp. | 1,544 | 108,358 | ||||||
DIC Corp. | 1,500 | 43,214 | ||||||
Disco Corp. | 111 | 32,383 | ||||||
Dowa Holdings Co. Ltd. | 1,500 | 65,948 | ||||||
East Japan Railway Co. | 347 | 23,471 | ||||||
Ebara Corp. | 4,300 | 214,491 | ||||||
Eisai Co. Ltd. | 300 | 24,812 | ||||||
Elecom Co. Ltd. | 600 | 9,732 | ||||||
Electric Power Development Co. Ltd. | 1,776 | 26,577 | ||||||
ENEOS Holdings, Inc. | 30,720 | 119,150 | ||||||
Ezaki Glico Co. Ltd. | 400 | 15,147 | ||||||
Fancl Corp. | 400 | 13,563 | ||||||
FANUC Corp. | 196 | 42,800 | ||||||
Food & Life Cos. Ltd. | 184 | 7,922 | ||||||
FP Corp. | 400 | 15,347 | ||||||
Fuji Electric Co. Ltd. | 1,488 | 64,540 | ||||||
Fuji Media Holdings, Inc. | 800 | 8,331 | ||||||
Fuji Oil Holdings, Inc. | 1,800 | 40,715 | ||||||
FUJIFILM Holdings Corp. | 751 | 61,989 | ||||||
Fujitsu General Ltd. | 1,300 | 32,553 | ||||||
Fujitsu Ltd. | 842 | 155,585 | ||||||
Fukuoka Financial Group, Inc. | 1,000 | 18,505 | ||||||
Fukuyama Transporting Co. Ltd. | 500 | 21,072 | ||||||
Furukawa Electric Co. Ltd. | 600 | 12,922 | ||||||
Fuyo General Lease Co. Ltd. | 200 | 13,836 | ||||||
GLP J REIT | 27 | 49,080 | ||||||
GMO Payment Gateway, Inc. | 100 | 13,171 | ||||||
GS Yuasa Corp. | 2,938 | 69,024 | ||||||
GungHo Online Entertainment, Inc. | 500 | 9,753 | ||||||
Gunma Bank Ltd. | 200 | 646 | ||||||
| See Notes to Financial Statements. | 17 |
DBX ETF Trust
Schedule of Investments
Xtrackers FTSE Developed ex US Multifactor ETF (Continued)
August 31, 2021
Number | Value | |||||||
| Japan (Continued) | ||||||||
Hakuhodo DY Holdings, Inc. | 7,869 | $ | 123,987 | |||||
Hamamatsu Photonics KK | 1,050 | 61,360 | ||||||
Hankyu Hanshin Holdings, Inc. | 867 | 26,004 | ||||||
Haseko Corp. | 1,497 | 20,767 | ||||||
Hikari Tsushin, Inc. | 100 | 17,540 | ||||||
Hino Motors Ltd. | 5,259 | 45,620 | ||||||
Hirose Electric Co. Ltd. | 440 | 73,413 | ||||||
Hisamitsu Pharmaceutical Co., Inc. (b) | 640 | 25,691 | ||||||
Hitachi Construction Machinery Co. Ltd. | 400 | 11,487 | ||||||
Hitachi Ltd. | 1,546 | 85,631 | ||||||
Hitachi Metals Ltd.* | 1,800 | 34,817 | ||||||
Hitachi Transport System Ltd. | 280 | 11,737 | ||||||
Hokuriku Electric Power Co. | 2,563 | 13,881 | ||||||
Honda Motor Co. Ltd. | 1,945 | 59,168 | ||||||
Horiba Ltd. | 500 | 35,818 | ||||||
Hoshizaki Corp. | 213 | 20,028 | ||||||
House Foods Group, Inc. | 1,357 | 43,603 | ||||||
Hoya Corp. | 500 | 80,921 | ||||||
Hulic Co. Ltd. | 4,848 | 56,926 | ||||||
Ibiden Co. Ltd. | 300 | 16,221 | ||||||
Idemitsu Kosan Co. Ltd. | 225 | 5,403 | ||||||
IHI Corp.* | 300 | 6,679 | ||||||
Iida Group Holdings Co. Ltd. | 1,800 | 45,811 | ||||||
Industrial & Infrastructure Fund Investment Corp. REIT | 17 | 34,229 | ||||||
Inpex Corp. | 1,499 | 10,343 | ||||||
Isetan Mitsukoshi Holdings Ltd. | 900 | 6,046 | ||||||
Isuzu Motors Ltd. | 7,100 | 89,962 | ||||||
Ito En Ltd. | 400 | 25,341 | ||||||
ITOCHU Corp. | 3,236 | 97,528 | ||||||
Itochu Techno-Solutions Corp. | 800 | 24,795 | ||||||
Itoham Yonekyu Holdings, Inc. | 4,000 | 27,053 | ||||||
Iwatani Corp. | 3,300 | 182,632 | ||||||
Iyo Bank Ltd. | 1,500 | 8,042 | ||||||
Izumi Co. Ltd. | 1,700 | 55,475 | ||||||
J. Front Retailing Co. Ltd. | 1,465 | 12,682 | ||||||
Japan Airlines Co. Ltd.* | 679 | 14,469 | ||||||
Japan Exchange Group, Inc. | 400 | 9,536 | ||||||
Japan Logistics Fund, Inc. REIT | 32 | 102,822 | ||||||
Japan Metropolitan Fund Invest REIT | 45 | 43,788 | ||||||
Japan Post Holdings Co. Ltd.* | 1,100 | 9,455 | ||||||
Japan Post Insurance Co. Ltd. | 700 | 12,712 | ||||||
Japan Prime Realty Investment Corp. REIT | 9 | 33,711 | ||||||
Japan Real Estate Investment Corp. REIT | 5 | 30,994 | ||||||
Japan Tobacco, Inc. | 3,464 | 67,240 | ||||||
JFE Holdings, Inc. | 3,500 | 56,868 | ||||||
JGC Holdings Corp. | 4,800 | 40,371 | ||||||
JSR Corp. | 4,532 | 157,378 | ||||||
JTEKT Corp. | 1,500 | 13,585 | ||||||
Justsystems Corp. | 107 | 6,331 | ||||||
Kagome Co. Ltd. | 865 | 23,038 | ||||||
Kajima Corp. | 7,900 | 102,327 | ||||||
Kakaku.com, Inc. | 786 | 24,540 | ||||||
Kaken Pharmaceutical Co. Ltd. | 547 | 24,746 | ||||||
Kamigumi Co. Ltd. | 3,732 | 80,782 | ||||||
Kandenko Co. Ltd. | 4,992 | 42,986 | ||||||
Number | Value | |||||||
| Japan (Continued) | ||||||||
Kaneka Corp. | 2,722 | $ | 112,859 | |||||
Kansai Electric Power Co., Inc. | 7,211 | 72,530 | ||||||
Kansai Paint Co. Ltd. | 1,288 | 33,425 | ||||||
Kao Corp. | 353 | 21,355 | ||||||
Kawasaki Heavy Industries Ltd.* | 543 | 11,576 | ||||||
KDDI Corp. | 1,329 | 40,768 | ||||||
Keihan Holdings Co. Ltd. | 310 | 8,917 | ||||||
Keikyu Corp. | 181 | 2,211 | ||||||
Keio Corp. | 419 | 22,579 | ||||||
Keisei Electric Railway Co. Ltd. | 600 | 18,487 | ||||||
Kenedix Office Investment Corp. REIT | 4 | 29,419 | ||||||
Kewpie Corp. | 1,159 | 28,590 | ||||||
Keyence Corp. | 28 | 16,855 | ||||||
Kikkoman Corp. | 1,273 | 95,713 | ||||||
Kinden Corp. | 4,000 | 67,832 | ||||||
Kintetsu Group Holdings Co. Ltd.* | 200 | 6,845 | ||||||
Kirin Holdings Co. Ltd. | 1,012 | 18,368 | ||||||
Kobayashi Pharmaceutical Co. Ltd. | 126 | 9,875 | ||||||
Koei Tecmo Holdings Co. Ltd. | 962 | 41,200 | ||||||
Koito Manufacturing Co. Ltd. | 1,800 | 110,268 | ||||||
Kokuyo Co. Ltd. | 1,300 | 22,779 | ||||||
Komatsu Ltd. | 3,070 | 74,403 | ||||||
Konami Holdings Corp. | 1,182 | 75,099 | ||||||
Kose Corp. | 200 | 24,213 | ||||||
K’s Holdings Corp. | 7,211 | 79,094 | ||||||
Kubota Corp. | 2,700 | 55,900 | ||||||
Kuraray Co. Ltd. | 3,781 | 35,621 | ||||||
Kurita Water Industries Ltd. | 2,228 | 104,647 | ||||||
Kyocera Corp. | 672 | 41,876 | ||||||
Kyoritsu Maintenance Co. Ltd. | 100 | 3,309 | ||||||
Kyowa Exeo Corp. | 2,472 | 62,149 | ||||||
Kyowa Kirin Co. Ltd. | 1,600 | 52,358 | ||||||
Kyudenko Corp. | 1,499 | 53,965 | ||||||
Kyushu Electric Power Co., Inc. | 8,264 | 63,187 | ||||||
Kyushu Railway Co. | 824 | 18,684 | ||||||
LaSalle Logiport REIT | 23 | 40,197 | ||||||
Lawson, Inc. (b) | 400 | 19,297 | ||||||
Lintec Corp. | 1,513 | 34,334 | ||||||
Lion Corp. | 1,406 | 23,971 | ||||||
Lixil Corp. | 2,511 | 73,255 | ||||||
Mabuchi Motor Co. Ltd. | 800 | 28,036 | ||||||
Maeda Corp. | 700 | 5,167 | ||||||
Maeda Road Construction Co. Ltd. | 300 | 5,044 | ||||||
Makita Corp. | 2,518 | 144,855 | ||||||
Marubeni Corp. | 10,991 | 87,600 | ||||||
Marui Group Co. Ltd. | 379 | 6,769 | ||||||
Maruichi Steel Tube Ltd. | 750 | 18,473 | ||||||
Matsumotokiyoshi Holdings Co. Ltd. | 697 | 32,357 | ||||||
Mazda Motor Corp.* | 3,600 | 31,294 | ||||||
Mebuki Financial Group, Inc. | 4,300 | 9,629 | ||||||
Medipal Holdings Corp. | 3,051 | 58,404 | ||||||
Megmilk Snow Brand Co. Ltd. | 400 | 8,392 | ||||||
MEIJI Holdings Co. Ltd. | 1,369 | 84,238 | ||||||
MINEBEA MITSUMI, Inc. | 1,371 | 35,354 | ||||||
MISUMI Group, Inc. | 2,240 | 89,001 | ||||||
Mitsubishi Chemical Holdings Corp. | 18,202 | 160,017 | ||||||
Mitsubishi Corp. | 1,736 | 52,320 | ||||||
| See Notes to Financial Statements. | 18 |
DBX ETF Trust
Schedule of Investments
Xtrackers FTSE Developed ex US Multifactor ETF (Continued)
August 31, 2021
Number | Value | |||||||
| Japan (Continued) | ||||||||
Mitsubishi Electric Corp. | 8,974 | $ | 122,978 | |||||
Mitsubishi Estate Co. Ltd. | 3,100 | 48,563 | ||||||
Mitsubishi Gas Chemical Co., Inc. | 8,367 | 158,033 | ||||||
Mitsubishi HC Capital, Inc. | 2,450 | 13,135 | ||||||
Mitsubishi Heavy Industries Ltd. | 3,913 | 103,613 | ||||||
Mitsubishi Logistics Corp. | 1,300 | 37,097 | ||||||
Mitsubishi Materials Corp. | 700 | 14,375 | ||||||
Mitsubishi Shokuhin Co. Ltd. | 500 | 13,112 | ||||||
Mitsui & Co. Ltd. | 6,325 | 139,845 | ||||||
Mitsui Chemicals, Inc. | 3,800 | 131,440 | ||||||
Mitsui Fudosan Co. Ltd. | 2,000 | 45,949 | ||||||
Mitsui Fudosan Logistics Park, Inc. REIT | 3 | 17,804 | ||||||
Mitsui OSK Lines Ltd. (b) | 1,500 | 116,057 | ||||||
Miura Co. Ltd. | 1,157 | 52,026 | ||||||
Mizuho Financial Group, Inc. | 1,580 | 22,191 | ||||||
Mochida Pharmaceutical Co. Ltd. | 261 | 8,707 | ||||||
MonotaRO Co. Ltd. | 600 | 13,288 | ||||||
Mori Hills REIT Investment Corp. REIT | 13 | 18,874 | ||||||
Morinaga & Co. Ltd. | 500 | 17,568 | ||||||
Morinaga Milk Industry Co. Ltd. | 700 | 44,220 | ||||||
MS&AD Insurance Group Holdings, Inc. | 900 | 29,123 | ||||||
Murata Manufacturing Co. Ltd. | 417 | 34,613 | ||||||
Nabtesco Corp. | 1,300 | 51,593 | ||||||
Nagase & Co. Ltd. | 3,565 | 58,897 | ||||||
Nagoya Railroad Co. Ltd.* | 776 | 13,668 | ||||||
Nankai Electric Railway Co. Ltd. | 1,018 | 21,896 | ||||||
NEC Corp. | 1,600 | 84,180 | ||||||
NEC Networks & System Integration Corp. | 1,700 | 32,480 | ||||||
NET One Systems Co. Ltd. | 100 | 3,177 | ||||||
Nexon Co. Ltd. | 600 | 10,978 | ||||||
NGK Insulators Ltd. | 2,177 | 36,164 | ||||||
NGK Spark Plug Co. Ltd. | 1,802 | 27,753 | ||||||
NH Foods Ltd. | 2,300 | 89,291 | ||||||
NHK Spring Co. Ltd. | 4,100 | 29,483 | ||||||
Nichirei Corp. | 1,200 | 30,628 | ||||||
Nidec Corp. | 72 | 8,271 | ||||||
Nifco, Inc. | 2,661 | 84,171 | ||||||
Nihon Kohden Corp. | 300 | 10,090 | ||||||
Nihon M&A Center, Inc. | 1,700 | 50,910 | ||||||
Nihon Unisys Ltd. | 1,300 | 35,441 | ||||||
Nikon Corp. | 600 | 6,330 | ||||||
Nippo Corp. | 1,761 | 51,855 | ||||||
Nippon Accommodations Fund, Inc. REIT | 2 | 12,033 | ||||||
Nippon Building Fund, Inc. REIT | 3 | 19,525 | ||||||
Nippon Electric Glass Co. Ltd. | 2,500 | 53,477 | ||||||
Nippon Express Co. Ltd. | 1,036 | 70,632 | ||||||
Nippon Kayaku Co. Ltd. | 7,100 | 78,717 | ||||||
Nippon Paper Industries Co. Ltd. | 1,230 | 13,704 | ||||||
Nippon Prologis REIT, Inc. REIT | 12 | 43,310 | ||||||
Nippon Sanso Holdings Corp. | 1,559 | 37,889 | ||||||
Nippon Shinyaku Co. Ltd. | 100 | 8,129 | ||||||
Nippon Shokubai Co. Ltd. | 700 | 37,147 | ||||||
Nippon Steel Corp. | 6,713 | 137,364 | ||||||
Nippon Telegraph & Telephone Corp. | 691 | 18,467 | ||||||
Nippon Television Holdings, Inc. | 700 | 7,449 | ||||||
Nippon Yusen KK | 3,000 | 242,217 | ||||||
Number | Value | |||||||
| Japan (Continued) | ||||||||
Nishi-Nippon Railroad Co. Ltd. | 400 | $ | 9,900 | |||||
Nissan Chemical Corp. | 2,483 | 139,451 | ||||||
Nissan Motor Co. Ltd.* | 8,300 | 43,706 | ||||||
Nisshin Seifun Group, Inc. | 2,278 | 37,407 | ||||||
Nissin Foods Holdings Co. Ltd. | 484 | 37,712 | ||||||
Nitori Holdings Co. Ltd. | 432 | 80,926 | ||||||
Nitto Denko Corp. | 2,643 | 201,124 | ||||||
Noevir Holdings Co. Ltd. | 200 | 10,632 | ||||||
NOF Corp. | 2,207 | 122,343 | ||||||
NOK Corp. | 2,500 | 30,675 | ||||||
Nomura Holdings, Inc. | 3,400 | 16,514 | ||||||
Nomura Real Estate Holdings, Inc. | 2,286 | 58,575 | ||||||
Nomura Real Estate Master Fund, Inc. REIT | 25 | 38,617 | ||||||
Nomura Research Institute Ltd. | 1,530 | 57,587 | ||||||
NS Solutions Corp. | 900 | 30,557 | ||||||
NSK Ltd. | 3,356 | 23,583 | ||||||
NTT Data Corp. | 1,317 | 23,748 | ||||||
Obayashi Corp. | 17,562 | 144,831 | ||||||
OBIC Business Consultants Co. Ltd. | 200 | 9,394 | ||||||
Obic Co. Ltd. | 200 | 38,139 | ||||||
Odakyu Electric Railway Co. Ltd. | 909 | 21,215 | ||||||
Oji Holdings Corp. | 14,488 | 75,961 | ||||||
OKUMA Corp. | 400 | 19,188 | ||||||
Olympus Corp. | 1,156 | 24,323 | ||||||
Omron Corp. | 1,000 | 94,484 | ||||||
Ono Pharmaceutical Co. Ltd. | 2,377 | 57,207 | ||||||
Open House Co. Ltd. | 1,145 | 55,864 | ||||||
Oracle Corp. | 200 | 16,457 | ||||||
Oriental Land Co. Ltd. | 100 | 15,165 | ||||||
ORIX Corp. | 9,436 | 176,206 | ||||||
Orix JREIT, Inc. REIT | 29 | 51,765 | ||||||
Osaka Gas Co. Ltd. | 5,829 | 109,460 | ||||||
OSG Corp. | 900 | 16,196 | ||||||
Otsuka Corp. | 508 | 26,357 | ||||||
Otsuka Holdings Co. Ltd. | 1,534 | 65,362 | ||||||
PALTAC Corp. | 382 | 16,656 | ||||||
Pan Pacific International Holdings Corp. | 3,499 | 66,789 | ||||||
Panasonic Corp. | 8,572 | 102,371 | ||||||
Penta-Ocean Construction Co. Ltd. | 5,520 | 35,122 | ||||||
Persol Holdings Co. Ltd. | 3,029 | 70,914 | ||||||
Pigeon Corp. | 500 | 14,496 | ||||||
Pola Orbis Holdings, Inc. | 200 | 4,376 | ||||||
Rakuten Group, Inc. | 3,815 | 40,004 | ||||||
Recruit Holdings Co. Ltd. | 626 | 37,038 | ||||||
Relo Group, Inc. | 200 | 4,489 | ||||||
Rengo Co. Ltd. | 3,212 | 26,226 | ||||||
Resona Holdings, Inc. | 6,400 | 24,800 | ||||||
Resorttrust, Inc. | 600 | 10,393 | ||||||
Ricoh Co. Ltd. | 2,700 | 27,526 | ||||||
Rinnai Corp. | 1,017 | 109,513 | ||||||
Rohm Co. Ltd. | 514 | 49,688 | ||||||
Rohto Pharmaceutical Co. Ltd. | 411 | 12,944 | ||||||
Sankyo Co. Ltd. | 809 | 20,634 | ||||||
Sankyu, Inc. | 1,000 | 46,696 | ||||||
Santen Pharmaceutical Co. Ltd. | 1,000 | 14,928 | ||||||
Sanwa Holdings Corp. | 12,300 | 163,686 | ||||||
| See Notes to Financial Statements. | 19 |
DBX ETF Trust
Schedule of Investments
Xtrackers FTSE Developed ex US Multifactor ETF (Continued)
August 31, 2021
Number | Value | |||||||
| Japan (Continued) | ||||||||
Sapporo Holdings Ltd. | 600 | $ | 12,955 | |||||
SBI Holdings, Inc. | 300 | 7,291 | ||||||
SCSK Corp. | 700 | 44,284 | ||||||
Secom Co. Ltd. | 1,135 | 86,215 | ||||||
Sega Sammy Holdings, Inc. | 3,800 | 51,400 | ||||||
Seibu Holdings, Inc.* | 1,200 | 14,484 | ||||||
Seiko Epson Corp. | 1,651 | 30,808 | ||||||
Seino Holdings Co. Ltd. | 6,800 | 83,994 | ||||||
Sekisui Chemical Co. Ltd. | 11,301 | 193,802 | ||||||
Sekisui House Ltd. | 7,236 | 144,443 | ||||||
Sekisui House Reit, Inc. REIT | 34 | 29,092 | ||||||
Seven & i Holdings Co. Ltd. | 2,200 | 96,423 | ||||||
Seven Bank Ltd. | 4,800 | 10,967 | ||||||
SG Holdings Co. Ltd. | 1,944 | 52,944 | ||||||
Shikoku Electric Power Co., Inc. | 2,000 | 14,036 | ||||||
Shimadzu Corp. | 2,296 | 103,138 | ||||||
Shimamura Co. Ltd. | 600 | 52,976 | ||||||
Shimano, Inc. | 566 | 166,410 | ||||||
Shimizu Corp. | 11,346 | 81,589 | ||||||
Shin-Etsu Chemical Co. Ltd. | 500 | 82,855 | ||||||
Shionogi & Co. Ltd. | 1,500 | 94,921 | ||||||
Ship Healthcare Holdings, Inc. | 1,038 | 26,437 | ||||||
Shizuoka Bank Ltd. | 1,500 | 11,769 | ||||||
SHO-BOND Holdings Co. Ltd. | 549 | 24,711 | ||||||
Shochiku Co. Ltd.* | 18 | 1,938 | ||||||
SKY Perfect JSAT Holdings, Inc. | 2,400 | 8,913 | ||||||
SMC Corp. | 67 | 43,002 | ||||||
SMS Co. Ltd. | 300 | 10,636 | ||||||
SoftBank Corp. | 1,105 | 14,821 | ||||||
Sohgo Security Services Co. Ltd. | 487 | 22,098 | ||||||
Sojitz Corp. | 14,900 | 43,808 | ||||||
Sompo Holdings, Inc. | 1,600 | 70,315 | ||||||
Sony Group Corp. | 508 | 52,529 | ||||||
Sotetsu Holdings, Inc. | 300 | 6,035 | ||||||
Square Enix Holdings Co. Ltd. | 400 | 23,339 | ||||||
Stanley Electric Co. Ltd. | 4,331 | 108,334 | ||||||
Subaru Corp. | 2,864 | 53,091 | ||||||
Sugi Holdings Co. Ltd. | 935 | 72,342 | ||||||
Sumitomo Bakelite Co. Ltd. | 1,300 | 56,208 | ||||||
Sumitomo Chemical Co. Ltd. | 11,000 | 55,871 | ||||||
Sumitomo Corp. | 7,132 | 100,917 | ||||||
Sumitomo Electric Industries Ltd. | 12,926 | 173,017 | ||||||
Sumitomo Forestry Co. Ltd. | 1,383 | 27,091 | ||||||
Sumitomo Heavy Industries Ltd. | 1,749 | 45,850 | ||||||
Sumitomo Metal Mining Co. Ltd. | 2,469 | 94,930 | ||||||
Sumitomo Mitsui Financial Group, Inc. | 900 | 31,139 | ||||||
Sumitomo Mitsui Trust Holdings, Inc. | 400 | 13,100 | ||||||
Sumitomo Realty & Development Co. Ltd. | 1,371 | 44,327 | ||||||
Sumitomo Rubber Industries Ltd. | 4,600 | 55,228 | ||||||
Sundrug Co. Ltd. | 1,388 | 46,178 | ||||||
Suntory Beverage & Food Ltd. | 574 | 23,015 | ||||||
Suzuken Co. Ltd. | 384 | 11,430 | ||||||
Suzuki Motor Corp. | 1,742 | 75,414 | ||||||
Sysmex Corp. | 327 | 37,266 | ||||||
T&D Holdings, Inc. | 1,341 | 16,296 | ||||||
Taiheiyo Cement Corp. | 2,400 | 55,096 | ||||||
Taisei Corp. | 4,234 | 132,770 | ||||||
Number | Value | |||||||
| Japan (Continued) | ||||||||
Taisho Pharmaceutical Holdings Co. Ltd. | 300 | $ | 17,531 | |||||
Taiyo Yuden Co. Ltd. | 200 | 11,360 | ||||||
Takara Holdings, Inc. | 1,900 | 24,645 | ||||||
Takashimaya Co. Ltd. | 1,000 | 10,013 | ||||||
Takeda Pharmaceutical Co. Ltd. | 300 | 10,046 | ||||||
TBS Holdings, Inc. | 1,472 | 21,559 | ||||||
TDK Corp. | 410 | 43,179 | ||||||
TechnoPro Holdings, Inc. | 1,287 | 34,571 | ||||||
Teijin Ltd. | 5,120 | 73,775 | ||||||
Terumo Corp. | 316 | 13,223 | ||||||
TIS, Inc. | 3,700 | 104,742 | ||||||
Tobu Railway Co. Ltd. | 600 | 15,680 | ||||||
Toda Corp. | 10,900 | 79,771 | ||||||
Toho Co. Ltd. | 1,359 | 58,883 | ||||||
Toho Gas Co. Ltd. | 1,449 | 67,662 | ||||||
Tohoku Electric Power Co., Inc. | 7,919 | 60,694 | ||||||
Tokai Rika Co. Ltd. | 2,900 | 42,262 | ||||||
Tokio Marine Holdings, Inc. | 600 | 29,366 | ||||||
Tokyo Century Corp. | 200 | 11,451 | ||||||
Tokyo Electric Power Co. Holdings, Inc.* | 10,904 | 28,684 | ||||||
Tokyo Electron Ltd. | 111 | 47,730 | ||||||
Tokyo Gas Co. Ltd. | 4,359 | 83,958 | ||||||
Tokyo Ohka Kogyo Co. Ltd. | 500 | 31,449 | ||||||
Tokyo Tatemono Co. Ltd. | 2,200 | 33,743 | ||||||
Tokyu Corp. | 1,200 | 16,548 | ||||||
Tokyu Fudosan Holdings Corp. | 3,422 | 19,842 | ||||||
TOPPAN, Inc. | 5,665 | 97,459 | ||||||
Toray Industries, Inc. | 33,900 | 228,901 | ||||||
Toshiba TEC Corp. | 491 | 21,051 | ||||||
Tosoh Corp. | 11,641 | 211,712 | ||||||
TOTO Ltd. | 2,080 | 113,410 | ||||||
Toyo Seikan Group Holdings Ltd. | 2,900 | 40,441 | ||||||
Toyo Suisan Kaisha Ltd. | 1,300 | 53,900 | ||||||
Toyo Tire Corp. | 600 | 10,683 | ||||||
Toyoda Gosei Co. Ltd. | 1,784 | 37,999 | ||||||
Toyota Boshoku Corp. | 2,300 | 43,358 | ||||||
Toyota Industries Corp. | 798 | 67,481 | ||||||
Toyota Motor Corp. | 100 | 8,731 | ||||||
Toyota Tsusho Corp. | 2,823 | 125,013 | ||||||
Trend Micro, Inc. | 1,339 | 73,495 | ||||||
TS Tech Co. Ltd. | 3,958 | 53,717 | ||||||
Tsuruha Holdings, Inc. | 328 | 41,351 | ||||||
TV Asahi Holdings Corp. | 1,500 | 23,184 | ||||||
Ube Industries Ltd. | 3,093 | 62,474 | ||||||
Unicharm Corp. | 1,177 | 52,540 | ||||||
United Urban Investment Corp. REIT | 30 | 42,490 | ||||||
Ushio, Inc. | 601 | 10,881 | ||||||
USS Co. Ltd. | 3,500 | 58,015 | ||||||
Welcia Holdings Co. Ltd. | 542 | 19,167 | ||||||
West Japan Railway Co. | 336 | 18,400 | ||||||
Yakult Honsha Co. Ltd. | 300 | 17,313 | ||||||
Yamada Holdings Co. Ltd. | 8,057 | 34,689 | ||||||
Yamaguchi Financial Group, Inc. | 100 | 584 | ||||||
Yamaha Corp. | 981 | 57,953 | ||||||
Yamaha Motor Co. Ltd. | 2,500 | 63,717 | ||||||
Yamato Holdings Co. Ltd. | 6,200 | 158,019 | ||||||
Yamato Kogyo Co. Ltd. | 1,900 | 71,946 | ||||||
| See Notes to Financial Statements. | 20 |
DBX ETF Trust
Schedule of Investments
Xtrackers FTSE Developed ex US Multifactor ETF (Continued)
August 31, 2021
Number | Value | |||||||
| Japan (Continued) | ||||||||
Yamazaki Baking Co. Ltd. | 653 | $ | 10,729 | |||||
Yaoko Co. Ltd. | 200 | 13,017 | ||||||
Yaskawa Electric Corp. | 300 | 14,691 | ||||||
Yokogawa Electric Corp. | 3,200 | 50,187 | ||||||
Yokohama Rubber Co. Ltd. | 1,700 | 29,045 | ||||||
Z Holdings Corp. | 1,682 | 10,978 | ||||||
Zenkoku Hosho Co. Ltd. | 1,638 | 78,128 | ||||||
Zensho Holdings Co. Ltd. | 1,000 | 24,804 | ||||||
Zeon Corp. | 6,559 | 87,167 | ||||||
ZOZO, Inc. | 200 | 7,637 | ||||||
|
| |||||||
(Cost $18,981,686) | 21,158,910 | |||||||
|
| |||||||
| Jordan — 0.1% | ||||||||
Hikma Pharmaceuticals PLC | 1,432 | 50,019 | ||||||
|
| |||||||
| Luxembourg — 0.5% | ||||||||
Aroundtown SA | 10,786 | 82,582 | ||||||
Eurofins Scientific SE | 1,043 | 147,844 | ||||||
L’Occitane International SA | 11,202 | 38,097 | ||||||
RTL Group SA | 1,674 | 104,040 | ||||||
Tenaris SA | 683 | 6,882 | ||||||
|
| |||||||
(Cost $304,855) | 379,445 | |||||||
|
| |||||||
| Netherlands — 3.0% | ||||||||
Aalberts NV | 2,107 | 131,573 | ||||||
Adyen NV, 144A* | 7 | 22,596 | ||||||
Akzo Nobel NV | 2,153 | 265,334 | ||||||
ASM International NV | 135 | 52,366 | ||||||
ASML Holding NV | 26 | 21,622 | ||||||
ASR Nederland NV (b) | 1,862 | 85,107 | ||||||
Euronext NV, 144A | 1,084 | 125,722 | ||||||
EXOR NV | 409 | 34,086 | ||||||
Heineken Holding NV | 248 | 22,981 | ||||||
Heineken NV | 59 | 6,456 | ||||||
IMCD NV | 197 | 38,801 | ||||||
JDE Peet’s NV | 319 | 10,958 | ||||||
Koninklijke Ahold Delhaize NV | 9,578 | 323,023 | ||||||
Koninklijke DSM NV (b) | 577 | 122,772 | ||||||
Koninklijke KPN NV | 31,267 | 100,171 | ||||||
Koninklijke Philips NV | 1,833 | 84,473 | ||||||
Koninklijke Vopak NV | 301 | 13,029 | ||||||
NN Group NV | 1,634 | 84,812 | ||||||
QIAGEN NV* | 814 | 45,037 | ||||||
Randstad NV | 2,466 | 181,355 | ||||||
Signify NV, 144A | 2,218 | 124,157 | ||||||
Stellantis NV | 2,595 | 51,867 | ||||||
Wolters Kluwer NV | 1,418 | 163,069 | ||||||
|
| |||||||
(Cost $1,487,070) | 2,111,367 | |||||||
|
| |||||||
| New Zealand — 1.0% | ||||||||
Auckland International Airport Ltd.* | 2,169 | 11,007 | ||||||
Contact Energy Ltd. | 12,324 | 70,695 | ||||||
Fisher & Paykel Healthcare Corp. Ltd. | 3,475 | 80,959 | ||||||
Fletcher Building Ltd. | 7,471 | 39,386 | ||||||
Infratil Ltd. | 18,831 | 99,075 | ||||||
Mercury NZ Ltd. | 9,520 | 44,559 | ||||||
Meridian Energy Ltd. | 8,616 | 31,838 | ||||||
Number | Value | |||||||
| New Zealand (Continued) | ||||||||
Ryman Healthcare Ltd. | 8,090 | $ | 88,145 | |||||
SKYCITY Entertainment Group Ltd.* | 11,506 | 26,401 | ||||||
Spark New Zealand Ltd. | 42,398 | 145,479 | ||||||
Xero Ltd.* | 338 | 37,504 | ||||||
|
| |||||||
(Cost $487,280) | 675,048 | |||||||
|
| |||||||
| Norway — 0.9% | ||||||||
Aker BP ASA | 335 | 8,735 | ||||||
Equinor ASA | 124 | 2,631 | ||||||
Gjensidige Forsikring ASA | 1,249 | 29,169 | ||||||
Leroy Seafood Group ASA | 2,104 | 18,552 | ||||||
Mowi ASA | 830 | 22,206 | ||||||
Norsk Hydro ASA | 24,690 | 170,228 | ||||||
Orkla ASA | 5,736 | 51,184 | ||||||
Salmar ASA | 379 | 25,373 | ||||||
Scatec ASA, 144A | 350 | 7,229 | ||||||
Schibsted ASA, Class A | 153 | 8,155 | ||||||
Schibsted ASA, Class B | 101 | 4,694 | ||||||
Telenor ASA | 2,506 | 43,857 | ||||||
TOMRA Systems ASA | 1,096 | 67,281 | ||||||
Yara International ASA | 3,705 | 185,817 | ||||||
|
| |||||||
(Cost $497,780) | 645,111 | |||||||
|
| |||||||
| Poland — 0.5% | ||||||||
Allegro.eu SA, 144A* | 950 | 17,619 | ||||||
Cyfrowy Polsat SA | 2,316 | 22,115 | ||||||
Dino Polska SA, 144A* | 357 | 30,266 | ||||||
InPost SA* | 772 | 15,037 | ||||||
KGHM Polska Miedz SA | 1,613 | 75,114 | ||||||
LPP SA | 8 | 29,168 | ||||||
Polski Koncern Naftowy ORLEN SA | 500 | 9,703 | ||||||
Polskie Gornictwo Naftowe i Gazownictwo SA | 64,046 | 105,383 | ||||||
Powszechna Kasa Oszczednosci Bank Polski SA* | 1,934 | 21,240 | ||||||
Powszechny Zaklad Ubezpieczen SA* | 1,038 | 11,007 | ||||||
|
| |||||||
(Cost $263,793) | 336,652 | |||||||
|
| |||||||
| Portugal — 0.1% | ||||||||
EDP — Energias de Portugal SA | 11,865 | 65,156 | ||||||
Galp Energia SGPS SA | 547 | 5,601 | ||||||
Jeronimo Martins SGPS SA | 380 | 8,052 | ||||||
|
| |||||||
(Cost $60,236) | 78,809 | |||||||
|
| |||||||
| Russia — 0.1% | ||||||||
Polymetal International PLC | 5,021 | 100,059 | ||||||
|
| |||||||
| Singapore — 2.0% | ||||||||
Ascendas Real Estate Investment Trust REIT | 28,036 | 63,363 | ||||||
BOC Aviation Ltd., 144A | 3,600 | 26,986 | ||||||
CapitaLand Integrated Commercial Trust REIT | 14,774 | 22,626 | ||||||
ComfortDelGro Corp. Ltd. | 41,944 | 50,516 | ||||||
DBS Group Holdings Ltd. | 426 | 9,492 | ||||||
Frasers Logistics & Commercial Trust REIT | 172,500 | 192,365 | ||||||
| See Notes to Financial Statements. | 21 |
DBX ETF Trust
Schedule of Investments
Xtrackers FTSE Developed ex US Multifactor ETF (Continued)
August 31, 2021
Number | Value | |||||||
| Singapore (Continued) | ||||||||
Genting Singapore Ltd. | 54,600 | $ | 31,053 | |||||
Golden Agri-Resources Ltd. | 163,800 | 28,008 | ||||||
Jardine Cycle & Carriage Ltd. | 1,905 | 27,518 | ||||||
Keppel REIT | 10,600 | 8,274 | ||||||
Keppel Corp. Ltd. | 2,262 | 8,745 | ||||||
Keppel DC REIT | 37,900 | 70,441 | ||||||
Mapletree Commercial Trust REIT | 41,091 | 62,014 | ||||||
Mapletree Industrial Trust REIT | 47,778 | 103,719 | ||||||
Mapletree Logistics Trust REIT | 56,781 | 85,693 | ||||||
Mapletree North Asia Commercial Trust REIT | 22,196 | 16,336 | ||||||
NetLink NBN Trust | 25,000 | 18,028 | ||||||
Olam International Ltd. | 15,364 | 18,276 | ||||||
Oversea-Chinese Banking Corp. Ltd. | 5,162 | 43,864 | ||||||
SATS Ltd.* | 10,865 | 32,875 | ||||||
Sembcorp Industries Ltd. | 10,253 | 14,711 | ||||||
SIA Engineering Co. Ltd.* | 5,600 | 8,868 | ||||||
Singapore Airlines Ltd.* | 6,727 | 25,306 | ||||||
Singapore Exchange Ltd. | 10,980 | 80,813 | ||||||
Singapore Post Ltd. | 28,800 | 14,024 | ||||||
Singapore Technologies Engineering Ltd. | 27,828 | 78,202 | ||||||
Singapore Telecommunications Ltd. | 19,366 | 33,402 | ||||||
StarHub Ltd. | 14,900 | 13,514 | ||||||
United Overseas Bank Ltd. | 2,600 | 49,445 | ||||||
UOL Group Ltd. | 1,129 | 5,875 | ||||||
Venture Corp. Ltd. | 6,462 | 92,047 | ||||||
Wilmar International Ltd. | 17,500 | 53,862 | ||||||
|
| |||||||
(Cost $1,308,768) | 1,390,261 | |||||||
|
| |||||||
| South Korea — 5.8% | ||||||||
Amorepacific Corp. | 122 | 23,938 | ||||||
AMOREPACIFIC Group | 70 | 3,490 | ||||||
BGF retail Co. Ltd. | 67 | 10,315 | ||||||
BNK Financial Group, Inc. | 4,071 | 27,246 | ||||||
Cheil Worldwide, Inc. | 3,573 | 71,186 | ||||||
CJ CheilJedang Corp. | 126 | 49,283 | ||||||
CJ Corp. | 272 | 23,811 | ||||||
CJ ENM Co. Ltd. | 353 | 46,612 | ||||||
CJ Logistics Corp.* | 162 | 23,892 | ||||||
Coway Co. Ltd. | 675 | 45,526 | ||||||
DB Insurance Co. Ltd. | 562 | 28,453 | ||||||
DGB Financial Group, Inc. | 6,130 | 48,112 | ||||||
DL E&C Co. Ltd.* | 325 | 39,523 | ||||||
DL Holdings Co. Ltd. | 503 | 31,366 | ||||||
Dongsuh Cos., Inc. | 672 | 16,750 | ||||||
Doosan Bobcat, Inc.* | 617 | 23,069 | ||||||
E-MART, Inc. | 350 | 54,034 | ||||||
Fila Holdings Corp. | 676 | 26,178 | ||||||
GS Engineering & Construction Corp. | 798 | 30,800 | ||||||
GS Holdings Corp. | 791 | 28,994 | ||||||
GS Retail Co. Ltd. | 363 | 10,739 | ||||||
Hana Financial Group, Inc. | 2,947 | 114,505 | ||||||
Hankook Tire & Technology Co. Ltd. | 3,086 | 124,031 | ||||||
Hanon Systems | 699 | 9,917 | ||||||
Hanwha Aerospace Co. Ltd. | 452 | 19,843 | ||||||
Hanwha Corp. | 1,664 | 49,944 | ||||||
Hanwha Solutions Corp.* | 363 | 12,758 | ||||||
Number | Value | |||||||
| South Korea (Continued) | ||||||||
Hyundai Department Store Co. Ltd. | 429 | $ | 29,896 | |||||
Hyundai Engineering & Construction Co. Ltd. | 1,292 | 61,845 | ||||||
Hyundai Glovis Co. Ltd. | 420 | 70,275 | ||||||
Hyundai Heavy Industries Holdings Co. Ltd. | 410 | 23,091 | ||||||
Hyundai Marine & Fire Insurance Co. Ltd. | 447 | 9,869 | ||||||
Hyundai Mobis Co. Ltd. | 560 | 134,029 | ||||||
Hyundai Motor Co. | 107 | 19,611 | ||||||
Hyundai Steel Co. | 707 | 31,098 | ||||||
Hyundai Wia Corp. | 138 | 10,890 | ||||||
Industrial Bank of Korea | 3,551 | 31,545 | ||||||
Kakao Corp. | 165 | 22,058 | ||||||
Kangwon Land, Inc.* | 2,256 | 53,897 | ||||||
KB Financial Group, Inc. | 2,416 | 110,230 | ||||||
KEPCO Plant Service & Engineering Co. Ltd. | 507 | 16,442 | ||||||
Kia Corp. | 2,331 | 171,088 | ||||||
Korea Aerospace Industries Ltd. | 717 | 20,314 | ||||||
Korea Electric Power Corp. | 2,076 | 42,972 | ||||||
Korea Gas Corp.* | 614 | 19,170 | ||||||
Korea Investment Holdings Co. Ltd. | 1,102 | 90,578 | ||||||
Korea Zinc Co. Ltd. | 236 | 108,286 | ||||||
Korean Air Lines Co. Ltd.* | 710 | 19,167 | ||||||
KT&G Corp. | 2,093 | 147,302 | ||||||
Kumho Petrochemical Co. Ltd. | 73 | 12,246 | ||||||
LG Chem Ltd. | 9 | 5,884 | ||||||
LG Corp. | 814 | 66,906 | ||||||
LG Display Co. Ltd.* | 4,139 | 73,181 | ||||||
LG Electronics, Inc. | 1,254 | 153,580 | ||||||
LG Household & Health Care Ltd. | 19 | 23,942 | ||||||
LG Innotek Co. Ltd. | 147 | 27,259 | ||||||
LG Uplus Corp. | 5,796 | 70,235 | ||||||
Lotte Chemical Corp. | 140 | 30,187 | ||||||
LOTTE Fine Chemical Co. Ltd. | 466 | 28,174 | ||||||
Lotte Shopping Co. Ltd. | 90 | 8,344 | ||||||
LS Corp. | 243 | 13,958 | ||||||
LX Holdings Corp.* | 439 | 3,737 | ||||||
Mando Corp.* | 339 | 17,747 | ||||||
Mirae Asset Securities Co. Ltd. | 7,488 | 56,962 | ||||||
NAVER Corp. | 101 | 38,241 | ||||||
NCSoft Corp. | 46 | 26,185 | ||||||
NH Investment & Securities Co. Ltd. | 3,105 | 35,483 | ||||||
NHN Corp.* | 162 | 9,864 | ||||||
NongShim Co. Ltd. | 60 | 15,447 | ||||||
Orion Corp. | 134 | 14,620 | ||||||
Ottogi Corp. | 28 | 12,485 | ||||||
POSCO | 892 | 259,264 | ||||||
Posco International Corp. | 2,697 | 52,919 | ||||||
S-1 Corp. | 225 | 15,932 | ||||||
Samsung C&T Corp. | 335 | 38,428 | ||||||
Samsung Card Co. Ltd. | 550 | 16,176 | ||||||
Samsung Electro-Mechanics Co. Ltd. | 510 | 81,155 | ||||||
Samsung Electronics Co. Ltd. | 351 | 23,219 | ||||||
Samsung Engineering Co. Ltd.* | 3,579 | 68,990 | ||||||
Samsung Fire & Marine Insurance Co. Ltd. | 486 | 94,731 | ||||||
| See Notes to Financial Statements. | 22 |
DBX ETF Trust
Schedule of Investments
Xtrackers FTSE Developed ex US Multifactor ETF (Continued)
August 31, 2021
Number | Value | |||||||
| South Korea (Continued) | ||||||||
Samsung Life Insurance Co. Ltd. | 554 | $ | 35,597 | |||||
Samsung SDI Co. Ltd. | 18 | 12,311 | ||||||
Samsung SDS Co. Ltd. | 102 | 15,175 | ||||||
Samsung Securities Co. Ltd. | 2,143 | 91,398 | ||||||
Shinhan Financial Group Co. Ltd. | 2,577 | 86,348 | ||||||
Shinsegae, Inc. | 70 | 16,240 | ||||||
SK Hynix, Inc. | 236 | 21,678 | ||||||
SK Innovation Co. Ltd.* | 62 | 13,342 | ||||||
SK Telecom Co. Ltd. | 292 | 75,049 | ||||||
SK, Inc. | 202 | 45,907 | ||||||
S-Oil Corp. | 259 | 21,244 | ||||||
Woori Financial Group, Inc. | 3,018 | 29,283 | ||||||
Yuhan Corp. | 281 | 15,147 | ||||||
|
| |||||||
(Cost $3,373,866) | 4,112,168 | |||||||
|
| |||||||
| Spain — 0.7% | ||||||||
Acciona SA | 196 | 31,836 | ||||||
ACS Actividades de Construccion y Servicios SA | 713 | 19,240 | ||||||
Bankinter SA | 1,477 | 8,653 | ||||||
EDP Renovaveis SA | 864 | 22,968 | ||||||
Enagas SA | 1,816 | 41,298 | ||||||
Endesa SA | 2,092 | 50,279 | ||||||
Ferrovial SA | 578 | 16,730 | ||||||
Grifols SA (b) | 464 | 11,332 | ||||||
Iberdrola SA | 3,142 | 38,926 | ||||||
Industria de Diseno Textil SA | 296 | 10,102 | ||||||
Linea Directa Aseguradora SA Cia de Seguros y Reaseguros | 1,477 | 3,123 | ||||||
Mapfre SA (b) | 3,036 | 6,544 | ||||||
Naturgy Energy Group SA (b) | 734 | 18,889 | ||||||
Red Electrica Corp. SA | 4,667 | 93,050 | ||||||
Repsol SA | 937 | 10,735 | ||||||
Siemens Gamesa Renewable Energy SA* | 228 | 6,758 | ||||||
Telefonica SA (b) | 14,595 | 72,042 | ||||||
Zardoya Otis SA | 1,525 | 10,063 | ||||||
|
| |||||||
(Cost $462,931) | 472,568 | |||||||
|
| |||||||
| Sweden — 7.8% | ||||||||
Alfa Laval AB | 3,218 | 130,379 | ||||||
Assa Abloy AB, Class B | 1,979 | 63,182 | ||||||
Atlas Copco AB, Class A | 975 | 66,861 | ||||||
Atlas Copco AB, Class B | 518 | 29,933 | ||||||
Boliden AB | 11,032 | 384,265 | ||||||
Castellum AB | 4,790 | 139,342 | ||||||
Electrolux AB, Series B | 15,073 | 381,420 | ||||||
Elekta AB, Class B (b) | 3,678 | 46,046 | ||||||
Epiroc AB, Class A | 5,430 | 119,020 | ||||||
Epiroc AB, Class B | 3,219 | 61,092 | ||||||
Essity AB, Class B | 1,836 | 58,829 | ||||||
Fastighets AB Balder, Class B* | 727 | 51,908 | ||||||
Getinge AB, Class B | 3,798 | 155,637 | ||||||
H & M Hennes & Mauritz AB, Class B* | 359 | 7,188 | ||||||
Hexagon AB, Class B | 11,600 | 200,749 | ||||||
Holmen AB, Class B | 1,339 | 67,968 | ||||||
Husqvarna AB, Class A | 699 | 9,435 | ||||||
Husqvarna AB, Class B | 20,401 | 273,355 | ||||||
Number | Value | |||||||
| Sweden (Continued) | ||||||||
ICA Gruppen AB | 600 | $ | 29,817 | |||||
Industrivarden AB, Class A | 2,835 | 104,229 | ||||||
Industrivarden AB, Class C | 1,753 | 61,040 | ||||||
Indutrade AB | 5,344 | 176,305 | ||||||
Investment AB Latour, Class B | 2,168 | 75,365 | ||||||
Investor AB, Class A | 2,642 | 63,308 | ||||||
Investor AB, Class B | 6,066 | 144,933 | ||||||
Kinnevik AB, Class B* | 16,213 | 634,545 | ||||||
L E Lundbergforetagen AB, Class B | 187 | 11,923 | ||||||
Lifco AB, Class B | 3,112 | 92,006 | ||||||
Lundin Energy AB | 1,312 | 40,034 | ||||||
Nibe Industrier AB, Class B | 16,472 | 229,385 | ||||||
Saab AB, Class B | 1,346 | 40,075 | ||||||
Sagax AB, Class B | 3,693 | 137,569 | ||||||
Sagax AB, Class D | 5,546 | 22,502 | ||||||
Sandvik AB | 3,707 | 94,406 | ||||||
Securitas AB, Class B | 11,511 | 190,880 | ||||||
Skanska AB, Class B | 8,276 | 238,068 | ||||||
SKF AB, Class B | 7,690 | 195,841 | ||||||
Svenska Cellulosa AB SCA, Class B | 3,268 | 57,596 | ||||||
Svenska Handelsbanken AB, Class A | 1,340 | 15,056 | ||||||
Sweco AB, Class B | 4,396 | 76,993 | ||||||
Swedbank AB, Class A | 277 | 5,343 | ||||||
Swedish Match AB | 17,080 | 157,540 | ||||||
Swedish Orphan Biovitrum AB* | 602 | 13,098 | ||||||
Tele2 AB, Class B | 4,599 | 68,863 | ||||||
Telefonaktiebolaget LM Ericsson, Class B | 6,994 | 82,824 | ||||||
Telia Co. AB | 2,878 | 12,340 | ||||||
Trelleborg AB, Class B | 7,531 | 182,812 | ||||||
Volvo AB, Class A | 508 | 11,755 | ||||||
Volvo AB, Class B | 1,276 | 28,824 | ||||||
|
| |||||||
(Cost $3,766,992) | 5,541,884 | |||||||
|
| |||||||
| Switzerland — 5.2% | ||||||||
ABB Ltd. | 3,989 | 147,707 | ||||||
Adecco Group AG | 1,125 | 62,609 | ||||||
Alcon, Inc. | 409 | 33,683 | ||||||
Baloise Holding AG | 264 | 42,105 | ||||||
Banque Cantonale Vaudoise | 68 | 5,768 | ||||||
Barry Callebaut AG | 14 | 35,671 | ||||||
BKW AG | 377 | 43,707 | ||||||
Chocoladefabriken Lindt & Spruengli AG Participation Certificates | 5 | 58,785 | ||||||
Cie Financiere Richemont SA, Class A | 552 | 60,861 | ||||||
Clariant AG* | 6,933 | 145,918 | ||||||
Coca-Cola HBC AG* | 1,613 | 58,361 | ||||||
Credit Suisse Group AG | 1,040 | 11,028 | ||||||
DKSH Holding AG | 1,230 | 95,803 | ||||||
EMS-Chemie Holding AG | 69 | 74,759 | ||||||
Flughafen Zurich AG* | 213 | 35,390 | ||||||
Geberit AG | 244 | 203,819 | ||||||
Georg Fischer AG | 96 | 157,511 | ||||||
Givaudan SA | 14 | 70,225 | ||||||
Helvetia Holding AG | 199 | 22,788 | ||||||
Holcim Ltd.* | 1,786 | 101,773 | ||||||
Kuehne + Nagel International AG | 461 | 168,638 | ||||||
Logitech International SA | 2,109 | 215,585 | ||||||
| See Notes to Financial Statements. | 23 |
DBX ETF Trust
Schedule of Investments
Xtrackers FTSE Developed ex US Multifactor ETF (Continued)
August 31, 2021
Number | Value | |||||||
| Switzerland (Continued) | ||||||||
Lonza Group AG | 76 | $ | 64,298 | |||||
Nestle SA | 50 | 6,317 | ||||||
OC Oerlikon Corp. AG | 4,321 | 48,208 | ||||||
Partners Group Holding AG | 164 | 290,744 | ||||||
PSP Swiss Property AG | 268 | 35,926 | ||||||
Schindler Holding AG | 80 | 24,942 | ||||||
Schindler Holding AG Participation Certificates | 150 | 48,436 | ||||||
SGS SA | 15 | 47,126 | ||||||
SIG Combibloc Group AG* | 3,542 | 108,420 | ||||||
Sika AG | 400 | 144,141 | ||||||
Sonova Holding AG | 557 | 214,640 | ||||||
STMicroelectronics NV | 206 | 9,171 | ||||||
Straumann Holding AG | 73 | 141,051 | ||||||
Sulzer AG | 98 | 14,763 | ||||||
Swatch Group AG — Bearer | 130 | 36,642 | ||||||
Swatch Group AG — Registered | 413 | 22,700 | ||||||
Swiss Life Holding AG | 78 | 40,667 | ||||||
Swiss Prime Site AG | 649 | 69,395 | ||||||
Swiss Re AG | 169 | 15,545 | ||||||
Swisscom AG | 67 | 39,306 | ||||||
Tecan Group AG | 299 | 182,295 | ||||||
Temenos AG | 148 | 23,491 | ||||||
UBS Group AG | 955 | 15,930 | ||||||
VAT Group AG, 144A | 337 | 141,120 | ||||||
Vifor Pharma AG | 110 | 15,659 | ||||||
Zurich Insurance Group AG | 51 | 22,381 | ||||||
|
| |||||||
(Cost $2,448,906) | 3,675,808 | |||||||
|
| |||||||
| United Kingdom — 8.0% | ||||||||
3i Group PLC | 1,852 | 34,090 | ||||||
Abrdn PLC | 7,026 | 25,673 | ||||||
Admiral Group PLC | 3,929 | 195,257 | ||||||
Amcor PLC CDI | 14,644 | 187,188 | ||||||
Anglo American PLC | 676 | 28,552 | ||||||
Ashmore Group PLC | 9,171 | 50,385 | ||||||
Ashtead Group PLC | 1,137 | 89,037 | ||||||
Associated British Foods PLC | 597 | 16,268 | ||||||
AstraZeneca PLC | 113 | 13,241 | ||||||
Auto Trader Group PLC, 144A | 12,296 | 106,442 | ||||||
AVEVA Group PLC | 292 | 16,621 | ||||||
Aviva PLC | 9,011 | 50,114 | ||||||
B&M European Value Retail SA | 14,174 | 109,044 | ||||||
BAE Systems PLC | 9,443 | 73,869 | ||||||
Berkeley Group Holdings PLC* | 1,360 | 90,347 | ||||||
British American Tobacco PLC | 856 | 32,150 | ||||||
BT Group PLC* | 14,218 | 33,226 | ||||||
Bunzl PLC | 5,920 | 214,765 | ||||||
Burberry Group PLC | 798 | 20,422 | ||||||
Centrica PLC* | 10,648 | 7,614 | ||||||
CNH Industrial NV | 3,160 | 52,223 | ||||||
ConvaTec Group PLC, 144A | 5,298 | 16,435 | ||||||
Croda International PLC | 84 | 10,576 | ||||||
Derwent London PLC REIT | 687 | 35,862 | ||||||
Diageo PLC | 514 | 24,716 | ||||||
Direct Line Insurance Group PLC | 33,574 | 142,777 | ||||||
Number | Value | |||||||
| United Kingdom (Continued) | ||||||||
DS Smith PLC | 15,810 | $ | 96,260 | |||||
Evraz PLC | 392 | 3,185 | ||||||
Ferguson PLC | 1,913 | 276,572 | ||||||
GlaxoSmithKline PLC | 1,043 | 20,986 | ||||||
Halma PLC | 1,688 | 69,763 | ||||||
Hargreaves Lansdown PLC | 1,751 | 36,352 | ||||||
HomeServe PLC | 2,211 | 28,512 | ||||||
Howden Joinery Group PLC | 5,928 | 77,146 | ||||||
IMI PLC | 8,629 | 216,493 | ||||||
Imperial Brands PLC | 7,526 | 159,663 | ||||||
Informa PLC* | 5,435 | 39,718 | ||||||
InterContinental Hotels Group PLC* | 174 | 11,095 | ||||||
Intertek Group PLC | 1,275 | 92,474 | ||||||
ITV PLC* | 59,240 | 94,411 | ||||||
J Sainsbury PLC | 10,212 | 42,725 | ||||||
Johnson Matthey PLC | 5,938 | 240,180 | ||||||
Kingfisher PLC | 19,900 | 95,938 | ||||||
Legal & General Group PLC | 8,961 | 33,323 | ||||||
Mondi PLC | 5,379 | 148,427 | ||||||
National Grid PLC | 3,154 | 40,859 | ||||||
Next PLC | 945 | 102,874 | ||||||
Pearson PLC | 6,323 | 66,797 | ||||||
Pennon Group PLC | 739 | 12,693 | ||||||
Persimmon PLC | 1,814 | 73,398 | ||||||
Phoenix Group Holdings PLC | 1,333 | 11,436 | ||||||
Prudential PLC | 462 | 9,633 | ||||||
Reckitt Benckiser Group PLC | 288 | 21,954 | ||||||
RELX PLC | 1,554 | 46,666 | ||||||
Renishaw PLC | 302 | 22,444 | ||||||
Rentokil Initial PLC | 7,660 | 61,186 | ||||||
Rightmove PLC | 12,814 | 123,694 | ||||||
Rio Tinto PLC | 1,135 | 84,069 | ||||||
Sage Group PLC | 8,695 | 88,815 | ||||||
Schroders PLC | 535 | 27,832 | ||||||
Segro PLC REIT | 24,128 | 426,367 | ||||||
Severn Trent PLC | 1,323 | 50,290 | ||||||
Smith & Nephew PLC | 2,210 | 42,429 | ||||||
Smiths Group PLC | 3,122 | 61,979 | ||||||
Spirax-Sarco Engineering PLC | 459 | 101,767 | ||||||
SSE PLC | 3,917 | 88,004 | ||||||
St James’s Place PLC | 1,110 | 24,595 | ||||||
Tate & Lyle PLC | 17,719 | 172,066 | ||||||
Tesco PLC | 16,972 | 59,597 | ||||||
Travis Perkins PLC* | 707 | 17,529 | ||||||
Unilever PLC | 123 | 6,849 | ||||||
United Utilities Group PLC | 3,531 | 51,390 | ||||||
Vodafone Group PLC | 25,834 | 43,362 | ||||||
Whitbread PLC* | 246 | 10,861 | ||||||
Wickes Group PLC* | 793 | 2,641 | ||||||
Wm Morrison Supermarkets PLC | 18,068 | 72,112 | ||||||
WPP PLC | 11,769 | 159,315 | ||||||
|
| |||||||
(Cost $4,242,439) | 5,645,620 | |||||||
|
| |||||||
| See Notes to Financial Statements. | 24 |
DBX ETF Trust
Schedule of Investments
Xtrackers FTSE Developed ex US Multifactor ETF (Continued)
August 31, 2021
Number | Value | |||||||
| United States — 0.1% | ||||||||
Samsonite International SA, 144A* | 7,497 | $ | 15,693 | |||||
Waste Connections, Inc. | 488 | 62,960 | ||||||
|
| |||||||
(Cost $60,512) | 78,653 | |||||||
|
| |||||||
TOTAL COMMON STOCKS | 69,821,522 | |||||||
|
| |||||||
| PREFERRED STOCKS — 0.7% | ||||||||
| Germany — 0.6% | ||||||||
FUCHS PETROLUB SE | 543 | 27,473 | ||||||
Henkel AG & Co. KGaA | 452 | 44,147 | ||||||
Porsche Automobil Holding SE | 3,143 | 318,183 | ||||||
Sartorius AG | 54 | 35,569 | ||||||
Volkswagen AG | 31 | 7,366 | ||||||
|
| |||||||
(Cost $383,760) | 432,738 | |||||||
|
| |||||||
| South Korea — 0.1% | ||||||||
Hanwha Corp. | 1,241 | 17,125 | ||||||
Hyundai Motor Co. — 2nd Preferred | 55 | 4,711 | ||||||
LG Electronics, Inc. | 365 | 22,005 | ||||||
Mirae Asset Securities Co. Ltd. | 4,081 | 16,719 | ||||||
|
| |||||||
(Cost $46,567) | 60,560 | |||||||
|
| |||||||
TOTAL PREFERRED STOCKS | 493,298 | |||||||
|
| |||||||
Number | Value | |||||||
| WARRANTS — 0.0% | ||||||||
| Switzerland — 0.0% | ||||||||
Cie Financiere Richemont SA*, expires 11/22/23 | 826 | $ | 424 | |||||
|
| |||||||
| SECURITIES LENDING COLLATERAL — 1.4% | ||||||||
DWS Government & Agency Securities Portfolio “DWS Government Cash Institutional Shares”, 0.01% (c)(d) | 990,427 | 990,427 | ||||||
|
| |||||||
| CASH EQUIVALENTS — 0.0% | ||||||||
DWS Government Money Market Series “Institutional Shares”, 0.04% (c) | 6,186 | 6,186 | ||||||
|
| |||||||
TOTAL INVESTMENTS — 100.9% (Cost $56,520,824) | $ | 71,311,857 | ||||||
Other assets and liabilities, net — (0.9%) | (623,013 | ) | ||||||
|
| |||||||
NET ASSETS — 100.0% | $ | 70,688,844 | ||||||
|
| |||||||
A summary of the Fund’s transactions with affiliated investments during the year ended August 31, 2021 is as follows:
| Value ($) at 8/31/2020 | Purchases Cost ($) | Sales Proceeds ($) | Net Realized Gain/(Loss) ($) | Net Change in Unrealized Appreciation (Depreciation) ($) | Income ($) | Capital Gain Distributions ($) | Number of Shares at 8/31/2021 | Value ($) at 8/31/2021 | ||||||||||||||||||||||||||||
COMMON STOCKS — 0.0% |
| |||||||||||||||||||||||||||||||||||
Germany — 0.0% |
| |||||||||||||||||||||||||||||||||||
DWS Group GmbH & Co. KGaA, 144A*(e) |
| |||||||||||||||||||||||||||||||||||
| 7,951 | — | (7,485 | ) | 1,203 | (1,669 | ) | — | — | — | — | ||||||||||||||||||||||||||
SECURITIES LENDING COLLATERAL — 1.4% |
| |||||||||||||||||||||||||||||||||||
DWS Government & Agency Securities Portfolio “DWS Government Cash Institutional Shares”, 0.01% (c)(d) |
| |||||||||||||||||||||||||||||||||||
| 1,188,901 | — | (198,474 | )(f) | — | — | 116 | — | 990,427 | 990,427 | |||||||||||||||||||||||||||
CASH EQUIVALENTS — 0.0% |
| |||||||||||||||||||||||||||||||||||
DWS Government Money Market Series “Institutional Shares”, 0.04% (c) |
| |||||||||||||||||||||||||||||||||||
| 15,272 | 9,925,040 | (9,934,126 | ) | — | — | 39 | — | 6,186 | 6,186 | |||||||||||||||||||||||||||
|
|
|
|
|
|
|
|
|
|
|
|
|
|
|
|
|
| |||||||||||||||||||
| 1,212,124 | 9,925,040 | (10,140,085 | ) | 1,203 | (1,669 | ) | 155 | — | 996,613 | 996,613 | ||||||||||||||||||||||||||
|
|
|
|
|
|
|
|
|
|
|
|
|
|
|
|
|
| |||||||||||||||||||
| * | Non-income producing security. |
| (a) | Stapled Security — A security contractually bound to one or more other securities to form a single saleable unit which cannot be sold separately. |
| (b) | All or a portion of these securities were on loan. In addition, “Other assets and liabilities, net” may include pending sales that are also on loan. The value of securities loaned at August 31, 2021 amounted to $1,107,618, which is 1.6% of net assets. |
| (c) | Affiliated fund managed by DWS Investment Management Americas, Inc. The rate shown is the annualized seven-day yield at period end. |
| (d) | Represents cash collateral held in connection with securities lending. Income earned by the Fund is net of borrower rebates. In addition, the Fund held non-cash U.S. Treasury securities collateral having a value of $185,153. |
| (e) | Affiliated issuer. This security is owned in proportion with its representation in the index. |
| (f) | Represents the net increase (purchase cost) or decrease (sales proceeds) in the amount invested in cash collateral for the year ended August 31, 2021. |
| See Notes to Financial Statements. | 25 |
DBX ETF Trust
Schedule of Investments
Xtrackers FTSE Developed ex US Multifactor ETF (Continued)
August 31, 2021
| CDI: | Chess Depositary Interest |
| REIT: | Real Estate Investment Trust |
| RSP: | Risparmio (Convertible Savings Shares) |
| 144A: | Security exempt from registration under Rule 144A of the Securities Act of 1933. These securities may be resold in transactions exempt from registration, normally to qualified institutional buyers. |
Securities are listed in country of domicile.
At August 31, 2021, open futures contracts purchased were as follows:
Contract Description | Currency | Number of Contracts | Notional Amount | Contract Value | Expiration Date | Unrealized Depreciation | ||||||||||||
MSCI EAFE Futures | USD | 3 | $ | 355,416 | $352,725 | 9/17/2021 | $ | (2,691 | ) | |||||||||
For information on the Fund’s policy and additional disclosures regarding open futures contracts, please refer to the Derivatives section of Note 2 in the accompanying Notes to Financial Statements.
Currency Abbreviations
| USD | U.S. Dollar |
Fair Value Measurements
Various inputs are used in determining the value of the Fund’s investments. These inputs are summarized in three broad levels. Level 1 includes quoted prices in active markets for identical securities. Level 2 includes other significant observable inputs (including quoted prices for similar securities, interest rates, prepayment speeds and credit risk). Level 3 includes significant unobservable inputs (including the Fund’s own assumptions in determining the fair value of investments). The level assigned to the securities valuations may not be an indication of the risk or liquidity associated with investing in those securities.
The following is a summary of the inputs used as of August 31, 2021 in valuing the Fund’s investments. For information on the Fund’s policy regarding the valuation of investments, please refer to the Security Valuation section of Note 2 in the accompanying Notes to Financial Statements.
Assets | Level 1 | Level 2 | Level 3 | Total | ||||||||||||
Common Stocks (g) | $ | 69,821,522 | $ | — | $ | — | $ | 69,821,522 | ||||||||
Preferred Stocks (g) | 493,298 | — | — | 493,298 | ||||||||||||
Warrants | 424 | — | — | 424 | ||||||||||||
Short-Term Investments (g) | 996,613 | — | — | 996,613 | ||||||||||||
|
|
|
|
|
|
|
| |||||||||
TOTAL | $ | 71,311,857 | $ | — | $ | — | $ | 71,311,857 | ||||||||
|
|
|
|
|
|
|
| |||||||||
Liabilities | Level 1 | Level 2 | Level 3 | Total | ||||||||||||
Derivatives (h) | ||||||||||||||||
Futures Contracts | $ | (2,691 | ) | $ | — | $ | — | $ | (2,691 | ) | ||||||
|
|
|
|
|
|
|
| |||||||||
TOTAL | $ | (2,691 | ) | $ | — | $ | — | $ | (2,691 | ) | ||||||
|
|
|
|
|
|
|
| |||||||||
| (g) | See Schedule of Investments for additional detailed categorizations. |
| (h) | Derivatives include unrealized appreciation (depreciation) on open futures contracts. |
| See Notes to Financial Statements. | 26 |
DBX ETF Trust
Schedule of Investments
Xtrackers MSCI Kokusai Equity ETF
August 31, 2021
Number | Value | |||||||
| COMMON STOCKS — 99.6% | ||||||||
| Argentina — 0.2% | ||||||||
MercadoLibre, Inc.* | 633 | $ | 1,182,096 | |||||
|
| |||||||
| Australia — 2.2% | ||||||||
Afterpay Ltd.* | 3,127 | 307,588 | ||||||
AGL Energy Ltd. | 9,630 | 45,396 | ||||||
Ampol Ltd. | 4,646 | 93,581 | ||||||
APA Group (a) | 15,387 | 103,235 | ||||||
Aristocrat Leisure Ltd. | 8,512 | 284,113 | ||||||
ASX Ltd. | 2,183 | 140,032 | ||||||
Aurizon Holdings Ltd. | 21,994 | 60,761 | ||||||
AusNet Services Ltd. | 30,604 | 43,280 | ||||||
Australia & New Zealand Banking Group Ltd. | 41,055 | 835,641 | ||||||
BHP Group Ltd. | 42,438 | 1,414,631 | ||||||
BHP Group PLC | 29,234 | 908,267 | ||||||
BlueScope Steel Ltd. | 8,090 | 148,997 | ||||||
Brambles Ltd. | 20,252 | 179,242 | ||||||
Cochlear Ltd. | 1,055 | 179,808 | ||||||
Coles Group Ltd. | 17,819 | 235,456 | ||||||
Commonwealth Bank of Australia | 24,651 | 1,803,781 | ||||||
Computershare Ltd. | 5,532 | 66,711 | ||||||
CSL Ltd. | 6,384 | 1,455,433 | ||||||
Dexus REIT | 16,186 | 125,866 | ||||||
Domino’s Pizza Enterprises Ltd. | 861 | 98,631 | ||||||
Endeavour Group Ltd.* | 18,563 | 99,037 | ||||||
Evolution Mining Ltd. | 24,539 | 70,123 | ||||||
Fortescue Metals Group Ltd. | 24,178 | 371,080 | ||||||
Goodman Group REIT | 23,424 | 395,972 | ||||||
GPT Group REIT | 29,836 | 105,757 | ||||||
Insurance Australia Group Ltd. | 32,904 | 126,011 | ||||||
Lendlease Corp. Ltd. (a) | 10,048 | 87,682 | ||||||
Macquarie Group Ltd. | 4,986 | 607,604 | ||||||
Magellan Financial Group Ltd. | 2,141 | 67,816 | ||||||
Medibank Pvt Ltd. | 41,992 | 108,949 | ||||||
Mirvac Group REIT | 59,213 | 135,021 | ||||||
National Australia Bank Ltd. | 46,964 | 951,795 | ||||||
Newcrest Mining Ltd. | 11,336 | 204,969 | ||||||
Northern Star Resources Ltd. | 15,813 | 112,796 | ||||||
Oil Search Ltd. | 24,502 | 66,973 | ||||||
Orica Ltd. | 7,132 | 68,648 | ||||||
Origin Energy Ltd. | 26,852 | 87,330 | ||||||
Qantas Airways Ltd.* | 11,258 | 41,880 | ||||||
QBE Insurance Group Ltd. | 21,391 | 184,946 | ||||||
Ramsay Health Care Ltd. | 2,748 | 138,377 | ||||||
REA Group Ltd. | 814 | 91,319 | ||||||
Reece Ltd. | 5,208 | 79,475 | ||||||
Rio Tinto Ltd. | 5,394 | 441,764 | ||||||
Santos Ltd. | 30,295 | 133,954 | ||||||
Scentre Group REIT | 71,339 | 148,594 | ||||||
SEEK Ltd. | 5,025 | 119,504 | ||||||
Sonic Healthcare Ltd. | 6,719 | 213,119 | ||||||
South32 Ltd. | 74,830 | 171,725 | ||||||
Stockland REIT | 40,259 | 135,936 | ||||||
Suncorp Group Ltd. | 14,669 | 133,796 | ||||||
Sydney Airport*(a) | 18,855 | 109,828 | ||||||
Tabcorp Holdings Ltd. | 37,702 | 131,986 | ||||||
Number | Value | |||||||
| Australia (Continued) | ||||||||
Telstra Corp. Ltd. | 51,242 | $ | 143,809 | |||||
Transurban Group (a) | 40,546 | 421,086 | ||||||
Treasury Wine Estates Ltd. | 11,986 | 110,638 | ||||||
Vicinity Centres REIT | 48,269 | 61,030 | ||||||
Wesfarmers Ltd. | 16,762 | 734,418 | ||||||
Westpac Banking Corp. | 52,584 | 992,289 | ||||||
WiseTech Global Ltd. | 2,013 | 71,118 | ||||||
Woodside Petroleum Ltd. (b) | 15,055 | 214,447 | ||||||
Woolworths Group Ltd. | 18,465 | 563,422 | ||||||
|
| |||||||
(Cost $14,652,618) | 17,786,473 | |||||||
|
| |||||||
| Austria — 0.1% | ||||||||
Erste Group Bank AG | 3,503 | 140,015 | ||||||
OMV AG | 2,501 | 138,552 | ||||||
Raiffeisen Bank International AG | 2,323 | 55,776 | ||||||
Verbund AG | 748 | 81,896 | ||||||
voestalpine AG | 1,388 | 62,917 | ||||||
|
| |||||||
(Cost $338,072) | 479,156 | |||||||
|
| |||||||
| Belgium — 0.3% | ||||||||
Ageas SA/NV | 2,143 | 107,133 | ||||||
Anheuser-Busch InBev SA/NV | 11,217 | 688,405 | ||||||
Elia Group SA/NV | 431 | 54,133 | ||||||
Etablissements Franz Colruyt NV | 810 | 45,313 | ||||||
Groupe Bruxelles Lambert SA | 1,373 | 157,376 | ||||||
KBC Group NV | 3,472 | 292,389 | ||||||
Proximus SADP | 2,216 | 43,437 | ||||||
Sofina SA | 285 | 125,959 | ||||||
Solvay SA | 1,149 | 150,486 | ||||||
UCB SA | 1,940 | 221,862 | ||||||
Umicore SA | 2,319 | 152,586 | ||||||
|
| |||||||
(Cost $1,783,602) | 2,039,079 | |||||||
|
| |||||||
| Bermuda — 0.1% | ||||||||
Arch Capital Group Ltd.* | 5,230 | 214,953 | ||||||
Athene Holding Ltd., Class A* | 1,969 | 131,864 | ||||||
Everest Re Group Ltd. | 589 | 156,026 | ||||||
RenaissanceRe Holdings Ltd. | 570 | 89,336 | ||||||
|
| |||||||
(Cost $466,252) | 592,179 | |||||||
|
| |||||||
| Canada — 3.5% | ||||||||
Agnico Eagle Mines Ltd. | 3,487 | 200,337 | ||||||
Air Canada* | 2,198 | 42,633 | ||||||
Algonquin Power & Utilities Corp. | 6,488 | 100,582 | ||||||
Alimentation Couche-Tard, Inc., Class B | 12,099 | 488,115 | ||||||
AltaGas Ltd. | 3,187 | 63,732 | ||||||
B2Gold Corp. | 15,619 | 60,318 | ||||||
Ballard Power Systems, Inc.* | 3,440 | 57,876 | ||||||
Bank of Montreal | 9,452 | 939,179 | ||||||
Bank of Nova Scotia | 17,285 | 1,068,985 | ||||||
Barrick Gold Corp. | 25,767 | 517,114 | ||||||
BCE, Inc. | 310 | 16,142 | ||||||
BlackBerry Ltd.* | 8,076 | 91,903 | ||||||
Brookfield Asset Management, Inc., Class A | 18,799 | 1,044,199 | ||||||
CAE, Inc.* | 4,074 | 117,450 | ||||||
Cameco Corp. | 5,858 | 108,060 | ||||||
Canadian Apartment Properties REIT | 1,184 | 57,258 | ||||||
| See Notes to Financial Statements. | 27 |
DBX ETF Trust
Schedule of Investments
Xtrackers MSCI Kokusai Equity ETF (Continued)
August 31, 2021
Number | Value | |||||||
| Canada (Continued) | ||||||||
Canadian Imperial Bank of Commerce | 6,264 | $ | 719,469 | |||||
Canadian National Railway Co. | 10,174 | 1,194,810 | ||||||
Canadian Natural Resources Ltd. | 17,081 | 564,343 | ||||||
Canadian Pacific Railway Ltd. | 9,623 | 660,165 | ||||||
Canadian Tire Corp. Ltd., Class A | 824 | 125,199 | ||||||
Canadian Utilities Ltd., Class A | 1,848 | 52,223 | ||||||
Canopy Growth Corp.* | 3,283 | 56,403 | ||||||
CCL Industries, Inc., Class B | 2,221 | 126,583 | ||||||
Cenovus Energy, Inc. | 18,136 | 150,266 | ||||||
CGI, Inc.* | 3,275 | 292,240 | ||||||
Constellation Software, Inc. | 283 | 478,857 | ||||||
Dollarama, Inc. | 3,697 | 168,313 | ||||||
Emera, Inc. | 3,901 | 183,867 | ||||||
Empire Co. Ltd., Class A | 3,473 | 112,134 | ||||||
Enbridge, Inc. | 28,562 | 1,122,228 | ||||||
Fairfax Financial Holdings Ltd. | 366 | 161,754 | ||||||
First Quantum Minerals Ltd. | 9,112 | 189,501 | ||||||
FirstService Corp. | 445 | 82,517 | ||||||
Fortis, Inc. | 7,349 | 336,147 | ||||||
Franco-Nevada Corp. | 2,902 | 422,675 | ||||||
George Weston Ltd. | 1,155 | 124,307 | ||||||
GFL Environmental, Inc. | 2,421 | 85,161 | ||||||
Gildan Activewear, Inc. | 3,121 | 119,787 | ||||||
Great-West Lifeco, Inc. | 3,362 | 103,841 | ||||||
Hydro One Ltd., 144A | 4,984 | 123,846 | ||||||
iA Financial Corp., Inc. | 1,085 | 60,069 | ||||||
IGM Financial, Inc. | 1,527 | 55,599 | ||||||
Imperial Oil Ltd. (b) | 3,759 | 99,326 | ||||||
Intact Financial Corp. | 2,328 | 316,559 | ||||||
Inter Pipeline Ltd. | 6,145 | 97,258 | ||||||
Ivanhoe Mines Ltd., Class A* | 8,586 | 69,169 | ||||||
Keyera Corp. (b) | 2,900 | 69,720 | ||||||
Kinross Gold Corp. | 19,101 | 114,729 | ||||||
Kirkland Lake Gold Ltd. | 3,613 | 143,845 | ||||||
Lightspeed Commerce, Inc.* | 1,721 | 190,752 | ||||||
Loblaw Cos. Ltd. | 2,185 | 153,701 | ||||||
Lululemon Athletica, Inc.* | 1,755 | 702,298 | ||||||
Lundin Mining Corp. | 8,635 | 69,701 | ||||||
Magna International, Inc. | 3,852 | 303,703 | ||||||
Manulife Financial Corp. | 27,388 | 532,523 | ||||||
Metro, Inc. | 3,126 | 158,990 | ||||||
National Bank of Canada | 4,762 | 377,373 | ||||||
Northland Power, Inc. | 3,646 | 120,432 | ||||||
Nutrien Ltd. | 8,311 | 504,454 | ||||||
Nuvei Corp., 144A* | 805 | 104,176 | ||||||
Onex Corp. | 965 | 67,508 | ||||||
Open Text Corp. | 3,319 | 181,781 | ||||||
Pan American Silver Corp. | 2,632 | 68,234 | ||||||
Parkland Corp. | 2,309 | 68,832 | ||||||
Pembina Pipeline Corp. | 8,885 | 270,350 | ||||||
Power Corp. of Canada | 8,294 | 285,776 | ||||||
Quebecor, Inc., Class B | 2,239 | 55,778 | ||||||
Restaurant Brands International, Inc. | 3,672 | 235,550 | ||||||
Ritchie Bros Auctioneers, Inc. | 1,938 | 121,235 | ||||||
Rogers Communications, Inc., Class B | 5,775 | 293,766 | ||||||
Royal Bank of Canada | 20,457 | 2,098,071 | ||||||
Saputo, Inc. | 3,295 | 92,541 | ||||||
Number | Value | |||||||
| Canada (Continued) | ||||||||
Shaw Communications, Inc., Class B | 6,361 | $ | 186,906 | |||||
Shopify, Inc., Class A* | 1,606 | 2,448,545 | ||||||
Sun Life Financial, Inc. | 8,231 | 423,128 | ||||||
Suncor Energy, Inc. | 20,730 | 386,499 | ||||||
TC Energy Corp. | 14,152 | 670,838 | ||||||
Teck Resources Ltd., Class B | 7,094 | 159,715 | ||||||
TELUS Corp. | 6,980 | 160,573 | ||||||
Thomson Reuters Corp. | 2,559 | 298,538 | ||||||
TMX Group Ltd. | 789 | 86,664 | ||||||
Toromont Industries Ltd. | 1,346 | 112,993 | ||||||
Toronto-Dominion Bank | 24,760 | 1,605,339 | ||||||
West Fraser Timber Co. Ltd. | 1,235 | 95,211 | ||||||
Wheaton Precious Metals Corp. | 5,966 | 268,450 | ||||||
WSP Global, Inc. | 1,369 | 178,464 | ||||||
Yamana Gold, Inc. | 14,483 | 63,839 | ||||||
|
| |||||||
(Cost $22,364,427) | 27,960,020 | |||||||
|
| |||||||
| Chile — 0.0% | ||||||||
Antofagasta PLC | 5,547 | 111,152 | ||||||
|
| |||||||
| Denmark — 0.8% | ||||||||
A.P. Moller — Maersk A/S, Class A | 31 | 83,899 | ||||||
A.P. Moller — Maersk A/S, Class B | 87 | 246,782 | ||||||
Ambu A/S, Class B | 2,695 | 85,173 | ||||||
Carlsberg A/S, Class B | 1,393 | 243,118 | ||||||
Chr Hansen Holding A/S | 1,551 | 143,089 | ||||||
Coloplast A/S, Class B | 1,541 | 266,868 | ||||||
Danske Bank A/S | 8,660 | 145,505 | ||||||
Demant A/S* | 1,319 | 74,745 | ||||||
DSV PANALPINA A/S | 2,862 | 729,146 | ||||||
Genmab A/S* | 970 | 459,144 | ||||||
GN Store Nord AS | 1,758 | 132,244 | ||||||
Novo Nordisk A/S, Class B | 23,890 | 2,380,335 | ||||||
Novozymes A/S, Class B | 2,816 | 227,431 | ||||||
Orsted AS, 144A | 2,676 | 425,197 | ||||||
Pandora A/S | 1,480 | 177,134 | ||||||
ROCKWOOL International A/S, Class B | 99 | 52,377 | ||||||
Tryg A/S | 4,164 | 103,078 | ||||||
Vestas Wind Systems A/S | 14,581 | 588,577 | ||||||
|
| |||||||
(Cost $4,965,312) | 6,563,842 | |||||||
|
| |||||||
| Finland — 0.4% | ||||||||
Elisa OYJ | 2,557 | 163,719 | ||||||
Fortum OYJ | 6,646 | 201,781 | ||||||
Kesko OYJ, Class B | 3,236 | 133,545 | ||||||
Kone OYJ, Class B | 4,796 | 397,660 | ||||||
Neste OYJ | 6,160 | 374,777 | ||||||
Nokia OYJ* | 79,486 | 476,653 | ||||||
Nordea Bank Abp | 45,368 | 532,632 | ||||||
Orion OYJ, Class B | 1,567 | 63,872 | ||||||
Sampo OYJ, Class A | 7,366 | 380,328 | ||||||
Stora Enso OYJ, Class R | 7,116 | 139,231 | ||||||
UPM-Kymmene OYJ | 8,254 | 335,467 | ||||||
Wartsila OYJ Abp | 6,799 | 96,351 | ||||||
|
| |||||||
(Cost $2,725,027) | 3,296,016 | |||||||
|
| |||||||
| See Notes to Financial Statements. | 28 |
DBX ETF Trust
Schedule of Investments
Xtrackers MSCI Kokusai Equity ETF (Continued)
August 31, 2021
Number | Value | |||||||
| France — 3.4% | ||||||||
Accor SA* | 2,694 | $ | 92,733 | |||||
Aeroports de Paris* | 586 | 68,787 | ||||||
Air Liquide SA | 6,873 | 1,231,752 | ||||||
Airbus SE* | 8,568 | 1,170,202 | ||||||
Alstom SA (b) | 3,640 | 156,405 | ||||||
Amundi SA, 144A | 1,168 | 110,508 | ||||||
Arkema SA | 863 | 114,505 | ||||||
Atos SE | 1,552 | 80,537 | ||||||
AXA SA | 27,923 | 783,830 | ||||||
BioMerieux | 594 | 72,818 | ||||||
BNP Paribas SA | 15,772 | 1,000,349 | ||||||
Bollore SA | 16,573 | 98,014 | ||||||
Bouygues SA | 3,687 | 154,203 | ||||||
Bureau Veritas SA | 4,625 | 153,469 | ||||||
Capgemini SE | 2,260 | 507,286 | ||||||
Carrefour SA | 9,858 | 196,082 | ||||||
Cie de Saint-Gobain | 7,673 | 556,046 | ||||||
Cie Generale des Etablissements Michelin SCA | 2,431 | 393,289 | ||||||
CNP Assurances | 2,556 | 43,735 | ||||||
Covivio REIT | 821 | 78,036 | ||||||
Credit Agricole SA | 16,316 | 235,167 | ||||||
Danone SA | 9,375 | 684,698 | ||||||
Dassault Aviation SA | 40 | 45,093 | ||||||
Dassault Systemes SE | 9,290 | 529,731 | ||||||
Edenred | 3,145 | 178,201 | ||||||
Eiffage SA | 1,295 | 134,555 | ||||||
Electricite de France SA | 5,486 | 74,312 | ||||||
Engie SA | 25,691 | 367,927 | ||||||
EssilorLuxottica SA | 4,215 | 827,243 | ||||||
Eurazeo SE | 543 | 55,830 | ||||||
Faurecia SE | 1,218 | 58,719 | ||||||
Gecina SA REIT | 674 | 104,664 | ||||||
Getlink SE | 6,933 | 111,426 | ||||||
Hermes International | 438 | 643,453 | ||||||
Iliad SA | 238 | 51,132 | ||||||
Ipsen SA | 247 | 24,690 | ||||||
Kering SA | 1,084 | 862,456 | ||||||
Klepierre SA REIT* | 2,340 | 57,179 | ||||||
La Francaise des Jeux SAEM, 144A | 1,372 | 70,954 | ||||||
Legrand SA | 3,604 | 412,331 | ||||||
L’Oreal SA | 3,576 | 1,672,898 | ||||||
LVMH Moet Hennessy Louis Vuitton SE | 3,924 | 2,903,393 | ||||||
Orange SA | 30,976 | 351,762 | ||||||
Orpea SA | 950 | 119,544 | ||||||
Pernod Ricard SA | 2,978 | 625,562 | ||||||
Publicis Groupe SA | 3,082 | 201,990 | ||||||
Remy Cointreau SA* | 173 | 34,064 | ||||||
Renault SA* | 3,637 | 135,024 | ||||||
Safran SA | 4,541 | 569,599 | ||||||
Sanofi | 16,178 | 1,673,308 | ||||||
Sartorius Stedim Biotech | 390 | 236,449 | ||||||
Schneider Electric SE | 7,851 | 1,402,206 | ||||||
SCOR SE | 1,477 | 45,314 | ||||||
SEB SA | 293 | 46,070 | ||||||
Societe Generale SA | 11,082 | 348,629 | ||||||
Sodexo SA* | 955 | 78,936 | ||||||
Number | Value | |||||||
| France (Continued) | ||||||||
Suez SA | 4,717 | $ | 109,415 | |||||
Teleperformance | 794 | 350,917 | ||||||
Thales SA | 1,755 | 178,041 | ||||||
TotalEnergies SE (b) | 35,419 | 1,561,409 | ||||||
Ubisoft Entertainment SA* | 957 | 60,913 | ||||||
Unibail-Rodamco-Westfield REIT* | 1,620 | 141,895 | ||||||
Valeo | 3,092 | 87,891 | ||||||
Veolia Environnement SA | 8,816 | 302,319 | ||||||
Vinci SA | 7,475 | 802,002 | ||||||
Vivendi SE (b) | 9,849 | 375,761 | ||||||
Wendel SE | 413 | 59,917 | ||||||
Worldline SA, 144A* | 3,273 | 290,814 | ||||||
|
| |||||||
(Cost $22,154,343) | 27,358,389 | |||||||
|
| |||||||
| Germany — 2.7% | ||||||||
adidas AG | 2,703 | 958,663 | ||||||
Allianz SE | 5,799 | 1,362,105 | ||||||
BASF SE | 12,887 | 996,721 | ||||||
Bayer AG | 14,032 | 780,914 | ||||||
Bayerische Motoren Werke AG | 4,831 | 458,331 | ||||||
Bechtle AG | 1,089 | 78,699 | ||||||
Beiersdorf AG | 1,560 | 189,215 | ||||||
Brenntag SE | 2,557 | 257,893 | ||||||
Carl Zeiss Meditec AG | 412 | 90,995 | ||||||
Commerzbank AG* | 15,051 | 94,343 | ||||||
Continental AG* | 1,755 | 235,800 | ||||||
Covestro AG, 144A | 2,704 | 175,237 | ||||||
Daimler AG | 12,105 | 1,020,546 | ||||||
Delivery Hero SE, 144A* | 2,232 | 323,022 | ||||||
Deutsche Bank AG*(c) | 28,662 | 356,205 | ||||||
Deutsche Boerse AG | 2,626 | 452,890 | ||||||
Deutsche Lufthansa AG*(b) | 3,687 | 36,929 | ||||||
Deutsche Post AG | 14,284 | 1,004,612 | ||||||
Deutsche Telekom AG | 47,825 | 1,016,643 | ||||||
Deutsche Wohnen SE | 4,257 | 264,123 | ||||||
E.ON SE | 30,024 | 396,169 | ||||||
Evonik Industries AG | 2,100 | 70,898 | ||||||
Fresenius Medical Care AG & Co. KGaA | 2,716 | 208,525 | ||||||
Fresenius SE & Co. KGaA | 5,522 | 287,138 | ||||||
GEA Group AG | 2,900 | 133,886 | ||||||
Hannover Rueck SE | 975 | 179,489 | ||||||
HeidelbergCement AG | 2,182 | 189,575 | ||||||
HelloFresh SE* | 2,146 | 231,235 | ||||||
Henkel AG & Co. KGaA | 1,357 | 122,063 | ||||||
Infineon Technologies AG | 18,651 | 794,028 | ||||||
KION Group AG | 1,192 | 127,511 | ||||||
Knorr-Bremse AG | 786 | 94,314 | ||||||
LANXESS AG | 1,564 | 113,986 | ||||||
LEG Immobilien SE | 1,179 | 187,886 | ||||||
Merck KGaA | 1,834 | 435,587 | ||||||
MTU Aero Engines AG | 782 | 179,407 | ||||||
Muenchener Rueckversicherungs-Gesellschaft AG in Muenchen | 1,942 | 567,263 | ||||||
Nemetschek SE | 1,153 | 112,995 | ||||||
Puma SE | 1,423 | 172,682 | ||||||
Rational AG | 65 | 74,320 | ||||||
RWE AG | 9,052 | 353,581 | ||||||
| See Notes to Financial Statements. | 29 |
DBX ETF Trust
Schedule of Investments
Xtrackers MSCI Kokusai Equity ETF (Continued)
August 31, 2021
Number | Value | |||||||
| Germany (Continued) | ||||||||
SAP SE | 14,628 | $ | 2,200,933 | |||||
Scout24 AG, 144A | 1,536 | 129,098 | ||||||
Siemens AG | 10,797 | 1,795,052 | ||||||
Siemens Energy AG* | 5,546 | 160,920 | ||||||
Siemens Healthineers AG, 144A | 4,076 | 283,398 | ||||||
Symrise AG | 1,940 | 276,183 | ||||||
TeamViewer AG, 144A* | 1,931 | 64,303 | ||||||
Telefonica Deutschland Holding AG | 14,484 | 40,641 | ||||||
Uniper SE | 1,143 | 45,375 | ||||||
United Internet AG | 1,944 | 84,013 | ||||||
Volkswagen AG | 422 | 141,076 | ||||||
Vonovia SE | 7,867 | 530,822 | ||||||
Zalando SE, 144A*(b) | 2,910 | 322,214 | ||||||
|
| |||||||
(Cost $18,885,471) | 21,260,452 | |||||||
|
| |||||||
| Hong Kong — 0.9% | ||||||||
AIA Group Ltd. | 171,650 | 2,051,453 | ||||||
BOC Hong Kong Holdings Ltd. | 47,750 | 144,895 | ||||||
Budweiser Brewing Co. APAC Ltd., 144A | 27,602 | 69,064 | ||||||
Chow Tai Fook Jewellery Group Ltd. | 29,654 | 60,091 | ||||||
CK Asset Holdings Ltd. | 28,662 | 186,846 | ||||||
CK Hutchison Holdings Ltd. | 36,929 | 269,465 | ||||||
CK Infrastructure Holdings Ltd. | 14,218 | 86,379 | ||||||
CLP Holdings Ltd. | 22,503 | 224,962 | ||||||
ESR Cayman Ltd., 144A* | 19,616 | 59,776 | ||||||
Futu Holdings Ltd., ADR*(b) | 804 | 76,533 | ||||||
Galaxy Entertainment Group Ltd.* | 28,228 | 180,931 | ||||||
Hang Lung Properties Ltd. | 38,126 | 91,573 | ||||||
Hang Seng Bank Ltd. | 9,507 | 170,158 | ||||||
Henderson Land Development Co. Ltd. | 23,831 | 107,858 | ||||||
HKT Trust & HKT Ltd. (a) | 43,342 | 59,072 | ||||||
Hong Kong & China Gas Co. Ltd. | 137,104 | 220,710 | ||||||
Hong Kong Exchanges & Clearing Ltd. | 17,348 | 1,094,769 | ||||||
Hongkong Land Holdings Ltd. | 19,600 | 82,320 | ||||||
Jardine Matheson Holdings Ltd. | 2,451 | 133,138 | ||||||
Link REIT | 33,356 | 306,868 | ||||||
Melco Resorts & Entertainment Ltd., ADR* | 3,379 | 46,495 | ||||||
MTR Corp. Ltd. | 23,490 | 132,290 | ||||||
New World Development Co. Ltd. | 22,541 | 106,077 | ||||||
Power Assets Holdings Ltd. | 15,535 | 97,576 | ||||||
Sino Land Co. Ltd. | 69,626 | 102,595 | ||||||
SITC International Holdings Co. Ltd. | 20,666 | 90,079 | ||||||
Sun Hung Kai Properties Ltd. | 19,822 | 279,336 | ||||||
Swire Pacific Ltd., Class A | 8,342 | 56,526 | ||||||
Swire Properties Ltd. | 17,987 | 48,683 | ||||||
Techtronic Industries Co. Ltd. | 19,478 | 432,018 | ||||||
WH Group Ltd., 144A | 125,327 | 108,772 | ||||||
Wharf Real Estate Investment Co. Ltd. | 19,119 | 94,767 | ||||||
Xinyi Glass Holdings Ltd. | 22,888 | 96,233 | ||||||
|
| |||||||
(Cost $6,613,992) | 7,368,308 | |||||||
|
| |||||||
| Ireland — 1.2% | ||||||||
Accenture PLC, Class A | 8,940 | 3,008,846 | ||||||
Allegion PLC | 1,062 | 152,917 | ||||||
Aptiv PLC* | 3,942 | 599,933 | ||||||
CRH PLC | 11,515 | 612,224 | ||||||
Number | Value | |||||||
| Ireland (Continued) | ||||||||
DCC PLC | 1,363 | $ | 115,926 | |||||
Experian PLC | 12,657 | 558,111 | ||||||
Flutter Entertainment PLC* | 2,140 | 416,186 | ||||||
James Hardie Industries PLC CDI | 5,972 | 231,500 | ||||||
Jazz Pharmaceuticals PLC* | 785 | 103,392 | ||||||
Kerry Group PLC, Class A | 2,522 | 369,756 | ||||||
Kingspan Group PLC | 1,940 | 221,634 | ||||||
Medtronic PLC | 19,329 | 2,580,035 | ||||||
Smurfit Kappa Group PLC | 2,897 | 166,132 | ||||||
Trane Technologies PLC | 3,525 | 699,713 | ||||||
|
| |||||||
(Cost $7,574,947) | 9,836,305 | |||||||
|
| |||||||
| Israel — 0.2% | ||||||||
Azrieli Group Ltd. | 666 | 62,323 | ||||||
Bank Hapoalim BM | 13,744 | 118,360 | ||||||
Bank Leumi Le-Israel BM | 19,605 | 162,164 | ||||||
Check Point Software Technologies Ltd.* | 1,575 | 197,867 | ||||||
CyberArk Software Ltd.* | 791 | 132,841 | ||||||
Elbit Systems Ltd. | 585 | 85,182 | ||||||
ICL Group Ltd. | 10,245 | 72,558 | ||||||
Israel Discount Bank Ltd., Class A* | 16,675 | 86,244 | ||||||
Mizrahi Tefahot Bank Ltd. | 2,487 | 82,829 | ||||||
Nice Ltd.* | 958 | 279,827 | ||||||
SolarEdge Technologies, Inc.* | 705 | 204,295 | ||||||
Teva Pharmaceutical Industries Ltd., ADR* | 16,466 | 155,110 | ||||||
Wix.com Ltd.* | 783 | 173,889 | ||||||
|
| |||||||
(Cost $1,488,016) | 1,813,489 | |||||||
|
| |||||||
| Italy — 0.6% | ||||||||
Amplifon SpA | 1,652 | 86,351 | ||||||
Assicurazioni Generali SpA | 14,995 | 305,694 | ||||||
Atlantia SpA* | 5,770 | 108,128 | ||||||
Davide Campari-Milano NV | 7,404 | 102,346 | ||||||
DiaSorin SpA | 391 | 89,196 | ||||||
Enel SpA | 119,485 | 1,088,453 | ||||||
Eni SpA | 35,896 | 442,972 | ||||||
Ferrari NV | 1,939 | 420,470 | ||||||
FinecoBank Banca Fineco SpA* | 7,129 | 131,407 | ||||||
Infrastrutture Wireless Italiane SpA, 144A | 3,852 | 45,789 | ||||||
Intesa Sanpaolo SpA | 236,540 | 669,439 | ||||||
Mediobanca Banca di Credito Finanziario SpA* | 7,554 | 88,993 | ||||||
Moncler SpA | 2,898 | 185,415 | ||||||
Nexi SpA, 144A* | 5,174 | 107,770 | ||||||
Poste Italiane SpA, 144A | 9,824 | 133,189 | ||||||
Prysmian SpA | 4,041 | 152,026 | ||||||
Recordati Industria Chimica e Farmaceutica SpA | 1,751 | 114,841 | ||||||
Snam SpA | 34,731 | 205,155 | ||||||
Telecom Italia SpA | 132,008 | 59,729 | ||||||
Telecom Italia SpA-RSP | 115,409 | 55,706 | ||||||
Terna —Rete Elettrica Nazionale | 17,351 | 137,148 | ||||||
UniCredit SpA | 32,034 | 399,624 | ||||||
|
| |||||||
(Cost $4,397,834) | 5,129,841 | |||||||
|
| |||||||
| See Notes to Financial Statements. | 30 |
DBX ETF Trust
Schedule of Investments
Xtrackers MSCI Kokusai Equity ETF (Continued)
August 31, 2021
Number | Value | |||||||
| Jersey Island — 0.0% | ||||||||
Novocure Ltd.*(b) | 1,202 | $ | 161,321 | |||||
|
| |||||||
| Jordan — 0.0% | ||||||||
Hikma Pharmaceuticals PLC | 2,699 | 94,274 | ||||||
|
| |||||||
| Luxembourg — 0.1% | ||||||||
ArcelorMittal SA | 10,231 | 342,932 | ||||||
Aroundtown SA | 14,489 | 110,933 | ||||||
Eurofins Scientific SE | 1,950 | 276,410 | ||||||
Tenaris SA | 6,683 | 67,340 | ||||||
|
| |||||||
(Cost $466,786) | 797,615 | |||||||
|
| |||||||
| Macau — 0.0% | ||||||||
Sands China Ltd.* | 35,190 | 112,891 | ||||||
Wynn Macau Ltd.* | 43,813 | 49,348 | ||||||
|
| |||||||
(Cost $233,871) | 162,239 | |||||||
|
| |||||||
| Netherlands — 2.0% | ||||||||
ABN AMRO Bank NV, 144A* | 3,887 | 54,244 | ||||||
Adyen NV, 144A* | 278 | 897,368 | ||||||
Aegon NV | 32,537 | 161,085 | ||||||
Akzo Nobel NV | 2,527 | 311,425 | ||||||
Argenx SE* | 678 | 228,739 | ||||||
ASM International NV | 672 | 260,666 | ||||||
ASML Holding NV | 5,921 | 4,924,067 | ||||||
EXOR NV | 1,736 | 144,678 | ||||||
Heineken Holding NV | 1,949 | 180,605 | ||||||
Heineken NV | 3,740 | 409,260 | ||||||
ING Groep NV | 57,316 | 791,607 | ||||||
JDE Peet’s NV | 1,043 | 35,828 | ||||||
Just Eat Takeaway.com NV, 144A* | 2,555 | 231,391 | ||||||
Koninklijke Ahold Delhaize NV | 15,438 | 520,654 | ||||||
Koninklijke DSM NV | 2,355 | 501,088 | ||||||
Koninklijke KPN NV | 50,460 | 161,661 | ||||||
Koninklijke Philips NV | 13,084 | 602,973 | ||||||
Koninklijke Vopak NV | 494 | 21,384 | ||||||
NN Group NV | 4,406 | 228,691 | ||||||
NXP Semiconductors NV | 3,771 | 811,255 | ||||||
Prosus NV* | 13,254 | 1,171,863 | ||||||
QIAGEN NV* | 3,881 | 214,727 | ||||||
Randstad NV | 1,948 | 143,260 | ||||||
Royal Dutch Shell PLC, Class A | 57,511 | 1,133,105 | ||||||
Royal Dutch Shell PLC, Class B | 50,581 | 996,149 | ||||||
Stellantis NV | 28,320 | 566,043 | ||||||
Wolters Kluwer NV | 3,691 | 424,463 | ||||||
|
| |||||||
(Cost $11,158,248) | 16,128,279 | |||||||
|
| |||||||
| New Zealand — 0.1% | ||||||||
a2 Milk Co. Ltd.* | 9,630 | 40,872 | ||||||
Auckland International Airport Ltd.* | 21,315 | 108,168 | ||||||
Fisher & Paykel Healthcare Corp. Ltd. | 7,337 | 170,933 | ||||||
Mercury NZ Ltd. | 11,753 | 55,011 | ||||||
Meridian Energy Ltd. | 26,853 | 99,228 | ||||||
Ryman Healthcare Ltd. | 4,771 | 51,983 | ||||||
Spark New Zealand Ltd. | 30,028 | 103,034 | ||||||
Xero Ltd.* | 1,569 | 174,093 | ||||||
|
| |||||||
(Cost $818,189) | 803,322 | |||||||
|
| |||||||
Number | Value | |||||||
| Norway — 0.2% | ||||||||
Adevinta ASA* | 2,334 | $ | 46,919 | |||||
DNB Bank ASA | 12,926 | 272,616 | ||||||
Equinor ASA | 13,344 | 283,179 | ||||||
Gjensidige Forsikring ASA | 2,417 | 56,445 | ||||||
Mowi ASA | 5,770 | 154,369 | ||||||
Norsk Hydro ASA | 22,192 | 153,005 | ||||||
Orkla ASA | 11,772 | 105,045 | ||||||
Schibsted ASA, Class A | 1,145 | 61,029 | ||||||
Schibsted ASA, Class B | 1,317 | 61,210 | ||||||
Telenor ASA | 10,615 | 185,770 | ||||||
Yara International ASA | 1,940 | 97,297 | ||||||
|
| |||||||
(Cost $1,185,728) | 1,476,884 | |||||||
|
| |||||||
| Poland — 0.0% | ||||||||
InPost SA* | 2,987 | 58,179 | ||||||
|
| |||||||
| Portugal — 0.0% | ||||||||
EDP — Energias de Portugal SA | 43,752 | 240,262 | ||||||
Galp Energia SGPS SA | 5,173 | 52,967 | ||||||
Jeronimo Martins SGPS SA | 1,912 | 40,514 | ||||||
|
| |||||||
(Cost $311,942) | 333,743 | |||||||
|
| |||||||
| Singapore — 0.4% | ||||||||
Ascendas Real Estate Investment Trust REIT | 41,279 | 93,293 | ||||||
CapitaLand Integrated Commercial Trust REIT | 72,004 | 110,273 | ||||||
CapitaLand Ltd. | 44,302 | 131,743 | ||||||
City Developments Ltd. | 9,800 | 49,834 | ||||||
DBS Group Holdings Ltd. | 25,307 | 563,862 | ||||||
Genting Singapore Ltd. | 38,000 | 21,612 | ||||||
Keppel Corp. Ltd. | 19,800 | 76,544 | ||||||
Mapletree Commercial Trust REIT | 30,800 | 46,483 | ||||||
Mapletree Logistics Trust REIT | 60,264 | 90,949 | ||||||
Oversea-Chinese Banking Corp. Ltd. | 45,185 | 383,960 | ||||||
Sea Ltd., ADR* | 1,038 | 351,176 | ||||||
Singapore Airlines Ltd.* | 20,950 | 78,810 | ||||||
Singapore Exchange Ltd. | 9,431 | 69,413 | ||||||
Singapore Technologies Engineering Ltd. | 21,102 | 59,301 | ||||||
Singapore Telecommunications Ltd. | 135,700 | 234,053 | ||||||
United Overseas Bank Ltd. | 16,901 | 321,409 | ||||||
UOL Group Ltd. | 5,901 | 30,709 | ||||||
Venture Corp. Ltd. | 4,056 | 57,775 | ||||||
Wilmar International Ltd. | 36,800 | 113,264 | ||||||
|
| |||||||
(Cost $2,488,486) | 2,884,463 | |||||||
|
| |||||||
| Spain — 0.7% | ||||||||
ACS Actividades de Construccion y Servicios SA | 2,892 | 78,041 | ||||||
Aena SME SA, 144A* | 976 | 155,767 | ||||||
Amadeus IT Group SA* | 6,680 | 407,833 | ||||||
Banco Bilbao Vizcaya Argentaria SA* | 97,386 | 637,680 | ||||||
Banco Santander SA* | 249,842 | 922,382 | ||||||
CaixaBank SA | 51,052 | 158,616 | ||||||
Cellnex Telecom SA, 144A* | 6,975 | 477,551 | ||||||
EDP Renovaveis SA | 3,934 | 104,580 | ||||||
Enagas SA | 3,663 | 83,302 | ||||||
| See Notes to Financial Statements. | 31 |
DBX ETF Trust
Schedule of Investments
Xtrackers MSCI Kokusai Equity ETF (Continued)
August 31, 2021
Number | Value | |||||||
| Spain (Continued) | ||||||||
Endesa SA | 4,485 | $ | 107,792 | |||||
Ferrovial SA | 7,877 | 227,997 | ||||||
Grifols SA (b) | 4,794 | 117,086 | ||||||
Iberdrola SA | 79,633 | 986,560 | ||||||
Industria de Diseno Textil SA | 15,430 | 526,577 | ||||||
Naturgy Energy Group SA (b) | 4,638 | 119,354 | ||||||
Red Electrica Corp. SA | 5,503 | 109,718 | ||||||
Repsol SA | 21,117 | 241,922 | ||||||
Siemens Gamesa Renewable Energy SA* | 2,715 | 80,476 | ||||||
Telefonica SA (b) | 71,512 | 352,987 | ||||||
|
| |||||||
(Cost $4,996,436) | 5,896,221 | |||||||
|
| |||||||
| Sweden — 1.1% | ||||||||
Alfa Laval AB | 4,664 | 188,965 | ||||||
Assa Abloy AB, Class B | 13,917 | 444,318 | ||||||
Atlas Copco AB, Class A | 9,613 | 659,217 | ||||||
Atlas Copco AB, Class B | 5,537 | 319,965 | ||||||
Autoliv, Inc. | 1,343 | 118,708 | ||||||
Boliden AB | 4,445 | 154,827 | ||||||
Electrolux AB, Series B | 3,061 | 77,458 | ||||||
Embracer Group AB* | 2,731 | 61,900 | ||||||
Epiroc AB, Class A | 9,674 | 212,044 | ||||||
Epiroc AB, Class B | 6,338 | 120,287 | ||||||
EQT AB | 3,357 | 170,868 | ||||||
Essity AB, Class B | 7,488 | 239,931 | ||||||
Evolution AB, 144A | 2,335 | 375,821 | ||||||
Fastighets AB Balder, Class B* | 1,102 | 78,683 | ||||||
H & M Hennes & Mauritz AB, Class B* | 11,647 | 233,192 | ||||||
Hexagon AB, Class B | 26,957 | 466,516 | ||||||
Husqvarna AB, Class B | 8,624 | 115,554 | ||||||
ICA Gruppen AB | 1,646 | 81,798 | ||||||
Industrivarden AB, Class A | 1,774 | 65,221 | ||||||
Industrivarden AB, Class C | 2,399 | 83,534 | ||||||
Investment AB Latour, Class B | 1,763 | 61,286 | ||||||
Investor AB, Class B | 26,111 | 623,860 | ||||||
Kinnevik AB, Class B* | 3,472 | 135,887 | ||||||
L E Lundbergforetagen AB, Class B | 868 | 55,344 | ||||||
Lundin Energy AB | 3,507 | 107,013 | ||||||
Nibe Industrier AB, Class B | 17,815 | 248,088 | ||||||
Sandvik AB | 15,230 | 387,861 | ||||||
Securitas AB, Class B | 2,889 | 47,907 | ||||||
Sinch AB, 144A* | 7,152 | 160,283 | ||||||
Skandinaviska Enskilda Banken AB, Class A | 24,224 | 325,000 | ||||||
Skanska AB, Class B | 3,878 | 111,555 | ||||||
SKF AB, Class B | 4,418 | 112,513 | ||||||
Svenska Cellulosa AB SCA, Class B | 8,083 | 142,457 | ||||||
Svenska Handelsbanken AB, Class A | 19,251 | 216,296 | ||||||
Swedbank AB, Class A | 13,035 | 251,416 | ||||||
Swedish Match AB | 23,511 | 216,857 | ||||||
Tele2 AB, Class B | 7,596 | 113,738 | ||||||
Telefonaktiebolaget LM Ericsson, Class B | 42,780 | 506,606 | ||||||
Telia Co. AB | 35,331 | 151,489 | ||||||
Volvo AB, Class A | 2,382 | 55,120 | ||||||
Volvo AB, Class B | 19,601 | 442,770 | ||||||
|
| |||||||
(Cost $7,015,543) | 8,742,153 | |||||||
|
| |||||||
Number | Value | |||||||
| Switzerland — 3.5% | ||||||||
ABB Ltd. | 24,593 | $ | 910,643 | |||||
Adecco Group AG | 1,954 | 108,744 | ||||||
Alcon, Inc. | 6,680 | 550,122 | ||||||
Baloise Holding AG | 661 | 105,422 | ||||||
Banque Cantonale Vaudoise | 444 | 37,660 | ||||||
Barry Callebaut AG | 53 | 135,038 | ||||||
Chocoladefabriken Lindt & Spruengli AG | 1 | 122,155 | ||||||
Chocoladefabriken Lindt & Spruengli AG Participation Certificates | 12 | 141,084 | ||||||
Chubb Ltd. | 6,568 | 1,207,987 | ||||||
Cie Financiere Richemont SA, Class A | 7,666 | 845,222 | ||||||
Clariant AG* | 2,278 | 47,945 | ||||||
Coca-Cola HBC AG* | 2,144 | 77,573 | ||||||
Credit Suisse Group AG | 36,643 | 388,571 | ||||||
EMS-Chemie Holding AG | 114 | 123,514 | ||||||
Garmin Ltd. | 1,959 | 341,708 | ||||||
Geberit AG | 525 | 438,546 | ||||||
Givaudan SA | 128 | 642,061 | ||||||
Glencore PLC* | 144,388 | 650,590 | ||||||
Holcim Ltd.* | 7,867 | 448,291 | ||||||
Julius Baer Group Ltd. | 3,687 | 251,958 | ||||||
Kuehne + Nagel International AG | 821 | 300,330 | ||||||
Logitech International SA | 2,320 | 237,154 | ||||||
Lonza Group AG | 1,010 | 854,484 | ||||||
Nestle SA | 40,696 | 5,141,810 | ||||||
Novartis AG | 31,830 | 2,946,199 | ||||||
Partners Group Holding AG | 323 | 572,624 | ||||||
Roche Holding AG | 9,845 | 3,952,294 | ||||||
Roche Holding AG | 460 | 205,884 | ||||||
Schindler Holding AG | 381 | 118,786 | ||||||
Schindler Holding AG Participation Certificates | 586 | 189,224 | ||||||
SGS SA | 87 | 273,332 | ||||||
Sika AG | 1,940 | 699,082 | ||||||
Sonova Holding AG | 782 | 301,344 | ||||||
STMicroelectronics NV | 9,572 | 426,152 | ||||||
Straumann Holding AG | 147 | 284,035 | ||||||
Swatch Group AG — Bearer | 386 | 108,799 | ||||||
Swatch Group AG — Registered | 992 | 54,525 | ||||||
Swiss Life Holding AG | 391 | 203,855 | ||||||
Swiss Prime Site AG | 965 | 103,184 | ||||||
Swiss Re AG | 4,200 | 386,324 | ||||||
Swisscom AG | 388 | 227,620 | ||||||
TE Connectivity Ltd. | 4,855 | 729,318 | ||||||
Temenos AG | 885 | 140,472 | ||||||
UBS Group AG | 52,624 | 877,785 | ||||||
Vifor Pharma AG | 561 | 79,858 | ||||||
Zurich Insurance Group AG | 2,119 | 929,903 | ||||||
|
| |||||||
(Cost $23,486,884) | 27,919,211 | |||||||
|
| |||||||
| United Kingdom — 4.4% | ||||||||
3i Group PLC | 15,624 | 287,596 | ||||||
Abrdn PLC | 23,681 | 86,529 | ||||||
Admiral Group PLC | 2,896 | 143,921 | ||||||
Amcor PLC | 23,131 | 297,233 | ||||||
Anglo American PLC | 17,831 | 753,130 | ||||||
Ashtead Group PLC | 5,889 | 461,160 | ||||||
| See Notes to Financial Statements. | 32 |
DBX ETF Trust
Schedule of Investments
Xtrackers MSCI Kokusai Equity ETF (Continued)
August 31, 2021
Number | Value | |||||||
| United Kingdom (Continued) | ||||||||
Associated British Foods PLC | 5,739 | $ | 156,386 | |||||
AstraZeneca PLC | 21,996 | 2,577,358 | ||||||
Auto Trader Group PLC, 144A | 14,443 | 125,027 | ||||||
AVEVA Group PLC | 1,386 | 78,893 | ||||||
Aviva PLC | 62,224 | 346,054 | ||||||
BAE Systems PLC | 49,570 | 387,767 | ||||||
Barclays PLC | 252,546 | 642,650 | ||||||
Barratt Developments PLC | 13,344 | 135,715 | ||||||
Berkeley Group Holdings PLC* | 1,684 | 111,871 | ||||||
BP PLC | 289,597 | 1,183,518 | ||||||
British American Tobacco PLC | 30,500 | 1,145,515 | ||||||
British Land Co. PLC REIT | 12,739 | 92,955 | ||||||
BT Group PLC* | 135,840 | 317,441 | ||||||
Bunzl PLC | 5,364 | 194,595 | ||||||
Burberry Group PLC | 4,986 | 127,599 | ||||||
Clarivate PLC* | 4,997 | 125,874 | ||||||
CNH Industrial NV | 13,352 | 220,659 | ||||||
Coca-Cola Europacific Partners PLC | 2,788 | 160,979 | ||||||
Compass Group PLC* | 24,601 | 508,026 | ||||||
Croda International PLC | 1,935 | 243,615 | ||||||
Diageo PLC | 33,824 | 1,626,467 | ||||||
Direct Line Insurance Group PLC | 24,352 | 103,560 | ||||||
Entain PLC* | 8,466 | 225,220 | ||||||
Evraz PLC | 7,251 | 58,917 | ||||||
Ferguson PLC | 3,125 | 451,797 | ||||||
GlaxoSmithKline PLC | 71,661 | 1,441,875 | ||||||
Halma PLC | 5,051 | 208,752 | ||||||
Hargreaves Lansdown PLC | 4,835 | 100,378 | ||||||
HSBC Holdings PLC | 293,824 | 1,561,698 | ||||||
IHS Markit Ltd. | 5,507 | 664,144 | ||||||
Imperial Brands PLC | 12,331 | 261,601 | ||||||
Informa PLC* | 18,090 | 132,200 | ||||||
InterContinental Hotels Group PLC* | 2,751 | 175,408 | ||||||
Intertek Group PLC | 2,558 | 185,528 | ||||||
J Sainsbury PLC | 25,350 | 106,059 | ||||||
JD Sports Fashion PLC | 8,986 | 124,845 | ||||||
Johnson Matthey PLC | 3,284 | 132,831 | ||||||
Kingfisher PLC | 24,146 | 116,408 | ||||||
Land Securities Group PLC REIT | 7,141 | 69,679 | ||||||
Legal & General Group PLC | 94,691 | 352,121 | ||||||
Liberty Global PLC, Class A* | 1,241 | 35,666 | ||||||
Liberty Global PLC, Class C* | 5,866 | 169,997 | ||||||
Linde PLC | 7,315 | 2,301,226 | ||||||
Lloyds Banking Group PLC | 1,029,371 | 620,148 | ||||||
London Stock Exchange Group PLC | 4,352 | 476,520 | ||||||
M&G PLC | 39,372 | 111,623 | ||||||
Melrose Industries PLC | 60,222 | 139,024 | ||||||
Mondi PLC | 7,712 | 212,804 | ||||||
National Grid PLC | 51,662 | 669,263 | ||||||
Natwest Group PLC | 69,577 | 204,055 | ||||||
Next PLC | 1,937 | 210,864 | ||||||
Ocado Group PLC* | 7,067 | 195,784 | ||||||
Pearson PLC | 11,213 | 118,455 | ||||||
Pentair PLC (b) | 2,325 | 179,397 | ||||||
Persimmon PLC | 4,418 | 178,760 | ||||||
Phoenix Group Holdings PLC | 6,436 | 55,218 | ||||||
Prudential PLC | 36,698 | 765,160 | ||||||
Number | Value | |||||||
| United Kingdom (Continued) | ||||||||
Reckitt Benckiser Group PLC | 10,168 | $ | 775,112 | |||||
RELX PLC | 26,719 | 802,366 | ||||||
Rentokil Initial PLC | 29,521 | 235,807 | ||||||
Rio Tinto PLC | 15,402 | 1,140,823 | ||||||
Rolls-Royce Holdings PLC* | 121,862 | 192,635 | ||||||
Sage Group PLC | 12,780 | 130,542 | ||||||
Schroders PLC | 2,320 | 120,692 | ||||||
Segro PLC REIT | 15,312 | 270,579 | ||||||
Severn Trent PLC | 3,848 | 146,270 | ||||||
Smith & Nephew PLC | 13,839 | 265,691 | ||||||
Smiths Group PLC | 6,347 | 126,003 | ||||||
Spirax-Sarco Engineering PLC | 921 | 204,199 | ||||||
SSE PLC | 13,420 | 301,511 | ||||||
St James’s Place PLC | 7,719 | 171,035 | ||||||
Standard Chartered PLC | 34,190 | 214,002 | ||||||
Taylor Wimpey PLC | 45,377 | 114,221 | ||||||
Tesco PLC | 113,723 | 399,339 | ||||||
Unilever PLC | 37,066 | 2,063,949 | ||||||
United Utilities Group PLC | 9,173 | 133,502 | ||||||
Vodafone Group PLC | 387,302 | 650,077 | ||||||
Whitbread PLC* | 2,894 | 127,770 | ||||||
Willis Towers Watson PLC | 1,930 | 425,990 | ||||||
Wm Morrison Supermarkets PLC | 26,702 | 106,571 | ||||||
WPP PLC | 17,317 | 234,417 | ||||||
|
| |||||||
(Cost $29,808,529) | 35,008,621 | |||||||
|
| |||||||
| United States — 70.5% | ||||||||
10X Genomics, Inc., Class A* | 825 | 145,134 | ||||||
3M Co. | 8,298 | 1,615,953 | ||||||
A O Smith Corp. | 1,940 | 141,077 | ||||||
Abbott Laboratories | 25,201 | 3,184,650 | ||||||
AbbVie, Inc. | 24,907 | 3,008,267 | ||||||
ABIOMED, Inc.* | 589 | 214,372 | ||||||
Activision Blizzard, Inc. | 11,011 | 906,976 | ||||||
Adobe, Inc.* | 6,768 | 4,491,922 | ||||||
Advance Auto Parts, Inc. | 976 | 197,982 | ||||||
Advanced Micro Devices, Inc.* | 17,359 | 1,921,988 | ||||||
AES Corp. | 9,707 | 231,706 | ||||||
Aflac, Inc. | 9,419 | 533,869 | ||||||
Agilent Technologies, Inc. | 4,344 | 762,242 | ||||||
AGNC Investment Corp. REIT | 6,325 | 103,161 | ||||||
Air Products and Chemicals, Inc. | 3,095 | 834,133 | ||||||
Airbnb, Inc., Class A* | 1,735 | 268,908 | ||||||
Akamai Technologies, Inc.* | 2,535 | 287,089 | ||||||
Albemarle Corp. | 1,719 | 406,956 | ||||||
Alexandria Real Estate Equities, Inc. REIT | 1,949 | 402,215 | ||||||
Align Technology, Inc.* | 1,083 | 767,847 | ||||||
Alleghany Corp.* | 197 | 133,308 | ||||||
Alliant Energy Corp. | 3,707 | 225,349 | ||||||
Allstate Corp. | 3,934 | 532,192 | ||||||
Ally Financial, Inc. | 5,619 | 297,245 | ||||||
Alnylam Pharmaceuticals, Inc.* | 1,755 | 353,510 | ||||||
Alphabet, Inc., Class A* | 4,266 | 12,345,591 | ||||||
Alphabet, Inc., Class C* | 4,127 | 12,006,433 | ||||||
Altice USA, Inc., Class A* | 2,995 | 82,183 | ||||||
Altria Group, Inc. | 26,970 | 1,354,703 | ||||||
Amazon.com, Inc.* | 6,431 | 22,320,650 | ||||||
| See Notes to Financial Statements. | 33 |
DBX ETF Trust
Schedule of Investments
Xtrackers MSCI Kokusai Equity ETF (Continued)
August 31, 2021
Number | Value | |||||||
| United States (Continued) | ||||||||
AMC Entertainment Holdings, Inc., Class A* | 7,150 | $ | 336,979 | |||||
AMERCO | 93 | 61,487 | ||||||
Ameren Corp. | 3,858 | 338,424 | ||||||
American Electric Power Co., Inc. | 6,910 | 618,929 | ||||||
American Express Co. | 9,632 | 1,598,527 | ||||||
American Financial Group, Inc. | 1,017 | 140,285 | ||||||
American International Group, Inc. | 12,161 | 663,504 | ||||||
American Tower Corp. REIT | 6,337 | 1,851,481 | ||||||
American Water Works Co., Inc. | 2,729 | 497,360 | ||||||
Ameriprise Financial, Inc. | 1,760 | 480,322 | ||||||
AmerisourceBergen Corp. | 2,110 | 257,863 | ||||||
AMETEK, Inc. | 3,552 | 482,965 | ||||||
Amgen, Inc. | 8,002 | 1,804,691 | ||||||
Amphenol Corp., Class A | 8,072 | 618,557 | ||||||
Analog Devices, Inc. | 7,703 | 1,255,204 | ||||||
Annaly Capital Management, Inc. REIT | 20,580 | 178,840 | ||||||
ANSYS, Inc.* | 1,164 | 425,279 | ||||||
Anthem, Inc. | 3,544 | 1,329,461 | ||||||
Aon PLC, Class A (b) | 3,334 | 956,391 | ||||||
Apollo Global Management, Inc. (b) | 2,528 | 151,124 | ||||||
Apple, Inc. | 236,487 | 35,905,821 | ||||||
Applied Materials, Inc. | 13,122 | 1,773,176 | ||||||
Aramark | 3,107 | 108,093 | ||||||
Archer-Daniels-Midland Co. | 7,799 | 467,940 | ||||||
Arista Networks, Inc.* | 785 | 290,081 | ||||||
Arrow Electronics, Inc.* | 1,179 | 142,918 | ||||||
Arthur J Gallagher & Co. | 2,946 | 423,105 | ||||||
Assurant, Inc. | 787 | 133,877 | ||||||
AT&T, Inc. | 98,607 | 2,703,804 | ||||||
Atmos Energy Corp. | 1,561 | 152,213 | ||||||
Autodesk, Inc.* | 3,236 | 1,003,451 | ||||||
Automatic Data Processing, Inc. | 6,194 | 1,294,794 | ||||||
AutoZone, Inc.* | 312 | 483,335 | ||||||
Avalara, Inc.* | 1,286 | 231,094 | ||||||
AvalonBay Communities, Inc. REIT | 2,145 | 492,449 | ||||||
Avantor, Inc.* | 6,978 | 275,212 | ||||||
Avery Dennison Corp. | 1,072 | 241,618 | ||||||
Baker Hughes Co. | 10,941 | 249,236 | ||||||
Ball Corp. | 5,052 | 484,790 | ||||||
Bank of America Corp. | 108,600 | 4,534,050 | ||||||
Bank of New York Mellon Corp. | 11,994 | 662,309 | ||||||
Bath & Body Works, Inc. | 3,337 | 225,181 | ||||||
Bausch Health Cos., Inc.* | 5,053 | 146,993 | ||||||
Baxter International, Inc. | 7,105 | 541,543 | ||||||
Becton Dickinson and Co. | 4,279 | 1,077,024 | ||||||
Bentley Systems, Inc., Class B (b) | 2,491 | 160,645 | ||||||
Berkshire Hathaway, Inc., Class B* | 18,589 | 5,312,179 | ||||||
Best Buy Co., Inc. | 3,329 | 387,862 | ||||||
Biogen, Inc.* | 2,104 | 713,067 | ||||||
BioMarin Pharmaceutical, Inc.* | 2,728 | 229,725 | ||||||
Bio-Rad Laboratories, Inc., Class A* | 326 | 262,371 | ||||||
Bio-Techne Corp. | 541 | 270,035 | ||||||
Black Knight, Inc.* | 2,534 | 191,748 | ||||||
BlackRock, Inc. | 2,135 | 2,013,924 | ||||||
Blackstone, Inc. | 9,445 | 1,187,520 | ||||||
Boeing Co.* | 7,873 | 1,728,123 | ||||||
Number | Value | |||||||
| United States (Continued) | ||||||||
Booking Holdings, Inc.* | 586 | $ | 1,347,607 | |||||
Booz Allen Hamilton Holding Corp. | 2,156 | 176,598 | ||||||
BorgWarner, Inc. | 2,947 | 125,778 | ||||||
Boston Beer Co., Inc., Class A*(b) | 132 | 75,268 | ||||||
Boston Properties, Inc. REIT | 1,953 | 220,669 | ||||||
Boston Scientific Corp.* | 20,471 | 924,266 | ||||||
Bristol-Myers Squibb Co. | 31,810 | 2,126,817 | ||||||
Broadcom, Inc. | 5,806 | 2,886,801 | ||||||
Broadridge Financial Solutions, Inc. | 1,604 | 276,241 | ||||||
Brookfield Renewable Corp., Class A | 1,192 | 52,155 | ||||||
Brown & Brown, Inc. | 2,689 | 156,096 | ||||||
Brown-Forman Corp., Class B | 4,663 | 327,436 | ||||||
Bunge Ltd. | 2,114 | 160,051 | ||||||
Burlington Stores, Inc.* | 981 | 293,800 | ||||||
C.H. Robinson Worldwide, Inc. | 1,824 | 164,269 | ||||||
Cable One, Inc. | 67 | 140,673 | ||||||
Cadence Design Systems, Inc.* | 3,857 | 630,542 | ||||||
Caesars Entertainment, Inc.* | 2,977 | 302,553 | ||||||
Camden Property Trust REIT | 1,351 | 202,704 | ||||||
Campbell Soup Co. | 3,111 | 129,822 | ||||||
Capital One Financial Corp. | 6,317 | 1,048,432 | ||||||
Cardinal Health, Inc. | 4,663 | 244,761 | ||||||
Carlyle Group, Inc. | 1,588 | 78,415 | ||||||
CarMax, Inc.* | 2,186 | 273,709 | ||||||
Carnival Corp.*(b) | 11,629 | 280,724 | ||||||
Carrier Global Corp. | 11,125 | 640,800 | ||||||
Carvana Co.*(b) | 1,047 | 343,479 | ||||||
Catalent, Inc.* | 2,158 | 281,490 | ||||||
Caterpillar, Inc. | 7,906 | 1,667,138 | ||||||
Cboe Global Markets, Inc. | 1,568 | 197,803 | ||||||
CBRE Group, Inc., Class A* | 4,475 | 430,942 | ||||||
CDW Corp. | 2,072 | 415,664 | ||||||
Celanese Corp. | 1,514 | 240,120 | ||||||
Centene Corp.* | 8,007 | 504,281 | ||||||
CenterPoint Energy, Inc. (b) | 7,832 | 196,505 | ||||||
Ceridian HCM Holding, Inc.* | 1,809 | 203,241 | ||||||
Cerner Corp. | 4,063 | 310,210 | ||||||
CF Industries Holdings, Inc. | 2,952 | 134,080 | ||||||
Charles River Laboratories International, Inc.* | 711 | 315,584 | ||||||
Charles Schwab Corp. | 20,789 | 1,514,479 | ||||||
Charter Communications, Inc., Class A*(b) | 1,855 | 1,514,904 | ||||||
Cheniere Energy, Inc.* | 3,109 | 271,913 | ||||||
Chevron Corp. | 27,575 | 2,668,433 | ||||||
Chewy, Inc., Class A*(b) | 1,063 | 93,672 | ||||||
Chipotle Mexican Grill, Inc.* | 390 | 742,299 | ||||||
Church & Dwight Co., Inc. | 3,858 | 322,760 | ||||||
Cigna Corp. | 4,830 | 1,022,269 | ||||||
Cincinnati Financial Corp. | 2,351 | 290,113 | ||||||
Cintas Corp. | 1,365 | 540,226 | ||||||
Cisco Systems, Inc. | 59,825 | 3,530,871 | ||||||
Citigroup, Inc. | 28,706 | 2,064,248 | ||||||
Citizens Financial Group, Inc. | 5,569 | 243,867 | ||||||
Citrix Systems, Inc. | 1,911 | 196,585 | ||||||
Clorox Co. | 1,644 | 276,274 | ||||||
Cloudflare, Inc., Class A* | 2,993 | 361,375 | ||||||
| See Notes to Financial Statements. | 34 |
DBX ETF Trust
Schedule of Investments
Xtrackers MSCI Kokusai Equity ETF (Continued)
August 31, 2021
Number | Value | |||||||
| United States (Continued) | ||||||||
CME Group, Inc. | 5,204 | $ | 1,049,751 | |||||
CMS Energy Corp. | 4,250 | 272,552 | ||||||
Coca-Cola Co. | 58,372 | 3,286,927 | ||||||
Cognex Corp. | 2,766 | 245,123 | ||||||
Cognizant Technology Solutions Corp., Class A | 7,714 | 588,655 | ||||||
Colgate-Palmolive Co. | 11,073 | 863,140 | ||||||
Comcast Corp., Class A | 64,978 | 3,942,865 | ||||||
Conagra Brands, Inc. | 7,518 | 248,996 | ||||||
ConocoPhillips | 17,916 | 994,875 | ||||||
Consolidated Edison, Inc. | 4,574 | 345,108 | ||||||
Constellation Brands, Inc., Class A | 2,267 | 478,654 | ||||||
Cooper Cos., Inc. | 704 | 317,300 | ||||||
Copart, Inc.* | 2,994 | 432,094 | ||||||
Corning, Inc. | 11,541 | 461,525 | ||||||
Corteva, Inc. | 10,940 | 481,032 | ||||||
CoStar Group, Inc.* | 5,850 | 495,729 | ||||||
Costco Wholesale Corp. | 6,296 | 2,867,765 | ||||||
Coupa Software, Inc.*(b) | 969 | 237,221 | ||||||
Crowdstrike Holdings, Inc., Class A* | 2,738 | 769,378 | ||||||
Crown Castle International Corp. REIT | 6,060 | 1,179,821 | ||||||
Crown Holdings, Inc. | 1,866 | 204,868 | ||||||
CSX Corp. | 31,731 | 1,032,209 | ||||||
Cummins, Inc. | 2,122 | 500,750 | ||||||
CVS Health Corp. | 18,561 | 1,603,485 | ||||||
D.R. Horton, Inc. | 4,778 | 456,872 | ||||||
Danaher Corp. | 9,098 | 2,949,208 | ||||||
Darden Restaurants, Inc. | 1,823 | 274,635 | ||||||
Datadog, Inc., Class A* | 2,795 | 385,151 | ||||||
DaVita, Inc.* | 928 | 121,355 | ||||||
Deere & Co. | 4,252 | 1,607,384 | ||||||
Dell Technologies, Inc., Class C* | 3,571 | 348,030 | ||||||
Delta Air Lines, Inc.* | 2,708 | 109,512 | ||||||
DENTSPLY SIRONA, Inc. | 2,992 | 184,606 | ||||||
Devon Energy Corp. | 8,736 | 258,149 | ||||||
Dexcom, Inc.* | 1,364 | 722,129 | ||||||
Digital Realty Trust, Inc. REIT | 4,216 | 691,045 | ||||||
Discover Financial Services | 4,479 | 574,297 | ||||||
Discovery, Inc., Class A*(b) | 2,625 | 75,705 | ||||||
Discovery, Inc., Class C* | 3,961 | 109,284 | ||||||
DISH Network Corp., Class A* | 3,711 | 161,762 | ||||||
DocuSign, Inc.* | 2,784 | 824,732 | ||||||
Dollar General Corp. | 3,424 | 763,244 | ||||||
Dollar Tree, Inc.* | 3,331 | 301,589 | ||||||
Dominion Energy, Inc. | 11,203 | 872,042 | ||||||
Domino’s Pizza, Inc. | 585 | 302,381 | ||||||
DoorDash, Inc., Class A* | 1,030 | 197,142 | ||||||
Dover Corp. | 1,840 | 320,822 | ||||||
Dow, Inc. | 10,796 | 679,068 | ||||||
DraftKings, Inc., Class A*(b) | 4,582 | 271,667 | ||||||
Dropbox, Inc., Class A* | 3,707 | 117,549 | ||||||
DTE Energy Co. | 2,922 | 351,633 | ||||||
Duke Energy Corp. | 10,996 | 1,150,841 | ||||||
Duke Realty Corp. REIT | 5,001 | 262,603 | ||||||
DuPont de Nemours, Inc. | 7,981 | 590,754 | ||||||
Dynatrace, Inc.* | 2,154 | 148,044 | ||||||
Eastman Chemical Co. | 1,930 | 218,399 | ||||||
Number | Value | |||||||
| United States (Continued) | ||||||||
Eaton Corp. PLC | 5,430 | $ | 914,195 | |||||
eBay, Inc. | 9,575 | 734,785 | ||||||
Ecolab, Inc. | 3,330 | 750,449 | ||||||
Edison International | 5,393 | 311,931 | ||||||
Edwards Lifesciences Corp.* | 9,058 | 1,061,416 | ||||||
Elanco Animal Health, Inc.* | 5,574 | 186,060 | ||||||
Electronic Arts, Inc. | 4,089 | 593,764 | ||||||
Eli Lilly & Co. | 11,537 | 2,979,892 | ||||||
Emerson Electric Co. | 8,291 | 874,700 | ||||||
Enphase Energy, Inc.* | 1,699 | 295,167 | ||||||
Entergy Corp. | 2,947 | 325,968 | ||||||
EOG Resources, Inc. | 8,498 | 573,785 | ||||||
EPAM Systems, Inc.* | 781 | 494,225 | ||||||
Equifax, Inc. | 1,689 | 459,847 | ||||||
Equinix, Inc. REIT | 1,280 | 1,079,616 | ||||||
Equitable Holdings, Inc. | 5,578 | 172,974 | ||||||
Equity LifeStyle Properties, Inc. REIT | 2,766 | 235,304 | ||||||
Equity Residential REIT | 5,062 | 425,562 | ||||||
Erie Indemnity Co., Class A | 314 | 55,606 | ||||||
Essential Utilities, Inc. | 3,107 | 154,200 | ||||||
Essex Property Trust, Inc. REIT | 950 | 314,203 | ||||||
Estee Lauder Cos., Inc., Class A | 3,262 | 1,110,678 | ||||||
Etsy, Inc.*(b) | 1,717 | 371,318 | ||||||
Evergy, Inc. | 3,707 | 253,744 | ||||||
Eversource Energy | 4,574 | 414,999 | ||||||
Exact Sciences Corp.*(b) | 2,340 | 244,249 | ||||||
Exelon Corp. | 14,192 | 695,692 | ||||||
Expedia Group, Inc.* | 1,916 | 276,862 | ||||||
Expeditors International of Washington, Inc. | 2,280 | 284,179 | ||||||
Extra Space Storage, Inc. REIT | 1,855 | 346,718 | ||||||
Exxon Mobil Corp. | 59,023 | 3,217,934 | ||||||
F5 Networks, Inc.* | 784 | 159,599 | ||||||
Facebook, Inc., Class A* | 33,944 | 12,877,675 | ||||||
FactSet Research Systems, Inc. | 588 | 223,569 | ||||||
Fair Isaac Corp.* | 390 | 179,299 | ||||||
Fastenal Co. | 7,650 | 427,252 | ||||||
FedEx Corp. | 3,519 | 934,963 | ||||||
Fidelity National Financial, Inc. | 4,671 | 228,085 | ||||||
Fidelity National Information Services, Inc. | 9,078 | 1,159,896 | ||||||
Fifth Third Bancorp | 10,375 | 403,172 | ||||||
First Republic Bank | 2,535 | 504,313 | ||||||
FirstEnergy Corp. | 8,139 | 316,363 | ||||||
Fiserv, Inc.* | 8,501 | 1,001,333 | ||||||
FleetCor Technologies, Inc.* | 1,209 | 318,306 | ||||||
FMC Corp. | 2,145 | 200,836 | ||||||
Ford Motor Co.* | 56,467 | 735,765 | ||||||
Fortinet, Inc.* | 2,081 | 655,806 | ||||||
Fortive Corp. | 4,342 | 320,744 | ||||||
Fortune Brands Home & Security, Inc. | 1,963 | 191,137 | ||||||
Fox Corp., Class A | 3,823 | 143,133 | ||||||
Fox Corp., Class B | 2,918 | 101,050 | ||||||
Franklin Resources, Inc. | 4,441 | 144,066 | ||||||
Freeport-McMoRan, Inc. | 21,031 | 765,318 | ||||||
Gartner, Inc.* | 1,316 | 406,302 | ||||||
Generac Holdings, Inc.* | 826 | 360,945 | ||||||
| See Notes to Financial Statements. | 35 |
DBX ETF Trust
Schedule of Investments
Xtrackers MSCI Kokusai Equity ETF (Continued)
August 31, 2021
Number | Value | |||||||
| United States (Continued) | ||||||||
General Dynamics Corp. | 3,269 | $ | 654,813 | |||||
General Electric Co. | 15,465 | 1,630,166 | ||||||
General Mills, Inc. | 8,172 | 472,423 | ||||||
General Motors Co.* | 18,930 | 927,759 | ||||||
Genuine Parts Co. | 2,155 | 263,319 | ||||||
Gilead Sciences, Inc. | 17,654 | 1,284,858 | ||||||
Global Payments, Inc. | 4,253 | 691,708 | ||||||
Globe Life, Inc. | 1,405 | 134,978 | ||||||
GoDaddy, Inc., Class A* | 2,766 | 202,775 | ||||||
Goldman Sachs Group, Inc. | 4,792 | 1,981,540 | ||||||
Guidewire Software, Inc.* | 1,157 | 137,058 | ||||||
Halliburton Co. | 12,609 | 251,928 | ||||||
Hartford Financial Services Group, Inc. | 4,526 | 304,238 | ||||||
Hasbro, Inc. | 1,764 | 173,419 | ||||||
HCA Healthcare, Inc. | 3,753 | 949,434 | ||||||
Healthpeak Properties, Inc. REIT | 8,103 | 291,708 | ||||||
HEICO Corp. | 446 | 56,562 | ||||||
HEICO Corp., Class A | 1,151 | 131,490 | ||||||
Henry Schein, Inc.* | 1,763 | 133,265 | ||||||
Hershey Co. | 2,145 | 381,166 | ||||||
Hess Corp. | 3,900 | 268,125 | ||||||
Hewlett Packard Enterprise Co. | 16,336 | 252,555 | ||||||
Hilton Worldwide Holdings, Inc.* | 4,248 | 530,405 | ||||||
Hologic, Inc.* | 3,786 | 299,662 | ||||||
Home Depot, Inc. | 14,980 | 4,886,176 | ||||||
Honeywell International, Inc. | 9,601 | 2,226,568 | ||||||
Horizon Therapeutics PLC* | 3,024 | 326,864 | ||||||
Hormel Foods Corp. | 4,468 | 203,473 | ||||||
Host Hotels & Resorts, Inc. REIT* | 11,832 | 195,938 | ||||||
Howmet Aerospace, Inc. | 5,774 | 183,324 | ||||||
HP, Inc. | 18,305 | 544,391 | ||||||
HubSpot, Inc.* | 614 | 420,265 | ||||||
Humana, Inc. | 1,787 | 724,486 | ||||||
Huntington Bancshares, Inc. | 21,134 | 328,211 | ||||||
Huntington Ingalls Industries, Inc. | 589 | 120,256 | ||||||
IAC/InterActiveCorp* | 1,153 | 152,254 | ||||||
IDEX Corp. | 1,170 | 262,080 | ||||||
IDEXX Laboratories, Inc.* | 1,235 | 832,094 | ||||||
Illinois Tool Works, Inc. | 4,534 | 1,055,787 | ||||||
Illumina, Inc.* | 2,145 | 980,608 | ||||||
Incyte Corp.* | 2,728 | 208,665 | ||||||
Ingersoll Rand, Inc.* | 5,729 | �� | 303,752 | |||||
Insulet Corp.* | 975 | 290,365 | ||||||
Intel Corp. | 57,943 | 3,132,399 | ||||||
Intercontinental Exchange, Inc. | 7,863 | 939,864 | ||||||
International Business Machines Corp. | 12,796 | 1,795,791 | ||||||
International Flavors & Fragrances, Inc. | 3,566 | 540,249 | ||||||
International Paper Co. | 5,200 | 312,468 | ||||||
Interpublic Group of Cos., Inc. | 6,382 | 237,602 | ||||||
Intuit, Inc. | 3,899 | 2,207,263 | ||||||
Intuitive Surgical, Inc.* | 1,670 | 1,759,445 | ||||||
Invesco Ltd. | 5,803 | 146,932 | ||||||
Invitation Homes, Inc. REIT | 8,689 | 357,813 | ||||||
IPG Photonics Corp.* | 571 | 97,458 | ||||||
IQVIA Holdings, Inc.* | 2,776 | 721,010 | ||||||
Iron Mountain, Inc. REIT | 3,786 | 180,782 | ||||||
J M Smucker Co. | 1,764 | 218,154 | ||||||
Number | Value | |||||||
| United States (Continued) | ||||||||
Jack Henry & Associates, Inc. | 1,176 | $ | 207,423 | |||||
Jacobs Engineering Group, Inc. | 1,920 | 259,123 | ||||||
JB Hunt Transport Services, Inc. | 1,372 | 243,393 | ||||||
Johnson & Johnson | 37,321 | 6,461,385 | ||||||
Johnson Controls International PLC | 10,240 | 765,952 | ||||||
JPMorgan Chase & Co. | 42,646 | 6,821,228 | ||||||
Juniper Networks, Inc. | 3,908 | 113,254 | ||||||
Kansas City Southern | 1,259 | 353,364 | ||||||
Kellogg Co. (b) | 3,342 | 211,014 | ||||||
Keurig Dr Pepper, Inc. (b) | 10,481 | 373,857 | ||||||
KeyCorp | 14,310 | 290,779 | ||||||
Keysight Technologies, Inc.* | 2,726 | 488,990 | ||||||
Kimberly-Clark Corp. | 4,859 | 669,619 | ||||||
Kinder Morgan, Inc. | 29,394 | 478,240 | ||||||
KKR & Co., Inc. | 6,914 | 444,501 | ||||||
KLA Corp. | 2,185 | 742,813 | ||||||
Knight-Swift Transportation Holdings, Inc. | 2,122 | 110,195 | ||||||
Kraft Heinz Co. | 9,036 | 325,206 | ||||||
Kroger Co. | 10,247 | 471,669 | ||||||
L3Harris Technologies, Inc. | 2,920 | 680,389 | ||||||
Laboratory Corp. of America Holdings* | 1,365 | 414,114 | ||||||
Lam Research Corp. | 2,053 | 1,241,695 | ||||||
Lamb Weston Holdings, Inc. | 2,376 | 154,796 | ||||||
Las Vegas Sands Corp.* | 5,233 | 233,444 | ||||||
Lear Corp. | 781 | 124,913 | ||||||
Leidos Holdings, Inc. | 2,156 | 211,525 | ||||||
Lennar Corp., Class A | 3,809 | 408,744 | ||||||
Lennox International, Inc. | 588 | 197,086 | ||||||
Liberty Broadband Corp., Class A* | 237 | 44,027 | ||||||
Liberty Broadband Corp., Class C* | 2,300 | 440,036 | ||||||
Liberty Media Corp.-Liberty Formula One, Class C* | 3,330 | 168,298 | ||||||
Liberty Media Corp-Liberty SiriusXM, Class A* | 1,200 | 59,400 | ||||||
Liberty Media Corp-Liberty SiriusXM, Class C* | 2,527 | 124,707 | ||||||
Lincoln National Corp. | 2,711 | 186,110 | ||||||
Live Nation Entertainment, Inc.* | 2,347 | 203,485 | ||||||
LKQ Corp.* | 4,252 | 224,038 | ||||||
Lockheed Martin Corp. | 3,480 | 1,252,104 | ||||||
Loews Corp. | 3,426 | 191,411 | ||||||
Lowe’s Cos., Inc. | 9,938 | 2,026,259 | ||||||
Lumen Technologies, Inc. (b) | 11,346 | 139,556 | ||||||
Lyft, Inc., Class A* | 3,796 | 180,728 | ||||||
LyondellBasell Industries NV, Class A | 4,054 | 406,819 | ||||||
M&T Bank Corp. | 1,825 | 255,518 | ||||||
Marathon Petroleum Corp. | 9,139 | 541,669 | ||||||
Markel Corp.* | 196 | 248,969 | ||||||
MarketAxess Holdings, Inc. | 585 | 278,413 | ||||||
Marriott International, Inc., Class A* | 4,034 | 545,155 | ||||||
Marsh & McLennan Cos., Inc. | 7,328 | 1,151,962 | ||||||
Martin Marietta Materials, Inc. | 818 | 311,863 | ||||||
Marvell Technology, Inc. | 12,053 | 737,523 | ||||||
Masco Corp. | 4,088 | 248,223 | ||||||
Masimo Corp.* | 760 | 206,370 | ||||||
Mastercard, Inc., Class A | 12,455 | 4,312,295 | ||||||
Match Group, Inc.* | 3,414 | 469,220 | ||||||
| See Notes to Financial Statements. | 36 |
DBX ETF Trust
Schedule of Investments
Xtrackers MSCI Kokusai Equity ETF (Continued)
August 31, 2021
Number | Value | |||||||
| United States (Continued) | ||||||||
McCormick & Co., Inc. | 3,907 | $ | 337,135 | |||||
McDonald’s Corp. | 10,311 | 2,448,450 | ||||||
McKesson Corp. | 2,340 | 477,688 | ||||||
Medical Properties Trust, Inc. REIT | 8,540 | 174,899 | ||||||
Merck & Co., Inc. | 35,251 | 2,689,299 | ||||||
MetLife, Inc. | 10,843 | 672,266 | ||||||
Mettler-Toledo International, Inc.* | 342 | 531,068 | ||||||
MGM Resorts International | 6,437 | 274,345 | ||||||
Microchip Technology, Inc. | 3,708 | 583,491 | ||||||
Micron Technology, Inc.* | 16,046 | 1,182,590 | ||||||
Microsoft Corp. | 101,315 | 30,584,972 | ||||||
Mid-America Apartment Communities, Inc. REIT | 1,544 | 297,019 | ||||||
Moderna, Inc.* | 4,858 | 1,829,960 | ||||||
Mohawk Industries, Inc.* | 891 | 176,204 | ||||||
Molina Healthcare, Inc.* | 794 | 213,403 | ||||||
Molson Coors Beverage Co., Class B | 2,514 | 119,490 | ||||||
Mondelez International, Inc., Class A | 18,916 | 1,174,116 | ||||||
MongoDB, Inc.* | 826 | 323,652 | ||||||
Monolithic Power Systems, Inc. | 573 | 283,595 | ||||||
Monster Beverage Corp.* | 5,445 | 531,269 | ||||||
Moody’s Corp. | 2,359 | 898,236 | ||||||
Morgan Stanley | 19,959 | 2,084,318 | ||||||
Mosaic Co. | 5,391 | 173,482 | ||||||
Motorola Solutions, Inc. | 2,340 | 571,475 | ||||||
MSCI, Inc. | 1,162 | 737,382 | ||||||
Nasdaq, Inc. | 1,754 | 343,398 | ||||||
NetApp, Inc. | 3,230 | 287,244 | ||||||
Netflix, Inc.* | 6,262 | 3,564,268 | ||||||
Neurocrine Biosciences, Inc.* | 1,372 | 130,614 | ||||||
Newell Brands, Inc. | 6,578 | 167,147 | ||||||
Newmont Corp. | 11,576 | 671,292 | ||||||
News Corp., Class A | 5,710 | 128,304 | ||||||
NextEra Energy, Inc. | 27,592 | 2,317,452 | ||||||
NIKE, Inc., Class B | 18,041 | 2,972,074 | ||||||
NiSource, Inc. | 6,185 | 152,460 | ||||||
Nordson Corp. | 772 | 184,199 | ||||||
Norfolk Southern Corp. | 3,678 | 932,520 | ||||||
Northern Trust Corp. | 2,566 | 304,122 | ||||||
Northrop Grumman Corp. | 2,215 | 814,456 | ||||||
NortonLifeLock, Inc. | 7,620 | 202,387 | ||||||
Novavax, Inc.*(b) | 1,089 | 259,770 | ||||||
NRG Energy, Inc. | 3,489 | 159,343 | ||||||
Nucor Corp. | 4,072 | 478,704 | ||||||
NVIDIA Corp. | 35,334 | 7,909,516 | ||||||
NVR, Inc.* | 50 | 258,997 | ||||||
Oak Street Health, Inc.*(b) | 1,508 | 70,469 | ||||||
Occidental Petroleum Corp. | 14,014 | 360,020 | ||||||
Okta, Inc.*(b) | 1,754 | 462,354 | ||||||
Old Dominion Freight Line, Inc. | 1,289 | 372,160 | ||||||
Omega Healthcare Investors, Inc. REIT | 2,987 | 100,154 | ||||||
Omnicom Group, Inc. | 2,918 | 213,656 | ||||||
ON Semiconductor Corp.* | 5,426 | 240,697 | ||||||
ONEOK, Inc. | 6,147 | 322,840 | ||||||
Oracle Corp. | 26,719 | 2,381,464 | ||||||
O’Reilly Automotive, Inc.* | 1,014 | 602,397 | ||||||
Otis Worldwide Corp. | 5,813 | 536,075 | ||||||
Number | Value | |||||||
| United States (Continued) | ||||||||
Owens Corning | 1,767 | $ | 168,837 | |||||
PACCAR, Inc. | 4,792 | 392,321 | ||||||
Packaging Corp. of America | 1,171 | 177,641 | ||||||
Palantir Technologies, Inc., Class A* | 21,800 | 574,212 | ||||||
Palo Alto Networks, Inc.* | 1,392 | 641,768 | ||||||
Parker-Hannifin Corp. | 1,866 | 553,586 | ||||||
Paychex, Inc. | 4,662 | 533,659 | ||||||
Paycom Software, Inc.* | 780 | 381,342 | ||||||
PayPal Holdings, Inc.* | 15,871 | 4,581,323 | ||||||
Peloton Interactive, Inc., Class A* | 3,547 | 355,374 | ||||||
PepsiCo, Inc. | 19,707 | 3,081,978 | ||||||
PerkinElmer, Inc. | 1,658 | 306,398 | ||||||
Pfizer, Inc. | 79,351 | 3,655,701 | ||||||
PG&E Corp.* | 21,450 | 196,697 | ||||||
Philip Morris International, Inc. | 21,715 | 2,236,645 | ||||||
Phillips 66 | 6,129 | 435,711 | ||||||
Pinnacle West Capital Corp. | 1,587 | 122,040 | ||||||
Pinterest, Inc., Class A* | 7,512 | 417,442 | ||||||
Pioneer Natural Resources Co. | 3,235 | 484,182 | ||||||
Plug Power, Inc.*(b) | 6,856 | 178,667 | ||||||
PNC Financial Services Group, Inc. | 6,181 | 1,181,189 | ||||||
Pool Corp. | 496 | 245,173 | ||||||
PPD, Inc.* | 1,376 | 63,723 | ||||||
PPG Industries, Inc. | 3,435 | 548,054 | ||||||
PPL Corp. | 11,573 | 339,668 | ||||||
Principal Financial Group, Inc. | 3,694 | 246,796 | ||||||
Procter & Gamble Co. | 34,498 | 4,912,170 | ||||||
Progressive Corp. | 8,482 | 817,156 | ||||||
Prologis, Inc. REIT | 10,624 | 1,430,628 | ||||||
Prudential Financial, Inc. | 5,612 | 594,199 | ||||||
PTC, Inc.* | 1,843 | 242,649 | ||||||
Public Service Enterprise Group, Inc. | 7,713 | 493,169 | ||||||
Public Storage REIT | 2,137 | 691,555 | ||||||
PulteGroup, Inc. | 3,868 | 208,330 | ||||||
Qorvo, Inc.* | 1,755 | 329,993 | ||||||
QUALCOMM, Inc. | 16,205 | 2,377,111 | ||||||
Quest Diagnostics, Inc. | 1,770 | 270,509 | ||||||
Raymond James Financial, Inc. | 1,830 | 256,017 | ||||||
Raytheon Technologies Corp. | 21,723 | 1,841,241 | ||||||
Realty Income Corp. REIT (b) | 5,446 | 393,310 | ||||||
Regency Centers Corp. REIT | 1,693 | 116,174 | ||||||
Regeneron Pharmaceuticals, Inc.* | 1,448 | 975,083 | ||||||
Regions Financial Corp. | 12,023 | 245,630 | ||||||
Republic Services, Inc. | 3,469 | 430,607 | ||||||
ResMed, Inc. | 2,144 | 622,896 | ||||||
RingCentral, Inc., Class A* | 1,170 | 295,144 | ||||||
Robert Half International, Inc. | 1,735 | 179,399 | ||||||
Rockwell Automation, Inc. | 1,755 | 571,165 | ||||||
Roku, Inc.* | 1,560 | 549,744 | ||||||
Rollins, Inc. | 3,162 | 123,065 | ||||||
Roper Technologies, Inc. | 1,560 | 753,917 | ||||||
Ross Stores, Inc. | 5,230 | 619,232 | ||||||
Royal Caribbean Cruises Ltd.* | 3,263 | 269,948 | ||||||
Royalty Pharma PLC, Class A | 2,642 | 102,113 | ||||||
RPM International, Inc. | 1,764 | 145,160 | ||||||
S&P Global, Inc. (b) | 3,406 | 1,511,651 | ||||||
salesforce.com, Inc.* | 13,800 | 3,660,726 | ||||||
| See Notes to Financial Statements. | 37 |
DBX ETF Trust
Schedule of Investments
Xtrackers MSCI Kokusai Equity ETF (Continued)
August 31, 2021
Number | Value | |||||||
| United States (Continued) | ||||||||
SBA Communications Corp. REIT | 1,484 | $ | 532,711 | |||||
Schlumberger N.V. | 19,523 | 547,425 | ||||||
Seagate Technology Holdings PLC | 2,727 | 238,858 | ||||||
Seagen, Inc.* | 1,755 | 294,138 | ||||||
Sealed Air Corp. | 2,717 | 165,819 | ||||||
SEI Investments Co. | 1,562 | 98,109 | ||||||
Sempra Energy | 4,579 | 606,076 | ||||||
Sensata Technologies Holding PLC* | 2,159 | 127,770 | ||||||
ServiceNow, Inc.* | 2,767 | 1,780,952 | ||||||
Sherwin-Williams Co. | 3,525 | 1,070,437 | ||||||
Simon Property Group, Inc. REIT | 4,756 | 639,444 | ||||||
Sirius XM Holdings, Inc. (b) | 10,866 | 68,130 | ||||||
Skyworks Solutions, Inc. | 2,452 | 449,844 | ||||||
Snap, Inc., Class A* | 13,423 | 1,021,625 | ||||||
Snap-on, Inc. | 834 | 187,608 | ||||||
Snowflake, Inc., Class A* | 2,638 | 802,875 | ||||||
Southern Co. | 15,130 | 994,495 | ||||||
Southwest Airlines Co.* | 2,158 | 107,425 | ||||||
Splunk, Inc.* | 2,340 | 357,716 | ||||||
Square, Inc., Class A* | 5,573 | 1,493,954 | ||||||
SS&C Technologies Holdings, Inc. | 3,462 | 261,935 | ||||||
Stanley Black & Decker, Inc. | 2,339 | 452,059 | ||||||
Starbucks Corp. | 17,032 | 2,001,090 | ||||||
State Street Corp. | 4,861 | 451,636 | ||||||
Steel Dynamics, Inc. | 3,336 | 225,147 | ||||||
STERIS PLC | 1,364 | 293,274 | ||||||
Stryker Corp. | 4,859 | 1,346,429 | ||||||
Sun Communities, Inc. REIT | 1,554 | 313,115 | ||||||
Sunrun, Inc.* | 2,609 | 115,448 | ||||||
SVB Financial Group* | 777 | 434,732 | ||||||
Synchrony Financial | 7,592 | 377,702 | ||||||
Synopsys, Inc.* | 2,086 | 693,053 | ||||||
Sysco Corp. | 6,797 | 541,381 | ||||||
T. Rowe Price Group, Inc. | 3,301 | 738,995 | ||||||
Take-Two Interactive Software, Inc.* | 1,615 | 260,370 | ||||||
Target Corp. | 7,137 | 1,762,696 | ||||||
Teladoc Health, Inc.* | 2,076 | 299,816 | ||||||
Teledyne Technologies, Inc.* | 677 | 313,708 | ||||||
Teleflex, Inc. | 589 | 232,926 | ||||||
Teradyne, Inc. | 2,398 | 291,213 | ||||||
Tesla, Inc.* | 11,606 | 8,538,766 | ||||||
Texas Instruments, Inc. | 12,954 | 2,473,048 | ||||||
Textron, Inc. | 3,146 | 228,620 | ||||||
Thermo Fisher Scientific, Inc. | 5,630 | 3,124,369 | ||||||
TJX Cos., Inc. | 17,220 | 1,252,238 | ||||||
T-Mobile US, Inc.* | 8,876 | 1,216,190 | ||||||
Tractor Supply Co. | 1,623 | 315,268 | ||||||
Trade Desk, Inc., Class A* | 5,830 | 466,692 | ||||||
Tradeweb Markets, Inc., Class A | 1,356 | 117,986 | ||||||
TransDigm Group, Inc.* | 722 | 438,593 | ||||||
TransUnion | 2,946 | 358,027 | ||||||
Travelers Cos., Inc. | 3,631 | 579,907 | ||||||
Trimble, Inc.* | 3,709 | 349,462 | ||||||
Truist Financial Corp. | 18,943 | 1,080,888 | ||||||
Twilio, Inc., Class A* | 2,269 | 809,942 | ||||||
Twitter, Inc.* | 11,835 | 763,358 | ||||||
Tyler Technologies, Inc.* | 588 | 285,592 | ||||||
Number | Value | |||||||
| United States (Continued) | ||||||||
Tyson Foods, Inc., Class A | 3,939 | $ | 309,290 | |||||
Uber Technologies, Inc.* | 17,425 | 682,015 | ||||||
UDR, Inc. REIT | 3,821 | 206,410 | ||||||
UGI Corp. | 2,760 | 127,816 | ||||||
Ulta Beauty, Inc.* | 785 | 304,038 | ||||||
Union Pacific Corp. | 9,135 | 1,980,833 | ||||||
United Parcel Service, Inc., Class B | 10,210 | 1,997,382 | ||||||
United Rentals, Inc.* | 1,013 | 357,234 | ||||||
UnitedHealth Group, Inc. | 13,452 | 5,599,664 | ||||||
Unity Software, Inc.*(b) | 794 | 100,640 | ||||||
Universal Health Services, Inc., Class B | 1,116 | 173,828 | ||||||
US Bancorp | 20,095 | 1,153,252 | ||||||
Vail Resorts, Inc.* | 587 | 178,947 | ||||||
Valero Energy Corp. | 6,182 | 409,928 | ||||||
Veeva Systems, Inc., Class A* | 1,950 | 647,361 | ||||||
Ventas, Inc. REIT | 5,180 | 289,769 | ||||||
VEREIT, Inc. REIT | 2,571 | 129,913 | ||||||
VeriSign, Inc.* | 1,369 | 296,060 | ||||||
Verisk Analytics, Inc. | 2,140 | 431,766 | ||||||
Verizon Communications, Inc. | 58,312 | 3,207,160 | ||||||
Vertex Pharmaceuticals, Inc.* | 3,675 | 736,066 | ||||||
VF Corp. | 4,867 | 372,179 | ||||||
ViacomCBS, Inc., Class B | 7,895 | 327,248 | ||||||
Viatris, Inc. | 16,851 | 246,530 | ||||||
VICI Properties, Inc. REIT | 7,953 | 245,827 | ||||||
Visa, Inc., Class A | 24,079 | 5,516,499 | ||||||
Vistra Corp. | 6,186 | 118,091 | ||||||
VMware, Inc., Class A* | 1,372 | 204,250 | ||||||
Vornado Realty Trust REIT | 2,303 | 96,450 | ||||||
Voya Financial, Inc. (b) | 1,941 | 126,126 | ||||||
Vulcan Materials Co. | 1,751 | 325,563 | ||||||
W.R. Berkley Corp. | 2,376 | 178,937 | ||||||
W.W. Grainger, Inc. | 596 | 258,485 | ||||||
Walgreens Boots Alliance, Inc. | 10,078 | 511,459 | ||||||
Walmart, Inc. | 21,806 | 3,229,469 | ||||||
Walt Disney Co.* | 25,660 | 4,652,158 | ||||||
Waste Connections, Inc. | 3,489 | 450,814 | ||||||
Waste Management, Inc. | 5,922 | 918,561 | ||||||
Waters Corp.* | 897 | 371,376 | ||||||
Wayfair, Inc., Class A*(b) | 969 | 272,047 | ||||||
WEC Energy Group, Inc. | 4,858 | 458,984 | ||||||
Wells Fargo & Co. | 58,857 | 2,689,765 | ||||||
Welltower, Inc. REIT | 5,718 | 500,497 | ||||||
West Pharmaceutical Services, Inc. | 970 | 438,071 | ||||||
Western Digital Corp.* | 4,038 | 255,202 | ||||||
Western Union Co. | 6,970 | 150,831 | ||||||
Westinghouse Air Brake Technologies Corp. | 2,345 | 210,558 | ||||||
Westrock Co. | 3,487 | 181,463 | ||||||
Weyerhaeuser Co. REIT | 9,834 | 354,024 | ||||||
Whirlpool Corp. | 784 | 173,680 | ||||||
Williams Cos., Inc. | 17,994 | 444,272 | ||||||
Workday, Inc., Class A* | 2,535 | 692,461 | ||||||
WP Carey, Inc. REIT (b) | 2,326 | 181,707 | ||||||
Wynn Resorts Ltd.* | 1,396 | 141,959 | ||||||
Xcel Energy, Inc. | 8,104 | 557,150 | ||||||
Xilinx, Inc. | 3,615 | 562,458 | ||||||
| See Notes to Financial Statements. | 38 |
DBX ETF Trust
Schedule of Investments
Xtrackers MSCI Kokusai Equity ETF (Continued)
August 31, 2021
Number | Value | |||||||
| United States (Continued) | ||||||||
Xylem, Inc. | 2,728 | $ | 371,854 | |||||
Yum! Brands, Inc. | 4,042 | 529,623 | ||||||
Zebra Technologies Corp., Class A* | 785 | 460,928 | ||||||
Zendesk, Inc.*(b) | 1,622 | 200,479 | ||||||
Zillow Group, Inc., Class A* | 850 | 81,260 | ||||||
Zillow Group, Inc., Class C* | 1,961 | 187,805 | ||||||
Zimmer Biomet Holdings, Inc. | 2,922 | 439,615 | ||||||
Zoetis, Inc. | 6,916 | 1,414,737 | ||||||
Zoom Video Communications, Inc., Class A* | 3,027 | 876,317 | ||||||
Zscaler, Inc.* | 1,135 | 315,916 | ||||||
|
| |||||||
(Cost $437,576,893) | 566,234,132 | |||||||
|
| |||||||
TOTAL COMMON STOCKS | 799,477,454 | |||||||
|
| |||||||
| PREFERRED STOCKS — 0.2% | ||||||||
| Germany — 0.2% | ||||||||
Bayerische Motoren Werke AG | 629 | 52,643 | ||||||
FUCHS PETROLUB SE | 819 | 41,436 | ||||||
Henkel AG & Co. KGaA | 2,714 | 265,078 | ||||||
Porsche Automobil Holding SE | 2,364 | 239,321 | ||||||
Sartorius AG | 404 | 266,111 | ||||||
Volkswagen AG | 2,554 | 606,894 | ||||||
|
| |||||||
(Cost $1,189,307) | 1,471,483 | |||||||
|
| |||||||
Number | Value | |||||||
| WARRANTS — 0.0% | ||||||||
| Switzerland — 0.0% | ||||||||
Cie Financiere Richemont SA*, expires 11/22/23 | 19,824 | $ | 10,171 | |||||
|
| |||||||
| SECURITIES LENDING COLLATERAL — 0.1% | ||||||||
DWS Government & Agency Securities Portfolio “DWS Government Cash Institutional Shares”, 0.01% (d)(e) | 430,881 | 430,881 | ||||||
|
| |||||||
| CASH EQUIVALENTS — 0.1% | ||||||||
DWS Government Money Market Series “Institutional Shares”, 0.04% (d) | 985,575 | 985,575 | ||||||
|
| |||||||
TOTAL INVESTMENTS — 100.0% (Cost $631,633,539) | $ | 802,375,564 | ||||||
Other assets and liabilities, net — 0.0% | 380,995 | |||||||
|
| |||||||
NET ASSETS — 100.0% | $ | 802,756,559 | ||||||
|
| |||||||
A summary of the Fund’s transactions with affiliated investments during the year ended August 31, 2021 is as follows:
| Value ($) at 8/31/2020 | Purchases Cost ($) | Sales Proceeds ($) | Net Realized Gain/(Loss) ($) | Net Change in Unrealized Appreciation (Depreciation) ($) | Income ($) | Capital Gain Distributions ($) | Number of Shares at 8/31/2021 | Value ($) at 8/31/2021 | ||||||||||||||||||||||||||||
COMMON STOCKS — 0.1% |
| |||||||||||||||||||||||||||||||||||
Germany — 0.1% |
| |||||||||||||||||||||||||||||||||||
Deutsche Bank AG*(c) |
| |||||||||||||||||||||||||||||||||||
| 62,816 | 351,382 | (173,244 | ) | 62,569 | 52,682 | — | — | 28,662 | 356,205 | |||||||||||||||||||||||||||
SECURITIES LENDING COLLATERAL — 0.1% |
| |||||||||||||||||||||||||||||||||||
DWS Government & Agency Securities Portfolio “DWS Government Cash Institutional Shares”, 0.01% (d)(e) |
| |||||||||||||||||||||||||||||||||||
| 70,099 | 360,782(f | ) | — | — | — | 233 | — | 430,881 | 430,881 | |||||||||||||||||||||||||||
CASH EQUIVALENTS — 0.1% |
| |||||||||||||||||||||||||||||||||||
DWS Government Money Market Series “Institutional Shares”, 0.04% (d) |
| |||||||||||||||||||||||||||||||||||
| 358,192 | 18,578,553 | (17,951,170 | ) | — | — | 249 | — | 985,575 | | 985,575 | | |||||||||||||||||||||||||
|
|
|
|
|
|
|
|
|
|
|
|
|
|
|
|
|
| |||||||||||||||||||
| 491,107 | 19,290,717 | (18,124,414 | ) | 62,569 | 52,682 | 482 | — | 1,445,118 | 1,772,661 | |||||||||||||||||||||||||||
|
|
|
|
|
|
|
|
|
|
|
|
|
|
|
|
|
| |||||||||||||||||||
| * | Non-income producing security. |
| (a) | Stapled Security — A security contractually bound to one or more other securities to form a single saleable unit which cannot be sold separately. |
| (b) | All or a portion of these securities were on loan. In addition, “Other assets and liabilities, net” may include pending sales that are also on loan. The value of securities loaned at August 31, 2021 amounted to $10,706,170, which is 1.3% of net assets. |
| (c) | Affiliated issuer. This security is owned in proportion with its representation in the index. |
| (d) | Affiliated fund managed by DWS Investment Management Americas, Inc. The rate shown is the annualized seven-day yield at period end. |
| (e) | Represents cash collateral held in connection with securities lending. Income earned by the Fund is net of borrower rebates. In addition, the Fund held non-cash U.S. Treasury securities collateral having a value of $10,662,668. |
| See Notes to Financial Statements. | 39 |
DBX ETF Trust
Schedule of Investments
Xtrackers MSCI Kokusai Equity ETF (Continued)
August 31, 2021
| (f) | Represents the net increase (purchase cost) or decrease (sales proceeds) in the amount invested in cash collateral for the year ended August 31, 2021. |
| ADR: | American Depositary Receipt |
| CDI: | Chess Depositary Interest |
| REIT: | Real Estate Investment Trust |
| RSP: | Risparmio (Convertible Savings Shares) |
| 144A: | Security exempt from registration under Rule 144A of the Securities Act of 1933. These securities may be resold in transactions exempt from registration, normally to qualified institutional buyers. |
Securities are listed in country of domicile.
At August 31, 2021, open futures contracts purchased were as follows:
Contract Description | Currency | Number of Contracts | Notional Amount | Contract Value | Expiration Date | Unrealized Appreciation (Depreciation) | ||||||||||||
E-Mini S&P 500 Futures | USD | 5 | $ | 1,082,648 | $ | 1,130,125 | 9/17/2021 | $ | 47,477 | |||||||||
MINI S&P/TSX 60 Futures | CAD | 2 | 97,519 | 97,329 | 9/16/2021 | (190 | ) | |||||||||||
MSCI EAFE Futures | USD | 7 | 824,228 | 823,025 | 9/17/2021 | (1,203 | ) | |||||||||||
|
| |||||||||||||||||
Total net unrealized appreciation | $ | 46,084 | ||||||||||||||||
|
| |||||||||||||||||
For information on the Fund’s policy and additional disclosures regarding open futures contracts, please refer to the Derivatives section of Note 2 in the accompanying Notes to Financial Statements.
Currency Abbreviations
| CAD | Canadian Dollar |
| USD | U.S. Dollar |
Fair Value Measurements
Various inputs are used in determining the value of the Fund’s investments. These inputs are summarized in three broad levels. Level 1 includes quoted prices in active markets for identical securities. Level 2 includes other significant observable inputs (including quoted prices for similar securities, interest rates, prepayment speeds and credit risk). Level 3 includes significant unobservable inputs (including the Fund’s own assumptions in determining the fair value of investments). The level assigned to the securities valuations may not be an indication of the risk or liquidity associated with investing in those securities.
The following is a summary of the inputs used as of August 31, 2021 in valuing the Fund’s investments. For information on the Fund’s policy regarding the valuation of investments, please refer to the Security Valuation section of Note 2 in the accompanying Notes to Financial Statements.
Assets | Level 1 | Level 2 | Level 3 | Total | ||||||||||||
Common Stocks (g) | $ | 799,477,454 | $ | — | $ | — | $ | 799,477,454 | ||||||||
Preferred Stocks (g) | 1,471,483 | — | — | 1,471,483 | ||||||||||||
Warrants | 10,171 | — | — | 10,171 | ||||||||||||
Short-Term Investments (g) | 1,416,456 | — | — | 1,416,456 | ||||||||||||
Derivatives (h) | ||||||||||||||||
Futures Contracts | 47,477 | – | – | 47,477 | ||||||||||||
|
|
|
|
|
|
|
| |||||||||
TOTAL | $ | 802,423,041 | $ | — | $ | — | $ | 802,423,041 | ||||||||
|
|
|
|
|
|
|
| |||||||||
Liabilities | Level 1 | Level 2 | Level 3 | Total | ||||||||||||
Derivatives (h) | ||||||||||||||||
Futures Contracts | $ | (1,393 | ) | $ | — | $ | — | $ | (1,393 | ) | ||||||
|
|
|
|
|
|
|
| |||||||||
TOTAL | $ | (1,393 | ) | $ | — | $ | — | $ | (1,393 | ) | ||||||
|
|
|
|
|
|
|
| |||||||||
| (g) | See Schedule of Investments for additional detailed categorizations. |
| (h) | Derivatives include unrealized appreciation (depreciation) on open futures contracts and forward foreign currency contracts. |
| See Notes to Financial Statements. | 40 |
DBX ETF Trust
Schedule of Investments
Xtrackers Russell 1000 US Quality at a Reasonable Price ETF
August 31, 2021
Number | Value | |||||||
| COMMON STOCKS — 99.4% | ||||||||
| Communication Services — 12.8% | ||||||||
Activision Blizzard, Inc. | 819 | $ | 67,461 | |||||
Alphabet, Inc., Class A* | 381 | 1,102,595 | ||||||
Alphabet, Inc., Class C* | 380 | 1,105,511 | ||||||
AT&T, Inc. | 10,290 | 282,152 | ||||||
Charter Communications, Inc., Class A*(a) | 91 | 74,316 | ||||||
Discovery, Inc., Class C* | 472 | 13,023 | ||||||
DISH Network Corp., Class A* | 224 | 9,764 | ||||||
Electronic Arts, Inc. | 688 | 99,905 | ||||||
Facebook, Inc., Class A* | 4,374 | 1,659,408 | ||||||
Fox Corp., Class A | 800 | 29,952 | ||||||
Fox Corp., Class B | 348 | 12,051 | ||||||
Interpublic Group of Cos., Inc. | 958 | 35,666 | ||||||
Lumen Technologies, Inc. (a) | 694 | 8,536 | ||||||
New York Times Co., Class A | 326 | 16,554 | ||||||
News Corp., Class A | 415 | 9,325 | ||||||
Nexstar Media Group, Inc., Class A | 52 | 7,787 | ||||||
Omnicom Group, Inc. | 363 | 26,579 | ||||||
Take-Two Interactive Software, Inc.* | 215 | 34,662 | ||||||
Verizon Communications, Inc. | 8,056 | 443,080 | ||||||
Walt Disney Co.* | 272 | 49,314 | ||||||
|
| |||||||
(Cost $3,491,913) | 5,087,641 | |||||||
|
| |||||||
| Consumer Discretionary — 14.3% | ||||||||
Advance Auto Parts, Inc. | 234 | 47,467 | ||||||
Amazon.com, Inc.* | 458 | 1,589,622 | ||||||
AutoNation, Inc.* | 120 | 13,091 | ||||||
AutoZone, Inc.* | 43 | 66,613 | ||||||
Bath & Body Works, Inc. | 205 | 13,833 | ||||||
Best Buy Co., Inc. | 1,040 | 121,170 | ||||||
Booking Holdings, Inc.* | 57 | 131,081 | ||||||
BorgWarner, Inc. | 338 | 14,426 | ||||||
Brunswick Corp. | 173 | 16,759 | ||||||
Carnival Corp.* | 713 | 17,212 | ||||||
Carter’s, Inc. | 89 | 9,112 | ||||||
Chipotle Mexican Grill, Inc.* | 20 | 38,067 | ||||||
Columbia Sportswear Co. | 78 | 7,957 | ||||||
D.R. Horton, Inc. | 571 | 54,599 | ||||||
Darden Restaurants, Inc. | 261 | 39,320 | ||||||
Deckers Outdoor Corp.* | 53 | 22,178 | ||||||
Dick’s Sporting Goods, Inc. (a) | 294 | 41,398 | ||||||
Dollar General Corp. | 742 | 165,399 | ||||||
Dollar Tree, Inc.* | 649 | 58,760 | ||||||
Domino’s Pizza, Inc. | 38 | 19,642 | ||||||
eBay, Inc. | 2,368 | 181,720 | ||||||
Etsy, Inc.*(a) | 131 | 28,330 | ||||||
Expedia Group, Inc.* | 169 | 24,420 | ||||||
Five Below, Inc.* | 50 | 10,641 | ||||||
Floor & Decor Holdings, Inc., Class A* | 122 | 15,043 | ||||||
Foot Locker, Inc. | 429 | 24,320 | ||||||
Gap, Inc. | 283 | 7,565 | ||||||
Garmin Ltd. | 362 | 63,144 | ||||||
Gentex Corp. | 772 | 23,778 | ||||||
Genuine Parts Co. | 283 | 34,580 | ||||||
Grand Canyon Education, Inc.* | 126 | 11,232 | ||||||
Home Depot, Inc. | 1,891 | 616,806 | ||||||
Kohl’s Corp. | 149 | 8,553 | ||||||
Number | Value | |||||||
| Consumer Discretionary (Continued) | ||||||||
Las Vegas Sands Corp.* | 215 | $ | 9,591 | |||||
Lear Corp. | 79 | 12,635 | ||||||
Lennar Corp., Class A | 682 | 73,185 | ||||||
LKQ Corp.* | 478 | 25,186 | ||||||
Lowe’s Cos., Inc. | 1,897 | 386,779 | ||||||
Lululemon Athletica, Inc.* | 106 | 42,418 | ||||||
MGM Resorts International | 304 | 12,956 | ||||||
Mohawk Industries, Inc.* | 156 | 30,851 | ||||||
Newell Brands, Inc. | 407 | 10,342 | ||||||
NIKE, Inc., Class B | 1,154 | 190,110 | ||||||
NVR, Inc.* | 10 | 51,799 | ||||||
Ollie’s Bargain Outlet Holdings, Inc.*(a) | 130 | 9,409 | ||||||
O’Reilly Automotive, Inc.* | 156 | 92,676 | ||||||
Polaris, Inc. (a) | 191 | 22,874 | ||||||
Pool Corp. | 46 | 22,738 | ||||||
PulteGroup, Inc. | 889 | 47,882 | ||||||
Qurate Retail, Inc., Series A | 763 | 8,416 | ||||||
Ralph Lauren Corp. | 74 | 8,594 | ||||||
Ross Stores, Inc. | 579 | 68,554 | ||||||
Royal Caribbean Cruises Ltd.* | 163 | 13,485 | ||||||
Starbucks Corp. | 1,453 | 170,713 | ||||||
Tapestry, Inc.* | 414 | 16,692 | ||||||
Target Corp. | 1,940 | 479,141 | ||||||
Tempur Sealy International, Inc. | 319 | 14,259 | ||||||
Thor Industries, Inc. (a) | 100 | 11,343 | ||||||
TJX Cos., Inc. | 1,136 | 82,610 | ||||||
Tractor Supply Co. | 352 | 68,376 | ||||||
Ulta Beauty, Inc.* | 93 | 36,020 | ||||||
Victoria’s Secret & Co.* | 68 | 4,508 | ||||||
Wayfair, Inc., Class A*(a) | 105 | 29,479 | ||||||
Whirlpool Corp. | 102 | 22,596 | ||||||
Williams-Sonoma, Inc. | 297 | 55,450 | ||||||
YETI Holdings, Inc.* | 110 | 10,927 | ||||||
Yum China Holdings, Inc. | 116 | 7,141 | ||||||
|
| |||||||
(Cost $4,888,564) | 5,687,573 | |||||||
|
| |||||||
| Consumer Staples — 7.6% | ||||||||
Altria Group, Inc. | 2,943 | 147,827 | ||||||
Boston Beer Co., Inc., Class A*(a) | 8 | 4,562 | ||||||
Campbell Soup Co. (a) | 182 | 7,595 | ||||||
Church & Dwight Co., Inc. | 232 | 19,409 | ||||||
Clorox Co. | 254 | 42,685 | ||||||
Colgate-Palmolive Co. | 1,176 | 91,669 | ||||||
Conagra Brands, Inc. | 420 | 13,910 | ||||||
Costco Wholesale Corp. | 1,231 | 560,708 | ||||||
Darling Ingredients, Inc.* | 109 | 8,121 | ||||||
Estee Lauder Cos., Inc., Class A | 227 | 77,291 | ||||||
General Mills, Inc. | 663 | 38,328 | ||||||
Herbalife Nutrition Ltd.* | 260 | 13,348 | ||||||
Hershey Co. | 208 | 36,962 | ||||||
Hormel Foods Corp. | 645 | 29,373 | ||||||
Ingredion, Inc. | 118 | 10,368 | ||||||
J M Smucker Co. | 131 | 16,201 | ||||||
Kellogg Co. (a) | 245 | 15,469 | ||||||
Kimberly-Clark Corp. | 599 | 82,548 | ||||||
Kroger Co. | 1,480 | 68,124 | ||||||
Monster Beverage Corp.* | 697 | 68,006 | ||||||
| See Notes to Financial Statements. | 41 |
DBX ETF Trust
Schedule of Investments
Xtrackers Russell 1000 US Quality at a Reasonable Price ETF (Continued)
August 31, 2021
Number | Value | |||||||
| Consumer Staples (Continued) | ||||||||
PepsiCo, Inc. | 221 | $ | 34,562 | |||||
Philip Morris International, Inc. | 3,268 | 336,604 | ||||||
Procter & Gamble Co. | 3,345 | 476,295 | ||||||
Spectrum Brands Holdings, Inc. | 90 | 7,025 | ||||||
Sysco Corp. | 667 | 53,127 | ||||||
Tyson Foods, Inc., Class A | 338 | 26,540 | ||||||
Walgreens Boots Alliance, Inc. | 1,375 | 69,781 | ||||||
Walmart, Inc. | 4,600 | 681,260 | ||||||
|
| |||||||
(Cost $2,712,743) | 3,037,698 | |||||||
|
| |||||||
| Energy — 2.4% | ||||||||
Cabot Oil & Gas Corp. | 1,157 | 18,385 | ||||||
Chevron Corp. | 2,730 | 264,182 | ||||||
ConocoPhillips | 2,133 | 118,445 | ||||||
Devon Energy Corp. | 647 | 19,119 | ||||||
Diamondback Energy, Inc. | 136 | 10,491 | ||||||
DT Midstream, Inc.* | 82 | 3,811 | ||||||
EOG Resources, Inc. | 1,742 | 117,620 | ||||||
Exxon Mobil Corp. | 4,714 | 257,007 | ||||||
Marathon Oil Corp. | 751 | 8,824 | ||||||
Marathon Petroleum Corp. | 998 | 59,151 | ||||||
Phillips 66 | 186 | 13,223 | ||||||
Pioneer Natural Resources Co. | 295 | 44,153 | ||||||
Valero Energy Corp. | 182 | 12,068 | ||||||
|
| |||||||
(Cost $1,142,412) | 946,479 | |||||||
|
| |||||||
| Financials — 8.1% | ||||||||
Aflac, Inc. | 574 | 32,534 | ||||||
Allstate Corp. | 600 | 81,168 | ||||||
Aon PLC, Class A (a) | 238 | 68,273 | ||||||
Apollo Global Management, Inc. (a) | 214 | 12,793 | ||||||
Arch Capital Group Ltd.* | 608 | 24,989 | ||||||
Berkshire Hathaway, Inc., Class B* | 4,717 | 1,347,977 | ||||||
Brown & Brown, Inc. | 194 | 11,262 | ||||||
Capital One Financial Corp. | 450 | 74,686 | ||||||
Cboe Global Markets, Inc. | 270 | 34,060 | ||||||
Cincinnati Financial Corp. | 436 | 53,802 | ||||||
Credit Acceptance Corp.*(a) | 32 | 18,550 | ||||||
Erie Indemnity Co., Class A | 65 | 11,511 | ||||||
Evercore, Inc., Class A | 267 | 37,284 | ||||||
FactSet Research Systems, Inc. | 78 | 29,657 | ||||||
Fidelity National Financial, Inc. | 1,009 | 49,269 | ||||||
First American Financial Corp. | 360 | 25,391 | ||||||
Franklin Resources, Inc. (a) | 767 | 24,881 | ||||||
Hartford Financial Services Group, Inc. | 236 | 15,864 | ||||||
Lazard Ltd., Class A | 460 | 21,804 | ||||||
LPL Financial Holdings, Inc. | 309 | 45,686 | ||||||
Markel Corp.* | 8 | 10,162 | ||||||
MarketAxess Holdings, Inc. | 53 | 25,224 | ||||||
Marsh & McLennan Cos., Inc. | 663 | 104,224 | ||||||
MGIC Investment Corp. (a) | 2,034 | 31,059 | ||||||
Moody’s Corp. | 348 | 132,508 | ||||||
MSCI, Inc. | 137 | 86,937 | ||||||
Nasdaq, Inc. | 105 | 20,557 | ||||||
Old Republic International Corp. | 585 | 15,210 | ||||||
Progressive Corp. | 2,662 | 256,457 | ||||||
S&P Global, Inc. | 526 | 233,449 | ||||||
Number | Value | |||||||
| Financials (Continued) | ||||||||
SEI Investments Co. | 391 | $ | 24,559 | |||||
Synchrony Financial | 725 | 36,069 | ||||||
T. Rowe Price Group, Inc. | 756 | 169,246 | ||||||
Travelers Cos., Inc. | 158 | 25,234 | ||||||
White Mountains Insurance Group Ltd. | 13 | 14,571 | ||||||
|
| |||||||
(Cost $2,461,344) | 3,206,907 | |||||||
|
| |||||||
| Health Care — 14.1% | ||||||||
AbbVie, Inc. | 1,535 | 185,397 | ||||||
ABIOMED, Inc.* | 53 | 19,290 | ||||||
Align Technology, Inc.* | 57 | 40,413 | ||||||
AmerisourceBergen Corp. | 267 | 32,630 | ||||||
Amgen, Inc. | 1,121 | 252,819 | ||||||
Anthem, Inc. | 827 | 310,233 | ||||||
Biogen, Inc.* | 755 | 255,877 | ||||||
Bio-Rad Laboratories, Inc., Class A* | 71 | 57,142 | ||||||
Bristol-Myers Squibb Co. | 488 | 32,628 | ||||||
Cardinal Health, Inc. | 751 | 39,420 | ||||||
Cerner Corp. | 721 | 55,048 | ||||||
Chemed Corp. | 40 | 19,068 | ||||||
Cigna Corp. | 1,403 | 296,945 | ||||||
CVS Health Corp. | 2,550 | 220,295 | ||||||
DaVita, Inc.* | 185 | 24,192 | ||||||
Edwards Lifesciences Corp.* | 857 | 100,423 | ||||||
Eli Lilly & Co. | 564 | 145,676 | ||||||
Exelixis, Inc.* | 499 | 9,566 | ||||||
Gilead Sciences, Inc. | 243 | 17,686 | ||||||
HCA Healthcare, Inc. | 366 | 92,591 | ||||||
Henry Schein, Inc.* | 436 | 32,957 | ||||||
Hologic, Inc.* | 245 | 19,392 | ||||||
Humana, Inc. | 637 | 258,253 | ||||||
IDEXX Laboratories, Inc.* | 55 | 37,057 | ||||||
Illumina, Inc.* | 74 | 33,830 | ||||||
Incyte Corp.* | 98 | 7,496 | ||||||
Intuitive Surgical, Inc.* | 56 | 58,999 | ||||||
Jazz Pharmaceuticals PLC* | 97 | 12,776 | ||||||
Johnson & Johnson | 4,972 | 860,802 | ||||||
Laboratory Corp. of America Holdings* | 117 | 35,495 | ||||||
Masimo Corp.* | 43 | 11,676 | ||||||
McKesson Corp. | 573 | 116,972 | ||||||
Merck & Co., Inc. | 1,831 | 139,687 | ||||||
Mettler-Toledo International, Inc.* | 37 | 57,455 | ||||||
Molina Healthcare, Inc.* | 83 | 22,308 | ||||||
Neurocrine Biosciences, Inc.* | 107 | 10,186 | ||||||
Organon & Co. | 1,046 | 35,449 | ||||||
PerkinElmer, Inc. | 92 | 17,002 | ||||||
Pfizer, Inc. | 3,618 | 166,681 | ||||||
Premier, Inc., Class A | 290 | 10,782 | ||||||
Quest Diagnostics, Inc. | 228 | 34,845 | ||||||
Quidel Corp.*(a) | 127 | 16,377 | ||||||
Regeneron Pharmaceuticals, Inc.* | 266 | 179,124 | ||||||
ResMed, Inc. | 117 | 33,992 | ||||||
Sage Therapeutics, Inc.* | 177 | 8,179 | ||||||
Seagen, Inc.* | 110 | 18,436 | ||||||
Thermo Fisher Scientific, Inc. | 347 | 192,568 | ||||||
United Therapeutics Corp.* | 74 | 15,901 | ||||||
UnitedHealth Group, Inc. | 1,810 | 753,449 | ||||||
| See Notes to Financial Statements. | 42 |
DBX ETF Trust
Schedule of Investments
Xtrackers Russell 1000 US Quality at a Reasonable Price ETF (Continued)
August 31, 2021
Number | Value | |||||||
| Health Care (Continued) | ||||||||
Universal Health Services, Inc., Class B | 220 | $ | 34,267 | |||||
Vertex Pharmaceuticals, Inc.* | 464 | 92,935 | ||||||
Waters Corp.* | 102 | 42,230 | ||||||
West Pharmaceutical Services, Inc. | 102 | 46,065 | ||||||
|
| |||||||
(Cost $4,720,802) | 5,620,962 | |||||||
|
| |||||||
| Industrials — 7.0% | ||||||||
3M Co. | 684 | 133,202 | ||||||
A O Smith Corp. | 409 | 29,742 | ||||||
Acuity Brands, Inc. (a) | 140 | 25,834 | ||||||
AGCO Corp. | 156 | 21,469 | ||||||
Alaska Air Group, Inc.* | 287 | 16,457 | ||||||
Boeing Co.* | 142 | 31,169 | ||||||
Booz Allen Hamilton Holding Corp. | 99 | 8,109 | ||||||
C.H. Robinson Worldwide, Inc. | 140 | 12,608 | ||||||
Carlisle Cos., Inc. | 41 | 8,640 | ||||||
Carrier Global Corp. | 2,742 | 157,939 | ||||||
Caterpillar, Inc. | 313 | 66,002 | ||||||
Cintas Corp. | 64 | 25,329 | ||||||
Copart, Inc.* | 343 | 49,502 | ||||||
Cummins, Inc. | 469 | 110,675 | ||||||
Delta Air Lines, Inc.* | 1,534 | 62,035 | ||||||
Donaldson Co., Inc. | 204 | 13,821 | ||||||
Eaton Corp. PLC | 321 | 54,044 | ||||||
Emerson Electric Co. | 1,065 | 112,358 | ||||||
Expeditors International of Washington, Inc. | 464 | 57,833 | ||||||
Fastenal Co. | 1,303 | 72,773 | ||||||
FedEx Corp. | 168 | 44,636 | ||||||
Fortune Brands Home & Security, Inc. | 80 | 7,790 | ||||||
FTI Consulting, Inc.* | 102 | 14,250 | ||||||
General Dynamics Corp. | 163 | 32,651 | ||||||
Graco, Inc. | 317 | 24,859 | ||||||
Honeywell International, Inc. | 110 | 25,510 | ||||||
Huntington Ingalls Industries, Inc. | 159 | 32,463 | ||||||
Illinois Tool Works, Inc. | 247 | 57,516 | ||||||
ITT, Inc. | 204 | 19,517 | ||||||
Jacobs Engineering Group, Inc. | 112 | 15,116 | ||||||
JB Hunt Transport Services, Inc. | 258 | 45,769 | ||||||
JetBlue Airways Corp.* | 521 | 7,883 | ||||||
Johnson Controls International PLC | 706 | 52,809 | ||||||
Knight-Swift Transportation Holdings, Inc. | 552 | 28,665 | ||||||
L3Harris Technologies, Inc. | 175 | 40,777 | ||||||
Landstar System, Inc. | 90 | 15,123 | ||||||
Lennox International, Inc. | 34 | 11,396 | ||||||
Lincoln Electric Holdings, Inc. | 115 | 16,055 | ||||||
Lockheed Martin Corp. | 804 | 289,279 | ||||||
ManpowerGroup, Inc. | 134 | 16,270 | ||||||
Masco Corp. | 607 | 36,857 | ||||||
MSC Industrial Direct Co., Inc., Class A | 144 | 12,126 | ||||||
Northrop Grumman Corp. | 145 | 53,317 | ||||||
Old Dominion Freight Line, Inc. | 190 | 54,857 | ||||||
Oshkosh Corp. | 156 | 17,874 | ||||||
Otis Worldwide Corp. | 970 | 89,453 | ||||||
Owens Corning | 161 | 15,384 | ||||||
PACCAR, Inc. | 283 | 23,169 | ||||||
Parker-Hannifin Corp. | 91 | 26,997 | ||||||
Number | Value | |||||||
| Industrials (Continued) | ||||||||
Pentair PLC | 171 | $ | 13,194 | |||||
Quanta Services, Inc. | 242 | 24,708 | ||||||
Republic Services, Inc. | 148 | 18,371 | ||||||
Robert Half International, Inc. | 295 | 30,503 | ||||||
Rockwell Automation, Inc. | 126 | 41,007 | ||||||
Snap-on, Inc. | 140 | 31,493 | ||||||
Southwest Airlines Co.* | 1,510 | 75,168 | ||||||
Stanley Black & Decker, Inc. | 78 | 15,075 | ||||||
Textron, Inc. | 174 | 12,645 | ||||||
Toro Co. | 98 | 10,774 | ||||||
Trane Technologies PLC | 134 | 26,599 | ||||||
Trex Co., Inc.*(a) | 144 | 15,805 | ||||||
Union Pacific Corp. | 94 | 20,383 | ||||||
United Airlines Holdings, Inc.* | 294 | 13,674 | ||||||
United Parcel Service, Inc., Class B | 802 | 156,895 | ||||||
United Rentals, Inc.* | 69 | 24,333 | ||||||
W.W. Grainger, Inc. | 97 | 42,069 | ||||||
Watsco, Inc. | 88 | 24,501 | ||||||
|
| |||||||
(Cost $2,337,032) | 2,795,106 | |||||||
|
| |||||||
| Information Technology — 29.4% | ||||||||
Accenture PLC, Class A | 1,259 | 423,729 | ||||||
Adobe, Inc.* | 682 | 452,643 | ||||||
Advanced Micro Devices, Inc.* | 1,027 | 113,709 | ||||||
Akamai Technologies, Inc.* | 117 | 13,250 | ||||||
Amdocs Ltd. | 378 | 29,117 | ||||||
Analog Devices, Inc. | 287 | 46,767 | ||||||
Apple, Inc. | 14,649 | 2,224,158 | ||||||
Applied Materials, Inc. | 1,329 | 179,588 | ||||||
Arista Networks, Inc.* | 99 | 36,583 | ||||||
Arrow Electronics, Inc.* | 140 | 16,971 | ||||||
Autodesk, Inc.* | 161 | 49,924 | ||||||
Automatic Data Processing, Inc. | 854 | 178,520 | ||||||
Avnet, Inc. | 271 | 10,965 | ||||||
Broadridge Financial Solutions, Inc. | 265 | 45,638 | ||||||
Cadence Design Systems, Inc.* | 397 | 64,902 | ||||||
CDW Corp. | 73 | 14,645 | ||||||
Ciena Corp.* | 401 | 22,909 | ||||||
Cirrus Logic, Inc.* | 151 | 12,634 | ||||||
Cisco Systems, Inc. | 12,742 | 752,033 | ||||||
Citrix Systems, Inc. | 290 | 29,832 | ||||||
Cognex Corp. | 138 | 12,230 | ||||||
Cognizant Technology Solutions Corp., Class A | 1,868 | 142,547 | ||||||
Dell Technologies, Inc., Class C* | 181 | 17,640 | ||||||
Dolby Laboratories, Inc., Class A | 120 | 11,893 | ||||||
Enphase Energy, Inc.* | 56 | 9,729 | ||||||
EPAM Systems, Inc.* | 41 | 25,945 | ||||||
F5 Networks, Inc.* | 116 | 23,614 | ||||||
Fortinet, Inc.* | 202 | 63,658 | ||||||
Hewlett Packard Enterprise Co. | 987 | 15,259 | ||||||
HP, Inc. | 6,327 | 188,165 | ||||||
Intel Corp. | 18,678 | 1,009,733 | ||||||
International Business Machines Corp. | 647 | 90,800 | ||||||
Intuit, Inc. | 329 | 186,250 | ||||||
IPG Photonics Corp.* | 49 | 8,363 | ||||||
Jabil, Inc. | 359 | 22,179 | ||||||
| See Notes to Financial Statements. | 43 |
DBX ETF Trust
Schedule of Investments
Xtrackers Russell 1000 US Quality at a Reasonable Price ETF (Continued)
August 31, 2021
Number | Value | |||||||
| Information Technology (Continued) | ||||||||
Jack Henry & Associates, Inc. | 148 | $ | 26,104 | |||||
Keysight Technologies, Inc.* | 172 | 30,853 | ||||||
KLA Corp. | 171 | 58,133 | ||||||
Lam Research Corp. | 201 | 121,569 | ||||||
Mastercard, Inc., Class A | 1,319 | 456,677 | ||||||
Micron Technology, Inc.* | 3,719 | 274,090 | ||||||
Microsoft Corp. | 6,735 | 2,033,162 | ||||||
MKS Instruments, Inc. | 59 | 8,684 | ||||||
Monolithic Power Systems, Inc. | 32 | 15,838 | ||||||
National Instruments Corp. | 224 | 9,368 | ||||||
NetApp, Inc. | 643 | 57,182 | ||||||
NortonLifeLock, Inc. | 617 | 16,388 | ||||||
NVIDIA Corp. | 1,470 | 329,059 | ||||||
Oracle Corp. | 3,054 | 272,203 | ||||||
Paychex, Inc. | 671 | 76,809 | ||||||
PayPal Holdings, Inc.* | 133 | 38,392 | ||||||
Qorvo, Inc.* | 158 | 29,709 | ||||||
salesforce.com, Inc.* | 617 | 163,672 | ||||||
Skyworks Solutions, Inc. | 386 | 70,816 | ||||||
SYNNEX Corp. | 99 | 12,580 | ||||||
Synopsys, Inc.* | 186 | 61,797 | ||||||
Teledyne Technologies, Inc.* | 33 | 15,292 | ||||||
Teradyne, Inc. | 397 | 48,212 | ||||||
Texas Instruments, Inc. | 2,123 | 405,302 | ||||||
Tyler Technologies, Inc.* | 26 | 12,628 | ||||||
Universal Display Corp. | 56 | 11,681 | ||||||
VeriSign, Inc.* | 143 | 30,925 | ||||||
Visa, Inc., Class A (a) | 1,481 | 339,297 | ||||||
VMware, Inc., Class A*(a) | 100 | 14,887 | ||||||
Western Union Co. | 1,001 | 21,662 | ||||||
Xilinx, Inc. | 200 | 31,118 | ||||||
Zebra Technologies Corp., Class A* | 37 | 21,725 | ||||||
|
| |||||||
(Cost $9,270,502) | 11,662,336 | |||||||
|
| |||||||
| Materials — 1.8% | ||||||||
Air Products and Chemicals, Inc. | 305 | 82,201 | ||||||
Amcor PLC | 2,697 | 34,656 | ||||||
Berry Global Group, Inc.* | 145 | 9,740 | ||||||
Celanese Corp. | 250 | 39,650 | ||||||
CF Industries Holdings, Inc. | 331 | 15,034 | ||||||
Corteva, Inc. | 1,665 | 73,210 | ||||||
Dow, Inc. | 1,250 | 78,625 | ||||||
DuPont de Nemours, Inc. | 92 | 6,810 | ||||||
Eagle Materials, Inc. | 70 | 10,979 | ||||||
International Paper Co. | 688 | 41,342 | ||||||
Louisiana-Pacific Corp. | 287 | 18,207 | ||||||
LyondellBasell Industries NV, Class A | 395 | 39,638 | ||||||
Mosaic Co. | 308 | 9,911 | ||||||
Newmont Corp. | 1,304 | 75,619 | ||||||
Nucor Corp. | 429 | 50,433 | ||||||
Packaging Corp. of America | 159 | 24,120 | ||||||
Reliance Steel & Aluminum Co. | 201 | 30,158 | ||||||
Scotts Miracle-Gro Co. | 79 | 12,390 | ||||||
Sherwin-Williams Co. | 208 | 63,163 | ||||||
Steel Dynamics, Inc. | 252 | 17,008 | ||||||
|
| |||||||
(Cost $622,193) | 732,894 | |||||||
|
| |||||||
Number | Value | |||||||
| Real Estate — 1.1% | ||||||||
Apartment Income REIT Corp. REIT | 148 | $ | 7,521 | |||||
Boston Properties, Inc. REIT | 102 | 11,525 | ||||||
CBRE Group, Inc., Class A* | 1,096 | 105,545 | ||||||
Gaming and Leisure Properties, Inc. REIT | 182 | 8,973 | ||||||
Highwoods Properties, Inc. REIT | 166 | 7,584 | ||||||
Host Hotels & Resorts, Inc. REIT* | 1,138 | 18,845 | ||||||
Jones Lang LaSalle, Inc.* | 83 | 20,122 | ||||||
Kimco Realty Corp. REIT (a) | 883 | 19,241 | ||||||
Public Storage REIT | 331 | 107,115 | ||||||
Simon Property Group, Inc. REIT | 430 | 57,813 | ||||||
VICI Properties, Inc. REIT (a) | 511 | 15,795 | ||||||
Vornado Realty Trust REIT | 412 | 17,255 | ||||||
Weyerhaeuser Co. REIT | 589 | 21,204 | ||||||
|
| |||||||
(Cost $341,809) | 418,538 | |||||||
|
| |||||||
| Utilities — 0.8% | ||||||||
AES Corp. | 809 | 19,311 | ||||||
DTE Energy Co. | 164 | 19,736 | ||||||
Entergy Corp. | 134 | 14,822 | ||||||
Evergy, Inc. | 282 | 19,303 | ||||||
Exelon Corp. | 1,277 | 62,598 | ||||||
NRG Energy, Inc. | 961 | 43,889 | ||||||
PPL Corp. | 552 | 16,201 | ||||||
Public Service Enterprise Group, Inc. | 638 | 40,794 | ||||||
Sempra Energy | 246 | 32,561 | ||||||
Vistra Corp. | 1,493 | 28,501 | ||||||
|
| |||||||
(Cost $271,625) | 297,716 | |||||||
|
| |||||||
TOTAL COMMON STOCKS | 39,493,850 | |||||||
|
| |||||||
| SECURITIES LENDING COLLATERAL — 0.0% | ||||||||
DWS Government & Agency Securities Portfolio “DWS Government Cash Institutional Shares”, 0.01% (b)(c) | 18,629 | 18,629 | ||||||
|
| |||||||
| CASH EQUIVALENTS — 0.5% | ||||||||
DWS Government Money Market Series “Institutional Shares”, 0.04% (b) | 187,481 | 187,481 | ||||||
|
| |||||||
TOTAL INVESTMENTS — 99.9% | $ | 39,699,960 | ||||||
Other assets and liabilities, net — 0.1% | 37,306 | |||||||
|
| |||||||
NET ASSETS — 100.0% | $ | 39,737,266 | ||||||
|
| |||||||
| See Notes to Financial Statements. | 44 |
DBX ETF Trust
Schedule of Investments
Xtrackers Russell 1000 US Quality at a Reasonable Price ETF (Continued)
August 31, 2021
A summary of the Fund’s transactions with affiliated investments during the year ended August 31, 2021 is as follows:
| Value ($) at 8/31/2020 | Purchases Cost ($) | Sales Proceeds ($) | Net Realized Gain/(Loss) ($) | Net Change in Unrealized Appreciation (Depreciation) ($) | Income ($) | Capital Gain Distributions ($) | Number of Shares at 8/31/2021 | Value ($) at 8/31/2021 | ||||||||||||||||||||||||||||
SECURITIES LENDING COLLATERAL — 0.0% |
| |||||||||||||||||||||||||||||||||||
DWS Government & Agency Securities Portfolio “DWS Government Cash Institutional Shares”, 0.01% (b)(c) |
| |||||||||||||||||||||||||||||||||||
| 37,088 | — | (18,459 | )(d) | — | — | 2 | — | 18,629 | 18,629 | |||||||||||||||||||||||||||
CASH EQUIVALENTS — 0.5% |
| |||||||||||||||||||||||||||||||||||
DWS Government Money Market Series “Institutional Shares”, 0.04% (b) |
| |||||||||||||||||||||||||||||||||||
| 483,373 | 2,427,555 | (2,723,447 | ) | — | — | 142 | — | 187,481 | 187,481 | |||||||||||||||||||||||||||
|
|
|
|
|
|
|
|
|
|
|
|
|
|
|
|
|
| |||||||||||||||||||
| 520,461 | 2,427,555 | (2,741,906 | ) | — | — | 144 | — | 206,110 | 206,110 | |||||||||||||||||||||||||||
|
|
|
|
|
|
|
|
|
|
|
|
|
|
|
|
|
| |||||||||||||||||||
| * | Non-income producing security. |
| (a) | All or a portion of these securities were on loan. In addition, “Other assets and liabilities, net” may include pending sales that are also on loan. The value of securities loaned at August 31, 2021 amounted to $785,717, which is 2.0% of net assets. |
| (b) | Affiliated fund managed by DWS Investment Management Americas, Inc. The rate shown is the annualized seven-day yield at period end. |
| (c) | Represents cash collateral held in connection with securities lending. Income earned by the Fund is net of borrower rebates. In addition, the Fund held non-cash U.S. Treasury securities collateral having a value of $788,522. |
| (d) | Represents the net increase (purchase cost) or decrease (sales proceeds) in the amount invested in cash collateral for the year ended August 31, 2021. |
| REIT: | Real Estate Investment Trust |
At August 31, 2021, open futures contracts purchased were as follows:
Contract Description | Currency | Number of Contracts | Notional Amount | Contract Value | Expiration Date | Unrealized Appreciation | ||||||||||||
E-Mini S&P 500 Futures | USD | 1 | $ | 212,282 | $226,025 | 9/17/2021 | $ | 13,743 | ||||||||||
For information on the Fund’s policy and additional disclosures regarding open futures contracts, please refer to the Derivatives section of Note 2 in the accompanying Notes to Financial Statements.
Currency Abbreviations
| USD | U.S. Dollar |
Fair Value Measurements
Various inputs are used in determining the value of the Fund’s investments. These inputs are summarized in three broad levels. Level 1 includes quoted prices in active markets for identical securities. Level 2 includes other significant observable inputs (including quoted prices for similar securities, interest rates, prepayment speeds and credit risk). Level 3 includes significant unobservable inputs (including the Fund’s own assumptions in determining the fair value of investments). The level assigned to the securities valuations may not be an indication of the risk or liquidity associated with investing in those securities.
The following is a summary of the inputs used as of August 31, 2021 in valuing the Fund’s investments. For information on the Fund’s policy regarding the valuation of investments, please refer to the Security Valuation section of Note 2 in the accompanying Notes to Financial Statements.
Assets | Level 1 | Level 2 | Level 3 | Total | ||||||||||||
Common Stocks (e) | $ | 39,493,850 | $ | — | $ | — | $ | 39,493,850 | ||||||||
Short-Term Investments (e) | 206,110 | — | — | 206,110 | ||||||||||||
Derivatives (f) | ||||||||||||||||
Futures Contracts | 13,743 | — | — | 13,743 | ||||||||||||
|
|
|
|
|
|
|
| |||||||||
TOTAL | $ | 39,713,703 | $ | — | $ | — | $ | 39,713,703 | ||||||||
|
|
|
|
|
|
|
| |||||||||
| (e) | See Schedule of Investments for additional detailed categorizations. |
| (f) | Derivatives include unrealized appreciation (depreciation) on open futures contracts. |
| See Notes to Financial Statements. | 45 |
DBX ETF Trust
Schedule of Investments
Xtrackers Russell US Multifactor ETF
August 31, 2021
Number | Value | |||||||
| COMMON STOCKS — 99.8% | ||||||||
| Communication Services — 2.9% | ||||||||
Activision Blizzard, Inc. | 1,786 | $ | 147,113 | |||||
Alphabet, Inc., Class A* | 50 | 144,697 | ||||||
Alphabet, Inc., Class C* | 59 | 171,645 | ||||||
Altice USA, Inc., Class A* | 7,378 | 202,452 | ||||||
AT&T, Inc. | 2,114 | 57,966 | ||||||
Cable One, Inc. | 24 | 50,390 | ||||||
Charter Communications, Inc., Class A*(a) | 183 | 149,449 | ||||||
Comcast Corp., Class A | 1,700 | 103,156 | ||||||
Discovery, Inc., Class A*(a) | 2,182 | 62,929 | ||||||
Discovery, Inc., Class C* | 6,375 | 175,886 | ||||||
DISH Network Corp., Class A* | 3,834 | 167,124 | ||||||
Electronic Arts, Inc. | 1,059 | 153,777 | ||||||
Facebook, Inc., Class A* | 185 | 70,185 | ||||||
Fox Corp., Class A | 3,867 | 144,780 | ||||||
Fox Corp., Class B | 1,890 | 65,451 | ||||||
IAC/InterActiveCorp* | 154 | 20,336 | ||||||
Interpublic Group of Cos., Inc. | 37,376 | 1,391,508 | ||||||
Liberty Broadband Corp., Class C* | 152 | 29,081 | ||||||
Liberty Media Corp-Liberty SiriusXM, Class A* | 707 | 34,996 | ||||||
Liberty Media Corp-Liberty SiriusXM, Class C* | 1,648 | 81,329 | ||||||
Lumen Technologies, Inc. (a) | 20,004 | 246,049 | ||||||
Madison Square Garden Sports Corp.* | 104 | 18,801 | ||||||
Match Group, Inc.* | 947 | 130,156 | ||||||
New York Times Co., Class A | 1,393 | 70,737 | ||||||
News Corp., Class A | 9,850 | 221,329 | ||||||
News Corp., Class B | 3,194 | 70,364 | ||||||
Nexstar Media Group, Inc., Class A | 2,201 | 329,600 | ||||||
Omnicom Group, Inc. | 10,030 | 734,397 | ||||||
Playtika Holding Corp.* | 1,235 | 32,592 | ||||||
Sirius XM Holdings, Inc. (a) | 4,878 | 30,585 | ||||||
Take-Two Interactive Software, Inc.* | 1,398 | 225,386 | ||||||
Twitter, Inc.* | 157 | 10,126 | ||||||
Verizon Communications, Inc. | 1,249 | 68,695 | ||||||
ViacomCBS, Inc., Class B | 5,241 | 217,239 | ||||||
Vimeo, Inc.* | 947 | 36,100 | ||||||
Walt Disney Co.* | 136 | 24,657 | ||||||
World Wrestling Entertainment, Inc., Class A | 927 | 48,306 | ||||||
Zynga, Inc., Class A* | 1,743 | 15,426 | ||||||
|
| |||||||
(Cost $5,030,939) | 5,954,795 | |||||||
|
| |||||||
| Consumer Discretionary — 11.4% | ||||||||
Advance Auto Parts, Inc. | 2,994 | 607,333 | ||||||
Amazon.com, Inc.* | 15 | 52,062 | ||||||
Aptiv PLC* | 652 | 99,228 | ||||||
Aramark | 777 | 27,032 | ||||||
AutoNation, Inc.* | 4,512 | 492,214 | ||||||
AutoZone, Inc.* | 301 | 466,294 | ||||||
Bath & Body Works, Inc. | 457 | 30,838 | ||||||
Best Buy Co., Inc. | 7,431 | 865,786 | ||||||
Booking Holdings, Inc.* | 12 | 27,596 | ||||||
BorgWarner, Inc. | 1,865 | 79,598 | ||||||
Bright Horizons Family Solutions, Inc.* | 178 | 25,945 | ||||||
Number | Value | |||||||
| Consumer Discretionary (Continued) | ||||||||
Brunswick Corp. | 4,335 | $ | 419,931 | |||||
Burlington Stores, Inc.* | 72 | 21,563 | ||||||
CarMax, Inc.* | 1,021 | 127,839 | ||||||
Carter’s, Inc. | 1,364 | 139,646 | ||||||
Chipotle Mexican Grill, Inc.* | 87 | 165,590 | ||||||
Choice Hotels International, Inc. | 362 | 43,208 | ||||||
Columbia Sportswear Co. | 1,226 | 125,064 | ||||||
D.R. Horton, Inc. | 5,654 | 540,636 | ||||||
Darden Restaurants, Inc. | 216 | 32,540 | ||||||
Deckers Outdoor Corp.* | 800 | 334,760 | ||||||
Dick’s Sporting Goods, Inc. (a) | 3,252 | 457,914 | ||||||
Dollar General Corp. | 2,086 | 464,990 | ||||||
Dollar Tree, Inc.* | 6,031 | 546,047 | ||||||
Domino’s Pizza, Inc. | 433 | 223,813 | ||||||
eBay, Inc. | 10,020 | 768,935 | ||||||
Etsy, Inc.*(a) | 245 | 52,984 | ||||||
Five Below, Inc.* | 931 | 198,126 | ||||||
Floor & Decor Holdings, Inc., Class A* | 1,131 | 139,452 | ||||||
Foot Locker, Inc. | 7,080 | 401,365 | ||||||
Ford Motor Co.* | 42,593 | 554,987 | ||||||
Frontdoor, Inc.* | 830 | 36,205 | ||||||
Gap, Inc. | 718 | 19,192 | ||||||
Garmin Ltd. | 3,475 | 606,144 | ||||||
General Motors Co.* | 6,545 | 320,770 | ||||||
Gentex Corp. | 9,575 | 294,910 | ||||||
Genuine Parts Co. | 7,822 | 955,770 | ||||||
Grand Canyon Education, Inc.* | 717 | 63,913 | ||||||
H&R Block, Inc. | 3,774 | 96,803 | ||||||
Hanesbrands, Inc. | 8,918 | 166,588 | ||||||
Harley-Davidson, Inc. | 6,256 | 247,300 | ||||||
Hasbro, Inc. | 719 | 70,685 | ||||||
Hilton Worldwide Holdings, Inc.* | 643 | 80,285 | ||||||
Home Depot, Inc. | 167 | 54,472 | ||||||
Kohl’s Corp. | 1,364 | 78,294 | ||||||
Lear Corp. | 1,021 | 163,299 | ||||||
Leggett & Platt, Inc. | 5,582 | 270,113 | ||||||
Lennar Corp., Class A | 5,128 | 550,286 | ||||||
Lennar Corp., Class B | 578 | 50,587 | ||||||
Lithia Motors, Inc. | 147 | 48,701 | ||||||
LKQ Corp.* | 14,629 | 770,802 | ||||||
Lowe’s Cos., Inc. | 1,833 | 373,730 | ||||||
Lululemon Athletica, Inc.* | 147 | 58,825 | ||||||
Marriott International, Inc., Class A* | 303 | 40,947 | ||||||
Mattel, Inc.* | 5,329 | 113,774 | ||||||
McDonald’s Corp. | 293 | 69,576 | ||||||
Mohawk Industries, Inc.* | 1,967 | 388,994 | ||||||
Newell Brands, Inc. | 10,323 | 262,307 | ||||||
NIKE, Inc., Class B | 323 | 53,211 | ||||||
NVR, Inc.* | 75 | 388,496 | ||||||
Ollie’s Bargain Outlet Holdings, Inc.*(a) | 181 | 13,101 | ||||||
O’Reilly Automotive, Inc.* | 1,084 | 643,983 | ||||||
Penske Automotive Group, Inc. | 1,535 | 138,043 | ||||||
Petco Health & Wellness Co., Inc., | 1,344 | 28,936 | ||||||
Polaris, Inc. | 2,090 | 250,298 | ||||||
Pool Corp. | 1,506 | 744,416 | ||||||
PulteGroup, Inc. | 11,346 | 611,096 | ||||||
| See Notes to Financial Statements. | 46 |
DBX ETF Trust
Schedule of Investments
Xtrackers Russell US Multifactor ETF (Continued)
August 31, 2021
Number | Value | |||||||
| Consumer Discretionary (Continued) | ||||||||
PVH Corp.* | 213 | $ | 22,320 | |||||
Qurate Retail, Inc., Series A | 21,221 | 234,068 | ||||||
Ralph Lauren Corp. | 665 | 77,226 | ||||||
Ross Stores, Inc. | 1,435 | 169,904 | ||||||
Service Corp. International | 6,299 | 395,325 | ||||||
Skechers U.S.A., Inc., Class A* | 1,253 | 63,189 | ||||||
Starbucks Corp. | 183 | 21,501 | ||||||
Tapestry, Inc.* | 1,232 | 49,674 | ||||||
Target Corp. | 4,326 | 1,068,436 | ||||||
Terminix Global Holdings, Inc.* | 1,703 | 70,896 | ||||||
Thor Industries, Inc. | 270 | 30,626 | ||||||
TJX Cos., Inc. | 2,514 | 182,818 | ||||||
Toll Brothers, Inc. | 3,295 | 211,078 | ||||||
TopBuild Corp.* | 517 | 113,114 | ||||||
Tractor Supply Co. | 4,811 | 934,537 | ||||||
Travel + Leisure Co. | 622 | 34,061 | ||||||
Ulta Beauty, Inc.* | 379 | 146,791 | ||||||
Under Armour, Inc., Class A* | 965 | 22,330 | ||||||
Vail Resorts, Inc.* | 615 | 187,483 | ||||||
VF Corp. | 827 | 63,241 | ||||||
Victoria’s Secret & Co.* | 152 | 10,078 | ||||||
Whirlpool Corp. | 3,199 | 708,674 | ||||||
Williams-Sonoma, Inc. | 3,165 | 590,906 | ||||||
YETI Holdings, Inc.* | 440 | 43,710 | ||||||
Yum China Holdings, Inc. | 1,320 | 81,259 | ||||||
Yum! Brands, Inc. | 2,448 | 320,761 | ||||||
|
| |||||||
(Cost $17,846,401) | 23,512,174 | |||||||
|
| |||||||
| Consumer Staples — 4.3% | ||||||||
Albertsons Cos., Inc., Class A (a) | 10,822 | 328,556 | ||||||
Altria Group, Inc. | 7,600 | 381,748 | ||||||
Archer-Daniels-Midland Co. | 2,847 | 170,820 | ||||||
Boston Beer Co., Inc., Class A*(a) | 309 | 176,195 | ||||||
Brown-Forman Corp., Class A | 625 | 41,375 | ||||||
Brown-Forman Corp., Class B | 849 | 59,617 | ||||||
Campbell Soup Co. (a) | 2,192 | 91,472 | ||||||
Casey’s General Stores, Inc. | 1,482 | 303,158 | ||||||
Church & Dwight Co., Inc. | 2,904 | 242,949 | ||||||
Clorox Co. | 575 | 96,629 | ||||||
Coca-Cola Co. | 765 | 43,077 | ||||||
Colgate-Palmolive Co. | 3,130 | 243,983 | ||||||
Conagra Brands, Inc. | 7,353 | 243,531 | ||||||
Constellation Brands, Inc., Class A | 1,154 | 243,656 | ||||||
Costco Wholesale Corp. | 652 | 296,979 | ||||||
Darling Ingredients, Inc.* | 6,933 | 516,508 | ||||||
Estee Lauder Cos., Inc., Class A | 656 | 223,361 | ||||||
Flowers Foods, Inc. | 6,123 | 147,748 | ||||||
Freshpet, Inc.* | 180 | 23,065 | ||||||
General Mills, Inc. | 3,885 | 224,592 | ||||||
Grocery Outlet Holding Corp.*(a) | 848 | 22,073 | ||||||
Hain Celestial Group, Inc.* | 1,522 | 56,938 | ||||||
Herbalife Nutrition Ltd.* | 3,610 | 185,337 | ||||||
Hershey Co. | 2,744 | 487,609 | ||||||
Hormel Foods Corp. | 2,303 | 104,879 | ||||||
Ingredion, Inc. | 1,745 | 153,316 | ||||||
J M Smucker Co. (a) | 3,887 | 480,705 | ||||||
Kellogg Co. (a) | 2,242 | 141,560 | ||||||
Number | Value | |||||||
| Consumer Staples (Continued) | ||||||||
Keurig Dr Pepper, Inc. (a) | 2,366 | $ | 84,395 | |||||
Kimberly-Clark Corp. | 1,188 | 163,718 | ||||||
Kraft Heinz Co. | 3,519 | 126,649 | ||||||
Kroger Co. | 11,473 | 528,102 | ||||||
Lamb Weston Holdings, Inc. | 1,336 | 87,040 | ||||||
McCormick & Co., Inc. | 1,276 | 110,106 | ||||||
Molson Coors Beverage Co., Class B | 4,083 | 194,065 | ||||||
Mondelez International, Inc., Class A | 2,822 | 175,162 | ||||||
Monster Beverage Corp.* | 2,337 | 228,021 | ||||||
PepsiCo, Inc. | 400 | 62,556 | ||||||
Philip Morris International, Inc. | 2,633 | 271,199 | ||||||
Pilgrim’s Pride Corp.* | 2,177 | 60,608 | ||||||
Post Holdings, Inc.* | 1,415 | 158,353 | ||||||
Procter & Gamble Co. | 255 | 36,309 | ||||||
Seaboard Corp. | 9 | 38,291 | ||||||
Spectrum Brands Holdings, Inc. | 1,129 | 88,130 | ||||||
Sysco Corp. | 2,030 | 161,690 | ||||||
Tyson Foods, Inc., Class A | 5,276 | 414,272 | ||||||
Walgreens Boots Alliance, Inc. | 2,103 | 106,727 | ||||||
Walmart, Inc. | 195 | 28,880 | ||||||
|
| |||||||
(Cost $7,748,444) | 8,855,709 | |||||||
|
| |||||||
| Energy — 0.9% | ||||||||
Baker Hughes Co. | 3,531 | 80,436 | ||||||
Cabot Oil & Gas Corp. | 3,792 | 60,255 | ||||||
Cheniere Energy, Inc.* | 3,134 | 274,100 | ||||||
Chevron Corp. | 206 | 19,935 | ||||||
Cimarex Energy Co. | 675 | 43,349 | ||||||
ConocoPhillips | 706 | 39,204 | ||||||
DT Midstream, Inc.* | 2,251 | 104,604 | ||||||
EOG Resources, Inc. | 2,737 | 184,802 | ||||||
EQT Corp.* | 2,054 | 37,650 | ||||||
Exxon Mobil Corp. | 349 | 19,027 | ||||||
Hess Corp. | 301 | 20,694 | ||||||
Kinder Morgan, Inc. | 8,138 | 132,405 | ||||||
Marathon Oil Corp. | 2,338 | 27,472 | ||||||
Marathon Petroleum Corp. | 266 | 15,766 | ||||||
NOV, Inc.* | 2,420 | 31,871 | ||||||
ONEOK, Inc. | 1,552 | 81,511 | ||||||
Phillips 66 | 345 | 24,526 | ||||||
Pioneer Natural Resources Co. | 1,099 | 164,487 | ||||||
Schlumberger N.V. | 1,209 | 33,900 | ||||||
Texas Pacific Land Corp. | 86 | 116,938 | ||||||
Valero Energy Corp. | 336 | 22,280 | ||||||
Williams Cos., Inc. | 8,915 | 220,111 | ||||||
|
| |||||||
(Cost $1,731,421) | 1,755,323 | |||||||
|
| |||||||
| Financials — 17.1% | ||||||||
Affiliated Managers Group, Inc. | 2,906 | 494,340 | ||||||
Aflac, Inc. | 11,788 | 668,144 | ||||||
AGNC Investment Corp. REIT | 7,057 | 115,100 | ||||||
Alleghany Corp.* | 339 | 229,398 | ||||||
Allstate Corp. | 6,822 | 922,880 | ||||||
Ally Financial, Inc. | 6,572 | 347,659 | ||||||
American Express Co. | 470 | 78,001 | ||||||
American Financial Group, Inc. | 2,478 | 341,815 | ||||||
American International Group, Inc. | 385 | 21,006 | ||||||
| See Notes to Financial Statements. | 47 |
DBX ETF Trust
Schedule of Investments
Xtrackers Russell US Multifactor ETF (Continued)
August 31, 2021
Number | Value | |||||||
| Financials (Continued) | ||||||||
Ameriprise Financial, Inc. | 1,889 | $ | 515,527 | |||||
Annaly Capital Management, Inc. REIT | 2,264 | 19,674 | ||||||
Aon PLC, Class A (a) | 1,622 | 465,287 | ||||||
Arch Capital Group Ltd.* | 13,429 | 551,932 | ||||||
Ares Management Corp., Class A | 590 | 45,536 | ||||||
Arthur J Gallagher & Co. | 3,921 | 563,134 | ||||||
Assurant, Inc. | 2,092 | 355,870 | ||||||
Assured Guaranty Ltd. | 4,163 | 207,567 | ||||||
Athene Holding Ltd., Class A* | 1,502 | 100,589 | ||||||
Axis Capital Holdings Ltd. | 920 | 47,076 | ||||||
Bank of America Corp. | 962 | 40,164 | ||||||
Bank of Hawaii Corp. | 746 | 62,522 | ||||||
Bank of New York Mellon Corp. | 4,687 | 258,816 | ||||||
Bank OZK | 2,909 | 123,429 | ||||||
Berkshire Hathaway, Inc., Class B* | 460 | 131,454 | ||||||
BlackRock, Inc. | 176 | 166,019 | ||||||
Blackstone, Inc. | 2,440 | 306,781 | ||||||
BOK Financial Corp. (a) | 336 | 29,585 | ||||||
Brown & Brown, Inc. | 5,234 | 303,834 | ||||||
Capital One Financial Corp. | 3,431 | 569,443 | ||||||
Carlyle Group, Inc. | 1,082 | 53,429 | ||||||
Cboe Global Markets, Inc. | 2,992 | 377,441 | ||||||
Charles Schwab Corp. | 1,377 | 100,314 | ||||||
Chubb Ltd. | 1,577 | 290,042 | ||||||
Cincinnati Financial Corp. | 9,193 | 1,134,416 | ||||||
Citigroup, Inc. | 504 | 36,243 | ||||||
Citizens Financial Group, Inc. | 3,817 | 167,146 | ||||||
CME Group, Inc. | 410 | 82,705 | ||||||
CNA Financial Corp. | 1,083 | 48,031 | ||||||
Comerica, Inc. | 2,697 | 199,335 | ||||||
Commerce Bancshares, Inc. | 1,624 | 114,849 | ||||||
Credit Acceptance Corp.*(a) | 127 | 73,619 | ||||||
Cullen/Frost Bankers, Inc. | 1,110 | 126,784 | ||||||
Discover Financial Services | 2,293 | 294,008 | ||||||
East West Bancorp, Inc. | 3,533 | 259,110 | ||||||
Equitable Holdings, Inc. | 1,032 | 32,002 | ||||||
Erie Indemnity Co., Class A | 480 | 85,003 | ||||||
Evercore, Inc., Class A | 3,962 | 553,254 | ||||||
Everest Re Group Ltd. | 943 | 249,801 | ||||||
FactSet Research Systems, Inc. | 545 | 207,220 | ||||||
Fidelity National Financial, Inc. | 14,689 | 717,264 | ||||||
Fifth Third Bancorp | 4,779 | 185,712 | ||||||
First American Financial Corp. | 5,766 | 406,676 | ||||||
First Citizens BancShares, Inc., Class A (a) | 189 | 169,665 | ||||||
First Hawaiian, Inc. | 3,373 | 94,140 | ||||||
First Horizon Corp. | 13,320 | 218,315 | ||||||
First Republic Bank | 1,128 | 224,404 | ||||||
FNB Corp. | 8,185 | 95,601 | ||||||
Franklin Resources, Inc. | 9,939 | 322,421 | ||||||
Globe Life, Inc. | 3,913 | 375,922 | ||||||
Goldman Sachs Group, Inc. | 230 | 95,107 | ||||||
Hanover Insurance Group, Inc. | 2,056 | 290,533 | ||||||
Hartford Financial Services Group, Inc. | 10,093 | 678,451 | ||||||
Huntington Bancshares, Inc. | 11,552 | 179,403 | ||||||
Interactive Brokers Group, Inc., Class A | 2,918 | 188,620 | ||||||
Intercontinental Exchange, Inc. | 1,012 | 120,964 | ||||||
Number | Value | |||||||
| Financials (Continued) | ||||||||
Invesco Ltd. | 15,389 | $ | 389,649 | |||||
Janus Henderson Group PLC | 7,931 | 343,888 | ||||||
Jefferies Financial Group, Inc. | 15,327 | 566,486 | ||||||
Kemper Corp. | 1,423 | 97,618 | ||||||
KeyCorp | 11,347 | 230,571 | ||||||
KKR & Co., Inc. | 1,641 | 105,500 | ||||||
Lazard Ltd., Class A | 9,978 | 472,957 | ||||||
Lincoln National Corp. | 1,886 | 129,474 | ||||||
Loews Corp. | 2,370 | 132,412 | ||||||
LPL Financial Holdings, Inc. | 3,982 | 588,739 | ||||||
M&T Bank Corp. | 1,576 | 220,656 | ||||||
Markel Corp.* | 279 | 354,400 | ||||||
MarketAxess Holdings, Inc. | 104 | 49,496 | ||||||
Marsh & McLennan Cos., Inc. | 2,659 | 417,995 | ||||||
Mercury General Corp. | 2,608 | 155,724 | ||||||
MetLife, Inc. | 6,847 | 424,514 | ||||||
MGIC Investment Corp. | 21,570 | 329,374 | ||||||
Moody’s Corp. | 566 | 215,516 | ||||||
Morgan Stanley | 1,473 | 153,825 | ||||||
Morningstar, Inc. | 1,076 | 288,357 | ||||||
MSCI, Inc. | 656 | 416,285 | ||||||
Nasdaq, Inc. | 2,097 | 410,551 | ||||||
New York Community Bancorp, Inc. (a) | 5,681 | 71,126 | ||||||
Northern Trust Corp. | 2,075 | 245,929 | ||||||
Old Republic International Corp. | 23,577 | 613,002 | ||||||
OneMain Holdings, Inc. | 539 | 31,170 | ||||||
People’s United Financial, Inc. | 10,523 | 172,893 | ||||||
Pinnacle Financial Partners, Inc. | 2,050 | 198,686 | ||||||
PNC Financial Services Group, Inc. | 1,226 | 234,289 | ||||||
Popular, Inc. | 3,038 | 230,706 | ||||||
Primerica, Inc. | 1,275 | 194,999 | ||||||
Principal Financial Group, Inc. | 5,513 | 368,324 | ||||||
Progressive Corp. | 8,636 | 831,992 | ||||||
Prosperity Bancshares, Inc. | 1,487 | 103,912 | ||||||
Prudential Financial, Inc. | 3,626 | 383,921 | ||||||
Raymond James Financial, Inc. | 5,528 | 773,367 | ||||||
Regions Financial Corp. | 13,012 | 265,835 | ||||||
Reinsurance Group of America, Inc. | 1,782 | 206,391 | ||||||
RenaissanceRe Holdings Ltd. | 407 | 63,789 | ||||||
Rocket Cos., Inc., Class A (a) | 623 | 10,809 | ||||||
S&P Global, Inc. (a) | 428 | 189,955 | ||||||
Santander Consumer USA Holdings, Inc. | 1,785 | 74,488 | ||||||
SEI Investments Co. | 2,863 | 179,825 | ||||||
Signature Bank | 956 | 247,919 | ||||||
SLM Corp. | 16,790 | 314,813 | ||||||
Starwood Property Trust, Inc. REIT | 9,612 | 247,990 | ||||||
State Street Corp. | 2,667 | 247,791 | ||||||
Sterling Bancorp | 3,860 | 88,355 | ||||||
Stifel Financial Corp. | 6,293 | 434,846 | ||||||
SVB Financial Group* | 383 | 214,289 | ||||||
Synchrony Financial | 14,386 | 715,704 | ||||||
Synovus Financial Corp. | 2,215 | 95,467 | ||||||
T. Rowe Price Group, Inc. | 4,074 | 912,046 | ||||||
Tradeweb Markets, Inc., Class A | 688 | 59,863 | ||||||
Travelers Cos., Inc. | 3,358 | 536,306 | ||||||
Truist Financial Corp. | 3,699 | 211,065 | ||||||
Unum Group | 7,580 | 201,780 | ||||||
| See Notes to Financial Statements. | 48 |
DBX ETF Trust
Schedule of Investments
Xtrackers Russell US Multifactor ETF (Continued)
August 31, 2021
Number | Value | |||||||
| Financials (Continued) | ||||||||
US Bancorp | 3,090 | $ | 177,335 | |||||
Virtu Financial, Inc., Class A | 3,355 | 82,130 | ||||||
Voya Financial, Inc. (a) | 2,276 | 147,894 | ||||||
W.R. Berkley Corp. | 3,430 | 258,313 | ||||||
Webster Financial Corp. | 1,831 | 92,502 | ||||||
Wells Fargo & Co. | 734 | 33,544 | ||||||
Western Alliance Bancorp | 1,832 | 178,730 | ||||||
White Mountains Insurance Group Ltd. | 295 | 330,639 | ||||||
Willis Towers Watson PLC | 1,346 | 297,089 | ||||||
Wintrust Financial Corp. | 177 | 13,247 | ||||||
Zions Bancorp NA | 3,837 | 222,162 | ||||||
|
| |||||||
(Cost $28,924,633) | 35,231,746 | |||||||
|
| |||||||
| Health Care — 9.6% | ||||||||
Abbott Laboratories | 677 | 85,552 | ||||||
AbbVie, Inc. | 143 | 17,272 | ||||||
ABIOMED, Inc.* | 147 | 53,502 | ||||||
Acadia Healthcare Co., Inc.* | 299 | 19,770 | ||||||
Agilent Technologies, Inc. | 2,199 | 385,859 | ||||||
Align Technology, Inc.* | 337 | 238,933 | ||||||
Amedisys, Inc.* | 635 | 116,491 | ||||||
AmerisourceBergen Corp. | 995 | 121,599 | ||||||
Amgen, Inc. | 422 | 95,174 | ||||||
Anthem, Inc. | 1,814 | 680,486 | ||||||
Avantor, Inc.* | 2,500 | 98,600 | ||||||
Baxter International, Inc. | 1,061 | 80,869 | ||||||
Becton Dickinson and Co. | 238 | 59,905 | ||||||
Biogen, Inc.* | 575 | 194,873 | ||||||
Bio-Rad Laboratories, Inc., Class A* | 886 | 713,070 | ||||||
Bio-Techne Corp. | 723 | 360,878 | ||||||
Boston Scientific Corp.* | 1,273 | 57,476 | ||||||
Bristol-Myers Squibb Co. | 891 | 59,572 | ||||||
Bruker Corp. | 2,471 | 218,214 | ||||||
Cardinal Health, Inc. | 3,544 | 186,025 | ||||||
Catalent, Inc.* | 771 | 100,569 | ||||||
Centene Corp.* | 745 | 46,920 | ||||||
Cerner Corp. | 3,008 | 229,661 | ||||||
Charles River Laboratories International, Inc.* | 827 | 367,072 | ||||||
Chemed Corp. | 396 | 188,773 | ||||||
Cigna Corp. | 1,717 | 363,403 | ||||||
Cooper Cos., Inc. | 321 | 144,678 | ||||||
CureVac NV*(a) | 504 | 33,178 | ||||||
CVS Health Corp. | 4,440 | 383,572 | ||||||
Danaher Corp. | 154 | 49,921 | ||||||
DaVita, Inc.* | 3,537 | 462,533 | ||||||
DENTSPLY SIRONA, Inc. | 2,225 | 137,282 | ||||||
Edwards Lifesciences Corp.* | 1,927 | 225,806 | ||||||
Eli Lilly & Co. | 342 | 88,335 | ||||||
Encompass Health Corp. | 2,725 | 213,776 | ||||||
Envista Holdings Corp.* | 1,018 | 43,560 | ||||||
Exelixis, Inc.* | 445 | 8,531 | ||||||
Gilead Sciences, Inc. | 614 | 44,687 | ||||||
Globus Medical, Inc., Class A* | 2,295 | 187,272 | ||||||
HCA Healthcare, Inc. | 1,989 | 503,177 | ||||||
Henry Schein, Inc.* | 6,598 | 498,743 | ||||||
Hill-Rom Holdings, Inc. | 899 | 130,876 | ||||||
Number | Value | |||||||
| Health Care (Continued) | ||||||||
Hologic, Inc.* | 3,029 | $ | 239,745 | |||||
Horizon Therapeutics PLC* | 1,698 | 183,537 | ||||||
Humana, Inc. | 1,089 | 441,502 | ||||||
ICU Medical, Inc.* | 422 | 84,126 | ||||||
IDEXX Laboratories, Inc.* | 734 | 494,540 | ||||||
Illumina, Inc.* | 137 | 62,631 | ||||||
Insulet Corp.* | 62 | 18,464 | ||||||
Integra LifeSciences Holdings Corp.* | 1,249 | 93,962 | ||||||
Intuitive Surgical, Inc.* | 163 | 171,730 | ||||||
IQVIA Holdings, Inc.* | 1,125 | 292,196 | ||||||
Jazz Pharmaceuticals PLC* | 2,482 | 326,904 | ||||||
Johnson & Johnson | 158 | 27,355 | ||||||
Laboratory Corp. of America Holdings* | 3,470 | 1,052,729 | ||||||
Maravai LifeSciences Holdings, Inc., Class A* | 2,450 | 144,991 | ||||||
Masimo Corp.* | 276 | 74,945 | ||||||
McKesson Corp. | 2,263 | 461,969 | ||||||
Medtronic PLC | 693 | 92,502 | ||||||
Merck & Co., Inc. | 607 | 46,308 | ||||||
Mettler-Toledo International, Inc.* | 349 | 541,938 | ||||||
Molina Healthcare, Inc.* | 1,364 | 366,602 | ||||||
Neurocrine Biosciences, Inc.* | 109 | 10,377 | ||||||
Organon & Co. | 21,412 | 725,653 | ||||||
PerkinElmer, Inc. | 3,406 | 629,429 | ||||||
Perrigo Co. PLC | 434 | 17,772 | ||||||
Pfizer, Inc. | 2,507 | 115,497 | ||||||
Premier, Inc., Class A | 3,048 | 113,325 | ||||||
QIAGEN NV* | 2,291 | 127,884 | ||||||
Quest Diagnostics, Inc. | 4,196 | 641,275 | ||||||
Regeneron Pharmaceuticals, Inc.* | 97 | 65,320 | ||||||
Repligen Corp.* | 280 | 79,234 | ||||||
ResMed, Inc. | 887 | 257,700 | ||||||
Royalty Pharma PLC, Class A | 483 | 18,668 | ||||||
Seagen, Inc.* | 121 | 20,280 | ||||||
STERIS PLC | 816 | 175,448 | ||||||
Stryker Corp. | 344 | 95,322 | ||||||
Syneos Health, Inc.* | 499 | 46,297 | ||||||
Teleflex, Inc. | 121 | 47,851 | ||||||
Thermo Fisher Scientific, Inc. | 254 | 140,957 | ||||||
United Therapeutics Corp.* | 3,145 | 675,798 | ||||||
UnitedHealth Group, Inc. | 158 | 65,771 | ||||||
Universal Health Services, Inc., Class B | 4,454 | 693,755 | ||||||
Veeva Systems, Inc., Class A* | 274 | 90,963 | ||||||
Vertex Pharmaceuticals, Inc.* | 184 | 36,853 | ||||||
Waters Corp.* | 1,365 | 565,137 | ||||||
West Pharmaceutical Services, Inc. | 1,227 | 554,138 | ||||||
Zimmer Biomet Holdings, Inc. | 520 | 78,234 | ||||||
Zoetis, Inc. | 802 | 164,057 | ||||||
|
| |||||||
(Cost $14,491,071) | 19,768,116 | |||||||
|
| |||||||
| Industrials — 17.3% | ||||||||
3M Co. | 1,039 | 202,335 | ||||||
A O Smith Corp. | 7,186 | 522,566 | ||||||
Acuity Brands, Inc. | 2,044 | 377,179 | ||||||
Advanced Drainage Systems, Inc. | 2,225 | 253,984 | ||||||
AECOM* | 990 | 64,904 | ||||||
AGCO Corp. | 5,154 | 709,293 | ||||||
| See Notes to Financial Statements. | 49 |
DBX ETF Trust
Schedule of Investments
Xtrackers Russell US Multifactor ETF (Continued)
August 31, 2021
Number | Value | |||||||
| Industrials (Continued) | ||||||||
Allegion PLC | 1,482 | $ | 213,393 | |||||
Allison Transmission Holdings, Inc. | 2,441 | 90,268 | ||||||
AMERCO | 875 | 578,506 | ||||||
AMETEK, Inc. | 2,867 | 389,826 | ||||||
Armstrong World Industries, Inc. | 172 | 17,876 | ||||||
Booz Allen Hamilton Holding Corp. | 1,563 | 128,025 | ||||||
Builders FirstSource, Inc.* | 1,179 | 62,829 | ||||||
BWX Technologies, Inc. | 785 | 45,083 | ||||||
C.H. Robinson Worldwide, Inc. | 2,921 | 263,065 | ||||||
CACI International, Inc., Class A* | 813 | 209,380 | ||||||
Carlisle Cos., Inc. | 2,250 | 474,165 | ||||||
Carrier Global Corp. | 16,352 | 941,875 | ||||||
Caterpillar, Inc. | 503 | 106,068 | ||||||
Cintas Corp. | 537 | 212,528 | ||||||
Clean Harbors, Inc.* | 1,173 | 120,373 | ||||||
Colfax Corp.* | 782 | 37,669 | ||||||
Copart, Inc.* | 2,986 | 430,940 | ||||||
CoStar Group, Inc.* | 980 | 83,045 | ||||||
Crane Co. | 1,585 | 161,305 | ||||||
CSX Corp. | 6,127 | 199,311 | ||||||
Cummins, Inc. | 2,383 | 562,340 | ||||||
Curtiss-Wright Corp. | 953 | 116,056 | ||||||
Deere & Co. | 688 | 260,085 | ||||||
Donaldson Co., Inc. | 3,614 | 244,849 | ||||||
Dover Corp. | 2,441 | 425,613 | ||||||
Dun & Bradstreet Holdings, Inc.* | 750 | 13,748 | ||||||
Eaton Corp. PLC | 2,666 | 448,848 | ||||||
Emerson Electric Co. | 3,748 | 395,414 | ||||||
Equifax, Inc. | 836 | 227,609 | ||||||
Expeditors International of Washington, Inc. | 7,548 | 940,783 | ||||||
Fastenal Co. | 7,447 | 415,915 | ||||||
FedEx Corp. | 520 | 138,159 | ||||||
Flowserve Corp. | 2,332 | 90,645 | ||||||
Fortive Corp. | 2,505 | 185,044 | ||||||
Fortune Brands Home & Security, Inc. | 3,430 | 333,979 | ||||||
FTI Consulting, Inc.* | 1,825 | 254,971 | ||||||
Generac Holdings, Inc.* | 1,294 | 565,452 | ||||||
General Dynamics Corp. | 1,336 | 267,614 | ||||||
General Electric Co. | 1,739 | 183,308 | ||||||
Graco, Inc. | 5,768 | 452,327 | ||||||
GXO Logistics, Inc.* | 684 | 55,944 | ||||||
HEICO Corp. | 191 | 24,223 | ||||||
HEICO Corp., Class A | 359 | 41,012 | ||||||
Hexcel Corp.* | 358 | 20,302 | ||||||
Honeywell International, Inc. | 625 | 144,944 | ||||||
Howmet Aerospace, Inc. | 415 | 13,176 | ||||||
Hubbell, Inc. | 1,746 | 359,868 | ||||||
Huntington Ingalls Industries, Inc. | 1,435 | 292,984 | ||||||
IAA, Inc.* | 874 | 46,427 | ||||||
IDEX Corp. | 1,295 | 290,080 | ||||||
IHS Markit Ltd. | 1,833 | 221,060 | ||||||
Illinois Tool Works, Inc. | 976 | 227,271 | ||||||
ITT, Inc. | 3,544 | 339,054 | ||||||
Jacobs Engineering Group, Inc. | 4,740 | 639,710 | ||||||
JB Hunt Transport Services, Inc. | 3,175 | 563,245 | ||||||
Johnson Controls International PLC | 8,039 | 601,317 | ||||||
Number | Value | |||||||
| Industrials (Continued) | ||||||||
Kansas City Southern | 1,604 | $ | 450,195 | |||||
Kirby Corp.* | 564 | 30,225 | ||||||
Knight-Swift Transportation Holdings, Inc. | 4,581 | 237,891 | ||||||
L3Harris Technologies, Inc. | 1,109 | 258,408 | ||||||
Landstar System, Inc. | 2,277 | 382,604 | ||||||
Leidos Holdings, Inc. | 1,470 | 144,222 | ||||||
Lennox International, Inc. | 1,314 | 440,427 | ||||||
Lincoln Electric Holdings, Inc. | 2,288 | 319,428 | ||||||
Lockheed Martin Corp. | 421 | 151,476 | ||||||
ManpowerGroup, Inc. | 4,386 | 532,548 | ||||||
Masco Corp. | 7,016 | 426,012 | ||||||
MasTec, Inc.* | 1,856 | 169,713 | ||||||
Mercury Systems, Inc.* | 134 | 6,751 | ||||||
Middleby Corp.* | 1,252 | 229,041 | ||||||
MSA Safety, Inc. | 1,044 | 170,005 | ||||||
MSC Industrial Direct Co., Inc., Class A | 2,959 | 249,177 | ||||||
Nielsen Holdings PLC | 14,108 | 302,758 | ||||||
Nordson Corp. | 278 | 66,331 | ||||||
Norfolk Southern Corp. | 1,081 | 274,077 | ||||||
Northrop Grumman Corp. | 705 | 259,229 | ||||||
nVent Electric PLC | 2,192 | 75,317 | ||||||
Old Dominion Freight Line, Inc. | 1,408 | 406,518 | ||||||
Oshkosh Corp. | 1,332 | 152,621 | ||||||
Otis Worldwide Corp. | 4,978 | 459,071 | ||||||
Owens Corning | 3,482 | 332,705 | ||||||
PACCAR, Inc. | 1,629 | 133,366 | ||||||
Parker-Hannifin Corp. | 516 | 153,082 | ||||||
Pentair PLC (a) | 8,283 | 639,116 | ||||||
Quanta Services, Inc. | 13,535 | 1,381,924 | ||||||
Regal Beloit Corp. | 2,101 | 313,931 | ||||||
Republic Services, Inc. | 3,098 | 384,555 | ||||||
Robert Half International, Inc. | 6,132 | 634,049 | ||||||
Rockwell Automation, Inc. | 473 | 153,938 | ||||||
Rollins, Inc. | 3,891 | 151,438 | ||||||
Roper Technologies, Inc. | 203 | 98,106 | ||||||
Ryder System, Inc. | 4,006 | 318,437 | ||||||
Schneider National, Inc., Class B | 2,482 | 55,944 | ||||||
Science Applications International Corp. | 1,213 | 102,171 | ||||||
Sensata Technologies Holding PLC* | 2,960 | 175,173 | ||||||
Shoals Technologies Group, Inc., Class A*(a) | 2,297 | 74,813 | ||||||
SiteOne Landscape Supply, Inc.* | 970 | 194,097 | ||||||
Snap-on, Inc. | 3,774 | 848,961 | ||||||
Stanley Black & Decker, Inc. | 1,609 | 310,971 | ||||||
Stericycle, Inc.* | 1,869 | 130,082 | ||||||
Textron, Inc. | 4,339 | 315,315 | ||||||
Timken Co. | 2,821 | 207,456 | ||||||
Toro Co. | 5,222 | 574,107 | ||||||
Trane Technologies PLC | 3,407 | 676,290 | ||||||
TransDigm Group, Inc.* | 81 | 49,205 | ||||||
TransUnion | 951 | 115,575 | ||||||
Trex Co., Inc.*(a) | 1,233 | 135,334 | ||||||
Union Pacific Corp. | 450 | 97,578 | ||||||
United Parcel Service, Inc., Class B | 1,597 | 312,421 | ||||||
United Rentals, Inc.* | 628 | 221,464 | ||||||
Univar Solutions, Inc.* | 1,147 | 27,081 | ||||||
| See Notes to Financial Statements. | 50 |
DBX ETF Trust
Schedule of Investments
Xtrackers Russell US Multifactor ETF (Continued)
August 31, 2021
Number | Value | |||||||
| Industrials (Continued) | ||||||||
Valmont Industries, Inc. | 1,816 | $ | 451,930 | |||||
Verisk Analytics, Inc. | 530 | 106,933 | ||||||
Vertiv Holdings Co. | 3,225 | 90,848 | ||||||
W.W. Grainger, Inc. | 1,066 | 462,324 | ||||||
Waste Management, Inc. | 2,230 | 345,895 | ||||||
Watsco, Inc. | 2,416 | 672,663 | ||||||
Westinghouse Air Brake Technologies Corp. | 1,295 | 116,278 | ||||||
Woodward, Inc. | 995 | 120,335 | ||||||
XPO Logistics, Inc.* | 684 | 59,446 | ||||||
Xylem, Inc. | 3,171 | 432,239 | ||||||
|
| |||||||
(Cost $26,452,243) | 35,670,788 | |||||||
|
| |||||||
| Information Technology — 18.9% | ||||||||
Accenture PLC, Class A | 547 | 184,098 | ||||||
Adobe, Inc.* | 126 | 83,626 | ||||||
Advanced Micro Devices, Inc.* | 660 | 73,075 | ||||||
Akamai Technologies, Inc.* | 2,374 | 268,855 | ||||||
Allegro MicroSystems, Inc.* | 2,075 | 62,354 | ||||||
Amdocs Ltd. | 10,690 | 823,451 | ||||||
Amphenol Corp., Class A | 7,942 | 608,595 | ||||||
Analog Devices, Inc. | 7,433 | 1,211,207 | ||||||
ANSYS, Inc.* | 533 | 194,737 | ||||||
Apple, Inc. | 2,091 | 317,477 | ||||||
Applied Materials, Inc. | 3,635 | 491,198 | ||||||
Arista Networks, Inc.* | 624 | 230,587 | ||||||
Arrow Electronics, Inc.* | 7,226 | 875,936 | ||||||
Aspen Technology, Inc.* | 2,574 | 333,333 | ||||||
Atlassian Corp. PLC, Class A* | 259 | 95,069 | ||||||
Autodesk, Inc.* | 654 | 202,799 | ||||||
Automatic Data Processing, Inc. | 1,316 | 275,097 | ||||||
Avnet, Inc. | 9,677 | 391,531 | ||||||
Bentley Systems, Inc., Class B (a) | 3,217 | 207,464 | ||||||
Black Knight, Inc.* | 349 | 26,409 | ||||||
Broadcom, Inc. | 252 | 125,297 | ||||||
Broadridge Financial Solutions, Inc. | 2,662 | 458,450 | ||||||
Brooks Automation, Inc. | 932 | 79,183 | ||||||
Cadence Design Systems, Inc.* | 3,601 | 588,691 | ||||||
CDK Global, Inc. | 3,442 | 143,187 | ||||||
CDW Corp. | 4,097 | 821,899 | ||||||
Ciena Corp.* | 1,393 | 79,582 | ||||||
Cirrus Logic, Inc.* | 2,538 | 212,354 | ||||||
Cisco Systems, Inc. | 1,934 | 114,145 | ||||||
Citrix Systems, Inc. | 977 | 100,504 | ||||||
Cognex Corp. | 1,861 | 164,922 | ||||||
Cognizant Technology Solutions Corp., Class A | 15,280 | 1,166,017 | ||||||
CommScope Holding Co., Inc.* | 1,411 | 22,294 | ||||||
Concentrix Corp.* | 1,196 | 207,374 | ||||||
Corning, Inc. | 11,988 | 479,400 | ||||||
Datto Holding Corp.* | 628 | 16,014 | ||||||
Dell Technologies, Inc., Class C* | 11,680 | 1,138,333 | ||||||
DocuSign, Inc.* | 106 | 31,401 | ||||||
Dolby Laboratories, Inc., Class A | 4,409 | 436,976 | ||||||
Dropbox, Inc., Class A* | 2,691 | 85,332 | ||||||
Duck Creek Technologies, Inc.* | 1,289 | 60,106 | ||||||
DXC Technology Co.* | 1,662 | 61,029 | ||||||
Number | Value | |||||||
| Information Technology (Continued) | ||||||||
Entegris, Inc. | 4,780 | $ | 574,269 | |||||
EPAM Systems, Inc.* | 2,004 | 1,268,151 | ||||||
Euronet Worldwide, Inc.* | 145 | 19,318 | ||||||
F5 Networks, Inc.* | 2,680 | 545,568 | ||||||
Fair Isaac Corp.* | 167 | 76,777 | ||||||
Fidelity National Information Services, Inc. | 282 | 36,031 | ||||||
FireEye, Inc.* | 915 | 16,644 | ||||||
First Solar, Inc.* | 861 | 80,934 | ||||||
Fiserv, Inc.* | 605 | 71,263 | ||||||
Five9, Inc.* | 89 | 14,082 | ||||||
FleetCor Technologies, Inc.* | 255 | 67,136 | ||||||
Fortinet, Inc.* | 2,052 | 646,667 | ||||||
Gartner, Inc.* | 3,516 | 1,085,530 | ||||||
Genpact Ltd. | 4,203 | 218,052 | ||||||
Global Payments, Inc. | 293 | 47,654 | ||||||
Globant SA* | 268 | 86,371 | ||||||
GoDaddy, Inc., Class A* | 320 | 23,459 | ||||||
Guidewire Software, Inc.* | 165 | 19,546 | ||||||
Hewlett Packard Enterprise Co. | 46,407 | 717,452 | ||||||
HP, Inc. | 87,325 | 2,597,045 | ||||||
HubSpot, Inc.* | 131 | 89,666 | ||||||
Intel Corp. | 1,587 | 85,793 | ||||||
International Business Machines Corp. | 2,182 | 306,222 | ||||||
Intuit, Inc. | 739 | 418,355 | ||||||
IPG Photonics Corp.* | 494 | 84,316 | ||||||
Jabil, Inc. | 10,712 | 661,787 | ||||||
Jack Henry & Associates, Inc. | 404 | 71,258 | ||||||
Jamf Holding Corp.*(a) | 1,108 | 38,946 | ||||||
Juniper Networks, Inc. | 6,332 | 183,501 | ||||||
Keysight Technologies, Inc.* | 1,580 | 283,420 | ||||||
KLA Corp. | 2,413 | 820,323 | ||||||
Lam Research Corp. | 508 | 307,249 | ||||||
Littelfuse, Inc. | 550 | 156,970 | ||||||
Lumentum Holdings, Inc.*(a) | 124 | 10,743 | ||||||
Manhattan Associates, Inc.* | 949 | 154,678 | ||||||
Marvell Technology, Inc. | 3,373 | 206,394 | ||||||
Mastercard, Inc., Class A | 40 | 13,849 | ||||||
McAfee Corp., Class A | 1,380 | 36,653 | ||||||
Microchip Technology, Inc. | 1,038 | 163,340 | ||||||
Micron Technology, Inc.* | 3,452 | 254,412 | ||||||
Microsoft Corp. | 574 | 173,279 | ||||||
MKS Instruments, Inc. | 1,246 | 183,386 | ||||||
Monolithic Power Systems, Inc. | 1,178 | 583,028 | ||||||
Motorola Solutions, Inc. | 2,099 | 512,618 | ||||||
National Instruments Corp. | 2,208 | 92,339 | ||||||
NCR Corp.* | 4,197 | 178,289 | ||||||
NetApp, Inc. | 17,127 | 1,523,104 | ||||||
NortonLifeLock, Inc. | 7,877 | 209,213 | ||||||
Nuance Communications, Inc.* | 7,667 | 422,068 | ||||||
NVIDIA Corp. | 120 | 26,862 | ||||||
NXP Semiconductors NV | 1,489 | 320,329 | ||||||
ON Semiconductor Corp.* | 1,432 | 63,524 | ||||||
Oracle Corp. | 1,949 | 173,714 | ||||||
Palo Alto Networks, Inc.* | 681 | 313,968 | ||||||
Paychex, Inc. | 4,036 | 462,001 | ||||||
Paycom Software, Inc.* | 148 | 72,357 | ||||||
| See Notes to Financial Statements. | 51 |
DBX ETF Trust
Schedule of Investments
Xtrackers Russell US Multifactor ETF (Continued)
August 31, 2021
Number | Value | |||||||
| Information Technology (Continued) | ||||||||
Paylocity Holding Corp.* | 141 | $ | 37,957 | |||||
PayPal Holdings, Inc.* | 110 | 31,753 | ||||||
Paysafe Ltd.* | 4,071 | 34,441 | ||||||
Proofpoint, Inc.*(b) | 825 | 145,200 | ||||||
PTC, Inc.* | 1,075 | 141,534 | ||||||
Qorvo, Inc.* | 4,884 | 918,339 | ||||||
QUALCOMM, Inc. | 1,039 | 152,411 | ||||||
salesforce.com, Inc.* | 249 | 66,052 | ||||||
ServiceNow, Inc.* | 206 | 132,590 | ||||||
Skyworks Solutions, Inc. | 2,645 | 485,252 | ||||||
Snowflake, Inc., Class A* | 56 | 17,044 | ||||||
Square, Inc., Class A*(a) | 149 | 39,942 | ||||||
SS&C Technologies Holdings, Inc. | 2,908 | 220,019 | ||||||
Switch, Inc., Class A (a) | 1,207 | 29,946 | ||||||
SYNNEX Corp. | 4,119 | 523,401 | ||||||
Synopsys, Inc.* | 1,712 | 568,795 | ||||||
Teledyne Technologies, Inc.* | 315 | 145,965 | ||||||
Teradata Corp.* | 3,593 | 196,501 | ||||||
Teradyne, Inc. | 4,725 | 573,804 | ||||||
Texas Instruments, Inc. | 1,949 | 372,084 | ||||||
Trimble, Inc.* | 3,107 | 292,742 | ||||||
Tyler Technologies, Inc.* | 682 | 331,247 | ||||||
Ubiquiti, Inc. (a) | 56 | 18,220 | ||||||
Unity Software, Inc.*(a) | 266 | 33,715 | ||||||
Universal Display Corp. | 294 | 61,325 | ||||||
VeriSign, Inc.* | 1,061 | 229,452 | ||||||
Viasat, Inc.* | 617 | 31,862 | ||||||
Visa, Inc., Class A (a) | 82 | 18,786 | ||||||
VMware, Inc., Class A*(a) | 1,180 | 175,667 | ||||||
Vontier Corp. | 7,718 | 280,704 | ||||||
Western Digital Corp.* | 1,125 | 71,100 | ||||||
Western Union Co. | 7,214 | 156,111 | ||||||
WEX, Inc.* | 121 | 22,212 | ||||||
Workday, Inc., Class A* | 427 | 116,639 | ||||||
Xerox Holdings Corp. | 4,192 | 94,362 | ||||||
Xilinx, Inc. | 2,053 | 319,426 | ||||||
Zebra Technologies Corp., Class A* | 879 | 516,122 | ||||||
Zendesk, Inc.*(a) | 321 | 39,676 | ||||||
|
| |||||||
(Cost $28,596,565) | 39,061,689 | |||||||
|
| |||||||
| Materials — 7.9% | ||||||||
Air Products and Chemicals, Inc. | 806 | 217,225 | ||||||
Albemarle Corp. | 1,503 | 355,820 | ||||||
Alcoa Corp.* | 1,445 | 64,115 | ||||||
Amcor PLC | 23,534 | 302,412 | ||||||
AptarGroup, Inc. | 1,759 | 237,113 | ||||||
Ardagh Group SA | 601 | 15,788 | ||||||
Ashland Global Holdings, Inc. | 234 | 21,320 | ||||||
Avery Dennison Corp. | 2,941 | 662,872 | ||||||
Axalta Coating Systems Ltd.* | 2,646 | 80,809 | ||||||
Ball Corp. | 1,783 | 171,097 | ||||||
Berry Global Group, Inc.* | 8,231 | 552,876 | ||||||
Celanese Corp. | 6,609 | 1,048,187 | ||||||
CF Industries Holdings, Inc. | 6,008 | 272,883 | ||||||
Chemours Co. (a) | 1,088 | 36,459 | ||||||
Corteva, Inc. | 12,202 | 536,522 | ||||||
Crown Holdings, Inc. | 4,516 | 495,812 | ||||||
Number | Value | |||||||
| Materials (Continued) | ||||||||
Dow, Inc. | 3,593 | $ | 226,000 | |||||
DuPont de Nemours, Inc. | 1,845 | 136,567 | ||||||
Eagle Materials, Inc. | 4,040 | 633,634 | ||||||
Eastman Chemical Co. | 4,794 | 542,489 | ||||||
Ecolab, Inc. | 428 | 96,454 | ||||||
Element Solutions, Inc. | 6,092 | 138,471 | ||||||
FMC Corp. | 1,070 | 100,184 | ||||||
Freeport-McMoRan, Inc. | 1,756 | 63,901 | ||||||
Graphic Packaging Holding Co. | 11,874 | 243,654 | ||||||
Huntsman Corp. | 9,728 | 257,111 | ||||||
International Flavors & Fragrances, Inc. | 464 | 70,296 | ||||||
International Paper Co. | 18,376 | 1,104,214 | ||||||
Louisiana-Pacific Corp. | 7,822 | 496,228 | ||||||
LyondellBasell Industries NV, Class A | 1,803 | 180,931 | ||||||
Martin Marietta Materials, Inc. | 1,106 | 421,662 | ||||||
Mosaic Co. | 6,386 | 205,501 | ||||||
NewMarket Corp. | 75 | 26,230 | ||||||
Newmont Corp. | 5,403 | 313,320 | ||||||
Nucor Corp. | 8,621 | 1,013,485 | ||||||
Olin Corp. | 706 | 35,187 | ||||||
Packaging Corp. of America | 3,345 | 507,437 | ||||||
PPG Industries, Inc. | 2,231 | 355,956 | ||||||
Reliance Steel & Aluminum Co. | 5,490 | 823,720 | ||||||
Royal Gold, Inc. | 582 | 64,794 | ||||||
RPM International, Inc. | 1,916 | 157,668 | ||||||
Scotts Miracle-Gro Co. | 2,569 | 402,896 | ||||||
Sealed Air Corp. | 7,076 | 431,848 | ||||||
Sherwin-Williams Co. | 1,053 | 319,765 | ||||||
Silgan Holdings, Inc. | 2,919 | 123,853 | ||||||
Sonoco Products Co. | 4,494 | 293,458 | ||||||
Southern Copper Corp. | 1,048 | 65,594 | ||||||
Steel Dynamics, Inc. | 5,756 | 388,472 | ||||||
Valvoline, Inc. | 4,226 | 127,456 | ||||||
Vulcan Materials Co. | 1,405 | 261,232 | ||||||
W.R. Grace & Co. | 943 | 65,671 | ||||||
Westlake Chemical Corp. | 1,172 | 102,374 | ||||||
Westrock Co. | 8,900 | 463,156 | ||||||
|
| |||||||
(Cost $12,966,781) | 16,332,179 | |||||||
|
| |||||||
| Real Estate — 5.2% | ||||||||
Alexandria Real Estate Equities, Inc. REIT | 583 | 120,314 | ||||||
American Campus Communities, Inc. REIT | 1,069 | 54,359 | ||||||
American Homes 4 Rent, Class A REIT | 2,685 | 112,609 | ||||||
American Tower Corp. REIT | 112 | 32,723 | ||||||
Americold Realty Trust REIT | 993 | 36,483 | ||||||
Apartment Income REIT Corp. REIT | 1,614 | 82,024 | ||||||
AvalonBay Communities, Inc. REIT | 1,362 | 312,688 | ||||||
Boston Properties, Inc. REIT | 2,229 | 251,855 | ||||||
Brixmor Property Group, Inc. REIT | 4,309 | 101,046 | ||||||
Camden Property Trust REIT | 908 | 136,236 | ||||||
CBRE Group, Inc., Class A* | 9,927 | 955,970 | ||||||
CoreSite Realty Corp. REIT | 344 | 51,039 | ||||||
Cousins Properties, Inc. REIT | 2,459 | 94,819 | ||||||
Crown Castle International Corp. REIT | 323 | 62,885 | ||||||
CubeSmart REIT | 6,580 | 352,030 | ||||||
CyrusOne, Inc. REIT | 245 | 18,860 | ||||||
| See Notes to Financial Statements. | 52 |
DBX ETF Trust
Schedule of Investments
Xtrackers Russell US Multifactor ETF (Continued)
August 31, 2021
Number | Value | |||||||
| Real Estate (Continued) | ||||||||
Digital Realty Trust, Inc. REIT | 342 | $ | 56,057 | |||||
Douglas Emmett, Inc. REIT | 1,057 | 34,892 | ||||||
Duke Realty Corp. REIT | 3,777 | 198,330 | ||||||
Equinix, Inc. REIT | 47 | 39,642 | ||||||
Equity LifeStyle Properties, Inc. REIT | 1,549 | 131,773 | ||||||
Equity Residential REIT | 3,489 | 293,320 | ||||||
Essex Property Trust, Inc. REIT | 770 | 254,670 | ||||||
Extra Space Storage, Inc. REIT | 3,265 | 610,261 | ||||||
Federal Realty Investment Trust REIT | 730 | 88,892 | ||||||
First Industrial Realty Trust, Inc. REIT | 3,468 | 194,173 | ||||||
Gaming and Leisure Properties, Inc. REIT | 1,175 | 57,928 | ||||||
Healthcare Trust of America, Inc., Class A REIT | 1,208 | 36,639 | ||||||
Healthpeak Properties, Inc. REIT | 3,983 | 143,388 | ||||||
Highwoods Properties, Inc. REIT | 3,542 | 161,834 | ||||||
Howard Hughes Corp.* | 200 | 18,106 | ||||||
Hudson Pacific Properties, Inc. REIT | 629 | 16,593 | ||||||
Invitation Homes, Inc. REIT | 2,571 | 105,874 | ||||||
Iron Mountain, Inc. REIT | 10,703 | 511,068 | ||||||
Jones Lang LaSalle, Inc.* | 3,112 | 754,442 | ||||||
Kilroy Realty Corp. REIT | 990 | 64,994 | ||||||
Kimco Realty Corp. REIT | 22,795 | 496,703 | ||||||
Lamar Advertising Co., Class A REIT | 1,665 | 189,527 | ||||||
Life Storage, Inc. REIT | 2,362 | 293,927 | ||||||
Medical Properties Trust, Inc. REIT | 4,130 | 84,582 | ||||||
Mid-America Apartment Communities, Inc. REIT | 1,269 | 244,118 | ||||||
National Retail Properties, Inc. REIT | 2,336 | 111,217 | ||||||
Omega Healthcare Investors, Inc. REIT | 556 | 18,643 | ||||||
Prologis, Inc. REIT | 896 | 120,655 | ||||||
Public Storage REIT | 1,649 | 533,633 | ||||||
Rayonier, Inc. REIT | 2,257 | 83,012 | ||||||
Realty Income Corp. REIT (a) | 896 | 64,709 | ||||||
Regency Centers Corp. REIT | 1,031 | 70,747 | ||||||
Rexford Industrial Realty, Inc. REIT (a) | 1,199 | 74,254 | ||||||
SBA Communications Corp. REIT | 51 | 18,307 | ||||||
Simon Property Group, Inc. REIT | 1,046 | 140,635 | ||||||
SL Green Realty Corp. REIT (a) | 2,772 | 194,262 | ||||||
Spirit Realty Capital, Inc. REIT | 777 | 40,225 | ||||||
STORE Capital Corp. REIT | 2,182 | 78,705 | ||||||
Sun Communities, Inc. REIT | 461 | 92,887 | ||||||
UDR, Inc. REIT | 1,897 | 102,476 | ||||||
Ventas, Inc. REIT | 852 | 47,661 | ||||||
VEREIT, Inc. REIT | 1,850 | 93,481 | ||||||
VICI Properties, Inc. REIT (a) | 7,328 | 226,508 | ||||||
Welltower, Inc. REIT | 551 | 48,229 | ||||||
Weyerhaeuser Co. REIT | 13,861 | 498,996 | ||||||
WP Carey, Inc. REIT (a) | 1,674 | 130,773 | ||||||
|
| |||||||
(Cost $8,299,924) | 10,647,688 | |||||||
|
| |||||||
| Utilities — 4.3% | ||||||||
AES Corp. | 28,012 | 668,646 | ||||||
Alliant Energy Corp. | 3,427 | 208,327 | ||||||
Ameren Corp. | 3,631 | 318,511 | ||||||
American Electric Power Co., Inc. | 2,764 | 247,571 | ||||||
American Water Works Co., Inc. | 1,441 | 262,622 | ||||||
Atmos Energy Corp. | 1,195 | 116,524 | ||||||
Number | Value | |||||||
| Utilities (Continued) | ||||||||
Avangrid, Inc. (a) | 1,477 | $ | 80,718 | |||||
Brookfield Renewable Corp., Class A (a) | 1,031 | 45,168 | ||||||
CenterPoint Energy, Inc. (a) | 8,021 | 201,247 | ||||||
CMS Energy Corp. | 3,072 | 197,007 | ||||||
Consolidated Edison, Inc. | 3,112 | 234,800 | ||||||
Dominion Energy, Inc. | 1,058 | 82,355 | ||||||
DTE Energy Co. | 4,502 | 541,771 | ||||||
Duke Energy Corp. | 2,859 | 299,223 | ||||||
Edison International | 2,654 | 153,507 | ||||||
Entergy Corp. | 3,040 | 336,254 | ||||||
Essential Utilities, Inc. | 954 | 47,347 | ||||||
Evergy, Inc. | 3,406 | 233,141 | ||||||
Eversource Energy | 1,670 | 151,519 | ||||||
Exelon Corp. | 8,755 | 429,170 | ||||||
FirstEnergy Corp. | 3,438 | 133,635 | ||||||
Hawaiian Electric Industries, Inc. | 3,616 | 157,658 | ||||||
IDACORP, Inc. | 1,530 | 161,186 | ||||||
MDU Resources Group, Inc. | 12,306 | 395,884 | ||||||
National Fuel Gas Co. | 3,181 | 164,808 | ||||||
NextEra Energy, Inc. | 1,162 | 97,596 | ||||||
NiSource, Inc. | 6,194 | 152,682 | ||||||
NRG Energy, Inc. | 3,165 | 144,546 | ||||||
OGE Energy Corp. | 3,220 | 114,020 | ||||||
Pinnacle West Capital Corp. | 3,014 | 231,777 | ||||||
PPL Corp. | 10,934 | 320,913 | ||||||
Public Service Enterprise Group, Inc. | 8,040 | 514,078 | ||||||
Sempra Energy | 2,333 | 308,796 | ||||||
Southern Co. | 4,731 | 310,969 | ||||||
UGI Corp. | 8,583 | 397,479 | ||||||
Vistra Corp. | 3,207 | 61,222 | ||||||
WEC Energy Group, Inc. | 2,229 | 210,596 | ||||||
Xcel Energy, Inc. | 3,125 | 214,844 | ||||||
|
| |||||||
(Cost $7,899,899) | 8,948,117 | |||||||
|
| |||||||
TOTAL COMMON STOCKS | 205,738,324 | |||||||
|
| |||||||
| SECURITIES LENDING COLLATERAL — 0.3% | ||||||||
DWS Government & Agency Securities Portfolio “DWS Government Cash Institutional Shares”, 0.01% (c)(d) | 639,018 | 639,018 | ||||||
|
| |||||||
| CASH EQUIVALENTS — 0.2% | ||||||||
DWS Government Money Market Series “Institutional Shares”, 0.04% (c) | 426,619 | 426,619 | ||||||
|
| |||||||
TOTAL INVESTMENTS — 100.3% | $ | 206,803,961 | ||||||
Other assets and liabilities, net — (0.3%) | (644,199 | ) | ||||||
|
| |||||||
NET ASSETS — 100.0% | $ | 206,159,762 | ||||||
|
| |||||||
| See Notes to Financial Statements. | 53 |
DBX ETF Trust
Schedule of Investments
Xtrackers Russell US Multifactor ETF (Continued)
August 31, 2021
A summary of the Fund’s transactions with affiliated investments during the year ended August 31, 2021 is as follows:
| Value ($) at 8/31/2020 | Purchases Cost ($) | Sales Proceeds ($) | Net Realized Gain/(Loss) ($) | Net Change in Unrealized Appreciation (Depreciation) ($) | Income ($) | Capital Gain Distributions ($) | Number of Shares at 8/31/2021 | Value ($) at 8/31/2021 | ||||||||||||||||||||||||||||
SECURITIES LENDING COLLATERAL — 0.3% |
| |||||||||||||||||||||||||||||||||||
DWS Government & Agency Securities Portfolio “DWS Government Cash Institutional Shares”, 0.01% (c)(d) |
| |||||||||||||||||||||||||||||||||||
| 50,625 | 588,393 | (e) | — | — | — | 25 | — | 639,018 | 639,018 | |||||||||||||||||||||||||||
CASH EQUIVALENTS — 0.2% |
| |||||||||||||||||||||||||||||||||||
DWS Government Money Market Series “Institutional Shares”, 0.04% (c) |
| |||||||||||||||||||||||||||||||||||
| 1,498,098 | 7,284,011 | (8,355,490 | ) | — | — | 362 | — | 426,619 | 426,619 | |||||||||||||||||||||||||||
|
|
|
|
|
|
|
|
|
|
|
|
|
|
|
|
|
| |||||||||||||||||||
| 1,548,723 | 7,872,404 | (8,355,490 | ) | — | — | 387 | — | 1,065,637 | 1,065,637 | |||||||||||||||||||||||||||
|
|
|
|
|
|
|
|
|
|
|
|
|
|
|
|
|
| |||||||||||||||||||
| * | Non-income producing security. |
| (a) | All or a portion of these securities were on loan. In addition, “Other assets and liabilities, net” may include pending sales that are also on loan. The value of securities loaned at August 31, 2021 amounted to $4,809,459, which is 2.3% of net assets. |
| (b) | Investment was valued using significant unobservable inputs. |
| (c) | Affiliated fund managed by DWS Investment Management Americas, Inc. The rate shown is the annualized seven-day yield at period end. |
| (d) | Represents cash collateral held in connection with securities lending. Income earned by the Fund is net of borrower rebates. In addition, the Fund held non-cash U.S. Treasury securities collateral having a value of $4,257,814. |
| (e) | Represents the net increase (purchase cost) or decrease (sales proceeds) in the amount invested in cash collateral for the year ended August 31, 2021. |
| REIT: | Real Estate Investment Trust |
At August 31, 2021, open futures contracts purchased were as follows:
Contract Description | Currency | Number of Contracts | Notional Amount | Contract Value | Expiration Date | Unrealized Appreciation | ||||||||||||
E-Mini S&P 500 Futures | USD | 2 | $ | 426,645 | $ | 452,050 | 9/17/2021 | $ | 25,405 | |||||||||
For information on the Fund’s policy and additional disclosures regarding open futures contracts, please refer to the Derivatives section of Note 2 in the accompanying Notes to Financial Statements.
Currency Abbreviations
| USD | U.S. Dollar |
Fair Value Measurements
Various inputs are used in determining the value of the Fund’s investments. These inputs are summarized in three broad levels. Level 1 includes quoted prices in active markets for identical securities. Level 2 includes other significant observable inputs (including quoted prices for similar securities, interest rates, prepayment speeds and credit risk). Level 3 includes significant unobservable inputs (including the Fund’s own assumptions in determining the fair value of investments). The level assigned to the securities valuations may not be an indication of the risk or liquidity associated with investing in those securities.
The following is a summary of the inputs used as of August 31, 2021 in valuing the Fund’s investments. For information on the Fund’s policy regarding the valuation of investments, please refer to the Security Valuation section of Note 2 in the accompanying Notes to Financial Statements.
Assets | Level 1 | Level 2 | Level 3 | Total | ||||||||||||
Common Stocks (f) | $ | 205,593,124 | $ | — | $ | 145,200 | $ | 205,738,324 | ||||||||
Short-Term Investments (f) | 1,065,637 | — | — | 1,065,637 | ||||||||||||
Derivatives (g) | ||||||||||||||||
Futures Contracts | 25,405 | — | — | 25,405 | ||||||||||||
|
|
|
|
|
|
|
| |||||||||
TOTAL | $ | 206,684,166 | $ | — | $ | 145,200 | $ | 206,829,366 | ||||||||
|
|
|
|
|
|
|
| |||||||||
| (f) | See Schedule of Investments for additional detailed categorizations. |
| (g) | Derivatives include unrealized appreciation (depreciation) on open futures contracts. |
During the period ended August 31, 2021, the amount of transfers from Level 1 to Level 3 was $64,486. The investments were transferred from Level 1 to Level 3 due to the lack of observable market data due to a decrease in market activity.
| See Notes to Financial Statements. | 54 |
This Page is Intentionally Left Blank
55
DBX ETF Trust
August 31, 2021
| Xtrackers FTSE Developed ex US Multifactor ETF | Xtrackers MSCI Kokusai Equity ETF | Xtrackers Russell 1000 US Quality at a Reasonable Price ETF | Xtrackers Russell US Multifactor ETF | |||||||||||||
Assets | ||||||||||||||||
Investment in non-affiliated securities at value | $ | 70,315,244 | $ | 800,602,903 | $ | 39,493,850 | $ | 205,738,324 | ||||||||
Investment in affiliated securities at value | — | 356,205 | — | — | ||||||||||||
Investment in DWS Government Money Market Series | 6,186 | 985,575 | 187,481 | 426,619 | ||||||||||||
Investment in DWS Government & Agency Securities Portfolio* | 990,427 | 430,881 | 18,629 | 639,018 | ||||||||||||
Cash | — | — | — | 26 | ||||||||||||
Foreign currency at value | 154,868 | 456,248 | — | — | ||||||||||||
Deposit with broker for futures contracts | 18,177 | 104,553 | 11,500 | 23,000 | ||||||||||||
| Receivables: | ||||||||||||||||
Investment securities sold | — | 9,138,577 | — | — | ||||||||||||
Capital shares | — | 4,256,643 | — | — | ||||||||||||
Variation margin on futures contracts | — | 80,040 | — | — | ||||||||||||
Dividends | 161,785 | 1,281,082 | 50,613 | 249,595 | ||||||||||||
Interest | 1 | 36 | 6 | 13 | ||||||||||||
Securities lending income | 928 | 1,948 | 89 | 890 | ||||||||||||
Foreign tax reclaim | 46,584 | 208,278 | — | — | ||||||||||||
|
|
|
|
|
|
|
| |||||||||
Total assets | $ | 71,694,200 | $ | 817,902,969 | $ | 39,762,168 | $ | 207,077,485 | ||||||||
|
|
|
|
|
|
|
| |||||||||
Liabilities | ||||||||||||||||
Payable upon return of securities loaned | $ | 990,427 | $ | 430,881 | $ | 18,629 | $ | 639,018 | ||||||||
| Payables: | ||||||||||||||||
Investment securities purchased | — | 10,407,637 | — | 248,955 | ||||||||||||
Capital shares | — | 4,247,396 | — | — | ||||||||||||
Investment advisory fees | 14,599 | 60,496 | 6,038 | 29,280 | ||||||||||||
Variation margin on futures contracts | 330 | — | 235 | 470 | ||||||||||||
|
|
|
|
|
|
|
| |||||||||
Total liabilities | 1,005,356 | 15,146,410 | 24,902 | 917,723 | ||||||||||||
|
|
|
|
|
|
|
| |||||||||
Net Assets, at value | $ | 70,688,844 | $ | 802,756,559 | $ | 39,737,266 | $ | 206,159,762 | ||||||||
|
|
|
|
|
|
|
| |||||||||
Net Assets Consist of | ||||||||||||||||
Paid-in capital | $ | 67,659,275 | $ | 629,965,555 | $ | 36,001,703 | $ | 184,958,408 | ||||||||
Distributable earnings (loss) | 3,029,569 | 172,791,004 | 3,735,563 | 21,201,354 | ||||||||||||
|
|
|
|
|
|
|
| |||||||||
Net Assets, at value | $ | 70,688,844 | $ | 802,756,559 | $ | 39,737,266 | $ | 206,159,762 | ||||||||
|
|
|
|
|
|
|
| |||||||||
Number of Common Shares outstanding | 2,150,001 | 9,450,001 | 950,001 | 4,450,001 | ||||||||||||
|
|
|
|
|
|
|
| |||||||||
Net Asset Value | $ | 32.88 | $ | 84.95 | $ | 41.83 | $ | 46.33 | ||||||||
|
|
|
|
|
|
|
| |||||||||
Investment in non-affiliated securities at cost | $ | 55,524,211 | $ | 629,932,162 | $ | 32,260,939 | $ | 159,988,321 | ||||||||
|
|
|
|
|
|
|
| |||||||||
Investment in affiliated securities at cost | $ | — | $ | 284,921 | $ | — | $ | — | ||||||||
|
|
|
|
|
|
|
| |||||||||
Value of securities loaned | $ | 1,107,618 | $ | 10,706,170 | $ | 785,717 | $ | 4,809,459 | ||||||||
|
|
|
|
|
|
|
| |||||||||
Investment in DWS Government Money Market Series at cost | $ | 6,186 | $ | 985,575 | $ | 187,481 | $ | 426,619 | ||||||||
|
|
|
|
|
|
|
| |||||||||
Investment in DWS Government & Agency Securities Portfolio at cost* | $ | 990,427 | $ | 430,881 | $ | 18,629 | $ | 639,018 | ||||||||
|
|
|
|
|
|
|
| |||||||||
Non-cash collateral for securities on loan | $ | 185,153 | $ | 10,662,668 | $ | 788,522 | $ | 4,257,814 | ||||||||
|
|
|
|
|
|
|
| |||||||||
Foreign currency at cost | $ | 154,600 | $ | 455,876 | $ | — | $ | — | ||||||||
|
|
|
|
|
|
|
| |||||||||
| * | Represents collateral on securities loaned. |
| See Notes to Financial Statements. | 56 |
DBX ETF Trust
For the Year Ended August 31, 2021
| Xtrackers FTSE Developed ex US Multifactor ETF | Xtrackers MSCI Kokusai Equity ETF | Xtrackers Russell 1000 US Quality at a Reasonable Price ETF | Xtrackers Russell US Multifactor ETF | |||||||||||||
Investment Income | ||||||||||||||||
Unaffiliated dividend income* | $ | 1,736,583 | $ | 13,604,795 | $ | 1,202,040 | $ | 2,658,518 | ||||||||
Income distributions from affiliated funds | 39 | 249 | 142 | 362 | ||||||||||||
Affiliated securities lending income | 116 | 233 | 2 | 25 | ||||||||||||
Unaffiliated non-cash dividend income | 421,182 | — | — | 150,840 | ||||||||||||
Unaffiliated securities lending income, net of borrower rebates | 11,336 | 30,531 | 1,346 | 18,274 | ||||||||||||
|
|
|
|
|
|
|
| |||||||||
Total investment income | 2,169,256 | 13,635,808 | 1,203,530 | 2,828,019 | ||||||||||||
|
|
|
|
|
|
|
| |||||||||
Expenses | ||||||||||||||||
Investment advisory fees | 253,793 | 674,770 | 134,449 | 307,219 | ||||||||||||
Other expenses | 57 | 30 | 172 | 57 | ||||||||||||
|
|
|
|
|
|
|
| |||||||||
Total expenses | 253,850 | 674,800 | 134,621 | 307,276 | ||||||||||||
|
|
|
|
|
|
|
| |||||||||
Less fees waived (see note 3): | ||||||||||||||||
Waiver | (79,819 | ) | (310 | ) | (220 | ) | (569 | ) | ||||||||
|
|
|
|
|
|
|
| |||||||||
Net expenses | 174,031 | 674,490 | 134,401 | 306,707 | ||||||||||||
|
|
|
|
|
|
|
| |||||||||
Net investment income (loss) | 1,995,225 | 12,961,318 | 1,069,129 | 2,521,312 | ||||||||||||
|
|
|
|
|
|
|
| |||||||||
Realized and Unrealized Gain (Loss) | ||||||||||||||||
Net realized gain (loss) from: | ||||||||||||||||
Investments | 270,400 | 667,114 | (59,878 | ) | (1,001,684 | ) | ||||||||||
Investments in affiliates | 1,180 | (187 | ) | — | — | |||||||||||
In-kind redemptions | 5,165,328 | 65,816,748 | 28,511,525 | 24,006,634 | ||||||||||||
In-kind redemptions in affiliates | 23 | 62,756 | — | — | ||||||||||||
Futures contracts | 113,349 | 371,234 | 165,327 | 392,378 | ||||||||||||
Foreign currency transactions | (4,773 | ) | (65,083 | ) | — | (2,860 | ) | |||||||||
|
|
|
|
|
|
|
| |||||||||
Net realized gain (loss) | 5,545,507 | 66,852,582 | 28,616,974 | 23,394,468 | ||||||||||||
Net change in unrealized appreciation (depreciation) on: | ||||||||||||||||
Investments | 7,498,557 | 147,574,352 | (7,456,007 | ) | 28,367,504 | |||||||||||
Investments in affiliates | (1,669 | ) | 52,682 | — | — | |||||||||||
Futures contracts | (15,911 | ) | 26,119 | (58,522 | ) | (83,947 | ) | |||||||||
Foreign currency translations | (9,250 | ) | (6,327 | ) | — | — | ||||||||||
|
|
|
|
|
|
|
| |||||||||
Net change in unrealized appreciation (depreciation) | 7,471,727 | 147,646,826 | (7,514,529 | ) | 28,283,557 | |||||||||||
|
|
|
|
|
|
|
| |||||||||
Net realized and unrealized gain (loss) on investments, futures and foreign currency transactions | 13,017,234 | 214,499,408 | 21,102,445 | 51,678,025 | ||||||||||||
|
|
|
|
|
|
|
| |||||||||
Net Increase (Decrease) in Net Assets Resulting from Operations | $ | 15,012,459 | $ | 227,460,726 | $ | 22,171,574 | $ | 54,199,337 | ||||||||
|
|
|
|
|
|
|
| |||||||||
* Unaffiliated foreign tax withheld | $ | 266,323 | $ | 539,661 | $ | — | $ | 114 | ||||||||
| See Notes to Financial Statements. | 57 |
DBX ETF Trust
| Xtrackers FTSE Developed ex US Multifactor ETF | Xtrackers MSCI Kokusai Equity ETF | |||||||||||||||
| Year Ended August 31, 2021 | Year Ended August 31, 2020 | Year Ended August 31, 2021 | For the Period April 8, 2020(1) to August 31, 2020 | |||||||||||||
Increase (Decrease) in Net Assets from Operations | ||||||||||||||||
Net investment income (loss) | $ | 1,995,225 | $ | 1,708,506 | $ | 12,961,318 | $ | 767,418 | ||||||||
Net realized gain (loss) | 5,545,507 | (6,610,086 | ) | 66,852,582 | 1,295,060 | |||||||||||
Net change in net unrealized appreciation (depreciation) | 7,471,727 | 8,981,710 | 147,646,826 | 23,140,960 | ||||||||||||
|
|
|
|
|
|
|
| |||||||||
Net increase (decrease) in net assets resulting from operations | 15,012,459 | 4,080,130 | 227,460,726 | 25,203,438 | ||||||||||||
|
|
|
|
|
|
|
| |||||||||
Distributions to Shareholders | (2,769,501 | ) | (2,471,676 | ) | (11,461,571 | ) | — | |||||||||
|
|
|
|
|
|
|
| |||||||||
Fund Shares Transactions | ||||||||||||||||
Proceeds from shares sold | 3,122,218 | 13,809,804 | 738,181,720 | 115,024,649 | ||||||||||||
Value of shares redeemed | (17,052,937 | ) | (15,395,512 | ) | (283,087,229 | ) | (8,565,224 | ) | ||||||||
|
|
|
|
|
|
|
| |||||||||
Net increase (decrease) in net assets resulting from fund share transactions | (13,930,719 | ) | (1,585,708 | ) | 455,094,491 | 106,459,425 | ||||||||||
|
|
|
|
|
|
|
| |||||||||
Total net increase (decrease) in Net Assets | (1,687,761 | ) | 22,746 | 671,093,646 | 131,662,863 | |||||||||||
Net Assets | ||||||||||||||||
Beginning of period | 72,376,605 | 72,353,859 | 131,662,913 | 50 | ||||||||||||
|
|
|
|
|
|
|
| |||||||||
End of period | $ | 70,688,844 | $ | 72,376,605 | $ | 802,756,559 | $ | 131,662,913 | ||||||||
|
|
|
|
|
|
|
| |||||||||
Changes in Shares Outstanding | ||||||||||||||||
Shares outstanding, beginning of period | 2,600,001 | 2,700,001 | 2,000,001 | 1 | ||||||||||||
Shares sold | 100,000 | 550,000 | 11,250,000 | 2,150,000 | ||||||||||||
Shares redeemed | (550,000 | ) | (650,000 | ) | (3,800,000 | ) | (150,000 | ) | ||||||||
|
|
|
|
|
|
|
| |||||||||
Shares outstanding, end of period | 2,150,001 | 2,600,001 | 9,450,001 | 2,000,001 | ||||||||||||
|
|
|
|
|
|
|
| |||||||||
| (1) | Commencement of Operations. |
| See Notes to Financial Statements. | 58 |
DBX ETF Trust
Statements of Changes in Net Assets (Continued)
| Xtrackers Russell 1000 US Quality at a Reasonable Price ETF | Xtrackers Russell US Multifactor ETF | |||||||||||||||
| Year Ended August 31, 2021 | Year Ended August 31, 2020 | Year Ended August 31, 2021 | Year Ended August 31, 2020 | |||||||||||||
Increase (Decrease) in Net Assets from Operations | ||||||||||||||||
Net investment income (loss) | $ | 1,069,129 | $ | 1,866,796 | $ | 2,521,312 | $ | 3,260,210 | ||||||||
Net realized gain (loss) | 28,616,974 | 4,545,372 | 23,394,468 | (1,248,251 | ) | |||||||||||
Net change in net unrealized appreciation (depreciation) | (7,514,529 | ) | 10,910,970 | 28,283,557 | (2,005,958 | ) | ||||||||||
|
|
|
|
|
|
|
| |||||||||
Net increase (decrease) in net assets resulting from operations | 22,171,574 | 17,323,138 | 54,199,337 | 6,001 | ||||||||||||
|
|
|
|
|
|
|
| |||||||||
Distributions to Shareholders | (1,304,404 | ) | (2,168,938 | ) | (2,600,903 | ) | (3,463,473 | ) | ||||||||
|
|
|
|
|
|
|
| |||||||||
Fund Shares Transactions | ||||||||||||||||
Proceeds from shares sold | 22,826,382 | 24,136,207 | 79,876,610 | 74,739,642 | ||||||||||||
Value of shares redeemed | (104,524,407 | ) | (49,740,049 | ) | (75,144,279 | ) | (124,756,049 | ) | ||||||||
|
|
|
|
|
|
|
| |||||||||
Net increase (decrease) in net assets resulting from fund share transactions | (81,698,025 | ) | (25,603,842 | ) | 4,732,331 | (50,016,407 | ) | |||||||||
|
|
|
|
|
|
|
| |||||||||
Total net increase (decrease) in Net Assets | (60,830,855 | ) | (10,449,642 | ) | 56,330,765 | (53,473,879 | ) | |||||||||
Net Assets | ||||||||||||||||
Beginning of year | 100,568,121 | 111,017,763 | 149,828,997 | 203,302,876 | ||||||||||||
|
|
|
|
|
|
|
| |||||||||
End of year | $ | 39,737,266 | $ | 100,568,121 | $ | 206,159,762 | $ | 149,828,997 | ||||||||
|
|
|
|
|
|
|
| |||||||||
Changes in Shares Outstanding | ||||||||||||||||
Shares outstanding, beginning of year | 3,200,001 | 4,100,001 | 4,300,001 | 6,000,001 | ||||||||||||
Shares sold | 700,000 | 900,000 | 1,950,000 | 2,250,000 | ||||||||||||
Shares redeemed | (2,950,000 | ) | (1,800,000 | ) | (1,800,000 | ) | (3,950,000 | ) | ||||||||
|
|
|
|
|
|
|
| |||||||||
Shares outstanding, end of year | 950,001 | 3,200,001 | 4,450,001 | 4,300,001 | ||||||||||||
|
|
|
|
|
|
|
| |||||||||
| See Notes to Financial Statements. | 59 |
DBX ETF Trust
| Xtrackers FTSE Developed ex US Multifactor ETF Selected Per Share Data | Years Ended August 31, | |||||||||||||||||||
| 2021 | 2020 | 2019 | 2018 | 2017 | ||||||||||||||||
Net Asset Value, beginning of year | $ | 27.84 | $ | 26.80 | $ | 28.84 | $ | 28.17 | $ | 25.41 | ||||||||||
|
|
|
|
|
|
|
|
|
| |||||||||||
| Income (loss) from investment operations: | ||||||||||||||||||||
Net investment income (loss)(a) | 0.84 | 0.62 | 0.83 | 0.77 | 0.54 | |||||||||||||||
Net realized and unrealized gain (loss) | 5.35 | 1.32 | (2.11 | ) | 0.72 | 3.19 | ||||||||||||||
|
|
|
|
|
|
|
|
|
| |||||||||||
Total from investment operations | 6.19 | 1.94 | (1.28 | ) | 1.49 | 3.73 | ||||||||||||||
|
|
|
|
|
|
|
|
|
| |||||||||||
| Less distributions from: | ||||||||||||||||||||
Net investment income | (1.15 | ) | (0.90 | ) | (0.76 | ) | (0.82 | ) | (0.97 | ) | ||||||||||
|
|
|
|
|
|
|
|
|
| |||||||||||
Total distributions | (1.15 | ) | (0.90 | ) | (0.76 | ) | (0.82 | ) | (0.97 | ) | ||||||||||
|
|
|
|
|
|
|
|
|
| |||||||||||
Net Asset Value, end of year | $ | 32.88 | $ | 27.84 | $ | 26.80 | $ | 28.84 | $ | 28.17 | ||||||||||
|
|
|
|
|
|
|
|
|
| |||||||||||
Total Return (%) | 22.69 | (b) | 7.49 | (b) | (4.51 | )(b) | 5.32 | 15.16 | ||||||||||||
Ratios to Average Net Assets and Supplemental Data | ||||||||||||||||||||
Net Assets, end of year ($ millions) | 71 | 72 | 72 | 59 | 15 | |||||||||||||||
Ratio of expenses before fee waiver (%) | 0.35 | 0.35 | 0.35 | 0.35 | 0.35 | |||||||||||||||
Ratio of expenses after fee waiver (%) | 0.24 | 0.24 | 0.29 | 0.35 | 0.35 | |||||||||||||||
Ratio of net investment income (loss) (%) | 2.75 | 2.37 | 3.05 | 2.62 | 2.10 | |||||||||||||||
Portfolio turnover rate (%)(c) | 53 | 43 | 51 | 45 | 45 | |||||||||||||||
| Xtrackers MSCI Kokusai Equity ETF Selected Per Share Data | Year Ended 8/31/2021 | Period Ended 8/31/2020(d) | ||||||||||||||||||
Net Asset Value, beginning of period | $ | 65.83 | $ | 50.00 | ||||||||||||||||
|
|
|
| |||||||||||||||||
| Income (loss) from investment operations: | ||||||||||||||||||||
Net investment income (loss)(a) | 1.28 | 0.49 | ||||||||||||||||||
Net realized and unrealized gain (loss) | 18.91 | 15.34 | ||||||||||||||||||
|
|
|
| |||||||||||||||||
Total from investment operations | 20.19 | 15.83 | ||||||||||||||||||
|
|
|
| |||||||||||||||||
| Less distributions from: | ||||||||||||||||||||
Net investment income | (1.06 | ) | — | |||||||||||||||||
Net realized gains | (0.01 | ) | — | |||||||||||||||||
|
|
|
| |||||||||||||||||
Total distributions | (1.07 | ) | — | |||||||||||||||||
|
|
|
| |||||||||||||||||
Net Asset Value, end of period | $ | 84.95 | $ | 65.83 | ||||||||||||||||
|
|
|
| |||||||||||||||||
Total Return (%)(b) | 30.87 | 31.66 | ** | |||||||||||||||||
Ratios to Average Net Assets and Supplemental Data | ||||||||||||||||||||
Net Assets, end of period ($ millions) | 803 | 132 | ||||||||||||||||||
Ratio of expenses before fee waiver (%) | 0.09 | 0.09 | * | |||||||||||||||||
Ratio of expenses after fee waiver (%) | 0.09 | 0.09 | * | |||||||||||||||||
Ratio of net investment income (loss) (%) | 1.73 | 2.08 | * | |||||||||||||||||
Portfolio turnover rate (%)(c) | 6 | 7 | ** | |||||||||||||||||
| (a) | Based on average shares outstanding during the period. |
| (b) | Total Return would have been lower if certain expenses had not been reimbursed by the Advisor. |
| (c) | Portfolio turnover rate does not include securities received or delivered from processing creations or redemptions. |
| (d) | For the period April 8, 2020 (commencement of operations) through August 31, 2020. |
| * | Annualized. |
| ** | Not Annualized. |
| See Notes to Financial Statements. | 60 |
DBX ETF Trust
Financial Highlights (Continued)
| Xtrackers Russell 1000 US Quality at a Reasonable Price ETF Selected Per Share Data | Years Ended August 31, | Period Ended 8/31/2018(a) | ||||||||||||||||||
| 2021 | 2020 | 2019 | ||||||||||||||||||
Net Asset Value, beginning of period | $ | 31.43 | $ | 27.08 | $ | 27.29 | $ | 25.00 | ||||||||||||
|
|
|
|
|
|
|
| |||||||||||||
| Income (loss) from investment operations: | ||||||||||||||||||||
Net investment income (loss)(b) | 0.52 | 0.52 | 0.51 | 0.21 | ||||||||||||||||
Net realized and unrealized gain (loss) | 10.44 | 4.42 | (0.25 | ) | 2.16 | |||||||||||||||
|
|
|
|
|
|
|
| |||||||||||||
Total from investment operations | 10.96 | 4.94 | 0.26 | 2.37 | ||||||||||||||||
|
|
|
|
|
|
|
| |||||||||||||
| Less distributions from: | ||||||||||||||||||||
Net investment income | (0.56 | ) | (0.59 | ) | (0.47 | ) | (0.08 | ) | ||||||||||||
|
|
|
|
|
|
|
| |||||||||||||
Total distributions | (0.56 | ) | (0.59 | ) | (0.47 | ) | (0.08 | ) | ||||||||||||
|
|
|
|
|
|
|
| |||||||||||||
Net Asset Value, end of period | $ | 41.83 | $ | 31.43 | $ | 27.08 | $ | 27.29 | ||||||||||||
|
|
|
|
|
|
|
| |||||||||||||
Total Return (%) | 35.25 | (c) | 18.72 | (c) | 1.03 | (c) | 9.52 | ** | ||||||||||||
Ratios to Average Net Assets and Supplemental Data | ||||||||||||||||||||
Net Assets, end of period ($ millions) | 40 | 101 | 111 | 61 | ||||||||||||||||
Ratio of expenses before fee waiver (%) | 0.19 | 0.19 | 0.19 | 0.19 | * | |||||||||||||||
Ratio of expenses after fee waiver (%) | 0.19 | 0.19 | 0.19 | 0.19 | * | |||||||||||||||
Ratio of net investment income (loss) (%) | 1.51 | 1.85 | 1.93 | 2.00 | * | |||||||||||||||
Portfolio turnover rate (%)(d) | 13 | 22 | 31 | 26 | ** | |||||||||||||||
| Xtrackers Russell US Multifactor ETF Selected Per Share Data | Years Ended August 31, | |||||||||||||||||||
| 2021 | 2020 | 2019 | 2018 | 2017 | ||||||||||||||||
Net Asset Value, beginning of year | $ | 34.84 | $ | 33.88 | $ | 33.93 | $ | 29.47 | $ | 26.76 | ||||||||||
|
|
|
|
|
|
|
|
|
| |||||||||||
| Income (loss) from investment operations: | ||||||||||||||||||||
Net investment income (loss)(b) | 0.56 | 0.62 | 0.57 | 0.52 | 0.51 | |||||||||||||||
Net realized and unrealized gain (loss) | 11.47 | 0.96 | (e) | (0.09 | ) | 4.44 | 2.85 | |||||||||||||
|
|
|
|
|
|
|
|
|
| |||||||||||
Total from investment operations | 12.03 | 1.58 | 0.48 | 4.96 | 3.36 | |||||||||||||||
|
|
|
|
|
|
|
|
|
| |||||||||||
| Less distributions from: | ||||||||||||||||||||
Net investment income | (0.54 | ) | (0.62 | ) | (0.53 | ) | (0.50 | ) | (0.65 | ) | ||||||||||
|
|
|
|
|
|
|
|
|
| |||||||||||
Total distributions | (0.54 | ) | (0.62 | ) | (0.53 | ) | (0.50 | ) | (0.65 | ) | ||||||||||
|
|
|
|
|
|
|
|
|
| |||||||||||
Net Asset Value, end of year | $ | 46.33 | $ | 34.84 | $ | 33.88 | $ | 33.93 | $ | 29.47 | ||||||||||
|
|
|
|
|
|
|
|
|
| |||||||||||
Total Return (%)(c) | 34.85 | 4.93 | 1.53 | 16.97 | 12.75 | |||||||||||||||
Ratios to Average Net Assets and Supplemental Data | ||||||||||||||||||||
Net Assets, end of year ($ millions) | 206 | 150 | 203 | 171 | 100 | |||||||||||||||
Ratio of expenses before fee waiver (%) | 0.17 | 0.17 | 0.17 | 0.19 | 0.23 | |||||||||||||||
Ratio of expenses after fee waiver (%) | 0.17 | 0.17 | 0.17 | 0.18 | 0.21 | |||||||||||||||
Ratio of net investment income (loss) (%) | 1.40 | 1.85 | 1.77 | 1.62 | 1.83 | |||||||||||||||
Portfolio turnover rate (%)(d) | 39 | 47 | 48 | 45 | 67 | |||||||||||||||
| (a) | For the period April 5, 2018 (commencement of operations) through August 31, 2018. |
| (b) | Based on average shares outstanding during the period. |
| (c) | Total Return would have been lower if certain expenses had not been reimbursed by the Advisor. |
| (d) | Portfolio turnover rate does not include securities received or delivered from processing creations or redemptions. |
| (e) | Because of the timing of subscriptions and redemptions in relation to fluctuating markets at value, the amount shown may not agree with the change in aggregate gains and losses. |
| * | Annualized. |
| ** | Not Annualized. |
| See Notes to Financial Statements. | 61 |
DBX ETF Trust
1. Organization
DBX ETF Trust (the “Trust”) is registered under the Investment Company Act of 1940, as amended (the “Act”), as an open-end registered management investment company organized as a Delaware statutory trust.
As of August 31, 2021, the Trust consists of thirty-five investment series of exchange-traded funds (“ETFs”) (each a “Fund” and collectively, the “Funds”) in operation and trading. These financial statements report on the Funds listed below:
| Xtrackers FTSE Developed ex US Multifactor ETF* |
| Xtrackers MSCI Kokusai Equity ETF |
| Xtrackers Russell 1000 US Quality at a Reasonable Price ETF |
| Xtrackers Russell US Multifactor ETF** |
DBX Advisors LLC (“DBX” or the “Advisor”), an indirect, wholly-owned subsidiary of DWS Group GmbH & Co. KGaA (“DWS Group”), serves as investment advisor to the Funds and has overall responsibility for the general management and administration of the Funds, subject to the supervision of the Funds’ Board of Trustees (“Board”).
Each Fund offers shares that are listed and traded on the NYSE Arca, Inc. (“NYSE Arca”). Unlike conventional mutual funds, each Fund issues and redeems shares on a continuous basis, at net asset value (“NAV”), only in large specified lots consisting of 50,000 shares, each called a “Creation Unit”, to authorized participants who have entered into agreements with the Funds’ distributor. Shares are not individually redeemable securities of the Funds, and owners of the shares may acquire those shares from the Funds, or tender such shares for redemption to the Funds, in Creation Units only.
The investment objective of each Fund is to track the performance, before fees and expenses, of a particular index (the “Underlying Index”). The underlying indices for the Funds are:
Fund | Underlying Index | |
| Xtrackers FTSE Developed ex US Multifactor ETF* | FTSE Developed ex US Comprehensive Factor Index | |
| Xtrackers MSCI Kokusai Equity ETF | MSCI Kokusai Index | |
| Xtrackers Russell 1000 US Quality at a Reasonable Price ETF | Russell 1000 2Qual/Val 5% Capped Factor Index | |
| Xtrackers Russell US Multifactor ETF** | Russell 1000 Comprehensive Factor Index |
| * | On January 28, 2021, the Fund changed its name from Xtrackers FTSE Developed ex US Comprehensive Factor ETF to Xtrackers FTSE Developed ex US Multifactor ETF. |
| ** | On January 28, 2021, the Fund changed its name from Xtrackers Russell 1000 Comprehensive Factor ETF to Xtrackers Russell US Multifactor ETF. |
The FTSE Developed ex US Comprehensive Factor Index is designed to track the equity market performance of companies in developed countries (except the United States) selected on the investment style criteria (“factors”) of value, momentum, quality, low volatility and size. The companies eligible for the Underlying Index are derived from its starting universe, the FTSE Developed ex US Index, which is comprised of large- and mid-capitalization equity securities from developed markets (except the United States). The Underlying Index is rebalanced semiannually in March and September after the close of business on the third Friday of the review month.
The MSCI Kokusai Index, also known as the MSCI World ex Japan Index, is designed to track the performance of equity markets in developed markets (excluding Japan). The index is reviewed quarterly in February, May, August and November, with the objective of reflecting change in the underlying equity markets in a timely manner, while limiting undue index turnover. During the May and November semi-annual index reviews, the index is rebalanced and the large and mid capitalization cutoff points are recalculated.
The Russell 1000 2Qual/Val 5% Capped Factor Index is designed to track the equity market performance of companies in the United States selected on the investment style criteria (“factors”) of quality and value. The companies eligible for the Underlying Index are derived from its starting universe, the Russell 1000 Index, which is comprised of large-cap equity securities from issuers in the United States. The Underlying Index is rebalanced annually in June after the close of business on the third Friday of the review month. Upon a rebalancing, no issuer in the Underlying Index may represent more than 5% of the Underlying Index. In the event an issuer
62
DBX ETF Trust
Notes to Financial Statements (Unaudited) (Continued)
represents more than 5% of the Underlying Index at a rebalancing, such amount in excess of 5% shall be reallocated pro-rata to the other issuers in the Underlying Index.
The Russell 1000 Comprehensive Factor Index is designed to track the equity market performance of companies in the United States selected on the investment style criteria (“factors”) of value, momentum, quality, low volatility and size. The companies eligible for the Underlying Index are derived from its starting universe, the Russell 1000 Index, which is comprised of large-cap equity securities from issuers in the United States. The Underlying Index is rebalanced semiannually in June and December after the close of business on the third Friday of the review month.
Each Fund is entitled to use its respective Underlying Index pursuant to a licensing agreement between the Index Provider and DBX. There is no charge to the Funds in connection with these licensing agreements.
Each Fund, except Xtrackers MSCI Kokusai Equity ETF is diversified. Xtrackers MSCI Kokusai Equity ETF is non-diversified and is not limited by the Act with regard to the percentage of its assets that may be invested in the securities of a single issuer. This means the securities of a particular issuer (or securities of issuers in particular industries) may dominate the Underlying Index of the Fund and, consequently, the Fund’s investment portfolio. This may adversely affect the Fund’s performance or subject the Fund’s shares to greater price volatility than that experienced by more diversified investment companies. Each Fund may change its diversification status over time and then change it back again, without shareholder approval, solely as a result of a change in relative market capitalization or index weighting of one or more constituents of the index each Fund tracks.
Pursuant to the Trust’s organizational documents, the Trust’s officers and trustees are indemnified against certain liabilities that may arise out of the performance of their duties to the Funds. Additionally, in the normal course of business the Trust enters into contracts that contain a variety of representations that provide indemnification for certain liabilities. The Trust’s maximum exposure under these arrangements is unknown, as this would involve future claims that may be made against the Funds that have not yet occurred. However, the Trust expects the risk of loss to be remote.
2. Significant Accounting Policies
The financial statements have been prepared in conformity with U.S. generally accepted accounting principles (“U.S. GAAP”), which require management to make certain estimates and assumptions that affect the reported amounts and disclosures in the financial statements. Actual results could differ from those estimates. Each Fund qualifies as an investment company under Topic 946 of the Accounting Standards Codification of U.S. GAAP. The following is a summary of significant accounting policies followed by the Funds.
Security Valuation The NAV of each Fund’s shares is calculated each business day as of the close of regular trading on the New York Stock Exchange, generally 4:00 p.m. Eastern Time. NAV per share is calculated by dividing a Fund’s net assets by the number of Fund shares outstanding.
Various inputs are used in determining the value of the Funds’ investments. These inputs are summarized in three broad levels. Level 1 includes quoted prices in active markets for identical securities. Level 2 includes other significant observable inputs (including quoted prices for similar securities, interest rates, prepayment speeds, and credit risk). Level 3 includes significant unobservable inputs (including the Funds’ own assumptions in determining the fair value of investments). The level assigned to the securities valuations may not be an indication of the risk or liquidity associated with investing in those securities.
Equity securities and ETFs are valued at the most recent sale price or official closing price reported on the exchange (U.S. or foreign) or over-the-counter market on which they trade. Securities or ETFs for which no sales are reported are valued at the calculated mean between the most recent bid and asked quotations on the relevant market or, if a mean cannot be determined, at the most recent bid quotation. Equity securities and ETFs are generally categorized as Level 1.
Corporate and sovereign debt securities are valued at prices supplied by independent pricing services approved by the Funds’ Board. Such services may use various pricing techniques which take into account appropriate factors such as yield, quality, coupon rate, maturity, type of issue, trading characteristics and other data, as well as broker quotes. If the pricing services are unable to provide valuations, securities are valued at the mean
63
DBX ETF Trust
Notes to Financial Statements (Unaudited) (Continued)
between the bid and ask quotations or evaluated prices, as applicable, obtained from broker dealers. These securities are generally categorized as Level 2.
Investments in open-end investment companies are valued at their NAV each business day and are categorized as Level 1.
Futures contracts are generally valued at the settlement prices established each day on the exchange on which they are traded and are categorized as Level 1.
Securities and other assets for which market quotations are not readily available or for which the above valuation procedures are deemed not to reflect fair value are valued in a manner that is intended to reflect their fair value as determined in accordance with procedures approved by the Board and are generally categorized as Level 3. In accordance with the Funds’ valuation procedures, factors considered in determining value may include, but are not limited to, the type of the security; the size of the holding; the initial cost of the security; the existence of any contractual restrictions on the security’s disposition; the price and extent of public trading in similar securities of the issuer or of comparable companies; quotations or evaluated prices from broker-dealers and/or pricing services; information obtained from the issuer, analysts, and/or the appropriate stock exchange (for exchange-traded securities); an analysis of the company’s or issuer’s financial statements; an evaluation of the forces that influence the issuer and the market(s) in which the security is purchased and sold; and with respect to debt securities, the maturity, coupon, creditworthiness, currency denomination and the movement of the market in which the security is normally traded. The value determined under these procedures may differ from published values for the same securities.
Fair value pricing could result in a difference between the prices used to calculate a Fund’s NAV and the prices used by the Fund’s Underlying Index, which in turn could result in a difference between the Fund’s performance and the performance of the Fund’s Underlying Index.
Disclosure about the classification of the fair value measurements is included in a table following the Fund’s Schedule of Investments.
Cash Cash consists of cash held at banks and is on deposit with major financial institutions.
Investment Transactions and Investment Income Investment transactions are recorded as of the date that the securities are purchased or sold (trade date). Realized gains and losses from the sale or disposition of securities are calculated on the identified cost-method. Dividend income is net of any foreign taxes withheld at source. Certain dividends from foreign securities may be recorded subsequent to the ex-dividend date as soon as the Fund is informed of such dividends. Interest income is recorded on the accrual basis. Distributions received from foreign domiciled corporations, generally determined to be passive foreign investment companies for tax reporting purposes, are included in dividend income.
Tax Information and Dividends and Distributions to Shareholders It is each Fund’s policy to comply with all requirements of the Internal Revenue Code of 1986, as amended (“the Code”). Each Fund intends to qualify for and to elect treatment as a separate Regulated Investment Company (“RIC”) under Subchapter M of the Code. It is the policy of each Fund to pay out dividends from its net investment income, if any, to investors quarterly. Prior to March 1, 2021 it was the policy of Xtrackers MSCI Kokusai Equity ETF to pay out dividends from its net investment income, if any, to investors annually. Taxable net realized gains from investment transactions, reduced by capital loss carryforwards, if any, are declared and distributed to shareholders at least annually. The capital loss carryforward amount, if any, is available to offset future net capital gains. The Funds may occasionally be required to make supplemental distributions at some other time during the year. The Funds reserve the right to declare special distributions if, in their reasonable discretion, such action is necessary or advisable to preserve the status of each Fund as a RIC or to avoid imposition of income or excise taxes on undistributed income. Dividends and distributions to shareholders, if any, are recorded on the ex-dividend date. The amount of dividends and distributions from net investment income and net realized capital gains are determined in accordance with Federal income tax regulations which may differ from U.S. GAAP. These “book/tax” differences are either considered temporary or permanent in nature. To the extent these differences are permanent in nature, such amounts are reclassified at the end of the year within the components of net assets based on their federal tax treatment; temporary differences do not require reclassification. Dividends and distributions, which exceed earnings and profits for the full year for tax purposes, are reported as a tax return of capital.
64
DBX ETF Trust
Notes to Financial Statements (Unaudited) (Continued)
In accordance with U.S. GAAP requirements regarding accounting for uncertainties in income taxes, management has analyzed the Funds’ tax positions taken or expected to be taken on foreign, federal and state income tax returns for all open tax years and has concluded that no provision for income tax is required in the Funds’ financial statements.
The Funds recognize interest and penalties, if any, related to uncertain tax positions as income tax expense on the Statements of Operations. For the year ended August 31, 2021, the Funds did not incur any interest or penalties.
As of August 31, 2021, the components of accumulated earnings (losses) on a tax basis were as follows:
| Undistributed Ordinary Income* | Capital and Other Gains (Losses) | Unrealized Appreciation (Depreciation) | Total Accumulated Earnings (Losses) | |||||||||||||
Xtrackers FTSE Developed ex US Multifactor ETF | $ | 753,053 | $ | (11,327,048 | ) | $ | 13,603,564 | $ | 3,029,569 | |||||||
Xtrackers MSCI Kokusai Equity ETF | 2,835,471 | — | 169,955,533 | 172,791,004 | ||||||||||||
Xtrackers Russell 1000 US Quality at a Reasonable Price ETF | 93,484 | (3,412,401 | ) | 7,054,480 | 3,735,563 | |||||||||||
Xtrackers Russell US Multifactor ETF | 468,036 | (23,194,781 | ) | 43,928,099 | 21,201,354 | |||||||||||
The tax character of dividends and distributions declared for the years ended August 31, 2021 and August 31, 2020 were as follows:
| Year Ended August 31, 2021 | ||||||||
| Ordinary Income* | Long Term Capital Gains | |||||||
Xtrackers FTSE Developed ex US Multifactor ETF | $ | 2,769,501 | $ | — | ||||
Xtrackers MSCI Kokusai Equity ETF | 11,426,407 | 35,164 | ||||||
Xtrackers Russell 1000 US Quality at a Reasonable Price ETF | 1,304,404 | — | ||||||
Xtrackers Russell US Multifactor ETF | 2,600,903 | — | ||||||
| Year Ended August 31, 2020 | ||||
| Ordinary Income* | ||||
Xtrackers FTSE Developed ex US Multifactor ETF | $ | 2,471,676 | ||
Xtrackers Russell 1000 US Quality at a Reasonable Price ETF | 2,168,938 | |||
Xtrackers Russell US Multifactor ETF | 3,463,473 | |||
| * | For tax purposes short-term capital gain distributions are considered ordinary income distributions. |
At August 31, 2021, for Federal income tax purposes, the Funds have capital loss carryforwards available as shown in the table below, to the extent provided by regulations, to offset future capital gains for an unlimited period. To the extent that these loss carryforwards are used to offset future capital gains, it is probable that the capital gains so offset will not be distributed to shareholders.
| Short-Term | Long-Term | Total Amount | ||||||||||
Xtrackers FTSE Developed ex US Multifactor ETF | $ | 4,361,472 | $ | 6,965,576 | $ | 11,327,048 | ||||||
Xtrackers Russell 1000 US Quality at a Reasonable Price ETF | 453,671 | 2,958,730 | 3,412,401 | |||||||||
Xtrackers Russell US Multifactor ETF | 14,999,514 | 8,195,267 | 23,194,781 | |||||||||
For the fiscal year ended August 31, 2021, the effect of permanent “book/tax” reclassifications to the components of net assets are included below. These differences are primarily due to redemptions-in-kind and equalization.
| Distributable earnings (loss) | Paid-In Capital | |||||||
Xtrackers FTSE Developed ex US Multifactor ETF | $ | (4,813,950 | ) | $ | 4,813,950 | |||
Xtrackers MSCI Kokusai Equity ETF | (67,159,632 | ) | 67,159,632 | |||||
Xtrackers Russell 1000 US Quality at a Reasonable Price ETF | (27,255,407 | ) | 27,255,407 | |||||
Xtrackers Russell US Multifactor ETF | (23,436,089 | ) | 23,436,089 | |||||
65
DBX ETF Trust
Notes to Financial Statements (Unaudited) (Continued)
As of August 31, 2021, the aggregate cost of investments for federal income tax purposes, the net unrealized appreciation or (depreciation) and the aggregated gross unrealized appreciation (depreciation) on investments were as follows:
| Aggregate Tax Cost | Net Unrealized Appreciation (Depreciation) | Aggregate Gross Unrealized Appreciation | Aggregate Gross Unrealized (Depreciation) | |||||||||||||
Xtrackers FTSE Developed ex US Multifactor ETF | $ | 57,709,682 | $ | 13,602,175 | $ | 15,353,361 | $ | (1,751,186 | ) | |||||||
Xtrackers MSCI Kokusai Equity ETF | 632,419,518 | 169,955,856 | 176,074,827 | (6,118,971 | ) | |||||||||||
Xtrackers Russell 1000 US Quality at a Reasonable Price ETF | 32,465,480 | 7,054,480 | 7,649,954 | (595,474 | ) | |||||||||||
Xtrackers Russell US Multifactor ETF | 162,875,862 | 43,928,099 | 45,100,533 | (1,172,434 | ) | |||||||||||
Foreign Taxes The Funds may be subject to foreign taxes (a portion of which may be reclaimable) on income, capital gains on investments, certain foreign currency transactions or other corporate events. All foreign taxes are recorded in accordance with the applicable foreign tax regulations and rates that exist in the foreign jurisdictions in which the Funds invest. These foreign taxes, if any, are paid by the Funds and are reflected in their Statements of Operations as follows: foreign taxes withheld at source are presented as a reduction of income, foreign taxes on capital gains from sales of investments and foreign currency transactions are included in their respective net realized gain (loss) categories, and deferred foreign taxes on unrealized gains are included in net change in unrealized appreciation (depreciation). Receivables and payables related to foreign taxes as of August 31, 2021, if any, are disclosed in the Funds’ Statements of Assets and Liabilities.
Foreign Currency Translations The books and records of the Funds are maintained in U.S. dollars. Investment securities and other assets and liabilities denominated in a foreign currency are translated into U.S. dollars at the prevailing exchange rates at period end. Purchases and sales of investment securities, income and expenses are translated into U.S. dollars at the prevailing exchange rates on the respective dates of the transactions.
Net realized and unrealized gains and losses on foreign currency transactions represent net gains and losses between trade and settlement dates on securities transactions, the acquisition and disposition of foreign currencies, and the difference between the amount of net investment income accrued and the U.S. dollar amount actually received. The portion of both realized and unrealized gains and losses on investments that results from fluctuations in foreign currency exchange rates is not separately disclosed, but is included with net realized and unrealized gain/appreciation and loss/depreciation on investments.
Securities Lending The Funds may lend securities to certain financial institutions under the terms of their securities lending agreement. During the term of the loans, the Funds continue to receive interest and dividends generated by the securities and to participate in any changes in their market value. The Funds require the borrowers of the securities to maintain collateral with the Funds consisting of cash and/or securities issued or guaranteed by the U.S. Government, its agencies or instrumentalities having a value at least equal to the value of the securities loaned. When the collateral falls below specified amounts, the lending agent will use its best effort to obtain additional collateral on the next business day to meet required amounts under the securities lending agreement. During the year ended August 31, 2021, the Funds invested the cash collateral into a joint trading account in DWS Government & Agency Securities Portfolio, an affiliated money market fund managed by DWS Investment Management Americas, Inc. DWS Investment Management Americas, Inc. receives a management/administration fee (0.02% annualized effective rate as of August 31, 2021) on the cash collateral invested in DWS Government & Agency Securities Portfolio. The Funds receive compensation for lending their securities either in the form of fees or by earning interest on invested cash collateral, net of borrower rebates and fees paid to a lending agent. Either the Fund or the borrower may terminate the loan at any time and the borrower, after notice, is required to return borrowed securities within a standard time period. There may be risks of delay and costs in recovery of securities or even loss of rights in the collateral should the borrower of the securities fail financially. If the Funds are not able to recover securities lent, the Funds may sell the collateral and purchase a replacement investment in the market, incurring the risk that the value of the replacement security is greater than the value of the collateral. The Funds are also subject to all investment risks associated with the reinvestment of any cash collateral received, including, but not limited to, interest rate, credit and liquidity risk associated with such investments.
66
DBX ETF Trust
Notes to Financial Statements (Unaudited) (Continued)
As of August 31, 2021, the Funds listed below had securities on loan. The value of the related collateral exceeded the value of the securities loaned at year end.
Remaining Contractual Maturity of the Agreements, as of August 31, 2021 | ||||||||||||||||||||
| Securities Lending Transactions | Overnight and Continuous | <30 Days | Between 30 & 90 days | >90 days | Total | |||||||||||||||
Xtrackers FTSE Developed ex US Multifactor ETF |
| |||||||||||||||||||
Common Stocks | $ | 990,427 | $ | 797 | $ | — | $ | 184,356 | $ | 1,175,580 | ||||||||||
|
|
|
|
|
|
|
|
|
| |||||||||||
Gross amount of recognized liabilities and non-cash collateral for securities lending transactions |
| $ | 1,175,580 | |||||||||||||||||
Xtrackers MSCI Kokusai Equity ETF |
| |||||||||||||||||||
Common Stocks | $ | 430,881 | $ | 21,046 | $ | 200,893 | $ | 10,440,729 | $ | 11,093,549 | ||||||||||
|
|
|
|
|
|
|
|
|
| |||||||||||
Gross amount of recognized liabilities and non-cash collateral for securities lending transactions |
| $ | 11,093,549 | |||||||||||||||||
Xtrackers Russell 1000 US Quality at a Reasonable Price ETF |
| |||||||||||||||||||
Common Stocks | $ | 18,629 | $ | 1,704 | $ | 32,684 | $ | 754,134 | $ | 807,151 | ||||||||||
|
|
|
|
|
|
|
|
|
| |||||||||||
Gross amount of recognized liabilities and non-cash collateral for securities lending transactions |
| $ | 807,151 | |||||||||||||||||
Xtrackers Russell US Multifactor ETF |
| |||||||||||||||||||
Common Stocks | $ | 639,018 | $ | 24,248 | $ | 138,380 | $ | 4,095,186 | $ | 4,896,832 | ||||||||||
|
|
|
|
|
|
|
|
|
| |||||||||||
Gross amount of recognized liabilities and non-cash collateral for securities lending transactions |
| $ | 4,896,832 | |||||||||||||||||
Derivatives
Futures Contracts Each Fund may enter into futures contracts. These futures contracts will be used to simulate investment in the respective Underlying Index, to facilitate trading or to reduce transaction costs. Each Fund will enter into futures contracts that are traded on a U.S. or non-U.S. exchange. No Fund will use futures for speculative purposes. Futures contracts provide for the future sale by one party and purchase by another party of a specified amount of a specific instrument or index at a specified future time and at a specified price. For the year ended August 31, 2021, Xtrackers FTSE Developed ex US Multifactor ETF, Xtrackers MSCI Kokusai Equity ETF, Xtrackers Russell 1000 US Quality at a Reasonable Price ETF and Xtrackers Russell US Multifactor ETF utilized futures in order to simulate investment in the Underlying Index. To the extent required by law, liquid assets committed to futures contracts will be maintained.
At the time each Fund enters into a futures contract, each Fund deposits and maintains as collateral an initial margin with the broker, as required by the exchange on which the transaction is affected. Pursuant to the contract, each Fund agrees to receive from or pay to the broker an amount of cash equal to the daily fluctuation in the value of the contract. Such receipts or payments are known as variation margin and are recorded by each Fund as unrealized gains or losses. Risks may arise from the potential inability of a counterparty to meet the terms of the contract. The credit/counterparty risk for exchange-traded futures contracts is generally less than privately negotiated futures contracts, since the clearinghouse, which is the issuer or counterparty to each exchange-traded future, provides a guarantee of performance. The guarantee is supported by a daily payment system (i.e., margin requirements).
Use of long futures contracts subjects each Fund to risk of loss in excess of the amounts shown on the Statement of Assets and Liabilities, up to the notional value of the futures contracts. Use of short futures contracts subjects each Fund to unlimited risk of loss. Under some circumstances, futures exchanges may establish daily limits on the amount that the price of a futures contract can vary from the previous day’s settlement price, which could effectively prevent liquidation of unfavorable positions.
A summary of the open futures contracts as of August 31, 2021 is included in a table following the Funds’ Schedule of Investments.
67
DBX ETF Trust
Notes to Financial Statements (Unaudited) (Continued)
The following tables summarize the value of the Funds’ derivative instruments held as of August 31, 2021 and the related location in the accompanying Statement of Assets and Liabilities, presented by primary underlying risk exposure:
Asset Derivatives | Liability Derivatives | |||||||||||||
| Xtrackers FTSE Developed ex US Multifactor ETF |
| |||||||||||||
| Equity contracts | Unrealized appreciation on futures contracts* | $ | — | Unrealized depreciation on futures contracts* | $ | 2,691 | ||||||||
| Xtrackers MSCI Kokusai Equity ETF |
| |||||||||||||
| Equity contracts | Unrealized appreciation on futures contracts* | $ | 47,477 | Unrealized depreciation on futures contracts* | $ | 1,393 | ||||||||
| Xtrackers Russell 1000 US Quality at a Reasonable Price ETF |
| |||||||||||||
| Equity contracts | Unrealized appreciation on futures contracts* | $ | 13,743 | Unrealized depreciation on futures contracts* | $ | — | ||||||||
| Xtrackers Russell US Multifactor ETF |
| |||||||||||||
| Equity contracts | Unrealized appreciation on futures contracts* | $ | 25,405 | Unrealized depreciation on futures contracts* | $ | — | ||||||||
| * | Includes cumulative appreciation or cumulative depreciation of futures contracts as disclosed in the Schedule of Investments. Unsettled variation margin is disclosed separately within the Statement of Assets and Liabilities. |
Additionally, the amount of realized and unrealized gains and losses on derivative instruments recognized in the Funds’ earnings during the year ended August 31, 2021 and the related location in the accompanying Statement of Operations is summarized in the following tables by primary underlying risk exposure:
Net Realized Gain (Loss) from: | ||||
| Futures Contracts — Equity Contracts | ||||
Xtrackers FTSE Developed ex US Multifactor ETF | $ | 113,349 | ||
Xtrackers MSCI Kokusai Equity ETF | 371,234 | |||
Xtrackers Russell 1000 US Quality at a Reasonable Price ETF | 165,327 | |||
Xtrackers Russell US Multifactor ETF | 392,378 | |||
Net Change in Unrealized Appreciation (Depreciation) on: | ||||
| Futures Contracts — Equity Contracts | ||||
Xtrackers FTSE Developed ex US Multifactor ETF | $ | (15,911 | ) | |
Xtrackers MSCI Kokusai Equity ETF | 26,119 | |||
Xtrackers Russell 1000 US Quality at a Reasonable Price ETF | (58,522 | ) | ||
Xtrackers Russell US Multifactor ETF | (83,947 | ) | ||
For the year ended August 31, 2021 the average monthly volume of derivatives was as follows:
| Futures Contracts (Contract Value) | ||||
Xtrackers FTSE Developed ex US Multifactor ETF | $ | 375,315 | ||
Xtrackers MSCI Kokusai Equity ETF | 1,344,255 | |||
Xtrackers Russell 1000 US Quality at a Reasonable Price ETF | 400,865 | |||
Xtrackers Russell US Multifactor ETF | 919,660 | |||
Affiliated Cash Management Vehicles The Funds may invest uninvested cash balances in DWS Government Money Market Series and DWS ESG Liquidity Fund, affiliated money market funds which are managed by DWS Investment Management Americas, Inc. (“DIMA”), also an indirect, wholly owned subsidiary of DWS Group GmbH & Co. KGaA. Each affiliated money market fund is managed in accordance with Rule 2a-7 under the 1940 Act, which governs the quality, maturity, diversity and liquidity of instruments in which a money market fund may
68
DBX ETF Trust
Notes to Financial Statements (Unaudited) (Continued)
invest. DWS Government Money Market Series seeks to maintain a stable NAV, and DWS ESG Liquidity Fund maintains a floating NAV. The Funds indirectly bear their proportionate share of the expenses of each affiliated money market fund in which they invest. The Advisor will waive an amount of the unitary advisory fee payable to the Advisor by the Funds equal to such acquired fund’s fees and expenses on the Funds’ assets invested in the affiliated money market funds.
3. Investment Advisory and Other Agreements
The Advisor has overall responsibility for the general management and administration of the Funds, subject to the supervision of the Funds’ Board of Trustees. Under an investment advisory agreement between the Trust, on behalf of the Funds, and the Advisor (the “Investment Advisory Agreement”), the Advisor is responsible for arranging sub-advisory, transfer agency, custody, fund administration, and all other non-distribution related services for the Funds to operate.
For its investment advisory services to the Funds below, the Advisor is entitled to receive a unitary advisory fee from each Fund based on each Fund’s average daily net assets, computed and accrued daily and payable monthly, at an annual rate equal to:
| Unitary Advisory Fee | ||||
Xtrackers FTSE Developed ex US Multifactor ETF | 0.35 | % | ||
Xtrackers MSCI Kokusai Equity ETF | 0.09 | % | ||
Xtrackers Russell 1000 US Quality at a Reasonable Price ETF | 0.19 | % | ||
Xtrackers Russell US Multifactor ETF | 0.17 | % | ||
The Advisor for Xtrackers FTSE Developed ex US Multifactor ETF has contractually agreed, until December 17, 2021, to waive a portion of its unitary advisory fee to the extent necessary to prevent the operating expenses of the Fund (excluding interest expense, taxes, brokerage expenses, distribution fees or expenses, litigation expenses and other extraordinary expenses) from exceeding 0.24% of the Fund’s average daily net assets. For the year ended August 31, 2021, the Advisor waived $79,763 of expenses to the Fund.
The Advisor for the Funds below has contractually agreed to waive a portion of its unitary advisory fee in an amount equal to the acquired fund’s fees and expenses attributable to the Funds’ investments in affiliated Funds. For the year ended August 31, 2021, the Advisor waived expenses of the Funds as follows:
| Expenses Waived | ||||
Xtrackers FTSE Developed ex US Multifactor ETF | $ | 56 | ||
Xtrackers MSCI Kokusai Equity ETF | 310 | |||
Xtrackers Russell 1000 US Quality at a Reasonable Price ETF | 220 | |||
Xtrackers Russell US Multifactor ETF | 569 | |||
Out of the unitary advisory fee, the Advisor pays substantially all expenses of each Fund, including the cost of transfer agency, custody, fund administration, legal, audit and other services, and expenses of the Independent Trustees. Each Fund is responsible for the payment of interest expense, acquired fund fees and expenses, taxes, brokerage expenses, distribution fees or expenses, if any, litigation expenses and extraordinary expenses.
The Bank of New York Mellon, a wholly-owned subsidiary of The Bank of New York Mellon Corporation, serves as Administrator, Custodian, Accounting Agent, Lending Agent and Transfer Agent for each Fund.
ALPS Distributors, Inc. (the “Distributor”) serves as the distributor of Creation Units for each Fund on an agency basis. The Distributor does not maintain a secondary market in shares of the Funds.
The Board of Trustees is currently comprised of three Independent Trustees. The Advisor paid retainer fees and attendance fees to each Independent Trustee; retainer fees to the Chairman of the Board of Trustees and Chairman of the Audit Committee; and attendance fees to each member of the Audit Committee (which is comprised of all of the Funds’ Independent Trustees).
69
DBX ETF Trust
Notes to Financial Statements (Unaudited) (Continued)
4. Investment Portfolio Transactions
For the year ended August 31, 2021, the cost of investments purchased and proceeds from sale of investments (excluding in-kind transactions and short-term investments) were as follows:
| Purchases | Sales | |||||||
Xtrackers FTSE Developed ex US Multifactor ETF | $ | 38,772,012 | $ | 37,422,000 | ||||
Xtrackers MSCI Kokusai Equity ETF | 41,878,214 | 44,044,943 | ||||||
Xtrackers Russell 1000 US Quality at a Reasonable Price ETF | 9,934,610 | 9,318,438 | ||||||
Xtrackers Russell US Multifactor ETF | 69,246,992 | 68,857,046 | ||||||
For the year ended August 31, 2021, the cost of in-kind purchases and proceeds from in-kind sales were as follows:
| Purchases | Sales | |||||||
Xtrackers FTSE Developed ex US Multifactor ETF | $ | — | $ | 16,257,151 | ||||
Xtrackers MSCI Kokusai Equity ETF | 735,592,934 | 278,036,276 | ||||||
Xtrackers Russell 1000 US Quality at a Reasonable Price ETF | 22,601,841 | 104,523,207 | ||||||
Xtrackers Russell US Multifactor ETF | 79,855,839 | 73,588,153 | ||||||
5. Fund Share Transactions
As of August 31, 2021, there were unlimited Fund shares, no par value, authorized by the Trust. Fund shares are issued and redeemed by each Fund only in Creation Units or multiples thereof. Except when aggregated in Creation Units, shares of each Fund are not redeemable. Transactions in capital shares for each Fund are disclosed in detail in the Statements of Changes in Net Assets. The consideration for the purchase of Creation Units of a Fund generally consists of the in-kind contribution of a designated portfolio of securities constituting a portfolio sampling representation of the securities included in the respective Fund’s Underlying Index and an amount of cash, which under certain circumstances may include cash in lieu of portfolio securities. Investors purchasing and redeeming Creation Units pay a purchase transaction fee and a redemption transaction fee to offset transfer and other transaction costs associated with the issuance and redemption of Creation Units.
6. Other — COVID-19 Pandemic
A novel coronavirus known as COVID-19, declared a pandemic by the World Health Organization, has caused significant uncertainty, market volatility, decreased economic and other activity, increased government activity, including economic stimulus measures, and supply chain interruptions. The full effects, duration and costs of the COVID-19 pandemic are impossible to predict, and the circumstances surrounding the COVID-19 pandemic will continue to evolve, including the risk of future increased rates of infection due to low vaccination rates and/or the lack of effectiveness of current vaccines against new variants. The pandemic has affected and may continue to affect certain countries, industries, economic sectors, companies and investment products more than others, may exacerbate existing economic, political, or social tensions and may increase the probability of an economic recession or depression. The Funds’ and their investments may be adversely affected by the effects of the COVID-19 pandemic, and the pandemic may result in the Funds and their service providers experiencing operational difficulties in coordinating a remote workforce and implementing their business continuity plans, among others. Management will continue to monitor the impact COVID-19 has on the Funds and reflect the consequences as appropriate in the Funds’ accounting and financial reporting.
70
DBX ETF Trust
To the Shareholders of
Xtrackers FTSE Developed ex US Multifactor ETF (formerly Xtrackers FTSE Developed ex US Comprehensive Factor ETF), Xtrackers MSCI Kokusai Equity ETF, Xtrackers Russell 1000 US Quality at a Reasonable Price ETF and Xtrackers Russell US Multifactor ETF (formerly Xtrackers Russell 1000 Comprehensive Factor ETF) and the Board of Trustees of DBX ETF Trust
Opinion on the Financial Statements
We have audited the accompanying statements of assets and liabilities of Xtrackers FTSE Developed ex US Multifactor ETF (formerly Xtrackers FTSE Developed Ex US Comprehensive Factor ETF), Xtrackers MSCI Kokusai Equity ETF, Xtrackers Russell 1000 US Quality at a Reasonable Price ETF and Xtrackers Russell US Multifactor ETF (formerly Xtrackers Russell 1000 Comprehensive Factor ETF) (collectively referred to as the “Funds”), (four of the funds constituting DBX ETF Trust (the “Trust”)), including the schedules of investments, as of August 31, 2021, and the related statements of operations and changes in net assets, and the financial highlights for each of the periods indicated in the table below and the related notes (collectively referred to as the “financial statements”). In our opinion, the financial statements present fairly, in all material respects, the financial position of each of the Funds (four of the funds constituting DBX ETF Trust) at August 31, 2021, and the results of their operations, changes in net assets and financial highlights for each of the periods indicated in the table below, in conformity with U.S. generally accepted accounting principles.
| Individual fund constituting the DBX ETF Trust | Statement of operations | Statements of changes in net assets | Financial highlights | |||
Xtrackers FTSE Developed ex US Multifactor ETF
Xtrackers Russell US Multifactor ETF | For the year ended August 31, 2021 | For each of the two years in the period ended August 31, 2021 | For each of the five years in the period ended August 31, 2021 | |||
| Xtrackers Russell 1000 US Quality at a Reasonable Price ETF | For the year ended August 31, 2021 | For each of the two years in the period ended August 31, 2021 | For each of the three years in the period ended August 31, 2021 and the period from April 5, 2018 (commencement of operations) through August 31, 2018 | |||
| Xtrackers MSCI Kokusai Equity ETF | For the year ended August 31, 2021 | For the year ended August 31, 2021 and the period from April 8, 2020 (commencement of operations) through August 31, 2020 | ||||
Basis for Opinion
These financial statements are the responsibility of the Trust’s management. Our responsibility is to express an opinion on each of the Funds’ financial statements based on our audits. We are a public accounting firm registered with the Public Company Accounting Oversight Board (United States) (“PCAOB”) and are required to be independent with respect to the Trust in accordance with the U.S. federal securities laws and the applicable rules and regulations of the Securities and Exchange Commission and the PCAOB.
We conducted our audits in accordance with the standards of the PCAOB. Those standards require that we plan and perform the audit to obtain reasonable assurance about whether the financial statements are free of material misstatement, whether due to error or fraud. The Trust is not required to have, nor were we engaged to perform, an audit of the Trust’s internal control over financial reporting. As part of our audits we are required to obtain an understanding of internal control over financial reporting but not for the purpose of expressing an opinion on the effectiveness of the Trust’s internal control over financial reporting. Accordingly, we express no such opinion.
Our audits included performing procedures to assess the risks of material misstatement of the financial statements, whether due to error or fraud, and performing procedures that respond to those risks. Such
71
DBX ETF Trust
Report of Independent Registered Public Accounting Firm (Continued)
procedures included examining, on a test basis, evidence regarding the amounts and disclosures in the financial statements. Our procedures included confirmation of securities owned as of August 31, 2021, by correspondence with the custodians and brokers or by other appropriate auditing procedures where replies from brokers were not received. Our audits also included evaluating the accounting principles used and significant estimates made by management, as well as evaluating the overall presentation of the financial statements. We believe that our audits provide a reasonable basis for our opinion.

We have served as the auditor of one or more investment companies in the DWS family of funds since at least 1979, but we are unable to determine the specific year.
New York, New York
October 25, 2021
72
DBX ETF Trust
Identification and Background
The Board has responsibility for the overall management and operations of the funds, including general supervision of the duties performed by the Advisor and other service providers. Each Board Member serves until his or her successor is duly elected or appointed and qualified. Each officer serves until he or she resigns, is removed, dies, retires or becomes disqualified.
The Trust currently has three Board Members. The three Independent Board Members have no affiliation or business connection with the Advisor or any of its affiliated persons and do not own any stock or other securities issued by the Advisor.
The Independent Board Members of the Trust, their term of office and length of time served, their principal business occupations during the past five years, the number of portfolios in the fund complex (defined below) overseen by each Independent Board Member, and other directorships, if any, held by the Board Members are shown below. The fund complex includes all registered open- and closed-end funds (including all of their portfolios) advised by the Advisor and any registered funds that have an investment advisor that is an affiliated person of the Advisor. As of the date of this shareholder report, the fund complex consists of the funds in the Trust, as well as the registered funds advised by affiliates of the Advisor.
Shareholder Communications to the Board. Shareholders may send communications to the Trust’s Board by addressing the communications directly to the Board (or individual Board Members) and/or otherwise clearly indicating in the salutation that the communication is for the Board (or individual Board Members). The shareholder may send the communication to either the Trust’s office or directly to such Board members c/o 875 Third Avenue, New York, NY 10022. Other shareholder communications received by the Trust not directly addressed and sent to the Board will be reviewed and generally responded to by management. Such communications will be forwarded to the Board at management’s discretion based on the matters contained therein.
Independent Board Members | ||||||
| Name, Year of Birth, Position with the Trust and Length of Time Served(1) | Business Experience and Directorships During the Past 5 Years | Number of Portfolios in Fund Complex Overseen | Other Directorships Held by Board Member | |||
| Stephen R. Byers (1953) Chairman since 2016, and Board Member since 2011 (formerly, Lead Independent Board Member, 2015-2016) | Independent Director (2011- present); Independent Consultant (2014-present); Director of Investment Management, the Dreyfus Corporation (2000-2006) and Vice Chairman and Chief Investment Officer, the Dreyfus Corporation (2002-2006). | 35 | The Arbitrage Funds, Sierra Income Corporation, Mutual Fund Directors Forum | |||
| George O. Elston (1964) Board Member since 2011, Chairman of the Audit Committee since 2015 | Chief Financial Officer, EyePoint Pharmaceuticals, Inc. (2019-present); Chief Financial Officer, Enzyvant (2018-2019); Chief Executive Officer, 2X Oncology, Inc. (2017- 2018); Senior Vice President and Chief Financial Officer, Juniper Pharmaceuticals, Inc. (2014-2016); Senior Vice President and Chief Financial Officer, KBI BioPharma Inc. (2013-2014); Managing Partner, Chatham Street Partners (2010-2013). | 35 | — | |||
| J. David Officer (1948) Board Member since 2011, Chairman of the Nominating Committee since 2015 | Independent Director (2010- present); Vice Chairman, the Dreyfus Corporation (2006-2009); President, The Dreyfus Family of Funds, Inc. (2006-2009). | 35 | (Chairman of) Ilex Management Ltd; Old Westbury Funds | |||
73
DBX ETF Trust
Board Members and Officers (Unaudited) (Continued)
Officers(2) | ||||||
| Name, Year of Birth, Position with the Trust and Length of Time Served(3) | Business Experience and Directorships During the Past 5 Years | |||||
| Freddi Klassen(4) (1975) President and Chief Executive Officer, 2016-present | Programmes (Head since 2021), of DWS Investment Management Americas, Inc. and Manager and Chief Operating Officer of the Advisor (2016-present). Formerly: Chief Operating Officer in the Americas for the Traditional Asset Classes Department (2014-2020); Manager and Chief Operating Officer of DWS Investment Management Americas, Inc. (2018-2020); Global Chief Operating Officer for Equities Technology in the Investment Bank Division at Deutsche Bank AG (2013-2014); Chief Operating Officer for Exchange Traded Funds and Systematic Funds in Europe (2008-2013). | |||||
| Diane Kenneally(5) (1966) Treasurer, Chief Financial Officer and Controller, 2019-present | Fund Administration Treasurer’s Office (Co-Head since 2018), of DWS Investment Management Americas, Inc.; Chief Financial Officer and Treasurer for DWS US registered investment companies advised by DWS Investment Management Americas, Inc. (2018-present); Treasurer and Chief Financial Officer, The European Equity Fund, Inc., The New Germany Fund, Inc. and The Central and Eastern Europe Fund, Inc. (2018-present); formerly: Assistant Treasurer for the DWS funds (2007-2018). | |||||
| Frank Gecsedi(4) (1967) Chief Compliance Officer, 2010-present | AFC Compliance US (Senior Team Lead), of DWS Investment Management Americas, Inc.; Compliance Department (2016-present), Vice President in the Deutsche Asset Management Compliance Department at Deutsche Bank AG (2013-2016) and Chief Compliance Officer of the Advisor (2010-present); Chief Compliance Officer of DWS Distributors, Inc. (2019-present); Vice President in Deutsche Bank’s Global Markets Legal, Risk and Capital Division (2010-2012). | |||||
| Bryan Richards(4) (1978) Vice President, 2016-present | Portfolio Engineering, Systematic Investments Solutions (Head), of DWS Investment Management Americas, Inc. (2018-present); Portfolio Manager in the Passive Asset Management Department at DWS (2011-present); Primary Portfolio Manager for the PowerShares DB Commodity ETFs (2011-2015). | |||||
| John Millette(5) (1962) Secretary, 2020-present | Legal (Associate General Counsel), DWS US Retail Legal (2003-present), of DWS Investment Management Americas, Inc.; Vice President and Secretary of DWS US registered investment companies advised by DWS Investment Management Americas, Inc. (1999-present); Chief Legal Officer, DWS Investment Management Americas, Inc. (2015-present); Director and Vice President of DWS Trust Company (2016-present); Vice President, DBX Advisors LLC (2021-present); Secretary, The European Equity Fund, Inc., The New Germany Fund, Inc. and The Central and Eastern Europe Fund, Inc. (2011-present); formerly: Secretary of Deutsche Investment Management Americas Inc. (2015-2017); and Assistant Secretary of DBX ETF Trust (2019-2020). | |||||
74
DBX ETF Trust
Board Members and Officers (Unaudited) (Continued)
| Name, Year of Birth, Position with the Trust and Length of Time Served(3) | Business Experience and Directorships During the Past 5 Years | |||||
| Caroline Pearson(5) (1962) Assistant Secretary, 2020-present | Legal (Senior Team Lead), DWS US Retail Legal, of DWS Investment Management Americas, Inc.; Chief Legal Officer of DWS US registered investment companies advised by DWS Investment Management Americas, Inc. (2010-present); Chief Legal Officer, DBX Advisors LLC (2020-present); Chief Legal Officer, The European Equity Fund, Inc., The New Germany Fund, Inc. and The Central and Eastern Europe Fund, Inc. (2012-present); formerly: Secretary, Deutsche AM Distributors, Inc. (2002-2017); and Secretary, Deutsche AM Service Company (2010-2017); and Chief Legal Officer, DBX Strategic Advisors LLC (2020–2021). | |||||
| Paul Antosca(5) (1957) Assistant Treasurer, 2019-present | Fund Administration Tax (Head), of DWS Investment Management Americas, Inc.; Assistant Treasurer for DWS US registered investment companies advised by DWS Investment Management Americas, Inc. (2007-present). | |||||
| Jeffrey Berry(5) (1959) Assistant Treasurer, 2019-present | Fund Administration (Senior Specialist), of DWS Investment Management Americas, Inc. | |||||
| Sheila Cadogan(5) (1966) Assistant Treasurer, 2019-present | Fund Administration Treasurer’s Office (Co-Head since 2018), of DWS Investment Management Americas, Inc.; Assistant Treasurer for DWS US registered investment companies advised by DWS Investment Management Americas, Inc. (2017-present); Director and Vice President, DWS Trust Company (2018-present); Assistant Treasurer, The European Equity Fund, Inc., The New Germany Fund, Inc. and The Central and Eastern Europe Fund, Inc. (2018-present). | |||||
| Christina A. Morse(6) (1964) Assistant Secretary, 2017-present | Vice President at BNY Mellon Asset Servicing (2014-present); Vice President and Counsel at Lord Abbett & Co. LLC (2013-2014). | |||||
| Christian Rijs(4) (1980) Anti-Money Laundering Compliance Officer, since October 6, 2021 | Americas Head of Anti-Financial Crime and AML Officer, of DWS Investment Management Americas, Inc.; AML Officer, DWS Trust Company (since October 6, 2021); AML Officer, of DWS US registered investment companies advised by DWS Investment Management Americas, Inc. (since October 6, 2021); AML Officer, The European Equity Fund, Inc., The New Germany Fund, Inc. and The Central and Eastern Europe Fund, Inc. (since October 6, 2021.); formerly: DWS UK & Ireland Head of Anti-Financial Crime and MLRO | |||||
| (1) | The length of time served is represented by the year in which the Board Member joined the Board. |
| (2) | As a result of their respective positions held with the Advisor and its affiliates, these individuals are considered “interested persons” of the Advisor within the meaning of the 1940 Act. Interested persons receive no compensation from the Funds. |
| (3) | The length of time served is represented by the year in which the officer was first elected to the Trust in such capacity. |
| (4) | Address: 875 Third Avenue, New York, New York 10022. |
| (5) | Address: 100 Summer Street, Boston, MA 02110. |
| (6) | Address: BNY Mellon Asset Servicing, 240 Greenwich Street, New York, NY 10286. |
The Funds’ Statement of Additional Information (“SAI”) includes additional information about the Funds’ Board Members. The SAI is available by calling 855-329-3837, or on the Company’s website at www.Xtrackers.com.
75
DBX ETF Trust
Proxy Voting Policies and Procedures
The Funds’ policies and procedures for voting proxies for portfolio securities and information about how each Fund voted proxies related to its portfolio securities during the most recent 12-month period ended June 30 are available on our Web site — www.Xtrackers.com (click on “Resources” and “Proxy Voting” at the top of the page) — or on the SEC’s Web site — www.sec.gov. To obtain a written copy of the Funds’ policies and procedures without charge, upon request, call us toll free at (855) 329-3837.
Portfolio Holdings Information
The Funds are required to file their complete schedule of portfolio holdings with the SEC for their first and third fiscal quarters on Form N-PORT. Copies of the filings are available without charge, upon request on the SEC’s website at www.sec.gov and are available by calling the Trust at 855-329-3837.
Information about each Fund’s portfolio holdings is available daily at www.Xtrackers.com.
Discount & Premium Information
Information regarding how often shares of each Fund traded on NYSE Arca at a price above (i.e., at a premium) or below (i.e., at a discount) the NAV of the Fund can be found at www.Xtrackers.com.
Tax Information
Form 1099-DIV and other year-end tax information provide shareholders with actual calendar year amounts that should be included in their tax returns. Shareholders should consult their tax advisors.
Each Fund designates the following amounts or, if subsequently determined to be different, the maximum allowable for its year ended August 31, 2021.
| Qualified Dividend Income* | Dividends Received Deduction* | |||||||
Xtrackers FTSE Developed ex US Multifactor ETF | 78% | 0% | ||||||
Xtrackers MSCI Kokusai Equity ETF | 88% | 42% | ||||||
Xtrackers Russell 1000 US Quality at a Reasonable Price ETF | 100% | 99% | ||||||
Xtrackers Russell US Multifactor ETF | 100% | 91% | ||||||
* The above percentage is based on ordinary income dividends paid to shareholders during each Fund’s fiscal year.
Each Fund intends to elect to pass through to shareholders the credit for taxes paid to foreign countries. The gross foreign source income and foreign taxes paid are as follows:
| Gross Foreign Income | Foreign Taxes Income | |||||||
Xtrackers FTSE Developed ex US Multifactor ETF | $ | 2,422,751 | $ | 230,106 | ||||
76
DBX ETF Trust
DBX Advisors LLC (“Advisors”) collects non-public information about you from the following sources: (i) information received from you on applications or other forms; and (ii) information about your transactions with the Advisors, Advisors’ affiliates and third-party service providers and vendors. Advisors does not disclose any non-public personal information about you to anyone, other than as set forth below, as permitted by applicable law and regulation. Advisors may disclose non-public personal information about you to the funds in which you invest, to Advisors’ affiliates, and to non-affiliated companies that work with Advisors to service your account(s), or to provide services or process transactions that you have requested. Advisors may disclose non-public personal information in situations that may include, but are not limited to, in response to legal and/or regulatory inquiries and the proposed or actual sale, assignment merger or other transfer of all or a portion of Advisors’ business to another business entity. Advisors may also disclose non-public personal information about you to parties representing you, such as your investment representative, your accountant, your tax advisor, or to other third parties at your direction/consent. Advisors will not sell, rent, license or trade your personal and financial information to or with third parties for their own direct marketing use unless you give us general or specific consent to do so. If you decide to close your account(s) or become an inactive customer, Advisors will adhere to the privacy policies and practices as described in this notice. Advisors restricts access to your personal and account information to those employees who need to know that information to provide products and services to you. Advisors maintains reasonable and customary physical, electronic and procedural safeguards to guard your non-public personal information.
California residents may go to https://fundsus.dws.com/us/en-us/legal-resources/privacy-policy.html to obtain additional information relating to their rights under California state law.
Advisors reserves the right, at their discretion, to change, modify, add, or remove portions of this Privacy Policy Notice, and any of the policies described herein, at any time. Advisors will indicate any such changes to the Privacy Policy Notice at the privacy link which can be found at www.Xtrackers.com. At all times, you are bound by the then-current version of the Privacy Policy and all applicable laws. Advisors highly recommends that you review this Privacy Policy Notice from time to time to ensure that you are familiar with the most recent version. The examples contained in this Privacy Policy Notice are illustrations; they are not intended to be exclusive.
77
DBX ETF Trust
This report is intended for the shareholders of the DBX ETF Trust.
This report must be preceded or accompanied by a prospectus.
Investing involves risk, including the possible loss of principal. Stocks may decline in value. Foreign investing involves greater and different risks than investing in U.S. companies, including currency fluctuations, less liquidity, less developed or less efficient trading markets, lack of comprehensive company information, political instability and differing auditing and legal standards. Funds investing in a single industry, country or in a limited geographic region, generally are more volatile than more diversified funds. Investing in derivatives entails special risks relating to liquidity, leverage and credit that may reduce returns and/or increase volatility. Because the Funds seek to provide exposure to stocks based on the following multifactors — value, momentum, quality, low volatility and size — it is expected, exposure to such investment factors will detract from performance in some market environments, as more fully explained in the Funds’ prospectus. KOKU is currently non-diversified and can take larger positions in fewer issues, increasing its potential risk. Performance of a Fund may diverge from that of its Underlying Index due to operating expenses, transaction costs, cash flows, use of sampling strategies or operational inefficiencies. An investment in any Fund should be considered only as a supplement to a complete investment program for those investors willing to accept the risks associated with that Fund. Please read the prospectus for more information.
War, terrorism, economic uncertainty, trade disputes, public health crises (including the ongoing pandemic spread of the novel coronavirus) and related geopolitical events could lead to increased market volatility, disruption to U.S. and world economies and markets and may have significant adverse effects on the Funds and their investments.
Shares of the Funds are bought and sold at market price (not NAV) throughout the day on the NYSE Arca, Inc. Transactions in Fund shares may result in brokerage commissions and may generate tax consequences. There can be no assurance that an active trading market for shares of a Fund will develop or be maintained.
DBX ETF Trust Funds are distributed by ALPS Distributors, Inc. (“ALPS”). The Funds are managed by DBX Advisors LLC which is not affiliated with ALPS.
The brand DWS represents DWS Group GmbH & Co. KGaA and any of its subsidiaries such as DWS Distributors, Inc. which offers investment products or Deutsche Investment Management Americas Inc. and RREEF America L.L.C. which offer advisory services.
DEEF, DEUS and QARP have been developed solely by DBX Advisors LLC. The Funds are not in any way connected to or sponsored, endorsed, issued, sold or promoted by the London Stock Exchange Group plc and its group undertakings (collectively, the “LSE Group”). FTSE Russell is a trading name of certain of the LSE Group companies.
All rights in the Russell 1000 Comprehensive Factor Index and Russell 1000 2Qual/Val 5% Capped Factor Index vest in the relevant LSE Group company which owns the Indexes. “FTSE®” “Russell®” and “FTSE Russell®” are a trademarks of the relevant LSE Group company and are used by any other LSE Group company under license.
The Index is calculated by or on behalf of FTSE International Limited or its affiliate, agent or partner. The LSE Group does not accept any liability whatsoever to any person arising out of (a) the use of, reliance on or any error in the Index or (b) investment in or operation of the Funds. The LSE Group makes no claim, prediction, warranty or representation either as to the results to be obtained from the Funds or the suitability of the Indexes for the purpose to which it is being put by DBX Advisors LLC.
KOKU is not sponsored, endorsed, issued, sold or promoted by MSCI, and MSCI bears no liability with respect to any such funds or securities or any index on which such funds or securities are based. The Prospectus contains a more detailed description of the limited relationship MSCI has with DBX Advisors LLC and any related funds.
Copyright © 2021 DWS Group. All rights reserved. XtrackersTM is a trademark of DWS Investment GmbH. All other trademarks, servicemarks or registered trademarks are the property of their respective owners.
Not FDIC Insured | No Bank Guarantee | May Lose Value
DBX ETF Trust
Investment advisor DBX Advisors LLC 875 Third Avenue New York, NY 10022 | Administrator, custodian, fund accounting agent, lending agent & transfer agent The Bank of New York Mellon 240 Greenwich Street New York, NY 10286 | Distributor ALPS Distributors, Inc. 1290 Broadway Suite 1000 Denver, CO 80203 | ||
Independent registered public accounting firm Ernst & Young LLP One Manhattan West New York, NY 10001 | Legal counsel Vedder Price P.C. 1633 Broadway New York, NY | |||
R-047731-6 (10/21) DBX004975 (10/22)
August 31, 2021
Annual Report
DBX ETF Trust
Xtrackers Emerging Markets Carbon Reduction and Climate Improvers ETF (EMCR)
(Formerly known as Xtrackers MSCI ACWI ex USA ESG Leaders Equity ETF (ACSG))
Xtrackers MSCI EAFE ESG Leaders Equity ETF (EASG)
Xtrackers MSCI Emerging Markets ESG Leaders Equity ETF (EMSG)
Xtrackers MSCI USA ESG Leaders Equity ETF (USSG)
Xtrackers S&P 500 ESG ETF (SNPE)
Xtrackers S&P MidCap 400 ESG ETF (MIDE)
Xtrackers S&P SmallCap 600 ESG ETF (SMLE)

DBX ETF Trust
| Page | ||||
| 1 | ||||
| 3 | ||||
Xtrackers Emerging Markets Carbon Reduction and Climate Improvers ETF | 6 | |||
| 8 | ||||
| 10 | ||||
| 12 | ||||
| 14 | ||||
| 16 | ||||
| 18 | ||||
| 20 | ||||
Xtrackers Emerging Markets Carbon Reduction and Climate Improvers ETF | 21 | |||
| 34 | ||||
| 40 | ||||
| 48 | ||||
| 52 | ||||
| 57 | ||||
| 61 | ||||
| 66 | ||||
| 68 | ||||
| 70 | ||||
| 73 | ||||
| 77 | ||||
| 89 | ||||
| 91 | ||||
| 94 | ||||
| 95 | ||||
To our Shareholders: (Unaudited)
We are pleased to provide this annual report for seven of our equity ETFs tracking the environmental, social, and governance (ESG) market for the period ended August 31, 2021.
The global economy staged a rebound from its post-pandemic recession, supported by accommodative fiscal and monetary policies, rapid vaccination rollouts, favorable economic data, and corporate earnings results. Major economies, such as the U.S. and China, witnessed more pronounced recovery, while most developing nations continued to grapple with the emerging “Delta” variant of the virus. The Eurozone economy posted positive growth in Q2 2021 after contracting for two consecutive quarters driven by largely burgeoning household spending.
According to Citigroup, in 2020, half of new EMEA passive funds were launched as “sustainable” funds — passive funds linked to ESG goals. Demand for ESG investments has accelerated in recent years, particularly in Europe, partly driven by growing evidence that companies that perform well on various ESG criteria tend to outperform over the longer term. With advancements in technology, such as artificial intelligence, and the regulatory landscape becoming clearer, ESG-mandated assets are on their way to reaching almost USD35tn by 2025, according to Deloitte. Equities remained the most popular asset class for sustainable investment, due mainly to an increase in the number of sustainable products, market appreciation, and positive inflows.
In the U.S., a favorable unemployment rate along with healthy corporate earnings results, drove a surge in markets in H1 2021. Biden’s administrative policies toward climate change proved to be a growth catalyst in the alternative energy space. The USD2.3tn infrastructure plan is expected to provide a huge impetus to ESG-oriented companies. The growing preference for electric vehicles (EVs) over combustion engines has been at the forefront of this “green revolution.” The industry has seen a massive inflow of funds, prompted partly by government policies to pare carbon emissions. The Eurozone economy began its recovery as lockdown restrictions were eased, shoring up key pandemic-affected sectors, especially the hospitality sector. In its pursuit to become the global bellwether in green initiatives, the European Union (EU) is aiming to cut net CO2 emissions to zero by 2050 to retard climate change. Given the supply-demand imbalance in the market, prices in the “green” sector have seen a significant escalation, with ESG funds turning out to be one of the most crowded trades.
Developments with vaccine administration in emerging markets were mixed, but generally lagged behind those in developed markets. China still leads in sustainable investing among the emerging markets. Following President Xi Jinping’s announcement of China’s net carbon neutrality goals, net flow into ESG funds jumped dramatically in Q4 2020. However, net inflow dipped in H1 2021. Strong performance of many sustainable funds in China, coupled with the government’s new crackdown on national security, technology, and monopolies, led many investors toward profit booking.
While vaccination rollouts in developed nations have been swift, progress remains slow in other parts of the world, and new coronavirus variants, such as “Delta,” remain a viable threat. Accelerating inflation in the U.S. and some emerging markets points to a possible bumpy transition from ultra-low interest rates and easy financing conditions to a post-pandemic “normalized” state. On the ESG front, sustainable investing has only gotten bigger, gathering more steam. The pandemic has shown investors that companies with robust ESG characteristics have, on average, better tools to cope with the changing political and economic environment.
Our team appreciates your trust and looks forward to serving your investment needs through innovative index-driven strategies.
Sincerely,
/s/ Freddi Klassen
Freddi Klassen
President and Chief Executive Officer
Assumptions, estimates and opinions contained in this document constitute our judgment as of the date of the document and are subject to change without notice. Any projections are based on a number of assumptions as to market conditions and there can be no guarantee that any projected results will be achieved. Past performance is not a guarantee of future results.
1
This Page is Intentionally Left Blank
2
DBX ETF Trust
Xtrackers Emerging Markets Carbon Reduction and Climate Improvers ETF (EMCR)
The Xtrackers Emerging Markets Carbon Reduction and Climate Improvers ETF (EMCR), seeks investment results that correspond generally to the performance, before fees and expenses, of the Solactive ISS Emerging Markets Carbon Reduction & Climate Improvers Index NTR (the “EMCR Index”). The EMCR index is comprised of large and mid-capitalization companies in emerging markets countries that meet certain environmental, social and governance (“ESG”) criteria and/or have committed to greenhouse gas emissions reduction targets. The fund’s performance reflects the result of the current strategy and the strategy in place prior to August 18, 2021, when the MSCI ACWI ex USA ESG Leaders Equity ETF’s name changed to Xtrackers Emerging Markets Carbon Reduction and Climate Improvers ETF and the Fund’s ticker symbol changed to EMCR. At that time the underlying index replaced the MSCI ACWI ex USA ESG Leaders Index which provides exposure to companies in the developed and emerging markets that exhibit high Environmental, Social and Governance (ESG) performance relative to their sector peers. For the 12-month period ended August 31, 2021 EMCR shares returned 26.80%, compared to the EMCR Index return of 27.32%.
All sectors contributed positively to performance during the period with the greatest contributions coming from Financials, Information Technology and Industrials. From a geographical perspective, Japan, Canada and Taiwan were the major positive contributors, while the United States, Hong Kong and Malaysia contributed negatively to performance.
Xtrackers MSCI EAFE ESG Leaders Equity ETF (EASG)
Xtrackers MSCI EAFE ESG Leaders Equity ETF (EASG), seeks investment results that correspond generally to the performance, before fees and expenses, of the MSCI EAFE ESG Leaders Index. (the EASG Index). The EASG Index provides exposure to companies across developed market countries, (except the United States and Canada) that exhibit high environmental, social and governance (ESG) performance relative to their sector peers. For the 12-month period ended August 31, 2021 EASG shares returned 25.28%, compared to the EASG Index return of 25.37%.
All sectors contributed positively to performance during the period with the greatest contributions coming from Financials, Industrials and Information Technology. From a geographical perspective, all the countries contributed positively with the greatest contribution coming from Japan, Netherlands and France.
Xtrackers MSCI Emerging Markets ESG Leaders Equity ETF (EMSG)
Xtrackers MSCI Emerging Markets ESG Leaders Equity ETF (EMSG), seeks investment results that correspond generally to the performance, before fees and expenses, of the MSCI Emerging Markets ESG Leaders Index (the EMSG Index). The EMSG Index is designed to provide exposure to large and mid-sized companies across emerging markets that exhibit high Environmental, Social and Governance (ESG) performance relative to its sector peers. For the 12-month period ended August 31, 2021, EMSG shares returned 18.43%, compared to the EMSG Index return of 18.74%.
The majority of sectors contributed positively to performance during the period with the greatest contributions coming from Information Technology, Financials and Materials. The Consumer Discretionary and Real Estate sectors were the only negative contributors to performance. From a geographical perspective, Taiwan, India and Korea were the major positive contributors, while the United States, Hong Kong and Netherlands contributed negatively to performance.
Xtrackers MSCI USA ESG Leaders Equity ETF (USSG)
Xtrackers MSCI USA ESG Leaders Equity ETF (USSG), seeks investment results that correspond generally to the performance, before fees and expenses, of the MSCI USA ESG Leaders Index (the USSG Index). The USSG Index is designed to provide exposure to large and medium sized companies in US markets that exhibit high Environmental, Social and Governance (ESG) performance relative to its sector peers. For the 12-month period ended August 31, 2021, USSG shares returned 33.48%, compared to the USSG Index return of 33.59%.
All sectors contributed positively to performance during the period with the greatest contributions coming from Information Technology, Communication Services and Financials.
Xtrackers S&P 500 ESG ETF (SNPE)
Xtrackers S&P 500 ESG ETF (SNPE), seeks investment results that correspond generally to the performance, before fees and expenses, of the S&P 500 ESG Index (the SNPE Index). The SNPE Index measures the
3
DBX ETF Trust
Management’s Discussion of Fund Performance (Unaudited) (Continued)
performance of securities that fulfills sustainability criteria, while preserving similar overall industry group weights as S&P 500 index. For the 12-month period ended August 31, 2021 SNPE shares returned 30.16%, compared to the SNPE Index return of 30.27%.
All sectors contributed positively to performance during the period with the greatest contributions coming from Information Technology, Financials and Communication Services.
Xtrackers S&P MidCap 400 ESG ETF (MIDE)
Xtrackers S&P MidCap 400 ESG ETF (MIDE), seeks investment results that correspond generally to the performance, before fees and expenses, of the S&P MidCap 400 ESG Index (the MIDE Index). The MIDE Index measures the performance of securities that fulfills sustainability criteria, while preserving similar overall industry group weights as S&P MidCap 400 Index. For the period February 24, 2021 (commencement of operations) to August 31, 2021 MIDE shares returned 9.92%, compared to the MIDE Index return of 10.01%.
The majority of sectors contributed positively to performance during the period with the greatest contributions coming from Industrials, Consumer Discretionary and Real Estate. The Communication Services sector was the only negative contributor to performance.
Xtrackers S&P SmallCap 600 ESG ETFs (SMLE)
Xtrackers S&P SmallCap 600 ESG ETF (SMLE), seeks investment results that correspond generally to the performance, before fees and expenses, of the S&P SmallCap 600 ESG Index (the SMLE Index). The SMLE Index measures the performance of securities that fulfills sustainability criteria, while preserving similar overall industry group weights as S&P SmallCap 600 Index. For the period February 24, 2021 (commencement of operations) to August 31, 2021 MIDE shares returned 7.01%, compared to the MIDE Index return of 7.10%.
The majority of sectors contributed positively to performance during the period with the greatest contributions coming from Consumer Discretionary, Industrials and Information Technology. The Energy and Materials’ sectors were the only negative contributors to performance.
*************************
Performance data quoted represents past performance and does not guarantee future results. Investment returns and principal value of an investment will fluctuate so that an investor’s shares, when sold or redeemed, may be worth more or less than their original cost. Current performance may be lower or higher than the performance data quoted. To obtain the most recent month-end performance data visit www.Xtrackers.com. Returns assume that dividends and capital gains distributions have been reinvested. See pages 6-19 of this report for additional performance information, including performance data based on market value.
The views expressed in this report reflect those of the portfolio management team only through the end of the period of the report as stated on the cover. The management team’s views are subject to change at any time based on market and other conditions and should not be construed as a recommendation. Current and future portfolio holdings are subject to risk.
4
This Page is Intentionally Left Blank
5
DBX ETF Trust
Xtrackers Emerging Markets Carbon Reduction and Climate Improvers ETF (EMCR)
The Xtrackers Emerging Markets Carbon Reduction and Climate Improvers ETF (the “Fund”), using a “passive” or indexing investment approach, seeks investment results that correspond generally to the performance, before fees and expenses, of the Solactive ISS Emerging Markets Carbon Reduction & Climate Improvers Index NTR (the “Underlying Index”). The Underlying Index is comprised of large and mid-capitalization companies in emerging markets countries that meet certain environmental, social and governance (“ESG”) criteria and/or have committed to greenhouse gas emissions reduction targets. The Underlying Index is then weighted in such a manner seeking to align its constituent companies’ greenhouse gas emissions with the long-term global warming target of the Paris Climate Agreement. On August 18, 2021 the Xtrackers MSCI ACWI ex USA ESG Leaders Equity ETF name changed to Xtrackers Emerging Markets Carbon Reduction and Climate Improvers ETF and the Fund’s ticker symbol cahnged to EMCR. At that time, the Underlying Index replaced the MSCI ACWI ex USA ESG Leaders Index which is a capitalization weighted index that provides exposure to companies with high environmental, social and governance (“ESG”) performance relative to their sector peers and is constructed using regional indexes that provide exposure to large- and medium-capitalization companies from developed and emerging markets countries (excluding the United States). It is not possible to invest directly into an index.
| Performance as of August 31, 2021 |
| Average Annual Total Return | ||||||||||||
| Net Asset Value | Market Value | Solactive ISS Emerging Markets Carbon Reduction & Climate Improvers Index NTR2 | MSCI ACWI ex USA ESG Leaders Index | MSCI Emerging Markets Index | MSCI ACWI ex USA Index | |||||||
One Year | 26.80% | 26.59% | 27.32% | 23.85% | 21.12% | 24.87% | ||||||
Since Inception1 | 15.35% | 15.29% | 15.59% | 14.43% | 12.33% | 12.85% | ||||||
| Cumulative Total Returns | ||||||||||||
| Net Asset Value | Market Value | Solactive ISS Emerging Markets Carbon Reduction & Climate Improvers Index NTR2 | MSCI ACWI ex USA ESG Leaders Index | MSCI Emerging Markets Index | MSCI ACWI ex USA Index | |||||||
One Year | 26.80% | 26.59% | 27.32% | 23.85% | 21.12% | 24.87% | ||||||
Since Inception1 | 47.88% | 47.74% | 48.78% | 44.72% | 37.55% | 39.32% | ||||||
1 Total returns are calculated based on the commencement of operations, December 6, 2018 (“Inception”).
2 On August 18, 2021, the Fund changed its Underlying Index from MSCI ACWI ex USA ESG Leaders Index to the Solactive ISS Emerging Markets Carbon Reduction & Climate Improvers Index NTR. Returns reflect performance for the MSCI ACWI ex USA ESG Leaders Index through August 17, 2021.
Prior to August 18, 2021, the Fund was known as Xtrackers MSCI ACWI ex USA ESG Leaders Equity ETF (ASCG) and had a different investment strategy. Past performance may have been different if the Fund’s current investment strategy had been in effect.
Past performance is no guarantee of future results. Current performance may be lower or higher than the performance data quoted. Performance data current to the most recent month-end is available at www.Xtrackers.com. Performance results assume reinvestment of all dividends and capital gain distributions and do not reflect the deduction of taxes that a shareholder would pay on fund distributions or on the sale of fund shares or redemption of fund creation units. The investment return and principal value of shares will vary with changes in market conditions. Shares may be worth more or less than their original cost when they are sold in the market or redeemed. Performance for certain funds may reflect a waiver of a portion of the unitary advisory fee. Without such waiver, performance would have been lower. The gross expense ratio of the Fund, as stated in the fee table of the prospectus dated August 18, 2021, was 0.15%, and may differ from the expense ratio disclosed in the Financial Highlights table in this report.
The Fund’s net asset value or “NAV” is calculated by dividing the value of the Fund’s total assets less total liabilities by the number of shares outstanding. The price used to calculate market return (“Market Price”) is determined by using the midpoint between the highest bid and the lowest offer on the primary stock exchange on which shares of a fund are listed for trading, as of the time that such fund’s NAV is calculated. Since shares of a fund may not have traded in the secondary market until after the fund’s inception, for the period from inception to the first day of secondary trading, the NAV of the fund is used as a proxy for the Market Price to calculate market returns. Market and NAV returns assume that dividends and capital gain distributions have been reinvested at Market Price and NAV, respectively.
An index is a statistical composite that tracks a specified financial market or sector. Unlike a fund, an index does not actually hold a portfolio of securities and therefore does not incur the expenses incurred by a fund. These expenses negatively impact fund performance. Also, market returns do not include brokerage commissions that may be payable on secondary market transactions. If brokerage commissions were included, market returns would be lower.
6
DBX ETF Trust
Performance Summary (Unaudited)
Xtrackers Emerging Markets Carbon Reduction and Climate Improvers ETF (EMCR) (Continued)
| Growth of an Assumed $10,000 Investment |
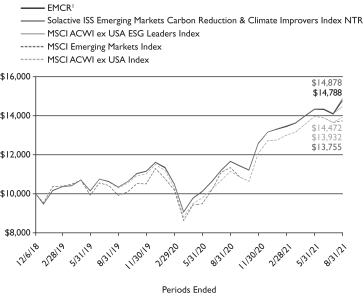
1 Based on Net Asset Value from commencement of operations, December 6, 2018.
| Sector Diversification* as of August 31, 2021 |
Financials | 25.4% | |||
Information Technology | 25.4% | |||
Consumer Discretionary | 14.8% | |||
Communication Services | 13.1% | |||
Materials | 6.2% | |||
Health Care | 4.3% | |||
Industrials | 4.2% | |||
Consumer Staples | 4.1% | |||
Real Estate | 1.8% | |||
Utilities | 0.7% | |||
|
| |||
Total | 100.0% |
| Ten Largest Equity Holdings as of August 31, 2021 (31.3% of Net Assets) |
| Description | % of Net Assets | |||
Taiwan Semiconductor Manufacturing Co. Ltd. (Taiwan) | 10.2% | |||
Tencent Holdings Ltd. (China) | 7.1% | |||
Samsung Electronics Co. Ltd. (South Korea) | 3.6% | |||
Alibaba Group Holding Ltd. (China) | 3.6% | |||
Meituan (China) | 1.5% | |||
China Construction Bank Corp. (China) | 1.3% | |||
Housing Development Finance Corp. Ltd. (India) | 1.2% | |||
NIO, Inc. (China) | 1.0% | |||
Infosys Ltd. (India) | 0.9% | |||
Tata Consultancy Services Ltd. (India) | 0.9% | |||
| Country Diversification* as of August 31, 2021 |
China | 34.1% | |||
Taiwan | 19.5% | |||
India | 12.0% | |||
South Korea | 11.9% | |||
Brazil | 4.5% | |||
South Africa | 3.3% | |||
Saudi Arabia | 2.1% | |||
Other | 12.6% | |||
|
| |||
Total | 100.0% |
* As a percent of total investments excluding exchange-traded funds, securities lending collateral and cash equivalents.
Portfolio holdings and characteristics are subject to change. For more complete details about the Fund’s investment portfolio see page 21.
7
DBX ETF Trust
Performance Summary (Unaudited)
Xtrackers MSCI EAFE ESG Leaders Equity ETF (EASG)
The Xtrackers MSCI EAFE ESG Leaders Equity ETF (the “Fund”), using a “passive” or indexing investment approach, seeks investment results that correspond generally to the performance, before fees and expenses, of the MSCI EAFE ESG Leaders Index (the “Underlying Index”). The Underlying Index is a capitalization weighted index that provides exposure to companies with high environmental, social and governance (“ESG”) performance relative to their sector peers and consists of large- and medium-capitalization companies across developed markets countries, excluding Canada and the United States. It is not possible to invest directly into an index.
| Performance as of August 31, 2021 |
| Average Annual Total Return | ||||||||
| Net Asset Value | Market Value | MSCI EAFE ESG Leaders Index | MSCI EAFE Index | |||||
One Year | 25.28% | 26.07% | 25.37% | 26.12% | ||||
Since Inception1 | 11.04% | 11.13% | 11.02% | 9.75% | ||||
| Cumulative Total Returns | ||||||||
| Net Asset Value | Market Value | MSCI EAFE ESG Leaders Index | MSCI EAFE Index | |||||
One Year | 25.28% | 26.07% | 25.37% | 26.12% | ||||
Since Inception1 | 36.71% | 37.09% | 36.69% | 32.07% | ||||
1 Total returns are calculated based on the commencement of operations, September 6, 2018 (“Inception”).
Past performance is no guarantee of future results. Current performance may be lower or higher than the performance data quoted. Performance data current to the most recent month-end is available at www.Xtrackers.com. Performance results assume reinvestment of all dividends and capital gain distributions and do not reflect the deduction of taxes that a shareholder would pay on fund distributions or on the sale of fund shares or redemption of fund creation units. The investment return and principal value of shares will vary with changes in market conditions. Shares may be worth more or less than their original cost when they are sold in the market or redeemed. Performance for certain funds may reflect a waiver of a portion of the unitary advisory fee. Without such waiver, performance would have been lower. The gross expense ratio of the Fund, as stated in the fee table of the prospectus dated December 18, 2020, was 0.14%, and may differ from the expense ratio disclosed in the Financial Highlights table in this report.
The Fund’s net asset value or “NAV” is calculated by dividing the value of the Fund’s total assets less total liabilities by the number of shares outstanding. The price used to calculate market return (“Market Price”) is determined by using the midpoint between the highest bid and the lowest offer on the primary stock exchange on which shares of a fund are listed for trading, as of the time that such fund’s NAV is calculated. Since shares of a fund may not have traded in the secondary market until after the fund’s inception, for the period from inception to the first day of secondary trading, the NAV of the fund is used as a proxy for the Market Price to calculate market returns. Market and NAV returns assume that dividends and capital gain distributions have been reinvested at Market Price and NAV, respectively.
An index is a statistical composite that tracks a specified financial market or sector. Unlike a fund, an index does not actually hold a portfolio of securities and therefore does not incur the expenses incurred by a fund. These expenses negatively impact fund performance. Also, market returns do not include brokerage commissions that may be payable on secondary market transactions. If brokerage commissions were included, market returns would be lower.
8
DBX ETF Trust
Performance Summary (Unaudited)
Xtrackers MSCI EAFE ESG Leaders Equity ETF (EASG) (Continued)
| Growth of an Assumed $10,000 Investment |
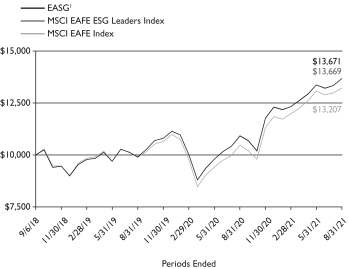
1 Based on Net Asset Value from commencement of operations, September 6, 2018.
| Sector Diversification* as of August 31, 2021 |
Financials | 16.5% | |||
Industrials | 15.7% | |||
Health Care | 14.4% | |||
Consumer Discretionary | 11.9% | |||
Information Technology | 9.9% | |||
Consumer Staples | 9.3% | |||
Materials | 8.8% | |||
Communication Services | 5.0% | |||
Utilities | 3.3% | |||
Real Estate | 2.9% | |||
Energy | 2.3% | |||
|
| |||
Total | 100.0% |
| Ten Largest Equity Holdings as of August 31, 2021 (19.7% of Net Assets) |
| Description | % of Net Assets | |||
ASML Holding NV (Netherlands) | 3.9% | |||
Roche Holding AG (Switzerland) | 3.1% | |||
AstraZeneca PLC (United Kingdom) | 2.0% | |||
Novo Nordisk A/S (Denmark) | 1.9% | |||
SAP SE (Germany) | 1.8% | |||
Unilever PLC (United Kingdom) | 1.6% | |||
Sony Group Corp. (Japan) | 1.5% | |||
Commonwealth Bank of Australia (Australia) | 1.4% | |||
L’Oreal SA (France) | 1.3% | |||
TotalEnergies SE (France) | 1.2% | |||
| Country Diversification* as of August 31, 2021 |
Japan | 24.2% | |||
United Kingdom | 13.2% | |||
France | 10.7% | |||
Switzerland | 9.5% | |||
Germany | 8.6% | |||
Netherlands | 7.3% | |||
Australia | 6.7% | |||
Denmark | 4.0% | |||
Sweden | 3.6% | |||
Spain | 2.3% | |||
Other | 9.9% | |||
|
| |||
Total | 100.0% |
* As a percent of total investments excluding securities lending collateral and cash equivalents.
Portfolio holdings and characteristics are subject to change. For more complete details about the Fund’s investment portfolio see page 34.
9
DBX ETF Trust
Performance Summary (Unaudited)
Xtrackers MSCI Emerging Markets ESG Leaders Equity ETF (EMSG)
The Xtrackers MSCI Emerging Markets ESG Leaders Equity ETF (the “Fund”), using a “passive” or indexing investment approach, seeks investment results that correspond generally to the performance, before fees and expenses, of the MSCI Emerging Markets ESG Leaders Index (the “Underlying Index”). The Underlying Index is a capitalization weighted index that provides exposure to companies with high environmental, social and governance (“ESG”) performance relative to their sector peers and consists of large- and medium-capitalization companies across emerging markets countries. It is not possible to invest directly into an index.
| Performance as of August 31, 2021 |
| Average Annual Total Return | ||||||||
| Net Asset Value | Market Value | MSCI Emerging Markets ESG Leaders Index | MSCI Emerging Markets Index | |||||
One Year | 18.43% | 18.09% | 18.74% | 21.12% | ||||
Since Inception1 | 13.73% | 13.71% | 14.08% | 12.33% | ||||
| Cumulative Total Returns | ||||||||
| Net Asset Value | Market Value | MSCI Emerging Markets ESG Leaders Index | MSCI Emerging Markets Index | |||||
One Year | 18.43% | 18.09% | 18.74% | 21.12% | ||||
Since Inception1 | 42.26% | 42.25% | 43.52% | 37.55% | ||||
1 Total returns are calculated based on the commencement of operations, December 6, 2018 (“Inception”).
Past performance is no guarantee of future results. Current performance may be lower or higher than the performance data quoted. Performance data current to the most recent month-end is available at www.Xtrackers.com. Performance results assume reinvestment of all dividends and capital gain distributions and do not reflect the deduction of taxes that a shareholder would pay on fund distributions or on the sale of fund shares or redemption of fund creation units. The investment return and principal value of shares will vary with changes in market conditions. Shares may be worth more or less than their original cost when they are sold in the market or redeemed. Performance for certain funds may reflect a waiver of a portion of the unitary advisory fee. Without such waiver, performance would have been lower. The gross expense ratio of the Fund, as stated in the fee table of the prospectus dated December 18, 2020, was 0.20%, and may differ from the expense ratio disclosed in the Financial Highlights table in this report.
The Fund’s net asset value or “NAV” is calculated by dividing the value of the Fund’s total assets less total liabilities by the number of shares outstanding. The price used to calculate market return (“Market Price”) is determined by using the midpoint between the highest bid and the lowest offer on the primary stock exchange on which shares of a fund are listed for trading, as of the time that such fund’s NAV is calculated. Since shares of a fund may not have traded in the secondary market until after the fund’s inception, for the period from inception to the first day of secondary trading, the NAV of the fund is used as a proxy for the Market Price to calculate market returns. Market and NAV returns assume that dividends and capital gain distributions have been reinvested at Market Price and NAV, respectively.
An index is a statistical composite that tracks a specified financial market or sector. Unlike a fund, an index does not actually hold a portfolio of securities and therefore does not incur the expenses incurred by a fund. These expenses negatively impact fund performance. Also, market returns do not include brokerage commissions that may be payable on secondary market transactions. If brokerage commissions were included, market returns would be lower.
10
DBX ETF Trust
Performance Summary (Unaudited)
Xtrackers MSCI Emerging Markets ESG Leaders Equity ETF (EMSG) (Continued)
| Growth of an Assumed $10,000 Investment |
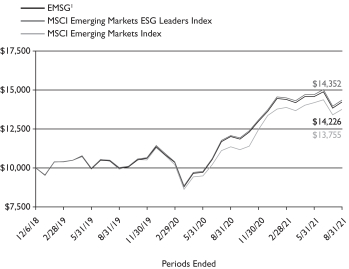
1 Based on Net Asset Value from commencement of operations, December 6, 2018.
| Sector Diversification* as of August 31, 2021 |
Information Technology | 20.9% | |||
Consumer Discretionary | 19.1% | |||
Financials | 17.6% | |||
Communication Services | 12.4% | |||
Materials | 6.9% | |||
Energy | 5.4% | |||
Consumer Staples | 5.3% | |||
Health Care | 4.5% | |||
Industrials | 4.4% | |||
Real Estate | 2.0% | |||
Utilities | 1.5% | |||
|
| |||
Total | 100.0% |
| Ten Largest Equity Holdings as of August 31, 2021 (38.4% of Net Assets) |
| Description | % of Net Assets | |||
Taiwan Semiconductor Manufacturing Co. Ltd. (Taiwan) | 11.9% | |||
Tencent Holdings Ltd. (China) | 7.8% | |||
Alibaba Group Holding Ltd. (China) | 7.0% | |||
Meituan (China) | 2.8% | |||
Reliance Industries Ltd. (India) | 1.9% | |||
Infosys Ltd. (India) | 1.7% | |||
China Construction Bank Corp. (China) | 1.5% | |||
Housing Development Finance Corp. Ltd. (India) | 1.4% | |||
Wuxi Biologics Cayman, Inc. (China) | 1.2% | |||
NIO, Inc. (China) | 1.2% | |||
| Country Diversification* as of August 31, 2021 |
China | 33.3% | |||
Taiwan | 21.2% | |||
India | 11.8% | |||
South Korea | 7.6% | |||
South Africa | 4.7% | |||
Brazil | 3.1% | |||
Russia | 3.0% | |||
Thailand | 2.2% | |||
Hong Kong | 2.2% | |||
Other | 10.9% | |||
|
| |||
Total | 100.0% |
* As a percent of total investments excluding exchange-traded funds, securities lending collateral and cash equivalents.
Portfolio holdings and characteristics are subject to change. For more complete details about the Fund’s investment portfolio see page 40.
11
DBX ETF Trust
Performance Summary (Unaudited)
Xtrackers MSCI USA ESG Leaders Equity ETF (USSG)
Xtrackers MSCI USA ESG Leaders Equity ETF (the “Fund”), using a “passive” or indexing investment approach, seeks investment results that correspond generally to the performance, before fees and expenses, of the MSCI USA ESG Leaders Index (the “Underlying Index”). The Underlying Index is a capitalization weighted index that provides exposure to companies with high environmental, social and governance (“ESG”) performance relative to their sector peers and consists of large- and medium-capitalization companies in the U.S. market. The S&P 500 Index or the Standard & Poor’s 500 Index is a market-capitalization-weighted index of the 500 largest U.S. publicly traded companies. It is not possible to invest directly into an index.
| Performance as of August 31, 2021 |
| Average Annual Total Return | ||||||||
| Net Asset Value | Market Value | MSCI USA ESG Leaders Index | S&P 500 Index | |||||
One Year | 33.48% | 33.60% | 33.59% | 31.17% | ||||
Since Inception1 | 24.88% | 24.86% | 24.95% | 23.91% | ||||
| Cumulative Total Returns | ||||||||
| Net Asset Value | Market Value | MSCI USA ESG Leaders Index | S&P 500 Index | |||||
One Year | 33.48% | 33.60% | 33.59% | 31.17% | ||||
Since Inception1 | 73.79% | 73.83% | 74.16% | 70.55% | ||||
1 Total returns are calculated based on the commencement of operations, March 7, 2019 (“Inception”).
Past performance is no guarantee of future results. Current performance may be lower or higher than the performance data quoted. Performance data current to the most recent month-end is available at www.Xtrackers.com. Performance results assume reinvestment of all dividends and capital gain distributions and do not reflect the deduction of taxes that a shareholder would pay on fund distributions or on the sale of fund shares or redemption of fund creation units. The investment return and principal value of shares will vary with changes in market conditions. Shares may be worth more or less than their original cost when they are sold in the market or redeemed. Performance for certain funds may reflect a waiver of a portion of the unitary advisory fee. Without such waiver, performance would have been lower. The gross expense ratio of the Fund, as stated in the fee table of the prospectus dated December 18, 2020, was 0.10%, and may differ from the expense ratio disclosed in the Financial Highlights table in this report.
The Fund’s net asset value or “NAV” is calculated by dividing the value of the Fund’s total assets less total liabilities by the number of shares outstanding. The price used to calculate market return (“Market Price”) is determined by using the midpoint between the highest bid and the lowest offer on the primary stock exchange on which shares of a fund are listed for trading, as of the time that such fund’s NAV is calculated. Since shares of a fund may not have traded in the secondary market until after the fund’s inception, for the period from inception to the first day of secondary trading, the NAV of the fund is used as a proxy for the Market Price to calculate market returns. Market and NAV returns assume that dividends and capital gain distributions have been reinvested at Market Price and NAV, respectively.
An index is a statistical composite that tracks a specified financial market or sector. Unlike a fund, an index does not actually hold a portfolio of securities and therefore does not incur the expenses incurred by a fund. These expenses negatively impact fund performance. Also, market returns do not include brokerage commissions that may be payable on secondary market transactions. If brokerage commissions were included, market returns would be lower.
12
DBX ETF Trust
Performance Summary (Unaudited)
Xtrackers MSCI USA ESG Leaders Equity ETF (USSG) (Continued)
| Growth of an Assumed $10,000 Investment |
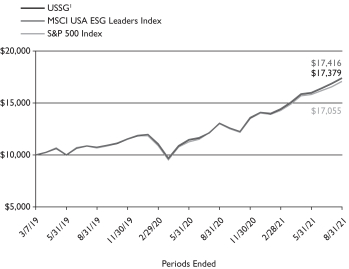
1 Based on Net Asset Value from commencement of operations, March 7, 2019.
| Sector Diversification* as of August 31, 2021 |
Information Technology | 29.0% | |||
Health Care | 13.5% | |||
Consumer Discretionary | 12.3% | |||
Communication Services | 12.0% | |||
Financials | 11.1% | |||
Industrials | 8.4% | |||
Consumer Staples | 5.9% | |||
Materials | 2.9% | |||
Real Estate | 2.8% | |||
Energy | 1.1% | |||
Utilities | 1.0% | |||
|
| |||
Total | 100.0% |
| Ten Largest Equity Holdings as of August 31, 2021 (35.2% of Net Assets) |
| Description | % of Net Assets | |||
Microsoft Corp. | 10.6% | |||
Alphabet, Inc. | 8.4% | |||
Tesla, Inc. | 2.9% | |||
NVIDIA Corp. | 2.7% | |||
Johnson & Johnson | 2.2% | |||
Visa, Inc. | 1.9% | |||
Procter & Gamble Co. | 1.7% | |||
Home Depot, Inc. | 1.7% | |||
Walt Disney Co. | 1.6% | |||
Adobe, Inc. | 1.5% | |||
* As a percent of total investments excluding securities lending collateral and cash equivalents.
Portfolio holdings and characteristics are subject to change. For more complete details about the Fund’s investment portfolio see page 48.
13
DBX ETF Trust
Performance Summary (Unaudited)
Xtrackers S&P 500 ESG ETF (SNPE)
Xtrackers S&P 500 ESG ETF (the “Fund”), using a “passive” or indexing investment approach, seeks investment results that correspond generally to the performance, before fees and expenses, of the S&P 500 ESG Index (the “Underlying Index”). The Underlying Index is a broad-based, market capitalization weighted index that provides exposure to companies with high environmental, social and governance (“ESG”) performance relative to their sector peers, while maintaining similar overall industry group weights as the S&P 500 Index. It is not possible to invest directly into an index.
| Performance as of August 31, 2021 |
| Average Annual Total Return | ||||||||
| Net Asset Value | Market Value | S&P 500 ESG Index | S&P 500 Index | |||||
One Year | 30.16% | 30.16% | 30.27% | 31.17% | ||||
Since Inception1 | 25.98% | 25.94% | 26.09% | 24.35% | ||||
| Cumulative Total Returns | ||||||||
| Net Asset Value | Market Value | S&P 500 ESG Index | S&P 500 Index | |||||
One Year | 30.16% | 30.16% | 30.27% | 31.17% | ||||
Since Inception1 | 65.58% | 65.59% | 66.01% | 61.03% | ||||
1 Total returns are calculated based on the commencement of operations, June 26, 2019 (“Inception”).
Past performance is no guarantee of future results. Current performance may be lower or higher than the performance data quoted. Performance data current to the most recent month-end is available at www.Xtrackers.com. Performance results assume reinvestment of all dividends and capital gain distributions and do not reflect the deduction of taxes that a shareholder would pay on fund distributions or on the sale of fund shares or redemption of fund creation units. The investment return and principal value of shares will vary with changes in market conditions. Shares may be worth more or less than their original cost when they are sold in the market or redeemed. Performance for certain funds may reflect a waiver of a portion of the unitary advisory fee. Without such waiver, performance would have been lower. The gross expense ratio of the Fund, as stated in the fee table of the prospectus dated December 18, 2020, was 0.11%, and may differ from the expense ratio disclosed in the Financial Highlights table in this report.
The Fund’s net asset value or “NAV” is calculated by dividing the value of the Fund’s total assets less total liabilities by the number of shares outstanding. The price used to calculate market return (“Market Price”) is determined by using the midpoint between the highest bid and the lowest offer on the primary stock exchange on which shares of a fund are listed for trading, as of the time that such fund’s NAV is calculated. Since shares of a fund may not have traded in the secondary market until after the fund’s inception, for the period from inception to the first day of secondary trading, the NAV of the fund is used as a proxy for the Market Price to calculate market returns. Market and NAV returns assume that dividends and capital gain distributions have been reinvested at Market Price and NAV, respectively.
An index is a statistical composite that tracks a specified financial market or sector. Unlike a fund, an index does not actually hold a portfolio of securities and therefore does not incur the expenses incurred by a fund. These expenses negatively impact fund performance. Also, market returns do not include brokerage commissions that may be payable on secondary market transactions. If brokerage commissions were included, market returns would be lower.
14
DBX ETF Trust
Performance Summary (Unaudited)
Xtrackers S&P 500 ESG ETF (SNPE) (Continued)
| Growth of an Assumed $10,000 Investment |
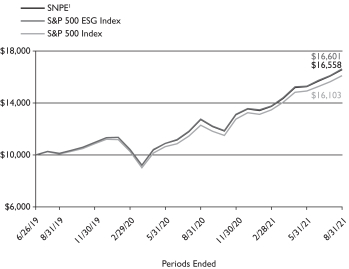
1 Based on Net Asset Value from commencement of operations, June 26, 2019.
| Sector Diversification* as of August 31, 2021 |
Information Technology | 30.8% | |||
Consumer Discretionary | 13.7% | |||
Health Care | 12.9% | |||
Financials | 10.6% | |||
Communication Services | 10.5% | |||
Industrials | 6.9% | |||
Consumer Staples | 5.3% | |||
Energy | 2.7% | |||
Real Estate | 2.6% | |||
Materials | 2.5% | |||
Utilities | 1.5% | |||
|
| |||
Total | 100.0% |
| Ten Largest Equity Holdings as of August 31, 2021 (36.5% of Net Assets) |
| Description | % of Net Assets | |||
Apple, Inc. | 8.2% | |||
Microsoft Corp. | 7.8% | |||
Alphabet, Inc. | 5.9% | |||
Amazon.com, Inc. | 5.1% | |||
Tesla, Inc. | 2.0% | |||
NVIDIA Corp. | 1.9% | |||
JPMorgan Chase & Co. | 1.7% | |||
UnitedHealth Group, Inc. | 1.4% | |||
Visa, Inc. | 1.3% | |||
Procter & Gamble Co. | 1.2% | |||
* As a percent of total investments excluding securities lending collateral and cash equivalents.
Portfolio holdings and characteristics are subject to change. For more complete details about the Fund’s investment portfolio see page 52.
15
DBX ETF Trust
Performance Summary (Unaudited)
Xtrackers S&P MidCap 400 ESG ETF (MIDE)
Xtrackers S&P MidCap 400 ESG ETF (the “Fund”), using a “passive” or indexing investment approach, seeks investment results that correspond generally to the performance, before fees and expenses, of the S&P MidCap 400 ESG Index (the “Underlying Index”). The Underlying Index is a broad-based, market capitalization weighted index that provides exposure to companies with high environmental, social and governance (“ESG”) performance relative to their sector peers, while maintaining similar overall industry group weights as the S&P MidCap 400 Index. It is not possible to invest directly into an index.
| Performance as of August 31, 2021 |
| Cumulative Total Returns | ||||||||
| Net Asset Value | Market Value | S&P MidCap 400 ESG Index | S&P MidCap 400 Index | |||||
Since Inception1 | 9.92% | 9.92% | 10.01% | 9.49% | ||||
1 Total returns are calculated based on the commencement of operations, February 24, 2021 (“Inception”).
Past performance is no guarantee of future results. Current performance may be lower or higher than the performance data quoted. Performance data current to the most recent month-end is available at www.Xtrackers.com. Performance results assume reinvestment of all dividends and capital gain distributions and do not reflect the deduction of taxes that a shareholder would pay on fund distributions or on the sale of fund shares or redemption of fund creation units. The investment return and principal value of shares will vary with changes in market conditions. Shares may be worth more or less than their original cost when they are sold in the market or redeemed. Performance for certain funds may reflect a waiver of a portion of the unitary advisory fee. Without such waiver, performance would have been lower. The gross expense ratio of the Fund, as stated in the fee table of the prospectus dated January 26, 2021, was 0.15%, and may differ from the expense ratio disclosed in the Financial Highlights table in this report.
The Fund’s net asset value or “NAV” is calculated by dividing the value of the Fund’s total assets less total liabilities by the number of shares outstanding. The price used to calculate market return (“Market Price”) is determined by using the midpoint between the highest bid and the lowest offer on the primary stock exchange on which shares of a fund are listed for trading, as of the time that such fund’s NAV is calculated. Since shares of a fund may not have traded in the secondary market until after the fund’s inception, for the period from inception to the first day of secondary trading, the NAV of the fund is used as a proxy for the Market Price to calculate market returns. Market and NAV returns assume that dividends and capital gain distributions have been reinvested at Market Price and NAV, respectively.
An index is a statistical composite that tracks a specified financial market or sector. Unlike a fund, an index does not actually hold a portfolio of securities and therefore does not incur the expenses incurred by a fund. These expenses negatively impact fund performance. Also, market returns do not include brokerage commissions that may be payable on secondary market transactions. If brokerage commissions were included, market returns would be lower.
16
DBX ETF Trust
Performance Summary (Unaudited)
Xtrackers S&P MidCap 400 ESG ETF (MIDE) (Continued)
| Growth of an Assumed $10,000 Investment |
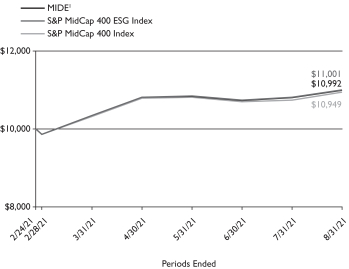
1 Based on Net Asset Value from commencement of operations, February 24, 2021.
| Sector Diversification* as of August 31, 2021 |
Industrials | 18.8% | |||
Financials | 16.5% | |||
Consumer Discretionary | 15.5% | |||
Information Technology | 14.5% | |||
Real Estate | 10.5% | |||
Health Care | 9.3% | |||
Materials | 7.1% | |||
Consumer Staples | 3.2% | |||
Communication Services | 2.1% | |||
Energy | 1.3% | |||
Utilities | 1.2% | |||
|
| |||
Total | 100.0% |
| Ten Largest Equity Holdings as of August 31, 2021 (8.9% of Net Assets) |
| Description | % of Net Assets | |||
Molina Healthcare, Inc. | 1.0% | |||
Cognex Corp. | 0.9% | |||
SolarEdge Technologies, Inc. | 0.9% | |||
Signature Bank | 0.9% | |||
Ceridian HCM Holding, Inc. | 0.9% | |||
Camden Property Trust | 0.9% | |||
FactSet Research Systems, Inc. | 0.9% | |||
Williams-Sonoma, Inc. | 0.9% | |||
Masimo Corp. | 0.8% | |||
Brown & Brown, Inc. | 0.8% | |||
* As a percent of total investments excluding securities lending collateral and cash equivalents.
Portfolio holdings and characteristics are subject to change. For more complete details about the Fund’s investment portfolio see page 57.
17
DBX ETF Trust
Performance Summary (Unaudited)
Xtrackers S&P SmallCap 600 ESG ETF (SMLE)
Xtrackers S&P SmallCap 600 ESG ETF (the “Fund”), using a “passive” or indexing investment approach, seeks investment results that correspond generally to the performance, before fees and expenses, of the S&P SmallCap 600 ESG Index (the “Underlying Index”). The Underlying Index is a broad-based, market capitalization weighted index that provides exposure to companies with high environmental, social and governance (“ESG”) performance relative to their sector peers, while maintaining similar overall industry group weights as the S&P SmallCap 600 Index. It is not possible to invest directly into an index.
| Performance as of August 31, 2021 |
| Cumulative Total Returns | ||||||||
| Net Asset Value | Market Value | S&P SmallCap 600 ESG Index | S&P SmallCap 600 Index | |||||
Since Inception1 | 7.01% | 7.01% | 7.10% | 6.73% | ||||
1 Total returns are calculated based on the commencement of operations, February 24, 2021 (“Inception”).
Past performance is no guarantee of future results. Current performance may be lower or higher than the performance data quoted. Performance data current to the most recent month-end is available at www.Xtrackers.com. Performance results assume reinvestment of all dividends and capital gain distributions and do not reflect the deduction of taxes that a shareholder would pay on fund distributions or on the sale of fund shares or redemption of fund creation units. The investment return and principal value of shares will vary with changes in market conditions. Shares may be worth more or less than their original cost when they are sold in the market or redeemed. Performance for certain funds may reflect a waiver of a portion of the unitary advisory fee. Without such waiver, performance would have been lower. The gross expense ratio of the Fund, as stated in the fee table of the prospectus dated January 26, 2021, was 0.15%, and may differ from the expense ratio disclosed in the Financial Highlights table in this report.
The Fund’s net asset value or “NAV” is calculated by dividing the value of the Fund’s total assets less total liabilities by the number of shares outstanding. The price used to calculate market return (“Market Price”) is determined by using the midpoint between the highest bid and the lowest offer on the primary stock exchange on which shares of a fund are listed for trading, as of the time that such fund’s NAV is calculated. Since shares of a fund may not have traded in the secondary market until after the fund’s inception, for the period from inception to the first day of secondary trading, the NAV of the fund is used as a proxy for the Market Price to calculate market returns. Market and NAV returns assume that dividends and capital gain distributions have been reinvested at Market Price and NAV, respectively.
An index is a statistical composite that tracks a specified financial market or sector. Unlike a fund, an index does not actually hold a portfolio of securities and therefore does not incur the expenses incurred by a fund. These expenses negatively impact fund performance. Also, market returns do not include brokerage commissions that may be payable on secondary market transactions. If brokerage commissions were included, market returns would be lower.
18
DBX ETF Trust
Performance Summary (Unaudited)
Xtrackers S&P SmallCap 600 ESG ETF (SMLE) (Continued)
| Growth of an Assumed $10,000 Investment |
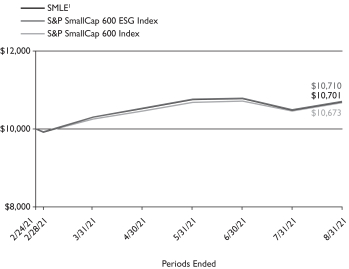
1 Based on Net Asset Value from commencement of operations, February 24, 2021.
| Sector Diversification* as of August 31, 2021 |
Industrials | 18.1% | |||
Financials | 17.6% | |||
Information Technology | 15.4% | |||
Consumer Discretionary | 14.3% | |||
Health Care | 12.3% | |||
Real Estate | 8.3% | |||
Materials | 5.2% | |||
Consumer Staples | 4.0% | |||
Energy | 2.7% | |||
Communication Services | 1.3% | |||
Utilities | 0.8% | |||
|
| |||
Total | 100.0% |
| Ten Largest Equity Holdings as of August 31, 2021 (7.9% of Net Assets) |
| Description | % of Net Assets | |||
Macy’s, Inc. | 0.9% | |||
Chart Industries, Inc. | 0.9% | |||
Omnicell, Inc. | 0.9% | |||
Power Integrations, Inc. | 0.9% | |||
Exponent, Inc. | 0.8% | |||
MicroStrategy, Inc. | 0.7% | |||
AMN Healthcare Services, Inc. | 0.7% | |||
Agree Realty Corp. | 0.7% | |||
Watts Water Technologies, Inc. | 0.7% | |||
SPS Commerce, Inc. | 0.7% | |||
* As a percent of total investments excluding securities lending collateral and cash equivalents.
Portfolio holdings and characteristics are subject to change. For more complete details about the Fund’s investment portfolio see page 61.
19
DBX ETF Trust
As a shareholder of one or more of the Funds, you incur two types of costs: (1) transaction costs, including brokerage commissions paid on purchases and sales of fund shares, and (2) ongoing costs, including management fees and other Fund expenses. In the most recent six-month period the Funds limited these expenses; had they not done so, expenses would have been higher. The expense examples below are intended to help you understand your ongoing costs (in dollars) of investing in the Funds and to compare these costs with the ongoing costs of investing in other funds.
The examples in the tables are based on an investment of $1,000 invested at the beginning of the period and held for the entire period (March 1, 2021 to August 31, 2021).
Actual expenses
The first line in the following tables provides information about actual account values and actual expenses. You may use the information in this line, together with the amount you invested, to estimate the expenses that you paid over the period. Simply divide your account value by $1,000 (for example, an $8,600 account value divided by $1,000 = 8.6), then multiply the result by the number in the first line under the heading “Expenses Paid During the Period” to estimate the expenses you paid on your account during this period.
Hypothetical example for comparison purposes
The second line in the following tables provides information about hypothetical account values and hypothetical expenses based on the Funds’ actual expense ratios and an assumed rate of return of 5% per year before expenses (which is not the Funds’ actual return). The hypothetical account values and expenses may not be used to estimate the actual ending account balance or expenses you paid for the period. You may use this information to compare the ongoing costs of investing in the Fund and other funds. To do so, compare this 5% hypothetical example with the 5% hypothetical examples that appear in the shareholder reports of the other funds.
Please note that the expenses shown in the tables are meant to highlight your ongoing costs only, and do not reflect any transactional costs. Therefore the second line in the table is useful in comparing ongoing costs only, and will not help you determine the relative total costs of owning different funds. In addition, if these transactional costs were included, your costs would have been higher.
Beginning Account Value | Ending Account Value | Annualized Expense Ratio | Expenses Paid During the Period(1) | |||||||||||||
| Xtrackers Emerging Markets Carbon Reduction and Climate Improvers ETF |
| |||||||||||||||
Actual | $ | 1,000.00 | $ | 1,098.90 | 0.16 | % | $ | 0.82 | ||||||||
Hypothetical (5% return before expenses) | $ | 1,000.00 | $ | 1,024.43 | 0.16 | % | $ | 0.79 | ||||||||
| Xtrackers MSCI EAFE ESG Leaders Equity ETF |
| |||||||||||||||
Actual | $ | 1,000.00 | $ | 1,109.30 | 0.14 | % | $ | 0.74 | ||||||||
Hypothetical (5% return before expenses) | $ | 1,000.00 | $ | 1,024.50 | 0.14 | % | $ | 0.71 | ||||||||
| Xtrackers MSCI Emerging Markets ESG Leaders Equity ETF |
| |||||||||||||||
Actual | $ | 1,000.00 | $ | 989.20 | 0.20 | % | $ | 1.01 | ||||||||
Hypothetical (5% return before expenses) | $ | 1,000.00 | $ | 1,024.19 | 0.20 | % | $ | 1.03 | ||||||||
| Xtrackers MSCI USA ESG Leaders Equity ETF |
| |||||||||||||||
Actual | $ | 1,000.00 | $ | 1,207.60 | 0.09 | % | $ | 0.50 | ||||||||
Hypothetical (5% return before expenses) | $ | 1,000.00 | $ | 1,024.75 | 0.09 | % | $ | 0.46 | ||||||||
| Xtrackers S&P 500 ESG ETF |
| |||||||||||||||
Actual | $ | 1,000.00 | $ | 1,206.10 | 0.10 | % | $ | 0.56 | ||||||||
Hypothetical (5% return before expenses) | $ | 1,000.00 | $ | 1,024.70 | 0.10 | % | $ | 0.51 | ||||||||
| Xtrackers S&P MidCap 400 ESG ETF |
| |||||||||||||||
Actual | $ | 1,000.00 | $ | 1,114.30 | 0.15 | % | $ | 0.80 | ||||||||
Hypothetical (5% return before expenses) | $ | 1,000.00 | $ | 1,024.45 | 0.15 | % | $ | 0.77 | ||||||||
| Xtrackers S&P SmallCap 600 ESG ETF |
| |||||||||||||||
Actual | $ | 1,000.00 | $ | 1,078.30 | 0.15 | % | $ | 0.79 | ||||||||
Hypothetical (5% return before expenses) | $ | 1,000.00 | $ | 1,024.45 | 0.15 | % | $ | 0.77 | ||||||||
(1) Expenses are equal to each Fund’s annualized expense ratio, multiplied by the average account value over the period, multiplied by 184 (the number of days in the most recent six-month period), then divided by 365.
20
DBX ETF Trust
Xtrackers Emerging Markets Carbon Reduction and Climate Improvers ETF
August 31, 2021
Number | Value | |||||||
| COMMON STOCKS — 97.7% | ||||||||
| Argentina — 0.0% | ||||||||
Despegar.com Corp.* (a) | 4,860 | $ | 58,271 | |||||
Grupo Financiero Galicia SA, ADR | 9,725 | 104,836 | ||||||
Telecom Argentina SA, ADR | 12,010 | 67,376 | ||||||
|
| |||||||
(Cost $219,693) | 230,483 | |||||||
|
| |||||||
| Brazil — 3.2% | ||||||||
Ambev SA | 251,903 | 841,391 | ||||||
Americanas SA* | 32,935 | 266,076 | ||||||
Atacadao SA | 14,300 | 50,697 | ||||||
B3 SA — Brasil Bolsa Balcao | 582,206 | 1,600,070 | ||||||
Banco Bradesco SA | 128,782 | 501,590 | ||||||
Banco BTG Pactual SA | 113,857 | 628,492 | ||||||
Banco do Brasil SA | 82,177 | 488,450 | ||||||
Banco Inter SA | 34,137 | 452,022 | ||||||
Banco Santander Brasil SA | 32,709 | 267,956 | ||||||
BB Seguridade Participacoes SA | 66,448 | 247,385 | ||||||
BRF SA* | 32,937 | 150,674 | ||||||
CCR SA | 40,712 | 97,415 | ||||||
Cia de Saneamento Basico do Estado de Sao Paulo | 20,303 | 143,284 | ||||||
Cia Siderurgica Nacional SA | 25,737 | 175,248 | ||||||
Cielo SA | 109,852 | 61,583 | ||||||
Energisa SA | 17,730 | 153,662 | ||||||
Equatorial Energia SA | 31,220 | 155,199 | ||||||
Hapvida Participacoes e Investimentos SA, 144A | 79,313 | 228,045 | ||||||
Hypera SA | 28,307 | 196,674 | ||||||
Itau Unibanco Holding SA | 42,145 | 235,687 | ||||||
Klabin SA* | 37,854 | 194,536 | ||||||
Localiza Rent a Car SA | 34,137 | 369,806 | ||||||
Lojas Renner SA | 55,868 | 415,337 | ||||||
Magazine Luiza SA | 158,000 | 562,924 | ||||||
Multiplan Empreendimentos Imobiliarios SA | 21,157 | 87,198 | ||||||
Natura & Co. Holding SA* | 85,263 | 859,700 | ||||||
Notre Dame Intermedica Participacoes SA | 42,714 | 666,964 | ||||||
Pagseguro Digital Ltd., Class A* (a) | 15,442 | 918,336 | ||||||
Raia Drogasil SA | 111,854 | 558,445 | ||||||
Rede D’Or Sao Luiz SA, 144A | 59,586 | 800,990 | ||||||
Rumo SA* | 124,493 | 455,218 | ||||||
Sendas Distribuidora SA | 63,589 | 208,794 | ||||||
StoneCo Ltd., Class A* | 12,012 | 559,038 | ||||||
Suzano SA* | 44,718 | 532,820 | ||||||
Telefonica Brasil SA | 24,589 | 210,033 | ||||||
TIM SA | 33,223 | 80,858 | ||||||
Via S/A* | 118,434 | 240,359 | ||||||
WEG SA | 83,318 | 578,720 | ||||||
XP, Inc., Class A* | 11,438 | 556,459 | ||||||
|
| |||||||
(Cost $15,657,905) | 15,798,135 | |||||||
|
| |||||||
| Chile — 0.3% | ||||||||
Banco de Chile | 2,628,237 | 256,465 | ||||||
Banco de Credito e Inversiones SA | 6,003 | 259,664 | ||||||
Banco Santander Chile | 6,352,322 | 335,178 | ||||||
Cencosud SA | 78,746 | 148,357 | ||||||
Number | Value | |||||||
| Chile (Continued) | ||||||||
Cencosud Shopping SA | 25,000 | $ | 35,486 | |||||
Empresas CMPC SA | 61,859 | 137,216 | ||||||
Falabella SA | 50,148 | 198,340 | ||||||
|
| |||||||
(Cost $1,338,086) | 1,370,706 | |||||||
|
| |||||||
| China — 34.0% | ||||||||
360 Security Technology, Inc., Class A* | 23,500 | 43,343 | ||||||
51job, Inc., ADR* (a) | 3,431 | 263,501 | ||||||
AAC Technologies Holdings, Inc. | 42,713 | 238,077 | ||||||
Agile Group Holdings Ltd. | 56,152 | 64,402 | ||||||
Agricultural Bank of China Ltd., Class A | 476,600 | 218,651 | ||||||
Agricultural Bank of China Ltd., Class H | 2,648,998 | 888,977 | ||||||
Aier Eye Hospital Group Co. Ltd., Class A | 18,700 | 122,309 | ||||||
Air China Ltd., Class A* | 76,800 | 86,180 | ||||||
Air China Ltd., Class H* | 144,847 | 97,218 | ||||||
Airtac International Group | 4,577 | 139,555 | ||||||
Alibaba Group Holding Ltd., ADR* | 106,247 | 17,742,187 | ||||||
A-Living Smart City Services Co. Ltd., 144A | 49,294 | 195,215 | ||||||
Aluminum Corp. of China Ltd., Class A* | 105,400 | 127,421 | ||||||
Aluminum Corp. of China Ltd., Class H* | 249,044 | 180,602 | ||||||
Angang Steel Co. Ltd., Class A | 134,500 | 118,824 | ||||||
Angang Steel Co. Ltd., Class H | 139,129 | 106,440 | ||||||
Anhui Conch Cement Co. Ltd., Class A | 28,600 | 177,132 | ||||||
Anhui Conch Cement Co. Ltd., Class H | 62,729 | 339,562 | ||||||
ANTA Sports Products Ltd. | 63,587 | 1,308,147 | ||||||
Autohome, Inc., ADR | 3,430 | 151,812 | ||||||
Baidu, Inc., ADR* | 16,300 | 2,559,426 | ||||||
Bank of Beijing Co. Ltd., Class A | 129,600 | 87,177 | ||||||
Bank of China Ltd., Class A | 187,300 | 87,960 | ||||||
Bank of China Ltd., Class H | 4,719,911 | 1,656,780 | ||||||
Bank of Communications Co. Ltd., Class A | 288,500 | 197,639 | ||||||
Bank of Communications Co. Ltd., Class H | 658,299 | 378,355 | ||||||
Bank of Jiangsu Co. Ltd., Class A | 91,200 | 90,889 | ||||||
Bank of Nanjing Co. Ltd., Class A | 52,600 | 76,471 | ||||||
Bank of Ningbo Co. Ltd., Class A | 28,600 | 143,177 | ||||||
Bank of Shanghai Co. Ltd., Class A | 91,200 | 101,914 | ||||||
Baoshan Iron & Steel Co. Ltd., Class A | 86,200 | 136,140 | ||||||
BBMG Corp., Class A | 231,100 | 97,068 | ||||||
BeiGene Ltd., ADR* | 4,287 | 1,321,682 | ||||||
Beijing-Shanghai High Speed Railway Co. Ltd., Class A | 211,500 | 155,708 | ||||||
Bilibili, Inc., ADR* (a) | 13,727 | 1,101,317 | ||||||
BOE Technology Group Co. Ltd., Class A | 153,700 | 138,644 | ||||||
BYD Co. Ltd., Class A | 5,700 | 244,715 | ||||||
BYD Co. Ltd., Class H | 47,292 | 1,601,665 | ||||||
By-health Co. Ltd., Class A | 3,000 | 11,694 | ||||||
CanSino Biologics, Inc., Class H, 144A* | 3,717 | 146,915 | ||||||
CGN Power Co. Ltd., Class A | 35,000 | 14,375 | ||||||
CGN Power Co. Ltd., Class H, 144A | 1,286,326 | 284,477 | ||||||
Changchun High & New Technology Industry Group, Inc., Class A | 1,000 | 39,560 | ||||||
Changzhou Xingyu Automotive Lighting Systems Co. Ltd., Class A | 2,700 | 80,983 | ||||||
| See Notes to Financial Statements. | 21 |
DBX ETF Trust
Schedule of Investments
Xtrackers Emerging Markets Carbon Reduction and Climate Improvers ETF (Continued)
August 31, 2021
Number | Value | |||||||
| China (Continued) | ||||||||
China Bohai Bank Co. Ltd., Class H, 144A | 192,887 | $ | 78,372 | |||||
China Cinda Asset Management Co. Ltd., Class H | 415,336 | 73,697 | ||||||
China CITIC Bank Corp. Ltd., Class H | 503,513 | 231,773 | ||||||
China Conch Venture Holdings Ltd. | 67,875 | 277,527 | ||||||
China Construction Bank Corp., Class A | 86,200 | 78,157 | ||||||
China Construction Bank Corp., Class H | 8,816,388 | 6,370,820 | ||||||
China Eastern Airlines Corp. Ltd., | 38,500 | 28,046 | ||||||
China Everbright Bank Co. Ltd., Class A | 221,200 | 114,851 | ||||||
China Everbright Bank Co. Ltd., Class H | 366,487 | 131,471 | ||||||
China Evergrande Group (a) | 113,630 | 63,701 | ||||||
China Feihe Ltd., 144A | 88,694 | 160,570 | ||||||
China Galaxy Securities Co. Ltd., Class H | 233,885 | 131,417 | ||||||
China Hongqiao Group Ltd. | 137,414 | 204,954 | ||||||
China International Capital Corp. Ltd., Class H, 144A | 120,152 | 279,317 | ||||||
China International Marine Containers Group Co. Ltd., Class H | 36,139 | 79,180 | ||||||
China Lesso Group Holdings Ltd. | 81,890 | 175,207 | ||||||
China Life Insurance Co. Ltd., Class A | 23,500 | 105,043 | ||||||
China Life Insurance Co. Ltd., Class H | 691,728 | 1,158,016 | ||||||
China Literature Ltd., 144A* | 33,224 | 278,955 | ||||||
China Merchants Bank Co. Ltd., Class A | 124,800 | 947,025 | ||||||
China Merchants Bank Co. Ltd., Class H | 391,032 | 3,230,381 | ||||||
China Merchants Securities Co. Ltd., Class A | 43,000 | 121,029 | ||||||
China Merchants Securities Co. Ltd., Class H, 144A | 19,400 | 29,334 | ||||||
China Merchants Shekou Industrial Zone Holdings Co. Ltd., Class A | 8,800 | 13,585 | ||||||
China Minsheng Banking Corp. Ltd., Class A | 173,000 | 106,449 | ||||||
China Minsheng Banking Corp. Ltd., Class H | 353,155 | 147,576 | ||||||
China Molybdenum Co. Ltd., Class H | 202,036 | 157,943 | ||||||
China National Building Material Co. Ltd., Class H | 202,326 | 276,797 | ||||||
China National Nuclear Power Co. Ltd., Class A | 124,800 | 105,999 | ||||||
China Northern Rare Earth Group High-Tech Co. Ltd., Class A | 18,700 | 168,190 | ||||||
China Pacific Insurance Group Co. Ltd., Class A | 33,400 | 136,147 | ||||||
China Pacific Insurance Group Co. Ltd., Class H | 138,139 | 388,981 | ||||||
China Railway Group Ltd., Class A | 139,500 | 121,727 | ||||||
China Railway Group Ltd., Class H | 240,751 | 115,464 | ||||||
China Railway Signal & Communication Corp. Ltd., Class H, 144A | 278,779 | 101,083 | ||||||
China Resources Mixc Lifestyle Services Ltd., 144A | 36,136 | 189,802 | ||||||
China Resources Pharmaceutical Group Ltd., 144A | 44,163 | 22,998 | ||||||
China Southern Airlines Co. Ltd., | 166,008 | 96,693 | ||||||
Number | Value | |||||||
| China (Continued) | ||||||||
China State Construction Engineering Corp. Ltd., Class A | 206,700 | $ | 153,776 | |||||
China Tower Corp. Ltd., Class H, 144A | 2,012,468 | 263,935 | ||||||
China Vanke Co. Ltd., Class A | 52,600 | 161,420 | ||||||
China Vanke Co. Ltd., Class H | 102,545 | 276,887 | ||||||
China Yangtze Power Co. Ltd., Class A | 129,600 | 388,479 | ||||||
Chongqing Changan Automobile Co. Ltd., Class A | 23,500 | 75,104 | ||||||
Chongqing Rural Commercial Bank Co. Ltd., Class H | 196,892 | 75,442 | ||||||
Chongqing Zhifei Biological Products Co. Ltd., Class A | 5,800 | 159,113 | ||||||
CIFI Holdings Group Co. Ltd. | 216,158 | 145,637 | ||||||
CITIC Securities Co. Ltd., Class A | 52,600 | 209,356 | ||||||
CITIC Securities Co. Ltd., Class H | 116,267 | 294,504 | ||||||
Contemporary Amperex Technology Co. Ltd., Class A | 14,200 | 1,089,144 | ||||||
COSCO SHIPPING Holdings Co. Ltd., Class A* | 47,700 | 153,332 | ||||||
COSCO SHIPPING Holdings Co. Ltd., Class H* (a) | 189,169 | 357,549 | ||||||
Country Garden Holdings Co. Ltd. | 484,646 | 535,909 | ||||||
Country Garden Services Holdings Co. Ltd. | 98,703 | 751,947 | ||||||
CSC Financial Co. Ltd., Class H, 144A | 80,748 | 88,459 | ||||||
Dada Nexus Ltd., ADR* | 17,728 | 419,799 | ||||||
Dali Foods Group Co. Ltd., 144A | 110,428 | 61,906 | ||||||
Dongfeng Motor Group Co. Ltd., Class H | 96,413 | 105,619 | ||||||
East Money Information Co. Ltd., Class A | 38,200 | 183,244 | ||||||
Ecovacs Robotics Co. Ltd., Class A | 1,300 | 29,556 | ||||||
Eve Energy Co. Ltd., Class A | 9,300 | 147,024 | ||||||
Everbright Securities Co. Ltd., Class A | 33,400 | 82,309 | ||||||
Evergrande Property Services Group Ltd., 144A * (a) | 222,737 | 167,253 | ||||||
Flat Glass Group Co. Ltd., Class H | 36,994 | 215,951 | ||||||
Foshan Haitian Flavouring & Food Co. Ltd., Class A | 4,300 | 63,300 | ||||||
Foxconn Industrial Internet Co. Ltd., Class A | 43,000 | 76,510 | ||||||
Fuyao Glass Industry Group Co. Ltd., Class A | 9,300 | 69,044 | ||||||
Fuyao Glass Industry Group Co. Ltd., Class H, 144A | 28,935 | 178,208 | ||||||
Ganfeng Lithium Co. Ltd., Class A | 4,300 | 146,621 | ||||||
Ganfeng Lithium Co. Ltd., Class H, 144A | 12,870 | 296,541 | ||||||
Gaotu Techedu, Inc., ADR* (a) | 24,020 | 69,178 | ||||||
GDS Holdings Ltd., ADR* | 17,157 | 1,003,341 | ||||||
GF Securities Co. Ltd., Class A | 30,900 | 90,947 | ||||||
GF Securities Co. Ltd., Class H | 66,907 | 119,063 | ||||||
GoerTek, Inc., Class A | 7,500 | 54,100 | ||||||
Gotion High-tech Co. Ltd., Class A* | 3,500 | 29,158 | ||||||
Great Wall Motor Co. Ltd., Class A | 4,900 | 50,215 | ||||||
Great Wall Motor Co. Ltd., Class H | 119,866 | 551,756 | ||||||
Guangdong Haid Group Co. Ltd., Class A | 4,300 | 42,820 | ||||||
Guangzhou Automobile Group Co. Ltd., Class H | 96,413 | 97,066 | ||||||
| See Notes to Financial Statements. | 22 |
DBX ETF Trust
Schedule of Investments
Xtrackers Emerging Markets Carbon Reduction and Climate Improvers ETF (Continued)
August 31, 2021
Number | Value | |||||||
| China (Continued) | ||||||||
Guangzhou Baiyunshan Pharmaceutical Holdings Co. Ltd., Class A | 21,700 | $ | 99,083 | |||||
Guangzhou Kingmed Diagnostics Group Co. Ltd., Class A | 2,000 | 32,703 | ||||||
Guangzhou R&F Properties Co. Ltd., Class H | 31,229 | 26,662 | ||||||
Guangzhou Tinci Materials Technology Co. Ltd., Class A | 4,300 | 90,779 | ||||||
Guosen Securities Co. Ltd., Class A | 40,500 | 76,581 | ||||||
Guotai Junan Securities Co. Ltd., Class A | 47,700 | 131,301 | ||||||
Guotai Junan Securities Co. Ltd., Class H, 144A | 48,149 | 67,357 | ||||||
Haidilao International Holding Ltd., 144A (a) | 52,439 | 213,738 | ||||||
Haier Smart Home Co. Ltd., Class A | 28,600 | 119,950 | ||||||
Haier Smart Home Co. Ltd., Class H | 123,293 | 464,488 | ||||||
Haitong Securities Co. Ltd., Class A | 59,100 | 116,423 | ||||||
Haitong Securities Co. Ltd., Class H | 155,249 | 143,525 | ||||||
Hangzhou First Applied Material Co. Ltd., Class A | 7,600 | 179,045 | ||||||
Hangzhou Tigermed Consulting Co. Ltd., Class A | 4,300 | 89,359 | ||||||
Hangzhou Tigermed Consulting Co. Ltd., Class H, 144A | 6,002 | 106,498 | ||||||
Hansoh Pharmaceutical Group Co. Ltd., 144A | 72,453 | 197,963 | ||||||
Hello Group, Inc., ADR | 10,297 | 135,303 | ||||||
Hengan International Group Co. Ltd. | 35,853 | 207,908 | ||||||
HengTen Networks Group Ltd.* (a) | 394,177 | 193,608 | ||||||
Hua Hong Semiconductor Ltd., 144A* | 58,441 | 344,153 | ||||||
Huadong Medicine Co. Ltd., Class A | 14,200 | 67,677 | ||||||
Huatai Securities Co. Ltd., Class A | 43,500 | 110,436 | ||||||
Huatai Securities Co. Ltd., Class H, 144A | 77,501 | 111,209 | ||||||
Huaxia Bank Co. Ltd., Class A | 67,100 | 58,239 | ||||||
Huaxin Cement Co. Ltd., Class B | 31,500 | 55,188 | ||||||
Huazhu Group Ltd., ADR* | 5,719 | 276,171 | ||||||
Hunan Valin Steel Co. Ltd., Class A | 76,800 | 92,846 | ||||||
Hundsun Technologies, Inc., Class A | 4,300 | 33,030 | ||||||
HUYA, Inc., ADR* (a) | 7,148 | 76,412 | ||||||
Iflytek Co. Ltd., Class A | 9,300 | 75,501 | ||||||
Industrial & Commercial Bank of China Ltd., Class A | 351,100 | 251,408 | ||||||
Industrial & Commercial Bank of China Ltd., Class H | 7,417,003 | 4,138,915 | ||||||
Industrial Bank Co. Ltd., Class A | 76,800 | 220,211 | ||||||
Inner Mongolia BaoTou Steel Union Co. Ltd., Class A* | 173,100 | 100,877 | ||||||
Inner Mongolia Yili Industrial Group Co. Ltd., Class A | 28,600 | 150,757 | ||||||
Innovent Biologics, Inc., 144A* | 47,287 | 381,222 | ||||||
Intco Medical Technology Co. Ltd., Class A | 2,000 | 31,671 | ||||||
iQIYI, Inc., ADR* | 18,303 | 165,825 | ||||||
JA Solar Technology Co. Ltd., Class A | 4,300 | 51,851 | ||||||
Jafron Biomedical Co. Ltd., Class A | 9,300 | 70,600 | ||||||
JD Health International, Inc., 144A* (a) | 39,023 | 362,767 | ||||||
JD.com, Inc., ADR* | 52,136 | 4,095,804 | ||||||
Number | Value | |||||||
| China (Continued) | ||||||||
Jiangsu Hengrui Medicine Co. Ltd., Class A | 23,500 | $ | 164,631 | |||||
Jiangxi Copper Co. Ltd., Class A | 23,500 | 96,630 | ||||||
Jiangxi Copper Co. Ltd., Class H (a) | 47,001 | 95,605 | ||||||
KE Holdings, Inc., ADR* | 36,765 | 665,079 | ||||||
Kingdee International Software Group Co. Ltd.* | 263,055 | 957,197 | ||||||
Kingfa Sci & Tech Co. Ltd., Class A | 2,700 | 6,783 | ||||||
Kingsoft Cloud Holdings Ltd., ADR* (a) | 16,869 | 543,013 | ||||||
Kingsoft Corp. Ltd. | 79,257 | 317,442 | ||||||
Kuaishou Technology, 144A* (a) | 104,136 | 1,131,425 | ||||||
KWG Group Holdings Ltd. | 43,572 | 45,940 | ||||||
Legend Holdings Corp., Class H, 144A | 87,265 | 140,704 | ||||||
Lenovo Group Ltd. | 584,491 | 647,819 | ||||||
Lens Technology Co. Ltd., Class A | 28,600 | 104,613 | ||||||
Li Auto, Inc., ADR* (a) | 54,782 | 1,690,573 | ||||||
Li Ning Co. Ltd. | 124,496 | 1,672,785 | ||||||
Lingyi iTech Guangdong Co., Class A | 27,000 | 27,996 | ||||||
Logan Group Co. Ltd. | 125,639 | 149,914 | ||||||
Longfor Group Holdings Ltd., 144A | 94,127 | 407,861 | ||||||
LONGi Green Energy Technology Co. Ltd., Class A | 38,200 | 529,661 | ||||||
Lufax Holding Ltd., ADR* | 188,585 | 1,635,032 | ||||||
Luxshare Precision Industry Co. Ltd., Class A | 28,600 | 150,092 | ||||||
Mango Excellent Media Co. Ltd., Class A | 5,600 | 39,752 | ||||||
Maxscend Microelectronics Co. Ltd., Class A | 2,500 | 146,854 | ||||||
Meituan, Class B, 144A* | 225,020 | 7,204,251 | ||||||
Metallurgical Corp. of China Ltd., Class A | 124,900 | 96,985 | ||||||
Metallurgical Corp. of China Ltd., Class H | 150,000 | 59,789 | ||||||
Microport Scientific Corp. (a) | 55,009 | 340,564 | ||||||
Midea Group Co. Ltd., Class A | 14,200 | 145,257 | ||||||
Ming Yuan Cloud Group Holdings Ltd.* | 26,880 | 93,317 | ||||||
MINISO Group Holding Ltd., ADR | 17,445 | 235,856 | ||||||
Muyuan Foods Co. Ltd., Class A | 14,200 | 93,119 | ||||||
NARI Technology Co. Ltd., Class A | 17,060 | 92,571 | ||||||
NAURA Technology Group Co. Ltd., Class A | 3,000 | 165,460 | ||||||
NetEase, Inc., ADR | 21,561 | 2,100,473 | ||||||
New China Life Insurance Co. Ltd., Class A | 18,700 | 117,730 | ||||||
New China Life Insurance Co. Ltd., Class H | 82,822 | 243,865 | ||||||
New Oriental Education & Technology Group, Inc., ADR* | 88,919 | 200,957 | ||||||
NIO, Inc., ADR* | 127,461 | 5,010,492 | ||||||
Nongfu Spring Co. Ltd., Class H, 144A (a) | 99,276 | 525,270 | ||||||
OneConnect Financial Technology Co. Ltd., ADR* | 30,133 | 141,625 | ||||||
Orient Securities Co. Ltd., Class A | 34,100 | 79,119 | ||||||
Ovctek China, Inc., Class A | 2,500 | 25,883 | ||||||
People’s Insurance Co. Group of China Ltd., Class A | 115,300 | 91,854 | ||||||
People’s Insurance Co. Group of China Ltd., Class H | 726,186 | 224,093 | ||||||
| See Notes to Financial Statements. | 23 |
DBX ETF Trust
Schedule of Investments
Xtrackers Emerging Markets Carbon Reduction and Climate Improvers ETF (Continued)
August 31, 2021
Number | Value | |||||||
| China (Continued) | ||||||||
Pharmaron Beijing Co. Ltd., Class H, 144A | 7,151 | $ | 158,700 | |||||
PICC Property & Casualty Co. Ltd., Class H | 380,913 | 344,310 | ||||||
Pinduoduo, Inc., ADR* | 37,336 | 3,734,347 | ||||||
Ping An Bank Co. Ltd., Class A | 71,800 | 198,084 | ||||||
Ping An Healthcare and Technology Co. Ltd., 144A* (a) | 27,739 | 204,725 | ||||||
Ping An Insurance Group Co. of China Ltd., Class A | 66,200 | 511,993 | ||||||
Ping An Insurance Group Co. of China Ltd., Class H | 544,753 | 4,230,629 | ||||||
Poly Developments and Holdings Group Co. Ltd., Class A | 33,400 | 58,962 | ||||||
Postal Savings Bank of China Co. Ltd., Class A | 124,800 | 99,422 | ||||||
Postal Savings Bank of China Co. Ltd., Class H, 144A | 700,691 | 505,426 | ||||||
Rongsheng Petrochemical Co. Ltd., Class A | 16,900 | 48,877 | ||||||
Sanan Optoelectronics Co. Ltd., Class A | 9,300 | 52,338 | ||||||
Sangfor Technologies, Inc., Class A | 1,000 | 42,219 | ||||||
Sany Heavy Industry Co. Ltd., Class A | 23,500 | 95,537 | ||||||
SDIC Capital Co. Ltd., Class A | 76,800 | 111,058 | ||||||
Seazen Group Ltd.* | 114,429 | 101,520 | ||||||
SF Holding Co. Ltd., Class A | 9,300 | 83,054 | ||||||
SG Micro Corp., Class A | 600 | 29,758 | ||||||
Shandong Gold Mining Co. Ltd., Class H, 144A | 71,878 | 116,264 | ||||||
Shandong Hualu Hengsheng Chemical Co. Ltd., Class A | 14,200 | 80,156 | ||||||
Shandong Weigao Group Medical Polymer Co. Ltd., Class H | 144,850 | 238,395 | ||||||
Shanghai Baosight Software Co. Ltd., Class B | 33,400 | 125,851 | ||||||
Shanghai Fosun Pharmaceutical Group Co. Ltd., Class A | 15,200 | 149,126 | ||||||
Shanghai Fosun Pharmaceutical Group Co. Ltd., Class H | 42,878 | 275,108 | ||||||
Shanghai International Airport Co. Ltd., Class A* | 14,200 | 95,232 | ||||||
Shanghai Junshi Biosciences Co. Ltd., Class H, 144A* | 12,584 | 71,193 | ||||||
Shanghai Pharmaceuticals Holding Co. Ltd., Class H | 36,995 | 73,444 | ||||||
Shanghai Pudong Development Bank Co. Ltd., Class A | 120,200 | 168,600 | ||||||
Shanxi Taigang Stainless Steel Co. Ltd., Class A | 71,800 | 112,507 | ||||||
Shenwan Hongyuan Group Co. Ltd., Class A | 112,200 | 81,733 | ||||||
Shenzhen Inovance Technology Co. Ltd., Class A | 6,750 | 74,300 | ||||||
Shenzhen Mindray Bio-Medical Electronics Co. Ltd., Class A | 4,300 | 218,599 | ||||||
Shenzhou International Group Holdings Ltd. | 44,714 | 975,074 | ||||||
Number | Value | |||||||
| China (Continued) | ||||||||
Sichuan Kelun Pharmaceutical Co. Ltd., Class A | 14,200 | $ | 40,056 | |||||
Sinopharm Group Co. Ltd., Class H | 128,497 | 330,109 | ||||||
Sinotrans Ltd., Class H | 110,000 | 44,835 | ||||||
Sinotruk Hong Kong Ltd. | 34,484 | 67,927 | ||||||
Sunac China Holdings Ltd. | 141,418 | 361,848 | ||||||
Sunac Services Holdings Ltd., 144A | 47,288 | 123,124 | ||||||
Sungrow Power Supply Co. Ltd., Class A | 7,600 | 185,265 | ||||||
Suning.com Co. Ltd., Class A* | 30,900 | 25,287 | ||||||
Sunny Optical Technology Group Co. Ltd. | 24,877 | 752,322 | ||||||
Sunwoda Electronic Co. Ltd., Class A | 7,000 | 42,649 | ||||||
TAL Education Group, ADR* | 26,305 | 139,943 | ||||||
TCL Technology Group Corp., Class A | 67,100 | 74,151 | ||||||
Tencent Holdings Ltd. | 565,957 | 35,016,877 | ||||||
Tencent Music Entertainment Group, | 71,993 | 636,418 | ||||||
Thunder Software Technology Co. Ltd., Class A | 2,000 | 36,748 | ||||||
Tianjin Zhonghuan Semiconductor Co. Ltd., Class A | 18,700 | 156,510 | ||||||
Tingyi Cayman Islands Holding Corp. | 73,882 | 131,475 | ||||||
Tongcheng-Elong Holdings Ltd.* | 51,365 | 119,540 | ||||||
Tongwei Co. Ltd., Class A | 14,200 | 134,253 | ||||||
Topsports International Holdings Ltd., 144A | 145,136 | 191,839 | ||||||
TravelSky Technology Ltd., Class H | 96,413 | 180,743 | ||||||
Trip.com Group Ltd., ADR* | 34,706 | 1,058,186 | ||||||
Unigroup Guoxin Microelectronics Co. Ltd., Class A | 4,300 | 149,087 | ||||||
Vipshop Holdings Ltd., ADR* | 31,565 | 466,846 | ||||||
Walvax Biotechnology Co. Ltd., Class A | 4,300 | 51,784 | ||||||
Wanhua Chemical Group Co. Ltd., Class A | 9,300 | 153,799 | ||||||
Want Want China Holdings Ltd. | 246,184 | 167,450 | ||||||
Weibo Corp., ADR* (a) | 3,718 | 187,833 | ||||||
Weichai Power Co. Ltd., Class A | 33,400 | 103,896 | ||||||
Weichai Power Co. Ltd., Class H | 115,573 | 291,557 | ||||||
Wens Foodstuffs Group Co. Ltd., Class A | 43,000 | 86,507 | ||||||
Western Securities Co. Ltd., Class A | 69,900 | 88,296 | ||||||
Will Semiconductor Co. Ltd., Class A | 4,300 | 161,343 | ||||||
Wingtech Technology Co. Ltd., Class A | 4,300 | 79,542 | ||||||
WuXi AppTec Co. Ltd., Class A | 7,568 | 155,770 | ||||||
WuXi AppTec Co. Ltd., Class H, 144A | 20,590 | 410,352 | ||||||
Wuxi Biologics Cayman, Inc., 144A* | 196,602 | 3,043,566 | ||||||
Wuxi Lead Intelligent Equipment Co. Ltd., Class A | 9,300 | 107,529 | ||||||
Xinjiang Goldwind Science & Technology Co. Ltd., Class A | 52,800 | 119,397 | ||||||
Xinjiang Goldwind Science & Technology Co. Ltd., Class H | 78,615 | 150,208 | ||||||
Xinyi Solar Holdings Ltd. | 475,438 | 1,149,265 | ||||||
XPeng, Inc., ADR* (a) | 55,065 | 2,340,262 | ||||||
Yatsen Holding Ltd., ADR* | 28,079 | 142,361 | ||||||
Yifeng Pharmacy Chain Co. Ltd., Class A | 4,300 | 34,549 | ||||||
Yihai International Holding Ltd.* | 26,019 | 140,510 | ||||||
| See Notes to Financial Statements. | 24 |
DBX ETF Trust
Schedule of Investments
Xtrackers Emerging Markets Carbon Reduction and Climate Improvers ETF (Continued)
August 31, 2021
Number | Value | |||||||
| China (Continued) | ||||||||
Yonyou Network Technology Co. Ltd., Class A | 14,200 | $ | 73,729 | |||||
Yunnan Baiyao Group Co. Ltd., Class A | 4,300 | 59,108 | ||||||
Yunnan Energy New Material Co. Ltd., Class A | 4,300 | 188,208 | ||||||
Zai Lab Ltd., ADR* (a) | 5,431 | 784,779 | ||||||
Zhangzhou Pientzehuang Pharmaceutical Co. Ltd., Class A | 2,800 | 150,611 | ||||||
Zhejiang Chint Electrics Co. Ltd., Class A | 5,200 | 50,735 | ||||||
Zhejiang Expressway Co. Ltd., Class H | 55,010 | 48,239 | ||||||
Zhejiang Huayou Cobalt Co. Ltd., Class A | 1,800 | 39,116 | ||||||
Zhejiang Sanhua Intelligent Controls Co. Ltd., Class A | 18,700 | 73,183 | ||||||
ZhongAn Online P&C Insurance Co. Ltd., Class H, 144A* | 67,306 | 327,991 | ||||||
Zhongsheng Group Holdings Ltd. | 20,874 | 174,457 | ||||||
Zhuzhou CRRC Times Electric Co. Ltd., Class H* | 31,223 | 188,084 | ||||||
Zijin Mining Group Co. Ltd., Class A | 67,100 | 115,543 | ||||||
Zijin Mining Group Co. Ltd., Class H | 205,458 | 292,706 | ||||||
Zoomlion Heavy Industry Science and Technology Co. Ltd., Class H | 121,005 | 115,290 | ||||||
ZTE Corp., Class A | 23,500 | 120,924 | ||||||
ZTE Corp., Class H | 31,506 | 110,795 | ||||||
ZTO Express Cayman, Inc., ADR | 26,591 | 750,132 | ||||||
|
| |||||||
(Cost $164,163,124) | 168,826,045 | |||||||
|
| |||||||
| Colombia — 0.1% | ||||||||
Bancolombia SA | 23,731 | 195,935 | ||||||
Interconexion Electrica SA ESP | 24,875 | 150,053 | ||||||
|
| |||||||
(Cost $339,707) | 345,988 | |||||||
|
| |||||||
| Czech Republic — 0.1% | ||||||||
Komercni banka AS* | 6,579 | 252,873 | ||||||
Moneta Money Bank AS, 144A* | 46,202 | 187,348 | ||||||
|
| |||||||
(Cost $436,422) | 440,221 | |||||||
|
| |||||||
| Egypt — 0.1% | ||||||||
Commercial International Bank Egypt | 189,173 | 563,904 | ||||||
Fawry for Banking & Payment Technology Services SAE* | 90,123 | 93,510 | ||||||
|
| |||||||
(Cost $659,322) | 657,414 | |||||||
|
| |||||||
| France — 0.0% | ||||||||
Alstom SA (a) | 1 | 43 | ||||||
|
| |||||||
| Greece — 0.2% | ||||||||
Alpha Services and Holdings SA* | 122,312 | 169,723 | ||||||
Eurobank Ergasias Services and Holdings SA* | 250,176 | 238,324 | ||||||
Hellenic Telecommunications Organization SA | 20,589 | 405,031 | ||||||
JUMBO SA | 7,718 | 121,172 | ||||||
LAMDA Development SA* | 8,576 | 83,975 | ||||||
National Bank of Greece SA* | 54,495 | 164,810 | ||||||
|
| |||||||
(Cost $1,154,946) | 1,183,035 | |||||||
|
| |||||||
Number | Value | |||||||
| Hong Kong — 0.9% | ||||||||
Beijing Enterprises Water Group Ltd.* | 192,602 | $ | 79,494 | |||||
BOC Hong Kong Holdings Ltd. | 204,324 | 620,011 | ||||||
China Everbright Environment Group Ltd. | 126,206 | 87,303 | ||||||
China Jinmao Holdings Group Ltd. | 391,315 | 127,296 | ||||||
China Mengniu Dairy Co. Ltd.* | 170,015 | 1,021,968 | ||||||
China Merchants Port Holdings Co. Ltd. | 63,302 | 106,625 | ||||||
China Overseas Land & Investment Ltd. | 267,913 | 616,617 | ||||||
China Resources Cement Holdings Ltd. | 194,605 | 190,918 | ||||||
China Resources Land Ltd. | 159,435 | 593,472 | ||||||
China State Construction International Holdings Ltd. | 110,141 | 89,219 | ||||||
China Taiping Insurance Holdings Co. Ltd. | 137,985 | 201,548 | ||||||
Futu Holdings Ltd., ADR* (a) | 5,719 | 544,392 | ||||||
Orient Overseas International Ltd. | 8,577 | 220,784 | ||||||
Shenzhen International Holdings Ltd. | 104,136 | 135,771 | ||||||
|
| |||||||
(Cost $4,549,395) | 4,635,418 | |||||||
|
| |||||||
| Hungary — 0.3% | ||||||||
OTP Bank Nyrt* | 20,873 | 1,259,639 | ||||||
Richter Gedeon Nyrt | 8,581 | 257,036 | ||||||
|
| |||||||
(Cost $1,481,690) | 1,516,675 | |||||||
|
| |||||||
| India — 12.0% | ||||||||
ACC Ltd. | 6,576 | 217,364 | ||||||
Adani Green Energy Ltd.* | 44,716 | 654,348 | ||||||
Adani Ports & Special Economic Zone Ltd. | 40,139 | 411,410 | ||||||
Adani Transmission Ltd.* | 21,731 | 470,472 | ||||||
Alkem Laboratories Ltd. | 2,287 | 121,499 | ||||||
Ambuja Cements Ltd. | 31,796 | 183,374 | ||||||
Apollo Hospitals Enterprise Ltd. | 7,149 | 486,626 | ||||||
Ashok Leyland Ltd. | 113,287 | 190,473 | ||||||
Asian Paints Ltd. | 34,709 | 1,521,976 | ||||||
AU Small Finance Bank Ltd., 144A* | 12,010 | 186,013 | ||||||
Aurobindo Pharma Ltd. | 16,585 | 165,220 | ||||||
Avenue Supermarts Ltd., 144A* | 13,728 | 743,643 | ||||||
Axis Bank Ltd.* | 153,998 | 1,659,000 | ||||||
Axis Bank Ltd., GDR* | 9,850 | 545,690 | ||||||
Bajaj Auto Ltd. | 3,072 | 156,860 | ||||||
Bajaj Finance Ltd. | 14,867 | 1,532,264 | ||||||
Bajaj Finserv Ltd. | 2,286 | 536,959 | ||||||
Bajaj Holdings & Investment Ltd. | 2,000 | 119,351 | ||||||
Bandhan Bank Ltd., 144A | 58,440 | 228,133 | ||||||
Bank of Baroda* | 84,976 | 90,030 | ||||||
Berger Paints India Ltd. | 20,872 | 234,657 | ||||||
Bharti Airtel Ltd.* | 134,269 | 1,221,263 | ||||||
Biocon Ltd.* | 35,568 | 174,826 | ||||||
Britannia Industries Ltd. | 4,292 | 235,007 | ||||||
Cadila Healthcare Ltd. | 13,152 | 99,828 | ||||||
Cholamandalam Investment and Finance Co. Ltd. | 34,709 | 263,405 | ||||||
Cipla Ltd. | 27,453 | 356,401 | ||||||
Colgate-Palmolive India Ltd. | 10,864 | 251,974 | ||||||
Container Corp. Of India Ltd. | 14,585 | 135,756 | ||||||
Dabur India Ltd. | 35,852 | 305,202 | ||||||
Divi’s Laboratories Ltd. | 7,433 | 526,732 | ||||||
| See Notes to Financial Statements. | 25 |
DBX ETF Trust
Schedule of Investments
Xtrackers Emerging Markets Carbon Reduction and Climate Improvers ETF (Continued)
August 31, 2021
Number | Value | |||||||
| India (Continued) | ||||||||
DLF Ltd. | 38,138 | $ | 167,450 | |||||
Dr. Reddy’s Laboratories Ltd. | 11,153 | 718,615 | ||||||
Eicher Motors Ltd. | 5,347 | 196,226 | ||||||
Embassy Office Parks REIT | 73,881 | 361,879 | ||||||
Godrej Consumer Products Ltd.* | 35,795 | 538,978 | ||||||
Godrej Properties Ltd.* | 7,719 | 157,430 | ||||||
Grasim Industries Ltd. | 21,159 | 434,845 | ||||||
Havells India Ltd. | 21,448 | 372,643 | ||||||
HCL Technologies Ltd. | 55,583 | 900,124 | ||||||
HDFC Asset Management Co. Ltd., 144A | 4,287 | 180,523 | ||||||
HDFC Life Insurance Co. Ltd., 144A | 69,308 | 681,380 | ||||||
Hero MotoCorp Ltd. | 7,722 | 290,005 | ||||||
Hindalco Industries Ltd. | 79,200 | 508,021 | ||||||
Hindustan Unilever Ltd. | 46,715 | 1,743,058 | ||||||
Honeywell Automation India Ltd. | 3 | 1,627 | ||||||
Housing Development Finance Corp. Ltd. | 148,333 | 5,685,853 | ||||||
ICICI Bank Ltd. | 289,125 | 2,847,589 | ||||||
ICICI Lombard General Insurance Co. Ltd., 144A | 12,011 | 262,339 | ||||||
ICICI Prudential Life Insurance Co. Ltd., 144A | 38,424 | 346,886 | ||||||
IDFC First Bank Ltd.* | 363,758 | 213,997 | ||||||
Indus Towers Ltd. | 40,425 | 119,242 | ||||||
Info Edge India Ltd. | 5,434 | 460,157 | ||||||
Infosys Ltd. | 197,461 | 4,615,380 | ||||||
Infosys Ltd., ADR | 116,024 | 2,763,692 | ||||||
InterGlobe Aviation Ltd., 144A* | 4,574 | 119,297 | ||||||
JSW Steel Ltd. | 55,867 | 526,167 | ||||||
Jubilant Foodworks Ltd. | 5,436 | 297,460 | ||||||
Kansai Nerolac Paints Ltd. | 8,577 | 72,785 | ||||||
Kotak Mahindra Bank Ltd. | 83,260 | 1,999,973 | ||||||
Larsen & Toubro Infotech Ltd., 144A | 3,429 | 249,514 | ||||||
Lupin Ltd. | 12,008 | 157,544 | ||||||
Mahindra & Mahindra Ltd. | 61,587 | 669,205 | ||||||
Marico Ltd. | 42,426 | 316,390 | ||||||
Maruti Suzuki India Ltd. | 7,718 | 723,737 | ||||||
Mindtree Ltd. | 4,005 | 198,981 | ||||||
Motherson Sumi Systems Ltd.* | 56,552 | 169,329 | ||||||
Mphasis Ltd.* | 4,291 | 170,335 | ||||||
MRF Ltd. | 254 | 277,433 | ||||||
Muthoot Finance Ltd. | 8,867 | 183,880 | ||||||
Nestle India Ltd. | 2,001 | 533,575 | ||||||
NHPC Ltd. | 176,586 | 65,185 | ||||||
NMDC Ltd. | 40,426 | 85,301 | ||||||
Oracle Financial Services Software Ltd. | 2,285 | 147,087 | ||||||
Page Industries Ltd. | 287 | 123,826 | ||||||
PI Industries Ltd. | 6,007 | 279,256 | ||||||
Pidilite Industries Ltd. | 6,293 | 196,558 | ||||||
Piramal Enterprises Ltd. | 4,864 | 173,664 | ||||||
Power Finance Corp. Ltd. | 51,867 | 91,681 | ||||||
Power Grid Corp. of India Ltd. | 143,994 | 345,846 | ||||||
Punjab National Bank* | 174,589 | 87,644 | ||||||
REC Ltd. | 52,151 | 108,363 | ||||||
SBI Cards & Payment Services Ltd.* | 17,155 | 268,002 | ||||||
SBI Life Insurance Co. Ltd., 144A | 39,284 | 641,420 | ||||||
Shree Cement Ltd. | 289 | 111,978 | ||||||
Number | Value | |||||||
| India (Continued) | ||||||||
Shriram Transport Finance Co. Ltd. | 10,865 | $ | 201,309 | |||||
Siemens Ltd. | 3,433 | 106,854 | ||||||
SRF Ltd. | 2,000 | 277,773 | ||||||
State Bank of India | 170,298 | 993,808 | ||||||
Steel Authority of India Ltd. | 96,703 | 161,067 | ||||||
Sun Pharmaceutical Industries Ltd. | 60,732 | 660,538 | ||||||
Tata Consultancy Services Ltd. | 83,893 | 4,351,014 | ||||||
Tata Consumer Products Ltd. | 50,148 | 594,124 | ||||||
Tata Motors Ltd.* | 90,365 | 355,605 | ||||||
Tech Mahindra Ltd. | 33,221 | 658,732 | ||||||
Titan Co. Ltd. | 19,733 | 519,384 | ||||||
Torrent Pharmaceuticals Ltd. | 4,001 | 170,211 | ||||||
UltraTech Cement Ltd. | 6,006 | 644,341 | ||||||
UPL Ltd. | 25,165 | 255,502 | ||||||
Voltas Ltd. | 16,586 | 226,239 | ||||||
Wipro Ltd. | 119,863 | 1,052,305 | ||||||
Yes Bank Ltd.* | 1,333,792 | 197,308 | ||||||
|
| |||||||
(Cost $56,660,148) | 59,411,225 | |||||||
|
| |||||||
| Indonesia — 1.2% | ||||||||
Aneka Tambang Tbk | 637,247 | 106,785 | ||||||
PT Bank Central Asia Tbk | 616,888 | 1,416,518 | ||||||
PT Bank Mandiri Persero Tbk | 1,104,260 | 472,286 | ||||||
PT Bank Negara Indonesia Persero Tbk | 687,679 | 260,366 | ||||||
PT Bank Rakyat Indonesia Persero Tbk | 4,953,063 | 1,364,805 | ||||||
PT Bank Syariah Indonesia Tbk* | 2,509,988 | 390,687 | ||||||
PT Barito Pacific Tbk | 2,151,784 | 160,677 | ||||||
PT Charoen Pokphand Indonesia Tbk | 269,390 | 120,883 | ||||||
PT Elang Mahkota Teknologi Tbk* | 1,342,084 | 204,194 | ||||||
PT Indah Kiat Pulp & Paper Tbk | 151,537 | 83,936 | ||||||
PT Indocement Tunggal Prakarsa Tbk | 144,671 | 114,114 | ||||||
PT Indofood Sukses Makmur Tbk* | 216,037 | 93,534 | ||||||
PT Kalbe Farma Tbk | 1,127,871 | 106,362 | ||||||
PT Merdeka Copper Gold Tbk* | 796,445 | 157,474 | ||||||
PT Sarana Menara Nusantara Tbk | 1,771,528 | 166,440 | ||||||
PT Semen Indonesia Persero Tbk | 194,593 | 126,204 | ||||||
PT Telkom Indonesia Persero Tbk | 2,640,762 | 629,524 | ||||||
PT Unilever Indonesia Tbk | 548,714 | 155,814 | ||||||
|
| |||||||
(Cost $6,005,972) | 6,130,603 | |||||||
|
| |||||||
| Kuwait — 0.7% | ||||||||
Agility Public Warehousing Co. KSC | 85,894 | 285,266 | ||||||
Boubyan Bank KSCP* | 81,033 | 210,934 | ||||||
Kuwait Finance House KSCP | 332,874 | 914,076 | ||||||
Mobile Telecommunications Co. KSC | 255,905 | 519,807 | ||||||
National Bank of Kuwait SAKP | 496,369 | 1,544,552 | ||||||
|
| |||||||
(Cost $3,441,635) | 3,474,635 | |||||||
|
| |||||||
| Malaysia — 0.8% | ||||||||
AMMB Holdings Bhd* | 57,400 | 41,838 | ||||||
Axiata Group Bhd | 171,352 | 170,651 | ||||||
CIMB Group Holdings Bhd | 257,429 | 304,060 | ||||||
DiGi.Com Bhd | 171,700 | 181,737 | ||||||
Hartalega Holdings Bhd | 57,000 | 101,193 | ||||||
Hong Leong Bank Bhd | 28,500 | 131,496 | ||||||
Hong Leong Financial Group Bhd | 300 | 1,316 | ||||||
IHH Healthcare Bhd | 57,300 | 88,218 | ||||||
Inari Amertron Bhd | 171,500 | 141,920 | ||||||
| See Notes to Financial Statements. | 26 |
DBX ETF Trust
Schedule of Investments
Xtrackers Emerging Markets Carbon Reduction and Climate Improvers ETF (Continued)
August 31, 2021
Number | Value | |||||||
| Malaysia (Continued) | ||||||||
Kossan Rubber Industries | 57,100 | $ | 42,581 | |||||
Kuala Lumpur Kepong Bhd | 28,600 | 146,956 | ||||||
Malayan Banking Bhd | 143,089 | 289,138 | ||||||
Malaysia Airports Holdings Bhd* | 28,900 | 46,093 | ||||||
Maxis Bhd | 109,800 | 123,878 | ||||||
MR DIY Group M Bhd, 144A | 142,800 | 124,697 | ||||||
Nestle Malaysia Bhd | 19 | 616 | ||||||
Petronas Chemicals Group Bhd | 85,500 | 170,712 | ||||||
PPB Group Bhd | 28,700 | 127,862 | ||||||
Press Metal Aluminium Holdings Bhd | 171,400 | 222,651 | ||||||
Public Bank Bhd | 657,700 | 661,339 | ||||||
RHB Bank Bhd | 114,214 | 153,586 | ||||||
Sime Darby Bhd | 86,000 | 48,824 | ||||||
Sime Darby Plantation Bhd | 57,500 | 55,743 | ||||||
Supermax Corp. Bhd | 57,328 | 45,509 | ||||||
Telekom Malaysia Bhd | 85,600 | 125,816 | ||||||
TIME dotCom Bhd | 57,300 | 63,406 | ||||||
Top Glove Corp. Bhd | 228,500 | 219,870 | ||||||
Westports Holdings Bhd | 57,100 | 60,438 | ||||||
|
| |||||||
(Cost $3,779,188) | 3,892,144 | |||||||
|
| |||||||
| Mexico — 1.9% | ||||||||
Alfa SAB de CV, Class A | 293,230 | 206,320 | ||||||
America Movil SAB de CV, Series L | 1,709,597 | 1,686,605 | ||||||
Arca Continental SAB de CV | 25,166 | 162,465 | ||||||
Cemex SAB de CV, Series CPO* | 801,310 | 659,778 | ||||||
Coca-Cola Femsa SAB de CV | 46,489 | 269,731 | ||||||
Fibra Uno Administracion SA de CV REIT | 183,156 | 208,843 | ||||||
Gruma SAB de CV, Class B | 11,722 | 134,169 | ||||||
Grupo Aeroportuario del Pacifico SAB de CV, Class B* | 21,733 | 253,645 | ||||||
Grupo Aeroportuario del Sureste SAB de CV, Class B* | 7,432 | 133,672 | ||||||
Grupo Bimbo SAB de CV, Series A | 89,662 | 227,382 | ||||||
Grupo Elektra SAB DE CV (a) | 4,292 | 342,747 | ||||||
Grupo Financiero Banorte SAB de CV, Class O | 276,820 | 1,831,423 | ||||||
Grupo Financiero Inbursa SAB de CV, Class O* | 115,451 | 110,787 | ||||||
Grupo Mexico SAB de CV, Series B | 176,293 | 822,985 | ||||||
Grupo Televisa SAB, Series CPO | 244,740 | 646,550 | ||||||
Industrias Penoles SAB de CV* | 7,434 | 105,574 | ||||||
Kimberly-Clark de Mexico SAB de CV, Class A | 162,686 | 287,955 | ||||||
Orbia Advance Corp. SAB de CV | 60,499 | 173,109 | ||||||
Telesites SAB de CV* | 110,593 | 101,931 | ||||||
Wal-Mart de Mexico SAB de CV | 291,457 | 1,039,323 | ||||||
|
| |||||||
(Cost $9,022,973) | 9,404,994 | |||||||
|
| |||||||
| Peru — 0.1% | ||||||||
Credicorp Ltd.* | 1,733 | 184,755 | ||||||
Credicorp Ltd.* | 1,250 | 133,288 | ||||||
Intercorp Financial Services, Inc. | 2,500 | 56,525 | ||||||
|
| |||||||
(Cost $363,562) | 374,568 | |||||||
|
| |||||||
| Philippines — 0.5% | ||||||||
Ayala Corp. | 14,320 | 228,113 | ||||||
Ayala Land, Inc. | 428,800 | 290,894 | ||||||
Number | Value | |||||||
| Philippines (Continued) | ||||||||
Bank of the Philippine Islands | 160,130 | $ | 267,795 | |||||
BDO Unibank, Inc. | 160,110 | 353,690 | ||||||
International Container Terminal Services, Inc. | 45,730 | 171,062 | ||||||
Jollibee Foods Corp. | 25,750 | 104,449 | ||||||
Manila Electric Co. | 11,440 | 64,846 | ||||||
Metropolitan Bank & Trust Co. | 85,600 | 77,771 | ||||||
PLDT, Inc. | 4,295 | 126,476 | ||||||
SM Investments Corp. | 17,170 | 348,232 | ||||||
SM Prime Holdings, Inc. | 600,200 | 410,187 | ||||||
Universal Robina Corp. | 45,760 | 138,706 | ||||||
|
| |||||||
(Cost $2,528,493) | 2,582,221 | |||||||
|
| |||||||
| Qatar — 0.8% | ||||||||
Commercial Bank PSQC | 99,849 | 165,583 | ||||||
Industries Qatar QSC | 168,009 | 592,946 | ||||||
Masraf Al Rayan QSC | 220,732 | 275,839 | ||||||
Mesaieed Petrochemical Holding Co. | 366,619 | 201,384 | ||||||
Ooredoo QPSC | 32,364 | 61,448 | ||||||
Qatar International Islamic Bank QSC | 75,027 | 197,819 | ||||||
Qatar Islamic Bank SAQ | 68,736 | 345,474 | ||||||
Qatar National Bank QPSC | 413,623 | 2,177,740 | ||||||
|
| |||||||
(Cost $4,027,257) | 4,018,233 | |||||||
|
| |||||||
| Russia — 1.4% | ||||||||
Alrosa PJSC | 116,597 | 232,096 | ||||||
MMC Norilsk Nickel PJSC | 3,433 | 1,127,413 | ||||||
Mobile TeleSystems PJSC, ADR | 24,880 | 233,374 | ||||||
Mobile TeleSystems PJSC | 19,731 | 88,627 | ||||||
Novolipetsk Steel PJSC | 88,347 | 297,759 | ||||||
Polymetal International PLC | 17,729 | 354,120 | ||||||
Polyus PJSC | 1,713 | 308,829 | ||||||
Sberbank of Russia PJSC | 607,454 | 2,727,717 | ||||||
United Co RUSAL International PJSC* | 156,680 | 113,138 | ||||||
Yandex NV, Class A* | 18,012 | 1,374,071 | ||||||
|
| |||||||
(Cost $6,641,191) | 6,857,144 | |||||||
�� |
| |||||||
| Saudi Arabia — 2.1% | ||||||||
Advanced Petrochemical Co. | 8,294 | 158,331 | ||||||
Al Rajhi Bank | 70,451 | 2,272,795 | ||||||
Alinma Bank | 75,310 | 459,807 | ||||||
Almarai Co. JSC | 18,012 | 278,534 | ||||||
Arab National Bank | 42,145 | 257,093 | ||||||
Arabian Centres Co. Ltd. | 14,869 | 99,108 | ||||||
Bank AlBilad* | 29,737 | 338,939 | ||||||
Banque Saudi Fransi | 45,001 | 485,920 | ||||||
Bupa Arabia for Cooperative Insurance Co. | 4,289 | 190,968 | ||||||
Dar Al Arkan Real Estate Development | 43,858 | 119,271 | ||||||
Dr Sulaiman Al Habib Medical Services Group Co. | 6,293 | 308,048 | ||||||
Etihad Etisalat Co. | 28,650 | 244,434 | ||||||
Jarir Marketing Co. | 4,860 | 280,661 | ||||||
Mouwasat Medical Services Co. | 3,717 | 194,239 | ||||||
National Industrialization Co.* | 26,304 | 146,433 | ||||||
National Petrochemical Co. | 10,008 | 126,744 | ||||||
Riyad Bank | 111,572 | 800,194 | ||||||
| See Notes to Financial Statements. | 27 |
DBX ETF Trust
Schedule of Investments
Xtrackers Emerging Markets Carbon Reduction and Climate Improvers ETF (Continued)
August 31, 2021
Number | Value | |||||||
| Saudi Arabia (Continued) | ||||||||
Sahara International Petrochemical Co. | 29,508 | $ | 261,982 | |||||
Saudi British Bank | 66,448 | 610,322 | ||||||
Saudi Industrial Investment Group | 18,587 | 177,906 | ||||||
Saudi Kayan Petrochemical Co.* | 57,013 | 283,036 | ||||||
Saudi National Bank | 124,209 | 2,013,466 | ||||||
Savola Group | 20,305 | 217,358 | ||||||
|
| |||||||
(Cost $10,200,156) | 10,325,589 | |||||||
|
| |||||||
| Singapore — 0.0% | ||||||||
Ascendas Real Estate Investment Trust REIT | 72 | 163 | ||||||
BOC Aviation Ltd., 144A | 8,579 | 64,309 | ||||||
JOYY, Inc., ADR | 2,859 | 180,975 | ||||||
|
| |||||||
(Cost $223,922) | 245,447 | |||||||
|
| |||||||
| South Africa — 3.3% | ||||||||
Absa Group Ltd.* | 56,207 | 614,139 | ||||||
Anglo American Platinum Ltd. | 2,575 | 293,445 | ||||||
AngloGold Ashanti Ltd. | 21,159 | 356,785 | ||||||
Aspen Pharmacare Holdings Ltd.* | 20,876 | 283,027 | ||||||
Bid Corp. Ltd.* | 18,014 | 398,363 | ||||||
Bidvest Group Ltd. | 11,722 | 166,126 | ||||||
Capitec Bank Holdings Ltd. | 3,434 | 450,515 | ||||||
Clicks Group Ltd. | 14,013 | 293,106 | ||||||
Discovery Ltd.* | 32,765 | 291,680 | ||||||
FirstRand Ltd. | 351,506 | 1,503,955 | ||||||
Gold Fields Ltd. (a) | 42,769 | 403,533 | ||||||
Harmony Gold Mining Co. Ltd. | 41,341 | 152,531 | ||||||
Impala Platinum Holdings Ltd. | 44,774 | 689,950 | ||||||
Kumba Iron Ore Ltd. (a) | 3,143 | 141,886 | ||||||
MTN Group Ltd.* | 90,521 | 835,058 | ||||||
MultiChoice Group | 23,732 | 188,511 | ||||||
Naspers Ltd., Class N (a) | 24,306 | 4,167,223 | ||||||
Nedbank Group Ltd.* | 38,197 | 488,520 | ||||||
Northam Platinum Ltd.* | 19,159 | 264,888 | ||||||
Old Mutual Ltd. | 442,368 | 469,739 | ||||||
Pepkor Holdings Ltd., 144A* | 65,130 | 103,650 | ||||||
Rand Merchant Investment Holdings Ltd. | 56,779 | 124,352 | ||||||
Sanlam Ltd. | 157,539 | 701,819 | ||||||
Shoprite Holdings Ltd. | 22,876 | 290,754 | ||||||
Sibanye Stillwater Ltd. | 160,115 | 651,972 | ||||||
Standard Bank Group Ltd. | 121,744 | 1,251,611 | ||||||
Vodacom Group Ltd. | 32,133 | 319,109 | ||||||
Woolworths Holdings Ltd.* | 89,661 | 394,533 | ||||||
|
| |||||||
(Cost $15,383,082) | 16,290,780 | |||||||
|
| |||||||
| South Korea — 11.2% | ||||||||
Alteogen, Inc.* | 1,716 | 125,801 | ||||||
Amorepacific Corp. | 1,432 | 280,978 | ||||||
AMOREPACIFIC Group | 1,145 | 57,080 | ||||||
BGF retail Co. Ltd. | 574 | 88,369 | ||||||
BNK Financial Group, Inc. | 25,165 | 168,425 | ||||||
Celltrion Healthcare Co. Ltd.* | 4,288 | 457,480 | ||||||
Celltrion Pharm, Inc.* | 1,141 | 170,149 | ||||||
Celltrion, Inc.* | 4,859 | 1,227,899 | ||||||
Cheil Worldwide, Inc. | 4,288 | 85,431 | ||||||
CJ CheilJedang Corp. | 521 | 203,781 | ||||||
CJ Corp. | 572 | 50,074 | ||||||
Number | Value | |||||||
| South Korea (Continued) | ||||||||
CJ ENM Co. Ltd. | 859 | $ | 113,427 | |||||
Coway Co. Ltd. | 4,578 | 308,767 | ||||||
CS Wind Corp. | 1,431 | 98,613 | ||||||
DB Insurance Co. Ltd. | 3,718 | 188,233 | ||||||
DL E&C Co. Ltd.* | 1,427 | 173,537 | ||||||
Doosan Bobcat, Inc.* | 2,000 | 74,777 | ||||||
Doosan Fuel Cell Co. Ltd.* | 2,575 | 121,926 | ||||||
Doosan Heavy Industries & Construction Co. Ltd.* | 13,440 | 242,267 | ||||||
Douzone Bizon Co. Ltd. | 1,716 | 126,245 | ||||||
Ecopro BM Co. Ltd. | 289 | 79,862 | ||||||
E-MART, Inc. | 859 | 132,615 | ||||||
Fila Holdings Corp. | 2,858 | 110,677 | ||||||
Genexine, Inc.* | 1,428 | 91,879 | ||||||
Green Cross Corp. | 287 | 95,299 | ||||||
GS Engineering & Construction Corp. | 2,286 | 88,230 | ||||||
Hana Financial Group, Inc. | 24,877 | 966,587 | ||||||
Hankook Tire & Technology Co. Ltd. | 4,289 | 172,381 | ||||||
Hanmi Pharm. Co. Ltd. | 289 | 77,020 | ||||||
Hanmi Science Co. Ltd. | 1,429 | 90,464 | ||||||
Hanon Systems | 8,577 | 121,688 | ||||||
Hansol Chemical Co. Ltd. | 573 | 143,565 | ||||||
Hanwha Life Insurance Co. Ltd. | 41,855 | 120,390 | ||||||
Hanwha Solutions Corp.* | 5,433 | 190,948 | ||||||
Helixmith Co. Ltd.* | 4,860 | 110,031 | ||||||
HLB, Inc.* | 3,719 | 178,019 | ||||||
HMM Co. Ltd.* | 20,586 | 745,709 | ||||||
Hugel, Inc.* | 570 | 95,864 | ||||||
HYBE Co. Ltd.* | 1,428 | 356,554 | ||||||
Hyundai Elevator Co. Ltd. | 2,002 | 86,679 | ||||||
Hyundai Engineering & Construction Co. Ltd. | 4,001 | 191,518 | ||||||
Hyundai Glovis Co. Ltd. | 860 | 143,896 | ||||||
Hyundai Marine & Fire Insurance Co. Ltd. | 5,146 | 113,621 | ||||||
Hyundai Mipo Dockyard Co. Ltd.* | 1,432 | 94,236 | ||||||
Hyundai Mobis Co. Ltd. | 3,146 | 752,956 | ||||||
Hyundai Motor Co. | 6,861 | 1,257,460 | ||||||
Hyundai Steel Co. | 4,575 | 201,238 | ||||||
Industrial Bank of Korea | 12,867 | 114,304 | ||||||
Kakao Corp. | 13,437 | 1,796,313 | ||||||
Kakao Games Corp.* | 2,576 | 180,406 | ||||||
KB Financial Group, Inc. | 30,081 | 1,372,448 | ||||||
KCC Corp. | 287 | 89,111 | ||||||
Kia Corp. | 12,298 | 902,635 | ||||||
KIWOOM Securities Co. Ltd. | 1,141 | 116,122 | ||||||
KMW Co. Ltd.* | 2,001 | 73,520 | ||||||
Korea Investment Holdings Co. Ltd. | 1,718 | 141,210 | ||||||
Korea Zinc Co. Ltd. | 571 | 261,997 | ||||||
Korean Air Lines Co. Ltd.* | 10,865 | 293,307 | ||||||
Kumho Petrochemical Co. Ltd. | 857 | 143,763 | ||||||
LEENO Industrial, Inc. | 858 | 131,869 | ||||||
LG Chem Ltd. | 2,428 | 1,587,325 | ||||||
LG Corp. | 5,150 | 423,300 | ||||||
LG Display Co. Ltd.* | 12,296 | 217,403 | ||||||
LG Electronics, Inc. | 8,581 | 1,050,931 | ||||||
LG Household & Health Care Ltd. | 488 | 614,919 | ||||||
| See Notes to Financial Statements. | 28 |
DBX ETF Trust
Schedule of Investments
Xtrackers Emerging Markets Carbon Reduction and Climate Improvers ETF (Continued)
August 31, 2021
Number | Value | |||||||
| South Korea (Continued) | ||||||||
LG Innotek Co. Ltd. | 575 | $ | 106,624 | |||||
LG Uplus Corp. | 20,873 | 252,935 | ||||||
Lotte Chemical Corp. | 859 | 185,217 | ||||||
LS Corp. | 1,713 | 98,396 | ||||||
Mando Corp.* | 2,289 | 119,835 | ||||||
Meritz Fire & Marine Insurance Co. Ltd. | 3,145 | 72,017 | ||||||
Meritz Securities Co. Ltd. | 22,875 | 105,748 | ||||||
Mirae Asset Securities Co. Ltd. | 28,650 | 217,942 | ||||||
NAVER Corp. | 6,864 | 2,598,901 | ||||||
NCSoft Corp. | 857 | 487,835 | ||||||
Netmarble Corp., 144A | 1,141 | 126,947 | ||||||
NH Investment & Securities Co. Ltd. | 7,146 | 81,663 | ||||||
Orion Corp. | 860 | 93,829 | ||||||
Pan Ocean Co. Ltd. | 11,438 | 81,978 | ||||||
Pearl Abyss Corp.* | 1,717 | 139,646 | ||||||
S-1 Corp. | 1,428 | 101,116 | ||||||
Samsung Biologics Co. Ltd., 144A* | 794 | 660,839 | ||||||
Samsung C&T Corp. | 4,004 | 459,297 | ||||||
Samsung Electro-Mechanics Co. Ltd. | 2,861 | 455,263 | ||||||
Samsung Electronics Co. Ltd. | 268,601 | 17,768,508 | ||||||
Samsung Engineering Co. Ltd.* | 8,290 | 159,801 | ||||||
Samsung Fire & Marine Insurance Co. Ltd. | 2,859 | 557,276 | ||||||
Samsung Life Insurance Co. Ltd. | 6,290 | 404,161 | ||||||
Samsung SDI Co. Ltd. | 4,291 | 2,934,808 | ||||||
Samsung SDS Co. Ltd. | 1,716 | 255,302 | ||||||
Samsung Securities Co. Ltd. | 5,147 | 219,517 | ||||||
Seegene, Inc. | 2,290 | 129,960 | ||||||
Shin Poong Pharmaceutical Co. Ltd. | 2,287 | 139,258 | ||||||
Shinhan Financial Group Co. Ltd. | 42,144 | 1,412,130 | ||||||
Shinsegae, Inc. | 288 | 66,818 | ||||||
SK Biopharmaceuticals Co. Ltd.* | 1,718 | 185,958 | ||||||
SK Bioscience Co. Ltd.* | 33 | 8,923 | ||||||
SK Chemicals Co. Ltd. | 572 | 133,201 | ||||||
SK Hynix, Inc. | 26,594 | 2,442,762 | ||||||
SK IE Technology Co. Ltd., 144A* | 1,716 | 307,102 | ||||||
SK Materials Co. Ltd. | 285 | 99,429 | ||||||
SK Telecom Co. Ltd. | 1,141 | 293,258 | ||||||
Soulbrain Co. Ltd./New | 289 | 70,614 | ||||||
SSANGYONG C&E Co. Ltd. | 11,152 | 81,083 | ||||||
Studio Dragon Corp.* | 1,141 | 85,616 | ||||||
WONIK IPS Co. Ltd. | 3,145 | 122,876 | ||||||
Woori Financial Group, Inc. | 24,303 | 235,809 | ||||||
Yuhan Corp. | 1,431 | 77,138 | ||||||
|
| |||||||
(Cost $53,673,193) | 55,320,864 | |||||||
|
| |||||||
| Taiwan — 19.5% | ||||||||
Accton Technology Corp. | 36,366 | 368,076 | ||||||
Acer, Inc. | 287,699 | 261,606 | ||||||
Advantech Co. Ltd. | 22,306 | 310,683 | ||||||
ASE Technology Holding Co. Ltd.* | 138,560 | 642,465 | ||||||
Asia Cement Corp. | 74,457 | 120,631 | ||||||
ASMedia Technology, Inc. | 2,002 | 149,896 | ||||||
Asustek Computer, Inc. | 34,708 | 405,773 | ||||||
AU Optronics Corp. | 784,870 | 498,447 | ||||||
Catcher Technology Co. Ltd. | 39,281 | 236,705 | ||||||
Cathay Financial Holding Co. Ltd. | 692,685 | 1,489,672 | ||||||
Number | Value | |||||||
| Taiwan (Continued) | ||||||||
Chailease Holding Co. Ltd. | 122,721 | $ | 1,180,116 | |||||
Chang Hwa Commercial Bank Ltd. | 534,830 | 318,426 | ||||||
Cheng Shin Rubber Industry Co. Ltd. | 108,428 | 145,739 | ||||||
Chicony Electronics Co. Ltd. | 37,853 | 107,221 | ||||||
China Airlines Ltd.* | 179,446 | 111,694 | ||||||
China Development Financial Holding Corp. | 1,355,295 | 694,434 | ||||||
China Life Insurance Co. Ltd. | 210,099 | 219,094 | ||||||
China Steel Corp. | 657,230 | 904,733 | ||||||
Chroma ATE, Inc. | 30,367 | 196,687 | ||||||
Chunghwa Telecom Co. Ltd. | 208,329 | 841,931 | ||||||
Compal Electronics, Inc. | 217,876 | 180,034 | ||||||
CTBC Financial Holding Co. Ltd. | 1,652,712 | 1,371,619 | ||||||
Delta Electronics, Inc. | 176,588 | 1,723,602 | ||||||
E.Sun Financial Holding Co. Ltd. | 1,067,484 | 1,024,594 | ||||||
Eclat Textile Co. Ltd. | 17,440 | 350,518 | ||||||
Eva Airways Corp. | 156,001 | 108,078 | ||||||
Evergreen Marine Corp. Taiwan Ltd. | 146,276 | 717,828 | ||||||
Far Eastern New Century Corp. | 147,709 | 160,162 | ||||||
Far EasTone Telecommunications Co. Ltd. | 154,855 | 344,203 | ||||||
Feng TAY Enterprise Co. Ltd. | 39,856 | 310,639 | ||||||
First Financial Holding Co. Ltd. | 916,941 | 757,679 | ||||||
Formosa Chemicals & Fibre Corp. | 184,174 | 558,899 | ||||||
Formosa Plastics Corp. | 172,586 | 638,319 | ||||||
Foxconn Technology Co. Ltd. | 69,305 | 165,801 | ||||||
Fubon Financial Holding Co. Ltd. | 556,472 | 1,706,754 | ||||||
Giant Manufacturing Co. Ltd. | 17,727 | 214,283 | ||||||
Globalwafers Co. Ltd. | 12,009 | 376,994 | ||||||
Highwealth Construction Corp. | 61,299 | 106,613 | ||||||
Hiwin Technologies Corp. | 12,297 | 144,652 | ||||||
Hon Hai Precision Industry Co. Ltd. | 674,102 | 2,699,959 | ||||||
Hotai Motor Co. Ltd. | 14,586 | 306,841 | ||||||
Hua Nan Financial Holdings Co. Ltd.* | 864,413 | 651,893 | ||||||
Innolux Corp. | 512,667 | 319,105 | ||||||
Inventec Corp. | 93,843 | 82,284 | ||||||
Largan Precision Co. Ltd. | 5,146 | 497,638 | ||||||
Lite-On Technology Corp. | 114,147 | 252,072 | ||||||
Macronix International Co. Ltd.* | 116,720 | 169,730 | ||||||
MediaTek, Inc. | 83,034 | 2,699,538 | ||||||
Mega Financial Holding Co. Ltd. | 911,075 | 1,078,293 | ||||||
Merida Industry Co. Ltd. | 20,014 | 230,374 | ||||||
Micro-Star International Co. Ltd. | 65,591 | 308,861 | ||||||
momo.com, Inc. | 4,577 | 283,239 | ||||||
Nan Ya Plastics Corp. | 266,199 | 860,643 | ||||||
Nan Ya Printed Circuit Board Corp. | 12,866 | 195,682 | ||||||
Nanya Technology Corp. | 110,426 | 264,575 | ||||||
Nien Made Enterprise Co. Ltd. | 8,865 | 132,430 | ||||||
Novatek Microelectronics Corp. | 20,591 | 333,605 | ||||||
Oneness Biotech Co. Ltd.* | 17,444 | 121,482 | ||||||
Pegatron Corp. | 96,415 | 225,439 | ||||||
Phison Electronics Corp. | 10,006 | 154,169 | ||||||
Pou Chen Corp. | 128,499 | 152,779 | ||||||
Powertech Technology, Inc. | 39,856 | 161,791 | ||||||
Quanta Computer, Inc. | 145,423 | 411,394 | ||||||
Realtek Semiconductor Corp. | 17,157 | 342,973 | ||||||
Ruentex Development Co. Ltd. | 53,011 | 132,559 | ||||||
| See Notes to Financial Statements. | 29 |
DBX ETF Trust
Schedule of Investments
Xtrackers Emerging Markets Carbon Reduction and Climate Improvers ETF (Continued)
August 31, 2021
Number | Value | |||||||
| Taiwan (Continued) | ||||||||
Ruentex Industries Ltd. | 24,305 | $ | 97,348 | |||||
Shanghai Commercial & Savings Bank Ltd. | 308,912 | 501,598 | ||||||
Shin Kong Financial Holding Co. Ltd. | 1,057,874 | 362,632 | ||||||
Silicon Motion Technology Corp., ADR | 2,857 | 213,304 | ||||||
Sino-American Silicon Products, Inc. | 31,221 | 217,427 | ||||||
SinoPac Financial Holdings Co. Ltd. | 956,883 | 492,020 | ||||||
Standard Foods Corp. | 61,873 | 116,541 | ||||||
Synnex Technology International Corp. | 52,720 | 102,345 | ||||||
Taishin Financial Holding Co. Ltd.* | 1,000,111 | 698,293 | ||||||
Taiwan Business Bank* | 168,011 | 58,745 | ||||||
Taiwan Cement Corp. | 217,300 | 379,894 | ||||||
Taiwan Cooperative Financial Holding Co. Ltd. | 466,235 | 376,003 | ||||||
Taiwan Fertilizer Co. Ltd. | 54,556 | 111,224 | ||||||
Taiwan High Speed Rail Corp. | 211,813 | 230,817 | ||||||
Taiwan Mobile Co. Ltd. | 151,423 | 551,851 | ||||||
Taiwan Semiconductor Manufacturing Co. Ltd. | 2,292,788 | 50,797,331 | ||||||
Tatung Co. Ltd.* | 123,637 | 136,291 | ||||||
Teco Electric and Machinery Co. Ltd. | 117,573 | 132,364 | ||||||
Tripod Technology Corp. | 38,138 | 157,569 | ||||||
Unimicron Technology Corp. | 92,124 | 490,313 | ||||||
Uni-President Enterprises Corp.* | 176,305 | 459,951 | ||||||
United Microelectronics Corp. | 1,064,452 | 2,423,617 | ||||||
Vanguard International Semiconductor Corp. | 86,691 | 462,961 | ||||||
Voltronic Power Technology Corp. | 4,864 | 217,633 | ||||||
Walsin Lihwa Corp. | 212,441 | 205,822 | ||||||
Walsin Technology Corp.* | 21,443 | 139,660 | ||||||
Wan Hai Lines Ltd.* | 40,429 | 361,787 | ||||||
Win Semiconductors Corp. | 18,300 | 218,238 | ||||||
Winbond Electronics Corp. | 167,724 | 178,536 | ||||||
Wistron Corp. | 251,044 | 248,204 | ||||||
Wiwynn Corp. | 7,150 | 250,257 | ||||||
WPG Holdings Ltd. | 67,018 | 117,043 | ||||||
Yageo Corp. | 21,446 | 371,059 | ||||||
Yang Ming Marine Transport Corp.* | 130,214 | 627,260 | ||||||
Yuanta Financial Holding Co. Ltd. | 1,048,152 | 945,525 | ||||||
Zhen Ding Technology Holding Ltd. | 55,295 | 198,127 | ||||||
|
| |||||||
(Cost $92,141,083) | 96,884,238 | |||||||
|
| |||||||
| Thailand — 1.4% | ||||||||
Advanced Info Service PCL, NVDR | 57,400 | 334,793 | ||||||
Airports of Thailand PCL, NVDR | 228,600 | 452,129 | ||||||
Bangkok Bank PCL | 57,100 | 201,952 | ||||||
Bangkok Bank PCL, NVDR | 57,100 | 201,952 | ||||||
Bangkok Dusit Medical Services PCL, NVDR | 371,700 | 269,845 | ||||||
Bangkok Expressway & Metro PCL | 371,800 | 99,777 | ||||||
Bangkok Expressway & Metro PCL, NVDR | 371,800 | 99,777 | ||||||
Berli Jucker PCL, NVDR | 85,500 | 96,157 | ||||||
BTS Group Holdings PCL, NVDR | 286,100 | 83,436 | ||||||
Bumrungrad Hospital PCL, NVDR | 28,600 | 118,011 | ||||||
Carabao Group PCL, NVDR | 28,500 | 123,788 | ||||||
Central Pattana PCL, NVDR | 114,300 | 190,603 | ||||||
Number | Value | |||||||
| Thailand (Continued) | ||||||||
Central Retail Corp. PCL | 142,800 | $ | 148,415 | |||||
Central Retail Corp. PCL, NVDR | 142,800 | 151,738 | ||||||
Charoen Pokphand Foods PCL, NVDR | 200,300 | 167,784 | ||||||
Energy Absolute PCL, NVDR | 200,200 | 406,829 | ||||||
Fabrinet* | 1,713 | 176,473 | ||||||
Home Product Center PCL, NVDR | 343,200 | 152,261 | ||||||
Indorama Ventures PCL, NVDR | 114,300 | 155,142 | ||||||
Intouch Holdings PCL, Class F | 57,000 | 151,198 | ||||||
Intouch Holdings PCL, NVDR | 114,400 | 303,458 | ||||||
Kasikornbank PCL, NVDR | 143,000 | 545,692 | ||||||
Krung Thai Bank PCL, NVDR | 486,300 | 168,977 | ||||||
Krungthai Card PCL | 28,900 | 59,401 | ||||||
Krungthai Card PCL, NVDR | 28,900 | 59,401 | ||||||
Land & Houses PCL, NVDR | 343,200 | 86,778 | ||||||
Minor International PCL, NVDR* | 114,631 | 116,471 | ||||||
Muangthai Capital PCL | 600 | 1,205 | ||||||
Osotspa PCL | 85,700 | 80,761 | ||||||
Osotspa PCL, NVDR | 85,700 | 97,047 | ||||||
SCG Packaging PCL | 57,000 | 118,483 | ||||||
SCG Packaging PCL, NVDR | 57,000 | 123,788 | ||||||
Siam Cement PCL, NVDR | 28,600 | 381,540 | ||||||
Siam Commercial Bank PCL, NVDR | 114,200 | 377,330 | ||||||
Sri Trang Gloves Thailand PCL | 57,500 | 66,674 | ||||||
Thai Union Group PCL, NVDR | 86,000 | 53,096 | ||||||
TMBThanachart Bank PCL, NVDR | 4,105,700 | 136,294 | ||||||
True Corp. PCL, NVDR | 2,258,900 | 232,670 | ||||||
|
| |||||||
(Cost $6,520,142) | 6,791,126 | |||||||
|
| |||||||
| Turkey — 0.6% | ||||||||
Akbank TAS | 324,685 | 230,007 | ||||||
Akcansa Cimento AS | 113,449 | 208,764 | ||||||
Arcelik AS | 41,054 | 158,597 | ||||||
BIM Birlesik Magazalar AS | 30,989 | 267,792 | ||||||
Coca-Cola Icecek AS | 12,010 | 126,463 | ||||||
Eregli Demir ve Celik Fabrikalari TAS | 91,091 | 205,748 | ||||||
Ford Otomotiv Sanayi AS | 4,859 | 100,400 | ||||||
Kardemir Karabuk Demir Celik Sanayi ve Ticaret AS, Class D* | 173,379 | 162,233 | ||||||
Petkim Petrokimya Holding AS* | 124,891 | 93,129 | ||||||
Sasa Polyester Sanayi AS* | 24,020 | 79,388 | ||||||
Tekfen Holding AS | 50,207 | 89,068 | ||||||
Turk Hava Yollari AO* | 84,228 | 128,452 | ||||||
Turk Telekomunikasyon AS | 111,449 | 99,325 | ||||||
Turkcell Iletisim Hizmetleri AS | 65,129 | 128,386 | ||||||
Turkiye Garanti Bankasi AS | 216,894 | 257,732 | ||||||
Turkiye Is Bankasi AS, Class C | 180,297 | 124,687 | ||||||
Turkiye Sise ve Cam Fabrikalari AS | 193,450 | 207,072 | ||||||
Yapi ve Kredi Bankasi AS | 307,239 | 97,554 | ||||||
|
| |||||||
(Cost $2,700,769) | 2,764,797 | |||||||
|
| |||||||
| United Arab Emirates — 1.0% | ||||||||
Abu Dhabi Commercial Bank PJSC | 147,706 | 301,995 | ||||||
Aldar Properties PJSC | 226,454 | 255,852 | ||||||
Dubai Islamic Bank PJSC | 104,425 | 144,989 | ||||||
Emaar Properties PJSC | 202,321 | 231,340 | ||||||
Emirates Integrated Telecommunications Co. PJSC | 79,316 | 143,165 | ||||||
| See Notes to Financial Statements. | 30 |
DBX ETF Trust
Schedule of Investments
Xtrackers Emerging Markets Carbon Reduction and Climate Improvers ETF (Continued)
August 31, 2021
Number | Value | |||||||
| United Arab Emirates (Continued) | ||||||||
Emirates NBD Bank PJSC | 184,884 | $ | 697,125 | |||||
Emirates Telecommunications Group Co. PJSC | 91,838 | 590,059 | ||||||
First Abu Dhabi Bank PJSC | 252,474 | 1,168,495 | ||||||
International Holding Co. PJSC* | 36,709 | 1,469,100 | ||||||
|
| |||||||
(Cost $4,987,803) | 5,002,120 | |||||||
|
| |||||||
TOTAL COMMON STOCKS | 484,774,891 | |||||||
|
| |||||||
| PREFERRED STOCKS — 2.2% | ||||||||
| Brazil — 1.3% | ||||||||
Alpargatas SA* | 14,872 | 174,209 | ||||||
Banco Bradesco SA | 457,369 | 2,068,169 | ||||||
Bradespar SA | 17,442 | 215,148 | ||||||
Gerdau SA | 66,734 | 369,155 | ||||||
Itau Unibanco Holding SA | 457,653 | 2,765,826 | ||||||
Itausa SA | 271,058 | 612,052 | ||||||
Lojas Americanas SA | 81,319 | 94,669 | ||||||
Usinas Siderurgicas de Minas Gerais SA Usiminas, Class A | 40,712 | 147,037 | ||||||
|
| |||||||
(Cost $6,227,322) | 6,446,265 | |||||||
|
| |||||||
| Chile — 0.1% | ||||||||
Embotelladora Andina SA, Class B | 32,082 | 76,132 | ||||||
Sociedad Quimica y Minera de Chile SA, Class B | 7,723 | 403,426 | ||||||
|
| |||||||
(Cost $469,584) | 479,558 | |||||||
|
| |||||||
| Colombia — 0.1% | ||||||||
Bancolombia SA | 44,855 | 374,279 | ||||||
Grupo Aval Acciones y Valores SA | 75,000 | 22,322 | ||||||
|
| |||||||
(Cost $386,104) | 396,601 | |||||||
|
| |||||||
| Russia — 0.0% | ||||||||
Sberbank of Russia PJSC | 43,916 | 185,869 | ||||||
|
| |||||||
| South Korea — 0.7% | ||||||||
Hyundai Motor Co. | 1,145 | 101,223 | ||||||
Hyundai Motor Co. — 2nd Preferred | 1,718 | 147,136 | ||||||
LG Chem Ltd. | 3 | 895 | ||||||
LG Electronics, Inc. | 1,716 | 103,453 | ||||||
Samsung Electronics Co. Ltd. | 47,004 | 2,870,226 | ||||||
|
| |||||||
(Cost $3,154,521) | 3,222,933 | |||||||
|
| |||||||
TOTAL PREFERRED STOCKS | 10,731,226 | |||||||
|
| |||||||
Principal | ||||||||
| CORPORATE BONDS — 0.0% | ||||||||
| India — 0.0% | ||||||||
Britannia Industries Ltd. | INR | 2,494 | 35 | |||||
|
| |||||||
Number | Value | |||||||
| WARRANTS — 0.0% | ||||||||
| Switzerland — 0.0% | ||||||||
Cie Financiere Richemont SA*, expires 11/22/23 | 746 | $ | 383 | |||||
|
| |||||||
| Thailand — 0.0% | ||||||||
BTS Group Holdings PCL*, expires 9/5/22 (b) | 200 | 5 | ||||||
BTS Group Holdings PCL*, expires 11/7/24 (b) | 400 | 10 | ||||||
BTS Group Holdings PCL*, expires 11/20/26 (b) | 800 | 16 | ||||||
Minor International PCL*, expires 9/30/21 | 80 | 1 | ||||||
Minor International PCL*, expires 2/15/24 | 52 | 7 | ||||||
|
| |||||||
(Cost $0) | 39 | |||||||
|
| |||||||
TOTAL WARRANTS | 422 | |||||||
|
| |||||||
| EXCHANGE-TRADED FUNDS — 0.0% | ||||||||
Xtrackers MSCI EAFE ESG Leaders Equity ETF (c) | 97 | 3,087 | ||||||
|
| |||||||
| SECURITIES LENDING COLLATERAL — 0.3% | ||||||||
DWS Government & Agency Securities Portfolio “DWS Government Cash Institutional Shares”, 0.01% (d)(e) | 1,768,050 | 1,768,050 | ||||||
|
| |||||||
| CASH EQUIVALENTS — 0.8% | ||||||||
DWS Government Money Market Series “Institutional Shares”, 0.04% (d) | 3,753,775 | 3,753,775 | ||||||
|
| |||||||
TOTAL INVESTMENTS — 101.0% | $ | 501,031,486 | ||||||
Other assets and liabilities, net — (1.0%) | (4,929,382 | ) | ||||||
|
| |||||||
NET ASSETS — 100.0% | $ | 496,102,104 | ||||||
|
| |||||||
| See Notes to Financial Statements. | 31 |
DBX ETF Trust
Schedule of Investments
Xtrackers Emerging Markets Carbon Reduction and Climate Improvers ETF (Continued)
August 31, 2021
A summary of the Fund’s transactions with affiliated investments during the year ended August 31, 2021 is as follows:
| Value ($) at 8/31/2020 | Purchases Cost ($) | Sales Proceeds ($) | Net Realized Gain/(Loss) ($) | Net Change in Unrealized Appreciation (Depreciation) ($) | Income ($) | Capital Gain Distributions ($) | Number of Shares at 8/31/2021 | Value ($) at 8/31/2021 | ||||||||||||||||||||||||||||
EXCHANGE-TRADED FUNDS — 0.0% |
| |||||||||||||||||||||||||||||||||||
Xtrackers MSCI EAFE ESG Leaders Equity ETF (c) |
| |||||||||||||||||||||||||||||||||||
| 12,303 | 85,183 | (98,530 | ) | 5,132 | (1,001 | ) | 975 | — | 97 | 3,087 | ||||||||||||||||||||||||||
Xtrackers MSCI Emerging Markets ESG Leaders Equity ETF (c) |
| |||||||||||||||||||||||||||||||||||
| 5,738 | 38,547 | (45,875 | ) | 2,495 | (905 | ) | 143 | — | — | — | ||||||||||||||||||||||||||
SECURITIES LENDING COLLATERAL — 0.3% |
| |||||||||||||||||||||||||||||||||||
DWS Government & Agency Securities Portfolio “DWS Government Cash Institutional Shares”, 0.01% (d)(e) |
| |||||||||||||||||||||||||||||||||||
| 18,551 | 1,749,499 | (f) | — | — | — | 11 | — | 1,768,050 | 1,768,050 | |||||||||||||||||||||||||||
CASH EQUIVALENTS — 0.8% |
| |||||||||||||||||||||||||||||||||||
DWS Government Money Market Series “Institutional Shares”, 0.04% (d) |
| |||||||||||||||||||||||||||||||||||
| 6,027 | 4,137,709 | (389,961 | ) | — | — | 7 | — | 3,753,775 | 3,753,775 | |||||||||||||||||||||||||||
|
|
|
|
|
|
|
|
|
|
|
|
|
|
|
|
|
| |||||||||||||||||||
| 42,619 | 6,010,938 | (534,366 | ) | 7,627 | (1,906 | ) | 1,136 | — | 5,521,922 | 5,524,912 | ||||||||||||||||||||||||||
|
|
|
|
|
|
|
|
|
|
|
|
|
|
|
|
|
| |||||||||||||||||||
| * | Non-income producing security. |
| (a) | All or a portion of these securities were on loan. In addition, “Other assets and liabilities, net” may include pending sales that are also on loan. The value of securities loaned at August 31, 2021 amounted to $6,478,517, which is 1.3% of net assets. |
| (b) | Investment was valued using significant unobservable inputs. |
| (c) | Affiliated fund advised by DBX Advisors LLC. |
| (d) | Affiliated fund managed by DWS Investment Management Americas, Inc. The rate shown is the annualized seven-day yield at period end. |
| (e) | Represents cash collateral held in connection with securities lending. Income earned by the Fund is net of borrower rebates. In addition, the Fund held non-cash U.S. Treasury securities collateral having a value of $4,796,817. |
| (f) | Represents the net increase (purchase cost) or decrease (sales proceeds) in the amount invested in cash collateral for the year ended August 31, 2021. |
| ADR: | American Depositary Receipt |
| CPO: | Ordinary Participation Certificates |
| GDR: | Global Depositary Receipt |
| JSC: | Joint Stock Company |
| KSC: | Kuwait Shareholding Company |
| KSCP: | Kuwait Shareholding Company Public |
| NVDR: | Non Voting Depositary Receipt |
| PJSC: | Public Joint Stock Company |
| PSQC: | Public Shareholders Qatari Company |
| QPSC: | Qatari Public Shareholders Company |
| QSC: | Qatari Shareholders Company |
| REIT: | Real Estate Investment Trust |
| SAE: | Societe Anonyme Egyptienne |
| SAQ: | Societe Anonyme Qatar |
| 144A: | Security exempt from registration under Rule 144A of the Securities Act of 1933. These securities may be resold in transactions exempt from registration, normally to qualified institutional buyers. |
Securities are listed in country of domicile.
At August 31, 2021, open futures contracts purchased were as follows:
Contract Description | Currency | Number of Contracts | Notional Amount | Contract Value | Expiration Date | Unrealized Appreciation (Depreciation) | ||||||||||||
MINI TOPIX Index Futures | JPY | 1 | $ | 17,811 | $ | 17,882 | 9/09/2021 | $ | 71 | |||||||||
EURO STOXX 50 Futures | EUR | 1 | 49,887 | 49,360 | 9/17/2021 | (527 | ) | |||||||||||
|
| |||||||||||||||||
Total net unrealized depreciation | $ | (456 | ) | |||||||||||||||
|
| |||||||||||||||||
| See Notes to Financial Statements. | 32 |
DBX ETF Trust
Schedule of Investments
Xtrackers Emerging Markets Carbon Reduction and Climate Improvers ETF (Continued)
August 31, 2021
For information on the Fund’s policy and additional disclosures regarding open futures contracts, please refer to the Derivatives section of Note 2 in the accompanying Notes to Financial Statements.
Currency Abbreviations
| EUR | Euro |
| INR | Indian Rupee |
| JPY | Japanese Yen |
Fair Value Measurements
Various inputs are used in determining the value of the Fund’s investments. These inputs are summarized in three broad levels. Level 1 includes quoted prices in active markets for identical securities. Level 2 includes other significant observable inputs (including quoted prices for similar securities, interest rates, prepayment speeds and credit risk). Level 3 includes significant unobservable inputs (including the Fund’s own assumptions in determining the fair value of investments). The level assigned to the securities valuations may not be an indication of the risk or liquidity associated with investing in those securities.
The following is a summary of the inputs used as of August 31, 2021 in valuing the Fund’s investments. For information on the Fund’s policy regarding the valuation of investments, please refer to the Security Valuation section of Note 2 in the accompanying Notes to Financial Statements.
Assets | Level 1 | Level 2 | Level 3 | Total | ||||||||||||
Common Stocks (g) | $ | 484,774,891 | $ | — | $ | — | $ | 484,774,891 | ||||||||
Preferred Stocks (g) | 10,731,226 | — | — | 10,731,226 | ||||||||||||
Corporate Bonds | — | 35 | — | 35 | ||||||||||||
Warrants (g) | 391 | — | 31 | 422 | ||||||||||||
Exchange-Traded Funds | 3,087 | — | — | 3,087 | ||||||||||||
Short-Term Investments (g) | 5,521,825 | — | — | 5,521,825 | ||||||||||||
Derivatives (h) | ||||||||||||||||
Futures Contracts | 71 | — | — | 71 | ||||||||||||
|
|
|
|
|
|
|
| |||||||||
TOTAL | $ | 501,031,491 | $ | 35 | $ | 31 | $ | 501,031,557 | ||||||||
|
|
|
|
|
|
|
| |||||||||
Liabilities | Level 1 | Level 2 | Level 3 | Total | ||||||||||||
Derivatives (h) | ||||||||||||||||
Futures Contracts | $ | (527 | ) | $ | — | $ | — | $ | (527 | ) | ||||||
|
|
|
|
|
|
|
| |||||||||
TOTAL | $ | (527 | ) | $ | — | $ | — | $ | (527 | ) | ||||||
|
|
|
|
|
|
|
| |||||||||
| (g) | See Schedule of Investments for additional detailed categorizations. |
| (h) | Derivatives include unrealized appreciation (depreciation) on open futures contracts. |
| See Notes to Financial Statements. | 33 |
DBX ETF Trust
Schedule of Investments
Xtrackers MSCI EAFE ESG Leaders Equity ETF
August 31, 2021
Number | Value | |||||||
| COMMON STOCKS — 99.4% | ||||||||
| Australia — 6.7% | ||||||||
Afterpay Ltd.* | 459 | $ | 45,150 | |||||
APA Group (a) | 2,539 | 17,035 | ||||||
Aristocrat Leisure Ltd. | 1,213 | 40,487 | ||||||
ASX Ltd. | 394 | 25,274 | ||||||
Aurizon Holdings Ltd. | 3,860 | 10,664 | ||||||
AusNet Services Ltd. | 4,361 | 6,167 | ||||||
Australia & New Zealand Banking Group Ltd. | 6,018 | 122,491 | ||||||
BlueScope Steel Ltd. | 979 | 18,031 | ||||||
Brambles Ltd. | 3,083 | 27,286 | ||||||
Cochlear Ltd. | 136 | 23,179 | ||||||
Coles Group Ltd. | 2,797 | 36,959 | ||||||
Commonwealth Bank of Australia | 3,773 | 276,081 | ||||||
Computershare Ltd. | 1,024 | 12,348 | ||||||
Dexus REIT | 2,206 | 17,154 | ||||||
Evolution Mining Ltd. | 3,348 | 9,567 | ||||||
Fortescue Metals Group Ltd. | 3,601 | 55,268 | ||||||
Goodman Group REIT | 3,492 | 59,031 | ||||||
GPT Group REIT | 4,236 | 15,015 | ||||||
Insurance Australia Group Ltd. | 5,066 | 19,401 | ||||||
Lendlease Corp. Ltd. (a) | 1,419 | 12,383 | ||||||
Macquarie Group Ltd. | 726 | 88,472 | ||||||
Mirvac Group REIT | 8,290 | 18,903 | ||||||
Newcrest Mining Ltd. | 1,709 | 30,901 | ||||||
Northern Star Resources Ltd. | 2,584 | 18,432 | ||||||
Orica Ltd. | 790 | 7,604 | ||||||
QBE Insurance Group Ltd. | 3,109 | 26,880 | ||||||
Ramsay Health Care Ltd. | 418 | 21,049 | ||||||
REA Group Ltd. | 103 | 11,555 | ||||||
SEEK Ltd. | 687 | 16,338 | ||||||
Sonic Healthcare Ltd. | 917 | 29,086 | ||||||
Stockland REIT | 4,988 | 16,842 | ||||||
Sydney Airport* (a) | 2,981 | 17,364 | ||||||
Telstra Corp. Ltd. | 8,841 | 24,812 | ||||||
Transurban Group (a) | 5,701 | 59,207 | ||||||
Vicinity Centres REIT | 9,454 | 11,953 | ||||||
Woodside Petroleum Ltd. | 2,025 | 28,845 | ||||||
|
| |||||||
(Cost $1,064,256) | 1,277,214 | |||||||
|
| |||||||
| Austria — 0.3% | ||||||||
Erste Group Bank AG | 602 | 24,062 | ||||||
OMV AG | 311 | 17,229 | ||||||
voestalpine AG | 227 | 10,290 | ||||||
|
| |||||||
(Cost $35,579) | 51,581 | |||||||
|
| |||||||
| Belgium — 0.7% | ||||||||
Etablissements Franz Colruyt NV | 128 | 7,161 | ||||||
KBC Group NV | 530 | 44,633 | ||||||
Solvay SA | 169 | 22,134 | ||||||
UCB SA | 263 | 30,077 | ||||||
Umicore SA | 409 | 26,912 | ||||||
|
| |||||||
(Cost $107,899) | 130,917 | |||||||
|
| |||||||
| Chile — 0.1% | ||||||||
Antofagasta PLC | 839 | 16,812 | ||||||
|
| |||||||
Number | Value | |||||||
| Denmark — 4.0% | ||||||||
Ambu A/S, Class B | 352 | $ | 11,125 | |||||
Chr Hansen Holding A/S | 217 | 20,020 | ||||||
Coloplast A/S, Class B | 252 | 43,641 | ||||||
Demant A/S* | 255 | 14,450 | ||||||
Genmab A/S* | 138 | 65,321 | ||||||
GN Store Nord AS | 268 | 20,160 | ||||||
Novo Nordisk A/S, Class B | 3,569 | 355,605 | ||||||
Novozymes A/S, Class B | 446 | 36,021 | ||||||
Orsted AS, 144A | 399 | 63,398 | ||||||
Pandora A/S | 214 | 25,613 | ||||||
Tryg A/S | 693 | 17,155 | ||||||
Vestas Wind Systems A/S | 2,142 | 86,464 | ||||||
|
| |||||||
(Cost $454,887) | 758,973 | |||||||
|
| |||||||
| Finland — 1.4% | ||||||||
Elisa OYJ | 295 | 18,888 | ||||||
Kesko OYJ, Class B | 586 | 24,183 | ||||||
Neste OYJ | 899 | 54,696 | ||||||
Nordea Bank Abp | 6,899 | 80,996 | ||||||
Orion OYJ, Class B | 261 | 10,639 | ||||||
Stora Enso OYJ, Class R | 1,203 | 23,538 | ||||||
UPM-Kymmene OYJ | 1,129 | 45,886 | ||||||
Wartsila OYJ Abp | 941 | 13,335 | ||||||
|
| |||||||
(Cost $223,913) | 272,161 | |||||||
|
| |||||||
| France — 10.7% | ||||||||
Accor SA* | 368 | 12,667 | ||||||
Air Liquide SA | 1,007 | 180,471 | ||||||
Alstom SA (b) | 674 | 28,961 | ||||||
Amundi SA, 144A | 136 | 12,867 | ||||||
Atos SE | 192 | 9,963 | ||||||
AXA SA | 4,094 | 114,923 | ||||||
BNP Paribas SA | 2,396 | 151,968 | ||||||
Bouygues SA | 470 | 19,657 | ||||||
Bureau Veritas SA | 609 | 20,208 | ||||||
Carrefour SA | 1,309 | 26,037 | ||||||
Cie Generale des Etablissements Michelin SCA | 353 | 57,109 | ||||||
CNP Assurances | 379 | 6,485 | ||||||
Covivio REIT | 114 | 10,836 | ||||||
Danone SA | 1,395 | 101,883 | ||||||
Eiffage SA | 192 | 19,949 | ||||||
EssilorLuxottica SA | 612 | 120,112 | ||||||
Eurazeo SE | 77 | 7,917 | ||||||
Gecina SA REIT | 89 | 13,821 | ||||||
Kering SA | 160 | 127,300 | ||||||
Klepierre SA REIT* | 425 | 10,385 | ||||||
L’Oreal SA | 535 | 250,280 | ||||||
Orange SA | 4,231 | 48,047 | ||||||
Publicis Groupe SA | 473 | 31,000 | ||||||
Schneider Electric SE | 1,140 | 203,606 | ||||||
SEB SA | 53 | 8,333 | ||||||
Societe Generale SA | 1,717 | 54,015 | ||||||
Teleperformance | 126 | 55,687 | ||||||
TotalEnergies SE | 5,278 | 232,675 | ||||||
Unibail-Rodamco-Westfield REIT* | 269 | 23,562 | ||||||
Valeo | 517 | 14,696 | ||||||
| See Notes to Financial Statements. | 34 |
DBX ETF Trust
Schedule of Investments
Xtrackers MSCI EAFE ESG Leaders Equity ETF (Continued)
August 31, 2021
Number | Value | |||||||
| France (Continued) | ||||||||
Vivendi SE (b) | 1,512 | $ | 57,686 | |||||
Wendel SE | 58 | 8,414 | ||||||
|
| |||||||
(Cost $1,710,433) | 2,041,520 | |||||||
|
| |||||||
| Germany — 8.4% | ||||||||
adidas AG | 406 | 143,995 | ||||||
Allianz SE | 878 | 206,230 | ||||||
BASF SE | 1,950 | 150,819 | ||||||
Bayerische Motoren Werke AG | 716 | 67,929 | ||||||
Beiersdorf AG | 232 | 28,140 | ||||||
Brenntag SE | 321 | 32,375 | ||||||
Commerzbank AG* | 2,223 | 13,934 | ||||||
Delivery Hero SE, 144A* (b) | 331 | 47,903 | ||||||
Deutsche Boerse AG | 406 | 70,020 | ||||||
Deutsche Post AG | 2,098 | 147,555 | ||||||
Deutsche Wohnen SE | 739 | 45,851 | ||||||
HeidelbergCement AG | 313 | 27,194 | ||||||
Henkel AG & Co. KGaA | 228 | 20,509 | ||||||
LANXESS AG | 173 | 12,608 | ||||||
Merck KGaA | 274 | 65,077 | ||||||
MTU Aero Engines AG | 114 | 26,154 | ||||||
Muenchener Rueckversicherungs-Gesellschaft AG in Muenchen | 298 | 87,046 | ||||||
Puma SE | 205 | 24,877 | ||||||
SAP SE | 2,227 | 335,075 | ||||||
Symrise AG | 272 | 38,723 | ||||||
Telefonica Deutschland Holding AG | 2,312 | 6,487 | ||||||
|
| |||||||
(Cost $1,372,089) | 1,598,501 | |||||||
|
| |||||||
| Hong Kong — 1.6% | ||||||||
BOC Hong Kong Holdings Ltd. | 7,876 | 23,899 | ||||||
ESR Cayman Ltd., 144A* | 4,034 | 12,293 | ||||||
Hang Seng Bank Ltd. | 1,598 | 28,601 | ||||||
HKT Trust & HKT Ltd. (a) | 7,739 | 10,548 | ||||||
Hong Kong & China Gas Co. Ltd. | 23,461 | 37,768 | ||||||
Hong Kong Exchanges & Clearing Ltd. | 2,542 | 160,416 | ||||||
MTR Corp. Ltd. | 3,010 | 16,952 | ||||||
Swire Pacific Ltd., Class A | 1,081 | 7,325 | ||||||
Swire Properties Ltd. | 2,436 | 6,593 | ||||||
|
| |||||||
(Cost $247,593) | 304,395 | |||||||
|
| |||||||
| Ireland — 1.0% | ||||||||
CRH PLC | 1,686 | 89,641 | ||||||
DCC PLC | 198 | 16,840 | ||||||
Kerry Group PLC, Class A | 342 | 50,141 | ||||||
Kingspan Group PLC | 329 | 37,586 | ||||||
|
| |||||||
(Cost $135,188) | 194,208 | |||||||
|
| |||||||
| Israel — 0.3% | ||||||||
Bank Hapoalim BM | 2,195 | 18,903 | ||||||
Bank Leumi Le-Israel BM | 3,370 | 27,875 | ||||||
CyberArk Software Ltd.* | 77 | 12,931 | ||||||
|
| |||||||
(Cost $46,679) | 59,709 | |||||||
|
| |||||||
| Italy — 1.7% | ||||||||
Amplifon SpA | 255 | 13,329 | ||||||
Assicurazioni Generali SpA | 2,345 | 47,806 | ||||||
Enel SpA | 17,242 | 157,067 | ||||||
Number | Value | |||||||
| Italy (Continued) | ||||||||
Intesa Sanpaolo SpA | 35,008 | $ | 99,077 | |||||
|
| |||||||
(Cost $276,554) | 317,279 | |||||||
|
| |||||||
| Japan — 24.1% | ||||||||
Aeon Co. Ltd. (b) | 1,400 | 37,205 | ||||||
Ajinomoto Co., Inc. | 1,000 | 29,529 | ||||||
ANA Holdings, Inc.* | 300 | 7,115 | ||||||
Asahi Kasei Corp. | 2,600 | 26,885 | ||||||
Astellas Pharma, Inc. | 4,000 | 67,613 | ||||||
Azbil Corp. | 300 | 13,039 | ||||||
Bridgestone Corp. | 1,200 | 55,314 | ||||||
Capcom Co. Ltd. | 400 | 11,178 | ||||||
Casio Computer Co. Ltd. | 400 | 6,186 | ||||||
Central Japan Railway Co. | 310 | 45,501 | ||||||
Chugai Pharmaceutical Co. Ltd. | 1,398 | 54,821 | ||||||
CyberAgent, Inc. | 912 | 16,777 | ||||||
Dai Nippon Printing Co. Ltd. | 465 | 11,073 | ||||||
Daifuku Co. Ltd. | 216 | 19,111 | ||||||
Dai-ichi Life Holdings, Inc. | 2,200 | 43,445 | ||||||
Daikin Industries Ltd. | 554 | 138,197 | ||||||
Daiwa House Industry Co. Ltd. | 1,200 | 36,658 | ||||||
Denso Corp. | 960 | 67,373 | ||||||
East Japan Railway Co. | 629 | 42,546 | ||||||
Eisai Co. Ltd. | 458 | 37,879 | ||||||
ENEOS Holdings, Inc. | 6,400 | 24,823 | ||||||
Fast Retailing Co. Ltd. | 128 | 84,494 | ||||||
FUJIFILM Holdings Corp. | 800 | 66,033 | ||||||
Fujitsu Ltd. | 409 | 75,575 | ||||||
Hankyu Hanshin Holdings, Inc. | 500 | 14,996 | ||||||
Hirose Electric Co. Ltd. | 80 | 13,348 | ||||||
Hitachi Construction Machinery Co. Ltd. | 200 | 5,744 | ||||||
Hitachi Metals Ltd.* | 400 | 7,737 | ||||||
Hoshizaki Corp. | 100 | 9,403 | ||||||
Hoya Corp. | 800 | 129,474 | ||||||
Hulic Co. Ltd. | 500 | 5,871 | ||||||
Ibiden Co. Ltd. | 200 | 10,814 | ||||||
Inpex Corp. | 2,300 | 15,869 | ||||||
Isuzu Motors Ltd. | 1,200 | 15,205 | ||||||
ITOCHU Corp. | 2,500 | 75,346 | ||||||
JFE Holdings, Inc. | 1,100 | 17,873 | ||||||
JSR Corp. | 400 | 13,890 | ||||||
Kajima Corp. | 1,100 | 14,248 | ||||||
Kansai Paint Co. Ltd. | 300 | 7,785 | ||||||
Kao Corp. | 984 | 59,527 | ||||||
KDDI Corp. | 3,400 | 104,296 | ||||||
Keio Corp. | 239 | 12,879 | ||||||
Kikkoman Corp. | 300 | 22,556 | ||||||
Kobayashi Pharmaceutical Co. Ltd. | 80 | 6,270 | ||||||
Komatsu Ltd. | 1,900 | 46,047 | ||||||
Kubota Corp. | 2,200 | 45,548 | ||||||
Kurita Water Industries Ltd. | 200 | 9,394 | ||||||
Kyowa Kirin Co. Ltd. | 600 | 19,634 | ||||||
Lawson, Inc. | 100 | 4,824 | ||||||
Lixil Corp. | 600 | 17,504 | ||||||
Marubeni Corp. | 3,300 | 26,302 | ||||||
Mazda Motor Corp.* | 1,300 | 11,301 | ||||||
Mercari, Inc.* | 250 | 12,379 | ||||||
| See Notes to Financial Statements. | 35 |
DBX ETF Trust
Schedule of Investments
Xtrackers MSCI EAFE ESG Leaders Equity ETF (Continued)
August 31, 2021
Number | Value | |||||||
| Japan (Continued) | ||||||||
Mitsubishi Chemical Holdings Corp. | 2,700 | $ | 23,736 | |||||
Mitsubishi Estate Co. Ltd. | 2,500 | 39,164 | ||||||
Mitsui Chemicals, Inc. | 400 | 13,836 | ||||||
Mitsui Fudosan Co. Ltd. | 1,900 | 43,652 | ||||||
Miura Co. Ltd. | 200 | 8,993 | ||||||
Mizuho Financial Group, Inc. | 5,090 | 71,490 | ||||||
MS&AD Insurance Group Holdings, Inc. | 1,000 | 32,359 | ||||||
Murata Manufacturing Co. Ltd. | 1,200 | 99,607 | ||||||
Nabtesco Corp. | 250 | 9,922 | ||||||
NEC Corp. | 500 | 26,306 | ||||||
Nintendo Co. Ltd. | 239 | 115,084 | ||||||
Nippon Building Fund, Inc. REIT | 3 | 19,525 | ||||||
Nippon Express Co. Ltd. | 150 | 10,227 | ||||||
Nippon Paint Holdings Co. Ltd. | 1,550 | 19,315 | ||||||
Nippon Yusen KK | 300 | 24,222 | ||||||
Nissin Foods Holdings Co. Ltd. | 100 | 7,792 | ||||||
Nitori Holdings Co. Ltd. | 144 | 26,975 | ||||||
Nitto Denko Corp. | 350 | 26,634 | ||||||
Nomura Holdings, Inc. | 6,500 | 31,571 | ||||||
Nomura Real Estate Holdings, Inc. | 200 | 5,125 | ||||||
Nomura Real Estate Master Fund, Inc. REIT | 9 | 13,902 | ||||||
Nomura Research Institute Ltd. | 800 | 30,111 | ||||||
NSK Ltd. | 800 | 5,622 | ||||||
NTT Data Corp. | 1,300 | 23,442 | ||||||
Obayashi Corp. | 1,300 | 10,721 | ||||||
Odakyu Electric Railway Co. Ltd. | 600 | 14,003 | ||||||
Omron Corp. | 413 | 39,022 | ||||||
Oriental Land Co. Ltd. | 415 | 62,934 | ||||||
ORIX Corp. | 2,600 | 48,552 | ||||||
Orix JREIT, Inc. REIT | 6 | 10,710 | ||||||
Osaka Gas Co. Ltd. | 800 | 15,023 | ||||||
Otsuka Corp. | 250 | 12,971 | ||||||
Pan Pacific International Holdings Corp. | 900 | 17,179 | ||||||
Panasonic Corp. | 4,700 | 56,130 | ||||||
Recruit Holdings Co. Ltd. | 2,900 | 171,582 | ||||||
Resona Holdings, Inc. | 5,000 | 19,375 | ||||||
Rohm Co. Ltd. | 150 | 14,500 | ||||||
SCSK Corp. | 100 | 6,326 | ||||||
Secom Co. Ltd. | 440 | 33,423 | ||||||
Sekisui Chemical Co. Ltd. | 800 | 13,719 | ||||||
Sekisui House Ltd. | 1,300 | 25,950 | ||||||
Seven & i Holdings Co. Ltd. | 1,600 | 70,126 | ||||||
SG Holdings Co. Ltd. | 700 | 19,064 | ||||||
Sharp Corp. | 400 | 5,290 | ||||||
Shimadzu Corp. | 540 | 24,257 | ||||||
Shimizu Corp. | 1,200 | 8,629 | ||||||
Shin-Etsu Chemical Co. Ltd. | 743 | 123,123 | ||||||
Shionogi & Co. Ltd. | 600 | 37,968 | ||||||
Shiseido Co. Ltd. | 850 | 56,427 | ||||||
SoftBank Corp. | 6,100 | 81,816 | ||||||
Sohgo Security Services Co. Ltd. | 200 | 9,075 | ||||||
Sompo Holdings, Inc. | 640 | 28,126 | ||||||
Sony Group Corp. | 2,705 | 279,709 | ||||||
Stanley Electric Co. Ltd. | 200 | 5,003 | ||||||
Sumitomo Chemical Co. Ltd. | 3,600 | 18,285 | ||||||
Sumitomo Metal Mining Co. Ltd. | 553 | 21,262 | ||||||
Number | Value | |||||||
| Japan (Continued) | ||||||||
Sumitomo Mitsui Trust Holdings, Inc. | 700 | $ | 22,926 | |||||
Suntory Beverage & Food Ltd. | 300 | 12,029 | ||||||
Sysmex Corp. | 350 | 39,887 | ||||||
T&D Holdings, Inc. | 1,200 | 14,582 | ||||||
Taisei Corp. | 374 | 11,728 | ||||||
Takeda Pharmaceutical Co. Ltd. | 3,350 | 112,185 | ||||||
TDK Corp. | 275 | 28,962 | ||||||
Terumo Corp. | 1,350 | 56,490 | ||||||
Tobu Railway Co. Ltd. | 400 | 10,453 | ||||||
Toho Gas Co. Ltd. | 150 | 7,004 | ||||||
Tokyo Century Corp. | 100 | 5,726 | ||||||
Tokyo Electron Ltd. | 323 | 138,891 | ||||||
Tokyo Gas Co. Ltd. | 800 | 15,409 | ||||||
Tokyu Corp. | 1,100 | 15,169 | ||||||
Toray Industries, Inc. | 2,900 | 19,581 | ||||||
TOTO Ltd. | 300 | 16,357 | ||||||
Toyo Suisan Kaisha Ltd. | 250 | 10,365 | ||||||
Unicharm Corp. | 800 | 35,711 | ||||||
USS Co. Ltd. | 500 | 8,288 | ||||||
West Japan Railway Co. | 350 | 19,166 | ||||||
Yakult Honsha Co. Ltd. | 280 | 16,159 | ||||||
Yamada Holdings Co. Ltd. | 2,000 | 8,611 | ||||||
Yamaha Corp. | 319 | 18,845 | ||||||
Yamaha Motor Co. Ltd. | 600 | 15,292 | ||||||
Yaskawa Electric Corp. | 501 | 24,535 | ||||||
Yokogawa Electric Corp. | 400 | 6,273 | ||||||
Z Holdings Corp. | 5,600 | 36,548 | ||||||
ZOZO, Inc. | 200 | 7,637 | ||||||
|
| |||||||
(Cost $3,807,029) | 4,598,135 | |||||||
|
| |||||||
| Luxembourg — 0.1% | ||||||||
Tenaris SA | 1,048 | 10,560 | ||||||
|
| |||||||
| Netherlands — 7.3% | ||||||||
Aegon NV | 3,308 | 16,377 | ||||||
Akzo Nobel NV | 401 | 49,419 | ||||||
ASML Holding NV | 885 | 735,990 | ||||||
ING Groep NV | 8,280 | 114,357 | ||||||
JDE Peet’s NV | 157 | 5,393 | ||||||
Koninklijke Ahold Delhaize NV | 2,226 | 75,073 | ||||||
Koninklijke DSM NV (b) | 363 | 77,238 | ||||||
Koninklijke KPN NV | 7,170 | 22,971 | ||||||
Koninklijke Vopak NV | 143 | 6,190 | ||||||
NN Group NV | 612 | 31,766 | ||||||
Prosus NV* | 1,973 | 174,444 | ||||||
Randstad NV | 247 | 18,165 | ||||||
Wolters Kluwer NV | 572 | 65,780 | ||||||
|
| |||||||
(Cost $769,176) | 1,393,163 | |||||||
|
| |||||||
| New Zealand — 0.6% | ||||||||
Auckland International Airport Ltd.* | 2,678 | 13,590 | ||||||
Fisher & Paykel Healthcare Corp. Ltd. | 1,212 | 28,236 | ||||||
Mercury NZ Ltd. | 1,617 | 7,569 | ||||||
Meridian Energy Ltd. | 2,640 | 9,755 | ||||||
Ryman Healthcare Ltd. | 810 | 8,825 | ||||||
Spark New Zealand Ltd. | 3,846 | 13,197 | ||||||
Xero Ltd.* | 271 | 30,070 | ||||||
|
| |||||||
(Cost $97,096) | 111,242 | |||||||
|
| |||||||
| See Notes to Financial Statements. | 36 |
DBX ETF Trust
Schedule of Investments
Xtrackers MSCI EAFE ESG Leaders Equity ETF (Continued)
August 31, 2021
Number | Value | |||||||
| Norway — 0.7% | ||||||||
DNB Bank ASA | 1,980 | $ | 41,759 | |||||
Mowi ASA | 999 | 26,727 | ||||||
Norsk Hydro ASA | 2,800 | 19,305 | ||||||
Orkla ASA | 1,726 | 15,402 | ||||||
Telenor ASA | 1,486 | 26,006 | ||||||
|
| |||||||
(Cost $119,797) | 129,199 | |||||||
|
| |||||||
| Portugal — 0.1% | ||||||||
Galp Energia SGPS SA | 1,052 | 10,772 | ||||||
Jeronimo Martins SGPS SA | 540 | 11,442 | ||||||
|
| |||||||
(Cost $25,060) | 22,214 | |||||||
|
| |||||||
| Singapore — 1.3% | ||||||||
Ascendas Real Estate Investment Trust REIT | 203 | 459 | ||||||
CapitaLand Integrated Commercial Trust REIT | 9,684 | 14,831 | ||||||
CapitaLand Ltd. | 5,700 | 16,950 | ||||||
City Developments Ltd. | 1,100 | 5,594 | ||||||
DBS Group Holdings Ltd. | 3,847 | 85,715 | ||||||
Keppel Corp. Ltd. | 3,300 | 12,757 | ||||||
Oversea-Chinese Banking Corp. Ltd. | 7,000 | 59,483 | ||||||
Singapore Airlines Ltd.* | 3,150 | 11,850 | ||||||
Singapore Exchange Ltd. | 1,700 | 12,512 | ||||||
Singapore Telecommunications Ltd. | 16,800 | 28,976 | ||||||
UOL Group Ltd. | 1,100 | 5,724 | ||||||
|
| |||||||
(Cost $244,125) | 254,851 | |||||||
|
| |||||||
| Spain — 2.2% | ||||||||
Banco Bilbao Vizcaya Argentaria SA* | 14,170 | 92,784 | ||||||
CaixaBank SA | 9,160 | 28,460 | ||||||
Iberdrola SA | 12,496 | 154,811 | ||||||
Industria de Diseno Textil SA | 2,341 | 79,891 | ||||||
Naturgy Energy Group SA (b) | 631 | 16,238 | ||||||
Red Electrica Corp. SA | 886 | 17,665 | ||||||
Repsol SA | 3,170 | 36,316 | ||||||
|
| |||||||
(Cost $367,702) | 426,165 | |||||||
|
| |||||||
| Sweden — 3.6% | ||||||||
Alfa Laval AB | 675 | 27,348 | ||||||
Assa Abloy AB, Class B | 2,123 | 67,780 | ||||||
Atlas Copco AB, Class A | 1,468 | 100,669 | ||||||
Atlas Copco AB, Class B | 773 | 44,669 | ||||||
Boliden AB | 577 | 20,098 | ||||||
Electrolux AB, Series B | 523 | 13,234 | ||||||
Essity AB, Class B | 1,305 | 41,815 | ||||||
Evolution AB, 144A | 361 | 58,103 | ||||||
H & M Hennes & Mauritz AB, Class B* | 1,571 | 31,454 | ||||||
Husqvarna AB, Class B | 888 | 11,898 | ||||||
ICA Gruppen AB | 223 | 11,082 | ||||||
Nibe Industrier AB, Class B | 3,010 | 41,917 | ||||||
Sandvik AB | 2,392 | 60,917 | ||||||
SKF AB, Class B | 879 | 22,385 | ||||||
Svenska Cellulosa AB SCA, Class B | 1,354 | 23,863 | ||||||
Tele2 AB, Class B | 1,067 | 15,977 | ||||||
Telefonaktiebolaget LM Ericsson, Class B | 6,183 | 73,220 | ||||||
Telia Co. AB | 5,532 | 23,720 | ||||||
|
| |||||||
(Cost $552,419) | 690,149 | |||||||
|
| |||||||
Number | Value | |||||||
| Switzerland — 9.4% | ||||||||
ABB Ltd. | 3,696 | $ | 136,858 | |||||
Adecco Group AG | 325 | 18,087 | ||||||
Chocoladefabriken Lindt & Spruengli AG Participation Certificates | 4 | 47,028 | ||||||
Cie Financiere Richemont SA, Class A | 1,109 | 122,274 | ||||||
Clariant AG* | 415 | 8,734 | ||||||
Coca-Cola HBC AG* | 438 | 15,848 | ||||||
Geberit AG | 75 | 62,649 | ||||||
Givaudan SA | 20 | 100,322 | ||||||
Kuehne + Nagel International AG | 113 | 41,337 | ||||||
Lonza Group AG | 158 | 133,672 | ||||||
Roche Holding AG | 1,488 | 597,360 | ||||||
SGS SA | 13 | 40,843 | ||||||
Sika AG | 300 | 108,105 | ||||||
Sonova Holding AG | 118 | 45,471 | ||||||
Straumann Holding AG | 22 | 42,509 | ||||||
Swiss Life Holding AG | 68 | 35,453 | ||||||
Swiss Re AG | 639 | 58,776 | ||||||
Swisscom AG | 56 | 32,852 | ||||||
Vifor Pharma AG | 102 | 14,520 | ||||||
Zurich Insurance Group AG | 320 | 140,429 | ||||||
|
| |||||||
(Cost $1,251,751) | 1,803,127 | |||||||
|
| |||||||
| United Kingdom — 13.1% | ||||||||
Abrdn PLC | 4,565 | 16,680 | ||||||
Ashtead Group PLC | 960 | 75,176 | ||||||
Associated British Foods PLC | 814 | 22,181 | ||||||
AstraZeneca PLC | 3,283 | 384,682 | ||||||
Barratt Developments PLC | 1,934 | 19,670 | ||||||
Berkeley Group Holdings PLC* | 262 | 17,405 | ||||||
British Land Co. PLC REIT | 1,955 | 14,265 | ||||||
BT Group PLC* | 18,977 | 44,347 | ||||||
Burberry Group PLC | 929 | 23,774 | ||||||
CNH Industrial NV | 2,174 | 35,928 | ||||||
Coca-Cola Europacific Partners PLC | 438 | 25,290 | ||||||
Compass Group PLC* | 3,772 | 77,894 | ||||||
Croda International PLC | 299 | 37,644 | ||||||
Ferguson PLC | 477 | 68,962 | ||||||
GlaxoSmithKline PLC | 10,723 | 215,755 | ||||||
Informa PLC* | 3,146 | 22,991 | ||||||
InterContinental Hotels Group PLC* | 367 | 23,401 | ||||||
Intertek Group PLC | 339 | 24,587 | ||||||
J Sainsbury PLC | 3,641 | 15,233 | ||||||
JD Sports Fashion PLC | 1,118 | 15,533 | ||||||
Johnson Matthey PLC | 403 | 16,301 | ||||||
Kingfisher PLC | 4,525 | 21,815 | ||||||
Legal & General Group PLC | 12,691 | 47,193 | ||||||
Lloyds Banking Group PLC | 150,666 | 90,769 | ||||||
Mondi PLC | 1,008 | 27,815 | ||||||
National Grid PLC | 7,396 | 95,813 | ||||||
Next PLC | 288 | 31,352 | ||||||
Reckitt Benckiser Group PLC | 1,519 | 115,794 | ||||||
RELX PLC | 4,122 | 123,783 | ||||||
Rentokil Initial PLC | 3,914 | 31,264 | ||||||
Schroders PLC | 261 | 13,578 | ||||||
Segro PLC REIT | 2,566 | 45,344 | ||||||
Spirax-Sarco Engineering PLC | 156 | 34,587 | ||||||
| See Notes to Financial Statements. | 37 |
DBX ETF Trust
Schedule of Investments
Xtrackers MSCI EAFE ESG Leaders Equity ETF (Continued)
August 31, 2021
Number | Value | |||||||
| United Kingdom (Continued) | ||||||||
St James’s Place PLC | 1,103 | $ | 24,440 | |||||
Standard Chartered PLC | 5,699 | 35,671 | ||||||
Taylor Wimpey PLC | 7,747 | 19,500 | ||||||
Tesco PLC | 16,436 | 57,715 | ||||||
Unilever PLC | 5,615 | 312,661 | ||||||
Vodafone Group PLC | 59,234 | 99,423 | ||||||
Whitbread PLC* | 465 | 20,530 | ||||||
Wm Morrison Supermarkets PLC | 4,870 | 19,437 | ||||||
WPP PLC | 2,550 | 34,519 | ||||||
|
| |||||||
(Cost $2,328,064) | 2,500,702 | |||||||
|
| |||||||
TOTAL COMMON STOCKS | 18,962,777 | |||||||
|
| |||||||
| PREFERRED STOCKS — 0.3% | ||||||||
| Germany — 0.3% | ||||||||
Bayerische Motoren Werke AG | 97 | 8,118 | ||||||
Henkel AG & Co. KGaA | 372 | 36,334 | ||||||
|
| |||||||
(Cost $47,931) | 44,452 | |||||||
|
| |||||||
Number | Value | |||||||
| WARRANTS — 0.0% | ||||||||
| Switzerland — 0.0% | ||||||||
Cie Financiere Richemont SA*, expires 11/22/23 | 1,880 | $ | 965 | |||||
|
| |||||||
| SECURITIES LENDING COLLATERAL — 0.3% | ||||||||
DWS Government & Agency Securities Portfolio “DWS Government Cash Institutional Shares”, 0.01% (c)(d) | 61,137 | 61,137 | ||||||
|
| |||||||
| CASH EQUIVALENTS — 0.0% | ||||||||
DWS Government Money Market Series “Institutional Shares”, 0.04% (c) | 2,532 | 2,532 | ||||||
|
| |||||||
TOTAL INVESTMENTS — 100.0% | $ | 19,071,863 | ||||||
Other assets and liabilities, net — 0.0% | 4,223 | |||||||
|
| |||||||
NET ASSETS — 100.0% | $ | 19,076,086 | ||||||
|
| |||||||
A summary of the Fund’s transactions with affiliated investments during the year ended August 31, 2021 is as follows:
| Value ($) at 8/31/2020 | Purchases Cost ($) | Sales Proceeds ($) | Net Realized Gain/(Loss) ($) | Net Change in Unrealized Appreciation (Depreciation) ($) | Income ($) | Capital Gain Distributions ($) | Number of Shares at 8/31/2021 | Value ($) at 8/31/2021 | ||||||||||||||||||||||||||||
SECURITIES LENDING COLLATERAL — 0.3% |
| |||||||||||||||||||||||||||||||||||
DWS Government & Agency Securities Portfolio “DWS Government Cash Institutional Shares”, 0.01% (c)(d) |
| |||||||||||||||||||||||||||||||||||
| 55,300 | 5,837 | (e) | — | — | — | 20 | — | 61,137 | 61,137 | |||||||||||||||||||||||||||
CASH EQUIVALENTS — 0.0% |
| |||||||||||||||||||||||||||||||||||
DWS Government Money Market Series “Institutional Shares”, 0.04% (c) |
| |||||||||||||||||||||||||||||||||||
| 143 | 631,787 | (629,398 | ) | — | — | 3 | — | 2,532 | 2,532 | |||||||||||||||||||||||||||
|
|
|
|
|
|
|
|
|
|
|
|
|
|
|
|
|
| |||||||||||||||||||
| 55,443 | 637,624 | (629,398 | ) | — | — | 23 | — | 63,669 | 63,669 | |||||||||||||||||||||||||||
|
|
|
|
|
|
|
|
|
|
|
|
|
|
|
|
|
| |||||||||||||||||||
| * | Non-income producing security. |
| (a) | Stapled Security — A security contractually bound to one or more other securities to form a single saleable unit which cannot be sold separately. |
| (b) | All or a portion of these securities were on loan. In addition, “Other assets and liabilities, net” may include pending sales that are also on loan. The value of securities loaned at August 31, 2021 amounted to $170,080, which is 0.9% of net assets. |
| (c) | Affiliated fund managed by DWS Investment Management Americas, Inc. The rate shown is the annualized seven-day yield at period end. |
| (d) | Represents cash collateral held in connection with securities lending. Income earned by the Fund is net of borrower rebates. In addition, the Fund held non-cash U.S. Treasury securities collateral having a value of $119,195. |
| (e) | Represents the net increase (purchase cost) or decrease (sales proceeds) in the amount invested in cash collateral for the year ended August 31, 2021. |
| REIT: | Real Estate Investment Trust |
| 144A: | Security exempt from registration under Rule 144A of the Securities Act of 1933. These securities may be resold in transactions exempt from registration, normally to qualified institutional buyers. |
Securities are listed in country of domicile.
| See Notes to Financial Statements. | 38 |
DBX ETF Trust
Schedule of Investments
Xtrackers MSCI EAFE ESG Leaders Equity ETF (Continued)
August 31, 2021
At August 31, 2021, open futures contracts purchased were as follows:
Contract Description | Currency | Number of Contracts | Notional Amount | Contract Value | Expiration Date | Unrealized Appreciation | ||||||||||||
MINI TOPIX Index Futures | JPY | 2 | $ | 35,681 | $ | 35,764 | 9/09/2021 | $ | 83 | |||||||||
For information on the Fund’s policy and additional disclosures regarding open futures contracts, please refer to the Derivatives section of Note 2 in the accompanying Notes to Financial Statements.
Currency Abbreviations
| JPY | Japanese Yen |
Fair Value Measurements
Various inputs are used in determining the value of the Fund’s investments. These inputs are summarized in three broad levels. Level 1 includes quoted prices in active markets for identical securities. Level 2 includes other significant observable inputs (including quoted prices for similar securities, interest rates, prepayment speeds and credit risk). Level 3 includes significant unobservable inputs (including the Fund’s own assumptions in determining the fair value of investments). The level assigned to the securities valuations may not be an indication of the risk or liquidity associated with investing in those securities.
The following is a summary of the inputs used as of August 31, 2021 in valuing the Fund’s investments. For information on the Fund’s policy regarding the valuation of investments, please refer to the Security Valuation section of Note 2 in the accompanying Notes to Financial Statements.
Assets | Level 1 | Level 2 | Level 3 | Total | ||||||||||||
Common Stocks (f) | $ | 18,962,777 | $ | — | $ | — | $ | 18,962,777 | ||||||||
Preferred Stocks | 44,452 | — | — | 44,452 | ||||||||||||
Warrants | 965 | — | — | 965 | ||||||||||||
Short-Term Investments (f) | 63,669 | — | — | 63,669 | ||||||||||||
Derivatives (g) | ||||||||||||||||
Futures Contracts | 83 | — | — | 83 | ||||||||||||
|
|
|
|
|
|
|
| |||||||||
TOTAL | $ | 19,071,946 | $ | — | $ | — | $ | 19,071,946 | ||||||||
|
|
|
|
|
|
|
| |||||||||
| (f) | See Schedule of Investments for additional detailed categorizations. |
| (g) | Derivatives include unrealized appreciation (depreciation) on open futures contracts. |
| See Notes to Financial Statements. | 39 |
DBX ETF Trust
Schedule of Investments
Xtrackers MSCI Emerging Markets ESG Leaders Equity ETF
August 31, 2021
Number | Value | |||||||
| COMMON STOCKS — 98.3% | ||||||||
| Argentina — 0.0% | ||||||||
Adecoagro SA* | 607 | $ | 5,675 | |||||
|
| |||||||
| Brazil — 2.6% | ||||||||
Americanas SA* | 2,205 | 17,814 | ||||||
Atacadao SA | 2,553 | 9,051 | ||||||
B3 SA — Brasil Bolsa Balcao | 33,459 | 91,955 | ||||||
Banco Bradesco SA | 8,066 | 31,416 | ||||||
Banco do Brasil SA | 5,089 | 30,248 | ||||||
Banco Santander Brasil SA | 2,151 | 17,621 | ||||||
CCR SA | 6,648 | 15,907 | ||||||
Cosan SA | 6,110 | 26,316 | ||||||
CPFL Energia SA | 1,270 | 7,204 | ||||||
Energisa SA | 911 | 7,895 | ||||||
Equatorial Energia SA | 5,014 | 24,925 | ||||||
Klabin SA* | 4,203 | 21,600 | ||||||
Localiza Rent a Car SA | 3,305 | 35,803 | ||||||
Lojas Renner SA | 4,928 | 36,636 | ||||||
Natura & Co. Holding SA* | 4,909 | 49,497 | ||||||
Notre Dame Intermedica Participacoes SA | 2,831 | 44,205 | ||||||
Rede D’Or Sao Luiz SA, 144A | 2,195 | 29,507 | ||||||
Rumo SA* | 7,024 | 25,684 | ||||||
Telefonica Brasil SA | 2,716 | 23,200 | ||||||
TIM SA | 3,968 | 9,657 | ||||||
Ultrapar Participacoes SA | 4,393 | 12,391 | ||||||
Via S/A* | 7,659 | 15,544 | ||||||
WEG SA | 9,056 | 62,902 | ||||||
|
| |||||||
(Cost $656,228) | 646,978 | |||||||
|
| |||||||
| Chile — 0.3% | ||||||||
Cencosud Shopping SA | 1,212 | 1,720 | ||||||
Empresas CMPC SA | 6,575 | 14,585 | ||||||
Empresas COPEC SA | 2,062 | 19,155 | ||||||
Enel Americas SA | 125,793 | 17,651 | ||||||
Falabella SA | 4,076 | 16,121 | ||||||
|
| |||||||
(Cost $80,776) | 69,232 | |||||||
|
| |||||||
| China — 33.0% | ||||||||
360 Security Technology, Inc., Class A* | 800 | 1,476 | ||||||
3SBio, Inc., 144A* | 7,378 | 8,225 | ||||||
51job, Inc., ADR* (a) | 177 | 13,594 | ||||||
AAC Technologies Holdings, Inc. | 4,225 | 23,550 | ||||||
Air China Ltd., Class A* | 4,600 | 5,162 | ||||||
Air China Ltd., Class H* | 5,074 | 3,406 | ||||||
Alibaba Group Holding Ltd.* | 83,278 | 1,772,134 | ||||||
A-Living Smart City Services Co. Ltd., 144A | 3,103 | 12,289 | ||||||
Angel Yeast Co. Ltd., Class A | 200 | 1,242 | ||||||
Baozun, Inc., ADR* | 339 | 8,163 | ||||||
BBMG Corp., Class A | 1,800 | 756 | ||||||
Beijing Capital International Airport Co. Ltd., Class H* | 10,259 | 6,187 | ||||||
BYD Co. Ltd., Class A | 600 | 25,759 | ||||||
BYD Co. Ltd., Class H | 4,311 | 146,003 | ||||||
By-health Co. Ltd., Class A | 300 | 1,169 | ||||||
CanSino Biologics, Inc., Class A* | 26 | 1,552 | ||||||
CanSino Biologics, Inc., Class H, 144A* | 412 | 16,284 | ||||||
Number | Value | |||||||
| China (Continued) | ||||||||
Changzhou Xingyu Automotive Lighting Systems Co. Ltd., Class A | 100 | $ | 2,999 | |||||
China Aoyuan Group Ltd. | 6,000 | 3,595 | ||||||
China Communications Services Corp. Ltd., Class H | 13,055 | 6,949 | ||||||
China Conch Venture Holdings Ltd. | 9,056 | 37,028 | ||||||
China Construction Bank Corp., Class A | 1,800 | 1,632 | ||||||
China Construction Bank Corp., Class H | 528,376 | 381,810 | ||||||
China East Education Holdings Ltd., 144A* (a) | 2,000 | 2,145 | ||||||
China Eastern Airlines Corp. Ltd., Class A* | 4,800 | 3,497 | ||||||
China Feihe Ltd., 144A | 19,567 | 35,424 | ||||||
China Jushi Co. Ltd., Class A | 1,028 | 2,796 | ||||||
China Lesso Group Holdings Ltd. | 5,105 | 10,922 | ||||||
China Medical System Holdings Ltd. | 7,095 | 13,903 | ||||||
China Merchants Bank Co. Ltd., Class H | 21,739 | 179,590 | ||||||
China Merchants Shekou Industrial Zone Holdings Co. Ltd., Class A | 2,100 | 3,242 | ||||||
China Molybdenum Co. Ltd., Class A | 4,200 | 5,091 | ||||||
China Molybdenum Co. Ltd., Class H | 21,869 | 17,096 | ||||||
China National Medicines Corp. Ltd., Class A | 200 | 905 | ||||||
China Resources Pharmaceutical Group Ltd., 144A | 4,506 | 2,346 | ||||||
China Resources Sanjiu Medical & Pharmaceutical Co. Ltd., Class A | 400 | 1,733 | ||||||
China Southern Airlines Co. Ltd., Class H* | 9,335 | 5,437 | ||||||
China Tourism Group Duty Free Corp. Ltd., Class A | 600 | 21,230 | ||||||
China Vanke Co. Ltd., Class A | 3,300 | 10,127 | ||||||
China Vanke Co. Ltd., Class H | 9,055 | 24,450 | ||||||
Chongqing Changan Automobile Co. Ltd., Class A | 2,000 | 6,392 | ||||||
CIFI Ever Sunshine Services Group Ltd. | 4,248 | 8,772 | ||||||
CIFI Holdings Group Co. Ltd. | 20,133 | 13,565 | ||||||
CITIC Ltd. | 31,757 | 39,526 | ||||||
Contemporary Amperex Technology Co. Ltd., Class A | 804 | 61,667 | ||||||
Country Garden Services Holdings Co. Ltd. | 8,241 | 62,782 | ||||||
CSPC Pharmaceutical Group Ltd. | 50,890 | 64,583 | ||||||
Dali Foods Group Co. Ltd., 144A | 5,848 | 3,278 | ||||||
Dongfeng Motor Group Co. Ltd., Class H | 15,043 | 16,479 | ||||||
ENN Energy Holdings Ltd. | 4,386 | 86,791 | ||||||
Eve Energy Co. Ltd., Class A | 480 | 7,588 | ||||||
Fosun International Ltd. | 14,001 | 17,714 | ||||||
Fu Jian Anjoy Foods Co. Ltd., Class A | 100 | 2,422 | ||||||
Fuyao Glass Industry Group Co. Ltd., Class A | 600 | 4,454 | ||||||
Fuyao Glass Industry Group Co. Ltd., Class H, 144A | 3,010 | 18,538 | ||||||
Ganfeng Lithium Co. Ltd., Class A | 400 | 13,639 | ||||||
Ganfeng Lithium Co. Ltd., Class H, 144A | 1,423 | 32,788 | ||||||
GEM Co. Ltd., Class A | 1,200 | 2,498 | ||||||
Genscript Biotech Corp.* | 6,941 | 32,977 | ||||||
GoerTek, Inc., Class A | 700 | 5,049 | ||||||
Gotion High-tech Co. Ltd., Class A* | 500 | 4,165 | ||||||
| See Notes to Financial Statements. | 40 |
DBX ETF Trust
Schedule of Investments
Xtrackers MSCI Emerging Markets ESG Leaders Equity ETF (Continued)
August 31, 2021
Number | Value | |||||||
| China (Continued) | ||||||||
Great Wall Motor Co. Ltd., Class A | 600 | $ | 6,149 | |||||
Great Wall Motor Co. Ltd., Class H | 16,548 | 76,172 | ||||||
Greenland Holdings Corp. Ltd., Class A | 1,260 | 869 | ||||||
Greentown Service Group Co. Ltd. | 8,419 | 9,006 | ||||||
Guangzhou Automobile Group Co. Ltd., Class H | 15,043 | 15,145 | ||||||
Guangzhou Baiyunshan Pharmaceutical Holdings Co. Ltd., Class A | 300 | 1,370 | ||||||
Guangzhou Kingmed Diagnostics Group Co. Ltd., Class A | 200 | 3,270 | ||||||
Guangzhou R&F Properties Co. Ltd., Class H | 8,808 | 7,520 | ||||||
Hangzhou Robam Appliances Co. Ltd., Class A | 300 | 1,660 | ||||||
Hansoh Pharmaceutical Group Co. Ltd., 144A | 7,187 | 19,637 | ||||||
HengTen Networks Group Ltd.* (a) | 18,050 | 8,866 | ||||||
Huaxia Bank Co. Ltd., Class A | 5,100 | 4,427 | ||||||
Industrial Bank Co. Ltd., Class A | 7,500 | 21,505 | ||||||
Inner Mongolia Yili Industrial Group Co. Ltd., Class A | 2,000 | 10,542 | ||||||
Jafron Biomedical Co. Ltd., Class A | 200 | 1,518 | ||||||
Jiangsu Zhongtian Technology Co. Ltd., Class A | 1,100 | 1,386 | ||||||
Jinke Properties Group Co. Ltd., Class A | 1,400 | 1,042 | ||||||
Jinxin Fertility Group Ltd., 144A* | 6,019 | 9,566 | ||||||
Kaisa Group Holdings Ltd.* | 10,000 | 3,330 | ||||||
Kingdee International Software Group Co. Ltd.* | 13,539 | 49,265 | ||||||
Kuang-Chi Technologies Co. Ltd., Class A* | 600 | 2,125 | ||||||
KWG Group Holdings Ltd. | 6,775 | 7,143 | ||||||
Lenovo Group Ltd. | 41,508 | 46,005 | ||||||
Li Auto, Inc., ADR* (a) | 2,968 | 91,593 | ||||||
Li Ning Co. Ltd. | 12,036 | 161,721 | ||||||
Liaoning Cheng Da Co. Ltd., Class A | 700 | 2,636 | ||||||
Logan Group Co. Ltd. | 6,775 | 8,084 | ||||||
Longfor Group Holdings Ltd., 144A | 10,252 | 44,423 | ||||||
Meituan, Class B, 144A* | 22,008 | 704,609 | ||||||
Microport Scientific Corp. | 3,528 | 21,842 | ||||||
Minth Group Ltd. | 4,801 | 19,939 | ||||||
NARI Technology Co. Ltd., Class A | 1,260 | 6,837 | ||||||
NIO, Inc., ADR* | 7,434 | 292,231 | ||||||
Offshore Oil Engineering Co. Ltd., Class A | 100 | 70 | ||||||
Ovctek China, Inc., Class A | 140 | 1,449 | ||||||
Pharmaron Beijing Co. Ltd., Class A | 200 | 5,967 | ||||||
Pharmaron Beijing Co. Ltd., Class H, 144A | 752 | 16,689 | ||||||
Ping An Insurance Group Co. of China Ltd., Class A | 3,900 | 30,163 | ||||||
Ping An Insurance Group Co. of China Ltd., Class H | 34,598 | 268,693 | ||||||
Poly Developments and Holdings Group Co. Ltd., Class A | 4,100 | 7,238 | ||||||
Poly Property Services Co. Ltd., Class H | 400 | 2,446 | ||||||
Shandong Sinocera Functional Material Co. Ltd., Class A | 300 | 2,128 | ||||||
Shandong Weigao Group Medical Polymer Co. Ltd., Class H | 14,373 | 23,655 | ||||||
Number | Value | |||||||
| China (Continued) | ||||||||
Shanghai Electric Group Co. Ltd., Class A | 2,300 | $ | 1,743 | |||||
Shanghai Fosun Pharmaceutical Group Co. Ltd., Class A | 600 | 5,887 | ||||||
Shanghai Fosun Pharmaceutical Group Co. Ltd., Class H | 3,012 | 19,325 | ||||||
Shanghai M&G Stationery, Inc., Class A | 200 | 2,136 | ||||||
Shanghai Pharmaceuticals Holding Co. Ltd., Class A | 300 | 893 | ||||||
Shanghai Pharmaceuticals Holding Co. Ltd., Class H | 4,327 | 8,590 | ||||||
Shenzhen Inovance Technology Co. Ltd., Class A | 850 | 9,356 | ||||||
Shenzhen Overseas Chinese Town Co. Ltd., Class A | 1,900 | 1,985 | ||||||
Shenzhou International Group Holdings Ltd. | 4,512 | 98,393 | ||||||
Sichuan Chuantou Energy Co. Ltd., Class A | 700 | 1,235 | ||||||
Sinotruk Hong Kong Ltd. | 3,625 | 7,141 | ||||||
Skshu Paint Co. Ltd., Class A | 140 | 3,162 | ||||||
Sungrow Power Supply Co. Ltd., Class A | 500 | 12,188 | ||||||
Suning.com Co. Ltd., Class A* | 2,700 | 2,210 | ||||||
TCL Technology Group Corp., Class A | 3,700 | 4,089 | ||||||
Tencent Holdings Ltd. | 31,579 | 1,953,855 | ||||||
Tongcheng-Elong Holdings Ltd.* | 4,814 | 11,203 | ||||||
Topchoice Medical Corp., Class A* | 100 | 3,642 | ||||||
Topsports International Holdings Ltd., 144A | 9,026 | 11,930 | ||||||
Uni-President China Holdings Ltd. | 8,468 | 8,024 | ||||||
Unisplendour Corp. Ltd., Class A | 1,040 | 3,828 | ||||||
Vipshop Holdings Ltd., ADR* | 2,446 | 36,176 | ||||||
Want Want China Holdings Ltd. | 25,992 | 17,679 | ||||||
Wuchan Zhongda Group Co. Ltd., Class A | 1,100 | 1,037 | ||||||
Wuhu Sanqi Interactive Entertainment Network Technology Group Co. Ltd., Class A | 1,100 | 2,907 | ||||||
WuXi AppTec Co. Ltd., Class A | 856 | 17,619 | ||||||
WuXi AppTec Co. Ltd., Class H, 144A | 2,115 | 42,151 | ||||||
Wuxi Biologics Cayman, Inc., 144A* | 19,665 | 304,431 | ||||||
Xinjiang Goldwind Science & Technology Co. Ltd., Class A | 1,700 | 3,844 | ||||||
Xinjiang Goldwind Science & Technology Co. Ltd., Class H | 2,818 | 5,384 | ||||||
Xinyi Solar Holdings Ltd. | 27,439 | 66,328 | ||||||
XPeng, Inc., ADR* (a) | 2,118 | 90,015 | ||||||
Yadea Group Holdings Ltd., 144A | 6,019 | 10,696 | ||||||
Yum China Holdings, Inc. | 2,328 | 143,312 | ||||||
Yunnan Baiyao Group Co. Ltd., Class A | 300 | 4,124 | ||||||
Yutong Bus Co. Ltd., Class A | 600 | 1,144 | ||||||
Zhejiang Chint Electrics Co. Ltd., Class A | 700 | 6,830 | ||||||
Zhejiang Expressway Co. Ltd., Class H | 9,035 | 7,923 | ||||||
Zhejiang Huayou Cobalt Co. Ltd., Class A | 300 | 6,519 | ||||||
Zhejiang Jiuzhou Pharmaceutical Co. Ltd., Class A | 300 | 1,874 | ||||||
Zhejiang Weixing New Building Materials Co. Ltd., Class A | 300 | 919 | ||||||
Zhenro Properties Group Ltd. | 4,000 | 2,335 | ||||||
| See Notes to Financial Statements. | 41 |
DBX ETF Trust
Schedule of Investments
Xtrackers MSCI Emerging Markets ESG Leaders Equity ETF (Continued)
August 31, 2021
Number | Value | |||||||
| China (Continued) | ||||||||
Zhongsheng Group Holdings Ltd. | 3,010 | $ | 25,156 | |||||
Zoomlion Heavy Industry Science and Technology Co. Ltd., Class A | 3,800 | 4,641 | ||||||
Zoomlion Heavy Industry Science and Technology Co. Ltd., Class H | 7,378 | 7,030 | ||||||
|
| |||||||
(Cost $7,845,791) | 8,327,385 | |||||||
|
| |||||||
| Czech Republic — 0.1% | ||||||||
Komercni banka AS* | 358 | 13,760 | ||||||
Moneta Money Bank AS, 144A* | 2,105 | 8,536 | ||||||
|
| |||||||
(Cost $19,287) | 22,296 | |||||||
|
| |||||||
| Egypt — 0.1% | ||||||||
Commercial International Bank Egypt SAE* | 8,865 | 26,426 | ||||||
|
| |||||||
| Greece — 0.1% | ||||||||
Eurobank Ergasias Services and Holdings SA* | 14,292 | 13,615 | ||||||
Hellenic Telecommunications Organization SA | 1,265 | 24,885 | ||||||
|
| |||||||
(Cost $32,432) | 38,500 | |||||||
|
| |||||||
| Hong Kong — 2.1% | ||||||||
Alibaba Health Information Technology Ltd.* | 22,679 | 37,209 | ||||||
Beijing Enterprises Water Group Ltd.* | 24,465 | 10,098 | ||||||
China Education Group Holdings Ltd. | 4,512 | 8,517 | ||||||
China Everbright Environment Group Ltd. | 17,100 | 11,829 | ||||||
China Gas Holdings Ltd. | 17,935 | 52,001 | ||||||
China Jinmao Holdings Group Ltd. | 30,086 | 9,787 | ||||||
China Mengniu Dairy Co. Ltd.* | 16,890 | 101,527 | ||||||
China Overseas Land & Investment Ltd. | 21,060 | 48,471 | ||||||
China Resources Gas Group Ltd. | 5,014 | 30,429 | ||||||
Geely Automobile Holdings Ltd. | 32,143 | 116,134 | ||||||
Hopson Development Holdings Ltd. | 3,462 | 13,488 | ||||||
Hutchmed China Ltd., ADR* (a) | 445 | 17,960 | ||||||
Lee & Man Paper Manufacturing Ltd. | 4,038 | 3,546 | ||||||
Shenzhen International Holdings Ltd. | 6,769 | 8,825 | ||||||
Shenzhen Investment Ltd. | 9,074 | 2,695 | ||||||
Shimao Group Holdings Ltd. | 6,769 | 13,995 | ||||||
Sino Biopharmaceutical Ltd. | 59,046 | 49,424 | ||||||
Vinda International Holdings Ltd. (a) | 1,753 | 5,162 | ||||||
|
| |||||||
(Cost $519,180) | 541,097 | |||||||
|
| |||||||
| Hungary — 0.4% | ||||||||
MOL Hungarian Oil & Gas PLC | 2,284 | 18,718 | ||||||
OTP Bank Nyrt* | 1,229 | 74,167 | ||||||
|
| |||||||
(Cost $79,006) | 92,885 | |||||||
|
| |||||||
| India — 11.7% | ||||||||
Adani Green Energy Ltd.* | 2,241 | 32,793 | ||||||
Adani Total Gas Ltd. | 958 | 19,060 | ||||||
Asian Paints Ltd. | 2,105 | 92,303 | ||||||
Axis Bank Ltd.* | 12,473 | 134,370 | ||||||
Bajaj Auto Ltd. | 390 | 19,914 | ||||||
Bandhan Bank Ltd., 144A | 3,468 | 13,538 | ||||||
Berger Paints India Ltd. | 1,280 | 14,391 | ||||||
Bharat Petroleum Corp. Ltd. | 4,919 | 31,778 | ||||||
Number | Value | |||||||
| India (Continued) | ||||||||
Biocon Ltd.* | 2,210 | $ | 10,863 | |||||
Britannia Industries Ltd. | 581 | 31,812 | ||||||
Colgate-Palmolive India Ltd. | 655 | 15,192 | ||||||
Dabur India Ltd. | 3,311 | 28,186 | ||||||
DLF Ltd. | 3,259 | 14,309 | ||||||
Eicher Motors Ltd. | 806 | 29,579 | ||||||
Grasim Industries Ltd. | 1,454 | 29,882 | ||||||
Havells India Ltd. | 1,250 | 21,718 | ||||||
HCL Technologies Ltd. | 5,939 | 96,177 | ||||||
Hero MotoCorp Ltd. | 654 | 24,561 | ||||||
Hindalco Industries Ltd. | 8,662 | 55,561 | ||||||
Hindustan Unilever Ltd. | 4,508 | 168,205 | ||||||
Housing Development Finance Corp. Ltd. | 9,401 | 360,356 | ||||||
Info Edge India Ltd. | 428 | 36,243 | ||||||
Infosys Ltd. | 5,955 | 139,190 | ||||||
Infosys Ltd., ADR | 12,406 | 295,511 | ||||||
Lupin Ltd. | 1,274 | 16,715 | ||||||
Mahindra & Mahindra Ltd. | 4,794 | 52,092 | ||||||
Marico Ltd. | 3,076 | 22,939 | ||||||
Motherson Sumi Systems Ltd.* | 7,023 | 21,028 | ||||||
Nestle India Ltd. | 185 | 49,331 | ||||||
PI Industries Ltd. | 465 | 21,617 | ||||||
Pidilite Industries Ltd. | 757 | 23,644 | ||||||
Piramal Enterprises Ltd. | 524 | 18,709 | ||||||
Reliance Industries Ltd. | 15,648 | 483,999 | ||||||
Shree Cement Ltd. | 62 | 24,023 | ||||||
Siemens Ltd. | 372 | 11,579 | ||||||
State Bank of India | 9,829 | 57,359 | ||||||
Tata Consultancy Services Ltd. | 5,069 | 262,898 | ||||||
Titan Co. Ltd. | 1,958 | 51,536 | ||||||
Trent Ltd. | 1,018 | 14,040 | ||||||
UPL Ltd. | 2,658 | 26,987 | ||||||
Wipro Ltd. | 7,004 | 61,490 | ||||||
Wipro Ltd., ADR | 508 | 4,745 | ||||||
|
| |||||||
(Cost $2,350,120) | 2,940,223 | |||||||
|
| |||||||
| Indonesia — 0.8% | ||||||||
Aneka Tambang Tbk | 45,742 | 7,665 | ||||||
PT Bank Central Asia Tbk | 60,616 | 139,188 | ||||||
PT Barito Pacific Tbk | 165,986 | 12,394 | ||||||
PT Indah Kiat Pulp & Paper Tbk | 13,000 | 7,201 | ||||||
PT Kalbe Farma Tbk | 110,845 | 10,453 | ||||||
PT Merdeka Copper Gold Tbk* | 58,830 | 11,632 | ||||||
PT Tower Bersama Infrastructure Tbk | 43,033 | 9,444 | ||||||
PT Unilever Indonesia Tbk | 43,223 | 12,274 | ||||||
|
| |||||||
(Cost $204,717) | 210,251 | |||||||
|
| |||||||
| Kuwait — 0.3% | ||||||||
Kuwait Finance House KSCP | ||||||||
(Cost $65,089) | 25,616 | 70,342 | ||||||
|
| |||||||
| Malaysia — 1.9% | ||||||||
AMMB Holdings Bhd* | 10,100 | 7,362 | ||||||
Axiata Group Bhd | 12,883 | 12,830 | ||||||
CIMB Group Holdings Bhd | 38,401 | 45,357 | ||||||
Dialog Group Bhd | 22,400 | 14,333 | ||||||
DiGi.Com Bhd | 17,700 | 18,735 | ||||||
Fraser & Neave Holdings Bhd | 300 | 2,012 | ||||||
| See Notes to Financial Statements. | 42 |
DBX ETF Trust
Schedule of Investments
Xtrackers MSCI Emerging Markets ESG Leaders Equity ETF (Continued)
August 31, 2021
Number | Value | |||||||
| Malaysia (Continued) | ||||||||
HAP Seng Consolidated Bhd | 2,200 | $ | 4,498 | |||||
Hartalega Holdings Bhd | 10,400 | 18,463 | ||||||
IHH Healthcare Bhd | 9,300 | 14,318 | ||||||
Kossan Rubber Industries | 6,200 | 4,624 | ||||||
Kuala Lumpur Kepong Bhd | 2,800 | 14,387 | ||||||
Malayan Banking Bhd | 22,472 | 45,409 | ||||||
Malaysia Airports Holdings Bhd* | 5,400 | 8,612 | ||||||
Maxis Bhd | 12,200 | 13,764 | ||||||
MISC Bhd | 7,200 | 12,471 | ||||||
Nestle Malaysia Bhd | 500 | 16,202 | ||||||
Petronas Dagangan Bhd | 1,500 | 7,202 | ||||||
Petronas Gas Bhd | 4,600 | 18,590 | ||||||
PPB Group Bhd | 4,100 | 18,266 | ||||||
Press Metal Aluminium Holdings Bhd | 18,200 | 23,642 | ||||||
Public Bank Bhd | 80,475 | 80,920 | ||||||
QL Resources Bhd | 5,400 | 7,223 | ||||||
RHB Bank Bhd | 8,794 | 11,826 | ||||||
Sime Darby Bhd | 15,000 | 8,516 | ||||||
Supermax Corp. Bhd | 4,177 | 3,316 | ||||||
Telekom Malaysia Bhd | 6,100 | 8,966 | ||||||
Top Glove Corp. Bhd | 28,600 | 27,520 | ||||||
Westports Holdings Bhd | 2,700 | 2,858 | ||||||
|
| |||||||
(Cost $473,917) | 472,222 | |||||||
|
| |||||||
| Mexico — 1.4% | ||||||||
Arca Continental SAB de CV | 2,422 | 15,636 | ||||||
Cemex SAB de CV, Series CPO* | 83,556 | 68,798 | ||||||
Coca-Cola Femsa SAB de CV | 2,972 | 17,244 | ||||||
Fomento Economico Mexicano SAB de CV | 10,755 | 93,851 | ||||||
Gruma SAB de CV, Class B | 1,282 | 14,674 | ||||||
Grupo Bimbo SAB de CV, Series A | 8,444 | 21,414 | ||||||
Grupo Financiero Banorte SAB de CV, Class O | 14,194 | 93,906 | ||||||
Industrias Penoles SAB de CV* | 756 | 10,736 | ||||||
Kimberly-Clark de Mexico SAB de CV, Class A | 8,677 | 15,358 | ||||||
|
| |||||||
(Cost $323,308) | 351,617 | |||||||
|
| |||||||
| Philippines — 0.6% | ||||||||
Ayala Land, Inc. | 43,000 | 29,171 | ||||||
Bank of the Philippine Islands | 10,720 | 17,928 | ||||||
Globe Telecom, Inc. | 130 | 7,108 | ||||||
GT Capital Holdings, Inc. | 460 | 4,993 | ||||||
JG Summit Holdings, Inc. | 16,920 | 22,072 | ||||||
SM Investments Corp. | 1,382 | 28,029 | ||||||
SM Prime Holdings, Inc. | 55,300 | 37,793 | ||||||
Universal Robina Corp. | 5,280 | 16,004 | ||||||
|
| |||||||
(Cost $160,130) | 163,098 | |||||||
|
| |||||||
| Poland — 1.0% | ||||||||
Bank Polska Kasa Opieki SA* | 1,010 | 28,278 | ||||||
CD Projekt SA | 418 | 18,485 | ||||||
Cyfrowy Polsat SA | 1,259 | 12,022 | ||||||
KGHM Polska Miedz SA | 758 | 35,299 | ||||||
Orange Polska SA* | 4,561 | 9,864 | ||||||
Polski Koncern Naftowy ORLEN SA | 1,653 | 32,077 | ||||||
Powszechna Kasa Oszczednosci Bank Polski SA* | 4,767 | 52,354 | ||||||
Number | Value | |||||||
| Poland (Continued) | ||||||||
Powszechny Zaklad Ubezpieczen SA* | 3,256 | $ | 34,526 | |||||
Santander Bank Polska SA* | 223 | 17,589 | ||||||
|
| |||||||
(Cost $226,012) | 240,494 | |||||||
|
| |||||||
| Qatar — 0.7% | ||||||||
Commercial Bank PSQC | 10,242 | 16,985 | ||||||
Ooredoo QPSC | 3,312 | 6,288 | ||||||
Qatar Fuel QSC | 2,569 | 12,912 | ||||||
Qatar National Bank QPSC | 25,083 | 132,063 | ||||||
|
| |||||||
(Cost $160,286) | 168,248 | |||||||
|
| |||||||
| Romania — 0.1% | ||||||||
NEPI Rockcastle PLC | 2,573 | 18,658 | ||||||
|
| |||||||
| Russia — 2.9% | ||||||||
Gazprom PJSC | 65,265 | 272,626 | ||||||
LUKOIL PJSC | 2,272 | 194,226 | ||||||
LUKOIL PJSC, ADR | 1 | 85 | ||||||
Mobile TeleSystems PJSC, ADR | 2,678 | 25,120 | ||||||
Moscow Exchange MICEX-RTS PJSC | 7,202 | 18,022 | ||||||
Novatek PJSC, GDR | 505 | 119,685 | ||||||
Novolipetsk Steel PJSC | 7,931 | 26,730 | ||||||
PhosAgro PJSC, GDR | 759 | 14,952 | ||||||
Polymetal International PLC | 1,940 | 38,750 | ||||||
Polyus PJSC | 181 | 32,632 | ||||||
|
| |||||||
(Cost $638,096) | 742,828 | |||||||
|
| |||||||
| Saudi Arabia — 1.1% | ||||||||
Almarai Co. JSC | 1,417 | 21,912 | ||||||
Bank AlBilad* | 2,124 | 24,209 | ||||||
Dr Sulaiman Al Habib Medical Services Group Co. | 309 | 15,126 | ||||||
Saudi Arabian Mining Co.* | 2,339 | 45,399 | ||||||
Saudi Basic Industries Corp. | 4,915 | 161,182 | ||||||
Savola Group | 1,599 | 17,117 | ||||||
|
| |||||||
(Cost $250,672) | 284,945 | |||||||
|
| |||||||
| Singapore — 0.0% | ||||||||
BOC Aviation Ltd., 144A | 1,104 | 8,276 | ||||||
|
| |||||||
| South Africa — 4.7% | ||||||||
Absa Group Ltd.* | 3,894 | 42,547 | ||||||
Anglo American Platinum Ltd. (a) | 298 | 33,960 | ||||||
Aspen Pharmacare Holdings Ltd.* | 2,296 | 31,128 | ||||||
Bid Corp. Ltd.* | 1,823 | 40,314 | ||||||
Bidvest Group Ltd. | 1,511 | 21,414 | ||||||
Capitec Bank Holdings Ltd. | 446 | 58,512 | ||||||
Clicks Group Ltd. | 1,265 | 26,460 | ||||||
Discovery Ltd.* | 2,378 | 21,169 | ||||||
FirstRand Ltd. | 27,938 | 119,536 | ||||||
Gold Fields Ltd. (a) | 5,036 | 47,516 | ||||||
Growthpoint Properties Ltd. REIT | 19,917 | 21,315 | ||||||
Impala Platinum Holdings Ltd. | 4,302 | 66,292 | ||||||
Kumba Iron Ore Ltd. | 404 | 18,238 | ||||||
MTN Group Ltd.* | 9,332 | 86,088 | ||||||
MultiChoice Group | 2,060 | 16,363 | ||||||
Naspers Ltd., Class N (a) | 1,200 | 205,738 | ||||||
| See Notes to Financial Statements. | 43 |
DBX ETF Trust
Schedule of Investments
Xtrackers MSCI Emerging Markets ESG Leaders Equity ETF (Continued)
August 31, 2021
Number | Value | |||||||
| South Africa (Continued) | ||||||||
Nedbank Group Ltd.* | 2,034 | $ | 26,014 | |||||
Northam Platinum Ltd.* | 1,957 | 27,057 | ||||||
Old Mutual Ltd. | 25,332 | 26,899 | ||||||
Remgro Ltd. | 2,812 | 23,485 | ||||||
Sanlam Ltd. | 10,457 | 46,585 | ||||||
Shoprite Holdings Ltd. | 2,932 | 37,266 | ||||||
SPAR Group Ltd. | 1,005 | 14,426 | ||||||
Standard Bank Group Ltd. | 6,941 | 71,358 | ||||||
Vodacom Group Ltd. | 3,477 | 34,530 | ||||||
Woolworths Holdings Ltd.* | 5,465 | 24,047 | ||||||
|
| |||||||
(Cost $1,061,897) | 1,188,257 | |||||||
|
| |||||||
| South Korea — 7.5% | ||||||||
Amorepacific Corp. | 178 | 34,926 | ||||||
AMOREPACIFIC Group | 165 | 8,225 | ||||||
BGF retail Co. Ltd. | 19 | 2,925 | ||||||
Celltrion Healthcare Co. Ltd.* | 458 | 48,863 | ||||||
CJ CheilJedang Corp. | 46 | 17,992 | ||||||
CJ Corp. | 52 | 4,552 | ||||||
CJ Logistics Corp.* | 47 | 6,932 | ||||||
Coway Co. Ltd. | 311 | 20,976 | ||||||
Doosan Bobcat, Inc.* | 266 | 9,945 | ||||||
Fila Holdings Corp. | 282 | 10,921 | ||||||
GS Engineering & Construction Corp. | 341 | 13,161 | ||||||
GS Holdings Corp. | 210 | 7,698 | ||||||
Hankook Tire & Technology Co. Ltd. | 445 | 17,885 | ||||||
Hanon Systems | 1,010 | 14,330 | ||||||
Hanwha Solutions Corp.* | 638 | 22,423 | ||||||
Hyundai Engineering & Construction Co. Ltd. | 432 | 20,679 | ||||||
Hyundai Glovis Co. Ltd. | 102 | 17,067 | ||||||
Hyundai Heavy Industries Holdings Co. Ltd. | 271 | 15,263 | ||||||
Kakao Corp. | 1,706 | 228,065 | ||||||
KB Financial Group, Inc. | 2,180 | 99,463 | ||||||
Korean Air Lines Co. Ltd.* | 875 | 23,621 | ||||||
LG Chem Ltd. | 252 | 164,747 | ||||||
LG Corp. | 463 | 38,056 | ||||||
LG Display Co. Ltd.* | 1,245 | 22,013 | ||||||
LG Electronics, Inc. | 605 | 74,095 | ||||||
LG Household & Health Care Ltd. | 49 | 61,744 | ||||||
Lotte Chemical Corp. | 103 | 22,209 | ||||||
NAVER Corp. | 676 | 255,952 | ||||||
POSCO Chemical Co. Ltd. | 167 | 22,397 | ||||||
Samsung Electro-Mechanics Co. Ltd. | 316 | 50,284 | ||||||
Samsung Engineering Co. Ltd.* | 907 | 17,484 | ||||||
Samsung Fire & Marine Insurance Co. Ltd. | 178 | 34,696 | ||||||
Samsung SDI Co. Ltd. | 300 | 205,183 | ||||||
Samsung SDS Co. Ltd. | 189 | 28,119 | ||||||
Shinhan Financial Group Co. Ltd. | 2,419 | 81,054 | ||||||
SK Biopharmaceuticals Co. Ltd.* | 151 | 16,344 | ||||||
SK Innovation Co. Ltd.* | 281 | 60,468 | ||||||
SK Telecom Co. Ltd. | 47 | 12,080 | ||||||
SK, Inc. | 175 | 39,771 | ||||||
SKC Co. Ltd. | 116 | 15,958 | ||||||
Yuhan Corp. | 268 | 14,446 | ||||||
|
| |||||||
(Cost $1,657,332) | 1,883,012 | |||||||
|
| |||||||
Number | Value | |||||||
| Taiwan — 21.0% | ||||||||
Acer, Inc. | 15,863 | $ | 14,424 | |||||
ASE Technology Holding Co. Ltd.* | 17,213 | 79,812 | ||||||
AU Optronics Corp. | 45,365 | 28,810 | ||||||
Cathay Financial Holding Co. Ltd. | 43,555 | 93,668 | ||||||
Chailease Holding Co. Ltd. | 6,819 | 65,573 | ||||||
Cheng Shin Rubber Industry Co. Ltd. | 8,317 | 11,179 | ||||||
China Steel Corp. | 65,256 | 89,830 | ||||||
Chunghwa Telecom Co. Ltd. | 21,363 | 86,335 | ||||||
Compal Electronics, Inc. | 25,161 | 20,791 | ||||||
CTBC Financial Holding Co. Ltd. | 101,884 | 84,556 | ||||||
Delta Electronics, Inc. | 10,979 | 107,161 | ||||||
E.Sun Financial Holding Co. Ltd. | 66,271 | 63,608 | ||||||
Eclat Textile Co. Ltd. | 1,048 | 21,063 | ||||||
Evergreen Marine Corp. Taiwan Ltd. | 15,000 | 73,610 | ||||||
Far Eastern New Century Corp. | 16,906 | 18,331 | ||||||
Far EasTone Telecommunications Co. Ltd. | 8,251 | 18,340 | ||||||
Feng TAY Enterprise Co. Ltd. | 3,012 | 23,476 | ||||||
First Financial Holding Co. Ltd. | 57,120 | 47,199 | ||||||
Fubon Financial Holding Co. Ltd. | 37,347 | 114,547 | ||||||
Hiwin Technologies Corp. | 1,543 | 18,151 | ||||||
Hotai Motor Co. Ltd. | 1,795 | 37,761 | ||||||
Hua Nan Financial Holdings Co. Ltd.* | 46,372 | 34,971 | ||||||
Innolux Corp. | 48,955 | 30,472 | ||||||
Inventec Corp. | 14,673 | 12,866 | ||||||
Lite-On Technology Corp. | 12,337 | 27,244 | ||||||
MediaTek, Inc. | 8,304 | 269,973 | ||||||
Mega Financial Holding Co. Ltd. | 58,665 | 69,432 | ||||||
Nan Ya Plastics Corp. | 28,799 | 93,110 | ||||||
Nien Made Enterprise Co. Ltd. | 752 | 11,234 | ||||||
Oneness Biotech Co. Ltd.* | 1,505 | 10,481 | ||||||
President Chain Store Corp.* | 2,961 | 30,504 | ||||||
Ruentex Development Co. Ltd. | 3,014 | 7,537 | ||||||
Shanghai Commercial & Savings Bank Ltd. | 19,555 | �� | 31,753 | |||||
SinoPac Financial Holdings Co. Ltd. | 56,181 | 28,888 | ||||||
Taishin Financial Holding Co. Ltd.* | 54,795 | 38,259 | ||||||
Taiwan Cement Corp. | 27,079 | 47,341 | ||||||
Taiwan High Speed Rail Corp. | 10,181 | 11,094 | ||||||
Taiwan Mobile Co. Ltd. | 8,690 | 31,670 | ||||||
Taiwan Semiconductor Manufacturing Co. Ltd. | 135,122 | 2,993,664 | ||||||
Uni-President Enterprises Corp.* | 27,159 | 70,853 | ||||||
United Microelectronics Corp. | 65,202 | 148,456 | ||||||
Wan Hai Lines Ltd.* | 3,027 | 27,088 | ||||||
Wistron Corp. | 14,686 | 14,520 | ||||||
Yageo Corp. | 2,268 | 39,241 | ||||||
Yang Ming Marine Transport Corp.* | 8,646 | 41,649 | ||||||
Yuanta Financial Holding Co. Ltd. | 55,510 | 50,075 | ||||||
|
| |||||||
(Cost $3,861,174) | 5,290,600 | |||||||
|
| |||||||
| Thailand — 2.2% | ||||||||
Advanced Info Service PCL, NVDR | 6,200 | 36,162 | ||||||
Airports of Thailand PCL, NVDR | 23,600 | 46,677 | ||||||
Asset World Corp. PCL, NVDR* | 27,400 | 3,689 | ||||||
B Grimm Power PCL, NVDR | 5,600 | 8,035 | ||||||
Bangkok Dusit Medical Services PCL, NVDR | 50,900 | 36,952 | ||||||
| See Notes to Financial Statements. | 44 |
DBX ETF Trust
Schedule of Investments
Xtrackers MSCI Emerging Markets ESG Leaders Equity ETF (Continued)
August 31, 2021
Number | Value | |||||||
| Thailand (Continued) | ||||||||
Berli Jucker PCL, NVDR | 7,600 | $ | 8,547 | |||||
BTS Group Holdings PCL, NVDR | 46,000 | 13,415 | ||||||
Bumrungrad Hospital PCL, NVDR | 2,900 | 11,966 | ||||||
Central Pattana PCL, NVDR | 11,700 | 19,511 | ||||||
Charoen Pokphand Foods PCL, NVDR | 22,000 | 18,429 | ||||||
CP ALL PCL, NVDR | 31,500 | 63,523 | ||||||
Energy Absolute PCL, NVDR | 8,700 | 17,679 | ||||||
Gulf Energy Development PCL, NVDR | 16,500 | 21,372 | ||||||
Home Product Center PCL, NVDR | 31,400 | 13,931 | ||||||
Indorama Ventures PCL, NVDR | 8,900 | 12,080 | ||||||
Intouch Holdings PCL, NVDR | 6,100 | 16,181 | ||||||
Land & Houses PCL, NVDR | 52,300 | 13,224 | ||||||
Minor International PCL, NVDR* | 17,374 | 17,653 | ||||||
Muangthai Capital PCL, NVDR | 4,500 | 9,040 | ||||||
Osotspa PCL, NVDR | 4,400 | 4,983 | ||||||
PTT Exploration & Production PCL, NVDR | 7,600 | 26,290 | ||||||
PTT Global Chemical PCL, NVDR | 12,200 | 24,224 | ||||||
Siam Cement PCL, NVDR | 4,300 | 57,364 | ||||||
Siam Commercial Bank PCL, NVDR | 4,600 | 15,199 | ||||||
Sri Trang Gloves Thailand PCL, NVDR | 3,500 | 4,018 | ||||||
Thai Oil PCL, NVDR | 6,100 | 9,415 | ||||||
Thai Union Group PCL, NVDR | 14,700 | 9,076 | ||||||
True Corp. PCL, NVDR | 62,400 | 6,427 | ||||||
|
| |||||||
(Cost $533,729) | 545,062 | |||||||
|
| |||||||
| Turkey — 0.2% | ||||||||
KOC Holding AS | 4,872 | 13,501 | ||||||
Turkcell Iletisim Hizmetleri AS | 6,597 | 13,004 | ||||||
Turkiye Garanti Bankasi AS | 14,875 | 17,676 | ||||||
Turkiye Is Bankasi AS, Class C | 7,426 | 5,135 | ||||||
|
| |||||||
(Cost $46,343) | 49,316 | |||||||
|
| |||||||
| United Arab Emirates — 1.2% | ||||||||
Abu Dhabi Commercial Bank PJSC | 15,685 | 32,069 | ||||||
Abu Dhabi Islamic Bank PJSC | 7,652 | 11,749 | ||||||
Aldar Properties PJSC | 23,199 | 26,211 | ||||||
Emirates NBD Bank PJSC | 13,873 | 52,310 | ||||||
Emirates Telecommunications Group Co. PJSC | 9,915 | 63,704 | ||||||
First Abu Dhabi Bank PJSC | 23,857 | 110,414 | ||||||
|
| |||||||
(Cost $259,136) | 296,457 | |||||||
|
| |||||||
| Uruguay — 0.3% | ||||||||
Globant SA* | 226 | 72,835 | ||||||
|
| |||||||
TOTAL COMMON STOCKS (Cost $21,602,991) | 24,767,215 | |||||||
|
| |||||||
| PREFERRED STOCKS — 0.8% | ||||||||
| Brazil — 0.5% | ||||||||
Banco Bradesco SA | 26,583 | 120,205 | ||||||
Cia Energetica de Minas Gerais | 6,023 | 15,894 | ||||||
|
| |||||||
(Cost $156,233) | 136,099 | |||||||
|
| |||||||
| Chile — 0.1% | ||||||||
Sociedad Quimica y Minera de Chile SA, Class B | 726 | 37,924 | ||||||
|
| |||||||
Number | Value | |||||||||
| Colombia — 0.1% | ||||||||||
Bancolombia SA | 2,722 | $ | 22,713 | |||||||
|
| |||||||||
| South Korea — 0.1% | ||||||||||
LG Chem Ltd. | 44 | 13,130 | ||||||||
LG Household & Health Care Ltd. | 13 | 7,703 | ||||||||
|
| |||||||||
(Cost $20,506) | 20,833 | |||||||||
|
| |||||||||
TOTAL PREFERRED STOCKS (Cost $232,116) | 217,569 | |||||||||
|
| |||||||||
Principal | ||||||||||
| CORPORATE BONDS — 0.0% |
| |||||||||
| India — 0.0% | ||||||||||
Britannia Industries Ltd. | INR | 4,500 | 64 | |||||||
Series N3, 5.50%, 6/3/24 | INR | 12,383 | 171 | |||||||
|
| |||||||||
(Cost $234) | 235 | |||||||||
|
| |||||||||
Number | ||||||||||
| WARRANTS — 0.0% |
| |||||||||
| Thailand — 0.0% | ||||||||||
BTS Group Holdings PCL*, expires 9/5/22 (b) | 1,525 | 43 | ||||||||
BTS Group Holdings PCL*, expires 11/7/24 (b) | 3,050 | 80 | ||||||||
BTS Group Holdings PCL*, expires 11/20/26 (b) | 6,100 | 120 | ||||||||
Minor International PCL*, expires 9/30/21 | 305 | 3 | ||||||||
Minor International PCL*, expires 2/15/24 | 380 | 52 | ||||||||
|
| |||||||||
(Cost $0) | 298 | |||||||||
|
| |||||||||
| EXCHANGE-TRADED FUNDS — 0.3% | ||||||||||
iShares ESG Aware MSCI EM ETF (a) | ||||||||||
(Cost $74,925) | 1,717 | 74,106 | ||||||||
|
| |||||||||
| SECURITIES LENDING COLLATERAL — 0.3% | ||||||||||
DWS Government & Agency Securities Portfolio “DWS Government Cash Institutional Shares”, 0.01% (c)(d) (Cost $79,911) | 79,911 | 79,911 | ||||||||
|
| |||||||||
| CASH EQUIVALENTS — 0.6% | ||||||||||
DWS Government Money Market Series “Institutional Shares”, 0.04% (c) | 149,313 | 149,313 | ||||||||
|
| |||||||||
TOTAL INVESTMENTS — 100.3% (Cost $22,139,490) | $ | 25,288,647 | ||||||||
Other assets and liabilities, net — (0.3%) | (85,307 | ) | ||||||||
|
| |||||||||
NET ASSETS — 100.0% | $ | 25,203,340 | ||||||||
|
| |||||||||
| See Notes to Financial Statements. | 45 |
DBX ETF Trust
Schedule of Investments
Xtrackers MSCI Emerging Markets ESG Leaders Equity ETF (Continued)
August 31, 2021
A summary of the Fund’s transactions with affiliated investments during the year ended August 31, 2021 is as follows:
| Value ($) at 8/31/2020 | Purchases Cost ($) | Sales Proceeds ($) | Net Realized Gain/(Loss) ($) | Net Change in Unrealized Appreciation (Depreciation) ($) | Income ($) | Capital Gain Distributions ($) | Number of Shares at 8/31/2021 | Value ($) at 8/31/2021 | ||||||||||||||||||||||||||||
SECURITIES LENDING COLLATERAL — 0.3% |
| |||||||||||||||||||||||||||||||||||
DWS Government & Agency Securities Portfolio “DWS Government Cash Institutional Shares”, 0.01% (c)(d) |
| |||||||||||||||||||||||||||||||||||
| 29,475 | 50,436 | (e) | — | — | — | 6 | — | 79,911 | 79,911 | |||||||||||||||||||||||||||
CASH EQUIVALENTS — 0.6% |
| |||||||||||||||||||||||||||||||||||
DWS Government Money Market Series “Institutional Shares”, 0.04% (c) |
| |||||||||||||||||||||||||||||||||||
| 32,100 | 7,160,933 | (7,043,720 | ) | — | — | 28 | — | 149,313 | 149,313 | |||||||||||||||||||||||||||
|
|
|
|
|
|
|
|
|
|
|
|
|
|
|
|
|
| |||||||||||||||||||
| 61,575 | 7,211,369 | (7,043,720 | ) | — | — | 34 | — | 229,224 | 229,224 | |||||||||||||||||||||||||||
|
|
|
|
|
|
|
|
|
|
|
|
|
|
|
|
|
| |||||||||||||||||||
| * | Non-income producing security. |
| (a) | All or a portion of these securities were on loan. In addition, “Other assets and liabilities, net” may include pending sales that are also on loan. The value of securities loaned at August 31, 2021 amounted to $288,300, which is 1.1% of net assets. |
| (b) | Investment was valued using significant unobservable inputs. |
| (c) | Affiliated fund managed by DWS Investment Management Americas, Inc. The rate shown is the annualized seven-day yield at period end. |
| (d) | Represents cash collateral held in connection with securities lending. Income earned by the Fund is net of borrower rebates. In addition, the Fund held non-cash U.S. Treasury securities collateral having a value of $205,841. |
| (e) | Represents the net increase (purchase cost) or decrease (sales proceeds) in the amount invested in cash collateral for the year ended August 31, 2021. |
| ADR: | American Depositary Receipt |
| CPO: | Ordinary Participation Certificates |
| GDR: | Global Depositary Receipt |
| JSC: | Joint Stock Company |
| KSCP: | Kuwait Shareholding Company Public |
| NVDR: | Non Voting Depositary Receipt |
| PJSC: | Public Joint Stock Company |
| PSQC: | Public Shareholders Qatari Company |
| QPSC: | Qatari Public Shareholders Company |
| QSC: | Qatari Shareholders Company |
| REIT: | Real Estate Investment Trust |
| SAE: | Societe Anonyme Egyptienne |
| 144A: | Security exempt from registration under Rule 144A of the Securities Act of 1933. These securities may be resold in transactions exempt from registration, normally to qualified institutional buyers. |
Securities are listed in country of domicile.
At August 31, 2021, open futures contracts purchased were as follows:
Contract Description | Currency | Number of Contracts | Notional Amount | Contract Value | Expiration Date | Unrealized Appreciation | ||||||||||||
MSCI Emerging Markets Index Futures | USD | 3 | $ | 190,815 | $194,880 | 9/17/2021 | $ | 4,065 | ||||||||||
For information on the Fund’s policy and additional disclosures regarding open futures contracts, please refer to the Derivatives section of Note 2 in the accompanying Notes to Financial Statements.
Currency Abbreviations
| INR | Indian Rupee |
| USD | U.S. Dollar |
| See Notes to Financial Statements. | 46 |
DBX ETF Trust
Schedule of Investments
Xtrackers MSCI Emerging Markets ESG Leaders Equity ETF (Continued)
August 31, 2021
Fair Value Measurements
Various inputs are used in determining the value of the Fund’s investments. These inputs are summarized in three broad levels. Level 1 includes quoted prices in active markets for identical securities. Level 2 includes other significant observable inputs (including quoted prices for similar securities, interest rates, prepayment speeds and credit risk). Level 3 includes significant unobservable inputs (including the Fund’s own assumptions in determining the fair value of investments). The level assigned to the securities valuations may not be an indication of the risk or liquidity associated with investing in those securities.
The following is a summary of the inputs used as of August 31, 2021 in valuing the Fund’s investments. For information on the Fund’s policy regarding the valuation of investments, please refer to the Security Valuation section of Note 2 in the accompanying Notes to Financial Statements.
Assets | Level 1 | Level 2 | Level 3 | Total | ||||||||||||
Common Stocks (f) | $ | 24,767,215 | $ | — | $ | — | $ | 24,767,215 | ||||||||
Preferred Stocks (f) | 217,569 | — | — | 217,569 | ||||||||||||
Corporate Bonds | — | 235 | — | 235 | ||||||||||||
Warrants | 55 | — | 243 | 298 | ||||||||||||
Exchange-Traded Funds | 74,106 | — | — | 74,106 | ||||||||||||
Short-Term Investments (f) | 229,224 | — | — | 229,224 | ||||||||||||
Derivatives (g) | ||||||||||||||||
Futures Contracts | 4,065 | — | — | 4,065 | ||||||||||||
|
|
|
|
|
|
|
| |||||||||
TOTAL | $ | 25,292,234 | $ | 235 | $ | 243 | $ | 25,292,712 | ||||||||
|
|
|
|
|
|
|
| |||||||||
| (f) | See Schedule of Investments for additional detailed categorizations. |
| (g) | Derivatives include unrealized appreciation (depreciation) on open futures contracts. |
| See Notes to Financial Statements. | 47 |
DBX ETF Trust
Schedule of Investments
Xtrackers MSCI USA ESG Leaders Equity ETF
August 31, 2021
Number | Value | |||||||
| COMMON STOCKS — 99.9% | ||||||||
| Communication Services — 12.0% | ||||||||
Activision Blizzard, Inc. | 148,003 | $ | 12,191,007 | |||||
Alphabet, Inc., Class A* | 57,189 | 165,502,107 | ||||||
Alphabet, Inc., Class C* | 55,510 | 161,491,912 | ||||||
Cable One, Inc. | 1,006 | 2,112,188 | ||||||
Discovery, Inc., Class A* (a) | 39,528 | 1,139,988 | ||||||
Discovery, Inc., Class C* | 51,687 | 1,426,044 | ||||||
Electronic Arts, Inc. | 54,966 | 7,981,613 | ||||||
Interpublic Group of Cos., Inc. | 76,142 | 2,834,767 | ||||||
Omnicom Group, Inc. | 42,037 | 3,077,949 | ||||||
Sirius XM Holdings, Inc. (a) | 171,627 | 1,076,101 | ||||||
Take-Two Interactive Software, Inc.* | 21,486 | 3,463,973 | ||||||
Verizon Communications, Inc. | 789,265 | 43,409,575 | ||||||
Walt Disney Co.* | 346,631 | 62,844,200 | ||||||
|
| |||||||
(Cost $273,140,047) | 468,551,424 | |||||||
|
| |||||||
| Consumer Discretionary — 12.3% | ||||||||
Advance Auto Parts, Inc. | 11,598 | 2,352,654 | ||||||
Aptiv PLC* | 51,326 | 7,811,304 | ||||||
Best Buy Co., Inc. | 41,976 | 4,890,624 | ||||||
Booking Holdings, Inc.* | 7,804 | 17,946,625 | ||||||
BorgWarner, Inc. | 43,109 | 1,839,892 | ||||||
Burlington Stores, Inc.* | 12,869 | 3,854,137 | ||||||
CarMax, Inc.* | 31,293 | 3,918,196 | ||||||
Darden Restaurants, Inc. | 23,906 | 3,601,439 | ||||||
Domino’s Pizza, Inc. | 7,501 | 3,877,192 | ||||||
eBay, Inc. | 130,029 | 9,978,425 | ||||||
Garmin Ltd. | 30,180 | 5,264,297 | ||||||
Genuine Parts Co. | 27,519 | 3,362,547 | ||||||
Hasbro, Inc. | 25,803 | 2,536,693 | ||||||
Hilton Worldwide Holdings, Inc.* | 52,994 | 6,616,831 | ||||||
Home Depot, Inc. | 202,623 | 66,091,570 | ||||||
LKQ Corp.* | 55,552 | 2,927,035 | ||||||
Lowe’s Cos., Inc. | 134,095 | 27,340,630 | ||||||
Lululemon Athletica, Inc.* | 23,623 | 9,453,216 | ||||||
McDonald’s Corp. | 142,223 | 33,772,274 | ||||||
MercadoLibre, Inc.* | 8,581 | 16,024,588 | ||||||
Mohawk Industries, Inc.* | 10,671 | 2,110,297 | ||||||
Newell Brands, Inc. | 75,500 | 1,918,455 | ||||||
NIKE, Inc., Class B | 242,619 | 39,969,054 | ||||||
NVR, Inc.* | 640 | 3,315,162 | ||||||
Pool Corp. | 7,396 | 3,655,843 | ||||||
Starbucks Corp. | 224,865 | 26,419,389 | ||||||
Target Corp. | 94,532 | 23,347,513 | ||||||
Tesla, Inc.* | 155,891 | 114,692,126 | ||||||
TJX Cos., Inc. | 231,663 | 16,846,533 | ||||||
Tractor Supply Co. | 21,767 | 4,228,240 | ||||||
Vail Resorts, Inc.* | 7,928 | 2,416,851 | ||||||
VF Corp. | 63,405 | 4,848,580 | ||||||
|
| |||||||
(Cost $276,099,588) | 477,228,212 | |||||||
|
| |||||||
| Consumer Staples — 5.9% | ||||||||
Bunge Ltd. | 25,798 | 1,953,167 | ||||||
Campbell Soup Co. | 36,737 | 1,533,035 | ||||||
Clorox Co. | 23,289 | 3,913,716 | ||||||
Coca-Cola Co. | 781,928 | 44,030,366 | ||||||
Colgate-Palmolive Co. | 154,011 | 12,005,157 | ||||||
Number | Value | |||||||
| Consumer Staples (Continued) | ||||||||
Conagra Brands, Inc. | 89,503 | $ | 2,964,339 | |||||
Estee Lauder Cos., Inc., Class A | 43,947 | 14,963,514 | ||||||
General Mills, Inc. | 116,837 | 6,754,347 | ||||||
Hormel Foods Corp. | 53,819 | 2,450,917 | ||||||
J M Smucker Co. | 20,989 | 2,595,710 | ||||||
Kellogg Co. | 46,635 | 2,944,534 | ||||||
Keurig Dr Pepper, Inc. (a) | 137,399 | 4,901,022 | ||||||
Kimberly-Clark Corp. | 64,686 | 8,914,378 | ||||||
Kroger Co. | 135,051 | 6,216,398 | ||||||
Lamb Weston Holdings, Inc. | 29,444 | 1,918,277 | ||||||
McCormick & Co., Inc. | 48,674 | 4,200,079 | ||||||
PepsiCo, Inc. | 263,742 | 41,246,611 | ||||||
Procter & Gamble Co. | 467,116 | 66,512,647 | ||||||
|
| |||||||
(Cost $193,894,708) | 230,018,214 | |||||||
|
| |||||||
| Energy — 1.1% | ||||||||
Baker Hughes Co. | 140,162 | 3,192,890 | ||||||
Cheniere Energy, Inc.* | 46,138 | 4,035,230 | ||||||
Marathon Petroleum Corp. | 124,155 | 7,358,667 | ||||||
ONEOK, Inc. | 85,145 | 4,471,815 | ||||||
Phillips 66 | 83,355 | 5,925,707 | ||||||
Schlumberger N.V. | 266,662 | 7,477,203 | ||||||
Valero Energy Corp. | 78,061 | 5,176,225 | ||||||
Williams Cos., Inc. | 227,944 | 5,627,937 | ||||||
|
| |||||||
(Cost $43,124,917) | 43,265,674 | |||||||
|
| |||||||
| Financials — 11.1% | ||||||||
Aflac, Inc. | 124,933 | 7,081,202 | ||||||
Allstate Corp. | 56,974 | 7,707,443 | ||||||
Ally Financial, Inc. | 72,478 | 3,834,086 | ||||||
American Express Co. | 130,611 | 21,676,202 | ||||||
American Financial Group, Inc. | 13,835 | 1,908,400 | ||||||
American International Group, Inc. | 160,460 | 8,754,698 | ||||||
Ameriprise Financial, Inc. | 21,832 | 5,958,171 | ||||||
Annaly Capital Management, Inc. REIT | 258,917 | 2,249,989 | ||||||
Aon PLC, Class A (a) | 43,150 | 12,378,009 | ||||||
Arch Capital Group Ltd.* | 78,886 | 3,242,215 | ||||||
Arthur J Gallagher & Co. | 39,385 | 5,656,474 | ||||||
Assurant, Inc. | 11,957 | 2,034,005 | ||||||
Bank of New York Mellon Corp. | 159,776 | 8,822,831 | ||||||
BlackRock, Inc. | 28,888 | 27,249,761 | ||||||
Carlyle Group, Inc. | 28,163 | 1,390,689 | ||||||
Cboe Global Markets, Inc. | 19,372 | 2,443,778 | ||||||
Charles Schwab Corp. | 275,390 | 20,062,161 | ||||||
Chubb Ltd. | 84,654 | 15,569,564 | ||||||
Citizens Financial Group, Inc. | 77,377 | 3,388,339 | ||||||
CME Group, Inc. | 68,516 | 13,821,047 | ||||||
Discover Financial Services | 58,327 | 7,478,688 | ||||||
Equitable Holdings, Inc. | 78,103 | 2,421,974 | ||||||
Erie Indemnity Co., Class A | 5,237 | 927,420 | ||||||
FactSet Research Systems, Inc. | 6,934 | 2,636,445 | ||||||
First Republic Bank | 32,802 | 6,525,630 | ||||||
Franklin Resources, Inc. | 58,494 | 1,897,545 | ||||||
Hartford Financial Services Group, Inc. | 69,061 | 4,642,280 | ||||||
Huntington Bancshares, Inc. | 281,547 | 4,372,425 | ||||||
Intercontinental Exchange, Inc. | 107,302 | 12,825,808 | ||||||
Invesco Ltd. | 71,374 | 1,807,190 | ||||||
KeyCorp | 192,506 | �� | 3,911,722 | |||||
| See Notes to Financial Statements. | 48 |
DBX ETF Trust
Schedule of Investments
Xtrackers MSCI USA ESG Leaders Equity ETF (Continued)
August 31, 2021
Number | Value | |||||||
| Financials (Continued) | ||||||||
Lincoln National Corp. | 32,882 | $ | 2,257,349 | |||||
Loews Corp. | 41,038 | 2,292,793 | ||||||
M&T Bank Corp. | 24,568 | 3,439,766 | ||||||
MarketAxess Holdings, Inc. | 7,058 | 3,359,043 | ||||||
Marsh & McLennan Cos., Inc. | 97,155 | 15,272,766 | ||||||
Moody’s Corp. | 32,071 | 12,211,675 | ||||||
Morgan Stanley | 265,998 | 27,778,171 | ||||||
Nasdaq, Inc. | 21,999 | 4,306,964 | ||||||
Northern Trust Corp. | 38,339 | 4,543,938 | ||||||
PNC Financial Services Group, Inc. | 80,548 | 15,392,723 | ||||||
Principal Financial Group, Inc. | 51,427 | 3,435,838 | ||||||
Progressive Corp. | 112,268 | 10,815,899 | ||||||
Prudential Financial, Inc. | 75,911 | 8,037,457 | ||||||
Raymond James Financial, Inc. | 23,512 | 3,289,329 | ||||||
Regions Financial Corp. | 179,909 | 3,675,541 | ||||||
S&P Global, Inc. | 45,896 | 20,369,563 | ||||||
State Street Corp. | 67,077 | 6,232,124 | ||||||
SVB Financial Group* | 10,946 | 6,124,287 | ||||||
T. Rowe Price Group, Inc. | 43,341 | 9,702,750 | ||||||
Travelers Cos., Inc. | 47,737 | 7,624,076 | ||||||
Truist Financial Corp. | 252,514 | 14,408,449 | ||||||
US Bancorp | 267,308 | 15,340,806 | ||||||
Voya Financial, Inc. (a) | 21,870 | 1,421,113 | ||||||
Willis Towers Watson PLC | 24,188 | 5,338,775 | ||||||
|
| |||||||
(Cost $311,507,591) | 431,347,386 | |||||||
|
| |||||||
| Health Care — 13.5% | ||||||||
ABIOMED, Inc.* | 8,633 | 3,142,067 | ||||||
Agilent Technologies, Inc. | 58,230 | 10,217,618 | ||||||
Align Technology, Inc.* | 14,317 | 10,150,753 | ||||||
AmerisourceBergen Corp. | 28,743 | 3,512,682 | ||||||
Amgen, Inc. | 109,066 | 24,597,655 | ||||||
Baxter International, Inc. | 96,652 | 7,366,815 | ||||||
Biogen, Inc.* | 28,275 | 9,582,680 | ||||||
BioMarin Pharmaceutical, Inc.* | 34,530 | 2,907,771 | ||||||
Bio-Techne Corp. | 7,597 | 3,791,967 | ||||||
Bristol-Myers Squibb Co. | 423,901 | 28,342,021 | ||||||
Cardinal Health, Inc. | 52,721 | 2,767,325 | ||||||
Catalent, Inc.* | 33,302 | 4,343,913 | ||||||
Centene Corp.* | 110,961 | 6,988,324 | ||||||
Cerner Corp. | 58,632 | 4,476,553 | ||||||
Cigna Corp. | 65,724 | 13,910,485 | ||||||
DaVita, Inc.* | 13,530 | 1,769,318 | ||||||
DENTSPLY SIRONA, Inc. | 41,201 | 2,542,102 | ||||||
Dexcom, Inc.* | 18,404 | 9,743,446 | ||||||
Edwards Lifesciences Corp.* | 119,278 | 13,976,996 | ||||||
Eli Lilly & Co. | 154,995 | 40,033,659 | ||||||
Gilead Sciences, Inc. | 239,759 | 17,449,660 | ||||||
HCA Healthcare, Inc. | 50,971 | 12,894,644 | ||||||
Hologic, Inc.* | 48,023 | 3,801,021 | ||||||
Horizon Therapeutics PLC* | 41,676 | 4,504,759 | ||||||
Humana, Inc. | 24,664 | 9,999,279 | ||||||
IDEXX Laboratories, Inc.* | 16,369 | 11,028,777 | ||||||
Illumina, Inc.* | 28,126 | 12,858,082 | ||||||
Insulet Corp.* | 12,990 | 3,868,552 | ||||||
Jazz Pharmaceuticals PLC* | 10,509 | 1,384,140 | ||||||
Johnson & Johnson | 500,252 | 86,608,629 | ||||||
Number | Value | |||||||
| Health Care (Continued) | ||||||||
Laboratory Corp. of America Holdings* | 17,987 | $ | 5,456,896 | |||||
Merck & Co., Inc. | 483,386 | 36,877,518 | ||||||
Mettler-Toledo International, Inc.* | 4,321 | 6,709,778 | ||||||
Novocure Ltd.* (a) | 17,406 | 2,336,059 | ||||||
Quest Diagnostics, Inc. | 24,942 | 3,811,886 | ||||||
ResMed, Inc. | 27,800 | 8,076,734 | ||||||
STERIS PLC | 19,013 | 4,087,985 | ||||||
Teladoc Health, Inc.* | 25,724 | 3,715,060 | ||||||
Teleflex, Inc. | 9,105 | 3,600,663 | ||||||
Thermo Fisher Scientific, Inc. | 74,761 | 41,488,617 | ||||||
Vertex Pharmaceuticals, Inc.* | 49,544 | 9,923,168 | ||||||
Waters Corp.* | 11,668 | 4,830,785 | ||||||
West Pharmaceutical Services, Inc. | 13,727 | 6,199,388 | ||||||
Zoetis, Inc. | 90,840 | 18,582,230 | ||||||
|
| |||||||
(Cost $415,258,730) | 524,258,460 | |||||||
|
| |||||||
| Industrials — 8.4% | ||||||||
3M Co. | 110,531 | 21,524,807 | ||||||
Allegion PLC | 18,473 | 2,659,927 | ||||||
AMERCO | 1,982 | 1,310,399 | ||||||
C.H. Robinson Worldwide, Inc. | 25,324 | 2,280,679 | ||||||
Caterpillar, Inc. | 104,102 | 21,951,989 | ||||||
Copart, Inc.* | 41,202 | 5,946,273 | ||||||
CSX Corp. | 436,089 | 14,185,975 | ||||||
Cummins, Inc. | 28,132 | 6,638,589 | ||||||
Deere & Co. | 57,028 | 21,558,295 | ||||||
Delta Air Lines, Inc.* | 32,362 | 1,308,719 | ||||||
Dover Corp. | 26,635 | 4,644,079 | ||||||
Eaton Corp. PLC | 75,896 | 12,777,851 | ||||||
Expeditors International of Washington, Inc. | 33,109 | 4,126,706 | ||||||
Fastenal Co. | 109,168 | 6,097,033 | ||||||
Fortive Corp. | 60,893 | 4,498,166 | ||||||
Fortune Brands Home & Security, Inc. | 26,713 | 2,601,045 | ||||||
Generac Holdings, Inc.* | 11,794 | 5,153,742 | ||||||
Howmet Aerospace, Inc. | 70,767 | 2,246,852 | ||||||
IDEX Corp. | 14,021 | 3,140,704 | ||||||
IHS Markit Ltd. | 71,675 | 8,644,005 | ||||||
Illinois Tool Works, Inc. | 60,199 | 14,017,939 | ||||||
Johnson Controls International PLC | 136,743 | 10,228,376 | ||||||
Kansas City Southern | 16,762 | 4,704,591 | ||||||
Lennox International, Inc. | 5,885 | 1,972,534 | ||||||
Masco Corp. | 51,106 | 3,103,156 | ||||||
Norfolk Southern Corp. | 47,996 | 12,168,906 | ||||||
Owens Corning | 19,810 | 1,892,845 | ||||||
PACCAR, Inc. | 66,191 | 5,419,057 | ||||||
Pentair PLC (a) | 32,773 | 2,528,765 | ||||||
Robert Half International, Inc. | 20,487 | 2,118,356 | ||||||
Rockwell Automation, Inc. | 22,126 | 7,200,907 | ||||||
Roper Technologies, Inc. | 20,042 | 9,685,898 | ||||||
Snap-on, Inc. | 10,326 | 2,322,834 | ||||||
Stanley Black & Decker, Inc. | 29,899 | 5,778,580 | ||||||
Trane Technologies PLC | 45,331 | 8,998,203 | ||||||
Union Pacific Corp. | 126,456 | 27,420,719 | ||||||
United Parcel Service, Inc., Class B | 137,282 | 26,856,478 | ||||||
United Rentals, Inc.* | 13,818 | 4,872,918 | ||||||
| See Notes to Financial Statements. | 49 |
DBX ETF Trust
Schedule of Investments
Xtrackers MSCI USA ESG Leaders Equity ETF (Continued)
August 31, 2021
Number | Value | |||||||
| Industrials (Continued) | ||||||||
W. W. Grainger, Inc. | 8,345 | $ | 3,619,226 | |||||
Waste Management, Inc. | 80,573 | 12,497,678 | ||||||
Xylem, Inc. | 33,972 | 4,630,723 | ||||||
|
| |||||||
(Cost $219,645,750) | 325,334,524 | |||||||
|
| |||||||
| Information Technology — 28.9% | ||||||||
Accenture PLC, Class A | 121,241 | 40,804,871 | ||||||
Adobe, Inc.* | 90,954 | 60,366,170 | ||||||
ANSYS, Inc.* | 16,831 | 6,149,374 | ||||||
Applied Materials, Inc. | 175,246 | 23,680,992 | ||||||
Autodesk, Inc.* | 42,141 | 13,067,503 | ||||||
Automatic Data Processing, Inc. | 80,882 | 16,907,573 | ||||||
Cadence Design Systems, Inc.* | 51,884 | 8,481,996 | ||||||
Cisco Systems, Inc. | 800,801 | 47,263,275 | ||||||
Citrix Systems, Inc. | 23,386 | 2,405,718 | ||||||
Cognex Corp. | 31,746 | 2,813,330 | ||||||
Hewlett Packard Enterprise Co. | 243,025 | 3,757,166 | ||||||
HP, Inc. | 237,823 | 7,072,856 | ||||||
Intel Corp. | 769,865 | 41,618,902 | ||||||
International Business Machines Corp. | 170,567 | 23,937,373 | ||||||
Intuit, Inc. | 51,885 | 29,372,617 | ||||||
Keysight Technologies, Inc.* | 35,391 | 6,348,438 | ||||||
Lam Research Corp. | 26,861 | 16,246,070 | ||||||
Mastercard, Inc., Class A | 168,422 | 58,312,749 | ||||||
Microsoft Corp. | 1,362,513 | 411,315,424 | ||||||
Motorola Solutions, Inc. | 32,357 | 7,902,227 | ||||||
NVIDIA Corp. | 474,458 | 106,207,423 | ||||||
Okta, Inc.* | 23,818 | 6,278,425 | ||||||
salesforce.com, Inc.* | 185,057 | 49,090,070 | ||||||
Teledyne Technologies, Inc.* | 9,091 | 4,212,588 | ||||||
Texas Instruments, Inc. | 175,624 | 33,528,378 | ||||||
Trimble, Inc.* | 49,435 | 4,657,766 | ||||||
Visa, Inc., Class A | 323,614 | 74,139,967 | ||||||
VMware, Inc., Class A* (a) | 15,310 | 2,279,200 | ||||||
Western Union Co. | 68,484 | 1,481,994 | ||||||
Workday, Inc., Class A* | 36,021 | 9,839,496 | ||||||
Zebra Technologies Corp., Class A* | 10,015 | 5,880,508 | ||||||
|
| |||||||
(Cost $669,331,459) | 1,125,420,439 | |||||||
|
| |||||||
| Materials — 2.9% | ||||||||
Amcor PLC | 297,852 | 3,827,398 | ||||||
Ball Corp. | 62,584 | 6,005,561 | ||||||
DuPont de Nemours, Inc. | 101,907 | 7,543,156 | ||||||
Ecolab, Inc. | 49,027 | 11,048,725 | ||||||
International Flavors & Fragrances, Inc. | 47,009 | 7,121,864 | ||||||
International Paper Co. | 70,559 | 4,239,890 | ||||||
Linde PLC | 98,972 | 31,135,601 | ||||||
LyondellBasell Industries NV, Class A | 51,472 | 5,165,215 | ||||||
Mosaic Co. | 70,439 | 2,266,727 | ||||||
Newmont Corp. | 152,236 | 8,828,166 | ||||||
PPG Industries, Inc. | 44,853 | 7,156,296 | ||||||
Sherwin-Williams Co. | 48,696 | 14,787,514 | ||||||
Steel Dynamics, Inc. | 41,491 | 2,800,228 | ||||||
|
| |||||||
(Cost $80,821,738) | 111,926,341 | |||||||
|
| |||||||
Number | Value | |||||||
| Real Estate — 2.8% | ||||||||
American Tower Corp. REIT | 86,901 | $ | 25,389,865 | |||||
Boston Properties, Inc. REIT | 27,126 | 3,064,967 | ||||||
CBRE Group, Inc., Class A* | 64,010 | 6,164,163 | ||||||
Crown Castle International Corp. REIT | 81,664 | 15,899,164 | ||||||
Equinix, Inc. REIT | 17,064 | 14,392,631 | ||||||
Equity Residential REIT | 65,251 | 5,485,652 | ||||||
Healthpeak Properties, Inc. REIT | 100,699 | 3,625,164 | ||||||
Host Hotels & Resorts, Inc. REIT* | 140,954 | 2,334,198 | ||||||
Prologis, Inc. REIT | 141,149 | 19,007,124 | ||||||
Welltower, Inc. REIT | 79,910 | 6,994,522 | ||||||
Weyerhaeuser Co. REIT | 143,779 | 5,176,044 | ||||||
|
| |||||||
(Cost $80,814,827) | 107,533,494 | |||||||
|
| |||||||
| Utilities — 1.0% | ||||||||
American Water Works Co., Inc. | 34,768 | 6,336,468 | ||||||
Atmos Energy Corp. | 25,496 | 2,486,115 | ||||||
CenterPoint Energy, Inc. | 112,494 | 2,822,475 | ||||||
Consolidated Edison, Inc. | 64,094 | 4,835,892 | ||||||
Edison International | 73,768 | 4,266,741 | ||||||
Essential Utilities, Inc. | 43,157 | 2,141,882 | ||||||
Eversource Energy | 65,877 | 5,977,020 | ||||||
Sempra Energy | 60,545 | 8,013,736 | ||||||
UGI Corp. | 37,851 | 1,752,880 | ||||||
|
| |||||||
(Cost $35,117,423) | 38,633,209 | |||||||
|
| |||||||
TOTAL COMMON STOCKS | 3,883,517,377 | |||||||
|
| |||||||
| SECURITIES LENDING COLLATERAL —0.0% | ||||||||
DWS Government & Agency Securities Portfolio “DWS Government Cash Institutional Shares”, 0.01% (b)(c) | 852,902 | 852,902 | ||||||
|
| |||||||
| CASH EQUIVALENTS — 0.1% | ||||||||
DWS Government Money Market Series “Institutional Shares”, 0.04% (b) | 3,332,190 | 3,332,190 | ||||||
|
| |||||||
TOTAL INVESTMENTS — 100.0% | $ | 3,887,702,469 | ||||||
Other assets and liabilities, net — 0.0% | 1,699,997 | |||||||
|
| |||||||
NET ASSETS — 100.0% | $ | 3,889,402,466 | ||||||
|
| |||||||
| See Notes to Financial Statements. | 50 |
DBX ETF Trust
Schedule of Investments
Xtrackers MSCI USA ESG Leaders Equity ETF (Continued)
August 31, 2021
A summary of the Fund’s transactions with affiliated investments during the year ended August 31, 2021 is as follows:
Value ($) at | Purchases Cost ($) | Sales Proceeds ($) | Net Realized Gain/(Loss) ($) | Net Change in Unrealized Appreciation (Depreciation) ($) | Income ($) | Capital Gain Distributions ($) | Number of Shares at 8/31/2021 | Value ($) at 8/31/2021 | ||||||||||||||||||||||||||
SECURITIES LENDING COLLATERAL — 0.0% |
| |||||||||||||||||||||||||||||||||
DWS Government & Agency Securities Portfolio “DWS Government Cash Institutional Shares”, 0.01% (b)(c) |
| |||||||||||||||||||||||||||||||||
| 95,593 | 757,309 | (d) | — | — | — | 193 | — | 852,902 | 852,902 | |||||||||||||||||||||||||
CASH EQUIVALENTS — 0.1% |
| |||||||||||||||||||||||||||||||||
DWS Government Money Market Series “Institutional Shares”, 0.04% (b) |
| |||||||||||||||||||||||||||||||||
| 2,101,479 | 84,067,464 | (82,836,753 | ) | — | — | 1,441 | — | 3,332,190 | 3,332,190 | |||||||||||||||||||||||||
|
|
|
|
|
|
|
|
|
|
|
|
|
|
|
|
| ||||||||||||||||||
| 2,197,072 | 84,824,773 | (82,836,753 | ) | — | — | 1,634 | — | 4,185,092 | 4,185,092 | |||||||||||||||||||||||||
|
|
|
|
|
|
|
|
|
|
|
|
|
|
|
|
| ||||||||||||||||||
| * | Non-income producing security. |
| (a) | All or a portion of these securities were on loan. In addition, “Other assets and liabilities, net” may include pending sales that are also on loan. The value of securities loaned at August 31, 2021 amounted to $22,456,790, which is 0.6% of net assets. |
| (b) | Affiliated fund managed by DWS Investment Management Americas, Inc. The rate shown is the annualized seven-day yield at period end. |
| (c) | Represents cash collateral held in connection with securities lending. Income earned by the Fund is net of borrower rebates. In addition, the Fund held non-cash U.S. Treasury securities collateral having a value of $21,977,534. |
| (d) | Represents the net increase (purchase cost) or decrease (sales proceeds) in the amount invested in cash collateral for the year ended August 31, 2021. |
| REIT: | Real Estate Investment Trust |
At August 31, 2021, open futures contracts purchased were as follows:
Contract Description | Currency | Number of Contracts | Notional Amount | Contract Value | Expiration Date | Unrealized Appreciation | ||||||||||||||||||
E-Mini S&P 500 Futures | USD | 2 | $ | 447,625 | $ | 452,050 | 9/17/2021 | $ | 4,425 | |||||||||||||||
MSCI USA ESG Leaders GTR Index Futures | USD | 96 | 4,419,980 | 4,711,680 | 9/17/2021 | 291,700 | ||||||||||||||||||
|
| |||||||||||||||||||||||
Total unrealized appreciation | $ | 296,125 | ||||||||||||||||||||||
|
| |||||||||||||||||||||||
For information on the Fund’s policy and additional disclosures regarding open futures contracts, please refer to the Derivatives section of Note 2 in the accompanying Notes to Financial Statements.
Currency Abbreviations
| USD | U.S. Dollar |
Fair Value Measurements
Various inputs are used in determining the value of the Fund’s investments. These inputs are summarized in three broad levels. Level 1 includes quoted prices in active markets for identical securities. Level 2 includes other significant observable inputs (including quoted prices for similar securities, interest rates, prepayment speeds and credit risk). Level 3 includes significant unobservable inputs (including the Fund’s own assumptions in determining the fair value of investments). The level assigned to the securities valuations may not be an indication of the risk or liquidity associated with investing in those securities.
The following is a summary of the inputs used as of August 31, 2021 in valuing the Fund’s investments. For information on the Fund’s policy regarding the valuation of investments, please refer to the Security Valuation section of Note 2 in the accompanying Notes to Financial Statements.
Assets | Level 1 | Level 2 | Level 3 | Total | ||||||||||||
Common Stocks (e) | $ | 3,883,517,377 | $ | — | $ | — | $ | 3,883,517,377 | ||||||||
Short-Term Investments (e) | 4,185,092 | — | — | 4,185,092 | ||||||||||||
Derivatives (f) | ||||||||||||||||
Futures Contracts | 296,125 | — | — | 296,125 | ||||||||||||
|
|
|
|
|
|
|
| |||||||||
TOTAL | $ | 3,887,998,594 | $ | — | $ | — | $ | 3,887,998,594 | ||||||||
|
|
|
|
|
|
|
| |||||||||
| (e) | See Schedule of Investments for additional detailed categorizations. |
| (f) | Derivatives include unrealized appreciation (depreciation) on open futures contracts. |
| See Notes to Financial Statements. | 51 |
DBX ETF Trust
Schedule of Investments
August 31, 2021
Number | Value | |||||||
| COMMON STOCKS — 99.7% | ||||||||
| Communication Services — 10.5% | ||||||||
Activision Blizzard, Inc. | 19,912 | $ | 1,640,152 | |||||
Alphabet, Inc., Class A* | 7,752 | 22,433,901 | ||||||
Alphabet, Inc., Class C* | 7,309 | 21,263,635 | ||||||
AT&T, Inc. | 182,986 | 5,017,476 | ||||||
Charter Communications, Inc., | 3,513 | 2,868,927 | ||||||
Comcast Corp., Class A | 117,765 | 7,145,980 | ||||||
Discovery, Inc., Class A* (a) | 4,155 | 119,830 | ||||||
Discovery, Inc., Class C* | 7,453 | 205,628 | ||||||
Electronic Arts, Inc. | 7,406 | 1,075,425 | ||||||
Interpublic Group of Cos., Inc. | 10,042 | 373,864 | ||||||
Live Nation Entertainment, Inc.* | 3,724 | 322,871 | ||||||
News Corp., Class A | 12,898 | 289,818 | ||||||
Omnicom Group, Inc. | 5,515 | 403,808 | ||||||
Take-Two Interactive Software, Inc.* | 2,967 | 478,340 | ||||||
Verizon Communications, Inc. | 106,231 | 5,842,705 | ||||||
Walt Disney Co.* | 46,618 | 8,451,843 | ||||||
|
| |||||||
(Cost $60,479,909) | 77,934,203 | |||||||
|
| |||||||
| Consumer Discretionary — 13.7% | ||||||||
Amazon.com, Inc.* | 11,009 | 38,209,927 | ||||||
Aptiv PLC * | 6,967 | 1,060,308 | ||||||
Best Buy Co., Inc. | 5,926 | 690,438 | ||||||
Booking Holdings, Inc.* | 1,063 | 2,444,549 | ||||||
BorgWarner, Inc. | 6,127 | 261,500 | ||||||
CarMax, Inc.* | 4,161 | 520,999 | ||||||
Dollar Tree, Inc.* | 6,027 | 545,685 | ||||||
eBay, Inc. | 16,623 | 1,275,649 | ||||||
Etsy, Inc.* (a) | 3,262 | 705,440 | ||||||
Ford Motor Co.* | 100,209 | 1,305,723 | ||||||
Gap, Inc. | 4,857 | 129,828 | ||||||
General Motors Co.* | 32,558 | 1,595,668 | ||||||
Hanesbrands, Inc. | 8,591 | 160,480 | ||||||
Hasbro, Inc. | 3,257 | 320,196 | ||||||
Hilton Worldwide Holdings, Inc.* | 7,141 | 891,625 | ||||||
Home Depot, Inc. | 27,278 | 8,897,538 | ||||||
Las Vegas Sands Corp.* | 8,472 | 377,936 | ||||||
Leggett & Platt, Inc. | 3,219 | 155,767 | ||||||
Lowe’s Cos., Inc. | 18,159 | 3,702,438 | ||||||
Marriott International, Inc., Class A * | 6,827 | 922,601 | ||||||
McDonald’s Corp. | 19,161 | 4,549,971 | ||||||
MGM Resorts International | 10,629 | 453,008 | ||||||
Newell Brands, Inc. | 9,717 | 246,909 | ||||||
NIKE, Inc., Class B | 32,672 | 5,382,385 | ||||||
PulteGroup, Inc. | 6,638 | 357,523 | ||||||
PVH Corp.* | 1,733 | 181,601 | ||||||
Ralph Lauren Corp. | 1,233 | 143,188 | ||||||
Royal Caribbean Cruises Ltd.* | 5,635 | 466,184 | ||||||
Starbucks Corp. | 30,240 | 3,552,898 | ||||||
Tapestry, Inc.* | 7,461 | 300,827 | ||||||
Target Corp. | 12,905 | 3,187,277 | ||||||
Tesla, Inc.* | 19,775 | 14,548,863 | ||||||
TJX Cos., Inc. | 30,875 | 2,245,230 | ||||||
Under Armour, Inc., Class A * | 5,245 | 121,369 | ||||||
Under Armour, Inc., Class C * | 5,068 | 101,664 | ||||||
VF Corp. | 8,234 | 629,654 | ||||||
Number | Value | |||||||
| Consumer Discretionary (Continued) | ||||||||
Whirlpool Corp. | 1,573 | $ | 348,467 | |||||
Yum! Brands, Inc. | 7,735 | 1,013,517 | ||||||
|
| |||||||
(Cost $87,372,885) | 102,004,830 | |||||||
|
| |||||||
| Consumer Staples — 5.3% | ||||||||
Archer-Daniels-Midland Co. | 14,224 | 853,440 | ||||||
Brown-Forman Corp., Class B | 4,711 | 330,806 | ||||||
Campbell Soup Co. | 5,167 | 215,619 | ||||||
Coca-Cola Co. | 99,573 | 5,606,956 | ||||||
Colgate-Palmolive Co. | 21,709 | 1,692,217 | ||||||
Conagra Brands, Inc. | 12,531 | 415,027 | ||||||
Constellation Brands, Inc., Class A | 4,382 | 925,215 | ||||||
General Mills, Inc. | 15,638 | 904,033 | ||||||
Hershey Co. | 3,764 | 668,863 | ||||||
Hormel Foods Corp. | 6,924 | 315,319 | ||||||
J M Smucker Co. | 2,688 | 332,425 | ||||||
Kellogg Co. (a) | 6,445 | 406,937 | ||||||
Kraft Heinz Co. | 16,674 | 600,097 | ||||||
Kroger Co. | 19,563 | 900,485 | ||||||
McCormick & Co., Inc. | 6,362 | 548,977 | ||||||
Molson Coors Beverage Co., Class B | 4,581 | 217,735 | ||||||
Mondelez International, Inc., Class A | 36,131 | 2,242,651 | ||||||
PepsiCo, Inc. | 35,378 | 5,532,765 | ||||||
Procter & Gamble Co. | 62,851 | 8,949,354 | ||||||
Sysco Corp. | 13,110 | 1,044,211 | ||||||
Tyson Foods, Inc., Class A | 7,526 | 590,942 | ||||||
Walgreens Boots Alliance, Inc. | 18,383 | 932,937 | ||||||
Walmart, Inc. | 35,260 | 5,222,006 | ||||||
|
| |||||||
(Cost $36,370,119) | 39,449,017 | |||||||
|
| |||||||
| Energy — 2.7% | ||||||||
APA Corp. | 10,342 | 201,462 | ||||||
Chevron Corp. | 49,634 | 4,803,082 | ||||||
ConocoPhillips | 34,644 | 1,923,781 | ||||||
Devon Energy Corp. | 15,143 | 447,476 | ||||||
Exxon Mobil Corp. | 108,694 | 5,925,997 | ||||||
Halliburton Co. | 22,756 | 454,665 | ||||||
Hess Corp. | 6,989 | 480,494 | ||||||
Kinder Morgan, Inc. | 49,757 | 809,546 | ||||||
Marathon Petroleum Corp. | 16,740 | 992,180 | ||||||
Occidental Petroleum Corp. | 21,525 | 552,977 | ||||||
ONEOK, Inc. | 11,459 | 601,827 | ||||||
Pioneer Natural Resources Co. | 5,948 | 890,237 | ||||||
Schlumberger N.V. | 35,684 | 1,000,579 | ||||||
Williams Cos., Inc. | 31,182 | 769,884 | ||||||
|
| |||||||
(Cost $18,695,551) | 19,854,187 | |||||||
|
| |||||||
| Financials — 10.6% | ||||||||
Aflac, Inc. | 16,296 | 923,657 | ||||||
Allstate Corp. | 7,809 | 1,056,402 | ||||||
American Express Co. | 16,766 | 2,782,485 | ||||||
Ameriprise Financial, Inc. | 3,015 | 822,824 | ||||||
Arthur J Gallagher & Co. | 5,263 | 755,872 | ||||||
Assurant, Inc. | 1,566 | 266,392 | ||||||
Bank of America Corp. | 193,597 | 8,082,675 | ||||||
Bank of New York Mellon Corp. | 20,657 | 1,140,680 | ||||||
BlackRock, Inc. | 3,655 | 3,447,725 | ||||||
Capital One Financial Corp. | 11,820 | 1,961,765 | ||||||
| See Notes to Financial Statements. | 52 |
DBX ETF Trust
Schedule of Investments
Xtrackers S&P 500 ESG ETF (Continued)
August 31, 2021
Number | Value | |||||||
| Financials (Continued) | ||||||||
Cboe Global Markets, Inc. | 2,726 | $ | 343,885 | |||||
Charles Schwab Corp. | 38,438 | 2,800,208 | ||||||
Chubb Ltd. | 11,541 | 2,122,621 | ||||||
Citigroup, Inc. | 53,560 | 3,851,500 | ||||||
CME Group, Inc. | 9,231 | 1,862,077 | ||||||
Comerica, Inc. | 3,469 | 256,394 | ||||||
Discover Financial Services | 7,888 | 1,011,399 | ||||||
Fifth Third Bancorp | 18,258 | 709,506 | ||||||
Franklin Resources, Inc. | 7,953 | 257,995 | ||||||
Globe Life, Inc. | 2,330 | 223,843 | ||||||
Goldman Sachs Group, Inc. | 8,763 | 3,623,588 | ||||||
Hartford Financial Services Group, Inc. | 9,183 | 617,281 | ||||||
Intercontinental Exchange, Inc. | 14,414 | 1,722,905 | ||||||
Invesco Ltd. | 9,662 | 244,642 | ||||||
JPMorgan Chase & Co. | 77,715 | 12,430,514 | ||||||
KeyCorp | 24,867 | 505,297 | ||||||
Lincoln National Corp. | 4,582 | 314,554 | ||||||
MarketAxess Holdings, Inc. | 999 | 475,444 | ||||||
Marsh & McLennan Cos., Inc. | 12,987 | 2,041,556 | ||||||
MetLife, Inc. | 19,080 | 1,182,960 | ||||||
Moody’s Corp. | 4,124 | 1,570,295 | ||||||
Morgan Stanley | 38,423 | 4,012,514 | ||||||
MSCI, Inc. | 2,145 | 1,361,174 | ||||||
Nasdaq, Inc. | 2,941 | 575,789 | ||||||
Northern Trust Corp. | 5,334 | 632,186 | ||||||
PNC Financial Services Group, Inc. | 10,890 | 2,081,079 | ||||||
Principal Financial Group, Inc. | 6,402 | 427,718 | ||||||
Progressive Corp. | 14,970 | 1,442,210 | ||||||
Prudential Financial, Inc. | 10,254 | 1,085,694 | ||||||
Raymond James Financial, Inc. | 3,044 | 425,856 | ||||||
Regions Financial Corp. | 24,643 | 503,457 | ||||||
S&P Global, Inc. | 6,206 | 2,754,347 | ||||||
State Street Corp. | 9,005 | 836,655 | ||||||
Synchrony Financial | 13,991 | 696,052 | ||||||
T. Rowe Price Group, Inc. | 5,862 | 1,312,326 | ||||||
Travelers Cos., Inc. | 6,407 | 1,023,262 | ||||||
Unum Group | 5,617 | 149,525 | ||||||
|
| |||||||
(Cost $60,329,166) | 78,728,785 | |||||||
|
| |||||||
| Health Care — 12.8% | ||||||||
Abbott Laboratories | 45,501 | 5,749,961 | ||||||
AbbVie, Inc. | 45,384 | 5,481,479 | ||||||
Agilent Technologies, Inc. | 7,850 | 1,377,439 | ||||||
AmerisourceBergen Corp. | 3,748 | 458,043 | ||||||
Amgen, Inc. | 14,849 | 3,348,895 | ||||||
Anthem, Inc. | 6,314 | 2,368,571 | ||||||
Baxter International, Inc. | 12,984 | 989,640 | ||||||
Becton Dickinson and Co. | 7,461 | 1,877,934 | ||||||
Biogen, Inc.* | 3,936 | 1,333,950 | ||||||
Bio-Rad Laboratories, Inc., Class A * | 526 | 423,335 | ||||||
Boston Scientific Corp.* | 36,421 | 1,644,408 | ||||||
Bristol-Myers Squibb Co. | 57,608 | 3,851,671 | ||||||
Cardinal Health, Inc. | 7,456 | 391,365 | ||||||
Cigna Corp. | 8,824 | 1,867,600 | ||||||
CVS Health Corp. | 33,693 | 2,910,738 | ||||||
Danaher Corp. | 16,299 | 5,283,484 | ||||||
DaVita, Inc.* | 1,779 | 232,640 | ||||||
Number | Value | |||||||
| Health Care (Continued) | ||||||||
Edwards Lifesciences Corp.* | 16,050 | $ | 1,880,739 | |||||
Eli Lilly & Co. | 20,444 | 5,280,481 | ||||||
Gilead Sciences, Inc. | 32,309 | 2,351,449 | ||||||
Henry Schein, Inc.* | 3,565 | 269,478 | ||||||
Hologic, Inc.* | 6,639 | 525,477 | ||||||
Humana, Inc. | 3,318 | 1,345,184 | ||||||
IDEXX Laboratories, Inc.* | 2,205 | 1,485,641 | ||||||
Illumina, Inc.* | 3,748 | 1,713,436 | ||||||
Incyte Corp.* | 4,795 | 366,769 | ||||||
Laboratory Corp. of America Holdings * | 2,539 | 770,282 | ||||||
McKesson Corp. | 4,087 | 834,320 | ||||||
Medtronic PLC | 34,618 | 4,620,811 | ||||||
Merck & Co., Inc. | 65,029 | 4,961,062 | ||||||
Mettler-Toledo International, Inc.* | 626 | 972,072 | ||||||
PerkinElmer, Inc. | 2,913 | 538,322 | ||||||
Perrigo Co. PLC | 3,423 | 140,172 | ||||||
Pfizer, Inc. | 143,777 | 6,623,806 | ||||||
Quest Diagnostics, Inc. | 3,372 | 515,343 | ||||||
Regeneron Pharmaceuticals, Inc.* | 2,691 | 1,812,119 | ||||||
Thermo Fisher Scientific, Inc. | 10,107 | 5,608,880 | ||||||
UnitedHealth Group, Inc. | 24,278 | 10,106,203 | ||||||
Vertex Pharmaceuticals, Inc.* | 6,695 | 1,340,942 | ||||||
Viatris, Inc. | 30,876 | 451,716 | ||||||
Waters Corp.* | 1,542 | 638,419 | ||||||
West Pharmaceutical Services, Inc. | 1,903 | 859,433 | ||||||
|
| |||||||
(Cost $79,010,824) | 95,603,709 | |||||||
|
| |||||||
| Industrials — 6.8% | ||||||||
Alaska Air Group, Inc.* | 3,046 | 174,658 | ||||||
American Airlines Group, Inc.* (a) | 15,717 | 313,397 | ||||||
AMETEK, Inc. | 5,922 | 805,214 | ||||||
Caterpillar, Inc. | 14,022 | 2,956,819 | ||||||
Cintas Corp. | 2,260 | 894,440 | ||||||
CSX Corp. | 58,722 | 1,910,227 | ||||||
Cummins, Inc. | 3,779 | 891,768 | ||||||
Deere & Co. | 8,070 | 3,050,702 | ||||||
Delta Air Lines, Inc.* | 16,440 | 664,834 | ||||||
Dover Corp. | 3,656 | 637,460 | ||||||
Eaton Corp. PLC | 10,185 | 1,714,747 | ||||||
Emerson Electric Co. | 15,377 | 1,622,273 | ||||||
Fastenal Co. | 14,695 | 820,716 | ||||||
FedEx Corp. | 6,279 | 1,668,268 | ||||||
Fortive Corp. | 8,612 | 636,168 | ||||||
General Electric Co. | 28,158 | 2,968,135 | ||||||
Howmet Aerospace, Inc. | 9,934 | 315,405 | ||||||
IDEX Corp. | 1,916 | 429,184 | ||||||
IHS Markit Ltd. | 9,564 | 1,153,418 | ||||||
Illinois Tool Works, Inc. | 7,380 | 1,718,507 | ||||||
Ingersoll Rand, Inc.* | 9,607 | 509,363 | ||||||
Johnson Controls International PLC | 18,496 | 1,383,501 | ||||||
L3Harris Technologies, Inc. | 5,261 | 1,225,866 | ||||||
Leidos Holdings, Inc. | 3,414 | 334,948 | ||||||
Nielsen Holdings PLC | 8,901 | 191,015 | ||||||
Norfolk Southern Corp. | 6,441 | 1,633,051 | ||||||
PACCAR, Inc. | 8,910 | 729,462 | ||||||
Parker-Hannifin Corp. | 3,320 | 984,944 | ||||||
Pentair PLC (a) | 4,207 | 324,612 | ||||||
| See Notes to Financial Statements. | 53 |
DBX ETF Trust
Schedule of Investments
Xtrackers S&P 500 ESG ETF (Continued)
August 31, 2021
Number | Value | |||||||
| Industrials (Continued) | ||||||||
Republic Services, Inc. | 5,288 | $ | 656,399 | |||||
Robert Half International, Inc. | 2,911 | 300,997 | ||||||
Rockwell Automation, Inc. | 2,982 | 970,492 | ||||||
Roper Technologies, Inc. | 2,698 | 1,303,889 | ||||||
Snap-on, Inc. | 1,362 | 306,382 | ||||||
Stanley Black & Decker, Inc. | 4,122 | 796,659 | ||||||
Trane Technologies PLC | 6,109 | 1,212,637 | ||||||
TransDigm Group, Inc.* | 1,421 | 863,215 | ||||||
Union Pacific Corp. | 17,185 | 3,726,395 | ||||||
United Parcel Service, Inc., Class B | 18,509 | 3,620,916 | ||||||
United Rentals, Inc.* | 1,857 | 654,871 | ||||||
Verisk Analytics, Inc. | 4,162 | 839,725 | ||||||
W.W. Grainger, Inc. | 1,120 | 485,744 | ||||||
Waste Management, Inc. | 9,946 | 1,542,724 | ||||||
Westinghouse Air Brake Technologies Corp. | 4,541 | 407,736 | ||||||
Xylem, Inc. | 4,551 | 620,347 | ||||||
|
| |||||||
(Cost $40,810,543) | 50,972,230 | |||||||
|
| |||||||
| Information Technology — 30.7% | ||||||||
Accenture PLC, Class A | 16,313 | 5,490,303 | ||||||
Adobe, Inc.* | 12,309 | 8,169,483 | ||||||
Advanced Micro Devices, Inc.* | 31,159 | 3,449,925 | ||||||
Akamai Technologies, Inc.* | 4,175 | 472,819 | ||||||
Amphenol Corp., Class A | 15,354 | 1,176,577 | ||||||
Analog Devices, Inc. | 13,807 | 2,249,851 | ||||||
ANSYS, Inc.* | 2,233 | 815,849 | ||||||
Apple, Inc. | 403,033 | 61,192,500 | ||||||
Applied Materials, Inc. | 23,557 | 3,183,257 | ||||||
Arista Networks, Inc.* | 1,427 | 527,319 | ||||||
Autodesk, Inc.* | 5,645 | 1,750,458 | ||||||
Cisco Systems, Inc. | 108,398 | 6,397,650 | ||||||
Corning, Inc. | 19,732 | 789,083 | ||||||
DXC Technology Co.* | 6,343 | 232,915 | ||||||
Hewlett Packard Enterprise Co. | 33,458 | 517,261 | ||||||
HP, Inc. | 32,077 | 953,970 | ||||||
Intel Corp. | 104,374 | 5,642,458 | ||||||
Intuit, Inc. | 7,046 | 3,988,811 | ||||||
Juniper Networks, Inc. | 8,300 | 240,534 | ||||||
Keysight Technologies, Inc.* | 4,786 | 858,513 | ||||||
KLA Corp. | 3,982 | 1,353,721 | ||||||
Lam Research Corp. | 3,680 | 2,225,738 | ||||||
Mastercard, Inc., Class A | 22,457 | 7,775,287 | ||||||
Micron Technology, Inc.* | 28,725 | 2,117,033 | ||||||
Microsoft Corp. | 193,516 | 58,418,610 | ||||||
Motorola Solutions, Inc. | 4,369 | 1,066,997 | ||||||
NortonLifeLock, Inc. | 14,658 | 389,317 | ||||||
NVIDIA Corp. | 63,972 | 14,320,132 | ||||||
Oracle Corp. | 46,620 | 4,155,241 | ||||||
QUALCOMM, Inc. | 29,161 | 4,277,627 | ||||||
salesforce.com, Inc.* | 24,812 | 6,581,879 | ||||||
Seagate Technology Holdings PLC | 5,133 | 449,599 | ||||||
TE Connectivity Ltd. | 8,509 | 1,278,222 | ||||||
Texas Instruments, Inc. | 23,731 | 4,530,485 | ||||||
Trimble, Inc.* | 6,442 | 606,965 | ||||||
Visa, Inc., Class A (a) | 43,553 | 9,977,992 | ||||||
Number | Value | |||||||
| Information Technology (Continued) | ||||||||
Zebra Technologies Corp., Class A * | 1,392 | $ | 817,341 | |||||
|
| |||||||
(Cost $171,217,400) | 228,441,722 | |||||||
|
| |||||||
| Materials — 2.5% | ||||||||
Air Products and Chemicals, Inc. | 5,662 | 1,525,966 | ||||||
Albemarle Corp. | 2,994 | 708,800 | ||||||
Ball Corp. | 8,433 | 809,231 | ||||||
CF Industries Holdings, Inc. | 5,309 | 241,135 | ||||||
Corteva, Inc. | 19,104 | 840,003 | ||||||
Dow, Inc. | 19,114 | 1,202,271 | ||||||
Eastman Chemical Co. | 3,632 | 410,997 | ||||||
Ecolab, Inc. | 6,364 | 1,434,191 | ||||||
FMC Corp. | 3,323 | 311,132 | ||||||
Freeport-McMoRan, Inc. | 37,516 | 1,365,207 | ||||||
International Flavors & Fragrances, Inc. | 6,378 | 966,267 | ||||||
International Paper Co. | 10,052 | 604,025 | ||||||
Linde PLC | 13,422 | 4,222,427 | ||||||
LyondellBasell Industries NV, Class A | 6,621 | 664,417 | ||||||
Martin Marietta Materials, Inc. | 1,594 | 607,712 | ||||||
Mosaic Co. | 8,875 | 285,598 | ||||||
Newmont Corp. | 20,578 | 1,193,318 | ||||||
PPG Industries, Inc. | 6,059 | 966,713 | ||||||
Westrock Co. | 6,762 | 351,894 | ||||||
|
| |||||||
(Cost $15,685,887) | 18,711,304 | |||||||
|
| |||||||
| Real Estate — 2.6% | ||||||||
American Tower Corp. REIT | 11,635 | 3,399,398 | ||||||
AvalonBay Communities, Inc. REIT | 3,607 | 828,095 | ||||||
Boston Properties, Inc. REIT | 3,663 | 413,882 | ||||||
CBRE Group, Inc., Class A * | 8,619 | 830,010 | ||||||
Digital Realty Trust, Inc. REIT | 7,200 | 1,180,152 | ||||||
Duke Realty Corp. REIT | 9,629 | 505,619 | ||||||
Equinix, Inc. REIT | 2,285 | 1,927,283 | ||||||
Equity Residential REIT | 8,837 | 742,927 | ||||||
Essex Property Trust, Inc. REIT | 1,652 | 546,382 | ||||||
Extra Space Storage, Inc. REIT | 3,388 | 633,251 | ||||||
Healthpeak Properties, Inc. REIT | 13,945 | 502,020 | ||||||
Host Hotels & Resorts, Inc. REIT * | 18,247 | 302,170 | ||||||
Iron Mountain, Inc. REIT | 7,422 | 354,401 | ||||||
Kimco Realty Corp. REIT | 15,426 | 336,133 | ||||||
Prologis, Inc. REIT | 19,017 | 2,560,829 | ||||||
Realty Income Corp. REIT (a) | 9,636 | 695,912 | ||||||
Regency Centers Corp. REIT | 3,851 | 264,256 | ||||||
Simon Property Group, Inc. REIT | 8,477 | 1,139,733 | ||||||
Ventas, Inc. REIT | 9,664 | 540,604 | ||||||
Vornado Realty Trust REIT | 3,672 | 153,783 | ||||||
Welltower, Inc. REIT | 10,759 | 941,735 | ||||||
Weyerhaeuser Co. REIT | 19,258 | 693,288 | ||||||
|
| |||||||
(Cost $15,908,716) | 19,491,863 | |||||||
|
| |||||||
| Utilities — 1.5% | ||||||||
American Water Works Co., Inc. | 4,679 | 852,748 | ||||||
Consolidated Edison, Inc. | 8,782 | 662,602 | ||||||
Edison International | 9,729 | 562,725 | ||||||
Entergy Corp. | 5,137 | 568,203 | ||||||
Eversource Energy | 8,814 | 799,694 | ||||||
Exelon Corp. | 24,946 | 1,222,853 | ||||||
FirstEnergy Corp. | 13,949 | 542,198 | ||||||
| See Notes to Financial Statements. | 54 |
DBX ETF Trust
Schedule of Investments
Xtrackers S&P 500 ESG ETF (Continued)
August 31, 2021
Number | Value | |||||||
| Utilities (Continued) | ||||||||
NextEra Energy, Inc. | 50,338 | $ | 4,227,889 | |||||
Public Service Enterprise Group, Inc. | 12,966 | 829,046 | ||||||
Sempra Energy | 8,099 | 1,071,984 | ||||||
|
| |||||||
(Cost $10,077,173) | 11,339,942 | |||||||
|
| |||||||
TOTAL COMMON STOCKS | 742,531,792 | |||||||
|
| |||||||
| SECURITIES LENDING COLLATERAL — 0.0% | ||||||||
DWS Government & Agency Securities Portfolio “DWS Government Cash Institutional Shares”, 0.01% (b)(c) | 107,727 | 107,727 | ||||||
|
| |||||||
| CASH EQUIVALENTS — 0.2% | ||||||||
DWS Government Money Market Series “Institutional Shares”, 0.04% (b) | 1,353,973 | 1,353,973 | ||||||
|
| |||||||
TOTAL INVESTMENTS — 99.9% | $ | 743,993,492 | ||||||
Other assets and liabilities, net — 0.1% | 758,642 | |||||||
|
| |||||||
NET ASSETS — 100.0% | $ | 744,752,134 | ||||||
|
| |||||||
A summary of the Fund’s transactions with affiliated investments during the year ended August 31, 2021 is as follows:
Value ($) at | Purchases Cost ($) | Sales Proceeds ($) | Net Realized Gain/(Loss) ($) | Net Change in Unrealized Appreciation (Depreciation) ($) | Income ($) | Capital Gain Distributions ($) | Number of Shares at 8/31/2021 | Value ($) at 8/31/2021 | ||||||||||||||||||||||||||
SECURITIES LENDING COLLATERAL — 0.0% |
| |||||||||||||||||||||||||||||||||
DWS Government & Agency Securities Portfolio “DWS Government Cash Institutional Shares”, 0.01% (b)(c) |
| |||||||||||||||||||||||||||||||||
| 84,196 | 23,531 | (d) | — | — | — | 15 | — | 107,727 | 107,727 | |||||||||||||||||||||||||
CASH EQUIVALENTS — 0.2% |
| |||||||||||||||||||||||||||||||||
DWS Government Money Market Series “Institutional Shares”, 0.04% (b) |
| |||||||||||||||||||||||||||||||||
| 344,797 | 11,397,855 | (10,388,679 | ) | — | — | 281 | — | 1,353,973 | 1,353,973 | |||||||||||||||||||||||||
|
|
|
|
|
|
|
|
|
|
|
|
|
|
|
|
| ||||||||||||||||||
| 428,993 | 11,421,386 | (10,388,679 | ) | — | — | 296 | — | 1,461,700 | 1,461,700 | |||||||||||||||||||||||||
|
|
|
|
|
|
|
|
|
|
|
|
|
|
|
|
| ||||||||||||||||||
| * | Non-income producing security. |
| (a) | All or a portion of these securities were on loan. In addition, “Other assets and liabilities, net” may include pending sales that are also on loan. The value of securities loaned at August 31, 2021 amounted to $14,021,303, which is 1.9% of net assets. |
| (b) | Affiliated fund managed by DWS Investment Management Americas, Inc. The rate shown is the annualized seven-day yield at period end. |
| (c) | Represents cash collateral held in connection with securities lending. Income earned by the Fund is net of borrower rebates. In addition, the Fund held non-cash U.S. Treasury securities collateral having a value of $14,267,599. |
| (d) | Represents the net increase (purchase cost) or decrease (sales proceeds) in the amount invested in cash collateral for the year ended August 31, 2021. |
| REIT: | Real Estate Investment Trust |
At August 31, 2021, open futures contracts purchased were as follows:
Contract Description | Currency | Number of Contracts | Notional Amount | Contract Value | Expiration Date | Unrealized Appreciation | ||||||||||||
E-Mini S&P 500 ESG Futures | USD | 10 | $ | 1,861,940 | $ | 1,934,500 | 9/17/2021 | $ | 72,560 | |||||||||
For information on the Fund’s policy and additional disclosures regarding open futures contracts, please refer to the Derivatives section of Note 2 in the accompanying Notes to Financial Statements.
| See Notes to Financial Statements. | 55 |
DBX ETF Trust
Schedule of Investments
Xtrackers S&P 500 ESG ETF (Continued)
August 31, 2021
Currency Abbreviations
| USD | U.S. Dollar |
Fair Value Measurements
Various inputs are used in determining the value of the Fund’s investments. These inputs are summarized in three broad levels. Level 1 includes quoted prices in active markets for identical securities. Level 2 includes other significant observable inputs (including quoted prices for similar securities, interest rates, prepayment speeds and credit risk). Level 3 includes significant unobservable inputs (including the Fund’s own assumptions in determining the fair value of investments). The level assigned to the securities valuations may not be an indication of the risk or liquidity associated with investing in those securities.
The following is a summary of the inputs used as of August 31, 2021 in valuing the Fund’s investments. For information on the Fund’s policy regarding the valuation of investments, please refer to the Security Valuation section of Note 2 in the accompanying Notes to Financial Statements.
Assets | Level 1 | Level 2 | Level 3 | Total | ||||||||||||
Common Stocks (e) | $ | 742,531,792 | $ | — | $ | — | $ | 742,531,792 | ||||||||
Short-Term Investments (e) | 1,461,700 | — | — | 1,461,700 | ||||||||||||
Derivatives (f) | ||||||||||||||||
Futures Contracts | 72,560 | — | — | 72,560 | ||||||||||||
|
|
|
|
|
|
|
| |||||||||
TOTAL | $ | 744,066,052 | $ | — | $ | — | $ | 744,066,052 | ||||||||
|
|
|
|
|
|
|
| |||||||||
| (e) | See Schedule of Investments for additional detailed categorizations. |
| (f) | Derivatives include unrealized appreciation (depreciation) on open futures contracts. |
| See Notes to Financial Statements. | 56 |
DBX ETF Trust
Schedule of Investments
Xtrackers S&P MidCap 400 ESG ETF
August 31, 2021
Number | Value | |||||||
| COMMON STOCKS — 99.9% | ||||||||
| Communication Services — 2.1% | ||||||||
Cable One, Inc. | 36 | $ | 75,585 | |||||
Iridium Communications, Inc.* | 790 | 35,163 | ||||||
New York Times Co., Class A | 953 | 48,394 | ||||||
TEGNA, Inc. | 1,481 | 26,243 | ||||||
TripAdvisor, Inc.* | 636 | 22,260 | ||||||
Yelp, Inc.* | 449 | 17,291 | ||||||
|
| |||||||
(Cost $223,383) | 224,936 | |||||||
|
| |||||||
| Consumer Discretionary — 15.5% | ||||||||
American Eagle Outfitters, Inc. (a) | 981 | 29,940 | ||||||
AutoNation, Inc.* | 351 | 38,291 | ||||||
Brunswick Corp. | 518 | 50,179 | ||||||
Capri Holdings Ltd.* | 1,007 | 56,906 | ||||||
Carter’s, Inc. | 293 | 29,997 | ||||||
Columbia Sportswear Co. | 206 | 21,014 | ||||||
Cracker Barrel Old Country Store, Inc. | 158 | 22,686 | ||||||
Dana, Inc. | 968 | 22,516 | ||||||
Deckers Outdoor Corp.* | 184 | 76,995 | ||||||
Dick’s Sporting Goods, Inc. (a) | 436 | 61,393 | ||||||
Foot Locker, Inc. | 684 | 38,776 | ||||||
Gentex Corp. | 1,591 | 49,003 | ||||||
Goodyear Tire & Rubber Co.* | 1,803 | 28,560 | ||||||
Graham Holdings Co., Class B | 26 | 16,037 | ||||||
Grand Canyon Education, Inc.* | 311 | 27,723 | ||||||
H&R Block, Inc. | 1,214 | 31,139 | ||||||
Harley-Davidson, Inc. | 1,008 | 39,846 | ||||||
Helen of Troy Ltd.* | 159 | 38,031 | ||||||
Jack in the Box, Inc. | 145 | 15,364 | ||||||
KB Home | 587 | 25,259 | ||||||
Kohl’s Corp. | 1,038 | 59,581 | ||||||
Lear Corp. | 364 | 58,218 | ||||||
Lithia Motors, Inc. | 198 | 65,597 | ||||||
Mattel, Inc.* | 2,318 | 49,489 | ||||||
Murphy USA, Inc. | 162 | 25,155 | ||||||
Nordstrom, Inc.* | 720 | 20,599 | ||||||
Papa John’s International, Inc. | 214 | 27,291 | ||||||
Polaris, Inc. (a) | 378 | 45,269 | ||||||
RH* | 112 | 78,475 | ||||||
Service Corp. International | 1,102 | 69,162 | ||||||
Six Flags Entertainment Corp.* | 511 | 21,585 | ||||||
Tempur Sealy International, Inc. | 1,219 | 54,489 | ||||||
Texas Roadhouse, Inc. | 430 | 40,850 | ||||||
Thor Industries, Inc. (a) | 360 | 40,835 | ||||||
Toll Brothers, Inc. | 735 | 47,084 | ||||||
Travel + Leisure Co. | 573 | 31,377 | ||||||
Urban Outfitters, Inc.* | 465 | 15,354 | ||||||
Visteon Corp.* | 188 | 19,868 | ||||||
Wendy’s Co. | 1,140 | 26,243 | ||||||
Williams-Sonoma, Inc. | 505 | 94,283 | ||||||
Wingstop, Inc. | 194 | 33,354 | ||||||
WW International, Inc.* | 350 | 7,578 | ||||||
Wyndham Hotels & Resorts, Inc. | 611 | 44,420 | ||||||
|
| |||||||
(Cost $1,563,483) | 1,695,811 | |||||||
|
| |||||||
Number | Value | |||||||
| Consumer Staples — 3.3% | ||||||||
BJ’s Wholesale Club Holdings, Inc.* | 893 | $ | 50,597 | |||||
Boston Beer Co., Inc., Class A * | 62 | 35,353 | ||||||
Coty, Inc., Class A* | 1,807 | 17,654 | ||||||
Darling Ingredients, Inc.* | 1,082 | 80,609 | ||||||
Flowers Foods, Inc. | 1,300 | 31,369 | ||||||
Hain Celestial Group, Inc.* | 548 | 20,501 | ||||||
Ingredion, Inc. | 440 | 38,658 | ||||||
Nu Skin Enterprises, Inc., Class A | 324 | 16,401 | ||||||
Pilgrim’s Pride Corp.* | 307 | 8,547 | ||||||
Sanderson Farms, Inc. | 131 | 25,742 | ||||||
Sprouts Farmers Market, Inc.* (a) | 801 | 19,945 | ||||||
TreeHouse Foods, Inc.* | 355 | 13,302 | ||||||
|
| |||||||
(Cost $360,101) | 358,678 | |||||||
|
| |||||||
| Energy — 1.3% | ||||||||
Cimarex Energy Co. | 674 | 43,284 | ||||||
CNX Resources Corp.* | 1,401 | 15,915 | ||||||
EQT Corp.* | 1,843 | 33,782 | ||||||
Equitrans Midstream Corp. | 2,731 | 23,842 | ||||||
Murphy Oil Corp. | 969 | 20,601 | ||||||
|
| |||||||
(Cost $126,050) | 137,424 | |||||||
|
| |||||||
| Financials — 16.5% | ||||||||
Affiliated Managers Group, Inc. | 272 | 46,270 | ||||||
Alleghany Corp.* | 93 | 62,932 | ||||||
Associated Banc-Corp. | 1,033 | 21,300 | ||||||
BancorpSouth Bank | 657 | 19,270 | ||||||
Bank of Hawaii Corp. | 272 | 22,796 | ||||||
Bank OZK | 791 | 33,562 | ||||||
Brown & Brown, Inc. | 1,551 | 90,036 | ||||||
CIT Group, Inc. | 646 | 35,801 | ||||||
CNO Financial Group, Inc. | 858 | 20,987 | ||||||
Commerce Bancshares, Inc. | 686 | 48,514 | ||||||
East West Bancorp, Inc. | 941 | 69,013 | ||||||
Essent Group Ltd. | 769 | 36,205 | ||||||
Evercore, Inc., Class A | 266 | 37,144 | ||||||
FactSet Research Systems, Inc. | 251 | 95,435 | ||||||
First American Financial Corp. | 716 | 50,500 | ||||||
First Horizon Corp. | 3,617 | 59,283 | ||||||
FNB Corp. | 2,057 | 24,026 | ||||||
Fulton Financial Corp. | 1,036 | 16,421 | ||||||
Hancock Whitney Corp. | 582 | 26,749 | ||||||
Hanover Insurance Group, Inc. | 240 | 33,914 | ||||||
Interactive Brokers Group, Inc., Class A | 530 | 34,259 | ||||||
Janus Henderson Group PLC | 1,115 | 48,346 | ||||||
Kemper Corp. | 412 | 28,263 | ||||||
MGIC Investment Corp. (a) | 2,239 | 34,190 | ||||||
Navient Corp. | 1,172 | 27,202 | ||||||
New York Community Bancorp, Inc. | 3,043 | 38,098 | ||||||
PacWest Bancorp | 767 | 32,636 | ||||||
Pinnacle Financial Partners, Inc. | 495 | 47,975 | ||||||
Primerica, Inc. | 259 | 39,611 | ||||||
PROG Holdings, Inc. | 444 | 21,010 | ||||||
Prosperity Bancshares, Inc. | 609 | 42,557 | ||||||
Reinsurance Group of America, Inc. | 443 | 51,308 | ||||||
RenaissanceRe Holdings Ltd. | 329 | 51,564 | ||||||
RLI Corp. | 261 | 28,509 | ||||||
| See Notes to Financial Statements. | 57 |
DBX ETF Trust
Schedule of Investments
Xtrackers S&P MidCap 400 ESG ETF (Continued)
August 31, 2021
Number | Value | |||||||
| Financials (Continued) | ||||||||
SEI Investments Co. | 787 | $ | 49,432 | |||||
Selective Insurance Group, Inc. | 393 | 32,843 | ||||||
Signature Bank | 382 | 99,064 | ||||||
SLM Corp. | 2,155 | 40,406 | ||||||
Sterling Bancorp | 1,290 | 29,528 | ||||||
Synovus Financial Corp. | 974 | 41,979 | ||||||
Texas Capital Bancshares, Inc.* | 336 | 22,845 | ||||||
UMB Financial Corp. | 292 | 26,741 | ||||||
Umpqua Holdings Corp. | 1,478 | 28,777 | ||||||
Webster Financial Corp. | 594 | 30,009 | ||||||
Wintrust Financial Corp. | 378 | 28,290 | ||||||
|
| |||||||
(Cost $1,697,376) | 1,805,600 | |||||||
|
| |||||||
| Health Care — 9.3% | ||||||||
Acadia Healthcare Co., Inc.* | 582 | 38,482 | ||||||
Amedisys, Inc.* | 215 | 39,442 | ||||||
Emergent BioSolutions, Inc.* | 302 | 19,050 | ||||||
Encompass Health Corp. | 662 | 51,934 | ||||||
Exelixis, Inc.* | 2,053 | 39,356 | ||||||
Haemonetics Corp.* | 338 | 21,209 | ||||||
Hill-Rom Holdings, Inc. | 435 | 63,327 | ||||||
ICU Medical, Inc.* | 132 | 26,314 | ||||||
Integra LifeSciences Holdings Corp.* | 464 | 34,907 | ||||||
Jazz Pharmaceuticals PLC * | 400 | 52,684 | ||||||
LHC Group, Inc.* | 206 | 38,473 | ||||||
Ligand Pharmaceuticals, Inc.* | 106 | 14,024 | ||||||
LivaNova PLC * | 342 | 28,280 | ||||||
Masimo Corp.* | 336 | 91,237 | ||||||
Molina Healthcare, Inc.* | 387 | 104,014 | ||||||
Neurocrine Biosciences, Inc.* | 629 | 59,881 | ||||||
NuVasive, Inc.* | 340 | 21,128 | ||||||
Penumbra, Inc.* | 226 | 62,139 | ||||||
Quidel Corp.* | 252 | 32,495 | ||||||
Syneos Health, Inc.* | 672 | 62,348 | ||||||
Tenet Healthcare Corp.* | 710 | 53,499 | ||||||
United Therapeutics Corp.* | 298 | 64,034 | ||||||
|
| |||||||
(Cost $1,010,396) | 1,018,257 | |||||||
|
| |||||||
| Industrials — 18.7% | ||||||||
Acuity Brands, Inc. (a) | 238 | 43,918 | ||||||
AECOM* | 961 | 63,003 | ||||||
AGCO Corp. | 410 | 56,424 | ||||||
Avis Budget Group, Inc.* (a) | 340 | 30,855 | ||||||
Axon Enterprise, Inc.* | 429 | 78,022 | ||||||
Brink’s Co. | 326 | 25,480 | ||||||
Carlisle Cos., Inc. | 347 | 73,127 | ||||||
Clean Harbors, Inc.* | 335 | 34,378 | ||||||
Colfax Corp.* | 766 | 36,898 | ||||||
Crane Co. | 324 | 32,973 | ||||||
Curtiss-Wright Corp. | 274 | 33,368 | ||||||
Donaldson Co., Inc. | 822 | 55,690 | ||||||
Dycom Industries, Inc.* | 208 | 15,669 | ||||||
EMCOR Group, Inc. | 359 | 43,618 | ||||||
EnerSys | 288 | 24,362 | ||||||
Flowserve Corp. | 845 | 32,845 | ||||||
FTI Consulting, Inc.* | 224 | 31,295 | ||||||
Graco, Inc. | 1,124 | 88,144 | ||||||
Number | Value | |||||||
| Industrials (Continued) | ||||||||
Herman Miller, Inc. | 477 | $ | 20,048 | |||||
Hexcel Corp.* | 549 | 31,134 | ||||||
Hubbell, Inc. | 361 | 74,406 | ||||||
Insperity, Inc. | 247 | 27,254 | ||||||
ITT, Inc. | 565 | 54,054 | ||||||
KAR Auction Services, Inc.* | 826 | 13,968 | ||||||
KBR, Inc. | 920 | 35,825 | ||||||
Kennametal, Inc. | 547 | 20,337 | ||||||
Kirby Corp.* | 404 | 21,650 | ||||||
Lincoln Electric Holdings, Inc. | 391 | 54,588 | ||||||
ManpowerGroup, Inc. | 364 | 44,197 | ||||||
MasTec, Inc.* | 369 | 33,741 | ||||||
Mercury Systems, Inc.* | 368 | 18,540 | ||||||
Middleby Corp.* | 370 | 67,688 | ||||||
MSA Safety, Inc. | 237 | 38,593 | ||||||
Nordson Corp. | 358 | 85,419 | ||||||
Oshkosh Corp. | 456 | 52,248 | ||||||
Owens Corning | 682 | 65,165 | ||||||
Regal Beloit Corp. | 273 | 40,792 | ||||||
Ryder System, Inc. | 353 | 28,060 | ||||||
Science Applications International Corp. | 388 | 32,681 | ||||||
Stericycle, Inc.* | 596 | 41,482 | ||||||
Terex Corp. | 461 | 23,534 | ||||||
Tetra Tech, Inc. | 357 | 51,351 | ||||||
Timken Co. | 446 | 32,799 | ||||||
Toro Co. | 710 | 78,057 | ||||||
Trinity Industries, Inc. | 525 | 15,241 | ||||||
Univar Solutions, Inc.* | 1,114 | 26,302 | ||||||
Werner Enterprises, Inc. | 394 | 18,581 | ||||||
Woodward, Inc. | 386 | 46,683 | ||||||
XPO Logistics, Inc.* | 676 | 58,751 | ||||||
|
| |||||||
(Cost $1,845,568) | 2,053,238 | |||||||
|
| |||||||
| Information Technology — 14.4% | ||||||||
ACI Worldwide, Inc.* | 777 | 25,043 | ||||||
Alliance Data Systems Corp. | 329 | 32,278 | ||||||
Amkor Technology, Inc. | 717 | 19,696 | ||||||
Arrow Electronics, Inc.* | 486 | 58,913 | ||||||
Avnet, Inc. | 667 | 26,987 | ||||||
Belden, Inc. | 303 | 17,347 | ||||||
Blackbaud, Inc.* | 320 | 22,301 | ||||||
Ceridian HCM Holding, Inc.* | 871 | 97,857 | ||||||
Ciena Corp.* | 1,031 | 58,901 | ||||||
CMC Materials, Inc. | 192 | 25,463 | ||||||
Cognex Corp. | 1,171 | 103,774 | ||||||
Coherent, Inc.* | 160 | 40,427 | ||||||
CommVault Systems, Inc.* | 300 | 24,291 | ||||||
Cree, Inc.* | 766 | 65,095 | ||||||
Fair Isaac Corp.* | 189 | 86,891 | ||||||
First Solar, Inc.* | 565 | 53,110 | ||||||
Jabil, Inc. | 889 | 54,922 | ||||||
Littelfuse, Inc. | 161 | 45,949 | ||||||
LiveRamp Holdings, Inc.* | 449 | 22,001 | ||||||
Manhattan Associates, Inc.* | 423 | 68,945 | ||||||
Maximus, Inc. | 406 | 35,358 | ||||||
National Instruments Corp. | 872 | 36,467 | ||||||
NetScout Systems, Inc.* | 467 | 12,805 | ||||||
| See Notes to Financial Statements. | 58 |
DBX ETF Trust
Schedule of Investments
Xtrackers S&P MidCap 400 ESG ETF (Continued)
August 31, 2021
Number | Value | |||||||
| Information Technology (Continued) | ||||||||
Paylocity Holding Corp.* | 250 | $ | 67,300 | |||||
Qualys, Inc.* | 226 | 26,528 | ||||||
Semtech Corp.* | 435 | 30,415 | ||||||
Silicon Laboratories, Inc.* | 298 | 46,971 | ||||||
SolarEdge Technologies, Inc.* | 345 | 99,974 | ||||||
Synaptics, Inc.* | 229 | 43,460 | ||||||
SYNNEX Corp. | 270 | 34,309 | ||||||
Teradata Corp.* | 713 | 38,994 | ||||||
Universal Display Corp. | 280 | 58,405 | ||||||
Viasat, Inc.* | 457 | 23,599 | ||||||
WEX, Inc.* | 298 | 54,704 | ||||||
Xerox Holdings Corp. | 1,063 | 23,928 | ||||||
|
| |||||||
(Cost $1,478,076) | 1,583,408 | |||||||
|
| |||||||
| Materials — 7.1% | ||||||||
AptarGroup, Inc. | 436 | 58,773 | ||||||
Ashland Global Holdings, Inc. | 363 | 33,073 | ||||||
Avient Corp. | 612 | 31,879 | ||||||
Cabot Corp. | 381 | 20,345 | ||||||
Chemours Co. | 1,079 | 36,157 | ||||||
Cleveland-Cliffs, Inc. * (a) | 3,053 | 71,654 | ||||||
Commercial Metals Co. | 791 | 25,802 | ||||||
Compass Minerals International, Inc. | 216 | 14,457 | ||||||
Eagle Materials, Inc. | 283 | 44,386 | ||||||
Greif, Inc., Class A | 169 | 10,701 | ||||||
Ingevity Corp.* | 258 | 20,741 | ||||||
Minerals Technologies, Inc. | 216 | 16,986 | ||||||
Olin Corp. | 940 | 46,850 | ||||||
RPM International, Inc. | 861 | 70,852 | ||||||
Scotts Miracle-Gro Co. | 276 | 43,285 | ||||||
Sonoco Products Co. | 660 | 43,098 | ||||||
Steel Dynamics, Inc. | 1,332 | 89,897 | ||||||
United States Steel Corp. (a) | 1,765 | 47,214 | ||||||
Valvoline, Inc. | 1,191 | 35,920 | ||||||
Worthington Industries, Inc. | 238 | 13,792 | ||||||
|
| |||||||
(Cost $695,122) | 775,862 | |||||||
|
| |||||||
| Real Estate — 10.5% | ||||||||
American Campus Communities, Inc. REIT | 906 | 46,070 | ||||||
Brixmor Property Group, Inc. REIT | 1,951 | 45,751 | ||||||
Camden Property Trust REIT | 648 | 97,226 | ||||||
CoreSite Realty Corp. REIT | 279 | 41,395 | ||||||
Corporate Office Properties Trust REIT | 756 | 21,304 | ||||||
Cousins Properties, Inc. REIT | 969 | 37,365 | ||||||
CyrusOne, Inc. REIT | 814 | 62,662 | ||||||
Douglas Emmett, Inc. REIT | 1,091 | 36,014 | ||||||
Healthcare Realty Trust, Inc. REIT | 920 | 27,628 | ||||||
Highwoods Properties, Inc. REIT | 696 | 31,800 | ||||||
Hudson Pacific Properties, Inc. REIT | 1,013 | 26,723 | ||||||
JBG SMITH Properties REIT | 743 | 22,387 | ||||||
Jones Lang LaSalle, Inc.* | 336 | 81,456 | ||||||
Kilroy Realty Corp. REIT | 694 | 45,561 | ||||||
Life Storage, Inc. REIT | 511 | 63,589 | ||||||
Macerich Co. REIT (a) | 1,088 | 18,583 | ||||||
Medical Properties Trust, Inc. REIT | 3,908 | 80,036 | ||||||
National Retail Properties, Inc. REIT | 1,145 | 54,513 | ||||||
Park Hotels & Resorts, Inc. REIT * | 1,566 | 29,973 | ||||||
Number | Value | |||||||
| Real Estate (Continued) | ||||||||
Pebblebrook Hotel Trust REIT | 873 | $ | 19,232 | |||||
PotlatchDeltic Corp. REIT | 451 | 23,429 | ||||||
PS Business Parks, Inc. REIT | 136 | 21,383 | ||||||
Rayonier, Inc. REIT | 902 | 33,176 | ||||||
Rexford Industrial Realty, Inc. REIT | 893 | 55,304 | ||||||
SL Green Realty Corp. REIT (a) | 457 | 32,027 | ||||||
Spirit Realty Capital, Inc. REIT | 760 | 39,345 | ||||||
STORE Capital Corp. REIT | 1,588 | 57,279 | ||||||
|
| |||||||
(Cost $1,030,289) | 1,151,211 | |||||||
|
| |||||||
| Utilities — 1.2% | ||||||||
Hawaiian Electric Industries, Inc. | 717 | 31,261 | ||||||
National Fuel Gas Co. | 605 | 31,345 | ||||||
New Jersey Resources Corp. (a) | 647 | 24,159 | ||||||
Southwest Gas Holdings, Inc. | 377 | 26,507 | ||||||
Spire, Inc. | 347 | 23,145 | ||||||
|
| |||||||
(Cost $127,635) | 136,417 | |||||||
|
| |||||||
TOTAL COMMON STOCKS | 10,940,842 | |||||||
|
| |||||||
| SECURITIES LENDING COLLATERAL — 0.0% | ||||||||
DWS Government & Agency Securities Portfolio “DWS Government Cash Institutional Shares”, 0.01% (b)(c) (Cost $1,305) | 1,305 | 1,305 | ||||||
|
| |||||||
| CASH EQUIVALENTS — 0.1% | ||||||||
DWS Government Money Market Series “Institutional Shares”, 0.04% (b) | 10,177 | 10,177 | ||||||
|
| |||||||
TOTAL INVESTMENTS — 100.0% | $ | 10,952,324 | ||||||
Other assets and liabilities, net — 0.0% | 4,431 | |||||||
|
| |||||||
NET ASSETS — 100.0% | $ | 10,956,755 | ||||||
|
| |||||||
| See Notes to Financial Statements. | 59 |
DBX ETF Trust
Schedule of Investments
Xtrackers S&P MidCap 400 ESG ETF (Continued)
August 31, 2021
A summary of the Fund’s transactions with affiliated investments during the period ended August 31, 2021 is as follows:
| Value ($) at 2/24/2021 (Commencement of Operations) | Purchases Cost ($) | Sales Proceeds ($) | Net Realized Gain/(Loss) ($) | Net Change in Unrealized Appreciation (Depreciation) ($) | Income ($) | Capital Gain Distributions ($) | Number of Shares at 8/31/2021 | Value ($) at 8/31/2021 | ||||||||||||||||||||||||||||
SECURITIES LENDING COLLATERAL — 0.0% |
| |||||||||||||||||||||||||||||||||||
DWS Government & Agency Securities Portfolio “DWS Government Cash Institutional Shares”, 0.01% (b)(c) |
| |||||||||||||||||||||||||||||||||||
| — | 1,305 | (d) | — | — | — | — | — | 1,305 | 1,305 | |||||||||||||||||||||||||||
CASH EQUIVALENTS — 0.1% |
| |||||||||||||||||||||||||||||||||||
DWS Government Money Market Series “Institutional Shares”, 0.04% (b) |
| |||||||||||||||||||||||||||||||||||
| — | 10,147,201 | (10,137,024 | ) | — | — | 12 | — | 10,177 | 10,177 | |||||||||||||||||||||||||||
|
|
|
|
|
|
|
|
|
|
|
|
|
|
|
|
|
| |||||||||||||||||||
| — | 10,148,506 | (10,137,024 | ) | — | — | 12 | — | 11,482 | 11,482 | |||||||||||||||||||||||||||
|
|
|
|
|
|
|
|
|
|
|
|
|
|
|
|
|
| |||||||||||||||||||
| * | Non-income producing security. |
| (a) | All or a portion of these securities were on loan. In addition, “Other assets and liabilities, net” may include pending sales that are also on loan. The value of securities loaned at August 31, 2021 amounted to $457,260, which is 4.2% of net assets. |
| (b) | Affiliated fund managed by DWS Investment Management Americas, Inc. The rate shown is the annualized seven-day yield at period end. |
| (c) | Represents cash collateral held in connection with securities lending. Income earned by the Fund is net of borrower rebates. In addition, the Fund held non-cash U.S. Treasury securities collateral having a value of $471,616. |
| (d) | Represents the net increase (purchase cost) or decrease (sales proceeds) in the amount invested in cash collateral for the period ended August 31, 2021. |
| REIT: | Real Estate Investment Trust |
Fair Value Measurements
Various inputs are used in determining the value of the Fund’s investments. These inputs are summarized in three broad levels. Level 1 includes quoted prices in active markets for identical securities. Level 2 includes other significant observable inputs (including quoted prices for similar securities, interest rates, prepayment speeds and credit risk). Level 3 includes significant unobservable inputs (including the Fund’s own assumptions in determining the fair value of investments). The level assigned to the securities valuations may not be an indication of the risk or liquidity associated with investing in those securities.
The following is a summary of the inputs used as of August 31, 2021 in valuing the Fund’s investments. For information on the Fund’s policy regarding the valuation of investments, please refer to the Security Valuation section of Note 2 in the accompanying Notes to Financial Statements.
Assets | Level 1 | Level 2 | Level 3 | Total | ||||||||||||
Common Stocks (e) | $ | 10,940,842 | $ | — | $ | — | $ | 10,940,842 | ||||||||
Short-Term Investments (e) | 11,482 | — | — | 11,482 | ||||||||||||
|
|
|
|
|
|
|
| |||||||||
TOTAL | $ | 10,952,324 | $ | — | $ | — | $ | 10,952,324 | ||||||||
|
|
|
|
|
|
|
| |||||||||
| (e) | See Schedule of Investments for additional detailed categorizations. |
| See Notes to Financial Statements. | 60 |
DBX ETF Trust
Schedule of Investments
Xtrackers S&P SmallCap 600 ESG ETF
August 31, 2021
Number | Value | |||||||
| COMMON STOCKS — 99.9% | ||||||||
| Communication Services — 1.3% | ||||||||
ATN International, Inc. | 154 | $ | 7,021 | |||||
Consolidated Communications Holdings, | 1,019 | 9,446 | ||||||
EW Scripps Co., Class A | 855 | 15,852 | ||||||
Marcus Corp.* | 367 | 5,725 | ||||||
Meredith Corp.* | 585 | 25,161 | ||||||
QuinStreet, Inc.* | 850 | 15,223 | ||||||
Scholastic Corp. | 500 | 16,620 | ||||||
Shenandoah Telecommunications Co. | 630 | 18,793 | ||||||
TechTarget, Inc.* (a) | 352 | 29,772 | ||||||
|
| |||||||
(Cost $145,902) | 143,613 | |||||||
|
| |||||||
| Consumer Discretionary — 14.3% | ||||||||
Abercrombie & Fitch Co., Class A* | 900 | 32,184 | ||||||
American Axle & Manufacturing Holdings, | 1,689 | 14,981 | ||||||
American Public Education, Inc.* | 260 | 6,838 | ||||||
Asbury Automotive Group, Inc.* | 278 | 51,775 | ||||||
Bed Bath & Beyond, Inc.* (a) | 1,541 | 42,439 | ||||||
Big Lots, Inc. (a) | 461 | 22,432 | ||||||
Bloomin’ Brands, Inc.* | 1,199 | 32,121 | ||||||
Boot Barn Holdings, Inc.* | 417 | 37,230 | ||||||
Brinker International, Inc.* | 600 | 31,962 | ||||||
Buckle, Inc. | 436 | 16,886 | ||||||
Caleres, Inc. | 572 | 14,066 | ||||||
Cato Corp., Class A | 267 | 4,608 | ||||||
Cheesecake Factory, Inc.* | 674 | 31,442 | ||||||
Chico’s FAS, Inc.* | 1,788 | 9,244 | ||||||
Children’s Place, Inc.* | 212 | 18,410 | ||||||
Cooper-Standard Holdings, Inc.* | 236 | 5,494 | ||||||
Designer Brands, Inc., Class A* | 908 | 13,166 | ||||||
Dine Brands Global, Inc.* | 274 | 22,665 | ||||||
Ethan Allen Interiors, Inc. | 306 | 7,350 | ||||||
Fiesta Restaurant Group, Inc.* | 283 | 3,399 | ||||||
Fossil Group, Inc.* | 654 | 8,764 | ||||||
Genesco, Inc.* | 199 | 12,344 | ||||||
Gentherm, Inc.* | 482 | 41,365 | ||||||
G-III Apparel Group Ltd.* | 643 | 19,888 | ||||||
Group 1 Automotive, Inc. | 250 | 41,360 | ||||||
Guess?, Inc. (a) | 562 | 13,595 | ||||||
Hibbett, Inc. | 232 | 22,200 | ||||||
Installed Building Products, Inc. | 331 | 41,104 | ||||||
iRobot Corp.* (a) | 406 | 32,935 | ||||||
Kontoor Brands, Inc. | 695 | 37,502 | ||||||
La-Z-Boy, Inc. | 666 | 23,317 | ||||||
LCI Industries | 368 | 52,131 | ||||||
Macy’s, Inc.* | 4,512 | 101,024 | ||||||
MarineMax, Inc.* | 321 | 15,607 | ||||||
MDC Holdings, Inc. | 804 | 42,009 | ||||||
Meritage Homes Corp.* | 552 | 61,570 | ||||||
ODP Corp.* | 764 | 36,038 | ||||||
Oxford Industries, Inc. | 248 | 22,394 | ||||||
Perdoceo Education Corp.* | 1,150 | 12,627 | ||||||
Red Robin Gourmet Burgers, Inc.* | 218 | 5,337 | ||||||
Regis Corp.* | 317 | 1,718 | ||||||
Rent-A-Center, Inc. | 858 | 54,123 | ||||||
Number | Value | |||||||
| Consumer Discretionary (Continued) | ||||||||
Ruth’s Hospitality Group, Inc.* | 481 | $ | 9,856 | |||||
Sally Beauty Holdings, Inc.* | 1,614 | 30,004 | ||||||
Shake Shack, Inc., Class A* | 491 | 42,594 | ||||||
Shoe Carnival, Inc. | 240 | 9,187 | ||||||
Signet Jewelers Ltd. | 779 | 61,697 | ||||||
Sleep Number Corp.* | 351 | 32,471 | ||||||
Standard Motor Products, Inc. | 281 | 12,052 | ||||||
Steven Madden Ltd. | 1,110 | 44,922 | ||||||
Sturm Ruger & Co., Inc. | 254 | 19,860 | ||||||
Tupperware Brands Corp.* | 718 | 17,139 | ||||||
Unifi, Inc.* | 198 | 4,602 | ||||||
Universal Electronics, Inc.* | 193 | 9,750 | ||||||
Vera Bradley, Inc.* | 296 | 3,392 | ||||||
Vista Outdoor, Inc.* | 838 | 34,232 | ||||||
Winnebago Industries, Inc. | 488 | 33,975 | ||||||
Wolverine World Wide, Inc. | 1,204 | 43,175 | ||||||
|
| |||||||
(Cost $1,465,487) | 1,526,552 | |||||||
|
| |||||||
| Consumer Staples — 4.0% | ||||||||
Andersons, Inc. | 470 | 14,279 | ||||||
B&G Foods, Inc. (a) | 928 | 28,174 | ||||||
Calavo Growers, Inc. | 251 | 11,777 | ||||||
Cal-Maine Foods, Inc. | 552 | 19,960 | ||||||
Celsius Holdings, Inc.* (a) | 485 | 39,654 | ||||||
Chefs’ Warehouse, Inc.* | 472 | 14,269 | ||||||
Coca-Cola Consolidated, Inc. | 68 | 27,619 | ||||||
Edgewell Personal Care Co. | 775 | 32,782 | ||||||
elf Beauty, Inc.* | 574 | 17,765 | ||||||
Fresh Del Monte Produce, Inc. | 424 | 13,941 | ||||||
J & J Snack Foods Corp. | 222 | 36,355 | ||||||
John B Sanfilippo & Son, Inc. | 135 | 11,474 | ||||||
Medifast, Inc. | 173 | 39,427 | ||||||
MGP Ingredients, Inc. | 184 | 12,015 | ||||||
Seneca Foods Corp., Class A* | 102 | 4,995 | ||||||
Simply Good Foods Co.* | 1,236 | 44,026 | ||||||
SpartanNash Co. (a) | 505 | 10,857 | ||||||
United Natural Foods, Inc.* | 811 | 29,845 | ||||||
USANA Health Sciences, Inc.* | 166 | 16,107 | ||||||
|
| |||||||
(Cost $400,271) | 425,321 | |||||||
|
| |||||||
| Energy — 2.7% | ||||||||
Callon Petroleum Co.* | 677 | 23,133 | ||||||
Core Laboratories NV | 671 | 18,493 | ||||||
Helix Energy Solutions Group, Inc.* | 2,139 | 8,043 | ||||||
Helmerich & Payne, Inc. | 1,570 | 42,264 | ||||||
Laredo Petroleum, Inc.* | 138 | 7,456 | ||||||
Par Pacific Holdings, Inc.* | 750 | 12,368 | ||||||
PBF Energy, Inc., Class A* | 1,411 | 14,674 | ||||||
Range Resources Corp.* | 3,744 | 54,737 | ||||||
Renewable Energy Group, Inc.* (a) | 630 | 30,505 | ||||||
SM Energy Co. | 1,630 | 31,133 | ||||||
Southwestern Energy Co.* | 9,427 | 42,893 | ||||||
|
| |||||||
(Cost $283,552) | 285,699 | |||||||
|
| |||||||
| Financials — 17.6% | ||||||||
Ambac Financial Group, Inc.* | 642 | 9,046 | ||||||
Ameris Bancorp | 1,006 | 49,535 | ||||||
AMERISAFE, Inc. | 288 | 16,574 | ||||||
| See Notes to Financial Statements. | 61 |
DBX ETF Trust
Schedule of Investments
Xtrackers S&P SmallCap 600 ESG ETF (Continued)
August 31, 2021
Number | Value | |||||||
| Financials (Continued) | ||||||||
Assured Guaranty Ltd. | 1,086 | $ | 54,148 | |||||
Banc of California, Inc. | 624 | 11,213 | ||||||
BankUnited, Inc. | 1,340 | 56,320 | ||||||
Banner Corp. | 512 | 29,286 | ||||||
Berkshire Hills Bancorp, Inc. | 752 | 19,274 | ||||||
Blucora, Inc.* | 674 | 11,060 | ||||||
Brightsphere Investment Group, Inc. | 872 | 23,710 | ||||||
Cadence BanCorp | 1,852 | 39,837 | ||||||
Capstead Mortgage Corp. REIT | 1,355 | 9,336 | ||||||
Central Pacific Financial Corp. | 394 | 9,972 | ||||||
City Holding Co. | 235 | 18,306 | ||||||
Columbia Banking System, Inc. | 1,054 | 38,323 | ||||||
Community Bank System, Inc. | 808 | 59,792 | ||||||
Customers Bancorp, Inc.* | 438 | 18,138 | ||||||
Donnelley Financial Solutions, Inc.* | 450 | 15,007 | ||||||
Eagle Bancorp, Inc. | 463 | 26,715 | ||||||
eHealth, Inc.* | 300 | 11,595 | ||||||
Employers Holdings, Inc. | 421 | 17,333 | ||||||
Encore Capital Group, Inc.* | 461 | 22,686 | ||||||
Enova International, Inc.* | 540 | 17,809 | ||||||
First BanCorp | 3,126 | 39,794 | ||||||
First Financial Bancorp | 1,386 | 32,585 | ||||||
First Hawaiian, Inc. | 1,877 | 52,387 | ||||||
First Midwest Bancorp, Inc. | 1,632 | 30,567 | ||||||
Granite Point Mortgage Trust, Inc. REIT | 770 | 10,595 | ||||||
Great Western Bancorp, Inc. | 803 | 24,861 | ||||||
Green Dot Corp., Class A* | 798 | 41,688 | ||||||
Greenhill & Co., Inc. | 188 | 2,771 | ||||||
Hanmi Financial Corp. | 430 | 8,290 | ||||||
Heritage Financial Corp. | 502 | 12,776 | ||||||
Hilltop Holdings, Inc. | 931 | 31,161 | ||||||
HomeStreet, Inc. | 350 | 14,297 | ||||||
Hope Bancorp, Inc. | 1,801 | 24,836 | ||||||
Horace Mann Educators Corp. | 598 | 24,518 | ||||||
Independent Bank Corp. (a) | 486 | 37,276 | ||||||
Independent Bank Group, Inc. | 524 | 36,905 | ||||||
Invesco Mortgage Capital, Inc. REIT (a) | 4,158 | 12,973 | ||||||
Investors Bancorp, Inc. | 3,301 | 47,237 | ||||||
KKR Real Estate Finance Trust, Inc. REIT | 381 | 8,127 | ||||||
Meta Financial Group, Inc. | 477 | 23,464 | ||||||
National Bank Holdings Corp., Class A | 442 | 16,575 | ||||||
NBT Bancorp, Inc. | 646 | 23,166 | ||||||
New York Mortgage Trust, Inc. REIT | 5,460 | 24,133 | ||||||
NMI Holdings, Inc., Class A* | 1,223 | 27,603 | ||||||
Northfield Bancorp, Inc. | 656 | 11,086 | ||||||
Northwest Bancshares, Inc. | 1,827 | 23,788 | ||||||
OFG Bancorp | 764 | 18,191 | ||||||
Old National Bancorp. | 2,362 | 39,351 | ||||||
Pacific Premier Bancorp, Inc. | 1,362 | 54,426 | ||||||
Palomar Holdings, Inc.* | 313 | 28,107 | ||||||
Park National Corp. (a) | 204 | 23,917 | ||||||
PennyMac Mortgage Investment Trust REIT | 1,406 | 27,290 | ||||||
Piper Sandler Cos. | 206 | 29,442 | ||||||
PRA Group, Inc.* | 656 | 27,552 | ||||||
Preferred Bank | 190 | 12,139 | ||||||
ProAssurance Corp. | 783 | 19,967 | ||||||
Provident Financial Services, Inc. | 1,043 | 23,019 | ||||||
Number | Value | |||||||
| Financials (Continued) | ||||||||
Redwood Trust, Inc. REIT | 1,627 | $ | 20,289 | |||||
S&T Bancorp, Inc. | 584 | 17,403 | ||||||
Safety Insurance Group, Inc. | 204 | 16,587 | ||||||
Seacoast Banking Corp. of Florida | 806 | 25,744 | ||||||
Simmons First National Corp., Class A | 1,575 | 45,754 | ||||||
Southside Bancshares, Inc. | 435 | 16,395 | ||||||
Stewart Information Services Corp. | 407 | 25,621 | ||||||
Tompkins Financial Corp. | 169 | 13,451 | ||||||
Trupanion, Inc.* (a) | 497 | 45,515 | ||||||
United Community Banks, Inc. | 1,286 | 38,799 | ||||||
United Fire Group, Inc. | 301 | 7,814 | ||||||
Universal Insurance Holdings, Inc. | 398 | 5,668 | ||||||
Veritex Holdings, Inc. | 711 | 25,546 | ||||||
WisdomTree Investments, Inc. (a) | 1,571 | 9,913 | ||||||
WSFS Financial Corp. | 676 | 30,697 | ||||||
|
| |||||||
(Cost $1,856,547) | 1,877,071 | |||||||
|
| |||||||
| Health Care — 12.3% | ||||||||
Addus HomeCare Corp.* | 221 | 19,872 | ||||||
Allscripts Healthcare Solutions, Inc.* (a) | 2,141 | 32,886 | ||||||
AMN Healthcare Services, Inc.* | 677 | 76,853 | ||||||
Amphastar Pharmaceuticals, Inc.* | 558 | 10,970 | ||||||
AngioDynamics, Inc.* | 581 | 16,442 | ||||||
Anika Therapeutics, Inc.* | 237 | 10,222 | ||||||
Cardiovascular Systems, Inc.* | 566 | 20,257 | ||||||
Coherus Biosciences, Inc.* (a) | 1,028 | 16,428 | ||||||
Collegium Pharmaceutical, Inc.* | 527 | 10,819 | ||||||
Community Health Systems, Inc.* | 1,797 | 22,121 | ||||||
Computer Programs and Systems, Inc.* | 193 | 6,865 | ||||||
CONMED Corp. | 418 | 54,900 | ||||||
Corcept Therapeutics, Inc.* | 1,529 | 32,537 | ||||||
CorVel Corp.* | 136 | 22,414 | ||||||
Covetrus, Inc.* | 1,459 | 32,959 | ||||||
Cross Country Healthcare, Inc.* | 488 | 10,614 | ||||||
CryoLife, Inc.* (a) | 591 | 15,508 | ||||||
Cutera, Inc.* | 266 | 13,231 | ||||||
Cytokinetics, Inc.* (a) | 1,176 | 38,773 | ||||||
Eagle Pharmaceuticals, Inc.* | 162 | 8,646 | ||||||
Enanta Pharmaceuticals, Inc.* | 251 | 14,357 | ||||||
Endo International PLC* | 2,094 | 4,795 | ||||||
Ensign Group, Inc. | 741 | 60,518 | ||||||
Glaukos Corp.* | 600 | 35,778 | ||||||
Heska Corp.* | 143 | 37,938 | ||||||
Inogen, Inc.* | 270 | 15,981 | ||||||
Invacare Corp.* (a) | 541 | 4,577 | ||||||
Magellan Health, Inc.* | 331 | 31,319 | ||||||
Merit Medical Systems, Inc.* | 713 | 51,172 | ||||||
Myriad Genetics, Inc.* | 1,100 | 39,358 | ||||||
Natus Medical, Inc.* | 550 | 14,586 | ||||||
NextGen Healthcare, Inc.* | 777 | 11,857 | ||||||
Omnicell, Inc.* | 627 | 97,354 | ||||||
OraSure Technologies, Inc.* | 1,056 | 11,563 | ||||||
Orthofix Medical, Inc.* | 300 | 12,720 | ||||||
Owens & Minor, Inc. | 1,080 | 40,262 | ||||||
Pacira BioSciences, Inc.* (a) | 648 | 38,420 | ||||||
Phibro Animal Health Corp., Class A | 283 | 6,874 | ||||||
Prestige Consumer Healthcare, Inc.* | 747 | 42,870 | ||||||
| See Notes to Financial Statements. | 62 |
DBX ETF Trust
Schedule of Investments
Xtrackers S&P SmallCap 600 ESG ETF (Continued)
August 31, 2021
Number | Value | |||||||
| Health Care (Continued) | ||||||||
RadNet, Inc.* | 621 | $ | 19,506 | |||||
REGENXBIO, Inc.* | 520 | 16,796 | ||||||
Select Medical Holdings Corp. | 1,554 | 53,722 | ||||||
Spectrum Pharmaceuticals, Inc.* | 2,733 | 6,423 | ||||||
Supernus Pharmaceuticals, Inc.* | 779 | 21,446 | ||||||
Surmodics, Inc.* | 192 | 11,533 | ||||||
Tabula Rasa HealthCare, Inc.* (a) | 331 | 10,364 | ||||||
Tactile Systems Technology, Inc.* | 340 | 15,123 | ||||||
Tivity Health, Inc.* | 558 | 12,974 | ||||||
US Physical Therapy, Inc. | 186 | 21,836 | ||||||
Vanda Pharmaceuticals, Inc.* (a) | 806 | 13,492 | ||||||
Vericel Corp.* (a) | 681 | 36,890 | ||||||
Xencor, Inc.* | 780 | 26,419 | ||||||
|
| |||||||
(Cost $1,250,000) | 1,312,140 | |||||||
|
| |||||||
| Industrials — 18.1% | ||||||||
AAR Corp.* | 497 | 16,823 | ||||||
ABM Industries, Inc. | 983 | 48,678 | ||||||
AeroVironment, Inc.* | 321 | 32,858 | ||||||
Alamo Group, Inc. | 145 | 22,476 | ||||||
Albany International Corp., Class A | 438 | 34,309 | ||||||
Applied Industrial Technologies, Inc. | 560 | 49,734 | ||||||
ArcBest Corp. | 371 | 24,757 | ||||||
Arcosa, Inc. | 702 | 35,676 | ||||||
Astec Industries, Inc. | 333 | 20,360 | ||||||
Atlas Air Worldwide Holdings, Inc.* | 392 | 28,683 | ||||||
AZZ, Inc. | 352 | 18,850 | ||||||
Barnes Group, Inc. | 680 | 32,416 | ||||||
Boise Cascade Co. | 560 | 32,396 | ||||||
Brady Corp., Class A | 713 | 38,024 | ||||||
Chart Industries, Inc.* (a) | 523 | 98,523 | ||||||
CIRCOR International, Inc.* | 280 | 10,010 | ||||||
Comfort Systems USA, Inc. | 532 | 40,421 | ||||||
CoreCivic, Inc.* | 1,735 | 16,864 | ||||||
Deluxe Corp. | 603 | 23,125 | ||||||
Echo Global Logistics, Inc.* | 372 | 12,231 | ||||||
Encore Wire Corp. | 298 | 25,333 | ||||||
Enerpac Tool Group Corp. | 894 | 22,493 | ||||||
EnPro Industries, Inc. | 299 | 25,567 | ||||||
ESCO Technologies, Inc. | 372 | 33,525 | ||||||
Exponent, Inc. | 749 | 87,558 | ||||||
Federal Signal Corp. | 891 | 36,201 | ||||||
Forward Air Corp. | 390 | 34,386 | ||||||
Franklin Electric Co., Inc. | 563 | 47,844 | ||||||
GMS, Inc.* | 622 | 30,733 | ||||||
Granite Construction, Inc. | 657 | 26,635 | ||||||
Greenbrier Cos., Inc. (a) | 482 | 21,256 | ||||||
Harsco Corp.* | 1,137 | 20,739 | ||||||
Heartland Express, Inc. | 682 | 11,444 | ||||||
Heidrick & Struggles International, Inc. | 271 | 11,713 | ||||||
Hillenbrand, Inc. | 1,090 | 50,598 | ||||||
HNI Corp. | 620 | 23,492 | ||||||
Hub Group, Inc., Class A* | 484 | 33,977 | ||||||
Interface, Inc. | 820 | 11,792 | ||||||
John Bean Technologies Corp. | 456 | 66,526 | ||||||
Kaman Corp. | 418 | 16,335 | ||||||
Kelly Services, Inc., Class A | 468 | 9,098 | ||||||
Number | Value | |||||||
| Industrials (Continued) | ||||||||
Lindsay Corp. | 158 | $ | 26,030 | |||||
Lydall, Inc.* | 251 | 15,557 | ||||||
Marten Transport Ltd. | 887 | 13,828 | ||||||
Matson, Inc. | 635 | 50,273 | ||||||
Meritor, Inc.* | 1,042 | 24,716 | ||||||
Mueller Industries, Inc. | 815 | 36,357 | ||||||
MYR Group, Inc.* | 242 | 25,170 | ||||||
National Presto Industries, Inc. | 73 | 6,098 | ||||||
Pitney Bowes, Inc. | 2,510 | 18,750 | ||||||
Powell Industries, Inc. | 139 | 3,517 | ||||||
Proto Labs, Inc.* | 350 | 25,956 | ||||||
Raven Industries, Inc.* | 523 | 30,517 | ||||||
SPX Corp.* | 656 | 40,987 | ||||||
SPX FLOW, Inc. | 617 | 49,687 | ||||||
Standex International Corp. | 173 | 17,168 | ||||||
Team, Inc.* | 505 | 2,262 | ||||||
Tennant Co. | 268 | 19,827 | ||||||
Titan International, Inc.* | 704 | 5,850 | ||||||
Triumph Group, Inc.* | 905 | 16,706 | ||||||
UniFirst Corp. | 228 | 52,228 | ||||||
US Ecology, Inc.* | 474 | 16,993 | ||||||
Veritiv Corp.* | 174 | 15,603 | ||||||
Viad Corp.* | 286 | 12,352 | ||||||
Vicor Corp.* | 304 | 37,504 | ||||||
Wabash National Corp. | 727 | 11,298 | ||||||
Watts Water Technologies, Inc., Class A | 412 | 70,687 | ||||||
|
| |||||||
(Cost $1,813,921) | 1,930,380 | |||||||
|
| |||||||
| Information Technology — 15.4% | ||||||||
8x8, Inc.* | 1,485 | 35,863 | ||||||
ADTRAN, Inc. | 734 | 15,164 | ||||||
Advanced Energy Industries, Inc. | 560 | 50,501 | ||||||
Agilysys, Inc.* | 297 | 16,879 | ||||||
Badger Meter, Inc. | 424 | 45,406 | ||||||
Benchmark Electronics, Inc. | 508 | 13,731 | ||||||
Bottomline Technologies DE, Inc.* | 563 | 23,798 | ||||||
Cohu, Inc.* | 725 | 25,868 | ||||||
CSG Systems International, Inc. | 479 | 23,093 | ||||||
CTS Corp. | 487 | 17,084 | ||||||
Diodes, Inc.* | 616 | 59,647 | ||||||
Ebix, Inc. | 400 | 11,512 | ||||||
EVERTEC, Inc. | 878 | 40,608 | ||||||
ExlService Holdings, Inc.* | 482 | 59,354 | ||||||
Extreme Networks, Inc.* | 1,794 | 19,429 | ||||||
Fabrinet* | 536 | 55,219 | ||||||
FARO Technologies, Inc.* | 264 | 18,200 | ||||||
FormFactor, Inc.* | 1,131 | 43,973 | ||||||
Ichor Holdings Ltd.* | 414 | 18,344 | ||||||
Insight Enterprises, Inc.* | 528 | 54,326 | ||||||
Itron, Inc.* | 658 | 55,279 | ||||||
Knowles Corp.* | 1,318 | 26,360 | ||||||
Kulicke & Soffa Industries, Inc. | 901 | 63,241 | ||||||
LivePerson, Inc.* (a) | 920 | 58,972 | ||||||
MaxLinear, Inc.* | 989 | 51,655 | ||||||
Methode Electronics, Inc. | 553 | 25,753 | ||||||
MicroStrategy, Inc., Class A* (a) | 112 | 77,762 | ||||||
NETGEAR, Inc.* | 427 | 15,257 | ||||||
| See Notes to Financial Statements. | 63 |
DBX ETF Trust
Schedule of Investments
Xtrackers S&P SmallCap 600 ESG ETF (Continued)
August 31, 2021
Number | Value | |||||||
| Information Technology (Continued) | ||||||||
OneSpan, Inc.* | 560 | $ | 10,791 | |||||
Onto Innovation, Inc.* | 708 | 52,484 | ||||||
PDF Solutions, Inc.* | 410 | 9,233 | ||||||
Plantronics, Inc.* | 544 | 16,200 | ||||||
Plexus Corp.* | 409 | 37,558 | ||||||
Power Integrations, Inc. | 871 | 94,625 | ||||||
Progress Software Corp. | 644 | 29,985 | ||||||
Rogers Corp.* | 271 | 57,563 | ||||||
Sanmina Corp.* | 956 | 37,743 | ||||||
ScanSource, Inc.* | 356 | 12,666 | ||||||
SPS Commerce, Inc.* | 516 | 69,933 | ||||||
TTEC Holdings, Inc. | 260 | 27,420 | ||||||
TTM Technologies, Inc.* | 1,427 | 19,978 | ||||||
Unisys Corp.* | 985 | 23,847 | ||||||
Veeco Instruments, Inc.* (a) | 740 | 16,865 | ||||||
Viavi Solutions, Inc.* | 3,305 | 53,838 | ||||||
Vonage Holdings Corp.* | 3,406 | 48,025 | ||||||
|
| |||||||
(Cost $1,530,156) | 1,641,032 | |||||||
|
| |||||||
| Materials — 5.1% | ||||||||
AdvanSix, Inc.* | 392 | 14,308 | ||||||
Allegheny Technologies, Inc.* | 1,860 | 33,220 | ||||||
American Vanguard Corp. | 372 | 5,703 | ||||||
Balchem Corp. | 466 | 65,436 | ||||||
Carpenter Technology Corp. | 705 | 23,512 | ||||||
Century Aluminum Co.* | 751 | 9,628 | ||||||
Clearwater Paper Corp.* | 232 | 7,538 | ||||||
Ferro Corp.* | 1,186 | 24,669 | ||||||
GCP Applied Technologies, Inc.* | 718 | 17,117 | ||||||
Glatfelter Corp. | 686 | 10,839 | ||||||
Hawkins, Inc. | 264 | 10,000 | ||||||
Haynes International, Inc. | 173 | 6,790 | ||||||
HB Fuller Co. | 758 | 51,218 | ||||||
Innospec, Inc. | 350 | 32,760 | ||||||
Kaiser Aluminum Corp. | 227 | 28,661 | ||||||
Koppers Holdings, Inc.* | 295 | 9,706 | ||||||
Kraton Corp.* | 467 | 19,670 | ||||||
Livent Corp.* (a) | 2,305 | 57,325 | ||||||
Mercer International, Inc. | 553 | 6,293 | ||||||
Neenah, Inc. | 236 | 11,892 | ||||||
Stepan Co. | 315 | 37,031 | ||||||
SunCoke Energy, Inc. | 1,156 | 8,034 | ||||||
TimkenSteel Corp.* | 530 | 7,250 | ||||||
Tredegar Corp. | 361 | 4,794 | ||||||
Trinseo SA | 567 | 29,444 | ||||||
Warrior Met Coal, Inc. | 751 | 16,815 | ||||||
|
| |||||||
(Cost $540,506) | 549,653 | |||||||
|
| |||||||
| Real Estate — 8.3% | ||||||||
Acadia Realty Trust REIT | 1,240 | 26,313 | ||||||
Agree Realty Corp. REIT | 996 | 74,252 | ||||||
Alexander & Baldwin, Inc. REIT | 1,067 | 22,279 | ||||||
American Assets Trust, Inc. REIT | 722 | 28,750 | ||||||
Armada Hoffler Properties, Inc. REIT | 910 | 12,221 | ||||||
Brandywine Realty Trust REIT | 2,438 | 33,839 | ||||||
CareTrust REIT, Inc. REIT | 1,429 | 31,424 | ||||||
Centerspace REIT | 189 | 19,123 | ||||||
Number | Value | |||||||
| Real Estate (Continued) | ||||||||
Chatham Lodging Trust REIT* | 748 | $ | 8,976 | |||||
Community Healthcare Trust, Inc. REIT | 336 | 16,299 | ||||||
DiamondRock Hospitality Co. REIT* | 3,009 | 27,201 | ||||||
Diversified Healthcare Trust REIT | 3,538 | 13,268 | ||||||
Easterly Government Properties, Inc. REIT | 1,220 | 26,071 | ||||||
Four Corners Property Trust, Inc. REIT | 1,086 | 31,070 | ||||||
GEO Group, Inc. REIT | 1,777 | 13,772 | ||||||
Getty Realty Corp. REIT | 547 | 17,302 | ||||||
Hersha Hospitality Trust REIT* | 511 | 4,793 | ||||||
Independence Realty Trust, Inc. REIT | 1,457 | 29,839 | ||||||
iStar, Inc. REIT (a) | 1,088 | 28,778 | ||||||
Kite Realty Group Trust REIT | 1,211 | 24,535 | ||||||
Lexington Realty Trust REIT | 4,028 | 54,499 | ||||||
LTC Properties, Inc. REIT | 576 | 19,878 | ||||||
Office Properties Income Trust REIT | 712 | 18,889 | ||||||
Realogy Holdings Corp.* | 1,704 | 29,905 | ||||||
Retail Opportunity Investments Corp. REIT | 1,736 | 31,387 | ||||||
Retail Properties of America, Inc., Class A REIT | 3,072 | 40,612 | ||||||
RPT Realty REIT | 1,135 | 14,687 | ||||||
SITE Centers Corp. REIT | 2,444 | 39,373 | ||||||
Summit Hotel Properties, Inc. REIT* | 1,607 | 14,977 | ||||||
Tanger Factory Outlet Centers, Inc. REIT (a) | 1,475 | 24,662 | ||||||
Uniti Group, Inc. REIT | 3,330 | 43,523 | ||||||
Washington Real Estate Investment Trust REIT (a) | 1,205 | 30,294 | ||||||
Whitestone REIT | 558 | 5,474 | ||||||
Xenia Hotels & Resorts, Inc. REIT* | 1,626 | 28,325 | ||||||
|
| |||||||
(Cost $808,442) | 886,590 | |||||||
|
| |||||||
| Utilities — 0.8% | ||||||||
California Water Service Group | 733 | 46,582 | ||||||
South Jersey Industries, Inc. (a) | 1,626 | 40,341 | ||||||
|
| |||||||
(Cost $84,473) | 86,923 | |||||||
|
| |||||||
TOTAL COMMON STOCKS | 10,664,974 | |||||||
|
| |||||||
| SECURITIES LENDING COLLATERAL — 0.5% | ||||||||
DWS Government & Agency Securities Portfolio “DWS Government Cash Institutional Shares”, 0.01% (b)(c) | 50,397 | 50,397 | ||||||
|
| |||||||
| CASH EQUIVALENTS — 0.1% | ||||||||
DWS Government Money Market Series “Institutional Shares”, 0.04% (b) | 12,273 | 12,273 | ||||||
|
| |||||||
TOTAL INVESTMENTS — 100.5% (Cost $10,241,927) | $ | 10,727,644 | ||||||
Other assets and liabilities, net — (0.5%) | (56,937 | ) | ||||||
|
| |||||||
NET ASSETS — 100.0% | $ | 10,670,707 | ||||||
|
| |||||||
| See Notes to Financial Statements. | 64 |
DBX ETF Trust
Schedule of Investments
Xtrackers S&P SmallCap 600 ESG ETF (Continued)
August 31, 2021
A summary of the Fund’s transactions with affiliated investments during the period ended August 31, 2021 is as follows:
| Value ($) at 2/24/2021 (Commencement of Operations) | Purchases Cost ($) | Sales Proceeds ($) | Net Realized Gain/(Loss) ($) | Net Change in Unrealized Appreciation (Depreciation) ($) | Income ($) | Capital Gain Distributions ($) | Number of Shares at 8/31/2021 | Value ($) at 8/31/2021 | ||||||||||||||||||||||||||||
SECURITIES LENDING COLLATERAL — 0.5% |
| |||||||||||||||||||||||||||||||||||
DWS Government & Agency Securities Portfolio “DWS Government Cash Institutional Shares”, 0.01% (b)(c) |
| |||||||||||||||||||||||||||||||||||
| — | 50,397 | (d) | — | — | — | 5 | — | 50,397 | 50,397 | |||||||||||||||||||||||||||
CASH EQUIVALENTS — 0.1% |
| |||||||||||||||||||||||||||||||||||
DWS Government Money Market Series “Institutional Shares”, 0.04% (b) |
| |||||||||||||||||||||||||||||||||||
| — | 10,336,414 | (10,324,141 | ) | — | — | 12 | — | 12,273 | 12,273 | |||||||||||||||||||||||||||
|
|
|
|
|
|
|
|
|
|
|
|
|
|
|
|
|
| |||||||||||||||||||
| — | 10,386,811 | (10,324,141 | ) | — | — | 17 | — | 62,670 | 62,670 | |||||||||||||||||||||||||||
|
|
|
|
|
|
|
|
|
|
|
|
|
|
|
|
|
| |||||||||||||||||||
| *Non-income | producing security. |
| (a) | All or a portion of these securities were on loan. In addition, “Other assets and liabilities, net” may include pending sales that are also on loan. The value of securities loaned at August 31, 2021 amounted to $871,859, which is 8.2% of net assets. |
| (b) | Affiliated fund managed by DWS Investment Management Americas, Inc. The rate shown is the annualized seven-day yield at period end. |
| (c) | Represents cash collateral held in connection with securities lending. Income earned by the Fund is net of borrower rebates. In addition, the Fund held non-cash U.S. Treasury securities collateral having a value of $842,400. |
| (d) | Represents the net increase (purchase cost) or decrease (sales proceeds) in the amount invested in cash collateral for the period ended August 31, 2021. |
| REIT: | Real Estate Investment Trust |
Fair Value Measurements
Various inputs are used in determining the value of the Fund’s investments. These inputs are summarized in three broad levels. Level 1 includes quoted prices in active markets for identical securities. Level 2 includes other significant observable inputs (including quoted prices for similar securities, interest rates, prepayment speeds and credit risk). Level 3 includes significant unobservable inputs (including the Fund’s own assumptions in determining the fair value of investments). The level assigned to the securities valuations may not be an indication of the risk or liquidity associated with investing in those securities.
The following is a summary of the inputs used as of August 31, 2021 in valuing the Fund’s investments. For information on the Fund’s policy regarding the valuation of investments, please refer to the Security Valuation section of Note 2 in the accompanying Notes to Financial Statements.
Assets | Level 1 | Level 2 | Level 3 | Total | ||||||||||||
Common Stocks (e) | $ | 10,664,974 | $ | — | $ | — | $ | 10,664,974 | ||||||||
Short-Term Investments (e) | 62,670 | — | — | 62,670 | ||||||||||||
|
|
|
|
|
|
|
| |||||||||
TOTAL | $ | 10,727,644 | $ | — | $ | — | $ | 10,727,644 | ||||||||
|
|
|
|
|
|
|
| |||||||||
| (e) | See Schedule of Investments for additional detailed categorizations. |
| See Notes to Financial Statements. | 65 |
DBX ETF Trust
August 31, 2021
| Xtrackers Emerging Markets Carbon Reduction and Climate Improvers ETF | Xtrackers MSCI EAFE ESG Leaders Equity ETF | Xtrackers MSCI Emerging Markets ESG Leaders Equity ETF | Xtrackers MSCI USA ESG Leaders Equity ETF | |||||||||||||
Assets | ||||||||||||||||
Investment in non-affiliated securities at value | $ | 495,506,574 | $ | 19,008,194 | $ | 25,059,423 | $ | 3,883,517,377 | ||||||||
Investment in affiliated securities at value | 3,087 | — | – | — | ||||||||||||
Investment in DWS Government Money Market Series | 3,753,775 | 2,532 | 149,313 | 3,332,190 | ||||||||||||
Investment in DWS Government & Agency Securities Portfolio* | 1,768,050 | 61,137 | 79,911 | 852,902 | ||||||||||||
Cash | 209,495 | — | — | — | ||||||||||||
Foreign currency at value | 2,647,570 | 18,008 | 32,743 | — | ||||||||||||
Deposit with broker for futures contracts | 4,434 | 1,391 | 10,947 | 23,000 | ||||||||||||
| Receivables: | ||||||||||||||||
Investment securities sold | 2,022 | 13,923 | 256,400 | 22,572,831 | ||||||||||||
Capital shares | 4,796,045 | — | — | 6,293,855 | ||||||||||||
Variation margin on futures contracts | — | 355 | 2,850 | 72,513 | ||||||||||||
Dividends | 112,141 | 37,581 | 26,795 | 4,805,484 | ||||||||||||
Interest | 4 | — | 7 | 99 | ||||||||||||
Securities lending income | 140 | 47 | 135 | 4,170 | ||||||||||||
Foreign tax reclaim | 4,991 | 16,296 | 372 | – | ||||||||||||
|
|
|
|
|
|
|
| |||||||||
Total assets | $ | 508,808,328 | $ | 19,159,464 | $ | 25,618,896 | $ | 3,921,474,421 | ||||||||
|
|
|
|
|
|
|
| |||||||||
Liabilities | ||||||||||||||||
Payable upon return of securities loaned | $ | 1,768,050 | $ | 61,137 | $ | 79,911 | $ | 852,902 | ||||||||
Payables: | ||||||||||||||||
Investment securities purchased | 10,594,863 | 19,993 | 263,899 | 24,643,554 | ||||||||||||
Capital shares | — | — | – | 6,283,365 | ||||||||||||
Investment advisory fees | 9,644 | 2,248 | 3,642 | 292,134 | ||||||||||||
Deferred foreign tax payable | 333,667 | — | 68,104 | — | ||||||||||||
|
|
|
|
|
|
|
| |||||||||
Total liabilities | 12,706,224 | 83,378 | 415,556 | 32,071,955 | ||||||||||||
|
|
|
|
|
|
|
| |||||||||
Net Assets, at value | $ | 496,102,104 | $ | 19,076,086 | $ | 25,203,340 | $ | 3,889,402,466 | ||||||||
|
|
|
|
|
|
|
| |||||||||
Net Assets Consist of | ||||||||||||||||
Paid-in capital | $ | 479,875,203 | $ | 15,697,157 | $ | 22,410,185 | $ | 2,631,685,567 | ||||||||
Distributable earnings (loss) | 16,226,901 | 3,378,929 | 2,793,155 | 1,257,716,899 | ||||||||||||
|
|
|
|
|
|
|
| |||||||||
Net Assets, at value | $ | 496,102,104 | $ | 19,076,086 | $ | 25,203,340 | $ | 3,889,402,466 | ||||||||
|
|
|
|
|
|
|
| |||||||||
Number of Common Shares outstanding | 14,300,001 | 600,001 | 750,001 | 92,850,001 | ||||||||||||
|
|
|
|
|
|
|
| |||||||||
Net Asset Value | $ | 34.69 | $ | 31.79 | $ | 33.60 | $ | 41.89 | ||||||||
|
|
|
|
|
|
|
| |||||||||
Investment in non-affiliated securities at cost | $ | 478,719,386 | $ | 15,316,525 | $ | 21,910,266 | $ | 2,598,756,778 | ||||||||
|
|
|
|
|
|
|
| |||||||||
Investment in affiliated securities at cost | $ | 2,844 | $ | – | $ | – | $ | – | ||||||||
|
|
|
|
|
|
|
| |||||||||
Value of securities loaned | $ | 6,478,517 | $ | 170,080 | $ | 288,300 | $ | 22,456,790 | ||||||||
|
|
|
|
|
|
|
| |||||||||
Investment in DWS Government Money Market Series at cost | $ | 3,753,775 | $ | 2,532 | $ | 149,313 | $ | 3,332,190 | ||||||||
|
|
|
|
|
|
|
| |||||||||
Investment in DWS Government & Agency Securities Portfolio at cost* | $ | 1,768,050 | $ | 61,137 | $ | 79,911 | $ | 852,902 | ||||||||
|
|
|
|
|
|
|
| |||||||||
Non-cash collateral for securities on loan | $ | 4,796,817 | $ | 119,195 | $ | 205,841 | $ | 21,977,534 | ||||||||
|
|
|
|
|
|
|
| |||||||||
Foreign currency at cost | $ | 2,646,440 | $ | 18,037 | $ | 32,518 | $ | — | ||||||||
|
|
|
|
|
|
|
| |||||||||
| * | Represents collateral on securities loaned. |
| See Notes to Financial Statements. | 66 |
DBX ETF Trust
Statements of Assets and Liabilities (Continued)
August 31, 2021
| Xtrackers S&P 500 ESG ETF | Xtrackers S&P MidCap 400 ESG ETF | Xtrackers S&P SmallCap 600 ESG ETF | ||||||||||
Assets | ||||||||||||
Investment in non-affiliated securities at value | $ | 742,531,792 | $ | 10,940,842 | $ | 10,664,974 | ||||||
Investment in DWS Government Money Market Series | 1,353,973 | 10,177 | 12,273 | |||||||||
Investment in DWS Government & Agency Securities Portfolio* | 107,727 | 1,305 | 50,397 | |||||||||
Deposit with broker for futures contracts | 95,000 | — | — | |||||||||
| Receivables: | ||||||||||||
Capital shares | 13,983,455 | — | — | |||||||||
Dividends | 828,826 | 7,064 | 6,124 | |||||||||
Interest | 53 | — | — | |||||||||
Securities lending income | 1,595 | 47 | 153 | |||||||||
|
|
|
|
|
| |||||||
Total assets | $ | 758,902,421 | $ | 10,959,435 | $ | 10,733,921 | ||||||
|
|
|
|
|
| |||||||
Liabilities | ||||||||||||
Payable upon return of securities loaned | $ | 107,727 | $ | 1,305 | $ | 50,397 | ||||||
Payables: | ||||||||||||
Investment securities purchased | 13,981,735 | — | 11,484 | |||||||||
Investment advisory fees | 59,325 | 1,375 | 1,333 | |||||||||
Variation margin on futures contracts | 1,500 | — | — | |||||||||
|
|
|
|
|
| |||||||
Total liabilities | 14,150,287 | 2,680 | 63,214 | |||||||||
|
|
|
|
|
| |||||||
Net Assets, at value | $ | 744,752,134 | $ | 10,956,755 | $ | 10,670,707 | ||||||
|
|
|
|
|
| |||||||
Net Assets Consist of | ||||||||||||
Paid-in capital | $ | 599,124,936 | $ | 10,172,141 | $ | 10,142,260 | ||||||
Distributable earnings (loss) | 145,627,198 | 784,614 | 528,447 | |||||||||
|
|
|
|
|
| |||||||
Net Assets, at value | $ | 744,752,134 | $ | 10,956,755 | $ | 10,670,707 | ||||||
|
|
|
|
|
| |||||||
Number of Common Shares outstanding | 18,650,001 | 400,001 | 400,001 | |||||||||
|
|
|
|
|
| |||||||
Net Asset Value | $ | 39.93 | $ | 27.39 | $ | 26.68 | ||||||
|
|
|
|
|
| |||||||
Investment in non-affiliated securities at cost | $ | 595,958,173 | $ | 10,157,479 | $ | 10,179,257 | ||||||
|
|
|
|
|
| |||||||
Value of securities loaned | $ | 14,021,303 | $ | 457,260 | $ | 871,859 | ||||||
|
|
|
|
|
| |||||||
Investment in DWS Government Money Market Series at cost | $ | 1,353,973 | $ | 10,177 | $ | 12,273 | ||||||
|
|
|
|
|
| |||||||
Investment in DWS Government & Agency Securities Portfolio at cost* | $ | 107,727 | $ | 1,305 | $ | 50,397 | ||||||
|
|
|
|
|
| |||||||
Non-cash collateral for securities on loan | $ | 14,267,599 | $ | 471,616 | $ | 842,400 | ||||||
|
|
|
|
|
| |||||||
| * | Represents collateral on securities loaned. |
| See Notes to Financial Statements. | 67 |
DBX ETF Trust
For the Year Ended August 31, 2021
| Xtrackers Emerging Markets Carbon Reduction and Climate Improvers ETF | Xtrackers MSCI EAFE ESG Leaders Equity ETF | Xtrackers MSCI Emerging Markets ESG Leaders Equity ETF | Xtrackers MSCI USA ESG Leaders Equity ETF | |||||||||||||
Investment Income | ||||||||||||||||
Unaffiliated dividend income* | $ | 316,964 | $ | 391,918 | $ | 226,951 | $ | 47,547,335 | ||||||||
Affiliated dividend income | 1,118 | — | — | — | ||||||||||||
Income distributions from affiliated funds | 7 | 3 | 28 | 1,441 | ||||||||||||
Affiliated securities lending income | 11 | 20 | 6 | 193 | ||||||||||||
Unaffiliated non-cash dividend income | — | 37,012 | — | — | ||||||||||||
Unaffiliated securities lending income, net of borrower rebates | 2,470 | 2,514 | 719 | 102,077 | ||||||||||||
|
|
|
|
|
|
|
| |||||||||
Total investment income | 320,570 | 431,467 | 227,704 | 47,651,046 | ||||||||||||
|
|
|
|
|
|
|
| |||||||||
Expenses | ||||||||||||||||
Investment advisory fees | 23,492 | 23,314 | 27,127 | 3,213,850 | ||||||||||||
Other expenses | 57 | 57 | 177 | 401 | ||||||||||||
|
|
|
|
|
|
|
| |||||||||
Total expenses | 23,549 | 23,371 | 27,304 | 3,214,251 | ||||||||||||
|
|
|
|
|
|
|
| |||||||||
Less fees waived (see note 3): | ||||||||||||||||
Waiver | (43 | ) | (5 | ) | (40 | ) | (323,385 | ) | ||||||||
|
|
|
|
|
|
|
| |||||||||
Net expenses | 23,506 | 23,366 | 27,264 | 2,890,866 | ||||||||||||
|
|
|
|
|
|
|
| |||||||||
Net investment income (loss) | 297,064 | 408,101 | 200,440 | 44,760,180 | ||||||||||||
|
|
|
|
|
|
|
| |||||||||
Realized and Unrealized Gain (Loss) | ||||||||||||||||
Net realized gain (loss) from: | ||||||||||||||||
Investments** | (42,017 | ) | (138,569 | ) | (263,333 | ) | (13,859,466 | ) | ||||||||
Investments in affiliates | 7,627 | — | — | — | ||||||||||||
In-kind redemptions | 1,823,712 | 393,092 | — | 92,199,804 | ||||||||||||
Futures contracts | 14,862 | 14,707 | 17,095 | 1,332,245 | ||||||||||||
Foreign currency transactions | (292,427 | ) | (5,054 | ) | (17,162 | ) | 22 | |||||||||
|
|
|
|
|
|
|
| |||||||||
Net realized gain (loss) | 1,511,757 | 264,176 | (263,400 | ) | 79,672,605 | |||||||||||
|
|
|
|
|
|
|
| |||||||||
Net change in unrealized appreciation (depreciation) on: | ||||||||||||||||
Investments*** | 15,576,200 | 2,956,968 | 1,854,655 | 828,718,505 | ||||||||||||
Investments in affiliates | (1,906 | ) | — | — | — | |||||||||||
Futures contracts | (6,111 | ) | 171 | (1,590 | ) | (13,955 | ) | |||||||||
Foreign currency translations | (5,490 | ) | (1,634 | ) | 585 | — | ||||||||||
|
|
|
|
|
|
|
| |||||||||
Net change in unrealized appreciation (depreciation) | 15,562,693 | 2,955,505 | 1,853,650 | 828,704,550 | ||||||||||||
|
|
|
|
|
|
|
| |||||||||
Net realized and unrealized gain (loss) on investments, futures and foreign currency transactions | 17,074,450 | 3,219,681 | 1,590,250 | 908,377,155 | ||||||||||||
|
|
|
|
|
|
|
| |||||||||
Net Increase (Decrease) in Net Assets Resulting from Operations | $ | 17,371,514 | $ | 3,627,782 | $ | 1,790,690 | $ | 953,137,335 | ||||||||
|
|
|
|
|
|
|
| |||||||||
* Unaffiliated foreign tax withheld | $ | 51,583 | $ | 52,269 | $ | 29,414 | $ | 8,710 | ||||||||
** Net of foreign taxes | $ | 2,848 | $ | — | $ | 2,637 | $ | — | ||||||||
*** Net of change in deferred foreign taxes | $ | 330,980 | $ | — | $ | 63,666 | $ | — | ||||||||
| See Notes to Financial Statements. | 68 |
DBX ETF Trust
Statements of Operations (Continued)
For the Year Ended August 31, 2021
| Xtrackers S&P 500 ESG ETF | Xtrackers S&P MidCap 400 ESG ETF(1) | Xtrackers S&P SmallCap 600 ESG ETF(1) | ||||||||||
Investment Income | ||||||||||||
Unaffiliated dividend income* | $ | 7,263,865 | $ | 62,861 | $ | 72,414 | ||||||
Income distributions from affiliated funds | 281 | 12 | 12 | |||||||||
Affiliated securities lending income | 15 | — | 5 | |||||||||
Unaffiliated securities lending income, net of borrower rebates | 12,080 | 276 | 792 | |||||||||
|
|
|
|
|
| |||||||
Total investment income | 7,276,241 | 63,149 | 73,223 | |||||||||
|
|
|
|
|
| |||||||
Expenses | ||||||||||||
Investment advisory fees | 531,466 | 8,268 | 8,176 | |||||||||
Other expenses | 57 | — | — | |||||||||
|
|
|
|
|
| |||||||
Total expenses | 531,523 | 8,268 | 8,176 | |||||||||
|
|
|
|
|
| |||||||
Less fees waived (see note 3): | ||||||||||||
Waiver | (48,644 | ) | (22 | ) | (22 | ) | ||||||
|
|
|
|
|
| |||||||
Net expenses | 482,879 | 8,246 | 8,154 | |||||||||
|
|
|
|
|
| |||||||
Net investment income (loss) | 6,793,362 | 54,903 | 65,069 | |||||||||
|
|
|
|
|
| |||||||
Realized and Unrealized Gain (Loss) | ||||||||||||
Net realized gain (loss) from: | ||||||||||||
Investments | (2,171,431 | ) | (16,639 | ) | 9,666 | |||||||
In-kind redemptions | 24,895,450 | 148,732 | 118,830 | |||||||||
Futures contracts | 248,170 | — | — | |||||||||
|
|
|
|
|
| |||||||
Net realized gain (loss) | 22,972,189 | 132,093 | 128,496 | |||||||||
|
|
|
|
|
| |||||||
Net change in unrealized appreciation (depreciation) on: | ||||||||||||
Investments | 109,432,495 | 783,363 | 485,717 | |||||||||
Futures contracts | 22,300 | — | — | |||||||||
|
|
|
|
|
| |||||||
Net change in unrealized appreciation (depreciation) | 109,454,795 | 783,363 | 485,717 | |||||||||
|
|
|
|
|
| |||||||
Net realized and unrealized gain (loss) on investments and futures | 132,426,984 | 915,456 | 614,213 | |||||||||
|
|
|
|
|
| |||||||
Net Increase (Decrease) in Net Assets Resulting from Operations | $ | 139,220,346 | $ | 970,359 | $ | 679,282 | ||||||
|
|
|
|
|
| |||||||
* Unaffiliated foreign tax withheld | $ | 466 | $ | 39 | $ | 124 | ||||||
| (1) | For the period February 24, 2021 (commencement of operations) through August 31, 2021. |
| See Notes to Financial Statements. | 69 |
DBX ETF Trust
| Xtrackers Emerging Markets Carbon Reduction and Climate Improvers ETF | Xtrackers MSCI EAFE ESG Leaders Equity ETF | |||||||||||||||
| Year Ended August 31, 2021 | Year Ended August 31, 2020 | Year Ended August 31, 2021 | Year Ended August 31, 2020 | |||||||||||||
Increase (Decrease) in Net Assets from Operations | ||||||||||||||||
Net investment income (loss) | $ | 297,064 | $ | 203,185 | $ | 408,101 | $ | 229,188 | ||||||||
Net realized gain (loss) | 1,511,757 | (48,254 | ) | 264,176 | (175,028 | ) | ||||||||||
Net change in net unrealized appreciation (depreciation) | 15,562,693 | 808,500 | 2,955,505 | 989,572 | ||||||||||||
|
|
|
|
|
|
|
| |||||||||
Net increase (decrease) in net assets resulting from operations | 17,371,514 | 963,431 | 3,627,782 | 1,043,732 | ||||||||||||
|
|
|
|
|
|
|
| |||||||||
Distributions to Shareholders | (192,472 | ) | (218,581 | ) | (404,392 | ) | (223,206 | ) | ||||||||
|
|
|
|
|
|
|
| |||||||||
Fund Shares Transactions | ||||||||||||||||
Proceeds from shares sold | 475,859,618 | — | 5,739,352 | 3,628,617 | ||||||||||||
Value of shares redeemed | (5,307,482 | ) | — | (1,567,175 | ) | — | ||||||||||
|
|
|
|
|
|
|
| |||||||||
Net increase (decrease) in net assets resulting from fund share transactions | 470,552,136 | — | 4,172,177 | 3,628,617 | ||||||||||||
|
|
|
|
|
|
|
| |||||||||
Total net increase (decrease) in Net Assets | 487,731,178 | 744,850 | 7,395,567 | 4,449,143 | ||||||||||||
Net Assets | ||||||||||||||||
Beginning of year | 8,370,926 | 7,626,076 | 11,680,519 | 7,231,376 | ||||||||||||
|
|
|
|
|
|
|
| |||||||||
End of year | $ | 496,102,104 | $ | 8,370,926 | $ | 19,076,086 | $ | 11,680,519 | ||||||||
|
|
|
|
|
|
|
| |||||||||
Changes in Shares Outstanding | ||||||||||||||||
Shares outstanding, beginning of year | 300,001 | 300,001 | 450,001 | 300,001 | ||||||||||||
Shares sold | 14,150,000 | — | 200,000 | 150,000 | ||||||||||||
Shares redeemed | (150,000 | ) | — | (50,000 | ) | — | ||||||||||
|
|
|
|
|
|
|
| |||||||||
Shares outstanding, end of year | 14,300,001 | 300,001 | 600,001 | 450,001 | ||||||||||||
|
|
|
|
|
|
|
| |||||||||
| See Notes to Financial Statements. | 70 |
DBX ETF Trust
Statements of Changes in Net Assets (Continued)
| Xtrackers MSCI Emerging Markets ESG Leaders Equity ETF | Xtrackers MSCI USA ESG Leaders Equity ETF | |||||||||||||||
| Year Ended August 31, 2021 | Year Ended August 31, 2020 | Year Ended August 31, 2021 | Year Ended August 31, 2020 | |||||||||||||
Increase (Decrease) in Net Assets from Operations | ||||||||||||||||
Net investment income (loss) | $ | 200,440 | $ | 258,084 | $ | 44,760,180 | $ | 33,012,859 | ||||||||
Net realized gain (loss) | (263,400 | ) | (164,600 | ) | 79,672,605 | 4,492,657 | ||||||||||
Net change in net unrealized appreciation (depreciation) | 1,853,650 | 1,385,759 | 828,704,550 | 386,265,567 | ||||||||||||
|
|
|
|
|
|
|
| |||||||||
Net increase (decrease) in net assets resulting from operations | 1,790,690 | 1,479,243 | 953,137,335 | 423,771,083 | ||||||||||||
|
|
|
|
|
|
|
| |||||||||
Distributions to Shareholders | (82,138 | ) | (318,526 | ) | (44,278,620 | ) | (29,554,714 | ) | ||||||||
|
|
|
|
|
|
|
| |||||||||
Fund Shares Transactions | ||||||||||||||||
Proceeds from shares sold | 14,924,326 | — | 610,533,251 | 1,074,035,689 | ||||||||||||
Value of shares redeemed | — | — | (296,434,378 | ) | (142,918,766 | ) | ||||||||||
|
|
|
|
|
|
|
| |||||||||
Net increase (decrease) in net assets resulting from fund share transactions | 14,924,326 | — | 314,098,873 | 931,116,923 | ||||||||||||
|
|
|
|
|
|
|
| |||||||||
Total net increase (decrease) in Net Assets | 16,632,878 | 1,160,717 | 1,222,957,588 | 1,325,333,292 | ||||||||||||
Net Assets | ||||||||||||||||
Beginning of year | 8,570,462 | 7,409,745 | 2,666,444,878 | 1,341,111,586 | ||||||||||||
|
|
|
|
|
|
|
| |||||||||
End of year | $ | 25,203,340 | $ | 8,570,462 | $ | 3,889,402,466 | $ | 2,666,444,878 | ||||||||
|
|
|
|
|
|
|
| |||||||||
Changes in Shares Outstanding | ||||||||||||||||
Shares outstanding, beginning of year | 300,001 | 300,001 | 83,750,001 | 50,250,001 | ||||||||||||
Shares sold | 450,000 | — | 17,200,000 | 38,450,000 | ||||||||||||
Shares redeemed | — | — | (8,100,000 | ) | (4,950,000 | ) | ||||||||||
|
|
|
|
|
|
|
| |||||||||
Shares outstanding, end of year | 750,001 | 300,001 | 92,850,001 | 83,750,001 | ||||||||||||
|
|
|
|
|
|
|
| |||||||||
| See Notes to Financial Statements. | 71 |
DBX ETF Trust
Statements of Changes in Net Assets (Continued)
| Xtrackers S&P 500 ESG ETF | Xtrackers S&P MidCap 400 ESG ETF | Xtrackers S&P SmallCap 600 ESG ETF | ||||||||||||||
| Year Ended August 31, 2021 | Year Ended August 31, 2020 | For the Period February 24, 2021(1) to August 31, 2021 | For the Period February 24, 2021(1) to August 31, 2021 | |||||||||||||
Increase (Decrease) in Net Assets from Operations | ||||||||||||||||
Net investment income (loss) | $ | 6,793,362 | $ | 2,350,149 | $ | 54,903 | $ | 65,069 | ||||||||
Net realized gain (loss) | 22,972,189 | 745,744 | 132,093 | 128,496 | ||||||||||||
Net change in net unrealized appreciation (depreciation) | 109,454,795 | 37,102,920 | 783,363 | 485,717 | ||||||||||||
|
|
|
|
|
|
|
| |||||||||
Net increase (decrease) in net assets resulting from operations | 139,220,346 | 40,198,813 | 970,359 | 679,282 | ||||||||||||
|
|
|
|
|
|
|
| |||||||||
Distributions to Shareholders | (5,646,092 | ) | (1,693,157 | ) | (33,536 | ) | (27,800 | ) | ||||||||
|
|
|
|
|
|
|
| |||||||||
Fund Shares Transactions | ||||||||||||||||
Proceeds from shares sold | 428,551,169 | 280,622,402 | 11,371,328 | 11,335,683 | ||||||||||||
Value of shares redeemed | (87,808,140 | ) | (60,077,355 | ) | (1,351,421 | ) | (1,316,483 | ) | ||||||||
|
|
|
|
|
|
|
| |||||||||
Net increase (decrease) in net assets resulting from fund share transactions | 340,743,029 | 220,545,047 | 10,019,907 | 10,019,200 | ||||||||||||
|
|
|
|
|
|
|
| |||||||||
Total net increase (decrease) in Net Assets | 474,317,283 | 259,050,703 | 10,956,730 | 10,670,682 | ||||||||||||
Net Assets | ||||||||||||||||
Beginning of period | 270,434,851 | 11,384,148 | 25 | 25 | ||||||||||||
|
|
|
|
|
|
|
| |||||||||
End of period | $ | 744,752,134 | $ | 270,434,851 | $ | 10,956,755 | $ | 10,670,707 | ||||||||
|
|
|
|
|
|
|
| |||||||||
Changes in Shares Outstanding | ||||||||||||||||
Shares outstanding, beginning of period | 8,700,001 | 450,001 | 1 | 1 | ||||||||||||
Shares sold | 12,450,000 | 10,700,000 | 450,000 | 450,000 | ||||||||||||
Shares redeemed | (2,500,000 | ) | (2,450,000 | ) | (50,000 | ) | (50,000 | ) | ||||||||
|
|
|
|
|
|
|
| |||||||||
Shares outstanding, end of period | 18,650,001 | 8,700,001 | 400,001 | 400,001 | ||||||||||||
|
|
|
|
|
|
|
| |||||||||
| (1) | Commencement of Operations. |
| See Notes to Financial Statements. | 72 |
DBX ETF Trust
| Xtrackers Emerging Markets Carbon Reduction and Climate Improvers ETF Selected Per Share Data | Years Ended August 31, | Period Ended 8/31/2019(a) | ||||||||||
| 2021 | 2020 | |||||||||||
Net Asset Value, beginning of period | $ | 27.90 | $ | 25.42 | $ | 25.00 | ||||||
|
|
|
|
|
| |||||||
| Income (loss) from investment operations: | ||||||||||||
Net investment income (loss) (b) | 0.57 | 0.68 | 0.60 | |||||||||
Net realized and unrealized gain (loss) | 6.86 | 2.53 | 0.27 | |||||||||
|
|
|
|
|
| |||||||
Total from investment operations | 7.43 | 3.21 | 0.87 | |||||||||
|
|
|
|
|
| |||||||
| Less distributions from: | ||||||||||||
Net investment income | (0.64 | ) | (0.73 | ) | (0.45 | ) | ||||||
|
|
|
|
|
| |||||||
Total distributions | (0.64 | ) | (0.73 | ) | (0.45 | ) | ||||||
|
|
|
|
|
| |||||||
Net Asset Value, end of period | $ | 34.69 | $ | 27.90 | $ | 25.42 | ||||||
|
|
|
|
|
| |||||||
Total Return (%) (c) | 26.80 | 12.74 | 3.44 | ** | ||||||||
Ratios to Average Net Assets and Supplemental Data | ||||||||||||
Net Assets, end of period ($ millions) | 496 | 8 | 8 | |||||||||
Ratio of expenses before fee waiver (%) | 0.16 | 0.16 | 0.16 | * | ||||||||
Ratio of expenses after fee waiver (%) | 0.16 | 0.16 | 0.16 | * | ||||||||
Ratio of net investment income (loss) (%) | 1.97 | 2.61 | 3.17 | * | ||||||||
Portfolio turnover rate (%) (d) | 17 | 13 | 10 | ** | ||||||||
| Xtrackers MSCI EAFE ESG Leaders Equity ETF Selected Per Share Data | Years Ended August 31, | Period Ended 8/31/2019(e) | ||||||||||
| 2021 | 2020 | |||||||||||
Net Asset Value, beginning of period | $ | 25.96 | $ | 24.10 | $ | 25.00 | ||||||
|
|
|
|
|
| |||||||
| Income (loss) from investment operations: | ||||||||||||
Net investment income (loss) (b) | 0.72 | 0.59 | 0.78 | |||||||||
Net realized and unrealized gain (loss) | 5.80 | 1.83 | (1.01 | ) | ||||||||
|
|
|
|
|
| |||||||
Total from investment operations | 6.52 | 2.42 | (0.23 | ) | ||||||||
|
|
|
|
|
| |||||||
Less distributions from: | ||||||||||||
Net investment income | (0.69 | ) | (0.56 | ) | (0.66 | ) | ||||||
Net realized gains | — | — | (0.01 | ) | ||||||||
|
|
|
|
|
| |||||||
Total distributions | (0.69 | ) | (0.56 | ) | (0.67 | ) | ||||||
|
|
|
|
|
| |||||||
Net Asset Value, end of period | $ | 31.79 | $ | 25.96 | $ | 24.10 | ||||||
|
|
|
|
|
| |||||||
Total Return (%) (c) | 25.28 | 10.12 | (0.91 | )** | ||||||||
Ratios to Average Net Assets and Supplemental Data | ||||||||||||
Net Assets, end of period ($ millions) | 19 | 12 | 7 | |||||||||
Ratio of expenses before fee waiver (%) | 0.14 | 0.14 | 0.14 | * | ||||||||
Ratio of expenses after fee waiver (%) | 0.14 | 0.14 | 0.14 | * | ||||||||
Ratio of net investment income (loss) (%) | 2.45 | 2.39 | 3.25 | * | ||||||||
Portfolio turnover rate (%) (d) | 22 | 16 | 10 | ** | ||||||||
| (a) | For the period December 6, 2018 (commencement of operations) through August 31, 2019. |
| (b) | Based on average shares outstanding during the period. |
| (c) | Total Return would have been lower if certain expenses had not been reimbursed by the Advisor. |
| (d) | Portfolio turnover rate does not include securities received or delivered from processing creations or redemptions. |
| (e) | For the period September 6, 2018 (commencement of operations) through August 31, 2019. |
| * | Annualized. |
| ** | Not Annualized. |
| See Notes to Financial Statements. | 73 |
DBX ETF Trust
Financial Highlights (Continued)
| Xtrackers MSCI Emerging Markets ESG Leaders Equity ETF Selected Per Share Data | Years Ended August 31, | Period Ended 8/31/2019(a) | ||||||||||
| 2021 | 2020 | |||||||||||
Net Asset Value, beginning of period | $ | 28.57 | $ | 24.70 | $ | 25.00 | ||||||
|
|
|
|
|
| |||||||
| Income (loss) from investment operations: | ||||||||||||
Net investment income (loss) (b) | 0.49 | 0.86 | 0.50 | |||||||||
Net realized and unrealized gain (loss) | 4.77 | 4.07 | (0.53 | ) | ||||||||
|
|
|
|
|
| |||||||
Total from investment operations | 5.26 | 4.93 | (0.03 | ) | ||||||||
|
|
|
|
|
| |||||||
| Less distributions from: | ||||||||||||
Net investment income | (0.23 | ) | (1.06 | ) | (0.27 | ) | ||||||
Net realized gains | — | (0.00 | )(c) | — | ||||||||
|
|
|
|
|
| |||||||
Total distributions | (0.23 | ) | (1.06 | ) | (0.27 | ) | ||||||
|
|
|
|
|
| |||||||
Net Asset Value, end of period | $ | 33.60 | $ | 28.57 | $ | 24.70 | ||||||
|
|
|
|
|
| |||||||
Total Return (%) (d) | 18.43 | 20.32 | (0.17 | )** | ||||||||
Ratios to Average Net Assets and Supplemental Data | ||||||||||||
Net Assets, end of period ($ millions) | 25 | 9 | 7 | |||||||||
Ratio of expenses before fee waiver (%) | 0.20 | 0.20 | 0.20 | * | ||||||||
Ratio of expenses after fee waiver (%) | 0.20 | 0.20 | 0.20 | * | ||||||||
Ratio of net investment income (loss) (%) | 1.48 | 3.38 | 2.68 | * | ||||||||
Portfolio turnover rate (%) (e) | 26 | 17 | 16 | ** | ||||||||
| Xtrackers MSCI USA ESG Leaders Equity ETF Selected Per Share Data | Years Ended August 31, | Period Ended 8/31/2019(f) | ||||||||||
| 2021 | 2020 | |||||||||||
Net Asset Value, beginning of period | $ | 31.84 | $ | 26.69 | $ | 25.00 | ||||||
|
|
|
|
|
| |||||||
| Income (loss) from investment operations: | ||||||||||||
Net investment income (loss) (b) | 0.50 | 0.51 | 0.24 | |||||||||
Net realized and unrealized gain (loss) | 10.05 | 5.10 | 1.57 | |||||||||
|
|
|
|
|
| |||||||
Total from investment operations | 10.55 | 5.61 | 1.81 | |||||||||
|
|
|
|
|
| |||||||
Less distributions from: | ||||||||||||
Net investment income | (0.50 | ) | (0.46 | ) | (0.12 | ) | ||||||
|
|
|
|
|
| |||||||
Total distributions | (0.50 | ) | (0.46 | ) | (0.12 | ) | ||||||
|
|
|
|
|
| |||||||
Net Asset Value, end of period | $ | 41.89 | $ | 31.84 | $ | 26.69 | ||||||
|
|
|
|
|
| |||||||
Total Return (%) (d) | 33.48 | 21.42 | 7.23 | ** | ||||||||
Ratios to Average Net Assets and Supplemental Data | ||||||||||||
Net Assets, end of period ($ millions) | 3,889 | 2,666 | 1,341 | |||||||||
Ratio of expenses before fee waiver (%) | 0.10 | 0.10 | 0.10 | * | ||||||||
Ratio of expenses after fee waiver (%) | 0.09 | 0.09 | 0.10 | * | ||||||||
Ratio of net investment income (loss) (%) | 1.39 | 1.83 | 1.89 | * | ||||||||
Portfolio turnover rate (%) (e) | 12 | 9 | 5 | ** | ||||||||
| (a) | For the period December 6, 2018 (commencement of operations) through August 31, 2019. |
| (b) | Based on average shares outstanding during the period. |
| (c) | Amount represents less than $0.005. |
| (d) | Total Return would have been lower if certain expenses had not been reimbursed by the Advisor. |
| (e) | Portfolio turnover rate does not include securities received or delivered from processing creations or redemptions. |
| (f) | For the period March 7, 2019 (commencement of operations) through August 31, 2019. |
| * | Annualized. |
| ** | Not Annualized. |
| See Notes to Financial Statements. | 74 |
DBX ETF Trust
Financial Highlights (Continued)
| Xtrackers S&P 500 ESG ETF Selected Per Share Data | Years Ended August 31, | Period Ended 8/31/2019(a) | ||||||||||
| 2021 | 2020 | |||||||||||
Net Asset Value, beginning of period | $ | 31.08 | $ | 25.30 | $ | 25.00 | ||||||
|
|
|
|
|
| |||||||
| Income (loss) from investment operations: | ||||||||||||
Net investment income (loss) (b) | 0.49 | 0.50 | 0.10 | |||||||||
Net realized and unrealized gain (loss) | 8.79 | 5.85 | 0.20 | |||||||||
|
|
|
|
|
| |||||||
Total from investment operations | 9.28 | 6.35 | 0.30 | |||||||||
|
|
|
|
|
| |||||||
| Less distributions from: | ||||||||||||
Net investment income | (0.43 | ) | (0.57 | ) | — | |||||||
|
|
|
|
|
| |||||||
Total distributions | (0.43 | ) | (0.57 | ) | — | |||||||
|
|
|
|
|
| |||||||
Net Asset Value, end of period | $ | 39.93 | $ | 31.08 | $ | 25.30 | ||||||
|
|
|
|
|
| |||||||
Total Return (%) (c) | 30.16 | 25.71 | 1.20 | ** | ||||||||
Ratios to Average Net Assets and Supplemental Data | ||||||||||||
Net Assets, end of period ($ millions) | 745 | 270 | 11 | |||||||||
Ratio of expenses before fee waiver (%) | 0.11 | 0.11 | 0.11 | * | ||||||||
Ratio of expenses after fee waiver (%) | 0.10 | 0.11 | 0.11 | * | ||||||||
Ratio of net investment income (loss) (%) | 1.41 | 1.86 | 2.08 | * | ||||||||
Portfolio turnover rate (%) (d) | 13 | 11 | 0 | ** | ||||||||
| Xtrackers S&P MidCap 400 ESG ETF Selected Per Share Data | Period Ended 8/31/2021(e) | |||||||||||
Net Asset Value, beginning of period | $ | 25.00 | ||||||||||
|
| |||||||||||
| Income (loss) from investment operations: | ||||||||||||
Net investment income (loss) (b) | 0.14 | |||||||||||
Net realized and unrealized gain (loss) | 2.33 | |||||||||||
|
| |||||||||||
Total from investment operations | 2.47 | |||||||||||
|
| |||||||||||
| Less distributions from: | ||||||||||||
Net investment income | (0.08 | ) | ||||||||||
|
| |||||||||||
Total distributions | (0.08 | ) | ||||||||||
|
| |||||||||||
Net Asset Value, end of period | $ | 27.39 | ||||||||||
|
| |||||||||||
Total Return (%) (c) | 9.92 | ** | ||||||||||
Ratios to Average Net Assets and Supplemental Data | ||||||||||||
Net Assets, end of period ($ millions) | 11 | |||||||||||
Ratio of expenses before fee waiver (%) | 0.15 | * | ||||||||||
Ratio of expenses after fee waiver (%) | 0.15 | * | ||||||||||
Ratio of net investment income (loss) (%) | 1.00 | * | ||||||||||
Portfolio turnover rate (%) (d) | 27 | ** | ||||||||||
| (a) | For the period June 26, 2019 (commencement of operations) through August 31, 2019. |
| (b) | Based on average shares outstanding during the period. |
| (c) | Total Return would have been lower if certain expenses had not been reimbursed by the Advisor. |
| (d) | Portfolio turnover rate does not include securities received or delivered from processing creations or redemptions. |
| (e) | For the period February 24, 2021 (commencement of operations) through August 31, 2021. |
| * | Annualized. |
| ** | Not Annualized. |
| See Notes to Financial Statements. | 75 |
DBX ETF Trust
Financial Highlights (Continued)
| Xtrackers S&P SmallCap 600 ESG ETF Selected Per Share Data | Period Ended 8/31/2021(a) | |||
Net Asset Value, beginning of period | $ | 25.00 | ||
|
| |||
| Income (loss) from investment operations: | ||||
Net investment income (loss) (b) | 0.16 | |||
Net realized and unrealized gain (loss) | 1.59 | |||
|
| |||
Total from investment operations | 1.75 | |||
|
| |||
| Less distributions from: | ||||
Net investment income | (0.07 | ) | ||
|
| |||
Total distributions | (0.07 | ) | ||
|
| |||
Net Asset Value, end of period | $ | 26.68 | ||
|
| |||
Total Return (%) (c) | 7.01 | ** | ||
Ratios to Average Net Assets and Supplemental Data | ||||
Net Assets, end of period ($ millions) | 11 | |||
Ratio of expenses before fee waiver (%) | 0.15 | * | ||
Ratio of expenses after fee waiver (%) | 0.15 | * | ||
Ratio of net investment income (loss) (%) | 1.19 | * | ||
Portfolio turnover rate (%) (d) | 25 | ** | ||
| (a) | For the period February 24, 2021 (commencement of operations) through August 31, 2021. |
| (b) | Based on average shares outstanding during the period. |
| (c) | Total Return would have been lower if certain expenses had not been reimbursed by the Advisor. |
| (d) | Portfolio turnover rate does not include securities received or delivered from processing creations or redemptions. |
| * | Annualized. |
| ** | Not Annualized. |
| See Notes to Financial Statements. | 76 |
DBX ETF Trust
1. Organization
DBX ETF Trust (the “Trust”) is registered under the Investment Company Act of 1940, as amended (the “Act”), as an open-end registered management investment company organized as a Delaware statutory trust.
As of August 31, 2021, the Trust consists of thirty-five investment series of exchange-traded funds (“ETFs”) (each a “Fund” and collectively, the “Funds”) in operation and trading. These financial statements report on the Funds listed below:
| Xtrackers Emerging Markets Carbon Reduction and Climate Improvers ETF* |
| Xtrackers MSCI EAFE ESG Leaders Equity ETF |
| Xtrackers MSCI Emerging Markets ESG Leaders Equity ETF |
| Xtrackers MSCI USA ESG Leaders Equity ETF |
| Xtrackers S&P 500 ESG ETF |
| Xtrackers S&P MidCap 400 ESG ETF |
| Xtrackers S&P SmallCap 600 ESG ETF |
DBX Advisors LLC (“DBX” or the “Advisor”), an indirect, wholly-owned subsidiary of DWS Group GmbH & Co. KGaA (“DWS Group”), serves as investment advisor to the Funds and has overall responsibility for the general management and administration of the Funds, subject to the supervision of the Funds’ Board of Trustees (“Board”).
Each Fund offers shares that are listed and traded on the NYSE Arca, Inc. (“NYSE Arca”). Unlike conventional mutual funds, each Fund issues and redeems shares on a continuous basis, at net asset value (“NAV”), only in large specified lots consisting of 50,000 shares, each called a “Creation Unit”, to authorized participants who have entered into agreements with the Funds’ distributor. Shares are not individually redeemable securities of the Funds, and owners of the shares may acquire those shares from the Funds, or tender such shares for redemption to the Funds, in Creation Units only.
The investment objective of each Fund is to track the performance, before fees and expenses, of a particular index (the “Underlying Index”). The underlying indices for the Funds are:
Fund | Underlying Index | |
| Xtrackers Emerging Markets Carbon Reduction and Climate Improvers ETF* | Solactive ISS Emerging Markets Carbon Reduction & Climate Improvers Index NTR* | |
Xtrackers MSCI EAFE ESG Leaders Equity ETF Xtrackers MSCI Emerging Markets ESG Leaders Equity ETF Xtrackers MSCI USA ESG Leaders Equity ETF Xtrackers S&P 500 ESG ETF | MSCI EAFE ESG Leaders Index MSCI Emerging Markets ESG Leaders Index MSCI USA ESG Leaders Index S&P 500 ESG Index | |
| Xtrackers S&P MidCap 400 ESG ETF | S&P MidCap 400 ESG Index | |
| Xtrackers S&P SmallCap 600 ESG ETF | S&P SmallCap 600 ESG Index |
| * | On August 18, 2021, the Fund changed its name from Xtrackers MSCI ACWI ex USA ESG Leaders Equity ETF to Xtrackers Emerging Markets Carbon Reduction and Climate Improvers ETF and its Underlying Index from MSCI ACWI ex USA ESG Leaders Index to the Solactive ISS Emerging Markets Carbon Reduction & Climate Improvers Index NTR. |
The Solactive ISS Emerging Markets Carbon Reduction & Climate Improvers Index NTR is comprised of large and mid-capitalization companies in emerging markets countries that meet certain environmental, social and governance (“ESG”) criteria and/or have committed to greenhouse gas emissions reduction targets. The Underlying Index is then weighted in such a manner seeking to align its constituent companies’ greenhouse gas emissions with the long-term global warming target of the Paris Climate Agreement. Under normal circumstances, the Underlying Index is rebalanced semi-annually in February and August, and thus the Fund updates and rebalances its portfolio in a corresponding fashion.
The MSCI EAFE ESG Leaders Index is a capitalization weighted index that provides exposure to companies with high ESG performance relative to their sector peers. The Underlying Index consists of large- and medium-capitalization companies across developed markets countries, excluding Canada and the United States. The annual review of the Underlying Index takes place in May and it is rebalanced in August, November and February, and thus the Fund updates and rebalances its portfolio in a corresponding fashion.
77
DBX ETF Trust
Notes to Financial Statements (Continued)
The MSCI Emerging Markets ESG Leaders Index is a capitalization weighted index that provides exposure to companies with high ESG performance relative to their sector peers. The Underlying Index consists of large- and medium-capitalization companies across emerging markets countries. The annual review of the Underlying Index takes place in May and it is rebalanced in August, November and February, and thus the Fund updates and rebalances its portfolio in a corresponding fashion.
MSCI USA ESG Leaders Index is a capitalization weighted index that provides exposure to companies with high ESG performance relative to their sector peers. The Underlying Index consists of large- and medium-capitalization companies in the U.S market. The annual review of the Underlying Index takes place in May and it is rebalanced in August, November and February, and thus the Fund updates and rebalances its portfolio in a corresponding fashion.
S&P 500 ESG Index is a broad-based, market capitalization weighted index that provides exposure to companies with high ESG performance relative to their sector peers, while maintaining similar overall industry group weights as the S&P 500 Index. Under normal circumstances, the Underlying Index is rebalanced annually, effective after the close of the last business day of April. The Fund rebalances its portfolio in accordance with the Underlying Index, and therefore, any changes to the Underlying Index’s rebalance schedule will result in corresponding changes to the Fund’s rebalance schedule.
S&P MidCap 400 ESG Index is a broad-based, market capitalization weighted index that provides exposure to companies with high ESG performance relative to their sector peers, while maintaining similar overall industry group weights as the S&P MidCap 400 Index. Under normal circumstances, the Underlying Index is rebalanced annually, effective after the close of the last business day of April. The Fund rebalances its portfolio in accordance with the Underlying Index, and, therefore, any changes to the Underlying Index’s rebalance schedule will result in corresponding changes to the Fund’s rebalance schedule.
S&P SmallCap 600 ESG is a broad-based, market capitalization weighted index that provides exposure to companies with high ESG performance relative to their sector peers, while maintaining similar overall industry group weights as the S&P SmallCap 600 Index. Under normal circumstances, the Underlying Index is rebalanced annually, effective after the close of the last business day of April. The Fund rebalances its portfolio in accordance with the Underlying Index, and, therefore, any changes to the Underlying Index’s rebalance schedule will result in corresponding changes to the Fund’s rebalance schedule.
Each Fund is entitled to use its respective Underlying Index pursuant to a licensing agreement between the Index Provider and DBX. There is no charge to the Funds in connection with these licensing agreements.
Each Fund, except Xtrackers MSCI EAFE ESG Leaders Equity ETF (effective September 13, 2021), is non-diversified and is not limited by the Act with regard to the percentage of its assets that may be invested in the securities of a single issuer. This means the securities of a particular issuer (or securities of issuers in particular industries) may dominate the Underlying Index of the Fund and, consequently, the Fund’s investment portfolio. This may adversely affect the Fund’s performance or subject the Fund’s shares to greater price volatility than that experienced by more diversified investment companies. Each Fund may change its diversification status over time and then change it back again, without shareholder approval, solely as a result of a change in relative market capitalization or index weighting of one or more constituents of the index each Fund tracks.
Pursuant to the Trust’s organizational documents, the Trust’s officers and trustees are indemnified against certain liabilities that may arise out of the performance of their duties to the Funds. Additionally, in the normal course of business the Trust enters into contracts that contain a variety of representations that provide indemnification for certain liabilities. The Trust’s maximum exposure under these arrangements is unknown, as this would involve future claims that may be made against the Funds that have not yet occurred. However, the Trust expects the risk of loss to be remote.
2. Significant Accounting Policies
The financial statements have been prepared in conformity with U.S. generally accepted accounting principles (“U.S. GAAP”), which require management to make certain estimates and assumptions that affect the reported amounts and disclosures in the financial statements. Actual results could differ from those estimates. Each Fund
78
DBX ETF Trust
Notes to Financial Statements (Continued)
qualifies as an investment company under Topic 946 of Accounting Standards Codification of U.S. GAAP. The following is a summary of significant accounting policies followed by the Funds.
Security Valuation The NAV of each Fund’s shares is calculated each business day as of the close of regular trading on the New York Stock Exchange, generally 4:00 p.m. Eastern Time. NAV per share is calculated by dividing a Fund’s net assets by the number of Fund shares outstanding.
Various inputs are used in determining the value of the Funds’ investments. These inputs are summarized in three broad levels. Level 1 includes quoted prices in active markets for identical securities. Level 2 includes other significant observable inputs (including quoted prices for similar securities, interest rates, prepayment speeds, and credit risk). Level 3 includes significant unobservable inputs (including the Funds’ own assumptions in determining the fair value of investments). The level assigned to the securities valuations may not be an indication of the risk or liquidity associated with investing in those securities.
Equity securities and ETFs are valued at the most recent sale price or official closing price reported on the exchange (U.S. or foreign) or over-the-counter market on which they trade. Securities or ETFs for which no sales are reported are valued at the calculated mean between the most recent bid and asked quotations on the relevant market or, if a mean cannot be determined, at the most recent bid quotation. Equity securities and ETFs are generally categorized as Level 1.
Corporate and sovereign debt securities are valued at prices supplied by independent pricing services approved by the Funds’ Board. Such services may use various pricing techniques which take into account appropriate factors such as yield, quality, coupon rate, maturity, type of issue, trading characteristics and other data, as well as broker quotes. If the pricing services are unable to provide valuations, securities are valued at the mean between the bid and ask quotations or evaluated prices, as applicable, obtained from broker dealers. These securities are generally categorized as Level 2
Investments in open-end investment companies are valued at their NAV each business day and are categorized as Level 1.
Futures contracts are generally valued at the settlement prices established each day on the exchange on which they are traded and are categorized as Level 1.
Securities and other assets for which market quotations are not readily available or for which the above valuation procedures are deemed not to reflect fair value are valued in a manner that is intended to reflect their fair value as determined in accordance with procedures approved by the Board and are generally categorized as Level 3. In accordance with the Funds’ valuation procedures, factors considered in determining value may include, but are not limited to, the type of the security; the size of the holding; the initial cost of the security; the existence of any contractual restrictions on the security’s disposition; the price and extent of public trading in similar securities of the issuer or of comparable companies; quotations or evaluated prices from broker-dealers and/or pricing services; information obtained from the issuer, analysts, and/or the appropriate stock exchange (for exchange-traded securities); an analysis of the company’s or issuer’s financial statements; an evaluation of the forces that influence the issuer and the market(s) in which the security is purchased and sold; and with respect to debt securities, the maturity, coupon, creditworthiness, currency denomination and the movement of the market in which the security is normally traded. The value determined under these procedures may differ from published values for the same securities.
Fair value pricing could result in a difference between the prices used to calculate a Fund’s NAV and the prices used by the Fund’s Underlying Index, which in turn could result in a difference between the Fund’s performance and the performance of the Fund’s Underlying Index.
Disclosure about the classification of the fair value measurements is included in a table following the Fund’s Schedule of Investments.
Cash Cash consists of cash held at banks and is on deposit with major financial institutions.
Investment Transactions and Investment Income Investment transactions are recorded as of the date that the securities are purchased or sold (trade date). Realized gains and losses from the sale or disposition of securities are calculated on the identified cost-method. Dividend income is net of any foreign taxes withheld at source.
79
DBX ETF Trust
Notes to Financial Statements (Continued)
Certain dividends from foreign securities may be recorded subsequent to the ex-dividend date as soon as the fund is informed of such dividends. Interest income is recorded on the accrual basis. Distributions received from foreign domiciled corporations, generally determined to be passive foreign investment companies for tax reporting purposes, are included in dividend income.
Tax Information and Dividends and Distributions to Shareholders It is each Fund’s policy to comply with all requirements of the Internal Revenue Code of 1986, as amended (“the Code”). Each Fund intends to qualify for and to elect treatment as a separate Regulated Investment Company (“RIC”) under Subchapter M of the Code. It is the policy of Xtrackers Emerging Markets Carbon Reduction and Climate Improvers ETF, Xtrackers MSCI EAFE ESG Leaders Equity ETF and Xtrackers MSCI Emerging Markets ESG Leaders Equity ETF to pay out dividends from its net investment income, if any, to investors semi-annually. It is the policy of Xtrackers MSCI USA ESG Leaders Equity ETF, Xtrackers S&P 500 ESG ETF, Xtrackers S&P MidCap 400 ESG ETF and Xtrackers S&P SmallCap 600 ESG ETF to pay out dividends from its net investment income, if any, to investors quarterly. Taxable net realized gains from investment transactions, reduced by capital loss carryforwards, if any, are declared and distributed to shareholders at least annually. The capital loss carryforward amount, if any, is available to offset future net capital gains. The Funds may occasionally be required to make supplemental distributions at some other time during the year. The Funds reserve the right to declare special distributions if, in their reasonable discretion, such action is necessary or advisable to preserve the status of each Fund as a RIC or to avoid imposition of income or excise taxes on undistributed income. Dividends and distributions to shareholders, if any, are recorded on the ex-dividend date. The amount of dividends and distributions from net investment income and net realized capital gains are determined in accordance with Federal income tax regulations which may differ from U.S. GAAP. These “book/tax” differences are either considered temporary or permanent in nature. To the extent these differences are permanent in nature, such amounts are reclassified at the end of the year within the components of net assets based on their federal tax treatment; temporary differences do not require reclassification. Dividends and distributions, which exceed earnings and profits for the full year for tax purposes, are reported as a tax return of capital.
In accordance with U.S. GAAP requirements regarding accounting for uncertainties in income taxes, management has analyzed the Funds’ tax positions taken or expected to be taken on foreign, federal and state income tax returns for all open tax years and has concluded that no provision for income tax is required in the Funds’ financial statements.
The Funds recognize interest and penalties, if any, related to uncertain tax positions as income tax expense on the Statements of Operations. For the period ended August 31, 2021, the Funds did not incur any interest or penalties.
As of August 31, 2021, the components of accumulated earnings (losses) on a tax basis were as follows:
| Undistributed Ordinary Income* | Capital and Other Gains (Losses) | Unrealized Appreciation (Depreciation) | Total Accumulated Earnings (Losses) | |||||||||||||
Xtrackers Emerging Markets Carbon Reduction and Climate Improvers ETF | $ | 266,563 | $ | (61,591 | ) | $ | 16,021,929 | $ | 16,226,901 | |||||||
Xtrackers MSCI EAFE ESG Leaders Equity ETF | 69,340 | (247,525 | ) | 3,557,114 | 3,378,929 | |||||||||||
Xtrackers MSCI Emerging Markets ESG Leaders Equity ETF | 142,046 | (242,908 | ) | 2,894,017 | 2,793,155 | |||||||||||
Xtrackers MSCI USA ESG Leaders Equity ETF | 8,318,142 | (25,243,752 | ) | 1,274,642,509 | 1,257,716,899 | |||||||||||
Xtrackers S&P 500 ESG ETF | 1,891,596 | (304,487 | ) | 144,040,089 | 145,627,198 | |||||||||||
Xtrackers S&P MidCap 400 ESG ETF | 21,723 | — | 762,891 | 784,614 | ||||||||||||
Xtrackers S&P SmallCap 600 ESG ETF | 85,555 | — | 442,892 | 528,447 | ||||||||||||
80
DBX ETF Trust
Notes to Financial Statements (Continued)
The tax character of dividends and distributions declared for the period ended August 31, 2021 and year ended August 31, 2020 were as follows:
| Period Ended August 31, 2021 | ||||
| Ordinary Income* | ||||
Xtrackers Emerging Markets Carbon Reduction and Climate Improvers ETF | $ | 192,472 | ||
Xtrackers MSCI EAFE ESG Leaders Equity ETF | 404,392 | |||
Xtrackers MSCI Emerging Markets ESG Leaders Equity ETF | 82,138 | |||
Xtrackers MSCI USA ESG Leaders Equity ETF | 44,278,620 | |||
Xtrackers S&P 500 ESG ETF | 5,646,092 | |||
Xtrackers S&P MidCap 400 ESG ETF | 33,536 | |||
Xtrackers S&P SmallCap 600 ESG ETF | 27,800 | |||
| Year Ended August 31, 2020 | ||||||||
| Ordinary Income* | Long Term Capital Gain | |||||||
Xtrackers Emerging Markets Carbon Reduction and Climate Improvers ETF | $ | 218,581 | $ | — | ||||
Xtrackers MSCI EAFE ESG Leaders Equity ETF | 223,206 | — | ||||||
Xtrackers MSCI Emerging Markets ESG Leaders Equity ETF | 317,935 | 591 | ||||||
Xtrackers MSCI USA ESG Leaders Equity ETF | 29,554,714 | — | ||||||
Xtrackers S&P 500 ESG ETF | 1,693,157 | — | ||||||
| * | For tax purposes short-term capital gain distributions are considered ordinary income distributions. |
At August 31, 2021, for Federal income tax purposes, the Funds have capital loss carryforwards available as shown in the table below, to the extent provided by regulations, to offset future capital gains for an unlimited period. To the extent that these loss carryforwards are used to offset future capital gains, it is probable that the capital gains so offset will not be distributed to shareholders.
| Short-Term | Long-Term | Total Amount | ||||||||||
Xtrackers Emerging Markets Carbon Reduction and Climate Improvers ETF | $ | 56,337 | $ | 5,254 | $ | 61,591 | ||||||
Xtrackers MSCI EAFE ESG Leaders Equity ETF | 75,738 | 171,787 | 247,525 | |||||||||
Xtrackers MSCI Emerging Markets ESG Leaders Equity ETF | 49,283 | 193,625 | 242,908 | |||||||||
Xtrackers MSCI USA ESG Leaders Equity ETF | 4,036,785 | 21,206,967 | 25,243,752 | |||||||||
Xtrackers S&P 500 ESG ETF | 304,487 | — | 304,487 | |||||||||
For the period ended August 31, 2021, the effect of permanent “book/tax” reclassifications to the components of net assets are included below. These differences are primarily due to redemptions-in-kind, excise tax and equalization.
| Distributable earnings (loss) | Paid-In Capital | |||||||
Xtrackers Emerging Markets Carbon Reduction and Climate Improvers ETF | $ | (1,821,504 | ) | $ | 1,821,504 | |||
Xtrackers MSCI EAFE ESG Leaders Equity ETF | (388,724 | ) | 388,724 | |||||
Xtrackers MSCI Emerging Markets ESG Leaders Equity ETF | 120 | (120 | ) | |||||
Xtrackers MSCI USA ESG Leaders Equity ETF | (89,649,159 | ) | 89,649,159 | |||||
Xtrackers S&P 500 ESG ETF | (24,548,017 | ) | 24,548,017 | |||||
Xtrackers S&P MidCap 400 ESG ETF | (152,209 | ) | 152,209 | |||||
Xtrackers S&P SmallCap 600 ESG ETF | (123,035 | ) | 123,035 | |||||
81
DBX ETF Trust
Notes to Financial Statements (Continued)
As of August 31, 2021, the aggregate cost of investments for federal income tax purposes, the net unrealized appreciation or (depreciation) and the aggregated gross unrealized appreciation (depreciation) on investments were as follows:
| Aggregate Tax Cost | Net Unrealized Appreciation (Depreciation) | Aggregate Gross Unrealized Appreciation | Aggregate Gross Unrealized (Depreciation) | |||||||||||||
Xtrackers Emerging Markets Carbon Reduction and Climate Improvers ETF | $ | 484,672,330 | $ | 16,359,227 | $ | 18,027,181 | $ | (1,667,954 | ) | |||||||
Xtrackers MSCI EAFE ESG Leaders Equity ETF | 15,515,051 | 3,556,895 | 3,970,952 | (414,057 | ) | |||||||||||
Xtrackers MSCI Emerging Markets ESG Leaders Equity ETF | 22,326,991 | 2,961,656 | 3,733,486 | (771,830 | ) | |||||||||||
Xtrackers MSCI USA ESG Leaders Equity ETF | 2,613,059,960 | 1,274,642,509 | 1,289,542,739 | (14,900,230 | ) | |||||||||||
Xtrackers S&P 500 ESG ETF | 599,953,403 | 144,040,089 | 147,236,303 | (3,196,214 | ) | |||||||||||
Xtrackers S&P MidCap 400 ESG ETF | 10,189,433 | 762,891 | 1,142,858 | (379,967 | ) | |||||||||||
Xtrackers S&P SmallCap 600 ESG ETF | 10,284,752 | 442,892 | 1,044,269 | (601,377 | ) | |||||||||||
Foreign Taxes The Funds may be subject to foreign taxes (a portion of which may be reclaimable) on income, capital gains on investments, certain foreign currency transactions or other corporate events. All foreign taxes are recorded in accordance with the applicable foreign tax regulations and rates that exist in the foreign jurisdictions in which the Funds invest. These foreign taxes, if any, are paid by the Funds and are reflected in their Statements of Operations as follows: foreign taxes withheld at source are presented as a reduction of income, foreign taxes on capital gains from sales of investments and foreign currency transactions are included in their respective net realized gain (loss) categories, and deferred foreign taxes on unrealized gains are included in net change in unrealized appreciation (depreciation). Receivables and payables related to foreign taxes as of August 31, 2021, if any, are disclosed in the Funds’ Statements of Assets and Liabilities.
Foreign Currency Translations The books and records of the Funds are maintained in U.S. dollars. Investment securities and other assets and liabilities denominated in a foreign currency are translated into U.S. dollars at the prevailing exchange rates at period end. Purchases and sales of investment securities, income and expenses are translated into U.S. dollars at the prevailing exchange rates on the respective dates of the transactions.
Net realized and unrealized gains and losses on foreign currency transactions represent net gains and losses between trade and settlement dates on securities transactions, the acquisition and disposition of foreign currencies, and the difference between the amount of net investment income accrued and the U.S. dollar amount actually received. The portion of both realized and unrealized gains and losses on investments that results from fluctuations in foreign currency exchange rates is not separately disclosed, but is included with net realized and unrealized gain/appreciation and loss/depreciation on investments.
Securities Lending The Funds may lend securities to certain financial institutions under the terms of their securities lending agreement. During the term of the loans, the Funds continue to receive interest and dividends generated by the securities and to participate in any changes in their market value. The Funds require the borrowers of the securities to maintain collateral with the Funds consisting of cash and/or securities issued or guaranteed by the U.S. Government, its agencies or instrumentalities having a value at least equal to the value of the securities loaned. When the collateral falls below specified amounts, the lending agent will use its best effort to obtain additional collateral on the next business day to meet required amounts under the securities lending agreement. During the period ended August 31, 2021, the Funds invested the cash collateral into a joint trading account in DWS Government & Agency Securities Portfolio, an affiliated money market fund managed by DWS Investment Management Americas, Inc. DWS Investment Management Americas, Inc. receives a management/administration fee (0.02% annualized effective rate as of August 31, 2021) on the cash collateral invested in DWS Government & Agency Securities Portfolio. The Funds receive compensation for lending their securities either in the form of fees or by earning interest on invested cash collateral, net of borrower rebates and fees paid to a lending agent. Either the Fund or the borrower may terminate the loan at any time and the borrower, after notice, is required to return borrowed securities within a standard time period. There may be risks of delay and costs in
82
DBX ETF Trust
Notes to Financial Statements (Continued)
recovery of securities or even loss of rights in the collateral should the borrower of the securities fail financially. If the Funds are not able to recover securities lent, the Funds may sell the collateral and purchase a replacement investment in the market, incurring the risk that the value of the replacement security is greater than the value of the collateral. The Funds are also subject to all investment risks associated with the reinvestment of any cash collateral received, including, but not limited to, interest rate, credit and liquidity risk associated with such investments.
As of August 31, 2021, the Funds listed below had securities on loan. The value of the related collateral exceeded the value of the securities loaned at period end.
Remaining Contractual Maturity of the Agreements, as of August 31, 2021 | ||||||||||||||||||||
| Securities Lending Transactions | Overnight and Continuous | <30 Days | Between 30 & 90 days | >90 days | Total | |||||||||||||||
Xtrackers Emerging Markets Carbon Reduction and Climate Improvers ETF |
| |||||||||||||||||||
Common Stocks | $ | 1,768,050 | $ | 69,030 | $ | 287,483 | $ | 4,440,304 | $ | 6,564,867 | ||||||||||
|
|
|
|
|
|
|
|
|
| |||||||||||
Gross amount of recognized liabilities and non-cash collateral for securities lending transactions |
| $ | 6,564,867 | |||||||||||||||||
Xtrackers MSCI EAFE ESG Leaders Equity ETF |
| |||||||||||||||||||
Common Stocks | $ | 61,137 | $ | 590 | $ | — | $ | 118,605 | $ | 180,332 | ||||||||||
|
|
|
|
|
|
|
|
|
| |||||||||||
Gross amount of recognized liabilities and non-cash collateral for securities lending transactions |
| $ | 180,332 | |||||||||||||||||
Xtrackers MSCI Emerging Markets ESG Leaders Equity ETF |
| |||||||||||||||||||
Common Stocks | $ | 75,561 | $ | 950 | $ | 16,976 | $ | 187,915 | $ | 281,402 | ||||||||||
Exchange- Trade Funds | 4,350 | — | — | — | 4,350 | |||||||||||||||
|
|
|
|
|
|
|
|
|
| |||||||||||
Total Borrowings | $ | 79,911 | $ | 950 | $ | 16,976 | $ | 187,915 | $ | 285,752 | ||||||||||
|
|
|
|
|
|
|
|
|
| |||||||||||
Gross amount of recognized liabilities and non-cash collateral for securities lending transactions |
| $ | 285,752 | |||||||||||||||||
Xtrackers MSCI USA ESG Leaders Equity ETF |
| |||||||||||||||||||
Common Stocks | $ | 852,902 | $ | 168,704 | $ | 421,610 | $ | 21,387,220 | $ | 22,830,436 | ||||||||||
|
|
|
|
|
|
|
|
|
| |||||||||||
Gross amount of recognized liabilities and non-cash collateral for securities lending transactions |
| $ | 22,830,436 | |||||||||||||||||
Xtrackers S&P 500 ESG ETF |
| |||||||||||||||||||
Common Stocks | $ | 107,727 | $ | 3,757 | $ | 444,756 | $ | 13,819,086 | $ | 14,375,326 | ||||||||||
|
|
|
|
|
|
|
|
|
| |||||||||||
Gross amount of recognized liabilities and non-cash collateral for securities lending transactions |
| $ | 14,375,326 | |||||||||||||||||
Xtrackers S&P MidCap 400 ESG ETF |
| |||||||||||||||||||
Common Stocks | $ | 1,305 | $ | 2,789 | $ | 33,880 | $ | 434,947 | $ | 472,921 | ||||||||||
|
|
|
|
|
|
|
|
|
| |||||||||||
Gross amount of recognized liabilities and non-cash collateral for securities lending transactions |
| $ | 472,921 | |||||||||||||||||
Xtrackers S&P SmallCap 600 ESG ETF |
| |||||||||||||||||||
Common Stocks | $ | 50,397 | $ | 4,838 | $ | 67,318 | $ | 770,244 | $ | 892,797 | ||||||||||
|
|
|
|
|
|
|
|
|
| |||||||||||
Gross amount of recognized liabilities and non-cash collateral for securities lending transactions |
| $ | 892,797 | |||||||||||||||||
Derivatives
Futures Contracts Each Fund may enter into futures contracts. These futures contracts will be used to simulate investment in the respective Underlying Index, to facilitate trading or to reduce transaction costs. Each Fund will enter into futures contracts that are traded on a U.S. or non-U.S. exchange. No Fund will use futures for speculative purposes. Futures contracts provide for the future sale by one party and purchase by another party of a specified amount of a specific instrument or index at a specified future time and at a specified price. For the period ended August 31, 2021, Xtrackers Emerging Markets Carbon Reduction and Climate Improvers ETF, Xtrackers MSCI EAFE ESG Leaders Equity ETF, Xtrackers MSCI Emerging Markets ESG Leaders Equity ETF, Xtrackers MSCI USA ESG Leaders Equity ETF and Xtrackers S&P 500 ESG ETF utilized futures in order to simulate investment in the Funds’ Underlying Index. To the extent required by law, liquid assets committed to futures contracts will be maintained.
83
DBX ETF Trust
Notes to Financial Statements (Continued)
At the time each Fund enters into a futures contract, each Fund deposits and maintains as collateral an initial margin with the broker, as required by the exchange on which the transaction is affected. Pursuant to the contract, each Fund agrees to receive from or pay to the broker an amount of cash equal to the daily fluctuation in the value of the contract. Such receipts or payments are known as variation margin and are recorded by each Fund as unrealized gains or losses. Risks may arise from the potential inability of a counterparty to meet the terms of the contract. The credit/counterparty risk for exchange-traded futures contracts is generally less than privately negotiated futures contracts, since the clearinghouse, which is the issuer or counterparty to each exchange-traded future, provides a guarantee of performance. The guarantee is supported by a daily payment system (i.e., margin requirements).
Use of long futures contracts subjects each Fund to risk of loss in excess of the amounts shown on the Statement of Assets and Liabilities, up to the notional value of the futures contracts. Use of short futures contracts subjects each Fund to unlimited risk of loss. Under some circumstances, futures exchanges may establish daily limits on the amount that the price of a futures contract can vary from the previous day’s settlement price, which could effectively prevent liquidation of unfavorable positions.
A summary of the open futures contracts as of August 31, 2021 is included in a table following the Funds’ Schedule of Investments.
The following tables summarize the value of the Funds’ derivative instruments held as of August 31, 2021 and the related location in the accompanying Statement of Assets and Liabilities, presented by primary underlying risk exposure:
Asset Derivatives | Liability Derivatives | |||||||||||||
Xtrackers Emerging Markets Carbon Reduction and Climate Improvers ETF |
| |||||||||||||
| Equity contracts | Unrealized appreciation on futures contracts* | $ | 71 | Unrealized depreciation on futures contracts* | $ | 527 | ||||||||
Xtrackers MSCI EAFE ESG Leaders Equity ETF |
| |||||||||||||
| Equity contracts | Unrealized appreciation on futures contracts* | $ | 83 | Unrealized depreciation on futures contracts* | $ | — | ||||||||
Xtrackers MSCI Emerging Markets ESG Leaders Equity ETF |
| |||||||||||||
| Equity contracts | Unrealized appreciation on futures contracts* | $ | 4,065 | Unrealized depreciation on futures contracts* | $ | — | ||||||||
Xtrackers MSCI USA ESG Leaders Equity ETF |
| |||||||||||||
| Equity contracts | Unrealized appreciation on futures contracts* | $ | 296,125 | Unrealized depreciation on futures contracts* | $ | — | ||||||||
Xtrackers S&p 500 ESG ETF |
| |||||||||||||
| Equity contracts | Unrealized appreciation on futures contracts* | $ | 72,560 | Unrealized depreciation on futures contracts* | $ | — | ||||||||
| * | Includes cumulative appreciation or cumulative depreciation of futures contracts as disclosed in the Schedule of Investments. Unsettled variation margin is disclosed separately within the Statement of Assets and Liabilities. |
Additionally, the amount of realized and unrealized gains and losses on derivative instruments recognized in the Funds’ earnings during the period ended August 31, 2021 and the related location in the accompanying Statement of Operations is summarized in the following tables by primary underlying risk exposure:
Net Realized Gain (Loss) from: | ||||
| Futures Contracts — Equity Contracts | ||||
Xtrackers Emerging Markets Carbon Reduction and Climate Improvers ETF | $ | 14,862 | ||
Xtrackers MSCI EAFE ESG Leaders Equity ETF | 14,707 | |||
Xtrackers MSCI Emerging Markets ESG Leaders Equity ETF | 17,095 | |||
Xtrackers MSCI USA ESG Leaders Equity ETF | 1,332,245 | |||
Xtrackers S&P 500 ESG ETF | 248,170 | |||
84
DBX ETF Trust
Notes to Financial Statements (Continued)
Net Change in Unrealized Appreciation (Depreciation) on: | ||||
| Futures Contracts — Equity Contracts | ||||
Xtrackers Emerging Markets Carbon Reduction and Climate Improvers ETF | $ | (6,111 | ) | |
Xtrackers MSCI EAFE ESG Leaders Equity ETF | 171 | |||
Xtrackers MSCI Emerging Markets ESG Leaders Equity ETF | (1,590 | ) | ||
Xtrackers MSCI USA ESG Leaders Equity ETF | (13,955 | ) | ||
Xtrackers S&P 500 ESG ETF | 22,300 | |||
For the period ended August 31, 2021 the average monthly volume of derivatives was as follows:
| Futures Contracts (Contract Value) | ||||
Xtrackers Emerging Markets Carbon Reduction and Climate Improvers ETF | $ | 63,280 | ||
Xtrackers MSCI EAFE ESG Leaders Equity ETF | 61,704 | |||
Xtrackers MSCI Emerging Markets ESG Leaders Equity ETF | 98,547 | |||
Xtrackers MSCI USA ESG Leaders Equity ETF | 4,882,312 | |||
Xtrackers S&P 500 ESG ETF | 1,030,735 | |||
Affiliated Cash Management Vehicles The Funds may invest uninvested cash balances in DWS Government Money Market Series and DWS ESG Liquidity Fund, affiliated money market funds which are managed by DWS Investment Management Americas, Inc. (“DIMA”), also an indirect, wholly owned subsidiary of DWS Group GmbH & Co. KGaA. Each affiliated money market fund is managed in accordance with Rule 2a-7 under the 1940 Act, which governs the quality, maturity, diversity and liquidity of instruments in which a money market fund may invest. DWS Government Money Market Series seeks to maintain a stable NAV, and DWS ESG Liquidity Fund maintains a floating NAV. The Funds indirectly bear their proportionate share of the expenses of each affiliated money market fund in which they invest. The Advisor will waive an amount of the unitary advisory fee payable to the Advisor by the Funds equal to such acquired fund’s fees and expenses on the Funds’ assets invested in the affiliated money market funds.
3. Investment Advisory and Other Agreements
The Advisor has overall responsibility for the general management and administration of the Funds, subject to the supervision of the Funds’ Board of Trustees. Under an investment advisory agreement between the Trust, on behalf of the Funds, and the Advisor (the “Investment Advisory Agreement”), the Advisor is responsible for arranging sub-advisory, transfer agency, custody, fund administration, and all other non-distribution related services for the Funds to operate.
For its investment advisory services to the Funds below, the Advisor was entitled to receive a unitary advisory fee based on each Fund’s average daily net assets, computed and accrued daily and payable monthly, at an annual rate equal to:
| Unitary Advisory Fee | ||||
Xtrackers MSCI EAFE ESG Leaders Equity ETF | 0.14 | % | ||
Xtrackers MSCI Emerging Markets ESG Leaders Equity ETF | 0.20 | % | ||
Xtrackers MSCI USA ESG Leaders Equity ETF | 0.10 | % | ||
Xtrackers S&P 500 ESG ETF | 0.11 | % | ||
Xtrackers S&P MidCap 400 ESG ETF | 0.15 | % | ||
Xtrackers S&P SmallCap 600 ESG ETF | 0.15 | % | ||
For its investment advisory services to Xtrackers Emerging Markets Carbon Reduction and Climate Improvers ETF, for the period from September 1, 2020 through August 17, 2021, the Advisor was entitled to receive a unitary advisory fee from the Fund based on the Fund’s average daily net assets, computed and accrued daily and payable monthly, at an annual rate equal to 0.16%.
Effective August 18, 2021, for its investment advisory services to Xtrackers Emerging Markets Carbon Reduction and Climate Improvers ETF, the Advisor is entitled to receive a unitary advisory fee from the Fund based on the Fund’s average daily net assets, computed and accrued daily and payable monthly, at an annual rate equal to 0.15%.
85
DBX ETF Trust
Notes to Financial Statements (Continued)
The Advisor for the Xtrackers MSCI USA ESG Leaders Equity ETF has voluntarily elected to waive its fees and/or reimburse Fund expenses to the extent necessary to maintain the Fund’s total annual operating expenses (excluding certain expenses such as extraordinary expenses, taxes, brokerage, interest expense and acquired fund fees and expenses) at 0.09% of the Fund’s average daily net assets. Any voluntary waiver or reimbursement implemented by the Advisor may be eliminated by the Advisor at any time. For the year ended August 31, 2021, the Advisor waived $321,385 of expenses to the Fund.
The Advisor for the Xtrackers S&P 500 ESG ETF has contractually agreed through December 17, 2021 to waive its fees and/or reimburse fund expenses to the extent necessary to prevent the operating expenses of the fund (excluding interest expense, taxes, brokerage expenses, distribution fees or expenses, litigation expenses and other extraordinary expenses) from exceeding 0.10% of the fund’s average daily net assets. This agreement may only be terminated by the Fund’s Board (and may not be terminated by the Advisor) prior to that time. For the year ended August 31, 2021, the Advisor waived $48,315 of expenses to the Fund.
The Advisor for the Funds below has contractually agreed to waive a portion of its unitary advisory fee in an amount equal to the acquired fund’s fees and expenses attributable to the Funds’ investments in affiliated Funds. For the period ended August 31, 2021, the Advisor waived expenses of the Funds as follows:
| Expenses Waived | ||||
Xtrackers Emerging Markets Carbon Reduction and Climate Improvers ETF | $ | 43 | ||
Xtrackers MSCI EAFE ESG Leaders Equity ETF | 5 | |||
Xtrackers MSCI Emerging Markets ESG Leaders Equity ETF | 40 | |||
Xtrackers MSCI USA ESG Leaders Equity ETF | 2,000 | |||
Xtrackers S&P 500 ESG ETF | 329 | |||
Xtrackers S&P MidCap 400 ESG ETF | 22 | |||
Xtrackers S&P SmallCap 600 ESG ETF | 22 | |||
Out of the unitary advisory fee, the Advisor pays substantially all expenses of each Fund, including the cost of transfer agency, custody, fund administration, legal, audit and other services, and expenses of the Independent Trustees. Each Fund is responsible for the payment of interest expense, acquired fund fees and expenses, taxes, brokerage expenses, distribution fees or expenses, if any, litigation expenses and extraordinary expenses.
The Bank of New York Mellon, a wholly-owned subsidiary of The Bank of New York Mellon Corporation, serves as Administrator, Custodian, Accounting Agent, Lending Agent and Transfer Agent for each Fund.
ALPS Distributors, Inc. (the “Distributor”) serves as the distributor of Creation Units for each Fund on an agency basis. The Distributor does not maintain a secondary market in shares of the Funds.
The Board of Trustees is currently comprised of three Independent Trustees. The Advisor paid retainer fees and attendance fees to each Independent Trustee; retainer fees to the Chairman of the Board of Trustees and Chairman of the Audit Committee; and attendance fees to each member of the Audit Committee (which is comprised of all of the Funds’ Independent Trustees).
4. Investment Portfolio Transactions
For the period ended August 31, 2021, the cost of investments purchased and proceeds from sale of investments (excluding in-kind transactions and short-term investments) were as follows:
| Purchases | Sales | |||||||
Xtrackers Emerging Markets Carbon Reduction and Climate Improvers ETF | $ | 372,117,776 | $ | 7,753,802 | ||||
Xtrackers MSCI EAFE ESG Leaders Equity ETF | 5,210,096 | 3,618,765 | ||||||
Xtrackers MSCI Emerging Markets ESG Leaders Equity ETF | 14,909,377 | 3,523,215 | ||||||
Xtrackers MSCI USA ESG Leaders Equity ETF | 372,919,575 | 372,557,804 | ||||||
Xtrackers S&P 500 ESG ETF | 62,168,390 | 61,814,889 | ||||||
Xtrackers S&P MidCap 400 ESG ETF | 12,906,568 | 2,889,425 | ||||||
Xtrackers S&P SmallCap 600 ESG ETF | 12,688,052 | 2,646,971 | ||||||
86
DBX ETF Trust
Notes to Financial Statements (Continued)
For the period ended August 31, 2021, the cost of in-kind purchases and proceeds from in-kind sales were as follows:
| Purchases | Sales | |||||||
Xtrackers Emerging Markets Carbon Reduction and Climate Improvers ETF | $ | 110,159,140 | $ | 5,029,016 | ||||
Xtrackers MSCI EAFE ESG Leaders Equity ETF | 4,112,124 | 1,556,694 | ||||||
Xtrackers MSCI Emerging Markets ESG Leaders Equity ETF | 3,495,657 | — | ||||||
Xtrackers MSCI USA ESG Leaders Equity ETF | 610,234,475 | 292,615,143 | ||||||
Xtrackers S&P 500 ESG ETF | 428,234,907 | 87,726,205 | ||||||
Xtrackers S&P MidCap 400 ESG ETF | 1,370,006 | 1,355,204 | ||||||
Xtrackers S&P SmallCap 600 ESG ETF | 1,333,295 | 1,317,951 | ||||||
5. Fund Share Transactions
As of August 31, 2021, there were unlimited Fund shares, no par value, authorized by the Trust. Fund shares are issued and redeemed by each Fund only in Creation Units or multiples thereof. Except when aggregated in Creation Units, shares of each Fund are not redeemable. Transactions in capital shares for each Fund are disclosed in detail in the Statements of Changes in Net Assets. The consideration for the purchase of Creation Units of a Fund generally consists of the in-kind contribution of a designated portfolio of securities constituting a portfolio sampling representation of the securities included in the respective Fund’s Underlying Index and an amount of cash, which under certain circumstances may include cash in lieu of portfolio securities. Investors purchasing and redeeming Creation Units pay a purchase transaction fee and a redemption transaction fee to offset transfer and other transaction costs associated with the issuance and redemption of Creation Units.
6. Concentration of Ownership
From time to time, the Funds may have a concentration of several shareholder accounts holding a significant percentage of shares outstanding. Investment activities of these shareholders could have a material impact on the Fund. At August 31, 2021, there was one affiliated shareholder account for each of the funds listed below holding a significant percentage of the shares outstanding:
| Approximate Percent of Outstanding Shares Held | ||||
Xtrackers S&P MidCap 400 ESG ETF | 88 | % | ||
Xtrackers S&P SmallCap 600 ESG ETF | 96 | % | ||
7. Investing in Emerging Markets
The securities of issuers located in emerging markets tend to be more volatile and less liquid than securities of issuers located in more mature economies, and emerging markets generally have less diverse and less mature economic structures and less stable political systems than those of developed countries. The securities of issuers located or doing substantial business in emerging markets are often subject to rapid and large changes in price.
Investing in securities of Chinese issuers involves certain risks and considerations not typically associated with investing in securities of U.S. issuers, including, among others; more frequent (and potentially widespread) trading suspensions and government interventions with respect to Chinese issuers, resulting in lack of liquidity and in price volatility; currency revaluations and other currency exchange rate fluctuations or blockage; the nature and extent of intervention by the Chinese government in the Chinese securities markets (including both direct and indirect market stabilization efforts, which may affect valuations of Chinese issuers), whether such intervention will continue and the impact of such intervention or its discontinuation; the risk of nationalization or expropriation of assets; the risk that the Chinese government may decide not to continue to support economic reform programs; limitations on the use of brokers (or action by the Chinese government that discourages brokers from serving international clients); higher rates of inflation; greater political, economic and social uncertainty; higher market volatility caused by any potential regional territorial conflicts or natural disasters; the risk of increased trade tariffs, embargoes and other trade limitations; restrictions on foreign ownership; custody risks associated with investing through Stock Connect, an Renminbi Qualified Foreign Investors or other programs to access the Chinese securities markets, both interim and permanent market regulations which may affect the ability of certain
87
DBX ETF Trust
Notes to Financial Statements (Continued)
stockholders to sell Chinese securities when it would otherwise be advisable; and different and less stringent financial reporting standards. In addition, in June 2021, President Biden issued an executive order (“CMIC Order”) prohibiting U.S. persons, including the Funds, from purchasing or selling publicly traded securities (including publicly traded securities that are derivative of, or designed to provide exposure to, such securities) of any Chinese company identified as a “Chinese Military-Industrial Complex Company” (“CMIC”). This prohibition, effective August 2, 2021, expands on similar sanctions imposed by the prior administration on certain designated Chinese military companies (“CCMCs”) that took effect in January 2021. To the extent that any company in an Underlying Index is identified as a CMIC at any time (or was previously designated as a CCMC), it may have material adverse effect on a fund’s ability to track its Underlying Index.
8. Line of Credit
The Trust has entered into a senior unsecured credit facility with a syndication of banks which allows the Xtrackers Emerging Markets Carbon Reduction and Climate Improvers ETF, Xtrackers MSCI Emerging Markets ESG Leaders Equity ETF and certain other funds managed by the Advisor to borrow up to $105 million. Each Fund may borrow money under this credit facility to the extent necessary for temporary or emergency purposes, including the funding of shareholder redemption requests, trade settlements, and as necessary to distribute to shareholders any income necessary to maintain each Funds’ status as a regulated investment company. Borrowings are charged an interest rate of 1.25% per annum plus the greater of the Federal Funds Effective Rate or the one-month LIBOR Rate. Each Fund may borrow up to the lesser of 33 percent of its net assets as permitted by the Act or 25 percent of adjusted total net assets. The Funds had no outstanding loans at August 31, 2021.
9. Other — COVID-19 Pandemic
A novel coronavirus known as COVID-19, declared a pandemic by the World Health Organization, has caused significant uncertainty, market volatility, decreased economic and other activity, increased government activity, including economic stimulus measures, and supply chain interruptions. The full effects, duration and costs of the COVID-19 pandemic are impossible to predict, and the circumstances surrounding the COVID-19 pandemic will continue to evolve, including the risk of future increased rates of infection due to low vaccination rates and/or the lack of effectiveness of current vaccines against new variants. The pandemic has affected and may continue to affect certain countries, industries, economic sectors, companies and investment products more than others, may exacerbate existing economic, political, or social tensions and may increase the probability of an economic recession or depression. The Funds’ and their investments may be adversely affected by the effects of the COVID-19 pandemic, and the pandemic may result in the Funds and their service providers experiencing operational difficulties in coordinating a remote workforce and implementing their business continuity plans, among others. Management will continue to monitor the impact COVID-19 has on the Funds and reflect the consequences as appropriate in the Funds’ accounting and financial reporting.
88
DBX ETF Trust
To the Shareholders of
Xtrackers Emerging Markets Carbon Reduction and Climate Improvers ETF (formerly Xtrackers MSCI ACWI ex USA ESG Leaders Equity ETF), Xtrackers MSCI EAFE ESG Leaders Equity ETF, Xtrackers MSCI Emerging Markets ESG Leaders Equity ETF, Xtrackers MSCI USA ESG Leaders Equity ETF, Xtrackers S&P 500 ESG ETF, Xtrackers S&P MidCap 400 ESG ETF and Xtrackers S&P SmallCap 600 ESG ETF and the Board of Trustees of DBX ETF Trust
Opinion on the Financial Statements
We have audited the accompanying statements of assets and liabilities of Xtrackers Emerging Markets Carbon Reduction and Climate Improvers ETF (formerly Xtrackers MSCI ACWI ex USA ESG Leaders Equity ETF), Xtrackers MSCI EAFE ESG Leaders Equity ETF, Xtrackers MSCI Emerging Markets ESG Leaders Equity ETF, Xtrackers MSCI USA ESG Leaders Equity ETF, Xtrackers S&P 500 ESG ETF, Xtrackers S&P MidCap 400 ESG ETF and Xtrackers S&P SmallCap 600 ESG ETF (collectively referred to as the “Funds”), (seven of the funds constituting DBX ETF Trust (the “Trust”)), including the schedules of investments, as of August 31, 2021, and the related statements of operations and changes in net assets, and the financial highlights for each of the periods indicated in the table below and the related notes (collectively referred to as the “financial statements”). In our opinion, the financial statements present fairly, in all material respects, the financial position of each of the Funds (seven of the funds constituting DBX ETF Trust) at August 31, 2021, and the results of their operations, changes in net assets and financial highlights for each of the periods indicated in the table below, in conformity with U.S. generally accepted accounting principles.
| Individual fund constituting the DBX ETF Trust | Statement of operations | Statements of changes in net assets | Financial highlights | |||
Xtrackers Emerging Markets Carbon Reduction and Climate Improvers ETF
Xtrackers MSCI Emerging Markets ESG Leaders Equity ETF | For the year ended August 31, 2021 | For each of the two years in the period ended August 31, 2021 | For each of the two years in the period ended August 31, 2021 and the period from December 6, 2018 (commencement of operations) through August 31, 2019 | |||
| Xtrackers MSCI EAFE ESG Leaders Equity ETF | For the year ended August 31, 2021 | For each of the two years in the period ended August 31, 2021 | For each of the two years in the period ended August 31, 2021 and the period from September 6, 2018 (commencement of operations) through August 31, 2019 | |||
| Xtrackers MSCI USA ESG Leaders Equity ETF | For the year ended August 31, 2021 | For each of the two years in the period ended August 31, 2021 | For each of the two years in the period ended August 31, 2021 and the period from March 7, 2019 (commencement of operations) through August 31, 2019 | |||
| Xtrackers S&P 500 ESG ETF | For the year ended August 31, 2021 | For each of the two years in the period ended August 31, 2021 | For each of the two years in the period ended August 31, 2021 and the period from June 26, 2019 (commencement of operations) through August 31, 2019 | |||
Xtrackers S&P MidCap 400 ESG ETF
Xtrackers S&P SmallCap 600 ESG ETF | For the period from February 24, 2021 (commencement of operations) through August 31, 2021 | |||||
89
DBX ETF Trust
Report of Independent Registered Public Accounting Firm (Continued)
Basis for Opinion
These financial statements are the responsibility of the Trust’s management. Our responsibility is to express an opinion on each of the Funds’ financial statements based on our audits. We are a public accounting firm registered with the Public Company Accounting Oversight Board (United States) (“PCAOB”) and are required to be independent with respect to the Trust in accordance with the U.S. federal securities laws and the applicable rules and regulations of the Securities and Exchange Commission and the PCAOB.
We conducted our audits in accordance with the standards of the PCAOB. Those standards require that we plan and perform the audit to obtain reasonable assurance about whether the financial statements are free of material misstatement, whether due to error or fraud. The Trust is not required to have, nor were we engaged to perform, an audit of the Trust’s internal control over financial reporting. As part of our audits we are required to obtain an understanding of internal control over financial reporting but not for the purpose of expressing an opinion on the effectiveness of the Trust’s internal control over financial reporting. Accordingly, we express no such opinion.
Our audits included performing procedures to assess the risks of material misstatement of the financial statements, whether due to error or fraud, and performing procedures that respond to those risks. Such procedures included examining, on a test basis, evidence regarding the amounts and disclosures in the financial statements. Our procedures included confirmation of securities owned as of August 31, 2021, by correspondence with the custodians and brokers or by other appropriate auditing procedures where replies from brokers were not received. Our audits also included evaluating the accounting principles used and significant estimates made by management, as well as evaluating the overall presentation of the financial statements. We believe that our audits provide a reasonable basis for our opinion.

We have served as the auditor of one or more investment companies in the DWS family of funds since at least 1979, but we are unable to determine the specific year.
New York, New York
October 25, 2021
90
DBX ETF Trust
Identification and Background
The Board has responsibility for the overall management and operations of the funds, including general supervision of the duties performed by the Advisor and other service providers. Each Board Member serves until his or her successor is duly elected or appointed and qualified. Each officer serves until he or she resigns, is removed, dies, retires or becomes disqualified.
The Trust currently has three Board Members. The three Independent Board Members have no affiliation or business connection with the Advisor or any of its affiliated persons and do not own any stock or other securities issued by the Advisor.
The Independent Board Members of the Trust, their term of office and length of time served, their principal business occupations during the past five years, the number of portfolios in the fund complex (defined below) overseen by each Independent Board Member, and other directorships, if any, held by the Board Members are shown below. The fund complex includes all registered open- and closed-end funds (including all of their portfolios) advised by the Advisor and any registered funds that have an investment advisor that is an affiliated person of the Advisor. As of the date of this shareholder report, the fund complex consists of the funds in the Trust, as well as the registered funds advised by affiliates of the Advisor.
Shareholder Communications to the Board. Shareholders may send communications to the Trust’s Board by addressing the communications directly to the Board (or individual Board Members) and/or otherwise clearly indicating in the salutation that the communication is for the Board (or individual Board Members). The shareholder may send the communication to either the Trust’s office or directly to such Board members c/o 875 Third Avenue, New York, NY 10022. Other shareholder communications received by the Trust not directly addressed and sent to the Board will be reviewed and generally responded to by management. Such communications will be forwarded to the Board at management’s discretion based on the matters contained therein.
Independent Board Members | ||||||
| Name, Year of Birth, Position with the Trust and Length of Time Served(1) | Business Experience and Directorships During the Past 5 Years | Number of Portfolios in Fund Complex Overseen | Other Directorships Held by Board Member | |||
| Stephen R. Byers (1953) Chairman since 2016, and Board Member since 2011 (formerly, Lead Independent Board Member, 2015-2016) | Independent Director (2011- present); Independent Consultant (2014-present); Director of Investment Management, the Dreyfus Corporation (2000-2006) and Vice Chairman and Chief Investment Officer, the Dreyfus Corporation (2002-2006). | 35 | The Arbitrage Funds, Sierra Income Corporation, Mutual Fund Directors Forum | |||
| George O. Elston (1964) Board Member since 2011, Chairman of the Audit Committee since 2015 | Chief Financial Officer, EyePoint Pharmaceuticals, Inc. (2019-present); Chief Financial Officer, Enzyvant (2018-2019); Chief Executive Officer, 2X Oncology, Inc. (2017- 2018); Senior Vice President and Chief Financial Officer, Juniper Pharmaceuticals, Inc. (2014-2016); Senior Vice President and Chief Financial Officer, KBI BioPharma Inc. (2013-2014); Managing Partner, Chatham Street Partners (2010-2013). | 35 | — | |||
| J. David Officer (1948) Board Member since 2011, Chairman of the Nominating Committee since 2015 | Independent Director (2010- present); Vice Chairman, the Dreyfus Corporation (2006-2009); President, The Dreyfus Family of Funds, Inc. (2006-2009). | 35 | (Chairman of) Ilex Management Ltd; Old Westbury Funds | |||
91
DBX ETF Trust
Board Members and Officers (Unaudited) (Continued)
Officers(2) | ||||||
| Name, Year of Birth, Position with the Trust and Length of Time Served(3) | Business Experience and Directorships During the Past 5 Years | |||||
| Freddi Klassen(4) (1975) President and Chief Executive Officer, 2016-present | Programmes (Head since 2021), of DWS Investment Management Americas, Inc. and Manager and Chief Operating Officer of the Advisor (2016-present). Formerly: Chief Operating Officer in the Americas for the Traditional Asset Classes Department (2014-2020); Manager and Chief Operating Officer of DWS Investment Management Americas, Inc. (2018-2020); Global Chief Operating Officer for Equities Technology in the Investment Bank Division at Deutsche Bank AG (2013-2014); Chief Operating Officer for Exchange Traded Funds and Systematic Funds in Europe (2008-2013). | |||||
| Diane Kenneally(5) (1966) Treasurer, Chief Financial Officer and Controller, 2019-present | Fund Administration Treasurer’s Office (Co-Head since 2018), of DWS Investment Management Americas, Inc.; Chief Financial Officer and Treasurer for DWS US registered investment companies advised by DWS Investment Management Americas, Inc. (2018-present); Treasurer and Chief Financial Officer, The European Equity Fund, Inc., The New Germany Fund, Inc. and The Central and Eastern Europe Fund, Inc. (2018-present); formerly: Assistant Treasurer for the DWS funds (2007-2018). | |||||
| Frank Gecsedi(4) (1967) Chief Compliance Officer, 2010-present | AFC Compliance US (Senior Team Lead), of DWS Investment Management Americas, Inc.; Compliance Department (2016-present), Vice President in the Deutsche Asset Management Compliance Department at Deutsche Bank AG (2013-2016) and Chief Compliance Officer of the Advisor (2010-present); Chief Compliance Officer of DWS Distributors, Inc. (2019-present); Vice President in Deutsche Bank’s Global Markets Legal, Risk and Capital Division (2010-2012). | |||||
| Bryan Richards(4) (1978) Vice President, 2016-present | Portfolio Engineering, Systematic Investments Solutions (Head), of DWS Investment Management Americas, Inc. (2018-present); Portfolio Manager in the Passive Asset Management Department at DWS (2011-present); Primary Portfolio Manager for the PowerShares DB Commodity ETFs (2011-2015). | |||||
| John Millette(5) (1962) Secretary, 2020-present | Legal (Associate General Counsel), DWS US Retail Legal (2003-present), of DWS Investment Management Americas, Inc.; Vice President and Secretary of DWS US registered investment companies advised by DWS Investment Management Americas, Inc. (1999-present); Chief Legal Officer, DWS Investment Management Americas, Inc. (2015-present); Director and Vice President of DWS Trust Company (2016-present); Vice President, DBX Advisors LLC (2021-present); Secretary, The European Equity Fund, Inc., The New Germany Fund, Inc. and The Central and Eastern Europe Fund, Inc. (2011-present); formerly: Secretary of Deutsche Investment Management Americas Inc. (2015-2017); and Assistant Secretary of DBX ETF Trust (2019-2020). | |||||
92
DBX ETF Trust
Board Members and Officers (Unaudited) (Continued)
| Name, Year of Birth, Position with the Trust and Length of Time Served(3) | Business Experience and Directorships During the Past 5 Years | |||||
| Caroline Pearson(5) (1962) Assistant Secretary, 2020-present | Legal (Senior Team Lead), DWS US Retail Legal, of DWS Investment Management Americas, Inc.; Chief Legal Officer of DWS US registered investment companies advised by DWS Investment Management Americas, Inc. (2010-present); Chief Legal Officer, DBX Advisors LLC (2020-present); Chief Legal Officer, The European Equity Fund, Inc., The New Germany Fund, Inc. and The Central and Eastern Europe Fund, Inc. (2012-present); formerly: Secretary, Deutsche AM Distributors, Inc. (2002-2017); and Secretary, Deutsche AM Service Company (2010-2017); and Chief Legal Officer, DBX Strategic Advisors LLC (2020–2021). | |||||
| Paul Antosca(5) (1957) Assistant Treasurer, 2019-present | Fund Administration Tax (Head), of DWS Investment Management Americas, Inc.; Assistant Treasurer for DWS US registered investment companies advised by DWS Investment Management Americas, Inc. (2007-present). | |||||
| Jeffrey Berry(5) (1959) Assistant Treasurer, 2019-present | Fund Administration (Senior Specialist), of DWS Investment Management Americas, Inc. | |||||
| Sheila Cadogan(5) (1966) Assistant Treasurer, 2019-present | Fund Administration Treasurer’s Office (Co-Head since 2018), of DWS Investment Management Americas, Inc.; Assistant Treasurer for DWS US registered investment companies advised by DWS Investment Management Americas, Inc. (2017-present); Director and Vice President, DWS Trust Company (2018-present); Assistant Treasurer, The European Equity Fund, Inc., The New Germany Fund, Inc. and The Central and Eastern Europe Fund, Inc. (2018-present). | |||||
| Christina A. Morse(6) (1964) Assistant Secretary, 2017-present | Vice President at BNY Mellon Asset Servicing (2014-present); Vice President and Counsel at Lord Abbett & Co. LLC (2013-2014). | |||||
Christian Rijs(4) (1980) Anti-Money Laundering Compliance Officer, since October 6, 2021 | Americas Head of Anti-Financial Crime and AML Officer, of DWS Investment Management Americas, Inc.; AML Officer, DWS Trust Company (since October 6, 2021); AML Officer, of DWS US registered investment companies advised by DWS Investment Management Americas, Inc. (since October 6, 2021); AML Officer, The European Equity Fund, Inc., The New Germany Fund, Inc. and The Central and Eastern Europe Fund, Inc. (since October 6, 2021.); formerly: DWS UK & Ireland Head of Anti-Financial Crime and MLRO | |||||
| (1) | The length of time served is represented by the year in which the Board Member joined the Board. |
| (2) | As a result of their respective positions held with the Advisor and its affiliates, these individuals are considered “interested persons” of the Advisor within the meaning of the 1940 Act. Interested persons receive no compensation from the Funds. |
| (3) | The length of time served is represented by the year in which the officer was first elected to the Trust in such capacity. |
| (4) | Address: 875 Third Avenue, New York, New York 10022. |
| (5) | Address: 100 Summer Street, Boston, MA 02110. |
| (6) | Address: BNY Mellon Asset Servicing, 240 Greenwich Street, New York, NY 10286. |
The Funds’ Statement of Additional Information (“SAI”) includes additional information about the Funds’ Board Members. The SAI is available by calling 855-329-3837, or on the Company’s website at www.Xtrackers.com.
93
DBX ETF Trust
Proxy Voting Policies and Procedures
The Funds’ policies and procedures for voting proxies for portfolio securities and information about how each Fund voted proxies related to its portfolio securities during the most recent 12-month period ended June 30 are available on our Web site — www.Xtrackers.com (click on “Resources” and “Proxy Voting” at the top of the page) — or on the SEC’s Web site — www.sec.gov. To obtain a written copy of the Funds’ policies and procedures without charge, upon request, call us toll free at (855) 329-3837.
Portfolio Holdings Information
The Funds are required to file their complete schedule of portfolio holdings with the SEC for their first and third fiscal quarters on Form N-PORT. Copies of the filings are available without charge, upon request on the SEC’s website at www.sec.gov and are available by calling the Trust at 855-329-3837.
Information about each Fund’s portfolio holdings is available daily at www.Xtrackers.com.
Discount & Premium Information
Information regarding how often shares of each Fund traded on NYSE Arca at a price above (i.e.,at a premium) or below (i.e., at a discount) the NAV of the Fund can be found at www.Xtrackers.com.
Tax Information
Form 1099-DIV and other year-end tax information provide shareholders with actual calendar year amounts that should be included in their tax returns. Shareholders should consult their tax advisors.
Each Fund designates the following amounts or, if subsequently determined to be different, the maximum allowable for its period ended August 31, 2021.
| Qualified Dividend Income* | Dividends Received Deduction* | |||||||
Xtrackers Emerging Markets Carbon Reduction and Climate Improvers ETF | 65% | 0% | ||||||
Xtrackers MSCI EAFE ESG Leaders Equity ETF | 94% | 0% | ||||||
Xtrackers MSCI Emerging Markets ESG Leaders Equity ETF | 71% | 0% | ||||||
Xtrackers MSCI USA ESG Leaders Equity ETF | 100% | 96% | ||||||
Xtrackers S&P 500 ESG ETF | 100% | 98% | ||||||
Xtrackers S&P MidCap 400 ESG ETF | 100% | 95% | ||||||
Xtrackers S&P SmallCap 600 ESG ETF | 56% | 55% | ||||||
* The above percentage is based on ordinary income dividends paid to shareholders during each Fund’s fiscal year.
Each Fund intends to elect to pass through to shareholders the credit for taxes paid to foreign countries. The gross foreign source income and foreign taxes paid are as follows:
| Gross Foreign Income | Foreign Taxes Income | |||||||
Xtrackers Emerging Markets Carbon Reduction and Climate Improvers ETF | $ | 369,103 | $ | 22,873 | ||||
Xtrackers MSCI EAFE ESG Leaders Equity ETF | 479,571 | 42,774 | ||||||
Xtrackers MSCI Emerging Markets ESG Leaders Equity ETF | 257,877 | 27,612 | ||||||
94
DBX ETF Trust
DBX Advisors LLC (“Advisors”) collects non-public information about you from the following sources: (i) information received from you on applications or other forms; and (ii) information about your transactions with the Advisors, Advisors’ affiliates and third-party service providers and vendors. Advisors does not disclose any non-public personal information about you to anyone, other than as set forth below, as permitted by applicable law and regulation. Advisors may disclose non-public personal information about you to the funds in which you invest, to Advisors’ affiliates, and to non-affiliated companies that work with Advisors to service your account(s), or to provide services or process transactions that you have requested. Advisors may disclose non-public personal information in situations that may include, but are not limited to, in response to legal and/or regulatory inquiries and the proposed or actual sale, assignment merger or other transfer of all or a portion of Advisors’ business to another business entity. Advisors may also disclose non-public personal information about you to parties representing you, such as your investment representative, your accountant, your tax advisor, or to other third parties at your direction/consent. Advisors will not sell, rent, license or trade your personal and financial information to or with third parties for their own direct marketing use unless you give us general or specific consent to do so. If you decide to close your account(s) or become an inactive customer, Advisors will adhere to the privacy policies and practices as described in this notice. Advisors restricts access to your personal and account information to those employees who need to know that information to provide products and services to you. Advisors maintains reasonable and customary physical, electronic and procedural safeguards to guard your non-public personal information.
California residents may go to https://fundsus.dws.com/us/en-us/legal-resources/privacy-policy.html to obtain additional information relating to their rights under California state law.
Advisors reserves the right, at their discretion, to change, modify, add, or remove portions of this Privacy Policy Notice, and any of the policies described herein, at any time. Advisors will indicate any such changes to the Privacy Policy Notice at the privacy link which can be found at www.Xtrackers.com. At all times, you are bound by the then-current version of the Privacy Policy and all applicable laws. Advisors highly recommends that you review this Privacy Policy Notice from time to time to ensure that you are familiar with the most recent version. The examples contained in this Privacy Policy Notice are illustrations; they are not intended to be exclusive.
95
DBX ETF Trust
This report is intended for the shareholders of the DBX ETF Trust.
This report must be preceded or accompanied by a prospectus.
Investing involves risk, including the possible loss of principal. ESG criteria in a Fund’s investment strategy does not guarantee a return or protect against loss, limits the types and number of investment opportunities available to the Fund and, as a result, the Fund may underperform other funds that do not have an ESG focus. Stocks may decline in value. Foreign investing involves greater and different risks than investing in US companies, including currency fluctuations, less liquidity, less developed or less efficient trading markets, lack of comprehensive company information, political instability and differing auditing and legal standards. Emerging markets tend to be more volatile and less liquid than the markets of more mature economies, and generally have less diverse and less mature economic structures and less stable political systems than those of developed countries. Stocks of medium-sized companies involve greater risk than securities of larger, more established companies. Small company stocks tend to be more volatile than medium-sized or large company stocks. Each Fund, except EASG, is currently non-diversified and can take larger positions in fewer issues, increasing its potential risk. Funds investing in a single industry, country or in a limited geographic region generally are more volatile than more diversified funds. Performance of a Fund may diverge from that of its Underlying Index due to operating expenses, transaction costs, cash flows, use of sampling strategies or operational inefficiencies. In certain situations, it may be difficult or impossible to sell an investment at an acceptable price. Any fund that focuses in a particular segment of the market or region of the world will generally be more volatile than a fund that invests more broadly. An investment in any Fund should be considered only as a supplement to a complete investment program for those investors willing to accept the risks associated with the Fund. Please read the prospectus for more information.
War, terrorism, economic uncertainty, trade disputes, public health crises (including the ongoing pandemic spread of the novel coronavirus) and related geopolitical events could lead to increased market volatility, disruption to U.S. and world economies and markets and may have significant adverse effects on the Funds and their investments.
Shares of the Funds are bought and sold at market price (not NAV) throughout the day on the NYSE Arca, Inc. Transactions in Fund shares may result in brokerage commissions and may generate tax consequences. There can be no assurance that an active trading market for shares of a Fund will develop or be maintained.
DBX ETF Trust Funds are distributed by ALPS Distributors, Inc. (“ALPS”). The Funds are managed by DBX Advisors LLC which is not affiliated with ALPS.
The brand DWS represents DWS Group GmbH & Co. KGaA and any of its subsidiaries such as DWS Distributors, Inc. which offers investment products or Deutsche Investment Management Americas Inc. and RREEF America L.L.C. which offer advisory services.
The Funds or securities referred to herein are not sponsored, endorsed, issued, sold or promoted by MSCI, and MSCI bears no liability with respect to any such Funds or securities or any index on which such Funds or securities are based. The prospectus contains a more detailed description of the limited relationship MSCI has with DBX Advisors LLC and any related funds.
The S&P 400 ESG Index, S&P 500 ESG Index and S&P 600 ESG Index are products of S&P Dow Jones Indices LLC or its affiliates (“SPDJI”), and have been licensed for use by DBX Advisors. S&P®, S&P 400®, S&P 500® and S&P 600®, are registered trademarks of Standard & Poor’s Financial Services LLC (“S&P”); Dow Jones® is a registered trademark of Dow Jones Trademark Holdings LLC (“Dow Jones”); and these trademarks have been licensed for use by SPDJI and sublicensed for certain purposes by DBX Advisors. The ESG Scores used in the Indexes are calculated by SAM. DBX Advisors LLC. Xtrackers ETFs are not sponsored, endorsed, sold or promoted by SPDJI, Dow Jones, S&P, their respective affiliates or SAM, and none of such parties make any representation regarding the advisability of investing in such ETFs, nor do they have any liability for any errors, omissions, or interruptions of the S&P 400 ESG Index, S&P 500 ESG Index and S&P 600 ESG Index.
EMCR (the “Fund”) is not sponsored, endorsed, sold or promoted by Solactive. Neither Solactive nor any other party makes any representation or warranty, express or implied, to the owners of the Fund or any member of the public regarding advisability of investing in funds generally or in this Fund particularly or the ability of the Underlying Indexes to track general stock market performance. Neither Solactive nor any other party makes any express or implied warranties, and Solactive hereby expressly disclaims all warranties of merchantability or fitness for a particular purpose with respect to the Underlying Indexes or any data included therein. The prospectus contains a more detailed description of the limited relationship Solactive has with DBX Advisors LLC and any related funds.
Copyright © 2021 DWS Group. All rights reserved. XtrackersTM is a trademark of DWS Investment GmbH. All other trademarks, servicemarks or registered trademarks are the property of their respective owners.
Not FDIC Insured | No Bank Guarantee | May Lose Value
DBX ETF Trust
Investment advisor DBX Advisors LLC 875 Third Avenue New York, NY 10022 | Administrator, custodian, fund accounting agent, lending agent & transfer agent The Bank of New York Mellon 240 Greenwich Street New York, NY 10286 | Distributor ALPS Distributors, Inc. 1290 Broadway Suite 1000 Denver, CO 80203 | ||
Independent registered public accounting firm Ernst & Young LLP One Manhattan West New York, NY 10001 | Legal counsel Vedder Price P.C. 1633 Broadway New York, NY 10019 | |||
R-070013-3 (10/21) DBX004977 (10/22)
August 31, 2021
Annual Report
DBX ETF Trust
Xtrackers High Beta High Yield Bond ETF (HYUP)
Xtrackers Low Beta High Yield Bond ETF (HYDW)
Xtrackers Short Duration High Yield Bond ETF (SHYL)
Xtrackers USD High Yield Corporate Bond ETF (HYLB)

DBX ETF Trust
| Page | ||||
| 1 | ||||
| 2 | ||||
| 4 | ||||
| 6 | ||||
| 8 | ||||
| 10 | ||||
| 12 | ||||
| 13 | ||||
| 25 | ||||
| 36 | ||||
| 45 | ||||
| 64 | ||||
| 65 | ||||
| 66 | ||||
| 68 | ||||
| 70 | ||||
| 78 | ||||
| 80 | ||||
| 83 | ||||
| 84 | ||||
Dear Shareholder,
We are pleased to provide this annual report for four of our ETFs tracking the fixed income market for the period ended August 31, 2021.
The global economy continued to recover during the reporting period, supported by a robust pace of vaccinations and extension of monetary and fiscal stimulus globally. Policy measures across the world supported economic growth, although at the risk of widening government deficits. The U.S. economy grew strongly, led by personal consumption, rapid vaccination and unparalleled liquidity provided by the central bank. The Eurozone economy came out of a recession in Q2 2021 as it posted positive economic growth after two quarters on easing lockdown restrictions as well as government support.
Central banks across the world are determined to help support the economy; however, rising inflationary pressures have begun to take a toll on the quantum of monetary stimulus. The U.S. economy benefited from continued fiscal and monetary stimulus, easing lockdown restrictions, and healthy corporate earnings results. Following the reopening of businesses in the U.S., labor markets continued to improve steadily and unemployment levels were the lowest since March 2020. The Federal Reserve Board (Fed), at its July meeting, indicated that it would start tapering asset purchases by the end of 2021 or the start of 2022. Although, the central bank showed no intentions to hike interest rates. The U.S. 10-year Treasury yield fell after the Fed chair Jerome Powell reiterated the Fed’s commitment to remain accommodative, irrespective of inflation being more persistent than anticipated. The Biden administration looks to fund its USD1.9tn economic relief package through stronger tax enforcement rather than formal tax increases.
Bond markets, in general, generated low returns in Q1 2021 due to concerns over the likelihood of rising interest rates. However, in Q2 2021, central banks adopted a firm stance and conveyed that it was not the time to change monetary policy. The global High Yield bond issuances remained buoyant during the reporting period as the spreads tightened. Low default rates and ample liquidity in the global financial system spurred the returns. The Eurozone economy started recovering as easing lockdown restrictions drove household spending and export numbers. In countries, such as France and Luxembourg, abundant liquidity ensured robust High Yield bond issuance, which more than doubled year-on-year in H1 2021. The German bond yields, on the other hand, started rising as the economy faced high inflation. The European Central Bank could be seen supportive in keeping interest rates lower by retaining the EUR1.85tn Pandemic Emergency Purchase Program and the EUR20bn monthly bond buying scheme even though inflation exceeded its target.
The global economic recovery is likely to continue in the coming quarters, aided by the rapid implementation of vaccination campaigns and the reopening of economies. Despite the positive outlook, the spread of the Delta variants, political tensions, and a sudden rise in inflation pose a threat to the recovery. Nevertheless, central banks across the world are likely to maintain an accommodative stance even if inflation targets are exceeded for a longer period, as protecting jobs remains the primary objective.
Our team appreciates your trust and looks forward to serving your investment needs through innovative index-driven strategies.
Sincerely,
/s/ Freddi Klassen
Freddi Klassen
President and Chief Executive Officer
Assumptions, estimates and opinions contained in this document constitute our judgment as of the date of the document and are subject to change without notice. Any projections are based on a number of assumptions as to market conditions and there can be no guarantee that any projected results will be achieved. Past performance is not a guarantee of future results.
1
DBX ETF Trust
Xtrackers High Beta High Yield Bond ETF (HYUP)
The Xtrackers High Beta High Yield Bond ETF (HYUP) seeks investment results that correspond generally to the performance, before fees and expenses, of the Solactive USD High Yield Corporates Total Market High Beta Index (the HYUP Index). The HYUP Index is a rules-based, market value weighted index engineered to mirror the performance of the higher yielding segment of the High Yield rated corporate bond market issued in USD. For the 12-month period ended August 31, 2021 HYUP shares returned 11.67%, compared to the HYUP Index return of 12.00%.
The majority of sectors contributed positively to performance during the period with the greatest contributions coming from Energy, Consumer Cyclical, and Consumer Non-Cyclical, The Utility sector was the only negative contributor to performance.
Xtrackers Low Beta High Yield Bond ETF (HYDW)
The Xtrackers Low Beta High Yield Bond ETF (HYDW) seeks investment results that correspond generally to the performance, before fees and expenses, of the Solactive USD High Yield Corporates Total Market Low Beta Index (the HYDW Index). The HYDW Index is a rules-based, market value weighted index engineered to mirror the performance of the lower yielding segment of the High Yield rated corporate bond market issued in USD. For the 12-month period ended August 31, 2021 HYDW shares returned 5.12%, compared to the HYDW Index return of 5.26%.
All sectors contributed positively to performance during the period with the greatest contributions coming from Energy, Consumer Cyclical and Communications.
Xtrackers Short Duration High Yield Bond ETF (SHYL)
The Xtrackers Short Duration High Yield Bond ETF (SHYL) seeks investment results that correspond generally to the performance, before fees and expenses, of the Solactive USD High Yield Corporates Total Market 0-5 Year Index (the SHYL Index). The SHYL Index a rules-based, market value weighted Index designed to track the performance of High Yield rated corporate bonds issued in USD with 0 to 5 years term to maturity. For the 12-month period ended August 31, 2021, SHYL shares returned 8.86%, compared to the SHYL Index return of 9.15%.
The majority of sectors contributed positively to performance during the period with the greatest contributions coming from Consumer Cyclical, Energy and Consumer Non-Cyclical. The Utility sector was the only negative contributor to performance.
Xtrackers USD High Yield Corporate Bond ETF (HYLB)
The Xtrackers USD High Yield Corporate Bond ETF (HYLB) seeks investment results that correspond generally to the performance, before fees and expenses, of the Solactive USD High Yield Corporates Total Market Index (the HYLB Index). The HYLB Index is a rules-based, market value weighted index engineered to mirror the performance of high-yield-rated corporate bonds issued in U.S. dollars. For the 12-month period ended August 31, 2021, HYLB shares returned 8.31%, compared to the HYLB Index return of 8.60%.
All sectors contributed positively to performance during the period with the greatest contributions coming from Energy, Consumer Cyclical and Consumer Non-Cyclical.
*************************
Performance data quoted represents past performance and does not guarantee future results. Investment returns and principal value of an investment will fluctuate so that an investor’s shares, when sold or redeemed, may be worth more or less than their original cost. Current performance may be lower or higher than the performance data quoted. To obtain the most recent month-end performance data visit www.Xtrackers.com. Returns assume that dividends and capital gains distributions have been reinvested. See pages 4-11 of this report for additional performance information, including performance data based on market value.
The views expressed in this report reflect those of the portfolio management team only through the end of the period of the report as stated on the cover. The management team’s views are subject to change at any time based on market and other conditions and should not be construed as a recommendation. Current and future portfolio holdings are subject to risk.
2
This Page is Intentionally Left Blank
3
DBX ETF Trust
Xtrackers High Beta High Yield Bond ETF (HYUP)
The Xtrackers High Beta High Yield Bond ETF (the “Fund”), using a “passive” or indexing investment approach, seeks investment results that correspond generally to the performance, before fees and expenses, of the Solactive USD High Yield Corporates Total Market High Beta Index (the “Underlying Index”). The Underlying Index is designed to track the performance of the segment of the U.S. dollar denominated high yield corporate bond market that exhibits higher overall beta to the broader high yield corporate fixed income market. It is not possible to invest directly into an index.
| Performance as of August 31, 2021 | ||||||||
| Average Annual Total Returns | ||||||||
| Net Asset Value | Market Value | Solactive USD High Yield Corporates Total Market High Beta Index | Solactive USD High Yield Corporates Total Market Index | |||||
One Year | 11.67% | 12.10% | 12.00% | 8.60% | ||||
Since Inception1 | 6.00% | 6.02% | 5.97% | 5.59% | ||||
| Cumulative Total Returns | ||||||||
| Net Asset Value | Market Value | Solactive USD High Yield Corporates Total Market High Beta Index | Solactive USD High Yield Corporates Total Market Index | |||||
One Year | 11.67% | 12.10% | 12.00% | 8.60% | ||||
Since Inception1 | 23.59% | 23.71% | 23.52% | 21.89% | ||||
1 Total returns are calculated based on the commencement of operations, January 11, 2018 (“Inception”).
Past performance is no guarantee of future results. Current performance may be lower or higher than the performance data quoted. Performance data current to the most recent month-end is available at www.Xtrackers.com. Performance results assume reinvestment of all dividends and capital gain distributions and do not reflect the deduction of taxes that a shareholder would pay on fund distributions or on the sale of fund shares or redemption of fund creation units. The investment return and principal value of shares will vary with changes in market conditions. Shares may be worth more or less than their original cost when they are sold in the market or redeemed. Performance for certain funds may reflect a waiver of a portion of the unitary advisory fee. Without such waiver, performance would have been lower. The gross expense ratio of the Fund, as stated in the fee table of the prospectus dated December 18, 2020, was 0.35%, and may differ from the expense ratio disclosed in the Financial Highlights table in this report.
The Fund’s net asset value or “NAV” is calculated by dividing the value of the Fund’s total assets less total liabilities by the number of shares outstanding. The price used to calculate market return (“Market Price”) is determined by using the midpoint between the highest bid and the lowest offer on the primary stock exchange on which shares of a fund are listed for trading, as of the time that such fund’s NAV is calculated. Since shares of a fund may not have traded in the secondary market until after the fund’s inception, for the period from inception to the first day of secondary trading, the NAV of the fund is used as a proxy for the Market Price to calculate market returns. Market and NAV returns assume that dividends and capital gain distributions have been reinvested at Market Price and NAV, respectively.
An index is a statistical composite that tracks a specified financial market or sector. Unlike a fund, an index does not actually hold a portfolio of securities and therefore does not incur the expenses incurred by a fund. These expenses negatively impact fund performance. Also, market returns do not include brokerage commissions that may be payable on secondary market transactions. If brokerage commissions were included, market returns would be lower.
4
DBX ETF Trust
Performance Summary (Unaudited)
Xtrackers High Beta High Yield Bond ETF (HYUP) (Continued)
| Growth of an Assumed $10,000 Investment |
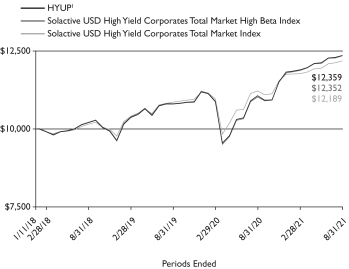
1 Based on Net Asset Value from commencement of operations, January 11, 2018.
| Sector Diversification* as of August 31, 2021 | ||
Communications | 20.5% | |||
Consumer, Cyclical | 20.4% | |||
Consumer, Non-cyclical | 18.2% | |||
Energy | 12.7% | |||
Industrial | 8.9% | |||
Financial | 8.5% | |||
Basic Materials | 4.7% | |||
Technology | 3.4% | |||
Utilities | 2.7% | |||
|
| |||
Total | 100.0% |
Modified duration to worst as of August 31, 2021: 3.8 years
Modified duration to worst is the measure of sensitivity of the price of a bond to a change in interest rates, assuming worst case scenario.
| Quality* as of August 31, 2021 | ||
| Description | % of Market Value | |||
BBB | 1.1% | |||
BB | 46.3% | |||
B | 40.1% | |||
CCC | 12.4% | |||
CC | 0.1% | |||
|
| |||
Total | 100% | |||
The quality ratings represents the average of Moody’s Investor Services, Inc. (“Moody’s”), S&P Global Ratings (S&P) or Fitch Ratings Inc. (Fitch) credit ratings. The ratings of Moody’s, S&P and Fitch represent their opinions as to the quality of the securities they rate. Credit quality measures a bond issuer’s ability to repay interest and principal in a timely manner and is measured on a scale that ranges from AAA (highest) to D (lowest). Ratings are relative and subjective and are not absolute standards of quality. Credit quality does not remove market risk and is subject to change.
| Country Diversification* as of August 31, 2021 | ||
United States | 84.7% | |||
Canada | 5.0% | |||
Luxembourg | 2.2% | |||
Netherlands | 2.1% | |||
Other | 6.0% | |||
|
| |||
Total | 100.0% |
* As a percent of total investments excluding securities lending collateral and cash equivalents.
Portfolio holdings and characteristics are subject to change. For more complete details about the Fund’s investment portfolio see page 13.
5
DBX ETF Trust
Xtrackers Low Beta High Yield Bond ETF (HYDW)
The Xtrackers Low Beta High Yield Bond ETF (the “Fund”), using a “passive” or indexing investment approach, seeks investment results that correspond generally to the performance, before fees and expenses, of the Solactive USD High Yield Corporates Total Market Low Beta Index (the “Underlying Index”). The Underlying Index is designed to track the performance of the segment of the U.S. dollar denominated high yield corporate bond market that exhibits lower overall beta to the broader high yield corporate fixed income market. It is not possible to invest directly into an index.
| Performance as of August 31, 2021 | ||||||||
| Average Annual Total Returns | ||||||||
| Net Asset Value | Market Value | Solactive USD High Yield Corporates Total Market Low Beta Index | Solactive USD High Yield Corporates Total Market Index | |||||
One Year | 5.12% | 5.12% | 5.26% | 8.60% | ||||
Since Inception1 | 4.94% | 4.94% | 4.94% | 5.59% | ||||
| Cumulative Total Returns | ||||||||
| Net Asset Value | Market Value | Solactive USD High Yield Corporates Total Market Low Beta Index | Solactive USD High Yield Corporates Total Market Index | |||||
One Year | 5.12% | 5.12% | 5.26% | 8.60% | ||||
Since Inception1 | 19.18% | 19.20% | 19.20% | 21.89% | ||||
1 Total returns are calculated based on the commencement of operations, January 11, 2018 (“Inception”).
Past performance is no guarantee of future results. Current performance may be lower or higher than the performance data quoted. Performance data current to the most recent month-end is available at www.Xtrackers.com. Performance results assume reinvestment of all dividends and capital gain distributions and do not reflect the deduction of taxes that a shareholder would pay on fund distributions or on the sale of fund shares or redemption of fund creation units. The investment return and principal value of shares will vary with changes in market conditions. Shares may be worth more or less than their original cost when they are sold in the market or redeemed. Performance for certain funds may reflect a waiver of a portion of the unitary advisory fee. Without such waiver, performance would have been lower. The gross expense ratio of the Fund, as stated in the fee table of the prospectus dated December 18, 2020, was 0.25%, and may differ from the expense ratio disclosed in the Financial Highlights table in this report.
The Fund’s net asset value or “NAV” is calculated by dividing the value of the Fund’s total assets less total liabilities by the number of shares outstanding. The price used to calculate market return (“Market Price”) is determined by using the midpoint between the highest bid and the lowest offer on the primary stock exchange on which shares of a fund are listed for trading, as of the time that such fund’s NAV is calculated. Since shares of a fund may not have traded in the secondary market until after the fund’s inception, for the period from inception to the first day of secondary trading, the NAV of the fund is used as a proxy for the Market Price to calculate market returns. Market and NAV returns assume that dividends and capital gain distributions have been reinvested at Market Price and NAV, respectively.
An index is a statistical composite that tracks a specified financial market or sector. Unlike a fund, an index does not actually hold a portfolio of securities and therefore does not incur the expenses incurred by a fund. These expenses negatively impact fund performance. Also, market returns do not include brokerage commissions that may be payable on secondary market transactions. If brokerage commissions were included, market returns would be lower.
6
DBX ETF Trust
Performance Summary (Unaudited)
Xtrackers Low Beta High Yield Bond ETF (HYDW) (Continued)
| Growth of an Assumed $10,000 Investment |
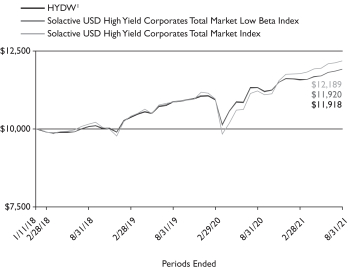
1 Based on Net Asset Value from commencement of operations, January 11, 2018.
| Sector Diversification* as of August 31, 2021 | ||
Consumer, Cyclical | 19.6% | |||
Consumer, Non-cyclical | 18.9% | |||
Communications | 18.6% | |||
Energy | 13.3% | |||
Financial | 11.4% | |||
Industrial | 7.0% | |||
Technology | 4.7% | |||
Basic Materials | 3.8% | |||
Utilities | 2.7% | |||
|
| |||
Total | 100.0% |
Modified duration to worst as of August 31, 2021: 2.7 years
Modified duration to worst is the measure of sensitivity of the price of a bond to a change in interest rates, assuming worst case scenario
| Quality* as of August 31, 2021 | ||
| Description | % of Market Value | |||
BBB | 17.9% | |||
BB | 70.6% | |||
B | 11.1% | |||
CCC | 0.4% | |||
|
| |||
Total | 100.0% | |||
The quality ratings represents the average of Moody’s Investor Services, Inc. (“Moody’s”), S&P Global Ratings (S&P) or Fitch Ratings Inc. (Fitch) credit ratings. The ratings of Moody’s, S&P and Fitch represent their opinions as to the quality of the securities they rate. Credit quality measures a bond issuer’s ability to repay interest and principal in a timely manner and is measured on a scale that ranges from AAA (highest) to D (lowest). Ratings are relative and subjective and are not absolute standards of quality. Credit quality does not remove market risk and is subject to change.
| Country Diversification* as of August 31, 2021 | ||
United States | 91.1% | |||
Netherlands | 2.2% | |||
Canada | 2.2% | |||
Other | 4.5% | |||
|
| |||
Total | 100.0% |
* As a percent of total investments excluding securities lending collateral and cash equivalents.
Portfolio holdings and characteristics are subject to change. For more complete details about the Fund’s investment portfolio see page 25.
7
DBX ETF Trust
Xtrackers Short Duration High Yield Bond ETF (SHYL)
The Xtrackers Short Duration High Yield Bond ETF (the “Fund”), using a “passive” or indexing investment approach, seeks investment results that correspond generally to the performance, before fees and expenses, of the Solactive USD High Yield Corporates Total Market 0-5 Year Index (the “Underlying Index”). The Underlying Index is designed to track the performance of short-term publicly issued U.S. dollar-denominated below investment grade corporate debt. It is not possible to invest directly into an index.
| Performance as of August 31, 2021 | ||||||||
| Average Annual Total Returns | ||||||||
| Net Asset Value | Market Value | Solactive USD High Yield Corporates Total Market 0-5 Year Index | Solactive USD High Yield Corporates Total Market Index | |||||
One Year | 8.86% | 9.11% | 9.15% | 8.60% | ||||
Since Inception1 | 4.54% | 4.55% | 4.70% | 5.50% | ||||
| Cumulative Total Returns | ||||||||
| Net Asset Value | Market Value | Solactive USD High Yield Corporates Total Market 0-5 Year Index | Solactive USD High Yield Corporates Total Market Index | |||||
One Year | 8.86% | 9.11% | 9.15% | 8.60% | ||||
Since Inception1 | 17.53% | 17.61% | 18.23% | 21.53% | ||||
1 Total returns are calculated based on the commencement of operations, January 10, 2018 (“Inception”).
Past performance is no guarantee of future results. Current performance may be lower or higher than the performance data quoted. Performance data current to the most recent month-end is available at www.Xtrackers.com. Performance results assume reinvestment of all dividends and capital gain distributions and do not reflect the deduction of taxes that a shareholder would pay on fund distributions or on the sale of fund shares or redemption of fund creation units. The investment return and principal value of shares will vary with changes in market conditions. Shares may be worth more or less than their original cost when they are sold in the market or redeemed. Performance for certain funds may reflect a waiver of a portion of the unitary advisory fee. Without such waiver, performance would have been lower. The gross expense ratio of the Fund, as stated in the fee table of the prospectus dated December 18, 2020, was 0.20%, and may differ from the expense ratio disclosed in the Financial Highlights table in this report.
The Fund’s net asset value or “NAV” is calculated by dividing the value of the Fund’s total assets less total liabilities by the number of shares outstanding. The price used to calculate market return (“Market Price”) is determined by using the midpoint between the highest bid and the lowest offer on the primary stock exchange on which shares of a fund are listed for trading, as of the time that such fund’s NAV is calculated. Since shares of a fund may not have traded in the secondary market until after the fund’s inception, for the period from inception to the first day of secondary trading, the NAV of the fund is used as a proxy for the Market Price to calculate market returns. Market and NAV returns assume that dividends and capital gain distributions have been reinvested at Market Price and NAV, respectively.
An index is a statistical composite that tracks a specified financial market or sector. Unlike a fund, an index does not actually hold a portfolio of securities and therefore does not incur the expenses incurred by a fund. These expenses negatively impact fund performance. Also, market returns do not include brokerage commissions that may be payable on secondary market transactions. If brokerage commissions were included, market returns would be lower.
8
DBX ETF Trust
Performance Summary (Unaudited)
Xtrackers Short Duration High Yield Bond ETF (SHYL) (Continued)
| Growth of an Assumed $10,000 Investment |
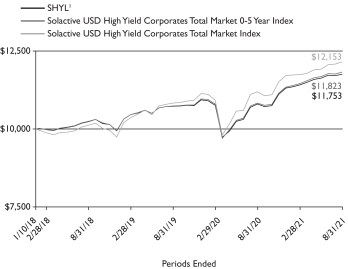
1 Based on Net Asset Value from commencement of operations, January 10, 2018.
| Sector Diversification* as of August 31, 2021 | ||
Consumer, Cyclical | 29.3% | |||
Energy | 14.2% | |||
Communications | 13.9% | |||
Consumer, Non-cyclical | 11.8% | |||
Financial | 11.4% | |||
Industrial | 10.0% | |||
Technology | 4.2% | |||
Basic Materials | 3.3% | |||
Utilities | 1.9% | |||
|
| |||
Total | 100.0% |
Modified duration to worst as of August 31, 2021: 1.8 years
Modified duration to worst is the measure of sensitivity of the price of a bond to a change in interest rates, assuming worst case scenario.
| Quality* as of August 31, 2021 | ||
| Description | % of Market Value | |||
BBB | 9.2% | |||
BB | 59.2% | |||
B | 25.0% | |||
CCC | 6.6% | |||
|
| |||
Total | 100.0% | |||
The quality ratings represents the average of Moody’s Investor Services, Inc. (“Moody’s”), S&P Global Ratings (S&P) or Fitch Ratings Inc. (Fitch) credit ratings. The ratings of Moody’s, S&P and Fitch represent their opinions as to the quality of the securities they rate. Credit quality measures a bond issuer’s ability to repay interest and principal in a timely manner and is measured on a scale that ranges from AAA (highest) to D (lowest). Ratings are relative and subjective and are not absolute standards of quality. Credit quality does not remove market risk and is subject to change.
| Country Diversification* as of August 31, 2021 | ||
United States | 89.0% | |||
Canada | 3.0% | |||
Other | 8.0% | |||
|
| |||
Total | 100.0% |
* As a percent of total investments excluding securities lending collateral and cash equivalents.
Portfolio holdings and characteristics are subject to change. For more complete details about the Fund’s investment portfolio see page 36.
9
DBX ETF Trust
Xtrackers USD High Yield Corporate Bond ETF (HYLB)
The Xtrackers USD High Yield Corporate Bond ETF (the “Fund”), using a “passive” or indexing investment approach, seeks investment results that correspond generally to the performance, before fees and expenses, of the Solactive USD High Yield Corporates Total Market Index (the “Underlying Index”). The Underlying Index is designed to track the performance of a basket of U.S. dollar-denominated high yield liquid corporate bonds. It is not possible to invest directly into an index.
| Performance as of August 31, 2021 | ||||||||
| Average Annual Total Returns | ||||||||
| Net Asset Value | Market Value | Solactive USD High Yield Corporates Total Market Index | iBoxx USD Liquid High Yield Index | |||||
One Year | 8.31% | 8.61% | 8.60% | 8.62% | ||||
Since Inception1 | 5.75% | 5.78% | 6.04% | 5.99% | ||||
| Cumulative Total Returns | ||||||||
| Net Asset Value | Market Value | Solactive USD High Yield Corporates Total Market Index | iBoxx USD Liquid High Yield Index | |||||
One Year | 8.31% | 8.61% | 8.60% | 8.62% | ||||
Since Inception1 | 30.28% | 30.48% | 32.00% | 31.70% | ||||
1 Total returns are calculated based on the commencement of operations, December 7, 2016 (“Inception”).
Past performance is no guarantee of future results. Current performance may be lower or higher than the performance data quoted. Performance data current to the most recent month-end is available at www.Xtrackers.com. Performance results assume reinvestment of all dividends and capital gain distributions and do not reflect the deduction of taxes that a shareholder would pay on fund distributions or on the sale of fund shares or redemption of fund creation units. The investment return and principal value of shares will vary with changes in market conditions. Shares may be worth more or less than their original cost when they are sold in the market or redeemed. Performance for certain funds may reflect a waiver of a portion of the unitary advisory fee. Without such waiver, performance would have been lower. The gross expense ratio of the Fund, as stated in the fee table of the prospectus dated December 18, 2020, was 0.20%, and may differ from the expense ratio disclosed in the Financial Highlights table in this report.
The Fund’s net asset value or “NAV” is calculated by dividing the value of the Fund’s total assets less total liabilities by the number of shares outstanding. The price used to calculate market return (“Market Price”) is determined by using the midpoint between the highest bid and the lowest offer on the primary stock exchange on which shares of a fund are listed for trading, as of the time that such fund’s NAV is calculated. Since shares of a fund may not have traded in the secondary market until after the fund’s inception, for the period from inception to the first day of secondary trading, the NAV of the fund is used as a proxy for the Market Price to calculate market returns. Market and NAV returns assume that dividends and capital gain distributions have been reinvested at Market Price and NAV, respectively.
An index is a statistical composite that tracks a specified financial market or sector. Unlike a fund, an index does not actually hold a portfolio of securities and therefore does not incur the expenses incurred by a fund. These expenses negatively impact fund performance. Also, market returns do not include brokerage commissions that may be payable on secondary market transactions. If brokerage commissions were included, market returns would be lower.
10
DBX ETF Trust
Performance Summary (Unaudited)
Xtrackers USD High Yield Corporate Bond ETF (HYLB) (Continued)
| Growth of an Assumed $10,000 Investment |
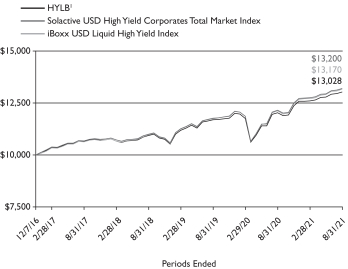
1 Based on Net Asset Value from commencement of operations, December 7, 2016.
| Sector Diversification* as of August 31, 2021 | ||
Consumer, Cyclical | 20.9% | |||
Communications | 19.4% | |||
Consumer, Non-cyclical | 18.6% | |||
Energy | 12.6% | |||
Financial | 9.8% | |||
Industrial | 8.0% | |||
Basic Materials | 4.1% | |||
Technology | 3.9% | |||
Utilities | 2.7% | |||
|
| |||
Total | 100.0% |
Modified duration to worst as of August 31, 2021: 3.2 years
Modified duration to worst is the measure of sensitivity of the price of a bond to a change in interest rates, assuming worst case scenario.
| Quality* as of August 31, 2021 | ||
| Description | % of Market Value | |||
BBB | 9.2% | |||
BB | 58.3% | |||
B | 25.6% | |||
CCC | 6.8% | |||
CC | 0.1% | |||
|
| |||
Total | 100.0% | |||
The quality ratings represents the average of Moody’s Investor Services, Inc. (“Moody’s”), S&P Global Ratings (S&P) or Fitch Ratings Inc. (Fitch) credit ratings. The ratings of Moody’s, S&P and Fitch represent their opinions as to the quality of the securities they rate. Credit quality measures a bond issuer’s ability to repay interest and principal in a timely manner and is measured on a scale that ranges from AAA (highest) to D (lowest). Ratings are relative and subjective and are not absolute standards of quality. Credit quality does not remove market risk and is subject to change.
| Country Diversification* as of August 31, 2021 | ||
United States | 87.7% | |||
Canada | 3.6% | |||
Netherlands | 2.2% | |||
Other | 6.5% | |||
|
| |||
Total | 100.0% |
* As a percent of total investments excluding securities lending collateral and cash equivalents.
Portfolio holdings and characteristics are subject to change. For more complete details about the Fund’s investment portfolio see page 45.
11
DBX ETF Trust
As a shareholder of one or more of the Funds, you incur two types of costs: (1) transaction costs, including brokerage commissions paid on purchases and sales of fund shares, and (2) ongoing costs, including management fees and other Fund expenses. In the most recent six-month period the Funds limited these expenses; had they not done so, expenses would have been higher. The expense examples below are intended to help you understand your ongoing costs (in dollars) of investing in the Funds and to compare these costs with the ongoing costs of investing in other funds.
The examples in the tables are based on an investment of $1,000 invested at the beginning of the six-month period and held for the entire period (March 1, 2021 to August 31, 2021).
Actual expenses
The first line in the following tables provides information about actual account values and actual expenses. You may use the information in this line, together with the amount you invested, to estimate the expenses that you paid over the period. Simply divide your account value by $1,000 (for example, an $8,600 account value divided by $1,000 = 8.6), then multiply the result by the number in the first line under the heading “Expenses Paid During the Period” to estimate the expenses you paid on your account during this period.
Hypothetical example for comparison purposes
The second line in the following tables provides information about hypothetical account values and hypothetical expenses based on the Funds’ actual expense ratios and an assumed rate of return of 5% per year before expenses (which is not the Funds’ actual return). The hypothetical account values and expenses may not be used to estimate the actual ending account balance or expenses you paid for the period. You may use this information to compare the ongoing costs of investing in the Fund and other funds. To do so, compare this 5% hypothetical example with the 5% hypothetical examples that appear in the shareholder reports of the other funds.
Please note that the expenses shown in the tables are meant to highlight your ongoing costs only, and do not reflect any transactional costs. Therefore the second line in the table is useful in comparing ongoing costs only, and will not help you determine the relative total costs of owning different funds. In addition, if these transactional costs were included, your costs would have been higher.
| Beginning Account Value March 1, 2021 | Ending Account Value August 31, 2021 | Annualized Expense Ratio | Expenses Paid During the Period Per $1,000(1) | |||||||||||||
| Xtrackers High Beta High Yield Bond ETF | ||||||||||||||||
Actual | $ | 1,000.00 | $ | 1,038.60 | 0.20 | % | $ | 1.03 | ||||||||
Hypothetical (5% return before expenses) | $ | 1,000.00 | $ | 1,024.20 | 0.20 | % | $ | 1.02 | ||||||||
| Xtrackers Low Beta High Yield Bond ETF | ||||||||||||||||
Actual | $ | 1,000.00 | $ | 1,028.60 | 0.20 | % | $ | 1.02 | ||||||||
Hypothetical (5% return before expenses) | $ | 1,000.00 | $ | 1,024.20 | 0.20 | % | $ | 1.02 | ||||||||
| Xtrackers Short Duration High Yield Bond ETF | ||||||||||||||||
Actual | $ | 1,000.00 | $ | 1,029.30 | 0.20 | % | $ | 1.02 | ||||||||
Hypothetical (5% return before expenses) | $ | 1,000.00 | $ | 1,024.20 | 0.20 | % | $ | 1.02 | ||||||||
| Xtrackers USD High Yield Corporate Bond ETF | ||||||||||||||||
Actual | $ | 1,000.00 | $ | 1,033.50 | 0.15 | % | $ | 0.77 | ||||||||
Hypothetical (5% return before expenses) | $ | 1,000.00 | $ | 1,024.45 | 0.15 | % | $ | 0.76 | ||||||||
(1) Expenses are equal to each Fund’s annualized expense ratio, multiplied by the average account value over the period, multiplied by 184 (the number of days in the most recent six-month period), then divided by 365.
12
DBX ETF Trust
Xtrackers High Beta High Yield Bond ETF
August 31, 2021
Principal | Value | |||||||
| CORPORATE BONDS — 98.0% | ||||||||
| Basic Materials — 4.6% | ||||||||
| Chemicals — 2.5% | ||||||||
Axalta Coating Systems LLC, 144A, | $ | 21,000 | $ | 20,635 | ||||
Chemours Co. | 10,000 | 10,876 | ||||||
144A, 5.75%, 11/15/28 | 38,000 | 40,328 | ||||||
144A, 4.625%, 11/15/29 | 18,000 | 17,939 | ||||||
Consolidated Energy Finance SA, 144A, | 25,000 | 25,844 | ||||||
INEOS Group Holdings SA, 144A, | 16,000 | 16,041 | ||||||
Methanex Corp. | 25,000 | 27,259 | ||||||
5.25%, 12/15/29 | 25,000 | 27,158 | ||||||
NOVA Chemicals Corp. | 37,000 | 39,584 | ||||||
144A, 4.25%, 5/15/29 | 17,000 | 17,106 | ||||||
OCI NV, 144A, | 20,000 | 20,650 | ||||||
Olin Corp., | 18,000 | 19,341 | ||||||
SCIH Salt Holdings, Inc. | 40,000 | 40,342 | ||||||
144A, 6.625%, 5/1/29 (a) | 21,000 | 20,682 | ||||||
TPC Group, Inc., 144A, | 30,000 | 27,788 | ||||||
Tronox, Inc., 144A, | 37,000 | 37,562 | ||||||
Valvoline, Inc. | 13,000 | 13,506 | ||||||
144A, 3.625%, 6/15/31 | 27,000 | 26,902 | ||||||
WR Grace Holdings LLC, 144A, | 37,000 | 38,635 | ||||||
|
| |||||||
(Cost $483,557) | 488,178 | |||||||
|
| |||||||
| Forest Products & Paper — 0.2% | ||||||||
Mercer International, Inc., | ||||||||
(Cost $25,640) | 25,000 | 25,281 | ||||||
|
| |||||||
| Iron/Steel — 0.6% | ||||||||
Cleveland-Cliffs, Inc. | 25,000 | 26,156 | ||||||
144A, 4.875%, 3/1/31 (a) | 25,000 | 26,926 | ||||||
United States Steel Corp. | 35,000 | 36,093 | ||||||
6.875%, 3/1/29 (a) | 25,000 | 27,344 | ||||||
|
| |||||||
(Cost $109,258) | 116,519 | |||||||
|
| |||||||
| Mining — 1.3% | ||||||||
Arconic Corp., 144A, | 35,000 | 37,457 | ||||||
Constellium SE, 144A, | 10,000 | 9,960 | ||||||
FMG Resources August 2006 Pty Ltd., 144A, | 52,000 | 56,074 | ||||||
Principal | Value | |||||||
| Mining (Continued) | ||||||||
Hudbay Minerals, Inc. | $ | 17,000 | $ | 17,110 | ||||
144A, 6.125%, 4/1/29 (a) | 20,000 | 21,525 | ||||||
Kaiser Aluminum Corp. | 15,000 | 15,582 | ||||||
144A, 4.50%, 6/1/31 | 16,000 | 16,602 | ||||||
Novelis Corp. | 55,000 | 58,678 | ||||||
144A, 3.875%, 8/15/31 | 22,000 | 22,233 | ||||||
|
| |||||||
(Cost $248,563) | 255,221 | |||||||
|
| |||||||
| Communications — 20.1% | ||||||||
| Advertising — 1.1% | ||||||||
Clear Channel Outdoor Holdings, Inc. | 62,000 | 64,731 | ||||||
144A, 7.50%, 6/1/29 | 13,000 | 13,471 | ||||||
Lamar Media Corp., 144A, | 25,000 | 24,974 | ||||||
Midas OpCo Holdings LLC, 144A, | 12,000 | 12,299 | ||||||
Outfront Media Capital LLC / Outfront Media Capital Corp. | 25,000 | 25,806 | ||||||
144A, 4.25%, 1/15/29 (a) | 10,000 | 10,038 | ||||||
144A, 4.625%, 3/15/30 | 20,000 | 20,276 | ||||||
Terrier Media Buyer, Inc., 144A, | 33,000 | 35,186 | ||||||
|
| |||||||
(Cost $203,380) | 206,781 | |||||||
|
| |||||||
| Internet — 1.1% | ||||||||
Arches Buyer, Inc. | 15,000 | 15,263 | ||||||
144A, 6.125%, 12/1/28 | 25,000 | 25,834 | ||||||
Go Daddy Operating Co. LLC / GD Finance Co., Inc., 144A, | 28,000 | 27,689 | ||||||
Photo Holdings Merger Sub, Inc., 144A, | 32,000 | 34,760 | ||||||
Uber Technologies, Inc. | 50,000 | 54,563 | ||||||
144A, 6.25%, 1/15/28 (a) | 15,000 | 16,106 | ||||||
144A, 4.50%, 8/15/29 | 42,000 | 41,541 | ||||||
|
| |||||||
(Cost $210,235) | 215,756 | |||||||
|
| |||||||
| Media — 11.4% | ||||||||
Altice Financing SA | 40,000 | 40,026 | ||||||
144A, 5.75%, 8/15/29 | 51,000 | 52,451 | ||||||
AMC Networks, Inc., | 35,000 | 34,781 | ||||||
Cable One, Inc., 144A, | 21,000 | 21,275 | ||||||
CCO Holdings LLC / CCO Holdings Capital Corp. | 92,000 | 96,249 | ||||||
144A, 4.25%, 2/1/31 | 99,000 | 101,726 | ||||||
4.50%, 5/1/32 | 98,000 | 102,540 | ||||||
| See Notes to Financial Statements. | 13 |
DBX ETF Trust
Schedule of Investments
Xtrackers High Beta High Yield Bond ETF (Continued)
August 31, 2021
Principal | Value | |||||||
| Media (Continued) | ||||||||
144A, 4.50%, 6/1/33 | $ | 50,000 | $ | 51,808 | ||||
144A, 4.25%, 1/15/34 | 62,000 | 62,656 | ||||||
Clear Channel Worldwide Holdings, Inc., 144A, | 35,000 | 36,071 | ||||||
CSC Holdings LLC | 100,000 | 105,802 | ||||||
144A, 4.125%, 12/1/30 | 31,000 | 31,078 | ||||||
144A, 4.625%, 12/1/30 | 90,000 | 88,354 | ||||||
144A, 3.375%, 2/15/31 | 51,000 | 48,582 | ||||||
144A, 4.50%, 11/15/31 | 25,000 | 25,182 | ||||||
144A, 5.00%, 11/15/31 | 7,000 | 6,975 | ||||||
Diamond Sports Group LLC / Diamond Sports Finance Co. | 99,000 | 65,781 | ||||||
144A, 6.625%, 8/15/27 (a) | 55,000 | 23,719 | ||||||
DIRECTV Holdings LLC / DIRECTV Financing Co., Inc., 144A, | 74,000 | 77,452 | ||||||
DISH DBS Corp. | 65,000 | 74,535 | ||||||
7.375%, 7/1/28 (a) | 40,000 | 43,095 | ||||||
144A, 5.125%, 6/1/29 | 44,000 | 43,835 | ||||||
Gray Television, Inc. | 30,000 | 32,214 | ||||||
144A, 4.75%, 10/15/30 | 25,000 | 24,742 | ||||||
iHeartCommunications, Inc., | 70,000 | 74,448 | ||||||
LCPR Senior Secured Financing DAC | 30,000 | 32,100 | ||||||
144A, 5.125%, 7/15/29 | 30,000 | 31,087 | ||||||
Mav Acquisition Corp. | 30,000 | 29,972 | ||||||
144A, 8.00%, 8/1/29 | 24,000 | 23,611 | ||||||
Nexstar Media, Inc. | 68,000 | 72,325 | ||||||
144A, 4.75%, 11/1/28 (a) | 30,000 | 31,231 | ||||||
Radiate Holdco LLC / Radiate Finance, Inc. | 30,000 | 31,274 | ||||||
144A, 6.50%, 9/15/28 | 30,000 | 30,638 | ||||||
Scripps Escrow II, Inc. | 12,000 | 12,008 | ||||||
144A, 5.375%, 1/15/31 | 20,000 | 19,821 | ||||||
Sinclair Television Group, Inc. | 25,000 | 24,531 | ||||||
144A, 4.125%, 12/1/30 | 30,000 | 29,366 | ||||||
Sirius XM Radio, Inc. | 45,000 | 46,125 | ||||||
144A, 3.875%, 9/1/31 | 51,000 | 50,763 | ||||||
TEGNA, Inc. | 54,000 | 56,054 | ||||||
5.00%, 9/15/29 | 20,000 | 21,148 | ||||||
Univision Communications, Inc. | 49,000 | 53,118 | ||||||
144A, 4.50%, 5/1/29 (a) | 36,000 | 36,563 | ||||||
UPC Broadband Finco BV, 144A, | 42,000 | 42,937 | ||||||
Principal | Value | |||||||
| Media (Continued) | ||||||||
Virgin Media Finance PLC, 144A, | $ | 15,000 | $ | 15,551 | ||||
Virgin Media Secured Finance PLC | 50,000 | 53,625 | ||||||
144A, 4.50%, 8/15/30 | 34,000 | 34,529 | ||||||
Ziggo Bond Co. BV, 144A, | 20,000 | 20,559 | ||||||
Ziggo BV, 144A, | 35,000 | 36,100 | ||||||
|
| |||||||
(Cost $2,210,136) | 2,200,413 | |||||||
|
| |||||||
| Telecommunications — 6.5% | ||||||||
Altice France Holding SA | 20,000 | 22,000 | ||||||
144A, 6.00%, 2/15/28 (a) | 45,000 | 44,765 | ||||||
Altice France SA | 34,000 | 35,020 | ||||||
144A, 5.125%, 1/15/29 | 20,000 | 20,171 | ||||||
144A, 5.125%, 7/15/29 | 75,000 | 75,920 | ||||||
Avaya, Inc., 144A, | 58,000 | 61,262 | ||||||
C&W Senior Financing DAC | 16,000 | 16,683 | ||||||
144A, 6.875%, 9/15/27 | 40,000 | 42,574 | ||||||
CommScope Technologies LLC | 53,000 | 53,967 | ||||||
144A, 5.00%, 3/15/27 (a) | 22,000 | 21,719 | ||||||
CommScope, Inc. | 30,000 | 31,664 | ||||||
144A, 7.125%, 7/1/28 | 21,000 | 22,050 | ||||||
Connect Finco SARL / Connect US Finco LLC, 144A, | 59,000 | 61,286 | ||||||
Consolidated Communications, Inc. | 20,000 | 20,567 | ||||||
144A, 6.50%, 10/1/28 | 15,000 | 16,425 | ||||||
Frontier Communications Holdings LLC | 35,000 | 37,339 | ||||||
144A, 5.00%, 5/1/28 | 57,000 | 59,636 | ||||||
144A, 6.75%, 5/1/29 | 33,000 | 35,358 | ||||||
5.875%, 11/1/29 | 20,000 | 20,366 | ||||||
Hughes Satellite Systems Corp., | 26,000 | 29,578 | ||||||
Level 3 Financing, Inc. | 35,000 | 35,462 | ||||||
144A, 3.625%, 1/15/29 | 20,000 | 19,436 | ||||||
144A, 3.75%, 7/15/29 | 32,000 | 31,240 | ||||||
Lumen Technologies, Inc. | 36,000 | 37,269 | ||||||
144A, 4.50%, 1/15/29 | 30,000 | 29,479 | ||||||
144A, 5.375%, 6/15/29 | 45,000 | 46,293 | ||||||
Telesat Canada / Telesat LLC | 15,000 | 14,424 | ||||||
144A, 4.875%, 6/1/27 | 11,000 | 10,169 | ||||||
144A, 6.50%, 10/15/27 (a) | 20,000 | 16,924 | ||||||
Viasat, Inc. | 25,000 | 25,479 | ||||||
144A, 5.625%, 4/15/27 | 30,000 | 31,163 | ||||||
144A, 6.50%, 7/15/28 | 10,000 | 10,561 | ||||||
| See Notes to Financial Statements. | 14 |
DBX ETF Trust
Schedule of Investments
Xtrackers High Beta High Yield Bond ETF (Continued)
August 31, 2021
Principal | Value | |||||||
| Telecommunications (Continued) | ||||||||
Vmed O2 UK Financing I PLC | $ | 45,000 | $ | 45,283 | ||||
144A, 4.75%, 7/15/31 | 46,000 | 47,323 | ||||||
Windstream Escrow LLC / Windstream Escrow Finance Corp., 144A, | 45,000 | 46,547 | ||||||
Zayo Group Holdings, Inc. | 65,000 | 64,348 | ||||||
144A, 6.125%, 3/1/28 | 25,000 | 25,469 | ||||||
|
| |||||||
(Cost $1,259,395) | 1,265,219 | |||||||
|
| |||||||
| Consumer, Cyclical — 20.0% | ||||||||
| Airlines — 1.5% | ||||||||
Air Canada, 144A, | 27,000 | 27,203 | ||||||
American Airlines Group, Inc., 144A, | 16,000 | 14,262 | ||||||
American Airlines, Inc., 144A, | 82,000 | 101,906 | ||||||
Delta Air Lines, Inc. | 17,000 | 18,004 | ||||||
3.75%, 10/28/29 (a) | 20,000 | 20,320 | ||||||
Hawaiian Brand Intellectual Property Ltd. / HawaiianMiles Loyalty Ltd., 144A, | 40,000 | 42,175 | ||||||
United Airlines, Inc., 144A, | 67,000 | 69,611 | ||||||
|
| |||||||
(Cost $273,375) | 293,481 | |||||||
|
| |||||||
| Auto Manufacturers — 0.6% | ||||||||
Allison Transmission, Inc., 144A, | 27,000 | 27,004 | ||||||
Ford Motor Co., | 27,000 | 38,533 | ||||||
Jaguar Land Rover Automotive PLC | 20,000 | 19,681 | ||||||
144A, 5.875%, 1/15/28 (a) | 15,000 | 15,488 | ||||||
144A, 5.50%, 7/15/29 | 16,000 | 15,899 | ||||||
|
| |||||||
(Cost $113,050) | 116,605 | |||||||
|
| |||||||
| Auto Parts & Equipment — 1.8% | ||||||||
Adient Global Holdings Ltd., 144A, | 25,000 | 25,719 | ||||||
American Axle & Manufacturing, Inc. | 16,000 | 16,820 | ||||||
6.875%, 7/1/28 (a) | 20,000 | 21,634 | ||||||
5.00%, 10/1/29 | 16,000 | 16,017 | ||||||
Clarios Global LP / Clarios US Finance Co., 144A, 8.50%, 5/15/27 | 63,000 | 67,331 | ||||||
Dana, Inc., | 12,000 | 12,494 | ||||||
Goodyear Tire & Rubber Co. | 25,000 | 26,873 | ||||||
144A, 5.00%, 7/15/29 | 23,000 | 24,390 | ||||||
5.25%, 4/30/31 (a) | 16,000 | 17,142 | ||||||
144A, 5.25%, 7/15/31 (a) | 28,000 | 29,992 | ||||||
5.625%, 4/30/33 | 13,000 | 14,123 | ||||||
Principal | Value | |||||||
| Auto Parts & Equipment (Continued) | ||||||||
Tenneco, Inc. | $ | 10,000 | $ | 9,987 | ||||
144A, 7.875%, 1/15/29 | 14,000 | 15,768 | ||||||
144A, 5.125%, 4/15/29 | 41,000 | 42,585 | ||||||
|
| |||||||
(Cost $331,745) | 340,875 | |||||||
|
| |||||||
| Distribution/Wholesale — 0.6% | ||||||||
American Builders & Contractors Supply Co., Inc., 144A, | 15,000 | 14,925 | ||||||
H&E Equipment Services, Inc., 144A, | 41,000 | 41,244 | ||||||
Wolverine Escrow LLC | 15,000 | 14,269 | ||||||
144A, 9.00%, 11/15/26 | 25,000 | 24,031 | ||||||
144A, 13.125%, 11/15/27 | 25,000 | 20,313 | ||||||
|
| |||||||
(Cost $114,324) | 114,782 | |||||||
|
| |||||||
| Entertainment — 3.8% | ||||||||
AMC Entertainment Holdings, Inc., 144A, | 16,000 | 17,160 | ||||||
Banijay Entertainment SASU, 144A, | 20,000 | 20,575 | ||||||
Caesars Entertainment, Inc., 144A, | 68,000 | 75,245 | ||||||
Caesars Resort Collection LLC / CRC Finco, Inc., 144A, | 49,000 | 49,757 | ||||||
Cedar Fair LP, | 10,000 | 10,259 | ||||||
Cedar Fair LP / Canada’s Wonderland Co. / Magnum Management Corp. / Millennium Op | 32,000 | 33,400 | ||||||
5.375%, 4/15/27 | 15,000 | 15,394 | ||||||
Churchill Downs, Inc. | 18,000 | 18,720 | ||||||
144A, 4.75%, 1/15/28 | 21,000 | 21,988 | ||||||
Cinemark USA, Inc. | 20,000 | 19,925 | ||||||
144A, 5.25%, 7/15/28 (a) | 22,000 | 20,929 | ||||||
Cirsa Finance International SARL, 144A, | 17,000 | 17,335 | ||||||
Lions Gate Capital Holdings LLC, 144A, | 30,000 | 30,669 | ||||||
Live Nation Entertainment, Inc., 144A, | 50,000 | 50,863 | ||||||
Mohegan Gaming & Entertainment | 10,000 | 10,500 | ||||||
144A, 8.00%, 2/1/26 | 40,000 | 42,015 | ||||||
Penn National Gaming, Inc. | 13,000 | 13,471 | ||||||
144A, 4.125%, 7/1/29 | 13,000 | 13,000 | ||||||
Premier Entertainment Sub LLC / Premier Entertainment Finance Corp. | 24,000 | 24,646 | ||||||
144A, 5.875%, 9/1/31 | 24,000 | 24,639 | ||||||
Resorts World Las Vegas LLC / RWLV Capital, Inc., 144A, | 18,000 | 18,629 | ||||||
| See Notes to Financial Statements. | 15 |
DBX ETF Trust
Schedule of Investments
Xtrackers High Beta High Yield Bond ETF (Continued)
August 31, 2021
Principal | Value | |||||||
| Entertainment (Continued) | ||||||||
Scientific Games International, Inc. | $ | 40,000 | $ | 42,595 | ||||
144A, 7.00%, 5/15/28 | 50,000 | 53,960 | ||||||
Six Flags Entertainment Corp., 144A, | 55,000 | 55,664 | ||||||
Wynn Resorts Finance LLC / Wynn Resorts Capital Corp. | 10,000 | 10,638 | ||||||
144A, 5.125%, 10/1/29 | 26,000 | 27,078 | ||||||
|
| |||||||
(Cost $725,942) | 739,054 | |||||||
|
| |||||||
| Food Service — 0.4% | ||||||||
Aramark Services, Inc., 144A, | 40,000 | 41,643 | ||||||
TKC Holdings, Inc. | 13,000 | 13,536 | ||||||
144A, 10.50%, 5/15/29 | 20,000 | 22,025 | ||||||
|
| |||||||
(Cost $75,357) | 77,204 | |||||||
|
| |||||||
| Home Builders — 0.7% | ||||||||
Brookfield Residential Properties, Inc. / Brookfield Residential US LLC | 25,000 | 26,417 | ||||||
144A, 4.875%, 2/15/30 | 17,000 | 17,186 | ||||||
Century Communities, Inc., 144A, | 16,000 | 16,265 | ||||||
Mattamy Group Corp. | 29,000 | 30,270 | ||||||
144A, 4.625%, 3/1/30 | 9,000 | 9,237 | ||||||
Taylor Morrison Communities, Inc., 144A, | 17,000 | 18,621 | ||||||
Williams Scotsman International, Inc., 144A, | 19,000 | 19,736 | ||||||
|
| |||||||
(Cost $135,629) | 137,732 | |||||||
|
| |||||||
| Housewares — 0.1% | ||||||||
Scotts Miracle-Gro Co. | 8,000 | 8,370 | ||||||
144A, 4.00%, 4/1/31 | 21,000 | 21,079 | ||||||
|
| |||||||
(Cost $29,229) | 29,449 | |||||||
|
| |||||||
| Leisure Time — 3.6% | ||||||||
Carnival Corp. | 15,000 | 17,325 | ||||||
144A, 7.625%, 3/1/26 | 28,000 | 29,732 | ||||||
144A, 5.75%, 3/1/27 | 135,000 | 138,246 | ||||||
144A, 9.875%, 8/1/27 | 30,000 | 34,612 | ||||||
144A, 4.00%, 8/1/28 | 80,000 | 80,532 | ||||||
Life Time, Inc. | 40,000 | 41,050 | ||||||
144A, 8.00%, 4/15/26 (a) | 10,000 | 10,488 | ||||||
NCL Corp. Ltd. | 29,000 | 34,257 | ||||||
144A, 3.625%, 12/15/24 | 16,000 | 15,140 | ||||||
144A, 10.25%, 2/1/26 | 31,000 | 35,850 | ||||||
144A, 5.875%, 3/15/26 | 42,000 | 42,158 | ||||||
Principal | Value | |||||||
| Leisure Time (Continued) | ||||||||
Royal Caribbean Cruises Ltd. | $ | 41,000 | $ | 47,253 | ||||
144A, 4.25%, 7/1/26 | 26,000 | 25,383 | ||||||
144A, 5.50%, 8/31/26 | 10,000 | 10,150 | ||||||
3.70%, 3/15/28 | 73,000 | 69,155 | ||||||
Viking Cruises Ltd. | 30,000 | 34,764 | ||||||
144A, 5.875%, 9/15/27 | 25,000 | 24,225 | ||||||
|
| |||||||
(Cost $683,534) | 690,320 | |||||||
|
| |||||||
| Lodging — 2.3% | ||||||||
Boyd Gaming Corp. | 29,000 | 29,943 | ||||||
144A, 4.75%, 6/15/31 | 33,000 | 34,093 | ||||||
Hilton Domestic Operating Co., Inc. | 37,000 | 38,208 | ||||||
144A, 3.625%, 2/15/32 | 50,000 | 49,820 | ||||||
Hilton Grand Vacations Borrower Escrow LLC / Hilton Grand Vacations Borrower Esc | 31,000 | 31,426 | ||||||
144A, 4.875%, 7/1/31 | 14,000 | 13,895 | ||||||
Marriott Ownership Resorts, Inc., 144A, | 14,000 | 14,156 | ||||||
Melco Resorts Finance Ltd. | 16,000 | 16,480 | ||||||
144A, 5.625%, 7/17/27 | 19,000 | 19,685 | ||||||
144A, 5.75%, 7/21/28 | 30,000 | 31,313 | ||||||
144A, 5.375%, 12/4/29 | 38,000 | 39,375 | ||||||
MGM Resorts International | 20,000 | 21,800 | ||||||
4.75%, 10/15/28 | 27,000 | 28,386 | ||||||
Travel + Leisure Co., 144A, | 37,000 | 41,856 | ||||||
Wynn Las Vegas LLC / Wynn Las Vegas Capital Corp., 144A, | 31,000 | 32,593 | ||||||
|
| |||||||
(Cost $438,133) | 443,029 | |||||||
|
| |||||||
| Retail — 4.6% | ||||||||
1011778 BC ULC / New Red Finance, Inc. 144A, 4.375%, 1/15/28 | 25,000 | 25,406 | ||||||
144A, 3.50%, 2/15/29 | 14,000 | 13,949 | ||||||
144A, 4.00%, 10/15/30 | 102,000 | 101,564 | ||||||
Carvana Co. | 30,000 | 31,238 | ||||||
144A, 5.50%, 4/15/27 | 16,000 | 16,534 | ||||||
144A, 5.875%, 10/1/28 (a) | 10,000 | 10,450 | ||||||
144A, 4.875%, 9/1/29 | 20,000 | 19,820 | ||||||
eG Global Finance PLC | 21,000 | 21,604 | ||||||
144A, 8.50%, 10/30/25 | 25,000 | 26,220 | ||||||
Ferrellgas LP / Ferrellgas Finance Corp. | 19,000 | 18,691 | ||||||
144A, 5.875%, 4/1/29 (a) | 24,000 | 23,589 | ||||||
Golden Nugget, Inc., 144A, | 43,000 | 43,153 | ||||||
LBM Acquisition LLC, 144A, | 23,000 | 23,115 | ||||||
| See Notes to Financial Statements. | 16 |
DBX ETF Trust
Schedule of Investments
Xtrackers High Beta High Yield Bond ETF (Continued)
August 31, 2021
Principal | Value | |||||||
| Retail (Continued) | ||||||||
Macy’s Retail Holdings LLC, 144A, | $ | 17,000 | $ | 18,595 | ||||
Michaels Cos., Inc. | 25,000 | 25,688 | ||||||
144A, 7.875%, 5/1/29 | 44,000 | 45,395 | ||||||
NMG Holding Co, Inc. / Neiman Marcus Group LLC, 144A, | 41,000 | 43,460 | ||||||
Party City Holdings, Inc., 144A, | 25,000 | 26,094 | ||||||
PetSmart, Inc. / PetSmart Finance Corp. | 40,000 | 41,700 | ||||||
144A, 7.75%, 2/15/29 | 40,000 | 44,000 | ||||||
QVC, Inc., | 14,000 | 14,364 | ||||||
Rite Aid Corp. | 19,000 | 19,565 | ||||||
144A, 8.00%, 11/15/26 | 29,000 | 29,940 | ||||||
SRS Distribution, Inc. | 24,000 | 24,762 | ||||||
144A, 6.125%, 7/1/29 (a) | 13,000 | 13,520 | ||||||
Staples, Inc. | 78,000 | 78,878 | ||||||
144A, 10.75%, 4/15/27 (a) | 25,000 | 24,406 | ||||||
Suburban Propane Partners LP/Suburban Energy Finance Corp., 144A, | 20,000 | 20,634 | ||||||
Yum! Brands, Inc., | 34,000 | 36,843 | ||||||
|
| |||||||
(Cost $875,222) | 883,177 | |||||||
|
| |||||||
| Consumer, Non-cyclical — 17.9% | ||||||||
| Agriculture — 0.3% | ||||||||
Vector Group Ltd. | 20,000 | 21,125 | ||||||
144A, 5.75%, 2/1/29 | 30,000 | 30,563 | ||||||
|
| |||||||
(Cost $52,095) | 51,688 | |||||||
|
| |||||||
| Beverages — 0.1% | ||||||||
Primo Water Holdings, Inc., 144A, | ||||||||
(Cost $21,984) | 22,000 | 22,237 | ||||||
|
| |||||||
| Commercial Services — 4.1% | ||||||||
ADT Security Corp., 144A, | 33,000 | 32,999 | ||||||
Allied Universal Holdco LLC / Allied Universal Finance Corp. | 64,000 | 68,480 | ||||||
144A, 9.75%, 7/15/27 | 34,000 | 37,230 | ||||||
144A, 6.00%, 6/1/29 | 31,000 | 31,037 | ||||||
Allied Universal Holdco LLC / Allied Universal Finance Corp. / Atlas Luxco 4 SARL, 144A, | 40,000 | 40,225 | ||||||
APX Group, Inc. | 42,000 | 44,835 | ||||||
144A, 5.75%, 7/15/29 | 17,000 | 17,021 | ||||||
Principal | Value | |||||||
| Commercial Services (Continued) | ||||||||
Avis Budget Car Rental LLC / Avis Budget Finance, Inc. | $ | 13,000 | $ | 13,585 | ||||
144A, 4.75%, 4/1/28 | 20,000 | 20,660 | ||||||
144A, 5.375%, 3/1/29 (a) | 17,000 | 17,871 | ||||||
Garda World Security Corp. | 17,000 | 17,064 | ||||||
144A, 9.50%, 11/1/27 | 17,000 | 18,534 | ||||||
144A, 6.00%, 6/1/29 | 19,000 | 18,381 | ||||||
Gartner, Inc., 144A, | 25,000 | 26,191 | ||||||
MPH Acquisition Holdings LLC | 28,000 | 28,542 | ||||||
144A, 5.75%, 11/1/28 (a) | 43,000 | 41,115 | ||||||
Nielsen Finance LLC / Nielsen Finance Co. 144A, 5.625%, 10/1/28 | 50,000 | 52,625 | ||||||
144A, 4.50%, 7/15/29 | 14,000 | 13,893 | ||||||
144A, 5.875%, 10/1/30 | 27,000 | 28,923 | ||||||
144A, 4.75%, 7/15/31 | 14,000 | 13,841 | ||||||
Prime Security Services Borrower LLC / Prime Finance, Inc. | 45,000 | 48,739 | ||||||
144A, 3.375%, 8/31/27 | 10,000 | 9,663 | ||||||
144A, 6.25%, 1/15/28 | 73,000 | 75,738 | ||||||
RR Donnelley & Sons Co., 144A, | 12,000 | 12,615 | ||||||
Sabre GLBL, Inc. | 35,000 | 40,381 | ||||||
144A, 7.375%, 9/1/25 | 5,000 | 5,294 | ||||||
Service Corp. International, | 24,000 | 24,897 | ||||||
|
| |||||||
(Cost $796,197) | 800,379 | |||||||
|
| |||||||
| Cosmetics/Personal Care — 0.4% | ||||||||
Coty, Inc. | 29,000 | 29,934 | ||||||
144A, 6.50%, 4/15/26 (a) | 21,000 | 21,683 | ||||||
Edgewell Personal Care Co. | 17,000 | 18,020 | ||||||
144A, 4.125%, 4/1/29 | 10,000 | 10,075 | ||||||
|
| |||||||
(Cost $77,819) | 79,712 | |||||||
|
| |||||||
| Food — 2.2% | ||||||||
Albertsons Cos., Inc. / Safeway, Inc. / New Albertsons LP / Albertsons LLC | 61,000 | 61,686 | ||||||
144A, 4.875%, 2/15/30 | 27,000 | 29,497 | ||||||
B&G Foods, Inc., | 20,000 | 20,795 | ||||||
Performance Food Group, Inc. | 32,000 | 33,360 | ||||||
144A, 4.25%, 8/1/29 | 35,000 | 35,165 | ||||||
Pilgrim’s Pride Corp., 144A, | 30,000 | 32,343 | ||||||
Post Holdings, Inc. | 20,000 | 21,075 | ||||||
144A, 5.50%, 12/15/29 | 25,000 | 26,812 | ||||||
144A, 4.625%, 4/15/30 | 50,000 | 51,116 | ||||||
144A, 4.50%, 9/15/31 | 64,000 | 64,640 | ||||||
| See Notes to Financial Statements. | 17 |
DBX ETF Trust
Schedule of Investments
Xtrackers High Beta High Yield Bond ETF (Continued)
August 31, 2021
Principal | Value | |||||||
| Food (Continued) | ||||||||
Sigma Holdco BV, 144A, | $ | 10,000 | $ | 10,038 | ||||
US Foods, Inc., 144A, | 35,000 | 35,875 | ||||||
|
| |||||||
(Cost $413,995) | 422,402 | |||||||
|
| |||||||
| Healthcare-Services — 4.5% | ||||||||
CHS/Community Health Systems, Inc. | 89,000 | 94,006 | ||||||
144A, 6.875%, 4/1/28 (a) | 25,000 | 24,837 | ||||||
144A, 6.00%, 1/15/29 | 35,000 | 37,362 | ||||||
144A, 6.875%, 4/15/29 | 54,000 | 56,252 | ||||||
144A, 6.125%, 4/1/30 | 48,000 | 48,450 | ||||||
144A, 4.75%, 2/15/31 | 20,000 | 20,428 | ||||||
DaVita, Inc. | 84,000 | 87,872 | ||||||
144A, 3.75%, 2/15/31 | 57,000 | 56,401 | ||||||
Encompass Health Corp., | 15,000 | 16,012 | ||||||
Envision Healthcare Corp., 144A, | 35,000 | 29,619 | ||||||
Legacy LifePoint Health LLC, 144A, | 45,000 | 44,944 | ||||||
MEDNAX, Inc., 144A, | 35,000 | 36,925 | ||||||
Radiology Partners, Inc., 144A, | 15,000 | 16,106 | ||||||
RegionalCare Hospital Partners Holdings, Inc. / LifePoint Health, Inc., 144A, | 50,000 | 53,250 | ||||||
Select Medical Corp., 144A, | 37,000 | 39,174 | ||||||
Tenet Healthcare Corp. | 40,000 | 41,750 | ||||||
144A, 4.625%, 6/15/28 | 10,000 | 10,363 | ||||||
144A, 6.125%, 10/1/28 | 110,000 | 116,325 | ||||||
144A, 4.25%, 6/1/29 | 38,000 | 38,876 | ||||||
|
| |||||||
(Cost $844,164) | 868,952 | |||||||
|
| |||||||
| Household Products/Wares — 0.4% | ||||||||
Central Garden & Pet Co. | 15,000 | 15,434 | ||||||
144A, 4.125%, 4/30/31 | 12,000 | 12,197 | ||||||
Kronos Acquisition Holdings, Inc. / KIK Custom Products, Inc., 144A, | 28,000 | 27,272 | ||||||
Spectrum Brands, Inc., 144A, | 11,000 | 10,875 | ||||||
|
| |||||||
(Cost $67,175) | 65,778 | |||||||
|
| |||||||
| Pharmaceuticals — 5.9% | ||||||||
AdaptHealth LLC | 16,000 | 16,065 | ||||||
144A, 5.125%, 3/1/30 | 19,000 | 19,268 | ||||||
Bausch Health Americas, Inc. | 43,000 | 46,332 | ||||||
144A, 8.50%, 1/31/27 | 50,000 | 53,835 | ||||||
Principal | Value | |||||||
| Pharmaceuticals (Continued) | ||||||||
Bausch Health Cos., Inc. | $ | 91,000 | $ | 93,161 | ||||
144A, 5.75%, 8/15/27 | 15,000 | 15,769 | ||||||
144A, 5.00%, 1/30/28 | 30,000 | 28,665 | ||||||
144A, 4.875%, 6/1/28 | 53,000 | 54,524 | ||||||
144A, 6.25%, 2/15/29 | 98,000 | 97,381 | ||||||
144A, 5.25%, 1/30/30 (a) | 70,000 | 65,898 | ||||||
144A, 5.25%, 2/15/31 (a) | 35,000 | 32,692 | ||||||
Cheplapharm Arzneimittel GmbH, 144A, | 17,000 | 17,404 | ||||||
Endo Dac / Endo Finance LLC / Endo Finco, Inc. | 30,000 | 29,441 | ||||||
144A, 6.00%, 6/30/28 | 45,000 | 28,187 | ||||||
Endo Luxembourg Finance Co I Sarl / Endo US, Inc., 144A, | 37,000 | 36,677 | ||||||
HLF Financing Sarl LLC / Herbalife International, Inc., 144A, | 20,000 | 20,075 | ||||||
Jazz Securities DAC, 144A, | 45,000 | 46,694 | ||||||
Organon & Co. / Organon Foreign Debt Co.-Issuer BV | 63,000 | 65,076 | ||||||
144A, 5.125%, 4/30/31 | 69,000 | 72,467 | ||||||
Par Pharmaceutical, Inc., 144A, | 68,000 | 68,935 | ||||||
Prestige Brands, Inc., 144A, | 18,000 | 17,798 | ||||||
Teva Pharmaceutical Finance Netherlands III BV | 40,000 | 43,738 | ||||||
3.15%, 10/1/26 | 160,000 | 153,022 | ||||||
6.75%, 3/1/28 (a) | 20,000 | 22,629 | ||||||
|
| |||||||
(Cost $1,167,428) | 1,145,733 | |||||||
|
| |||||||
| Energy — 12.4% | ||||||||
| Energy-Alternate Sources — 0.1% | ||||||||
TerraForm Power Operating LLC, 144A, | ||||||||
(Cost $26,115) | 25,000 | 26,343 | ||||||
|
| |||||||
| Oil & Gas — 7.3% | ||||||||
Antero Resources Corp. | 30,000 | 33,038 | ||||||
144A, 5.375%, 3/1/30 (a) | 18,000 | 18,343 | ||||||
Ascent Resources Utica Holdings LLC / ARU Finance Corp. | 25,000 | 25,500 | ||||||
144A, 5.875%, 6/30/29 | 13,000 | 12,480 | ||||||
Callon Petroleum Co. | 25,000 | 24,156 | ||||||
144A, 8.00%, 8/1/28 (a) | 16,000 | 15,424 | ||||||
Calumet Specialty Products Partners LP / Calumet Finance Corp., 144A, | 18,000 | 18,607 | ||||||
Citgo Holding, Inc., 144A, | 57,000 | 57,185 | ||||||
| See Notes to Financial Statements. | 18 |
DBX ETF Trust
Schedule of Investments
Xtrackers High Beta High Yield Bond ETF (Continued)
August 31, 2021
Principal | Value | |||||||
| Oil & Gas (Continued) | ||||||||
CITGO Petroleum Corp. | $ | 23,000 | $ | 23,604 | ||||
144A, 6.375%, 6/15/26 | 20,000 | 20,326 | ||||||
CNX Resources Corp. | 21,000 | 22,287 | ||||||
144A, 6.00%, 1/15/29 | 20,000 | 20,859 | ||||||
Comstock Resources, Inc. | 42,000 | 44,037 | ||||||
144A, 5.875%, 1/15/30 | 23,000 | 23,092 | ||||||
CrownRock LP / CrownRock Finance, Inc. | 45,000 | 46,403 | ||||||
144A, 5.00%, 5/1/29 | 10,000 | 10,287 | ||||||
CVR Energy, Inc., 144A, | 40,000 | 39,252 | ||||||
Endeavor Energy Resources LP / EER Finance, Inc. | 16,000 | 16,584 | ||||||
144A, 5.75%, 1/30/28 | 32,000 | 33,720 | ||||||
Hilcorp Energy I LP / Hilcorp Finance Co. | 22,000 | 22,357 | ||||||
144A, 6.00%, 2/1/31 | 35,000 | 36,006 | ||||||
Laredo Petroleum, Inc. | 19,000 | 19,553 | ||||||
144A, 7.75%, 7/31/29 (a) | 13,000 | 12,608 | ||||||
Leviathan Bond Ltd. | 20,000 | 22,124 | ||||||
144A,REGS, 6.75%, 6/30/30 | 18,000 | 20,205 | ||||||
Matador Resources Co., | 35,000 | 35,250 | ||||||
MEG Energy Corp. | 25,000 | 26,338 | ||||||
144A, 5.875%, 2/1/29 | 35,000 | 35,833 | ||||||
Moss Creek Resources Holdings, Inc., 144A, | 42,000 | 35,936 | ||||||
Murphy Oil Corp. | 65,000 | 66,544 | ||||||
6.375%, 7/15/28 | 15,000 | 15,806 | ||||||
Nabors Industries Ltd., 144A, | 17,000 | 15,831 | ||||||
Nabors Industries, Inc., | 25,000 | 21,125 | ||||||
Occidental Petroleum Corp. | 20,000 | 27,473 | ||||||
7.50%, 5/1/31 | 36,000 | 47,154 | ||||||
7.875%, 9/15/31 | 14,000 | 18,617 | ||||||
Parkland Corp., 144A, | 27,000 | 27,715 | ||||||
PBF Holding Co. LLC / PBF Finance Corp. 144A, | 41,000 | 39,616 | ||||||
6.00%, 2/15/28 | 57,000 | 37,414 | ||||||
PDC Energy, Inc. | 13,000 | 13,230 | ||||||
5.75%, 5/15/26 | 24,000 | 24,950 | ||||||
Puma International Financing SA, 144A, | 50,000 | 50,188 | ||||||
Principal | Value | |||||||
| Oil & Gas (Continued) | ||||||||
Range Resources Corp. | $ | 27,000 | $ | 29,560 | ||||
144A, 8.25%, 1/15/29 | 15,000 | 16,670 | ||||||
SM Energy Co. | 16,000 | 17,860 | ||||||
6.75%, 9/15/26 (a) | 12,000 | 12,075 | ||||||
6.625%, 1/15/27 (a) | 12,000 | 12,075 | ||||||
6.50%, 7/15/28 (a) | 11,000 | 11,067 | ||||||
Southwestern Energy Co. | 14,000 | 15,172 | ||||||
5.375%, 3/15/30 | 34,000 | 35,346 | ||||||
Sunoco LP / Sunoco Finance Corp., | 27,000 | 27,380 | ||||||
Transocean, Inc. | 15,000 | 11,719 | ||||||
144A, 7.50%, 1/15/26 | 10,000 | 7,662 | ||||||
144A, 11.50%, 1/30/27 | 22,000 | 22,190 | ||||||
144A, 8.00%, 2/1/27 | 25,000 | 18,406 | ||||||
|
| |||||||
(Cost $1,383,340) | 1,414,239 | |||||||
|
| |||||||
| Oil & Gas Services — 1.0% | ||||||||
Archrock Partners LP / Archrock Partners Finance Corp. | 25,000 | 26,000 | ||||||
144A, 6.25%, 4/1/28 | 16,000 | 16,320 | ||||||
CGG SA, 144A, | 15,000 | 14,607 | ||||||
USA Compression Partners LP / USA Compression Finance Corp. | 34,000 | 35,372 | ||||||
6.875%, 9/1/27 | 19,000 | 19,925 | ||||||
Weatherford International Ltd., 144A, | 77,000 | 80,561 | ||||||
|
| |||||||
(Cost $186,389) | 192,785 | |||||||
|
| |||||||
| Pipelines — 4.0% | ||||||||
Antero Midstream Partners LP / Antero Midstream Finance Corp. | 50,000 | 51,563 | ||||||
144A, 5.375%, 6/15/29 | 21,000 | 21,525 | ||||||
Buckeye Partners LP, 144A, | 15,000 | 15,511 | ||||||
CQP Holdco LP / BIP-V Chinook Holdco LLC, 144A, | 46,000 | 47,496 | ||||||
Crestwood Midstream Partners LP / Crestwood Midstream Finance Corp. | 25,000 | 25,219 | ||||||
144A, 6.00%, 2/1/29 | 20,000 | 20,380 | ||||||
EnLink Midstream LLC, | 15,000 | 15,420 | ||||||
EnLink Midstream Partners LP, | 20,000 | 20,840 | ||||||
EQM Midstream Partners LP | 21,000 | 23,390 | ||||||
5.50%, 7/15/28 | 20,000 | 21,850 | ||||||
144A, 4.50%, 1/15/29 | 45,000 | 45,620 | ||||||
144A, 4.75%, 1/15/31 | 35,000 | 35,569 | ||||||
| See Notes to Financial Statements. | 19 |
DBX ETF Trust
Schedule of Investments
Xtrackers High Beta High Yield Bond ETF (Continued)
August 31, 2021
Principal | Value | |||||||
| Pipelines (Continued) | ||||||||
Genesis Energy LP / Genesis Energy Finance Corp. | $ | 20,000 | $ | 19,625 | ||||
8.00%, 1/15/27 | 34,000 | 33,806 | ||||||
7.75%, 2/1/28 | 19,000 | 18,650 | ||||||
ITT Holdings LLC, 144A, | 40,000 | 40,850 | ||||||
New Fortress Energy, Inc. | 75,000 | 76,219 | ||||||
144A, 6.50%, 9/30/26 | 15,000 | 15,097 | ||||||
NGL Energy Operating LLC / NGL Energy Finance Corp., 144A, | 66,000 | 67,073 | ||||||
NGL Energy Partners LP / NGL Energy Finance Corp., | 20,000 | 18,725 | ||||||
NuStar Logistics LP, | 31,000 | 34,317 | ||||||
Rockies Express Pipeline LLC, 144A, | 19,000 | 19,791 | ||||||
Tallgrass Energy Partners LP / Tallgrass Energy Finance Corp. | 15,000 | 16,181 | ||||||
144A, 6.00%, 3/1/27 (a) | 35,000 | 36,270 | ||||||
144A, 5.50%, 1/15/28 | 20,000 | 20,226 | ||||||
144A, 6.00%, 12/31/30 | 15,000 | 15,278 | ||||||
|
| |||||||
(Cost $769,523) | 776,491 | |||||||
|
| |||||||
| Financial — 8.3% | ||||||||
| Banks — 0.4% | ||||||||
Freedom Mortgage Corp. | 19,000 | 19,407 | ||||||
144A, 7.625%, 5/1/26 | 18,000 | 18,052 | ||||||
144A, 6.625%, 1/15/27 | 21,000 | 20,140 | ||||||
Intesa Sanpaolo SpA, 144A, | 25,000 | 25,770 | ||||||
|
| |||||||
(Cost $83,931) | 83,369 | |||||||
|
| |||||||
| Diversified Financial Services — 2.4% | ||||||||
Jefferies Finance LLC / JFIN Co.-Issuer Corp., 144A, | 26,000 | 26,684 | ||||||
LD Holdings Group LLC | 11,000 | 11,234 | ||||||
144A, 6.125%, 4/1/28 | 28,000 | 27,553 | ||||||
LPL Holdings, Inc., 144A, | 15,000 | 15,546 | ||||||
Midcap Financial Issuer Trust | 33,000 | 34,574 | ||||||
144A, 5.625%, 1/15/30 | 13,000 | 12,953 | ||||||
Nationstar Mortgage Holdings, Inc. | 15,000 | 15,825 | ||||||
144A, 5.125%, 12/15/30 | 45,000 | 46,070 | ||||||
Navient Corp. | 8,000 | 8,930 | ||||||
6.75%, 6/15/26 | 14,000 | 15,785 | ||||||
5.00%, 3/15/27 | 15,000 | 15,772 | ||||||
4.875%, 3/15/28 | 30,000 | 30,569 | ||||||
Principal | Value | |||||||
| Diversified Financial Services (Continued) | ||||||||
NFP Corp., 144A, | $ | 61,000 | $ | 62,677 | ||||
OneMain Finance Corp. | 25,000 | 25,156 | ||||||
5.375%, 11/15/29 | 17,000 | 18,596 | ||||||
4.00%, 9/15/30 | 31,000 | 31,108 | ||||||
PennyMac Financial Services, Inc., 144A, | 23,000 | 22,168 | ||||||
United Wholesale Mortgage LLC | 30,000 | 30,788 | ||||||
144A, 5.50%, 4/15/29 | 21,000 | 20,608 | ||||||
|
| |||||||
(Cost $470,017) | 472,596 | |||||||
|
| |||||||
| Insurance — 1.2% | ||||||||
Acrisure LLC / Acrisure Finance, Inc. | 50,000 | 51,000 | ||||||
144A, 4.25%, 2/15/29 | 25,000 | 24,782 | ||||||
144A, 6.00%, 8/1/29 | 8,000 | 7,891 | ||||||
Alliant Holdings Intermediate LLC / Alliant Holdings Co-Issuer | 22,000 | 22,082 | ||||||
144A, 6.75%, 10/15/27 | 40,000 | 41,550 | ||||||
AssuredPartners, Inc., 144A, | 25,000 | 25,193 | ||||||
HUB International Ltd., 144A, | 50,000 | 51,793 | ||||||
|
| |||||||
(Cost $222,093) | 224,291 | |||||||
|
| |||||||
| Real Estate — 0.6% | ||||||||
Howard Hughes Corp. | 23,000 | 23,144 | ||||||
144A, 4.375%, 2/1/31 | 20,000 | 20,200 | ||||||
Kennedy-Wilson, Inc. | 18,000 | 18,539 | ||||||
5.00%, 3/1/31 | 18,000 | 18,750 | ||||||
Realogy Group LLC / Realogy Co.-Issuer Corp., 144A, | 30,000 | 31,434 | ||||||
|
| |||||||
(Cost $111,044) | 112,067 | |||||||
|
| |||||||
| Real Estate Investment Trusts — 3.1% | ||||||||
Apollo Commercial Real Estate Finance, Inc., 144A, | 14,000 | 13,653 | ||||||
Diversified Healthcare Trust | 22,000 | 22,309 | ||||||
4.375%, 3/1/31 | 13,000 | 12,773 | ||||||
EPR Properties, | 9,000 | 9,050 | ||||||
Iron Mountain, Inc. | 15,000 | 15,694 | ||||||
144A, 4.875%, 9/15/29 | 29,000 | 30,626 | ||||||
144A, 5.25%, 7/15/30 | 40,000 | 42,750 | ||||||
144A, 4.50%, 2/15/31 | 40,000 | 41,188 | ||||||
144A, 5.625%, 7/15/32 | 26,000 | 28,291 | ||||||
iStar, Inc., | 20,000 | 20,975 | ||||||
| See Notes to Financial Statements. | 20 |
DBX ETF Trust
Schedule of Investments
Xtrackers High Beta High Yield Bond ETF (Continued)
August 31, 2021
Principal | Value | |||||||
| Real Estate Investment Trusts (Continued) | ||||||||
Ladder Capital Finance Holdings LLLP / Ladder Capital Finance Corp. | $ | 25,000 | $ | 25,156 | ||||
144A, 4.75%, 6/15/29 | 19,000 | 19,451 | ||||||
Park Intermediate Holdings LLC / PK Domestic Property LLC / PK Finance Co.-Issuer | 17,000 | 18,126 | ||||||
144A, 4.875%, 5/15/29 | 32,000 | 32,938 | ||||||
RHP Hotel Properties LP / RHP Finance Corp. | 16,000 | 16,689 | ||||||
144A, 4.50%, 2/15/29 | 26,000 | 26,363 | ||||||
Service Properties Trust | 55,000 | 62,155 | ||||||
5.50%, 12/15/27 (a) | 45,000 | 48,319 | ||||||
3.95%, 1/15/28 | 10,000 | 9,514 | ||||||
4.95%, 10/1/29 | 18,000 | 17,711 | ||||||
Uniti Group LP / Uniti Fiber Holdings, Inc. / CSL Capital LLC, 144A, | 19,000 | 19,565 | ||||||
Uniti Group LP / Uniti Group Finance, Inc. / CSL Capital LLC | 17,000 | 17,383 | ||||||
144A, 6.50%, 2/15/29 | 38,000 | 39,710 | ||||||
XHR LP, 144A, | 15,000 | 15,469 | ||||||
|
| |||||||
(Cost $587,627) | 605,858 | |||||||
|
| |||||||
| Venture Capital — 0.6% | ||||||||
Compass Group Diversified Holdings LLC, 144A, | 30,000 | 31,441 | ||||||
Icahn Enterprises LP / Icahn Enterprises Finance Corp. | 55,000 | 57,200 | ||||||
4.375%, 2/1/29 | 22,000 | 22,105 | ||||||
|
| |||||||
(Cost $110,267) | 110,746 | |||||||
|
| |||||||
| Industrial — 8.7% | ||||||||
| Aerospace/Defense — 3.0% | ||||||||
Bombardier, Inc. | 40,000 | 41,742 | ||||||
144A, 7.50%, 3/15/25 | 50,000 | 51,426 | ||||||
144A, 7.125%, 6/15/26 (a) | 20,000 | 21,125 | ||||||
144A, 7.875%, 4/15/27 (a) | 110,000 | 115,467 | ||||||
Rolls-Royce PLC, 144A, | 32,000 | 35,139 | ||||||
Spirit AeroSystems, Inc. | 25,000 | 26,500 | ||||||
4.60%, 6/15/28 (a) | 25,000 | 24,469 | ||||||
TransDigm, Inc. | 15,000 | 15,593 | ||||||
7.50%, 3/15/27 | 10,000 | 10,592 | ||||||
5.50%, 11/15/27 | 149,000 | 152,725 | ||||||
144A, 4.875%, 5/1/29 (a) | 17,000 | 16,916 | ||||||
Triumph Group, Inc. | 8,000 | 8,820 | ||||||
144A, 6.25%, 9/15/24 | 50,000 | 50,677 | ||||||
|
| |||||||
(Cost $555,397) | 571,191 | |||||||
|
| |||||||
Principal | Value | |||||||
| Building Materials — 1.6% | ||||||||
Builders FirstSource, Inc. | $ | 17,000 | $ | 18,211 | ||||
144A, 4.25%, 2/1/32 | 33,000 | 33,941 | ||||||
Griffon Corp., | 35,000 | 37,185 | ||||||
JELD-WEN, Inc., 144A, | 12,000 | 12,526 | ||||||
SRM Escrow Issuer LLC, 144A, | 31,000 | 32,899 | ||||||
Standard Industries, Inc. | 26,000 | 26,910 | ||||||
144A, 4.75%, 1/15/28 | 30,000 | 31,186 | ||||||
144A, 4.375%, 7/15/30 | 48,000 | 49,375 | ||||||
144A, 3.375%, 1/15/31 | 32,000 | 30,800 | ||||||
Summit Materials LLC / Summit Materials Finance Corp., 144A, | 30,000 | 31,801 | ||||||
|
| |||||||
(Cost $303,049) | 304,834 | |||||||
|
| |||||||
| Electrical Components & Equipment — 0.3% | ||||||||
Energizer Holdings, Inc. | 11,000 | 11,316 | ||||||
144A, 4.375%, 3/31/29 | 44,000 | 44,181 | ||||||
|
| |||||||
(Cost $55,640) | 55,497 | |||||||
|
| |||||||
| Engineering & Construction — 0.2% | ||||||||
Brand Industrial Services, Inc., 144A, | 25,000 | 25,219 | ||||||
Fluor Corp., | 20,000 | 21,015 | ||||||
|
| |||||||
(Cost $44,001) | 46,234 | |||||||
|
| |||||||
| Environmental Control — 0.8% | ||||||||
Covanta Holding Corp., | 15,000 | 15,469 | ||||||
GFL Environmental, Inc. | 15,000 | 14,907 | ||||||
144A, 4.75%, 6/15/29 | 24,000 | 24,690 | ||||||
144A, 4.375%, 8/15/29 | 18,000 | 18,122 | ||||||
Madison IAQ LLC | 23,000 | 23,161 | ||||||
144A, 5.875%, 6/30/29 | 34,000 | 34,850 | ||||||
Stericycle, Inc., 144A, | 15,000 | 15,285 | ||||||
|
| |||||||
(Cost $145,814) | 146,484 | |||||||
|
| |||||||
| Machinery-Diversified — 0.3% | ||||||||
TK Elevator US Newco, Inc., 144A, | ||||||||
|
| |||||||
(Cost $58,775) | 56,000 | 59,238 | ||||||
|
| |||||||
| Miscellaneous Manufacturing — 0.2% | ||||||||
FXI Holdings, Inc. | 17,000 | 17,488 | ||||||
144A, 12.25%, 11/15/26 | 25,000 | 28,507 | ||||||
|
| |||||||
(Cost $44,573) | 45,995 | |||||||
|
| |||||||
| See Notes to Financial Statements. | 21 |
DBX ETF Trust
Schedule of Investments
Xtrackers High Beta High Yield Bond ETF (Continued)
August 31, 2021
Principal | Value | |||||||
| Packaging & Containers — 2.0% | ||||||||
Ardagh Metal Packaging Finance USA LLC / Ardagh Metal Packaging Finance PLC, 144A, | $ | 40,000 | $ | 40,820 | ||||
Ardagh Packaging Finance PLC / Ardagh Holdings USA, Inc. | 45,000 | 46,631 | ||||||
144A, 5.25%, 8/15/27 | 15,000 | 15,544 | ||||||
Cascades, Inc./Cascades USA, Inc., 144A, | 25,000 | 26,375 | ||||||
Flex Acquisition Co., Inc., 144A, | 35,000 | 35,394 | ||||||
Graphic Packaging International LLC, 144A, | 14,000 | 14,198 | ||||||
LABL, Inc., 144A, | 25,000 | 27,276 | ||||||
Mauser Packaging Solutions Holding Co., 144A, | 60,000 | 59,388 | ||||||
Owens-Brockway Glass Container, Inc., 144A, | 30,000 | 32,395 | ||||||
Reynolds Group Issuer, Inc. / Reynolds Group Issuer LLC / Reynolds Group Issuer Lu, 144A, | 30,000 | 30,027 | ||||||
Trivium Packaging Finance BV, 144A, | 46,000 | 48,527 | ||||||
|
| |||||||
(Cost $372,401) | 376,575 | |||||||
|
| |||||||
| Transportation — 0.1% | ||||||||
Seaspan Corp., 144A, | ||||||||
|
| |||||||
(Cost $24,958) | 25,000 | 25,594 | ||||||
|
| |||||||
| Trucking & Leasing — 0.2% | ||||||||
Fortress Transportation and Infrastructure Investors LLC | 35,000 | 39,550 | ||||||
144A, 5.50%, 5/1/28 | 8,000 | 8,120 | ||||||
|
| |||||||
(Cost $46,025) | 47,670 | |||||||
|
| |||||||
| Technology — 3.4% | ||||||||
| Computers — 1.7% | ||||||||
Banff Merger Sub, Inc., 144A, | 44,000 | 46,200 | ||||||
Booz Allen Hamilton, Inc. | 20,000 | 20,641 | ||||||
144A, 4.00%, 7/1/29 | 20,000 | 20,757 | ||||||
Diebold Nixdorf, Inc., 144A, | 35,000 | 38,500 | ||||||
Exela Intermediate LLC / Exela Finance, Inc., 144A, 10.00%, 7/15/23 | 28,000 | 21,035 | ||||||
NCR Corp. | 19,000 | 20,117 | ||||||
144A, 5.00%, 10/1/28 | 14,000 | 14,508 | ||||||
144A, 5.125%, 4/15/29 | 37,000 | 38,409 | ||||||
144A, 6.125%, 9/1/29 | 25,000 | 27,282 | ||||||
144A, 5.25%, 10/1/30 | 15,000 | 15,696 | ||||||
Principal | Value | |||||||
| Computers (Continued) | ||||||||
Seagate HDD Cayman | $ | 7,000 | $ | 7,412 | ||||
144A, 4.125%, 1/15/31 | 39,000 | 41,179 | ||||||
144A, 3.375%, 7/15/31 | 12,000 | 11,897 | ||||||
|
| |||||||
(Cost $321,067) | 323,633 | |||||||
|
| |||||||
| Office/Business Equipment — 0.3% | ||||||||
Pitney Bowes, Inc., 144A, | 9,000 | 9,596 | ||||||
Xerox Holdings Corp. | 15,000 | 15,839 | ||||||
144A, 5.50%, 8/15/28 (a) | 35,000 | 36,613 | ||||||
|
| |||||||
(Cost $61,211) | 62,048 | |||||||
|
| |||||||
| Semiconductors — 0.1% | ||||||||
ams AG, 144A, | ||||||||
|
| |||||||
(Cost $21,558) | 20,000 | 21,446 | ||||||
|
| |||||||
| Software — 1.3% | ||||||||
Black Knight InfoServ LLC, 144A, | 35,000 | 35,481 | ||||||
Change Healthcare Holdings LLC / Change Healthcare Finance, Inc., 144A, | 43,000 | 43,484 | ||||||
J2 Global, Inc., 144A, | 30,000 | 31,805 | ||||||
MicroStrategy, Inc., 144A, | 14,000 | 14,419 | ||||||
Rackspace Technology Global, Inc. | 20,000 | 19,225 | ||||||
144A, 5.375%, 12/1/28 (a) | 13,000 | 12,885 | ||||||
Twilio, Inc., | 15,000 | 15,696 | ||||||
Veritas US, Inc. / Veritas Bermuda Ltd., 144A, | 68,000 | 70,785 | ||||||
|
| |||||||
(Cost $241,803) | 243,780 | |||||||
|
| |||||||
| Utilities — 2.6% | ||||||||
| Electric — 2.6% | ||||||||
Calpine Corp. | 75,000 | 77,344 | ||||||
144A, 5.125%, 3/15/28 | 25,000 | 25,469 | ||||||
144A, 4.625%, 2/1/29 | 10,000 | 10,046 | ||||||
144A, 5.00%, 2/1/31 | 25,000 | 25,471 | ||||||
144A, 3.75%, 3/1/31 | 40,000 | 39,283 | ||||||
Clearway Energy Operating LLC, 144A, | 28,000 | 28,459 | ||||||
NRG Energy, Inc. | 31,000 | 31,505 | ||||||
144A, 3.875%, 2/15/32 | 27,000 | 27,421 | ||||||
PG&E Corp. | 10,000 | 9,939 | ||||||
5.25%, 7/1/30 | 51,000 | 50,304 | ||||||
Talen Energy Supply LLC | 25,000 | 10,973 | ||||||
144A, 10.50%, 1/15/26 | 30,000 | 14,015 | ||||||
144A, 7.25%, 5/15/27 | 33,000 | 28,575 | ||||||
| See Notes to Financial Statements. | 22 |
DBX ETF Trust
Schedule of Investments
Xtrackers High Beta High Yield Bond ETF (Continued)
August 31, 2021
Principal | Value | |||||||
| Electric (Continued) | ||||||||
Vistra Operations Co. LLC | $ | 40,000 | $ | 41,702 | ||||
144A, 5.00%, 7/31/27 | 40,000 | 41,554 | ||||||
144A, 4.375%, 5/1/29 | 46,000 | 46,748 | ||||||
|
| |||||||
(Cost $537,494) | 508,808 | |||||||
|
| |||||||
TOTAL CORPORATE BONDS | 18,953,769 | |||||||
|
| |||||||
Number | ||||||||
| SECURITIES LENDING COLLATERAL — 7.5% | ||||||||
DWS Government & Agency Securities Portfolio “DWS Government Cash Institutional Shares”, 0.01% (b)(c) | 1,444,823 | 1,444,823 | ||||||
|
| |||||||
| CASH EQUIVALENTS — 0.9% | ||||||||
DWS Government Money Market Series “Institutional Shares”, 0.04% (b) | 171,850 | 171,850 | ||||||
|
| |||||||
TOTAL INVESTMENTS — 106.4% (Cost $20,387,346) | $ | 20,570,442 | ||||||
Other assets and liabilities, net — (6.4%) | (1,231,809 | ) | ||||||
|
| |||||||
NET ASSETS — 100.0% | $ | 19,338,633 | ||||||
|
| |||||||
A summary of the Fund’s transactions with affiliated investments during the year ended August 31, 2021 is as follows:
| Value ($) at 8/31/2020 | Purchases Cost ($) | Sales Proceeds ($) | Net Realized Gain/(Loss) ($) | Net Change in Unrealized Appreciation (Depreciation) ($) | Income ($) | Capital Gain Distributions ($) | Number of Shares at 8/31/2021 | Value ($) at 8/31/2021 | ||||||||||||||||||||||||||||
SECURITIES LENDING COLLATERAL — 7.5% |
| |||||||||||||||||||||||||||||||||||
DWS Government & Agency Securities Portfolio “DWS Government Cash Institutional Shares”, 0.01% (b)(c) |
| |||||||||||||||||||||||||||||||||||
| 168,578 | 1,276,245(d | ) | — | — | — | 74 | — | 1,444,823 | 1,444,823 | |||||||||||||||||||||||||||
CASH EQUIVALENTS — 0.9% |
| |||||||||||||||||||||||||||||||||||
DWS Government Money Market Series “Institutional Shares”, 0.04% (b) |
| |||||||||||||||||||||||||||||||||||
| 503,524 | 2,394,727 | (2,726,401 | ) | — | — | 53 | — | 171,850 | 171,850 | |||||||||||||||||||||||||||
|
|
|
|
|
|
|
|
|
|
|
|
|
|
|
|
|
| |||||||||||||||||||
| 672,102 | 3,670,972 | (2,726,401 | ) | — | — | 127 | — | 1,616,673 | 1,616,673 | |||||||||||||||||||||||||||
|
|
|
|
|
|
|
|
|
|
|
|
|
|
|
|
|
| |||||||||||||||||||
| (a) | All or a portion of these securities were on loan. In addition, “Other assets and liabilities, net” may include pending sales that are also on loan. The value of securities loaned at August 31, 2021 amounted to $2,165,066, which is 11.2% of net assets. |
| (b) | Affiliated fund managed by DWS Investment Management Americas, Inc. The rate shown is the annualized seven-day yield at period end. |
| (c) | Represents cash collateral held in connection with securities lending. Income earned by the Fund is net of borrower rebates. In addition, the Fund held non-cash U.S. Treasury securities collateral having a value of $809,195. |
| (d) | Represents the net increase (purchase cost) or decrease (sales proceeds) in the amount invested in cash collateral for the year ended August 31, 2021. |
| REGS: | Securities sold under Regulation S may not be offered, sold or delivered within the United States or to, or for the account or benefit of, U.S. persons, except pursuant to an exemption from, or in a transaction not subject to, the registration requirements of the Securities Act of 1933. |
| 144A: | Security exempt from registration under Rule 144A of the Securities Act of 1933. These securities may be resold in transactions exempt from registration, normally to qualified institutional buyers. |
| See Notes to Financial Statements. | 23 |
DBX ETF Trust
Schedule of Investments
Xtrackers High Beta High Yield Bond ETF (Continued)
August 31, 2021
Fair Value Measurements
Various inputs are used in determining the value of the Fund’s investments. These inputs are summarized in three broad levels. Level 1 includes quoted prices in active markets for identical securities. Level 2 includes other significant observable inputs (including quoted prices for similar securities, interest rates, prepayment speeds and credit risk). Level 3 includes significant unobservable inputs (including the Fund’s own assumptions in determining the fair value of investments). The level assigned to the securities valuations may not be an indication of the risk or liquidity associated with investing in those securities.
The following is a summary of the inputs used as of August 31, 2021 in valuing the Fund’s investments. For information on the Fund’s policy regarding the valuation of investments, please refer to the Security Valuation section of Note 2 in the accompanying Notes to Financial Statements.
Assets | Level 1 | Level 2 | Level 3 | Total | ||||||||||||
Corporate Bonds (e) | $ | — | $ | 18,953,769 | $ | — | $ | 18,953,769 | ||||||||
Short-Term Investments (e) | 1,616,673 | — | — | 1,616,673 | ||||||||||||
|
|
|
|
|
|
|
| |||||||||
TOTAL | $ | 1,616,673 | $ | 18,953,769 | $ | — | $ | 20,570,442 | ||||||||
|
|
|
|
|
|
|
| |||||||||
| (e) | See Schedule of Investments for additional detailed categorizations. |
| See Notes to Financial Statements. | 24 |
DBX ETF Trust
Schedule of Investments
Xtrackers Low Beta High Yield Bond ETF
August 31, 2021
Principal | Value | |||||||
| CORPORATE BONDS — 98.4% | ||||||||
| Basic Materials — 3.7% | ||||||||
| Chemicals — 1.3% | ||||||||
Ashland LLC | $ | 542,000 | $ | 558,260 | ||||
144A, 3.375%, 9/1/31 | 583,000 | 599,974 | ||||||
CF Industries, Inc., | 880,000 | 926,763 | ||||||
INEOS Quattro Finance 2 PLC, 144A, | 639,000 | 647,786 | ||||||
NOVA Chemicals Corp. | 1,299,000 | 1,375,316 | ||||||
144A, 5.00%, 5/1/25 | 660,000 | 703,897 | ||||||
Olin Corp. 144A, | 625,000 | 784,219 | ||||||
5.125%, 9/15/27 | 625,000 | 650,000 | ||||||
5.625%, 8/1/29 | 1,013,000 | 1,119,163 | ||||||
SPCM SA, 144A, | 648,000 | 663,659 | ||||||
Tronox, Inc., 144A, | 625,000 | 660,156 | ||||||
WR Grace & Co.-Conn, 144A, | 880,000 | 914,100 | ||||||
|
| |||||||
(Cost $9,540,538) | 9,603,293 | |||||||
|
| |||||||
| Iron/Steel — 0.4% | ||||||||
Allegheny Technologies, Inc., | 758,000 | 817,726 | ||||||
Cleveland-Cliffs, Inc. | 843,000 | 978,934 | ||||||
144A, 6.75%, 3/15/26 | 1,048,000 | 1,125,290 | ||||||
|
| |||||||
(Cost $2,920,482) | 2,921,950 | |||||||
|
| |||||||
| Mining — 2.0% | ||||||||
Alcoa Nederland Holding BV | 613,000 | 641,235 | ||||||
144A, 5.50%, 12/15/27 | 1,055,000 | 1,136,762 | ||||||
144A, 6.125%, 5/15/28 | 522,000 | 568,327 | ||||||
144A, 4.125%, 3/31/29 | 686,000 | 724,642 | ||||||
Arconic Corp., 144A, | 1,223,000 | 1,296,135 | ||||||
Constellium SE, 144A, | 625,000 | 642,219 | ||||||
FMG Resources August 2006 Pty Ltd. | 880,000 | 947,628 | ||||||
144A, 4.50%, 9/15/27 | 804,000 | 873,570 | ||||||
Freeport-McMoRan, Inc. | 1,267,000 | 1,311,345 | ||||||
4.55%, 11/14/24 | 942,000 | 1,020,893 | ||||||
5.00%, 9/1/27 | 543,000 | 572,186 | ||||||
4.125%, 3/1/28 | 824,000 | 862,110 | ||||||
4.375%, 8/1/28 | 867,000 | 920,104 | ||||||
5.25%, 9/1/29 | 950,000 | 1,052,553 | ||||||
4.25%, 3/1/30 | 672,000 | 726,600 | ||||||
4.625%, 8/1/30 (a) | 1,080,000 | 1,190,700 | ||||||
Novelis Corp., 144A, | 971,000 | 996,722 | ||||||
|
| |||||||
(Cost $15,356,655) | 15,483,731 | |||||||
|
| |||||||
Principal | Value | |||||||
| Communications — 18.3% | ||||||||
| Advertising — 0.3% | ||||||||
Lamar Media Corp. | $ | 848,000 | $ | 872,346 | ||||
4.00%, 2/15/30 | 646,000 | 667,948 | ||||||
Outfront Media Capital LLC / Outfront Media Capital Corp., 144A, | 500,000 | 531,675 | ||||||
|
| |||||||
(Cost $2,022,923) | 2,071,969 | |||||||
|
| |||||||
| Internet — 3.1% | ||||||||
Cogent Communications Group, Inc., 144A, | 693,000 | 707,726 | ||||||
Go Daddy Operating Co. LLC / GD Finance Co., Inc., 144A, | 1,088,000 | 1,148,330 | ||||||
Match Group Holdings II LLC | 522,000 | 549,640 | ||||||
144A, 4.625%, 6/1/28 | 768,000 | 802,906 | ||||||
144A, 4.125%, 8/1/30 | 648,000 | 679,590 | ||||||
Netflix, Inc. | 815,000 | 906,524 | ||||||
5.875%, 2/15/25 | 1,165,000 | 1,338,294 | ||||||
144A, 3.625%, 6/15/25 | 628,000 | 673,530 | ||||||
4.375%, 11/15/26 | 1,295,000 | 1,466,788 | ||||||
4.875%, 4/15/28 | 2,035,000 | 2,381,011 | ||||||
5.875%, 11/15/28 | 2,325,000 | 2,885,988 | ||||||
6.375%, 5/15/29 | 1,181,000 | 1,514,756 | ||||||
144A, 5.375%, 11/15/29 | 1,168,000 | 1,438,001 | ||||||
144A, 4.875%, 6/15/30 | 1,187,000 | 1,422,299 | ||||||
NortonLifeLock, Inc., 144A, | 996,000 | 1,008,121 | ||||||
Twitter, Inc., 144A, | 886,000 | 957,700 | ||||||
Uber Technologies, Inc. | 1,519,000 | 1,621,532 | ||||||
144A, 8.00%, 11/1/26 | 1,675,000 | 1,785,969 | ||||||
|
| |||||||
(Cost $22,808,369) | 23,288,705 | |||||||
|
| |||||||
| Media — 7.6% | ||||||||
AMC Networks, Inc. | 325,000 | 329,469 | ||||||
4.75%, 8/1/25 (a) | 1,082,000 | 1,110,402 | ||||||
CCO Holdings LLC / CCO Holdings Capital Corp. | 994,000 | 1,001,256 | ||||||
144A, 5.75%, 2/15/26 | 922,000 | 948,507 | ||||||
144A, 5.50%, 5/1/26 | 603,000 | 621,910 | ||||||
144A, 5.125%, 5/1/27 | 4,265,000 | 4,464,154 | ||||||
144A, 5.00%, 2/1/28 | 3,327,000 | 3,489,524 | ||||||
144A, 5.375%, 6/1/29 | 1,876,000 | 2,051,875 | ||||||
144A, 4.75%, 3/1/30 | 3,950,000 | 4,184,353 | ||||||
CSC Holdings LLC | 812,000 | 845,495 | ||||||
5.25%, 6/1/24 | 938,000 | 1,013,040 | ||||||
144A, 5.50%, 4/15/27 | 1,663,000 | 1,741,789 | ||||||
144A, 5.375%, 2/1/28 | 1,548,000 | 1,631,205 | ||||||
144A, 6.50%, 2/1/29 | 2,158,000 | 2,384,590 | ||||||
| See Notes to Financial Statements. | 25 |
DBX ETF Trust
Schedule of Investments
Xtrackers Low Beta High Yield Bond ETF (Continued)
August 31, 2021
Principal | Value | |||||||
| Media (Continued) | ||||||||
DISH DBS Corp. | $ | 1,975,000 | $ | 2,063,875 | ||||
5.875%, 11/15/24 | 2,590,000 | 2,787,487 | ||||||
Gray Television, Inc., 144A, | 886,000 | 914,755 | ||||||
iHeartCommunications, Inc. | 1,326,150 | 1,402,404 | ||||||
144A, 5.25%, 8/15/27 | 834,000 | 869,445 | ||||||
Meredith Corp., | 1,279,000 | 1,326,962 | ||||||
News Corp., 144A, | 1,295,000 | 1,332,024 | ||||||
Quebecor Media, Inc., | 1,219,000 | 1,295,188 | ||||||
Sirius XM Radio, Inc. | 1,306,000 | 1,341,105 | ||||||
144A, 3.125%, 9/1/26 | 1,450,000 | 1,479,218 | ||||||
144A, 5.00%, 8/1/27 | 1,860,000 | 1,953,000 | ||||||
144A, 4.00%, 7/15/28 | 2,516,000 | 2,582,485 | ||||||
144A, 5.50%, 7/1/29 | 1,628,000 | 1,784,695 | ||||||
TEGNA, Inc., 144A, | 885,000 | 940,313 | ||||||
Telenet Finance Luxembourg Notes SARL, 144A, | 1,200,000 | 1,265,400 | ||||||
Univision Communications, Inc., 144A, | 1,546,000 | 1,576,039 | ||||||
UPC Holding BV, 144A, | 693,000 | 732,293 | ||||||
Videotron Ltd. | 664,000 | 732,060 | ||||||
144A, 5.125%, 4/15/27 | 851,000 | 887,168 | ||||||
144A, 3.625%, 6/15/29 (a) | 659,000 | 679,808 | ||||||
Ziggo Bond Co. BV, 144A, | 954,000 | 999,325 | ||||||
Ziggo BV, 144A, | 2,001,000 | 2,070,715 | ||||||
|
| |||||||
(Cost $56,511,061) | 56,833,333 | |||||||
|
| |||||||
| Telecommunications — 7.3% | ||||||||
Altice France SA | 1,995,000 | 2,073,244 | ||||||
144A, 8.125%, 2/1/27 | 2,180,000 | 2,370,750 | ||||||
Cincinnati Bell, Inc., 144A, | 809,000 | 825,180 | ||||||
CommScope, Inc., 144A, | 1,876,000 | 1,970,644 | ||||||
Hughes Satellite Systems Corp., | 992,000 | 1,124,397 | ||||||
Level 3 Financing, Inc. | 600,000 | 614,550 | ||||||
5.25%, 3/15/26 | 650,000 | 670,962 | ||||||
144A, 4.625%, 9/15/27 | 1,345,000 | 1,388,712 | ||||||
Lumen Technologies, Inc. | ||||||||
Series W, 6.75%, 12/1/23 | 921,000 | 1,014,297 | ||||||
Series Y, 7.50%, 4/1/24 | 1,232,000 | 1,372,140 | ||||||
5.625%, 4/1/25 | 701,000 | 759,537 | ||||||
144A, 4.00%, 2/15/27 | 1,600,000 | 1,644,000 | ||||||
Principal | Value | |||||||
| Telecommunications (Continued) | ||||||||
Nokia OYJ, | $ | 625,000 | $ | 694,356 | ||||
Sprint Communications, Inc., | 2,852,000 | 3,015,990 | ||||||
Sprint Corp. | 5,504,000 | 6,242,637 | ||||||
7.125%, 6/15/24 | 3,238,000 | 3,727,748 | ||||||
7.625%, 2/15/25 | 2,216,000 | 2,625,960 | ||||||
7.625%, 3/1/26 | 1,943,000 | 2,398,051 | ||||||
Switch Ltd. | 740,000 | 753,842 | ||||||
144A, 4.125%, 6/15/29 | 689,000 | 711,703 | ||||||
Telecom Italia SpA, 144A, | 1,876,000 | 2,039,118 | ||||||
T-Mobile USA, Inc. | 919,000 | 939,678 | ||||||
2.625%, 4/15/26 | 1,780,000 | 1,831,175 | ||||||
5.375%, 4/15/27 | 531,000 | 563,890 | ||||||
4.75%, 2/1/28 | 2,021,000 | 2,159,135 | ||||||
2.625%, 2/15/29 | 1,295,000 | 1,312,806 | ||||||
3.375%, 4/15/29 | 1,619,000 | 1,712,594 | ||||||
2.875%, 2/15/31 | 1,261,000 | 1,297,254 | ||||||
3.50%, 4/15/31 | 1,748,000 | 1,860,729 | ||||||
VEON Holdings BV | 662,000 | 706,182 | ||||||
144A, 7.25%, 4/26/23 | 1,153,000 | 1,243,144 | ||||||
144A, 4.95%, 6/16/24 | 666,000 | 718,744 | ||||||
144A, 4.00%, 4/9/25 | 1,251,000 | 1,321,400 | ||||||
144A, 3.375%, 11/25/27 | 1,520,000 | 1,548,766 | ||||||
|
| |||||||
(Cost $54,402,565) | 55,253,315 | |||||||
|
| |||||||
| Consumer, Cyclical — 19.3% | ||||||||
| Airlines — 0.9% | ||||||||
Delta Air Lines, Inc. | 625,000 | 647,867 | ||||||
2.90%, 10/28/24 | 1,166,000 | 1,188,720 | ||||||
7.375%, 1/15/26 | 1,467,000 | 1,728,268 | ||||||
United Airlines Holdings, Inc., | 829,000 | 846,616 | ||||||
United Airlines, Inc., 144A, | 2,451,000 | 2,547,521 | ||||||
|
| |||||||
(Cost $6,885,062) | 6,958,992 | |||||||
|
| |||||||
| Apparel — 0.7% | ||||||||
Hanesbrands, Inc. | 1,478,000 | 1,570,375 | ||||||
144A, 5.375%, 5/15/25 | 682,000 | 717,109 | ||||||
144A, 4.875%, 5/15/26 | 1,093,000 | 1,194,102 | ||||||
Levi Strauss & Co., 144A, | 625,000 | 644,616 | ||||||
William Carter Co. | 655,000 | 689,024 | ||||||
144A, 5.625%, 3/15/27 | 562,000 | 587,993 | ||||||
|
| |||||||
(Cost $5,326,520) | 5,403,219 | |||||||
|
| |||||||
| See Notes to Financial Statements. | 26 |
DBX ETF Trust
Schedule of Investments
Xtrackers Low Beta High Yield Bond ETF (Continued)
August 31, 2021
Principal | Value | |||||||
| Auto Manufacturers — 4.9% | ||||||||
Allison Transmission, Inc. | $ | 503,000 | $ | 527,901 | ||||
144A, 5.875%, 6/1/29 (a) | 629,000 | 692,718 | ||||||
Ford Motor Co. | 4,498,000 | 4,981,535 | ||||||
9.00%, 4/22/25 | 4,070,000 | 4,977,406 | ||||||
4.346%, 12/8/26 | 2,049,000 | 2,210,041 | ||||||
Ford Motor Credit Co. LLC | 585,000 | 602,550 | ||||||
MTN, 3.55%, 10/7/22 | 425,000 | 435,625 | ||||||
3.35%, 11/1/22 | 796,000 | 814,507 | ||||||
3.087%, 1/9/23 | 1,139,000 | 1,161,780 | ||||||
4.14%, 2/15/23 | 629,000 | 651,015 | ||||||
3.096%, 5/4/23 | 614,000 | 628,398 | ||||||
4.375%, 8/6/23 | 760,000 | 795,264 | ||||||
3.37%, 11/17/23 | 962,000 | 993,986 | ||||||
3.81%, 1/9/24 | 746,000 | 774,907 | ||||||
5.584%, 3/18/24 | 1,061,000 | 1,151,132 | ||||||
3.664%, 9/8/24 | 621,000 | 648,169 | ||||||
4.063%, 11/1/24 | 1,131,000 | 1,196,824 | ||||||
4.687%, 6/9/25 | 666,000 | 722,264 | ||||||
5.125%, 6/16/25 | 1,320,000 | 1,450,350 | ||||||
4.134%, 8/4/25 | 1,221,000 | 1,304,944 | ||||||
3.375%, 11/13/25 | 1,495,000 | 1,549,194 | ||||||
GMTN, 4.389%, 1/8/26 | 1,053,000 | 1,130,659 | ||||||
4.542%, 8/1/26 | 531,000 | 577,462 | ||||||
2.70%, 8/10/26 | 200,000 | 202,090 | ||||||
4.271%, 1/9/27 | 543,000 | 582,091 | ||||||
4.125%, 8/17/27 | 887,000 | 949,236 | ||||||
3.815%, 11/2/27 | 594,000 | 626,094 | ||||||
2.90%, 2/16/28 | 531,000 | 529,747 | ||||||
5.113%, 5/3/29 | 1,051,000 | 1,191,887 | ||||||
4.00%, 11/13/30 | 1,267,000 | 1,341,772 | ||||||
3.625%, 6/17/31 | 730,000 | 752,875 | ||||||
Jaguar Land Rover Automotive PLC, 144A, | 907,000 | 989,582 | ||||||
|
| |||||||
(Cost $36,486,905) | 37,144,005 | |||||||
|
| |||||||
| Auto Parts & Equipment — 1.3% | ||||||||
Adient US LLC, 144A, | 705,000 | 769,487 | ||||||
American Axle & Manufacturing, Inc. | 750,000 | 775,912 | ||||||
6.25%, 3/15/26 | 518,000 | 534,188 | ||||||
Clarios Global LP, 144A, | 528,000 | 559,680 | ||||||
Clarios Global LP / Clarios US Finance Co., 144A, | 1,168,000 | 1,232,240 | ||||||
Dana Financing Luxembourg SARL, 144A, | 518,000 | 534,835 | ||||||
Dana, Inc. | 512,000 | 540,800 | ||||||
5.625%, 6/15/28 | 527,000 | 567,516 | ||||||
Goodyear Tire & Rubber Co. | 1,036,000 | 1,148,976 | ||||||
5.00%, 5/31/26 | 1,223,000 | 1,260,840 | ||||||
Principal | Value | |||||||
| Auto Parts & Equipment (Continued) | ||||||||
ZF North America Capital, Inc., 144A, | $ | 1,383,000 | $ | 1,505,741 | ||||
|
| |||||||
(Cost $9,354,062) | 9,430,215 | |||||||
|
| |||||||
| Distribution/Wholesale — 0.4% | ||||||||
American Builders & Contractors Supply Co., Inc., 144A, | 907,000 | 937,974 | ||||||
Avient Corp. | 750,000 | 797,813 | ||||||
144A, 5.75%, 5/15/25 | 939,000 | 992,288 | ||||||
|
| |||||||
(Cost $2,695,325) | 2,728,075 | |||||||
|
| |||||||
| Entertainment — 2.6% | ||||||||
Bally’s Corp., 144A, | 680,000 | 736,100 | ||||||
Caesars Entertainment, Inc., 144A, | 4,350,000 | 4,603,170 | ||||||
Caesars Resort Collection LLC / CRC Finco, Inc., 144A, | 1,349,000 | 1,418,136 | ||||||
International Game Technology PLC | 1,522,000 | 1,697,030 | ||||||
144A, 4.125%, 4/15/26 | 900,000 | 935,820 | ||||||
144A, 6.25%, 1/15/27 | 971,000 | 1,108,154 | ||||||
144A, 5.25%, 1/15/29 | 984,000 | 1,051,650 | ||||||
Live Nation Entertainment, Inc. | 719,000 | 729,785 | ||||||
144A, 6.50%, 5/15/27 | 1,501,000 | 1,656,729 | ||||||
Scientific Games International, Inc., 144A, | 1,566,000 | 1,612,667 | ||||||
Six Flags Theme Parks, Inc., 144A, | 1,225,000 | 1,310,750 | ||||||
Vail Resorts, Inc., 144A, | 704,000 | 751,020 | ||||||
WMG Acquisition Corp. | 606,000 | 639,342 | ||||||
144A, 3.00%, 2/15/31 | 1,123,000 | 1,107,710 | ||||||
|
| |||||||
(Cost $19,209,667) | 19,358,063 | |||||||
|
| |||||||
| Food Service — 0.4% | ||||||||
Aramark Services, Inc. | 664,000 | 681,972 | ||||||
144A, 6.375%, 5/1/25 | 2,027,000 | 2,148,214 | ||||||
|
| |||||||
(Cost $2,813,184) | 2,830,186 | |||||||
|
| |||||||
| Home Builders — 0.8% | ||||||||
Century Communities, Inc., | 648,000 | 693,179 | ||||||
Meritage Homes Corp. | 582,000 | 668,118 | ||||||
144A, 3.875%, 4/15/29 | 612,000 | 652,628 | ||||||
Taylor Morrison Communities, Inc. | 625,000 | 708,772 | ||||||
144A, 5.75%, 1/15/28 | 574,000 | 648,066 | ||||||
| See Notes to Financial Statements. | 27 |
DBX ETF Trust
Schedule of Investments
Xtrackers Low Beta High Yield Bond ETF (Continued)
August 31, 2021
Principal | Value | |||||||
| Home Builders (Continued) | ||||||||
Toll Brothers Finance Corp. | $ | 601,000 | $ | 627,294 | ||||
4.875%, 3/15/27 | 567,000 | 644,435 | ||||||
4.35%, 2/15/28 | 517,000 | 573,275 | ||||||
3.80%, 11/1/29 (a) | 489,000 | 532,937 | ||||||
|
| |||||||
(Cost $5,637,160) | 5,748,704 | |||||||
|
| |||||||
| Housewares — 0.7% | ||||||||
Newell Brands, Inc. | 1,458,000 | 1,539,750 | ||||||
4.875%, 6/1/25 | 687,000 | 765,544 | ||||||
4.70%, 4/1/26 | 2,547,000 | 2,849,456 | ||||||
|
| |||||||
(Cost $5,045,135) | 5,154,750 | |||||||
|
| |||||||
| Leisure Time — 0.9% | ||||||||
Carnival Corp., 144A, | 2,584,000 | 2,906,173 | ||||||
Royal Caribbean Cruises Ltd. | 906,000 | 928,650 | ||||||
144A, 10.875%, 6/1/23 | 1,244,000 | 1,401,574 | ||||||
144A, 9.125%, 6/15/23 | 1,214,000 | 1,324,778 | ||||||
|
| |||||||
(Cost $6,534,413) | 6,561,175 | |||||||
|
| |||||||
| Lodging — 2.1% | ||||||||
Boyd Gaming Corp., 144A, | 704,000 | 764,579 | ||||||
Diamond Resorts International, Inc. | 78,000 | 79,511 | ||||||
144A, 10.75%, 9/1/24 | 590,000 | 605,859 | ||||||
Hilton Domestic Operating Co., Inc. | 434,000 | 455,873 | ||||||
144A, 5.75%, 5/1/28 | 411,000 | 441,328 | ||||||
144A, 3.75%, 5/1/29 | 1,020,000 | 1,041,716 | ||||||
4.875%, 1/15/30 | 1,259,000 | 1,354,999 | ||||||
Hilton Worldwide Finance LLC / Hilton Worldwide Finance Corp., | 1,212,000 | 1,258,668 | ||||||
Marriott Ownership Resorts, Inc., 144A, | 670,000 | 705,202 | ||||||
Melco Resorts Finance Ltd., 144A, | 1,295,000 | 1,319,281 | ||||||
MGM Resorts International | 1,563,000 | 1,656,780 | ||||||
6.75%, 5/1/25 | 879,000 | 932,839 | ||||||
5.75%, 6/15/25 | 1,205,000 | 1,320,981 | ||||||
4.625%, 9/1/26 | 500,000 | 528,275 | ||||||
Travel + Leisure Co., | 582,000 | 600,397 | ||||||
Wynn Las Vegas LLC / Wynn Las Vegas Capital Corp. | 644,000 | 661,575 | ||||||
144A, 5.50%, 3/1/25 | 2,251,000 | 2,388,874 | ||||||
|
| |||||||
(Cost $16,032,009) | 16,116,737 | |||||||
|
| |||||||
| Retail — 3.3% | ||||||||
1011778 BC ULC / New Red Finance, Inc. | 656,000 | 692,080 | ||||||
Principal | Value | |||||||
| Retail (Continued) | ||||||||
144A, 3.875%, 1/15/28 | $ | 2,007,000 | $ | 2,034,596 | ||||
Bath & Body Works, Inc. | 637,000 | 824,915 | ||||||
5.25%, 2/1/28 | 648,000 | 726,700 | ||||||
7.50%, 6/15/29 | 728,000 | 844,935 | ||||||
144A, 6.625%, 10/1/30 | 1,295,000 | 1,494,106 | ||||||
Gap, Inc. | 609,000 | 683,299 | ||||||
144A, 8.625%, 5/15/25 | 912,000 | 996,178 | ||||||
144A, 8.875%, 5/15/27 | 1,304,000 | 1,499,600 | ||||||
Golden Nugget, Inc., 144A, | 165,000 | 174,281 | ||||||
IRB Holding Corp., 144A, | 971,000 | 1,039,504 | ||||||
KFC Holding Co./Pizza Hut Holdings LLC/Taco Bell of America LLC, 144A, | 980,000 | 1,028,449 | ||||||
Lithia Motors, Inc. | 522,000 | 553,973 | ||||||
144A, 3.875%, 6/1/29 | 850,000 | 892,330 | ||||||
144A, 4.375%, 1/15/31 | 895,000 | 972,194 | ||||||
Macy’s Retail Holdings LLC, | 696,000 | 709,050 | ||||||
Murphy Oil USA, Inc. | 654,000 | 692,423 | ||||||
144A, 3.75%, 2/15/31 | 629,000 | 635,469 | ||||||
Penske Automotive Group, | 894,000 | 926,060 | ||||||
3.75%, 6/15/29 | 589,000 | 600,235 | ||||||
QVC, Inc. | 847,000 | 888,291 | ||||||
4.85%, 4/1/24 | 985,000 | 1,072,173 | ||||||
4.45%, 2/15/25 | 683,000 | 731,614 | ||||||
4.75%, 2/15/27 | 711,000 | 762,782 | ||||||
Yum! Brands, Inc. | 777,000 | 838,103 | ||||||
144A, 4.75%, 1/15/30 | 1,036,000 | 1,144,832 | ||||||
3.625%, 3/15/31 | 1,360,000 | 1,398,984 | ||||||
|
| |||||||
(Cost $24,600,853) | 24,857,156 | |||||||
|
| |||||||
| Toys/Games/Hobbies — 0.3% | ||||||||
Mattel, Inc. 144A, | 931,000 | 968,301 | ||||||
144A, 5.875%, 12/15/27 | 716,000 | 782,266 | ||||||
144A, 3.75%, 4/1/29 (a) | 704,000 | 739,939 | ||||||
|
| |||||||
(Cost $2,452,860) | 2,490,506 | |||||||
|
| |||||||
| Consumer, Non-cyclical — 18.6% | ||||||||
| Agriculture — 0.1% | ||||||||
Darling Ingredients, Inc., 144A, | ||||||||
|
| |||||||
(Cost $960,790) | 924,000 | 966,208 | ||||||
|
| |||||||
| Commercial Services — 3.2% | ||||||||
ADT Security Corp., | 889,000 | 935,672 | ||||||
| See Notes to Financial Statements. | 28 |
DBX ETF Trust
Schedule of Investments
Xtrackers Low Beta High Yield Bond ETF (Continued)
August 31, 2021
Principal | Value | |||||||
| Commercial Services (Continued) | ||||||||
Brink’s Co. | $ | 481,000 | $ | 505,964 | ||||
144A, 4.625%, 10/15/27 | 750,000 | 788,685 | ||||||
Gartner, Inc. | 891,000 | 944,460 | ||||||
144A, 3.625%, 6/15/29 | 825,000 | 850,410 | ||||||
Herc Holdings, Inc., 144A, | 1,501,000 | 1,584,230 | ||||||
Jaguar Holding Co. II / PPD Development LP | 633,000 | 665,315 | ||||||
144A, 5.00%, 6/15/28 | 888,000 | 957,930 | ||||||
Modulaire Global Finance PLC, 144A, | 16,000 | 16,439 | ||||||
Nielsen Co. Luxembourg SARL, 144A, | 651,000 | 668,118 | ||||||
Prime Security Services Borrower LLC / Prime Finance, Inc., 144A, | 943,000 | 1,005,474 | ||||||
Service Corp. International | 775,000 | 820,299 | ||||||
5.125%, 6/1/29 | 899,000 | 981,438 | ||||||
3.375%, 8/15/30 | 1,101,000 | 1,109,846 | ||||||
Square, Inc. | 1,047,000 | 1,076,871 | ||||||
144A, 3.50%, 6/1/31 | 1,408,000 | 1,463,440 | ||||||
United Rentals North America, Inc. | 1,207,000 | 1,245,202 | ||||||
5.50%, 5/15/27 | 1,295,000 | 1,367,598 | ||||||
4.875%, 1/15/28 | 2,162,000 | 2,296,012 | ||||||
5.25%, 1/15/30 | 1,360,000 | 1,492,668 | ||||||
4.00%, 7/15/30 | 788,000 | 826,446 | ||||||
3.875%, 2/15/31 | 1,250,000 | 1,295,994 | ||||||
3.75%, 1/15/32 | 971,000 | 992,988 | ||||||
Verscend Escrow Corp., 144A, | 40,000 | 42,350 | ||||||
|
| |||||||
(Cost $23,524,366) | 23,933,849 | |||||||
|
| |||||||
| Food — 3.9% | ||||||||
Albertsons Cos., Inc. / Safeway, Inc. / New Albertsons LP / Albertsons LLC | 943,000 | 971,469 | ||||||
144A, 3.25%, 3/15/26 | 980,000 | 1,006,950 | ||||||
144A, 7.50%, 3/15/26 | 804,000 | 876,171 | ||||||
144A, 4.625%, 1/15/27 | 41,000 | 43,460 | ||||||
144A, 5.875%, 2/15/28 | 943,000 | 1,012,546 | ||||||
B&G Foods, Inc., | 1,357,000 | 1,394,318 | ||||||
JBS USA Food Co. | 1,295,000 | 1,365,383 | ||||||
144A, 5.75%, 1/15/28 | 594,000 | 627,888 | ||||||
JBS USA LUX SA / JBS USA Finance, Inc., 144A, | 1,126,000 | 1,235,785 | ||||||
JBS USA LUX SA / JBS USA Food Co. / JBS USA Finance, Inc. | 1,751,000 | 1,985,196 | ||||||
Principal | Value | |||||||
| Food (Continued) | ||||||||
144A, 5.50%, 1/15/30 | $ | 1,563,000 | $ | 1,765,877 | ||||
144A, 3.75%, 12/1/31 (a) | 705,000 | 744,656 | ||||||
Kraft Heinz Foods Co. | 2,343,000 | 2,485,953 | ||||||
3.875%, 5/15/27 | 1,684,000 | 1,857,561 | ||||||
4.625%, 1/30/29 | 1,346,000 | 1,559,648 | ||||||
3.75%, 4/1/30 | 825,000 | 912,937 | ||||||
4.25%, 3/1/31 | 1,688,000 | 1,950,876 | ||||||
Lamb Weston Holdings, Inc. | 1,039,000 | 1,067,573 | ||||||
144A, 4.875%, 11/1/26 | 1,004,000 | 1,033,997 | ||||||
144A, 4.875%, 5/15/28 | 625,000 | 696,017 | ||||||
Pilgrim’s Pride Corp., 144A, | 1,245,000 | 1,330,307 | ||||||
Post Holdings, Inc., 144A, | 1,540,000 | 1,613,843 | ||||||
US Foods, Inc., 144A, | 1,566,000 | 1,652,130 | ||||||
|
| |||||||
(Cost $28,788,441) | 29,190,541 | |||||||
|
| |||||||
| Healthcare-Products — 0.7% | ||||||||
Avantor Funding, Inc., 144A, | 1,939,000 | 2,052,722 | ||||||
Hologic, Inc. | 490,000 | 521,872 | ||||||
144A, 3.25%, 2/15/29 | 1,191,000 | 1,221,907 | ||||||
Teleflex, Inc. | 587,000 | 615,616 | ||||||
144A, 4.25%, 6/1/28 | 805,000 | 839,213 | ||||||
|
| |||||||
(Cost $5,156,985) | 5,251,330 | |||||||
|
| |||||||
| Healthcare-Services — 9.1% | ||||||||
Catalent Pharma Solutions, Inc. | 619,000 | 649,204 | ||||||
144A, 3.125%, 2/15/29 | 647,000 | 640,077 | ||||||
Centene Corp. | 3,116,000 | 3,295,170 | ||||||
2.45%, 7/15/28 | 2,979,000 | 3,026,865 | ||||||
4.625%, 12/15/29 | 4,608,000 | 5,060,229 | ||||||
3.375%, 2/15/30 | 2,553,000 | 2,671,076 | ||||||
3.00%, 10/15/30 | 2,810,000 | 2,902,976 | ||||||
2.50%, 3/1/31 | 2,902,000 | 2,898,140 | ||||||
2.625%, 8/1/31 | 1,684,000 | 1,709,260 | ||||||
Charles River Laboratories International, Inc. | 664,000 | 694,740 | ||||||
144A, 3.75%, 3/15/29 | 648,000 | 668,820 | ||||||
144A, 4.00%, 3/15/31 | 648,000 | 692,576 | ||||||
CHS/Community Health Systems, Inc. | 1,528,000 | 1,608,033 | ||||||
144A, 8.00%, 3/15/26 | 2,721,000 | 2,916,096 | ||||||
144A, 8.00%, 12/15/27 | 1,231,000 | 1,357,177 | ||||||
Encompass Health Corp. | 1,036,000 | 1,086,505 | ||||||
4.625%, 4/1/31 | 518,000 | 556,109 | ||||||
HCA, Inc. | 1,587,000 | 1,711,976 | ||||||
| See Notes to Financial Statements. | 29 |
DBX ETF Trust
Schedule of Investments
Xtrackers Low Beta High Yield Bond ETF (Continued)
August 31, 2021
Principal | Value | |||||||
| Healthcare-Services (Continued) | ||||||||
5.375%, 2/1/25 | $ | 3,367,000 | $ | 3,798,431 | ||||
5.875%, 2/15/26 | 2,113,000 | 2,453,299 | ||||||
5.375%, 9/1/26 | 1,402,000 | 1,619,030 | ||||||
5.625%, 9/1/28 | 1,988,000 | 2,373,245 | ||||||
5.875%, 2/1/29 | 1,139,000 | 1,382,558 | ||||||
3.50%, 9/1/30 | 3,497,000 | 3,758,034 | ||||||
IQVIA, Inc. | 1,313,000 | 1,354,031 | ||||||
144A, 5.00%, 5/15/27 | 1,376,000 | 1,439,544 | ||||||
Legacy LifePoint Health LLC, 144A, | 704,000 | 741,840 | ||||||
Molina Healthcare, Inc. | 918,000 | 952,884 | ||||||
144A, 4.375%, 6/15/28 | 1,177,000 | 1,235,850 | ||||||
144A, 3.875%, 11/15/30 | 813,000 | 867,987 | ||||||
Tenet Healthcare Corp. | 2,557,000 | 2,774,345 | ||||||
4.625%, 7/15/24 | 2,313,000 | 2,347,695 | ||||||
144A, 4.625%, 9/1/24 | 936,000 | 961,047 | ||||||
144A, 7.50%, 4/1/25 | 907,000 | 971,660 | ||||||
144A, 4.875%, 1/1/26 | 2,720,000 | 2,824,856 | ||||||
144A, 5.125%, 11/1/27 | 1,943,000 | 2,047,436 | ||||||
|
| |||||||
(Cost $66,862,991) | 68,048,801 | |||||||
|
| |||||||
| Household Products/Wares — 0.0% | ||||||||
Spectrum Brands, Inc., | ||||||||
(Cost $419,393) | 412,000 | 422,300 | ||||||
|
| |||||||
| Pharmaceuticals — 1.6% | ||||||||
Bausch Health Cos., Inc. | 2,267,000 | 2,321,748 | ||||||
144A, 9.00%, 12/15/25 | 1,893,000 | 2,016,045 | ||||||
Elanco Animal Health, Inc. | 932,000 | 999,617 | ||||||
5.90%, 8/28/28 | 965,000 | 1,131,091 | ||||||
Prestige Brands, Inc., 144A, | 469,000 | 491,864 | ||||||
Teva Pharmaceutical Finance Co. BV, | 1,094,000 | 1,103,572 | ||||||
Teva Pharmaceutical Finance Netherlands III BV, | 3,885,000 | 3,845,140 | ||||||
|
| |||||||
(Cost $11,858,950) | 11,909,077 | |||||||
|
| |||||||
| Energy — 13.1% | ||||||||
| Energy-Alternate Sources — 0.2% | ||||||||
TerraForm Power Operating LLC 144A, | 687,000 | 706,751 | ||||||
144A, 5.00%, 1/31/28 | 897,000 | 970,191 | ||||||
|
| |||||||
(Cost $1,653,796) | 1,676,942 | |||||||
|
| |||||||
| Oil & Gas — 6.4% | ||||||||
Antero Resources Corp., | 701,000 | 716,531 | ||||||
Apache Corp. | 767,000 | 831,014 | ||||||
4.375%, 10/15/28 | 690,000 | 745,476 | ||||||
4.25%, 1/15/30 | 903,000 | 973,222 | ||||||
Principal | Value | |||||||
| Oil & Gas (Continued) | ||||||||
Chesapeake Energy Corp. | $ | 998,000 | $ | 1,044,866 | ||||
144A, 5.875%, 2/1/29 | 408,000 | 436,068 | ||||||
Continental Resources, Inc. | 841,000 | 877,794 | ||||||
3.80%, 6/1/24 | 1,379,000 | 1,473,806 | ||||||
4.375%, 1/15/28 (a) | 1,272,000 | 1,429,614 | ||||||
144A, 5.75%, 1/15/31 (a) | 1,943,000 | 2,370,460 | ||||||
Endeavor Energy Resources LP / EER Finance, Inc., 144A, | 750,000 | 796,275 | ||||||
EQT Corp. | 773,000 | 790,261 | ||||||
6.625%, 2/1/25 | 1,186,000 | 1,360,899 | ||||||
144A, 3.125%, 5/15/26 | 758,000 | 779,792 | ||||||
3.90%, 10/1/27 | 1,619,000 | 1,750,204 | ||||||
7.50%, 2/1/30 | 1,022,000 | 1,329,239 | ||||||
144A, 3.625%, 5/15/31 | 587,000 | 620,098 | ||||||
Leviathan Bond Ltd. | 728,000 | 760,593 | ||||||
144A,REGS, 6.125%, 6/30/25 (a) | 688,000 | 751,399 | ||||||
Occidental Petroleum Corp. | 300,000 | 305,520 | ||||||
6.95%, 7/1/24 | 801,000 | 902,290 | ||||||
2.90%, 8/15/24 | 1,726,000 | 1,771,308 | ||||||
3.50%, 6/15/25 | 816,000 | 857,130 | ||||||
8.00%, 7/15/25 | 1,035,000 | 1,248,469 | ||||||
5.875%, 9/1/25 (a) | 967,000 | 1,089,142 | ||||||
5.50%, 12/1/25 (a) | 972,000 | 1,085,034 | ||||||
5.55%, 3/15/26 | 1,438,000 | 1,605,168 | ||||||
3.40%, 4/15/26 | 1,170,000 | 1,203,637 | ||||||
3.20%, 8/15/26 | 1,264,000 | 1,306,148 | ||||||
3.00%, 2/15/27 | 925,000 | 928,792 | ||||||
8.50%, 7/15/27 | 492,000 | 621,423 | ||||||
6.375%, 9/1/28 | 727,000 | 861,353 | ||||||
3.50%, 8/15/29 | 2,010,000 | 2,072,330 | ||||||
6.625%, 9/1/30 | 1,943,000 | 2,425,923 | ||||||
6.125%, 1/1/31 | 1,619,000 | 1,959,953 | ||||||
Ovintiv Exploration, Inc. | 1,251,000 | 1,394,844 | ||||||
5.375%, 1/1/26 | 861,000 | 974,185 | ||||||
Parkland Corp., 144A, | 658,000 | 701,922 | ||||||
Range Resources Corp. | 666,000 | 684,355 | ||||||
4.875%, 5/15/25 | 985,000 | 1,020,706 | ||||||
Southwestern Energy Co., | 1,195,000 | 1,303,912 | ||||||
Sunoco LP / Sunoco Finance Corp. | 1,074,000 | 1,104,829 | ||||||
6.00%, 4/15/27 | 823,000 | 861,027 | ||||||
|
| |||||||
(Cost $46,620,266) | 48,127,011 | |||||||
|
| |||||||
| Oil & Gas Services — 0.2% | ||||||||
TechnipFMC PLC, 144A, | ||||||||
(Cost $1,389,716) | 1,295,000 | 1,376,226 | ||||||
|
| |||||||
| See Notes to Financial Statements. | 30 |
DBX ETF Trust
Schedule of Investments
Xtrackers Low Beta High Yield Bond ETF (Continued)
August 31, 2021
Principal | Value | |||||||
| Pipelines — 6.3% | ||||||||
Antero Midstream Partners LP / Antero Midstream Finance Corp., 144A, | $ | 712,000 | $ | 784,987 | ||||
Buckeye Partners LP | 627,000 | 648,189 | ||||||
144A, 4.125%, 3/1/25 | 587,000 | 607,566 | ||||||
3.95%, 12/1/26 | 945,000 | 977,026 | ||||||
4.125%, 12/1/27 | 400,000 | 410,652 | ||||||
Cheniere Energy Partners LP | 1,253,000 | 1,298,296 | ||||||
4.50%, 10/1/29 | 1,943,000 | 2,096,011 | ||||||
144A, 4.00%, 3/1/31 | 2,030,000 | 2,139,112 | ||||||
Cheniere Energy, Inc., | 2,501,000 | 2,641,681 | ||||||
Crestwood Midstream Partners LP / Crestwood Midstream Finance Corp., | 752,000 | 768,920 | ||||||
DCP Midstream Operating LP | 605,000 | 622,690 | ||||||
5.375%, 7/15/25 | 1,068,000 | 1,177,470 | ||||||
5.625%, 7/15/27 | 679,000 | 772,600 | ||||||
5.125%, 5/15/29 | 777,000 | 863,523 | ||||||
DT Midstream, Inc. | 1,425,000 | 1,462,406 | ||||||
144A, 4.375%, 6/15/31 | 1,295,000 | 1,338,706 | ||||||
EnLink Midstream Partners LP | 701,000 | 730,056 | ||||||
4.15%, 6/1/25 | 998,000 | 1,029,168 | ||||||
EQM Midstream Partners LP | 728,000 | 761,670 | ||||||
4.00%, 8/1/24 | 691,000 | 708,137 | ||||||
144A, 6.00%, 7/1/25 | 939,000 | 1,015,294 | ||||||
4.125%, 12/1/26 | 587,000 | 599,304 | ||||||
Hess Midstream Operations LP | 1,312,000 | 1,363,981 | ||||||
144A, 5.125%, 6/15/28 | 610,000 | 639,738 | ||||||
144A, 4.25%, 2/15/30 | 1,000,000 | 1,013,950 | ||||||
NuStar Logistics LP | 727,000 | 782,434 | ||||||
6.00%, 6/1/26 | 658,000 | 712,963 | ||||||
Rockies Express Pipeline LLC, 144A, | 518,000 | 533,789 | ||||||
Targa Resources Partners LP / Targa Resources Partners Finance Corp. | 924,000 | 967,890 | ||||||
5.375%, 2/1/27 | 585,000 | 605,475 | ||||||
6.50%, 7/15/27 | 1,119,000 | 1,212,962 | ||||||
5.00%, 1/15/28 | 907,000 | 954,218 | ||||||
6.875%, 1/15/29 | 880,000 | 990,396 | ||||||
5.50%, 3/1/30 | 1,320,000 | 1,456,950 | ||||||
4.875%, 2/1/31 | 1,277,000 | 1,390,717 | ||||||
144A, 4.00%, 1/15/32 | 1,284,000 | 1,341,889 | ||||||
Venture Global Calcasieu Pass LLC | 1,619,000 | 1,670,727 | ||||||
144A, 4.125%, 8/15/31 | 1,619,000 | 1,702,128 | ||||||
Western Midstream Operating LP | 1,295,000 | 1,362,431 | ||||||
Principal | Value | |||||||
| Pipelines (Continued) | ||||||||
3.95%, 6/1/25 | $ | 675,000 | $ | 706,219 | ||||
4.65%, 7/1/26 | 648,000 | 699,354 | ||||||
4.50%, 3/1/28 | 559,000 | 603,077 | ||||||
4.75%, 8/15/28 | 820,000 | 903,353 | ||||||
5.30%, 2/1/30 | 1,554,000 | 1,733,961 | ||||||
|
| |||||||
(Cost $45,982,645) | 46,802,066 | |||||||
|
| |||||||
| Financial — 11.2% | ||||||||
| Banks — 1.6% | ||||||||
CIT Group, Inc. | 971,000 | 1,047,466 | ||||||
4.75%, 2/16/24 | 648,000 | 699,840 | ||||||
3.929%, 6/19/24 | 648,000 | 680,400 | ||||||
5.25%, 3/7/25 | 632,000 | 713,180 | ||||||
6.125%, 3/9/28 | 539,000 | 661,954 | ||||||
Commerzbank AG, 144A, | 1,259,000 | 1,421,772 | ||||||
Deutsche Bank AG, | 1,619,000 | 1,672,217 | ||||||
Intesa Sanpaolo SpA | 2,590,000 | 2,812,652 | ||||||
144A, 5.71%, 1/15/26 | 1,943,000 | 2,186,758 | ||||||
|
| |||||||
(Cost $11,720,891) | 11,896,239 | |||||||
|
| |||||||
| Diversified Financial Services — 3.0% | ||||||||
Ally Financial, Inc., | 1,357,000 | 1,550,025 | ||||||
LPL Holdings, Inc. | 667,000 | 692,043 | ||||||
144A, 4.00%, 3/15/29 | 1,074,000 | 1,098,219 | ||||||
Navient Corp. | 1,233,000 | 1,294,650 | ||||||
7.25%, 9/25/23 | 807,000 | 887,601 | ||||||
MTN, 6.125%, 3/25/24 | 972,000 | 1,055,057 | ||||||
5.875%, 10/25/24 | 627,000 | 684,026 | ||||||
OneMain Finance Corp. | 1,129,000 | 1,194,013 | ||||||
6.125%, 3/15/24 | 1,789,000 | 1,929,884 | ||||||
6.875%, 3/15/25 | 1,564,000 | 1,773,185 | ||||||
8.875%, 6/1/25 | 768,000 | 843,226 | ||||||
7.125%, 3/15/26 | 2,006,000 | 2,344,512 | ||||||
3.50%, 1/15/27 | 912,000 | 924,321 | ||||||
6.625%, 1/15/28 | 1,139,000 | 1,316,530 | ||||||
PennyMac Financial Services, Inc., 144A, | 903,000 | 935,544 | ||||||
Quicken Loans LLC / Quicken Loans Co.-Issuer, Inc. | 915,000 | 935,587 | ||||||
144A, 3.875%, 3/1/31 | 1,577,000 | 1,615,420 | ||||||
Rocket Mortgage LLC, 144A, | 1,433,000 | 1,510,024 | ||||||
|
| |||||||
(Cost $22,222,470) | 22,583,867 | |||||||
|
| |||||||
| Insurance — 0.4% | ||||||||
MGIC Investment Corp., | 843,000 | 903,064 | ||||||
| See Notes to Financial Statements. | 31 |
DBX ETF Trust
Schedule of Investments
Xtrackers Low Beta High Yield Bond ETF (Continued)
August 31, 2021
Principal | Value | |||||||
| Insurance (Continued) | ||||||||
Radian Group, Inc. | $ | 295,000 | $ | 319,338 | ||||
6.625%, 3/15/25 | 931,000 | 1,050,866 | ||||||
4.875%, 3/15/27 | 583,000 | 643,183 | ||||||
|
| |||||||
(Cost $2,825,715) | 2,916,451 | |||||||
|
| |||||||
| Real Estate — 0.4% | ||||||||
Howard Hughes Corp., 144A, | 955,000 | 1,013,494 | ||||||
Realogy Group LLC / Realogy Co.-Issuer Corp. | 680,000 | 708,764 | ||||||
144A, 7.625%, 6/15/25 | 795,000 | 857,002 | ||||||
144A, 9.375%, 4/1/27 | 675,000 | 745,905 | ||||||
|
| |||||||
(Cost $3,297,454) | 3,325,165 | |||||||
|
| |||||||
| Real Estate Investment Trusts — 5.1% | ||||||||
Diversified Healthcare Trust, | 1,510,000 | 1,662,887 | ||||||
EPR Properties | 593,000 | 640,867 | ||||||
4.50%, 6/1/27 | 583,000 | 618,334 | ||||||
4.95%, 4/15/28 | 576,000 | 622,776 | ||||||
HAT Holdings I LLC / HAT Holdings II LLC | 562,000 | 593,157 | ||||||
144A, 3.375%, 6/15/26 | 1,251,000 | 1,276,395 | ||||||
Iron Mountain, Inc. | 1,013,000 | 1,056,052 | ||||||
144A, 5.25%, 3/15/28 | 1,253,000 | 1,317,216 | ||||||
iStar, Inc. | 975,000 | 1,035,986 | ||||||
4.25%, 8/1/25 | 710,000 | 741,062 | ||||||
MGM Growth Properties Operating Partnership LP / MGP Finance Co-Issuer, Inc. | 1,313,000 | 1,432,811 | ||||||
144A, 4.625%, 6/15/25 | 1,001,000 | 1,077,126 | ||||||
4.50%, 9/1/26 | 532,000 | 580,356 | ||||||
5.75%, 2/1/27 | 971,000 | 1,119,247 | ||||||
144A, 3.875%, 2/15/29 | 938,000 | 995,579 | ||||||
MPT Operating Partnership LP / MPT Finance Corp. | 612,000 | 631,388 | ||||||
5.00%, 10/15/27 | 1,866,000 | 1,977,960 | ||||||
4.625%, 8/1/29 | 1,056,000 | 1,130,361 | ||||||
3.50%, 3/15/31 | 1,626,000 | 1,673,796 | ||||||
Park Intermediate Holdings LLC / PK Domestic Property LLC / PK Finance Co.-Issuer, 144A, | 450,000 | 482,067 | ||||||
SBA Communications Corp. | 1,375,000 | 1,397,344 | ||||||
3.875%, 2/15/27 | 2,272,000 | 2,364,084 | ||||||
144A, 3.125%, 2/1/29 | 1,861,000 | 1,830,796 | ||||||
Service Properties Trust, | 718,000 | 735,085 | ||||||
Principal | Value | |||||||
| Real Estate Investment Trusts (Continued) | ||||||||
Starwood Property Trust, Inc. | $ | 690,000 | $ | 723,638 | ||||
144A, 3.625%, 7/15/26 | 492,000 | 495,690 | ||||||
Uniti Group LP / Uniti Fiber Holdings, Inc. / CSL Capital LLC, 144A, | 2,814,000 | 3,010,980 | ||||||
VICI Properties LP / VICI Note Co., Inc. | 971,000 | 996,489 | ||||||
144A, 4.25%, 12/1/26 | 1,619,000 | 1,702,650 | ||||||
144A, 3.75%, 2/15/27 | 971,000 | 1,011,054 | ||||||
144A, 4.625%, 12/1/29 | 1,026,000 | 1,117,058 | ||||||
144A, 4.125%, 8/15/30 | 1,620,000 | 1,731,375 | ||||||
XHR LP, 144A, | 648,000 | 687,690 | ||||||
|
| |||||||
(Cost $37,736,871) | 38,469,356 | |||||||
|
| |||||||
| Venture Capital — 0.7% | ||||||||
Icahn Enterprises LP / Icahn Enterprises Finance Corp. | 817,000 | 833,340 | ||||||
4.75%, 9/15/24 | 1,383,000 | 1,435,675 | ||||||
6.375%, 12/15/25 | 934,000 | 963,188 | ||||||
6.25%, 5/15/26 | 1,561,000 | 1,646,855 | ||||||
|
| |||||||
(Cost $4,850,321) | 4,879,058 | |||||||
|
| |||||||
| Industrial — 6.9% | ||||||||
| Aerospace/Defense — 1.8% | ||||||||
Bombardier, Inc., 144A, | 725,000 | 780,495 | ||||||
Howmet Aerospace, Inc. | 1,617,000 | 1,779,153 | ||||||
6.875%, 5/1/25 | 1,508,000 | 1,784,160 | ||||||
Rolls-Royce PLC, 144A, | 1,355,000 | 1,380,677 | ||||||
Spirit AeroSystems, Inc., 144A, | 625,000 | 654,712 | ||||||
TransDigm, Inc. | 1,747,000 | 1,871,474 | ||||||
144A, 6.25%, 3/15/26 | 5,366,000 | 5,647,715 | ||||||
|
| |||||||
(Cost $13,717,740) | 13,898,386 | |||||||
|
| |||||||
| Building Materials — 0.2% | ||||||||
Builders FirstSource, Inc., 144A, | 909,000 | 971,494 | ||||||
JELD-WEN, Inc., 144A, | 692,000 | 706,072 | ||||||
|
| |||||||
(Cost $1,664,960) | 1,677,566 | |||||||
|
| |||||||
| Electrical Components & Equipment — 0.5% | ||||||||
WESCO Distribution, Inc. | 1,876,000 | 2,020,340 | ||||||
144A, 7.25%, 6/15/28 | 1,657,000 | 1,844,970 | ||||||
|
| |||||||
(Cost $3,818,351) | 3,865,310 | |||||||
|
| |||||||
| Electronics — 1.1% | ||||||||
Imola Merger Corp., 144A, | 2,590,000 | 2,683,887 | ||||||
| See Notes to Financial Statements. | 32 |
DBX ETF Trust
Schedule of Investments
Xtrackers Low Beta High Yield Bond ETF (Continued)
August 31, 2021
Principal | Value | |||||||
| Electronics (Continued) | ||||||||
Sensata Technologies BV | $ | 816,000 | $ | 874,964 | ||||
144A, 5.625%, 11/1/24 | 640,000 | 712,800 | ||||||
144A, 5.00%, 10/1/25 | 765,000 | 856,127 | ||||||
144A, 4.00%, 4/15/29 | 1,295,000 | 1,341,374 | ||||||
Sensata Technologies, Inc. | 587,000 | 630,350 | ||||||
144A, 3.75%, 2/15/31 | 953,000 | 959,085 | ||||||
|
| |||||||
(Cost $7,980,497) | 8,058,587 | |||||||
|
| |||||||
| Engineering & Construction — 0.1% | ||||||||
Fluor Corp., | 685,000 | 720,781 | ||||||
|
| |||||||
| Environmental Control — 0.7% | ||||||||
Covanta Holding Corp. | 518,000 | 535,483 | ||||||
6.00%, 1/1/27 | 593,000 | 614,496 | ||||||
GFL Environmental, Inc. | 625,000 | 649,219 | ||||||
144A, 3.75%, 8/1/25 | 1,013,000 | 1,044,656 | ||||||
144A, 5.125%, 12/15/26 | 625,000 | 660,156 | ||||||
144A, 3.50%, 9/1/28 | 971,000 | 970,175 | ||||||
Stericycle, Inc., 144A, | 750,000 | 769,710 | ||||||
|
| |||||||
(Cost $5,228,206) | 5,243,895 | |||||||
|
| |||||||
| Miscellaneous Manufacturing — 0.1% | ||||||||
Hillenbrand, Inc., | 497,000 | 526,199 | ||||||
|
| |||||||
| Packaging & Containers — 2.1% | ||||||||
Ardagh Metal Packaging Finance USA LLC / Ardagh Metal Packaging Finance PLC, 144A, | 777,000 | 783,799 | ||||||
Ardagh Packaging Finance PLC / Ardagh Holdings USA, Inc. | 907,000 | 950,082 | ||||||
144A, 4.125%, 8/15/26 | 1,636,000 | 1,702,994 | ||||||
Ball Corp. | 1,264,000 | 1,338,260 | ||||||
5.25%, 7/1/25 | 1,295,000 | 1,464,969 | ||||||
4.875%, 3/15/26 | 1,046,000 | 1,175,442 | ||||||
2.875%, 8/15/30 | 1,684,000 | 1,690,382 | ||||||
Berry Global, Inc., 144A, | 648,000 | 682,830 | ||||||
Crown Americas LLC / Crown Americas Capital Corp. IV, | 1,295,000 | 1,358,714 | ||||||
Owens-Brockway Glass Container, Inc., 144A, | 877,000 | 932,909 | ||||||
Sealed Air Corp. | 532,000 | 551,285 | ||||||
144A, 5.25%, 4/1/23 | 550,000 | 578,188 | ||||||
144A, 5.125%, 12/1/24 | 573,000 | 622,619 | ||||||
Principal | Value | |||||||
| Packaging & Containers (Continued) | ||||||||
144A, 5.50%, 9/15/25 | $ | 493,000 | $ | 553,718 | ||||
144A, 4.00%, 12/1/27 | 550,000 | 590,741 | ||||||
Silgan Holdings, Inc., | 642,000 | 665,228 | ||||||
|
| |||||||
(Cost $15,383,302) | 15,642,160 | |||||||
|
| |||||||
| Transportation — 0.3% | ||||||||
XPO Logistics, Inc. | 690,000 | 690,000 | ||||||
144A, 6.25%, 5/1/25 | 1,438,000 | 1,520,685 | ||||||
|
| |||||||
(Cost $2,206,568) | 2,210,685 | |||||||
|
| |||||||
| Technology — 4.6% | ||||||||
| Computers — 1.3% | ||||||||
Dell International LLC / EMC Corp., 144A, | 1,553,000 | 1,587,943 | ||||||
EMC Corp., | 1,607,000 | 1,661,236 | ||||||
Seagate HDD Cayman | 443,000 | 472,018 | ||||||
4.875%, 3/1/24 | 1,479,000 | 1,599,331 | ||||||
4.75%, 1/1/25 | 340,000 | 375,343 | ||||||
4.875%, 6/1/27 | 540,000 | 604,951 | ||||||
Vericast Corp., 144A, | 20,200 | 21,436 | ||||||
Western Digital Corp., | 2,979,000 | 3,330,760 | ||||||
|
| |||||||
(Cost $9,509,885) | 9,653,018 | |||||||
|
| |||||||
| Office/Business Equipment — 0.7% | ||||||||
CDW LLC / CDW Finance Corp. | 546,000 | 604,395 | ||||||
4.125%, 5/1/25 | 795,000 | 827,794 | ||||||
4.25%, 4/1/28 | 945,000 | 991,069 | ||||||
3.25%, 2/15/29 | 875,000 | 900,156 | ||||||
Xerox Corp., | 1,647,000 | 1,726,797 | ||||||
|
| |||||||
(Cost $4,972,769) | 5,050,211 | |||||||
|
| |||||||
| Semiconductors — 0.3% | ||||||||
Microchip Technology, Inc., | 1,501,000 | 1,582,991 | ||||||
ON Semiconductor Corp., 144A, | 868,000 | 906,010 | ||||||
|
| |||||||
(Cost $2,453,105) | 2,489,001 | |||||||
|
| |||||||
| Software — 2.3% | ||||||||
CDK Global, Inc. | 458,000 | 508,952 | ||||||
4.875%, 6/1/27 | 1,144,000 | 1,202,630 | ||||||
144A, 5.25%, 5/15/29 | 759,000 | 826,149 | ||||||
Dun & Bradstreet Corp. | 615,000 | 648,825 | ||||||
144A, 10.25%, 2/15/27 | 623,000 | 676,737 | ||||||
MSCI, Inc. | 712,000 | 760,274 | ||||||
144A, 4.00%, 11/15/29 | 1,295,000 | 1,387,269 | ||||||
144A, 3.625%, 9/1/30 | 1,166,000 | 1,229,780 | ||||||
| See Notes to Financial Statements. | 33 |
DBX ETF Trust
Schedule of Investments
Xtrackers Low Beta High Yield Bond ETF (Continued)
August 31, 2021
Principal | Value | |||||||
| Software (Continued) | ||||||||
144A, 3.875%, 2/15/31 | $ | 1,295,000 | $ | 1,384,031 | ||||
144A, 3.625%, 11/1/31 | 777,000 | 826,033 | ||||||
144A, 3.25%, 8/15/33 | 907,000 | 935,434 | ||||||
Open Text Corp. | 1,063,000 | 1,098,610 | ||||||
144A, 3.875%, 2/15/28 | 1,166,000 | 1,202,437 | ||||||
PTC, Inc. | 613,000 | 627,559 | ||||||
144A, 4.00%, 2/15/28 | 678,000 | 701,730 | ||||||
SS&C Technologies, Inc., 144A, | 2,502,000 | 2,652,620 | ||||||
Twilio, Inc., | 790,000 | 816,426 | ||||||
|
| |||||||
(Cost $17,277,036) | 17,485,496 | |||||||
|
| |||||||
| Utilities — 2.7% | ||||||||
| Electric — 2.2% | ||||||||
Calpine Corp., 144A, | 1,063,000 | 1,097,547 | ||||||
Clearway Energy Operating LLC, 144A, | 1,070,000 | 1,134,146 | ||||||
DPL, Inc., | 521,000 | 558,382 | ||||||
FirstEnergy Corp. | 1,193,000 | 1,243,643 | ||||||
Series B, 4.40%, 7/15/27 | 1,827,000 | 2,052,695 | ||||||
2.65%, 3/1/30 | 754,000 | 769,080 | ||||||
Series B, 2.25%, 9/1/30 | 678,000 | 672,196 | ||||||
FirstEnergy Transmission LLC | 777,000 | 856,066 | ||||||
144A, 2.866%, 9/15/28 | 648,000 | 686,104 | ||||||
NextEra Energy Operating Partners LP | 907,000 | 958,608 | ||||||
144A, 3.875%, 10/15/26 | 736,000 | 781,319 | ||||||
144A, 4.50%, 9/15/27 | 652,000 | 706,044 | ||||||
NRG Energy, Inc. | 30,000 | 31,173 | ||||||
5.75%, 1/15/28 | 1,063,000 | 1,137,410 | ||||||
Principal | Value | |||||||
| Electric (Continued) | ||||||||
144A, 3.375%, 2/15/29 | $ | 687,000 | $ | 691,294 | ||||
144A, 5.25%, 6/15/29 | 906,000 | 984,777 | ||||||
TransAlta Corp., | 518,000 | 539,070 | ||||||
Vistra Operations Co. LLC, 144A, | 1,251,000 | 1,288,280 | ||||||
|
| |||||||
(Cost $15,903,971) | 16,187,834 | |||||||
|
| |||||||
| Gas — 0.5% | ||||||||
AmeriGas Partners LP / AmeriGas Finance Corp. | 941,000 | 1,030,395 | ||||||
5.50%, 5/20/25 | 900,000 | 990,000 | ||||||
5.875%, 8/20/26 | 881,000 | 992,226 | ||||||
5.75%, 5/20/27 | 575,000 | 647,758 | ||||||
|
| |||||||
(Cost $3,623,109) | 3,660,379 | |||||||
|
| |||||||
TOTAL CORPORATE BONDS | 738,382,074 | |||||||
|
| |||||||
Number | ||||||||
| SECURITIES LENDING COLLATERAL — 0.6% | ||||||||
DWS Government & Agency Securities Portfolio “DWS Government Cash Institutional Shares”, 0.01% (c)(d) | 4,866,433 | 4,866,433 | ||||||
|
| |||||||
| CASH EQUIVALENTS — 4.0% | ||||||||
DWS Government Money Market Series “Institutional Shares”, 0.04% (c) | 29,654,545 | 29,654,545 | ||||||
|
| |||||||
TOTAL INVESTMENTS — 103.0% (Cost $762,002,418) | $ | 772,903,052 | ||||||
Other assets and liabilities, | (22,518,784 | ) | ||||||
|
| |||||||
NET ASSETS — 100.0% | $ | 750,384,268 | ||||||
|
| |||||||
A summary of the Fund’s transactions with affiliated investments during the year ended August 31, 2021 is as follows:
| Value ($) at 8/31/2020 | Purchases Cost ($) | Sales Proceeds ($) | Net Realized Gain/(Loss) ($) | Net Change in Unrealized Appreciation (Depreciation) ($) | Income ($) | Capital Gain Distributions ($) | Number of Shares at 8/31/2021 | Value ($) at 8/31/2021 | ||||||||||||||||||||||||||||
CORPORATE BONDS — 0.2% |
| |||||||||||||||||||||||||||||||||||
Financial — 0.2% |
| |||||||||||||||||||||||||||||||||||
Deutsche Bank AG , 3.73%, 1/14/32 (b) |
| |||||||||||||||||||||||||||||||||||
| — | 1,610,022 | — | — | 62,195 | 19,917 | — | 1,619,000 | 1,672,217 | ||||||||||||||||||||||||||||
SECURITIES LENDING COLLATERAL — 0.6% |
| |||||||||||||||||||||||||||||||||||
DWS Government & Agency Securities Portfolio “DWS Government Cash Institutional Shares”, 0.01% (c)(d) |
| |||||||||||||||||||||||||||||||||||
| 612,989 | 4,253,444(e | ) | — | — | — | 227 | — | 4,866,433 | 4,866,433 | |||||||||||||||||||||||||||
CASH EQUIVALENTS — 4.0% |
| |||||||||||||||||||||||||||||||||||
DWS Government Money Market Series “Institutional Shares”, 0.04% (c) |
| |||||||||||||||||||||||||||||||||||
| 1,116,381 | 104,126,511 | (75,588,347 | ) | — | — | 1,775 | — | 29,654,545 | 29,654,545 | |||||||||||||||||||||||||||
|
|
|
|
|
|
|
|
|
|
|
|
|
|
|
|
|
| |||||||||||||||||||
| 1,729,370 | 109,989,977 | (75,588,347 | ) | — | 62,195 | 21,919 | — | 36,139,978 | 36,193,195 | |||||||||||||||||||||||||||
|
|
|
|
|
|
|
|
|
|
|
|
|
|
|
|
|
| |||||||||||||||||||
| See Notes to Financial Statements. | 34 |
DBX ETF Trust
Schedule of Investments
Xtrackers Low Beta High Yield Bond ETF (Continued)
August 31, 2021
| (a) | All or a portion of these securities were on loan. In addition, “Other assets and liabilities, net” may include pending sales that are also on loan. The value of securities loaned at August 31, 2021 amounted to $12,878,522, which is 1.7% of net assets. |
| (b) | Affiliated issuer. This security is owned in proportion with its representation in the index. |
| (c) | Affiliated fund managed by DWS Investment Management Americas, Inc. The rate shown is the annualized seven-day yield at period end. |
| (d) | Represents cash collateral held in connection with securities lending. Income earned by the Fund is net of borrower rebates. In addition, the Fund held non-cash U.S. Treasury securities collateral having a value of $8,439,017. |
| (e) | Represents the net increase (purchase cost) or decrease (sales proceeds) in the amount invested in cash collateral for the year ended August 31, 2021. |
| GMTN: | Global Medium Term Note |
| MTN: | Medium Term Note |
| REGS: | Securities sold under Regulation S may not be offered, sold or delivered within the United States or to, or for the account or benefit of, U.S. persons, except pursuant to an exemption from, or in a transaction not subject to, the registration requirements of the Securities Act of 1933. |
| 144A: | Security exempt from registration under Rule 144A of the Securities Act of 1933. These securities may be resold in transactions exempt from registration, normally to qualified institutional buyers. |
Fair Value Measurements
Various inputs are used in determining the value of the Fund’s investments. These inputs are summarized in three broad levels. Level 1 includes quoted prices in active markets for identical securities. Level 2 includes other significant observable inputs (including quoted prices for similar securities, interest rates, prepayment speeds and credit risk). Level 3 includes significant unobservable inputs (including the Fund’s own assumptions in determining the fair value of investments). The level assigned to the securities valuations may not be an indication of the risk or liquidity associated with investing in those securities.
The following is a summary of the inputs used as of August 31, 2021 in valuing the Fund’s investments. For information on the Fund’s policy regarding the valuation of investments, please refer to the Security Valuation section of Note 2 in the accompanying Notes to Financial Statements.
Assets | Level 1 | Level 2 | Level 3 | Total | ||||||||||||
Corporate Bonds (f) | $ | — | $ | 738,382,074 | $ | — | $ | 738,382,074 | ||||||||
Short-Term Investments (f) | 34,520,978 | — | — | 34,520,978 | ||||||||||||
|
|
|
|
|
|
|
| |||||||||
TOTAL | $ | 34,520,978 | $ | 738,382,074 | $ | — | $ | 772,903,052 | ||||||||
|
|
|
|
|
|
|
| |||||||||
| (f) | See Schedule of Investments for additional detailed categorizations. |
| See Notes to Financial Statements. | 35 |
DBX ETF Trust
Schedule of Investments
Xtrackers Short Duration High Yield Bond ETF
August 31, 2021
Principal | Value | |||||||
| CORPORATE BONDS — 94.6% | ||||||||
| Basic Materials — 3.1% | ||||||||
| Chemicals — 1.6% | ||||||||
Ashland LLC, | $ | 64,000 | $ | 65,920 | ||||
CF Industries, Inc., | 102,000 | 107,420 | ||||||
Consolidated Energy Finance SA, 144A, | 150,000 | 155,062 | ||||||
INEOS Quattro Finance 2 PLC, 144A, | 85,000 | 86,169 | ||||||
NOVA Chemicals Corp. | 144,000 | 152,460 | ||||||
144A, 5.00%, 5/1/25 | 50,000 | 53,325 | ||||||
OCI NV, 144A, | 155,000 | 160,038 | ||||||
Olin Corp., 144A, | 75,000 | 94,106 | ||||||
TPC Group, Inc., 144A, | 151,000 | 139,864 | ||||||
Tronox, Inc., 144A, | 219,000 | 231,319 | ||||||
|
| |||||||
(Cost $1,223,955) | 1,245,683 | |||||||
|
| |||||||
| Iron/Steel — 0.7% | ||||||||
Allegheny Technologies, Inc., | 61,000 | 65,807 | ||||||
Cleveland-Cliffs, Inc. | 109,000 | 126,576 | ||||||
144A, 6.75%, 3/15/26 | 215,000 | 230,856 | ||||||
United States Steel Corp., | 105,000 | 108,279 | ||||||
|
| |||||||
(Cost $522,593) | 531,518 | |||||||
|
| |||||||
| Mining — 0.8% | ||||||||
Arconic Corp., 144A, | 150,000 | 158,970 | ||||||
FMG Resources August 2006 Pty Ltd., 144A, | 117,000 | 125,992 | ||||||
Freeport-McMoRan, Inc. | 135,000 | 139,725 | ||||||
4.55%, 11/14/24 | 85,000 | 92,119 | ||||||
Hudbay Minerals, Inc., 144A, | 85,000 | 85,548 | ||||||
|
| |||||||
(Cost $594,050) | 602,354 | |||||||
|
| |||||||
| Communications — 13.2% | ||||||||
| Advertising — 0.1% | ||||||||
Outfront Media Capital LLC / Outfront Media Capital Corp., 144A, | ||||||||
(Cost $66,924) | 65,000 | 69,118 | ||||||
|
| |||||||
| Internet — 1.1% | ||||||||
Cogent Communications Group, Inc., 144A, | 70,000 | 71,487 | ||||||
Netflix, Inc. | 38,000 | 38,803 | ||||||
Principal | Value | |||||||
| Internet (Continued) | ||||||||
5.75%, 3/1/24 | $ | 61,000 | $ | 67,850 | ||||
5.875%, 2/15/25 | 160,000 | 183,800 | ||||||
144A, 3.625%, 6/15/25 | 68,000 | 72,930 | ||||||
NortonLifeLock, Inc. | 61,000 | 61,898 | ||||||
144A, 5.00%, 4/15/25 | 115,000 | 116,400 | ||||||
Uber Technologies, Inc., 144A, | 175,000 | 186,813 | ||||||
|
| |||||||
(Cost $787,114) | 799,981 | |||||||
|
| |||||||
| Media — 4.5% | ||||||||
AMC Networks, Inc. | 81,000 | 82,114 | ||||||
4.75%, 8/1/25 (a) | 215,000 | 220,644 | ||||||
CCO Holdings LLC / CCO Holdings Capital Corp. | 68,000 | 68,496 | ||||||
144A, 5.75%, 2/15/26 | 250,000 | 257,187 | ||||||
CSC Holdings LLC | 166,000 | 167,934 | ||||||
5.875%, 9/15/22 | 154,000 | 160,352 | ||||||
5.25%, 6/1/24 | 62,000 | 66,960 | ||||||
Diamond Sports Group LLC / Diamond Sports Finance Co., 144A, | 512,000 | 340,198 | ||||||
DISH DBS Corp. | 318,000 | 329,267 | ||||||
5.00%, 3/15/23 | 225,000 | 235,125 | ||||||
5.875%, 11/15/24 | 405,000 | 435,881 | ||||||
7.75%, 7/1/26 | 285,000 | 326,809 | ||||||
iHeartCommunications, Inc., | 130,000 | 137,475 | ||||||
Meredith Corp., | 148,000 | 153,550 | ||||||
Quebecor Media, Inc., | 115,000 | 122,188 | ||||||
TEGNA, Inc., 144A, | 75,000 | 79,688 | ||||||
Univision Communications, Inc., 144A, | 172,000 | 175,342 | ||||||
Videotron Ltd., 144A, | 111,000 | 122,378 | ||||||
|
| |||||||
(Cost $3,426,775) | 3,481,588 | |||||||
|
| |||||||
| Telecommunications — 7.5% | ||||||||
Cincinnati Bell, Inc., 144A, | 62,000 | 63,240 | ||||||
CommScope Technologies LLC, 144A, | 193,000 | 196,522 | ||||||
CommScope, Inc., 144A, | 310,000 | 325,639 | ||||||
DKT Finance ApS, 144A, | 150,000 | 153,394 | ||||||
Hughes Satellite Systems Corp. | 125,000 | 141,683 | ||||||
6.625%, 8/1/26 | 125,000 | 142,201 | ||||||
| See Notes to Financial Statements. | 36 |
DBX ETF Trust
Schedule of Investments
Xtrackers Short Duration High Yield Bond ETF (Continued)
August 31, 2021
Principal | Value | |||||||
| Telecommunications (Continued) | ||||||||
Lumen Technologies, Inc. | $ | 231,000 | $ | 236,486 | ||||
Series W, 6.75%, 12/1/23 | 162,000 | 178,411 | ||||||
Series Y, 7.50%, 4/1/24 | 216,000 | 240,570 | ||||||
5.625%, 4/1/25 | 123,000 | 133,271 | ||||||
Qwest Corp., | 131,000 | 133,063 | ||||||
Sprint Communications, Inc. | 157,000 | 160,430 | ||||||
6.00%, 11/15/22 | 265,000 | 280,237 | ||||||
Sprint Corp. | 406,000 | 407,401 | ||||||
7.875%, 9/15/23 | 553,000 | 627,213 | ||||||
7.125%, 6/15/24 | 495,000 | 569,869 | ||||||
7.625%, 2/15/25 | 140,000 | 165,900 | ||||||
7.625%, 3/1/26 | 250,000 | 308,550 | ||||||
Telecom Italia SpA, 144A, | 244,000 | 265,216 | ||||||
T-Mobile USA, Inc. | 44,000 | 44,715 | ||||||
2.25%, 2/15/26 | 300,000 | 306,750 | ||||||
2.625%, 4/15/26 | 175,000 | 180,031 | ||||||
VEON Holdings BV, 144A, | 300,000 | 316,883 | ||||||
Viasat, Inc., 144A, | 150,000 | 152,872 | ||||||
|
| |||||||
(Cost $5,631,930) | 5,730,547 | |||||||
|
| |||||||
| Consumer, Cyclical — 27.7% | ||||||||
| Airlines — 3.0% | ||||||||
Air Canada, 144A, | 201,000 | 202,509 | ||||||
American Airlines Group, Inc., 144A, | 100,000 | 89,135 | ||||||
American Airlines, Inc., 144A, | 416,000 | 516,984 | ||||||
Delta Air Lines, Inc. | 130,000 | 131,378 | ||||||
3.80%, 4/19/23 | 100,000 | 103,659 | ||||||
2.90%, 10/28/24 | 266,000 | 271,183 | ||||||
7.375%, 1/15/26 | 169,000 | 199,098 | ||||||
Hawaiian Brand Intellectual Property Ltd. / HawaiianMiles Loyalty Ltd., 144A, | 233,000 | 245,671 | ||||||
United Airlines Holdings, Inc., | 167,000 | 170,549 | ||||||
United Airlines, Inc., 144A, | 326,000 | 338,838 | ||||||
|
| |||||||
(Cost $2,202,130) | 2,269,004 | |||||||
|
| |||||||
| Apparel — 0.6% | ||||||||
Hanesbrands, Inc. | 122,000 | 129,625 | ||||||
144A, 4.875%, 5/15/26 | 222,000 | 242,535 | ||||||
William Carter Co., 144A, | 75,000 | 78,896 | ||||||
|
| |||||||
(Cost $443,749) | 451,056 | |||||||
|
| |||||||
Principal | Value | |||||||
| Auto Manufacturers — 4.7% | ||||||||
Ford Motor Co. | $ | 205,000 | $ | 227,037 | ||||
9.00%, 4/22/25 | 545,000 | 666,508 | ||||||
Ford Motor Credit Co. LLC | 449,000 | 460,225 | ||||||
3.087%, 1/9/23 | 200,000 | 204,000 | ||||||
3.096%, 5/4/23 | 200,000 | 204,690 | ||||||
4.375%, 8/6/23 | 218,000 | 228,115 | ||||||
5.584%, 3/18/24 | 115,000 | 124,769 | ||||||
3.664%, 9/8/24 | 442,000 | 461,338 | ||||||
5.125%, 6/16/25 | 200,000 | 219,750 | ||||||
4.134%, 8/4/25 | 25,000 | 26,719 | ||||||
3.375%, 11/13/25 | 330,000 | 341,962 | ||||||
Jaguar Land Rover Automotive PLC | 300,000 | 301,875 | ||||||
144A, 7.75%, 10/15/25 | 100,000 | 109,105 | ||||||
|
| |||||||
(Cost $3,443,371) | 3,576,093 | |||||||
|
| |||||||
| Auto Parts & Equipment — 1.3% | ||||||||
Adient US LLC, 144A, | 100,000 | 109,147 | ||||||
American Axle & Manufacturing, Inc. | 52,000 | 53,797 | ||||||
6.25%, 3/15/26 | 60,000 | 61,875 | ||||||
Clarios Global LP, 144A, | 134,000 | 142,040 | ||||||
Clarios Global LP / Clarios US Finance Co., 144A, | 100,000 | 105,500 | ||||||
Goodyear Tire & Rubber Co., | 160,000 | 177,448 | ||||||
Tenneco, Inc., | 125,000 | 124,844 | ||||||
ZF North America Capital, Inc., 144A, | 246,000 | 267,832 | ||||||
|
| |||||||
(Cost $1,010,110) | 1,042,483 | |||||||
|
| |||||||
| Distribution/Wholesale — 0.5% | ||||||||
Avient Corp. | 32,000 | 34,040 | ||||||
144A, 5.75%, 5/15/25 | 250,000 | 264,187 | ||||||
Wolverine Escrow LLC, 144A, | 88,000 | 83,710 | ||||||
|
| |||||||
(Cost $371,238) | 381,937 | |||||||
|
| |||||||
| Entertainment — 4.1% | ||||||||
AMC Entertainment Holdings, Inc., 144A, | 60,000 | 64,350 | ||||||
Banijay Entertainment SASU, 144A, | 105,000 | 108,019 | ||||||
Caesars Entertainment, Inc., 144A, | 553,000 | 585,185 | ||||||
Caesars Resort Collection LLC / CRC Finco, Inc. | 163,000 | 171,354 | ||||||
144A, 5.25%, 10/15/25 | 276,000 | 280,264 | ||||||
| See Notes to Financial Statements. | 37 |
DBX ETF Trust
Schedule of Investments
Xtrackers Short Duration High Yield Bond ETF (Continued)
August 31, 2021
Principal | Value | |||||||
| Entertainment (Continued) | ||||||||
Cedar Fair LP / Canada’s Wonderland Co. / Magnum Management Corp. / Millennium Op, 144A, | $ | 192,000 | $ | 200,400 | ||||
Cinemark USA, Inc., 144A, | 13,000 | 12,951 | ||||||
Cirsa Finance International SARL, 144A, | 70,000 | 71,378 | ||||||
International Game Technology PLC | 175,000 | 195,125 | ||||||
144A, 4.125%, 4/15/26 | 200,000 | 207,960 | ||||||
Live Nation Entertainment, Inc., 144A, | 178,000 | 180,670 | ||||||
Mohegan Gaming & Entertainment, 144A, | 183,000 | 192,218 | ||||||
Scientific Games International, Inc. | 52,000 | 56,204 | ||||||
144A, 5.00%, 10/15/25 | 330,000 | 339,834 | ||||||
144A, 8.25%, 3/15/26 | 135,000 | 143,758 | ||||||
Six Flags Entertainment Corp., 144A, | 200,000 | 202,414 | ||||||
Six Flags Theme Parks, Inc., 144A, | 77,000 | 82,390 | ||||||
Vail Resorts, Inc., 144A, | 50,000 | 53,339 | ||||||
|
| |||||||
(Cost $3,098,451) | 3,147,813 | |||||||
|
| |||||||
| Food Service — 0.6% | ||||||||
Aramark Services, Inc., 144A, | 410,000 | 434,518 | ||||||
|
| |||||||
| Home Builders — 0.3% | ||||||||
Meritage Homes Corp., | 80,000 | 91,838 | ||||||
Toll Brothers Finance Corp. | 57,000 | 57,632 | ||||||
4.375%, 4/15/23 | 56,000 | 58,450 | ||||||
|
| |||||||
(Cost $200,066) | 207,920 | |||||||
|
| |||||||
| Housewares — 0.8% | ||||||||
Newell Brands, Inc. | 157,000 | 165,803 | ||||||
4.875%, 6/1/25 | 68,000 | 75,774 | ||||||
4.70%, 4/1/26 | 305,000 | 341,219 | ||||||
|
| |||||||
(Cost $572,373) | 582,796 | |||||||
|
| |||||||
| Leisure Time — 4.8% | ||||||||
Carnival Corp. | 484,000 | 544,345 | ||||||
144A, 10.50%, 2/1/26 (a) | 105,000 | 121,277 | ||||||
144A, 7.625%, 3/1/26 | 515,000 | 546,866 | ||||||
Life Time, Inc. | 212,000 | 217,565 | ||||||
144A, 8.00%, 4/15/26 | 100,000 | 104,875 | ||||||
NCL Corp. Ltd. | 227,000 | 268,146 | ||||||
144A, 3.625%, 12/15/24 | 370,000 | 350,113 | ||||||
144A, 10.25%, 2/1/26 | 160,000 | 185,034 | ||||||
Principal | Value | |||||||
| Leisure Time (Continued) | ||||||||
Royal Caribbean Cruises Ltd. | $ | 88,000 | $ | 90,200 | ||||
144A, 10.875%, 6/1/23 | 336,000 | 378,560 | ||||||
144A, 9.125%, 6/15/23 | 283,000 | 308,824 | ||||||
144A, 11.50%, 6/1/25 | 114,000 | 131,385 | ||||||
144A, 4.25%, 7/1/26 | 110,000 | 107,388 | ||||||
144A, 5.50%, 8/31/26 | 200,000 | 203,000 | ||||||
Viking Cruises Ltd., 144A, | 79,000 | 91,544 | ||||||
|
| |||||||
(Cost $3,616,484) | 3,649,122 | |||||||
|
| |||||||
| Lodging — 3.2% | ||||||||
Boyd Gaming Corp., 144A, | 90,000 | 97,744 | ||||||
Diamond Resorts International, Inc. | 77,000 | 78,492 | ||||||
144A, 10.75%, 9/1/24 | 66,000 | 67,774 | ||||||
Hilton Domestic Operating Co., Inc., 144A, | 81,000 | 85,082 | ||||||
Marriott Ownership Resorts, Inc., 144A, | 65,000 | 68,415 | ||||||
Melco Resorts Finance Ltd. | 200,000 | 203,750 | ||||||
144A, 5.25%, 4/26/26 | 200,000 | 206,004 | ||||||
MGM Resorts International | 230,000 | 238,384 | ||||||
6.00%, 3/15/23 | 204,000 | 216,240 | ||||||
6.75%, 5/1/25 | 91,000 | 96,574 | ||||||
5.75%, 6/15/25 | 200,000 | 219,250 | ||||||
Travel + Leisure Co. | 104,000 | 104,390 | ||||||
3.90%, 3/1/23 | 133,000 | 137,204 | ||||||
144A, 6.625%, 7/31/26 | 150,000 | 169,688 | ||||||
Wynn Las Vegas LLC / Wynn Las Vegas Capital Corp. | 304,000 | 312,296 | ||||||
144A, 5.50%, 3/1/25 | 179,000 | 189,964 | ||||||
|
| |||||||
(Cost $2,436,189) | 2,491,251 | |||||||
|
| |||||||
| Retail — 3.7% | ||||||||
1011778 BC ULC / New Red Finance, Inc., 144A, | 190,000 | 200,450 | ||||||
Bath & Body Works, Inc., 144A, | 76,000 | 98,420 | ||||||
Carvana Co., 144A, | 60,000 | 62,475 | ||||||
eG Global Finance PLC | 100,000 | 102,875 | ||||||
144A, 8.50%, 10/30/25 | 90,000 | 94,392 | ||||||
Ferrellgas LP / Ferrellgas Finance Corp., 144A, 5.375%, 4/1/26 | 288,000 | 283,320 | ||||||
Gap, Inc. | 85,000 | 95,370 | ||||||
144A, 8.625%, 5/15/25 | 120,000 | 131,076 | ||||||
Golden Nugget, Inc., 144A, | 183,000 | 183,650 | ||||||
| See Notes to Financial Statements. | 38 |
DBX ETF Trust
Schedule of Investments
Xtrackers Short Duration High Yield Bond ETF (Continued)
August 31, 2021
Principal | Value | |||||||
| Retail (Continued) | ||||||||
IRB Holding Corp., 144A, | $ | 237,000 | $ | 253,720 | ||||
Macy’s Retail Holdings LLC, | 171,000 | 174,206 | ||||||
NMG Holding Co, Inc. / Neiman Marcus Group LLC, 144A, | 155,000 | 164,300 | ||||||
Party City Holdings, Inc., 144A, | 105,000 | 109,594 | ||||||
Penske Automotive Group, Inc., | 150,000 | 155,379 | ||||||
QVC, Inc. | 101,000 | 105,924 | ||||||
4.85%, 4/1/24 | 148,000 | 161,098 | ||||||
4.45%, 2/15/25 | 150,000 | 160,677 | ||||||
Rite Aid Corp. | 100,000 | 102,974 | ||||||
144A, 8.00%, 11/15/26 | 91,000 | 93,948 | ||||||
Yum! Brands, Inc., 144A, | 125,000 | 134,830 | ||||||
|
| |||||||
(Cost $2,804,362) | 2,868,678 | |||||||
|
| |||||||
| Toys/Games/Hobbies — 0.1% | ||||||||
Mattel, Inc., 144A, | 90,000 | 93,606 | ||||||
|
| |||||||
| Consumer, Non-cyclical — 11.2% | ||||||||
| Commercial Services — 1.8% | ||||||||
ADT Security Corp., | 98,000 | 103,145 | ||||||
Allied Universal Holdco LLC / Allied Universal Finance Corp., 144A, | 316,000 | 338,120 | ||||||
APX Group, Inc., | 33,000 | 33,668 | ||||||
Nielsen Co. Luxembourg SARL, 144A, | 63,000 | 64,657 | ||||||
Prime Security Services Borrower LLC / Prime Finance, Inc. | 92,000 | 98,095 | ||||||
144A, 5.75%, 4/15/26 | 243,000 | 263,190 | ||||||
Sabre GLBL, Inc. | 149,000 | 171,909 | ||||||
144A, 7.375%, 9/1/25 | 96,000 | 101,640 | ||||||
Square, Inc., 144A, | 165,000 | 169,707 | ||||||
|
| |||||||
(Cost $1,318,767) | 1,344,131 | |||||||
|
| |||||||
| Cosmetics/Personal Care — 0.4% | ||||||||
Coty, Inc. | 175,000 | 180,639 | ||||||
144A, 6.50%, 4/15/26 (a) | 127,000 | 131,127 | ||||||
|
| |||||||
(Cost $305,153) | 311,766 | |||||||
|
| |||||||
Principal | Value | |||||||
| Food — 1.8% | ||||||||
Albertsons Cos., Inc. / Safeway, Inc. / New Albertsons LP / Albertsons LLC | $ | 102,000 | $ | 105,079 | ||||
144A, 3.25%, 3/15/26 | 100,000 | 102,750 | ||||||
144A, 7.50%, 3/15/26 | 150,000 | 163,465 | ||||||
B&G Foods, Inc., | 120,000 | 123,300 | ||||||
Kraft Heinz Foods Co., | 330,000 | 350,134 | ||||||
Lamb Weston Holdings, Inc., 144A, | 163,000 | 167,483 | ||||||
Sigma Holdco BV, 144A, | 80,000 | 80,300 | ||||||
US Foods, Inc., 144A, | 269,000 | 283,795 | ||||||
|
| |||||||
(Cost $1,366,016) | 1,376,306 | |||||||
|
| |||||||
| Healthcare-Services — 3.8% | ||||||||
CHS/Community Health Systems, Inc. | 270,000 | 284,142 | ||||||
144A, 8.00%, 3/15/26 | 250,000 | 267,925 | ||||||
HCA, Inc. | 191,000 | 206,041 | ||||||
5.375%, 2/1/25 | 450,000 | 507,661 | ||||||
5.875%, 2/15/26 | 231,000 | 268,203 | ||||||
Legacy LifePoint Health LLC, 144A, | 100,000 | 105,375 | ||||||
Molina Healthcare, Inc., | 98,000 | 101,724 | ||||||
Tenet Healthcare Corp. | 286,000 | 310,310 | ||||||
4.625%, 7/15/24 | 218,000 | 221,270 | ||||||
144A, 4.625%, 9/1/24 | 116,000 | 119,104 | ||||||
144A, 7.50%, 4/1/25 | 200,000 | 214,258 | ||||||
144A, 4.875%, 1/1/26 | 304,000 | 315,719 | ||||||
|
| |||||||
(Cost $2,861,979) | 2,921,732 | |||||||
|
| |||||||
| Pharmaceuticals — 3.4% | ||||||||
Bausch Health Americas, Inc., 144A, | 300,000 | 323,250 | ||||||
Bausch Health Cos., Inc. | 456,000 | 466,830 | ||||||
144A, 5.50%, 11/1/25 | 313,000 | 320,559 | ||||||
144A, 9.00%, 12/15/25 | 190,000 | 202,350 | ||||||
Elanco Animal Health, Inc., | 108,000 | 115,835 | ||||||
Teva Pharmaceutical Finance Co. BV | 101,000 | 101,551 | ||||||
2.95%, 12/18/22 | 215,000 | 216,881 | ||||||
Teva Pharmaceutical Finance Netherlands III BV | 506,000 | 500,808 | ||||||
6.00%, 4/15/24 | 190,000 | 199,223 | ||||||
7.125%, 1/31/25 | 136,000 | 148,709 | ||||||
|
| |||||||
(Cost $2,565,039) | 2,595,996 | |||||||
|
| |||||||
| See Notes to Financial Statements. | 39 |
DBX ETF Trust
Schedule of Investments
Xtrackers Short Duration High Yield Bond ETF (Continued)
August 31, 2021
Principal | Value | |||||||
| Energy — 13.4% | ||||||||
| Energy-Alternate Sources — 0.3% | ||||||||
TerraForm Power Operating LLC, 144A, | $ | 256,000 | $ | 263,360 | ||||
|
| |||||||
| Oil & Gas — 8.2% | ||||||||
Antero Resources Corp., | 100,000 | 102,215 | ||||||
Apache Corp., | 100,000 | 108,346 | ||||||
Callon Petroleum Co., | 88,000 | 85,030 | ||||||
Calumet Specialty Products Partners LP / Calumet Finance Corp., 144A, | 100,000 | 103,375 | ||||||
Chesapeake Energy Corp., 144A, | 130,000 | 136,105 | ||||||
Citgo Holding, Inc., 144A, | 86,000 | 86,279 | ||||||
CITGO Petroleum Corp., 144A, | 566,000 | 580,857 | ||||||
Continental Resources, Inc. | 24,000 | 25,050 | ||||||
3.80%, 6/1/24 | 204,000 | 218,025 | ||||||
CrownRock LP / CrownRock Finance, Inc., 144A, | 270,000 | 278,419 | ||||||
CVR Energy, Inc., 144A, | 27,000 | 26,495 | ||||||
Endeavor Energy Resources LP / EER Finance, Inc., 144A, | 184,000 | 195,353 | ||||||
EQT Corp. | 87,000 | 88,943 | ||||||
6.625%, 2/1/25 | 174,000 | 199,660 | ||||||
144A, 3.125%, 5/15/26 | 76,000 | 78,185 | ||||||
Laredo Petroleum, Inc., | 75,000 | 77,183 | ||||||
Leviathan Bond Ltd. | 72,000 | 75,223 | ||||||
144A,REGS, 6.125%, 6/30/25 | 93,000 | 101,570 | ||||||
Moss Creek Resources Holdings, Inc., 144A, | 155,000 | 132,621 | ||||||
Murphy Oil Corp., | 90,000 | 92,137 | ||||||
Nabors Industries Ltd., 144A, | 85,000 | 79,156 | ||||||
Nabors Industries, Inc., | 87,000 | 73,515 | ||||||
Occidental Petroleum Corp. | 150,000 | 168,968 | ||||||
2.90%, 8/15/24 | 100,000 | 102,625 | ||||||
3.50%, 6/15/25 | 160,000 | 168,065 | ||||||
5.875%, 9/1/25 (a) | 264,000 | 297,346 | ||||||
5.50%, 12/1/25 (a) | 100,000 | 111,629 | ||||||
5.55%, 3/15/26 | 194,000 | 216,553 | ||||||
3.40%, 4/15/26 | 75,000 | 77,156 | ||||||
3.20%, 8/15/26 | 300,000 | 310,004 | ||||||
Principal | Value | |||||||
| Oil & Gas (Continued) | ||||||||
Ovintiv Exploration, Inc. | $ | 130,000 | $ | 144,948 | ||||
5.375%, 1/1/26 | 100,000 | 113,146 | ||||||
PBF Holding Co. LLC / PBF Finance Corp. | 25,000 | 24,156 | ||||||
7.25%, 6/15/25 | 50,000 | 35,066 | ||||||
PDC Energy, Inc. | 72,000 | 73,272 | ||||||
5.75%, 5/15/26 (a) | 161,000 | 167,376 | ||||||
Puma International Financing SA | 200,000 | 200,751 | ||||||
144A, 5.00%, 1/24/26 | 200,000 | 200,427 | ||||||
Range Resources Corp. | 199,000 | 204,484 | ||||||
4.875%, 5/15/25 (a) | 115,000 | 119,169 | ||||||
SM Energy Co., 144A, | 159,000 | 177,484 | ||||||
Southwestern Energy Co. | 130,000 | 141,848 | ||||||
7.50%, 4/1/26 (a) | 100,000 | 106,125 | ||||||
Transocean, Inc. | 76,000 | 59,375 | ||||||
144A, 7.50%, 1/15/26 | 141,000 | 108,041 | ||||||
|
| |||||||
(Cost $5,989,214) | 6,271,756 | |||||||
|
| |||||||
| Oil & Gas Services — 1.2% | ||||||||
TechnipFMC PLC, 144A, | 163,000 | 173,224 | ||||||
USA Compression Partners LP / USA Compression Finance Corp., | 110,000 | 114,437 | ||||||
Weatherford International Ltd. | 193,000 | 200,961 | ||||||
144A, 11.00%, 12/1/24 | 385,000 | 402,806 | ||||||
|
| |||||||
(Cost $824,124) | 891,428 | |||||||
|
| |||||||
| Pipelines — 3.7% | ||||||||
Antero Midstream Partners LP / Antero Midstream Finance Corp., 144A, | 75,000 | 82,688 | ||||||
Buckeye Partners LP | 68,000 | 70,298 | ||||||
144A, 4.125%, 3/1/25 | 68,000 | 70,382 | ||||||
Crestwood Midstream Partners LP / Crestwood Midstream Finance Corp., | 50,000 | 51,125 | ||||||
DCP Midstream Operating LP | 73,000 | 75,135 | ||||||
5.375%, 7/15/25 | 112,000 | 123,480 | ||||||
EnLink Midstream Partners LP | 180,000 | 187,461 | ||||||
4.15%, 6/1/25 | 50,000 | 51,561 | ||||||
4.85%, 7/15/26 | 250,000 | 260,498 | ||||||
EQM Midstream Partners LP | 100,000 | 104,625 | ||||||
4.00%, 8/1/24 | 25,000 | 25,620 | ||||||
144A, 6.00%, 7/1/25 | 170,000 | 183,812 | ||||||
| See Notes to Financial Statements. | 40 |
DBX ETF Trust
Schedule of Investments
Xtrackers Short Duration High Yield Bond ETF (Continued)
August 31, 2021
Principal | Value | |||||||
| Pipelines (Continued) | ||||||||
Genesis Energy LP / Genesis Energy Finance Corp., | $ | 60,000 | $ | 58,876 | ||||
Hess Midstream Operations LP, 144A, | 100,000 | 103,962 | ||||||
NGL Energy Partners LP / NGL Energy Finance Corp., | 525,000 | 491,531 | ||||||
NuStar Logistics LP | 100,000 | 107,625 | ||||||
6.00%, 6/1/26 | 150,000 | 162,530 | ||||||
Rockies Express Pipeline LLC, 144A, | 54,000 | 55,646 | ||||||
Tallgrass Energy Partners LP / Tallgrass Energy Finance Corp., 144A, | 98,000 | 105,717 | ||||||
Targa Resources Partners LP / Targa Resources Partners Finance Corp., | 100,000 | 104,750 | ||||||
Western Midstream Operating LP | 300,000 | 315,621 | ||||||
4.65%, 7/1/26 | 33,000 | 35,615 | ||||||
|
| |||||||
(Cost $2,768,979) | 2,828,558 | |||||||
|
| |||||||
| Financial — 10.8% | ||||||||
| Banks — 2.2% | ||||||||
CIT Group, Inc. | 275,000 | 286,261 | ||||||
5.00%, 8/1/23 | 114,000 | 122,977 | ||||||
4.75%, 2/16/24 | 50,000 | 54,000 | ||||||
3.929%, 6/19/24 | 50,000 | 52,500 | ||||||
5.25%, 3/7/25 | 75,000 | 84,634 | ||||||
Commerzbank AG, 144A, | 136,000 | 153,583 | ||||||
Freedom Mortgage Corp. | 102,000 | 103,408 | ||||||
144A, 8.25%, 4/15/25 | 76,000 | 77,627 | ||||||
144A, 7.625%, 5/1/26 | 180,000 | 180,516 | ||||||
Intesa Sanpaolo SpA | 265,000 | 287,781 | ||||||
144A, 5.71%, 1/15/26 | 290,000 | 326,382 | ||||||
|
| |||||||
(Cost $1,699,728) | 1,729,669 | |||||||
|
| |||||||
| Diversified Financial Services — 3.4% | ||||||||
Ally Financial, Inc., | 180,000 | 205,604 | ||||||
LD Holdings Group LLC, 144A, | 18,000 | 18,382 | ||||||
Navient Corp. | 149,000 | 154,774 | ||||||
5.50%, 1/25/23 | 166,000 | 174,300 | ||||||
7.25%, 9/25/23 | 68,000 | 74,792 | ||||||
MTN, 6.125%, 3/25/24 | 145,000 | 157,390 | ||||||
5.875%, 10/25/24 | 56,000 | 61,093 | ||||||
6.75%, 6/25/25 | 110,000 | 122,787 | ||||||
6.75%, 6/15/26 | 100,000 | 112,750 | ||||||
Principal | Value | |||||||
| Diversified Financial Services (Continued) | ||||||||
OneMain Finance Corp. | $ | 153,000 | $ | 157,973 | ||||
5.625%, 3/15/23 | 147,000 | 155,465 | ||||||
6.125%, 3/15/24 | 117,000 | 126,214 | ||||||
6.875%, 3/15/25 | 265,000 | 300,444 | ||||||
8.875%, 6/1/25 | 200,000 | 219,590 | ||||||
7.125%, 3/15/26 | 255,000 | 298,031 | ||||||
PennyMac Financial Services, Inc., 144A, | 106,000 | 109,820 | ||||||
United Wholesale Mortgage LLC, 144A, | 130,000 | 133,413 | ||||||
|
| |||||||
(Cost $2,524,923) | 2,582,822 | |||||||
|
| |||||||
| Insurance — 0.8% | ||||||||
Acrisure LLC / Acrisure Finance, Inc., 144A, | 126,000 | 128,520 | ||||||
AssuredPartners, Inc., 144A, | 176,000 | 179,080 | ||||||
HUB International Ltd., 144A, | 150,000 | 155,377 | ||||||
Radian Group, Inc., | 160,000 | 180,600 | ||||||
|
| |||||||
(Cost $629,847) | 643,577 | |||||||
|
| |||||||
| Real Estate — 0.4% | ||||||||
Realogy Group LLC / Realogy Co.-Issuer Corp. | 62,000 | 64,623 | ||||||
144A, 7.625%, 6/15/25 | 200,000 | 215,598 | ||||||
|
| |||||||
(Cost $272,149) | 280,221 | |||||||
|
| |||||||
| Real Estate Investment Trusts — 3.2% | ||||||||
Diversified Healthcare Trust, | 248,000 | 273,110 | ||||||
HAT Holdings I LLC / HAT Holdings II LLC, 144A, | 150,000 | 153,045 | ||||||
iStar, Inc. | 94,000 | 99,880 | ||||||
4.25%, 8/1/25 | 150,000 | 156,562 | ||||||
5.50%, 2/15/26 | 65,000 | 68,169 | ||||||
Ladder Capital Finance Holdings LLLP / Ladder Capital Finance Corp., 144A, | 76,000 | 76,361 | ||||||
MGM Growth Properties Operating Partnership LP / MGP Finance Co-Issuer, Inc. | 102,000 | 111,307 | ||||||
144A, 4.625%, 6/15/25 | 122,000 | 131,278 | ||||||
SBA Communications Corp., | 143,000 | 145,324 | ||||||
Service Properties Trust | 118,000 | 119,333 | ||||||
4.35%, 10/1/24 | 130,000 | 131,950 | ||||||
7.50%, 9/15/25 | 170,000 | 192,116 | ||||||
Starwood Property Trust, Inc. | 70,000 | 70,100 | ||||||
4.75%, 3/15/25 | 70,000 | 73,412 | ||||||
144A, 3.625%, 7/15/26 | 65,000 | 65,488 | ||||||
| See Notes to Financial Statements. | 41 |
DBX ETF Trust
Schedule of Investments
Xtrackers Short Duration High Yield Bond ETF (Continued)
August 31, 2021
Principal | Value | |||||||
| Real Estate Investment Trusts (Continued) | ||||||||
Uniti Group LP / Uniti Fiber Holdings, Inc. / CSL Capital LLC | $ | 150,000 | $ | 154,462 | ||||
144A, 7.875%, 2/15/25 | 322,000 | 344,540 | ||||||
VICI Properties LP / VICI Note Co., Inc., 144A, | 50,000 | 51,313 | ||||||
XHR LP, 144A, | 50,000 | 53,063 | ||||||
|
| |||||||
(Cost $2,405,609) | 2,470,813 | |||||||
|
| |||||||
| Venture Capital — 0.8% | ||||||||
Icahn Enterprises LP / Icahn Enterprises Finance Corp. | 115,000 | 117,300 | ||||||
4.75%, 9/15/24 | 178,000 | 184,779 | ||||||
6.25%, 5/15/26 | 270,000 | 284,850 | ||||||
|
| |||||||
(Cost $575,292) | 586,929 | |||||||
|
| |||||||
| Industrial — 9.4% | ||||||||
| Aerospace/Defense — 4.0% | ||||||||
Bombardier, Inc. | 74,000 | 74,181 | ||||||
144A, 6.125%, 1/15/23 | 90,000 | 96,889 | ||||||
144A, 7.50%, 12/1/24 | �� | 250,000 | 260,888 | |||||
144A, 7.50%, 3/15/25 | 225,000 | 231,417 | ||||||
144A, 7.125%, 6/15/26 | 213,000 | 224,981 | ||||||
Howmet Aerospace, Inc. | 241,000 | 265,168 | ||||||
6.875%, 5/1/25 | 125,000 | 147,891 | ||||||
Rolls-Royce PLC, 144A, | 156,000 | 158,956 | ||||||
Spirit AeroSystems, Inc. | 100,000 | 104,754 | ||||||
144A, 7.50%, 4/15/25 | 45,000 | 47,700 | ||||||
TransDigm, Inc. | 180,000 | 192,825 | ||||||
144A, 6.25%, 3/15/26 | 880,000 | 926,200 | ||||||
Triumph Group, Inc. | 114,000 | 125,685 | ||||||
144A, 6.25%, 9/15/24 | 71,000 | 71,962 | ||||||
7.75%, 8/15/25 (a) | 118,000 | 117,853 | ||||||
|
| |||||||
(Cost $2,905,427) | 3,047,350 | |||||||
|
| |||||||
| Building Materials — 0.1% | ||||||||
JELD-WEN, Inc., 144A, | 80,000 | 81,627 | ||||||
|
| |||||||
| Electrical Components & Equipment — 0.5% | ||||||||
WESCO Distribution, Inc., 144A, | 325,000 | 350,005 | ||||||
|
| |||||||
| Electronics — 0.3% | ||||||||
Sensata Technologies BV | 76,000 | 81,492 | ||||||
144A, 5.625%, 11/1/24 | 61,000 | 67,938 | ||||||
144A, 5.00%, 10/1/25 | 107,000 | 119,746 | ||||||
|
| |||||||
(Cost $261,896) | 269,176 | |||||||
|
| |||||||
Principal | Value | |||||||
| Engineering & Construction — 0.3% | ||||||||
Brand Industrial Services, Inc., 144A, | $ | 153,000 | $ | 154,339 | ||||
Fluor Corp., | 68,000 | 71,552 | ||||||
|
| |||||||
(Cost $220,838) | 225,891 | |||||||
|
| |||||||
| Environmental Control — 0.6% | ||||||||
GFL Environmental, Inc. | 232,000 | 240,990 | ||||||
144A, 3.75%, 8/1/25 | 50,000 | 51,562 | ||||||
Stericycle, Inc., 144A, | 149,000 | 152,916 | ||||||
|
| |||||||
(Cost $440,633) | 445,468 | |||||||
|
| |||||||
| Miscellaneous Manufacturing — 0.3% | ||||||||
FXI Holdings, Inc., 144A, | 175,000 | 180,022 | ||||||
Hillenbrand, Inc., | 50,000 | 52,938 | ||||||
|
| |||||||
(Cost $227,528) | 232,960 | |||||||
|
| |||||||
| Packaging & Containers — 2.8% | ||||||||
Ball Corp. | 292,000 | 298,205 | ||||||
4.00%, 11/15/23 | 83,000 | 87,876 | ||||||
5.25%, 7/1/25 | 250,000 | 282,812 | ||||||
4.875%, 3/15/26 | 100,000 | 112,375 | ||||||
Crown Americas LLC / Crown Americas Capital Corp. IV, | 157,000 | 164,724 | ||||||
Flex Acquisition Co., Inc., 144A, | 206,000 | 208,317 | ||||||
LABL, Inc., 144A, | 100,000 | 105,125 | ||||||
Mauser Packaging Solutions Holding Co. | 400,000 | 405,180 | ||||||
144A, 7.25%, 4/15/25 | 182,000 | 180,144 | ||||||
Owens-Brockway Glass Container, Inc., 144A, | 110,000 | 117,013 | ||||||
Sealed Air Corp. | 58,000 | 60,103 | ||||||
144A, 5.125%, 12/1/24 | 50,000 | 54,330 | ||||||
144A, 5.50%, 9/15/25 | 80,000 | 89,853 | ||||||
|
| |||||||
(Cost $2,117,318) | 2,166,057 | |||||||
|
| |||||||
| Transportation — 0.4% | ||||||||
XPO Logistics, Inc., 144A, | 275,000 | 290,813 | ||||||
|
| |||||||
| Trucking & Leasing — 0.1% | ||||||||
Fortress Transportation and Infrastructure Investors LLC, 144A, | 105,000 | 108,281 | ||||||
|
| |||||||
| See Notes to Financial Statements. | 42 |
DBX ETF Trust
Schedule of Investments
Xtrackers Short Duration High Yield Bond ETF (Continued)
August 31, 2021
Principal | Value | |||||||
| Technology — 4.0% | ||||||||
| Computers — 1.6% | ||||||||
Diebold Nixdorf, Inc. | $ | 33,000 | $ | 33,743 | ||||
144A, 9.375%, 7/15/25 | 200,000 | 220,000 | ||||||
EMC Corp., | 121,000 | 125,084 | ||||||
Exela Intermediate LLC / Exela Finance, Inc., 144A, | 161,000 | 120,951 | ||||||
Seagate HDD Cayman | 103,000 | 111,380 | ||||||
4.75%, 1/1/25 | 120,000 | 132,474 | ||||||
Vericast Corp., 144A, | 66,000 | 66,956 | ||||||
Western Digital Corp., | 375,000 | 419,280 | ||||||
|
| |||||||
(Cost $1,169,684) | 1,229,868 | |||||||
|
| |||||||
| Office/Business Equipment — 0.8% | ||||||||
CDW LLC / CDW Finance Corp. | 108,000 | 119,551 | ||||||
4.125%, 5/1/25 | 170,000 | 177,012 | ||||||
Xerox Corp., | 153,000 | 160,413 | ||||||
Xerox Holdings Corp., 144A, | 175,000 | 184,795 | ||||||
|
| |||||||
(Cost $629,557) | 641,771 | |||||||
|
| |||||||
| Semiconductors — 0.4% | ||||||||
ams AG, 144A, | 75,000 | 80,422 | ||||||
Microchip Technology, Inc., | 198,000 | 208,816 | ||||||
|
| |||||||
(Cost $286,242) | 289,238 | |||||||
|
| |||||||
| Software — 1.2% | ||||||||
Boxer Parent Co., Inc., 144A, | 102,000 | 109,313 | ||||||
CDK Global, Inc., | 52,000 | 57,785 | ||||||
Change Healthcare Holdings LLC / Change Healthcare Finance, Inc., 144A, | 260,000 | 262,925 | ||||||
PTC, Inc., 144A, | 132,000 | 135,135 | ||||||
Veritas US, Inc. / Veritas Bermuda Ltd., 144A, | 338,000 | 351,845 | ||||||
|
| |||||||
(Cost $905,608) | 917,003 | |||||||
|
| |||||||
| Utilities — 1.8% | ||||||||
| Electric — 1.2% | ||||||||
DPL, Inc., | 260,000 | 278,655 | ||||||
FirstEnergy Corp., | 100,000 | 104,245 | ||||||
Principal | Value | |||||||
| Electric (Continued) | ||||||||
FirstEnergy Transmission LLC, 144A, | $ | 142,000 | $ | 156,450 | ||||
NextEra Energy Operating Partners LP, 144A, | 300,000 | 317,070 | ||||||
Talen Energy Supply LLC, | 25,000 | 10,973 | ||||||
TransAlta Corp., | 54,000 | 56,196 | ||||||
|
| |||||||
(Cost $922,270) | 923,589 | |||||||
|
| |||||||
| Gas — 0.6% | ||||||||
AmeriGas Partners LP / AmeriGas Finance Corp. | 121,000 | 132,495 | ||||||
5.50%, 5/20/25 | 107,000 | 117,700 | ||||||
5.875%, 8/20/26 | 200,000 | 225,250 | ||||||
|
| |||||||
(Cost $468,608) | 475,445 | |||||||
|
| |||||||
TOTAL CORPORATE BONDS | 72,450,672 | |||||||
|
| |||||||
Number | ||||||||
| SECURITIES LENDING COLLATERAL — 1.7% | ||||||||
DWS Government & Agency Securities Portfolio “DWS Government Cash Institutional Shares”, 0.01% (b)(c) | 1,323,612 | 1,323,612 | ||||||
|
| |||||||
| CASH EQUIVALENTS — 6.9% | ||||||||
DWS Government Money Market Series “Institutional Shares”, 0.04% (b) | 5,311,866 | 5,311,866 | ||||||
|
| |||||||
TOTAL INVESTMENTS — 103.2% | $ | 79,086,150 | ||||||
Other assets and liabilities, | (2,458,197 | ) | ||||||
|
| |||||||
NET ASSETS — 100.0% | $ | 76,627,953 | ||||||
|
| |||||||
| See Notes to Financial Statements. | 43 |
DBX ETF Trust
Schedule of Investments
Xtrackers Short Duration High Yield Bond ETF (Continued)
August 31, 2021
A summary of the Fund’s transactions with affiliated investments during the year ended August 31, 2021 is as follows:
| Value ($) at 8/31/2020 | Purchases Cost ($) | Sales Proceeds ($) | Net Realized Gain/(Loss) ($) | Net Change in Unrealized Appreciation (Depreciation) ($) | Income ($) | Capital Gain Distributions ($) | Number of Shares at 8/31/2021 | Value ($) at 8/31/2021 | ||||||||||||||||||||||||||||
SECURITIES LENDING COLLATERAL — 1.7% |
| |||||||||||||||||||||||||||||||||||
DWS Government & Agency Securities Portfolio “DWS Government Cash Institutional Shares”, 0.01% (b)(c) |
| |||||||||||||||||||||||||||||||||||
| 1,815,630 | — | (492,018 | )(d) | — | — | 291 | — | 1,323,612 | 1,323,612 | |||||||||||||||||||||||||||
CASH EQUIVALENTS — 6.9% |
| |||||||||||||||||||||||||||||||||||
DWS Government Money Market Series “Institutional Shares”, 0.04% (b) |
| |||||||||||||||||||||||||||||||||||
| 1,670,002 | 24,403,755 | (20,761,891 | ) | — | — | 771 | — | 5,311,866 | 5,311,866 | |||||||||||||||||||||||||||
|
|
|
|
|
|
|
|
|
|
|
|
|
|
|
|
|
| |||||||||||||||||||
| 3,485,632 | 24,403,755 | (21,253,909 | ) | — | — | 1,062 | — | 6,635,478 | 6,635,478 | |||||||||||||||||||||||||||
|
|
|
|
|
|
|
|
|
|
|
|
|
|
|
|
|
| |||||||||||||||||||
| (a) | All or a portion of these securities were on loan. In addition, “Other assets and liabilities, net” may include pending sales that are also on loan. The value of securities loaned at August 31, 2021 amounted to $2,620,240, which is 3.4% of net assets. |
| (b) | Affiliated fund managed by DWS Investment Management Americas, Inc. The rate shown is the annualized seven-day yield at period end. |
| (c) | Represents cash collateral held in connection with securities lending. Income earned by the Fund is net of borrower rebates. In addition, the Fund held non-cash U.S. Treasury securities collateral having a value of $1,401,605. |
| (d) | Represents the net increase (purchase cost) or decrease (sales proceeds) in the amount invested in cash collateral for the year ended August 31, 2021. |
| MTN: | Medium Term Note |
| REGS: | Securities sold under Regulation S may not be offered, sold or delivered within the United States or to, or for the account or benefit of, U.S. persons, except pursuant to an exemption from, or in a transaction not subject to, the registration requirements of the Securities Act of 1933. |
| 144A: | Security exempt from registration under Rule 144A of the Securities Act of 1933. These securities may be resold in transactions exempt from registration, normally to qualified institutional buyers. |
Fair Value Measurements
Various inputs are used in determining the value of the Fund’s investments. These inputs are summarized in three broad levels. Level 1 includes quoted prices in active markets for identical securities. Level 2 includes other significant observable inputs (including quoted prices for similar securities, interest rates, prepayment speeds and credit risk). Level 3 includes significant unobservable inputs (including the Fund’s own assumptions in determining the fair value of investments). The level assigned to the securities valuations may not be an indication of the risk or liquidity associated with investing in those securities.
The following is a summary of the inputs used as of August 31, 2021 in valuing the Fund’s investments. For information on the Fund’s policy regarding the valuation of investments, please refer to the Security Valuation section of Note 2 in the accompanying Notes to Financial Statements.
Assets | Level 1 | Level 2 | Level 3 | Total | ||||||||||||
Corporate Bonds (e) | $ | — | $ | 72,450,672 | $ | — | $ | 72,450,672 | ||||||||
Short-Term Investments (e) | 6,635,478 | — | — | 6,635,478 | ||||||||||||
|
|
|
|
|
|
|
| |||||||||
TOTAL | $ | 6,635,478 | $ | 72,450,672 | $ | — | $ | 79,086,150 | ||||||||
|
|
|
|
|
|
|
| |||||||||
| (e) | See Schedule of Investments for additional detailed categorizations. |
| See Notes to Financial Statements. | 44 |
DBX ETF Trust
Schedule of Investments
Xtrackers USD High Yield Corporate Bond ETF
August 31, 2021
Principal | Value | |||||||
| CORPORATE BONDS — 98.8% | ||||||||
| Basic Materials — 4.0% | ||||||||
| Chemicals — 1.8% | ||||||||
Ashland LLC | $ | 2,252,000 | $ | 2,319,560 | ||||
144A, 3.375%, 9/1/31 | 2,500,000 | 2,572,787 | ||||||
Axalta Coating Systems LLC, 144A, | 3,867,000 | 3,799,695 | ||||||
CF Industries, Inc., | 4,097,000 | 4,314,715 | ||||||
Chemours Co. | 2,785,000 | 3,028,813 | ||||||
144A, 5.75%, 11/15/28 | 4,580,000 | 4,860,525 | ||||||
144A, 4.625%, 11/15/29 | 3,600,000 | 3,587,868 | ||||||
Consolidated Energy Finance SA | 2,731,000 | 2,823,171 | ||||||
144A, 6.50%, 5/15/26 | 2,189,000 | 2,224,779 | ||||||
INEOS Group Holdings SA, 144A, | 2,737,000 | 2,743,993 | ||||||
INEOS Quattro Finance 2 PLC, 144A, | 2,762,000 | 2,799,977 | ||||||
Methanex Corp. | 3,889,000 | 4,240,468 | ||||||
5.25%, 12/15/29 (a) | 3,900,000 | 4,236,707 | ||||||
NOVA Chemicals Corp. | 5,800,000 | 6,140,750 | ||||||
144A, 5.00%, 5/1/25 | 2,861,000 | 3,051,285 | ||||||
144A, 5.25%, 6/1/27 | 5,814,000 | 6,220,050 | ||||||
144A, 4.25%, 5/15/29 | 3,215,000 | 3,235,094 | ||||||
OCI NV, 144A, | 3,270,000 | 3,376,275 | ||||||
Olin Corp. | 2,737,000 | 3,434,251 | ||||||
5.125%, 9/15/27 | 2,851,000 | 2,965,040 | ||||||
5.625%, 8/1/29 | 4,143,000 | 4,577,186 | ||||||
5.00%, 2/1/30 | 3,127,000 | 3,360,024 | ||||||
SCIH Salt Holdings, Inc. | 6,121,000 | 6,173,335 | ||||||
144A, 6.625%, 5/1/29 (a) | 3,867,000 | 3,808,357 | ||||||
SPCM SA, 144A, | 2,837,000 | 2,905,556 | ||||||
TPC Group, Inc., 144A, | 5,181,000 | 4,798,901 | ||||||
Tronox, Inc. | 2,787,000 | 2,943,769 | ||||||
144A, 4.625%, 3/15/29 | 5,938,000 | 6,028,258 | ||||||
Valvoline, Inc. | 3,342,000 | 3,471,954 | ||||||
144A, 3.625%, 6/15/31 | 2,979,000 | 2,968,231 | ||||||
WR Grace & Co.-Conn, 144A, | 4,275,000 | 4,440,656 | ||||||
WR Grace Holdings LLC, 144A, | 6,400,000 | 6,682,880 | ||||||
|
| |||||||
(Cost $123,169,143) | 124,134,910 | |||||||
|
| |||||||
Principal | Value | |||||||
| Forest Products & Paper — 0.1% | ||||||||
Mercer International, Inc., | $ | 4,818,000 | $ | 4,872,203 | ||||
|
| |||||||
| Iron/Steel — 0.4% | ||||||||
Allegheny Technologies, Inc., | 2,787,000 | 3,006,602 | ||||||
Cleveland-Cliffs, Inc. | 4,204,000 | 4,881,895 | ||||||
144A, 6.75%, 3/15/26 | 4,422,000 | 4,748,122 | ||||||
5.875%, 6/1/27 | 2,973,000 | 3,110,501 | ||||||
144A, 4.625%, 3/1/29 (a) | 2,762,000 | 2,910,457 | ||||||
144A, 4.875%, 3/1/31 (a) | 2,769,000 | 2,982,365 | ||||||
United States Steel Corp. | 3,325,000 | 3,428,840 | ||||||
6.875%, 3/1/29 (a) | 4,178,000 | 4,569,688 | ||||||
|
| |||||||
(Cost $28,932,604) | 29,638,470 | |||||||
|
| |||||||
| Mining — 1.7% | ||||||||
Alcoa Nederland Holding BV | 2,715,000 | 2,840,053 | ||||||
144A, 5.50%, 12/15/27 | 4,464,000 | 4,809,960 | ||||||
144A, 6.125%, 5/15/28 | 2,610,000 | 2,841,637 | ||||||
144A, 4.125%, 3/31/29 | 2,673,000 | 2,823,570 | ||||||
Arconic Corp. | 4,076,000 | 4,319,745 | ||||||
144A, 6.125%, 2/15/28 | 4,984,000 | 5,333,827 | ||||||
Constellium SE | 2,737,000 | 2,812,404 | ||||||
144A, 3.75%, 4/15/29 (a) | 2,885,000 | 2,873,417 | ||||||
FMG Resources August 2006 Pty Ltd. | 4,105,000 | 4,420,469 | ||||||
144A, 4.50%, 9/15/27 | 3,315,000 | 3,601,847 | ||||||
144A, 4.375%, 4/1/31 (a) | 8,548,000 | 9,217,736 | ||||||
Freeport-McMoRan, Inc. | 5,462,000 | 5,653,170 | ||||||
4.55%, 11/14/24 | 4,269,000 | 4,626,529 | ||||||
5.00%, 9/1/27 | 3,136,000 | 3,304,560 | ||||||
4.125%, 3/1/28 | 4,114,000 | 4,304,272 | ||||||
4.375%, 8/1/28 | 3,621,000 | 3,842,786 | ||||||
5.25%, 9/1/29 | 3,342,000 | 3,702,769 | ||||||
4.25%, 3/1/30 | 3,315,000 | 3,584,344 | ||||||
4.625%, 8/1/30 | 4,696,000 | 5,177,340 | ||||||
Hudbay Minerals, Inc. | 3,322,000 | 3,343,427 | ||||||
144A, 6.125%, 4/1/29 | 3,284,000 | 3,534,405 | ||||||
Kaiser Aluminum Corp. | 2,778,000 | 2,885,773 | ||||||
144A, 4.50%, 6/1/31 | 3,097,000 | 3,213,571 | ||||||
Novelis Corp. | 4,200,000 | 4,311,258 | ||||||
144A, 4.75%, 1/30/30 | 8,740,000 | 9,324,487 | ||||||
144A, 3.875%, 8/15/31 | 4,200,000 | 4,244,541 | ||||||
|
| |||||||
(Cost $109,890,959) | 110,947,897 | |||||||
|
| |||||||
| See Notes to Financial Statements. | 45 |
DBX ETF Trust
Schedule of Investments
Xtrackers USD High Yield Corporate Bond ETF (Continued)
August 31, 2021
Principal | Value | |||||||
| Communications — 19.1% | ||||||||
| Advertising — 0.7% | ||||||||
Clear Channel Outdoor Holdings, Inc. | $ | 5,737,000 | $ | 5,989,715 | ||||
144A, 7.50%, 6/1/29 | 5,814,000 | 6,024,757 | ||||||
Lamar Media Corp. | 3,257,000 | 3,350,508 | ||||||
4.00%, 2/15/30 | 3,010,000 | 3,112,265 | ||||||
144A, 3.625%, 1/15/31 | 3,004,000 | 3,000,831 | ||||||
Midas OpCo Holdings LLC, 144A, | 6,200,000 | 6,354,690 | ||||||
Outfront Media Capital LLC / Outfront Media Capital Corp. | 2,111,000 | 2,244,732 | ||||||
144A, 5.00%, 8/15/27 | 3,599,000 | 3,715,032 | ||||||
144A, 4.25%, 1/15/29 | 2,769,000 | 2,779,384 | ||||||
144A, 4.625%, 3/15/30 | 2,771,000 | 2,809,170 | ||||||
Terrier Media Buyer, Inc., 144A, | 5,556,000 | 5,924,085 | ||||||
|
| |||||||
(Cost $45,135,531) | 45,305,169 | |||||||
|
| |||||||
| Internet — 2.0% | ||||||||
Arches Buyer, Inc. | 3,817,000 | 3,883,874 | ||||||
144A, 6.125%, 12/1/28 | 2,826,000 | 2,920,332 | ||||||
Cogent Communications Group, Inc., 144A, | 2,769,000 | 2,827,841 | ||||||
Go Daddy Operating Co. LLC / GD Finance Co., Inc. | 3,284,000 | 3,466,098 | ||||||
144A, 3.50%, 3/1/29 | 4,480,000 | 4,430,205 | ||||||
Match Group Holdings II LLC | 2,463,000 | 2,593,416 | ||||||
144A, 4.625%, 6/1/28 | 2,848,000 | 2,977,442 | ||||||
144A, 4.125%, 8/1/30 (a) | 2,769,000 | 2,903,989 | ||||||
Netflix, Inc. | 2,206,000 | 2,453,734 | ||||||
5.875%, 2/15/25 | 5,288,000 | 6,074,590 | ||||||
144A, 3.625%, 6/15/25 | 2,665,000 | 2,858,212 | ||||||
4.375%, 11/15/26 (a) | 5,571,000 | 6,310,021 | ||||||
4.875%, 4/15/28 | 8,859,000 | 10,365,296 | ||||||
5.875%, 11/15/28 | 10,520,000 | 13,058,318 | ||||||
6.375%, 5/15/29 | 4,430,000 | 5,681,940 | ||||||
144A, 5.375%, 11/15/29 | 4,983,000 | 6,134,895 | ||||||
144A, 4.875%, 6/15/30 | 5,463,000 | 6,545,930 | ||||||
NortonLifeLock, Inc., 144A, | 6,159,000 | 6,233,955 | ||||||
Photo Holdings Merger Sub, Inc., 144A, | 4,597,000 | 4,993,491 | ||||||
Twitter, Inc., 144A, | 3,881,000 | 4,195,070 | ||||||
Uber Technologies, Inc. | 5,937,000 | 6,337,748 | ||||||
144A, 8.00%, 11/1/26 | 8,422,000 | 8,979,957 | ||||||
144A, 7.50%, 9/15/27 | 6,745,000 | 7,360,481 | ||||||
144A, 6.25%, 1/15/28 (a) | 2,862,000 | 3,073,073 | ||||||
Principal | Value | |||||||
| Internet (Continued) | ||||||||
144A, 4.50%, 8/15/29 | $ | 8,000,000 | $ | 7,912,600 | ||||
|
| |||||||
(Cost $133,097,584) | 134,572,508 | |||||||
|
| |||||||
| Media — 9.4% | ||||||||
Altice Financing SA | 6,629,000 | 6,633,243 | ||||||
144A, 5.75%, 8/15/29 | 10,500,000 | 10,798,725 | ||||||
AMC Networks, Inc. | 2,228,000 | 2,258,635 | ||||||
4.75%, 8/1/25 (a) | 4,363,000 | 4,477,529 | ||||||
4.25%, 2/15/29 (a) | 5,523,000 | 5,488,481 | ||||||
Cable One, Inc., 144A, | 3,649,000 | 3,696,784 | ||||||
CCO Holdings LLC / CCO Holdings Capital Corp. | 2,731,000 | 2,750,936 | ||||||
144A, 5.75%, 2/15/26 | 7,578,000 | 7,795,867 | ||||||
144A, 5.50%, 5/1/26 | 2,621,000 | 2,703,195 | ||||||
144A, 5.125%, 5/1/27 | 17,854,000 | 18,687,693 | ||||||
144A, 5.00%, 2/1/28 | 13,962,000 | 14,644,044 | ||||||
144A, 5.375%, 6/1/29 | 8,662,000 | 9,474,062 | ||||||
144A, 4.75%, 3/1/30 | 17,138,000 | 18,154,798 | ||||||
144A, 4.50%, 8/15/30 | 15,374,000 | 16,083,971 | ||||||
144A, 4.25%, 2/1/31 | 16,784,000 | 17,246,147 | ||||||
4.50%, 5/1/32 | 16,023,000 | 16,765,265 | ||||||
144A, 4.50%, 6/1/33 | 9,690,000 | 10,040,439 | ||||||
144A, 4.25%, 1/15/34 | 11,000,000 | 11,116,380 | ||||||
Clear Channel Worldwide Holdings, Inc., 144A, | 6,921,000 | 7,132,783 | ||||||
CSC Holdings LLC | 3,552,000 | 3,698,520 | ||||||
5.25%, 6/1/24 | 4,243,000 | 4,582,440 | ||||||
144A, 5.50%, 4/15/27 | 7,156,000 | 7,495,033 | ||||||
144A, 5.375%, 2/1/28 | 5,473,000 | 5,767,174 | ||||||
144A, 7.50%, 4/1/28 | 5,778,000 | 6,334,132 | ||||||
144A, 6.50%, 2/1/29 | 9,599,000 | 10,606,895 | ||||||
144A, 5.75%, 1/15/30 | 12,429,000 | 13,150,131 | ||||||
144A, 4.125%, 12/1/30 | 6,009,000 | 6,024,143 | ||||||
144A, 4.625%, 12/1/30 | 12,914,000 | 12,677,803 | ||||||
144A, 3.375%, 2/15/31 | 5,473,000 | 5,213,470 | ||||||
144A, 4.50%, 11/15/31 | 8,743,000 | 8,806,649 | ||||||
144A, 5.00%, 11/15/31 | 2,970,000 | 2,959,219 | ||||||
Diamond Sports Group LLC / Diamond Sports Finance Co. | 16,961,000 | 11,269,736 | ||||||
144A, 6.625%, 8/15/27 (a) | 9,726,000 | 4,194,337 | ||||||
DIRECTV Holdings LLC / DIRECTV Financing Co., Inc., 144A, | 12,800,000 | 13,397,184 | ||||||
DISH DBS Corp. | 8,271,000 | 8,643,195 | ||||||
5.875%, 11/15/24 | 11,204,000 | 12,058,305 | ||||||
7.75%, 7/1/26 | 11,344,000 | 13,008,165 | ||||||
7.375%, 7/1/28 (a) | 5,519,000 | 5,946,046 | ||||||
144A, 5.125%, 6/1/29 | 8,254,000 | 8,223,047 | ||||||
| See Notes to Financial Statements. | 46 |
DBX ETF Trust
Schedule of Investments
Xtrackers USD High Yield Corporate Bond ETF (Continued)
August 31, 2021
Principal | Value | |||||||
| Media (Continued) | ||||||||
Gray Television, Inc. | $ | 3,838,000 | $ | 3,962,562 | ||||
144A, 7.00%, 5/15/27 | 4,403,000 | 4,727,941 | ||||||
144A, 4.75%, 10/15/30 (a) | 4,430,000 | 4,384,260 | ||||||
iHeartCommunications, Inc. | 4,419,839 | 4,673,980 | ||||||
8.375%, 5/1/27 | 8,546,083 | 9,089,187 | ||||||
144A, 5.25%, 8/15/27 | 4,105,000 | 4,279,462 | ||||||
144A, 4.75%, 1/15/28 | 2,762,000 | 2,855,218 | ||||||
LCPR Senior Secured Financing DAC | 7,143,000 | 7,643,010 | ||||||
144A, 5.125%, 7/15/29 | 4,654,000 | 4,822,708 | ||||||
Mav Acquisition Corp. | 5,044,000 | 5,039,208 | ||||||
144A, 8.00%, 8/1/29 | 4,082,000 | 4,015,851 | ||||||
Meredith Corp., | 5,129,000 | 5,321,338 | ||||||
News Corp., 144A, | 5,584,000 | 5,743,647 | ||||||
Nexstar Media, Inc. | 10,307,000 | 10,962,628 | ||||||
144A, 4.75%, 11/1/28 | 5,473,000 | 5,697,557 | ||||||
Quebecor Media, Inc., | 4,706,000 | 5,000,125 | ||||||
Radiate Holdco LLC / Radiate Finance, Inc. | 4,983,000 | 5,194,678 | ||||||
144A, 6.50%, 9/15/28 | 5,612,000 | 5,731,255 | ||||||
Scripps Escrow II, Inc. | 3,045,000 | 3,047,071 | ||||||
144A, 5.375%, 1/15/31 | 2,771,000 | 2,746,248 | ||||||
Sinclair Television Group, Inc. | 2,228,000 | 2,167,443 | ||||||
144A, 5.50%, 3/1/30 (a) | 2,831,000 | 2,777,890 | ||||||
144A, 4.125%, 12/1/30 | 4,205,000 | 4,116,169 | ||||||
Sirius XM Radio, Inc. | 5,574,000 | 5,723,829 | ||||||
144A, 3.125%, 9/1/26 | 5,600,000 | 5,712,840 | ||||||
144A, 5.00%, 8/1/27 | 8,333,000 | 8,749,650 | ||||||
144A, 4.00%, 7/15/28 | 11,448,000 | 11,750,513 | ||||||
144A, 5.50%, 7/1/29 | 6,828,000 | 7,485,195 | ||||||
144A, 4.125%, 7/1/30 | 8,194,000 | 8,398,850 | ||||||
144A, 3.875%, 9/1/31 | 8,300,000 | 8,261,364 | ||||||
TEGNA, Inc. | 3,010,000 | 3,198,125 | ||||||
4.625%, 3/15/28 | 5,564,000 | 5,775,599 | ||||||
5.00%, 9/15/29 | 6,109,000 | 6,459,519 | ||||||
Telenet Finance Luxembourg Notes SARL, 144A, | 5,400,000 | 5,694,300 | ||||||
Univision Communications, Inc. | 8,391,000 | 8,554,037 | ||||||
144A, 6.625%, 6/1/27 | 8,210,000 | 8,900,051 | ||||||
144A, 4.50%, 5/1/29 (a) | 5,867,000 | 5,958,819 | ||||||
UPC Broadband Finco BV, 144A, | 6,903,000 | 7,056,937 | ||||||
Principal | Value | |||||||
| Media (Continued) | ||||||||
UPC Holding BV, 144A, | $ | 2,886,000 | $ | 3,049,636 | ||||
Videotron Ltd. | 3,374,000 | 3,719,835 | ||||||
144A, 5.125%, 4/15/27 | 3,284,000 | 3,423,570 | ||||||
144A, 3.625%, 6/15/29 (a) | 2,869,000 | 2,959,589 | ||||||
Virgin Media Finance PLC, 144A, | 5,097,000 | 5,284,060 | ||||||
Virgin Media Secured Finance PLC | 8,182,000 | 8,775,195 | ||||||
144A, 4.50%, 8/15/30 | 5,074,000 | 5,152,901 | ||||||
Ziggo Bond Co. BV | 4,314,000 | 4,518,958 | ||||||
144A, 5.125%, 2/28/30 | 2,737,000 | 2,813,554 | ||||||
Ziggo BV | 8,740,000 | 9,044,502 | ||||||
144A, 4.875%, 1/15/30 | 5,539,000 | 5,713,146 | ||||||
|
| |||||||
(Cost $634,215,073) | 626,138,611 | |||||||
|
| |||||||
| Telecommunications — 7.0% | ||||||||
Altice France Holding SA | 9,183,000 | 10,101,300 | ||||||
144A, 6.00%, 2/15/28 (a) | 6,705,000 | 6,669,966 | ||||||
Altice France SA | 12,556,000 | 13,048,446 | ||||||
144A, 8.125%, 2/1/27 (a) | 9,620,000 | 10,461,750 | ||||||
144A, 5.50%, 1/15/28 | 6,134,000 | 6,318,020 | ||||||
144A, 5.125%, 1/15/29 | 2,874,000 | 2,898,573 | ||||||
144A, 5.125%, 7/15/29 | 13,886,000 | 14,056,381 | ||||||
Avaya, Inc., 144A, | 5,571,000 | 5,884,369 | ||||||
C&W Senior Financing DAC | 2,887,000 | 3,010,275 | ||||||
144A, 6.875%, 9/15/27 | 6,664,000 | 7,092,828 | ||||||
Cincinnati Bell, Inc., 144A, | 3,843,000 | 3,919,860 | ||||||
CommScope Technologies LLC | 7,448,000 | 7,583,926 | ||||||
144A, 5.00%, 3/15/27 (a) | 4,253,000 | 4,198,647 | ||||||
CommScope, Inc. | 8,444,000 | 8,870,000 | ||||||
144A, 8.25%, 3/1/27 | 5,337,000 | 5,632,937 | ||||||
144A, 7.125%, 7/1/28 | 3,874,000 | 4,067,700 | ||||||
144A, 4.75%, 9/1/29 | 7,000,000 | 7,097,685 | ||||||
Connect Finco SARL / Connect US Finco LLC, 144A, | 11,589,000 | 12,038,074 | ||||||
Consolidated Communications, Inc. | 2,264,000 | 2,328,184 | ||||||
144A, 6.50%, 10/1/28 | 4,105,000 | 4,494,975 | ||||||
DKT Finance ApS, 144A, | 2,240,000 | 2,290,680 | ||||||
Frontier Communications Holdings LLC | 6,487,000 | 6,920,575 | ||||||
144A, 5.00%, 5/1/28 | 8,583,000 | 8,979,964 | ||||||
144A, 6.75%, 5/1/29 | 5,656,000 | 6,060,121 | ||||||
| See Notes to Financial Statements. | 47 |
DBX ETF Trust
Schedule of Investments
Xtrackers USD High Yield Corporate Bond ETF (Continued)
August 31, 2021
Principal | Value | |||||||
| Telecommunications (Continued) | ||||||||
5.875%, 11/1/29 | $ | 4,202,828 | $ | 4,279,824 | ||||
Hughes Satellite Systems Corp. | 4,244,000 | 4,810,425 | ||||||
6.625%, 8/1/26 | 4,099,500 | 4,663,632 | ||||||
Level 3 Financing, Inc. | 2,863,000 | 2,932,428 | ||||||
5.25%, 3/15/26 | 2,755,000 | 2,843,849 | ||||||
144A, 4.625%, 9/15/27 | 5,787,000 | 5,975,077 | ||||||
144A, 4.25%, 7/1/28 | 6,629,000 | 6,716,569 | ||||||
144A, 3.625%, 1/15/29 | 4,485,000 | 4,358,433 | ||||||
144A, 3.75%, 7/15/29 | 5,064,000 | 4,943,730 | ||||||
Lumen Technologies, Inc. | 4,105,000 | 4,520,836 | ||||||
Series Y, 7.50%, 4/1/24 | 5,498,000 | 6,123,397 | ||||||
5.625%, 4/1/25 | 2,937,000 | 3,182,254 | ||||||
144A, 5.125%, 12/15/26 | 6,921,000 | 7,164,965 | ||||||
144A, 4.00%, 2/15/27 (a) | 6,948,000 | 7,139,070 | ||||||
144A, 4.50%, 1/15/29 | 5,571,000 | 5,474,176 | ||||||
144A, 5.375%, 6/15/29 | 5,571,000 | 5,731,111 | ||||||
Nokia OYJ, | 2,806,000 | 3,117,382 | ||||||
Sprint Communications, Inc., | 12,479,000 | 13,196,542 | ||||||
Sprint Corp. | 23,860,000 | 27,062,012 | ||||||
7.125%, 6/15/24 | 13,843,000 | 15,936,754 | ||||||
7.625%, 2/15/25 | 8,456,000 | 10,020,360 | ||||||
7.625%, 3/1/26 | 8,223,000 | 10,148,827 | ||||||
Switch Ltd. | 3,322,000 | 3,384,138 | ||||||
144A, 4.125%, 6/15/29 | 2,839,000 | 2,932,545 | ||||||
Telecom Italia SpA, 144A, | 8,413,000 | 9,144,510 | ||||||
Telesat Canada / Telesat LLC | 2,812,000 | 2,704,075 | ||||||
144A, 4.875%, 6/1/27 | 2,278,000 | 2,105,852 | ||||||
144A, 6.50%, 10/15/27 | 3,064,000 | 2,592,818 | ||||||
T-Mobile USA, Inc. | 5,637,000 | 5,763,833 | ||||||
2.625%, 4/15/26 | 6,798,000 | 6,993,443 | ||||||
5.375%, 4/15/27 | 2,767,000 | 2,938,388 | ||||||
4.75%, 2/1/28 | 8,410,000 | 8,984,824 | ||||||
2.625%, 2/15/29 | 5,553,000 | 5,629,354 | ||||||
3.375%, 4/15/29 | 6,966,000 | 7,368,704 | ||||||
2.875%, 2/15/31 | 5,713,000 | 5,877,249 | ||||||
3.50%, 4/15/31 | 7,539,000 | 8,025,190 | ||||||
VEON Holdings BV | 2,861,000 | 3,051,943 | ||||||
144A, 7.25%, 4/26/23 | 3,862,000 | 4,163,939 | ||||||
144A, 4.95%, 6/16/24 | 2,708,000 | 2,922,460 | ||||||
144A, 4.00%, 4/9/25 | 5,503,000 | 5,812,681 | ||||||
144A, 3.375%, 11/25/27 | 6,897,000 | 7,027,526 | ||||||
Viasat, Inc. | 4,651,000 | 4,740,043 | ||||||
144A, 5.625%, 4/15/27 | 3,267,000 | 3,393,596 | ||||||
144A, 6.50%, 7/15/28 (a) | 2,215,000 | 2,339,162 | ||||||
Principal | Value | |||||||
| Telecommunications (Continued) | ||||||||
Vmed O2 UK Financing I PLC | $ | 7,365,000 | $ | 7,411,326 | ||||
144A, 4.75%, 7/15/31 | 8,022,000 | 8,252,633 | ||||||
Windstream Escrow LLC / Windstream Escrow Finance Corp., 144A, | 7,734,000 | 7,999,934 | ||||||
Zayo Group Holdings, Inc. | 8,276,000 | 8,193,033 | ||||||
144A, 6.125%, 3/1/28 | 5,995,000 | 6,107,406 | ||||||
|
| |||||||
(Cost $467,681,363) | 470,227,494 | |||||||
|
| |||||||
| Consumer, Cyclical — 20.7% | ||||||||
| Airlines — 1.2% | ||||||||
Air Canada, 144A, | 6,700,000 | 6,750,317 | ||||||
American Airlines Group, Inc., 144A, | 2,949,000 | 2,628,591 | ||||||
American Airlines, Inc., 144A, | 13,795,000 | 17,143,736 | ||||||
Delta Air Lines, Inc. | 2,737,000 | 2,837,140 | ||||||
2.90%, 10/28/24 | 5,107,000 | 5,206,514 | ||||||
7.375%, 1/15/26 | 6,199,000 | 7,303,020 | ||||||
4.375%, 4/19/28 | 2,737,000 | 2,898,694 | ||||||
3.75%, 10/28/29 (a) | 3,333,000 | 3,386,378 | ||||||
Hawaiian Brand Intellectual Property Ltd. / HawaiianMiles Loyalty Ltd., 144A, | 6,684,998 | 7,048,528 | ||||||
United Airlines Holdings, Inc., | 2,197,000 | 2,243,686 | ||||||
United Airlines, Inc. | 11,140,000 | 11,578,693 | ||||||
144A, 4.625%, 4/15/29 | 11,141,000 | 11,575,221 | ||||||
|
| |||||||
(Cost $78,877,685) | 80,600,518 | |||||||
|
| |||||||
| Apparel — 0.4% | ||||||||
Hanesbrands, Inc. | 5,016,000 | 5,329,500 | ||||||
144A, 5.375%, 5/15/25 | 4,131,000 | 4,343,664 | ||||||
144A, 4.875%, 5/15/26 | 4,926,000 | 5,381,655 | ||||||
Levi Strauss & Co., 144A, | 2,908,000 | 2,999,268 | ||||||
William Carter Co. | 2,882,000 | 3,031,705 | ||||||
144A, 5.625%, 3/15/27 | 2,737,000 | 2,863,586 | ||||||
|
| |||||||
(Cost $23,694,483) | 23,949,378 | |||||||
|
| |||||||
| Auto Manufacturers — 4.0% | ||||||||
Allison Transmission, Inc. | 2,189,000 | 2,297,366 | ||||||
144A, 5.875%, 6/1/29 (a) | 2,609,000 | 2,873,292 | ||||||
144A, 3.75%, 1/30/31 | 5,688,000 | 5,688,825 | ||||||
Ford Motor Co. | 19,530,000 | 21,629,475 | ||||||
9.00%, 4/22/25 | 19,722,000 | 24,119,020 | ||||||
4.346%, 12/8/26 | 8,377,000 | 9,035,390 | ||||||
9.625%, 4/22/30 | 5,575,000 | 7,956,305 | ||||||
| See Notes to Financial Statements. | 48 |
DBX ETF Trust
Schedule of Investments
Xtrackers USD High Yield Corporate Bond ETF (Continued)
August 31, 2021
Principal | Value | |||||||
| Auto Manufacturers (Continued) | ||||||||
Ford Motor Credit Co. LLC | $ | 5,689,000 | $ | 5,859,670 | ||||
MTN, 3.55%, 10/7/22 | 3,294,000 | 3,376,350 | ||||||
3.35%, 11/1/22 | 6,848,000 | 7,007,216 | ||||||
3.087%, 1/9/23 | 8,468,000 | 8,637,360 | ||||||
4.14%, 2/15/23 | 5,063,000 | 5,240,205 | ||||||
3.096%, 5/4/23 | 5,550,000 | 5,680,147 | ||||||
4.375%, 8/6/23 | 5,537,000 | 5,793,917 | ||||||
3.37%, 11/17/23 | 5,617,000 | 5,803,765 | ||||||
3.81%, 1/9/24 | 4,176,000 | 4,337,820 | ||||||
5.584%, 3/18/24 | 8,372,000 | 9,083,201 | ||||||
3.664%, 9/8/24 | 4,143,000 | 4,324,256 | ||||||
4.063%, 11/1/24 | 8,455,000 | 8,947,081 | ||||||
4.687%, 6/9/25 | 3,284,000 | 3,561,432 | ||||||
5.125%, 6/16/25 | 9,690,000 | 10,646,887 | ||||||
4.134%, 8/4/25 | 7,852,000 | 8,391,825 | ||||||
3.375%, 11/13/25 | 12,102,000 | 12,540,697 | ||||||
GMTN, 4.389%, 1/8/26 | 6,645,000 | 7,135,069 | ||||||
4.542%, 8/1/26 | 4,153,000 | 4,516,388 | ||||||
2.70%, 8/10/26 | 8,000,000 | 8,083,600 | ||||||
4.271%, 1/9/27 | 4,998,000 | 5,357,806 | ||||||
4.125%, 8/17/27 | 6,842,000 | 7,322,069 | ||||||
3.815%, 11/2/27 | 4,153,000 | 4,377,387 | ||||||
2.90%, 2/16/28 | 4,105,000 | 4,095,312 | ||||||
5.113%, 5/3/29 | 8,334,000 | 9,451,173 | ||||||
4.00%, 11/13/30 | 9,198,000 | 9,740,820 | ||||||
3.625%, 6/17/31 | 5,587,000 | 5,762,069 | ||||||
Jaguar Land Rover Automotive PLC 144A, 5.625%, 2/1/23 | 2,192,000 | 2,205,700 | ||||||
144A, 7.75%, 10/15/25 | 4,272,000 | 4,660,966 | ||||||
144A, 4.50%, 10/1/27 (a) | 2,794,000 | 2,749,450 | ||||||
144A, 5.875%, 1/15/28 (a) | 3,640,000 | 3,758,482 | ||||||
144A, 5.50%, 7/15/29 | 2,762,000 | 2,744,517 | ||||||
|
| |||||||
(Cost $260,964,007) | 264,792,310 | |||||||
|
| |||||||
| Auto Parts & Equipment — 1.4% | ||||||||
Adient Global Holdings Ltd., 144A, | 4,360,000 | 4,485,350 | ||||||
Adient US LLC, 144A, | 3,177,000 | 3,467,605 | ||||||
American Axle & Manufacturing, Inc. | 3,192,000 | 3,302,284 | ||||||
6.25%, 3/15/26 | 2,398,000 | 2,472,937 | ||||||
6.50%, 4/1/27 (a) | 3,540,000 | 3,721,425 | ||||||
6.875%, 7/1/28 (a) | 2,239,000 | 2,421,956 | ||||||
5.00%, 10/1/29 | 3,000,000 | 3,003,165 | ||||||
Clarios Global LP, 144A, | 2,741,000 | 2,905,460 | ||||||
Clarios Global LP / Clarios US Finance Co. | 4,983,000 | 5,257,065 | ||||||
144A, 8.50%, 5/15/27 | 11,197,000 | 11,966,794 | ||||||
Dana, Inc. | 2,189,000 | 2,312,131 | ||||||
5.625%, 6/15/28 | 2,266,500 | 2,440,748 | ||||||
4.25%, 9/1/30 (a) | 2,265,000 | 2,358,239 | ||||||
Principal | Value | |||||||
| Auto Parts & Equipment (Continued) | ||||||||
Goodyear Tire & Rubber Co. | $ | 4,379,000 | $ | 4,856,530 | ||||
5.00%, 5/31/26 | 4,172,000 | 4,301,082 | ||||||
4.875%, 3/15/27 | 3,876,000 | 4,166,467 | ||||||
144A, 5.00%, 7/15/29 | 4,723,000 | 5,008,458 | ||||||
5.25%, 4/30/31 | 3,118,000 | 3,340,563 | ||||||
144A, 5.25%, 7/15/31 | 3,336,000 | 3,573,290 | ||||||
5.625%, 4/30/33 | 2,513,000 | 2,730,148 | ||||||
Tenneco, Inc. | 2,700,000 | 2,696,625 | ||||||
144A, 7.875%, 1/15/29 | 2,737,000 | 3,082,546 | ||||||
144A, 5.125%, 4/15/29 | 4,566,000 | 4,742,476 | ||||||
ZF North America Capital, Inc., 144A, | 5,966,000 | 6,495,482 | ||||||
|
| |||||||
(Cost $93,754,339) | 95,108,826 | |||||||
|
| |||||||
| Distribution/Wholesale — 0.5% | ||||||||
American Builders & Contractors Supply Co., Inc. | 3,867,000 | 3,999,058 | ||||||
144A, 3.875%, 11/15/29 | 2,228,000 | 2,216,905 | ||||||
Avient Corp. | 3,284,000 | 3,493,355 | ||||||
144A, 5.75%, 5/15/25 | 3,558,000 | 3,759,916 | ||||||
H&E Equipment Services, Inc., 144A, | 6,878,000 | 6,918,924 | ||||||
Wolverine Escrow LLC | 3,558,000 | 3,384,548 | ||||||
144A, 9.00%, 11/15/26 | 5,084,000 | 4,886,995 | ||||||
144A, 13.125%, 11/15/27 (a) | 2,907,000 | 2,361,937 | ||||||
|
| |||||||
(Cost $31,630,313) | 31,021,638 | |||||||
|
| |||||||
| Entertainment — 3.2% | ||||||||
AMC Entertainment Holdings, Inc., 144A, | 2,737,000 | 2,935,432 | ||||||
Bally’s Corp., 144A, | 2,900,000 | 3,139,250 | ||||||
Banijay Entertainment SASU, 144A, | 2,206,000 | 2,269,422 | ||||||
Caesars Entertainment, Inc. | 19,675,000 | 20,820,085 | ||||||
144A, 8.125%, 7/1/27 (a) | 10,035,000 | 11,104,229 | ||||||
Caesars Resort Collection LLC / CRC Finco, Inc. | 5,252,000 | 5,521,165 | ||||||
144A, 5.25%, 10/15/25 | 9,387,000 | 9,532,029 | ||||||
Cedar Fair LP, | 2,884,000 | 2,958,523 | ||||||
Cedar Fair LP / Canada’s Wonderland Co. / Magnum Management Corp. / Millennium Op | 5,133,000 | 5,357,569 | ||||||
5.375%, 4/15/27 (a) | 2,737,000 | 2,808,846 | ||||||
Churchill Downs, Inc. | 3,315,000 | 3,447,600 | ||||||
144A, 4.75%, 1/15/28 | 3,951,000 | 4,136,895 | ||||||
| See Notes to Financial Statements. | 49 |
DBX ETF Trust
Schedule of Investments
Xtrackers USD High Yield Corporate Bond ETF (Continued)
August 31, 2021
Principal | Value | |||||||
| Entertainment (Continued) | ||||||||
Cinemark USA, Inc. | $ | 2,243,000 | $ | 2,234,589 | ||||
144A, 5.25%, 7/15/28 (a) | 4,226,000 | 4,020,342 | ||||||
Cirsa Finance International SARL, 144A, | 2,709,000 | 2,762,327 | ||||||
International Game Technology PLC | 6,012,000 | 6,703,380 | ||||||
144A, 4.125%, 4/15/26 | 4,151,000 | 4,316,210 | ||||||
144A, 6.25%, 1/15/27 | 4,082,000 | 4,658,582 | ||||||
144A, 5.25%, 1/15/29 | 4,389,000 | 4,690,744 | ||||||
Lions Gate Capital Holdings LLC, 144A, | 5,537,000 | 5,660,475 | ||||||
Live Nation Entertainment, Inc. | 3,147,000 | 3,194,205 | ||||||
144A, 6.50%, 5/15/27 | 6,729,000 | 7,427,134 | ||||||
144A, 4.75%, 10/15/27 (a) | 5,310,000 | 5,401,597 | ||||||
144A, 3.75%, 1/15/28 (a) | 2,912,000 | 2,916,426 | ||||||
Mohegan Gaming & Entertainment | 2,148,000 | 2,255,400 | ||||||
144A, 8.00%, 2/1/26 | 6,566,000 | 6,896,729 | ||||||
Penn National Gaming, Inc. | 2,189,000 | 2,268,351 | ||||||
144A, 4.125%, 7/1/29 | 2,228,000 | 2,228,045 | ||||||
Premier Entertainment Sub LLC / Premier Entertainment Finance Corp. | 4,200,000 | 4,313,106 | ||||||
144A, 5.875%, 9/1/31 | 4,000,000 | 4,106,540 | ||||||
Resorts World Las Vegas LLC / RWLV Capital, Inc., 144A, | 5,600,000 | 5,795,812 | ||||||
Scientific Games International, Inc. | 3,123,000 | 3,375,455 | ||||||
144A, 5.00%, 10/15/25 | 6,905,000 | 7,110,769 | ||||||
144A, 8.25%, 3/15/26 | 6,370,000 | 6,783,270 | ||||||
144A, 7.00%, 5/15/28 | 3,855,000 | 4,160,316 | ||||||
144A, 7.25%, 11/15/29 (a) | 2,713,000 | 3,031,778 | ||||||
Six Flags Entertainment Corp. | 6,037,000 | 6,109,867 | ||||||
144A, 5.50%, 4/15/27 | 2,737,000 | 2,836,216 | ||||||
Six Flags Theme Parks, Inc., 144A, | 4,118,000 | 4,406,260 | ||||||
Vail Resorts, Inc., 144A, | 3,284,000 | 3,503,338 | ||||||
WMG Acquisition Corp. | 2,928,000 | 3,089,099 | ||||||
144A, 3.00%, 2/15/31 | 4,419,000 | 4,358,835 | ||||||
Wynn Resorts Finance LLC / Wynn Resorts Capital Corp. | 3,434,000 | 3,653,055 | ||||||
144A, 5.125%, 10/1/29 | 4,203,000 | 4,377,172 | ||||||
|
| |||||||
(Cost $211,839,360) | 212,676,469 | |||||||
|
| |||||||
| Food Service — 0.4% | ||||||||
Aramark Services, Inc. | 3,322,000 | 3,411,913 | ||||||
144A, 6.375%, 5/1/25 | 8,306,000 | 8,802,699 | ||||||
144A, 5.00%, 2/1/28 (a) | 6,406,000 | 6,669,078 | ||||||
Principal | Value | |||||||
| Food Service (Continued) | ||||||||
TKC Holdings, Inc. | $ | 2,322,000 | $ | 2,417,783 | ||||
144A, 10.50%, 5/15/29 | 3,738,000 | 4,116,472 | ||||||
|
| |||||||
(Cost $25,112,206) | 25,417,945 | |||||||
|
| |||||||
| Home Builders — 0.7% | ||||||||
Brookfield Residential Properties, Inc. / Brookfield Residential US LLC | 3,484,000 | 3,681,430 | ||||||
144A, 4.875%, 2/15/30 | 2,737,000 | 2,766,915 | ||||||
Century Communities, Inc. | 2,800,000 | 2,995,216 | ||||||
144A, 3.875%, 8/15/29 | 2,800,000 | 2,846,438 | ||||||
Mattamy Group Corp. | 2,769,000 | 2,890,282 | ||||||
144A, 4.625%, 3/1/30 | 3,322,000 | 3,409,618 | ||||||
Meritage Homes Corp. | 2,215,000 | 2,542,754 | ||||||
144A, 3.875%, 4/15/29 | 2,555,000 | 2,724,614 | ||||||
Taylor Morrison Communities, Inc. | 2,746,000 | 3,114,060 | ||||||
144A, 5.75%, 1/15/28 | 2,463,000 | 2,780,813 | ||||||
144A, 5.125%, 8/1/30 | 2,842,000 | 3,112,914 | ||||||
Toll Brothers Finance Corp. | 2,110,000 | 2,202,312 | ||||||
4.875%, 3/15/27 | 2,463,000 | 2,799,372 | ||||||
4.35%, 2/15/28 | 2,365,000 | 2,622,430 | ||||||
3.80%, 11/1/29 (a) | 2,210,000 | 2,408,569 | ||||||
Williams Scotsman International, Inc., 144A, | 2,819,000 | 2,928,236 | ||||||
|
| |||||||
(Cost $45,430,048) | 45,825,973 | |||||||
|
| |||||||
| Housewares — 0.4% | ||||||||
Newell Brands, Inc. | 6,042,000 | 6,380,775 | ||||||
4.875%, 6/1/25 | 2,785,000 | 3,103,406 | ||||||
4.70%, 4/1/26 | 11,265,000 | 12,602,719 | ||||||
Scotts Miracle-Gro Co. | 2,333,000 | 2,440,901 | ||||||
144A, 4.00%, 4/1/31 | 2,762,000 | 2,772,454 | ||||||
144A, 4.375%, 2/1/32 | 2,000,000 | 2,030,620 | ||||||
|
| |||||||
(Cost $29,025,036) | 29,330,875 | |||||||
|
| |||||||
| Leisure Time — 2.2% | ||||||||
Carnival Corp. | 11,367,000 | 12,784,238 | ||||||
144A, 10.50%, 2/1/26 (a) | 4,210,000 | 4,862,634 | ||||||
144A, 7.625%, 3/1/26 | 8,086,000 | 8,586,321 | ||||||
144A, 5.75%, 3/1/27 | 20,110,000 | 20,593,545 | ||||||
144A, 9.875%, 8/1/27 | 5,038,000 | 5,812,592 | ||||||
144A, 4.00%, 8/1/28 | 13,411,000 | 13,500,250 | ||||||
Life Time, Inc. | 5,122,000 | 5,256,452 | ||||||
144A, 8.00%, 4/15/26 (a) | 2,679,000 | 2,809,601 | ||||||
NCL Corp. Ltd. | 3,929,000 | 4,641,171 | ||||||
| See Notes to Financial Statements. | 50 |
DBX ETF Trust
Schedule of Investments
Xtrackers USD High Yield Corporate Bond ETF (Continued)
August 31, 2021
Principal | Value | |||||||
| Leisure Time (Continued) | ||||||||
144A, 3.625%, 12/15/24 | $ | 3,151,000 | $ | 2,981,634 | ||||
144A, 10.25%, 2/1/26 | 4,353,000 | 5,034,092 | ||||||
144A, 5.875%, 3/15/26 | 7,890,000 | 7,919,587 | ||||||
Royal Caribbean Cruises Ltd. | 3,866,000 | 3,962,650 | ||||||
144A, 10.875%, 6/1/23 | 5,887,000 | 6,632,692 | ||||||
144A, 9.125%, 6/15/23 | 5,774,000 | 6,300,878 | ||||||
144A, 11.50%, 6/1/25 | 7,949,000 | 9,161,223 | ||||||
144A, 4.25%, 7/1/26 | 3,591,000 | 3,505,714 | ||||||
144A, 5.50%, 8/31/26 | 5,000,000 | 5,075,000 | ||||||
3.70%, 3/15/28 (a) | 3,220,000 | 3,050,403 | ||||||
144A, 5.50%, 4/1/28 | 8,121,000 | 8,202,210 | ||||||
Viking Cruises Ltd. | 3,730,000 | 4,322,287 | ||||||
144A, 5.875%, 9/15/27 | 4,566,000 | 4,424,522 | ||||||
|
| |||||||
(Cost $149,303,570) | 149,419,696 | |||||||
|
| |||||||
| Lodging — 2.2% | ||||||||
Boyd Gaming Corp. | 3,402,000 | 3,694,742 | ||||||
4.75%, 12/1/27 (a) | 5,432,000 | 5,608,540 | ||||||
144A, 4.75%, 6/15/31 | 5,075,000 | 5,243,109 | ||||||
Diamond Resorts International, Inc. | 2,737,000 | 2,790,043 | ||||||
144A, 10.75%, 9/1/24 (a) | 3,235,000 | 3,321,957 | ||||||
Hilton Domestic Operating Co., Inc. | 2,737,000 | 2,874,945 | ||||||
144A, 5.75%, 5/1/28 | 2,733,000 | 2,934,668 | ||||||
144A, 3.75%, 5/1/29 | 4,520,000 | 4,616,231 | ||||||
4.875%, 1/15/30 | 5,587,000 | 6,013,009 | ||||||
144A, 4.00%, 5/1/31 | 6,091,000 | 6,289,841 | ||||||
144A, 3.625%, 2/15/32 | 8,306,000 | 8,276,057 | ||||||
Hilton Grand Vacations Borrower Escrow LLC / Hilton Grand Vacations Borrower Esc | 4,690,000 | 4,754,487 | ||||||
144A, 4.875%, 7/1/31 | 2,821,000 | 2,799,899 | ||||||
Hilton Worldwide Finance LLC / Hilton Worldwide Finance Corp., | 3,619,000 | 3,758,350 | ||||||
Marriott Ownership Resorts, Inc. | 2,785,000 | 2,931,324 | ||||||
144A, 4.50%, 6/15/29 | 2,737,000 | 2,767,518 | ||||||
Melco Resorts Finance Ltd. | 5,554,000 | 5,658,137 | ||||||
144A, 5.25%, 4/26/26 | 2,797,000 | 2,880,966 | ||||||
144A, 5.625%, 7/17/27 | 3,484,000 | 3,609,598 | ||||||
144A, 5.75%, 7/21/28 | 4,721,000 | 4,927,544 | ||||||
144A, 5.375%, 12/4/29 | 6,387,000 | 6,618,145 | ||||||
MGM Resorts International | 6,828,000 | 7,237,680 | ||||||
6.75%, 5/1/25 | 4,097,000 | 4,347,941 | ||||||
5.75%, 6/15/25 | 3,863,000 | 4,234,814 | ||||||
4.625%, 9/1/26 | 2,213,000 | 2,338,145 | ||||||
5.50%, 4/15/27 | 3,887,000 | 4,236,772 | ||||||
4.75%, 10/15/28 | 4,153,000 | 4,366,236 | ||||||
Principal | Value | |||||||
| Lodging (Continued) | ||||||||
Travel + Leisure Co. | $ | 2,056,000 | $ | 2,120,990 | ||||
144A, 6.625%, 7/31/26 | 3,791,000 | 4,288,569 | ||||||
6.00%, 4/1/27 | 2,210,000 | 2,448,205 | ||||||
Wynn Las Vegas LLC / Wynn Las Vegas Capital Corp. | 2,737,000 | 2,811,693 | ||||||
144A, 5.50%, 3/1/25 | 9,814,000 | 10,415,107 | ||||||
144A, 5.25%, 5/15/27 (a) | 5,239,000 | 5,508,232 | ||||||
|
| |||||||
(Cost $146,424,182) | 146,723,494 | |||||||
|
| |||||||
| Retail — 3.9% | ||||||||
1011778 BC ULC / New Red Finance, Inc. | 2,737,000 | 2,887,535 | ||||||
144A, 3.875%, 1/15/28 | 8,849,000 | 8,970,674 | ||||||
144A, 4.375%, 1/15/28 | 4,097,000 | 4,163,576 | ||||||
144A, 3.50%, 2/15/29 | 4,363,000 | 4,347,228 | ||||||
144A, 4.00%, 10/15/30 | 16,016,000 | 15,947,612 | ||||||
Bath & Body Works, Inc. | 2,769,000 | 3,585,855 | ||||||
5.25%, 2/1/28 | 2,798,000 | 3,137,817 | ||||||
7.50%, 6/15/29 | 2,869,000 | 3,329,833 | ||||||
144A, 6.625%, 10/1/30 | 5,571,000 | 6,427,541 | ||||||
Carvana Co. | 2,819,000 | 2,935,284 | ||||||
144A, 5.50%, 4/15/27 | 3,548,000 | 3,666,432 | ||||||
144A, 5.875%, 10/1/28 | 3,400,000 | 3,553,000 | ||||||
144A, 4.875%, 9/1/29 | 4,000,000 | 3,963,980 | ||||||
eG Global Finance PLC | 4,355,000 | 4,480,206 | ||||||
144A, 8.50%, 10/30/25 | 3,476,000 | 3,645,611 | ||||||
Ferrellgas LP / Ferrellgas Finance Corp. | 3,599,000 | 3,540,516 | ||||||
144A, 5.875%, 4/1/29 (a) | 4,568,000 | 4,489,842 | ||||||
Gap, Inc. | 2,786,000 | 3,125,895 | ||||||
144A, 8.625%, 5/15/25 | 4,155,000 | 4,538,506 | ||||||
144A, 8.875%, 5/15/27 | 5,688,000 | 6,541,200 | ||||||
Golden Nugget, Inc. | 7,362,000 | 7,388,135 | ||||||
144A, 8.75%, 10/1/25 (a) | 1,468,000 | 1,550,575 | ||||||
IRB Holding Corp. | 4,353,000 | 4,660,104 | ||||||
144A, 6.75%, 2/15/26 | 2,655,000 | 2,734,650 | ||||||
KFC Holding Co./Pizza Hut Holdings LLC/Taco Bell of America LLC, 144A, | 4,355,000 | 4,570,304 | ||||||
LBM Acquisition LLC, 144A, | 4,580,000 | 4,602,900 | ||||||
Lithia Motors, Inc. | 2,228,000 | 2,364,465 | ||||||
144A, 3.875%, 6/1/29 | 4,456,000 | 4,677,909 | ||||||
144A, 4.375%, 1/15/31 | 3,046,000 | 3,308,718 | ||||||
Macy’s Retail Holdings LLC | 2,785,000 | 2,837,219 | ||||||
144A, 5.875%, 4/1/29 (a) | 2,737,000 | 2,993,867 | ||||||
| See Notes to Financial Statements. | 51 |
DBX ETF Trust
Schedule of Investments
Xtrackers USD High Yield Corporate Bond ETF (Continued)
August 31, 2021
Principal | Value | |||||||
| Retail (Continued) | ||||||||
Michaels Cos., Inc. | $ | 4,706,000 | $ | 4,835,415 | ||||
144A, 7.875%, 5/1/29 | 7,242,000 | 7,471,571 | ||||||
Murphy Oil USA, Inc. | 2,762,000 | 2,924,268 | ||||||
144A, 3.75%, 2/15/31 | 2,812,000 | 2,840,921 | ||||||
NMG Holding Co, Inc. / Neiman Marcus Group LLC, 144A, | 6,091,000 | 6,456,460 | ||||||
Party City Holdings, Inc., 144A, | 4,153,000 | 4,334,694 | ||||||
Penske Automotive Group, Inc. | 3,010,000 | 3,117,943 | ||||||
3.75%, 6/15/29 | 2,780,000 | 2,833,029 | ||||||
PetSmart, Inc. / PetSmart Finance Corp. | 6,795,000 | 7,083,788 | ||||||
144A, 7.75%, 2/15/29 | 6,368,000 | 7,004,800 | ||||||
QVC, Inc. | 4,776,000 | 5,008,830 | ||||||
4.85%, 4/1/24 | 3,168,000 | 3,448,368 | ||||||
4.45%, 2/15/25 | 3,322,000 | 3,558,449 | ||||||
4.75%, 2/15/27 | 3,184,000 | 3,415,891 | ||||||
4.375%, 9/1/28 | 2,839,000 | 2,912,885 | ||||||
Rite Aid Corp. | 3,349,000 | 3,448,616 | ||||||
144A, 8.00%, 11/15/26 (a) | 4,652,000 | 4,802,725 | ||||||
SRS Distribution, Inc. | 3,551,000 | 3,663,744 | ||||||
144A, 6.125%, 7/1/29 (a) | 2,563,000 | 2,665,520 | ||||||
Staples, Inc. | 11,225,000 | 11,351,281 | ||||||
144A, 10.75%, 4/15/27 (a) | 5,582,000 | 5,449,428 | ||||||
Suburban Propane Partners LP/Suburban Energy Finance Corp., 144A, | 3,639,000 | 3,754,302 | ||||||
Yum! Brands, Inc. | 3,934,000 | 4,243,370 | ||||||
144A, 4.75%, 1/15/30 | 4,506,000 | 4,979,355 | ||||||
3.625%, 3/15/31 | 5,814,000 | 5,980,658 | ||||||
4.625%, 1/31/32 | 6,103,000 | 6,613,394 | ||||||
|
| |||||||
(Cost $261,512,242) | 263,166,694 | |||||||
|
| |||||||
| Toys/Games/Hobbies — 0.2% | ||||||||
Mattel, Inc. | 3,367,000 | 3,501,899 | ||||||
144A, 5.875%, 12/15/27 | 3,442,000 | 3,760,557 | ||||||
144A, 3.75%, 4/1/29 (a) | 3,522,000 | 3,701,798 | ||||||
|
| |||||||
(Cost $10,836,118) | 10,964,254 | |||||||
|
| |||||||
| Consumer, Non-cyclical — 18.4% | ||||||||
| Agriculture — 0.2% | ||||||||
Darling Ingredients, Inc., 144A, | 2,919,000 | 3,052,340 | ||||||
Vector Group Ltd. | 3,108,000 | 3,282,825 | ||||||
144A, 5.75%, 2/1/29 | 4,874,000 | 4,965,387 | ||||||
|
| |||||||
(Cost $11,370,810) | 11,300,552 | |||||||
|
| |||||||
Principal | Value | |||||||
| Beverages — 0.1% | ||||||||
Primo Water Holdings, Inc., 144A, | $ | 4,193,000 | $ | 4,238,117 | ||||
|
| |||||||
| Commercial Services — 3.8% | ||||||||
ADT Security Corp. | 3,947,000 | 4,154,218 | ||||||
144A, 4.125%, 8/1/29 | 5,549,000 | 5,548,889 | ||||||
Allied Universal Holdco LLC / Allied Universal Finance Corp. | 10,598,000 | 11,339,860 | ||||||
144A, 9.75%, 7/15/27 | 5,769,000 | 6,317,055 | ||||||
144A, 6.00%, 6/1/29 | 5,511,000 | 5,517,641 | ||||||
Allied Universal Holdco LLC / Allied Universal Finance Corp. / Atlas Luxco 4 SARL, 144A, | 6,692,000 | 6,729,643 | ||||||
APX Group, Inc. | 2,189,000 | 2,233,327 | ||||||
144A, 6.75%, 2/15/27 | 3,378,000 | 3,606,015 | ||||||
144A, 5.75%, 7/15/29 | 4,469,000 | 4,474,586 | ||||||
Avis Budget Car Rental LLC / Avis Budget Finance, Inc. | 2,215,000 | 2,314,675 | ||||||
144A, 4.75%, 4/1/28 | 2,769,000 | 2,860,349 | ||||||
144A, 5.375%, 3/1/29 (a) | 3,284,000 | 3,452,305 | ||||||
Brink’s Co. | 2,189,000 | 2,302,609 | ||||||
144A, 4.625%, 10/15/27 | 3,284,000 | 3,453,389 | ||||||
Garda World Security Corp. | 3,120,000 | 3,131,700 | ||||||
144A, 9.50%, 11/1/27 | 3,902,000 | 4,254,116 | ||||||
144A, 6.00%, 6/1/29 | 2,715,000 | 2,626,545 | ||||||
Gartner, Inc. | 4,404,000 | 4,668,240 | ||||||
144A, 3.625%, 6/15/29 | 3,322,000 | 3,424,318 | ||||||
144A, 3.75%, 10/1/30 | 4,404,000 | 4,613,851 | ||||||
Herc Holdings, Inc., 144A, | 6,685,000 | 7,055,683 | ||||||
Jaguar Holding Co. II / PPD Development LP | 2,912,000 | 3,060,658 | ||||||
144A, 5.00%, 6/15/28 | 3,900,000 | 4,207,125 | ||||||
Modulaire Global Finance PLC, 144A, | 856,000 | 879,467 | ||||||
MPH Acquisition Holdings LLC | 6,000,000 | 6,116,220 | ||||||
144A, 5.75%, 11/1/28 (a) | 7,201,000 | 6,885,380 | ||||||
Nielsen Co. Luxembourg SARL, 144A, | 2,705,000 | 2,776,128 | ||||||
Nielsen Finance LLC / Nielsen Finance Co. | 5,596,000 | 5,889,790 | ||||||
144A, 4.50%, 7/15/29 | 3,508,000 | 3,481,076 | ||||||
144A, 5.875%, 10/1/30 | 4,210,000 | 4,509,899 | ||||||
144A, 4.75%, 7/15/31 | 3,532,000 | 3,491,824 | ||||||
| See Notes to Financial Statements. | 52 |
DBX ETF Trust
Schedule of Investments
Xtrackers USD High Yield Corporate Bond ETF (Continued)
August 31, 2021
Principal | Value | |||||||
| Commercial Services (Continued) | ||||||||
Prime Security Services Borrower LLC / Prime Finance, Inc. | $ | 4,215,000 | $ | 4,494,244 | ||||
144A, 5.75%, 4/15/26 | 7,519,000 | 8,143,735 | ||||||
144A, 3.375%, 8/31/27 | 5,587,000 | 5,398,439 | ||||||
144A, 6.25%, 1/15/28 | 7,198,000 | 7,467,925 | ||||||
RR Donnelley & Sons Co., 144A, | 2,492,000 | 2,619,715 | ||||||
Sabre GLBL, Inc. | 4,327,000 | 4,992,276 | ||||||
144A, 7.375%, 9/1/25 | 4,746,000 | 5,024,828 | ||||||
Service Corp. International | 3,066,000 | 3,245,208 | ||||||
5.125%, 6/1/29 | 4,153,000 | 4,533,830 | ||||||
3.375%, 8/15/30 | 4,694,000 | 4,731,716 | ||||||
4.00%, 5/15/31 | 4,508,000 | 4,676,441 | ||||||
Sotheby’s, 144A, | 4,000,000 | 4,249,200 | ||||||
Square, Inc. | 5,424,000 | 5,578,747 | ||||||
144A, 3.50%, 6/1/31 | 5,737,000 | 5,962,894 | ||||||
United Rentals North America, Inc. | 5,563,000 | 5,739,069 | ||||||
5.50%, 5/15/27 | 5,608,000 | 5,922,384 | ||||||
4.875%, 1/15/28 | 9,119,000 | 9,684,241 | ||||||
5.25%, 1/15/30 | 4,097,000 | 4,496,662 | ||||||
4.00%, 7/15/30 | 4,324,000 | 4,534,968 | ||||||
3.875%, 2/15/31 | 6,221,000 | 6,449,902 | ||||||
3.75%, 1/15/32 | 4,000,000 | 4,090,580 | ||||||
Verscend Escrow Corp., 144A, | 6,021,000 | 6,374,734 | ||||||
|
| |||||||
(Cost $253,551,975) | 253,788,319 | |||||||
|
| |||||||
| Cosmetics/Personal Care — 0.2% | ||||||||
Coty, Inc. | 5,014,000 | 5,175,551 | ||||||
144A, 6.50%, 4/15/26 (a) | 3,064,000 | 3,163,580 | ||||||
Edgewell Personal Care Co. | 4,083,000 | 4,327,980 | ||||||
144A, 4.125%, 4/1/29 | 2,856,000 | 2,877,420 | ||||||
|
| |||||||
(Cost $15,407,200) | 15,544,531 | |||||||
|
| |||||||
| Food — 3.1% | ||||||||
Albertsons Cos., Inc. / Safeway, Inc. / New Albertsons LP / Albertsons LLC | 4,147,000 | 4,272,198 | ||||||
144A, 3.25%, 3/15/26 | 4,135,000 | 4,248,712 | ||||||
144A, 7.50%, 3/15/26 | 3,284,000 | 3,578,788 | ||||||
144A, 4.625%, 1/15/27 | 7,375,000 | 7,817,500 | ||||||
144A, 5.875%, 2/15/28 | 4,169,000 | 4,476,464 | ||||||
144A, 3.50%, 3/15/29 | 7,608,000 | 7,693,590 | ||||||
144A, 4.875%, 2/15/30 | 5,537,000 | 6,049,172 | ||||||
B&G Foods, Inc. | 4,631,000 | 4,758,352 | ||||||
5.25%, 9/15/27 | 3,164,000 | 3,289,769 | ||||||
JBS USA Food Co. | 5,713,000 | 6,023,502 | ||||||
Principal | Value | |||||||
| Food (Continued) | ||||||||
144A, 5.75%, 1/15/28 | $ | 4,105,000 | $ | 4,339,190 | ||||
JBS USA LUX SA / JBS USA Finance, Inc., 144A, | 5,016,000 | 5,505,060 | ||||||
JBS USA LUX SA / JBS USA Food Co. / JBS USA Finance, Inc. | 7,802,000 | 8,845,517 | ||||||
144A, 5.50%, 1/15/30 | 7,042,000 | 7,956,052 | ||||||
144A, 3.75%, 12/1/31 | 2,737,000 | 2,890,956 | ||||||
Kraft Heinz Foods Co. | 10,482,000 | 11,121,534 | ||||||
3.875%, 5/15/27 | 7,858,000 | 8,667,882 | ||||||
4.625%, 1/30/29 | 4,151,000 | 4,809,879 | ||||||
3.75%, 4/1/30 | 4,091,000 | 4,527,061 | ||||||
4.25%, 3/1/31 | 7,475,000 | 8,639,099 | ||||||
Lamb Weston Holdings, Inc. | 4,559,000 | 4,684,372 | ||||||
144A, 4.875%, 11/1/26 | 5,109,000 | 5,261,644 | ||||||
144A, 4.875%, 5/15/28 | 2,785,000 | 3,101,453 | ||||||
Performance Food Group, Inc. | 5,728,000 | 5,971,440 | ||||||
144A, 4.25%, 8/1/29 | 5,679,000 | 5,705,805 | ||||||
Pilgrim’s Pride Corp. | 4,745,000 | 5,070,127 | ||||||
144A, 4.25%, 4/15/31 (a) | 5,653,000 | 6,094,429 | ||||||
Post Holdings, Inc. | 7,368,000 | 7,721,296 | ||||||
144A, 5.625%, 1/15/28 | 5,245,000 | 5,526,919 | ||||||
144A, 5.50%, 12/15/29 | 4,328,000 | 4,641,780 | ||||||
144A, 4.625%, 4/15/30 | 9,063,000 | 9,265,264 | ||||||
144A, 4.50%, 9/15/31 | 10,056,000 | 10,156,560 | ||||||
Sigma Holdco BV, 144A, | 2,668,000 | 2,678,005 | ||||||
US Foods, Inc. | 5,563,000 | 5,868,965 | ||||||
144A, 4.75%, 2/15/29 | 4,984,000 | 5,108,600 | ||||||
|
| |||||||
(Cost $204,469,733) | 206,366,936 | |||||||
|
| |||||||
| Healthcare-Products — 0.3% | ||||||||
Avantor Funding, Inc., 144A, | 8,635,000 | 9,141,443 | ||||||
Hologic, Inc. | 2,339,000 | 2,491,140 | ||||||
144A, 3.25%, 2/15/29 | 5,190,000 | 5,324,680 | ||||||
Teleflex, Inc. | 2,769,000 | 2,903,989 | ||||||
144A, 4.25%, 6/1/28 | 2,785,000 | 2,903,363 | ||||||
|
| |||||||
(Cost $22,591,707) | 22,764,615 | |||||||
|
| |||||||
| Healthcare-Services — 6.6% | ||||||||
Catalent Pharma Solutions, Inc. | 3,019,000 | 3,166,312 | ||||||
144A, 3.125%, 2/15/29 | 2,999,000 | 2,966,911 | ||||||
Centene Corp. | 13,886,000 | 14,684,445 | ||||||
2.45%, 7/15/28 | 12,833,000 | 13,039,194 | ||||||
4.625%, 12/15/29 | 19,497,000 | 21,410,436 | ||||||
3.375%, 2/15/30 | 11,459,000 | 11,988,979 | ||||||
| See Notes to Financial Statements. | 53 |
DBX ETF Trust
Schedule of Investments
Xtrackers USD High Yield Corporate Bond ETF (Continued)
August 31, 2021
Principal | Value | |||||||
| Healthcare-Services (Continued) | ||||||||
3.00%, 10/15/30 | $ | 12,356,000 | $ | 12,764,829 | ||||
2.50%, 3/1/31 | 12,256,000 | 12,239,700 | ||||||
2.625%, 8/1/31 | 7,000,000 | 7,105,000 | ||||||
Charles River Laboratories International, Inc. | 2,787,000 | 2,916,024 | ||||||
144A, 3.75%, 3/15/29 | 2,837,000 | 2,928,153 | ||||||
144A, 4.00%, 3/15/31 | 2,767,000 | 2,957,342 | ||||||
CHS/Community Health Systems, Inc. | 7,986,000 | 8,404,287 | ||||||
144A, 8.00%, 3/15/26 | 12,491,000 | 13,386,605 | ||||||
144A, 5.625%, 3/15/27 | 10,585,000 | 11,180,406 | ||||||
144A, 8.00%, 12/15/27 | 3,831,000 | 4,223,677 | ||||||
144A, 6.875%, 4/1/28 (a) | 4,198,000 | 4,170,608 | ||||||
144A, 6.00%, 1/15/29 | 5,009,000 | 5,347,107 | ||||||
144A, 6.875%, 4/15/29 | 9,982,000 | 10,398,249 | ||||||
144A, 6.125%, 4/1/30 | 8,039,000 | 8,114,366 | ||||||
144A, 4.75%, 2/15/31 (a) | 5,993,000 | 6,121,130 | ||||||
DaVita, Inc. | 15,374,000 | 16,082,741 | ||||||
144A, 3.75%, 2/15/31 | 8,356,000 | 8,268,262 | ||||||
Encompass Health Corp. | 4,430,000 | 4,645,962 | ||||||
4.75%, 2/1/30 | 4,520,000 | 4,825,055 | ||||||
4.625%, 4/1/31 | 2,228,000 | 2,391,914 | ||||||
Envision Healthcare Corp., 144A, | 5,607,000 | 4,744,924 | ||||||
HCA, Inc. | 6,922,000 | 7,467,107 | ||||||
5.375%, 2/1/25 | 14,761,000 | 16,652,401 | ||||||
5.875%, 2/15/26 | 8,483,000 | 9,849,187 | ||||||
5.375%, 9/1/26 | 5,571,000 | 6,433,391 | ||||||
5.625%, 9/1/28 | 8,306,000 | 9,915,578 | ||||||
5.875%, 2/1/29 | 5,563,000 | 6,752,564 | ||||||
3.50%, 9/1/30 | 15,215,000 | 16,350,724 | ||||||
IQVIA, Inc. | 5,897,000 | 6,081,281 | ||||||
144A, 5.00%, 5/15/27 | 6,009,000 | 6,286,496 | ||||||
Legacy LifePoint Health LLC | 3,278,000 | 3,454,192 | ||||||
144A, 4.375%, 2/15/27 | 3,284,000 | 3,279,895 | ||||||
LifePoint Health, Inc., 144A, | 2,819,000 | 2,772,966 | ||||||
MEDNAX, Inc., 144A, | 5,571,000 | 5,877,405 | ||||||
Molina Healthcare, Inc. | 3,931,000 | 4,080,378 | ||||||
144A, 4.375%, 6/15/28 | 4,457,000 | 4,679,850 | ||||||
144A, 3.875%, 11/15/30 | 3,597,000 | 3,840,283 | ||||||
Radiology Partners, Inc., 144A, | 3,981,000 | 4,274,599 | ||||||
RegionalCare Hospital Partners Holdings, Inc. / LifePoint Health, Inc., 144A, | 8,504,000 | 9,056,760 | ||||||
Select Medical Corp., 144A, | 6,692,000 | 7,085,155 | ||||||
Principal | Value | |||||||
| Healthcare-Services (Continued) | ||||||||
Tenet Healthcare Corp. | $ | 10,363,000 | $ | 11,243,855 | ||||
4.625%, 7/15/24 | 10,288,000 | 10,442,320 | ||||||
144A, 4.625%, 9/1/24 | 3,057,000 | 3,138,805 | ||||||
144A, 7.50%, 4/1/25 | 4,599,000 | 4,926,863 | ||||||
144A, 4.875%, 1/1/26 | 11,707,000 | 12,158,305 | ||||||
144A, 6.25%, 2/1/27 | 8,147,000 | 8,503,431 | ||||||
144A, 5.125%, 11/1/27 | 8,376,000 | 8,826,210 | ||||||
144A, 4.625%, 6/15/28 | 3,244,000 | 3,361,595 | ||||||
144A, 6.125%, 10/1/28 | 13,975,000 | 14,778,563 | ||||||
144A, 4.25%, 6/1/29 | 7,766,000 | 7,944,929 | ||||||
|
| |||||||
(Cost $435,773,263) | 439,987,706 | |||||||
|
| |||||||
| Household Products/Wares — 0.2% | ||||||||
Central Garden & Pet Co. | 2,762,000 | 2,842,001 | ||||||
144A, 4.125%, 4/30/31 | 2,239,000 | 2,275,697 | ||||||
Kronos Acquisition Holdings, Inc. / KIK Custom Products, Inc. | 2,646,000 | 2,636,713 | ||||||
144A, 7.00%, 12/31/27 (a) | 2,912,000 | 2,836,332 | ||||||
Spectrum Brands, Inc. | 2,209,000 | 2,264,225 | ||||||
144A, 3.875%, 3/15/31 | 2,919,000 | 2,885,796 | ||||||
|
| |||||||
(Cost $16,008,133) | 15,740,764 | |||||||
|
| |||||||
| Pharmaceuticals — 3.9% | ||||||||
AdaptHealth LLC | 2,800,000 | 2,811,340 | ||||||
144A, 5.125%, 3/1/30 | 3,300,000 | 3,346,513 | ||||||
Bausch Health Americas, Inc. | 8,356,000 | 9,003,590 | ||||||
144A, 8.50%, 1/31/27 | 9,759,000 | 10,507,515 | ||||||
Bausch Health Cos., Inc. | 16,873,000 | 17,273,734 | ||||||
144A, 5.50%, 11/1/25 | 9,919,000 | 10,158,544 | ||||||
144A, 9.00%, 12/15/25 | 8,210,000 | 8,743,650 | ||||||
144A, 5.75%, 8/15/27 | 2,769,000 | 2,911,050 | ||||||
144A, 7.00%, 1/15/28 | 4,353,000 | 4,517,065 | ||||||
144A, 5.00%, 1/30/28 | 6,922,000 | 6,614,075 | ||||||
144A, 4.875%, 6/1/28 | 8,913,000 | 9,169,249 | ||||||
144A, 5.00%, 2/15/29 | 5,373,000 | 5,030,713 | ||||||
144A, 6.25%, 2/15/29 | 8,683,000 | 8,628,123 | ||||||
144A, 7.25%, 5/30/29 | 4,105,000 | 4,233,569 | ||||||
144A, 5.25%, 1/30/30 | 6,857,000 | 6,455,146 | ||||||
144A, 5.25%, 2/15/31 (a) | 5,524,000 | 5,159,720 | ||||||
Cheplapharm Arzneimittel GmbH, 144A, | 2,737,000 | 2,802,045 | ||||||
Elanco Animal Health, Inc. | 4,005,000 | 4,295,563 | ||||||
5.90%, 8/28/28 | 4,125,000 | 4,834,974 | ||||||
Endo Dac / Endo Finance LLC / Endo Finco, Inc. | 5,345,000 | 5,245,423 | ||||||
144A, 6.00%, 6/30/28 | 7,001,000 | 4,385,251 | ||||||
Endo Luxembourg Finance Co I Sarl / Endo US, Inc., 144A, | 7,088,000 | 7,026,228 | ||||||
| See Notes to Financial Statements. | 54 |
DBX ETF Trust
Schedule of Investments
Xtrackers USD High Yield Corporate Bond ETF (Continued)
August 31, 2021
Principal | Value | |||||||
| Pharmaceuticals (Continued) | ||||||||
HLF Financing Sarl LLC / Herbalife International, Inc., 144A, | $ | 3,342,000 | $ | 3,354,566 | ||||
Jazz Securities DAC, 144A, | 8,336,000 | 8,649,809 | ||||||
Organon & Co. / Organon Foreign Debt Co.-Issuer BV | 11,701,000 | 12,086,548 | ||||||
144A, 5.125%, 4/30/31 (a) | 11,147,000 | 11,707,025 | ||||||
Par Pharmaceutical, Inc., 144A, | 11,299,000 | 11,454,361 | ||||||
Prestige Brands, Inc. | 2,215,000 | 2,322,981 | ||||||
144A, 3.75%, 4/1/31 | 3,343,000 | 3,305,508 | ||||||
Teva Pharmaceutical Finance Co. BV, | 4,742,000 | 4,783,493 | ||||||
Teva Pharmaceutical Finance Netherlands III BV | 16,712,000 | 16,540,535 | ||||||
6.00%, 4/15/24 (a) | 7,034,000 | 7,375,430 | ||||||
7.125%, 1/31/25 | 5,558,000 | 6,077,395 | ||||||
3.15%, 10/1/26 (a) | 19,580,000 | 18,726,018 | ||||||
6.75%, 3/1/28 (a) | 6,920,000 | 7,829,599 | ||||||
|
| |||||||
(Cost $261,947,120) | 257,366,348 | |||||||
|
| |||||||
| Energy — 12.4% | ||||||||
| Energy-Alternate Sources — 0.2% | ||||||||
TerraForm Power Operating LLC | 2,762,000 | 2,841,408 | ||||||
144A, 5.00%, 1/31/28 | 3,882,000 | 4,198,752 | ||||||
144A, 4.75%, 1/15/30 | 3,876,000 | 4,084,199 | ||||||
|
| |||||||
(Cost $11,215,099) | 11,124,359 | |||||||
|
| |||||||
| Oil & Gas — 6.6% | ||||||||
Antero Resources Corp. | 3,548,000 | 3,626,606 | ||||||
144A, 7.625%, 2/1/29 | 3,926,000 | 4,323,547 | ||||||
144A, 5.375%, 3/1/30 | 3,284,000 | 3,346,511 | ||||||
Apache Corp. | 2,769,000 | 3,000,101 | ||||||
4.375%, 10/15/28 | 3,900,000 | 4,213,560 | ||||||
4.25%, 1/15/30 (a) | 3,409,000 | 3,674,101 | ||||||
Ascent Resources Utica Holdings LLC / ARU Finance Corp. | 3,342,000 | 3,408,840 | ||||||
144A, 5.875%, 6/30/29 | 2,238,000 | 2,148,413 | ||||||
Callon Petroleum Co. | 2,520,000 | 2,434,950 | ||||||
144A, 8.00%, 8/1/28 (a) | 3,558,000 | 3,429,965 | ||||||
Calumet Specialty Products Partners LP / Calumet Finance Corp., 144A, | 3,110,000 | 3,214,963 | ||||||
Chesapeake Energy Corp. | 2,970,000 | 3,109,471 | ||||||
144A, 5.875%, 2/1/29 | 2,785,000 | 2,976,594 | ||||||
Citgo Holding, Inc., 144A, | 7,699,000 | 7,724,022 | ||||||
Principal | Value | |||||||
| Oil & Gas (Continued) | ||||||||
CITGO Petroleum Corp. | $ | 6,229,000 | $ | 6,392,511 | ||||
144A, 6.375%, 6/15/26 | 3,608,000 | 3,666,792 | ||||||
CNX Resources Corp. | 3,876,000 | 4,113,463 | ||||||
144A, 6.00%, 1/15/29 | 2,785,000 | 2,904,574 | ||||||
Comstock Resources, Inc. | 6,922,000 | 7,257,752 | ||||||
144A, 5.875%, 1/15/30 | 5,433,000 | 5,454,705 | ||||||
Continental Resources, Inc. | 3,556,000 | 3,711,575 | ||||||
3.80%, 6/1/24 | 5,593,000 | 5,977,519 | ||||||
4.375%, 1/15/28 (a) | 5,536,000 | 6,221,966 | ||||||
144A, 5.75%, 1/15/31 | 8,301,000 | 10,127,220 | ||||||
CrownRock LP / CrownRock Finance, Inc. | 6,473,000 | 6,674,828 | ||||||
144A, 5.00%, 5/1/29 | 2,415,000 | 2,484,407 | ||||||
CVR Energy, Inc. | 3,315,000 | 3,252,976 | ||||||
144A, 5.75%, 2/15/28 (a) | 2,246,000 | 2,221,204 | ||||||
Endeavor Energy Resources LP / EER Finance, Inc. | 3,334,000 | 3,539,708 | ||||||
144A, 5.50%, 1/30/26 | 2,737,000 | 2,836,818 | ||||||
144A, 5.75%, 1/30/28 | 5,623,000 | 5,925,236 | ||||||
EQT Corp. | 3,039,000 | 3,106,861 | ||||||
6.625%, 2/1/25 | 5,537,000 | 6,353,541 | ||||||
144A, 3.125%, 5/15/26 | 2,800,000 | 2,880,500 | ||||||
3.90%, 10/1/27 | 6,905,700 | 7,465,338 | ||||||
7.50%, 2/1/30 | 4,143,000 | 5,388,489 | ||||||
144A, 3.625%, 5/15/31 (a) | 2,762,000 | 2,917,735 | ||||||
Hilcorp Energy I LP / Hilcorp Finance Co. | 3,278,000 | 3,389,813 | ||||||
144A, 5.75%, 2/1/29 | 3,315,000 | 3,368,869 | ||||||
144A, 6.00%, 2/1/31 | 3,372,000 | 3,468,945 | ||||||
Laredo Petroleum, Inc. | 3,263,000 | 3,357,970 | ||||||
144A, 7.75%, 7/31/29 (a) | 2,207,000 | 2,140,393 | ||||||
Leviathan Bond Ltd. | 2,736,649 | 2,859,169 | ||||||
144A,REGS, 6.125%, 6/30/25 | 3,284,379 | 3,587,035 | ||||||
144A,REGS, 6.50%, 6/30/27 (a) | 3,284,379 | 3,633,147 | ||||||
144A,REGS, 6.75%, 6/30/30 | 3,245,514 | 3,643,089 | ||||||
Matador Resources Co., | 5,800,000 | 5,841,470 | ||||||
MEG Energy Corp. | 6,760,000 | 7,121,728 | ||||||
144A, 5.875%, 2/1/29 | 3,284,000 | 3,362,143 | ||||||
Moss Creek Resources Holdings, Inc. | 3,956,000 | 3,384,833 | ||||||
144A, 10.50%, 5/15/27 (a) | 2,727,000 | 2,481,611 | ||||||
Murphy Oil Corp. | 3,147,000 | 3,221,741 | ||||||
5.875%, 12/1/27 (a) | 2,953,000 | 3,074,811 | ||||||
6.375%, 7/15/28 | 3,010,000 | 3,171,788 | ||||||
| See Notes to Financial Statements. | 55 |
DBX ETF Trust
Schedule of Investments
Xtrackers USD High Yield Corporate Bond ETF (Continued)
August 31, 2021
Principal | Value | |||||||
| Oil & Gas (Continued) | ||||||||
Nabors Industries Ltd., 144A, | $ | 3,101,000 | $ | 2,887,806 | ||||
Nabors Industries, Inc., | 3,645,000 | 3,080,025 | ||||||
Occidental Petroleum Corp. | 2,449,000 | 2,494,062 | ||||||
6.95%, 7/1/24 | 3,883,000 | 4,374,025 | ||||||
2.90%, 8/15/24 | 5,600,000 | 5,747,000 | ||||||
3.50%, 6/15/25 | 3,226,000 | 3,388,607 | ||||||
8.00%, 7/15/25 | 2,812,000 | 3,391,975 | ||||||
5.875%, 9/1/25 (a) | 5,261,000 | 5,925,517 | ||||||
5.50%, 12/1/25 | 4,097,000 | 4,573,440 | ||||||
5.55%, 3/15/26 | 5,907,000 | 6,593,689 | ||||||
3.40%, 4/15/26 | 5,311,000 | 5,463,691 | ||||||
3.20%, 8/15/26 | 5,008,000 | 5,174,992 | ||||||
3.00%, 2/15/27 | 4,405,000 | 4,423,061 | ||||||
8.50%, 7/15/27 | 2,799,000 | 3,535,291 | ||||||
6.375%, 9/1/28 | 3,354,000 | 3,973,836 | ||||||
3.50%, 8/15/29 | 8,333,000 | 8,591,406 | ||||||
8.875%, 7/15/30 | 5,537,000 | 7,605,872 | ||||||
6.625%, 9/1/30 | 8,210,000 | 10,250,554 | ||||||
6.125%, 1/1/31 (a) | 7,147,000 | 8,652,122 | ||||||
7.50%, 5/1/31 | 4,867,000 | 6,374,894 | ||||||
7.875%, 9/15/31 | 2,682,000 | 3,566,577 | ||||||
Ovintiv Exploration, Inc. | 5,532,000 | 6,168,085 | ||||||
5.375%, 1/1/26 | 3,911,000 | 4,425,131 | ||||||
Parkland Corp. | 2,887,000 | 3,079,707 | ||||||
144A, 4.50%, 10/1/29 | 4,379,000 | 4,494,934 | ||||||
PBF Holding Co. LLC / PBF Finance Corp. 144A, 9.25%, 5/15/25 | 6,928,000 | 6,694,180 | ||||||
7.25%, 6/15/25 | 4,062,000 | 2,848,782 | ||||||
6.00%, 2/15/28 | 5,563,000 | 3,651,442 | ||||||
PDC Energy, Inc. | 2,270,000 | 2,310,100 | ||||||
5.75%, 5/15/26 (a) | 4,120,000 | 4,283,152 | ||||||
Puma International Financing SA | 3,240,000 | 3,252,166 | ||||||
144A, 5.00%, 1/24/26 (a) | 4,188,000 | 4,196,941 | ||||||
Range Resources Corp. | 3,048,000 | 3,132,003 | ||||||
4.875%, 5/15/25 | 4,143,000 | 4,293,184 | ||||||
9.25%, 2/1/26 (a) | 5,093,000 | 5,575,918 | ||||||
144A, 8.25%, 1/15/29 | 3,315,000 | 3,684,109 | ||||||
SM Energy Co. | 2,445,000 | 2,729,231 | ||||||
6.75%, 9/15/26 (a) | 2,295,000 | 2,309,367 | ||||||
6.625%, 1/15/27 (a) | 2,331,000 | 2,345,592 | ||||||
6.50%, 7/15/28 | 2,249,000 | 2,262,775 | ||||||
Southwestern Energy Co. | 4,888,000 | 5,333,492 | ||||||
7.75%, 10/1/27 (a) | 2,431,000 | 2,634,596 | ||||||
5.375%, 3/15/30 | 6,700,000 | 6,965,220 | ||||||
Sunoco LP / Sunoco Finance Corp. | 4,674,000 | 4,808,167 | ||||||
Principal | Value | |||||||
| Oil & Gas (Continued) | ||||||||
6.00%, 4/15/27 | $ | 3,719,000 | $ | 3,890,836 | ||||
4.50%, 5/15/29 | 4,430,000 | 4,492,286 | ||||||
Transocean, Inc. | 2,241,000 | 1,750,781 | ||||||
144A, 7.50%, 1/15/26 | 3,100,000 | 2,375,375 | ||||||
144A, 11.50%, 1/30/27 | 3,872,000 | 3,905,454 | ||||||
144A, 8.00%, 2/1/27 | 3,470,000 | 2,554,788 | ||||||
|
| |||||||
(Cost $435,495,999) | 443,132,153 | |||||||
|
| |||||||
| Oil & Gas Services — 0.6% | ||||||||
Archrock Partners LP / Archrock Partners Finance Corp. | 2,737,000 | 2,846,507 | ||||||
144A, 6.25%, 4/1/28 | 4,430,000 | 4,518,600 | ||||||
CGG SA, 144A, | 2,767,000 | 2,694,504 | ||||||
TechnipFMC PLC, 144A, | 5,637,000 | 5,990,569 | ||||||
USA Compression Partners LP / USA Compression Finance Corp. | 3,968,000 | 4,128,069 | ||||||
6.875%, 9/1/27 | 4,228,000 | 4,433,777 | ||||||
Weatherford International Ltd. | 2,987,000 | 3,110,214 | ||||||
144A, 11.00%, 12/1/24 | 11,472,000 | 12,002,580 | ||||||
|
| |||||||
(Cost $39,137,721) | 39,724,820 | |||||||
|
| |||||||
| Pipelines — 5.0% | ||||||||
Antero Midstream Partners LP / Antero Midstream Finance Corp. | 3,038,000 | 3,349,425 | ||||||
144A, 5.75%, 3/1/27 | 3,902,000 | 4,024,016 | ||||||
144A, 5.75%, 1/15/28 | 3,301,000 | 3,441,359 | ||||||
144A, 5.375%, 6/15/29 | 4,400,000 | 4,510,000 | ||||||
Buckeye Partners LP | 2,889,000 | 2,986,634 | ||||||
144A, 4.125%, 3/1/25 | 2,871,000 | 2,971,585 | ||||||
3.95%, 12/1/26 | 3,358,000 | 3,471,803 | ||||||
4.125%, 12/1/27 | 2,211,000 | 2,269,879 | ||||||
144A, 4.50%, 3/1/28 | 2,737,000 | 2,830,222 | ||||||
Cheniere Energy Partners LP | 6,038,000 | 6,256,274 | ||||||
4.50%, 10/1/29 | 8,343,000 | 9,000,011 | ||||||
144A, 4.00%, 3/1/31 | 8,457,000 | 8,911,564 | ||||||
Cheniere Energy, Inc., | 10,923,000 | 11,537,419 | ||||||
CQP Holdco LP / BIP-V Chinook Holdco LLC, 144A, | 7,734,000 | 7,985,587 | ||||||
Crestwood Midstream Partners LP / Crestwood Midstream Finance Corp. | 2,773,000 | 2,835,392 | ||||||
144A, 5.625%, 5/1/27 | 3,342,000 | 3,371,242 | ||||||
144A, 6.00%, 2/1/29 | 3,900,000 | 3,974,178 | ||||||
DCP Midstream Operating LP | 2,762,000 | 2,842,761 | ||||||
5.375%, 7/15/25 | 4,868,000 | 5,366,970 | ||||||
5.625%, 7/15/27 | 2,762,000 | 3,142,742 | ||||||
| See Notes to Financial Statements. | 56 |
DBX ETF Trust
Schedule of Investments
Xtrackers USD High Yield Corporate Bond ETF (Continued)
August 31, 2021
Principal | Value | |||||||
| Pipelines (Continued) | ||||||||
5.125%, 5/15/29 | $ | 3,315,000 | $ | 3,684,142 | ||||
DT Midstream, Inc. | 6,091,000 | 6,250,889 | ||||||
144A, 4.375%, 6/15/31 | 5,537,000 | 5,723,874 | ||||||
EnLink Midstream LLC, | 2,750,000 | 2,827,083 | ||||||
EnLink Midstream Partners LP | 2,883,000 | 3,002,500 | ||||||
4.15%, 6/1/25 | 3,989,000 | 4,113,576 | ||||||
4.85%, 7/15/26 | 2,688,000 | 2,800,869 | ||||||
EQM Midstream Partners LP | 3,302,000 | 3,454,717 | ||||||
4.00%, 8/1/24 | 2,712,000 | 2,779,258 | ||||||
144A, 6.00%, 7/1/25 | 3,787,000 | 4,094,694 | ||||||
4.125%, 12/1/26 | 2,680,000 | 2,736,173 | ||||||
144A, 6.50%, 7/1/27 | 5,362,000 | 5,972,222 | ||||||
5.50%, 7/15/28 | 4,552,000 | 4,973,060 | ||||||
144A, 4.50%, 1/15/29 | 4,427,000 | 4,487,982 | ||||||
144A, 4.75%, 1/15/31 | 6,203,000 | 6,303,799 | ||||||
Genesis Energy LP / Genesis Energy Finance Corp. | 2,927,000 | 2,872,148 | ||||||
8.00%, 1/15/27 | 5,524,000 | 5,492,403 | ||||||
7.75%, 2/1/28 | 4,112,000 | 4,036,339 | ||||||
Hess Midstream Operations LP | 4,401,000 | 4,575,368 | ||||||
144A, 5.125%, 6/15/28 | 3,038,000 | 3,186,103 | ||||||
144A, 4.25%, 2/15/30 | 4,200,000 | 4,258,590 | ||||||
ITT Holdings LLC, 144A, | 6,664,000 | 6,805,610 | ||||||
New Fortress Energy, Inc. | 6,922,000 | 7,034,483 | ||||||
144A, 6.50%, 9/30/26 | 8,436,000 | 8,490,412 | ||||||
NGL Energy Operating LLC / NGL Energy Finance Corp., 144A, | 11,325,000 | 11,509,031 | ||||||
NGL Energy Partners LP / NGL Energy Finance Corp., | 3,125,000 | 2,925,781 | ||||||
NuStar Logistics LP | 3,542,000 | 3,812,078 | ||||||
6.00%, 6/1/26 | 2,785,000 | 3,017,631 | ||||||
5.625%, 4/28/27 | 3,031,000 | 3,227,954 | ||||||
6.375%, 10/1/30 | 3,322,000 | 3,677,454 | ||||||
Rockies Express Pipeline LLC | 2,210,000 | 2,277,361 | ||||||
144A, 4.95%, 7/15/29 | 3,045,000 | 3,171,839 | ||||||
Tallgrass Energy Partners LP / Tallgrass Energy Finance Corp. | 3,306,000 | 3,566,314 | ||||||
144A, 6.00%, 3/1/27 (a) | 2,354,000 | 2,439,403 | ||||||
144A, 5.50%, 1/15/28 | 4,130,000 | 4,176,690 | ||||||
144A, 6.00%, 12/31/30 | 4,248,000 | 4,326,843 | ||||||
Targa Resources Partners LP / Targa Resources Partners Finance Corp. | 5,262,000 | 5,511,945 | ||||||
5.375%, 2/1/27 | 2,730,000 | 2,825,550 | ||||||
Principal | Value | |||||||
| Pipelines (Continued) | ||||||||
6.50%, 7/15/27 | $ | 4,099,000 | $ | 4,443,193 | ||||
5.00%, 1/15/28 | 3,967,000 | 4,173,522 | ||||||
6.875%, 1/15/29 | 3,718,000 | 4,184,423 | ||||||
5.50%, 3/1/30 | 5,243,000 | 5,786,961 | ||||||
4.875%, 2/1/31 | 5,563,000 | 6,058,385 | ||||||
144A, 4.00%, 1/15/32 | 5,463,000 | 5,709,299 | ||||||
Venture Global Calcasieu Pass LLC 144A, 3.875%, 8/15/29 | 7,000,000 | 7,223,650 | ||||||
144A, 4.125%, 8/15/31 | 7,000,000 | 7,359,415 | ||||||
Western Midstream Operating LP | 5,600,000 | 5,891,592 | ||||||
3.95%, 6/1/25 | 2,800,000 | 2,929,500 | ||||||
4.65%, 7/1/26 | 2,785,000 | 3,005,711 | ||||||
4.50%, 3/1/28 | 4,385,000 | 4,730,757 | ||||||
4.75%, 8/15/28 | 2,239,000 | 2,466,594 | ||||||
5.30%, 2/1/30 | 6,795,000 | 7,581,895 | ||||||
|
| |||||||
(Cost $330,026,928) | 333,046,128 | |||||||
|
| |||||||
| Financial — 9.7% | ||||||||
| Banks — 1.0% | ||||||||
CIT Group, Inc. | 4,566,000 | 4,925,573 | ||||||
4.75%, 2/16/24 | 2,731,000 | 2,949,480 | ||||||
3.929%, 6/19/24 | 2,737,000 | 2,873,850 | ||||||
5.25%, 3/7/25 | 2,731,000 | 3,081,797 | ||||||
6.125%, 3/9/28 | 2,210,000 | 2,714,134 | ||||||
Commerzbank AG, 144A, | 5,463,000 | 6,169,293 | ||||||
Deutsche Bank AG, | 6,978,000 | 7,207,371 | ||||||
Freedom Mortgage Corp. | 2,337,000 | 2,369,262 | ||||||
144A, 8.25%, 4/15/25 | 3,010,000 | 3,074,444 | ||||||
144A, 7.625%, 5/1/26 | 3,372,000 | 3,381,661 | ||||||
144A, 6.625%, 1/15/27 | 3,621,000 | 3,472,792 | ||||||
Intesa Sanpaolo SpA | 11,155,000 | 12,113,951 | ||||||
144A, 5.71%, 1/15/26 | 8,337,000 | 9,382,912 | ||||||
144A, 4.198%, 6/1/32 | 4,201,000 | 4,330,382 | ||||||
|
| |||||||
(Cost $67,394,566) | 68,046,902 | |||||||
|
| |||||||
| Diversified Financial Services — 2.7% | ||||||||
Ally Financial, Inc., | 5,800,000 | 6,625,015 | ||||||
Jefferies Finance LLC / JFIN Co.-Issuer Corp., 144A, | 5,600,000 | 5,747,336 | ||||||
LD Holdings Group LLC | 2,785,000 | 2,844,181 | ||||||
144A, 6.125%, 4/1/28 | 3,342,000 | 3,288,595 | ||||||
LPL Holdings, Inc. | 2,291,000 | 2,377,016 | ||||||
144A, 4.00%, 3/15/29 | 5,066,000 | 5,180,238 | ||||||
144A, 4.375%, 5/15/31 | 2,210,000 | 2,290,466 | ||||||
Midcap Financial Issuer Trust | 5,393,000 | 5,650,300 | ||||||
144A, 5.625%, 1/15/30 | 2,393,000 | 2,384,397 | ||||||
| See Notes to Financial Statements. | 57 |
DBX ETF Trust
Schedule of Investments
Xtrackers USD High Yield Corporate Bond ETF (Continued)
August 31, 2021
Principal | Value | |||||||
| Diversified Financial Services (Continued) | ||||||||
Nationstar Mortgage Holdings, Inc. | $ | 3,284,000 | $ | 3,464,620 | ||||
144A, 5.50%, 8/15/28 | 4,652,000 | 4,838,080 | ||||||
144A, 5.125%, 12/15/30 | 3,658,000 | 3,744,951 | ||||||
Navient Corp. | 5,463,000 | 5,736,150 | ||||||
7.25%, 9/25/23 | 2,856,000 | 3,141,250 | ||||||
MTN, 6.125%, 3/25/24 | 4,757,000 | 5,163,486 | ||||||
5.875%, 10/25/24 | 2,737,000 | 2,985,930 | ||||||
6.75%, 6/25/25 | 2,769,000 | 3,090,896 | ||||||
6.75%, 6/15/26 | 2,769,000 | 3,122,047 | ||||||
5.00%, 3/15/27 | 3,831,000 | 4,028,201 | ||||||
4.875%, 3/15/28 | 2,869,000 | 2,923,396 | ||||||
NFP Corp., 144A, | 9,899,000 | 10,171,222 | ||||||
OneMain Finance Corp. | 4,818,000 | 5,095,445 | ||||||
6.125%, 3/15/24 | 7,090,000 | 7,648,338 | ||||||
6.875%, 3/15/25 | 7,328,000 | 8,308,120 | ||||||
8.875%, 6/1/25 | 3,284,000 | 3,605,668 | ||||||
7.125%, 3/15/26 | 8,913,000 | 10,417,069 | ||||||
3.50%, 1/15/27 | 4,178,000 | 4,234,445 | ||||||
6.625%, 1/15/28 | 4,430,000 | 5,120,482 | ||||||
3.875%, 9/15/28 | 3,300,000 | 3,320,641 | ||||||
5.375%, 11/15/29 | 4,203,000 | 4,597,599 | ||||||
4.00%, 9/15/30 | 4,746,000 | 4,762,469 | ||||||
PennyMac Financial Services, Inc. | 3,591,000 | 3,720,420 | ||||||
144A, 4.25%, 2/15/29 | 3,591,000 | 3,461,167 | ||||||
Quicken Loans LLC / Quicken Loans Co.-Issuer, Inc. | 4,155,000 | 4,248,487 | ||||||
144A, 3.875%, 3/1/31 | 6,949,000 | 7,118,295 | ||||||
Rocket Mortgage LLC, 144A, | 5,627,000 | 5,929,451 | ||||||
United Wholesale Mortgage LLC | 4,379,000 | 4,493,949 | ||||||
144A, 5.50%, 4/15/29 | 3,899,000 | 3,826,245 | ||||||
|
| |||||||
(Cost $177,825,370) | 178,706,063 | |||||||
|
| |||||||
| Insurance — 0.8% | ||||||||
Acrisure LLC / Acrisure Finance, Inc. 144A, 7.00%, 11/15/25 | 5,203,000 | 5,307,060 | ||||||
144A, 10.125%, 8/1/26 | 2,189,000 | 2,459,889 | ||||||
144A, 4.25%, 2/15/29 | 3,876,000 | 3,842,163 | ||||||
144A, 6.00%, 8/1/29 | 2,800,000 | 2,761,724 | ||||||
Alliant Holdings Intermediate LLC / Alliant Holdings Co-Issuer | 2,907,000 | 2,917,901 | ||||||
144A, 6.75%, 10/15/27 | 7,520,000 | 7,811,400 | ||||||
AssuredPartners, Inc. | 2,785,000 | 2,833,737 | ||||||
144A, 5.625%, 1/15/29 | 3,124,000 | 3,148,149 | ||||||
HUB International Ltd., 144A, | 9,303,000 | 9,636,513 | ||||||
MGIC Investment Corp., | 3,621,000 | 3,878,996 | ||||||
Principal | Value | |||||||
| Insurance (Continued) | ||||||||
Radian Group, Inc. | $ | 2,463,000 | $ | 2,666,197 | ||||
6.625%, 3/15/25 | 3,100,000 | 3,499,125 | ||||||
4.875%, 3/15/27 | 2,517,000 | 2,776,830 | ||||||
|
| |||||||
(Cost $53,376,660) | 53,539,684 | |||||||
|
| |||||||
| Real Estate — 0.6% | ||||||||
Howard Hughes Corp. | 4,143,000 | 4,396,759 | ||||||
144A, 4.125%, 2/1/29 | 3,583,000 | 3,605,394 | ||||||
144A, 4.375%, 2/1/31 | 3,591,000 | 3,626,910 | ||||||
Kennedy-Wilson, Inc. | 3,509,000 | 3,614,217 | ||||||
4.75%, 2/1/30 | 3,300,000 | 3,395,007 | ||||||
5.00%, 3/1/31 | 3,315,000 | 3,453,119 | ||||||
Realogy Group LLC / Realogy Co.-Issuer Corp. | 2,199,000 | 2,292,018 | ||||||
144A, 7.625%, 6/15/25 | 3,345,000 | 3,605,877 | ||||||
144A, 9.375%, 4/1/27 | 3,160,000 | 3,491,942 | ||||||
144A, 5.75%, 1/15/29 | 4,975,000 | 5,212,805 | ||||||
|
| |||||||
(Cost $36,476,375) | 36,694,048 | |||||||
|
| |||||||
| Real Estate Investment Trusts — 4.0% | ||||||||
Apollo Commercial Real Estate Finance, Inc., 144A, | 2,815,000 | 2,745,244 | ||||||
Diversified Healthcare Trust | 5,473,000 | 6,027,141 | ||||||
4.75%, 2/15/28 | 2,819,000 | 2,858,649 | ||||||
4.375%, 3/1/31 | 2,737,000 | 2,689,171 | ||||||
EPR Properties | 2,507,000 | 2,709,365 | ||||||
4.50%, 6/1/27 | 2,463,000 | 2,612,276 | ||||||
4.95%, 4/15/28 | 2,185,000 | 2,362,438 | ||||||
3.75%, 8/15/29 | 2,916,000 | 2,932,192 | ||||||
HAT Holdings I LLC / HAT Holdings II LLC 144A, 6.00%, 4/15/25 | 2,189,000 | 2,310,358 | ||||||
144A, 3.375%, 6/15/26 | 5,473,000 | 5,584,102 | ||||||
Iron Mountain, Inc. | 5,627,000 | 5,866,147 | ||||||
144A, 5.25%, 3/15/28 | 4,462,000 | 4,690,677 | ||||||
144A, 5.00%, 7/15/28 | 2,710,000 | 2,835,337 | ||||||
144A, 4.875%, 9/15/29 | 5,765,000 | 6,088,128 | ||||||
144A, 5.25%, 7/15/30 | 7,328,000 | 7,831,800 | ||||||
144A, 4.50%, 2/15/31 | 5,949,000 | 6,125,626 | ||||||
144A, 5.625%, 7/15/32 | 3,251,000 | 3,537,494 | ||||||
iStar, Inc. | 4,184,000 | 4,445,709 | ||||||
4.25%, 8/1/25 | 3,117,000 | 3,253,369 | ||||||
5.50%, 2/15/26 | 2,289,000 | 2,400,589 | ||||||
Ladder Capital Finance Holdings LLLP / Ladder Capital Finance Corp. | 3,568,000 | 3,590,300 | ||||||
144A, 4.75%, 6/15/29 | 3,632,000 | 3,718,260 | ||||||
| See Notes to Financial Statements. | 58 |
DBX ETF Trust
Schedule of Investments
Xtrackers USD High Yield Corporate Bond ETF (Continued)
August 31, 2021
Principal | Value | |||||||
| Real Estate Investment Trusts (Continued) | ||||||||
MGM Growth Properties Operating Partnership LP / MGP Finance Co-Issuer, Inc. | $ | 5,866,000 | $ | 6,401,272 | ||||
144A, 4.625%, 6/15/25 | 4,529,000 | 4,873,430 | ||||||
4.50%, 9/1/26 | 2,793,000 | 3,046,870 | ||||||
5.75%, 2/1/27 | 4,096,000 | 4,721,354 | ||||||
144A, 3.875%, 2/15/29 | 4,130,000 | 4,383,520 | ||||||
MPT Operating Partnership LP / MPT Finance Corp. | 2,717,000 | 2,803,075 | ||||||
5.00%, 10/15/27 | 7,812,000 | 8,280,720 | ||||||
4.625%, 8/1/29 | 5,224,000 | 5,591,861 | ||||||
3.50%, 3/15/31 | 7,162,000 | 7,372,527 | ||||||
Park Intermediate Holdings LLC / PK Domestic Property LLC / PK Finance Co.-Issuer | 3,492,000 | 3,740,840 | ||||||
144A, 5.875%, 10/1/28 | 4,005,000 | 4,270,331 | ||||||
144A, 4.875%, 5/15/29 | 4,143,000 | 4,264,431 | ||||||
RHP Hotel Properties LP / RHP Finance Corp. | 3,973,000 | 4,144,189 | ||||||
144A, 4.50%, 2/15/29 | 3,342,000 | 3,388,621 | ||||||
SBA Communications Corp. | 6,107,000 | 6,206,239 | ||||||
3.875%, 2/15/27 | 8,332,000 | 8,669,696 | ||||||
144A, 3.125%, 2/1/29 | 8,381,000 | 8,244,976 | ||||||
Service Properties Trust | 2,793,000 | 2,859,459 | ||||||
4.35%, 10/1/24 | 4,716,000 | 4,786,740 | ||||||
7.50%, 9/15/25 | 4,457,000 | 5,036,834 | ||||||
4.75%, 10/1/26 | 2,481,000 | 2,477,899 | ||||||
4.95%, 2/15/27 (a) | 2,273,000 | 2,276,569 | ||||||
5.50%, 12/15/27 (a) | 2,492,000 | 2,675,807 | ||||||
3.95%, 1/15/28 | 2,240,000 | 2,131,091 | ||||||
4.95%, 10/1/29 | 2,323,000 | 2,285,658 | ||||||
4.375%, 2/15/30 | 2,217,000 | 2,132,710 | ||||||
Starwood Property Trust, Inc. | 2,762,000 | 2,896,648 | ||||||
144A, 3.625%, 7/15/26 | 2,210,000 | 2,226,575 | ||||||
Uniti Group LP / Uniti Fiber Holdings, Inc. / CSL Capital LLC | 3,421,000 | 3,522,775 | ||||||
144A, 7.875%, 2/15/25 | 12,612,000 | 13,494,840 | ||||||
Uniti Group LP / Uniti Group Finance, Inc. / CSL Capital LLC | 3,155,000 | 3,225,988 | ||||||
144A, 6.50%, 2/15/29 | 6,141,000 | 6,417,345 | ||||||
VICI Properties LP / VICI Note Co., Inc. 144A, 3.50%, 2/15/25 (a) | 4,097,000 | 4,204,546 | ||||||
144A, 4.25%, 12/1/26 | 6,971,000 | 7,331,174 | ||||||
144A, 3.75%, 2/15/27 (a) | 4,176,000 | 4,348,260 | ||||||
144A, 4.625%, 12/1/29 | 5,557,000 | 6,050,184 | ||||||
144A, 4.125%, 8/15/30 | 5,568,000 | 5,950,800 | ||||||
Principal | Value | |||||||
| Real Estate Investment Trusts (Continued) | ||||||||
XHR LP | $ | 2,812,000 | $ | 2,984,235 | ||||
144A, 4.875%, 6/1/29 | 2,787,000 | 2,874,094 | ||||||
|
| |||||||
(Cost $266,251,520) | 269,808,555 | |||||||
|
| |||||||
| Venture Capital — 0.6% | ||||||||
Compass Group Diversified Holdings LLC, 144A, | 5,534,000 | 5,799,853 | ||||||
Icahn Enterprises LP / Icahn Enterprises Finance Corp. | 2,679,000 | 2,732,580 | ||||||
4.75%, 9/15/24 | 6,124,000 | 6,357,248 | ||||||
6.375%, 12/15/25 | 4,185,000 | 4,315,781 | ||||||
6.25%, 5/15/26 | 6,918,000 | 7,298,490 | ||||||
5.25%, 5/15/27 | 8,139,000 | 8,464,601 | ||||||
4.375%, 2/1/29 | 4,267,000 | 4,287,247 | ||||||
|
| |||||||
(Cost $39,154,399) | 39,255,800 | |||||||
|
| |||||||
| Industrial — 7.9% | ||||||||
| Aerospace/Defense — 2.4% | ||||||||
Bombardier, Inc. | 2,815,000 | 2,821,897 | ||||||
144A, 6.125%, 1/15/23 | 2,922,000 | 3,145,664 | ||||||
144A, 7.50%, 12/1/24 | 5,698,000 | 5,946,148 | ||||||
144A, 7.50%, 3/15/25 | 8,194,000 | 8,427,693 | ||||||
144A, 7.125%, 6/15/26 (a) | 6,600,000 | 6,971,250 | ||||||
144A, 7.875%, 4/15/27 (a) | 11,275,000 | 11,835,367 | ||||||
144A, 6.00%, 2/15/28 | 4,000,000 | 4,039,320 | ||||||
Howmet Aerospace, Inc. | 7,052,000 | 7,759,175 | ||||||
6.875%, 5/1/25 | 6,581,000 | 7,786,179 | ||||||
Rolls-Royce PLC | 5,463,000 | 5,566,524 | ||||||
144A, 5.75%, 10/15/27 | 5,590,000 | 6,138,295 | ||||||
Spirit AeroSystems, Inc. | 2,737,000 | 2,867,117 | ||||||
144A, 7.50%, 4/15/25 | 6,629,000 | 7,026,740 | ||||||
4.60%, 6/15/28 (a) | 4,006,000 | 3,920,872 | ||||||
TransDigm, Inc. | 6,009,000 | 6,437,141 | ||||||
144A, 6.25%, 3/15/26 | 24,395,000 | 25,675,737 | ||||||
6.375%, 6/15/26 | 5,129,000 | 5,331,852 | ||||||
7.50%, 3/15/27 | 3,547,000 | 3,756,895 | ||||||
5.50%, 11/15/27 | 15,003,000 | 15,378,075 | ||||||
144A, 4.625%, 1/15/29 | 6,590,000 | 6,515,863 | ||||||
144A, 4.875%, 5/1/29 | 4,123,000 | 4,102,653 | ||||||
Triumph Group, Inc. | 3,271,000 | 3,606,278 | ||||||
144A, 6.25%, 9/15/24 | 2,906,000 | 2,945,376 | ||||||
7.75%, 8/15/25 (a) | 2,862,000 | 2,858,423 | ||||||
|
| |||||||
(Cost $159,178,974) | 160,860,534 | |||||||
|
| |||||||
| Building Materials — 0.9% | ||||||||
Builders FirstSource, Inc. 144A, | 3,904,000 | 4,172,400 | ||||||
144A, 5.00%, 3/1/30 | 3,045,000 | 3,261,956 | ||||||
144A, 4.25%, 2/1/32 | 5,571,000 | 5,729,857 | ||||||
| See Notes to Financial Statements. | 59 |
DBX ETF Trust
Schedule of Investments
Xtrackers USD High Yield Corporate Bond ETF (Continued)
August 31, 2021
Principal | Value | |||||||
| Building Materials (Continued) | ||||||||
Griffon Corp., | $ | 5,520,000 | $ | 5,864,669 | ||||
JELD-WEN, Inc. 144A, | 2,214,000 | 2,259,024 | ||||||
144A, 4.875%, 12/15/27 | 2,415,000 | 2,520,765 | ||||||
SRM Escrow Issuer LLC, 144A, | 6,128,000 | 6,503,340 | ||||||
Standard Industries, Inc. | 4,696,000 | 4,860,360 | ||||||
144A, 4.75%, 1/15/28 | 5,571,000 | 5,791,194 | ||||||
144A, 4.375%, 7/15/30 (a) | 6,228,000 | 6,406,463 | ||||||
144A, 3.375%, 1/15/31 | 6,027,000 | 5,800,988 | ||||||
Summit Materials LLC / Summit Materials Finance Corp., 144A, | 3,910,000 | 4,144,756 | ||||||
|
| |||||||
(Cost $57,547,411) | 57,315,772 | |||||||
|
| |||||||
| Electrical Components & Equipment — 0.4% | ||||||||
Energizer Holdings, Inc. | 3,284,000 | 3,378,415 | ||||||
144A, 4.375%, 3/31/29 | 4,535,000 | 4,553,684 | ||||||
WESCO Distribution, Inc. | 8,286,000 | 8,923,525 | ||||||
144A, 7.25%, 6/15/28 | 7,381,000 | 8,218,301 | ||||||
|
| |||||||
(Cost $25,055,188) | 25,073,925 | |||||||
|
| |||||||
| Electronics — 0.5% | ||||||||
Imola Merger Corp., 144A, | 10,925,000 | 11,321,031 | ||||||
Sensata Technologies BV | 2,838,000 | 3,043,074 | ||||||
144A, 5.625%, 11/1/24 | 2,153,000 | 2,397,904 | ||||||
144A, 5.00%, 10/1/25 | 3,942,000 | 4,411,571 | ||||||
144A, 4.00%, 4/15/29 | 5,439,000 | 5,633,771 | ||||||
Sensata Technologies, Inc. 144A, | 2,422,000 | 2,600,865 | ||||||
144A, 3.75%, 2/15/31 | 4,474,000 | 4,502,566 | ||||||
|
| |||||||
(Cost $33,625,249) | 33,910,782 | |||||||
|
| |||||||
| Engineering & Construction — 0.2% | ||||||||
Brand Industrial Services, Inc., 144A, | 5,537,000 | 5,585,449 | ||||||
Fluor Corp. | 2,771,000 | 2,915,743 | ||||||
4.25%, 9/15/28 (a) | 3,325,000 | 3,493,710 | ||||||
|
| |||||||
(Cost $11,793,452) | 11,994,902 | |||||||
|
| |||||||
| Environmental Control — 0.7% | ||||||||
Covanta Holding Corp. | 2,189,000 | 2,262,879 | ||||||
6.00%, 1/1/27 | 2,326,000 | 2,410,317 | ||||||
5.00%, 9/1/30 | 2,210,000 | 2,279,062 | ||||||
GFL Environmental, Inc. | 2,787,000 | 2,894,996 | ||||||
144A, 3.75%, 8/1/25 | 4,213,000 | 4,344,656 | ||||||
144A, 5.125%, 12/15/26 | 2,769,000 | 2,924,756 | ||||||
144A, 4.00%, 8/1/28 | 2,785,000 | 2,767,649 | ||||||
144A, 3.50%, 9/1/28 | 4,178,000 | 4,174,449 | ||||||
Principal | Value | |||||||
| Environmental Control (Continued) | ||||||||
144A, 4.75%, 6/15/29 | $ | 4,178,000 | $ | 4,298,118 | ||||
144A, 4.375%, 8/15/29 | 3,100,000 | 3,121,049 | ||||||
Madison IAQ LLC | 3,942,000 | 3,969,673 | ||||||
144A, 5.875%, 6/30/29 | 5,718,000 | 5,860,950 | ||||||
Stericycle, Inc. | 3,488,000 | 3,579,665 | ||||||
144A, 3.875%, 1/15/29 | 2,769,000 | 2,821,625 | ||||||
|
| |||||||
(Cost $47,795,521) | 47,709,844 | |||||||
|
| |||||||
| Machinery-Diversified — 0.2% | ||||||||
TK Elevator US Newco, Inc., 144A, | 8,711,000 | 9,214,670 | ||||||
Vertical Holdco GmbH, 144A, | 2,560,000 | 2,776,013 | ||||||
|
| |||||||
(Cost $11,909,884) | 11,990,683 | |||||||
|
| |||||||
| Miscellaneous Manufacturing — 0.1% | ||||||||
FXI Holdings, Inc. 144A, | 2,813,000 | 2,893,733 | ||||||
144A, 12.25%, 11/15/26 | 4,244,000 | 4,839,348 | ||||||
Hillenbrand, Inc., | 2,235,000 | 2,366,306 | ||||||
|
| |||||||
(Cost $9,978,313) | 10,099,387 | |||||||
|
| |||||||
| Packaging & Containers — 2.1% | ||||||||
Ardagh Metal Packaging Finance USA LLC / Ardagh Metal Packaging Finance PLC | 3,278,000 | 3,306,682 | ||||||
144A, 4.00%, 9/1/29 | 5,742,000 | 5,859,711 | ||||||
Ardagh Packaging Finance PLC / Ardagh Holdings USA, Inc. | 3,831,000 | 4,012,972 | ||||||
144A, 4.125%, 8/15/26 | 6,787,000 | 7,064,928 | ||||||
144A, 5.25%, 8/15/27 | 5,545,000 | 5,746,006 | ||||||
144A, 5.25%, 8/15/27 | 4,479,000 | 4,641,364 | ||||||
Ball Corp. | 5,559,000 | 5,885,591 | ||||||
5.25%, 7/1/25 | 5,554,000 | 6,282,962 | ||||||
4.875%, 3/15/26 | 4,180,000 | 4,697,275 | ||||||
2.875%, 8/15/30 | 7,238,000 | 7,265,432 | ||||||
Berry Global, Inc., 144A, | 2,797,000 | 2,947,339 | ||||||
Cascades, Inc./Cascades USA, Inc., 144A, | 3,497,000 | 3,689,335 | ||||||
Crown Americas LLC / Crown Americas Capital Corp. IV, | 5,473,000 | 5,742,272 | ||||||
Flex Acquisition Co., Inc. | 3,521,000 | 3,560,611 | ||||||
144A, 7.875%, 7/15/26 | 2,737,000 | 2,877,271 | ||||||
Graphic Packaging International LLC, 144A, | 2,463,000 | 2,497,790 | ||||||
LABL, Inc. | 3,831,000 | 4,027,339 | ||||||
144A, 10.50%, 7/15/27 | 3,807,000 | 4,153,627 | ||||||
| See Notes to Financial Statements. | 60 |
DBX ETF Trust
Schedule of Investments
Xtrackers USD High Yield Corporate Bond ETF (Continued)
August 31, 2021
Principal | Value | |||||||
| Packaging & Containers (Continued) | ||||||||
Mauser Packaging Solutions Holding Co. 144A, 5.50%, 4/15/24 | $ | 8,509,000 | $ | 8,619,192 | ||||
144A, 7.25%, 4/15/25 | 7,475,000 | 7,398,755 | ||||||
Owens-Brockway Glass Container, Inc. 144A, 5.875%, 8/15/23 | 3,950,000 | 4,201,812 | ||||||
144A, 6.625%, 5/13/27 | 3,867,000 | 4,175,703 | ||||||
Reynolds Group Issuer, Inc. / Reynolds Group Issuer LLC / Reynolds Group Issuer Lu, 144A, | 5,571,000 | 5,576,042 | ||||||
Sealed Air Corp. | 2,326,000 | 2,410,318 | ||||||
144A, 5.25%, 4/1/23 | 2,326,000 | 2,445,207 | ||||||
144A, 5.125%, 12/1/24 | 2,326,000 | 2,527,420 | ||||||
144A, 5.50%, 9/15/25 | 2,439,000 | 2,739,387 | ||||||
144A, 4.00%, 12/1/27 | 2,422,000 | 2,601,410 | ||||||
Silgan Holdings, Inc., | 3,156,000 | 3,270,184 | ||||||
Trivium Packaging Finance BV | 5,800,000 | 6,118,594 | ||||||
144A, 8.50%, 8/15/27 | 3,975,000 | 4,282,069 | ||||||
|
| |||||||
(Cost $139,852,323) | 140,624,600 | |||||||
|
| |||||||
| Transportation — 0.2% | ||||||||
Seaspan Corp., 144A, | 4,297,000 | 4,399,054 | ||||||
XPO Logistics, Inc. | 2,928,000 | 2,928,000 | ||||||
144A, 6.25%, 5/1/25 | 6,406,000 | 6,774,345 | ||||||
|
| |||||||
(Cost $13,991,771) | 14,101,399 | |||||||
|
| |||||||
| Trucking & Leasing — 0.2% | ||||||||
Fortress Transportation and Infrastructure Investors LLC | 4,696,000 | 4,842,750 | ||||||
144A, 9.75%, 8/1/27 | 2,210,000 | 2,497,300 | ||||||
144A, 5.50%, 5/1/28 | 2,882,000 | 2,925,230 | ||||||
|
| |||||||
(Cost $10,365,671) | 10,265,280 | |||||||
|
| |||||||
| Technology — 3.9% | ||||||||
| Computers — 1.4% | ||||||||
Banff Merger Sub, Inc., 144A, | 6,365,000 | 6,683,250 | ||||||
Booz Allen Hamilton, Inc. 144A, | 3,876,000 | 4,000,245 | ||||||
144A, 4.00%, 7/1/29 | 2,767,000 | 2,871,676 | ||||||
Dell International LLC / EMC Corp., 144A, | 8,394,000 | 8,582,865 | ||||||
Diebold Nixdorf, Inc. | 2,214,000 | 2,263,815 | ||||||
144A, 9.375%, 7/15/25 | 3,867,000 | 4,253,700 | ||||||
EMC Corp., | 5,524,000 | 5,710,435 | ||||||
Exela Intermediate LLC / Exela Finance, Inc., 144A, | 5,463,000 | 4,104,079 | ||||||
Principal | Value | |||||||
| Computers (Continued) | ||||||||
NCR Corp. | $ | 2,707,000 | $ | 2,866,171 | ||||
144A, 5.00%, 10/1/28 | 3,599,000 | 3,729,518 | ||||||
144A, 5.125%, 4/15/29 | 6,645,000 | 6,898,091 | ||||||
144A, 6.125%, 9/1/29 | 2,763,000 | 3,015,207 | ||||||
144A, 5.25%, 10/1/30 | 2,481,000 | 2,596,069 | ||||||
Seagate HDD Cayman | 3,052,000 | 3,251,914 | ||||||
4.875%, 3/1/24 | 2,785,000 | 3,011,588 | ||||||
4.75%, 1/1/25 | 2,587,000 | 2,855,919 | ||||||
4.875%, 6/1/27 | 2,764,000 | 3,096,454 | ||||||
144A, 4.091%, 6/1/29 | 2,787,000 | 2,951,112 | ||||||
144A, 3.125%, 7/15/29 | 2,946,000 | 2,895,675 | ||||||
144A, 4.125%, 1/15/31 | 2,781,000 | 2,936,402 | ||||||
144A, 3.375%, 7/15/31 | 2,785,000 | 2,761,007 | ||||||
Western Digital Corp., | 12,813,000 | 14,325,959 | ||||||
|
| |||||||
(Cost $95,008,501) | 95,661,151 | |||||||
|
| |||||||
| Office/Business Equipment — 0.5% | ||||||||
CDW LLC / CDW Finance Corp. | 3,184,000 | 3,524,529 | ||||||
4.125%, 5/1/25 | 3,284,000 | 3,419,465 | ||||||
4.25%, 4/1/28 | 3,315,000 | 3,476,606 | ||||||
3.25%, 2/15/29 | 3,861,000 | 3,972,004 | ||||||
Pitney Bowes, Inc., 144A, | 2,378,000 | 2,535,543 | ||||||
Xerox Corp., | 5,571,000 | 5,840,915 | ||||||
Xerox Holdings Corp. | 4,278,000 | 4,517,450 | ||||||
144A, 5.50%, 8/15/28 (a) | 4,078,000 | 4,265,914 | ||||||
|
| |||||||
(Cost $31,299,384) | 31,552,426 | |||||||
|
| |||||||
| Semiconductors — 0.2% | ||||||||
ams AG, 144A, | 2,542,000 | 2,725,786 | ||||||
Microchip Technology, Inc., | 6,705,000 | 7,071,256 | ||||||
ON Semiconductor Corp., 144A, | 3,876,000 | 4,045,730 | ||||||
|
| |||||||
(Cost $13,758,286) | 13,842,772 | |||||||
|
| |||||||
| Software — 1.8% | ||||||||
Black Knight InfoServ LLC, 144A, | 5,537,000 | 5,613,134 | ||||||
Boxer Parent Co., Inc., 144A, | 3,278,000 | 3,513,033 | ||||||
CDK Global, Inc. | 2,750,000 | 3,055,937 | ||||||
4.875%, 6/1/27 | 3,365,000 | 3,537,456 | ||||||
144A, 5.25%, 5/15/29 | 2,769,000 | 3,013,973 | ||||||
Change Healthcare Holdings LLC / Change Healthcare Finance, Inc., 144A, 5.75%, 3/1/25 | 7,537,000 | 7,621,791 | ||||||
Dun & Bradstreet Corp. | 2,304,000 | 2,430,720 | ||||||
| See Notes to Financial Statements. | 61 |
DBX ETF Trust
Schedule of Investments
Xtrackers USD High Yield Corporate Bond ETF (Continued)
August 31, 2021
Principal | Value | |||||||
| Software (Continued) | ||||||||
144A, 10.25%, 2/15/27 | $ | 2,507,000 | $ | 2,723,241 | ||||
J2 Global, Inc., 144A, | 4,293,000 | 4,551,267 | ||||||
MicroStrategy, Inc., 144A, | 2,787,000 | 2,870,443 | ||||||
MSCI, Inc. | 2,761,000 | 2,948,196 | ||||||
144A, 4.00%, 11/15/29 | 5,614,000 | 6,013,997 | ||||||
144A, 3.625%, 9/1/30 | 5,151,000 | 5,432,760 | ||||||
144A, 3.875%, 2/15/31 | 5,537,000 | 5,917,669 | ||||||
144A, 3.625%, 11/1/31 | 3,322,000 | 3,531,635 | ||||||
144A, 3.25%, 8/15/33 | 3,900,000 | 4,022,265 | ||||||
Open Text Corp. | 4,652,000 | 4,807,842 | ||||||
144A, 3.875%, 2/15/28 | 5,134,000 | 5,294,438 | ||||||
PTC, Inc. | 2,762,000 | 2,827,598 | ||||||
144A, 4.00%, 2/15/28 | 2,785,000 | 2,882,475 | ||||||
Rackspace Technology Global, Inc. 144A, 3.50%, 2/15/28 | 3,036,000 | 2,918,416 | ||||||
144A, 5.375%, 12/1/28 (a) | 3,004,000 | 2,977,309 | ||||||
SS&C Technologies, Inc., 144A, | 11,142,000 | 11,812,748 | ||||||
Twilio, Inc. | 2,762,000 | 2,854,389 | ||||||
3.875%, 3/15/31 | 2,762,000 | 2,890,115 | ||||||
Veritas US, Inc. / Veritas Bermuda Ltd., 144A, | 9,767,000 | 10,167,056 | ||||||
|
| |||||||
(Cost $115,341,220) | 116,229,903 | |||||||
|
| |||||||
| Utilities — 2.7% | ||||||||
| Electric — 2.5% | ||||||||
Calpine Corp. | 4,591,000 | 4,740,208 | ||||||
144A, 4.50%, 2/15/28 | 7,231,000 | 7,456,969 | ||||||
144A, 5.125%, 3/15/28 | 8,139,000 | 8,291,606 | ||||||
144A, 4.625%, 2/1/29 | 3,634,000 | 3,650,716 | ||||||
144A, 5.00%, 2/1/31 | 4,603,000 | 4,689,674 | ||||||
144A, 3.75%, 3/1/31 | 4,851,000 | 4,764,070 | ||||||
Clearway Energy Operating LLC | 4,652,000 | 4,930,887 | ||||||
144A, 3.75%, 2/15/31 | 5,121,000 | 5,204,959 | ||||||
DPL, Inc., | 2,286,000 | 2,450,021 | ||||||
FirstEnergy Corp. | 4,681,000 | 4,879,708 | ||||||
Series B, 4.40%, 7/15/27 | 8,194,000 | 9,206,229 | ||||||
2.65%, 3/1/30 | 3,560,000 | 3,631,200 | ||||||
Series B, 2.25%, 9/1/30 | 2,463,000 | 2,441,917 | ||||||
FirstEnergy Transmission LLC | 3,309,000 | 3,645,717 | ||||||
144A, 2.866%, 9/15/28 | 2,737,000 | 2,897,941 | ||||||
NextEra Energy Operating Partners LP 144A, 4.25%, 7/15/24 | 3,742,000 | 3,954,920 | ||||||
144A, 3.875%, 10/15/26 | 2,737,000 | 2,905,531 | ||||||
Principal | Value | |||||||
| Electric (Continued) | ||||||||
144A, 4.50%, 9/15/27 | $ | 3,179,000 | $ | 3,442,507 | ||||
NRG Energy, Inc. | 4,756,000 | 4,941,983 | ||||||
5.75%, 1/15/28 | 4,544,000 | 4,862,080 | ||||||
144A, 3.375%, 2/15/29 | 3,341,000 | 3,361,881 | ||||||
144A, 5.25%, 6/15/29 | 4,012,000 | 4,360,843 | ||||||
144A, 3.625%, 2/15/31 | 5,448,000 | 5,536,748 | ||||||
144A, 3.875%, 2/15/32 | 6,100,000 | 6,195,130 | ||||||
PG&E Corp. | 5,563,000 | 5,529,260 | ||||||
5.25%, 7/1/30 | 5,563,000 | 5,487,065 | ||||||
Talen Energy Supply LLC | 2,970,000 | 1,303,592 | ||||||
144A, 10.50%, 1/15/26 | 3,437,000 | 1,605,646 | ||||||
144A, 7.25%, 5/15/27 | 4,255,000 | 3,684,490 | ||||||
144A, 6.625%, 1/15/28 (a) | 2,659,000 | 2,285,756 | ||||||
144A, 7.625%, 6/1/28 | 2,178,000 | 1,887,498 | ||||||
TransAlta Corp., | 2,189,000 | 2,278,038 | ||||||
Vistra Operations Co. LLC | 5,913,000 | 6,089,207 | ||||||
144A, 5.625%, 2/15/27 | 7,101,000 | 7,403,219 | ||||||
144A, 5.00%, 7/31/27 | 7,115,000 | 7,391,418 | ||||||
144A, 4.375%, 5/1/29 | 6,963,000 | 7,076,149 | ||||||
|
| |||||||
(Cost $168,741,121) | 164,464,783 | |||||||
|
| |||||||
| Gas — 0.2% | ||||||||
AmeriGas Partners LP / AmeriGas Finance Corp. | 3,729,000 | 4,083,255 | ||||||
5.50%, 5/20/25 | 4,046,000 | 4,450,600 | ||||||
5.875%, 8/20/26 | 3,895,000 | 4,386,744 | ||||||
5.75%, 5/20/27 | 2,917,000 | 3,286,103 | ||||||
|
| |||||||
(Cost $16,082,795) | 16,206,702 | |||||||
|
| |||||||
TOTAL CORPORATE BONDS | 6,586,916,577 | |||||||
|
| |||||||
Number | ||||||||
| SECURITIES LENDING COLLATERAL — 3.3% | ||||||||
DWS Government & Agency Securities Portfolio “DWS Government Cash Institutional Shares”, 0.01% (c)(d) | 219,083,931 | 219,083,931 | ||||||
|
| |||||||
| CASH EQUIVALENTS — 2.5% | ||||||||
DWS Government Money Market Series “Institutional Shares”, | 168,443,173 | 168,443,173 | ||||||
|
| |||||||
TOTAL INVESTMENTS — 104.6% (Cost $6,945,995,104) | $ | 6,974,443,681 | ||||||
Other assets and liabilities, | (307,946,799 | ) | ||||||
|
| |||||||
NET ASSETS — 100.0% | $ | 6,666,496,882 | ||||||
|
| |||||||
| See Notes to Financial Statements. | 62 |
DBX ETF Trust
Schedule of Investments
Xtrackers USD High Yield Corporate Bond ETF (Continued)
August 31, 2021
A summary of the Fund’s transactions with affiliated investments during the year ended August 31, 2021 is as follows:
| Value ($) at 8/31/2020 | Purchases Cost ($) | Sales Proceeds ($) | Net Realized Gain/(Loss) ($) | Net Change in Unrealized Appreciation (Depreciation) ($) | Income($) | Capital Gain Distributions ($) | Number of Shares at 8/31/2021 | Value ($) at 8/31/2021 | ||||||||||||||||||||||||||||
CORPORATE BONDS — 0.1% |
| |||||||||||||||||||||||||||||||||||
Financial — 0.1% |
| |||||||||||||||||||||||||||||||||||
Deutsche Bank AG, 3.73%, 1/14/2032(b) |
| |||||||||||||||||||||||||||||||||||
| — | 10,786,624 | (3,811,277 | ) | 20,146 | 211,878 | 158,403 | — | 6,978,000 | 7,207,371 | |||||||||||||||||||||||||||
SECURITIES LENDING COLLATERAL — 3.3% |
| |||||||||||||||||||||||||||||||||||
DWS Government & Agency Securities Portfolio “DWS Government Cash Institutional Shares”, 0.01% (c)(d) |
| |||||||||||||||||||||||||||||||||||
| 134,912,900 | 84,171,031(e | ) | — | — | — | 27,081 | — | 219,083,931 | 219,083,931 | |||||||||||||||||||||||||||
CASH EQUIVALENTS — 2.5% |
| |||||||||||||||||||||||||||||||||||
DWS Government Money Market Series “Institutional Shares”, 0.04% (c) |
| |||||||||||||||||||||||||||||||||||
| 103,636,616 | 1,577,669,908 | (1,512,863,351 | ) | — | — | 22,052 | — | 168,443,173 | 168,443,173 | |||||||||||||||||||||||||||
|
|
|
|
|
|
|
|
|
|
|
|
|
|
|
|
|
| |||||||||||||||||||
| 238,549,516 | 1,672,627,563 | (1,516,674,628 | ) | 20,146 | 211,878 | 207,536 | — | 394,505,104 | 394,734,475 | |||||||||||||||||||||||||||
|
|
|
|
|
|
|
|
|
|
|
|
|
|
|
|
|
| |||||||||||||||||||
| (a) | All or a portion of these securities were on loan. In addition, “Other assets and liabilities, net” may include pending sales that are also on loan. The value of securities loaned at August 31, 2021 amounted to $274,628,491, which is 4.1% of net assets. |
| (b) | Affiliated issuer. This security is owned in proportion with its representation in the index. |
| (c) | Affiliated fund managed by DWS Investment Management Americas, Inc. The rate shown is the annualized seven-day yield at period end. |
| (d) | Represents cash collateral held in connection with securities lending. Income earned by the Fund is net of borrower rebates. In addition, the Fund held non-cash U.S. Treasury securities collateral having a value of $66,538,974. |
| (e) | Represents the net increase (purchase cost) or decrease (sales proceeds) in the amount invested in cash collateral for the year ended August 31, 2021. |
| GMTN: | Global Medium Term Note |
| MTN: | Medium Term Note |
| REGS: | Securities sold under Regulation S may not be offered, sold or delivered within the United States or to, or for the account or benefit of, U.S. persons, except pursuant to an exemption from, or in a transaction not subject to, the registration requirements of the Securities Act of 1933. |
| 144A: | Security exempt from registration under Rule 144A of the Securities Act of 1933. These securities may be resold in transactions exempt from registration, normally to qualified institutional buyers. |
Fair Value Measurements
Various inputs are used in determining the value of the Fund’s investments. These inputs are summarized in three broad levels. Level 1 includes quoted prices in active markets for identical securities. Level 2 includes other significant observable inputs (including quoted prices for similar securities, interest rates, prepayment speeds and credit risk). Level 3 includes significant unobservable inputs (including the Fund’s own assumptions in determining the fair value of investments). The level assigned to the securities valuations may not be an indication of the risk or liquidity associated with investing in those securities.
The following is a summary of the inputs used as of August 31, 2021 in valuing the Fund’s investments. For information on the Fund’s policy regarding the valuation of investments, please refer to the Security Valuation section of Note 2 in the accompanying Notes to Financial Statements.
Assets | Level 1 | Level 2 | Level 3 | Total | ||||||||||||
Corporate Bonds (f) | $ | — | $ | 6,586,916,577 | $ | — | $ | 6,586,916,577 | ||||||||
Short-Term Investments (f) | 387,527,104 | — | — | 387,527,104 | ||||||||||||
|
|
|
|
|
|
|
| |||||||||
TOTAL | $ | 387,527,104 | $ | 6,586,916,577 | $ | — | $ | 6,974,443,681 | ||||||||
|
|
|
|
|
|
|
| |||||||||
| (f) | See Schedule of Investments for additional detailed categorizations. |
| See Notes to Financial Statements. | 63 |
DBX ETF Trust
August 31, 2021
| Xtrackers High Beta High Yield Bond ETF | Xtrackers Low Beta High Yield Bond ETF | Xtrackers Short Duration High Yield Bond ETF | Xtrackers USD High Yield Corporate Bond ETF | |||||||||||||
Assets | ||||||||||||||||
Investment in non-affiliated securities at value | $ | 18,953,769 | $ | 736,709,857 | $ | 72,450,672 | $ | 6,579,709,206 | ||||||||
Investment in affiliated securities at value | — | 1,672,217 | — | 7,207,371 | ||||||||||||
Investment in DWS Government Money Market Series | 171,850 | 29,654,545 | 5,311,866 | 168,443,173 | ||||||||||||
Investment in DWS Government & Agency Securities Portfolio* | 1,444,823 | 4,866,433 | 1,323,612 | 219,083,931 | ||||||||||||
Cash | — | 274 | 107,815 | — | ||||||||||||
| Receivables: | ||||||||||||||||
Investment securities sold | 1,323,399 | 37,455,272 | 258,691 | 86,229,947 | ||||||||||||
Capital shares | — | — | — | 20,145,711 | ||||||||||||
Interest | 284,273 | 9,490,141 | 1,170,522 | 90,976,360 | ||||||||||||
Securities lending income | 587 | 2,046 | 705 | 105,242 | ||||||||||||
|
|
|
|
|
|
|
| |||||||||
Total assets | $ | 22,178,701 | $ | 819,850,785 | $ | 80,623,883 | $ | 7,171,900,941 | ||||||||
|
|
|
|
|
|
|
| |||||||||
Liabilities | ||||||||||||||||
Payable upon return of securities loaned | $ | 1,444,823 | $ | 4,866,433 | $ | 1,323,612 | $ | 219,083,931 | ||||||||
| Payables: | ||||||||||||||||
Investment securities purchased | 1,391,991 | 64,479,187 | 2,659,935 | 273,387,137 | ||||||||||||
Capital shares | — | — | — | 12,094,193 | ||||||||||||
Investment advisory fees | 3,254 | 120,897 | 12,383 | 838,798 | ||||||||||||
|
|
|
|
|
|
|
| |||||||||
Total liabilities | 2,840,068 | 69,466,517 | 3,995,930 | 505,404,059 | ||||||||||||
|
|
|
|
|
|
|
| |||||||||
Net Assets, at value | $ | 19,338,633 | $ | 750,384,268 | $ | 76,627,953 | $ | 6,666,496,882 | ||||||||
|
|
|
|
|
|
|
| |||||||||
Net Assets Consist of | ||||||||||||||||
Paid-in capital | $ | 29,563,784 | $ | 742,293,695 | $ | 75,210,165 | $ | 6,727,081,116 | ||||||||
Distributable earnings (loss) | (10,225,151 | ) | 8,090,573 | 1,417,788 | (60,584,234 | ) | ||||||||||
|
|
|
|
|
|
|
| |||||||||
Net Assets, at value | $ | 19,338,633 | $ | 750,384,268 | $ | 76,627,953 | $ | 6,666,496,882 | ||||||||
|
|
|
|
|
|
|
| |||||||||
Number of Common Shares outstanding | 400,001 | 14,700,001 | 1,600,001 | 165,387,501 | ||||||||||||
|
|
|
|
|
|
|
| |||||||||
Net Asset Value | $ | 48.35 | $ | 51.05 | $ | 47.89 | $ | 40.31 | ||||||||
|
|
|
|
|
|
|
| |||||||||
Investment in non-affiliated securities at cost | $ | 18,770,673 | $ | 725,871,418 | $ | 70,725,397 | $ | 6,551,472,507 | ||||||||
|
|
|
|
|
|
|
| |||||||||
Investment in affiliated securities at cost | $ | — | $ | 1,610,022 | $ | — | $ | 6,995,493 | ||||||||
|
|
|
|
|
|
|
| |||||||||
Value of securities loaned | $ | 2,165,066 | $ | 12,878,522 | $ | 2,620,240 | $ | 274,628,491 | ||||||||
|
|
|
|
|
|
|
| |||||||||
Investment in DWS Government Money Market Series at cost | $ | 171,850 | $ | 29,654,545 | $ | 5,311,866 | $ | 168,443,173 | ||||||||
|
|
|
|
|
|
|
| |||||||||
Investment in DWS Government & Agency Securities Portfolio at cost* | $ | 1,444,823 | $ | 4,866,433 | $ | 1,323,612 | $ | 219,083,931 | ||||||||
|
|
|
|
|
|
|
| |||||||||
Non-cash collateral for securities on loan | $ | 809,195 | $ | 8,439,017 | $ | 1,401,605 | $ | 66,538,974 | ||||||||
|
|
|
|
|
|
|
| |||||||||
| * | Represents collateral on securities loaned. |
| See Notes to Financial Statements. | 64 |
DBX ETF Trust
For the Year Ended August 31, 2021
| Xtrackers High Beta High Yield Bond ETF | Xtrackers Low Beta High Yield Bond ETF | Xtrackers Short Duration High Yield Bond ETF | Xtrackers USD High Yield Corporate Bond ETF | |||||||||||||
Investment Income | ||||||||||||||||
Unaffiliated interest income | $ | 702,254 | $ | 8,532,561 | $ | 2,578,658 | $ | 304,019,304 | ||||||||
Affiliated interest income | — | 19,917 | — | 158,403 | ||||||||||||
Income distributions from affiliated funds | 53 | 1,775 | 771 | 22,052 | ||||||||||||
Affiliated securities lending income | 74 | 227 | 291 | 27,081 | ||||||||||||
Unaffiliated securities lending income, net of borrower rebates | 3,125 | 10,602 | 9,677 | 938,767 | ||||||||||||
|
|
|
|
|
|
|
| |||||||||
Total investment income | 705,506 | 8,565,082 | 2,589,397 | 305,165,607 | ||||||||||||
|
|
|
|
|
|
|
| |||||||||
Expenses | ||||||||||||||||
Investment advisory fees | 43,688 | 692,979 | 100,540 | 13,794,156 | ||||||||||||
Other expenses | 401 | 401 | 57 | 4,166 | ||||||||||||
|
|
|
|
|
|
|
| |||||||||
Total expenses | 44,089 | 693,380 | 100,597 | 13,798,322 | ||||||||||||
|
|
|
|
|
|
|
| |||||||||
Less fees waived (see note 3): | ||||||||||||||||
Waiver | (18,778 | ) | (139,393 | ) | (647 | ) | (3,472,942 | ) | ||||||||
|
|
|
|
|
|
|
| |||||||||
Net expenses | 25,311 | 553,987 | 99,950 | 10,325,380 | ||||||||||||
|
|
|
|
|
|
|
| |||||||||
Net investment income (loss) | 680,195 | 8,011,095 | 2,489,447 | 294,840,227 | ||||||||||||
|
|
|
|
|
|
|
| |||||||||
Realized and Unrealized Gain (Loss) | ||||||||||||||||
Net realized gain (loss) from: | ||||||||||||||||
Investments | 331,044 | 1,737,928 | 968,615 | 19,233,742 | ||||||||||||
In-kind redemptions | — | 368,690 | 302,917 | 242,281,066 | ||||||||||||
In-kind redemptions in affiliates | — | — | — | 20,146 | ||||||||||||
|
|
|
|
|
|
|
| |||||||||
Net realized gain (loss) | 331,044 | 2,106,618 | 1,271,532 | 261,534,954 | ||||||||||||
|
|
|
|
|
|
|
| |||||||||
Net change in unrealized appreciation (depreciation) on: | ||||||||||||||||
Investments | 178,690 | 9,986,052 | 185,876 | (14,007,508 | ) | |||||||||||
Investments in affiliates | — | 62,195 | — | 211,878 | ||||||||||||
|
|
|
|
|
|
|
| |||||||||
Net change in unrealized appreciation (depreciation) | 178,690 | 10,048,247 | 185,876 | (13,795,630 | ) | |||||||||||
|
|
|
|
|
|
|
| |||||||||
Net realized and unrealized gain (loss) on investments | 509,734 | 12,154,865 | 1,457,408 | 247,739,324 | ||||||||||||
|
|
|
|
|
|
|
| |||||||||
Net Increase (Decrease) in Net Assets Resulting from Operations | $ | 1,189,929 | $ | 20,165,960 | $ | 3,946,855 | $ | 542,579,551 | ||||||||
|
|
|
|
|
|
|
| |||||||||
| See Notes to Financial Statements. | 65 |
DBX ETF Trust
| Xtrackers High Beta High Yield Bond ETF | Xtrackers Low Beta High Yield Bond ETF | |||||||||||||||
| Year Ended August 31, 2021 | Year Ended August 31, 2020 | Year Ended August 31, 2021 | Year Ended August 31, 2020 | |||||||||||||
Increase (Decrease) in Net Assets from Operations | ||||||||||||||||
Net investment income (loss) | $ | 680,195 | $ | 8,833,615 | $ | 8,011,095 | $ | 6,141,236 | ||||||||
Net realized gain (loss) | 331,044 | (8,560,108 | ) | 2,106,618 | 4,293,704 | |||||||||||
Net change in net unrealized appreciation (depreciation) | 178,690 | 2,181,907 | 10,048,247 | (2,775,645 | ) | |||||||||||
|
|
|
|
|
|
|
| |||||||||
Net increase (decrease) in net assets resulting from operations | 1,189,929 | 2,455,414 | 20,165,960 | 7,659,295 | ||||||||||||
|
|
|
|
|
|
|
| |||||||||
Distributions to Shareholders | (825,490 | ) | (9,663,912 | ) | (8,258,522 | ) | (7,126,652 | ) | ||||||||
|
|
|
|
|
|
|
| |||||||||
Fund Shares Transactions | ||||||||||||||||
Proceeds from shares sold | 11,992,336 | — | 715,759,317 | 54,342,652 | ||||||||||||
Value of shares redeemed | — | (136,509,024 | ) | (15,156,196 | ) | (161,280,463 | ) | |||||||||
|
|
|
|
|
|
|
| |||||||||
Net increase (decrease) in net assets resulting from fund share transactions | 11,992,336 | (136,509,024 | ) | 700,603,121 | (106,937,811 | ) | ||||||||||
|
|
|
|
|
|
|
| |||||||||
Total net increase (decrease) in Net Assets | 12,356,775 | (143,717,522 | ) | 712,510,559 | (106,405,168 | ) | ||||||||||
Net Assets | ||||||||||||||||
Beginning of year | 6,981,858 | 150,699,380 | 37,873,709 | 144,278,877 | ||||||||||||
|
|
|
|
|
|
|
| |||||||||
End of year | $ | 19,338,633 | $ | 6,981,858 | $ | 750,384,268 | $ | 37,873,709 | ||||||||
|
|
|
|
|
|
|
| |||||||||
Changes in Shares Outstanding | ||||||||||||||||
Shares outstanding, beginning of year | 150,001 | 3,100,001 | 750,001 | 2,850,001 | ||||||||||||
Shares sold | 250,000 | — | 14,250,000 | 1,100,000 | ||||||||||||
Shares redeemed | — | (2,950,000 | ) | (300,000 | ) | (3,200,000 | ) | |||||||||
|
|
|
|
|
|
|
| |||||||||
Shares outstanding, end of year | 400,001 | 150,001 | 14,700,001 | 750,001 | ||||||||||||
|
|
|
|
|
|
|
| |||||||||
| See Notes to Financial Statements. | 66 |
DBX ETF Trust
Statements of Changes in Net Assets (Continued)
| Xtrackers Short Duration High Yield Bond ETF | Xtrackers USD High Yield Corporate Bond ETF | |||||||||||||||
| Year Ended August 31, 2021 | Year Ended August 31, 2020 | Year Ended August 31, 2021 | Year Ended August 31, 2020 | |||||||||||||
Increase (Decrease) in Net Assets from Operations | ||||||||||||||||
Net investment income (loss) | $ | 2,489,447 | $ | 2,503,717 | $ | 294,840,227 | $ | 225,278,292 | ||||||||
Net realized gain (loss) | 1,271,532 | 1,209,705 | 261,534,954 | (84,875,854 | ) | |||||||||||
Net change in net unrealized appreciation (depreciation) | 185,876 | 1,585,148 | (13,795,630 | ) | 18,508,043 | |||||||||||
|
|
|
|
|
|
|
| |||||||||
Net increase (decrease) in net assets resulting from operations | 3,946,855 | 5,298,570 | 542,579,551 | 158,910,481 | ||||||||||||
|
|
|
|
|
|
|
| |||||||||
Distributions to Shareholders | (2,657,928 | ) | (2,545,587 | ) | (328,072,536 | ) | (231,469,345 | ) | ||||||||
|
|
|
|
|
|
|
| |||||||||
Fund Shares Transactions | ||||||||||||||||
Proceeds from shares sold | 45,259,188 | 175,438,715 | 8,910,076,826 | 8,095,596,847 | ||||||||||||
Value of shares redeemed | (7,179,887 | ) | (163,041,545 | ) | (8,666,637,450 | ) | (4,876,338,905 | ) | ||||||||
|
|
|
|
|
|
|
| |||||||||
Net increase (decrease) in net assets resulting from fund share transactions | 38,079,301 | 12,397,170 | 243,439,376 | 3,219,257,942 | ||||||||||||
|
|
|
|
|
|
|
| |||||||||
Total net increase (decrease) in Net Assets | 39,368,228 | 15,150,153 | 457,946,391 | 3,146,699,078 | ||||||||||||
Net Assets | ||||||||||||||||
Beginning of year | 37,259,725 | 22,109,572 | 6,208,550,491 | 3,061,851,413 | ||||||||||||
|
|
|
|
|
|
|
| |||||||||
End of year | $ | 76,627,953 | $ | 37,259,725 | $ | 6,666,496,882 | $ | 6,208,550,491 | ||||||||
|
|
|
|
|
|
|
| |||||||||
Changes in Shares Outstanding | ||||||||||||||||
Shares outstanding, beginning of year | 800,001 | 450,001 | 158,937,501 | * | 76,187,501 | * | ||||||||||
Shares sold | 950,000 | 4,100,000 | 224,750,000 | * | 212,312,500 | * | ||||||||||
Shares redeemed | (150,000 | ) | (3,750,000 | ) | (218,300,000 | )* | (129,562,500 | )* | ||||||||
|
|
|
|
|
|
|
| |||||||||
Shares outstanding, end of year | 1,600,001 | 800,001 | 165,387,501 | * | 158,937,501 | * | ||||||||||
|
|
|
|
|
|
|
| |||||||||
| * | Shares for the year ended August 31, 2020, and through April 12, 2021 have been adjusted to reflect the effects of a stock split effective April 13, 2021. See Note 9. |
| See Notes to Financial Statements. | 67 |
DBX ETF Trust
Xtrackers High Beta High Yield Bond ETF Selected Per Share Data | Years Ended August 31, | Period Ended 8/31/2018(a) | ||||||||||||||
| 2021 | 2020 | 2019 | ||||||||||||||
Net Asset Value, beginning of period | $ | 46.55 | $ | 48.61 | $ | 49.17 | $ | 50.00 | ||||||||
|
|
|
|
|
|
|
| |||||||||
| Income (loss) from investment operations: | ||||||||||||||||
Net investment income (loss)(b) | 2.60 | 3.01 | (c) | 3.32 | 2.07 | |||||||||||
Net realized and unrealized gain (loss) | 2.65 | (1.95 | )(c) | (0.58 | ) | (1.11 | ) | |||||||||
|
|
|
|
|
|
|
| |||||||||
Total from investment operations | 5.25 | 1.06 | 2.74 | 0.96 | ||||||||||||
|
|
|
|
|
|
|
| |||||||||
| Less distributions from: |
| |||||||||||||||
Net investment income | (3.45 | ) | (3.12 | ) | (3.30 | ) | (1.79 | ) | ||||||||
|
|
|
|
|
|
|
| |||||||||
Total distributions | (3.45 | ) | (3.12 | ) | (3.30 | ) | (1.79 | ) | ||||||||
|
|
|
|
|
|
|
| |||||||||
Net Asset Value, end of period | $ | 48.35 | $ | 46.55 | $ | 48.61 | $ | 49.17 | ||||||||
|
|
|
|
|
|
|
| |||||||||
Total Return (%) | 11.67 | (d) | 2.46 | (d) | 5.90 | (d) | 2.01 | ** | ||||||||
Ratios to Average Net Assets and Supplemental Data | ||||||||||||||||
Net Assets, end of period ($ millions) | 19 | 7 | 151 | 148 | ||||||||||||
Ratio of expenses before fee waiver (%) | 0.35 | 0.35 | 0.35 | 0.35 | * | |||||||||||
Ratio of expenses after fee waiver (%) | 0.20 | 0.20 | 0.31 | 0.35 | * | |||||||||||
Ratio of net investment income (loss) (%) | 5.45 | 6.50 | (c) | 6.91 | 6.71 | * | ||||||||||
Portfolio turnover rate (%)(e) | 98 | 98 | 51 | 34 | ** | |||||||||||
Xtrackers Low Beta High Yield Bond ETF Selected Per Share Data | Years Ended August 31, | Period Ended 8/31/2018(a) | ||||||||||||||
| 2021 | 2020 | 2019 | ||||||||||||||
Net Asset Value, beginning of period | $ | 50.50 | $ | 50.62 | $ | 49.16 | $ | 50.00 | ||||||||
|
|
|
|
|
|
|
| |||||||||
| Income (loss) from investment operations: | ||||||||||||||||
Net investment income (loss)(b) | 1.45 | 2.02 | (c) | 2.29 | 1.37 | |||||||||||
Net realized and unrealized gain (loss) | 1.07 | 0.12 | (c) | 1.44 | (1.05 | ) | ||||||||||
|
|
|
|
|
|
|
| |||||||||
Total from investment operations | 2.52 | 2.14 | 3.73 | 0.32 | ||||||||||||
|
|
|
|
|
|
|
| |||||||||
| Less distributions from: | ||||||||||||||||
Net investment income | (1.97 | ) | (2.26 | ) | (2.27 | ) | (1.16 | ) | ||||||||
|
|
|
|
|
|
|
| |||||||||
Total distributions | (1.97 | ) | (2.26 | ) | (2.27 | ) | (1.16 | ) | ||||||||
|
|
|
|
|
|
|
| |||||||||
Net Asset Value, end of period | $ | 51.05 | $ | 50.50 | $ | 50.62 | $ | 49.16 | ||||||||
|
|
|
|
|
|
|
| |||||||||
Total Return (%) | 5.12 | (d) | 4.42 | (d) | 7.84 | (d) | 0.68 | ** | ||||||||
Ratios to Average Net Assets and Supplemental Data | ||||||||||||||||
Net Assets, end of period ($ millions) | 750 | 38 | 144 | 138 | ||||||||||||
Ratio of expenses before fee waiver (%) | 0.25 | 0.25 | 0.25 | 0.25 | * | |||||||||||
Ratio of expenses after fee waiver (%) | 0.20 | 0.20 | 0.24 | 0.25 | * | |||||||||||
Ratio of net investment income (loss) (%) | 2.89 | 4.09 | (c) | 4.66 | 4.44 | * | ||||||||||
Portfolio turnover rate (%)(e) | 88 | 111 | 55 | 52 | ** | |||||||||||
| (a) | For the period January 11, 2018 (commencement of operations) through August 31, 2018. |
| (b) | Based on average shares outstanding during the period. |
| (c) | The Financial Accounting Standards Board issued Accounting Standards Update (ASU) 2017-08 to amend the amortization period to the earliest call date for purchased callable debt securities held at a premium. Effective September 1, 2019, the Fund adopted ASU 2017-08 and the effect of this change for the year ended August 31, 2020 was a decrease to net investment income per share by $0.04 and $0.23, increase to net realized and unrealized gain (loss) from investments per share by $0.04 and $0.23, and decrease to the ratio of net investment income to average net assets of 0.08% and 0.47%, for Xtrackers High Beta High Yield Bond ETF and Xtrackers Low Beta High Yield Bond ETF respectively. Per share data and ratios for years prior to August 31, 2020 have not been restated to reflect this change in presentation. |
| (d) | Total Return would have been lower if certain expenses had not been reimbursed by the Advisor. |
| (e) | Portfolio turnover rate does not include securities received or delivered from processing creations or redemptions. |
| * | Annualized. |
| ** | Not Annualized. |
| See Notes to Financial Statements. | 68 |
DBX ETF Trust
Financial Highlights (Continued)
Xtrackers Short Duration High Yield Bond ETF Selected Per Share Data | Years Ended August 31, | Period Ended 8/31/2018(a) | ||||||||||||||
| 2021 | 2020 | 2019 | ||||||||||||||
Net Asset Value, beginning of period | $ | 46.57 | $ | 49.13 | $ | 49.69 | $ | 50.00 | ||||||||
|
|
|
|
|
|
|
| |||||||||
| Income (loss) from investment operations: | ||||||||||||||||
Net investment income (loss)(b) | 2.34 | 2.69 | (c) | 2.83 | 1.76 | |||||||||||
Net realized and unrealized gain (loss) | 1.67 | (2.47 | )(c)(d) | (0.54 | ) | (0.59 | ) | |||||||||
|
|
|
|
|
|
|
| |||||||||
Total from investment operations | 4.01 | 0.22 | 2.29 | 1.17 | ||||||||||||
|
|
|
|
|
|
|
| |||||||||
| Less distributions from: |
| |||||||||||||||
Net investment income | (2.69 | ) | (2.78 | ) | (2.85 | ) | (1.48 | ) | ||||||||
|
|
|
|
|
|
|
| |||||||||
Total distributions | (2.69 | ) | (2.78 | ) | (2.85 | ) | (1.48 | ) | ||||||||
|
|
|
|
|
|
|
| |||||||||
Net Asset Value, end of period | $ | 47.89 | $ | 46.57 | $ | 49.13 | $ | 49.69 | ||||||||
|
|
|
|
|
|
|
| |||||||||
Total Return (%) | 8.86 | (e) | 0.61 | (e) | 4.79 | (e) | 2.41 | ** | ||||||||
Ratios to Average Net Assets and Supplemental Data | ||||||||||||||||
Net Assets, end of period ($ millions) | 77 | 37 | 22 | 40 | ||||||||||||
Ratio of expenses before fee waiver (%) | 0.20 | 0.20 | 0.20 | 0.20 | * | |||||||||||
Ratio of expenses after fee waiver (%) | 0.20 | 0.20 | 0.20 | 0.20 | * | |||||||||||
Ratio of net investment income (loss) (%) | 4.95 | 6.13 | (c) | 5.78 | 5.56 | * | ||||||||||
Portfolio turnover rate (%)(f) | 52 | 150 | 45 | 37 | ** | |||||||||||
Xtrackers USD High Yield Corporate Bond ETF Selected Per Share Data | Years Ended August 31, | Period Ended 8/31/2017(g)(h) | ||||||||||||||||||
| 2021 | 2020(h) | 2019(h) | 2018(h) | |||||||||||||||||
Net Asset Value, beginning of period | $ | 39.06 | (h) | $ | 40.19 | $ | 39.90 | $ | 40.97 | $ | 40.00 | |||||||||
|
|
|
|
|
|
|
|
|
| |||||||||||
| Income (loss) from investment operations: | ||||||||||||||||||||
Net investment income (loss)(b) | 1.70 | 2.03 | (c) | 2.39 | 2.32 | 1.66 | ||||||||||||||
Net realized and unrealized gain (loss) | 1.79 | (0.95 | )(c) | 0.23 | (1.24 | ) | 0.89 | |||||||||||||
|
|
|
|
|
|
|
|
|
| |||||||||||
Total from investment operations | 3.49 | 1.08 | 2.62 | 1.08 | 2.55 | |||||||||||||||
|
|
|
|
|
|
|
|
|
| |||||||||||
| Less distributions from: |
| |||||||||||||||||||
Net investment income | (2.24 | ) | (2.21 | ) | (2.34 | ) | (2.15 | ) | (1.58 | ) | ||||||||||
|
|
|
|
|
|
|
|
|
| |||||||||||
Total distributions | (2.24 | ) | (2.21 | ) | (2.34 | ) | (2.15 | ) | (1.58 | ) | ||||||||||
|
|
|
|
|
|
|
|
|
| |||||||||||
Net Asset Value, end of period | $ | 40.31 | $ | 39.06 | $ | 40.19 | $ | 39.90 | $ | 40.97 | ||||||||||
|
|
|
|
|
|
|
|
|
| |||||||||||
Total Return (%) | 8.31 | (e) | 2.91 | (e) | 6.87 | (e) | 2.76 | (e) | 6.43 | ** | ||||||||||
Ratios to Average Net Assets and Supplemental Data | ||||||||||||||||||||
Net Assets, end of period ($ millions) | 6,666 | 6,209 | 3,062 | 1,796 | 220 | |||||||||||||||
Ratio of expenses before fee waiver (%) | 0.20 | 0.20 | 0.20 | 0.20 | 0.25 | * | ||||||||||||||
Ratio of expenses after fee waiver (%) | 0.15 | 0.15 | 0.17 | 0.20 | 0.25 | * | ||||||||||||||
Ratio of net investment income (loss) (%) | 4.27 | 5.27 | (c) | 6.06 | 5.86 | 5.57 | * | |||||||||||||
Portfolio turnover rate (%)(f) | 37 | 54 | 29 | 32 | 36 | ** | ||||||||||||||
| (a) | For the period January 10, 2018 (commencement of operations) through August 31, 2018. |
| (b) | Based on average shares outstanding during the period. |
| (c) | The Financial Accounting Standards Board issued Accounting Standards Update (ASU) 2017-08 to amend the amortization period to the earliest call date for purchased callable debt securities held at a premium. Effective September 1, 2019, the Fund adopted ASU 2017-08 and the effect of this change for the year ended August 31, 2020 was a decrease to net investment income per share by $0.10 and $0.12, increase to net realized and unrealized gain (loss) from investments per share by $0.10 and $0.12, and decrease to the ratio of net investment income to average net assets of 0.22% and 0.32%, for Xtrackers Short Duration High Yield Bond ETF and Xtrackers USD High Yield Corporate Bond ETF respectively. Per share data and ratios for years prior to August 31, 2020 have not been restated to reflect this change in presentation. |
| (d) | Because of the timing of subscriptions and redemptions in relation to fluctuating markets at value, the amount shown may not agree with the change in aggregate gains and losses. |
| (e) | Total Return would have been lower if certain expenses had not been reimbursed by the Advisor. |
| (f) | Portfolio turnover rate does not include securities received or delivered from processing creations or redemptions. |
| (g) | For the period December 7, 2016 (commencement of operations) through August 31, 2017. |
| (h) | On April 13, 2021, the Xtrackers USD High Yield Corporate Bond ETF implemented a 5 for 4 stock split. Net asset value and per share information through April 12, 2021 have been updated to reflect the effect of the split. Shareholders received 5 shares for every 4 shares owned and net asset value per share decreased correspondingly. |
| * | Annualized. |
| ** | Not Annualized. |
| See Notes to Financial Statements. | 69 |
DBX ETF Trust
1. Organization
DBX ETF Trust (the “Trust”) is registered under the Investment Company Act of 1940, as amended (the “Act”), as an open-end registered management investment company organized as a Delaware statutory trust.
As of August 31, 2021, the Trust consists of thirty-five investment series of exchange-traded funds (“ETFs”) (each a “Fund” and collectively, the “Funds”) in operation and trading. These financial statements report on the Funds listed below, each a diversified series of the Trust:
| Xtrackers High Beta High Yield Bond ETF |
| Xtrackers Low Beta High Yield Bond ETF |
| Xtrackers Short Duration High Yield Bond ETF |
| Xtrackers USD High Yield Corporate Bond ETF |
DBX Advisors LLC (“DBX” or the “Advisor”), an indirect, wholly-owned subsidiary of DWS Group GmbH & Co. KGaA (“DWS Group”), serves as investment advisor to the Funds and has overall responsibility for the general management and administration of the Funds, subject to the supervision of the Funds’ Board of Trustees (“Board”).
Each Fund offers shares that are listed and traded on the NYSE Arca, Inc. (“NYSE Arca”). Unlike conventional mutual funds, each Fund issues and redeems shares on a continuous basis, at net asset value (“NAV”), only in large specified lots consisting of 50,000 shares, except for Xtrackers USD High Yield Corporate Bond ETF which lots consist of 100,000 shares effective April 14, 2021, each called a “Creation Unit”, to authorized participants who have entered into agreements with the Funds’ distributor. Shares are not individually redeemable securities of the Funds, and owners of the shares may acquire those shares from the Funds, or tender such shares for redemption to the Funds, in Creation Units only.
The investment objective of each Fund is to track the performance, before fees and expenses, of a particular index (the “Underlying Index”). The underlying indices for the Funds are:
Fund | Underlying Index | |
| Xtrackers High Beta High Yield Bond ETF | Solactive USD High Yield Corporates Total Market High Beta Index | |
| Xtrackers Low Beta High Yield Bond ETF | Solactive USD High Yield Corporates Total Market Low Beta Index | |
| Xtrackers Short Duration High Yield Bond ETF | Solactive USD High Yield Corporates Total Market 0-5 Year Index | |
| Xtrackers USD High Yield Corporate Bond ETF | Solactive USD High Yield Corporates Total Market Index |
The Solactive USD High Yield Corporates Total Market High Beta Index is designed to track the performance of the segment of the U.S. dollar denominated high yield corporate bond market that exhibits higher overall beta to the broader high yield corporate fixed income market. The Solactive USD High Yield Corporates Total Market Low Beta Index is designed to track the performance of the segment of the U.S. dollar-denominated high yield corporate bond market that exhibits lower overall beta to the broader high yield corporate fixed income market. The Solactive USD High Yield Corporates Total Market 0-5 Year Index is designed to track the performance of short-term publicly issued U.S. dollar-denominated below investment grade corporate debt. The Solactive USD High Yield Corporates Total Market Index is designed to track the performance of a basket of U.S. dollar-denominated high yield liquid corporate bonds. Under normal circumstances, the Solactive Indexes are reconstituted monthly on the last day of each month. The Funds reconstitute and rebalance their portfolios in accordance with their respective underlying indexes, and therefore any changes to the underlying indexes reconstitution and rebalance schedules will result in corresponding changes to a Fund’s reconstitution and rebalance schedule.
Each Fund is entitled to use its respective Underlying Index pursuant to a licensing agreement between the Index Provider and DBX. There is no charge to the Funds in connection with these licensing agreements.
Pursuant to the Trust’s organizational documents, the Trust’s officers and trustees are indemnified against certain liabilities that may arise out of the performance of their duties to the Funds. Additionally, in the normal course of business the Trust enters into contracts that contain a variety of representations that provide indemnification for certain liabilities. The Trust’s maximum exposure under these arrangements is unknown, as this would involve future claims that may be made against the Funds that have not yet occurred. However, the Trust expects the risk of loss to be remote.
70
DBX ETF Trust
Notes to Financial Statements (Unaudited) (Continued)
2. Significant Accounting Policies
The financial statements have been prepared in conformity with U.S. generally accepted accounting principles (“U.S. GAAP”), which require management to make certain estimates and assumptions that affect the reported amounts and disclosures in the financial statements. Actual results could differ from those estimates. Each Fund qualifies as an investment company under Topic 946 of the Accounting Standards Codification of U.S. GAAP. The following is a summary of significant accounting policies followed by the Funds.
Security Valuation The NAV of each Fund’s shares is calculated each business day as of the close of regular trading on the New York Stock Exchange, generally 4:00 p.m. Eastern Time. NAV per share is calculated by dividing a Fund’s net assets by the number of Fund shares outstanding.
Various inputs are used in determining the value of the Funds’ investments. These inputs are summarized in three broad levels. Level 1 includes quoted prices in active markets for identical securities. Level 2 includes other significant observable inputs (including quoted prices for similar securities, interest rates, prepayment speeds, and credit risk). Level 3 includes significant unobservable inputs (including the Funds’ own assumptions in determining the fair value of investments). The level assigned to the securities valuations may not be an indication of the risk or liquidity associated with investing in those securities.
Corporate and sovereign debt securities are valued at prices supplied by independent pricing services approved by the Funds’ Board. Such services may use various pricing techniques which take into account appropriate factors such as yield, quality, coupon rate, maturity, type of issue, trading characteristics and other data, as well as broker quotes. If the pricing services are unable to provide valuations, securities are valued at the mean between the bid and ask quotations or evaluated prices, as applicable, obtained from broker dealers. These securities are generally categorized as Level 2.
ETFs are valued at the most recent sale price or official closing price reported on the exchange (U.S. or foreign) or over-the-counter market on which they trade. ETFs for which no sales are reported are valued at the calculated mean between the most recent bid and asked quotations on the relevant market or, if a mean cannot be determined, at the most recent bid quotation. ETFs are generally categorized as Level 1.
Investments in open-end investment companies are valued at their NAV each business day and are categorized as Level 1.
Securities and other assets for which market quotations are not readily available or for which the above valuation procedures are deemed not to reflect fair value are valued in a manner that is intended to reflect their fair value as determined in accordance with procedures approved by the Board and are generally categorized as Level 3. In accordance with the Funds’ valuation procedures, factors considered in determining value may include, but are not limited to, the type of the security; the size of the holding; the initial cost of the security; the existence of any contractual restrictions on the security’s disposition; the price and extent of public trading in similar securities of the issuer or of comparable companies; quotations or evaluated prices from broker-dealers and/or pricing services; information obtained from the issuer, analysts, and/or the appropriate stock exchange (for exchange-traded securities); an analysis of the company’s or issuer’s financial statements; an evaluation of the forces that influence the issuer and the market(s) in which the security is purchased and sold; length of time of a halt in trading of the security; movement in the security’s proxy index; and with respect to debt securities, the maturity, coupon, creditworthiness, currency denomination and the movement of the market in which the security is normally traded. The value determined under these procedures may differ from published values for the same securities.
Fair value pricing could result in a difference between the prices used to calculate a Fund’s NAV and the prices used by the Fund’s Underlying Index, which in turn could result in a difference between the Fund’s performance and the performance of the Fund’s Underlying Index
Disclosure about the classification of the fair value measurements is included in a table following the Fund’s Schedule of Investments.
Cash Cash consists of cash held at banks and is on deposit with major financial institutions.
Investment Transactions and Investment Income Investment transactions are recorded as of the date that the securities are purchased or sold (trade date). Realized gains and losses from the sale or disposition of securities are calculated on the identified cost-method. Interest income is recorded on the accrual basis. All premiums and discounts are amortized/accreted for both tax and financial reporting purposes.
71
DBX ETF Trust
Notes to Financial Statements (Unaudited) (Continued)
Tax Information and Dividends and Distributions to Shareholders It is each Fund’s policy to comply with all requirements of the Internal Revenue Code of 1986, as amended (“the Code”). Each Fund intends to qualify for and to elect treatment as a separate Regulated Investment Company (“RIC”) under Subchapter M of the Code. It is the policy of each Fund to pay out dividends from its net investment income, if any, to investors monthly. Taxable net realized gains from investment transactions, reduced by capital loss carryforwards, if any, are declared and distributed to shareholders at least annually. The capital loss carryforward amount, if any, is available to offset future net capital gains. The Funds may occasionally be required to make supplemental distributions at some other time during the year. The Funds reserve the right to declare special distributions if, in their reasonable discretion, such action is necessary or advisable to preserve the status of each Fund as a RIC or to avoid imposition of income or excise taxes on undistributed income. Dividends and distributions to shareholders, if any, are recorded on the ex-dividend date. The amount of dividends and distributions from net investment income and net realized capital gains are determined in accordance with Federal income tax regulations which may differ from U.S. GAAP. These “book/tax” differences are either considered temporary or permanent in nature. To the extent these differences are permanent in nature, such amounts are reclassified at the end of the year within the components of net assets based on their federal tax treatment; temporary differences do not require reclassification. Dividends and distributions, which exceed earnings and profits for the full year for tax purposes, are reported as a tax return of capital.
In accordance with U.S. GAAP requirements regarding accounting for uncertainties in income taxes, management has analyzed the Funds’ tax positions taken or expected to be taken on foreign, federal and state income tax returns for all open tax years and has concluded that no provision for income tax is required in the Funds’ financial statements.
The Funds recognize interest and penalties, if any, related to uncertain tax positions as income tax expense on the Statements of Operations. For the year ended August 31, 2021, the Funds did not incur any interest or penalties.
As of August 31, 2021, the components of accumulated earnings (losses) on a tax basis were as follows:
| Undistributed Ordinary Income | Capital and Other Gains (Losses) | Unrealized Appreciation (Depreciation) | Total Accumulated Earnings (Losses) | |||||||||||||
Xtrackers High Beta High Yield Bond ETF | $ | 107,775 | $ | (10,490,074 | ) | $ | 157,148 | $ | (10,225,151 | ) | ||||||
Xtrackers Low Beta High Yield Bond ETF | 1,678,398 | (3,244,451 | ) | 9,656,626 | 8,090,573 | |||||||||||
Xtrackers Short Duration High Yield Bond ETF | 250,149 | (420,709 | ) | 1,588,348 | 1,417,788 | |||||||||||
Xtrackers USD High Yield Corporate Bond ETF | 17,344,168 | (77,869,569 | ) | (58,833 | ) | (60,584,234 | ) | |||||||||
The tax character of dividends and distributions declared for the years ended August 31, 2021 and August 31, 2020 were as follows:
| Year Ended August 31, 2021 | ||||
| Ordinary Income* | ||||
Xtrackers High Beta High Yield Bond ETF | $ | 825,490 | ||
Xtrackers Low Beta High Yield Bond ETF | 8,258,522 | |||
Xtrackers Short Duration High Yield Bond ETF | 2,657,928 | |||
Xtrackers USD High Yield Corporate Bond ETF | 328,072,536 | |||
| Year Ended August 31, 2020 | ||||
| Ordinary Income* | ||||
Xtrackers High Beta High Yield Bond ETF | $ | 9,663,912 | ||
Xtrackers Low Beta High Yield Bond ETF | 7,126,652 | |||
Xtrackers Short Duration High Yield Bond ETF | 2,545,587 | |||
Xtrackers USD High Yield Corporate Bond ETF | 231,469,345 | |||
| * | For tax purposes short-term capital gain distributions are considered ordinary income distributions. |
72
DBX ETF Trust
Notes to Financial Statements (Unaudited) (Continued)
At August 31, 2021, for Federal income tax purposes, the Funds have capital loss carryforwards available as shown in the table below, to the extent provided by regulations, to offset future capital gains for an unlimited period. To the extent that these loss carryforwards are used to offset future capital gains, it is probable that the capital gains so offset will not be distributed to shareholders.
| Short-Term | Long-Term | Total Amount | ||||||||||
Xtrackers High Beta High Yield Bond ETF | $ | 2,689,526 | $ | 7,800,548 | $ | 10,490,074 | ||||||
Xtrackers Low Beta High Yield Bond ETF | 2,299,291 | 945,160 | 3,244,451 | |||||||||
Xtrackers Short Duration High Yield Bond ETF | — | 420,709 | 420,709 | |||||||||
Xtrackers USD High Yield Corporate Bond ETF | 16,148,977 | 61,720,592 | 77,869,569 | |||||||||
For the fiscal year ended August 31, 2021, the effect of permanent “book/tax” reclassifications to the components of net assets are included below. These differences are primarily due to premium amortization on debt securities and redemptions-in-kind.
| Distributable earnings (loss) | Paid-In Capital | |||||||
Xtrackers Low Beta High Yield Bond ETF | $ | (360,181 | ) | $ | 360,181 | |||
Xtrackers Short Duration High Yield Bond ETF | (302,704 | ) | 302,704 | |||||
Xtrackers USD High Yield Corporate Bond ETF | (221,875,030 | ) | 221,875,030 | |||||
As of August 31, 2021, the aggregate cost of investments for federal income tax purposes, the net unrealized appreciation or (depreciation) and the aggregated gross unrealized appreciation (depreciation) on investments were as follows:
| Aggregate Tax Cost | Net Unrealized Appreciation (Depreciation) | Aggregate Gross Unrealized Appreciation | Aggregate Gross Unrealized (Depreciation) | |||||||||||||
Xtrackers High Beta High Yield Bond ETF | $ | 20,413,294 | $ | 157,148 | $ | 334,227 | $ | (177,079 | ) | |||||||
Xtrackers Low Beta High Yield Bond ETF | 763,246,426 | 9,656,626 | 10,135,340 | (478,714 | ) | |||||||||||
Xtrackers Short Duration High Yield Bond ETF | 77,497,802 | 1,588,348 | 1,672,322 | (83,974 | ) | |||||||||||
Xtrackers USD High Yield Corporate Bond ETF | 6,974,502,514 | (58,833 | ) | 58,267,957 | (58,326,790 | ) | ||||||||||
Foreign Taxes The Funds may be subject to foreign taxes (a portion of which may be reclaimable) on income, capital gains on investments, certain foreign currency transactions or other corporate events. All foreign taxes are recorded in accordance with the applicable foreign tax regulations and rates that exist in the foreign jurisdictions in which the Funds invest. These foreign taxes, if any, are paid by the Funds and are reflected in their Statements of Operations as follows: foreign taxes withheld at source are presented as a reduction of income, and foreign taxes on capital gains from sales of investments and foreign currency transactions are included in their respective net realized gain (loss) categories. Receivables and payables related to foreign taxes as of August 31, 2021, if any, are disclosed in the Funds’ Statements of Assets and Liabilities.
Foreign Currency Translations The books and records of the Funds are maintained in U.S. dollars. Investment securities and other assets and liabilities denominated in a foreign currency are translated into U.S. dollars at the prevailing exchange rates at period end. Purchases and sales of investment securities, income and expenses are translated into U.S. dollars at the prevailing exchange rates on the respective dates of the transactions.
Net realized and unrealized gains and losses on foreign currency transactions represent net gains and losses between trade and settlement dates on securities transactions, the acquisition and disposition of foreign currencies, and the difference between the amount of net investment income accrued and the U.S. dollar amount actually received. The portion of both realized and unrealized gains and losses on investments that results from fluctuations in foreign currency exchange rates is not separately disclosed, but is included with net realized and unrealized gain/appreciation and loss/depreciation on investments.
Securities Lending The Funds may lend securities to certain financial institutions under the terms of their securities lending agreement. During the term of the loans the Funds continue to receive interest and dividends generated by the securities and to participate in any changes in their market value. The Funds require the borrowers of the securities to maintain collateral with the Funds consisting of cash and/or securities issued or guaranteed by the U.S. Government, its agencies or instrumentalities having a value at least equal to the value of
73
DBX ETF Trust
Notes to Financial Statements (Unaudited) (Continued)
the securities loaned. When the collateral falls below specified amounts, the lending agent will use its best effort to obtain additional collateral on the next business day to meet required amounts under the securities lending agreement. During the year ended August 31, 2021, the Funds invested the cash collateral into a joint trading account in DWS Government & Agency Securities Portfolio, an affiliated money market fund managed by DWS Investment Management Americas, Inc. DWS Investment Management Americas, Inc. receives a management/administration fee (0.02% annualized effective rate as of August 31, 2021) on the cash collateral invested in DWS Government & Agency Securities Portfolio. The Funds receive compensation for lending their securities either in the form of fees or by earning interest on invested cash collateral, net of borrower rebates and fees paid to a lending agent. Either the Fund or the borrower may terminate the loan at any time and the borrower, after notice, is required to return borrowed securities within a standard time period. There may be risks of delay and costs in recovery of securities or even loss of rights in the collateral should the borrower of the securities fail financially. If the Funds are not able to recover securities lent, the Funds may sell the collateral and purchase a replacement investment in the market, incurring the risk that the value of the replacement security is greater than the value of the collateral. The Funds are also subject to all investment risks associated with the reinvestment of any cash collateral received, including, but not limited to, interest rate, credit and liquidity risk associated with such investments.
As of August 31, 2021, the Funds listed below had securities on loan. The value of the related collateral exceeded the value of the securities loaned at year end.
Remaining Contractual Maturity of the Agreements, as of August 31, 2021 | ||||||||||||||||||||
| Securities Lending Transactions | Overnight and Continuous | <30 Days | Between 30 & 90 days | >90 days | Total | |||||||||||||||
Xtrackers High Beta High Yield Bond ETF |
| |||||||||||||||||||
Corporate Bonds | $ | 1,444,823 | $ | — | $ | 65,714 | $ | 743,481 | $ | 2,254,018 | ||||||||||
|
|
|
|
|
|
|
|
|
| |||||||||||
Gross amount of recognized liabilities and non-cash collateral for securities lending transactions |
| $ | 2,254,018 | |||||||||||||||||
Xtrackers Low Beta High Yield Bond ETF |
| |||||||||||||||||||
Corporate Bonds | $ | 4,866,433 | $ | 4,274 | $ | 735,191 | $ | 7,699,552 | $ | 13,305,450 | ||||||||||
|
|
|
|
|
|
|
|
|
| |||||||||||
Gross amount of recognized liabilities and non-cash collateral for securities lending transactions |
| $ | 13,305,450 | |||||||||||||||||
Xtrackers Short Duration High Yield Bond ETF |
| |||||||||||||||||||
Corporate Bonds | $ | 1,323,612 | $ | — | $ | 113,754 | $ | 1,287,851 | $ | 2,725,217 | ||||||||||
|
|
|
|
|
|
|
|
|
| |||||||||||
Gross amount of recognized liabilities and non-cash collateral for securities lending transactions |
| $ | 2,725,217 | |||||||||||||||||
Xtrackers USD High Yield Corporate Bond ETF |
| |||||||||||||||||||
Corporate Bonds | $ | 219,083,931 | $ | 23,896 | $ | 5,673,650 | $ | 60,841,428 | $ | 285,622,905 | ||||||||||
|
|
|
|
|
|
|
|
|
| |||||||||||
Gross amount of recognized liabilities and non-cash collateral for securities lending transactions |
| $ | 285,622,905 | |||||||||||||||||
Affiliated Cash Management Vehicles The Funds may invest uninvested cash balances in DWS Government Money Market Series and DWS ESG Liquidity Fund, affiliated money market funds which are managed by DWS Investment Management Americas, Inc. (“DIMA”), also an indirect, wholly owned subsidiary of DWS Group GmbH & Co. KGaA. Each affiliated money market fund is managed in accordance with Rule 2a-7 under the 1940 Act, which governs the quality, maturity, diversity and liquidity of instruments in which a money market fund may invest. DWS Government Money Market Series seeks to maintain a stable NAV, and DWS ESG Liquidity Fund maintains a floating NAV. The Funds indirectly bear their proportionate share of the expenses of each affiliated money market fund in which they invest. The Advisor will waive an amount of the unitary advisory fee payable to the Advisor by the Funds equal to such acquired fund’s fees and expenses on the Funds’ assets invested in the affiliated money market funds.
3. Investment Advisory and Other Agreements
The Advisor has overall responsibility for the general management and administration of the Funds, subject to the supervision of the Funds’ Board of Trustees. Under an investment advisory agreement between the Trust, on behalf of the Funds, and the Advisor (the “Investment Advisory Agreement”), the Advisor is responsible for arranging sub-advisory, transfer agency, custody, fund administration, and all other non-distribution related services for the Funds to operate.
74
DBX ETF Trust
Notes to Financial Statements (Unaudited) (Continued)
For its investment advisory services to the Funds below, the Advisor was entitled to receive a unitary advisory fee based on each Fund’s average daily net assets, computed and accrued daily and payable monthly, at an annual rate equal to:
| Unitary Advisory Fee | ||||
Xtrackers High Beta High Yield Bond ETF | 0.35 | % | ||
Xtrackers Low Beta High Yield Bond ETF | 0.25 | % | ||
Xtrackers Short Duration High Yield Bond ETF | 0.20 | % | ||
Xtrackers USD High Yield Corporate Bond ETF | 0.20 | % | ||
The Advisor for Xtrackers High Beta High Yield Bond ETF has contractually agreed, until December 17, 2021, to waive a portion of its unitary advisory fee to the extent necessary to prevent the operating expenses (except for interest expense, taxes, brokerage expenses, distribution fees or expenses, litigation expenses and other extraordinary expenses) of the fund from exceeding 0.20% of the Fund’s average daily net assets. For the year ended August 31, 2021, the Advisor waived $18,723 of expenses to the Fund.
The Advisor for Xtrackers Low Beta High Yield Bond ETF has contractually agreed, until December 17, 2021, to waive a portion of its unitary advisory fee to the extent necessary to prevent the operating expenses (except for interest expense, taxes, brokerage expenses, distribution fees or expenses, litigation expenses and other extraordinary expenses) of the fund from exceeding 0.20% of the Fund’s average daily net assets. For the year ended August 31, 2021, the Advisor waived $138,596 of expenses to the Fund.
The Advisor for Xtrackers USD High Yield Corporate Bond ETF has contractually agreed, until December 17, 2021, to waive a portion of its unitary advisory fee to the extent necessary to prevent the operating expenses (except for interest expense, taxes, brokerage expenses, distribution fees or expenses, litigation expenses and other extraordinary expenses) of the fund from exceeding 0.15% of the Fund’s average daily net assets. For the year ended August 31, 2021, the Advisor waived $3,448,539 of expenses to the Fund.
The Advisor for the Funds below has contractually agreed to waive a portion of its unitary advisory fee in an amount equal to the acquired fund’s fees and expenses attributable to the Funds’ investments in affiliated Funds. For the year ended August 31, 2021, the Advisor waived expenses of the Funds as follows:
| Expenses Waived | ||||
Xtrackers High Beta High Yield Bond ETF | $ | 55 | ||
Xtrackers Low Beta High Yield Bond ETF | 797 | |||
Xtrackers Short Duration High Yield Bond ETF | 647 | |||
Xtrackers USD High Yield Corporate Bond ETF | 24,403 | |||
Out of the unitary advisory fee, the Advisor pays substantially all expenses of each Fund, including the cost of transfer agency, custody, fund administration, legal, audit and other services, and expenses of the Independent Trustees. Each Fund is responsible for the payment of interest expense, acquired fund fees and expenses, taxes, brokerage expenses, distribution fees or expenses, if any, litigation expenses and extraordinary expenses.
The Bank of New York Mellon, a wholly-owned subsidiary of The Bank of New York Mellon Corporation, serves as Administrator, Custodian, Accounting Agent, Lending Agent and Transfer Agent for each Fund.
ALPS Distributors, Inc. (the “Distributor”) serves as the distributor of Creation Units for each Fund on an agency basis. The Distributor does not maintain a secondary market in shares of the Funds.
The Board of Trustees is currently comprised of three Independent Trustees. The Advisor paid retainer fees and attendance fees to each Independent Trustee; retainer fees to the Chairman of the Board of Trustees and the Chairman of the Audit Committee; and attendance fees to each member of the Audit Committee (which is comprised of all of the Funds’ Independent Trustees).
75
DBX ETF Trust
Notes to Financial Statements (Unaudited) (Continued)
4. Investment Portfolio Transactions
For the year ended August 31, 2021, the cost of investments purchased and proceeds from sale of investments (excluding in-kind transactions and short-term investments) were as follows:
| Purchases | Sales | |||||||
Xtrackers High Beta High Yield Bond ETF | $ | 11,803,929 | $ | 11,824,067 | ||||
Xtrackers Low Beta High Yield Bond ETF | 252,102,845 | 243,207,470 | ||||||
Xtrackers Short Duration High Yield Bond ETF | 24,530,960 | 28,878,805 | ||||||
Xtrackers USD High Yield Corporate Bond ETF | 2,562,456,177 | 2,482,295,951 | ||||||
For the year ended August 31, 2021, the cost of in-kind purchases and proceeds from in-kind sales were as follows:
| Purchases | Sales | |||||||
Xtrackers High Beta High Yield Bond ETF | $ | 11,826,374 | $ | — | ||||
Xtrackers Low Beta High Yield Bond ETF | 699,487,892 | 14,884,014 | ||||||
Xtrackers Short Duration High Yield Bond ETF | 45,066,805 | 6,870,142 | ||||||
Xtrackers USD High Yield Corporate Bond ETF | 8,710,747,478 | 8,492,677,720 | ||||||
Transactions with Affiliates. The Funds may purchase securities from, or sell securities to, an affiliated fund provided the affiliation is solely due to having a common investment advisor, common officers, or common trustees. During the year ended August 31, 2021, the Funds engaged in securities purchases and securities sales with an affiliated fund in compliance with Rule 17a-7 under the 1940 Act as follows:
| Securities Purchased | Securities Sold | Net Realized Gain (Loss) on Securities Sold | ||||||||||
Xtrackers High Beta High Yield Bond ETF | $ | 3,775,536 | $ | 6,419,608 | $ | 280,167 | ||||||
Xtrackers Low Beta High Yield Bond ETF | 10,173,887 | 6,425,597 | 1,049 | |||||||||
Xtrackers Short Duration High Yield Bond ETF | 796,114 | 73,456 | (177 | ) | ||||||||
Xtrackers USD High Yield Corporate Bond ETF | 2,692,513 | 4,655,461 | (23,616 | ) | ||||||||
5. Fund Share Transactions
As of August 31, 2021, there were unlimited Fund shares, no par value, authorized by the Trust. Fund shares are issued and redeemed by each Fund only in Creation Units or multiples thereof. Except when aggregated in Creation Units, shares of each Fund are not redeemable. Transactions in capital shares for each Fund are disclosed in detail in the Statements of Changes in Net Assets. The consideration for the purchase of Creation Units of a Fund generally consists of the in-kind contribution of a designated portfolio of securities constituting a portfolio sampling representation of the securities included in the respective Fund’s Underlying Index and an amount of cash, which under certain circumstances may include cash in lieu of portfolio securities. Investors purchasing and redeeming Creation Units pay a purchase transaction fee and a redemption transaction fee to offset transfer and other transaction costs associated with the issuance and redemption of Creation Units.
6. Investing in High-Yield Debt Securities
High-yield debt securities or junk bonds are generally regarded as speculative with respect to the issuer’s continuing ability to meet principal and interest payments. A Fund’s performance could be hurt if an issuer of a debt security suffers an adverse change in financial condition that results in the issuer not making timely payments of interest or principal, a security downgrade or an inability to meet a financial obligation. High-yield debt securities’ total return and yield may generally be expected to fluctuate more than the total return and yield of investment-grade debt securities. A real or perceived economic downturn or an increase in market interest rates could cause a decline in the value of high-yield debt securities, result in increased redemptions and/or result in increased portfolio turnover, which could result in a decline in NAV of a Fund, reduce liquidity for certain investments and/or increase costs. High-yield debt securities are often thinly traded and can be more difficult to sell and value accurately than investment-grade debt securities as there may be no established secondary market. Investments in high-yield debt securities could increase liquidity risk for a Fund. In addition, the market for
76
DBX ETF Trust
Notes to Financial Statements (Unaudited) (Continued)
high-yield debt securities can experience sudden and sharp volatility which is generally associated more with investments in stocks.
7. Line of Credit
The Trust has entered into a senior unsecured credit facility with a syndication of banks which allows the Xtrackers USD High Yield Corporate Bond ETF and certain other funds managed by the Advisor to borrow up to $105 million. The Fund may borrow money under this credit facility to the extent necessary for temporary or emergency purposes, including the funding of shareholder redemption requests, trade settlements, and as necessary to distribute to shareholders any income necessary to maintain the Fund’s status as a regulated investment company. Borrowings are charged an interest rate of 1.25% per annum plus the greater of the Federal Funds Effective Rate or the one-month LIBOR Rate. The Fund may borrow up to the lesser of 33 percent of its net assets as permitted by the Act or 25 percent of adjusted total net assets. The Fund had no outstanding loans at August 31, 2021.
8. Other — COVID-19 Pandemic
A novel coronavirus known as COVID-19, declared a pandemic by the World Health Organization, has caused significant uncertainty, market volatility, decreased economic and other activity, increased government activity, including economic stimulus measures, and supply chain interruptions. The full effects, duration and costs of the COVID-19 pandemic are impossible to predict, and the circumstances surrounding the COVID-19 pandemic will continue to evolve, including the risk of future increased rates of infection due to low vaccination rates and/or the lack of effectiveness of current vaccines against new variants. The pandemic has affected and may continue to affect certain countries, industries, economic sectors, companies and investment products more than others, may exacerbate existing economic, political, or social tensions and may increase the probability of an economic recession or depression. The Funds’ and their investments may be adversely affected by the effects of the COVID-19 pandemic, and the pandemic may result in the Funds and their service providers experiencing operational difficulties in coordinating a remote workforce and implementing their business continuity plans, among others. Management will continue to monitor the impact COVID-19 has on the Funds and reflect the consequences as appropriate in the Funds’ accounting and financial reporting.
9. Stock Split
On April 13, 2021, the Xtrackers USD High Yield Corporate Bond ETF implemented a 5 for 4 stock split of its outstanding shares. The net effect of the stock split was to increase the number of outstanding shares and decrease the net asset value per share by a proportionate amount for the shares of the Fund. The stock split had no impact on the overall value of a shareholder’s investment in the Fund. Capital share activity referenced in the Statement of Changes in Net Assets, and per share and net asset value data in the Financial Highlights tables have been restated to reflect the stock split.
77
DBX ETF Trust
To the Shareholders of
Xtrackers High Beta High Yield Bond ETF, Xtrackers Low Beta High Yield Bond ETF, Xtrackers Short Duration High Yield Bond ETF and Xtrackers USD High Yield Corporate Bond ETF and the Board of Trustees of DBX ETF Trust
Opinion on the Financial Statements
We have audited the accompanying statements of assets and liabilities of Xtrackers High Beta High Yield Bond ETF, Xtrackers Low Beta High Yield Bond ETF, Xtrackers Short Duration High Yield Bond ETF and Xtrackers USD High Yield Corporate Bond ETF (collectively referred to as the “Funds”), (four of the funds constituting DBX ETF Trust (the “Trust”)), including the schedules of investments, as of August 31, 2021, and the related statements of operations and changes in net assets, and the financial highlights for each of the periods indicated in the table below and the related notes (collectively referred to as the “financial statements”). In our opinion, the financial statements present fairly, in all material respects, the financial position of each of the Funds (four of the funds constituting DBX ETF Trust) at August 31, 2021, and the results of their operations, changes in net assets and financial highlights for each of the periods indicated in the table below, in conformity with U.S. generally accepted accounting principles.
| Individual fund constituting the DBX ETF Trust | Statement of operations | Statements of changes in net assets | Financial highlights | |||
Xtrackers High Beta High Yield Bond ETF
Xtrackers Low Beta High Yield Bond ETF | For the year ended August 31, 2021 | For each of the two years in the period ended August 31, 2021 | For each of the three years in the period ended August 31, 2021 and the period from January 11, 2018 (commencement of operations) through August 31, 2018 | |||
| Xtrackers Short Duration High Yield Bond ETF | For the year ended August 31, 2021 | For each of the two years in the period ended August 31, 2021 | For each of the three years in the period ended August 31, 2021 and the period from January 10, 2018 (commencement of operations) through August 31, 2018 | |||
| Xtrackers USD High Yield Corporate Bond ETF | For the year ended August 31, 2021 | For each of the two years in the period ended August 31, 2021 | For each of the four years in the period ended August 31, 2021 and the period from December 7, 2016 (commencement of operations) through August 31, 2017 |
Basis for Opinion
These financial statements are the responsibility of the Trust’s management. Our responsibility is to express an opinion on each of the Funds’ financial statements based on our audits. We are a public accounting firm registered with the Public Company Accounting Oversight Board (United States) (“PCAOB”) and are required to be independent with respect to the Trust in accordance with the U.S. federal securities laws and the applicable rules and regulations of the Securities and Exchange Commission and the PCAOB.
We conducted our audits in accordance with the standards of the PCAOB. Those standards require that we plan and perform the audit to obtain reasonable assurance about whether the financial statements are free of material misstatement, whether due to error or fraud. The Trust is not required to have, nor were we engaged to perform, an audit of the Trust’s internal control over financial reporting. As part of our audits we are required to obtain an
78
DBX ETF Trust
Report of Independent Registered Public Accounting Firm (Continued)
understanding of internal control over financial reporting but not for the purpose of expressing an opinion on the effectiveness of the Trust’s internal control over financial reporting. Accordingly, we express no such opinion.
Our audits included performing procedures to assess the risks of material misstatement of the financial statements, whether due to error or fraud, and performing procedures that respond to those risks. Such procedures included examining, on a test basis, evidence regarding the amounts and disclosures in the financial statements. Our procedures included confirmation of securities owned as of August 31, 2021, by correspondence with the custodians and brokers or by other appropriate auditing procedures where replies from brokers were not received. Our audits also included evaluating the accounting principles used and significant estimates made by management, as well as evaluating the overall presentation of the financial statements. We believe that our audits provide a reasonable basis for our opinion.

We have served as the auditor of one or more investment companies in the DWS family of funds since at least 1979, but we are unable to determine the specific year.
New York, New York
October 25, 2021
79
DBX ETF Trust
Identification and Background
The Board has responsibility for the overall management and operations of the funds, including general supervision of the duties performed by the Advisor and other service providers. Each Board Member serves until his or her successor is duly elected or appointed and qualified. Each officer serves until he or she resigns, is removed, dies, retires or becomes disqualified.
The Trust currently has three Board Members. The three Independent Board Members have no affiliation or business connection with the Advisor or any of its affiliated persons and do not own any stock or other securities issued by the Advisor.
The Independent Board Members of the Trust, their term of office and length of time served, their principal business occupations during the past five years, the number of portfolios in the fund complex (defined below) overseen by each Independent Board Member, and other directorships, if any, held by the Board Members are shown below. The fund complex includes all registered open- and closed-end funds (including all of their portfolios) advised by the Advisor and any registered funds that have an investment advisor that is an affiliated person of the Advisor. As of the date of this shareholder report, the fund complex consists of the funds in the Trust, as well as the registered funds advised by affiliates of the Advisor.
Shareholder Communications to the Board. Shareholders may send communications to the Trust’s Board by addressing the communications directly to the Board (or individual Board Members) and/or otherwise clearly indicating in the salutation that the communication is for the Board (or individual Board Members). The shareholder may send the communication to either the Trust’s office or directly to such Board members c/o 875 Third Avenue, New York, NY 10022. Other shareholder communications received by the Trust not directly addressed and sent to the Board will be reviewed and generally responded to by management. Such communications will be forwarded to the Board at management’s discretion based on the matters contained therein.
Independent Board Members
| Name, Year of Birth, Position with the Trust and Length of Time Served(1) | Business Experience and Directorships During the Past 5 Years | Number of Portfolios in Fund Complex Overseen | Other Directorships Held by Board Member | |||
| Stephen R. Byers (1953) Chairman since 2016, and Board Member since 2011 (formerly, Lead Independent Board Member, 2015-2016) | Independent Director (2011- present); Independent Consultant (2014-present); Director of Investment Management, the Dreyfus Corporation (2000-2006) and Vice Chairman and Chief Investment Officer, the Dreyfus Corporation (2002-2006). | 35 | The Arbitrage Funds, Sierra Income Corporation, Mutual Fund Directors Forum | |||
| George O. Elston (1964) Board Member since 2011, Chairman of the Audit Committee since 2015 | Chief Financial Officer, EyePoint Pharmaceuticals, Inc. (2019-present); Chief Financial Officer, Enzyvant (2018-2019); Chief Executive Officer, 2X Oncology, Inc. (2017- 2018); Senior Vice President and Chief Financial Officer, Juniper Pharmaceuticals, Inc. (2014-2016); Senior Vice President and Chief Financial Officer, KBI BioPharma Inc. (2013-2014); Managing Partner, Chatham Street Partners (2010-2013). | 35 | — | |||
| J. David Officer (1948) Board Member since 2011, Chairman of the Nominating Committee since 2015 | Independent Director (2010- present); Vice Chairman, the Dreyfus Corporation (2006-2009); President, The Dreyfus Family of Funds, Inc. (2006-2009). | 35 | (Chairman of) Ilex Management Ltd; Old Westbury Funds |
80
DBX ETF Trust
Board Members and Officers (Unaudited) (Continued)
Officers(2)
| Name, Year of Birth, Position with the Trust and Length of Time Served(3) | Business Experience and Directorships During the Past 5 Years | |
| Freddi Klassen(4) (1975) President and Chief Executive Officer, 2016-present | Programmes (Head since 2021), of DWS Investment Management Americas, Inc. and Manager and Chief Operating Officer of the Advisor (2016 -present). Formerly: Chief Operating Officer in the Americas for the Traditional Asset Classes Department (2014 -2020); Manager and Chief Operating Officer of DWS Investment Management Americas, Inc. (2018-2020); Global Chief Operating Officer for Equities Technology in the Investment Bank Division at Deutsche Bank AG (2013- 2014); Chief Operating Officer for Exchange Traded Funds and Systematic Funds in Europe (2008-2013). | |
| Diane Kenneally(5) (1966) Treasurer, Chief Financial Officer and Controller, 2019-present | Fund Administration Treasurer’s Office (Co-Head since 2018), of DWS Investment Management Americas, Inc.; Chief Financial Officer and Treasurer for DWS US registered investment companies advised by DWS Investment Management Americas, Inc. (2018- present); Treasurer and Chief Financial Officer, The European Equity Fund, Inc., The New Germany Fund, Inc. and The Central and Eastern Europe Fund, Inc. (2018-present); formerly: Assistant Treasurer for the DWS funds (2007-2018). | |
| Frank Gecsedi(4) (1967) Chief Compliance Officer, 2010-present | AFC Compliance US (Senior Team Lead), of DWS Investment Management Americas, Inc.; Compliance Department (2016-present), Vice President in the Deutsche Asset Management Compliance Department at Deutsche Bank AG (2013-2016) and Chief Compliance Officer of the Advisor (2010-present); Chief Compliance Officer of DWS Distributors, Inc. (2019-present); Vice President in Deutsche Bank’s Global Markets Legal, Risk and Capital Division (2010- 2012). | |
| Bryan Richards(4) (1978) Vice President, 2016-present | Portfolio Engineering, Systematic Investments Solutions (Head), of DWS Investment Management Americas, Inc.(2018-present); Portfolio Manager in the Passive Asset Management Department at DWS (2011-present); Primary Portfolio Manager for the PowerShares DB Commodity ETFs (2011-2015). | |
| John Millette(5) (1962) Secretary, 2020-present | Legal (Associate General Counsel), DWS US Retail Legal (2003-present), of DWS Investment Management Americas, Inc.; Vice President and Secretary of DWS US registered investment companies advised by DWS Investment Management Americas, Inc. (1999-present); Chief Legal Officer, DWS Investment Management Americas, Inc. (2015- present); Director and Vice President of DWS Trust Company (2016-present); Vice President, DBX Advisors LLC (2021-present); Secretary, The European Equity Fund, Inc., The New Germany Fund, Inc. and The Central and Eastern Europe Fund, Inc. (2011- present); formerly: Secretary of Deutsche Investment Management Americas Inc. (2015-2017); and Assistant Secretary of DBX ETF Trust (2019-2020). |
81
DBX ETF Trust
Board Members and Officers (Unaudited) (Continued)
| Name, Year of Birth, Position with the Trust and Length of Time Served(3) | Business Experience and Directorships During the Past 5 Years | |
| Caroline Pearson(5) (1962) Assistant Secretary, 2020-present | Legal (Senior Team Lead), DWS US Retail Legal, of DWS Investment Management Americas, Inc.; Chief Legal Officer of DWS US registered investment companies advised by DWS Investment Management Americas, Inc. (2010-present); Chief Legal Officer, DBX Advisors LLC (2020- present); Chief Legal Officer, The European Equity Fund, Inc., The New Germany Fund, Inc. and The Central and Eastern Europe Fund, Inc. (2012-present); formerly: Secretary, Deutsche AM Distributors, Inc. (2002-2017); and Secretary, Deutsche AM Service Company (2010-2017); and Chief Legal Officer, DBX Strategic Advisors LLC (2020–2021). | |
| Paul Antosca(5) (1957) Assistant Treasurer, 2019-present | Fund Administration Tax (Head), of DWS Investment Management Americas, Inc.; Assistant Treasurer for DWS US registered investment companies advised by DWS Investment Management Americas, Inc. (2007- present). | |
| Jeffrey Berry(5) (1959) Assistant Treasurer, 2019-present | Fund Administration (Senior Specialist), of DWS Investment Management Americas, Inc. | |
| Sheila Cadogan(5) (1966) Assistant Treasurer, 2019-present | Fund Administration Treasurer’s Office (Co-Head since 2018), of DWS Investment Management Americas, Inc.; Assistant Treasurer for DWS US registered investment companies advised by DWS Investment Management Americas, Inc. (2017-present); Director and Vice President, DWS Trust Company (2018- present); Assistant Treasurer, The European Equity Fund, Inc., The New Germany Fund, Inc. and The Central and Eastern Europe Fund, Inc. (2018-present). | |
| Christina A. Morse(6) (1964) Assistant Secretary, 2017-present | Vice President at BNY Mellon Asset Servicing (2014- present); Vice President and Counsel at Lord Abbett & Co. LLC (2013-2014). | |
| Christian Rijs(4) (1980) Anti-Money Laundering Compliance Officer, since October 6, 2021 | Americas Head of Anti-Financial Crime and AML Officer, of DWS Investment Management Americas, Inc.; AML Officer, DWS Trust Company (since October 6, 2021); AML Officer, of DWS US registered investment companies advised by DWS Investment Management Americas, Inc. (since October 6, 2021); AML Officer, The European Equity Fund, Inc., The New Germany Fund, Inc. and The Central and Eastern Europe Fund, Inc. (since October 6, 2021.); formerly: DWS UK & Ireland Head of Anti-Financial Crime and MLRO |
| (1) | The length of time served is represented by the year in which the Board Member joined the Board. |
| (2) | As a result of their respective positions held with the Advisor and its affiliates, these individuals are considered “interested persons” of the Advisor within the meaning of the 1940 Act. Interested persons receive no compensation from the Funds. |
| (3) | The length of time served is represented by the year in which the officer was first elected to the Trust in such capacity. |
| (4) | Address: 875 Third Avenue, New York, New York 10022. |
| (5) | Address: 100 Summer Street, Boston, MA 02110. |
| (6) | Address: BNY Mellon Asset Servicing, 240 Greenwich Street, New York, NY 10286. |
The Funds’ Statement of Additional Information (“SAI”) includes additional information about the Funds’ Board Members. The SAI is available by calling 855-329-3837, or on the Company’s website at www.Xtrackers.com.
82
DBX ETF Trust
Proxy Voting Policies and Procedures
The Funds’ policies and procedures for voting proxies for portfolio securities and information about how each Fund voted proxies related to its portfolio securities during the most recent 12-month period ended June 30 are available on our Web site — www.Xtrackers.com (click on “Resources” and “Proxy Voting” at the top of the page) — or on the SEC’s Web site — www.sec.gov. To obtain a written copy of the Funds’ policies and procedures without charge, upon request, call us toll free at 855-329-3837.
Portfolio Holdings Information
The Funds are required to file their complete schedule of portfolio holdings with the SEC for their first and third fiscal quarters on Form N-PORT. Copies of the filings are available without charge, upon request on the SEC’s website at www.sec.gov and are available by calling the Trust at 855-329-3837.
Information about each Fund’s portfolio holdings is available daily at www.Xtrackers.com.
Discount/Premium Information
Information regarding how often shares of each Fund traded on NYSE Arca or Cboe, as applicable, at a price above (i.e., at a premium) or below (i.e., at a discount) the NAV of the Fund can be found at www.Xtrackers.com.
83
DBX ETF Trust
DBX Advisors LLC (“Advisors”) collects non-public information about you from the following sources: (i) information received from you on applications or other forms; and (ii) information about your transactions with the Advisors, Advisors’ affiliates and third-party service providers and vendors. Advisors does not disclose any non-public personal information about you to anyone, other than as set forth below, as permitted by applicable law and regulation. Advisors may disclose non-public personal information about you to the funds in which you invest, to Advisors’ affiliates, and to non-affiliated companies that work with Advisors to service your account(s), or to provide services or process transactions that you have requested. Advisors may disclose non-public personal information in situations that may include, but are not limited to, in response to legal and/or regulatory inquiries and the proposed or actual sale, assignment merger or other transfer of all or a portion of Advisors’ business to another business entity. Advisors may also disclose non-public personal information about you to parties representing you, such as your investment representative, your accountant, your tax advisor, or to other third parties at your direction/consent. Advisors will not sell, rent, license or trade your personal and financial information to or with third parties for their own direct marketing use unless you give us general or specific consent to do so. If you decide to close your account(s) or become an inactive customer, Advisors will adhere to the privacy policies and practices as described in this notice. Advisors restricts access to your personal and account information to those employees who need to know that information to provide products and services to you. Advisors maintains reasonable and customary physical, electronic and procedural safeguards to guard your non-public personal information.
California residents may go to https://fundsus.dws.com/us/en-us/legal-resources/privacy-policy.html to obtain additional information relating to their rights under California state law.
Advisors reserves the right, at their discretion, to change, modify, add, or remove portions of this Privacy Policy Notice, and any of the policies described herein, at any time. Advisors will indicate any such changes to the Privacy Policy Notice at the privacy link which can be found at www.Xtrackers.com. At all times, you are bound by the then-current version of the Privacy Policy and all applicable laws. Advisors highly recommends that you review this Privacy Policy Notice from time to time to ensure that you are familiar with the most recent version. The examples contained in this Privacy Policy Notice are illustrations; they are not intended to be exclusive.
84
DBX ETF Trust
This report is intended for the shareholders of the DBX ETF Trust.
This report must be preceded or accompanied by a prospectus.
Investing involves risk, including the possible loss of principal. Bond investments are subject to interest rate, credit, liquidity and market risks to varying degrees. When interest rates rise, bond prices generally fall. Foreign investing involves greater and different risks than investing in U.S. companies, including currency fluctuations, less liquidity, less developed or less efficient trading markets, lack of comprehensive company information, political instability and differing auditing and legal standards. Investing in a single industry, or group of industries, country or in a limited geographic region generally are more volatile than more diversified funds. Investments in lower-quality (“junk bonds”) and non-rated securities present greater risk of loss than investments in higher-quality securities. Distressed securities are speculative and involve substantial risks beyond the risks of investing in junk bonds, such as no interest payments or repayment of principal, or the loss of the entire investment in the distressed security. Credit risk refers to the ability of an issuer to make timely payments of principal and interest. Investing in derivatives entails special risks relating to liquidity, leverage and credit that may reduce returns and/or increase volatility. Performance of the Funds may diverge from that of the Underlying Index due to operating expenses, transaction costs, cash flows, use of sampling strategies or operational inefficiencies. An investment in these Funds should be considered only as a supplement to a complete investment program for those investors willing to accept the risks associated with the Funds. Please read the prospectus for more information.
War, terrorism, economic uncertainty, trade disputes, public health crises (including the ongoing pandemic spread of the novel coronavirus) and related geopolitical events could lead to increased market volatility, disruption to U.S. and world economies and markets and may have significant adverse effects on the Funds and their investments.
Shares of the Funds are bought and sold at market price (not NAV) throughout the day on the NYSE Arca, Inc. or Cboe BZX Exchange, Inc., as applicable. Transactions in Fund shares may result in brokerage commissions and may generate tax consequences. There can be no assurance that an active trading market for shares of a Fund will develop or be maintained.
DBX ETF Trust Funds are distributed by ALPS Distributors, Inc. (“ALPS”) The Funds are managed by DBX Advisors LLC which is not affiliated with ALPS.
The brand DWS represents DWS Group GmbH & Co. KGaA and any of its subsidiaries such as DWS Distributors, Inc. which offers investment products or DWS Investment Management Americas Inc. and RREEF America L.L.C. which offer advisory services.
HYUP, HYDW, SHYL and HYLB (the “Funds”) are not sponsored, endorsed, sold or promoted by Solactive. Neither Solactive nor any other party makes any representation or warranty, express or implied, to the owners of the Funds or any member of the public regarding advisability of investing in funds generally or in these Funds particularly or the ability of the Underlying Indexes to track general stock market performance. Neither Solactive nor any other party makes any express or implied warranties, and Solactive hereby expressly disclaims all warranties of merchantability or fitness for a particular purpose with respect to the Underlying Indexes or any data included therein. The prospectus contains a more detailed description of the limited relationship Solactive has with DBX Advisors LLC and any related funds.
Copyright © 2021 DWS Group. All rights reserved. XtrackersTM is a trademark of DWS Investment GmbH. All other trademarks, servicemarks or registered trademarks are the property of their respective owners.
Not FDIC Insured | No Bank Guarantee | May Lose Value
DBX ETF Trust
Investment advisor DBX Advisors LLC 875 Third Avenue New York, NY 10022 | Administrator, custodian, fund accounting agent, lending agent & transfer agent The Bank of New York Mellon 240 Greenwich Street New York, NY 10286 | Distributor ALPS Distributors, Inc. 1290 Broadway Suite 1000 Denver, CO 80203 | ||
Independent registered public accounting firm Ernst & Young LLP One Manhattan West New York, NY, 10001 | Legal counsel Vedder Price P.C. 1633 Broadway New York, NY 10019 | |||
R-052201-5 (10/21) DBX004976 (10/22)
| (b) | Not applicable |
| Item 2. | Code of Ethics. |
| (a) | The registrant, as of the end of the period covered by this report, has adopted a code of ethics that applies to the registrant’s principal executive officer, principal financial officer, principal accounting officer or controller, or persons performing similar functions, regardless of whether these individuals are employed by the registrant or a third party. |
| (b) | There have been no amendments, during the period covered by this report, to a provision of the code of ethics that applies to the registrant’s principal executive officer, principal financial officer, principal accounting officer or controller, or persons performing similar functions, regardless of whether these individuals are employed by the registrant or a third party, and that relates to any element of the code of ethics description. |
| (c) | The registrant has not granted any waivers, including an implicit waiver, from a provision of the code of ethics that applies to the registrant’s principal executive officer, principal financial officer, principal accounting officer or controller, or persons performing similar functions, regardless of whether these individuals are employed by the registrant or a third party, that relates to one or more of the items set forth in paragraph (b) of this item’s instructions. |
| Item 3. | Audit Committee Financial Expert. |
Stephen R. Byers, George O. Elston, and J. David Officer are the designated financial experts on the Audit Committee of DBX ETF Trust. With respect to DBX ETF Trust, Stephen Byers, George O. Elston, and J. David Officer are not “interested persons” as such terms are defined by Section 2(a)(19) of the Act (15 U.S.C. 80a-2(a)(19)).
| Item 4. | Principal Accountant Fees and Services. |
Audit Fees
| (a) | The aggregate fees billed for each of the last two fiscal years for professional services rendered by the principal accountant for the audit of the registrant’s annual financial statements or services that are normally provided by the accountant in connection with statutory and regulatory filings or engagements for those fiscal years are $329,455 for 2021 and $284,595 for 2020. |
Audit-Related Fees
| (b) | The aggregate fees billed in each of the last two fiscal years for assurance and related services by the principal accountant that are reasonably related to the performance of the audit of the registrant’s financial statements and are not reported under paragraph (a) of this Item are $0 for 2021 and $0 for 2020. |
Tax Fees
| (c) | The aggregate fees billed in each of the last two fiscal years for professional services rendered by the principal accountant for tax compliance, tax advice, and tax planning are $153,258 for 2021 and $235,418 for 2020. |
All Other Fees
| (d) | The aggregate fees billed in each of the last two fiscal years for products and services provided by the principal accountant, other than the services reported in paragraphs (a) through (c) of this Item are $0 for 2021 and $0 for 2020. |
| (e)(1) | Disclose the audit committee’s pre-approval policies and procedures described in paragraph (c)(7) of Rule 2-01 of Regulation S-X. |
In accordance with Rule 2-01(c)(7)(A), the Audit Committee pre-approves all of the audit and permissible non-audit services of the Registrant.
| (e)(2) | All of the services described in paragraphs (b) through (d) above were approved by the Audit Committee in accordance with paragraph (c) (7) (i) (c) of Rule 2-01 of Regulation S-X. |
| (f) | Not Applicable. |
| (g) | The aggregate non-audit fees billed by the registrant’s accountant for services rendered to the registrant, and rendered to the registrant’s investment adviser (not including any sub-adviser whose role is primarily portfolio management and is subcontracted with or overseen by another investment adviser), and any entity controlling, controlled by, or under common control with the adviser that provides ongoing services to the registrant for each of the last two fiscal years of the registrant was $0 for 2021 and $0 for 2020. |
| (h) | The registrant’s audit committee of the board of directors has considered whether the provision of non-audit services that were rendered to the registrant’s investment adviser (not including any sub-adviser whose role is primarily portfolio management and is subcontracted with or overseen by another investment adviser), and any entity controlling, controlled by, or under common control with the investment adviser that provides ongoing services to the registrant that were not pre-approved pursuant to paragraph (c)(7)(ii) of Rule 2-01 of Regulation S-X is compatible with maintaining the principal accountant’s independence. |
Pursuant to PCAOB Rule 3526, EY is required to describe in writing to the Funds’ Audit Committee, on at least an annual basis, all relationships between EY, or any of its affiliates, and the Xtrackers ETFs, or persons in financial reporting oversight roles at DWS that, as of the date of the communication, may reasonably be thought to bear on EY’s independence. Pursuant to PCAOB Rule 3526, EY has reported the matters set forth below that may reasonably be thought to bear on EY’s independence. With respect to each reported matter in the aggregate, EY advised the Audit Committee that, after careful consideration of the facts and circumstances and the applicable independence rules, it concluded that the matters do not and will not impair EY’s ability to exercise objective and impartial judgement in connection with the audits of the financial statements for the Funds and a reasonable investor with knowledge of all relevant facts and circumstances would conclude that EY has been and is capable of exercising objective and impartial judgment on all issues encompassed within EY’s audit engagements. EY also confirmed to the Audit Committee that it can continue to act as the Independent Registered Public Accounting Firm for the Funds.
| • | EY advised the Funds’ Audit Committee that various covered persons within EY and EY’s affiliates held investments in, or had other financial relationships with, entities within the Xtrackers ETFs “investment company complex” (as defined in Regulation S-X). EY informed the Audit Committee that these investments and financial relationships were inconsistent with Rule 2-01(c)(1) of Regulation S-X. EY reported that all breaches have been resolved and that none of the breaches involved any professionals who were part of the audit engagement team for the Funds ETFs or in the position to influence the audit engagement team for the Funds. |
| Item 5. | Audit Committee of Listed Registrants. |
The Registrant is a listed issuer as defined in Rule 10A-3 under the Exchange Act and has a separately-designated standing audit committee established in accordance with Section 3(a)(58)(A) of the Exchange Act. The Registrant’s audit committee members are Stephen R. Byers, George O. Elston, and J. David Officer.
| Item 6. | Investments. |
| (a) | Schedule of Investments in securities of unaffiliated issuers as of the close of the reporting period is included as part of the report to shareholders filed under Item 1(b) of this Form. |
| (b) | Not applicable. |
| Item 7. | Disclosure of Proxy Voting Policies and Procedures for Closed-End Management Investment Companies. |
Not applicable.
| Item 8. | Portfolio Managers of Closed-End Management Investment Companies. |
Not applicable.
| Item 9. | Purchases of Equity Securities by Closed-End Management Investment Company and Affiliated Purchasers. |
Not applicable.
| Item 10. | Submission of Matters to a Vote of Security Holders. |
There were no material changes to the procedures by which shareholders may recommend nominees to the Registrant’s Board of Trustees.
| Item 11. | Controls and Procedures. |
| (a) | The Chief Executive and Financial Officers concluded that the Registrant’s Disclosure Controls and Procedures are effective based on the evaluation of the Disclosure Controls and Procedures as of a date within 90 days of the filing date of this report. |
| (b) | There have been no changes in the registrant’s internal control over financial reporting that occurred during the period covered by this report that has materially affected, or is reasonably likely to materially affect, the registrant’s internal controls over financial reporting. |
| Item 12. | Disclosure of Securities Lending Activities for Closed-End Management Investment Companies |
Not applicable.
| Item 13. | Exhibits. |
SIGNATURES
Pursuant to the requirements of the Securities Exchange Act of 1934 and the Investment Company Act of 1940, the registrant has duly caused this report to be signed on its behalf by the undersigned, thereunto duly authorized.
| (Registrant) | DBX ETF Trust |
| By (Signature and Title) | /s/ Freddi Klassen | |
| Freddi Klassen | ||
| President and Chief Executive Officer | ||
| Date November 4, 2021 | ||
Pursuant to the requirements of the Securities Exchange Act of 1934 and the Investment Company Act of 1940, this report has been signed below by the following persons on behalf of the registrant and in the capacities and on the dates indicated.
| By (Signature and Title) | /s/ Freddi Klassen | |
| Freddi Klassen | ||
| President and Chief Executive Officer |
| Date November 4, 2021 | ||
| By (Signature and Title) | /s/ Diane Kenneally | |
| Diane Kenneally | ||
| Treasurer and Chief Financial Officer |
| Date November 4, 2021 | ||