UNITED STATES
SECURITIES AND EXCHANGE COMMISSION
Washington, D.C. 20549
FORM N-CSR
CERTIFIED SHAREHOLDER REPORT OF REGISTERED
MANAGEMENT INVESTMENT COMPANIES
Investment Company Act file number 811-22487
DBX ETF Trust
(Exact name of registrant as specified in charter)
875 Third Avenue
New York, New York 10022
(Address of principal executive offices) (Zip code)
Diane Kenneally
One International Place
Boston, MA 02110
(Name and address of agent for service)
Registrant’s telephone number, including area code: (212) 454-4500
Date of fiscal year end: May 31
Date of reporting period: May 31, 2020
Form N-CSR is to be used by management investment companies to file reports with the Commission not later than 10 days after the transmission to stockholders of any report that is required to be transmitted to stockholders under Rule 30e-1 under the Investment Company Act of 1940 (17 CFR 270.30e-1). The Commission may use the information provided on Form N-CSR in its regulatory, disclosure review, inspection, and policymaking roles.
A registrant is required to disclose the information specified by Form N-CSR, and the Commission will make this information public. A registrant is not required to respond to the collection of information contained in Form N-CSR unless the Form displays a currently valid Office of Management and Budget (“OMB”) control number. Please direct comments concerning the accuracy of the information collection burden estimate and any suggestions for reducing the burden to Secretary, Securities and Exchange Commission, 450 Fifth Street, NW, Washington, DC 20549-0609. The OMB has reviewed this collection of information under the clearance requirements of 44 U.S.C. § 3507.
| Item 1. | Reports to Stockholders. |
The Report to Shareholders is attached herewith.
May 31, 2020
Annual Report
DBX ETF Trust
Xtrackers MSCI All World ex US Hedged Equity ETF (DBAW)
Xtrackers MSCI Emerging Markets Hedged Equity ETF (DBEM)
Xtrackers MSCI Europe Hedged Equity ETF (DBEU)
Xtrackers MSCI Eurozone Hedged Equity ETF (DBEZ)
Xtrackers MSCI Germany Hedged Equity ETF (DBGR)
Xtrackers MSCI Japan Hedged Equity ETF (DBJP)

DBX ETF Trust
| Page | ||||
| 1 | ||||
| 3 | ||||
| 6 | ||||
| 8 | ||||
| 10 | ||||
| 12 | ||||
| 14 | ||||
| 16 | ||||
| 18 | ||||
| 19 | ||||
| 44 | ||||
| 64 | ||||
| 72 | ||||
| 81 | ||||
| 84 | ||||
| 90 | ||||
| 92 | ||||
| 94 | ||||
| 97 | ||||
| 100 | ||||
| 113 | ||||
| 114 | ||||
| 115 | ||||
Board Considerations in Approval of Investment Advisory and Sub-Advisory Contracts | 118 | |||
| 121 | ||||
| 122 | ||||
To our Shareholders: (Unaudited)
Dear Shareholders,
We are pleased to provide this annual report for 6 of our currency-hedged equity ETFs for the period ended May 31, 2020.
During the reporting period, developed and emerging economies alike shifted from a “sustaining growth” approach to ‘low-growth’ position, however equity markets across these regions avoided their lowest levels anchored by government stimulus. Through the initial phase of the review period, economies were focusing their efforts towards ensuring favorable employment rates, achieving target inflation levels and improving corporate earnings. Each of these factors saw varied levels of success to keep the overall expansion levels afloat. However, as the global pandemic and the accompanying business lockdown ensued, a slowdown took shape globally, causing enormous economic and human losses. Monetary backing from central banks and fiscal stimulus from governments were at the forefront, providing a base for the economies and businesses to recover and partially offset losses.
The U.S. GDP1 increment was marginal by the end of the review period, as lockdown measures culminated in the highest unemployment levels historically. A dire employment scenario led to a steeper spiraling down of consumer consumption than what businesses had anticipated. The direct impact was on the equity markets, which lost all the gains they had accumulated during the period. A relief fund to the tune of USD3.6 trillion was approved by the Treasury through the Coronavirus Aid, Relief and Economic Security (CARES) Act, while the Federal Reserve Board (FRB) brought the federal funds rate near zero levels to infuse liquidity into the economy. A volatile oil market saw oil become the first commodity in history to record negative prices. As a result, inflation levels waned towards the end of the review period.
The Eurozone, which was facing recessionary pressures even before the COVID-19 outbreak, contracted over the review period, drawing down major equity indices by a larger impact. With dwindling household consumption in Germany and France’s GDP impacted by constant strikes over the government’s pension reforms, the euro area’s power houses had already come under pressure. Serving as a virus hotspots, Italy and Spain inflicted the highest damage, further straining the region’s stability. The European Central Bank’s (ECB) efforts to contain the economic damage were not far behind the U.S., as it issued EUR1.35 trillion in the form of Pandemic Emergency Purchase Programme (PEPP). In addition, the regular asset purchase programme was reinitiated, while keeping interest rates at the zero level. The U.K.’s economy contracted as well, following the global trend, and yet again postponed Brexit2 negotiations.
In another first, the world’s fastest growing major economy, China, contracted, as the epicenter of the pandemic underwent a two-month shutdown. Industrial production detracted sharper than the services sector. Over a short positive stint, the first phase of U.S.-China negotiations was convened by the global giants, relaxing tensions prior to the COVID-19 outbreak. However, disrupted supply chains amid a travel ban globally revived growth sustainability concerns for all export-reliant economies, which include emerging economies. Elsewhere, the Japanese economy was formally declared to be in a technical recession3 as it underwent two consecutive quarters of negative growth.
A second wave of the pandemic and U.S.-China trade tensions are among the visible causes of concerns in the near future. Nevertheless, the availability of reasonable debt and synchronized efforts by economies globally to ensure liquidity are expected to ease recessionary concerns. Our team appreciates your trust and looks forward to continue serving your investment needs
1
through innovative index-driven strategies. In view of an appreciating U.S. dollar, our currency-hedged strategy plays a significant role in managing investments in international equities.
Sincerely,
/s/ Freddi Klassen
Freddi Klassen
President and Chief Executive Officer
1 The gross domestic product (GDP) is the monetary value of all the finished goods and services produced within a country’s borders in a specific time period.
2 Brexit is a combination of words “Britain” and “Exit” and describes the exit of the United Kingdom from the European Union.
3. A “technical recession” is when you have 2 negative quarters of GDP, but it is due mainly to slowing growth or an isolated event rather than a major underlying cause. Technical recessions are usually short in duration and mild in severity.
Assumptions, estimates and opinions contained in this document constitute our judgment as of the date of the document and are subject to change without notice. Any projections are based on a number of assumptions as to market conditions and there can be no guarantee that any projected results will be achieved. Past performance is not a guarantee of future results.
2
DBX ETF Trust
Xtrackers MSCI All World ex US Hedged Equity ETF (DBAW)
The Xtrackers MSCI All World ex US Hedged Equity ETF (DBAW) seeks investment results that correspond generally to the performance, before fees and expenses, of the MSCI ACWI ex USA US Dollar Hedged Index (the DBAW Index). The DBAW Index is designed to provide exposure to equity securities in developed and emerging stock markets (excluding the U.S.), while at the same time mitigating exposure to fluctuation between the value of the U.S. dollar and select non-U.S. currencies. For the 12-month period ended May 31, 2020, DBAW returned -0.78%, compared to the DBAW Index return of -0.37%.
Financials, Energy and Real Estate were the major negative contributors, while Health Care, Information Technology and Consumer Discretionary sectors contributed the most to performance. From a geographical perspective, United Kingdom, Brazil and India were the major negative contributors, while Japan and Switzerland contributed positively to performance. The Fund entered into forward foreign currency contracts during the period to hedge against changes in the value of the U.S. dollar against specified non-U.S. currencies. The currency hedging strategy contributed positively to performance.
Xtrackers MSCI Emerging Markets Hedged Equity ETF (DBEM)
The Xtrackers MSCI Emerging Markets Hedged Equity ETF (DBEM) seeks investment results that correspond generally to the performance, before fees and expenses, of the MSCI EM US Dollar Hedged Index (the DBEM Index). The DBEM Index is designed to provide exposure to equity securities in the global emerging markets, while at the same time mitigating exposure to fluctuations between the value of the US dollar and the currencies of countries included in the underlying index. For the 12-month period ended May 31, 2020, DBEM returned -1.01%, compared to the DBEM Index return of -0.17%.
Financials, Energy and Materials were the major negative contributors, while Information Technology, Consumer Discretionary and Communication Services sectors contributed the most to performance. From a geographical perspective, majority of countries contributed negatively to performance during the period with the greatest negative contributions coming from Brazil, India and South Africa, while Taiwan and Hong Kong were among the positive contributors. The Fund entered into forward foreign currency contracts during the period to hedge against changes in the value of the U.S. dollar against specified non-U.S. currencies. The currency hedging strategy contributed positively to performance.
Xtrackers MSCI Europe Hedged Equity ETF (DBEU)
The Xtrackers MSCI Europe Hedged Equity ETF (DBEU) seeks investment results that correspond generally to the performance, before fees and expenses, of the MSCI Europe US Dollar Hedged Index (the DBEU Index). The DBEU index is designed to provide exposure to equity securities in 15 developed European stock markets, while at the same time mitigating exposure to fluctuations between the value of the U.S. dollar and selected non-U.S. currencies. For the 12-month period ended May 31, 2020, DBEU returned -2.16%, compared to the DBEU Index return of -1.96%.
Majority of sectors contributed negatively to performance during the period with the greatest negative contributions coming from Financials, Energy and Communication Services. The Health Care, Information Technology and Utilities sectors contributed positively to performance. From a geographical perspective, United Kingdom, France and Spain were the major detractors, while Switzerland, Denmark and Sweden contributed positively to performance. The Fund entered into forward foreign currency contracts during the period to hedge against changes in the value of the U.S. dollar against specified non-U.S. currencies. The currency hedging strategy contributed positively to performance.
Xtrackers MSCI Eurozone Hedged Equity ETF (DBEZ)
The Xtrackers MSCI Eurozone Hedged Equity ETF (DBEZ) seeks investment results that correspond generally to the performance, before fees and expenses, of the MSCI EMU IMI U.S. Dollar Hedged Index (the DBEZ Index). The DBEZ Index is designed to provide exposure to equities in countries in the European Monetary Union, or the “Eurozone” that have adopted the euro as their common currency and sole legal tender, while at the same time mitigating exposure to the fluctuations between the value of the U.S. dollar and the euro. For the 12-month period ended May 31, 2020, DBEZ returned -2.80%, compared to the DBEZ Index return of -2.57%.
3
DBX ETF Trust
Management’s Discussion of Fund Performance (Unaudited) (Continued)
Majority of sectors contributed negatively to performance during the period with the greatest negative contributions coming from Financials, Industrials and Energy. The Health Care, Information Technology and Utilities sectors contributed positively to performance. Most countries contributed negatively with France, Spain and Italy being the most significant detractors. However, Netherlands, Finland and Ireland contributed positively to the performance. The Fund entered into forward foreign currency contracts during the period to hedge against changes in the value of the U.S. dollar against the euro. The currency hedging strategy contributed positively to performance.
Xtrackers MSCI Germany Hedged Equity ETF (DBGR)
The Xtrackers MSCI Germany Hedged Equity ETF (DBGR) seeks investment results that correspond generally to the performance, before fees and expenses, of the MSCI German US Dollar Hedged Index (the DBGR Index). The DBGR Index is designed to provide exposure to Germany’s equity market, while at the same time mitigating exposure to fluctuations between the value of the US dollar and euro. For the 12-month period ended May 31, 2020, DBGR returned 1.15%, compared to the DBGR Index return of 1.40%.
The Health Care, Utilities and Information Technology sectors were the major positive contributors, while Consumer Discretionary and Materials sectors detracted most from the performance. The Fund entered into forward foreign currency contracts during the period to hedge against changes in the value of the U.S. dollar against specified non-U.S. currencies. The currency hedging strategy contributed positively to performance.
Xtrackers MSCI Japan Hedged Equity ETF (DBJP)
The Xtrackers MSCI Japan Hedged Equity ETF (DBJP) seeks investment results that correspond generally to the performance, before fees and expenses, of the MSCI Japan US Dollar Hedged Index (the DBJP Index). The DBJP Index is designed to track the performance of the Japanese equity market, while at the same time mitigating exposure to fluctuations between the value of the U.S. dollar and Japanese yen. For the 12-month period ended May 31, 2020, DBJP returned 7.88%, compared to the DBJP Index return of 8.32%.
Health Care, Information Technology and Consumer Discretionary were the major positive contributors, while Financials, Real Estate and Energy sectors detracted most from the performance. The Fund entered into forward foreign currency contracts during the period to hedge against changes in the value of the U.S. dollar against the Japanese yen. The currency hedging strategy contributed positively to performance.
*************************
Performance data quoted represents past performance and does not guarantee future results. Investment returns and principal value of an investment will fluctuate so that an investor’s shares, when sold or redeemed, may be worth more or less than their original cost. Current performance may be lower or higher than the performance data quoted. To obtain the most recent month-end performance data visit www.Xtrackers.com. Returns assume that dividends and capital gains distributions have been reinvested. See pages 6-17 of this report for additional performance information, including performance data based on market value. The views expressed in this report reflect those of the portfolio management team only through the end of the period of the report as stated on the cover. The management team’s views are subject to change at any time based on market and other conditions and should not be construed as a recommendation. Current and future portfolio holdings are subject to risk.
4
This Page is Intentionally Left Blank
5
DBX ETF Trust
Xtrackers MSCI All World ex US Hedged Equity ETF (DBAW)
The Xtrackers MSCI All World ex US Hedged Equity ETF (the “Fund”), using a “passive” or indexing investment approach, seeks investment results that correspond generally to the performance, before fees and expenses, of the MSCI ACWI ex USA US Dollar Hedged Index (the “Underlying Index”). The Underlying Index is designed to track the performance of equity securities in developed and emerging stock markets (excluding the United States), while mitigating exposure to fluctuations between the value of the U.S. dollar and the currencies of the countries included in the Underlying Index. It is not possible to invest directly into an index.
| Performance as of May 31, 2020 |
| Average Annual Total Return | ||||||||
| Net Asset Value | Market Value | MSCI ACWI ex USA US Dollar Hedged Index | MSCI ACWI ex USA Index | |||||
One Year | -0.78% | -0.44% | -0.37% | -3.43% | ||||
Five Year | 2.22% | 2.13% | 2.68% | 0.79% | ||||
Since Inception1 | 4.11% | 4.11% | 4.57% | 1.12% | ||||
| Cumulative Total Returns | ||||||||
| Net Asset Value | Market Value | MSCI ACWI ex USA US Dollar Hedged Index | MSCI ACWI ex USA Index | |||||
One Year | -0.78% | -0.44% | -0.37% | -3.43% | ||||
Five Year | 11.58% | 11.10% | 14.14% | 4.01% | ||||
Since Inception1 | 29.17% | 29.18% | 32.83% | 7.34% | ||||
1 Total returns are calculated based on the commencement of operations, January 23, 2014 (“Inception”).
Past performance is no guarantee of future results. Current performance may be lower or higher than the performance data quoted. Performance data current to the most recent month-end is available at www.Xtrackers.com. Performance results assume reinvestment of all dividends and capital gain distributions and do not reflect the deduction of taxes that a shareholder would pay on fund distributions or on the sale of fund shares or redemption of fund creation units. The investment return and principal value of shares will vary with changes in market conditions. Shares may be worth more or less than their original cost when they are sold in the market or redeemed. Performance for certain funds may reflect a waiver of a portion of investment management fees. Without such waiver, performance would have been lower. The estimated operating expense ratio as disclosed in the most recent prospectus dated October 1, 2019, was 0.40%, and may differ from the expense ratio disclosed in the Financial Highlights table in this report.
The Fund’s net asset value or “NAV” is calculated by dividing the value of the Fund’s total assets less total liabilities by the number of shares outstanding. The price used to calculate market return (“Market Price”) is determined by using the midpoint between the highest bid and the lowest offer on the primary stock exchange on which shares of a fund are listed for trading, as of the time that such fund’s NAV is calculated. Since shares of a fund may not have traded in the secondary market until after the fund’s inception, for the period from inception to the first day of secondary trading, the NAV of the fund is used as a proxy for the Market Price to calculate market returns. Market and NAV returns assume that dividends and capital gain distributions have been reinvested at Market Price and NAV, respectively.
An index is a statistical composite that tracks a specified financial market or sector. Unlike a fund, an index does not actually hold a portfolio of securities and therefore does not incur the expenses incurred by a fund. These expenses negatively impact fund performance. Also, market returns do not include brokerage commissions that may be payable on secondary market transactions. If brokerage commissions were included, market returns would be lower.
6
DBX ETF Trust
Performance Summary (Unaudited)
Xtrackers MSCI All World ex US Hedged Equity ETF (DBAW) (Continued)
| Growth of an Assumed $10,000 Investment |
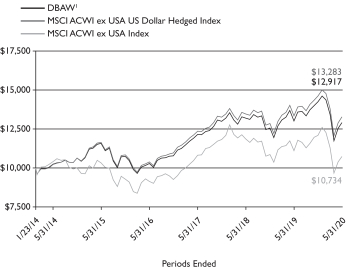
1 Based on Net Asset Value from commencement of operations, January 23, 2014.
| Sector Diversification* as of May 31, 2020 |
Financials | 18.0% | |||
Consumer Discretionary | 12.5% | |||
Industrials | 11.5% | |||
Health Care | 11.0% | |||
Information Technology | 10.6% | |||
Consumer Staples | 10.1% | |||
Materials | 7.5% | |||
Communication Services | 7.3% | |||
Energy | 5.0% | |||
Utilities | 3.6% | |||
Real Estate | 2.9% | |||
|
| |||
Total | 100.0% |
| Ten Largest Equity Holdings as of May 31, 2020 (11.8% of Net Assets) |
| Description | % of Net Assets | |||
Alibaba Group Holding Ltd. (China) | 2.0% | |||
Nestle SA (Switzerland) | 1.6% | |||
Tencent Holdings Ltd. (China) | 1.5% | |||
Roche Holding AG (Switzerland) | 1.2% | |||
Taiwan Semiconductor Manufacturing Co. Ltd. (Taiwan) | 1.2% | |||
Samsung Electronics Co. Ltd. (South Korea) | 1.2% | |||
Novartis AG (Switzerland) | 1.0% | |||
AstraZeneca PLC (United Kingdom) | 0.7% | |||
ASML Holding NV (Netherlands) | 0.7% | |||
Toyota Motor Corp. (Japan) | 0.7% | |||
| Country Diversification* as of May 31, 2020 |
Japan | 17.2% | |||
China | 10.3% | |||
United Kingdom | 8.7% | |||
Switzerland | 7.0% | |||
France | 6.8% | |||
Canada | 6.6% | |||
Germany | 5.9% | |||
Australia | 4.3% | |||
Taiwan | 3.4% | |||
South Korea | 3.2% | |||
Hong Kong | 3.1% | |||
Netherlands | 3.0% | |||
India | 2.3% | |||
Other | 18.2% | |||
|
| |||
Total | 100.0% |
* As a percent of total investments excluding securities lending collateral and cash equivalents.
Portfolio holdings and characteristics are subject to change. For more complete details about the Fund’s investment portfolio see page 19.
7
DBX ETF Trust
Performance Summary (Unaudited)
Xtrackers MSCI Emerging Markets Hedged Equity ETF (DBEM)
The Xtrackers MSCI Emerging Markets Hedged Equity ETF (the “Fund”), using a “passive” or indexing investment approach, seeks investment results that correspond generally to the performance, before fees and expenses, of the MSCI EM US Dollar Hedged Index (the “Underlying Index”). The Underlying Index is designed to track emerging market performance while mitigating exposure to fluctuations between the value of the U.S. dollar and the currencies of the countries included in the Underlying Index. It is not possible to invest directly into and index.
| Performance as of May 31, 2020 |
| Average Annual Total Return | ||||||||
| Net Asset Value | Market Value | MSCI EM US Dollar Hedged Index | MSCI EM Index | |||||
One Year | -1.01% | 0.15% | -0.17% | -4.39% | ||||
Five Year | 1.07% | 1.12% | 2.26% | 0.88% | ||||
Since Inception1 | 0.51% | 0.59% | 2.38% | 0.09% | ||||
| Cumulative Total Returns | ||||||||
| Net Asset Value | Market Value | MSCI EM US Dollar Hedged Index | MSCI EM Index | |||||
One Year | -1.01% | 0.15% | -0.17% | -4.39% | ||||
Five Year | 5.46% | 5.73% | 11.82% | 4.47% | ||||
Since Inception1 | 4.71% | 5.42% | 23.58% | 0.84% | ||||
1 Total returns are calculated based on the commencement of operations, June 9, 2011 (“Inception”).
Past performance is no guarantee of future results. Current performance may be lower or higher than the performance data quoted. Performance data current to the most recent month-end is available at www.Xtrackers.com. Performance results assume reinvestment of all dividends and capital gain distributions and do not reflect the deduction of taxes that a shareholder would pay on fund distributions or on the sale of fund shares or redemption of fund creation units. The investment return and principal value of shares will vary with changes in market conditions. Shares may be worth more or less than their original cost when they are sold in the market or redeemed. Performance for certain funds may reflect a waiver of a portion of investment management fees. Without such waiver, performance would have been lower. The estimated operating expense ratio as disclosed in the most recent prospectus dated October 1, 2019, was 0.65%, and may differ from the expense ratio disclosed in the Financial Highlights table in this report.
The Fund’s net asset value or “NAV” is calculated by dividing the value of the Fund’s total assets less total liabilities by the number of shares outstanding. The price used to calculate market return (“Market Price”) is determined by using the midpoint between the highest bid and the lowest offer on the primary stock exchange on which shares of a fund are listed for trading, as of the time that such fund’s NAV is calculated. Since shares of a fund may not have traded in the secondary market until after the fund’s inception, for the period from inception to the first day of secondary trading, the NAV of the fund is used as a proxy for the Market Price to calculate market returns. Market and NAV returns assume that dividends and capital gain distributions have been reinvested at Market Price and NAV, respectively.
An index is a statistical composite that tracks a specified financial market or sector. Unlike a fund, an index does not actually hold a portfolio of securities and therefore does not incur the expenses incurred by a fund. These expenses negatively impact fund performance. Also, market returns do not include brokerage commissions that may be payable on secondary market transactions. If brokerage commissions were included, market returns would be lower.
8
DBX ETF Trust
Performance Summary (Unaudited)
Xtrackers MSCI Emerging Markets Hedged Equity ETF (DBEM) (Continued)
| Growth of an Assumed $10,000 Investment |
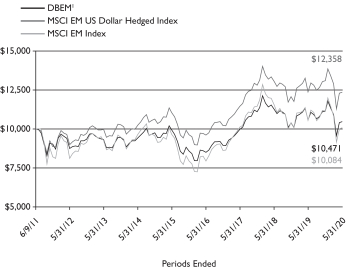
1 Based on Net Asset Value from commencement of operations, June 9, 2011.
| Sector Diversification* as of May 31, 2020 |
Financials | 19.8% | |||
Consumer Discretionary | 17.0% | |||
Information Technology | 16.4% | |||
Communication Services | 12.9% | |||
Materials | 7.0% | |||
Consumer Staples | 6.7% | |||
Energy | 6.2% | |||
Industrials | 4.9% | |||
Health Care | 4.0% | |||
Real Estate | 2.6% | |||
Utilities | 2.5% | |||
|
| |||
Total | 100.0% |
| Ten Largest Equity Holdings as of May 31, 2020 (28.0% of Net Assets) |
| Description | % of Net Assets | |||
Alibaba Group Holding Ltd. (China) | 7.1% | |||
Tencent Holdings Ltd. (China) | 5.6% | |||
Taiwan Semiconductor Manufacturing Co. Ltd. (Taiwan) | 4.4% | |||
Samsung Electronics Co. Ltd. (South Korea) | 4.1% | |||
China Construction Bank Corp. (China) | 1.4% | |||
Naspers Ltd. (South Africa) | 1.3% | |||
Meituan Dianping (China) | 1.2% | |||
Ping An Insurance Group Co. of China Ltd. (China) | 1.1% | |||
Reliance Industries Ltd. (India) | 1.0% | |||
China Mobile Ltd. (Hong Kong) | 0.8% | |||
| Country Diversification* as of May 31, 2020 |
China | 36.5% | |||
Taiwan | 12.0% | |||
South Korea | 11.5% | |||
India | 8.1% | |||
Brazil | 5.2% | |||
Hong Kong | 3.8% | |||
South Africa | 3.6% | |||
Russia | 3.5% | |||
Saudi Arabia | 2.8% | |||
Thailand | 2.4% | |||
Other | 10.6% | |||
|
| |||
Total | 100.0% |
* As a percent of total investments excluding exchange-traded funds, securities lending collateral and cash equivalents.
Portfolio holdings and characteristics are subject to change. For more complete details about the Fund’s investment portfolio see page 44.
9
DBX ETF Trust
Performance Summary (Unaudited)
Xtrackers MSCI Europe Hedged Equity ETF (DBEU)
The X-trackers MSCI Europe Hedged Equity ETF (the “Fund”), using a “passive” or indexing investment approach, seeks investment results that correspond generally to the performance, before fees and expenses, of the MSCI Europe US Dollar Hedged Index (the “Underlying Index”). The Underlying Index is designed to track the performance of the developed markets in Europe, while mitigating exposure to fluctuations between the value of the U.S. dollar and the currencies of the countries included in the Underlying Index. It is not possible to invest directly into an index.
| Performance as of May 31, 2020 | ||||||||
| Average Annual Total Return | ||||||||
| Net Asset Value | Market Value | MSCI Europe US Dollar Hedged Index | MSCI Europe Index | |||||
One Year | -2.16% | -1.87% | -1.96% | -4.41% | ||||
Five Year | 2.90% | 2.88% | 3.22% | 0.03% | ||||
Since Inception1 | 5.55% | 5.58% | 5.88% | 1.24% | ||||
| Cumulative Total Returns | ||||||||
| Net Asset Value | Market Value | MSCI Europe US Dollar Hedged Index | MSCI Europe Index | |||||
One Year | -2.16% | -1.87% | -1.96% | -4.41% | ||||
Five Year | 15.36% | 15.25% | 17.17% | 0.13% | ||||
Since Inception1 | 43.32% | 43.63% | 46.36% | 8.55% | ||||
1 Total returns are calculated based on the commencement of operations, October 1, 2013 (“Inception”).
Past performance is no guarantee of future results. Current performance may be lower or higher than the performance data quoted. Performance data current to the most recent month-end is available at www.Xtrackers.com. Performance results assume reinvestment of all dividends and capital gain distributions and do not reflect the deduction of taxes that a shareholder would pay on fund distributions or on the sale of fund shares or redemption of fund creation units. The investment return and principal value of shares will vary with changes in market conditions. Shares may be worth more or less than their original cost when they are sold in the market or redeemed. Performance for certain funds may reflect a waiver of a portion of investment management fees. Without such waiver, performance would have been lower. The estimated operating expense ratio as disclosed in the most recent prospectus dated October 1, 2019, was 0.45%, and may differ from the expense ratio disclosed in the Financial Highlights table in this report.
The Fund’s net asset value or “NAV” is calculated by dividing the value of the Fund’s total assets less total liabilities by the number of shares outstanding. The price used to calculate market return (“Market Price”) is determined by using the midpoint between the highest bid and the lowest offer on the primary stock exchange on which shares of a fund are listed for trading, as of the time that such fund’s NAV is calculated. Since shares of a fund may not have traded in the secondary market until after the fund’s inception, for the period from inception to the first day of secondary trading, the NAV of the fund is used as a proxy for the Market Price to calculate market returns. Market and NAV returns assume that dividends and capital gain distributions have been reinvested at Market Price and NAV, respectively.
An index is a statistical composite that tracks a specified financial market or sector. Unlike a fund, an index does not actually hold a portfolio of securities and therefore does not incur the expenses incurred by a fund. These expenses negatively impact fund performance. Also, market returns do not include brokerage commissions that may be payable on secondary market transactions. If brokerage commissions were included, market returns would be lower.
10
DBX ETF Trust
Performance Summary (Unaudited)
Xtrackers MSCI Europe Hedged Equity ETF (DBEU) (Continued)
| Growth of an Assumed $10,000 Investment |
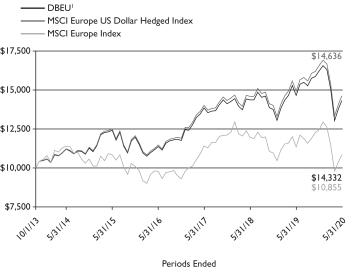
1 Based on Net Asset Value from commencement of operations, October 1, 2013.
| Sector Diversification* as of May 31, 2020 |
Health Care | 17.2% | |||
Consumer Staples | 15.1% | |||
Financials | 14.6% | |||
Industrials | 13.2% | |||
Consumer Discretionary | 9.9% | |||
Materials | 7.4% | |||
Information Technology | 7.3% | |||
Utilities | 4.9% | |||
Energy | 4.8% | |||
Communication Services | 4.2% | |||
Real Estate | 1.4% | |||
|
| |||
Total | 100.0% |
| Ten Largest Equity Holdings as of May 31, 2020 (20.0% of Net Assets) | ||
| Description | % of Net Assets | |||
Nestle SA (Switzerland) | 4.0% | |||
Roche Holding AG (Switzerland) | 3.0% | |||
Novartis AG (Switzerland) | 2.3% | |||
AstraZeneca PLC (United Kingdom) | 1.7% | |||
ASML Holding NV (Netherlands) | 1.7% | |||
SAP SE (Germany) | 1.6% | |||
Royal Dutch Shell PLC (Netherlands) | 1.5% | |||
LVMH Moet Hennessy Louis Vuitton SE (France) | 1.4% | |||
Novo Nordisk A/S (Denmark) | 1.4% | |||
Sanofi (France) | 1.4% | |||
| Country Diversification* as of May 31, 2020 |
United Kingdom | 21.3% | |||
Switzerland | 17.2% | |||
France | 16.7% | |||
Germany | 14.4% | |||
Netherlands | 7.3% | |||
Sweden | 4.6% | |||
Spain | 3.9% | |||
Denmark | 3.8% | |||
Italy | 3.2% | |||
Finland | 2.0% | |||
Other | 5.6% | |||
|
| |||
Total | 100.0% |
* As a percent of total investments excluding exchange-traded funds, securities lending collateral and cash equivalents.
Portfolio holdings and characteristics are subject to change. For more complete details about the Fund’s investment portfolio see page 64.
11
DBX ETF Trust
Performance Summary (Unaudited)
Xtrackers MSCI Eurozone Hedged Equity ETF (DBEZ)
The Xtrackers MSCI Eurozone Hedged Equity ETF (the “Fund”), using a “passive” or indexing investment approach, seeks investment results that correspond generally to the performance, before fees and expenses, of the MSCI EMU IMI US Dollar Hedged Index (the “Underlying Index”). The Underlying Index is designed to track the performance of equity securities based in the countries in the European Monetary Union (the “EMU”), while seeking to mitigate exposure to fluctuations between the value of the U.S. dollar and the euro. It is not possible to invest directly into an index.
| Performance as of May 31, 2020 | ||||||||
| Average Annual Total Return | ||||||||
| Net Asset Value | Market Value | MSCI EMU IMI US Dollar Hedged Index | MSCI EMU Index | |||||
One Year | -2.80% | -2.08% | -2.57% | -5.30% | ||||
Five Year | 2.31% | 2.29% | 2.45% | 0.68% | ||||
Since Inception1 | 5.11% | 5.20% | 5.27% | 1.37% | ||||
| Cumulative Total Returns | ||||||||
| Net Asset Value | Market Value | MSCI EMU IMI US Dollar Hedged Index | MSCI EMU Index | |||||
One Year | -2.80% | -2.08% | -2.57% | -5.30% | ||||
Five Year | 12.11% | 11.98% | 12.88% | 3.45% | ||||
Since Inception1 | 31.39% | 32.04% | 32.53% | 7.77% | ||||
1 Total returns are calculated based on the commencement of operations, December 10, 2014 (“Inception”).
Past performance is no guarantee of future results. Current performance may be lower or higher than the performance data quoted. Performance data current to the most recent month-end is available at www.Xtrackers.com. Performance results assume reinvestment of all dividends and capital gain distributions and do not reflect the deduction of taxes that a shareholder would pay on fund distributions or on the sale of fund shares or redemption of fund creation units. The investment return and principal value of shares will vary with changes in market conditions. Shares may be worth more or less than their original cost when they are sold in the market or redeemed. Performance for certain funds may reflect a waiver of a portion of investment management fees. Without such waiver, performance would have been lower. The estimated operating expense ratio as disclosed in the most recent prospectus dated October 1, 2019, was 0.45%, and may differ from the expense ratio disclosed in the Financial Highlights table in this report.
The Fund’s net asset value or “NAV” is calculated by dividing the value of the Fund’s total assets less total liabilities by the number of shares outstanding. The price used to calculate market return (“Market Price”) is determined by using the midpoint between the highest bid and the lowest offer on the primary stock exchange on which shares of a fund are listed for trading, as of the time that such fund’s NAV is calculated. Since shares of a fund may not have traded in the secondary market until after the fund’s inception, for the period from inception to the first day of secondary trading, the NAV of the fund is used as a proxy for the Market Price to calculate market returns. Market and NAV returns assume that dividends and capital gain distributions have been reinvested at Market Price and NAV, respectively.
An index is a statistical composite that tracks a specified financial market or sector. Unlike a fund, an index does not actually hold a portfolio of securities and therefore does not incur the expenses incurred by a fund. These expenses negatively impact fund performance. Also, market returns do not include brokerage commissions that may be payable on secondary market transactions. If brokerage commissions were included, market returns would be lower.
12
DBX ETF Trust
Performance Summary (Unaudited)
Xtrackers MSCI Eurozone Hedged Equity ETF (DBEZ) (Continued)
| Growth of an Assumed $10,000 Investment |
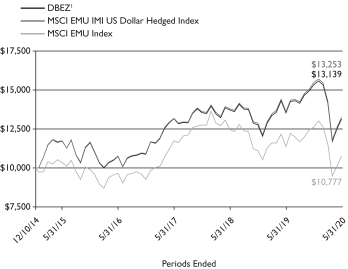
1 Based on Net Asset Value from commencement of operations, December 10, 2014.
| Sector Diversification* as of May 31, 2020 |
Industrials | 14.4% | |||
Consumer Discretionary | 14.4% | |||
Financials | 13.5% | |||
Information Technology | 12.2% | |||
Consumer Staples | 9.7% | |||
Health Care | 9.6% | |||
Utilities | 7.1% | |||
Materials | 7.1% | |||
Communication Services | 5.2% | |||
Energy | 4.0% | |||
Real Estate | 2.8% | |||
|
| |||
Total | 100.0% |
| Ten Largest Equity Holdings as of May 31, 2020 (21.7% of Net Assets) | ||
| Description | % of Net Assets | |||
ASML Holding NV (Netherlands) | 3.1% | |||
SAP SE (Germany) | 3.0% | |||
LVMH Moet Hennessy Louis Vuitton SE (France) | 2.6% | |||
Sanofi (France) | 2.5% | |||
TOTAL SA (France) | 2.1% | |||
Siemens AG (Germany) | 1.9% | |||
Allianz SE (Germany) | 1.7% | |||
Unilever NV (United Kingdom) | 1.7% | |||
L’Oreal SA (France) | 1.6% | |||
Bayer AG (Germany) | 1.5% | |||
| Country Diversification* as of May 31, 2020 |
France | 31.0% | |||
Germany | 28.2% | |||
Netherlands | 11.7% | |||
Spain | 7.9% | |||
Italy | 7.1% | |||
Finland | 3.7% | |||
Belgium | 3.3% | |||
United Kingdom | 2.3% | |||
Ireland | 2.1% | |||
Other | 2.7% | |||
|
| |||
Total | 100.0% |
* As a percent of total investments excluding securities lending collateral and cash equivalents.
Portfolio holdings and characteristics are subject to change. For more complete details about the Fund’s investment portfolio see page 72.
13
DBX ETF Trust
Performance Summary (Unaudited)
Xtrackers MSCI Germany Hedged Equity ETF (DBGR)
The Xtrackers MSCI Germany Hedged Equity ETF (the “Fund”), using a “passive” or indexing investment approach, seeks investment results that correspond generally to the performance, before fees and expenses, of the MSCI Germany US Dollar Hedged Index (the “Underlying Index”). The Underlying Index is designed to track the performance of the German equity market while mitigating exposure to fluctuations between the value of the US dollar and the euro. It is not possible to invest directly into an index.
| Performance as of May 31, 2020 | ||||||||
| Average Annual Total Return | ||||||||
| Net Asset Value | Market Value | MSCI Germany US Dollar Hedged Index | MSCI Germany Index | |||||
One Year | 1.15% | 2.23% | 1.40% | -1.54% | ||||
Five Year | 1.48% | 1.62% | 1.82% | 0.05% | ||||
Since Inception1 | 4.06% | 4.13% | 4.41% | 0.92% | ||||
| Cumulative Total Returns | ||||||||
| Net Asset Value | Market Value | MSCI Germany US Dollar Hedged Index | MSCI Germany Index | |||||
One Year | 1.15% | 2.23% | 1.40% | -1.54% | ||||
Five Year | 7.61% | 8.36% | 9.43% | 0.27% | ||||
Since Inception1 | 43.01% | 43.92% | 47.35% | 8.60% | ||||
1 Total returns are calculated based on the commencement of operations, June 9, 2011 (“Inception”).
Prior to May 31, 2013, this Fund was known as dbx-trackers MSCI Canada Hedged Equity Fund (DBCN) and had a different investment strategy. Past performance may have been different if the Fund’s current investment strategy had been in effect.
Past performance is no guarantee of future results. Current performance may be lower or higher than the performance data quoted. Performance data current to the most recent month-end is available at www.Xtrackers.com. Performance results assume reinvestment of all dividends and capital gain distributions and do not reflect the deduction of taxes that a shareholder would pay on fund distributions or on the sale of fund shares or redemption of fund creation units. The investment return and principal value of shares will vary with changes in market conditions. Shares may be worth more or less than their original cost when they are sold in the market or redeemed. Performance for certain funds may reflect a waiver of a portion of investment management fees. Without such waiver, performance would have been lower. The estimated operating expense ratio as disclosed in the most recent prospectus dated October 1, 2019, was 0.45%, and may differ from the expense ratio disclosed in the Financial Highlights table in this report.
The Fund’s net asset value or “NAV” is calculated by dividing the value of the Fund’s total assets less total liabilities by the number of shares outstanding. The price used to calculate market return (“Market Price”) is determined by using the midpoint between the highest bid and the lowest offer on the primary stock exchange on which shares of a fund are listed for trading, as of the time that such fund’s NAV is calculated. Since shares of a fund may not have traded in the secondary market until after the fund’s inception, for the period from inception to the first day of secondary trading, the NAV of the fund is used as a proxy for the Market Price to calculate market returns. Market and NAV returns assume that dividends and capital gain distributions have been reinvested at Market Price and NAV, respectively.
An index is a statistical composite that tracks a specified financial market or sector. Unlike a fund, an index does not actually hold a portfolio of securities and therefore does not incur the expenses incurred by a fund. These expenses negatively impact fund performance. Also, market returns do not include brokerage commissions that may be payable on secondary market transactions. If brokerage commissions were included, market returns would be lower.
14
DBX ETF Trust
Performance Summary (Unaudited)
Xtrackers MSCI Germany Hedged Equity ETF (DBGR) (Continued)
| Growth of an Assumed $10,000 Investment |
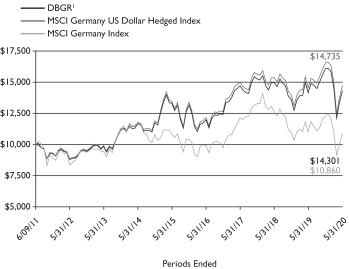
1 Based on Net Asset Value from commencement of operations, June 9, 2011.
| Sector Diversification* as of May 31, 2020 | ||
Consumer Discretionary | 16.0% | |||
Information Technology | 15.8% | |||
Financials | 14.8% | |||
Health Care | 13.5% | |||
Industrials | 13.2% | |||
Materials | 8.0% | |||
Communication Services | 6.0% | |||
Real Estate | 5.2% | |||
Utilities | 4.3% | |||
Consumer Staples | 3.2% | |||
|
| |||
Total | 100.0% |
| Ten Largest Equity Holdings as of May 31, 2020 (51.6% of Net Assets) | ||
| Description | % of Net Assets | |||
SAP SE | 11.2% | |||
Siemens AG | 7.1% | |||
Allianz SE | 6.4% | |||
Bayer AG | 5.6% | |||
Deutsche Telekom AG | 4.5% | |||
adidas AG | 4.3% | |||
BASF SE | 4.2% | |||
Muenchener Rueckversicherungs-Gesellschaft AG in Muenchen | 2.8% | |||
Volkswagen AG | 2.8% | |||
Daimler AG | 2.7% | |||
* As a percent of total investments excluding exchange-traded funds, securities lending collateral and cash equivalents.
Portfolio holdings and characteristics are subject to change. For more complete details about the Fund’s investment portfolio see page 81.
15
DBX ETF Trust
Performance Summary (Unaudited) (Continued)
Xtrackers MSCI Japan Hedged Equity ETF (DBJP)
The Xtrackers MSCI Japan Hedged Equity ETF (the “Fund”), using a “passive” or indexing investment approach, seeks investment results that correspond generally to the performance, before fees and expenses, of the MSCI Japan US Dollar Hedged Index (the “Underlying Index”). The Underlying Index is designed to track the performance of the Japanese equity market while mitigating exposure to fluctuations between the value of the US dollar and Japanese yen. It is not possible to invest directly into an index.
| Performance as of May 31, 2020 | ||||||||
| Average Annual Total Return | ||||||||
| Net Asset Value | Market Value | MSCI Japan US Dollar Hedged Index | MSCI Japan Index | |||||
One Year | 7.88% | 8.66% | 8.32% | 6.98% | ||||
Five Year | 0.80% | 0.87% | 1.36% | 3.09% | ||||
Since Inception1 | 8.88% | 8.84% | 9.56% | 5.70% | ||||
| Cumulative Total Returns | ||||||||
| Net Asset Value | Market Value | MSCI Japan US Dollar Hedged Index | MSCI Japan Index | |||||
One Year | 7.88% | 8.66% | 8.32% | 6.98% | ||||
Five Year | 4.09% | 4.42% | 6.97% | 16.46% | ||||
Since Inception1 | 114.68% | 114.03% | 127.14% | 64.61% | ||||
1 Total returns are calculated based on the commencement of operations, June 9, 2011 (“Inception”).
Past performance is no guarantee of future results. Current performance may be lower or higher than the performance data quoted. Performance data current to the most recent month-end is available at www.Xtrackers.com. Performance results assume reinvestment of all dividends and capital gain distributions and do not reflect the deduction of taxes that a shareholder would pay on fund distributions or on the sale of fund shares or redemption of fund creation units. The investment return and principal value of shares will vary with changes in market conditions. Shares may be worth more or less than their original cost when they are sold in the market or redeemed. Performance for certain funds may reflect a waiver of a portion of investment management fees. Without such waiver, performance would have been lower. The estimated operating expense ratio as disclosed in the most recent prospectus dated October 1, 2019, was 0.45%, and may differ from the expense ratio disclosed in the Financial Highlights table in this report.
The Fund’s net asset value or “NAV” is calculated by dividing the value of the Fund’s total assets less total liabilities by the number of shares outstanding. The price used to calculate market return (“Market Price”) is determined by using the midpoint between the highest bid and the lowest offer on the primary stock exchange on which shares of a fund are listed for trading, as of the time that such fund’s NAV is calculated. Since shares of a fund may not have traded in the secondary market until after the fund’s inception, for the period from inception to the first day of secondary trading, the NAV of the fund is used as a proxy for the Market Price to calculate market returns. Market and NAV returns assume that dividends and capital gain distributions have been reinvested at Market Price and NAV, respectively.
An index is a statistical composite that tracks a specified financial market or sector. Unlike a fund, an index does not actually hold a portfolio of securities and therefore does not incur the expenses incurred by a fund. These expenses negatively impact fund performance. Also, market returns do not include brokerage commissions that may be payable on secondary market transactions. If brokerage commissions were included, market returns would be lower.
16
DBX ETF Trust
Performance Summary (Unaudited)
Xtrackers MSCI Japan Hedged Equity ETF (DBJP) (Continued)
| Growth of an Assumed $10,000 Investment |
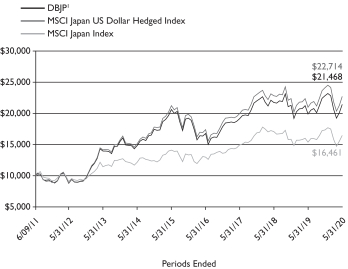
1 Based on Net Asset Value from commencement of operations, June 9, 2011.
| Sector Diversification* as of May 31, 2020 | ||
Industrials | 20.4% | |||
Consumer Discretionary | 17.7% | |||
Information Technology | 12.2% | |||
Health Care | 12.1% | |||
Financials | 9.3% | |||
Communication Services | 9.1% | |||
Consumer Staples | 8.4% | |||
Materials | 4.8% | |||
Real Estate | 3.7% | |||
Utilities | 1.6% | |||
Energy | 0.7% | |||
|
| |||
Total | 100.0% |
| Ten Largest Equity Holdings as of May 31, 2020 (19.3% of Net Assets) | ||
| Description | % of Net Assets | |||
Toyota Motor Corp. | 3.9% | |||
Sony Corp. | 2.4% | |||
Keyence Corp. | 2.2% | |||
SoftBank Group Corp. | 2.0% | |||
Takeda Pharmaceutical Co. Ltd. | 1.8% | |||
Daiichi Sankyo Co. Ltd. | 1.5% | |||
Mitsubishi UFJ Financial Group, Inc. | 1.5% | |||
KDDI Corp. | 1.4% | |||
Nintendo Co. Ltd. | 1.3% | |||
Recruit Holdings Co. Ltd. | 1.3% | |||
* As a percent of total investments excluding securities lending collateral and cash equivalents.
Portfolio holdings and characteristics are subject to change. For more complete details about the Fund’s investment portfolio see page 84.
17
DBX ETF Trust
As a shareholder of one or more of the Funds, you incur two types of costs: (1) transaction costs, including brokerage commissions paid on purchases and sales of fund shares, and (2) ongoing costs, including management fees and other Fund expenses. In the most recent six-month period the Funds limted these expenses; had they not done so, expenses would have been higher. The expense examples below are intended to help you understand your ongoing costs (in dollars) of investing in the Funds and to compare these costs with the ongoing costs of investing in other funds.
The examples in the tables are based on an investment of $1,000 invested at the beginning of the six-month period and held for the entire period (December 1, 2019 to May 31, 2020).
Actual expenses
The first line in the following tables provides information about actual account values and actual expenses. You may use the information in this line, together with the amount you invested, to estimate the expenses that you paid over the period. Simply divide your account value by $1,000 (for example, an $8,600 account value divided by $1,000 = 8.6), then multiply the result by the number in the first line under the heading “Expenses Paid During the Period” to estimate the expenses you paid on your account during this period.
Hypothetical example for comparison purposes
The second line in the following tables provides information about hypothetical account values and hypothetical expenses based on the Funds’ actual expense ratios and an assumed rate of return of 5% per year before expenses (which is not the Funds’ actual return). The hypothetical account values and expenses may not be used to estimate the actual ending account balance or expenses you paid for the period. You may use this information to compare the ongoing costs of investing in the Fund and other funds. To do so, compare this 5% hypothetical example with the 5% hypothetical examples that appear in the shareholder reports of the other funds.
Please note that the expenses shown in the tables are meant to highlight your ongoing costs only, and do not reflect any transactional costs. Therefore the second line in the table is useful in comparing ongoing costs only, and will not help you determine the relative total costs of owning different funds. In addition, if these transactional costs were included, your costs would have been higher.
Beginning | Ending Account Value May 31, 2020 | Annualized Expense Ratio | Expenses Paid During the Period Per $1,000(1) | |||||||||||||
| Xtrackers MSCI All World ex US Hedged Equity ETF |
| |||||||||||||||
Actual | $ | 1,000.00 | $ | 906.50 | 0.40 | % | $ | 1.91 | ||||||||
Hypothetical (5% return before expenses) | $ | 1,000.00 | $ | 1,023.00 | 0.40 | % | $ | 2.02 | ||||||||
| Xtrackers MSCI Emerging Markets Hedged Equity ETF |
| |||||||||||||||
Actual | $ | 1,000.00 | $ | 938.60 | 0.65 | % | $ | 3.15 | ||||||||
Hypothetical (5% return before expenses) | $ | 1,000.00 | $ | 1,021.75 | 0.65 | % | $ | 3.29 | ||||||||
| Xtrackers MSCI Europe Hedged Equity ETF | ||||||||||||||||
Actual | $ | 1,000.00 | $ | 882.30 | 0.46 | % | $ | 2.16 | ||||||||
Hypothetical (5% return before expenses) | $ | 1,000.00 | $ | 1,022.70 | 0.46 | % | $ | 2.33 | ||||||||
| Xtrackers MSCI Eurozone Hedged Equity ETF | ||||||||||||||||
Actual | $ | 1,000.00 | $ | 856.60 | 0.46 | % | $ | 2.14 | ||||||||
Hypothetical (5% return before expenses) | $ | 1,000.00 | $ | 1,022.70 | 0.46 | % | $ | 2.33 | ||||||||
| Xtrackers MSCI Germany Hedged Equity ETF | ||||||||||||||||
Actual | $ | 1,000.00 | $ | 890.00 | 0.45 | % | $ | 2.13 | ||||||||
Hypothetical (5% return before expenses) | $ | 1,000.00 | $ | 1,022.75 | 0.45 | % | $ | 2.28 | ||||||||
| Xtrackers MSCI Japan Hedged Equity ETF | ||||||||||||||||
Actual | $ | 1,000.00 | $ | 940.20 | 0.46 | % | $ | 2.23 | ||||||||
Hypothetical (5% return before expenses) | $ | 1,000.00 | $ | 1,022.70 | 0.46 | % | $ | 2.33 | ||||||||
(1) Expenses are equal to each Fund’s annualized expense ratio, multiplied by the average account value over the period, multiplied by 183 (the number of days in the most recent six-month period), then divided by 366.
18
DBX ETF Trust
Xtrackers MSCI All World ex US Hedged Equity ETF
May 31, 2020
Number | Value | |||||||
| COMMON STOCKS — 96.1% | ||||||||
| Argentina — 0.0% | ||||||||
Globant SA* | 181 | $ | 25,378 | |||||
|
| |||||||
| Australia — 4.2% | ||||||||
Afterpay Ltd.* | 1,048 | 33,118 | ||||||
AGL Energy Ltd. | 3,095 | 34,575 | ||||||
AMP Ltd.* | 15,634 | 16,986 | ||||||
Ampol Ltd. | 1,484 | 26,796 | ||||||
APA Group (a) | 5,682 | 43,971 | ||||||
Aristocrat Leisure Ltd. | 2,688 | 46,082 | ||||||
ASX Ltd. | 996 | 58,541 | ||||||
Aurizon Holdings Ltd. | 10,650 | 33,719 | ||||||
AusNet Services | 9,095 | 10,639 | ||||||
Australia & New Zealand Banking Group Ltd. | 14,354 | 171,165 | ||||||
BHP Group Ltd. | 14,640 | 338,027 | ||||||
BHP Group PLC | 10,520 | 205,433 | ||||||
BlueScope Steel Ltd. | 2,849 | 20,946 | ||||||
Brambles Ltd. | 8,014 | 62,178 | ||||||
Coca-Cola Amatil Ltd. | 2,948 | 17,213 | ||||||
Cochlear Ltd. | 298 | 38,338 | ||||||
Coles Group Ltd. | 6,687 | 68,463 | ||||||
Commonwealth Bank of Australia | 8,875 | 377,122 | ||||||
Computershare Ltd. | 2,238 | 19,542 | ||||||
Crown Resorts Ltd. | 2,004 | 12,810 | ||||||
CSL Ltd. | 2,254 | 414,994 | ||||||
Dexus REIT | 4,980 | 29,875 | ||||||
Evolution Mining Ltd. | 7,946 | 32,308 | ||||||
Fortescue Metals Group Ltd. (b) | 6,995 | 64,809 | ||||||
Goodman Group REIT | 8,965 | 91,845 | ||||||
GPT Group REIT | 9,236 | 24,564 | ||||||
Insurance Australia Group Ltd. | 12,013 | 48,924 | ||||||
Lendlease Group (a) | 2,917 | 25,140 | ||||||
Macquarie Group Ltd. | 1,622 | 118,893 | ||||||
Magellan Financial Group Ltd. | 611 | 23,764 | ||||||
Medibank Pvt Ltd. | 13,038 | 24,768 | ||||||
Mirvac Group REIT | 19,016 | 29,787 | ||||||
National Australia Bank Ltd. | 16,028 | 190,273 | ||||||
Newcrest Mining Ltd. | 4,334 | 88,340 | ||||||
Northern Star Resources Ltd. | 3,656 | 36,066 | ||||||
Oil Search Ltd. | 15,926 | 36,942 | ||||||
Orica Ltd. | 1,847 | 21,151 | ||||||
Origin Energy Ltd. | 9,011 | 35,377 | ||||||
Qantas Airways Ltd. | 3,569 | 9,492 | ||||||
QBE Insurance Group Ltd. | 6,965 | 40,993 | ||||||
Ramsay Health Care Ltd. | 897 | 41,883 | ||||||
REA Group Ltd. | 266 | 17,814 | ||||||
Santos Ltd. | 8,962 | 32,019 | ||||||
Scentre Group REIT | 26,667 | 39,638 | ||||||
SEEK Ltd. | 1,626 | 21,817 | ||||||
Sonic Healthcare Ltd. | 2,036 | 38,229 | ||||||
South32 Ltd. | 24,709 | 31,457 | ||||||
Stockland REIT | 11,935 | 28,400 | ||||||
Suncorp Group Ltd. | 6,201 | 38,150 | ||||||
Sydney Airport (a) | 5,460 | 21,290 | ||||||
Tabcorp Holdings Ltd. | 10,292 | 22,090 | ||||||
Telstra Corp. Ltd. | 20,380 | 44,013 | ||||||
Number | Value | |||||||
| Australia (Continued) | ||||||||
TPG Telecom Ltd. | 1,814 | $ | 10,278 | |||||
Transurban Group (a) | 13,166 | 125,406 | ||||||
Treasury Wine Estates Ltd. | 3,772 | 24,287 | ||||||
Vicinity Centres REIT | 6,728 | 7,220 | ||||||
Wesfarmers Ltd. | 5,538 | 149,020 | ||||||
Westpac Banking Corp. | 18,104 | 207,798 | ||||||
WiseTech Global Ltd. (b) | 1,583 | 21,515 | ||||||
Woodside Petroleum Ltd. | 4,610 | 69,660 | ||||||
Woolworths Group Ltd. | 6,426 | 151,370 | ||||||
|
| |||||||
(Cost $4,923,308) | 4,167,323 | |||||||
|
| |||||||
| Austria — 0.1% | ||||||||
ANDRITZ AG* | 404 | 15,131 | ||||||
Erste Group Bank AG* | 1,490 | 32,691 | ||||||
OMV AG* | 744 | 24,545 | ||||||
Raiffeisen Bank International AG | 747 | 13,715 | ||||||
Verbund AG* | 344 | 15,289 | ||||||
voestalpine AG | 458 | 8,915 | ||||||
|
| |||||||
(Cost $158,350) | 110,286 | |||||||
|
| |||||||
| Belgium — 0.6% | ||||||||
Ageas SA/NV* | 1,046 | 35,611 | ||||||
Anheuser-Busch InBev SA/NV | 3,323 | 154,593 | ||||||
Colruyt SA | 290 | 17,506 | ||||||
Elia Group SA/NV | 233 | 27,313 | ||||||
Galapagos NV* | 213 | 43,351 | ||||||
Groupe Bruxelles Lambert SA | 409 | 33,016 | ||||||
KBC Group NV | 1,154 | 60,297 | ||||||
Proximus SADP | 765 | 15,960 | ||||||
Sofina SA | 113 | 30,857 | ||||||
Solvay SA (b) | 370 | 28,126 | ||||||
Telenet Group Holding NV | 106 | 4,337 | ||||||
UCB SA | 658 | 65,737 | ||||||
Umicore SA | 935 | 41,350 | ||||||
|
| |||||||
(Cost $823,970) | 558,054 | |||||||
|
| |||||||
| Brazil — 1.1% | ||||||||
Ambev SA | 23,396 | 54,716 | ||||||
Atacadao SA | 1,728 | 5,987 | ||||||
B2W Cia Digital* | 954 | 16,379 | ||||||
B3 SA — Brasil Bolsa Balcao | 10,585 | 90,352 | ||||||
Banco Bradesco SA | 6,568 | 21,909 | ||||||
Banco BTG Pactual SA | 1,039 | 9,509 | ||||||
Banco do Brasil SA | 4,076 | 23,556 | ||||||
Banco Santander Brasil SA | 4,922 | 23,520 | ||||||
BB Seguridade Participacoes SA | 3,822 | 18,106 | ||||||
BRF SA* | 2,728 | 11,824 | ||||||
CCR SA | 5,921 | 16,311 | ||||||
Cia Brasileira de Distribuicao | 602 | 7,105 | ||||||
Cia de Saneamento Basico do Estado de Sao Paulo | 1,860 | 18,934 | ||||||
Cia Siderurgica Nacional SA | 2,953 | 5,711 | ||||||
Cosan SA* | 1,941 | 23,952 | ||||||
CPFL Energia SA* | 2,808 | 16,970 | ||||||
Energisa SA | 1,284 | 11,429 | ||||||
Engie Brasil Energia SA | 1,304 | 10,364 | ||||||
Equatorial Energia SA* | 5,327 | 20,015 | ||||||
| See Notes to Financial Statements. | 19 |
DBX ETF Trust
Schedule of Investments
Xtrackers MSCI All World ex US Hedged Equity ETF (Continued)
May 31, 2020
Number | Value | |||||||
| Brazil (Continued) | ||||||||
Hapvida Participacoes e Investimentos SA, 144A | 1,049 | $ | 10,784 | |||||
Hypera SA | 1,860 | 11,231 | ||||||
JBS SA | 5,696 | 23,451 | ||||||
Klabin SA | 2,672 | 9,869 | ||||||
Localiza Rent a Car SA | 5,003 | 36,077 | ||||||
Lojas Renner SA | 4,064 | 29,359 | ||||||
Magazine Luiza SA | 3,621 | 43,665 | ||||||
Multiplan Empreendimentos Imobiliarios SA | 1,318 | 5,110 | ||||||
Natura & Co. Holding SA | 3,169 | 22,080 | ||||||
Notre Dame Intermedica Participacoes SA | 2,392 | 27,926 | ||||||
Petrobras Distribuidora SA | 3,362 | 13,634 | ||||||
Petroleo Brasileiro SA | 18,496 | 72,233 | ||||||
Porto Seguro SA | 2,119 | 18,783 | ||||||
Raia Drogasil SA | 1,317 | 27,010 | ||||||
Rumo SA* | 6,562 | 27,705 | ||||||
Sul America SA | 3,150 | 26,475 | ||||||
Suzano SA* | 2,344 | 16,630 | ||||||
TIM Participacoes SA | 3,349 | 8,548 | ||||||
Ultrapar Participacoes SA | 3,444 | 11,049 | ||||||
Vale SA | 18,287 | 181,626 | ||||||
WEG SA | 6,083 | 47,683 | ||||||
|
| |||||||
(Cost $1,044,027) | 1,077,577 | |||||||
|
| |||||||
| Canada — 6.4% | ||||||||
Agnico Eagle Mines Ltd. | 1,190 | 76,135 | ||||||
Algonquin Power & Utilities Corp. | 2,592 | 36,296 | ||||||
Alimentation Couche-Tard, Inc., Class B | 4,318 | 135,168 | ||||||
AltaGas Ltd. | 712 | 7,643 | ||||||
Atco Ltd., Class I | 377 | 10,627 | ||||||
Aurora Cannabis, Inc.*(b) | 2 | 28 | ||||||
B2Gold Corp. | 5,088 | 28,048 | ||||||
Bank of Montreal | 3,190 | 157,363 | ||||||
Bank of Nova Scotia | 6,192 | 248,112 | ||||||
Barrick Gold Corp. | 8,727 | 209,864 | ||||||
BCE, Inc. | 729 | 30,302 | ||||||
BlackBerry Ltd.* | 3,338 | 15,516 | ||||||
Brookfield Asset Management, Inc., Class A | 6,778 | 212,814 | ||||||
CAE, Inc. | 1,397 | 20,962 | ||||||
Cameco Corp. | 1,698 | 18,449 | ||||||
Canadian Apartment Properties REIT | 525 | 17,898 | ||||||
Canadian Imperial Bank of Commerce | 2,156 | 138,253 | ||||||
Canadian National Railway Co. | 3,675 | 316,560 | ||||||
Canadian Natural Resources Ltd. | 5,974 | 109,123 | ||||||
Canadian Pacific Railway Ltd. | 691 | 173,195 | ||||||
Canadian Tire Corp. Ltd., Class A (b) | 241 | 20,588 | ||||||
Canadian Utilities Ltd., Class A | 660 | 15,838 | ||||||
Canopy Growth Corp.* | 981 | 17,250 | ||||||
CCL Industries, Inc., Class B | 756 | 25,472 | ||||||
Cenovus Energy, Inc. | 2,514 | 10,955 | ||||||
CGI, Inc.* | 1,205 | 76,999 | ||||||
Constellation Software, Inc. | 99 | 112,538 | ||||||
Dollarama, Inc. | 1,566 | 53,093 | ||||||
Emera, Inc. | 1,178 | 46,834 | ||||||
Empire Co. Ltd., Class A | 856 | 19,372 | ||||||
Number | Value | |||||||
| Canada (Continued) | ||||||||
Enbridge, Inc. | 10,383 | $ | 337,692 | |||||
Fairfax Financial Holdings Ltd. | 130 | 36,112 | ||||||
First Quantum Minerals Ltd. | 3,309 | 19,395 | ||||||
Fortis, Inc. | 2,240 | 86,242 | ||||||
Franco-Nevada Corp. | 953 | 133,767 | ||||||
George Weston Ltd. | 374 | 27,017 | ||||||
Gildan Activewear, Inc. | 1,128 | 15,648 | ||||||
Great-West Lifeco, Inc. | 1,500 | 24,425 | ||||||
Hydro One Ltd., 144A | 1,804 | 34,957 | ||||||
iA Financial Corp., Inc. | 533 | 17,021 | ||||||
IGM Financial, Inc. | 549 | 13,039 | ||||||
Imperial Oil Ltd. (b) | 1,386 | 21,653 | ||||||
Intact Financial Corp. | 699 | 66,730 | ||||||
Inter Pipeline Ltd. | 1,778 | 16,284 | ||||||
Keyera Corp. | 1,084 | 17,179 | ||||||
Kinross Gold Corp.* | 6,908 | 44,904 | ||||||
Kirkland Lake Gold Ltd. | 1,541 | 59,375 | ||||||
Loblaw Cos. Ltd. | 972 | 48,118 | ||||||
Lundin Mining Corp. | 3,317 | 15,274 | ||||||
Magna International, Inc. | 1,586 | 66,880 | ||||||
Manulife Financial Corp. | 9,551 | 118,620 | ||||||
Metro, Inc. | 1,309 | 54,590 | ||||||
National Bank of Canada | 1,586 | 69,068 | ||||||
Nutrien Ltd. | 2,375 | 81,073 | ||||||
Onex Corp. | 387 | 18,160 | ||||||
Open Text Corp. | 1,239 | 51,473 | ||||||
Pan American Silver Corp. | 1,028 | 30,231 | ||||||
Parkland Corp. | 721 | 20,276 | ||||||
Pembina Pipeline Corp. (b) | 3,259 | 81,425 | ||||||
Power Corp. of Canada | 2,807 | 45,688 | ||||||
Quebecor, Inc., Class B | 840 | 18,467 | ||||||
Restaurant Brands International, Inc. | 1,531 | 83,641 | ||||||
Ritchie Bros Auctioneers, Inc. | 541 | 23,414 | ||||||
Rogers Communications, Inc., Class B | 1,857 | 77,822 | ||||||
Royal Bank of Canada | 7,336 | 475,960 | ||||||
Saputo, Inc. | 1,069 | 26,266 | ||||||
Shaw Communications, Inc., Class B | 2,564 | 43,259 | ||||||
Shopify, Inc., Class A* | 494 | 374,925 | ||||||
Sun Life Financial, Inc. (b) | 3,009 | 103,218 | ||||||
Suncor Energy, Inc. (b) | 7,026 | 120,787 | ||||||
TC Energy Corp. | 4,641 | 209,154 | ||||||
Teck Resources Ltd., Class B | 2,554 | 24,263 | ||||||
TELUS Corp. | 2,027 | 35,127 | ||||||
Thomson Reuters Corp. | 1,022 | 68,452 | ||||||
TMX Group Ltd. | 277 | 27,765 | ||||||
Toronto-Dominion Bank | 8,988 | 385,018 | ||||||
Wheaton Precious Metals Corp. | 2,545 | 109,648 | ||||||
WSP Global, Inc. | 477 | 30,785 | ||||||
Yamana Gold, Inc. | 4,670 | 25,269 | ||||||
|
| |||||||
(Cost $6,405,223) | 6,296,851 | |||||||
|
| |||||||
| Chile — 0.2% | ||||||||
Antofagasta PLC | 2,087 | 22,589 | ||||||
Banco de Chile | 215,346 | 18,298 | ||||||
Banco de Credito e Inversiones SA | 187 | 6,332 | ||||||
Banco Santander Chile | 312,455 | 12,726 | ||||||
Cencosud SA | 8,433 | 9,851 | ||||||
| See Notes to Financial Statements. | 20 |
DBX ETF Trust
Schedule of Investments
Xtrackers MSCI All World ex US Hedged Equity ETF (Continued)
May 31, 2020
Number | Value | |||||||
| Chile (Continued) | ||||||||
Empresa Nacional de Telecomunicaciones SA | 868 | $ | 5,531 | |||||
Empresas CMPC SA | 8,312 | 16,927 | ||||||
Empresas COPEC SA | 2,150 | 13,565 | ||||||
Enel Americas SA | 190,503 | 27,728 | ||||||
Enel Chile SA | 123,794 | 9,278 | ||||||
Falabella SA | 2,985 | 6,955 | ||||||
|
| |||||||
(Cost $212,490) | 149,780 | |||||||
|
| |||||||
| China — 10.0% | ||||||||
360 Security Technology, Inc., Class A | 3,700 | 9,227 | ||||||
51job, Inc., ADR*(b) | 118 | 7,610 | ||||||
58.com, Inc., ADR* | 537 | 25,781 | ||||||
AAC Technologies Holdings, Inc. (b) | 1,620 | 8,318 | ||||||
Accelink Technologies Co. Ltd., Class A | 2,700 | 10,346 | ||||||
Agile Group Holdings Ltd. | 7,957 | 8,181 | ||||||
Agricultural Bank of China Ltd., Class A | 19,900 | 9,480 | ||||||
Agricultural Bank of China Ltd., Class H | 136,802 | 55,240 | ||||||
Aier Eye Hospital Group Co. Ltd., Class A | 3,510 | 19,258 | ||||||
Air China Ltd., Class H | 10,875 | 6,510 | ||||||
AK Medical Holdings Ltd., 144A | 4,000 | 12,204 | ||||||
Alibaba Group Holding Ltd., ADR* | 9,280 | 1,924,579 | ||||||
A-Living Services Co. Ltd., Class H, 144A (b) | 4,750 | 25,431 | ||||||
Aluminum Corp. of China Ltd., Class H* | 20,450 | 3,773 | ||||||
Anhui Conch Cement Co. Ltd., Class A | 1,200 | 9,550 | ||||||
Anhui Conch Cement Co. Ltd., Class H | 6,071 | 45,465 | ||||||
Anhui Gujing Distillery Co. Ltd., Class B | 1,300 | 14,540 | ||||||
ANTA Sports Products Ltd. | 5,343 | 47,630 | ||||||
Anxin Trust Co. Ltd., Class A*(c) | 1,500 | 525 | ||||||
Autohome, Inc., ADR (b) | 320 | 24,618 | ||||||
BAIC Motor Corp. Ltd., Class H, 144A | 10,311 | 4,150 | ||||||
Baidu, Inc., ADR* | 1,375 | 146,506 | ||||||
Bank of Beijing Co. Ltd., Class A | 11,100 | 7,589 | ||||||
Bank of China Ltd., Class A | 16,800 | 8,121 | ||||||
Bank of China Ltd., Class H* | 412,558 | 150,621 | ||||||
Bank of Communications Co. Ltd., Class A | 13,200 | 9,450 | ||||||
Bank of Communications Co. Ltd., Class H | 59,882 | 36,308 | ||||||
Bank of Jiangsu Co. Ltd., Class A | 10,000 | 8,294 | ||||||
Bank of Ningbo Co. Ltd., Class A | 2,300 | 8,253 | ||||||
Bank of Shanghai Co. Ltd., Class A | 5,590 | 6,344 | ||||||
Baozun, Inc., ADR* | 184 | 4,874 | ||||||
BeiGene Ltd., ADR*(b) | 164 | 27,149 | ||||||
Beijing Capital International Airport Co. Ltd., Class H | 7,123 | 4,438 | ||||||
BEST, Inc., ADR* | 2,662 | 13,789 | ||||||
BOE Technology Group Co. Ltd., Class A* | 31,000 | 16,114 | ||||||
BYD Co. Ltd., Class A | 2,100 | 16,891 | ||||||
BYD Co. Ltd., Class H (b) | 3,102 | 17,408 | ||||||
BYD Electronic International Co. Ltd. (b) | 3,177 | 6,082 | ||||||
CanSino Biologics, Inc., Class H, 144A* | 200 | 4,680 | ||||||
CGN Power Co. Ltd., Class H, 144A | 51,498 | 11,826 | ||||||
Changchun High & New Technology Industry Group, Inc., Class A* | 200 | 18,662 | ||||||
China Aoyuan Group Ltd.* | 5,569 | 5,906 | ||||||
China Cinda Asset Management Co. Ltd., Class H | 59,929 | 11,056 | ||||||
Number | Value | |||||||
| China (Continued) | ||||||||
China CITIC Bank Corp. Ltd., Class H | 46,587 | $ | 20,254 | |||||
China Communications Construction Co. Ltd., Class H | 24,316 | 15,465 | ||||||
China Communications Services Corp. Ltd., Class H | 15,597 | 10,322 | ||||||
China Conch Venture Holdings Ltd. | 8,082 | 36,284 | ||||||
China Construction Bank Corp., Class H | 479,300 | 376,564 | ||||||
China East Education Holdings Ltd., 144A | 10,436 | 20,491 | ||||||
China Eastern Airlines Corp. Ltd., Class H* | 6,242 | 2,110 | ||||||
China Everbright Bank Co. Ltd., Class A | 14,000 | 7,473 | ||||||
China Everbright Bank Co. Ltd., Class H | 14,787 | 5,990 | ||||||
China Evergrande Group (b) | 8,711 | 18,250 | ||||||
China Feihe Ltd., 144A* | 10,000 | 18,061 | ||||||
China Galaxy Securities Co. Ltd., Class H* | 12,246 | 5,877 | ||||||
China Hongqiao Group Ltd. | 8,230 | 3,620 | ||||||
China International Capital Corp. Ltd., Class H, 144A*(b) | 5,058 | 8,183 | ||||||
China International Travel Service Corp. Ltd., Class A | 800 | 11,346 | ||||||
China Lesso Group Holdings Ltd. | 14,000 | 16,905 | ||||||
China Life Insurance Co. Ltd., Class A | 700 | 2,511 | ||||||
China Life Insurance Co. Ltd., Class H | 35,783 | 67,028 | ||||||
China Literature Ltd., 144A* | 2,240 | 12,672 | ||||||
China Merchants Bank Co. Ltd., Class A | 8,100 | 38,381 | ||||||
China Merchants Bank Co. Ltd., Class H | 20,816 | 97,481 | ||||||
China Merchants Shekou Industrial Zone Holdings Co. Ltd., Class A | 2,200 | 4,941 | ||||||
China Minsheng Banking Corp. Ltd., Class A | 13,500 | 10,762 | ||||||
China Minsheng Banking Corp. Ltd., Class H | 33,356 | 23,194 | ||||||
China Molybdenum Co. Ltd., Class H | 16,711 | 5,131 | ||||||
China National Building Material Co. Ltd., Class H | 15,008 | 16,844 | ||||||
China National Nuclear Power Co. Ltd., Class A | 12,600 | 7,114 | ||||||
China Oilfield Services Ltd., Class H | 12,051 | 10,478 | ||||||
China Pacific Insurance Group Co. Ltd., Class A | 1,600 | 6,339 | ||||||
China Pacific Insurance Group Co. Ltd., Class H | 13,157 | 36,153 | ||||||
China Petroleum & Chemical Corp., Class A | 9,200 | 5,336 | ||||||
China Petroleum & Chemical Corp., Class H | 118,834 | 55,036 | ||||||
China Railway Construction Corp. Ltd., Class H | 10,726 | 9,589 | ||||||
China Railway Group Ltd., Class A | 15,300 | 11,254 | ||||||
China Railway Group Ltd., Class H | 20,256 | 11,054 | ||||||
China Shenhua Energy Co. Ltd., Class H | 18,462 | 33,725 | ||||||
China Shipbuilding Industry Co. Ltd., Class A | 8,500 | 4,835 | ||||||
China Southern Airlines Co. Ltd., Class H | 8,335 | 3,419 | ||||||
China State Construction Engineering Corp. Ltd., Class A | 9,600 | 6,725 | ||||||
China Telecom Corp. Ltd., Class H | 71,007 | 23,542 | ||||||
China Tower Corp. Ltd., Class H, 144A | 217,035 | 43,679 | ||||||
| See Notes to Financial Statements. | 21 |
DBX ETF Trust
Schedule of Investments
Xtrackers MSCI All World ex US Hedged Equity ETF (Continued)
May 31, 2020
Number | Value | |||||||
| China (Continued) | ||||||||
China United Network Communications Ltd., Class A | 9,100 | $ | 6,324 | |||||
China Vanke Co. Ltd., Class A | 2,400 | 8,642 | ||||||
China Vanke Co. Ltd., Class H | 6,217 | 20,171 | ||||||
China Yangtze Power Co. Ltd., Class A | 10,800 | 26,314 | ||||||
China Yuhua Education Corp. Ltd., 144A | 12,000 | 11,704 | ||||||
CIFI Holdings Group Co. Ltd. | 13,094 | 9,409 | ||||||
CITIC Securities Co. Ltd., Class A | 3,100 | 9,672 | ||||||
CITIC Securities Co. Ltd., Class H | 15,910 | 28,530 | ||||||
CNOOC Ltd. | 89,461 | 99,600 | ||||||
Contemporary Amperex Technology Co. Ltd., Class A | 619 | 12,621 | ||||||
COSCO SHIPPING Holdings Co. Ltd., Class A* | 16,200 | 7,172 | ||||||
Country Garden Holdings Co. Ltd. | 38,190 | 47,199 | ||||||
Country Garden Services Holdings Co. Ltd.* | 6,808 | 31,882 | ||||||
CRRC Corp. Ltd., Class A | 9,800 | 8,019 | ||||||
CRRC Corp. Ltd., Class H | 24,010 | 11,213 | ||||||
CSPC Pharmaceutical Group Ltd.* | 20,902 | 40,933 | ||||||
Dali Foods Group Co. Ltd., 144A | 17,259 | 10,955 | ||||||
Daqin Railway Co. Ltd., Class A | 10,400 | 9,937 | ||||||
Dongfeng Motor Group Co. Ltd., Class H | 13,883 | 8,704 | ||||||
East Money Information Co. Ltd., Class A | 9,600 | 19,166 | ||||||
ENN Energy Holdings Ltd. | 4,411 | 51,442 | ||||||
Focus Media Information Technology Co. Ltd., Class A | 3,200 | 2,215 | ||||||
Foshan Haitian Flavouring & Food Co. Ltd., Class A | 600 | 9,659 | ||||||
Fosun International Ltd. | 15,117 | 19,404 | ||||||
GCL System Integration Technology Co. Ltd., Class A* | 12,400 | 4,430 | ||||||
GDS Holdings Ltd., ADR*(b) | 344 | 19,608 | ||||||
Genscript Biotech Corp.* | 4,043 | 8,867 | ||||||
Gigadevice Semiconductor Beijing, Inc., Class A | 420 | 11,380 | ||||||
Great Wall Motor Co. Ltd., Class H* | 21,547 | 13,648 | ||||||
Gree Electric Appliances, Inc. of Zhuhai, Class A | 1,300 | 10,371 | ||||||
Greentown Service Group Co. Ltd. | 4,808 | 6,414 | ||||||
GSX Techedu, Inc., ADR* | 378 | 11,854 | ||||||
Guangzhou Automobile Group Co. Ltd., Class H | 14,124 | 11,607 | ||||||
Guotai Junan Securities Co. Ltd., Class A | 8,400 | 18,442 | ||||||
Haidilao International Holding Ltd., 144A* | 7,000 | 33,819 | ||||||
Haitian International Holdings Ltd. | 4,920 | 10,384 | ||||||
Haitong Securities Co. Ltd., Class H | 15,568 | 11,769 | ||||||
Hangzhou Hikvision Digital Technology Co. Ltd., Class A | 3,400 | 13,086 | ||||||
Hansoh Pharmaceutical Group Co. Ltd., 144A* | 2,000 | 8,682 | ||||||
Henan Shuanghui Investment & Development Co. Ltd., Class A* | 3,200 | 17,736 | ||||||
Hengan International Group Co. Ltd. | 3,470 | 28,337 | ||||||
Hua Hong Semiconductor Ltd., 144A*(b) | 2,953 | 5,493 | ||||||
Huatai Securities Co. Ltd., Class A | 2,100 | 5,084 | ||||||
Huatai Securities Co. Ltd., Class H, 144A | 7,057 | 11,052 | ||||||
Number | Value | |||||||
| China (Continued) | ||||||||
Huaxia Bank Co. Ltd., Class A | 9,400 | $ | 8,389 | |||||
Huazhu Group Ltd., ADR (b) | 661 | 22,355 | ||||||
HUYA, Inc., ADR*(b) | 794 | 12,323 | ||||||
Industrial & Commercial Bank of China Ltd., Class A | 14,000 | 10,043 | ||||||
Industrial & Commercial Bank of China Ltd., Class H | 335,161 | 216,191 | ||||||
Industrial Bank Co. Ltd., Class A | 5,000 | 11,278 | ||||||
Industrial Securities Co. Ltd., Class A | 1,500 | 1,196 | ||||||
Inner Mongolia BaoTou Steel Union Co. Ltd., Class A | 32,600 | 5,024 | ||||||
Inner Mongolia Yili Industrial Group Co. Ltd., Class A* | 1,500 | 5,979 | ||||||
Innovent Biologics, Inc., 144A* | 6,500 | 35,471 | ||||||
iQIYI, Inc., ADR*(b) | 821 | 13,620 | ||||||
JD.com, Inc., ADR* | 3,823 | 207,704 | ||||||
Jiangsu Expressway Co. Ltd., Class H | 9,726 | 11,456 | ||||||
Jiangsu Hengrui Medicine Co. Ltd., Class A | 1,200 | 13,232 | ||||||
Jiangsu Yanghe Brewery Joint-Stock Co. Ltd., Class A | 200 | 2,956 | ||||||
JOYY, Inc., ADR* | 244 | 14,896 | ||||||
Kingdee International Software Group Co. Ltd.* | 13,211 | 23,179 | ||||||
Kingsoft Corp. Ltd.*(b) | 4,779 | 15,494 | ||||||
Koolearn Technology Holding Ltd., 144A* | 3,000 | 12,133 | ||||||
Kweichow Moutai Co. Ltd., Class A | 400 | 76,588 | ||||||
KWG Group Holdings Ltd.* | 5,818 | 8,121 | ||||||
Legend Holdings Corp., Class H, 144A (b) | 3,532 | 4,274 | ||||||
Lenovo Group Ltd. | 35,135 | 19,083 | ||||||
Li Ning Co. Ltd. | 12,847 | 43,091 | ||||||
Logan Property Holdings Co. Ltd. | 9,750 | 14,515 | ||||||
Longfor Group Holdings Ltd., 144A | 8,628 | 39,069 | ||||||
LONGi Green Energy Technology Co. Ltd., Class A | 4,400 | 19,980 | ||||||
Luxshare Precision Industry Co. Ltd., Class A | 961 | 5,992 | ||||||
Luzhou Laojiao Co. Ltd., Class A | 800 | 9,561 | ||||||
Maanshan Iron & Steel Co. Ltd., Class A | 26,500 | 9,728 | ||||||
Meituan Dianping, Class B* | 17,551 | 332,159 | ||||||
Metallurgical Corp. of China Ltd., Class A | 21,100 | 7,391 | ||||||
Momo, Inc., ADR | 862 | 16,723 | ||||||
Muyuan Foodstuff Co. Ltd., Class A | 1,300 | 21,891 | ||||||
NetEase, Inc., ADR | 354 | 135,547 | ||||||
New China Life Insurance Co. Ltd., Class H | 4,923 | 15,306 | ||||||
New Hope Liuhe Co. Ltd., Class A | 4,800 | 18,844 | ||||||
New Oriental Education & Technology Group, Inc., ADR* | 754 | 90,450 | ||||||
Ninestar Corp., Class A | 2,648 | 10,202 | ||||||
NIO, Inc., ADR*(b) | 3,269 | 13,011 | ||||||
OFILM Group Co. Ltd., Class A* | 4,203 | 8,350 | ||||||
Orient Securities Co. Ltd., Class A | 1,600 | 2,056 | ||||||
People’s Insurance Co. Group of China Ltd., Class H | 33,693 | 10,128 | ||||||
PetroChina Co. Ltd., Class A | 7,700 | 4,585 | ||||||
PetroChina Co. Ltd., Class H | 99,313 | 34,080 | ||||||
| See Notes to Financial Statements. | 22 |
DBX ETF Trust
Schedule of Investments
Xtrackers MSCI All World ex US Hedged Equity ETF (Continued)
May 31, 2020
Number | Value | |||||||
| China (Continued) | ||||||||
PICC Property & Casualty Co. Ltd., Class H | 39,275 | $ | 33,998 | |||||
Pinduoduo, Inc., ADR* | 1,396 | 93,350 | ||||||
Ping An Bank Co. Ltd., Class A | 3,800 | 6,921 | ||||||
Ping An Healthcare and Technology Co. Ltd., 144A*(b) | 1,600 | 21,075 | ||||||
Ping An Insurance Group Co. of China Ltd., Class A | 4,300 | 42,600 | ||||||
Ping An Insurance Group Co. of China Ltd., Class H | 29,292 | 289,084 | ||||||
Poly Developments and Holdings Group Co. Ltd., Class A | 3,400 | 6,841 | ||||||
Poly Property Development Co. Ltd., | 1,400 | 15,803 | ||||||
Postal Savings Bank of China Co. Ltd., Class H, 144A | 63,685 | 40,504 | ||||||
Power Construction Corp. of China Ltd., Class A | 14,500 | 6,928 | ||||||
SAIC Motor Corp. Ltd., Class A | 2,000 | 5,021 | ||||||
Sanan Optoelectronics Co. Ltd., Class A | 4,700 | 15,317 | ||||||
Sany Heavy Industry Co. Ltd., Class A | 9,100 | 23,370 | ||||||
Seazen Group Ltd.* | 10,549 | 9,758 | ||||||
Semiconductor Manufacturing International Corp.*(b) | 20,221 | 43,930 | ||||||
SF Holding Co. Ltd., Class A | 2,300 | 14,688 | ||||||
Shandong Weigao Group Medical Polymer Co. Ltd., Class H | 9,093 | 15,907 | ||||||
Shanghai Electric Group Co. Ltd., Class H | 14,557 | 4,019 | ||||||
Shanghai Fosun Pharmaceutical Group Co. Ltd., Class H | 3,305 | 10,489 | ||||||
Shanghai Lujiazui Finance & Trade Zone Development Co. Ltd., Class B | 3,931 | 2,775 | ||||||
Shanghai Pudong Development Bank Co. Ltd., Class A | 9,300 | 13,773 | ||||||
Shenwan Hongyuan Group Co. Ltd., | 11,900 | 7,203 | ||||||
Shenzhen Goodix Technology Co. Ltd., Class A | 400 | 12,133 | ||||||
Shenzhen Kingdom Sci-Tech Co. Ltd., Class A* | 3,900 | 8,803 | ||||||
Shenzhen Mindray Bio-Medical Electronics Co. Ltd., Class A | 700 | 27,343 | ||||||
Shenzhou International Group Holdings Ltd. | 3,846 | 45,721 | ||||||
Silergy Corp. | 1,000 | 53,955 | ||||||
SINA Corp.* | 393 | 12,305 | ||||||
Sino-Ocean Group Holding Ltd. | 13,001 | 3,002 | ||||||
Sinopec Engineering Group Co. Ltd., | 7,834 | 3,285 | ||||||
Sinopec Shanghai Petrochemical Co. Ltd., Class H | 16,218 | 3,996 | ||||||
Sinopharm Group Co. Ltd., Class H | 6,046 | 14,866 | ||||||
Sinotruk Hong Kong Ltd. | 3,686 | 8,949 | ||||||
SOHO China Ltd.* | 10,116 | 3,406 | ||||||
Sunac China Holdings Ltd. | 14,419 | 60,362 | ||||||
Sunny Optical Technology Group Co. Ltd. | 3,265 | 43,132 | ||||||
TAL Education Group, ADR* | 2,062 | 116,420 | ||||||
Tencent Holdings Ltd. | 28,585 | 1,513,421 | ||||||
Number | Value | |||||||
| China (Continued) | ||||||||
Tencent Music Entertainment Group, ADR* | 2,544 | $ | 32,868 | |||||
Tianma Microelectronics Co. Ltd., Class A | 1,000 | 1,898 | ||||||
Tingyi Cayman Islands Holding Corp. | 11,317 | 19,447 | ||||||
Tongcheng-Elong Holdings Ltd.* | 9,600 | 17,215 | ||||||
Topsports International Holdings Ltd., 144A | 16,213 | 23,008 | ||||||
TravelSky Technology Ltd., Class H | 4,761 | 9,557 | ||||||
Trip.com Group Ltd., ADR* | 2,357 | 62,625 | ||||||
Tsingtao Brewery Co. Ltd., Class H | 1,980 | 13,704 | ||||||
Uni-President China Holdings Ltd. | 11,236 | 11,625 | ||||||
Vipshop Holdings Ltd., ADR* | 2,179 | 37,784 | ||||||
Wanhua Chemical Group Co. Ltd., Class A | 2,400 | 15,629 | ||||||
Want Want China Holdings Ltd. | 29,747 | 21,375 | ||||||
Weichai Power Co. Ltd., Class H | 13,085 | 22,654 | ||||||
Wens Foodstuffs Group Co. Ltd., Class A | 1,200 | 4,444 | ||||||
Wingtech Technology Co. Ltd., Class A* | 200 | 2,740 | ||||||
Wuliangye Yibin Co. Ltd., Class A | 1,600 | 33,222 | ||||||
WuXi AppTec Co. Ltd., Class A | 1,200 | 17,906 | ||||||
WuXi AppTec Co. Ltd., Class H, 144A (b) | 983 | 10,399 | ||||||
Wuxi Biologics Cayman, Inc., 144A* | 4,366 | 68,603 | ||||||
Wuxi Lead Intelligent Equipment Co. Ltd., Class A | 2,170 | 12,769 | ||||||
Xiaomi Corp., Class B, 144A* | 56,472 | 87,569 | ||||||
Xinyi Solar Holdings Ltd. | 15,406 | 11,190 | ||||||
Yangzijiang Shipbuilding Holdings Ltd. | 11,300 | 7,518 | ||||||
Yihai International Holding Ltd.* | 2,266 | 20,244 | ||||||
Yum China Holdings, Inc. | 1,890 | 87,583 | ||||||
Zai Lab Ltd., ADR* | 284 | 21,130 | ||||||
Zhaojin Mining Industry Co. Ltd., Class H | 8,500 | 10,395 | ||||||
Zhejiang Dahua Technology Co. Ltd., Class A | 4,800 | 10,007 | ||||||
Zhejiang Expressway Co. Ltd., Class H | 6,370 | 4,479 | ||||||
Zhenro Properties Group Ltd.* | 18,000 | 11,448 | ||||||
ZhongAn Online P&C Insurance Co. Ltd., Class H, 144A* | 4,400 | 15,525 | ||||||
Zhongsheng Group Holdings Ltd. | 2,526 | 12,970 | ||||||
Zijin Mining Group Co. Ltd., Class H* | 29,355 | 11,740 | ||||||
Zoomlion Heavy Industry Science and Technology Co. Ltd., Class H (b) | 18,400 | 15,073 | ||||||
ZTE Corp., Class A* | 3,312 | 16,728 | ||||||
ZTE Corp., Class H* | 3,812 | 9,639 | ||||||
ZTO Express Cayman, Inc., ADR | 1,841 | 60,053 | ||||||
|
| |||||||
(Cost $8,793,557) | 9,831,005 | |||||||
|
| |||||||
| Colombia — 0.0% | ||||||||
Ecopetrol SA | 23,874 | 12,737 | ||||||
Interconexion Electrica SA ESP | 1,750 | 9,196 | ||||||
|
| |||||||
(Cost $18,862) | 21,933 | |||||||
|
| |||||||
| Cyprus — 0.0% | ||||||||
Polymetal International PLC | 1,093 | 21,963 | ||||||
|
| |||||||
| Czech Republic — 0.0% | ||||||||
CEZ AS | 1,090 | 21,380 | ||||||
Komercni banka AS* | 512 | 10,961 | ||||||
|
| |||||||
(Cost $32,950) | 32,341 | |||||||
|
| |||||||
| See Notes to Financial Statements. | 23 |
DBX ETF Trust
Schedule of Investments
Xtrackers MSCI All World ex US Hedged Equity ETF (Continued)
May 31, 2020
Number | Value | |||||||
| Denmark — 1.5% | ||||||||
A.P. Moller — Maersk A/S, Class A | 16 | $ | 14,594 | |||||
A.P. Moller — Maersk A/S, Class B | 34 | 33,164 | ||||||
Ambu A/S, Class B | 801 | 26,707 | ||||||
Carlsberg A/S, Class B | 546 | 70,462 | ||||||
Chr Hansen Holding A/S | 542 | 52,399 | ||||||
Coloplast A/S, Class B | 612 | 102,529 | ||||||
Danske Bank A/S* | 2,853 | 35,255 | ||||||
Demant A/S* | 554 | 15,617 | ||||||
DSV PANALPINA A/S | 1,094 | 115,344 | ||||||
Genmab A/S* | 322 | 98,780 | ||||||
GN Store Nord A/S | 628 | 33,826 | ||||||
H Lundbeck A/S | 342 | 13,109 | ||||||
Novo Nordisk A/S, Class B | 8,997 | 584,491 | ||||||
Novozymes A/S, Class B | 1,111 | 60,620 | ||||||
Orsted A/S, 144A | 911 | 106,740 | ||||||
Pandora A/S | 290 | 14,411 | ||||||
Tryg A/S | 547 | 15,298 | ||||||
Vestas Wind Systems A/S | 903 | 91,952 | ||||||
|
| |||||||
(Cost $1,178,287) | 1,485,298 | |||||||
|
| |||||||
| Egypt — 0.0% | ||||||||
Commercial International Bank Egypt SAE | 6,605 | 26,033 | ||||||
Eastern Co. SAE | 4,376 | 3,435 | ||||||
ElSewedy Electric Co. | 4,141 | 1,940 | ||||||
|
| |||||||
(Cost $34,987) | 31,408 | |||||||
|
| |||||||
| Finland — 0.8% | ||||||||
Elisa OYJ | 719 | 44,998 | ||||||
Fortum OYJ | 2,266 | 43,315 | ||||||
Kone OYJ, Class B | 1,726 | 115,493 | ||||||
Metso OYJ | 549 | 17,777 | ||||||
Neste OYJ (b) | 2,040 | 82,247 | ||||||
Nokia OYJ | 28,049 | 111,015 | ||||||
Nordea Bank Abp* | 15,511 | 104,761 | ||||||
Orion OYJ, Class B | 586 | 31,288 | ||||||
Sampo OYJ, Class A*(b) | 2,170 | 77,371 | ||||||
Stora Enso OYJ, Class R* | 2,737 | 33,496 | ||||||
UPM-Kymmene OYJ | 2,595 | 74,809 | ||||||
Wartsila OYJ Abp | 2,233 | 17,411 | ||||||
|
| |||||||
(Cost $844,247) | 753,981 | |||||||
|
| |||||||
| France — 6.6% | ||||||||
Accor SA* | 1,045 | 29,406 | ||||||
Aeroports de Paris | 56 | 5,822 | ||||||
Air Liquide SA | 2,387 | 323,527 | ||||||
Airbus SE* | 2,893 | 182,085 | ||||||
Alstom SA | 1,153 | 48,431 | ||||||
Amundi SA, 144A* | 318 | 23,633 | ||||||
Arkema SA | 354 | 30,792 | ||||||
Atos SE* | 448 | 33,727 | ||||||
AXA SA* | 9,636 | 175,208 | ||||||
BioMerieux | 193 | 27,658 | ||||||
BNP Paribas SA* | 5,499 | 196,890 | ||||||
Bollore SA | 3,385 | 9,642 | ||||||
Bouygues SA* | 968 | 29,593 | ||||||
Bureau Veritas SA* | 1,467 | 29,784 | ||||||
Capgemini SE | 796 | 81,380 | ||||||
Carrefour SA | 2,807 | 42,548 | ||||||
Number | Value | |||||||
| France (Continued) | ||||||||
Cie de Saint-Gobain | 2,802 | $ | 90,418 | |||||
Cie Generale des Etablissements Michelin SCA* | 805 | 81,192 | ||||||
CNP Assurances* | 922 | 9,677 | ||||||
Covivio REIT (b) | 296 | 17,299 | ||||||
Credit Agricole SA* | 5,586 | 48,515 | ||||||
Danone SA* | 3,119 | 213,136 | ||||||
Dassault Aviation SA* | 13 | 11,068 | ||||||
Dassault Systemes SE | 629 | 106,304 | ||||||
Edenred | 1,193 | 49,767 | ||||||
Eiffage SA* | 383 | 34,862 | ||||||
Electricite de France SA | 1,960 | 17,310 | ||||||
Engie SA* | 9,152 | 108,043 | ||||||
EssilorLuxottica SA* | 1,407 | 180,783 | ||||||
Eurazeo SE* | 203 | 9,870 | ||||||
Faurecia SE* | 376 | 14,466 | ||||||
Gecina SA REIT | 226 | 29,026 | ||||||
Getlink SE* | 2,545 | 36,670 | ||||||
Hermes International | 152 | 126,175 | ||||||
ICADE REIT | 166 | 11,858 | ||||||
Iliad SA | 125 | 21,979 | ||||||
Ingenico Group SA | 303 | 41,774 | ||||||
Ipsen SA* | 64 | 5,023 | ||||||
Kering SA | 380 | 198,086 | ||||||
Klepierre SA REIT (b) | 1,035 | 19,577 | ||||||
Legrand SA (b) | 1,317 | 89,617 | ||||||
L’Oreal SA* | 1,260 | 366,310 | ||||||
LVMH Moet Hennessy Louis Vuitton SE | 1,375 | 572,370 | ||||||
Natixis SA* | 4,697 | 10,391 | ||||||
Orange SA | 10,011 | 120,517 | ||||||
Orpea | 254 | 29,774 | ||||||
Pernod Ricard SA | 1,048 | 162,983 | ||||||
Peugeot SA* | 2,935 | 41,719 | ||||||
Publicis Groupe SA | 1,011 | 28,640 | ||||||
Remy Cointreau SA | 102 | 12,092 | ||||||
Renault SA | 967 | 21,688 | ||||||
Safran SA* | 1,626 | 154,972 | ||||||
Sanofi | 5,743 | 558,005 | ||||||
Sartorius Stedim Biotech* | 140 | 37,888 | ||||||
Schneider Electric SE | 2,764 | 273,804 | ||||||
SCOR SE* | 761 | 18,737 | ||||||
SEB SA | 147 | 20,136 | ||||||
Societe Generale SA* | 4,177 | 61,353 | ||||||
Sodexo SA | 411 | 27,620 | ||||||
Suez SA (b) | 1,777 | 20,140 | ||||||
Teleperformance* | 272 | 64,342 | ||||||
Thales SA | 523 | 39,931 | ||||||
TOTAL SA | 12,191 | 455,034 | ||||||
Ubisoft Entertainment SA* | 489 | 37,812 | ||||||
Unibail-Rodamco-Westfield REIT | 276 | 14,614 | ||||||
Valeo SA* | 1,211 | 29,776 | ||||||
Veolia Environnement SA (b) | 2,656 | 58,037 | ||||||
Vinci SA | 2,682 | 247,223 | ||||||
Vivendi SA | 3,980 | 90,260 | ||||||
Wendel SE* | 136 | 12,470 | ||||||
Worldline SA, 144A* | 674 | 50,217 | ||||||
|
| |||||||
(Cost $6,889,084) | 6,481,476 | |||||||
|
| |||||||
| See Notes to Financial Statements. | 24 |
DBX ETF Trust
Schedule of Investments
Xtrackers MSCI All World ex US Hedged Equity ETF (Continued)
May 31, 2020
Number | Value | |||||||
| Germany — 5.3% | ||||||||
adidas AG* | 997 | $ | 262,514 | |||||
Allianz SE | 2,141 | 386,961 | ||||||
BASF SE* | 4,739 | 255,898 | ||||||
Bayer AG | 4,783 | 322,385 | ||||||
Bayerische Motoren Werke AG | 1,565 | 91,378 | ||||||
Beiersdorf AG | 488 | 51,061 | ||||||
Brenntag AG | 767 | 40,365 | ||||||
Carl Zeiss Meditec AG* | 206 | 21,061 | ||||||
Commerzbank AG* | 2,922 | 11,356 | ||||||
Continental AG* | 552 | 54,191 | ||||||
Covestro AG, 144A* | 354 | 13,082 | ||||||
Daimler AG* | 4,678 | 173,336 | ||||||
Delivery Hero SE, 144A* | 779 | 74,522 | ||||||
Deutsche Bank AG* (d) | 9,839 | 82,252 | ||||||
Deutsche Boerse AG | 972 | 159,580 | ||||||
Deutsche Lufthansa AG*(b) | 1,085 | 11,011 | ||||||
Deutsche Post AG* | 4,974 | 154,489 | ||||||
Deutsche Telekom AG* | 17,257 | 271,538 | ||||||
Deutsche Wohnen SE | 1,864 | 83,221 | ||||||
E.ON SE | 11,092 | 117,044 | ||||||
Evonik Industries AG | 1,001 | 24,612 | ||||||
Fraport AG Frankfurt Airport Services Worldwide*(b) | 230 | 11,392 | ||||||
Fresenius Medical Care AG & Co. KGaA* | 1,084 | 90,969 | ||||||
Fresenius SE & Co. KGaA* | 2,055 | 98,546 | ||||||
GEA Group AG | 871 | 25,902 | ||||||
Hannover Rueck SE | 287 | 46,067 | ||||||
HeidelbergCement AG* | 677 | 33,540 | ||||||
Henkel AG & Co. KGaA* | 514 | 41,109 | ||||||
HOCHTIEF AG | 93 | 8,166 | ||||||
Infineon Technologies AG | 6,273 | 131,301 | ||||||
KION Group AG* | 387 | 21,565 | ||||||
Knorr-Bremse AG | 237 | 25,040 | ||||||
LANXESS AG* | 467 | 24,095 | ||||||
LEG Immobilien AG* | 341 | 42,425 | ||||||
Merck KGaA | 646 | 73,968 | ||||||
MTU Aero Engines AG* | 204 | 32,813 | ||||||
Muenchener Rueckversicherungs-Gesellschaft AG in Muenchen | 734 | 166,703 | ||||||
Puma SE* | 521 | 37,118 | ||||||
RWE AG* | 3,161 | 104,529 | ||||||
SAP SE | 4,970 | 626,174 | ||||||
Scout24 AG, 144A | 532 | 40,600 | ||||||
Siemens AG | 3,878 | 424,150 | ||||||
Siemens Healthineers AG, 144A | 665 | 34,300 | ||||||
Symrise AG* | 609 | 66,520 | ||||||
TeamViewer AG* | 638 | 32,404 | ||||||
Telefonica Deutschland Holding AG | 3,236 | 9,936 | ||||||
thyssenkrupp AG*(b) | 2,115 | 14,227 | ||||||
Uniper SE | 962 | 30,007 | ||||||
United Internet AG | 391 | 16,007 | ||||||
Volkswagen AG* | 161 | 25,450 | ||||||
Vonovia SE* | 2,434 | 139,903 | ||||||
Wirecard AG (b) | 592 | 62,140 | ||||||
Zalando SE, 144A* | 826 | 55,784 | ||||||
|
| |||||||
(Cost $5,898,402) | 5,254,707 | |||||||
|
| |||||||
Number | Value | |||||||
| Greece — 0.0% | ||||||||
FF Group*(c) | 197 | $ | 1,050 | |||||
Hellenic Telecommunications Organization SA | 1,360 | 19,112 | ||||||
JUMBO SA | 669 | 12,119 | ||||||
OPAP SA | 782 | 7,292 | ||||||
|
| |||||||
(Cost $39,291) | 39,573 | |||||||
|
| |||||||
| Hong Kong — 3.0% | ||||||||
AIA Group Ltd. | 60,824 | 493,168 | ||||||
Alibaba Health Information Technology Ltd.* | 14,938 | 34,996 | ||||||
Alibaba Pictures Group Ltd.* | 56,769 | 6,884 | ||||||
ASM Pacific Technology Ltd. | 1,169 | 10,632 | ||||||
Bank of East Asia Ltd. | 5,962 | 10,753 | ||||||
Beijing Enterprises Water Group Ltd.* | 32,433 | 12,259 | ||||||
BOC Hong Kong Holdings Ltd. | 18,715 | 52,150 | ||||||
Brilliance China Automotive Holdings Ltd. | 15,169 | 13,268 | ||||||
Budweiser Brewing Co. APAC Ltd., 144A | 5,700 | 15,957 | ||||||
China Ding Yi Feng Holdings Ltd.* | 7,780 | 4,125 | ||||||
China Everbright International Ltd. | 18,662 | 9,582 | ||||||
China Everbright Ltd. | 8,000 | 11,208 | ||||||
China Gas Holdings Ltd. | 9,466 | 33,094 | ||||||
China Jinmao Holdings Group Ltd. | 31,925 | 22,075 | ||||||
China Mengniu Dairy Co. Ltd.* | 14,298 | 51,094 | ||||||
China Merchants Port Holdings Co. Ltd. | 6,845 | 8,327 | ||||||
China Mobile Ltd. | 30,011 | 209,456 | ||||||
China Overseas Land & Investment Ltd. | 18,372 | 55,935 | ||||||
China Resources Beer Holdings Co. Ltd. | 6,285 | 33,284 | ||||||
China Resources Cement Holdings Ltd. | 11,672 | 14,651 | ||||||
China Resources Gas Group Ltd. | 4,884 | 26,621 | ||||||
China Resources Land Ltd. | 19,200 | 75,670 | ||||||
China Resources Power Holdings Co. Ltd. | 8,490 | 9,836 | ||||||
China Taiping Insurance Holdings Co. Ltd. | 9,224 | 13,685 | ||||||
China Traditional Chinese Medicine Holdings Co. Ltd. | 39,418 | 16,679 | ||||||
China Unicom Hong Kong Ltd.* | 27,042 | 15,664 | ||||||
CITIC Ltd. | 30,670 | 29,121 | ||||||
CK Asset Holdings Ltd. | 12,246 | 66,590 | ||||||
CK Hutchison Holdings Ltd. | 13,595 | 83,133 | ||||||
CK Infrastructure Holdings Ltd. | 3,415 | 17,050 | ||||||
CLP Holdings Ltd. | 8,134 | 79,698 | ||||||
COSCO SHIPPING Ports Ltd. | 8,735 | 4,361 | ||||||
Far East Horizon Ltd. | 12,824 | 11,333 | ||||||
Galaxy Entertainment Group Ltd. | 12,932 | 87,253 | ||||||
Geely Automobile Holdings Ltd. | 25,189 | 34,445 | ||||||
Guangdong Investment Ltd. | 15,674 | 30,857 | ||||||
Haier Electronics Group Co. Ltd. | 9,353 | 26,063 | ||||||
Hang Lung Properties Ltd. | 9,627 | 20,244 | ||||||
Hang Seng Bank Ltd. | 3,813 | 57,996 | ||||||
Henderson Land Development Co. Ltd. | 7,395 | 26,378 | ||||||
HK Electric Investments & HK Electric Investments Ltd. (a) | 12,644 | 12,527 | ||||||
HKT Trust & HKT Ltd. (a) | 18,549 | 26,370 | ||||||
Hong Kong & China Gas Co. Ltd. | 50,303 | 84,622 | ||||||
Hong Kong Exchanges & Clearing Ltd. | 6,132 | 213,748 | ||||||
Hongkong Land Holdings Ltd. | 5,900 | 22,184 | ||||||
Hutchison China MediTech Ltd., ADR* | 272 | 5,932 | ||||||
| See Notes to Financial Statements. | 25 |
DBX ETF Trust
Schedule of Investments
Xtrackers MSCI All World ex US Hedged Equity ETF (Continued)
May 31, 2020
Number | Value | |||||||
| Hong Kong (Continued) | ||||||||
Jardine Matheson Holdings Ltd. | 1,021 | $ | 40,993 | |||||
Jardine Strategic Holdings Ltd. | 1,146 | 22,863 | ||||||
Kerry Properties Ltd. | 4,014 | 9,476 | ||||||
Kunlun Energy Co. Ltd. | 16,221 | 9,940 | ||||||
Link REIT | 10,582 | 79,111 | ||||||
Melco Resorts & Entertainment Ltd., ADR | 1,216 | 19,492 | ||||||
MTR Corp. Ltd. | 7,298 | 34,977 | ||||||
New World Development Co. Ltd. | 29,755 | 29,980 | ||||||
Nine Dragons Paper Holdings Ltd. | 12,519 | 10,950 | ||||||
PCCW Ltd. | 13,612 | 7,463 | ||||||
Power Assets Holdings Ltd. | 6,817 | 37,948 | ||||||
Shenzhen International Holdings Ltd. | 3,792 | 6,330 | ||||||
Shimao Property Holdings Ltd. | 6,607 | 27,446 | ||||||
Sino Biopharmaceutical Ltd. | 32,360 | 50,931 | ||||||
Sino Land Co. Ltd. | 16,451 | 19,164 | ||||||
SJM Holdings Ltd. | 12,719 | 14,128 | ||||||
SSY Group Ltd. | 7,414 | 4,543 | ||||||
Sun Art Retail Group Ltd. | 11,832 | 18,103 | ||||||
Sun Hung Kai Properties Ltd. | 7,727 | 88,719 | ||||||
Swire Pacific Ltd., Class A | 2,782 | 14,428 | ||||||
Swire Properties Ltd. | 6,234 | 13,881 | ||||||
Techtronic Industries Co. Ltd. | 8,679 | 74,681 | ||||||
WH Group Ltd., 144A | 47,212 | 40,686 | ||||||
Wharf Holdings Ltd. (b) | 9,000 | 16,046 | ||||||
Wharf Real Estate Investment Co. Ltd. (b) | 6,085 | 23,393 | ||||||
Wheelock & Co. Ltd. | 3,725 | 25,157 | ||||||
Yuexiu Property Co. Ltd. | 27,696 | 4,966 | ||||||
|
| |||||||
(Cost $3,304,947) | 2,946,753 | |||||||
|
| |||||||
| Hungary — 0.1% | ||||||||
MOL Hungarian Oil & Gas PLC | 1,547 | 9,746 | ||||||
OTP Bank Nyrt* | 1,218 | 40,394 | ||||||
Richter Gedeon Nyrt | 707 | 15,398 | ||||||
|
| |||||||
(Cost $64,751) | 65,538 | |||||||
|
| |||||||
| India — 2.2% | ||||||||
Adani Ports & Special Economic Zone Ltd. | 2,391 | 10,239 | ||||||
Ambuja Cements Ltd. | 2,048 | 5,188 | ||||||
Asian Paints Ltd. | 1,212 | 26,977 | ||||||
Aurobindo Pharma Ltd. | 1,595 | 15,728 | ||||||
Avenue Supermarts Ltd., 144A* | 1,052 | 31,572 | ||||||
Axis Bank Ltd. | 10,575 | 53,836 | ||||||
Bajaj Auto Ltd. | 521 | 18,676 | ||||||
Bajaj Finance Ltd. | 372 | 9,611 | ||||||
Berger Paints India Ltd. | 2,698 | 17,546 | ||||||
Bharat Petroleum Corp. Ltd. | 6,654 | 30,165 | ||||||
Bharti Airtel Ltd.* | 13,257 | 96,882 | ||||||
Bharti Infratel Ltd. | 2,785 | 8,469 | ||||||
Biocon Ltd. | 3,398 | 15,939 | ||||||
Britannia Industries Ltd. | 312 | 13,941 | ||||||
Cipla Ltd. | 1,780 | 15,257 | ||||||
Coal India Ltd. | 6,331 | 11,830 | ||||||
Dabur India Ltd. | 2,705 | 16,686 | ||||||
Divi’s Laboratories Ltd. | 378 | 11,948 | ||||||
Dr. Reddy’s Laboratories Ltd., ADR | 564 | 30,140 | ||||||
Eicher Motors Ltd. | 65 | 14,225 | ||||||
GAIL India Ltd. | 7,774 | 9,494 | ||||||
Number | Value | |||||||
| India (Continued) | ||||||||
Godrej Consumer Products Ltd. | 2,049 | $ | 17,174 | |||||
Grasim Industries Ltd. | 1,418 | 11,049 | ||||||
HCL Technologies Ltd. | 5,957 | 43,348 | ||||||
HDFC Asset Management Co. Ltd., 144A | 494 | 16,492 | ||||||
HDFC Life Insurance Co. Ltd., 144A* | 4,881 | 33,772 | ||||||
Hero MotoCorp Ltd. | 557 | 17,390 | ||||||
Hindalco Industries Ltd. | 5,786 | 10,625 | ||||||
Hindustan Unilever Ltd. | 4,125 | 112,232 | ||||||
Housing Development Finance Corp. Ltd. | 8,338 | 182,922 | ||||||
ICICI Bank Ltd. | 23,637 | 103,765 | ||||||
ICICI Lombard General Insurance Co. Ltd., 144A | 659 | 11,336 | ||||||
Indian Oil Corp. Ltd. | 8,950 | 9,848 | ||||||
Indraprastha Gas Ltd. | 2,574 | 16,070 | ||||||
Info Edge India Ltd. | 291 | 10,328 | ||||||
Infosys Ltd., ADR | 1,178 | 10,720 | ||||||
Infosys Ltd. | 16,502 | 150,799 | ||||||
ITC Ltd.* | 17,894 | 46,701 | ||||||
JSW Steel Ltd. | 4,127 | 10,053 | ||||||
Jubilant Foodworks Ltd. | 783 | 17,154 | ||||||
Larsen & Toubro Ltd. | 2,431 | 29,971 | ||||||
Lupin Ltd. | 1,453 | 16,714 | ||||||
Mahindra & Mahindra Ltd. | 3,735 | 21,553 | ||||||
Marico Ltd. | 2,701 | 12,281 | ||||||
Maruti Suzuki India Ltd. | 591 | 43,853 | ||||||
Nestle India Ltd. | 130 | 30,156 | ||||||
NTPC Ltd. | 11,858 | 15,345 | ||||||
Oil & Natural Gas Corp. Ltd. | 12,131 | 13,348 | ||||||
Page Industries Ltd. | 15 | 3,743 | ||||||
Petronet LNG Ltd. | 3,652 | 12,197 | ||||||
Pidilite Industries Ltd. | 846 | 16,429 | ||||||
Power Grid Corp. of India Ltd. | 9,465 | 19,721 | ||||||
Reliance Industries Ltd. | 14,398 | 278,835 | ||||||
SBI Life Insurance Co. Ltd., 144A* | 1,643 | 16,701 | ||||||
Shree Cement Ltd. | 41 | 11,309 | ||||||
Siemens Ltd. | 945 | 13,612 | ||||||
State Bank of India* | 9,492 | 20,248 | ||||||
Sun Pharmaceutical Industries Ltd. | 3,997 | 25,068 | ||||||
Tata Consultancy Services Ltd. | 4,410 | 115,029 | ||||||
Tata Consumer Products Ltd.* | 2,120 | 10,287 | ||||||
Tata Motors Ltd.* | 7,221 | 8,308 | ||||||
Tech Mahindra Ltd. | 915 | 6,419 | ||||||
Titan Co. Ltd. | 1,500 | 17,655 | ||||||
Torrent Pharmaceuticals Ltd. | 248 | 7,749 | ||||||
UltraTech Cement Ltd. | 749 | 38,679 | ||||||
United Spirits Ltd.* | 1,067 | 8,383 | ||||||
UPL Ltd.* | 2,605 | 13,982 | ||||||
Vedanta Ltd. | 9,028 | 11,008 | ||||||
Wipro Ltd. | 5,503 | 15,487 | ||||||
Zee Entertainment Enterprises Ltd. | 4,114 | 9,986 | ||||||
|
| |||||||
(Cost $2,641,781) | 2,160,183 | |||||||
|
| |||||||
| Indonesia — 0.4% | ||||||||
PT Astra International Tbk | 95,289 | 31,111 | ||||||
PT Bank Central Asia Tbk | 48,572 | 86,273 | ||||||
PT Bank Mandiri Persero Tbk | 94,033 | 28,770 | ||||||
PT Bank Negara Indonesia Persero Tbk | 34,620 | 9,075 | ||||||
| See Notes to Financial Statements. | 26 |
DBX ETF Trust
Schedule of Investments
Xtrackers MSCI All World ex US Hedged Equity ETF (Continued)
May 31, 2020
Number | Value | |||||||
| Indonesia (Continued) | ||||||||
PT Bank Rakyat Indonesia Persero Tbk | 282,629 | $ | 57,067 | |||||
PT Barito Pacific Tbk* | 118,895 | 10,986 | ||||||
PT Charoen Pokphand Indonesia Tbk | 38,504 | 15,220 | ||||||
PT Indofood CBP Sukses Makmur Tbk | 12,656 | 7,060 | ||||||
PT Indofood Sukses Makmur Tbk | 17,083 | 6,723 | ||||||
PT Kalbe Farma Tbk | 106,184 | 10,284 | ||||||
PT Semen Indonesia Persero Tbk | 19,237 | 12,904 | ||||||
PT Telekomunikasi Indonesia Persero Tbk | 245,534 | 52,938 | ||||||
PT Unilever Indonesia Tbk | 52,194 | 27,687 | ||||||
PT United Tractors Tbk | 9,367 | 10,066 | ||||||
|
| |||||||
(Cost $417,837) | 366,164 | |||||||
|
| |||||||
| Ireland — 0.7% | ||||||||
AerCap Holdings NV* | 676 | 21,794 | ||||||
CRH PLC | 3,924 | 127,626 | ||||||
DCC PLC | 511 | 42,485 | ||||||
Experian PLC | 4,528 | 157,305 | ||||||
Flutter Entertainment PLC | 401 | 51,323 | ||||||
Flutter Entertainment PLC (b) | 322 | 40,881 | ||||||
James Hardie Industries PLC CDI | 2,316 | 40,060 | ||||||
Kerry Group PLC, Class A | 800 | 98,839 | ||||||
Kingspan Group PLC | 770 | 47,481 | ||||||
Smurfit Kappa Group PLC | 1,027 | 33,357 | ||||||
|
| |||||||
(Cost $570,305) | 661,151 | |||||||
|
| |||||||
| Isle of Man — 0.0% | ||||||||
GVC Holdings PLC | 3,125 | 30,597 | ||||||
|
| |||||||
| Israel — 0.4% | ||||||||
Azrieli Group Ltd. | 204 | 10,684 | ||||||
Bank Hapoalim BM | 5,372 | 32,907 | ||||||
Bank Leumi Le-Israel BM | 7,587 | 40,058 | ||||||
Check Point Software Technologies Ltd.* | 585 | 64,157 | ||||||
CyberArk Software Ltd.* | 182 | 18,888 | ||||||
Elbit Systems Ltd. | 115 | 15,982 | ||||||
ICL Group Ltd. | 3,196 | 11,040 | ||||||
Israel Discount Bank Ltd., Class A | 6,827 | 21,600 | ||||||
Mizrahi Tefahot Bank Ltd. | 653 | 12,760 | ||||||
Nice Ltd.* | 350 | 63,142 | ||||||
Teva Pharmaceutical Industries Ltd., ADR* | 5,139 | 64,392 | ||||||
Wix.com Ltd.* | 219 | 48,690 | ||||||
|
| |||||||
(Cost $471,576) | 404,300 | |||||||
|
| |||||||
| Italy — 1.3% | ||||||||
Assicurazioni Generali SpA | 5,278 | 73,148 | ||||||
Atlantia SpA* | 2,393 | 38,769 | ||||||
Davide Campari-Milano SpA | 2,786 | 22,576 | ||||||
DiaSorin SpA* | 165 | 34,525 | ||||||
Enel SpA | 41,834 | 320,468 | ||||||
Eni SpA | 12,515 | 112,847 | ||||||
Ferrari NV | 625 | 105,385 | ||||||
FinecoBank Banca Fineco SpA* | 3,000 | 34,983 | ||||||
Infrastrutture Wireless Italiane SpA, 144A | 2,069 | 21,049 | ||||||
Intesa Sanpaolo SpA* | 73,428 | 126,534 | ||||||
Leonardo SpA* | 2,082 | 12,942 | ||||||
Mediobanca Banca di Credito Finanziario SpA | 3,458 | 22,402 | ||||||
Number | Value | |||||||
| Italy (Continued) | ||||||||
Moncler SpA* | 816 | $ | 30,299 | |||||
Nexi SpA, 144A* | 2,085 | 34,185 | ||||||
Poste Italiane SpA, 144A | 3,014 | 26,411 | ||||||
Prysmian SpA | 1,228 | 26,097 | ||||||
Recordati SpA | 519 | 23,575 | ||||||
Snam SpA | 10,782 | 50,077 | ||||||
Telecom Italia SpA* | 41,726 | 15,378 | ||||||
Telecom Italia SpA-RSP | 17,235 | 6,635 | ||||||
Terna Rete Elettrica Nazionale SpA | 6,957 | 46,876 | ||||||
UniCredit SpA* | 9,897 | 84,220 | ||||||
|
| |||||||
(Cost $1,471,904) | 1,269,381 | |||||||
|
| |||||||
| Japan — 16.7% | ||||||||
ABC-Mart, Inc. | 200 | 12,147 | ||||||
Acom Co. Ltd. | 1,700 | 6,920 | ||||||
Advantest Corp. | 1,000 | 49,330 | ||||||
Aeon Co. Ltd. | 3,500 | 77,354 | ||||||
Aeon Mall Co. Ltd. | 500 | 7,024 | ||||||
AGC, Inc. | 800 | 22,625 | ||||||
Air Water, Inc. | 1,000 | 14,512 | ||||||
Aisin Seiki Co. Ltd. | 800 | 25,184 | ||||||
Ajinomoto Co., Inc. | 2,200 | 37,474 | ||||||
Alfresa Holdings Corp. | 900 | 18,134 | ||||||
Amada Co. Ltd. | 1,100 | 9,802 | ||||||
ANA Holdings, Inc.*(b) | 600 | 14,460 | ||||||
Aozora Bank Ltd. | 400 | 7,425 | ||||||
Asahi Group Holdings Ltd. | 1,700 | 63,968 | ||||||
Asahi Intecc Co. Ltd. | 1,000 | 30,599 | ||||||
Asahi Kasei Corp. | 6,200 | 48,866 | ||||||
Astellas Pharma, Inc. | 9,300 | 165,097 | ||||||
Bandai Namco Holdings, Inc. | 900 | 50,039 | ||||||
Bank of Kyoto Ltd. | 200 | 7,177 | ||||||
Benesse Holdings, Inc. | 200 | 5,410 | ||||||
Bridgestone Corp. | 2,800 | 92,870 | ||||||
Brother Industries Ltd. | 919 | 17,290 | ||||||
Calbee, Inc. | 300 | 8,665 | ||||||
Canon, Inc. | 5,000 | 102,879 | ||||||
Casio Computer Co. Ltd. | 700 | 12,313 | ||||||
Central Japan Railway Co. | 700 | 119,658 | ||||||
Chiba Bank Ltd. | 4,100 | 19,465 | ||||||
Chubu Electric Power Co., Inc. | 3,600 | 48,436 | ||||||
Chugai Pharmaceutical Co. Ltd. | 1,188 | 175,041 | ||||||
Chugoku Electric Power Co., Inc. | 1,200 | 16,468 | ||||||
Coca-Cola Bottlers Japan Holdings, Inc. | 600 | 11,906 | ||||||
Concordia Financial Group Ltd. | 2,100 | 6,854 | ||||||
CyberAgent, Inc. | 600 | 30,210 | ||||||
Dai Nippon Printing Co. Ltd. | 1,000 | 22,709 | ||||||
Daicel Corp. | 1,000 | 8,457 | ||||||
Daifuku Co. Ltd. | 500 | 38,852 | ||||||
Dai-ichi Life Holdings, Inc. | 5,300 | 68,950 | ||||||
Daiichi Sankyo Co. Ltd. | 2,942 | 275,118 | ||||||
Daikin Industries Ltd. | 1,313 | 192,972 | ||||||
Daito Trust Construction Co. Ltd. | 300 | 31,670 | ||||||
Daiwa House Industry Co. Ltd. | 2,871 | 71,199 | ||||||
Daiwa House REIT Investment Corp. REIT | 11 | 27,172 | ||||||
Daiwa Securities Group, Inc. | 4,700 | 19,468 | ||||||
Denso Corp. | 2,100 | 80,440 | ||||||
| See Notes to Financial Statements. | 27 |
DBX ETF Trust
Schedule of Investments
Xtrackers MSCI All World ex US Hedged Equity ETF (Continued)
May 31, 2020
Number | Value | |||||||
| Japan (Continued) | ||||||||
Dentsu Group, Inc. | 900 | $ | 24,076 | |||||
Disco Corp. | 100 | 22,310 | ||||||
East Japan Railway Co. | 1,670 | 130,850 | ||||||
Eisai Co. Ltd. | 1,200 | 93,890 | ||||||
Electric Power Development Co. Ltd. | 700 | 13,196 | ||||||
FamilyMart Co. Ltd. | 1,200 | 22,466 | ||||||
FANUC Corp. | 1,025 | 182,627 | ||||||
Fast Retailing Co. Ltd. | 300 | 168,381 | ||||||
Fuji Electric Co. Ltd. | 600 | 16,017 | ||||||
FUJIFILM Holdings Corp. | 1,700 | 78,517 | ||||||
Fujitsu Ltd. | 1,000 | 102,926 | ||||||
Fukuoka Financial Group, Inc. | 800 | 13,004 | ||||||
GLP J REIT | 18 | 23,984 | ||||||
GMO Payment Gateway, Inc. | 200 | 22,495 | ||||||
Hakuhodo DY Holdings, Inc. | 1,200 | 14,899 | ||||||
Hamamatsu Photonics KK | 600 | 27,150 | ||||||
Hankyu Hanshin Holdings, Inc. | 1,100 | 40,595 | ||||||
Hikari Tsushin, Inc. | 100 | 21,893 | ||||||
Hino Motors Ltd. | 1,000 | 6,760 | ||||||
Hirose Electric Co. Ltd. | 105 | 12,531 | ||||||
Hisamitsu Pharmaceutical Co., Inc. | 300 | 15,105 | ||||||
Hitachi Construction Machinery Co. Ltd. | 300 | 7,872 | ||||||
Hitachi Ltd. | 4,941 | 158,293 | ||||||
Hitachi Metals Ltd. | 2,048 | 23,586 | ||||||
Honda Motor Co. Ltd. | 8,243 | 212,792 | ||||||
Hoshizaki Corp. | 378 | 30,494 | ||||||
Hoya Corp. | 1,978 | 185,429 | ||||||
Hulic Co. Ltd. (b) | 1,300 | 13,139 | ||||||
Idemitsu Kosan Co. Ltd. | 1,032 | 22,871 | ||||||
Iida Group Holdings Co. Ltd. | 500 | 7,418 | ||||||
Inpex Corp. | 3,700 | 25,762 | ||||||
Isetan Mitsukoshi Holdings Ltd. | 1,400 | 9,360 | ||||||
Isuzu Motors Ltd. | 3,000 | 28,082 | ||||||
ITOCHU Corp. | 6,900 | 147,795 | ||||||
Itochu Techno-Solutions Corp. | 400 | 13,501 | ||||||
Japan Airlines Co. Ltd. | 500 | 9,815 | ||||||
Japan Airport Terminal Co. Ltd. | 200 | 8,790 | ||||||
Japan Exchange Group, Inc. | 2,600 | 55,860 | ||||||
Japan Post Bank Co. Ltd. | 1,800 | 14,855 | ||||||
Japan Post Holdings Co. Ltd. | 6,399 | 46,525 | ||||||
Japan Post Insurance Co. Ltd. | 1,100 | 13,953 | ||||||
Japan Prime Realty Investment Corp. REIT | 3 | 9,152 | ||||||
Japan Real Estate Investment Corp. REIT | 7 | 38,166 | ||||||
Japan Retail Fund Investment Corp. REIT | 13 | 17,141 | ||||||
Japan Tobacco, Inc. | 5,388 | 106,791 | ||||||
JFE Holdings, Inc. | 1,000 | 7,344 | ||||||
JGC Holdings Corp. | 1,000 | 10,747 | ||||||
JSR Corp. | 600 | 11,750 | ||||||
JXTG Holdings, Inc. | 18,393 | 70,659 | ||||||
Kajima Corp. | 2,500 | 28,328 | ||||||
Kakaku.com, Inc. | 600 | 14,499 | ||||||
Kamigumi Co. Ltd. | 500 | 9,759 | ||||||
Kansai Electric Power Co., Inc. | 3,600 | 35,835 | ||||||
Kansai Paint Co. Ltd. | 800 | 16,557 | ||||||
Kao Corp. | 2,511 | 201,332 | ||||||
Kawasaki Heavy Industries Ltd. | 600 | 9,491 | ||||||
KDDI Corp. | 8,800 | 255,893 | ||||||
Number | Value | |||||||
| Japan (Continued) | ||||||||
Keihan Holdings Co. Ltd. | 600 | $ | 28,485 | |||||
Keikyu Corp. | 1,100 | 18,370 | ||||||
Keio Corp. | 500 | 29,672 | ||||||
Keisei Electric Railway Co. Ltd. | 500 | 16,389 | ||||||
Keyence Corp. | 900 | 370,115 | ||||||
Kikkoman Corp. | 700 | 35,180 | ||||||
Kintetsu Group Holdings Co. Ltd. | 800 | 39,242 | ||||||
Kirin Holdings Co. Ltd. | 4,200 | 85,971 | ||||||
Kobayashi Pharmaceutical Co. Ltd. | 300 | 26,705 | ||||||
Koito Manufacturing Co. Ltd. | 600 | 25,398 | ||||||
Komatsu Ltd. | 4,600 | 92,985 | ||||||
Konami Holdings Corp. | 400 | 14,039 | ||||||
Kose Corp. | 200 | 25,017 | ||||||
Kubota Corp. | 5,000 | 67,203 | ||||||
Kuraray Co. Ltd. | 1,500 | 15,745 | ||||||
Kurita Water Industries Ltd. | 400 | 11,079 | ||||||
Kyocera Corp. | 1,584 | 85,644 | ||||||
Kyowa Kirin Co. Ltd. | 1,000 | 27,094 | ||||||
Kyushu Electric Power Co., Inc. | 1,700 | 14,124 | ||||||
Kyushu Railway Co. | 700 | 19,829 | ||||||
Lasertec Corp. | 400 | 32,825 | ||||||
Lawson, Inc. | 300 | 16,579 | ||||||
LINE Corp.* | 200 | 9,996 | ||||||
Lion Corp. | 1,032 | 23,588 | ||||||
LIXIL Group Corp. | 600 | 8,368 | ||||||
M3, Inc. | 2,442 | 98,273 | ||||||
Makita Corp. | 1,000 | 33,845 | ||||||
Marubeni Corp. | 7,600 | 36,878 | ||||||
Marui Group Co. Ltd. | 900 | 16,215 | ||||||
Maruichi Steel Tube Ltd. | 200 | 5,117 | ||||||
Mazda Motor Corp. | 2,900 | 18,528 | ||||||
McDonald’s Holdings Co. Japan Ltd. | 300 | 15,940 | ||||||
Mebuki Financial Group, Inc. | 3,944 | 8,923 | ||||||
Medipal Holdings Corp. | 865 | 17,140 | ||||||
MEIJI Holdings Co. Ltd. | 500 | 37,600 | ||||||
Mercari, Inc.* | 400 | 11,906 | ||||||
MINEBEA MITSUMI, Inc. | 1,600 | 28,055 | ||||||
MISUMI Group, Inc. | 1,500 | 39,807 | ||||||
Mitsubishi Chemical Holdings Corp. | 6,000 | 35,290 | ||||||
Mitsubishi Corp. | 7,144 | 166,602 | ||||||
Mitsubishi Electric Corp. | 9,800 | 128,901 | ||||||
Mitsubishi Estate Co. Ltd. | 5,500 | 87,362 | ||||||
Mitsubishi Gas Chemical Co., Inc. | 600 | 8,924 | ||||||
Mitsubishi Heavy Industries Ltd. | 1,500 | 38,771 | ||||||
Mitsubishi Materials Corp. | 500 | 11,373 | ||||||
Mitsubishi Motors Corp. | 4,400 | 12,403 | ||||||
Mitsubishi UFJ Financial Group, Inc. | 60,800 | 250,428 | ||||||
Mitsubishi UFJ Lease & Finance Co. Ltd. | 1,500 | 7,316 | ||||||
Mitsui & Co. Ltd. | 8,100 | 122,839 | ||||||
Mitsui Chemicals, Inc. | 800 | 16,616 | ||||||
Mitsui Fudosan Co. Ltd. | 4,400 | 84,597 | ||||||
Miura Co. Ltd. | 400 | 17,062 | ||||||
Mizuho Financial Group, Inc. | 120,700 | 150,532 | ||||||
MonotaRO Co. Ltd. | 600 | 21,781 | ||||||
MS&AD Insurance Group Holdings, Inc. | 2,500 | 73,369 | ||||||
Murata Manufacturing Co. Ltd. | 2,900 | 161,746 | ||||||
Nabtesco Corp. | 700 | 21,712 | ||||||
| See Notes to Financial Statements. | 28 |
DBX ETF Trust
Schedule of Investments
Xtrackers MSCI All World ex US Hedged Equity ETF (Continued)
May 31, 2020
Number | Value | |||||||
| Japan (Continued) | ||||||||
Nagoya Railroad Co. Ltd. | 800 | $ | 24,109 | |||||
NEC Corp. | 1,300 | 58,283 | ||||||
Nexon Co. Ltd. | 2,660 | 55,398 | ||||||
NGK Insulators Ltd. | 1,000 | 14,641 | ||||||
NGK Spark Plug Co. Ltd. | 800 | 12,885 | ||||||
NH Foods Ltd. | 500 | 18,452 | ||||||
Nidec Corp. | 2,200 | 135,086 | ||||||
Nihon M&A Center, Inc. | 700 | 28,105 | ||||||
Nikon Corp. | 1,600 | 14,688 | ||||||
Nintendo Co. Ltd. | 579 | 233,758 | ||||||
Nippon Building Fund, Inc. REIT | 9 | 56,414 | ||||||
Nippon Express Co. Ltd. | 300 | 15,411 | ||||||
Nippon Paint Holdings Co. Ltd. | 700 | 48,746 | ||||||
Nippon Prologis REIT, Inc. REIT (b) | 10 | 28,189 | ||||||
Nippon Shinyaku Co. Ltd. | 200 | 17,210 | ||||||
Nippon Steel Corp. | 4,310 | 39,669 | ||||||
Nippon Telegraph & Telephone Corp. | 6,300 | 142,772 | ||||||
Nippon Yusen KK | 800 | 11,520 | ||||||
Nissan Chemical Corp. | 600 | 26,455 | ||||||
Nissan Motor Co. Ltd. | 11,400 | 42,378 | ||||||
Nisshin Seifun Group, Inc. | 850 | 13,233 | ||||||
Nissin Foods Holdings Co. Ltd. | 415 | 34,633 | ||||||
Nitori Holdings Co. Ltd. | 401 | 72,637 | ||||||
Nitto Denko Corp. | 700 | 37,841 | ||||||
Nomura Holdings, Inc. | 15,400 | 66,101 | ||||||
Nomura Real Estate Holdings, Inc. | 600 | 11,094 | ||||||
Nomura Real Estate Master Fund, Inc. REIT | 22 | 27,030 | ||||||
Nomura Research Institute Ltd. | 1,656 | 43,732 | ||||||
NSK Ltd. | 1,800 | 13,152 | ||||||
NTT Data Corp. | 3,400 | 39,251 | ||||||
NTT DOCOMO, Inc. | 5,742 | 157,147 | ||||||
Obayashi Corp. | 3,100 | 28,659 | ||||||
Obic Co. Ltd. | 300 | 51,963 | ||||||
Odakyu Electric Railway Co. Ltd. | 1,500 | 37,401 | ||||||
Oji Holdings Corp. | 4,822 | 24,189 | ||||||
Olympus Corp. | 6,000 | 104,122 | ||||||
Omron Corp. | 900 | 59,586 | ||||||
Ono Pharmaceutical Co. Ltd. | 1,800 | 51,357 | ||||||
Oracle Corp. | 200 | 23,330 | ||||||
Oriental Land Co. Ltd. | 1,025 | 148,411 | ||||||
ORIX Corp. | 6,700 | 88,778 | ||||||
Orix JREIT, Inc. REIT | 12 | 17,336 | ||||||
Osaka Gas Co. Ltd. | 2,308 | 46,077 | ||||||
Otsuka Corp. | 508 | 24,494 | ||||||
Otsuka Holdings Co. Ltd. | 2,183 | 98,457 | ||||||
Pan Pacific International Holdings Corp. | 2,300 | 46,301 | ||||||
Panasonic Corp. | 9,800 | 87,509 | ||||||
Park24 Co. Ltd. | 400 | 7,756 | ||||||
PeptiDream, Inc.* | 500 | 22,416 | ||||||
Persol Holdings Co. Ltd. | 1,000 | 13,213 | ||||||
Pigeon Corp. | 600 | 23,367 | ||||||
Pola Orbis Holdings, Inc. | 400 | 7,774 | ||||||
Rakuten, Inc. | 4,300 | 38,915 | ||||||
Recruit Holdings Co. Ltd. | 6,700 | 230,488 | ||||||
Renesas Electronics Corp.* | 4,300 | 22,288 | ||||||
Resona Holdings, Inc. | 10,600 | 38,117 | ||||||
Number | Value | |||||||
| Japan (Continued) | ||||||||
Ricoh Co. Ltd. | 3,500 | $ | 25,833 | |||||
Rinnai Corp. | 100 | 8,410 | ||||||
Rohm Co. Ltd. | 400 | 26,890 | ||||||
Ryohin Keikaku Co. Ltd. | 1,150 | 17,371 | ||||||
Santen Pharmaceutical Co. Ltd. | 2,100 | 38,750 | ||||||
SBI Holdings, Inc. | 1,317 | 28,197 | ||||||
Secom Co. Ltd. | 1,000 | 86,550 | ||||||
Sega Sammy Holdings, Inc. | 700 | 9,113 | ||||||
Seibu Holdings, Inc. | 400 | 5,222 | ||||||
Seiko Epson Corp. | 1,500 | 16,885 | ||||||
Sekisui Chemical Co. Ltd. | 1,800 | 25,119 | ||||||
Sekisui House Ltd. | 3,500 | 66,612 | ||||||
Seven & i Holdings Co. Ltd. | 3,887 | 132,889 | ||||||
Seven Bank Ltd. | 3,600 | 10,248 | ||||||
SG Holdings Co. Ltd. | 700 | 22,815 | ||||||
Sharp Corp. | 900 | 9,739 | ||||||
Shimadzu Corp. | 1,200 | 32,435 | ||||||
Shimano, Inc. | 453 | 83,211 | ||||||
Shimizu Corp. | 3,200 | 27,061 | ||||||
Shin-Etsu Chemical Co. Ltd. | 1,855 | 217,072 | ||||||
Shinsei Bank Ltd. | 1,856 | 23,664 | ||||||
Shionogi & Co. Ltd. | 1,509 | 89,005 | ||||||
Shiseido Co. Ltd. | 1,906 | 116,115 | ||||||
Shizuoka Bank Ltd. | 1,800 | 11,450 | ||||||
Showa Denko KK | 800 | 19,102 | ||||||
SMC Corp. | 300 | 151,245 | ||||||
Softbank Corp. | 8,800 | 111,464 | ||||||
SoftBank Group Corp. | 7,700 | 344,999 | ||||||
Sohgo Security Services Co. Ltd. | 400 | 19,658 | ||||||
Sompo Holdings, Inc. | 1,700 | 60,405 | ||||||
Sony Corp. | 6,200 | 395,186 | ||||||
Sony Financial Holdings, Inc. | 900 | 21,664 | ||||||
Square Enix Holdings Co. Ltd. | 400 | 19,398 | ||||||
Stanley Electric Co. Ltd. | 800 | 19,428 | ||||||
Subaru Corp. | 2,600 | 57,343 | ||||||
SUMCO Corp. | 1,300 | 19,902 | ||||||
Sumitomo Chemical Co. Ltd. | 7,500 | 23,228 | ||||||
Sumitomo Corp. | 5,700 | 68,604 | ||||||
Sumitomo Dainippon Pharma Co. Ltd. | 1,000 | 14,122 | ||||||
Sumitomo Electric Industries Ltd. | 3,500 | 40,714 | ||||||
Sumitomo Heavy Industries Ltd. | 400 | 9,124 | ||||||
Sumitomo Metal Mining Co. Ltd. | 1,200 | 33,392 | ||||||
Sumitomo Mitsui Financial Group, Inc. | 6,100 | 176,419 | ||||||
Sumitomo Mitsui Trust Holdings, Inc. | 1,610 | 47,339 | ||||||
Sumitomo Realty & Development Co. Ltd. | 1,539 | 42,590 | ||||||
Sumitomo Rubber Industries Ltd. | 400 | 4,065 | ||||||
Sundrug Co. Ltd. | 400 | 13,464 | ||||||
Suntory Beverage & Food Ltd. | 700 | 28,560 | ||||||
Suzuken Co. Ltd. | 400 | 14,521 | ||||||
Suzuki Motor Corp. | 1,800 | 62,523 | ||||||
Sysmex Corp. | 800 | 63,869 | ||||||
T&D Holdings, Inc. | 1,500 | 13,533 | ||||||
Taiheiyo Cement Corp. | 600 | 14,170 | ||||||
Taisei Corp. | 900 | 31,211 | ||||||
Taisho Pharmaceutical Holdings Co. Ltd. | 100 | 6,342 | ||||||
Taiyo Nippon Sanso Corp. | 500 | 8,401 | ||||||
Takeda Pharmaceutical Co. Ltd. | 7,687 | 298,727 | ||||||
| See Notes to Financial Statements. | 29 |
DBX ETF Trust
Schedule of Investments
Xtrackers MSCI All World ex US Hedged Equity ETF (Continued)
May 31, 2020
Number | Value | |||||||
| Japan (Continued) | ||||||||
TDK Corp. | 600 | $ | 56,081 | |||||
Teijin Ltd. | 600 | 9,814 | ||||||
Terumo Corp. | 3,300 | 129,436 | ||||||
THK Co. Ltd. | 700 | 18,174 | ||||||
Tobu Railway Co. Ltd. | 1,192 | 42,222 | ||||||
Toho Co. Ltd. | 500 | 18,360 | ||||||
Toho Gas Co. Ltd. | 400 | 19,695 | ||||||
Tohoku Electric Power Co., Inc. | 2,400 | 24,836 | ||||||
Tokio Marine Holdings, Inc. | 3,234 | 139,982 | ||||||
Tokyo Century Corp. | 200 | 8,688 | ||||||
Tokyo Electric Power Co. Holdings, Inc.* | 7,200 | 24,235 | ||||||
Tokyo Electron Ltd. | 798 | 159,089 | ||||||
Tokyo Gas Co. Ltd. | 1,700 | 40,520 | ||||||
Tokyu Corp. | 2,600 | 41,178 | ||||||
Tokyu Fudosan Holdings Corp. | 3,300 | 16,707 | ||||||
Toppan Printing Co. Ltd. | 1,500 | 25,634 | ||||||
Toray Industries, Inc. | 6,400 | 31,091 | ||||||
Toshiba Corp. | 1,851 | 50,529 | ||||||
Tosoh Corp. | 1,500 | 20,835 | ||||||
TOTO Ltd. | 640 | 25,340 | ||||||
Toyo Suisan Kaisha Ltd. | 400 | 20,882 | ||||||
Toyoda Gosei Co. Ltd. | 100 | 2,135 | ||||||
Toyota Industries Corp. | 700 | 35,764 | ||||||
Toyota Motor Corp. | 10,484 | 656,678 | ||||||
Toyota Tsusho Corp. | 1,000 | 25,314 | ||||||
Trend Micro, Inc. | 600 | 32,936 | ||||||
Tsuruha Holdings, Inc. | 200 | 29,524 | ||||||
Unicharm Corp. | 2,105 | 78,270 | ||||||
United Urban Investment Corp. REIT (b) | 12 | 12,707 | ||||||
USS Co. Ltd. | 1,100 | 19,155 | ||||||
Welcia Holdings Co. Ltd. | 200 | 16,783 | ||||||
West Japan Railway Co. | 800 | 51,563 | ||||||
Yakult Honsha Co. Ltd. | 500 | 30,599 | ||||||
Yamada Denki Co. Ltd. | 3,276 | 15,918 | ||||||
Yamaha Corp. | 700 | 34,012 | ||||||
Yamaha Motor Co. Ltd. | 1,300 | 18,745 | ||||||
Yamato Holdings Co. Ltd. | 1,400 | 30,948 | ||||||
Yamazaki Baking Co. Ltd. | 1,000 | 17,905 | ||||||
Yaskawa Electric Corp. | 1,200 | 43,062 | ||||||
Yokogawa Electric Corp. | 961 | 13,830 | ||||||
Yokohama Rubber Co. Ltd. | 500 | 7,543 | ||||||
Z Holdings Corp. | 13,000 | 53,039 | ||||||
ZOZO, Inc. | 433 | 7,966 | ||||||
|
| |||||||
(Cost $15,393,920) | 16,456,826 | |||||||
|
| |||||||
| Jordan — 0.0% | ||||||||
Hikma Pharmaceuticals PLC | 1,008 | 32,006 | ||||||
|
| |||||||
| Luxembourg — 0.1% | ||||||||
ArcelorMittal SA* | 3,042 | 29,057 | ||||||
Aroundtown SA | 4,606 | 25,268 | ||||||
Eurofins Scientific SE | 55 | 37,108 | ||||||
Reinet Investments SCA | 671 | 10,513 | ||||||
SES SA | 783 | 5,784 | ||||||
Tenaris SA | 2,316 | 14,376 | ||||||
|
| |||||||
(Cost $204,183) | 122,106 | |||||||
|
| |||||||
Number | Value | |||||||
| Macau — 0.1% | ||||||||
Sands China Ltd. | 14,271 | $ | 55,508 | |||||
Wynn Macau Ltd. | 8,449 | 14,279 | ||||||
|
| |||||||
(Cost $85,537) | 69,787 | |||||||
|
| |||||||
| Malaysia — 0.5% | ||||||||
AMMB Holdings Bhd | 6,287 | 4,584 | ||||||
Axiata Group Bhd | 13,276 | 11,604 | ||||||
CIMB Group Holdings Bhd | 23,413 | 20,303 | ||||||
Dialog Group Bhd | 17,600 | 16,153 | ||||||
DiGi.Com Bhd | 24,244 | 25,373 | ||||||
Fraser & Neave Holdings Bhd | 800 | 5,988 | ||||||
Gamuda Bhd | 13,475 | 12,088 | ||||||
Genting Bhd | 17,700 | 16,285 | ||||||
Genting Plantations Bhd | 1,000 | 2,323 | ||||||
HAP Seng Consolidated Bhd | 2,069 | 3,564 | ||||||
Hartalega Holdings Bhd | 7,400 | 21,345 | ||||||
Hong Leong Bank Bhd | 5,982 | 18,713 | ||||||
Hong Leong Financial Group Bhd | 1,753 | 5,403 | ||||||
IHH Healthcare Bhd | 7,891 | 9,856 | ||||||
IOI Corp. Bhd | 13,200 | 13,815 | ||||||
Kuala Lumpur Kepong Bhd | 1,320 | 6,692 | ||||||
Malayan Banking Bhd | 26,007 | 44,865 | ||||||
Maxis Bhd | 15,300 | 18,582 | ||||||
MISC Bhd | 6,700 | 12,791 | ||||||
Nestle Malaysia Bhd | 300 | 9,592 | ||||||
Petronas Chemicals Group Bhd | 10,857 | 15,733 | ||||||
Petronas Dagangan Bhd | 1,500 | 8,101 | ||||||
Petronas Gas Bhd | 2,841 | 12,416 | ||||||
PPB Group Bhd | 2,740 | 10,941 | ||||||
Press Metal Aluminium Holdings Bhd | 5,200 | 4,509 | ||||||
Public Bank Bhd | 15,100 | 50,918 | ||||||
QL Resources Bhd | 8,300 | 19,321 | ||||||
RHB Bank Bhd | 6,800 | 7,461 | ||||||
Sime Darby Plantation Bhd | 14,911 | 17,012 | ||||||
Telekom Malaysia Bhd | 4,400 | 4,281 | ||||||
Tenaga Nasional Bhd | 16,600 | 42,994 | ||||||
Top Glove Corp. Bhd | 5,500 | 16,826 | ||||||
Westports Holdings Bhd | 12,000 | 11,013 | ||||||
|
| |||||||
(Cost $550,641) | 501,445 | |||||||
|
| |||||||
| Mexico — 0.5% | ||||||||
America Movil SAB de CV, Series L | 166,278 | 111,054 | ||||||
Arca Continental SAB de CV | 1,935 | 8,631 | ||||||
Becle SAB de CV* | 11,223 | 19,435 | ||||||
Cemex SAB de CV, Series CPO | 71,786 | 16,996 | ||||||
Coca-Cola Femsa SAB de CV | 2,468 | 10,773 | ||||||
Fibra Uno Administracion SA de CV REIT | 33,142 | 25,274 | ||||||
Fomento Economico Mexicano SAB de CV | 9,674 | 65,423 | ||||||
Gruma SAB de CV, Class B | 1,049 | 10,411 | ||||||
Grupo Aeroportuario del Pacifico SAB de CV, Class B | 1,882 | 12,424 | ||||||
Grupo Aeroportuario del Sureste SAB de CV, Class B | 1,012 | 10,431 | ||||||
Grupo Bimbo SAB de CV, Series A | 7,709 | 12,053 | ||||||
Grupo Financiero Banorte SAB de CV, Class O | 17,499 | 53,070 | ||||||
Grupo Mexico SAB de CV, Series B | 15,916 | 34,079 | ||||||
| See Notes to Financial Statements. | 30 |
DBX ETF Trust
Schedule of Investments
Xtrackers MSCI All World ex US Hedged Equity ETF (Continued)
May 31, 2020
Number | Value | |||||||
| Mexico (Continued) | ||||||||
Grupo Televisa SAB, Series CPO* | 11,737 | $ | 13,905 | |||||
Kimberly-Clark de Mexico SAB de CV, Class A | 6,625 | 10,283 | ||||||
Megacable Holdings SAB de CV, Series CPO | 2,093 | 6,331 | ||||||
Wal-Mart de Mexico SAB de CV | 26,375 | 65,835 | ||||||
|
| |||||||
(Cost $752,257) | 486,408 | |||||||
|
| |||||||
| Netherlands — 2.9% | ||||||||
ABN AMRO Bank NV, 144A | 1,437 | 11,501 | ||||||
Adyen NV, 144A* | 89 | 116,874 | ||||||
Aegon NV | 6,911 | 18,450 | ||||||
Akzo Nobel NV | 1,171 | 95,670 | ||||||
Altice Europe NV* | 1,888 | 7,545 | ||||||
ASML Holding NV | 2,115 | 687,775 | ||||||
EXOR NV | 442 | 23,777 | ||||||
Heineken Holding NV | 613 | 50,422 | ||||||
Heineken NV | 1,306 | 119,573 | ||||||
ING Groep NV | 18,342 | 118,213 | ||||||
Just Eat Takeaway.com NV, 144A* | 564 | 61,079 | ||||||
Koninklijke Ahold Delhaize NV | 5,731 | 145,110 | ||||||
Koninklijke DSM NV | 937 | 119,666 | ||||||
Koninklijke KPN NV | 15,589 | 38,139 | ||||||
Koninklijke Philips NV* | 4,749 | 215,030 | ||||||
Koninklijke Vopak NV | 374 | 20,472 | ||||||
NN Group NV | 1,273 | 39,242 | ||||||
Prosus NV* | 2,490 | 206,196 | ||||||
QIAGEN NV* | 1,167 | 50,923 | ||||||
Randstad NV | 471 | 19,727 | ||||||
Royal Dutch Shell PLC, Class A | 19,928 | 309,903 | ||||||
Royal Dutch Shell PLC, Class B | 17,991 | 272,404 | ||||||
Wolters Kluwer NV | 1,332 | 105,985 | ||||||
|
| |||||||
(Cost $3,026,010) | 2,853,676 | |||||||
|
| |||||||
| New Zealand — 0.2% | ||||||||
a2 Milk Co. Ltd.* | 3,355 | 39,570 | ||||||
Auckland International Airport Ltd. | 4,782 | 19,295 | ||||||
Fisher & Paykel Healthcare Corp. Ltd. | 2,746 | 51,103 | ||||||
Mercury NZ Ltd. | 6,742 | 19,461 | ||||||
Meridian Energy Ltd. | 6,453 | 19,027 | ||||||
Ryman Healthcare Ltd. | 2,994 | 22,488 | ||||||
Spark New Zealand Ltd. | 8,975 | 24,625 | ||||||
|
| |||||||
(Cost $146,290) | 195,569 | |||||||
|
| |||||||
| Norway — 0.4% | ||||||||
DNB ASA* | 4,958 | 67,428 | ||||||
Equinor ASA | 4,890 | 71,005 | ||||||
Gjensidige Forsikring ASA* | 977 | 17,719 | ||||||
Mowi ASA | 2,262 | 42,595 | ||||||
Norsk Hydro ASA* | 6,886 | 17,483 | ||||||
Orkla ASA | 4,199 | 37,728 | ||||||
Schibsted ASA, Class B* | 546 | 13,087 | ||||||
Telenor ASA | 3,677 | 55,756 | ||||||
Yara International ASA | 907 | 31,034 | ||||||
|
| |||||||
(Cost $429,197) | 353,835 | |||||||
|
| |||||||
| Peru — 0.1% | ||||||||
Cia de Minas Buenaventura SAA, ADR | 998 | 7,834 | ||||||
Number | Value | |||||||
| Peru (Continued) | ||||||||
Credicorp Ltd. | 342 | $ | 47,135 | |||||
Southern Copper Corp. (b) | 387 | 14,048 | ||||||
|
| |||||||
(Cost $91,493) | 69,017 | |||||||
|
| |||||||
| Philippines — 0.2% | ||||||||
Altus San Nicolas Corp.*(c) | 170 | 18 | ||||||
Ayala Corp. | 1,520 | 22,446 | ||||||
Ayala Land, Inc. | 63,800 | 40,332 | ||||||
BDO Unibank, Inc. | 10,610 | 21,044 | ||||||
Globe Telecom, Inc. | 155 | 7,024 | ||||||
International Container Terminal Services, Inc. | 13,310 | 23,060 | ||||||
JG Summit Holdings, Inc. | 28,750 | 27,716 | ||||||
Manila Electric Co. | 920 | 5,143 | ||||||
Metropolitan Bank & Trust Co. | 491 | 341 | ||||||
PLDT, Inc. | 235 | 5,919 | ||||||
SM Investments Corp.* | 1,225 | 22,143 | ||||||
SM Prime Holdings, Inc.* | 53,100 | 31,627 | ||||||
Universal Robina Corp. | 4,790 | 12,396 | ||||||
|
| |||||||
(Cost $250,337) | 219,209 | |||||||
|
| |||||||
| Poland — 0.2% | ||||||||
Bank Polska Kasa Opieki SA | 1,995 | 26,142 | ||||||
CD Projekt SA* | 324 | 32,618 | ||||||
Cyfrowy Polsat SA | 981 | 6,388 | ||||||
Dino Polska SA, 144A* | 306 | 13,930 | ||||||
Grupa Lotos SA | 464 | 6,888 | ||||||
KGHM Polska Miedz SA* | 641 | 13,788 | ||||||
LPP SA | 3 | 5,131 | ||||||
Orange Polska SA* | 3,303 | 5,369 | ||||||
Polski Koncern Naftowy ORLEN SA | 1,475 | 24,550 | ||||||
Powszechna Kasa Oszczednosci Bank Polski SA | 4,459 | 24,791 | ||||||
Powszechny Zaklad Ubezpieczen SA | 3,045 | 22,653 | ||||||
|
| |||||||
(Cost $202,268) | 182,248 | |||||||
|
| |||||||
| Portugal — 0.1% | ||||||||
EDP—Energias de Portugal SA | 11,768 | 55,165 | ||||||
Galp Energia SGPS SA | 2,525 | 30,033 | ||||||
Jeronimo Martins SGPS SA* | 1,147 | 19,582 | ||||||
|
| |||||||
(Cost $100,746) | 104,780 | |||||||
|
| |||||||
| Qatar — 0.2% | ||||||||
Barwa Real Estate Co. | 8,950 | 7,129 | ||||||
Commercial Bank PSQC | 8,970 | 9,103 | ||||||
Industries Qatar QSC | 9,750 | 21,075 | ||||||
Masraf Al Rayan QSC | 18,600 | 20,025 | ||||||
Mesaieed Petrochemical Holding Co. | 20,910 | 11,509 | ||||||
Qatar Electricity & Water Co. QSC | 1,690 | 6,925 | ||||||
Qatar Fuel QSC | 1,750 | 7,690 | ||||||
Qatar International Islamic Bank QSC | 4,987 | 10,629 | ||||||
Qatar Islamic Bank SAQ | 5,600 | 23,686 | ||||||
Qatar National Bank QPSC | 23,084 | 112,091 | ||||||
|
| |||||||
(Cost $217,988) | 229,862 | |||||||
|
| |||||||
| Romania — 0.0% | ||||||||
NEPI Rockcastle PLC | ||||||||
(Cost $26,361) | 2,088 | 10,647 | ||||||
|
| |||||||
| See Notes to Financial Statements. | 31 |
DBX ETF Trust
Schedule of Investments
Xtrackers MSCI All World ex US Hedged Equity ETF (Continued)
May 31, 2020
Number | Value | |||||||
| Russia — 0.9% | ||||||||
Alrosa PJSC | 13,206 | $ | 12,391 | |||||
Gazprom PJSC | 61,643 | 175,222 | ||||||
Inter RAO UES PJSC | 172,920 | 12,154 | ||||||
LUKOIL PJSC | 2,033 | 151,516 | ||||||
Magnit PJSC, GDR | 770 | 8,778 | ||||||
Magnitogorsk Iron & Steel Works PJSC | 10,753 | 6,182 | ||||||
MMC Norilsk Nickel PJSC | 324 | 101,839 | ||||||
Mobile TeleSystems PJSC, ADR | 2,491 | 22,145 | ||||||
Moscow Exchange MICEX-RTS PJSC | 7,013 | 11,394 | ||||||
Novatek PJSC, GDR | 463 | 66,996 | ||||||
Novolipetsk Steel PJSC | 5,971 | 11,694 | ||||||
PhosAgro PJSC, GDR | 544 | 7,507 | ||||||
Polyus PJSC | 196 | 32,525 | ||||||
Rosneft Oil Co. PJSC | 5,275 | 28,211 | ||||||
Sberbank of Russia PJSC | 52,223 | 148,853 | ||||||
Severstal PAO | 1,075 | 14,283 | ||||||
Surgutneftegas PJSC | 36,607 | 20,614 | ||||||
Tatneft PJSC | 7,582 | 57,343 | ||||||
VTB Bank PJSC | 14,659,382 | 7,567 | ||||||
X5 Retail Group NV, GDR | 551 | 16,363 | ||||||
|
| |||||||
(Cost $860,605) | 913,577 | |||||||
|
| |||||||
| Saudi Arabia — 0.8% | ||||||||
Advanced Petrochemical Co. | 842 | 10,861 | ||||||
Al Rajhi Bank | 6,434 | 96,270 | ||||||
Alinma Bank* | 5,516 | 21,559 | ||||||
Almarai Co. JSC | 788 | 10,291 | ||||||
Arab National Bank | 2,846 | 14,973 | ||||||
Bank AlBilad | 1,067 | 6,170 | ||||||
Bank Al-Jazira | 5,918 | 17,678 | ||||||
Banque Saudi Fransi | 3,056 | 24,206 | ||||||
Bupa Arabia for Cooperative Insurance Co. | 297 | 8,935 | ||||||
Dar Al Arkan Real Estate Development Co.* | 4,027 | 7,333 | ||||||
Etihad Etisalat Co.* | 2,668 | 18,398 | ||||||
Jarir Marketing Co. | 225 | 8,135 | ||||||
National Commercial Bank | 7,286 | 72,550 | ||||||
Rabigh Refining & Petrochemical Co.* | 1,926 | 6,922 | ||||||
Riyad Bank | 6,641 | 28,997 | ||||||
Sahara International Petrochemical Co. | 2,629 | 10,079 | ||||||
Samba Financial Group | 5,453 | 34,205 | ||||||
Saudi Arabian Fertilizer Co. | 1,668 | 33,529 | ||||||
Saudi Arabian Mining Co.* | 2,313 | 20,661 | ||||||
Saudi Arabian Oil Co., 144A | 5,947 | 52,250 | ||||||
Saudi Basic Industries Corp. | 4,460 | 98,557 | ||||||
Saudi British Bank | 2,869 | 17,492 | ||||||
Saudi Cement Co. | 623 | 7,630 | ||||||
Saudi Electricity Co.* | 2,882 | 12,967 | ||||||
Saudi Kayan Petrochemical Co.* | 5,149 | 11,378 | ||||||
Saudi Telecom Co. | 2,972 | 79,127 | ||||||
Savola Group | 735 | 8,023 | ||||||
Yanbu National Petrochemical Co. | 1,255 | 16,673 | ||||||
|
| |||||||
(Cost $918,377) | 755,849 | |||||||
|
| |||||||
| Singapore — 0.7% | ||||||||
Ascendas Real Estate Investment Trust REIT | 14,752 | 32,682 | ||||||
BOC Aviation Ltd., 144A | 771 | 4,237 | ||||||
Number | Value | |||||||
| Singapore (Continued) | ||||||||
CapitaLand Commercial Trust REIT | 13,907 | $ | 17,226 | |||||
CapitaLand Ltd.* | 11,657 | 23,845 | ||||||
CapitaLand Mall Trust REIT | 13,709 | 19,698 | ||||||
City Developments Ltd. | 2,100 | 11,430 | ||||||
DBS Group Holdings Ltd. | 8,900 | 122,652 | ||||||
Genting Singapore Ltd. | 36,200 | 20,114 | ||||||
Keppel Corp. Ltd. | 7,200 | 30,119 | ||||||
Mapletree Commercial Trust REIT | 16,100 | 22,792 | ||||||
Oversea-Chinese Banking Corp. Ltd. | 16,270 | 98,463 | ||||||
Singapore Airlines Ltd. (b) | 7,250 | 19,603 | ||||||
Singapore Exchange Ltd. | 3,593 | 21,058 | ||||||
Singapore Technologies Engineering Ltd. | 7,930 | 17,905 | ||||||
Singapore Telecommunications Ltd. | 40,100 | 70,675 | ||||||
Suntec Real Estate Investment Trust REIT | 9,028 | 9,394 | ||||||
United Overseas Bank Ltd. | 6,322 | 87,259 | ||||||
UOL Group Ltd.* | 2,200 | 10,651 | ||||||
Venture Corp. Ltd. | 1,500 | 16,244 | ||||||
Wilmar International Ltd. | 14,637 | 41,234 | ||||||
|
| |||||||
(Cost $852,307) | 697,281 | |||||||
|
| |||||||
| South Africa — 0.9% | ||||||||
Absa Group Ltd. | 1,142 | 5,283 | ||||||
Anglo American Platinum Ltd. | 301 | 19,034 | ||||||
AngloGold Ashanti Ltd. | 2,073 | 50,136 | ||||||
Aspen Pharmacare Holdings Ltd.* | 1,317 | 10,481 | ||||||
Bid Corp. Ltd. | 1,518 | 21,301 | ||||||
Bidvest Group Ltd. | 1,653 | 14,301 | ||||||
Capitec Bank Holdings Ltd. | 242 | 11,661 | ||||||
Clicks Group Ltd. | 1,163 | 15,423 | ||||||
Discovery Ltd. (b) | 2,255 | 12,623 | ||||||
FirstRand Ltd. | 22,954 | 52,481 | ||||||
Gold Fields Ltd. | 4,861 | 37,970 | ||||||
Growthpoint Properties Ltd. REIT | 13,996 | 9,952 | ||||||
Impala Platinum Holdings Ltd. | 3,903 | 26,035 | ||||||
Kumba Iron Ore Ltd. | 337 | 9,107 | ||||||
Mr Price Group Ltd. | 1,099 | 8,140 | ||||||
MTN Group Ltd. | 8,207 | 25,203 | ||||||
MultiChoice Group* | 2,209 | 10,888 | ||||||
Naspers Ltd., Class N | 2,232 | 354,573 | ||||||
Nedbank Group Ltd. | 2,015 | 11,340 | ||||||
Northam Platinum Ltd.* | 1,743 | 10,886 | ||||||
Old Mutual Ltd. | 26,893 | 17,206 | ||||||
Remgro Ltd. | 2,605 | 20,624 | ||||||
RMB Holdings Ltd. | 4,734 | 14,284 | ||||||
Sanlam Ltd. | 9,251 | 29,816 | ||||||
Shoprite Holdings Ltd. | 2,586 | 15,245 | ||||||
Sibanye Stillwater Ltd.* | 11,084 | 20,441 | ||||||
SPAR Group Ltd. | 774 | 7,725 | ||||||
Standard Bank Group Ltd. | 8,950 | 51,812 | ||||||
Vodacom Group Ltd. | 2,870 | 20,640 | ||||||
Woolworths Holdings Ltd. | 4,793 | 7,897 | ||||||
|
| |||||||
(Cost $1,237,313) | 922,508 | |||||||
|
| |||||||
| South Korea — 2.9% | ||||||||
Amorepacific Corp. | 89 | 11,714 | ||||||
BGF retail Co. Ltd. | 34 | 4,585 | ||||||
Celltrion Healthcare Co. Ltd.* | 346 | 25,368 | ||||||
| See Notes to Financial Statements. | 32 |
DBX ETF Trust
Schedule of Investments
Xtrackers MSCI All World ex US Hedged Equity ETF (Continued)
May 31, 2020
Number | Value | |||||||
| South Korea (Continued) | ||||||||
Celltrion Pharm, Inc.* | 210 | $ | 15,549 | |||||
Celltrion, Inc.* | 438 | 75,508 | ||||||
Cheil Worldwide, Inc. | 320 | 4,289 | ||||||
CJ CheilJedang Corp. | 28 | 6,715 | ||||||
CJ Logistics Corp.* | 156 | 20,280 | ||||||
Coway Co. Ltd. | 184 | 9,895 | ||||||
Daelim Industrial Co. Ltd. | 137 | 10,210 | ||||||
DB Insurance Co. Ltd. | 302 | 10,583 | ||||||
Douzone Bizon Co. Ltd. | 206 | 19,960 | ||||||
E-MART, Inc. | 89 | 8,157 | ||||||
Fila Holdings Corp. | 235 | 7,296 | ||||||
GS Engineering & Construction Corp. | 342 | 7,884 | ||||||
GS Retail Co. Ltd. | 176 | 6,054 | ||||||
Hana Financial Group, Inc. | 1,448 | 34,784 | ||||||
Hanmi Pharm. Co. Ltd. | 18 | 3,445 | ||||||
Hanon Systems | 837 | 6,583 | ||||||
Hanwha Solutions Corp. | 647 | 8,437 | ||||||
HLB, Inc.* | 147 | 13,401 | ||||||
Hotel Shilla Co. Ltd. | 152 | 9,721 | ||||||
Hyundai Engineering & Construction Co. Ltd. | 901 | 24,881 | ||||||
Hyundai Glovis Co. Ltd. | 90 | 8,212 | ||||||
Hyundai Heavy Industries Holdings Co. Ltd. | 3 | 655 | ||||||
Hyundai Mobis Co. Ltd. | 324 | 51,800 | ||||||
Hyundai Motor Co. | 725 | 57,370 | ||||||
Kakao Corp. | 322 | 68,511 | ||||||
Kangwon Land, Inc. | 553 | 10,806 | ||||||
KB Financial Group, Inc. | 1,982 | 54,413 | ||||||
Kia Motors Corp. | 1,317 | 36,422 | ||||||
KMW Co. Ltd.* | 317 | 14,923 | ||||||
Korea Electric Power Corp.* | 1,204 | 20,999 | ||||||
Korea Investment Holdings Co. Ltd. | 206 | 8,766 | ||||||
Korea Shipbuilding & Offshore Engineering Co. Ltd.* | 196 | 14,370 | ||||||
Korea Zinc Co. Ltd. | 32 | 9,767 | ||||||
KT&G Corp. | 589 | 39,902 | ||||||
Kumho Petrochemical Co. Ltd. | 50 | 2,862 | ||||||
LG Chem Ltd. | 230 | 72,522 | ||||||
LG Corp. | 492 | 25,068 | ||||||
LG Electronics, Inc. | 498 | 23,845 | ||||||
LG Household & Health Care Ltd. | 53 | 58,630 | ||||||
LG Innotek Co. Ltd. | 88 | 10,481 | ||||||
LG Uplus Corp. | 2,219 | 23,562 | ||||||
Lotte Chemical Corp. | 94 | 14,270 | ||||||
Mirae Asset Daewoo Co. Ltd. | 1,783 | 8,883 | ||||||
NAVER Corp. | 713 | 130,113 | ||||||
NCSoft Corp. | 88 | 56,135 | ||||||
Orion Corp. | 120 | 12,790 | ||||||
Ottogi Corp. | 8 | 3,559 | ||||||
Pearl Abyss Corp.* | 18 | 2,972 | ||||||
POSCO | 393 | 57,437 | ||||||
POSCO Chemical Co. Ltd. | 133 | 5,960 | ||||||
S-1 Corp. | 77 | 5,795 | ||||||
Samsung Biologics Co. Ltd., 144A* | 88 | 44,197 | ||||||
Samsung C&T Corp. | 591 | 47,291 | ||||||
Samsung Card Co. Ltd. | 213 | 5,082 | ||||||
Number | Value | |||||||
| South Korea (Continued) | ||||||||
Samsung Electro-Mechanics Co. Ltd. | 308 | $ | 31,087 | |||||
Samsung Electronics Co. Ltd. | 23,966 | 981,127 | ||||||
Samsung Fire & Marine Insurance Co. Ltd. | 149 | 21,957 | ||||||
Samsung Life Insurance Co. Ltd. | 218 | 8,044 | ||||||
Samsung SDI Co. Ltd. | 290 | 84,065 | ||||||
Samsung SDS Co. Ltd. | 164 | 25,227 | ||||||
Samsung Securities Co. Ltd. | 383 | 8,644 | ||||||
Shinhan Financial Group Co. Ltd. | 2,258 | 54,971 | ||||||
Shinsegae, Inc. | 19 | 3,759 | ||||||
SK Holdings Co. Ltd. | 241 | 46,509 | ||||||
SK Hynix, Inc. | 2,824 | 185,842 | ||||||
SK Innovation Co. Ltd. | 272 | 26,026 | ||||||
SK Telecom Co. Ltd. | 77 | 13,430 | ||||||
S-Oil Corp. | 231 | 13,187 | ||||||
Woori Financial Group, Inc. | 2,704 | 19,934 | ||||||
Yuhan Corp. | 195 | 8,172 | ||||||
|
| |||||||
(Cost $2,396,910) | 2,885,650 | |||||||
|
| |||||||
| Spain — 1.5% | ||||||||
ACS Actividades de Construccion y Servicios SA | 1,060 | 27,004 | ||||||
Aena SME SA, 144A* | 324 | 46,108 | ||||||
Amadeus IT Group SA | 1,949 | 101,554 | ||||||
Banco Bilbao Vizcaya Argentaria SA | 32,549 | 100,914 | ||||||
Banco Santander SA | 80,347 | 181,723 | ||||||
Banco Santander SA | 3,060 | 6,537 | ||||||
Bankinter SA | 3,337 | 14,117 | ||||||
CaixaBank SA | 17,581 | 32,777 | ||||||
Cellnex Telecom SA, 144A* | 1,353 | 76,477 | ||||||
Enagas SA | 1,108 | 24,857 | ||||||
Endesa SA | 1,574 | 37,303 | ||||||
Ferrovial SA* | 33 | 894 | ||||||
Ferrovial SA | 2,413 | 65,410 | ||||||
Grifols SA (b) | 1,532 | 47,821 | ||||||
Iberdrola SA | 30,163 | 324,378 | ||||||
Industria de Diseno Textil SA | 5,612 | 156,052 | ||||||
Mapfre SA | 3,817 | 6,707 | ||||||
Naturgy Energy Group SA | 1,580 | 29,281 | ||||||
Red Electrica Corp. SA | 2,050 | 36,046 | ||||||
Repsol SA | 7,421 | 68,949 | ||||||
Siemens Gamesa Renewable Energy SA* | 1,190 | 19,993 | ||||||
Telefonica SA | 23,152 | 108,993 | ||||||
|
| |||||||
(Cost $2,196,924) | 1,513,895 | |||||||
|
| |||||||
| Sweden — 1.8% | ||||||||
Alfa Laval AB* | 2,055 | 41,416 | ||||||
Assa Abloy AB, Class B | 4,885 | 98,866 | ||||||
Atlas Copco AB, Class A | 3,285 | 128,715 | ||||||
Atlas Copco AB, Class B | 2,000 | 70,512 | ||||||
Boliden AB | 1,449 | 31,402 | ||||||
Electrolux AB, Series B | 1,265 | 20,695 | ||||||
Epiroc AB, Class A | 3,189 | 35,384 | ||||||
Epiroc AB, Class B | 2,337 | 26,017 | ||||||
Essity AB, Class B* | 3,142 | 103,638 | ||||||
Evolution Gaming Group AB, 144A* | 628 | 37,043 | ||||||
Hennes & Mauritz AB, Class B | 4,066 | 61,340 | ||||||
Hexagon AB, Class B* | 1,519 | 83,377 | ||||||
Husqvarna AB, Class B | 2,076 | 15,260 | ||||||
| See Notes to Financial Statements. | 33 |
DBX ETF Trust
Schedule of Investments
Xtrackers MSCI All World ex US Hedged Equity ETF (Continued)
May 31, 2020
Number | Value | |||||||
| Sweden (Continued) | ||||||||
ICA Gruppen AB (b) | 374 | $ | 17,556 | |||||
Industrivarden AB, Class C* | 838 | 18,623 | ||||||
Investment AB Latour, Class B | 731 | 13,103 | ||||||
Investor AB, Class B | 2,214 | 117,719 | ||||||
Kinnevik AB, Class B | 1,144 | 28,774 | ||||||
L E Lundbergforetagen AB, Class B* | 389 | 19,288 | ||||||
Lundin Energy AB | 937 | 22,573 | ||||||
Nibe Industrier AB, Class B* | 1,542 | 34,203 | ||||||
Sandvik AB* | 5,583 | 92,373 | ||||||
Securitas AB, Class B* | 1,546 | 20,476 | ||||||
Skandinaviska Enskilda Banken AB, | 7,889 | 68,420 | ||||||
Skanska AB, Class B* | 1,704 | 34,017 | ||||||
SKF AB, Class B | 1,834 | 33,634 | ||||||
Svenska Cellulosa AB SCA, Class B* | 2,995 | 37,348 | ||||||
Svenska Handelsbanken AB, Class A* | 7,227 | 68,369 | ||||||
Swedbank AB, Class A* | 4,446 | 55,678 | ||||||
Swedish Match AB | 935 | 64,857 | ||||||
Tele2 AB, Class B | 2,515 | 33,444 | ||||||
Telefonaktiebolaget LM Ericsson, Class B | 15,440 | 140,332 | ||||||
Telia Co. AB | 11,049 | 37,852 | ||||||
Volvo AB, Class B* | 7,307 | 103,333 | ||||||
|
| |||||||
(Cost $1,863,964) | 1,815,637 | |||||||
|
| |||||||
| Switzerland — 6.8% | ||||||||
ABB Ltd. | 9,061 | 177,960 | ||||||
Adecco Group AG | 658 | 31,210 | ||||||
Alcon, Inc.* | 2,434 | 156,598 | ||||||
Baloise Holding AG | 233 | 33,092 | ||||||
Barry Callebaut AG | 20 | 40,175 | ||||||
Chocoladefabriken Lindt & Spruengli AG Participation Certificates | 10 | 83,281 | ||||||
Cie Financiere Richemont SA | 2,479 | 144,028 | ||||||
Clariant AG* | 1,111 | 20,348 | ||||||
Coca-Cola HBC AG* | 782 | 19,682 | ||||||
Credit Suisse Group AG | 11,929 | 108,748 | ||||||
EMS-Chemie Holding AG | 42 | 31,026 | ||||||
Geberit AG | 177 | 85,997 | ||||||
Givaudan SA | 45 | 161,276 | ||||||
Glencore PLC* | 49,124 | 90,893 | ||||||
Julius Baer Group Ltd. | 1,131 | 48,095 | ||||||
Kuehne + Nagel International AG* | 285 | 41,011 | ||||||
LafargeHolcim Ltd.* | 2,572 | 106,271 | ||||||
Logitech International SA | 812 | 47,852 | ||||||
Lonza Group AG | 382 | 187,267 | ||||||
Nestle SA | 14,716 | 1,589,108 | ||||||
Novartis AG | 10,855 | 937,087 | ||||||
Pargesa Holding SA | 228 | 17,187 | ||||||
Partners Group Holding AG | 87 | 71,858 | ||||||
Roche Holding AG | 3,523 | 1,218,655 | ||||||
Schindler Holding AG | 92 | 21,273 | ||||||
Schindler Holding AG Participation Certificates | 212 | 49,176 | ||||||
SGS SA | 31 | 72,681 | ||||||
Sika AG | 655 | 112,027 | ||||||
Sonova Holding AG | 261 | 57,123 | ||||||
STMicroelectronics NV | 3,817 | 93,597 | ||||||
Number | Value | |||||||
| Switzerland (Continued) | ||||||||
Straumann Holding AG | 51 | $ | 41,254 | |||||
Swatch Group AG — Bearer | 117 | 23,344 | ||||||
Swatch Group AG — Registered | 258 | 10,016 | ||||||
Swiss Life Holding AG | 143 | 50,164 | ||||||
Swiss Prime Site AG | 462 | 42,943 | ||||||
Swiss Re AG | 1,376 | 93,164 | ||||||
Swisscom AG | 138 | 71,712 | ||||||
Temenos AG | 320 | 48,808 | ||||||
UBS Group AG | 18,022 | 192,999 | ||||||
Vifor Pharma AG | 216 | 32,811 | ||||||
Zurich Insurance Group AG | 744 | 239,414 | ||||||
|
| |||||||
(Cost $6,122,447) | 6,701,211 | |||||||
|
| |||||||
| Taiwan — 3.3% | ||||||||
Accton Technology Corp. | 3,780 | 30,404 | ||||||
Acer, Inc. | 17,300 | 9,421 | ||||||
Advantech Co. Ltd. | 1,525 | 15,085 | ||||||
Airtac International Group | 1,178 | 20,205 | ||||||
ASE Technology Holding Co. Ltd. | 16,148 | 33,237 | ||||||
Asia Cement Corp. | 10,572 | 15,334 | ||||||
Asustek Computer, Inc. | 3,170 | 22,224 | ||||||
AU Optronics Corp. | 46,038 | 11,623 | ||||||
Catcher Technology Co. Ltd. | 3,107 | 22,559 | ||||||
Cathay Financial Holding Co. Ltd. | 38,652 | 51,557 | ||||||
Chailease Holding Co. Ltd. | 5,065 | 19,653 | ||||||
Chang Hwa Commercial Bank Ltd. | 48,284 | 30,233 | ||||||
Cheng Shin Rubber Industry Co. Ltd. | 9,594 | 10,481 | ||||||
Chicony Electronics Co. Ltd. | 2,237 | 6,407 | ||||||
China Development Financial Holding Corp. | 86,713 | 26,252 | ||||||
China Life Insurance Co. Ltd.* | 8,087 | 5,589 | ||||||
China Steel Corp. | 60,999 | 40,226 | ||||||
Chunghwa Telecom Co. Ltd. | 19,017 | 69,988 | ||||||
Compal Electronics, Inc. | 22,036 | 14,018 | ||||||
CTBC Financial Holding Co. Ltd. | 93,398 | 62,058 | ||||||
Delta Electronics, Inc. | 9,932 | 45,649 | ||||||
E.Sun Financial Holding Co. Ltd. | 56,061 | 49,759 | ||||||
Eclat Textile Co. Ltd. | 1,246 | 12,823 | ||||||
Eva Airways Corp. | 10,317 | 3,780 | ||||||
Far Eastern New Century Corp. | 15,056 | 13,489 | ||||||
Far EasTone Telecommunications Co. Ltd. | 9,250 | 19,933 | ||||||
Feng TAY Enterprise Co. Ltd. | 2,138 | 12,889 | ||||||
First Financial Holding Co. Ltd. | 53,947 | 41,055 | ||||||
Formosa Chemicals & Fibre Corp. | 17,575 | 42,145 | ||||||
Formosa Petrochemical Corp. | 6,988 | 20,411 | ||||||
Formosa Plastics Corp. | 23,023 | 63,644 | ||||||
Foxconn Technology Co. Ltd. | 4,226 | 7,586 | ||||||
Fubon Financial Holding Co. Ltd. | 40,185 | 56,748 | ||||||
Giant Manufacturing Co. Ltd. | 1,876 | 14,683 | ||||||
Globalwafers Co. Ltd. | 1,575 | 18,963 | ||||||
Highwealth Construction Corp. | 14,468 | 21,371 | ||||||
Hiwin Technologies Corp. | 949 | 9,688 | ||||||
Hon Hai Precision Industry Co. Ltd. | 62,743 | 158,399 | ||||||
Hotai Motor Co. Ltd. | 1,520 | 27,135 | ||||||
Hua Nan Financial Holdings Co. Ltd. | 48,107 | 31,163 | ||||||
Inventec Corp. | 13,870 | 11,272 | ||||||
Largan Precision Co. Ltd. | 542 | 69,228 | ||||||
| See Notes to Financial Statements. | 34 |
DBX ETF Trust
Schedule of Investments
Xtrackers MSCI All World ex US Hedged Equity ETF (Continued)
May 31, 2020
Number | Value | |||||||
| Taiwan (Continued) | ||||||||
Lite-On Technology Corp. | 9,228 | $ | 14,783 | |||||
MediaTek, Inc. | 7,722 | 119,077 | ||||||
Mega Financial Holding Co. Ltd. | 50,675 | 51,899 | ||||||
Micro-Star International Co. Ltd. | 1,704 | 5,732 | ||||||
Nan Ya Plastics Corp. | 24,234 | 50,768 | ||||||
Nanya Technology Corp. | 6,135 | 12,219 | ||||||
Nien Made Enterprise Co. Ltd. | 661 | 5,658 | ||||||
Novatek Microelectronics Corp. | 2,585 | 17,649 | ||||||
Pegatron Corp. | 10,138 | 21,779 | ||||||
Phison Electronics Corp. | 756 | 6,924 | ||||||
Pou Chen Corp. | 11,351 | 11,171 | ||||||
Powertech Technology, Inc. | 1,605 | 5,185 | ||||||
President Chain Store Corp. | 2,564 | 25,234 | ||||||
Quanta Computer, Inc. | 12,507 | 29,159 | ||||||
Realtek Semiconductor Corp. | 1,613 | 13,887 | ||||||
Ruentex Development Co. Ltd.* | 2,518 | 3,833 | ||||||
Shanghai Commercial & Savings Bank Ltd. | 13,602 | 19,389 | ||||||
Shin Kong Financial Holding Co. Ltd.* | 39,103 | 10,862 | ||||||
SinoPac Financial Holdings Co. Ltd. | 52,678 | 20,703 | ||||||
Standard Foods Corp. | 2,737 | 5,788 | ||||||
Synnex Technology International Corp. | 7,783 | 11,509 | ||||||
Taishin Financial Holding Co. Ltd. | 46,657 | 20,201 | ||||||
Taiwan Business Bank | 19,625 | 6,928 | ||||||
Taiwan Cement Corp. | 25,330 | 35,896 | ||||||
Taiwan Cooperative Financial Holding Co. Ltd. | 67,613 | 45,939 | ||||||
Taiwan High Speed Rail Corp. | 9,687 | 12,163 | ||||||
Taiwan Mobile Co. Ltd. | 11,217 | 40,161 | ||||||
Taiwan Semiconductor Manufacturing Co. Ltd. | 123,112 | 1,197,292 | ||||||
Uni-President Enterprises Corp. | 24,378 | 59,108 | ||||||
United Microelectronics Corp. | 51,679 | 26,593 | ||||||
Vanguard International Semiconductor Corp. | 4,827 | 11,816 | ||||||
Walsin Technology Corp. | 2,110 | 13,141 | ||||||
Win Semiconductors Corp. | 2,249 | 19,250 | ||||||
Wistron Corp. | 8,893 | 8,471 | ||||||
WPG Holdings Ltd. | 10,759 | 14,065 | ||||||
Yageo Corp. | 914 | 11,278 | ||||||
Yuanta Financial Holding Co. Ltd. | 48,345 | 26,165 | ||||||
Zhen Ding Technology Holding Ltd. | 2,151 | 8,561 | ||||||
|
| |||||||
(Cost $2,478,318) | 3,288,603 | |||||||
|
| |||||||
| Thailand — 0.6% | ||||||||
Advanced Info Service PCL, NVDR | 6,000 | 36,309 | ||||||
Airports of Thailand PCL, NVDR | 21,700 | 42,295 | ||||||
Bangkok Bank PCL, NVDR | 900 | 3,084 | ||||||
Bangkok Dusit Medical Services PCL, NVDR | 50,400 | 35,649 | ||||||
Bangkok Expressway & Metro PCL, NVDR | 53,700 | 16,628 | ||||||
Berli Jucker PCL, NVDR | 6,100 | 8,150 | ||||||
BTS Group Holdings PCL, NVDR | 38,600 | 14,683 | ||||||
Bumrungrad Hospital PCL, NVDR | 2,400 | 9,054 | ||||||
Central Pattana PCL, NVDR | 13,300 | 20,592 | ||||||
Central Retail Corp. PCL, NVDR* | 8,300 | 10,046 | ||||||
Charoen Pokphand Foods PCL, NVDR | 19,100 | 18,914 | ||||||
Number | Value | |||||||
| Thailand (Continued) | ||||||||
CP ALL PCL, NVDR | 30,600 | $ | 67,818 | |||||
Electricity Generating PCL, NVDR | 1,600 | 13,882 | ||||||
Energy Absolute PCL, NVDR | 8,200 | 10,053 | ||||||
Global Power Synergy PCL, Class F | 7,200 | 17,089 | ||||||
Gulf Energy Development PCL, NVDR | 14,500 | 17,208 | ||||||
Home Product Center PCL, NVDR | 25,200 | 11,725 | ||||||
Indorama Ventures PCL, NVDR | 8,700 | 7,795 | ||||||
Intouch Holdings PCL, NVDR | 12,300 | 20,783 | ||||||
IRPC PCL, NVDR | 112,383 | 9,539 | ||||||
Kasikornbank PCL, NVDR | 10,300 | 31,084 | ||||||
Krung Thai Bank PCL, NVDR | 21,700 | 7,095 | ||||||
Land & Houses PCL, NVDR | 44,300 | 10,166 | ||||||
Minor International PCL, NVDR* | 14,600 | 8,537 | ||||||
PTT Exploration & Production PCL, NVDR | 7,200 | 19,013 | ||||||
PTT Global Chemical PCL, NVDR | 7,000 | 9,462 | ||||||
PTT PCL, NVDR | 58,000 | 64,728 | ||||||
Ratch Group PCL, NVDR | 3,800 | 8,362 | ||||||
Siam Cement PCL | 700 | 7,548 | ||||||
Siam Cement PCL, NVDR | 3,500 | 37,740 | ||||||
Siam Commercial Bank PCL, NVDR | 1,200 | 2,792 | ||||||
Thai Oil PCL, NVDR | 8,800 | 11,896 | ||||||
Thai Union Group PCL, NVDR | 16,700 | 7,192 | ||||||
True Corp. PCL, NVDR | 54,500 | 6,339 | ||||||
|
| |||||||
(Cost $724,109) | 623,250 | |||||||
|
| |||||||
| Turkey — 0.1% | ||||||||
Akbank T.A.S.* | 32,552 | 27,131 | ||||||
BIM Birlesik Magazalar AS | 2,061 | 19,653 | ||||||
Eregli Demir ve Celik Fabrikalari TAS* | 7,049 | 8,312 | ||||||
Ford Otomotiv Sanayi AS | 241 | 2,183 | ||||||
KOC Holding AS | 4,182 | 9,887 | ||||||
Turkcell Iletisim Hizmetleri AS | 4,843 | 10,045 | ||||||
Turkiye Garanti Bankasi AS* | 11,543 | 13,222 | ||||||
Yapi ve Kredi Bankasi AS* | 42,754 | 14,529 | ||||||
|
| |||||||
(Cost $161,456) | 104,962 | |||||||
|
| |||||||
| United Arab Emirates — 0.2% | ||||||||
Abu Dhabi Commercial Bank PJSC | 13,268 | 15,894 | ||||||
Aldar Properties PJSC | 32,065 | 15,102 | ||||||
DP World PLC | 840 | 13,230 | ||||||
Dubai Islamic Bank PJSC | 16,461 | 15,909 | ||||||
Emaar Properties PJSC* | 14,089 | 9,589 | ||||||
Emirates Telecommunications Group Co. PJSC | 8,658 | 36,865 | ||||||
First Abu Dhabi Bank PJSC | 13,709 | 41,353 | ||||||
NMC Health PLC (c) | 462 | 0 | ||||||
|
| |||||||
(Cost $214,902) | 147,942 | |||||||
|
| |||||||
| United Kingdom — 8.5% | ||||||||
3i Group PLC | 4,320 | 44,015 | ||||||
Admiral Group PLC | 779 | 22,445 | ||||||
Anglo American PLC | 6,491 | 136,327 | ||||||
Ashtead Group PLC | 2,163 | 63,924 | ||||||
Associated British Foods PLC | 1,527 | 34,341 | ||||||
AstraZeneca PLC | 6,662 | 705,926 | ||||||
Auto Trader Group PLC, 144A | 4,590 | 31,642 | ||||||
AVEVA Group PLC | 360 | 18,175 | ||||||
Aviva PLC | 17,680 | 54,085 | ||||||
| See Notes to Financial Statements. | 35 |
DBX ETF Trust
Schedule of Investments
Xtrackers MSCI All World ex US Hedged Equity ETF (Continued)
May 31, 2020
Number | Value | |||||||
| United Kingdom (Continued) | ||||||||
BAE Systems PLC | 16,080 | $ | 98,539 | |||||
Barclays PLC | 81,476 | 115,958 | ||||||
Barratt Developments PLC | 4,246 | 26,062 | ||||||
Berkeley Group Holdings PLC | 630 | 31,861 | ||||||
BP PLC | 98,278 | 371,099 | ||||||
British American Tobacco PLC | 11,276 | 444,166 | ||||||
British Land Co. PLC REIT | 3,250 | 16,348 | ||||||
BT Group PLC | 40,458 | 58,085 | ||||||
Bunzl PLC | 1,708 | 39,793 | ||||||
Burberry Group PLC | 1,724 | 31,841 | ||||||
CNH Industrial NV* | 4,194 | 25,382 | ||||||
Coca-Cola European Partners PLC | 1,141 | 43,016 | ||||||
Compass Group PLC | 9,386 | 137,246 | ||||||
Croda International PLC | 607 | 38,907 | ||||||
Diageo PLC | 11,755 | 405,109 | ||||||
Direct Line Insurance Group PLC | 5,332 | 17,424 | ||||||
Ferguson PLC | 1,100 | 86,482 | ||||||
Fiat Chrysler Automobiles NV* | 5,442 | 47,977 | ||||||
GlaxoSmithKline PLC | 25,294 | 522,239 | ||||||
Halma PLC | 2,048 | 58,932 | ||||||
Hargreaves Lansdown PLC | 1,946 | 44,065 | ||||||
HSBC Holdings PLC | 99,857 | 456,420 | ||||||
Imperial Brands PLC | 4,401 | 79,708 | ||||||
Informa PLC | 9,124 | 51,202 | ||||||
InterContinental Hotels Group PLC | 978 | 46,755 | ||||||
Intertek Group PLC | 767 | 52,155 | ||||||
ITV PLC | 12,917 | 12,807 | ||||||
J Sainsbury PLC | 6,654 | 15,942 | ||||||
JD Sports Fashion PLC | 1,489 | 12,107 | ||||||
Johnson Matthey PLC | 766 | 19,989 | ||||||
Kingfisher PLC | 8,235 | 19,751 | ||||||
Land Securities Group PLC REIT | 2,773 | 20,747 | ||||||
Legal & General Group PLC | 27,323 | 66,982 | ||||||
Lloyds Banking Group PLC | 345,504 | 127,455 | ||||||
London Stock Exchange Group PLC | 1,672 | 165,813 | ||||||
M&G PLC | 9,744 | 16,847 | ||||||
Melrose Industries PLC | 19,850 | 28,229 | ||||||
Mondi PLC | 2,351 | 43,785 | ||||||
National Grid PLC | 17,884 | 204,523 | ||||||
Next PLC | 571 | 34,300 | ||||||
Ocado Group PLC* | 2,241 | 60,639 | ||||||
Pearson PLC | 2,950 | 16,883 | ||||||
Persimmon PLC | 1,394 | 39,476 | ||||||
Prudential PLC | 12,977 | 167,799 | ||||||
Reckitt Benckiser Group PLC | 3,560 | 317,611 | ||||||
RELX PLC | 10,042 | 232,349 | ||||||
Rentokil Initial PLC | 9,135 | 56,048 | ||||||
Rio Tinto Ltd. | 1,797 | 111,874 | ||||||
Rio Tinto PLC | 5,723 | 304,839 | ||||||
Rolls-Royce Holdings PLC* | 8,152 | 27,344 | ||||||
Royal Bank of Scotland Group PLC | 20,172 | 27,491 | ||||||
RSA Insurance Group PLC | 4,071 | 19,824 | ||||||
Sage Group PLC | 5,344 | 45,605 | ||||||
Schroders PLC | 591 | 21,568 | ||||||
Segro PLC REIT | 5,432 | 56,325 | ||||||
Severn Trent PLC | 1,293 | 38,979 | ||||||
Smith & Nephew PLC | 4,348 | 88,172 | ||||||
Number | Value | |||||||
| United Kingdom (Continued) | ||||||||
Smiths Group PLC | 2,088 | $ | 33,690 | |||||
Spirax-Sarco Engineering PLC | 358 | 43,638 | ||||||
SSE PLC | 5,153 | 79,009 | ||||||
St James’s Place PLC | 2,180 | 24,737 | ||||||
Standard Chartered PLC | 12,366 | 56,262 | ||||||
Standard Life Aberdeen PLC | 9,830 | 31,358 | ||||||
Taylor Wimpey PLC | 13,475 | 23,897 | ||||||
Tesco PLC | 49,842 | 140,530 | ||||||
Unilever NV | 7,511 | 387,615 | ||||||
Unilever PLC | 5,905 | 315,919 | ||||||
United Utilities Group PLC | 3,385 | 38,360 | ||||||
Vodafone Group PLC | 128,623 | 211,302 | ||||||
Whitbread PLC (b) | 516 | 16,110 | ||||||
Wm Morrison Supermarkets PLC | 9,756 | 22,495 | ||||||
WPP PLC | 5,451 | 41,173 | ||||||
|
| |||||||
(Cost $10,315,549) | 8,345,849 | |||||||
|
| |||||||
TOTAL COMMON STOCKS | 94,846,636 | |||||||
|
| |||||||
| PREFERRED STOCKS — 1.0% | ||||||||
| Brazil — 0.4% | ||||||||
Banco Bradesco SA | 22,358 | 79,396 | ||||||
Cia Paranaense de Energia | 1,364 | 16,180 | ||||||
Gerdau SA | 4,941 | 12,435 | ||||||
Itau Unibanco Holding SA | 24,503 | 105,794 | ||||||
Itausa — Investimentos Itau SA | 21,676 | 35,989 | ||||||
Lojas Americanas SA | 2,850 | 15,088 | ||||||
Petroleo Brasileiro SA | 26,141 | 99,640 | ||||||
Telefonica Brasil SA | 1,890 | 16,696 | ||||||
|
| |||||||
(Cost $452,510) | 381,218 | |||||||
|
| |||||||
| Chile — 0.0% | ||||||||
Sociedad Quimica y Minera de Chile SA, Class B | 457 | 11,219 | ||||||
|
| |||||||
| Colombia — 0.0% | ||||||||
Bancolombia SA | 2,740 | 18,071 | ||||||
|
| |||||||
| Germany — 0.4% | ||||||||
Bayerische Motoren Werke AG | 186 | 8,544 | ||||||
FUCHS PETROLUB SE | 385 | 15,309 | ||||||
Henkel AG & Co. KGaA* | 837 | 74,589 | ||||||
Porsche Automobil Holding SE | 783 | 42,511 | ||||||
Sartorius AG* | 165 | 61,065 | ||||||
Volkswagen AG* | 922 | 135,609 | ||||||
|
| |||||||
(Cost $396,025) | 337,627 | |||||||
|
| |||||||
| Russia — 0.0% | ||||||||
Surgutneftegas PJSC | 35,522 | 17,882 | ||||||
|
| |||||||
| South Korea — 0.2% | ||||||||
AMOREPACIFIC Group | 10 | 278 | ||||||
Hyundai Motor Co. — 2nd Preferred | 171 | 8,312 | ||||||
LG Chem Ltd. | 27 | 3,859 | ||||||
LG Household & Health Care Ltd. | 26 | 15,011 | ||||||
| See Notes to Financial Statements. | 36 |
DBX ETF Trust
Schedule of Investments
Xtrackers MSCI All World ex US Hedged Equity ETF (Continued)
May 31, 2020
Number | Value | |||||||
| South Korea (Continued) | ||||||||
Samsung Electronics Co. Ltd. | 4,355 | $ | 150,682 | |||||
|
| |||||||
(Cost $119,837) | 178,142 | |||||||
|
| |||||||
TOTAL PREFERRED STOCKS | 944,159 | |||||||
|
| |||||||
Principal Amount | ||||||||
| CORPORATE BONDS — 0.0% | ||||||||
| India — 0.0% | ||||||||
Britannia Industries Ltd. | INR | 9,360 | 127 | |||||
|
| |||||||
Number | ||||||||
| RIGHTS — 0.0% | ||||||||
| Brazil — 0.0% | ||||||||
Natura & Co. Holding SA*, | 166 | 155 | ||||||
|
| |||||||
| China — 0.0% | ||||||||
Zhengqi Financial Holding Corp.*(c) | 271 | 0 | ||||||
|
| |||||||
| India — 0.0% | ||||||||
Reliance Industries Ltd.*, | 959 | 2,815 | ||||||
|
| |||||||
Number | Value | |||||||
| Italy — 0.0% | ||||||||
Davide Campari-Milano SpA*, expires 6/21/20 (c) | 2,786 | $ | 0 | |||||
|
| |||||||
| United Kingdom — 0.0% | ||||||||
Whitbread PLC*, | 327 | 4,047 | ||||||
|
| |||||||
TOTAL RIGHTS | 7,017 | |||||||
|
| |||||||
| WARRANTS — 0.0% | ||||||||
| Thailand — 0.0% | ||||||||
BTS Group Holdings PCL*, | 3,710 | 156 | ||||||
|
| |||||||
| SECURITIES LENDING COLLATERAL — 1.3% |
| |||||||
DWS Government & Agency Securities Portfolio “DWS Government Cash Institutional Shares”, 0.07% (e)(f) | 1,267,996 | 1,267,996 | ||||||
|
| |||||||
| CASH EQUIVALENTS — 2.0% | ||||||||
DWS Government Money Market Series “Institutional Shares”, 0.12% (e) | 1,949,518 | 1,949,518 | ||||||
|
| |||||||
TOTAL INVESTMENTS — 100.4% | $ | 99,015,609 | ||||||
Other assets and liabilities, net — (0.4%) | (345,831 | ) | ||||||
|
| |||||||
NET ASSETS — 100.0% | $ | 98,669,778 | ||||||
|
| |||||||
A summary of the Fund’s transactions with affiliated investments during the year ended May 31, 2020 is as follows:
Value ($) at | Purchases Cost ($) | Sales Proceeds ($) | Net Realized Gain/(Loss) ($) | Net Change in Unrealized Appreciation (Depreciation) ($) | Income ($) | Capital Gain Distributions ($) | Number of Shares at 5/31/2020 | Value ($) at 5/31/2020 | ||||||||||||||||||||||||||||
COMMON STOCKS — 0.1% |
| |||||||||||||||||||||||||||||||||||
Germany — 0.1% |
| |||||||||||||||||||||||||||||||||||
Deutsche Bank AG*(d) |
| |||||||||||||||||||||||||||||||||||
| 64,295 | 5,329 | (1,078 | ) | 36 | 13,670 | — | — | 9,839 | 82,252 | |||||||||||||||||||||||||||
SECURITIES LENDING COLLATERAL —1.3% |
| |||||||||||||||||||||||||||||||||||
DWS Government & Agency Securities Portfolio “DWS Government Cash Institutional Shares”, 0.07% (e)(f) |
| |||||||||||||||||||||||||||||||||||
| 1,641,117 | — | (373,121 | )(g) | — | — | 16,441 | — | 1,267,996 | 1,267,996 | |||||||||||||||||||||||||||
CASH EQUIVALENTS — 2.0% |
| |||||||||||||||||||||||||||||||||||
DWS Government Money Market Series “Institutional Shares”, 0.12% (e) |
| |||||||||||||||||||||||||||||||||||
| 856,243 | 30,253,989 | (29,160,714 | ) | — | — | 32,975 | — | 1,949,518 | 1,949,518 | |||||||||||||||||||||||||||
|
|
|
|
|
|
|
|
|
|
|
|
|
|
|
|
|
|
| ||||||||||||||||||
| 2,561,655 | 30,259,318 | (29,534,913 | ) | 36 | 13,670 | 49,416 | — | 3,227,353 | 3,299,766 | |||||||||||||||||||||||||||
|
|
|
|
|
|
|
|
|
|
|
|
|
|
|
|
|
|
| ||||||||||||||||||
| * | Non-income producing security. |
| (a) | Stapled Security — A security contractually bound to one or more other securities to form a single saleable unit which cannot be sold separately. |
| See Notes to Financial Statements. | 37 |
DBX ETF Trust
Schedule of Investments
Xtrackers MSCI All World ex US Hedged Equity ETF (Continued)
May 31, 2020
| (b) | All or a portion of these securities were on loan. In addition, “Other assets and liabilities, net” may include pending sales that are also on loan. The value of securities loaned at May 31, 2020 amounted to $1,481,130, which is 1.5% of net assets. |
| (c) | Investment was valued using significant unobservable inputs. |
| (d) | Affiliated issuer. This security is owned in proportion with its representation in the index. |
| (e) | Affiliated fund managed by DWS Investment Management Americas, Inc. The rate shown is the annualized seven-day yield at period end. |
| (f) | Represents cash collateral held in connection with securities lending. Income earned by the Fund is net of borrower rebates. In addition, the Fund held non-cash U.S. Treasury securities collateral having a value of $341,623. |
| (g) | Represents the net increase (purchase cost) or decrease (sales proceeds) in the amount invested in cash collateral for the year ended May 31, 2020. |
| ADR: | American Depositary Receipt |
| CDI: | Chess Depositary Interest |
| CPO: | Ordinary Participation Certificates |
| GDR: | Global Depositary Receipt |
| JSC: | Joint Stock Company |
| NVDR: | Non Voting Depositary Receipt |
| PJSC: | Public Joint Stock Company |
| PSQC: | Public Shareholders Qatari Company |
| QPSC: | Qatari Public Shareholders Company |
| QSC: | Qatari Shareholders Company |
| REIT: | Real Estate Investment Trust |
| RSP: | Risparmio (Convertible Savings Shares) |
| SAE: | Societe Anonyme Egyptienne |
| SAQ: | Societe Anonyme Qatar |
| 144A: | Security exempt from registration under Rule 144A of the Securities Act of 1933. These securities may be resold in transactions exempt from registration, normally to qualified institutional buyers. |
At May 31, 2020, open futures contracts purchased were as follows:
Contract Description | Currency | Number of Contracts | Notional Amount | Contract Value | Expiration Date | Unrealized Appreciation | ||||||||||||||||
MINI S&P/TSX 60 Futures | CAD | 5 | $ | 148,431 | $ | 166,267 | 6/18/2020 | $ | 17,836 | |||||||||||||
MSCI EAFE Futures | USD | 22 | 1,571,016 | 1,898,160 | 6/19/2020 | 327,144 | ||||||||||||||||
MSCI Emerging Markets Index Futures | USD | 16 | 673,990 | 746,320 | 6/19/2020 | 72,330 | ||||||||||||||||
|
| |||||||||||||||||||||
Total unrealized appreciation | $ | 417,310 | ||||||||||||||||||||
|
| |||||||||||||||||||||
As of May 31, 2020, the Fund had the following forward foreign currency contracts outstanding:
Counterparty | Settlement Date | Currency To Deliver | Currency To Receive | Unrealized Appreciation | Unrealized Depreciation | |||||||||||||||||
Citigroup Global Markets | 6/3/2020 | AED | 669,700 | USD | 182,301 | $ | — | $ | (20 | ) | ||||||||||||
JP Morgan & Chase Co. | 6/3/2020 | AUD | 3,413,500 | USD | 2,234,972 | — | (40,304 | ) | ||||||||||||||
RBC Capital Markets | 6/3/2020 | AUD | 2,470,600 | USD | 1,617,638 | — | (29,146 | ) | ||||||||||||||
RBC Capital Markets | 6/3/2020 | AUD | 208,000 | USD | 136,184 | — | (2,459 | ) | ||||||||||||||
JP Morgan & Chase Co. | 6/3/2020 | BRL | 3,304,800 | USD | 605,768 | — | (13,437 | ) | ||||||||||||||
RBC Capital Markets | 6/3/2020 | BRL | 3,141,600 | USD | 578,922 | — | (9,705 | ) | ||||||||||||||
RBC Capital Markets | 6/3/2020 | BRL | 613,000 | USD | 112,954 | — | (1,901 | ) | ||||||||||||||
Citigroup Global Markets | 6/3/2020 | CAD | 2,802,900 | USD | 2,018,159 | — | (17,579 | ) | ||||||||||||||
JP Morgan & Chase Co. | 6/3/2020 | CAD | 2,549,000 | USD | 1,835,186 | — | (16,145 | ) | ||||||||||||||
RBC Capital Markets | 6/3/2020 | CAD | 1,182,000 | USD | 851,057 | — | (7,426 | ) | ||||||||||||||
RBC Capital Markets | 6/3/2020 | CAD | 2,389,300 | USD | 1,720,422 | — | (14,920 | ) | ||||||||||||||
Citigroup Global Markets | 6/3/2020 | CHF | 3,460,800 | USD | 3,588,404 | — | (10,157 | ) | ||||||||||||||
JP Morgan & Chase Co. | 6/3/2020 | CHF | 1,452,400 | USD | 1,505,930 | — | (4,284 | ) | ||||||||||||||
RBC Capital Markets | 6/3/2020 | CHF | 512,000 | USD | 530,888 | — | (1,493 | ) | ||||||||||||||
RBC Capital Markets | 6/3/2020 | CHF | 1,285,100 | USD | 1,332,497 | — | (3,758 | ) | ||||||||||||||
Citigroup Global Markets | 6/3/2020 | CLP | 159,063,400 | USD | 190,402 | — | (8,327 | ) | ||||||||||||||
JP Morgan & Chase Co. | 6/3/2020 | CLP | 13,480,400 | USD | 16,158 | — | (684 | ) | ||||||||||||||
JP Morgan & Chase Co. | 6/3/2020 | CNH | 6,861,400 | USD | 971,222 | 10,102 | — | |||||||||||||||
Citigroup Global Markets | 6/3/2020 | COP | 332,003,700 | USD | 84,446 | — | (4,538 | ) | ||||||||||||||
JP Morgan & Chase Co. | 6/3/2020 | COP | 23,380,500 | USD | 5,929 | — | (338 | ) | ||||||||||||||
Citigroup Global Markets | 6/3/2020 | CZK | 1,161,500 | USD | 47,066 | — | (847 | ) | ||||||||||||||
| See Notes to Financial Statements. | 38 |
DBX ETF Trust
Schedule of Investments
Xtrackers MSCI All World ex US Hedged Equity ETF (Continued)
May 31, 2020
Counterparty | Settlement Date | Currency To Deliver | Currency To Receive | Unrealized Appreciation | Unrealized Depreciation | |||||||||||||||||
JP Morgan & Chase Co. | 6/3/2020 | DKK | 1,351,000 | USD | 198,464 | $ | — | $ | (2,736 | ) | ||||||||||||
RBC Capital Markets | 6/3/2020 | DKK | 7,952,300 | USD | 1,168,176 | — | (16,131 | ) | ||||||||||||||
Citigroup Global Markets | 6/3/2020 | EGP | 632,000 | USD | 39,698 | — | (83 | ) | ||||||||||||||
Citigroup Global Markets | 6/3/2020 | EUR | 1,774,000 | USD | 1,944,100 | — | (25,251 | ) | ||||||||||||||
Citigroup Global Markets | 6/3/2020 | EUR | 2,337,800 | USD | 2,561,855 | — | (33,381 | ) | ||||||||||||||
JP Morgan & Chase Co. | 6/3/2020 | EUR | 7,668,000 | USD | 8,403,170 | — | (109,222 | ) | ||||||||||||||
RBC Capital Markets | 6/3/2020 | EUR | 6,284,000 | USD | 6,886,541 | — | (89,445 | ) | ||||||||||||||
Citigroup Global Markets | 6/3/2020 | GBP | 786,000 | USD | 991,493 | 20,768 | — | |||||||||||||||
Citigroup Global Markets | 6/3/2020 | GBP | 585,800 | USD | 738,959 | 15,485 | — | |||||||||||||||
JP Morgan & Chase Co. | 6/3/2020 | GBP | 4,429,900 | USD | 5,587,942 | 116,933 | — | |||||||||||||||
RBC Capital Markets | 6/3/2020 | GBP | 2,095,100 | USD | 2,643,251 | 55,764 | — | |||||||||||||||
JP Morgan & Chase Co. | 6/3/2020 | HKD | 50,130,200 | USD | 6,463,460 | — | (3,255 | ) | ||||||||||||||
RBC Capital Markets | 6/3/2020 | HKD | 6,000,000 | USD | 773,590 | — | (400 | ) | ||||||||||||||
RBC Capital Markets | 6/3/2020 | HKD | 12,796,900 | USD | 1,649,989 | — | (791 | ) | ||||||||||||||
Citigroup Global Markets | 6/3/2020 | HUF | 5,831,900 | USD | 18,167 | — | (483 | ) | ||||||||||||||
JP Morgan & Chase Co. | 6/3/2020 | HUF | 16,042,500 | USD | 49,964 | — | (1,340 | ) | ||||||||||||||
Citigroup Global Markets | 6/3/2020 | ILS | 708,300 | USD | 204,227 | 2,509 | — | |||||||||||||||
RBC Capital Markets | 6/3/2020 | ILS | 165,000 | USD | 47,567 | 576 | — | |||||||||||||||
JP Morgan & Chase Co. | 6/3/2020 | INR | 140,527,300 | USD | 1,863,658 | 5,770 | — | |||||||||||||||
JP Morgan & Chase Co. | 6/3/2020 | INR | 24,742,000 | USD | 328,039 | 929 | — | |||||||||||||||
Citigroup Global Markets | 6/3/2020 | JPY | 587,581,900 | USD | 5,496,428 | 47,796 | — | |||||||||||||||
JP Morgan & Chase Co. | 6/3/2020 | JPY | 547,950,300 | USD | 5,125,797 | 44,668 | — | |||||||||||||||
JP Morgan & Chase Co. | 6/3/2020 | JPY | 44,227,000 | USD | 413,715 | 3,600 | — | |||||||||||||||
RBC Capital Markets | 6/3/2020 | JPY | 600,252,200 | USD | 5,614,976 | 48,853 | — | |||||||||||||||
Citigroup Global Markets | 6/3/2020 | KRW | 1,189,186,700 | USD | 985,242 | 25,028 | — | |||||||||||||||
JP Morgan & Chase Co. | 6/3/2020 | KRW | 2,113,059,800 | USD | 1,754,669 | 48,470 | — | |||||||||||||||
RBC Capital Markets | 6/3/2020 | KRW | 251,403,000 | USD | 208,763 | 5,767 | — | |||||||||||||||
RBC Capital Markets | 6/3/2020 | KRW | 327,187,000 | USD | 270,626 | 6,438 | — | |||||||||||||||
Citigroup Global Markets | 6/3/2020 | MXN | 9,408,000 | USD | 393,209 | — | (30,868 | ) | ||||||||||||||
JP Morgan & Chase Co. | 6/3/2020 | MXN | 968,700 | USD | 40,481 | — | (3,184 | ) | ||||||||||||||
RBC Capital Markets | 6/3/2020 | MXN | 2,305,000 | USD | 96,334 | — | (7,567 | ) | ||||||||||||||
RBC Capital Markets | 6/3/2020 | MYR | 2,370,900 | USD | 549,965 | 4,695 | — | |||||||||||||||
Citigroup Global Markets | 6/3/2020 | NOK | 3,889,900 | USD | 380,676 | — | (19,499 | ) | ||||||||||||||
JP Morgan & Chase Co. | 6/3/2020 | NZD | 13,300 | USD | 8,203 | — | (52 | ) | ||||||||||||||
RBC Capital Markets | 6/3/2020 | NZD | 256,100 | USD | 157,969 | — | (1,003 | ) | ||||||||||||||
JP Morgan & Chase Co. | 6/3/2020 | PHP | 561,200 | USD | 11,119 | 34 | — | |||||||||||||||
RBC Capital Markets | 6/3/2020 | PHP | 13,280,600 | USD | 263,107 | 771 | — | |||||||||||||||
Citigroup Global Markets | 6/3/2020 | PLN | 654,500 | USD | 158,004 | — | (5,169 | ) | ||||||||||||||
JP Morgan & Chase Co. | 6/3/2020 | PLN | 54,900 | USD | 13,252 | — | (435 | ) | ||||||||||||||
Citigroup Global Markets | 6/3/2020 | QAR | 858,700 | USD | 235,907 | 62 | — | |||||||||||||||
Citigroup Global Markets | 6/3/2020 | RUB | 37,921,400 | USD | 510,659 | — | (28,206 | ) | ||||||||||||||
JP Morgan & Chase Co. | 6/3/2020 | RUB | 20,400,000 | USD | 274,727 | — | (15,158 | ) | ||||||||||||||
JP Morgan & Chase Co. | 6/3/2020 | SEK | 1,949,000 | USD | 199,592 | — | (7,258 | ) | ||||||||||||||
JP Morgan & Chase Co. | 6/3/2020 | SEK | 4,986,200 | USD | 510,620 | — | (18,572 | ) | ||||||||||||||
RBC Capital Markets | 6/3/2020 | SEK | 10,941,600 | USD | 1,120,492 | — | (40,756 | ) | ||||||||||||||
JP Morgan & Chase Co. | 6/3/2020 | SGD | 795,900 | USD | 565,431 | 2,076 | — | |||||||||||||||
RBC Capital Markets | 6/3/2020 | SGD | 212,300 | USD | 150,822 | 552 | — | |||||||||||||||
JP Morgan & Chase Co. | 6/3/2020 | TRY | 911,400 | USD | 129,432 | — | (3,955 | ) | ||||||||||||||
Citigroup Global Markets | 6/3/2020 | TWD | 4,084,700 | USD | 138,324 | 2,275 | — | |||||||||||||||
Citigroup Global Markets | 6/3/2020 | TWD | 9,943,000 | USD | 336,055 | 4,886 | — | |||||||||||||||
JP Morgan & Chase Co. | 6/3/2020 | TWD | 21,134,600 | USD | 715,215 | 11,289 | — | |||||||||||||||
RBC Capital Markets | 6/3/2020 | TWD | 67,626,400 | USD | 2,292,576 | 40,157 | — | |||||||||||||||
Citigroup Global Markets | 6/3/2020 | USD | 182,326 | AED | 669,700 | — | (5 | ) | ||||||||||||||
JP Morgan & Chase Co. | 6/3/2020 | USD | 2,265,881 | AUD | 3,413,500 | 9,394 | — | |||||||||||||||
RBC Capital Markets | 6/3/2020 | USD | 1,778,079 | AUD | 2,678,600 | 7,348 | — | |||||||||||||||
JP Morgan & Chase Co. | 6/3/2020 | USD | 608,265 | BRL | 3,304,800 | 10,940 | — | |||||||||||||||
RBC Capital Markets | 6/3/2020 | USD | 691,270 | BRL | 3,754,600 | 12,212 | — | |||||||||||||||
Citigroup Global Markets | 6/3/2020 | USD | 2,027,863 | CAD | 2,802,900 | 7,875 | — | |||||||||||||||
JP Morgan & Chase Co. | 6/3/2020 | USD | 1,844,164 | CAD | 2,549,000 | 7,167 | — | |||||||||||||||
| See Notes to Financial Statements. | 39 |
DBX ETF Trust
Schedule of Investments
Xtrackers MSCI All World ex US Hedged Equity ETF (Continued)
May 31, 2020
Counterparty | Settlement Date | Currency To Deliver | Currency To Receive | Unrealized Appreciation | Unrealized Depreciation | |||||||||||||||||
RBC Capital Markets | 6/3/2020 | USD | 2,583,787 | CAD | 3,571,300 | $ | 10,038 | $ | — | |||||||||||||
Citigroup Global Markets | 6/3/2020 | USD | 3,602,486 | CHF | 3,460,800 | — | (3,925 | ) | ||||||||||||||
JP Morgan & Chase Co. | 6/3/2020 | USD | 1,511,814 | CHF | 1,452,400 | — | (1,600 | ) | ||||||||||||||
RBC Capital Markets | 6/3/2020 | USD | 1,870,615 | CHF | 1,797,100 | — | (1,980 | ) | ||||||||||||||
Citigroup Global Markets | 6/3/2020 | USD | 197,560 | CLP | 159,063,400 | 1,169 | — | |||||||||||||||
JP Morgan & Chase Co. | 6/3/2020 | USD | 16,763 | CLP | 13,480,400 | 79 | — | |||||||||||||||
JP Morgan & Chase Co. | 6/3/2020 | USD | 957,718 | CNH | 6,861,400 | 3,401 | — | |||||||||||||||
Citigroup Global Markets | 6/3/2020 | USD | 89,410 | COP | 332,003,700 | — | (426 | ) | ||||||||||||||
JP Morgan & Chase Co. | 6/3/2020 | USD | 6,306 | COP | 23,380,500 | — | (40 | ) | ||||||||||||||
Citigroup Global Markets | 6/3/2020 | USD | 47,994 | CZK | 1,161,500 | — | (81 | ) | ||||||||||||||
JP Morgan & Chase Co. | 6/3/2020 | USD | 201,621 | DKK | 1,351,000 | — | (421 | ) | ||||||||||||||
RBC Capital Markets | 6/3/2020 | USD | 1,186,786 | DKK | 7,952,300 | — | (2,480 | ) | ||||||||||||||
Citigroup Global Markets | 6/3/2020 | USD | 39,905 | EGP | 632,000 | — | (124 | ) | ||||||||||||||
Citigroup Global Markets | 6/3/2020 | USD | 4,573,864 | EUR | 4,111,800 | — | (9,277 | ) | ||||||||||||||
JP Morgan & Chase Co. | 6/3/2020 | USD | 123,297 | EUR | 113,000 | 2,147 | — | |||||||||||||||
JP Morgan & Chase Co. | 6/3/2020 | USD | 8,403,804 | EUR | 7,555,000 | — | (16,857 | ) | ||||||||||||||
RBC Capital Markets | 6/3/2020 | USD | 6,990,146 | EUR | 6,284,000 | — | (14,159 | ) | ||||||||||||||
Citigroup Global Markets | 6/3/2020 | USD | 1,695,960 | GBP | 1,371,800 | — | (1,762 | ) | ||||||||||||||
JP Morgan & Chase Co. | 6/3/2020 | USD | 5,366,672 | GBP | 4,340,900 | — | (5,580 | ) | ||||||||||||||
JP Morgan & Chase Co. | 6/3/2020 | USD | 110,580 | GBP | 89,000 | — | (664 | ) | ||||||||||||||
RBC Capital Markets | 6/3/2020 | USD | 2,590,193 | GBP | 2,095,100 | — | (2,706 | ) | ||||||||||||||
JP Morgan & Chase Co. | 6/3/2020 | USD | 6,345,141 | HKD | 49,179,200 | — | (1,103 | ) | ||||||||||||||
JP Morgan & Chase Co. | 6/3/2020 | USD | 122,621 | HKD | 951,000 | 57 | — | |||||||||||||||
RBC Capital Markets | 6/3/2020 | USD | 2,425,094 | HKD | 18,796,900 | — | (324 | ) | ||||||||||||||
Citigroup Global Markets | 6/3/2020 | USD | 18,730 | HUF | 5,831,900 | — | (80 | ) | ||||||||||||||
JP Morgan & Chase Co. | 6/3/2020 | USD | 51,524 | HUF | 16,042,500 | — | (220 | ) | ||||||||||||||
Citigroup Global Markets | 6/3/2020 | USD | 202,178 | ILS | 708,300 | — | (460 | ) | ||||||||||||||
RBC Capital Markets | 6/3/2020 | USD | 47,098 | ILS | 165,000 | — | (107 | ) | ||||||||||||||
JP Morgan & Chase Co. | 6/3/2020 | USD | 2,186,970 | INR | 165,269,300 | — | (1,972 | ) | ||||||||||||||
Citigroup Global Markets | 6/3/2020 | USD | 5,454,006 | JPY | 587,581,900 | — | (5,375 | ) | ||||||||||||||
JP Morgan & Chase Co. | 6/3/2020 | USD | 5,496,610 | JPY | 592,177,300 | — | (5,366 | ) | ||||||||||||||
RBC Capital Markets | 6/3/2020 | USD | 213,103 | JPY | 22,757,000 | — | (2,078 | ) | ||||||||||||||
RBC Capital Markets | 6/3/2020 | USD | 5,360,405 | JPY | 577,495,200 | — | (5,307 | ) | ||||||||||||||
Citigroup Global Markets | 6/3/2020 | USD | 961,192 | KRW | 1,189,186,700 | — | (978 | ) | ||||||||||||||
JP Morgan & Chase Co. | 6/3/2020 | USD | 1,707,551 | KRW | 2,113,059,800 | — | (1,352 | ) | ||||||||||||||
RBC Capital Markets | 6/3/2020 | USD | 467,926 | KRW | 578,590,000 | — | (741 | ) | ||||||||||||||
Citigroup Global Markets | 6/3/2020 | USD | 425,071 | MXN | 9,408,000 | — | (993 | ) | ||||||||||||||
JP Morgan & Chase Co. | 6/3/2020 | USD | 43,767 | MXN | 968,700 | — | (102 | ) | ||||||||||||||
RBC Capital Markets | 6/3/2020 | USD | 104,143 | MXN | 2,305,000 | — | (242 | ) | ||||||||||||||
RBC Capital Markets | 6/3/2020 | USD | 545,662 | MYR | 2,370,900 | — | (391 | ) | ||||||||||||||
Citigroup Global Markets | 6/3/2020 | USD | 400,193 | NOK | 3,889,900 | — | (18 | ) | ||||||||||||||
JP Morgan & Chase Co. | 6/3/2020 | USD | 8,236 | NZD | 13,300 | 20 | — | |||||||||||||||
RBC Capital Markets | 6/3/2020 | USD | 158,590 | NZD | 256,100 | 382 | — | |||||||||||||||
JP Morgan & Chase Co. | 6/3/2020 | USD | 11,116 | PHP | 561,200 | — | (31 | ) | ||||||||||||||
RBC Capital Markets | 6/3/2020 | USD | 262,826 | PHP | 13,280,600 | — | (490 | ) | ||||||||||||||
Citigroup Global Markets | 6/3/2020 | USD | 163,453 | PLN | 654,500 | — | (280 | ) | ||||||||||||||
JP Morgan & Chase Co. | 6/3/2020 | USD | 13,711 | PLN | 54,900 | — | (24 | ) | ||||||||||||||
Citigroup Global Markets | 6/3/2020 | USD | 235,848 | QAR | 858,700 | — | (3 | ) | ||||||||||||||
Citigroup Global Markets | 6/3/2020 | USD | 537,032 | RUB | 37,921,400 | 1,832 | — | |||||||||||||||
JP Morgan & Chase Co. | 6/3/2020 | USD | 288,698 | RUB | 20,400,000 | 1,187 | — | |||||||||||||||
JP Morgan & Chase Co. | 6/3/2020 | USD | 736,356 | SEK | 6,935,200 | — | (313 | ) | ||||||||||||||
RBC Capital Markets | 6/3/2020 | USD | 1,161,744 | SEK | 10,941,600 | — | (497 | ) | ||||||||||||||
JP Morgan & Chase Co. | 6/3/2020 | USD | 563,110 | SGD | 795,900 | 244 | — | |||||||||||||||
RBC Capital Markets | 6/3/2020 | USD | 150,205 | SGD | 212,300 | 65 | — | |||||||||||||||
JP Morgan & Chase Co. | 6/3/2020 | USD | 133,589 | TRY | 911,400 | — | (202 | ) | ||||||||||||||
Citigroup Global Markets | 6/3/2020 | USD | 467,590 | TWD | 14,027,700 | — | (372 | ) | ||||||||||||||
JP Morgan & Chase Co. | 6/3/2020 | USD | 704,369 | TWD | 21,134,600 | — | (443 | ) | ||||||||||||||
RBC Capital Markets | 6/3/2020 | USD | 2,254,589 | TWD | 67,626,400 | — | (2,170 | ) | ||||||||||||||
JP Morgan & Chase Co. | 6/3/2020 | USD | 408,719 | ZAR | 7,206,200 | 1,715 | — | |||||||||||||||
| See Notes to Financial Statements. | 40 |
DBX ETF Trust
Schedule of Investments
Xtrackers MSCI All World ex US Hedged Equity ETF (Continued)
May 31, 2020
Counterparty | Settlement Date | Currency To Deliver | Currency To Receive | Unrealized Appreciation | Unrealized Depreciation | |||||||||||||||||
RBC Capital Markets | 6/3/2020 | USD | 660,379 | ZAR | 11,643,400 | $ | 2,780 | $ | — | |||||||||||||
JP Morgan & Chase Co. | 6/3/2020 | ZAR | 4,007,200 | USD | 217,480 | — | (10,753 | ) | ||||||||||||||
JP Morgan & Chase Co. | 6/3/2020 | ZAR | 3,199,000 | USD | 173,610 | — | (8,592 | ) | ||||||||||||||
RBC Capital Markets | 6/3/2020 | ZAR | 11,643,400 | USD | 631,918 | — | (31,240 | ) | ||||||||||||||
JP Morgan & Chase Co. | 6/4/2020 | IDR | 4,195,241,900 | USD | 277,794 | — | (9,190 | ) | ||||||||||||||
RBC Capital Markets | 6/4/2020 | IDR | 1,679,087,700 | USD | 111,088 | — | (3,774 | ) | ||||||||||||||
JP Morgan & Chase Co. | 6/4/2020 | THB | 16,913,900 | USD | 521,599 | — | (10,109 | ) | ||||||||||||||
JP Morgan & Chase Co. | 6/4/2020 | USD | 286,756 | IDR | 4,195,241,900 | 228 | — | |||||||||||||||
RBC Capital Markets | 6/4/2020 | USD | 114,613 | IDR | 1,679,087,700 | 248 | — | |||||||||||||||
JP Morgan & Chase Co. | 6/4/2020 | USD | 531,750 | THB | 16,913,900 | — | (41 | ) | ||||||||||||||
Citigroup Global Markets | 7/3/2020 | AED | 669,700 | USD | 182,293 | — | (3 | ) | ||||||||||||||
JP Morgan & Chase Co. | 7/3/2020 | AUD | 3,413,500 | USD | 2,265,881 | — | (9,456 | ) | ||||||||||||||
RBC Capital Markets | 7/3/2020 | AUD | 477,000 | USD | 316,634 | — | (1,320 | ) | ||||||||||||||
RBC Capital Markets | 7/3/2020 | AUD | 2,678,600 | USD | 1,778,084 | — | (7,391 | ) | ||||||||||||||
JP Morgan & Chase Co. | 7/3/2020 | BRL | 3,304,800 | USD | 607,352 | — | (10,888 | ) | ||||||||||||||
JP Morgan & Chase Co. | 7/3/2020 | BRL | 1,010,000 | USD | 185,875 | — | (3,069 | ) | ||||||||||||||
RBC Capital Markets | 7/3/2020 | BRL | 3,754,600 | USD | 690,197 | — | (12,189 | ) | ||||||||||||||
Citigroup Global Markets | 7/3/2020 | CAD | 2,802,900 | USD | 2,027,886 | — | (7,891 | ) | ||||||||||||||
JP Morgan & Chase Co. | 7/3/2020 | CAD | 2,549,000 | USD | 1,844,190 | — | (7,177 | ) | ||||||||||||||
RBC Capital Markets | 7/3/2020 | CAD | 3,571,300 | USD | 2,583,826 | — | (10,049 | ) | ||||||||||||||
Citigroup Global Markets | 7/3/2020 | CHF | 3,460,800 | USD | 3,605,458 | 3,816 | — | |||||||||||||||
JP Morgan & Chase Co. | 7/3/2020 | CHF | 1,452,400 | USD | 1,513,043 | 1,535 | — | |||||||||||||||
RBC Capital Markets | 7/3/2020 | CHF | 1,797,100 | USD | 1,872,145 | 1,909 | — | |||||||||||||||
Citigroup Global Markets | 7/3/2020 | CLP | 159,063,400 | USD | 197,494 | — | (1,227 | ) | ||||||||||||||
JP Morgan & Chase Co. | 7/3/2020 | CLP | 13,480,400 | USD | 16,761 | — | (80 | ) | ||||||||||||||
JP Morgan & Chase Co. | 7/3/2020 | CNH | 824,000 | USD | 114,747 | — | (434 | ) | ||||||||||||||
JP Morgan & Chase Co. | 7/3/2020 | CNH | 6,861,400 | USD | 955,527 | — | (3,576 | ) | ||||||||||||||
Citigroup Global Markets | 7/3/2020 | COP | 332,003,700 | USD | 89,105 | 373 | — | |||||||||||||||
JP Morgan & Chase Co. | 7/3/2020 | COP | 23,380,500 | USD | 6,285 | 37 | — | |||||||||||||||
Citigroup Global Markets | 7/3/2020 | CZK | 1,161,500 | USD | 48,001 | 80 | — | |||||||||||||||
JP Morgan & Chase Co. | 7/3/2020 | DKK | 1,351,000 | USD | 201,739 | 412 | — | |||||||||||||||
JP Morgan & Chase Co. | 7/3/2020 | DKK | 1,147,000 | USD | 171,280 | 354 | — | |||||||||||||||
RBC Capital Markets | 7/3/2020 | DKK | 7,952,300 | USD | 1,187,478 | 2,425 | — | |||||||||||||||
Citigroup Global Markets | 7/3/2020 | EUR | 4,111,800 | USD | 4,576,569 | 9,141 | — | |||||||||||||||
Citigroup Global Markets | 7/3/2020 | EUR | 845,000 | USD | 940,514 | 1,879 | — | |||||||||||||||
JP Morgan & Chase Co. | 7/3/2020 | EUR | 7,555,000 | USD | 8,408,700 | 16,530 | — | |||||||||||||||
RBC Capital Markets | 7/3/2020 | EUR | 6,284,000 | USD | 6,994,218 | 13,888 | — | |||||||||||||||
Citigroup Global Markets | 7/3/2020 | GBP | 1,371,800 | USD | 1,696,166 | 1,730 | — | |||||||||||||||
JP Morgan & Chase Co. | 7/3/2020 | GBP | 4,340,900 | USD | 5,367,306 | 5,463 | — | |||||||||||||||
RBC Capital Markets | 7/3/2020 | GBP | 2,095,100 | USD | 2,590,465 | 2,616 | — | |||||||||||||||
JP Morgan & Chase Co. | 7/3/2020 | HKD | 49,179,200 | USD | 6,339,242 | — | (325 | ) | ||||||||||||||
RBC Capital Markets | 7/3/2020 | HKD | 18,796,900 | USD | 2,423,218 | 156 | — | |||||||||||||||
Citigroup Global Markets | 7/3/2020 | HUF | 5,831,900 | USD | 18,727 | 80 | — | |||||||||||||||
JP Morgan & Chase Co. | 7/3/2020 | HUF | 16,042,500 | USD | 51,508 | 214 | — | |||||||||||||||
JP Morgan & Chase Co. | 7/3/2020 | IDR | 4,195,241,900 | USD | 284,732 | — | (1,098 | ) | ||||||||||||||
RBC Capital Markets | 7/3/2020 | IDR | 1,679,087,700 | USD | 113,976 | — | (424 | ) | ||||||||||||||
Citigroup Global Markets | 7/3/2020 | ILS | 708,300 | USD | 202,272 | 452 | — | |||||||||||||||
RBC Capital Markets | 7/3/2020 | ILS | 165,000 | USD | 47,116 | 102 | — | |||||||||||||||
JP Morgan & Chase Co. | 7/3/2020 | INR | 165,269,300 | USD | 2,179,299 | 702 | — | |||||||||||||||
Citigroup Global Markets | 7/3/2020 | JPY | 587,581,900 | USD | 5,456,361 | 5,309 | — | |||||||||||||||
JP Morgan & Chase Co. | 7/3/2020 | JPY | 592,177,300 | USD | 5,498,958 | 5,274 | — | |||||||||||||||
RBC Capital Markets | 7/3/2020 | JPY | 577,495,200 | USD | 5,362,570 | 5,093 | — | |||||||||||||||
RBC Capital Markets | 7/3/2020 | JPY | 131,829,000 | USD | 1,224,169 | 1,179 | — | |||||||||||||||
Citigroup Global Markets | 7/3/2020 | KRW | 1,189,186,700 | USD | 961,114 | 954 | — | |||||||||||||||
JP Morgan & Chase Co. | 7/3/2020 | KRW | 2,113,059,800 | USD | 1,707,261 | 1,157 | — | |||||||||||||||
RBC Capital Markets | 7/3/2020 | KRW | 578,590,000 | USD | 467,869 | 710 | — | |||||||||||||||
Citigroup Global Markets | 7/3/2020 | MXN | 9,408,000 | USD | 423,064 | 924 | — | |||||||||||||||
JP Morgan & Chase Co. | 7/3/2020 | MXN | 968,700 | USD | 43,565 | 100 | — | |||||||||||||||
RBC Capital Markets | 7/3/2020 | MXN | 2,305,000 | USD | 103,662 | 236 | — | |||||||||||||||
| See Notes to Financial Statements. | 41 |
DBX ETF Trust
Schedule of Investments
Xtrackers MSCI All World ex US Hedged Equity ETF (Continued)
May 31, 2020
Counterparty | Settlement Date | Currency To Deliver | Currency To Receive | Unrealized Appreciation | Unrealized Depreciation | |||||||||||||||||||||||
RBC Capital Markets | 7/3/2020 | MYR | 2,370,900 | USD | 545,411 | $ | 901 | $ | — | |||||||||||||||||||
Citigroup Global Markets | 7/3/2020 | NOK | 3,889,900 | USD | 400,290 | 18 | — | |||||||||||||||||||||
JP Morgan & Chase Co. | 7/3/2020 | NZD | 13,300 | USD | 8,235 | — | (20 | ) | ||||||||||||||||||||
RBC Capital Markets | 7/3/2020 | NZD | 256,100 | USD | 158,568 | — | (382 | ) | ||||||||||||||||||||
JP Morgan & Chase Co. | 7/3/2020 | PHP | 561,200 | USD | 11,085 | 9 | — | |||||||||||||||||||||
RBC Capital Markets | 7/3/2020 | PHP | 13,280,600 | USD | 262,203 | 99 | — | |||||||||||||||||||||
Citigroup Global Markets | 7/3/2020 | PLN | 654,500 | USD | 163,439 | 279 | — | |||||||||||||||||||||
JP Morgan & Chase Co. | 7/3/2020 | PLN | 54,900 | USD | 13,709 | 23 | — | |||||||||||||||||||||
Citigroup Global Markets | 7/3/2020 | QAR | 858,700 | USD | 235,835 | — | (42 | ) | ||||||||||||||||||||
Citigroup Global Markets | 7/3/2020 | RUB | 37,921,400 | USD | 533,987 | — | (2,561 | ) | ||||||||||||||||||||
JP Morgan & Chase Co. | 7/3/2020 | RUB | 11,994,000 | USD | 169,005 | — | (697 | ) | ||||||||||||||||||||
JP Morgan & Chase Co. | 7/3/2020 | RUB | 20,400,000 | USD | 287,460 | — | (1,178 | ) | ||||||||||||||||||||
JP Morgan & Chase Co. | 7/3/2020 | SEK | 6,935,200 | USD | 736,549 | 297 | — | |||||||||||||||||||||
JP Morgan & Chase Co. | 7/3/2020 | SEK | 1,309,000 | USD | 139,022 | 56 | — | |||||||||||||||||||||
RBC Capital Markets | 7/3/2020 | SEK | 10,941,600 | USD | 1,162,053 | 475 | — | |||||||||||||||||||||
JP Morgan & Chase Co. | 7/3/2020 | SGD | 795,900 | USD | 563,129 | — | (275 | ) | ||||||||||||||||||||
RBC Capital Markets | 7/3/2020 | SGD | 212,300 | USD | 150,213 | — | (71 | ) | ||||||||||||||||||||
JP Morgan & Chase Co. | 7/3/2020 | THB | 16,913,900 | USD | 531,289 | — | (363 | ) | ||||||||||||||||||||
JP Morgan & Chase Co. | 7/3/2020 | THB | 2,981,000 | USD | 93,626 | — | (75 | ) | ||||||||||||||||||||
JP Morgan & Chase Co. | 7/3/2020 | TRY | 911,400 | USD | 132,270 | 53 | — | |||||||||||||||||||||
Citigroup Global Markets | 7/3/2020 | TWD | 14,027,700 | USD | 468,324 | 933 | — | |||||||||||||||||||||
JP Morgan & Chase Co. | 7/3/2020 | TWD | 21,134,600 | USD | 705,357 | 1,170 | — | |||||||||||||||||||||
RBC Capital Markets | 7/3/2020 | TWD | 67,626,400 | USD | 2,257,977 | 4,725 | — | |||||||||||||||||||||
JP Morgan & Chase Co. | 7/3/2020 | ZAR | 7,206,200 | USD | 407,393 | — | (1,754 | ) | ||||||||||||||||||||
RBC Capital Markets | 7/3/2020 | ZAR | 11,643,400 | USD | 658,292 | — | (2,786 | ) | ||||||||||||||||||||
Citigroup Global Markets | 7/6/2020 | EGP | 632,000 | USD | 39,316 | 245 | — | |||||||||||||||||||||
|
|
|
| |||||||||||||||||||||||||
Total unrealized appreciation (depreciation) | $ | 700,894 | $ | (906,289 | ) | |||||||||||||||||||||||
|
|
|
| |||||||||||||||||||||||||
For information on the Fund’s policy and additional disclosures regarding open futures contracts and forward foreign currency contracts, please refer to the Derivatives section of Note 2 in the accompanying Notes to Financial Statements.
Currency Abbreviations
| AED | Arab Emirates Dirham |
| AUD | Australian Dollar |
| BRL | Brazilian Real |
| CAD | Canadian Dollar |
| CHF | Swiss Franc |
| CLP | Chilean Peso |
| CNH | Chinese Yuan |
| COP | Colombian Peso |
| CZK | Czech Koruna |
| DKK | Danish Krone |
| EGP | Egyptian Pound |
| EUR | Euro |
| GBP | Pound Sterling |
| HKD | Hong Kong Dollar |
| HUF | Hungarian Forint |
| IDR | Indonesian Rupiah |
| ILS | Israeli Shekel |
| INR | Indian Rupee |
| JPY | Japanese Yen |
| KRW | South Korean Won |
| MXN | Mexican Peso |
| MYR | Malaysian Ringgit |
| NOK | Norwegian Krone |
| NZD | New Zealand Dollar |
| PHP | Philippine Peso |
| PLN | Polish Zloty |
| QAR | Qatari Rial |
| RUB | Russian Ruble |
| SEK | Swedish Krona |
| SGD | Singapore Dollar |
| THB | Thai Baht |
| TRY | Turkish Lira |
| TWD | New Taiwan Dollar |
| USD | U.S. Dollar |
| ZAR | South African Rand |
| See Notes to Financial Statements. | 42 |
DBX ETF Trust
Schedule of Investments
Xtrackers MSCI All World ex US Hedged Equity ETF (Continued)
May 31, 2020
Fair Value Measurements
Various inputs are used in determining the value of the Fund’s investments. These inputs are summarized in three broad levels. Level 1 includes quoted prices in active markets for identical securities. Level 2 includes other significant observable inputs (including quoted prices for similar securities, interest rates, prepayment speeds and credit risk). Level 3 includes significant unobservable inputs (including the Fund’s own assumptions in determining the fair value of investments). The level assigned to the securities valuations may not be an indication of the risk or liquidity associated with investing in those securities.
The following is a summary of the inputs used as of May 31, 2020 in valuing the Fund’s investments. For information on the Fund’s policy regarding the valuation of investments, please refer to the Security Valuation section of Note 2 in the accompanying Notes to Financial Statements.
Assets | Level 1 | Level 2 | Level 3 | Total | ||||||||||||
Common Stocks (h) | $ | 94,845,043 | $ | — | $ | 1,593 | $ | 94,846,636 | ||||||||
Preferred Stocks (h) | 944,159 | — | — | 944,159 | ||||||||||||
Rights (h) | 7,017 | — | 0 | 7,017 | ||||||||||||
Corporate Bonds | — | 127 | — | 127 | ||||||||||||
Warrants | 156 | — | — | 156 | ||||||||||||
Short-Term Investments (h) | 3,217,514 | — | — | 3,217,514 | ||||||||||||
Derivatives (i) | ||||||||||||||||
Forward Foreign Currency Contracts | — | 700,894 | — | 700,894 | ||||||||||||
Futures Contracts | 417,310 | — | — | 417,310 | ||||||||||||
|
|
|
|
|
|
|
| |||||||||
TOTAL | $ | 99,431,199 | $ | 701,021 | $ | 1,593 | $ | 100,133,813 | ||||||||
|
|
|
|
|
|
|
| |||||||||
Liabilities | Level 1 | Level 2 | Level 3 | Total | ||||||||||||
Derivatives (i) | ||||||||||||||||
Forward Foreign Currency Contracts | $ | — | $ | (906,289 | ) | $ | — | $ | (906,289 | ) | ||||||
|
|
|
|
|
|
|
| |||||||||
TOTAL | $ | — | $ | (906,289 | ) | $ | — | $ | (906,289 | ) | ||||||
|
|
|
|
|
|
|
| |||||||||
| (h) | See Schedule of Investments for additional detailed categorizations. |
| (i) | Derivatives include unrealized appreciation (depreciation) on open futures contracts and forward foreign currency contracts. |
During the year ended May 31, 2020, the amount of transfers from Level 1 to Level 3 was $14,108 and from Level 3 to Level 1 was $22,905. The investments were transferred from Level 1 to Level 3 due to the lack of observable market data due to a decrease in market activity. The investment was transferred from Level 3 to Level 1 due to the availability of a pricing source supported by observable inputs.
| See Notes to Financial Statements. | 43 |
DBX ETF Trust
Schedule of Investments
Xtrackers MSCI Emerging Markets Hedged Equity ETF
May 31, 2020
Number | Value | |||||||
| COMMON STOCKS — 96.7% | ||||||||
| Argentina — 0.1% | ||||||||
Globant SA* | 547 | $ | 76,695 | |||||
Telecom Argentina SA, ADR | 1,430 | 12,284 | ||||||
YPF SA, ADR | 2,984 | 15,039 | ||||||
|
| |||||||
(Cost $119,947) | 104,018 | |||||||
|
| |||||||
| Brazil — 3.7% | ||||||||
Ambev SA | 76,426 | 178,737 | ||||||
Atacadao SA | 7,667 | 26,566 | ||||||
B2W Cia Digital* | 3,674 | 63,080 | ||||||
B3 SA — Brasil Bolsa Balcao | 33,877 | 289,170 | ||||||
Banco Bradesco SA | 21,940 | 73,184 | ||||||
Banco BTG Pactual SA | 3,812 | 34,889 | ||||||
Banco do Brasil SA | 13,294 | 76,830 | ||||||
Banco Santander Brasil SA | 7,488 | 35,782 | ||||||
BB Seguridade Participacoes SA | 11,028 | 52,244 | ||||||
BR Malls Participacoes SA | 13,522 | 24,858 | ||||||
BRF SA* | 9,071 | 39,318 | ||||||
CCR SA | 21,487 | 59,191 | ||||||
Centrais Eletricas Brasileiras SA* | 3,714 | 19,926 | ||||||
Cia Brasileira de Distribuicao | 2,878 | 33,967 | ||||||
Cia de Saneamento Basico do Estado de Sao Paulo | 5,716 | 58,185 | ||||||
Cia Siderurgica Nacional SA | 12,269 | 23,727 | ||||||
Cielo SA | 22,795 | 17,471 | ||||||
Cogna Educacao | 30,432 | 29,997 | ||||||
Cosan SA* | 2,540 | 31,344 | ||||||
CPFL Energia SA* | 3,841 | 23,213 | ||||||
Energisa SA | 2,936 | 26,134 | ||||||
Engie Brasil Energia SA | 3,082 | 24,494 | ||||||
Equatorial Energia SA* | 13,584 | 51,039 | ||||||
Hapvida Participacoes e Investimentos SA, 144A | 3,509 | 36,074 | ||||||
Hypera SA | 6,402 | 38,655 | ||||||
IRB Brasil Resseguros S/A | 11,360 | 17,669 | ||||||
JBS SA | 16,547 | 68,125 | ||||||
Klabin SA | 12,059 | 44,541 | ||||||
Localiza Rent a Car SA | 10,686 | 77,057 | ||||||
Lojas Renner SA | 12,217 | 88,257 | ||||||
Magazine Luiza SA | 11,503 | 138,714 | ||||||
Multiplan Empreendimentos Imobiliarios SA | 5,298 | 20,541 | ||||||
Natura & Co. Holding SA | 11,107 | 77,387 | ||||||
Notre Dame Intermedica Participacoes SA | 7,713 | 90,047 | ||||||
Petrobras Distribuidora SA | 12,786 | 51,850 | ||||||
Petroleo Brasileiro SA | 61,600 | 240,568 | ||||||
Porto Seguro SA | 1,790 | 15,866 | ||||||
Raia Drogasil SA | 3,555 | 72,908 | ||||||
Rumo SA* | 17,741 | 74,903 | ||||||
Sul America SA | 4,157 | 34,938 | ||||||
Suzano SA* | 8,708 | 61,782 | ||||||
TIM Participacoes SA | 14,140 | 36,090 | ||||||
Ultrapar Participacoes SA | 13,331 | 42,769 | ||||||
Vale SA | 60,358 | 599,474 | ||||||
WEG SA | 14,136 | 110,809 | ||||||
|
| |||||||
(Cost $3,085,207) | 3,332,370 | |||||||
|
| |||||||
Number | Value | |||||||
| Chile — 0.5% | ||||||||
Aguas Andinas SA, Class A | 52,645 | $ | 15,463 | |||||
Banco de Chile | 704,646 | 59,874 | ||||||
Banco de Credito e Inversiones SA | 870 | 29,457 | ||||||
Banco Santander Chile | 1,008,582 | 41,079 | ||||||
Cencosud SA | 28,187 | 32,927 | ||||||
Cencosud Shopping SA | 5,673 | 9,746 | ||||||
Cia Cervecerias Unidas SA | 2,771 | 20,038 | ||||||
Colbun SA | 152,058 | 24,872 | ||||||
Empresa Nacional de Telecomunicaciones SA | 3,034 | 19,332 | ||||||
Empresas CMPC SA | 19,232 | 39,166 | ||||||
Empresas COPEC SA | 7,229 | 45,610 | ||||||
Enel Americas SA | 531,674 | 77,386 | ||||||
Enel Chile SA | 429,114 | 32,162 | ||||||
Falabella SA | 12,336 | 28,744 | ||||||
|
| |||||||
(Cost $687,244) | 475,856 | |||||||
|
| |||||||
| China — 36.1% | ||||||||
360 Security Technology, Inc., Class A | 1,500 | 3,741 | ||||||
3SBio, Inc., 144A* | 23,408 | 27,782 | ||||||
51job, Inc., ADR*(a) | 451 | 29,085 | ||||||
58.com, Inc., ADR* | 1,524 | 73,167 | ||||||
AAC Technologies Holdings, Inc. (a) | 11,721 | 60,181 | ||||||
AECC Aviation Power Co. Ltd., Class A* | 2,500 | 8,424 | ||||||
Agile Group Holdings Ltd. | 21,733 | 22,346 | ||||||
Agricultural Bank of China Ltd., Class A | 95,400 | 45,445 | ||||||
Agricultural Bank of China Ltd., Class H | 425,695 | 171,893 | ||||||
Aier Eye Hospital Group Co. Ltd., Class A | 6,383 | 35,021 | ||||||
Air China Ltd., Class A | 1,000 | 906 | ||||||
Air China Ltd., Class H | 35,116 | 21,020 | ||||||
Aisino Corp., Class A | 500 | 1,117 | ||||||
AK Medical Holdings Ltd., 144A | 6,000 | 18,306 | ||||||
Alibaba Group Holding Ltd., ADR* | 30,713 | 6,369,569 | ||||||
A-Living Services Co. Ltd., Class H, 144A | 6,260 | 33,515 | ||||||
Aluminum Corp. of China Ltd., Class A* | 18,200 | 7,140 | ||||||
Aluminum Corp. of China Ltd., Class H* | 75,057 | 13,847 | ||||||
Angang Steel Co. Ltd., Class A | 19,690 | 6,786 | ||||||
Anhui Conch Cement Co. Ltd., Class A | 4,800 | 38,199 | ||||||
Anhui Conch Cement Co. Ltd., Class H | 18,746 | 140,386 | ||||||
Anhui Gujing Distillery Co. Ltd., Class A | 660 | 13,848 | ||||||
Anhui Gujing Distillery Co. Ltd., Class B | 1,400 | 15,659 | ||||||
ANTA Sports Products Ltd. | 17,681 | 157,616 | ||||||
Anxin Trust Co. Ltd., Class A*(b) | 1,400 | 490 | ||||||
Asymchem Laboratories Tianjin Co. Ltd., Class A | 660 | 20,117 | ||||||
Autobio Diagnostics Co. Ltd., Class A* | 500 | 10,228 | ||||||
Autohome, Inc., ADR (a) | 863 | 66,391 | ||||||
AVIC Aircraft Co. Ltd., Class A | 4,900 | 11,808 | ||||||
Avic Capital Co. Ltd., Class A | 2,300 | 1,221 | ||||||
AVIC Jonhon Optronic Technology Co. Ltd., Class A | 2,550 | 12,494 | ||||||
AVIC Shenyang Aircraft Co. Ltd., Class A* | 2,455 | 11,557 | ||||||
AviChina Industry & Technology Co. Ltd., Class H | 41,841 | 19,054 | ||||||
BAIC Motor Corp. Ltd., Class H, 144A | 31,664 | 12,745 | ||||||
Baidu, Inc., ADR* | 4,461 | 475,320 | ||||||
| See Notes to Financial Statements. | 44 |
DBX ETF Trust
Schedule of Investments
Xtrackers MSCI Emerging Markets Hedged Equity ETF (Continued)
May 31, 2020
Number | Value | |||||||
| China (Continued) | ||||||||
Bank of Beijing Co. Ltd., Class A | 16,300 | $ | 11,145 | |||||
Bank of Chengdu Co. Ltd., Class A | 14,155 | 15,806 | ||||||
Bank of China Ltd., Class A | 35,100 | 16,966 | ||||||
Bank of China Ltd., Class H* | 1,293,653 | 472,301 | ||||||
Bank of Communications Co. Ltd., Class A | 33,700 | 24,127 | ||||||
Bank of Communications Co. Ltd., Class H | 144,901 | 87,858 | ||||||
Bank of Guiyang Co. Ltd., Class A | 840 | 911 | ||||||
Bank of Hangzhou Co. Ltd., Class A | 15,560 | 19,838 | ||||||
Bank of Jiangsu Co. Ltd., Class A | 12,479 | 10,350 | ||||||
Bank of Nanjing Co. Ltd., Class A | 8,400 | 9,297 | ||||||
Bank of Ningbo Co. Ltd., Class A | 8,900 | 31,934 | ||||||
Bank of Shanghai Co. Ltd., Class A | 12,540 | 14,231 | ||||||
Baoshan Iron & Steel Co. Ltd., Class A* | 14,000 | 9,592 | ||||||
Baozun, Inc., ADR* | 740 | 19,603 | ||||||
BBMG Corp., Class A | 22,100 | 9,753 | ||||||
Beijing Capital International Airport Co. Ltd., Class H | 30,204 | 18,820 | ||||||
Beijing Dabeinong Technology Group Co. Ltd., Class A | 2,100 | 2,430 | ||||||
Beijing New Building Materials PLC, Class A | 3,870 | 12,563 | ||||||
Beijing Oriental Yuhong Waterproof Technology Co. Ltd., Class A* | 1,605 | 8,669 | ||||||
Beijing Shiji Information Technology Co. Ltd., Class A | 200 | 832 | ||||||
Beijing Shunxin Agriculture Co. Ltd., Class A* | 800 | 6,142 | ||||||
Beijing Sinnet Technology Co. Ltd., Class A | 1,800 | 6,280 | ||||||
Beijing Tiantan Biological Products Corp. Ltd., Class A | 1,200 | 6,473 | ||||||
Beijing Tongrentang Co. Ltd., Class A | 300 | 1,053 | ||||||
BEST, Inc., ADR* | 2,764 | 14,318 | ||||||
Betta Pharmaceuticals Co. Ltd., Class A | 600 | 8,836 | ||||||
BGI Genomics Co. Ltd., Class A | 600 | 10,136 | ||||||
Bilibili, Inc., ADR* | 1,606 | 52,083 | ||||||
BOE Technology Group Co. Ltd., Class A* | 33,400 | 17,361 | ||||||
BYD Co. Ltd., Class A | 1,300 | 10,457 | ||||||
BYD Co. Ltd., Class H(a) | 11,155 | 62,600 | ||||||
BYD Electronic International Co. Ltd. | 12,204 | 23,364 | ||||||
Caitong Securities Co. Ltd., Class A | 7,080 | 9,860 | ||||||
CanSino Biologics, Inc., Class H, 144A* | 1,000 | 23,402 | ||||||
CGN Power Co. Ltd., Class H, 144A | 175,391 | 40,276 | ||||||
Changchun High & New Technology Industry Group, Inc., Class A* | 280 | 26,127 | ||||||
Changjiang Securities Co. Ltd., Class A | 1,400 | 1,226 | ||||||
Chaozhou Three-Circle Group Co. Ltd., Class A | 2,000 | 5,573 | ||||||
China Aoyuan Group Ltd.* | 20,798 | 22,055 | ||||||
China Cinda Asset Management Co. Ltd., Class H | 124,839 | 23,030 | ||||||
China CITIC Bank Corp. Ltd., Class A | 1,400 | 985 | ||||||
China CITIC Bank Corp. Ltd., Class H | 145,588 | 63,295 | ||||||
China Communications Construction Co. Ltd., Class A | 700 | 752 | ||||||
Number | Value | |||||||
| China (Continued) | ||||||||
China Communications Construction Co. Ltd., Class H | 72,724 | $ | 46,253 | |||||
China Communications Services Corp. Ltd., Class H | 48,562 | 32,139 | ||||||
China Conch Venture Holdings Ltd. | 26,142 | 117,363 | ||||||
China Construction Bank Corp., Class A | 10,400 | 9,282 | ||||||
China Construction Bank Corp., Class H | 1,569,760 | 1,233,289 | ||||||
China East Education Holdings Ltd., 144A | 6,541 | 12,843 | ||||||
China Eastern Airlines Corp. Ltd., Class A* | 22,000 | 12,823 | ||||||
China Eastern Airlines Corp. Ltd., Class H* | 24,014 | 8,117 | ||||||
China Everbright Bank Co. Ltd., Class A | 57,800 | 30,854 | ||||||
China Everbright Bank Co. Ltd., Class H | 27,090 | 10,974 | ||||||
China Evergrande Group | 30,659 | 64,233 | ||||||
China Feihe Ltd., 144A* | 14,000 | 25,285 | ||||||
China Film Co. Ltd., Class A | 500 | 925 | ||||||
China Fortune Land Development Co. Ltd., Class A | 2,500 | 7,587 | ||||||
China Galaxy Securities Co. Ltd., Class H* | 67,168 | 32,234 | ||||||
China Gezhouba Group Co. Ltd., Class A | 1,200 | 1,000 | ||||||
China Grand Automotive Services Group Co. Ltd., Class A | 1,400 | 612 | ||||||
China Greatwall Technology Group Co. Ltd., Class A | 3,300 | 6,348 | ||||||
China Hongqiao Group Ltd. | 31,205 | 13,728 | ||||||
China Huarong Asset Management Co. Ltd., Class H, 144A | 175,593 | 17,896 | ||||||
China International Capital Corp. Ltd., Class H, 144A*(a) | 24,143 | 39,057 | ||||||
China International Travel Service Corp. Ltd., Class A | 2,800 | 39,712 | ||||||
China Jushi Co. Ltd., Class A | 4,000 | 4,949 | ||||||
China Lesso Group Holdings Ltd. | 16,210 | 19,574 | ||||||
China Life Insurance Co. Ltd., Class A | 2,400 | 8,608 | ||||||
China Life Insurance Co. Ltd., Class H | 120,441 | 225,608 | ||||||
China Literature Ltd., 144A* | 4,577 | 25,892 | ||||||
China Longyuan Power Group Corp. Ltd., Class H* | 60,361 | 29,357 | ||||||
China Medical System Holdings Ltd. | 24,429 | 27,828 | ||||||
China Merchants Bank Co. Ltd., Class A | 18,963 | 89,854 | ||||||
China Merchants Bank Co. Ltd., Class H | 65,742 | 307,867 | ||||||
China Merchants Energy Shipping Co. Ltd., Class A | 7,700 | 6,387 | ||||||
China Merchants Securities Co. Ltd., Class A | 5,000 | 11,629 | ||||||
China Merchants Shekou Industrial Zone Holdings Co. Ltd., Class A | 11,500 | 25,828 | ||||||
China Minsheng Banking Corp. Ltd., Class A | 30,600 | 24,394 | ||||||
China Minsheng Banking Corp. Ltd., Class H | 96,594 | 67,167 | ||||||
China Molybdenum Co. Ltd., Class A | 15,700 | 7,523 | ||||||
China Molybdenum Co. Ltd., Class H | 68,780 | 21,118 | ||||||
China National Building Material Co. Ltd., Class H | 63,179 | 70,910 | ||||||
| See Notes to Financial Statements. | 45 |
DBX ETF Trust
Schedule of Investments
Xtrackers MSCI Emerging Markets Hedged Equity ETF (Continued)
May 31, 2020
Number | Value | |||||||
| China (Continued) | ||||||||
China National Chemical Engineering Co. Ltd., Class A | 13,200 | $ | 10,283 | |||||
China National Nuclear Power Co. Ltd., Class A | 11,400 | 6,437 | ||||||
China National Software & Service Co. Ltd., Class A* | 600 | 6,592 | ||||||
China Northern Rare Earth Group High-Tech Co. Ltd., Class A | 7,000 | 9,955 | ||||||
China Oilfield Services Ltd., Class H | 28,361 | 24,660 | ||||||
China Pacific Insurance Group Co. Ltd., Class A | 5,300 | 21,000 | ||||||
China Pacific Insurance Group Co. Ltd., Class H | 46,243 | 127,069 | ||||||
China Petroleum & Chemical Corp., Class A | 38,600 | 22,390 | ||||||
China Petroleum & Chemical Corp., Class H | 372,755 | 172,636 | ||||||
China Railway Construction Corp. Ltd., Class A | 11,700 | 14,179 | ||||||
China Railway Construction Corp. Ltd., Class H | 34,209 | 30,584 | ||||||
China Railway Group Ltd., Class A | 18,600 | 13,681 | ||||||
China Railway Group Ltd., Class H | 67,155 | 36,647 | ||||||
China Railway Signal & Communication Corp. Ltd., Class H, 144A* | 27,284 | 12,038 | ||||||
China Reinsurance Group Corp., Class H | 111,897 | 11,693 | ||||||
China Resources Pharmaceutical Group Ltd., 144A | 23,653 | 12,877 | ||||||
China Resources Sanjiu Medical & Pharmaceutical Co. Ltd., Class A | 200 | 759 | ||||||
China Shenhua Energy Co. Ltd., Class A | 3,965 | 9,099 | ||||||
China Shenhua Energy Co. Ltd., Class H | 55,782 | 101,899 | ||||||
China Shipbuilding Industry Co. Ltd., Class A | 32,085 | 18,251 | ||||||
China South Publishing & Media Group Co. Ltd., Class A | 6,200 | 9,251 | ||||||
China Southern Airlines Co. Ltd., Class A | 1,800 | 1,276 | ||||||
China Southern Airlines Co. Ltd., Class H | 36,515 | 14,980 | ||||||
China Spacesat Co. Ltd., Class A* | 300 | 1,354 | ||||||
China State Construction Engineering Corp. Ltd., Class A | 44,040 | 30,851 | ||||||
China Telecom Corp. Ltd., Class H | 212,485 | 70,449 | ||||||
China Tower Corp. Ltd., Class H, 144A | 729,613 | 146,836 | ||||||
China TransInfo Technology Co. Ltd., Class A* | 1,700 | 5,278 | ||||||
China United Network Communications Ltd., Class A | 46,055 | 32,005 | ||||||
China Vanke Co. Ltd., Class A | 11,300 | 40,688 | ||||||
China Vanke Co. Ltd., Class H | 24,307 | 78,865 | ||||||
China Yangtze Power Co. Ltd., Class A | 24,900 | 60,667 | ||||||
China Yuhua Education Corp. Ltd., 144A | 18,000 | 17,555 | ||||||
Chinese Universe Publishing and Media Group Co. Ltd., Class A | 300 | 477 | ||||||
Chongqing Changan Automobile Co. Ltd., Class A | 1,000 | 1,381 | ||||||
Chongqing Rural Commercial Bank Co. Ltd., Class H | 32,315 | 12,382 | ||||||
Number | Value | |||||||
| China (Continued) | ||||||||
Chongqing Zhifei Biological Products Co. Ltd., Class A | 1,700 | $ | 19,960 | |||||
CIFI Holdings Group Co. Ltd. | 47,813 | 34,357 | ||||||
CITIC Securities Co. Ltd., Class A | 13,400 | 41,810 | ||||||
CITIC Securities Co. Ltd., Class H | 33,235 | 59,597 | ||||||
CNOOC Ltd. | 285,943 | 318,350 | ||||||
Contemporary Amperex Technology Co. Ltd., Class A | 2,439 | 49,730 | ||||||
COSCO SHIPPING Development Co. Ltd., Class A | 2,000 | 518 | ||||||
COSCO SHIPPING Energy Transportation Co. Ltd., Class H | 19,629 | 9,699 | ||||||
COSCO SHIPPING Holdings Co. Ltd., Class A* | 1,900 | 841 | ||||||
COSCO SHIPPING Holdings Co. Ltd., Class H* | 46,390 | 11,730 | ||||||
Country Garden Holdings Co. Ltd. | 120,952 | 149,483 | ||||||
Country Garden Services Holdings Co. Ltd.* | 22,210 | 104,009 | ||||||
CRRC Corp. Ltd., Class A | 20,500 | 16,774 | ||||||
CRRC Corp. Ltd., Class H | 74,271 | 34,685 | ||||||
CSC Financial Co. Ltd., Class A | 2,925 | 13,106 | ||||||
CSPC Pharmaceutical Group Ltd.* | 80,497 | 157,640 | ||||||
Dali Foods Group Co. Ltd., 144A | 34,724 | 22,040 | ||||||
Daqin Railway Co. Ltd., Class A | 12,100 | 11,562 | ||||||
Dawning Information Industry Co. Ltd., Class A | 1,400 | 7,301 | ||||||
DHC Software Co. Ltd., Class A | 800 | 1,209 | ||||||
Dong-E-E-Jiao Co. Ltd., Class A | 200 | 1,001 | ||||||
Dongfang Electric Corp. Ltd., Class A | 7,080 | 8,689 | ||||||
Dongfeng Motor Group Co. Ltd., Class H | 46,579 | 29,204 | ||||||
Dongxing Securities Co. Ltd., Class A | 600 | 881 | ||||||
East Money Information Co. Ltd., Class A | 6,456 | 12,889 | ||||||
ENN Energy Holdings Ltd. | 12,880 | 150,210 | ||||||
Eve Energy Co. Ltd., Class A* | 1,035 | 9,415 | ||||||
Everbright Securities Co. Ltd., Class A | 7,600 | 11,638 | ||||||
Fangda Carbon New Material Co. Ltd., Class A* | 596 | 785 | ||||||
Fiberhome Telecommunication Technologies Co. Ltd., Class A | 1,300 | 5,091 | ||||||
Financial Street Holdings Co. Ltd., Class A | 800 | 741 | ||||||
First Capital Securities Co. Ltd., Class A | 900 | 861 | ||||||
Focus Media Information Technology Co. Ltd., Class A | 11,720 | 8,112 | ||||||
Foshan Haitian Flavouring & Food Co. Ltd., Class A | 3,120 | 50,226 | ||||||
Fosun International Ltd. | 39,836 | 51,134 | ||||||
Founder Securities Co. Ltd., Class A | 14,700 | 14,252 | ||||||
Foxconn Industrial Internet Co. Ltd., Class A | 3,700 | 6,952 | ||||||
Fuyao Glass Industry Group Co. Ltd., Class A* | 500 | 1,376 | ||||||
Fuyao Glass Industry Group Co. Ltd., Class H, 144A | 9,719 | 21,315 | ||||||
Ganfeng Lithium Co. Ltd., Class A | 1,200 | 8,322 | ||||||
GD Power Development Co. Ltd., Class A | 20,300 | 5,176 | ||||||
| See Notes to Financial Statements. | 46 |
DBX ETF Trust
Schedule of Investments
Xtrackers MSCI Emerging Markets Hedged Equity ETF (Continued)
May 31, 2020
Number | Value | |||||||
| China (Continued) | ||||||||
GDS Holdings Ltd., ADR*(a) | 1,279 | $ | 72,903 | |||||
Gemdale Corp., Class A | 7,300 | 13,040 | ||||||
Genscript Biotech Corp.* | 16,104 | 35,318 | ||||||
GF Securities Co. Ltd., Class A | 6,700 | 12,372 | ||||||
GF Securities Co. Ltd., Class H | 19,457 | 19,805 | ||||||
Giant Network Group Co. Ltd., Class A | 300 | 700 | ||||||
Gigadevice Semiconductor Beijing, Inc., Class A | 658 | 17,829 | ||||||
Glodon Co. Ltd., Class A | 1,200 | 9,640 | ||||||
GoerTek, Inc., Class A | 3,900 | 11,606 | ||||||
GOME Retail Holdings Ltd.*(a) | 203,938 | 25,257 | ||||||
Great Wall Motor Co. Ltd., Class H* | 51,941 | 32,901 | ||||||
Gree Electric Appliances, Inc. of Zhuhai, Class A | 3,400 | 27,124 | ||||||
Greenland Holdings Corp. Ltd., Class A | 12,173 | 9,124 | ||||||
Greentown Service Group Co. Ltd. | 16,696 | 22,271 | ||||||
GSX Techedu, Inc., ADR* | 1,236 | 38,761 | ||||||
Guangdong Haid Group Co. Ltd., Class A | 1,885 | 12,782 | ||||||
Guangdong HEC Technology Holding Co. Ltd., Class A* | 6,000 | 5,330 | ||||||
Guangzhou Automobile Group Co. Ltd., Class H | 43,676 | 35,892 | ||||||
Guangzhou Baiyunshan Pharmaceutical Holdings Co. Ltd., Class A | 2,300 | 9,712 | ||||||
Guangzhou Haige Communications Group, Inc. Co., Class A | 600 | 1,005 | ||||||
Guangzhou R&F Properties Co. Ltd., Class H | 22,133 | 27,325 | ||||||
Guangzhou Shiyuan Electronic Technology Co. Ltd., Class A* | 1,200 | 15,325 | ||||||
Guosen Securities Co. Ltd., Class A | 8,900 | 13,317 | ||||||
Guotai Junan Securities Co. Ltd., Class A | 6,100 | 13,392 | ||||||
Guotai Junan Securities Co. Ltd., Class H, 144A | 7,476 | 9,818 | ||||||
Guoyuan Securities Co. Ltd., Class A | 9,100 | 10,136 | ||||||
Haidilao International Holding Ltd., 144A* | 12,325 | 59,546 | ||||||
Haier Smart Home Co. Ltd., Class A | 4,700 | 10,898 | ||||||
Haitian International Holdings Ltd. | 10,433 | 22,019 | ||||||
Haitong Securities Co. Ltd., Class A | 7,800 | 12,622 | ||||||
Haitong Securities Co. Ltd., Class H | 52,812 | 39,925 | ||||||
Hangzhou Hikvision Digital Technology Co. Ltd., Class A | 9,700 | 37,333 | ||||||
Hangzhou Robam Appliances Co. Ltd., Class A* | 200 | 954 | ||||||
Hangzhou Tigermed Consulting Co. Ltd., Class A | 600 | 7,133 | ||||||
Hansoh Pharmaceutical Group Co. Ltd., 144A* | 8,360 | 36,292 | ||||||
Henan Shuanghui Investment & Development Co. Ltd., Class A* | 2,308 | 12,792 | ||||||
Hengan International Group Co. Ltd. | 10,386 | 84,814 | ||||||
Hengli Petrochemical Co. Ltd., Class A | 6,210 | 12,111 | ||||||
Hengtong Optic-electric Co. Ltd., Class A | 420 | 966 | ||||||
Hengyi Petrochemical Co. Ltd., Class A | 7,241 | 9,283 | ||||||
Hesteel Co. Ltd., Class A | 2,700 | 760 | ||||||
Hithink RoyalFlush Information Network Co. Ltd., Class A | 500 | 7,516 | ||||||
Number | Value | |||||||
| China (Continued) | ||||||||
HLA Corp. Ltd., Class A* | 600 | $ | 512 | |||||
Hua Hong Semiconductor Ltd., 144A*(a) | 8,882 | 16,523 | ||||||
Huaan Securities Co. Ltd., Class A | 900 | 895 | ||||||
Huadian Power International Corp. Ltd., Class A | 2,000 | 1,023 | ||||||
Huadong Medicine Co. Ltd., Class A | 3,000 | 9,520 | ||||||
Hualan Biological Engineering, Inc., Class A | 4,173 | 24,076 | ||||||
Huaneng Power International, Inc., Class A | 1,200 | 728 | ||||||
Huaneng Power International, Inc., Class H | 69,210 | 25,714 | ||||||
Huatai Securities Co. Ltd., Class A | 9,300 | 22,516 | ||||||
Huatai Securities Co. Ltd., Class H, 144A | 21,004 | 32,895 | ||||||
Huaxia Bank Co. Ltd., Class A | 14,100 | 12,584 | ||||||
Huaxin Cement Co. Ltd., Class A | 1,500 | 5,222 | ||||||
Huayu Automotive Systems Co. Ltd., Class A | 3,200 | 8,586 | ||||||
Huazhu Group Ltd., ADR(a) | 1,958 | 66,220 | ||||||
Hubei Biocause Pharmaceutical Co. Ltd., Class A | 1,000 | 685 | ||||||
Hubei Energy Group Co. Ltd., Class A | 1,100 | 546 | ||||||
Hundsun Technologies, Inc., Class A* | 1,760 | 25,968 | ||||||
HUYA, Inc., ADR*(a) | 900 | 13,968 | ||||||
Iflytek Co. Ltd., Class A | 3,050 | 13,653 | ||||||
Industrial & Commercial Bank of China Ltd., Class A | 49,800 | 35,724 | ||||||
Industrial & Commercial Bank of China Ltd., Class H | 992,833 | 640,413 | ||||||
Industrial Bank Co. Ltd., Class A | 25,500 | 57,521 | ||||||
Industrial Securities Co. Ltd., Class A | 18,900 | 15,067 | ||||||
Inner Mongolia BaoTou Steel Union Co. Ltd., Class A | 49,800 | 7,675 | ||||||
Inner Mongolia Junzheng Energy & Chemical Industry Group Co. Ltd., Class A | 21,800 | 7,575 | ||||||
Inner Mongolia Yili Industrial Group Co. Ltd., Class A* | 7,600 | 30,294 | ||||||
Inner Mongolia Yitai Coal Co. Ltd., Class B | 19,900 | 11,661 | ||||||
Innovent Biologics, Inc., 144A* | 14,907 | 81,348 | ||||||
Inspur Electronic Information Industry Co. Ltd., Class A | 1,585 | 8,556 | ||||||
iQIYI, Inc., ADR*(a) | 3,572 | 59,259 | ||||||
Jafron Biomedical Co. Ltd., Class A | 950 | 8,385 | ||||||
JD.com, Inc., ADR* | 12,190 | 662,283 | ||||||
Jiangsu Expressway Co. Ltd., Class H | 23,490 | 27,667 | ||||||
Jiangsu Hengli Hydraulic Co. Ltd., Class A | 900 | 9,278 | ||||||
Jiangsu Hengrui Medicine Co. Ltd., Class A | 5,232 | 57,690 | ||||||
Jiangsu King’s Luck Brewery JSC Ltd., Class A* | 2,640 | 13,560 | ||||||
Jiangsu Yanghe Brewery Joint-Stock Co. Ltd., Class A | 2,100 | 31,043 | ||||||
Jiangxi Copper Co. Ltd., Class A | 500 | 893 | ||||||
Jiangxi Copper Co. Ltd., Class H | 20,163 | 18,468 | ||||||
| See Notes to Financial Statements. | 47 |
DBX ETF Trust
Schedule of Investments
Xtrackers MSCI Emerging Markets Hedged Equity ETF (Continued)
May 31, 2020
Number | Value | |||||||
| China (Continued) | ||||||||
Jiangxi Zhengbang Technology Co. Ltd., Class A | 2,800 | $ | 6,077 | |||||
Jinduicheng Molybdenum Co. Ltd., Class A | 700 | 594 | ||||||
Jinke Properties Group Co. Ltd., Class A | 1,400 | 1,510 | ||||||
Jointown Pharmaceutical Group Co. Ltd., Class A | 500 | 1,261 | ||||||
Jonjee Hi-Tech Industrial And Commercial Holding Co. Ltd., Class A | 1,980 | 15,258 | ||||||
JOYY, Inc., ADR* | 921 | 56,227 | ||||||
Juewei Food Co. Ltd., Class A | 1,200 | 11,626 | ||||||
Kaisa Group Holdings Ltd.* | 42,823 | 15,634 | ||||||
Kingdee International Software Group Co. Ltd.* | 38,393 | 67,360 | ||||||
Kingsoft Corp. Ltd.*(a) | 15,734 | 51,050 | ||||||
Koolearn Technology Holding Ltd., 144A* | 3,500 | 14,155 | ||||||
Kweichow Moutai Co. Ltd., Class A | 1,300 | 248,910 | ||||||
KWG Group Holdings Ltd.* | 22,191 | 30,975 | ||||||
Legend Holdings Corp., Class H, 144A | 6,017 | 7,281 | ||||||
Lenovo Group Ltd. | 119,303 | 64,796 | ||||||
Lens Technology Co. Ltd., Class A | 3,700 | 8,450 | ||||||
Lepu Medical Technology Beijing Co. Ltd., Class A | 3,020 | 14,780 | ||||||
Li Ning Co. Ltd. | 35,226 | 118,155 | ||||||
Liaoning Cheng Da Co. Ltd., Class A* | 400 | 917 | ||||||
Lingyi iTech Guangdong Co., Class A* | 6,890 | 8,707 | ||||||
Logan Property Holdings Co. Ltd. | 25,037 | 37,274 | ||||||
Lomon Billions Group Co. Ltd., Class A | 2,300 | 5,033 | ||||||
Longfor Group Holdings Ltd., 144A | 28,914 | 130,927 | ||||||
LONGi Green Energy Technology Co. Ltd., Class A | 3,250 | 14,758 | ||||||
Luxshare Precision Industry Co. Ltd., Class A | 5,285 | 32,950 | ||||||
Luye Pharma Group Ltd., 144A | 20,745 | 10,357 | ||||||
Luzhou Laojiao Co. Ltd., Class A | 1,200 | 14,341 | ||||||
Maanshan Iron & Steel Co. Ltd., Class A | 1,500 | 551 | ||||||
Mango Excellent Media Co. Ltd., Class A* | 2,735 | 20,309 | ||||||
Meinian Onehealth Healthcare Holdings Co. Ltd., Class A | 3,708 | 6,104 | ||||||
Meituan Dianping, Class B* | 58,183 | 1,101,135 | ||||||
Metallurgical Corp. of China Ltd., Class A | 21,700 | 7,601 | ||||||
Momo, Inc., ADR | 2,493 | 48,364 | ||||||
Muyuan Foodstuff Co. Ltd., Class A | 1,960 | 33,005 | ||||||
NanJi E-Commerce Co. Ltd., Class A* | 3,900 | 10,300 | ||||||
Nanjing Securities Co. Ltd., Class A | 4,000 | 7,706 | ||||||
NARI Technology Co. Ltd., Class A | 3,870 | 10,036 | ||||||
NAURA Technology Group Co. Ltd., Class A | 565 | 12,032 | ||||||
NavInfo Co. Ltd., Class A | 2,200 | 4,565 | ||||||
NetEase, Inc., ADR | 1,163 | 445,313 | ||||||
New China Life Insurance Co. Ltd., Class A | 2,100 | 12,872 | ||||||
New China Life Insurance Co. Ltd., Class H | 14,755 | 45,874 | ||||||
Number | Value | |||||||
| China (Continued) | ||||||||
New Hope Liuhe Co. Ltd., Class A | 4,300 | $ | 16,881 | |||||
New Oriental Education & Technology Group, Inc., ADR* | 2,331 | 279,627 | ||||||
Ninestar Corp., Class A | 200 | 771 | ||||||
Ningbo Joyson Electronic Corp., Class A* | 1,500 | 4,142 | ||||||
Ningbo Zhoushan Port Co. Ltd., Class A* | 9,400 | 4,478 | ||||||
NIO, Inc., ADR*(a) | 11,387 | 45,320 | ||||||
Noah Holdings Ltd., ADR*(a) | 513 | 13,610 | ||||||
Oceanwide Holdings Co. Ltd., Class A | 11,900 | 5,652 | ||||||
Offcn Education Technology Co. Ltd., Class A | 2,700 | 11,122 | ||||||
Offshore Oil Engineering Co. Ltd., Class A | 14,000 | 8,984 | ||||||
OFILM Group Co. Ltd., Class A* | 7,400 | 14,702 | ||||||
Oppein Home Group, Inc., Class A | 900 | 15,265 | ||||||
Orient Securities Co. Ltd., Class A | 11,600 | 14,903 | ||||||
Oriental Pearl Group Co. Ltd., Class A | 910 | 1,275 | ||||||
People’s Insurance Co. Group of China Ltd., Class A | 6,700 | 5,829 | ||||||
People’s Insurance Co. Group of China Ltd., Class H | 142,826 | 42,932 | ||||||
Perfect World Co. Ltd., Class A | 1,500 | 9,236 | ||||||
PetroChina Co. Ltd., Class A | 13,632 | 8,117 | ||||||
PetroChina Co. Ltd., Class H | 324,360 | 111,307 | ||||||
PICC Property & Casualty Co. Ltd., Class H | 109,660 | 94,926 | ||||||
Pinduoduo, Inc., ADR* | 4,219 | 282,125 | ||||||
Ping An Bank Co. Ltd., Class A | 20,100 | 36,610 | ||||||
Ping An Healthcare and Technology Co. Ltd., 144A*(a) | 6,128 | 80,716 | ||||||
Ping An Insurance Group Co. of China Ltd., Class A | 10,900 | 107,985 | ||||||
Ping An Insurance Group Co. of China Ltd., Class H | 96,231 | 949,709 | ||||||
Poly Developments and Holdings Group Co. Ltd., Class A | 14,400 | 28,972 | ||||||
Poly Property Development Co. Ltd., Class H* | 1,800 | 20,319 | ||||||
Postal Savings Bank of China Co. Ltd., Class H, 144A | 162,456 | 103,323 | ||||||
Power Construction Corp. of China Ltd., Class A | 12,201 | 5,829 | ||||||
RiseSun Real Estate Development Co. Ltd., Class A | 8,800 | 9,605 | ||||||
Rongsheng Petro Chemical Co. Ltd., Class A | 1,850 | 3,009 | ||||||
SAIC Motor Corp. Ltd., Class A | 8,100 | 20,337 | ||||||
Sanan Optoelectronics Co. Ltd., Class A | 4,900 | 15,968 | ||||||
Sangfor Technologies, Inc., Class A | 375 | 9,879 | ||||||
Sany Heavy Industry Co. Ltd., Class A | 6,600 | 16,950 | ||||||
SDIC Capital Co. Ltd., Class A | 6,600 | 11,022 | ||||||
SDIC Power Holdings Co. Ltd., Class A | 5,900 | 6,241 | ||||||
Seazen Group Ltd.* | 34,845 | 32,231 | ||||||
Seazen Holdings Co. Ltd., Class A* | 2,200 | 9,648 | ||||||
Semiconductor Manufacturing International Corp.*(a) | 53,684 | 116,628 | ||||||
| See Notes to Financial Statements. | 48 |
DBX ETF Trust
Schedule of Investments
Xtrackers MSCI Emerging Markets Hedged Equity ETF (Continued)
May 31, 2020
Number | Value | |||||||
| China (Continued) | ||||||||
SF Holding Co. Ltd., Class A | 2,455 | $ | 15,678 | |||||
Shaanxi Coal Industry Co. Ltd., Class A | 7,100 | 7,132 | ||||||
Shandong Buchang Pharmaceuticals Co. Ltd., Class A | 338 | 1,100 | ||||||
Shandong Gold Mining Co. Ltd., Class A | 3,240 | 16,841 | ||||||
Shandong Weigao Group Medical Polymer Co. Ltd., Class H | 37,764 | 66,062 | ||||||
Shanghai 2345 Network Holding Group Co. Ltd., Class A | 1,521 | 607 | ||||||
Shanghai Baosight Software Co. Ltd., Class A | 1,000 | 7,929 | ||||||
Shanghai Electric Group Co. Ltd., Class A | 2,000 | 1,222 | ||||||
Shanghai Electric Group Co. Ltd., Class H | 56,766 | 15,672 | ||||||
Shanghai Fosun Pharmaceutical Group Co. Ltd., Class A | 1,700 | 7,324 | ||||||
Shanghai Fosun Pharmaceutical Group Co. Ltd., Class H | 11,355 | 36,036 | ||||||
Shanghai International Airport Co. Ltd., Class A | 900 | 9,128 | ||||||
Shanghai International Port Group Co. Ltd., Class A | 11,400 | 6,469 | ||||||
Shanghai Lujiazui Finance & Trade Zone Development Co. Ltd., Class B | 22,159 | 15,644 | ||||||
Shanghai M&G Stationery, Inc., Class A | 2,075 | 16,202 | ||||||
Shanghai Pharmaceuticals Holding Co. Ltd., Class A | 500 | 1,247 | ||||||
Shanghai Pharmaceuticals Holding Co. Ltd., Class H | 13,247 | 20,952 | ||||||
Shanghai Pudong Development Bank Co. Ltd., Class A | 33,600 | 49,759 | ||||||
Shanghai RAAS Blood Products Co. Ltd., Class A* | 5,600 | 6,442 | ||||||
Shanghai Tunnel Engineering Co. Ltd., Class A | 800 | 702 | ||||||
Shanxi Lu’an Environmental Energy Development Co. Ltd., Class A | 700 | 544 | ||||||
Shanxi Meijin Energy Co. Ltd., Class A* | 4,700 | 4,122 | ||||||
Shanxi Securities Co. Ltd., Class A | 10,500 | 10,195 | ||||||
Shanxi Xinghuacun Fen Wine Factory Co. Ltd., Class A | 700 | 12,564 | ||||||
Shanxi Xishan Coal & Electricity Power Co. Ltd., Class A | 800 | 536 | ||||||
Shenergy Co. Ltd., Class A | 1,100 | 829 | ||||||
Shengyi Technology Co. Ltd., Class A | 2,455 | 9,218 | ||||||
Shennan Circuits Co. Ltd., Class A | 658 | 13,921 | ||||||
Shenwan Hongyuan Group Co. Ltd., Class A* | 21,000 | 12,710 | ||||||
Shenzhen Energy Group Co. Ltd., Class A | 12,300 | 9,478 | ||||||
Shenzhen Expressway Co. Ltd., Class H* | 8,908 | 9,010 | ||||||
Shenzhen Goodix Technology Co. Ltd., Class A | 565 | 17,138 | ||||||
Shenzhen Inovance Technology Co. Ltd., Class A | 1,800 | 8,658 | ||||||
Shenzhen Kangtai Biological Products Co. Ltd., Class A | 470 | 9,614 | ||||||
Shenzhen Mindray Bio-Medical Electronics Co. Ltd., Class A | 992 | 38,749 | ||||||
Number | Value | |||||||
| China (Continued) | ||||||||
Shenzhen Overseas Chinese Town Co. Ltd., Class A* | 17,700 | $ | 14,482 | |||||
Shenzhen Salubris Pharmaceuticals Co. Ltd., Class A | 200 | 558 | ||||||
Shenzhen Sunway Communication Co. Ltd., Class A* | 1,100 | 6,012 | ||||||
Shenzhou International Group Holdings Ltd. | 12,855 | 152,821 | ||||||
Shui On Land Ltd. | 61,945 | 10,229 | ||||||
Sichuan Chuantou Energy Co. Ltd., Class A | 12,600 | 15,676 | ||||||
Sichuan Kelun Pharmaceutical Co. Ltd., Class A | 400 | 1,149 | ||||||
Silergy Corp. | 1,000 | 53,955 | ||||||
SINA Corp.* | 1,121 | 35,099 | ||||||
Sinolink Securities Co. Ltd., Class A | 800 | 1,103 | ||||||
Sino-Ocean Group Holding Ltd. | 60,422 | 13,953 | ||||||
Sinopec Engineering Group Co. Ltd., Class H | 22,915 | 9,608 | ||||||
Sinopec Shanghai Petrochemical Co. Ltd., Class A | 1,200 | 599 | ||||||
Sinopec Shanghai Petrochemical Co. Ltd., Class H | 47,643 | 11,739 | ||||||
Sinopharm Group Co. Ltd., Class H | 22,474 | 55,261 | ||||||
Sinotruk Hong Kong Ltd. | 12,017 | 29,176 | ||||||
SOHO China Ltd.* | 28,361 | 9,549 | ||||||
Songcheng Performance Development Co. Ltd., Class A | 2,520 | 6,454 | ||||||
SooChow Securities Co. Ltd., Class A | 1,040 | 1,097 | ||||||
Spring Airlines Co. Ltd., Class A* | 2,600 | 13,059 | ||||||
Sunac China Holdings Ltd. | 42,177 | 176,565 | ||||||
Suning.com Co. Ltd., Class A | 8,800 | 10,813 | ||||||
Sunny Optical Technology Group Co. Ltd. | 11,533 | 152,355 | ||||||
Sunwoda Electronic Co. Ltd., Class A | 1,800 | 3,589 | ||||||
Suzhou Dongshan Precision Manufacturing Co. Ltd., Class A | 2,500 | 8,172 | ||||||
Suzhou Gold Mantis Construction Decoration Co. Ltd., Class A | 700 | 777 | ||||||
TAL Education Group, ADR* | 6,263 | 353,609 | ||||||
Tasly Pharmaceutical Group Co. Ltd., Class A | 420 | 869 | ||||||
TBEA Co. Ltd., Class A | 11,100 | 10,684 | ||||||
TCL Technology Group Corp., Class A | 12,800 | 9,361 | ||||||
Tencent Holdings Ltd. | 93,704 | 4,961,120 | ||||||
Tencent Music Entertainment Group, ADR* | 5,976 | 77,210 | ||||||
Tianjin Zhonghuan Semiconductor Co. Ltd., Class A | 3,200 | 7,868 | ||||||
Tianma Microelectronics Co. Ltd., Class A | 1,000 | 1,898 | ||||||
Tianqi Lithium Corp., Class A | 1,700 | 4,737 | ||||||
Tingyi Cayman Islands Holding Corp. | 35,554 | 61,095 | ||||||
Tongcheng-Elong Holdings Ltd.* | 13,200 | 23,670 | ||||||
Tonghua Dongbao Pharmaceutical Co. Ltd., Class A | 400 | 888 | ||||||
Tongling Nonferrous Metals Group Co. Ltd., Class A* | 2,600 | 688 | ||||||
| See Notes to Financial Statements. | 49 |
DBX ETF Trust
Schedule of Investments
Xtrackers MSCI Emerging Markets Hedged Equity ETF (Continued)
May 31, 2020
Number | Value | |||||||
| China (Continued) | ||||||||
Tongwei Co. Ltd., Class A | 3,800 | $ | 7,294 | |||||
Topchoice Medical Corp., Class A* | 755 | 15,008 | ||||||
Topsports International Holdings Ltd., 144A | 20,768 | 29,471 | ||||||
TravelSky Technology Ltd., Class H | 13,795 | 27,691 | ||||||
Trip.com Group Ltd., ADR* | 7,635 | 202,862 | ||||||
Tsingtao Brewery Co. Ltd., Class A | 200 | 1,773 | ||||||
Tsingtao Brewery Co. Ltd., Class H | 7,216 | 49,944 | ||||||
Tunghsu Optoelectronic Technology Co. Ltd., Class A | 17,600 | 6,830 | ||||||
Unigroup Guoxin Microelectronics Co. Ltd., Class A* | 700 | 6,757 | ||||||
Uni-President China Holdings Ltd. | 22,460 | 23,238 | ||||||
Unisplendour Corp. Ltd., Class A* | 3,296 | 17,673 | ||||||
Venustech Group, Inc., Class A | 1,000 | 5,494 | ||||||
Vipshop Holdings Ltd., ADR* | 7,193 | 124,727 | ||||||
Walvax Biotechnology Co. Ltd., Class A | 1,300 | 7,632 | ||||||
Wanda Film Holding Co. Ltd., Class A* | 2,400 | 5,431 | ||||||
Wanhua Chemical Group Co. Ltd., Class A | 3,395 | 22,109 | ||||||
Want Want China Holdings Ltd. | 82,325 | 59,156 | ||||||
Weibo Corp., ADR*(a) | 942 | 28,985 | ||||||
Weichai Power Co. Ltd., Class A | 5,900 | 10,779 | ||||||
Weichai Power Co. Ltd., Class H | 33,202 | 57,482 | ||||||
Weifu High-Technology Group Co. Ltd., Class A | 200 | 551 | ||||||
Wens Foodstuffs Group Co. Ltd., Class A | 6,234 | 23,085 | ||||||
Western Securities Co. Ltd., Class A | 900 | 1,004 | ||||||
Will Semiconductor Ltd., Class A | 850 | 21,863 | ||||||
Wingtech Technology Co. Ltd., Class A* | 935 | 12,809 | ||||||
Winning Health Technology Group Co. Ltd., Class A | 1,900 | 6,205 | ||||||
Wuhan Guide Infrared Co. Ltd., Class A* | 1,100 | 7,089 | ||||||
Wuhu Sanqi Interactive Entertainment Network Technology Group Co. Ltd., Class A | 1,000 | 4,764 | ||||||
Wuliangye Yibin Co. Ltd., Class A | 4,100 | 85,131 | ||||||
WUS Printed Circuit Kunshan Co. Ltd., Class A | 2,000 | 6,565 | ||||||
WuXi AppTec Co. Ltd., Class A | 1,225 | 18,279 | ||||||
WuXi AppTec Co. Ltd., Class H, 144A(a) | 3,584 | 37,914 | ||||||
Wuxi Biologics Cayman, Inc., 144A* | 14,662 | 230,385 | ||||||
Wuxi Lead Intelligent Equipment Co. Ltd., Class A | 1,000 | 5,884 | ||||||
XCMG Construction Machinery Co. Ltd., Class A | 8,400 | 6,908 | ||||||
Xiamen C & D, Inc., Class A | 700 | 856 | ||||||
Xiaomi Corp., Class B, 144A* | 170,988 | 265,146 | ||||||
Xinhu Zhongbao Co. Ltd., Class A | 2,200 | 922 | ||||||
Xinjiang Goldwind Science & Technology Co. Ltd., Class A | 8,833 | 11,732 | ||||||
Xinjiang Goldwind Science & Technology Co. Ltd., Class H | 14,439 | 13,002 | ||||||
Xinyi Solar Holdings Ltd. | 68,824 | 49,988 | ||||||
Yantai Jereh Oilfield Services Group Co. Ltd., Class A | 1,100 | 3,927 | ||||||
Yanzhou Coal Mining Co. Ltd., Class H | 36,425 | 27,819 | ||||||
Number | Value | |||||||
| China (Continued) | ||||||||
Yealink Network Technology Corp. Ltd., Class A | 600 | $ | 7,566 | |||||
Yifeng Pharmacy Chain Co. Ltd., Class A | 1,100 | 12,146 | ||||||
Yihai International Holding Ltd.* | 7,844 | 70,076 | ||||||
Yonghui Superstores Co. Ltd., Class A | 7,800 | 10,185 | ||||||
Yonyou Network Technology Co. Ltd., Class A | 2,697 | 13,188 | ||||||
Yum China Holdings, Inc. | 5,822 | 269,791 | ||||||
Yunda Holding Co. Ltd., Class A | 1,200 | 5,610 | ||||||
Yunnan Baiyao Group Co. Ltd., Class A | 1,900 | 23,474 | ||||||
Yunnan Energy New Material Co. Ltd. | 800 | 6,647 | ||||||
Yuzhou Properties Co. Ltd. | 33,291 | 13,614 | ||||||
Zai Lab Ltd., ADR*(a) | 863 | 64,207 | ||||||
Zhangzhou Pientzehuang Pharmaceutical Co. Ltd., Class A | 1,100 | 22,612 | ||||||
Zhaojin Mining Industry Co. Ltd., Class H | 15,551 | 19,019 | ||||||
Zhejiang Century Huatong Group Co. Ltd., Class A | 6,900 | 12,954 | ||||||
Zhejiang Chint Electrics Co. Ltd., Class A | 4,000 | 14,252 | ||||||
Zhejiang Dahua Technology Co. Ltd., Class A | 5,600 | 11,675 | ||||||
Zhejiang Expressway Co. Ltd., Class H | 28,655 | 20,147 | ||||||
Zhejiang Huayou Cobalt Co. Ltd., Class A | 752 | 3,421 | ||||||
Zhejiang Longsheng Group Co. Ltd., Class A | 5,300 | 9,044 | ||||||
Zhejiang NHU Co. Ltd., Class A | 4,245 | 15,047 | ||||||
Zhejiang Sanhua Intelligent Controls Co. Ltd., Class A* | 5,850 | 18,319 | ||||||
Zhejiang Supor Co. Ltd., Class A | 945 | 8,964 | ||||||
Zhengzhou Yutong Bus Co. Ltd., Class A | 503 | 853 | ||||||
Zhenro Properties Group Ltd.* | 27,749 | 17,649 | ||||||
ZhongAn Online P&C Insurance Co. Ltd., Class H, 144A* | 6,155 | 21,717 | ||||||
Zhongji Innolight Co. Ltd., Class A | 700 | 5,589 | ||||||
Zhongjin Gold Corp. Ltd., Class A | 900 | 1,170 | ||||||
Zhongsheng Group Holdings Ltd. | 10,609 | 54,472 | ||||||
Zhuzhou CRRC Times Electric Co. Ltd., Class H | 9,526 | 24,640 | ||||||
Zijin Mining Group Co. Ltd., Class A | 26,800 | 14,193 | ||||||
Zijin Mining Group Co. Ltd., Class H* | 87,522 | 35,002 | ||||||
Zoomlion Heavy Industry Science and Technology Co. Ltd., Class A | 6,976 | 6,226 | ||||||
Zoomlion Heavy Industry Science and Technology Co. Ltd., Class H (a) | 25,462 | 20,858 | ||||||
ZTE Corp., Class A* | 3,600 | 18,183 | ||||||
ZTE Corp., Class H* | 11,612 | 29,361 | ||||||
ZTO Express Cayman, Inc., ADR | 6,064 | 197,808 | ||||||
|
| |||||||
(Cost $26,883,823) | 32,249,858 | |||||||
|
| |||||||
| Colombia — 0.2% | ||||||||
Bancolombia SA | 4,079 | 27,339 | ||||||
Ecopetrol SA | 88,265 | 47,091 | ||||||
Grupo de Inversiones Suramericana SA | 3,686 | 17,985 | ||||||
Interconexion Electrica SA ESP | 7,633 | 40,109 | ||||||
|
| |||||||
(Cost $157,317) | 132,524 | |||||||
|
| |||||||
| See Notes to Financial Statements. | 50 |
DBX ETF Trust
Schedule of Investments
Xtrackers MSCI Emerging Markets Hedged Equity ETF (Continued)
May 31, 2020
Number | Value | |||||||
| Cyprus — 0.1% | ||||||||
Polymetal International PLC | 3,860 | $ | 77,565 | |||||
|
| |||||||
| Czech Republic — 0.1% | ||||||||
CEZ AS | 2,674 | 52,449 | ||||||
Komercni banka AS* | 1,290 | 27,618 | ||||||
Moneta Money Bank AS, 144A | 7,868 | 17,396 | ||||||
|
| |||||||
(Cost $122,722) | 97,463 | |||||||
|
| |||||||
| Egypt — 0.1% | ||||||||
Commercial International Bank Egypt SAE | 21,416 | 84,408 | ||||||
Eastern Co. SAE | 17,485 | 13,726 | ||||||
ElSewedy Electric Co. | 16,555 | 7,755 | ||||||
|
| |||||||
(Cost $116,179) | 105,889 | |||||||
|
| |||||||
| Greece — 0.2% | ||||||||
FF Group*(b) | 1,458 | 7,769 | ||||||
Hellenic Telecommunications Organization SA | 3,974 | 55,847 | ||||||
JUMBO SA | 1,954 | 35,399 | ||||||
Motor Oil Hellas Corinth Refineries SA | 1,162 | 19,348 | ||||||
OPAP SA | 3,067 | 28,598 | ||||||
|
| |||||||
(Cost $170,495) | 146,961 | |||||||
|
| |||||||
| Hong Kong — 3.8% | ||||||||
Alibaba Health Information Technology Ltd.* | 60,442 | 141,602 | ||||||
Alibaba Pictures Group Ltd.* | 252,998 | 30,680 | ||||||
Beijing Enterprises Holdings Ltd. | 8,260 | 27,439 | ||||||
Beijing Enterprises Water Group Ltd.* | 74,043 | 27,988 | ||||||
Bosideng International Holdings Ltd. | 54,735 | 14,052 | ||||||
Brilliance China Automotive Holdings Ltd. | 56,861 | 49,735 | ||||||
China Ding Yi Feng Holdings Ltd.* | 22,249 | 11,797 | ||||||
China Education Group Holdings Ltd. | 11,301 | 19,536 | ||||||
China Everbright International Ltd. | 66,969 | 34,385 | ||||||
China Everbright Ltd. | 16,808 | 23,548 | ||||||
China Gas Holdings Ltd. | 44,522 | 155,653 | ||||||
China Jinmao Holdings Group Ltd. | 91,197 | 63,061 | ||||||
China Mengniu Dairy Co. Ltd.* | 44,826 | 160,186 | ||||||
China Merchants Port Holdings Co. Ltd. | 26,329 | 32,030 | ||||||
China Mobile Ltd. | 99,996 | 697,902 | ||||||
China Overseas Land & Investment Ltd. | 61,983 | 188,712 | ||||||
China Overseas Property Holdings Ltd. | 20,000 | 22,628 | ||||||
China Power International Development Ltd. | 65,498 | 14,365 | ||||||
China Resources Beer Holdings Co. Ltd. | 23,795 | 126,012 | ||||||
China Resources Cement Holdings Ltd. | 43,279 | 54,326 | ||||||
China Resources Gas Group Ltd. | 14,858 | 80,984 | ||||||
China Resources Land Ltd. | 50,733 | 199,947 | ||||||
China Resources Power Holdings Co. Ltd. | 34,270 | 39,701 | ||||||
China State Construction International Holdings Ltd. | 40,493 | 24,970 | ||||||
China Taiping Insurance Holdings Co. Ltd. | 29,869 | 44,313 | ||||||
China Traditional Chinese Medicine Holdings Co. Ltd. | 41,479 | 17,552 | ||||||
Number | Value | |||||||
| Hong Kong (Continued) | ||||||||
China Unicom Hong Kong Ltd.* | 101,566 | $ | 58,831 | |||||
CITIC Ltd. | 88,482 | 84,013 | ||||||
COSCO SHIPPING Ports Ltd. | 29,062 | 14,509 | ||||||
Far East Horizon Ltd. | 39,615 | 35,008 | ||||||
Geely Automobile Holdings Ltd. | 81,713 | 111,741 | ||||||
Guangdong Investment Ltd. | 49,465 | 97,379 | ||||||
Haier Electronics Group Co. Ltd. | 21,624 | 60,257 | ||||||
Hutchison China MediTech Ltd., ADR* | 1,010 | 22,028 | ||||||
Kingboard Holdings Ltd. | 12,571 | 30,327 | ||||||
Kingboard Laminates Holdings Ltd. | 19,629 | 17,093 | ||||||
Kunlun Energy Co. Ltd. | 55,667 | 34,112 | ||||||
Lee & Man Paper Manufacturing Ltd. | 28,609 | 15,390 | ||||||
Nine Dragons Paper Holdings Ltd. | 26,958 | 23,579 | ||||||
Shanghai Industrial Holdings Ltd. | 9,818 | 15,275 | ||||||
Shenzhen International Holdings Ltd. | 17,040 | 28,446 | ||||||
Shenzhen Investment Ltd. | 49,117 | 15,144 | ||||||
Shimao Property Holdings Ltd. | 18,912 | 78,561 | ||||||
Sino Biopharmaceutical Ltd. | 110,541 | 173,979 | ||||||
SSY Group Ltd. | 26,110 | 16,000 | ||||||
Sun Art Retail Group Ltd. | 38,732 | 59,261 | ||||||
Vinda International Holdings Ltd. | 6,000 | 18,229 | ||||||
Wharf Holdings Ltd. (a) | 18,229 | 32,500 | ||||||
Yuexiu Property Co. Ltd. | 111,772 | 20,043 | ||||||
|
| |||||||
(Cost $3,610,643) | 3,364,809 | |||||||
|
| |||||||
| Hungary — 0.2% | ||||||||
MOL Hungarian Oil & Gas PLC | 7,109 | 44,788 | ||||||
OTP Bank Nyrt* | 3,700 | 122,707 | ||||||
Richter Gedeon Nyrt | 2,049 | 44,625 | ||||||
|
| |||||||
(Cost $184,479) | 212,120 | |||||||
|
| |||||||
| India — 8.0% | ||||||||
Adani Ports & Special Economic Zone Ltd. | 7,637 | 32,703 | ||||||
Ambuja Cements Ltd. | 9,810 | 24,851 | ||||||
Asian Paints Ltd. | 4,597 | 102,322 | ||||||
Aurobindo Pharma Ltd. | 4,097 | 40,400 | ||||||
Avenue Supermarts Ltd., 144A* | 2,461 | 73,858 | ||||||
Axis Bank Ltd. | 12,941 | 65,881 | ||||||
Axis Bank Ltd., GDR | 4,537 | 113,198 | ||||||
Bajaj Auto Ltd. | 1,487 | 53,302 | ||||||
Bajaj Finance Ltd. | 2,869 | 74,125 | ||||||
Bajaj Finserv Ltd. | 665 | 38,738 | ||||||
Bandhan Bank Ltd., 144A | 7,577 | 21,859 | ||||||
Berger Paints India Ltd. | 3,192 | 20,758 | ||||||
Bharat Forge Ltd. | 4,206 | 18,136 | ||||||
Bharat Petroleum Corp. Ltd. | 11,131 | 50,461 | ||||||
Bharti Airtel Ltd.* | 39,873 | 291,390 | ||||||
Bharti Infratel Ltd. | 6,014 | 18,289 | ||||||
Biocon Ltd. | 4,341 | 20,363 | ||||||
Bosch Ltd. | 120 | 15,427 | ||||||
Britannia Industries Ltd. | 1,089 | 48,661 | ||||||
Cipla Ltd. | 5,831 | 49,981 | ||||||
Coal India Ltd. | 22,209 | 41,501 | ||||||
Colgate-Palmolive India Ltd. | 853 | 15,697 | ||||||
Container Corp. Of India Ltd. | 3,624 | 18,025 | ||||||
Dabur India Ltd. | 9,261 | 57,128 | ||||||
| See Notes to Financial Statements. | 51 |
DBX ETF Trust
Schedule of Investments
Xtrackers MSCI Emerging Markets Hedged Equity ETF (Continued)
May 31, 2020
Number | Value | |||||||
| India (Continued) | ||||||||
Divi’s Laboratories Ltd. | 1,435 | $ | 45,358 | |||||
DLF Ltd. | 8,973 | 17,877 | ||||||
Dr. Reddy’s Laboratories Ltd., ADR | 1,921 | 102,658 | ||||||
Eicher Motors Ltd. | 244 | 53,399 | ||||||
GAIL India Ltd. | 27,552 | 33,649 | ||||||
Godrej Consumer Products Ltd. | 6,164 | 51,665 | ||||||
Grasim Industries Ltd. | 5,593 | 43,581 | ||||||
Havells India Ltd. | 4,049 | 26,573 | ||||||
HCL Technologies Ltd. | 17,397 | 126,596 | ||||||
HDFC Asset Management Co. Ltd., 144A | 687 | 22,935 | ||||||
HDFC Life Insurance Co. Ltd., 144A* | 11,048 | 76,443 | ||||||
Hero MotoCorp Ltd. | 1,719 | 53,670 | ||||||
Hindalco Industries Ltd. | 17,892 | 32,854 | ||||||
Hindustan Petroleum Corp. Ltd. | 11,413 | 29,364 | ||||||
Hindustan Unilever Ltd. | 13,387 | 364,231 | ||||||
Housing Development Finance Corp. Ltd. | 26,756 | 586,984 | ||||||
ICICI Bank Ltd. | 48,899 | 214,663 | ||||||
ICICI Bank Ltd., ADR (a) | 15,167 | 131,953 | ||||||
ICICI Lombard General Insurance Co. Ltd., 144A | 2,992 | 51,466 | ||||||
ICICI Prudential Life Insurance Co. Ltd., 144A | 5,024 | 26,118 | ||||||
Indian Oil Corp. Ltd. | 31,012 | 34,122 | ||||||
Indraprastha Gas Ltd. | 3,185 | 19,885 | ||||||
Info Edge India Ltd. | 948 | 33,647 | ||||||
Infosys Ltd. | 26,687 | 243,872 | ||||||
Infosys Ltd., ADR | 29,352 | 267,103 | ||||||
InterGlobe Aviation Ltd., 144A | 1,521 | 19,421 | ||||||
ITC Ltd.* | 54,871 | 143,207 | ||||||
JSW Steel Ltd. | 15,206 | 37,042 | ||||||
Jubilant Foodworks Ltd. | 1,048 | 22,960 | ||||||
Larsen & Toubro Ltd. | 7,526 | 92,786 | ||||||
LIC Housing Finance Ltd. | 5,993 | 18,986 | ||||||
Lupin Ltd. | 3,731 | 42,917 | ||||||
Mahindra & Mahindra Ltd. | 13,538 | 78,122 | ||||||
Marico Ltd. | 5,640 | 25,643 | ||||||
Maruti Suzuki India Ltd. | 1,883 | 139,720 | ||||||
Motherson Sumi Systems Ltd. | 14,792 | 18,643 | ||||||
Nestle India Ltd. | 369 | 85,597 | ||||||
NTPC Ltd. | 40,883 | 52,904 | ||||||
Oil & Natural Gas Corp. Ltd. | 43,540 | 47,907 | ||||||
Page Industries Ltd. | 92 | 22,954 | ||||||
Petronet LNG Ltd. | 11,376 | 37,995 | ||||||
Pidilite Industries Ltd. | 2,037 | 39,557 | ||||||
Piramal Enterprises Ltd. | 1,697 | 21,717 | ||||||
Power Grid Corp. of India Ltd. | 26,462 | 55,135 | ||||||
REC Ltd. | 13,897 | 16,274 | ||||||
Reliance Industries Ltd., GDR, 144A | 23,731 | 912,457 | ||||||
SBI Life Insurance Co. Ltd., 144A* | 5,717 | 58,114 | ||||||
Shree Cement Ltd. | 161 | 44,409 | ||||||
Shriram Transport Finance Co. Ltd. | 1,496 | 11,322 | ||||||
Siemens Ltd. | 1,003 | 14,448 | ||||||
State Bank of India* | 27,124 | 57,859 | ||||||
Sun Pharmaceutical Industries Ltd. | 13,706 | 85,961 | ||||||
Tata Consultancy Services Ltd. | 14,680 | 382,908 | ||||||
Tata Consumer Products Ltd.* | 6,661 | 32,320 | ||||||
Tata Motors Ltd., ADR* | 5,365 | 30,634 | ||||||
Number | Value | |||||||
| India (Continued) | ||||||||
Tata Steel Ltd. | 6,263 | $ | 24,450 | |||||
Tech Mahindra Ltd. | 7,881 | 55,285 | ||||||
Titan Co. Ltd. | 5,252 | 61,816 | ||||||
Torrent Pharmaceuticals Ltd. | 745 | 23,277 | ||||||
UltraTech Cement Ltd. | 1,777 | 91,765 | ||||||
United Spirits Ltd.* | 5,391 | 42,356 | ||||||
UPL Ltd.* | 9,464 | 50,795 | ||||||
Vedanta Ltd. | 32,667 | 39,831 | ||||||
Wipro Ltd., ADR | 8,591 | 28,436 | ||||||
Wipro Ltd. | 8,462 | 23,814 | ||||||
Zee Entertainment Enterprises Ltd. | 14,746 | 35,794 | ||||||
|
| |||||||
(Cost $7,021,940) | 7,125,258 | |||||||
|
| |||||||
| Indonesia — 1.4% | ||||||||
PT Ace Hardware Indonesia Tbk* | 109,101 | 11,612 | ||||||
PT Adaro Energy Tbk | 279,522 | 21,045 | ||||||
PT Astra International Tbk | 320,390 | 104,604 | ||||||
PT Bank Central Asia Tbk | 156,639 | 278,219 | ||||||
PT Bank Mandiri Persero Tbk | 289,551 | 88,589 | ||||||
PT Bank Negara Indonesia Persero Tbk | 125,050 | 32,782 | ||||||
PT Bank Rakyat Indonesia Persero Tbk | 879,120 | 177,509 | ||||||
PT Barito Pacific Tbk* | 449,551 | 41,540 | ||||||
PT Charoen Pokphand Indonesia Tbk | 121,620 | 48,074 | ||||||
PT Gudang Garam Tbk | 7,947 | 26,517 | ||||||
PT Hanjaya Mandala Sampoerna Tbk* | 177,465 | 23,565 | ||||||
PT Indah Kiat Pulp & Paper Corp. Tbk | 47,643 | 17,120 | ||||||
PT Indocement Tunggal Prakarsa Tbk* | 32,232 | 26,695 | ||||||
PT Indofood CBP Sukses Makmur Tbk | 44,482 | 24,814 | ||||||
PT Indofood Sukses Makmur Tbk | 57,836 | 22,762 | ||||||
PT Kalbe Farma Tbk | 277,367 | 26,863 | ||||||
PT Perusahaan Gas Negara Tbk | 207,906 | 12,238 | ||||||
PT Semen Indonesia Persero Tbk | 50,428 | 33,826 | ||||||
PT Telekomunikasi Indonesia Persero Tbk | 766,846 | 165,336 | ||||||
PT Unilever Indonesia Tbk | 111,089 | 58,928 | ||||||
PT United Tractors Tbk | 28,476 | 30,600 | ||||||
PT XL Axiata Tbk* | 48,589 | 8,614 | ||||||
|
| |||||||
(Cost $1,568,409) | 1,281,852 | |||||||
|
| |||||||
| Luxembourg — 0.0% | ||||||||
Reinet Investments SCA | 2,458 | 38,511 | ||||||
|
| |||||||
| Malaysia — 1.8% | ||||||||
AMMB Holdings Bhd | 30,746 | 22,419 | ||||||
Axiata Group Bhd | 49,199 | 43,003 | ||||||
Carlsberg Brewery Malaysia Bhd | 2,900 | 19,264 | ||||||
CIMB Group Holdings Bhd | 96,584 | 83,754 | ||||||
Dialog Group Bhd | 70,136 | 64,369 | ||||||
DiGi.Com Bhd | 55,660 | 58,253 | ||||||
Fraser & Neave Holdings Bhd | 1,800 | 13,473 | ||||||
Gamuda Bhd | 32,085 | 28,782 | ||||||
Genting Bhd | 37,467 | 34,472 | ||||||
Genting Malaysia Bhd | 45,934 | 24,512 | ||||||
Genting Plantations Bhd | 2,900 | 6,737 | ||||||
HAP Seng Consolidated Bhd | 11,451 | 19,728 | ||||||
Hartalega Holdings Bhd | 26,202 | 75,577 | ||||||
Hong Leong Bank Bhd | 11,541 | 36,103 | ||||||
| See Notes to Financial Statements. | 52 |
DBX ETF Trust
Schedule of Investments
Xtrackers MSCI Emerging Markets Hedged Equity ETF (Continued)
May 31, 2020
Number | Value | |||||||
| Malaysia (Continued) | ||||||||
Hong Leong Financial Group Bhd | 3,100 | $ | 9,555 | |||||
IHH Healthcare Bhd | 33,335 | 41,635 | ||||||
IJM Corp. Bhd | 41,664 | 18,400 | ||||||
IOI Corp. Bhd | 31,994 | 33,484 | ||||||
Kuala Lumpur Kepong Bhd | 7,210 | 36,552 | ||||||
Malayan Banking Bhd | 63,035 | 108,744 | ||||||
Malaysia Airports Holdings Bhd | 16,200 | 18,631 | ||||||
Maxis Bhd | 37,096 | 45,053 | ||||||
MISC Bhd | 20,400 | 38,947 | ||||||
Nestle Malaysia Bhd | 1,300 | 41,564 | ||||||
Petronas Chemicals Group Bhd | 37,924 | 54,956 | ||||||
Petronas Dagangan Bhd | 4,304 | 23,245 | ||||||
Petronas Gas Bhd | 13,135 | 57,404 | ||||||
PPB Group Bhd | 9,862 | 39,380 | ||||||
Press Metal Aluminium Holdings Bhd | 24,100 | 20,899 | ||||||
Public Bank Bhd | 47,222 | 159,235 | ||||||
QL Resources Bhd | 11,400 | 26,537 | ||||||
RHB Bank Bhd | 24,053 | 26,391 | ||||||
Sime Darby Bhd | 46,823 | 22,510 | ||||||
Sime Darby Plantation Bhd | 36,823 | 42,011 | ||||||
Telekom Malaysia Bhd | 18,945 | 18,433 | ||||||
Tenaga Nasional Bhd | 37,205 | 96,361 | ||||||
Top Glove Corp. Bhd | 27,000 | 82,599 | ||||||
Westports Holdings Bhd | 14,807 | 13,589 | ||||||
YTL Corp. Bhd | 55,098 | 13,180 | ||||||
|
| |||||||
(Cost $1,783,356) | 1,619,741 | |||||||
|
| |||||||
| Mexico — 1.8% | ||||||||
Alfa SAB de CV, Class A | 48,431 | 25,641 | ||||||
America Movil SAB de CV, Series L | 551,451 | 368,306 | ||||||
Arca Continental SAB de CV | 6,643 | 29,631 | ||||||
Becle SAB de CV* | 8,852 | 15,329 | ||||||
Cemex SAB de CV, Series CPO | 230,665 | 54,612 | ||||||
Coca-Cola Femsa SAB de CV | 8,593 | 37,508 | ||||||
Fibra Uno Administracion SA de CV REIT | 49,505 | 37,752 | ||||||
Fomento Economico Mexicano SAB de CV | 31,953 | 216,089 | ||||||
Gruma SAB de CV, Class B | 3,316 | 32,911 | ||||||
Grupo Aeroportuario del Pacifico SAB de CV, Class B | 5,893 | 38,904 | ||||||
Grupo Aeroportuario del Sureste SAB de CV, Class B | 3,461 | 35,672 | ||||||
Grupo Bimbo SAB de CV, Series A | 27,196 | 42,521 | ||||||
Grupo Carso SAB de CV, Series A1 | 6,868 | 15,483 | ||||||
Grupo Financiero Banorte SAB de CV, Class O | 41,148 | 124,792 | ||||||
Grupo Financiero Inbursa SAB de CV, Class O* | 40,170 | 27,535 | ||||||
Grupo Mexico SAB de CV, Series B | 50,104 | 107,283 | ||||||
Grupo Televisa SAB, Series CPO* | 40,559 | 48,050 | ||||||
Industrias Penoles SAB de CV | 2,241 | 21,311 | ||||||
Infraestructura Energetica Nova SAB de CV | 8,675 | 24,623 | ||||||
Kimberly-Clark de Mexico SAB de CV, Class A | 24,725 | 38,379 | ||||||
Megacable Holdings SAB de CV, Series CPO | 5,498 | 16,630 | ||||||
Number | Value | |||||||
| Mexico (Continued) | ||||||||
Orbia Advance Corp. SAB de CV | 16,848 | $ | 24,724 | |||||
Promotora y Operadora de Infraestructura SAB de CV* | 3,794 | 28,609 | ||||||
Wal-Mart de Mexico SAB de CV | 86,721 | 216,465 | ||||||
|
| |||||||
(Cost $2,795,904) | 1,628,760 | |||||||
|
| |||||||
| Peru — 0.3% | ||||||||
Cia de Minas Buenaventura SAA, ADR | 3,290 | 25,826 | ||||||
Credicorp Ltd. | 1,109 | 152,842 | ||||||
Southern Copper Corp. (a) | 1,445 | 52,454 | ||||||
|
| |||||||
(Cost $287,744) | 231,122 | |||||||
|
| |||||||
| Philippines — 0.8% | ||||||||
Aboitiz Equity Ventures, Inc. | 33,290 | 28,213 | ||||||
Aboitiz Power Corp. | 22,646 | 12,437 | ||||||
Altus San Nicolas Corp.*(b) | 871 | 89 | ||||||
Ayala Corp. | 4,626 | 68,312 | ||||||
Ayala Land, Inc. | 120,724 | 76,317 | ||||||
Bank of the Philippine Islands | 17,024 | 22,297 | ||||||
BDO Unibank, Inc. | 33,135 | 65,720 | ||||||
Globe Telecom, Inc. | 574 | 26,013 | ||||||
GT Capital Holdings, Inc.* | 1,504 | 11,498 | ||||||
International Container Terminal Services, Inc. | 16,232 | 28,122 | ||||||
JG Summit Holdings, Inc. | 48,242 | 46,508 | ||||||
Jollibee Foods Corp. | 6,833 | 14,673 | ||||||
Manila Electric Co. | 3,630 | 20,294 | ||||||
Megaworld Corp. | 191,200 | 10,765 | ||||||
Metro Pacific Investments Corp. | 275,127 | 15,708 | ||||||
Metropolitan Bank & Trust Co. | 27,112 | 18,853 | ||||||
PLDT, Inc. | 1,616 | 40,703 | ||||||
Puregold Price Club, Inc. | 13,600 | 12,359 | ||||||
Robinsons Land Corp. | 36,539 | 10,669 | ||||||
SM Investments Corp.* | 3,768 | 68,110 | ||||||
SM Prime Holdings, Inc.* | 158,991 | 94,697 | ||||||
Universal Robina Corp. | 14,909 | 38,583 | ||||||
|
| |||||||
(Cost $1,032,182) | 730,940 | |||||||
|
| |||||||
| Poland — 0.8% | ||||||||
Bank Polska Kasa Opieki SA | 2,783 | 36,468 | ||||||
CD Projekt SA* | 1,129 | 113,659 | ||||||
Cyfrowy Polsat SA | 4,472 | 29,122 | ||||||
Dino Polska SA, 144A* | 763 | 34,735 | ||||||
Grupa Lotos SA | 1,453 | 21,568 | ||||||
KGHM Polska Miedz SA* | 2,373 | 51,045 | ||||||
LPP SA | 23 | 39,336 | ||||||
mBank SA* | 281 | 15,090 | ||||||
Orange Polska SA* | 8,806 | 14,314 | ||||||
PGE Polska Grupa Energetyczna SA* | 15,307 | 18,455 | ||||||
Polski Koncern Naftowy ORLEN SA | 5,007 | 83,337 | ||||||
Polskie Gornictwo Naftowe i Gazownictwo SA | 27,431 | 28,750 | ||||||
Powszechna Kasa Oszczednosci Bank Polski SA | 14,718 | 81,827 | ||||||
Powszechny Zaklad Ubezpieczen SA | 10,117 | 75,265 | ||||||
Santander Bank Polska SA* | 616 | 25,002 | ||||||
|
| |||||||
(Cost $891,270) | 667,973 | |||||||
|
| |||||||
| See Notes to Financial Statements. | 53 |
DBX ETF Trust
Schedule of Investments
Xtrackers MSCI Emerging Markets Hedged Equity ETF (Continued)
May 31, 2020
Number | Value | |||||||
| Qatar — 0.9% | ||||||||
Barwa Real Estate Co. | 28,937 | $ | 23,048 | |||||
Commercial Bank PSQC | 27,672 | 28,082 | ||||||
Industries Qatar QSC | 30,872 | 66,730 | ||||||
Masraf Al Rayan QSC | 60,108 | 64,714 | ||||||
Mesaieed Petrochemical Holding Co. | 80,210 | 44,147 | ||||||
Ooredoo QPSC | 16,570 | 28,666 | ||||||
Qatar Electricity & Water Co. QSC | 7,912 | 32,422 | ||||||
Qatar Fuel QSC | 7,672 | 33,714 | ||||||
Qatar International Islamic Bank QSC | 12,652 | 26,965 | ||||||
Qatar Islamic Bank SAQ | 19,312 | 81,682 | ||||||
Qatar National Bank QPSC | 74,173 | 360,170 | ||||||
|
| |||||||
(Cost $744,825) | 790,340 | |||||||
|
| |||||||
| Romania — 0.0% | ||||||||
NEPI Rockcastle PLC | 6,574 | 33,522 | ||||||
|
| |||||||
| Russia — 3.4% | ||||||||
Alrosa PJSC | 42,237 | 39,629 | ||||||
Gazprom PJSC | 179,270 | 509,579 | ||||||
Gazprom PJSC, ADR | 7,409 | 41,150 | ||||||
Inter RAO UES PJSC | 597,307 | 41,981 | ||||||
LUKOIL PJSC | 3,648 | 271,879 | ||||||
LUKOIL PJSC, ADR | 3,184 | 236,380 | ||||||
Magnit PJSC, GDR | 5,866 | 66,872 | ||||||
Magnitogorsk Iron & Steel Works PJSC | 38,347 | 22,046 | ||||||
MMC Norilsk Nickel PJSC | 1,073 | 337,264 | ||||||
Mobile TeleSystems PJSC, ADR | 8,351 | 74,240 | ||||||
Moscow Exchange MICEX-RTS PJSC | 21,238 | 34,507 | ||||||
Novatek PJSC, GDR | 1,463 | 211,696 | ||||||
Novolipetsk Steel PJSC | 19,137 | 37,478 | ||||||
PhosAgro PJSC, GDR | 2,200 | 30,360 | ||||||
Polyus PJSC | 563 | 93,427 | ||||||
Rosneft Oil Co. PJSC, GDR | 19,254 | 100,198 | ||||||
Sberbank of Russia PJSC | 176,434 | 502,897 | ||||||
Severstal PAO | 725 | 9,633 | ||||||
Severstal PAO, GDR | 2,697 | 35,385 | ||||||
Surgutneftegas PJSC, ADR | 11,092 | 61,671 | ||||||
Tatneft PJSC | 23,115 | 174,819 | ||||||
VTB Bank PJSC, GDR | 10,145 | 9,983 | ||||||
VTB Bank PJSC | 36,674,306 | 18,931 | ||||||
X5 Retail Group NV, GDR | 1,793 | 53,248 | ||||||
|
| |||||||
(Cost $2,881,808) | 3,015,253 | |||||||
|
| |||||||
| Saudi Arabia — 2.8% | ||||||||
Abdullah Al Othaim Markets Co. | 731 | 22,265 | ||||||
Advanced Petrochemical Co. | 1,740 | 22,445 | ||||||
Al Rajhi Bank | 20,033 | 299,748 | ||||||
Alinma Bank* | 16,631 | 65,001 | ||||||
Almarai Co. JSC | 4,475 | 58,439 | ||||||
Arab National Bank | 8,833 | 46,470 | ||||||
Bank AlBilad | 6,574 | 38,016 | ||||||
Bank Al-Jazira | 6,916 | 20,660 | ||||||
Banque Saudi Fransi | 9,123 | 72,260 | ||||||
Bupa Arabia for Cooperative Insurance Co. | 988 | 29,724 | ||||||
Co. for Cooperative Insurance* | 1,093 | 20,370 | ||||||
Dar Al Arkan Real Estate Development Co.* | 9,461 | 17,229 | ||||||
Number | Value | |||||||
| Saudi Arabia (Continued) | ||||||||
Emaar Economic City* | 6,611 | $ | 12,198 | |||||
Etihad Etisalat Co.* | 6,609 | 45,573 | ||||||
Jarir Marketing Co. | 1,021 | 36,915 | ||||||
National Commercial Bank | 24,097 | 239,944 | ||||||
National Industrialization Co.* | 5,760 | 15,090 | ||||||
Rabigh Refining & Petrochemical Co.* | 3,791 | 13,626 | ||||||
Riyad Bank | 22,109 | 96,536 | ||||||
Sahara International Petrochemical Co. | 5,966 | 22,873 | ||||||
Samba Financial Group | 14,933 | 93,669 | ||||||
Saudi Airlines Catering Co. | 696 | 14,083 | ||||||
Saudi Arabian Fertilizer Co. | 2,993 | 60,163 | ||||||
Saudi Arabian Mining Co.* | 6,854 | 61,222 | ||||||
Saudi Arabian Oil Co., 144A | 19,624 | 172,415 | ||||||
Saudi Basic Industries Corp. | 14,750 | 325,945 | ||||||
Saudi British Bank | 10,823 | 65,987 | ||||||
Saudi Cement Co. | 1,309 | 16,031 | ||||||
Saudi Electricity Co.* | 13,807 | 62,124 | ||||||
Saudi Industrial Investment Group | 3,904 | 20,268 | ||||||
Saudi Kayan Petrochemical Co.* | 12,956 | 28,630 | ||||||
Saudi Telecom Co. | 9,854 | 262,354 | ||||||
Savola Group | 4,563 | 49,809 | ||||||
Yanbu National Petrochemical Co. | 4,026 | 53,487 | ||||||
|
| |||||||
(Cost $2,956,353) | 2,481,569 | |||||||
|
| |||||||
| Singapore — 0.0% | ||||||||
BOC Aviation Ltd., 144A | 3,716 | 20,422 | ||||||
|
| |||||||
| South Africa — 3.5% | ||||||||
Absa Group Ltd. | 12,120 | 56,070 | ||||||
Anglo American Platinum Ltd. | 805 | 50,906 | ||||||
AngloGold Ashanti Ltd. | 6,845 | 165,548 | ||||||
Aspen Pharmacare Holdings Ltd.* | 6,720 | 53,478 | ||||||
Bid Corp. Ltd. | 5,141 | 72,142 | ||||||
Bidvest Group Ltd. | 4,497 | 38,905 | ||||||
Capitec Bank Holdings Ltd. | 779 | 37,537 | ||||||
Clicks Group Ltd. | 4,247 | 56,320 | ||||||
Discovery Ltd. (a) | 6,799 | 38,058 | ||||||
Exxaro Resources Ltd. | 4,043 | 28,547 | ||||||
FirstRand Ltd. | 54,471 | 124,540 | ||||||
Gold Fields Ltd. | 13,734 | 107,277 | ||||||
Growthpoint Properties Ltd. REIT | 43,106 | 30,650 | ||||||
Impala Platinum Holdings Ltd. | 12,701 | 84,722 | ||||||
Kumba Iron Ore Ltd. | 1,122 | 30,321 | ||||||
Life Healthcare Group Holdings Ltd. | 21,769 | 22,709 | ||||||
Momentum Metropolitan Holdings | 17,362 | 17,053 | ||||||
Mr Price Group Ltd. | 4,419 | 32,730 | ||||||
MTN Group Ltd. | 27,046 | 83,055 | ||||||
MultiChoice Group* | 7,017 | 34,585 | ||||||
Naspers Ltd., Class N | 7,280 | 1,156,492 | ||||||
Nedbank Group Ltd. | 6,250 | 35,174 | ||||||
Northam Platinum Ltd.* | 5,369 | 33,532 | ||||||
Old Mutual Ltd. | 78,132 | 49,990 | ||||||
Pepkor Holdings Ltd., 144A | 10,101 | 6,906 | ||||||
Pick n Pay Stores Ltd. | 6,977 | 21,183 | ||||||
PSG Group Ltd. | 2,151 | 19,911 | ||||||
Rand Merchant Investment Holdings Ltd. | 12,920 | 20,000 | ||||||
| See Notes to Financial Statements. | 54 |
DBX ETF Trust
Schedule of Investments
Xtrackers MSCI Emerging Markets Hedged Equity ETF (Continued)
May 31, 2020
Number | Value | |||||||
| South Africa (Continued) | ||||||||
Remgro Ltd. | 8,769 | $ | 69,425 | |||||
RMB Holdings Ltd. | 13,448 | 40,577 | ||||||
Sanlam Ltd. | 31,540 | 101,653 | ||||||
Sasol Ltd.*(a) | 8,739 | 45,059 | ||||||
Shoprite Holdings Ltd. | 7,938 | 46,795 | ||||||
Sibanye Stillwater Ltd.* | 35,998 | 66,389 | ||||||
SPAR Group Ltd. | 3,029 | 30,233 | ||||||
Standard Bank Group Ltd. | 20,882 | 120,888 | ||||||
Tiger Brands Ltd. | 2,670 | 23,884 | ||||||
Vodacom Group Ltd. | 10,809 | 77,736 | ||||||
Woolworths Holdings Ltd. | 15,151 | 24,964 | ||||||
|
| |||||||
(Cost $5,294,054) | 3,155,944 | |||||||
|
| |||||||
| South Korea — 10.8% | ||||||||
Amorepacific Corp. | 526 | 69,230 | ||||||
AMOREPACIFIC Group | 507 | 23,662 | ||||||
BGF retail Co. Ltd. | 168 | 22,654 | ||||||
BNK Financial Group, Inc. | 5,322 | 21,830 | ||||||
Celltrion Healthcare Co. Ltd.* | 1,103 | 80,869 | ||||||
Celltrion Pharm, Inc.* | 259 | 19,177 | ||||||
Celltrion, Inc.* | 1,538 | 265,140 | ||||||
Cheil Worldwide, Inc. | 1,128 | 15,120 | ||||||
CJ CheilJedang Corp. | 138 | 33,095 | ||||||
CJ Corp. | 306 | 22,707 | ||||||
CJ ENM Co. Ltd. | 204 | 19,931 | ||||||
CJ Logistics Corp.* | 160 | 20,800 | ||||||
Coway Co. Ltd. | 750 | 40,333 | ||||||
Daelim Industrial Co. Ltd. | 452 | 33,687 | ||||||
Daewoo Engineering & Construction Co. Ltd.* | 3,119 | 9,646 | ||||||
Daewoo Shipbuilding & Marine Engineering Co. Ltd.* | 797 | 14,029 | ||||||
DB Insurance Co. Ltd. | 721 | 25,267 | ||||||
Doosan Bobcat, Inc. | 736 | 14,085 | ||||||
Douzone Bizon Co. Ltd. | 313 | 30,328 | ||||||
E-MART, Inc. | 375 | 34,368 | ||||||
Fila Holdings Corp. | 852 | 26,452 | ||||||
GS Engineering & Construction Corp. | 996 | 22,961 | ||||||
GS Holdings Corp. | 805 | 24,505 | ||||||
GS Retail Co. Ltd. | 605 | 20,811 | ||||||
Hana Financial Group, Inc. | 4,476 | 107,522 | ||||||
Hankook Tire & Technology Co. Ltd. | 953 | 18,045 | ||||||
Hanmi Pharm. Co. Ltd. | 121 | 23,156 | ||||||
Hanon Systems | 2,349 | 18,474 | ||||||
Hanwha Corp. | 414 | 6,719 | ||||||
Hanwha Solutions Corp. | 1,666 | 21,725 | ||||||
Helixmith Co. Ltd.* | 372 | 18,804 | ||||||
HLB, Inc.* | 675 | 61,535 | ||||||
Hotel Shilla Co. Ltd. | 560 | 35,813 | ||||||
Hyundai Department Store Co. Ltd. | 219 | 11,317 | ||||||
Hyundai Engineering & Construction Co. Ltd. | 1,416 | 39,103 | ||||||
Hyundai Glovis Co. Ltd. | 300 | 27,373 | ||||||
Hyundai Heavy Industries Holdings Co. Ltd. | 184 | 40,189 | ||||||
Hyundai Marine & Fire Insurance Co. Ltd. | 1,240 | 24,280 | ||||||
Hyundai Mobis Co. Ltd. | 1,075 | 171,868 | ||||||
Number | Value | |||||||
| South Korea (Continued) | ||||||||
Hyundai Motor Co. | 2,372 | $ | 187,699 | |||||
Hyundai Steel Co. | 1,405 | 24,788 | ||||||
Industrial Bank of Korea | 4,142 | 27,693 | ||||||
Kakao Corp. | 919 | 195,532 | ||||||
Kangwon Land, Inc. | 1,636 | 31,968 | ||||||
KB Financial Group, Inc. | 6,402 | 175,758 | ||||||
Kia Motors Corp. | 4,186 | 115,766 | ||||||
KMW Co. Ltd.* | 432 | 20,336 | ||||||
Korea Aerospace Industries Ltd. | 1,354 | 27,715 | ||||||
Korea Electric Power Corp.* | 3,873 | 67,550 | ||||||
Korea Gas Corp. | 386 | 9,304 | ||||||
Korea Investment Holdings Co. Ltd. | 777 | 33,064 | ||||||
Korea Shipbuilding & Offshore Engineering Co. Ltd.* | 658 | 48,243 | ||||||
Korea Zinc Co. Ltd. | 162 | 49,446 | ||||||
Korean Air Lines Co. Ltd.* | 990 | 16,547 | ||||||
KT&G Corp. | 1,847 | 125,127 | ||||||
Kumho Petrochemical Co. Ltd. | 378 | 21,640 | ||||||
LG Chem Ltd. | 743 | 234,278 | ||||||
LG Corp. | 1,334 | 67,968 | ||||||
LG Display Co. Ltd.* | 4,330 | 35,662 | ||||||
LG Electronics, Inc. | 1,574 | 75,367 | ||||||
LG Household & Health Care Ltd. | 151 | 167,039 | ||||||
LG Innotek Co. Ltd. | 288 | 34,301 | ||||||
LG Uplus Corp. | 3,645 | 38,703 | ||||||
Lotte Chemical Corp. | 299 | 45,389 | ||||||
Lotte Corp. | 345 | 9,555 | ||||||
Lotte Shopping Co. Ltd. | 218 | 15,666 | ||||||
Meritz Securities Co. Ltd. | 5,293 | 14,040 | ||||||
Mirae Asset Daewoo Co. Ltd. | 3,238 | 16,132 | ||||||
NAVER Corp. | 2,018 | 368,257 | ||||||
NCSoft Corp. | 269 | 171,594 | ||||||
Neoplux Co. Ltd.* | 25 | 40 | ||||||
Netmarble Corp., 144A* | 344 | 25,638 | ||||||
NH Investment & Securities Co. Ltd. | 1,159 | 9,106 | ||||||
Orion Corp. | 425 | 45,299 | ||||||
Ottogi Corp. | 31 | 13,792 | ||||||
Pan Ocean Co. Ltd.* | 5,010 | 14,462 | ||||||
Pearl Abyss Corp.* | 117 | 19,320 | ||||||
POSCO | 1,162 | 169,827 | ||||||
POSCO Chemical Co. Ltd. | 481 | 21,556 | ||||||
Posco International Corp. | 988 | 12,764 | ||||||
S-1 Corp. | 320 | 24,082 | ||||||
Samsung Biologics Co. Ltd., 144A* | 280 | 140,627 | ||||||
Samsung C&T Corp. | 1,437 | 114,988 | ||||||
Samsung Card Co. Ltd. | 467 | 11,143 | ||||||
Samsung Electro-Mechanics Co. Ltd. | 948 | 95,684 | ||||||
Samsung Electronics Co. Ltd. | 78,082 | 3,196,542 | ||||||
Samsung Engineering Co. Ltd.* | 2,746 | 26,829 | ||||||
Samsung Fire & Marine Insurance Co. Ltd. | 463 | 68,228 | ||||||
Samsung Heavy Industries Co. Ltd.* | 7,964 | 30,963 | ||||||
Samsung Life Insurance Co. Ltd. | 1,261 | 46,532 | ||||||
Samsung SDI Co. Ltd. | 899 | 260,601 | ||||||
Samsung SDS Co. Ltd. | 522 | 80,295 | ||||||
Samsung Securities Co. Ltd. | 1,050 | 23,697 | ||||||
Shinhan Financial Group Co. Ltd. | 7,181 | 174,821 | ||||||
| See Notes to Financial Statements. | 55 |
DBX ETF Trust
Schedule of Investments
Xtrackers MSCI Emerging Markets Hedged Equity ETF (Continued)
May 31, 2020
Number | Value | |||||||
| South Korea (Continued) | ||||||||
Shinsegae, Inc. | 120 | $ | 23,739 | |||||
SK Holdings Co. Ltd. | 566 | 109,229 | ||||||
SK Hynix, Inc. | 8,959 | 589,575 | ||||||
SK Innovation Co. Ltd. | 882 | 84,393 | ||||||
SK Telecom Co. Ltd. | 350 | 61,044 | ||||||
S-Oil Corp. | 829 | 47,326 | ||||||
Woori Financial Group, Inc. | 8,858 | 65,302 | ||||||
Yuhan Corp. | 795 | 33,316 | ||||||
|
| |||||||
(Cost $7,483,423) | 9,649,497 | |||||||
|
| |||||||
| Taiwan — 11.9% | ||||||||
Accton Technology Corp. | 8,112 | 65,247 | ||||||
Acer, Inc. | 58,804 | 32,022 | ||||||
Advantech Co. Ltd. | 6,121 | 60,547 | ||||||
Airtac International Group | 2,210 | 37,907 | ||||||
ASE Technology Holding Co. Ltd. | 53,502 | 110,122 | ||||||
Asia Cement Corp. | 35,398 | 51,343 | ||||||
Asustek Computer, Inc. | 11,409 | 79,986 | ||||||
AU Optronics Corp. | 136,474 | 34,454 | ||||||
Catcher Technology Co. Ltd. | 10,692 | 77,631 | ||||||
Cathay Financial Holding Co. Ltd. | 126,509 | 168,749 | ||||||
Chailease Holding Co. Ltd. | 19,811 | 76,869 | ||||||
Chang Hwa Commercial Bank Ltd. | 92,742 | 58,070 | ||||||
Cheng Shin Rubber Industry Co. Ltd. | 36,610 | 39,994 | ||||||
Chicony Electronics Co. Ltd. | 12,128 | 34,738 | ||||||
China Airlines Ltd. | 28,482 | 7,779 | ||||||
China Development Financial Holding Corp. | 216,578 | 65,568 | ||||||
China Life Insurance Co. Ltd.* | 42,642 | 29,469 | ||||||
China Steel Corp. | 190,114 | 125,371 | ||||||
Chunghwa Telecom Co. Ltd. | 62,522 | 230,098 | ||||||
Compal Electronics, Inc. | 68,943 | 43,857 | ||||||
CTBC Financial Holding Co. Ltd. | 286,219 | 190,177 | ||||||
Delta Electronics, Inc. | 30,329 | 139,397 | ||||||
E.Sun Financial Holding Co. Ltd. | 171,762 | 152,455 | ||||||
Eclat Textile Co. Ltd. | 2,518 | 25,914 | ||||||
Eva Airways Corp. | 47,910 | 17,552 | ||||||
Evergreen Marine Corp. Taiwan Ltd.* | 53,835 | 19,544 | ||||||
Far Eastern New Century Corp. | 55,555 | 49,773 | ||||||
Far EasTone Telecommunications Co. Ltd. | 22,472 | 48,424 | ||||||
Feng TAY Enterprise Co. Ltd. | 4,358 | 26,271 | ||||||
First Financial Holding Co. Ltd. | 164,387 | 125,104 | ||||||
Formosa Chemicals & Fibre Corp. | 53,316 | 127,852 | ||||||
Formosa Petrochemical Corp. | 18,509 | 54,063 | ||||||
Formosa Plastics Corp. | 59,532 | 164,568 | ||||||
Formosa Taffeta Co. Ltd. | 17,850 | 20,332 | ||||||
Foxconn Technology Co. Ltd. | 16,450 | 29,531 | ||||||
Fubon Financial Holding Co. Ltd. | 107,684 | 152,067 | ||||||
Giant Manufacturing Co. Ltd. | 4,882 | 38,210 | ||||||
Globalwafers Co. Ltd. | 3,810 | 45,872 | ||||||
Highwealth Construction Corp. | 15,731 | 23,236 | ||||||
Hiwin Technologies Corp. | 3,555 | 36,290 | ||||||
Hon Hai Precision Industry Co. Ltd. | 202,264 | 510,628 | ||||||
Hotai Motor Co. Ltd. | 5,064 | 90,401 | ||||||
Hua Nan Financial Holdings Co. Ltd. | 129,311 | 83,767 | ||||||
Innolux Corp. | 136,321 | 28,240 | ||||||
Number | Value | |||||||
| Taiwan (Continued) | ||||||||
Inventec Corp. | 37,404 | $ | 30,397 | |||||
Largan Precision Co. Ltd. | 1,591 | 203,213 | ||||||
Lite-On Technology Corp. | 36,933 | 59,167 | ||||||
MediaTek, Inc. | 24,951 | 384,756 | ||||||
Mega Financial Holding Co. Ltd. | 178,860 | 183,179 | ||||||
Micro-Star International Co. Ltd. | 10,576 | 35,576 | ||||||
Nan Ya Plastics Corp. | 81,141 | 169,984 | ||||||
Nanya Technology Corp. | 21,550 | 42,921 | ||||||
Nien Made Enterprise Co. Ltd. | 2,946 | 25,216 | ||||||
Novatek Microelectronics Corp. | 10,048 | 68,604 | ||||||
Pegatron Corp. | 31,406 | 67,467 | ||||||
Phison Electronics Corp. | 2,823 | 25,856 | ||||||
Pou Chen Corp. | 36,766 | 36,184 | ||||||
Powertech Technology, Inc. | 10,097 | 32,620 | ||||||
President Chain Store Corp. | 9,474 | 93,241 | ||||||
Quanta Computer, Inc. | 45,635 | 106,393 | ||||||
Realtek Semiconductor Corp. | 8,294 | 71,407 | ||||||
Ruentex Development Co. Ltd.* | 12,986 | 19,766 | ||||||
Shanghai Commercial & Savings Bank Ltd. | 50,972 | 72,660 | ||||||
Shin Kong Financial Holding Co. Ltd.* | 188,370 | 52,323 | ||||||
SinoPac Financial Holdings Co. Ltd. | 174,056 | 68,405 | ||||||
Standard Foods Corp. | 7,588 | 16,048 | ||||||
Synnex Technology International Corp. | 17,611 | 26,043 | ||||||
Taishin Financial Holding Co. Ltd. | 165,081 | 71,476 | ||||||
Taiwan Business Bank | 96,039 | 33,906 | ||||||
Taiwan Cement Corp. | 72,060 | 102,120 | ||||||
Taiwan Cooperative Financial Holding Co. Ltd. | 136,553 | 92,779 | ||||||
Taiwan High Speed Rail Corp. | 33,255 | 41,756 | ||||||
Taiwan Mobile Co. Ltd. | 26,378 | 94,442 | ||||||
Taiwan Semiconductor Manufacturing Co. Ltd. | 401,702 | 3,906,644 | ||||||
Tatung Co. Ltd.* | 35,528 | 24,553 | ||||||
Uni-President Enterprises Corp. | 77,860 | 188,783 | ||||||
United Microelectronics Corp. | 189,265 | 97,390 | ||||||
Vanguard International Semiconductor Corp. | 16,396 | 40,137 | ||||||
Walsin Technology Corp. | 6,010 | 37,431 | ||||||
Win Semiconductors Corp. | 5,929 | 50,749 | ||||||
Winbond Electronics Corp. | 55,240 | 25,297 | ||||||
Wistron Corp. | 53,625 | 51,080 | ||||||
Wiwynn Corp. | 1,252 | 33,401 | ||||||
WPG Holdings Ltd. | 21,501 | 28,107 | ||||||
Yageo Corp. | 4,890 | 60,341 | ||||||
Yuanta Financial Holding Co. Ltd. | 144,897 | 78,421 | ||||||
Zhen Ding Technology Holding Ltd. | 9,348 | 37,205 | ||||||
|
| |||||||
(Cost $7,388,297) | 10,616,933 | |||||||
|
| |||||||
| Thailand — 2.4% | ||||||||
Advanced Info Service PCL, NVDR | 20,074 | 121,479 | ||||||
Airports of Thailand PCL, NVDR | 69,400 | 135,266 | ||||||
Asset World Corp. PCL, NVDR | 91,000 | 13,560 | ||||||
B Grimm Power PCL, NVDR | 10,800 | 17,910 | ||||||
Bangkok Bank PCL, NVDR | 8,646 | 29,626 | ||||||
Bangkok Commercial Asset Management PCL, NVDR | 25,700 | 19,067 | ||||||
| See Notes to Financial Statements. | 56 |
DBX ETF Trust
Schedule of Investments
Xtrackers MSCI Emerging Markets Hedged Equity ETF (Continued)
May 31, 2020
Number | Value | |||||||
| Thailand (Continued) | ||||||||
Bangkok Dusit Medical Services PCL, NVDR | 146,900 | $ | 103,906 | |||||
Bangkok Expressway & Metro PCL, NVDR | 134,100 | 41,524 | ||||||
Berli Jucker PCL, NVDR | 19,000 | 25,385 | ||||||
BTS Group Holdings PCL, NVDR | 125,844 | 47,869 | ||||||
Bumrungrad Hospital PCL, NVDR | 7,300 | 27,539 | ||||||
Central Pattana PCL, NVDR | 37,200 | 57,595 | ||||||
Central Retail Corp. PCL, NVDR* | 28,600 | 34,615 | ||||||
Charoen Pokphand Foods PCL, NVDR | 65,643 | 65,003 | ||||||
CP ALL PCL, NVDR | 94,800 | 210,104 | ||||||
Electricity Generating PCL, NVDR | 3,900 | 33,838 | ||||||
Energy Absolute PCL, NVDR | 28,800 | 35,310 | ||||||
Global Power Synergy PCL, NVDR | 10,800 | 25,633 | ||||||
Gulf Energy Development PCL, NVDR | 45,500 | 53,996 | ||||||
Home Product Center PCL, NVDR | 98,400 | 45,782 | ||||||
Indorama Ventures PCL, NVDR | 28,097 | 25,173 | ||||||
Intouch Holdings PCL, NVDR | 35,900 | 60,661 | ||||||
IRPC PCL, NVDR | 190,918 | 16,205 | ||||||
Kasikornbank PCL, NVDR | 30,679 | 92,587 | ||||||
Krung Thai Bank PCL, NVDR | 68,206 | 22,299 | ||||||
Krungthai Card PCL, NVDR | 11,700 | 14,161 | ||||||
Land & Houses PCL, NVDR | 124,100 | 28,479 | ||||||
Minor International PCL, NVDR* | 40,500 | 23,681 | ||||||
Muangthai Capital PCL, NVDR | 10,100 | 17,701 | ||||||
Osotspa PCL, NVDR | 10,800 | 14,429 | ||||||
PTT Exploration & Production PCL, NVDR | 23,813 | 62,883 | ||||||
PTT Global Chemical PCL, NVDR | 40,600 | 54,882 | ||||||
PTT PCL | 47,400 | 52,899 | ||||||
PTT PCL, NVDR | 141,780 | 158,227 | ||||||
Ratch Group PCL, NVDR | 11,200 | 24,646 | ||||||
Siam Cement PCL | 6,458 | 69,635 | ||||||
Siam Cement PCL, NVDR | 6,300 | 67,932 | ||||||
Siam Commercial Bank PCL, NVDR | 14,098 | 32,796 | ||||||
Srisawad Corp. PCL, NVDR* | 10,800 | 19,352 | ||||||
Thai Oil PCL, NVDR | 18,157 | 24,544 | ||||||
Thai Union Group PCL, NVDR | 54,700 | 23,558 | ||||||
TMB Bank PCL, NVDR | 420,026 | 15,185 | ||||||
Total Access Communication PCL, NVDR | 11,600 | 16,228 | ||||||
True Corp. PCL, NVDR | 189,500 | 22,042 | ||||||
|
| |||||||
(Cost $2,375,188) | 2,105,192 | |||||||
|
| |||||||
| Turkey — 0.4% | ||||||||
Akbank T.A.S.* | 45,545 | 37,960 | ||||||
Anadolu Efes Biracilik Ve Malt Sanayii AS* | 3,943 | 10,708 | ||||||
Aselsan Elektronik Sanayi Ve Ticaret AS | 5,352 | 23,660 | ||||||
BIM Birlesik Magazalar AS | 7,100 | 67,703 | ||||||
Eregli Demir ve Celik Fabrikalari TAS* | 22,518 | 26,552 | ||||||
Ford Otomotiv Sanayi AS | 1,335 | 12,095 | ||||||
Haci Omer Sabanci Holding AS | 15,448 | 18,781 | ||||||
KOC Holding AS | 12,751 | 30,145 | ||||||
TAV Havalimanlari Holding AS | 3,190 | 9,485 | ||||||
Tupras Turkiye Petrol Rafinerileri AS* | 2,020 | 25,357 | ||||||
Turk Hava Yollari AO* | 10,531 | 19,436 | ||||||
Turkcell Iletisim Hizmetleri AS | 13,444 | 27,884 | ||||||
Turkiye Garanti Bankasi AS* | 38,612 | 44,228 | ||||||
Number | Value | |||||||
| Turkey (Continued) | ||||||||
Turkiye Is Bankasi AS, Class C* | 23,601 | $ | 17,112 | |||||
Yapi ve Kredi Bankasi AS* | 56,351 | 19,150 | ||||||
|
| |||||||
(Cost $776,082) | 390,256 | |||||||
|
| |||||||
| United Arab Emirates — 0.6% | ||||||||
Abu Dhabi Commercial Bank PJSC | 46,177 | 55,315 | ||||||
Aldar Properties PJSC | 63,178 | 29,756 | ||||||
DP World PLC | 3,094 | 48,730 | ||||||
Dubai Islamic Bank PJSC | 27,536 | 26,613 | ||||||
Emaar Malls PJSC* | 43,172 | 15,514 | ||||||
Emaar Properties PJSC* | 64,943 | 44,201 | ||||||
Emirates NBD Bank PJSC | 20,944 | 49,265 | ||||||
Emirates Telecommunications Group Co. PJSC | 28,435 | 121,074 | ||||||
First Abu Dhabi Bank PJSC | 48,032 | 144,888 | ||||||
|
| |||||||
(Cost $655,408) | 535,356 | |||||||
|
| |||||||
TOTAL COMMON STOCKS | 86,417,874 | |||||||
|
| |||||||
| PREFERRED STOCKS — 2.2% | ||||||||
| Brazil — 1.4% | ||||||||
Banco Bradesco SA | 71,663 | 254,486 | ||||||
Braskem SA, Class A | 3,473 | 18,054 | ||||||
Centrais Eletricas Brasileiras SA, Class B* | 4,441 | 25,549 | ||||||
Cia Energetica de Minas Gerais | 17,569 | 35,558 | ||||||
Cia Paranaense de Energia | 1,687 | 20,012 | ||||||
Gerdau SA | 18,889 | 47,538 | ||||||
Itau Unibanco Holding SA | 78,893 | 340,628 | ||||||
Itausa — Investimentos Itau SA | 72,056 | 119,637 | ||||||
Lojas Americanas SA | 13,202 | 69,891 | ||||||
Petroleo Brasileiro SA | 75,445 | 287,568 | ||||||
Telefonica Brasil SA | 6,690 | 59,098 | ||||||
|
| |||||||
(Cost $1,420,513) | 1,278,019 | |||||||
|
| |||||||
| Chile — 0.1% | ||||||||
Embotelladora Andina SA, Class B | 5,576 | 13,383 | ||||||
Sociedad Quimica y Minera de Chile SA, Class B | 2,045 | 50,202 | ||||||
|
| |||||||
(Cost $52,923) | 63,585 | |||||||
|
| |||||||
| Colombia — 0.0% | ||||||||
Bancolombia SA | 7,347 | 48,455 | ||||||
|
| |||||||
| Russia — 0.1% | ||||||||
Surgutneftegas PJSC | 104,162 | 52,434 | ||||||
|
| |||||||
| South Korea — 0.6% | ||||||||
Amorepacific Corp. | 212 | 9,877 | ||||||
AMOREPACIFIC Group | 37 | 1,031 | ||||||
Hyundai Motor Co. | 468 | 21,275 | ||||||
Hyundai Motor Co. — 2nd Preferred | 584 | 28,388 | ||||||
LG Chem Ltd. | 134 | 19,151 | ||||||
LG Household & Health Care Ltd. | 33 | 19,052 | ||||||
| See Notes to Financial Statements. | 57 |
DBX ETF Trust
Schedule of Investments
Xtrackers MSCI Emerging Markets Hedged Equity ETF (Continued)
May 31, 2020
Number | Value | |||||||
| South Korea (Continued) | ||||||||
Samsung Electronics Co. Ltd. | 13,276 | $ | 459,346 | |||||
|
| |||||||
(Cost $367,096) | 558,120 | |||||||
|
| |||||||
TOTAL PREFERRED STOCKS | 2,000,613 | |||||||
|
| |||||||
Principal | ||||||||
| CORPORATE BONDS — 0.0% | ||||||||
| India — 0.0% | ||||||||
Britannia Industries Ltd. | INR 29,160 | 395 | ||||||
|
| |||||||
Number | ||||||||
| RIGHTS — 0.0% | ||||||||
| Brazil — 0.0% | ||||||||
Natura & Co. Holding SA*, | 584 | 545 | ||||||
|
| |||||||
| China — 0.0% | ||||||||
Zhengqi Financial Holding Corp.*(b) (Cost $0) | 532 | 0 | ||||||
|
| |||||||
TOTAL RIGHTS | 545 | |||||||
|
| |||||||
| WARRANTS — 0.0% | ||||||||
| Thailand — 0.0% | ||||||||
BTS Group Holdings PCL*, | 14,384 | 606 | ||||||
Number | ||||||||
| Thailand (Continued) | ||||||||
Minor International PCL*, | 2,475 | $ | 133 | |||||
|
| |||||||
TOTAL WARRANTS | 739 | |||||||
|
| |||||||
| EXCHANGE-TRADED FUNDS — 0.0% | ||||||||
Global X MSCI Pakistan ETF | 875 | 20,475 | ||||||
|
| |||||||
| SECURITIES LENDING COLLATERAL — 0.5% | ||||||||
DWS Government & Agency Securities Portfolio “DWS Government Cash Institutional Shares”, 0.07% (c)(d) | ||||||||
(Cost $404,374) | 404,374 | 404,374 | ||||||
|
| |||||||
| CASH EQUIVALENTS — 1.2% | ||||||||
DWS Government Money Market Series “Institutional Shares”, 0.12% (c) | ||||||||
(Cost $1,075,539) | 1,075,539 | 1,075,539 | ||||||
|
| |||||||
TOTAL INVESTMENTS — 100.6% | $ | 89,920,554 | ||||||
Other assets and liabilities, net — (0.6%) | (532,490 | ) | ||||||
|
| |||||||
NET ASSETS — 100.0% | $ | 89,388,064 | ||||||
|
| |||||||
A summary of the Fund’s transactions with affiliated investments during the year ended May 31, 2020 is as follows:
| Value ($) at 5/31/2019 | Purchases Cost ($) | Sales Proceeds ($) | Net Realized Gain/(Loss) ($) | Net Change in Unrealized Appreciation (Depreciation) ($) | Income ($) | Capital Gain Distributions ($) | Number of Shares at 5/31/2020 | Value ($) at 5/31/2020 | ||||||||||||||||||||||||||||||
SECURITIES LENDING COLLATERAL — 0.5% | ||||||||||||||||||||||||||||||||||||||
DWS Government & Agency Securities Portfolio “DWS Government Cash Institutional Shares”, 0.07% (c)(d) | ||||||||||||||||||||||||||||||||||||||
| 751,459 | — | (347,085 | )(e) | — | – | 11,609 | — | 404,374 | 404,374 | |||||||||||||||||||||||||||||
CASH EQUIVALENTS —1.2% | ||||||||||||||||||||||||||||||||||||||
DWS Government Money Market Series “Institutional Shares”, 0.12% (c) | ||||||||||||||||||||||||||||||||||||||
| 879,859 | 40,845,800 | (40,650,120 | ) | — | — | 26,672 | — | 1,075,539 | 1,075,539 | |||||||||||||||||||||||||||||
|
|
|
|
|
|
|
|
|
|
|
|
|
|
|
|
|
| |||||||||||||||||||||
| 1,631,318 | 40,845,800 | (40,997,205 | ) | — | — | 38,281 | — | 1,479,913 | 1,479,913 | |||||||||||||||||||||||||||||
|
|
|
|
|
|
|
|
|
|
|
|
|
|
|
|
|
| |||||||||||||||||||||
| * | Non-income producing security. |
| (a) | All or a portion of these securities were on loan. In addition, “Other assets and liabilities, net” may include pending sales that are also on loan. The value of securities loaned at May 31, 2020 amounted to $1,029,929, which is 1.2% of net assets. |
| (b) | Investment was valued using significant unobservable inputs. |
| (c) | Affiliated fund managed by DWS Investment Management Americas, Inc. The rate shown is the annualized seven-day yield at period end. |
| (d) | Represents cash collateral held in connection with securities lending. Income earned by the Fund is net of borrower rebates. In addition, the Fund held non-cash U.S. Treasury securities collateral having a value of $679,558. |
| (e) | Represents the net increase (purchase cost) or decrease (sales proceeds) in the amount invested in cash collateral for the year ended May 31, 2020. |
| See Notes to Financial Statements. | 58 |
DBX ETF Trust
Schedule of Investments
Xtrackers MSCI Emerging Markets Hedged Equity ETF (Continued)
May 31, 2020
| ADR: | American Depositary Receipt |
| CPO: | Ordinary Participation Certificates |
| GDR: | Global Depositary Receipt |
| JSC: | Joint Stock Company |
| NVDR: | Non Voting Depositary Receipt |
| PJSC: | Public Joint Stock Company |
| PSQC | Public Shareholders Qatari Company |
| QPSC: | Qatari Public Shareholders Company |
| QSC: | Qatari Shareholders Company |
| REIT: | Real Estate Investment Trust |
| SAE: | Societe Anonyme Egyptienne |
| SAQ: | Societe Anonyme Qatar |
| 144A: | Security exempt from registration under Rule 144A of the Securities Act of 1933. These securities may be resold in transactions exempt from registration, normally to qualified institutional buyers. |
At May 31, 2020, open futures contracts purchased were as follows:
Contract Description | Currency | Number of Contracts | Notional Amount | Contract Value | Expiration Date | Unrealized Appreciation | ||||||||||||||||||
MSCI Emerging Markets Index Futures | USD | 24 | $ | 990,085 | $ | 1,119,480 | 6/19/2020 | $ | 129,395 | |||||||||||||||
As of May 31, 2020, the Fund had the following forward foreign currency contracts outstanding:
Counterparty | Settlement Date | Currency To Deliver | Currency To Receive | Unrealized Appreciation | Unrealized Depreciation | |||||||||||||||||
Citigroup Global Markets | 6/3/2020 | AED | 1,694,300 | USD | 461,210 | $ | – | $ | (50 | ) | ||||||||||||
Citigroup Global Markets | 6/3/2020 | BRL | 5,962,800 | USD | 1,098,769 | – | (18,453 | ) | ||||||||||||||
JP Morgan & Chase Co. | 6/3/2020 | BRL | 4,570,800 | USD | 837,826 | – | (18,584 | ) | ||||||||||||||
JP Morgan & Chase Co. | 6/3/2020 | BRL | 3,206,000 | USD | 590,663 | – | (10,031 | ) | ||||||||||||||
RBC Capital Markets | 6/3/2020 | BRL | 10,992,200 | USD | 2,025,600 | – | (33,958 | ) | ||||||||||||||
Citigroup Global Markets | 6/3/2020 | CLP | 429,500,300 | USD | 514,119 | – | (22,484 | ) | ||||||||||||||
RBC Capital Markets | 6/3/2020 | CLP | 80,649,000 | USD | 96,551 | – | (4,209 | ) | ||||||||||||||
RBC Capital Markets | 6/3/2020 | CLP | 14,715,400 | USD | 17,619 | – | (765 | ) | ||||||||||||||
JP Morgan & Chase Co. | 6/3/2020 | CNH | 12,402,200 | USD | 1,755,514 | 18,260 | – | |||||||||||||||
JP Morgan & Chase Co. | 6/3/2020 | CNH | 2,889,000 | USD | 408,927 | 4,246 | – | |||||||||||||||
RBC Capital Markets | 6/3/2020 | CNH | 14,483,700 | USD | 2,050,206 | 21,383 | – | |||||||||||||||
Citigroup Global Markets | 6/3/2020 | COP | 959,445,400 | USD | 244,037 | – | (13,113 | ) | ||||||||||||||
JP Morgan & Chase Co. | 6/3/2020 | CZK | 2,364,000 | USD | 95,793 | – | (1,725 | ) | ||||||||||||||
Citigroup Global Markets | 6/3/2020 | EGP | 1,817,600 | USD | 114,171 | – | (239 | ) | ||||||||||||||
JP Morgan & Chase Co. | 6/3/2020 | EUR | 201,800 | USD | 221,148 | – | (2,874 | ) | ||||||||||||||
Citigroup Global Markets | 6/3/2020 | HKD | 58,012,100 | USD | 7,480,027 | – | (3,440 | ) | ||||||||||||||
JP Morgan & Chase Co. | 6/3/2020 | HKD | 34,211,200 | USD | 4,410,968 | – | (2,222 | ) | ||||||||||||||
JP Morgan & Chase Co. | 6/3/2020 | HKD | 21,283,000 | USD | 2,744,104 | – | (1,368 | ) | ||||||||||||||
RBC Capital Markets | 6/3/2020 | HKD | 61,228,300 | USD | 7,894,569 | – | (3,784 | ) | ||||||||||||||
JP Morgan & Chase Co. | 6/3/2020 | HUF | 26,696,000 | USD | 83,144 | – | (2,230 | ) | ||||||||||||||
RBC Capital Markets | 6/3/2020 | HUF | 44,286,400 | USD | 137,090 | – | (4,538 | ) | ||||||||||||||
Citigroup Global Markets | 6/3/2020 | INR | 90,272,800 | USD | 1,198,205 | 4,724 | – | |||||||||||||||
JP Morgan & Chase Co. | 6/3/2020 | INR | 378,257,200 | USD | 5,016,408 | 15,532 | – | |||||||||||||||
JP Morgan & Chase Co. | 6/3/2020 | INR | 98,738,000 | USD | 1,309,766 | 4,367 | – | |||||||||||||||
JP Morgan & Chase Co. | 6/3/2020 | KRW | 1,764,397,000 | USD | 1,459,035 | 34,366 | – | |||||||||||||||
JP Morgan & Chase Co. | 6/3/2020 | KRW | 2,481,553,400 | USD | 2,060,663 | 56,923 | – | |||||||||||||||
RBC Capital Markets | 6/3/2020 | KRW | 9,340,673,500 | USD | 7,756,424 | 214,260 | – | |||||||||||||||
Citigroup Global Markets | 6/3/2020 | MXN | 23,153,500 | USD | 967,705 | – | (75,968 | ) | ||||||||||||||
JP Morgan & Chase Co. | 6/3/2020 | MXN | 3,835,000 | USD | 160,249 | – | (12,619 | ) | ||||||||||||||
JP Morgan & Chase Co. | 6/3/2020 | MXN | 2,208,400 | USD | 92,287 | – | (7,259 | ) | ||||||||||||||
RBC Capital Markets | 6/3/2020 | MXN | 11,175,500 | USD | 467,063 | – | (36,686 | ) | ||||||||||||||
RBC Capital Markets | 6/3/2020 | MYR | 6,808,800 | USD | 1,579,402 | 13,483 | – | |||||||||||||||
RBC Capital Markets | 6/3/2020 | MYR | 439,000 | USD | 101,503 | 540 | – | |||||||||||||||
Citigroup Global Markets | 6/3/2020 | PHP | 18,058,100 | USD | 358,047 | 1,339 | – | |||||||||||||||
JP Morgan & Chase Co. | 6/3/2020 | PHP | 423,100 | USD | 8,383 | 26 | – | |||||||||||||||
RBC Capital Markets | 6/3/2020 | PHP | 16,343,200 | USD | 323,782 | 949 | – | |||||||||||||||
Citigroup Global Markets | 6/3/2020 | PLN | 2,192,800 | USD | 529,368 | – | (17,317 | ) | ||||||||||||||
| See Notes to Financial Statements. | 59 |
DBX ETF Trust
Schedule of Investments
Xtrackers MSCI Emerging Markets Hedged Equity ETF (Continued)
May 31, 2020
Counterparty | Settlement Date | Currency To Deliver | Currency To Receive | Unrealized Appreciation | Unrealized Depreciation | |||||||||||||||||
JP Morgan & Chase Co. | 6/3/2020 | PLN | 284,200 | USD | 68,603 | $ | – | $ | (2,251 | ) | ||||||||||||
JP Morgan & Chase Co. | 6/3/2020 | PLN | 378,000 | USD | 91,248 | – | (2,991 | ) | ||||||||||||||
Citigroup Global Markets | 6/3/2020 | QAR | 3,028,200 | USD | 831,923 | 217 | – | |||||||||||||||
Citigroup Global Markets | 6/3/2020 | RUB | 52,125,800 | USD | 701,939 | – | (38,771 | ) | ||||||||||||||
JP Morgan & Chase Co. | 6/3/2020 | RUB | 136,596,100 | USD | 1,839,543 | – | (101,493 | ) | ||||||||||||||
JP Morgan & Chase Co. | 6/3/2020 | RUB | 29,959,000 | USD | 403,386 | – | (22,333 | ) | ||||||||||||||
JP Morgan & Chase Co. | 6/3/2020 | TRY | 925,200 | USD | 131,392 | – | (4,015 | ) | ||||||||||||||
RBC Capital Markets | 6/3/2020 | TRY | 1,385,100 | USD | 196,985 | – | (5,730 | ) | ||||||||||||||
Citigroup Global Markets | 6/3/2020 | TWD | 122,078,700 | USD | 4,134,057 | 68,006 | – | |||||||||||||||
JP Morgan & Chase Co. | 6/3/2020 | TWD | 125,591,900 | USD | 4,250,149 | 67,085 | – | |||||||||||||||
JP Morgan & Chase Co. | 6/3/2020 | TWD | 46,871,000 | USD | 1,586,857 | 25,734 | – | |||||||||||||||
RBC Capital Markets | 6/3/2020 | TWD | 55,209,500 | USD | 1,871,635 | 32,784 | – | |||||||||||||||
Citigroup Global Markets | 6/3/2020 | USD | 461,272 | AED | 1,694,300 | – | (12 | ) | ||||||||||||||
Citigroup Global Markets | 6/3/2020 | USD | 1,098,486 | BRL | 5,962,800 | 18,737 | – | |||||||||||||||
JP Morgan & Chase Co. | 6/3/2020 | USD | �� | 1,431,359 | BRL | 7,776,800 | 25,745 | – | ||||||||||||||
RBC Capital Markets | 6/3/2020 | USD | 1,836,379 | BRL | 9,974,200 | 32,441 | – | |||||||||||||||
RBC Capital Markets | 6/3/2020 | USD | 182,274 | BRL | 1,018,000 | 8,464 | – | |||||||||||||||
Citigroup Global Markets | 6/3/2020 | USD | 533,448 | CLP | 429,500,300 | 3,155 | – | |||||||||||||||
RBC Capital Markets | 6/3/2020 | USD | 118,442 | CLP | 95,364,400 | 703 | – | |||||||||||||||
JP Morgan & Chase Co. | 6/3/2020 | USD | 197,782 | CNH | 1,411,000 | – | (135 | ) | ||||||||||||||
JP Morgan & Chase Co. | 6/3/2020 | USD | 1,937,406 | CNH | 13,880,200 | 6,880 | – | |||||||||||||||
RBC Capital Markets | 6/3/2020 | USD | 2,021,564 | CNH | 14,483,700 | 7,259 | – | |||||||||||||||
Citigroup Global Markets | 6/3/2020 | USD | 258,382 | COP | 959,445,400 | – | (1,232 | ) | ||||||||||||||
JP Morgan & Chase Co. | 6/3/2020 | USD | 97,684 | CZK | 2,364,000 | – | (167 | ) | ||||||||||||||
Citigroup Global Markets | 6/3/2020 | USD | 114,766 | EGP | 1,817,600 | – | (356 | ) | ||||||||||||||
JP Morgan & Chase Co. | 6/3/2020 | USD | 224,472 | EUR | 201,800 | – | (450 | ) | ||||||||||||||
Citigroup Global Markets | 6/3/2020 | USD | 7,484,452 | HKD | 58,012,100 | – | (984 | ) | ||||||||||||||
JP Morgan & Chase Co. | 6/3/2020 | USD | 7,159,907 | HKD | 55,494,200 | – | (1,245 | ) | ||||||||||||||
RBC Capital Markets | 6/3/2020 | USD | 1,138,058 | HKD | 8,826,000 | 482 | – | |||||||||||||||
RBC Capital Markets | 6/3/2020 | USD | 6,760,715 | HKD | 52,402,300 | – | (902 | ) | ||||||||||||||
JP Morgan & Chase Co. | 6/3/2020 | USD | 85,740 | HUF | 26,696,000 | – | (366 | ) | ||||||||||||||
RBC Capital Markets | 6/3/2020 | USD | 142,236 | HUF | 44,286,400 | – | (608 | ) | ||||||||||||||
Citigroup Global Markets | 6/3/2020 | USD | 1,195,191 | INR | 90,272,800 | – | (1,710 | ) | ||||||||||||||
JP Morgan & Chase Co. | 6/3/2020 | USD | 5,941,196 | INR | 448,976,200 | – | (5,356 | ) | ||||||||||||||
JP Morgan & Chase Co. | 6/3/2020 | USD | 368,540 | INR | 28,019,000 | 1,894 | – | |||||||||||||||
JP Morgan & Chase Co. | 6/3/2020 | USD | 3,431,126 | KRW | 4,245,950,400 | – | (2,717 | ) | ||||||||||||||
RBC Capital Markets | 6/3/2020 | USD | 6,910,494 | KRW | 8,544,825,500 | – | (10,940 | ) | ||||||||||||||
RBC Capital Markets | 6/3/2020 | USD | 649,672 | KRW | 795,848,000 | – | (7,061 | ) | ||||||||||||||
Citigroup Global Markets | 6/3/2020 | USD | 1,046,117 | MXN | 23,153,500 | – | (2,444 | ) | ||||||||||||||
JP Morgan & Chase Co. | 6/3/2020 | USD | 273,050 | MXN | 6,043,400 | – | (636 | ) | ||||||||||||||
RBC Capital Markets | 6/3/2020 | USD | 504,924 | MXN | 11,175,500 | – | (1,174 | ) | ||||||||||||||
RBC Capital Markets | 6/3/2020 | USD | 1,668,078 | MYR | 7,247,800 | – | (1,197 | ) | ||||||||||||||
Citigroup Global Markets | 6/3/2020 | USD | 357,232 | PHP | 18,058,100 | – | (525 | ) | ||||||||||||||
JP Morgan & Chase Co. | 6/3/2020 | USD | 8,381 | PHP | 423,100 | – | (23 | ) | ||||||||||||||
RBC Capital Markets | 6/3/2020 | USD | 323,436 | PHP | 16,343,200 | – | (603 | ) | ||||||||||||||
Citigroup Global Markets | 6/3/2020 | USD | 547,623 | PLN | 2,192,800 | – | (938 | ) | ||||||||||||||
JP Morgan & Chase Co. | 6/3/2020 | USD | 165,376 | PLN | 662,200 | – | (284 | ) | ||||||||||||||
Citigroup Global Markets | 6/3/2020 | USD | 831,717 | QAR | 3,028,200 | – | (11 | ) | ||||||||||||||
Citigroup Global Markets | 6/3/2020 | USD | 738,191 | RUB | 52,125,800 | 2,519 | – | |||||||||||||||
JP Morgan & Chase Co. | 6/3/2020 | USD | 183,216 | RUB | 13,821,000 | 13,181 | – | |||||||||||||||
JP Morgan & Chase Co. | 6/3/2020 | USD | 2,161,471 | RUB | 152,734,100 | 8,886 | – | |||||||||||||||
JP Morgan & Chase Co. | 6/3/2020 | USD | 135,612 | TRY | 925,200 | – | (205 | ) | ||||||||||||||
RBC Capital Markets | 6/3/2020 | USD | 202,990 | TRY | 1,385,100 | – | (275 | ) | ||||||||||||||
Citigroup Global Markets | 6/3/2020 | USD | 4,069,290 | TWD | 122,078,700 | – | (3,239 | ) | ||||||||||||||
JP Morgan & Chase Co. | 6/3/2020 | USD | 5,184,966 | TWD | 155,574,900 | – | (3,264 | ) | ||||||||||||||
JP Morgan & Chase Co. | 6/3/2020 | USD | 569,905 | TWD | 16,888,000 | – | (7,420 | ) | ||||||||||||||
RBC Capital Markets | 6/3/2020 | USD | 1,840,623 | TWD | 55,209,500 | – | (1,772 | ) | ||||||||||||||
JP Morgan & Chase Co. | 6/3/2020 | USD | 2,130,396 | ZAR | 37,561,400 | 8,941 | – | |||||||||||||||
| See Notes to Financial Statements. | 60 |
DBX ETF Trust
Schedule of Investments
Xtrackers MSCI Emerging Markets Hedged Equity ETF (Continued)
May 31, 2020
Counterparty | Settlement Date | Currency To Deliver | Currency To Receive | Unrealized Appreciation | Unrealized Depreciation | |||||||||||||||||
JP Morgan & Chase Co. | 6/3/2020 | USD | 147,153 | ZAR | 2,761,000 | $ | 10,102 | $ | – | |||||||||||||
RBC Capital Markets | 6/3/2020 | USD | 1,358,593 | ZAR | 23,953,900 | 5,719 | – | |||||||||||||||
JP Morgan & Chase Co. | 6/3/2020 | ZAR | 27,968,400 | USD | 1,517,913 | – | (75,048 | ) | ||||||||||||||
JP Morgan & Chase Co. | 6/3/2020 | ZAR | 12,354,000 | USD | 670,510 | – | (33,121 | ) | ||||||||||||||
RBC Capital Markets | 6/3/2020 | ZAR | 23,953,900 | USD | 1,300,041 | – | (64,271 | ) | ||||||||||||||
Citigroup Global Markets | 6/4/2020 | IDR | 9,073,743,800 | USD | 601,109 | – | (19,598 | ) | ||||||||||||||
JP Morgan & Chase Co. | 6/4/2020 | IDR | 8,804,007,900 | USD | 582,970 | – | (19,286 | ) | ||||||||||||||
RBC Capital Markets | 6/4/2020 | IDR | 1,516,118,300 | USD | 100,306 | – | (3,408 | ) | ||||||||||||||
JP Morgan & Chase Co. | 6/4/2020 | THB | 57,472,600 | USD | 1,772,369 | – | (34,351 | ) | ||||||||||||||
JP Morgan & Chase Co. | 6/4/2020 | THB | 10,795,000 | USD | 332,957 | – | (6,397 | ) | ||||||||||||||
Citigroup Global Markets | 6/4/2020 | USD | 620,639 | IDR | 9,073,743,800 | 68 | – | |||||||||||||||
JP Morgan & Chase Co. | 6/4/2020 | USD | 601,778 | IDR | 8,804,007,900 | 478 | – | |||||||||||||||
RBC Capital Markets | 6/4/2020 | USD | 103,489 | IDR | 1,516,118,300 | 224 | – | |||||||||||||||
JP Morgan & Chase Co. | 6/4/2020 | USD | 2,039,569 | THB | 64,874,600 | – | (158 | ) | ||||||||||||||
JP Morgan & Chase Co. | 6/4/2020 | USD | 104,874 | THB | 3,393,000 | 1,789 | – | |||||||||||||||
Citigroup Global Markets | 7/3/2020 | AED | 390,000 | USD | 106,156 | – | (4 | ) | ||||||||||||||
Citigroup Global Markets | 7/3/2020 | AED | 1,694,300 | USD | 461,191 | – | (7 | ) | ||||||||||||||
Citigroup Global Markets | 7/3/2020 | BRL | 2,356,000 | USD | 432,961 | – | (7,784 | ) | ||||||||||||||
Citigroup Global Markets | 7/3/2020 | BRL | 5,962,800 | USD | 1,096,829 | – | (18,652 | ) | ||||||||||||||
JP Morgan & Chase Co. | 7/3/2020 | BRL | 7,776,800 | USD | 1,429,209 | – | (25,622 | ) | ||||||||||||||
RBC Capital Markets | 7/3/2020 | BRL | 9,974,200 | USD | 1,833,526 | – | (32,380 | ) | ||||||||||||||
Citigroup Global Markets | 7/3/2020 | CLP | 429,500,300 | USD | 533,269 | – | (3,313 | ) | ||||||||||||||
RBC Capital Markets | 7/3/2020 | CLP | 95,364,400 | USD | 118,391 | – | (749 | ) | ||||||||||||||
JP Morgan & Chase Co. | 7/3/2020 | CNH | 2,167,000 | USD | 301,767 | – | (1,141 | ) | ||||||||||||||
JP Morgan & Chase Co. | 7/3/2020 | CNH | 13,880,200 | USD | 1,932,974 | – | (7,234 | ) | ||||||||||||||
RBC Capital Markets | 7/3/2020 | CNH | 14,483,700 | USD | 2,016,891 | – | (7,675 | ) | ||||||||||||||
Citigroup Global Markets | 7/3/2020 | COP | 959,445,400 | USD | 257,501 | 1,077 | – | |||||||||||||||
JP Morgan & Chase Co. | 7/3/2020 | CZK | 2,364,000 | USD | 97,695 | 160 | – | |||||||||||||||
JP Morgan & Chase Co. | 7/3/2020 | EUR | 201,800 | USD | 224,603 | 442 | – | |||||||||||||||
Citigroup Global Markets | 7/3/2020 | HKD | 58,012,100 | USD | 7,479,011 | 817 | – | |||||||||||||||
JP Morgan & Chase Co. | 7/3/2020 | HKD | 8,818,000 | USD | 1,136,627 | – | (79 | ) | ||||||||||||||
JP Morgan & Chase Co. | 7/3/2020 | HKD | 55,494,200 | USD | 7,153,251 | – | (367 | ) | ||||||||||||||
RBC Capital Markets | 7/3/2020 | HKD | 52,402,300 | USD | 6,755,485 | 436 | – | |||||||||||||||
JP Morgan & Chase Co. | 7/3/2020 | HUF | 26,696,000 | USD | 85,713 | 356 | – | |||||||||||||||
RBC Capital Markets | 7/3/2020 | HUF | 44,286,400 | USD | 142,188 | 588 | – | |||||||||||||||
Citigroup Global Markets | 7/3/2020 | IDR | 9,073,743,800 | USD | 617,345 | – | (867 | ) | ||||||||||||||
JP Morgan & Chase Co. | 7/3/2020 | IDR | 8,804,007,900 | USD | 597,530 | – | (2,305 | ) | ||||||||||||||
RBC Capital Markets | 7/3/2020 | IDR | 1,516,118,300 | USD | 102,913 | – | (383 | ) | ||||||||||||||
Citigroup Global Markets | 7/3/2020 | INR | 90,272,800 | USD | 1,191,091 | 1,106 | – | |||||||||||||||
JP Morgan & Chase Co. | 7/3/2020 | INR | 27,021,000 | USD | 356,074 | – | (120 | ) | ||||||||||||||
JP Morgan & Chase Co. | 7/3/2020 | INR | 448,976,200 | USD | 5,920,357 | 1,907 | – | |||||||||||||||
JP Morgan & Chase Co. | 7/3/2020 | KRW | 4,245,950,400 | USD | 3,430,544 | 2,326 | – | |||||||||||||||
JP Morgan & Chase Co. | 7/3/2020 | KRW | 606,554,000 | USD | 490,666 | 929 | – | |||||||||||||||
RBC Capital Markets | 7/3/2020 | KRW | 8,544,825,500 | USD | 6,909,656 | 10,486 | – | |||||||||||||||
Citigroup Global Markets | 7/3/2020 | MXN | 23,153,500 | USD | 1,041,179 | 2,275 | – | |||||||||||||||
JP Morgan & Chase Co. | 7/3/2020 | MXN | 6,043,400 | USD | 271,790 | 621 | – | |||||||||||||||
RBC Capital Markets | 7/3/2020 | MXN | 11,175,500 | USD | 502,592 | 1,144 | – | |||||||||||||||
RBC Capital Markets | 7/3/2020 | MYR | 7,247,800 | USD | 1,667,311 | 2,753 | – | |||||||||||||||
Citigroup Global Markets | 7/3/2020 | PHP | 18,058,100 | USD | 356,562 | 170 | – | |||||||||||||||
JP Morgan & Chase Co. | 7/3/2020 | PHP | 423,100 | USD | 8,357 | 7 | – | |||||||||||||||
RBC Capital Markets | 7/3/2020 | PHP | 16,343,200 | USD | 322,669 | 122 | – | |||||||||||||||
Citigroup Global Markets | 7/3/2020 | PLN | 2,192,800 | USD | 547,575 | 935 | – | |||||||||||||||
JP Morgan & Chase Co. | 7/3/2020 | PLN | 662,200 | USD | 165,362 | 283 | – | |||||||||||||||
Citigroup Global Markets | 7/3/2020 | QAR | 3,028,200 | USD | 831,672 | – | (148 | ) | ||||||||||||||
Citigroup Global Markets | 7/3/2020 | RUB | 52,125,800 | USD | 734,005 | – | (3,521 | ) | ||||||||||||||
JP Morgan & Chase Co. | 7/3/2020 | RUB | 24,444,000 | USD | 344,436 | – | (1,421 | ) | ||||||||||||||
JP Morgan & Chase Co. | 7/3/2020 | RUB | 152,734,100 | USD | 2,152,206 | – | (8,822 | ) | ||||||||||||||
JP Morgan & Chase Co. | 7/3/2020 | THB | 5,404,000 | USD | 169,727 | – | (136 | ) | ||||||||||||||
| See Notes to Financial Statements. | 61 |
DBX ETF Trust
Schedule of Investments
Xtrackers MSCI Emerging Markets Hedged Equity ETF (Continued)
May 31, 2020
Counterparty | Settlement Date | Currency To Deliver | Currency To Receive | Unrealized Appreciation | Unrealized Depreciation | |||||||||||||||||
JP Morgan & Chase Co. | 7/3/2020 | THB | 64,874,600 | USD | 2,037,800 | $ | – | $ | (1,393 | ) | ||||||||||||
JP Morgan & Chase Co. | 7/3/2020 | TRY | 925,200 | USD | 134,273 | 54 | – | |||||||||||||||
RBC Capital Markets | 7/3/2020 | TRY | 1,385,100 | USD | 200,987 | 50 | – | |||||||||||||||
Citigroup Global Markets | 7/3/2020 | TWD | 122,078,700 | USD | 4,075,675 | 8,121 | – | |||||||||||||||
JP Morgan & Chase Co. | 7/3/2020 | TWD | 7,401,000 | USD | 247,010 | 416 | – | |||||||||||||||
JP Morgan & Chase Co. | 7/3/2020 | TWD | 155,574,900 | USD | 5,192,234 | 8,615 | – | |||||||||||||||
RBC Capital Markets | 7/3/2020 | TWD | 55,209,500 | USD | 1,843,389 | 3,857 | – | |||||||||||||||
Citigroup Global Markets | 7/3/2020 | USD | 81,764 | CLP | 65,795,000 | 434 | – | |||||||||||||||
JP Morgan & Chase Co. | 7/3/2020 | USD | 129,118 | EUR | 116,000 | – | (264 | ) | ||||||||||||||
Citigroup Global Markets | 7/3/2020 | USD | 130,355 | MXN | 2,898,000 | – | (321 | ) | ||||||||||||||
JP Morgan & Chase Co. | 7/3/2020 | USD | 118,974 | ZAR | 2,104,000 | 485 | – | |||||||||||||||
JP Morgan & Chase Co. | 7/3/2020 | ZAR | 37,561,400 | USD | 2,123,483 | – | (9,141 | ) | ||||||||||||||
RBC Capital Markets | 7/3/2020 | ZAR | 23,953,900 | USD | 1,354,299 | – | (5,731 | ) | ||||||||||||||
Citigroup Global Markets | 7/6/2020 | EGP | 1,817,600 | USD | 113,071 | 703 | – | |||||||||||||||
|
|
|
| |||||||||||||||||||
Total unrealized appreciation (depreciation) | $ | 793,566 | $ | (924,969 | ) | |||||||||||||||||
|
|
|
| |||||||||||||||||||
For information on the Fund’s policy and additional disclosures regarding open futures contracts and forward foreign currency contracts, please refer to the Derivatives section of Note 2 in the accompanying Notes to Financial Statements.
Currency Abbreviations
| AED | Arab Emirates Dirham |
| BRL | Brazilian Real |
| CLP | Chilean Peso |
| CNH | Chinese Yuan |
| COP | Colombian Peso |
| CZK | Czech Koruna |
| EGP | Egyptian Pound |
| EUR | Euro |
| HKD | Hong Kong Dollar |
| HUF | Hungarian Forint |
| IDR | Indonesian Rupiah |
| INR | Indian Rupee |
| KRW | South Korean Won |
| MXN | Mexican Peso |
| MYR | Malaysian Ringgit |
| PHP | Philippine Peso |
| PLN | Polish Zloty |
| QAR | Qatari Rial |
| RUB | Russian Ruble |
| THB | Thai Baht |
| TRY | Turkish Lira |
| TWD | New Taiwan Dollar |
| USD | U.S. Dollar |
| ZAR | South African Rand |
| See Notes to Financial Statements. | 62 |
DBX ETF Trust
Schedule of Investments
Xtrackers MSCI Emerging Markets Hedged Equity ETF (Continued)
May 31, 2020
Fair Value Measurements
Various inputs are used in determining the value of the Fund’s investments. These inputs are summarized in three broad levels. Level 1 includes quoted prices in active markets for identical securities. Level 2 includes other significant observable inputs (including quoted prices for similar securities, interest rates, prepayment speeds and credit risk). Level 3 includes significant unobservable inputs (including the Fund’s own assumptions in determining the fair value of investments). The level assigned to the securities valuations may not be an indication of the risk or liquidity associated with investing in those securities.
The following is a summary of the inputs used as of May 31, 2020 in valuing the Fund’s investments. For information on the Fund’s policy regarding the valuation of investments, please refer to the Security Valuation section of Note 2 in the accompanying Notes to Financial Statements.
Assets | Level 1 | Level 2 | Level 3 | Total | ||||||||||||
Common Stocks (f) | $ | 86,409,526 | $ | — | $ | 8,348 | $ | 86,417,874 | ||||||||
Preferred Stocks (f) | 2,000,613 | — | — | 2,000,613 | ||||||||||||
Corporate Bonds | — | 395 | — | 395 | ||||||||||||
Rights (f) | 545 | — | 0 | 545 | ||||||||||||
Warrants | 739 | — | — | 739 | ||||||||||||
Exchange-Traded Funds | 20,475 | — | — | 20,475 | ||||||||||||
Short-Term Investments (f) | 1,479,913 | — | — | 1,479,913 | ||||||||||||
Derivatives (g) | ||||||||||||||||
Forward Foreign Currency Contracts | — | 793,566 | — | 793,566 | ||||||||||||
Futures Contracts | 129,395 | — | — | 129,395 | ||||||||||||
|
|
|
|
|
|
|
| |||||||||
TOTAL | $ | 90,041,206 | $ | 793,961 | $ | 8,348 | $ | 90,843,515 | ||||||||
|
|
|
|
|
|
|
| |||||||||
Liabilities | Level 1 | Level 2 | Level 3 | Total | ||||||||||||
Derivatives (g) | ||||||||||||||||
Forward Foreign Currency Contracts | $ | — | $ | (924,969 | ) | $ | — | $ | (924,969 | ) | ||||||
|
|
|
|
|
|
|
| |||||||||
TOTAL | $ | — | $ | (924,969 | ) | $ | — | $ | (924,969 | ) | ||||||
|
|
|
|
|
|
|
| |||||||||
| (f) | See Schedule of Investments for additional detailed categorizations. |
| (g) | Derivatives include unrealized appreciation (depreciation) on open futures contracts and forward foreign currency contracts. |
During the year ended May 31, 2020, the amount of transfers from Level 1 to Level 3 was $1,044 and from level 3 to level 1 were $65,801. The investments were transferred from Level 1 to Level 3 due to the lack of observable market data due to a decrease in market activity. The investments were transferred from Level 3 to Level 1 due to the availability of a pricing source supported by observable inputs.
| See Notes to Financial Statements. | 63 |
DBX ETF Trust
Schedule of Investments
Xtrackers MSCI Europe Hedged Equity ETF
May 31, 2020
Number | Value | |||||||
| COMMON STOCKS — 97.1% | ||||||||
| Australia — 0.5% | ||||||||
BHP Group PLC | 128,569 | $ | 2,510,674 | |||||
|
| |||||||
| Austria — 0.3% | ||||||||
ANDRITZ AG* | 4,212 | 157,752 | ||||||
Erste Group Bank AG* | 17,782 | 390,140 | ||||||
OMV AG* | 8,835 | 291,473 | ||||||
Raiffeisen Bank International AG | 9,184 | 168,620 | ||||||
Verbund AG* | 3,786 | 168,274 | ||||||
voestalpine AG | 6,982 | 135,903 | ||||||
|
| |||||||
(Cost $2,020,392) | 1,312,162 | |||||||
|
| |||||||
| Belgium — 1.4% | ||||||||
Ageas SA/NV* | 10,606 | 361,084 | ||||||
Anheuser-Busch InBev SA/NV | 46,250 | 2,151,652 | ||||||
Colruyt SA | 3,407 | 205,662 | ||||||
Elia Group SA/NV | 1,823 | 213,694 | ||||||
Galapagos NV* | 2,569 | 522,863 | ||||||
Groupe Bruxelles Lambert SA | 5,011 | 404,502 | ||||||
KBC Group NV | 15,226 | 795,560 | ||||||
Proximus SADP | 8,821 | 184,036 | ||||||
Sofina SA | 926 | 252,865 | ||||||
Solvay SA (a) | 4,472 | 339,945 | ||||||
Telenet Group Holding NV | 3,016 | 123,404 | ||||||
UCB SA | 7,697 | 768,965 | ||||||
Umicore SA | 11,843 | 523,750 | ||||||
|
| |||||||
(Cost $11,205,782) | 6,847,982 | |||||||
|
| |||||||
| Chile — 0.0% | ||||||||
Antofagasta PLC | ||||||||
(Cost $254,544) | 23,057 | 249,559 | ||||||
|
| |||||||
| Denmark — 3.7% | ||||||||
A.P. Moller — Maersk A/S, Class A | 212 | 193,369 | ||||||
A.P. Moller — Maersk A/S, Class B | 382 | 372,605 | ||||||
Ambu A/S, Class B | 9,886 | 329,624 | ||||||
Carlsberg A/S, Class B | 6,454 | 832,898 | ||||||
Chr Hansen Holding A/S | 6,302 | 609,258 | ||||||
Coloplast A/S, Class B | 7,202 | 1,206,563 | ||||||
Danske Bank A/S* | 41,999 | 518,987 | ||||||
Demant A/S* | 6,697 | 188,788 | ||||||
DSV PANALPINA A/S | 12,746 | 1,343,852 | ||||||
Genmab A/S* | 3,935 | 1,207,136 | ||||||
GN Store Nord A/S | 7,758 | 417,871 | ||||||
H Lundbeck A/S | 4,466 | 171,187 | ||||||
Novo Nordisk A/S, Class B | 107,758 | 7,000,503 | ||||||
Novozymes A/S, Class B | 13,055 | 712,323 | ||||||
Orsted A/S, 144A | 11,395 | 1,335,128 | ||||||
Pandora A/S | 6,250 | 310,585 | ||||||
Tryg A/S | 8,133 | 227,453 | ||||||
Vestas Wind Systems A/S | 12,148 | 1,237,024 | ||||||
|
| |||||||
(Cost $16,846,673) | 18,215,154 | |||||||
|
| |||||||
| Finland — 1.9% | ||||||||
Elisa OYJ | 8,628 | 539,980 | ||||||
Fortum OYJ | 27,613 | 527,824 | ||||||
Kone OYJ, Class B | 20,643 | 1,381,302 | ||||||
Metso OYJ | 6,367 | 206,165 | ||||||
Number | Value | |||||||
| Finland (Continued) | ||||||||
Neste OYJ (a) | 25,396 | $ | 1,023,891 | |||||
Nokia OYJ | 343,847 | 1,360,907 | ||||||
Nordea Bank Abp* | 198,322 | 1,339,469 | ||||||
Orion OYJ, Class B | 6,276 | 335,097 | ||||||
Sampo OYJ, Class A*(a) | 28,499 | 1,016,127 | ||||||
Stora Enso OYJ, Class R* | 37,233 | 455,669 | ||||||
UPM-Kymmene OYJ | 32,529 | 937,746 | ||||||
Wartsila OYJ Abp | 25,966 | 202,457 | ||||||
|
| |||||||
(Cost $11,555,575) | 9,326,634 | |||||||
|
| |||||||
| France — 16.4% | ||||||||
Accor SA* | 11,869 | 333,991 | ||||||
Aeroports de Paris | 1,737 | 180,572 | ||||||
Air Liquide SA | 28,831 | 3,907,672 | ||||||
Airbus SE* | 35,559 | 2,238,078 | ||||||
Alstom SA | 11,639 | 488,888 | ||||||
Amundi SA, 144A* | 3,593 | 267,024 | ||||||
Arkema SA | 4,305 | 374,464 | ||||||
Atos SE* | 5,987 | 450,723 | ||||||
AXA SA* | 117,643 | 2,139,059 | ||||||
BioMerieux | 2,517 | 360,705 | ||||||
BNP Paribas SA* | 68,448 | 2,450,759 | ||||||
Bollore SA | 52,229 | 148,769 | ||||||
Bouygues SA* | 14,167 | 433,096 | ||||||
Bureau Veritas SA* | 17,116 | 347,503 | ||||||
Capgemini SE | 9,724 | 994,139 | ||||||
Carrefour SA | 37,006 | 560,927 | ||||||
Casino Guichard Perrachon SA*(a) | 2,608 | 98,083 | ||||||
Cie de Saint-Gobain | 31,532 | 1,017,511 | ||||||
Cie Generale des Etablissements Michelin SCA* | 10,313 | 1,040,161 | ||||||
CNP Assurances* | 10,370 | 108,839 | ||||||
Covivio REIT (a) | 3,168 | 185,151 | ||||||
Credit Agricole SA* | 72,159 | 626,703 | ||||||
Danone SA*(a) | 37,446 | 2,558,861 | ||||||
Dassault Aviation SA* | 169 | 143,888 | ||||||
Dassault Systemes SE | 7,974 | 1,347,647 | ||||||
Edenred | 14,498 | 604,794 | ||||||
Eiffage SA* | 5,066 | 461,128 | ||||||
Electricite de France SA | 38,260 | 337,896 | ||||||
Engie SA* | 111,151 | 1,312,181 | ||||||
EssilorLuxottica SA* | 17,284 | 2,220,792 | ||||||
Eurazeo SE* | 2,358 | 114,647 | ||||||
Faurecia SE* | 4,487 | 172,634 | ||||||
Gecina SA REIT | 2,680 | 344,200 | ||||||
Getlink SE* | 27,115 | 390,685 | ||||||
Hermes International | 1,957 | 1,624,497 | ||||||
ICADE REIT | 1,971 | 140,792 | ||||||
Iliad SA | 838 | 147,347 | ||||||
Ingenico Group SA | 3,739 | 515,490 | ||||||
Ipsen SA* | 2,318 | 181,918 | ||||||
JCDecaux SA* | 5,304 | 107,686 | ||||||
Kering SA | 4,595 | 2,395,280 | ||||||
Klepierre SA REIT (a) | 11,955 | 226,132 | ||||||
La Francaise des Jeux SAEM, 144A* | 5,078 | 172,882 | ||||||
Legrand SA (a) | 16,187 | 1,101,462 | ||||||
L’Oreal SA* | 15,293 | 4,446,015 | ||||||
| See Notes to Financial Statements. | 64 |
DBX ETF Trust
Schedule of Investments
Xtrackers MSCI Europe Hedged Equity ETF (Continued)
May 31, 2020
Number | Value | |||||||
| France (Continued) | ||||||||
LVMH Moet Hennessy Louis Vuitton SE | 16,853 | $ | 7,015,380 | |||||
Natixis SA* | 57,506 | 127,222 | ||||||
Orange SA | 120,495 | 1,450,579 | ||||||
Orpea | 3,067 | 359,518 | ||||||
Pernod Ricard SA | 12,805 | 1,991,409 | ||||||
Peugeot SA* | 35,518 | 504,860 | ||||||
Publicis Groupe SA | 12,790 | 362,321 | ||||||
Remy Cointreau SA (a) | 1,280 | 151,748 | ||||||
Renault SA | 11,383 | 255,304 | ||||||
Safran SA* | 19,507 | 1,859,191 | ||||||
Sanofi | 68,449 | 6,650,690 | ||||||
Sartorius Stedim Biotech* | 1,665 | 450,600 | ||||||
Schneider Electric SE | 33,548 | 3,323,295 | ||||||
SCOR SE* | 9,628 | 237,050 | ||||||
SEB SA | 1,429 | 195,745 | ||||||
Societe Generale SA* | 49,684 | 729,768 | ||||||
Sodexo SA | 5,340 | 358,861 | ||||||
Suez SA (a) | 20,347 | 230,605 | ||||||
Teleperformance* | 3,588 | 848,748 | ||||||
Thales SA | 6,395 | 488,254 | ||||||
TOTAL SA | 150,182 | 5,605,610 | ||||||
Ubisoft Entertainment SA* | 5,544 | 428,696 | ||||||
Unibail-Rodamco-Westfield REIT | 8,279 | 438,368 | ||||||
Valeo SA* | 14,578 | 358,438 | ||||||
Veolia Environnement SA (a) | 32,248 | 704,662 | ||||||
Vinci SA | 31,460 | 2,899,938 | ||||||
Vivendi SA | 50,330 | 1,141,400 | ||||||
Wendel SE* | 1,614 | 147,988 | ||||||
Worldline SA, 144A* | 8,359 | 622,801 | ||||||
|
| |||||||
(Cost $96,493,191) | 79,760,720 | |||||||
|
| |||||||
| Germany — 13.2% | ||||||||
adidas AG* | 11,586 | 3,050,640 | ||||||
Allianz SE | 25,380 | 4,587,141 | ||||||
BASF SE* | 55,967 | 3,022,129 | ||||||
Bayer AG | 59,655 | 4,020,882 | ||||||
Bayerische Motoren Werke AG | 20,080 | 1,172,444 | ||||||
Beiersdorf AG | 6,243 | 653,226 | ||||||
Brenntag AG | 9,047 | 476,121 | ||||||
Carl Zeiss Meditec AG* | 2,318 | 236,982 | ||||||
Commerzbank AG* | 61,394 | 238,595 | ||||||
Continental AG* | 6,640 | 651,868 | ||||||
Covestro AG, 144A* | 10,269 | 379,476 | ||||||
Daimler AG* | 52,369 | 1,940,454 | ||||||
Delivery Hero SE, 144A* | 7,780 | 744,267 | ||||||
Deutsche Bank AG*(b) | 118,803 | 993,168 | ||||||
Deutsche Boerse AG | 11,535 | 1,893,775 | ||||||
Deutsche Lufthansa AG* | 13,710 | 139,130 | ||||||
Deutsche Post AG* | 59,702 | 1,854,297 | ||||||
Deutsche Telekom AG* | 202,711 | 3,189,650 | ||||||
Deutsche Wohnen SE | 20,906 | 933,374 | ||||||
E.ON SE | 136,940 | 1,445,010 | ||||||
Evonik Industries AG | 12,356 | 303,805 | ||||||
Fraport AG Frankfurt Airport Services Worldwide* | 2,316 | 114,713 | ||||||
Fresenius Medical Care AG & Co. KGaA* | 13,034 | 1,093,811 | ||||||
Fresenius SE & Co. KGaA* | 25,238 | 1,210,268 | ||||||
Number | Value | |||||||
| Germany (Continued) | ||||||||
GEA Group AG | 9,303 | $ | 276,655 | |||||
Hannover Rueck SE | 3,700 | 593,899 | ||||||
HeidelbergCement AG* | 8,803 | 436,114 | ||||||
Henkel AG & Co. KGaA* | 6,278 | 502,109 | ||||||
HOCHTIEF AG | 1,614 | 141,717 | ||||||
Infineon Technologies AG | 76,364 | 1,598,383 | ||||||
KION Group AG* | 4,127 | 229,975 | ||||||
Knorr-Bremse AG | 2,870 | 303,229 | ||||||
LANXESS AG* | 4,860 | 250,752 | ||||||
LEG Immobilien AG* | 4,133 | 514,205 | ||||||
Merck KGaA | 7,754 | 887,846 | ||||||
METRO AG | 11,098 | 103,433 | ||||||
MTU Aero Engines AG* | 3,237 | 520,659 | ||||||
Muenchener Rueckversicherungs-Gesellschaft AG in Muenchen | 8,850 | 2,009,979 | ||||||
Nemetschek SE* | 3,499 | 275,380 | ||||||
Puma SE* | 4,870 | 346,954 | ||||||
RWE AG* | 35,345 | 1,168,803 | ||||||
SAP SE | 63,527 | 8,003,812 | ||||||
Scout24 AG, 144A | 6,510 | 496,817 | ||||||
Siemens AG | 46,493 | 5,085,091 | ||||||
Siemens Healthineers AG, 144A | 9,237 | 476,431 | ||||||
Symrise AG* | 7,804 | 852,423 | ||||||
TeamViewer AG* | 7,886 | 400,533 | ||||||
Telefonica Deutschland Holding AG | 63,575 | 195,201 | ||||||
thyssenkrupp AG* | 24,020 | 161,580 | ||||||
Uniper SE | 12,423 | 387,503 | ||||||
United Internet AG | 6,529 | 267,289 | ||||||
Volkswagen AG* | 1,985 | 313,771 | ||||||
Vonovia SE* | 31,486 | 1,809,765 | ||||||
Wirecard AG | 7,063 | 741,377 | ||||||
Zalando SE, 144A* | 9,231 | 623,420 | ||||||
|
| |||||||
(Cost $82,564,678) | 64,320,331 | |||||||
|
| |||||||
| Ireland — 1.5% | ||||||||
AerCap Holdings NV* | 7,723 | 248,989 | ||||||
CRH PLC | 47,531 | 1,545,921 | ||||||
DCC PLC | 5,937 | 493,604 | ||||||
Experian PLC | 55,706 | 1,935,258 | ||||||
Flutter Entertainment PLC(a) | 8,435 | 1,079,586 | ||||||
Kerry Group PLC, Class A | 9,530 | 1,177,418 | ||||||
Kingspan Group PLC | 9,195 | 566,994 | ||||||
Smurfit Kappa Group PLC | 14,143 | 459,366 | ||||||
|
| |||||||
(Cost $7,060,411) | 7,507,136 | |||||||
|
| |||||||
| Isle of Man — 0.1% | ||||||||
GVC Holdings PLC | ||||||||
(Cost $454,735) | 34,622 | 338,987 | ||||||
|
| |||||||
| Italy — 3.2% | ||||||||
Assicurazioni Generali SpA | 66,274 | 918,490 | ||||||
Atlantia SpA* | 31,031 | 502,739 | ||||||
Davide Campari-Milano SpA | 36,219 | 293,496 | ||||||
DiaSorin SpA* | 1,517 | 317,424 | ||||||
Enel SpA | 495,672 | 3,797,074 | ||||||
Eni SpA | 155,579 | 1,402,846 | ||||||
Ferrari NV | 7,664 | 1,292,278 | ||||||
FinecoBank Banca Fineco SpA* | 38,156 | 444,940 | ||||||
| See Notes to Financial Statements. | 65 |
DBX ETF Trust
Schedule of Investments
Xtrackers MSCI Europe Hedged Equity ETF (Continued)
May 31, 2020
Number | Value | |||||||
| Italy (Continued) | ||||||||
Infrastrutture Wireless Italiane SpA, 144A | 14,234 | $ | 144,811 | |||||
Intesa Sanpaolo SpA* | 907,662 | 1,564,122 | ||||||
Leonardo SpA* | 23,591 | 146,648 | ||||||
Mediobanca Banca di Credito Finanziario SpA | 36,274 | 234,992 | ||||||
Moncler SpA* | 11,699 | 434,398 | ||||||
Nexi SpA, 144A* | 18,771 | 307,759 | ||||||
Pirelli & C SpA, 144A* | 21,898 | 97,961 | ||||||
Poste Italiane SpA, 144A | 31,702 | 277,796 | ||||||
Prysmian SpA | 14,581 | 309,874 | ||||||
Recordati SpA | 6,512 | 295,796 | ||||||
Snam SpA | 123,897 | 575,434 | ||||||
Telecom Italia SpA* | 542,962 | 200,101 | ||||||
Telecom Italia SpA-RSP | 358,761 | 138,111 | ||||||
Terna Rete Elettrica Nazionale SpA | 83,820 | 564,780 | ||||||
UniCredit SpA* | 127,635 | 1,086,129 | ||||||
|
| |||||||
(Cost $20,726,552) | 15,347,999 | |||||||
|
| |||||||
| Jordan — 0.1% | ||||||||
Hikma Pharmaceuticals PLC | ||||||||
(Cost $280,464) | 8,789 | 279,067 | ||||||
|
| |||||||
| Luxembourg — 0.3% | ||||||||
ArcelorMittal SA* | 43,342 | 414,002 | ||||||
Aroundtown SA | 72,733 | 399,004 | ||||||
Eurofins Scientific SE | 799 | 539,076 | ||||||
SES SA | 21,428 | 158,273 | ||||||
Tenaris SA | 28,084 | 174,329 | ||||||
|
| |||||||
(Cost $3,234,843) | 1,684,684 | |||||||
|
| |||||||
| Netherlands — 7.2% | ||||||||
ABN AMRO Bank NV, 144A | 25,117 | 201,023 | ||||||
Adyen NV, 144A* | 1,094 | 1,436,629 | ||||||
Aegon NV | 111,623 | 297,997 | ||||||
Akzo Nobel NV | 12,226 | 998,861 | ||||||
Altice Europe NV* | 40,202 | 160,655 | ||||||
ASML Holding NV | 25,853 | 8,407,118 | ||||||
EXOR NV | 6,628 | 356,540 | ||||||
Heineken Holding NV | 6,866 | 564,761 | ||||||
Heineken NV | 15,598 | 1,428,105 | ||||||
ING Groep NV | 238,389 | 1,536,406 | ||||||
Just Eat Takeaway.com NV, 144A* | 7,369 | 798,037 | ||||||
Koninklijke Ahold Delhaize NV | 66,242 | 1,677,264 | ||||||
Koninklijke DSM NV | 10,602 | 1,353,995 | ||||||
Koninklijke KPN NV | 211,188 | 516,682 | ||||||
Koninklijke Philips NV* | 54,956 | 2,488,350 | ||||||
Koninklijke Vopak NV | 4,130 | 226,062 | ||||||
NN Group NV | 18,456 | 568,927 | ||||||
Prosus NV* | 29,597 | 2,450,920 | ||||||
QIAGEN NV* | 14,170 | 618,323 | ||||||
Randstad NV | 7,012 | 293,678 | ||||||
Royal Dutch Shell PLC, Class A | 250,359 | 3,893,366 | ||||||
Royal Dutch Shell PLC, Class B | 226,330 | 3,426,888 | ||||||
Wolters Kluwer NV | 16,784 | 1,335,476 | ||||||
|
| |||||||
(Cost $41,565,892) | 35,036,063 | |||||||
|
| |||||||
Number | Value | |||||||
| Norway — 0.9% | ||||||||
DNB ASA* | 56,833 | $ | 772,916 | |||||
Equinor ASA | 60,755 | 882,192 | ||||||
Gjensidige Forsikring ASA* | 11,903 | 215,878 | ||||||
Mowi ASA | 26,527 | 499,526 | ||||||
Norsk Hydro ASA* | 80,070 | 203,290 | ||||||
Orkla ASA | 46,325 | 416,226 | ||||||
Schibsted ASA, Class B* | 6,032 | 144,583 | ||||||
Telenor ASA | 45,395 | 688,344 | ||||||
Yara International ASA | 10,620 | 363,368 | ||||||
|
| |||||||
(Cost $5,472,130) | 4,186,323 | |||||||
|
| |||||||
| Portugal — 0.3% | ||||||||
EDP — Energias de Portugal SA | 155,013 | 726,661 | ||||||
Galp Energia SGPS SA | 29,765 | 354,031 | ||||||
Jeronimo Martins SGPS SA* | 14,401 | 245,862 | ||||||
|
| |||||||
(Cost $1,318,027) | 1,326,554 | |||||||
|
| |||||||
| Russia — 0.0% | ||||||||
Evraz PLC | ||||||||
(Cost $225,233) | 30,110 | 105,013 | ||||||
|
| |||||||
| Spain — 3.8% | ||||||||
ACS Actividades de Construccion y Servicios SA | 15,861 | 404,069 | ||||||
Aena SME SA, 144A* | 4,256 | 605,665 | ||||||
Amadeus IT Group SA | 26,444 | 1,377,885 | ||||||
Banco Bilbao Vizcaya Argentaria SA | 402,413 | 1,247,629 | ||||||
Banco Santander SA | 1,010,423 | 2,285,302 | ||||||
Bankinter SA | 39,476 | 166,999 | ||||||
CaixaBank SA | 211,204 | 393,754 | ||||||
Cellnex Telecom SA, 144A* | 15,185 | 858,313 | ||||||
Enagas SA | 15,472 | 347,101 | ||||||
Endesa SA | 18,919 | 448,372 | ||||||
Ferrovial SA* | 428 | 11,602 | ||||||
Ferrovial SA | 29,385 | 796,552 | ||||||
Grifols SA(a) | 18,207 | 568,325 | ||||||
Iberdrola SA | 353,845 | 3,805,309 | ||||||
Industria de Diseno Textil SA | 66,586 | 1,851,541 | ||||||
Mapfre SA | 61,157 | 107,466 | ||||||
Naturgy Energy Group SA | 17,833 | 330,486 | ||||||
Red Electrica Corp. SA | 25,769 | 453,101 | ||||||
Repsol SA | 85,661 | 795,887 | ||||||
Siemens Gamesa Renewable Energy SA* | 14,239 | 239,224 | ||||||
Telefonica SA | 281,382 | 1,324,669 | ||||||
|
| |||||||
(Cost $30,933,638) | 18,419,251 | |||||||
|
| |||||||
| Sweden — 4.5% | ||||||||
Alfa Laval AB* | 18,699 | 376,856 | ||||||
Assa Abloy AB, Class B | 60,380 | 1,222,012 | ||||||
Atlas Copco AB, Class A | 40,603 | 1,590,931 | ||||||
Atlas Copco AB, Class B | 23,261 | 820,086 | ||||||
Boliden AB | 16,903 | 366,312 | ||||||
Electrolux AB, Series B | 13,518 | 221,150 | ||||||
Epiroc AB, Class A | 39,165 | 434,564 | ||||||
Epiroc AB, Class B | 23,237 | 258,695 | ||||||
EQT AB* | 14,409 | 227,775 | ||||||
Essity AB, Class B* | 36,614 | 1,207,702 | ||||||
| See Notes to Financial Statements. | 66 |
DBX ETF Trust
Schedule of Investments
Xtrackers MSCI Europe Hedged Equity ETF (Continued)
May 31, 2020
Number | Value | |||||||
| Sweden (Continued) | ||||||||
Evolution Gaming Group AB, 144A* | 7,703 | $ | 454,370 | |||||
Hennes & Mauritz AB, Class B(a) | 49,033 | 739,719 | ||||||
Hexagon AB, Class B* | 17,380 | 953,981 | ||||||
Husqvarna AB, Class B | 24,820 | 182,438 | ||||||
ICA Gruppen AB(a) | 6,136 | 288,027 | ||||||
Industrivarden AB, Class C* | 9,911 | 220,255 | ||||||
Investment AB Latour, Class B | 9,047 | 162,168 | ||||||
Investor AB, Class B | 27,571 | 1,465,959 | ||||||
Kinnevik AB, Class B | 14,934 | 375,626 | ||||||
L E Lundbergforetagen AB, Class B* | 4,479 | 222,083 | ||||||
Lundin Energy AB | 11,118 | 267,845 | ||||||
Nibe Industrier AB, Class B* | 18,945 | 420,216 | ||||||
Sandvik AB* | 70,123 | 1,160,214 | ||||||
Securitas AB, Class B* | 17,999 | 238,394 | ||||||
Skandinaviska Enskilda Banken AB, Class A* | 98,628 | 855,382 | ||||||
Skanska AB, Class B* | 19,988 | 399,015 | ||||||
SKF AB, Class B | 23,871 | 437,770 | ||||||
Svenska Cellulosa AB SCA, Class B* | 36,540 | 455,657 | ||||||
Svenska Handelsbanken AB, Class A* | 94,726 | 896,135 | ||||||
Swedbank AB, Class A* | 54,260 | 679,506 | ||||||
Swedish Match AB | 10,503 | 728,546 | ||||||
Tele2 AB, Class B | 29,728 | 395,320 | ||||||
Telefonaktiebolaget LM Ericsson, Class B | 178,332 | 1,620,830 | ||||||
Telia Co. AB | 157,287 | 538,838 | ||||||
Volvo AB, Class B* | 89,561 | 1,266,537 | ||||||
|
| |||||||
(Cost $24,551,790) | 22,150,914 | |||||||
|
| |||||||
| Switzerland — 16.9% | ||||||||
ABB Ltd. | 112,350 | 2,206,583 | ||||||
Adecco Group AG | 9,446 | 448,042 | ||||||
Alcon, Inc.* | 29,895 | 1,923,376 | ||||||
Baloise Holding AG | 2,916 | 414,146 | ||||||
Banque Cantonale Vaudoise | 1,829 | 177,613 | ||||||
Barry Callebaut AG | 183 | 367,598 | ||||||
Chocoladefabriken Lindt & Spruengli AG | 6 | 520,275 | ||||||
Chocoladefabriken Lindt & Spruengli AG Participation Certificates | 69 | 574,641 | ||||||
Cie Financiere Richemont SA | 31,403 | 1,824,495 | ||||||
Clariant AG* | 11,538 | 211,314 | ||||||
Coca-Cola HBC AG* | 11,959 | 301,000 | ||||||
Credit Suisse Group AG | 147,475 | 1,344,418 | ||||||
EMS-Chemie Holding AG | 494 | 364,927 | ||||||
Geberit AG | 2,232 | 1,084,439 | ||||||
Givaudan SA | 562 | 2,014,155 | ||||||
Glencore PLC* | 612,377 | 1,133,068 | ||||||
Julius Baer Group Ltd. | 13,302 | 565,660 | ||||||
Kuehne + Nagel International AG* | 3,189 | 458,887 | ||||||
LafargeHolcim Ltd.* | 31,857 | 1,316,279 | ||||||
Logitech International SA | 9,953 | 586,542 | ||||||
Lonza Group AG | 4,567 | 2,238,865 | ||||||
Nestle SA | 181,040 | 19,549,609 | ||||||
Novartis AG | 130,647 | 11,278,458 | ||||||
Pargesa Holding SA | 2,316 | 174,579 | ||||||
Partners Group Holding AG | 1,120 | 925,066 | ||||||
Roche Holding AG | 42,713 | 14,775,021 | ||||||
Schindler Holding AG | 1,254 | 289,966 | ||||||
Number | Value | |||||||
| Switzerland (Continued) | ||||||||
Schindler Holding AG Participation Certificates | 2,494 | $ | 578,511 | |||||
SGS SA | 364 | 853,421 | ||||||
Sika AG | 8,605 | 1,471,743 | ||||||
Sonova Holding AG | 3,279 | 717,643 | ||||||
STMicroelectronics NV | 39,041 | 957,325 | ||||||
Straumann Holding AG | 637 | 515,269 | ||||||
Swatch Group AG — Bearer | 1,747 | 348,564 | ||||||
Swatch Group AG — Registered | 3,380 | 131,222 | ||||||
Swiss Life Holding AG | 1,952 | 684,763 | ||||||
Swiss Prime Site AG | 4,498 | 418,092 | ||||||
Swiss Re AG | 17,900 | 1,211,944 | ||||||
Swisscom AG | 1,568 | 814,812 | ||||||
Temenos AG | 4,102 | 625,664 | ||||||
UBS Group AG | 223,580 | 2,394,338 | ||||||
Vifor Pharma AG | 2,721 | 413,327 | ||||||
Zurich Insurance Group AG | 9,094 | 2,926,381 | ||||||
|
| |||||||
(Cost $81,494,749) | 82,132,041 | |||||||
|
| |||||||
| United Arab Emirates(c) — 0.0% | ||||||||
NMC Health PLC(d) | ||||||||
(Cost $293,106) | 6,475 | 0 | ||||||
|
| |||||||
| United Kingdom — 20.9% | ||||||||
3i Group PLC | 57,866 | 589,583 | ||||||
Admiral Group PLC | 11,385 | 328,031 | ||||||
Anglo American PLC | 74,554 | 1,565,815 | ||||||
Ashtead Group PLC | 27,537 | 813,817 | ||||||
Associated British Foods PLC | 21,780 | 489,818 | ||||||
AstraZeneca PLC | 79,722 | 8,447,589 | ||||||
Auto Trader Group PLC, 144A | 56,533 | 389,726 | ||||||
AVEVA Group PLC | 3,762 | 189,931 | ||||||
Aviva PLC | 235,696 | 721,017 | ||||||
BAE Systems PLC | 196,074 | 1,201,556 | ||||||
Barclays PLC | 1,046,741 | 1,489,738 | ||||||
Barratt Developments PLC | 60,391 | 370,677 | ||||||
Berkeley Group Holdings PLC | 7,385 | 373,484 | ||||||
BP PLC | 1,230,616 | 4,646,825 | ||||||
British American Tobacco PLC | 139,179 | 5,482,310 | ||||||
British Land Co. PLC REIT | 56,117 | 282,277 | ||||||
BT Group PLC | 541,125 | 776,887 | ||||||
Bunzl PLC | 20,353 | 474,190 | ||||||
Burberry Group PLC | 25,362 | 468,422 | ||||||
CNH Industrial NV* | 60,389 | 365,474 | ||||||
Coca-Cola European Partners PLC | 12,531 | 472,419 | ||||||
Compass Group PLC | 108,462 | 1,585,976 | ||||||
Croda International PLC | 7,699 | 493,479 | ||||||
Diageo PLC | 142,639 | 4,915,725 | ||||||
Direct Line Insurance Group PLC | 81,975 | 267,879 | ||||||
Ferguson PLC | 13,694 | 1,076,624 | ||||||
Fiat Chrysler Automobiles NV* | 67,372 | 593,953 | ||||||
GlaxoSmithKline PLC | 305,212 | 6,301,634 | ||||||
Halma PLC | 22,540 | 648,600 | ||||||
Hargreaves Lansdown PLC | 20,312 | 459,940 | ||||||
HSBC Holdings PLC | 1,236,757 | 5,652,893 | ||||||
Imperial Brands PLC | 57,456 | 1,040,602 | ||||||
Informa PLC | 91,169 | 511,626 | ||||||
InterContinental Hotels Group PLC | 10,639 | 508,617 | ||||||
| See Notes to Financial Statements. | 67 |
DBX ETF Trust
Schedule of Investments
Xtrackers MSCI Europe Hedged Equity ETF (Continued)
May 31, 2020
Number | Value | |||||||
| United Kingdom (Continued) | ||||||||
Intertek Group PLC | 9,791 | $ | 665,780 | |||||
ITV PLC | 215,656 | 213,814 | ||||||
J Sainsbury PLC | 104,874 | 251,268 | ||||||
JD Sports Fashion PLC | 26,482 | 215,332 | ||||||
Johnson Matthey PLC | 11,503 | 300,177 | ||||||
Kingfisher PLC | 125,656 | 301,370 | ||||||
Land Securities Group PLC REIT | 40,818 | 305,385 | ||||||
Legal & General Group PLC | 358,066 | 877,790 | ||||||
Lloyds Banking Group PLC | 4,266,438 | 1,573,867 | ||||||
London Stock Exchange Group PLC | 19,159 | 1,900,009 | ||||||
M&G PLC | 154,535 | 267,191 | ||||||
Melrose Industries PLC | 293,527 | 417,426 | ||||||
Mondi PLC | 29,599 | 551,246 | ||||||
National Grid PLC | 214,218 | 2,449,820 | ||||||
Next PLC | 8,117 | 487,592 | ||||||
Ocado Group PLC* | 28,554 | 772,639 | ||||||
Pearson PLC | 46,481 | 266,010 | ||||||
Persimmon PLC | 19,397 | 549,295 | ||||||
Prudential PLC | 158,142 | 2,044,849 | ||||||
Reckitt Benckiser Group PLC | 42,980 | 3,834,524 | ||||||
RELX PLC | 117,721 | 2,723,798 | ||||||
Rentokil Initial PLC | 111,362 | 683,260 | ||||||
Rio Tinto PLC | 68,270 | 3,636,442 | ||||||
Rolls-Royce Holdings PLC* | 117,245 | 393,271 | ||||||
Royal Bank of Scotland Group PLC | 292,511 | 398,641 | ||||||
RSA Insurance Group PLC | 60,062 | 292,478 | ||||||
Sage Group PLC | 64,685 | 552,013 | ||||||
Schroders PLC | 7,827 | 285,641 | ||||||
Segro PLC REIT | 67,174 | 696,532 | ||||||
Severn Trent PLC | 14,979 | 451,563 | ||||||
Smith & Nephew PLC | 52,838 | 1,071,487 | ||||||
Smiths Group PLC | 23,590 | 380,631 | ||||||
Spirax-Sarco Engineering PLC | 4,423 | 539,140 | ||||||
SSE PLC | 62,750 | 962,117 | ||||||
St James’s Place PLC | 31,542 | 357,913 | ||||||
Standard Chartered PLC | 164,391 | 747,937 | ||||||
Standard Life Aberdeen PLC | 145,333 | 463,613 | ||||||
Taylor Wimpey PLC | 195,166 | 346,119 | ||||||
Tesco PLC | 595,086 | 1,677,849 | ||||||
Unilever NV | 89,046 | 4,595,330 | ||||||
Unilever PLC | 71,032 | 3,800,229 | ||||||
United Utilities Group PLC | 42,015 | 476,129 | ||||||
Vodafone Group PLC | 1,627,274 | 2,673,283 | ||||||
Whitbread PLC (a) | 7,724 | 241,150 | ||||||
Wm Morrison Supermarkets PLC | 148,402 | 342,177 | ||||||
WPP PLC | 75,624 | 571,208 | ||||||
|
| |||||||
(Cost $141,570,680) | 101,602,469 | |||||||
|
| |||||||
TOTAL COMMON STOCKS | 472,659,717 | |||||||
|
| |||||||
| PREFERRED STOCKS — 0.9% | ||||||||
| Germany — 0.9% | ||||||||
Bayerische Motoren Werke AG | 3,344 | 153,603 | ||||||
FUCHS PETROLUB SE | 4,509 | 179,287 | ||||||
Henkel AG & Co. KGaA* | 10,839 | 965,916 | ||||||
Number | Value | |||||||
| Germany (Continued) | ||||||||
Porsche Automobil Holding SE | 9,176 | $ | 498,188 | |||||
Sartorius AG* | 2,168 | 802,357 | ||||||
Volkswagen AG* | 11,223 | 1,650,698 | ||||||
|
| |||||||
(Cost $5,583,273) | 4,250,049 | |||||||
|
| |||||||
TOTAL PREFERRED STOCKS | 4,250,049 | |||||||
|
| |||||||
| RIGHTS — 0.0% | ||||||||
| Italy — 0.0% | ||||||||
Davide Campari-Milano SpA*, | ||||||||
(Cost $0) | 36,219 | 0 | ||||||
|
| |||||||
| United Kingdom — 0.0% | ||||||||
Whitbread PLC*, | ||||||||
(Cost $103,000) | 3,862 | 47,791 | ||||||
|
| |||||||
TOTAL RIGHTS | 47,791 | |||||||
|
| |||||||
| EXCHANGE-TRADED FUNDS — 0.1% | ||||||||
iShares Currency Hedged MSCI Eurozone ETF (a) | 14,688 | 394,960 | ||||||
iShares Currency Hedged MSCI United Kingdom ETF | 7,000 | 139,642 | ||||||
|
| |||||||
TOTAL EXCHANGE-TRADED FUNDS | 534,602 | |||||||
|
| |||||||
| SECURITIES LENDING COLLATERAL — 1.6% |
| |||||||
DWS Government & Agency Securities Portfolio “DWS Government Cash Institutional Shares”, 0.07%(e)(f) | 7,981,610 | 7,981,610 | ||||||
|
| |||||||
| CASH EQUIVALENTS — 1.9% | ||||||||
DWS ESG Liquidity Fund “Capital Shares”, 0.47% (e) | 639,124 | 639,380 | ||||||
DWS Government Money Market Series “Institutional Shares”, 0.12% (e) | 8,725,094 | 8,725,094 | ||||||
|
| |||||||
TOTAL CASH EQUIVALENTS | 9,364,474 | |||||||
|
| |||||||
TOTAL INVESTMENTS — 101.6% | $ | 494,838,243 | ||||||
Other assets and liabilities, net — (1.6%) | (7,822,267 | ) | ||||||
|
| |||||||
NET ASSETS — 100.0% | $ | 487,015,976 | ||||||
|
| |||||||
| See Notes to Financial Statements. | 68 |
DBX ETF Trust
Schedule of Investments
Xtrackers MSCI Europe Hedged Equity ETF (Continued)
May 31, 2020
A summary of the Fund’s transactions with affiliated investments during the year ended May 31, 2020 is as follows:
| Value ($) at 5/31/2019 | Purchases Cost ($) | Sales Proceeds ($) | Net Realized Gain/ (Loss) ($) | Net Change in Unrealized Appreciation (Depreciation) ($) | Income ($) | Capital Gain Distributions ($) | Number of Shares at 5/31/2020 | Value ($) at 5/31/2020 | ||||||||||||||||||||||||||||||
COMMON STOCKS — 0.2% | ||||||||||||||||||||||||||||||||||||||
Germany — 0.2% | ||||||||||||||||||||||||||||||||||||||
Deutsche Bank AG*(b) | ||||||||||||||||||||||||||||||||||||||
| 1,318,613 | 232,377 | (850,233 | ) | (1,112,810 | ) | 1,405,221 | — | — | 118,803 | 993,168 | ||||||||||||||||||||||||||||
SECURITIES LENDING COLLATERAL — 1.6% | ||||||||||||||||||||||||||||||||||||||
DWS Government & Agency Securities Portfolio “DWS Government Cash Institutional Shares”, 0.07% (e)(f) | ||||||||||||||||||||||||||||||||||||||
| 26,160,853 | — | (18,179,243 | )(g) | — | — | 155,304 | — | 7,981,610 | 7,981,610 | |||||||||||||||||||||||||||||
CASH EQUIVALENTS — 1.9% | ||||||||||||||||||||||||||||||||||||||
DWS ESG Liquidity Fund “Capital Shares”, 0.47% (e) | ||||||||||||||||||||||||||||||||||||||
| 9,320,708 | 18,416 | (8,701,740 | ) | 1,740 | 256 | 21,048 | — | 639,124 | 639,380 | |||||||||||||||||||||||||||||
DWS Government Money Market Series “Institutional Shares”, 0.12% (e) | ||||||||||||||||||||||||||||||||||||||
| 15,462,354 | 346,167,057 | (352,904,317 | ) | — | — | 189,576 | — | 8,725,094 | 8,725,094 | |||||||||||||||||||||||||||||
|
|
|
|
|
|
|
|
|
|
|
|
|
|
|
|
|
| |||||||||||||||||||||
| 52,262,528 | 346,417,850 | (380,635,533 | ) | (1,111,070 | ) | 1,405,477 | 365,928 | — | 17,464,631 | 18,339,252 | ||||||||||||||||||||||||||||
|
|
|
|
|
|
|
|
|
|
|
|
|
|
|
|
|
| |||||||||||||||||||||
| * | Non-income producing security. |
| (a) | All or a portion of these securities were on loan. In addition, “Other assets and liabilities, net” may include pending sales that are also on loan. The value of securities loaned at May 31, 2020 amounted to $7,754,778, which is 1.6% of net assets. |
| (b) | Affiliated issuer. This security is owned in proportion with its representation in the index. |
| (c) | Securities are listed in country of domicile and trade on exchanges within the MSCI Europe US Dollar Hedged Index. |
| (d) | Investment was valued using significant unobservable inputs. |
| (e) | Affiliated fund managed by DWS Investment Management Americas, Inc. The rate shown is the annualized seven-day yield at period end. |
| (f) | Represents cash collateral held in connection with securities lending. Income earned by the Fund is net of borrower rebates. In addition, the Fund held non-cash U.S. Treasury securities collateral having a value of $276,240. |
| (g) | Represents the net increase (purchase cost) or decrease (sales proceeds) in the amount invested in cash collateral for the year ended May 31, 2020. |
| REIT: | Real Estate Investment Trust |
| RSP: | Risparmio (Convertible Savings Shares) |
| 144A: | Security exempt from registration under Rule 144A of the Securities Act of 1933. These securities may be resold in transactions exempt from registration, normally to qualified institutional buyers. |
At May 31, 2020, open futures contracts purchased were as follows:
Contract Description | Currency | Number of Contracts | Notional Amount | Contract Value | Expiration Date | Unrealized Appreciation | ||||||||||||||||
AMSTERDAM Index Futures | EUR | 6 | $ | 693,706 | $ | 708,843 | 6/19/2020 | $ | 15,137 | |||||||||||||
CAC40 10 EURO Futures | EUR | 37 | 1,836,336 | 1,924,627 | 6/19/2020 | 88,291 | ||||||||||||||||
DAX Index Futures | EUR | 4 | 1,063,694 | 1,287,936 | 6/19/2020 | 224,242 | ||||||||||||||||
FTSE/MIB Index Futures | EUR | 2 | 190,096 | 201,774 | 6/19/2020 | 11,678 | ||||||||||||||||
FTSE 100 Index Futures | GBP | 33 | 2,323,119 | 2,469,959 | 6/19/2020 | 146,840 | ||||||||||||||||
IBEX 35 Index Futures | EUR | 12 | 888,071 | 940,914 | 6/19/2020 | 52,843 | ||||||||||||||||
OMXS30 Index Futures | SEK | 44 | 728,790 | 760,219 | 6/18/2020 | 31,429 | ||||||||||||||||
SWISS MKT IX Futures | CHF | 12 | 1,145,626 | 1,226,076 | 6/19/2020 | 80,450 | ||||||||||||||||
|
| |||||||||||||||||||||
Total unrealized appreciation | $ | 650,910 | ||||||||||||||||||||
|
| |||||||||||||||||||||
| See Notes to Financial Statements. | 69 |
DBX ETF Trust
Schedule of Investments
Xtrackers MSCI Europe Hedged Equity ETF (Continued)
May 31, 2020
As of May 31, 2020, the Fund had the following forward foreign currency contracts outstanding:
Counterparty | Settlement Date | Currency To Deliver | Currency To Receive | Unrealized Appreciation | Unrealized Depreciation | |||||||||||||||||
Citigroup Global Markets | 6/3/2020 | CHF | 6,697,000 | USD | 6,943,926 | $ | — | $ | (19,654 | ) | ||||||||||||
JP Morgan & Chase Co. | 6/3/2020 | CHF | 32,040,722 | USD | 33,221,618 | — | (94,515 | ) | ||||||||||||||
JP Morgan & Chase Co. | 6/3/2020 | CHF | 346,000 | USD | 358,573 | — | (1,200 | ) | ||||||||||||||
JP Morgan & Chase Co. | 6/3/2020 | CHF | 6,644,000 | USD | 6,889,043 | — | (19,427 | ) | ||||||||||||||
RBC Capital Markets | 6/3/2020 | CHF | 32,983,917 | USD | 34,200,426 | — | (96,446 | ) | ||||||||||||||
Citigroup Global Markets | 6/3/2020 | DKK | 35,513,500 | USD | 5,216,935 | — | (71,960 | ) | ||||||||||||||
JP Morgan & Chase Co. | 6/3/2020 | DKK | 37,558,142 | USD | 5,517,337 | — | (76,058 | ) | ||||||||||||||
JP Morgan & Chase Co. | 6/3/2020 | DKK | 13,236,000 | USD | 1,944,397 | — | (26,791 | ) | ||||||||||||||
RBC Capital Markets | 6/3/2020 | DKK | 31,499,500 | USD | 4,627,210 | — | (63,894 | ) | ||||||||||||||
Citigroup Global Markets | 6/3/2020 | EUR | 19,372,000 | USD | 21,228,612 | — | (276,609 | ) | ||||||||||||||
Citigroup Global Markets | 6/3/2020 | EUR | 2,350,000 | USD | 2,562,976 | — | (45,804 | ) | ||||||||||||||
JP Morgan & Chase Co. | 6/3/2020 | EUR | 91,852,623 | USD | 100,658,993 | — | (1,308,333 | ) | ||||||||||||||
JP Morgan & Chase Co. | 6/3/2020 | EUR | 19,668,000 | USD | 21,553,670 | — | (280,148 | ) | ||||||||||||||
RBC Capital Markets | 6/3/2020 | EUR | 77,322,273 | USD | 84,736,319 | — | (1,100,592 | ) | ||||||||||||||
Citigroup Global Markets | 6/3/2020 | GBP | 509,000 | USD | 632,141 | 3,517 | — | |||||||||||||||
Citigroup Global Markets | 6/3/2020 | GBP | 15,990,054 | USD | 20,170,702 | 422,687 | — | |||||||||||||||
JP Morgan & Chase Co. | 6/3/2020 | GBP | 40,692,850 | USD | 51,330,571 | 1,074,144 | — | |||||||||||||||
JP Morgan & Chase Co. | 6/3/2020 | GBP | 8,615,000 | USD | 10,867,383 | 227,698 | — | |||||||||||||||
RBC Capital Markets | 6/3/2020 | GBP | 25,920,820 | USD | 32,702,614 | 689,919 | — | |||||||||||||||
Citigroup Global Markets | 6/3/2020 | NOK | 12,520,900 | USD | 1,225,329 | — | (62,762 | ) | ||||||||||||||
JP Morgan & Chase Co. | 6/3/2020 | NOK | 4,579,000 | USD | 448,123 | — | (22,943 | ) | ||||||||||||||
JP Morgan & Chase Co. | 6/3/2020 | NOK | 9,924,691 | USD | 971,299 | — | (49,706 | ) | ||||||||||||||
RBC Capital Markets | 6/3/2020 | NOK | 15,523,500 | USD | 1,519,186 | — | (77,798 | ) | ||||||||||||||
Citigroup Global Markets | 6/3/2020 | SEK | 54,257,250 | USD | 5,556,298 | — | (202,100 | ) | ||||||||||||||
JP Morgan & Chase Co. | 6/3/2020 | SEK | 43,342,536 | USD | 4,438,564 | — | (161,440 | ) | ||||||||||||||
JP Morgan & Chase Co. | 6/3/2020 | SEK | 22,534,000 | USD | 2,307,651 | — | (83,914 | ) | ||||||||||||||
RBC Capital Markets | 6/3/2020 | SEK | 85,995,000 | USD | 8,806,452 | — | (320,318 | ) | ||||||||||||||
Citigroup Global Markets | 6/3/2020 | USD | 6,971,176 | CHF | 6,697,000 | — | (7,596 | ) | ||||||||||||||
JP Morgan & Chase Co. | 6/3/2020 | USD | 40,627,378 | CHF | 39,030,722 | — | (43,002 | ) | ||||||||||||||
RBC Capital Markets | 6/3/2020 | USD | 34,333,212 | CHF | 32,983,917 | — | (36,340 | ) | ||||||||||||||
Citigroup Global Markets | 6/3/2020 | USD | 5,300,064 | DKK | 35,513,500 | — | (11,169 | ) | ||||||||||||||
JP Morgan & Chase Co. | 6/3/2020 | USD | 7,580,423 | DKK | 50,794,142 | — | (15,839 | ) | ||||||||||||||
RBC Capital Markets | 6/3/2020 | USD | 4,700,927 | DKK | 31,499,500 | — | (9,823 | ) | ||||||||||||||
Citigroup Global Markets | 6/3/2020 | USD | 24,163,010 | EUR | 21,722,000 | — | (49,009 | ) | ||||||||||||||
JP Morgan & Chase Co. | 6/3/2020 | USD | 124,049,965 | EUR | 111,520,623 | — | (248,822 | ) | ||||||||||||||
RBC Capital Markets | 6/3/2020 | USD | 86,011,131 | EUR | 77,322,273 | — | (174,221 | ) | ||||||||||||||
Citigroup Global Markets | 6/3/2020 | USD | 20,397,830 | GBP | 16,499,054 | — | (21,191 | ) | ||||||||||||||
JP Morgan & Chase Co. | 6/3/2020 | USD | 60,959,492 | GBP | 49,307,850 | — | (63,380 | ) | ||||||||||||||
RBC Capital Markets | 6/3/2020 | USD | 32,046,169 | GBP | 25,920,820 | — | (33,474 | ) | ||||||||||||||
Citigroup Global Markets | 6/3/2020 | USD | 1,288,150 | NOK | 12,520,900 | — | (59 | ) | ||||||||||||||
JP Morgan & Chase Co. | 6/3/2020 | USD | 1,492,126 | NOK | 14,503,691 | — | (55 | ) | ||||||||||||||
RBC Capital Markets | 6/3/2020 | USD | 1,597,043 | NOK | 15,523,500 | — | (59 | ) | ||||||||||||||
Citigroup Global Markets | 6/3/2020 | USD | 5,760,851 | SEK | 54,257,250 | — | (2,453 | ) | ||||||||||||||
JP Morgan & Chase Co. | 6/3/2020 | USD | 6,994,547 | SEK | 65,876,536 | — | (2,978 | ) | ||||||||||||||
RBC Capital Markets | 6/3/2020 | USD | 9,130,677 | SEK | 85,995,000 | — | (3,907 | ) | ||||||||||||||
Citigroup Global Markets | 7/3/2020 | CHF | 6,697,000 | USD | 6,976,928 | 7,384 | — | |||||||||||||||
Citigroup Global Markets | 7/3/2020 | CHF | 1,363,000 | USD | 1,419,947 | 1,478 | — | |||||||||||||||
JP Morgan & Chase Co. | 7/3/2020 | CHF | 39,030,722 | USD | 40,660,390 | 41,254 | — | |||||||||||||||
RBC Capital Markets | 7/3/2020 | CHF | 32,983,917 | �� | USD | 34,361,289 | 35,042 | — | ||||||||||||||
Citigroup Global Markets | 7/3/2020 | DKK | 35,513,500 | USD | 5,303,134 | 10,909 | — | |||||||||||||||
JP Morgan & Chase Co. | 7/3/2020 | DKK | 50,794,142 | USD | 7,584,851 | 15,503 | — | |||||||||||||||
RBC Capital Markets | 7/3/2020 | DKK | 31,499,500 | USD | 4,703,664 | 9,605 | — | |||||||||||||||
RBC Capital Markets | 7/3/2020 | DKK | 14,949,000 | USD | 2,232,236 | 4,534 | — | |||||||||||||||
Citigroup Global Markets | 7/3/2020 | EUR | 14,640,000 | USD | 16,294,818 | 32,559 | — | |||||||||||||||
Citigroup Global Markets | 7/3/2020 | EUR | 21,722,000 | USD | 24,177,303 | 48,288 | — | |||||||||||||||
JP Morgan & Chase Co. | 7/3/2020 | EUR | 111,520,623 | USD | 124,122,230 | 244,007 | — | |||||||||||||||
| See Notes to Financial Statements. | 70 |
DBX ETF Trust
Schedule of Investments
Xtrackers MSCI Europe Hedged Equity ETF (Continued)
May 31, 2020
Counterparty | Settlement Date | Currency To Deliver | Currency To Receive | Unrealized Appreciation | Unrealized Depreciation | |||||||||||||||||
RBC Capital Markets | 7/3/2020 | EUR | 77,322,273 | USD | 86,061,236 | $ | 170,882 | $ | — | |||||||||||||
Citigroup Global Markets | 7/3/2020 | GBP | 16,499,054 | USD | 20,400,305 | 20,812 | — | |||||||||||||||
Citigroup Global Markets | 7/3/2020 | GBP | 1,180,000 | USD | 1,459,016 | 1,490 | — | |||||||||||||||
JP Morgan & Chase Co. | 7/3/2020 | GBP | 49,307,850 | USD | 60,966,691 | 62,049 | — | |||||||||||||||
RBC Capital Markets | 7/3/2020 | GBP | 25,920,820 | USD | 32,049,539 | 32,359 | — | |||||||||||||||
Citigroup Global Markets | 7/3/2020 | NOK | 12,520,900 | USD | 1,288,463 | 58 | — | |||||||||||||||
JP Morgan & Chase Co. | 7/3/2020 | NOK | 14,503,691 | USD | 1,492,494 | 58 | — | |||||||||||||||
RBC Capital Markets | 7/3/2020 | NOK | 15,523,500 | USD | 1,597,374 | — | — | |||||||||||||||
Citigroup Global Markets | 7/3/2020 | SEK | 34,738,000 | USD | 3,689,299 | 1,457 | — | |||||||||||||||
Citigroup Global Markets | 7/3/2020 | SEK | 54,257,250 | USD | 5,762,423 | 2,387 | — | |||||||||||||||
JP Morgan & Chase Co. | 7/3/2020 | SEK | 65,876,536 | USD | 6,996,379 | 2,820 | — | |||||||||||||||
RBC Capital Markets | 7/3/2020 | SEK | 85,995,000 | USD | 9,133,101 | 3,735 | — | |||||||||||||||
|
|
|
| |||||||||||||||||||
Total unrealized appreciation (depreciation) | $ | 3,166,635 | $ | (5,185,789 | ) | |||||||||||||||||
|
|
|
| |||||||||||||||||||
For information on the Fund’s policy and additional disclosures regarding open futures contracts and forward foreign currency contracts, please refer to the Derivatives section of Note 2 in the accompanying Notes to Financial Statements.
Currency Abbreviations
| CHF | Swiss Franc |
| DKK | Danish Krone |
| EUR | Euro |
| GBP | Pound Sterling |
| NOK | Norwegian Krone |
| SEK | Swedish Krona |
| USD | U.S. Dollar |
Fair Value Measurements
Various inputs are used in determining the value of the Fund’s investments. These inputs are summarized in three broad levels. Level 1 includes quoted prices in active markets for identical securities. Level 2 includes other significant observable inputs (including quoted prices for similar securities, interest rates, prepayment speeds and credit risk). Level 3 includes significant unobservable inputs (including the Fund’s own assumptions in determining the fair value of investments). The level assigned to the securities valuations may not be an indication of the risk or liquidity associated with investing in those securities.
The following is a summary of the inputs used as of May 31, 2020 in valuing the Fund’s investments. For information on the Fund’s policy regarding the valuation of investments, please refer to the Security Valuation section of Note 2 in the accompanying Notes to Financial Statements.
Assets | Level 1 | Level 2 | Level 3 | Total | ||||||||||||
Common Stocks (h) | $ | 472,659,717 | $ | — | $ | 0 | $ | 472,659,717 | ||||||||
Preferred Stocks | 4,250,049 | — | — | 4,250,049 | ||||||||||||
Rights (h) | 47,791 | — | 0 | 47,791 | ||||||||||||
Exchange-Traded Funds | 534,602 | — | — | 534,602 | ||||||||||||
Short-Term Investments (h) | 17,346,084 | — | — | 17,346,084 | ||||||||||||
Derivatives (i) | ||||||||||||||||
Forward Foreign Currency Contracts | — | 3,166,635 | — | 3,166,635 | ||||||||||||
Futures Contracts | 650,910 | — | — | 650,910 | ||||||||||||
|
|
|
|
|
|
|
| |||||||||
TOTAL | $ | 495,489,153 | $ | 3,166,635 | $ | 0 | $ | 498,655,788 | ||||||||
|
|
|
|
|
|
|
| |||||||||
Liabilities | Level 1 | Level 2 | Level 3 | Total | ||||||||||||
Derivatives (i) | ||||||||||||||||
Forward Foreign Currency Contracts | $ | — | $ | (5,185,789 | ) | $ | — | $ | (5,185,789 | ) | ||||||
|
|
|
|
|
|
|
| |||||||||
TOTAL | $ | — | $ | (5,185,789 | ) | $ | — | $ | (5,185,789 | ) | ||||||
|
|
|
|
|
|
|
| |||||||||
| (h) | See Schedule of Investments for additional detailed categorizations. |
| (i) | Derivatives include unrealized appreciation (depreciation) on open futures contracts and forward foreign currency contracts. |
During the year ended May 31, 2020, the amount of transfers from Level 1 to Level 3 was $300,531. The investment was transferred from Level 1 to Level 3 due to the lack of observable market data due to a decrease in market activity.
| See Notes to Financial Statements. | 71 |
DBX ETF Trust
Schedule of Investments
Xtrackers MSCI Eurozone Hedged Equity ETF
May 31, 2020
Number | Value | |||||||
| COMMON STOCKS — 97.0% | ||||||||
| Austria — 0.9% | ||||||||
Agrana Beteiligungs AG | 84 | $ | 1,622 | |||||
ANDRITZ AG* | 350 | 13,109 | ||||||
AT&S Austria Technologie & Systemtechnik AG | 111 | 2,021 | ||||||
BAWAG Group AG, 144A* | 290 | 9,561 | ||||||
CA Immobilien Anlagen AG* | 293 | 9,855 | ||||||
DO & CO AG | 27 | 1,498 | ||||||
Erste Group Bank AG* | 1,346 | 29,531 | ||||||
EVN AG | 174 | 2,971 | ||||||
FACC AG | 99 | 732 | ||||||
IMMOFINANZ AG* | 416 | 7,776 | ||||||
Kapsch TrafficCom AG | 21 | 408 | ||||||
Lenzing AG* | 68 | 3,329 | ||||||
Oesterreichische Post AG* | 177 | 5,924 | ||||||
OMV AG* | 673 | 22,203 | ||||||
Palfinger AG* | 70 | 1,531 | ||||||
Porr AG (a) | 39 | 658 | ||||||
Raiffeisen Bank International AG | 697 | 12,797 | ||||||
S IMMO AG | 218 | 4,114 | ||||||
S&T AG*(a) | 203 | 5,318 | ||||||
Schoeller-Bleckmann Oilfield Equipment AG | 66 | 1,788 | ||||||
Semperit AG Holding* | 47 | 596 | ||||||
Telekom Austria AG* | 732 | 5,265 | ||||||
UNIQA Insurance Group AG* | 630 | 4,245 | ||||||
Verbund AG* | 306 | 13,601 | ||||||
Vienna Insurance Group AG Wiener Versicherung Gruppe* | 174 | 3,650 | ||||||
voestalpine AG | 534 | 10,394 | ||||||
Wienerberger AG* | 556 | 11,109 | ||||||
Zumtobel Group AG* | 126 | 867 | ||||||
|
| |||||||
(Cost $243,614) | 186,473 | |||||||
|
| |||||||
| Belgium — 3.3% | ||||||||
Ackermans & van Haaren NV | 108 | 14,830 | ||||||
Aedifica SA REIT | 112 | 11,948 | ||||||
Ageas SA/NV* | 869 | 29,585 | ||||||
AGFA-Gevaert NV* | 808 | 3,238 | ||||||
Akka Technologies (a) | 59 | 1,637 | ||||||
Anheuser-Busch InBev SA/NV | 3,635 | 169,108 | ||||||
Barco NV | 42 | 7,292 | ||||||
Befimmo SA REIT | 111 | 4,596 | ||||||
Bekaert SA | 159 | 3,399 | ||||||
Biocartis NV, 144A* | 227 | 1,237 | ||||||
bpost SA | 442 | 2,900 | ||||||
Cie d’Entreprises CFE* | 39 | 2,810 | ||||||
Cofinimmo SA REIT | 120 | 16,304 | ||||||
Colruyt SA | 261 | 15,755 | ||||||
D’ieteren SA/NV | 114 | 6,821 | ||||||
Econocom Group SA/NV | 563 | 1,237 | ||||||
Elia Group SA/NV | 153 | 17,935 | ||||||
Euronav NV | 756 | 7,553 | ||||||
Exmar NV* | 152 | 692 | ||||||
Fagron | 352 | 8,401 | ||||||
Galapagos NV* | 199 | 40,502 | ||||||
Gimv NV | 111 | 6,654 | ||||||
Number | Value | |||||||
| Belgium (Continued) | ||||||||
Groupe Bruxelles Lambert SA | 402 | $ | 32,451 | |||||
Intervest Offices & Warehouses NV REIT | 138 | 3,347 | ||||||
Ion Beam Applications* | 96 | 820 | ||||||
KBC Ancora | 171 | 5,698 | ||||||
KBC Group NV | 1,187 | 62,021 | ||||||
Kinepolis Group NV* | 69 | 2,845 | ||||||
Melexis NV | 87 | 5,703 | ||||||
Mithra Pharmaceuticals SA* | 60 | 1,569 | ||||||
Montea C.V.A REIT | 49 | 4,580 | ||||||
Ontex Group NV | 354 | 5,588 | ||||||
Orange Belgium SA | 145 | 2,363 | ||||||
Proximus SADP | 705 | 14,709 | ||||||
Recticel SA | 129 | 1,071 | ||||||
Retail Estates NV REIT* | 32 | 2,099 | ||||||
Sioen Industries NV* | 35 | 697 | ||||||
Sofina SA | 69 | 18,842 | ||||||
Solvay SA(a) | 336 | 25,541 | ||||||
Telenet Group Holding NV | 221 | 9,043 | ||||||
Tessenderlo Group SA* | 101 | 2,915 | ||||||
UCB SA | 603 | 60,242 | ||||||
Umicore SA | 966 | 42,721 | ||||||
Van de Velde NV* | 24 | 578 | ||||||
Warehouses De Pauw CVA REIT | 565 | 14,867 | ||||||
X-Fab Silicon Foundries SE, 144A* | 228 | 769 | ||||||
|
| |||||||
(Cost $999,696) | 695,513 | |||||||
|
| |||||||
| Finland — 3.6% | ||||||||
Aktia Bank OYJ* | 200 | 1,983 | ||||||
Cargotec OYJ, Class B | 217 | 4,745 | ||||||
Caverion OYJ* | 578 | 3,715 | ||||||
Citycon OYJ(a) | 339 | 2,280 | ||||||
Elisa OYJ | 653 | 40,868 | ||||||
Finnair OYJ*(a) | 223 | 872 | ||||||
Fortum OYJ | 2,039 | 38,976 | ||||||
F-Secure OYJ* | 383 | 1,316 | ||||||
Huhtamaki OYJ* | 441 | 17,780 | ||||||
Kemira OYJ | 450 | 5,744 | ||||||
Kesko OYJ, Class B | 1,224 | 20,652 | ||||||
Kone OYJ, Class B | 1,620 | 108,400 | ||||||
Konecranes OYJ* | 298 | 7,119 | ||||||
Metsa Board OYJ* | 1,087 | 7,740 | ||||||
Metso OYJ | 480 | 15,542 | ||||||
Neste OYJ (a) | 2,028 | 81,763 | ||||||
Nokia OYJ | 26,554 | 105,098 | ||||||
Nokian Renkaat OYJ | 566 | 13,156 | ||||||
Oriola OYJ, Class B | 502 | 1,165 | ||||||
Orion OYJ, Class B | 528 | 28,192 | ||||||
Outokumpu OYJ* | 1,296 | 3,874 | ||||||
Outotec OYJ | 807 | 4,137 | ||||||
Rovio Entertainment OYJ, 144A | 227 | 1,361 | ||||||
Sampo OYJ, Class A*(a) | 2,235 | 79,689 | ||||||
Sanoma OYJ | 307 | 2,972 | ||||||
Stora Enso OYJ, Class R* | 2,701 | 33,056 | ||||||
TietoEVRY OYJ* | 492 | 12,933 | ||||||
Tokmanni Group Corp. | 263 | 3,533 | ||||||
UPM-Kymmene OYJ | 2,574 | 74,203 | ||||||
Uponor OYJ | 233 | 2,912 | ||||||
| See Notes to Financial Statements. | 72 |
DBX ETF Trust
Schedule of Investments
Xtrackers MSCI Eurozone Hedged Equity ETF (Continued)
May 31, 2020
Number | Value | |||||||
| Finland (Continued) | ||||||||
Valmet OYJ* | 607 | $ | 15,753 | |||||
Wartsila OYJ Abp | 2,160 | 16,841 | ||||||
YIT OYJ | 890 | 4,890 | ||||||
|
| |||||||
(Cost $788,565) | 763,260 | |||||||
|
| |||||||
| France — 30.6% | ||||||||
ABC arbitrage | 101 | 762 | ||||||
Accor SA* | 910 | 25,607 | ||||||
Aeroports de Paris | 137 | 14,242 | ||||||
Air France-KLM*(a) | 940 | 4,240 | ||||||
Air Liquide SA | 2,227 | 301,841 | ||||||
Airbus SE* | 2,789 | 175,539 | ||||||
AKWEL | 36 | 611 | ||||||
Albioma SA | 98 | 3,470 | ||||||
ALD SA, 144A (a) | 518 | 5,698 | ||||||
Alstom SA | 884 | 37,132 | ||||||
Alten SA | 136 | 10,900 | ||||||
Amundi SA, 144A* | 268 | 19,917 | ||||||
Arkema SA | 323 | 28,096 | ||||||
Atos SE* | 451 | 33,953 | ||||||
Aubay | 23 | 725 | ||||||
AXA SA* | 9,285 | 168,826 | ||||||
Beneteau SA | 126 | 892 | ||||||
BioMerieux | 196 | 28,088 | ||||||
BNP Paribas SA* | 5,352 | 191,627 | ||||||
Boiron SA* | 27 | 989 | ||||||
Bollore SA | 3,903 | 11,117 | ||||||
Bonduelle SCA | 54 | 1,271 | ||||||
Bouygues SA* | 1,126 | 34,423 | ||||||
Bureau Veritas SA* | 1,456 | 29,561 | ||||||
Capgemini SE | 766 | 78,312 | ||||||
Carmila SA REIT* | 244 | 3,023 | ||||||
Carrefour SA | 2,815 | 42,669 | ||||||
Casino Guichard Perrachon SA*(a) | 177 | 6,657 | ||||||
Cellectis SA* | 114 | 2,088 | ||||||
CGG SA* | 3,365 | 3,614 | ||||||
Chargeurs SA | 80 | 1,398 | ||||||
Cie de Saint-Gobain | 2,400 | 77,446 | ||||||
Cie des Alpes | 24 | 518 | ||||||
Cie Generale des Etablissements Michelin SCA* | 821 | 82,805 | ||||||
Cie Plastic Omnium SA | 301 | 6,191 | ||||||
CNP Assurances* | 807 | 8,470 | ||||||
Coface SA* | 413 | 2,352 | ||||||
Covivio REIT (a) | 254 | 14,845 | ||||||
Credit Agricole SA* | 5,584 | 48,497 | ||||||
Danone SA* | 2,906 | 198,581 | ||||||
Dassault Aviation SA* | 11 | 9,365 | ||||||
Dassault Systemes SE | 622 | 105,121 | ||||||
DBV Technologies SA* | 129 | 1,201 | ||||||
Derichebourg SA | 323 | 991 | ||||||
Devoteam SA | 21 | 1,641 | ||||||
Edenred | 1,165 | 48,599 | ||||||
Eiffage SA* | 397 | 36,137 | ||||||
Electricite de France SA | 2,871 | 25,355 | ||||||
Elior Group SA, 144A | 474 | 2,910 | ||||||
Elis SA* | 945 | 11,644 | ||||||
Number | Value | |||||||
| France (Continued) | ||||||||
Engie SA* | 8,733 | $ | 103,096 | |||||
Eramet*(a) | 39 | 1,354 | ||||||
EssilorLuxottica SA* | 1,338 | 171,917 | ||||||
Etablissements Maurel et Prom SA | 219 | 416 | ||||||
Eurazeo SE* | 189 | 9,189 | ||||||
Europcar Mobility Group, 144A*(a) | 383 | 658 | ||||||
Eutelsat Communications SA | 803 | 7,987 | ||||||
Faurecia SE* | 396 | 15,236 | ||||||
FFP | 21 | 1,525 | ||||||
Fnac Darty SA* | 70 | 2,280 | ||||||
Gaztransport Et Technigaz SA | 99 | 7,319 | ||||||
Gecina SA REIT | 218 | 27,998 | ||||||
Genfit*(a) | 126 | 670 | ||||||
Getlink SE* | 2,166 | 31,209 | ||||||
GL Events | 54 | 743 | ||||||
Groupe Crit | 5 | 305 | ||||||
Groupe Guillin | 23 | 468 | ||||||
Guerbet | 23 | 892 | ||||||
Hermes International | 151 | 125,344 | ||||||
ICADE REIT | 128 | 9,143 | ||||||
ID Logistics Group* | 12 | 2,432 | ||||||
Iliad SA | 64 | 11,253 | ||||||
Imerys SA | 145 | 4,996 | ||||||
Ingenico Group SA | 276 | 38,052 | ||||||
Innate Pharma SA*(a) | 171 | 1,077 | ||||||
Interparfums SA* | 74 | 2,686 | ||||||
Ipsen SA* | 171 | 13,420 | ||||||
IPSOS | 189 | 4,584 | ||||||
Jacquet Metal Service SA | 65 | 805 | ||||||
JCDecaux SA* | 436 | 8,852 | ||||||
Kaufman & Broad SA* | 59 | 2,083 | ||||||
Kering SA | 361 | 188,182 | ||||||
Klepierre SA REIT (a) | 921 | 17,421 | ||||||
Korian SA | 219 | 7,867 | ||||||
La Francaise des Jeux SAEM, 144A* | 415 | 14,129 | ||||||
Lagardere SCA* | 256 | 3,586 | ||||||
Legrand SA (a) | 1,278 | 86,963 | ||||||
LISI* | 75 | 1,427 | ||||||
LNA Sante SA | 20 | 985 | ||||||
L’Oreal SA* | 1,189 | 345,669 | ||||||
LVMH Moet Hennessy Louis Vuitton SE | 1,313 | 546,561 | ||||||
Maisons du Monde SA, 144A | 184 | 2,194 | ||||||
Manitou BF SA | 36 | 660 | ||||||
Mercialys SA REIT | 219 | 1,771 | ||||||
Mersen SA | 84 | 1,916 | ||||||
Metropole Television SA* | 111 | 1,286 | ||||||
Natixis SA* | 4,402 | 9,739 | ||||||
Nexans SA* | 119 | 4,845 | ||||||
Nexity SA | 188 | 5,747 | ||||||
Orange SA | 9,511 | 114,498 | ||||||
Orpea | 247 | 28,954 | ||||||
Pernod Ricard SA | 1,012 | 157,384 | ||||||
Peugeot SA* | 2,798 | 39,771 | ||||||
Publicis Groupe SA | 1,024 | 29,008 | ||||||
Quadient | 156 | 2,246 | ||||||
Remy Cointreau SA | 106 | 12,567 | ||||||
Renault SA | 938 | 21,038 | ||||||
| See Notes to Financial Statements. | 73 |
DBX ETF Trust
Schedule of Investments
Xtrackers MSCI Eurozone Hedged Equity ETF (Continued)
May 31, 2020
Number | Value | |||||||
| France (Continued) | ||||||||
Rexel SA | 1,137 | $ | 11,465 | |||||
Rubis SCA | 413 | 19,668 | ||||||
Safran SA* | 1,518 | 144,679 | ||||||
Sanofi | 5,333 | 518,169 | ||||||
Sartorius Stedim Biotech* | 128 | 34,641 | ||||||
Schneider Electric SE | 2,606 | 258,153 | ||||||
SCOR SE* | 744 | 18,318 | ||||||
SEB SA | 99 | 13,561 | ||||||
SMCP SA, 144A* | 168 | 914 | ||||||
Societe BIC SA | 114 | 6,059 | ||||||
Societe Generale SA* | 3,933 | 57,769 | ||||||
Sodexo SA | 405 | 27,217 | ||||||
SOITEC*(a) | 97 | 9,400 | ||||||
Sopra Steria Group | 75 | 8,833 | ||||||
SPIE SA | 528 | 8,159 | ||||||
Suez SA (a) | 1,614 | 18,292 | ||||||
Synergie SA | 25 | 587 | ||||||
Tarkett SA | 133 | 1,367 | ||||||
Teleperformance* | 284 | 67,181 | ||||||
Television Francaise 1* | 189 | 1,062 | ||||||
Thales SA | 524 | 40,007 | ||||||
TOTAL SA | 11,693 | 436,446 | ||||||
Trigano SA | 34 | 3,110 | ||||||
Ubisoft Entertainment SA* | 429 | 33,173 | ||||||
Unibail-Rodamco-Westfield REIT | 692 | 36,641 | ||||||
Valeo SA* | 1,112 | 27,341 | ||||||
Vallourec SA*(a) | 33 | 1,199 | ||||||
Veolia Environnement SA(a) | 2,620 | 57,250 | ||||||
Verallia SA, 144A* | 147 | 4,047 | ||||||
Vicat SA | 92 | 2,768 | ||||||
Vilmorin & Cie SA | 34 | 1,793 | ||||||
Vinci SA | 2,434 | 224,363 | ||||||
Virbac SA* | 15 | 3,164 | ||||||
Vivendi SA | 3,961 | 89,829 | ||||||
Wendel SE* | 126 | 11,553 | ||||||
Worldline SA, 144A* | 649 | 48,355 | ||||||
|
| |||||||
(Cost $7,076,727) | 6,450,893 | |||||||
|
| |||||||
| Germany — 26.0% | ||||||||
Aareal Bank AG* | 241 | 4,601 | ||||||
adidas AG* | 901 | 237,237 | ||||||
ADO Properties SA, 144A | 232 | 6,716 | ||||||
ADVA Optical Networking SE* | 204 | 1,318 | ||||||
AIXTRON SE* | 644 | 6,784 | ||||||
Allianz SE | 1,968 | 355,693 | ||||||
alstria office REIT-AG REIT* | 721 | 10,485 | ||||||
Amadeus Fire AG* | 21 | 2,354 | ||||||
AURELIUS Equity Opportunities SE & Co. KGaA | 96 | 1,693 | ||||||
Aurubis AG | 176 | 10,159 | ||||||
BASF SE* | 4,401 | 237,647 | ||||||
Basler AG | 23 | 1,282 | ||||||
Bayer AG | 4,635 | 312,409 | ||||||
Bayerische Motoren Werke AG | 1,583 | 92,429 | ||||||
BayWa AG* | 60 | 1,848 | ||||||
Bechtle AG | 145 | 25,512 | ||||||
Beiersdorf AG | 485 | 50,747 | ||||||
Number | Value | |||||||
| Germany (Continued) | ||||||||
Bertrandt AG | 21 | $ | 833 | |||||
bet-at-home.com AG* | 5 | 223 | ||||||
Bilfinger SE* | 112 | 2,131 | ||||||
Borussia Dortmund GmbH & Co. KGaA | 301 | 2,118 | ||||||
Brenntag AG | 713 | 37,523 | ||||||
CANCOM SE | 195 | 12,230 | ||||||
Carl Zeiss Meditec AG* | 186 | 19,016 | ||||||
CECONOMY AG* | 810 | 2,386 | ||||||
Cewe Stiftung & Co. KGaA | 21 | 2,149 | ||||||
Commerzbank AG* | 4,609 | 17,912 | ||||||
CompuGroup Medical SE | 118 | 9,608 | ||||||
Continental AG* | 505 | 49,577 | ||||||
Covestro AG, 144A* | 801 | 29,600 | ||||||
CropEnergies AG | 232 | 2,264 | ||||||
CTS Eventim AG & Co. KGaA* | 275 | 12,455 | ||||||
Daimler AG* | 4,067 | 150,696 | ||||||
Datagroup SE | 51 | 2,972 | ||||||
Delivery Hero SE, 144A* | 604 | 57,781 | ||||||
Dermapharm Holding SE | 71 | 3,834 | ||||||
Deutsche Bank AG*(b) | 9,480 | 79,251 | ||||||
Deutsche Beteiligungs AG | 52 | 1,706 | ||||||
Deutsche Boerse AG | 904 | 148,416 | ||||||
Deutsche EuroShop AG | 191 | 2,784 | ||||||
Deutsche Lufthansa AG*(a) | 1,168 | 11,853 | ||||||
Deutsche Pfandbriefbank AG, 144A | 597 | 4,109 | ||||||
Deutsche Post AG* | 4,699 | 145,947 | ||||||
Deutsche Telekom AG* | 15,727 | 247,464 | ||||||
Deutsche Wohnen SE | 1,612 | 71,970 | ||||||
Deutz AG* | 548 | 2,178 | ||||||
DIC Asset AG* | 201 | 2,606 | ||||||
Draegerwerk AG & Co. KGaA* | 11 | 706 | ||||||
Duerr AG | 263 | 6,218 | ||||||
E.ON SE | 10,717 | 113,087 | ||||||
Eckert & Ziegler Strahlen- und Medizintechnik AG* | 19 | 2,980 | ||||||
Elmos Semiconductor AG | 43 | 959 | ||||||
ElringKlinger AG* | 127 | 663 | ||||||
Encavis AG (a) | 368 | 5,000 | ||||||
Evonik Industries AG | 1,075 | 26,432 | ||||||
Evotec SE*(a) | 669 | 18,061 | ||||||
Flatex AG* | 61 | 2,116 | ||||||
Fraport AG Frankfurt Airport Services Worldwide*(a) | 190 | 9,411 | ||||||
Freenet AG | 604 | 10,443 | ||||||
Fresenius Medical Care AG & Co. KGaA* | 1,005 | 84,339 | ||||||
Fresenius SE & Co. KGaA* | 1,987 | 95,285 | ||||||
GEA Group AG | 698 | 20,757 | ||||||
Gerresheimer AG | 136 | 11,579 | ||||||
GRENKE AG*(a) | 133 | 10,696 | ||||||
Hamborner REIT AG REIT* | 354 | 3,291 | ||||||
Hamburger Hafen und Logistik AG | 111 | 1,799 | ||||||
Hannover Rueck SE | 277 | 44,462 | ||||||
HeidelbergCement AG* | 683 | 33,837 | ||||||
HelloFresh SE* | 639 | 25,961 | ||||||
Henkel AG & Co. KGaA* | 473 | 37,830 | ||||||
HOCHTIEF AG | 110 | 9,659 | ||||||
Hornbach Holding AG & Co. KGaA | 39 | 2,805 | ||||||
| See Notes to Financial Statements. | 74 |
DBX ETF Trust
Schedule of Investments
Xtrackers MSCI Eurozone Hedged Equity ETF (Continued)
May 31, 2020
Number | Value | |||||||
| Germany (Continued) | ||||||||
HUGO BOSS AG | 290 | $ | 7,900 | |||||
Hypoport SE* | 20 | 8,880 | ||||||
Indus Holding AG* | 66 | 2,128 | ||||||
Infineon Technologies AG | 5,968 | 124,917 | ||||||
Isra Vision AG | 67 | 3,719 | ||||||
Jenoptik AG | 259 | 6,227 | ||||||
JOST Werke AG, 144A* | 94 | 2,682 | ||||||
K+S AG*(a) | 905 | 5,740 | ||||||
KION Group AG* | 306 | 17,052 | ||||||
Kloeckner & Co. SE* | 324 | 1,370 | ||||||
Knorr-Bremse AG | 217 | 22,927 | ||||||
Koenig & Bauer AG* | 53 | 1,114 | ||||||
Krones AG | 66 | 4,293 | ||||||
KWS Saat SE & Co. KGaA | 65 | 4,575 | ||||||
LANXESS AG* | 378 | 19,503 | ||||||
LEG Immobilien AG* | 339 | 42,176 | ||||||
Leoni AG*(a) | 129 | 1,068 | ||||||
LPKF Laser & Electronics AG* | 129 | 3,029 | ||||||
MBB SE* | 6 | 406 | ||||||
Merck KGaA | 599 | 68,587 | ||||||
METRO AG | 797 | 7,428 | ||||||
MLP SE* | 278 | 1,605 | ||||||
MorphoSys AG* | 142 | 18,387 | ||||||
MTU Aero Engines AG* | 246 | 39,568 | ||||||
Muenchener Rueckversicherungs-Gesellschaft AG in Muenchen | 683 | 155,120 | ||||||
Nemetschek SE* | 255 | 20,069 | ||||||
New Work SE | 14 | 4,367 | ||||||
Nordex SE* | 292 | 2,817 | ||||||
Norma Group SE* | 135 | 3,947 | ||||||
OHB SE* | 24 | 944 | ||||||
OSRAM Licht AG* | 459 | 20,141 | ||||||
PATRIZIA AG* | 204 | 5,005 | ||||||
Pfeiffer Vacuum Technology AG | 22 | 3,893 | ||||||
ProSiebenSat.1 Media SE(a) | 1,012 | 12,919 | ||||||
Puma SE* | 384 | 27,357 | ||||||
Rational AG* | 17 | 9,103 | ||||||
Rheinmetall AG | 197 | 15,955 | ||||||
RIB Software SE*(a) | 203 | 6,535 | ||||||
Rocket Internet SE, 144A* | 322 | 6,402 | ||||||
RWE AG* | 2,792 | 92,327 | ||||||
Salzgitter AG*(a) | 152 | 2,042 | ||||||
SAP SE | 4,928 | 620,882 | ||||||
Scout24 AG, 144A | 512 | 39,074 | ||||||
SGL Carbon SE* | 217 | 676 | ||||||
Siemens AG | 3,615 | 395,384 | ||||||
Siemens Healthineers AG, 144A | 740 | 38,168 | ||||||
Siltronic AG* | 102 | 9,930 | ||||||
Sixt Leasing SE* | 54 | 1,127 | ||||||
Sixt SE (a) | 64 | 5,122 | ||||||
SMA Solar Technology AG* | 54 | 1,602 | ||||||
Software AG* | 203 | 7,837 | ||||||
STRATEC SE* | 21 | 1,912 | ||||||
Stroeer SE & Co. KGaA | 137 | 9,908 | ||||||
Suedzucker AG | 313 | 4,673 | ||||||
Symrise AG* | 617 | 67,394 | ||||||
TAG Immobilien AG* | 621 | 14,393 | ||||||
Number | Value | |||||||
| Germany (Continued) | ||||||||
Takkt AG* | 144 | $ | 1,391 | |||||
TeamViewer AG* | 613 | 31,134 | ||||||
Telefonica Deutschland Holding AG | 5,249 | 16,117 | ||||||
thyssenkrupp AG*(a) | 1,899 | 12,774 | ||||||
Uniper SE | 924 | 28,822 | ||||||
United Internet AG | 502 | 20,551 | ||||||
Varta AG*(a) | 94 | 9,610 | ||||||
VERBIO Vereinigte BioEnergie AG | 114 | 1,125 | ||||||
Volkswagen AG* | 149 | 23,553 | ||||||
Vonovia SE* | 2,446 | 140,592 | ||||||
Vossloh AG* | 47 | 2,035 | ||||||
Wacker Chemie AG* | 75 | 4,677 | ||||||
Wacker Neuson SE* | 129 | 1,750 | ||||||
Washtec AG* | 64 | 2,629 | ||||||
Wirecard AG (a) | 563 | 59,096 | ||||||
Wuestenrot & Wuerttembergische AG | 84 | 1,531 | ||||||
Zalando SE, 144A* | 735 | 49,639 | ||||||
zooplus AG* | 35 | 5,463 | ||||||
|
| |||||||
(Cost $6,199,624) | 5,505,677 | |||||||
|
| |||||||
| Ireland — 2.1% | ||||||||
AerCap Holdings NV* | 585 | 18,860 | ||||||
AIB Group PLC* | 3,762 | 4,172 | ||||||
Bank of Ireland Group PLC* | 4,440 | 7,970 | ||||||
Cairn Homes PLC | 4,027 | 4,050 | ||||||
CRH PLC | 3,790 | 123,268 | ||||||
Dalata Hotel Group PLC | 738 | 2,662 | ||||||
Flutter Entertainment PLC(a) | 640 | 81,913 | ||||||
Glanbia PLC | 936 | 10,198 | ||||||
Glenveagh Properties PLC, 144A* | 4,492 | 3,261 | ||||||
Hibernia REIT PLC REIT | 2,966 | 3,582 | ||||||
Irish Residential Properties REIT PLC REIT | 2,460 | 3,577 | ||||||
Kerry Group PLC, Class A | 751 | 92,785 | ||||||
Kingspan Group PLC | 747 | 46,063 | ||||||
Origin Enterprises PLC | 559 | 1,725 | ||||||
Smurfit Kappa Group PLC | 1,036 | 33,649 | ||||||
Uniphar PLC | 1,451 | 3,093 | ||||||
|
| |||||||
(Cost $483,208) | 440,828 | |||||||
|
| |||||||
| Italy — 7.1% | ||||||||
A2A SpA | 7,478 | 10,355 | ||||||
ACEA SpA | 237 | 4,578 | ||||||
Amplifon SpA* | 586 | 16,230 | ||||||
Anima Holding SpA, 144A | 1,230 | 5,188 | ||||||
Arnoldo Mondadori Editore SpA* | 419 | 490 | ||||||
Ascopiave SpA* | 222 | 1,003 | ||||||
Assicurazioni Generali SpA | 5,330 | 73,868 | ||||||
ASTM SpA* | 323 | 6,633 | ||||||
Atlantia SpA* | 2,334 | 37,814 | ||||||
Autogrill SpA | 554 | 3,112 | ||||||
Azimut Holding SpA | 523 | 8,650 | ||||||
Banca Carige SpA*(c) | 462,340 | 770 | ||||||
Banca Farmafactoring SpA, 144A* | 832 | 4,932 | ||||||
Banca Generali SpA* | 253 | 6,841 | ||||||
Banca IFIS SpA* | 79 | 727 | ||||||
Banca Mediolanum SpA | 839 | 5,579 | ||||||
Banca Monte dei Paschi di Siena SpA* | 1,327 | 1,937 | ||||||
| See Notes to Financial Statements. | 75 |
DBX ETF Trust
Schedule of Investments
Xtrackers MSCI Eurozone Hedged Equity ETF (Continued)
May 31, 2020
Number | Value | |||||||
| Italy (Continued) | ||||||||
Banca Popolare di Sondrio SCPA* | 1,971 | $ | 3,179 | |||||
Banco BPM SpA* | 6,873 | 8,778 | ||||||
Biesse SpA* | 49 | 504 | ||||||
BPER Banca* | 1,780 | 4,242 | ||||||
Brunello Cucinelli SpA* | 141 | 4,580 | ||||||
Buzzi Unicem SpA | 358 | 7,107 | ||||||
Buzzi Unicem SpA-RSP | 189 | 2,174 | ||||||
Cairo Communication SpA* | 354 | 575 | ||||||
Carel Industries SpA, 144A | 128 | 2,413 | ||||||
Cementir Holding NV | 114 | 776 | ||||||
Cerved Group SpA* | 879 | 6,074 | ||||||
CIR SpA-Compagnie Industriali | 3,390 | 1,539 | ||||||
Credito Emiliano SpA* | 405 | 1,947 | ||||||
Credito Valtellinese SpA* | 26,604 | 1,639 | ||||||
Danieli & C Officine Meccaniche SpA | 54 | 699 | ||||||
Danieli & C Officine Meccaniche SpA-RSP | 144 | 1,018 | ||||||
Datalogic SpA* | 81 | 1,017 | ||||||
Davide Campari-Milano SpA | 2,639 | 21,385 | ||||||
De’ Longhi SpA* | 308 | 6,585 | ||||||
DeA Capital SpA* | 399 | 614 | ||||||
DiaSorin SpA* | 120 | 25,109 | ||||||
doValue SpA, 144A* | 152 | 1,159 | ||||||
El.En. SpA* | 39 | 926 | ||||||
Enav SpA, 144A | 1,319 | 5,974 | ||||||
Enel SpA | 38,756 | 296,889 | ||||||
Eni SpA | 12,004 | 108,239 | ||||||
ERG SpA | 274 | 6,037 | ||||||
Falck Renewables SpA | 578 | 3,455 | ||||||
Ferrari NV | 596 | 100,496 | ||||||
Fila SpA* | 99 | 918 | ||||||
Fincantieri SpA*(a) | 2,190 | 1,473 | ||||||
FinecoBank Banca Fineco SpA* | 2,843 | 33,152 | ||||||
Freni Brembo SpA* | 891 | 8,313 | ||||||
Gruppo MutuiOnline SpA* | 99 | 1,967 | ||||||
Hera SpA | 3,814 | 14,606 | ||||||
Illimity Bank SpA* | 284 | 2,270 | ||||||
IMA Industria Macchine Automatiche SpA* | 102 | 6,205 | ||||||
Immobiliare Grande Distribuzione SIIQ SpA REIT* | 278 | 1,001 | ||||||
Infrastrutture Wireless Italiane SpA, 144A | 1,268 | 12,900 | ||||||
Interpump Group SpA | 354 | 10,563 | ||||||
Intesa Sanpaolo SpA* | 70,546 | 121,568 | ||||||
Iren SpA | 2,711 | 6,729 | ||||||
Italgas SpA | 2,323 | 12,599 | ||||||
Italmobiliare SpA | 66 | 1,766 | ||||||
Juventus Football Club SpA* | 2,213 | 2,285 | ||||||
La Doria SpA | 20 | 234 | ||||||
Leonardo SpA* | 1,819 | 11,307 | ||||||
Maire Tecnimont SpA*(a) | 530 | 833 | ||||||
MARR SpA* | 159 | 2,319 | ||||||
Mediaset SpA*(a) | 1,978 | 3,384 | ||||||
Mediobanca Banca di Credito Finanziario SpA | 2,861 | 18,534 | ||||||
Moncler SpA* | 896 | 33,270 | ||||||
Nexi SpA, 144A* | 1,487 | 24,380 | ||||||
Piaggio & C SpA | 759 | 1,818 | ||||||
Number | Value | |||||||
| Italy (Continued) | ||||||||
Pirelli & C SpA, 144A* | 1,715 | $ | 7,672 | |||||
Poste Italiane SpA, 144A | 2,438 | 21,364 | ||||||
Prysmian SpA | 1,220 | 25,927 | ||||||
RAI Way SpA, 144A* | 466 | 2,824 | ||||||
Recordati SpA | 473 | 21,485 | ||||||
Reply SpA | 125 | 10,913 | ||||||
Saipem SpA | 2,713 | 6,430 | ||||||
Salvatore Ferragamo SpA* | 189 | 2,629 | ||||||
Saras SpA* | 2,585 | 2,310 | ||||||
Sesa SpA | 38 | 2,134 | ||||||
Snam SpA | 9,610 | 44,633 | ||||||
Societa Cattolica di Assicurazioni SC* | 622 | 2,853 | ||||||
Tamburi Investment Partners SpA | 370 | 2,452 | ||||||
Technogym SpA, 144A* | 399 | 3,289 | ||||||
Telecom Italia SpA* | 41,652 | 15,350 | ||||||
Telecom Italia SpA-RSP | 25,785 | 9,926 | ||||||
Terna Rete Elettrica Nazionale SpA | 6,653 | 44,828 | ||||||
Tinexta SpA | 125 | 1,604 | ||||||
Tod’s SpA* | 41 | 1,081 | ||||||
UniCredit SpA* | 10,164 | 86,492 | ||||||
Unione di Banche Italiane SpA* | 4,349 | 12,267 | ||||||
Unipol Gruppo SpA* | 1,999 | 7,003 | ||||||
Webuild SpA(a) | 809 | 1,116 | ||||||
Zignago Vetro SpA | 63 | 827 | ||||||
|
| |||||||
(Cost $1,744,156) | 1,485,639 | |||||||
|
| |||||||
| Luxembourg — 0.8% | ||||||||
APERAM SA | 247 | 6,786 | ||||||
ArcelorMittal SA* | 3,538 | 33,795 | ||||||
Aroundtown SA | 5,408 | 29,668 | ||||||
Befesa SA, 144A | 197 | 7,468 | ||||||
Corestate Capital Holding SA*(a) | 55 | 1,107 | ||||||
Eurofins Scientific SE | 62 | 41,831 | ||||||
Grand City Properties SA | 487 | 11,017 | ||||||
SES SA | 1,655 | 12,224 | ||||||
Solutions 30 SE*(a) | 308 | 4,096 | ||||||
Stabilus SA | 106 | 5,735 | ||||||
Tenaris SA | 2,167 | 13,451 | ||||||
|
| |||||||
(Cost $284,003) | 167,178 | |||||||
|
| |||||||
| Netherlands — 11.5% | ||||||||
Aalberts NV* | 456 | 12,477 | ||||||
ABN AMRO Bank NV, 144A | 1,919 | 15,359 | ||||||
Accell Group NV* | 110 | 2,668 | ||||||
Adyen NV, 144A* | 85 | 111,621 | ||||||
Aegon NV | 9,121 | 24,350 | ||||||
Akzo Nobel NV | 935 | 76,389 | ||||||
Alfen Beheer BV, 144A* | 101 | 3,122 | ||||||
Altice Europe NV* | 3,158 | 12,620 | ||||||
AMG Advanced Metallurgical Group NV | 145 | 2,425 | ||||||
Arcadis NV* | 311 | 5,317 | ||||||
Argenx SE* | 209 | 44,428 | ||||||
ASM International NV | 230 | 26,693 | ||||||
ASML Holding NV | 2,006 | 652,330 | ||||||
ASR Nederland NV | 638 | 17,493 | ||||||
Basic-Fit NV, 144A* | 188 | 4,758 | ||||||
BE Semiconductor Industries NV | 332 | 12,648 | ||||||
| See Notes to Financial Statements. | 76 |
DBX ETF Trust
Schedule of Investments
Xtrackers MSCI Eurozone Hedged Equity ETF (Continued)
May 31, 2020
Number | Value | |||||||
| Netherlands (Continued) | ||||||||
Boskalis Westminster* | 376 | $ | 6,945 | |||||
Brunel International NV* | 109 | 692 | ||||||
Corbion NV* | 282 | 10,346 | ||||||
Eurocommercial Properties NV | 186 | 2,358 | ||||||
Euronext NV, 144A | 249 | 22,914 | ||||||
EXOR NV | 493 | 26,520 | ||||||
Flow Traders, 144A | 142 | 4,968 | ||||||
ForFarmers NV | 95 | 603 | ||||||
Fugro NV*(a) | 348 | 1,313 | ||||||
Heineken Holding NV | 542 | 44,582 | ||||||
Heineken NV | 1,219 | 111,608 | ||||||
IMCD NV* | 255 | 24,009 | ||||||
ING Groep NV | 18,467 | 119,019 | ||||||
Intertrust NV, 144A | 387 | 6,109 | ||||||
Just Eat Takeaway.com NV, 144A* | 573 | 62,054 | ||||||
Koninklijke Ahold Delhaize NV | 5,200 | 131,665 | ||||||
Koninklijke BAM Groep NV* | 1,368 | 2,314 | ||||||
Koninklijke DSM NV | 813 | 103,829 | ||||||
Koninklijke KPN NV | 17,597 | 43,052 | ||||||
Koninklijke Philips NV* | 4,234 | 191,711 | ||||||
Koninklijke Vopak NV | 338 | 18,501 | ||||||
NIBC Holding NV, 144A | 234 | 1,862 | ||||||
NN Group NV | 1,381 | 42,571 | ||||||
NSI NV REIT | 84 | 3,184 | ||||||
OCI NV* | 400 | 4,507 | ||||||
Pharming Group NV* | 2,520 | 3,728 | ||||||
PostNL NV | 1,875 | 2,784 | ||||||
Prosus NV* | 2,287 | 189,386 | ||||||
QIAGEN NV* | 1,123 | 49,003 | ||||||
Randstad NV | 615 | 25,758 | ||||||
SBM Offshore NV | 790 | 10,778 | ||||||
Shop Apotheke Europe NV, 144A* | 50 | 5,145 | ||||||
SIF Holding NV* | 38 | 428 | ||||||
Signify NV, 144A* | 605 | 12,915 | ||||||
TKH Group NV | 186 | 6,553 | ||||||
TomTom NV* | 323 | 2,734 | ||||||
Vastned Retail NV REIT | 71 | 1,416 | ||||||
Wereldhave NV REIT(a) | 173 | 1,462 | ||||||
Wolters Kluwer NV | 1,299 | 103,359 | ||||||
|
| |||||||
(Cost $2,111,163) | 2,427,383 | |||||||
|
| |||||||
| Portugal — 0.6% | ||||||||
Altri SGPS SA | 294 | 1,350 | ||||||
Banco Comercial Portugues SA, Class R | 40,733 | 4,454 | ||||||
Corticeira Amorim SGPS SA | 224 | 2,293 | ||||||
CTT-Correios de Portugal SA* | 577 | 1,313 | ||||||
EDP—Energias de Portugal SA | 11,950 | 56,018 | ||||||
Galp Energia SGPS SA | 2,303 | 27,392 | ||||||
Jeronimo Martins SGPS SA* | 1,165 | 19,890 | ||||||
Mota-Engil SGPS SA | 467 | 595 | ||||||
Navigator Co. SA* | 1,124 | 2,777 | ||||||
NOS SGPS SA* | 1,266 | 5,202 | ||||||
REN—Redes Energeticas Nacionais SGPS SA | 2,236 | 6,007 | ||||||
Semapa-Sociedade de Investimento e Gestao* | 107 | 985 | ||||||
Sonae SGPS SA | 3,626 | 2,701 | ||||||
|
| |||||||
(Cost $143,152) | 130,977 | |||||||
|
| |||||||
Number | Value | |||||||
| Spain — 7.8% | ||||||||
Acciona SA(a) | 98 | $ | 9,769 | |||||
Acerinox SA* | 872 | 6,905 | ||||||
ACS Actividades de Construccion y Servicios SA | 1,217 | 31,004 | ||||||
Aedas Homes SA, 144A* | 107 | 1,758 | ||||||
Aena SME SA, 144A* | 318 | 45,254 | ||||||
Almirall SA* | 255 | 3,354 | ||||||
Amadeus IT Group SA | 2,061 | 107,390 | ||||||
Applus Services SA | 574 | 4,533 | ||||||
Atresmedia Corp. de Medios de Comunicacion SA | 384 | 1,027 | ||||||
Banco Bilbao Vizcaya Argentaria SA | 31,946 | 99,044 | ||||||
Banco de Sabadell SA | 26,504 | 7,961 | ||||||
Banco Santander SA | 78,270 | 177,025 | ||||||
Bankia SA | 5,465 | 4,816 | ||||||
Bankinter SA | 2,994 | 12,666 | ||||||
Bolsas y Mercados Espanoles SHMSF SA | 375 | 13,704 | ||||||
CaixaBank SA | 16,929 | 31,561 | ||||||
Cellnex Telecom SA, 144A* | 1,200 | 67,829 | ||||||
Cia de Distribucion Integral Logista Holdings SA | 219 | 4,031 | ||||||
CIE Automotive SA | 380 | 6,838 | ||||||
Construcciones y Auxiliar de Ferrocarriles SA | 86 | 2,964 | ||||||
Corp. Financiera Alba SA | 90 | 3,597 | ||||||
Distribuidora Internacional de Alimentacion SA* | 20,449 | 2,604 | ||||||
Ebro Foods SA | 402 | 8,398 | ||||||
eDreams ODIGEO SA* | 343 | 1,089 | ||||||
Enagas SA | 1,237 | 27,751 | ||||||
Ence Energia y Celulosa SA | 486 | 1,490 | ||||||
Endesa SA | 1,508 | 35,739 | ||||||
Euskaltel SA, 144A | 368 | 2,896 | ||||||
Faes Farma SA | 1,221 | 4,927 | ||||||
Ferrovial SA* | 32 | 867 | ||||||
Ferrovial SA | 2,304 | 62,456 | ||||||
Fluidra SA* | 213 | 2,624 | ||||||
Fomento de Construcciones y Contratas SA* | 373 | 3,760 | ||||||
Gestamp Automocion SA, 144A | 691 | 2,036 | ||||||
Global Dominion Access SA, 144A* | 459 | 1,572 | ||||||
Grifols SA | 1,443 | 45,043 | ||||||
Grupo Catalana Occidente SA | 207 | 4,665 | ||||||
Grupo Empresarial San Jose SA* | 174 | 917 | ||||||
Iberdrola SA | 27,262 | 293,180 | ||||||
Indra Sistemas SA* | 676 | 5,215 | ||||||
Industria de Diseno Textil SA | 5,141 | 142,955 | ||||||
Inmobiliaria Colonial Socimi SA REIT | 1,451 | 13,095 | ||||||
Lar Espana Real Estate Socimi SA REIT | 407 | 2,004 | ||||||
Liberbank SA* | 10,395 | 1,802 | ||||||
Mapfre SA | 5,144 | 9,039 | ||||||
Masmovil Ibercom SA* | 420 | 8,728 | ||||||
Mediaset Espana Comunicacion SA* | 704 | 2,499 | ||||||
Melia Hotels International SA | 488 | 2,417 | ||||||
Merlin Properties Socimi SA REIT | 1,626 | 13,627 | ||||||
Metrovacesa SA, 144A* | 172 | 1,105 | ||||||
Miquel y Costas & Miquel SA | 111 | 1,641 | ||||||
| See Notes to Financial Statements. | 77 |
DBX ETF Trust
Schedule of Investments
Xtrackers MSCI Eurozone Hedged Equity ETF (Continued)
May 31, 2020
Number | Value | |||||||
| Spain (Continued) | ||||||||
Naturgy Energy Group SA | 1,382 | $ | 25,612 | |||||
Neinor Homes SA, 144A* | 382 | 3,452 | ||||||
Pharma Mar SA* | 881 | 6,039 | ||||||
Promotora de Informaciones SA, Class A* | 1,286 | 802 | ||||||
Prosegur Cash SA, 144A | 2,298 | 2,033 | ||||||
Prosegur Cia de Seguridad SA | 1,177 | 2,637 | ||||||
Red Electrica Corp. SA | 2,056 | 36,151 | ||||||
Repsol SA | 6,808 | 63,254 | ||||||
Sacyr SA | 1,700 | 3,321 | ||||||
Siemens Gamesa Renewable Energy SA* | 1,117 | 18,766 | ||||||
Solaria Energia y Medio Ambiente SA* | 234 | 2,596 | ||||||
Talgo SA, 144A* | 459 | 2,150 | ||||||
Tecnicas Reunidas SA* | 144 | 2,238 | ||||||
Telefonica SA | 22,099 | 104,036 | ||||||
Unicaja Banco SA, 144A* | 3,980 | 2,166 | ||||||
Viscofan SA | 167 | 10,974 | ||||||
Zardoya Otis SA | 808 | 5,740 | ||||||
|
| |||||||
(Cost $2,470,653) | 1,641,138 | |||||||
|
| |||||||
| Switzerland(d) — 0.4% | ||||||||
STMicroelectronics NV | ||||||||
(Cost $38,124) | 3,004 | 73,661 | ||||||
|
| |||||||
| United Kingdom(d) — 2.3% | ||||||||
CNH Industrial NV* | 4,689 | 28,378 | ||||||
Coca-Cola European Partners PLC | 975 | 36,757 | ||||||
Dialog Semiconductor PLC* | 354 | 13,958 | ||||||
Fiat Chrysler Automobiles NV* | 5,350 | 47,166 | ||||||
Unilever NV(a) | 6,891 | 355,619 | ||||||
|
| |||||||
(Cost $483,672) | 481,878 | |||||||
|
| |||||||
TOTAL COMMON STOCKS | 20,450,498 | |||||||
|
| |||||||
| PREFERRED STOCKS — 1.6% | ||||||||
| Germany — 1.6% | ||||||||
Bayerische Motoren Werke AG | 254 | 11,667 | ||||||
Draegerwerk AG & Co. KGaA* | 36 | 2,849 | ||||||
FUCHS PETROLUB SE | 346 | 13,758 | ||||||
Henkel AG & Co. KGaA* | 858 | 76,460 | ||||||
Number | Value | |||||||
| Germany (Continued) | ||||||||
Jungheinrich AG* | 203 | $ | 3,934 | |||||
Porsche Automobil Holding SE | 703 | 38,168 | ||||||
Sartorius AG* | 173 | 64,026 | ||||||
Sixt SE | 76 | 4,146 | ||||||
STO SE & Co. KGaA | 9 | 1,031 | ||||||
Volkswagen AG* | 876 | 128,844 | ||||||
|
| |||||||
(Cost $366,289) | 344,883 | |||||||
|
| |||||||
TOTAL PREFERRED STOCKS | 344,883 | |||||||
|
| |||||||
| RIGHTS — 0.0% | ||||||||
| Italy — 0.0% | ||||||||
Davide Campari-Milano SpA*, | 2,639 | 0 | ||||||
|
| |||||||
| WARRANTS — 0.0% | ||||||||
| Spain — 0.0% | ||||||||
Abengoa SA*, | 7,125 | 79 | ||||||
|
| |||||||
| SECURITIES LENDING COLLATERAL — 3.2% | ||||||||
DWS Government & Agency Securities Portfolio “DWS Government Cash Institutional Shares”, 0.07% (e)(f) | 667,973 | 667,973 | ||||||
|
| |||||||
| CASH EQUIVALENTS — 1.4% | ||||||||
DWS Government Money Market Series “Institutional Shares”, 0.12% (e) | 290,364 | 290,364 | ||||||
|
| |||||||
TOTAL INVESTMENTS — 103.2% | $ | 21,753,797 | ||||||
Other assets and liabilities, net — (3.2%) | (676,743 | ) | ||||||
|
| |||||||
NET ASSETS — 100.0% | $ | 21,077,054 | ||||||
|
| |||||||
A summary of the Fund’s transactions with affiliated investments during the year ended May 31, 2020 is as follows:
| Value ($) at 5/31/2019 | Purchases Cost ($) | Sales Proceeds ($) | Net Realized Gain/(Loss) ($) | Net Change in Unrealized Appreciation (Depreciation) ($) | Income ($) | Capital Gain Distributions ($) | Number of Shares at 5/31/2020 | Value ($) at 5/31/2020 | ||||||||||||||||||||||||||||||
COMMON STOCKS — 0.3% | ||||||||||||||||||||||||||||||||||||||
Germany — 0.3% | ||||||||||||||||||||||||||||||||||||||
Deutsche Bank AG*(b) | ||||||||||||||||||||||||||||||||||||||
| 86,260 | 3,127 | (27,547 | ) | (33,816 | ) | 51,227 | — | — | 9,480 | 79,251 | ||||||||||||||||||||||||||||
SECURITIES LENDING COLLATERAL — 3.2% | ||||||||||||||||||||||||||||||||||||||
DWS Government & Agency Securities Portfolio “DWS Government Cash Institutional Shares”, 0.07% (e)(f) | ||||||||||||||||||||||||||||||||||||||
| 1,747,284 | — | (1,079,311 | )(g) | — | — | 7,938 | — | 667,973 | 667,973 | |||||||||||||||||||||||||||||
CASH EQUIVALENTS — 1.4% | ||||||||||||||||||||||||||||||||||||||
DWS Government Money Market Series “Institutional Shares”, 0.12% (e) | ||||||||||||||||||||||||||||||||||||||
| 720,256 | 7,638,894 | (8,068,786 | ) | — | — | 9,036 | — | 290,364 | 290,364 | |||||||||||||||||||||||||||||
|
|
|
|
|
|
|
|
|
|
|
|
|
|
|
|
|
| |||||||||||||||||||||
| 2,553,800 | 7,642,021 | (9,175,644 | ) | (33,816 | ) | 51,227 | 16,974 | – | 967,817 | 1,037,588 | ||||||||||||||||||||||||||||
|
|
|
|
|
|
|
|
|
|
|
|
|
|
|
|
|
| |||||||||||||||||||||
| See Notes to Financial Statements. | 78 |
DBX ETF Trust
Schedule of Investments
Xtrackers MSCI Eurozone Hedged Equity ETF (Continued)
May 31, 2020
| * | Non-income producing security. |
| (a) | All or a portion of these securities were on loan. In addition, “Other assets and liabilities, net” may include pending sales that are also on loan. The value of securities loaned at May 31, 2020 amounted to $625,994, which is 3.0% of net assets. |
| (b) | Affiliated issuer. This security is owned in proportion with its representation in the index. |
| (c) | Investment was valued using significant unobservable inputs. |
| (d) | Securities listed in country of domicile and traded on an exchange within Eurozone. |
| (e) | Affiliated fund managed by DWS Investment Management Americas, Inc. The rate shown is the annualized seven-day yield at period end. |
| (f) | Represents cash collateral held in connection with securities lending. Income earned by the Fund is net of borrower rebates. In addition, the Fund held non-cash U.S. Treasury securities collateral having a value of $30,530. |
| (g) | Represents the net increase (purchase cost) or decrease (sales proceeds) in the amount invested in cash collateral for the year ended May 31, 2020. |
| REIT: | Real Estate Investment Trust |
| RSP: | Risparmio (Convertible Savings Shares) |
| 144A: | Security exempt from registration under Rule 144A of the Securities Act of 1933. These securities may be resold in transactions exempt from registration, normally to qualified institutional buyers. |
At May 31, 2020, open futures contracts purchased were as follows:
Contract Description | Currency | Number of Contracts | Notional Amount | Contract Value | Expiration Date | Unrealized Appreciation | ||||||||||||
EURO STOXX 50 Futures | EUR | 7 | $ | 218,394 | $236,685 | 6/19/2020 | $ | 18,291 | ||||||||||
As of May 31, 2020, the Fund had the following forward foreign currency contracts outstanding:
Counterparty | Settlement Date | Currency To Deliver | Currency To Receive | Unrealized Appreciation | Unrealized Depreciation | |||||||||||||||||
Citigroup Global Markets | 6/3/2020 | EUR | 999,000 | USD | 1,094,744 | $ | – | $ | (14,265 | ) | ||||||||||||
Citigroup Global Markets | 6/3/2020 | EUR | 2,057,000 | USD | 2,254,235 | – | (29,279 | ) | ||||||||||||||
Citigroup Global Markets | 6/3/2020 | EUR | 150,000 | USD | 163,647 | – | (2,871 | ) | ||||||||||||||
JP Morgan & Chase Co. | 6/3/2020 | EUR | 8,187,330 | USD | 8,972,290 | – | (116,619 | ) | ||||||||||||||
RBC Capital Markets | 6/3/2020 | EUR | 6,954,000 | USD | 7,620,784 | – | (98,982 | ) | ||||||||||||||
Citigroup Global Markets | 6/3/2020 | USD | 3,566,274 | EUR | 3,206,000 | – | (7,233 | ) | ||||||||||||||
JP Morgan & Chase Co. | 6/3/2020 | USD | 9,107,177 | EUR | 8,187,330 | – | (18,267 | ) | ||||||||||||||
RBC Capital Markets | 6/3/2020 | USD | 7,735,435 | EUR | 6,954,000 | – | (15,669 | ) | ||||||||||||||
Citigroup Global Markets | 7/3/2020 | EUR | 762,000 | USD | 848,132 | 1,695 | – | |||||||||||||||
Citigroup Global Markets | 7/3/2020 | EUR | 3,206,000 | USD | 3,568,384 | 7,127 | – | |||||||||||||||
JP Morgan & Chase Co. | 7/3/2020 | EUR | 8,187,330 | USD | 9,112,482 | 17,914 | – | |||||||||||||||
RBC Capital Markets | 7/3/2020 | EUR | 6,954,000 | USD | 7,739,941 | 15,368 | – | |||||||||||||||
|
|
|
| |||||||||||||||||||
Total unrealized appreciation (depreciation) | $ | 42,104 | $ | (303,185 | ) | |||||||||||||||||
|
|
|
| |||||||||||||||||||
For information on the Fund’s policy and additional disclosures regarding open futures contracts and forward foreign currency contracts, please refer to the Derivatives section of Note 2 in the accompanying Notes to Financial Statements.
Currency Abbreviations
| EUR | Euro |
| USD | U.S. Dollar |
| See Notes to Financial Statements. | 79 |
DBX ETF Trust
Schedule of Investments
Xtrackers MSCI Eurozone Hedged Equity ETF (Continued)
May 31, 2020
Fair Value Measurements
Various inputs are used in determining the value of the Fund’s investments. These inputs are summarized in three broad levels. Level 1 includes quoted prices in active markets for identical securities. Level 2 includes other significant observable inputs (including quoted prices for similar securities, interest rates, prepayment speeds and credit risk). Level 3 includes significant unobservable inputs (including the Fund’s own assumptions in determining the fair value of investments). The level assigned to the securities valuations may not be an indication of the risk or liquidity associated with investing in those securities.
The following is a summary of the inputs used as of May 31, 2020 in valuing the Fund’s investments. For information on the Fund’s policy regarding the valuation of investments, please refer to the Security Valuation section of Note 2 in the accompanying Notes to Financial Statements.
Assets | Level 1 | Level 2 | Level 3 | Total | ||||||||||||
Common Stocks (h) | $ | 20,449,728 | $ | — | $ | 770 | $ | 20,450,498 | ||||||||
Preferred Stocks | 344,883 | — | — | 344,883 | ||||||||||||
Rights | — | — | 0 | 0 | ||||||||||||
Warrants | 79 | — | — | 79 | ||||||||||||
Short-Term Investments (h) | 958,337 | — | — | 958,337 | ||||||||||||
Derivatives (i) | ||||||||||||||||
Forward Foreign Currency Contracts | — | 42,104 | — | 42,104 | ||||||||||||
Futures Contracts | 18,291 | — | — | 18,291 | ||||||||||||
|
|
|
|
|
|
|
| |||||||||
TOTAL | $ | 21,771,318 | $ | 42,104 | $ | 770 | $ | 21,814,192 | ||||||||
|
|
|
|
|
|
|
| |||||||||
Liabilities | Level 1 | Level 2 | Level 3 | Total | ||||||||||||
Derivatives (i) | ||||||||||||||||
Forward Foreign Currency Contracts | $ | — | $ | (303,185 | ) | $ | — | $ | (303,185 | ) | ||||||
|
|
|
|
|
|
|
| |||||||||
TOTAL | $ | — | $ | (303,185 | ) | $ | — | $ | (303,185 | ) | ||||||
|
|
|
|
|
|
|
| |||||||||
| (h) | See Schedule of Investments for additional detailed categorizations. |
| (i) | Derivatives include unrealized appreciation (depreciation) on open futures contracts and forward foreign currency contracts. |
| See Notes to Financial Statements. | 80 |
DBX ETF Trust
Schedule of Investments
Xtrackers MSCI Germany Hedged Equity ETF
May 31, 2020
Number | Value | |||||||
| COMMON STOCKS — 91.4% | ||||||||
| Communication Services — 5.8% | ||||||||
Deutsche Telekom AG* | 43,424 | $ | 683,275 | |||||
Scout24 AG, 144A | 1,397 | 106,613 | ||||||
Telefonica Deutschland Holding AG | 13,521 | 41,515 | ||||||
United Internet AG | 1,317 | 53,917 | ||||||
|
| |||||||
(Cost $1,038,506) | 885,320 | |||||||
|
| |||||||
| Consumer Discretionary — 12.4% | ||||||||
adidas AG* | 2,480 | 652,994 | ||||||
Bayerische Motoren Werke AG | 4,308 | 251,538 | ||||||
Continental AG* | 1,431 | 140,486 | ||||||
Daimler AG* | 11,144 | 412,924 | ||||||
Delivery Hero SE, 144A* | 1,667 | 159,472 | ||||||
Puma SE* | 1,079 | 76,871 | ||||||
Volkswagen AG* | 425 | 67,180 | ||||||
Zalando SE, 144A* | 1,976 | 133,450 | ||||||
|
| |||||||
(Cost $2,607,356) | 1,894,915 | |||||||
|
| |||||||
| Consumer Staples — 1.7% | ||||||||
Beiersdorf AG | 1,313 | 137,383 | ||||||
Henkel AG & Co. KGaA* | 1,351 | 108,052 | ||||||
METRO AG | 2,394 | 22,312 | ||||||
|
| |||||||
(Cost $319,068) | 267,747 | |||||||
|
| |||||||
| Financials — 14.4% | ||||||||
Allianz SE | 5,432 | 981,771 | ||||||
Commerzbank AG* | 12,991 | 50,487 | ||||||
Deutsche Bank AG*(a) | 25,568 | 213,743 | ||||||
Deutsche Boerse AG | 2,474 | 406,172 | ||||||
Hannover Rueck SE | 786 | 126,163 | ||||||
Muenchener Rueckversicherungs-Gesellschaft AG in Muenchen | 1,880 | 426,979 | ||||||
|
| |||||||
(Cost $2,773,514) | 2,205,315 | |||||||
|
| |||||||
| Health Care — 12.0% | ||||||||
Bayer AG | 12,798 | 862,614 | ||||||
Carl Zeiss Meditec AG* | 517 | 52,856 | ||||||
Fresenius Medical Care AG & Co. KGaA* | 2,777 | 233,045 | ||||||
Fresenius SE & Co. KGaA* | 5,444 | 261,063 | ||||||
Merck KGaA | 1,683 | 192,706 | ||||||
QIAGEN NV* | 3,019 | 131,737 | ||||||
Siemens Healthineers AG, 144A | 1,954 | 100,785 | ||||||
|
| |||||||
(Cost $2,880,664) | 1,834,806 | |||||||
|
| |||||||
| Industrials — 12.8% | ||||||||
Brenntag AG | 2,010 | 105,781 | ||||||
Deutsche Lufthansa AG* | 3,148 | 31,946 | ||||||
Deutsche Post AG* | 12,884 | 400,167 | ||||||
Fraport AG Frankfurt Airport Services Worldwide* | 545 | 26,994 | ||||||
GEA Group AG | 1,999 | 59,447 | ||||||
HOCHTIEF AG | 322 | 28,273 | ||||||
KION Group AG* | 854 | 47,589 | ||||||
Knorr-Bremse AG | 629 | 66,457 | ||||||
MTU Aero Engines AG* | 691 | 111,145 | ||||||
Siemens AG | 9,964 | 1,089,795 | ||||||
|
| |||||||
(Cost $2,191,006) | 1,967,594 | |||||||
|
| |||||||
Number | Value | |||||||
| Information Technology — 15.4% | ||||||||
Infineon Technologies AG | 16,293 | $ | 341,031 | |||||
Nemetschek SE* | 749 | 58,948 | ||||||
SAP SE | 13,604 | 1,713,978 | ||||||
TeamViewer AG* | 1,692 | 85,937 | ||||||
Wirecard AG | 1,529 | 160,493 | ||||||
|
| |||||||
(Cost $1,827,944) | 2,360,387 | |||||||
|
| |||||||
| Materials — 7.6% | ||||||||
BASF SE* | 11,950 | 645,281 | ||||||
Covestro AG, 144A* | 2,256 | 83,367 | ||||||
Evonik Industries AG | 2,723 | 66,952 | ||||||
HeidelbergCement AG* | 1,930 | 95,615 | ||||||
LANXESS AG* | 1,078 | 55,620 | ||||||
Symrise AG* | 1,675 | 182,959 | ||||||
thyssenkrupp AG* | 5,162 | 34,724 | ||||||
|
| |||||||
(Cost $1,941,108) | 1,164,518 | |||||||
|
| |||||||
| Real Estate — 5.1% | ||||||||
Aroundtown SA | 15,007 | 82,327 | ||||||
Deutsche Wohnen SE | 4,454 | 198,854 | ||||||
LEG Immobilien AG* | 897 | 111,600 | ||||||
Vonovia SE* | 6,716 | 386,025 | ||||||
|
| |||||||
(Cost $663,292) | 778,806 | |||||||
|
| |||||||
| Utilities — 4.2% | ||||||||
E.ON SE | 29,252 | 308,671 | ||||||
RWE AG* | 7,608 | 251,584 | ||||||
Uniper SE | 2,623 | 81,818 | ||||||
|
| |||||||
(Cost $729,405) | 642,073 | |||||||
|
| |||||||
TOTAL COMMON STOCKS | 14,001,481 | |||||||
|
| |||||||
| PREFERRED STOCKS — 6.0% | ||||||||
| Consumer Discretionary — 3.3% | ||||||||
Bayerische Motoren Werke AG | 746 | 34,267 | ||||||
Porsche Automobil Holding SE | 1,992 | 108,151 | ||||||
Volkswagen AG* | 2,415 | 355,202 | ||||||
|
| |||||||
(Cost $878,369) | 497,620 | |||||||
|
| |||||||
| Consumer Staples — 1.4% | ||||||||
Henkel AG & Co. KGaA* | 2,322 | 206,924 | ||||||
|
| |||||||
| Health Care — 1.1% | ||||||||
Sartorius AG* | 463 | 171,352 | ||||||
|
| |||||||
| Materials — 0.2% | ||||||||
FUCHS PETROLUB SE | 886 | 35,229 | ||||||
|
| |||||||
TOTAL PREFERRED STOCKS | 911,125 | |||||||
|
| |||||||
| EXCHANGE-TRADED FUNDS — 0.9% | ||||||||
iShares Currency Hedged MSCI Germany ETF (b) | 5,183 | 134,538 | ||||||
|
| |||||||
| See Notes to Financial Statements. | 81 |
DBX ETF Trust
Schedule of Investments
Xtrackers MSCI Germany Hedged Equity ETF (Continued)
May 31, 2020
Number | Value | |||||||
| SECURITIES LENDING COLLATERAL — 0.7% | ||||||||
DWS Government & Agency Securities Portfolio “DWS Government Cash Institutional Shares”, 0.07% (c)(d) | 111,300 | $ | 111,300 | |||||
|
| |||||||
| CASH EQUIVALENTS — 1.5% | ||||||||
DWS Government Money Market Series “Institutional Shares”, 0.12% (c) | 229,525 | 229,525 | ||||||
|
| |||||||
TOTAL INVESTMENTS — 100.5% | $ | 15,387,969 | ||||||
Other assets and liabilities, net — (0.5%) |
| (74,043 | ) | |||||
|
| |||||||
NET ASSETS — 100.0% | $ | 15,313,926 | ||||||
|
| |||||||
A summary of the Fund’s transactions with affiliated investments during the year ended May 31, 2020 is as follows:
| Value ($) at 5/31/2019 | Purchases Cost ($) | Sales Proceeds ($) | Net Realized Gain/(Loss) ($) | Net Change in Unrealized Appreciation (Depreciation) ($) | Income ($) | Capital Gain Distributions ($) | Number of Shares at 5/31/2020 | Value ($) at 5/31/2020 | ||||||||||||||||||||||||||||||
COMMON STOCKS — 1.4% | ||||||||||||||||||||||||||||||||||||||
Financials — 1.4% | ||||||||||||||||||||||||||||||||||||||
Deutsche Bank AG*(a) | ||||||||||||||||||||||||||||||||||||||
| 264,960 | �� | 25,417 | (135,498 | ) | (271,350 | ) | 330,214 | — | — | 25,568 | 213,743 | |||||||||||||||||||||||||||
SECURITIES LENDING COLLATERAL — 0.7% | ||||||||||||||||||||||||||||||||||||||
DWS Government & Agency Securities Portfolio “DWS Government Cash Institutional Shares”, 0.07% (c)(d) | ||||||||||||||||||||||||||||||||||||||
| — | 111,300(e | ) | — | — | — | 93 | — | 111,300 | 111,300 | |||||||||||||||||||||||||||||
CASH EQUIVALENTS —1.5% | ||||||||||||||||||||||||||||||||||||||
DWS Government Money Market Series “Institutional Shares”, 0.12% (c) | ||||||||||||||||||||||||||||||||||||||
| 266,383 | 4,818,677 | (4,855,535 | ) | — | — | 5,035 | — | 229,525 | 229,525 | |||||||||||||||||||||||||||||
|
|
|
|
|
|
|
|
|
|
|
|
|
|
|
|
|
| |||||||||||||||||||||
| 531,343 | 4,955,394 | (4,991,033 | ) | (271,350 | ) | 330,214 | 5,128 | — | 366,393 | 554,568 | ||||||||||||||||||||||||||||
|
|
|
|
|
|
|
|
|
|
|
|
|
|
|
|
|
| |||||||||||||||||||||
| * | Non-income producing security. |
| (a) | Affiliated issuer. This security is owned in proportion with its representation in the index. |
| (b) | All or a portion of these securities were on loan. In addition, “Other assets and liabilities, net” may include pending sales that are also on loan. The value of securities loaned at May 31, 2020 amounted to $109,022, which is 0.7% of net assets. |
| (c) | Affiliated fund managed by DWS Investment Management Americas, Inc. The rate shown is the annualized seven-day yield at period end. |
| (d) | Represents cash collateral held in connection with securities lending. Income earned by the Fund is net of borrower rebates. |
| (e) | Represents the net increase (purchase cost) or decrease (sales proceeds) in the amount invested in cash collateral for the year ended May 31, 2020. |
144A: Security exempt from registration under Rule 144A of the Securities Act of 1933. These securities may be resold in transactions exempt from registration, normally to qualified institutional buyers.
At May 31, 2020, open futures contracts purchased were as follows:
Contract Description | Currency | Number of Contracts | Notional Amount | Contract Value | Expiration Date | Unrealized Appreciation | ||||||||||||
DAX Mini Futures | EUR | 3 | $ | 179,893 | $ | 193,190 | 6/19/2020 | $ | 13,297 | |||||||||
| See Notes to Financial Statements. | 82 |
DBX ETF Trust
Schedule of Investments
Xtrackers MSCI Germany Hedged Equity ETF (Continued)
May 31, 2020
As of May 31, 2020, the Fund had the following forward foreign currency contracts outstanding:
Counterparty | Settlement Date | Currency To Deliver | Currency To Receive | Unrealized Appreciation | Unrealized Depreciation | |||||||||||||||||
Citigroup Global Markets | 6/3/2020 | EUR | 5,765,367 | USD | 6,317,920 | $ | — | $ | (82,323 | ) | ||||||||||||
JP Morgan & Chase Co. | 6/3/2020 | EUR | 2,461,000 | USD | 2,696,948 | — | (35,054 | ) | ||||||||||||||
JP Morgan & Chase Co. | 6/3/2020 | EUR | 1,643,000 | USD | 1,800,552 | — | (23,373 | ) | ||||||||||||||
RBC Capital Markets | 6/3/2020 | EUR | 3,086,919 | USD | 3,382,908 | — | (43,939 | ) | ||||||||||||||
RBC Capital Markets | 6/3/2020 | EUR | 96,000 | USD | 104,714 | — | (1,857 | ) | ||||||||||||||
Citigroup Global Markets | 6/3/2020 | USD | 6,413,250 | EUR | 5,765,367 | — | (13,007 | ) | ||||||||||||||
JP Morgan & Chase Co. | 6/3/2020 | USD | 4,565,084 | EUR | 4,104,000 | — | (9,157 | ) | ||||||||||||||
RBC Capital Markets | 6/3/2020 | USD | 3,540,590 | EUR | 3,182,919 | — | (7,171 | ) | ||||||||||||||
Citigroup Global Markets | 7/3/2020 | EUR | 5,765,367 | USD | 6,417,044 | 12,816 | — | |||||||||||||||
JP Morgan & Chase Co. | 7/3/2020 | EUR | 4,104,000 | USD | 4,567,744 | 8,980 | — | |||||||||||||||
RBC Capital Markets | 7/3/2020 | EUR | 704,000 | USD | 783,568 | 1,558 | — | |||||||||||||||
RBC Capital Markets | 7/3/2020 | EUR | 3,182,919 | USD | 3,542,653 | 7,034 | — | |||||||||||||||
|
|
|
| |||||||||||||||||||
Total unrealized appreciation (depreciation) | $ | 30,388 | $ | (215,881 | ) | |||||||||||||||||
|
|
|
| |||||||||||||||||||
For information on the Fund’s policy and additional disclosures regarding open futures contracts and forward foreign currency contracts, please refer to the Derivatives section of Note 2 in the accompanying Notes to Financial Statements.
Currency Abbreviations
| EUR | Euro |
| USD | U.S. Dollar |
Fair Value Measurements
Various inputs are used in determining the value of the Fund’s investments. These inputs are summarized in three broad levels. Level 1 includes quoted prices in active markets for identical securities. Level 2 includes other significant observable inputs (including quoted prices for similar securities, interest rates, prepayment speeds and credit risk). Level 3 includes significant unobservable inputs (including the Fund’s own assumptions in determining the fair value of investments). The level assigned to the securities valuations may not be an indication of the risk or liquidity associated with investing in those securities.
The following is a summary of the inputs used as of May 31, 2020 in valuing the Fund’s investments. For information on the Fund’s policy regarding the valuation of investments, please refer to the Security Valuation section of Note 2 in the accompanying Notes to Financial Statements.
Assets | Level 1 | Level 2 | Level 3 | Total | ||||||||||||
Common Stocks (f) | $ | 14,001,481 | $ | — | $ | — | $ | 14,001,481 | ||||||||
Preferred Stocks (f) | 911,125 | — | — | 911,125 | ||||||||||||
Exchange-Traded Funds | 134,538 | — | — | 134,538 | ||||||||||||
Short-Term Investments (f) | 340,825 | — | — | 340,825 | ||||||||||||
Derivatives (g) | ||||||||||||||||
Forward Foreign Currency Contracts | — | 30,388 | — | 30,388 | ||||||||||||
Futures Contracts | 13,297 | — | — | 13,297 | ||||||||||||
|
|
|
|
|
|
|
| |||||||||
TOTAL | $ | 15,401,266 | $ | 30,388 | $ | — | $ | 15,431,654 | ||||||||
|
|
|
|
|
|
|
| |||||||||
Liabilities | Level 1 | Level 2 | Level 3 | Total | ||||||||||||
Derivatives (g) | ||||||||||||||||
Forward Foreign Currency Contracts | $ | — | $ | (215,881 | ) | $ | — | $ | (215,881 | ) | ||||||
|
|
|
|
|
|
|
| |||||||||
TOTAL | $ | — | $ | (215,881 | ) | $ | — | $ | (215,881 | ) | ||||||
|
|
|
|
|
|
|
| |||||||||
| (f) | See Schedule of Investments for additional detailed categorizations. |
| (g) | Derivatives include unrealized appreciation (depreciation) on open futures contracts and forward foreign currency contracts. |
| See Notes to Financial Statements. | 83 |
DBX ETF Trust
Schedule of Investments
Xtrackers MSCI Japan Hedged Equity ETF
May 31, 2020
Number | Value | |||||||
| COMMON STOCKS — 96.8% | ||||||||
| Communication Services — 8.8% | ||||||||
CyberAgent, Inc. | 6,500 | $ | 327,275 | |||||
Dentsu Group, Inc. | 14,336 | 383,507 | ||||||
Hakuhodo DY Holdings, Inc. | 15,680 | 194,682 | ||||||
Kakaku.com, Inc. | 8,036 | 194,184 | ||||||
KDDI Corp. | 106,115 | 3,085,694 | ||||||
Konami Holdings Corp. | 5,964 | 209,316 | ||||||
LINE Corp.* | 3,747 | 187,272 | ||||||
Nexon Co. Ltd. | 31,164 | 649,027 | ||||||
Nintendo Co. Ltd. | 7,221 | 2,915,317 | ||||||
Nippon Telegraph & Telephone Corp. | 82,752 | 1,875,339 | ||||||
NTT DOCOMO, Inc. | 75,205 | 2,058,209 | ||||||
Softbank Corp. | 122,600 | 1,552,892 | ||||||
SoftBank Group Corp. | 100,686 | 4,511,241 | ||||||
Square Enix Holdings Co. Ltd. (a) | 5,900 | 286,124 | ||||||
Toho Co. Ltd. | 7,098 | 260,634 | ||||||
Z Holdings Corp. | 172,528 | 703,902 | ||||||
|
| |||||||
(Cost $19,554,125) | 19,394,615 | |||||||
|
| |||||||
| Consumer Discretionary — 17.1% | ||||||||
ABC-Mart, Inc. | 2,011 | 122,139 | ||||||
Aisin Seiki Co. Ltd. | 10,423 | 328,120 | ||||||
Bandai Namco Holdings, Inc. | 12,707 | 706,488 | ||||||
Benesse Holdings, Inc. | 4,588 | 124,097 | ||||||
Bridgestone Corp. | 35,107 | 1,164,428 | ||||||
Casio Computer Co. Ltd. | 12,292 | 216,217 | ||||||
Denso Corp. | 27,810 | 1,065,261 | ||||||
Fast Retailing Co. Ltd. | 3,789 | 2,126,646 | ||||||
Hikari Tsushin, Inc. | 1,352 | 295,987 | ||||||
Honda Motor Co. Ltd. | 105,045 | 2,711,718 | ||||||
Iida Group Holdings Co. Ltd. | 9,066 | 134,504 | ||||||
Isetan Mitsukoshi Holdings Ltd. | 20,875 | 139,560 | ||||||
Isuzu Motors Ltd. | 35,295 | 330,384 | ||||||
JTEKT Corp. | 11,784 | 94,954 | ||||||
Koito Manufacturing Co. Ltd. | 6,672 | 282,421 | ||||||
Marui Group Co. Ltd. | 11,602 | 209,029 | ||||||
Mazda Motor Corp. | 36,504 | 233,217 | ||||||
McDonald’s Holdings Co. Japan Ltd. | 4,519 | 240,103 | ||||||
Mercari, Inc.* | 5,400 | 160,731 | ||||||
Mitsubishi Motors Corp. | 40,238 | 113,425 | ||||||
NGK Spark Plug Co. Ltd. | 10,190 | 164,125 | ||||||
Nikon Corp. | 19,859 | 182,302 | ||||||
Nissan Motor Co. Ltd. | 145,447 | 540,681 | ||||||
Nitori Holdings Co. Ltd. | 5,147 | 932,326 | ||||||
Oriental Land Co. Ltd. | 12,825 | 1,856,946 | ||||||
Pan Pacific International Holdings Corp. | 26,600 | 535,478 | ||||||
Panasonic Corp. | 143,544 | 1,281,774 | ||||||
Rakuten, Inc. | 54,938 | 497,190 | ||||||
Rinnai Corp. | 2,255 | 189,650 | ||||||
Ryohin Keikaku Co. Ltd. | 15,800 | 238,659 | ||||||
Sega Sammy Holdings, Inc. | 11,188 | 145,653 | ||||||
Sekisui Chemical Co. Ltd. | 23,852 | 332,860 | ||||||
Sekisui House Ltd. | 39,452 | 750,848 | ||||||
Sharp Corp. | 13,055 | 141,269 | ||||||
Shimamura Co. Ltd. | 1,470 | 103,321 | ||||||
Shimano, Inc. | 4,784 | 878,771 | ||||||
Sony Corp. | 81,793 | 5,213,455 | ||||||
Number | Value | |||||||
| Consumer Discretionary (Continued) | ||||||||
Stanley Electric Co. Ltd. | 7,746 | $ | 188,110 | |||||
Subaru Corp. | 39,917 | 880,361 | ||||||
Sumitomo Electric Industries Ltd. | 48,913 | 568,977 | ||||||
Sumitomo Rubber Industries Ltd. | 11,030 | 112,095 | ||||||
Suzuki Motor Corp. | 23,689 | 822,838 | ||||||
Toyoda Gosei Co. Ltd. | 4,163 | 88,900 | ||||||
Toyota Industries Corp. | 9,099 | 464,885 | ||||||
Toyota Motor Corp. | 136,573 | 8,554,412 | ||||||
USS Co. Ltd. | 14,218 | 247,591 | ||||||
Yamada Denki Co. Ltd. | 45,747 | 222,277 | ||||||
Yamaha Corp. | 8,507 | 413,340 | ||||||
Yamaha Motor Co. Ltd. | 18,424 | 265,653 | ||||||
Yokohama Rubber Co. Ltd. | 7,646 | 115,351 | ||||||
ZOZO, Inc. | 6,834 | 125,724 | ||||||
|
| |||||||
(Cost $41,837,742) | 37,855,251 | |||||||
|
| |||||||
| Consumer Staples — 8.2% | ||||||||
Aeon Co. Ltd. | 42,102 | 930,503 | ||||||
Ajinomoto Co., Inc. | 29,901 | 509,325 | ||||||
Asahi Group Holdings Ltd. | 24,797 | 933,063 | ||||||
Calbee, Inc. | 5,608 | 161,982 | ||||||
Coca-Cola Bottlers Japan Holdings, Inc. | 7,700 | 152,793 | ||||||
Cosmos Pharmaceutical Corp. | 1,200 | 172,136 | ||||||
FamilyMart Co. Ltd. | 15,836 | 296,471 | ||||||
Ito En Ltd. | 3,300 | 189,105 | ||||||
Japan Tobacco, Inc. | 76,789 | 1,521,967 | ||||||
Kao Corp. | 30,984 | 2,484,294 | ||||||
Kikkoman Corp.(a) | 9,048 | 454,728 | ||||||
Kirin Holdings Co. Ltd. | 53,089 | 1,086,689 | ||||||
Kobayashi Pharmaceutical Co. Ltd. | 3,200 | 284,853 | ||||||
Kobe Bussan Co. Ltd. | 3,900 | 201,790 | ||||||
Kose Corp. | 2,088 | 261,182 | ||||||
Lawson, Inc. | 3,269 | 180,660 | ||||||
Lion Corp. | 14,788 | 338,008 | ||||||
MEIJI Holdings Co. Ltd. | 7,393 | 555,957 | ||||||
NH Foods Ltd. | 5,311 | 196,001 | ||||||
Nisshin Seifun Group, Inc. | 12,475 | 194,219 | ||||||
Nissin Foods Holdings Co. Ltd. | 4,170 | 347,999 | ||||||
Pigeon Corp. | 7,400 | 288,191 | ||||||
Pola Orbis Holdings, Inc. | 5,479 | 106,486 | ||||||
Seven & i Holdings Co. Ltd. | 48,502 | 1,658,184 | ||||||
Shiseido Co. Ltd. | 25,707 | 1,566,090 | ||||||
Sundrug Co. Ltd. | 4,657 | 156,752 | ||||||
Suntory Beverage & Food Ltd. | 9,036 | 368,662 | ||||||
Toyo Suisan Kaisha Ltd. | 5,712 | 298,192 | ||||||
Tsuruha Holdings, Inc. | 2,397 | 353,843 | ||||||
Unicharm Corp. | 25,874 | 962,073 | ||||||
Welcia Holdings Co. Ltd. | 3,000 | 251,750 | ||||||
Yakult Honsha Co. Ltd. | 7,638 | 467,438 | ||||||
Yamazaki Baking Co. Ltd. | 7,806 | 139,769 | ||||||
|
| |||||||
(Cost $19,900,330) | 18,071,155 | |||||||
|
| |||||||
| Energy — 0.7% | ||||||||
Idemitsu Kosan Co. Ltd. | 12,160 | 269,483 | ||||||
Inpex Corp. | 65,944 | 459,153 | ||||||
JXTG Holdings, Inc. | 199,737 | 767,315 | ||||||
|
| |||||||
(Cost $2,508,327) | 1,495,951 | |||||||
|
| |||||||
| See Notes to Financial Statements. | 84 |
DBX ETF Trust
Schedule of Investments
Xtrackers MSCI Japan Hedged Equity ETF (Continued)
May 31, 2020
Number | Value | |||||||
| Financials — 9.0% | ||||||||
Acom Co. Ltd. | 26,674 | $ | 108,581 | |||||
Aozora Bank Ltd. | 7,292 | 135,366 | ||||||
Bank of Kyoto Ltd. | 3,304 | 118,563 | ||||||
Chiba Bank Ltd. | 34,060 | 161,702 | ||||||
Concordia Financial Group Ltd. | 69,638 | 227,294 | ||||||
Dai-ichi Life Holdings, Inc. | 69,419 | 903,100 | ||||||
Daiwa Securities Group, Inc. | 93,144 | 385,808 | ||||||
Fukuoka Financial Group, Inc. | 11,148 | 181,209 | ||||||
Japan Exchange Group, Inc. | 32,332 | 694,638 | ||||||
Japan Post Bank Co. Ltd. (a) | 26,625 | 219,725 | ||||||
Japan Post Holdings Co. Ltd. | 101,270 | 736,296 | ||||||
Japan Post Insurance Co. Ltd. | 14,700 | 186,468 | ||||||
Mebuki Financial Group, Inc. | 57,362 | 129,782 | ||||||
Mitsubishi UFJ Financial Group, Inc. | 785,942 | 3,237,196 | ||||||
Mitsubishi UFJ Lease & Finance Co. Ltd. | 27,216 | 132,742 | ||||||
Mizuho Financial Group, Inc. | 1,546,072 | 1,928,200 | ||||||
MS&AD Insurance Group Holdings, Inc. | 28,989 | 850,760 | ||||||
Nomura Holdings, Inc. | 202,577 | 869,515 | ||||||
ORIX Corp. | 84,827 | 1,124,000 | ||||||
Resona Holdings, Inc. | 135,176 | 486,080 | ||||||
SBI Holdings, Inc. | 15,299 | 327,557 | ||||||
Seven Bank Ltd. | 37,504 | 106,762 | ||||||
Shinsei Bank Ltd. | 10,447 | 133,197 | ||||||
Shizuoka Bank Ltd. | 26,582 | 169,088 | ||||||
Sompo Holdings, Inc. | 21,575 | 766,613 | ||||||
Sony Financial Holdings, Inc. | 9,482 | 228,247 | ||||||
Sumitomo Mitsui Financial Group, Inc. | 83,872 | 2,425,674 | ||||||
Sumitomo Mitsui Trust Holdings, Inc. | 21,662 | 636,934 | ||||||
T&D Holdings, Inc. | 35,349 | 318,926 | ||||||
Tokio Marine Holdings, Inc. | 40,971 | 1,773,403 | ||||||
Tokyo Century Corp. | 2,800 | 121,637 | ||||||
|
| |||||||
(Cost $27,940,168) | 19,825,063 | |||||||
|
| |||||||
| Health Care — 11.7% | ||||||||
Alfresa Holdings Corp. | 12,690 | 255,695 | ||||||
Asahi Intecc Co. Ltd. | 13,000 | 397,793 | ||||||
Astellas Pharma, Inc. | 119,735 | 2,125,575 | ||||||
Chugai Pharmaceutical Co. Ltd. | 14,445 | 2,128,342 | ||||||
Daiichi Sankyo Co. Ltd. | 36,461 | 3,409,608 | ||||||
Eisai Co. Ltd. | 16,312 | 1,276,282 | ||||||
Hisamitsu Pharmaceutical Co., Inc. | 3,406 | 171,492 | ||||||
Hoya Corp. | 24,286 | 2,276,707 | ||||||
Kyowa Kirin Co. Ltd. | 17,260 | 467,650 | ||||||
M3, Inc. | 28,384 | 1,142,256 | ||||||
Medipal Holdings Corp. | 11,382 | 225,540 | ||||||
Nippon Shinyaku Co. Ltd. | 3,000 | 258,148 | ||||||
Olympus Corp. | 74,876 | 1,299,369 | ||||||
Ono Pharmaceutical Co. Ltd. | 23,683 | 675,716 | ||||||
Otsuka Holdings Co. Ltd. | 25,100 | 1,132,055 | ||||||
PeptiDream, Inc.* | 6,000 | 268,997 | ||||||
Santen Pharmaceutical Co. Ltd. | 23,674 | 436,842 | ||||||
Shionogi & Co. Ltd. | 17,308 | 1,020,874 | ||||||
Sumitomo Dainippon Pharma Co. Ltd. | 11,548 | 163,082 | ||||||
Suzuken Co. Ltd. | 4,232 | 153,631 | ||||||
Sysmex Corp. | 10,844 | 865,750 | ||||||
Taisho Pharmaceutical Holdings Co. Ltd. | 2,046 | 129,766 | ||||||
Number | Value | |||||||
| Health Care (Continued) | ||||||||
Takeda Pharmaceutical Co. Ltd. | 101,223 | $ | 3,933,660 | |||||
Terumo Corp. | 41,402 | 1,623,909 | ||||||
|
| |||||||
(Cost $20,879,380) | 25,838,739 | |||||||
|
| |||||||
| Industrials — 19.7% | ||||||||
AGC, Inc. | 12,562 | 355,270 | ||||||
Amada Co. Ltd. | 21,134 | 188,324 | ||||||
ANA Holdings, Inc.*(a) | 7,518 | 181,179 | ||||||
Central Japan Railway Co. | 9,326 | 1,594,184 | ||||||
Dai Nippon Printing Co. Ltd. | 15,743 | 357,500 | ||||||
Daifuku Co. Ltd. | 6,500 | 505,077 | ||||||
Daikin Industries Ltd. | 16,048 | 2,358,578 | ||||||
East Japan Railway Co. | 19,085 | 1,495,371 | ||||||
FANUC Corp. | 12,489 | 2,225,195 | ||||||
Fuji Electric Co. Ltd. | 7,906 | 211,056 | ||||||
Hankyu Hanshin Holdings, Inc. | 14,940 | 551,358 | ||||||
Hino Motors Ltd. | 17,460 | 118,024 | ||||||
Hitachi Construction Machinery Co. Ltd. | 6,920 | 181,590 | ||||||
Hoshizaki Corp. | 3,354 | 270,572 | ||||||
ITOCHU Corp. | 86,388 | 1,850,399 | ||||||
Japan Airlines Co. Ltd. | 6,554 | 128,655 | ||||||
Japan Airport Terminal Co. Ltd. | 3,135 | 137,789 | ||||||
JGC Holdings Corp. | 13,683 | 147,050 | ||||||
Kajima Corp. | 27,976 | 316,998 | ||||||
Kamigumi Co. Ltd. | 5,742 | 112,077 | ||||||
Kawasaki Heavy Industries Ltd. | 8,593 | 135,933 | ||||||
Keihan Holdings Co. Ltd. | 6,104 | 289,791 | ||||||
Keikyu Corp. | 14,181 | 236,821 | ||||||
Keio Corp. | 6,636 | 393,810 | ||||||
Keisei Electric Railway Co. Ltd. | 7,984 | 261,704 | ||||||
Kintetsu Group Holdings Co. Ltd. | 11,010 | 540,061 | ||||||
Komatsu Ltd. | 56,837 | 1,148,914 | ||||||
Kubota Corp. | 67,763 | 910,774 | ||||||
Kurita Water Industries Ltd. | 6,242 | 172,886 | ||||||
Kyushu Railway Co. (a) | 10,200 | 288,942 | ||||||
LIXIL Group Corp. | 17,716 | 247,066 | ||||||
Makita Corp. | 14,044 | 475,317 | ||||||
Marubeni Corp. | 106,087 | 514,770 | ||||||
MINEBEA MITSUMI, Inc. | 23,924 | 419,494 | ||||||
MISUMI Group, Inc. | 18,220 | 483,524 | ||||||
Mitsubishi Corp. | 86,291 | 2,012,350 | ||||||
Mitsubishi Electric Corp. | 118,026 | 1,552,412 | ||||||
Mitsubishi Heavy Industries Ltd. | 20,602 | 532,506 | ||||||
Mitsui & Co. Ltd. | 106,871 | 1,620,729 | ||||||
Miura Co. Ltd. | 5,500 | 234,596 | ||||||
MonotaRO Co. Ltd. | 8,000 | 290,417 | ||||||
Nabtesco Corp. | 7,372 | 228,655 | ||||||
Nagoya Railroad Co. Ltd. | 11,801 | 355,633 | ||||||
NGK Insulators Ltd. | 16,064 | 235,199 | ||||||
Nidec Corp. | 28,690 | 1,761,650 | ||||||
Nihon M&A Center, Inc. | 9,500 | 381,427 | ||||||
Nippon Express Co. Ltd. | 4,639 | 238,306 | ||||||
Nippon Yusen KK | 9,612 | 138,416 | ||||||
NSK Ltd. | 22,098 | 161,465 | ||||||
Obayashi Corp. | 42,508 | 392,976 | ||||||
Odakyu Electric Railway Co. Ltd. | 18,877 | 470,678 | ||||||
Park24 Co. Ltd. | 7,168 | 138,980 | ||||||
| See Notes to Financial Statements. | 85 |
DBX ETF Trust
Schedule of Investments
Xtrackers MSCI Japan Hedged Equity ETF (Continued)
May 31, 2020
Number | Value | |||||||
| Industrials (Continued) | ||||||||
Persol Holdings Co. Ltd. | 12,100 | $ | 159,882 | |||||
Recruit Holdings Co. Ltd. | 81,791 | 2,813,711 | ||||||
Secom Co. Ltd. | 13,472 | 1,166,004 | ||||||
Seibu Holdings, Inc. | 14,530 | 189,700 | ||||||
SG Holdings Co. Ltd. | 10,200 | 332,449 | ||||||
Shimizu Corp. | 35,468 | 299,938 | ||||||
SMC Corp. | 3,658 | 1,844,179 | ||||||
Sohgo Security Services Co. Ltd. | 4,522 | 222,232 | ||||||
Sumitomo Corp. | 75,273 | 905,970 | ||||||
Sumitomo Heavy Industries Ltd. | 7,158 | 163,278 | ||||||
Taisei Corp. | 12,652 | 438,764 | ||||||
THK Co. Ltd. | 7,276 | 188,908 | ||||||
Tobu Railway Co. Ltd. | 12,090 | 428,242 | ||||||
Tokyu Corp. | 32,222 | 510,317 | ||||||
Toppan Printing Co. Ltd. | 17,639 | 301,439 | ||||||
Toshiba Corp. | 24,523 | 669,440 | ||||||
TOTO Ltd. | 9,038 | 357,849 | ||||||
Toyota Tsusho Corp. | 13,431 | 339,994 | ||||||
West Japan Railway Co. | 10,379 | 668,964 | ||||||
Yamato Holdings Co. Ltd. | 20,417 | 451,334 | ||||||
Yaskawa Electric Corp. | 15,482 | 555,569 | ||||||
|
| |||||||
(Cost $47,511,197) | 43,560,611 | |||||||
|
| |||||||
| Information Technology — 11.8% | ||||||||
Advantest Corp. | 12,900 | 636,358 | ||||||
Brother Industries Ltd. | 14,722 | 276,980 | ||||||
Canon, Inc. | 64,497 | 1,327,079 | ||||||
Disco Corp. | 1,800 | 401,576 | ||||||
FUJIFILM Holdings Corp. | 22,957 | 1,060,307 | ||||||
Fujitsu Ltd. | 12,640 | 1,300,978 | ||||||
GMO Payment Gateway, Inc. | 2,700 | 303,686 | ||||||
Hamamatsu Photonics KK | 8,788 | 397,658 | ||||||
Hirose Electric Co. Ltd. | 2,266 | 270,420 | ||||||
Hitachi Ltd. | 62,234 | 1,993,773 | ||||||
Itochu Techno-Solutions Corp. | 6,000 | 202,513 | ||||||
Keyence Corp. | 11,686 | 4,805,731 | ||||||
Kyocera Corp. | 20,508 | 1,108,834 | ||||||
Lasertec Corp. | 4,800 | 393,899 | ||||||
Murata Manufacturing Co. Ltd. | 36,945 | 2,060,589 | ||||||
NEC Corp. | 15,593 | 699,079 | ||||||
Nomura Research Institute Ltd. | 20,722 | 547,232 | ||||||
NTT Data Corp. | 40,240 | 464,545 | ||||||
Obic Co. Ltd. | 4,462 | 772,870 | ||||||
Omron Corp. | 12,017 | 795,599 | ||||||
Oracle Corp. | 2,472 | 288,356 | ||||||
Otsuka Corp. | 6,660 | 321,128 | ||||||
Renesas Electronics Corp.* | 49,400 | 256,058 | ||||||
Ricoh Co. Ltd. | 42,934 | 316,894 | ||||||
Rohm Co. Ltd. | 5,512 | 370,550 | ||||||
SCSK Corp. | 3,300 | 161,259 | ||||||
Seiko Epson Corp. | 17,824 | 200,643 | ||||||
Shimadzu Corp. | 14,236 | 384,792 | ||||||
SUMCO Corp. | 17,100 | 261,784 | ||||||
TDK Corp. | 8,328 | 778,397 | ||||||
TIS, Inc. | 14,100 | 300,317 | ||||||
Tokyo Electron Ltd. | 9,614 | 1,916,649 | ||||||
Trend Micro, Inc. | 8,572 | 470,548 | ||||||
Yokogawa Electric Corp. | 14,608 | 210,224 | ||||||
|
| |||||||
(Cost $24,475,170) | 26,057,305 | |||||||
|
| |||||||
Number | Value | |||||||
| Materials — 4.6% | ||||||||
Air Water, Inc. | 12,404 | $ | 180,001 | |||||
Asahi Kasei Corp. | 82,184 | 647,748 | ||||||
Daicel Corp. | 15,746 | 133,157 | ||||||
Hitachi Metals Ltd. | 12,846 | 147,941 | ||||||
JFE Holdings, Inc. | 32,019 | 235,143 | ||||||
JSR Corp. | 13,151 | 257,545 | ||||||
Kansai Paint Co. Ltd. | 11,406 | 236,063 | ||||||
Kuraray Co. Ltd. | 21,121 | 221,698 | ||||||
Maruichi Steel Tube Ltd. | 3,532 | 90,359 | ||||||
Mitsubishi Chemical Holdings Corp. | 81,696 | 480,502 | ||||||
Mitsubishi Gas Chemical Co., Inc. | 9,876 | 146,888 | ||||||
Mitsubishi Materials Corp. | 7,072 | 160,857 | ||||||
Mitsui Chemicals, Inc. | 12,181 | 253,006 | ||||||
Nippon Paint Holdings Co. Ltd. | 9,463 | 658,975 | ||||||
Nippon Steel Corp. | 51,237 | 471,583 | ||||||
Nissan Chemical Corp. | 8,002 | 352,817 | ||||||
Nitto Denko Corp. | 10,118 | 546,970 | ||||||
Oji Holdings Corp. | 52,584 | 263,785 | ||||||
Shin-Etsu Chemical Co. Ltd. | 22,831 | 2,671,679 | ||||||
Showa Denko KK | 8,200 | 195,790 | ||||||
Sumitomo Chemical Co. Ltd. | 93,756 | 290,366 | ||||||
Sumitomo Metal Mining Co. Ltd. | 15,005 | 417,544 | ||||||
Taiheiyo Cement Corp. | 7,778 | 183,695 | ||||||
Taiyo Nippon Sanso Corp. | 9,680 | 162,642 | ||||||
Teijin Ltd. | 11,759 | 192,340 | ||||||
Toray Industries, Inc. | 90,042 | 437,415 | ||||||
Tosoh Corp. | 15,900 | 220,856 | ||||||
|
| |||||||
(Cost $13,684,100) | 10,257,365 | |||||||
|
| |||||||
| Real Estate — 3.6% | ||||||||
Aeon Mall Co. Ltd. | 6,422 | 90,216 | ||||||
Daito Trust Construction Co. Ltd. | 4,151 | 438,213 | ||||||
Daiwa House Industry Co. Ltd. | 36,517 | 905,603 | ||||||
Daiwa House REIT Investment Corp. REIT | 123 | 303,836 | ||||||
GLP J REIT | 227 | 302,470 | ||||||
Hulic Co. Ltd. (a) | 19,410 | 196,179 | ||||||
Japan Prime Realty Investment Corp. REIT | 51 | 155,584 | ||||||
Japan Real Estate Investment Corp. REIT | 84 | 457,991 | ||||||
Japan Retail Fund Investment Corp. REIT | 171 | 225,474 | ||||||
Mitsubishi Estate Co. Ltd. | 76,624 | 1,217,088 | ||||||
Mitsui Fudosan Co. Ltd. | 59,682 | 1,147,486 | ||||||
Nippon Building Fund, Inc. REIT | 84 | 526,533 | ||||||
Nippon Prologis REIT, Inc. REIT (a) | 134 | 377,727 | ||||||
Nomura Real Estate Holdings, Inc. | 8,028 | 148,434 | ||||||
Nomura Real Estate Master Fund, Inc. REIT | 268 | 329,269 | ||||||
Orix JREIT, Inc. REIT | 159 | 229,702 | ||||||
Sumitomo Realty & Development Co. Ltd. | 20,050 | 554,863 | ||||||
Tokyu Fudosan Holdings Corp. | 38,327 | 194,043 | ||||||
United Urban Investment Corp. REIT | 194 | 205,432 | ||||||
|
| |||||||
(Cost $10,053,122) | 8,006,143 | |||||||
|
| |||||||
| Utilities — 1.6% | ||||||||
Chubu Electric Power Co., Inc. | 41,234 | 554,783 | ||||||
Chugoku Electric Power Co., Inc. | 18,768 | 257,561 | ||||||
| See Notes to Financial Statements. | 86 |
DBX ETF Trust
Schedule of Investments
Xtrackers MSCI Japan Hedged Equity ETF (Continued)
May 31, 2020
Number | Value | |||||||
| Utilities (Continued) | ||||||||
Electric Power Development Co. Ltd. | 9,066 | $ | 170,904 | |||||
Kansai Electric Power Co., Inc. | 45,107 | 449,000 | ||||||
Kyushu Electric Power Co., Inc. | 23,790 | 197,652 | ||||||
Osaka Gas Co. Ltd. | 24,489 | 488,894 | ||||||
Toho Gas Co. Ltd. | 4,928 | 242,642 | ||||||
Tohoku Electric Power Co., Inc. | 27,921 | 288,932 | ||||||
Tokyo Electric Power Co. Holdings, Inc.* | 93,484 | 314,662 | ||||||
Tokyo Gas Co. Ltd. | 23,865 | 568,825 | ||||||
|
| |||||||
(Cost $4,367,642) | 3,533,855 | |||||||
|
| |||||||
TOTAL COMMON STOCKS | 213,896,053 | |||||||
|
| |||||||
| SECURITIES LENDING COLLATERAL — 0.5% | ||||||||
DWS Government & Agency Securities Portfolio “DWS Government Cash Institutional Shares”, 0.07% (b)(c) | 1,079,236 | 1,079,236 | ||||||
|
| |||||||
Number | Value | |||||||
| CASH EQUIVALENTS — 2.2% | ||||||||
DWS ESG Liquidity Fund “Capital Shares”, 0.47% (b) | 117,533 | $ | 117,580 | |||||
DWS Government Money Market Series “Institutional Shares”, 0.12% (b) | 4,794,642 | 4,794,642 | ||||||
|
| |||||||
TOTAL CASH EQUIVALENTS | 4,912,222 | |||||||
|
| |||||||
TOTAL INVESTMENTS — 99.5% | $ | 219,887,511 | ||||||
Other assets and liabilities, net — 0.5% | 1,042,792 | |||||||
|
| |||||||
NET ASSETS — 100.0% | $ | 220,930,303 | ||||||
|
| |||||||
A summary of the Fund’s transactions with affiliated investments during the year ended May 31, 2020 is as follows:
| Value ($) at 5/31/2019 | Purchases Cost ($) | Sales Proceeds ($) | Net Realized Gain/(Loss) ($) | Net Change in Unrealized Appreciation (Depreciation) ($) | Income ($) | Capital Gain Distributions ($) | Number of Shares at 5/31/2020 | Value ($) at 5/31/2020 | ||||||||||||||||||||||||||||||
SECURITIES LENDING COLLATERAL — 0.5% | ||||||||||||||||||||||||||||||||||||||
DWS Government & Agency Securities Portfolio “DWS Government Cash Institutional Shares”, 0.07% (b)(c) | ||||||||||||||||||||||||||||||||||||||
| 10,080 | 1,069,156 | (d) | — | — | — | 25,590 | — | 1,079,236 | 1,079,236 | |||||||||||||||||||||||||||||
CASH EQUIVALENTS — 2.2% | ||||||||||||||||||||||||||||||||||||||
DWS ESG Liquidity Fund “Capital Shares”, 0.47% (b) | ||||||||||||||||||||||||||||||||||||||
| 115,456 | 2,075 | — | — | 49 | 2,110 | — | 117,533 | 117,580 | ||||||||||||||||||||||||||||||
DWS Government Money Market Series “Institutional Shares”, 0.12% (b) | ||||||||||||||||||||||||||||||||||||||
| 1,732,723 | 125,866,567 | (122,804,648 | ) | — | — | 100,193 | — | 4,794,642 | 4,794,642 | |||||||||||||||||||||||||||||
|
|
|
|
|
|
|
|
|
|
|
|
|
|
|
|
|
| |||||||||||||||||||||
| 1,858,259 | 126,937,798 | (122,804,648 | ) | — | 49 | 127,893 | — | 5,991,411 | 5,991,458 | |||||||||||||||||||||||||||||
|
|
|
|
|
|
|
|
|
|
|
|
|
|
|
|
|
| |||||||||||||||||||||
| * | Non-income producing security. |
| (a) | All or a portion of these securities were on loan. In addition, “Other assets and liabilities, net” may include pending sales that are also on loan. The value of securities loaned at May 31, 2020 amounted to $1,399,960, which is 0.6% of net assets. |
| (b) | Affiliated fund managed by DWS Investment Management Americas, Inc. The rate shown is the annualized seven-day yield at period end. |
| (c) | Represents cash collateral held in connection with securities lending. Income earned by the Fund is net of borrower rebates. In addition, the Fund held non-cash U.S. Treasury securities collateral having a value of $409,390. |
| (d) | Represents the net increase (purchase cost) or decrease (sales proceeds) in the amount invested in cash collateral for the year ended May 31, 2020. |
REIT: Real Estate Investment Trust
At May 31, 2020, open futures contracts purchased were as follows:
Contract Description | Currency | Number of Contracts | Notional Amount | Contract Value | Expiration Date | Unrealized Appreciation | ||||||||||||||||
Nikkei 225 Futures | JPY | 3 | $ | 536,881 | $ | 606,704 | 6/11/2020 | $ | 69,823 | |||||||||||||
TOPIX Index Futures | JPY | 43 | 5,629,886 | 6,216,051 | 6/11/2020 | 586,165 | ||||||||||||||||
|
| |||||||||||||||||||||
Total unrealized appreciation | $ | 655,988 | ||||||||||||||||||||
|
| |||||||||||||||||||||
| See Notes to Financial Statements. | 87 |
DBX ETF Trust
Schedule of Investments
Xtrackers MSCI Japan Hedged Equity ETF (Continued)
May 31, 2020
As of May 31, 2020, the Fund had the following forward foreign currency contracts outstanding:
Counterparty | Settlement Date | Currency To Deliver | Currency To Receive | Unrealized Appreciation | Unrealized Depreciation | |||||||||||||||||
Citigroup Global Markets | 6/3/2020 | JPY | 8,342,200,100 | USD | 78,035,594 | $ | 678,590 | $ | — | |||||||||||||
JP Morgan & Chase Co. | 6/3/2020 | JPY | 7,878,056,100 | USD | 73,695,222 | 642,213 | — | |||||||||||||||
RBC Capital Markets | 6/3/2020 | JPY | 7,487,436,800 | USD | 70,040,194 | 609,387 | — | |||||||||||||||
RBC Capital Markets | 6/3/2020 | JPY | 174,812,000 | USD | 1,635,275 | 14,247 | — | |||||||||||||||
Citigroup Global Markets | 6/3/2020 | USD | 676,806 | JPY | 72,269,000 | — | (6,657 | ) | ||||||||||||||
Citigroup Global Markets | 6/3/2020 | USD | 21,589,737 | JPY | 2,322,949,900 | — | (49,083 | ) | ||||||||||||||
Citigroup Global Markets | 6/3/2020 | USD | 55,200,598 | JPY | 5,946,981,200 | — | (54,396 | ) | ||||||||||||||
JP Morgan & Chase Co. | 6/3/2020 | USD | 73,124,389 | JPY | 7,878,056,100 | — | (71,380 | ) | ||||||||||||||
RBC Capital Markets | 6/3/2020 | USD | 71,122,249 | JPY | 7,662,248,800 | — | (70,415 | ) | ||||||||||||||
Citigroup Global Markets | 7/3/2020 | JPY | 5,946,981,200 | USD | 55,224,434 | 53,730 | — | |||||||||||||||
JP Morgan & Chase Co. | 7/3/2020 | JPY | 7,878,056,100 | USD | 73,155,625 | 70,158 | — | |||||||||||||||
RBC Capital Markets | 7/3/2020 | JPY | 7,662,248,800 | USD | 71,150,978 | 67,575 | — | |||||||||||||||
RBC Capital Markets | 7/3/2020 | JPY | 2,143,262,000 | USD | 19,902,404 | 19,161 | — | |||||||||||||||
|
|
|
| |||||||||||||||||||
Total unrealized appreciation (depreciation) | $ | 2,155,061 | $ | (251,931 | ) | |||||||||||||||||
|
|
|
| |||||||||||||||||||
For information on the Fund’s policy and additional disclosures regarding open futures contracts and forward foreign currency contracts, please refer to the Derivatives section of Note 2 in the accompanying Notes to Financial Statements.
Currency Abbreviations
| JPY | Japanese Yen |
| USD | U.S. Dollar |
Fair Value Measurements
Various inputs are used in determining the value of the Fund’s investments. These inputs are summarized in three broad levels. Level 1 includes quoted prices in active markets for identical securities. Level 2 includes other significant observable inputs (including quoted prices for similar securities, interest rates, prepayment speeds and credit risk). Level 3 includes significant unobservable inputs (including the Fund’s own assumptions in determining the fair value of investments). The level assigned to the securities valuations may not be an indication of the risk or liquidity associated with investing in those securities.
The following is a summary of the inputs used as of May 31, 2020 in valuing the Fund’s investments. For information on the Fund’s policy regarding the valuation of investments, please refer to the Security Valuation section of Note 2 in the accompanying Notes to Financial Statements.
Assets | Level 1 | Level 2 | Level 3 | Total | ||||||||||||
Common Stocks (e) | $ | 213,896,053 | $ | — | $ | — | $ | 213,896,053 | ||||||||
Short-Term Investments (e) | 5,991,458 | — | — | 5,991,458 | ||||||||||||
Derivatives (f) | ||||||||||||||||
Forward Foreign Currency Contracts | — | 2,155,061 | — | 2,155,061 | ||||||||||||
Futures Contracts | 655,988 | — | — | 655,988 | ||||||||||||
|
|
|
|
|
|
|
| |||||||||
TOTAL | $ | 220,543,499 | $ | 2,155,061 | $ | — | $ | 222,698,560 | ||||||||
|
|
|
|
|
|
|
| |||||||||
Liabilities | Level 1 | Level 2 | Level 3 | Total | ||||||||||||
Derivatives (f) | ||||||||||||||||
Forward Foreign Currency Contracts | $ | — | $ | (251,931 | ) | $ | — | $ | (251,931 | ) | ||||||
|
|
|
|
|
|
|
| |||||||||
TOTAL | $ | — | $ | (251,931 | ) | $ | — | $ | (251,931 | ) | ||||||
|
|
|
|
|
|
|
| |||||||||
| (e) | See Schedule of Investments for additional detailed categorizations. |
| (f) | Derivatives include unrealized appreciation (depreciation) on open futures contracts and forward foreign currency contracts. |
| See Notes to Financial Statements. | 88 |
This Page is Intentionally Left Blank
89
DBX ETF Trust
May 31, 2020
| Xtrackers MSCI All World ex US Hedged Equity ETF | Xtrackers MSCI Emerging Markets Hedged Equity ETF | Xtrackers MSCI Europe Hedged Equity ETF | Xtrackers MSCI Eurozone Hedged Equity ETF | |||||||||||||
Assets | ||||||||||||||||
Investment in non-affiliated securities at value | $ | 95,715,843 | $ | 88,440,641 | $ | 476,498,991 | $ | 20,716,209 | ||||||||
Investment in affiliated securities at value | 82,252 | — | 993,168 | 79,251 | ||||||||||||
Investment in DWS ESG Liquidity Fund* | — | — | 639,380 | — | ||||||||||||
Investment in DWS Government Money Market Series* | 1,949,518 | 1,075,539 | 8,725,094 | 290,364 | ||||||||||||
Investment in DWS Government & Agency Securities Portfolio** | 1,267,996 | 404,374 | 7,981,610 | 667,973 | ||||||||||||
Cash | — | 75 | — | — | ||||||||||||
Foreign currency at value | 525,580 | 227,607 | 3,295,424 | 90,101 | ||||||||||||
Receivable for return of collateral pledged for forward foreign currency contracts | — | 20,000 | 280,000 | — | ||||||||||||
Unrealized appreciation on forward foreign currency contracts | 700,894 | 793,566 | 3,166,635 | 42,104 | ||||||||||||
Deposit with broker for futures contracts | 299,956 | 127,200 | 1,210,982 | 42,312 | ||||||||||||
Foreign tax receivable | 338 | — | — | — | ||||||||||||
| Receivables: | ||||||||||||||||
Investment securities sold | 2,724,809 | 2,570,659 | 5,548,852 | 329,988 | ||||||||||||
Variation margin on futures contracts | 21,850 | 6,483 | 635,119 | 36,673 | ||||||||||||
Dividends | 264,326 | 147,298 | 613,728 | 14,287 | ||||||||||||
Interest | 292 | 181 | 1,488 | 38 | ||||||||||||
Securities lending income | 1,987 | 813 | 11,198 | 393 | ||||||||||||
Foreign tax reclaim | 86,241 | 349 | 1,911,800 | 17,216 | ||||||||||||
|
|
|
|
|
|
|
| |||||||||
Total assets | $ | 103,641,882 | $ | 93,814,785 | $ | 511,513,469 | $ | 22,326,909 | ||||||||
|
|
|
|
|
|
|
| |||||||||
Liabilities | ||||||||||||||||
Payable upon return of securities loaned | $ | 1,267,996 | $ | 404,374 | $ | 7,981,610 | $ | 667,973 | ||||||||
Payable upon return of deposit for forward foreign currency contracts | 40,000 | 290,000 | 129,768 | — | ||||||||||||
Unrealized depreciation on forward foreign currency contracts | 906,289 | 924,969 | 5,185,789 | 303,185 | ||||||||||||
| Payables: | ||||||||||||||||
Investment securities purchased | 2,725,494 | 2,758,873 | 11,021,764 | 271,064 | ||||||||||||
Investment advisory fees | 32,325 | 48,505 | 178,562 | 7,633 | ||||||||||||
|
|
|
|
|
|
|
| |||||||||
Total liabilities | 4,972,104 | 4,426,721 | 24,497,493 | 1,249,855 | ||||||||||||
|
|
|
|
|
|
|
| |||||||||
Net Assets, at value | $ | 98,669,778 | $ | 89,388,064 | $ | 487,015,976 | $ | 21,077,054 | ||||||||
|
|
|
|
|
|
|
| |||||||||
Net Assets Consist of | ||||||||||||||||
Paid-in capital | $ | 103,830,624 | $ | 106,094,020 | $ | 683,837,321 | $ | 25,254,631 | ||||||||
Distributable earnings (loss) | (5,160,846 | ) | (16,705,956 | ) | (196,821,345 | ) | (4,177,577 | ) | ||||||||
|
|
|
|
|
|
|
| |||||||||
Net Assets, at value | $ | 98,669,778 | $ | 89,388,064 | $ | 487,015,976 | $ | 21,077,054 | ||||||||
|
|
|
|
|
|
|
| |||||||||
Number of Common Shares outstanding | 3,850,001 | 4,250,800 | 18,100,001 | 750,001 | ||||||||||||
|
|
|
|
|
|
|
| |||||||||
Net Asset Value | $ | 25.63 | $ | 21.03 | $ | 26.91 | $ | 28.10 | ||||||||
|
|
|
|
|
|
|
| |||||||||
Investment in non-affiliated securities at cost | $ | 99,053,686 | $ | 83,281,249 | $ | 585,483,280 | $ | 23,174,515 | ||||||||
|
|
|
|
|
|
|
| |||||||||
Investment in affiliated securities at cost | $ | 140,075 | $ | — | $ | 3,703,086 | $ | 258,174 | ||||||||
|
|
|
|
|
|
|
| |||||||||
Value of securities loaned | $ | 1,481,130 | $ | 1,029,929 | $ | 7,754,778 | $ | 625,994 | ||||||||
|
|
|
|
|
|
|
| |||||||||
Investment in DWS ESG Liquidity Fund at cost* | $ | — | $ | — | $ | 639,124 | $ | — | ||||||||
|
|
|
|
|
|
|
| |||||||||
Investment in DWS Government Money Market Series at cost* | $ | 1,949,518 | $ | 1,075,539 | $ | 8,725,094 | $ | 290,364 | ||||||||
|
|
|
|
|
|
|
| |||||||||
Investment in DWS Government & Agency Securities Portfolio at cost** | $ | 1,267,996 | $ | 404,374 | $ | 7,981,610 | $ | 667,973 | ||||||||
|
|
|
|
|
|
|
| |||||||||
Non-cash collateral for securities on loan | $ | 341,623 | $ | 679,558 | $ | 276,240 | $ | 30,530 | ||||||||
|
|
|
|
|
|
|
| |||||||||
Foreign currency at cost | $ | 517,127 | $ | 226,250 | $ | 3,193,067 | $ | 88,513 | ||||||||
|
|
|
|
|
|
|
| |||||||||
*Includescollateral held for forward foreign currency contracts | $ | 40,000 | $ | 290,000 | $ | 129,768 | $ | — | ||||||||
|
|
|
|
|
|
|
| |||||||||
| ** | Represents collateral on securities loaned. |
| See Notes to Financial Statements. | 90 |
DBX ETF Trust
Statements of Assets and Liabilities (Continued)
May 31, 2020
| Xtrackers MSCI Germany Hedged Equity ETF | Xtrackers MSCI Japan Hedged Equity ETF | |||||||
Assets | ||||||||
Investment in non-affiliated securities at value | $ | 14,833,401 | $ | 213,896,053 | ||||
Investment in affiliated securities at value | 213,743 | — | ||||||
Investment in DWS ESG Liquidity Fund* | — | 117,580 | ||||||
Investment in DWS Government Money Market Series* | 229,525 | 4,794,642 | ||||||
Investment in DWS Government & Agency Securities Portfolio** | 111,300 | 1,079,236 | ||||||
Foreign currency at value | 156,458 | 746,859 | ||||||
Unrealized appreciation on forward foreign currency contracts | 30,388 | 2,155,061 | ||||||
Deposit with broker for futures contracts | 44,741 | 243,390 | ||||||
| Receivables: | ||||||||
Investment securities sold | 432,146 | 3,792,458 | ||||||
Variation margin on futures contracts | 27,557 | — | ||||||
Dividends | 18,611 | 1,988,254 | ||||||
Interest | 28 | 436 | ||||||
Securities lending income | 31 | 540 | ||||||
|
|
|
| |||||
Total assets | $ | 16,097,929 | $ | 228,814,509 | ||||
|
|
|
| |||||
Liabilities | ||||||||
Payable upon return of securities loaned | $ | 111,300 | $ | 1,079,236 | ||||
Payable upon return of deposit for forward foreign currency contracts | — | 1,567,638 | ||||||
Unrealized depreciation on forward foreign currency contracts | 215,881 | 251,931 | ||||||
| Payables: | ||||||||
Investment securities purchased | 451,329 | 4,791,101 | ||||||
Investment advisory fees | 5,493 | 86,441 | ||||||
Variation margin on futures contracts | — | 107,859 | ||||||
|
|
|
| |||||
Total liabilities | 784,003 | 7,884,206 | ||||||
|
|
|
| |||||
Net Assets, at value | $ | 15,313,926 | $ | 220,930,303 | ||||
|
|
|
| |||||
Net Assets Consist of | ||||||||
Paid-in capital | $ | 25,516,066 | $ | 403,893,755 | ||||
Distributable earnings (loss) | (10,202,140 | ) | (182,963,452 | ) | ||||
|
|
|
| |||||
Net Assets, at value | $ | 15,313,926 | $ | 220,930,303 | ||||
|
|
|
| |||||
Number of Common Shares outstanding | 600,800 | 5,550,800 | ||||||
|
|
|
| |||||
Net Asset Value | $ | 25.49 | $ | 39.80 | ||||
|
|
|
| |||||
Investment in non-affiliated securities at cost | $ | 17,508,113 | $ | 232,711,303 | ||||
|
|
|
| |||||
Investment in affiliated securities at cost | $ | 856,614 | $ | — | ||||
|
|
|
| |||||
Value of securities loaned | $ | 109,022 | $ | 1,399,960 | ||||
|
|
|
| |||||
Investment in DWS ESG Liquidity Fund at cost* | $ | — | $ | 117,531 | ||||
|
|
|
| |||||
Investment in DWS Government Money Market Series at cost* | $ | 229,525 | $ | 4,794,642 | ||||
|
|
|
| |||||
Investment in DWS Government & Agency Securities Portfolio at cost** | $ | 111,300 | $ | 1,079,236 | ||||
|
|
|
| |||||
Non-cash collateral for securities on loan | $ | — | $ | 409,390 | ||||
|
|
|
| |||||
Foreign currency at cost | $ | 153,072 | $ | 767,729 | ||||
|
|
|
| |||||
*Includescollateral held for forward foreign currency contracts | $ | — | $ | 1,567,638 | ||||
|
|
|
| |||||
** Represents collateral on securities loaned. | ||||||||
| See Notes to Financial Statements. | 91 |
DBX ETF Trust
For the Year Ended May 31, 2020
| Xtrackers MSCI All World ex US Hedged Equity ETF | Xtrackers MSCI Emerging Markets Hedged Equity ETF | Xtrackers MSCI Europe Hedged Equity ETF | Xtrackers MSCI Eurozone Hedged Equity ETF | |||||||||||||
Investment Income | ||||||||||||||||
Unaffiliated dividend income* | $ | 2,488,383 | $ | 2,770,465 | $ | 16,617,570 | $ | 414,755 | ||||||||
Income distributions from affiliated funds | 32,975 | 26,672 | 210,624 | 9,036 | ||||||||||||
Affiliated securities lending income | 16,441 | 11,609 | 155,304 | 7,938 | ||||||||||||
Unaffiliated non-cash dividend income | 191,788 | 708,109 | — | — | ||||||||||||
Unaffiliated securities lending income, net of borrower rebates | 6,793 | 9,963 | — | 6,951 | ||||||||||||
|
|
|
|
|
|
|
| |||||||||
Total investment income | 2,736,380 | 3,526,818 | 16,983,498 | 438,680 | ||||||||||||
|
|
|
|
|
|
|
| |||||||||
Expenses | ||||||||||||||||
Investment advisory fees | 405,330 | 700,413 | 3,391,052 | 111,228 | ||||||||||||
Other expenses | 9,750 | 9,180 | 91,609 | 3,890 | ||||||||||||
|
|
|
|
|
|
|
| |||||||||
Total expenses | 415,080 | 709,593 | 3,482,661 | 115,118 | ||||||||||||
|
|
|
|
|
|
|
| |||||||||
Less fees waived (see note 3): | ||||||||||||||||
Waiver | (1,748 | ) | (1,450 | ) | (9,832 | ) | (415 | ) | ||||||||
|
|
|
|
|
|
|
| |||||||||
Net expenses | 413,332 | 708,143 | 3,472,829 | 114,703 | ||||||||||||
|
|
|
|
|
|
|
| |||||||||
Net investment income (loss) | 2,323,048 | 2,818,675 | 13,510,669 | 323,977 | ||||||||||||
|
|
|
|
|
|
|
| |||||||||
Realized and Unrealized Gain (Loss) | ||||||||||||||||
Net realized gain (loss) from: | ||||||||||||||||
Investments** | (3,973,806 | ) | (2,388,452 | ) | (24,543,839 | ) | (441,070 | ) | ||||||||
Investments in affiliates | — | — | (147,586 | ) | — | |||||||||||
In-kind redemptions | 176,951 | 875,506 | 44,215,272 | 1,104,938 | ||||||||||||
In-kind redemptions in affiliates | 36 | — | (963,484 | ) | (33,816 | ) | ||||||||||
Futures contracts | (446,166 | ) | (611,394 | ) | (311,692 | ) | (26,632 | ) | ||||||||
Foreign currency transactions | (736 | ) | (86,871 | ) | (65,306 | ) | 1,175 | |||||||||
Forward foreign currency contracts | 3,313,847 | 4,836,767 | 27,526,271 | 1,217,837 | ||||||||||||
Payments by Affiliates (see note 8) | — | 6,700 | — | — | ||||||||||||
|
|
|
|
|
|
|
| |||||||||
Net realized gain (loss) | (929,874 | ) | 2,632,256 | 45,709,636 | 1,822,432 | |||||||||||
|
|
|
|
|
|
|
| |||||||||
Net change in unrealized appreciation (depreciation) on: | ||||||||||||||||
Investments*** | (2,657,504 | ) | (7,274,385 | ) | (33,084,722 | ) | (1,807,214 | ) | ||||||||
Investments in affiliates | 13,669 | — | 1,405,477 | 51,227 | ||||||||||||
Futures contracts | 480,606 | 167,520 | 690,703 | 32,165 | ||||||||||||
Foreign currency translations | 6,409 | (5,127 | ) | 192,572 | 1,520 | |||||||||||
Forward foreign currency contracts | (478,442 | ) | (869,547 | ) | (9,604,939 | ) | (442,022 | ) | ||||||||
|
|
|
|
|
|
|
| |||||||||
Net change in unrealized appreciation (depreciation) | (2,635,262 | ) | (7,981,539 | ) | (40,400,909 | ) | (2,164,324 | ) | ||||||||
|
|
|
|
|
|
|
| |||||||||
Net realized and unrealized gain (loss) on investments, futures and foreign currency transactions | (3,565,136 | ) | (5,349,283 | ) | 5,308,727 | (341,892 | ) | |||||||||
|
|
|
|
|
|
|
| |||||||||
Net Increase (Decrease) in Net Assets Resulting from Operations | $ | (1,242,088 | ) | $ | (2,530,608 | ) | $ | 18,819,396 | $ | (17,915 | ) | |||||
|
|
|
|
|
|
|
| |||||||||
* Unaffiliated foreign tax withheld | $ | 285,852 | $ | 350,561 | $ | 1,575,472 | $ | 79,180 | ||||||||
** Net of foreign taxes | $ | 368 | $ | — | $ | — | $ | — | ||||||||
*** Net of change in deferred foreign taxes | $ | (338 | ) | $ | (97,449 | ) | $ | — | $ | — | ||||||
| See Notes to Financial Statements. | 92 |
DBX ETF Trust
Statements of Operations (Continued)
For the Year Ended May 31, 2020
| Xtrackers MSCI Germany Hedged Equity ETF | Xtrackers MSCI Japan Hedged Equity ETF | |||||||
Investment Income | ||||||||
Unaffiliated dividend income* | $ | 241,422 | $ | 6,636,083 | ||||
Income distributions from affiliated funds | 5,035 | 102,303 | ||||||
Affiliated securities lending income | 93 | 25,590 | ||||||
Unaffiliated securities lending income, net of borrower rebates | 34 | 12,586 | ||||||
|
|
|
| |||||
Total investment income | 246,584 | 6,776,562 | ||||||
|
|
|
| |||||
Expenses | ||||||||
Investment advisory fees | 82,172 | 1,422,226 | ||||||
Other expenses | 650 | 30,964 | ||||||
|
|
|
| |||||
Total expenses | 82,822 | 1,453,190 | ||||||
|
|
|
| |||||
Less fees waived (see note 3): | ||||||||
Waiver | (237 | ) | (5,051 | ) | ||||
|
|
|
| |||||
Net expenses | 82,585 | 1,448,139 | ||||||
|
|
|
| |||||
Net investment income (loss) | 163,999 | 5,328,423 | ||||||
|
|
|
| |||||
Realized and Unrealized Gain (Loss) | ||||||||
| Net realized gain (loss) from: | ||||||||
Investments | (760,477 | ) | (2,930,839 | ) | ||||
Investments in affiliates | (100,005 | ) | — | |||||
In-kind redemptions | 270,391 | (1,677,613 | ) | |||||
In-kind redemptions in affiliates | (171,345 | ) | — | |||||
Futures contracts | 25,897 | (404,655 | ) | |||||
Foreign currency transactions | 3,708 | 346,498 | ||||||
Forward foreign currency contracts | 957,873 | (9,958,336 | ) | |||||
Payments by Affiliates (see note 8) | — | 16,074 | ||||||
|
|
|
| |||||
Net realized gain (loss) | 226,042 | (14,608,871 | ) | |||||
|
|
|
| |||||
Net change in unrealized appreciation (depreciation) on: | ||||||||
Investments | 267,533 | 24,848,405 | ||||||
Investments in affiliates | 330,214 | 49 | ||||||
Futures contracts | 23,421 | 1,177,175 | ||||||
Foreign currency translations | (629 | ) | (262,578 | ) | ||||
Forward foreign currency contracts | (317,173 | ) | 14,218,630 | |||||
|
|
|
| |||||
Net change in unrealized appreciation (depreciation) | 303,366 | 39,981,681 | ||||||
|
|
|
| |||||
Net realized and unrealized gain (loss) on investments, futures and foreign currency transactions | 529,408 | 25,372,810 | ||||||
|
|
|
| |||||
Net Increase (Decrease) in Net Assets Resulting from Operations | $ | 693,407 | $ | 30,701,233 | ||||
|
|
|
| |||||
* Unaffiliated foreign tax withheld | $ | 40,948 | $ | 737,870 | ||||
| See Notes to Financial Statements. | 93 |
DBX ETF Trust
| Xtrackers MSCI All World ex US Hedged Equity ETF | Xtrackers MSCI Emerging Markets Hedged Equity ETF | |||||||||||||||
| Year Ended May 31, 2020 | Year Ended May 31, 2019 | Year Ended May 31, 2020 | Year Ended May 31, 2019 | |||||||||||||
Increase (Decrease) in Net Assets from Operations | ||||||||||||||||
Net investment income (loss) | $ | 2,323,048 | $ | 2,954,717 | $ | 2,818,675 | $ | 3,039,387 | ||||||||
Net realized gain (loss) | (929,874 | ) | 9,965,487 | 2,632,256 | 12,289,264 | |||||||||||
Net change in net unrealized appreciation (depreciation) | (2,635,262 | ) | (15,964,037 | ) | (7,981,539 | ) | (25,515,305 | ) | ||||||||
|
|
|
|
|
|
|
| |||||||||
Net increase (decrease) in net assets resulting from operations | (1,242,088 | ) | (3,043,833 | ) | (2,530,608 | ) | (10,186,654 | ) | ||||||||
|
|
|
|
|
|
|
| |||||||||
Distributions to Shareholders | (3,108,889 | ) | (2,871,618 | ) | (3,043,154 | ) | (3,308,776 | ) | ||||||||
|
|
|
|
|
|
|
| |||||||||
Fund Shares Transactions | ||||||||||||||||
Proceeds from shares sold | 5,902,631 | 13,773,648 | 7,124,993 | 2,222,874 | ||||||||||||
Value of shares redeemed | (1,340,557 | ) | (36,854,026 | ) | (24,500,575 | ) | (71,261,537 | ) | ||||||||
|
|
|
|
|
|
|
| |||||||||
Net increase (decrease) in net assets resulting from fund share transactions | 4,562,074 | (23,080,378 | ) | (17,375,582 | ) | (69,038,663 | ) | |||||||||
|
|
|
|
|
|
|
| |||||||||
Total net increase (decrease) in Net Assets | 211,097 | (28,995,829 | ) | (22,949,344 | ) | (82,534,093 | ) | |||||||||
Net Assets | ||||||||||||||||
Beginning of year | 98,458,681 | 127,454,510 | 112,337,408 | 194,871,501 | ||||||||||||
|
|
|
|
|
|
|
| |||||||||
End of year | $ | 98,669,778 | $ | 98,458,681 | $ | 89,388,064 | $ | 112,337,408 | ||||||||
|
|
|
|
|
|
|
| |||||||||
Changes in Shares Outstanding | ||||||||||||||||
Shares outstanding, beginning of year | 3,700,001 | 4,600,001 | 5,150,800 | 8,150,800 | ||||||||||||
Shares sold | 200,000 | 500,000 | 300,000 | 100,000 | ||||||||||||
Shares redeemed | (50,000 | ) | (1,400,000 | ) | (1,200,000 | ) | (3,100,000 | ) | ||||||||
|
|
|
|
|
|
|
| |||||||||
Shares outstanding, end of year | 3,850,001 | 3,700,001 | 4,250,800 | 5,150,800 | ||||||||||||
|
|
|
|
|
|
|
| |||||||||
| See Notes to Financial Statements. | 94 |
DBX ETF Trust
Statements of Changes in Net Assets (Continued)
| Xtrackers MSCI Europe Hedged Equity ETF | Xtrackers MSCI Eurozone Hedged Equity ETF | |||||||||||||||
| Year Ended May 31, 2020 | Year Ended May 31, 2019 | Year Ended May 31, 2020 | Year Ended May 31, 2019 | |||||||||||||
Increase (Decrease) in Net Assets from Operations | ||||||||||||||||
Net investment income (loss) | $ | 13,510,669 | $ | 28,225,910 | $ | 323,977 | $ | 901,991 | ||||||||
Net realized gain (loss) | 45,709,636 | 118,798,682 | 1,822,432 | 4,606,762 | ||||||||||||
Net change in net unrealized appreciation (depreciation) | (40,400,909 | ) | (138,127,594 | ) | (2,164,324 | ) | (6,378,806 | ) | ||||||||
|
|
|
|
|
|
|
| |||||||||
Net increase (decrease) in net assets resulting from operations | 18,819,396 | 8,896,998 | (17,915 | ) | (870,053 | ) | ||||||||||
|
|
|
|
|
|
|
| |||||||||
Distributions to Shareholders | (25,632,832 | ) | (41,023,718 | ) | (871,374 | ) | (915,112 | ) | ||||||||
|
|
|
|
|
|
|
| |||||||||
Fund Shares Transactions | ||||||||||||||||
Proceeds from shares sold | 93,076,067 | 113,864,798 | — | — | ||||||||||||
Value of shares redeemed | (448,670,118 | ) | (775,486,486 | ) | (9,320,761 | ) | (8,639,289 | ) | ||||||||
|
|
|
|
|
|
|
| |||||||||
Net increase (decrease) in net assets resulting from fund share transactions | (355,594,051 | ) | (661,621,688 | ) | (9,320,761 | ) | (8,639,289 | ) | ||||||||
|
|
|
|
|
|
|
| |||||||||
Total net increase (decrease) in Net Assets | (362,407,487 | ) | (693,748,408 | ) | (10,210,050 | ) | (10,424,454 | ) | ||||||||
Net Assets | ||||||||||||||||
Beginning of year | 849,423,463 | 1,543,171,871 | 31,287,104 | 41,711,558 | ||||||||||||
|
|
|
|
|
|
|
| |||||||||
End of year | $ | 487,015,976 | $ | 849,423,463 | $ | 21,077,054 | $ | 31,287,104 | ||||||||
|
|
|
|
|
|
|
| |||||||||
Changes in Shares Outstanding | ||||||||||||||||
Shares outstanding, beginning of year | 30,000,001 | 53,750,001 | 1,050,001 | 1,350,001 | ||||||||||||
Shares sold | 3,100,000 | 4,000,000 | — | — | ||||||||||||
Shares redeemed | (15,000,000 | ) | (27,750,000 | ) | (300,000 | ) | (300,000 | ) | ||||||||
|
|
|
|
|
|
|
| |||||||||
Shares outstanding, end of year | 18,100,001 | 30,000,001 | 750,001 | 1,050,001 | ||||||||||||
|
|
|
|
|
|
|
| |||||||||
| See Notes to Financial Statements. | 95 |
DBX ETF Trust
Statements of Changes in Net Assets (Continued)
| Xtrackers MSCI Germany Hedged Equity ETF | Xtrackers MSCI Japan Hedged Equity ETF | |||||||||||||||
| Year Ended May 31, 2020 | Year Ended May 31, 2019 | Year Ended May 31, 2020 | Year Ended May 31, 2019 | |||||||||||||
Increase (Decrease) in Net Assets from Operations | ||||||||||||||||
Net investment income (loss) | $ | 163,999 | $ | 557,637 | $ | 5,328,423 | $ | 12,926,499 | ||||||||
Net realized gain (loss) | 226,042 | 2,745,810 | (14,608,871 | ) | 57,226,949 | |||||||||||
Net change in net unrealized appreciation (depreciation) | 303,366 | (5,431,377 | ) | 39,981,681 | (142,660,983 | ) | ||||||||||
|
|
|
|
|
|
|
| |||||||||
Net increase (decrease) in net assets resulting from operations | 693,407 | (2,127,930 | ) | 30,701,233 | (72,507,535 | ) | ||||||||||
|
|
|
|
|
|
|
| |||||||||
Distributions to Shareholders | (538,046 | ) | (859,921 | ) | (11,391,476 | ) | (35,027,849 | ) | ||||||||
|
|
|
|
|
|
|
| |||||||||
Fund Shares Transactions | ||||||||||||||||
Proceeds from shares sold | — | — | 14,116,878 | 89,826,392 | ||||||||||||
Value of shares redeemed | (8,052,872 | ) | (10,125,607 | ) | (226,135,390 | ) | (721,905,897 | ) | ||||||||
|
|
|
|
|
|
|
| |||||||||
Net increase (decrease) in net assets resulting from fund share transactions | (8,052,872 | ) | (10,125,607 | ) | (212,018,512 | ) | (632,079,505 | ) | ||||||||
|
|
|
|
|
|
|
| |||||||||
Total net increase (decrease) in Net Assets | (7,897,511 | ) | (13,113,458 | ) | (192,708,755 | ) | (739,614,889 | ) | ||||||||
Net Assets | ||||||||||||||||
Beginning of year | 23,211,437 | 36,324,895 | 413,639,058 | 1,153,253,947 | ||||||||||||
|
|
|
|
|
|
|
| |||||||||
End of year | $ | 15,313,926 | $ | 23,211,437 | $ | 220,930,303 | $ | 413,639,058 | ||||||||
|
|
|
|
|
|
|
| |||||||||
Changes in Shares Outstanding | ||||||||||||||||
Shares outstanding, beginning of year | 900,800 | 1,300,800 | 10,900,800 | 26,850,800 | ||||||||||||
Shares sold | — | — | 400,000 | 2,200,000 | ||||||||||||
Shares redeemed | (300,000 | ) | (400,000 | ) | (5,750,000 | ) | (18,150,000 | ) | ||||||||
|
|
|
|
|
|
|
| |||||||||
Shares outstanding, end of year | 600,800 | 900,800 | 5,550,800 | 10,900,800 | ||||||||||||
|
|
|
|
|
|
|
| |||||||||
| See Notes to Financial Statements. | 96 |
DBX ETF Trust
| Xtrackers MSCI All World ex US Hedged Equity ETF Selected Per Share Data | Years Ended May 31, | |||||||||||||||||||
| 2020 | 2019 | 2018 | 2017 | 2016 | ||||||||||||||||
Net Asset Value, beginning of year | $ | 26.61 | $ | 27.71 | $ | 26.20 | $ | 22.62 | $ | 26.87 | ||||||||||
|
|
|
|
|
|
|
|
|
| |||||||||||
| Income (loss) from investment operations: | ||||||||||||||||||||
Net investment income (loss)(a) | 0.62 | 0.73 | 0.67 | 0.64 | 0.64 | |||||||||||||||
Net realized and unrealized gain (loss) | (0.76 | ) | (1.12 | ) | 1.51 | 3.42 | (3.57 | ) | ||||||||||||
|
|
|
|
|
|
|
|
|
| |||||||||||
Total from investment operations | (0.14 | ) | (0.39 | ) | 2.18 | 4.06 | (2.93 | ) | ||||||||||||
|
|
|
|
|
|
|
|
|
| |||||||||||
| Less distributions from: |
| |||||||||||||||||||
Net investment income | (0.84 | ) | (0.71 | ) | (0.67 | ) | (0.48 | ) | (0.86 | ) | ||||||||||
Net realized gains | — | — | — | — | (0.46 | ) | ||||||||||||||
|
|
|
|
|
|
|
|
|
| |||||||||||
Total distributions | (0.84 | ) | (0.71 | ) | (0.67 | ) | (0.48 | ) | (1.32 | ) | ||||||||||
|
|
|
|
|
|
|
|
|
| |||||||||||
Net Asset Value, end of year | $ | 25.63 | $ | 26.61 | $ | 27.71 | $ | 26.20 | $ | 22.62 | ||||||||||
|
|
|
|
|
|
|
|
|
| |||||||||||
Total Return (%) | (0.78 | )(b) | (1.30 | )(b) | 8.43 | 18.30 | (11.17 | ) | ||||||||||||
Ratios to Average Net Assets and Supplemental Data | ||||||||||||||||||||
Net Assets, end of year ($ millions) | 99 | 98 | 127 | 105 | 68 | |||||||||||||||
Ratio of expenses before fee waiver (%) | 0.41 | 0.41 | 0.40 | 0.40 | 0.40 | |||||||||||||||
Ratio of expenses after fee waiver (%) | 0.41 | 0.41 | 0.40 | 0.40 | 0.40 | |||||||||||||||
Ratio of net investment income (loss) (%) | 2.29 | 2.74 | 2.46 | 2.67 | 2.76 | |||||||||||||||
Portfolio turnover rate (%)(c) | 10 | 13 | 11 | 15 | 24 | |||||||||||||||
| Xtrackers MSCI Emerging Markets Hedged Equity ETF Selected Per Share Data | Years Ended May 31, | |||||||||||||||||||
| 2020 | 2019 | 2018 | 2017 | 2016 | ||||||||||||||||
Net Asset Value, beginning of year | $ | 21.81 | $ | 23.91 | $ | 21.47 | $ | 18.62 | $ | 22.43 | ||||||||||
|
|
|
|
|
|
|
|
|
| |||||||||||
| Income (loss) from investment operations: | ||||||||||||||||||||
Net investment income (loss)(a) | 0.58 | 0.52 | 0.41 | 0.35 | 0.43 | |||||||||||||||
Net realized and unrealized gain (loss) | (0.74 | ) | (2.02 | ) | 2.39 | 2.81 | (3.60 | ) | ||||||||||||
|
|
|
|
|
|
|
|
|
| |||||||||||
Total from investment operations | (0.16 | ) | (1.50 | ) | 2.80 | 3.16 | (3.17 | ) | ||||||||||||
|
|
|
|
|
|
|
|
|
| |||||||||||
Less distributions from: |
| |||||||||||||||||||
Net investment income | (0.62 | ) | (0.60 | ) | (0.36 | ) | (0.31 | ) | (0.64 | ) | ||||||||||
|
|
|
|
|
|
|
|
|
| |||||||||||
Total distributions | (0.62 | ) | (0.60 | ) | (0.36 | ) | (0.31 | ) | (0.64 | ) | ||||||||||
|
|
|
|
|
|
|
|
|
| |||||||||||
Net Asset Value, end of year | $ | 21.03 | $ | 21.81 | $ | 23.91 | $ | 21.47 | $ | 18.62 | ||||||||||
|
|
|
|
|
|
|
|
|
| |||||||||||
Total Return (%) | (1.01 | )(b) | (6.18 | )(b) | 13.09 | 17.19 | (14.32 | ) | ||||||||||||
Ratios to Average Net Assets and Supplemental Data | ||||||||||||||||||||
Net Assets, end of year ($ millions) | 89 | 112 | 195 | 188 | 130 | |||||||||||||||
Ratio of expenses before fee waiver (%) | 0.66 | 0.66 | 0.65 | 0.65 | 0.65 | |||||||||||||||
Ratio of expenses after fee waiver (%) | 0.66 | 0.66 | 0.65 | 0.65 | 0.65 | |||||||||||||||
Ratio of net investment income (loss) (%) | 2.62 | 2.29 | 1.74 | 1.74 | 2.20 | |||||||||||||||
Portfolio turnover rate (%)(c) | 20 | 13 | 15 | 43 | 32 | |||||||||||||||
| (a) | Based on average shares outstanding during the period. |
| (b) | Total Return would have been lower if certain expenses had not been reimbursed by the Advisor. |
| (c) | Portfolio turnover rate does not include securities received or delivered from processing creations or redemptions. |
| See Notes to Financial Statements. | 97 |
DBX ETF Trust
Financial Highlights (Continued)
| Xtrackers MSCI Europe Hedged Equity ETF Selected Per Share Data | Years Ended May 31, | |||||||||||||||||||
| 2020 | 2019 | 2018 | 2017 | 2016 | ||||||||||||||||
Net Asset Value, beginning of year | $ | 28.31 | $ | 28.71 | $ | 28.29 | $ | 25.65 | $ | 29.47 | ||||||||||
|
|
|
|
|
|
|
|
|
| |||||||||||
| Income (loss) from investment operations: | ||||||||||||||||||||
Net investment income (loss)(a) | 0.52 | 0.75 | 0.68 | 0.76 | 0.79 | |||||||||||||||
Net realized and unrealized gain (loss) | (1.06 | )(b) | (0.26 | ) | 0.39 | 4.40 | (3.19 | ) | ||||||||||||
|
|
|
|
|
|
|
|
|
| |||||||||||
Total from investment operations | (0.54 | ) | 0.49 | 1.07 | 5.16 | (2.40 | ) | |||||||||||||
|
|
|
|
|
|
|
|
|
| |||||||||||
| Less distributions from: |
| |||||||||||||||||||
Net investment income | (0.86 | ) | (0.89 | ) | (0.65 | ) | (0.85 | ) | (1.28 | ) | ||||||||||
Net realized gains | — | — | — | (1.67 | ) | (0.14 | ) | |||||||||||||
|
|
|
|
|
|
|
|
|
| |||||||||||
Total distributions | (0.86 | ) | (0.89 | ) | (0.65 | ) | (2.52 | ) | (1.42 | ) | ||||||||||
|
|
|
|
|
|
|
|
|
| |||||||||||
Net Asset Value, end of year | $ | 26.91 | $ | 28.31 | $ | 28.71 | $ | 28.29 | $ | 25.65 | ||||||||||
|
|
|
|
|
|
|
|
|
| |||||||||||
Total Return (%) | (2.16 | )(c) | 1.88 | (c) | 3.82 | 21.77 | (8.46 | ) | ||||||||||||
Ratios to Average Net Assets and Supplemental Data | ||||||||||||||||||||
Net Assets, end of year ($ millions) | 487 | 849 | 1,543 | 2,747 | 3,310 | |||||||||||||||
Ratio of expenses before fee waiver (%) | 0.46 | 0.47 | 0.45 | 0.45 | 0.45 | |||||||||||||||
Ratio of expenses after fee waiver (%) | 0.46 | 0.47 | 0.45 | 0.45 | 0.45 | |||||||||||||||
Ratio of net investment income (loss) (%) | 1.79 | 2.67 | 2.41 | 2.95 | 3.08 | |||||||||||||||
Portfolio turnover rate (%)(d) | 13 | 7 | 11 | 17 | 18 | |||||||||||||||
| Xtrackers MSCI Eurozone Hedged Equity ETF Selected Per Share Data | Years Ended May 31, | |||||||||||||||||||
| 2020 | 2019 | 2018 | 2017 | 2016 | ||||||||||||||||
Net Asset Value, beginning of year | $ | 29.80 | $ | 30.90 | $ | 30.29 | $ | 25.64 | $ | 29.30 | ||||||||||
|
|
|
|
|
|
|
|
|
| |||||||||||
| Income (loss) from investment operations: | ||||||||||||||||||||
Net investment income (loss)(a) | 0.40 | 0.71 | 0.62 | 0.73 | 0.78 | |||||||||||||||
Net realized and unrealized gain (loss) | (1.15 | ) | (1.13 | ) | 0.63 | 4.84 | (3.15 | ) | ||||||||||||
|
|
|
|
|
|
|
|
|
| |||||||||||
Total from investment operations | (0.75 | ) | (0.42 | ) | 1.25 | 5.57 | (2.37 | ) | ||||||||||||
|
|
|
|
|
|
|
|
|
| |||||||||||
Less distributions from: |
| |||||||||||||||||||
Net investment income | (0.95 | ) | (0.68 | ) | (0.64 | ) | (0.92 | ) | (1.29 | ) | ||||||||||
|
|
|
|
|
|
|
|
|
| |||||||||||
Total distributions | (0.95 | ) | (0.68 | ) | (0.64 | ) | (0.92 | ) | (1.29 | ) | ||||||||||
|
|
|
|
|
|
|
|
|
| |||||||||||
Net Asset Value, end of year | $ | 28.10 | $ | 29.80 | $ | 30.90 | $ | 30.29 | $ | 25.64 | ||||||||||
|
|
|
|
|
|
|
|
|
| |||||||||||
Total Return (%) | (2.80 | )(c) | (1.34 | )(c) | 4.19 | 22.56 | (8.45 | ) | ||||||||||||
Ratios to Average Net Assets and Supplemental Data | ||||||||||||||||||||
Net Assets, end of year ($ millions) | 21 | 31 | 42 | 65 | 83 | |||||||||||||||
Ratio of expenses before fee waiver (%) | 0.47 | 0.47 | 0.45 | 0.45 | 0.45 | |||||||||||||||
Ratio of expenses after fee waiver (%) | 0.46 | 0.47 | 0.45 | 0.45 | 0.45 | |||||||||||||||
Ratio of net investment income (loss) (%) | 1.31 | 2.42 | 2.05 | 2.76 | 3.11 | |||||||||||||||
Portfolio turnover rate (%)(d) | 11 | 5 | 14 | 16 | 22 | |||||||||||||||
| (a) | Based on average shares outstanding during the period. |
| (b) | Because of the timing of subscriptions and redemptions in relation to fluctuating markets at value, the amount shown may not agree with the change in aggregate gains and losses. |
| (c) | Total Return would have been lower if certain expenses had not been reimbursed by the Advisor. |
| (d) | Portfolio turnover rate does not include securities received or delivered from processing creations or redemptions. |
| See Notes to Financial Statements. | 98 |
DBX ETF Trust
Financial Highlights (Continued)
| Xtrackers MSCI Germany Hedged Equity ETF Selected Per Share Data | Years Ended May 31, | |||||||||||||||||||
| 2020 | 2019 | 2018 | 2017 | 2016 | ||||||||||||||||
Net Asset Value, beginning of year | $ | 25.77 | $ | 27.93 | $ | 27.87 | $ | 23.40 | $ | 27.34 | ||||||||||
|
|
|
|
|
|
|
|
|
| |||||||||||
| Income (loss) from investment operations: | ||||||||||||||||||||
Net investment income (loss)(a) | 0.24 | 0.53 | 0.57 | 0.40 | 0.33 | |||||||||||||||
Net realized and unrealized gain (loss) | 0.08 | (2.02 | ) | (0.09 | ) | 4.78 | (2.93 | ) | ||||||||||||
|
|
|
|
|
|
|
|
|
| |||||||||||
Total from investment operations | 0.32 | (1.49 | ) | 0.48 | 5.18 | (2.60 | ) | |||||||||||||
|
|
|
|
|
|
|
|
|
| |||||||||||
Less distributions from: |
| |||||||||||||||||||
Net investment income | (0.60 | ) | (0.67 | ) | (0.42 | ) | (0.71 | ) | (1.34 | ) | ||||||||||
|
|
|
|
|
|
|
|
|
| |||||||||||
Total distributions | (0.60 | ) | (0.67 | ) | (0.42 | ) | (0.71 | ) | (1.34 | ) | ||||||||||
|
|
|
|
|
|
|
|
|
| |||||||||||
Net Asset Value, end of year | $ | 25.49 | $ | 25.77 | $ | 27.93 | $ | 27.87 | $ | 23.40 | ||||||||||
|
|
|
|
|
|
|
|
|
| |||||||||||
Total Return (%) | 1.15 | (b) | (5.48 | )(b) | 1.73 | 22.93 | (9.99 | ) | ||||||||||||
Ratios to Average Net Assets and Supplemental Data | ||||||||||||||||||||
Net Assets, end of year ($ millions) | 15 | 23 | 36 | 66 | 110 | |||||||||||||||
Ratio of expenses before fee waiver (%) | 0.45 | 0.46 | 0.45 | 0.45 | 0.45 | |||||||||||||||
Ratio of expenses after fee waiver (%) | 0.45 | 0.46 | 0.45 | 0.45 | 0.45 | |||||||||||||||
Ratio of net investment income (loss) (%) | 0.90 | 2.03 | 2.04 | 1.63 | 1.37 | |||||||||||||||
Portfolio turnover rate (%)(c) | 14 | 11 | 17 | 12 | 16 | |||||||||||||||
| Xtrackers MSCI Japan Hedged Equity ETF Selected Per Share Data | Years Ended May 31, | |||||||||||||||||||
| 2020 | 2019 | 2018 | 2017 | 2016 | ||||||||||||||||
Net Asset Value, beginning of year | $ | 37.95 | $ | 42.95 | $ | 38.65 | $ | 34.32 | $ | 44.54 | ||||||||||
|
|
|
|
|
|
|
|
|
| |||||||||||
| Income (loss) from investment operations: | ||||||||||||||||||||
Net investment income (loss)(a) | 0.67 | 0.64 | 0.52 | 0.53 | 0.48 | |||||||||||||||
Net realized and unrealized gain (loss) | 2.27 | (4.24 | ) | 4.69 | 4.22 | (8.44 | ) | |||||||||||||
|
|
|
|
|
|
|
|
|
| |||||||||||
Total from investment operations | 2.94 | (3.60 | ) | 5.21 | 4.75 | (7.96 | ) | |||||||||||||
|
|
|
|
|
|
|
|
|
| |||||||||||
Less distributions from: |
| |||||||||||||||||||
Net investment income | (1.09 | ) | (1.40 | ) | (0.91 | ) | (0.42 | ) | (1.39 | ) | ||||||||||
Net realized gains | — | — | — | — | (0.87 | ) | ||||||||||||||
|
|
|
|
|
|
|
|
|
| |||||||||||
Total distributions | (1.09 | ) | (1.40 | ) | (0.91 | ) | (0.42 | ) | (2.26 | ) | ||||||||||
|
|
|
|
|
|
|
|
|
| |||||||||||
Net Asset Value, end of year | $ | 39.80 | $ | 37.95 | $ | 42.95 | $ | 38.65 | $ | 34.32 | ||||||||||
|
|
|
|
|
|
|
|
|
| |||||||||||
Total Return (%) | 7.88 | (b) | (8.59 | )(b) | 13.74 | 14.08 | (18.65 | ) | ||||||||||||
Ratios to Average Net Assets and Supplemental Data | ||||||||||||||||||||
Net Assets, end of year ($ millions) | 221 | 414 | 1,153 | 1,780 | 1,026 | |||||||||||||||
Ratio of expenses before fee waiver (%) | 0.46 | 0.47 | 0.46 | 0.45 | 0.45 | |||||||||||||||
Ratio of expenses after fee waiver (%) | 0.46 | 0.47 | 0.46 | 0.45 | 0.45 | |||||||||||||||
Ratio of net investment income (loss) (%) | 1.69 | 1.55 | 1.24 | 1.50 | 1.29 | |||||||||||||||
Portfolio turnover rate (%)(c) | 12 | 15 | 12 | 22 | 15 | |||||||||||||||
| (a) | Based on average shares outstanding during the period. |
| (b) | Total Return would have been lower if certain expenses had not been reimbursed by the Advisor. |
| (c) | Portfolio turnover rate does not include securities received or delivered from processing creations or redemptions. |
| See Notes to Financial Statements. | 99 |
DBX ETF Trust
1. Organization
DBX ETF Trust (the “Trust”) is registered under the Investment Company Act of 1940, as amended (the “Act”), as an open-end registered management investment company organized as a Delaware statutory trust.
As of May 31, 2020, the Trust consists of thirty-four investment series of exchange-traded funds (“ETFs”) (each a “Fund” and collectively, the “Funds”) in operation and trading. These financial statements report on the Funds listed below:
| Xtrackers MSCI All World ex US Hedged Equity ETF | ||
| Xtrackers MSCI Emerging Markets Hedged Equity ETF | ||
| Xtrackers MSCI Europe Hedged Equity ETF | ||
| Xtrackers MSCI Eurozone Hedged Equity ETF | ||
| Xtrackers MSCI Germany Hedged Equity ETF | ||
| Xtrackers MSCI Japan Hedged Equity ETF |
DBX Advisors LLC (“DBX” or the “Advisor”), an indirect, wholly-owned subsidiary of DWS Group GmbH & Co. KGaA (“DWS Group”), serves as investment advisor to the Funds and has overall responsibility for the general management and administration of the Funds, subject to the supervision of the Funds’ Board of Trustees (“Board”).
Each Fund offers shares that are listed and traded on the NYSE Arca, Inc. (“NYSE Arca”). Unlike conventional mutual funds, each Fund issues and redeems shares on a continuous basis, at net asset value (“NAV”), only in large specified lots consisting of 50,000 shares, each called a “Creation Unit”, to authorized participants who have entered into agreements with the Funds’ distributor. Shares are not individually redeemable securities of the Funds, and owners of the shares may acquire those shares from the Funds, or tender such shares for redemption to the Funds, in Creation Units only.
The investment objective of each Fund is to track the performance, before fees and expenses, of a particular index (the “Underlying Index”). The underlying indices for the Funds are:
Fund | Underlying Index | |
| Xtrackers MSCI All World ex US Hedged Equity ETF | MSCI ACWI ex USA US Dollar Hedged Index | |
| Xtrackers MSCI Emerging Markets Hedged Equity ETF | MSCI EM US Dollar Hedged Index | |
| Xtrackers MSCI Europe Hedged Equity ETF | MSCI Europe US Dollar Hedged Index | |
| Xtrackers MSCI Eurozone Hedged Equity ETF | MSCI EMU IMI US Dollar Hedged Index | |
| Xtrackers MSCI Germany Hedged Equity ETF | MSCI Germany US Dollar Hedged Index | |
| Xtrackers MSCI Japan Hedged Equity ETF | MSCI Japan US Dollar Hedged Index |
The MSCI ACWI ex USA US Dollar Hedged Index is designed to provide exposure to equity securities in developed and emerging stock markets (excluding the United States), while at the same time mitigating exposure to fluctuations between the value of the U.S. dollar and selected non-U.S. currencies.
The MSCI EM US Dollar Hedged Index is designed to provide exposure to equity securities in the global emerging markets, while at the same time mitigating exposure to fluctuations between the value of the U.S. dollar and selected emerging market currencies.
The MSCI Europe US Dollar Hedged Index is designed to provide exposure to equity securities in developed stock markets in Europe, while at the same time mitigating exposure to fluctuations between the value of the U.S. dollar and selected non-U.S. currencies.
The MSCI EMU IMI US Dollar Hedged Index is designed to provide exposure to equity securities from countries in the European Monetary Union, while mitigating exposure to fluctuations between the value of the U.S. dollar and the euro.
The MSCI Germany US Dollar Hedged Index is designed to provide exposure to German equity markets, while at the same time mitigating exposure to fluctuations between the value of the U.S. dollar and the euro.
The MSCI Japan US Dollar Hedged Index is designed to provide exposure to Japanese equity markets, while at the same time mitigating exposure to fluctuations between the value of the U.S. dollar and Japanese yen.
100
DBX ETF Trust
Notes to Financial Statements (Continued)
The MSCI Hedged Underlying Indices are rebalanced monthly on the last trading day of the month, when the index will take into account the effect of rolling into new 1-month forward contracts based on the newly determined weights of currency to be sold for the next month’s index calculation. The currency weights are determined as of the close of two business days before the first calendar day of the following month and remain constant intra month. This means that no changes in the weights are made during the month to account for changes in the indexes due to price movement of securities, corporate events, additions, deletions or any other changes. The daily calculation of MSCI Hedged Indices marks to market the one-month forward contracts on a daily basis by using an equal and offsetting forward position.
Each Fund is entitled to use its respective Underlying Index pursuant to a licensing agreement between the Index Provider and DBX. There is no charge to the Funds in connection with these licensing agreements.
Each Fund, except Xtrackers MSCI Germany Hedged Equity ETF, is diversified. Xtrackers MSCI Germany Hedged Equity ETF is non-diversified and is not limited by the Act with regard to the percentage of its assets that may be invested in the securities of a single issuer. This means the securities of a particular issuer (or securities of issuers in particular industries) may dominate the Underlying Index of the Fund and, consequently, the Fund’s investment portfolio. This may adversely affect the Fund’s performance or subject the Fund’s shares to greater price volatility than that experienced by more diversified investment companies. In addition, each Fund may change its diversification status over time and then change it back again, without shareholder approval, solely as a result of a change in relative market capitalization or index weighting of one or more constituents of the index each Fund tracks.
Pursuant to the Trust’s organizational documents, the Trust’s officers and trustees are indemnified against certain liabilities that may arise out of the performance of their duties to the Funds. Additionally, in the normal course of business the Trust enters into contracts that contain a variety of representations that provide indemnification for certain liabilities. The Trust’s maximum exposure under these arrangements is unknown, as this would involve future claims that may be made against the Funds that have not yet occurred. However, the Trust expects the risk of loss to be remote.
2. Significant Accounting Policies
The financial statements have been prepared in conformity with U.S. generally accepted accounting principles (“U.S. GAAP”), which require management to make certain estimates and assumptions that affect the reported amounts and disclosures in the financial statements. Actual results could differ from those estimates. Each Fund qualifies as an investment company under Topic 946 of the Accounting Standards Codification of U.S. GAAP. The following is a summary of significant accounting policies followed by the Funds.
Security Valuation The NAV of each Fund’s shares is calculated each business day as of the close of regular trading on the New York Stock Exchange, generally 4:00 p.m. Eastern Time. NAV per share is calculated by dividing a Fund’s net assets by the number of Fund shares outstanding.
Various inputs are used in determining the value of the Funds’ investments. These inputs are summarized in three broad levels. Level 1 includes quoted prices in active markets for identical securities. Level 2 includes other significant observable inputs (including quoted prices for similar securities, interest rates, prepayment speeds, and credit risk). Level 3 includes significant unobservable inputs (including the Funds’ own assumptions in determining the fair value of investments). The level assigned to the securities valuations may not be an indication of the risk or liquidity associated with investing in those securities.
Equity securities and ETFs are valued at the most recent sale price or official closing price reported on the exchange (U.S. or foreign) or over-the-counter market on which they trade. Securities or ETFs for which no sales are reported are valued at the calculated mean between the most recent bid and asked quotations on the relevant market or, if a mean cannot be determined, at the most recent bid quotation. Equity securities and ETFs are generally categorized as Level 1.
Investments in open-end investment companies are valued at their NAV each business day and are categorized as Level 1.
Forward currency contracts are valued at the prevailing forward exchange rate of the underlying currencies and are categorized as Level 2.
101
DBX ETF Trust
Notes to Financial Statements (Continued)
Futures contracts are generally valued at the settlement prices established each day on the exchange on which they are traded and are categorized as Level 1.
Securities and other assets for which market quotations are not readily available or for which the above valuation procedures are deemed not to reflect fair value are valued in a manner that is intended to reflect their fair value as determined in accordance with procedures approved by the Board and are generally categorized as Level 3. In accordance with the Funds’ valuation procedures, factors considered in determining value may include, but are not limited to, the type of the security; the size of the holding; the initial cost of the security; the existence of any contractual restrictions on the security’s disposition; the price and extent of public trading in similar securities of the issuer or of comparable companies; quotations or evaluated prices from broker-dealers and/or pricing services; information obtained from the issuer, analysts, and/or the appropriate stock exchange (for exchange-traded securities); an analysis of the company’s or issuer’s financial statements; an evaluation of the forces that influence the issuer and the market(s) in which the security is purchased and sold; and with respect to debt securities, the maturity, coupon, creditworthiness, currency denomination and the movement of the market in which the security is normally traded. The value determined under these procedures may differ from published values for the same securities.
Fair value pricing could result in a difference between the prices used to calculate a Fund’s NAV and the prices used by the Fund’s Underlying Index, which in turn could result in a difference between the Fund’s performance and the performance of the Fund’s Underlying Index.
Disclosure about the classification of the fair value measurements is included in a table following the Fund’s Schedule of Investments.
Cash Cash consists of cash held at banks and is on deposit with major financial institutions.
Investment Transactions and Investment Income Investment transactions are recorded as of the date that the securities are purchased or sold (trade date). Realized gains and losses from the sale or disposition of securities are calculated on the identified cost-method. Dividend income is net of any foreign taxes withheld at source. Certain dividends from foreign securities may be recorded subsequent to the ex-dividend date as soon as the Fund is informed of such dividends. Interest income is recorded on the accrual basis.
Tax Information and Dividends and Distributions to Shareholders It is each Fund’s policy to comply with all requirements of the Internal Revenue Code of 1986, as amended (“the Code”). Each Fund intends to qualify for and to elect treatment as a separate Regulated Investment Company (“RIC”) under Subchapter M of the Code. It is the policy of each Fund to pay out dividends from its net investment income, if any, to investors semi-annually. Taxable net realized gains from investment transactions, reduced by capital loss carryforwards, if any, are declared and distributed to shareholders at least annually. The capital loss carryforward amount, if any, is available to offset future net capital gains. The Funds may occasionally be required to make supplemental distributions at some other time during the year. The Funds reserve the right to declare special distributions if, in their reasonable discretion, such action is necessary or advisable to preserve the status of each Fund as a RIC or to avoid imposition of income or excise taxes on undistributed income. Dividends and distributions to shareholders, if any, are recorded on the ex-dividend date. The amount of dividends and distributions from net investment income and net realized capital gains are determined in accordance with Federal income tax regulations which may differ from U.S. GAAP. These “book/tax” differences are either considered temporary or permanent in nature. To the extent these differences are permanent in nature, such amounts are reclassified at the end of the year within the components of net assets based on their federal tax treatment; temporary differences do not require reclassification. Dividends and distributions, which exceed earnings and profits for the full year for tax purposes, are reported as a tax return of capital.
In accordance with U.S. GAAP requirements regarding accounting for uncertainties in income taxes, management has analyzed the Funds’ tax positions taken or expected to be taken on foreign, federal and state income tax returns for all open tax years and has concluded that no provision for income tax is required in the Funds’ financial statements.
The Funds recognize interest and penalties, if any, related to uncertain tax positions as income tax expense on the Statements of Operations. For the year ended May 31, 2020, the Funds did not incur any interest or penalties.
102
DBX ETF Trust
Notes to Financial Statements (Continued)
As of May 31, 2020, the components of accumulated earnings (losses) on a tax basis were as follows:
| Undistributed Ordinary Income | Capital and Other Gains (Losses) | Unrealized Appreciation (Depreciation) | Total Accumulated Earnings (Losses) | |||||||||||||
Xtrackers MSCI All World ex US Hedged Equity ETF | $ | 786,956 | $ | (1,496,679 | ) | $ | (4,451,123 | ) | $ | (5,160,846 | ) | |||||
Xtrackers MSCI Emerging Markets Hedged Equity ETF | 266,652 | (18,391,003 | ) | 1,418,395 | (16,705,956 | ) | ||||||||||
Xtrackers MSCI Europe Hedged Equity ETF | 6,218,883 | (83,522,829 | ) | (119,517,399 | ) | (196,821,345 | ) | |||||||||
Xtrackers MSCI Eurozone Hedged Equity ETF | 169,543 | (1,307,560 | ) | (3,039,560 | ) | (4,177,577 | ) | |||||||||
Xtrackers MSCI Germany Hedged Equity ETF | 167,617 | (6,819,082 | ) | (3,550,675 | ) | (10,202,140 | ) | |||||||||
Xtrackers MSCI Japan Hedged Equity ETF | 5,905,764 | (167,638,146 | ) | (21,231,070 | ) | (182,963,452 | ) | |||||||||
The tax character of dividends and distributions declared for the years ended May 31, 2020 and May 31, 2019 were as follows:
| Year Ended May 31, 2020 | ||||
| Ordinary Income* | ||||
Xtrackers MSCI All World ex US Hedged Equity ETF | $ | 3,108,889 | ||
Xtrackers MSCI Emerging Markets Hedged Equity ETF | 3,043,154 | |||
Xtrackers MSCI Europe Hedged Equity ETF | 25,632,832 | |||
Xtrackers MSCI Eurozone Hedged Equity ETF | 871,374 | |||
Xtrackers MSCI Germany Hedged Equity ETF | 538,046 | |||
Xtrackers MSCI Japan Hedged Equity ETF | 11,391,476 | |||
| Year Ended May 31, 2019 | ||||
| Ordinary Income* | ||||
Xtrackers MSCI All World ex US Hedged Equity ETF | $ | 2,871,618 | ||
Xtrackers MSCI Emerging Markets Hedged Equity ETF | 3,308,776 | |||
Xtrackers MSCI Europe Hedged Equity ETF | 41,023,718 | |||
Xtrackers MSCI Eurozone Hedged Equity ETF | 915,112 | |||
Xtrackers MSCI Germany Hedged Equity ETF | 859,921 | |||
Xtrackers MSCI Japan Hedged Equity ETF | 35,027,849 | |||
| * | For tax purposes short-term capital gain distributions are considered ordinary income distributions. |
At May 31, 2020, for Federal income tax purposes, the Funds have capital loss carryforwards available as shown in the table below, to the extent provided by regulations, to offset future capital gains for an unlimited period. To the extent that these loss carryforwards are used to offset future capital gains, it is probable that the capital gains so offset will not be distributed to shareholders.
| Short-Term | Long-Term | Total Amount | ||||||||||
Xtrackers MSCI All World ex US Hedged Equity ETF | $ | — | $ | 1,496,679 | $ | 1,496,679 | ||||||
Xtrackers MSCI Emerging Markets Hedged Equity ETF | 10,392,893 | 7,998,110 | 18,391,003 | |||||||||
Xtrackers MSCI Europe Hedged Equity ETF | — | 83,522,829 | 83,522,829 | |||||||||
Xtrackers MSCI Eurozone Hedged Equity ETF | — | 1,307,560 | 1,307,560 | |||||||||
Xtrackers MSCI Germany Hedged Equity ETF | 1,391,384 | 5,427,698 | 6,819,082 | |||||||||
Xtrackers MSCI Japan Hedged Equity ETF | 72,266,077 | 95,372,069 | 167,638,146 | |||||||||
For the fiscal year ended May 31, 2020, the effect of permanent “book/tax” reclassifications to the components of net assets are included below. These differences are primarily due to recognition of certain foreign currency gains (losses) as ordinary income (loss), Passive Foreign Investment Companies (“PFICs”), redemptions-in-kind, partnership investments, and accrued foreign capital gain taxes.
103
DBX ETF Trust
Notes to Financial Statements (Continued)
| Distributable earnings (loss) | Paid-In Capital | |||||||
Xtrackers MSCI All World ex US Hedged Equity ETF | $ | (162,283 | ) | $ | 162,283 | |||
Xtrackers MSCI Emerging Markets Hedged Equity ETF | (467,153 | ) | 467,153 | |||||
Xtrackers MSCI Europe Hedged Equity ETF | (24,978,807 | ) | 24,978,807 | |||||
Xtrackers MSCI Eurozone Hedged Equity ETF | (920,775 | ) | 920,775 | |||||
Xtrackers MSCI Germany Hedged Equity ETF | 122,003 | (122,003 | ) | |||||
Xtrackers MSCI Japan Hedged Equity ETF | 5,249,127 | (5,249,127 | ) | |||||
As of May 31, 2020, the aggregate cost of investments for federal income tax purposes, the net unrealized appreciation or depreciation and the aggregated gross unrealized appreciation (depreciation) on investments were as follows:
| Aggregate Tax Cost | Net Unrealized Appreciation (Depreciation) | Aggregate Gross Unrealized Appreciation | Aggregate Gross Unrealized (Depreciation) | |||||||||||||
Xtrackers MSCI All World ex US Hedged Equity ETF | $ | 103,515,665 | $ | (4,460,717 | ) | $ | 13,611,891 | $ | (18,072,608 | ) | ||||||
Xtrackers MSCI Emerging Markets Hedged Equity ETF | 88,614,155 | 1,424,075 | 19,587,544 | (18,163,469 | ) | |||||||||||
Xtrackers MSCI Europe Hedged Equity ETF | 614,442,701 | (119,640,065 | ) | 37,237,135 | (156,877,200 | ) | ||||||||||
Xtrackers MSCI Eurozone Hedged Equity ETF | 24,795,245 | (3,041,448 | ) | 2,922,037 | (5,963,485 | ) | ||||||||||
Xtrackers MSCI Germany Hedged Equity ETF | 18,942,505 | (3,554,536 | ) | 1,598,746 | (5,153,282 | ) | ||||||||||
Xtrackers MSCI Japan Hedged Equity ETF | 241,764,331 | (21,220,832 | ) | 21,699,733 | (42,920,565 | ) | ||||||||||
Foreign Taxes The Funds may be subject to foreign taxes (a portion of which may be reclaimable) on income, capital gains on investments, certain foreign currency transactions or other corporate events. All foreign taxes are recorded in accordance with the applicable foreign tax regulations and rates that exist in the foreign jurisdictions in which the Funds invest. These foreign taxes, if any, are paid by the Funds and are reflected in their Statements of Operations as follows: foreign taxes withheld at source are presented as a reduction of income, foreign taxes on capital gains from sales of investments and foreign currency transactions are included in their respective net realized gain (loss) categories, and deferred foreign taxes on unrealized gains are included in net change in unrealized appreciation (depreciation). Receivables and payables related to foreign taxes as of May 31, 2020, if any, are disclosed in the Funds’ Statements of Assets and Liabilities.
Foreign Currency Translations The books and records of the Funds are maintained in U.S. dollars. Investment securities and other assets and liabilities denominated in a foreign currency are translated into U.S. dollars at the prevailing exchange rates at period end. Purchases and sales of investment securities, income and expenses are translated into U.S. dollars at the prevailing exchange rates on the respective dates of the transactions.
Net realized and unrealized gains and losses on foreign currency transactions represent net gains and losses between trade and settlement dates on securities transactions, the acquisition and disposition of foreign currencies, and the difference between the amount of net investment income accrued and the U.S. dollar amount actually received. The portion of both realized and unrealized gains and losses on investments that results from fluctuations in foreign currency exchange rates is not separately disclosed, but is included with net realized and unrealized gain/appreciation and loss/depreciation on investments.
Securities Lending The Funds may lend securities to certain financial institutions under the terms of their securities lending agreement. During the term of the loans the Funds continue to receive interest and dividends generated by the securities and to participate in any changes in their market value. The Funds require the borrowers of the securities to maintain collateral with the Funds consisting of cash and/or securities issued or guaranteed by the U.S. Government, its agencies or instrumentalities having a value at least equal to the value of the securities loaned. When the collateral falls below specified amounts, the lending agent will use its best effort to obtain additional collateral on the next business day to meet required amounts under the securities lending agreement. During the year ended May 31, 2020, the Funds invested the cash collateral into a joint trading account in DWS Government &
104
DBX ETF Trust
Notes to Financial Statements (Continued)
Agency Securities Portfolio, an affiliated money market fund managed by DWS Investment Management Americas, Inc. DWS Investment Management Americas, Inc. receives a management/administration fee (0.12% annualized effective rate as of May 31, 2020) on the cash collateral invested in DWS Government & Agency Securities Portfolio. The Funds receive compensation for lending their securities either in the form of fees or by earning interest on invested cash collateral net of borrower rebates and fees paid to a lending agent. Either the Fund or the borrower may terminate the loan at any time and the borrower, after notice, is required to return borrowed securities within a standard time period. There may be risks of delay and costs in recovery of securities or even loss of rights in the collateral should the borrower of the securities fail financially. If the Funds are not able to recover securities lent, the Funds may sell the collateral and purchase a replacement investment in the market, incurring the risk that the value of the replacement security is greater than the value of the collateral. The Funds are also subject to all investment risks associated with the reinvestment of any cash collateral received, including, but not limited to, interest rate, credit and liquidity risk associated with such investments.
As of May 31, 2020, the Funds listed below had securities on loan. The value of the related collateral exceeded the value of the securities loaned at period end.
Remaining Contractual Maturity of the Agreements, as of November 30, 2019 | ||||||||||||||||||||
| Securities Lending Transactions | Overnight and Continuous | <30 Days | Between 30 & 90 days | >90 days | Total | |||||||||||||||
Xtrackers MSCI All World ex US Hedged Equity ETF |
| |||||||||||||||||||
Common Stocks | $ | 1,267,996 | $ | 266 | $ | 1,559 | $ | 339,798 | $ | 1,609,619 | ||||||||||
|
|
|
|
|
|
|
|
|
| |||||||||||
Gross amount of recognized liabilities and non-cash collateral for securities lending transactions |
| $ | 1,609,619 | |||||||||||||||||
Xtrackers MSCI Emerging Markets Hedged Equity ETF |
| |||||||||||||||||||
Common Stocks | $ | 404,374 | $ | 1,092 | $ | 7,819 | $ | 670,647 | $ | 1,083,932 | ||||||||||
|
|
|
|
|
|
|
|
|
| |||||||||||
Gross amount of recognized liabilities and non-cash collateral for securities lending transactions |
| $ | 1,083,932 | |||||||||||||||||
Xtrackers MSCI Europe Hedged Equity ETF |
| |||||||||||||||||||
Common Stocks | $ | 7,981,610 | $ | — | $ | — | $ | 276,240 | $ | 8,257,850 | ||||||||||
|
|
|
|
|
|
|
|
|
| |||||||||||
Gross amount of recognized liabilities and non-cash collateral for securities lending transactions |
| $ | 8,257,850 | |||||||||||||||||
Xtrackers MSCI Eurozone Hedged Equity ETF |
| |||||||||||||||||||
Common Stocks | $ | 667,973 | $ | — | $ | — | $ | 30,530 | $ | 698,503 | ||||||||||
|
|
|
|
|
|
|
|
|
| |||||||||||
Gross amount of recognized liabilities and non-cash collateral for securities lending transactions |
| $ | 698,503 | |||||||||||||||||
Xtrackers MSCI Germany Hedged Equity ETF |
| |||||||||||||||||||
Common Stocks | $ | 111,300 | $ | — | $ | — | $ | — | $ | 111,300 | ||||||||||
|
|
|
|
|
|
|
|
|
| |||||||||||
Gross amount of recognized liabilities and non-cash collateral for securities lending transactions |
| $ | 111,300 | |||||||||||||||||
Xtrackers MSCI Japan Hedged Equity ETF |
| |||||||||||||||||||
Common Stocks | $ | 1,079,236 | $ | — | $ | — | $ | 409,390 | $ | 1,488,626 | ||||||||||
|
|
|
|
|
|
|
|
|
| |||||||||||
Gross amount of recognized liabilities and non-cash collateral for securities lending transactions |
| $ | 1,488,626 | |||||||||||||||||
Derivatives
Forward Foreign Currency Contracts Each Fund may enter into forward foreign currency contracts (“forward currency contracts”) designed to offset the Fund’s exposure to non-U.S. currencies. In addition, the Funds may enter into forward currency contracts and foreign currency futures contracts to facilitate local securities settlements or to protect against currency exposure in connection with distributions to shareholders.
A forward currency contract is a commitment to purchase or sell a foreign currency at a future date at a negotiated forward rate. For the year ended May 31, 2020, The Xtrackers MSCI All World ex US Hedged Equity ETF, Xtrackers MSCI Emerging Markets Hedged Equity ETF, Xtrackers MSCI Europe Hedged Equity ETF and Xtrackers MSCI Eurozone Hedged Equity ETF invested in forward currency contracts to hedge against changes in the value of the U.S. dollar against specified non-U.S. currencies. Similarly, the Xtrackers MSCI Germany Hedged Equity ETF and Xtrackers MSCI Japan Hedged Equity ETF each invested in forward currency contracts to hedge against changes in the value of the U.S. dollar against the euro and the Japanese yen, respectively.
105
DBX ETF Trust
Notes to Financial Statements (Continued)
The gain or loss arising from the difference between the original contract and the closing of such contract would be included in net realized gain or loss on forward currency contracts. Risks may arise from the potential inability of a counterparty to meet the terms of a contract and from unanticipated movements in the value of a foreign currency relative to the U.S. dollar. The face or contract amount, in U.S. dollars reflects the total exposure the Fund has in that particular currency contract.
A summary of the open forward currency contracts as of May 31, 2020 is included in a table following the Funds’ Schedule of Investments. The investment in forward currency contracts short vs. U.S. dollars had a contract value generally indicative of a range of the total exposure the respective Fund had to the value of non U.S currencies during the year ended May 31, 2020.
Futures Contracts Each Fund may enter into futures contracts. These futures contracts will be used to simulate investment in the respective Underlying Index, to facilitate trading or to reduce transaction costs. Each Fund will enter into futures contracts that are traded on a U.S. or non-U.S. exchange. No Fund will use futures for speculative purposes. Futures contracts provide for the future sale by one party and purchase by another party of a specified amount of a specific instrument or index at a specified future time and at a specified price. For the year ended May 31, 2020, Xtrackers MSCI All World ex US Hedged Equity ETF, Xtrackers MSCI Emerging Markets Hedged Equity ETF, Xtrackers MSCI Europe Hedged Equity ETF, Xtrackers MSCI Eurozone Hedged Equity ETF, Xtrackers MSCI Germany Hedged Equity ETF and Xtrackers MSCI Japan Hedged Equity ETF utilized futures in order to simulate investments in the Funds’ Underlying Index. To the extent required by law, liquid assets committed to futures contracts will be maintained.
At the time each Fund enters into a futures contract, each Fund deposits and maintains as collateral an initial margin with the broker, as required by the exchange on which the transaction is affected. Pursuant to the contract, each Fund agrees to receive from or pay to the broker an amount of cash equal to the daily fluctuation in the value of the contract. Such receipts or payments are known as variation margin and are recorded by each Fund as unrealized gains or losses. Risks may arise from the potential inability of a counterparty to meet the terms of the contract. The credit/counterparty risk for exchange-traded futures contracts is generally less than privately negotiated futures contracts, since the clearinghouse, which is the issuer or counterparty to each exchange-traded future, provides a guarantee of performance. The guarantee is supported by a daily payment system (i.e., margin requirements).
Use of long futures contracts subjects each Fund to risk of loss in excess of the amounts shown on the Statement of Assets and Liabilities, up to the notional value of the futures contracts. Use of short futures contracts subjects each Fund to unlimited risk of loss. Under some circumstances, futures exchanges may establish daily limits on the amount that the price of a futures contract can vary from the previous day’s settlement price, which could effectively prevent liquidation of unfavorable positions.
A summary of the open futures contracts as of May 31, 2020 is included in a table following the Funds’ Schedule of Investments.
106
DBX ETF Trust
Notes to Financial Statements (Continued)
The following tables summarize the value of the Funds’ derivative instruments held as of May 31, 2020 and the related location in the accompanying Statement of Assets and Liabilities, presented by primary underlying risk exposure:
Asset Derivatives | Liability Derivatives | |||||||||||||
| Xtrackers MSCI All World ex US Hedged Equity ETF | ||||||||||||||
| Equity contracts | Unrealized appreciation on futures contracts* | $ | 417,310 | Unrealized depreciation on futures contracts* | $ | — | ||||||||
| Foreign exchange contracts | Unrealized appreciation on forward foreign currency contracts | $ | 700,894 | Unrealized depreciation on forward foreign currency contracts | $ | 906,289 | ||||||||
|
|
|
| |||||||||||
| Total | $ | 1,118,204 | Total | $ | 906,289 | |||||||||
|
|
|
| |||||||||||
| Xtrackers MSCI Emerging Markets Hedged Equity ETF | ||||||||||||||
| Equity contracts | Unrealized appreciation on futures contracts* | $ | 129,395 | Unrealized depreciation on futures contracts* | $ | — | ||||||||
| Foreign exchange contracts | Unrealized appreciation on forward foreign currency contracts | $ | 793,566 | Unrealized depreciation on forward foreign currency contracts | 924,969 | |||||||||
|
|
|
| |||||||||||
| Total | $ | 922,961 | Total | $ | 924,969 | |||||||||
|
|
|
| |||||||||||
| Xtrackers MSCI Europe Hedged Equity ETF | ||||||||||||||
| Equity contracts | Unrealized appreciation on futures contracts* | $ | 650,910 | Unrealized depreciation on futures contracts* | $ | — | ||||||||
| Foreign exchange contracts | Unrealized appreciation on forward foreign currency contracts | 3,166,635 | Unrealized depreciation on forward foreign currency contracts | 5,185,789 | ||||||||||
|
|
|
| |||||||||||
| Total | $ | 3,817,545 | Total | $ | 5,185,789 | |||||||||
|
|
|
| |||||||||||
| Xtrackers MSCI Eurozone Hedged Equity ETF | ||||||||||||||
| Equity contracts | Unrealized appreciation on futures contracts* | $ | 18,291 | Unrealized depreciation on futures contracts* | $ | — | ||||||||
| Foreign exchange contracts | Unrealized appreciation on forward foreign currency contracts | 42,104 | Unrealized depreciation on forward foreign currency contracts | 303,185 | ||||||||||
|
|
|
| |||||||||||
| Total | $ | 60,395 | Total | $ | 303,185 | |||||||||
|
|
|
| |||||||||||
| Xtrackers MSCI Germany Hedged Equity ETF | ||||||||||||||
| Equity contracts | Unrealized appreciation on futures contracts* | $ | 13,297 | Unrealized depreciation on futures contracts* | $ | — | ||||||||
| Foreign exchange contracts | Unrealized appreciation on forward foreign currency contracts | 30,388 | Unrealized depreciation on forward foreign currency contracts | 215,881 | ||||||||||
|
|
|
| |||||||||||
| Total | $ | 43,685 | Total | $ | 215,881 | |||||||||
|
|
|
| |||||||||||
| Xtrackers MSCI Japan Hedged Equity ETF | ||||||||||||||
| Equity contracts | Unrealized appreciation on futures contracts* | $ | 655,988 | Unrealized depreciation on futures contracts* | $ | — | ||||||||
| Foreign exchange contracts | Unrealized appreciation on forward foreign currency contracts | 2,155,061 | Unrealized depreciation on forward foreign currency contracts | 251,931 | ||||||||||
|
|
|
| |||||||||||
| Total | $ | 2,811,049 | $ | 251,931 | ||||||||||
|
|
|
| |||||||||||
| * | Includes cumulative appreciation or cumulative depreciation on futures contracts as disclosed in the Schedule of Investments. Unsettled variation margin is disclosed separately within the Statement of Assets and Liabilities. |
107
DBX ETF Trust
Notes to Financial Statements (Continued)
Additionally, the amount of realized and unrealized gains and losses on derivative instruments recognized in the Funds’ earnings during the year ended May 31, 2020 and the related location in the accompanying Statement of Operations is summarized in the following tables by primary underlying risk exposure:
Net Realized Gain (Loss) from: | ||||||||||||
| Futures Contracts—Equity Contracts | Forward Foreign Currency Contracts—Foreign Exchange Contracts | Total | ||||||||||
Xtrackers MSCI All World ex US Hedged Equity ETF | $ | (446,166 | ) | $ | 3,313,847 | $ | 2,867,681 | |||||
Xtrackers MSCI Emerging Markets Hedged Equity ETF | (611,394 | ) | 4,836,767 | 4,225,373 | ||||||||
Xtrackers MSCI Europe Hedged Equity ETF | (311,692 | ) | 27,526,271 | 27,214,579 | ||||||||
Xtrackers MSCI Eurozone Hedged Equity ETF | (26,632 | ) | 1,217,837 | 1,191,205 | ||||||||
Xtrackers MSCI Germany Hedged Equity ETF | 25,897 | 957,873 | 983,770 | |||||||||
Xtrackers MSCI Japan Hedged Equity ETF | (404,655 | ) | (9,958,336 | ) | (10,362,991 | ) | ||||||
Net Change in Unrealized Appreciation (Depreciation) on: | ||||||||||||
| Futures Contracts—Equity Contracts | Forward Foreign Currency Contracts—Foreign Exchange Contracts | Total | ||||||||||
Xtrackers MSCI All World ex US Hedged Equity ETF | $ | 480,606 | $ | (478,442 | ) | $ | 2,164 | |||||
Xtrackers MSCI Emerging Markets Hedged Equity ETF | 167,520 | (869,547 | ) | (702,027 | ) | |||||||
Xtrackers MSCI Europe Hedged Equity ETF | 690,703 | (9,604,939 | ) | (8,914,236 | ) | |||||||
Xtrackers MSCI Eurozone Hedged Equity ETF | 32,165 | (442,022 | ) | (409,857 | ) | |||||||
Xtrackers MSCI Germany Hedged Equity ETF | 23,421 | (317,173 | ) | (293,752 | ) | |||||||
Xtrackers MSCI Japan Hedged Equity ETF | 1,177,175 | 14,218,630 | 15,395,805 | |||||||||
For the year ended May 31, 2020 the average monthly volume of derivatives was as follows:
| Futures Contracts (Contract Value) | Forward Foreign Currency Contracts (Contract Value) | |||||||
Xtrackers MSCI All World ex US Hedged Equity ETF | $ | 2,719,275 | $ | (98,568,880 | ) | |||
Xtrackers MSCI Emerging Markets Hedged Equity ETF | 2,478,411 | (96,464,638 | ) | |||||
Xtrackers MSCI Europe Hedged Equity ETF | 17,246,615 | (728,555,552 | ) | |||||
Xtrackers MSCI Eurozone Hedged Equity ETF | 599,456 | (24,250,207 | ) | |||||
Xtrackers MSCI Germany Hedged Equity ETF | 344,400 | (18,025,795 | ) | |||||
Xtrackers MSCI Japan Hedged Equity ETF | 7,893,430 | (310,907,472 | ) | |||||
As of May 31, 2020, the Funds have transactions subject to enforceable master netting agreements which govern the terms of certain transactions, and reduce the counterparty risk associated with such transactions. Master netting agreements allow a Fund to close out and net total exposure to a counterparty in the event of a deterioration in the credit quality or contractual default with respect to all of the transactions with a counterparty. As defined by the master netting agreement, the Funds may have collateral agreements with certain counterparties to mitigate risk. Interest expense from collateral received, if any, is included in Other expenses on the Statements of Operations. For financial reporting purposes the Statement of Assets and Liabilities generally shows derivatives assets and liabilities on a gross basis, which reflects the full risks and exposures prior to
108
DBX ETF Trust
Notes to Financial Statements (Continued)
netting. A reconciliation of the gross amounts on the Statement of Assets and Liabilities to the net amounts by counterparty, including any collateral exposure, is included in the following tables:
| Fund | Gross Amounts of Assets Presented in the Statement of Assets and Liabilities | Financial Instruments and Derivatives Available for Offset | Collateral Received (a) | Net Amount of Derivatives Assets | Gross Amounts of Liabilities Presented in the Statements of Assets and Liabilities | Financial Instruments and Derivatives Available for Offset | Collateral Pledged (a) | Net Amount of Derivatives Liabilities | ||||||||||||||||||||||||
| Xtrackers MSCI All World ex US Hedged Equity ETF |
| |||||||||||||||||||||||||||||||
Citigroup Global Markets | $ | 155,898 | $ | (155,898 | ) | $ | — | $ | — | $ | 220,291 | $ | (155,898 | ) | $ | — | $ | 64,393 | ||||||||||||||
JP Morgan & Chase Co. | 313,836 | (313,836 | ) | — | — | 355,799 | (313,836 | ) | — | 41,963 | ||||||||||||||||||||||
RBC Capital Markets | 231,160 | (231,160 | ) | — | — | 330,199 | (231,160 | ) | — | 99,039 | ||||||||||||||||||||||
|
|
|
|
|
|
|
|
|
|
|
|
|
|
|
| |||||||||||||||||
| $ | 700,894 | $ | (700,894 | ) | $ | — | $ | — | $ | 906,289 | $ | (700,894 | ) | $ | — | $ | 205,395 | |||||||||||||||
|
|
|
|
|
|
|
|
|
|
|
|
|
|
|
| |||||||||||||||||
| Xtrackers MSCI Emerging Markets Hedged Equity ETF |
| |||||||||||||||||||||||||||||||
Citigroup Global Markets | $ | 114,403 | $ | (114,403 | ) | $ | — | $ | — | $ | 255,501 | $ | (114,403 | ) | $ | — | $ | 141,098 | ||||||||||||||
JP Morgan & Chase Co. | 321,036 | (321,036 | ) | — | — | 440,669 | (321,036 | ) | (20,000 | ) | 99,633 | |||||||||||||||||||||
RBC Capital Markets | 358,127 | (228,799 | ) | 129,328 | — | 228,799 | (228,799 | ) | — | — | ||||||||||||||||||||||
|
|
|
|
|
|
|
|
|
|
|
|
|
|
|
| |||||||||||||||||
| $ | 793,566 | $ | (664,238 | ) | $ | 129,328 | $ | — | $ | 924,969 | $ | (664,238 | ) | $ | (20,000 | ) | $ | 240,731 | ||||||||||||||
|
|
|
|
|
|
|
|
|
|
|
|
|
|
|
| |||||||||||||||||
| Xtrackers MSCI Europe Hedged Equity ETF |
| |||||||||||||||||||||||||||||||
Citigroup Global Markets | $ | 553,026 | $ | (553,026 | ) | $ | — | $ | — | $ | 770,366 | $ | (553,026 | ) | $ | — | $ | 217,340 | ||||||||||||||
JP Morgan & Chase Co. | 1,667,533 | (1,667,533 | ) | — | — | 2,498,551 | (1,667,533 | ) | — | 831,018 | ||||||||||||||||||||||
RBC Capital Markets | 946,076 | (946,076 | ) | — | — | 1,916,872 | (946,076 | ) | (280,000 | ) | 690,796 | |||||||||||||||||||||
|
|
|
|
|
|
|
|
|
|
|
|
|
|
|
| |||||||||||||||||
| $ | 3,166,635 | $ | (3,166,635 | ) | $ | — | $ | — | $ | 5,185,789 | $ | (3,166,635 | ) | $ | (280,000 | ) | $ | 1,739,154 | ||||||||||||||
|
|
|
|
|
|
|
|
|
|
|
|
|
|
|
| |||||||||||||||||
| Xtrackers MSCI Eurozone Hedged Equity ETF |
| |||||||||||||||||||||||||||||||
Citigroup Global Markets | $ | 8,822 | $ | (8,822 | ) | $ | — | $ | — | $ | 53,648 | $ | (8,822 | ) | $ | — | $ | 44,826 | ||||||||||||||
JP Morgan & Chase Co. | 17,914 | (17,914 | ) | — | — | 134,886 | (17,914 | ) | — | 116,972 | ||||||||||||||||||||||
RBC Capital Markets | 15,368 | (15,368 | ) | — | — | 114,651 | (15,368 | ) | — | 99,283 | ||||||||||||||||||||||
|
|
|
|
|
|
|
|
|
|
|
|
|
|
|
| |||||||||||||||||
| $ | 42,104 | $ | (42,104 | ) | $ | — | $ | — | $ | 303,185 | $ | (42,104 | ) | $ | — | $ | 261,081 | |||||||||||||||
|
|
|
|
|
|
|
|
|
|
|
|
|
|
|
| |||||||||||||||||
| Xtrackers MSCI Germany Hedged Equity ETF |
| |||||||||||||||||||||||||||||||
Citigroup Global Markets | $ | 12,816 | $ | (12,816 | ) | $ | — | $ | — | $ | 95,330 | $ | (12,816 | ) | $ | — | $ | 82,514 | ||||||||||||||
JP Morgan & Chase Co. | 8,980 | (8,980 | ) | — | — | 67,584 | (8,980 | ) | — | 58,604 | ||||||||||||||||||||||
RBC Capital Markets | 8,592 | (8,592 | ) | — | — | 52,967 | (8,592 | ) | — | 44,375 | ||||||||||||||||||||||
|
|
|
|
|
|
|
|
|
|
|
|
|
|
|
| |||||||||||||||||
| $ | 30,388 | $ | (30,388 | ) | $ | — | $ | — | $ | 215,881 | $ | (30,388 | ) | $ | — | $ | 185,493 | |||||||||||||||
|
|
|
|
|
|
|
|
|
|
|
|
|
|
|
| |||||||||||||||||
| Xtrackers MSCI Japan Hedged Equity ETF |
| |||||||||||||||||||||||||||||||
Citigroup Global Markets | $ | 732,320 | $ | (110,136 | ) | $ | 622,184 | $ | — | $ | 110,136 | $ | (110,136 | ) | $ | — | $ | — | ||||||||||||||
JP Morgan & Chase Co. | 712,371 | (71,380 | ) | 560,000 | 80,991 | 71,380 | (71,380 | ) | — | — | ||||||||||||||||||||||
RBC Capital Markets | 710,370 | (70,415 | ) | 360,000 | 279,955 | 70,415 | (70,415 | ) | — | — | ||||||||||||||||||||||
|
|
|
|
|
|
|
|
|
|
|
|
|
|
|
| |||||||||||||||||
| $ | 2,155,061 | $ | (251,931 | ) | $ | 1,542,184 | $ | 360,946 | $ | 251,931 | $ | (251,931 | ) | $ | — | $ | — | |||||||||||||||
|
|
|
|
|
|
|
|
|
|
|
|
|
|
|
| |||||||||||||||||
| (a) | The actual collateral received or pledged may be more than amount shown. |
Affiliated Cash Management Vehicles The Funds may invest uninvested cash balances in DWS Government Money Market Series and DWS ESG Liquidity Fund, affiliated money market funds which are managed by DWS Investment Management Americas, Inc. (“DIMA”), also an indirect, wholly owned subsidiary of DWS Group GmbH & Co. KGaA. Each affiliated money market fund is managed in accordance with Rule 2a-7 under the 1940 Act, which governs the quality, maturity, diversity and liquidity of instruments in which a money market fund may invest. DWS Government Money Market Series seeks to maintain a stable NAV, and DWS ESG Liquidity Fund maintains a floating NAV. The Funds indirectly bear their proportionate share of the expenses of each affiliated money market fund in which they invest. The Advisor will waive an amount of the unitary management fee
109
DBX ETF Trust
Notes to Financial Statements (Continued)
payable to the Advisor by the Funds equal to such acquired fund’s fees and expenses on the Funds’ assets invested in the affiliated money market funds.
3. Investment Advisory and Other Agreements
The Advisor has overall responsibility for the general management and administration of the Funds, subject to the supervision of the Funds’ Board of Trustees. Under an investment advisory agreement between the Trust, on behalf of the Funds, and the Advisor (the “Investment Advisory Agreement”), the Advisor is responsible for arranging sub-advisory, transfer agency, custody, fund administration, and all other non-distribution related services for the Funds to operate.
For its investment advisory services to the Funds below, the Advisor was entitled to receive a unitary management fee based on each Fund’s average daily net assets, computed and accrued daily and payable monthly, at an annual rate equal to:
| Unitary Management Fee | ||||
Xtrackers MSCI All World ex US Hedged Equity ETF | 0.40 | % | ||
Xtrackers MSCI Emerging Markets Hedged Equity ETF | 0.65 | % | ||
Xtrackers MSCI Europe Hedged Equity ETF | 0.45 | % | ||
Xtrackers MSCI Eurozone Hedged Equity ETF | 0.45 | % | ||
Xtrackers MSCI Germany Hedged Equity ETF | 0.45 | % | ||
Xtrackers MSCI Japan Hedged Equity ETF | 0.45 | % | ||
The Advisor for the funds below has contractually agreed to waive a portion of its management fees in an amount equal to the acquired fund’s fees and expenses attributable to the Fund’s investments in affiliated cash management vehicles. For the year ended May 31, 2020, the Advisor waived expenses of the Funds as follows:
| Expenses Waived | ||||
Xtrackers MSCI All World ex US Hedged Equity ETF | $ | 1,748 | ||
Xtrackers MSCI Emerging Markets Hedged Equity ETF | 1,450 | |||
Xtrackers MSCI Europe Hedged Equity ETF | 9,832 | |||
Xtrackers MSCI Eurozone Hedged Equity ETF | 415 | |||
Xtrackers MSCI Germany Hedged Equity ETF | 237 | |||
Xtrackers MSCI Japan Hedged Equity ETF | 5,051 | |||
Out of the unitary management fee, the Advisor pays substantially all expenses of each Fund, including the cost of transfer agency, custody, fund administration, legal, audit and other services, and expenses of the Independent Trustees. Each Fund is responsible for the payment of interest expense, acquired fund fees and expenses, taxes, brokerage expenses, distribution fees or expenses, if any, litigation expenses and extraordinary expenses.
The Bank of New York Mellon, a wholly-owned subsidiary of The Bank of New York Mellon Corporation, serves as Administrator, Custodian, Accounting Agent, Lending Agent and Transfer Agent for each Fund.
ALPS Distributors, Inc. (the “Distributor”) serves as the distributor of Creation Units for each Fund on an agency basis. The Distributor does not maintain a secondary market in shares of the Funds.
The Board of Trustees is currently comprised of three Independent Trustees. The Advisor paid retainer fees and attendance fees to each Independent Trustee; retainer fees to the Chairman of the Board of Trustees and Chairman of the Audit Committee; and attendance fees to each member of the Audit Committee (which is comprised of all of the Funds’ Independent Trustees).
110
DBX ETF Trust
Notes to Financial Statements (Continued)
4. Investment Portfolio Transactions
For the year ended May 31, 2020, the cost of investments purchased and proceeds from sale of investments (excluding in-kind transactions and short-term investments) were as follows:
| Purchases | Sales | |||||||
Xtrackers MSCI All World ex US Hedged Equity ETF | $ | 12,071,651 | $ | 9,424,282 | ||||
Xtrackers MSCI Emerging Markets Hedged Equity ETF | 21,005,160 | 26,642,170 | ||||||
Xtrackers MSCI Europe Hedged Equity ETF | 91,266,364 | 99,594,140 | ||||||
Xtrackers MSCI Eurozone Hedged Equity ETF | 3,212,660 | 2,748,184 | ||||||
Xtrackers MSCI Germany Hedged Equity ETF | 2,671,223 | 2,523,806 | ||||||
Xtrackers MSCI Japan Hedged Equity ETF | 36,407,497 | 42,759,703 | ||||||
For the year ended May 31, 2020, the cost of in-kind purchases and proceeds from in-kind sales were as follows:
| Purchases | Sales | |||||||
Xtrackers MSCI All World ex US Hedged Equity ETF | $ | 4,440,603 | $ | 1,013,018 | ||||
Xtrackers MSCI Emerging Markets Hedged Equity ETF | 2,066,159 | 9,902,283 | ||||||
Xtrackers MSCI Europe Hedged Equity ETF | 91,689,776 | 434,468,060 | ||||||
Xtrackers MSCI Eurozone Hedged Equity ETF | — | 9,123,240 | ||||||
Xtrackers MSCI Germany Hedged Equity ETF | — | 7,809,529 | ||||||
Xtrackers MSCI Japan Hedged Equity ETF | 13,760,970 | 221,538,530 | ||||||
5. Fund Share Transactions
As of May 31, 2020, there were unlimited Fund shares, no par value, authorized by the Trust. Fund shares are issued and redeemed by each Fund only in Creation Units or multiples thereof. Except when aggregated in Creation Units, shares of each Fund are not redeemable. Transactions in capital shares for each Fund are disclosed in detail in the Statements of Changes in Net Assets. The consideration for the purchase of Creation Units of a Fund generally consists of the in-kind contribution of a designated portfolio of securities constituting a portfolio sampling representation of the securities included in the respective Fund’s Underlying Index and an amount of cash, which under certain circumstances may include cash in lieu of portfolio securities. Investors purchasing and redeeming Creation Units pay a purchase transaction fee and a redemption transaction fee to offset transfer and other transaction costs associated with the issuance and redemption of Creation Units.
6. Investing in Emerging Markets
The securities of issuers located in emerging markets tend to be more volatile and less liquid than securities of issuers located in more mature economies, and emerging markets generally have less diverse and less mature economic structures and less stable political systems than those of developed countries. The securities of issuers located or doing substantial business in emerging markets are often subject to rapid and large changes in price.
7. Line of Credit
The Trust has entered into a senior unsecured credit facility with a syndication of banks which allows the Xtrackers MSCI All World ex US Hedged Equity ETF, Xtrackers MSCI Emerging Markets Hedged Equity ETF and certain other funds managed by the Advisor to borrow up to $105 million. Each Fund may borrow money under this credit facility to the extent necessary for temporary or emergency purposes, including the funding of shareholder redemption requests, trade settlements, and as necessary to distribute to shareholders any income necessary to maintain each Funds’ status as a regulated investment company. Borrowings are charged an interest rate of 1.25% per annum plus the greater of the Federal Funds Effective Rate or the one-month LIBOR Rate. Each Fund may borrow up to the lesser of a pro-rata share of the credit facility at the amount listed below or 33 percent of its net assets as permitted by the Act. The Funds had no outstanding loans at May 31, 2020.
| Pro-rata Share | ||||
Xtrackers MSCI All World ex US Hedged Equity ETF | $ | 9,450,000 | ||
Xtrackers MSCI Emerging Markets Hedged Equity ETF | 14,700,000 | |||
111
DBX ETF Trust
Notes to Financial Statements (Continued)
8. Payments by Affiliates
During the year ended May 31, 2020, the Advisor agreed to reimburse Xtrackers MSCI Emerging Markets Hedged Equity ETF $6,700 for a loss due to a trade executed incorrectly. The amount of the loss was less than 0.01% of the Fund’s average net assets, thus having no impact on the Fund’s total return.
During the year ended May 31, 2020, the Advisor agreed to reimburse Xtrackers MSCI Japan Hedged Equity ETF $16,074 for a loss due to a trade executed incorrectly. The amount of the loss was less than 0.01% of the Fund’s average net assets, thus having no impact on the Fund’s total return.
9. Other
A novel strain of coronavirus (COVID-19) outbreak was declared a pandemic by the World Health Organization on March 11, 2020. The situation is evolving with various cities and countries around the world responding in different ways to address the pandemic. There are direct and indirect economic effects developing for various industries and individual companies throughout the world. The recent pandemic spread of the novel coronavirus and related geopolitical events could lead to increased financial market volatility, disruption to U.S. and world economies and markets and may have significant adverse effects on a Fund and its investments. A prolonged disruption may result in a Fund and its service providers experiencing operational difficulties in implementing their business continuity plans. Management will continue to monitor the impact COVID-19 has on the Funds and reflect the consequences as appropriate in each Fund’s accounting and financial reporting.
10. Subsequent Event
On June 17, 2020, Deutsche Bank AG (“DB”), an affiliate of DWS Group, resolved with the Commodity Futures Trading Commission (“CFTC”) charges stemming from alleged violations of various swap data reporting requirements and corresponding supervision and other failures. The matter, which was resolved by the issuance of a federal court order (“Consent Order”), involved unintentional conduct that resulted from a system outage that prevented DB from reporting data in accordance with applicable CFTC requirements for a period of five days in April 2016.
The matter giving rise to the Consent Order did not arise out of any investment advisory, fund management activities or distribution activities of DBX Advisors LLC or their advisory affiliates (the “DWS Service Providers”). DWS Group, of which the DWS Service Providers are wholly-owned subsidiaries (except for Harvest Global Management Limited which is partially owned by DWS Group), is a separate publicly traded company but continues to be an affiliate of DB due to, among other things, DB’s 79.49% ownership interest in DWS Group. Under the provisions of the Investment Company Act of 1940, as a result of the Consent Order, the DWS Service Providers would not be eligible to continue to provide investment advisory services to the Funds absent an order from the Securities and Exchange Commission (the “SEC”). DB and the DWS Service Providers are seeking temporary and permanent orders from the SEC to permit the DWS Service Providers to continue to provide investment advisory services to the Funds and other registered investment companies notwithstanding the Consent Order. While there can be no assurance that the requested exemptive orders will be granted, the SEC has granted this type of relief in the past. Consistent with their fiduciary and other relationships with the Funds, and in accordance with the desire of the Board of the Funds, the DWS Service Providers continue to provide investment advisory services to the Funds. Subject to the receipt of the temporary and permanent exemptive orders, the DWS Service Providers have informed the Funds that they do not believe the Consent Order will have any material impact on the Funds or the ability of the DWS Service Providers to provide services for the Funds.
112
DBX ETF Trust
To the Shareholders of Xtrackers MSCI All World ex US Hedged Equity ETF, Xtrackers MSCI Emerging Markets Hedged Equity ETF, Xtrackers MSCI Europe Hedged Equity ETF, Xtrackers MSCI Eurozone Hedged Equity ETF, Xtrackers MSCI Germany Hedged Equity ETF, Xtrackers MSCI Japan Hedged Equity ETF, and the Board of Trustees of DBX ETF Trust
Opinion on the Financial Statements
We have audited the accompanying statements of assets and liabilities of Xtrackers MSCI All World ex US Hedged Equity ETF, Xtrackers MSCI Emerging Markets Hedged Equity ETF, Xtrackers MSCI Europe Hedged Equity ETF, Xtrackers MSCI Eurozone Hedged Equity ETF, Xtrackers MSCI Germany Hedged Equity ETF, and Xtrackers MSCI Japan Hedged Equity ETF (collectively referred to as the “Funds”), (six of the funds constituting DBX ETF Trust, “the Trust”)), including the schedules of investments, as of May 31, 2020, and the related statements of operations for the year then ended, the changes in net assets for each of the two years in the period then ended, the financial highlights for each of the five years in the period then ended and the related notes (collectively referred to as the “financial statements”). In our opinion, the financial statements present fairly, in all material respects, the financial position of each of the Funds (six of the funds constituting the DBX ETF Trust) at May 31, 2020, and the results of their operations for the year then ended, changes in net assets for each of the two years in the period then ended and financial highlights for each of the five years in the period then ended, in conformity with U.S. generally accepted accounting principles.
Basis for Opinion
These financial statements are the responsibility of the Trust’s management. Our responsibility is to express an opinion on each of the Funds’ financial statements based on our audits. We are a public accounting firm registered with the Public Company Accounting Oversight Board (United States) (“PCAOB”) and are required to be independent with respect to the Trust in accordance with the U.S. federal securities laws and the applicable rules and regulations of the Securities and Exchange Commission and the PCAOB.
We conducted our audits in accordance with the standards of the PCAOB. Those standards require that we plan and perform the audit to obtain reasonable assurance about whether the financial statements are free of material misstatement, whether due to error or fraud. The Trust is not required to have, nor were we engaged to perform, an audit of the Trust’s internal control over financial reporting. As part of our audits we are required to obtain an understanding of the internal control over financial reporting but not for the purpose of expressing an opinion on the effectiveness of the Trust’s internal control over financial reporting. Accordingly, we express no such opinion.
Our audits included performing procedures to assess the risks of material misstatement of the financial statements, whether due to error or fraud, and performing procedures that respond to those risks. Such procedures included examining, on a test basis, evidence regarding the amounts and disclosures in the financial statements. Our procedures included confirmation of securities owned as of May 31, 2020, by correspondence with the custodians and brokers or by other appropriate auditing procedures where replies from brokers were not received. Our audits also included evaluating the accounting principles used and significant estimates made by management, as well as evaluating the overall presentation of the financial statements. We believe that our audits provide a reasonable basis for our opinion.

We have served as the auditor of one or more investment companies in the DWS family of funds since at least 1979, but we are unable to determine the specific year.
New York, New York
July 27, 2020
113
DBX ETF Trust
All Funds
In accordance with Rule 22e-4 (the “Liquidity Rule”) under the Investment Company Act of 1940 (the “1940 Act”), your Fund has adopted a liquidity risk management program (the “Program”), and the Board has designated DBX Advisors LLC (“Advisors”) as Program administrator. The Program is designed to assess and manage your Fund’s liquidity risk (the risk that the Fund would be unable to meet requests to redeem shares of the Fund without significant dilution of remaining investors’ interests in the Fund). Advisors has designated a committee (the “Committee”) composed of personnel from multiple departments within an affiliate of Advisors that is responsible for the implementation and ongoing administration of the Program, which includes assessing the Fund’s liquidity risk under both normal and reasonably foreseeable stressed conditions. Under the Program, every investment held by a Fund is classified on a daily basis into one of four liquidity categories based on calculations of the investment’s ability to be sold during designated timeframes in current market conditions without significantly changing the investment’s market value.
Xtrackers MSCI Emerging Markets Hedged Equity ETF (DBEM), Xtrackers MSCI Europe Hedged Equity ETF (DBEU),
Xtrackers MSCI Germany Hedged Equity ETF (DBGR) and Xtrackers MSCI Eurozone Hedged Equity ETF (DBEZ) only
In February 2020, as required by the Program and the Liquidity Rule, Advisors provided the Board with an annual written report (the “Report”) addressing the operation of the Program and assessing the adequacy and effectiveness of its implementation during the period from December 1, 2018 through November 30, 2019 (the “Reporting Period”). During the Reporting Period, your Fund was primarily invested in highly liquid investments (investments that the Fund anticipates can be converted to cash within three business days or less in current market conditions without significantly changing their market value). As a result, your Fund is not required to adopt, and has not adopted, a “Highly Liquid Investment Minimum” as defined in the Liquidity Rule. During the Reporting Period, the Fund did not approach the 15% limit imposed by the Liquidity Rule on holdings in illiquid investments (investments that cannot be sold or disposed of in seven days or less in current market conditions without the sale of the investment significantly changing the market value of the investment). Your Fund did not experience any issues meeting investor redemptions at any time during the Reporting Period. In the Report, Advisors stated that it believes the Program has operated adequately and effectively to manage the Fund’s liquidity risk during the Reporting Period. Advisors also reported on a material change made to the Program in May 2019 to address Securities and Exchange Commission guidance relating to extended foreign market holidays.
Xtrackers MSCI All World ex US Hedged Equity ETF (DBAW) and Xtrackers MSCI Japan Hedged Equity ETF (DBJP) only
In February 2020, as required by the Program and the Liquidity Rule, Advisors provided the Board with an annual written report (the “Report”) addressing the operation of the Program and assessing the adequacy and effectiveness of its implementation during the period from December 1, 2018 through November 30, 2019 (the “Reporting Period”). During the Reporting Period, your Fund was primarily invested in highly liquid investments (investments that the Fund anticipates can be converted to cash within three business days or less in current market conditions without significantly changing their market value). As a result, your Fund is not required to adopt, and has not adopted, a “Highly Liquid Investment Minimum” as defined in the Liquidity Rule. During the Reporting Period, the Fund did experience a temporary breach of the 15% limit imposed by the Liquidity Rule on holdings in illiquid investments (investments that cannot be sold or disposed of in seven days or less in current market conditions without the sale of the investment significantly changing the market value of the investment). The breach was caused by the temporary reclassification of Japanese securities as illiquid due to an extended Japanese holiday market closure. The temporary reclassification of Japanese securities caused the Fund to exceed the 15% limit on illiquid investments for a two day period. Because the holiday closure was anticipated in advance, no actions were needed to rebalance the Fund’s portfolio. Your Fund did not experience any issues meeting investor redemptions at any time during the Reporting Period. In the Report, Advisors stated that it believes the Program has operated adequately and effectively to manage the Fund’s liquidity risk during the Reporting Period. Advisors also reported on a material change made to the Program in May 2019 to address Securities and Exchange Commission guidance relating to extended foreign market holidays.
114
DBX ETF Trust
Identification and Background
The Board has responsibility for the overall management and operations of the funds, including general supervision of the duties performed by the Advisor and other service providers. Each Board Member serves until his or her successor is duly elected or appointed and qualified. Each officer serves until he or she resigns, is removed, dies, retires or becomes disqualified.
The Trust currently has three Board Members. The three Independent Board Members have no affiliation or business connection with the Advisor or any of its affiliated persons and do not own any stock or other securities issued by the Advisor.
The Independent Board Members of the Trust, their term of office and length of time served, their principal business occupations during the past five years, the number of portfolios in the fund complex (defined below) overseen by each Independent Board Member, and other directorships, if any, held by the Board Members are shown below. The fund complex includes all registered open- and closed-end funds (including all of their portfolios) advised by the Advisor and any registered funds that have an investment advisor that is an affiliated person of the Advisor. As of the date of this shareholder report, the fund complex consists of the funds in the Trust, as well as the registered funds advised by affiliates of the Advisor.
Shareholder Communications to the Board. Shareholders may send communications to the Trust’s Board by addressing the communications directly to the Board (or individual Board Members) and/or otherwise clearly indicating in the salutation that the communication is for the Board (or individual Board Members). The shareholder may send the communication to either the Trust’s office or directly to such Board members c/o 875 Third Avenue, New York, NY 10022. Other shareholder communications received by the Trust not directly addressed and sent to the Board will be reviewed and generally responded to by management. Such communications will be forwarded to the Board at management’s discretion based on the matters contained therein.
Independent Board Members
| Name, Year of Birth, Position with the Trust and Length of Time Served(1) | Business Experience and Directorships During the Past 5 Years | Number of Portfolios in Fund Complex Overseen | Other Directorships Held by Board Member | |||
Stephen R. Byers (1953) Chairman since 2016, | Independent Director (2011- present); Independent Consultant (2014-present); Director of Investment Management, the Dreyfus Corporation (2000-2006) and Vice Chairman and Chief Investment Officer, the Dreyfus Corporation (2002-2006). | 34 | The Arbitrage Funds, Sierra Income Corporation, Mutual Fund Directors Forum | |||
| George O. Elston (1964) Board Member since 2011, Chairman of the Audit Committee since 2015 | Chief Financial Officer, Enzyvant (2018-present); Chief Executive Officer, 2X Oncology, Inc. (2017-2018); Senior Vice President and Chief Financial Officer, Juniper Pharmaceuticals, Inc. (2014-2016); Senior Vice President and Chief Financial Officer, KBI BioPharma Inc. (2013-2014); Managing Partner, Chatham Street Partners (2010-2013). | 34 | — | |||
J. David Officer (1948) Board Member since 2011, Chairman of the Nominating Committee since 2015 | Independent Director (2010-present); Vice Chairman, the Dreyfus Corporation (2006-2009); President, The Dreyfus Family of Funds, Inc. (2006-2009). | 34 | (Chairman of) Ilex Management Ltd; Old Westbury Funds |
115
DBX ETF Trust
Board Members and Officers (Unaudited) (Continued)
Officers(2) |
| Name, Year of Birth, Position with the Trust and Length of Time Served(4) | Business Experience and Directorships During the Past 5 Years | |
Freddi Klassen(5) (1975) President and Chief Executive Officer, 2016-present | Director(3) in DWS and Chief Operating Officer in the Americas for the Traditional Asset Classes Department (2014–present); Manager and Chief Operating Officer of DWS Investment Management Americas, Inc. (2018–present) and the Advisor (2016–present); Global Chief Operating Officer for Equities Technology in the Investment Bank Division at Deutsche Bank AG (2013-2014); Chief Operating Officer for Exchange Traded Funds and Systematic Funds in Europe (2008-2013). | |
Luke Oliver(5) (1980) | Managing Director(3) in DWS (2017-present); Director(3) in DWS (2009-2017); Head of Passive Americas Asset Management Platform (2019-present); Manager, Chief Executive Officer and Chief Investment Officer of the Advisor (2019-present); Head of ETF Capital Markets, Americas (2012-2018); Lead Portfolio Manager of PowerShares DB ETFs (2009-2012). | |
Diane Kenneally(6) (1966) Treasurer, Chief Financial Officer and Controller, 2019-present | Director(3) in DWS; Chief Financial Officer and Treasurer for DWS US registered investment companies advised by DWS Investment Management Americas, Inc. (2018-present); Treasurer and Chief Financial Officer, The European Equity Fund, Inc., The New Germany Fund, Inc. and The Central and Eastern Europe Fund, Inc. (2018-present); formerly: Assistant Treasurer for the DWS funds (2007-2018). | |
Frank Gecsedi(5) (1967) | Director(3) in DWS Compliance Department (2016-present), Vice President in the Deutsche Asset Management Compliance Department at Deutsche Bank AG (2013-2016) and Chief Compliance Officer of the Advisor (2010-present); Chief Compliance Officer of DWS Distributors, Inc. (2019-present); Vice President in Deutsche Bank’s Global Markets Legal, Risk and Capital Division (2010-2012). | |
Bryan Richards(5) (1978) Vice President, 2016-present | Managing Director(3) in DWS (2018-present); Director(3) in DWS (2014-2018); Portfolio Manager in the Passive Asset Management Department at DWS (2011-present); Primary Portfolio Manager for the PowerShares DB Commodity ETFs (2011-2015). | |
John Millette(6) (1962) Secretary, 2020-present | Director(3) in DWS US Retail Legal (2003-present); Vice President and Secretary of DWS US registered investment companies advised by DWS Investment Management Americas, Inc. (1999-present); Chief Legal Officer, DWS Investment Management Americas, Inc. (2015-present); Director and Vice President of DWS Trust Company (2016-present); Secretary, The European Equity Fund, Inc., The New Germany Fund, Inc. and The Central and Eastern Europe Fund, Inc. (2011-present); formerly: Secretary of Deutsche Investment Management Americas Inc. (2015-2017); Assistant Secretary of DBX ETF Trust (2019-2020); Assistant Secretary (July 14, 2006-December 31, 2010) and Secretary (January 31, 2006-July 13, 2006), The European Equity Fund, Inc., The New Germany Fund, Inc. and The Central and Eastern Europe Fund, Inc. | |
Caroline Pearson(6) (1962) | Managing Director(3) in DWS US Retail Legal; Chief Legal Officer of DWS US registered investment companies advised by DWS Investment Management Americas, Inc. (2010-present); Chief Legal Officer, The European Equity Fund, Inc., The New Germany Fund, Inc. and The Central and Eastern Europe Fund, Inc. (2012-present); formerly: Secretary, Deutsche AM Distributors, Inc. (2002-2017); and Secretary, Deutsche AM Service Company (2010-2017). |
116
DBX ETF Trust
Board Members and Officers (Unaudited) (Continued)
Officers(2) |
| Name, Year of Birth, Position with the Trust and Length of Time Served(4) | Business Experience and Directorships During the Past 5 Years | |
Paul Antosca(6) (1957) | Director(3) in DWS; Assistant Treasurer for DWS US registered investment companies advised by DWS Investment Management Americas, Inc. (2007-present). | |
Jeffrey Berry(6) (1959) | Director(3) in DWS. | |
Sheila Cadogan(6) (1966) | Director(3) in DWS; Assistant Treasurer for DWS US registered investment companies advised by DWS Investment Management Americas, Inc. (2017-present); Director and Vice President, DWS Trust Company (2018-present); Assistant Treasurer, The European Equity Fund, Inc., The New Germany Fund, Inc. and The Central and Eastern Europe Fund, Inc. (2018-present). | |
Christina A. Morse(7) (1964) | Vice President at BNY Mellon-Asset Servicing (2014-present); Vice President and Counsel at Lord Abbett & Co. LLC (2013-2014). | |
Michelle Goveia-Pine(5) (1970) Interim Anti-Money Laundering Compliance Officer, since July 9, 2020 | Director(3) in DWS; Interim AML Officer, DWS Trust Company (since July 28, 2020); and Interim AML Officer of DWS US registered investment companies advised by DWS Investment Management Americas, Inc. (since July 10, 2020); Interim AML Officer, The European Equity Fund, Inc., The New Germany Fund, Inc. and The Central and Eastern Europe Fund, Inc. (since July 24, 2020). |
(1) The length of time served is represented by the year in which the Board Member joined the Board.
(2) As a result of their respective positions held with the Advisor and its affiliates, these individuals are considered “interested persons” of the Advisor within the meaning of the 1940 Act. Interested persons receive no compensation from the Funds.
(3) Executive title, not a board directorship.
(4) The length of time served is represented by the year in which the officer was first elected to the Trust in such capacity.
(5) Address: 875 Third Avenue, New York, New York 10022.
(6) Address: One International Place, Boston, Massachusetts 02110.
(7) Address: BNY Mellon Asset Servicing, Atlantic Terminal Office Tower, 2 Hanson Place, Brooklyn, NY 11217.
The Funds’ Statement of Additional Information (“SAI”) includes additional information about the Funds’ Board Members. The SAI is available by calling 855-329-3837, or on the Company’s website at www.Xtrackers.com.
117
DBX ETF Trust
Xtrackers MSCI All World ex-US Hedged Equity ETF, Xtrackers MSCI Emerging Markets Hedged Equity ETF, Xtrackers MSCI Europe Hedged Equity ETF, Xtrackers MSCI Eurozone Hedged Equity ETF, Xtrackers MSCI Germany Hedged Equity ETF and Xtrackers MSCI Japan Hedged Equity ETF
After discussions at the meeting of the Board of Trustees (“Board” or “Trustees”) held on February 26-27, 2020 (the “Meeting”), the Trustees, all of whom are the Independent Trustees (those not affiliated with DBX ETF Trust (the “Trust”) or its service providers), unanimously approved the continuance of the Investment Advisory Agreement with respect to Xtrackers MSCI All World ex-US Hedged Equity ETF, Xtrackers MSCI Emerging Markets Hedged Equity ETF, Xtrackers MSCI Europe Hedged Equity ETF, Xtrackers MSCI Eurozone Hedged Equity ETF, Xtrackers MSCI Germany Hedged Equity ETF, and Xtrackers MSCI Japan Hedged Equity ETF (each a “Fund,” and collectively, the “Funds”). The Independent Trustees were advised throughout the review and Meeting by K&L Gates LLP (“Independent Trustee Counsel”).
Before reaching their decision to approve the Investment Advisory Agreement for another annual period, the Independent Trustees evaluated the materials furnished to them in advance of the Meeting from DBX Advisors LLC (“DBX” or the “Advisor”) for purposes of reviewing the agreement’s terms, including statistical information prepared by Broadridge Financial Solutions Inc. (“Broadridge”) regarding (a) fee and expense information for each Fund (including the fee and expense components and any amounts waived or reimbursed) as compared to a peer group of other exchange-traded funds (“ETFs”) selected pursuant to Broadridge’s proprietary methodology (each, a “Peer Group”) and (b) each Fund’s tracking error as compared to its underlying index over the previous five years (or since inception, if shorter). The Independent Trustees also took into consideration the discussions they had with management during the Meeting and among themselves during their Executive Sessions held on February 26 and February 27, 2020. The Independent Trustees also noted that they had received and should take into consideration a substantial amount of information furnished throughout the year at regular Board meetings, which information included, among other things, an analysis of each Fund’s investment performance, tracking error and related financial information, presentations given by DBX, as well as its periodic reports on brokerage commissions, portfolio execution and other services provided to the Funds.
In reaching its decision to continue in effect the Investment Advisory Agreement for another annual period, the Board considered all factors it believed relevant, including (1) the nature, extent and quality of the services provided to the Funds and their shareholders; (2) the financial resources of DBX and its resulting ability to perform its obligations under the Investment Advisory Agreement; (3) the competitiveness of the advisory fee; (4) the total cost of the services provided by and the profits realized by the Advisor from its relationship with the Funds; (5) the extent to which economies of scale have been realized, and if the Funds’ shareholders have benefitted from those economies; and (6) fall out benefits, if any, enjoyed by the Advisor.
The Board reached a determination, with the assistance of Independent Trustee Counsel and Dechert LLP (“Trust Counsel”) and through the exercise of its business judgment, that approval of the Investment Advisory Agreement and the compensation to be received thereunder is in the best interests of each Fund and its shareholders as well as consistent with the Board’s duties under state and federal law. The Board reached this conclusion based on multiple factors.
The Board considered the following in determining whether to approve the Investment Advisory Agreement:
Nature, Extent and Quality of Services. The Board reviewed in detail the nature, extent and quality of services provided and the risks incurred by the Advisor under the Investment Advisory Agreement. In doing so, the Board considered the information it had received from and the discussions it had with the Advisor continuously during the prior year, in addition to the information the Advisor had provided in response to the Board’s requests prior to the Meeting. The Board considered that these services include, among other things, furnishing a continuous investment program for the Funds, including arranging for, or implementing, the purchase and sale of portfolio securities, the provision of general corporate services such as portfolio management compliance services and the preparation and filing of certain reports on behalf of the Trust. The Board also considered, among other things, the professional experience, qualifications and performance of the senior management and key professional personnel of the Advisor, including portfolio management.
118
DBX ETF Trust
Board Considerations in Approval of Investment Advisory and
Sub-Advisory Contracts (Unaudited) (Continued)
The Board considered that the Advisor provides, at its own expense, office facilities and equipment for use by the Funds and supervisory persons responsible for supervising and monitoring the Trust’s service providers. The Board also considered that the Advisor pays or arranges for the compensation of officers of the Trust who are also officers or employees of the Advisor or one of its DWS Group affiliates, except as may otherwise be determined by the Board. In addition, the Board considered that the Advisor arranges for the provision of transfer agency, custody, fund administration and accounting, and other non-distribution services necessary for the Funds’ operations. The Board also considered that in addition to managing the Funds’ portfolios directly, the Advisor provides oversight of day-to-day operations, including monitoring tracking error, providing services in connection with the creation and redemption of creation units and assistance in meeting legal, compliance and regulatory requirements applicable to the Funds.
The Board considered the information regarding each Fund’s tracking error compared to its underlying index that had been provided by the Advisor and by Broadridge. The Board took note of the detailed information provided by the Advisor throughout the year with respect to each Fund’s tracking error and the sources thereof. The Trustees noted that tracking error for each Fund during the year was in an expected range.
Based on its review, the Board concluded that the nature, extent, and quality of services provided by the Advisor under the Investment Advisory Agreement are reasonable and appropriate in relation to the fees paid to the Advisor, taking special consideration of the fact that the advisory fee is a unitary fee and, as a result, a portion of the unitary advisory fee will be used to compensate the Funds’ service providers. The Board considered the staffing of the Advisor, including the training, qualifications and experience of investment personnel in managing the Funds. The Board also considered the expertise of the Advisor in supervising third party service providers to the Funds, such as the administrator and the custodian, noting the Advisor’s extensive work with these service providers (including onsite due diligence sessions) to conduct such supervision. The Board further considered the compliance program of the Advisor, which supports the Funds’ compliance program.
Advisor’s Financial Resources. In connection with the assessment of the ability of the Advisor to perform its duties under the Investment Advisory Agreement, the Board considered the Advisor’s financial condition and whether it has the resources necessary to carry out its functions. The Board concluded that the Advisor has the financial resources necessary to perform its obligations under the Investment Advisory Agreement.
Reasonableness of Advisory Fee. The Board compared each Fund’s advisory fee and total expenses to those of the other ETFs in its Peer Group. The Board noted that due to the special characteristics of certain Funds, there were limitations faced by Broadridge in providing comparable funds in the Peer Groups and the information in the Broadridge reports accordingly may or may not provide meaningful direct comparisons to the Funds. The Board also noted that the advisory fees and total expenses (after waivers/reimbursements) for the Funds were below or equal to the average and/or median of the ETFs in each Fund’s respective Peer Group compiled by Broadridge.
The Board accordingly noted that each Fund’s fee is competitive with the fees of applicable peer ETFs.
The Board considered that the fee for each of the Funds is a unitary fee pursuant to which the Advisor pays all of the Funds’ costs (subject to certain specified exceptions). The Board considered that each Fund’s fee had been priced to scale when it was established. The Board also considered that each Fund’s portfolio is managed on a day-to-day basis by the Advisor and that the Advisor also provides oversight of day-to-day operations, including monitoring tracking error, providing services in connection with creation and redemption units and assistance in meeting legal and regulatory requirements applicable to the Funds. Based on its review, the Board concluded that the advisory fee for each Fund is reasonable in light of the services provided.
Costs of Services and Profitability. The Board considered the expenses of the Advisor in developing and rendering services provided to the Funds and the information provided by the Advisor to the Board regarding the Funds’ profitability. The Board considered that the Advisor had provided extensive information about the Advisor’s profitability and the Advisor’s methodology in determining profitability. While the Advisor had provided information about the Advisor’s expenses relating to marketing the Funds, the Board considered the Advisor’s profitability without accounting for such expenses. The Board determined that, although only some of the Funds
119
DBX ETF Trust
Board Considerations in Approval of Investment Advisory and
Sub-Advisory Contracts (Unaudited) (Continued)
were profitable as of this time, the Advisor’s profitability with respect to each profitable Fund was not excessive. The Board considered whether the Advisor would benefit in other ways from its relationships with the Funds and concluded that there were no material fall-out benefits likely to accrue to the Advisor related to the operation of the Funds.
Economies of Scale. The Board considered that certain Funds had attracted a substantial amount of assets, but determined that those Funds were not experiencing economies of scale beyond what was reflected in each Fund’s unitary fee, which the Board noted was very competitive. The Board considered that the other Funds were not experiencing economies of scale at this time and determined to revisit this matter after the Funds had attracted more assets.
Given all the information available to it and considering all material factors, the Board concluded that the Investment Advisory Agreement was fair and reasonable and it was unanimously approved.
120
DBX ETF Trust
Proxy Voting Policies and Procedures
The Funds’ policies and procedures for voting proxies for portfolio securities and information about how each Fund voted proxies related to its portfolio securities during the most recent 12-month period ended June 30 are available on our Web site — www.Xtrackers.com (click on “Resources” and “Proxy Voting” at the top of the page) — or on the SEC’s Web site — www.sec.gov. To obtain a written copy of the Funds’ policies and procedures without charge, upon request, call us toll free at 855-329-3837.
Portfolio Holdings Information
The Funds are required to file their complete schedule of portfolio holdings with the SEC for their first and third fiscal quarters on Form N-PORT. Copies of the filings are available without charge, upon request on the SEC’s website at www.sec.gov and are available by calling the Trust at 855-329-3837.
Information about each Fund’s portfolio holdings is available daily at www.Xtrackers.com.
Discount/Premium Information
Information regarding how often shares of each Fund traded on NYSE Arca or Cboe, as applicable, at a price above (i.e., at a premium) or below (i.e., at a discount) the NAV of the Fund can be found at www.Xtrackers.com.
Tax Information
Form 1099-DIV and other year-end tax information provide shareholders with actual calendar year amounts that should be included in their tax returns. Shareholders should consult their tax advisors.
Each Fund designates the following amounts or, if subsequently determined to be different, the maximum allowable for its year ended May 31, 2020.
| Qualified Dividend Income* | ||||
Xtrackers MSCI All World ex US Hedged Equity ETF | 91% | |||
Xtrackers MSCI Emerging Markets Hedged Equity ETF | 80% | |||
Xtrackers MSCI Europe Hedged Equity ETF | 94% | |||
Xtrackers MSCI Eurozone Hedged Equity ETF | 100% | |||
Xtrackers MSCI Germany Hedged Equity ETF | 100% | |||
Xtrackers MSCI Japan Hedged Equity ETF | 100% | |||
* The above percentage is based on ordinary income dividends paid to shareholders during each Fund’s fiscal year.
Each Fund intends to elect to pass through to shareholders the credit for taxes paid to foreign countries. The gross foreign source income and foreign taxes paid are as follows:
| Gross Foreign Income | Foreign Taxes Paid | |||||||
Xtrackers MSCI All World ex US Hedged Equity ETF | $ 2,974,871 | $241,878 | ||||||
Xtrackers MSCI Emerging Markets Hedged Equity ETF | 3,836,528 | 335,732 | ||||||
Xtrackers MSCI Europe Hedged Equity ETF | 18,292,917 | 1,179,004 | ||||||
Xtrackers MSCI Eurozone Hedged Equity ETF | 498,896 | 64,286 | ||||||
Xtrackers MSCI Germany Hedged Equity ETF | 282,815 | 40,948 | ||||||
Xtrackers MSCI Japan Hedged Equity ETF | 7,410,230 | 619,755 | ||||||
121
DBX ETF Trust
DBX Advisors LLC (“Advisors”) collects non-public information about you from the following sources: (i) information received from you on applications or other forms; and (ii) information about your transactions with the Advisors, Advisors’ affiliates and third-party service providers and vendors. Advisors does not disclose any non-public personal information about you to anyone, other than as set forth below, as permitted by applicable law and regulation. Advisors may disclose non-public personal information about you to the funds in which you invest, to Advisors’ affiliates, and to non-affiliated companies that work with Advisors to service your account(s), or to provide services or process transactions that you have requested. Advisors may disclose non-public personal information in situations that may include, but are not limited to, in response to legal and/or regulatory inquiries and the proposed or actual sale, assignment merger or other transfer of all or a portion of Advisors’ business to another business entity. Advisors may also disclose non-public personal information about you to parties representing you, such as your investment representative, your accountant, your tax advisor, or to other third parties at your direction/consent. Advisors will not sell, rent, license or trade your personal and financial information to or with third parties for their own direct marketing use unless you give us general or specific consent to do so. If you decide to close your account(s) or become an inactive customer, Advisors will adhere to the privacy policies and practices as described in this notice. Advisors restricts access to your personal and account information to those employees who need to know that information to provide products and services to you. Advisors maintains reasonable and customary physical, electronic and procedural safeguards to guard your non-public personal information.
California residents may go to https://fundsus.dws.com/us/en-us/legal-resources/privacy-policy.html to obtain additional information relating to their rights under California state law.
Advisors reserves the right, at their discretion, to change, modify, add, or remove portions of this Privacy Policy Notice, and any of the policies described herein, at any time. Advisors will indicate any such changes to the Privacy Policy Notice at the privacy link which can be found at www.Xtrackers.com. At all times, you are bound by the then-current version of the Privacy Policy and all applicable laws. Advisors highly recommends that you review this Privacy Policy Notice from time to time to ensure that you are familiar with the most recent version. The examples contained in this Privacy Policy Notice are illustrations; they are not intended to be exclusive.
122
DBX ETF Trust
This report is intended for the shareholders of DBX ETF Trust.
This report must be preceded or accompanied by a prospectus.
Investing involves risk, including the possible loss of principal. Stocks may decline in value. Foreign investing involves greater and different risks than investing in U.S companies, including currency fluctuations, less liquidity, less developed or less efficient trading markets, lack of comprehensive company information, political instability and differing auditing and legal standards. The European financial markets have recently experienced volatility and adverse trends in recent years due to concerns about economic downturns or rising government debt levels in several European countries, including Greece, Ireland, Italy, Portugal and Spain. A default or debt restructuring by any European country would adversely impact holders of that country’s debt, and sellers of credit default swaps linked to that country’s creditworthiness (which may be located in countries other than those listed in the previous sentence). These events have adversely affected the exchange rate of the euro, the common currency of certain EU countries, and may continue to significantly affect every country in Europe, including countries that do not use the euro. Italy, Portugal and Spain currently have high levels of debt and public spending, which may stifle economic growth, contribute to prolonged periods of recession or lower sovereign debt ratings and adversely impact investments in the Fund. Emerging markets tend to be more volatile and less liquid than the markets of more mature economies, and generally have less diverse and less mature economic structures and less stable political systems than those of developed countries. The Funds’ use of forward currency contracts may not be successful in hedging currency exchange rates changes and could eliminate some or all of the benefit of an increase in the value of a foreign currency versus the U.S. dollar. Funds investing in a single industry, country or in a limited geographic region generally are more volatile than more diversified funds. Investing in derivatives entails special risks relating to liquidity, leverage and credit that may reduce returns and/or increase volatility. DBGR is currently non-diversified and can take larger positions in fewer issues, increasing each Fund’s potential risk. Performance of the Funds may diverge from that of the Underlying Index due to operating expenses, transaction costs, cash flows, use of sampling strategies or operational inefficiencies. An investment in these Funds should be considered only as a supplement to a complete investment program for those investors willing to accept the risks associated with the Funds. Please read the prospectus for more information.
War, terrorism, economic uncertainty, trade disputes, public health crises (including the recent pandemic spread of the novel coronavirus) and related geopolitical events could lead to increased market volatility, disruption to U.S. and world economies and markets and may have significant adverse effects on the Funds and their investments.
In June 2016, citizens of the United Kingdom approved a referendum to leave the European Union and in March 2017, the United Kingdom initiated the formal process of withdrawing from the EU and the withdrawal is expected to take effect on January 31, 2020. Significant uncertainty exists regarding any adverse economic and political effects the United Kingdom’s withdrawal may have on the United Kingdom, other EU countries and the global economy.
Shares of the Funds are bought and sold at market price (not NAV) throughout the day on the NYSE Arca, Inc. Transactions in Fund shares may result in brokerage commissions and may generate tax consequences. There can be no assurance that an active trading market for shares of a Fund will develop or be maintained.
DBX ETF Trust Funds are distributed by ALPS Distributors, Inc. (“ALPS”). The Funds are managed by DBX Advisors LLC which is not affiliated with ALPS.
The brand DWS represents DWS Group GmbH & Co. KGaA and any of its subsidiaries such as DWS Distributors, Inc. which offers investment products or DWS Investment Management Americas, Inc. and RREEF America L.L.C. which offer advisory services.
The Funds or securities referred to herein are not sponsored, endorsed, issued, sold or promoted by MSCI, and MSCI bears no liability with respect to any such Funds or securities or any index on which such Funds or securities are based. The prospectus contains a more detailed description of the limited relationship MSCI has with DBX Advisors LLC and any related funds.
Copyright © 2020 DWS Group. All rights reserved. XtrackersTM is a trademark of DWS Investment GmbH. All other trademarks, servicemarks or registered trademarks are the property of their respective owners.
Not FDIC Insured | No Bank Guarantee | May Lose Value
DBX ETF Trust
Investment advisor DBX Advisors LLC 875 Third Avenue New York, NY 10022 | Investment sub-advisor Harvest Global Investments Limited 31/F, One Exchange Square 8 Connaught Place Central, Hong Kong | Administrator, custodian, fund accounting agent, lending agent & transfer agent The Bank of New York Mellon 240 Greenwich Street New York, NY 10286 | ||
Distributor ALPS Distributors, Inc. 1290 Broadway Suite 1000 Denver, CO 80203 | Independent registered public accounting firm Ernst & Young LLP 5 Times Square New York, NY 10036 | Legal counsel Dechert LLP 1095 Avenue of the Americas New York, NY 10036 | ||
R-35361-7 (7/20) DBX004442 (7/21)
May 31, 2020
Annual Report
DBX ETF Trust
Xtrackers MSCI EAFE Hedged Equity ETF (DBEF)

DBX ETF Trust
| Page | ||||
| 1 | ||||
| 3 | ||||
| 4 | ||||
| 6 | ||||
| 7 | ||||
| 22 | ||||
| 23 | ||||
| 24 | ||||
| 25 | ||||
| 26 | ||||
| 35 | ||||
| 36 | ||||
| 37 | ||||
Board Considerations in Approval of Investment Advisory Contract | 40 | |||
| 43 | ||||
| 44 | ||||
To our Shareholders: (Unaudited)
Dear shareholders,
We are pleased to provide this annual report for the period ended May 31, 2020.
Economies worldwide experienced subdued growth owing to weak manufacturing activity and global trade over the majority of the reporting period. While optimism around the US-China trade deal and accommodative monetary policies drove equity markets to record highs, the unprecedented emergence of the coronavirus contagion rapidly eroded gains. The pandemic heightened concerns of a slowdown as governments initiated stringent containment measures, causing large parts of the global economy to shut down. As expected, global growth contracted sharply in Q120 for developed and emerging economies alike. The US economy performed strongly over most of the reporting period, driven by the Federal Reserve’s (Fed) dovish stance, low unemployment rates and the “phase one” trade deal signed between the US and China. However, growth faltered as COVID-19 precautions impacted manufacturing and services sectors, dwindled consumption expenditure and led to a spike in unemployment claims. The Federal Reserve Board and the US government worked in tandem to sustain the economy. The Fed announced emergency rate cuts of 100bps, bringing interest rates to near zero, while the US government announced its CARES1 Act, amassing $2.7 tn in relief funds.
In contrast, the European Union experienced weak growth and inflation rates owing to Brexit2 concerns and geopolitical tensions, while mass quarantine measures worsened the slump in economic activity. Mass protests against pension reforms hurt household spending in France, while trade tensions weighed on domestic and external demand, hurting the export-reliant German economy. Currently, France and Germany are in technical recession3 owing to two consecutive quarters of contraction. The UK also slowed due to weak manufacturing activity, uncertainty surrounding Brexit and internal political instability. A slowdown in manufacturing and consumption and fixed investment were further exacerbated by the impact of the coronavirus. The European Central Bank (ECB) relaunched its targeted longer-term refinancing operation programme and cut deposit rates considering the bloc’s weakness. The shift in the economic landscape due to the pandemic drove the ECB to initiate a €1.35 tn Pandemic Emergency Purchase Programme.
Across the Pacific, the Japanese economy shrank for the second consecutive quarter as an increase in the consumption tax coupled with lockdown measures considerably hurt domestic and global demand. The Bank of Japan injected liquidity to support its weakening economy and improve market sentiment, while continuing to keep interest rates in the negative territory. The Australian economy was still combatting the aftermath of the bushfires when the pandemic hit, stunting retail sales, composite Purchasing Manager’s Indices and business confidence. The Reserve Bank of Australia maintained its dovish stance and kept interest rates unchanged, helping the economy remain relatively resilient amid the global slowdown.
Overall, markets remain vigilant as most economies have begun easing lockdown restrictions, allowing private consumption expenditure and business spending to gradually improve. While the near-term outlook remains challenging, the commitment by central banks and governments to fiscal and monetary stimulus may be pivotal in smoothening the path to recovery.
1
Our team appreciates your trust and looks forward to serving your investment needs through innovative index-driven strategies.
Sincerely,
/s/ Freddi Klassen
Freddi Klassen
President and Chief Executive Officer
1. Coronavirus Aid, Relief, and Economic Security (CARES) Act
2. Brexit is a combination of the words “Britain” and “Exit” and describes the exit of the United Kingdom from the European Union.
3. A “technical recession” is when you have 2 negative quarters of GDP, but it is due mainly to slowing growth or an isolated event rather than a major underlying cause. Technical recessions are usually short in duration and mild in severity. The gross domestic product (GDP) is the monetary value of all the finished goods and services produced within a country’s borders in a specific time period.
Assumptions, estimates and opinions contained in this document constitute our judgment as of the date of the document and are subject to change without notice. Any projections are based on a number of assumptions as to market conditions and there can be no guarantee that any projected results will be achieved. Past performance is not a guarantee of future results.
2
DBX ETF Trust
Xtrackers MSCI EAFE Hedged Equity ETF
The Xtrackers MSCI EAFE Hedged Equity ETF (DBEF) seeks investment results that correspond generally to the performance, before fees and expenses, of the MSCI EAFE US Dollar Hedged Index (the DBEF Index). The DBEF Index is designed to provide exposure to equity securities in developed international stock markets while at the same time mitigating exposure to fluctuation between the value of the U.S. dollar and select non-U.S. currencies. For the 12-month period ended May 31, 2020, DBEF returned -0.56%, compared to the DBEF Index return of -0.38%.
Financials, Energy and Real Estate were the major negative contributors, while Health Care, Information Technology and Utilities sectors contributed positively to performance. From a geographical perspective, United Kingdom, Australia and France were the major negative contributors, while Japan, Switzerland and Denmark contributed positively to performance. The Fund entered into forward foreign currency contracts during the period to hedge against changes in the value of the U.S. dollar against specified non-U.S. currencies. The currency hedging strategy contributed positively to performance.
*************************
Performance data quoted represents past performance and does not guarantee future results. Investment returns and principal value of an investment will fluctuate so that an investor’s shares, when sold or redeemed, may be worth more or less than their original cost. Current performance may be lower or higher than the performance data quoted. To obtain the most recent month-end performance data visit www.Xtrackers.com. Returns assume that dividends and capital gains distributions have been reinvested. See pages 4-5 of this report for additional performance information, including performance data based on market value. The views expressed in this report reflect those of the portfolio management team only through the end of the period of the report as stated on the cover. The management team’s views are subject to change at any time based on market and other conditions and should not be construed as a recommendation. Current and future portfolio holdings are subject to risk.
3
DBX ETF Trust
Xtrackers MSCI EAFE Hedged Equity ETF (DBEF)
The Xtrackers MSCI EAFE Hedged Equity ETF (the “Fund”), using a “passive” or indexing investment approach, seeks investment results that correspond generally to the performance, before fees and expenses, of the MSCI EAFE US Dollar Hedged Index (the “Underlying Index”). The Underlying Index is designed to track developed market performance while mitigating exposure to fluctuations between the value of the U.S. dollar and the currencies of the countries included in the Underlying Index. The MSCI EAFE Index includes large and mid capitalization securities across developed markets in Europe, Australasia and the Far East. It is not possible to invest directly into an index.
| Performance as of May 31, 2020 |
| Average Annual Total Return | ||||||||
| Net Asset Value | Market Value | MSCI EAFE US Dollar Hedged Index | MSCI EAFE Index | |||||
One Year | -0.56% | 0.03% | -0.38% | -2.81% | ||||
Five Year | 2.45% | 2.48% | 2.75% | 0.79% | ||||
Since Inception1 | 6.65% | 6.68% | 7.02% | 3.07% | ||||
| Cumulative Total Returns | ||||||||
| Net Asset Value | Market Value | MSCI EAFE US Dollar Hedged Index | MSCI EAFE Index | |||||
One Year | -0.56% | 0.03% | -0.38% | -2.81% | ||||
Five Year | 12.87% | 13.01% | 14.55% | 4.02% | ||||
Since Inception1 | 78.22% | 78.82% | 83.96% | 31.23% | ||||
1 Total returns are calculated based on the commencement of operations, June 9, 2011 (“Inception”).
Past performance is no guarantee of future results. Current performance may be lower or higher than the performance data quoted. Performance data current to the most recent month-end is available at www.Xtrackers.com. Performance results assume reinvestment of all dividends and capital gain distributions and do not reflect the deduction of taxes that a shareholder would pay on fund distributions or on the sale of fund shares or redemption of fund creation units. The investment return and principal value of shares will vary with changes in market conditions. Shares may be worth more or less than their original cost when they are sold in the market or redeemed. Performance for certain funds may reflect a waiver of a portion of investment management fees. Without such waiver, performance would have been lower. The estimated operating expense ratio as disclosed in the most recent prospectus dated October 1, 2019, was 0.35%, and may differ from the expense ratio disclosed in the Financial Highlights table in this report.
The Fund’s net asset value or “NAV” is calculated by dividing the value of the Fund’s total assets less total liabilities by the number of shares outstanding. The price used to calculate market return (“Market Price”) is determined by using the midpoint between the highest bid and the lowest offer on the primary stock exchange on which shares of a fund are listed for trading, as of the time that such fund’s NAV is calculated. Since shares of a fund may not have traded in the secondary market until after the fund’s inception, for the period from inception to the first day of secondary trading, the NAV of the fund is used as a proxy for the Market Price to calculate market returns. Market and NAV returns assume that dividends and capital gain distributions have been reinvested at Market Price and NAV, respectively.
An index is a statistical composite that tracks a specified financial market or sector. Unlike a fund, an index does not actually hold a portfolio of securities and therefore does not incur the expenses incurred by a fund. These expenses negatively impact fund performance. Also, market returns do not include brokerage commissions that may be payable on secondary market transactions. If brokerage commissions were included, market returns would be lower.
4
DBX ETF Trust
Xtrackers MSCI EAFE Hedged Equity ETF (DBEF) (Continued)
| Growth of an Assumed $10,000 Investment |
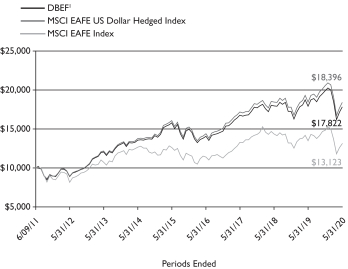
1 Based on Net Asset Value from commencement of operations, June 9, 2011.
| Sector Diversification* as of May 31, 2020 |
Financials | 15.5% | |||
Health Care | 14.9% | |||
Industrials | 14.5% | |||
Consumer Staples | 12.3% | |||
Consumer Discretionary | 11.4% | |||
Information Technology | 8.1% | |||
Materials | 7.1% | |||
Communication Services | 5.4% | |||
Utilities | 4.0% | |||
Energy | 3.5% | |||
Real Estate | 3.3% | |||
|
| |||
Total | 100.0% |
| Ten Largest Equity Holdings as of May 31, 2020 (12.7% of Net Assets) |
| Description | % of Net Assets | |||
Nestle SA (Switzerland) | 2.5% | |||
Roche Holding AG (Switzerland) | 1.9% | |||
Novartis AG (Switzerland) | 1.4% | |||
AstraZeneca PLC (United Kingdom) | 1.1% | |||
ASML Holding NV (Netherlands) | 1.1% | |||
Toyota Motor Corp. (Japan) | 1.0% | |||
SAP SE (Germany) | 1.0% | |||
Royal Dutch Shell PLC (Netherlands) | 0.9% | |||
LVMH Moet Hennessy Louis Vuitton SE (France) | 0.9% | |||
Novo Nordisk A/S (Denmark) | 0.9% | |||
| Country Diversification* as of May 31, 2020 |
Japan | 26.2% | |||
United Kingdom | 13.4% | |||
Switzerland | 10.7% | |||
France | 10.4% | |||
Germany | 8.9% | |||
Australia | 6.6% | |||
Netherlands | 4.5% | |||
Hong Kong | 3.1% | |||
Sweden | 2.9% | |||
Spain | 2.4% | |||
Denmark | 2.4% | |||
Italy | 2.0% | |||
Other | 6.5% | |||
|
| |||
Total | 100.0% |
* As a percent of total investments excluding securities lending collateral and cash equivalents.
Portfolio holdings and characteristics are subject to change. For more complete details about the Fund’s investment portfolio see page 7.
5
DBX ETF Trust
As a shareholder of the Fund, you incur two types of costs: (1) transaction costs, including brokerage commissions paid on purchases and sales of fund shares, and (2) ongoing costs, including management fees and other Fund expenses. In the most resent six-month period the Fund limited these expenses; had it not done so, expenses would have been higher. The expense examples below are intended to help you understand your ongoing costs (in dollars) of investing in the Fund and to compare these costs with the ongoing costs of investing in other funds.
The examples in the tables are based on an investment of $1,000 invested at the beginning of the six-month period and held for the entire period (December 1, 2019 to May 31, 2020).
Actual expenses
The first line in the following tables provides information about actual account values and actual expenses. You may use the information in this line, together with the amount you invested, to estimate the expenses that you paid over the period. Simply divide your account value by $1,000 (for example, an $8,600 account value divided by $1,000 = 8.6), then multiply the result by the number in the first line under the heading “Expenses Paid During the Period” to estimate the expenses you paid on your account during this period.
Hypothetical example for comparison purposes
The second line in the following tables provides information about hypothetical account values and hypothetical expenses based on the Fund’s actual expense ratios and an assumed rate of return of 5% per year before expenses (which is not the Funds’ actual return). The hypothetical account values and expenses may not be used to estimate the actual ending account balance or expenses you paid for the period. You may use this information to compare the ongoing costs of investing in the Fund and other funds. To do so, compare this 5% hypothetical example with the 5% hypothetical examples that appear in the shareholder reports of the other funds.
Please note that the expenses shown in the tables are meant to highlight your ongoing costs only, and do not reflect any transactional costs. Therefore the second line in the table is useful in comparing ongoing costs only, and will not help you determine the relative total costs of owning different funds. In addition, if these transactional costs were included, your costs would have been higher.
| Beginning Account Value December 1, 2019 | Ending Account Value May 31, 2020 | Annualized Expense Ratio | Expenses Paid During the Period Per $1,000(1) | |||||||||||||
| Xtrackers MSCI EAFE Hedged Equity ETF | ||||||||||||||||
Actual | $ | 1,000.00 | $ | 893.90 | 0.36 | % | $ | 1.70 | ||||||||
Hypothetical (5% return before expenses) | $ | 1,000.00 | $ | 1,023.20 | 0.36 | % | $ | 1.82 | ||||||||
(1) Expenses are equal to the Fund’s annualized expense ratio, multiplied by the average account value over the period, multiplied by 183 (the number of days in the most recent six-month period), then divided by 366.
6
DBX ETF Trust
Xtrackers MSCI EAFE Hedged Equity ETF
May 31, 2020
Number | Value | |||||||
| COMMON STOCKS — 97.0% | ||||||||
| Australia — 6.5% | ||||||||
Afterpay Ltd.* | 61,676 | $ | 1,949,032 | |||||
AGL Energy Ltd. | 191,515 | 2,139,487 | ||||||
AMP Ltd.* | 1,122,186 | 1,219,229 | ||||||
Ampol Ltd. | 75,624 | 1,365,530 | ||||||
APA Group (a) | 347,344 | 2,687,972 | ||||||
Aristocrat Leisure Ltd. | 169,659 | 2,908,577 | ||||||
ASX Ltd. | 56,182 | 3,302,175 | ||||||
Aurizon Holdings Ltd. | 577,329 | 1,827,889 | ||||||
AusNet Services | 547,812 | 640,828 | ||||||
Australia & New Zealand Banking Group Ltd. | 835,252 | 9,960,029 | ||||||
BHP Group Ltd. | 869,308 | 20,071,707 | ||||||
BHP Group PLC | 626,146 | 12,227,275 | ||||||
BlueScope Steel Ltd. | 157,462 | 1,157,668 | ||||||
Brambles Ltd. | 457,978 | 3,553,287 | ||||||
CIMIC Group Ltd. | 26,377 | 438,485 | ||||||
Coca-Cola Amatil Ltd. | 156,616 | 914,477 | ||||||
Cochlear Ltd. | 19,036 | 2,448,997 | ||||||
Coles Group Ltd. | 396,084 | 4,055,190 | ||||||
Commonwealth Bank of Australia | 521,334 | 22,152,818 | ||||||
Computershare Ltd. | 144,543 | 1,262,121 | ||||||
Crown Resorts Ltd. | 100,730 | 643,888 | ||||||
CSL Ltd. | 133,512 | 24,581,488 | ||||||
Dexus REIT | 321,750 | 1,930,162 | ||||||
Evolution Mining Ltd. | 455,354 | 1,851,449 | ||||||
Fortescue Metals Group Ltd. | 489,573 | 4,535,916 | ||||||
Goodman Group REIT | 483,028 | 4,948,561 | ||||||
GPT Group REIT | 585,972 | 1,558,413 | ||||||
Insurance Australia Group Ltd. | 681,008 | 2,773,487 | ||||||
Lendlease Group (a) | 196,294 | 1,691,758 | ||||||
Macquarie Group Ltd. | 99,965 | 7,327,485 | ||||||
Magellan Financial Group Ltd. | 37,889 | 1,473,624 | ||||||
Medibank Pvt Ltd. | 817,757 | 1,553,466 | ||||||
Mirvac Group REIT | 1,171,756 | 1,835,430 | ||||||
National Australia Bank Ltd. | 941,268 | 11,174,033 | ||||||
Newcrest Mining Ltd. | 240,194 | 4,895,898 | ||||||
Northern Star Resources Ltd. | 213,142 | 2,102,633 | ||||||
Oil Search Ltd. | 586,607 | 1,360,690 | ||||||
Orica Ltd. | 131,526 | 1,506,148 | ||||||
Origin Energy Ltd. | 504,188 | 1,979,432 | ||||||
Qantas Airways Ltd. | 213,750 | 568,476 | ||||||
QBE Insurance Group Ltd. | 432,150 | 2,543,478 | ||||||
Ramsay Health Care Ltd. | 52,357 | 2,444,644 | ||||||
REA Group Ltd. | 16,467 | 1,102,767 | ||||||
Santos Ltd. | 528,467 | 1,888,058 | ||||||
Scentre Group REIT | 1,541,872 | 2,291,849 | ||||||
SEEK Ltd. | 97,789 | 1,312,099 | ||||||
Sonic Healthcare Ltd. | 136,273 | 2,558,759 | ||||||
South32 Ltd. | 1,480,067 | 1,884,289 | ||||||
Stockland REIT | 707,991 | 1,684,724 | ||||||
Suncorp Group Ltd. | 368,423 | 2,266,633 | ||||||
Sydney Airport (a) | 334,252 | 1,303,355 | ||||||
Tabcorp Holdings Ltd. | 571,084 | 1,225,712 | ||||||
Telstra Corp. Ltd. | 1,208,027 | 2,608,882 | ||||||
TPG Telecom Ltd. | 106,571 | 603,797 | ||||||
Transurban Group (a) | 806,907 | 7,685,789 | ||||||
Number | Value | |||||||
| Australia (Continued) | ||||||||
Treasury Wine Estates Ltd. | 215,097 | $ | 1,384,982 | |||||
Vicinity Centres REIT | 948,324 | 1,017,690 | ||||||
Washington H Soul Pattinson & Co. Ltd. | 35,539 | 448,661 | ||||||
Wesfarmers Ltd. | 336,676 | 9,059,488 | ||||||
Westpac Banking Corp. | 1,059,730 | 12,163,572 | ||||||
WiseTech Global Ltd. (b) | 42,513 | 577,792 | ||||||
Woodside Petroleum Ltd. | 279,799 | 4,227,956 | ||||||
Woolworths Group Ltd. | 374,493 | 8,821,511 | ||||||
|
| |||||||
(Cost $319,721,647) | 247,681,697 | |||||||
|
| |||||||
| Austria — 0.2% | ||||||||
ANDRITZ AG* | 20,311 | 760,710 | ||||||
Erste Group Bank AG* | 86,501 | 1,897,845 | ||||||
OMV AG* | 40,538 | 1,337,377 | ||||||
Raiffeisen Bank International AG | 46,068 | 845,819 | ||||||
Verbund AG* | 19,471 | 865,416 | ||||||
voestalpine AG | 35,160 | 684,380 | ||||||
|
| |||||||
(Cost $8,359,894) | 6,391,547 | |||||||
|
| |||||||
| Belgium — 0.9% | ||||||||
Ageas SA/NV* | 55,539 | 1,890,839 | ||||||
Anheuser-Busch InBev SA/NV | 226,253 | 10,525,790 | ||||||
Colruyt SA | 15,743 | 950,319 | ||||||
Elia Group SA/NV | 7,618 | 892,992 | ||||||
Galapagos NV* | 12,472 | 2,538,398 | ||||||
Groupe Bruxelles Lambert SA | 23,203 | 1,873,013 | ||||||
KBC Group NV | 74,148 | 3,874,238 | ||||||
Proximus SADP | 49,954 | 1,042,210 | ||||||
Sofina SA | 4,539 | 1,239,476 | ||||||
Solvay SA | 21,327 | 1,621,199 | ||||||
Telenet Group Holding NV | 14,267 | 583,755 | ||||||
UCB SA | 37,540 | 3,750,416 | ||||||
Umicore SA | 58,274 | 2,577,133 | ||||||
|
| |||||||
(Cost $52,382,134) | 33,359,778 | |||||||
|
| |||||||
| Chile — 0.0% | ||||||||
Antofagasta PLC | ||||||||
(Cost $1,269,915) | 113,098 | 1,224,122 | ||||||
|
| |||||||
| China — 0.1% | ||||||||
BeiGene Ltd., ADR*(b) | 11,224 | 1,858,021 | ||||||
Yangzijiang Shipbuilding Holdings Ltd. | 729,900 | 485,636 | ||||||
|
| |||||||
(Cost $2,379,886) | 2,343,657 | |||||||
|
| |||||||
| Denmark — 2.3% | ||||||||
A.P. Moller — Maersk A/S, Class A | 952 | 868,335 | ||||||
A.P. Moller — Maersk A/S, Class B | 1,926 | 1,878,633 | ||||||
Ambu A/S, Class B | 47,212 | 1,574,167 | ||||||
Carlsberg A/S, Class B | 31,758 | 4,098,417 | ||||||
Chr Hansen Holding A/S | 31,324 | 3,028,308 | ||||||
Coloplast A/S, Class B | 35,281 | 5,910,683 | ||||||
Danske Bank A/S* | 192,008 | 2,372,668 | ||||||
Demant A/S* | 33,245 | 937,176 | ||||||
DSV PANALPINA A/S | 62,583 | 6,598,328 | ||||||
Genmab A/S* | 19,328 | 5,929,232 | ||||||
GN Store Nord A/S | 34,620 | 1,864,747 | ||||||
H Lundbeck A/S | 20,688 | 792,996 | ||||||
| See Notes to Financial Statements. | 7 |
DBX ETF Trust
Schedule of Investments
Xtrackers MSCI EAFE Hedged Equity ETF (Continued)
May 31, 2020
Number | Value | |||||||
| Denmark (Continued) | ||||||||
Novo Nordisk A/S, Class B | 520,431 | $ | 33,809,822 | |||||
Novozymes A/S, Class B | 62,615 | 3,416,474 | ||||||
Orsted A/S, 144A | 56,174 | 6,581,789 | ||||||
Pandora A/S (b) | 30,512 | 1,516,251 | ||||||
Tryg A/S | 35,293 | 987,026 | ||||||
Vestas Wind Systems A/S | 56,109 | 5,713,548 | ||||||
|
| |||||||
(Cost $73,500,118) | 87,878,600 | |||||||
|
| |||||||
| Finland — 1.2% | ||||||||
Elisa OYJ | 42,239 | 2,643,513 | ||||||
Fortum OYJ | 131,882 | 2,520,933 | ||||||
Kone OYJ, Class B | 100,931 | 6,753,681 | ||||||
Metso OYJ | 30,850 | 998,928 | ||||||
Neste OYJ (b) | 125,625 | 5,064,827 | ||||||
Nokia OYJ | 1,674,855 | 6,628,883 | ||||||
Nordea Bank Abp* | 962,047 | 6,497,675 | ||||||
Orion OYJ, Class B | 29,039 | 1,550,492 | ||||||
Sampo OYJ, Class A*(b) | 131,631 | 4,693,279 | ||||||
Stora Enso OYJ, Class R* | 167,234 | 2,046,661 | ||||||
UPM-Kymmene OYJ | 160,869 | 4,637,533 | ||||||
Wartsila OYJ Abp | 131,774 | 1,027,441 | ||||||
|
| |||||||
(Cost $52,046,784) | 45,063,846 | |||||||
|
| |||||||
| France — 10.1% | ||||||||
Accor SA* | 55,024 | 1,548,363 | ||||||
Aeroports de Paris | 8,358 | 868,866 | ||||||
Air Liquide SA | 140,459 | 19,037,413 | ||||||
Airbus SE* | 173,294 | 10,907,100 | ||||||
Alstom SA | 56,611 | 2,377,906 | ||||||
Amundi SA, 144A* | 18,013 | 1,338,688 | ||||||
Arkema SA | 20,479 | 1,781,336 | ||||||
Atos SE* | 29,178 | 2,196,625 | ||||||
AXA SA* | 572,815 | 10,415,281 | ||||||
BioMerieux | 12,306 | 1,763,542 | ||||||
BNP Paribas SA* | 334,000 | 11,958,762 | ||||||
Bollore SA | 250,464 | 713,419 | ||||||
Bouygues SA* | 63,907 | 1,953,687 | ||||||
Bureau Veritas SA* | 82,301 | 1,670,943 | ||||||
Capgemini SE | 47,192 | 4,824,704 | ||||||
Carrefour SA | 185,111 | 2,805,864 | ||||||
Casino Guichard Perrachon SA* | 12,269 | 461,419 | ||||||
Cie de Saint-Gobain | 146,090 | 4,714,202 | ||||||
Cie Generale des Etablissements Michelin SCA* | 51,561 | 5,200,400 | ||||||
CNP Assurances* | 54,660 | 573,686 | ||||||
Covivio REIT (b) | 15,510 | 906,469 | ||||||
Credit Agricole SA* | 342,621 | 2,975,675 | ||||||
Danone SA* | 180,391 | 12,326,965 | ||||||
Dassault Aviation SA* | 700 | 595,986 | ||||||
Dassault Systemes SE | 38,864 | 6,568,217 | ||||||
Edenred | 70,364 | 2,935,283 | ||||||
Eiffage SA* | 23,273 | 2,118,405 | ||||||
Electricite de France SA | 184,169 | 1,626,500 | ||||||
Engie SA* | 542,336 | 6,402,486 | ||||||
EssilorLuxottica SA* | 84,254 | 10,825,656 | ||||||
Eurazeo SE* | 10,106 | 491,356 | ||||||
Faurecia SE* | 22,549 | 867,558 | ||||||
Number | Value | |||||||
| France (Continued) | ||||||||
Gecina SA REIT | 14,351 | $ | 1,843,140 | |||||
Getlink SE* | 132,219 | 1,905,071 | ||||||
Hermes International | 9,362 | 7,771,356 | ||||||
ICADE REIT | 9,208 | 657,744 | ||||||
Iliad SA | 4,162 | 731,813 | ||||||
Ingenico Group SA | 17,546 | 2,419,037 | ||||||
Ipsen SA* | 10,394 | 815,727 | ||||||
JCDecaux SA* | 25,272 | 513,093 | ||||||
Kering SA | 22,503 | 11,730,356 | ||||||
Klepierre SA REIT | 59,003 | 1,116,057 | ||||||
La Francaise des Jeux SAEM, 144A* | 21,682 | 738,169 | ||||||
Legrand SA | 78,814 | 5,362,984 | ||||||
L’Oreal SA* | 74,570 | 21,679,154 | ||||||
LVMH Moet Hennessy Louis Vuitton SE | 81,821 | 34,059,538 | ||||||
Natixis SA* | 284,162 | 628,660 | ||||||
Orange SA | 592,392 | 7,131,509 | ||||||
Orpea | 15,223 | 1,784,460 | ||||||
Pernod Ricard SA | 62,156 | 9,666,381 | ||||||
Peugeot SA* | 173,690 | 2,468,864 | ||||||
Publicis Groupe SA | 62,561 | 1,772,258 | ||||||
Remy Cointreau SA (b) | 6,443 | 763,839 | ||||||
Renault SA | 61,053 | 1,369,331 | ||||||
Safran SA* | 94,535 | 9,010,029 | ||||||
Sanofi (b) | 331,789 | 32,237,519 | ||||||
Sartorius Stedim Biotech* | 7,940 | 2,148,804 | ||||||
Schneider Electric SE | 164,165 | 16,262,332 | ||||||
SCOR SE* | 45,575 | 1,122,098 | ||||||
SEB SA | 7,007 | 959,820 | ||||||
Societe Generale SA* | 244,325 | 3,588,691 | ||||||
Sodexo SA | 25,922 | 1,742,022 | ||||||
Suez SA (b) | 104,649 | 1,186,051 | ||||||
Teleperformance* | 17,470 | 4,132,559 | ||||||
Thales SA | 31,634 | 2,415,233 | ||||||
TOTAL SA | 726,058 | 27,100,438 | ||||||
Ubisoft Entertainment SA* | 28,199 | 2,180,519 | ||||||
Unibail-Rodamco-Westfield REIT | 27,459 | 1,453,938 | ||||||
Unibail-Rodamco-Westfield CDI | 300,032 | 827,943 | ||||||
Valeo SA* | 72,764 | 1,789,093 | ||||||
Veolia Environnement SA | 158,794 | 3,469,862 | ||||||
Vinci SA | 152,754 | 14,080,648 | ||||||
Vivendi SA | 246,050 | 5,580,003 | ||||||
Wendel SE* | 7,562 | 693,361 | ||||||
Worldline SA, 144A* | 40,325 | 3,004,478 | ||||||
|
| |||||||
(Cost $423,746,772) | 387,666,744 | |||||||
|
| |||||||
| Germany — 8.1% | ||||||||
adidas AG* | 55,679 | 14,660,501 | ||||||
Allianz SE | 122,857 | 22,204,978 | ||||||
BASF SE* | 270,491 | 14,606,082 | ||||||
Bayer AG | 288,857 | 19,469,615 | ||||||
Bayerische Motoren Werke AG | 98,299 | 5,739,546 | ||||||
Beiersdorf AG | 29,931 | 3,131,781 | ||||||
Brenntag AG | 44,855 | 2,360,606 | ||||||
Carl Zeiss Meditec AG* | 11,461 | 1,171,723 | ||||||
Commerzbank AG* | 289,936 | 1,126,774 | ||||||
Continental AG* | 32,668 | 3,207,111 | ||||||
| See Notes to Financial Statements. | 8 |
DBX ETF Trust
Schedule of Investments
Xtrackers MSCI EAFE Hedged Equity ETF (Continued)
May 31, 2020
Number | Value | |||||||
| Germany (Continued) | ||||||||
Covestro AG, 144A* | 50,962 | $ | 1,883,228 | |||||
Daimler AG* | 249,544 | 9,246,474 | ||||||
Delivery Hero SE, 144A* | 37,849 | 3,620,792 | ||||||
Deutsche Bank AG*(c) | 583,010 | 4,873,841 | ||||||
Deutsche Boerse AG | 56,411 | 9,261,358 | ||||||
Deutsche Lufthansa AG*(b) | 69,282 | 703,079 | ||||||
Deutsche Post AG* | 294,096 | 9,134,389 | ||||||
Deutsche Telekom AG* | 989,685 | 15,572,658 | ||||||
Deutsche Wohnen SE | 100,975 | 4,508,153 | ||||||
E.ON SE | 666,651 | 7,034,594 | ||||||
Evonik Industries AG | 59,795 | 1,470,217 | ||||||
Fraport AG Frankfurt Airport Services Worldwide*(b) | 11,922 | 590,502 | ||||||
Fresenius Medical Care AG & Co. KGaA* | 63,281 | 5,310,529 | ||||||
Fresenius SE & Co. KGaA* | 123,627 | 5,928,431 | ||||||
GEA Group AG | 45,548 | 1,354,518 | ||||||
Hannover Rueck SE | 17,906 | 2,874,151 | ||||||
HeidelbergCement AG* | 42,786 | 2,119,685 | ||||||
Henkel AG & Co. KGaA* | 31,039 | 2,482,472 | ||||||
HOCHTIEF AG | 7,219 | 633,864 | ||||||
Infineon Technologies AG | 371,419 | 7,774,212 | ||||||
KION Group AG* | 18,086 | 1,007,834 | ||||||
Knorr-Bremse AG | 15,731 | 1,662,052 | ||||||
LANXESS AG* | 22,329 | 1,152,068 | ||||||
LEG Immobilien AG* | 20,323 | 2,528,475 | ||||||
Merck KGaA | 37,838 | 4,332,515 | ||||||
METRO AG | 49,125 | 457,844 | ||||||
MTU Aero Engines AG* | 15,497 | 2,492,635 | ||||||
Muenchener Rueckversicherungs-Gesellschaft AG in Muenchen | 42,857 | 9,733,524 | ||||||
Nemetschek SE* | 15,870 | 1,249,010 | ||||||
Puma SE* | 24,477 | 1,743,816 | ||||||
RWE AG* | 170,900 | 5,651,390 | ||||||
SAP SE | 307,057 | 38,686,333 | ||||||
Scout24 AG, 144A | 29,563 | 2,256,129 | ||||||
Siemens AG | 224,371 | 24,540,189 | ||||||
Siemens Healthineers AG, 144A | 44,539 | 2,297,254 | ||||||
Symrise AG* | 38,201 | 4,172,655 | ||||||
TeamViewer AG* | 37,441 | 1,901,642 | ||||||
Telefonica Deutschland Holding AG | 295,853 | 908,387 | ||||||
thyssenkrupp AG*(b) | 115,819 | 779,103 | ||||||
Uniper SE | 58,210 | 1,815,711 | ||||||
United Internet AG | 30,653 | 1,254,893 | ||||||
Volkswagen AG*(b) | 9,640 | 1,523,806 | ||||||
Vonovia SE* | 152,970 | 8,792,472 | ||||||
Wirecard AG (b) | 34,852 | 3,658,288 | ||||||
Zalando SE, 144A* | 41,291 | 2,788,607 | ||||||
|
| |||||||
(Cost $373,206,287) | 311,442,496 | |||||||
|
| |||||||
| Hong Kong — 3.0% | ||||||||
AIA Group Ltd. | 3,537,005 | 28,678,419 | ||||||
ASM Pacific Technology Ltd. | 96,626 | 878,815 | ||||||
Bank of East Asia Ltd. | 353,134 | 636,885 | ||||||
BOC Hong Kong Holdings Ltd. | 1,079,519 | 3,008,142 | ||||||
Budweiser Brewing Co. APAC Ltd., 144A | 454,035 | 1,271,052 | ||||||
Number | Value | |||||||
| Hong Kong (Continued) | ||||||||
CK Asset Holdings Ltd. | 767,676 | $ | 4,174,359 | |||||
CK Hutchison Holdings Ltd. | 801,625 | 4,901,893 | ||||||
CK Infrastructure Holdings Ltd. | 201,605 | 1,006,529 | ||||||
CLP Holdings Ltd. | 474,831 | 4,652,443 | ||||||
Dairy Farm International Holdings Ltd. | 105,800 | 446,476 | ||||||
Galaxy Entertainment Group Ltd. | 644,687 | 4,349,755 | ||||||
Hang Lung Properties Ltd. | 614,687 | 1,292,575 | ||||||
Hang Seng Bank Ltd. | 221,327 | 3,366,375 | ||||||
Henderson Land Development Co. Ltd. | 434,957 | 1,551,514 | ||||||
HK Electric Investments & HK Electric Investments Ltd. (a) | 862,963 | 855,003 | ||||||
HKT Trust & HKT Ltd. (a) | 1,151,613 | 1,637,202 | ||||||
Hong Kong & China Gas Co. Ltd. | 3,015,847 | 5,073,424 | ||||||
Hong Kong Exchanges & Clearing Ltd. | 348,205 | 12,137,650 | ||||||
Hongkong Land Holdings Ltd. | 348,100 | 1,308,856 | ||||||
Jardine Matheson Holdings Ltd. | 65,457 | 2,628,099 | ||||||
Jardine Strategic Holdings Ltd. | 67,087 | 1,338,386 | ||||||
Kerry Properties Ltd. | 190,754 | 450,338 | ||||||
Link REIT | 618,890 | 4,626,805 | ||||||
Melco Resorts & Entertainment Ltd., ADR | 67,593 | 1,083,516 | ||||||
MTR Corp. Ltd. | 481,363 | 2,306,990 | ||||||
New World Development Co. Ltd. | 1,822,926 | 1,836,683 | ||||||
NWS Holdings Ltd. | 442,124 | 346,786 | ||||||
PCCW Ltd. | 1,111,666 | 609,505 | ||||||
Power Assets Holdings Ltd. | 432,018 | 2,404,899 | ||||||
Sino Land Co. Ltd. | 897,792 | 1,045,870 | ||||||
SJM Holdings Ltd. | 582,007 | 646,466 | ||||||
Sun Hung Kai Properties Ltd. | 384,496 | 4,414,648 | ||||||
Swire Pacific Ltd., Class A | 151,976 | 788,162 | ||||||
Swire Properties Ltd. | 350,881 | 781,295 | ||||||
Techtronic Industries Co. Ltd. | 395,371 | 3,402,083 | ||||||
WH Group Ltd., 144A | 2,785,000 | 2,400,026 | ||||||
Wharf Real Estate Investment Co. Ltd. (b) | 312,254 | 1,200,435 | ||||||
Wheelock & Co. Ltd. | 217,863 | 1,471,345 | ||||||
|
| |||||||
(Cost $124,604,471) | 115,009,704 | |||||||
|
| |||||||
| Ireland — 1.0% | ||||||||
AerCap Holdings NV* | 36,163 | 1,165,895 | ||||||
CRH PLC | 235,189 | 7,649,399 | ||||||
DCC PLC | 29,215 | 2,428,943 | ||||||
Experian PLC | 269,754 | 9,371,409 | ||||||
Flutter Entertainment PLC (b) | 41,098 | 5,260,084 | ||||||
James Hardie Industries PLC CDI | 131,457 | 2,273,808 | ||||||
Kerry Group PLC, Class A | 46,138 | 5,700,286 | ||||||
Kingspan Group PLC | 43,909 | 2,707,574 | ||||||
Smurfit Kappa Group PLC | 70,827 | 2,300,466 | ||||||
|
| |||||||
(Cost $32,907,903) | 38,857,864 | |||||||
|
| |||||||
| Isle of Man — 0.1% | ||||||||
GVC Holdings PLC | ||||||||
(Cost $2,214,788) | 172,810 | 1,691,998 | ||||||
|
| |||||||
| Israel — 0.6% | ||||||||
Azrieli Group Ltd. | 12,176 | 637,667 | ||||||
Bank Hapoalim BM | 338,505 | 2,073,542 | ||||||
Bank Leumi Le-Israel BM | 446,171 | 2,355,691 | ||||||
| See Notes to Financial Statements. | 9 |
DBX ETF Trust
Schedule of Investments
Xtrackers MSCI EAFE Hedged Equity ETF (Continued)
May 31, 2020
Number | Value | |||||||
| Israel (Continued) | ||||||||
Check Point Software Technologies Ltd.* | 33,890 | $ | 3,716,716 | |||||
CyberArk Software Ltd.* | 10,364 | 1,075,576 | ||||||
Elbit Systems Ltd. | 7,182 | 998,096 | ||||||
ICL Group Ltd. | 202,099 | 698,124 | ||||||
Israel Discount Bank Ltd., Class A | 349,930 | 1,107,140 | ||||||
Mizrahi Tefahot Bank Ltd. | 41,316 | 807,377 | ||||||
Nice Ltd.* | 18,449 | 3,328,333 | ||||||
Teva Pharmaceutical Industries Ltd., ADR* | 324,277 | 4,063,191 | ||||||
Wix.com Ltd.* | 14,424 | 3,206,888 | ||||||
|
| |||||||
(Cost $28,851,238) | 24,068,341 | |||||||
|
| |||||||
| Italy — 1.9% | ||||||||
Assicurazioni Generali SpA | 326,285 | 4,521,977 | ||||||
Atlantia SpA* | 145,334 | 2,354,583 | ||||||
Davide Campari-Milano SpA | 172,454 | 1,397,458 | ||||||
DiaSorin SpA* | 7,059 | 1,477,057 | ||||||
Enel SpA | 2,415,058 | 18,500,450 | ||||||
Eni SpA | 755,372 | 6,811,144 | ||||||
Ferrari NV | 35,812 | 6,038,500 | ||||||
FinecoBank Banca Fineco SpA* | 184,373 | 2,149,988 | ||||||
Infrastrutture Wireless Italiane SpA, 144A | 53,046 | 539,669 | ||||||
Intesa Sanpaolo SpA* | 4,419,328 | 7,615,573 | ||||||
Leonardo SpA* | 119,386 | 742,137 | ||||||
Mediobanca Banca di Credito Finanziario SpA | 184,412 | 1,194,668 | ||||||
Moncler SpA* | 53,622 | 1,991,048 | ||||||
Nexi SpA, 144A* | 105,167 | 1,724,260 | ||||||
Pirelli & C SpA, 144A* | 126,531 | 566,037 | ||||||
Poste Italiane SpA, 144A | 157,636 | 1,381,323 | ||||||
Prysmian SpA | 71,660 | 1,522,912 | ||||||
Recordati SpA | 32,335 | 1,468,761 | ||||||
Snam SpA | 590,384 | 2,742,009 | ||||||
Telecom Italia SpA* | 2,711,741 | 999,376 | ||||||
Telecom Italia SpA-RSP | 1,899,705 | 731,321 | ||||||
Terna Rete Elettrica Nazionale SpA | 417,780 | 2,815,004 | ||||||
UniCredit SpA* | 604,240 | 5,141,869 | ||||||
|
| |||||||
(Cost $94,083,112) | 74,427,124 | |||||||
|
| |||||||
| Japan — 25.6% | ||||||||
ABC-Mart, Inc. | 11,100 | 674,162 | ||||||
Acom Co. Ltd. | 118,300 | 481,559 | ||||||
Advantest Corp. | 57,900 | 2,856,210 | ||||||
Aeon Co. Ltd. | 190,400 | 4,208,062 | ||||||
Aeon Mall Co. Ltd. | 30,000 | 421,438 | ||||||
AGC, Inc. | 49,700 | 1,405,582 | ||||||
Air Water, Inc. | 49,800 | 722,676 | ||||||
Aisin Seiki Co. Ltd. | 47,754 | 1,503,313 | ||||||
Ajinomoto Co., Inc. | 132,947 | 2,264,580 | ||||||
Alfresa Holdings Corp. | 56,600 | 1,140,450 | ||||||
Amada Co. Ltd. | 93,700 | 834,955 | ||||||
ANA Holdings, Inc.*(b) | 33,400 | 804,920 | ||||||
Aozora Bank Ltd. | 29,800 | 553,198 | ||||||
Asahi Group Holdings Ltd. | 103,965 | 3,912,003 | ||||||
Asahi Intecc Co. Ltd. | 55,800 | 1,707,451 | ||||||
Number | Value | |||||||
| Japan (Continued) | ||||||||
Asahi Kasei Corp. | 372,300 | $ | 2,934,350 | |||||
Astellas Pharma, Inc. | 549,332 | 9,751,923 | ||||||
Bandai Namco Holdings, Inc. | 59,200 | 3,291,420 | ||||||
Bank of Kyoto Ltd. | 16,800 | 602,865 | ||||||
Benesse Holdings, Inc. | 21,200 | 573,419 | ||||||
Bridgestone Corp. | 157,676 | 5,229,793 | ||||||
Brother Industries Ltd. | 64,200 | 1,207,861 | ||||||
Calbee, Inc. | 29,700 | 857,856 | ||||||
Canon, Inc. | 296,486 | 6,100,444 | ||||||
Casio Computer Co. Ltd. | 52,300 | 919,960 | ||||||
Central Japan Railway Co. | 42,354 | 7,239,983 | ||||||
Chiba Bank Ltd. | 152,200 | 722,578 | ||||||
Chubu Electric Power Co., Inc. | 188,500 | 2,536,172 | ||||||
Chugai Pharmaceutical Co. Ltd. | 66,500 | 9,798,183 | ||||||
Chugoku Electric Power Co., Inc. | 83,400 | 1,144,531 | ||||||
Coca-Cola Bottlers Japan Holdings, Inc. | 33,354 | 661,853 | ||||||
Concordia Financial Group Ltd. | 306,115 | 999,142 | ||||||
Cosmos Pharmaceutical Corp. | 5,900 | 846,335 | ||||||
CyberAgent, Inc. | 30,400 | 1,530,641 | ||||||
Dai Nippon Printing Co. Ltd. | 75,200 | 1,707,680 | ||||||
Daicel Corp. | 74,200 | 627,478 | ||||||
Daifuku Co. Ltd. | 29,921 | 2,324,985 | ||||||
Dai-ichi Life Holdings, Inc. | 320,338 | 4,167,409 | ||||||
Daiichi Sankyo Co. Ltd. | 167,931 | 15,703,873 | ||||||
Daikin Industries Ltd. | 73,388 | 10,785,848 | ||||||
Daito Trust Construction Co. Ltd. | 19,613 | 2,070,509 | ||||||
Daiwa House Industry Co. Ltd. | 167,636 | 4,157,286 | ||||||
Daiwa House REIT Investment Corp. REIT | 573 | 1,415,431 | ||||||
Daiwa Securities Group, Inc. | 447,987 | 1,855,587 | ||||||
Denso Corp. | 125,853 | 4,820,796 | ||||||
Dentsu Group, Inc. | 64,200 | 1,717,437 | ||||||
Disco Corp. | 9,100 | 2,030,191 | ||||||
East Japan Railway Co. | 87,353 | 6,844,386 | ||||||
Eisai Co. Ltd. | 74,552 | 5,833,092 | ||||||
Electric Power Development Co. Ltd. | 37,632 | 709,406 | ||||||
FamilyMart Co. Ltd. | 75,768 | 1,418,476 | ||||||
FANUC Corp. | 57,417 | 10,230,123 | ||||||
Fast Retailing Co. Ltd. | 17,017 | 9,551,106 | ||||||
Fuji Electric Co. Ltd. | 35,100 | 937,020 | ||||||
FUJIFILM Holdings Corp. | 106,454 | 4,916,754 | ||||||
Fujitsu Ltd. | 58,302 | 6,000,762 | ||||||
Fukuoka Financial Group, Inc. | 46,000 | 747,721 | ||||||
GLP J REIT | 1,072 | 1,428,406 | ||||||
GMO Payment Gateway, Inc. | 12,500 | 1,405,953 | ||||||
Hakuhodo DY Holdings, Inc. | 73,659 | 914,548 | ||||||
Hamamatsu Photonics KK | 38,700 | 1,751,180 | ||||||
Hankyu Hanshin Holdings, Inc. | 66,840 | 2,466,718 | ||||||
Hikari Tsushin, Inc. | 6,300 | 1,379,229 | ||||||
Hino Motors Ltd. | 90,800 | 613,781 | ||||||
Hirose Electric Co. Ltd. | 9,666 | 1,153,521 | ||||||
Hisamitsu Pharmaceutical Co., Inc. | 14,600 | 735,111 | ||||||
Hitachi Construction Machinery Co. Ltd. | 31,200 | 818,731 | ||||||
Hitachi Ltd. | 285,101 | 9,133,701 | ||||||
Hitachi Metals Ltd. | 63,700 | 733,603 | ||||||
| See Notes to Financial Statements. | 10 |
DBX ETF Trust
Schedule of Investments
Xtrackers MSCI EAFE Hedged Equity ETF (Continued)
May 31, 2020
Number | Value | |||||||
| Japan (Continued) | ||||||||
Honda Motor Co. Ltd. | 483,499 | $ | 12,481,443 | |||||
Hoshizaki Corp. | 15,100 | 1,218,137 | ||||||
Hoya Corp. | 111,974 | 10,497,076 | ||||||
Hulic Co. Ltd. (b) | 94,000 | 950,067 | ||||||
Idemitsu Kosan Co. Ltd. | 58,184 | 1,289,441 | ||||||
Iida Group Holdings Co. Ltd. | 38,100 | 565,256 | ||||||
Inpex Corp. | 303,617 | 2,114,016 | ||||||
Isetan Mitsukoshi Holdings Ltd. | 94,000 | 628,439 | ||||||
Isuzu Motors Ltd. | 157,300 | 1,472,431 | ||||||
Ito En Ltd. | 15,800 | 905,411 | ||||||
ITOCHU Corp. | 400,454 | 8,577,577 | ||||||
Itochu Techno-Solutions Corp. | 30,400 | 1,026,065 | ||||||
Japan Airlines Co. Ltd. | 30,373 | 596,223 | ||||||
Japan Airport Terminal Co. Ltd. | 14,400 | 632,908 | ||||||
Japan Exchange Group, Inc. | 151,878 | 3,263,029 | ||||||
Japan Post Bank Co. Ltd. | 117,658 | 970,983 | ||||||
Japan Post Holdings Co. Ltd. | 463,013 | 3,366,392 | ||||||
Japan Post Insurance Co. Ltd. | 65,300 | 828,322 | ||||||
Japan Prime Realty Investment Corp. REIT | 263 | 802,327 | ||||||
Japan Real Estate Investment Corp. REIT | 358 | 1,951,912 | ||||||
Japan Retail Fund Investment Corp. REIT | 811 | 1,069,351 | ||||||
Japan Tobacco, Inc. | 348,541 | 6,908,122 | ||||||
JFE Holdings, Inc. | 144,085 | 1,058,142 | ||||||
JGC Holdings Corp. | 71,500 | 768,404 | ||||||
JSR Corp. | 56,900 | 1,114,310 | ||||||
JTEKT Corp. | 59,100 | 476,220 | ||||||
JXTG Holdings, Inc. | 921,228 | 3,539,012 | ||||||
Kajima Corp. | 120,700 | 1,367,661 | ||||||
Kakaku.com, Inc. | 36,900 | 891,663 | ||||||
Kamigumi Co. Ltd. | 30,000 | 585,563 | ||||||
Kansai Electric Power Co., Inc. | 207,767 | 2,068,134 | ||||||
Kansai Paint Co. Ltd. | 51,800 | 1,072,072 | ||||||
Kao Corp. | 144,004 | 11,546,225 | ||||||
Kawasaki Heavy Industries Ltd. | 39,000 | 616,941 | ||||||
KDDI Corp. | 487,433 | 14,173,952 | ||||||
Keihan Holdings Co. Ltd. | 30,500 | 1,448,004 | ||||||
Keikyu Corp. | 63,450 | 1,059,608 | ||||||
Keio Corp. | 29,760 | 1,766,090 | ||||||
Keisei Electric Railway Co. Ltd. | 34,128 | 1,118,665 | ||||||
Keyence Corp. | 53,970 | 22,194,534 | ||||||
Kikkoman Corp. | 42,682 | 2,145,083 | ||||||
Kintetsu Group Holdings Co. Ltd. | 50,640 | 2,483,987 | ||||||
Kirin Holdings Co. Ltd. | 244,023 | 4,994,954 | ||||||
Kobayashi Pharmaceutical Co. Ltd. | 15,100 | 1,344,151 | ||||||
Kobe Bussan Co. Ltd. | 16,500 | 853,725 | ||||||
Koito Manufacturing Co. Ltd. | 30,400 | 1,286,810 | ||||||
Komatsu Ltd. | 250,273 | 5,059,068 | ||||||
Konami Holdings Corp. | 29,666 | 1,041,178 | ||||||
Kose Corp. | 11,000 | 1,375,956 | ||||||
Kubota Corp. | 307,781 | 4,136,757 | ||||||
Kuraray Co. Ltd. | 93,400 | 980,377 | ||||||
Kurita Water Industries Ltd. | 30,400 | 841,994 | ||||||
Kyocera Corp. | 94,600 | 5,114,865 | ||||||
Kyowa Kirin Co. Ltd. | 71,000 | 1,923,705 | ||||||
Number | Value | |||||||
| Japan (Continued) | ||||||||
Kyushu Electric Power Co., Inc. | 110,400 | $ | 917,227 | |||||
Kyushu Railway Co. (b) | 46,276 | 1,310,892 | ||||||
Lasertec Corp. | 22,200 | 1,821,781 | ||||||
Lawson, Inc. | 17,500 | 967,129 | ||||||
LINE Corp.* | 20,547 | 1,026,921 | ||||||
Lion Corp. | 68,400 | 1,563,410 | ||||||
LIXIL Group Corp. | 83,600 | 1,165,881 | ||||||
M3, Inc. | 131,042 | 5,273,516 | ||||||
Makita Corp. | 66,300 | 2,243,915 | ||||||
Marubeni Corp. | 464,900 | 2,255,850 | ||||||
Marui Group Co. Ltd. | 57,796 | 1,041,287 | ||||||
Maruichi Steel Tube Ltd. | 16,800 | 429,795 | ||||||
Mazda Motor Corp. | 165,200 | 1,055,430 | ||||||
McDonald’s Holdings Co. Japan Ltd. | 19,622 | 1,042,552 | ||||||
Mebuki Financial Group, Inc. | 275,350 | 622,981 | ||||||
Medipal Holdings Corp. | 52,600 | 1,042,294 | ||||||
MEIJI Holdings Co. Ltd. | 33,290 | 2,503,425 | ||||||
Mercari, Inc.* | 22,800 | 678,641 | ||||||
MINEBEA MITSUMI, Inc. | 107,320 | 1,881,794 | ||||||
MISUMI Group, Inc. | 85,700 | 2,274,314 | ||||||
Mitsubishi Chemical Holdings Corp. | 377,400 | 2,219,712 | ||||||
Mitsubishi Corp. | 401,725 | 9,368,430 | ||||||
Mitsubishi Electric Corp. | 541,179 | 7,118,201 | ||||||
Mitsubishi Estate Co. Ltd. | 350,351 | 5,564,943 | ||||||
Mitsubishi Gas Chemical Co., Inc. | 45,200 | 672,269 | ||||||
Mitsubishi Heavy Industries Ltd. | 94,099 | 2,432,203 | ||||||
Mitsubishi Materials Corp. | 30,000 | 682,368 | ||||||
Mitsubishi Motors Corp. | 218,100 | 614,793 | ||||||
Mitsubishi UFJ Financial Group, Inc. | 3,599,852 | 14,827,338 | ||||||
Mitsubishi UFJ Lease & Finance Co. Ltd. | 114,300 | 557,483 | ||||||
Mitsui & Co. Ltd. | 491,160 | 7,448,581 | ||||||
Mitsui Chemicals, Inc. | 55,300 | 1,148,611 | ||||||
Mitsui Fudosan Co. Ltd. | 259,326 | 4,985,975 | ||||||
Miura Co. Ltd. | 25,800 | 1,100,468 | ||||||
Mizuho Financial Group, Inc. | 7,163,480 | 8,934,008 | ||||||
MonotaRO Co. Ltd. | 32,200 | 1,168,928 | ||||||
MS&AD Insurance Group Holdings, Inc. | 128,921 | 3,783,532 | ||||||
Murata Manufacturing Co. Ltd. | 170,077 | 9,485,958 | ||||||
Nabtesco Corp. | 29,725 | 921,973 | ||||||
Nagoya Railroad Co. Ltd. | 51,040 | 1,538,133 | ||||||
NEC Corp. | 74,359 | 3,333,727 | ||||||
Nexon Co. Ltd. | 146,345 | 3,047,808 | ||||||
NGK Insulators Ltd. | 78,100 | 1,143,492 | ||||||
NGK Spark Plug Co. Ltd. | 46,900 | 755,392 | ||||||
NH Foods Ltd. | 27,896 | 1,029,497 | ||||||
Nidec Corp. | 133,146 | 8,175,556 | ||||||
Nihon M&A Center, Inc. | 44,000 | 1,766,609 | ||||||
Nikon Corp. | 93,700 | 860,151 | ||||||
Nintendo Co. Ltd. | 32,971 | 13,311,302 | ||||||
Nippon Building Fund, Inc. REIT | 367 | 2,300,450 | ||||||
Nippon Express Co. Ltd. | 24,400 | 1,253,429 | ||||||
Nippon Paint Holdings Co. Ltd. | 43,042 | 2,997,315 | ||||||
Nippon Prologis REIT, Inc. REIT (b) | 562 | 1,584,200 | ||||||
Nippon Shinyaku Co. Ltd. | 13,500 | 1,161,667 | ||||||
Nippon Steel Corp. | 239,509 | 2,204,429 | ||||||
| See Notes to Financial Statements. | 11 |
DBX ETF Trust
Schedule of Investments
Xtrackers MSCI EAFE Hedged Equity ETF (Continued)
May 31, 2020
Number | Value | |||||||
| Japan (Continued) | ||||||||
Nippon Telegraph & Telephone Corp. | 382,202 | $ | 8,661,521 | |||||
Nippon Yusen KK | 45,000 | 648,013 | ||||||
Nissan Chemical Corp. | 36,449 | 1,607,075 | ||||||
Nissan Motor Co. Ltd. | 689,042 | 2,561,426 | ||||||
Nisshin Seifun Group, Inc. | 61,000 | 949,687 | ||||||
Nissin Foods Holdings Co. Ltd. | 18,700 | 1,560,573 | ||||||
Nitori Holdings Co. Ltd. | 24,101 | 4,365,645 | ||||||
Nitto Denko Corp. | 46,724 | 2,525,856 | ||||||
Nomura Holdings, Inc. | 922,654 | 3,960,281 | ||||||
Nomura Real Estate Holdings, Inc. | 36,536 | 675,532 | ||||||
Nomura Real Estate Master Fund, Inc. REIT | 1,216 | 1,493,996 | ||||||
Nomura Research Institute Ltd. | 100,243 | 2,647,244 | ||||||
NSK Ltd. | 104,600 | 764,289 | ||||||
NTT Data Corp. | 177,234 | 2,046,051 | ||||||
NTT DOCOMO, Inc. | 346,689 | 9,488,178 | ||||||
Obayashi Corp. | 189,200 | 1,749,107 | ||||||
Obic Co. Ltd. | 20,600 | 3,568,158 | ||||||
Odakyu Electric Railway Co. Ltd. | 88,050 | 2,195,433 | ||||||
Oji Holdings Corp. | 268,968 | 1,349,267 | ||||||
Olympus Corp. | 340,616 | 5,910,917 | ||||||
Omron Corp. | 52,492 | 3,475,292 | ||||||
Ono Pharmaceutical Co. Ltd. | 109,406 | 3,121,538 | ||||||
Oracle Corp. (b) | 12,800 | 1,493,106 | ||||||
Oriental Land Co. Ltd. | 59,300 | 8,586,114 | ||||||
ORIX Corp. | 396,846 | 5,258,407 | ||||||
Orix JREIT, Inc. REIT | 776 | 1,121,061 | ||||||
Osaka Gas Co. Ltd. | 104,000 | 2,076,239 | ||||||
Otsuka Corp. | 29,900 | 1,441,699 | ||||||
Otsuka Holdings Co. Ltd. | 115,667 | 5,216,786 | ||||||
Pan Pacific International Holdings Corp. | 129,472 | 2,606,368 | ||||||
Panasonic Corp. | 656,085 | 5,858,499 | ||||||
Park24 Co. Ltd. | 33,800 | 655,346 | ||||||
PeptiDream, Inc.* | 30,400 | 1,362,919 | ||||||
Persol Holdings Co. Ltd. | 51,000 | 673,884 | ||||||
Pigeon Corp. | 30,700 | 1,195,605 | ||||||
Pola Orbis Holdings, Inc. | 28,100 | 546,132 | ||||||
Rakuten, Inc. | 251,686 | 2,277,765 | ||||||
Recruit Holdings Co. Ltd. | 375,053 | 12,902,282 | ||||||
Renesas Electronics Corp.* | 226,000 | 1,171,440 | ||||||
Resona Holdings, Inc. | 606,125 | 2,179,566 | ||||||
Ricoh Co. Ltd. | 200,600 | 1,480,621 | ||||||
Rinnai Corp. | 11,300 | 950,355 | ||||||
Rohm Co. Ltd. | 25,600 | 1,720,988 | ||||||
Ryohin Keikaku Co. Ltd. | 70,800 | 1,069,435 | ||||||
Santen Pharmaceutical Co. Ltd. | 101,351 | 1,870,170 | ||||||
SBI Holdings, Inc. | 67,625 | 1,447,875 | ||||||
SCSK Corp. | 15,300 | 747,656 | ||||||
Secom Co. Ltd. | 62,300 | 5,392,074 | ||||||
Sega Sammy Holdings, Inc. | 47,200 | 614,482 | ||||||
Seibu Holdings, Inc. | 58,500 | 763,763 | ||||||
Seiko Epson Corp. | 83,859 | 943,992 | ||||||
Sekisui Chemical Co. Ltd. | 106,200 | 1,482,044 | ||||||
Sekisui House Ltd. | 184,451 | 3,510,461 | ||||||
Seven & i Holdings Co. Ltd. | 220,676 | 7,544,461 | ||||||
Seven Bank Ltd. | 174,700 | 497,315 | ||||||
Number | Value | |||||||
| Japan (Continued) | ||||||||
SG Holdings Co. Ltd. | 41,600 | $ | 1,355,872 | |||||
Sharp Corp. | 61,273 | 663,040 | ||||||
Shimadzu Corp. | 65,000 | 1,756,920 | ||||||
Shimamura Co. Ltd. | 8,500 | 597,431 | ||||||
Shimano, Inc. | 22,294 | 4,095,175 | ||||||
Shimizu Corp. | 176,100 | 1,489,204 | ||||||
Shin-Etsu Chemical Co. Ltd. | 104,604 | 12,240,739 | ||||||
Shinsei Bank Ltd. | 54,700 | 697,413 | ||||||
Shionogi & Co. Ltd. | 78,995 | 4,659,346 | ||||||
Shiseido Co. Ltd. | 118,557 | 7,222,583 | ||||||
Shizuoka Bank Ltd. | 144,700 | 920,434 | ||||||
Showa Denko KK | 39,500 | 943,136 | ||||||
SMC Corp. | 17,182 | 8,662,296 | ||||||
Softbank Corp. | 563,900 | 7,142,542 | ||||||
SoftBank Group Corp. | 461,628 | 20,683,263 | ||||||
Sohgo Security Services Co. Ltd. | 21,100 | 1,036,951 | ||||||
Sompo Holdings, Inc. | 99,135 | 3,522,512 | ||||||
Sony Corp. | 374,316 | 23,858,762 | ||||||
Sony Financial Holdings, Inc. | 42,600 | 1,025,449 | ||||||
Square Enix Holdings Co. Ltd. (b) | 29,400 | 1,425,768 | ||||||
Stanley Electric Co. Ltd. | 37,500 | 910,682 | ||||||
Subaru Corp. | 178,534 | 3,937,532 | ||||||
SUMCO Corp. | 74,300 | 1,137,459 | ||||||
Sumitomo Chemical Co. Ltd. | 420,522 | 1,302,372 | ||||||
Sumitomo Corp. | 347,476 | 4,182,149 | ||||||
Sumitomo Dainippon Pharma Co. Ltd. | 46,400 | 655,266 | ||||||
Sumitomo Electric Industries Ltd. | 214,300 | 2,492,831 | ||||||
Sumitomo Heavy Industries Ltd. | 30,400 | 693,440 | ||||||
Sumitomo Metal Mining Co. Ltd. | 69,500 | 1,933,975 | ||||||
Sumitomo Mitsui Financial Group, Inc. | 387,515 | 11,207,374 | ||||||
Sumitomo Mitsui Trust Holdings, Inc. | 94,081 | 2,766,293 | ||||||
Sumitomo Realty & Development Co. Ltd. | 91,303 | 2,526,717 | ||||||
Sumitomo Rubber Industries Ltd. | 40,100 | 407,526 | ||||||
Sundrug Co. Ltd. | 21,100 | 710,214 | ||||||
Suntory Beverage & Food Ltd. | 40,800 | 1,664,611 | ||||||
Suzuken Co. Ltd. | 19,810 | 719,145 | ||||||
Suzuki Motor Corp. | 105,726 | 3,672,396 | ||||||
Sysmex Corp. | 49,407 | 3,944,497 | ||||||
T&D Holdings, Inc. | 159,300 | 1,437,238 | ||||||
Taiheiyo Cement Corp. | 30,000 | 708,517 | ||||||
Taisei Corp. | 59,515 | 2,063,945 | ||||||
Taisho Pharmaceutical Holdings Co. Ltd. | 9,434 | 598,345 | ||||||
Taiyo Nippon Sanso Corp. | 34,000 | 571,264 | ||||||
Takeda Pharmaceutical Co. Ltd. | 460,611 | 17,899,956 | ||||||
TDK Corp. | 37,924 | 3,544,661 | ||||||
Teijin Ltd. | 47,304 | 773,742 | ||||||
Terumo Corp. | 190,644 | 7,477,622 | ||||||
THK Co. Ltd. | 35,128 | 912,035 | ||||||
TIS, Inc. | 65,900 | 1,403,610 | ||||||
Tobu Railway Co. Ltd. | 56,579 | 2,004,096 | ||||||
Toho Co. Ltd. | 29,800 | 1,094,237 | ||||||
Toho Gas Co. Ltd. | 22,828 | 1,123,990 | ||||||
Tohoku Electric Power Co., Inc. | 120,813 | 1,250,195 | ||||||
Tokio Marine Holdings, Inc. | 189,750 | 8,213,204 | ||||||
Tokyo Century Corp. | 12,700 | 551,713 | ||||||
| See Notes to Financial Statements. | 12 |
DBX ETF Trust
Schedule of Investments
Xtrackers MSCI EAFE Hedged Equity ETF (Continued)
May 31, 2020
Number | Value | |||||||
| Japan (Continued) | ||||||||
Tokyo Electric Power Co. Holdings, Inc.* | 443,600 | $ | 1,493,132 | |||||
Tokyo Electron Ltd. | 43,764 | 8,724,799 | ||||||
Tokyo Gas Co. Ltd. | 108,980 | 2,597,553 | ||||||
Tokyu Corp. | 149,910 | 2,374,206 | ||||||
Tokyu Fudosan Holdings Corp. | 177,900 | 900,676 | ||||||
Toppan Printing Co. Ltd. | 85,889 | 1,467,786 | ||||||
Toray Industries, Inc. | 412,443 | 2,003,606 | ||||||
Toshiba Corp. | 114,516 | 3,126,108 | ||||||
Tosoh Corp. | 78,640 | 1,092,334 | ||||||
TOTO Ltd. | 39,115 | 1,548,714 | ||||||
Toyo Suisan Kaisha Ltd. | 27,800 | 1,451,287 | ||||||
Toyoda Gosei Co. Ltd. | 19,200 | 410,011 | ||||||
Toyota Industries Corp. | 42,400 | 2,166,294 | ||||||
Toyota Motor Corp. | 624,864 | 39,139,101 | ||||||
Toyota Tsusho Corp. | 63,111 | 1,597,599 | ||||||
Trend Micro, Inc. | 36,976 | 2,029,746 | ||||||
Tsuruha Holdings, Inc. | 11,900 | 1,756,669 | ||||||
Unicharm Corp. | 119,600 | 4,447,086 | ||||||
United Urban Investment Corp. REIT | 877 | 928,679 | ||||||
USS Co. Ltd. | 58,800 | 1,023,936 | ||||||
Welcia Holdings Co. Ltd. | 14,100 | 1,183,226 | ||||||
West Japan Railway Co. | 47,106 | 3,036,152 | ||||||
Yakult Honsha Co. Ltd. | 31,979 | 1,957,081 | ||||||
Yamada Denki Co. Ltd. | 182,300 | 885,764 | ||||||
Yamaha Corp. | 42,181 | 2,049,501 | ||||||
Yamaha Motor Co. Ltd. | 85,974 | 1,239,646 | ||||||
Yamato Holdings Co. Ltd. | 94,071 | 2,079,515 | ||||||
Yamazaki Baking Co. Ltd. | 35,300 | 632,058 | ||||||
Yaskawa Electric Corp. | 73,620 | 2,641,842 | ||||||
Yokogawa Electric Corp. | 66,944 | 963,393 | ||||||
Yokohama Rubber Co. Ltd. | 30,004 | 452,654 | ||||||
Z Holdings Corp. | 793,600 | 3,237,832 | ||||||
ZOZO, Inc. | 30,397 | 559,207 | ||||||
|
| |||||||
(Cost $953,202,214) | 980,401,277 | |||||||
|
| |||||||
| Jordan — 0.0% | ||||||||
Hikma Pharmaceuticals PLC | ||||||||
(Cost $1,201,022) | 37,637 | 1,195,045 | ||||||
|
| |||||||
| Luxembourg — 0.2% | ||||||||
ArcelorMittal SA* | 194,596 | 1,858,778 | ||||||
Aroundtown SA | 362,240 | 1,987,201 | ||||||
Eurofins Scientific SE | 3,641 | 2,456,541 | ||||||
SES SA | 104,660 | 773,048 | ||||||
Tenaris SA | 135,210 | 839,303 | ||||||
|
| |||||||
(Cost $15,393,739) | 7,914,871 | |||||||
|
| |||||||
| Macau — 0.1% | ||||||||
Sands China Ltd. | 720,411 | 2,802,089 | ||||||
Wynn Macau Ltd. | 466,119 | 787,739 | ||||||
|
| |||||||
(Cost $4,555,306) | 3,589,828 | |||||||
|
| |||||||
| Netherlands — 4.4% | ||||||||
ABN AMRO Bank NV, 144A | 109,942 | 879,917 | ||||||
Adyen NV, 144A* | 5,277 | 6,929,702 | ||||||
Aegon NV | 531,322 | 1,418,455 | ||||||
Akzo Nobel NV | 60,066 | 4,907,375 | ||||||
Number | Value | |||||||
| Netherlands (Continued) | ||||||||
Altice Europe NV* | 191,028 | $ | 763,383 | |||||
ASML Holding NV | 125,295 | 40,744,589 | ||||||
EXOR NV | 32,196 | 1,731,921 | ||||||
Heineken Holding NV | 32,515 | 2,674,513 | ||||||
Heineken NV | 77,415 | 7,087,882 | ||||||
ING Groep NV | 1,157,020 | 7,456,939 | ||||||
Just Eat Takeaway.com NV, 144A* | 34,161 | 3,699,517 | ||||||
Koninklijke Ahold Delhaize NV | 322,386 | 8,162,894 | ||||||
Koninklijke DSM NV | 50,271 | 6,420,175 | ||||||
Koninklijke KPN NV | 1,014,268 | 2,481,458 | ||||||
Koninklijke Philips NV* | 263,172 | 11,916,153 | ||||||
Koninklijke Vopak NV | 20,874 | 1,142,571 | ||||||
NN Group NV | 89,719 | 2,765,687 | ||||||
Prosus NV* | 144,726 | 11,984,725 | ||||||
QIAGEN NV* | 69,382 | 3,027,559 | ||||||
Randstad NV | 35,506 | 1,487,069 | ||||||
Royal Dutch Shell PLC, Class A | 1,214,867 | 18,892,556 | ||||||
Royal Dutch Shell PLC, Class B | 1,092,269 | 16,538,166 | ||||||
Wolters Kluwer NV | 81,071 | 6,450,691 | ||||||
|
| |||||||
(Cost $184,074,462) | 169,563,897 | |||||||
|
| |||||||
| New Zealand — 0.3% | ||||||||
a2 Milk Co. Ltd.* | 218,507 | 2,577,127 | ||||||
Auckland International Airport Ltd. | 360,829 | 1,455,900 | ||||||
Fisher & Paykel Healthcare Corp. Ltd. | 174,871 | 3,254,365 | ||||||
Mercury NZ Ltd. | 196,797 | 568,052 | ||||||
Meridian Energy Ltd. | 365,283 | 1,077,060 | ||||||
Ryman Healthcare Ltd. | 138,356 | 1,039,203 | ||||||
Spark New Zealand Ltd. | 526,088 | 1,443,436 | ||||||
|
| |||||||
(Cost $8,290,905) | 11,415,143 | |||||||
|
| |||||||
| Norway — 0.5% | ||||||||
DNB ASA* | 278,780 | 3,791,345 | ||||||
Equinor ASA | 301,193 | 4,373,468 | ||||||
Gjensidige Forsikring ASA* | 59,390 | 1,077,124 | ||||||
Mowi ASA | 128,858 | 2,426,506 | ||||||
Norsk Hydro ASA* | 392,537 | 996,612 | ||||||
Orkla ASA | 234,387 | 2,105,945 | ||||||
Schibsted ASA, Class B* | 26,431 | 633,534 | ||||||
Telenor ASA | 214,159 | 3,247,387 | ||||||
Yara International ASA | 52,951 | 1,811,743 | ||||||
|
| |||||||
(Cost $26,278,007) | 20,463,664 | |||||||
|
| |||||||
| Portugal — 0.2% | ||||||||
EDP — Energias de Portugal SA | 758,625 | 3,556,239 | ||||||
Galp Energia SGPS SA | 148,835 | 1,770,271 | ||||||
Jeronimo Martins SGPS SA* | 78,192 | 1,334,939 | ||||||
|
| |||||||
(Cost $6,266,407) | 6,661,449 | |||||||
|
| |||||||
| Russia — 0.0% | ||||||||
Evraz PLC | ||||||||
(Cost $1,100,190) | 147,174 | 513,290 | ||||||
|
| |||||||
| Singapore — 1.1% | ||||||||
Ascendas Real Estate Investment Trust REIT | 914,052 | 2,025,044 | ||||||
CapitaLand Commercial Trust REIT | 801,180 | 992,402 | ||||||
CapitaLand Ltd.* | 767,400 | 1,569,781 | ||||||
| See Notes to Financial Statements. | 13 |
DBX ETF Trust
Schedule of Investments
Xtrackers MSCI EAFE Hedged Equity ETF (Continued)
May 31, 2020
Number | Value | |||||||
| Singapore (Continued) | ||||||||
CapitaLand Mall Trust REIT | 860,600 | $ | 1,236,564 | |||||
City Developments Ltd. | 136,800 | 744,615 | ||||||
DBS Group Holdings Ltd. | 514,295 | 7,087,573 | ||||||
Genting Singapore Ltd. | 1,746,378 | 970,347 | ||||||
Jardine Cycle & Carriage Ltd. | 29,900 | 462,637 | ||||||
Keppel Corp. Ltd. | 424,400 | 1,775,343 | ||||||
Mapletree Commercial Trust REIT | 638,200 | 903,454 | ||||||
Mapletree Logistics Trust REIT | 783,400 | 1,136,729 | ||||||
Oversea-Chinese Banking Corp. Ltd. | 984,682 | 5,959,110 | ||||||
Singapore Airlines Ltd. | 353,250 | 955,135 | ||||||
Singapore Exchange Ltd. | 255,900 | 1,499,754 | ||||||
Singapore Technologies Engineering Ltd. | 464,000 | 1,047,678 | ||||||
Singapore Telecommunications Ltd. | 2,424,389 | 4,272,883 | ||||||
Suntec Real Estate Investment Trust REIT | 480,700 | 500,162 | ||||||
United Overseas Bank Ltd. | 334,954 | 4,623,162 | ||||||
UOL Group Ltd.* | 151,081 | 731,451 | ||||||
Venture Corp. Ltd. | 90,300 | 977,909 | ||||||
Wilmar International Ltd. | 570,366 | 1,606,779 | ||||||
|
| |||||||
(Cost $51,888,375) | 41,078,512 | |||||||
|
| |||||||
| Spain — 2.3% | ||||||||
ACS Actividades de Construccion y Servicios SA | 75,866 | 1,932,736 | ||||||
Aena SME SA, 144A* | 19,831 | 2,822,119 | ||||||
Amadeus IT Group SA | 126,775 | 6,605,709 | ||||||
Banco Bilbao Vizcaya Argentaria SA | 1,986,755 | 6,159,677 | ||||||
Banco Santander SA | 4,894,024 | 11,068,950 | ||||||
Bankinter SA | 204,886 | 866,750 | ||||||
CaixaBank SA | 1,065,647 | 1,986,717 | ||||||
Cellnex Telecom SA, 144A* | 73,287 | 4,142,457 | ||||||
Enagas SA | 79,318 | 1,779,429 | ||||||
Endesa SA | 92,873 | 2,201,051 | ||||||
Ferrovial SA* | 2,089 | 56,628 | ||||||
Ferrovial SA | 144,926 | 3,928,572 | ||||||
Grifols SA | 88,573 | 2,764,772 | ||||||
Iberdrola SA | 1,709,433 | 18,383,530 | ||||||
Industria de Diseno Textil SA | 320,139 | 8,902,029 | ||||||
Mapfre SA | 316,787 | 556,661 | ||||||
Naturgy Energy Group SA | 88,293 | 1,636,272 | ||||||
Red Electrica Corp. SA | 128,528 | 2,259,933 | ||||||
Repsol SA | 419,986 | 3,902,141 | ||||||
Siemens Gamesa Renewable Energy SA* | 70,791 | 1,189,332 | ||||||
Telefonica SA | 1,395,229 | 6,568,353 | ||||||
|
| |||||||
(Cost $146,144,182) | 89,713,818 | |||||||
|
| |||||||
| Sweden — 2.8% | ||||||||
Alfa Laval AB* | 93,094 | 1,876,196 | ||||||
Assa Abloy AB, Class B | 297,618 | 6,023,396 | ||||||
Atlas Copco AB, Class A | 199,964 | 7,835,109 | ||||||
Atlas Copco AB, Class B | 118,078 | 4,162,940 | ||||||
Boliden AB | 81,216 | 1,760,066 | ||||||
Electrolux AB, Series B | 63,995 | 1,046,938 | ||||||
Epiroc AB, Class A | 195,685 | 2,171,266 | ||||||
Epiroc AB, Class B | 115,792 | 1,289,097 | ||||||
Number | Value | |||||||
| Sweden (Continued) | ||||||||
EQT AB* | 65,617 | $ | 1,037,262 | |||||
Essity AB, Class B* | 180,081 | 5,939,918 | ||||||
Evolution Gaming Group AB, 144A* | 36,582 | 2,157,832 | ||||||
Hennes & Mauritz AB, Class B (b) | 238,547 | 3,598,756 | ||||||
Hexagon AB, Class B* | 78,108 | 4,287,317 | ||||||
Husqvarna AB, Class B | 130,942 | 962,483 | ||||||
ICA Gruppen AB (b) | 28,124 | 1,320,157 | ||||||
Industrivarden AB, Class C* | 44,806 | 995,736 | ||||||
Investment AB Latour, Class B | 43,600 | 781,534 | ||||||
Investor AB, Class B | 135,253 | 7,191,445 | ||||||
Kinnevik AB, Class B | 69,801 | 1,755,665 | ||||||
L E Lundbergforetagen AB, Class B* | 22,573 | 1,119,241 | ||||||
Lundin Energy AB | 54,271 | 1,307,450 | ||||||
Nibe Industrier AB, Class B* | 91,836 | 2,036,999 | ||||||
Sandvik AB* | 339,407 | 5,615,630 | ||||||
Securitas AB, Class B* | 104,200 | 1,380,111 | ||||||
Skandinaviska Enskilda Banken AB, Class A* | 479,560 | 4,159,134 | ||||||
Skanska AB, Class B* | 100,997 | 2,016,178 | ||||||
SKF AB, Class B | 112,995 | 2,072,214 | ||||||
Svenska Cellulosa AB SCA, Class B* | 178,427 | 2,225,000 | ||||||
Svenska Handelsbanken AB, Class A* | 461,835 | 4,369,090 | ||||||
Swedbank AB, Class A* | 268,905 | 3,367,537 | ||||||
Swedish Match AB | 50,467 | 3,500,669 | ||||||
Tele2 AB, Class B | 143,092 | 1,902,821 | ||||||
Telefonaktiebolaget LM Ericsson, Class B | 855,931 | 7,779,415 | ||||||
Telia Co. AB | 718,321 | 2,460,841 | ||||||
Volvo AB, Class B* | 438,839 | 6,205,889 | ||||||
|
| |||||||
(Cost $113,262,463) | 107,711,332 | |||||||
|
| |||||||
| Switzerland — 10.4% | ||||||||
ABB Ltd. | 547,160 | 10,746,363 | ||||||
Adecco Group AG | 46,082 | 2,185,757 | ||||||
Alcon, Inc.* | 143,313 | 9,220,429 | ||||||
Baloise Holding AG | 13,708 | 1,946,884 | ||||||
Banque Cantonale Vaudoise | 8,873 | 861,653 | ||||||
Barry Callebaut AG | 919 | 1,846,026 | ||||||
Chocoladefabriken Lindt & Spruengli AG | 31 | 2,688,085 | ||||||
Chocoladefabriken Lindt & Spruengli AG Participation Certificates | 300 | 2,498,440 | ||||||
Cie Financiere Richemont SA | 152,853 | 8,880,667 | ||||||
Clariant AG* | 61,663 | 1,129,334 | ||||||
Coca-Cola HBC AG* | 58,912 | 1,482,775 | ||||||
Credit Suisse Group AG | 703,100 | 6,409,629 | ||||||
EMS-Chemie Holding AG | 2,489 | 1,838,672 | ||||||
Geberit AG | 11,003 | 5,345,916 | ||||||
Givaudan SA | 2,746 | 9,841,404 | ||||||
Glencore PLC* | 2,912,104 | 5,388,203 | ||||||
Julius Baer Group Ltd. | 65,517 | 2,786,073 | ||||||
Kuehne + Nagel International AG* | 16,037 | 2,307,674 | ||||||
LafargeHolcim Ltd.* | 146,307 | 6,045,166 | ||||||
Logitech International SA | 46,689 | 2,751,437 | ||||||
Lonza Group AG | 22,079 | 10,823,714 | ||||||
Nestle SA | 875,273 | 94,516,379 | ||||||
Novartis AG | 631,879 | 54,548,673 | ||||||
| See Notes to Financial Statements. | 14 |
DBX ETF Trust
Schedule of Investments
Xtrackers MSCI EAFE Hedged Equity ETF (Continued)
May 31, 2020
Number | Value | |||||||
| Switzerland (Continued) | ||||||||
Pargesa Holding SA | 13,254 | $ | 999,080 | |||||
Partners Group Holding AG | 5,545 | 4,579,900 | ||||||
Roche Holding AG | 207,029 | 71,614,211 | ||||||
Schindler Holding AG | 5,981 | 1,383,005 | ||||||
Schindler Holding AG Participation Certificates | 12,026 | 2,789,562 | ||||||
SGS SA | 1,795 | 4,208,489 | ||||||
Sika AG | 41,085 | 7,026,910 | ||||||
Sonova Holding AG | 16,723 | 3,660,004 | ||||||
STMicroelectronics NV | 190,332 | 4,667,134 | ||||||
Straumann Holding AG | 3,062 | 2,476,852 | ||||||
Swatch Group AG — Bearer (b) | 8,477 | 1,691,346 | ||||||
Swatch Group AG — Registered | 15,443 | 599,544 | ||||||
Swiss Life Holding AG | 9,313 | 3,267,006 | ||||||
Swiss Prime Site AG | 22,677 | 2,107,843 | ||||||
Swiss Re AG | 87,501 | 5,924,376 | ||||||
Swisscom AG | 7,644 | 3,972,210 | ||||||
Temenos AG | 19,528 | 2,978,538 | ||||||
UBS Group AG | 1,068,957 | 11,447,554 | ||||||
Vifor Pharma AG | 13,343 | 2,026,837 | ||||||
Zurich Insurance Group AG | 44,420 | 14,294,022 | ||||||
|
| |||||||
(Cost $380,616,281) | 397,803,776 | |||||||
|
| |||||||
| United Arab Emirates — 0.0% | ||||||||
NMC Health PLC (d) | ||||||||
(Cost $1,368,921) | 31,933 | 0 | ||||||
|
| |||||||
| United Kingdom — 13.1% | ||||||||
3i Group PLC | 297,923 | 3,035,465 | ||||||
Admiral Group PLC | 60,571 | 1,745,206 | ||||||
Anglo American PLC | 361,720 | 7,596,997 | ||||||
Ashtead Group PLC | 136,264 | 4,027,088 | ||||||
Associated British Foods PLC | 105,784 | 2,379,015 | ||||||
AstraZeneca PLC | 386,227 | 40,925,802 | ||||||
Auto Trader Group PLC, 144A | 287,887 | 1,984,628 | ||||||
AVEVA Group PLC | 18,225 | 920,123 | ||||||
Aviva PLC | 1,161,363 | 3,552,722 | ||||||
BAE Systems PLC | 957,708 | 5,868,906 | ||||||
Barclays PLC | 5,128,472 | 7,298,919 | ||||||
Barratt Developments PLC | 302,333 | 1,855,706 | ||||||
Berkeley Group Holdings PLC | 35,267 | 1,783,568 | ||||||
BP PLC | 5,949,602 | 22,465,788 | ||||||
British American Tobacco PLC | 673,749 | 26,539,212 | ||||||
British Land Co. PLC REIT | 253,775 | 1,276,529 | ||||||
BT Group PLC | 2,494,190 | 3,580,880 | ||||||
Bunzl PLC | 105,176 | 2,450,421 | ||||||
Burberry Group PLC | 118,340 | 2,185,673 | ||||||
CNH Industrial NV* | 300,941 | 1,821,293 | ||||||
Coca-Cola European Partners PLC | 60,535 | 2,282,170 | ||||||
Compass Group PLC | 517,965 | 7,573,897 | ||||||
Croda International PLC | 38,243 | 2,451,244 | ||||||
Diageo PLC | 688,229 | 23,718,230 | ||||||
Direct Line Insurance Group PLC | 405,861 | 1,326,278 | ||||||
Ferguson PLC | 67,260 | 5,287,992 | ||||||
Fiat Chrysler Automobiles NV* | 319,800 | 2,819,363 | ||||||
GlaxoSmithKline PLC | 1,481,372 | 30,585,510 | ||||||
Halma PLC | 111,032 | 3,195,004 | ||||||
Hargreaves Lansdown PLC | 97,437 | 2,206,338 | ||||||
Number | Value | |||||||
| United Kingdom (Continued) | ||||||||
HSBC Holdings PLC | 5,971,233 | $ | 27,292,944 | |||||
Imperial Brands PLC | 275,067 | 4,981,818 | ||||||
Informa PLC | 445,626 | 2,500,784 | ||||||
InterContinental Hotels Group PLC | 49,342 | 2,358,887 | ||||||
Intertek Group PLC | 46,115 | 3,135,781 | ||||||
ITV PLC | 1,063,268 | 1,054,186 | ||||||
J Sainsbury PLC | 504,407 | 1,208,510 | ||||||
JD Sports Fashion PLC | 120,563 | 980,327 | ||||||
Johnson Matthey PLC | 56,204 | 1,466,675 | ||||||
Kingfisher PLC | 602,850 | 1,445,858 | ||||||
Land Securities Group PLC REIT | 203,853 | 1,525,154 | ||||||
Legal & General Group PLC | 1,796,190 | 4,403,318 | ||||||
Lloyds Banking Group PLC | 20,798,426 | 7,672,431 | ||||||
London Stock Exchange Group PLC | 93,294 | 9,252,020 | ||||||
M&G PLC | 771,995 | 1,334,780 | ||||||
Melrose Industries PLC | 1,417,044 | 2,015,183 | ||||||
Mondi PLC | 149,689 | 2,787,780 | ||||||
National Grid PLC | 1,033,536 | 11,819,630 | ||||||
Next PLC | 38,780 | 2,329,532 | ||||||
Ocado Group PLC* | 134,782 | 3,647,049 | ||||||
Pearson PLC | 232,223 | 1,329,011 | ||||||
Persimmon PLC | 94,626 | 2,679,673 | ||||||
Prudential PLC | 772,037 | 9,982,793 | ||||||
Reckitt Benckiser Group PLC | 210,644 | 18,792,913 | ||||||
RELX PLC | 575,657 | 13,319,403 | ||||||
Rentokil Initial PLC | 553,640 | 3,396,850 | ||||||
Rio Tinto Ltd. | 109,323 | 6,805,988 | ||||||
Rio Tinto PLC | 330,844 | 17,622,601 | ||||||
Rolls-Royce Holdings PLC* | 520,651 | 1,746,400 | ||||||
Royal Bank of Scotland Group PLC | 1,436,436 | 1,957,609 | ||||||
RSA Insurance Group PLC | 295,247 | 1,437,737 | ||||||
Sage Group PLC | 308,508 | 2,632,763 | ||||||
Schroders PLC | 36,912 | 1,347,077 | ||||||
Segro PLC REIT | 323,151 | 3,350,775 | ||||||
Severn Trent PLC | 70,502 | 2,125,380 | ||||||
Smith & Nephew PLC | 259,804 | 5,268,491 | ||||||
Smiths Group PLC | 117,637 | 1,898,107 | ||||||
Spirax-Sarco Engineering PLC | 21,894 | 2,668,760 | ||||||
SSE PLC | 311,020 | 4,768,725 | ||||||
St James’s Place PLC | 151,713 | 1,721,516 | ||||||
Standard Chartered PLC | 806,699 | 3,670,273 | ||||||
Standard Life Aberdeen PLC | 708,920 | 2,261,460 | ||||||
Taylor Wimpey PLC | 973,896 | 1,727,167 | ||||||
Tesco PLC | 2,867,484 | 8,084,892 | ||||||
Unilever NV | 431,039 | 22,244,303 | ||||||
Unilever PLC | 344,132 | 18,411,144 | ||||||
United Utilities Group PLC | 202,472 | 2,294,487 | ||||||
Vodafone Group PLC | 7,948,505 | 13,057,790 | ||||||
Whitbread PLC (b) | 40,107 | 1,252,174 | ||||||
Wm Morrison Supermarkets PLC | 713,872 | 1,646,008 | ||||||
WPP PLC | 374,717 | 2,830,337 | ||||||
|
| |||||||
(Cost $678,722,114) | 500,285,221 | |||||||
|
| |||||||
TOTAL COMMON STOCKS | 3,715,418,641 | |||||||
|
| |||||||
| See Notes to Financial Statements. | 15 |
DBX ETF Trust
Schedule of Investments
Xtrackers MSCI EAFE Hedged Equity ETF (Continued)
May 31, 2020
Number | Value | |||||||
| PREFERRED STOCKS — 0.5% | ||||||||
| Germany — 0.5% | ||||||||
Bayerische Motoren Werke AG | 16,878 | $ | 775,272 | |||||
FUCHS PETROLUB SE | 24,034 | 955,640 | ||||||
Henkel AG & Co. KGaA* | 53,702 | 4,785,645 | ||||||
Porsche Automobil Holding SE | 45,473 | 2,468,846 | ||||||
Sartorius AG* | 10,235 | 3,787,879 | ||||||
Volkswagen AG* | 54,857 | 8,068,460 | ||||||
|
| |||||||
(Cost $28,571,949) | 20,841,742 | |||||||
|
| |||||||
TOTAL PREFERRED STOCKS | 20,841,742 | |||||||
|
| |||||||
| RIGHTS — 0.0% | ||||||||
| Italy — 0.0% | ||||||||
Davide Campari-Milano SpA*, expires 6/21/20 (d) | 174,893 | 0 | ||||||
|
| |||||||
| United Kingdom — 0.0% | ||||||||
Whitbread PLC*, expires 6/12/20 | 20,337 | 251,665 | ||||||
|
| |||||||
TOTAL RIGHTS | 251,665 | |||||||
|
| |||||||
Number | Value | |||||||
| SECURITIES LENDING COLLATERAL — 1.5% | ||||||||
DWS Government & Agency Securities Portfolio “DWS Government Cash Institutional Shares”, 0.07% (e)(f) | 56,545,490 | $ | 56,545,490 | |||||
|
| |||||||
| CASH EQUIVALENTS — 1.5% | ||||||||
DWS ESG Liquidity Fund “Capital Shares”, 0.47% (e) | 36,305,055 | 36,319,577 | ||||||
DWS Government Money Market Series “Institutional Shares”, 0.12% (e) | 21,017,231 | 21,017,231 | ||||||
|
| |||||||
TOTAL CASH EQUIVALENTS | 57,336,808 | |||||||
|
| |||||||
TOTAL INVESTMENTS — 100.5% (Cost $4,304,637,638) | $ | 3,850,394,346 | ||||||
Other assets and liabilities, net — (0.5%) | (19,875,899 | ) | ||||||
|
| |||||||
NET ASSETS — 100.0% | $ | 3,830,518,447 | ||||||
|
| |||||||
A summary of the Fund’s transactions with affiliated investments during the year ended May 31, 2020 is as follows:
| Value ($) at 5/31/2019 | Purchases Cost ($) | Sales Proceeds ($) | Net Realized Gain/(Loss) ($) | Net Change in Unrealized Appreciation (Depreciation) ($) | Income ($) | Capital Gain Distributions ($) | Number of Shares at 5/31/2020 | Value ($) at 5/31/2020 | ||||||||||||||||||||||||||||
COMMON STOCKS — 0.1% |
| |||||||||||||||||||||||||||||||||||
Germany — 0.1% |
| |||||||||||||||||||||||||||||||||||
Deutsche Bank AG (c) |
| |||||||||||||||||||||||||||||||||||
| 4,581,152 | 202,486 | (764,197 | ) | (1,848,046 | ) | 2,702,446 | — | — | 583,010 | 4,873,841 | ||||||||||||||||||||||||||
SECURITIES LENDING COLLATERAL — 1.5% |
| |||||||||||||||||||||||||||||||||||
DWS Government & Agency Securities Portfolio “DWS Government Cash Institutional Shares”, 0.07% (e)(f) |
| |||||||||||||||||||||||||||||||||||
| 98,060,983 | — | (41,515,493 | ) (g) | — | — | 675,461 | — | 56,545,490 | 56,545,490 | |||||||||||||||||||||||||||
CASH EQUIVALENTS — 1.5% |
| |||||||||||||||||||||||||||||||||||
DWS ESG Liquidity Fund “Capital Shares”, 0.47% (e) |
| |||||||||||||||||||||||||||||||||||
| 50,653,027 | 652,028 | (15,003,000 | ) | 3,000 | 14,522 | 666,333 | — | 36,305,055 | 36,319,577 | |||||||||||||||||||||||||||
DWS Government Money Market Series “Institutional Shares”, 0.12% (e) |
| |||||||||||||||||||||||||||||||||||
| 36,831,101 | 1,788,637,750 | (1,804,451,620 | ) | — | — | 1,268,186 | — | 21,017,231 | 21,017,231 | |||||||||||||||||||||||||||
|
|
|
|
|
|
|
|
|
|
|
|
|
|
|
|
|
| |||||||||||||||||||
| 190,126,263 | 1,789,492,264 | (1,861,734,310 | ) | (1,845,046 | ) | 2,716,968 | 2,609,980 | — | 114,450,786 | 118,756,139 | ||||||||||||||||||||||||||
|
|
|
|
|
|
|
|
|
|
|
|
|
|
|
|
|
| |||||||||||||||||||
| * | Non-income producing security. |
| (a) | Stapled Security — A security contractually bound to one or more other securities to form a single saleable unit which cannot be sold separately. |
| (b) | All or a portion of these securities were on loan. In addition, “Other assets and liabilities, net” may include pending sales that are also on loan. The value of securities loaned at May 31, 2020 amounted to $57,986,585, which is 1.5% of net assets. |
| (c) | Affiliated issuer. This security is owned in proportion with its representation in the index. |
| (d) | Investment was valued using significant unobservable inputs. |
| (e) | Affiliated fund managed by DWS Investment Management Americas, Inc. The rate shown is the annualized seven-day yield at period end. |
| (f) | Represents cash collateral held in connection with securities lending. Income earned by the Fund is net of borrower rebates. In addition, the Fund held non-cash U.S. Treasury securities collateral having a value of $4,936,218. |
| (g) | Represents the net increase (purchase cost) or decrease (sales proceeds) in the amount invested in cash collateral for the period ended May 31, 2020. |
| See Notes to Financial Statements. | 16 |
DBX ETF Trust
Schedule of Investments
Xtrackers MSCI EAFE Hedged Equity ETF (Continued)
May 31, 2020
| ADR: | American Depositary Receipt |
| CDI: | Chess Depositary Interest |
| REIT: | Real Estate Investment Trust |
| RSP: | Risparmio (Convertible Savings Shares) |
| 144A: | Security exempt from registration under Rule 144A of the Securities Act of 1933. These securities may be resold in transactions exempt from registration, normally to qualified institutional buyers. |
At May 31, 2020, open futures contracts purchased were as follows:
Contract Description | Currency | Number of Contracts | Notional Amount | Contract Value | Expiration Date | Unrealized Appreciation | ||||||||||||||||
AMSTERDAM Index Futures | EUR | 26 | $ | 3,005,213 | $ | 3,071,652 | 6/19/2020 | $ | 66,439 | |||||||||||||
CAC40 10 EURO Futures | EUR | 185 | 9,186,457 | 9,623,138 | 6/19/2020 | 436,681 | ||||||||||||||||
DAX Index Futures | EUR | 23 | 5,934,183 | 7,405,632 | 6/19/2020 | 1,471,449 | ||||||||||||||||
FTSE/MIB Index Futures | EUR | 15 | 1,284,552 | 1,513,304 | 6/19/2020 | 228,752 | ||||||||||||||||
FTSE 100 Index Futures | GBP | 169 | 11,243,310 | 12,649,182 | 6/19/2020 | 1,405,872 | ||||||||||||||||
HANG SENG Index Futures | HKD | 27 | 3,916,335 | 3,965,445 | 6/29/2020 | 49,110 | ||||||||||||||||
IBEX 35 Index Futures | EUR | 24 | 1,775,873 | 1,881,829 | 6/19/2020 | 105,956 | ||||||||||||||||
MSCI EAFE Futures | USD | 82 | 6,390,580 | 7,074,960 | 6/19/2020 | 684,380 | ||||||||||||||||
MSCI SING IX ETS | SGD | 39 | 791,352 | 795,017 | 6/29/2020 | 3,665 | ||||||||||||||||
OMXS30 Index Futures | SEK | 163 | 2,699,836 | 2,816,265 | 6/18/2020 | 116,429 | ||||||||||||||||
SPI 200 Futures | AUD | 57 | 4,767,710 | 5,460,594 | 6/18/2020 | 692,884 | ||||||||||||||||
SWISS MKT IX Futures | CHF | 85 | 7,616,678 | 8,684,706 | 6/19/2020 | 1,068,028 | ||||||||||||||||
TOPIX Index Futures | JPY | 178 | 22,753,607 | 25,731,559 | 6/11/2020 | 2,977,952 | ||||||||||||||||
|
| |||||||||||||||||||||
Total unrealized appreciation | $ | 9,307,597 | ||||||||||||||||||||
|
| |||||||||||||||||||||
As of May 31, 2020, the Fund had the following forward foreign currency contracts outstanding:
Counterparty | Settlement Date | Currency To Deliver | Currency To Receive | Unrealized Appreciation | Unrealized Depreciation | |||||||||||||||||
Citigroup Global Markets | 6/3/2020 | AUD | 116,981,842 | USD | 76,593,861 | $ | — | $ | (1,380,635 | ) | ||||||||||||
JP Morgan & Chase Co. | 6/3/2020 | AUD | 171,004,500 | USD | 111,964,341 | — | (2,019,073 | ) | ||||||||||||||
RBC Capital Markets | 6/3/2020 | AUD | 48,037,600 | USD | 31,452,859 | — | (566,706 | ) | ||||||||||||||
RBC Capital Markets | 6/3/2020 | AUD | 18,813,000 | USD | 12,317,435 | — | (222,410 | ) | ||||||||||||||
Citigroup Global Markets | 6/3/2020 | CHF | 115,387,400 | USD | 119,641,865 | — | (338,636 | ) | ||||||||||||||
Citigroup Global Markets | 6/3/2020 | CHF | 33,019,000 | USD | 34,237,229 | — | (96,122 | ) | ||||||||||||||
JP Morgan & Chase Co. | 6/3/2020 | CHF | 1,247,000 | USD | 1,292,288 | — | (4,350 | ) | ||||||||||||||
JP Morgan & Chase Co. | 6/3/2020 | CHF | 107,683,100 | USD | 111,651,878 | — | (317,647 | ) | ||||||||||||||
RBC Capital Markets | 6/3/2020 | CHF | 132,027,700 | USD | 136,897,131 | — | (386,053 | ) | ||||||||||||||
Citigroup Global Markets | 6/3/2020 | DKK | 64,732,000 | USD | 9,509,231 | — | (131,067 | ) | ||||||||||||||
Citigroup Global Markets | 6/3/2020 | DKK | 142,082,100 | USD | 20,871,866 | — | (287,896 | ) | ||||||||||||||
JP Morgan & Chase Co. | 6/3/2020 | DKK | 169,927,100 | USD | 24,962,500 | — | (344,116 | ) | ||||||||||||||
RBC Capital Markets | 6/3/2020 | DKK | 196,836,400 | USD | 28,914,851 | — | (399,268 | ) | ||||||||||||||
Citigroup Global Markets | 6/3/2020 | EUR | 368,556,600 | USD | 403,879,065 | — | (5,262,556 | ) | ||||||||||||||
JP Morgan & Chase Co. | 6/3/2020 | EUR | 369,326,300 | USD | 404,735,459 | — | (5,260,620 | ) | ||||||||||||||
RBC Capital Markets | 6/3/2020 | EUR | 9,865,000 | USD | 10,760,495 | — | (190,827 | ) | ||||||||||||||
RBC Capital Markets | 6/3/2020 | EUR | 197,368,600 | USD | 216,293,288 | — | (2,809,310 | ) | ||||||||||||||
RBC Capital Markets | 6/3/2020 | EUR | 104,066,000 | USD | 114,042,703 | — | (1,482,922 | ) | ||||||||||||||
Citigroup Global Markets | 6/3/2020 | GBP | 45,570,000 | USD | 57,483,866 | 1,204,068 | — | |||||||||||||||
Citigroup Global Markets | 6/3/2020 | GBP | 2,108,000 | USD | 2,619,038 | 15,619 | — | |||||||||||||||
Citigroup Global Markets | 6/3/2020 | GBP | 91,996,500 | USD | 116,049,261 | 2,431,872 | — | |||||||||||||||
JP Morgan & Chase Co. | 6/3/2020 | GBP | 141,880,200 | USD | 178,969,812 | 3,745,125 | — | |||||||||||||||
RBC Capital Markets | 6/3/2020 | GBP | 175,982,400 | USD | 222,025,555 | 4,684,017 | — | |||||||||||||||
Citigroup Global Markets | 6/3/2020 | HKD | 112,122,000 | USD | 14,456,344 | — | (7,214 | ) | ||||||||||||||
JP Morgan & Chase Co. | 6/3/2020 | HKD | 238,786,000 | USD | 30,787,504 | — | (15,506 | ) | ||||||||||||||
RBC Capital Markets | 6/3/2020 | HKD | 659,557,400 | USD | 85,041,086 | — | (40,758 | ) | ||||||||||||||
Citigroup Global Markets | 6/3/2020 | ILS | 8,966,300 | USD | 2,585,289 | 31,758 | — | |||||||||||||||
JP Morgan & Chase Co. | 6/3/2020 | ILS | 11,086,900 | USD | 3,196,639 | 39,177 | — | |||||||||||||||
RBC Capital Markets | 6/3/2020 | ILS | 21,503,700 | USD | 6,199,176 | 75,091 | — | |||||||||||||||
Citigroup Global Markets | 6/3/2020 | JPY | 2,922,456,000 | USD | 27,337,813 | 237,955 | — | |||||||||||||||
| See Notes to Financial Statements. | 17 |
DBX ETF Trust
Schedule of Investments
Xtrackers MSCI EAFE Hedged Equity ETF (Continued)
May 31, 2020
Counterparty | Settlement Date | Currency To Deliver | Currency To Receive | Unrealized Appreciation | Unrealized Depreciation | |||||||||||||||||
Citigroup Global Markets | 6/3/2020 | JPY | 33,038,175,800 | USD | 309,049,609 | $ | 2,687,464 | $ | — | |||||||||||||
JP Morgan & Chase Co. | 6/3/2020 | JPY | 31,981,548,600 | USD | 299,171,179 | 2,607,110 | — | |||||||||||||||
JP Morgan & Chase Co. | 6/3/2020 | JPY | 228,215,000 | USD | 2,136,844 | 20,612 | — | |||||||||||||||
RBC Capital Markets | 6/3/2020 | JPY | 34,921,841,600 | USD | 326,671,546 | 2,842,217 | — | |||||||||||||||
Citigroup Global Markets | 6/3/2020 | NOK | 27,831,400 | USD | 2,723,655 | — | (139,508 | ) | ||||||||||||||
JP Morgan & Chase Co. | 6/3/2020 | NOK | 18,040,000 | USD | 1,765,480 | — | (90,390 | ) | ||||||||||||||
JP Morgan & Chase Co. | 6/3/2020 | NOK | 6,681,200 | USD | 653,869 | — | (33,462 | ) | ||||||||||||||
RBC Capital Markets | 6/3/2020 | NOK | 158,785,500 | USD | 15,539,327 | — | (795,777 | ) | ||||||||||||||
Citigroup Global Markets | 6/3/2020 | NZD | 7,776,900 | USD | 4,797,103 | — | (30,347 | ) | ||||||||||||||
JP Morgan & Chase Co. | 6/3/2020 | NZD | 2,300,400 | USD | 1,418,891 | — | (9,064 | ) | ||||||||||||||
JP Morgan & Chase Co. | 6/3/2020 | NZD | 3,540,000 | USD | 2,183,447 | — | (13,980 | ) | ||||||||||||||
RBC Capital Markets | 6/3/2020 | NZD | 6,064,800 | USD | 3,740,932 | — | (23,745 | ) | ||||||||||||||
Citigroup Global Markets | 6/3/2020 | SEK | 126,728,000 | USD | 12,977,978 | — | (471,842 | ) | ||||||||||||||
Citigroup Global Markets | 6/3/2020 | SEK | 258,435,900 | USD | 26,465,530 | — | (962,635 | ) | ||||||||||||||
JP Morgan & Chase Co. | 6/3/2020 | SEK | 329,618,200 | USD | 33,755,099 | — | (1,227,743 | ) | ||||||||||||||
RBC Capital Markets | 6/3/2020 | SEK | 311,544,200 | USD | 31,904,168 | — | (1,160,455 | ) | ||||||||||||||
Citigroup Global Markets | 6/3/2020 | SGD | 9,652,000 | USD | 6,857,062 | 25,180 | — | |||||||||||||||
Citigroup Global Markets | 6/3/2020 | SGD | 5,953,000 | USD | 4,228,980 | 15,326 | — | |||||||||||||||
JP Morgan & Chase Co. | 6/3/2020 | SGD | 30,293,400 | USD | 21,521,313 | 79,030 | — | |||||||||||||||
RBC Capital Markets | 6/3/2020 | SGD | 16,739,200 | USD | 11,891,888 | 43,543 | — | |||||||||||||||
Citigroup Global Markets | 6/3/2020 | USD | 77,652,547 | AUD | 116,981,842 | 321,949 | — | |||||||||||||||
JP Morgan & Chase Co. | 6/3/2020 | USD | 3,222,677 | AUD | 4,846,000 | 7,434 | — | |||||||||||||||
JP Morgan & Chase Co. | 6/3/2020 | USD | 108,151,474 | AUD | 162,927,800 | 448,399 | — | |||||||||||||||
JP Morgan & Chase Co. | 6/3/2020 | USD | 2,072,559 | AUD | 3,230,700 | 80,871 | — | |||||||||||||||
RBC Capital Markets | 6/3/2020 | USD | 44,376,030 | AUD | 66,850,600 | 183,380 | — | |||||||||||||||
Citigroup Global Markets | 6/3/2020 | USD | 3,647,911 | CHF | 3,545,000 | 38,201 | — | |||||||||||||||
Citigroup Global Markets | 6/3/2020 | USD | 5,509,964 | CHF | 5,317,600 | 19,308 | — | |||||||||||||||
Citigroup Global Markets | 6/3/2020 | USD | 145,256,748 | CHF | 139,543,800 | — | (158,279 | ) | ||||||||||||||
JP Morgan & Chase Co. | 6/3/2020 | USD | 113,386,177 | CHF | 108,930,100 | — | (120,014 | ) | ||||||||||||||
RBC Capital Markets | 6/3/2020 | USD | 137,428,646 | CHF | 132,027,700 | — | (145,462 | ) | ||||||||||||||
Citigroup Global Markets | 6/3/2020 | USD | 28,916,661 | DKK | 193,758,400 | — | (60,937 | ) | ||||||||||||||
Citigroup Global Markets | 6/3/2020 | USD | 1,153,662 | DKK | 7,833,400 | 12,938 | — | |||||||||||||||
Citigroup Global Markets | 6/3/2020 | USD | 757,965 | DKK | 5,222,300 | 19,773 | — | |||||||||||||||
JP Morgan & Chase Co. | 6/3/2020 | USD | 25,359,604 | DKK | 169,927,100 | — | (52,988 | ) | ||||||||||||||
RBC Capital Markets | 6/3/2020 | USD | 29,375,498 | DKK | 196,836,400 | — | (61,379 | ) | ||||||||||||||
Citigroup Global Markets | 6/3/2020 | USD | 15,740,736 | EUR | 14,328,700 | 165,824 | — | |||||||||||||||
Citigroup Global Markets | 6/3/2020 | USD | 394,034,260 | EUR | 354,227,900 | — | (799,200 | ) | ||||||||||||||
JP Morgan & Chase Co. | 6/3/2020 | USD | 400,194,386 | EUR | 359,773,800 | — | (802,718 | ) | ||||||||||||||
JP Morgan & Chase Co. | 6/3/2020 | USD | 10,336,063 | EUR | 9,552,500 | 268,347 | — | |||||||||||||||
RBC Capital Markets | 6/3/2020 | USD | 346,280,959 | EUR | 311,299,600 | — | (701,412 | ) | ||||||||||||||
Citigroup Global Markets | 6/3/2020 | USD | 172,680,003 | GBP | 139,674,500 | — | (179,397 | ) | ||||||||||||||
JP Morgan & Chase Co. | 6/3/2020 | USD | 175,407,059 | GBP | 141,880,200 | — | (182,372 | ) | ||||||||||||||
RBC Capital Markets | 6/3/2020 | USD | 7,703,518 | GBP | 6,248,600 | 13,620 | — | |||||||||||||||
RBC Capital Markets | 6/3/2020 | USD | 5,048,516 | GBP | 4,165,700 | 96,201 | — | |||||||||||||||
RBC Capital Markets | 6/3/2020 | USD | 204,693,498 | GBP | 165,568,100 | — | (213,813 | ) | ||||||||||||||
Citigroup Global Markets | 6/3/2020 | USD | 14,465,460 | HKD | 112,122,000 | — | (1,903 | ) | ||||||||||||||
JP Morgan & Chase Co. | 6/3/2020 | USD | 30,808,366 | HKD | 238,786,000 | — | (5,356 | ) | ||||||||||||||
RBC Capital Markets | 6/3/2020 | USD | 1,186,950 | HKD | 9,200,000 | — | (165 | ) | ||||||||||||||
RBC Capital Markets | 6/3/2020 | USD | 82,125,842 | HKD | 636,557,400 | — | (10,961 | ) | ||||||||||||||
RBC Capital Markets | 6/3/2020 | USD | 1,780,065 | HKD | 13,800,000 | 113 | — | |||||||||||||||
Citigroup Global Markets | 6/3/2020 | USD | 2,559,358 | ILS | 8,966,300 | — | (5,826 | ) | ||||||||||||||
JP Morgan & Chase Co. | 6/3/2020 | USD | 3,164,711 | ILS | 11,086,900 | — | (7,249 | ) | ||||||||||||||
RBC Capital Markets | 6/3/2020 | USD | 163,171 | ILS | 572,800 | — | (42 | ) | ||||||||||||||
RBC Capital Markets | 6/3/2020 | USD | 5,974,559 | ILS | 20,930,900 | — | (13,603 | ) | ||||||||||||||
Citigroup Global Markets | 6/3/2020 | USD | 13,100,813 | JPY | 1,407,936,500 | — | (45,054 | ) | ||||||||||||||
Citigroup Global Markets | 6/3/2020 | USD | 312,009,867 | JPY | 33,614,071,000 | — | (307,461 | ) | ||||||||||||||
Citigroup Global Markets | 6/3/2020 | USD | 8,754,934 | JPY | 938,624,300 | — | (51,095 | ) | ||||||||||||||
JP Morgan & Chase Co. | 6/3/2020 | USD | 298,972,141 | JPY | 32,209,763,600 | — | (291,841 | ) | ||||||||||||||
| See Notes to Financial Statements. | 18 |
DBX ETF Trust
Schedule of Investments
Xtrackers MSCI EAFE Hedged Equity ETF (Continued)
May 31, 2020
Counterparty | Settlement Date | Currency To Deliver | Currency To Receive | Unrealized Appreciation | Unrealized Depreciation | |||||||||||||||||
RBC Capital Markets | 6/3/2020 | USD | 324,150,256 | JPY | 34,921,841,600 | $ | — | $ | (320,927 | ) | ||||||||||||
Citigroup Global Markets | 6/3/2020 | USD | 2,863,295 | NOK | 27,831,400 | — | (132 | ) | ||||||||||||||
JP Morgan & Chase Co. | 6/3/2020 | USD | 2,543,294 | NOK | 24,721,200 | — | (94 | ) | ||||||||||||||
RBC Capital Markets | 6/3/2020 | USD | 16,036,039 | NOK | 155,872,700 | — | (590 | ) | ||||||||||||||
RBC Capital Markets | 6/3/2020 | USD | 294,633 | NOK | 2,912,800 | 5,022 | — | |||||||||||||||
Citigroup Global Markets | 6/3/2020 | USD | 168,220 | NZD | 271,300 | 187 | — | |||||||||||||||
Citigroup Global Markets | 6/3/2020 | USD | 4,647,843 | NZD | 7,505,600 | 11,200 | — | |||||||||||||||
JP Morgan & Chase Co. | 6/3/2020 | USD | 3,616,668 | NZD | 5,840,400 | 8,715 | — | |||||||||||||||
RBC Capital Markets | 6/3/2020 | USD | 3,755,627 | NZD | 6,064,800 | 9,050 | — | |||||||||||||||
Citigroup Global Markets | 6/3/2020 | USD | 947,453 | SEK | 9,344,400 | 44,281 | — | |||||||||||||||
Citigroup Global Markets | 6/3/2020 | USD | 38,415,006 | SEK | 361,802,900 | — | (16,357 | ) | ||||||||||||||
Citigroup Global Markets | 6/3/2020 | USD | 1,456,381 | SEK | 14,016,600 | 31,220 | — | |||||||||||||||
JP Morgan & Chase Co. | 6/3/2020 | USD | 34,997,740 | SEK | 329,618,200 | — | (14,898 | ) | ||||||||||||||
RBC Capital Markets | 6/3/2020 | USD | 33,078,778 | SEK | 311,544,200 | — | (14,155 | ) | ||||||||||||||
Citigroup Global Markets | 6/3/2020 | USD | 11,040,807 | SGD | 15,605,000 | 4,728 | — | |||||||||||||||
JP Morgan & Chase Co. | 6/3/2020 | USD | 20,424,296 | SGD | 28,867,700 | 8,848 | — | |||||||||||||||
JP Morgan & Chase Co. | 6/3/2020 | USD | 399,606 | SGD | 570,300 | 4,064 | — | |||||||||||||||
JP Morgan & Chase Co. | 6/3/2020 | USD | 603,763 | SGD | 855,400 | 1,706 | — | |||||||||||||||
RBC Capital Markets | 6/3/2020 | USD | 11,843,215 | SGD | 16,739,200 | 5,130 | — | |||||||||||||||
Citigroup Global Markets | 7/3/2020 | AUD | 116,981,842 | USD | 77,653,366 | — | (323,248 | ) | ||||||||||||||
JP Morgan & Chase Co. | 7/3/2020 | AUD | 162,927,800 | USD | 108,151,474 | — | (451,349 | ) | ||||||||||||||
JP Morgan & Chase Co. | 7/3/2020 | AUD | 34,470,000 | USD | 22,880,566 | — | (96,111 | ) | ||||||||||||||
RBC Capital Markets | 7/3/2020 | AUD | 66,850,600 | USD | 44,376,164 | — | (184,457 | ) | ||||||||||||||
Citigroup Global Markets | 7/3/2020 | CHF | 139,543,800 | USD | 145,376,600 | 153,855 | — | |||||||||||||||
JP Morgan & Chase Co. | 7/3/2020 | CHF | 4,336,000 | USD | 4,517,057 | 4,597 | — | |||||||||||||||
JP Morgan & Chase Co. | 7/3/2020 | CHF | 108,930,100 | USD | 113,478,311 | 115,136 | — | |||||||||||||||
RBC Capital Markets | 7/3/2020 | CHF | 132,027,700 | USD | 137,541,032 | 140,266 | — | |||||||||||||||
Citigroup Global Markets | 7/3/2020 | DKK | 193,758,400 | USD | 28,933,415 | 59,517 | — | |||||||||||||||
JP Morgan & Chase Co. | 7/3/2020 | DKK | 54,176,000 | USD | 8,090,020 | 16,707 | — | |||||||||||||||
JP Morgan & Chase Co. | 7/3/2020 | DKK | 169,927,100 | USD | 25,374,418 | 51,863 | — | |||||||||||||||
RBC Capital Markets | 7/3/2020 | DKK | 196,836,400 | USD | 29,392,605 | 60,023 | — | |||||||||||||||
Citigroup Global Markets | 7/3/2020 | EUR | 354,227,900 | USD | 394,267,342 | 787,447 | — | |||||||||||||||
JP Morgan & Chase Co. | 7/3/2020 | EUR | 359,773,800 | USD | 400,427,520 | 787,184 | — | |||||||||||||||
RBC Capital Markets | 7/3/2020 | EUR | 59,329,000 | USD | 66,034,542 | 131,295 | — | |||||||||||||||
RBC Capital Markets | 7/3/2020 | EUR | 311,299,600 | USD | 346,482,681 | 687,971 | — | |||||||||||||||
Citigroup Global Markets | 7/3/2020 | GBP | 139,674,500 | USD | 172,700,955 | 176,186 | — | |||||||||||||||
JP Morgan & Chase Co. | 7/3/2020 | GBP | 141,880,200 | USD | 175,427,773 | 178,542 | — | |||||||||||||||
RBC Capital Markets | 7/3/2020 | GBP | 165,568,100 | USD | 204,715,022 | 206,696 | — | |||||||||||||||
Citigroup Global Markets | 7/3/2020 | HKD | 112,122,000 | USD | 14,454,944 | 1,578 | — | |||||||||||||||
JP Morgan & Chase Co. | 7/3/2020 | HKD | 238,786,000 | USD | 30,779,725 | — | (1,579 | ) | ||||||||||||||
RBC Capital Markets | 7/3/2020 | HKD | 636,557,400 | USD | 82,062,318 | 5,300 | — | |||||||||||||||
Citigroup Global Markets | 7/3/2020 | ILS | 8,966,300 | USD | 2,560,536 | 5,719 | — | |||||||||||||||
JP Morgan & Chase Co. | 7/3/2020 | ILS | 11,086,900 | USD | 3,165,930 | 6,879 | — | |||||||||||||||
RBC Capital Markets | 7/3/2020 | ILS | 20,930,900 | USD | 5,976,842 | 12,886 | — | |||||||||||||||
Citigroup Global Markets | 7/3/2020 | JPY | 6,835,780,000 | USD | 63,478,170 | 61,996 | — | |||||||||||||||
Citigroup Global Markets | 7/3/2020 | JPY | 33,614,071,000 | USD | 312,144,594 | 303,698 | — | |||||||||||||||
JP Morgan & Chase Co. | 7/3/2020 | JPY | 32,209,763,600 | USD | 299,099,849 | 286,844 | — | |||||||||||||||
RBC Capital Markets | 7/3/2020 | JPY | 34,921,841,600 | USD | 324,281,192 | 307,985 | — | |||||||||||||||
Citigroup Global Markets | 7/3/2020 | NOK | 27,831,400 | USD | 2,863,990 | 128 | — | |||||||||||||||
JP Morgan & Chase Co. | 7/3/2020 | NOK | 24,721,200 | USD | 2,543,921 | 99 | — | |||||||||||||||
RBC Capital Markets | 7/3/2020 | NOK | 155,872,700 | USD | 16,039,360 | — | (4 | ) | ||||||||||||||
Citigroup Global Markets | 7/3/2020 | NZD | 7,505,600 | USD | 4,647,182 | — | (11,232 | ) | ||||||||||||||
JP Morgan & Chase Co. | 7/3/2020 | NZD | 5,840,400 | USD | 3,616,200 | — | (8,693 | ) | ||||||||||||||
RBC Capital Markets | 7/3/2020 | NZD | 6,064,800 | USD | 3,755,118 | — | (9,052 | ) | ||||||||||||||
Citigroup Global Markets | 7/3/2020 | SEK | 159,783,000 | USD | 16,969,522 | 6,703 | — | |||||||||||||||
Citigroup Global Markets | 7/3/2020 | SEK | 361,802,900 | USD | 38,425,491 | 15,917 | — | |||||||||||||||
JP Morgan & Chase Co. | 7/3/2020 | SEK | 329,618,200 | USD | 35,006,906 | 14,111 | — | |||||||||||||||
RBC Capital Markets | 7/3/2020 | SEK | 311,544,200 | USD | 33,087,561 | 13,530 | — | |||||||||||||||
| See Notes to Financial Statements. | 19 |
DBX ETF Trust
Schedule of Investments
Xtrackers MSCI EAFE Hedged Equity ETF (Continued)
May 31, 2020
Counterparty | Settlement Date | Currency To Deliver | Currency To Receive | Unrealized Appreciation | Unrealized Depreciation | |||||||||||||||||
Citigroup Global Markets | 7/3/2020 | SGD | 15,605,000 | USD | 11,041,526 | $ | — | $ | (4,995 | ) | ||||||||||||
JP Morgan & Chase Co. | 7/3/2020 | SGD | 28,867,700 | USD | 20,424,987 | — | (9,979 | ) | ||||||||||||||
RBC Capital Markets | 7/3/2020 | SGD | 16,739,200 | USD | 11,843,818 | — | (5,584 | ) | ||||||||||||||
RBC Capital Markets | 7/3/2020 | USD | 3,104,831 | GBP | 2,511,000 | — | (3,265 | ) | ||||||||||||||
RBC Capital Markets | 7/3/2020 | USD | 16,781,345 | HKD | 130,152,000 | — | (3,777 | ) | ||||||||||||||
JP Morgan & Chase Co. | 7/3/2020 | USD | 2,568,733 | SGD | 3,630,000 | 884 | — | |||||||||||||||
|
|
|
| |||||||||||||||||||
Total unrealized appreciation (depreciation) | $ | 27,197,215 | $ | (32,221,645 | ) | |||||||||||||||||
|
|
|
| |||||||||||||||||||
For information on the Fund’s policy and additional disclosures regarding open futures contracts and forward foreign currency contracts, please refer to the Derivatives section of Note 2 in the accompanying Notes to Financial Statements.
Currency Abbreviations
| AUD | Australian Dollar |
| CHF | Swiss Franc |
| DKK | Danish Krone |
| EUR | Euro |
| GBP | Pound Sterling |
| HKD | Hong Kong Dollar |
| ILS | Israeli Shekel |
| JPY | Japanese Yen |
| NOK | Norwegian Krone |
| NZD | New Zealand Dollar |
| SEK | Swedish Krona |
| SGD | Singapore Dollar |
| USD | U.S. Dollar |
Fair Value Measurements
Various inputs are used in determining the value of the Fund’s investments. These inputs are summarized in three broad levels. Level 1 includes quoted prices in active markets for identical securities. Level 2 includes other significant observable inputs (including quoted prices for similar securities, interest rates, prepayment speeds and credit risk). Level 3 includes significant unobservable inputs (including the Fund’s own assumptions in determining the fair value of investments). The level assigned to the securities valuations may not be an indication of the risk or liquidity associated with investing in those securities.
The following is a summary of the inputs used as of May 31, 2020 in valuing the Fund’s investments. For information on the Fund’s policy regarding the valuation of investments, please refer to the Security Valuation section of Note 2 in the accompanying Notes to Financial Statements.
Assets | Level 1 | Level 2 | Level 3 | Total | ||||||||||||
Common Stocks (h) | $ | 3,715,418,641 | $ | — | $ | 0 | $ | 3,715,418,641 | ||||||||
Preferred Stocks | 20,841,742 | — | — | 20,841,742 | ||||||||||||
Rights (h) | 251,665 | — | 0 | 251,665 | ||||||||||||
Short-Term Investments (h) | 113,882,298 | — | — | 113,882,298 | ||||||||||||
Derivatives (i) | ||||||||||||||||
Forward Foreign Currency Contracts | — | 27,197,215 | — | 27,197,215 | ||||||||||||
Futures Contracts | 9,307,597 | — | — | 9,307,597 | ||||||||||||
|
|
|
|
|
|
|
| |||||||||
TOTAL | $ | 3,859,701,943 | $ | 27,197,215 | $ | 0 | $ | 3,886,899,158 | ||||||||
|
|
|
|
|
|
|
| |||||||||
Liabilities | Level 1 | Level 2 | Level 3 | Total | ||||||||||||
Derivatives (i) | ||||||||||||||||
Forward Foreign Currency Contracts | $ | — | $ | (32,221,645 | ) | $ | — | $ | (32,221,645 | ) | ||||||
|
|
|
|
|
|
|
| |||||||||
TOTAL | $ | — | $ | (32,221,645 | ) | $ | — | $ | (32,221,645 | ) | ||||||
|
|
|
|
|
|
|
| |||||||||
| (h) | See Schedule of Investments for additional detailed categorizations. |
| (i) | Derivatives include unrealized appreciation (depreciation) on open futures contracts and forward foreign currency contracts. |
During the year ended May 31, 2020, the amount of transfers from Level 1 to Level 3 was $900,397. The investment was transferred from Level 1 to Level 3 due to the lack of observable market data due to a decrease in market activity.
| See Notes to Financial Statements. | 20 |
This Page is Intentionally Left Blank
21
DBX ETF Trust
May 31, 2020
| Xtrackers MSCI EAFE Hedged Equity ETF | ||||
Assets | ||||
Investment in non-affiliated securities at value | $ | 3,731,638,207 | ||
Investment in affiliated securities at value | 4,873,841 | |||
Investment in DWS ESG Liquidity Fund* | 36,319,577 | |||
Investment in DWS Government Money Market Series* | 21,017,231 | |||
Investment in DWS Government & Agency Securities Portfolio** | 56,545,490 | |||
Foreign currency at value | 12,123,433 | |||
Unrealized appreciation on forward foreign currency contracts | 27,197,215 | |||
Deposit with broker for futures contracts | 8,897,891 | |||
| Receivables: | ||||
Investment securities sold | 66,745,571 | |||
Dividends | 13,479,127 | |||
Interest | 5,621 | |||
Securities lending income | 73,651 | |||
Foreign tax reclaim | 9,432,627 | |||
|
| |||
Total assets | $ | 3,988,349,482 | ||
|
| |||
Liabilities | ||||
Payable upon return of securities loaned | 56,545,490 | |||
Payable upon return of deposit for forward foreign currency contracts | 2,592,430 | |||
Unrealized depreciation on forward foreign currency contracts | 32,221,645 | |||
| Payables: | ||||
Investment securities purchased | 64,600,912 | |||
Investment advisory fees | 1,108,538 | |||
Variation margin on futures contracts | 762,020 | |||
|
| |||
Total liabilities | 157,831,035 | |||
|
| |||
Net Assets, at value | $ | 3,830,518,447 | ||
|
| |||
Net Assets Consist of | ||||
Paid-in capital | $ | 4,390,185,903 | ||
Distributable earnings (loss) | (559,667,456 | ) | ||
|
| |||
Net Assets, at value | $ | 3,830,518,447 | ||
|
| |||
Number of Common Shares outstanding | 128,750,800 | |||
|
| |||
Net Asset Value | $ | 29.75 | ||
|
| |||
Investment in non-affiliated securities at cost | $ | 4,171,543,029 | ||
|
| |||
Investment in affiliated securities at cost | $ | 19,226,833 | ||
|
| |||
Value of securities loaned | $ | 57,986,585 | ||
|
| |||
Investment in DWS ESG Liquidity Fund at cost* | $ | 36,305,055 | ||
|
| |||
Investment in DWS Government Money Market Series at cost* | $ | 21,017,231 | ||
|
| |||
Investment in DWS Government & Agency Securities Portfolio at cost** | $ | 56,545,490 | ||
|
| |||
Non-cash collateral for securities on loan | $ | 4,936,218 | ||
|
| |||
Foreign currency at cost | $ | 12,149,214 | ||
|
| |||
* Includes collateral held for forward foreign currency contracts | $ | 2,592,430 | ||
|
| |||
| ** | Represents collateral on securities loaned. |
| See Notes to Financial Statements. | 22 |
DBX ETF Trust
For the Year Ended May 31, 2020
| Xtrackers MSCI EAFE Hedged Equity ETF | ||||
Investment Income | ||||
Unaffiliated dividend income* | $ | 113,888,396 | ||
Income distributions from affiliated funds | 1,934,519 | |||
Affiliated securities lending income | 675,461 | |||
Unaffiliated securities lending income, net of borrower rebates | 172,167 | |||
|
| |||
Total investment income | 116,670,543 | |||
|
| |||
Expenses | ||||
Investment advisory fees | 16,592,952 | |||
Other expenses | 423,805 | |||
|
| |||
Total expenses | 17,016,757 | |||
|
| |||
Less fees waived (see note 3): | ||||
Waiver | (80,946 | ) | ||
|
| |||
Net expenses | 16,935,811 | |||
|
| |||
Net investment income (loss) | 99,734,732 | |||
|
| |||
Realized and Unrealized Gain (Loss) | ||||
| Net realized gain (loss) from: | ||||
Investments | (114,732,245 | ) | ||
Investments in affiliates | 3,000 | |||
In-kind redemptions | (63,229,478 | ) | ||
In-kind redemptions in affiliates | (1,848,046 | ) | ||
Futures contracts | (16,347,344 | ) | ||
Foreign currency transactions | 813,572 | |||
Forward foreign currency contracts | 141,389,405 | |||
Payments by Affilliates (see note 6) | 122,770 | |||
|
| |||
Net realized gain (loss) | (53,828,366 | ) | ||
|
| |||
Net change in unrealized appreciation (depreciation) on: | ||||
Investments | (146,175,349 | ) | ||
Investments in affiliates | 2,716,968 | |||
Futures contracts | 10,392,316 | |||
Foreign currency translations | 227,651 | |||
Forward foreign currency contracts | (10,386,211 | ) | ||
|
| |||
Net change in unrealized appreciation (depreciation) | (143,224,625 | ) | ||
|
| |||
Net realized and unrealized gain (loss) on investments, futures and foreign currency transactions | (197,052,991 | ) | ||
|
| |||
Net Increase (Decrease) in Net Assets Resulting from Operations | $ | (97,318,259 | ) | |
|
| |||
* Unaffiliated foreign tax withheld | $ | 10,163,603 | ||
| See Notes to Financial Statements. | 23 |
DBX ETF Trust
| Xtrackers MSCI EAFE Hedged Equity ETF | ||||||||
| Year Ended May 31, 2020 | Year Ended May 31, 2019 | |||||||
Increase (Decrease) in Net Assets from Operations | ||||||||
Net investment income (loss) | $ | 99,734,732 | $ | 158,783,318 | ||||
Net realized gain (loss) | (53,828,366 | ) | 406,716,574 | |||||
Net change in net unrealized appreciation (depreciation) | (143,224,625 | ) | (611,668,057 | ) | ||||
|
|
|
| |||||
Net increase (decrease) in net assets resulting from operations | (97,318,259 | ) | (46,168,165 | ) | ||||
|
|
|
| |||||
Distributions to Shareholders | (157,107,983 | ) | (162,803,052 | ) | ||||
|
|
|
| |||||
Fund Shares Transactions | ||||||||
Proceeds from shares sold | 78,850,231 | — | ||||||
Value of shares redeemed | (708,987,904 | ) | (1,216,365,527 | ) | ||||
|
|
|
| |||||
Net increase (decrease) in net assets resulting from fund share transactions | (630,137,673 | ) | (1,216,365,527 | ) | ||||
|
|
|
| |||||
Total net increase (decrease) in Net Assets | (884,563,915 | ) | (1,425,336,744 | ) | ||||
Net Assets | ||||||||
Beginning of period | 4,715,082,362 | 6,140,419,106 | ||||||
|
|
|
| |||||
End of period | $ | 3,830,518,447 | $ | 4,715,082,362 | ||||
|
|
|
| |||||
Changes in Shares Outstanding | ||||||||
Shares outstanding, beginning of period | 152,750,800 | 192,750,800 | ||||||
Shares sold | 2,400,000 | — | ||||||
Shares redeemed | (26,400,000 | ) | (40,000,000 | ) | ||||
|
|
|
| |||||
Shares outstanding, end of period | 128,750,800 | 152,750,800 | ||||||
|
|
|
| |||||
| See Notes to Financial Statements. | 24 |
DBX ETF Trust
| Xtrackers MSCI EAFE Hedged Equity ETF Selected Per Share Data | Years Ended May 31, | |||||||||||||||||||
| 2020 | 2019 | 2018 | 2017 | 2016 | ||||||||||||||||
Net Asset Value, beginning of year | $ | 30.87 | $ | 31.86 | $ | 30.68 | $ | 26.48 | $ | 30.75 | ||||||||||
|
|
|
|
|
|
|
|
|
| |||||||||||
| Income (loss) from investment operations: | ||||||||||||||||||||
Net investment income (loss)(a) | 0.66 | 0.91 | 0.80 | 0.74 | 0.76 | |||||||||||||||
Net realized and unrealized gain (loss) | (0.76 | ) | (1.00 | ) | 1.33 | 4.18 | (4.03 | ) | ||||||||||||
|
|
|
|
|
|
|
|
|
| |||||||||||
Total from investment operations | (0.10 | ) | (0.09 | ) | 2.13 | 4.92 | (3.27 | ) | ||||||||||||
|
|
|
|
|
|
|
|
|
| |||||||||||
| Less distributions from: |
| |||||||||||||||||||
Net investment income | (1.02 | ) | (0.90 | ) | (0.95 | ) | (0.72 | ) | (0.88 | ) | ||||||||||
Net realized gains | — | — | — | — | (0.12 | ) | ||||||||||||||
|
|
|
|
|
|
|
|
|
| |||||||||||
Total distributions | (1.02 | ) | (0.90 | ) | (0.95 | ) | (0.72 | ) | (1.00 | ) | ||||||||||
|
|
|
|
|
|
|
|
|
| |||||||||||
Net Asset Value, end of year | $ | 29.75 | $ | 30.87 | $ | 31.86 | $ | 30.68 | $ | 26.48 | ||||||||||
|
|
|
|
|
|
|
|
|
| |||||||||||
Total Return (%) | (0.56 | )(b) | (0.14 | )(b) | 7.05 | 19.17 | (10.90 | ) | ||||||||||||
Ratios to Average Net Assets and Supplemental Data | ||||||||||||||||||||
Net Assets, end of year ($ millions) | 3,831 | 4,715 | 6,140 | 8,638 | 11,984 | |||||||||||||||
Ratio of expenses before fee waiver (%) | 0.36 | 0.36 | 0.35 | 0.35 | 0.35 | |||||||||||||||
Ratio of expenses after fee waiver (%) | 0.36 | 0.36 | 0.35 | 0.35 | 0.35 | |||||||||||||||
Ratio of net investment income (loss) (%) | 2.10 | 2.93 | 2.57 | 2.72 | 2.82 | |||||||||||||||
Portfolio turnover rate (%)(c) | 9 | 5 | 10 | 14 | 15 | |||||||||||||||
| (a) | Based on average shares outstanding during the period. |
| (b) | Total Return would have been lower if certain expenses had not been reimbursed by the Advisor. |
| (c) | Portfolio turnover rate does not include securities received or delivered from processing creations or redemptions. |
| See Notes to Financial Statements. | 25 |
DBX ETF Trust
1. Organization
DBX ETF Trust (the “Trust”) is registered under the Investment Company Act of 1940, as amended (the “Act”), as an open-end registered management investment company organized as a Delaware statutory trust.
As of May 31, 2020, the Trust consists of thirty-four investment series of exchange-traded funds (“ETFs”) in operation and trading. These financial statements report on Xtrackers MSCI EAFE Hedged Equity ETF (the “Fund”), a diversified series of the Trust. The Fund may change its diversification status over time and then change it back again, without shareholder approval, solely as a result of a change in relative market capitalization or index weighting of one or more constituents of the index each Fund tracks.
DBX Advisors LLC (“DBX” or the “Advisor”), an indirect, wholly-owned subsidiary of DWS Group GmbH & Co. KGaA (“DWS Group”), serves as investment advisor to the Fund and has overall responsibility for the general management and administration of the Fund, subject to the supervision of the Fund’s Board of Trustees (“Board”).
The Fund offers shares that are listed and traded on the NYSE Arca, Inc. (“NYSE Arca”). Unlike conventional mutual funds, the Fund issues and redeems shares on a continuous basis, at net asset value (“NAV”), only in large specified lots consisting of 200,000 shares, each called a “Creation Unit”, to authorized participants who have entered into agreements with the Fund’s distributor. Shares are not individually redeemable securities of the Fund, and owners of shares may acquire those shares from the Fund or tender such shares for redemption to the Fund, in Creation Units only.
The investment objective of the Fund is to track the performance, before fees and expenses, of the MSCI EAFE US Dollar Hedged Index (the “Underlying Index”).
MSCI is the creator of the MSCI EAFE US Dollar Hedged Index. The MSCI EAFE US Dollar Hedged Index is designed to provide exposure to equity securities in developed international stock markets, while at the same time mitigating exposure to fluctuations between the value of the U.S. dollar and selected non-U.S. currencies.
The Underlying Index is rebalanced monthly on the last trading day of the month, when the index will take into account the effect of rolling into new 1-month forward contracts based on the newly determined weights of currency to be sold for the next month’s index calculation. The currency weights are determined as of the close of two business days before the first calendar day of following month and remain constant intra month. This means that no changes in the weights are made during the month to account for changes in the indexes due to price movement of securities, corporate events, additions, deletions or any other changes. The daily calculation of the Underlying Index marks to market the one-month forward contracts on a daily basis by using an equal and offsetting forward position.
The Fund is entitled to use its Underlying Index pursuant to a licensing agreement between the Index Provider and DBX. There is no charge to the Fund in connection with the licensing agreement.
Pursuant to the Trust’s organizational documents, the Trust’s officers and trustees are indemnified against certain liabilities that may arise out of the performance of their duties to the Fund. Additionally, in the normal course of business the Trust enters into contracts that contain a variety of representations that provide indemnification for certain liabilities. The Trust’s maximum exposure under these arrangements is unknown, as this would involve future claims that may be made against the Fund that have not yet occurred. However, the Trust expects the risk of loss to be remote.
2. Significant Accounting Policies
The financial statements have been prepared in conformity with U.S. generally accepted accounting principles (“U.S. GAAP”), which require management to make certain estimates and assumptions that affect the reported amounts and disclosures in the financial statements. Actual results could differ from those estimates. The Fund qualifies as an investment company under Topic 946 of the Accounting Standards Codification of U.S. GAAP. The following is a summary of significant accounting policies followed by the Fund.
26
DBX ETF Trust
Notes to Financial Statements (Continued)
Security Valuation The NAV of the Fund’s shares is calculated each business day as of the close of regular trading on the New York Stock Exchange, generally 4:00 p.m. Eastern Time. NAV per share is calculated by dividing a Fund’s net assets by the number of Fund shares outstanding.
Various inputs are used in determining the value of the Fund’s investments. These inputs are summarized in three broad levels. Level 1 includes quoted prices in active markets for identical securities. Level 2 includes other significant observable inputs (including quoted prices for similar securities, interest rates, prepayment speeds, and credit risk). Level 3 includes significant unobservable inputs (including the Fund’s own assumptions in determining the fair value of investments). The level assigned to the securities valuations may not be an indication of the risk or liquidity associated with investing in those securities.
Equity securities are valued at the most recent sale price or official closing price reported on the exchange (U.S. or foreign) or over-the-counter market on which they trade. Securities for which no sales are reported are valued at the calculated mean between the most recent bid and asked quotations on the relevant market or, if a mean cannot be determined, at the most recent bid quotation. Equity securities are generally categorized as Level 1.
Investments in open-ended investment companies are valued at their NAV each business day and are categorized as Level 1.
Futures contracts are generally valued at the settlement prices established each day on the exchange on which they are traded and are categorized as Level 1.
Forward currency contracts are valued at the prevailing forward exchange rate of the underlying currencies and are categorized as Level 2.
Securities and other assets for which market quotations are not readily available or for which the above valuation procedures are deemed not to reflect fair value are valued in a manner that is intended to reflect their fair value as determined in accordance with procedures approved by the Board and are generally categorized as Level 3. In accordance with the Fund’s valuation procedures, factors considered in determining value may include, but are not limited to, the type of the security; the size of the holding; the initial cost of the security; the existence of any contractual restrictions on the security’s disposition; the price and extent of public trading in similar securities of the issuer or of comparable companies; quotations or evaluated prices from broker-dealers and/or pricing services; information obtained from the issuer, analysts, and/or the appropriate stock exchange (for exchange-traded securities); an analysis of the company’s or issuer’s financial statements; an evaluation of the forces that influence the issuer and the market(s) in which the security is purchased and sold; and with respect to debt securities, the maturity, coupon, creditworthiness, currency denomination and the movement of the market in which the security is normally traded. The value determined under these procedures may differ from published values for the same securities.
Fair value pricing could result in a difference between the prices used to calculate the Fund’s NAV and the prices used by the Fund’s Underlying Index, which in turn could result in a difference between the Fund’s performance and the performance of the Fund’s Underlying Index.
Disclosure about the classification of the fair value measurements is included in a table following the Fund’s Schedule of Investments.
Cash Cash consists of cash held at banks and is on deposit with major financial institutions.
Investment Transactions and Investment Income Investment transactions are recorded as of the date that the securities are purchased or sold (trade date). Realized gains and losses from the sale or disposition of securities are calculated on the identified cost-method. Dividend income is net of any foreign taxes withheld at source. Certain dividends from foreign securities may be recorded subsequent to the ex-dividend date as soon as the fund is informed of such dividends. Interest income is recorded on the accrual basis.
Tax Information and Dividends and Distributions to Shareholders It is the Fund’s policy to comply with all requirements of the Internal Revenue Code of 1986, as amended (“the Code”). The Fund intends to qualify for and to elect treatment as a separate Regulated Investment Company (“RIC”) under Subchapter M of the Code. It is the policy of the Fund to pay out dividends from its net investment income, if any, to investors semi-annually. Taxable net realized gains from investment transactions, reduced by capital loss carryforwards, if any, are
27
DBX ETF Trust
Notes to Financial Statements (Continued)
declared and distributed to shareholders at least annually. The capital loss carryforward amount, if any, is available to offset future net capital gains. The Fund may occasionally be required to make supplemental distributions at some other time during the year. The Fund reserves the right to declare special distributions if, in their reasonable discretion, such action is necessary or advisable to preserve the status of the Fund as a RIC or to avoid imposition of income or excise taxes on undistributed income. Dividends and distributions to shareholders, if any, are recorded on the ex-dividend date. The amount of dividends and distributions from net investment income and net realized capital gains are determined in accordance with Federal income tax regulations which may differ from U.S. GAAP. These “book/tax” differences are either considered temporary or permanent in nature. To the extent these differences are permanent in nature, such amounts are reclassified at the end of the year within the components of net assets based on their federal tax treatment; temporary differences do not require reclassification. Dividends and distributions, which exceed earnings and profits for the full year for tax purposes, are reported as a tax return of capital.
In accordance with U.S. GAAP requirements regarding accounting for uncertainties in income taxes, management has analyzed the Fund’s tax positions taken or expected to be taken on foreign, federal and state income tax returns for all open tax years and has concluded that no provision for income tax is required in the Fund’s financial statements.
The Fund recognizes interest and penalties, if any, related to uncertain tax positions as income tax expense on the Statement of Operations. For the year ended May 31, 2020, the Fund did not incur any interest or penalties.
As of May 31, 2020, the components of accumulated earnings (losses) on a tax basis were as follows:
| Undistributed Ordinary Income* | Capital and Other Gains (Losses) | Unrealized Appreciation (Depreciation) | Total Accumulated Earnings (Losses) | |||||||||||||
| $ | 43,631,421 | $ | (120,826,668 | ) | $ | (482,472,209 | ) | $ | (559,667,456 | ) | ||||||
The tax character of dividends and distributions declared for the years ended May 31, 2020 and May 31, 2019 were as follows:
| Ordinary Income* | ||||
2020 | $ | 157,107,983 | ||
2019 | 162,803,052 | |||
| * | for tax purposes short-term capital gain distributions are considered ordinary income distributions |
At May 31, 2020, for Federal income tax purposes, the Fund had capital loss carryforwards available as shown in the table below, to the extent provided by regulations, to offset future capital gains for an unlimited period. To the extent that these capital loss carryforwards are used to offset future capital gains, it is probable that the capital gains so offset will not be distributed to shareholders.
| Short-Term | Long-Term | Total Amount | ||||||||||
| $ | 949,614 | $ | 119,877,054 | $ | 120,826,668 | |||||||
For the fiscal year ended May 31, 2020, the effect of permanent “book/tax” reclassifications to the components of net assets are included below. These differences are primarily due to recognition of certain foreign currency gain (losses) as ordinary income (loss), passive foreign investment companies (“PFICs”), redemptions-in-kind and partnership investments.
| Distributable earnings (loss) | Paid-In Capital | |||||||
| $ | 78,817,621 | $ | (78,817,621 | ) | ||||
As of May 31, 2020, the aggregate cost of investments for federal income tax purposes, the net unrealized appreciation or depreciation and the aggregated gross unrealized appreciation (depreciation) on investments were as follows:
| Aggregate Tax Cost | Net Unrealized Appreciation (Depreciation) | Aggregate Gross Unrealized Appreciation | Aggregate Gross Unrealized (Depreciation) | |||||||||||||
| $ | 4,336,737,752 | $ | (482,694,717 | ) | $ | 534,603,420 | $ | (1,017,298,137 | ) | |||||||
28
DBX ETF Trust
Notes to Financial Statements (Continued)
Foreign Taxes The Fund may be subject to foreign taxes (a portion of which may be reclaimable) on income, capital gains on investments, certain foreign currency transactions or other corporate events. All foreign taxes are recorded in accordance with the applicable foreign tax regulations and rates that exist in the foreign jurisdictions in which the Fund invests. These foreign taxes, if any, are paid by the Fund and are reflected in their Statement of Operations as follows: foreign taxes withheld at source are presented as a reduction of income, foreign taxes on capital gains from sales of investments and foreign currency transactions are included in their respective net realized gain (loss) categories. Receivables and payables related to foreign taxes as of May 31, 2020, if any, are disclosed in the Fund’s Statement of Assets and Liabilities.
Foreign Currency Translations The books and records of the Fund is maintained in U.S. dollars. Investment securities and other assets and liabilities denominated in a foreign currency are translated into U.S. dollars at the prevailing exchange rates at period end. Purchases and sales of investment securities, income and expenses are translated into U.S. dollars at the prevailing exchange rates on the respective dates of the transactions.
Net realized and unrealized gains and losses on foreign currency transactions represent net gains and losses between trade and settlement dates on securities transactions, the acquisition and disposition of foreign currencies, and the difference between the amount of net investment income accrued and the U.S. dollar amount actually received. The portion of both realized and unrealized gains and losses on investments that results from fluctuations in foreign currency exchange rates is not separately disclosed, but is included with net realized and unrealized gain/appreciation and loss/depreciation on investments.
Securities Lending The Fund may lend securities to certain financial institutions under the terms of its securities lending agreement. During the term of the loans, the Fund continues to receive interest and dividends generated by the securities and to participate in any changes in their market value. The Fund requires the borrowers of the securities to maintain collateral with the Fund consisting of cash and/or securities issued or guaranteed by the U.S. Government, its agencies or instrumentalities having a value at least equal to the value of the securities loaned. When the collateral falls below specified amounts, the lending agent will use its best effort to obtain additional collateral on the next business day to meet required amounts under the securities lending agreement. During the year ended May 31, 2020, the Fund invested the cash collateral into a joint trading account in DWS Government & Agency Securities Portfolio, an affiliated money market fund managed by DWS Investment Management Americas, Inc. DWS Investment Management Americas, Inc. receives a management/administration fee (0.12% annualized effective rate as of May 31, 2020) on the cash collateral invested in DWS Government & Agency Securities Portfolio. The Fund receives compensation for lending its securities either in the form of fees or by earning interest on invested cash collateral net of borrower rebates and fees paid to a lending agent. Either the Fund or the borrower may terminate the loan at any time and the borrower, after notice, is required to return borrowed securities within a standard time period. There may be risks of delay and costs in recovery of securities or even loss of rights in the collateral should the borrower of the securities fail financially. If the Fund is not able to recover securities lent, the Fund may sell the collateral and purchase a replacement investment in the market, incurring the risk that the value of the replacement security is greater than the value of the collateral. The Fund is also subject to all investment risks associated with the reinvestment of any cash collateral received, including, but not limited to, interest rate, credit and liquidity risk associated with such investments.
As of May 31, 2020, the Fund had securities on loan. The value of the related collateral exceeded the value of the securities loaned at period end.
Remaining Contractual Maturity of the Agreements, as of May 31, 2020 | ||||||||||||||||||||
| Overnight and Continuous | <30 Days | Between 30 & 90 days | >90 days | Total | ||||||||||||||||
Securities Lending Transactions | ||||||||||||||||||||
Common Stocks | $ | 56,545,490 | $ | 4,237 | $ | 24,555 | $ | 4,907,426 | $ | 61,481,708 | ||||||||||
|
|
|
|
|
|
|
|
|
| |||||||||||
Gross amount of recognized liabilities and non-cash collateral for securities lending transactions |
| $ | 61,481,708 | |||||||||||||||||
29
DBX ETF Trust
Notes to Financial Statements (Continued)
Derivatives
Forward Foreign Currency Contracts The Fund may enter into forward foreign currency contracts (“forward currency contracts”) designed to offset the Fund’s exposure to non-U.S. currencies. In addition, the Fund may enter into forward currency contracts to facilitate local securities settlements or to protect against currency exposure in connection with distributions to shareholders.
A forward currency contract is a commitment to purchase or sell a foreign currency at a future date at a negotiated forward rate. For the year ended May 31, 2020, the Fund invested in forward currency contracts to hedge against changes in the value of the U.S. dollar against specified non-U.S. currencies.
The gain or loss arising from the difference between the original contract and the closing of such contract would be included in net realized gain or loss on forward currency contracts. Risks may arise from the potential inability of a counterparty to meet the terms of a contract and from unanticipated movements in the value of a foreign currency relative to the U.S. dollar. The face or contract amount, in U.S. dollars reflects the total exposure the Fund has in that particular currency contract.
A summary of the open forward currency contracts as of May 31, 2020 is included in a table following the Fund’s Schedule of Investments. The investment in forward currency contracts short vs. U.S. dollars had a contract value generally indicative of a range of the total exposure the Fund had to the value of non U.S currencies during the year ended May 31, 2020.
Futures Contracts The Fund may enter into futures contracts. These futures contracts will be used to simulate investment in the respective Underlying Index, to facilitate trading or to reduce transaction costs. The Fund will enter into futures contracts that are traded on a U.S. or non-U.S. exchange. The Fund will not use futures for speculative purposes. Futures contracts provide for the future sale by one party and purchase by another party of a specified amount of a specific instrument or index at a specified future time and at a specified price. For the year ended May 31, 2020, the Fund utilized futures in order to simulate investment in the Fund’s Underlying Index. To the extent required by law, liquid assets committed to futures contracts will be maintained.
At the time the Fund enters into a futures contract, the Fund deposits and maintains as collateral an initial margin with the broker, as required by the exchange on which the transaction is affected. Pursuant to the contract, the Fund agrees to receive from or pay to the broker an amount of cash equal to the daily fluctuation in the value of the contract. Such receipts or payments are known as variation margin and are recorded by the Fund as unrealized gains or losses. Risks may arise from the potential inability of a counterparty to meet the terms of the contract. The credit/counterparty risk for exchange-traded futures contracts is generally less than privately negotiated futures contracts, since the clearinghouse, which is the issuer or counterparty to each exchange-traded future, provides a guarantee of performance. The guarantee is supported by a daily payment system (i.e., margin requirements).
Use of long futures contracts subjects the Fund to risk of loss in excess of the amounts shown on the Statement of Assets and Liabilities, up to the notional value of the futures contracts. Use of short futures contracts subjects the Fund to unlimited risk of loss. Under some circumstances, futures exchanges may establish daily limits on the amount that the price of a futures contract can vary from the previous day’s settlement price, which could effectively prevent liquidation of unfavorable positions.
A summary of the open futures contracts as of May 31, 2020 is included in a table following the Fund’s Schedule of Investments.
30
DBX ETF Trust
Notes to Financial Statements (Continued)
The following table summarizes the value of the Fund’s derivative instruments held as of May 31, 2020 and the related location in the accompanying Statement of Assets and Liabilities, presented by primary underlying risk exposure:
Asset Derivatives | Liability Derivatives | |||||||||||||
| Equity contracts | Unrealized appreciation on futures contracts* | $ | 9,307,597 | Unrealized depreciation on futures contracts* | $ | — | ||||||||
| Foreign exchange contracts | Unrealized appreciation on forward foreign currency contracts | 27,197,215 | Unrealized depreciation on forward foreign currency contracts | 32,221,645 | ||||||||||
|
|
|
| |||||||||||
| Total | $ | 36,504,812 | Total | $ | 32,221,645 | |||||||||
|
|
|
| |||||||||||
| * | Includes cumulative appreciation or cumulative depreciation of futures contracts as disclosed in the Schedule of Investments. Unsettled variation margin is disclosed separately within the Statement of Assets and Liabilities. |
Additionally, the amount of realized and unrealized gains and losses on derivative instruments recognized in the Fund’s earnings during the year ended May 31, 2020 and the related location in the accompanying Statement of Operations is summarized in the following table by primary underlying risk exposure:
Net Realized Gain (Loss) from: | ||||||||||||
| Futures Contracts — Equity Contracts | Forward Foreign Currency Contracts — Foreign Exchange Contracts | Total | ||||||||||
| $ | (16,347,344 | ) | $ | 141,389,405 | $ | 125,042,061 | ||||||
Net Change in Unrealized Appreciation (Depreciation) on: | ||||||||||||
| Futures Contracts — Equity Contracts | Forward Foreign Currency Contracts — Foreign Exchange Contracts | Total | ||||||||||
| $ | 10,392,316 | $ | (10,386,211 | ) | $ | 6,105 | ||||||
For the year ended May 31, 2020 the average monthly volume of derivatives was as follows:
| Futures Contracts (Contract Value) | Forward Foreign Currency Contracts (Contract Value) | |||||||
| $ | 135,493,976 | $ | (4,581,808,136 | ) | ||||
As of May 31, 2020, the Fund has transactions subject to enforceable master netting agreements which govern the terms of certain transactions, and reduce the counterparty risk associated with such transactions. Master netting agreements allow a Fund to close out and net total exposure to a counterparty in the event of a deterioration in the credit quality or contractual default with respect to all of the transactions with a counterparty. As defined by the master netting agreement, the Fund may have collateral agreements with certain counterparties to mitigate risk. Interest expense from collateral received, if any, is included in Other expenses on the Statement of Operations. For financial reporting purposes the Statement of Assets and Liabilities generally shows derivatives
31
DBX ETF Trust
Notes to Financial Statements (Continued)
assets and liabilities on a gross basis, which reflects the full risks and exposures prior to netting. A reconciliation of the gross amounts on the Statement of Assets and Liabilities to the net amounts by counterparty, including any collateral exposure, is included in the following tables:
| Gross Amounts of Assets Presented in the Statement of Assets and Liabilities | Financial Instruments and Derivatives Available for Offset | Collateral Received(a) | Net Amount of Derivatives Assets | Gross Amounts of Liabilities Presented in the Statement of Assets and Liabilities | Financial Instruments and Derivatives Available for Offset | Collateral Pledged(a) | Net Amount of Derivatives Liabilities | |||||||||||||||||||||||||
Citigroup Global Markets | $ | 8,891,595 | $ | (8,891,595 | ) | $ | — | $ | — | $ | 11,073,574 | $ | (8,891,595 | ) | $ | — | $ | 2,181,979 | ||||||||||||||
JP Morgan & Chase Co. | 8,782,284 | (8,782,284 | ) | — | — | 11,381,192 | (8,782,284 | ) | — | 2,598,908 | ||||||||||||||||||||||
RBC Capital Markets | 9,523,336 | (9,523,336 | ) | — | — | 9,766,879 | (9,523,336 | ) | — | 243,543 | ||||||||||||||||||||||
|
|
|
|
|
|
|
|
|
|
|
|
|
|
|
| |||||||||||||||||
| $ | 27,197,215 | $ | (27,197,215 | ) | $ | — | $ | — | $ | 32,221,645 | $ | (27,197,215 | ) | — | $ | 5,024,430 | ||||||||||||||||
|
|
|
|
|
|
|
|
|
|
|
|
|
|
|
| |||||||||||||||||
| (a) | The actual collateral received or pledged may be more than amount shown. |
Affiliated Cash Management Vehicles The Fund may invest uninvested cash balances in DWS Government Money Market Series and DWS ESG Liquidity Fund, affiliated money market funds which are managed by DWS Investment Management Americas, Inc. (“DIMA”), also an indirect, wholly owned subsidiary of DWS Group GmbH & Co. KGaA. Each affiliated money market fund is managed in accordance with Rule 2a-7 under the 1940 Act, which governs the quality, maturity, diversity and liquidity of instruments in which a money market fund may invest. DWS Government Money Market Series seeks to maintain a stable NAV and DWS ESG Liquidity Fund maintains a floating NAV. The Fund indirectly bears its proportionate share of the expenses of each affiliated money market fund in which it invests. To the extent that the affiliated money market funds pay an investment management fee to DIMA, the Advisor will waive an amount of the unitary management fee payable to the Advisor by the Fund equal to the amount of the unitary management fee payable on the Fund’s assets invested in the affiliated money market funds.
3. Investment Advisory and Other Agreements
The Advisor has overall responsibility for the general management and administration of the Fund, subject to the supervision of the Fund’s Board of Trustees. Under an investment advisory agreement between the Trust, on behalf of the Fund, and the Advisor (the “Investment Advisory Agreement”), the Advisor is responsible for arranging sub-advisory, transfer agency, custody, fund administration, and all other non-distribution related services for the Fund to operate.
For its investment advisory services to the Fund, the Advisor is entitled to receive a unitary management fee from the Fund based on the Fund’s average daily net assets, computed and accrued daily and payable monthly, at an annual rate equal to 0.35%.
The Advisor for the Fund has contractually agreed to waive a portion of its management fees in an amount equal to the acquired fund’s fees and expenses attributable to the Fund’s investments in affiliated cash management vehicles. For the period from June 1, 2019 through May 31, 2020, the Advisor waived $80,946 of expenses to the Fund.
Out of the unitary management fee, the Advisor pays substantially all expenses of the Fund, including the cost of transfer agency, custody, fund administration, legal, audit and other services, and expenses of the Independent Trustees. The Fund is responsible for the payment of interest expense, acquired fund fees and expenses, taxes, brokerage expenses, distribution fees or expenses, if any, litigation expenses and extraordinary expenses.
The Bank of New York Mellon, a wholly-owned subsidiary of The Bank of New York Mellon Corporation, serves as Administrator, Custodian, Accounting Agent, Lending Agent and Transfer Agent for the Fund.
ALPS Distributors, Inc. (the “Distributor”) serves as the distributor of Creation Units for the Fund on an agency basis. The Distributor does not maintain a secondary market in shares of the Fund.
32
DBX ETF Trust
Notes to Financial Statements (Continued)
The Board of Trustees is currently comprised of three Independent Trustees. The Advisor paid retainer fees and attendance fees to each Independent Trustee; retainer fees to the Chairman of the Board of Trustees and Chairman of the Audit Committee; and attendance fees to each member of the Audit Committee (which is comprised of all of the Fund’s Independent Trustees).
4. Investment Portfolio Transactions
For the year ended May 31, 2020, the cost of investments purchased and proceeds from sale of investments (excluding in-kind transactions and short-term investments) were as follows:
| Purchases | Sales | |||||||
| $ | 448,254,321 | $ | 429,543,824 | |||||
For the year ended May 31, 2020, the cost of in-kind purchases and proceeds from in-kind sales were as follows:
| Purchases | Sales | |||||||
| $ | 74,307,482 | $ | 662,267,375 | |||||
5. Fund Share Transactions
As of May 31, 2020, there were unlimited Fund shares, no par value, authorized by the Trust. Fund shares are issued and redeemed by the Fund only in Creation Units or multiples thereof. Except when aggregated in Creation Units, shares of the Fund are not redeemable. Transactions in capital shares for the Fund are disclosed in detail in the Statement of Changes in Net Assets. The consideration for the purchase of Creation Units of a Fund generally consists of the in-kind contribution of a designated portfolio of securities constituting a portfolio sampling representation of the securities included in the Fund’s Underlying Index and an amount of cash, which under certain circumstances may include cash in lieu of portfolio securities. Investors purchasing and redeeming Creation Units pay a purchase transaction fee and a redemption transaction fee to offset transfer and other transaction costs associated with the issuance and redemption of Creation Units.
6. Payments by Affiliates
During the year ended May 31, 2020, the Advisor agreed to reimburse Xtrackers MSCI EAFE Hedged Equity ETF $122,770 for a loss due to a trade executed incorrectly. The amount of the loss was less than 0.01% of the Fund’s average net assets, thus having no impact on the Fund’s total return.
7. Other
A novel strain of coronavirus (COVID-19) outbreak was declared a pandemic by the World Health Organization on March 11, 2020. The situation is evolving with various cities and countries around the world responding in different ways to address the pandemic. There are direct and indirect economic effects developing for various industries and individual companies throughout the world. The recent pandemic spread of the novel coronavirus and related geopolitical events could lead to increased financial market volatility, disruption to U.S. and world economies and markets and may have significant adverse effects on the Fund and its investments. A prolonged disruption may result in the Fund and its service providers experiencing operational difficulties in implementing their business continuity plans. Management will continue to monitor the impact COVID-19 has on the Fund and reflect the consequences as appropriate in the Fund’s accounting and financial reporting.
8. Subsequent Event
On June 17, 2020, Deutsche Bank AG (“DB”), an affiliate of DWS Group, resolved with the Commodity Futures Trading Commission (“CFTC”) charges stemming from alleged violations of various swap data reporting requirements and corresponding supervision and other failures. The matter, which was resolved by the issuance of a federal court order (“Consent Order”), involved unintentional conduct that resulted from a system outage that prevented DB from reporting data in accordance with applicable CFTC requirements for a period of five days in April 2016.
The matter giving rise to the Consent Order did not arise out of any investment advisory, fund management activities or distribution activities of DBX Advisors LLC or their advisory affiliates (the “DWS Service Providers”).
33
DBX ETF Trust
Notes to Financial Statements (Continued)
DWS Group, of which the DWS Service Providers are wholly-owned subsidiaries (except for Harvest Global Management Limited which is partially owned by DWS Group), is a separate publicly traded company but continues to be an affiliate of DB due to, among other things, DB’s 79.49% ownership interest in DWS Group. Under the provisions of the Investment Company Act of 1940, as a result of the Consent Order, the DWS Service Providers would not be eligible to continue to provide investment advisory services to the Fund absent an order from the Securities and Exchange Commission (the “SEC”). DB and the DWS Service Providers are seeking temporary and permanent orders from the SEC to permit the DWS Service Providers to continue to provide investment advisory services to the Fund and other registered investment companies notwithstanding the Consent Order. While there can be no assurance that the requested exemptive orders will be granted, the SEC has granted this type of relief in the past. Consistent with their fiduciary and other relationships with the Fund, and in accordance with the desire of the Board of the Fund, the DWS Service Providers continue to provide investment advisory services to the Fund. Subject to the receipt of the temporary and permanent exemptive orders, the DWS Service Providers have informed the Fund that they do not believe the Consent Order will have any material impact on the Fund or the ability of the DWS Service Providers to provide services for the Fund.
34
DBX ETF Trust
To the Shareholders and the Board of Trustees of Xtrackers MSCI EAFE Hedged Equity ETF
Opinion on the Financial Statements
We have audited the accompanying statements of assets and liabilities of Xtrackers MSCI EAFE Hedged Equity ETF (the “Fund”), (one of the funds constituting DBX ETF Trust (the “Trust”)), including the schedule of investments, as of May 31, 2020, and the related statement of operations for the year then ended, the statement of changes in net assets for each of the two years in the period then ended, the financial highlights for each of the five years in the period then ended and the related notes (collectively referred to as the “financial statements”). In our opinion, the financial statements present fairly, in all material respects, the financial position of the Fund (one of the funds constituting DBX ETF Trust) at May 31, 2020, and the results of its operations for the year then ended, changes in net assets for each of the two years in the period then ended and financial highlights for each of the five years in the period then ended, in conformity with U.S. generally accepted accounting principles.
Basis for Opinion
These financial statements are the responsibility of the Trust’s management. Our responsibility is to express an opinion on each of the Funds’ financial statements based on our audits. We are a public accounting firm registered with the Public Company Accounting Oversight Board (United States) (“PCAOB”) and are required to be independent with respect to the Trust in accordance with the U.S. federal securities laws and the applicable rules and regulations of the Securities and Exchange Commission and the PCAOB.
We conducted our audits in accordance with the standards of the PCAOB. Those standards require that we plan and perform the audit to obtain reasonable assurance about whether the financial statements are free of material misstatement, whether due to error or fraud. The Trust is not required to have, nor were we engaged to perform, an audit of the Trust’s internal control over financial reporting. As part of our audits we are required to obtain an understanding of the internal control over financial reporting but not for the purpose of expressing an opinion on the effectiveness of the Trust’s internal control over financial reporting. Accordingly, we express no such opinion.
Our audits included performing procedures to assess the risks of material misstatement of the financial statements, whether due to error or fraud, and performing procedures that respond to those risks. Such procedures included examining, on a test basis, evidence regarding the amounts and disclosures in the financial statements. Our procedures included confirmation of securities owned as of May 31, 2020, by correspondence with the custodians and brokers or by other appropriate auditing procedures where replies from brokers were not received. Our audits also included evaluating the accounting principles used and significant estimates made by management, as well as evaluating the overall presentation of the financial statements. We believe that our audits provide a reasonable basis for our opinion.

We have served as the auditor of one or more investment companies in the DWS family of funds since at least 1979, but we are unable to determine the specific year.
New York, New York
July 27, 2020
35
DBX ETF Trust
In accordance with Rule 22e-4 (the “Liquidity Rule”) under the Investment Company Act of 1940 (the “1940 Act”), your Fund has adopted a liquidity risk management program (the “Program”), and the Board has designated DBX Advisors LLC (“Advisors”) as Program administrator. The Program is designed to assess and manage your Fund’s liquidity risk (the risk that the Fund would be unable to meet requests to redeem shares of the Fund without significant dilution of remaining investors’ interests in the Fund). Advisors has designated a committee (the “Committee”) composed of personnel from multiple departments within an affiliate of Advisors that is responsible for the implementation and ongoing administration of the Program, which includes assessing the Fund’s liquidity risk under both normal and reasonably foreseeable stressed conditions. Under the Program, every investment held by a Fund is classified on a daily basis into one of four liquidity categories based on calculations of the investment’s ability to be sold during designated timeframes in current market conditions without significantly changing the investment’s market value.
In February 2020, as required by the Program and the Liquidity Rule, Advisors provided the Board with an annual written report (the “Report”) addressing the operation of the Program and assessing the adequacy and effectiveness of its implementation during the period from December 1, 2018 through November 30, 2019 (the “Reporting Period”). During the Reporting Period, your Fund was primarily invested in highly liquid investments (investments that the Fund anticipates can be converted to cash within three business days or less in current market conditions without significantly changing their market value). As a result, your Fund is not required to adopt, and has not adopted, a “Highly Liquid Investment Minimum” as defined in the Liquidity Rule. During the Reporting Period, the Fund did experience a temporary breach of the 15% limit imposed by the Liquidity Rule on holdings in illiquid investments (investments that cannot be sold or disposed of in seven days or less in current market conditions without the sale of the investment significantly changing the market value of the investment). The breach was caused by the temporary reclassification of Japanese securities as illiquid due to an extended Japanese holiday market closure. The temporary reclassification of Japanese securities caused the Fund to exceed the 15% limit on illiquid investments for a two day period. Because the holiday closure was anticipated in advance, no actions were needed to rebalance the Fund’s portfolio. Your Fund did not experience any issues meeting investor redemptions at any time during the Reporting Period. In the Report, Advisors stated that it believes the Program has operated adequately and effectively to manage the Fund’s liquidity risk during the Reporting Period. Advisors also reported on a material change made to the Program in May 2019 to address Securities and Exchange Commission guidance relating to extended foreign market holidays.
36
DBX ETF Trust
Identification and Background
The Board has responsibility for the overall management and operations of the funds, including general supervision of the duties performed by the Advisor and other service providers. Each Board Member serves until his or her successor is duly elected or appointed and qualified. Each officer serves until he or she resigns, is removed, dies, retires or becomes disqualified.
The Trust currently has three Board Members. The three Independent Board Members have no affiliation or business connection with the Advisor or any of its affiliated persons and do not own any stock or other securities issued by the Advisor.
The Independent Board Members of the Trust, their term of office and length of time served, their principal business occupations during the past five years, the number of portfolios in the fund complex (defined below) overseen by each Independent Board Member, and other directorships, if any, held by the Board Members are shown below. The fund complex includes all registered open- and closed-end funds (including all of their portfolios) advised by the Advisor and any registered funds that have an investment advisor that is an affiliated person of the Advisor. As of the date of this shareholder report, the fund complex consists of the funds in the Trust, as well as the registered funds advised by affiliates of the Advisor.
Shareholder Communications to the Board. Shareholders may send communications to the Trust’s Board by addressing the communications directly to the Board (or individual Board Members) and/or otherwise clearly indicating in the salutation that the communication is for the Board (or individual Board Members). The shareholder may send the communication to either the Trust’s office or directly to such Board members c/o 875 Third Avenue, New York, NY 10022. Other shareholder communications received by the Trust not directly addressed and sent to the Board will be reviewed and generally responded to by management. Such communications will be forwarded to the Board at management’s discretion based on the matters contained therein.
Independent Board Members | ||||||
Name, Year of Birth, Position with the Trust and Length of Time Served(1) | Business Experience and Directorships During the Past 5 Years | Number of Portfolios in Fund Complex Overseen | Other Directorships Held by Board Member | |||
Stephen R. Byers (1953) Chairman since 2016, and Board Member since 2011 (formerly, Lead Independent Board Member, 2015-2016) | Independent Director (2011- present); Independent Consultant (2014-present); Director of Investment Management, the Dreyfus Corporation (2000-2006) and Vice Chairman and Chief Investment Officer, the Dreyfus Corporation (2002-2006). | 34 | The Arbitrage Funds, Sierra Income Corporation, Mutual Fund Directors Forum | |||
George O. Elston (1964) Board Member since 2011, Chairman of the Audit Committee since 2015 | Chief Financial Officer, Enzyvant (2018-present); Chief Executive Officer, 2X Oncology, Inc. (2017-2018); Senior Vice President and Chief Financial Officer, Juniper Pharmaceuticals, Inc. (2014-2016); Senior Vice President and Chief Financial Officer, KBI BioPharma Inc. (2013-2014); Managing Partner, Chatham Street Partners (2010-2013). | 34 | — | |||
J. David Officer (1948) Board Member since 2011, Chairman of the Nominating Committee since 2015 | Independent Director (2010-present); Vice Chairman, the Dreyfus Corporation (2006-2009); President, The Dreyfus Family of Funds, Inc. (2006-2009). | 34 | (Chairman of) Ilex Management Ltd; Old Westbury Funds | |||
37
DBX ETF Trust
Board Members and Officers (Unaudited) (Continued)
Officers(2) | ||||||
| Name, Year of Birth, Position with the Trust and Length of Time Served(4) | Business Experience and Directorships During the Past 5 Years | |||||
| Freddi Klassen(5) (1975) President and Chief Executive Officer, 2016-present | Director(3) in DWS and Chief Operating Officer in the Americas for the Traditional Asset Classes Department (2014-present); Manager and Chief Operating Officer of DWS Investment Management Americas, Inc. (2018-present) and the Advisor (2016-present); Global Chief Operating Officer for Equities Technology in the Investment Bank Division at Deutsche Bank AG (2013-2014); Chief Operating Officer for Exchange Traded Funds and Systematic Funds in Europe (2008-2013). | |||||
| Luke Oliver(5) (1980) Chief Operating Officer, 2019-present | Managing Director(3) in DWS (2017-present); Director(3) in DWS (2009-2017); Head of Passive Americas Asset Management Platform (2019-present); Manager, Chief Executive Officer and Chief Investment Officer of the Advisor (2019-present); Head of ETF Capital Markets, Americas (2012-2018); Lead Portfolio Manager of PowerShares DB ETFs (2009-2012). | |||||
| Diane Kenneally(6) (1966) Treasurer, Chief Financial Officer and Controller, 2019-present | Director(3) in DWS; Chief Financial Officer and Treasurer for DWS US registered investment companies advised by DWS Investment Management Americas, Inc. (2018-present); Treasurer and Chief Financial Officer, The European Equity Fund, Inc., The New Germany Fund, Inc. and The Central and Eastern Europe Fund, Inc. (2018-present); formerly: Assistant Treasurer for the DWS funds (2007-2018). | |||||
| Frank Gecsedi(5) (1967) Chief Compliance Officer, 2010-present | Director(3) in DWS Compliance Department (2016-present), Vice President in the Deutsche Asset Management Compliance Department at Deutsche Bank AG (2013-2016) and Chief Compliance Officer of the Advisor (2010-present); Chief Compliance Officer of DWS Distributors, Inc. (2019-present); Vice President in Deutsche Bank’s Global Markets Legal, Risk and Capital Division (2010-2012). | |||||
| Bryan Richards(5) (1978) Vice President, 2016-present | Managing Director(3) in DWS (2018-present); Director(3) in DWS (2014-2018); Portfolio Manager in the Passive Asset Management Department at DWS (2011-present); Primary Portfolio Manager for the PowerShares DB Commodity ETFs (2011-2015). | |||||
John Millette(6) (1962) Secretary, 2020-present | Director(3) in DWS US Retail Legal (2003-present); Vice President and Secretary of DWS US registered investment companies advised by DWS Investment Management Americas, Inc. (1999-present); Chief Legal Officer, DWS Investment Management Americas, Inc. (2015-present); Director and Vice President of DWS Trust Company (2016-present); Secretary, The European Equity Fund, Inc., The New Germany Fund, Inc. and The Central and Eastern Europe Fund, Inc. (2011-present); formerly: Secretary of Deutsche Investment Management Americas Inc. (2015-2017); Assistant Secretary of DBX ETF Trust (2019-2020); Assistant Secretary (July 14, 2006-December 31, 2010) and Secretary (January 31, 2006-July 13, 2006), The European Equity Fund, Inc., The New Germany Fund, Inc. and The Central and Eastern Europe Fund, Inc. | |||||
38
DBX ETF Trust
Board Members and Officers (Unaudited) (Continued)
| Name, Year of Birth, Position with the Trust and Length of Time Served(4) | Business Experience and Directorships During the Past 5 Years | |||||
| Caroline Pearson(6) (1962) Assistant Secretary, 2020-present | Managing Director(3) in DWS US Retail Legal; Chief Legal Officer of DWS US registered investment companies advised by DWS Investment Management Americas, Inc. (2010-present); Chief Legal Officer, The European Equity Fund, Inc., The New Germany Fund, Inc. and The Central and Eastern Europe Fund, Inc. (2012-present); formerly: Secretary, Deutsche AM Distributors, Inc. (2002-2017); and Secretary, Deutsche AM Service Company (2010-2017). | |||||
| Paul Antosca(6) (1957) Assistant Treasurer, 2019-present | Director(3) in DWS; Assistant Treasurer for DWS US registered investment companies advised by DWS Investment Management Americas, Inc. (2007-present). | |||||
| Jeffrey Berry(6) (1959) Assistant Treasurer, 2019-present | Director(3) in DWS. | |||||
| Sheila Cadogan(6) (1966) Assistant Treasurer, 2019-present | Director(3) in DWS; Assistant Treasurer for DWS US registered investment companies advised by DWS Investment Management Americas, Inc. (2017-present); Director and Vice President, DWS Trust Company (2018-present); Assistant Treasurer, The European Equity Fund, Inc., The New Germany Fund, Inc. and The Central and Eastern Europe Fund, Inc. (2018-present). | |||||
| Christina A. Morse(7) (1964) Assistant Secretary, 2017-present | Vice President at BNY Mellon-Asset Servicing (2014-present); Vice President and Counsel at Lord Abbett & Co. LLC (2013-2014). | |||||
Michelle Goveia-Pine(5) (1970) | Director(3) in DWS; Interim AML Officer, DWS Trust Company (since July 28, 2020); and Interim AML Officer of DWS US registered investment companies advised by DWS Investment Management Americas, Inc. (since July 10, 2020); Interim AML Officer, The European Equity Fund, Inc., The New Germany Fund, Inc. and The Central and Eastern Europe Fund, Inc. (since July 24, 2020). | |||||
| (1) | The length of time served is represented by the year in which the Board Member joined the Board. |
| (2) | As a result of their respective positions held with the Advisor and its affiliates, these individuals are considered “interested persons” of the Advisor within the meaning of the 1940 Act. Interested persons receive no compensation from the Funds. |
| (3) | Executive title, not a board directorship. |
| (4) | The length of time served is represented by the year in which the officer was first elected to the Trust in such capacity. |
| (5) | Address: 875 Third Avenue, New York, New York 10022. |
| (6) | Address: One International Place, Boston, Massachusetts 02110. |
| (7) | Address: BNY Mellon Asset Servicing, Atlantic Terminal Office Tower, 2 Hanson Place, Brooklyn, NY 11217. |
The Funds’ Statement of Additional Information (“SAI”) includes additional information about the Funds’ Board Members. The SAI is available by calling 855-329-3837, or on the Company’s website at www.Xtrackers.com.
39
DBX ETF Trust
Xtrackers MSCI EAFE Hedged Equity ETF
After discussions at the meeting of the Board of Trustees (“Board” or “Trustees”) held on February 26-27, 2020 (the “Meeting”), the Trustees, all of whom are the Independent Trustees (those not affiliated with DBX ETF Trust (the “Trust”) or its service providers), unanimously approved the continuance of the Investment Advisory Agreement with respect to Xtrackers MSCI EAFE Hedged Equity ETF (the “Fund”). The Independent Trustees were advised throughout the review and Meeting by K&L Gates LLP (“Independent Trustee Counsel”).
Before reaching their decision to approve the Investment Advisory Agreement for another annual period, the Independent Trustees evaluated the materials furnished to them in advance of the Meeting from DBX Advisors LLC (“DBX” or the “Advisor”) for purposes of reviewing the agreement’s terms, including statistical information prepared by Broadridge Financial Solutions Inc. (“Broadridge”) regarding (a) fee and expense information for the Fund (including the fee and expense components and any amounts waived or reimbursed) as compared to a peer group of other exchange-traded funds (“ETFs”) selected pursuant to Broadridge’s proprietary methodology (the “Peer Group”) and (b) the Fund’s tracking error as compared to its underlying index over the previous five years (or since inception, if shorter). The Independent Trustees also took into consideration the discussions they had with management during the Meeting and among themselves during their Executive Sessions held on February 26 and February 27, 2020. The Independent Trustees also noted that they had received and should take into consideration a substantial amount of information furnished throughout the year at regular Board meetings, which information included, among other things, an analysis of the Fund’s investment performance, tracking error and related financial information, presentations given by DBX, as well as its periodic reports on brokerage commissions, portfolio execution and other services provided to the Fund.
In reaching its decision to continue in effect the Investment Advisory Agreement for another annual period, the Board considered all factors it believed relevant, including (1) the nature, extent and quality of the services provided to the Fund and its shareholders; (2) the financial resources of DBX and its resulting ability to perform its obligations under the Investment Advisory Agreement; (3) the competitiveness of the advisory fee; (4) the total cost of the services provided by and the profits realized by the Advisor from its relationship with the Fund; (5) the extent to which economies of scale have been realized, and if the Fund’s shareholders have benefitted from those economies; and (6) fall out benefits, if any, enjoyed by the Advisor.
The Board reached a determination, with the assistance of Independent Trustee Counsel and Dechert LLP (“Trust Counsel”) and through the exercise of its business judgment, that approval of the Investment Advisory Agreement and the compensation to be received thereunder is in the best interests of the Fund and its shareholders as well as consistent with the Board’s duties under state and federal law. The Board reached this conclusion based on multiple factors.
The Board considered the following in determining whether to approve the Investment Advisory Agreement:
Nature, Extent and Quality of Services. The Board reviewed in detail the nature, extent and quality of services provided and the risks incurred by the Advisor under the Investment Advisory Agreement. In doing so, the Board considered the information it had received from and the discussions it had with the Advisor continuously during the prior year, in addition to the information the Advisor had provided in response to the Board’s requests prior to the Meeting. The Board considered that these services include, among other things, furnishing a continuous investment program for the Fund, including arranging for, or implementing, the purchase and sale of portfolio securities, the provision of general corporate services such as portfolio management compliance services and the preparation and filing of certain reports on behalf of the Trust. The Board also considered, among other things, the professional experience, qualifications and performance of the senior management and key professional personnel of the Advisor, including portfolio management.
The Board considered that the Advisor provides, at its own expense, office facilities and equipment for use by the Fund and supervisory persons responsible for supervising and monitoring the Trust’s service providers. The Board also considered that the Advisor pays or arranges for the compensation of officers of the Trust who are also officers or employees of the Advisor or one of its DWS Group affiliates, except as may otherwise be determined by the Board. In addition, the Board considered that the Advisor arranges for the provision of transfer
40
DBX ETF Trust
Board Considerations in Approval of Investment Advisory Contract (Unaudited) (Continued)
agency, custody, fund administration and accounting, and other non-distribution services necessary for the Fund’s operations. The Board also considered that in addition to managing the Fund’s portfolios directly, the Advisor provides oversight of day-to-day operations, including monitoring tracking error, providing services in connection with the creation and redemption of creation units and assistance in meeting legal, compliance and regulatory requirements applicable to the Fund.
The Board considered the information regarding the Fund’s tracking error compared to its underlying index that had been provided by the Advisor and by Broadridge. The Board took note of the detailed information provided by the Advisor throughout the year with respect to the Fund’s tracking error and the sources thereof. The Trustees noted that tracking error for the Fund during the year was in an expected range.
Based on its review, the Board concluded that the nature, extent, and quality of services provided by the Advisor under the Investment Advisory Agreement are reasonable and appropriate in relation to the fees paid to the Advisor, taking special consideration of the fact that the advisory fee is a unitary fee and, as a result, a portion of the unitary advisory fee will be used to compensate the Fund’s service providers. The Board considered the staffing of the Advisor, including the training, qualifications and experience of investment personnel in managing the Fund. The Board also considered the expertise of the Advisor in supervising third party service providers to the Fund, such as the administrator and the custodian, noting the Advisor’s extensive work with these service providers (including onsite due diligence sessions) to conduct such supervision. The Board further considered the compliance program of the Advisor, which supports the Fund’s compliance program.
Advisor’s Financial Resources. In connection with the assessment of the ability of the Advisor to perform its duties under the Investment Advisory Agreement, the Board considered the Advisor’s financial condition and whether it has the resources necessary to carry out its functions. The Board concluded that the Advisor has the financial resources necessary to perform its obligations under the Investment Advisory Agreement.
Reasonableness of Advisory Fee. The Board compared the Fund’s advisory fee and total expenses to those of the other ETFs in its Peer Group. The Board noted that due to the special characteristics of certain Funds, there were limitations faced by Broadridge in providing comparable funds in the Peer Groups and the information in the Broadridge reports accordingly may or may not provide meaningful direct comparisons to the Fund. The Board also noted that the advisory fees and total expenses (after waivers/reimbursements) for the Fund were below or equal to the average and/or median of the ETFs in the Fund’s respective Peer Group compiled by Broadridge.
The Board accordingly noted that the Fund’s fee is competitive with the fees of applicable peer ETFs.
The Board considered that the fee for the Fund is a unitary fee pursuant to which the Advisor pays all of the Fund’s costs (subject to certain specified exceptions). The Board considered that the Fund’s fee had been priced to scale when it was established. The Board also considered that the Fund’s portfolio is managed on a day-to-day basis by the Advisor and that the Advisor also provides oversight of day-to-day operations, including monitoring tracking error, providing services in connection with creation and redemption units and assistance in meeting legal and regulatory requirements applicable to the Fund. Based on its review, the Board concluded that the advisory fee for the Fund is reasonable in light of the services provided.
Costs of Services and Profitability. The Board considered the expenses of the Advisor in developing and rendering services provided to the Fund and the information provided by the Advisor to the Board regarding the Fund’s profitability. The Board considered that the Advisor had provided extensive information about the Advisor’s profitability and the Advisor’s methodology in determining profitability. While the Advisor had provided information about the Advisor’s expenses relating to marketing the Fund, the Board considered the Advisor’s profitability without accounting for such expenses. The Board determined that, although only some of the Funds were profitable as of this time, the Advisor’s profitability with respect to each profitable Fund was not excessive. The Board considered whether the Advisor would benefit in other ways from its relationships with the Fund and concluded that there were no material fall-out benefits likely to accrue to the Advisor related to the operation of the Fund.
41
DBX ETF Trust
Board Considerations in Approval of Investment Advisory Contract (Unaudited) (Continued)
Economies of Scale. The Board considered that the Fund had attracted a substantial amount of assets, but determined that the Fund was not experiencing economies of scale beyond what was reflected in the Fund’s unitary fee, which the Board noted was very competitive. The Board determined to revisit this matter after the Fund had attracted more assets.
Given all the information available to it and considering all material factors, the Board concluded that the Investment Advisory Agreement was fair and reasonable and it was unanimously approved.
42
DBX ETF Trust
Proxy Voting Policies and Procedures
The Fund’s policies and procedures for voting proxies for portfolio securities and information about how the Fund voted proxies related to its portfolio securities during the most recent 12-month period ended June 30 are available on our Web site — www.Xtrackers.com (click on “Resources” and “Proxy Voting” at the top of the page) — or on the SEC’s Web site — www.sec.gov. To obtain a written copy of the Fund’s policies and procedures without charge, upon request, call us toll free at (855) 329-3837.
Portfolio Holdings Information
The Fund is required to file its complete schedule of portfolio holdings with the SEC for its first and third fiscal quarters on Form N-PORT. Copies of the filings are available without charge, upon request on the SEC’s website at www.sec.gov and are available by calling the Trust at 855-329-3837.
Information about the Fund’s portfolio holdings is available daily at www.Xtrackers.com.
Discount & Premium Information
Information regarding how often shares of the Fund traded on NYSE Arca at a price above (i.e., at a premium) or below (i.e., at a discount) the NAV of the Fund can be found at www.Xtrackers.com.
Tax Information
Form 1099-DIV and other year-end tax information provide shareholders with actual calendar year amounts that should be included in their tax returns. Shareholders should consult their tax advisors.
The Fund designates the following amounts or, if subsequently determined to be different, the maximum allowable for its fiscal year ended May 31, 2020.
| Qualified Dividend Income* | ||
| 92% |
* The above percentage is based on ordinary income dividends paid to shareholders during each Fund’s fiscal year.
The Fund intends to elect to pass through to shareholders the credit for taxes paid to foreign countries. The gross foreign source income and foreign taxes paid are as follows:
| Gross Foreign Income | Foreign Taxes Paid | |||
| $124,257,233 | $7,947,747 |
43
DBX ETF Trust
DBX Advisors LLC (“Advisors”) collects non-public information about you from the following sources: (i) information received from you on applications or other forms; and (ii) information about your transactions with the Advisors, Advisors’ affiliates and third-party service providers and vendors. Advisors does not disclose any non-public personal information about you to anyone, other than as set forth below, as permitted by applicable law and regulation. Advisors may disclose non-public personal information about you to the funds in which you invest, to Advisors’ affiliates, and to non-affiliated companies that work with Advisors to service your account(s), or to provide services or process transactions that you have requested. Advisors may disclose non-public personal information in situations that may include, but are not limited to, in response to legal and/or regulatory inquiries and the proposed or actual sale, assignment merger or other transfer of all or a portion of Advisors’ business to another business entity. Advisors may also disclose non-public personal information about you to parties representing you, such as your investment representative, your accountant, your tax advisor, or to other third parties at your direction/consent. Advisors will not sell, rent, license or trade your personal and financial information to or with third parties for their own direct marketing use unless you give us general or specific consent to do so. If you decide to close your account(s) or become an inactive customer, Advisors will adhere to the privacy policies and practices as described in this notice. Advisors restricts access to your personal and account information to those employees who need to know that information to provide products and services to you. Advisors maintains reasonable and customary physical, electronic and procedural safeguards to guard your non-public personal information.
California residents may go to https://fundsus.dws.com/us/en-us/legal-resources/privacy-policy.html to obtain additional information relating to their rights under California state law.
Advisors reserves the right, at their discretion, to change, modify, add, or remove portions of this Privacy Policy Notice, and any of the policies described herein, at any time. Advisors will indicate any such changes to the Privacy Policy Notice at the privacy link which can be found at www.Xtrackers.com. At all times, you are bound by the then-current version of the Privacy Policy and all applicable laws. Advisors highly recommends that you review this Privacy Policy Notice from time to time to ensure that you are familiar with the most recent version. The examples contained in this Privacy Policy Notice are illustrations; they are not intended to be exclusive.
44
DBX ETF Trust
This report is intended for the shareholders of DBX ETF Trust.
This report must be preceded or accompanied by a prospectus.
Investing involves risk, including the possible loss of principal. Stocks may decline in value. Foreign investing involves greater and different risks than investing in U.S. companies, including currency fluctuations, less liquidity, less developed or less efficient trading markets, lack of comprehensive company information, political instability and differing auditing and legal standards. The Fund’s use of forward currency contracts may not be successful in hedging currency exchange rates changes and could eliminate some or all of the benefit of an increase in the value of a foreign currency versus the U.S. dollar. Funds investing in a single industry, country or in a limited geographic region generally are more volatile than more diversified funds. Investing in derivatives entails special risks relating to liquidity, leverage and credit that may reduce returns and/or increase volatility. Performance of the Fund may diverge from that of the Underlying Index due to operating expenses, transaction costs, cash flows, use of sampling strategies or operational inefficiencies. An investment in the Fund should be considered only as a supplement to a complete investment program for those investors willing to accept the risks associated with the fund. Please read the prospectus for more information.
War, terrorism, economic uncertainty, trade disputes, public health crises (including the recent pandemic spread of the novel coronavirus) and related geopolitical events could lead to increased market volatility, disruption to U.S. and world economies and markets and may have significant adverse effects on the Funds and their investments.
Shares of the Funds are bought and sold at market price (not NAV) throughout the day on the NYSE Arca, Inc. Transactions in Fund shares may result in brokerage commissions and may generate tax consequences. There can be no assurance that an active trading market for shares of a Fund will develop or be maintained.
DBX ETF Trust Funds are distributed by ALPS Distributors, Inc. (“ALPS”). The Funds are managed by DBX Advisors LLC which is not affiliated with ALPS.
The brand DWS represents DWS Group GmbH & Co. KGaA and any of its subsidiaries such as DWS Distributors, Inc. which offers investment products or DWS Investment Management Americas, Inc. and RREEF America L.L.C. which offer advisory services.
The Funds or securities referred to herein are not sponsored, endorsed, issued, sold or promoted by MSCI, and MSCI bears no liability with respect to any such Funds or securities or any index on which such Funds or securities are based. The prospectus contains a more detailed description of the limited relationship MSCI has with DBX Advisors LLC and any related funds.
Copyright © 2020 DWS Group. All rights reserved. XtrackersTM is a trademark of DWS Investment GmbH. All other trademarks, servicemarks or registered trademarks are the property of their respective owners.
Not FDIC Insured | No Bank Guarantee | May Lose Value
DBX ETF Trust
Investment advisor DBX Advisors LLC 875 Third Avenue New York, NY 10022 | Administrator, custodian, fund accounting agent, lending agent & transfer agent The Bank of New York Mellon 240 Greenwich Street New York, NY 10286 | Distributor ALPS Distributors, Inc. 1290 Broadway Suite 1000 Denver, CO 80203 | ||
Independent registered public accounting firm Ernst & Young LLP 5 Times Square New York, NY 10036 | Legal counsel Dechert LLP 1095 Avenue of the Americas New York, NY 10036 | |||
R-38753-6 (7/20) DBX004443 (7/21)
May 31, 2020
Annual Report
DBX ETF Trust
Xtrackers Bloomberg Barclays US Investment Grade Corporate ESG ETF (ESCR)
(Formerly known as Xtrackers Investment Grade Bond — Interest Rate Hedged ETF (IGIH))
Xtrackers J.P. Morgan ESG Emerging Markets Sovereign ETF (ESEB)
(Formerly known as Xtrackers Emerging Markets Bond — Interest Rate Hedged ETF (EMIH))
Xtrackers J.P. Morgan ESG USD High Yield Corporate Bond ETF (ESHY)
(Formerly known as Xtrackers High Yield Corporate Bond — Interest Rate Hedged ETF (HYIH))
Xtrackers Municipal Infrastructure Revenue Bond ETF (RVNU)
Xtrackers MSCI All World ex US High Dividend Yield Equity ETF (HDAW)
Xtrackers MSCI EAFE High Dividend Yield Equity ETF (HDEF)

DBX ETF Trust
| Page | ||||
| 1 | ||||
| 3 | ||||
Xtrackers Bloomberg Barclays US Investment Grade Corporate ESG ETF | 6 | |||
| 8 | ||||
| 10 | ||||
| 12 | ||||
Xtrackers MSCI All World ex US High Dividend Yield Equity ETF | 14 | |||
| 16 | ||||
| 18 | ||||
Xtrackers Bloomberg Barclays US Investment Grade Corporate ESG ETF | 19 | |||
| 28 | ||||
| 31 | ||||
| 39 | ||||
Xtrackers MSCI All World ex US High Dividend Yield Equity ETF | 45 | |||
| 51 | ||||
| 54 | ||||
| 56 | ||||
| 58 | ||||
| 61 | ||||
| 64 | ||||
| 76 | ||||
| 78 | ||||
| 79 | ||||
Board Considerations in Approval of Investment Advisory Contract | 82 | |||
| 85 | ||||
| 86 | ||||
To our Shareholders: (Unaudited)
Dear Shareholders,
We are pleased to provide this annual report for our six ETFs tracking the fixed income market for the period ended May 31, 2020.
The global economy contracted during the reporting period in the aftermath of trade conflicts, volatile energy prices and COVID-19 related disruptions. The unprecedented emergence of the pandemic this year has dealt a major blow to manufacturing, services, consumer sentiment and social governance. The U.S. economy experienced its steepest rate of contraction since the 2008 financial crisis, with the pandemic taking a heavy toll on the manufacturing and services sectors. The decline in the U.S. economy also led to a spike in unemployment claims, affecting consumer spending, which accounts for two-thirds of economic activity. As the pandemic hit economic activity, from retailers to auto exporters, the European economy also shrank, with Germany, France and Italy entering into a technical recession1. Many emerging markets entered the year in a weakened state, followed by capital outflows and an energy price decline. Furthermore, China’s economy experienced its first contraction on record as the outbreak paralyzed production, exacerbated by commodity price slumps and financial market turbulence overseas.
Policymakers acknowledged the need to avert a deeper slump, deploying an array of programs, as small and medium-size businesses bore most of the brunt of the economic impact. Central banks have moved aggressively, with nearly all developed economies now with policy rates at or near zero. Beyond the conventional interest rate cuts, the central banks have also expanded their balance sheets by trillions of dollars and injected unlimited liquidity into their respective banking sectors. The Federal Reserve Board (FRB) kept its current interest rate target at 0-0.25% and pledged to maintain it until a recovery is firmly in place. To insulate the economy against the fallout from the pandemic, the FRB is also prepared to use its full range of tools to support the flow of credit to households and businesses. In addition, all U.S. government-bond maturities yielded less than 1% for the first time in history, while risk premiums on euro high-yield bonds doubled virtually overnight. The European Central Bank followed suit by maintaining a dovish tilt and unveiled a string of measures to stem an economic meltdown. The measures include increasing the Pandemic Emergency Purchase Programme envelope, lowering the interest rate on emergency loans for banks and offering a new series of non-targeted pandemic emergency longer-term refinancing operations to provide extra liquidity to banks.
Fiscal and monetary policy in several other countries also shifted into crisis mode, with a range of unprecedented responses to mitigate the near-term economic crisis. The People’s Bank of China has rolled out a slew of measures to backstop the economy, including cutting key policy rates and reducing the amount of reserves banks must hold. Other emerging-market central banks have followed suit, taking advantage of the current low inflation levels. As widely expected, the Bank of Japan left its short-term interest rate unchanged and pledged to guide 10-year government bond yields to around 0%. The Bank of England also reduced interest rates sharply, to its lowest levels on record.
As different regions adopted measures to contain or at least slow the spread of the virus, they experienced dire economic consequences. However, with the pandemic starting to recede in many countries, economic data is poised to improve. Moreover, policy support remains in place, with central banks ready to act if needed, while the major economies continue to increase their fiscal response. Given the economic backdrop of an uncertain environment, hedging interest-rate exposure would play a significant role in managing investments in fixed income markets.
1
Our team appreciates your trust and looks forward to serving your investment needs through innovative index-driven strategies.
Sincerely,
/s/ Freddi Klassen
Freddi Klassen
President and Chief Executive Officer
1 A “technical recession” is when you have 2 negative quarters of GDP, but it is due mainly to slowing growth or an isolated event rather than a major underlying cause. Technical recessions are usually short in duration and mild in severity. The gross domestic product (GDP) is the monetary value of all the finished goods and services produced within a country’s borders in a specific time period.
Assumptions, estimates and opinions contained in this document constitute our judgment as of the date of the document and are subject to change without notice. Any projections are based on a number of assumptions as to market conditions and there can be no guarantee that any projected results will be achieved. Past performance is not a guarantee of future results.
2
DBX ETF Trust
Xtrackers Bloomberg Barclays US Investment Grade Corporate ESG ETF
Xtrackers Bloomberg Barclays US Investment Grade Corporate ESG ETF (ESCR), seeks to track the performance, before fees and expenses, of the Bloomberg Barclays MSCI US Corporate Sustainability SRI Sector/Credit/Maturity Neutral Index (the ESCR Index). The ESCR index measures the investment grade, fixed-rate, taxable corporate bond market, including USD denominated securities publicly issued by US and non-US industrial, utility and financial issuers, while implementing ESG considerations. The Fund’s performance reflects the result of the current strategy and the strategy in place prior to May 12, 2020, when Xtrackers Investment Grade Bond – Interest Rate Hedged ETF’s name changed to Xtrackers Bloomberg Barclays US Investment Grade Corporate ESG ETF and the fund’s ticker symbol changed to ESCR. At that time, the Underlying Index replaced the Solactive USD Investment Grade Bond — Interest Rate Hedged Index which provides exposure to a basket of liquid USD-denominated Investment Grade corporate bonds while mitigating any rising Treasury interest rate risk. For the 12-month period ended May 31, 2020, ESCR returned -1.16%, compared to the ESCR1 Index return of -3.46%.
Most of the sectors contributed positively to performance with the greatest positive contribution coming from Financial Institutions, Consumer Non-Cyclical, Communication Services and Technology. The Fund entered into futures contracts during the period to seek to mitigate the potential negative impact of rising Treasury interest rates on the performance of the Fund’s long bond investments. The interest rate hedging strategy contributed positively to performance relative to the ESCR Index.
Xtrackers J.P. Morgan ESG Emerging Markets Sovereign ETF
Xtrackers J.P. Morgan ESG Emerging Markets Sovereign ETF (ESEB), seeks to track the performance, before fees and expenses, of the J.P. Morgan ESG EMBI Global Diversified Sovereign Index (the ESEB Index). The index is an unmanaged, market-capitalization weighted, total-return index tracking the traded market for U.S.-dollar-denominated Brady bonds, Eurobonds, traded loans, and local market debt instruments issued by sovereign and quasi-sovereign entities, while implementing ESG considerations. The Fund’s performance reflects the result of the current strategy and the strategy in place prior to May 12, 2020, when The Xtrackers Emerging Markets Bond — Interest Rate Hedged ETF’s name changed to Xtrackers J.P. Morgan ESG Emerging Markets Sovereign ETF and the fund’s ticker symbol changed to ESEB. At that time, the Underlying Index replaced the Solactive Emerging Markets Bond — Interest Rate Hedged Index which provides exposure to USD-denominated government debt issued by emerging market countries, while mitigating any rising Treasury interest rate risk. For the 12-month period ended May 31, 2020, ESEB returned -6.79%, compared to the ESEB1 Index return of -10.62%.
From a geographical perspective, Ecuador and Sri Lanka were the major negative contributors, while Chile contributed positively to performance. The Fund entered into futures contracts during the period to seek to mitigate the potential negative impact of rising Treasury interest rates on the performance of the Fund’s long bond investments. The interest rate hedging strategy contributed positively to performance relative to the ESEB Index.
Xtrackers J.P. Morgan ESG USD High Yield Corporate Bond ETF
Xtrackers J.P. Morgan ESG USD High Yield Corporate Bond ETF (ESHY), seeks to track the performance, before fees and expenses, of the J.P. Morgan ESG DM Corporate High Yield USD Index (the ESHY Index). The ESHY Index provides exposure to a USD denominated high yield corporate bond index of developed market issuers while implementing ESG considerations. The Fund’s performance reflects the result of the current strategy and the strategy in place prior to May 12, 2020, when The Xtrackers High Yield Corporate Bond — Interest Rate Hedged ETF’s name changed to J.P. Morgan ESG USD High Yield Corporate Bond ETF and the fund’s ticker symbol changed to ESHY. At that time, the Underlying Index replaced the Solactive USD High Yield Corporate Bond — Interest Rate Hedged Index, which provides exposure to a basket of liquid USD-denominated high-yield corporate bonds while mitigating any rising Treasury interest rate risk. For the 12-month period ended May 31, 2020, ESHY returned -4.58%, compared to the ESHY1 Index return of -7.07%.
Energy, Consumer Cyclical and Transportation were the primary negative contributors to performance, while Consumer Non-Cyclical, Technology and Communications sectors contributed positively to performance. The Fund entered into futures contracts during the period to seek to mitigate the potential negative impact of rising
3
DBX ETF Trust
Management’s Discussion of Fund Performance (Unaudited) (Continued)
Treasury interest rates on the performance of the Fund’s long bond investments. The interest rate hedging strategy contributed positively to performance relative to the ESHY Index.
Xtrackers Municipal Infrastructure Revenue Bond ETF
The Xtrackers Municipal Infrastructure Revenue Bond ETF (RVNU) seeks investment results that correspond generally to the performance, before fees and expenses, of the Solactive Municipal Infrastructure Revenue Bond Index (the RVNU Index). The RVNU Index is designed to track returns of the segment of the U.S. long-term tax-exempt bond market that consists of infrastructure revenue bonds. For the 12-month period ended May 31, 2020, RVNU returned 2.77%, compared to the RVNU Index return of 2.90%.
Majority of the sectors contributed positively to performance during the review period with the greatest positive contributions coming from the Utility and Transportation sector bonds, while Corporate Municipalities, partially offset performance.
Xtrackers MSCI All World ex US High Dividend Yield Equity ETF
The Xtrackers MSCI All World ex US High Dividend Yield Equity ETF (HDAW) seeks investment results that correspond generally to the performance, before fees and expenses, of the MSCI ACWI ex USA High Dividend Yield Index (the HDAW Index). The HDAW Index is designed to give investors exposure to equity securities across developed and emerging market countries (excluding the United States), with higher dividend income and quality characteristics than average dividend yields of equities in its parent index (excluding REITs), where such higher dividend income and quality characteristics are both sustainable and persistent. For the 12-month period ended May 31, 2020, HDAW returned -8.19%, compared to the HDAW Index return of -8.11%.
Majority of sectors contributed negatively to performance during the period with the greatest negative contributions coming from Financials, Energy and Materials. Health Care, Utilities and Info Tech sectors contributed positively to performance. From a geographical perspective, Canada, Hong Kong and South Africa were the major negative contributors, while Switzerland, Taiwan and United Kingdom contributed positively to performance.
Xtrackers MSCI EAFE High Dividend Yield Equity ETF
The Xtrackers MSCI EAFE High Dividend Yield Equity ETF (HDEF) seeks investment results that correspond generally to the performance, before fees and expenses, of the MSCI EAFE High Dividend Yield Index (the HDEF Index). The HDEF Index is designed to give investors exposure to equity securities in developed international stock markets, with higher dividend income and quality characteristics than average dividend yields of equities in its parent index (excluding REITs), where such higher dividend income and quality characteristics are both sustainable and persistent. For the 12-month period ended May 31, 2020, HDEF returned -5.58%, compared to the HDEF Index return of -5.57%.
From a geographical perspective, Hong Kong, France and Germany were the major negative contributors, while Switzerland, Spain and Finland contributed positively to performance.
(1) Index performance reflects the prior Underlying Index performance through May 11, 2020 and the current Underlying Index performance from May 12, 2020 through May 31, 2020.
*************************
Performance data quoted represents past performance and does not guarantee future results. Investment returns and principal value of an investment will fluctuate so that an investor’s shares, when sold or redeemed, may be worth more or less than their original cost. Current performance may be lower or higher than the performance data quoted. To obtain the most recent month-end performance data visit www.Xtrackers.com. Returns assume that dividends and capital gains distributions have been reinvested. See pages 6-17 of this report for additional performance information, including performance data based on market value. The views expressed in this report reflect those of the portfolio management team only through the end of the period of the report as stated on the cover. The management team’s views are subject to change at any time based on market and other conditions and should not be construed as a recommendation. Current and future portfolio holdings are subject to risk.
4
This Page is Intentionally Left Blank
5
DBX ETF Trust
Xtrackers Bloomberg Barclays US Investment Grade Corporate ESG ETF (ESCR)
The Xtrackers Bloomberg Barclays US Investment Grade Corporate ESG ETF (the “fund”), using a “passive” or indexing investment approach, seeks investment results that correspond generally to the performance, before fees and expenses, of the Bloomberg Barclays MSCI US Corpo-rate Sustainability SRI Sector/Credit/Maturity Neutral Index (the “Underlying Index”). The Underlying Index is designed to apply environmental, social and governance (“ESG”) considerations to a broader parent index. The Underlying Index generally aims to keep the broad characteristics of its parent index, the Bloomberg Barclays US Corporate Index (an investment grade corporate bond universe), resulting in a broad investment grade fixed income market exposure with ESG aspects. On May 12, 2020 the Xtrackers Investment Grade Bond — Interest Rate Hedged ETF name changed to Xtrackers Bloomberg Barclays US Investment Grade Corporate ESG ETF and the Fund’s ticker symbol changed to ESCR. At that time, the Underlying Index replaced the Solactive Investment Grade Bond — Interest Rate Hedged Index which is designed to track the performance of a basket of U.S. dollar denominated investment grade liquid corporate bonds and is comprised of (a) long positions in U.S. dollar-denominated investment-grade corporate bonds and (b) short positions in U.S. Treasury notes or bonds (“Treasury Securities”) of, in aggregate, approximate equivalent duration to the investment-grade corporate bonds. It is not possible to invest directly into an index.
| Performance as of May 31, 2020 |
| Average Annual Total Return | ||||||||||
| Net Asset Value | Market Value | Bloomberg Barclays MSCI US Corporate Sustainability SRI Sector/Credit/ Maturity Neutral Index2 | Bloomberg Barclays US Aggregate Bond Index | Solactive Investment Grade Bond Index (Long only component) | ||||||
One Year | -1.16% | -1.44% | -3.46% | 9.42% | 12.96% | |||||
Five Year | 1.56% | 1.53% | 0.48% | 3.94% | 5.85% | |||||
Since Inception1 | 1.29% | 1.33% | 0.29% | 3.80% | 5.41% | |||||
| Cumulative Total Returns | ||||||||||
| Net Asset Value | Market Value | Bloomberg Barclays MSCI US Corporate Sustainability SRI Sector/Credit/ Maturity Neutral Index2 | Bloomberg Barclays US Aggregate Bond Index | Solactive Investment Grade Bond Index (Long only component) | ||||||
One Year | -1.16% | -1.44% | -3.46% | 9.42% | 12.96% | |||||
Five Year | 8.07% | 7.88% | 2.43% | 21.34% | 32.89% | |||||
Since Inception1 | 6.96% | 7.20% | 1.54% | 21.60% | 31.83% | |||||
1 Total returns are calculated based on the commencement of operations, March 3, 2015 (“Inception”).
2 On May 12, 2020, the Fund changed its Underlying Index from Solactive Investment Grade Bond—Interest Rate Hedged Index to the Bloomberg Barclays MSCI US Corporate Sustainability SRI Sector/Credit/Maturity Neutral Index. Returns reflect performance for the Solactive Investment Grade Bond—Interest Rate Hedged Index through May 11, 2020.
Prior to May 12, 2020, the Fund was known as Xtrackers Investment Grade Bond—Interest Rate Hedged ETF and had a different investment strategy. Past performance may have been different if the Fund’s current investment strategy had been in effect.
Past performance is no guarantee of future results. Current performance may be lower or higher than the performance data quoted. Performance data current to the most recent month-end is available at www.Xtrackers.com. Performance results assume reinvestment of all dividends and capital gain distributions and do not reflect the deduction of taxes that a shareholder would pay on fund distributions or on the sale of fund shares or redemption of fund creation units. The investment return and principal value of shares will vary with changes in market conditions. Shares may be worth more or less than their original cost when they are sold in the market or redeemed. Performance for certain funds may reflect a waiver of a portion of investment management fees. Without such waiver, performance would have been lower. The estimated operating expense ratio as disclosed in the most recent prospectus dated May 12, 2020, was 0.15%, and may differ from the expense ratio disclosed in the Financial Highlights table in this report.
The Fund’s net asset value or “NAV” is calculated by dividing the value of the Fund’s total assets less total liabilities by the number of shares outstanding. The price used to calculate market return (“Market Price”) is determined by using the midpoint between the highest bid and the lowest offer on the primary stock exchange on which shares of a fund are listed for trading, as of the time that such fund’s NAV is calculated. Since shares of a fund may not have traded in the secondary market until after the fund’s inception, for the period from inception to the first day of secondary trading, the NAV of the fund is used as a proxy for the Market Price to calculate market returns. Market and NAV returns assume that dividends and capital gain distributions have been reinvested at Market Price and NAV, respectively.
An index is a statistical composite that tracks a specified financial market or sector. Unlike a fund, an index does not actually hold a portfolio of securities and therefore does not incur the expenses incurred by a fund. These expenses negatively impact fund performance. Also, market returns do not include brokerage commissions that may be payable on secondary market transactions. If brokerage commissions were included, market returns would be lower.
6
DBX ETF Trust
Performance Summary (Unaudited)
Xtrackers Bloomberg Barclays US Investment Grade Corporate ESG ETF (ESCR) (Continued)
| Growth of an Assumed $10,000 Investment |
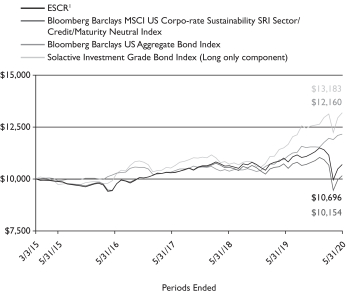
1 Based on Net Asset Value from commencement of operations, March 3, 2015.
| Sector Diversification * as of May 31, 2020 |
Financial | 32.6% | |||
Consumer, Non-cyclical | 19.5% | |||
Technology | 10.9% | |||
Utilities | 7.8% | |||
Communications | 7.6% | |||
Industrial | 7.4% | |||
Energy | 6.8% | |||
Consumer, Cyclical | 4.4% | |||
Basic Materials | 3.0% | |||
|
| |||
Total | 100.0% |
Modified duration as of May 31, 2020: 8.4 years
Modified duration is an approximate measure of a fund’s sensitivity to movements in interest rates based on the current rate environment.
| Quality* as of May 31, 2020 |
| Description | % of Market Value | |||
AAA | 2.7% | |||
AA | 8.2% | |||
A | 45.5% | |||
BBB | 43.6% | |||
|
| |||
Total | 100.0% | |||
The quality ratings represent the higher of Moody’s Investor Services, Inc. (“Moody’s”) or S&P Global Ratings (S&P) credit ratings. The ratings of Moody’s and S&P represent their opinions as to the quality of the securities they rate. Credit quality measures a bond issuer’s ability to repay interest and principal in a timely manner and is measured on a scale that ranges from AAA (highest) to D (lowest). Ratings are relative and subjective and are not absolute standards of quality. Credit quality does not remove market risk and is subject to change.
| Country Diversification* as of May 31, 2020 |
United States | 87.6% | |||
Canada | 4.4% | |||
Japan | 2.5% | |||
United Kingdom | 1.8% | |||
Australia | 1.0% | |||
Netherlands | 0.9% | |||
Ireland | 0.7% | |||
Guernsey | 0.5% | |||
France | 0.4% | |||
Cayman Islands | 0.1% | |||
Luxembourg | 0.1% | |||
|
| |||
Total | 100.0% |
* As a percent of total investments excluding securities lending collateral and cash equivalents.
Portfolio holdings and characteristics are subject to change. For more complete details about the Fund’s investment portfolio see page 19.
7
DBX ETF Trust
Performance Summary (Unaudited)
Xtrackers J.P. Morgan ESG Emerging Markets Sovereign ETF (ESEB)
The Xtrackers J.P. Morgan ESG Emerging Markets Sovereign ETF (the “fund”), using a “passive” or indexing investment approach, seeks investment results that correspond generally to the performance, before fees and expenses, of the J.P. Morgan ESG EMBI Global Diversified Sovereign Index (the “Underlying Index”). The Underlying Index is designed to apply environmental, social and governance (“ESG”) considerations to a broader parent index. The Underlying Index generally aims to keep the broad characteristics of its parent index, the J.P. Morgan EMBI Global Diversified Sovereign Index, resulting in a broad emerging markets sovereign debt market exposure with ESG aspects. On May 12, 2020 the Xtrackers Emerging Markets Bond—Interest Rate Hedged ETF name changed to Xtrackers J.P. Morgan ESG Emerging Markets Sovereign ETF and the Fund’s ticker symbol changed to ESEB. At that time, the Underlying Index replaced the Solactive Emerging Markets Bond—Interest Rate Hedged Index which is designed to track the performance of a basket of U.S. dollar denominated emerging markets bonds and is comprised of (a) long positions in U.S. dollar-denominated government debt issued by emerging market countries, and (b) short positions in U.S. Treasury notes or bonds of, in aggregate, approximate equivalent duration to the emerging markets sovereign debt. It is not possible to invest directly into an index.
| Performance as of May 31, 2020 |
| Average Annual Total Return | ||||||||||
| Net Asset Value | Market Value | J.P. Morgan ESG EMBI Global Diversified Sovereign Index2 | J.P. Morgan EMBI Global Diversified Sovereign Index | Solactive Emerging Markets Bond Index (Long only component) | ||||||
One Year | -6.79% | -6.36% | -10.62% | -0.36% | 2.77% | |||||
Five Year | 1.74% | 1.79% | 0.28% | 4.07% | 5.05% | |||||
Since Inception1 | 1.83% | 1.98% | 0.41% | 4.07% | 5.00% | |||||
| Cumulative Total Returns | ||||||||||
| Net Asset Value | Market Value | J.P. Morgan ESG EMBI Global Diversified Sovereign Index2 | J.P. Morgan EMBI Global Diversified Sovereign Index | Solactive Emerging Markets Bond Index (Long only component) | ||||||
One Year | -6.79% | -6.36% | -10.62% | -0.36% | 2.77% | |||||
Five Year | 9.00% | 9.30% | 1.41% | 22.10% | 27,92% | |||||
Since Inception1 | 9.99% | 10.82% | 2.20% | 23.29% | 29.19% | |||||
1 Total returns are calculated based on the commencement of operations, March 3, 2015 (“Inception”).
2 On May 12, 2020, the Fund changed its Underlying Index from Solactive Emerging Markets Bond—Interest Rate Hedged Index to the J.P. Morgan ESG EMBI Global Diversified Sovereign Index. Returns reflect performance for the Solactive Emerging Markets Bond—Interest Rate Hedged Index through May 11, 2020.
Prior to May 12, 2020, the Fund was known as Xtrackers Emerging Markets Bond—Interest Rate Hedged ETF and had a different investment strategy. Past performance may have been different if the Fund’s current investment strategy had been in effect.
Past performance is no guarantee of future results. Current performance may be lower or higher than the performance data quoted. Performance data current to the most recent month-end is available at www.Xtrackers.com. Performance results assume reinvestment of all dividends and capital gain distributions and do not reflect the deduction of taxes that a shareholder would pay on fund distributions or on the sale of fund shares or redemption of fund creation units. The investment return and principal value of shares will vary with changes in market conditions. Shares may be worth more or less than their original cost when they are sold in the market or redeemed. Performance for certain funds may reflect a waiver of a portion of investment management fees. Without such waiver, performance would have been lower. The estimated operating expense ratio as disclosed in the most recent prospectus dated May 12, 2020, was 0.35%, and may differ from the expense ratio disclosed in the Financial Highlights table in this report.
The Fund’s net asset value or “NAV” is calculated by dividing the value of the Fund’s total assets less total liabilities by the number of shares outstanding. The price used to calculate market return (“Market Price”) is determined by using the midpoint between the highest bid and the lowest offer on the primary stock exchange on which shares of a fund are listed for trading, as of the time that such fund’s NAV is calculated. Since shares of a fund may not have traded in the secondary market until after the fund’s inception, for the period from inception to the first day of secondary trading, the NAV of the fund is used as a proxy for the Market Price to calculate market returns. Market and NAV returns assume that dividends and capital gain distributions have been reinvested at Market Price and NAV, respectively.
An index is a statistical composite that tracks a specified financial market or sector. Unlike a fund, an index does not actually hold a portfolio of securities and therefore does not incur the expenses incurred by a fund. These expenses negatively impact fund performance. Also, market returns do not include brokerage commissions that may be payable on secondary market transactions. If brokerage commissions were included, market returns would be lower.
8
DBX ETF Trust
Performance Summary (Unaudited)
Xtrackers J.P. Morgan ESG Emerging Markets Sovereign ETF (ESEB) (Continued)
| Growth of an Assumed $10,000 Investment |
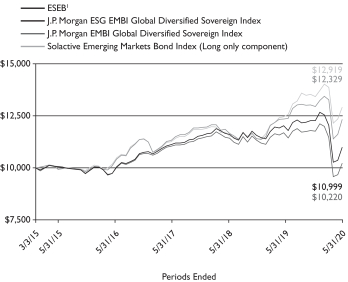
1 Based on Net Asset Value from commencement of operations, March 3, 2015.
| Quality* as of May 31, 2020 |
| Description | % of Market Value | |||
AA | 6.4% | |||
A | 11.5% | |||
BBB | 40.3% | |||
BB | 17.3% | |||
B | 21.3% | |||
C | 3.2% | |||
|
| |||
Total | 100.0% | |||
The quality ratings represent the higher of Moody’s Investor Services, Inc. (“Moody’s”) or S&P Global Ratings (S&P) credit ratings. The ratings of Moody’s and S&P represent their opinions as to the quality of the securities they rate. Credit quality measures a bond issuer’s ability to repay interest and principal in a timely manner and is measured on a scale that ranges from AAA (highest) to D (lowest). Ratings are relative and subjective and are not absolute standards of quality. Credit quality does not remove market risk and is subject to change.
| Country Diversification * as of May 31, 2020 |
Uruguay | 5.5% | |||
Panama | 5.4% | |||
Qatar | 4.6% | |||
Colombia | 4.0% | |||
Philippines | 3.9% | |||
Oman | 3.6% | |||
Indonesia | 3.6% | |||
Saudi Arabia | 3.4% | |||
Peru | 3.3% | |||
Brazil | 3.3% | |||
Russia | 3.1% | |||
Turkey | 3.0% | |||
United Arab Emirates | 3.0% | |||
Egypt | 2.9% | |||
Mexico | 2.8% | |||
Poland | 2.6% | |||
Dominican Republic | 2.6% | |||
Romania | 2.6% | |||
Hungary | 2.6% | |||
South Africa | 2.4% | |||
Ukraine | 2.1% | |||
Other | 29.7% | |||
|
| |||
Total | 100.0% |
Modified duration as of May 31, 2020: 7.7 years
Modified duration is an approximate measure of a fund’s sensitivity to movements in interest rates based on the current rate environment.
* As a percent of total investments excluding cash equivalents.
Portfolio holdings and characteristics are subject to change. For more complete details about the Fund’s investment portfolio see page 28.
9
DBX ETF Trust
Performance Summary (Unaudited)
Xtrackers J.P. Morgan ESG USD High Yield Corporate Bond ETF (ESHY)
The Xtrackers J.P. Morgan ESG USD High Yield Corporate Bond ETF (the “fund”), using a “passive” or indexing investment approach, seeks investment results that correspond generally to the performance, before fees and expenses, of the J.P. Morgan ESG DM Corporate High Yield USD Index (the “Underlying Index”). The Underlying Index is designed to apply environmental, social and governance (“ESG”) considerations to a broader parent index. The Underlying Index generally aims to keep the broad characteristics of its parent index, the J.P. Morgan DM High Yield USD Index (a USD denominated high yield corporate bond index of developed market issuers), resulting in a broad high yield fixed income market expo-sure with ESG aspects. On May 12, 2020 the Xtrackers High Yield Corporate Bond — Interest Rate Hedged ETF name changed to Xtrackers J.P. Morgan ESG USD High Yield Corporate Bond ETF and the Fund’s ticker symbol changed to ESHY. At that time, the Underlying Index replaced the Solactive High Yield Corporate Bond—Interest Rate Hedged Index which is designed to track the performance of a basket of U.S. dollar-denominated high yield liquid corporate bonds and is comprised of (a) long positions in U.S. dollar-denominated high yield corporate bonds and (b) short positions in U.S. Treasury notes or bonds (“Treasury Securities”) of, in aggregate, approximate equivalent duration to the high yield bonds. It is not possible to invest directly into an index.
| Performance as of May 31, 2020 |
| Average Annual Total Return | ||||||||||
| Net Asset Value | Market Value | J.P. Morgan ESG DM Corporate High Yield USD Index2 | Baseline JESG DM Corporate HY USD Index | Solactive High Yield Corporate Bond Index (Long only component) | ||||||
One Year | -4.58% | -3.76% | -7.07% | 1.49% | 1.07% | |||||
Five Year | 1.47% | 1.53% | 0.74% | 4.40% | 3.88% | |||||
Since Inception1 | 1.24% | 1.44% | 0.62% | 4.36% | 3.80% | |||||
| Cumulative Total Returns | ||||||||||
| Net Asset Value | Market Value | J.P. Morgan ESG DM Corporate High Yield USD Index2 | Baseline JESG DM Corporate HY USD Index | Solactive High Yield Corporate Bond Index (Long only component) | ||||||
One Year | -4.58% | -3.76% | -7.07% | 1.49% | 1.07% | |||||
Five Year | 7.59% | 7.87% | 3.78% | 24.04% | 20.98% | |||||
Since Inception1 | 6.66% | 7.81% | 3.32% | 25.12% | 21.62% | |||||
1 Total returns are calculated based on the commencement of operations, March 3, 2015 (“Inception”).
2 On May 12, 2020, the Fund changed its Underlying Index from Solactive High Yield Corporate Bond—Interest Rate Hedged Index to the J.P. Morgan ESG DM Corporate High Yield USD Index. Returns reflect performance for the Solactive High Yield Corporate Bond—Interest Rate Hedged Index through May 11, 2020.
Prior to May 12, 2020, the Fund was known as Xtrackers High Yield Corporate Bond — Interest Rate Hedged ETF and had a different investment strategy. Past performance may have been different if the Fund’s current investment strategy had been in effect.
Past performance is no guarantee of future results. Current performance may be lower or higher than the performance data quoted. Performance data current to the most recent month-end is available at www.Xtrackers.com. Performance results assume reinvestment of all dividends and capital gain distributions and do not reflect the deduction of taxes that a shareholder would pay on fund distributions or on the sale of fund shares or redemption of fund creation units. The investment return and principal value of shares will vary with changes in market conditions. Shares may be worth more or less than their original cost when they are sold in the market or redeemed. Performance for certain funds may reflect a waiver of a portion of investment management fees. Without such waiver, performance would have been lower. The estimated operating expense ratio as disclosed in the most recent prospectus dated May 12, 2020, was 0.20%, and may differ from the expense ratio disclosed in the Financial Highlights table in this report.
The Fund’s net asset value or “NAV” is calculated by dividing the value of the Fund’s total assets less total liabilities by the number of shares outstanding. The price used to calculate market return (“Market Price”) is determined by using the midpoint between the highest bid and the lowest offer on the primary stock exchange on which shares of a fund are listed for trading, as of the time that such fund’s NAV is calculated. Since shares of a fund may not have traded in the secondary market until after the fund’s inception, for the period from inception to the first day of secondary trading, the NAV of the fund is used as a proxy for the Market Price to calculate market returns. Market and NAV returns assume that dividends and capital gain distributions have been reinvested at Market Price and NAV, respectively.
An index is a statistical composite that tracks a specified financial market or sector. Unlike a fund, an index does not actually hold a portfolio of securities and therefore does not incur the expenses incurred by a fund. These expenses negatively impact fund performance. Also, market returns do not include brokerage commissions that may be payable on secondary market transactions. If brokerage commissions were included, market returns would be lower.
10
DBX ETF Trust
Performance Summary (Unaudited)
Xtrackers J.P. Morgan ESG USD High Yield Corporate Bond ETF (ESHY) (Continued)
| Growth of an Assumed $10,000 Investment |
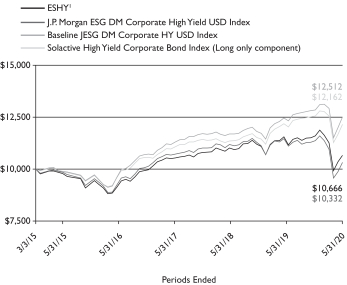
1 Based on Net Asset Value from commencement of operations, March 3, 2015.
| Sector Diversification * as of May 31, 2020 |
Consumer, Non-cyclical | 18.0% | |||
Communications | 17.2% | |||
Energy | 15.6% | |||
Consumer, Cyclical | 15.4% | |||
Industrial | 11.0% | |||
Financial | 10.7% | |||
Basic Materials | 5.8% | |||
Technology | 4.7% | |||
Utilities | 1.4% | |||
Diversified | 0.2% | |||
|
| |||
Total | 100.0% |
Modified duration as of May 31, 2020: 4.7 years
Modified duration is an approximate measure of a fund’s sensitivity to movements in interest rates based on the current rate environment.
| Quality* as of May 31, 2020 |
| Description | % of Market Value | |||
BBB | 1.2% | |||
BB | 52.6% | |||
B | 35.0% | |||
CCC | 11.0% | |||
C | 0.2% | |||
|
| |||
Total | 100.0% | |||
The quality ratings represent the higher of Moody’s Investor Services, Inc. (“Moody’s”) or S&P Global Ratings (S&P) credit ratings. The ratings of Moody’s and S&P represent their opinions as to the quality of the securities they rate. Credit quality measures a bond issuer’s ability to repay interest and principal in a timely manner and is measured on a scale that ranges from AAA (highest) to D (lowest). Ratings are relative and subjective and are not absolute standards of quality. Credit quality does not remove market risk and is subject to change.
| Country Diversification* as of May 31, 2020 |
United States | 85.7% | |||
Canada | 6.2% | |||
Netherlands | 2.5% | |||
Luxembourg | 2.2% | |||
France | 1.2% | |||
Australia | 0.8% | |||
Cayman Islands | 0.6% | |||
United Kingdom | 0.3% | |||
Puerto Rico | 0.3% | |||
Malta | 0.2% | |||
|
| |||
Total | 100.0% |
* As a percentage of total investments excluding securities lending collateral and cash equivalents.
Portfolio holdings and characteristics are subject to change. For more complete details about the Fund’s investment portfolio see page 31.
11
DBX ETF Trust
Performance Summary (Unaudited)
Xtrackers Municipal Infrastructure Revenue Bond ETF (RVNU)
The Xtrackers Municipal Infrastructure Revenue Bond ETF (the “Fund”), using a “passive” or indexing investment approach, seeks investment results that correspond generally to the performance, before fees and expenses, of the Solactive Municipal Infrastructure Revenue Bond Index (the “Underlying Index”). The Underlying Index is designed to track the performance of the U.S. long-term tax exempt bond market, consisting of infrastructure revenue bonds. It is not possible to invest directly into an index.
| Performance as of May 31, 2020 |
| Average Annual Total Return | ||||||||
| Net Asset Value | Market Value | Solactive Municipal Infrastructure Revenue Bond Index | S&P Municipal Bond Revenue Index | |||||
One Year | 2.77% | 2.62% | 2.90% | 3.14% | ||||
Five Year | 4.50% | 4.47% | 4.88% | 4.02% | ||||
Since Inception1 | 4.41% | 4.42% | 4.67% | 3.90% | ||||
| Cumulative Total Returns | ||||||||
| Net Asset Value | Market Value | Solactive Municipal Infrastructure Revenue Bond Index | S&P Municipal Bond Revenue Index | |||||
One Year | 2.77% | 2.62% | 2.90% | 3.14% | ||||
Five Year | 24.60% | 24.41% | 26.90% | 21.61% | ||||
Since Inception1 | 35.20% | 35.33% | 37.66% | 30.63% | ||||
1 Total returns are calculated based on the commencement of operations, June 4, 2013 (“Inception”).
Past performance is no guarantee of future results. Current performance may be lower or higher than the performance data quoted. Performance data current to the most recent month-end is available at www.Xtrackers.com. Performance results assume reinvestment of all dividends and capital gain distributions and do not reflect the deduction of taxes that a shareholder would pay on fund distributions or on the sale of fund shares or redemption of fund creation units. The investment return and principal value of shares will vary with changes in market conditions. Shares may be worth more or less than their original cost when they are sold in the market or redeemed. Performance for certain funds may reflect a waiver of a portion of investment management fees. Without such waiver, performance would have been lower. The estimated operating expense ratio as disclosed in the most recent prospectus dated October 1, 2019, as supplemented April 15, 2020, was 0.15%, and may differ from the expense ratio disclosed in the Financial Highlights table in this report.
The Fund’s net asset value or “NAV” is calculated by dividing the value of the Fund’s total assets less total liabilities by the number of shares outstanding. The price used to calculate market return (“Market Price”) is determined by using the midpoint between the highest bid and the lowest offer on the primary stock exchange on which shares of a fund are listed for trading, as of the time that such fund’s NAV is calculated. Since shares of a fund may not have traded in the secondary market until after the fund’s inception, for the period from inception to the first day of secondary trading, the NAV of the fund is used as a proxy for the Market Price to calculate market returns. Market and NAV returns assume that dividends and capital gain distributions have been reinvested at Market Price and NAV, respectively.
An index is a statistical composite that tracks a specified financial market or sector. Unlike a fund, an index does not actually hold a portfolio of securities and therefore does not incur the expenses incurred by a fund. These expenses negatively impact fund performance. Also, market returns do not include brokerage commissions that may be payable on secondary market transactions. If brokerage commissions were included, market returns would be lower.
12
DBX ETF Trust
Performance Summary (Unaudited)
Xtrackers Municipal Infrastructure Revenue Bond ETF (RVNU) (Continued)
| Growth of an Assumed $10,000 Investment |
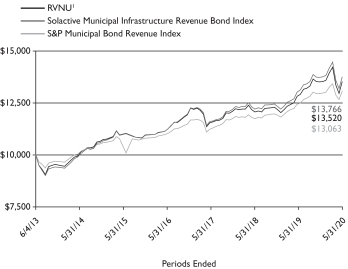
1 Based on Net Asset Value from commencement of operations, June 4, 2013.
| Sector Diversification* as of May 31, 2020 |
Transportation | 36.8% | |||
Airport | 29.3% | |||
Water | 16.9% | |||
Power | 7.1% | |||
General | 6.1% | |||
Development | 2.4% | |||
Utilities | 1.4% | |||
|
| |||
Total | 100.0% |
Modified duration as of May 31, 2020: 6.6 years Modified duration is an approximate measure of a fund’s sensitivity to movements in interest rates based on the current rate environment.
| Quality* as of May 31, 2020 |
| Description | % of Market Value | |||
AAA | 6.4% | |||
AA | 49.6% | |||
A | 42.7% | |||
BBB | 1.3% | |||
|
| |||
Total | 100% | |||
The quality ratings represent the higher of Moody’s Investor Services, Inc. (“Moody’s”) or S&P Global Ratings (S&P) credit ratings. The ratings of Moody’s and S&P represent their opinions as to the quality of the securities they rate. Credit quality measures a bond issuer’s ability to repay interest and principal in a timely manner and is measured on a scale that ranges from AAA (highest) to D (lowest). Ratings are relative and subjective and are not absolute standards of quality. Credit quality does not remove market risk and is subject to change.
* As a percent of total investments.
Portfolio holdings and characteristics are subject to change. For more complete details about the Fund’s investment portfolio see page 39.
13
DBX ETF Trust
Performance Summary (Unaudited)
Xtrackers MSCI All World ex US High Dividend Yield Equity ETF (HDAW)
The Xtrackers MSCI All World ex US High Dividend Yield Equity ETF (the “Fund”), using a “passive” or indexing investment approach, seeks investment results that correspond generally to the performance, before fees and expenses, of the MSCI ACWI ex USA High Dividend Yield Index (the “Underlying Index”). The Underlying Index is designed to reflect the performance of equities (excluding real estate investment trusts (“REITs”)) in developed and emerging stock markets (excluding the United States) in its parent index, the MSCI ACWI ex US Index, with higher dividend income and quality characteristics than average dividend yields of equities in the parent index, where such higher dividend income and quality characteristics are both sustainable and persistent. It is not possible to invest directly into an index.
| Performance as of May 31, 2020 |
| Average Annual Total Return | ||||||||
| Net Asset Value | Market Value | MSCI ACWI ex USA High Dividend Yield Index | MSCI ACWI ex US Index | |||||
One Year | -8.19% | -8.07% | -8.11% | -3.43% | ||||
Since Inception1 | -0.22% | -0.17% | -0.04% | 1.71% | ||||
| Cumulative Total Returns | ||||||||
| Net Asset Value | Market Value | MSCI ACWI ex USA High Dividend Yield Index | MSCI ACWI ex US Index | |||||
One Year | -8.19% | -8.07% | -8.11% | -3.43% | ||||
Since Inception1 | -1.06% | -0.79% | -0.18% | 8.51% | ||||
1 Total returns are calculated based on the commencement of operations, August 12, 2015 (“Inception”).
Prior to February 13, 2018, the Fund was known as Xtrackers MSCI All World ex US High Dividend Yield Hedged Equity ETF and had a different investment strategy. Past performance may have been different if the Fund’s current investment strategy had been in effect.
Past performance is no guarantee of future results. Current performance may be lower or higher than the performance data quoted. Performance data current to the most recent month-end is available at www.Xtrackers.com. Performance results assume reinvestment of all dividends and capital gain distributions and do not reflect the deduction of taxes that a shareholder would pay on fund distributions or on the sale of fund shares or redemption of fund creation units. The investment return and principal value of shares will vary with changes in market conditions. Shares may be worth more or less than their original cost when they are sold in the market or redeemed. Performance for certain funds may reflect a waiver of a portion of investment management fees. Without such waiver, performance would have been lower. The estimated operating expense ratio as disclosed in the most recent prospectus dated October 1, 2019, was 0.20%, and may differ from the expense ratio disclosed in the Financial Highlights table in this report.
The Fund’s net asset value or “NAV” is calculated by dividing the value of the Fund’s total assets less total liabilities by the number of shares outstanding. The price used to calculate market return (“Market Price”) is determined by using the midpoint between the highest bid and the lowest offer on the primary stock exchange on which shares of a fund are listed for trading, as of the time that such fund’s NAV is calculated. Since shares of a fund may not have traded in the secondary market until after the fund’s inception, for the period from inception to the first day of secondary trading, the NAV of the fund is used as a proxy for the Market Price to calculate market returns. Market and NAV returns assume that dividends and capital gain distributions have been reinvested at Market Price and NAV, respectively.
An index is a statistical composite that tracks a specified financial market or sector. Unlike a fund, an index does not actually hold a portfolio of securities and therefore does not incur the expenses incurred by a fund. These expenses negatively impact fund performance. Also, market returns do not include brokerage commissions that may be payable on secondary market transactions. If brokerage commissions were included, market returns would be lower.
14
DBX ETF Trust
Performance Summary (Unaudited)
Xtrackers MSCI All World ex US High Dividend Yield Equity ETF (HDAW) (Continued)
| Growth of an Assumed $10,000 Investment |
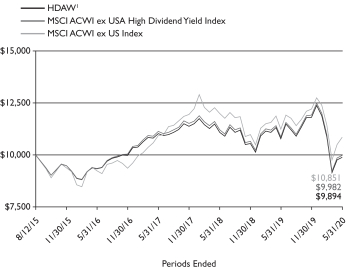
1 Based on Net Asset Value from commencement of operations, August 12, 2015.
| Sector Diversification* as of May 31, 2020 |
Financials | 27.4% | |||
Energy | 10.9% | |||
Materials | 10.4% | |||
Health Care | 8.9% | |||
Communication Services | 8.3% | |||
Utilities | 7.6% | |||
Industrials | 7.2% | |||
Consumer Discretionary | 6.3% | |||
Consumer Staples | 5.6% | |||
Real Estate | 4.6% | |||
Information Technology | 2.8% | |||
|
| |||
Total | 100.0% |
| Ten Largest Equity Holdings as of May 31, 2020 (26.8% of Net Assets) |
| Description | % of Net Assets | |||
Sanofi (France) | 3.4% | |||
GlaxoSmithKline PLC (United Kingdom) | 3.2% | |||
TOTAL SA (France) | 2.9% | |||
Royal Bank of Canada (Canada) | 2.9% | |||
British American Tobacco PLC (United Kingdom) | 2.8% | |||
Siemens AG (Germany) | 2.6% | |||
Allianz SE (Germany) | 2.4% | |||
China Construction Bank Corp. (China) | 2.4% | |||
BHP Group Ltd. (Australia) | 2.1% | |||
Bayer AG (Germany) | 2.1% | |||
| Country Diversification* as of May 31, 2020 |
United Kingdom | 13.3% | |||
Japan | 12.2% | |||
Canada | 9.0% | |||
China | 7.6% | |||
Germany | 7.5% | |||
Hong Kong | 7.1% | |||
France | 6.6% | |||
Australia | 4.8% | |||
Spain | 4.4% | |||
Russia | 3.5% | |||
Taiwan | 3.2% | |||
Switzerland | 3.0% | |||
Saudi Arabia | 2.5% | |||
Other | 15.3% | |||
|
| |||
Total | 100.0% |
* As a percent of total investments excluding securities lending collateral and cash equivalents.
Portfolio holdings and characteristics are subject to change. For more complete details about the Fund’s investment portfolio see page 45.
15
DBX ETF Trust
Performance Summary (Unaudited)
Xtrackers MSCI EAFE High Dividend Yield Equity ETF (HDEF)
The Xtrackers MSCI EAFE High Dividend Yield Equity ETF (the “Fund”), using a “passive” or indexing investment approach, seeks investment results that correspond generally to the performance, before fees and expenses, of the MSCI EAFE High Dividend Yield Index (the “Underlying Index”). The Underlying Index is designed to reflect the performance of equities (excluding real estate investment trusts (“REITs”)) in its parent index, the MSCI EAFE Index, with higher dividend income and quality characteristics than average dividend yields of equities in the parent index, where such higher dividend income and quality characteristics are both sustainable and persistent. It is not possible to invest directly into an index.
| Performance as of May 31, 2020 |
| Average Annual Total Return | ||||||||
| Net Asset Value | Market Value | MSCI EAFE High Index | MSCI EAFE Index | |||||
One Year | -5.58% | -5.29% | -5.57% | -2.81% | ||||
Since Inception1 | 0.11% | 0.22% | 0.30% | 1.14% | ||||
| Cumulative Total Returns | ||||||||
| Net Asset Value | Market Value | MSCI EAFE High Index | MSCI EAFE Index | |||||
One Year | -5.58% | -5.29% | -5.57% | -2.81% | ||||
Since Inception1 | 0.51% | 1.05% | 1.43% | 5.61% | ||||
1 Total returns are calculated based on the commencement of operations, August 12, 2015 (“Inception”).
Prior to February 13, 2018, the Fund was known as Xtrackers MSCI EAFE High Dividend Yield Hedged Equity ETF and had a different investment strategy. Past performance may have been different if the Fund’s current investment strategy had been in effect.
Past performance is no guarantee of future results. Current performance may be lower or higher than the performance data quoted. Performance data current to the most recent month-end is available at www.Xtrackers.com. Performance results assume reinvestment of all dividends and capital gain distributions and do not reflect the deduction of taxes that a shareholder would pay on fund distributions or on the sale of fund shares or redemption of fund creation units. The investment return and principal value of shares will vary with changes in market conditions. Shares may be worth more or less than their original cost when they are sold in the market or redeemed. Performance for certain funds may reflect a waiver of a portion of investment management fees. Without such waiver, performance would have been lower. The estimated operating expense ratio as disclosed in the most recent prospectus dated October 1, 2019, was 0.20%, and may differ from the expense ratio disclosed in the Financial Highlights table in this report.
The Fund’s net asset value or “NAV” is calculated by dividing the value of the Fund’s total assets less total liabilities by the number of shares outstanding. The price used to calculate market return (“Market Price”) is determined by using the midpoint between the highest bid and the lowest offer on the primary stock exchange on which shares of a fund are listed for trading, as of the time that such fund’s NAV is calculated. Since shares of a fund may not have traded in the secondary market until after the fund’s inception, for the period from inception to the first day of secondary trading, the NAV of the fund is used as a proxy for the Market Price to calculate market returns. Market and NAV returns assume that dividends and capital gain distributions have been reinvested at Market Price and NAV, respectively.
An index is a statistical composite that tracks a specified financial market or sector. Unlike a fund, an index does not actually hold a portfolio of securities and therefore does not incur the expenses incurred by a fund. These expenses negatively impact fund performance. Also, market returns do not include brokerage commissions that may be payable on secondary market transactions. If brokerage commissions were included, market returns would be lower.
16
DBX ETF Trust
Performance Summary (Unaudited)
Xtrackers MSCI EAFE High Dividend Yield Equity ETF (HDEF) (Continued)
| Growth of an Assumed $10,000 Investment |
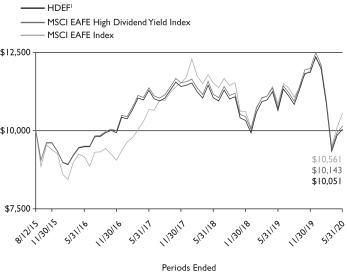
1 Based on Net Asset Value from commencement of operations, August 12, 2015.
| Sector Diversification* as of May 31, 2020 |
Financials | 20.5% | |||
Utilities | 12.1% | |||
Industrials | 10.4% | |||
Materials | 10.0% | |||
Health Care | 9.9% | |||
Consumer Staples | 8.5% | |||
Consumer Discretionary | 8.4% | |||
Communication Services | 8.0% | |||
Energy | 5.6% | |||
Real Estate | 5.0% | |||
Information Technology | 1.6% | |||
|
| |||
Total | 100.0% |
| Ten Largest Equity Holdings as of May 31, 2020 (40.4% of Net Assets) |
| Description | % of Net Assets | |||
British American Tobacco PLC (United Kingdom) | 5.0% | |||
TOTAL SA (France) | 5.0% | |||
Sanofi (France) | 4.9% | |||
GlaxoSmithKline PLC (United Kingdom) | 4.9% | |||
Siemens AG (Germany) | 4.7% | |||
Allianz SE (Germany) | 4.2% | |||
Iberdrola SA (Spain) | 3.5% | |||
Rio Tinto PLC (United Kingdom) | 3.3% | |||
Zurich Insurance Group AG (Switzerland) | 2.7% | |||
National Grid PLC (United Kingdom) | 2.2% | |||
| Country Diversification* as of May 31, 2020 |
United Kingdom | 23.9% | |||
Japan | 21.3% | |||
France | 10.8% | |||
Germany | 9.8% | |||
Hong Kong | 7.5% | |||
Spain | 6.9% | |||
Switzerland | 5.3% | |||
Australia | 4.7% | |||
Singapore | 2.2% | |||
Other | 7.6% | |||
|
| |||
Total | 100.0% |
* As a percent of total investments excluding securities lending collateral and cash equivalents.
Portfolio holdings and characteristics are subject to change. For more complete details about the Fund’s investment portfolio see page 51.
17
DBX ETF Trust
As a shareholder of one or more of the Funds, you incur two types of costs: (1) transaction costs, including brokerage commissions paid on purchases and sales of fund shares, and (2) ongoing costs, including management fees and other Fund expenses. In the most recent six-month period the Funds, except for Xtrackers Municipal Infrastructure Revenue Bond ETF, limited these expenses; had they not done so, expenses would have been higher. The expense examples below are intended to help you understand your ongoing costs (in dollars) of investing in the Funds and to compare these costs with the ongoing costs of investing in other funds.
The examples in the tables are based on an investment of $1,000 invested at the beginning of the six month period and held for the entire period (December 1, 2019 to May 31, 2020).
Actual expenses
The first line in the following tables provides information about actual account values and actual expenses. You may use the information in this line, together with the amount you invested, to estimate the expenses that you paid over the period. Simply divide your account value by $1,000 (for example, an $8,600 account value divided by $1,000 = 8.6), then multiply the result by the number in the first line under the heading “Expenses Paid During the Period” to estimate the expenses you paid on your account during this period.
Hypothetical example for comparison purposes
The second line in the following tables provides information about hypothetical account values and hypothetical expenses based on the Funds’ actual expense ratios and an assumed rate of return of 5% per year before expenses (which is not the Funds’ actual return). The hypothetical account values and expenses may not be used to estimate the actual ending account balance or expenses you paid for the period. You may use this information to compare the ongoing costs of investing in the Fund and other funds. To do so, compare this 5% hypothetical example with the 5% hypothetical examples that appear in the shareholder reports of the other funds.
Please note that the expenses shown in the tables are meant to highlight your ongoing costs only, and do not reflect any transactional costs. Therefore the second line in the table is useful in comparing ongoing costs only, and will not help you determine the relative total costs of owning different funds. In addition, if these transactional costs were included, your costs would have been higher.
| Beginning Account Value December 1, 2019 | Ending Account Value May 31, 2020 | Annualized Expense Ratio | Expenses Paid During the Period Per $1,000(1) | |||||||||||||
| Xtrackers Bloomberg Barclays US Investment Grade Corporate ESG ETF |
| |||||||||||||||
Actual | $ | 1,000.00 | $ | 945.40 | 0.23 | % | $ | 1.12 | ||||||||
Hypothetical (5% return before expenses) | $ | 1,000.00 | $ | 1,023.85 | 0.23 | % | $ | 1.16 | ||||||||
| Xtrackers J.P. Morgan ESG Emerging Markets Sovereign ETF |
| |||||||||||||||
Actual | $ | 1,000.00 | $ | 896.30 | 0.43 | % | $ | 2.04 | ||||||||
Hypothetical (5% return before expenses) | $ | 1,000.00 | $ | 1,022.85 | 0.43 | % | $ | 2.17 | ||||||||
| Xtrackers J.P. Morgan ESG USD High Yield Corporate Bond ETF |
| |||||||||||||||
Actual | $ | 1,000.00 | $ | 918.60 | 0.20 | % | $ | 0.96 | ||||||||
Hypothetical (5% return before expenses) | $ | 1,000.00 | $ | 1,024.00 | 0.20 | % | $ | 1.01 | ||||||||
| Xtrackers Municipal Infrastructure Revenue Bond ETF |
| |||||||||||||||
Actual | $ | 1,000.00 | $ | 999.00 | 0.15 | % | $ | 0.75 | ||||||||
Hypothetical (5% return before expenses) | $ | 1,000.00 | $ | 1,024.25 | 0.15 | % | $ | 0.76 | ||||||||
| Xtrackers MSCI All World ex US High Dividend Yield Equity ETF |
| |||||||||||||||
Actual | $ | 1,000.00 | $ | 837.90 | 0.20 | % | $ | 0.92 | ||||||||
Hypothetical (5% return before expenses) | $ | 1,000.00 | $ | 1,024.00 | 0.20 | % | $ | 1.01 | ||||||||
| Xtrackers MSCI EAFE High Dividend Yield Equity ETF |
| |||||||||||||||
Actual | $ | 1,000.00 | $ | 847.00 | 0.20 | % | $ | 0.92 | ||||||||
Hypothetical (5% return before expenses) | $ | 1,000.00 | $ | 1,024.00 | 0.20 | % | $ | 1.01 | ||||||||
(1) Expenses are equal to each Fund’s annualized expense ratio, multiplied by the average account value over the period, multiplied by 183 (the number of days in the most recent six-month period), then divided by 366.
18
DBX ETF Trust
Xtrackers Bloomberg Barclays US Investment Grade Corporate ESG ETF
May 31, 2020
Principal | Value | |||||||
| CORPORATE BONDS — 99.0% | ||||||||
| Basic Materials — 3.0% | ||||||||
| Chemicals — 2.2% | ||||||||
Dow Chemical Co. | $ | 20,000 | $ | 27,861 | ||||
DuPont de Nemours, Inc. | 20,000 | 20,430 | ||||||
4.205%, 11/15/23 | 15,000 | 16,286 | ||||||
5.419%, 11/15/48 | 15,000 | 19,900 | ||||||
Ecolab, Inc. | 25,000 | 27,401 | ||||||
LYB International Finance III LLC | 30,000 | 31,123 | ||||||
LyondellBasell Industries NV | 10,000 | 10,782 | ||||||
Nutrien Ltd. | 20,000 | 20,605 | ||||||
5.00%, 4/1/49 | 15,000 | 18,496 | ||||||
Sherwin-Williams Co. | 5,000 | 5,326 | ||||||
4.50%, 6/1/47 | 20,000 | 23,586 | ||||||
|
| |||||||
(Cost $212,108) | 221,796 | |||||||
|
| |||||||
| Forest Products & Paper — 0.2% | ||||||||
International Paper Co. | 5,000 | 5,326 | ||||||
4.80%, 6/15/44 | 10,000 | 11,466 | ||||||
|
| |||||||
(Cost $16,190) | 16,792 | |||||||
|
| |||||||
| Iron/Steel — 0.3% | ||||||||
Nucor Corp. | 20,000 | 22,262 | ||||||
Steel Dynamics, Inc. | 10,000 | 10,122 | ||||||
|
| |||||||
(Cost $31,341) | 32,384 | |||||||
|
| |||||||
| Mining — 0.3% | ||||||||
Newmont Corp. | 20,000 | 19,918 | ||||||
4.875%, 3/15/42 | 5,000 | 6,080 | ||||||
|
| |||||||
(Cost $24,648) | 25,998 | |||||||
|
| |||||||
| Communications — 7.5% | ||||||||
| Internet — 0.7% | ||||||||
Alphabet, Inc. | 10,000 | 11,132 | ||||||
1.998%, 8/15/26 | 25,000 | 27,082 | ||||||
eBay, Inc. | 15,000 | 15,330 | ||||||
4.00%, 7/15/42 | 15,000 | 15,664 | ||||||
|
| |||||||
(Cost $66,810) | 69,208 | |||||||
|
| |||||||
| Media — 1.9% | ||||||||
Discovery Communications LLC | 40,000 | 41,830 | ||||||
4.875%, 4/1/43 | 10,000 | 10,600 | ||||||
5.20%, 9/20/47 | 10,000 | 11,138 | ||||||
Principal | Value | |||||||
| Media (Continued) | ||||||||
TWDC Enterprises 18 Corp. | ||||||||
MTN, 2.95%, 6/15/27 (a) | $ | 15,000 | $ | 16,406 | ||||
Walt Disney Co. | 25,000 | 25,770 | ||||||
3.70%, 3/23/27 | 40,000 | 45,466 | ||||||
2.75%, 9/1/49 | 10,000 | 9,748 | ||||||
4.70%, 3/23/50 | 15,000 | 19,578 | ||||||
3.60%, 1/13/51 | 5,000 | 5,571 | ||||||
3.80%, 5/13/60 | 5,000 | 5,733 | ||||||
|
| |||||||
(Cost $184,484) | 191,840 | |||||||
|
| |||||||
| Telecommunications — 4.9% | ||||||||
Cisco Systems, Inc. | 5,000 | 5,322 | ||||||
5.50%, 1/15/40 | 10,000 | 14,518 | ||||||
Corning, Inc. | 15,000 | 18,871 | ||||||
4.375%, 11/15/57 | 5,000 | 5,560 | ||||||
Deutsche Telekom International Finance BV 8.75%, 6/15/30 | 10,000 | 15,139 | ||||||
Orange SA | 6,000 | 8,836 | ||||||
Rogers Communications, Inc. | 10,000 | 11,133 | ||||||
4.50%, 3/15/43 | 10,000 | 11,822 | ||||||
4.30%, 2/15/48 | 5,000 | 6,164 | ||||||
Telefonica Europe BV | 30,000 | 45,166 | ||||||
TELUS Corp. | 30,000 | 32,954 | ||||||
Verizon Communications, Inc. | 25,000 | 26,255 | ||||||
3.376%, 2/15/25 | 25,000 | 27,713 | ||||||
4.016%, 12/3/29 | 35,000 | 41,208 | ||||||
4.40%, 11/1/34 | 25,000 | 30,794 | ||||||
4.272%, 1/15/36 | 20,000 | 24,335 | ||||||
4.812%, 3/15/39 | 20,000 | 25,715 | ||||||
5.012%, 4/15/49 | 5,000 | 6,959 | ||||||
5.012%, 8/21/54 | 5,000 | 7,177 | ||||||
4.672%, 3/15/55 | 40,000 | 54,977 | ||||||
Vodafone Group PLC | 15,000 | 17,565 | ||||||
4.375%, 2/19/43 | 20,000 | 22,707 | ||||||
5.25%, 5/30/48 | 10,000 | 13,030 | ||||||
4.25%, 9/17/50 | 5,000 | 5,769 | ||||||
|
| |||||||
(Cost $432,386) | 479,689 | |||||||
|
| |||||||
| Consumer, Cyclical — 4.4% | ||||||||
| Apparel — 0.3% | ||||||||
NIKE, Inc. | 10,000 | 10,942 | ||||||
3.625%, 5/1/43 | 15,000 | 16,147 | ||||||
|
| |||||||
(Cost $25,412) | 27,089 | |||||||
|
| |||||||
| Auto Manufacturers — 1.1% | ||||||||
American Honda Finance Corp. | ||||||||
MTN, 2.15%, 9/10/24 | 40,000 | 40,849 | ||||||
| See Notes to Financial Statements. | 19 |
DBX ETF Trust
Schedule of Investments
Xtrackers Bloomberg Barclays US Investment Grade Corporate ESG ETF (Continued)
May 31, 2020
Principal | Value | |||||||
| Auto Manufacturers (Continued) | ||||||||
Toyota Motor Credit Corp. | ||||||||
MTN, 2.90%, 3/30/23 | $ | 25,000 | $ | 26,322 | ||||
GMTN, 3.45%, 9/20/23 | 10,000 | 10,806 | ||||||
3.65%, 1/8/29 | 25,000 | 28,301 | ||||||
|
| |||||||
(Cost $104,364) | 106,278 | |||||||
|
| |||||||
| Retail — 2.9% | ||||||||
Home Depot, Inc. | 20,000 | 22,368 | ||||||
2.70%, 4/15/30 | 50,000 | 54,726 | ||||||
3.90%, 6/15/47 | 5,000 | 6,064 | ||||||
4.50%, 12/6/48 | 5,000 | 6,638 | ||||||
3.50%, 9/15/56 | 10,000 | 11,438 | ||||||
Lowe’s Cos., Inc. | 30,000 | 33,766 | ||||||
4.375%, 9/15/45 | 14,000 | 16,501 | ||||||
4.55%, 4/5/49 | 10,000 | 12,481 | ||||||
Starbucks Corp. | 25,000 | 28,406 | ||||||
4.50%, 11/15/48 | 5,000 | 5,841 | ||||||
3.50%, 11/15/50 | 5,000 | 5,129 | ||||||
Target Corp. | 30,000 | 32,800 | ||||||
4.00%, 7/1/42 | 6,000 | 7,546 | ||||||
TJX Cos., Inc. | 8,000 | 8,466 | ||||||
Walgreens Boots Alliance, Inc. | 20,000 | 21,611 | ||||||
4.80%, 11/18/44 | 6,000 | 6,453 | ||||||
4.65%, 6/1/46 | 10,000 | 10,417 | ||||||
|
| |||||||
(Cost $273,232) | 290,651 | |||||||
|
| |||||||
| Toys/Games/Hobbies — 0.1% | ||||||||
Hasbro, Inc. | ||||||||
(Cost $6,083) | 6,000 | 6,037 | ||||||
|
| |||||||
| Consumer, Non-cyclical — 19.3% | ||||||||
| Agriculture — 0.2% | ||||||||
Archer-Daniels-Midland Co. | ||||||||
(Cost $19,018) | 15,000 | 19,709 | ||||||
|
| |||||||
| Beverages — 2.4% | ||||||||
Coca-Cola Co. | 10,000 | 10,554 | ||||||
2.875%, 10/27/25 | 5,000 | 5,572 | ||||||
3.45%, 3/25/30 | 40,000 | 46,499 | ||||||
4.20%, 3/25/50 | 10,000 | 12,986 | ||||||
Keurig Dr Pepper, Inc. | 50,000 | 52,985 | ||||||
4.597%, 5/25/28 | 10,000 | 11,940 | ||||||
PepsiCo, Inc. | 30,000 | 31,346 | ||||||
2.75%, 3/19/30 | 30,000 | 33,157 | ||||||
4.45%, 4/14/46 | 6,000 | 7,927 | ||||||
4.00%, 5/2/47 | 10,000 | 12,271 | ||||||
Principal | Value | |||||||
| Beverages (Continued) | ||||||||
3.625%, 3/19/50 | $ | 10,000 | $ | 12,084 | ||||
|
| |||||||
(Cost $227,264) | 237,321 | |||||||
|
| |||||||
| Biotechnology — 1.8% | ||||||||
Amgen, Inc. | 30,000 | 32,639 | ||||||
3.125%, 5/1/25 | 10,000 | 10,935 | ||||||
4.40%, 5/1/45 | 25,000 | 31,282 | ||||||
4.663%, 6/15/51 | 14,000 | 18,291 | ||||||
Biogen, Inc. | 10,000 | 11,480 | ||||||
5.20%, 9/15/45 | 15,000 | 20,047 | ||||||
Gilead Sciences, Inc. | 15,000 | 16,564 | ||||||
4.00%, 9/1/36 | 15,000 | 18,432 | ||||||
4.75%, 3/1/46 | 5,000 | 6,720 | ||||||
4.15%, 3/1/47 | 10,000 | 12,662 | ||||||
|
| |||||||
(Cost $161,408) | 179,052 | |||||||
|
| |||||||
| Commercial Services — 0.5% | ||||||||
IHS Markit Ltd. | 10,000 | 11,519 | ||||||
Moody’s Corp. | 10,000 | 13,271 | ||||||
PayPal Holdings, Inc. | 5,000 | 5,417 | ||||||
3.25%, 6/1/50 | 10,000 | 10,769 | ||||||
RELX Capital, Inc. | 5,000 | 5,603 | ||||||
S&P Global, Inc. | 5,000 | 6,471 | ||||||
|
| |||||||
(Cost $52,726) | 53,050 | |||||||
|
| |||||||
| Cosmetics/Personal Care — 0.9% | ||||||||
Colgate-Palmolive Co. | ||||||||
MTN, 4.00%, 8/15/45 | 5,000 | 6,428 | ||||||
Estee Lauder Cos., Inc. | 30,000 | 31,613 | ||||||
Procter & Gamble Co. | 15,000 | 15,595 | ||||||
2.85%, 8/11/27 | 11,000 | 12,441 | ||||||
3.60%, 3/25/50 | 15,000 | 18,893 | ||||||
|
| |||||||
(Cost $81,188) | 84,970 | |||||||
|
| |||||||
| Food — 1.6% | ||||||||
Campbell Soup Co. | 5,000 | 5,740 | ||||||
Conagra Brands, Inc. | 30,000 | 33,125 | ||||||
5.40%, 11/1/48 | 5,000 | 6,665 | ||||||
General Mills, Inc. | 10,000 | 11,192 | ||||||
4.70%, 4/17/48 | 10,000 | 13,235 | ||||||
Kroger Co. | 30,000 | 36,083 | ||||||
4.45%, 2/1/47 | 5,000 | 6,046 | ||||||
| See Notes to Financial Statements. | 20 |
DBX ETF Trust
Schedule of Investments
Xtrackers Bloomberg Barclays US Investment Grade Corporate ESG ETF (Continued)
May 31, 2020
Principal | Value | |||||||
| Food (Continued) | ||||||||
McCormick & Co., Inc. | $ | 5,000 | $ | 5,481 | ||||
Sysco Corp. | 5,000 | 5,248 | ||||||
3.25%, 7/15/27 | 25,000 | 25,447 | ||||||
6.60%, 4/1/50 | 10,000 | 13,011 | ||||||
|
| |||||||
(Cost $149,866) | 161,273 | |||||||
|
| |||||||
| Healthcare-Products — 0.6% | ||||||||
Abbott Laboratories | 10,000 | 10,964 | ||||||
4.75%, 4/15/43 | 15,000 | 19,949 | ||||||
4.90%, 11/30/46 | 6,000 | 8,477 | ||||||
Medtronic, Inc. | 5,000 | 5,671 | ||||||
4.625%, 3/15/45 | 6,000 | 8,103 | ||||||
|
| |||||||
(Cost $48,524) | 53,164 | |||||||
|
| |||||||
| Healthcare-Services — 1.0% | ||||||||
Aetna, Inc. | 5,000 | 5,508 | ||||||
HCA, Inc. | 15,000 | 16,240 | ||||||
4.125%, 6/15/29 | 5,000 | 5,439 | ||||||
5.50%, 6/15/47 | 7,000 | 8,411 | ||||||
5.25%, 6/15/49 | 10,000 | 11,815 | ||||||
Humana, Inc. | 30,000 | 32,352 | ||||||
Laboratory Corp. of America Holdings | 10,000 | 10,997 | ||||||
Quest Diagnostics, Inc. | 5,000 | 5,189 | ||||||
|
| |||||||
(Cost $90,032) | 95,951 | |||||||
|
| |||||||
| Household Products/Wares — 0.3% | ||||||||
Clorox Co. | 15,000 | 16,564 | ||||||
Kimberly-Clark Corp. | 15,000 | 16,104 | ||||||
|
| |||||||
(Cost $31,664) | 32,668 | |||||||
|
| |||||||
| Pharmaceuticals — 10.0% | ||||||||
AbbVie, Inc. | 20,000 | 22,093 | ||||||
3.60%, 5/14/25 | 70,000 | 77,200 | ||||||
4.25%, 11/14/28 | 50,000 | 58,318 | ||||||
4.70%, 5/14/45 | 25,000 | 29,968 | ||||||
4.25%, 11/21/49, 144A | 25,000 | 28,973 | ||||||
AstraZeneca PLC | 5,000 | 5,928 | ||||||
6.45%, 9/15/37 | 10,000 | 15,023 | ||||||
4.375%, 11/16/45 | 10,000 | 13,060 | ||||||
Becton Dickinson and Co. | 35,000 | 36,080 | ||||||
4.669%, 6/6/47 | 10,000 | 12,473 | ||||||
Bristol-Myers Squibb Co. | 30,000 | 31,230 | ||||||
3.40%, 7/26/29, 144A | 40,000 | 45,942 | ||||||
Principal | Value | |||||||
| Pharmaceuticals (Continued) | ||||||||
4.25%, 10/26/49, 144A | $ | 25,000 | $ | 33,028 | ||||
Cardinal Health, Inc. | 30,000 | 33,375 | ||||||
Cigna Corp. | 10,000 | 10,875 | ||||||
4.375%, 10/15/28 | 45,000 | 52,929 | ||||||
4.80%, 7/15/46, 144A | 15,000 | 18,799 | ||||||
4.90%, 12/15/48 | 12,000 | 15,789 | ||||||
CVS Health Corp. | 40,000 | 44,713 | ||||||
3.875%, 7/20/25 | 45,000 | 50,074 | ||||||
4.30%, 3/25/28 | 5,000 | 5,723 | ||||||
3.25%, 8/15/29 | 35,000 | 37,846 | ||||||
4.78%, 3/25/38 | 10,000 | 12,238 | ||||||
5.125%, 7/20/45 | 25,000 | 31,828 | ||||||
5.05%, 3/25/48 | 20,000 | 25,736 | ||||||
Eli Lilly and Co. | 10,000 | 10,255 | ||||||
3.95%, 3/15/49 | 5,000 | 6,340 | ||||||
2.25%, 5/15/50 | 10,000 | 9,465 | ||||||
GlaxoSmithKline Capital PLC | 15,000 | 17,302 | ||||||
GlaxoSmithKline Capital, Inc. | 10,000 | 10,624 | ||||||
Johnson & Johnson | 20,000 | 20,845 | ||||||
2.625%, 1/15/25 | 10,000 | 10,932 | ||||||
5.95%, 8/15/37 | 10,000 | 15,228 | ||||||
3.70%, 3/1/46 | 15,000 | 18,654 | ||||||
3.50%, 1/15/48 | 5,000 | 6,095 | ||||||
Merck & Co., Inc. | 25,000 | 26,746 | ||||||
4.15%, 5/18/43 | 5,000 | 6,433 | ||||||
3.70%, 2/10/45 | 10,000 | 12,206 | ||||||
4.00%, 3/7/49 | 5,000 | 6,447 | ||||||
Sanofi | 5,000 | 5,926 | ||||||
Shire Acquisitions Investments Ireland DAC 2.875%, 9/23/23 | 30,000 | 31,684 | ||||||
3.20%, 9/23/26 | 15,000 | 16,596 | ||||||
Zoetis, Inc. | 5,000 | 6,428 | ||||||
4.45%, 8/20/48 | 5,000 | 6,292 | ||||||
|
| |||||||
(Cost $934,702) | 993,739 | |||||||
|
| |||||||
| Energy — 6.7% | ||||||||
| Oil & Gas — 4.3% | ||||||||
BP Capital Markets America, Inc. | 15,000 | 15,775 | ||||||
3.017%, 1/16/27 | 35,000 | 37,720 | ||||||
4.234%, 11/6/28 | 5,000 | 5,786 | ||||||
3.00%, 2/24/50 | 10,000 | 9,833 | ||||||
BP Capital Markets PLC | 10,000 | 10,871 | ||||||
Chevron Corp. | 15,000 | 16,633 | ||||||
| See Notes to Financial Statements. | 21 |
DBX ETF Trust
Schedule of Investments
Xtrackers Bloomberg Barclays US Investment Grade Corporate ESG ETF (Continued)
May 31, 2020
Principal | Value | |||||||
| Oil & Gas (Continued) | ||||||||
2.236%, 5/11/30 | $ | 5,000 | $ | 5,260 | ||||
ConocoPhillips Co. | 7,000 | 8,361 | ||||||
5.95%, 3/15/46 | 15,000 | 21,542 | ||||||
Devon Energy Corp. | 25,000 | 26,957 | ||||||
Exxon Mobil Corp. | 40,000 | 41,860 | ||||||
2.709%, 3/6/25 | 15,000 | 16,242 | ||||||
2.44%, 8/16/29 | 3,000 | 3,169 | ||||||
2.61%, 10/15/30 | 40,000 | 42,509 | ||||||
3.567%, 3/6/45 | 5,000 | 5,542 | ||||||
3.095%, 8/16/49 | 5,000 | 5,215 | ||||||
4.327%, 3/19/50 | 10,000 | 12,542 | ||||||
Hess Corp. | 30,000 | 29,212 | ||||||
Marathon Oil Corp. | 5,000 | 4,632 | ||||||
Noble Energy, Inc. | 5,000 | 4,326 | ||||||
4.95%, 8/15/47 | 5,000 | 4,326 | ||||||
Ovintiv, Inc. | 10,000 | 7,654 | ||||||
Phillips 66 | 15,000 | 15,918 | ||||||
5.875%, 5/1/42 | 10,000 | 13,750 | ||||||
4.875%, 11/15/44 | 7,000 | 8,739 | ||||||
Suncor Energy, Inc. | 10,000 | 10,291 | ||||||
Total Capital International SA | 10,000 | 11,004 | ||||||
3.455%, 2/19/29 | 10,000 | 11,161 | ||||||
Valero Energy Corp. | 15,000 | 15,973 | ||||||
|
| |||||||
(Cost $401,397) | 422,803 | |||||||
|
| |||||||
| Oil & Gas Services — 0.6% | ||||||||
Baker Hughes a GE Co. LLC / Baker Hughes Co-Obligor, Inc. | 8,000 | 8,069 | ||||||
Halliburton Co. | 1,000 | 1,059 | ||||||
2.92%, 3/1/30 | 50,000 | 46,651 | ||||||
National Oilwell Varco, Inc. | 2,000 | 1,546 | ||||||
Schlumberger Investment SA | 5,000 | 5,298 | ||||||
|
| |||||||
(Cost $56,264) | 62,623 | |||||||
|
| |||||||
| Pipelines — 1.8% | ||||||||
Cheniere Corpus Christi Holdings LLC | 10,000 | 10,855 | ||||||
Enbridge, Inc. | 10,000 | 10,788 | ||||||
3.70%, 7/15/27 | 40,000 | 42,824 | ||||||
ONEOK, Inc. | 20,000 | 19,826 | ||||||
Principal | Value | |||||||
| Pipelines (Continued) | ||||||||
4.35%, 3/15/29 | $ | 25,000 | $ | 25,356 | ||||
5.20%, 7/15/48 | 5,000 | 5,056 | ||||||
TransCanada Pipelines Ltd. | 25,000 | 28,662 | ||||||
7.625%, 1/15/39 | 13,000 | 19,724 | ||||||
4.875%, 5/15/48 | 15,000 | 18,675 | ||||||
|
| |||||||
(Cost $167,406) | 181,766 | |||||||
|
| |||||||
| Financial — 32.3% | ||||||||
| Banks — 21.7% | ||||||||
Bank of New York Mellon Corp. | ||||||||
MTN, 2.20%, 8/16/23 | 5,000 | 5,214 | ||||||
MTN, 3.95%, 11/18/25 | 75,000 | 86,517 | ||||||
MTN, 3.30%, 8/23/29 | 10,000 | 11,057 | ||||||
Bank of Nova Scotia | 30,000 | 32,295 | ||||||
4.50%, 12/16/25 | 15,000 | 16,795 | ||||||
Canadian Imperial Bank of Commerce | 25,000 | 25,738 | ||||||
Citigroup, Inc. | 50,000 | 52,853 | ||||||
3.875%, 10/25/23 | 5,000 | 5,429 | ||||||
3.875%, 3/26/25 | 10,000 | 10,781 | ||||||
3.30%, 4/27/25 | 10,000 | 10,911 | ||||||
4.40%, 6/10/25 | 10,000 | 11,044 | ||||||
4.45%, 9/29/27 | 65,000 | 72,460 | ||||||
4.125%, 7/25/28 | 20,000 | 21,970 | ||||||
2.666%, 1/29/31 | 60,000 | 60,926 | ||||||
4.75%, 5/18/46 | 10,000 | 12,048 | ||||||
4.65%, 7/23/48 | 40,000 | 49,763 | ||||||
Cooperatieve Rabobank UA | 10,000 | 13,974 | ||||||
Credit Suisse Group Funding Guernsey Ltd. | 35,000 | 36,970 | ||||||
4.55%, 4/17/26 | 15,000 | 17,033 | ||||||
Deutsche Bank AG | 10,000 | 10,139 | ||||||
Discover Bank | 15,000 | 15,417 | ||||||
Goldman Sachs Group, Inc. | 25,000 | 25,553 | ||||||
3.625%, 1/22/23 | 55,000 | 58,810 | ||||||
4.00%, 3/3/24 | 15,000 | 16,414 | ||||||
MTN, 3.85%, 7/8/24 | 10,000 | 10,890 | ||||||
3.50%, 1/23/25 | 10,000 | 10,745 | ||||||
3.50%, 11/16/26 | 65,000 | 70,150 | ||||||
3.80%, 3/15/30 | 30,000 | 33,345 | ||||||
6.25%, 2/1/41 | 20,000 | 28,801 | ||||||
MTN, 4.80%, 7/8/44 | 5,000 | 6,207 | ||||||
5.15%, 5/22/45 | 5,000 | 6,194 | ||||||
4.75%, 10/21/45 | 30,000 | 37,324 | ||||||
HSBC Holdings PLC | 20,000 | 27,976 | ||||||
HSBC USA, Inc. | 170,000 | 184,366 | ||||||
| See Notes to Financial Statements. | 22 |
DBX ETF Trust
Schedule of Investments
Xtrackers Bloomberg Barclays US Investment Grade Corporate ESG ETF (Continued)
May 31, 2020
Principal | Value | |||||||
| Banks (Continued) | ||||||||
ING Groep NV | $ | 10,000 | $ | 11,131 | ||||
KeyCorp | ||||||||
MTN, 4.10%, 4/30/28 | 5,000 | 5,604 | ||||||
M&T Bank Corp. | 50,000 | 54,080 | ||||||
Mitsubishi UFJ Financial Group, Inc. | 15,000 | 15,983 | ||||||
3.287%, 7/25/27 | 20,000 | 21,690 | ||||||
4.05%, 9/11/28 | 75,000 | 86,580 | ||||||
3.741%, 3/7/29 | 5,000 | 5,599 | ||||||
Morgan Stanley | 50,000 | 51,918 | ||||||
Series F, 3.875%, 4/29/24 | 15,000 | 16,443 | ||||||
GMTN, 3.70%, 10/23/24 | 15,000 | 16,510 | ||||||
MTN, 2.72%, 7/22/25 | 25,000 | 26,209 | ||||||
MTN, 3.125%, 7/27/26 | 5,000 | 5,444 | ||||||
GMTN, 4.35%, 9/8/26 | 10,000 | 11,300 | ||||||
GMTN, 2.699%, 1/22/31 | 75,000 | 77,598 | ||||||
4.30%, 1/27/45 | 5,000 | 6,093 | ||||||
4.375%, 1/22/47 | 15,000 | 18,777 | ||||||
GMTN, 5.597%, 3/24/51 | 25,000 | 36,120 | ||||||
PNC Financial Services Group, Inc. | 20,000 | 21,827 | ||||||
2.20%, 11/1/24 | 55,000 | 57,724 | ||||||
3.45%, 4/23/29 | 5,000 | 5,643 | ||||||
Royal Bank of Canada | ||||||||
GMTN, 2.25%, 11/1/24 | 30,000 | 31,534 | ||||||
Santander Holdings USA, Inc. | 10,000 | 10,544 | ||||||
Santander UK PLC | 10,000 | 10,942 | ||||||
State Street Corp. | 10,000 | 10,659 | ||||||
3.152%, 3/30/31, 144A | 30,000 | 33,354 | ||||||
Sumitomo Mitsui Financial Group, Inc. | 5,000 | 5,619 | ||||||
2.632%, 7/14/26 | 30,000 | 31,681 | ||||||
3.364%, 7/12/27 | 75,000 | 80,717 | ||||||
Toronto-Dominion Bank | ||||||||
MTN, 1.90%, 12/1/22 | 50,000 | 51,627 | ||||||
GMTN, 3.50%, 7/19/23 | 10,000 | 10,932 | ||||||
Truist Bank | 25,000 | 26,247 | ||||||
3.20%, 4/1/24 | 5,000 | 5,396 | ||||||
Truist Financial Corp. | ||||||||
MTN, 3.05%, 6/20/22 | 75,000 | 78,279 | ||||||
MTN, 3.70%, 6/5/25 | 15,000 | 16,781 | ||||||
Westpac Banking Corp. | 75,000 | 77,871 | ||||||
3.35%, 3/8/27 | 15,000 | 16,793 | ||||||
|
| |||||||
(Cost $2,065,691) | 2,147,358 | |||||||
|
| |||||||
| Diversified Financial Services — 3.6% | ||||||||
Ally Financial, Inc. | 25,000 | 25,611 | ||||||
4.625%, 3/30/25 | 50,000 | 51,630 | ||||||
Principal | Value | |||||||
| Diversified Financial Services (Continued) | ||||||||
American Express Co. | $ | 25,000 | $ | 26,664 | ||||
American Express Credit Corp. | ||||||||
MTN, 3.30%, 5/3/27 | 5,000 | 5,559 | ||||||
BlackRock, Inc. | 30,000 | 34,164 | ||||||
Brookfield Finance, Inc. | 5,000 | 5,141 | ||||||
CME Group, Inc. | 5,000 | 7,419 | ||||||
GE Capital International Funding Co. Unlimited Co. | 25,000 | 25,035 | ||||||
Intercontinental Exchange, Inc. | 50,000 | 55,353 | ||||||
Mastercard, Inc. | 20,000 | 21,164 | ||||||
2.95%, 11/21/26 | 10,000 | 11,073 | ||||||
3.80%, 11/21/46 | 15,000 | 18,743 | ||||||
Visa, Inc. | 10,000 | 10,568 | ||||||
3.15%, 12/14/25 | 5,000 | 5,626 | ||||||
2.75%, 9/15/27 | 20,000 | 22,159 | ||||||
4.15%, 12/14/35 | 15,000 | 19,402 | ||||||
3.65%, 9/15/47 | 10,000 | 12,437 | ||||||
|
| |||||||
(Cost $341,951) | 357,748 | |||||||
|
| |||||||
| Insurance — 2.9% | ||||||||
Aflac, Inc. | 5,000 | 5,775 | ||||||
Allstate Corp. | 20,000 | 24,814 | ||||||
Chubb INA Holdings, Inc. | 40,000 | 44,663 | ||||||
4.35%, 11/3/45 | 5,000 | 6,440 | ||||||
Equitable Holdings, Inc. | 10,000 | 10,749 | ||||||
Lincoln National Corp. | 40,000 | 42,609 | ||||||
Manulife Financial Corp. | 10,000 | 11,424 | ||||||
Marsh & McLennan Cos., Inc. | 10,000 | 11,851 | ||||||
Progressive Corp. | 25,000 | 25,934 | ||||||
4.125%, 4/15/47 | 3,000 | 3,820 | ||||||
Prudential Financial, Inc. | ||||||||
MTN, 2.10%, 3/10/30 | 25,000 | 25,080 | ||||||
MTN, 4.60%, 5/15/44 | 10,000 | 11,650 | ||||||
3.905%, 12/7/47 | 25,000 | 26,699 | ||||||
Travelers Cos., Inc. | 30,000 | 35,241 | ||||||
|
| |||||||
(Cost $274,408) | 286,749 | |||||||
|
| |||||||
| Real Estate Investment Trusts — 4.1% | ||||||||
Alexandria Real Estate Equities, Inc. | 25,000 | 27,149 | ||||||
American Tower Corp. | 25,000 | 26,654 | ||||||
| See Notes to Financial Statements. | 23 |
DBX ETF Trust
Schedule of Investments
Xtrackers Bloomberg Barclays US Investment Grade Corporate ESG ETF (Continued)
May 31, 2020
Principal | Value | |||||||
| Real Estate Investment Trusts (Continued) | ||||||||
3.80%, 8/15/29 | $ | 7,000 | $ | 7,865 | ||||
2.90%, 1/15/30 | 20,000 | 21,097 | ||||||
AvalonBay Communities, Inc. | ||||||||
GMTN, 4.20%, 12/15/23 | 30,000 | 32,293 | ||||||
Boston Properties LP | 20,000 | 21,262 | ||||||
3.40%, 6/21/29 | 10,000 | 10,534 | ||||||
Crown Castle International Corp. | 30,000 | 33,261 | ||||||
3.80%, 2/15/28 | 6,000 | 6,700 | ||||||
Duke Realty LP | 20,000 | 21,371 | ||||||
Equinix, Inc. | 25,000 | 26,445 | ||||||
ERP Operating LP | 20,000 | 25,041 | ||||||
Healthpeak Properties, Inc. | 20,000 | 19,464 | ||||||
Kimco Realty Corp. | 20,000 | 20,666 | ||||||
4.25%, 4/1/45 | 15,000 | 13,389 | ||||||
Prologis LP | 20,000 | 23,609 | ||||||
Ventas Realty LP | 25,000 | 25,534 | ||||||
Welltower, Inc. | 15,000 | 15,384 | ||||||
Weyerhaeuser Co. 4.00%, 4/15/30 | 30,000 | 32,758 | ||||||
|
| |||||||
(Cost $401,436) | 410,476 | |||||||
|
| |||||||
| Industrial — 7.3% | ||||||||
| Building Materials — 0.8% | ||||||||
Carrier Global Corp. | 35,000 | 35,417 | ||||||
3.577%, 4/5/50, 144A | 10,000 | 8,918 | ||||||
Johnson Controls International PLC | 15,000 | 17,249 | ||||||
Owens Corning | 15,000 | 14,334 | ||||||
|
| |||||||
(Cost $74,207) | 75,918 | |||||||
|
| |||||||
| Electronics — 0.5% | ||||||||
Agilent Technologies, Inc. | 10,000 | 10,438 | ||||||
Fortive Corp. | 10,000 | 10,565 | ||||||
Roper Technologies, Inc. | 30,000 | 33,632 | ||||||
|
| |||||||
(Cost $52,653) | 54,635 | |||||||
|
| |||||||
| Environmental Control — 0.3% | ||||||||
Waste Management, Inc. | 18,000 | 19,985 | ||||||
4.10%, 3/1/45 | 5,000 | 6,002 | ||||||
|
| |||||||
(Cost $24,795) | 25,987 | |||||||
|
| |||||||
Principal | Value | |||||||
| Hand/Machine Tools — 0.3% | ||||||||
Stanley Black & Decker, Inc. | ||||||||
(Cost $25,989) | $ | 25,000 | $ | 26,144 | ||||
|
| |||||||
| Machinery-Construction & Mining — 0.5% | ||||||||
Caterpillar, Inc. | 30,000 | 31,070 | ||||||
3.803%, 8/15/42 | 5,000 | 5,948 | ||||||
3.25%, 9/19/49 | 15,000 | 16,693 | ||||||
|
| |||||||
(Cost $51,229) | 53,711 | |||||||
|
| |||||||
| Machinery-Diversified — 0.7% | ||||||||
Deere & Co. | 20,000 | 20,752 | ||||||
3.10%, 4/15/30 | 10,000 | 11,350 | ||||||
3.90%, 6/9/42 | 10,000 | 12,296 | ||||||
John Deere Capital Corp. | ||||||||
MTN, 3.45%, 3/13/25 | 10,000 | 11,203 | ||||||
Otis Worldwide Corp., 144A | 15,000 | 15,202 | ||||||
|
| |||||||
(Cost $68,103) | 70,803 | |||||||
|
| |||||||
| Miscellaneous Manufacturing — 1.3% | ||||||||
3M Co. | ||||||||
MTN, 2.25%, 3/15/23 | 20,000 | 21,029 | ||||||
MTN, 3.25%, 2/14/24 | 15,000 | 16,320 | ||||||
MTN, 4.00%, 9/14/48 | 15,000 | 18,704 | ||||||
Eaton Corp. | 15,000 | 17,791 | ||||||
Illinois Tool Works, Inc. | 10,000 | 10,968 | ||||||
Ingersoll-Rand Global Holding Co. Ltd. | 20,000 | 21,542 | ||||||
4.30%, 2/21/48 | 10,000 | 11,118 | ||||||
Parker-Hannifin Corp. | 10,000 | 10,792 | ||||||
|
| |||||||
(Cost $124,679) | 128,264 | |||||||
|
| |||||||
| Transportation — 2.9% | ||||||||
Canadian Pacific Railway Co. | 10,000 | 10,736 | ||||||
CSX Corp. | 12,000 | 14,227 | ||||||
2.40%, 2/15/30 | 30,000 | 31,179 | ||||||
3.80%, 11/1/46 | 25,000 | 28,035 | ||||||
Norfolk Southern Corp. | 35,000 | 40,725 | ||||||
Union Pacific Corp. | 25,000 | 26,059 | ||||||
3.70%, 3/1/29 | 10,000 | 11,441 | ||||||
2.40%, 2/5/30 | 35,000 | 36,666 | ||||||
3.799%, 10/1/51 | 5,000 | 5,847 | ||||||
3.839%, 3/20/60 | 25,000 | 29,041 | ||||||
United Parcel Service, Inc. | 35,000 | 43,322 | ||||||
3.75%, 11/15/47 | 10,000 | 11,476 | ||||||
|
| |||||||
(Cost $273,072) | 288,754 | |||||||
|
| |||||||
| See Notes to Financial Statements. | 24 |
DBX ETF Trust
Schedule of Investments
Xtrackers Bloomberg Barclays US Investment Grade Corporate ESG ETF (Continued)
May 31, 2020
Principal | Value | |||||||
| Technology — 10.8% | ||||||||
| Computers — 3.9% | ||||||||
Apple, Inc. | $ | 45,000 | $ | 47,669 | ||||
3.00%, 2/9/24 | 35,000 | 37,993 | ||||||
3.20%, 5/13/25 | 17,000 | 19,119 | ||||||
3.20%, 5/11/27 | 25,000 | 28,253 | ||||||
4.45%, 5/6/44 | 15,000 | 19,784 | ||||||
3.85%, 8/4/46 | 20,000 | 24,769 | ||||||
3.75%, 11/13/47 | 15,000 | 18,220 | ||||||
2.95%, 9/11/49 | 10,000 | 10,915 | ||||||
Dell International LLC / EMC Corp. | 30,000 | 32,243 | ||||||
6.02%, 6/15/26, 144A | 25,000 | 28,383 | ||||||
5.30%, 10/1/29, 144A | 35,000 | 38,084 | ||||||
Hewlett Packard Enterprise Co. | 25,000 | 26,779 | ||||||
4.90%, 10/15/25 | 10,000 | 11,232 | ||||||
6.35%, 10/15/45 | 15,000 | 17,854 | ||||||
International Business Machines Corp. | 15,000 | 17,565 | ||||||
Seagate HDD Cayman | 10,000 | 10,676 | ||||||
|
| |||||||
(Cost $363,959) | 389,538 | |||||||
|
| |||||||
| Semiconductors — 2.1% | ||||||||
Analog Devices, Inc. | 5,000 | 5,592 | ||||||
Applied Materials, Inc. | 3,000 | 3,902 | ||||||
Intel Corp. | 25,000 | 26,016 | ||||||
3.70%, 7/29/25 | 20,000 | 22,777 | ||||||
3.15%, 5/11/27 | 25,000 | 28,027 | ||||||
4.10%, 5/11/47 | 15,000 | 18,846 | ||||||
4.95%, 3/25/60 | 15,000 | 21,885 | ||||||
Lam Research Corp. | 2,000 | 2,725 | ||||||
2.875%, 6/15/50 | 5,000 | 5,100 | ||||||
Micron Technology, Inc. | 25,000 | 27,486 | ||||||
NVIDIA Corp. | 20,000 | 21,966 | ||||||
3.70%, 4/1/60 | 10,000 | 11,906 | ||||||
Texas Instruments, Inc. | 5,000 | 6,597 | ||||||
|
| |||||||
(Cost $191,528) | 202,825 | |||||||
|
| |||||||
| Software — 4.8% | ||||||||
Fiserv, Inc. | 40,000 | 46,444 | ||||||
3.50%, 7/1/29 | 10,000 | 11,063 | ||||||
Microsoft Corp. | 40,000 | 42,169 | ||||||
2.40%, 8/8/26 | 20,000 | 22,003 | ||||||
3.30%, 2/6/27 | 20,000 | 23,004 | ||||||
3.50%, 2/12/35 | 10,000 | 12,178 | ||||||
Principal | Value | |||||||
| Software (Continued) | ||||||||
3.75%, 2/12/45 | $ | 10,000 | $ | 12,537 | ||||
4.45%, 11/3/45 | 30,000 | 41,322 | ||||||
3.70%, 8/8/46 | 10,000 | 12,503 | ||||||
4.25%, 2/6/47 | 15,000 | 20,405 | ||||||
3.95%, 8/8/56 | 5,000 | 6,569 | ||||||
Oracle Corp. | 30,000 | 30,532 | ||||||
3.40%, 7/8/24 | 10,000 | 10,991 | ||||||
2.50%, 4/1/25 | 40,000 | 42,615 | ||||||
2.95%, 5/15/25 | 10,000 | 10,893 | ||||||
2.95%, 4/1/30 | 30,000 | 33,034 | ||||||
4.30%, 7/8/34 | 25,000 | 30,752 | ||||||
4.00%, 7/15/46 | 10,000 | 11,633 | ||||||
4.00%, 11/15/47 | 10,000 | 11,781 | ||||||
3.85%, 4/1/60 | 25,000 | 28,782 | ||||||
salesforce.com, Inc. | 5,000 | 5,778 | ||||||
VMware, Inc. | 10,000 | 10,967 | ||||||
|
| |||||||
(Cost $441,514) | 477,955 | |||||||
|
| |||||||
| Utilities — 7.7% | ||||||||
| Electric — 6.6% | ||||||||
CMS Energy Corp. | 30,000 | 32,061 | ||||||
Consolidated Edison Co. of New York, Inc. | ||||||||
Series 20A, 3.35%, 4/1/30 | 50,000 | 55,663 | ||||||
Series 20B, 3.95%, 4/1/50 | 45,000 | 53,030 | ||||||
4.625%, 12/1/54 | 5,000 | 6,309 | ||||||
Consumers Energy Co. | 30,000 | 35,665 | ||||||
Emera US Finance LP | 10,000 | 10,893 | ||||||
Eversource Energy | ||||||||
Series N, 3.80%, 12/1/23 | 50,000 | 54,721 | ||||||
3.45%, 1/15/50 | 25,000 | 26,100 | ||||||
FirstEnergy Corp. | ||||||||
Series C, 4.85%, 7/15/47 | 7,000 | 8,859 | ||||||
Series C, 3.40%, 3/1/50 | 25,000 | 26,343 | ||||||
Interstate Power and Light Co. | 30,000 | 32,538 | ||||||
Northern States Power Co. | 45,000 | 52,449 | ||||||
Public Service Co. of Colorado | 60,000 | 68,735 | ||||||
Public Service Electric and Gas Co. | ||||||||
MTN, 2.25%, 9/15/26 | 50,000 | 52,916 | ||||||
MTN, 3.80%, 3/1/46 | 25,000 | 29,540 | ||||||
Public Service Enterprise Group, Inc. | 25,000 | 26,023 | ||||||
San Diego Gas & Electric Co. | ||||||||
Series RRR, 3.75%, 6/1/47 | 20,000 | 22,247 | ||||||
Sempra Energy | 10,000 | 10,696 | ||||||
4.00%, 2/1/48 | 5,000 | 5,626 | ||||||
| See Notes to Financial Statements. | 25 |
DBX ETF Trust
Schedule of Investments
Xtrackers Bloomberg Barclays US Investment Grade Corporate ESG ETF (Continued)
May 31, 2020
Principal | Value | |||||||
| Electric (Continued) | ||||||||
WEC Energy Group, Inc. | $ | 30,000 | $ | 32,829 | ||||
Wisconsin Power and Light Co. | 15,000 | 16,324 | ||||||
|
| |||||||
(Cost $639,448) | 659,567 | |||||||
|
| |||||||
| Gas — 1.1% | ||||||||
Atmos Energy Corp. | 30,000 | 33,534 | ||||||
NiSource, Inc. | 15,000 | 16,762 | ||||||
4.375%, 5/15/47 | 15,000 | 17,927 | ||||||
Southern California Gas Co. | ||||||||
Series VV, 4.30%, 1/15/49 | 30,000 | 37,482 | ||||||
|
| |||||||
(Cost $98,531) | 105,705 | |||||||
|
| |||||||
TOTAL CORPORATE BONDS | ||||||||
(Cost $9,311,710) | 9,807,988 | |||||||
|
| |||||||
Number | Value | |||||||
| SECURITIES LENDING COLLATERAL — 0.1% | ||||||||
DWS Government & Agency Securities Portfolio “DWS Government Cash Institutional Shares”, 0.07% (c)(d) | 10,080 | $ | 10,080 | |||||
|
| |||||||
| CASH EQUIVALENTS — 0.8% | ||||||||
DWS Government Money Market Series “Institutional Shares”, 0.12% (c) | 83,235 | 83,235 | ||||||
|
| |||||||
TOTAL INVESTMENTS — 99.9% | $ | 9,901,303 | ||||||
Other assets and liabilities, net — 0.1% | 7,438 | |||||||
|
| |||||||
NET ASSETS — 100.0% | $ | 9,908,741 | ||||||
|
| |||||||
A summary of the Fund’s transactions with affiliated investments during the year ended May 31, 2020 is as follows:
| Value ($) at 5/31/2019 | Purchases Cost ($) | Sales Proceeds ($) | Net Realized Gain/(Loss) ($) | Net Change in Unrealized Appreciation (Depreciation) ($) | Income ($) | Capital Gain Distributions ($) | Number of Shares at 5/31/2020 | Value ($) at 5/31/2020 | ||||||||||||||||||||||||||||
CORPORATE BONDS — 0.1% |
| |||||||||||||||||||||||||||||||||||
Financial — 0.1% |
| |||||||||||||||||||||||||||||||||||
Deutsche Bank AG, 3.70%, 5/30/24 (b) |
| |||||||||||||||||||||||||||||||||||
| 19,488 | — | (10,332 | ) | 537 | 446 | 621 | — | 10,000 | 10,139 | |||||||||||||||||||||||||||
SECURITIES LENDING COLLATERAL — 0.1% |
| |||||||||||||||||||||||||||||||||||
DWS Government & Agency Securities Portfolio “DWS Government Cash Institutional Shares”, 0.07% (c)(d) |
| |||||||||||||||||||||||||||||||||||
| 34,230 | — | (24,150 | ) (e) | — | — | 378 | — | 10,080 | 10,080 | |||||||||||||||||||||||||||
CASH EQUIVALENTS — 0.8% |
| |||||||||||||||||||||||||||||||||||
DWS Government Money Market Series “Institutional Shares”, 0.12%(c) |
| |||||||||||||||||||||||||||||||||||
| — | 7,548,318 | (7,465,083) | — | — | 1,089 | — | 83,235 | 83,235 | ||||||||||||||||||||||||||||
|
|
|
|
|
|
|
|
|
|
|
|
|
|
|
|
|
| |||||||||||||||||||
| 53,718 | 7,548,318 | (7,499,565 | ) | 537 | 446 | 2,088 | — | 103,315 | 103,454 | |||||||||||||||||||||||||||
|
|
|
|
|
|
|
|
|
|
|
|
|
|
|
|
|
| |||||||||||||||||||
| (a) | All or a portion of these securities were on loan. In addition, “Other assets and liabilities, net” may include pending sales that are also on loan. The value of securities loaned at May 31, 2020 amounted to $9,844, which is 0.1% of net assets. |
| (b) | Affiliated issuer. This security is owned in proportion with its representation in the index. |
| (c) | Affiliated fund managed by DWS Investment Management Americas, Inc. The rate shown is the annualized seven-day yield at period end. |
| (d) | Represents cash collateral held in connection with securities lending. Income earned by the Fund is net of borrower rebates. |
| (e) | Represents the net increase (purchase cost) or decrease (sales proceeds) in the amount invested in cash collateral for the year ended May 31, 2020. |
| GMTN: | Global Medium Term Note |
| MTN: | Medium Term Note |
| 144A: | Security exempt from registration under Rule 144A of the Securities Act of 1933. These securities may be resold in transactions exempt from registration, normally to qualified institutional buyers. |
| See Notes to Financial Statements. | 26 |
DBX ETF Trust
Schedule of Investments
Xtrackers Bloomberg Barclays US Investment Grade Corporate ESG ETF (Continued)
May 31, 2020
Fair Value Measurements
Various inputs are used in determining the value of the Fund’s investments. These inputs are summarized in three broad levels. Level 1 includes quoted prices in active markets for identical securities. Level 2 includes other significant observable inputs (including quoted prices for similar securities, interest rates, prepayment speeds and credit risk). Level 3 includes significant unobservable inputs (including the Fund’s own assumptions in determining the fair value of investments). The level assigned to the securities valuations may not be an indication of the risk or liquidity associated with investing in those securities.
The following is a summary of the inputs used as of May 31, 2020 in valuing the Fund’s investments. For information on the Fund’s policy regarding the valuation of investments, please refer to the Security Valuation section of Note 2 in the accompanying Notes to Financial Statements.
Assets | Level 1 | Level 2 | Level 3 | Total | ||||||||||||
Corporate Bonds (f) | $ | — | $ | 9,807,988 | $ | — | $ | 9,807,988 | ||||||||
Short-Term Investments (f) | 93,315 | — | — | 93,315 | ||||||||||||
|
|
|
|
|
|
|
| |||||||||
TOTAL | $ | 93,315 | $ | 9,807,988 | $ | — | $ | 9,901,303 | ||||||||
|
|
|
|
|
|
|
| |||||||||
| (f) | See Schedule of Investments for additional detailed categorizations. |
| See Notes to Financial Statements. | 27 |
DBX ETF Trust
Schedule of Investments
Xtrackers J.P. Morgan ESG Emerging Markets Sovereign ETF
May 31, 2020
Principal | Value | |||||||
| SOVEREIGN BONDS — 98.2% |
| |||||||
| Argentina — 1.9% |
| |||||||
Argentine Republic Government International Bond | ||||||||
(Cost $217,000) | $ | 700,000 | $ | 271,040 | ||||
|
| |||||||
| Bahrain — 1.5% | ||||||||
Bahrain Government International Bond | ||||||||
(Cost $204,465) | 200,000 | 213,040 | ||||||
|
| |||||||
| Brazil — 3.2% | ||||||||
Brazilian Government International Bond | 200,000 | 210,537 | ||||||
8.25%, 1/20/34 | 50,000 | 63,735 | ||||||
7.125%, 1/20/37 | 55,000 | 64,655 | ||||||
5.625%, 1/7/41 | 125,000 | 127,969 | ||||||
|
| |||||||
(Cost $451,835) | 466,896 | |||||||
|
| |||||||
| Chile — 1.5% | ||||||||
Chile Government International Bond | ||||||||
(Cost $197,243) | 200,000 | 218,471 | ||||||
|
| |||||||
| Colombia — 3.9% | ||||||||
Colombia Government International Bond | 200,000 | 212,414 | ||||||
6.125%, 1/18/41 | 100,000 | 125,500 | ||||||
5.00%, 6/15/45 | 200,000 | 227,661 | ||||||
|
| |||||||
(Cost $526,813) | 565,575 | |||||||
|
| |||||||
| Costa Rica — 1.1% | ||||||||
Costa Rica Government International Bond 7.158%, 3/12/45, REGS | ||||||||
(Cost $156,024) | 200,000 | 158,502 | ||||||
|
| |||||||
| Croatia — 1.5% | ||||||||
Croatia Government International Bond 5.50%, 4/4/23, 144A | ||||||||
(Cost $212,951) | 200,000 | 219,607 | ||||||
|
| |||||||
| Dominican Republic — 2.6% | ||||||||
Dominican Republic International Bond 7.45%, 4/30/44, REGS | ||||||||
(Cost $376,405) | 375,000 | 370,687 | ||||||
|
| |||||||
| Ecuador — 1.2% | ||||||||
Ecuador Government International Bond 8.875%, 10/23/27, 144A* (a) | 275,000 | 102,094 | ||||||
7.775%, 1/23/28, REGS* (a) | 200,000 | 72,000 | ||||||
|
| |||||||
(Cost $348,487) | 174,094 | |||||||
|
| |||||||
| Egypt — 2.8% | ||||||||
Egypt Government International Bond 7.600%, 3/1/29, 144A | 200,000 | 203,279 | ||||||
7.600%, 3/1/29, REGS | 200,000 | 203,280 | ||||||
|
| |||||||
(Cost $403,078) | 406,559 | |||||||
|
| |||||||
| El Salvador — 0.9% | ||||||||
El Salvador Government International Bond 7.65%, 6/15/35, 144A | 30,000 | 24,504 | ||||||
Principal | Value | |||||||
| El Salvador (Continued) | ||||||||
7.65%, 6/15/35, REGS | $ | 135,000 | $ | 110,269 | ||||
|
| |||||||
(Cost $144,261) | 134,773 | |||||||
|
| |||||||
| Ghana — 1.5% | ||||||||
Ghana Government International Bond | ||||||||
(Cost $208,842) | 250,000 | 221,050 | ||||||
|
| |||||||
| Guatemala — 1.5% | ||||||||
Guatemala Government Bond | ||||||||
(Cost $209,957) | 200,000 | 211,212 | ||||||
|
| |||||||
| Hungary — 2.5% | ||||||||
Hungary Government International Bond | 100,000 | 109,200 | ||||||
5.375%, 3/25/24 | 76,000 | 86,061 | ||||||
7.625%, 3/29/41 | 100,000 | 169,204 | ||||||
|
| |||||||
(Cost $346,756) | 364,465 | |||||||
|
| |||||||
| Indonesia — 3.5% | ||||||||
Indonesia Government International Bond | 250,000 | 276,941 | ||||||
8.50%, 10/12/35, 144A | 150,000 | 231,133 | ||||||
|
| |||||||
(Cost $507,797) | 508,074 | |||||||
|
| |||||||
| Jamaica — 1.5% | ||||||||
Jamaica Government International Bond | ||||||||
(Cost $215,788) | 200,000 | 223,002 | ||||||
|
| |||||||
| Kazakhstan — 1.6% | ||||||||
Kazakhstan Government International Bond | ||||||||
(Cost $212,931) | 200,000 | 232,750 | ||||||
|
| |||||||
| Kenya — 1.3% | ||||||||
Kenya Government International Bond | ||||||||
(Cost $192,086) | 200,000 | 193,158 | ||||||
|
| |||||||
| Kuwait — 1.5% | ||||||||
Kuwait International Government Bond | ||||||||
(Cost $220,057) | 200,000 | 221,102 | ||||||
|
| |||||||
| Lebanon — 0.0% | ||||||||
Lebanon Government International Bond | ||||||||
(Cost $22,895) | 25,000 | 4,250 | ||||||
|
| |||||||
| Malaysia — 1.9% | ||||||||
Malaysia Sovereign Sukuk Bhd | ||||||||
(Cost $266,439) | 250,000 | 267,550 | ||||||
|
| |||||||
| Mexico — 2.7% | ||||||||
Mexico Government International Bond | 200,000 | 216,577 | ||||||
Series A, MTN, 6.75%, 9/27/34 | 10,000 | 12,861 | ||||||
6.05%, 1/11/40 | 26,000 | 31,641 | ||||||
MTN, 4.75%, 3/8/44 | 90,000 | 94,347 | ||||||
| See Notes to Financial Statements. | 28 |
DBX ETF Trust
Schedule of Investments
Xtrackers J.P. Morgan ESG Emerging Markets Sovereign ETF (Continued)
May 31, 2020
Principal | Value | |||||||
| Mexico (Continued) | ||||||||
5.55%, 1/21/45 | $ | 25,000 | $ | 29,156 | ||||
GMTN, 5.75%, 10/12/2110 | 10,000 | 10,868 | ||||||
|
| |||||||
(Cost $379,959) | 395,450 | |||||||
|
| |||||||
| Mongolia — 1.3% | ||||||||
Mongolia Government International Bond | ||||||||
(Cost $178,884) | 200,000 | 191,006 | ||||||
|
| |||||||
| Oman — 3.6% | ||||||||
Oman Government International Bond | 200,000 | 195,360 | ||||||
5.625%, 1/17/28, REGS | 200,000 | 167,515 | ||||||
6.75%, 1/17/48, REGS | 200,000 | 151,701 | ||||||
|
| |||||||
(Cost $512,883) | 514,576 | |||||||
|
| |||||||
| Pakistan — 1.3% | ||||||||
Pakistan Government International Bond | ||||||||
(Cost $180,098) | 200,000 | 187,408 | ||||||
|
| |||||||
| Panama — 5.3% | ||||||||
Panama Bonos del Tesoro | ||||||||
Series A, 5.625%, 7/25/22 | 70,000 | 74,446 | ||||||
Panama Government International Bond 4.00%, 9/22/24 | 200,000 | 215,802 | ||||||
6.70%, 1/26/36 | 125,000 | 174,444 | ||||||
4.50%, 4/1/56 | 250,000 | 296,628 | ||||||
|
| |||||||
(Cost $731,183) | 761,320 | |||||||
|
| |||||||
| Paraguay — 1.5% | ||||||||
Paraguay Government International Bond 5.00%, 4/15/26, REGS | ||||||||
(Cost $215,874) | 200,000 | 217,314 | ||||||
|
| |||||||
| Peru — 3.2% | ||||||||
Peruvian Government International Bond 4.125%, 8/25/27 | 220,000 | 250,760 | ||||||
6.55%, 3/14/37 | 40,000 | 60,622 | ||||||
5.625%, 11/18/50 | 100,000 | 155,880 | ||||||
|
| |||||||
(Cost $448,183) | 467,262 | |||||||
|
| |||||||
| Philippines — 3.9% | ||||||||
Philippine Government International Bond 9.50%, 2/2/30 | 200,000 | 325,499 | ||||||
3.70%, 2/2/42 | 200,000 | 230,327 | ||||||
|
| |||||||
(Cost $544,551) | 555,826 | |||||||
|
| |||||||
| Poland — 2.6% | ||||||||
Republic of Poland Government International Bond | 250,000 | 263,475 | ||||||
3.25%, 4/6/26 | 100,000 | 110,921 | ||||||
|
| |||||||
(Cost $366,073) | 374,396 | |||||||
|
| |||||||
| Qatar — 4.6% | ||||||||
Qatar Government International Bond 9.75%, 6/15/30, 144A | 220,000 | 360,989 | ||||||
6.40%, 1/20/40, 144A | 100,000 | 148,098 | ||||||
6.40%, 1/20/40, REGS | 100,000 | 148,099 | ||||||
|
| |||||||
(Cost $621,622) | 657,186 | |||||||
|
| |||||||
Principal | Value | |||||||
| Romania — 2.6% | ||||||||
Romanian Government International Bond 6.75%, 2/7/22, REGS | $ | 200,000 | $ | 214,070 | ||||
4.375%, 8/22/23, 144A | 10,000 | 10,506 | ||||||
6.125%, 1/22/44, 144A | 70,000 | 88,144 | ||||||
5.125%, 6/15/48, 144A | 50,000 | 56,847 | ||||||
|
| |||||||
(Cost $362,387) | 369,567 | |||||||
|
| |||||||
| Russia — 3.1% | ||||||||
Russian Foreign Bond — Eurobond | 120,000 | 209,476 | ||||||
4.375%, 3/21/29, 144A | 200,000 | 231,467 | ||||||
|
| |||||||
(Cost $411,906) | 440,943 | |||||||
|
| |||||||
| Saudi Arabia — 3.4% | ||||||||
Saudi Government International Bond 3.25%, 10/26/26, REGS | 250,000 | 264,602 | ||||||
4.50%, 10/26/46, REGS | 200,000 | 223,883 | ||||||
|
| |||||||
(Cost $473,067) | 488,485 | |||||||
|
| |||||||
| Senegal — 1.4% | ||||||||
Senegal Government International Bond 6.25%, 7/30/24, REGS | ||||||||
(Cost $201,028) | 200,000 | 200,363 | ||||||
|
| |||||||
| Slovak Republic — 1.5% | ||||||||
Slovakia Government International Bond 4.375%, 5/21/22, REGS | ||||||||
(Cost $211,755) | 200,000 | 212,148 | ||||||
|
| |||||||
| South Africa — 2.4% | ||||||||
Republic of South Africa Government International Bond | 200,000 | 180,200 | ||||||
5.65%, 9/27/47 | 200,000 | 163,500 | ||||||
|
| |||||||
(Cost $370,392) | 343,700 | |||||||
|
| |||||||
| Sri Lanka — 1.6% | ||||||||
Sri Lanka Government International Bond 7.85%, 3/14/29, 144A | 200,000 | 111,995 | ||||||
7.55%, 3/28/30, REGS | 200,000 | 111,995 | ||||||
|
| |||||||
(Cost $310,178) | 223,990 | |||||||
|
| |||||||
| Turkey — 2.9% | ||||||||
Turkey Government International Bond 7.375%, 2/5/25 | 55,000 | 57,002 | ||||||
4.875%, 10/9/26 | 200,000 | 181,600 | ||||||
11.875%, 1/15/30 | 140,000 | 185,135 | ||||||
|
| |||||||
(Cost $444,470) | 423,737 | |||||||
|
| |||||||
| Ukraine — 2.1% | ||||||||
Ukraine Government International Bond 7.75%, 9/1/25, 144A | 100,000 | 100,981 | ||||||
7.75%, 9/1/26, 144A | 100,000 | 100,106 | ||||||
7.75%, 9/1/27, REGS | 100,000 | 99,205 | ||||||
|
| |||||||
(Cost $305,023) | 300,292 | |||||||
|
| |||||||
| United Arab Emirates — 2.9% | ||||||||
Abu Dhabi Government International Bond 3.125%, 10/11/27, REGS | 200,000 | 215,625 | ||||||
| See Notes to Financial Statements. | 29 |
DBX ETF Trust
Schedule of Investments
Xtrackers J.P. Morgan ESG Emerging Markets Sovereign ETF (Continued)
May 31, 2020
Principal | Value | |||||||
| United Arab Emirates (Continued) | ||||||||
2.50%, 9/30/29, REGS | $ | 200,000 | $ | 206,246 | ||||
|
| |||||||
(Cost $419,182) | 421,871 | |||||||
|
| |||||||
| Uruguay — 5.4% | ||||||||
Uruguay Government International Bond 4.375%, 10/27/27 | 75,000 | 84,174 | ||||||
4.375%, 1/23/31 | 100,000 | 114,282 | ||||||
7.625%, 3/21/36 | 30,000 | 44,342 | ||||||
5.10%, 6/18/50 | 390,000 | 479,429 | ||||||
4.975%, 4/20/55 | 50,000 | 61,028 | ||||||
|
| |||||||
(Cost $735,984) | 783,255 | |||||||
|
| |||||||
TOTAL SOVEREIGN BONDS | 14,175,952 | |||||||
|
| |||||||
Number | Value | |||||||
| CASH EQUIVALENTS — 0.9% | ||||||||
DWS Government Money Market Series “Institutional Shares”, 0.12% (b) | ||||||||
(Cost $127,325) | 127,325 | $ | 127,325 | |||||
|
| |||||||
TOTAL INVESTMENTS — 99.1% (Cost $14,194,117) | $ | 14,303,277 | ||||||
Other assets and liabilities, net — 0.9% | 134,284 | |||||||
|
| |||||||
NET ASSETS — 100.0% | $ | 14,437,561 | ||||||
|
| |||||||
A summary of the Fund’s transactions with affiliated investments during the year ended May 31, 2020 is as follows:
| Value ($) at 5/31/2019 | Purchases Cost ($) | Sales Proceeds ($) | Net Realized Gain/(Loss) ($) | Net Change in Unrealized Appreciation (Depreciation) ($) | Income ($) | Capital Gain Distributions ($) | Number of Shares at 5/31/2020 | Value ($) at 5/31/2020 | ||||||||||||||||||||||||||||
SECURITIES LENDING COLLATERAL — 0.0% |
| |||||||||||||||||||||||||||||||||||
DWS Government & Agency Securities Portfolio “DWS Government Cash Institutional Shares”, 0.07% (b)(c) |
| |||||||||||||||||||||||||||||||||||
| — | 0 | (d) | — | — | — | 86 | — | — | — | |||||||||||||||||||||||||||
CASH EQUIVALENTS — 0.9% |
| |||||||||||||||||||||||||||||||||||
DWS Government Money Market Series “Institutional Shares”, 0.12% (b) |
| |||||||||||||||||||||||||||||||||||
| — | 13,577,596 | (13,450,271 | ) | — | — | 2,066 | — | 127,325 | 127,325 | |||||||||||||||||||||||||||
|
|
|
|
|
|
|
|
|
|
|
|
|
|
|
|
|
| |||||||||||||||||||
| — | 13,577,596 | (13,450,271 | ) | — | — | 2,152 | — | 127,325 | 127,325 | |||||||||||||||||||||||||||
|
|
|
|
|
|
|
|
|
|
|
|
|
|
|
|
|
| |||||||||||||||||||
| * | Non-income producing security. |
| (a) | Defaulted security or security for which income has been deemed uncollectible. |
| (b) | Affiliated fund managed by DWS Investment Management Americas, Inc. The rate shown is the annualized seven-day yield at period end. |
| (c) | Represents cash collateral held in connection with securities lending. Income earned by the Fund is net of borrower rebates. |
| (d) | Represents the net increase (purchase cost) or decrease (sales proceeds) in the amount invested in cash collateral for the period ended May 31, 2020. |
| GMTN: | Global Medium Term Note |
| MTN: | Medium Term Note |
| REGS: | Securities sold under Regulation S may not be offered, sold or delivered within the United States or to, or for the account or benefit of, U.S. persons, except pursuant to an exemption from, or in a transaction not subject to, the registration requirements of the Securities Act of 1933. |
| 144A: | Security exempt from registration under Rule 144A of the Securities Act of 1933. These securities may be resold in transactions exempt from registration, normally to qualified institutional buyers. |
Fair Value Measurements
Various inputs are used in determining the value of the Fund’s investments. These inputs are summarized in three broad levels. Level 1 includes quoted prices in active markets for identical securities. Level 2 includes other significant observable inputs (including quoted prices for similar securities, interest rates, prepayment speeds and credit risk). Level 3 includes significant unobservable inputs (including the Fund’s own assumptions in determining the fair value of investments). The level assigned to the securities valuations may not be an indication of the risk or liquidity associated with investing in those securities.
The following is a summary of the inputs used as of May 31, 2020 in valuing the Fund’s investments. For information on the Fund’s policy regarding the valuation of investments, please refer to the Security Valuation section of Note 2 in the accompanying Notes to Financial Statements.
Assets | Level 1 | Level 2 | Level 3 | Total | ||||||||||||
Sovereign Bonds (e) | $ | — | $ | 14,175,952 | $ | — | $ | 14,175,952 | ||||||||
Short-Term Investments | 127,325 | — | — | 127,325 | ||||||||||||
|
|
|
|
|
|
|
| |||||||||
TOTAL | $ | 127,325 | $ | 14,175,952 | $ | — | $ | 14,303,277 | ||||||||
|
|
|
|
|
|
|
| |||||||||
| (e) | See Schedule of Investments for additional detailed categorizations. |
| See Notes to Financial Statements. | 30 |
DBX ETF Trust
Schedule of Investments
Xtrackers J.P. Morgan ESG USD High Yield Corporate Bond ETF
May 31, 2020
Principal | Value | |||||||
| CORPORATE BONDS — 98.2% |
| |||||||
| Basic Materials — 5.7% |
| |||||||
| Chemicals — 2.8% | ||||||||
CF Industries, Inc. | ||||||||
5.375%, 3/15/44 | $ | 50,000 | $ | 53,538 | ||||
Ingevity Corp., 144A | ||||||||
4.50%, 2/1/26 | 50,000 | 48,553 | ||||||
Kraton Polymers LLC / Kraton Polymers Capital Corp., 144A | ||||||||
7.00%, 4/15/25 | 50,000 | 50,176 | ||||||
NOVA Chemicals Corp., 144A | ||||||||
4.875%, 6/1/24 | 75,000 | 69,195 | ||||||
OCI NV, 144A | ||||||||
6.625%, 4/15/23 | 200,000 | 205,000 | ||||||
Trinseo Materials Operating SCA / Trinseo Materials Finance, Inc., 144A | ||||||||
5.375%, 9/1/25 | 50,000 | 47,906 | ||||||
Valvoline, Inc., 144A | ||||||||
4.25%, 2/15/30 | 50,000 | 49,992 | ||||||
|
| |||||||
(Cost $509,585) | 524,360 | |||||||
|
| |||||||
| Forest Products & Paper — 0.3% | ||||||||
Mercer International, Inc. | ||||||||
7.375%, 1/15/25 | ||||||||
(Cost $48,328) | 50,000 | 49,182 | ||||||
|
| |||||||
| Iron/Steel — 0.2% | ||||||||
Cleveland-Cliffs, Inc. | ||||||||
5.875%, 6/1/27 | ||||||||
(Cost $32,387) | 50,000 | 34,866 | ||||||
|
| |||||||
| Mining — 2.4% | ||||||||
Compass Minerals International, Inc., 144A | ||||||||
6.75%, 12/1/27 | 100,000 | 105,378 | ||||||
FMG Resources August 2006 Pty Ltd., 144A | ||||||||
5.125%, 5/15/24 | 100,000 | 103,510 | ||||||
Freeport-McMoRan, Inc. | ||||||||
5.40%, 11/14/34 | 100,000 | 99,291 | ||||||
Hudbay Minerals, Inc., 144A | ||||||||
7.25%, 1/15/23 | 50,000 | 47,468 | ||||||
New Gold, Inc., 144A | ||||||||
6.25%, 11/15/22 | 50,000 | 50,320 | ||||||
Novelis Corp., 144A | ||||||||
5.875%, 9/30/26 | 50,000 | 51,355 | ||||||
|
| |||||||
(Cost $441,351) | 457,322 | |||||||
|
| |||||||
| Communications — 16.9% |
| |||||||
| Advertising — 0.6% | ||||||||
Lamar Media Corp. | ||||||||
5.75%, 2/1/26 | 50,000 | 52,178 | ||||||
Outfront Media Capital LLC / Outfront Media Capital Corp., 144A | ||||||||
5.00%, 8/15/27 | 50,000 | 48,789 | ||||||
|
| |||||||
(Cost $99,932) | 100,967 | |||||||
|
| |||||||
| Internet — 0.6% | ||||||||
NortonLifeLock, Inc., 144A | ||||||||
5.00%, 4/15/25 | ||||||||
(Cost $101,845) | 100,000 | 102,500 | ||||||
|
| |||||||
Principal | Value | |||||||
| Media — 7.5% | ||||||||
CCO Holdings LLC / CCO Holdings Capital Corp. | ||||||||
5.875%, 4/1/24, 144A | $ | 100,000 | $ | 103,385 | ||||
4.75%, 3/1/30, 144A | 100,000 | 104,731 | ||||||
Clear Channel Worldwide Holdings, Inc. | ||||||||
9.25%, 2/15/24 | 100,000 | 92,047 | ||||||
CSC Holdings LLC, 144A | ||||||||
5.75%, 1/15/30 | 200,000 | 210,313 | ||||||
DISH DBS Corp. | ||||||||
5.00%, 3/15/23 | 150,000 | 149,861 | ||||||
Houghton Mifflin Harcourt Publishers, Inc., 144A | ||||||||
9.00%, 2/15/25 | 50,000 | 44,734 | ||||||
iHeartCommunications, Inc., 144A | ||||||||
4.75%, 1/15/28 | 50,000 | 48,090 | ||||||
Nexstar Broadcasting, Inc., 144A | ||||||||
5.625%, 7/15/27 | 50,000 | 51,366 | ||||||
Quebecor Media, Inc. | ||||||||
5.75%, 1/15/23 | 100,000 | 105,585 | ||||||
Sinclair Television Group, Inc., 144A | ||||||||
5.625%, 8/1/24 | 50,000 | 49,630 | ||||||
Sirius XM Radio, Inc., 144A | ||||||||
4.625%, 7/15/24 | 100,000 | 102,651 | ||||||
TEGNA, Inc., 144A | ||||||||
4.625%, 3/15/28 | 100,000 | 95,235 | ||||||
Univision Communications, Inc., 144A | ||||||||
5.125%, 2/15/25 | 50,000 | 47,957 | ||||||
UPC Holding BV, 144A | ||||||||
5.50%, 1/15/28 | 200,000 | 193,537 | ||||||
|
| |||||||
(Cost $1,367,793) | 1,399,122 | |||||||
|
| |||||||
| Telecommunications — 8.2% | ||||||||
Altice France SA, 144A | ||||||||
7.375%, 5/1/26 | 200,000 | 210,963 | ||||||
CenturyLink, Inc. | ||||||||
Series W, 6.75%, 12/1/23 | 150,000 | 163,235 | ||||||
CommScope, Inc. | ||||||||
6.00%, 3/1/26, 144A | 50,000 | 52,695 | ||||||
8.25%, 3/1/27, 144A | 100,000 | 104,481 | ||||||
Connect Finco SARL / Connect US Finco LLC, 144A | ||||||||
6.75%, 10/1/26 | 50,000 | 48,578 | ||||||
Level 3 Financing, Inc. | ||||||||
5.375%, 5/1/25 | 150,000 | 154,487 | ||||||
Sprint Capital Corp. | ||||||||
8.75%, 3/15/32 | 100,000 | 144,451 | ||||||
Sprint Communications, Inc. | ||||||||
6.00%, 11/15/22 | 100,000 | 106,473 | ||||||
Sprint Corp. | ||||||||
7.625%, 2/15/25 | 100,000 | 117,043 | ||||||
Telecom Italia Capital SA | ||||||||
7.721%, 6/4/38 | 50,000 | 60,853 | ||||||
T-Mobile USA, Inc. | ||||||||
6.375%, 3/1/25 | 200,000 | 206,783 | ||||||
ViaSat, Inc., 144A | ||||||||
5.625%, 9/15/25 | 50,000 | 48,870 | ||||||
| See Notes to Financial Statements. | 31 |
DBX ETF Trust
Schedule of Investments
Xtrackers J.P. Morgan ESG USD High Yield Corporate Bond ETF (Continued)
May 31, 2020
Principal | Value | |||||||
| Telecommunications (Continued) | ||||||||
Vodafone Group PLC | ||||||||
7.00%, 4/4/79 | $ | 50,000 | $ | 58,021 | ||||
Zayo Group Holdings, Inc., 144A | ||||||||
6.125%, 3/1/28 | 50,000 | 49,492 | ||||||
|
| |||||||
(Cost $1,499,317) | 1,526,425 | |||||||
|
| |||||||
| Consumer, Cyclical — 15.1% |
| |||||||
| Apparel — 0.5% | ||||||||
Hanesbrands, Inc., 144A | ||||||||
4.625%, 5/15/24 | ||||||||
(Cost $100,146) | 100,000 | 102,011 | ||||||
|
| |||||||
| Auto Manufacturers — 2.1% | ||||||||
Ford Motor Co. | ||||||||
7.45%, 7/16/31 | 150,000 | 149,437 | ||||||
Ford Motor Credit Co. LLC | ||||||||
2.979%, 8/3/22 | 200,000 | 192,000 | ||||||
Tesla, Inc., 144A | ||||||||
5.30%, 8/15/25 | 50,000 | 50,156 | ||||||
|
| |||||||
(Cost $368,504) | 391,593 | |||||||
|
| |||||||
| Auto Parts & Equipment — 2.2% | ||||||||
American Axle & Manufacturing, Inc. | ||||||||
6.25%, 4/1/25 | 100,000 | 94,510 | ||||||
Cooper-Standard Automotive, Inc., 144A | ||||||||
5.625%, 11/15/26 | 50,000 | 32,178 | ||||||
Dana Financing Luxembourg SARL, 144A | ||||||||
5.75%, 4/15/25 | 50,000 | 49,682 | ||||||
Goodyear Tire & Rubber Co. | ||||||||
5.00%, 5/31/26 | 50,000 | 46,362 | ||||||
Panther BF Aggregator 2 LP / Panther Finance Co., Inc., 144A | ||||||||
8.50%, 5/15/27 | 50,000 | 49,116 | ||||||
ZF North America Capital, Inc., 144A | ||||||||
4.75%, 4/29/25 | 150,000 | 146,813 | ||||||
|
| |||||||
(Cost $398,242) | 418,661 | |||||||
|
| |||||||
| Distribution/Wholesale — 1.3% | ||||||||
American Builders & Contractors Supply Co., Inc., 144A | ||||||||
4.00%, 1/15/28 | 50,000 | 50,366 | ||||||
Anixter, Inc. | ||||||||
5.125%, 10/1/21 | 50,000 | 51,306 | ||||||
HD Supply, Inc., 144A | ||||||||
5.375%, 10/15/26 | 50,000 | 51,645 | ||||||
Performance Food Group, Inc., 144A | ||||||||
5.50%, 10/15/27 | 50,000 | 49,164 | ||||||
Wolverine Escrow LLC, 144A | ||||||||
9.00%, 11/15/26 | 50,000 | 33,350 | ||||||
|
| |||||||
(Cost $232,678) | 235,831 | |||||||
|
| |||||||
| Entertainment — 1.7% | ||||||||
Caesars Resort Collection LLC / CRC Finco, Inc., 144A | ||||||||
5.25%, 10/15/25 | 50,000 | 44,656 | ||||||
Cedar Fair LP / Canada’s Wonderland Co. / Magnum Management Corp. / Millennium Op | ||||||||
5.375%, 4/15/27 | 50,000 | 47,652 | ||||||
Principal | Value | |||||||
| Entertainment (Continued) | ||||||||
Cinemark USA, Inc. | ||||||||
4.875%, 6/1/23 | $ | 50,000 | $ | 43,656 | ||||
Scientific Games International, Inc., 144A | ||||||||
8.25%, 3/15/26 | 100,000 | 92,016 | ||||||
Speedway Motorsports LLC / Speedway Funding II, Inc., 144A | ||||||||
4.875%, 11/1/27 | 50,000 | 42,156 | ||||||
Stars Group Holdings BV / Stars Group US Co.-Borrower LLC, 144A | ||||||||
7.00%, 7/15/26 | 50,000 | 53,116 | ||||||
|
| |||||||
(Cost $301,503) | 323,252 | |||||||
|
| |||||||
| Home Builders — 1.9% | ||||||||
Brookfield Residential Properties, Inc. / Brookfield Residential US Corp., 144A | ||||||||
6.25%, 9/15/27 | 50,000 | 47,741 | ||||||
KB Home | ||||||||
7.625%, 5/15/23 | 50,000 | 54,755 | ||||||
Lennar Corp. | ||||||||
4.50%, 4/30/24 | 100,000 | 104,760 | ||||||
Taylor Morrison Communities, Inc., 144A | ||||||||
5.75%, 1/15/28 | 100,000 | 98,856 | ||||||
Toll Brothers Finance Corp. | ||||||||
4.875%, 3/15/27 | 50,000 | 52,803 | ||||||
|
| |||||||
(Cost $344,711) | 358,915 | |||||||
|
| |||||||
| Leisure Time — 0.2% | ||||||||
NCL Corp. Ltd., 144A | ||||||||
3.625%, 12/15/24 | ||||||||
(Cost $29,508) | 50,000 | 30,156 | ||||||
|
| |||||||
| Lodging — 1.6% | ||||||||
Hilton Domestic Operating Co., Inc., 144A | ||||||||
5.75%, 5/1/28 | 150,000 | 155,625 | ||||||
Station Casinos LLC, 144A | ||||||||
4.50%, 2/15/28 | 100,000 | 88,437 | ||||||
Wyndham Destinations, Inc. | ||||||||
5.75%, 4/1/27 | 50,000 | 45,385 | ||||||
|
| |||||||
(Cost $276,704) | 289,447 | |||||||
|
| |||||||
| Retail — 3.6% | ||||||||
1011778 BC ULC / New Red Finance, Inc., 144A | ||||||||
5.00%, 10/15/25 | 50,000 | 50,665 | ||||||
Beacon Roofing Supply, Inc., 144A | ||||||||
4.875%, 11/1/25 | 50,000 | 47,365 | ||||||
Bed Bath & Beyond, Inc. | ||||||||
5.165%, 8/1/44 | 50,000 | 25,688 | ||||||
Gap, Inc., 144A | ||||||||
8.875%, 5/15/27 | 50,000 | 52,625 | ||||||
Golden Nugget, Inc., 144A | ||||||||
6.75%, 10/15/24 | 50,000 | 40,531 | ||||||
L Brands, Inc. | ||||||||
6.875%, 11/1/35 | 50,000 | 41,611 | ||||||
Macy’s Retail Holdings, Inc. | ||||||||
3.625%, 6/1/24 | 100,000 | 69,500 | ||||||
Penske Automotive Group, Inc. | ||||||||
5.75%, 10/1/22 | 50,000 | 50,281 | ||||||
| See Notes to Financial Statements. | 32 |
DBX ETF Trust
Schedule of Investments
Xtrackers J.P. Morgan ESG USD High Yield Corporate Bond ETF (Continued)
May 31, 2020
Principal | Value | |||||||
| Retail (Continued) | ||||||||
PetSmart, Inc., 144A | ||||||||
7.125%, 3/15/23 | $ | 100,000 | $ | 97,312 | ||||
QVC, Inc. | ||||||||
4.45%, 2/15/25 | 50,000 | 47,875 | ||||||
Staples, Inc., 144A | ||||||||
7.50%, 4/15/26 | 100,000 | 87,589 | ||||||
Yum! Brands, Inc., 144A | ||||||||
4.75%, 1/15/30 | 50,000 | 52,053 | ||||||
|
| |||||||
(Cost $641,773) | 663,095 | |||||||
|
| |||||||
| Consumer, Non-cyclical — 17.7% |
| |||||||
| Agriculture — 0.5% | ||||||||
Cooke Omega Investments, Inc. / Alpha VesselCo Holdings, Inc., 144A | ||||||||
8.50%, 12/15/22 | 50,000 | 49,926 | ||||||
Darling Ingredients, Inc., 144A | ||||||||
5.25%, 4/15/27 | 50,000 | 52,145 | ||||||
|
| |||||||
(Cost $101,385) | 102,071 | |||||||
|
| |||||||
| Commercial Services — 5.2% | ||||||||
Allied Universal Holdco LLC / Allied Universal Finance Corp., 144A | ||||||||
9.75%, 7/15/27 | 100,000 | 106,540 | ||||||
AMN Healthcare, Inc., 144A | ||||||||
5.125%, 10/1/24 | 50,000 | 50,307 | ||||||
APX Group, Inc. | ||||||||
7.625%, 9/1/23 (a) | 50,000 | 45,682 | ||||||
Avis Budget Car Rental LLC / Avis Budget Finance, Inc., 144A | ||||||||
5.25%, 3/15/25 | 50,000 | 40,250 | ||||||
Emeco Pty Ltd. | ||||||||
Series B, 9.25%, 3/31/22 | 50,000 | 47,750 | ||||||
Jaguar Holding Co. II / PPD Development LP, 144A | ||||||||
6.375%, 8/1/23 | 50,000 | 51,531 | ||||||
Nielsen Finance LLC / Nielsen Finance Co., 144A | ||||||||
5.00%, 4/15/22 | 100,000 | 100,068 | ||||||
Prime Security Services Borrower LLC / Prime Finance, Inc., 144A | ||||||||
5.25%, 4/15/24 | 150,000 | 156,766 | ||||||
Refinitiv US Holdings, Inc., 144A | ||||||||
8.25%, 11/15/26 | 100,000 | 109,606 | ||||||
RR Donnelley & Sons Co., 144A | ||||||||
8.50%, 4/15/29 | 50,000 | 51,500 | ||||||
United Rentals North America, Inc. | ||||||||
5.875%, 9/15/26 | 100,000 | 105,066 | ||||||
4.875%, 1/15/28 | 100,000 | 103,262 | ||||||
|
| |||||||
(Cost $935,724) | 968,328 | |||||||
|
| |||||||
| Cosmetics/Personal Care — 0.2% | ||||||||
Coty, Inc., 144A | ||||||||
6.50%, 4/15/26 | ||||||||
(Cost $44,161) | 50,000 | 41,533 | ||||||
|
| |||||||
| Food — 4.0% | ||||||||
Albertsons Cos., Inc. / Safeway, Inc. / New Albertsons LP / Albertsons LLC | ||||||||
6.625%, 6/15/24 | 100,000 | 103,712 | ||||||
Principal | Value | |||||||
| Food (Continued) | ||||||||
B&G Foods, Inc. | ||||||||
5.25%, 4/1/25 | $ | 50,000 | $ | 51,505 | ||||
Chobani LLC / Chobani Finance Corp., Inc., 144A | ||||||||
7.50%, 4/15/25 | 50,000 | 49,906 | ||||||
Ingles Markets, Inc. | ||||||||
5.75%, 6/15/23 | 50,000 | 50,469 | ||||||
Kraft Heinz Foods Co. | ||||||||
4.00%, 6/15/23 | 150,000 | 159,258 | ||||||
7.125%, 8/1/39, 144A | 100,000 | 123,052 | ||||||
5.20%, 7/15/45 | 100,000 | 102,993 | ||||||
Post Holdings, Inc., 144A | ||||||||
4.625%, 4/15/30 | 50,000 | 49,469 | ||||||
US Foods, Inc., 144A | ||||||||
5.875%, 6/15/24 | 50,000 | 48,505 | ||||||
|
| |||||||
(Cost $728,522) | 738,869 | |||||||
|
| |||||||
| Healthcare-Products — 1.3% | ||||||||
Avantor, Inc., 144A | ||||||||
9.00%, 10/1/25 | 100,000 | 108,260 | ||||||
Hill-Rom Holdings, Inc., 144A | ||||||||
4.375%, 9/15/27 | 50,000 | 51,491 | ||||||
Immucor, Inc., 144A | ||||||||
11.125%, 2/15/22 | 50,000 | 38,676 | ||||||
Teleflex, Inc. | ||||||||
4.625%, 11/15/27 | 50,000 | 52,259 | ||||||
|
| |||||||
(Cost $258,011) | 250,686 | |||||||
|
| |||||||
| Healthcare-Services — 5.6% | ||||||||
AHP Health Partners, Inc., 144A | ||||||||
9.75%, 7/15/26 | 50,000 | 51,678 | ||||||
Catalent Pharma Solutions, Inc., 144A | ||||||||
5.00%, 7/15/27 | 50,000 | 51,366 | ||||||
Centene Corp., 144A | ||||||||
5.25%, 4/1/25 | 250,000 | 258,515 | ||||||
CHS/Community Health Systems, Inc., 144A | ||||||||
8.625%, 1/15/24 | 150,000 | 151,217 | ||||||
DaVita, Inc. | ||||||||
5.125%, 7/15/24 | 50,000 | 51,051 | ||||||
HCA, Inc. | ||||||||
7.69%, 6/15/25 | 100,000 | 114,739 | ||||||
7.50%, 11/6/33 | 50,000 | 58,678 | ||||||
One Call Corp., 144A | ||||||||
10.00%, 10/1/24 | 50,000 | 43,375 | ||||||
RegionalCare Hospital Partners Holdings, Inc. / LifePoint Health, Inc., 144A | ||||||||
9.75%, 12/1/26 | 50,000 | 54,283 | ||||||
Surgery Center Holdings, Inc., 144A | ||||||||
6.75%, 7/1/25 | 50,000 | 45,932 | ||||||
Tenet Healthcare Corp., 144A | ||||||||
4.875%, 1/1/26 | 100,000 | 102,928 | ||||||
US Renal Care, Inc., 144A | ||||||||
10.625%, 7/15/27 | 50,000 | 52,178 | ||||||
|
| |||||||
(Cost $1,025,567) | 1,035,940 | |||||||
|
| |||||||
| See Notes to Financial Statements. | 33 |
DBX ETF Trust
Schedule of Investments
Xtrackers J.P. Morgan ESG USD High Yield Corporate Bond ETF (Continued)
May 31, 2020
Principal | Value | |||||||
| Household Products/Wares — 0.3% | ||||||||
ACCO Brands Corp., 144A | ||||||||
5.25%, 12/15/24 | ||||||||
(Cost $49,930) | $ | 50,000 | $ | 50,432 | ||||
|
| |||||||
| Pharmaceuticals — 0.6% | ||||||||
Bausch Health Cos., Inc., 144A | ||||||||
7.00%, 1/15/28 | ||||||||
(Cost $102,831) | 100,000 | 105,295 | ||||||
|
| |||||||
| Diversified — 0.2% |
| |||||||
| Holding Companies-Diversified — 0.2% | ||||||||
VistaJet Malta Finance PLC / XO Management Holding, Inc., 144A | ||||||||
10.50%, 6/1/24 | ||||||||
(Cost $40,137) | 50,000 | 40,005 | ||||||
|
| |||||||
| Energy — 15.3% |
| |||||||
| Coal — 0.2% | ||||||||
SunCoke Energy Partners LP / SunCoke Energy Partners Finance Corp., 144A | ||||||||
7.50%, 6/15/25 | ||||||||
(Cost $36,703) | 50,000 | 38,000 | ||||||
|
| |||||||
| Oil & Gas — 8.6% | ||||||||
Antero Resources Corp. | ||||||||
5.125%, 12/1/22 | 50,000 | 35,111 | ||||||
Apache Corp. | ||||||||
5.10%, 9/1/40 | 150,000 | 120,605 | ||||||
Baytex Energy Corp., 144A | ||||||||
8.75%, 4/1/27 | 50,000 | 25,406 | ||||||
Cenovus Energy, Inc. | ||||||||
6.75%, 11/15/39 | 100,000 | 89,613 | ||||||
Continental Resources, Inc. | ||||||||
4.50%, 4/15/23 | 100,000 | 93,030 | ||||||
CVR Energy, Inc., 144A | ||||||||
5.25%, 2/15/25 | 50,000 | 45,156 | ||||||
EQT Corp. | ||||||||
6.125%, 2/1/25 | 100,000 | 102,519 | ||||||
Gulfport Energy Corp. | ||||||||
6.375%, 5/15/25 | 50,000 | 25,182 | ||||||
Hilcorp Energy I LP / Hilcorp Finance Co., 144A | ||||||||
5.75%, 10/1/25(a) | 50,000 | 44,317 | ||||||
Laredo Petroleum, Inc. | ||||||||
9.50%, 1/15/25 | 50,000 | 35,078 | ||||||
MEG Energy Corp., 144A | ||||||||
7.125%, 2/1/27 | 100,000 | 91,374 | ||||||
Murphy Oil Corp. | ||||||||
5.75%, 8/15/25 | 50,000 | 46,943 | ||||||
Nabors Industries Ltd., 144A | ||||||||
7.25%, 1/15/26 | 50,000 | 28,656 | ||||||
Occidental Petroleum Corp. | ||||||||
1.842%, 8/15/22 | 100,000 | 87,536 | ||||||
2.90%, 8/15/24 | 150,000 | 120,000 | ||||||
6.45%, 9/15/36 | 150,000 | 107,250 | ||||||
Parsley Energy LLC / Parsley Finance Corp., 144A | ||||||||
5.625%, 10/15/27 | 50,000 | 49,116 | ||||||
Principal | Value | |||||||
| Oil & Gas (Continued) | ||||||||
PBF Holding Co. LLC / PBF Finance Corp., 144A | ||||||||
6.00%, 2/15/28 | $ | 50,000 | $ | 42,156 | ||||
Precision Drilling Corp., 144A | ||||||||
7.125%, 1/15/26 | 50,000 | 25,178 | ||||||
QEP Resources, Inc. | ||||||||
5.375%, 10/1/22 | 50,000 | 28,661 | ||||||
Range Resources Corp., 144A | ||||||||
9.25%, 2/1/26 | 100,000 | 93,766 | ||||||
Seven Generations Energy Ltd. | ||||||||
6.875%, 6/30/23, 144A | 50,000 | 48,240 | ||||||
5.375%, 9/30/25, 144A | 50,000 | 41,531 | ||||||
Southwestern Energy Co. | ||||||||
6.20%, 1/23/25(a) | 50,000 | 45,066 | ||||||
Transocean Guardian Ltd., 144A | ||||||||
5.875%, 1/15/24 | 83,500 | 77,655 | ||||||
WPX Energy, Inc. | ||||||||
4.50%, 1/15/30 | 50,000 | 45,922 | ||||||
|
| |||||||
(Cost $1,497,712) | 1,595,067 | |||||||
|
| |||||||
| Oil & Gas Services — 1.1% | ||||||||
Archrock Partners LP / Archrock Partners Finance Corp., 144A | ||||||||
6.25%, 4/1/28 | 50,000 | 47,594 | ||||||
Oceaneering International, Inc. | ||||||||
4.65%, 11/15/24 | 50,000 | 38,784 | ||||||
USA Compression Partners LP / USA Compression Finance Corp. | ||||||||
6.875%, 4/1/26 | 50,000 | 48,242 | ||||||
Weatherford International Ltd., 144A | ||||||||
11.00%, 12/1/24 | 100,000 | 67,187 | ||||||
|
| |||||||
(Cost $193,878) | 201,807 | |||||||
|
| |||||||
| Pipelines — 5.4% | ||||||||
Antero Midstream Partners LP / Antero Midstream Finance Corp., 144A | ||||||||
5.75%, 1/15/28 | 50,000 | 39,248 | ||||||
Buckeye Partners LP, 144A | ||||||||
4.50%, 3/1/28 | 100,000 | 97,062 | ||||||
Cheniere Energy Partners LP | ||||||||
5.25%, 10/1/25 | 100,000 | 101,689 | ||||||
Crestwood Midstream Partners LP / Crestwood Midstream Finance Corp. | ||||||||
6.25%, 4/1/23 | 50,000 | 47,755 | ||||||
DCP Midstream Operating LP | ||||||||
5.375%, 7/15/25 | 100,000 | 97,018 | ||||||
EnLink Midstream Partners LP | ||||||||
5.60%, 4/1/44 | 100,000 | 60,794 | ||||||
EQM Midstream Partners LP | ||||||||
4.75%, 7/15/23 | 100,000 | 99,115 | ||||||
Genesis Energy LP / Genesis Energy Finance Corp. | ||||||||
7.75%, 2/1/28 | 50,000 | 46,823 | ||||||
Holly Energy Partners LP / Holly Energy Finance Corp., 144A | ||||||||
5.00%, 2/1/28 | 50,000 | 49,367 | ||||||
| See Notes to Financial Statements. | 34 |
DBX ETF Trust
Schedule of Investments
Xtrackers J.P. Morgan ESG USD High Yield Corporate Bond ETF (Continued)
May 31, 2020
Principal | Value | |||||||
| Pipelines (Continued) | ||||||||
NuStar Logistics LP | ||||||||
5.625%, 4/28/27 | $ | 50,000 | $ | 47,491 | ||||
Ruby Pipeline LLC, 144A | ||||||||
7.00%, 4/1/22 | 34,091 | 31,921 | ||||||
Targa Resources Partners LP / Targa Resources Partners Finance Corp. | ||||||||
6.75%, 3/15/24 | 50,000 | 51,000 | ||||||
6.50%, 7/15/27 | 100,000 | 104,680 | ||||||
Western Midstream Operating LP | ||||||||
4.05%, 2/1/30 | 100,000 | 90,220 | ||||||
5.45%, 4/1/44 | 50,000 | 40,750 | ||||||
|
| |||||||
(Cost $939,777) | 1,004,933 | |||||||
|
| |||||||
| Financial — 10.5% |
| |||||||
| Banks — 1.1% | ||||||||
CIT Group, Inc. | ||||||||
5.00%, 8/1/23 | 100,000 | 100,490 | ||||||
Freedom Mortgage Corp., 144A | ||||||||
8.25%, 4/15/25 | 50,000 | 46,406 | ||||||
Popular, Inc. | ||||||||
6.125%, 9/14/23 | 50,000 | 50,557 | ||||||
|
| |||||||
(Cost $189,038) | 197,453 | |||||||
|
| |||||||
| Diversified Financial Services — 3.4% | ||||||||
Ally Financial, Inc. | ||||||||
5.75%, 11/20/25 | 50,000 | 52,156 | ||||||
Fairstone Financial, Inc., 144A | ||||||||
7.875%, 7/15/24 | 50,000 | 49,995 | ||||||
Global Aircraft Leasing Co. Ltd., 144A | ||||||||
6.50%, 9/15/24 | 50,000 | 27,360 | ||||||
LPL Holdings, Inc., 144A | ||||||||
5.75%, 9/15/25 | 50,000 | 52,138 | ||||||
Nationstar Mortgage Holdings, Inc., 144A | ||||||||
9.125%, 7/15/26 | 50,000 | 51,328 | ||||||
Navient Corp. | ||||||||
5.50%, 1/25/23 | 150,000 | 143,344 | ||||||
NFP Corp., 144A | ||||||||
6.875%, 7/15/25 | 50,000 | 48,281 | ||||||
Quicken Loans LLC, 144A | ||||||||
5.75%, 5/1/25 | 50,000 | 51,130 | ||||||
Springleaf Finance Corp. | ||||||||
6.875%, 3/15/25 | 150,000 | 148,547 | ||||||
|
| |||||||
(Cost $609,043) | 624,279 | |||||||
|
| |||||||
| Insurance — 1.3% | ||||||||
Acrisure LLC / Acrisure Finance, Inc., 144A | ||||||||
7.00%, 11/15/25 | 50,000 | 47,594 | ||||||
Alliant Holdings Intermediate LLC / Alliant Holdings Co-Issuer, 144A | ||||||||
6.75%, 10/15/27 | 50,000 | 51,113 | ||||||
AssuredPartners, Inc., 144A | ||||||||
7.00%, 8/15/25 | 50,000 | 49,156 | ||||||
Genworth Holdings, Inc. | ||||||||
7.625%, 9/24/21 | 50,000 | 46,340 | ||||||
HUB International Ltd., 144A | ||||||||
7.00%, 5/1/26 | 50,000 | 51,511 | ||||||
|
| |||||||
(Cost $238,940) | 245,714 | |||||||
|
| |||||||
Principal | Value | |||||||
| Real Estate — 0.3% | ||||||||
Realogy Group LLC / Realogy Co.-Issuer Corp., 144A | ||||||||
5.25%, 12/1/21 | ||||||||
(Cost $45,483) | $ | 50,000 | $ | 47,891 | ||||
|
| |||||||
| Real Estate Investment Trusts — 3.9% | ||||||||
ESH Hospitality, Inc., 144A | ||||||||
5.25%, 5/1/25 | 100,000 | 97,510 | ||||||
HAT Holdings I LLC / HAT Holdings II LLC, 144A | ||||||||
5.25%, 7/15/24 | 50,000 | 50,755 | ||||||
Iron Mountain, Inc., 144A | ||||||||
4.875%, 9/15/27 | 100,000 | 100,790 | ||||||
MGM Growth Properties Operating Partnership LP / MGP Finance Co-Issuer, Inc. | ||||||||
5.75%, 2/1/27 | 100,000 | 105,046 | ||||||
MPT Operating Partnership LP / MPT Finance Corp. | ||||||||
5.00%, 10/15/27 | 100,000 | 103,690 | ||||||
SBA Communications Corp. | ||||||||
4.875%, 9/1/24 | 50,000 | 51,703 | ||||||
Service Properties Trust | ||||||||
4.95%, 10/1/29 | 25,000 | 20,051 | ||||||
Uniti Group LP / Uniti Fiber Holdings, Inc. / CSL Capital LLC, 144A | ||||||||
7.875%, 2/15/25 | 100,000 | 101,938 | ||||||
VICI Properties LP / VICI Note Co., Inc., 144A | ||||||||
4.25%, 12/1/26 | 100,000 | 99,300 | ||||||
|
| |||||||
(Cost $710,052) | 730,783 | |||||||
|
| |||||||
| Venture Capital — 0.5% | ||||||||
Icahn Enterprises LP / Icahn Enterprises Finance Corp. | ||||||||
6.25%, 2/1/22 | ||||||||
(Cost $100,533) | 100,000 | 100,723 | ||||||
|
| |||||||
| Industrial — 10.8% |
| |||||||
| Aerospace/Defense — 1.9% | ||||||||
Bombardier, Inc., 144A | ||||||||
6.00%, 10/15/22 | 150,000 | 97,219 | ||||||
Signature Aviation US Holdings, Inc., 144A | ||||||||
5.375%, 5/1/26 | 50,000 | 48,093 | ||||||
Spirit AeroSystems, Inc., 144A | ||||||||
7.50%, 4/15/25 | 50,000 | 49,969 | ||||||
TransDigm, Inc. | ||||||||
6.25%, 3/15/26, 144A | 100,000 | 102,484 | ||||||
7.50%, 3/15/27 | 50,000 | 49,322 | ||||||
|
| |||||||
(Cost $333,294) | 347,087 | |||||||
|
| |||||||
| Building Materials — 0.8% | ||||||||
Builders FirstSource, Inc., 144A | ||||||||
5.00%, 3/1/30 | 50,000 | 46,367 | ||||||
Standard Industries, Inc., 144A | ||||||||
6.00%, 10/15/25 | 50,000 | 51,656 | ||||||
Summit Materials LLC / Summit Materials Finance Corp. | ||||||||
6.125%, 7/15/23 | 50,000 | 50,078 | ||||||
|
| |||||||
(Cost $146,081) | 148,101 | |||||||
|
| |||||||
| See Notes to Financial Statements. | 35 |
DBX ETF Trust
Schedule of Investments
Xtrackers J.P. Morgan ESG USD High Yield Corporate Bond ETF (Continued)
May 31, 2020
Principal | Value | |||||||
| Electrical Components & Equipment — 1.1% | ||||||||
Energizer Holdings, Inc., 144A | ||||||||
6.375%, 7/15/26 | $ | 100,000 | $ | 105,731 | ||||
EnerSys, 144A | ||||||||
5.00%, 4/30/23 | 50,000 | 49,995 | ||||||
WESCO Distribution, Inc. | ||||||||
5.375%, 12/15/21 | 50,000 | 49,864 | ||||||
|
| |||||||
(Cost $203,057) | 205,590 | |||||||
|
| |||||||
| Electronics — 0.8% | ||||||||
Sensata Technologies BV, 144A | ||||||||
5.625%, 11/1/24 | 100,000 | 104,980 | ||||||
TTM Technologies, Inc., 144A | ||||||||
5.625%, 10/1/25 | 50,000 | 50,583 | ||||||
|
| |||||||
(Cost $152,264) | 155,563 | |||||||
|
| |||||||
| Engineering & Construction — 0.5% | ||||||||
Brand Industrial Services, Inc., 144A | ||||||||
8.50%, 7/15/25 | 50,000 | 44,281 | ||||||
frontdoor, Inc., 144A | ||||||||
6.75%, 8/15/26 | 50,000 | 53,678 | ||||||
|
| |||||||
(Cost $91,854) | 97,959 | |||||||
|
| |||||||
| Environmental Control — 0.5% | ||||||||
Advanced Disposal Services, Inc., 144A | ||||||||
5.625%, 11/15/24 | 50,000 | 51,870 | ||||||
Covanta Holding Corp. | ||||||||
6.00%, 1/1/27 | 50,000 | 49,428 | ||||||
|
| |||||||
(Cost $100,573) | 101,298 | |||||||
|
| |||||||
| Machinery-Diversified — 0.5% | ||||||||
SPX FLOW, Inc., 144A | ||||||||
5.625%, 8/15/24 | 50,000 | 50,683 | ||||||
Titan Acquisition Ltd. / Titan Co-Borrower LLC, 144A | ||||||||
7.75%, 4/15/26 | 50,000 | 46,770 | ||||||
|
| |||||||
(Cost $97,234) | 97,453 | |||||||
|
| |||||||
| Miscellaneous Manufacturing — 0.3% | ||||||||
FXI Holdings, Inc., 144A | ||||||||
12.25%, 11/15/26 | ||||||||
(Cost $42,979) | 50,000 | 45,867 | ||||||
|
| |||||||
| Packaging & Containers — 3.6% | ||||||||
ARD Finance SA, 144A | ||||||||
6.50%, 6/30/27 | 200,000 | 198,037 | ||||||
Ball Corp. | ||||||||
4.875%, 3/15/26 | 100,000 | 110,293 | ||||||
Berry Global, Inc., 144A | ||||||||
5.625%, 7/15/27 | 100,000 | 105,315 | ||||||
Cascades, Inc./Cascades USA, Inc., 144A | ||||||||
5.125%, 1/15/26 | 50,000 | 51,406 | ||||||
Crown Americas LLC / Crown Americas Capital Corp. IV | ||||||||
4.50%, 1/15/23 | 100,000 | 103,562 | ||||||
Reynolds Group Issuer, Inc. / Reynolds Group Issuer LLC / Reynolds Group Issuer Lu, 144A | ||||||||
7.00%, 7/15/24 | 100,000 | 100,766 | ||||||
|
| |||||||
(Cost $655,869) | 669,379 | |||||||
|
| |||||||
Principal | Value | |||||||
| Transportation — 0.5% | ||||||||
Kenan Advantage Group, Inc., 144A | ||||||||
7.875%, 7/31/23 (a) | $ | 50,000 | $ | 41,682 | ||||
XPO Logistics, Inc., 144A | ||||||||
6.50%, 6/15/22 | 50,000 | 50,174 | ||||||
|
| |||||||
(Cost $91,974) | 91,856 | |||||||
|
| |||||||
| Trucking & Leasing — 0.3% | ||||||||
Fortress Transportation and Infrastructure Investors LLC, 144A | ||||||||
6.75%, 3/15/22 | ||||||||
(Cost $45,574) | 50,000 | 46,390 | ||||||
|
| |||||||
| Technology — 4.6% |
| |||||||
| Computers — 2.1% | ||||||||
Banff Merger Sub, Inc., 144A | ||||||||
9.75%, 9/1/26 | 50,000 | 50,343 | ||||||
Booz Allen Hamilton, Inc., 144A | ||||||||
5.125%, 5/1/25 | 50,000 | 50,757 | ||||||
Dell International LLC / EMC Corp., 144A | ||||||||
7.125%, 6/15/24 | 50,000 | 51,984 | ||||||
NCR Corp., 144A | ||||||||
6.125%, 9/1/29 | 50,000 | 49,884 | ||||||
Presidio Holdings, Inc., 144A | ||||||||
8.25%, 2/1/28 | 50,000 | 49,531 | ||||||
Vericast Corp., 144A | ||||||||
8.375%, 8/15/22 | 50,000 | 38,113 | ||||||
Western Digital Corp. | ||||||||
4.75%, 2/15/26 | 100,000 | 105,485 | ||||||
|
| |||||||
(Cost $386,387) | 396,097 | |||||||
|
| |||||||
| Office/Business Equipment — 0.8% | ||||||||
CDW LLC / CDW Finance Corp. | ||||||||
5.00%, 9/1/25 | 50,000 | 51,823 | ||||||
Pitney Bowes, Inc. | ||||||||
4.625%, 3/15/24 | 50,000 | 34,130 | ||||||
Xerox Corp. | ||||||||
6.75%, 12/15/39 | 50,000 | 51,277 | ||||||
|
| |||||||
(Cost $137,493) | 137,230 | |||||||
|
| |||||||
| Semiconductors — 0.6% | ||||||||
Advanced Micro Devices, Inc. | ||||||||
7.50%, 8/15/22 | 50,000 | 56,238 | ||||||
Amkor Technology, Inc., 144A | ||||||||
6.625%, 9/15/27 | 50,000 | 52,991 | ||||||
|
| |||||||
(Cost $107,894) | 109,229 | |||||||
|
| |||||||
| Software — 1.1% | ||||||||
CDK Global, Inc. | ||||||||
5.875%, 6/15/26 | 50,000 | 52,741 | ||||||
Change Healthcare Holdings LLC / Change Healthcare Finance, Inc., 144A | ||||||||
5.75%, 3/1/25 | 50,000 | 50,084 | ||||||
Open Text Corp., 144A | ||||||||
5.875%, 6/1/26 | 100,000 | 103,481 | ||||||
|
| |||||||
(Cost $207,014) | 206,306 | |||||||
|
| |||||||
| See Notes to Financial Statements. | 36 |
DBX ETF Trust
Schedule of Investments
Xtrackers J.P. Morgan ESG USD High Yield Corporate Bond ETF (Continued)
May 31, 2020
Principal | Value | |||||||
| Utilities — 1.4% |
| |||||||
| Electric — 1.4% | ||||||||
Calpine Corp. | ||||||||
5.75%, 1/15/25 | $ | 50,000 | $ | 51,281 | ||||
Clearway Energy Operating LLC, 144A | ||||||||
4.75%, 3/15/28 | 100,000 | 103,406 | ||||||
NextEra Energy Operating Partners LP, 144A | ||||||||
4.50%, 9/15/27 | 100,000 | 106,291 | ||||||
|
| |||||||
(Cost $256,454) | 260,978 | |||||||
|
| |||||||
TOTAL CORPORATE BONDS (Cost $17,697,729) | 18,243,897 | |||||||
|
| |||||||
Number | Value | |||||||
| SECURITIES LENDING COLLATERAL — 0.5% | ||||||||
DWS Government & Agency Securities Portfolio “DWS Government Cash Institutional Shares”, 0.07% (b)(c) | 102,098 | $ | 102,098 | |||||
|
| |||||||
| CASH EQUIVALENTS — 0.7% | ||||||||
DWS Government Money Market Series “Institutional Shares”, 0.12% (b) | 121,095 | 121,095 | ||||||
|
| |||||||
TOTAL INVESTMENTS — 99.4% (Cost $17,920,922) | $ | 18,467,090 | ||||||
Other assets and liabilities, net — 0.6% | 105,006 | |||||||
|
| |||||||
NET ASSETS — 100.0% | $ | 18,572,096 | ||||||
|
| |||||||
A summary of the Fund’s transactions with affiliated investments during the year ended May 31, 2020 is as follows:
| Value ($) at 5/31/2019 | Purchases Cost ($) | Sales Proceeds ($) | Net Realized Gain/(Loss) ($) | Net Change in Unrealized Appreciation (Depreciation) ($) | Income ($) | Capital Gain Distributions ($) | Number of Shares at 5/31/2020 | Value ($) at 5/31/2020 | ||||||||||||||||||||||||||||
EXCHANGE-TRADED FUNDS — 0.0% |
| |||||||||||||||||||||||||||||||||||
Xtrackers High Beta High Yield Bond ETF (e) |
| |||||||||||||||||||||||||||||||||||
| 460,768 | 471,530 | (910,254 | ) | (26,301 | ) | 4,257 | 24,881 | — | — | — | ||||||||||||||||||||||||||
Xtrackers USD High Yield Corporate Bond ETF (e) |
| |||||||||||||||||||||||||||||||||||
| 6,043,035 | 4,180,531 | (9,513,996 | ) | (793,443 | ) | 83,873 | 486,290 | — | — | — | ||||||||||||||||||||||||||
SECURITIES LENDING COLLATERAL — 0.5% |
| |||||||||||||||||||||||||||||||||||
DWS Government & Agency Securities Portfolio “DWS Government Cash Institutional Shares”, 0.07% (b)(c) |
| |||||||||||||||||||||||||||||||||||
| 582,275 | — | (480,177 | ) (d) | — | — | 16,133 | — | 102,098 | 102,098 | |||||||||||||||||||||||||||
CASH EQUIVALENTS — 0.7% |
| |||||||||||||||||||||||||||||||||||
DWS Government Money Market Series “Institutional Shares”, 0.12% (b) |
| |||||||||||||||||||||||||||||||||||
| 1,893 | 9,947,715 | (9,828,513 | ) | — | — | 869 | — | 121,095 | 121,095 | |||||||||||||||||||||||||||
|
|
|
|
|
|
|
|
|
|
|
|
|
|
|
|
|
| |||||||||||||||||||
| 7,087,971 | 14,599,776 | (20,732,940 | ) | (819,744 | ) | 88,130 | 528,173 | — | 223,193 | 223,193 | ||||||||||||||||||||||||||
|
|
|
|
|
|
|
|
|
|
|
|
|
|
|
|
|
| |||||||||||||||||||
| (a) | All or a portion of these securities were on loan. In addition, “Other assets and liabilities, net” may include pending sales that are also on loan. The value of securities loaned at May 31, 2020 amounted to $98,615, which is 0.5% of net assets. |
| (b) | Affiliated fund managed by DWS Investment Management Americas, Inc. The rate shown is the annualized seven-day yield at period end. |
| (c) | Represents cash collateral held in connection with securities lending. Income earned by the Fund is net of borrower rebates. |
| (d) | Represents the net increase (purchase cost) or decrease (sales proceeds) in the amount invested in cash collateral for the year ended May 31, 2020. |
| (e) | Affiliated fund advised by DBX Advisors LLC. |
| 144A: | Security exempt from registration under Rule 144A of the Securities Act of 1933. These securities may be resold in transactions exempt from registration, normally to qualified institutional buyers. |
| See Notes to Financial Statements. | 37 |
DBX ETF Trust
Schedule of Investments
Xtrackers J.P. Morgan ESG USD High Yield Corporate Bond ETF (Continued)
May 31, 2020
Fair Value Measurements
Various inputs are used in determining the value of the Fund’s investments. These inputs are summarized in three broad levels. Level 1 includes quoted prices in active markets for identical securities. Level 2 includes other significant observable inputs (including quoted prices for similar securities, interest rates, prepayment speeds and credit risk). Level 3 includes significant unobservable inputs (including the Fund’s own assumptions in determining the fair value of investments). The level assigned to the securities valuations may not be an indication of the risk or liquidity associated with investing in those securities.
The following is a summary of the inputs used as of May 31, 2020 in valuing the Fund’s investments. For information on the Fund’s policy regarding the valuation of investments, please refer to the Security Valuation section of Note 2 in the accompanying Notes to Financial Statements.
Assets | Level 1 | Level 2 | Level 3 | Total | ||||||||||||
Corporate Bonds(f) | $ | — | $ | 18,243,897 | $ | — | $ | 18,243,897 | ||||||||
Short-Term Investments(f) | 223,193 | — | — | 223,193 | ||||||||||||
|
|
|
|
|
|
|
| |||||||||
TOTAL | $ | 223,193 | $ | 18,243,897 | — | $ | 18,467,090 | |||||||||
|
|
|
|
|
|
|
| |||||||||
| (f) | See Schedule of Investments for additional detailed categorizations. |
| See Notes to Financial Statements. | 38 |
DBX ETF Trust
Schedule of Investments
Xtrackers Municipal Infrastructure Revenue Bond ETF
May 31, 2020
Principal | Value | |||||||
| MUNICIPAL BONDS — 98.3% | ||||||||
| Alabama — 0.5% | ||||||||
Alabama Federal Aid Highway Finance Authority, Government FD/ Grant Revenue, | $ | 200,000 | $ | 246,918 | ||||
Lower Alabama Gas District, Natural Gas Revenue, | 160,000 | 200,181 | ||||||
|
| |||||||
(Cost $426,856) | 447,099 | |||||||
|
| |||||||
| Arizona — 2.6% | ||||||||
City of Mesa AZ Utility System Revenue, Multiple Utility Revenue, | 500,000 | 632,440 | ||||||
Salt River Project Agricultural Improvement & Power District, Electric, Power & Light Revenue, | 35,000 | 44,715 | ||||||
Series A, 5.00%, 1/1/38 | 450,000 | 550,287 | ||||||
Series A, 5.00%, 1/1/39 | 500,000 | 623,790 | ||||||
Series A, 5.00%, 1/1/47 | 500,000 | 643,110 | ||||||
|
| |||||||
(Cost $2,378,512) | 2,494,342 | |||||||
|
| |||||||
| California — 19.6% | ||||||||
Alameda Corridor Transportation Authority, Transit Revenue, | 165,000 | 179,041 | ||||||
Bay Area Toll Authority, Highway Revenue Tolls, | 260,000 | 280,537 | ||||||
4.00%, 4/1/38 | 25,000 | 28,009 | ||||||
Series 7, 4.00%, 4/1/42 | 35,000 | 38,772 | ||||||
Sub-Series S-H, 5.00%, 4/1/44 | 405,000 | 490,196 | ||||||
Sub-Series S-8, 3.00%, 4/1/54 | 300,000 | 309,027 | ||||||
Series F-1, 5.00%, 4/1/56 | 100,000 | 117,143 | ||||||
Sub-Series S-8, 5.00%, 4/1/56 | 900,000 | 1,082,412 | ||||||
City of Long Beach CA Harbor Revenue, Private Airport & Marina Revenue, | 125,000 | 154,002 | ||||||
City of Los Angeles Department of Airports, Private Airport & Marina Revenue, | 790,000 | 886,965 | ||||||
Series D, AMT, 5.00%, 5/15/43 | 125,000 | 146,452 | ||||||
Series A, AMT, 4.00%, 5/15/44 | 1,225,000 | 1,308,398 | ||||||
Series C, AMT, 5.00%, 5/15/44 | 200,000 | 229,086 | ||||||
Series F, AMT, 3.00%, 5/15/49 | 330,000 | 305,184 | ||||||
Series F, AMT, 4.00%, 5/15/49 | 500,000 | 530,980 | ||||||
Series D, 5.00%, 5/15/49 | 100,000 | 115,491 | ||||||
City of San Francisco CA Public Utilities Commission Water Revenue, Water Revenue, | 150,000 | 190,938 | ||||||
East Bay Municipal Utility District Water System Revenue, Water Revenue, | 100,000 | 120,971 | ||||||
Principal | Value | |||||||
| California (Continued) | ||||||||
Los Angeles County Metropolitan Transportation Authority, Sales Tax Revenue, | $ | 175,000 | $ | 217,000 | ||||
Los Angeles County Sanitation Districts Financing Authority, Sewer Revenue, | 100,000 | 111,202 | ||||||
Los Angeles Department of Water & Power Power System Revenue, Electric, Power & Light Revenue, | 500,000 | 628,120 | ||||||
Los Angeles Department of Water & Power, Electric, Power & Light Revenue, | 25,000 | 33,277 | ||||||
Series A, 5.00%, 7/1/42 | 500,000 | 606,340 | ||||||
Series A, 5.00%, 7/1/46 | 750,000 | 887,550 | ||||||
Series D, 5.00%, 7/1/49 | 100,000 | 126,498 | ||||||
Los Angeles Department of Water, Water Revenue, | 500,000 | 596,415 | ||||||
Series A, 5.00%, Issued 5/11/17, 7/1/41 | 200,000 | 243,502 | ||||||
Norman Y Mineta San Jose International Airport SJC, Private Airport & Marina Revenue, | 500,000 | 568,775 | ||||||
San Diego County Regional Transportation Commission, Sales Tax Revenue, | ||||||||
Series A, 5.00%, 4/1/41 | 280,000 | 334,376 | ||||||
San Francisco City & County Airport Commission-San Francisco International Airport, Private Airport & Marina Revenue, | 1,000,000 | 1,188,130 | ||||||
Series A, AMT, 5.00%, 5/1/44 | 150,000 | 175,085 | ||||||
Series E, AMT, 5.00%, 5/1/45 | 1,225,000 | 1,427,309 | ||||||
Series B, AMT, 5.00%, 5/1/46 | 500,000 | 559,035 | ||||||
Series C, 5.00%, 5/1/46 | 600,000 | 692,748 | ||||||
Series A, AMT, 5.00%, 5/1/47 | 200,000 | 225,798 | ||||||
Series B, 5.00%, 5/1/47 | 25,000 | 29,282 | ||||||
Series D, AMT, 5.25%, 5/1/48 | 870,000 | 1,014,211 | ||||||
Series A, 4.00%, 5/1/49 | 1,300,000 | 1,395,953 | ||||||
Series A, AMT, 5.00%, 5/1/49 | 200,000 | 232,134 | ||||||
Series F, 5.00%, 5/1/50 | 900,000 | 1,086,426 | ||||||
Southern California Public Power Authority, Natural Gas Revenue, | 150,000 | 190,004 | ||||||
|
| |||||||
(Cost $18,798,605) | 19,082,774 | |||||||
|
| |||||||
| Colorado — 2.8% | ||||||||
City & County of Denver Co. Airport System Revenue, Private Airport & Marina Revenue, | 150,000 | 198,762 | ||||||
Series A, AMT, 5.00%, 12/1/38 | 320,000 | 376,739 | ||||||
Series A, AMT, 4.00%, 12/1/43 | 650,000 | 697,613 | ||||||
Series A, AMT, 5.00%, 12/1/43 | 325,000 | 378,300 | ||||||
Series A, AMT, 5.00%, 12/1/48 | 700,000 | 809,956 | ||||||
| See Notes to Financial Statements. | 39 |
DBX ETF Trust
Schedule of Investments
Xtrackers Municipal Infrastructure Revenue Bond ETF (Continued)
May 31, 2020
Principal | Value | |||||||
| Colorado (Continued) | ||||||||
Colorado Bridge Enterprise, Miscellaneous Revenue, | $ | 250,000 | $ | 272,922 | ||||
|
| |||||||
(Cost $2,597,925) | 2,734,292 | |||||||
|
| |||||||
| District of Columbia — 5.7% | ||||||||
District of Columbia Water & Sewer Authority, Water Revenue, | 245,000 | 294,855 | ||||||
Series B, 5.00%, 10/1/49 | 250,000 | 309,320 | ||||||
District of Columbia, Income Tax Revenue, Series A, 5.00%, 3/1/44 | 500,000 | 642,350 | ||||||
Metropolitan Washington Airports Authority Dulles Toll Road Revenue, Highway Revenue Tolls, | 1,000,000 | 1,022,190 | ||||||
Series B, 3.00%, 10/1/50 | 700,000 | 702,884 | ||||||
Series B, 4.00%, 10/1/53 | 1,750,000 | 1,768,970 | ||||||
Metropolitan Washington Airports Authority, Private Airport & Marina Revenue, | 455,000 | 524,770 | ||||||
Washington Metropolitan Area Transit Authority, Transit Revenue, | 250,000 | 292,732 | ||||||
|
| |||||||
(Cost $5,785,775) | 5,558,071 | |||||||
|
| |||||||
| Florida — 8.3% | ||||||||
Central Florida Expressway Authority, Highway Revenue Tolls, 5.00%, 7/1/38 | 105,000 | 122,312 | ||||||
City of Cape Coral FL Water & Sewer Revenue, Water Revenue, 5.00%, 10/1/39 | 150,000 | 185,340 | ||||||
City of Gainesville FL Utilities System Revenue, Multiple Utility Revenue, | 100,000 | 126,570 | ||||||
County of Broward FL Airport System Revenue, Private Airport & Marina Revenue, | 100,000 | 106,559 | ||||||
Series A, AMT, 4.00%, 10/1/49 | 150,000 | 158,929 | ||||||
County of Broward FL Port Facilities Revenue, Private Airport & Marina Revenue, | 500,000 | 528,100 | ||||||
County of Miami-Dade FL Aviation Revenue, Private Airport & Marina Revenue, | 500,000 | 555,825 | ||||||
Series B, AMT, 5.00%, 10/1/40 | 395,000 | 450,695 | ||||||
5.00%, 10/1/41 | 425,000 | 482,260 | ||||||
Series A, AMT, 4.00%, 10/1/44 | 100,000 | 106,144 | ||||||
Series A, AMT, 5.00%, 10/1/44 | 100,000 | 116,331 | ||||||
Series A, AMT, 5.00%, 10/1/49 | 350,000 | 404,901 | ||||||
County of Miami-Dade FL Transit System, Sales Tax Revenue, 4.00%, 7/1/38 | 90,000 | 97,047 | ||||||
Principal | Value | |||||||
| Florida (Continued) | ||||||||
County of Miami-Dade FL Water & Sewer System Revenue, Water Revenue, | $ | 165,000 | $ | 187,013 | ||||
Series B, 4.00%, 10/1/44 | 150,000 | 174,977 | ||||||
4.00%, 10/1/48 | 400,000 | 458,188 | ||||||
Series B, 3.00%, 10/1/49 | 150,000 | 161,321 | ||||||
Series B, 4.00%, 10/1/49 | 575,000 | 665,292 | ||||||
Greater Orlando Aviation Authority, Private Airport & Marina Revenue, | 100,000 | 114,403 | ||||||
Series A, AMT, 4.00%, 10/1/49 | 500,000 | 538,105 | ||||||
Sub-Series A, 5.00%, 10/1/52 | 500,000 | 569,620 | ||||||
Series A, AMT, 3.25%, 10/1/54 | 250,000 | 246,987 | ||||||
Hillsborough County Aviation Authority, Private Airport & Marina Revenue, | 50,000 | 56,933 | ||||||
Putnam County Development Authority, Electric, Power & Light Revenue, | 250,000 | 303,103 | ||||||
Tampa-Hillsborough County Expressway Authority, Highway Revenue Tolls, | 1,000,000 | 1,109,600 | ||||||
|
| |||||||
(Cost $7,900,349) | 8,026,555 | |||||||
|
| |||||||
| Georgia — 1.0% | ||||||||
City of Atlanta GA Department of Aviation, Private Airport & Marina Revenue, | 200,000 | 216,442 | ||||||
City of Atlanta GA Water & Wastewater, Water Revenue, | 250,000 | 306,202 | ||||||
Development Authority of Burke County, Electric, Power & Light Revenue, | 290,000 | 294,234 | ||||||
Main Street Natural Gas, Inc., Natural Gas Revenue, | 30,000 | 33,635 | ||||||
Municipal Electric Authority of Georgia, Electric, Power & Light Revenue, | 100,000 | 103,736 | ||||||
|
| |||||||
(Cost $937,035) | 954,249 | |||||||
|
| |||||||
| Guam — 0.1% | ||||||||
Guam Government Waterworks Authority, Water Revenue, 5.00%, 1/1/46 | 125,000 | 133,674 | ||||||
|
| |||||||
| Hawaii — 1.1% | ||||||||
City & County Honolulu HI Wastewater System, Sewer Revenue, | 500,000 | 587,645 | ||||||
State of Hawaii Airports System Revenue, Private Airport & Marina Revenue, | 400,000 | 464,124 | ||||||
|
| |||||||
(Cost $1,001,940) | 1,051,769 | |||||||
|
| |||||||
| See Notes to Financial Statements. | 40 |
DBX ETF Trust
Schedule of Investments
Xtrackers Municipal Infrastructure Revenue Bond ETF (Continued)
May 31, 2020
Principal | Value | |||||||
| Illinois — 6.5% | ||||||||
Chicago Midway International Airport, Private Airport & Marina Revenue, | $ | 500,000 | $ | 550,630 | ||||
Chicago O’Hare International Airport, Private Airport & Marina Revenue, | 800,000 | 886,856 | ||||||
Series A, AMT, 4.00%, 1/1/43 | 40,000 | 41,902 | ||||||
Series B, 4.00%, 1/1/44 | 75,000 | 79,300 | ||||||
Series D, 5.00%, 1/1/47 | 500,000 | 558,260 | ||||||
Series B, 5.00%, 1/1/48 | 800,000 | 917,904 | ||||||
Series D, 5.00%, 1/1/52 | 140,000 | 155,798 | ||||||
Series D, AMT, 5.00%, 1/1/52 | 375,000 | 411,694 | ||||||
Series A, AMT, 4.375%, 1/1/53 | 25,000 | 26,682 | ||||||
Illinois Municipal Electric Agency, Electric, Power & Light Revenue, | 45,000 | 49,491 | ||||||
Illinois State Toll Highway Authority, Highway Revenue Tolls, | 10,000 | 11,887 | ||||||
Series C, 5.00%, 1/1/36 | 50,000 | 57,258 | ||||||
Series A, 5.00%, 1/1/40 | 1,090,000 | 1,258,481 | ||||||
Series A, 5.00%, 1/1/42 | 500,000 | 589,250 | ||||||
Series A, 4.00%, 1/1/44 | 300,000 | 330,726 | ||||||
Series A, 5.00%, 1/1/44 | 300,000 | 361,416 | ||||||
|
| |||||||
(Cost $6,144,144) | 6,287,535 | |||||||
|
| |||||||
| Indiana — 0.4% | ||||||||
Indiana Finance Authority, Sewer Revenue, Series A, 5.00%, 10/1/41 | 100,000 | 118,919 | ||||||
Indiana Municipal Power Agency, Electric, Power & Light Revenue, | 200,000 | 235,326 | ||||||
|
| |||||||
(Cost $340,802) | 354,245 | |||||||
|
| |||||||
| Kentucky — 0.3% | ||||||||
Kentucky Economic Development Finance Authority, Lease Revenue, | 255,000 | 270,305 | ||||||
Kentucky Municipal Power Agency, Electric, Power & Light Revenue, | 45,000 | 48,274 | ||||||
Louisville & Jefferson County Metropolitan Sewer District, Sewer Revenue, | 10,000 | 10,311 | ||||||
|
| |||||||
(Cost $333,285) | 328,890 | |||||||
|
| |||||||
| Louisiana — 1.3% | ||||||||
East Baton Rouge Sewerage Commission, Sewer Revenue, | 30,000 | 35,142 | ||||||
Jefferson Sales Tax District, Sales Tax Revenue, | 400,000 | 461,216 | ||||||
Louisiana Local Government Environmental Facilities & Community Development Authority, Industrial Revenue, 3.50%, 11/1/32 | 450,000 | 447,300 | ||||||
Principal | Value | |||||||
| Louisiana (Continued) | ||||||||
New Orleans Aviation Board, Private Airport & Marina Revenue, | $ | 250,000 | $ | 281,948 | ||||
|
| |||||||
(Cost $1,223,853) | 1,225,606 | |||||||
|
| |||||||
| Maryland — 0.2% | ||||||||
State of Maryland Department of Transportation, Fuel Sales Tax Revenue, 3.50%, 10/1/33 | 190,000 | 211,476 | ||||||
|
| |||||||
| Massachusetts — 0.5% | ||||||||
Massachusetts Port Authority, Private Airport & Marina Revenue, | 400,000 | 465,736 | ||||||
|
| |||||||
| Michigan — 0.8% | ||||||||
Great Lakes Water Authority Sewage Disposal System Revenue, Water Revenue, | 430,000 | 516,163 | ||||||
Great Lakes Water Authority Water Supply System Revenue, Water Revenue, | 125,000 | 143,241 | ||||||
Lansing Board of Water & Light, Electric, Power & Light Revenue, | 35,000 | 44,224 | ||||||
Series A, 5.00%, 7/1/48 | 90,000 | 113,219 | ||||||
|
| |||||||
(Cost $766,009) | 816,847 | |||||||
|
| |||||||
| Missouri — 0.6% | ||||||||
Metropolitan St Louis Sewer District, Sewer Revenue, | 245,000 | 297,430 | ||||||
Missouri Joint Municipal Electric Utility Commission, Electric, Power & Light Revenue | 235,000 | 279,023 | ||||||
|
| |||||||
(Cost $563,755) | 576,453 | |||||||
|
| |||||||
| Nevada — 0.8% | ||||||||
Las Vegas Convention & Visitors Authority, Hotel Occupancy Tax, | 500,000 | 551,575 | ||||||
Series B, 4.00%, 7/1/49 | 250,000 | 251,185 | ||||||
|
| |||||||
(Cost $800,080) | 802,760 | |||||||
|
| |||||||
| New Jersey — 2.4% | ||||||||
New Jersey Turnpike Authority, Highway Revenue Tolls, | 10,000 | 12,046 | ||||||
Series B, 5.00%, 1/1/31 | 20,000 | 24,627 | ||||||
Series A, 5.00%, 1/1/33 | 10,000 | 11,900 | ||||||
Series B, 5.00%, 1/1/34 | 130,000 | 157,254 | ||||||
Series G, 3.25%, 1/1/38 | 395,000 | 408,750 | ||||||
Series E, 5.00%, 1/1/45 | 850,000 | 948,336 | ||||||
Series A, 5.00%, 1/1/48 | 650,000 | 768,963 | ||||||
|
| |||||||
(Cost $2,239,413) | 2,331,876 | |||||||
|
| |||||||
| See Notes to Financial Statements. | 41 |
DBX ETF Trust
Schedule of Investments
Xtrackers Municipal Infrastructure Revenue Bond ETF (Continued)
May 31, 2020
Principal | Value | |||||||
| New York — 20.7% | ||||||||
Long Island Power Authority, Electric, Power & Light Revenue, 5.00%, 9/1/42 | $ | 185,000 | $ | 220,773 | ||||
Metropolitan Transportation Authority, Fuel Sales Tax Revenue, | 600,000 | 698,202 | ||||||
Metropolitan Transportation Authority, Transit Revenue, | 100,000 | 107,528 | ||||||
Series C-1, 4.00%, 11/15/37 | 155,000 | 155,312 | ||||||
Series B, 5.00%, 11/15/37 | 1,000,000 | 1,049,160 | ||||||
Sub-Series D-1, 5.00%, 11/15/39 | 20,000 | 20,653 | ||||||
Series D, 4.00%, 11/15/42 | 300,000 | 300,012 | ||||||
Series - A-1 - Group 1, 4.00%, 11/15/44 | 500,000 | 534,810 | ||||||
Series A, Sub-Series A-2, 5.00%, 11/15/44 | 100,000 | 113,652 | ||||||
Sub-Series D-1, 5.25%, 11/15/44 | 50,000 | 52,384 | ||||||
Series C-1, 4.75%, 11/15/45 | 1,000,000 | 1,062,750 | ||||||
Sub-Series A-1, 5.00%, 11/15/45 | 200,000 | 208,826 | ||||||
Series D, 4.00%, 11/15/46 | 500,000 | 497,435 | ||||||
Series C-1, 5.00%, 11/15/50 | 500,000 | 540,285 | ||||||
New York City Transitional Finance Authority Future Tax Secured Revenue, Income Tax Revenue, | 300,000 | 357,405 | ||||||
Sub-Series E-1, 5.00%, 2/1/35 | 180,000 | 213,905 | ||||||
Series A, Sub-Series E-1, 5.00%, 2/1/36 | 200,000 | 240,066 | ||||||
Sub-Series E-1, 5.00%, 2/1/38 | 300,000 | 354,186 | ||||||
Sub-Series A-1, 5.00%, 5/1/40 | 500,000 | 591,885 | ||||||
Sub-Series A-1, 4.00%, 5/1/42 | 15,000 | 16,438 | ||||||
New York City Water & Sewer System, Water Revenue, | 95,000 | 108,990 | ||||||
Sub-Series CC-1, 5.00%, 6/15/38 | 715,000 | 866,659 | ||||||
Series GG, 5.00%, 6/15/39 | 650,000 | 764,549 | ||||||
Series HH, 5.00%, 6/15/39 | 150,000 | 176,434 | ||||||
Series AA, 4.00%, 6/15/40 | 1,100,000 | 1,300,420 | ||||||
Sub-Series EE-2, 5.00%, 6/15/40 | 35,000 | 44,833 | ||||||
Sub-Series CC-1, 4.00%, 6/15/46 | 50,000 | 55,421 | ||||||
Series CC, 5.00%, 6/15/46 | 500,000 | 583,340 | ||||||
Sub-Series CC-1, 5.00%, 6/15/46 | 300,000 | 355,389 | ||||||
Series DD, 5.00%, 6/15/47 | 1,200,000 | 1,437,216 | ||||||
Series CC, 5.00%, 6/15/48 | 965,000 | 1,165,151 | ||||||
Series DD-1, 5.00%, 6/15/48 | 300,000 | 366,345 | ||||||
Series BB-1, 4.00%, 6/15/49 | 200,000 | 232,310 | ||||||
Series CC-1, 4.00%, 6/15/49 | 100,000 | 116,155 | ||||||
Series DD-1, 5.00%, 6/15/49 | 400,000 | 493,352 | ||||||
Sub-Series DD-1, 4.00%, 6/15/50 | 250,000 | 291,895 | ||||||
New York Convention Center Development Corp., Hotel Occupancy Tax, | 25,000 | 26,951 | ||||||
New York Liberty Development Corp., Industrial Revenue, | 500,000 | 489,330 | ||||||
New York State Environmental Facilities Corp., Water Revenue, | 100,000 | 121,260 | ||||||
Principal | Value | |||||||
| New York (Continued) | ||||||||
New York Transportation Development Corp., Industrial Revenue, | $ | 485,000 | $ | 492,047 | ||||
AMT, 5.00%, 1/1/34 | 500,000 | 503,130 | ||||||
Port Authority of New York & New Jersey, Private Airport & Marina Revenue, | 700,000 | 895,167 | ||||||
5.00%, 10/15/35 | 65,000 | 75,892 | ||||||
5.00%, 10/15/41 | 1,150,000 | 1,334,380 | ||||||
Triborough Bridge & Tunnel Authority, Highway Revenue Tolls, | 450,000 | 506,889 | ||||||
|
| |||||||
(Cost $19,878,835) | 20,139,172 | |||||||
|
| |||||||
| Ohio — 0.1% | ||||||||
Northeast Ohio Regional Sewer District, Sewer Revenue, | 100,000 | 107,775 | ||||||
Ohio Water Development Authority Water Pollution Control Loan Fund, Water Revenue, | 10,000 | 12,833 | ||||||
Series A, 5.00%, 6/1/30 | 10,000 | 12,799 | ||||||
|
| |||||||
(Cost $126,825) | 133,407 | |||||||
|
| |||||||
| Oklahoma — 0.8% | ||||||||
Oklahoma Turnpike Authority, Highway Revenue Tolls, | ||||||||
Series C, 4.00%, 1/1/42 | 350,000 | 396,434 | ||||||
Series A, 5.00%, 1/1/43 | 280,000 | 338,120 | ||||||
|
| |||||||
(Cost $692,911) | 734,554 | |||||||
|
| |||||||
| Oregon — 1.1% | ||||||||
Port of Portland OR Airport Revenue, Private Airport & Marina Revenue, | 1,000,000 | 1,116,880 | ||||||
|
| |||||||
| Pennsylvania — 3.9% | ||||||||
City of Philadelphia PA Airport Revenue, Private Airport & Marina Revenue, | 300,000 | 336,033 | ||||||
City of Philadelphia PA Water & Wastewater, Water Revenue, | 35,000 | 42,665 | ||||||
Delaware River Joint Toll Bridge Commission, Highway Revenue Tolls, 5.00%, 7/1/42 | 40,000 | 48,938 | ||||||
Pennsylvania Turnpike Commission, Fran. Tax & Bus. LIC Fees, | 300,000 | 371,466 | ||||||
Series A, 5.00%, 12/1/48 | 250,000 | 303,530 | ||||||
Pennsylvania Turnpike Commission, Highway Revenue Tolls, | 100,000 | 114,018 | ||||||
Series A-2, 5.00%, 12/1/43 | 250,000 | 298,080 | ||||||
Sub-Series A, 5.00%, 12/1/44 | 500,000 | 588,645 | ||||||
Series A-1, 5.00%, 12/1/46 | 900,000 | 1,022,508 | ||||||
Series A-1, 5.00%, 12/1/47 | 500,000 | 571,590 | ||||||
Sub-Series A, 4.00%, 12/1/49 | 100,000 | 110,145 | ||||||
|
| |||||||
(Cost $3,723,239) | 3,807,618 | |||||||
|
| |||||||
| See Notes to Financial Statements. | 42 |
DBX ETF Trust
Schedule of Investments
Xtrackers Municipal Infrastructure Revenue Bond ETF (Continued)
May 31, 2020
Principal | Value | |||||||
| Puerto Rico — 0.7% | ||||||||
Puerto Rico Highway & Transportation Authority, Fuel Sales Tax Revenue, | $ | 425,000 | $ | 453,148 | ||||
Series N, 5.25%, 7/1/36 | 175,000 | 186,578 | ||||||
Puerto Rico Highway & Transportation Authority, Highway Revenue Tolls, | 50,000 | 49,260 | ||||||
Series L, 5.25%, 7/1/41 | 25,000 | 26,349 | ||||||
|
| |||||||
(Cost $725,992) | 715,335 | |||||||
|
| |||||||
| South Carolina — 0.6% | ||||||||
South Carolina Ports Authority, Private Airport & Marina Revenue, | 100,000 | 100,867 | ||||||
South Carolina Public Service Authority, Nuclear Revenue, | 365,000 | 391,711 | ||||||
Series E, 5.25%, 12/1/55 | 50,000 | 54,614 | ||||||
|
| |||||||
(Cost $539,439) | 547,192 | |||||||
|
| |||||||
| Tennessee — 1.4% | ||||||||
Metropolitan Nashville Airport Authority, Private Airport & Marina Revenue, | ||||||||
Series B, AMT, 4.00%, 7/1/54 | 550,000 | 584,408 | ||||||
Series A, 5.00%, 7/1/54 | 525,000 | 624,986 | ||||||
Series B, AMT, 5.00%, 7/1/54 | 100,000 | 117,129 | ||||||
|
| |||||||
(Cost $1,381,778) | 1,326,523 | |||||||
|
| |||||||
| Texas — 6.9% | ||||||||
Central Texas Regional Mobility Authority, Highway Revenue Tolls, | 100,000 | 107,986 | ||||||
City of Houston TX Combined Utility System, Water Revenue, | 500,000 | 611,520 | ||||||
Series D, 5.00%, 11/15/39 | 85,000 | 98,360 | ||||||
City of San Antonio TX Electric & Gas Systems, Electric, Power & Light Revenue, | 150,000 | 184,118 | ||||||
County of Harris TX, Highway Revenue Tolls, | 200,000 | 239,142 | ||||||
Dallas Area Rapid Transit, Sales Tax Revenue, | 855,000 | 996,357 | ||||||
Harris County Toll Road Authority, Highway Revenue Tolls, | 555,000 | 630,635 | ||||||
North Texas Tollway Authority, Highway Revenue Tolls, | 500,000 | 566,920 | ||||||
Series A, 5.00%, 1/1/43 | 125,000 | 149,145 | ||||||
Series A, 5.00%, 1/1/48 | 1,500,000 | 1,775,010 | ||||||
Series B, 5.00%, 1/1/48 | 390,000 | 443,598 | ||||||
San Antonio Water System, Water Revenue, | 155,000 | 182,443 | ||||||
Principal | Value | |||||||
| Texas (Continued) | ||||||||
Texas Water Development Board, Water Revenue, | $ | 600,000 | $ | 720,660 | ||||
|
| |||||||
(Cost $6,412,367) | 6,705,894 | |||||||
|
| |||||||
| Utah — 1.3% | ||||||||
Salt Lake City Corp Airport, Private Airport & Marina Revenue, | ||||||||
Series A, AMT, 5.00%, 7/1/43 | 400,000 | 456,968 | ||||||
Series A, AMT, 5.00%, 7/1/47 | 450,000 | 504,662 | ||||||
Series A, AMT, 5.25%, 7/1/48 | 225,000 | 259,443 | ||||||
|
| |||||||
(Cost $1,198,500) | 1,221,073 | |||||||
|
| |||||||
| Virginia — 1.6% | ||||||||
Chesapeake Bay Bridge & Tunnel District, Highway Revenue Tolls, | 190,000 | 225,042 | ||||||
Virginia Small Business Financing Authority, Highway Revenue Tolls, | 550,000 | 575,652 | ||||||
AMT, 5.00%, 12/31/56 | 750,000 | 782,647 | ||||||
|
| |||||||
(Cost $1,609,838) | 1,583,341 | |||||||
|
| |||||||
| Washington — 3.3% | ||||||||
Central Puget Sound Regional Transit Authority, Sales Tax Revenue, | 120,000 | 142,139 | ||||||
Series S-1, 5.00%, 11/1/45 | 400,000 | 466,084 | ||||||
Series 1, 5.00%, 11/1/50 | 190,000 | 220,539 | ||||||
Energy Northwest, Nuclear Revenue, Series A, 5.00%, 7/1/38 | 300,000 | 388,554 | ||||||
Port of Seattle WA, Private Airport & Marina Revenue, | 190,000 | 218,568 | ||||||
AMT, 5.00%, 4/1/44 | 1,500,000 | 1,731,405 | ||||||
|
| |||||||
(Cost $3,081,638) | 3,167,289 | |||||||
|
| |||||||
| Wisconsin — 0.4% | ||||||||
Wisconsin Department of Transportation, Miscellaneous Revenue, | 45,000 | 57,536 | ||||||
Wisconsin Health & Educational Facilities Authority, Electric, Power & Light Revenue, 5.00%, 4/1/44 | 245,000 | 301,389 | ||||||
|
| |||||||
(Cost $330,547) | 358,925 | |||||||
|
| |||||||
TOTAL MUNICIPAL BONDS | 95,441,452 | |||||||
|
| |||||||
TOTAL INVESTMENTS — 98.3% | $ | 95,441,452 | ||||||
Other assets and liabilities, net — 1.7% | 1,695,857 | |||||||
|
| |||||||
NET ASSETS — 100.0% | $ | 97,137,309 | ||||||
|
| |||||||
| AMT: | Alternative Minimum Tax |
| See Notes to Financial Statements. | 43 |
DBX ETF Trust
Schedule of Investments
Xtrackers Municipal Infrastructure Revenue Bond ETF (Continued)
May 31, 2020
Fair Value Measurements
Various inputs are used in determining the value of the Fund’s investments. These inputs are summarized in three broad levels. Level 1 includes quoted prices in active markets for identical securities. Level 2 includes other significant observable inputs (including quoted prices for similar securities, interest rates, prepayment speeds and credit risk). Level 3 includes significant unobservable inputs (including the Fund’s own assumptions in determining the fair value of investments). The level assigned to the securities valuations may not be an indication of the risk or liquidity associated with investing in those securities.
The following is a summary of the inputs used as of May 31, 2020 in valuing the Fund’s investments. For information on the Fund’s policy regarding the valuation of investments, please refer to the Security Valuation section of Note 2 in the accompanying Notes to Financial Statements.
Assets | Level 1 | Level 2 | Level 3 | Total | ||||||||||||
Municipal Bonds (a) | $ | — | $ | 95,441,452 | $ | — | $ | 95,441,452 | ||||||||
|
|
|
|
|
|
|
| |||||||||
TOTAL | $ | — | $ | 95,441,452 | $ | — | $ | 95,441,452 | ||||||||
|
|
|
|
|
|
|
| |||||||||
| (a) | See Schedule of Investments for additional detailed categorizations. |
| See Notes to Financial Statements. | 44 |
DBX ETF Trust
Schedule of Investments
Xtrackers MSCI All World ex US High Dividend Yield Equity ETF
May 31, 2020
Number | Value | |||||||
| COMMON STOCKS — 98.0% | ||||||||
| Australia — 4.8% | ||||||||
AGL Energy Ltd. | 3,918 | $ | 43,589 | |||||
Aurizon Holdings Ltd. | 12,553 | 39,580 | ||||||
BHP Group Ltd. | 18,227 | 419,112 | ||||||
Coca-Cola Amatil Ltd. | 3,115 | 18,114 | ||||||
Crown Resorts Ltd. | 2,329 | 14,826 | ||||||
Fortescue Metals Group Ltd. | 10,472 | 96,623 | ||||||
Insurance Australia Group Ltd. | 14,299 | 57,994 | ||||||
Medibank Pvt Ltd. | 17,465 | 33,041 | ||||||
Qantas Airways Ltd. | 4,379 | 11,598 | ||||||
Treasury Wine Estates Ltd. | 4,443 | 28,490 | ||||||
Wesfarmers Ltd. | 7,011 | 187,878 | ||||||
|
| |||||||
(Cost $1,043,002) | 950,845 | |||||||
|
| |||||||
| Belgium — 0.1% | ||||||||
Proximus SADP | 945 | 19,757 | ||||||
|
| |||||||
| Brazil — 0.3% | ||||||||
BB Seguridade Participacoes SA | 4,278 | 19,912 | ||||||
Cielo SA | 7,460 | 5,618 | ||||||
Engie Brasil Energia SA | 1,157 | 9,035 | ||||||
Hypera SA | 2,344 | 13,906 | ||||||
Porto Seguro SA | 587 | 5,112 | ||||||
|
| |||||||
(Cost $65,732) | 53,583 | |||||||
|
| |||||||
| Canada — 8.9% | ||||||||
BCE, Inc. | 942 | 39,004 | ||||||
Canadian Imperial Bank of Commerce | 2,756 | 176,043 | ||||||
Canadian Tire Corp. Ltd., Class A | 358 | 30,464 | ||||||
Great-West Lifeco, Inc. | 1,766 | 28,645 | ||||||
iA Financial Corp., Inc. | 660 | 20,996 | ||||||
IGM Financial, Inc. | 519 | 12,278 | ||||||
Inter Pipeline Ltd. | 2,599 | 23,711 | ||||||
Keyera Corp. | 1,345 | 21,233 | ||||||
Magna International, Inc. | 1,789 | 75,148 | ||||||
Manulife Financial Corp. | 12,044 | 149,003 | ||||||
Pembina Pipeline Corp. (a) | 3,390 | 84,370 | ||||||
Power Corp. of Canada | 3,498 | 56,714 | ||||||
Royal Bank of Canada | 8,817 | 569,833 | ||||||
Shaw Communications, Inc., Class B | 2,912 | 48,941 | ||||||
Sun Life Financial, Inc. (a) | 3,636 | 124,243 | ||||||
TC Energy Corp. | 5,809 | 260,779 | ||||||
TELUS Corp. | 2,684 | 46,332 | ||||||
|
| |||||||
(Cost $2,145,805) | 1,767,737 | |||||||
|
| |||||||
| Chile — 0.2% | ||||||||
Cia Cervecerias Unidas SA | 937 | 6,735 | ||||||
Enel Americas SA | 208,233 | 30,128 | ||||||
Enel Chile SA | 166,595 | 12,412 | ||||||
|
| |||||||
(Cost $57,756) | 49,275 | |||||||
|
| |||||||
| China — 7.5% | ||||||||
Beijing Capital International Airport Co. Ltd., Class H | 9,155 | 5,705 | ||||||
China Construction Bank Corp., Class H | 595,238 | 467,682 | ||||||
China Fortune Land Development Co. Ltd., Class A | 1,700 | 5,140 | ||||||
Number | Value | |||||||
| China (Continued) | ||||||||
China Medical System Holdings Ltd. | 8,000 | $ | 9,114 | |||||
China Pacific Insurance Group Co. Ltd., Class H | 17,000 | 46,717 | ||||||
China Petroleum & Chemical Corp., Class A | 8,900 | 5,143 | ||||||
China Petroleum & Chemical Corp., Class H | 149,944 | 69,449 | ||||||
China Shenhua Energy Co. Ltd., Class A | 1,500 | 3,430 | ||||||
China Shenhua Energy Co. Ltd., Class H | 21,842 | 39,902 | ||||||
China Telecom Corp. Ltd., Class H | 80,751 | 26,775 | ||||||
China Vanke Co. Ltd., Class A | 4,100 | 14,708 | ||||||
China Vanke Co. Ltd., Class H | 8,696 | 28,216 | ||||||
China Yangtze Power Co. Ltd., Class A | 9,300 | 22,574 | ||||||
CIFI Holdings Group Co. Ltd. | 17,004 | 12,219 | ||||||
CNOOC Ltd. | 111,480 | 124,122 | ||||||
Country Garden Holdings Co. Ltd. | 47,004 | 58,096 | ||||||
CRRC Corp. Ltd., Class H | 26,000 | 12,143 | ||||||
Daqin Railway Co. Ltd., Class A | 5,300 | 5,045 | ||||||
Dongfeng Motor Group Co. Ltd., Class H | 19,354 | 12,135 | ||||||
Fuyao Glass Industry Group Co. Ltd., Class A (b) | 800 | 2,193 | ||||||
Fuyao Glass Industry Group Co. Ltd., Class H, 144A | 2,863 | 6,279 | ||||||
Gemdale Corp., Class A | 1,900 | 3,381 | ||||||
Guangzhou Automobile Group Co. Ltd., Class H | 19,631 | 16,133 | ||||||
Hengan International Group Co. Ltd. | 3,937 | 32,152 | ||||||
Huaxin Cement Co. Ltd., Class A | 600 | 2,081 | ||||||
Huayu Automotive Systems Co. Ltd., Class A | 900 | 2,406 | ||||||
Industrial & Commercial Bank of China Ltd., Class H | 376,138 | 242,638 | ||||||
Jiangsu Expressway Co. Ltd., Class H | 7,491 | 8,824 | ||||||
Logan Property Holdings Co. Ltd. | 9,288 | 13,828 | ||||||
PICC Property & Casualty Co. Ltd., Class H | 42,000 | 36,359 | ||||||
Postal Savings Bank of China Co. Ltd., Class H, 144A | 61,258 | 38,963 | ||||||
RiseSun Real Estate Development Co. Ltd., Class A | 2,000 | 2,175 | ||||||
SAIC Motor Corp. Ltd., Class A | 2,700 | 6,754 | ||||||
Seazen Holdings Co. Ltd., Class A (b) | 900 | 3,932 | ||||||
Shanghai International Port Group Co. Ltd., Class A | 4,800 | 2,713 | ||||||
Shanghai Lujiazui Finance & Trade Zone Development Co. Ltd., Class B | 8,740 | 6,170 | ||||||
Shenergy Co. Ltd., Class A | 3,400 | 2,553 | ||||||
Shenzhen Expressway Co. Ltd., Class H (b) | 4,000 | 4,046 | ||||||
Shenzhen Overseas Chinese Town Co. Ltd., Class A (b) | 3,000 | 2,445 | ||||||
Sinopec Shanghai Petrochemical Co. Ltd., Class H | 23,938 | 5,899 | ||||||
Sinotruk Hong Kong Ltd. | 4,463 | 10,837 | ||||||
Wanhua Chemical Group Co. Ltd., Class A | 1,563 | 10,140 | ||||||
Want Want China Holdings Ltd. | 30,000 | 21,559 | ||||||
Weichai Power Co. Ltd., Class A | 2,100 | 3,822 | ||||||
Weichai Power Co. Ltd., Class H | 11,818 | 20,462 | ||||||
Youngor Group Co. Ltd., Class A | 2,900 | 2,514 | ||||||
| See Notes to Financial Statements. | 45 |
DBX ETF Trust
Schedule of Investments
Xtrackers MSCI All World ex US High Dividend Yield Equity ETF (Continued)
May 31, 2020
Number | Value | |||||||
| China (Continued) | ||||||||
Yuzhou Properties Co. Ltd. | 12,281 | $ | 5,023 | |||||
Zhejiang Expressway Co. Ltd., Class H | 10,049 | 7,066 | ||||||
|
| |||||||
(Cost $1,781,007) | 1,491,662 | |||||||
|
| |||||||
| Colombia — 0.1% | ||||||||
Ecopetrol SA | 29,732 | 15,935 | ||||||
|
| |||||||
| Cyprus — 0.1% | ||||||||
Polymetal International PLC | 1,449 | 28,994 | ||||||
|
| |||||||
| Denmark — 0.2% | ||||||||
Pandora A/S | 618 | 30,777 | ||||||
|
| |||||||
| Egypt — 0.0% | ||||||||
Eastern Co. SAE | 8,172 | 6,415 | ||||||
|
| |||||||
| Finland — 1.0% | ||||||||
Elisa OYJ | 880 | 55,189 | ||||||
Fortum OYJ | 2,731 | 52,311 | ||||||
UPM-Kymmene OYJ | 3,300 | 95,330 | ||||||
|
| |||||||
(Cost $216,762) | 202,830 | |||||||
|
| |||||||
| France — 6.6% | ||||||||
Faurecia SE* | 468 | 18,043 | ||||||
Sanofi | 6,992 | 680,770 | ||||||
Sodexo SA | 547 | 36,836 | ||||||
TOTAL SA | 15,300 | 572,263 | ||||||
|
| |||||||
(Cost $1,547,294) | 1,307,912 | |||||||
|
| |||||||
| Germany — 7.5% | ||||||||
Allianz SE | 2,583 | 467,815 | ||||||
Bayer AG | 6,086 | 411,060 | ||||||
Hannover Rueck SE | 373 | 59,995 | ||||||
HOCHTIEF AG | 155 | 13,638 | ||||||
METRO AG | 1,101 | 10,283 | ||||||
Siemens AG | 4,732 | 518,627 | ||||||
|
| |||||||
(Cost $1,645,976) | 1,481,418 | |||||||
|
| |||||||
| Greece — 0.1% | ||||||||
Motor Oil Hellas Corinth Refineries SA | 424 | 7,075 | ||||||
OPAP SA | 1,051 | 9,820 | ||||||
|
| |||||||
(Cost $22,229) | 16,895 | |||||||
|
| |||||||
| Hong Kong — 7.1% | ||||||||
Beijing Enterprises Holdings Ltd. | 3,000 | 9,967 | ||||||
BOC Hong Kong Holdings Ltd. | 23,104 | 64,385 | ||||||
Bosideng International Holdings Ltd. | 18,000 | 4,621 | ||||||
China Everbright International Ltd. | 23,477 | 12,055 | ||||||
China Merchants Port Holdings Co. Ltd. | 9,050 | 11,010 | ||||||
China Mobile Ltd. | 38,247 | 266,954 | ||||||
China Overseas Land & Investment Ltd. | 24,000 | 73,074 | ||||||
China Resources Cement Holdings Ltd. | 14,245 | 17,882 | ||||||
China Resources Land Ltd. | 20,000 | 78,829 | ||||||
China State Construction International Holdings Ltd. | 13,012 | 8,024 | ||||||
CK Asset Holdings Ltd. | 16,000 | 87,008 | ||||||
CK Hutchison Holdings Ltd. | 16,500 | 100,903 | ||||||
Number | Value | |||||||
| Hong Kong (Continued) | ||||||||
CK Infrastructure Holdings Ltd. | 4,108 | $ | 20,511 | |||||
CLP Holdings Ltd. | 10,244 | 100,378 | ||||||
Guangdong Investment Ltd. | 18,790 | 36,993 | ||||||
Hang Lung Properties Ltd. | 12,595 | 26,487 | ||||||
Hang Seng Bank Ltd. | 4,773 | 72,602 | ||||||
Henderson Land Development Co. Ltd. | 8,653 | 30,868 | ||||||
HKT Trust & HKT Ltd. (c) | 23,602 | 33,556 | ||||||
Jardine Matheson Holdings Ltd. | 1,400 | 56,210 | ||||||
Kerry Properties Ltd. | 4,101 | 9,682 | ||||||
Kingboard Holdings Ltd. | 4,653 | 11,226 | ||||||
Kingboard Laminates Holdings Ltd. | 6,279 | 5,468 | ||||||
Lee & Man Paper Manufacturing Ltd. | 8,064 | 4,338 | ||||||
New World Development Co. Ltd. | 37,517 | 37,803 | ||||||
Power Assets Holdings Ltd. | 8,833 | 49,174 | ||||||
Shimao Property Holdings Ltd. | 7,613 | 31,627 | ||||||
Sino Land Co. Ltd. | 19,850 | 23,126 | ||||||
Sun Hung Kai Properties Ltd. | 7,975 | 91,572 | ||||||
Wharf Real Estate Investment Co. Ltd. | 6,759 | 25,986 | ||||||
|
| |||||||
(Cost $1,664,925) | 1,402,319 | |||||||
|
| |||||||
| India — 0.5% | ||||||||
Bajaj Auto Ltd. | 519 | 18,604 | ||||||
Bharat Petroleum Corp. Ltd. | 4,035 | 18,292 | ||||||
Bharti Infratel Ltd. | 1,734 | 5,273 | ||||||
GAIL India Ltd. | 9,566 | 11,683 | ||||||
Hero MotoCorp Ltd. | 606 | 18,920 | ||||||
Hindustan Petroleum Corp. Ltd. | 3,965 | 10,202 | ||||||
Indian Oil Corp. Ltd. | 13,302 | 14,636 | ||||||
|
| |||||||
(Cost $123,475) | 97,610 | |||||||
|
| |||||||
| Indonesia — 1.0% | ||||||||
PT Adaro Energy Tbk | 112,376 | 8,461 | ||||||
PT Bank Mandiri Persero Tbk | 114,500 | 35,032 | ||||||
PT Bank Rakyat Indonesia Persero Tbk | 340,900 | 68,834 | ||||||
PT Gudang Garam Tbk | 2,985 | 9,960 | ||||||
PT Telekomunikasi Indonesia Persero Tbk | 305,127 | 65,787 | ||||||
PT United Tractors Tbk | 11,585 | 12,449 | ||||||
|
| |||||||
(Cost $227,632) | 200,523 | |||||||
|
| |||||||
| Israel — 0.2% | ||||||||
Bank Leumi Le-Israel BM | 8,923 | 47,221 | ||||||
|
| |||||||
| Italy — 1.1% | ||||||||
Assicurazioni Generali SpA | 6,816 | 94,658 | ||||||
Snam SpA | 12,581 | 58,553 | ||||||
Terna Rete Elettrica Nazionale SpA | 8,628 | 58,256 | ||||||
|
| |||||||
(Cost $229,478) | 211,467 | |||||||
|
| |||||||
| Japan — 12.2% | ||||||||
Amada Co. Ltd. | 2,000 | 17,840 | ||||||
Asahi Kasei Corp. | 7,700 | 60,751 | ||||||
Bridgestone Corp. | 3,300 | 109,566 | ||||||
Canon, Inc. | 6,170 | 127,083 | ||||||
Dai-ichi Life Holdings, Inc. | 6,700 | 87,252 | ||||||
Daito Trust Construction Co. Ltd. | 400 | 42,270 | ||||||
Daiwa House Industry Co. Ltd. | 3,500 | 86,887 | ||||||
Isuzu Motors Ltd. | 3,300 | 30,922 | ||||||
ITOCHU Corp. | 8,300 | 177,964 | ||||||
| See Notes to Financial Statements. | 46 |
DBX ETF Trust
Schedule of Investments
Xtrackers MSCI All World ex US High Dividend Yield Equity ETF (Continued)
May 31, 2020
Number | Value | |||||||
| Japan (Continued) | ||||||||
Japan Tobacco, Inc. | 7,409 | $ | 146,997 | |||||
Komatsu Ltd. | 5,400 | 109,268 | ||||||
Kuraray Co. Ltd. | 1,900 | 19,964 | ||||||
Marubeni Corp. | 10,200 | 49,544 | ||||||
Mitsubishi Chemical Holdings Corp. | 8,000 | 47,101 | ||||||
Mitsubishi Gas Chemical Co., Inc. | 1,000 | 14,888 | ||||||
MS&AD Insurance Group Holdings, Inc. | 2,778 | 81,611 | ||||||
NGK Spark Plug Co. Ltd. | 1,000 | 16,123 | ||||||
Nikon Corp. | 1,900 | 17,460 | ||||||
Nippon Telegraph & Telephone Corp. | 8,000 | 181,482 | ||||||
NSK Ltd. | 2,500 | 18,286 | ||||||
NTT DOCOMO, Inc. | 7,200 | 197,251 | ||||||
Pola Orbis Holdings, Inc. | 600 | 11,673 | ||||||
Seiko Epson Corp. | 1,700 | 19,156 | ||||||
Sekisui House Ltd. | 3,875 | 73,824 | ||||||
Softbank Corp. | 11,800 | 149,615 | ||||||
Sompo Holdings, Inc. | 2,100 | 74,694 | ||||||
Subaru Corp. | 3,848 | 84,954 | ||||||
Sumitomo Chemical Co. Ltd. | 9,400 | 29,142 | ||||||
Sumitomo Electric Industries Ltd. | 4,600 | 53,564 | ||||||
Sumitomo Heavy Industries Ltd. | 700 | 15,984 | ||||||
T&D Holdings, Inc. | 3,200 | 28,901 | ||||||
Tokio Marine Holdings, Inc. | 3,900 | 168,981 | ||||||
Tosoh Corp. | 1,600 | 22,247 | ||||||
Yamaha Motor Co. Ltd. | 1,800 | 25,980 | ||||||
Yokohama Rubber Co. Ltd. | 700 | 10,571 | ||||||
|
| |||||||
(Cost $2,619,591) | 2,409,796 | |||||||
|
| |||||||
| Luxembourg — 0.2% | ||||||||
Aroundtown SA | 7,092 | 38,986 | ||||||
|
| |||||||
| Malaysia — 0.7% | ||||||||
HAP Seng Consolidated Bhd | 5,182 | 8,928 | ||||||
Maxis Bhd | 14,400 | 17,489 | ||||||
MISC Bhd | 8,100 | 15,464 | ||||||
Petronas Gas Bhd | 4,900 | 21,415 | ||||||
Public Bank Bhd | 17,800 | 60,022 | ||||||
Sime Darby Bhd | 15,600 | 7,499 | ||||||
|
| |||||||
(Cost $132,160) | 130,817 | |||||||
|
| |||||||
| Mexico — 0.4% | ||||||||
Coca-Cola Femsa SAB de CV | 3,057 | 13,371 | ||||||
Grupo Aeroportuario del Pacifico SAB de CV, Class B | 2,473 | 16,359 | ||||||
Grupo Mexico SAB de CV, Series B | 19,215 | 41,226 | ||||||
Kimberly-Clark de Mexico SAB de CV, Class A | 9,163 | 14,252 | ||||||
|
| |||||||
(Cost $86,713) | 85,208 | |||||||
|
| |||||||
| Netherlands — 0.3% | ||||||||
NN Group NV | 1,787 | 55,200 | ||||||
|
| |||||||
| New Zealand — 0.2% | ||||||||
Spark New Zealand Ltd. | 11,599 | 31,747 | ||||||
|
| |||||||
Number | Value | |||||||
| Norway — 0.7% | ||||||||
Equinor ASA | 6,180 | $ | 89,742 | |||||
Mowi ASA | 2,704 | 50,922 | ||||||
|
| |||||||
(Cost $183,647) | 140,664 | |||||||
|
| |||||||
| Peru — 0.4% | ||||||||
Credicorp Ltd. | 419 | 57,747 | ||||||
Southern Copper Corp. (a) | 528 | 19,166 | ||||||
|
| |||||||
(Cost $75,882) | 76,913 | |||||||
|
| |||||||
| Philippines — 0.1% | ||||||||
Aboitiz Power Corp. | 9,400 | 5,163 | ||||||
Globe Telecom, Inc. | 227 | 10,287 | ||||||
International Container Terminal Services, Inc. | 5,760 | 9,979 | ||||||
|
| |||||||
(Cost $23,222) | 25,429 | |||||||
|
| |||||||
| Poland — 0.3% | ||||||||
Polski Koncern Naftowy ORLEN SA | 1,844 | 30,744 | ||||||
Powszechna Kasa Oszczednosci Bank Polski SA | 5,385 | 29,990 | ||||||
|
| |||||||
(Cost $60,752) | 60,734 | |||||||
|
| |||||||
| Portugal — 0.6% | ||||||||
EDP — Energias de Portugal SA | 15,690 | 73,703 | ||||||
Galp Energia SGPS SA | 3,257 | 38,820 | ||||||
|
| |||||||
(Cost $113,747) | 112,523 | |||||||
|
| |||||||
| Qatar — 0.4% | ||||||||
Barwa Real Estate Co. | 11,072 | 8,819 | ||||||
Industries Qatar QSC | 11,143 | 24,085 | ||||||
Masraf Al Rayan QSC | 22,561 | 24,290 | ||||||
Qatar Electricity & Water Co. QSC | 3,560 | 14,588 | ||||||
Qatar Fuel QSC | 2,991 | 13,144 | ||||||
|
| |||||||
(Cost $86,057) | 84,926 | |||||||
|
| |||||||
| Russia — 3.5% | ||||||||
Alrosa PJSC | 15,374 | 14,364 | ||||||
Gazprom PJSC | 73,145 | 207,037 | ||||||
Inter RAO UES PJSC | 233,773 | 16,361 | ||||||
LUKOIL PJSC | 2,563 | 190,208 | ||||||
Magnitogorsk Iron & Steel Works PJSC | 12,862 | 7,363 | ||||||
MMC Norilsk Nickel PJSC | 391 | 122,379 | ||||||
Mobile TeleSystems PJSC, ADR | 2,728 | 24,252 | ||||||
Novolipetsk Steel PJSC | 8,295 | 16,177 | ||||||
PhosAgro PJSC, GDR | 820 | 11,316 | ||||||
Severstal PAO | 1,438 | 19,025 | ||||||
Tatneft PJSC | 8,776 | 66,092 | ||||||
|
| |||||||
(Cost $650,923) | 694,574 | |||||||
|
| |||||||
| Saudi Arabia — 2.5% | ||||||||
Advanced Petrochemical Co. | 782 | 10,083 | ||||||
Al Rajhi Bank | 7,520 | 112,475 | ||||||
Arab National Bank | 3,939 | 20,714 | ||||||
Bank AlBilad | 2,256 | 13,041 | ||||||
Bank Al-Jazira | 2,466 | 7,364 | ||||||
Banque Saudi Fransi | 3,714 | 29,406 | ||||||
Jarir Marketing Co. | 361 | 13,047 | ||||||
National Commercial Bank | 9,024 | 89,820 | ||||||
| See Notes to Financial Statements. | 47 |
DBX ETF Trust
Schedule of Investments
Xtrackers MSCI All World ex US High Dividend Yield Equity ETF (Continued)
May 31, 2020
Number | Value | |||||||
| Saudi Arabia (Continued) | ||||||||
Riyad Bank | 7,825 | $ | 34,153 | |||||
Samba Financial Group | 6,016 | 37,721 | ||||||
Saudi British Bank | 4,691 | 28,589 | ||||||
Saudi Telecom Co. | 3,683 | 98,017 | ||||||
|
| |||||||
(Cost $581,857) | 494,430 | |||||||
|
| |||||||
| Singapore — 1.2% | ||||||||
Oversea-Chinese Banking Corp. Ltd. | 20,400 | 123,405 | ||||||
Singapore Exchange Ltd. | 5,241 | 30,703 | ||||||
Singapore Telecommunications Ltd. | 50,446 | 88,871 | ||||||
|
| |||||||
(Cost $321,928) | 242,979 | |||||||
|
| |||||||
| South Africa — 1.5% | ||||||||
Absa Group Ltd. | 4,381 | 20,178 | ||||||
Exxaro Resources Ltd. | 1,655 | 11,634 | ||||||
FirstRand Ltd. | 20,763 | 47,263 | ||||||
Kumba Iron Ore Ltd. | 445 | 11,973 | ||||||
Mr Price Group Ltd. | 1,455 | 10,729 | ||||||
Old Mutual Ltd. | 29,262 | 18,640 | ||||||
Pick n Pay Stores Ltd. | 2,084 | 6,299 | ||||||
Remgro Ltd. | 3,129 | 24,664 | ||||||
RMB Holdings Ltd. | 5,071 | 15,234 | ||||||
Sanlam Ltd. | 11,538 | 37,023 | ||||||
SPAR Group Ltd. | 1,188 | 11,806 | ||||||
Standard Bank Group Ltd. | 7,975 | 45,965 | ||||||
Vodacom Group Ltd. | 4,017 | 28,762 | ||||||
|
| |||||||
(Cost $572,452) | 290,170 | |||||||
|
| |||||||
| South Korea — 0.6% | ||||||||
Cheil Worldwide, Inc. | 416 | 5,576 | ||||||
Doosan Bobcat, Inc. | 306 | 5,856 | ||||||
KT&G Corp. | 724 | 49,048 | ||||||
Samsung Fire & Marine Insurance Co. Ltd. | 191 | 28,146 | ||||||
SK Telecom Co. Ltd. | 125 | 21,801 | ||||||
|
| |||||||
(Cost $144,898) | 110,427 | |||||||
|
| |||||||
| Spain — 4.4% | ||||||||
ACS Actividades de Construccion y Servicios SA | 1,583 | 40,411 | ||||||
Enagas SA | 1,540 | 34,620 | ||||||
Endesa SA | 1,951 | 46,334 | ||||||
Iberdrola SA | 35,926 | 387,155 | ||||||
Industria de Diseno Textil SA | 6,751 | 188,112 | ||||||
Mapfre SA | 7,457 | 13,131 | ||||||
Naturgy Energy Group SA | 1,880 | 34,913 | ||||||
Red Electrica Corp. SA | 2,668 | 47,009 | ||||||
Repsol SA | 8,653 | 80,563 | ||||||
|
| |||||||
(Cost $833,064) | 872,248 | |||||||
|
| |||||||
| Sweden — 0.1% | ||||||||
Lundin Energy AB | 1,148 | 27,669 | ||||||
|
| |||||||
| Switzerland — 2.9% | ||||||||
Adecco Group AG | 962 | 45,682 | ||||||
Baloise Holding AG | 284 | 40,381 | ||||||
Swiss Life Holding AG | 198 | 69,538 | ||||||
Swiss Prime Site AG | 481 | 44,761 | ||||||
Swisscom AG | 160 | 83,239 | ||||||
Number | Value | |||||||
| Switzerland (Continued) | ||||||||
Zurich Insurance Group AG | 926 | $ | 298,321 | |||||
|
| |||||||
(Cost $588,930) | 581,922 | |||||||
|
| |||||||
| Taiwan — 3.2% | ||||||||
Asia Cement Corp. | 13,000 | 18,856 | ||||||
Catcher Technology Co. Ltd. | 4,473 | 32,477 | ||||||
Chicony Electronics Co. Ltd. | 3,000 | 8,593 | ||||||
Compal Electronics, Inc. | 24,837 | 15,800 | ||||||
CTBC Financial Holding Co. Ltd. | 107,904 | 71,696 | ||||||
Eclat Textile Co. Ltd. | 1,000 | 10,291 | ||||||
Far EasTone Telecommunications Co. Ltd. | 9,570 | 20,622 | ||||||
Feng TAY Enterprise Co. Ltd. | 2,000 | 12,057 | ||||||
First Financial Holding Co. Ltd. | 61,330 | 46,674 | ||||||
Formosa Chemicals & Fibre Corp. | 21,266 | 50,996 | ||||||
Formosa Petrochemical Corp. | 7,298 | 21,317 | ||||||
Formosa Plastics Corp. | 23,011 | 63,611 | ||||||
Formosa Taffeta Co. Ltd. | 6,050 | 6,891 | ||||||
Foxconn Technology Co. Ltd. | 5,934 | 10,652 | ||||||
Globalwafers Co. Ltd. | 1,486 | 17,891 | ||||||
Lite-On Technology Corp. | 12,802 | 20,509 | ||||||
Micro-Star International Co. Ltd. | 4,394 | 14,781 | ||||||
Nien Made Enterprise Co. Ltd. | 1,245 | 10,657 | ||||||
Novatek Microelectronics Corp. | 4,037 | 27,563 | ||||||
Phison Electronics Corp. | 971 | 8,893 | ||||||
Pou Chen Corp. | 15,194 | 14,954 | ||||||
Powertech Technology, Inc. | 3,695 | 11,937 | ||||||
Shanghai Commercial & Savings Bank Ltd. | 20,000 | 28,510 | ||||||
Standard Foods Corp. | 3,041 | 6,431 | ||||||
Taiwan Cement Corp. | 28,449 | 40,317 | ||||||
Vanguard International Semiconductor Corp. | 5,419 | 13,265 | ||||||
Walsin Technology Corp. | 2,156 | 13,428 | ||||||
Zhen Ding Technology Holding Ltd. | 3,808 | 15,156 | ||||||
|
| |||||||
(Cost $647,759) | 634,825 | |||||||
|
| |||||||
| Thailand — 0.6% | ||||||||
Bangkok Commercial Asset Management PCL, NVDR | 11,000 | 8,161 | ||||||
Land & Houses PCL, NVDR | 54,000 | 12,392 | ||||||
PTT PCL, NVDR | 70,400 | 78,567 | ||||||
Siam Commercial Bank PCL, NVDR | 5,600 | 13,027 | ||||||
|
| |||||||
(Cost $170,200) | 112,147 | |||||||
|
| |||||||
| Turkey — 0.0% | ||||||||
Ford Otomotiv Sanayi AS | 589 | 5,341 | ||||||
TAV Havalimanlari Holding AS | 1,531 | 4,556 | ||||||
|
| |||||||
(Cost $15,172) | 9,897 | |||||||
|
| |||||||
| United Arab Emirates — 0.4% | ||||||||
Aldar Properties PJSC | 23,808 | 11,213 | ||||||
Dubai Islamic Bank PJSC | 10,699 | 10,340 | ||||||
Emirates NBD Bank PJSC | 7,670 | 18,042 | ||||||
Emirates Telecommunications Group Co. PJSC | 10,900 | 46,411 | ||||||
|
| |||||||
(Cost $90,417) | 86,006 | |||||||
|
| |||||||
| See Notes to Financial Statements. | 48 |
DBX ETF Trust
Schedule of Investments
Xtrackers MSCI All World ex US High Dividend Yield Equity ETF (Continued)
May 31, 2020
Number | Value | |||||||
| United Kingdom — 13.3% | ||||||||
3i Group PLC | 6,003 | $ | 61,227 | |||||
Admiral Group PLC | 1,182 | 34,092 | ||||||
Anglo American PLC | 7,591 | 159,597 | ||||||
Barratt Developments PLC | 6,306 | 38,747 | ||||||
British American Tobacco PLC | 14,191 | 559,577 | ||||||
GlaxoSmithKline PLC | 31,079 | 642,355 | ||||||
Imperial Brands PLC | 5,858 | 106,208 | ||||||
Johnson Matthey PLC | 1,190 | 31,086 | ||||||
Legal & General Group PLC | 36,953 | 90,685 | ||||||
M&G PLC | 16,066 | 27,807 | ||||||
National Grid PLC | 21,694 | 248,356 | ||||||
Rio Tinto Ltd. | 2,266 | 140,490 | ||||||
Rio Tinto PLC | 6,978 | 372,078 | ||||||
Schroders PLC | 775 | 28,313 | ||||||
Severn Trent PLC | 1,464 | 44,181 | ||||||
Standard Life Aberdeen PLC | 14,452 | 46,150 | ||||||
|
| |||||||
(Cost $2,811,158) | 2,630,949 | |||||||
|
| |||||||
TOTAL COMMON STOCKS | 19,424,361 | |||||||
|
| |||||||
| PREFERRED STOCKS — 1.5% | ||||||||
| Brazil — 0.4% | ||||||||
Itausa — Investimentos Itau SA | 28,473 | 46,449 | ||||||
Telefonica Brasil SA | 2,727 | 23,670 | ||||||
|
| |||||||
(Cost $102,954) | 70,119 | |||||||
|
| |||||||
| Chile — 0.1% | ||||||||
Embotelladora Andina SA, Class B | 2,478 | 5,912 | ||||||
Number | Value | |||||||
| Chile (Continued) | ||||||||
Sociedad Quimica y Minera de Chile SA, Class B | 760 | $ | 18,546 | |||||
|
| |||||||
(Cost $28,255) | 24,458 | |||||||
|
| |||||||
| South Korea — 1.0% | ||||||||
Hyundai Motor Co. | 172 | 7,819 | ||||||
Hyundai Motor Co. — 2nd Preferred | 208 | 10,111 | ||||||
Samsung Electronics Co. Ltd. | 5,100 | 176,458 | ||||||
|
| |||||||
(Cost $180,790) | 194,388 | |||||||
|
| |||||||
TOTAL PREFERRED STOCKS | 288,965 | |||||||
|
| |||||||
| SECURITIES LENDING COLLATERAL — 1.2% | ||||||||
DWS Government & Agency Securities Portfolio “DWS Government Cash Institutional Shares”, 0.07% (d)(e) | 237,415 | 237,415 | ||||||
|
| |||||||
| CASH EQUIVALENTS — 0.6% | ||||||||
DWS Government Money Market Series “Institutional Shares”, 0.12% (d) | 128,203 | 128,203 | ||||||
|
| |||||||
TOTAL INVESTMENTS — 101.3% | $ | 20,078,944 | ||||||
Other assets and liabilities, net — (1.3%) | (250,973 | ) | ||||||
|
| |||||||
NET ASSETS — 100.0% | $ | 19,827,971 | ||||||
|
| |||||||
A summary of the Fund’s transactions with affiliated investments during the year ended May 31, 2020 is as follows:
| Value ($) at 5/31/2019 | Purchases Cost ($) | Sales Proceeds ($) | Net Realized Gain/(Loss) ($) | Net Change in Unrealized Appreciation (Depreciation) ($) | Income ($) | Capital Gain Distributions ($) | Number of Shares at 5/31/2020 | Value ($) at 5/31/2020 | ||||||||||||||||||||||||||||
EXCHANGE-TRADED FUNDS — 0.0% |
| |||||||||||||||||||||||||||||||||||
Xtrackers MSCI EAFE High Dividend Yield Equity ETF (g) |
| |||||||||||||||||||||||||||||||||||
| — | 265,988 | (256,106 | ) | (9,882 | ) | — | 272 | — | — | — | ||||||||||||||||||||||||||
SECURITIES LENDING COLLATERAL — 1.2% |
| |||||||||||||||||||||||||||||||||||
DWS Government & Agency Securities Portfolio “DWS Government Cash Institutional Shares”, 0.07% (d)(e) |
| |||||||||||||||||||||||||||||||||||
| 372,442 | — | (135,027 | )(f) | — | — | 4,465 | — | 237,415 | 237,415 | |||||||||||||||||||||||||||
CASH EQUIVALENTS — 0.6% |
| |||||||||||||||||||||||||||||||||||
DWS Government Money Market Series “Institutional Shares”, 0.12% (d) |
| |||||||||||||||||||||||||||||||||||
| 7,618 | 3,171,354 | (3,050,769 | ) | — | — | 797 | — | 128,203 | 128,203 | |||||||||||||||||||||||||||
|
|
|
|
|
|
|
|
|
|
|
|
|
|
|
|
|
| |||||||||||||||||||
| 380,060 | 3,437,342 | (3,441,902 | ) | (9,882 | ) | — | 5,534 | — | 365,618 | 365,618 | ||||||||||||||||||||||||||
|
|
|
|
|
|
|
|
|
|
|
|
|
|
|
|
|
| |||||||||||||||||||
| * | Non-income producing security. |
| (a) | All or a portion of these securities were on loan. In addition, “Other assets and liabilities, net” may include pending sales that are also on loan. The value of securities loaned at May 31, 2020 amounted to $240,724, which is 1.2% of net assets. |
| (b) | Company declared its annual dividend during the 12-month period ended May, 31 2020, the scheduled payment date was subsequent to May, 31 2020. |
| (c) | Stapled Security — A security contractually bound to one or more other securities to form a single saleable unit which cannot be sold separately. |
| (d) | Affiliated fund managed by DWS Investment Management Americas, Inc. The rate shown is the annualized seven-day yield at year end. |
| See Notes to Financial Statements. | 49 |
DBX ETF Trust
Schedule of Investments
Xtrackers MSCI All World ex US High Dividend Yield Equity ETF (Continued)
May 31, 2020
| (e) | Represents cash collateral held in connection with securities lending. Income earned by the Fund is net of borrower rebates. In addition, the Fund held non-cash U.S. Treasury securities collateral having a value of $21,022. |
| (f) | Represents the net increase (purchase cost) or decrease (sales proceeds) in the amount invested in cash collateral for the year ended May 31, 2020. |
| (g) | Affiliated fund advised by DBX Advisors LLC. |
| ADR: | American Depositary Receipt |
| GDR: | Global Depositary Receipt |
| NVDR: | Non Voting Depositary Receipt |
| PJSC: | Public Joint Stock Company |
| QSC: | Qatari Shareholders Company |
| SAE: | Societe Anonyme Egyptienne |
| 144A: | Security exempt from registration under Rule 144A of the Securities Act of 1933. These securities may be resold in transactions exempt from registration, normally to qualified institutional buyers. |
At May 31, 2020, open futures contracts purchased were as follows:
Contract Description | Currency | Number of Contracts | Notional Amount | Contract Value | Expiration Date | Unrealized Appreciation | ||||||||||||
MSCI EAFE Futures | USD | 1 | $ | 67,330 | $ | 86,280 | 6/19/2020 | $ | 18,950 | |||||||||
MINI S&P/TSX 60 Futures | CAD | 1 | 28,809 | 33,125 | 6/18/2020 | 4,316 | ||||||||||||
|
| |||||||||||||||||
Total unrealized appreciation | $ | 23,266 | ||||||||||||||||
|
| |||||||||||||||||
For information on the Fund’s policy and additional disclosures regarding open futures contracts, please refer to the Derivatives section of Note 2 in the accompanying Notes to Financial Statements.
Currency Abbreviations
| CAD | Canadian Dollar |
| USD | U.S. Dollar |
Fair Value Measurements
Various inputs are used in determining the value of the Fund’s investments. These inputs are summarized in three broad levels. Level 1 includes quoted prices in active markets for identical securities. Level 2 includes other significant observable inputs (including quoted prices for similar securities, interest rates, prepayment speeds and credit risk). Level 3 includes significant unobservable inputs (including the Fund’s own assumptions in determining the fair value of investments). The level assigned to the securities valuations may not be an indication of the risk or liquidity associated with investing in those securities.
The following is a summary of the inputs used as of May 31, 2020 in valuing the Fund’s investments. For information on the Fund’s policy regarding the valuation of investments, please refer to the Security Valuation section of Note 2 in the accompanying Notes to Financial Statements.
Assets | Level 1 | Level 2 | Level 3 | Total | ||||||||||||
Common Stocks (h) | $ | 19,424,361 | $ | — | $ | — | $ | 19,424,361 | ||||||||
Preferred Stocks (h) | 288,965 | — | — | 288,965 | ||||||||||||
Short-Term Investments (h) | 365,618 | — | — | 365,618 | ||||||||||||
Derivatives (i) | ||||||||||||||||
Futures Contracts | 23,266 | — | — | 23,266 | ||||||||||||
|
|
|
|
|
|
|
| |||||||||
TOTAL | $ | 20,102,210 | $ | — | $ | — | $ | 20,102,210 | ||||||||
|
|
|
|
|
|
|
| |||||||||
| (h) | See Schedule of Investments for additional detailed categorizations. |
| (i) | Derivatives include unrealized appreciation (depreciation) on open futures contracts. |
| See Notes to Financial Statements. | 50 |
DBX ETF Trust
Schedule of Investments
Xtrackers MSCI EAFE High Dividend Yield Equity ETF
May 31, 2020
Number | Value | |||||||
| COMMON STOCKS — 98.7% | ||||||||
| Australia — 4.6% | ||||||||
Aurizon Holdings Ltd. | 446,485 | $ | 1,407,790 | |||||
Coca-Cola Amatil Ltd. | 115,920 | 674,062 | ||||||
Computershare Ltd. | 105,303 | 915,692 | ||||||
Crown Resorts Ltd. | 84,669 | 538,989 | ||||||
Fortescue Metals Group Ltd. (a) | 385,830 | 3,559,985 | ||||||
Insurance Australia Group Ltd. | 528,631 | 2,144,031 | ||||||
Medibank Pvt Ltd. | 631,066 | 1,193,870 | ||||||
Qantas Airways Ltd. | 154,589 | 409,439 | ||||||
Treasury Wine Estates Ltd. | 162,302 | 1,040,731 | ||||||
Wesfarmers Ltd. | 259,390 | 6,951,033 | ||||||
|
| |||||||
(Cost $18,692,548) | 18,835,622 | |||||||
|
| |||||||
| Belgium — 0.2% | ||||||||
Proximus SADP | 34,631 | 724,018 | ||||||
|
| |||||||
| Denmark — 0.3% | ||||||||
Pandora A/S | 22,659 | 1,128,436 | ||||||
|
| |||||||
| Finland — 1.8% | ||||||||
Elisa OYJ | 32,393 | 2,031,505 | ||||||
Fortum OYJ | 101,039 | 1,935,370 | ||||||
UPM-Kymmene OYJ | 121,390 | 3,506,684 | ||||||
|
| |||||||
(Cost $7,580,789) | 7,473,559 | |||||||
|
| |||||||
| France — 10.7% | ||||||||
Faurecia SE* | 16,548 | 637,993 | ||||||
Publicis Groupe SA | 49,304 | 1,399,602 | ||||||
Sanofi | 206,014 | 20,058,360 | ||||||
Sodexo SA | 19,735 | 1,328,989 | ||||||
TOTAL SA | 542,218 | 20,280,468 | ||||||
|
| |||||||
(Cost $48,402,774) | 43,705,412 | |||||||
|
| |||||||
| Germany — 9.6% | ||||||||
Allianz SE | 95,047 | 17,214,242 | ||||||
Hannover Rueck SE | 13,521 | 2,174,798 | ||||||
HOCHTIEF AG | 6,763 | 595,056 | ||||||
METRO AG | 38,013 | 355,015 | ||||||
Siemens AG | 174,126 | 19,084,196 | ||||||
|
| |||||||
(Cost $42,629,183) | 39,423,307 | |||||||
|
| |||||||
| Hong Kong — 7.5% | ||||||||
BOC Hong Kong Holdings Ltd. | 846,842 | 2,359,926 | ||||||
CK Asset Holdings Ltd. | 582,266 | 3,166,367 | ||||||
CK Hutchison Holdings Ltd. | 607,228 | 3,713,406 | ||||||
CK Infrastructure Holdings Ltd. | 151,409 | 755,971 | ||||||
CLP Holdings Ltd. | 370,029 | 3,625,816 | ||||||
Hang Lung Properties Ltd. | 463,307 | 974,313 | ||||||
Hang Seng Bank Ltd. | 175,313 | 2,666,676 | ||||||
Henderson Land Development Co. Ltd. | 328,857 | 1,173,126 | ||||||
HKT Trust & HKT Ltd. (b) | 865,832 | 1,230,998 | ||||||
Jardine Matheson Holdings Ltd. | 49,200 | 1,975,380 | ||||||
Kerry Properties Ltd. | 177,590 | 419,287 | ||||||
New World Development Co. Ltd. | 1,407,483 | 1,418,197 | ||||||
Power Assets Holdings Ltd. | 317,500 | 1,767,530 | ||||||
Sino Land Co. Ltd. | 719,042 | 837,692 | ||||||
Sun Hung Kai Properties Ltd. | 298,181 | 3,423,830 | ||||||
Number | Value | |||||||
| Hong Kong (Continued) | ||||||||
Wharf Real Estate Investment Co. Ltd. (a) | 242,515 | $ | 932,389 | |||||
|
| |||||||
(Cost $35,563,367) | 30,440,904 | |||||||
|
| |||||||
| Israel — 0.4% | ||||||||
Bank Leumi Le-Israel BM | 326,042 | 1,725,415 | ||||||
|
| |||||||
| Italy — 1.9% | ||||||||
Assicurazioni Generali SpA | 251,782 | 3,496,673 | ||||||
Snam SpA | 465,416 | 2,166,081 | ||||||
Terna Rete Elettrica Nazionale SpA | 321,431 | 2,170,292 | ||||||
|
| |||||||
(Cost $8,152,600) | 7,833,046 | |||||||
|
| |||||||
| Japan — 21.0% | ||||||||
Amada Co. Ltd. | 71,400 | 636,891 | ||||||
Asahi Kasei Corp. | 281,200 | 2,218,592 | ||||||
Bridgestone Corp. | 119,900 | 3,980,900 | ||||||
Canon, Inc. | 231,034 | 4,758,569 | ||||||
Dai-ichi Life Holdings, Inc. | 246,500 | 3,210,094 | ||||||
Daito Trust Construction Co. Ltd. | 15,100 | 1,595,707 | ||||||
Daiwa House Industry Co. Ltd. | 127,400 | 3,162,680 | ||||||
Isuzu Motors Ltd. | 123,700 | 1,159,095 | ||||||
ITOCHU Corp. | 303,900 | 6,516,072 | ||||||
Japan Tobacco, Inc. | 277,600 | 5,507,681 | ||||||
Komatsu Ltd. | 203,000 | 4,107,671 | ||||||
Kuraray Co. Ltd. | 69,900 | 734,458 | ||||||
Mitsubishi Chemical Holdings Corp. | 301,400 | 1,774,521 | ||||||
Mitsubishi Gas Chemical Co., Inc. | 37,600 | 559,803 | ||||||
MS&AD Insurance Group Holdings, Inc. | 99,700 | 2,928,951 | ||||||
NGK Spark Plug Co. Ltd. | 33,000 | 532,056 | ||||||
Nikon Corp. | 66,500 | 611,083 | ||||||
Nippon Telegraph & Telephone Corp. | 292,300 | 6,630,911 | ||||||
NTT DOCOMO, Inc. | 267,200 | 7,320,191 | ||||||
Pola Orbis Holdings, Inc. | 20,200 | 392,994 | ||||||
Seiko Epson Corp. | 62,300 | 702,021 | ||||||
Sekisui House Ltd. | 146,624 | 2,793,389 | ||||||
Softbank Corp. | 435,600 | 5,523,085 | ||||||
Sompo Holdings, Inc. | 75,800 | 2,696,112 | ||||||
Subaru Corp. | 142,200 | 3,139,395 | ||||||
Sumitomo Chemical Co. Ltd. | 347,500 | 1,077,319 | ||||||
Sumitomo Electric Industries Ltd. | 165,100 | 1,922,476 | ||||||
Sumitomo Heavy Industries Ltd. | 23,500 | 536,594 | ||||||
T&D Holdings, Inc. | 118,800 | 1,072,933 | ||||||
Tokio Marine Holdings, Inc. | 144,900 | 6,278,305 | ||||||
Tosoh Corp. | 56,900 | 791,165 | ||||||
Yamaha Motor Co. Ltd. | 67,100 | 968,492 | ||||||
|
| |||||||
(Cost $88,994,351) | 85,840,206 | |||||||
|
| |||||||
| Luxembourg — 0.3% | ||||||||
Aroundtown SA | 259,841 | 1,428,408 | ||||||
|
| |||||||
| Netherlands — 0.5% | ||||||||
NN Group NV | 66,500 | 2,054,184 | ||||||
|
| |||||||
| New Zealand — 0.3% | ||||||||
Spark New Zealand Ltd. | 427,532 | 1,170,191 | ||||||
|
| |||||||
| See Notes to Financial Statements. | 51 |
DBX ETF Trust
Schedule of Investments
Xtrackers MSCI EAFE High Dividend Yield Equity ETF (Continued)
May 31, 2020
Number | Value | |||||||
| Norway — 0.5% | ||||||||
Mowi ASA | 100,003 | $ | 1,883,258 | |||||
|
| |||||||
| Portugal — 1.0% | ||||||||
EDP — Energias de Portugal SA | 583,485 | 2,740,896 | ||||||
Galp Energia SGPS SA | 114,657 | 1,366,578 | ||||||
|
| |||||||
(Cost $4,061,622) | 4,107,474 | |||||||
|
| |||||||
| Singapore — 2.2% | ||||||||
Oversea-Chinese Banking Corp. Ltd. | 753,900 | 4,560,524 | ||||||
Singapore Exchange Ltd. | 184,150 | 1,078,790 | ||||||
Singapore Telecommunications Ltd. | 1,855,998 | 3,269,729 | ||||||
|
| |||||||
(Cost $11,104,599) | 8,909,043 | |||||||
|
| |||||||
| Spain — 6.8% | ||||||||
ACS Actividades de Construccion y Servicios SA | 58,188 | 1,485,449 | ||||||
Enagas SA | 56,899 | 1,279,124 | ||||||
Endesa SA | 72,293 | 1,716,864 | ||||||
Iberdrola SA | 1,325,846 | 14,287,919 | ||||||
Industria de Diseno Textil SA | 247,154 | 6,886,795 | ||||||
Mapfre SA | 247,485 | 435,784 | ||||||
Red Electrica Corp. SA | 98,599 | 1,737,279 | ||||||
|
| |||||||
(Cost $26,015,150) | 27,829,214 | |||||||
|
| |||||||
| Sweden — 0.2% | ||||||||
Lundin Energy AB | 41,639 | 1,003,578 | ||||||
|
| |||||||
| Switzerland — 5.2% | ||||||||
Adecco Group AG | 34,749 | 1,650,098 | ||||||
Baloise Holding AG | 10,382 | 1,476,196 | ||||||
Swiss Life Holding AG | 7,246 | 2,544,811 | ||||||
Swiss Prime Site AG | 17,319 | 1,611,657 | ||||||
Swisscom AG | 5,908 | 3,073,611 | ||||||
Zurich Insurance Group AG | 34,178 | 11,010,816 | ||||||
|
| |||||||
(Cost $21,075,299) | 21,367,189 | |||||||
|
| |||||||
| United Kingdom — 23.7% | ||||||||
3i Group PLC | 215,533 | 2,198,324 | ||||||
Number | Value | |||||||
| United Kingdom (Continued) | ||||||||
Admiral Group PLC | 43,650 | $ | 1,258,992 | |||||
Anglo American PLC | 280,781 | 5,903,286 | ||||||
Barratt Developments PLC | 231,345 | 1,421,479 | ||||||
British American Tobacco PLC | 522,009 | 20,583,752 | ||||||
GlaxoSmithKline PLC | 962,540 | 19,894,227 | ||||||
Imperial Brands PLC | 214,572 | 3,890,264 | ||||||
Johnson Matthey PLC | 42,876 | 1,120,051 | ||||||
Legal & General Group PLC | 1,363,174 | 3,345,305 | ||||||
M&G PLC | 583,127 | 1,009,288 | ||||||
National Grid PLC | 800,030 | 9,158,856 | ||||||
Rio Tinto Ltd. | 84,604 | 5,245,358 | ||||||
Rio Tinto PLC | 255,734 | 13,636,154 | ||||||
Schroders PLC | 28,519 | 1,041,875 | ||||||
Severn Trent PLC | 54,331 | 1,639,606 | ||||||
SSE PLC | 234,606 | 3,600,889 | ||||||
Standard Life Aberdeen PLC | 531,572 | 1,697,503 | ||||||
|
| |||||||
(Cost $98,418,603) | 96,645,209 | |||||||
|
| |||||||
TOTAL COMMON STOCKS | 403,527,673 | |||||||
|
| |||||||
| SECURITIES LENDING COLLATERAL — 1.4% | ||||||||
DWS Government & Agency Securities Portfolio “DWS Government Cash Institutional Shares”, 0.07% (c)(d) | 5,636,041 | 5,636,041 | ||||||
|
| |||||||
| CASH EQUIVALENTS — 0.2% | ||||||||
DWS Government Money Market Series “Institutional Shares”, 0.12% (c) | 802,916 | 802,916 | ||||||
|
| |||||||
TOTAL INVESTMENTS — 100.3% | $ | 409,966,630 | ||||||
Other assets and liabilities, net — (0.3%) | (1,295,113 | ) | ||||||
|
| |||||||
NET ASSETS — 100.0% | $ | 408,671,517 | ||||||
|
| |||||||
A summary of the Fund’s transactions with affiliated investments during the year ended May 31, 2020 is as follows:
| Value ($) at 5/31/2019 | Purchases Cost ($) | Sales Proceeds ($) | Net Realized Gain/(Loss) ($) | Net Change in Unrealized Appreciation (Depreciation) ($) | Income ($) | Capital Gain Distributions ($) | Number of Shares at 5/31/2020 | Value ($) at 5/31/2020 | ||||||||||||||||||||||||||||
SECURITIES LENDING COLLATERAL — 1.4% |
| |||||||||||||||||||||||||||||||||||
DWS Government & Agency Securities Portfolio “DWS Government Cash Institutional Shares”, 0.07% (c)(d) |
| |||||||||||||||||||||||||||||||||||
| 9,051,557 | — | (3,415,516 | )(e) | — | — | 41,229 | — | 5,636,041 | 5,636,041 | |||||||||||||||||||||||||||
CASH EQUIVALENTS — 0.2% |
| |||||||||||||||||||||||||||||||||||
DWS Government Money Market Series “Institutional Shares”, 0.12% (c) |
| |||||||||||||||||||||||||||||||||||
| — | 25,722,314 | (24,919,398 | ) | — | — | 6,140 | — | 802,916 | 802,916 | |||||||||||||||||||||||||||
|
|
|
|
|
|
|
|
|
|
|
|
|
|
|
|
|
| |||||||||||||||||||
| 9,051,557 | 25,722,314 | (28,334,914 | ) | — | — | 47,369 | — | 6,438,957 | 6,438,957 | |||||||||||||||||||||||||||
|
|
|
|
|
|
|
|
|
|
|
|
|
|
|
|
|
| |||||||||||||||||||
| * | Non-income producing security. |
| (a) | All or a portion of these securities were on loan. In addition, “Other assets and liabilities, net” may include pending sales that are also on loan. The value of securities loaned at May 31, 2020 amounted to $6,642,922, which is 1.6% of net assets. |
| See Notes to Financial Statements. | 52 |
DBX ETF Trust
Schedule of Investments
Xtrackers MSCI EAFE High Dividend Yield Equity ETF (Continued)
May 31, 2020
| (b) | Stapled Security — A security contractually bound to one or more other securities to form a single saleable unit which cannot be sold separately. |
| (c) | Affiliated fund managed by DWS Investment Management Americas, Inc. The rate shown is the annualized seven-day yield at period end. |
| (d) | Represents cash collateral held in connection with securities lending. Income earned by the Fund is net of borrower rebates. In addition, the Fund held non-cash U.S. Treasury securities collateral having a value of $1,486,770. |
| (e) | Represents the net increase (purchase cost) or decrease (sales proceeds) in the amount invested in cash collateral for the year ended May 31, 2020. |
At May 31, 2020, open futures contracts purchased were as follows:
Contract Description | Currency | Number of Contracts | Notional Amount | Contract Value | Expiration Date | Unrealized Appreciation | ||||||||||||
EURO STOXX 50 Futures | EUR | 11 | $ | 353,244 | $ | 372,704 | 6/19/2020 | $ | 19,460 | |||||||||
FTSE 100 Index Futures | GBP | 5 | 352,043 | 374,630 | 6/19/2020 | 22,587 | ||||||||||||
MSCI EAFE Futures | USD | 47 | 3,708,360 | 4,055,160 | 6/19/2020 | 346,800 | ||||||||||||
|
| |||||||||||||||||
Total unrealized appreciation | $ | 388,847 | ||||||||||||||||
|
| |||||||||||||||||
For information on the Fund’s policy and additional disclosures regarding open futures contracts, please refer to the Derivatives section of Note 2 in the accompanying Notes to Financial Statements.
Currency Abbreviations
| EUR | Euro |
| GBP | Pound Sterling |
| USD | U.S. Dollar |
Fair Value Measurements
Various inputs are used in determining the value of the Fund’s investments. These inputs are summarized in three broad levels. Level 1 includes quoted prices in active markets for identical securities. Level 2 includes other significant observable inputs (including quoted prices for similar securities, interest rates, prepayment speeds and credit risk). Level 3 includes significant unobservable inputs (including the Fund’s own assumptions in determining the fair value of investments). The level assigned to the securities valuations may not be an indication of the risk or liquidity associated with investing in those securities.
The following is a summary of the inputs used as of May 31, 2020 in valuing the Fund’s investments. For information on the Fund’s policy regarding the valuation of investments, please refer to the Security Valuation section of Note 2 in the accompanying Notes to Financial Statements.
Assets | Level 1 | Level 2 | Level 3 | Total | ||||||||||||
Common Stocks (f) | $ | 403,527,673 | $ | — | $ | — | $ | 403,527,673 | ||||||||
Short-Term Investments (f) | 6,438,957 | — | — | 6,438,957 | ||||||||||||
Derivatives (g) | ||||||||||||||||
Futures Contracts | 388,847 | — | — | 388,847 | ||||||||||||
|
|
|
|
|
|
|
| |||||||||
TOTAL | $ | 410,355,477 | $ | — | $ | — | $ | 410,355,477 | ||||||||
|
|
|
|
|
|
|
| |||||||||
| (f) | See Schedule of Investments for additional detailed categorizations. |
| (g) | Derivatives include unrealized appreciation (depreciation) on open futures contracts. |
| See Notes to Financial Statements. | 53 |
DBX ETF Trust
May 31, 2020
| Xtrackers Bloomberg Barclays US Investment Grade Corporate ESG ETF | Xtrackers J.P. Morgan ESG Emerging Markets Sovereign ETF | Xtrackers J.P. Morgan ESG USD High Yield Corporate Bond ETF | Xtrackers Municipal Infrastructure Revenue Bond ETF | |||||||||||||
Assets | ||||||||||||||||
Investment in non-affiliated securities at value | $ | 9,797,849 | $ | 14,175,952 | $ | 18,243,897 | $ | 95,441,452 | ||||||||
Investment in affiliated securities at value | 10,139 | — | — | — | ||||||||||||
Investment in DWS Government Money Market Series | 83,235 | 127,325 | 121,095 | — | ||||||||||||
Investment in DWS Government & Agency Securities Portfolio* | 10,080 | — | 102,098 | — | ||||||||||||
Cash | — | 175,583 | 44,074 | 561,302 | ||||||||||||
| Receivables: | ||||||||||||||||
Investment securities sold | 82,712 | 222,638 | 298,774 | — | ||||||||||||
Interest | 79,740 | 207,153 | 316,826 | 1,146,418 | ||||||||||||
Securities lending income | 3 | — | 20 | — | ||||||||||||
|
|
|
|
|
|
|
| |||||||||
Total assets | $ | 10,063,758 | $ | 14,908,651 | $ | 19,126,784 | $ | 97,149,172 | ||||||||
|
|
|
|
|
|
|
| |||||||||
Liabilities | ||||||||||||||||
Payable upon return of securities loaned | $ | 10,080 | $ | — | $ | 102,098 | $ | — | ||||||||
| Payables: | ||||||||||||||||
Investment securities purchased | 143,848 | 467,815 | 450,148 | — | ||||||||||||
Investment advisory fees | 1,089 | 3,275 | 2,442 | 11,863 | ||||||||||||
|
|
|
|
|
|
|
| |||||||||
Total liabilities | 155,017 | 471,090 | 554,688 | 11,863 | ||||||||||||
|
|
|
|
|
|
|
| |||||||||
Net Assets, at value | $ | 9,908,741 | $ | 14,437,561 | $ | 18,572,096 | $ | 97,137,309 | ||||||||
|
|
|
|
|
|
|
| |||||||||
Net Assets Consist of | ||||||||||||||||
Paid-in capital | $ | 10,701,174 | $ | 15,538,678 | $ | 20,165,027 | $ | 95,327,868 | ||||||||
Distributable earnings (loss) | (792,433 | ) | (1,101,117 | ) | (1,592,931 | ) | 1,809,441 | |||||||||
|
|
|
|
|
|
|
| |||||||||
Net Assets, at value | $ | 9,908,741 | $ | 14,437,561 | $ | 18,572,096 | $ | 97,137,309 | ||||||||
|
|
|
|
|
|
|
| |||||||||
Number of Common Shares outstanding | 450,001 | 700,001 | 950,001 | 3,500,001 | ||||||||||||
|
|
|
|
|
|
|
| |||||||||
Net Asset Value | $ | 22.02 | $ | 20.63 | $ | 19.55 | $ | 27.75 | ||||||||
|
|
|
|
|
|
|
| |||||||||
Investment in non-affiliated securities at cost | $ | 9,301,851 | $ | 14,066,792 | $ | 17,697,729 | $ | 93,824,302 | ||||||||
|
|
|
|
|
|
|
| |||||||||
Investment in affiliated securities at cost | $ | 9,859 | $ | — | $ | — | $ | — | ||||||||
|
|
|
|
|
|
|
| |||||||||
Value of securities loaned | $ | 9,844 | $ | — | $ | 98,615 | $ | — | ||||||||
|
|
|
|
|
|
|
| |||||||||
Investment in DWS Government Money Market Series at cost | $ | 83,235 | $ | 127,325 | $ | 121,095 | $ | — | ||||||||
|
|
|
|
|
|
|
| |||||||||
Investment in DWS Government & Agency Securities Portfolio at cost* | $ | 10,080 | $ | — | $ | 102,098 | $ | — | ||||||||
|
|
|
|
|
|
|
| |||||||||
| * | Represents collateral on securities loaned. |
| See Notes to Financial Statements. | 54 |
DBX ETF Trust
Statements of Assets and Liabilities (Continued)
May 31, 2020
| Xtrackers MSCI All World ex US High Dividend Yield Equity ETF | Xtrackers MSCI EAFE High Dividend Yield Equity ETF | |||||||
Assets | ||||||||
Investment in non-affiliated securities at value | $ | 19,713,326 | $ | 403,527,673 | ||||
Investment in DWS Government Money Market Series | 128,203 | 802,916 | ||||||
Investment in DWS Government & Agency Securities Portfolio* | 237,415 | 5,636,041 | ||||||
Foreign currency at value | 87,779 | 3,294,135 | ||||||
Deposit with broker for futures contracts | 13,111 | 521,366 | ||||||
Foreign tax receivable | 258 | — | ||||||
Receivables: | ||||||||
Investment securities sold | 4,441,677 | 142,212,641 | ||||||
Variation margin on futures contracts | 5,037 | — | ||||||
Dividends | 64,556 | 1,262,578 | ||||||
Interest | 4 | 64 | ||||||
Securities lending income | 366 | 13,591 | ||||||
Foreign tax reclaim | 21,299 | 310,127 | ||||||
|
|
|
| |||||
Total assets | $ | 24,713,031 | $ | 557,581,132 | ||||
|
|
|
| |||||
Liabilities | ||||||||
Payable upon return of securities loaned | 237,415 | 5,636,041 | ||||||
| Payables: | ||||||||
Investment securities purchased | 4,644,393 | 143,132,343 | ||||||
Investment advisory fees | 3,252 | 66,642 | ||||||
Variation margin on futures contracts | — | 74,589 | ||||||
|
|
|
| |||||
Total liabilities | 4,885,060 | 148,909,615 | ||||||
|
|
|
| |||||
Net Assets, at value | $ | 19,827,971 | $ | 408,671,517 | ||||
|
|
|
| |||||
Net Assets Consist of | ||||||||
Paid-in capital | $ | 25,836,406 | $ | 478,772,859 | ||||
Distributable earnings (loss) | (6,008,435 | ) | (70,101,342 | ) | ||||
|
|
|
| |||||
Net Assets, at value | $ | 19,827,971 | $ | 408,671,517 | ||||
|
|
|
| |||||
Number of Common Shares outstanding | 950,001 | 20,550,001 | ||||||
|
|
|
| |||||
Net Asset Value | $ | 20.87 | $ | 19.89 | ||||
|
|
|
| |||||
Investment in non-affiliated securities at cost | $ | 22,198,943 | $ | 422,340,705 | ||||
|
|
|
| |||||
Value of securities loaned | $ | 240,724 | $ | 6,642,922 | ||||
|
|
|
| |||||
Investment in DWS Government Money Market Series at cost | $ | 128,203 | $ | 802,916 | ||||
|
|
|
| |||||
Investment in DWS Government & Agency Securities Portfolio at cost* | $ | 237,415 | $ | 5,636,041 | ||||
|
|
|
| |||||
Non-cash collateral for securities on loan | $ | 21,022 | $ | 1,486,770 | ||||
|
|
|
| |||||
Foreign currency at cost | $ | 87,273 | $ | 3,227,038 | ||||
|
|
|
| |||||
| * | Represents collateral on securities loaned. |
| See Notes to Financial Statements. | 55 |
DBX ETF Trust
For the Year Ended May 31, 2020
| Xtrackers Bloomberg Barclays US Investment Grade Corporate ESG ETF | Xtrackers J.P. Morgan ESG Emerging Markets Sovereign ETF | Xtrackers J.P. Morgan ESG USD High Yield Corporate Bond ETF | Xtrackers Municipal Infrastructure Revenue Bond ETF | |||||||||||||
Investment Income | ||||||||||||||||
Unaffiliated interest income* | $ | 220,450 | $ | 436,139 | $ | 62,905 | $ | 2,227,315 | ||||||||
Affiliated interest income | 621 | — | — | — | ||||||||||||
Income distributions from affiliated funds | 1,089 | 2,066 | 512,040 | — | ||||||||||||
Affiliated securities lending income | 378 | 86 | 16,133 | — | ||||||||||||
|
|
|
|
|
|
|
| |||||||||
Total investment income | 222,538 | 438,291 | 591,078 | 2,227,315 | ||||||||||||
|
|
|
|
|
|
|
| |||||||||
Expenses | ||||||||||||||||
Investment advisory fees | 15,743 | 45,239 | 31,614 | 116,392 | ||||||||||||
Other expenses | 25 | 25 | 32 | 57 | ||||||||||||
|
|
|
|
|
|
|
| |||||||||
Total expenses | 15,768 | 45,264 | 31,646 | 116,449 | ||||||||||||
|
|
|
|
|
|
|
| |||||||||
Less fees waived (see note 3): | ||||||||||||||||
Waiver | (59 | ) | (125 | ) | (13,469 | ) | — | |||||||||
|
|
|
|
|
|
|
| |||||||||
Net expenses | 15,709 | 45,139 | 18,177 | 116,449 | ||||||||||||
|
|
|
|
|
|
|
| |||||||||
Net investment income (loss) | 206,829 | 393,152 | 572,901 | 2,110,866 | ||||||||||||
|
|
|
|
|
|
|
| |||||||||
Realized and Unrealized Gain (Loss) | ||||||||||||||||
Net realized gain (loss) from: | ||||||||||||||||
Investments | 152,893 | 51,312 | (4,574 | ) | 181,910 | |||||||||||
Investments in affiliates | — | — | (819,744 | ) | — | |||||||||||
In-kind redemptions | 202,479 | 325,963 | — | 317,345 | ||||||||||||
In-kind redemptions in affiliates | 537 | — | — | — | ||||||||||||
Futures contracts | (735,542 | ) | (653,425 | ) | (592,026 | ) | — | |||||||||
|
|
|
|
|
|
|
| |||||||||
Net realized gain (loss) | (379,633 | ) | (276,150 | ) | (1,416,344 | ) | 499,255 | |||||||||
Net change in unrealized appreciation (depreciation) on: | ||||||||||||||||
Investments | 390,487 | 96,645 | 546,168 | (806,061 | ) | |||||||||||
Investments in affiliates | 446 | — | 88,130 | — | ||||||||||||
Futures contracts | 51,126 | 45,942 | 26,025 | — | ||||||||||||
|
|
|
|
|
|
|
| |||||||||
Net change in unrealized appreciation (depreciation) | 442,059 | 142,587 | 660,323 | (806,061 | ) | |||||||||||
|
|
|
|
|
|
|
| |||||||||
Net realized and unrealized gain (loss) on investments and futures | 62,426 | (133,563 | ) | (756,021 | ) | (306,806 | ) | |||||||||
|
|
|
|
|
|
|
| |||||||||
Net Increase (Decrease) in Net Assets Resulting from Operations | $ | 269,255 | $ | 259,589 | $ | (183,120 | ) | $ | 1,804,060 | |||||||
|
|
|
|
|
|
|
| |||||||||
* Unaffiliated foreign tax withheld | $ | 25 | $ | — | $ | — | $ | — | ||||||||
| See Notes to Financial Statements. | 56 |
DBX ETF Trust
Statements of Operations (Continued)
For the Year Ended May 31, 2020
| Xtrackers MSCI All World ex US High Dividend Yield Equity ETF | Xtrackers MSCI EAFE High Dividend Yield Equity ETF | |||||||
Investment Income | ||||||||
Unaffiliated dividend income* | $ | 1,091,531 | $ | 14,375,099 | ||||
Affiliated dividend income | 797 | — | ||||||
Income distributions from affiliated funds | 272 | 6,140 | ||||||
Affiliated securities lending income | 4,465 | 41,229 | ||||||
Unaffiliated securities lending income, net of borrower rebates | — | 28,279 | ||||||
|
|
|
| |||||
Total investment income | 1,097,065 | 14,450,747 | ||||||
|
|
|
| |||||
Expenses | ||||||||
Investment advisory fees | 52,946 | 711,447 | ||||||
Other expenses | 57 | 171 | ||||||
|
|
|
| |||||
Total expenses | 53,003 | 711,618 | ||||||
|
|
|
| |||||
Less fees waived (see note 3): | ||||||||
Waiver | (35 | ) | (358 | ) | ||||
|
|
|
| |||||
Net expenses | 52,968 | 711,260 | ||||||
|
|
|
| |||||
Net investment income (loss) | 1,044,097 | 13,739,487 | ||||||
|
|
|
| |||||
Realized and Unrealized Gain (Loss) | ||||||||
Net realized gain (loss) from: | ||||||||
Investments** | (2,679,644 | ) | (52,408,992 | ) | ||||
Investments in affiliates | (9,882 | ) | — | |||||
In-kind redemptions | 631,838 | 8,916,402 | ||||||
Futures contracts | (21,788 | ) | (538,447 | ) | ||||
Foreign currency transactions | (9,417 | ) | (134,136 | ) | ||||
|
|
|
| |||||
Net realized gain (loss) | (2,088,893 | ) | (44,165,173 | ) | ||||
Net change in unrealized appreciation (depreciation) on: | ||||||||
Investments*** | (605,954 | ) | 1,557,824 | |||||
Futures contracts | 22,896 | 405,043 | ||||||
Foreign currency translations | 1,537 | 90,364 | ||||||
|
|
|
| |||||
Net change in unrealized appreciation (depreciation) | (581,521 | ) | 2,053,231 | |||||
|
|
|
| |||||
Net realized and unrealized gain (loss) on investments, futures and foreign currency transactions | (2,670,414 | ) | (42,111,942 | ) | ||||
|
|
|
| |||||
Net Increase (Decrease) in Net Assets Resulting from Operations | $ | (1,626,317 | ) | $ | (28,372,455 | ) | ||
|
|
|
| |||||
* Unaffiliated foreign tax withheld | $ | 121,014 | $ | 1,095,662 | ||||
** Net of foreign taxes | $ | 282 | $ | — | ||||
*** Net of change in deferred foreign taxes | $ | (772 | ) | $ | — | |||
| See Notes to Financial Statements. | 57 |
DBX ETF Trust
| Xtrackers Bloomberg Barclays US Investment Grade Corporate ESG ETF | Xtrackers J.P. Morgan ESG Emerging Markets Sovereign ETF | |||||||||||||||
| Year Ended May 31, | Year Ended May 31, | |||||||||||||||
| 2020 | 2019 | 2020 | 2019 | |||||||||||||
Increase (Decrease) in Net Assets from Operations | ||||||||||||||||
Net investment income (loss) | $ | 206,829 | $ | 318,263 | $ | 393,152 | $ | 344,329 | ||||||||
Net realized gain (loss) | (379,633 | ) | (495,969 | ) | (276,150 | ) | (417,236 | ) | ||||||||
Net change in net unrealized appreciation (depreciation) | 442,059 | 387,134 | 142,587 | 303,992 | ||||||||||||
|
|
|
|
|
|
|
| |||||||||
Net increase (decrease) in net assets resulting from operations | 269,255 | 209,428 | 259,589 | 231,085 | ||||||||||||
|
|
|
|
|
|
|
| |||||||||
Distributions to Shareholders | (213,862 | ) | (517,208 | ) | (384,666 | ) | (692,585 | ) | ||||||||
|
|
|
|
|
|
|
| |||||||||
Fund Shares Transactions |
| |||||||||||||||
Proceeds from shares sold | 5,325,572 | — | 19,649,326 | — | ||||||||||||
Value of shares redeemed | (2,383,293 | ) | (2,319,160 | ) | (12,017,544 | ) | (1,134,129 | ) | ||||||||
|
|
|
|
|
|
|
| |||||||||
Net increase (decrease) in net assets resulting from fund share transactions | 2,942,279 | (2,319,160 | ) | 7,631,782 | (1,134,129 | ) | ||||||||||
|
|
|
|
|
|
|
| |||||||||
Total net increase (decrease) in Net Assets | 2,997,672 | (2,626,940 | ) | 7,506,705 | (1,595,629 | ) | ||||||||||
Net Assets | ||||||||||||||||
Beginning of year | 6,911,069 | 9,538,009 | 6,930,856 | 8,526,485 | ||||||||||||
|
|
|
|
|
|
|
| |||||||||
End of year | $ | 9,908,741 | $ | 6,911,069 | $ | 14,437,561 | $ | 6,930,856 | ||||||||
|
|
|
|
|
|
|
| |||||||||
Changes in Shares Outstanding | ||||||||||||||||
Shares outstanding, beginning of year | 300,001 | 400,001 | 300,001 | 350,001 | ||||||||||||
Shares sold | 250,000 | — | 900,000 | — | ||||||||||||
Shares redeemed | (100,000 | ) | (100,000 | ) | (500,000 | ) | (50,000 | ) | ||||||||
|
|
|
|
|
|
|
| |||||||||
Shares outstanding, end of year | 450,001 | 300,001 | 700,001 | 300,001 | ||||||||||||
|
|
|
|
|
|
|
| |||||||||
| See Notes to Financial Statements. | 58 |
DBX ETF Trust
Statements of Changes in Net Assets (Continued)
| Xtrackers J.P. Morgan ESG USD High Yield Corporate Bond ETF | Xtrackers Municipal Infrastructure Revenue Bond ETF | |||||||||||||||
| Year Ended May 31, | Year Ended May 31, | |||||||||||||||
| 2020 | 2019 | 2020 | 2019 | |||||||||||||
Increase (Decrease) in Net Assets from Operations | ||||||||||||||||
Net investment income (loss) | $ | 572,901 | $ | 358,227 | $ | 2,110,866 | $ | 1,678,179 | ||||||||
Net realized gain (loss) | (1,416,344 | ) | (231,945 | ) | 499,255 | (150,370 | ) | |||||||||
Net change in net unrealized appreciation (depreciation) | 660,323 | (64,162 | ) | (806,061 | ) | 2,904,660 | ||||||||||
|
|
|
|
|
|
|
| |||||||||
Net increase (decrease) in net assets resulting from operations | (183,120 | ) | 62,120 | 1,804,060 | 4,432,469 | |||||||||||
|
|
|
|
|
|
|
| |||||||||
Distributions to Shareholders | (514,773 | ) | (371,816 | ) | (1,935,086 | ) | (1,651,620 | ) | ||||||||
|
|
|
|
|
|
|
| |||||||||
Fund Shares Transactions | ||||||||||||||||
Proceeds from shares sold | 12,754,870 | 4,533,388 | 33,722,192 | 8,070,798 | ||||||||||||
Value of shares redeemed | — | (1,110,970 | ) | (4,325,592 | ) | (1,322,758 | ) | |||||||||
|
|
|
|
|
|
|
| |||||||||
Net increase (decrease) in net assets resulting from fund share transactions | 12,754,870 | 3,422,418 | 29,396,600 | 6,748,040 | ||||||||||||
|
|
|
|
|
|
|
| |||||||||
Total net increase (decrease) in Net Assets | 12,056,977 | 3,112,722 | 29,265,574 | 9,528,889 | ||||||||||||
Net Assets | ||||||||||||||||
Beginning of year | 6,515,119 | 3,402,397 | 67,871,735 | 58,342,846 | ||||||||||||
|
|
|
|
|
|
|
| |||||||||
End of year | $ | 18,572,096 | $ | 6,515,119 | $ | 97,137,309 | $ | 67,871,735 | ||||||||
|
|
|
|
|
|
|
| |||||||||
Changes in Shares Outstanding | ||||||||||||||||
Shares outstanding, beginning of year | 300,001 | 150,001 | 2,450,001 | 2,200,001 | ||||||||||||
Shares sold | 650,000 | 200,000 | 1,200,000 | 300,000 | ||||||||||||
Shares redeemed | — | (50,000 | ) | (150,000 | ) | (50,000 | ) | |||||||||
|
|
|
|
|
|
|
| |||||||||
Shares outstanding, end of year | 950,001 | 300,001 | 3,500,001 | 2,450,001 | ||||||||||||
|
|
|
|
|
|
|
| |||||||||
| See Notes to Financial Statements. | 59 |
DBX ETF Trust
Statements of Changes in Net Assets (Continued)
| Xtrackers MSCI All World ex US High Dividend Yield Equity ETF | Xtrackers MSCI EAFE High Dividend Yield Equity ETF | |||||||||||||||
| Year Ended May 31, | Year Ended May 31, | |||||||||||||||
| 2020 | 2019 | 2020 | 2019 | |||||||||||||
Increase (Decrease) in Net Assets from Operations | ||||||||||||||||
Net investment income (loss) | $ | 1,044,097 | $ | 1,343,868 | $ | 13,739,487 | $ | 12,328,103 | ||||||||
Net realized gain (loss) | (2,088,893 | ) | (395,647 | ) | (44,165,173 | ) | (4,217,333 | ) | ||||||||
Net change in net unrealized appreciation (depreciation) | (581,521 | ) | (1,493,585 | ) | 2,053,231 | (20,084,730 | ) | |||||||||
|
|
|
|
|
|
|
| |||||||||
Net increase (decrease) in net assets resulting from operations | (1,626,317 | ) | (545,364 | ) | (28,372,455 | ) | (11,973,960 | ) | ||||||||
|
|
|
|
|
|
|
| |||||||||
Distributions to Shareholders | (1,173,193 | ) | (1,185,503 | ) | (13,640,273 | ) | (7,131,535 | ) | ||||||||
|
|
|
|
|
|
|
| |||||||||
Fund Shares Transactions | ||||||||||||||||
Proceeds from shares sold | 9,841,629 | 16,381,277 | 266,608,659 | 280,085,371 | ||||||||||||
Value of shares redeemed | (10,905,892 | ) | (17,651,055 | ) | (60,156,321 | ) | (40,438,708 | ) | ||||||||
|
|
|
|
|
|
|
| |||||||||
Net increase (decrease) in net assets resulting from fund share transactions | (1,064,263 | ) | (1,269,778 | ) | 206,452,338 | 239,646,663 | ||||||||||
|
|
|
|
|
|
|
| |||||||||
Total net increase (decrease) in Net Assets | (3,863,773 | ) | (3,000,645 | ) | 164,439,610 | 220,541,168 | ||||||||||
Net Assets | ||||||||||||||||
Beginning of year | 23,691,744 | 26,692,389 | 244,231,907 | 23,690,739 | ||||||||||||
|
|
|
|
|
|
|
| |||||||||
End of year | $ | 19,827,971 | $ | 23,691,744 | $ | 408,671,517 | $ | 244,231,907 | ||||||||
|
|
|
|
|
|
|
| |||||||||
Changes in Shares Outstanding | ||||||||||||||||
Shares outstanding, beginning of year | 1,000,001 | 1,050,001 | 11,100,001 | 1,000,001 | ||||||||||||
Shares sold | 400,000 | 650,000 | 12,200,000 | 11,850,000 | ||||||||||||
Shares redeemed | (450,000 | ) | (700,000 | ) | (2,750,000 | ) | (1,750,000 | ) | ||||||||
|
|
|
|
|
|
|
| |||||||||
Shares outstanding, end of year | 950,001 | 1,000,001 | 20,550,001 | 11,100,001 | ||||||||||||
|
|
|
|
|
|
|
| |||||||||
| See Notes to Financial Statements. | 60 |
DBX ETF Trust
| Xtrackers Bloomberg Barclays US Investment Grade Corporate ESG ETF Selected Per Share Data | Years Ended May 31, | |||||||||||||||||||
| 2020 | 2019 | 2018 | 2017 | 2016 | ||||||||||||||||
Net Asset Value, beginning of year | $ | 23.04 | $ | 23.84 | $ | 24.09 | $ | 23.79 | $ | 24.63 | ||||||||||
|
|
|
|
|
|
|
|
|
| |||||||||||
| Income (loss) from investment operations: | ||||||||||||||||||||
Net investment income (loss)(a) | 0.73 | 0.83 | 0.78 | 0.73 | 0.71 | |||||||||||||||
Net realized and unrealized gain (loss) | (0.98 | )(b) | (0.32 | ) | (0.28 | ) | 0.39 | (0.73 | ) | |||||||||||
|
|
|
|
|
|
|
|
|
| |||||||||||
Total from investment operations | (0.25 | ) | 0.51 | 0.50 | 1.12 | (0.02 | ) | |||||||||||||
|
|
|
|
|
|
|
|
|
| |||||||||||
Less distributions from: |
| |||||||||||||||||||
Net investment income | (0.77 | ) | (0.83 | ) | (0.75 | ) | (0.82 | ) | (0.82 | ) | ||||||||||
Net realized gains | — | (0.48 | ) | — | — | — | ||||||||||||||
|
|
|
|
|
|
|
|
|
| |||||||||||
Total distributions | (0.77 | ) | (1.31 | ) | (0.75 | ) | (0.82 | ) | (0.82 | ) | ||||||||||
|
|
|
|
|
|
|
|
|
| |||||||||||
Net Asset Value, end of year | $ | 22.02 | $ | 23.04 | $ | 23.84 | $ | 24.09 | $ | 23.79 | ||||||||||
|
|
|
|
|
|
|
|
|
| |||||||||||
Total Return (%) | (1.16 | )(c) | 2.28 | (c) | 2.05 | 4.79 | (0.04 | ) | ||||||||||||
Ratios to Average Net Assets and Supplemental Data | ||||||||||||||||||||
Net Assets, end of year ($ millions) | 10 | 7 | 10 | 6 | 5 | |||||||||||||||
Ratio of expenses before fee waiver (%) | 0.24 | 0.25 | 0.25 | 0.25 | 0.25 | |||||||||||||||
Ratio of expenses after fee waiver (%) | 0.24 | 0.25 | 0.25 | 0.25 | 0.25 | |||||||||||||||
Ratio of net investment income (loss) (%) | 3.18 | 3.53 | 3.22 | 3.04 | 3.00 | |||||||||||||||
Portfolio turnover rate (%)(d) | 57 | 25 | 33 | 26 | 14 | |||||||||||||||
Xtrackers J.P. Morgan ESG Emerging Markets Sovereign ETF | Years Ended May 31, | |||||||||||||||||||
| 2020 | 2019 | 2018 | 2017 | 2016 | ||||||||||||||||
Net Asset Value, beginning of year | $ | 23.10 | $ | 24.36 | $ | 24.91 | $ | 23.96 | $ | 25.03 | ||||||||||
|
|
|
|
|
|
|
|
|
| |||||||||||
| Income (loss) from investment operations: | ||||||||||||||||||||
Net investment income (loss)(a) | 0.89 | 1.05 | 0.99 | 1.07 | 1.07 | |||||||||||||||
Net realized and unrealized gain (loss) | (2.37 | ) | (0.29 | ) | (0.48 | ) | 1.18 | (0.80 | ) | |||||||||||
|
|
|
|
|
|
|
|
|
| |||||||||||
Total from investment operations | (1.48 | ) | 0.76 | 0.51 | 2.25 | 0.27 | ||||||||||||||
|
|
|
|
|
|
|
|
|
| |||||||||||
| Less distributions from: | ||||||||||||||||||||
Net investment income | (0.99 | ) | (1.04 | ) | (1.02 | ) | (1.30 | ) | (1.26 | ) | ||||||||||
Net realized gains | — | (0.98 | ) | (0.04 | ) | — | (0.08 | ) | ||||||||||||
|
|
|
|
|
|
|
|
|
| |||||||||||
Total distributions | (0.99 | ) | (2.02 | ) | (1.06 | ) | (1.30 | ) | (1.34 | ) | ||||||||||
|
|
|
|
|
|
|
|
|
| |||||||||||
Net Asset Value, end of year | $ | 20.63 | $ | 23.10 | $ | 24.36 | $ | 24.91 | $ | 23.96 | ||||||||||
|
|
|
|
|
|
|
|
|
| |||||||||||
Total Return (%) | (6.79 | )(c) | 3.31 | (c) | 2.03 | 9.61 | 1.22 | |||||||||||||
Ratios to Average Net Assets and Supplemental Data | ||||||||||||||||||||
Net Assets, end of year ($ millions) | 14 | 7 | 9 | 6 | 6 | |||||||||||||||
Ratio of expenses before fee waiver (%) | 0.44 | 0.45 | 0.45 | 0.47 | 0.50 | |||||||||||||||
Ratio of expenses after fee waiver (%) | 0.44 | 0.45 | 0.45 | 0.47 | 0.50 | |||||||||||||||
Ratio of net investment income (loss) (%) | 3.85 | 4.37 | 3.94 | 4.35 | 4.45 | |||||||||||||||
Portfolio turnover rate (%)(d) | 26 | 31 | 48 | 35 | 15 | |||||||||||||||
| (a) | Based on average shares outstanding during the period. |
| (b) | Because of the timing of subscriptions and redemptions in relation to fluctuating markets at value, the amount shown may not agree with the change in aggregate gains and losses. |
| (c) | Total Return would have been lower if certain expenses had not been reimbursed by the Advisor. |
| (d) | Portfolio turnover rate does not include securities received or delivered from processing creations or redemptions. |
| See Notes to Financial Statements. | 61 |
DBX ETF Trust
Financial Highlights (Continued)
| Xtrackers J.P. Morgan ESG USD High Yield Corporate Bond ETF Selected Per Share Data | Years Ended May 31, | |||||||||||||||||||
| 2020 | 2019 | 2018 | 2017 | 2016 | ||||||||||||||||
Net Asset Value, beginning of year | $ | 21.72 | $ | 22.68 | $ | 23.42 | $ | 22.23 | $ | 24.57 | ||||||||||
|
|
|
|
|
|
|
|
|
| |||||||||||
| Income (loss) from investment operations: | ||||||||||||||||||||
Net investment income (loss)(a) | 1.26 | 1.32 | 1.27 | 1.17 | 1.08 | |||||||||||||||
Net realized and unrealized gain (loss) | (2.19 | ) | (0.82 | ) | (0.53 | ) | 1.30 | (2.10 | ) | |||||||||||
|
|
|
|
|
|
|
|
|
| |||||||||||
Total from investment operations | (0.93 | ) | 0.50 | 0.74 | 2.47 | (1.02 | ) | |||||||||||||
|
|
|
|
|
|
|
|
|
| |||||||||||
Less distributions from: |
| |||||||||||||||||||
Net investment income | (1.24 | ) | (1.46 | ) | (1.48 | ) | (1.28 | ) | (1.32 | ) | ||||||||||
|
|
|
|
|
|
|
|
|
| |||||||||||
Total distributions | (1.24 | ) | (1.46 | ) | (1.48 | ) | (1.28 | ) | (1.32 | ) | ||||||||||
|
|
|
|
|
|
|
|
|
| |||||||||||
Net Asset Value, end of year | $ | 19.55 | $ | 21.72 | $ | 22.68 | $ | 23.42 | $ | 22.23 | ||||||||||
|
|
|
|
|
|
|
|
|
| |||||||||||
Total Return (%) | (4.58 | )(b) | 2.18 | (b) | 3.24 | (b) | 11.40 | (4.06 | ) | |||||||||||
Ratios to Average Net Assets and Supplemental Data | ||||||||||||||||||||
Net Assets, end of year ($ millions) | 19 | 7 | 3 | 11 | 9 | |||||||||||||||
Ratio of expenses before fee waiver (%) | 0.33 | (c) | 0.35 | (c) | 0.35 | (c) | 0.39 | 0.45 | ||||||||||||
Ratio of expenses after fee waiver (%) | 0.19 | (c) | 0.14 | (c) | 0.33 | (c) | 0.39 | 0.45 | ||||||||||||
Ratio of net investment income (loss) (%) | 6.06 | 5.91 | 5.47 | 5.08 | 4.81 | |||||||||||||||
Portfolio turnover rate (%)(d) | 113 | 19 | 50 | 33 | 35 | |||||||||||||||
| Xtrackers Municipal Infrastructure Revenue Bond ETF Selected Per Share Data | Years Ended May 31, | |||||||||||||||||||
| 2020 | 2019 | 2018 | 2017 | 2016 | ||||||||||||||||
Net Asset Value, beginning of year | $ | 27.70 | $ | 26.52 | $ | 26.71 | $ | 27.17 | $ | 25.49 | ||||||||||
|
|
|
|
|
|
|
|
|
| |||||||||||
| Income (loss) from investment operations: | ||||||||||||||||||||
Net investment income (loss)(a) | 0.76 | 0.75 | 0.70 | 0.66 | 0.80 | |||||||||||||||
Net realized and unrealized gain (loss) | (0.00 | )(e) | 1.18 | (0.20 | ) | (0.46 | ) | 1.67 | ||||||||||||
|
|
|
|
|
|
|
|
|
| |||||||||||
Total from investment operations | 0.76 | 1.93 | 0.50 | 0.20 | 2.47 | |||||||||||||||
|
|
|
|
|
|
|
|
|
| |||||||||||
Less distributions from: |
| |||||||||||||||||||
Net investment income | (0.71 | ) | (0.75 | ) | (0.69 | ) | (0.66 | ) | (0.79 | ) | ||||||||||
|
|
|
|
|
|
|
|
|
| |||||||||||
Total distributions | (0.71 | ) | (0.75 | ) | (0.69 | ) | (0.66 | ) | (0.79 | ) | ||||||||||
|
|
|
|
|
|
|
|
|
| |||||||||||
Net Asset Value, end of year | $ | 27.75 | $ | 27.70 | $ | 26.52 | $ | 26.71 | $ | 27.17 | ||||||||||
|
|
|
|
|
|
|
|
|
| |||||||||||
Total Return (%) | 2.77 | 7.45 | (b) | 1.87 | 0.77 | 9.89 | ||||||||||||||
Ratios to Average Net Assets and Supplemental Data | ||||||||||||||||||||
Net Assets, end of year ($ millions) | 97 | 68 | 58 | 60 | 37 | |||||||||||||||
Ratio of expenses before fee waiver (%) | 0.15 | 0.25 | 0.30 | 0.30 | 0.30 | |||||||||||||||
Ratio of expenses after fee waiver (%) | 0.15 | 0.22 | 0.30 | 0.30 | 0.30 | |||||||||||||||
Ratio of net investment income (loss) (%) | 2.72 | 2.85 | 2.61 | 2.50 | 3.07 | |||||||||||||||
Portfolio turnover rate (%)(d) | 12 | 25 | 28 | 0 | 13 | |||||||||||||||
| (a) | Based on average shares outstanding during the period. |
| (b) | Total Return would have been lower if certain expenses had not been reimbursed by the Advisor. |
| (c) | The Fund invested in other ETFs and indirectly bore its proportionate shares of fees and expenses incurred by the Underlying Funds in which the Fund had invested. This ratio does not included these indirect fees and expenses. |
| (d) | Portfolio turnover rate does not include securities received or delivered from processing creations or redemptions. |
| (e) | Less than 0.005. |
| See Notes to Financial Statements. | 62 |
DBX ETF Trust
Financial Highlights (Continued)
| Xtrackers MSCI All World ex US High Dividend Yield Equity ETF Selected Per Share Data | Years Ended May 31, | Period Ended 5/31/2016(a) | ||||||||||||||||||
| 2020 | 2019 | 2018 | 2017 | |||||||||||||||||
Net Asset Value, beginning of period | $ | 23.69 | $ | 25.42 | $ | 26.14 | $ | 22.96 | $ | 25.00 | ||||||||||
|
|
|
|
|
|
|
|
|
| |||||||||||
| Income (loss) from investment operations: | ||||||||||||||||||||
Net investment income (loss)(b) | 0.94 | 1.21 | 1.35 | 1.02 | 0.70 | |||||||||||||||
Net realized and unrealized gain (loss) | (2.78 | ) | (1.92 | ) | (1.20 | ) | 3.07 | (2.38 | ) | |||||||||||
|
|
|
|
|
|
|
|
|
| |||||||||||
Total from investment operations | (1.84 | ) | (0.71 | ) | 0.15 | 4.09 | (1.68 | ) | ||||||||||||
|
|
|
|
|
|
|
|
|
| |||||||||||
Less distributions from: |
| |||||||||||||||||||
Net investment income | (0.98 | ) | (1.02 | ) | (0.87 | ) | (0.60 | ) | (0.36 | ) | ||||||||||
Net realized gains | — | — | — | (0.31 | ) | — | ||||||||||||||
|
|
|
|
|
|
|
|
|
| |||||||||||
Total distributions | (0.98 | ) | (1.02 | ) | (0.87 | ) | (0.91 | ) | (0.36 | ) | ||||||||||
|
|
|
|
|
|
|
|
|
| |||||||||||
Net Asset Value, end of period | $ | 20.87 | $ | 23.69 | $ | 25.42 | $ | 26.14 | $ | 22.96 | ||||||||||
|
|
|
|
|
|
|
|
|
| |||||||||||
Total Return (%) | (8.19 | )(c) | (2.82 | )(c) | 0.54 | 18.17 | (6.67 | )** | ||||||||||||
Ratios to Average Net Assets and Supplemental Data | ||||||||||||||||||||
Net Assets, end of period ($ millions) | 20 | 24 | 27 | 4 | 3 | |||||||||||||||
Ratio of expenses before fee waiver (%) | 0.20 | 0.20 | 0.32 | 0.45 | 0.45 | * | ||||||||||||||
Ratio of expenses after fee waiver (%) | 0.20 | 0.20 | 0.32 | 0.45 | 0.45 | * | ||||||||||||||
Ratio of net investment income (loss) (%) | 3.94 | 4.96 | 5.29 | 4.17 | 3.83 | * | ||||||||||||||
Portfolio turnover rate (%)(d) | 40 | 30 | 76 | 36 | 33 | ** | ||||||||||||||
| Xtrackers MSCI EAFE High Dividend Yield Equity ETF Selected Per Share Data | Years Ended May 31, | Period Ended 5/31/2016(a) | ||||||||||||||||||
| 2020 | 2019 | 2018 | 2017 | |||||||||||||||||
Net Asset Value, beginning of period | $ | 22.00 | $ | 23.69 | $ | 24.99 | $ | 23.16 | $ | 25.00 | ||||||||||
|
|
|
|
|
|
|
|
|
| |||||||||||
| Income (loss) from investment operations: | ||||||||||||||||||||
Net investment income (loss)(b) | 0.85 | 1.36 | 1.50 | 1.06 | 0.88 | |||||||||||||||
Net realized and unrealized gain (loss) | (2.00 | ) | (2.25 | ) | (1.99 | ) | 3.03 | (2.17 | ) | |||||||||||
|
|
|
|
|
|
|
|
|
| |||||||||||
Total from investment operations | (1.15 | ) | (0.89 | ) | (0.49 | ) | 4.09 | (1.29 | ) | |||||||||||
|
|
|
|
|
|
|
|
|
| |||||||||||
Less distributions from: |
| |||||||||||||||||||
Net investment income | (0.96 | ) | (0.80 | ) | (0.81 | ) | (0.95 | ) | (0.38 | ) | ||||||||||
Net realized gains | — | — | — | (1.31 | ) | (0.17 | ) | |||||||||||||
|
|
|
|
|
|
|
|
|
| |||||||||||
Total distributions | (0.96 | ) | (0.80 | ) | (0.81 | ) | (2.26 | ) | (0.55 | ) | ||||||||||
|
|
|
|
|
|
|
|
|
| |||||||||||
Net Asset Value, end of period | $ | 19.89 | $ | 22.00 | $ | 23.69 | $ | 24.99 | $ | 23.16 | ||||||||||
|
|
|
|
|
|
|
|
|
| |||||||||||
Total Return (%) | (5.58 | )(c) | (3.76 | )(c) | (2.02 | ) | 18.93 | (e) | (5.08 | )** | ||||||||||
Ratios to Average Net Assets and Supplemental Data | ||||||||||||||||||||
Net Assets, end of period ($ millions) | 409 | 244 | 24 | 5 | 5 | |||||||||||||||
Ratio of expenses before fee waiver (%) | 0.20 | 0.20 | 0.33 | 0.45 | 0.45 | * | ||||||||||||||
Ratio of expenses after fee waiver (%) | 0.20 | 0.20 | 0.33 | 0.45 | 0.45 | * | ||||||||||||||
Ratio of net investment income (loss) (%) | 3.86 | 6.06 | 6.28 | 4.48 | 4.86 | * | ||||||||||||||
Portfolio turnover rate (%)(d) | 57 | 20 | 56 | 41 | 33 | ** | ||||||||||||||
| (a) | For the period August 12, 2015 (commencement of operations) through May 31, 2016. |
| (b) | Based on average shares outstanding during the period. |
| (c) | Total Return would have been lower if certain expenses had not been reimbursed by the Advisor. |
| (d) | Portfolio turnover rate does not include securities received or delivered from processing creations or redemptions. |
| (e) | The Fund’s total return includes a reimbursement by the Advisor for a realized loss on a trade executed incorrectly, which otherwise would have reduced total return by 0.32%. |
| * | Annualized. |
| ** | Not Annualized. |
| See Notes to Financial Statements. | 63 |
DBX ETF Trust
1. Organization
DBX ETF Trust (the “Trust”) is registered under the Investment Company Act of 1940, as amended (the “Act”), as an open-end registered management investment company organized as a Delaware statutory trust.
As of May 31, 2020, the Trust consists of thirty-four investment series of exchange-traded funds (“ETFs”)(each a “Fund” and collectively, the “Funds”) in operation and trading. These financial statements report on the Funds listed below:
| Xtrackers Bloomberg Barclays US Investment Grade Corporate ESG ETF* | ||
| Xtrackers J.P. Morgan ESG Emerging Markets Sovereign ETF** | ||
| Xtrackers J.P. Morgan ESG USD High Yield Corporate Bond ETF*** | ||
| Xtrackers Municipal Infrastructure Revenue Bond ETF | ||
| Xtrackers MSCI All World ex US High Dividend Yield Equity ETF | ||
| Xtrackers MSCI EAFE High Dividend Yield Equity ETF |
The Advisor, an indirect, wholly-owned subsidiary of DWS Group GmbH & Co.KGaA (“DWS Group”), serves as investment advisor to the Funds and has overall responsibility for the general management and administration of the Funds, subject to the supervision of the Funds’ Board of Trustees (“Board”).
Xtrackers Bloomberg Barclays US Investment Grade Corporate ESG ETF, Xtrackers J.P. Morgan ESG Emerging Markets Sovereign ETF and Xtrackers J.P. Morgan ESG USD High Yield Corporate Bond ETF offer shares that are listed and traded on the Cboe Bats BZX Exchange. Inc. (“Cboe”). Xtrackers Municipal Infrastructure Revenue Bond ETF, Xtrackers MSCI All World ex US High Dividend Yield Equity ETF and Xtrackers MSCI EAFE High Dividend Yield Equity ETF offer shares that are listed and traded on the NYSE Arca, Inc. (“NYSE Arca”). Unlike conventional mutual funds, each Fund issues and redeems shares on a continuous basis, at net asset value, (“NAV”) only in large specified lots consisting of 50,000 shares, each called a “Creation Unit”, to authorized participants who have entered into agreements with the Funds’ distributor. Shares are not individually redeemable securities of the Funds, and owners of the shares may acquire those shares from the Funds, or tender such shares for redemption to the Funds, in Creation Units only.
The investment objective of each Fund is to track the performance, before fees and expenses, of a particular index (the “Underlying Index”). The underlying indices for the Funds are:
Fund | Underlying Index | |
| Xtrackers Bloomberg Barclays US Investment Grade Corporate ESG ETF* | Bloomberg Barclays MSCI US Corpo-rate Sustainability SRI Sector/Credit/Maturity Neutral Index* | |
| Xtrackers J.P. Morgan ESG Emerging Markets Sovereign ETF** | J.P. Morgan ESG EMBI Global Diversified Sovereign Index** | |
| Xtrackers J.P. Morgan ESG USD High Yield Corporate Bond ETF*** | J.P. Morgan ESG DM Corporate High Yield USD Index*** | |
| Xtrackers Municipal Infrastructure Revenue Bond ETF | Solactive Municipal Infrastructure Revenue Bond Index | |
| Xtrackers MSCI All World ex US High Dividend Yield Equity ETF | MSCI ACWI ex USA High Dividend Yield Index | |
| Xtrackers MSCI EAFE High Dividend Yield Equity ETF | MSCI EAFE High Dividend Yield Index |
| * | On May 12, 2020, the Fund changed its name from Xtrackers Investment Grade Bond — Interest Rate Hedged ETF to Xtrackers Bloomberg Barclays US Investment Grade Corporate ESG ETF and its Underlying Index from Solactive Investment Grade Bond — Interest Rate Hedged Index to the Bloomberg Barclays MSCI US Corpo-rate Sustainability SRI Sector/Credit/Maturity Neutral Index. |
| ** | On May 12, 2020, the Fund changed its name from Xtrackers Emerging Markets Bond — Interest Rate Hedged ETF to Xtrackers J.P. Morgan ESG Emerging Markets Sovereign ETF and its Underlying Index from Solactive Emerging Markets Bond — Interest Rate Hedged Index to the J.P. Morgan ESG EMBI Global Diversified Sovereign Index. |
| *** | On May 12, 2020, the Fund changed its name from Xtrackers High Yield Corporate Bond — Interest Rate Hedged ETF to Xtrackers J.P. Morgan ESG USD High Yield Corporate Bond ETF and its Underlying Index from Solactive High Yield Corporate Bond — Interest Rate Hedged Index to the J.P. Morgan ESG DM Corporate High Yield USD Index. |
64
DBX ETF Trust
Notes to Financial Statements (Continued)
The Bloomberg Barclays MSCI US Corporate Sustainability SRI Sector/Credit/Maturity Neutral Index is designed to apply environmental, social and governance (“ESG”) considerations to a broader parent index. The Underlying Index generally aims to keep the broad characteristics of its parent index, the Bloomberg Barclays US Corporate Index (an investment grade corporate bond universe), resulting in a broad investment grade fixed income market exposure with ESG aspects. Under normal circumstances, the Bloomberg Barclays MSCI US Corporate Sustainability SRI Sector/Credit/Maturity Neutral Index is reconstituted and rebalanced on a monthly basis.
The J.P. Morgan ESG EMBI Global Diversified Sovereign Index is designed to apply environmental, social and governance (“ESG”) considerations to a broader parent index. The Underlying Index generally aims to keep the broad characteristics of its parent index, the J.P. Morgan EMBI Global Diversified Sovereign Index, resulting in a broad emerging markets sovereign debt market exposure with ESG aspects. The J.P. Morgan ESG DM Corporate High Yield USD Index is designed to apply environmental, social and governance (“ESG”) considerations to a broader parent index. The Underlying Index generally aims to keep the broad characteristics of its parent index, the J.P. Morgan DM High Yield USD Index (a USD denominated high yield corporate bond index of developed market issuers), resulting in a broad high yield fixed income market exposure with ESG aspects. Under normal circumstances, the J.P. Morgan Indices are reconstituted and rebalanced on a monthly basis.
The Solactive Municipal Infrastructure Revenue Bond Index is designed to track the returns of the segment of the U.S. long term tax-exempt bond market, consisting of infrastructure revenue bonds. It is comprised of tax-exempt municipal securities issued by states, cities, counties, districts, their respective agencies and other tax-exempt issuers. The Underlying Index is intended to track bonds that have been issued with the intention of funding federal, state and local infrastructure projects such as water and sewer systems, public power systems, toll roads, bridges, tunnels and many other public use projects. It is designed to only hold bonds issued by state and local municipalities where the interest and principal repayments are generated from dedicated revenue streams or a double-barreled revenue stream (pledged revenue stream and a general obligation pledge). The Solactive Municipal Infrastructure Revenue Bond Index is rebalanced monthly on the last business day of each month.
The MSCI ACWI ex USA High Dividend Yield Index is designed to track the performance of equity securities (excluding real estate investment trusts (“REITs”)) in developed and emerging stock markets (excluding the United States) in its parent index, the MSCI ACWI ex US Index, with higher dividend income and quality characteristics than average dividend yields of equities in the parent index, where such higher dividend income and quality characteristics are both sustainable and persistent. The MSCI EAFE High Dividend Yield Index is designed to reflect the performance of equities (excluding REITs) in developed markets in its parent index, the MSCI EAFE Index, with higher dividend income and quality characteristics than average dividend yields of equities in the parent index, where such higher dividend income and quality characteristics are both sustainable and persistent. The MSCI High Dividend Yield Indices are rebalanced semi-annually in May and November.
Each Fund is entitled to use its respective Underlying Index pursuant to a licensing agreement between the Index Provider and DBX. There is no charge to the Funds in connection with these licensing agreements.
Xtrackers Bloomberg Barclays US Investment Grade Corporate ESG ETF, Xtrackers Municipal Infrastructure Revenue Bond ETF and Xtrackers MSCI All World ex US High Dividend Yield Equity ETF are diversified series of the Trust. Xtrackers J.P. Morgan ESG Emerging Markets Sovereign ETF, Xtrackers J.P. Morgan ESG USD High Yield Corporate Bond ETF and Xtrackers MSCI EAFE High Dividend Yield Equity ETF are non-diversified and are not limited by the Act with regard to the percentage of its assets that may be invested in the securities of a single issuer. This means the securities of a particular issuer (or securities of issuers in particular industries) may dominate the Underlying Index of the Fund and, consequently, the Fund’s investment portfolio. This may adversely affect the Fund’s performance or subject the Fund’s shares to greater price volatility than that experienced by more diversified investment companies. In addition, each Fund, with the exception of Xtrackers Bloomberg Barclays US Investment Grade Corporate ESG ETF, Xtrackers J.P. Morgan ESG Emerging Markets Sovereign ETF, Xtrackers J.P. Morgan ESG USD High Yield Corporate Bond ETF and Xtrackers Municipal Infrastructure Revenue Bond ETF, may change its diversification status over time and then change it back again, without shareholder approval, solely as a result of a change in relative market capitalization or index weighting of one or more constituents of the index each Fund tracks.
65
DBX ETF Trust
Notes to Financial Statements (Continued)
Pursuant to the Trust’s organizational documents, the Trust’s officers and trustees are indemnified against certain liabilities that may arise out of the performance of their duties to the Funds. Additionally, in the normal course of business the Trust enters into contracts that contain a variety of representations that provide indemnification for certain liabilities. The Trust’s maximum exposure under these arrangements is unknown, as this would involve future claims that may be made against the Funds that have not yet occurred. However, the Trust expects the risk of loss to be remote.
2. Significant Accounting Policies
The financial statements have been prepared in conformity with U.S. generally accepted accounting principles (“U.S. GAAP”), which require management to make certain estimates and assumptions that affect the reported amounts and disclosures in the financial statements. Actual results could differ from those estimates. Each Fund qualifies as an investment company under Topic 946 of the Accounting Standards Codification of U.S. GAAP. The following is a summary of significant accounting policies followed by the Funds.
Security Valuation The NAV of each Fund’s shares is calculated each business day as of the close of regular trading on the New York Stock Exchange, generally 4:00 p.m. Eastern Time. NAV per share is calculated by dividing a Fund’s net assets by the number of Fund shares outstanding.
Various inputs are used in determining the value of the Funds’ investments. These inputs are summarized in three broad levels. Level 1 includes quoted prices in active markets for identical securities. Level 2 includes other significant observable inputs (including quoted prices for similar securities, interest rates, prepayment speeds, and credit risk). Level 3 includes significant unobservable inputs (including the Funds’ own assumptions in determining the fair value of investments). The level assigned to the securities valuations may not be an indication of the risk or liquidity associated with investing in those securities.
Municipal debt securities are valued at prices supplied by independent pricing services approved by the Funds’ Board. Such services may use various pricing techniques which take into account appropriate factors such as yield, quality, coupon rate, maturity, type of issue, trading characteristics and other data, as well as broker quotes. If the pricing services are unable to provide valuations, securities are valued at the mean between the bid and ask quotations or evaluated prices, as applicable, obtained from broker-dealers. These securities are generally categorized as Level 2.
Corporate and sovereign debt securities are valued at prices supplied by independent pricing services approved by the Funds’ Board. Such services may use various pricing techniques which take into account appropriate factors such as yield, quality, coupon rate, maturity, type of issue, trading characteristics and other data, as well as broker quotes. If the pricing services are unable to provide valuations, securities are valued at the mean between the bid and ask quotations or evaluated prices, as applicable, obtained from broker dealers. These securities are generally categorized as Level 2.
Equity securities and ETFs are valued at the most recent sale price or official closing price reported on the exchange (U.S. or foreign) or over-the-counter market on which they trade. Securities or ETFs for which no sales are reported are valued at the calculated mean between the most recent bid and asked quotations on the relevant market or, if a mean cannot be determined, at the most recent bid quotation. Equity securities and ETFs are generally categorized as Level 1.
Investments in open-end investment companies are valued at their NAV each business day and are categorized as Level 1.
Futures contracts are generally valued at the settlement prices established each day on the exchange on which they are traded and are categorized as Level 1.
Securities and other assets for which market quotations are not readily available or for which the above valuation procedures are deemed not to reflect fair value are valued in a manner that is intended to reflect their fair value as determined in accordance with procedures approved by the Board and are generally categorized as Level 3. In accordance with the Funds’ valuation procedures, factors considered in determining value may include, but are not limited to, the type of the security; the size of the holding; the initial cost of the security; the existence of any contractual restrictions on the security’s disposition; the price and extent of public trading in similar securities of
66
DBX ETF Trust
Notes to Financial Statements (Continued)
the issuer or of comparable companies; quotations or evaluated prices from broker-dealers and/or pricing services; information obtained from the issuer, analysts, and/or the appropriate stock exchange (for exchange-traded securities); an analysis of the company’s or issuer’s financial statements; an evaluation of the forces that influence the issuer and the market(s) in which the security is purchased and sold; and with respect to debt securities, the maturity, coupon, creditworthiness, currency denomination and the movement of the market in which the security is normally traded. The value determined under these procedures may differ from published values for the same securities.
Fair value pricing could result in a difference between the prices used to calculate a Fund’s NAV and the prices used by the Fund’s Underlying Index, which in turn could result in a difference between the Fund’s performance and the performance of the Fund’s Underlying Index.
Disclosure about the classification of the fair value measurements is included in a table following the Fund’s Schedule of Investments.
Cash Cash consists of cash held at banks and is on deposit with major financial institutions.
Investment Transactions and Investment Income Investment transactions are recorded as of the date that the securities are purchased or sold (trade date). Realized gains and losses from the sale or disposition of securities are calculated on the identified cost-method. Dividend income is net of any foreign taxes withheld at source. Certain dividends from foreign securities may be recorded subsequent to the ex-dividend date as soon as the Fund is informed of such dividends. Interest income is recorded on the accrual basis. All premiums and discounts are amortized/accreted for both tax and financial reporting purposes.
Accounting Standard Update In March 2017, the Financial Accounting Standards Board issued Accounting Standards Update 2017-08, Receivables-Nonrefundable fees and Other Costs (Subtopic 310-20): Premium Amortization on Purchased Callable Debt Securities which amends the amortization period for certain purchased callable debt securities. Under the new guidance, premium amortization of purchased callable debt securities that have explicit, non-contingent call features and are callable at fixed prices will be amortized to the earliest call date. Effective June 1, 2019 the Funds adopted ASU 2017-08 with no material impact to the Funds.
Tax Information and Dividends and Distributions to Shareholders It is each Fund’s policy to comply with all requirements of the Internal Revenue Code of 1986, as amended (“the Code”). Each Fund intends to qualify for and to elect treatment as a separate Regulated Investment Company (“RIC”) under Subchapter M of the Code. It is the policy of Xtrackers Bloomberg Barclays US Investment Grade Corporate ESG ETF, Xtrackers J.P. Morgan ESG Emerging Markets Sovereign ETF, Xtrackers J.P. Morgan ESG USD High Yield Corporate Bond ETF and Xtrackers Municipal Infrastructure Revenue Bond ETF to pay out dividends from its net investment income monthly and Xtrackers MSCI All World ex US High Dividend Yield Equity ETF and Xtrackers MSCI EAFE High Dividend Yield Equity ETF to pay out dividends from net investment income quarterly. Taxable net realized gains from investment transactions, reduced by capital loss carryforwards, if any, are declared and distributed to shareholders at least annually. The capital loss carryforward amount, if any, is available to offset future net capital gains. The Funds may occasionally be required to make supplemental distributions at some other time during the year. The Funds reserve the right to declare special distributions if, in their reasonable discretion, such action is necessary or advisable to preserve the status of each Fund as a RIC or to avoid imposition of income or excise taxes on undistributed income. Dividends and distributions to shareholders, if any, are recorded on the ex-dividend date. The amount of dividends and distributions from net investment income and net realized capital gains are determined in accordance with Federal income tax regulations which may differ from U.S. GAAP. These “book/tax” differences are either considered temporary or permanent in nature. To the extent these differences are permanent in nature, such amounts are reclassified at the end of the year within the components of net assets based on their federal tax treatment; temporary differences do not require reclassification. Dividends and distributions, which exceed earnings and profits for the full year for tax purposes, are reported as a tax return of capital.
In accordance with U.S. GAAP requirements regarding accounting for uncertainties in income taxes, management has analyzed the Funds’ tax positions taken or expected to be taken on foreign, federal and state income tax returns for all open tax years and has concluded that no provision for income tax is required in the Funds’ financial statements.
The Funds recognize interest and penalties, if any, related to uncertain tax positions as income tax expense on the Statements of Operations. For the year ended May 31, 2020, the Funds did not incur any interest or penalties.
67
DBX ETF Trust
Notes to Financial Statements (Continued)
As of May 31, 2020, the components of accumulated earnings (losses) on a tax basis were as follows:
| Undistributed Ordinary Income* | Capital and Other Gains (Losses) | Unrealized Appreciation (Depreciation) | Total Accumulated Earnings (Losses) | |||||||||||||
Xtrackers Bloomberg Barclays US Investment Grade Corporate ESG ETF | $ | 16,561 | $ | (1,303,211 | ) | $ | 494,217 | $ | (792,433 | ) | ||||||
Xtrackers J.P. Morgan ESG Emerging Markets Sovereign ETF | 44,922 | (1,228,250 | ) | 82,211 | (1,101,117 | ) | ||||||||||
Xtrackers J.P. Morgan ESG USD High Yield Corporate Bond ETF | 62,965 | (2,199,846 | ) | 543,950 | (1,592,931 | ) | ||||||||||
Xtrackers Municipal Infrastructure Revenue Bond ETF | 333,944 | (141,653 | ) | 1,617,150 | 1,809,441 | |||||||||||
Xtrackers MSCI All World ex US High Dividend Yield Equity ETF | 260,731 | (3,620,446 | ) | (2,648,720 | ) | (6,008,435 | ) | |||||||||
Xtrackers MSCI EAFE High Dividend Yield Equity ETF | 5,534,934 | (48,648,842 | ) | (26,987,434 | ) | (70,101,342 | ) | |||||||||
The tax character of dividends and distributions declared for the years ended May 31, 2020 and May 31, 2019 were as follows:
| Year Ended May 31, 2020 | ||||||||
| Ordinary Income* | Tax-Exempt | |||||||
Xtrackers Bloomberg Barclays US Investment Grade Corporate ESG ETF | $ | 213,862 | $ | — | ||||
Xtrackers J.P. Morgan ESG Emerging Markets Sovereign ETF | 384,666 | — | ||||||
Xtrackers J.P. Morgan ESG USD High Yield Corporate Bond ETF | 514,773 | — | ||||||
Xtrackers Municipal Infrastructure Revenue Bond ETF | — | 1,935,086 | ||||||
Xtrackers MSCI All World ex US High Dividend Yield Equity ETF | 1,173,193 | — | ||||||
Xtrackers MSCI EAFE High Dividend Yield Equity ETF | 13,640,273 | — | ||||||
| Year Ended May 31, 2019 | ||||||||||||
| Ordinary Income* | Tax-Exempt | Long Term Capital Gains | ||||||||||
Xtrackers Bloomberg Barclays US Investment Grade Corporate ESG ETF | $ | 378,453 | $ | — | $ | 138,755 | ||||||
Xtrackers J.P. Morgan ESG Emerging Markets Sovereign ETF | 479,978 | — | 212,607 | |||||||||
Xtrackers J.P. Morgan ESG USD High Yield Corporate Bond ETF | 371,816 | — | — | |||||||||
Xtrackers Municipal Infrastructure Revenue Bond ETF | — | 1,651,620 | — | |||||||||
Xtrackers MSCI All World ex US High Dividend Yield Equity ETF | 1,185,503 | — | — | |||||||||
Xtrackers MSCI EAFE High Dividend Yield Equity ETF | 7,131,535 | — | — | |||||||||
| * | For tax purposes short-term capital gain distributions are considered ordinary income distributions. |
At May 31, 2020, for Federal income tax purposes, the Funds have capital loss carryforwards available as shown in the table below, to the extent provided by regulations, to offset future capital gains for an unlimited period. To the extent that these loss carryforwards are used to offset future capital gains, it is probable that the capital gains so offset will not be distributed to shareholders.
| Short-Term | Long-Term | Total Amount | ||||||||||
Xtrackers Bloomberg Barclays US Investment Grade Corporate ESG ETF | $ | 534,428 | $ | 768,783 | $ | 1,303,211 | ||||||
Xtrackers J.P. Morgan ESG Emerging Markets Sovereign ETF | 454,690 | 773,560 | 1,228,250 | |||||||||
Xtrackers J.P. Morgan ESG USD High Yield Corporate Bond ETF | 722,743 | 1,477,103 | 2,199,846 | |||||||||
Xtrackers Municipal Infrastructure Revenue Bond ETF | 118,771 | 22,882 | 141,653 | |||||||||
Xtrackers MSCI All World ex US High Dividend Yield Equity ETF | 1,036,232 | 2,584,214 | 3,620,446 | |||||||||
Xtrackers MSCI EAFE High Dividend Yield Equity ETF | 18,487,982 | 30,160,860 | 48,648,842 | |||||||||
68
DBX ETF Trust
Notes to Financial Statements (Continued)
For the fiscal year ended May 31, 2020, the effect of permanent “book/tax” reclassifications to the components of net assets are included below. These differences are primarily due to the recognition of certain foreign currency gain (losses) as ordinary income (loss), redemptions-in-kind and passive foreign investment companies (“PFICs”).
| Distributable earnings (loss) | Paid-In Capital | |||||||
Xtrackers Bloomberg Barclays US Investment Grade Corporate ESG ETF | $ | (201,252 | ) | $ | 201,252 | |||
Xtrackers J.P. Morgan ESG Emerging Markets Sovereign ETF | (301,750 | ) | 301,750 | |||||
Xtrackers Municipal Infrastructure Revenue Bond ETF | (317,345 | ) | 317,345 | |||||
Xtrackers MSCI All World ex US High Dividend Yield Equity ETF | (333,372 | ) | 333,372 | |||||
Xtrackers MSCI EAFE High Dividend Yield Equity ETF | (8,495,772 | ) | 8,495,772 | |||||
As of May 31, 2020, the aggregate cost of investments for federal income tax purposes, the net unrealized appreciation or depreciation and the aggregated gross unrealized appreciation (depreciation) on investments were as follows:
| Aggregate Tax Cost | Net Unrealized Appreciation (Depreciation) | Aggregate Gross Unrealized Appreciation | Aggregate Gross Unrealized (Depreciation) | |||||||||||||
Xtrackers Bloomberg Barclays US Investment Grade Corporate ESG ETF | $ | 9,407,086 | $ | 494,217 | $ | 497,447 | $ | (3,230 | ) | |||||||
Xtrackers J.P. Morgan ESG Emerging Markets Sovereign ETF | 14,221,066 | 82,211 | 469,057 | (386,846 | ) | |||||||||||
Xtrackers J.P. Morgan ESG USD High Yield Corporate Bond ETF | 17,923,140 | 543,950 | 592,906 | (48,956 | ) | |||||||||||
Xtrackers Municipal Infrastructure Revenue Bond ETF | 93,824,302 | 1,617,150 | 2,721,835 | (1,104,685 | ) | |||||||||||
Xtrackers MSCI All World ex US High Dividend Yield Equity ETF | 22,733,654 | (2,650,394 | ) | 587,223 | (3,237,617 | ) | ||||||||||
Xtrackers MSCI EAFE High Dividend Yield Equity ETF | 437,036,347 | (27,069,717 | ) | 7,157,930 | (34,227,647 | ) | ||||||||||
Foreign Taxes The Funds may be subject to foreign taxes (a portion of which may be reclaimable) on income, capital gains on investments, certain foreign currency transactions or other corporate events. All foreign taxes are recorded in accordance with the applicable foreign tax regulations and rates that exist in the foreign jurisdictions in which the Funds invest. These foreign taxes, if any, are paid by the Funds and are reflected in their Statements of Operations as follows: foreign taxes withheld at source are presented as a reduction of income, foreign taxes on capital gains from sales of investments and foreign currency transactions are included in their respective net realized gain (loss) categories, and deferred foreign taxes on unrealized gains are included in net change in unrealized appreciation (depreciation). Receivables and payables related to foreign taxes as of May 31, 2020, if any, are disclosed in the Funds’ Statements of Assets and Liabilities.
Foreign Currency Translations The books and records of the Funds are maintained in U.S. dollars. Investment securities and other assets and liabilities denominated in a foreign currency are translated into U.S. dollars at the prevailing exchange rates at period end. Purchases and sales of investment securities, income and expenses are translated into U.S. dollars at the prevailing exchange rates on the respective dates of the transactions.
Net realized and unrealized gains and losses on foreign currency transactions represent net gains and losses between trade and settlement dates on securities transactions, the acquisition and disposition of foreign currencies, and the difference between the amount of net investment income accrued and the U.S. dollar amount actually received. The portion of both realized and unrealized gains and losses on investments that results from fluctuations in foreign currency exchange rates is not separately disclosed, but is included with net realized and unrealized gain/appreciation and loss/depreciation on investments.
Securities Lending The Funds, except the Xtrackers Municipal Infrastructure Revenue Bond ETF, may lend securities to certain financial institutions under the terms of their securities lending agreement. During the term of the loans, the Funds continue to receive interest and dividends generated by the securities and to participate in
69
DBX ETF Trust
Notes to Financial Statements (Continued)
any changes in their market value. The Funds require the borrowers of the securities to maintain collateral with the Funds consisting of cash and/or securities issued or guaranteed by the U.S. Government, its agencies or instrumentalities having a value at least equal to the value of the securities loaned. When the collateral falls below specified amounts, the lending agent will use its best effort to obtain additional collateral on the next business day to meet required amounts under the securities lending agreement. During the year ended May 31, 2020, the Funds invested the cash collateral into a joint trading account in DWS Government & Agency Securities Portfolio, an affiliated money market fund managed by DWS Investment Management Americas, Inc. DWS Investment Management Americas, Inc. receives a management/administration fee (0.12% annualized effective rate as of May 31, 2020) on the cash collateral invested in DWS Government & Agency Securities Portfolio. The Funds receive compensation for lending their securities either in the form of fees or by earning interest on invested cash collateral net of borrower rebates and fees paid to a lending agent. Either the Fund or the borrower may terminate the loan at any time and the borrower, after notice, is required to return borrowed securities within a standard time period. There may be risks of delay and costs in recovery of securities or even loss of rights in the collateral should the borrower of the securities fail financially. If the Funds are not able to recover securities lent, the Funds may sell the collateral and purchase a replacement investment in the market, incurring the risk that the value of the replacement security is greater than the value of the collateral. The Funds are also subject to all investment risks associated with the reinvestment of any cash collateral received, including, but not limited to, interest rate, credit and liquidity risk associated with such investments.
As of May 31, 2020, the Funds listed below had securities on loan. The value of the related collateral exceeded the value of the securities loaned at period end.
Remaining Contractual Maturity of the Agreements, as of May 31, 2020 | ||||||||||||||||||||
| Securities Lending Transactions | Overnight and Continuous | <30 Days | Between 30 & 90 days | >90 days | Total | |||||||||||||||
Xtrackers Bloomberg Barclays US Investment Grade Corporate ESG ETF |
| |||||||||||||||||||
Corporate Bonds | $ | 10,080 | $ | — | $ | — | $ | — | $ | 10,080 | ||||||||||
|
|
|
|
|
|
|
|
|
| |||||||||||
Gross amount of recognized liabilities and non-cash collateral for securities lending transactions |
| $ | 10,080 | |||||||||||||||||
Xtrackers J.P. Morgan ESG USD High Yield Corporate Bond ETF |
| |||||||||||||||||||
Corporate Bonds | $ | 102,098 | $ | — | $ | — | $ | — | $ | 102,098 | ||||||||||
|
|
|
|
|
|
|
|
|
| |||||||||||
Gross amount of recognized liabilities and non-cash collateral for securities lending transactions |
| $ | 102,098 | |||||||||||||||||
Xtrackers MSCI All World ex US High Dividend Yield Equity ETF |
| |||||||||||||||||||
Common Stocks | $ | 237,415 | $ | — | $ | 106 | $ | 20,916 | $ | 258,437 | ||||||||||
|
|
|
|
|
|
|
| |||||||||||||
Gross amount of recognized liabilities and non-cash collateral for securities lending transactions |
| $ | 258,437 | |||||||||||||||||
Xtrackers MSCI EAFE High Dividend Yield Equity ETF |
| |||||||||||||||||||
Common Stocks | $ | 5,636,041 | $ | — | $ | — | $ | 1,486,770 | $ | 7,122,811 | ||||||||||
|
|
|
|
|
|
|
|
|
| |||||||||||
Gross amount of recognized liabilities and non-cash collateral for securities lending transactions |
| $ | 7,122,811 | |||||||||||||||||
As of May 31, 2020, Xtrackers J.P. Morgan ESG Emerging Markets Sovereign ETF had no securities on loan.
Derivatives
Futures Contracts Each Fund may enter into futures contracts. These futures contracts will be used to simulate investment in the respective Underlying Index, to facilitate trading or to reduce transaction costs. Each Fund will enter into futures contracts that are traded on a U.S. or non-U.S. exchange. No Fund will use futures for speculative purposes. Futures contracts provide for the future sale by one party and purchase by another party of a specified amount of a specific instrument or index at a specified future time and at a specified price. For the year ended May 31, 2020, Xtrackers Bloomberg Barclays US Investment Grade Corporate ESG ETF, Xtrackers J.P. Morgan ESG Emerging Markets Sovereign ETF, Xtrackers J.P. Morgan ESG USD High Yield Corporate Bond ETF entered into short U.S. Treasury futures contracts to seek to mitigate the potential negative impact of rising Treasury interest rates on the performance of each Fund’s long bond investments and Xtrackers MSCI All World ex US High Dividend Yield Equity ETF and Xtrackers MSCI EAFE High Dividend Yield Equity ETF utilized futures in
70
DBX ETF Trust
Notes to Financial Statements (Continued)
order to simulate investment in the Underlying Index. To the extent required by law, liquid assets committed to futures contracts will be maintained.
At the time each Fund enters into a futures contract, each Fund deposits and maintains as collateral an initial margin with the broker, as required by the exchange on which the transaction is affected. Pursuant to the contract, each Fund agrees to receive from or pay to the broker an amount of cash equal to the daily fluctuation in the value of the contract. Such receipts or payments are known as variation margin and are recorded by each Fund as unrealized gains or losses. Risks may arise from the potential inability of a counterparty to meet the terms of the contract. The credit/counterparty risk for exchange-traded futures contracts is generally less than privately negotiated futures contracts, since the clearinghouse, which is the issuer or counterparty to each exchange-traded future, provides a guarantee of performance. The guarantee is supported by a daily payment system (i.e., margin requirements).
Use of long futures contracts subjects each Fund to risk of loss in excess of the amounts shown on the Statement of Assets and Liabilities, up to the notional value of the futures contracts. Use of short futures contracts subjects each Fund to unlimited risk of loss. Under some circumstances, futures exchanges may establish daily limits on the amount that the price of a futures contract can vary from the previous day’s settlement price, which could effectively prevent liquidation of unfavorable positions.
A summary of the open futures contracts as of May 31, 2020 is included in a table following the Funds’ Schedule of Investments.
The following tables summarize the value of the Funds’ derivative instruments held as of May 31, 2020 and the related location in the accompanying Statement of Assets and Liabilities, presented by primary underlying risk exposure:
Asset Derivatives | Liability Derivatives | |||||||||||||
| Xtrackers MSCI All World ex US High Dividend Yield Equity ETF |
| |||||||||||||
| Equity contracts | Unrealized appreciation on futures contracts* | $ | 23,266 | Unrealized depreciation on futures contracts* | $ | — | ||||||||
| Xtrackers MSCI EAFE High Dividend Yield Equity ETF | ||||||||||||||
| Equity contracts | Unrealized appreciation on futures contracts* | $ | 388,847 | Unrealized depreciation on futures contracts* | $ | — | ||||||||
| * | Includes cumulative appreciation or cumulative depreciation on futures contracts as disclosed in the Schedule of Investments. Unsettled variation margin is disclosed separately within the Statement of Assets and Liabilities. |
Additionally, the amount of realized and unrealized gains and losses on derivative instruments recognized in the Funds’ earnings during the year ended May 31, 2020 and the related location in the accompanying Statement of Operations is summarized in the following tables by primary underlying risk exposure:
Net Realized Gain (Loss) from: | ||||||||||||
| Futures Contracts — Interest Rate Contracts | Futures Contracts — Equity Contracts | Total | ||||||||||
Xtrackers Bloomberg Barclays US Investment Grade Corporate ESG ETF | $ | (735,542 | ) | $ | — | $ | (735,542 | ) | ||||
Xtrackers J.P. Morgan ESG Emerging Markets Sovereign ETF | (653,425 | ) | — | (653,425 | ) | |||||||
Xtrackers J.P. Morgan ESG USD High Yield Corporate Bond ETF | (592,026 | ) | — | (592,026 | ) | |||||||
Xtrackers MSCI All World ex US High Dividend Yield Equity ETF | — | (21,788 | ) | (21,788 | ) | |||||||
Xtrackers MSCI EAFE High Dividend Yield Equity ETF | — | (538,447 | ) | (538,447 | ) | |||||||
71
DBX ETF Trust
Notes to Financial Statements (Continued)
Net Change in Unrealized Appreciation (Depreciation) on: | ||||||||||||
| Futures Contracts — Interest Rate Contracts | Futures Contracts — Equity Contracts | Total | ||||||||||
Xtrackers Bloomberg Barclays US Investment Grade Corporate ESG ETF | $ | 51,126 | $ | — | $ | 51,126 | ||||||
Xtrackers J.P. Morgan ESG Emerging Markets Sovereign ETF | 45,942 | — | 45,942 | |||||||||
Xtrackers J.P. Morgan ESG USD High Yield Corporate Bond ETF | 26,025 | — | 26,025 | |||||||||
Xtrackers MSCI All World ex US High Dividend Yield Equity ETF | — | 22,896 | 22,896 | |||||||||
Xtrackers MSCI EAFE High Dividend Yield Equity ETF | — | 405,043 | 405,043 | |||||||||
For the year ended May 31, 2020 the average monthly volume of derivatives was as follows:
| Futures Contracts (Contract Value) | ||||
Xtrackers Bloomberg Barclays US Investment Grade Corporate ESG ETF | $ | (5,758,602 | ) | |
Xtrackers J.P. Morgan ESG Emerging Markets Sovereign ETF | (8,384,434 | ) | ||
Xtrackers J.P. Morgan ESG USD High Yield Corporate Bond ETF | (8,081,784 | ) | ||
Xtrackers MSCI All World ex US High Dividend Yield Equity ETF | 167,351 | |||
Xtrackers MSCI EAFE High Dividend Yield Equity ETF | 2,225,296 | |||
Affiliated Cash Management Vehicles The Funds may invest uninvested cash balances in DWS Government Money Market Series and DWS ESG Liquidity Fund, affiliated money market funds which are managed by DWS Investment Management Americas, Inc. (“DIMA”), also an indirect, wholly owned subsidiary of DWS Group GmbH & Co. KGaA. Each affiliated money market fund is managed in accordance with Rule 2a-7 under the 1940 Act, which governs the quality, maturity, diversity and liquidity of instruments in which a money market fund may invest. DWS Government Money Market Series seeks to maintain a stable NAV, and DWS ESG Liquidity Fund maintains a floating NAV. The Funds indirectly bear their proportionate share of the expenses of each affiliated money market fund in which they invest. The Advisor will waive an amount of the unitary management fee payable to the Advisor by the Funds equal to such acquired fund’s fees and expenses on the Funds’ assets invested in the affiliated money market funds.
3. Investment Advisory and Other Agreements
The Advisor has overall responsibility for the general management and administration of the Funds, subject to the supervision of the Funds’ Board of Trustees. Under an investment advisory agreement between the Trust, on behalf of the Funds, and the Advisor (the “Investment Advisory Agreement”), the Advisor is responsible for arranging sub-advisory, transfer agency, custody, fund administration, and all other non-distribution related services for the Funds to operate.
For its investment advisory services to the Funds below, for the period from June 1, 2019 through May 11, 2020, the Advisor was entitled to receive a unitary management fee based on each Fund’s average daily net assets, computed and accrued daily and payable monthly, at an annual rate equal to:
| Unitary Management Fee | ||||
Xtrackers Bloomberg Barclays US Investment Grade Corporate ESG ETF | 0.25 | % | ||
Xtrackers J.P. Morgan ESG Emerging Markets Sovereign ETF | 0.45 | % | ||
Xtrackers J.P. Morgan ESG USD High Yield Corporate Bond ETF | 0.35 | % | ||
For the period from June 1, 2019 through May 11, 2020, the Advisor for the Xtrackers J.P. Morgan ESG USD High Yield Corporate Bond ETF had contractually agreed to waive a portion of its management fees in an amount equal to the acquired fund’s fees and expenses attributable to the Fund’s investments in the Underlying Funds. For the period from June 1, 2019 through May 11, 2020, the Advisor waived $13,414 of expenses to the Fund.
72
DBX ETF Trust
Notes to Financial Statements (Continued)
Effective May 12, 2020, the Board of Trustees approved a reduction in the unitary management fee to the Funds below, at an annual rate equal to:
| Unitary Management Fee | ||||
Xtrackers Bloomberg Barclays US Investment Grade Corporate ESG ETF | 0.15 | % | ||
Xtrackers J.P. Morgan ESG Emerging Markets Sovereign ETF | 0.35 | % | ||
Xtrackers J.P. Morgan ESG USD High Yield Corporate Bond ETF | 0.20 | % | ||
For its investment advisory services to the Funds below, the Advisor is entitled to receive a unitary management fee based on each Fund’s average daily net assets, computed and accrued daily and payable monthly, at an annual rate equal to:
| Unitary Management Fee | ||||
Xtrackers Municipal Infrastructure Revenue Bond ETF | 0.15 | % | ||
Xtrackers MSCI All World ex US High Dividend Yield Equity ETF | 0.20 | % | ||
Xtrackers MSCI EAFE High Dividend Yield Equity ETF | 0.20 | % | ||
The Advisor for the Funds below has contractually agreed to waive a portion of its management fees in an amount equal to the acquired fund’s fees and expenses attributable to the Funds’ investments in affiliated cash management vehicles. For the year ended May 31, 2020, the Advisor waived expenses of the Funds as follows:
| Expenses Waived | ||||
Xtrackers Bloomberg Barclays US Investment Grade Corporate ESG ETF | $ | 59 | ||
Xtrackers J.P. Morgan ESG Emerging Markets Sovereign ETF | 125 | |||
Xtrackers J.P. Morgan ESG USD High Yield Corporate Bond ETF | 55 | |||
Xtrackers MSCI All World ex US High Dividend Yield Equity ETF | 35 | |||
Xtrackers MSCI EAFE High Dividend Yield Equity ETF | 358 | |||
Out of the unitary management fee, the Advisor pays substantially all expenses of each Fund, including the cost of transfer agency, custody, fund administration, legal, audit and other services, and expenses of the Independent Trustees. Each Fund is responsible for the payment of interest expense, acquired fund fees and expenses, taxes, brokerage expenses and extraordinary expenses.
The Bank of New York Mellon, a wholly-owned subsidiary of The Bank of New York Mellon Corporation, serves as Administrator, Custodian, Accounting Agent, Lending Agent and Transfer Agent for each Fund.
ALPS Distributors, Inc. (the “Distributor”) serves as the distributor of Creation Units for each Fund on an agency basis. The Distributor does not maintain a secondary market in shares of the Funds.
The Board of Trustees is currently comprised of three Independent Trustees. The Advisor paid retainer fees and attendance fees to each Independent Trustee; retainer fees to the Chairman of the Board of Trustees and the Chairman of the Audit Committee; and attendance fees to each member of the Audit Committee (which is comprised of all of the Funds’ Independent Trustees).
4. Investment Portfolio Transactions
For the year ended May 31, 2020, the cost of investments purchased and proceeds from sale of investments (excluding in-kind transactions and short-term investments) were as follows:
| Purchases | Sales | |||||||
Xtrackers Bloomberg Barclays US Investment Grade Corporate ESG ETF | $ | 8,362,644 | $ | 3,728,460 | ||||
Xtrackers J.P. Morgan ESG Emerging Markets Sovereign ETF | 20,817,925 | 2,472,656 | ||||||
Xtrackers J.P. Morgan ESG USD High Yield Corporate Bond ETF | 18,624,688 | 10,865,783 | ||||||
Xtrackers Municipal Infrastructure Revenue Bond ETF | 23,821,199 | 9,281,498 | ||||||
Xtrackers MSCI All World ex US High Dividend Yield Equity ETF | 10,508,708 | 12,905,722 | ||||||
Xtrackers MSCI EAFE High Dividend Yield Equity ETF | 208,800,330 | 201,148,865 | ||||||
73
DBX ETF Trust
Notes to Financial Statements (Continued)
For the year ended May 31, 2020, the cost of in-kind purchases and proceeds from in-kind sales were as follows:
| Purchases | Sales | |||||||
Xtrackers Bloomberg Barclays US Investment Grade Corporate ESG ETF | $ | — | $ | 2,307,186 | ||||
Xtrackers J.P. Morgan ESG Emerging Markets Sovereign ETF | — | 11,348,045 | ||||||
Xtrackers J.P. Morgan ESG USD High Yield Corporate Bond ETF | 4,166,886 | — | ||||||
Xtrackers Municipal Infrastructure Revenue Bond ETF | 19,625,430 | 4,294,950 | ||||||
Xtrackers MSCI All World ex US High Dividend Yield Equity ETF | 7,827,181 | 6,576,765 | ||||||
Xtrackers MSCI EAFE High Dividend Yield Equity ETF | 253,034,268 | 58,484,915 | ||||||
5. Fund Share Transactions
As of May 31, 2020, there were unlimited Fund shares, no par value, authorized by the Trust. Fund shares are issued and redeemed by each Fund only in Creation Units or multiples thereof. Except when aggregated in Creation Units, shares of each Fund are not redeemable. Transactions in capital shares for each Fund are disclosed in detail in the Statements of Changes in Net Assets. The consideration for the purchase of Creation Units of a Fund generally consists of the in-kind contribution of a designated portfolio of securities constituting a portfolio sampling representation of the securities included in the respective Fund’s Underlying Index and an amount of cash, which under certain circumstances may include cash in lieu of portfolio securities. Investors purchasing and redeeming Creation Units pay a purchase transaction fee and a redemption transaction fee to offset transfer and other transaction costs associated with the issuance and redemption of Creation Units.
6. Concentration of Ownership
From time to time, the Funds may have a concentration of several shareholder accounts holding a significant percentage of shares outstanding. Investment activities of these shareholders could have a material impact on the Fund. At May 31, 2020, there was one affiliated shareholder account for each of the funds listed below holding a significant percentage of the shares outstanding:
| Approximate Percent of Outstanding Shares Held | ||||
Xtrackers Bloomberg Barclays US Investment Grade Corporate ESG ETF | 52 | % | ||
Xtrackers J.P. Morgan ESG Emerging Markets Sovereign ETF | 64 | % | ||
Xtrackers J.P. Morgan ESG USD High Yield Corporate Bond ETF | 50 | % | ||
7. Investing in Emerging Markets
The securities of issuers located in emerging markets tend to be more volatile and less liquid than securities of issuers located in more mature economies, and emerging markets generally have less diverse and less mature economic structures and less stable political systems than those of developed countries. The securities of issuers located or doing substantial business in emerging markets are often subject to rapid and large changes in price.
8. Investing in High-Yield Debt Securities
High-yield debt securities or junk bonds are generally regarded as speculative with respect to the issuer’s continuing ability to meet principal and interest payments. A fund’s performance could be hurt if an issuer of a debt security suffers an adverse change in financial condition that results in the issuer not making timely payments of interest or principal, a security downgrade or an inability to meet a financial obligation. High-yield debt securities’ total return and yield may generally be expected to fluctuate more than the total return and yield of investment-grade debt securities. A real or perceived economic downturn or an increase in market interest rates could cause a decline in the value of high-yield debt securities, result in increased redemptions and/or result in increased portfolio turnover, which could result in a decline in NAV of a fund, reduce liquidity for certain investments and/or increase costs. High-yield debt securities are often thinly traded and can be more difficult to sell and value accurately than investment-grade debt securities as there may be no established secondary market. Investments in high-yield debt securities could increase liquidity risk for a fund. In addition, the market for high-yield debt securities can experience sudden and sharp volatility which is generally associated more with investments in stocks.
74
DBX ETF Trust
Notes to Financial Statements (Continued)
9. Line of Credit
The Trust has entered into a senior unsecured credit facility with a syndication of banks which allows the Xtrackers Bloomberg Barclays US Investment Grade Corporate ESG ETF, Xtrackers J.P. Morgan ESG Emerging Markets Sovereign ETF, Xtrackers MSCI All World ex US High Dividend Yield Equity ETF and certain other funds managed by the Advisor to borrow up to $105 million. Each Fund may borrow money under this credit facility to the extent necessary for temporary or emergency purposes, including the funding of shareholder redemption requests, trade settlements, and as necessary to distribute to shareholders any income necessary to maintain each Funds’ status as a regulated investment company. Borrowings are charged an interest rate of 1.25% per annum plus the greater of the Federal Funds Effective Rate or the one-month LIBOR Rate. Each Fund may borrow up to the lesser of a pro-rata share of the credit facility at the amount listed below or 33 percent of its net assets as permitted by the Act. The Funds had no outstanding loans at May 31, 2020.
| Pro-rata Share | ||||
Xtrackers Bloomberg Barclays US Investment Grade Corporate ESG ETF | $ | 525,000 | ||
Xtrackers J.P. Morgan ESG Emerging Markets Sovereign ETF | 525,000 | |||
Xtrackers MSCI All World ex US High Dividend Yield Equity ETF | 525,000 | |||
10. Other
A novel strain of coronavirus (COVID-19) outbreak was declared a pandemic by the World Health Organization on March 11, 2020. The situation is evolving with various cities and countries around the world responding in different ways to address the pandemic. There are direct and indirect economic effects developing for various industries and individual companies throughout the world. The recent pandemic spread of the novel coronavirus and related geopolitical events could lead to increased financial market volatility, disruption to U.S. and world economies and markets and may have significant adverse effects on a Fund and its investments. A prolonged disruption may result in a Fund and its service providers experiencing operational difficulties in implementing their business continuity plans. Management will continue to monitor the impact COVID-19 has on the Funds and reflect the consequences as appropriate in each Fund’s accounting and financial reporting.
11. Subsequent Event
On June 17, 2020, Deutsche Bank AG (“DB”), an affiliate of DWS Group, resolved with the Commodity Futures Trading Commission (“CFTC”) charges stemming from alleged violations of various swap data reporting requirements and corresponding supervision and other failures. The matter, which was resolved by the issuance of a federal court order (“Consent Order”), involved unintentional conduct that resulted from a system outage that prevented DB from reporting data in accordance with applicable CFTC requirements for a period of five days in April 2016.
The matter giving rise to the Consent Order did not arise out of any investment advisory, fund management activities or distribution activities of DBX Advisors LLC or their advisory affiliates (the “DWS Service Providers”). DWS Group, of which the DWS Service Providers are wholly-owned subsidiaries (except for Harvest Global Management Limited which is partially owned by DWS Group), is a separate publicly traded company but continues to be an affiliate of DB due to, among other things, DB’s 79.49% ownership interest in DWS Group. Under the provisions of the Investment Company Act of 1940, as a result of the Consent Order, the DWS Service Providers would not be eligible to continue to provide investment advisory services to the Funds absent an order from the Securities and Exchange Commission (the “SEC”). DB and the DWS Service Providers are seeking temporary and permanent orders from the SEC to permit the DWS Service Providers to continue to provide investment advisory services to the Funds and other registered investment companies notwithstanding the Consent Order. While there can be no assurance that the requested exemptive orders will be granted, the SEC has granted this type of relief in the past. Consistent with their fiduciary and other relationships with the Funds, and in accordance with the desire of the Board of the Funds, the DWS Service Providers continue to provide investment advisory services to the Funds. Subject to the receipt of the temporary and permanent exemptive orders, the DWS Service Providers have informed the Funds that they do not believe the Consent Order will have any material impact on the Funds or the ability of the DWS Service Providers to provide services for the Funds.
75
DBX ETF Trust
To the Shareholders of Xtrackers J.P. Morgan ESG Emerging Markets Sovereign ETF (formerly, Xtrackers Emerging Markets Bond — Interest Rate Hedged ETF), Xtrackers J.P. Morgan ESG USD High Yield Corporate Bond ETF (formerly, Xtrackers High Yield Corporate Bond — Interest Rate Hedged ETF), Xtrackers Bloomberg Barclays US Investment Grade Corporate ESG ETF (formerly, Xtrackers Investment Grade Bond — Interest Rate Hedged ETF), Xtrackers Municipal Infrastructure Revenue Bond ETF, Xtrackers MSCI All World ex US High Dividend Yield Equity ETF, and Xtrackers MSCI EAFE High Dividend Yield Equity ETF, and the Board of Trustees of DBX ETF Trust
Opinion on the Financial Statements
We have audited the accompanying statements of assets and liabilities of Xtrackers J.P. Morgan ESG Emerging Markets Sovereign ETF (formerly, Xtrackers Emerging Markets Bond — Interest Rate Hedged ETF), Xtrackers J.P. Morgan ESG USD High Yield Corporate Bond ETF (formerly, Xtrackers High Yield Corporate Bond — Interest Rate Hedged ETF), Xtrackers Bloomberg Barclays US Investment Grade Corporate ESG ETF (formerly, Xtrackers Investment Grade Bond — Interest Rate Hedged ETF), Xtrackers Municipal Infrastructure Revenue Bond ETF, Xtrackers MSCI All World ex US High Dividend Yield Equity ETF, and Xtrackers MSCI EAFE High Dividend Yield Equity ETF, (collectively referred to as the “Funds”), (six of the funds constituting DBX ETF Trust), including the schedules of investments, as of May 31, 2020, and the related statements of operations and changes in net assets, and the financial highlights for each of the periods indicated in the table below and the related notes (collectively referred to as the “financial statements”). In our opinion, the financial statements present fairly, in all material respects, the financial position of each of the Funds (six of the funds constituting DBX ETF Trust) at May 31, 2020, and the results of their operations, changes in net assets and financial highlights for each of the periods indicated in the table below, in conformity with U.S. generally accepted accounting principles.
Individual fund constituting the DBX ETF Trust | Statement of operations | Statements of changes in net assets | Financial highlights | |||
Xtrackers J.P. Morgan ESG Emerging Markets Sovereign ETF (formerly, Xtrackers Emerging Markets Bond — Interest Rate Hedged ETF)
Xtrackers J.P. Morgan ESG USD High Yield Corporate Bond ETF (formerly, Xtrackers High Yield Corporate Bond — Interest Rate Hedged ETF)
Xtrackers Bloomberg Barclays US Investment Grade Corporate ESG ETF (formerly, Xtrackers Investment Grade Bond — Interest Rate Hedged ETF)
Xtrackers Municipal Infrastructure Revenue Bond ETF | For the year ended May 31, 2020 | For each of the two years in the period ended May 31, 2020 | For each of the five years in the period ended May 31, 2020 |
76
DBX ETF Trust
Report of Independent Registered Public Accounting Firm (Continued)
Individual fund constituting the DBX ETF Trust | Statement of operations | Statements of changes in net assets | Financial highlights | |||
Xtrackers MSCI All World ex US High Dividend Yield Equity ETF
Xtrackers MSCI EAFE High Dividend Yield Equity ETF | For the year ended May 31, 2020 | For each of the two years in the period ended May 31, 2020 | For each of the four years in the period ended May 31, 2020 and the period from August 12, 2015 (commencement of operations) to May 31, 2016 |
Basis for Opinion
These financial statements are the responsibility of the Trust’s management. Our responsibility is to express an opinion on each of the Funds’ financial statements based on our audits. We are a public accounting firm registered with the Public Company Accounting Oversight Board (United States) (“PCAOB”) and are required to be independent with respect to the Trust in accordance with the U.S. federal securities laws and the applicable rules and regulations of the Securities and Exchange Commission and the PCAOB.
We conducted our audits in accordance with the standards of the PCAOB. Those standards require that we plan and perform the audit to obtain reasonable assurance about whether the financial statements are free of material misstatement, whether due to error or fraud. The Trust is not required to have, nor were we engaged to perform, an audit of the Trust’s internal control over financial reporting. As part of our audits we are required to obtain an understanding of the internal control over financial reporting but not for the purpose of expressing an opinion on the effectiveness of the Trust’s internal control over financial reporting. Accordingly, we express no such opinion.
Our audits included performing procedures to assess the risks of material misstatement of the financial statements, whether due to error or fraud, and performing procedures that respond to those risks. Such procedures included examining, on a test basis, evidence regarding the amounts and disclosures in the financial statements. Our procedures included confirmation of securities owned as of May 31, 2020, by correspondence with the custodians and brokers or by other appropriate auditing procedures where replies from brokers were not received. Our audits also included evaluating the accounting principles used and significant estimates made by management, as well as evaluating the overall presentation of the financial statements. We believe that our audits provide a reasonable basis for our opinion.

We have served as the auditor of one or more investment companies in the DWS family of funds since at least 1979, but we are unable to determine the specific year.
New York, New York
July 27, 2020
77
DBX ETF Trust
All Funds
In accordance with Rule 22e-4 (the “Liquidity Rule”) under the Investment Company Act of 1940 (the “1940 Act”), your Fund has adopted a liquidity risk management program (the “Program”), and the Board has designated DBX Advisors LLC (“Advisors”) as Program administrator. The Program is designed to assess and manage your Fund’s liquidity risk (the risk that the Fund would be unable to meet requests to redeem shares of the Fund without significant dilution of remaining investors’ interests in the Fund). Advisors has designated a committee (the “Committee”) composed of personnel from multiple departments within an affiliate of Advisors that is responsible for the implementation and ongoing administration of the Program, which includes assessing the Fund’s liquidity risk under both normal and reasonably foreseeable stressed conditions. Under the Program, every investment held by a Fund is classified on a daily basis into one of four liquidity categories based on calculations of the investment’s ability to be sold during designated timeframes in current market conditions without significantly changing the investment’s market value.
In February 2020, as required by the Program and the Liquidity Rule, Advisors provided the Board with an annual written report (the “Report”) addressing the operation of the Program and assessing the adequacy and effectiveness of its implementation during the period from December 1, 2018 through November 30, 2019 (the “Reporting Period”). During the Reporting Period, your Fund was primarily invested in highly liquid investments (investments that the Fund anticipates can be converted to cash within three business days or less in current market conditions without significantly changing their market value). As a result, your Fund is not required to adopt, and has not adopted, a “Highly Liquid Investment Minimum” as defined in the Liquidity Rule. During the Reporting Period, the Fund did not approach the 15% limit imposed by the Liquidity Rule on holdings in illiquid investments (investments that cannot be sold or disposed of in seven days or less in current market conditions without the sale of the investment significantly changing the market value of the investment). Your Fund did not experience any issues meeting investor redemptions at any time during the Reporting Period. In the Report, Advisors stated that it believes the Program has operated adequately and effectively to manage the Fund’s liquidity risk during the Reporting Period. Advisors also reported on a material change made to the Program in May 2019 to address Securities and Exchange Commission guidance relating to extended foreign market holidays.
78
DBX ETF Trust
Identification and Background
The Board has responsibility for the overall management and operations of the funds, including general supervision of the duties performed by the Advisor and other service providers. Each Board Member serves until his or her successor is duly elected or appointed and qualified. Each officer serves until he or she resigns, is removed, dies, retires or becomes disqualified.
The Trust currently has three Board Members. The three Independent Board Members have no affiliation or business connection with the Advisor or any of its affiliated persons and do not own any stock or other securities issued by the Advisor.
The Independent Board Members of the Trust, their term of office and length of time served, their principal business occupations during the past five years, the number of portfolios in the fund complex (defined below) overseen by each Independent Board Member, and other directorships, if any, held by the Board Members are shown below. The fund complex includes all registered open- and closed-end funds (including all of their portfolios) advised by the Advisor and any registered funds that have an investment advisor that is an affiliated person of the Advisor. As of the date of this shareholder report, the fund complex consists of the funds in the Trust, as well as the registered funds advised by affiliates of the Advisor.
Shareholder Communications to the Board. Shareholders may send communications to the Trust’s Board by addressing the communications directly to the Board (or individual Board Members) and/or otherwise clearly indicating in the salutation that the communication is for the Board (or individual Board Members). The shareholder may send the communication to either the Trust’s office or directly to such Board members c/o 875 Third Avenue, New York, NY 10022. Other shareholder communications received by the Trust not directly addressed and sent to the Board will be reviewed and generally responded to by management. Such communications will be forwarded to the Board at management’s discretion based on the matters contained therein.
Independent Board Members
| Name, Year of Birth, Position with the Trust and Length of Time Served(1) | Business Experience and Directorships During the Past 5 Years | Number of Portfolios in Fund Complex Overseen | Other Directorships Held by Board Member | |||
Stephen R. Byers (1953) Chairman since 2016, and Board Member since 2011 (formerly, Lead Independent Board Member, 2015-2016) | Independent Director (2011- present); Independent Consultant (2014-present); Director of Investment Management, the Dreyfus Corporation (2000-2006) and Vice Chairman and Chief Investment Officer, the Dreyfus Corporation (2002-2006). | 34 | The Arbitrage Funds, Sierra Income Corporation, Mutual Fund Directors Forum | |||
| George O. Elston (1964) Board Member since 2011, Chairman of the Audit Committee since 2015 | Chief Financial Officer, Enzyvant (2018-present); Chief Executive Officer, 2X Oncology, Inc. (2017-2018); Senior Vice President and Chief Financial Officer, Juniper Pharmaceuticals, Inc. (2014-2016); Senior Vice President and Chief Financial Officer, KBI BioPharma Inc. (2013-2014); Managing Partner, Chatham Street Partners (2010-2013). | 34 | - | |||
| J. David Officer (1948) Board Member since 2011, Chairman of the Nominating Committee since 2015 | Independent Director (2010-present); Vice Chairman, the Dreyfus Corporation (2006-2009); President, The Dreyfus Family of Funds, Inc. (2006-2009). | 34 | (Chairman of) Ilex Management Ltd; Old Westbury Funds |
79
DBX ETF Trust
Board Members and Officers (Unaudited) (Continued)
Officers(2)
| Name, Year of Birth, Position with the Trust and Length of Time Served(4) | Business Experience and Directorships During the Past 5 Years | |
Freddi Klassen(5) (1975) President and Chief Executive Officer, 2016-present | Director(3) in DWS and Chief Operating Officer in the Americas for the Traditional Asset Classes Department (2014–present); Manager and Chief Operating Officer of DWS Investment Management Americas, Inc. (2018–present) and the Advisor (2016–present); Global Chief Operating Officer for Equities Technology in the Investment Bank Division at Deutsche Bank AG (2013-2014); Chief Operating Officer for Exchange Traded Funds and Systematic Funds in Europe (2008-2013). | |
Luke Oliver(5) (1980) Chief Operating Officer, 2019-present | Managing Director(3) in DWS (2017-present); Director(3) in DWS (2009-2017); Head of Passive Americas Asset Management Platform (2019-present); Manager, Chief Executive Officer and Chief Investment Officer of the Advisor (2019-present); Head of ETF Capital Markets, Americas (2012-2018); Lead Portfolio Manager of PowerShares DB ETFs (2009-2012). | |
Diane Kenneally(6) (1966) Treasurer, Chief Financial Officer and Controller, 2019-present | Director(3) in DWS; Chief Financial Officer and Treasurer for DWS US registered investment companies advised by DWS Investment Management Americas, Inc. (2018-present); Treasurer and Chief Financial Officer, The European Equity Fund, Inc., The New Germany Fund, Inc. and The Central and Eastern Europe Fund, Inc. (2018-present); formerly: Assistant Treasurer for the DWS funds (2007-2018). | |
Frank Gecsedi(5) (1967) Chief Compliance Officer, 2010-present | Director(3) in DWS Compliance Department (2016-present), Vice President in the Deutsche Asset Management Compliance Department at Deutsche Bank AG (2013-2016) and Chief Compliance Officer of the Advisor (2010-present); Chief Compliance Officer of DWS Distributors, Inc. (2019-present); Vice President in Deutsche Bank’s Global Markets Legal, Risk and Capital Division (2010-2012). | |
Bryan Richards(5) (1978) Vice President, 2016-present | Managing Director(3) in DWS (2018-present); Director(3) in DWS (2014-2018); Portfolio Manager in the Passive Asset Management Department at DWS (2011-present); Primary Portfolio Manager for the PowerShares DB Commodity ETFs (2011-2015). | |
John Millette(6) (1962) Secretary, 2020-present | Director(3) in DWS US Retail Legal (2003-present); Vice President and Secretary of DWS US registered investment companies advised by DWS Investment Management Americas, Inc. (1999-present); Chief Legal Officer, DWS Investment Management Americas, Inc. (2015-present); Director and Vice President of DWS Trust Company (2016-present); Secretary, The European Equity Fund, Inc., The New Germany Fund, Inc. and The Central and Eastern Europe Fund, Inc. (2011-present); formerly: Secretary of Deutsche Investment Management Americas Inc. (2015-2017); Assistant Secretary of DBX ETF Trust (2019-2020); Assistant Secretary (July 14, 2006-December 31, 2010) and Secretary (January 31, 2006-July 13, 2006), The European Equity Fund, Inc., The New Germany Fund, Inc. and The Central and Eastern Europe Fund, Inc. |
80
DBX ETF Trust
Board Members and Officers (Unaudited) (Continued)
| Name, Year of Birth, Position with the Trust and Length of Time Served(4) | Business Experience and Directorships During the Past 5 Years | |
Caroline Pearson(6) (1962) Assistant Secretary, 2020-present | Managing Director(3) in DWS US Retail Legal; Chief Legal Officer of DWS US registered investment companies advised by DWS Investment Management Americas, Inc. (2010-present); Chief Legal Officer, The European Equity Fund, Inc., The New Germany Fund, Inc. and The Central and Eastern Europe Fund, Inc. (2012-present); formerly: Secretary, Deutsche AM Distributors, Inc. (2002-2017); and Secretary, Deutsche AM Service Company (2010-2017). | |
Paul Antosca(6) (1957) Assistant Treasurer, 2019-present | Director(3) in DWS; Assistant Treasurer for DWS US registered investment companies advised by DWS Investment Management Americas, Inc. (2007-present). | |
Jeffrey Berry(6) (1959) Assistant Treasurer, 2019-present | Director(3) in DWS. | |
Sheila Cadogan(6) (1966) Assistant Treasurer, 2019-present | Director(3) in DWS; Assistant Treasurer for DWS US registered investment companies advised by DWS Investment Management Americas, Inc. (2017-present); Director and Vice President, DWS Trust Company (2018-present); Assistant Treasurer, The European Equity Fund, Inc., The New Germany Fund, Inc. and The Central and Eastern Europe Fund, Inc. (2018-present). | |
Christina A. Morse(7) (1964) Assistant Secretary, 2017-present | Vice President at BNY Mellon-Asset Servicing (2014-present); Vice President and Counsel at Lord Abbett & Co. LLC (2013-2014). | |
Michelle Goveia-Pine(5) (1970) Interim Anti-Money Laundering Compliance Officer, since July 9, 2020 | Director(3) in DWS; Interim AML Officer, DWS Trust Company (since July 28, 2020); and Interim AML Officer of DWS US registered investment companies advised by DWS Investment Management Americas, Inc. (since July 10, 2020); Interim AML Officer, The European Equity Fund, Inc., The New Germany Fund, Inc. and The Central and Eastern Europe Fund, Inc. (since July 24, 2020). |
(1) The length of time served is represented by the year in which the Board Member joined the Board.
(2) As a result of their respective positions held with the Advisor and its affiliates, these individuals are considered “interested persons” of the Advisor within the meaning of the 1940 Act. Interested persons receive no compensation from the Funds.
(3) Executive title, not a board directorship.
(4) The length of time served is represented by the year in which the officer was first elected to the Trust in such capacity.
(5) Address: 875 Third Avenue, New York, New York 10022.
(6) Address: One International Place, Boston, Massachusetts 02110.
(7) Address: BNY Mellon Asset Servicing, Atlantic Terminal Office Tower, 2 Hanson Place, Brooklyn, NY 11217.
The Funds’ Statement of Additional Information (“SAI”) includes additional information about the Funds’ Board Members. The SAI is available by calling 855-329-3837, or on the Company’s website at www.Xtrackers.com.
81
DBX ETF Trust
Xtrackers Bloomberg Barclays US Investment Grade Corporate ESG ETF, Xtrackers J.P. Morgan ESG Emerging Markets Sovereign ETF, Xtrackers J.P Morgan ESG USD High Yield Corporate Bond ETF, Xtrackers Municipal Infrastructure Revenue Bond ETF, Xtrackers MSCI All World ex US High Dividend Yield Equity ETF and Xtrackers MSCI EAFE High Dividend Yield Equity ETF
After discussions at the meeting of the Board of Trustees (“Board” or “Trustees”) held on February 26-27, 2020 (the “Meeting”), the Trustees, all of whom are the Independent Trustees (those not affiliated with DBX ETF Trust (the “Trust”) or its service providers), unanimously approved the continuance of the Investment Advisory Agreement with respect to Xtrackers Investment Grade Bond — Interest Rate Hedged ETF (now known as Xtrackers Bloomberg Barclays US Investment Grade Corporate ESG ETF), Xtrackers Emerging Markets Bond — Interest Rate Hedged ETF (now known as Xtrackers J.P. Morgan ESG Emerging Markets Sovereign ETF), Xtrackers High Yield Corporate Bond — Interest Rate Hedged ETF (now known as Xtrackers J.P Morgan ESG USD High Yield Corporate Bond ETF), Xtrackers Municipal Infrastructure Revenue Bond ETF, Xtrackers MSCI All World ex US High Dividend Yield Equity ETF and Xtrackers MSCI EAFE High Dividend Yield Equity ETF (each a “Fund,” and collectively, the “Funds”). The Independent Trustees were advised throughout the review and Meeting by K&L Gates LLP (“Independent Trustee Counsel”).
Before reaching their decision to approve the Investment Advisory Agreement for another annual period, the Independent Trustees evaluated the materials furnished to them in advance of the Meeting from DBX Advisors LLC (“DBX” or the “Advisor”) for purposes of reviewing the agreement’s terms, including statistical information prepared by Broadridge Financial Solutions Inc. (“Broadridge”) regarding (a) fee and expense information for each Fund (including the fee and expense components and any amounts waived or reimbursed) as compared to a peer group of other exchange-traded funds (“ETFs”) selected pursuant to Broadridge’s proprietary methodology (each, a “Peer Group”) and (b) each Fund’s tracking error as compared to its underlying index over the previous five years (or since inception, if shorter). The Independent Trustees also took into consideration the discussions they had with management during the Meeting and among themselves during their Executive Sessions held on February 26 and February 27, 2020. The Independent Trustees also noted that they had received and should take into consideration a substantial amount of information furnished throughout the year at regular Board meetings, which information included, among other things, an analysis of each Fund’s investment performance, tracking error and related financial information, presentations given by DBX, as well as its periodic reports on brokerage commissions, portfolio execution and other services provided to the Funds.
In reaching its decision to continue in effect the Investment Advisory Agreement for another annual period, the Board considered all factors it believed relevant, including (1) the nature, extent and quality of the services provided to the Funds and their shareholders; (2) the financial resources of DBX and its resulting ability to perform its obligations under the Investment Advisory Agreement; (3) the competitiveness of the advisory fee; (4) the total cost of the services provided by and the profits realized by the Advisor from its relationship with the Funds; (5) the extent to which economies of scale have been realized, and if the Funds’ shareholders have benefitted from those economies; and (6) fall out benefits, if any, enjoyed by the Advisor.
The Board reached a determination, with the assistance of Independent Trustee Counsel and Dechert LLP (“Trust Counsel”) and through the exercise of its business judgment, that approval of the Investment Advisory Agreement and the compensation to be received thereunder is in the best interests of each Fund and its shareholders as well as consistent with the Board’s duties under state and federal law. The Board reached this conclusion based on multiple factors.
The Board considered the following in determining whether to approve the Investment Advisory Agreement:
Nature, Extent and Quality of Services. The Board reviewed in detail the nature, extent and quality of services provided and the risks incurred by the Advisor under the Investment Advisory Agreement. In doing so, the Board considered the information it had received from and the discussions it had with the Advisor continuously during the prior year, in addition to the information the Advisor had provided in response to the Board’s requests prior to the Meeting. The Board considered that these services include, among other things, furnishing a continuous investment program for the Funds, including arranging for, or implementing, the purchase and sale of portfolio securities, the provision of general corporate services such as portfolio management compliance services and the preparation and
82
DBX ETF Trust
Board Considerations in Approval of Investment Advisory
Contract (Unaudited) (Continued)
filing of certain reports on behalf of the Trust. The Board also considered, among other things, the professional experience, qualifications and performance of the senior management and key professional personnel of the Advisor, including portfolio management.
The Board considered that the Advisor provides, at its own expense, office facilities and equipment for use by the Funds and supervisory persons responsible for supervising and monitoring the Trust’s service providers. The Board also considered that the Advisor pays or arranges for the compensation of officers of the Trust who are also officers or employees of the Advisor or one of its DWS Group affiliates, except as may otherwise be determined by the Board. In addition, the Board considered that the Advisor arranges for the provision of transfer agency, custody, fund administration and accounting, and other non-distribution services necessary for the Funds’ operations. The Board also considered that in addition to managing the Funds’ portfolios directly, the Advisor provides oversight of day-to-day operations, including monitoring tracking error, providing services in connection with the creation and redemption of creation units and assistance in meeting legal, compliance and regulatory requirements applicable to the Funds.
The Board considered the information regarding each Fund’s tracking error compared to its underlying index that had been provided by the Advisor and by Broadridge. The Board took note of the detailed information provided by the Advisor throughout the year with respect to each Fund’s tracking error and the sources thereof. The Trustees noted that tracking error for each Fund during the year was in an expected range.
Based on its review, the Board concluded that the nature, extent, and quality of services provided by the Advisor under the Investment Advisory Agreement are reasonable and appropriate in relation to the fees paid to the Advisor, taking special consideration of the fact that the advisory fee is a unitary fee and, as a result, a portion of the unitary advisory fee will be used to compensate the Funds’ service providers. The Board considered the staffing of the Advisor, including the training, qualifications and experience of investment personnel in managing the Funds. The Board also considered the expertise of the Advisor in supervising third party service providers to the Funds, such as the administrator and the custodian, noting the Advisor’s extensive work with these service providers (including onsite due diligence sessions) to conduct such supervision. The Board further considered the compliance program of the Advisor, which supports the Funds’ compliance program.
Advisor’s Financial Resources. In connection with the assessment of the ability of the Advisor to perform its duties under the Investment Advisory Agreement, the Board considered the Advisor’s financial condition and whether it has the resources necessary to carry out its functions. The Board concluded that the Advisor has the financial resources necessary to perform its obligations under the Investment Advisory Agreement.
Reasonableness of Advisory Fee. The Board compared each Fund’s advisory fee and total expenses to those of the other ETFs in its Peer Group. The Board noted that due to the special characteristics of certain Funds, there were limitations faced by Broadridge in providing comparable funds in the Peer Groups and the information in the Broadridge reports accordingly may or may not provide meaningful direct comparisons to the Funds. The Board also noted that the advisory fees and total expenses (after waivers/reimbursements) for the Funds were below or equal to the average and/or median of the ETFs in each Fund’s respective Peer Group compiled by Broadridge.
The Board accordingly noted that each Fund’s fee is competitive with the fees of applicable peer ETFs.
The Board considered that the fee for each of the Funds is a unitary fee pursuant to which the Advisor pays all of the Funds’ costs (subject to certain specified exceptions). The Board considered that each Fund’s fee had been priced to scale when it was established. The Board also considered that each Fund’s portfolio is managed on a day-to-day basis by the Advisor and that the Advisor also provides oversight of day-to-day operations, including monitoring tracking error, providing services in connection with creation and redemption units and assistance in meeting legal and regulatory requirements applicable to the Funds. Based on its review, the Board concluded that the advisory fee for each Fund is reasonable in light of the services provided.
Costs of Services and Profitability. The Board considered the expenses of the Advisor in developing and rendering services provided to the Funds and the information provided by the Advisor to the Board regarding the Funds’ profitability. The Board considered that the Advisor had provided extensive information about the
83
DBX ETF Trust
Board Considerations in Approval of Investment Advisory
Contract (Unaudited) (Continued)
Advisor’s profitability and the Advisor’s methodology in determining profitability. While the Advisor had provided information about the Advisor’s expenses relating to marketing the Funds, the Board considered the Advisor’s profitability without accounting for such expenses. The Board determined that, although only some of the Funds were profitable as of this time, the Advisor’s profitability with respect to each profitable Fund was not excessive. The Board considered whether the Advisor would benefit in other ways from its relationships with the Funds and concluded that there were no material fall-out benefits likely to accrue to the Advisor related to the operation of the Funds.
Economies of Scale. The Board considered that certain Funds had attracted a substantial amount of assets, but determined that those Funds were not experiencing economies of scale beyond what was reflected in each Fund’s unitary fee, which the Board noted was very competitive. The Board considered that the other Funds were not experiencing economies of scale at this time and determined to revisit this matter after the Funds had attracted more assets.
Given all the information available to it and considering all material factors, the Board concluded that the Investment Advisory Agreement was fair and reasonable and it was unanimously approved.
84
DBX ETF Trust
Proxy Voting Policies and Procedures
The Funds’ policies and procedures for voting proxies for portfolio securities and information about how each Fund voted proxies related to its portfolio securities during the most recent 12-month period ended June 30 are available on our Web site — www.Xtrackers.com (click on “Resources” and “Proxy Voting” at the top of the page) — or on the SEC’s Web site — www.sec.gov. To obtain a written copy of the Funds’ policies and procedures without charge, upon request, call us toll free at 855-329-3837.
Portfolio Holdings Information
The Funds are required to file their complete schedule of portfolio holdings with the SEC for their first and third fiscal quarters on Form N-PORT. Copies of the filings are available without charge, upon request on the SEC’s website at www.sec.gov and are available by calling the Trust at 855-329-3837.
Information about each Fund’s portfolio holdings is available daily at www.Xtrackers.com.
Discount/Premium Information
Information regarding how often shares of each Fund traded on NYSE Arca or Cboe, as applicable, at a price
above (i.e., at a premium) or below (i.e., at a discount) the NAV of the Fund can be found at www.Xtrackers.com.
Tax Information
Form 1099-DIV and other year-end tax information provide shareholders with actual calendar year amounts that should be included in their tax returns. Shareholders should consult their tax advisors.
Each Fund designates the following amounts or, if subsequently determined to be different, the maximum allowable for its year ended May 31, 2020.
| Qualified Dividend Income* | ||||
Xtrackers MSCI All World ex US High Dividend Yield Equity ETF | 75% | |||
Xtrackers MSCI EAFE High Dividend Yield Equity ETF | 80% | |||
* The above percentage is based on ordinary income dividends paid to shareholders during each Fund’s fiscal year.
Each Fund intends to elect to pass through to shareholders the credit for taxes paid to foreign countries. The gross foreign source income and foreign taxes paid are as follows:
| Gross Foreign Income | Foreign Taxes Paid | |||||||
Xtrackers MSCI All World ex US High Dividend Yield Equity ETF | $1,212,797 | $98,496 | ||||||
Xtrackers MSCI EAFE High Dividend Yield Equity ETF | 15,473,089 | 719,430 | ||||||
85
DBX ETF Trust
DBX Advisors LLC (“Advisors”) collects non-public information about you from the following sources: (i) information received from you on applications or other forms; and (ii) information about your transactions with the Advisors, Advisors’ affiliates and third-party service providers and vendors. Advisors does not disclose any non-public personal information about you to anyone, other than as set forth below, as permitted by applicable law and regulation. Advisors may disclose non-public personal information about you to the funds in which you invest, to Advisors’ affiliates, and to non-affiliated companies that work with Advisors to service your account(s), or to provide services or process transactions that you have requested. Advisors may disclose non-public personal information in situations that may include, but are not limited to, in response to legal and/or regulatory inquiries and the proposed or actual sale, assignment merger or other transfer of all or a portion of Advisors’ business to another business entity. Advisors may also disclose non-public personal information about you to parties representing you, such as your investment representative, your accountant, your tax advisor, or to other third parties at your direction/consent. Advisors will not sell, rent, license or trade your personal and financial information to or with third parties for their own direct marketing use unless you give us general or specific consent to do so. If you decide to close your account(s) or become an inactive customer, Advisors will adhere to the privacy policies and practices as described in this notice. Advisors restricts access to your personal and account information to those employees who need to know that information to provide products and services to you. Advisors maintains reasonable and customary physical, electronic and procedural safeguards to guard your non-public personal information.
California residents may go to https://fundsus.dws.com/us/en-us/legal-resources/privacy-policy.html to obtain additional information relating to their rights under California state law.
Advisors reserves the right, at their discretion, to change, modify, add, or remove portions of this Privacy Policy Notice, and any of the policies described herein, at any time. Advisors will indicate any such changes to the Privacy Policy Notice at the privacy link which can be found at www.Xtrackers.com. At all times, you are bound by the then-current version of the Privacy Policy and all applicable laws. Advisors highly recommends that you review this Privacy Policy Notice from time to time to ensure that you are familiar with the most recent version. The examples contained in this Privacy Policy Notice are illustrations; they are not intended to be exclusive.
86
DBX ETF Trust
This report is intended for the shareholders of DBX ETF Trust.
This report must be preceded or accompanied by a prospectus.
Investing involves risk, including possible loss of principal. Bond investments are subject to interest-rate, credit, liquidity and market risks to varying degrees. When interest rates rise, bond prices generally fall. Credit risk refers to the ability of an issuer to make timely payments of principal and interest. Funds investing in a single industry, country or in a limited geographic region generally are more volatile than more diversified funds. In certain situations, it may be difficult or impossible to sell an investment at an acceptable price. Foreign investing involves greater and different risks than investing in U.S. companies, including currency fluctuations, less liquidity, less developed or less efficient trading markets, lack of comprehensive company information, political instability and differing auditing and legal standards. Emerging markets tend to be more volatile and less liquid than the markets of more mature economies, and generally have less diverse and less mature economic structures and less stable political systems than those of developed countries. Investments in lower-quality (“junk bonds”) and non-rated securities present greater risk of loss than investments in higher-quality securities. Municipal securities are subject to the risk that litigation, legislation or other political events, local business or economic conditions or the bankruptcy of the issuer could have a significant effect on an issuer’s ability to make payments of principal and/or interest. The market for municipal bonds may be less liquid than for taxable bonds and there may be less information available on the financial condition of issuers of municipal securities than for public corporations. Income from municipal bonds may be subject to state and local taxes and at times the alternative minimum tax. With respect to ESHY, ESCR and ESEB, investing in securities that meet ESG criteria may result in the fund forgoing otherwise attractive opportunities, which may result in underperformance when compared to funds that do not consider ESG factors. The Funds’ use of forward currency contracts may not be successful in hedging currency exchange rates changes and could eliminate some or all of the benefit of an increase in the value of a foreign currency versus the U.S. dollar. ESEB and HDEF are currently non-diversified and can take larger positions in fewer issues, increasing its potential risk. Stocks may decline in value. Dividends are not guaranteed. If the dividend-paying stocks held by the Fund reduce or stop paying dividends, the Fund’s ability to generate income may be adversely affected. Performance of the Funds may diverge from that of the Underlying Index due to operating expenses, transaction costs, cash flows, use of sampling strategies or operational inefficiencies. An investment in these Funds should be considered only as a supplement to a complete investment program for those investors willing to accept the risks associated with the Funds. Please read the prospectus for more information.
War, terrorism, economic uncertainty, trade disputes, public health crises (including the recent pandemic spread of the novel coronavirus) and related geopolitical events could lead to increased market volatility, disruption to U.S. and world economies and markets and may have significant adverse effects on the Funds and their investments.
Shares of the Funds are bought and sold at market price (not NAV) throughout the day on the NYSE Arca, Inc. or CBOE BZX Exchange, Inc., as applicable. Transactions in Fund shares may result in brokerage commissions and may generate tax consequences. There can be no assurance that an active trading market for shares of a Fund will develop or be maintained.
DBX ETF Trust Funds are distributed by ALPS Distributors, Inc. (“ALPS”). The Funds are managed by DBX Advisors LLC which is not affiliated with ALPS.
The brand DWS represents DWS Group GmbH & Co. KGaA and any of its subsidiaries such as DWS Distributors, Inc. which offers investment products or DWS Investment Management Americas, Inc. and RREEF America L.L.C. which offer advisory services.
ESHY and ESEB are not sponsored, endorsed, or promoted by JP Morgan Chase & Co. (“JP Morgan”) and JP Morgan bears no liability with respect to any index on which such fund is based. The accuracy, completeness or relevance of the information which has been obtained from external sources cannot be guaranteed, although it has been obtained from sources reasonably believed to be reliable. Subject to any applicable law, JP Morgan shall not assume any liability in this respect. The index described herein is a proprietary J.P. Morgan index. The prospectus contains a detailed description of the limited relationship that JP Morgan has with DBX Advisors, LLC. Index provider website: www.jpmorgan.com/country/US/en/jpmorgan/investbk/solutioins/research/indices/composition.
BLOOMBERG® is a trademark and service mark of Bloomberg Finance L.P. and its affiliates (collectively “Bloomberg”). BARCLAYS® is a trademark and service mark of Barclays Bank Plc (collectively with its affiliates, “Barclays”), used under license. Bloomberg or Bloomberg’s licensors, including Barclays, own all proprietary rights in the Bloomberg Barclays Indices. Neither Bloomberg nor Barclays is affiliated with, and neither approves, endorses, reviews or recommends the Xtrackers Bloomberg Barclays US Investment Grade Corporate ESG ETF. Neither Bloomberg nor Barclays guarantees the timeliness, accurateness or completeness of any data or information relating to the Bloomberg Barclays MSCI US Corporate Sustainability SRI Sector/Credit/Maturity Neutral Index, and neither shall be liable in any way to the DBX Advisors LLC, investors in the Xtrackers Bloomberg Barclays US Investment Grade Corporate ESG ETF or other third parties in respect of the use or accuracy of the Bloomberg Barclays MSCI US Corporate Sustainability SRI Sector/Credit/Maturity Neutral Index or any data included therein.
RVNU is not sponsored, endorsed, sold or promoted in any other manner by Solactive AG (the “Licensor”) nor does the trade mark or the Index Price at any time or in any other respect.
The Funds or securities referred to herein are not sponsored, endorsed, issued, sold or promoted by MSCI, and MSCI bears no liability with respect to any such Funds or securities or any index on which such funds or securities are based. The prospectus contains a more detailed description of the limited relationship MSCI has with DBX Advisors LLC and any related funds.
Copyright © 2020 DWS Group. All rights reserved. XtrackersTM is a trademark of DWS Investment GmbH. All other trademarks, servicemarks or registered trademarks are the property of their respective owners.
Not FDIC Insured | No Bank Guarantee | May Lose Value
DBX ETF Trust
Investment advisor DBX Advisors LLC 875 Third Avenue New York, NY 10022 | Administrator, custodian, The Bank of New York Mellon 240 Greenwich Street New York, NY 10286 | Distributor ALPS Distributors, Inc. 1290 Broadway Suite 1000 Denver, CO 80203 | ||
Independent registered public accounting firm Ernst & Young LLP 5 Times Square New York, NY 10036 | Legal counsel Dechert LLP 1095 Avenue of the Americas New York, NY 10036 | |||
R-35362-7 (7/20) DBX004444 (7/21)
May 31, 2020
Annual Report
DBX ETF Trust
Xtrackers Harvest CSI 300 China A-Shares ETF (ASHR)
Xtrackers Harvest CSI 500 China A-Shares Small Cap ETF (ASHS)
Xtrackers MSCI All China Equity ETF (CN)
Xtrackers MSCI China A Inclusion Equity ETF (ASHX)

DBX ETF Trust
| Page | ||||
| 1 | ||||
| 3 | ||||
| 6 | ||||
| 8 | ||||
| 10 | ||||
| 12 | ||||
| 14 | ||||
| 15 | ||||
| 20 | ||||
| 28 | ||||
| 33 | ||||
| 42 | ||||
| 43 | ||||
| 44 | ||||
| 46 | ||||
| 48 | ||||
| 58 | ||||
| 60 | ||||
| 61 | ||||
Board Considerations in Approval of Investment Advisory and Sub-Advisory Contracts | 64 | |||
| 70 | ||||
| 71 | ||||
To our Shareholders: (Unaudited)
Dear Shareholders,
We are pleased to provide this annual report for our flagship ETFs tracking China’s equity market for the period ended May 31, 2020.
During 2019-20, most economies across the globe experienced contractions following trade deficits, volatile energy prices and coronavirus-related disruptions. Economies focused their efforts through the initial phase of the review period on ensuring favorable employment rates, achieving target inflation levels, improving corporate earnings and driving expansion. However, as the coronavirus pandemic and its entailing shutdowns became more obvious, economies displayed concurrent absence in GDP1 growth. Almost all major economies endured commercial and social lockdowns, leading to a near collapse of small businesses and substantial fall in industrial and employment activities.
The Chinese economy saw its maiden contraction in decades in Q1 2020 owing to the government’s decision to cease all non-essential economic production and activity to tackle the coronavirus pandemic. China has been trying to find ways to grow exports amid the US embargo, but the pandemic threw a spanner in the efforts of the Communist Party regime. Also, the Chinese government failed to set a growth target for 2020 due to the high level of uncertainty caused by the global impact of the pandemic.
With businesses being shut in all major industrial provinces, key sectors suffered negative results. The automotive sector, which was battling growth saturation in 2019, was the most affected with sales falling to less than a tenth of its regular mid-quarter numbers in February. Labor-intensive heavyweights sectors such as manufacturing, industrials, and construction which demonstrated promising growth momentum in 2019 were the biggest affected; while agriculture was the only sector that reported growth. The nationwide lockdown restrictions saw retail sales and services diving to record lows. However, the services sector rebounded the sharpest in April after the restrictions were eased.
On the monetary policy front, the regime steadily reduced its benchmark rate over the last six months to rejuvenate economic activity in the post lockdown period of April-May, which showed underrated improvement. As a supplement to the cause, two stimuli packages were announced in the last six months by the Chinese Central Bank and the government, amounting to a combined total of over USD 600bn. These fiscal measures along with increased public spending are oriented to set the deficit back to 2016-17 levels.
Despite being the first victim of the pandemic, China has shown resilience with fresh reported cases being among the lowest in all major countries. Lockdown restrictions were reduced considerably by the end of March to spur normal business and social climate. The number of new cases have stayed within the single-digit range for a majority of the April-May period; although local experts and health officials are not ruling out the chances of a second wave of infections.
Though China seemingly came out of the coronavirus halt in May 2020, its growth prospects are seen in a conservative light as subdued retail sales for the month did not match robust production figures. This is also resonated in the capacity utilization being capped at two-third levels to dilate margins. With most of China’s international trading partners reeling under the pandemic, a lopsided external supply-demand scenario is estimated in the coming quarter. Economists are expecting a credible but protracted W-shaped recovery given the fear of resurgence of fresh cases expected locally and the lack of external support for the global trade major.
1
Our team appreciates your trust and looks forward to serving your investment needs through innovative index-driven strategies.
Sincerely,
/s/ Freddi Klassen
Freddi Klassen
President and Chief Executive Officer
1 The Gross Domestic Product (GDP) is the monetary value of all the finished goods and services produced within a country’s borders in a specific time period.
Assumptions, estimates and opinions contained in this document constitute our judgment as of the date of the document and are subject to change without notice. Any projections are based on a number of assumptions as to market conditions and there can be no guarantee that any projected results will be achieved. Past performance is not a guarantee of future results.
2
DBX ETF Trust
Xtrackers Harvest CSI 300 China A-Shares ETF
The Xtrackers Harvest CSI 300 China A-Shares ETF (ASHR) seeks investment results that correspond generally to the performance, before fees and expenses, of the CSI 300 Index (the ASHR Index). The ASHR Index is designed to reflect price fluctuations and performance of the China A-share market and is composed of the 300 largest and most liquid stocks in the China A-share market. ASHR is sub-advised by Harvest Global Investments. The continued strategic partnership between DWS and Harvest Global Investments provides investors with unique access to the expansive Chinese economy and stock market. For the 12-month period ended May 31, 2020, ASHR shares returned 4.50%, compared with the ASHR Index’s 4.88%.
Consumer Staples, Information Technology and Health Care were the major positive contributors, while Financials, Energy and Industrials sectors detracted most from the performance.
Xtrackers Harvest CSI 500 China A-Shares Small Cap ETF
The Xtrackers Harvest CSI 500 China A-Shares Small Cap ETF (ASHS) seeks investment results that correspond generally to the performance, before fees and expenses, of the CSI 500 Index (the ASHS Index). The ASHS Index tracks 500 small-cap companies listed on the Shanghai and Shenzhen Stock Exchanges. ASHS is sub-advised by Harvest Global Investments. The continued strategic partnership between DWS and Harvest Global Investments provides investors with unique access to the expansive Chinese economy and stock market. For the 12-month period ended May 31, 2020, ASHS returned 7.02%, compared with the ASHS Index’s 7.47%.
Information Technology, Health Care and Consumer Staples were the major positive contributors, while Materials, Real Estate and Industrials sectors detracted most from the performance.
Xtrackers MSCI All China Equity ETF
The Xtrackers MSCI All China Equity ETF (CN) seeks investment results that correspond generally to the performance, before fees and expenses, of the MSCI China All Shares Index (the CN Index). The CN Index captures large and midcap representations across China A-shares, B-shares, H-shares, Red-chips, and P-chips. The index aims to reflect the opportunity set of China share classes listed in Hong Kong, Shanghai, and Shenzhen. It is based on the concept of the integrated MSCI China equity universe, with China A-shares included. The Fund, using a passive or indexing approach, attempts to approximate the performance of the index. CN expects to gain exposure to the China A-share components of the index by investing in the Xtrackers Harvest CSI 300 China A-Shares ETF and Xtrackers Harvest CSI 500 China A-Shares Small Cap ETF, affiliated Funds sub-advised by Harvest Global Investments Limited; and Xtrackers MSCI China A Inclusion Equity ETF, an affiliated Fund advised by DBX Advisors LLC. For the 12-month period ended May 31, 2020, CN returned 9.35%, compared with the CN Index’s 10.70%.
Consumer Discretionary, Communication Services and Health Care were the major positive contributors, while Financials, Energy and Real Estate sectors detracted most from the performance.
Xtrackers MSCI China A Inclusion Equity ETF
The Xtrackers MSCI China A Inclusion Equity ETF (ASHX) seeks investment results that correspond generally to the performance, before fees and expenses, of the MSCI China A Inclusion Index (the ASHX Index). The ASHX Index is designed to track the progressive partial inclusion of A shares in the MSCI Emerging Markets Index over time. The index is designed for global investors accessing the A share market using the Stock Connect framework and is calculated using China A Stock Connect listings based on the offshore RMB exchange rate (CNH). For the 12-month period ended May 31, 2020, ASHX returned 8.49%, compared with the ASHX Index’s 9.12%.
Consumer Staples, Health Care and Information Technology were the major positive contributors, while Financials, Energy and Real Estate sectors detracted most from the performance.
*************************
Performance data quoted represents past performance and does not guarantee future results. Investment returns and principal value of an investment will fluctuate so that an investor’s shares, when sold or redeemed, may be worth more or less than their original cost. Current performance may be lower or higher than the performance
3
DBX ETF Trust
Management’s Discussion of Fund Performance (Unaudited) (Continued)
data quoted. To obtain the most recent month-end performance data visit www.Xtrackers.com. Returns assume that dividends and capital gains distributions have been reinvested. See pages 6-13 of this report for additional performance information, including performance data based on market value. The views expressed in this report reflect those of the portfolio management team only through the end of the period of the report as stated on the cover. The management team’s views are subject to change at any time based on market and other conditions and should not be construed as a recommendation. Current and future portfolio holdings are subject to risk.
4
This Page is Intentionally Left Blank
5
DBX ETF Trust
Xtrackers Harvest CSI 300 China A-Shares ETF (ASHR)
The Xtrackers Harvest CSI 300 China A-Shares ETF (the “Fund”), using a “passive” or indexing investment approach, seeks investment results that correspond generally to the performance, before fees and expenses, of the CSI 300 Index (the “Underlying Index”). The Underlying Index is designed to reflect the price fluctuation and performance of the China A-Share market and is composed of the 300 largest and most liquid stocks in the China A-Share market. The MSCI ACWI ex USA Index is designed to provide exposure to equity securities in developed and emerging stock markets (excluding the United States). It is not possible to invest directly into an index.
| Performance as of May 31, 2020 |
| Average Annual Total Return | ||||||||
| Net Asset Value | Market Value | CSI 300 Index | MSCI ACWI ex USA Index | |||||
One Year | 4.50% | 5.02% | 4.88% | -3.43% | ||||
Five Year | -5.94% | -6.00% | -5.34% | 0.79% | ||||
Since Inception1 | 6.09% | 6.03% | 6.99% | 1.36% | ||||
| Cumulative Total Returns | ||||||||
| Net Asset Value | Market Value | CSI 300 Index | MSCI ACWI ex USA Index | |||||
One Year | 4.50% | 5.02% | 4.88% | -3.43% | ||||
Five Year | -26.39% | -26.62% | -24.00% | 4.01% | ||||
Since Inception1 | 47.44% | 46.98% | 55.89% | 9.27% | ||||
1 Total returns are calculated based on the commencement of operations, November 6, 2013 (“Inception”).
Past performance is no guarantee of future results. Current performance may be lower or higher than the performance data quoted. Performance data current to the most recent month-end is available at www.Xtrackers.com. Performance results assume reinvestment of all dividends and capital gain distributions and do not reflect the deduction of taxes that a shareholder would pay on fund distributions or on the sale of fund shares or redemption of fund creation units. The investment return and principal value of shares will vary with changes in market conditions. Shares may be worth more or less than their original cost when they are sold in the market or redeemed. The estimated operating expense ratio as disclosed in the most recent prospectus dated October 1, 2019 was 0.65%, and may differ from the expense ratio disclosed in the Financial Highlights table in this report.
The Fund’s net asset value or “NAV” is calculated by dividing the value of the Fund’s total assets less total liabilities by the number of shares outstanding. The price used to calculate market return (“Market Price”) is determined by using the midpoint between the highest bid and the lowest offer on the primary stock exchange on which shares of a fund are listed for trading, as of the time that such fund’s NAV is calculated. Since shares of a fund may not have traded in the secondary market until after the fund’s inception, for the period from inception to the first day of secondary trading, the NAV of the fund is used as a proxy for the Market Price to calculate market returns. Market and NAV returns assume that dividends and capital gain distributions have been reinvested at Market Price and NAV, respectively.
An index is a statistical composite that tracks a specified financial market or sector. Unlike a fund, an index does not actually hold a portfolio of securities and therefore does not incur the expenses incurred by a fund. These expenses negatively impact fund performance. Also, market returns do not include brokerage commissions that may be payable on secondary market transactions. If brokerage commissions were included, market returns would be lower.
6
DBX ETF Trust
Performance Summary (Unaudited)
Xtrackers Harvest CSI 300 China A-Shares ETF (ASHR) (Continued)
| Growth of an Assumed $10,000 Investment |
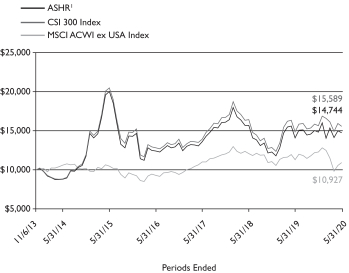
1 Based on Net Asset Value from commencement of operations, November 6, 2013.
| Sector Diversification* as of May 31, 2020 |
Financials | 30.5% | |||
Consumer Staples | 14.2% | |||
Industrials | 11.1% | |||
Information Technology | 10.4% | |||
Consumer Discretionary | 9.2% | |||
Health Care | 8.6% | |||
Materials | 6.0% | |||
Real Estate | 3.9% | |||
Utilities | 2.3% | |||
Communication Services | 2.1% | |||
Energy | 1.7% | |||
|
| |||
Total | 100.0% |
| Ten Largest Equity Holdings as of May 31, 2020 (27.2% of Net Assets) |
| Description | % of Net Assets | |||
Ping An Insurance Group Co. of China Ltd. | 5.9% | |||
Kweichow Moutai Co. Ltd. | 5.3% | |||
China Merchants Bank Co. Ltd. | 2.7% | |||
Jiangsu Hengrui Medicine Co. Ltd. | 2.2% | |||
Wuliangye Yibin Co. Ltd. | 2.2% | |||
Midea Group Co. Ltd. | 2.2% | |||
Gree Electric Appliances, Inc. of Zhuhai | 2.1% | |||
Industrial Bank Co. Ltd. | 1.8% | |||
CITIC Securities Co. Ltd. | 1.5% | |||
Inner Mongolia Yili Industrial Group Co. Ltd. | 1.3% | |||
* As a percentage of total investments.
Portfolio holdings and characteristics are subject to change. For more complete details about the Fund’s investment portfolio see page 15.
7
DBX ETF Trust
Performance Summary (Unaudited)
Xtrackers Harvest CSI 500 China A-Shares Small Cap ETF (ASHS)
The Xtrackers Harvest CSI 500 China A-Shares Small Cap ETF (the “Fund”), using a “passive” or indexing investment approach, seeks investment results that correspond generally to the performance, before fees and expenses, of the CSI 500 Index (the “Underlying Index”). The Underlying Index is designed to reflect the price fluctuation and performance of small-cap companies in the China A-Share market and is composed of the 500 smallest and most liquid stocks in the China A-Share market. The MSCI ACWI ex USA Index is designed to provide exposure to equity securities in developed and emerging stock markets (excluding the United States). It is not possible to invest directly into an index.
| Performance as of May 31, 2020 | ||||||||
| Average Annual Total Return | ||||||||
| Net Asset Value | Market Value | CSI 500 Index | MSCI ACWI ex USA Index | |||||
One Year | 7.02% | 6.72% | 7.47% | -3.43% | ||||
Five Year | -14.41% | -14.52% | -13.27% | 0.79% | ||||
Since Inception1 | 3.19% | 3.09% | 4.91% | 0.72% | ||||
| Cumulative Total Returns | ||||||||
| Net Asset Value | Market Value | CSI 500 Index | MSCI ACWI ex USA Index | |||||
One Year | 7.02% | 6.72% | 7.47% | -3.43% | ||||
Five Year | -54.07% | -54.37% | -50.93% | 4.01% | ||||
Since Inception1 | 20.88% | 20.15% | 33.55% | 4.45% | ||||
1 Total returns are calculated based on the commencement of operations, May 21, 2014 (“Inception”).
Past performance is no guarantee of future results. Current performance may be lower or higher than the performance data quoted. Performance data current to the most recent month-end is available at www.Xtrackers.com. Performance results assume reinvestment of all dividends and capital gain distributions and do not reflect the deduction of taxes that a shareholder would pay on fund distributions or on the sale of fund shares or redemption of fund creation units. The investment return and principal value of shares will vary with changes in market conditions. Shares may be worth more or less than their original cost when they are sold in the market or redeemed. The estimated operating expense ratio as disclosed in the most recent prospectus dated October 1, 2019, was 0.65%, and may differ from the expense ratio disclosed in the Financial Highlights table in this report.
The Fund’s net asset value or “NAV” is calculated by dividing the value of the Fund’s total assets less total liabilities by the number of shares outstanding. The price used to calculate market return (“Market Price”) is determined by using the midpoint between the highest bid and the lowest offer on the primary stock exchange on which shares of a fund are listed for trading, as of the time that such fund’s NAV is calculated. Since shares of a fund may not have traded in the secondary market until after the fund’s inception, for the period from inception to the first day of secondary trading, the NAV of the fund is used as a proxy for the Market Price to calculate market returns. Market and NAV returns assume that dividends and capital gain distributions have been reinvested at Market Price and NAV, respectively.
An index is a statistical composite that tracks a specified financial market or sector. Unlike a fund, an index does not actually hold a portfolio of securities and therefore does not incur the expenses incurred by a fund. These expenses negatively impact fund performance. Also, market returns do not include brokerage commissions that may be payable on secondary market transactions. If brokerage commissions were included, market returns would be lower.
8
DBX ETF Trust
Performance Summary (Unaudited)
Xtrackers Harvest CSI 500 China A-Shares Small Cap ETF (ASHS) (Continued)
| Growth of an Assumed $10,000 Investment |
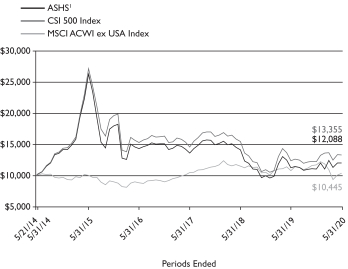
1 Based on Net Asset Value from commencement of operations, May 21, 2014.
| Sector Diversification* as of May 31, 2020 |
Information Technology | 21.8% | |||
Industrials | 17.0% | |||
Materials | 16.2% | |||
Health Care | 11.9% | |||
Consumer Discretionary | 8.3% | |||
Consumer Staples | 6.3% | |||
Communication Services | 5.6% | |||
Financials | 4.5% | |||
Real Estate | 3.6% | |||
Energy | 2.4% | |||
Utilities | 2.4% | |||
|
| |||
Total | 100.0% |
| Ten Largest Equity Holdings as of May 31, 2020 (7.0% of Net Assets) | ||
| Description | % of Net Assets | |||
NAURA Technology Group Co. Ltd. | 0.8% | |||
Wingtech Technology Co. Ltd. | 0.7% | |||
JCET Group Co. Ltd. | 0.7% | |||
NanJi E-Commerce Co. Ltd. | 0.7% | |||
Eve Energy Co. Ltd. | 0.7% | |||
Winning Health Technology Group Co. Ltd. | 0.7% | |||
Asymchem Laboratories Tianjin Co. Ltd. | 0.7% | |||
Tianjin Zhonghuan Semiconductor Co. Ltd. | 0.7% | |||
Unigroup Guoxin Microelectronics Co. Ltd. | 0.7% | |||
WUS Printed Circuit Kunshan Co. Ltd. | 0.6% | |||
* As a percentage of total investments.
Portfolio holdings and characteristics are subject to change. For more complete details about the Fund’s investment portfolio see page 20.
9
DBX ETF Trust
Performance Summary (Unaudited)
Xtrackers MSCI All China Equity ETF (CN)
The Xtrackers MSCI All China Equity ETF (the “Fund”), using a “passive” or indexing investment approach, seeks investment results that correspond generally to the performance, before fees and expenses, of the MSCI China All Shares Index (the “Underlying Index”). The Underlying Index is designed to capture large- and mid-capitalization representation across all China securities listed in Hong Kong, Shanghai and Shenzhen. The Underlying Index includes A-Shares, H-Shares, B-Shares, Red chips and P chips share classes, as well as securities of Chinese companies listed outside of China (e.g. American depository receipts). The Fund expects to gain exposure to the China A-share components of the Index by investing in Xtrackers MSCI China A Inclusion Equity ETF, an affiliated fund advised by DBX Advisors LLC., and Xtrackers Harvest CSI 300 China A-shares ETF and Xtrackers Harvest CSI 500 China A-Shares Small Cap ETF, affiliated funds subadvised by Harvest Global Investments Limited. It is not possible to invest directly into an index.
| Performance as of May 31, 2020 | ||||||
| Average Annual Total Return | ||||||
| Net Asset Value | Market Value | MSCI China All Shares Index | ||||
One Year | 9.35% | 9.90% | 10.70% | |||
Five Year | -0.68% | -0.64% | -1.96% | |||
Since Inception1 | 10.14% | 10.16% | 9.12% | |||
| Cumulative Total Returns | ||||||
| Net Asset Value | Market Value | MSCI China All Shares Index | ||||
One Year | 9.35% | 9.90% | 10.70% | |||
Five Year | -3.36% | -3.14% | -9.42% | |||
Since Inception1 | 80.00% | 80.35% | 70.17% | |||
1 Total returns are calculated based on the commencement of operations, April 30, 2014 (“Inception”).
Past performance is no guarantee of future results. Current performance may be lower or higher than the performance data quoted. Performance data current to the most recent month-end is available at www.Xtrackers.com. Performance results assume reinvestment of all dividends and capital gain distributions and do not reflect the deduction of taxes that a shareholder would pay on fund distributions or on the sale of fund shares or redemption of fund creation units. The investment return and principal value of shares will vary with changes in market conditions. Shares may be worth more or less than their original cost when they are sold in the market or redeemed. Performance for certain funds may reflect a waiver of a portion of investment management fees. Without such waiver, performance would have been lower. The estimated operating expense ratio as disclosed in the most recent prospectus dated October 1, 2019, was 0.73%, and may differ from the expense ratio disclosed in the Financial Highlights table in this report. This expense ratio includes net expenses of the affiliated funds in which CN invests.
The Fund’s net asset value or “NAV” is calculated by dividing the value of the Fund’s total assets less total liabilities by the number of shares outstanding. The price used to calculate market return (“Market Price”) is determined by using the midpoint between the highest bid and the lowest offer on the primary stock exchange on which shares of a fund are listed for trading, as of the time that such fund’s NAV is calculated. Since shares of a fund may not have traded in the secondary market until after the fund’s inception, for the period from inception to the first day of secondary trading, the NAV of the fund is used as a proxy for the Market Price to calculate market returns. Market and NAV returns assume that dividends and capital gain distributions have been reinvested at Market Price and NAV, respectively.
An index is a statistical composite that tracks a specified financial market or sector. Unlike a fund, an index does not actually hold a portfolio of securities and therefore does not incur the expenses incurred by a fund. These expenses negatively impact fund performance. Also, market returns do not include brokerage commissions that may be payable on secondary market transactions. If brokerage commissions were included, market returns would be lower.
10
DBX ETF Trust
Performance Summary (Unaudited)
Xtrackers MSCI All China Equity ETF (CN) (Continued)
| Growth of an Assumed $10,000 Investment |
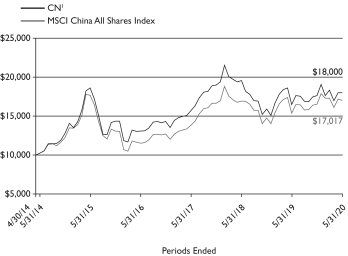
1 Based on Net Asset Value from commencement of operations, April 30, 2014.
| Sector Diversification * as of May 31, 2020 |
Consumer Discretionary | 23.1% | |||
Financials | 18.0% | |||
Communication Services | 15.4% | |||
Information Technology | 8.0% | |||
Industrials | 7.8% | |||
Consumer Staples | 7.4% | |||
Health Care | 7.0% | |||
Real Estate | 4.4% | |||
Materials | 4.2% | |||
Utilities | 2.4% | |||
Energy | 2.3% | |||
|
| |||
| 100.0% |
| Ten Largest Equity and ETF Holdings as of May 31, 2020 (71.2% of Net Assets) |
| Description | % of Net Assets | |||
Xtrackers MSCI China A Inclusion Equity ETF | 34.4% | |||
Alibaba Group Holding Ltd. | 12.0% | |||
Tencent Holdings Ltd. | 9.4% | |||
Xtrackers Harvest CSI 500 China A-Shares Small Cap ETF | 5.4% | |||
China Construction Bank Corp. | 2.3% | |||
Meituan Dianping | 2.1% | |||
Ping An Insurance Group Co. of China Ltd. | 1.8% | |||
China Mobile Ltd. | 1.3% | |||
JD.com, Inc. | 1.3% | |||
Industrial & Commercial Bank of China Ltd. | 1.2% | |||
* As a percentage of total investments excluding securities lending collateral and cash equivalents. Sector percentages include the sector allocations of the Fund’s investment in Xtrackers MSCI China A Inclusion Equity ETF and Xtrackers Harvest CSI 500 China A-Shares Small Cap ETF
Portfolio holdings and characteristics are subject to change. For more complete details about the Fund’s investment portfolio see page 28.
11
DBX ETF Trust
Performance Summary (Unaudited)
Xtrackers MSCI China A Inclusion Equity ETF (ASHX)
The Xtrackers MSCI China A Inclusion Equity ETF (the “Fund”), using a “passive” or indexing investment approach, seeks investment results that correspond generally to the performance, before fees and expenses, of the MSCI China A Inclusion Index (the “Underlying Index”). The Underlying Index is designed to track the equity market performance of China A-Shares that are accessible through the Shanghai-Hong Kong Stock Connect program or the Shenzhen-Hong Kong Stock Connect program. China A-Shares are equity securities issued by companies incorporated in mainland China and are denominated in renminbi. The MSCI ACWI ex USA Index is designed to provide exposure to equity securities in developed and emerging stock markets (excluding the United States). It is not possible to invest directly into an index.
| Performance as of May 31, 2020 | ||||||||
| Average Annual Total Return | ||||||||
| Net Asset Value | Market Value | MSCI China A Inclusion Index2 | MSCI ACWI ex USA Index | |||||
One Year | 8.49% | 8.11% | 9.12% | -3.43% | ||||
Since Inception1 | 0.70% | 0.63% | -0.23% | 2.78% | ||||
| Cumulative Total Returns | ||||||||
| Net Asset Value | Market Value | MSCI China A Inclusion Index2 | MSCI ACWI ex USA Index | |||||
One Year | 8.49% | 8.11% | 9.12% | -3.43% | ||||
Since Inception1 | 3.27% | 2.96% | -1.07% | 13.52% | ||||
1 Total returns are calculated based on the commencement of operations, October 20, 2015 (“Inception”).
2 On June 4, 2018, the Fund changed its Underlying Index from CSI 300 USD Hedged Index to the Underlying Index. Returns reflect performance for the CSI 300 USD Hedged Index through June 4, 2018. Past performance may have been different if the Fund’s current investment strategy had been in effect.
Past performance is no guarantee of future results. Current performance may be lower or higher than the performance data quoted. Performance data current to the most recent month-end is available at www.Xtrackers.com. Performance results assume reinvestment of all dividends and capital gain distributions and do not reflect the deduction of taxes that a shareholder would pay on fund distributions or on the sale of fund shares or redemption of fund creation units. The investment return and principal value of shares will vary with changes in market conditions. Shares may be worth more or less than their original cost when they are sold in the market or redeemed. Performance for certain funds may reflect a waiver of a portion of investment management fees. Without such waiver, performance would have been lower. The estimated operating expense ratio as disclosed in the most recent prospectus dated October 1, 2019, was 0.60%, and may differ from the expense ratio disclosed in the Financial Highlights table in this report. This expense ratio includes net expenses of the affiliated funds in which ASHX invests.
The Fund’s net asset value or “NAV” is calculated by dividing the value of the Fund’s total assets less total liabilities by the number of shares outstanding. The price used to calculate market return (“Market Price”) is determined by using the midpoint between the highest bid and the lowest offer on the primary stock exchange on which shares of a fund are listed for trading, as of the time that such fund’s NAV is calculated. Since shares of a fund may not have traded in the secondary market until after the fund’s inception, for the period from inception to the first day of secondary trading, the NAV of the fund is used as a proxy for the Market Price to calculate market returns. Market and NAV returns assume that dividends and capital gain distributions have been reinvested at Market Price and NAV, respectively.
An index is a statistical composite that tracks a specified financial market or sector. Unlike a fund, an index does not actually hold a portfolio of securities and therefore does not incur the expenses incurred by a fund. These expenses negatively impact fund performance. Also, market returns do not include brokerage commissions that may be payable on secondary market transactions. If brokerage commissions were included, market returns would be lower.
12
DBX ETF Trust
Performance Summary (Unaudited)
Xtrackers MSCI China A Inclusion Equity ETF (ASHX) (Continued)
| Growth of an Assumed $10,000 Investment |

1 Based on Net Asset Value from commencement of operations, October 20, 2015.
| Sector Diversification * as of May 31, 2020 |
Financials | 22.9% | |||
Consumer Staples | 16.3% | |||
Information Technology | 13.9% | |||
Industrials | 12.3% | |||
Health Care | 11.2% | |||
Materials | 6.9% | |||
Consumer Discretionary | 5.6% | |||
Real Estate | 3.8% | |||
Communication Services | 2.7% | |||
Utilities | 2.6% | |||
Energy | 1.8% | |||
|
| |||
Total | 100.0% |
| Ten Largest Equity Holdings as of May 31, 2020 (19.4% of Net Assets) |
| Description | % of Net Assets | |||
Kweichow Moutai Co. Ltd. | 5.7% | |||
Ping An Insurance Group Co. of China Ltd. | 2.6% | |||
China Merchants Bank Co. Ltd. | 2.3% | |||
Wuliangye Yibin Co. Ltd. | 1.9% | |||
Jiangsu Hengrui Medicine Co. Ltd. | 1.4% | |||
China Yangtze Power Co. Ltd. | 1.3% | |||
Industrial Bank Co. Ltd. | 1.1% | |||
Contemporary Amperex Technology Co. Ltd. | 1.1% | |||
Foshan Haitian Flavouring & Food Co. Ltd. | 1.0% | |||
Shanghai Pudong Development Bank Co. Ltd. | 1.0% | |||
* As a percent of total investments excluding exchange-traded funds, securities lending collateral and cash equivalents.
Portfolio holdings and characteristics are subject to change. For more complete details about the Fund’s investment portfolio see page 33.
13
DBX ETF Trust
As a shareholder of one or more of the Funds, you incur two types of costs: (1) transaction costs, including brokerage commissions paid on purchases and sales of fund shares, and (2) ongoing costs, including management fees and other fund expenses. In addition to the ongoing expenses which each Fund bears directly, the Xtrackers MSCI All China Equity ETF shareholders indirectly bear the expenses of Xtrackers MSCI China A Inclusion Equity ETF and Xtrackers Harvest CSI 500 China A-Shares Small Cap ETF (the “Underlying Funds”) in which the Xtrackers MSCI All China Equity ETF invests. These expenses are not included in Xtrackers MSCI All China Equity ETF’s annualized expense ratios used to calculate the expense estimate in the tables. In the most recent six-month period Xtrackers MSCI China A Inclusion Equity ETF and Xtrackers MSCI All China Equity ETF limited these expenses; had they not done so, expenses would have been higher. The expense examples below are intended to help you understand your ongoing costs (in dollars) of investing in the Funds and to compare these costs with the ongoing costs of investing in other funds.
The examples in the tables are based on an investment of $1,000 invested at the beginning of the six-month period and held for the entire period (December 1, 2019 to May 31, 2020).
Actual expenses
The first line in the following tables provides information about actual account values and actual expenses. You may use the information in this line, together with the amount you invested, to estimate the expenses that you paid over the period. Simply divide your account value by $1,000 (for example, an $8,600 account value divided by $1,000 = 8.6), then multiply the result by the number in the first line under the heading “Expenses Paid During the Period” to estimate the expenses you paid on your account during this period.
Hypothetical example for comparison purposes
The second line in the following tables provides information about hypothetical account values and hypothetical expenses based on the Funds’ actual expense ratios and an assumed rate of return of 5% per year before expenses (which is not the Funds’ actual return). The hypothetical account values and expenses may not be used to estimate the actual ending account balance or expenses you paid for the period. You may use this information to compare the ongoing costs of investing in the Fund and other funds. To do so, compare this 5% hypothetical example with the 5% hypothetical examples that appear in the shareholder reports of the other funds.
Please note that the expenses shown in the tables are meant to highlight your ongoing costs only, and do not reflect any transactional costs. Therefore the second line in the table is useful in comparing ongoing costs only, and will not help you determine the relative total costs of owning different funds. In addition, if these transactional costs were included, your costs would have been higher.
| Beginning Account Value December 1, 2019 | Ending Account Value May 31, 2020 | Annualized Expense Ratio | Expenses Paid During the Period Per $1,000(1) | |||||||||||||
| Xtrackers Harvest CSI 300 China A-Shares ETF |
| |||||||||||||||
Actual | $ | 1,000.00 | $ | 993.20 | 0.65 | % | $ | 3.24 | ||||||||
Hypothetical (5% return before expenses) | $ | 1,000.00 | $ | 1,021.75 | 0.65 | % | $ | 3.29 | ||||||||
| Xtrackers Harvest CSI 500 China A-Shares Small Cap ETF |
| |||||||||||||||
Actual | $ | 1,000.00 | $ | 1,087.80 | 0.65 | % | $ | 3.39 | ||||||||
Hypothetical (5% return before expenses) | $ | 1,000.00 | $ | 1,021.75 | 0.65 | % | $ | 3.29 | ||||||||
| Xtrackers MSCI All China Equity ETF (2) |
| |||||||||||||||
Actual | $ | 1,000.00 | $ | 1,021.60 | 0.26 | % | $ | 1.31 | ||||||||
Hypothetical (5% return before expenses) | $ | 1,000.00 | $ | 1,023.70 | 0.26 | % | $ | 1.32 | ||||||||
| Xtrackers MSCI China A Inclusion Equity ETF |
| |||||||||||||||
Actual | $ | 1,000.00 | $ | 1,026.90 | 0.60 | % | $ | 3.04 | ||||||||
Hypothetical (5% return before expenses) | $ | 1,000.00 | $ | 1,022.00 | 0.60 | % | $ | 3.03 | ||||||||
(1) Expenses are equal to each Fund’s annualized expense ratio, multiplied by the average account value over the period, multiplied by 183 (the number of days in the most recent six-month period), then divided by 366.
(2) The Fund invests in other ETFs and indirectly bears its proportionate share of fees and expenses incurred by the Underlying Funds in which the Fund is invested. This ratio does not include these indirect fees and expenses.
14
DBX ETF Trust
Schedule of Investments
Xtrackers Harvest CSI 300 China A-Shares ETF
May 31, 2020
Number | Value | |||||||
| COMMON STOCKS — 99.7% | ||||||||
| Communication Services — 2.1% | ||||||||
China Film Co. Ltd., Class A | 494,449 | $ | 914,434 | |||||
China Satellite Communications Co. Ltd., Class A* | 271,700 | 709,184 | ||||||
China United Network Communications Ltd., Class A | 6,461,663 | 4,490,378 | ||||||
Focus Media Information Technology Co. Ltd., Class A | 7,139,104 | 4,941,145 | ||||||
Giant Network Group Co. Ltd., Class A | 419,235 | 977,977 | ||||||
Mango Excellent Media Co. Ltd., Class A* | 368,883 | 2,739,186 | ||||||
Oriental Pearl Group Co. Ltd., Class A | 1,441,306 | 2,019,357 | ||||||
Perfect World Co. Ltd., Class A | 348,502 | 2,145,957 | ||||||
Wanda Film Holding Co. Ltd., Class A* | 584,819 | 1,323,278 | ||||||
Wuhu Sanqi Interactive Entertainment Network Technology Group Co. Ltd., Class A | 721,358 | 3,436,265 | ||||||
Zhejiang Century Huatong Group Co. Ltd., Class A | 1,634,960 | 3,069,509 | ||||||
|
| |||||||
(Cost $22,880,646) | 26,766,670 | |||||||
|
| |||||||
| Consumer Discretionary — 9.2% | ||||||||
BAIC BluePark New Energy Technology Co. Ltd., Class A* | 986,681 | 808,704 | ||||||
BYD Co. Ltd., Class A | 616,979 | 4,962,664 | ||||||
China Grand Automotive Services Group Co. Ltd., Class A | 2,279,893 | 996,611 | ||||||
China International Travel Service Corp. Ltd., Class A | 676,973 | 9,601,465 | ||||||
China Shipbuilding Industry Group Power Co. Ltd., Class A* | 449,445 | 987,999 | ||||||
Chongqing Changan Automobile Co. Ltd., Class A | 1,353,347 | 1,869,575 | ||||||
Fuyao Glass Industry Group Co. Ltd., Class A* | 983,190 | 2,705,428 | ||||||
Great Wall Motor Co. Ltd., Class A* | 834,411 | 934,079 | ||||||
Gree Electric Appliances, Inc. of Zhuhai, Class A | 3,327,303 | 26,544,022 | ||||||
Guangzhou Automobile Group Co. Ltd., Class A | 637,539 | 826,238 | ||||||
Haier Smart Home Co. Ltd., Class A | 2,570,223 | 5,959,718 | ||||||
Hangzhou Robam Appliances Co. Ltd., Class A* | 328,988 | 1,568,552 | ||||||
HLA Corp. Ltd., Class A* | 890,996 | 760,239 | ||||||
Huayu Automotive Systems Co. Ltd., Class A | 1,072,567 | 2,877,730 | ||||||
Midea Group Co. Ltd., Class A* | 3,368,263 | 27,852,367 | ||||||
Offcn Education Technology Co. Ltd., Class A | 473,166 | 1,949,026 | ||||||
Oppein Home Group, Inc., Class A | 83,376 | 1,414,161 | ||||||
SAIC Motor Corp. Ltd., Class A | 2,433,338 | 6,109,383 | ||||||
Shanghai Yuyuan Tourist Mart Group Co. Ltd., Class A | 1,079,983 | 1,251,352 | ||||||
Shenzhen Overseas Chinese Town Co. Ltd., Class A* | 2,850,323 | 2,332,189 | ||||||
Songcheng Performance Development Co. Ltd., Class A | 1,100,785 | 2,819,264 | ||||||
Number | Value | |||||||
| Consumer Discretionary (Continued) | ||||||||
Suning.com Co. Ltd., Class A | 2,568,307 | $ | 3,155,757 | |||||
TCL Technology Group Corp., Class A | 9,384,343 | 6,863,274 | ||||||
Zhejiang Supor Co. Ltd., Class A | 113,894 | 1,080,306 | ||||||
|
| |||||||
(Cost $88,925,878) | 116,230,103 | |||||||
|
| |||||||
| Consumer Staples — 14.2% | ||||||||
Anhui Gujing Distillery Co. Ltd., Class A | 77,467 | 1,625,435 | ||||||
Foshan Haitian Flavouring & Food Co. Ltd., Class A | 674,078 | 10,851,433 | ||||||
Guangdong Haid Group Co. Ltd., Class A | 540,595 | 3,665,847 | ||||||
Hebei Yangyuan Zhihui Beverage Co. Ltd., Class A | 355,075 | 1,111,374 | ||||||
Henan Shuanghui Investment & Development Co. Ltd., Class A* | 690,488 | 3,827,096 | ||||||
Inner Mongolia Yili Industrial Group Co. Ltd., Class A* | 4,233,405 | 16,874,426 | ||||||
Jiangsu Yanghe Brewery Joint-Stock Co. Ltd., Class A | 420,034 | 6,209,191 | ||||||
Kweichow Moutai Co. Ltd., Class A | 348,463 | 66,719,842 | ||||||
Luzhou Laojiao Co. Ltd., Class A | 507,863 | 6,069,494 | ||||||
Muyuan Foodstuff Co. Ltd., Class A | 601,445 | 10,127,941 | ||||||
New Hope Liuhe Co. Ltd., Class A | 1,437,370 | 5,642,787 | ||||||
Shanxi Xinghuacun Fen Wine Factory Co. Ltd., Class A | 177,761 | 3,190,630 | ||||||
Tongwei Co. Ltd., Class A | 1,789,771 | 3,435,381 | ||||||
Wens Foodstuffs Group Co. Ltd., Class A | 2,562,591 | 9,489,283 | ||||||
Wuliangye Yibin Co. Ltd., Class A | 1,345,760 | 27,942,981 | ||||||
Yonghui Superstores Co. Ltd., Class A | 2,670,565 | 3,487,193 | ||||||
|
| |||||||
(Cost $93,537,451) | 180,270,334 | |||||||
|
| |||||||
| Energy — 1.7% | ||||||||
China Coal Energy Co. Ltd., Class A | 1,256,510 | 667,210 | ||||||
China Oilfield Services Ltd., Class A | 427,214 | 750,585 | ||||||
China Petroleum & Chemical Corp., Class A | 9,266,391 | 5,374,869 | ||||||
China Shenhua Energy Co. Ltd., Class A | 2,296,357 | 5,269,995 | ||||||
CNOOC Energy Technology & Services Ltd., Class A* | 1,418,900 | 451,268 | ||||||
Offshore Oil Engineering Co. Ltd., Class A | 1,552,679 | 996,332 | ||||||
PetroChina Co. Ltd., Class A | 6,747,441 | 4,017,769 | ||||||
Shaanxi Coal Industry Co. Ltd., Class A | 2,759,403 | 2,771,987 | ||||||
Shanxi Meijin Energy Co. Ltd., Class A* | 859,200 | 753,573 | ||||||
Yanzhou Coal Mining Co. Ltd., Class A | 589,832 | 698,300 | ||||||
|
| |||||||
(Cost $25,706,606) | 21,751,888 | |||||||
|
| |||||||
| Financials — 30.4% | ||||||||
Agricultural Bank of China Ltd., Class A | 26,560,200 | 12,652,233 | ||||||
Anxin Trust Co. Ltd., Class A*(a) | 2,223,453 | 778,798 | ||||||
Avic Capital Co. Ltd., Class A | 3,741,414 | 1,986,698 | ||||||
Bank of Beijing Co. Ltd., Class A | 10,250,743 | 7,008,613 | ||||||
| See Notes to Financial Statements. | 15 |
DBX ETF Trust
Schedule of Investments
Xtrackers Harvest CSI 300 China A-Shares ETF (Continued)
May 31, 2020
Number | Value | |||||||
| Financials (Continued) | ||||||||
Bank of Changsha Co. Ltd., Class A | 687,877 | $ | 748,839 | |||||
Bank of Chengdu Co. Ltd., Class A | 1,271,842 | 1,420,196 | ||||||
Bank of China Ltd., Class A | 14,619,100 | 7,066,374 | ||||||
Bank of Communications Co. Ltd., Class A | 19,005,275 | 13,606,674 | ||||||
Bank of Guiyang Co. Ltd., Class A | 1,791,529 | 1,942,771 | ||||||
Bank of Hangzhou Co. Ltd., Class A | 1,643,721 | 2,095,687 | ||||||
Bank of Jiangsu Co. Ltd., Class A | 6,399,574 | 5,307,985 | ||||||
Bank of Nanjing Co. Ltd., Class A | 4,115,378 | 4,555,056 | ||||||
Bank of Ningbo Co. Ltd., Class A | 2,083,009 | 7,474,079 | ||||||
Bank of Shanghai Co. Ltd., Class A | 4,917,186 | 5,580,313 | ||||||
Bank of Xi’an Co. Ltd., Class A | 325,000 | 228,583 | ||||||
Caitong Securities Co. Ltd., Class A | 1,722,476 | 2,398,814 | ||||||
Changjiang Securities Co. Ltd., Class A | 2,672,086 | 2,339,847 | ||||||
China CITIC Bank Corp. Ltd., Class A | 2,113,136 | 1,486,237 | ||||||
China Construction Bank Corp., Class A | 4,653,628 | 4,153,250 | ||||||
China Everbright Bank Co. Ltd., Class A | 11,015,404 | 5,880,068 | ||||||
China Galaxy Securities Co. Ltd., Class A | 867,371 | 1,190,935 | ||||||
China Great Wall Securities Co. Ltd., Class A | 231,000 | 378,988 | ||||||
China Life Insurance Co. Ltd., Class A | 1,155,189 | 4,143,334 | ||||||
China Merchants Bank Co. Ltd., Class A | 7,157,799 | 33,916,421 | ||||||
China Merchants Securities Co. Ltd., Class A | 1,991,699 | 4,632,215 | ||||||
China Minsheng Banking Corp. Ltd., Class A | 17,203,948 | 13,715,047 | ||||||
China Pacific Insurance Group Co. Ltd., Class A | 2,179,594 | 8,635,986 | ||||||
Chinalin Securities Co. Ltd., Class A | 187,900 | 358,033 | ||||||
CITIC Securities Co. Ltd., Class A | 5,911,249 | 18,444,054 | ||||||
CSC Financial Co. Ltd., Class A | 314,909 | 1,410,979 | ||||||
Dongxing Securities Co. Ltd., Class A | 967,663 | 1,420,831 | ||||||
East Money Information Co. Ltd., Class A | 4,467,514 | 8,919,442 | ||||||
Everbright Securities Co. Ltd., Class A | 1,369,244 | 2,096,805 | ||||||
Founder Securities Co. Ltd., Class A | 2,848,586 | 2,761,800 | ||||||
GF Securities Co. Ltd., Class A | 2,052,501 | 3,790,144 | ||||||
Guosen Securities Co. Ltd., Class A | 1,718,969 | 2,572,150 | ||||||
Guotai Junan Securities Co. Ltd., Class A | 3,135,692 | 6,884,293 | ||||||
Guoyuan Securities Co. Ltd., Class A | 1,402,562 | 1,562,234 | ||||||
Haitong Securities Co. Ltd., Class A | 5,615,079 | 9,086,461 | ||||||
Hithink RoyalFlush Information Network Co. Ltd., Class A | 142,619 | 2,143,846 | ||||||
Hongta Securities Co. Ltd., Class A* | 275,500 | 752,299 | ||||||
Huatai Securities Co. Ltd., Class A | 3,044,557 | 7,370,972 | ||||||
Huaxia Bank Co. Ltd., Class A | 4,207,316 | 3,754,927 | ||||||
Hubei Biocause Pharmaceutical Co. Ltd., Class A | 1,351,420 | 925,884 | ||||||
Industrial & Commercial Bank of China Ltd., Class A | 14,921,884 | 10,704,109 | ||||||
Industrial Bank Co. Ltd., Class A | 10,078,213 | 22,733,502 | ||||||
Industrial Securities Co. Ltd., Class A | 3,244,109 | 2,586,215 | ||||||
Number | Value | |||||||
| Financials (Continued) | ||||||||
Minmetals Capital Co. Ltd., Class A | 321,960 | $ | 299,521 | |||||
New China Life Insurance Co. Ltd., Class A | 578,428 | 3,545,556 | ||||||
Orient Securities Co. Ltd., Class A | 2,465,387 | 3,167,462 | ||||||
People’s Insurance Co. Group of China Ltd., Class A | 733,743 | 638,399 | ||||||
Ping An Bank Co. Ltd., Class A | 6,730,716 | 12,259,183 | ||||||
Ping An Insurance Group Co. of China Ltd., Class A | 7,514,478 | 74,445,179 | ||||||
Qingdao Rural Commercial Bank Corp., Class A | 404,629 | 241,504 | ||||||
SDIC Capital Co. Ltd., Class A | 1,155,063 | 1,929,029 | ||||||
Shanghai Pudong Development Bank Co. Ltd., Class A | 8,148,883 | 12,067,852 | ||||||
Shenwan Hongyuan Group Co. Ltd., Class A* | 6,243,415 | 3,778,878 | ||||||
Sinolink Securities Co. Ltd., Class A | 1,678,875 | 2,314,570 | ||||||
SooChow Securities Co. Ltd., Class A | 2,173,065 | 2,292,580 | ||||||
Southwest Securities Co. Ltd., Class A | 1,958,332 | 1,201,759 | ||||||
Tianfeng Securities Co. Ltd., Class A | 466,980 | 357,884 | ||||||
Western Securities Co. Ltd., Class A | 1,216,594 | 1,356,799 | ||||||
Zheshang Securities Co. Ltd., Class A | 919,779 | 1,269,336 | ||||||
|
| |||||||
(Cost $360,274,420) | 386,768,512 | |||||||
|
| |||||||
| Health Care — 8.6% | ||||||||
Aier Eye Hospital Group Co. Ltd., Class A | 1,117,008 | 6,128,524 | ||||||
Beijing Tongrentang Co. Ltd., Class A | 383,998 | 1,348,240 | ||||||
Changchun High & New Technology Industry Group, Inc., Class A* | 97,057 | 9,056,451 | ||||||
Chengdu Kanghong Pharmaceutical Group Co. Ltd., Class A | 180,682 | 900,441 | ||||||
Chongqing Zhifei Biological Products Co. Ltd., Class A | 331,209 | 3,888,687 | ||||||
Dong-E-E-Jiao Co. Ltd., Class A | 323,701 | 1,620,444 | ||||||
Guangzhou Baiyunshan Pharmaceutical Holdings Co. Ltd., Class A | 396,513 | 1,674,394 | ||||||
Hangzhou Tigermed Consulting Co. Ltd., Class A | 356,526 | 4,238,381 | ||||||
Huadong Medicine Co. Ltd., Class A | 604,297 | 1,917,678 | ||||||
Hualan Biological Engineering, Inc., Class A | 764,344 | 4,409,935 | ||||||
Hubei Jumpcan Pharmaceutical Co. Ltd., Class A | 226,037 | 695,454 | ||||||
Jiangsu Hengrui Medicine Co. Ltd., Class A | 2,574,524 | 28,387,595 | ||||||
Jointown Pharmaceutical Group Co. Ltd., Class A | 398,814 | 1,005,772 | ||||||
Lepu Medical Technology Beijing Co. Ltd., Class A | 736,682 | 3,605,251 | ||||||
Meinian Onehealth Healthcare Holdings Co. Ltd., Class A | 1,916,817 | 3,155,553 | ||||||
Shanghai Fosun Pharmaceutical Group Co. Ltd., Class A | 697,250 | 3,003,935 | ||||||
Shanghai Pharmaceuticals Holding Co. Ltd., Class A | 772,667 | 1,926,945 | ||||||
Shanghai RAAS Blood Products Co. Ltd., Class A* | 1,370,601 | 1,576,562 | ||||||
| See Notes to Financial Statements. | 16 |
DBX ETF Trust
Schedule of Investments
Xtrackers Harvest CSI 300 China A-Shares ETF (Continued)
May 31, 2020
Number | Value | |||||||
| Health Care (Continued) | ||||||||
Shenzhen Salubris Pharmaceuticals Co. Ltd., Class A | 295,147 | $ | 824,143 | |||||
Sichuan Kelun Pharmaceutical Co. Ltd., Class A | 605,352 | 1,738,677 | ||||||
Tasly Pharmaceutical Group Co. Ltd., Class A | 613,158 | 1,267,990 | ||||||
Tonghua Dongbao Pharmaceutical Co. Ltd., Class A | 960,644 | 2,131,938 | ||||||
Walvax Biotechnology Co. Ltd., Class A | 856,652 | 5,028,927 | ||||||
WuXi AppTec Co. Ltd., Class A | 510,797 | 7,621,753 | ||||||
Yunnan Baiyao Group Co. Ltd., Class A | 353,576 | 4,368,273 | ||||||
Zhangzhou Pientzehuang Pharmaceutical Co. Ltd., Class A | 210,136 | 4,319,631 | ||||||
Zhejiang NHU Co. Ltd., Class A | 864,405 | 3,064,042 | ||||||
|
| |||||||
(Cost $70,121,340) | 108,905,616 | |||||||
|
| |||||||
| Industrials — 11.1% | ||||||||
AECC Aviation Power Co. Ltd., Class A* | 604,084 | 2,035,492 | ||||||
Air China Ltd., Class A | 2,082,330 | 1,887,604 | ||||||
AVIC Aircraft Co. Ltd., Class A | 970,372 | 2,338,426 | ||||||
AVIC Shenyang Aircraft Co. Ltd., Class A* | 296,827 | 1,397,332 | ||||||
AVICOPTER PLC, Class A | 207,308 | 1,206,534 | ||||||
Beijing New Building Materials PLC, Class A | 589,826 | 1,914,727 | ||||||
Beijing Originwater Technology Co. Ltd., Class A | 1,321,936 | 1,470,577 | ||||||
Bohai Leasing Co. Ltd., Class A* | 1,281,194 | 552,869 | ||||||
China Avionics Systems Co. Ltd., Class A | 361,392 | 670,889 | ||||||
China Communications Construction Co. Ltd., Class A | 1,645,809 | 1,768,609 | ||||||
China Eastern Airlines Corp. Ltd., Class A* | 3,121,665 | 1,819,435 | ||||||
China Gezhouba Group Co. Ltd., Class A | 1,925,712 | 1,605,333 | ||||||
China National Chemical Engineering Co. Ltd., Class A | 1,725,604 | 1,344,228 | ||||||
China Railway Construction Corp. Ltd., Class A | 3,200,480 | 3,878,718 | ||||||
China Railway Group Ltd., Class A | 5,673,557 | 4,173,224 | ||||||
China Shipbuilding Industry Co. Ltd., Class A | 6,340,194 | 3,606,497 | ||||||
China Southern Airlines Co. Ltd., Class A | 2,983,326 | 2,114,989 | ||||||
China Spacesat Co. Ltd., Class A* | 412,951 | 1,863,572 | ||||||
China State Construction Engineering Corp. Ltd., Class A | 14,535,694 | 10,182,694 | ||||||
COSCO SHIPPING Holdings Co. Ltd., Class A* | 2,673,087 | 1,183,470 | ||||||
CRRC Corp. Ltd., Class A | 6,762,035 | 5,532,828 | ||||||
Daqin Railway Co. Ltd., Class A | 4,132,328 | 3,948,536 | ||||||
Fangda Carbon New Material Co. Ltd., Class A* | 1,138,211 | 1,499,020 | ||||||
Number | Value | |||||||
| Industrials (Continued) | ||||||||
Guangzhou Baiyun International Airport Co. Ltd., Class A | 703,744 | $ | 1,612,090 | |||||
Hainan Airlines Holding Co. Ltd., Class A* | 8,005,000 | 1,816,909 | ||||||
Han’s Laser Technology Industry Group Co. Ltd., Class A* | 591,943 | 2,522,876 | ||||||
Jiangsu Zhongtian Technology Co. Ltd., Class A | 1,704,943 | 2,770,925 | ||||||
Metallurgical Corp. of China Ltd., Class A | 4,963,200 | 1,738,436 | ||||||
NARI Technology Co. Ltd., Class A | 1,608,699 | 4,171,940 | ||||||
Ningbo Zhoushan Port Co. Ltd., Class A* | 2,751,097 | 1,310,515 | ||||||
Power Construction Corp. of China Ltd., Class A | 5,301,471 | 2,532,839 | ||||||
Qingdao Port International Co. Ltd., Class A | 310,780 | 248,626 | ||||||
Sany Heavy Industry Co. Ltd., Class A | 4,071,372 | 10,455,870 | ||||||
SF Holding Co. Ltd., Class A | 610,620 | 3,899,440 | ||||||
Shanghai Construction Group Co. Ltd., Class A | 3,097,311 | 1,340,912 | ||||||
Shanghai Electric Group Co. Ltd., Class A | 2,512,659 | 1,534,889 | ||||||
Shanghai International Airport Co. Ltd., Class A | 668,087 | 6,775,924 | ||||||
Shanghai International Port Group Co. Ltd., Class A | 3,217,288 | 1,825,584 | ||||||
Shanghai M&G Stationery, Inc., Class A | 255,365 | 1,993,918 | ||||||
Shenzhen Inovance Technology Co. Ltd., Class A | 701,688 | 3,375,007 | ||||||
Siasun Robot & Automation Co. Ltd., Class A* | 761,611 | 1,381,847 | ||||||
Spring Airlines Co. Ltd., Class A* | 236,402 | 1,187,401 | ||||||
STO Express Co. Ltd., Class A* | 221,200 | 562,495 | ||||||
Suzhou Gold Mantis Construction Decoration Co. Ltd., Class A | 1,110,724 | 1,232,503 | ||||||
TBEA Co. Ltd., Class A | 2,562,612 | 2,466,588 | ||||||
Weichai Power Co. Ltd., Class A | 3,303,689 | 6,035,783 | ||||||
XCMG Construction Machinery Co. Ltd., Class A | 3,259,037 | 2,680,305 | ||||||
Xiamen C & D, Inc., Class A | 985,024 | 1,204,809 | ||||||
Xinjiang Goldwind Science & Technology Co. Ltd., Class A | 1,930,387 | 2,563,951 | ||||||
YTO Express Group Co. Ltd., Class A | 660,314 | 1,219,335 | ||||||
Yunda Holding Co. Ltd., Class A | 461,286 | 2,156,669 | ||||||
Zhejiang Chint Electrics Co. Ltd., Class A | 746,596 | 2,660,045 | ||||||
Zhejiang Sanhua Intelligent Controls Co. Ltd., Class A* | 958,913 | 3,002,712 | ||||||
Zhengzhou Yutong Bus Co. Ltd., Class A | 913,921 | 1,549,355 | ||||||
Zoomlion Heavy Industry Science and Technology Co. Ltd., Class A | 3,603,333 | 3,215,887 | ||||||
|
| |||||||
(Cost $130,044,528) | 141,041,988 | |||||||
|
| |||||||
| See Notes to Financial Statements. | 17 |
DBX ETF Trust
Schedule of Investments
Xtrackers Harvest CSI 300 China A-Shares ETF (Continued)
May 31, 2020
Number | Value | |||||||
| Information Technology — 10.3% | ||||||||
360 Security Technology, Inc., Class A | 282,882 | $ | 705,476 | |||||
Aisino Corp., Class A | 785,952 | 1,756,360 | ||||||
Avary Holding Shenzhen Co. Ltd., Class A | 169,200 | 995,887 | ||||||
AVIC Jonhon Optronic Technology Co. Ltd., Class A | 370,012 | 1,812,877 | ||||||
Beijing Shiji Information Technology Co. Ltd., Class A | 228,019 | 948,502 | ||||||
BOE Technology Group Co. Ltd., Class A* | 16,427,291 | 8,538,798 | ||||||
Chaozhou Three-Circle Group Co. Ltd., Class A | 711,096 | 1,981,618 | ||||||
Dawning Information Industry Co. Ltd., Class A | 610,193 | 3,182,003 | ||||||
Fiberhome Telecommunication Technologies Co. Ltd., Class A | 490,362 | 1,920,240 | ||||||
Foxconn Industrial Internet Co. Ltd., Class A | 1,249,194 | 2,347,014 | ||||||
Gigadevice Semiconductor Beijing, Inc., Class A | 187,023 | 5,067,409 | ||||||
Glodon Co. Ltd., Class A | 470,463 | 3,779,550 | ||||||
GoerTek, Inc., Class A | 1,565,419 | 4,658,457 | ||||||
Guangzhou Shiyuan Electronic Technology Co. Ltd., Class A* | 46,014 | 587,629 | ||||||
Hangzhou Hikvision Digital Technology Co. Ltd., Class A | 2,574,298 | 9,907,735 | ||||||
Hengtong Optic-electric Co. Ltd., Class A | 918,840 | 2,113,829 | ||||||
Hundsun Technologies, Inc., Class A* | 444,684 | 6,561,121 | ||||||
Iflytek Co. Ltd., Class A | 1,073,417 | 4,805,031 | ||||||
Lens Technology Co. Ltd., Class A | 891,372 | 2,035,652 | ||||||
LONGi Green Energy Technology Co. Ltd., Class A | 1,832,242 | 8,319,913 | ||||||
Luxshare Precision Industry Co. Ltd., Class A | 2,213,005 | 13,797,466 | ||||||
OFILM Group Co. Ltd., Class A* | 1,322,113 | 2,626,647 | ||||||
Sanan Optoelectronics Co. Ltd., Class A | 1,703,352 | 5,550,997 | ||||||
Shengyi Technology Co. Ltd., Class A | 795,925 | 2,988,573 | ||||||
Shennan Circuits Co. Ltd., Class A | 94,118 | 1,991,162 | ||||||
Shenzhen Goodix Technology Co. Ltd., Class A | 95,363 | 2,892,642 | ||||||
Shenzhen Sunway Communication Co. Ltd., Class A* | 520,329 | 2,843,878 | ||||||
Tsinghua Tongfang Co. Ltd., Class A* | 1,621,151 | 1,580,846 | ||||||
Tunghsu Optoelectronic Technology Co. Ltd., Class A | 3,034,245 | 1,177,572 | ||||||
Unisplendour Corp. Ltd., Class A* | 570,103 | 3,056,812 | ||||||
Wangsu Science & Technology Co. Ltd., Class A* | 1,370,875 | 1,496,209 | ||||||
Will Semiconductor Ltd., Class A | 120,936 | 3,110,555 | ||||||
Yonyou Network Technology Co. Ltd., Class A | 1,133,892 | 5,544,394 | ||||||
Zhejiang Dahua Technology Co. Ltd., Class A | 1,257,219 | 2,621,023 | ||||||
ZTE Corp., Class A* | 1,607,227 | 8,117,820 | ||||||
|
| |||||||
(Cost $86,260,796) | 131,421,697 | |||||||
|
| |||||||
Number | Value | |||||||
| Materials — 6.0% | ||||||||
Aluminum Corp. of China Ltd., Class A* | 4,550,217 | $ | 1,785,036 | |||||
Angang Steel Co. Ltd., Class A | 1,653,358 | 569,848 | ||||||
Anhui Conch Cement Co. Ltd., Class A | 1,375,869 | 10,949,199 | ||||||
Baiyin Nonferrous Group Co. Ltd., Class A* | 1,028,700 | 384,819 | ||||||
Baoshan Iron & Steel Co. Ltd., Class A* | 6,186,147 | 4,238,245 | ||||||
BBMG Corp., Class A | 2,302,029 | 1,015,964 | ||||||
Beijing Oriental Yuhong Waterproof Technology Co. Ltd., Class A* | 638,345 | 3,447,758 | ||||||
Bluestar Adisseo Co., Class A | 213,263 | 337,937 | ||||||
China Jushi Co. Ltd., Class A | 1,433,567 | 1,773,518 | ||||||
China Molybdenum Co. Ltd., Class A | 4,919,285 | 2,357,138 | ||||||
China Northern Rare Earth Group High-Tech Co. Ltd., Class A | 1,520,870 | 2,162,793 | ||||||
Ganfeng Lithium Co. Ltd., Class A | 529,086 | 3,669,344 | ||||||
Hengli Petrochemical Co. Ltd., Class A | 1,441,858 | 2,812,022 | ||||||
Hengyi Petrochemical Co. Ltd., Class A | 1,033,208 | 1,324,543 | ||||||
Hesteel Co. Ltd., Class A | 2,940,610 | 828,115 | ||||||
Hoshine Silicon Industry Co. Ltd., Class A | 100,379 | 347,374 | ||||||
Inner Mongolia BaoTou Steel Union Co. Ltd., Class A | 15,813,107 | 2,437,063 | ||||||
Inner Mongolia Junzheng Energy & Chemical Industry Group Co. Ltd., Class A | 2,349,273 | 816,285 | ||||||
Jiangxi Copper Co. Ltd., Class A | 701,190 | 1,252,573 | ||||||
Lomon Billions Group Co. Ltd., Class A | 694,488 | 1,519,857 | ||||||
Ningxia Baofeng Energy Group Co. Ltd., Class A | 559,800 | 698,039 | ||||||
Pangang Group Vanadium Titanium & Resources Co. Ltd., Class A* | 2,976,800 | 809,111 | ||||||
Rongsheng Petro Chemical Co. Ltd., Class A | 1,312,478 | 2,134,918 | ||||||
Shandong Gold Mining Co. Ltd., Class A | 701,908 | 3,648,472 | ||||||
Shandong Nanshan Aluminum Co. Ltd., Class A | 4,986,120 | 1,418,128 | ||||||
Tianqi Lithium Corp., Class A | 591,197 | 1,647,494 | ||||||
Tongling Nonferrous Metals Group Co. Ltd., Class A* | 4,371,020 | 1,157,448 | ||||||
Transfar Zhilian Co. Ltd., Class A | 883,895 | 704,644 | ||||||
Wanhua Chemical Group Co. Ltd., Class A | 1,073,801 | 6,992,731 | ||||||
YanAn Bicon Pharmaceutical Listed Co., Class A* | 401,876 | 387,380 | ||||||
Zhejiang Huayou Cobalt Co. Ltd., Class A | 475,896 | 2,164,966 | ||||||
Zhejiang Longsheng Group Co. Ltd., Class A | 1,817,000 | 3,100,696 | ||||||
Zhongjin Gold Corp. Ltd., Class A | 1,287,739 | 1,674,298 | ||||||
Zijin Mining Group Co. Ltd., Class A | 9,534,591 | 5,049,528 | ||||||
|
| |||||||
(Cost $65,093,297) | 75,617,284 | |||||||
|
| |||||||
| See Notes to Financial Statements. | 18 |
DBX ETF Trust
Schedule of Investments
Xtrackers Harvest CSI 300 China A-Shares ETF (Continued)
May 31, 2020
Number | Value | |||||||
| Real Estate — 3.9% | ||||||||
China Fortune Land Development Co. Ltd., Class A | 834,455 | $ | 2,532,318 | |||||
China Merchants Shekou Industrial Zone Holdings Co. Ltd., Class A | 2,205,570 | 4,953,490 | ||||||
China Vanke Co. Ltd., Class A | 4,052,787 | 14,592,974 | ||||||
Gemdale Corp., Class A | 1,552,497 | 2,773,307 | ||||||
Greenland Holdings Corp. Ltd., Class A | 2,537,735 | 1,902,203 | ||||||
Jiangsu Zhongnan Construction Group Co. Ltd., Class A | 1,273,658 | 1,404,380 | ||||||
Jinke Properties Group Co. Ltd., Class A | 1,474,600 | 1,590,823 | ||||||
Poly Developments and Holdings Group Co. Ltd., Class A | 4,965,894 | 9,990,996 | ||||||
Red Star Macalline Group Corp. Ltd., Class A | 279,060 | 400,755 | ||||||
RiseSun Real Estate Development Co. Ltd., Class A | 1,202,770 | 1,312,735 | ||||||
Seazen Holdings Co. Ltd., Class A* | 605,612 | 2,655,802 | ||||||
Shanghai Lingang Holdings Corp. Ltd., Class A* | 274,728 | 780,599 | ||||||
Shanghai Lujiazui Finance & Trade Zone Development Co. Ltd., Class A | 612,093 | 975,925 | ||||||
Xinhu Zhongbao Co. Ltd., Class A | 2,982,466 | 1,249,406 | ||||||
Yango Group Co. Ltd., Class A* | 1,127,610 | 1,025,323 | ||||||
Youngor Group Co. Ltd., Class A | 1,927,352 | 1,676,909 | ||||||
|
| |||||||
(Cost $45,478,078) | 49,817,945 | |||||||
|
| |||||||
Number | Value | |||||||
| Utilities — 2.2% | ||||||||
China National Nuclear Power Co. Ltd., Class A | 4,330,601 | $ | 2,445,176 | |||||
China Yangtze Power Co. Ltd., Class A | 6,108,591 | 14,883,242 | ||||||
GD Power Development Co. Ltd., Class A | 8,194,400 | 2,089,515 | ||||||
Huadian Power International Corp. Ltd., Class A | 2,276,800 | 1,164,326 | ||||||
Huaneng Lancang River Hydropower, Inc., Class A | 1,265,400 | 636,472 | ||||||
Huaneng Power International, Inc., Class A | 3,037,242 | 1,842,571 | ||||||
SDIC Power Holdings Co. Ltd., Class A | 2,363,057 | 2,499,643 | ||||||
Sichuan Chuantou Energy Co. Ltd., Class A | 1,225,136 | 1,524,243 | ||||||
Zhejiang Zheneng Electric Power Co. Ltd., Class A | 2,842,988 | 1,382,170 | ||||||
|
| |||||||
(Cost $29,519,161) | 28,467,358 | |||||||
|
| |||||||
TOTAL COMMON STOCKS | 1,267,059,395 | |||||||
|
| |||||||
TOTAL INVESTMENTS — 99.7% | $ | 1,267,059,395 | ||||||
Other assets and liabilities, net — 0.3% | 3,703,423 | |||||||
|
| |||||||
NET ASSETS — 100.0% | $ | 1,270,762,818 | ||||||
|
| |||||||
| * | Non-income producing security. |
| (a) | Investment was valued using significant unobservable inputs. |
Fair Value Measurements
Various inputs are used in determining the value of the Fund’s investments. These inputs are summarized in three broad levels. Level 1 includes quoted prices in active markets for identical securities. Level 2 includes other significant observable inputs (including quoted prices for similar securities, interest rates, prepayment speeds and credit risk). Level 3 includes significant unobservable inputs (including the Fund’s own assumptions in determining the fair value of investments). The level assigned to the securities valuations may not be an indication of the risk or liquidity associated with investing in those securities.
The following is a summary of the inputs used as of May 31, 2020 in valuing the Fund’s investments. For information on the Fund’s policy regarding the valuation of investments, please refer to the Security Valuation section of Note 2 in the accompanying Notes to Financial Statements.
Assets | Level 1 | Level 2 | Level 3 | Total | ||||||||||||
Common Stocks (b) | $ | 1,266,280,597 | $ | — | $ | 778,798 | $ | 1,267,059,395 | ||||||||
|
|
|
|
|
|
|
| |||||||||
TOTAL | $ | 1,266,280,597 | $ | — | $ | 778,798 | $ | 1,267,059,395 | ||||||||
|
|
|
|
|
|
|
| |||||||||
| (b) | See Schedule of Investments for additional detailed categorizations. |
During the year ended May 31, 2020, the amount of transfers from Level 1 to Level 3 was $1,409,810. The investments were transferred from Level 1 to Level 3 due to the lack of observable market data due to a decrease in market activity.
| See Notes to Financial Statements. | 19 |
DBX ETF Trust
Schedule of Investments
Xtrackers Harvest CSI 500 China A-Shares Small Cap ETF
May 31, 2020
Number | Value | |||||||
| COMMON STOCKS — 99.7% | ||||||||
| Communication Services — 5.6% | ||||||||
Beijing Enlight Media Co. Ltd., Class A | 42,600 | $ | 69,533 | |||||
Beijing Gehua CATV Network Co. Ltd., Class A (a) | 47,300 | 68,258 | ||||||
Beijing Kunlun Tech Co. Ltd., Class A* | 33,900 | 105,488 | ||||||
Bluefocus Intelligent Communications Group Co. Ltd., Class A | 97,600 | 98,456 | ||||||
Changjiang Publishing & Media Co. Ltd., Class A | 29,212 | 21,856 | ||||||
China South Publishing & Media Group Co. Ltd., Class A | 35,100 | 52,374 | ||||||
Chinese Universe Publishing and Media Group Co. Ltd., Class A | 33,189 | 52,731 | ||||||
Dr Peng Telecom & Media Group Co. Ltd., Class A* | 69,800 | 66,402 | ||||||
G-bits Network Technology Xiamen Co. Ltd., Class A | 2,073 | 117,338 | ||||||
Guizhou Broadcasting & TV Information Network Co. Ltd., Class A | 15,400 | 16,830 | ||||||
Hangzhou Shunwang Technology Co. Ltd., Class A* | 20,600 | 54,519 | ||||||
Huayi Brothers Media Corp., Class A* | 95,074 | 53,681 | ||||||
Jiangsu Broadcasting Cable Information Network Corp. Ltd., Class A* | 121,900 | 62,167 | ||||||
Jiangsu Phoenix Publishing & Media Corp. Ltd., Class A | 37,300 | 35,014 | ||||||
Leo Group Co. Ltd., Class A* | 226,995 | 130,394 | ||||||
NanJi E-Commerce Co. Ltd., Class A* | 84,150 | 222,240 | ||||||
Ourpalm Co. Ltd., Class A* | 135,000 | 115,567 | ||||||
People.cn Co. Ltd., Class A | 27,300 | 73,438 | ||||||
Shandong Publishing & Media Co. Ltd., Class A | 30,509 | 27,485 | ||||||
Wasu Media Holding Co. Ltd., Class A | 27,800 | 43,000 | ||||||
Xinhuanet Co. Ltd., Class A | 10,150 | 31,613 | ||||||
Youzu Interactive Co. Ltd., Class A* | 25,900 | 69,490 | ||||||
Zhejiang Daily Digital Culture Group Co. Ltd., Class A | 38,500 | 50,003 | ||||||
Zhejiang Huace Film & TV Co. Ltd., Class A | 51,800 | 49,569 | ||||||
|
| |||||||
(Cost $1,495,917) | 1,687,446 | |||||||
|
| |||||||
| Consumer Discretionary — 8.3% | ||||||||
Anhui Jianghuai Automobile Group Corp. Ltd., Class A* | 64,200 | 81,493 | ||||||
Anhui Xinhua Media Co. Ltd., Class A | 29,400 | 20,596 | ||||||
Anhui Zhongding Sealing Parts Co. Ltd., Class A* | 36,000 | 38,686 | ||||||
Beiqi Foton Motor Co. Ltd., Class A* | 225,000 | 55,797 | ||||||
Besttone Holdings Co. Ltd., Class A | 15,600 | 35,910 | ||||||
BTG Hotels Group Co. Ltd., Class A | 24,145 | 56,088 | ||||||
CCOOP Group Co. Ltd., Class A* | 88,100 | 48,633 | ||||||
Changzhou Xingyu Automotive Lighting Systems Co. Ltd., Class A* | 6,800 | 103,771 | ||||||
Chengdu Fusen Noble-House Industrial Co. Ltd., Class A | 11,170 | 17,967 | ||||||
China CYTS Tours Holding Co. Ltd., Class A | 28,200 | 39,628 | ||||||
Number | Value | |||||||
| Consumer Discretionary (Continued) | ||||||||
Chongqing Department Store Co. Ltd., Class A | 11,895 | $ | 51,997 | |||||
Chongqing Sokon Industry Group Co. Ltd., Class A | 14,000 | 15,751 | ||||||
Chow Tai Seng Jewellery Co. Ltd., Class A | 10,600 | 30,222 | ||||||
Dashang Co. Ltd., Class A* | 7,400 | 25,474 | ||||||
DongFeng Automobile Co. Ltd., Class A | 38,900 | 21,909 | ||||||
Eastern Pioneer Driving School Co. Ltd., Class A | 11,700 | 27,211 | ||||||
Ecovacs Robotics Co. Ltd., Class A | 8,033 | 31,142 | ||||||
Global Top E-Commerce Co. Ltd., Class A | 38,350 | 27,188 | ||||||
Hang Zhou Great Star Industrial Co. Ltd., Class A | 26,253 | 39,283 | ||||||
Hangzhou Lianluo Interactive Information Technology Co. Ltd., Class A* | 74,300 | 17,697 | ||||||
Hisense Visual Technology Co. Ltd., Class A | 38,800 | 74,420 | ||||||
Huizhou Desay Sv Automotive Co. Ltd., Class A | 7,800 | 57,067 | ||||||
Jason Furniture Hangzhou Co. Ltd., Class A | 8,814 | 57,917 | ||||||
Joyoung Co. Ltd., Class A | 14,800 | 67,163 | ||||||
KingClean Electric Co. Ltd., Class A | 3,700 | 12,032 | ||||||
Kuang-Chi Technologies Co. Ltd., Class A* | 20,700 | 21,549 | ||||||
Liaoning Cheng Da Co. Ltd., Class A* | 59,958 | 137,431 | ||||||
Loncin Motor Co. Ltd., Class A* | 49,950 | 24,145 | ||||||
Ningbo Huaxiang Electronic Co. Ltd., Class A | 24,600 | 52,492 | ||||||
Ningbo Joyson Electronic Corp., Class A* | 38,420 | 106,097 | ||||||
Ningbo Peacebird Fashion Co. Ltd., Class A* | 3,100 | 6,472 | ||||||
Ningbo Tuopu Group Co. Ltd., Class A | 20,907 | 70,067 | ||||||
Rainbow Department Store Co. Ltd., Class A | 23,200 | 30,977 | ||||||
Shandong Linglong Tyre Co. Ltd., Class A | 23,100 | 61,460 | ||||||
Shanghai Jinjiang International Hotels Co. Ltd., Class A | 15,800 | 60,344 | ||||||
Shenzhen Fenda Technology Co. Ltd., Class A* | 39,759 | 16,656 | ||||||
Shenzhen Tellus Holding Co. Ltd., Class A | 5,430 | 13,428 | ||||||
Shijiazhuang Changshan BeiMing Technology Co. Ltd., Class A* | 47,150 | 60,775 | ||||||
Sichuan Changhong Electric Co. Ltd., Class A | 180,700 | 66,331 | ||||||
Sinomach Automobile Co. Ltd., Class A | 21,050 | 13,950 | ||||||
Sou Yu Te Group Co. Ltd., Class A* | 75,824 | 28,471 | ||||||
Suofeiya Home Collection Co. Ltd., Class A | 31,418 | 113,787 | ||||||
Visual China Group Co. Ltd., Class A | 16,900 | 48,539 | ||||||
Wangfujing Group Co. Ltd., Class A | 18,630 | 62,748 | ||||||
Wanxiang Qianchao Co. Ltd., Class A | 66,900 | 44,522 | ||||||
Weifu High-Technology Group Co. Ltd., Class A | 28,600 | 78,819 | ||||||
Wuchan Zhongda Group Co. Ltd., Class A* | 123,900 | 77,248 | ||||||
| See Notes to Financial Statements. | 20 |
DBX ETF Trust
Schedule of Investments
Xtrackers Harvest CSI 500 China A-Shares Small Cap ETF (Continued)
May 31, 2020
Number | Value | |||||||
| Consumer Discretionary (Continued) | ||||||||
Wuhan Department Store Group Co. Ltd., Class A* | 22,809 | $ | 40,170 | |||||
Xiamen Intretech, Inc., Class A | 6,800 | 45,559 | ||||||
Xinhua Winshare Publishing and Media Co. Ltd., Class A | 7,300 | 10,769 | ||||||
Zhejiang Orient Financial Holdings Group Co. Ltd., Class A | 53,994 | 47,583 | ||||||
Zhejiang Wanfeng Auto Wheel Co. Ltd., Class A | 64,200 | 58,196 | ||||||
Zhejiang Yasha Decoration Co. Ltd., Class A | 39,200 | 53,109 | ||||||
Zotye Automobile Co. Ltd., Class A* | 59,500 | 16,089 | ||||||
|
| |||||||
(Cost $2,540,238) | 2,522,825 | |||||||
|
| |||||||
| Consumer Staples — 6.3% | ||||||||
Angel Yeast Co. Ltd., Class A | 24,175 | 143,205 | ||||||
Anhui Yingjia Distillery Co. Ltd., Class A | 12,000 | 33,894 | ||||||
Beijing Dabeinong Technology Group Co. Ltd., Class A | 122,862 | 142,185 | ||||||
Beijing Yanjing Brewery Co. Ltd., Class A | 69,100 | 61,767 | ||||||
Bright Dairy & Food Co. Ltd., Class A* | 29,600 | 65,442 | ||||||
Chongqing Brewery Co. Ltd., Class A | 11,800 | 102,006 | ||||||
Chongqing Fuling Zhacai Group Co. Ltd., Class A | 27,238 | 138,071 | ||||||
COFCO Tunhe Sugar Co. Ltd., Class A* | 52,100 | 56,644 | ||||||
DaShenLin Pharmaceutical Group Co. Ltd., Class A* | 7,990 | 90,865 | ||||||
Guangdong Marubi Biotechnology Co. Ltd., Class A* | 2,100 | 25,445 | ||||||
Hebei Chengde Lolo Co., Class A | 31,615 | 32,380 | ||||||
Heilongjiang Agriculture Co. Ltd., Class A | 34,600 | 72,473 | ||||||
Hunan Dakang International Food & Agriculture Co. Ltd., Class A* | 133,920 | 46,157 | ||||||
Juewei Food Co. Ltd., Class A | 14,900 | 144,357 | ||||||
Laobaixing Pharmacy Chain JSC, Class A | 5,610 | 66,455 | ||||||
New Hope Dairy Co. Ltd., Class A | 4,700 | 12,182 | ||||||
Opple Lighting Co. Ltd., Class A | 7,690 | 28,250 | ||||||
Shanghai Bailian Group Co. Ltd., Class A | 39,100 | 53,521 | ||||||
Shanghai Flyco Electrical Appliance Co. Ltd., Class A* | 2,400 | 14,694 | ||||||
Shanghai Jahwa United Co. Ltd., Class A | 16,764 | 90,614 | ||||||
Shanghai Maling Aquarius Co. Ltd., Class A | 31,700 | 40,772 | ||||||
Shenzhen Agricultural Products Group Co. Ltd., Class A | 33,200 | 35,026 | ||||||
Sichuan Swellfun Co. Ltd., Class A | 9,599 | 67,768 | ||||||
Sichuan Teway Food Group Co. Ltd., Class A | 3,190 | 21,578 | ||||||
Toly Bread Co. Ltd., Class A* | 9,635 | 67,807 | ||||||
Yantai Changyu Pioneer Wine Co. Ltd., Class A | 6,700 | 27,176 | ||||||
Yifeng Pharmacy Chain Co. Ltd., Class A | 10,360 | 114,392 | ||||||
Yuan Longping High-tech Agriculture Co. Ltd., Class A | 45,154 | 103,120 | ||||||
|
| |||||||
(Cost $1,415,868) | 1,898,246 | |||||||
|
| |||||||
Number | Value | |||||||
| Energy — 2.4% | ||||||||
China Merchants Energy Shipping Co. Ltd., Class A | 98,700 | $ | 81,864 | |||||
China Petroleum Engineering Corp. | 82,100 | 26,341 | ||||||
COFCO Capital Holdings Co. Ltd., Class A* | 9,100 | 10,761 | ||||||
COSCO SHIPPING Energy Transportation Co. Ltd., Class A | 67,200 | 61,104 | ||||||
Datong Coal Industry Co. Ltd., Class A* | 40,500 | 21,959 | ||||||
Geo-Jade Petroleum Corp., Class A* | 77,540 | 20,750 | ||||||
Guanghui Energy Co. Ltd., Class A | 198,800 | 72,975 | ||||||
Guizhou Gas Group Corp. Ltd., Class A | 11,200 | 15,582 | ||||||
Huolinhe Opencut Coal Industry Corp. Ltd. of Inner Mongolia, Class A | 28,000 | 31,659 | ||||||
Jizhong Energy Resources Co. Ltd., Class A* | 51,400 | 21,461 | ||||||
Nanjing Tanker Corp., Class A* | 97,800 | 33,297 | ||||||
Oriental Energy Co. Ltd., Class A* | 56,100 | 71,604 | ||||||
Shandong Xinchao Energy Corp. Ltd., Class A* | 199,000 | 45,167 | ||||||
Shanxi Lu’an Environmental Energy Development Co. Ltd., Class A | 58,100 | 45,178 | ||||||
Shanxi Xishan Coal & Electricity Power Co. Ltd., Class A | 77,000 | 51,568 | ||||||
Yang Quan Coal Industry Group Co. Ltd., Class A | 58,500 | 37,211 | ||||||
Yantai Jereh Oilfield Services Group Co. Ltd., Class A | 23,441 | 83,682 | ||||||
|
| |||||||
(Cost $836,940) | 732,163 | |||||||
|
| |||||||
| Financials — 4.5% | ||||||||
Bank of Qingdao Co. Ltd., Class A | 27,000 | 18,612 | ||||||
Bank of Zhengzhou Co. Ltd., Class A | 86,200 | 46,134 | ||||||
First Capital Securities Co. Ltd., Class A | 102,400 | 97,989 | ||||||
Guangdong Golden Dragon Development, Inc., Class A* | 21,874 | 37,665 | ||||||
Guangzhou Yuexiu Financial Holdings Group Co. Ltd., Class A | 27,085 | 44,285 | ||||||
Huaan Securities Co. Ltd., Class A | 88,643 | 88,178 | ||||||
Huaxi Securities Co. Ltd., Class A | 64,300 | 89,458 | ||||||
Jiangsu Changshu Rural Commercial Bank Co. Ltd., Class A | 133,855 | 136,529 | ||||||
Jiangsu Financial Leasing Co. Ltd., Class A | 43,700 | 32,756 | ||||||
Jiangsu Jiangyin Rural Commercial Bank Co. Ltd., Class A* | 106,380 | 60,065 | ||||||
Jiangsu Zhangjiagang Rural Commercial Bank Co. Ltd., Class A | 44,200 | 32,574 | ||||||
Jiangsu Zijin Rural Commercial Bank Co. Ltd., Class A | 19,600 | 10,682 | ||||||
Kunwu Jiuding Investment Holdings Co. Ltd., Class A | 6,300 | 22,685 | ||||||
Northeast Securities Co. Ltd., Class A | 68,749 | 77,057 | ||||||
Pacific Securities Co. Ltd., Class A* | 332,500 | 145,812 | ||||||
Polaris Bay Group Co. Ltd., Class A* | 34,400 | 53,787 | ||||||
Sealand Securities Co. Ltd., Class A | 187,570 | 109,849 | ||||||
Shaanxi International Trust Co. Ltd., Class A | 96,890 | 46,426 | ||||||
| See Notes to Financial Statements. | 21 |
DBX ETF Trust
Schedule of Investments
Xtrackers Harvest CSI 500 China A-Shares Small Cap ETF (Continued)
May 31, 2020
Number | Value | |||||||
| Financials (Continued) | ||||||||
Shanghai AJ Group Co. Ltd., Class A | 47,205 | $ | 50,925 | |||||
Shanxi Securities Co. Ltd., Class A | 82,700 | 80,296 | ||||||
Wuxi Rural Commercial Bank Co. Ltd., Class A* | 63,000 | 44,310 | ||||||
Xishui Strong Year Co. Ltd. Inner Mongolia, Class A | 31,700 | 35,842 | ||||||
|
| |||||||
(Cost $1,467,005) | 1,361,916 | |||||||
|
| |||||||
| Health Care — 11.9% | ||||||||
Anhui Anke Biotechnology Group Co. Ltd., Class A | 40,040 | 83,082 | ||||||
Asymchem Laboratories Tianjin Co. Ltd., Class A | 6,804 | 207,386 | ||||||
Beijing SL Pharmaceutical Co. Ltd., Class A | 29,800 | 46,971 | ||||||
Beijing Tiantan Biological Products Corp. Ltd., Class A | 25,630 | 138,250 | ||||||
Blue Sail Medical Co. Ltd., Class A | 18,400 | 61,639 | ||||||
China Animal Husbandry Industry Co. Ltd., Class A | 24,968 | 50,129 | ||||||
China National Accord Medicines Corp. Ltd., Class A | 7,273 | 41,085 | ||||||
China National Medicines Corp. Ltd., Class A* | 14,733 | 64,300 | ||||||
China Resources Double Crane Pharmaceutical Co. Ltd., Class A | 25,149 | 43,339 | ||||||
China Resources Sanjiu Medical & Pharmaceutical Co. Ltd., Class A | 19,218 | 72,888 | ||||||
Da An Gene Co. Ltd. of Sun Yat-Sen University, Class A | 27,638 | 84,028 | ||||||
Dezhan Healthcare Co. Ltd., Class A* | 43,700 | 31,899 | ||||||
Dian Diagnostics Group Co. Ltd., Class A | 18,440 | 64,589 | ||||||
Guangdong Zhongsheng Pharmaceutical Co. Ltd., Class A | 31,400 | 52,132 | ||||||
Guangzhou Kingmed Diagnostics Group Co. Ltd., Class A | 9,000 | 88,418 | ||||||
Guizhou Bailing Group Pharmaceutical Co. Ltd., Class A | 21,000 | 24,274 | ||||||
Guizhou Xinbang Pharmaceutical Co. Ltd., Class A* | 56,950 | 35,347 | ||||||
Haisco Pharmaceutical Group Co. Ltd., Class A* | 7,600 | 24,117 | ||||||
Harbin Gloria Pharmaceuticals Co. Ltd., Class A | 54,050 | 24,157 | ||||||
Harbin Pharmaceutical Group Co. Ltd., Class A* | 73,520 | 35,537 | ||||||
Humanwell Healthcare Group Co. Ltd., Class A* | 46,400 | 154,072 | ||||||
Hybio Pharmaceutical Co. Ltd., Class A* | 22,600 | 18,460 | ||||||
Jafron Biomedical Co. Ltd., Class A | 19,570 | 172,738 | ||||||
Jiangsu Kanion Pharmaceutical Co. Ltd., Class A | 20,448 | 37,932 | ||||||
Jiangsu Yuyue Medical Equipment & Supply Co. Ltd., Class A | 29,685 | 129,430 | ||||||
Jilin Aodong Pharmaceutical Group Co. Ltd., Class A | 45,200 | 96,068 | ||||||
Jilin Zixin Pharmaceutical Industrial Co. Ltd., Class A* | 37,600 | 21,019 | ||||||
Number | Value | |||||||
| Health Care (Continued) | ||||||||
Jinyu Bio-Technology Co. Ltd., Class A | 55,004 | $ | 184,029 | |||||
Joincare Pharmaceutical Group Industry Co. Ltd., Class A* | 46,956 | 83,748 | ||||||
Livzon Pharmaceutical Group, Inc., Class A | 18,162 | 101,352 | ||||||
Nanjing King-Friend Biochemical Pharmaceutical Co. Ltd., Class A | 10,600 | 92,850 | ||||||
Realcan Pharmaceutical Group Co. Ltd., Class A | 58,530 | 43,626 | ||||||
Shandong Buchang Pharmaceuticals Co. Ltd., Class A | 27,600 | 89,828 | ||||||
Shenzhen Hepalink Pharmaceutical Group Co. Ltd., Class A | 18,600 | 55,299 | ||||||
Shenzhen Neptunus Bioengineering Co. Ltd., Class A | 80,850 | 43,045 | ||||||
Shijiazhuang Yiling Pharmaceutical Co. Ltd., Class A | 23,300 | 89,251 | ||||||
Tianjin Chase Sun Pharmaceutical Co. Ltd., Class A* | 102,600 | 73,168 | ||||||
Tianjin ZhongXin Pharmaceutical Group Corp. Ltd., Class A | 14,162 | 31,072 | ||||||
Tonghua Golden-Horse Pharmaceutical Industry Co. Ltd., Class A* | 28,200 | 19,478 | ||||||
Topchoice Medical Corp., Class A* | 9,400 | 186,856 | ||||||
Vcanbio Cell & Gene Engineering Corp. Ltd., Class A* | 16,300 | 46,428 | ||||||
Winning Health Technology Group Co. Ltd., Class A | 64,319 | 210,058 | ||||||
Yifan Pharmaceutical Co. Ltd., Class A | 36,400 | 100,467 | ||||||
Zhejiang Conba Pharmaceutical Co. Ltd., Class A | 90,740 | 67,380 | ||||||
Zhejiang Huahai Pharmaceutical Co. Ltd., Class A* | 32,000 | 120,065 | ||||||
Zhejiang Medicine Co. Ltd., Class A | 33,000 | 74,577 | ||||||
|
| |||||||
(Cost $2,847,286) | 3,615,863 | |||||||
|
| |||||||
| Industrials — 16.9% | ||||||||
AECC Aero-Engine Control Co. Ltd., Class A | 27,700 | 51,345 | ||||||
Avic Aviation High-Technology Co. Ltd., Class A | 27,600 | 61,755 | ||||||
AVIC Electromechanical Systems Co. Ltd., Class A* | 88,200 | 99,106 | ||||||
Avic Heavy Machinery Co. Ltd., Class A* | 27,800 | 37,080 | ||||||
Beijing SPC Environment Protection Tech Co. Ltd., Class A | 32,100 | 24,601 | ||||||
Beijing Watertek Information Technology Co. Ltd., Class A* | 51,477 | 44,571 | ||||||
Centre Testing International Group Co. Ltd., Class A | 64,900 | 164,581 | ||||||
China Aerospace Times Electronics Co. Ltd., Class A* | 106,600 | 96,631 | ||||||
China Aluminum International Engineering Corp. Ltd., Class A | 14,800 | 8,522 | ||||||
China Baoan Group Co. Ltd., Class A | 126,280 | 122,079 | ||||||
China CAMC Engineering Co. Ltd., Class A* | 24,182 | 24,699 | ||||||
| See Notes to Financial Statements. | 22 |
DBX ETF Trust
Schedule of Investments
Xtrackers Harvest CSI 500 China A-Shares Small Cap ETF (Continued)
May 31, 2020
Number | Value | |||||||
| Industrials (Continued) | ||||||||
China CSSC Holdings Ltd., Class A* | 41,300 | $ | 104,386 | |||||
China First Heavy Industries, Class A* | 134,100 | 51,480 | ||||||
China High Speed Railway Technology Co. Ltd., Class A | 95,296 | 39,921 | ||||||
China International Marine Containers Group Co. Ltd., Class A | 51,820 | 51,040 | ||||||
China Meheco Co. Ltd., Class A | 25,987 | 48,897 | ||||||
China Merchants Port Group Co. Ltd., Class A | 5,400 | 10,463 | ||||||
China Nuclear Engineering & Construction Corp. Ltd., Class A | 38,000 | 32,583 | ||||||
China Railway Hi-tech Industry Co. Ltd., Class A | 54,000 | 70,286 | ||||||
China Railway Tielong Container Logistics Co. Ltd., Class A | 44,900 | 34,348 | ||||||
China XD Electric Co. Ltd., Class A | 99,800 | 70,752 | ||||||
Chongqing Construction Engineering Group Corp. Ltd., Class A | 17,800 | 9,128 | ||||||
CITIC Heavy Industries Co. Ltd., Class A | 84,400 | 40,560 | ||||||
CMST Development Co. Ltd., Class A | 42,600 | 26,023 | ||||||
COSCO SHIPPING Development Co. Ltd., Class A | 193,900 | 50,259 | ||||||
COSCO SHIPPING Specialized Carriers Co. Ltd., Class A* | 52,300 | 21,690 | ||||||
Dalian Port PDA Co. Ltd., Class A | 150,920 | 35,734 | ||||||
Deppon Logistics Co. Ltd., Class A | 14,400 | 27,236 | ||||||
Dongfang Electric Corp. Ltd., Class A | 53,900 | 66,153 | ||||||
Dongjiang Environmental Co. Ltd., Class A | 20,000 | 27,069 | ||||||
East Group Co. Ltd., Class A | 45,000 | 29,569 | ||||||
Eternal Asia Supply Chain Management Ltd., Class A | 72,600 | 45,467 | ||||||
Eve Energy Co. Ltd., Class A* | 23,700 | 215,601 | ||||||
Far East Smarter Energy Co. Ltd., Class A* | 54,000 | 30,339 | ||||||
Fujian Longking Co. Ltd., Class A | 36,200 | 44,531 | ||||||
Guangshen Railway Co. Ltd., Class A | 165,300 | 50,256 | ||||||
Guangxi Liugong Machinery Co. Ltd., Class A* | 50,430 | 45,219 | ||||||
Guangzhou Port Co. Ltd., Class A | 91,000 | 38,504 | ||||||
Guosheng Financial Holding, Inc., Class A* | 46,787 | 56,440 | ||||||
Guoxuan High-Tech Co. Ltd., Class A | 38,555 | 161,513 | ||||||
Hefei Meiya Optoelectronic Technology, Inc., Class A | 13,200 | 82,206 | ||||||
Henan Pinggao Electric Co. Ltd., Class A | 39,900 | 42,262 | ||||||
Henan Senyuan Electric Co. Ltd., Class A | 27,600 | 20,146 | ||||||
Hongfa Technology Co. Ltd., Class A | 21,780 | 103,232 | ||||||
Huaihe Energy Group Co. Ltd., Class A* | 75,600 | 26,268 | ||||||
Hunan Corun New Energy Co. Ltd., Class A* | 56,347 | 30,315 | ||||||
Infore Environment Technology Group Co. Ltd., Class A | 46,400 | 53,112 | ||||||
Inner Mongolia First Machinery Group Co. Ltd., Class A | 41,100 | 56,777 | ||||||
Jiangsu Hengli Hydraulic Co. Ltd., Class A | 12,800 | 131,955 | ||||||
Jiangxi Hongdu Aviation Industry Co. Ltd., Class A | 20,600 | 40,233 | ||||||
Number | Value | |||||||
| Industrials (Continued) | ||||||||
Jiangxi Special Electric Motor Co. Ltd., Class A* | 57,900 | $ | 11,114 | |||||
Jihua Group Corp. Ltd., Class A | 107,100 | 49,368 | ||||||
Juneyao Airlines Co. Ltd., Class A | 28,940 | 37,020 | ||||||
Keda Clean Energy Co. Ltd., Class A* | 61,700 | 34,751 | ||||||
Ming Yang Smart Energy Group Ltd., Class A | 13,600 | 22,866 | ||||||
Minmetals Development Co. Ltd., Class A* | 20,500 | 17,520 | ||||||
Nanyang Topsec Technologies Group, Inc., Class A* | 28,180 | 101,982 | ||||||
North Industries Group Red Arrow Co. Ltd., Class A | 33,547 | 42,583 | ||||||
North Navigation Control Technology Co. Ltd., Class A* | 51,100 | 55,128 | ||||||
Orient Group, Inc., Class A* | 145,190 | 78,723 | ||||||
Qingdao TGOOD Electric Co. Ltd., Class A | 29,481 | 80,545 | ||||||
Qinhuangdao Port Co. Ltd., Class A | 69,500 | 25,804 | ||||||
Rizhao Port Co. Ltd., Class A | 90,300 | 31,502 | ||||||
Saurer Intelligent Technology Co. Ltd., Class A | 46,300 | 32,305 | ||||||
Shandong Hi-speed Co. Ltd., Class A | 32,900 | 25,122 | ||||||
Shanghai Environment Group Co. Ltd., Class A* | 22,440 | 37,571 | ||||||
Shanghai Mechanical and Electrical Industry Co. Ltd., Class A | 15,949 | 33,518 | ||||||
Shanghai Tunnel Engineering Co. Ltd., Class A | 92,100 | 80,778 | ||||||
Shanghai Waigaoqiao Free Trade Zone Group Co. Ltd., Class A | 18,500 | 35,380 | ||||||
Shenzhen Airport Co. Ltd., Class A | 49,900 | 55,790 | ||||||
Shenzhen Colibri Technologies Co. Ltd., Class A* | 1,900 | 6,242 | ||||||
Shenzhen Grandland Group Co. Ltd., Class A | 37,600 | 17,437 | ||||||
Shenzhen Tagen Group Co. Ltd., Class A | 63,909 | 52,739 | ||||||
Shenzhen Techand Ecology & Environment Co. Ltd., Class A | 69,050 | 24,380 | ||||||
Shouhang High-Tech Energy Co. Ltd., Class A* | 99,355 | 35,636 | ||||||
Sichuan Road & Bridge Co. Ltd., Class A | 106,000 | 58,513 | ||||||
Sieyuan Electric Co. Ltd., Class A | 29,280 | 72,242 | ||||||
Sinochem International Corp., Class A | 66,260 | 46,046 | ||||||
Sinoma International Engineering Co., Class A | 51,150 | 40,347 | ||||||
Sinotrans Ltd., Class A | 77,100 | 35,539 | ||||||
Sungrow Power Supply Co. Ltd., Class A | 49,500 | 78,021 | ||||||
Sunwoda Electronic Co. Ltd., Class A | 53,000 | 105,667 | ||||||
Suzhou Anjie Technology Co. Ltd., Class A | 16,550 | 44,103 | ||||||
Taihai Manoir Nuclear Equipment Co. Ltd., Class A | 25,000 | 14,186 | ||||||
TangShan Port Group Co. Ltd., Class A* | 144,574 | 44,765 | ||||||
Tian Di Science & Technology Co. Ltd., Class A | 80,700 | 32,789 | ||||||
Tianjin Capital Environmental Protection Group Co. Ltd., Class A | 20,900 | 19,678 | ||||||
| See Notes to Financial Statements. | 23 |
DBX ETF Trust
Schedule of Investments
Xtrackers Harvest CSI 500 China A-Shares Small Cap ETF (Continued)
May 31, 2020
Number | Value | |||||||
| Industrials (Continued) | ||||||||
Tianjin Port Co. Ltd., Class A | 49,420 | $ | 37,390 | |||||
Tus Environmental Science And Technology Development Co. Ltd., Class A | 34,800 | 35,641 | ||||||
Wolong Electric Group Co. Ltd., Class A | 38,139 | 62,359 | ||||||
Xiamen ITG Group Corp. Ltd., Class A | 63,048 | 54,679 | ||||||
Xinjiang Communications Construction Group Co. Ltd., Class A | 3,100 | 6,254 | ||||||
Xinjiang Machinery Research Institute Co. Ltd., Class A | 57,800 | 32,555 | ||||||
Xuji Electric Co. Ltd., Class A | 30,000 | 53,633 | ||||||
Yingkou Port Liability Co. Ltd., Class A | 95,100 | 28,380 | ||||||
Zhefu Holding Group Co. Ltd., Class A | 77,500 | 39,524 | ||||||
Zhejiang Dingli Machinery Co. Ltd., Class A* | 6,900 | 89,558 | ||||||
Zhejiang Kaishan Compressor Co. Ltd., Class A* | 16,400 | 24,540 | ||||||
Zhejiang Wanliyang Co. Ltd., Class A | 26,100 | 31,375 | ||||||
Zhejiang Weiming Environment Protection Co. Ltd., Class A* | 9,397 | 38,115 | ||||||
Zhejiang Weixing New Building Materials Co. Ltd., Class A | 30,680 | 51,409 | ||||||
Zhengzhou Coal Mining Machinery Group Co. Ltd., Class A | 51,100 | 36,657 | ||||||
Zhongshan Broad Ocean Motor Co. Ltd., Class A* | 68,900 | 33,014 | ||||||
|
| |||||||
(Cost $5,515,659) | 5,129,706 | |||||||
|
| |||||||
| Information Technology — 21.8% | ||||||||
Accelink Technologies Co. Ltd., Class A | 19,900 | 76,255 | ||||||
Addsino Co. Ltd., Class A* | 54,900 | 112,070 | ||||||
Anhui Tatfook Technology Co. Ltd., Class A* | 18,340 | 34,303 | ||||||
Beijing Dahao Technology Corp. Ltd., Class A | 9,146 | 9,214 | ||||||
Beijing Jetsen Technology Co. Ltd., Class A* | 100,400 | 60,065 | ||||||
Beijing Lanxum Technology Co. Ltd., Class A* | 34,320 | 85,782 | ||||||
Beijing Orient National Communication Science & Technology Co. Ltd., Class A | 41,119 | 81,173 | ||||||
Beijing Sinnet Technology Co. Ltd., Class A | 52,748 | 184,019 | ||||||
Beijing Teamsun Technology Co. Ltd., Class A* | 54,060 | 105,204 | ||||||
Beijing Ultrapower Software Co. Ltd., Class A* | 95,400 | 75,786 | ||||||
Beijing Zhong Ke San Huan High-Tech Co. Ltd., Class A | 41,600 | 60,207 | ||||||
Bluedon Information Security Technology Co. Ltd., Class A | 36,300 | 18,106 | ||||||
China Greatwall Technology Group Co. Ltd., Class A | 85,819 | 165,086 | ||||||
China National Software & Service Co. Ltd., Class A* | 14,500 | 159,313 | ||||||
China TransInfo Technology Co. Ltd., Class A* | 36,400 | 113,013 | ||||||
CPT Technology Group Co. Ltd., Class A* | 67,300 | 13,201 | ||||||
Number | Value | |||||||
| Information Technology (Continued) | ||||||||
DHC Software Co. Ltd., Class A | 90,900 | $ | 137,418 | |||||
Eastern Communications Co. Ltd., Class A | 23,000 | 48,272 | ||||||
Flat Glass Group Co. Ltd., Class A | 7,600 | 13,864 | ||||||
GCI Science & Technology Co. Ltd., Class A | 16,400 | 29,663 | ||||||
GRG Banking Equipment Co. Ltd., Class A | 58,600 | 92,940 | ||||||
Guangdong Ellington Electronics Technology Co. Ltd., Class A | 19,400 | 26,501 | ||||||
Guangdong Fenghua Advanced Technology Holding Co. Ltd., Class A* | 34,900 | 119,358 | ||||||
Guangzhou Haige Communications Group, Inc. Co., Class A | 90,100 | 150,978 | ||||||
Guomai Technologies, Inc., Class A | 24,800 | 29,292 | ||||||
Hangzhou First Applied Material Co. Ltd., Class A | 10,766 | 56,912 | ||||||
Hangzhou Silan Microelectronics Co. Ltd., Class A | 37,980 | 75,562 | ||||||
Hengdian Group DMEGC Magnetics Co. Ltd., Class A | 40,400 | 60,961 | ||||||
Hexing Electrical Co. Ltd., Class A | 9,870 | 20,203 | ||||||
HNA Technology Co. Ltd., Class A* | 88,100 | 36,043 | ||||||
Holitech Technology Co. Ltd., Class A | 90,900 | 61,895 | ||||||
Huagong Tech Co. Ltd., Class A | 39,159 | 106,601 | ||||||
Hubei Kaile Science & Technology Co. Ltd., Class A | 38,900 | 73,740 | ||||||
Hytera Communications Corp. Ltd., Class A | 45,300 | 40,303 | ||||||
IRICO Display Devices Co. Ltd., Class A* | 35,100 | 19,228 | ||||||
JCET Group Co. Ltd., Class A* | 54,800 | 222,887 | ||||||
Jiangsu Zongyi Co. Ltd., Class A* | 38,400 | 28,353 | ||||||
Leyard Optoelectronic Co. Ltd., Class A | 86,600 | 69,038 | ||||||
MLS Co. Ltd., Class A* | 18,300 | 34,870 | ||||||
Nanjing Huadong Electronics Information & Technology Co. Ltd., Class A* | 132,200 | 27,042 | ||||||
NAURA Technology Group Co. Ltd., Class A | 12,000 | 255,553 | ||||||
Neusoft Corp., Class A* | 42,800 | 63,923 | ||||||
Newland Digital Technology Co. Ltd., Class A | 35,940 | 80,315 | ||||||
Ninestar Corp., Class A | 25,835 | 99,540 | ||||||
PCI-Suntek Technology Co. Ltd., Class A* | 65,000 | 83,328 | ||||||
Shanghai 2345 Network Holding Group Co. Ltd., Class A | 225,148 | 89,903 | ||||||
Shanghai Baosight Software Co. Ltd., Class A | 16,550 | 131,218 | ||||||
Shanghai Belling Co. Ltd., Class A* | 27,100 | 67,166 | ||||||
Shenzhen Aisidi Co. Ltd., Class A | 24,200 | 24,277 | ||||||
Shenzhen Everwin Precision Technology Co. Ltd., Class A | 26,780 | 66,412 | ||||||
Shenzhen Kaifa Technology Co. Ltd., Class A | 36,200 | 114,167 | ||||||
Shenzhen Kingdom Sci-Tech Co. Ltd., Class A* | 29,800 | 67,262 | ||||||
Shenzhen Kinwong Electronic Co. Ltd., Class A | 12,320 | 55,132 | ||||||
Shenzhen Suntak Circuit Technology Co. Ltd., Class A* | 17,200 | 42,750 | ||||||
| See Notes to Financial Statements. | 24 |
DBX ETF Trust
Schedule of Investments
Xtrackers Harvest CSI 500 China A-Shares Small Cap ETF (Continued)
May 31, 2020
Number | Value | |||||||
| Information Technology (Continued) | ||||||||
Suzhou Dongshan Precision Manufacturing Co. Ltd., Class A | 54,950 | $ | 179,613 | |||||
Suzhou Victory Precision Manufacture Co. Ltd., Class A* | 117,300 | 25,309 | ||||||
Taiji Computer Corp. Ltd., Class A | 12,100 | 67,184 | ||||||
Tianjin 712 Communication & Broadcasting Co. Ltd., Class A | 11,400 | 45,648 | ||||||
Tianjin Zhonghuan Semiconductor Co. Ltd., Class A | 81,800 | 201,135 | ||||||
Tianma Microelectronics Co. Ltd., Class A | 49,800 | 94,543 | ||||||
Tongding Interconnection Information Co. Ltd., Class A | 36,800 | 25,986 | ||||||
Unigroup Guoxin Microelectronics Co. Ltd., Class A* | 20,800 | 200,788 | ||||||
Universal Scientific Industrial Shanghai Co. Ltd., Class A* | 32,000 | 77,697 | ||||||
Venustech Group, Inc., Class A | 30,648 | 168,366 | ||||||
Visionox Technology, Inc., Class A* | 40,300 | 72,554 | ||||||
Westone Information Industry, Inc., Class A | 28,704 | 83,006 | ||||||
Wingtech Technology Co. Ltd., Class A* | 16,500 | 226,042 | ||||||
Wonders Information Co. Ltd., Class A | 45,894 | 132,330 | ||||||
Wuhan Guide Infrared Co. Ltd., Class A* | 18,550 | 119,552 | ||||||
Wuhu Token Science Co. Ltd., Class A* | 118,800 | 150,467 | ||||||
WUS Printed Circuit Kunshan Co. Ltd., Class A | 58,840 | 193,153 | ||||||
Xiamen Faratronic Co. Ltd., Class A | 6,600 | 49,490 | ||||||
Yangtze Optical Fibre and Cable Joint Stock Ltd. Co., Class A | 3,800 | 15,828 | ||||||
Zhejiang Crystal-Optech Co. Ltd., Class A | 59,162 | 120,273 | ||||||
Zhejiang Jingsheng Mechanical & Electrical Co. Ltd., Class A | 31,600 | 94,745 | ||||||
Zhongji Innolight Co. Ltd., Class A | 10,492 | 83,775 | ||||||
|
| |||||||
(Cost $4,915,691) | 6,603,151 | |||||||
|
| |||||||
| Materials — 16.1% | ||||||||
ADAMA Ltd., Class A | 22,400 | 28,873 | ||||||
Befar Group Co. Ltd., Class A* | 52,833 | 32,718 | ||||||
Beijing Sanju Environmental Protection and New Material Co. Ltd., Class A | 57,500 | 29,566 | ||||||
Beijing Shougang Co. Ltd., Class A* | 77,800 | 32,700 | ||||||
Bengang Steel Plates Co. Ltd., Class A | 67,800 | 31,157 | ||||||
Chengzhi Co. Ltd., Class A | 11,809 | 18,497 | ||||||
China Hainan Rubber Industry Group Co. Ltd., Class A | 83,800 | 65,866 | ||||||
China Nonferrous Metal Industry’s Foreign Engineering and Construction Co. Ltd., Class A | 67,000 | 44,213 | ||||||
China West Construction Group Co. Ltd., Class A | 24,900 | 34,503 | ||||||
Chongqing Iron & Steel Co. Ltd., Class A* | 286,000 | 51,691 | ||||||
COFCO Biotechnology Co. Ltd., Class A | 53,785 | 51,468 | ||||||
CSG Holding Co. Ltd., Class A | 68,461 | 43,643 | ||||||
Do-Fluoride Chemicals Co. Ltd., Class A | 33,600 | 49,429 | ||||||
Elion Clean Energy Co. Ltd., Class A | 66,800 | 31,446 | ||||||
Fangda Special Steel Technology Co. Ltd., Class A* | 52,746 | 37,689 | ||||||
Number | Value | |||||||
| Materials (Continued) | ||||||||
Gansu Jiu Steel Group Hongxing Iron & Steel Co. Ltd., Class A* | 152,800 | $ | 32,112 | |||||
GEM Co. Ltd., Class A* | 202,852 | 123,915 | ||||||
Grace Fabric Technology Co. Ltd., Class A | 4,800 | 7,626 | ||||||
Guangdong HEC Technology Holding Co. Ltd., Class A* | 73,105 | 64,937 | ||||||
Guangdong Tapai Group Co. Ltd., Class A | 34,900 | 59,606 | ||||||
Guangzhou Tinci Materials Technology Co. Ltd., Class A | 13,520 | 52,982 | ||||||
Hainan Mining Co. Ltd., Class A* | 18,800 | 14,461 | ||||||
Hangzhou Iron & Steel Co., Class A | 49,110 | 67,568 | ||||||
Hongda Xingye Co. Ltd., Class A | 75,478 | 39,550 | ||||||
Huafon Microfibre Shanghai Technology Co. Ltd. | 41,550 | 50,006 | ||||||
Huaibei Mining Holdings Co. Ltd., Class A* | 20,900 | 26,090 | ||||||
Huapont Life Sciences Co. Ltd., Class A | 77,550 | 55,304 | ||||||
Huaxin Cement Co. Ltd., Class A | 33,372 | 116,189 | ||||||
Hubei Xingfa Chemicals Group Co. Ltd., Class A | 25,520 | 32,108 | ||||||
Hunan Gold Corp. Ltd., Class A | 40,800 | 45,159 | ||||||
Hunan Valin Steel Co. Ltd., Class A | 90,020 | 47,927 | ||||||
Inner Mongolia Xingye Mining Co. Ltd., Class A* | 36,200 | 31,445 | ||||||
Jiangsu Eastern Shenghong Co. Ltd., Class A | 58,900 | 43,655 | ||||||
Jiangsu Shagang Co. Ltd., Class A* | 86,400 | 163,540 | ||||||
Jiangsu Yangnong Chemical Co. Ltd., Class A | 9,200 | 114,074 | ||||||
Jilin Yatai Group Co. Ltd., Class A* | 159,100 | 62,860 | ||||||
Jinduicheng Molybdenum Co. Ltd., Class A | 46,800 | 39,735 | ||||||
Kingenta Ecological Engineering Group Co. Ltd., Class A* | 79,800 | 26,162 | ||||||
Kingfa Sci & Tech Co. Ltd., Class A | 88,100 | 156,143 | ||||||
Lianhe Chemical Technology Co. Ltd., Class A | 36,459 | 85,918 | ||||||
Liuzhou Iron & Steel Co. Ltd., Class A | 25,400 | 15,516 | ||||||
Luxi Chemical Group Co. Ltd., Class A | 49,900 | 49,429 | ||||||
Maanshan Iron & Steel Co. Ltd., Class A | 146,000 | 53,593 | ||||||
Nanjing Iron & Steel Co. Ltd., Class A | 129,800 | 49,284 | ||||||
Ningbo Shanshan Co. Ltd., Class A | 38,180 | 61,356 | ||||||
ORG Technology Co. Ltd., Class A | 69,350 | 38,768 | ||||||
Red Avenue New Materials Group Co. Ltd., Class A | 5,400 | 13,005 | ||||||
Rising Nonferrous Metals Share Co. Ltd., Class A* | 7,700 | 36,486 | ||||||
Sansteel Minguang Co. Ltd. Fujian, Class A* | 60,050 | 56,790 | ||||||
SGIS Songshan Co. Ltd., Class A | 59,000 | 30,420 | ||||||
Shandong Chenming Paper Holdings Ltd., Class A | 64,950 | 43,771 | ||||||
Shandong Hualu Hengsheng Chemical Co. Ltd., Class A | 55,861 | 138,450 | ||||||
Shandong Iron and Steel Co. Ltd., Class A* | 320,630 | 55,704 | ||||||
| See Notes to Financial Statements. | 25 |
DBX ETF Trust
Schedule of Investments
Xtrackers Harvest CSI 500 China A-Shares Small Cap ETF (Continued)
May 31, 2020
Number | Value | |||||||
| Materials (Continued) | ||||||||
Shandong Sinocera Functional Material Co. Ltd., Class A | 32,900 | $ | 108,369 | |||||
Shandong Sun Paper Industry JSC Ltd., Class A* | 75,600 | 90,032 | ||||||
Shanghai Huayi Group Co. Ltd., Class A | 27,700 | 20,065 | ||||||
Shanghai Putailai New Energy Technology Co. Ltd., Class A | 6,300 | 76,792 | ||||||
Shanxi Taigang Stainless Steel Co. Ltd., Class A | 111,000 | 51,165 | ||||||
Shanying International Holding Co. Ltd., Class A* | 157,100 | 64,051 | ||||||
Shenghe Resources Holding Co. Ltd., Class A | 51,790 | 57,033 | ||||||
Shenzhen Jinjia Group Co. Ltd., Class A | 42,500 | 51,804 | ||||||
Shenzhen YUTO Packaging Technology Co. Ltd., Class A* | 12,740 | 46,427 | ||||||
Shenzhen Zhongjin Lingnan Nonfemet Co. Ltd., Class A | 121,600 | 60,481 | ||||||
Sichuan Hebang Biotechnology Co. Ltd., Class A* | 258,580 | 47,459 | ||||||
Tangshan Jidong Cement Co. Ltd., Class A | 46,081 | 112,080 | ||||||
Tangshan Sanyou Chemical Industries Co. Ltd., Class A | 60,100 | 36,124 | ||||||
Tibet Summit Resources Co. Ltd., Class A | 13,520 | 15,874 | ||||||
Tongkun Group Co. Ltd., Class A* | 53,800 | 92,262 | ||||||
Western Mining Co. Ltd., Class A | 93,500 | 72,574 | ||||||
Xiamen Tungsten Co. Ltd., Class A | 41,020 | 71,437 | ||||||
Xinfengming Group Co. Ltd., Class A | 7,916 | 10,703 | ||||||
Xinjiang Tianshan Cement Co. Ltd., Class A* | 30,700 | 53,250 | ||||||
Xinjiang Zhongtai Chemical Co. Ltd., Class A* | 84,000 | 52,371 | ||||||
Xinxing Ductile Iron Pipes Co. Ltd., Class A | 136,550 | 63,134 | ||||||
Xinyu Iron & Steel Co. Ltd., Class A | 77,800 | 44,473 | ||||||
Yintai Gold Co. Ltd., Class A | 48,520 | 108,699 | ||||||
Yunnan Aluminium Co. Ltd., Class A* | 76,200 | 43,025 | ||||||
Yunnan Chihong Zinc & Germanium Co. Ltd., Class A* | 124,000 | 60,458 | ||||||
Yunnan Copper Co. Ltd., Class A* | 41,400 | 54,698 | ||||||
Yunnan Energy New Material Co. Ltd. | 19,580 | 162,676 | ||||||
Yunnan Tin Co. Ltd., Class A* | 49,130 | 56,995 | ||||||
Zhejiang Hailiang Co. Ltd., Class A | 28,600 | 35,062 | ||||||
Zhejiang Huafeng Spandex Co. Ltd., Class A | 67,800 | 50,726 | ||||||
Zhejiang Jiahua Energy Chemical Industry Co. Ltd., Class A | 49,300 | 57,468 | ||||||
Zhejiang Jinke Culture Industry Co. Ltd., Class A | 68,791 | 22,168 | ||||||
Zhejiang Juhua Co. Ltd., Class A* | 66,590 | 61,296 | ||||||
Zhejiang Runtu Co. Ltd., Class A | 34,000 | 42,396 | ||||||
Zhejiang Sanmei Chemical Industry Co. Ltd., Class A* | 3,000 | 12,849 | ||||||
Zibo Qixiang Tengda Chemical Co. Ltd., Class A | 43,115 | 35,338 | ||||||
|
| |||||||
(Cost $5,117,753) | 4,886,917 | |||||||
|
| |||||||
Number | Value | |||||||
| Real Estate — 3.6% | ||||||||
Beijing Capital Development Co. Ltd., Class A | 62,700 | $ | 53,762 | |||||
Beijing Urban Construction Investment & Development Co. Ltd., Class A | 55,200 | 47,332 | ||||||
China Sports Industry Group Co. Ltd., Class A* | 33,001 | 38,468 | ||||||
Chongqing Dima Industry Co. Ltd., Class A | 70,900 | 27,417 | ||||||
Cinda Real Estate Co. Ltd., Class A | 41,800 | 22,547 | ||||||
Financial Street Holdings Co. Ltd., Class A | 58,000 | 53,714 | ||||||
Grandjoy Holdings Group Co. Ltd., Class A* | 62,400 | 42,839 | ||||||
Greattown Holdings Ltd., Class A | 78,264 | 68,533 | ||||||
Hangzhou Binjiang Real Estate Group Co. Ltd., Class A* | 60,500 | 35,431 | ||||||
HNA Infrastructure Investment Group Co. Ltd., Class A* | 76,200 | 62,989 | ||||||
Huafa Industrial Co. Ltd. Zhuhai, Class A | 82,440 | 76,232 | ||||||
Nanjing Gaoke Co. Ltd., Class A | 42,520 | 55,284 | ||||||
Shanghai Industrial Development Co. Ltd., Class A | 44,590 | 32,112 | ||||||
Shanghai Jinqiao Export Processing Zone Development Co. Ltd., Class A | 16,200 | 33,047 | ||||||
Shanghai Shimao Co. Ltd., Class A | 73,600 | 44,237 | ||||||
Shanghai SMI Holding Co. Ltd., Class A | 62,000 | 46,560 | ||||||
Shanghai Zhangjiang High-Tech Park Development Co. Ltd., Class A | 38,000 | 83,108 | ||||||
Shenzhen Huaqiang Industry Co. Ltd., Class A | 15,340 | 25,683 | ||||||
Shenzhen World Union Group, Inc., Class A | 60,110 | 22,486 | ||||||
Shenzhen Zhenye Group Co. Ltd., Class A | 46,200 | 31,135 | ||||||
Sichuan Languang Development Co. Ltd., Class A* | 72,965 | 52,341 | ||||||
Suning Universal Co. Ltd., Class A | 73,900 | 31,062 | ||||||
Tahoe Group Co. Ltd., Class A | 48,700 | 28,043 | ||||||
Tianjin Guangyu Development Co. Ltd., Class A | 27,700 | 25,109 | ||||||
Zhejiang China Commodities City Group Co. Ltd., Class A | 132,500 | 64,046 | ||||||
|
| |||||||
(Cost $1,314,162) | 1,103,517 | |||||||
|
| |||||||
| Utilities — 2.3% | ||||||||
An Hui Wenergy Co. Ltd., Class A* | 55,500 | 30,015 | ||||||
Beijing Capital Co. Ltd., Class A | 110,700 | 46,529 | ||||||
CECEP Wind-Power Corp., Class A | 81,100 | 24,316 | ||||||
Chengdu Xingrong Environment Co. Ltd., Class A* | 87,400 | 57,186 | ||||||
Chongqing Gas Group Corp. Ltd., Class A | 9,300 | 9,434 | ||||||
Guangdong Baolihua New Energy Stock Co. Ltd., Class A | 84,700 | 57,317 | ||||||
Guangzhou Development Group, Inc., Class A | 26,800 | 20,839 | ||||||
Hubei Energy Group Co. Ltd., Class A | 95,700 | 47,464 | ||||||
Inner Mongolia MengDian HuaNeng Thermal Power Corp. Ltd., Class A | 141,500 | 50,554 | ||||||
Jointo Energy Investment Co. Ltd. Hebei, Class A | 34,900 | 23,568 | ||||||
| See Notes to Financial Statements. | 26 |
DBX ETF Trust
Schedule of Investments
Xtrackers Harvest CSI 500 China A-Shares Small Cap ETF (Continued)
May 31, 2020
Number | Value | |||||||
| Utilities (Continued) | ||||||||
Luenmei Quantum Co. Ltd., Class A* | 33,750 | $ | 71,260 | |||||
Shanghai Electric Power Co. Ltd., Class A | 64,000 | 65,727 | ||||||
Shenergy Co. Ltd., Class A | 119,549 | 90,112 | ||||||
Shenzhen Energy Group Co. Ltd., Class A | 58,450 | 45,041 | ||||||
Shenzhen Gas Corp. Ltd., Class A | 27,900 | 27,011 | ||||||
Zhongshan Public Utilities Group Co. Ltd., Class A | 42,960 | 45,624 | ||||||
|
| |||||||
(Cost $804,652) | 711,997 | |||||||
|
| |||||||
TOTAL COMMON STOCKS | 30,253,747 | |||||||
|
| |||||||
TOTAL INVESTMENTS — 99.7% | $ | 30,253,747 | ||||||
Other assets and liabilities, net — 0.3% | 93,051 | |||||||
|
| |||||||
NET ASSETS — 100.0% | $ | 30,346,798 | ||||||
|
| |||||||
| * | Non-income producing security. |
| (a) | Investment was valued using significant unobservable inputs. |
| JSC: | Joint Stock Company |
Fair Value Measurements
Various inputs are used in determining the value of the Fund’s investments. These inputs are summarized in three broad levels. Level 1 includes quoted prices in active markets for identical securities. Level 2 includes other significant observable inputs (including quoted prices for similar securities, interest rates, prepayment speeds and credit risk). Level 3 includes significant unobservable inputs (including the Fund’s own assumptions in determining the fair value of investments). The level assigned to the securities valuations may not be an indication of the risk or liquidity associated with investing in those securities.
The following is a summary of the inputs used as of May 31, 2020 in valuing the Fund’s investments. For information on the Fund’s policy regarding the valuation of investments, please refer to the Security Valuation section of Note 2 in the accompanying Notes to Financial Statements.
Assets | Level 1 | Level 2 | Level 3 | Total | ||||||||||||
Common Stocks (b) | $ | 30,185,489 | $ | — | $ | 68,258 | $ | 30,253,747 | ||||||||
|
|
|
|
|
|
|
| |||||||||
TOTAL | $ | 30,185,489 | $ | — | $ | 68,258 | $ | 30,253,747 | ||||||||
|
|
|
|
|
|
|
| |||||||||
| (b) | See Schedule of Investments for additional detailed categorizations. |
During the year ended May 31, 2020, the amount of transfers from Level 1 to Level 3 was $150,187 and from Level 3 to Level 1 was $539,000. The investments were transferred from Level 1 to Level 3 due to the lack of observable market data due to a decrease in market activity. The investments were transferred from Level 3 to Level 1 due to the availability of a pricing source supported by observable inputs.
| See Notes to Financial Statements. | 27 |
DBX ETF Trust
Schedule of Investments
Xtrackers MSCI All China Equity ETF
May 31, 2020
Number | Value | |||||||
| COMMON STOCKS — 59.9% | ||||||||
| Communication Services — 14.1% | ||||||||
58.com, Inc., ADR* | 601 | $ | 28,854 | |||||
Alibaba Pictures Group Ltd.* | 71,109 | 8,624 | ||||||
Autohome, Inc., ADR (a) | 362 | 27,849 | ||||||
Baidu, Inc., ADR* | 1,673 | 178,258 | ||||||
Bilibili, Inc., ADR* | 592 | 19,199 | ||||||
China Literature Ltd., 144A* | 1,612 | 9,119 | ||||||
China Mobile Ltd. | 37,004 | 258,278 | ||||||
China Telecom Corp. Ltd., Class H | 74,325 | 24,644 | ||||||
China Tower Corp. Ltd., Class H, 144A | 268,134 | 53,966 | ||||||
China Unicom Hong Kong Ltd.* | 38,980 | 22,580 | ||||||
HUYA, Inc., ADR*(a) | 389 | 6,037 | ||||||
iQIYI, Inc., ADR*(a) | 1,349 | 22,380 | ||||||
JOYY, Inc., ADR* | 349 | 21,306 | ||||||
Momo, Inc., ADR | 995 | 19,303 | ||||||
NetEase, Inc., ADR | 433 | 165,796 | ||||||
SINA Corp.* | 383 | 11,992 | ||||||
Tencent Holdings Ltd. | 34,733 | 1,839,043 | ||||||
Tencent Music Entertainment Group, ADR* | 2,222 | 28,708 | ||||||
Weibo Corp., ADR*(a) | 366 | 11,262 | ||||||
|
| |||||||
(Cost $2,845,810) | 2,757,198 | |||||||
|
| |||||||
| Consumer Discretionary — 20.6% | ||||||||
Alibaba Group Holding Ltd., ADR* | 11,369 | 2,357,817 | ||||||
ANTA Sports Products Ltd. | 6,703 | 59,757 | ||||||
BAIC Motor Corp. Ltd., Class H, 144A | 12,034 | 4,844 | ||||||
Baozun, Inc., ADR* | 268 | 7,099 | ||||||
Bosideng International Holdings Ltd. | 24,873 | 6,386 | ||||||
Brilliance China Automotive Holdings Ltd. | 18,488 | 16,172 | ||||||
BYD Co. Ltd., Class H (a) | 3,391 | 19,031 | ||||||
China East Education Holdings Ltd., 144A | 3,532 | 6,936 | ||||||
China Education Group Holdings Ltd. | 2,725 | 4,711 | ||||||
China Yuhua Education Corp. Ltd., 144A | 8,000 | 7,803 | ||||||
Dongfeng Motor Group Co. Ltd., Class H | 15,927 | 9,986 | ||||||
Fuyao Glass Industry Group Co. Ltd., Class H, 144A | 3,887 | 8,525 | ||||||
Geely Automobile Holdings Ltd. | 31,457 | 43,020 | ||||||
GOME Retail Holdings Ltd.*(a) | 41,776 | 5,174 | ||||||
Great Wall Motor Co. Ltd., Class H* | 21,370 | 13,537 | ||||||
GSX Techedu, Inc., ADR* | 471 | 14,771 | ||||||
Guangzhou Automobile Group Co. Ltd., Class H | 17,749 | 14,587 | ||||||
Haidilao International Holding Ltd., 144A* | 4,172 | 20,158 | ||||||
Haier Electronics Group Co. Ltd. | 7,746 | 21,586 | ||||||
Huazhu Group Ltd., ADR (a) | 810 | 27,394 | ||||||
JD.com, Inc., ADR* | 4,541 | 246,713 | ||||||
Li Ning Co. Ltd. | 12,841 | 43,074 | ||||||
Luckin Coffee, Inc., ADR* | 586 | 1,266 | ||||||
Meituan Dianping, Class B* | 21,568 | 408,209 | ||||||
New Oriental Education & Technology Group, Inc., ADR* | 870 | 104,365 | ||||||
NIO, Inc., ADR*(a) | 4,427 | 17,619 | ||||||
Pinduoduo, Inc., ADR*(a) | 1,570 | 104,986 | ||||||
Shenzhou International Group Holdings Ltd. | 4,723 | 56,151 | ||||||
TAL Education Group, ADR* | 2,338 | 132,003 | ||||||
Number | Value | |||||||
| Consumer Discretionary (Continued) | ||||||||
Tongcheng-Elong Holdings Ltd.* | 5,200 | $ | 9,325 | |||||
Topsports International Holdings Ltd., 144A | 8,152 | 11,569 | ||||||
Trip.com Group Ltd., ADR* | 2,892 | 76,840 | ||||||
Vipshop Holdings Ltd., ADR* | 2,696 | 46,749 | ||||||
Yum China Holdings, Inc. | 2,177 | 100,882 | ||||||
Zhongsheng Group Holdings Ltd. | 3,689 | 18,942 | ||||||
|
| |||||||
(Cost $3,640,990) | 4,047,987 | |||||||
|
| |||||||
| Consumer Staples — 1.5% | ||||||||
Anhui Gujing Distillery Co. Ltd., Class B | 700 | 7,830 | ||||||
China Feihe Ltd., 144A* | 5,000 | 9,031 | ||||||
China Mengniu Dairy Co. Ltd.* | 17,268 | 61,711 | ||||||
China Resources Beer Holdings Co. Ltd. | 7,557 | 40,022 | ||||||
Dali Foods Group Co. Ltd., 144A | 15,460 | 9,813 | ||||||
Hengan International Group Co. Ltd. | 4,276 | 34,921 | ||||||
Sun Art Retail Group Ltd. | 15,817 | 24,202 | ||||||
Tingyi Cayman Islands Holding Corp. | 13,038 | 22,406 | ||||||
Tsingtao Brewery Co. Ltd., Class H | 2,779 | 19,235 | ||||||
Uni-President China Holdings Ltd. | 9,340 | 9,664 | ||||||
Vinda International Holdings Ltd. | 2,000 | 6,077 | ||||||
Want Want China Holdings Ltd. | 33,037 | 23,741 | ||||||
Yihai International Holding Ltd.* | 2,926 | 26,142 | ||||||
|
| |||||||
(Cost $239,302) | 294,795 | |||||||
|
| |||||||
| Energy — 1.5% | ||||||||
China Oilfield Services Ltd., Class H | 9,971 | 8,670 | ||||||
China Petroleum & Chemical Corp., Class H | 146,972 | 68,072 | ||||||
China Shenhua Energy Co. Ltd., Class H | 21,598 | 39,457 | ||||||
CNOOC Ltd. | 107,845 | 120,075 | ||||||
COSCO SHIPPING Energy Transportation Co. Ltd., Class H | 8,870 | 4,383 | ||||||
PetroChina Co. Ltd., Class H | 132,994 | 45,641 | ||||||
Yanzhou Coal Mining Co. Ltd., Class H | 9,010 | 6,882 | ||||||
|
| |||||||
(Cost $441,841) | 293,180 | |||||||
|
| |||||||
| Financials — 9.9% | ||||||||
Agricultural Bank of China Ltd., Class H | 167,559 | 67,663 | ||||||
Bank of China Ltd., Class H* | 481,419 | 175,773 | ||||||
Bank of Communications Co. Ltd., Class H | 50,063 | 30,357 | ||||||
China Cinda Asset Management Co. Ltd., Class H | 62,560 | 11,542 | ||||||
China CITIC Bank Corp. Ltd., Class H | 54,871 | 23,857 | ||||||
China Construction Bank Corp., Class H | 583,391 | 458,373 | ||||||
China Ding Yi Feng Holdings Ltd.* | 107,872 | 57,200 | ||||||
China Everbright Bank Co. Ltd., Class H | 21,555 | 8,732 | ||||||
China Everbright Ltd. | 5,245 | 7,349 | ||||||
China Galaxy Securities Co. Ltd., Class H* | 23,273 | 11,170 | ||||||
China Huarong Asset Management Co. Ltd., Class H, 144A | 75,692 | 7,715 | ||||||
China International Capital Corp. Ltd., Class H, 144A* | 7,918 | 12,810 | ||||||
China Life Insurance Co. Ltd., Class H | 45,007 | 84,312 | ||||||
China Merchants Bank Co. Ltd., Class H | 23,885 | 111,860 | ||||||
China Minsheng Banking Corp. Ltd., Class H | 35,085 | 24,398 | ||||||
| See Notes to Financial Statements. | 28 |
DBX ETF Trust
Schedule of Investments
Xtrackers MSCI All China Equity ETF (Continued)
May 31, 2020
Number | Value | |||||||
| Financials (Continued) | ||||||||
China Pacific Insurance Group Co. Ltd., Class H | 16,757 | $ | 46,049 | |||||
China Reinsurance Group Corp., Class H | 50,176 | 5,243 | ||||||
China Taiping Insurance Holdings Co. Ltd. | 9,450 | 14,021 | ||||||
Chongqing Rural Commercial Bank Co. Ltd., Class H | 9,796 | 3,754 | ||||||
CITIC Securities Co. Ltd., Class H | 12,966 | 23,252 | ||||||
Far East Horizon Ltd. | 14,133 | 12,490 | ||||||
GF Securities Co. Ltd., Class H | 7,223 | 7,352 | ||||||
Guotai Junan Securities Co. Ltd., Class H, 144A | 4,970 | 6,527 | ||||||
Haitong Securities Co. Ltd., Class H | 16,115 | 12,183 | ||||||
Huatai Securities Co. Ltd., Class H, 144A | 7,683 | 12,033 | ||||||
Industrial & Commercial Bank of China Ltd., Class H | 368,361 | 237,622 | ||||||
New China Life Insurance Co. Ltd., Class H | 4,993 | 15,525 | ||||||
Noah Holdings Ltd., ADR*(a) | 224 | 5,943 | ||||||
People’s Insurance Co. Group of China Ltd., Class H | 55,231 | 16,603 | ||||||
PICC Property & Casualty Co. Ltd., Class H | 39,744 | 34,406 | ||||||
Ping An Insurance Group Co. of China Ltd., Class H | 35,831 | 353,641 | ||||||
Postal Savings Bank of China Co. Ltd., Class H, 144A | 51,773 | 32,930 | ||||||
ZhongAn Online P&C Insurance Co. Ltd., Class H, 144A* | 1,249 | 4,407 | ||||||
|
| |||||||
(Cost $2,492,906) | 1,937,092 | |||||||
|
| |||||||
| Health Care — 2.5% | ||||||||
3SBio, Inc., 144A* | 8,017 | 9,516 | ||||||
AK Medical Holdings Ltd., 144A | 2,000 | 6,102 | ||||||
Alibaba Health Information Technology Ltd.* | 22,036 | 51,629 | ||||||
CanSino Biologics, Inc., Class H, 144A* | 400 | 9,361 | ||||||
China Medical System Holdings Ltd. | 7,370 | 8,396 | ||||||
China Resources Pharmaceutical Group Ltd., 144A | 7,953 | 4,330 | ||||||
China Traditional Chinese Medicine Holdings Co. Ltd. | 10,096 | 4,272 | ||||||
CSPC Pharmaceutical Group Ltd.* | 27,980 | 54,798 | ||||||
Genscript Biotech Corp.* | 5,008 | 10,984 | ||||||
Hansoh Pharmaceutical Group Co. Ltd., 144A* | 1,986 | 8,622 | ||||||
Hutchison China MediTech Ltd., ADR* | 433 | 9,444 | ||||||
Innovent Biologics, Inc., 144A* | 5,961 | 32,531 | ||||||
Luye Pharma Group Ltd., 144A | 9,737 | 4,862 | ||||||
Ping An Healthcare and Technology Co. Ltd., 144A* | 2,130 | 28,057 | ||||||
Shandong Weigao Group Medical Polymer Co. Ltd., Class H | 11,799 | 20,642 | ||||||
Shanghai Fosun Pharmaceutical Group Co. Ltd., Class H | 3,489 | 11,073 | ||||||
Shanghai Pharmaceuticals Holding Co. Ltd., Class H | 4,359 | 6,895 | ||||||
Sino Biopharmaceutical Ltd. | 43,605 | 68,634 | ||||||
Sinopharm Group Co. Ltd., Class H | 7,890 | 19,402 | ||||||
Number | Value | |||||||
| Health Care (Continued) | ||||||||
SSY Group Ltd. | 11,629 | $ | 7,126 | |||||
WuXi AppTec Co. Ltd., Class H, 144A | 1,511 | 15,985 | ||||||
Wuxi Biologics Cayman, Inc., 144A* | 5,383 | 84,589 | ||||||
Zai Lab Ltd., ADR* | 237 | 17,633 | ||||||
|
| |||||||
(Cost $378,426) | 494,883 | |||||||
|
| |||||||
| Industrials — 2.6% | ||||||||
51job, Inc., ADR*(a) | 162 | 10,447 | ||||||
Air China Ltd., Class H | 13,882 | 8,310 | ||||||
A-Living Services Co. Ltd., Class H, 144A | 2,720 | 14,563 | ||||||
AviChina Industry & Technology Co. Ltd., Class H | 18,583 | 8,463 | ||||||
Beijing Capital International Airport Co. Ltd., Class H | 13,449 | 8,381 | ||||||
BEST, Inc., ADR* | 1,281 | 6,636 | ||||||
BOC Aviation Ltd., 144A | 1,299 | 7,139 | ||||||
China Communications Construction Co. Ltd., Class H | 26,122 | 16,615 | ||||||
China Communications Services Corp. Ltd., Class H | 17,851 | 11,815 | ||||||
China Conch Venture Holdings Ltd. | 10,023 | 45,001 | ||||||
China Eastern Airlines Corp. Ltd., Class H* | 12,628 | 4,268 | ||||||
China Everbright International Ltd. | 24,967 | 12,820 | ||||||
China Lesso Group Holdings Ltd. | 7,072 | 8,540 | ||||||
China Merchants Port Holdings Co. Ltd. | 9,815 | 11,941 | ||||||
China Railway Construction Corp. Ltd., Class H | 11,018 | 9,851 | ||||||
China Railway Group Ltd., Class H | 21,282 | 11,614 | ||||||
China Southern Airlines Co. Ltd., Class H | 7,645 | 3,136 | ||||||
China State Construction International Holdings Ltd. | 15,126 | 9,328 | ||||||
CITIC Ltd. | 33,471 | 31,783 | ||||||
COSCO SHIPPING Holdings Co. Ltd., Class H* | 12,962 | 3,278 | ||||||
COSCO SHIPPING Ports Ltd. | 11,964 | 5,973 | ||||||
Country Garden Services Holdings Co. Ltd.* | 7,470 | 34,984 | ||||||
CRRC Corp. Ltd., Class H | 25,907 | 12,099 | ||||||
Fosun International Ltd. | 17,285 | 22,189 | ||||||
Greentown Service Group Co. Ltd. | 8,749 | 11,671 | ||||||
Haitian International Holdings Ltd. | 4,766 | 10,060 | ||||||
Jiangsu Expressway Co. Ltd., Class H | 8,947 | 10,539 | ||||||
Shanghai Electric Group Co. Ltd., Class H | 22,473 | 6,205 | ||||||
Shanghai Industrial Holdings Ltd. | 3,737 | 5,814 | ||||||
Shenzhen Expressway Co. Ltd., Class H* | 4,350 | 4,400 | ||||||
Shenzhen International Holdings Ltd. | 6,283 | 10,489 | ||||||
Sinopec Engineering Group Co. Ltd., Class H | 11,721 | 4,915 | ||||||
Sinotruk Hong Kong Ltd. | 4,274 | 10,378 | ||||||
Weichai Power Co. Ltd., Class H | 12,890 | 22,318 | ||||||
Xinjiang Goldwind Science & Technology Co. Ltd., Class H | 3,763 | 3,389 | ||||||
Zhejiang Expressway Co. Ltd., Class H | 11,339 | 7,973 | ||||||
Zhuzhou CRRC Times Electric Co. Ltd., Class H | 3,780 | 9,778 | ||||||
| See Notes to Financial Statements. | 29 |
DBX ETF Trust
Schedule of Investments
Xtrackers MSCI All China Equity ETF (Continued)
May 31, 2020
Number | Value | |||||||
| Industrials (Continued) | ||||||||
Zoomlion Heavy Industry Science and Technology Co. Ltd., Class H | 8,812 | $ | 7,219 | |||||
ZTO Express Cayman, Inc., ADR | 2,282 | 74,439 | ||||||
|
| |||||||
(Cost $585,435) | 518,761 | |||||||
|
| |||||||
| Information Technology — 2.0% | ||||||||
AAC Technologies Holdings, Inc. | 4,542 | 23,322 | ||||||
BYD Electronic International Co. Ltd. | 3,485 | 6,672 | ||||||
China Railway Signal & Communication Corp. Ltd., Class H, 144A* | 12,476 | 5,505 | ||||||
GDS Holdings Ltd., ADR*(a) | 391 | 22,287 | ||||||
Hua Hong Semiconductor Ltd., 144A* | 2,658 | 4,945 | ||||||
Kingboard Holdings Ltd. | 4,781 | 11,535 | ||||||
Kingboard Laminates Holdings Ltd. | 6,797 | 5,919 | ||||||
Kingdee International Software Group Co. Ltd.* | 14,554 | 25,537 | ||||||
Kingsoft Corp. Ltd.* | 4,738 | 15,414 | ||||||
Legend Holdings Corp., Class H, 144A | 3,171 | 3,838 | ||||||
Lenovo Group Ltd. | 46,005 | 24,988 | ||||||
Semiconductor Manufacturing International Corp.* | 19,512 | 42,392 | ||||||
Sunny Optical Technology Group Co. Ltd. | 4,528 | 59,820 | ||||||
TravelSky Technology Ltd., Class H | 5,018 | 10,074 | ||||||
Xiaomi Corp., Class B, 144A* | 63,361 | 98,258 | ||||||
Xinyi Solar Holdings Ltd. | 25,916 | 18,824 | ||||||
ZTE Corp., Class H* | 4,494 | 11,364 | ||||||
|
| |||||||
(Cost $337,323) | 390,694 | |||||||
|
| |||||||
| Materials — 0.9% | ||||||||
Aluminum Corp. of China Ltd., Class H* | 29,982 | 5,531 | ||||||
Anhui Conch Cement Co. Ltd., Class H | 7,658 | 57,354 | ||||||
China Hongqiao Group Ltd. | 12,075 | 5,312 | ||||||
China Molybdenum Co. Ltd., Class H | 14,224 | 4,368 | ||||||
China National Building Material Co. Ltd., Class H | 24,167 | 27,126 | ||||||
China Resources Cement Holdings Ltd. | 16,801 | 21,091 | ||||||
Jiangxi Copper Co. Ltd., Class H | 7,290 | 6,678 | ||||||
Lee & Man Paper Manufacturing Ltd. | 8,333 | 4,483 | ||||||
Nine Dragons Paper Holdings Ltd. | 10,384 | 9,083 | ||||||
Sinopec Shanghai Petrochemical Co. Ltd., Class H | 15,061 | 3,711 | ||||||
Zhaojin Mining Industry Co. Ltd., Class H | 8,269 | 10,114 | ||||||
Zijin Mining Group Co. Ltd., Class H* | 38,906 | 15,560 | ||||||
|
| |||||||
(Cost $158,405) | 170,411 | |||||||
|
| |||||||
| Real Estate — 2.9% | ||||||||
Agile Group Holdings Ltd. | 8,778 | 9,026 | ||||||
China Aoyuan Group Ltd.* | 6,687 | 7,092 | ||||||
China Evergrande Group | 10,589 | 22,186 | ||||||
China Jinmao Holdings Group Ltd. | 32,066 | 22,174 | ||||||
China Overseas Land & Investment Ltd. | 22,337 | 68,011 | ||||||
China Overseas Property Holdings Ltd. | 5,000 | 5,657 | ||||||
China Resources Land Ltd. | 18,568 | 73,185 | ||||||
China Vanke Co. Ltd., Class H | 8,542 | 27,717 | ||||||
CIFI Holdings Group Co. Ltd. | 20,067 | 14,421 | ||||||
Country Garden Holdings Co. Ltd. | 48,342 | 59,749 | ||||||
Number | Value | |||||||
| Real Estate (Continued) | ||||||||
Guangzhou R&F Properties Co. Ltd., Class H | 6,033 | $ | 7,449 | |||||
Kaisa Group Holdings Ltd.* | 17,992 | 6,569 | ||||||
KWG Group Holdings Ltd.* | 8,637 | 12,057 | ||||||
Logan Property Holdings Co. Ltd. | 9,085 | 13,526 | ||||||
Longfor Group Holdings Ltd., 144A | 11,296 | 51,153 | ||||||
Poly Property Development Co. Ltd., Class H* | 600 | 6,773 | ||||||
Seazen Group Ltd.* | 13,345 | 12,345 | ||||||
Shenzhen Investment Ltd. | 22,299 | 6,876 | ||||||
Shimao Property Holdings Ltd. | 7,406 | 30,767 | ||||||
Shui On Land Ltd. | 29,761 | 4,915 | ||||||
Sino-Ocean Group Holding Ltd. | 25,441 | 5,875 | ||||||
SOHO China Ltd.* | 16,028 | 5,397 | ||||||
Sunac China Holdings Ltd. | 15,169 | 63,506 | ||||||
Wharf Holdings Ltd. (a) | 4,272 | 7,617 | ||||||
Yuexiu Property Co. Ltd. | 49,742 | 8,920 | ||||||
Yuzhou Properties Co. Ltd. | 15,688 | 6,416 | ||||||
Zhenro Properties Group Ltd.* | 9,784 | 6,223 | ||||||
|
| |||||||
(Cost $588,885) | 565,602 | |||||||
|
| |||||||
| Utilities — 1.4% | ||||||||
Beijing Enterprises Holdings Ltd. | 3,605 | 11,976 | ||||||
Beijing Enterprises Water Group Ltd.* | 36,515 | 13,803 | ||||||
CGN Power Co. Ltd., Class H, 144A | 49,300 | 11,322 | ||||||
China Gas Holdings Ltd. | 15,046 | 52,606 | ||||||
China Longyuan Power Group Corp. Ltd., Class H* | 23,265 | 11,316 | ||||||
China Power International Development Ltd. | 32,624 | 7,155 | ||||||
China Resources Gas Group Ltd. | 5,685 | 30,989 | ||||||
China Resources Power Holdings Co. Ltd. | 12,897 | 14,942 | ||||||
ENN Energy Holdings Ltd. | 4,994 | 58,245 | ||||||
Guangdong Investment Ltd. | 18,192 | 35,816 | ||||||
Huaneng Power International, Inc., Class H | 25,977 | 9,652 | ||||||
Kunlun Energy Co. Ltd. | 23,129 | 14,174 | ||||||
|
| |||||||
(Cost $288,096) | 271,996 | |||||||
|
| |||||||
TOTAL COMMON STOCKS | 11,742,599 | |||||||
|
| |||||||
| RIGHTS — 0.0% | ||||||||
| Financials — 0.0% | ||||||||
Zhengqi Financial Holding Corp.*(b) | 2,516 | 0 | ||||||
|
| |||||||
| EXCHANGE-TRADED FUNDS — 39.8% | ||||||||
Xtrackers Harvest CSI 500 China A-Shares Small Cap ETF (a)(c) | 38,609 | 1,059,284 | ||||||
Xtrackers MSCI China A Inclusion Equity ETF (c) | 338,438 | 6,733,326 | ||||||
|
| |||||||
TOTAL EXCHANGE-TRADED FUNDS | 7,792,610 | |||||||
|
| |||||||
| See Notes to Financial Statements. | 30 |
DBX ETF Trust
Schedule of Investments
Xtrackers MSCI All China Equity ETF (Continued)
May 31, 2020
Number | Value | |||||||
| SECURITIES LENDING COLLATERAL — 9.1% | ||||||||
DWS Government & Agency Securities Portfolio “DWS Government Cash Institutional Shares”, 0.07% (d)(e) | 1,797,929 | $ | 1,797,929 | |||||
|
| |||||||
| CASH EQUIVALENTS — 0.1% | ||||||||
DWS Government Money Market Series “Institutional Shares”, 0.12% (d) | 11,737 | 11,737 | ||||||
|
| |||||||
TOTAL INVESTMENTS — 108.9% | $ | 21,344,875 | ||||||
Other assets and liabilities, net — (8.9%) | (1,750,937 | ) | ||||||
|
| |||||||
NET ASSETS — 100.0% | $ | 19,593,938 | ||||||
|
| |||||||
A summary of the Fund’s transactions with affiliated investments during the year ended May 31, 2020 is as follows:
| Value ($) at 5/31/2019 | Purchases Cost ($) | Sales Proceeds ($) | Net Realized Gain/(Loss) ($) | Net Change in Unrealized Appreciation (Depreciation) ($) | Income ($) | Capital Gain Distributions ($) | Number of Shares at 5/31/2020 | Value ($) at 5/31/2020 | ||||||||||||||||||||||||||||||
EXCHANGE-TRADED FUNDS — 39.8% | ||||||||||||||||||||||||||||||||||||||
Xtrackers Harvest CSI 500 China A-Shares Small Cap ETF (a)(c) | ||||||||||||||||||||||||||||||||||||||
| 12,298,745 | 619,797 | (11,848,321 | ) | (1,771,873 | ) | 1,760,936 | 11,898 | — | 38,609 | 1,059,284 | ||||||||||||||||||||||||||||
Xtrackers MSCI China A Inclusion Equity ETF (c) | ||||||||||||||||||||||||||||||||||||||
| 78,137,782 | 3,921,059 | (76,853,887 | ) | (6,137,347 | ) | 7,665,719 | 240,354 | — | 338,438 | 6,733,326 | ||||||||||||||||||||||||||||
SECURITIES LENDING COLLATERAL — 9.1% | ||||||||||||||||||||||||||||||||||||||
DWS Government & Agency Securities Portfolio “DWS Government Cash Institutional Shares”, 0.07% (d)(e) | ||||||||||||||||||||||||||||||||||||||
| 2,132,624 | — | (334,695 | ) (f) | — | — | 25,805 | — | 1,797,929 | 1,797,929 | |||||||||||||||||||||||||||||
CASH EQUIVALENTS — 0.1% | ||||||||||||||||||||||||||||||||||||||
DWS Government Money Market Series “Institutional Shares”, 0.12% (d) | ||||||||||||||||||||||||||||||||||||||
| — | 6,336,401 | (6,324,664 | ) | — | — | 5,091 | — | 11,737 | 11,737 | |||||||||||||||||||||||||||||
|
|
|
|
|
|
|
|
|
|
|
|
|
|
|
|
|
| |||||||||||||||||||||
| 92,569,151 | 10,877,257 | (95,361,567 | ) | (7,909,220 | ) | 9,426,655 | 283,148 | — | 2,186,713 | 9,602,276 | ||||||||||||||||||||||||||||
|
|
|
|
|
|
|
|
|
|
|
|
|
|
|
|
|
| |||||||||||||||||||||
| * | Non-income producing security. |
| (a) | All or a portion of these securities were on loan. In addition, “Other assets and liabilities, net” may include pending sales that are also on loan. The value of securities loaned at May 31, 2020 amounted to $2,077,347, which is 10.6% of net assets. |
| (b) | Investment was valued using significant unobservable inputs. |
| (c) | Affiliated fund advised by DBX Advisors LLC. |
| (d) | Affiliated fund managed by DWS Investment Management Americas, Inc. The rate shown is the annualized seven-day yield at period end. |
| (e) | Represents cash collateral held in connection with securities lending. Income earned by the Fund is net of borrower rebates. In addition, the Fund held non-cash U.S. Treasury securities collateral having a value of $320,830. |
| (f) | Represents the net increase (purchase cost) or decrease (sales proceeds) in the amount invested in cash collateral for the year ended May 31, 2020. |
| ADR: | American Depositary Receipt |
| 144A: | Security exempt from registration under Rule 144A of the Securities Act of 1933. These securities may be resold in transactions exempt from registration, normally to qualified institutional buyers. |
At May 31, 2020, open futures contracts purchased were as follows:
Contract Description | Currency | Number of Contracts | Notional Amount | Contract Value | Expiration Date | Unrealized Appreciation | ||||||||||||
MSCI China Free Index Futures | USD | 1 | $ | 37,575 | $42,895 | 6/19/2020 | $ | 5,320 | ||||||||||
For information on the Fund’s policy and additional disclosures regarding open futures contracts, please refer to the Derivatives section of Note 2 in the accompanying Notes to Financial Statements.
| See Notes to Financial Statements. | 31 |
DBX ETF Trust
Schedule of Investments
Xtrackers MSCI All China Equity ETF (Continued)
May 31, 2020
Currency Abbreviations
| USD | U.S. Dollar |
Fair Value Measurements
Various inputs are used in determining the value of the Fund’s investments. These inputs are summarized in three broad levels. Level 1 includes quoted prices in active markets for identical securities. Level 2 includes other significant observable inputs (including quoted prices for similar securities, interest rates, prepayment speeds and credit risk). Level 3 includes significant unobservable inputs (including the Fund’s own assumptions in determining the fair value of investments). The level assigned to the securities valuations may not be an indication of the risk or liquidity associated with investing in those securities.
The following is a summary of the inputs used as of May 31, 2020 in valuing the Fund’s investments. For information on the Fund’s policy regarding the valuation of investments, please refer to the Security Valuation section of Note 2 in the accompanying Notes to Financial Statements.
Assets | Level 1 | Level 2 | Level 3 | Total | ||||||||||||
Common Stocks (g) | $ | 11,742,599 | $ | — | $ | — | $ | 11,742,599 | ||||||||
Rights | — | — | 0 | 0 | ||||||||||||
Exchange-Traded Funds | 7,792,610 | — | — | 7,792,610 | ||||||||||||
Short-Term Investments (g) | 1,809,666 | — | — | 1,809,666 | ||||||||||||
Derivatives (h) | ||||||||||||||||
Futures Contracts | 5,320 | — | — | 5,320 | ||||||||||||
|
|
|
|
|
|
|
| |||||||||
TOTAL | $ | 21,350,195 | $ | — | $ | 0 | $ | 21,350,195 | ||||||||
|
|
|
|
|
|
|
| |||||||||
| (g) | See Schedule of Investments for additional detailed categorizations. |
| (h) | Derivatives include unrealized appreciation (depreciation) on open futures contracts. |
During the year ended May 31, 2020, the amount of transfers from Level 3 to Level 1 was $317,540. The investments was transferred from Level 3 to Level 1 due to the availability of a pricing source supported by observable inputs.
| See Notes to Financial Statements. | 32 |
DBX ETF Trust
Schedule of Investments
Xtrackers MSCI China A Inclusion Equity ETF
May 31, 2020
Number | Value | |||||||
| COMMON STOCKS — 99.9% | ||||||||
| Communication Services — 2.7% | ||||||||
Beijing Enlight Media Co. Ltd., Class A | 10,300 | $ | 16,749 | |||||
Beijing Kunlun Tech Co. Ltd., Class A* | 3,700 | 11,471 | ||||||
China Film Co. Ltd., Class A | 5,500 | 10,134 | ||||||
China South Publishing & Media Group Co. Ltd., Class A | 6,100 | 9,068 | ||||||
China United Network Communications Ltd., Class A | 86,600 | 59,956 | ||||||
Chinese Universe Publishing and Media Group Co. Ltd., Class A | 4,800 | 7,598 | ||||||
Focus Media Information Technology Co. Ltd., Class A | 48,623 | 33,527 | ||||||
G-bits Network Technology Xiamen Co. Ltd., Class A | 200 | 11,278 | ||||||
Giant Network Group Co. Ltd., Class A | 4,800 | 11,155 | ||||||
Leo Group Co. Ltd., Class A* | 21,400 | 12,247 | ||||||
Mango Excellent Media Co. Ltd., Class A* | 6,200 | 45,867 | ||||||
NanJi E-Commerce Co. Ltd., Class A* | 8,400 | 22,102 | ||||||
Oriental Pearl Group Co. Ltd., Class A | 11,597 | 16,187 | ||||||
Perfect World Co. Ltd., Class A | 4,500 | 27,606 | ||||||
Wanda Film Holding Co. Ltd., Class A* | 6,900 | 15,554 | ||||||
Wuhu Sanqi Interactive Entertainment Network Technology Group Co. Ltd., Class A | 7,100 | 33,695 | ||||||
Youzu Interactive Co. Ltd., Class A* | 3,200 | 8,554 | ||||||
Zhejiang Century Huatong Group Co. Ltd., Class A | 13,600 | 25,438 | ||||||
|
| |||||||
(Cost $336,596) | 378,186 | |||||||
|
| |||||||
| Consumer Discretionary — 5.6% | ||||||||
BAIC BluePark New Energy Technology Co. Ltd., Class A* | 11,200 | 9,145 | ||||||
BTG Hotels Group Co. Ltd., Class A | 3,500 | 8,100 | ||||||
BYD Co. Ltd., Class A | 6,098 | 48,866 | ||||||
Changzhou Xingyu Automotive Lighting Systems Co. Ltd., Class A* | 900 | 13,683 | ||||||
China Grand Automotive Services Group Co. Ltd., Class A | 28,891 | 12,582 | ||||||
China International Travel Service Corp. Ltd., Class A | 6,543 | 92,452 | ||||||
Chongqing Changan Automobile Co. Ltd., Class A | 13,900 | 19,130 | ||||||
Fuyao Glass Industry Group Co. Ltd., Class A* | 7,009 | 19,214 | ||||||
Gree Electric Appliances, Inc. of Zhuhai, Class A | 10,100 | 80,273 | ||||||
Haier Smart Home Co. Ltd., Class A | 20,800 | 48,050 | ||||||
Hangzhou Robam Appliances Co. Ltd., Class A* | 3,300 | 15,675 | ||||||
HLA Corp. Ltd., Class A* | 10,400 | 8,841 | ||||||
Huayu Automotive Systems Co. Ltd., Class A | 10,400 | 27,799 | ||||||
Joyoung Co. Ltd., Class A | 2,400 | 10,851 | ||||||
Liaoning Cheng Da Co. Ltd., Class A* | 5,200 | 11,875 | ||||||
NavInfo Co. Ltd., Class A | 6,900 | 14,264 | ||||||
Ningbo Joyson Electronic Corp., Class A* | 4,000 | 11,005 | ||||||
Ningbo Tuopu Group Co. Ltd., Class A | 3,400 | 11,352 | ||||||
Number | Value | |||||||
| Consumer Discretionary (Continued) | ||||||||
Offcn Education Technology Co. Ltd., Class A | 5,500 | $ | 22,571 | |||||
Oppein Home Group, Inc., Class A | 900 | 15,208 | ||||||
SAIC Motor Corp. Ltd., Class A | 25,927 | 64,852 | ||||||
Shandong Linglong Tyre Co. Ltd., Class A | 4,300 | 11,398 | ||||||
Shanghai Jinjiang International Hotels Co. Ltd., Class A | 2,600 | 9,893 | ||||||
Shanghai Yuyuan Tourist Mart Group Co. Ltd., Class A | 10,400 | 12,005 | ||||||
Shenzhen Overseas Chinese Town Co. Ltd., Class A* | 29,200 | 23,803 | ||||||
Songcheng Performance Development Co. Ltd., Class A | 9,343 | 23,839 | ||||||
Suning.com Co. Ltd., Class A | 30,964 | 37,904 | ||||||
Suofeiya Home Collection Co. Ltd., Class A | 2,900 | 10,464 | ||||||
TCL Technology Group Corp., Class A | 44,600 | 32,497 | ||||||
Weifu High-Technology Group Co. Ltd., Class A | 2,500 | 6,864 | ||||||
Wuchan Zhongda Group Co. Ltd., Class A* | 19,400 | 12,050 | ||||||
Xiamen Intretech, Inc., Class A | 1,400 | 9,345 | ||||||
Zhejiang Semir Garment Co. Ltd., Class A | 6,400 | 6,164 | ||||||
Zhejiang Supor Co. Ltd., Class A | 1,900 | 17,955 | ||||||
Zhejiang Wanfeng Auto Wheel Co. Ltd., Class A | 7,000 | 6,322 | ||||||
|
| |||||||
(Cost $768,179) | 786,291 | |||||||
|
| |||||||
| Consumer Staples — 16.3% | ||||||||
Angel Yeast Co. Ltd., Class A | 2,900 | 17,114 | ||||||
Anhui Gujing Distillery Co. Ltd., Class A | 1,300 | 27,175 | ||||||
Anhui Kouzi Distillery Co. Ltd., Class A* | 2,100 | 13,879 | ||||||
Beijing Dabeinong Technology Group Co. Ltd., Class A | 14,000 | 16,141 | ||||||
Beijing Shunxin Agriculture Co. Ltd., Class A* | 2,600 | 19,888 | ||||||
Beijing Yanjing Brewery Co. Ltd., Class A | 10,400 | 9,262 | ||||||
By-health Co. Ltd., Class A | 5,200 | 13,588 | ||||||
C&S Paper Co. Ltd., Class A | 4,000 | 11,301 | ||||||
Chacha Food Co. Ltd., Class A* | 1,600 | 13,067 | ||||||
Chongqing Brewery Co. Ltd., Class A | 1,700 | 14,641 | ||||||
Chongqing Fuling Zhacai Group Co. Ltd., Class A | 2,700 | 13,635 | ||||||
Foshan Haitian Flavouring & Food Co. Ltd., Class A | 9,131 | 146,444 | ||||||
Fujian Sunner Development Co. Ltd., Class A | 4,100 | 14,851 | ||||||
Guangdong Haid Group Co. Ltd., Class A | �� | 5,300 | 35,806 | |||||
Heilongjiang Agriculture Co. Ltd., Class A | 5,900 | 12,312 | ||||||
Henan Shuanghui Investment & Development Co. Ltd., Class A* | 9,300 | 51,354 | ||||||
Inner Mongolia Yili Industrial Group Co. Ltd., Class A* | 20,513 | 81,460 | ||||||
Jiangsu King’s Luck Brewery JSC Ltd., Class A* | 4,500 | 23,027 | ||||||
Jiangsu Yanghe Brewery Joint-Stock Co. Ltd., Class A | 5,024 | 73,990 | ||||||
| See Notes to Financial Statements. | 33 |
DBX ETF Trust
Schedule of Investments
Xtrackers MSCI China A Inclusion Equity ETF (Continued)
May 31, 2020
Number | Value | |||||||
| Consumer Staples (Continued) | ||||||||
Jiangxi Zhengbang Technology Co. Ltd., Class A | 8,700 | $ | 18,811 | |||||
Jonjee Hi-Tech Industrial And Commercial Holding Co. Ltd., Class A | 2,800 | 21,496 | ||||||
Juewei Food Co. Ltd., Class A | 2,000 | 19,304 | ||||||
Kweichow Moutai Co. Ltd., Class A | 4,200 | 801,167 | ||||||
Laobaixing Pharmacy Chain JSC, Class A | 900 | 10,622 | ||||||
Luzhou Laojiao Co. Ltd., Class A | 5,006 | 59,604 | ||||||
Muyuan Foodstuff Co. Ltd., Class A | 7,410 | 124,314 | ||||||
New Hope Liuhe Co. Ltd., Class A | 14,172 | 55,428 | ||||||
Proya Cosmetics Co. Ltd., Class A | 600 | 13,414 | ||||||
Shanghai Jahwa United Co. Ltd., Class A | 2,200 | 11,847 | ||||||
Shanxi Xinghuacun Fen Wine Factory Co. Ltd., Class A | 2,910 | 52,036 | ||||||
Sichuan Swellfun Co. Ltd., Class A | 1,700 | 11,957 | ||||||
Toly Bread Co. Ltd., Class A* | 1,900 | 13,321 | ||||||
Tongwei Co. Ltd., Class A | 13,000 | 24,860 | ||||||
Tsingtao Brewery Co. Ltd., Class A | 2,300 | 20,319 | ||||||
Wens Foodstuffs Group Co. Ltd., Class A | 17,787 | 65,619 | ||||||
Wuliangye Yibin Co. Ltd., Class A | 13,054 | 270,037 | ||||||
Yifeng Pharmacy Chain Co. Ltd., Class A | 1,820 | 20,021 | ||||||
Yonghui Superstores Co. Ltd., Class A | 32,066 | 41,715 | ||||||
Yuan Longping High-tech Agriculture Co. Ltd., Class A | 4,800 | 10,921 | ||||||
|
| |||||||
(Cost $1,495,248) | 2,275,748 | |||||||
|
| |||||||
| Energy — 1.9% | ||||||||
China Merchants Energy Shipping Co. Ltd., Class A | 24,200 | 19,997 | ||||||
China Petroleum & Chemical Corp., Class A | 85,850 | 49,610 | ||||||
China Shenhua Energy Co. Ltd., Class A | 17,400 | 39,783 | ||||||
COSCO SHIPPING Energy Transportation Co. Ltd., Class A | 11,500 | 10,418 | ||||||
Guanghui Energy Co. Ltd., Class A | 19,800 | 7,241 | ||||||
Offshore Oil Engineering Co. Ltd., Class A | 13,100 | 8,375 | ||||||
PetroChina Co. Ltd., Class A | 69,035 | 40,954 | ||||||
Shaanxi Coal Industry Co. Ltd., Class A | 29,699 | 29,723 | ||||||
Shanxi Lu’an Environmental Energy Development Co. Ltd., Class A | 10,600 | 8,212 | ||||||
Shanxi Meijin Energy Co. Ltd., Class A* | 14,600 | 12,757 | ||||||
Shanxi Xishan Coal & Electricity Power Co. Ltd., Class A | 11,000 | 7,339 | ||||||
Yantai Jereh Oilfield Services Group Co. Ltd., Class A | 3,400 | 12,092 | ||||||
Yanzhou Coal Mining Co. Ltd., Class A | 8,800 | 10,379 | ||||||
|
| |||||||
(Cost $343,399) | 256,880 | |||||||
|
| |||||||
| Financials — 22.8% | ||||||||
Agricultural Bank of China Ltd., Class A | 250,817 | 119,033 | ||||||
Anxin Trust Co. Ltd., Class A*(a) | 18,600 | 6,491 | ||||||
Avic Capital Co. Ltd., Class A | 31,110 | 16,458 | ||||||
Bank of Beijing Co. Ltd., Class A | 71,614 | 48,781 | ||||||
Bank of Chengdu Co. Ltd., Class A | 12,750 | 14,184 | ||||||
Bank of China Ltd., Class A | 120,212 | 57,889 | ||||||
Bank of Communications Co. Ltd., Class A | 131,838 | 94,036 | ||||||
Bank of Guiyang Co. Ltd., Class A | 11,480 | 12,403 | ||||||
Number | Value | |||||||
| Financials (Continued) | ||||||||
Bank of Hangzhou Co. Ltd., Class A | 20,940 | $ | 26,598 | |||||
Bank of Jiangsu Co. Ltd., Class A | 37,961 | 31,368 | ||||||
Bank of Nanjing Co. Ltd., Class A | 34,500 | 38,043 | ||||||
Bank of Ningbo Co. Ltd., Class A | 20,050 | 71,673 | ||||||
Bank of Shanghai Co. Ltd., Class A | 48,635 | 54,988 | ||||||
Caitong Securities Co. Ltd., Class A | 12,700 | 17,621 | ||||||
Changjiang Securities Co. Ltd., Class A | 16,900 | 14,743 | ||||||
China CITIC Bank Corp. Ltd., Class A | 19,900 | 13,944 | ||||||
China Construction Bank Corp., Class A | 32,100 | 28,541 | ||||||
China Everbright Bank Co. Ltd., Class A | 133,231 | 70,854 | ||||||
China Galaxy Securities Co. Ltd., Class A | 13,300 | 18,193 | ||||||
China Great Wall Securities Co. Ltd., Class A | 6,400 | 10,461 | ||||||
China Life Insurance Co. Ltd., Class A | 9,314 | 33,282 | ||||||
China Merchants Bank Co. Ltd., Class A | 69,343 | 327,347 | ||||||
China Merchants Securities Co. Ltd., Class A | 19,332 | 44,794 | ||||||
China Minsheng Banking Corp. Ltd., Class A | 118,971 | 94,490 | ||||||
China Pacific Insurance Group Co. Ltd., Class A | 21,077 | 83,199 | ||||||
CITIC Securities Co. Ltd., Class A | 32,955 | 102,441 | ||||||
CSC Financial Co. Ltd., Class A | 9,300 | 41,514 | ||||||
Dongxing Securities Co. Ltd., Class A | 9,800 | 14,336 | ||||||
East Money Information Co. Ltd., Class A | 27,600 | 54,898 | ||||||
Everbright Securities Co. Ltd., Class A | 13,837 | 21,110 | ||||||
First Capital Securities Co. Ltd., Class A | 10,900 | 10,392 | ||||||
Founder Securities Co. Ltd., Class A | 27,100 | 26,176 | ||||||
GF Securities Co. Ltd., Class A | 19,200 | 35,322 | ||||||
Guosen Securities Co. Ltd., Class A | 14,600 | 21,765 | ||||||
Guotai Junan Securities Co. Ltd., Class A | 25,651 | 56,106 | ||||||
Guoyuan Securities Co. Ltd., Class A | 11,800 | 13,094 | ||||||
Haitong Securities Co. Ltd., Class A | 26,714 | 43,068 | ||||||
Hithink RoyalFlush Information Network Co. Ltd., Class A | 1,800 | 26,957 | ||||||
Huaan Securities Co. Ltd., Class A | 12,900 | 12,784 | ||||||
Huatai Securities Co. Ltd., Class A | 24,480 | 59,046 | ||||||
Huaxi Securities Co. Ltd., Class A | 7,700 | 10,673 | ||||||
Huaxia Bank Co. Ltd., Class A | 42,198 | 37,520 | ||||||
Hubei Biocause Pharmaceutical Co. Ltd., Class A | 17,500 | 11,945 | ||||||
Industrial & Commercial Bank of China Ltd., Class A | 181,333 | 129,592 | ||||||
Industrial Bank Co. Ltd., Class A | 69,685 | 156,602 | ||||||
Industrial Securities Co. Ltd., Class A | 23,800 | 18,903 | ||||||
Jiangsu Changshu Rural Commercial Bank Co. Ltd., Class A | 9,200 | 9,349 | ||||||
Nanjing Securities Co. Ltd., Class A | 11,500 | 22,072 | ||||||
New China Life Insurance Co. Ltd., Class A | 6,864 | 41,917 | ||||||
Northeast Securities Co. Ltd., Class A | 9,100 | 10,162 | ||||||
Orient Securities Co. Ltd., Class A | 19,351 | 24,769 | ||||||
Pacific Securities Co. Ltd., Class A* | 23,200 | 10,136 | ||||||
People’s Insurance Co. Group of China Ltd., Class A | 20,300 | 17,596 | ||||||
Ping An Bank Co. Ltd., Class A | 65,066 | 118,067 | ||||||
Ping An Insurance Group Co. of China Ltd., Class A | 36,409 | 359,353 | ||||||
| See Notes to Financial Statements. | 34 |
DBX ETF Trust
Schedule of Investments
Xtrackers MSCI China A Inclusion Equity ETF (Continued)
May 31, 2020
Number | Value | |||||||
| Financials (Continued) | ||||||||
Qingdao Rural Commercial Bank Corp., Class A | 17,000 | $ | 10,109 | |||||
SDIC Capital Co. Ltd., Class A | 12,600 | 20,964 | ||||||
Sealand Securities Co. Ltd., Class A | 18,460 | 10,771 | ||||||
Shanghai Pudong Development Bank Co. Ltd., Class A | 98,327 | 145,071 | ||||||
Shanxi Securities Co. Ltd., Class A | 10,100 | 9,770 | ||||||
Shenwan Hongyuan Group Co. Ltd., Class A* | 73,695 | 44,438 | ||||||
Sinolink Securities Co. Ltd., Class A | 10,700 | 14,696 | ||||||
SooChow Securities Co. Ltd., Class A | 13,010 | 13,674 | ||||||
Southwest Securities Co. Ltd., Class A | 20,700 | 12,655 | ||||||
Tianfeng Securities Co. Ltd., Class A | 22,000 | 16,797 | ||||||
Western Securities Co. Ltd., Class A | 12,400 | 13,777 | ||||||
Zheshang Securities Co. Ltd., Class A | 8,500 | 11,687 | ||||||
|
| |||||||
(Cost $3,084,306) | 3,191,488 | |||||||
|
| |||||||
| Health Care — 11.2% | ||||||||
Aier Eye Hospital Group Co. Ltd., Class A | 13,615 | 74,421 | ||||||
Apeloa Pharmaceutical Co. Ltd., Class A | 3,500 | 8,833 | ||||||
Asymchem Laboratories Tianjin Co. Ltd., Class A | 800 | 24,293 | ||||||
Autobio Diagnostics Co. Ltd., Class A* | 1,000 | 20,379 | ||||||
Beijing Tiantan Biological Products Corp. Ltd., Class A | 3,700 | 19,884 | ||||||
Beijing Tongrentang Co. Ltd., Class A | 4,600 | 16,091 | ||||||
Betta Pharmaceuticals Co. Ltd., Class A | 1,400 | 20,540 | ||||||
BGI Genomics Co. Ltd., Class A | 1,400 | 23,563 | ||||||
Changchun High & New Technology Industry Group, Inc., Class A* | 700 | 65,074 | ||||||
Chengdu Kanghong Pharmaceutical Group Co. Ltd., Class A | 2,500 | 12,412 | ||||||
China National Accord Medicines Corp. Ltd., Class A | 1,200 | 6,754 | ||||||
China National Medicines Corp. Ltd., Class A* | 2,400 | 10,435 | ||||||
China Resources Sanjiu Medical & Pharmaceutical Co. Ltd., Class A | 3,375 | 12,752 | ||||||
Chongqing Zhifei Biological Products Co. Ltd., Class A | 5,300 | 61,994 | ||||||
Da An Gene Co. Ltd. of Sun Yat-Sen University, Class A | 2,600 | 7,875 | ||||||
Dong-E-E-Jiao Co. Ltd., Class A | 2,300 | 11,471 | ||||||
Guangzhou Baiyunshan Pharmaceutical Holdings Co. Ltd., Class A | 4,500 | 18,932 | ||||||
Guangzhou Kingmed Diagnostics Group Co. Ltd., Class A | 1,500 | 14,681 | ||||||
Guangzhou Wondfo Biotech Co. Ltd., Class A | 1,100 | 13,527 | ||||||
Hangzhou Tigermed Consulting Co. Ltd., Class A | 2,450 | 29,017 | ||||||
Huadong Medicine Co. Ltd., Class A | 5,960 | 18,843 | ||||||
Hualan Biological Engineering, Inc., Class A | 5,840 | 33,568 | ||||||
Hubei Jumpcan Pharmaceutical Co. Ltd., Class A | 2,800 | 8,583 | ||||||
Jafron Biomedical Co. Ltd., Class A | 2,650 | 23,303 | ||||||
Number | Value | |||||||
| Health Care (Continued) | ||||||||
Jiangsu Hengrui Medicine Co. Ltd., Class A | 17,814 | $ | 195,690 | |||||
Jiangsu Yuyue Medical Equipment & Supply Co. Ltd., Class A | 3,100 | 13,466 | ||||||
Jilin Aodong Pharmaceutical Group Co. Ltd., Class A | 3,200 | 6,776 | ||||||
Jinyu Bio-Technology Co. Ltd., Class A | 3,900 | 13,000 | ||||||
Joincare Pharmaceutical Group Industry Co. Ltd., Class A* | 6,700 | 11,905 | ||||||
Jointown Pharmaceutical Group Co. Ltd., Class A | 6,700 | 16,834 | ||||||
Lepu Medical Technology Beijing Co. Ltd., Class A | 5,900 | 28,766 | ||||||
Livzon Pharmaceutical Group, Inc., Class A | 2,100 | 11,675 | ||||||
Meinian Onehealth Healthcare Holdings Co. Ltd., Class A | 13,432 | 22,030 | ||||||
Nanjing King-Friend Biochemical Pharmaceutical Co. Ltd., Class A | 2,100 | 18,326 | ||||||
Ovctek China, Inc., Class A | 2,100 | 15,975 | ||||||
Shandong Buchang Pharmaceuticals Co. Ltd., Class A | 4,038 | 13,093 | ||||||
Shanghai Fosun Pharmaceutical Group Co. Ltd., Class A | 6,500 | 27,899 | ||||||
Shanghai Pharmaceuticals Holding Co. Ltd., Class A | 7,000 | 17,392 | ||||||
Shanghai RAAS Blood Products Co. Ltd., Class A* | 17,200 | 19,711 | ||||||
Shenzhen Hepalink Pharmaceutical Group Co. Ltd., Class A | 3,500 | 10,367 | ||||||
Shenzhen Kangtai Biological Products Co. Ltd., Class A | 2,200 | 44,834 | ||||||
Shenzhen Mindray Bio-Medical Electronics Co. Ltd., Class A | 3,400 | 132,313 | ||||||
Shenzhen Salubris Pharmaceuticals Co. Ltd., Class A | 2,900 | 8,067 | ||||||
Shijiazhuang Yiling Pharmaceutical Co. Ltd., Class A | 3,900 | 14,883 | ||||||
Sichuan Kelun Pharmaceutical Co. Ltd., Class A | 5,100 | 14,593 | ||||||
Tasly Pharmaceutical Group Co. Ltd., Class A | 5,320 | 10,961 | ||||||
Tianjin Chase Sun Pharmaceutical Co. Ltd., Class A* | 9,700 | 6,892 | ||||||
Tonghua Dongbao Pharmaceutical Co. Ltd., Class A | 7,300 | 16,140 | ||||||
Topchoice Medical Corp., Class A* | 1,100 | 21,784 | ||||||
Walvax Biotechnology Co. Ltd., Class A | 5,100 | 29,828 | ||||||
Winning Health Technology Group Co. Ltd., Class A | 5,700 | 18,546 | ||||||
WuXi AppTec Co. Ltd., Class A | 5,000 | 74,328 | ||||||
Yifan Pharmaceutical Co. Ltd., Class A | 4,200 | 11,549 | ||||||
Yunnan Baiyao Group Co. Ltd., Class A | 4,170 | 51,326 | ||||||
Zhangzhou Pientzehuang Pharmaceutical Co. Ltd., Class A | 1,996 | 40,877 | ||||||
Zhejiang Conba Pharmaceutical Co. Ltd., Class A | 9,800 | 7,250 | ||||||
| See Notes to Financial Statements. | 35 |
DBX ETF Trust
Schedule of Investments
Xtrackers MSCI China A Inclusion Equity ETF (Continued)
May 31, 2020
Number | Value | |||||||
| Health Care (Continued) | ||||||||
Zhejiang Huahai Pharmaceutical Co. Ltd., Class A* | 4,700 | $ | 17,569 | |||||
Zhejiang NHU Co. Ltd., Class A | 7,600 | 26,839 | ||||||
Zhejiang Wolwo Bio-Pharmaceutical Co. Ltd., Class A | 1,900 | 15,268 | ||||||
|
| |||||||
(Cost $1,205,998) | 1,563,977 | |||||||
|
| |||||||
| Industrials — 12.3% | ||||||||
AECC Aero-Engine Control Co. Ltd., Class A | 3,700 | 6,833 | ||||||
AECC Aviation Power Co. Ltd., Class A* | 7,400 | 24,842 | ||||||
Air China Ltd., Class A | 20,200 | 18,243 | ||||||
AVIC Aircraft Co. Ltd., Class A | 9,100 | 21,847 | ||||||
AVIC Electromechanical Systems Co. Ltd., Class A* | 11,600 | 12,986 | ||||||
AVIC Shenyang Aircraft Co. Ltd., Class A* | 3,700 | 17,353 | ||||||
AVICOPTER PLC, Class A | 2,000 | 11,597 | ||||||
Beijing New Building Materials PLC, Class A | 5,900 | 19,081 | ||||||
Beijing Originwater Technology Co. Ltd., Class A | 10,300 | 11,415 | ||||||
Bohai Leasing Co. Ltd., Class A* | 20,700 | 8,899 | ||||||
Centre Testing International Group Co. Ltd., Class A | 2,800 | 7,074 | ||||||
China Aerospace Times Electronics Co. Ltd., Class A* | 9,700 | 8,760 | ||||||
China Avionics Systems Co. Ltd., Class A | 4,500 | 8,323 | ||||||
China Communications Construction Co. Ltd., Class A | 15,200 | 16,273 | ||||||
China Eastern Airlines Corp. Ltd., Class A* | 33,200 | 19,278 | ||||||
China Gezhouba Group Co. Ltd., Class A | 16,300 | 13,537 | ||||||
China Meheco Co. Ltd., Class A | 3,700 | 6,936 | ||||||
China National Chemical Engineering Co. Ltd., Class A | 17,300 | 13,426 | ||||||
China Railway Construction Corp. Ltd., Class A | 38,494 | 46,477 | ||||||
China Railway Group Ltd., Class A | 65,900 | 48,292 | ||||||
China Railway Hi-tech Industry Co. Ltd., Class A | 6,600 | 8,558 | ||||||
China Shipbuilding Industry Co. Ltd., Class A | 78,100 | 44,260 | ||||||
China Southern Airlines Co. Ltd., Class A | 30,500 | 21,542 | ||||||
China Spacesat Co. Ltd., Class A* | 4,200 | 18,883 | ||||||
China State Construction Engineering Corp. Ltd., Class A | 141,811 | 98,972 | ||||||
Contemporary Amperex Technology Co. Ltd., Class A | 7,400 | 150,320 | ||||||
COSCO SHIPPING Development Co. Ltd., Class A | 18,800 | 4,855 | ||||||
COSCO SHIPPING Holdings Co. Ltd., Class A* | 28,400 | 12,527 | ||||||
CRRC Corp. Ltd., Class A | 80,144 | 65,331 | ||||||
Daqin Railway Co. Ltd., Class A | 49,913 | 47,515 | ||||||
Dongfang Electric Corp. Ltd., Class A | 9,800 | 11,983 | ||||||
Eve Energy Co. Ltd., Class A* | 3,400 | 30,815 | ||||||
Fangda Carbon New Material Co. Ltd., Class A* | 9,481 | 12,440 | ||||||
Number | Value | |||||||
| Industrials (Continued) | ||||||||
Guangzhou Baiyun International Airport Co. Ltd., Class A | 7,300 | $ | 16,660 | |||||
Guocheng Mining Co. Ltd., Class A* | 4,000 | 10,284 | ||||||
Guoxuan High-Tech Co. Ltd., Class A | 3,400 | 14,190 | ||||||
Hainan Airlines Holding Co. Ltd., Class A* | 49,800 | 11,261 | ||||||
Hefei Meiya Optoelectronic Technology, Inc., Class A | 2,300 | 14,270 | ||||||
Hongfa Technology Co. Ltd., Class A | 2,500 | 11,805 | ||||||
Inner Mongolia First Machinery Group Co. Ltd., Class A | 5,400 | 7,432 | ||||||
Jiangsu Hengli Hydraulic Co. Ltd., Class A | 3,100 | 31,839 | ||||||
Jiangsu Zhongtian Technology Co. Ltd., Class A | 10,000 | 16,192 | ||||||
Juneyao Airlines Co. Ltd., Class A | 5,900 | 7,519 | ||||||
Metallurgical Corp. of China Ltd., Class A | 54,214 | 18,918 | ||||||
Nanyang Topsec Technologies Group, Inc., Class A* | 3,500 | 12,619 | ||||||
NARI Technology Co. Ltd., Class A | 15,400 | 39,789 | ||||||
Ningbo Zhoushan Port Co. Ltd., Class A* | 28,000 | 13,288 | ||||||
Power Construction Corp. of China Ltd., Class A | 51,300 | 24,418 | ||||||
Sany Heavy Industry Co. Ltd., Class A | 28,150 | 72,023 | ||||||
SF Holding Co. Ltd., Class A | 9,800 | 62,349 | ||||||
Shanghai Construction Group Co. Ltd., Class A | 30,500 | 13,155 | ||||||
Shanghai Electric Group Co. Ltd., Class A | 28,300 | 17,223 | ||||||
Shanghai International Airport Co. Ltd., Class A | 3,195 | 32,284 | ||||||
Shanghai International Port Group Co. Ltd., Class A | 30,400 | 17,185 | ||||||
Shanghai M&G Stationery, Inc., Class A | 3,100 | 24,115 | ||||||
Shanghai Tunnel Engineering Co. Ltd., Class A | 11,600 | 10,136 | ||||||
Shenzhen Airport Co. Ltd., Class A | 7,300 | 8,131 | ||||||
Shenzhen Inovance Technology Co. Ltd., Class A | 6,100 | 29,230 | ||||||
Siasun Robot & Automation Co. Ltd., Class A* | 5,000 | 9,038 | ||||||
Sinotrans Ltd., Class A | 15,100 | 6,934 | ||||||
Spring Airlines Co. Ltd., Class A* | 3,398 | 17,004 | ||||||
STO Express Co. Ltd., Class A* | 5,200 | 13,174 | ||||||
Sunwoda Electronic Co. Ltd., Class A | 5,300 | 10,527 | ||||||
Suzhou Gold Mantis Construction Decoration Co. Ltd., Class A | 9,500 | 10,502 | ||||||
TBEA Co. Ltd., Class A | 13,881 | 13,311 | ||||||
Weichai Power Co. Ltd., Class A | 20,400 | 37,131 | ||||||
XCMG Construction Machinery Co. Ltd., Class A | 25,449 | 20,852 | ||||||
Xiamen C & D, Inc., Class A | 10,000 | 12,186 | ||||||
Xinjiang Goldwind Science & Technology Co. Ltd., Class A | 12,343 | 16,333 | ||||||
Yunda Holding Co. Ltd., Class A | 6,200 | 28,879 | ||||||
Zhejiang Chint Electrics Co. Ltd., Class A | 7,617 | 27,037 | ||||||
Zhejiang Dingli Machinery Co. Ltd., Class A* | 1,200 | 15,517 | ||||||
Zhejiang Sanhua Intelligent Controls Co. Ltd., Class A* | 9,600 | 29,949 | ||||||
| See Notes to Financial Statements. | 36 |
DBX ETF Trust
Schedule of Investments
Xtrackers MSCI China A Inclusion Equity ETF (Continued)
May 31, 2020
Number | Value | |||||||
| Industrials (Continued) | ||||||||
Zhejiang Weixing New Building Materials Co. Ltd., Class A | 5,300 | $ | 8,848 | |||||
Zhengzhou Yutong Bus Co. Ltd., Class A | 7,500 | 12,667 | ||||||
Zoomlion Heavy Industry Science and Technology Co. Ltd., Class A | 23,150 | 20,584 | ||||||
|
| |||||||
(Cost $1,656,196) | 1,716,261 | |||||||
|
| |||||||
| Information Technology — 13.9% | ||||||||
360 Security Technology, Inc., Class A | 7,300 | 18,137 | ||||||
Accelink Technologies Co. Ltd., Class A | 2,100 | 8,017 | ||||||
Addsino Co. Ltd., Class A* | 4,900 | 9,965 | ||||||
Aisino Corp., Class A | 6,596 | 14,685 | ||||||
AVIC Jonhon Optronic Technology Co. Ltd., Class A | 3,700 | 18,061 | ||||||
Beijing E-Hualu Information Technology Co. Ltd., Class A | 1,700 | 11,167 | ||||||
Beijing Shiji Information Technology Co. Ltd., Class A | 3,200 | 13,261 | ||||||
Beijing Sinnet Technology Co. Ltd., Class A | 5,200 | 18,073 | ||||||
Beijing Thunisoft Corp. Ltd., Class A | 2,300 | 8,559 | ||||||
BOE Technology Group Co. Ltd., Class A* | 112,802 | 58,415 | ||||||
Chaozhou Three-Circle Group Co. Ltd., Class A | 6,258 | 17,374 | ||||||
China Greatwall Technology Group Co. Ltd., Class A | 10,500 | 20,123 | ||||||
China National Software & Service Co. Ltd., Class A* | 1,700 | 18,608 | ||||||
China TransInfo Technology Co. Ltd., Class A* | 4,900 | 15,156 | ||||||
Dawning Information Industry Co. Ltd., Class A | 4,340 | 22,548 | ||||||
DHC Software Co. Ltd., Class A | 11,200 | 16,868 | ||||||
Fiberhome Telecommunication Technologies Co. Ltd., Class A | 3,800 | 14,825 | ||||||
Foxconn Industrial Internet Co. Ltd., Class A | 19,800 | 37,062 | ||||||
Fujian Star-net Communication Co. Ltd., Class A | 1,800 | 8,128 | ||||||
GCL System Integration Technology Co. Ltd., Class A* | 19,100 | 6,798 | ||||||
Gigadevice Semiconductor Beijing, Inc., Class A | 1,480 | 39,951 | ||||||
Glodon Co. Ltd., Class A | 3,900 | 31,214 | ||||||
GoerTek, Inc., Class A | 10,977 | 32,544 | ||||||
GRG Banking Equipment Co. Ltd., Class A | 8,100 | 12,799 | ||||||
Guangzhou Haige Communications Group, Inc. Co., Class A | 8,200 | 13,689 | ||||||
Guangzhou Shiyuan Electronic Technology Co. Ltd., Class A* | 2,100 | 26,718 | ||||||
Hangzhou Hikvision Digital Technology Co. Ltd., Class A | 31,300 | 120,015 | ||||||
Hangzhou Silan Microelectronics Co. Ltd., Class A | 5,100 | 10,109 | ||||||
Hengtong Optic-electric Co. Ltd., Class A | 6,800 | 15,585 | ||||||
Holitech Technology Co. Ltd., Class A | 10,900 | 7,394 | ||||||
Huagong Tech Co. Ltd., Class A | 2,800 | 7,594 | ||||||
Number | Value | |||||||
| Information Technology (Continued) | ||||||||
Hubei Kaile Science & Technology Co. Ltd., Class A | 3,200 | $ | 6,043 | |||||
Hundsun Technologies, Inc., Class A* | 2,680 | 39,395 | ||||||
Iflytek Co. Ltd., Class A | 7,534 | 33,599 | ||||||
Inspur Electronic Information Industry Co. Ltd., Class A | 5,088 | 27,364 | ||||||
Lens Technology Co. Ltd., Class A | 9,700 | 22,069 | ||||||
Leyard Optoelectronic Co. Ltd., Class A | 10,300 | 8,181 | ||||||
Lingyi iTech Guangdong Co., Class A* | 20,000 | 25,181 | ||||||
LONGi Green Energy Technology Co. Ltd., Class A | 12,610 | 57,046 | ||||||
Luxshare Precision Industry Co. Ltd., Class A | 17,911 | 111,253 | ||||||
NAURA Technology Group Co. Ltd., Class A | 1,700 | 36,068 | ||||||
Newland Digital Technology Co. Ltd., Class A | 3,700 | 8,237 | ||||||
Ninestar Corp., Class A | 3,400 | 13,051 | ||||||
OFILM Group Co. Ltd., Class A* | 9,800 | 19,397 | ||||||
Sanan Optoelectronics Co. Ltd., Class A | 13,979 | 45,386 | ||||||
Sangfor Technologies, Inc., Class A | 900 | 23,621 | ||||||
SG Micro Corp., Class A | 500 | 15,266 | ||||||
Shanghai 2345 Network Holding Group Co. Ltd., Class A | 21,746 | 8,651 | ||||||
Shanghai Baosight Software Co. Ltd., Class A | 2,900 | 22,907 | ||||||
Shengyi Technology Co. Ltd., Class A | 7,600 | 28,430 | ||||||
Shennan Circuits Co. Ltd., Class A | 1,580 | 33,302 | ||||||
Shenzhen Goodix Technology Co. Ltd., Class A | 1,500 | 45,330 | ||||||
Shenzhen Kaifa Technology Co. Ltd., Class A | 4,800 | 15,082 | ||||||
Shenzhen Kingdom Sci-Tech Co. Ltd., Class A* | 3,300 | 7,421 | ||||||
Shenzhen Sunway Communication Co. Ltd., Class A* | 3,400 | 18,513 | ||||||
Suzhou Dongshan Precision Manufacturing Co. Ltd., Class A | 5,800 | 18,888 | ||||||
Thunder Software Technology Co. Ltd., Class A | 1,300 | 10,510 | ||||||
Tianjin 712 Communication & Broadcasting Co. Ltd., Class A | 2,300 | 9,175 | ||||||
Tianjin Zhonghuan Semiconductor Co. Ltd., Class A | 9,800 | 24,007 | ||||||
Tianma Microelectronics Co. Ltd., Class A | 7,100 | 13,429 | ||||||
Tianshui Huatian Technology Co. Ltd., Class A* | 8,900 | 16,050 | ||||||
TongFu Microelectronics Co. Ltd., Class A* | 3,700 | 12,111 | ||||||
Tunghsu Optoelectronic Technology Co. Ltd., Class A | 20,800 | 8,042 | ||||||
Unigroup Guoxin Microelectronics Co. Ltd., Class A* | 2,100 | 20,196 | ||||||
Unisplendour Corp. Ltd., Class A* | 6,720 | 35,897 | ||||||
Universal Scientific Industrial Shanghai Co. Ltd., Class A* | 4,900 | 11,853 | ||||||
Venustech Group, Inc., Class A | 3,100 | 16,966 | ||||||
| See Notes to Financial Statements. | 37 |
DBX ETF Trust
Schedule of Investments
Xtrackers MSCI China A Inclusion Equity ETF (Continued)
May 31, 2020
Number | Value | |||||||
| Information Technology (Continued) | ||||||||
Visionox Technology, Inc., Class A* | 5,100 | $ | 9,148 | |||||
Wangsu Science & Technology Co. Ltd., Class A* | 8,600 | 9,351 | ||||||
Westone Information Industry, Inc., Class A | 2,900 | 8,355 | ||||||
Will Semiconductor Ltd., Class A | 1,900 | 48,687 | ||||||
Wingtech Technology Co. Ltd., Class A* | 3,100 | 42,310 | ||||||
Wonders Information Co. Ltd., Class A | 3,800 | 10,916 | ||||||
Wuhan Guide Infrared Co. Ltd., Class A* | 3,300 | 21,189 | ||||||
Wuhu Token Science Co. Ltd., Class A* | 7,400 | 9,338 | ||||||
WUS Printed Circuit Kunshan Co. Ltd., Class A | 6,200 | 20,277 | ||||||
Wuxi Lead Intelligent Equipment Co. Ltd., Class A | 3,200 | 18,760 | ||||||
Wuxi Taiji Industry Co. Ltd., Class A* | 6,500 | 9,908 | ||||||
Yealink Network Technology Corp. Ltd., Class A | 1,800 | 22,612 | ||||||
Yonyou Network Technology Co. Ltd., Class A | 10,926 | 53,225 | ||||||
Zhejiang Dahua Technology Co. Ltd., Class A | 10,800 | 22,432 | ||||||
Zhejiang Jingsheng Mechanical & Electrical Co. Ltd., Class A | 4,100 | 12,247 | ||||||
Zhongji Innolight Co. Ltd., Class A | 2,300 | 18,296 | ||||||
ZTE Corp., Class A* | 13,000 | 65,416 | ||||||
|
| |||||||
(Cost $1,604,556) | 1,943,826 | |||||||
|
| |||||||
| Materials — 6.9% | ||||||||
Aluminum Corp. of China Ltd., Class A* | 46,508 | 18,177 | ||||||
Angang Steel Co. Ltd., Class A | 15,290 | 5,250 | ||||||
Anhui Conch Cement Co. Ltd., Class A | 13,464 | 106,747 | ||||||
Baoshan Iron & Steel Co. Ltd., Class A* | 61,457 | 41,948 | ||||||
BBMG Corp., Class A | 29,600 | 13,015 | ||||||
Beijing Oriental Yuhong Waterproof Technology Co. Ltd., Class A* | 5,200 | 27,981 | ||||||
China Jushi Co. Ltd., Class A | 11,900 | 14,667 | ||||||
China Molybdenum Co. Ltd., Class A | 58,100 | 27,735 | ||||||
China Northern Rare Earth Group High-Tech Co. Ltd., Class A | 13,093 | 18,550 | ||||||
Ganfeng Lithium Co. Ltd., Class A | 3,500 | 24,183 | ||||||
GEM Co. Ltd., Class A* | 14,800 | 9,007 | ||||||
Guangdong HEC Technology Holding Co. Ltd., Class A* | 10,500 | 9,292 | ||||||
Guangdong Hongda Blasting Co. Ltd., Class A | 2,300 | 10,723 | ||||||
Hengli Petrochemical Co. Ltd., Class A | 19,520 | 37,927 | ||||||
Hengyi Petrochemical Co. Ltd., Class A | 13,260 | 16,935 | ||||||
Hesteel Co. Ltd., Class A | 39,200 | 10,998 | ||||||
Huaxin Cement Co. Ltd., Class A | 4,800 | 16,649 | ||||||
Hunan Valin Steel Co. Ltd., Class A | 18,500 | 9,813 | ||||||
Inner Mongolia BaoTou Steel Union Co. Ltd., Class A | 146,200 | 22,448 | ||||||
Inner Mongolia Junzheng Energy & Chemical Industry Group Co. Ltd., Class A | 29,995 | 10,383 | ||||||
Jiangsu Shagang Co. Ltd., Class A* | 7,300 | 13,766 | ||||||
Jiangsu Yangnong Chemical Co. Ltd., Class A | 900 | 11,118 | ||||||
Number | Value | |||||||
| Materials (Continued) | ||||||||
Jiangxi Copper Co. Ltd., Class A | 7,344 | $ | 13,070 | |||||
Jinduicheng Molybdenum Co. Ltd., Class A | 10,200 | 8,628 | ||||||
Lomon Billions Group Co. Ltd., Class A | 5,200 | 11,337 | ||||||
Maanshan Iron & Steel Co. Ltd., Class A | 21,600 | 7,899 | ||||||
Pangang Group Vanadium Titanium & Resources Co. Ltd., Class A* | 30,200 | 8,178 | ||||||
Rongsheng Petro Chemical Co. Ltd., Class A | 17,752 | 28,768 | ||||||
Sansteel Minguang Co. Ltd. Fujian, Class A* | 8,100 | 7,632 | ||||||
Shandong Gold Mining Co. Ltd., Class A | 8,967 | 46,436 | ||||||
Shandong Hualu Hengsheng Chemical Co. Ltd., Class A | 5,500 | 13,581 | ||||||
Shandong Nanshan Aluminum Co. Ltd., Class A | 42,600 | 12,071 | ||||||
Shandong Sinocera Functional Material Co. Ltd., Class A | 3,500 | 11,486 | ||||||
Shandong Sun Paper Industry JSC Ltd., Class A* | 9,000 | 10,678 | ||||||
Shanghai Putailai New Energy Technology Co. Ltd., Class A | 1,400 | 17,001 | ||||||
Shanxi Taigang Stainless Steel Co. Ltd., Class A | 19,100 | 8,771 | ||||||
Sinopec Shanghai Petrochemical Co. Ltd., Class A | 19,670 | 9,774 | ||||||
Tangshan Jidong Cement Co. Ltd., Class A | 4,600 | 11,147 | ||||||
Tianqi Lithium Corp., Class A | 5,190 | 14,409 | ||||||
Tongkun Group Co. Ltd., Class A* | 6,600 | 11,276 | ||||||
Tongling Nonferrous Metals Group Co. Ltd., Class A* | 26,500 | 6,991 | ||||||
Transfar Zhilian Co. Ltd., Class A | 11,590 | 9,205 | ||||||
Wanhua Chemical Group Co. Ltd., Class A | 10,500 | 68,122 | ||||||
Weihai Guangwei Composites Co. Ltd., Class A | 1,800 | 14,824 | ||||||
Xiamen Tungsten Co. Ltd., Class A | 4,800 | 8,328 | ||||||
Yintai Gold Co. Ltd., Class A | 6,700 | 14,954 | ||||||
Yunnan Energy New Material Co. Ltd. | 2,600 | 21,521 | ||||||
Zhejiang Huayou Cobalt Co. Ltd., Class A | 3,732 | 16,914 | ||||||
Zhejiang Juhua Co. Ltd., Class A* | 9,600 | 8,804 | ||||||
Zhejiang Longsheng Group Co. Ltd., Class A | 11,700 | 19,891 | ||||||
Zhongjin Gold Corp. Ltd., Class A | 12,200 | 15,803 | ||||||
Zijin Mining Group Co. Ltd., Class A | 64,697 | 34,136 | ||||||
|
| |||||||
(Cost $949,162) | 968,947 | |||||||
|
| |||||||
| Real Estate — 3.8% | ||||||||
Beijing Capital Development Co. Ltd., Class A | 8,800 | 7,517 | ||||||
China Enterprise Co. Ltd., Class A | 14,100 | 8,050 | ||||||
China Fortune Land Development Co. Ltd., Class A | 10,540 | 31,866 | ||||||
China Merchants Property Operation & Service Co. Ltd., Class A | 3,400 | 16,895 | ||||||
China Merchants Shekou Industrial Zone Holdings Co. Ltd., Class A | 22,115 | 49,483 | ||||||
China Vanke Co. Ltd., Class A | 32,696 | 117,290 | ||||||
| See Notes to Financial Statements. | 38 |
DBX ETF Trust
Schedule of Investments
Xtrackers MSCI China A Inclusion Equity ETF (Continued)
May 31, 2020
Number | Value | |||||||
| Real Estate (Continued) | ||||||||
Financial Street Holdings Co. Ltd., Class A | 10,300 | $ | 9,503 | |||||
Gemdale Corp., Class A | 15,022 | 26,734 | ||||||
Grandjoy Holdings Group Co. Ltd., Class A* | 8,400 | 5,745 | ||||||
Greenland Holdings Corp. Ltd., Class A | 28,873 | 21,562 | ||||||
Jiangsu Zhongnan Construction Group Co. Ltd., Class A | 12,700 | 13,951 | ||||||
Jinke Properties Group Co. Ltd., Class A | 16,600 | 17,842 | ||||||
Oceanwide Holdings Co. Ltd., Class A | 12,600 | 5,962 | ||||||
Poly Developments and Holdings Group Co. Ltd., Class A | 40,173 | 80,523 | ||||||
RiseSun Real Estate Development Co. Ltd., Class A | 15,600 | 16,963 | ||||||
Seazen Holdings Co. Ltd., Class A* | 7,513 | 32,824 | ||||||
Shanghai Zhangjiang High-Tech Park Development Co. Ltd., Class A | 5,600 | 12,202 | ||||||
Sichuan Languang Development Co. Ltd., Class A* | 7,400 | 5,289 | ||||||
Xinhu Zhongbao Co. Ltd., Class A | 31,000 | 12,938 | ||||||
Yango Group Co. Ltd., Class A* | 13,900 | 12,592 | ||||||
Youngor Group Co. Ltd., Class A | 14,600 | 12,655 | ||||||
Zhongtian Financial Group Co. Ltd., Class A | 22,400 | 9,661 | ||||||
|
| |||||||
(Cost $537,735) | 528,047 | |||||||
|
| |||||||
| Utilities — 2.5% | ||||||||
Chengdu Xingrong Environment Co. Ltd., Class A* | 12,200 | 7,952 | ||||||
China National Nuclear Power Co. Ltd., Class A | 45,884 | 25,811 | ||||||
China Yangtze Power Co. Ltd., Class A | 74,000 | 179,624 | ||||||
GD Power Development Co. Ltd., Class A | 69,800 | 17,732 | ||||||
Huadian Power International Corp. Ltd., Class A | 22,400 | 11,412 | ||||||
Huaneng Power International, Inc., Class A | 25,900 | 15,654 | ||||||
Number | Value | |||||||
| Utilities (Continued) | ||||||||
Hubei Energy Group Co. Ltd., Class A | 16,500 | $ | 8,153 | |||||
Inner Mongolia MengDian HuaNeng Thermal Power Corp. Ltd., Class A | 19,300 | 6,869 | ||||||
Luenmei Quantum Co. Ltd., Class A* | 4,800 | 10,097 | ||||||
SDIC Power Holdings Co. Ltd., Class A | 22,595 | 23,812 | ||||||
Shanghai Electric Power Co. Ltd., Class A | 8,100 | 8,287 | ||||||
Shenergy Co. Ltd., Class A | 17,400 | 13,067 | ||||||
Shenzhen Energy Group Co. Ltd., Class A | 11,000 | 8,445 | ||||||
Sichuan Chuantou Energy Co. Ltd., Class A | 14,400 | 17,849 | ||||||
|
| |||||||
(Cost $383,977) | 354,764 | |||||||
|
| |||||||
TOTAL COMMON STOCKS | 13,964,415 | |||||||
|
| |||||||
| EXCHANGE-TRADED FUNDS — 0.0% | ||||||||
Xtrackers Harvest CSI 300 China A-Shares ETF (b)(c) | 100 | 2,723 | ||||||
|
| |||||||
| SECURITIES LENDING COLLATERAL — 0.0% | ||||||||
DWS Government & Agency Securities Portfolio “DWS Government Cash Institutional Shares”, 0.07% (d)(e) | 2,613 | 2,613 | ||||||
|
| |||||||
| CASH EQUIVALENTS — 2.4% | ||||||||
DWS Government Money Market Series “Institutional Shares”, 0.12% (d) | 339,973 | 339,973 | ||||||
|
| |||||||
TOTAL INVESTMENTS — 102.3% | $ | 14,309,724 | ||||||
Other assets and liabilities, net — (2.3%) | (323,031 | ) | ||||||
|
| |||||||
NET ASSETS — 100.0% | $ | 13,986,693 | ||||||
|
| |||||||
A summary of the Fund’s transactions with affiliated investments during the year ended May 31, 2020 is as follows:
| Value ($) at 5/31/2019 | Purchases Cost ($) | Sales Proceeds ($) | Net Realized Gain/(Loss) ($) | Net Change in Unrealized Appreciation (Depreciation) ($) | Income ($) | Capital Gain Distributions ($) | Number of Shares at 5/31/2020 | Value ($) at 5/31/2020 | ||||||||||||||||||||||||||||
EXCHANGE-TRADED FUNDS — 0.0% |
| |||||||||||||||||||||||||||||||||||
Xtrackers Harvest CSI 300 China A-Shares ETF (b)(c) | ||||||||||||||||||||||||||||||||||||
| 6,530 | — | (4,249 | ) | 949 | (507 | ) | 29 | — | 100 | 2,723 | ||||||||||||||||||||||||||
SECURITIES LENDING COLLATERAL — 0.0% |
| |||||||||||||||||||||||||||||||||||
DWS Government & Agency Securities Portfolio “DWS Government Cash Institutional Shares”, 0.07% (d)(e) |
| |||||||||||||||||||||||||||||||||||
| 6,352 | — | (3,739 | ) (f) | — | — | 60 | — | 2,613 | 2,613 | |||||||||||||||||||||||||||
CASH EQUIVALENTS — 2.4% |
| |||||||||||||||||||||||||||||||||||
DWS Government Money Market Series “Institutional Shares”, 0.12% (d) |
| |||||||||||||||||||||||||||||||||||
| 501,496 | 70,575,578 | (70,737,101 | ) | — | — | 18,631 | — | 339,973 | 339,973 | |||||||||||||||||||||||||||
|
|
|
|
|
|
|
|
|
|
|
|
|
|
|
|
|
| |||||||||||||||||||
| 514,378 | 70,575,578 | (70,745,089 | ) | 949 | (507 | ) | 18,720 | — | 342,686 | 345,309 | ||||||||||||||||||||||||||
|
|
|
|
|
|
|
|
|
|
|
|
|
|
|
|
|
| |||||||||||||||||||
| * | Non-income producing security. |
| (a) | Investment was valued using significant unobservable inputs. |
| See Notes to Financial Statements. | 39 |
DBX ETF Trust
Schedule of Investments
Xtrackers MSCI China A Inclusion Equity ETF (Continued)
May 31, 2020
| (b) | All or a portion of these securities were on loan. In addition, “Other assets and liabilities, net” may include pending sales that are also on loan. The value of securities loaned at May 31, 2020 amounted to $2,587, which is 0.0% of net assets. |
| (c) | Affiliated fund advised by DBX Advisors LLC. |
| (d) | Affiliated fund managed by DWS Investment Management Americas, Inc. The rate shown is the annualized seven-day yield at period end. |
| (e) | Represents cash collateral held in connection with securities lending. Income earned by the Fund is net of borrower rebates. |
| (f) | Represents the net increase (purchase cost) or decrease (sales proceeds) in the amount invested in cash collateral for the year ended May 31, 2020. |
| JSC: | Joint Stock Company |
Fair Value Measurements
Various inputs are used in determining the value of the Fund’s investments. These inputs are summarized in three broad levels. Level 1 includes quoted prices in active markets for identical securities. Level 2 includes other significant observable inputs (including quoted prices for similar securities, interest rates, prepayment speeds and credit risk). Level 3 includes significant unobservable inputs (including the Fund’s own assumptions in determining the fair value of investments). The level assigned to the securities valuations may not be an indication of the risk or liquidity associated with investing in those securities.
The following is a summary of the inputs used as of May 31, 2020 in valuing the Fund’s investments. For information on the Fund’s policy regarding the valuation of investments, please refer to the Security Valuation section of Note 2 in the accompanying Notes to Financial Statements.
Assets | Level 1 | Level 2 | Level 3 | Total | ||||||||||||
Common Stocks (g) | $ | 13,957,924 | $ | — | $ | 6,491 | $ | 13,964,415 | ||||||||
Exchange-Traded Funds | 2,723 | — | — | 2,723 | ||||||||||||
Short-Term Investments (g) | 342,586 | — | — | 342,586 | ||||||||||||
|
|
|
|
|
| |||||||||||
TOTAL | $ | 14,303,233 | $ | — | $ | 6,491 | $ | 14,309,724 | ||||||||
|
|
|
|
|
|
|
| |||||||||
| (g) | See Schedule of Investments for additional detailed categorizations. |
During the year ended May 31, 2020, the amount of transfers from Level 1 to Level 3 was $115,655. The investments were transferred from Level 1 to Level 3 due to the lack of observable market data due to a decrease in market activity.
| See Notes to Financial Statements. | 40 |
This Page is Intentionally Left Blank
41
DBX ETF Trust
May 31, 2020
| Xtrackers Harvest CSI 300 China A-Shares ETF | Xtrackers Harvest CSI 500 China A-Shares Small Cap ETF | Xtrackers MSCI All China Equity ETF | Xtrackers MSCI China A Inclusion Equity ETF | |||||||||||||
Assets | ||||||||||||||||
Investment in non-affiliated securities at value | $ | 1,267,059,395 | $ | 30,253,747 | $ | 11,742,599 | $ | 13,964,415 | ||||||||
Investment in affiliated securities at value | — | — | 7,792,610 | 2,723 | ||||||||||||
Investment in DWS Government Money Market Series | — | — | 11,737 | 339,973 | ||||||||||||
Investment in DWS Government & Agency Securities Portfolio* | — | — | 1,797,929 | 2,613 | ||||||||||||
Cash | 59,395,110 | — | — | — | ||||||||||||
Foreign currency at value | 5,726,020 | † | 115,299 | † | 11,940 | 380,576 | ||||||||||
Deposit with broker for futures contracts | — | — | 5,455 | — | ||||||||||||
| Receivables: | ||||||||||||||||
Investment securities sold | — | — | 13,369,903 | — | ||||||||||||
Capital shares | 225,928 | — | 6,468 | — | ||||||||||||
Dividends | — | — | 53,608 | — | ||||||||||||
Interest | — | — | 3 | 29 | ||||||||||||
Securities lending income | — | — | 3,613 | 14 | ||||||||||||
|
|
|
|
|
|
|
| |||||||||
Total assets | $ | 1,332,406,453 | $ | 30,369,046 | $ | 34,795,865 | $ | 14,690,343 | ||||||||
|
|
|
|
|
|
|
| |||||||||
Liabilities | ||||||||||||||||
Due to custodian | $ | — | $ | 5,450 | $ | — | $ | — | ||||||||
Payable upon return of securities loaned | — | — | 1,797,929 | 2,613 | ||||||||||||
| Payables: | ||||||||||||||||
Investment securities purchased | — | — | 524,808 | 693,669 | ||||||||||||
Capital shares | 60,893,844 | — | 12,872,148 | — | ||||||||||||
Investment advisory fees | 749,791 | 16,798 | 7,042 | 7,368 | ||||||||||||
|
|
|
|
|
|
|
| |||||||||
Total liabilities | 61,643,635 | 22,248 | 15,201,927 | 703,650 | ||||||||||||
|
|
|
|
|
|
|
| |||||||||
Net Assets, at value | $ | 1,270,762,818 | $ | 30,346,798 | $ | 19,593,938 | $ | 13,986,693 | ||||||||
|
|
|
|
|
|
|
| |||||||||
Net Assets Consist of | ||||||||||||||||
Paid-in capital | $ | 1,300,083,193 | $ | 51,075,337 | $ | 31,907,654 | $ | 16,684,738 | ||||||||
Distributable earnings (loss) | (29,320,375 | ) | (20,728,539 | ) | (12,313,716 | ) | (2,698,045 | ) | ||||||||
|
|
|
|
|
|
|
| |||||||||
Net Assets, at value | $ | 1,270,762,818 | $ | 30,346,798 | $ | 19,593,938 | $ | 13,986,693 | ||||||||
|
|
|
|
|
|
|
| |||||||||
Number of Common Shares outstanding | 46,750,001 | 1,100,001 | 600,001 | 700,001 | ||||||||||||
|
|
|
|
|
|
|
| |||||||||
Net Asset Value | $ | 27.18 | $ | 27.59 | $ | 32.66 | $ | 19.98 | ||||||||
|
|
|
|
|
|
|
| |||||||||
Investment in non-affiliated securities at cost | $ | 1,017,842,201 | $ | 28,271,171 | $ | 11,997,419 | $ | 12,365,352 | ||||||||
|
|
|
|
|
|
|
| |||||||||
Investment in affiliated securities at cost | $ | — | $ | — | $ | 8,454,354 | $ | 2,201 | ||||||||
|
|
|
|
|
|
|
| |||||||||
Value of securities loaned | $ | — | $ | — | $ | 2,077,347 | $ | 2,587 | ||||||||
|
|
|
|
|
|
|
| |||||||||
Investment in DWS Government Money Market Series at cost | $ | — | $ | — | $ | 11,737 | $ | 339,973 | ||||||||
|
|
|
|
|
|
|
| |||||||||
Investment in DWS Government & Agency Securities Portfolio at cost* | $ | — | $ | — | $ | 1,797,929 | $ | 2,613 | ||||||||
|
|
|
|
|
|
|
| |||||||||
Non-cash collateral for securities on loan | $ | — | $ | — | $ | 320,830 | $ | — | ||||||||
|
|
|
|
|
|
|
| |||||||||
Foreign currency at cost | $ | 5,717,350 | $ | 115,420 | $ | 11,940 | $ | 380,576 | ||||||||
|
|
|
|
|
|
|
| |||||||||
| * | Represents collateral on securities loaned. |
| † | Included in foreign currency at value is $15,779 and $4,655 respectively which represents foreign investor minimum settlement reserve funds required by China Securities Depository and Clearing Corporation Limited. |
| See Notes to Financial Statements. | 42 |
DBX ETF Trust
For the Year Ended May 31, 2020
| Xtrackers Harvest CSI 300 China A-Shares ETF | Xtrackers Harvest CSI 500 China A-Shares Small Cap ETF | Xtrackers MSCI All China Equity ETF | Xtrackers MSCI China A Inclusion Equity ETF | |||||||||||||
Investment Income | ||||||||||||||||
Unaffiliated interest income | $ | 10,619 | $ | 1,135 | $ | — | $ | — | ||||||||
Unaffiliated dividend income* | 28,737,308 | 583,783 | 814,380 | 468,891 | ||||||||||||
Income distributions from affiliated funds | — | — | 257,343 | 18,660 | ||||||||||||
Affiliated securities lending income | — | — | 25,805 | 60 | ||||||||||||
Unaffiliated securities lending income, net of borrower rebates | — | — | 33,052 | 17 | ||||||||||||
|
|
|
|
|
|
|
| |||||||||
Total investment income | 28,747,927 | 584,918 | 1,130,580 | 487,628 | ||||||||||||
|
|
|
|
|
|
|
| |||||||||
Expenses | ||||||||||||||||
Investment advisory fees | 10,992,752 | 296,668 | 223,673 | 111,453 | ||||||||||||
Other expenses | 57 | 57 | 57 | 57 | ||||||||||||
|
|
|
|
|
|
|
| |||||||||
Total expenses | 10,992,809 | 296,725 | 223,730 | 111,510 | ||||||||||||
|
|
|
|
|
|
|
| |||||||||
Less fees waived (see note 3): | ||||||||||||||||
Waiver | — | — | (107,959 | ) | (460 | ) | ||||||||||
|
|
|
|
|
|
|
| |||||||||
Net expenses | 10,992,809 | 296,725 | 115,771 | 111,050 | ||||||||||||
|
|
|
|
|
|
|
| |||||||||
Net investment income (loss) | 17,755,118 | 288,193 | 1,014,809 | 376,578 | ||||||||||||
|
|
|
|
|
|
|
| |||||||||
Realized and Unrealized Gain (Loss) | ||||||||||||||||
Net realized gain (loss) from: | ||||||||||||||||
Investments | (117,608,181 | ) | (9,197,086 | ) | (5,725,169 | ) | (1,855,621 | ) | ||||||||
Investments in affiliates | — | — | (56,225 | ) | 949 | |||||||||||
In-kind redemptions | — | — | (3,899,441 | ) | — | |||||||||||
In-kind redemptions in affiliates | — | — | (7,852,995 | ) | — | |||||||||||
Futures contracts | — | — | 19,137 | 52,245 | ||||||||||||
Foreign currency transactions | (928,018 | ) | (166,327 | ) | 6,242 | (50,284 | ) | |||||||||
|
|
|
|
|
|
|
| |||||||||
Net realized gain (loss) | (118,536,199 | ) | (9,363,413 | ) | (17,508,451 | ) | (1,852,711 | ) | ||||||||
|
|
|
|
|
|
|
| |||||||||
Net change in unrealized appreciation (depreciation) on: | ||||||||||||||||
Investments | 105,396,115 | 11,855,159 | 13,595,921 | 3,633,953 | ||||||||||||
Investments in affiliates | — | — | 9,426,655 | (507 | ) | |||||||||||
Futures contracts | — | — | 5,770 | 675 | ||||||||||||
Foreign currency translations | (65,497 | ) | 10,119 | (1,137 | ) | (1,227 | ) | |||||||||
|
|
|
|
|
|
|
| |||||||||
Net change in unrealized appreciation (depreciation) | 105,330,618 | 11,865,278 | 23,027,209 | 3,632,894 | ||||||||||||
|
|
|
|
|
|
|
| |||||||||
Net realized and unrealized gain (loss) on investments, futures and foreign currency transactions | (13,205,581 | ) | 2,501,865 | 5,518,758 | 1,780,183 | |||||||||||
|
|
|
|
|
|
|
| |||||||||
Net Increase (Decrease) in Net Assets Resulting from Operations | $ | 4,549,537 | $ | 2,790,058 | $ | 6,533,567 | $ | 2,156,761 | ||||||||
|
|
|
|
|
|
|
| |||||||||
* Unaffiliated foreign tax withheld | $ | 3,207,337 | $ | 66,628 | $ | 53,763 | $ | 52,201 | ||||||||
| See Notes to Financial Statements. | 43 |
DBX ETF Trust
| Xtrackers Harvest CSI 300 China A-Shares ETF | Xtrackers Harvest CSI 500 China A-Shares Small Cap ETF | |||||||||||||||
| Year Ended May 31, | Year Ended May 31, | |||||||||||||||
| 2020 | 2019 | 2020 | 2019 | |||||||||||||
Increase (Decrease) in Net Assets from Operations | ||||||||||||||||
Net investment income (loss) | $ | 17,755,118 | $ | 10,665,149 | $ | 288,193 | $ | 251,842 | ||||||||
Net realized gain (loss) | (118,536,199 | ) | (135,091,369 | ) | (9,363,413 | ) | (1,349,407 | ) | ||||||||
Net change in net unrealized appreciation (depreciation) | 105,330,618 | 60,377,165 | 11,865,278 | (9,572,739 | ) | |||||||||||
|
|
|
|
|
|
|
| |||||||||
Net increase (decrease) in net assets resulting from operations | 4,549,537 | (64,049,055 | ) | 2,790,058 | (10,670,304 | ) | ||||||||||
|
|
|
|
|
|
|
| |||||||||
Distributions to Shareholders | (16,323,622 | ) | (14,203,859 | ) | (267,342 | ) | — | |||||||||
|
|
|
|
|
|
|
| |||||||||
Fund Shares Transactions | ||||||||||||||||
Proceeds from shares sold | 1,688,068,201 | 1,692,910,139 | 5,744,566 | 60,173,256 | ||||||||||||
Value of shares redeemed | (1,854,188,349 | ) | (851,830,790 | ) | (51,817,790 | ) | — | |||||||||
|
|
|
|
|
|
|
| |||||||||
Net increase (decrease) in net assets resulting from fund share transactions | (166,120,148 | ) | 841,079,349 | (46,073,224 | ) | 60,173,256 | ||||||||||
|
|
|
|
|
|
|
| |||||||||
Total net increase (decrease) in Net Assets | (177,894,233 | ) | 762,826,435 | (43,550,508 | ) | 49,502,952 | ||||||||||
Net Assets | ||||||||||||||||
Beginning of year | 1,448,657,051 | 685,830,616 | 73,897,306 | 24,394,354 | ||||||||||||
|
|
|
|
|
|
|
| |||||||||
End of year | $ | 1,270,762,818 | $ | 1,448,657,051 | $ | 30,346,798 | $ | 73,897,306 | ||||||||
|
|
|
|
|
|
|
| |||||||||
Changes in Shares Outstanding | ||||||||||||||||
Shares outstanding, beginning of year | 55,150,001 | 23,200,001 | 2,850,001 | 750,001 | ||||||||||||
Shares sold | 58,350,000 | 64,000,000 | 200,000 | 2,100,000 | ||||||||||||
Shares redeemed | (66,750,000 | ) | (32,050,000 | ) | (1,950,000 | ) | — | |||||||||
|
|
|
|
|
|
|
| |||||||||
Shares outstanding, end of year | 46,750,001 | 55,150,001 | 1,100,001 | 2,850,001 | ||||||||||||
|
|
|
|
|
|
|
| |||||||||
| See Notes to Financial Statements. | 44 |
DBX ETF Trust
Statements of Changes in Net Assets (Continued)
| Xtrackers MSCI All China Equity ETF | Xtrackers MSCI China A Inclusion Equity ETF | |||||||||||||||
| Year Ended May 31, | Year Ended May 31, | |||||||||||||||
| 2020 | 2019 | 2020 | 2019 | |||||||||||||
Increase (Decrease) in Net Assets from Operations | ||||||||||||||||
Net investment income (loss) | $ | 1,014,809 | $ | 1,069,662 | $ | 376,578 | $ | 252,019 | ||||||||
Net realized gain (loss) | (17,508,451 | ) | (948,491 | ) | (1,852,711 | ) | (1,747,339 | ) | ||||||||
Net change in net unrealized appreciation (depreciation) | 23,027,209 | (23,805,345 | ) | 3,632,894 | (2,385,759 | ) | ||||||||||
|
|
|
|
|
|
|
| |||||||||
Net increase (decrease) in net assets resulting from operations | 6,533,567 | (23,684,174 | ) | 2,156,761 | (3,881,079 | ) | ||||||||||
|
|
|
|
|
|
|
| |||||||||
Distributions to Shareholders | (1,586,476 | ) | (682,986 | ) | (280,238 | ) | (119,154 | ) | ||||||||
|
|
|
|
|
|
|
| |||||||||
Fund Shares Transactions | ||||||||||||||||
Proceeds from shares sold | 8,845,595 | 387,568,698 | — | 137,463,454 | ||||||||||||
Value of shares redeemed | (221,424,743 | ) | (171,870,648 | ) | (70,409,971 | ) | (53,023,564 | ) | ||||||||
|
|
|
|
|
|
|
| |||||||||
Net increase (decrease) in net assets resulting from fund share transactions | (212,579,148 | ) | 215,698,050 | (70,409,971 | ) | 84,439,890 | ||||||||||
|
|
|
|
|
|
|
| |||||||||
Total net increase (decrease) in Net Assets | (207,632,057 | ) | 191,330,890 | (68,533,448 | ) | 80,439,657 | ||||||||||
Net Assets | ||||||||||||||||
Beginning of year | 227,225,995 | 35,895,105 | 82,520,141 | 2,080,484 | ||||||||||||
|
|
|
|
|
|
|
| |||||||||
End of year | $ | 19,593,938 | $ | 227,225,995 | $ | 13,986,693 | $ | 82,520,141 | ||||||||
|
|
|
|
|
|
|
| |||||||||
Changes in Shares Outstanding | ||||||||||||||||
Shares outstanding, beginning of year | 7,300,001 | 950,001 | 4,400,001 | 100,001 | ||||||||||||
Shares sold | 250,000 | 11,250,000 | — | 6,900,000 | ||||||||||||
Shares redeemed | (6,950,000 | ) | (4,900,000 | ) | (3,700,000 | ) | (2,600,000 | ) | ||||||||
|
|
|
|
|
|
|
| |||||||||
Shares outstanding, end of year | 600,001 | 7,300,001 | 700,001 | 4,400,001 | ||||||||||||
|
|
|
|
|
|
|
| |||||||||
| See Notes to Financial Statements. | 45 |
DBX ETF Trust
| Xtrackers Harvest CSI 300 China A-Shares ETF Selected Per Share Data | Years Ended May 31, | |||||||||||||||||||
| 2020 | 2019 | 2018 | 2017 | 2016 | ||||||||||||||||
Net Asset Value, beginning of year | $ | 26.27 | $ | 29.56 | $ | 25.84 | $ | 23.74 | $ | 49.93 | ||||||||||
|
|
|
|
|
|
|
| �� |
| |||||||||||
| Income (loss) from investment operations: | ||||||||||||||||||||
Net investment income (loss)(a) | 0.29 | 0.22 | 0.25 | 0.30 | 0.43 | |||||||||||||||
Net realized and unrealized gain (loss) | 0.91 | (b) | (3.22 | ) | 3.73 | 1.97 | (18.19 | ) | ||||||||||||
|
|
|
|
|
|
|
|
|
| |||||||||||
Total from investment operations | 1.20 | (3.00 | ) | 3.98 | 2.27 | (17.76 | ) | |||||||||||||
|
|
|
|
|
|
|
|
|
| |||||||||||
| Less distributions from: |
| |||||||||||||||||||
Net investment income | (0.29 | ) | — | (0.26 | ) | (0.17 | ) | (0.33 | ) | |||||||||||
Net realized gains | — | (0.29 | ) | — | — | (8.10 | ) | |||||||||||||
|
|
|
|
|
|
|
|
|
| |||||||||||
Total distributions | (0.29 | ) | (0.29 | ) | (0.26 | ) | (0.17 | ) | (8.43 | ) | ||||||||||
|
|
|
|
|
|
|
|
|
| |||||||||||
Net Asset Value, end of year | $ | 27.18 | $ | 26.27 | $ | 29.56 | $ | 25.84 | $ | 23.74 | ||||||||||
|
|
|
|
|
|
|
|
|
| |||||||||||
Total Return (%) | 4.50 | (10.02 | ) | 15.38 | 9.62 | (38.10 | ) | |||||||||||||
Ratios to Average Net Assets and Supplemental Data | ||||||||||||||||||||
Net Assets, end of year ($ millions) | 1,271 | 1,449 | 686 | 367 | 326 | |||||||||||||||
Ratio of expenses (%) | 0.65 | 0.65 | 0.66 | 0.67 | 0.80 | |||||||||||||||
Ratio of net investment income (loss) (%) | 1.05 | 0.87 | 0.82 | 1.24 | 1.27 | |||||||||||||||
Portfolio turnover rate (%)(c) | 115 | 81 | 65 | 68 | 159 | |||||||||||||||
| Xtrackers Harvest CSI 500 China A-Shares Small Cap ETF Selected Per Share Data | Years Ended May 31, | |||||||||||||||||||
| 2020 | 2019 | 2018 | 2017 | 2016 | ||||||||||||||||
Net Asset Value, beginning of year | $ | 25.93 | $ | 32.53 | $ | 31.36 | $ | 33.00 | $ | 65.42 | ||||||||||
|
|
|
|
|
|
|
|
|
| |||||||||||
| Income (loss) from investment operations: | ||||||||||||||||||||
Net investment income (loss)(a) | 0.17 | 0.20 | 0.04 | (0.03 | ) | (0.05 | ) | |||||||||||||
Net realized and unrealized gain (loss) | 1.65 | (6.80 | ) | 1.13 | (1.61 | ) | (28.91 | ) | ||||||||||||
|
|
|
|
|
|
|
|
|
| |||||||||||
Total from investment operations | 1.82 | (6.60 | ) | 1.17 | (1.64 | ) | (28.96 | ) | ||||||||||||
|
|
|
|
|
|
|
|
|
| |||||||||||
| Less distributions from: |
| |||||||||||||||||||
Net investment income | (0.16 | ) | — | — | — | (0.17 | ) | |||||||||||||
Net realized gains | — | — | — | — | (3.29 | ) | ||||||||||||||
|
|
|
|
|
|
|
|
|
| |||||||||||
Total distributions | (0.16 | ) | — | — | — | (3.46 | ) | |||||||||||||
|
|
|
|
|
|
|
|
|
| |||||||||||
Net Asset Value, end of year | $ | 27.59 | $ | 25.93 | $ | 32.53 | $ | 31.36 | $ | 33.00 | ||||||||||
|
|
|
|
|
|
|
|
|
| |||||||||||
Total Return (%) | 7.02 | (20.29 | ) | 3.73 | (4.97 | ) | (45.37 | ) | ||||||||||||
Ratios to Average Net Assets and Supplemental Data | ||||||||||||||||||||
Net Assets, end of year ($ millions) | 30 | 74 | 24 | 20 | 21 | |||||||||||||||
Ratio of expenses (%) | 0.65 | 0.65 | 0.65 | 0.67 | 0.80 | |||||||||||||||
Ratio of net investment income (loss) (%) | 0.63 | 0.74 | 0.10 | (0.09 | ) | (0.11 | ) | |||||||||||||
Portfolio turnover rate (%)(c) | 48 | 16 | 29 | 51 | 215 | |||||||||||||||
| (a) | Based on average shares outstanding during the period. |
| (b) | Because of the timing of subscriptions and redemptions in relation to fluctuating markets at value, the amount shown may not agree with the change in aggregate gains and losses. |
| (c) | Portfolio turnover rate does not include securities received or delivered from processing creations or redemptions. |
| See Notes to Financial Statements. | 46 |
DBX ETF Trust
Financial Highlights (Continued)
| Xtrackers MSCI All China Equity ETF Selected Per Share Data | Years Ended May 31, | |||||||||||||||||||
| 2020 | 2019 | 2018 | 2017 | 2016 | ||||||||||||||||
Net Asset Value, beginning of year | $ | 31.13 | $ | 37.78 | $ | 30.54 | $ | 28.36 | $ | 46.01 | ||||||||||
|
|
|
|
|
|
|
|
|
| |||||||||||
| Income (loss) from investment operations: | ||||||||||||||||||||
Net investment income (loss)(a) | 0.76 | 0.36 | 0.79 | 0.91 | 2.15 | |||||||||||||||
Net realized and unrealized gain (loss) | 2.21 | (6.42 | ) | 6.75 | 4.26 | (15.46 | ) | |||||||||||||
|
|
|
|
|
|
|
|
|
| |||||||||||
Total from investment operations | 2.97 | (6.06 | ) | 7.54 | 5.17 | (13.31 | ) | |||||||||||||
|
|
|
|
|
|
|
|
|
| |||||||||||
| Less distributions from: |
| |||||||||||||||||||
Net investment income | (1.44 | ) | (0.59 | ) | (0.30 | ) | (2.99 | ) | (4.34 | ) | ||||||||||
|
|
|
|
|
|
|
|
|
| |||||||||||
Total distributions | (1.44 | ) | (0.59 | ) | (0.30 | ) | (2.99 | ) | (4.34 | ) | ||||||||||
|
|
|
|
|
|
|
|
|
| |||||||||||
Net Asset Value, end of year | $ | 32.66 | $ | 31.13 | $ | 37.78 | $ | 30.54 | $ | 28.36 | ||||||||||
|
|
|
|
|
|
|
|
|
| |||||||||||
Total Return (%)(b) | 9.35 | (15.89 | ) | 24.71 | 20.03 | (29.80 | ) | |||||||||||||
Ratios to Average Net Assets and Supplemental Data | ||||||||||||||||||||
Net Assets, end of year ($ millions) | 20 | 227 | 36 | 5 | 7 | |||||||||||||||
Ratio of expenses before fee waiver (%)(c) | 0.50 | 0.50 | 0.60 | 0.60 | 0.60 | |||||||||||||||
Ratio of expenses after fee waiver (%)(c) | 0.26 | 0.28 | 0.36 | 0.35 | 0.26 | |||||||||||||||
Ratio of net investment income (loss) (%) | 2.27 | 1.07 | 2.10 | 3.10 | 6.46 | |||||||||||||||
Portfolio turnover rate (%)(d) | 14 | 102 | 3 | 7 | 36 | |||||||||||||||
| Xtrackers MSCI China A Inclusion Equity ETF Selected Per Share Data | Years Ended May 31, | Period Ended 5/31/2016(e) | ||||||||||||||||||
| 2020 | 2019 | 2018 | 2017 | |||||||||||||||||
Net Asset Value, beginning of period | $ | 18.75 | $ | 20.80 | $ | 19.53 | $ | 21.86 | $ | 25.00 | ||||||||||
|
|
|
|
|
|
|
|
|
| |||||||||||
| Income (loss) from investment operations: | ||||||||||||||||||||
Net investment income (loss)(a) | 0.41 | 0.15 | 0.52 | 0.29 | 0.40 | |||||||||||||||
Net realized and unrealized gain (loss) | 1.19 | (2.03 | ) | 1.30 | 1.05 | (2.80 | ) | |||||||||||||
|
|
|
|
|
|
|
|
|
| |||||||||||
Total from investment operations | 1.60 | (1.88 | ) | 1.82 | 1.34 | (2.40 | ) | |||||||||||||
|
|
|
|
|
|
|
|
|
| |||||||||||
| Less distributions from: |
| |||||||||||||||||||
Net investment income | (0.37 | ) | (0.17 | ) | (0.55 | ) | (2.82 | ) | (0.74 | ) | ||||||||||
Net realized gains | — | — | — | (0.85 | ) | — | ||||||||||||||
|
|
|
|
|
|
|
|
|
| |||||||||||
Total distributions | (0.37 | ) | (0.17 | ) | (0.55 | ) | (3.67 | ) | (0.74 | ) | ||||||||||
|
|
|
|
|
|
|
|
|
| |||||||||||
Net Asset Value, end of period | $ | 19.98 | $ | 18.75 | $ | 20.80 | $ | 19.53 | $ | 21.86 | ||||||||||
|
|
|
|
|
|
|
|
|
| |||||||||||
Total Return (%)(b) | 8.49 | (8.91 | ) | 9.12 | 6.42 | (f) | (10.01 | )** | ||||||||||||
Ratios to Average Net Assets and Supplemental Data | ||||||||||||||||||||
Net Assets, end of period ($ millions) | 14 | 83 | 2 | 3 | 2 | |||||||||||||||
Ratio of expenses before fee waiver (%)(c) | 0.60 | 0.60 | 0.70 | 0.72 | 1.25 | *** | ||||||||||||||
Ratio of expenses after fee waiver (%)(c) | 0.60 | 0.60 | 0.05 | 0.05 | 0.45 | *** | ||||||||||||||
Ratio of net investment income (loss) (%) | 2.03 | 0.75 | 2.38 | 1.41 | 2.92 | * | ||||||||||||||
Portfolio turnover rate (%)(d) | 27 | 180 | 3 | 6 | 4 | ** | ||||||||||||||
| (a) | Based on average shares outstanding during the period. |
| (b) | Total Return would have been lower if certain expenses had not been reimbursed by the Advisor. |
| (c) | The Fund invests in other ETFs and indirectly bears its proportionate shares of fees and expenses incurred by the Underlying Funds in which the Fund is invested. This ratio does not included these indirect fees and expenses. |
| (d) | Portfolio turnover rate does not include securities received or delivered from processing creations or redemptions. |
| (e) | For the period October 20, 2015 (commencement of operations) through May 31, 2016. |
| (f) | The Fund’s total return includes a reimbursement by the Advisor for a realized loss on a trade executed incorrectly, which otherwise would have reduced total return by 0.41%. |
| * | Annualized. |
| ** | Not Annualized. |
| *** | Annualized. Includes excise tax expense that is not annualized. |
| See Notes to Financial Statements. | 47 |
DBX ETF Trust
1. Organization
DBX ETF Trust (the “Trust”) is registered under the Investment Company Act of 1940, as amended (the “Act”), as an open-end registered management investment company organized as a Delaware statutory trust.
As of May 31, 2020, the Trust consists of thirty-four investment series of exchange-traded funds (“ETFs”) (each a “Fund” and collectively, the “Funds”) in operation and trading. These financial statements report on the Funds listed below:
| Xtrackers Harvest CSI 300 China A-Shares ETF | ||
| Xtrackers Harvest CSI 500 China A-Shares Small Cap ETF | ||
| Xtrackers MSCI All China Equity ETF | ||
| Xtrackers MSCI China A Inclusion Equity ETF |
DBX Advisors LLC (“DBX” or the “Advisor”), an indirect, wholly-owned subsidiary of DWS Group GmbH & Co. KGaA (“DWS Group”), serves as investment advisor to the Funds and has overall responsibility for the general management and administration of the Funds, subject to the supervision of the Funds’ Board of Trustees (“Board”).
Each Fund offers shares that are listed and traded on the NYSE Arca, Inc. (“NYSE Arca”). Unlike conventional mutual funds, each Fund issues and redeems shares on a continuous basis, at net asset value (“NAV”), only in large specified lots consisting of 50,000 shares, each called a “Creation Unit”, to authorized participants who have entered into agreements with the Funds’ distributor. Shares are not individually redeemable securities of the Funds, and owners of the shares may acquire those shares from the Funds, or tender such shares for redemption to the Funds, in Creation Units only.
The investment objective of each Fund is to track the performance, before fees and expenses, of a particular index (the “Underlying Index”). The underlying indices for the Funds are:
Fund | Underlying Index | |
| Xtrackers Harvest CSI 300 China A-Shares ETF | CSI 300 Index | |
| Xtrackers Harvest CSI 500 China A-Shares Small Cap ETF | CSI 500 Index | |
| Xtrackers MSCI All China Equity ETF | MSCI China All Shares Index | |
| Xtrackers MSCI China A Inclusion Equity ETF | MSCI China A Inclusion Index |
CSI 300 Index is calculated and maintained by China Securities Index Co., Ltd. It is a modified free-float market capitalization weighted index composed of the 300 largest and most liquid stocks in the China A-Share market. Constituent stocks for the Underlying Index must have been listed on either the Shanghai Stock Exchange or the Shenzhen Stock Exchange. The composition of the Underlying Index is reviewed every six-months.
CSI 500 Index is calculated and maintained by China Securities Index Co., Ltd. It is a modified free-float market capitalization weighted index composed of the 500 smallest and most liquid stocks in the China A-Share market. Constituent stocks for the Underlying Index must have been listed on either the Shanghai Stock Exchange or the Shenzhen Stock Exchange. The composition of the Underlying Index is reviewed every six-months.
MSCI is the creator of the MSCI China All Shares Index and the MSCI China A Inclusion Equity Index. The MSCI China All Share Index is a rules-based, free-float adjusted market capitalization index comprised of equity securities that are listed in Hong Kong, Shanghai and Shenzhen. The Underlying Index is intended to give investors a means of tracking the overall performance of equity securities that are a representative sample of the entire Chinese investment universe. The Underlying Index is comprised of A-Shares, B-Shares, H-Shares, Red chips and P chips share classes as well as securities of Chinese companies listed outside of China (e.g. American depository receipts). The Underlying Index is rebalanced on a quarterly basis.
The MSCI China A Inclusion Index is designed to track the equity market performance of China A-Shares that are accessible through the Shanghai-Hong Kong Stock Connect program or the Shenzhen-Hong Kong Stock Connect program (together “Stock Connect”). “A-Shares” are equity securities issued by companies incorporated in mainland China and are denominated in renminbi. Certain eligible A-Shares are traded on the Shanghai or Shenzhen Stock Exchanges. The Underlying Index is designed to track the inclusion of A-Shares in the MSCI Emerging Markets Index over time and is constructed by MSCI, Inc. by applying eligibility criteria for the MSCI Global Investable Market Indexes, and then excluding mid- and small-capitalization A-Shares (as determined by
48
DBX ETF Trust
Notes to Financial Statements (Continued)
MSCI), A-Shares suspended for trading for more than 50 days in the past 12 months and A-Shares that are not accessible through Stock Connect. The Underlying Index is weighted by each issuer’s free float-adjusted market capitalization (i.e., includes only shares that are readily available for trading in the market) available to foreign investors and includes only large-capitalization companies, as determined by MSCI. The Underlying Index is rebalanced on a quarterly basis.
Each Fund is entitled to use its respective Underlying Index pursuant to a licensing agreement between the Index Provider and DBX. There is no charge to the Funds in connection with these licensing agreements.
Each Fund, except Xtrackers MSCI All China Equity ETF and Xtrackers MSCI China A Inclusion Equity ETF, is diversified. Xtrackers MSCI All China Equity ETF and Xtrackers MSCI China A Inclusion Equity ETF are non-diversified and are not limited by the Act with regard to the percentage of its assets that may be invested in the securities of a single issuer. This means the securities of a particular issuer (or securities of issuers in particular industries) may dominate the Underlying Index of the Fund and, consequently, the Fund’s investment portfolio. This may adversely affect the Fund’s performance or subject the fund’s shares to greater price volatility than that experienced by more diversified investment companies. In addition, each Fund, with the exception of Xtrackers MSCI All China Equity ETF, may change its diversification status over time and then change it back again, without shareholder approval, solely as a result of a change in relative market capitalization or index weighting of one or more constituents of the index each Fund tracks.
Pursuant to the Trust’s organizational documents, the Trust’s officers and trustees are indemnified against certain liabilities that may arise out of the performance of their duties to the Funds. Additionally, in the normal course of business the Trust enters into contracts that contain a variety of representations that provide indemnification for certain liabilities. The Trust’s maximum exposure under these arrangements is unknown, as this would involve future claims that may be made against the Funds that have not yet occurred. However, the Trust expects the risk of loss to be remote.
2. Significant Accounting Policies
The financial statements have been prepared in conformity with U.S. generally accepted accounting principles (“U.S. GAAP”), which require management to make certain estimates and assumptions that affect the reported amounts and disclosures in the financial statements. Actual results could differ from those estimates. Each Fund qualifies as an investment company under Topic 946 of the Accounting Standards Codification of U.S. GAAP. The following is a summary of significant accounting policies followed by the Funds.
Security Valuation The NAV of each Fund’s shares is calculated each business day as of the close of regular trading on the New York Stock Exchange, generally 4:00 p.m. Eastern Time. NAV per share is calculated by dividing a Fund’s net assets by the number of Fund shares outstanding.
Various inputs are used in determining the value of the Funds’ investments. These inputs are summarized in three broad levels. Level 1 includes quoted prices in active markets for identical securities. Level 2 includes other significant observable inputs (including quoted prices for similar securities, interest rates, prepayment speeds, and credit risk). Level 3 includes significant unobservable inputs (including the Funds’ own assumptions in determining the fair value of investments). The level assigned to the securities valuations may not be an indication of the risk or liquidity associated with investing in those securities.
Equity securities and ETFs are valued at the most recent sale price or official closing price reported on the exchange (U.S. or foreign) or over-the-counter market on which they trade. Securities or ETFs for which no sales are reported are valued at the calculated mean between the most recent bid and asked quotations on the relevant market or, if a mean cannot be determined, at the most recent bid quotation. Equity securities and ETFs are generally categorized as Level 1.
Investments in open-end investment companies are valued at their NAV each business day and are categorized as a Level 1.
Futures contracts are generally valued at the settlement prices established each day on the exchange on which they are traded and are categorized as Level 1.
49
DBX ETF Trust
Notes to Financial Statements (Continued)
Securities and other assets for which market quotations are not readily available or for which the above valuation procedures are deemed not to reflect fair value are valued in a manner that is intended to reflect their fair value as determined in accordance with procedures approved by the Board and are generally categorized as Level 3. In accordance with the Funds’ valuation procedures, factors considered in determining value may include, but are not limited to, the type of the security; the size of the holding; the initial cost of the security; the existence of any contractual restrictions on the security’s disposition; the price and extent of public trading in similar securities of the issuer or of comparable companies; quotations or evaluated prices from broker-dealers and/or pricing services; information obtained from the issuer, analysts, and/or the appropriate stock exchange (for exchange-traded securities); an analysis of the company’s or issuer’s financial statements; an evaluation of the forces that influence the issuer and the market(s) in which the security is purchased and sold; length of time of a halt in trading of the security; movement in the security’s proxy index; and with respect to debt securities, the maturity, coupon, creditworthiness, currency denomination and the movement of the market in which the security is normally traded. The value determined under these procedures may differ from published values for the same securities.
Fair value pricing could result in a difference between the prices used to calculate a Fund’s NAV and the prices used by the Fund’s Underlying Index, which in turn could result in a difference between the Fund’s performance and the performance of the Fund’s Underlying Index.
Disclosure about the classification of the fair value measurements is included in a table following the Fund’s Schedule of Investments.
Cash Cash consists of cash held at banks and is on deposit with major financial institutions.
Investment Transactions and Investment Income Investment transactions are recorded as of the date that the securities are purchased or sold (trade date). Realized gains and losses from the sale or disposition of securities are calculated on the identified cost-method. Dividend income is net of any foreign taxes withheld at source. Certain dividends from foreign securities may be recorded subsequent to the ex-dividend date as soon as the Fund is informed of such dividends. Distributions of income and capital gains from investments in affiliated funds are recorded on the ex-dividend date. Interest income is recorded on the accrual basis.
Tax Information and Dividends and Distributions to Shareholders It is each Fund’s policy to comply with all requirements of the Internal Revenue Code of 1986, as amended (“the Code”). Each Fund intends to qualify for and to elect treatment as a separate Regulated Investment Company (“RIC”) under Subchapter M of the Code. It is the policy of each Fund to pay out dividends from its net investment income, if any, to investors annually. Taxable net realized gains from investment transactions, reduced by capital loss carryforwards, if any, are declared and distributed to shareholders at least annually. The capital loss carryforward amount, if any, is available to offset future net capital gains. The Funds may occasionally be required to make supplemental distributions at some other time during the year. The Funds reserve the right to declare special distributions if, in their reasonable discretion, such action is necessary or advisable to preserve the status of each Fund as a RIC or to avoid imposition of income or excise taxes on undistributed income.
Dividends and distributions to shareholders, if any, are recorded on the ex-dividend date. The amount of dividends and distributions from net investment income and net realized capital gains are determined in accordance with Federal income tax regulations which may differ from U.S. GAAP. These “book/tax” differences are either considered temporary or permanent in nature. To the extent these differences are permanent in nature, such amounts are reclassified at the end of the year within the components of net assets based on their federal tax treatment; temporary differences do not require reclassification. Dividends and distributions, which exceed earnings and profits for the full year for tax purposes, are reported as a tax return of capital.
In accordance with U.S. GAAP requirements regarding accounting for uncertainties in income taxes, management has analyzed the Funds’ tax positions taken or expected to be taken on foreign, federal and state income tax returns for all open tax years and has concluded that no provision for income tax is required in the Funds’ financial statements.
The Funds’ recognize interest and penalties, if any, related to uncertain tax positions as income tax expense on the Statements of Operations. For the year ended May 31, 2020, the Funds did not incur any interest or penalties.
50
DBX ETF Trust
Notes to Financial Statements (Continued)
As of May 31, 2020, the components of accumulated earnings (losses) on a tax basis were as follows:
| Undistributed Ordinary Income* | Capital and Other Gains (Losses) | Unrealized Appreciation (Depreciation) | Total Accumulated Earnings (Losses) | |||||||||||||
Xtrackers Harvest CSI 300 China A-Shares ETF | $ | 6,350,022 | $ | (196,250,062 | ) | $ | 160,579,665 | $ | (29,320,375 | ) | ||||||
Xtrackers Harvest CSI 500 China A-Shares Small Cap ETF | 152,732 | (21,394,241 | ) | 512,970 | (20,728,539 | ) | ||||||||||
Xtrackers MSCI All China Equity ETF | 65,578 | (11,197,492 | ) | (1,181,802 | ) | (12,313,716 | ) | |||||||||
Xtrackers MSCI China A Inclusion Equity ETF | 1,953 | (4,143,124 | ) | 1,443,126 | (2,698,045 | ) | ||||||||||
The tax character of dividends and distributions declared for the years ended May 31, 2020 and May 31, 2019 were as follows:
| Year Ended May 31, 2020 | ||||
| Ordinary Income* | ||||
Xtrackers Harvest CSI 300 China A-Shares ETF | $ | 16,323,622 | ||
Xtrackers Harvest CSI 500 China A-Shares Small Cap ETF | 267,342 | |||
Xtrackers MSCI All China Equity ETF | 1,586,476 | |||
Xtrackers MSCI China A Inclusion Equity ETF | 280,238 | |||
| Year Ended May 31, 2019 | ||||||||
| Ordinary Income* | Long Term Capital Gain | |||||||
Xtrackers Harvest CSI 300 China A-Shares ETF | $ | 287 | $ | 14,203,572 | ||||
Xtrackers MSCI All China Equity ETF | 682,986 | — | ||||||
Xtrackers MSCI China A Inclusion Equity ETF | 119,154 | — | ||||||
| * | For tax purposes short-term capital gain distributions are considered ordinary income distributions |
At May 31, 2020, for Federal income tax purposes, the Funds have capital loss carryforwards available as shown in the table below, to the extent provided by regulations, to offset future capital gains for an unlimited period. To the extent that these loss carryforwards are used to offset future capital gains, it is probable that the capital gains so offset will not be distributed to shareholders.
| Short-Term | Long-Term | Total Amount | ||||||||||
Xtrackers Harvest CSI 300 China A-Shares ETF | $ | 98,419,937 | $ | 97,830,125 | $ | 196,250,062 | ||||||
Xtrackers Harvest CSI 500 China A-Shares Small Cap ETF | 14,804,329 | 6,589,912 | 21,394,241 | |||||||||
Xtrackers MSCI All China Equity ETF | 7,274,409 | 3,923,083 | 11,197,492 | |||||||||
Xtrackers MSCI China A Inclusion Equity ETF | 3,952,636 | 190,488 | 4,143,124 | |||||||||
For the fiscal year ended May 31, 2020, the effect of permanent “book/tax” reclassifications to the components of net assets are included below. These differences are primarily due to the recognition of certain foreign currency gain (losses) as ordinary income (loss), passive foreign investment companies (“PFICs”), net operating losses and redemptions-in-kind.
| Distributable earnings (loss) | Paid-In Capital | |||||||
Xtrackers MSCI All China Equity ETF | $ | 11,993,848 | $ | (11,993,848 | ) | |||
51
DBX ETF Trust
Notes to Financial Statements (Continued)
As of May 31, 2020, the aggregate cost of investments for federal income tax purposes, the net unrealized appreciation or depreciation and the aggregated gross unrealized appreciation (depreciation) on investments were as follows:
| Aggregate Tax Cost | Net Unrealized Appreciation (Depreciation) | Aggregate Gross Unrealized Appreciation | Aggregate Gross Unrealized (Depreciation) | |||||||||||||
Xtrackers Harvest CSI 300 China A-Shares ETF | $ | 1,106,488,011 | $ | 160,571,384 | $ | 275,333,053 | $ | (114,761,669 | ) | |||||||
Xtrackers Harvest CSI 500 China A-Shares Small Cap ETF | 29,740,388 | 513,359 | 5,429,178 | (4,915,819 | ) | |||||||||||
Xtrackers MSCI All China Equity ETF | 22,526,399 | (1,181,524 | ) | 1,339,731 | (2,521,255 | ) | ||||||||||
Xtrackers MSCI China A Inclusion Equity ETF | 12,865,367 | 1,444,357 | 2,466,060 | (1,021,703 | ) | |||||||||||
Foreign Taxes The Funds may be subject to foreign taxes (a portion of which may be reclaimable) on income, capital gains on investments, certain foreign currency transactions or other corporate events. All foreign taxes are recorded in accordance with the applicable foreign tax regulations and rates that exist in the foreign jurisdictions in which the Funds invest. These foreign taxes, if any, are paid by the Funds and are reflected in their Statements of Operations as follows: foreign taxes withheld at source are presented as a reduction of income, foreign taxes on capital gains from sales of investments and foreign currency transactions are included in their respective net realized gain (loss) categories, and deferred foreign taxes on unrealized gains are included in net change in unrealized appreciation (depreciation). Receivables and payables related to foreign taxes as of May 31, 2020, if any, are disclosed in the Funds’ Statements of Assets and Liabilities.
The Funds’ direct investments in China A-Shares will be subject to a number of Chinese tax rules and the application of many of those rules is evolving. Chinese taxes that may apply to the Funds’ direct investments in A-Shares include withholding income tax (“WHT”) on dividends, WHT on bank interest, WHT on capital gains realized from the disposal of equity investments prior to November 17, 2014 and stamp tax. China imposes WHT at a rate of 10% on dividends on shares and interest income derived by non People’s Republic of China (“PRC”) enterprises including Qualified Foreign Institutional Investors (“QFII”) and renminbi Qualified Foreign Institutional Investors (“RQFII”) from PRC resident issuers, subject to any lower rate provided by an applicable tax treaty.
With the approval from the PRC State Council, the PRC State Administration of Taxation, the PRC Ministry of Finance and the China Securities Regulatory Commission jointly issued Caishui [2014] 79 (Circular 79) on November 14, 2014. According to Circular 79, RQFIIs are temporarily exempt from WHT with respect to gains derived from the trading of equity investments (including shares in PRC enterprises) effective from November 17, 2014. With respect to gains derived from equity investments prior to November 17, 2014, RQFIIs are subject to WHT at a rate of 10% on such gains on a gross basis, subject to any lower rate provided by an applicable tax treaty. The above WHT treatment applies to RQFIIs which do not have a permanent establishment (“PE”) in the PRC. The Funds do not have PEs in the PRC, therefore, the Funds are only subject to WHT at 10% with respect to gross realized gains derived from the disposal of land-rich A-Share companies and exempt from WHT with respect to gross realized gains derived from non land-rich A-Share companies prior to November 17, 2014. Land-rich enterprises refer to companies whose value of immovable property in the PRC is greater than 50% of the value of their total assets at any time during the three-year period before the alienation of the PRC companies’ shares. The WHT relating to the realized gains from shares in land-rich companies prior to November 17, 2014 has been paid by the Xtrackers Harvest CSI 300 China A-Shares ETF and Xtrackers Harvest CSI 500 China A-Shares Small Cap ETF, respectively; while realized gains from shares in non land-rich companies prior to November 17, 2014 were granted treaty relief pursuant to the PRC-US Double Taxation Arrangement.
The PRC rules for taxation of RQFIIs (and QFIIs) are evolving and the tax regulations to be issued by the PRC State Administration of Taxation and/or PRC Ministry of Finance, as well as the practices adopted by the local PRC authorities, may apply retroactively which may adversely affect the Fund and its shareholders.
Foreign Currency Translations The books and records of the Funds are maintained in U.S. dollars. Investment securities and other assets and liabilities denominated in a foreign currency are translated into U.S. dollars at the
52
DBX ETF Trust
Notes to Financial Statements (Continued)
prevailing exchange rates at period end. Purchases and sales of investment securities, income and expenses are translated into U.S. dollars at the prevailing exchange rates on the respective dates of the transactions.
Net realized and unrealized gains and losses on foreign currency transactions represent net gains and losses between trade and settlement dates on securities transactions, the acquisition and disposition of foreign currencies, and the difference between the amount of net investment income accrued and the U.S. dollar amount actually received. The portion of both realized and unrealized gains and losses on investments that results from fluctuations in foreign currency exchange rates is not separately disclosed, but is included with net realized and unrealized gain/appreciation and loss/depreciation on investments.
Securities Lending The Xtrackers MSCI All China Equity ETF and Xtrackers MSCI China A Inclusion Equity ETF may lend securities to certain financial institutions under the terms of their securities lending agreement. During the term of the loans the Funds continue to receive interest and dividends generated by the securities and to participate in any changes in their market value. The Funds require the borrowers of the securities to maintain collateral with the Funds consisting of cash and/or securities issued or guaranteed by the U.S. Government, its agencies or instrumentalities having a value at least equal to the value of the securities loaned. When the collateral falls below specified amounts, the lending agent will use its best effort to obtain additional collateral on the next business day to meet required amounts under the securities lending agreement. During the year ended May 31, 2020, the Funds invested the cash collateral into a joint trading account in DWS Government & Agency Securities Portfolio, an affiliated money market fund managed by DWS Investment Management Americas, Inc. DWS Investment Management Americas, Inc. receives a management/administration fee (0.12% annualized effective rate as of May 31, 2020) on the cash collateral invested in DWS Government & Agency Securities Portfolio. The Funds receive compensation for lending their securities either in the form of fees or by earning interest on invested cash collateral net of borrower rebates and fees paid to a lending agent. Either the Fund or the borrower may terminate the loan at any time and the borrower, after notice, is required to return borrowed securities within a standard time period. There may be risks of delay and costs in recovery of securities or even loss of rights in the collateral should the borrower of the securities fail financially. If the Funds are not able to recover securities lent, the Funds may sell the collateral and purchase a replacement investment in the market, incurring the risk that the value of the replacement security is greater than the value of the collateral. The Funds are also subject to all investment risks associated with the reinvestment of any cash collateral received, including, but not limited to, interest rate, credit and liquidity risk associated with such investments.
As of May 31, 2020, the Funds listed below had securities on loan. The value of the related collateral exceeded the value of the securities loaned at period end.
Remaining Contractual Maturity of the Agreements, as of May 31, 2020 | ||||||||||||||||||||
| Securities Lending Transactions | Overnight and Continuous | <30 Days | Between 30 & 90 days | >90 days | Total | |||||||||||||||
Xtrackers MSCI All China Equity ETF |
| |||||||||||||||||||
Common Stocks | $ | 120,429 | $ | 1,096 | $ | 6,190 | $ | 313,544 | $ | 441,259 | ||||||||||
Exchange-Traded Funds | 1,677,500 | — | — | — | 1,677,500 | |||||||||||||||
|
|
|
|
|
|
|
|
|
| |||||||||||
Total Borrowings | $ | 1,797,929 | $ | 1,096 | $ | 6,190 | $ | 313,544 | $ | 2,118,759 | ||||||||||
|
|
|
|
|
|
|
|
|
| |||||||||||
Gross amount of recognized liabilities and non-cash collateral for securities lending transactions |
| $ | 2,118,759 | |||||||||||||||||
Xtrackers MSCI China A Inclusion Equity ETF |
| |||||||||||||||||||
Exchange-Traded Funds | $ | 2,613 | $ | — | $ | — | $ | — | $ | 2,613 | ||||||||||
|
|
|
|
|
|
|
|
|
| |||||||||||
Gross amount of recognized liabilities and non-cash collateral for securities lending transactions |
| $ | 2,613 | |||||||||||||||||
Derivatives
Futures Contracts Each Fund may enter into futures contracts. These futures contracts will be used to simulate investment in the respective Underlying Index, to facilitate trading or to reduce transaction costs. Each Fund will enter into futures contracts that are traded on a U.S. or non-U.S. exchange. No Fund will use futures for speculative purposes. Futures contracts provide for the future sale by one party and purchase by another party of a specified amount of a specific instrument or index at a specified future time and at a specified price. For the year ended May 31, 2020, Xtrackers MSCI All China Equity ETF and Xtrackers MSCI China A Inclusion Equity ETF
53
DBX ETF Trust
Notes to Financial Statements (Continued)
utilized futures in order to simulate investment in the Underlying Index. To the extent required by law, liquid assets committed to futures contracts will be maintained.
At the time each Fund enters into a futures contract, each Fund deposits and maintains as collateral an initial margin with the broker, as required by the exchange on which the transaction is affected. Pursuant to the contract, each Fund agrees to receive from or pay to the broker an amount of cash equal to the daily fluctuation in the value of the contract. Such receipts or payments are known as variation margin and are recorded by each Fund as unrealized gains or losses. Risks may arise from the potential inability of a counterparty to meet the terms of the contract. The credit/counterparty risk for exchange-traded futures contracts is generally less than privately negotiated futures contracts, since the clearinghouse, which is the issuer or counterparty to each exchange-traded future, provides a guarantee of performance. The guarantee is supported by a daily payment system (i.e., margin requirements).
Use of long futures contracts subjects each Fund to risk of loss in excess of the amounts shown on the Statement of Assets and Liabilities, up to the notional value of the futures contracts. Use of short futures contracts subjects each Fund to unlimited risk of loss. Under some circumstances, futures exchanges may establish daily limits on the amount that the price of a futures contract can vary from the previous day’s settlement price, which could effectively prevent liquidation of unfavorable positions.
A summary of the open futures contracts as of May 31, 2020 is included in a table following the Funds’ Schedule of Investments.
The following tables summarize the value of the Funds’ derivative instruments held as of May 31, 2020 and the related location in the accompanying Statement of Assets and Liabilities, presented by primary underlying risk exposure:
Asset Derivatives | Liability Derivatives | |||||||||||||
| Xtrackers MSCI All China Equity ETF | ||||||||||||||
| Equity contracts | Unrealized appreciation on futures contracts* | $ | 5,320 | Unrealized depreciation on futures contracts* | $ | — | ||||||||
| * | Includes cumulative appreciation or cumulative depreciation on futures contracts as disclosed in the Schedule of Investments. Unsettled variation margin is disclosed separately within the Statement of Assets and Liabilities. |
Additionally, the amount of realized and unrealized gains and losses on derivative instruments recognized in the Funds’ earnings during the year ended May 31, 2020 and the related location in the accompanying Statement of Operations is summarized in the following tables by primary underlying risk exposure:
Net Realized Gain (Loss) from: | ||||
| Futures Contracts— Equity Contracts | ||||
Xtrackers MSCI All China Equity ETF | $ | 19,137 | ||
Xtrackers MSCI China A Inclusion Equity ETF | 52,245 | |||
Net Change in Unrealized Appreciation (Depreciation) on: | ||||
| Futures Contracts— Equity Contracts | ||||
Xtrackers MSCI All China Equity ETF | $ | 5,770 | ||
Xtrackers MSCI China A Inclusion Equity ETF | 675 | |||
For the year ended May 31, 2020 the average monthly volume of derivatives was as follows:
| Futures Contracts (Contract Value) | ||||
Xtrackers MSCI All China Equity ETF | $ | 481,758 | ||
Xtrackers MSCI China A Inclusion Equity ETF | 56,194 | |||
54
DBX ETF Trust
Notes to Financial Statements (Continued)
Affiliated Cash Management Vehicles The Funds may invest uninvested cash balances in DWS Government Money Market Series and DWS ESG Liquidity Fund, affiliated money market funds which are managed by DWS Investment Management Americas, Inc. (“DIMA”), also an indirect, wholly owned subsidiary of DWS Group GmbH & Co. KGaA. Each affiliated money market fund is managed in accordance with Rule 2a-7 under the 1940 Act, which governs the quality, maturity, diversity and liquidity of instruments in which a money market fund may invest. DWS Government Money Market Series seeks to maintain a stable NAV, and DWS ESG Liquidity Fund maintains a floating NAV. The Funds indirectly bear their proportionate share of the expenses of each affiliated money market fund in which they invest. The Advisor will waive an amount of the unitary management fee payable to the Advisor by the Funds equal to such acquired fund’s fees and expenses on the Funds’ assets invested in the affiliated money market funds.
3. Investment Advisory and Other Agreements
The Advisor has overall responsibility for the general management and administration of the Funds, subject to the supervision of the Funds’ Board of Trustees. Under an investment advisory agreement between the Trust, on behalf of the Funds, and the Advisor (the “Investment Advisory Agreement”), the Advisor is responsible for arranging sub-advisory, transfer agency, custody, fund administration, and all other non-distribution related services for the Funds to operate.
Harvest Global Investments Limited serves as investment sub-Advisor (the “Sub-Advisor”) to the Xtrackers Harvest CSI 300 China A-Shares ETF and the Xtrackers Harvest CSI 500 China A-Shares Small Cap ETF. The Sub-Advisor is responsible for day-to-day management of each Fund, subject to supervision of the Advisor.
For its investment advisory services to the Funds below, the Advisor is entitled to receive a unitary management fee based on each Fund’s average daily net assets, computed and accrued daily and payable monthly, at an annual rate equal to:
| Unitary Management Fee | ||||
Xtrackers Harvest CSI 300 China A-Shares ETF | 0.65 | % | ||
Xtrackers Harvest CSI 500 China A-Shares Small Cap ETF | 0.65 | % | ||
Xtrackers MSCI All China Equity ETF | 0.50 | % | ||
Xtrackers MSCI China A Inclusion Equity ETF | 0.60 | % | ||
The Advisor for Xtrackers MSCI All China Equity ETF has contractually agreed, until November 14, 2021, to waive a portion of its management fees in an amount equal to the acquired fund’s fees and expenses attributable to the Fund’s investments in affiliated funds. In addition, the Advisor has contractually agreed, until September 30, 2020, to waive a portion of its management fees to the extent necessary to prevent the operating expenses of the Fund from exceeding 0.50% of the Fund’s average daily net assets. For the year ended May 31, 2020, the Advisor waived $107,766 of the expenses of the Fund which were attributable to the Fund’s investments in affiliated funds.
The Advisor for Xtrackers MSCI China A Inclusion Equity ETF has contractually agreed to waive a portion of its management fees in an amount equal to the acquired fund’s fees and expenses attributable to the Fund’s investments in affiliated funds. For the year ended May 31, 2020, the Advisor waived $28 of the expenses of the Fund.
The Advisor for the Funds below has contractually agreed to waive a portion of its management fees in an amount equal to the acquired funds’ fees and expenses attributable to the Funds’ investments in affiliated cash management vehicles. For the year ended May 31, 2020, the Advisor waived expenses of the Funds as follows:
| Expenses Waived | ||||
Xtrackers MSCI All China Equity ETF | $ | 193 | ||
Xtrackers MSCI China A Inclusion Equity ETF | 432 | |||
Out of the unitary management fee, the Advisor pays substantially all expenses of each Fund, including the cost of transfer agency, custody, fund administration, legal, audit and other services, and expenses of the Independent Trustees. Each Fund is responsible for the payment of interest expense, acquired fund fees and expenses, taxes, brokerage expenses, distribution fees or expenses, if any, litigation expenses and extraordinary expenses.
55
DBX ETF Trust
Notes to Financial Statements (Continued)
The Bank of New York Mellon, a wholly-owned subsidiary of The Bank of New York Mellon Corporation, serves as Administrator, Custodian, Accounting Agent, Lending Agent and Transfer Agent for each Fund.
ALPS Distributors, Inc. (the “Distributor”) serves as the distributor of Creation Units for each Fund on an agency basis. The Distributor does not maintain a secondary market in shares of the Funds.
The Board of Trustees is currently comprised of three Independent Trustees. The Advisor paid retainer fees and attendance fees to each Independent Trustee; retainer fees to the Chairman of the Board of Trustees and Chairman of the Audit Committee; and attendance fees to each member of the Audit Committee (which is comprised of all of the Funds’ Independent Trustees).
4. Investment Portfolio Transactions
For the year ended May 31, 2020, the cost of investments purchased and proceeds from sale of investments (excluding in-kind transactions and short-term investments) were as follows:
| Purchases | Sales | |||||||
Xtrackers Harvest CSI 300 China A-Shares ETF | $ | 1,877,923,108 | $ | 2,034,187,349 | ||||
Xtrackers Harvest CSI 500 China A-Shares Small Cap ETF | 21,455,384 | 67,126,892 | ||||||
Xtrackers MSCI All China Equity ETF | 6,837,239 | 80,412,576 | ||||||
Xtrackers MSCI China A Inclusion Equity ETF | 5,554,644 | 75,332,472 | ||||||
For the year ended May 31, 2020, the cost of in-kind purchases and proceeds from in-kind sale were as follows:
| Purchases | Sales | |||||||
Xtrackers MSCI All China Equity ETF | $ | 4,650,053 | $ | 143,542,697 | ||||
5. Fund Share Transactions
As of May 31, 2020 there were unlimited Fund shares, no par value, authorized by the Trust. Fund shares are issued and redeemed by each Fund only in Creation Units or multiples thereof. Except when aggregated in Creation Units, shares of each Fund are not redeemable. Transactions in capital shares for each Fund are disclosed in detail in the Statements of Changes in Net Assets. The consideration for the purchase of Creation Units of Xtrackers MSCI All China Equity ETF generally consists of the in-kind contribution of a designated portfolio of securities constituting a portfolio sampling representation of the securities included in the respective Fund’s Underlying Index and an amount of cash, which under certain circumstances may include cash in lieu of portfolio securities. The purchase of Creation Units for Xtrackers Harvest CSI 300 China A-Shares ETF, Xtrackers Harvest CSI 500 China A-Shares Small Cap ETF and Xtrackers MSCI China A Inclusion Equity ETF are generally issued in exchange for a specific amount of cash totaling the NAV of the Creation Units. Investors purchasing and redeeming Creation Units pay a purchase transaction fee and a redemption transaction fee to offset transfer and other transaction costs associated with the issuance and redemption of Creation Units.
6. Investing in China
Investing in securities of Chinese issuers involves certain risks and considerations not typically associated with investing in securities of U.S. issuers, including, among others; more frequent (and potentially widespread) trading suspensions and government interventions with respect to Chinese issuers, resulting in lack of liquidity and in price volatility; currency revaluations and other currency exchange rate fluctuations or blockage; the nature and extent of intervention by the Chinese government in the Chinese securities markets (including both direct and indirect market stabilization efforts, which may affect valuations of Chinese issuers), whether such intervention will continue and the impact of such intervention or its discontinuation; the risk of nationalization or expropriation of assets; the risk that the Chinese government may decide not to continue to support economic reform programs; limitations on the use of brokers (or action by the Chinese government that discourages brokers from serving international clients); higher rates of inflation; greater political, economic and social uncertainty; higher market volatility caused by any potential regional territorial conflicts or natural disasters; the risk of increased trade tariffs, embargoes and other trade limitations; restrictions on foreign ownership; custody risks associated with investing through Stock Connect, an RQFII or other programs to access the Chinese securities markets, both interim and permanent market regulations which may affect the ability of certain stockholders to sell Chinese securities when it would otherwise be advisable; and different and less stringent financial reporting standards.
56
DBX ETF Trust
Notes to Financial Statements (Continued)
7. Line of Credit
The Trust has entered into a senior unsecured credit facility with a syndication of banks which allows the Xtrackers Harvest CSI 300 China A-Shares ETF, Xtrackers Harvest CSI 500 China A-Shares Small Cap ETF, Xtrackers MSCI China A Inclusion Equity ETF and certain other funds managed by the Advisor to borrow up to $105 million. Each Fund may borrow money under this credit facility to the extent necessary for temporary or emergency purposes, including the funding of shareholder redemption requests, trade settlements, and as necessary to distribute to shareholders any income necessary to maintain each Funds’ status as a regulated investment company. Borrowings are charged an interest rate of 1.25% per annum plus the greater of the Federal Funds Effective Rate or the one-month LIBOR Rate. Each Fund may borrow up to the lesser of a pro-rata share of the credit facility at the amount listed below or 33 percent of its net assets as permitted by the Act. The Funds had no outstanding loans at May 31, 2020.
| Pro-rata Share | ||||
Xtrackers Harvest CSI 300 China A-Shares ETF | $ | 63,000,000 | ||
Xtrackers Harvest CSI 500 China A-Shares Small Cap ETF | 4,200,000 | |||
Xtrackers MSCI China A Inclusion Equity ETF | 5,250,000 | |||
8. Other
A novel strain of coronavirus (COVID-19) outbreak was declared a pandemic by the World Health Organization on March 11, 2020. The situation is evolving with various cities and countries around the world responding in different ways to address the pandemic. There are direct and indirect economic effects developing for various industries and individual companies throughout the world. The recent pandemic spread of the novel coronavirus and related geopolitical events could lead to increased financial market volatility, disruption to U.S. and world economies and markets and may have significant adverse effects on a Fund and its investments. A prolonged disruption may result in a Fund and its service providers experiencing operational difficulties in implementing their business continuity plans. Management will continue to monitor the impact COVID-19 has on the Funds and reflect the consequences as appropriate in each Fund’s accounting and financial reporting.
9. Subsequent Event
On June 17, 2020, Deutsche Bank AG (“DB”), an affiliate of DWS Group, resolved with the Commodity Futures Trading Commission (“CFTC”) charges stemming from alleged violations of various swap data reporting requirements and corresponding supervision and other failures. The matter, which was resolved by the issuance of a federal court order (“Consent Order”), involved unintentional conduct that resulted from a system outage that prevented DB from reporting data in accordance with applicable CFTC requirements for a period of five days in April 2016.
The matter giving rise to the Consent Order did not arise out of any investment advisory, fund management activities or distribution activities of DBX Advisors LLC or their advisory affiliates (the “DWS Service Providers”). DWS Group, of which the DWS Service Providers are wholly-owned subsidiaries (except for Harvest Global Management Limited which is partially owned by DWS Group), is a separate publicly traded company but continues to be an affiliate of DB due to, among other things, DB’s 79.49% ownership interest in DWS Group. Under the provisions of the Investment Company Act of 1940, as a result of the Consent Order, the DWS Service Providers would not be eligible to continue to provide investment advisory services to the Funds absent an order from the Securities and Exchange Commission (the “SEC”). DB and the DWS Service Providers are seeking temporary and permanent orders from the SEC to permit the DWS Service Providers to continue to provide investment advisory services to the Funds and other registered investment companies notwithstanding the Consent Order. While there can be no assurance that the requested exemptive orders will be granted, the SEC has granted this type of relief in the past. Consistent with their fiduciary and other relationships with the Funds, and in accordance with the desire of the Board of the Funds, the DWS Service Providers continue to provide investment advisory services to the Funds. Subject to the receipt of the temporary and permanent exemptive orders, the DWS Service Providers have informed the Funds that they do not believe the Consent Order will have any material impact on the Funds or the ability of the DWS Service Providers to provide services for the Funds.
57
DBX ETF Trust
To the Shareholders of Xtrackers Harvest CSI 300 China A-Shares ETF, Xtrackers Harvest CSI 500 China A-Shares Small Cap ETF, Xtrackers MSCI All China Equity ETF, Xtrackers MSCI China A Inclusion Equity ETF, and the Board of Trustees of DBX ETF Trust
Opinion on the Financial Statements
We have audited the accompanying statements of assets and liabilities of Xtrackers Harvest CSI 300 China A-Shares ETF, Xtrackers Harvest CSI 500 China A-Shares Small Cap ETF, Xtrackers MSCI All China Equity ETF, and Xtrackers MSCI China A Inclusion Equity ETF (collectively referred to as the “Funds”), (four of the funds constituting DBX ETF Trust (the “Trust”)), including the schedules of investments, as of May 31, 2020, and the related statements of operations and changes in net assets, and the financial highlights for each of the periods indicated in the table below and the related notes (collectively referred to as the “financial statements”). In our opinion, the financial statements present fairly, in all material respects, the financial position of each of the Funds (four of the funds constituting the DBX ETF Trust) at May 31, 2020, and the results of their operations, changes in net assets and financial highlights for each of the periods indicated in the table below, in conformity with U.S. generally accepted accounting principles.
Individual fund constituting the DBX ETF Trust | Statement of operations | Statements of changes in net assets | Financial highlights | |||
Xtrackers Harvest CSI 300 China A-Shares ETF
Xtrackers Harvest CSI 500 China A-Shares Small Cap ETF
Xtrackers MSCI All China Equity ETF | For the year ended May 31, 2020 | For each of the two years in the period ended May 31, 2020 | For each of the five years in the period ended May 31, 2020 | |||
| Xtrackers MSCI China A Inclusion Equity ETF | For the year ended May 31, 2020 | For each of the two years in the period ended May 31, 2020 | For each of the four years in the period ended May 31, 2020 and the period from October 20, 2015 (commencement of operations) through May 31, 2016 |
Basis for Opinion
These financial statements are the responsibility of the Trust’s management. Our responsibility is to express an opinion on each of the Funds’ financial statements based on our audits. We are a public accounting firm registered with the Public Company Accounting Oversight Board (United States) (“PCAOB”) and are required to be independent with respect to the Trust in accordance with the U.S. federal securities laws and the applicable rules and regulations of the Securities and Exchange Commission and the PCAOB.
We conducted our audits in accordance with the standards of the PCAOB. Those standards require that we plan and perform the audit to obtain reasonable assurance about whether the financial statements are free of material misstatement, whether due to error or fraud. The Trust is not required to have, nor were we engaged to perform, an audit of the Trust’s internal control over financial reporting. As part of our audits, we are required to obtain an understanding of the internal control over financial reporting, but not for the purpose of expressing an opinion on the effectiveness of the Trust’s internal control over financial reporting. Accordingly, we express no such opinion.
Our audits included performing procedures to assess the risks of material misstatement of the financial statements, whether due to error or fraud, and performing procedures that respond to those risks. Such procedures included examining, on a test basis, evidence regarding the amounts and disclosures in the financial statements. Our procedures included confirmation of securities owned as of May 31, 2020, by correspondence
58
DBX ETF Trust
Report of Independent Registered Public Accounting Firm(Continued)
with the custodians and brokers or by other appropriate auditing procedures where replies from brokers were not received. Our audits also included evaluating the accounting principles used and significant estimates made by management, as well as evaluating the overall presentation of the financial statements. We believe that our audits provide a reasonable basis for our opinion.

We have served as the auditor of one or more investment companies in the DWS family of funds since at least 1979, but we are unable to determine the specific year.
New York, New York
July 27, 2020
59
DBX ETF Trust
All Funds
In accordance with Rule 22e-4 (the “Liquidity Rule”) under the Investment Company Act of 1940 (the “1940 Act”), your Fund has adopted a liquidity risk management program (the “Program”), and the Board has designated DBX Advisors LLC (“Advisors”) as Program administrator. The Program is designed to assess and manage your Fund’s liquidity risk (the risk that the Fund would be unable to meet requests to redeem shares of the Fund without significant dilution of remaining investors’ interests in the Fund). Advisors has designated a committee (the “Committee”) composed of personnel from multiple departments within an affiliate of Advisors that is responsible for the implementation and ongoing administration of the Program, which includes assessing the Fund’s liquidity risk under both normal and reasonably foreseeable stressed conditions. Under the Program, every investment held by a Fund is classified on a daily basis into one of four liquidity categories based on calculations of the investment’s ability to be sold during designated timeframes in current market conditions without significantly changing the investment’s market value.
Xtrackers MSCI All China Equity ETF (CN) only
In February 2020, as required by the Program and the Liquidity Rule, Advisors provided the Board with an annual written report (the “Report”) addressing the operation of the Program and assessing the adequacy and effectiveness of its implementation during the period from December 1, 2018 through November 30, 2019 (the “Reporting Period”). During the Reporting Period, your Fund was primarily invested in highly liquid investments (investments that the Fund anticipates can be converted to cash within three business days or less in current market conditions without significantly changing their market value). As a result, your Fund is not required to adopt, and has not adopted, a “Highly Liquid Investment Minimum” as defined in the Liquidity Rule. During the Reporting Period, the Fund did not approach the 15% limit imposed by the Liquidity Rule on holdings in illiquid investments (investments that cannot be sold or disposed of in seven days or less in current market conditions without the sale of the investment significantly changing the market value of the investment). Your Fund did not experience any issues meeting investor redemptions at any time during the Reporting Period. In the Report, Advisors stated that it believes the Program has operated adequately and effectively to manage the Fund’s liquidity risk during the Reporting Period. Advisors also reported on a material change made to the Program in May 2019 to address Securities and Exchange Commission guidance relating to extended foreign market holidays.
Xtrackers Harvest CSI 300 China A-Shares ETF (ASHR), Xtrackers Harvest CSI 500 China A-Shares Small Cap ETF (ASHS) and Xtrackers MSCI China A Inclusion Equity ETF (ASHX) only
In February 2020, as required by the Program and the Liquidity Rule, Advisors provided the Board with an annual written report (the “Report”) addressing the operation of the Program and assessing the adequacy and effectiveness of its implementation during the period from December 1, 2018 through November 30, 2019 (the “Reporting Period”). During the Reporting Period, your Fund was primarily invested in highly liquid investments (investments that the Fund anticipates can be converted to cash within three business days or less in current market conditions without significantly changing their market value). As a result, your Fund is not required to adopt, and has not adopted, a “Highly Liquid Investment Minimum” as defined in the Liquidity Rule. During the Reporting Period, the Fund did experience a temporary breach of the 15% limit imposed by the Liquidity Rule on holdings in illiquid investments (investments that cannot be sold or disposed of in seven days or less in current market conditions without the sale of the investment significantly changing the market value of the investment). The breach was caused by the temporary reclassification of Chinese securities as illiquid due to an extended Chinese holiday market closure. The temporary reclassification of Chinese securities caused the Fund to exceed the 15% limit on illiquid investments for a one day period. Because the holiday closure was anticipated in advance, no actions were needed to rebalance the Fund’s portfolio. Your Fund did not experience any issues meeting investor redemptions at any time during the Reporting Period. In the Report, Advisors stated that it believes the Program has operated adequately and effectively to manage the Fund’s liquidity risk during the Reporting Period. Advisors also reported on a material change made to the Program in May 2019 to address Securities and Exchange Commission guidance relating to extended foreign market holidays.
60
DBX ETF Trust
Identification and Background
The Board has responsibility for the overall management and operations of the funds, including general supervision of the duties performed by the Advisor and other service providers. Each Board Member serves until his or her successor is duly elected or appointed and qualified. Each officer serves until he or she resigns, is removed, dies, retires or becomes disqualified.
The Trust currently has three Board Members. The three Independent Board Members have no affiliation or business connection with the Advisor or any of its affiliated persons and do not own any stock or other securities issued by the Advisor.
The Independent Board Members of the Trust, their term of office and length of time served, their principal business occupations during the past five years, the number of portfolios in the fund complex (defined below) overseen by each Independent Board Member, and other directorships, if any, held by the Board Members are shown below. The fund complex includes all registered open- and closed-end funds (including all of their portfolios) advised by the Advisor and any registered funds that have an investment advisor that is an affiliated person of the Advisor. As of the date of this shareholder report, the fund complex consists of the funds in the Trust, as well as the registered funds advised by affiliates of the Advisor.
Shareholder Communications to the Board. Shareholders may send communications to the Trust’s Board by addressing the communications directly to the Board (or individual Board Members) and/or otherwise clearly indicating in the salutation that the communication is for the Board (or individual Board Members). The shareholder may send the communication to either the Trust’s office or directly to such Board members c/o 875 Third Avenue, New York, NY 10022. Other shareholder communications received by the Trust not directly addressed and sent to the Board will be reviewed and generally responded to by management. Such communications will be forwarded to the Board at management’s discretion based on the matters contained therein.
| Name, Year of Birth, Position with the Trust and Length of Time Served(1) | Business Experience and Directorships During the Past 5 Years | Number of Portfolios in Fund Complex Overseen | Other Directorships Held by Board Member | |||
Stephen R. Byers (1953) Chairman since 2016, and Board Member since 2011 (formerly, Lead Independent Board Member, 2015-2016) | Independent Director (2011-present); Independent Consultant (2014-present); Director of Investment Management, the Dreyfus Corporation (2000-2006) and Vice Chairman and Chief Investment Officer, the Dreyfus Corporation (2002-2006). | 34 | The Arbitrage Funds, Sierra Income Corporation, Mutual Fund Directors Forum | |||
George O. Elston (1964) Board Member since 2011, Chairman of the Audit Committee since 2015 | Chief Financial Officer, Enzyvant (2018-present); Chief Executive Officer, 2X Oncology, Inc. (2017-2018); Senior Vice President and Chief Financial Officer, Juniper Pharmaceuticals, Inc. (2014-2016); Senior Vice President and Chief Financial Officer, KBI BioPharma Inc. (2013-2014); Managing Partner, Chatham Street Partners (2010-2013). | 34 | - | |||
J. David Officer (1948) Board Member since 2011, Chairman of the Nominating Committee since 2015 | Independent Director (2010-present); Vice Chairman, the Dreyfus Corporation (2006-2009); President, The Dreyfus Family of Funds, Inc. (2006-2009). | 34 | (Chairman of) Ilex Management Ltd; Old Westbury Funds |
61
DBX ETF Trust
Board Members and Officers (Unaudited) (Continued)
Officers(2) |
Name, Year of Birth, Position with the Trust and Length of Time Served(4) | Business Experience and Directorships During the Past 5 Years | |
Freddi Klassen(5) (1975) President and Chief Executive Officer, 2016-present | Director(3) in DWS and Chief Operating Officer in the Americas for the Traditional Asset Classes Department (2014-present); Manager and Chief Operating Officer of DWS Investment Management Americas, Inc. (2018-present) and the Advisor (2016-present); Global Chief Operating Officer for Equities Technology in the Investment Bank Division at Deutsche Bank AG (2013-2014); Chief Operating Officer for Exchange Traded Funds and Systematic Funds in Europe (2008-2013). | |
Luke Oliver(5) (1980) Chief Operating Officer, 2019-present | Managing Director(3) in DWS (2017-present); Director(3) in DWS (2009-2017); Head of Passive Americas Asset Management Platform (2019-present); Manager, Chief Executive Officer and Chief Investment Officer of the Advisor (2019-present); Head of ETF Capital Markets, Americas (2012-2018); Lead Portfolio Manager of PowerShares DB ETFs (2009-2012). | |
Diane Kenneally(6) (1966) Treasurer, Chief Financial Officer and Controller, 2019-present | Director(3) in DWS; Chief Financial Officer and Treasurer for DWS US registered investment companies advised by DWS Investment Management Americas, Inc. (2018-present); Treasurer and Chief Financial Officer, The European Equity Fund, Inc., The New Germany Fund, Inc. and The Central and Eastern Europe Fund, Inc. (2018-present); formerly: Assistant Treasurer for the DWS funds (2007-2018). | |
Frank Gecsedi(5) (1967) Chief Compliance Officer, 2010-present | Director(3) in DWS Compliance Department (2016-present), Vice President in the Deutsche Asset Management Compliance Department at Deutsche Bank AG (2013-2016) and Chief Compliance Officer of the Advisor (2010-present); Chief Compliance Officer of DWS Distributors, Inc. (2019-present); Vice President in Deutsche Bank’s Global Markets Legal, Risk and Capital Division (2010-2012). | |
Bryan Richards(5) (1978) Vice President, 2016-present | Managing Director(3) in DWS (2018-present); Director(3) in DWS (2014-2018); Portfolio Manager in the Passive Asset Management Department at DWS (2011-present); Primary Portfolio Manager for the PowerShares DB Commodity ETFs (2011-2015). | |
John Millette(6) (1962) Secretary, 2020-present | Director(3) in DWS US Retail Legal (2003-present); Vice President and Secretary of DWS US registered investment companies advised by DWS Investment Management Americas, Inc. (1999-present); Chief Legal Officer, DWS Investment Management Americas, Inc. (2015-present); Director and Vice President of DWS Trust Company (2016-present); Secretary, The European Equity Fund, Inc., The New Germany Fund, Inc. and The Central and Eastern Europe Fund, Inc. (2011-present); formerly: Secretary of Deutsche Investment Management Americas Inc. (2015-2017); Assistant Secretary of DBX ETF Trust (2019-2020); Assistant Secretary (July 14, 2006-December 31, 2010) and Secretary (January 31, 2006-July 13, 2006), The European Equity Fund, Inc., The New Germany Fund, Inc. and The Central and Eastern Europe Fund, Inc. | |
Caroline Pearson(6) (1962) Assistant Secretary, 2020-present | Managing Director(3) in DWS US Retail Legal; Chief Legal Officer of DWS US registered investment companies advised by DWS Investment Management Americas, Inc. (2010-present); Chief Legal Officer, The European Equity Fund, Inc., The New Germany Fund, Inc. and The Central and Eastern Europe Fund, Inc. (2012-present); formerly: Secretary, Deutsche AM Distributors, Inc. (2002-2017); and Secretary, Deutsche AM Service Company (2010-2017). | |
Paul Antosca(6) (1957) Assistant Treasurer, 2019-present | Director(3) in DWS; Assistant Treasurer for DWS US registered investment companies advised by DWS Investment Management Americas, Inc. (2007-present). |
62
DBX ETF Trust
Board Members and Officers (Unaudited) (Continued)
Officers(2) |
Name, Year of Birth, Position with the Trust and Length of Time Served(4) | Business Experience and Directorships During the Past 5 Years | |
Jeffrey Berry(6) (1959) Assistant Treasurer, 2019-present | Director(3) in DWS. | |
Sheila Cadogan(6) (1966) Assistant Treasurer, 2019-present | Director(3) in DWS; Assistant Treasurer for DWS US registered investment companies advised by DWS Investment Management Americas, Inc. (2017-present); Director and Vice President, DWS Trust Company (2018-present); Assistant Treasurer, The European Equity Fund, Inc., The New Germany Fund, Inc. and The Central and Eastern Europe Fund, Inc. (2018-present). | |
Christina A. Morse(7) (1964) Assistant Secretary, 2017-present | Vice President at BNY Mellon-Asset Servicing (2014-present); Vice President and Counsel at Lord Abbett & Co. LLC (2013-2014). | |
Michelle Goveia-Pine(5) (1970) Interim Anti-Money Laundering Compliance Officer, since July 9, 2020 | Director(3) in DWS; Interim AML Officer, DWS Trust Company (since July 28, 2020); and Interim AML Officer of DWS US registered investment companies advised by DWS Investment Management Americas, Inc. (since July 10, 2020); Interim AML Officer, The European Equity Fund, Inc., The New Germany Fund, Inc. and The Central and Eastern Europe Fund, Inc. (since July 24, 2020). |
(1) The length of time served is represented by the year in which the Board Member joined the Board.
(2) As a result of their respective positions held with the Advisor and its affiliates, these individuals are considered “interested persons” of the Advisor within the meaning of the 1940 Act. Interested persons receive no compensation from the Funds.
(3) Executive title, not a board directorship.
(4) The length of time served is represented by the year in which the officer was first elected to the Trust in such capacity.
(5) Address: 875 Third Avenue, New York, New York 10022.
(6) Address: One International Place, Boston, Massachusetts 02110.
(7) Address: BNY Mellon Asset Servicing, Atlantic Terminal Office Tower, 2 Hanson Place, Brooklyn, NY 11217.
The Funds’ Statement of Additional Information (“SAI”) includes additional information about the Funds’ Board Members. The SAI is available by calling 855-329-3837, or on the Company’s website at www.Xtrackers.com.
63
DBX ETF Trust
Xtrackers Harvest CSI 300 China A-Shares ETF and Xtrackers Harvest CSI 500 China A-Shares Small Cap ETF
After discussions at the meeting of the Board of Trustees (“Board” or “Trustees”) held on February 26-27, 2020 (the “Meeting”), the Trustees, all of whom are Independent Trustees (those not affiliated with DBX ETF Trust (the “Trust”) or its service providers), unanimously approved the continuance of the Investment Advisory Agreement and Investment Sub-Advisory Agreement with respect to Xtrackers Harvest CSI 300 China A-Shares ETF and Xtrackers Harvest CSI 500 China A-Shares Small Cap ETF (each a “Fund,” and collectively, the “Funds”). The Independent Trustees were advised throughout the review and Meeting by K&L Gates LLP (“Independent Trustee Counsel”).
Before reaching their decision to continue in effect the Investment Advisory Agreement and the Investment Sub-Advisory Agreement for another annual period, the Independent Trustees evaluated the materials furnished to them in advance of the Meeting from DBX Advisors LLC (“DBX” or the “Advisor”) and Harvest Global Investments Limited (“Harvest” or “Sub-Advisor”) for purposes of reviewing the agreements’ terms and also took into consideration the discussions they had with management during the Meeting and among themselves during their Executive Sessions held on February 26 and February 27, 2020. The Independent Trustees also noted that they had received and should take into consideration a substantial amount of information furnished throughout the year at regular Board meetings, which information included, among other things, an analysis of each Fund’s investment performance and related financial information, presentations given by DBX and Harvest, as well as periodic reports on brokerage commissions, portfolio execution and other services provided to the Funds.
In reaching its decision with respect to the Investment Advisory Agreement, the Board considered all factors it believed relevant, including (1) the nature, extent and quality of the services provided to the Funds and their shareholders; (2) the financial resources of DBX and its resulting ability to perform its obligations under the Investment Advisory Agreement; (3) the competitiveness of the advisory fee; (4) the total cost of the services provided by and the profits realized by the Advisor from its relationship with the Funds; (5) the extent to which economies of scale have been realized, and if the Funds’ shareholders have benefitted from those economies; and (6) fall out benefits, if any, enjoyed by the Advisor.
In reaching its decision with respect to the Investment Sub-Advisory Agreement, the Board considered all factors it believed relevant, including (1) the nature, extent and quality of the services provided to the Funds and their shareholders; (2) the performance of Harvest with respect to its management of the Funds, as well as Harvest’s financial resources and its resulting ability to perform its obligations under the Investment Sub-Advisory Agreement; (3) the total cost of the services provided by Harvest from its relationship with the Funds; (4) the extent to which economies of scale have been realized, and if the Funds’ shareholders have benefitted from those economies; and (5) fall out benefits, if any, enjoyed by the Sub-Advisor.
The Board reached a determination, with the assistance of Independent Trustee Counsel and Dechert LLP (“Trust Counsel”) and through the exercise of its business judgment, that approval of the Investment Advisory Agreement and the Investment Sub-Advisory Agreement and the compensation to be received thereunder is in the best interests of each Fund and its shareholders as well as consistent with the Board’s duties under state and federal law. The Board reached this conclusion based on multiple factors.
The Board considered the following in determining whether to approve the Investment Advisory Agreement:
Nature, Extent and Quality of Services. The Board reviewed in detail the nature, extent and quality of services provided and the risks incurred by the Advisor under the Investment Advisory Agreement. In doing so, the Board considered the information it had received from and the discussions it had with the Advisor continuously during the prior year, in addition to the information the Advisor had provided in response to the Board’s requests prior to the Meeting. The Board considered that these services include, among other things, furnishing a continuous investment program for the Funds, including arranging for, or implementing, the purchase and sale of portfolio securities, the provision of general corporate services such as portfolio management compliance services and the preparation and filing of certain reports on behalf of the Trust. The Board also considered, among other things, the professional experience, qualifications and performance of the senior management and key professional personnel of the Advisor, including portfolio management.
64
DBX ETF Trust
Board Considerations in Approval of Investment Advisory and
Sub-Advisory Contracts (Unaudited) (Continued)
The Board considered that the Advisor provides, at its own expense, office facilities and equipment for use by the Funds and supervisory persons responsible for supervising and monitoring the Trust’s service providers. The Board also considered that the Advisor pays or arranges for the compensation of officers of the Trust who are also officers or employees of the Advisor or one of its DWS Group affiliates, except as may otherwise be determined by the Board. The Board also considered that the Advisor arranges for the provision of transfer agency, custody, fund administration and accounting, and other non-distribution services necessary for the Funds’ operation. The Board also considered the role played by the Advisor in working with Harvest to manage the Funds’ portfolios, noting that the Advisor provides oversight of day-to-day operations, including monitoring tracking error, providing services in connection with the creation and redemption of creation units and assistance in meeting legal, compliance and regulatory requirements applicable to the Funds. The Board considered the information regarding each Fund’s tracking error compared to its underlying index that had been provided by the Advisor and by Broadridge Financial Solutions Inc. (“Broadridge”). The Board took note of the detailed information provided by the Advisor throughout the year with respect to each Fund’s tracking error and the sources thereof. The Trustees noted that tracking error for each Fund during the year was in an expected range.
Based on its review, the Board concluded that the nature, extent, and quality of services provided by the Advisor under the Investment Advisory Agreement are reasonable and appropriate in relation to the fees paid to the Advisor, taking special consideration of the fact that the advisory fee is a unitary fee and, as a result, a portion of the unitary advisory fee will be used to compensate the Funds’ service providers. The Board considered the staffing of the Advisor, including the training, qualifications and experience of investment personnel in managing the Funds. The Board also considered the expertise of the Advisor in supervising third party service providers to the Funds, such as the administrator and the custodian, noting the Advisor’s extensive work with these service providers (including onsite due diligence sessions) to conduct such supervision. The Board further considered the compliance program of the Advisor, which supports the Funds’ compliance program.
Advisor’s Financial Resources. In connection with the assessment of the ability of the Advisor to perform its duties under the Investment Advisory Agreement, the Board considered the Advisor’s financial condition and whether it has the resources necessary to carry out its functions. The Board concluded that the Advisor has the financial resources necessary to perform its obligations under the Investment Advisory Agreement.
Reasonableness of Advisory Fee. The Board compared each Fund’s advisory fee and total expenses to those of the other ETFs in its Peer Group. The Board noted that due to the special characteristics of certain Funds, there were limitations faced by Broadridge in providing comparable funds in the Peer Groups and the information in the Broadridge reports accordingly may or may not provide meaningful direct comparisons to the Funds. The Board considered that while each Fund’s advisory fees and total expenses after waivers/reimbursements were above the average and median of those Funds’ respective Peer Groups, many of those other ETFs in the Funds’ respective Peer Groups only invested directly in A-Shares through the Stock Connect programs, rather than also utilizing the Renminbi Qualified Foreign Institutional Investor (“RQFII”) program, as the Funds did using the quota allocated to the Sub-Advisor. The Board also noted that the Chinese authorities had announced that the quotas under the RQFII system would be abolished, but that it was unclear when that would occur.
The Board considered that the fee for the Funds is a unitary fee pursuant to which the Advisor pays all of the Funds’ costs (subject to certain specified exceptions). The Board considered that each Fund’s fee had been priced to scale when it was established. The Board also considered that the Funds’ portfolios are managed on a day-to-day basis by the Sub-Advisor, which receives a fee from the Advisor. The Board considered the allocation of responsibilities between the Advisor and Sub-Advisor and noted that the Advisor provides oversight of day-to-day operations, including monitoring tracking error, providing services in connection with creation and redemption units and assistance in meeting legal and regulatory requirements applicable to the Funds. Based on its review, the Board concluded that the advisory fee is reasonable in light of the services provided.
Costs of Services and Profitability. The Board considered the expenses of the Advisor in developing and rendering services to the Funds and the information provided by the Advisor to the Board regarding the Funds’ profitability. The Board considered that the Advisor had provided extensive information about the Advisor’s profitability and the Advisor’s methodology in determining profitability. While the Advisor had provided
65
DBX ETF Trust
Board Considerations in Approval of Investment Advisory and
Sub-Advisory Contracts (Unaudited) (Continued)
information about the Advisor’s expenses relating to marketing the Funds, the Board considered the Advisor’s profitability without accounting for such expenses. The Board determined that only Xtrackers Harvest CSI 300 China A-Shares ETF was profitable as of this time and the Advisor’s profitability with respect to the Fund was not excessive. The Board also noted that since the fee paid by the Advisor to the Sub-Advisor under the Investment Sub-Advisory Agreement contained breakpoints, the Advisor could experience increased profitability as the Funds’ assets increased. The Board considered whether the Advisor would benefit in other ways from its relationships with the Funds and concluded that there were no material fall-out benefits likely to accrue to the Advisor related to the operation of the Funds.
Economies of Scale. The Board considered that Xtrackers Harvest CSI 300 China A-Shares ETF had attracted a substantial amount of assets (though it had also experienced outflows during the year), but determined that the Fund was not experiencing economies of scale beyond what was reflected in the Fund’s unitary fee, which the Board noted was very competitive. The Board considered that Xtrackers Harvest CSI 500 China A-Shares Small Cap ETF was not experiencing economies of scale at this time and determined to evaluate the economies of scale on an ongoing basis as a result of asset growth of the Funds.
Given all the information available to it and considering all material factors, the Board concluded that the Investment Advisory Agreement was fair and reasonable and it was unanimously approved.
The Board considered the following in determining whether to approve the Investment Sub-Advisory Agreement:
Nature, Extent and Quality of Services. In considering the nature, extent and quality of services that Harvest provides to the Funds, the Board reviewed in detail the nature, extent and quality of services provided by Harvest under the Investment Sub-Advisory Agreement. In doing so, the Board considered the information it had received from the Sub-Advisor continuously during the prior year, in addition to the information the Sub-Advisor had provided in response to the Board’s requests prior to the Meeting. The Board considered that these services include, among other things, furnishing a continuous investment program for the Funds, including arranging for, or implementing, the purchase and sale of portfolio securities.
The Board also considered Harvest’s operational capabilities and resources, and its experience in serving as investment sub-Advisor to the Funds. The Board considered the professional experience, qualifications and performance of Harvest’s senior management and key professional personnel, as well as Harvest’s depth and breadth of experience in managing investment portfolios consisting of China A-Shares, and their techniques for implementing such strategies while minimizing index tracking error. The Board particularly considered the value of the access to China A-Shares provided to the Funds by Harvest through Harvest’s RQFII quota granted by the Chinese authorities, noting that it was in the Funds’ best interests to maintain as many means as possible to access China A-Shares. The Board also noted that the Chinese authorities had announced that the quotas under the RQFII system would be abolished, but that it was unclear when that would occur. In addition, the Board considered Harvest’s operational capabilities and resources, and Harvest’s experience in managing index funds covering various asset classes. The Board noted that Harvest manages its index-based portfolios using both full replication and sampling techniques and maintains strict discipline in the implementation of its indexing strategies. To that end, the Board noted that when there are changes to a benchmark index, Harvest closely monitors any such changes to devise strategies to realign its portfolios at the lowest possible cost while tracking the respective benchmark index. The Board also noted Harvest’s processes to minimize the cost of trading.
Based on its review, the Board concluded that the nature, extent, and quality of services provided by Harvest under the Investment Sub-Advisory Agreement are reasonable and appropriate in relation to the fees paid to Harvest, taking special consideration of the fact that the fees paid to Harvest are payable by the Advisor and not the Funds.
Performance of Harvest; Harvest’s Financial Resources. The Board considered Harvest’s performance in managing the Funds and its ability to minimize tracking error. The Board concluded that, given Harvest’s capabilities and experience in managing the Funds, Harvest had generally been able to keep the Funds’ tracking error within acceptable ranges.
66
DBX ETF Trust
Board Considerations in Approval of Investment Advisory and
Sub-Advisory Contracts (Unaudited) (Continued)
The Board also considered Harvest’s financial condition and whether it has the resources necessary to carry out its functions. The Board concluded that Harvest has the financial resources necessary to perform its obligations under the Investment Sub-Advisory Agreement.
Reasonableness of Sub-Advisory Fee. The Board considered that the fee paid to Harvest in respect of the Funds would be paid by the Advisor and not the Funds. The Board considered that the fee for the Funds was a unitary fee pursuant to which the Advisor would pay all of the Funds’ costs (subject to certain specified exceptions), and thus was not directly affected by the amount of the sub-advisory fee paid to Harvest. Based on its review, the Board concluded that the sub-advisory fee was reasonable in light of the services provided.
Costs of Services and Profitability. The Board considered that the fees paid by the Advisor to Harvest under the Investment Sub-Advisory Agreement contain breakpoints. The Board further considered that specific information about Harvest’s profitability with respect to its services provided to the Funds was not available because Harvest does not calculate the profitability of its sub-advisory services on a per-Fund level. The Board also considered that the overall fees paid by each Fund remained reasonable.
The Board also considered whether Harvest would benefit in other ways from its relationship with the Funds. The Board discussed Harvest’s practices regarding the selection and compensation of brokers and dealers that execute portfolio transactions for the Funds and the brokers’ and dealers’ provision of brokerage services to Harvest. The Board discussed the potential benefits Harvest might derive from the Funds’ soft dollar arrangements, whereby brokers provide brokerage services to the Funds or Harvest in return for allocating fund brokerage.
Economies of Scale. The Board considered that Xtrackers Harvest CSI 300 China A-Shares ETF had attracted a substantial amount of assets, but determined that the Fund was not experiencing economies of scale beyond what was reflected in the Fund’s unitary fee, which the Board noted was very competitive. The Board considered that Xtrackers Harvest CSI 500 China A-Shares Small Cap ETF was not experiencing economies of scale at this time and determined to evaluate the economies of scale on an ongoing basis as a result of asset growth of the Funds.
Given all the information available to it and considering all material factors, the Board concluded that the Investment Sub-Advisory Agreement was fair and reasonable and it was unanimously approved.
Xtrackers MSCI All China Equity ETF and Xtrackers MSCI China A Inclusion Equity ETF
After discussions at the meeting of the Board of Trustees (“Board” or “Trustees”) held on February 26-27, 2020 (the “Meeting”), the Trustees, all of whom are the Independent Trustees (those not affiliated with DBX ETF Trust (the “Trust”) or its service providers), unanimously approved the continuance of the Investment Advisory Agreement with respect to Xtrackers MSCI All China Equity ETF and Xtrackers MSCI China A Inclusion Equity ETF (each a “Fund,” and collectively, the “Funds”). The Independent Trustees were advised throughout the review and Meeting by K&L Gates LLP (“Independent Trustee Counsel”).
Before reaching their decision to approve the Investment Advisory Agreement for another annual period, the Independent Trustees evaluated the materials furnished to them in advance of the Meeting from DBX Advisors LLC (“DBX” or the “Advisor”) for purposes of reviewing the agreement’s terms, including statistical information prepared by Broadridge Financial Solutions Inc. (“Broadridge”) regarding (a) fee and expense information for each Fund (including the fee and expense components and any amounts waived or reimbursed) as compared to a peer group of other exchange-traded funds (“ETFs”) selected pursuant to Broadridge’s proprietary methodology (each, a “Peer Group”) and (b) each Fund’s tracking error as compared to its underlying index over the previous five years (or since inception, if shorter). The Independent Trustees also took into consideration the discussions they had with management during the Meeting and among themselves during their Executive Sessions held on February 26 and February 27, 2020. The Independent Trustees also noted that they had received and should take into consideration a substantial amount of information furnished throughout the year at regular Board meetings, which information included, among other things, an analysis of each Fund’s investment performance, tracking error and related financial information, presentations given by DBX, as well as its periodic reports on brokerage commissions, portfolio execution and other services provided to the Funds.
67
DBX ETF Trust
Board Considerations in Approval of Investment Advisory and
Sub-Advisory Contracts (Unaudited) (Continued)
In reaching its decision to continue in effect the Investment Advisory Agreement for another annual period, the Board considered all factors it believed relevant, including (1) the nature, extent and quality of the services provided to the Funds and their shareholders; (2) the financial resources of DBX and its resulting ability to perform its obligations under the Investment Advisory Agreement; (3) the competitiveness of the advisory fee; (4) the total cost of the services provided by and the profits realized by the Advisor from its relationship with the Funds; (5) the extent to which economies of scale have been realized, and if the Funds’ shareholders have benefitted from those economies; and (6) fall out benefits, if any, enjoyed by the Advisor.
The Board reached a determination, with the assistance of Independent Trustee Counsel and Dechert LLP (“Trust Counsel”) and through the exercise of its business judgment, that approval of the Investment Advisory Agreement and the compensation to be received thereunder is in the best interests of each Fund and its shareholders as well as consistent with the Board’s duties under state and federal law. The Board reached this conclusion based on multiple factors.
The Board considered the following in determining whether to approve the Investment Advisory Agreement:
Nature, Extent and Quality of Services. The Board reviewed in detail the nature, extent and quality of services provided and the risks incurred by the Advisor under the Investment Advisory Agreement. In doing so, the Board considered the information it had received from and the discussions it had with the Advisor continuously during the prior year, in addition to the information the Advisor had provided in response to the Board’s requests prior to the Meeting. The Board considered that these services include, among other things, furnishing a continuous investment program for the Funds, including arranging for, or implementing, the purchase and sale of portfolio securities, the provision of general corporate services such as portfolio management compliance services and the preparation and filing of certain reports on behalf of the Trust. The Board also considered, among other things, the professional experience, qualifications and performance of the senior management and key professional personnel of the Advisor, including portfolio management.
The Board considered that the Advisor provides, at its own expense, office facilities and equipment for use by the Funds and supervisory persons responsible for supervising and monitoring the Trust’s service providers. The Board also considered that the Advisor pays or arranges for the compensation of officers of the Trust who are also officers or employees of the Advisor or one of its DWS Group affiliates, except as may otherwise be determined by the Board. In addition, the Board considered that the Advisor arranges for the provision of transfer agency, custody, fund administration and accounting, and other non-distribution services necessary for the Funds’ operations. The Board also considered that in addition to managing the Funds’ portfolios directly, the Advisor provides oversight of day-to-day operations, including monitoring tracking error, providing services in connection with the creation and redemption of creation units and assistance in meeting legal, compliance and regulatory requirements applicable to the Funds.
The Board considered the information regarding each Fund’s tracking error compared to its underlying index that had been provided by the Advisor and by Broadridge. The Board took note of the detailed information provided by the Advisor throughout the year with respect to each Fund’s tracking error and the sources thereof. The Trustees noted that tracking error for each Fund during the year was in an expected range.
Based on its review, the Board concluded that the nature, extent, and quality of services provided by the Advisor under the Investment Advisory Agreement are reasonable and appropriate in relation to the fees paid to the Advisor, taking special consideration of the fact that the advisory fee is a unitary fee and, as a result, a portion of the unitary advisory fee will be used to compensate the Funds’ service providers. The Board considered the staffing of the Advisor, including the training, qualifications and experience of investment personnel in managing the Funds. The Board also considered the expertise of the Advisor in supervising third party service providers to the Funds, such as the administrator and the custodian, noting the Advisor’s extensive work with these service providers (including onsite due diligence sessions) to conduct such supervision. The Board further considered the compliance program of the Advisor, which supports the Funds’ compliance program.
Advisor’s Financial Resources. In connection with the assessment of the ability of the Advisor to perform its duties under the Investment Advisory Agreement, the Board considered the Advisor’s financial condition and
68
DBX ETF Trust
Board Considerations in Approval of Investment Advisory and
Sub-Advisory Contracts (Unaudited) (Continued)
whether it has the resources necessary to carry out its functions. The Board concluded that the Advisor has the financial resources necessary to perform its obligations under the Investment Advisory Agreement.
Reasonableness of Advisory Fee. The Board compared each Fund’s advisory fee and total expenses to those of the other ETFs in its Peer Group. The Board noted that due to the special characteristics of certain Funds, there were limitations faced by Broadridge in providing comparable funds in the Peer Groups and the information in the Broadridge reports accordingly may or may not provide meaningful direct comparisons to the Funds. The Board also noted that the advisory fees and total expenses (after waivers/reimbursements) for the Funds were below or equal to the average and/or median of the ETFs in each Fund’s respective Peer Group compiled by Broadridge.
The Board accordingly noted that each Fund’s fee is competitive with the fees of applicable peer ETFs.
The Board considered that the fee for each of the Funds is a unitary fee pursuant to which the Advisor pays all of the Funds’ costs (subject to certain specified exceptions). The Board considered that each Fund’s fee had been priced to scale when it was established. The Board also considered that each Fund’s portfolio is managed on a day-to-day basis by the Advisor and that the Advisor also provides oversight of day-to-day operations, including monitoring tracking error, providing services in connection with creation and redemption units and assistance in meeting legal and regulatory requirements applicable to the Funds. Based on its review, the Board concluded that the advisory fee for each Fund is reasonable in light of the services provided.
Costs of Services and Profitability. The Board considered the expenses of the Advisor in developing and rendering services provided to the Funds and the information provided by the Advisor to the Board regarding the Funds’ profitability. The Board considered that the Advisor had provided extensive information about the Advisor’s profitability and the Advisor’s methodology in determining profitability. While the Advisor had provided information about the Advisor’s expenses relating to marketing the Funds, the Board considered the Advisor’s profitability without accounting for such expenses. The Board determined that, although only some of the Funds were profitable as of this time, the Advisor’s profitability with respect to each profitable Fund was not excessive. The Board considered whether the Advisor would benefit in other ways from its relationships with the Funds and concluded that there were no material fall-out benefits likely to accrue to the Advisor related to the operation of the Funds.
Economies of Scale. The Board considered that certain Funds had attracted a substantial amount of assets, but determined that those Funds were not experiencing economies of scale beyond what was reflected in each Fund’s unitary fee, which the Board noted was very competitive. The Board considered that the other Funds were not experiencing economies of scale at this time and determined to revisit this matter after the Funds had attracted more assets.
Given all the information available to it and considering all material factors, the Board concluded that the Investment Advisory Agreement was fair and reasonable and it was unanimously approved.
69
DBX ETF Trust
Proxy Voting Policies and Procedures
The Funds’ policies and procedures for voting proxies for portfolio securities and information about how each Fund voted proxies related to its portfolio securities during the most recent 12-month period ended June 30 are available on our Web site — www.Xtrackers.com (click on “Resources” and “Proxy Voting” at the top of the page) — or on the SEC’s Web site — www.sec.gov. To obtain a written copy of the Funds’ policies and procedures without charge, upon request, call us toll free at (855) 329-3837.
Portfolio Holdings Information
The Funds are required to file their complete schedule of portfolio holdings with the SEC for their first and third fiscal quarters on Form N-PORT. Copies of the filings are available without charge, upon request on the SEC’s website at www.sec.gov and are available by calling the Trust at 855-329-3837.
Information about each Fund’s portfolio holdings is available daily at www.Xtrackers.com.
Discount & Premium Information
Information regarding how often shares of each Fund traded on NYSE Arca at a price above (i.e., at a premium) or below (i.e., at a discount) the NAV of the Fund can be found at www.Xtrackers.com.
Tax Information
Form 1099-DIV and other year-end tax information provide shareholders with actual calendar year amounts that should be included in their tax returns. Shareholders should consult their tax advisors.
Each Fund designates the following amounts or, if subsequently determined to be different, the maximum allowable for its period ended May 31, 2020.
| Qualified Dividend Income* | ||||
Xtrackers Harvest CSI 300 China A-Shares ETF | 100% | |||
Xtrackers Harvest CSI 500 China A-Shares Small Cap ETF | 100% | |||
Xtrackers MSCI All China Equity ETF | 78% | |||
Xtrackers MSCI China A Inclusion Equity ETF | 100% | |||
* The above percentage is based on ordinary income dividends paid to shareholders during each Fund’s fiscal year.
Each Fund intends to elect to pass through to shareholders the credit for taxes paid to foreign countries. The gross foreign source income and foreign taxes paid are as follows:
| Gross Foreign Income | Foreign Taxes Paid | |||||||
Xtrackers Harvest CSI 300 China A-Shares ETF | $31,956,192 | $3,198,842 | ||||||
Xtrackers Harvest CSI 500 China A-Shares Small Cap ETF | 651,946 | 66,443 | ||||||
Xtrackers MSCI China A Inclusion Equity ETF | 520,540 | 51,846 | ||||||
70
DBX ETF Trust
DBX Advisors LLC (“Advisors”) collects non-public information about you from the following sources: (i) information received from you on applications or other forms; and (ii) information about your transactions with the Advisors, Advisors’ affiliates and third-party service providers and vendors. Advisors does not disclose any non-public personal information about you to anyone, other than as set forth below, as permitted by applicable law and regulation. Advisors may disclose non-public personal information about you to the funds in which you invest, to Advisors’ affiliates, and to non-affiliated companies that work with Advisors to service your account(s), or to provide services or process transactions that you have requested. Advisors may disclose non-public personal information in situations that may include, but are not limited to, in response to legal and/or regulatory inquiries and the proposed or actual sale, assignment merger or other transfer of all or a portion of Advisors’ business to another business entity. Advisors may also disclose non-public personal information about you to parties representing you, such as your investment representative, your accountant, your tax advisor, or to other third parties at your direction/consent. Advisors will not sell, rent, license or trade your personal and financial information to or with third parties for their own direct marketing use unless you give us general or specific consent to do so. If you decide to close your account(s) or become an inactive customer, Advisors will adhere to the privacy policies and practices as described in this notice. Advisors restricts access to your personal and account information to those employees who need to know that information to provide products and services to you. Advisors maintains reasonable and customary physical, electronic and procedural safeguards to guard your non-public personal information.
California residents may go to https://fundsus.dws.com/us/en-us/legal-resources/privacy-policy.html to obtain additional information relating to their rights under California state law.
Advisors reserves the right, at their discretion, to change, modify, add, or remove portions of this Privacy Policy Notice, and any of the policies described herein, at any time. Advisors will indicate any such changes to the Privacy Policy Notice at the privacy link which can be found at www.Xtrackers.com. At all times, you are bound by the then-current version of the Privacy Policy and all applicable laws. Advisors highly recommends that you review this Privacy Policy Notice from time to time to ensure that you are familiar with the most recent version. The examples contained in this Privacy Policy Notice are illustrations; they are not intended to be exclusive.
71
DBX ETF Trust
This report is intended for the shareholders of DBX ETF Trust.
This report must be preceded or accompanied by a prospectus.
Investing involves risk, including possible loss of principal. Stocks may decline in value. Foreign investing involves greater and different risks than investing in U.S. companies, including currency fluctuations, less liquidity, less developed or less efficient trading markets, lack of comprehensive company information, political instability and differing auditing and legal standards. Funds investing in a single industry, country or in a limited geographic region generally are more volatile than more diversified funds. Special risks associated with investments in Chinese companies include exposure to currency fluctuations, less liquidity, less developed or less efficient trading markets, lack of comprehensive company information, political instability and differing auditing and legal standards, the nature and extent of intervention by the Chinese government in the Chinese securities markets, and the potential unavailability of A shares. Uncertainties in the Chinese tax rules governing taxation of income and gains from investments in A-shares could result in unexpected tax liabilities for the Funds which may reduce Fund returns. Any reduction or elimination of access to A-shares will have a material adverse effect on the ability of the Funds to achieve its investment objective. CN and ASHX are currently non-diversified and can take larger positions in fewer issues, increasing the Fund’s potential risk. Performance of the Funds may diverge from that of the Underlying Index due to operating expenses, transaction costs, cash flows, use of sampling strategies or operational inefficiencies. An investment in these Funds should be considered only as a supplement to a complete investment program for those investors willing to accept the risks associated with the Funds. Please read the prospectus for more information.
War, terrorism, economic uncertainty, trade disputes, public health crises (including the recent pandemic spread of the novel coronavirus) and related geopolitical events could lead to increased market volatility, disruption to U.S. and world economies and markets and may have significant adverse effects on the Funds and their investments.
Shares of the Funds are bought and sold at market price (not NAV) throughout the day on the NYSE Arca, Inc. Transactions in Fund shares may result in brokerage commissions and may generate tax consequences. There can be no assurance that an active trading market for shares of a Fund will develop or be maintained.
DBX ETF Trust Funds are distributed by ALPS Distributors, Inc. (“ALPS”). The Funds are managed by DBX Advisors LLC which is not affiliated with ALPS.
The brand DWS represents DWS Group GmbH & Co. KGaA and any of its subsidiaries such as DWS Distributors, Inc. which offers investment products or DWS Investment Management Americas, Inc. and RREEF America L.L.C. which offer advisory services.
The CSI Indexes are calculated by China Securities Index Co., Ltd. (CSI). CSI does not make any warranties, express or implied, to its customers or any other party regarding the accuracy or completeness of any data related to the Index. All information is provided for information purposes only. CSI accepts no liability for any errors or any loss arising from the use of information it provides.
The Funds or securities referred to herein are not sponsored, endorsed, issued, sold or promoted by MSCI, and MSCI bears no liability with respect to any such Funds or securities or any index on which such Funds or securities are based. The prospectus contains a more detailed description of the limited relationship MSCI has with DBX Advisors LLC and any related funds.
Copyright © 2020 DWS Group. All rights reserved. XtrackersTM is a trademark of DWS Investment GmbH. All other trademarks, servicemarks or registered trademarks are the property of their respective owners.
Not FDIC Insured | No Bank Guarantee | May Lose Value
DBX ETF Trust
Investment advisor DBX Advisors LLC 875 Third Avenue New York, NY 10022 | Investment sub-advisor Harvest Global Investments Limited 31/F, One Exchange Square 8 Connaught Place Central, Hong Kong | Administrator, custodian, fund accounting agent, lending agent & transfer agent The Bank of New York Mellon 240 Greenwich Street New York, NY 10286 | ||
Distributor ALPS Distributors, Inc. 1290 Broadway Suite 1000 Denver, CO 80203 | Independent registered public accounting firm Ernst & Young LLP 5 Times Square New York, NY 10036 | Legal counsel Dechert LLP 1095 Avenue of the Americas New York, NY 10036 | ||
R-35360-7 (7/20) DBX004441 (7/21)
May 31, 2020
Annual Report
DBX ETF Trust
Xtrackers Eurozone Equity ETF (EURZ)
Xtrackers International Real Estate ETF (HAUZ)
Xtrackers Japan JPX-Nikkei 400 Equity ETF (JPN)
Xtrackers MSCI Latin America Pacific Alliance ETF (PACA)

DBX ETF Trust
| Page | ||||
| 1 | ||||
| 3 | ||||
Performance Summary | ||||
| 6 | ||||
| 8 | ||||
| 10 | ||||
| 12 | ||||
| 14 | ||||
Schedules of Investments | ||||
| 15 | ||||
| 20 | ||||
| 28 | ||||
| 33 | ||||
| 36 | ||||
| 37 | ||||
| 38 | ||||
| 40 | ||||
| 42 | ||||
| 52 | ||||
| 54 | ||||
| 55 | ||||
Board Considerations in Approval of Investment Advisory Contract | 58 | |||
| 61 | ||||
| 62 | ||||
To our Shareholders: (Unaudited)
Dear Shareholders,
We are pleased to provide this annual report for 4 of our sector ETFs for the period ended May 31, 2020.
The global economy experienced weak growth during the reporting period owing to the COVID-19 pandemic, trade conflicts and volatile energy prices. As large parts of the global economy were shut down, most countries faced record economic declines, as the ensuing lockdown affected both production and consumption. While the U.S. experienced strong growth for the majority of the reporting period, the economy went through the sharpest quarterly decline in early 2020 since 2008. The Chinese economy contracted for the first time in decades in Q1 2020, as most of the economic activity was ceased to tackle the pandemic. Emerging market currencies came under pressure, as measures taken to contain the pandemic affected the fiscal situation of these countries.
An already weak Eurozone economy contracted in early 2020, as it was among the most infected regions in the world. The contraction was driven by weak business and household activity, due to measures taken by the government to contain the spread. France and Spain were among the hardest hit, leading to a significant contraction in their economies. Germany, too, saw unemployment numbers rising and the composite Purchasing Managers Index (PMI) falling to an all-time low. The European Central Bank (ECB) took drastic steps to keep its economies afloat during the lockdown, easing the requirements for its refinancing operations and announcing a new asset purchase program. The shift in the economic landscape due to the pandemic drove the ECB to initiate a EUR1.35 trillion Pandemic Emergency Purchase Program.
The Japanese economy entered a technical recession1 after contracting in two consecutive quarters, as an increase in consumption tax, coupled with lockdown measures, considerably hurt domestic and global demand. Exports decreased significantly, as supply chain disruptions from the COVID-19 outbreak took a toll on shipments of Japanese goods. To support businesses and consumers, the government decided to provide a stimulus package worth 20% of GDP2. Latin American economies also contracted owing to weak domestic activity, a drop in prices of export commodities, and a significant number of job losses. Most currencies across the region lost strength against the U.S. dollar (USD) amid fears of further economic downturn. To protect the economies from a further fallout due to the COVID-19 pandemic, all the major central banks in the region have cut interest rates by record levels and taken measures to increase liquidity in the financial system.
Global Real Estate markets remained steady throughout 2019 before facing a slowdown due to the COVID-19 pandemic. In Europe, despite low population growth, urbanization helped boost real estate returns. In a world with negative sovereign bond yields, real estate emerged as an attractive asset class, with yield spreads to sovereign bond yields averaging over 3% globally in 2019. Despite rental declines in most sectors during 2020, residential and logistics remained resilient, benefiting from a limited supply pipeline and sustained increase in demand from ecommerce.
The prime focus of policymakers across the world would be to cushion the pandemic’s health and economic consequences. While the near-term outlook remains challenging, economic activity has resumed gradually in most countries, as restrictions imposed under the lockdown are being relaxed. This, coupled with fiscal stimulus packages and accommodative central bank monetary policies, should boost economic growth.
1
Our team appreciates your trust and looks forward to serving your investment needs through innovative index-driven strategies.
Sincerely,
/s/ Freddi Klassen
Freddi Klassen
President and Chief Executive Officer
1 A “technical recession” is when you have 2 negative quarters of GDP, but it is due mainly to slowing growth or an isolated event rather than a major underlying cause. Technical recessions are usually short in duration and mild in severity. The gross domestic product (GDP) is the monetary value of all the finished goods and services produced within a country’s borders in a specific time period.
2 The gross domestic product (GDP) is the monetary value of all the finished goods and services produced within a country’s borders in a specific time period.
Assumptions, estimates and opinions contained in this document constitute our judgment as of the date of the document and are subject to change without notice. Any projections are based on a number of assumptions as to market conditions and there can be no guarantee that any projected results will be achieved. Past performance is not a guarantee of future results.
2
DBX ETF Trust
Xtrackers Eurozone Equity ETF (EURZ)
Xtrackers Eurozone Equity ETF (EURZ) seeks investment results that correspond generally to the performance, before fees and expenses, of the NASDAQ Eurozone Large Mid Cap Index (the EURZ Index). The EURZ Index is designed to track the performance of equity securities of large- and mid-capitalization companies based in the countries in the Economic and Monetary Union (the “EMU” or “Eurozone”) of the European Union (“EU”). For the 12-month period ended May 31, 2020, EURZ shares returned -5.29%, compared to the EURZ Index return of -5.12%.
Financials, Industrials, Energy and Consumer Staples were the major negative contributors, while Health Care, Information Technology and Utilities sectors positively contributed the most to performance. From a geographical perspective, France, Spain and Belgium were the major negative contributors, while Netherlands, Finland and Ireland contributed positively to performance.
Xtrackers International Real Estate ETF
Xtrackers International Real Estate ETF (HAUZ), seeks investment results that correspond generally to the performance, before fees and expenses, of the iSTOXX Developed and Emerging Markets ex USA PK VN Real Estate Index (the HAUZ Index). The HAUZ index is a free-float capitalization weighted index that provides exposure to publicly traded real estate securities in countries outside the United States, excluding Pakistan and Vietnam. For the 12-month period ended May 31, 2020, HAUZ shares returned -14.80%, compared to the HAUZ Index return of -14.99%.
Within Real Estate, most sub-sectors detracted from performance with highest detraction from Retail REIT’s, Diversified Real Estate Activities and Diversified REIT’s, while Industrial REIT’s was a positive contributor. From a geographical perspective, Hong Kong, Japan and Australia were the major Negative contributors, while Sweden, Switzerland and Belgium contributed positively to performance.
Xtrackers Japan JPX-Nikkei 400 Equity ETF Xtrackers
Japan JPX-Nikkei 400 Equity ETF (JPN) seeks investment results that correspond generally to the performance, before fees and expenses, of the JPX-Nikkei 400 Net Total Return Index (the JPN Index). The JPN Index is designed to track the performance of equity securities of issuers who are primarily listed on the JASDAQ Stock Exchange (JASDAQ) or the following sections of the Tokyo Stock Exchange (TSE): the first section (for large companies), the second section (for middle-sized companies), and the “Mothers” (for high growth and emerging stocks). For the 12-month period ended May 31, 2020, JPN shares returned 7.87%, compared to the JPN Index return of 7.77%.
Health Care, Information Technology and Consumer Discretionary were the major positive contributors, while Financials, Real Estate and Energy sectors detracted most from the performance.
Xtrackers MSCI Latin America Pacific Alliance ETF
Xtrackers MSCI Latin America Pacific Alliance ETF (PACA), using a “passive” or indexing investment approach, seeks investment results that correspond generally to the performance, before fees and expenses, of the MSCI Latin America Pacific Alliance Capped Index (the PACA Index). The Underlying Index is designed to provide exposure to equity securities of issuers from Latin American member states of the Pacific Alliance, as well as securities of countries that are headquartered and carry out the majority of operations in these countries. For the 12-month period ended May 31, 2020, PACA shares returned -27.01%, compared to the PACA Index return of -26.77%.
Majority of the sectors contributed negatively to performance during the period with the greatest negative contribution coming from Financials, Consumer Staples and Materials. The Health Care sector was the only positive contributor to performance. Most countries contributed negatively with Mexico, Chile and Colombia being the most significant detractors.
*************************
Performance data quoted represents past performance and does not guarantee future results. Investment returns and principal value of an investment will fluctuate so that an investor’s shares, when sold or redeemed, may be worth more or less than their original cost. Current performance may be lower or higher than the performance
3
DBX ETF Trust
Management’s Discussion of Fund Performance (Unaudited) (Continued)
data quoted. To obtain the most recent month-end performance data visit www.Xtrackers.com. Returns assume that dividends and capital gains distributions have been reinvested. See pages 6-13 of this report for additional performance information, including performance data based on market value. The views expressed in this report reflect those of the portfolio management team only through the end of the period of the report as stated on the cover. The management team’s views are subject to change at any time based on market and other conditions and should not be construed as a recommendation. Current and future portfolio holdings are subject to risk.
4
This Page is Intentionally Left Blank
5
DBX ETF Trust
Xtrackers Eurozone Equity ETF (EURZ)
The Xtrackers Eurozone Equity ETF (the “Fund”), using a “passive” or indexing investment approach, seeks investment results that correspond generally to the performance, before fees and expenses, of NASDAQ Eurozone Large Mid Cap Index (the “Underlying Index”). The Underlying Index is designed to track the performance of equity securities of large- and mid-capitalization companies based in the countries in the Economic and Monetary Union (the “EMU” or “Eurozone”) of the European Union (“EU”). The MSCI ACWI ex USA Index is designed to provide exposure to equity securities in developed and emerging stock markets (excluding the United States). It is not possible to invest directly into an index.
| Performance as of 5/31/20 |
| Average Annual Total Return | ||||||||
| Net Asset Value | Market Value | NASDAQ Eurozone Large Mid Cap Index | MSCI ACWI ex USA Index | |||||
One Year | -5.29% | -5.33% | -5.12% | -3.43% | ||||
Since Inception1 | -2.62% | -2.60% | -2.51% | 2.12% | ||||
| Cumulative Total Returns | ||||||||
| Net Asset Value | Market Value | NASDAQ Eurozone Large Mid Cap Index | MSCI ACWI ex USA Index | |||||
One Year | -5.29% | -5.33% | -5.12% | -3.43% | ||||
Since Inception1 | -11.94% | -11.85% | -11.47% | 10.55% | ||||
1 Total returns are calculated based on the commencement of operations, August 19, 2015 (“Inception”).
Prior to October 27, 2017, the Fund was known as Xtrackers MSCI Southern Europe Hedged Equity ETF (DBSE) and had a different investment strategy. Past performance may have been different if the Fund’s current investment strategy had been in effect.
Past performance is no guarantee of future results. Current performance may be lower or higher than the performance data quoted. Performance data current to the most recent month-end is available at www.Xtrackers.com. Performance results assume reinvestment of all dividends and capital gain distributions and do not reflect the deduction of taxes that a shareholder would pay on fund distributions or on the sale of fund shares or redemption of fund creation units. The investment return and principal value of shares will vary with changes in market conditions. Shares may be worth more or less than their original cost when they are sold in the market or redeemed. Performance for certain funds may reflect a waiver of a portion of investment management fees. Without such waiver, performance would have been lower. The estimated operating expense ratio as disclosed in the most recent prospectus dated October 01, 2019, was 0.09%, and may differ from the expense ratio disclosed in the Financial Highlights table in this report.
The Fund’s net asset value or “NAV” is calculated by dividing the value of the Fund’s total assets less total liabilities by the number of shares outstanding. The price used to calculate market return (“Market Price”) is determined by using the midpoint between the highest bid and the lowest offer on the primary stock exchange on which shares of a fund are listed for trading, as of the time that such fund’s NAV is calculated. Since shares of a fund may not have traded in the secondary market until after the fund’s inception, for the period from inception to the first day of secondary trading, the NAV of the fund is used as a proxy for the Market Price to calculate market returns. Market and NAV returns assume that dividends and capital gain distributions have been reinvested at Market Price and NAV, respectively.
An index is a statistical composite that tracks a specified financial market or sector. Unlike a fund, an index does not actually hold a portfolio of securities and therefore does not incur the expenses incurred by a fund. These expenses negatively impact fund performance. Also, market returns do not include brokerage commissions that may be payable on secondary market transactions. If brokerage commissions were included, market returns would be lower.
6
DBX ETF Trust
Performance Summary (Unaudited)
Xtrackers Eurozone Equity ETF (EURZ) (Continued)
| Growth of an Assumed $10,000 Investment |
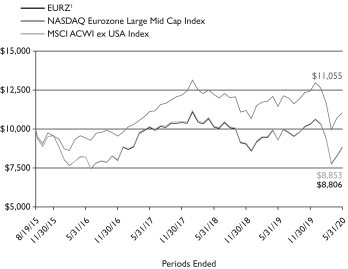
1 Based on Net Asset Value from commencement of operations, August 19, 2015.
| Sector Diversification* as of 5/31/20 |
Industrials | 14.7% | |||
Financials | 14.2% | |||
Consumer Discretionary | 12.9% | |||
Information Technology | 11.7% | |||
Consumer Staples | 10.3% | |||
Health Care | 9.5% | |||
Utilities | 7.4% | |||
Materials | 7.1% | |||
Communication Services | 5.5% | |||
Energy | 4.2% | |||
Real Estate | 2.5% | |||
|
| |||
Total | 100.0% |
| Ten Largest Equity Holdings as of 5/31/20 (23.4% of Net Assets) |
| Description | % of Net Assets | |||
SAP SE (Germany) | 3.3% | |||
ASML Holding NV (Netherlands) | 3.0% | |||
LVMH Moet Hennessy Louis Vuitton SE (France) | 2.9% | |||
Sanofi (France) | 2.7% | |||
TOTAL SA (France) | 2.3% | |||
Siemens AG (Germany) | 2.1% | |||
Unilever NV (United Kingdom) | 1.9% | |||
Allianz SE (Germany) | 1.8% | |||
L’Oreal SA (France) | 1.8% | |||
Bayer AG (Germany) | 1.6% | |||
| Country Diversification* as of 5/31/20 |
France | 33.1% | |||
Germany | 28.2% | |||
Netherlands | 10.8% | |||
Spain | 8.1% | |||
Italy | 6.1% | |||
Finland | 3.8% | |||
Belgium | 3.5% | |||
Ireland | 2.0% | |||
United Kingdom | 2.0% | |||
Other | 2.4% | |||
|
| |||
Total | 100.0% |
* As a percent of total investments excluding exchange-traded funds, securities lending collateral and cash equivalents.
Portfolio holdings and characteristics are subject to change. For more complete details about the Fund’s investment portfolio see page 15.
7
DBX ETF Trust
Performance Summary (Unaudited)
Xtrackers International Real Estate ETF (HAUZ)
The Xtrackers International Real Estate ETF (the “Fund”), using a “passive” or indexing investment approach, seeks investment results that correspond generally to the performance, before fees and expenses, of the iSTOXX Developed and Emerging Markets ex USA PK VN Real Estate Index (the “Underlying Index”). The Underlying Index is a free-float capitalization weighted index that provides exposure to publicly traded real estate securities in countries outside the United States, excluding Pakistan and Vietnam. The MSCI ACWI ex USA Index is designed to provide exposure to equity securities in developed and emerging stock markets (excluding the United States). It is not possible to invest directly into an index.
| Performance as of 5/31/20 |
| Average Annual Total Return | ||||||||
| Net Asset Value | Market Value | iSTOXX Developed and Emerging Markets ex USA PK VN Real Estate Index2 | MSCI ACWI ex USA Index | |||||
One Year | -14.80% | -14.94% | -14.99% | -3.43% | ||||
Five Year | -0.19% | -0.24% | 0.39% | 0.79% | ||||
Since Inception1 | 2.29% | 2.29% | 2.85% | 1.73% | ||||
| Cumulative Total Returns | ||||||||
| Net Asset Value | Market Value | iSTOXX Developed and Emerging Markets ex USA PK VN Real Estate Index2 | MSCI ACWI ex USA Index | |||||
One Year | -14.80% | -14.94% | -14.99% | -3.43% | ||||
Five Year | -0.93% | -1.22% | 1.98% | 4.01% | ||||
Since Inception1 | 16.26% | 16.33% | 20.61% | 12.11% | ||||
1 Total returns are calculated based on the commencement of operations, October 1, 2013 (“Inception”).
2 On February 22, 2019, the Fund changed its Underlying Index from MSCI Asia Pacific ex Japan US Dollar Hedged Index to the iSTOXX Developed and Emerging Markets ex USA PK VN Real Estate Index. Returns reflect performance for the MSCI Asia Pacific ex Japan US Dollar Hedged Index through February 21, 2019.
Prior to February 22, 2019, the Fund was known as Xtrackers MSCI Asia Pacific ex Japan Hedged Equity ETF (DBAP) and had a different investment strategy. Past performance may have been different if the Fund’s current investment strategy had been in effect.
Past performance is no guarantee of future results. Current performance may be lower or higher than the performance data quoted. Performance data current to the most recent month-end is available at www.Xtrackers.com. Performance results assume reinvestment of all dividends and capital gain distributions and do not reflect the deduction of taxes that a shareholder would pay on fund distributions or on the sale of fund shares or redemption of fund creation units. The investment return and principal value of shares will vary with changes in market conditions. Shares may be worth more or less than their original cost when they are sold in the market or redeemed. Performance for certain funds may reflect a waiver of a portion of investment management fees. Without such waiver, performance would have been lower. The estimated operating expense ratio as disclosed in the most recent prospectus dated October 1, 2019, was 0.12%, and may differ from the expense ratio disclosed in the Financial Highlights table in this report.
The Fund’s net asset value or “NAV” is calculated by dividing the value of the Fund’s total assets less total liabilities by the number of shares outstanding. The price used to calculate market return (“Market Price”) is determined by using the midpoint between the highest bid and the lowest offer on the primary stock exchange on which shares of a fund are listed for trading, as of the time that such fund’s NAV is calculated. Since shares of a fund may not have traded in the secondary market until after the fund’s inception, for the period from inception to the first day of secondary trading, the NAV of the fund is used as a proxy for the Market Price to calculate market returns. Market and NAV returns assume that dividends and capital gain distributions have been reinvested at Market Price and NAV, respectively.
An index is a statistical composite that tracks a specified financial market or sector. Unlike a fund, an index does not actually hold a portfolio of securities and therefore does not incur the expenses incurred by a fund. These expenses negatively impact fund performance. Also, market returns do not include brokerage commissions that may be payable on secondary market transactions. If brokerage commissions were included, market returns would be lower.
8
DBX ETF Trust
Performance Summary (Unaudited)
Xtrackers International Real Estate ETF (HAUZ) (Continued)
| Growth of an Assumed $10,000 Investment |
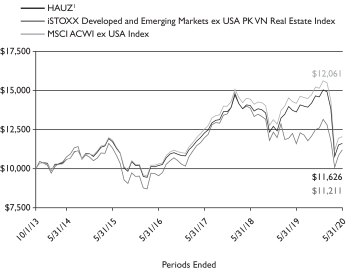
1 Based on Net Asset Value from commencement of operations, October 1, 2013.
| Sector Diversification* as of 5/31/20 |
Real Estate Operations/Development | 33.8% | |||
Diversified | 18.8% | |||
Real Estate Management/Services | 16.5% | |||
Shopping Centers | 8.1% | |||
Office Property | 6.9% | |||
Warehouse/Industry | 6.5% | |||
Apartments | 4.0% | |||
Other | 5.4% | |||
|
| |||
Total | 100.0% |
| Ten Largest Equity Holdings as of 5/31/20 (19.8% of Net Assets) |
| Description | % of Net Assets | |||
Vonovia SE (Germany) | 3.3% | |||
Mitsubishi Estate Co. Ltd. (Japan) | 2.5% | |||
Mitsui Fudosan Co. Ltd. (Japan) | 2.2% | |||
Sun Hung Kai Properties Ltd. (Hong Kong) | 2.0% | |||
Goodman Group (Australia) | 1.9% | |||
Link (Hong Kong) | 1.8% | |||
Deutsche Wohnen SE (Germany) | 1.7% | |||
CK Asset Holdings Ltd. (Hong Kong) | 1.6% | |||
Sumitomo Realty & Development Co. Ltd. (Japan) | 1.5% | |||
China Resources Land Ltd. (Hong Kong) | 1.3% | |||
| Country Diversification* as of 5/31/20 |
Japan | 22.7% | |||
Hong Kong | 14.8% | |||
Australia | 8.2% | |||
Germany | 7.3% | |||
Singapore | 6.8% | |||
United Kingdom | 6.2% | |||
Canada | 5.3% | |||
Sweden | 4.2% | |||
France | 3.3% | |||
Philippines | 2.4% | |||
Thailand | 2.2% | |||
Other | 16.6% | |||
|
| |||
Total | 100.0% |
* As a percent of total investments excluding securities lending collateral and cash equivalents.
Portfolio holdings and characteristics are subject to change. For more complete details about the Fund’s investment portfolio see page 20.
9
DBX ETF Trust
Performance Summary (Unaudited)
Xtrackers Japan JPX-Nikkei 400 Equity ETF (JPN)
The Xtrackers Japan JPX-Nikkei 400 Equity ETF (the “Fund”), using a “passive” or indexing investment approach, seeks investment results that correspond generally to the performance, before fees and expenses, of the JPX-Nikkei 400 Net Total Return Index (the “Underlying Index”). The Underlying Index is designed to track the performance of equity securities of issuers who are primarily listed on the JASDAQ Stock Exchange (“JASDAQ”) or the following sections of the Tokyo Stock Exchange (“TSE”): the first section (for large companies), the second section (for middle-sized companies) and the “Mothers” (for high-growth and emerging stocks). The MSCI ACWI ex USA Index is designed to provide exposure to equity securities in developed and emerging stock markets (excluding the United States). It is not possible to invest directly into an index.
| Performance as of 5/31/20 |
| Average Annual Total Return | ||||||||
| Net Asset Value | Market Value | JPX-Nikkei 400 Net Total Return Index | MSCI ACWI ex USA Index | |||||
One Year | 7.87% | 8.42% | 7.77% | -3.43% | ||||
Since Inception1 | 3.20% | 3.18% | 3.38% | 0.66% | ||||
| Cumulative Total Returns | ||||||||
| Net Asset Value | Market Value | JPX-Nikkei 400 Net Total Return Index | MSCI ACWI ex USA Index | |||||
One Year | 7.87% | 8.42% | 7.77% | -3.43% | ||||
Since Inception1 | 16.82% | 16.73% | 17.88% | 3.32% | ||||
1 Total returns are calculated based on the commencement of operations, June 24, 2015 (“Inception”).
Past performance is no guarantee of future results. Current performance may be lower or higher than the performance data quoted. Performance data current to the most recent month-end is available at www.Xtrackers.com. Performance results assume reinvestment of all dividends and capital gain distributions and do not reflect the deduction of taxes that a shareholder would pay on fund distributions or on the sale of fund shares or redemption of fund creation units. The investment return and principal value of shares will vary with changes in market conditions. Shares may be worth more or less than their original cost when they are sold in the market or redeemed. Performance for certain funds may reflect a waiver of a portion of investment management fees. Without such waiver, performance would have been lower. The estimated operating expense ratio as disclosed in the most recent prospectus dated October 1, 2019, was 0.09%, and may differ from the expense ratio disclosed in the Financial Highlights table in this report.
The Fund’s net asset value or “NAV” is calculated by dividing the value of the Fund’s total assets less total liabilities by the number of shares outstanding. The price used to calculate market return (“Market Price”) is determined by using the midpoint between the highest bid and the lowest offer on the primary stock exchange on which shares of a fund are listed for trading, as of the time that such fund’s NAV is calculated. Since shares of a fund may not have traded in the secondary market until after the fund’s inception, for the period from inception to the first day of secondary trading, the NAV of the fund is used as a proxy for the Market Price to calculate market returns. Market and NAV returns assume that dividends and capital gain distributions have been reinvested at Market Price and NAV, respectively.
An index is a statistical composite that tracks a specified financial market or sector. Unlike a fund, an index does not actually hold a portfolio of securities and therefore does not incur the expenses incurred by a fund. These expenses negatively impact fund performance. Also, market returns do not include brokerage commissions that may be payable on secondary market transactions. If brokerage commissions were included, market returns would be lower.
10
DBX ETF Trust
Performance Summary (Unaudited)
Xtrackers Japan JPX-Nikkei 400 Equity ETF (JPN) (Continued)
| Growth of an Assumed $10,000 Investment |
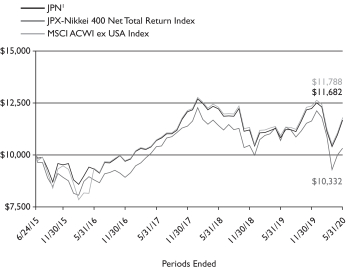
1 Based on Net Asset Value from commencement of operations, June 24, 2015.
| Sector Diversification* as of 5/31/20 |
Industrials | 22.6% | |||
Consumer Discretionary | 15.1% | |||
Health Care | 12.2% | |||
Information Technology | 11.7% | |||
Consumer Staples | 9.6% | |||
Financials | 9.3% | |||
Communication Services | 8.8% | |||
Materials | 5.4% | |||
Real Estate | 3.0% | |||
Utilities | 1.4% | |||
Energy | 0.9% | |||
|
| |||
Total | 100.0% |
| Ten Largest Equity Holdings as of 5/31/20 (15.2% of Net Assets) |
| Description | % of Net Assets | |||
Keyence Corp. | 1.8% | |||
Daiichi Sankyo Co. Ltd. | 1.7% | |||
Sony Corp. | 1.7% | |||
Nintendo Co. Ltd. | 1.5% | |||
Takeda Pharmaceutical Co. Ltd. | 1.5% | |||
Toyota Motor Corp. | 1.5% | |||
Recruit Holdings Co. Ltd. | 1.5% | |||
Nippon Telegraph & Telephone Corp. | 1.4% | |||
KDDI Corp. | 1.3% | |||
SoftBank Group Corp. | 1.3% | |||
* As a percent of total investments excluding securities lending collateral and cash equivalents.
Portfolio holdings and characteristics are subject to change. For more complete details about the Fund’s investment portfolio see page 28.
11
DBX ETF Trust
Performance Summary (Unaudited)
Xtrackers MSCI Latin America Pacific Alliance ETF (PACA)
The Xtrackers MSCI Latin America Pacific Alliance ETF (the “Fund”), using a “passive” or indexing investment approach, seeks investment results that correspond generally to the performance, before fees and expenses, of the MSCI Latin America Pacific Alliance Capped Index (the “Underlying Index”). The Underlying Index is designed to provide exposure to equity securities of issuers from Latin American member states of the Pacific Alliance, as well as securities of countries that are headquartered and carry out the majority of operations in these countries. The MSCI Emerging Markets Index is designed to represent the performance of large- and mid-cap securities in the emerging market countries that are included in its index. It is not possible to invest directly into an index.
| Performance as of 5/31/20 |
| Average Annual Total Return | ||||||||
| Net Asset Value | Market Value | MSCI Latin America Pacific Alliance Capped Index | MSCI Emerging Markets Index | |||||
One Year | -27.01% | -27.44% | -26.77% | -4.39% | ||||
Since Inception1 | -17.90% | -17.97% | -17.61% | 1.98% | ||||
| Cumulative Total Returns | ||||||||
| Net Asset Value | Market Value | MSCI Latin America Pacific Alliance Capped Index | MSCI Emerging Markets Index | |||||
One Year | -27.01% | -27.44% | -26.77% | -4.39% | ||||
Since Inception1 | -26.86% | -27.01% | -26.50% | 3.16% | ||||
1 Total returns are calculated based on the commencement of operations, October 30, 2018 (“Inception”).
Past performance is no guarantee of future results. Current performance may be lower or higher than the performance data quoted. Performance data current to the most recent month-end is available at www.Xtrackers.com. Performance results assume reinvestment of all dividends and capital gain distributions and do not reflect the deduction of taxes that a shareholder would pay on fund distributions or on the sale of fund shares or redemption of fund creation units. The investment return and principal value of shares will vary with changes in market conditions. Shares may be worth more or less than their original cost when they are sold in the market or redeemed. Performance for certain funds may reflect a waiver of a portion of investment management fees. Without such waiver, performance would have been lower. The estimated operating expense ratio as disclosed in the most recent prospectus dated October 1, 2019, was 0.45%, and may differ from the expense ratio disclosed in the Financial Highlights table in this report.
The Fund’s net asset value or “NAV” is calculated by dividing the value of the Fund’s total assets less total liabilities by the number of shares outstanding. The price used to calculate market return (“Market Price”) is determined by using the midpoint between the highest bid and the lowest offer on the primary stock exchange on which shares of a fund are listed for trading, as of the time that such fund’s NAV is calculated. Since shares of a fund may not have traded in the secondary market until after the fund’s inception, for the period from inception to the first day of secondary trading, the NAV of the fund is used as a proxy for the Market Price to calculate market returns. Market and NAV returns assume that dividends and capital gain distributions have been reinvested at Market Price and NAV, respectively.
An index is a statistical composite that tracks a specified financial market or sector. Unlike a fund, an index does not actually hold a portfolio of securities and therefore does not incur the expenses incurred by a fund. These expenses negatively impact fund performance. Also, market returns do not include brokerage commissions that may be payable on secondary market transactions. If brokerage commissions were included, market returns would be lower.
12
DBX ETF Trust
Xtrackers MSCI Latin America Pacific Alliance ETF (PACA) (Continued)
| Growth of an Assumed $10,000 Investment |
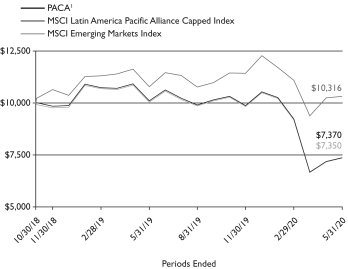
1 Based on Net Asset Value from commencement of operations, October 30, 2018.
| Sector Diversification* as of 5/31/20 |
Financials | 25.6% | |||
Consumer Staples | 22.6% | |||
Materials | 16.7% | |||
Communication Services | 12.2% | |||
Utilities | 9.0% | |||
Industrials | 5.5% | |||
Real Estate | 3.6% | |||
Energy | 3.0% | |||
Consumer Discretionary | 1.3% | |||
Health Care | 0.3% | |||
Information Technology | 0.2% | |||
|
| |||
Total | 100.0% |
| Ten Largest Equity as of 5/31/20 (46.6% of Net Assets) |
| Description | % of Net Assets | |||
America Movil SAB de CV (Mexico) | 9.8% | |||
Credicorp Ltd. (Peru) | 9.3% | |||
Fomento Economico Mexicano SAB de CV (Mexico) | 5.7% | |||
Wal-Mart de Mexico SAB de CV (Mexico) | 5.7% | |||
Grupo Financiero Banorte SAB de CV (Mexico) | 3.4% | |||
Southern Copper Corp. (Peru) | 3.1% | |||
Grupo Mexico SAB de CV (Mexico) | 2.9% | |||
Bancolombia SA (Colombia) | 2.8% | |||
Enel Americas SA (Chile) | 2.2% | |||
Cia de Minas Buenaventura SAA (Peru) | 1.7% | |||
| Country Diversification* as of 5/31/20 |
Mexico | 49.3% | |||
Peru | 21.4% | |||
Chile | 16.8% | |||
Colombia | 11.7% | |||
Canada | 0.8% | |||
|
| |||
Total | 100.0% |
* As a percent of total investments excluding cash equivalents.
Portfolio holdings and characteristics are subject to change. For more complete details about the Fund’s investment portfolio see page 33.
13
DBX ETF Trust
As a shareholder of one or more of the Funds, you incur two types of costs: (1) transaction costs, including brokerage commissions paid on purchases and sales of fund shares, and (2) ongoing costs, including management fees and other Fund expenses. In the most recent six-month period Xtrackers International Real Estate ETF, Xtrackers Japan JPX-Nikkei 400 Equity ETF and Xtrackers MSCI Latin America Pacific Alliance ETF limited these expenses; had they not done so, expenses would have been higher. The expense examples below are intended to help you understand your ongoing costs (in dollars) of investing in the Funds and to compare these costs with the ongoing costs of investing in other funds.
The examples in the tables are based on an investment of $1,000 invested at the beginning of the six-month period and held for the entire period (December 1, 2019 to May 31, 2020).
Actual expenses
The first line in the following tables provides information about actual account values and actual expenses. You may use the information in this line, together with the amount you invested, to estimate the expenses that you paid over the period. Simply divide your account value by $1,000 (for example, an $8,600 account value divided by $1,000 = 8.6), then multiply the result by the number in the first line under the heading “Expenses Paid During the Period” to estimate the expenses you paid on your account during this period.
Hypothetical example for comparison purposes
The second line in the following tables provides information about hypothetical account values and hypothetical expenses based on the Funds’ actual expense ratios and an assumed rate of return of 5% per year before expenses (which is not the Funds’ actual return). The hypothetical account values and expenses may not be used to estimate the actual ending account balance or expenses you paid for the period. You may use this information to compare the ongoing costs of investing in the Fund and other funds. To do so, compare this 5% hypothetical example with the 5% hypothetical examples that appear in the shareholder reports of the other funds.
Please note that the expenses shown in the tables are meant to highlight your ongoing costs only, and do not reflect any transactional costs. Therefore the second line in the table is useful in comparing ongoing costs only, and will not help you determine the relative total costs of owning different funds. In addition, if these transactional costs were included, your costs would have been higher.
| Beginning Account Value December 1, 2019 | Ending Account Value May 31, 2019 | Annualized Expense Ratio | Expenses Paid During the Period Per $1,000(1) | |||||||||||||
| Xtrackers Eurozone Equity ETF | ||||||||||||||||
Actual | $ | 1,000.00 | $ | 854.20 | 0.09 | % | $ | 0.42 | ||||||||
Hypothetical (5% return before expenses) | $ | 1,000.00 | $ | 1,024.55 | 0.09 | % | $ | 0.46 | ||||||||
| Xtrackers International Real Estate ETF | ||||||||||||||||
Actual | $ | 1,000.00 | $ | 796.60 | 0.10 | % | $ | 0.45 | ||||||||
Hypothetical (5% return before expenses) | $ | 1,000.00 | $ | 1,024.50 | 0.10 | % | $ | 0.51 | ||||||||
| Xtrackers Japan JPX-Nikkei 400 Equity ETF | ||||||||||||||||
Actual | $ | 1,000.00 | $ | 954.60 | 0.09 | % | $ | 0.44 | ||||||||
Hypothetical (5% return before expenses) | $ | 1,000.00 | $ | 1,024.55 | 0.09 | % | $ | 0.46 | ||||||||
| Xtrackers MSCI Latin America Pacific Alliance ETF | ||||||||||||||||
Actual | $ | 1,000.00 | $ | 745.90 | 0.45 | % | $ | 1.96 | ||||||||
Hypothetical (5% return before expenses) | $ | 1,000.00 | $ | 1,022.75 | 0.45 | % | $ | 2.28 | ||||||||
(1) Expenses are equal to each Fund’s annualized expense ratio, multiplied by the average account value over the period, multiplied by 183 (the number of days in the most recent six-month period), then divided by 366.
14
DBX ETF Trust
Schedule of Investments
May 31, 2020
Number | Value | |||||||
| COMMON STOCKS — 97.2% | ||||||||
| Austria — 0.7% | ||||||||
ANDRITZ AG* | 64 | $ | 2,402 | |||||
CA Immobilien Anlagen AG* | 67 | 2,258 | ||||||
Erste Group Bank AG* | 295 | 6,486 | ||||||
OMV AG* | 145 | 4,794 | ||||||
Raiffeisen Bank International AG | 136 | 2,502 | ||||||
Telekom Austria AG* | 137 | 987 | ||||||
Verbund AG* | 126 | 5,612 | ||||||
voestalpine AG | 124 | 2,419 | ||||||
|
| |||||||
(Cost $37,322) | 27,460 | |||||||
|
| |||||||
| Belgium — 3.4% | ||||||||
Ackermans & van Haaren NV | 24 | 3,302 | ||||||
Ageas SA/NV* | 177 | 6,038 | ||||||
Anheuser-Busch InBev SA/NV | 895 | 41,724 | ||||||
Cofinimmo SA REIT | 24 | 3,268 | ||||||
Colruyt SA | 55 | 3,327 | ||||||
Elia Group SA/NV | 65 | 7,635 | ||||||
Galapagos NV* | 44 | 8,974 | ||||||
Groupe Bruxelles Lambert SA | 78 | 6,309 | ||||||
KBC Group NV | 275 | 14,399 | ||||||
Proximus SADP | 136 | 2,843 | ||||||
Sofina SA | 16 | 4,378 | ||||||
Solvay SA | 72 | 5,485 | ||||||
Telenet Group Holding NV | 48 | 1,968 | ||||||
UCB SA | 128 | 12,814 | ||||||
Umicore SA | 181 | 8,021 | ||||||
Warehouses De Pauw CVA REIT | 130 | 3,428 | ||||||
|
| |||||||
(Cost $186,040) | 133,913 | |||||||
|
| |||||||
| Finland — 3.8% | ||||||||
Elisa OYJ | 147 | 9,219 | ||||||
Fortum OYJ | 428 | 8,198 | ||||||
Huhtamaki OYJ* | 96 | 3,879 | ||||||
Kesko OYJ, Class B | 256 | 4,328 | ||||||
Kone OYJ, Class B | 413 | 27,693 | ||||||
Metso OYJ | 136 | 4,413 | ||||||
Neste OYJ (a) | 422 | 17,049 | ||||||
Nokia OYJ | 5,735 | 22,746 | ||||||
Orion OYJ, Class B | 112 | 5,992 | ||||||
Sampo OYJ, Class A*(a) | 493 | 17,614 | ||||||
Stora Enso OYJ, Class R* | 642 | 7,873 | ||||||
UPM-Kymmene OYJ | 494 | 14,271 | ||||||
Wartsila OYJ Abp | 455 | 3,555 | ||||||
|
| |||||||
(Cost $155,119) | 146,830 | |||||||
|
| |||||||
| France — 32.8% | ||||||||
Accor SA* | 189 | 5,329 | ||||||
Aeroports de Paris | 28 | 2,917 | ||||||
Air France-KLM*(a) | 251 | 1,134 | ||||||
Air Liquide SA | 447 | 60,711 | ||||||
Airbus SE* | 605 | 38,158 | ||||||
Alstom SA | 189 | 7,955 | ||||||
Alten SA | 28 | 2,249 | ||||||
Amundi SA, 144A* | 60 | 4,468 | ||||||
Arkema SA | 68 | 5,927 | ||||||
Atos SE* | 101 | 7,619 | ||||||
AXA SA* | 1,931 | 35,183 | ||||||
Number | Value | |||||||
| France (Continued) | ||||||||
BioMerieux | 44 | $ | 6,319 | |||||
BNP Paribas SA* | 1,144 | 41,045 | ||||||
Bollore SA | 905 | 2,583 | ||||||
Bouygues SA* | 215 | 6,586 | ||||||
Bureau Veritas SA* | 275 | 5,595 | ||||||
Capgemini SE | 149 | 15,265 | ||||||
Carrefour SA | 620 | 9,417 | ||||||
Casino Guichard Perrachon SA* | 48 | 1,809 | ||||||
Cie de Saint-Gobain | 509 | 16,459 | ||||||
Cie Generale des Etablissements Michelin SCA* | 171 | 17,283 | ||||||
CNP Assurances* | 163 | 1,714 | ||||||
Covivio REIT(a) | 46 | 2,694 | ||||||
Credit Agricole SA* | 1,240 | 10,792 | ||||||
Danone SA* | 680 | 46,564 | ||||||
Dassault Systemes SE | 141 | 23,879 | ||||||
Edenred | 173 | 7,232 | ||||||
Eiffage SA* | 76 | 6,932 | ||||||
Elis SA* | 167 | 2,062 | ||||||
Engie SA* | 1,822 | 21,554 | ||||||
EssilorLuxottica SA* | 296 | 38,111 | ||||||
Eurazeo SE* | 43 | 2,095 | ||||||
Faurecia SE* | 76 | 2,930 | ||||||
Gecina SA REIT | 49 | 6,306 | ||||||
Getlink SE* | 414 | 5,978 | ||||||
Hermes International | 35 | 29,114 | ||||||
ICADE REIT | 32 | 2,291 | ||||||
Iliad SA | 17 | 2,995 | ||||||
Ipsen SA* | 36 | 2,831 | ||||||
JCDecaux SA* | 72 | 1,465 | ||||||
Kering SA | 75 | 39,177 | ||||||
Klepierre SA REIT | 211 | 3,999 | ||||||
Legrand SA | 263 | 17,933 | ||||||
L’Oreal SA* | 239 | 69,627 | ||||||
LVMH Moet Hennessy Louis Vuitton SE | 267 | 111,374 | ||||||
Natixis SA* | 921 | 2,042 | ||||||
Orange SA | 1,932 | 23,307 | ||||||
Orpea | 49 | 5,756 | ||||||
Pernod Ricard SA | 154 | 23,999 | ||||||
Peugeot SA* | 551 | 7,848 | ||||||
Publicis Groupe SA | 252 | 7,154 | ||||||
Remy Cointreau SA | 20 | 2,376 | ||||||
Renault SA | 207 | 4,652 | ||||||
Rubis SCA | 95 | 4,533 | ||||||
Safran SA* | 315 | 30,085 | ||||||
Sanofi | 1,067 | 103,888 | ||||||
Sartorius Stedim Biotech* | 24 | 6,509 | ||||||
Schneider Electric SE | 546 | 54,199 | ||||||
SCOR SE* | 185 | 4,564 | ||||||
SEB SA | 25 | 3,432 | ||||||
Societe Generale SA* | 744 | 10,951 | ||||||
Sodexo SA | 84 | 5,657 | ||||||
Suez SA(a) | 384 | 4,361 | ||||||
Teleperformance* | 52 | 12,326 | ||||||
Thales SA | 112 | 8,569 | ||||||
TOTAL SA | 2,379 | 88,981 | ||||||
Ubisoft Entertainment SA* | 114 | 8,833 | ||||||
| See Notes to Financial Statements. | 15 |
DBX ETF Trust
Schedule of Investments
Xtrackers Eurozone Equity ETF (Continued)
May 31, 2020
Number | Value | |||||||
| France (Continued) | ||||||||
Unibail-Rodamco-Westfield REIT | 136 | $ | 7,216 | |||||
Valeo SA* | 208 | 5,125 | ||||||
Veolia Environnement SA(a) | 550 | 12,043 | ||||||
Vinci SA | 547 | 50,526 | ||||||
Vivendi SA | 869 | 19,748 | ||||||
Wendel SE* | 28 | 2,573 | ||||||
|
| |||||||
(Cost $1,524,142) | 1,274,913 | |||||||
|
| |||||||
| Germany — 26.1% | ||||||||
1&1 Drillisch AG | 48 | 1,229 | ||||||
adidas AG* | 171 | 45,118 | ||||||
Allianz SE | 393 | 71,177 | ||||||
BASF SE* | 852 | 46,102 | ||||||
Bayer AG | 918 | 62,003 | �� | |||||
Bayerische Motoren Werke AG | 319 | 18,665 | ||||||
Bechtle AG | 26 | 4,584 | ||||||
Beiersdorf AG | 126 | 13,211 | ||||||
Brenntag AG | 144 | 7,594 | ||||||
Carl Zeiss Meditec AG* | 36 | 3,688 | ||||||
Commerzbank AG* | 1,036 | 4,035 | ||||||
Continental AG* | 110 | 10,821 | ||||||
Covestro AG, 144A* | 155 | 5,740 | ||||||
CTS Eventim AG & Co. KGaA* | 52 | 2,360 | ||||||
Daimler AG* | 766 | 28,442 | ||||||
Delivery Hero SE, 144A* | 122 | 11,695 | ||||||
Deutsche Bank AG*(b) | 1,918 | 16,067 | ||||||
Deutsche Boerse AG | 167 | 27,474 | ||||||
Deutsche Lufthansa AG* | 441 | 4,485 | ||||||
Deutsche Post AG* | 911 | 28,354 | ||||||
Deutsche Telekom AG* | 3,241 | 51,103 | ||||||
Deutsche Wohnen SE | 331 | 14,809 | ||||||
E.ON SE | 1,979 | 20,926 | ||||||
Evonik Industries AG | 177 | 4,361 | ||||||
Evotec SE* | 119 | 3,219 | ||||||
Fielmann AG | 24 | 1,703 | ||||||
Fraport AG Frankfurt Airport Services Worldwide* | 36 | 1,787 | ||||||
Fresenius Medical Care AG & Co. KGaA* | 211 | 17,744 | ||||||
Fresenius SE & Co. KGaA* | 387 | 18,597 | ||||||
FUCHS PETROLUB SE | 28 | 947 | ||||||
GEA Group AG | 155 | 4,619 | ||||||
GRENKE AG* | 28 | 2,256 | ||||||
Hannover Rueck SE | 60 | 9,651 | ||||||
HeidelbergCement AG* | 144 | 7,149 | ||||||
Hella GmbH & Co. KGaA | 44 | 1,718 | ||||||
Henkel AG & Co. KGaA* | 100 | 8,014 | ||||||
HOCHTIEF AG | 19 | 1,672 | ||||||
Infineon Technologies AG | 1,173 | 24,603 | ||||||
KION Group AG* | 68 | 3,797 | ||||||
LANXESS AG* | 68 | 3,516 | ||||||
LEG Immobilien AG* | 62 | 7,730 | ||||||
Merck KGaA | 129 | 14,801 | ||||||
METRO AG | 234 | 2,185 | ||||||
MorphoSys AG* | 22 | 2,855 | ||||||
MTU Aero Engines AG* | 47 | 7,575 | ||||||
Muenchener Rueckversicherungs-Gesellschaft AG in Muenchen | 134 | 30,497 | ||||||
Number | Value | |||||||
| Germany (Continued) | ||||||||
Nemetschek SE* | 60 | $ | 4,732 | |||||
Puma SE* | 90 | 6,425 | ||||||
Rational AG* | 3 | 1,610 | ||||||
Rheinmetall AG | 36 | 2,922 | ||||||
RWE AG* | 581 | 19,253 | ||||||
SAP SE | 1,021 | 128,903 | ||||||
Scout24 AG, 144A | 101 | 7,724 | ||||||
Siemens AG | 744 | 81,542 | ||||||
Sixt SE | 8 | 642 | ||||||
Stroeer SE & Co. KGaA | 21 | 1,522 | ||||||
Symrise AG* | 117 | 12,806 | ||||||
Talanx AG | 52 | 1,830 | ||||||
TeamViewer AG* | 87 | 4,428 | ||||||
Telefonica Deutschland Holding AG | 905 | 2,784 | ||||||
thyssenkrupp AG* | 485 | 3,269 | ||||||
Uniper SE | 99 | 3,094 | ||||||
United Internet AG | 88 | 3,610 | ||||||
Vonovia SE* | 461 | 26,552 | ||||||
Wirecard AG | 97 | 10,203 | ||||||
Zalando SE, 144A* | 136 | 9,204 | ||||||
|
| |||||||
(Cost $1,124,482) | 1,013,733 | |||||||
|
| |||||||
| Greece — 0.1% | ||||||||
Hellenic Telecommunications Organization SA | 247 | 3,478 | ||||||
OPAP SA | 166 | 1,551 | ||||||
|
| |||||||
(Cost $5,063) | 5,029 | |||||||
|
| |||||||
| Ireland — 2.0% | ||||||||
Bank of Ireland Group PLC* | 909 | 1,635 | ||||||
CRH PLC | 794 | 25,878 | ||||||
Kerry Group PLC, Class A | 146 | 18,076 | ||||||
Kingspan Group PLC | 156 | 9,639 | ||||||
Ryanair Holdings PLC, ADR* | 197 | 14,139 | ||||||
Smurfit Kappa Group PLC | 203 | 6,607 | ||||||
|
| |||||||
(Cost $77,900) | 75,974 | |||||||
|
| |||||||
| Italy — 6.1% | ||||||||
A2A SpA | 1,575 | 2,185 | ||||||
ACEA SpA | 48 | 929 | ||||||
Amplifon SpA* | 69 | 1,915 | ||||||
Assicurazioni Generali SpA | 1,270 | 17,637 | ||||||
ASTM SpA* | 91 | 1,873 | ||||||
Atlantia SpA* | 508 | 8,247 | ||||||
Banca Mediolanum SpA | 259 | 1,726 | ||||||
Buzzi Unicem SpA | 72 | 1,432 | ||||||
Buzzi Unicem SpA-RSP | 36 | 415 | ||||||
Davide Campari-Milano SpA | 246 | 1,998 | ||||||
DiaSorin SpA* | 11 | 2,306 | ||||||
Enel SpA | 6,647 | 51,025 | ||||||
Eni SpA | 2,508 | 22,661 | ||||||
FinecoBank Banca Fineco SpA* | 588 | 6,871 | ||||||
Hera SpA | 545 | 2,091 | ||||||
Infrastrutture Wireless Italiane SpA, 144A | 235 | 2,396 | ||||||
Intesa Sanpaolo SpA* | 15,415 | 26,619 | ||||||
Iren SpA | 794 | 1,975 | ||||||
Italgas SpA | 477 | 2,592 | ||||||
Leonardo SpA* | 396 | 2,467 | ||||||
| See Notes to Financial Statements. | 16 |
DBX ETF Trust
Schedule of Investments
Xtrackers Eurozone Equity ETF (Continued)
May 31, 2020
Number | Value | |||||||
| Italy (Continued) | ||||||||
Mediobanca Banca di Credito Finanziario SpA | 748 | $ | 4,856 | |||||
Moncler SpA* | 191 | 7,107 | ||||||
Nexi SpA, 144A* | 260 | 4,272 | ||||||
Pirelli & C SpA, 144A* | 505 | 2,264 | ||||||
Poste Italiane SpA, 144A | 469 | 4,118 | ||||||
Prysmian SpA | 259 | 5,516 | ||||||
Recordati SpA | 89 | 4,051 | ||||||
Saipem SpA | 519 | 1,233 | ||||||
Snam SpA | 2,037 | 9,480 | ||||||
Telecom Italia SpA* | 10,378 | 3,833 | ||||||
Telecom Italia SpA-RSP | 5,353 | 2,065 | ||||||
Terna Rete Elettrica Nazionale SpA | 1,419 | 9,581 | ||||||
UniCredit SpA* | 2,161 | 18,427 | ||||||
|
| |||||||
(Cost $280,266) | 236,163 | |||||||
|
| |||||||
| Luxembourg — 0.7% | ||||||||
ArcelorMittal SA* | 635 | 6,078 | ||||||
Aroundtown SA | 1,017 | 5,591 | ||||||
Eurofins Scientific SE | 12 | 8,113 | ||||||
Grand City Properties SA | 108 | 2,448 | ||||||
RTL Group SA* | 53 | 1,796 | ||||||
Tenaris SA | 477 | 2,967 | ||||||
|
| |||||||
(Cost $37,313) | 26,993 | |||||||
|
| |||||||
| Netherlands — 10.7% | ||||||||
Aalberts NV* | 72 | 1,974 | ||||||
ABN AMRO Bank NV, 144A | 426 | 3,417 | ||||||
Adyen NV, 144A* | 26 | 34,214 | ||||||
Aegon NV | 1,757 | 4,700 | ||||||
Akzo Nobel NV | 204 | 16,701 | ||||||
Altice Europe NV* | 650 | 2,603 | ||||||
Argenx SE* | 35 | 7,455 | ||||||
ASM International NV | 48 | 5,582 | ||||||
ASML Holding NV | 361 | 117,637 | ||||||
ASR Nederland NV | 124 | 3,407 | ||||||
Euronext NV, 144A | 61 | 5,625 | ||||||
EXOR NV | 112 | 6,037 | ||||||
Heineken Holding NV | 88 | 7,253 | ||||||
Heineken NV | 235 | 21,560 | ||||||
IMCD NV* | 43 | 4,057 | ||||||
ING Groep NV | 3,920 | 25,317 | ||||||
Just Eat Takeaway.com NV, 144A* | 113 | 12,263 | ||||||
Koninklijke Ahold Delhaize NV | 1,043 | 26,464 | ||||||
Koninklijke DSM NV | 171 | 21,884 | ||||||
Koninklijke KPN NV | 3,206 | 7,860 | ||||||
Koninklijke Philips NV* | 856 | 38,839 | ||||||
Koninklijke Vopak NV | 68 | 3,730 | ||||||
NN Group NV | 308 | 9,514 | ||||||
Randstad NV | 117 | 4,910 | ||||||
Signify NV, 144A* | 143 | 3,059 | ||||||
Wolters Kluwer NV | 263 | 20,970 | ||||||
|
| |||||||
(Cost $396,985) | 417,032 | |||||||
|
| |||||||
| Portugal — 0.5% | ||||||||
EDP—Energias de Portugal SA | 2,367 | 11,119 | ||||||
Galp Energia SGPS SA | 457 | 5,447 | ||||||
Number | Value | |||||||
| Portugal (Continued) | ||||||||
Jeronimo Martins SGPS SA* | 243 | $ | 4,157 | |||||
|
| |||||||
(Cost $20,058) | 20,723 | |||||||
|
| |||||||
| Spain — 8.0% | ||||||||
Acciona SA | 24 | 2,397 | ||||||
ACS Actividades de Construccion y Servicios SA | 291 | 7,429 | ||||||
Aena SME SA, 144A* | 72 | 10,267 | ||||||
Amadeus IT Group SA | 359 | 18,745 | ||||||
Banco Bilbao Vizcaya Argentaria SA | 6,187 | 19,222 | ||||||
Banco de Sabadell SA | 5,291 | 1,593 | ||||||
Banco Santander SA | 15,771 | 35,744 | ||||||
Bankia SA | 1,100 | 971 | ||||||
Bankinter SA | 627 | 2,658 | ||||||
CaixaBank SA | 3,502 | 6,542 | ||||||
Cellnex Telecom SA, 144A* | 293 | 16,596 | ||||||
Enagas SA | 227 | 5,103 | ||||||
Endesa SA | 316 | 7,505 | ||||||
Ferrovial SA* | 7 | 190 | ||||||
Ferrovial SA | 538 | 14,614 | ||||||
Grifols SA | 290 | 9,071 | ||||||
Grupo Catalana Occidente SA | 44 | 993 | ||||||
Iberdrola SA | 5,540 | 59,702 | ||||||
Industria de Diseno Textil SA | 1,126 | 31,375 | ||||||
Inmobiliaria Colonial Socimi SA REIT | 279 | 2,523 | ||||||
Mapfre SA | 955 | 1,682 | ||||||
Merlin Properties Socimi SA REIT | 360 | 3,023 | ||||||
Naturgy Energy Group SA | 324 | 6,017 | ||||||
Red Electrica Corp. SA | 432 | 7,612 | ||||||
Repsol SA | 1,425 | 13,267 | ||||||
Siemens Gamesa Renewable Energy SA* | 227 | 3,822 | ||||||
Telefonica SA | 4,352 | 20,530 | ||||||
|
| |||||||
(Cost $419,785) | 309,193 | |||||||
|
| |||||||
| Switzerland (c) — 0.4% | ||||||||
| STMicroelectronics NV (Cost $11,958) | 642 | 15,775 | ||||||
|
| |||||||
| United Kingdom (c) — 1.9% | ||||||||
| Unilever NV (Cost $84,266) | 1,455 | 75,243 | ||||||
|
| |||||||
TOTAL COMMON STOCKS | 3,778,974 | |||||||
|
| |||||||
| PREFERRED STOCKS — 2.0% | ||||||||
| Germany — 1.9% | ||||||||
Bayerische Motoren Werke AG | 52 | 2,394 | ||||||
FUCHS PETROLUB SE | 68 | 2,709 | ||||||
Henkel AG & Co. KGaA* | 175 | 15,627 | ||||||
Porsche Automobil Holding SE | 155 | 8,433 | ||||||
Sartorius AG* | 36 | 13,351 | ||||||
Sixt SE | 16 | 875 | ||||||
Volkswagen AG* | 205 | 30,214 | ||||||
|
| |||||||
(Cost $77,829) | 73,603 | |||||||
|
| |||||||
| Spain — 0.1% | ||||||||
| Grifols SA, Class B (Cost $5,524) | 259 | 4,961 | ||||||
|
| |||||||
TOTAL PREFERRED STOCKS | 78,564 | |||||||
|
| |||||||
| See Notes to Financial Statements. | 17 |
DBX ETF Trust
Schedule of Investments
Xtrackers Eurozone Equity ETF (Continued)
May 31, 2020
Number | Value | |||||||
| RIGHTS — 0.0% | ||||||||
| Italy — 0.0% | ||||||||
Davide Campari-Milano SpA*, expires 6/21/20(d) | 246 | $ | 0 | |||||
|
| |||||||
| EXCHANGE-TRADED FUNDS — 0.7% | ||||||||
| iShares MSCI Eurozone ETF (Cost $24,575) | 740 | 25,741 | ||||||
|
| |||||||
| SECURITIES LENDING COLLATERAL — 1.4% | ||||||||
DWS Government & Agency Securities Portfolio “DWS Government Cash Institutional Shares”, 0.07% (e)(f) | 55,855 | 55,855 | ||||||
|
| |||||||
Number | Value | |||||||
| CASH EQUIVALENTS — 0.0% | ||||||||
DWS Government Money Market Series “Institutional Shares”, 0.12% (e) | 187 | $ | 187 | |||||
|
| |||||||
TOTAL INVESTMENTS — 101.3% (Cost $4,524,669) | $ | 3,939,321 | ||||||
Other assets and liabilities, net — (1.3%) | (51,577 | ) | ||||||
|
| |||||||
NET ASSETS — 100.0% | $ | 3,887,744 | ||||||
|
| |||||||
A summary of the Fund’s transactions with affiliated investments during the year ended May 31, 2020 is as follows:
| Value ($) at 5/31/2019 | Purchases Cost ($) | Sales Proceeds ($) | Net Realized Gain/(Loss) ($) | Net Change in Unrealized Appreciation (Depreciation) ($) | Income ($) | Capital Gain Distributions ($) | Number of Shares at 5/31/2020 | Value ($) at 5/31/2020 | ||||||||||||||||||||||||||||
COMMON STOCKS — 0.4% |
| |||||||||||||||||||||||||||||||||||
Germany — 0.4% |
| |||||||||||||||||||||||||||||||||||
Deutsche Bank AG |
| |||||||||||||||||||||||||||||||||||
| 5,922 | 11,926 | (5,149 | ) | 69 | 3,299 | — | — | 1,918 | 16,067 | |||||||||||||||||||||||||||
SECURITIES LENDING COLLATERAL — 1.4% |
| |||||||||||||||||||||||||||||||||||
DWS Government & Agency Securities Portfolio “DWS Government Cash Institutional Shares”, 0.07% (e)(f) |
| |||||||||||||||||||||||||||||||||||
| 113,653 | — | (57,798 | )(g) | — | — | 779 | — | 55,855 | 55,855 | |||||||||||||||||||||||||||
CASH EQUIVALENTS — 0.0% |
| |||||||||||||||||||||||||||||||||||
DWS Government Money Market Series “Institutional Shares”, 0.12% (e) |
| |||||||||||||||||||||||||||||||||||
| 56 | 88,483 | (88,352 | ) | — | — | 28 | — | 187 | 187 | |||||||||||||||||||||||||||
|
|
|
|
|
|
|
|
|
|
|
|
|
|
|
|
|
| |||||||||||||||||||
| 119,631 | 100,409 | (151,299 | ) | 69 | 3,299 | 807 | — | 57,960 | 72,109 | |||||||||||||||||||||||||||
|
|
|
|
|
|
|
|
|
|
|
|
|
|
|
|
|
| |||||||||||||||||||
| * | Non-income producing security. |
| (a) | All or a portion of these securities were on loan. In addition, “Other assets and liabilities, net” may include pending sales that are also on loan. The value of securities loaned at May 31, 2020 amounted to $47,148, which is 1.2% of net assets. |
| (b) | Affiliated issuer. This security is owned in proportion with its representation in the index. |
| (c) | Securities listed in country of domicile and traded on an exchange within Eurozone. |
| (d) | Investment was valued using significant unobservable inputs. |
| (e) | Affiliated fund managed by DWS Investment Management Americas, Inc. The rate shown is the annualized seven-day yield at period end. |
| (f) | Represents cash collateral held in connection with securities lending. Income earned by the Fund is net of borrower rebates. |
| (g) | Represents the net increase (purchase cost) or decrease (sales proceeds) in the amount invested in cash collateral for the year ended May 31, 2020. |
| ADR: | American Depositary Receipt |
| REIT: | Real Estate Investment Trust |
| RSP: | Risparmio (Convertible Savings Shares) |
| 144A: | Security exempt from registration under Rule 144A of the Securities Act of 1933. These securities may be resold in transactions exempt from registration, normally to qualified institutional buyers. |
| See Notes to Financial Statements. | 18 |
DBX ETF Trust
Schedule of Investments
Xtrackers Eurozone Equity ETF (Continued)
May 31, 2020
Fair Value Measurements
Various inputs are used in determining the value of the Fund’s investments. These inputs are summarized in three broad levels. Level 1 includes quoted prices in active markets for identical securities. Level 2 includes other significant observable inputs (including quoted prices for similar securities, interest rates, prepayment speeds and credit risk). Level 3 includes significant unobservable inputs (including the Fund’s own assumptions in determining the fair value of investments). The level assigned to the securities valuations may not be an indication of the risk or liquidity associated with investing in those securities.
The following is a summary of the inputs used as of May 31, 2020 in valuing the Fund’s investments. For information on the Fund’s policy regarding the valuation of investments, please refer to the Security Valuation section of Note 2 in the accompanying Notes to Financial Statements.
Assets | Level 1 | Level 2 | Level 3 | Total | ||||||||||||
Common Stocks (h) | $ | 3,778,974 | $ | — | — | $ | 3,778,974 | |||||||||
Preferred Stocks (h) | 78,564 | — | — | 78,564 | ||||||||||||
Rights | — | — | 0 | 0 | ||||||||||||
Exchange-Traded Funds | 25,741 | — | — | 25,741 | ||||||||||||
Short-Term Investments (h) | 56,042 | — | — | 56,042 | ||||||||||||
|
|
|
|
|
|
|
| |||||||||
TOTAL | $ | 3,939,321 | $ | — | $ | 0 | $ | 3,939,321 | ||||||||
|
|
|
|
|
|
|
| |||||||||
| (h) | See Schedule of Investments for additional detailed categorizations. |
| See Notes to Financial Statements. | 19 |
DBX ETF Trust
Schedule of Investments
Xtrackers International Real Estate ETF
May 31, 2020
Number | Value | |||||||
| COMMON STOCKS — 99.1% | ||||||||
| Australia — 8.2% | ||||||||
Abacus Property Group REIT | 93,534 | $ | 160,187 | |||||
ALE Property Group REIT | 31,943 | 97,961 | ||||||
Arena REIT | 89,693 | 147,059 | ||||||
Aventus Group REIT (a) | 110,809 | 145,639 | ||||||
BWP Trust REIT | 130,532 | 327,526 | ||||||
Centuria Industrial REIT | 66,845 | 130,453 | ||||||
Centuria Office REIT | 106,955 | 140,573 | ||||||
Charter Hall Group REIT | 125,064 | 804,440 | ||||||
Charter Hall Long Wale REIT | 113,212 | 329,158 | ||||||
Charter Hall Retail REIT | 98,951 | 214,786 | ||||||
Charter Hall Social Infrastructure REIT | 89,825 | 149,065 | ||||||
Cromwell Property Group REIT (a) | 523,992 | 278,261 | ||||||
Dexus REIT | 288,595 | 1,724,125 | ||||||
GDI Property Group REIT | 145,560 | 104,836 | ||||||
Goodman Group REIT | 436,711 | 4,455,591 | ||||||
GPT Group REIT | 448,356 | 1,187,499 | ||||||
Growthpoint Properties Australia Ltd. REIT | 81,493 | 173,104 | ||||||
Ingenia Communities Group REIT | 73,835 | 212,711 | ||||||
Mirvac Group REIT | 1,035,779 | 1,615,743 | ||||||
National Storage REIT | 213,651 | 265,206 | ||||||
REA Group Ltd. | 13,510 | 901,009 | ||||||
Scentre Group REIT | 1,378,346 | 2,040,330 | ||||||
Shopping Centres Australasia Property Group REIT | 251,066 | 389,979 | ||||||
Stockland REIT | 641,171 | 1,519,425 | ||||||
US Masters Residential Property Fund REIT | 105,375 | 25,181 | ||||||
Vicinity Centres REIT | 955,599 | 1,021,266 | ||||||
Waypoint REIT (a) | 137,418 | 241,728 | ||||||
|
| |||||||
(Cost $21,972,355) | 18,802,841 | |||||||
|
| |||||||
| Austria — 0.5% | ||||||||
CA Immobilien Anlagen AG* | 15,436 | 520,259 | ||||||
IMMOFINANZ AG* | 25,654 | 480,550 | ||||||
S IMMO AG | 11,036 | 208,690 | ||||||
|
| |||||||
(Cost $1,402,492) | 1,209,499 | |||||||
|
| |||||||
| Belgium — 1.8% | ||||||||
Aedifica SA REIT | 6,590 | 704,451 | ||||||
Ascencio REIT | 1,616 | 83,586 | ||||||
Befimmo SA REIT | 5,419 | 224,838 | ||||||
Care Property Invest NV REIT | 5,414 | 166,817 | ||||||
Cofinimmo SA REIT | 6,622 | 901,597 | ||||||
Intervest Offices & Warehouses NV REIT | 6,606 | 160,558 | ||||||
Montea C.V.A REIT | 3,421 | 320,411 | ||||||
Retail Estates NV REIT* | 2,894 | 190,251 | ||||||
VGP NV | 2,221 | 289,052 | ||||||
Warehouses De Pauw CVA REIT | 34,025 | 897,180 | ||||||
Xior Student Housing NV REIT | 4,022 | 197,522 | ||||||
|
| |||||||
(Cost $4,083,047) | 4,136,263 | |||||||
|
| |||||||
| Brazil — 0.7% | ||||||||
Aliansce Sonae Shopping Centers SA* | 31,039 | 145,619 | ||||||
BR Malls Participacoes SA | 233,551 | 421,855 | ||||||
Cyrela Brazil Realty SA Empreendimentos e Participacoes | 86,077 | 268,639 | ||||||
Number | Value | |||||||
| Brazil (Continued) | ||||||||
Ez Tec Empreendimentos e Participacoes SA | 39,893 | $ | 239,530 | |||||
Iguatemi Empresa de Shopping Centers SA | 24,364 | 146,199 | ||||||
Multiplan Empreendimentos Imobiliarios SA | 82,196 | 313,129 | ||||||
|
| |||||||
(Cost $2,604,555) | 1,534,971 | |||||||
|
| |||||||
| Canada — 5.3% | ||||||||
Allied Properties Real Estate Investment Trust REIT | 33,060 | 956,736 | ||||||
Altus Group Ltd. | 9,846 | 306,948 | ||||||
American Hotel Income Properties REIT LP (a) | 21,131 | 38,373 | ||||||
Artis Real Estate Investment Trust REIT | 36,714 | 192,575 | ||||||
Boardwalk Real Estate Investment Trust REIT | 9,521 | 201,138 | ||||||
Canadian Apartment Properties REIT | 44,918 | 1,525,431 | ||||||
Chartwell Retirement Residences | 56,615 | 335,053 | ||||||
Choice Properties Real Estate Investment Trust REIT | 61,703 | 578,103 | ||||||
Colliers International Group, Inc. | 10,464 | 538,341 | ||||||
Cominar Real Estate Investment Trust REIT (a) | 45,639 | 254,908 | ||||||
Crombie Real Estate Investment Trust REIT (a) | 24,680 | 233,908 | ||||||
CT Real Estate Investment Trust REIT | 17,112 | 163,048 | ||||||
Dream Industrial Real Estate Investment Trust REIT (a) | 30,576 | 224,752 | ||||||
Dream Office Real Estate Investment Trust REIT | 10,237 | 145,016 | ||||||
DREAM Unlimited Corp., Class A | 18,926 | 113,649 | ||||||
First Capital Real Estate Investment Trust REIT | 52,449 | 496,714 | ||||||
FirstService Corp. | 8,637 | 799,776 | ||||||
Granite Real Estate Investment Trust REIT | 14,470 | 715,107 | ||||||
H&R Real Estate Investment Trust REIT | 76,472 | 536,665 | ||||||
InterRent Real Estate Investment Trust REIT | 32,997 | 349,259 | ||||||
Killam Apartment Real Estate Investment Trust REIT | 27,547 | 337,213 | ||||||
Minto Apartment Real Estate Investment Trust REIT | 8,734 | 126,378 | ||||||
Morguard Corp. | 1,205 | 108,103 | ||||||
Morguard North American Residential Real Estate Investment Trust REIT | 7,634 | 78,814 | ||||||
Northview Apartment Real Estate Investment Trust REIT (a) | 15,811 | 397,277 | ||||||
NorthWest Healthcare Properties Real Estate Investment Trust REIT (a) | 34,903 | 265,901 | ||||||
RioCan Real Estate Investment Trust REIT (a) | 82,614 | 870,250 | ||||||
SmartCentres Real Estate Investment Trust REIT | 34,622 | 503,474 | ||||||
Summit Industrial Income REIT | 34,140 | 259,594 | ||||||
Tricon Capital Group, Inc. | 51,614 | 301,723 | ||||||
| See Notes to Financial Statements. | 20 |
DBX ETF Trust
Schedule of Investments
Xtrackers International Real Estate ETF (Continued)
May 31, 2020
Number | Value | |||||||
| Canada (Continued) | ||||||||
True North Commercial Real Estate Investment Trust REIT | 16,756 | $ | 66,190 | |||||
WPT Industrial Real Estate Investment Trust REIT | 15,613 | 191,884 | ||||||
|
| |||||||
(Cost $15,290,380) | 12,212,301 | |||||||
|
| |||||||
| Chile — 0.2% | ||||||||
Parque Arauco SA | 182,488 | 305,960 | ||||||
Plaza SA | 66,142 | 92,001 | ||||||
|
| |||||||
(Cost $538,792) | 397,961 | |||||||
|
| |||||||
| China — 1.4% | ||||||||
A-Living Services Co. Ltd., Class H, 144A (a) | 115,207 | 616,835 | ||||||
China Vanke Co. Ltd., Class H | 385,055 | 1,249,404 | ||||||
Colour Life Services Group Co. Ltd.* | 52,782 | 23,698 | ||||||
Guangzhou R&F Properties Co. Ltd., Class H | 337,850 | 417,136 | ||||||
Midea Real Estate Holding Ltd., 144A* | 58,519 | 136,955 | ||||||
Powerlong Real Estate Holdings Ltd. | 399,206 | 221,466 | ||||||
Shanghai Jinqiao Export Processing Zone Development Co. Ltd., Class B | 91,332 | 81,103 | ||||||
Shanghai Lingang Holdings Corp. Ltd., Class B* | 14,355 | 16,178 | ||||||
Shanghai Lujiazui Finance & Trade Zone Development Co. Ltd., Class B | 292,352 | 206,400 | ||||||
Shanghai Shibei Hi-Tech Co. Ltd., Class B* | 54,765 | 18,730 | ||||||
Zhenro Properties Group Ltd.* | 517,999 | 329,472 | ||||||
|
| |||||||
(Cost $3,535,799) | 3,317,377 | |||||||
|
| |||||||
| Denmark — 0.0% | ||||||||
| Jeudan A/S* (Cost $57,086) | 1,805 | 70,576 | ||||||
|
| |||||||
| Egypt — 0.1% | ||||||||
Arab Co. for Asset Management & Development | 41,469 | 4,848 | ||||||
Emaar Misr for Development SAE* | 226,940 | 32,767 | ||||||
Heliopolis Housing | 43,177 | 12,468 | ||||||
Medinet Nasr Housing | 185,249 | 28,850 | ||||||
Palm Hills Developments SAE* | 635,916 | 42,822 | ||||||
Six of October Development & Investment | 27,740 | 16,494 | ||||||
Talaat Moustafa Group | 284,753 | 90,669 | ||||||
|
| |||||||
(Cost $335,769) | 228,918 | |||||||
|
| |||||||
| Finland — 0.5% | ||||||||
Citycon OYJ (a) | 23,094 | 155,673 | ||||||
Kojamo OYJ | 50,963 | 1,038,538 | ||||||
|
| |||||||
(Cost $1,049,431) | 1,194,211 | |||||||
|
| |||||||
| France — 3.2% | ||||||||
Altarea SCA REIT* | 993 | 146,465 | ||||||
Carmila SA REIT* | 17,403 | 216,038 | ||||||
Covivio REIT (a) | 15,434 | 903,896 | ||||||
Covivio Hotels SACA REIT (a) | 18,522 | 365,703 | ||||||
Gecina SA REIT | 12,660 | 1,629,329 | ||||||
ICADE REIT | 8,348 | 597,548 | ||||||
Number | Value | |||||||
| France (Continued) | ||||||||
Klepierre SA REIT (a) | 62,533 | $ | 1,185,279 | |||||
Mercialys SA REIT | 17,785 | 144,120 | ||||||
Nexity SA | 11,562 | 354,192 | ||||||
Unibail-Rodamco-Westfield REIT | 36,505 | 1,936,924 | ||||||
|
| |||||||
(Cost $12,156,752) | 7,479,494 | |||||||
|
| |||||||
| Germany — 7.2% | ||||||||
ADO Properties SA, 144A | 7,797 | 226,192 | ||||||
alstria office REIT-AG REIT* | 46,441 | 676,729 | ||||||
Deutsche EuroShop AG | 13,404 | 195,768 | ||||||
Deutsche Wohnen SE | 87,821 | 3,929,002 | ||||||
Hamborner REIT AG REIT* | 20,286 | 188,983 | ||||||
Instone Real Estate Group AG, 144A* | 10,255 | 222,211 | ||||||
LEG Immobilien AG* | 18,282 | 2,279,258 | ||||||
PATRIZIA AG* | 12,477 | 306,721 | ||||||
TAG Immobilien AG* | 39,210 | 910,687 | ||||||
Vonovia SE* | 133,805 | 7,706,837 | ||||||
|
| |||||||
(Cost $15,204,378) | 16,642,388 | |||||||
|
| |||||||
| Greece — 0.1% | ||||||||
| LAMDA Development SA* (Cost $149,444) | 21,197 | 147,366 | ||||||
|
| |||||||
| Guernsey — 0.1% | ||||||||
| UK Commercial Property REIT Ltd. REIT (Cost $188,546) | 186,850 | 142,991 | ||||||
|
| |||||||
| Hong Kong — 14.7% | ||||||||
Asia Standard International Group Ltd. | 35,571 | 4,084 | ||||||
C C Land Holdings Ltd. | 477,091 | 105,870 | ||||||
Champion REIT (a) | 652,829 | 295,630 | ||||||
China Jinmao Holdings Group Ltd. | 1,586,913 | 1,097,388 | ||||||
China Motor Bus Co. Ltd. | 5,438 | 66,054 | ||||||
China Oceanwide Holdings Ltd.* | 392,859 | 12,164 | ||||||
China Overseas Grand Oceans Group Ltd. | 480,331 | 255,317 | ||||||
China Overseas Land & Investment Ltd. | 986,350 | 3,003,207 | ||||||
China Overseas Property Holdings Ltd. | 346,794 | 392,386 | ||||||
China Resources Land Ltd. | 763,630 | 3,009,792 | ||||||
China Shandong Hi-Speed Financial Group Ltd.*(a) | 2,074,138 | 73,589 | ||||||
Chinese Estates Holdings Ltd. | 158,771 | 71,284 | ||||||
Chuang’s Consortium International Ltd. | 87,348 | 11,382 | ||||||
CK Asset Holdings Ltd. | 694,967 | 3,779,236 | ||||||
CSI Properties Ltd. | 693,200 | 19,765 | ||||||
Emperor International Holdings Ltd. | 150,765 | 23,536 | ||||||
ESR Cayman Ltd., 144A*(a) | 250,438 | 560,909 | ||||||
Far East Consortium International Ltd. | 327,168 | 95,394 | ||||||
Fullshare Holdings Ltd.* | 1,062,252 | 16,857 | ||||||
Gemdale Properties & Investment Corp. Ltd. | 1,383,687 | 205,295 | ||||||
Hang Lung Group Ltd. | 234,317 | 448,621 | ||||||
Hang Lung Properties Ltd. | 502,075 | 1,055,841 | ||||||
Henderson Land Development Co. Ltd. | 344,771 | 1,229,895 | ||||||
HKR International Ltd. | 182,492 | 73,458 | ||||||
Hong Kong Ferry Holdings Co. Ltd. | 74,127 | 57,286 | ||||||
Hongkong Land Holdings Ltd. | 305,987 | 1,150,511 | ||||||
Hysan Development Co. Ltd. | 170,012 | 460,618 | ||||||
Joy City Property Ltd. | 1,094,515 | 77,665 | ||||||
| See Notes to Financial Statements. | 21 |
DBX ETF Trust
Schedule of Investments
Xtrackers International Real Estate ETF (Continued)
May 31, 2020
Number | Value | |||||||
| Hong Kong (Continued) | ||||||||
K Wah International Holdings Ltd. | 279,530 | $ | 114,322 | |||||
Kerry Properties Ltd. | 162,873 | 384,541 | ||||||
Kowloon Development Co. Ltd. | 86,700 | 97,315 | ||||||
Lai Sun Development Co. Ltd. | 22,814 | 23,841 | ||||||
Landing International Development Ltd.* | 162,336 | 4,880 | ||||||
Langham Hospitality Investments and Langham Hospitality Investments Ltd. (b) | 114,953 | 14,979 | ||||||
Link REIT | 549,308 | 4,106,876 | ||||||
New World Development Co. Ltd. | 1,493,495 | 1,504,863 | ||||||
Poly Property Group Co. Ltd. | 508,683 | 162,101 | ||||||
Prosperity REIT | 384,074 | 108,518 | ||||||
Regal Real Estate Investment Trust REIT | 103,988 | 15,026 | ||||||
SEA Holdings Ltd. | 70,522 | 49,132 | ||||||
Shenzhen Investment Ltd. | 742,642 | 228,992 | ||||||
Sino Land Co. Ltd. | 864,317 | 1,006,939 | ||||||
Sun Hung Kai Properties Ltd. | 410,554 | 4,714,141 | ||||||
Suncity Group Holdings Ltd.* | 297,288 | 49,478 | ||||||
Sunlight Real Estate Investment Trust REIT | 254,299 | 119,751 | ||||||
Swire Properties Ltd. | 288,372 | 642,150 | ||||||
TAI Cheung Holdings Ltd. | 65,702 | 41,620 | ||||||
Wang On Properties Ltd. (a) | 974,745 | 115,697 | ||||||
Wharf Real Estate Investment Co. Ltd. (a) | 308,507 | 1,186,106 | ||||||
Wheelock & Co. Ltd. | 175,511 | 1,185,396 | ||||||
YT Realty Group Ltd. | 98,436 | 26,035 | ||||||
Yuexiu Property Co. Ltd. | 1,755,634 | 314,841 | ||||||
|
| |||||||
(Cost $41,843,050) | 33,870,574 | |||||||
|
| |||||||
| India — 0.5% | ||||||||
Brigade Enterprises Ltd. | 21,055 | 27,928 | ||||||
DLF Ltd. | 267,352 | 532,644 | ||||||
Godrej Properties Ltd.* | 31,261 | 284,596 | ||||||
Housing Development & Infrastructure Ltd.* | 35,478 | 751 | ||||||
Indiabulls Real Estate Ltd.* | 77,152 | 43,465 | ||||||
Oberoi Realty Ltd. | 28,369 | 119,980 | ||||||
Omaxe Ltd. | 25,197 | 59,164 | ||||||
Prestige Estates Projects Ltd. | 33,815 | 69,963 | ||||||
Sobha Ltd. | 10,631 | 27,310 | ||||||
Sunteck Realty Ltd. | 27,309 | 56,936 | ||||||
Unitech Ltd.* | 643,895 | 10,218 | ||||||
|
| |||||||
(Cost $1,777,004) | 1,232,955 | |||||||
|
| |||||||
| Indonesia — 0.3% | ||||||||
Ayana Land International PT* | 978,237 | 14,730 | ||||||
PT Alam Sutera Realty Tbk* | 3,002,154 | 21,781 | ||||||
PT Bumi Serpong Damai Tbk* | 2,660,161 | 115,620 | ||||||
PT Ciputra Development Tbk | 2,795,958 | 110,039 | ||||||
PT Jaya Real Property Tbk | 900,058 | 25,751 | ||||||
PT Jaya Sukses Makmur Sentosa Tbk* | 426,120 | 12,425 | ||||||
PT Lippo Cikarang Tbk* | 338,102 | 16,315 | ||||||
PT Lippo Karawaci Tbk* | 10,124,623 | 127,511 | ||||||
PT Pollux Properti Indonesia Tbk* | 306,899 | 164,373 | ||||||
PT PP Properti Tbk* | 6,552,605 | 22,425 | ||||||
PT Puradelta Lestari Tbk | 2,438,925 | 23,371 | ||||||
Number | Value | |||||||
| Indonesia (Continued) | ||||||||
PT Sanurhasta Mitra Tbk* | 399,745 | $ | 1,368 | |||||
PT Sitara Propertindo Tbk*(c) | 1,396,701 | 18,929 | ||||||
PT Summarecon Agung Tbk | 2,466,313 | 78,328 | ||||||
|
| |||||||
(Cost $1,274,039) | 752,966 | |||||||
|
| |||||||
| Ireland — 0.1% | ||||||||
| Hibernia REIT PLC REIT (Cost $251,720) | 180,484 | 218,429 | ||||||
|
| |||||||
| Israel — 1.4% | ||||||||
AFI Properties Ltd.* | 6,401 | 178,853 | ||||||
Airport City Ltd.* | 18,893 | 247,690 | ||||||
Alony Hetz Properties & Investments Ltd. | 36,008 | 409,990 | ||||||
Alrov Properties and Lodgings Ltd. | 1,572 | 36,794 | ||||||
Amot Investments Ltd. | 44,767 | 235,118 | ||||||
Arad Investment & Industrial Development Ltd. (a) | 1,226 | 93,960 | ||||||
Ashtrom Properties Ltd. | 11,465 | 50,201 | ||||||
Azrieli Group Ltd. | 10,048 | 527,438 | ||||||
Bayside Land Corp. | 361 | 202,737 | ||||||
Big Shopping Centers Ltd. | 1,760 | 124,085 | ||||||
Blue Square Real Estate Ltd. (a) | 1,414 | 70,349 | ||||||
Gazit-Globe Ltd. | 23,249 | 158,869 | ||||||
Israel Canada T.R Ltd. | 23,630 | 33,009 | ||||||
Isras Investment Co. Ltd. | 405 | 69,974 | ||||||
Melisron Ltd. | 5,051 | 193,193 | ||||||
Menivim- The New REIT Ltd. REIT | 117,020 | 54,445 | ||||||
Norstar Holdings, Inc. | 3,230 | 32,269 | ||||||
Property & Building Corp. Ltd. | 606 | 40,597 | ||||||
Reit 1 Ltd. REIT | 50,397 | 218,079 | ||||||
Sella Capital Real Estate Ltd. REIT | 52,696 | 102,582 | ||||||
Summit Real Estate Holdings Ltd. | 10,258 | 116,916 | ||||||
Villar International Ltd.* | 1,212 | 41,860 | ||||||
|
| |||||||
(Cost $3,814,939) | 3,239,008 | |||||||
|
| |||||||
| Italy — 0.0% | ||||||||
Immobiliare Grande Distribuzione SIIQ SpA REIT* | 14,630 | 52,808 | ||||||
|
| |||||||
| Japan — 22.5% | ||||||||
Activia Properties, Inc. REIT (a) | 193 | 656,560 | ||||||
Advance Residence Investment Corp. REIT | 369 | 1,149,111 | ||||||
Aeon Mall Co. Ltd. | 26,000 | 365,619 | ||||||
AEON REIT Investment Corp. REIT | 388 | 410,563 | ||||||
Comforia Residential REIT, Inc. REIT | 177 | 535,592 | ||||||
Daibiru Corp. | 16,800 | 163,735 | ||||||
Daito Trust Construction Co. Ltd. | 18,100 | 1,912,735 | ||||||
Daiwa House REIT Investment Corp. REIT | 482 | 1,191,858 | ||||||
Daiwa Office Investment Corp. REIT (a) | 74 | 432,042 | ||||||
Daiwa Securities Living Investments Corp. REIT | 545 | 500,306 | ||||||
Frontier Real Estate Investment Corp. REIT | 147 | 477,561 | ||||||
Fukuoka REIT Corp. REIT | 199 | 234,031 | ||||||
| See Notes to Financial Statements. | 22 |
DBX ETF Trust
Schedule of Investments
Xtrackers International Real Estate ETF (Continued)
May 31, 2020
Number | Value | |||||||
| Japan (Continued) | ||||||||
Global One Real Estate Investment Corp. REIT | 225 | $ | 211,770 | |||||
GLP J REIT | 1,023 | 1,364,506 | ||||||
Goldcrest Co. Ltd. | 4,700 | 68,841 | ||||||
Hankyu Hanshin REIT, Inc. REIT (a) | 202 | 255,184 | ||||||
Heiwa Real Estate Co. Ltd. | 7,200 | 196,816 | ||||||
Heiwa Real Estate REIT, Inc. REIT | 216 | 208,111 | ||||||
Hoshino Resorts REIT, Inc. REIT | 45 | 184,411 | ||||||
Hulic Co. Ltd. (a) | 142,900 | 1,445,779 | ||||||
Hulic Reit, Inc. REIT | 310 | 398,812 | ||||||
Ichigo Office REIT Investment Corp. REIT | 404 | 284,246 | ||||||
Industrial & Infrastructure Fund Investment Corp. REIT | 459 | 752,822 | ||||||
Invesco Office J-Reit, Inc. REIT | 2,401 | 348,778 | ||||||
Invincible Investment Corp. REIT | 1,637 | 414,511 | ||||||
Japan Excellent, Inc. REIT | 330 | 408,307 | ||||||
Japan Hotel REIT Investment Corp. REIT | 1,214 | 505,387 | ||||||
Japan Logistics Fund, Inc. REIT | 236 | 627,596 | ||||||
Japan Prime Realty Investment Corp. REIT | 233 | 711,533 | ||||||
Japan Real Estate Investment Corp. REIT | 374 | 2,041,231 | ||||||
Japan Retail Fund Investment Corp. REIT | 689 | 909,415 | ||||||
Kenedix Office Investment Corp. REIT | 118 | 654,977 | ||||||
Kenedix Residential Next Investment Corp. REIT | 186 | 313,007 | ||||||
Kenedix Retail REIT Corp. REIT | 165 | 306,920 | ||||||
LaSalle Logiport REIT | 375 | 559,359 | ||||||
Leopalace21 Corp.* | 60,700 | 150,996 | ||||||
LIFULL Co. Ltd. (a) | 20,200 | 79,686 | ||||||
MCUBS MidCity Investment Corp. REIT | 474 | 372,653 | ||||||
Mirai Corp. REIT | 411 | 151,261 | ||||||
Mitsubishi Estate Co. Ltd. | 367,200 | 5,838,526 | ||||||
Mitsubishi Estate Logistics REIT Investment Corp. REIT | 66 | 243,208 | ||||||
Mitsui Fudosan Co. Ltd. | 258,700 | 4,979,018 | ||||||
Mitsui Fudosan Logistics Park, Inc. REIT | 102 | 444,034 | ||||||
Mori Hills REIT Investment Corp. REIT | 410 | 553,720 | ||||||
Mori Trust Sogo Reit, Inc. REIT | 252 | 315,541 | ||||||
Nippon Accommodations Fund, Inc. REIT | 132 | 800,074 | ||||||
Nippon Building Fund, Inc. REIT | 379 | 2,378,094 | ||||||
Nippon Prologis REIT, Inc. REIT (a) | 543 | 1,532,204 | ||||||
NIPPON REIT Investment Corp. REIT | 130 | 456,723 | ||||||
Nomura Real Estate Holdings, Inc. | 35,200 | 651,495 | ||||||
Nomura Real Estate Master Fund, Inc. REIT | 1,225 | 1,506,590 | ||||||
Open House Co. Ltd. | 19,000 | 525,196 | ||||||
Orix JREIT, Inc. REIT | 750 | 1,084,606 | ||||||
Premier Investment Corp. REIT | 373 | 422,735 | ||||||
Relo Group, Inc. | 32,500 | 742,400 | ||||||
Sekisui House Reit, Inc. REIT | 1,137 | 708,151 | ||||||
Starts Corp., Inc. | 8,100 | 164,729 | ||||||
Sumitomo Realty & Development Co. Ltd. | 123,900 | 3,432,307 | ||||||
Takara Leben Co. Ltd. | 21,500 | 74,836 | ||||||
TOC Co. Ltd. | 11,900 | 77,319 | ||||||
Tokyo Tatemono Co. Ltd. | 55,800 | 719,415 | ||||||
Number | Value | |||||||
| Japan (Continued) | ||||||||
Tokyu Fudosan Holdings Corp. | 162,800 | $ | 825,069 | |||||
Tokyu REIT, Inc. REIT | 222 | 306,619 | ||||||
United Urban Investment Corp. REIT (a) | 818 | 867,087 | ||||||
Unizo Holdings Co. Ltd.*(a) | 7,600 | 421,850 | ||||||
|
| |||||||
(Cost $57,636,595) | 52,028,174 | |||||||
|
| |||||||
| Jersey Island — 0.1% | ||||||||
| Atrium European Real Estate Ltd.* (Cost $135,339) | 37,963 | 110,849 | ||||||
|
| |||||||
| Luxembourg — 1.1% | ||||||||
Aroundtown SA | 319,273 | 1,755,119 | ||||||
Grand City Properties SA | 26,195 | 593,833 | ||||||
Shurgard Self Storage SA | 7,288 | 239,151 | ||||||
|
| |||||||
(Cost $3,285,763) | 2,588,103 | |||||||
|
| |||||||
| Malaysia — 0.6% | ||||||||
Axis Real Estate Investment Trust REIT | 217,739 | 103,673 | ||||||
Capitaland Malaysia Mall Trust REIT | 158,700 | 29,203 | ||||||
Eastern & Oriental Bhd | 117,000 | 11,841 | ||||||
Eco World Development Group Bhd* | 200,600 | 22,609 | ||||||
Eco World International Bhd* | 344,000 | 35,607 | ||||||
IGB Bhd | 59,000 | 33,928 | ||||||
IGB Real Estate Investment Trust REIT | 387,300 | 155,900 | ||||||
IOI Properties Group Bhd | 349,225 | 86,754 | ||||||
KLCCP Stapled Group (b) | 51,100 | 90,622 | ||||||
KSL Holdings Bhd* | 28,800 | 4,405 | ||||||
Land & General Bhd | 129,400 | 2,976 | ||||||
LBS Bina Group Bhd | 62,300 | 5,302 | ||||||
Mah Sing Group Bhd | 93,900 | 10,043 | ||||||
Matrix Concepts Holdings Bhd | 121,896 | 47,665 | ||||||
MKH Bhd | 19,200 | 4,990 | ||||||
MRCB-QUILL REIT | 77,100 | 12,769 | ||||||
Paramount Corp. Bhd | 85,840 | 16,586 | ||||||
Pavilion Real Estate Investment Trust REIT | 64,800 | 24,892 | ||||||
Sime Darby Property Bhd | 617,446 | 96,576 | ||||||
SP Setia Bhd Group | 421,205 | 92,525 | ||||||
Sunway Bhd | 483,261 | 148,952 | ||||||
Sunway Real Estate Investment Trust REIT | 384,400 | 141,470 | ||||||
Tropicana Corp. Bhd* | 29,561 | 5,916 | ||||||
UEM Sunrise Bhd* | 384,300 | 42,430 | ||||||
UOA Development Bhd | 102,000 | 42,231 | ||||||
YNH Property Bhd* | 95,600 | 61,131 | ||||||
YTL Hospitality REIT | 351,400 | 84,870 | ||||||
|
| |||||||
(Cost $1,671,898) | 1,415,866 | |||||||
|
| |||||||
| Mexico — 0.8% | ||||||||
CFE Capital S de RL de CV REIT | 219,287 | 208,191 | ||||||
Corp. Inmobiliaria Vesta SAB de CV | 156,332 | 213,979 | ||||||
Fibra Uno Administracion SA de CV REIT | 1,022,756 | 781,518 | ||||||
Macquarie Mexico Real Estate Management SA de CV REIT, 144A | 220,174 | 235,499 | ||||||
PLA Administradora Industrial S de RL de CV REIT | 213,464 | 267,098 | ||||||
Prologis Property Mexico SA de CV REIT | 122,105 | 232,681 | ||||||
|
| |||||||
(Cost $2,571,761) | 1,938,966 | |||||||
|
| |||||||
| See Notes to Financial Statements. | 23 |
DBX ETF Trust
Schedule of Investments
Xtrackers International Real Estate ETF (Continued)
May 31, 2020
Number | Value | |||||||
| New Zealand — 0.6% | ||||||||
Argosy Property Ltd. | 236,366 | $ | 168,325 | |||||
Goodman Property Trust REIT | 262,743 | 357,948 | ||||||
Kiwi Property Group Ltd. | 402,664 | 254,337 | ||||||
Precinct Properties New Zealand Ltd. | 281,139 | 275,941 | ||||||
Property for Industry Ltd. (a) | 143,771 | 215,453 | ||||||
Vital Healthcare Property Trust REIT | 103,125 | 156,777 | ||||||
|
| |||||||
(Cost $1,576,660) | 1,428,781 | |||||||
|
| |||||||
| Norway — 0.4% | ||||||||
Entra ASA, 144A | 42,744 | 578,706 | ||||||
Norwegian Property ASA | 32,600 | 38,569 | ||||||
Olav Thon Eiendomsselskap ASA* | 8,582 | 125,373 | ||||||
Selvaag Bolig ASA | 12,267 | 63,227 | ||||||
|
| |||||||
(Cost $839,150) | 805,875 | |||||||
|
| |||||||
| Philippines — 2.4% | ||||||||
8990 Holdings, Inc.* | 324,200 | 62,893 | ||||||
Altus San Nicolas Corp.*(c) | 2,036 | 209 | ||||||
Ayala Corp. | 78,385 | 1,157,503 | ||||||
Ayala Land, Inc. | 2,101,496 | 1,328,484 | ||||||
Belle Corp. | 748,000 | 19,949 | ||||||
DoubleDragon Properties Corp.* | 221,870 | 70,216 | ||||||
Filinvest Development Corp.* | 341,740 | 55,967 | ||||||
Filinvest Land, Inc.* | 1,656,000 | 29,443 | ||||||
GT Capital Holdings, Inc.* | 25,811 | 197,330 | ||||||
Megaworld Corp. | 3,543,600 | 199,511 | ||||||
Robinsons Land Corp. | 309,361 | 90,327 | ||||||
SM Prime Holdings, Inc.* | 3,822,357 | 2,276,651 | ||||||
Vista Land & Lifescapes, Inc. | 1,017,700 | 65,340 | ||||||
|
| |||||||
(Cost $6,778,088) | 5,553,823 | |||||||
|
| |||||||
| Poland — 0.1% | ||||||||
Atal SA | 1,587 | 12,286 | ||||||
Develia SA | 127,902 | 62,606 | ||||||
Dom Development SA | 1,008 | 21,347 | ||||||
Echo Investment SA | 51,843 | 48,552 | ||||||
Globe Trade Centre SA* | 51,242 | 86,508 | ||||||
MLP Group SA | 2,636 | 39,499 | ||||||
|
| |||||||
(Cost $318,322) | 270,798 | |||||||
|
| |||||||
| Romania — 0.2% | ||||||||
| NEPI Rockcastle PLC (Cost $650,128) | 87,759 | 445,528 | ||||||
�� |
| |||||||
| Russia — 0.2% | ||||||||
| PIK Group PJSC* (Cost $429,633) | 73,582 | 399,881 | ||||||
|
| |||||||
| Singapore — 6.8% | ||||||||
AIMS APAC REIT | 141,300 | 126,964 | ||||||
ARA LOGOS Logistics Trust REIT | 282,600 | 102,971 | ||||||
Ascendas India Trust | 246,200 | 247,350 | ||||||
Ascendas Real Estate Investment Trust REIT | 789,374 | 1,748,083 | ||||||
Ascott Residence Trust | 460,996 | 313,115 | ||||||
Bukit Sembawang Estates Ltd. | 41,500 | 114,805 | ||||||
CapitaLand Commercial Trust REIT | 724,920 | 897,559 | ||||||
CapitaLand Ltd.* | 665,851 | 1,361,475 | ||||||
CapitaLand Mall Trust REIT | 702,501 | 1,008,969 | ||||||
Number | Value | |||||||
| Singapore (Continued) | ||||||||
CapitaLand Retail China Trust REIT | 200,041 | $ | 183,991 | |||||
CDL Hospitality Trusts (b) | 202,100 | 135,839 | ||||||
Chip Eng Seng Corp. Ltd.* | 120,900 | 44,480 | ||||||
City Developments Ltd. | 123,698 | 673,014 | ||||||
Cromwell European Real Estate Investment Trust REIT | 317,600 | 160,744 | ||||||
ESR REIT | 536,285 | 142,286 | ||||||
Far East Hospitality Trust (b) | 242,200 | 84,823 | ||||||
First Real Estate Investment Trust REIT | 141,900 | 88,851 | ||||||
Frasers Centrepoint Trust REIT | 216,100 | 371,532 | ||||||
Frasers Hospitality Trust (b) | 202,000 | 67,171 | ||||||
Frasers Logistics & Commercial Trust REIT | 777,478 | 610,585 | ||||||
Frasers Property Ltd. | 101,000 | 85,751 | ||||||
GuocoLand Ltd. | 80,800 | 85,179 | ||||||
Ho Bee Land Ltd. | 60,500 | 87,321 | ||||||
Keppel REIT | 457,700 | 346,497 | ||||||
Keppel DC REIT | 340,955 | 619,962 | ||||||
Keppel Pacific Oak US REIT | 221,965 | 163,144 | ||||||
Lippo Malls Indonesia Retail Trust REIT | 464,500 | 44,695 | ||||||
Manulife US Real Estate Investment Trust REIT | 381,126 | 316,335 | ||||||
Mapletree Commercial Trust REIT | 603,770 | 854,351 | ||||||
Mapletree Industrial Trust REIT | 406,088 | 781,491 | ||||||
Mapletree Logistics Trust REIT | 692,100 | 1,003,824 | ||||||
Mapletree North Asia Commercial Trust REIT | 516,700 | 305,253 | ||||||
OUE Commercial Real Estate Investment Trust REIT | 626,339 | 170,610 | ||||||
Parkway Life Real Estate Investment Trust REIT | 110,900 | 272,267 | ||||||
Prime US REIT | 132,300 | 98,563 | ||||||
Soilbuild Business Space REIT | 261,136 | 72,055 | ||||||
SPH REIT | 242,300 | 142,287 | ||||||
Starhill Global REIT | 383,800 | 131,699 | ||||||
Suntec Real Estate Investment Trust REIT | 553,000 | 575,145 | ||||||
United Industrial Corp. Ltd.* | 34,200 | 50,814 | ||||||
UOL Group Ltd.* | 121,017 | 585,649 | ||||||
Wing Tai Holdings Ltd. | 137,700 | 180,236 | ||||||
Yanlord Land Group Ltd.* | 159,300 | 123,978 | ||||||
|
| |||||||
(Cost $16,651,360) | 15,581,713 | |||||||
|
| |||||||
| South Africa — 0.6% | ||||||||
Attacq Ltd. REIT | 180,697 | 49,199 | ||||||
Equites Property Fund Ltd. REIT | 123,010 | 113,664 | ||||||
Fortress REIT Ltd., Class A REIT | 266,195 | 167,603 | ||||||
Fortress REIT Ltd., Class B REIT | 275,608 | 35,800 | ||||||
Growthpoint Properties Ltd. REIT | 680,736 | 481,896 | ||||||
Hyprop Investments Ltd. REIT | 57,569 | 55,677 | ||||||
Redefine Properties Ltd. REIT | 1,390,282 | 151,413 | ||||||
Resilient REIT Ltd. REIT | 80,914 | 170,966 | ||||||
SA Corporate Real Estate Ltd. REIT | 546,565 | 30,693 | ||||||
Vukile Property Fund Ltd. REIT | 224,249 | 78,483 | ||||||
|
| |||||||
(Cost $3,061,303) | 1,335,394 | |||||||
|
| |||||||
| See Notes to Financial Statements. | 24 |
DBX ETF Trust
Schedule of Investments
Xtrackers International Real Estate ETF (Continued)
May 31, 2020
Number | Value | |||||||
| South Korea — 0.1% | ||||||||
Korea Asset In Trust Co. Ltd. | 9,300 | $ | 19,937 | |||||
Korea Real Estate Investment & Trust Co. Ltd. | 55,841 | 83,641 | ||||||
LOTTE Reit Co. Ltd. REIT | 21,544 | 102,636 | ||||||
Shinhan Alpha REIT Co. Ltd. REIT | 13,730 | 78,381 | ||||||
SK D&D Co. Ltd. | 1,172 | 24,558 | ||||||
|
| |||||||
(Cost $295,407) | 309,153 | |||||||
|
| |||||||
| Spain — 0.8% | ||||||||
Aedas Homes SA, 144A* | 6,000 | 98,777 | ||||||
Inmobiliaria Colonial Socimi SA REIT | 73,438 | 664,130 | ||||||
Lar Espana Real Estate Socimi SA REIT | 18,742 | 92,459 | ||||||
Merlin Properties Socimi SA REIT | 98,082 | 823,717 | ||||||
Neinor Homes SA, 144A* | 15,456 | 139,947 | ||||||
|
| |||||||
(Cost $2,458,586) | 1,819,030 | |||||||
|
| |||||||
| Sweden — 4.1% | ||||||||
Atrium Ljungberg AB, Class B | 13,208 | 199,136 | ||||||
Castellum AB | 62,161 | 1,164,568 | ||||||
Catena AB | 7,040 | 275,819 | ||||||
Corem Property Group AB, Class B | 41,139 | 81,899 | ||||||
Dios Fastigheter AB | 24,644 | 166,546 | ||||||
Fabege AB | 73,005 | 883,655 | ||||||
Fastighets AB Balder, Class B* | 25,408 | 1,037,540 | ||||||
FastPartner AB, Class A | 14,303 | 100,685 | ||||||
Heba Fastighets AB, Class B | 10,245 | 90,285 | ||||||
Hufvudstaden AB, Class A | 31,337 | 402,595 | ||||||
JM AB | 15,264 | 298,932 | ||||||
Klovern AB, Class B | 133,794 | 211,665 | ||||||
Kungsleden AB | 50,074 | 363,127 | ||||||
L E Lundbergforetagen AB, Class B* | 19,668 | 975,637 | ||||||
Nyfosa AB* | 43,756 | 285,021 | ||||||
Pandox AB* | 26,554 | 310,697 | ||||||
Platzer Fastigheter Holding AB, Class B | 17,276 | 139,406 | ||||||
Sagax AB, Class B (a) | 39,857 | 518,824 | ||||||
Sagax AB, Class D | 27,081 | 86,260 | ||||||
Samhallsbyggnadsbolaget i Norden AB* | 261,929 | 523,950 | ||||||
Samhallsbyggnadsbolaget i Norden AB, Class D | 19,367 | 55,109 | ||||||
Wallenstam AB, Class B | 56,365 | 649,328 | ||||||
Wihlborgs Fastigheter AB | 35,683 | 573,226 | ||||||
|
| |||||||
(Cost $9,595,900) | 9,393,910 | |||||||
|
| |||||||
| Switzerland — 1.9% | ||||||||
Allreal Holding AG | 3,597 | 697,160 | ||||||
Mobimo Holding AG* | 1,818 | 517,563 | ||||||
PSP Swiss Property AG | 10,991 | 1,248,171 | ||||||
Swiss Prime Site AG | 20,106 | 1,871,007 | ||||||
|
| |||||||
(Cost $4,489,364) | 4,333,901 | |||||||
|
| |||||||
| Taiwan — 1.1% | ||||||||
Cathay No. 1 REIT | 391,737 | 221,930 | ||||||
Cathay No. 2 REIT | 174,043 | 102,194 | ||||||
Cathay Real Estate Development Co. Ltd. | 104,754 | 69,603 | ||||||
Chong Hong Construction Co. Ltd. | 54,079 | 150,575 | ||||||
Farglory Land Development Co. Ltd. | 84,928 | 123,609 | ||||||
Fubon No. 1 REIT | 100,358 | 55,351 | ||||||
Fubon No. 2 REIT | 206,796 | 99,937 | ||||||
Number | Value | |||||||
| Taiwan (Continued) | ||||||||
Highwealth Construction Corp. | 266,272 | $ | 393,311 | |||||
Hong Pu Real Estate Development Co. Ltd. | 72,132 | 55,856 | ||||||
Huaku Development Co. Ltd. | 65,747 | 207,807 | ||||||
Huang Hsiang Construction Corp. | 61,039 | 71,051 | ||||||
Hung Sheng Construction Ltd.* | 95,408 | 54,337 | ||||||
KEE TAI Properties Co. Ltd. | 141,788 | 48,168 | ||||||
Kindom Development Co. Ltd. | 85,599 | 84,102 | ||||||
Kuoyang Construction Co. Ltd. | 135,143 | 105,774 | ||||||
O-Bank No1 Real Estate Investment Trust REIT | 22,357 | 6,940 | ||||||
Prince Housing & Development Corp. | 334,611 | 107,544 | ||||||
Radium Life Tech Co. Ltd. | 247,672 | 80,921 | ||||||
Ruentex Development Co. Ltd.* | 169,303 | 257,690 | ||||||
Shin Kong No.1 REIT | 337,529 | 212,466 | ||||||
Shining Building Business Co. Ltd.* | 120,952 | 37,343 | ||||||
Sinyi Realty, Inc. | 68,653 | 61,279 | ||||||
Taiwan Land Development Corp.* | 93,531 | 20,217 | ||||||
|
| |||||||
(Cost $2,524,392) | 2,628,005 | |||||||
|
| |||||||
| Thailand — 2.2% | ||||||||
Amata Corp. PCL, NVDR | 262,400 | 119,610 | ||||||
Ananda Development PCL, NVDR | 424,200 | 18,669 | ||||||
AP Thailand PCL, NVDR | 653,700 | 114,053 | ||||||
Asset World Corp. PCL, NVDR | 2,196,200 | 327,255 | ||||||
Bangkok Land PCL, NVDR | 3,742,300 | 123,528 | ||||||
Central Pattana PCL, NVDR | 882,800 | 1,366,800 | ||||||
CPN Retail Growth Leasehold REIT | 428,700 | 390,830 | ||||||
Frasers Property Thailand Industrial Freehold & Leasehold REIT | 560,700 | 290,838 | ||||||
Frasers Property Thailand PCL, NVDR | 80,700 | 30,189 | ||||||
Golden Ventures Leasehold Real Estate Investment Trust REIT | 12,700 | 6,308 | ||||||
Grand Canal Land PCL, NVDR* | 458,300 | 32,849 | ||||||
IMPACT Growth Real Estate Investment Trust REIT | 157,000 | 87,853 | ||||||
Land & Houses PCL, NVDR | 2,293,700 | 526,376 | ||||||
LH Hotel Leasehold Real Estate Investment Trust, Class F REIT | 10,900 | 4,386 | ||||||
LPN Development PCL, NVDR | 383,700 | 68,755 | ||||||
MBK PCL, NVDR | 302,100 | 144,355 | ||||||
Noble Development PCL, NVDR | 59,000 | 21,886 | ||||||
Origin Property PCL, NVDR | 282,800 | 44,896 | ||||||
Platinum Group PCL, NVDR | 485,000 | 42,081 | ||||||
Principal Capital PCL, NVDR* | 464,400 | 38,834 | ||||||
Property Perfect PCL, NVDR | 2,488,330 | 27,379 | ||||||
Pruksa Holding PCL, NVDR | 222,200 | 83,124 | ||||||
Quality Houses PCL, NVDR | 2,263,000 | 153,665 | ||||||
Sansiri PCL, NVDR | 4,441,200 | 108,901 | ||||||
SC Asset Corp. PCL, NVDR | 464,400 | 29,490 | ||||||
Siam Future Development PCL, NVDR | 343,040 | 52,195 | ||||||
Singha Estate PCL, NVDR | 935,600 | 50,883 | ||||||
Supalai PCL, NVDR | 383,800 | 178,568 | ||||||
U City PCL, NVDR* | 777,500 | 28,841 | ||||||
Univentures PCL, NVDR | 161,600 | 16,968 | ||||||
WHA Corp. PCL, NVDR | 2,287,500 | 228,678 | ||||||
| See Notes to Financial Statements. | 25 |
DBX ETF Trust
Schedule of Investments
Xtrackers International Real Estate ETF (Continued)
May 31, 2020
Number | Value | |||||||
| Thailand (Continued) | ||||||||
WHA Premium Growth Freehold & Leasehold Real Estate InvestmentTrust, Class F REIT | 403,900 | $ | 218,393 | |||||
|
| |||||||
(Cost $5,893,810) | 4,977,436 | |||||||
|
| |||||||
| Turkey — 0.1% | ||||||||
AKIS Gayrimenkul Yatirimi AS REIT | 44,627 | 23,159 | ||||||
Alarko Gayrimenkul Yatirim Ortakligi AS REIT* | 1,317 | 2,826 | ||||||
Emlak Konut Gayrimenkul Yatirim Ortakligi AS REIT* | 588,777 | 126,879 | ||||||
Is Gayrimenkul Yatirim Ortakligi AS REIT* | 132,604 | 32,463 | ||||||
Torunlar Gayrimenkul Yatirim Ortakligi AS REIT* | 52,733 | 19,790 | ||||||
Yeni Gimat Gayrimenkul Ortakligi AS | 36,840 | 64,915 | ||||||
|
| |||||||
(Cost $261,856) | 270,032 | |||||||
|
| |||||||
| United Kingdom — 6.1% | ||||||||
Assura PLC REIT | 644,458 | 629,427 | ||||||
Big Yellow Group PLC REIT | 43,416 | 536,752 | ||||||
British Land Co. PLC REIT | 231,706 | 1,166,744 | ||||||
Capital & Counties Properties PLC REIT | 155,218 | 313,750 | ||||||
Derwent London PLC REIT | 27,446 | 997,586 | ||||||
Empiric Student Property PLC REIT | 167,969 | 129,165 | ||||||
Grainger PLC | 168,115 | 596,503 | ||||||
Great Portland Estates PLC REIT | 60,401 | 486,126 | ||||||
Hammerson PLC REIT | 221,382 | 201,439 | ||||||
Land Securities Group PLC REIT | 182,849 | 1,369,449 | ||||||
LondonMetric Property PLC REIT | 223,671 | 580,148 | ||||||
LXI REIT PLC REIT | 128,117 | 185,001 | ||||||
Primary Health Properties PLC REIT | 314,245 | 598,292 | ||||||
Safestore Holdings PLC REIT | 55,852 | 459,872 | ||||||
Savills PLC | 38,922 | 415,269 | ||||||
Segro PLC REIT | 289,765 | 3,007,754 | ||||||
Shaftesbury PLC REIT | 41,005 | 317,855 | ||||||
St. Modwen Properties PLC | 54,072 | 224,948 | ||||||
Tritax Big Box REIT PLC REIT | 456,437 | 783,239 | ||||||
UNITE Group PLC REIT | 79,944 | 858,380 | ||||||
Workspace Group PLC REIT | 34,595 | 312,861 | ||||||
|
| |||||||
(Cost $15,990,739) | 14,170,560 | |||||||
|
| |||||||
Number | Value | |||||||
| United States — 0.0% | ||||||||
| Eagle Hospitality Trust*(c) (Cost $94,982) | 173,500 | $ | 23,769 | |||||
|
| |||||||
TOTAL COMMON STOCKS | 228,713,444 | |||||||
|
| |||||||
| PREFERRED STOCKS — 0.0% | ||||||||
| Sweden — 0.0% | ||||||||
| Klovern AB (Cost $159,904) | 4,645 | 147,463 | ||||||
|
| |||||||
| RIGHTS — 0.0% | ||||||||
| Thailand — 0.0% | ||||||||
CPN Retail Growth Leasehold REIT*, expires 12/31/20 (c) | 136 | 0 | ||||||
CPN Retail Growth Leasehold REIT*, expires 12/31/20 (c) | 73,128 | 0 | ||||||
Frasers Property Thailand PCL, NVDR*, expires 7/3/20 | 11,925 | 487 | ||||||
|
| |||||||
TOTAL RIGHTS | 487 | |||||||
|
| |||||||
| WARRANTS — 0.0% | ||||||||
| Malaysia — 0.0% | ||||||||
| Paramount Corp. Bhd*, expires 7/28/24 (Cost $0) | 7,840 | 234 | ||||||
|
| |||||||
| SECURITIES LENDING COLLATERAL — 3.7% | ||||||||
DWS Government & Agency Securities Portfolio “DWS Government Cash Institutional Shares”, 0.07% (d)(e) | 8,505,313 | 8,505,313 | ||||||
|
| |||||||
| CASH EQUIVALENTS — 0.3% | ||||||||
DWS Government Money Market Series “Institutional Shares”, 0.12% (d) | 643,631 | 643,631 | ||||||
|
| |||||||
| TOTAL INVESTMENTS — 103.1% (Cost $274,137,328) | $ | 238,010,572 | ||||||
Other assets and liabilities, net — (3.1%) | (7,232,688 | ) | ||||||
|
| |||||||
NET ASSETS — 100.0% | $ | 230,777,884 | ||||||
|
| |||||||
A summary of the Fund’s transactions with affiliated investments during the year ended May 31, 2020 is as follows:
| Value ($) at 5/31/2019 | Purchases Cost ($) | Sales Proceeds ($) | Net Realized Gain/(Loss) ($) | Net Change in Unrealized Appreciation (Depreciation) ($) | Income ($) | Capital Gain Distributions ($) | Number of Shares at 5/31/2020 | Value ($) at 5/31/2020 | ||||||||||||||||||||||||||||
SECURITIES LENDING COLLATERAL — 3.7% |
| |||||||||||||||||||||||||||||||||||
DWS Government & Agency Securities Portfolio “DWS Government Cash Institutional Shares”, 0.07% (d)(e) |
| |||||||||||||||||||||||||||||||||||
| 412,237 | 8,093,076 | (f) | — | — | — | 14,878 | — | 8,505,313 | 8,505,313 | |||||||||||||||||||||||||||
CASH EQUIVALENTS — 0.3% |
| |||||||||||||||||||||||||||||||||||
DWS Government Money Market Series “Institutional Shares”, 0.12% (d) |
| |||||||||||||||||||||||||||||||||||
| 76,925 | 33,517,532 | (32,950,826 | ) | — | — | 4,723 | — | 643,631 | 643,631 | |||||||||||||||||||||||||||
|
|
|
|
|
|
|
|
|
|
|
|
|
|
|
|
|
| |||||||||||||||||||
| 489,162 | 41,610,608 | (32,950,826 | ) | — | — | 19,601 | — | 9,148,944 | 9,148,944 | |||||||||||||||||||||||||||
|
|
|
|
|
|
|
|
|
|
|
|
|
|
|
|
|
| |||||||||||||||||||
| * | Non-income producing security. |
| (a) | All or a portion of these securities were on loan. In addition, “Other assets and liabilities, net” may include pending sales that are also on loan. The value of securities loaned at May 31, 2020 amounted to $11,148,133, which is 4.8% of net assets. |
| See Notes to Financial Statements. | 26 |
DBX ETF Trust
Schedule of Investments
Xtrackers International Real Estate ETF (Continued)
May 31, 2020
| (b) | Stapled Security—A security contractually bound to one or more other securities to form a single saleable unit which cannot be sold separately. |
| (c) | Investment was valued using significant unobservable inputs. |
| (d) | Affiliated fund managed by DWS Investment Management Americas, Inc. The rate shown is the annualized seven-day yield at period end. |
| (e) | Represents cash collateral held in connection with securities lending. Income earned by the Fund is net of borrower rebates. In addition, the Fund held non-cash U.S. Treasury securities collateral having a value of $3,910,553. |
| (f) | Represents the net increase (purchase cost) or decrease (sales proceeds) in the amount invested in cash collateral for the year ended May 31, 2020. |
| NVDR: | Non Voting Depositary Receipt |
| PJSC: | Public Joint Stock Company |
| REIT: | Real Estate Investment Trust |
| SAE: | Societe Anonyme Egyptienne |
| 144A: | Security exempt from registration under Rule 144A of the Securities Act of 1933. These securities may be resold in transactions exempt from registration, normally to qualified institutional buyers. |
At May 31, 2020, open futures contracts purchased were as follows:
Contract Description | Currency | Number of Contracts | Notional Amount | Contract Value | Expiration Date | Unrealized Appreciation | ||||||||||||
MINI TPX Index Futures | JPY | 37 | $ | 481,059 | $ | 535,416 | 6/11/2020 | $ | 54,357 | |||||||||
EURO STOXX 50 Futures | EUR | 18 | 562,512 | 609,880 | 6/19/2020 | 47,368 | ||||||||||||
E-Mini S&P 500 Futures | USD | 2 | 295,210 | 304,200 | 6/19/2020 | 8,990 | ||||||||||||
MINI HSI Index Futures | HKD | 11 | 320,981 | 323,131 | 6/29/2020 | 2,150 | ||||||||||||
|
| |||||||||||||||||
Total unrealized appreciation | $ | 112,865 | ||||||||||||||||
|
| |||||||||||||||||
For information on the Fund’s policy and additional disclosures regarding open futures contracts, please refer to the Derivatives section of Note 2 in the accompanying Notes to Financial Statements.
Currency Abbreviations
| EUR | Euro |
| HKD | Hong Kong Dollar |
| JPY | Japanese Yen |
| USD | U.S. Dollar |
Fair Value Measurements
Various inputs are used in determining the value of the Fund’s investments. These inputs are summarized in three broad levels. Level 1 includes quoted prices in active markets for identical securities. Level 2 includes other significant observable inputs (including quoted prices for similar securities, interest rates, prepayment speeds and credit risk). Level 3 includes significant unobservable inputs (including the Fund’s own assumptions in determining the fair value of investments). The level assigned to the securities valuations may not be an indication of the risk or liquidity associated with investing in those securities.
The following is a summary of the inputs used as of May 31, 2020 in valuing the Fund’s investments. For information on the Fund’s policy regarding the valuation of investments, please refer to the Security Valuation section of Note 2 in the accompanying Notes to Financial Statements.
Assets | Level 1 | Level 2 | Level 3 | Total | ||||||||||||
Common Stocks (g) | $ | 228,670,537 | $ | — | $ | 42,907 | $ | 228,713,444 | ||||||||
Preferred Stocks | 147,463 | — | — | 147,463 | ||||||||||||
Rights | — | 487 | 0 | 487 | ||||||||||||
Warrants | 234 | — | — | 234 | ||||||||||||
Short-Term Investments (g) | 9,148,944 | — | — | 9,148,944 | ||||||||||||
Derivatives (h) | ||||||||||||||||
Futures Contracts | 112,865 | — | — | 112,865 | ||||||||||||
|
|
|
|
|
|
|
| |||||||||
TOTAL | $ | 238,080,043 | $ | 487 | $ | 42,907 | $ | 238,123,437 | ||||||||
|
|
|
|
|
|
|
| |||||||||
| (g) | See Schedule of Investments for additional detailed categorizations. |
| (h) | Derivatives include unrealized appreciation (depreciation) on open futures contracts. |
During the year ended May 31, 2020, the amount of transfers from Level 1 to Level 3 was $16,698 and from Level 3 to Level 1 was $6,381. The investments were transferred from Level 1 to Level 3 due to the lack of observable market data due to a decrease in market activity. The investments were transferred from Level 3 to Level 1 due to the availability of a pricing source supported by observable inputs.
| See Notes to Financial Statements. | 27 |
DBX ETF Trust
Schedule of Investments
Xtrackers Japan JPX-Nikkei 400 Equity ETF
May 31, 2020
Number | Value | |||||||
| COMMON STOCKS — 98.2% | ||||||||
| Communication Services — 8.7% | ||||||||
Akatsuki, Inc. | 100 | $ | 3,783 | |||||
Capcom Co. Ltd. | 700 | 24,723 | ||||||
COLOPL, Inc. | 500 | 4,998 | ||||||
CyberAgent, Inc. | 800 | 40,321 | ||||||
Daiichikosho Co. Ltd. | 300 | 10,554 | ||||||
DeNA Co. Ltd. | 700 | 9,616 | ||||||
Dentsu Group, Inc. | 1,200 | 32,134 | ||||||
Dip Corp. | 300 | 7,087 | ||||||
GungHo Online Entertainment, Inc. | 440 | 7,159 | ||||||
Hakuhodo DY Holdings, Inc. | 1,900 | 23,614 | ||||||
Kakaku.com, Inc. | 800 | 19,351 | ||||||
KDDI Corp. | 9,800 | 285,263 | ||||||
Konami Holdings Corp. | 500 | 17,566 | ||||||
Mixi, Inc. | 300 | 4,879 | ||||||
Nexon Co. Ltd. | 3,800 | 79,220 | ||||||
Nintendo Co. Ltd. | 830 | 335,436 | ||||||
Nippon Telegraph & Telephone Corp. | 13,400 | 303,983 | ||||||
Nippon Television Holdings, Inc. | 1,100 | 12,702 | ||||||
NTT DOCOMO, Inc. | 9,500 | 260,261 | ||||||
SoftBank Group Corp. | 6,300 | 282,560 | ||||||
Square Enix Holdings Co. Ltd. (a) | 500 | 24,273 | ||||||
Toho Co. Ltd. | 700 | 25,730 | ||||||
Z Holdings Corp. | 17,800 | 72,697 | ||||||
|
| |||||||
(Cost $1,818,387) | 1,887,910 | |||||||
|
| |||||||
| Consumer Discretionary — 14.8% | ||||||||
ABC-Mart, Inc. | 170 | 10,336 | ||||||
Aisin Seiki Co. Ltd. | 1,100 | 34,664 | ||||||
Bandai Namco Holdings, Inc. | 1,400 | 77,917 | ||||||
Bic Camera, Inc. | 800 | 8,428 | ||||||
Bridgestone Corp. | 3,900 | 129,487 | ||||||
Casio Computer Co. Ltd. | 1,000 | 17,608 | ||||||
Daikyonishikawa Corp. | 600 | 3,386 | ||||||
Denso Corp. | 2,900 | 111,198 | ||||||
Fast Retailing Co. Ltd. | 170 | 95,513 | ||||||
Fujitsu General Ltd. | 500 | 9,769 | ||||||
Goldwin, Inc. | 200 | 12,791 | ||||||
Haseko Corp. | 1,700 | 20,718 | ||||||
Hikari Tsushin, Inc. | 150 | 32,872 | ||||||
Honda Motor Co. Ltd. | 10,500 | 271,332 | ||||||
Iida Group Holdings Co. Ltd. | 1,100 | 16,336 | ||||||
Isuzu Motors Ltd. | 3,900 | 36,544 | ||||||
Izumi Co. Ltd. | 300 | 9,426 | ||||||
J. Front Retailing Co. Ltd. | 1,700 | 14,438 | ||||||
JTEKT Corp. | 1,200 | 9,679 | ||||||
Koito Manufacturing Co. Ltd. | 700 | 29,661 | ||||||
KOMEDA Holdings Co. Ltd. | 300 | 5,193 | ||||||
K’s Holdings Corp. | 1,100 | 14,090 | ||||||
Marui Group Co. Ltd. | 1,200 | 21,642 | ||||||
Mazda Motor Corp. | 4,000 | 25,581 | ||||||
McDonald’s Holdings Co. Japan Ltd. | 500 | 26,593 | ||||||
NGK Spark Plug Co. Ltd. | 1,000 | 16,123 | ||||||
Nifco, Inc. | 500 | 10,944 | ||||||
Nikon Corp. | 2,100 | 19,297 | ||||||
Nitori Holdings Co. Ltd. | 600 | 108,795 | ||||||
Nojima Corp. | 300 | 6,987 | ||||||
Number | Value | |||||||
| Consumer Discretionary (Continued) | ||||||||
Oriental Land Co. Ltd. | 1,400 | $ | 202,915 | |||||
PALTAC Corp. | 200 | 9,802 | ||||||
Pan Pacific International Holdings Corp. | 2,800 | 56,424 | ||||||
Panasonic Corp. | 15,400 | 137,654 | ||||||
Pressance Corp. | 400 | 4,801 | ||||||
Rakuten, Inc. | 5,800 | 52,544 | ||||||
Resorttrust, Inc. | 700 | 8,785 | ||||||
Rinnai Corp. | 300 | 25,256 | ||||||
Ryohin Keikaku Co. Ltd. | 1,900 | 28,729 | ||||||
Sekisui Chemical Co. Ltd. | 2,700 | 37,718 | ||||||
Sekisui House Ltd. | 4,500 | 85,731 | ||||||
Seria Co. Ltd. | 300 | 9,621 | ||||||
Shimamura Co. Ltd. | 200 | 14,072 | ||||||
Shimano, Inc. | 530 | 97,455 | ||||||
Skylark Holdings Co. Ltd. | 1,300 | 21,080 | ||||||
Sony Corp. | 5,700 | 363,687 | ||||||
Stanley Electric Co. Ltd. | 900 | 21,879 | ||||||
Starts Corp., Inc. | 200 | 4,067 | ||||||
Subaru Corp. | 4,200 | 92,725 | ||||||
Sumitomo Electric Industries Ltd. | 4,900 | 57,057 | ||||||
Sumitomo Forestry Co. Ltd. | 1,000 | 12,726 | ||||||
Sumitomo Rubber Industries Ltd. | 1,100 | 11,190 | ||||||
Suzuki Motor Corp. | 2,700 | 93,880 | ||||||
T-Gaia Corp. | 100 | 2,126 | ||||||
Tomy Co. Ltd. | 600 | 5,129 | ||||||
Topre Corp. | 500 | 6,010 | ||||||
Toyoda Gosei Co. Ltd. | 400 | 8,551 | ||||||
Toyota Boshoku Corp. | 600 | 8,454 | ||||||
Toyota Industries Corp. | 1,100 | 56,258 | ||||||
Toyota Motor Corp. | 5,146 | 322,655 | ||||||
TPR Co. Ltd. | 300 | 4,091 | ||||||
TS Tech Co. Ltd. | 400 | 11,250 | ||||||
United Arrows Ltd. | 200 | 3,436 | ||||||
USS Co. Ltd. | 1,500 | 26,147 | ||||||
Workman Co. Ltd. | 100 | 8,168 | ||||||
Yamaha Corp. | 800 | 38,910 | ||||||
Yamaha Motor Co. Ltd. | 1,800 | 25,980 | ||||||
Yokohama Rubber Co. Ltd. | 700 | 10,571 | ||||||
Zensho Holdings Co. Ltd. | 700 | 14,912 | ||||||
ZOZO, Inc. | 900 | 16,574 | ||||||
|
| |||||||
(Cost $3,442,019) | 3,226,368 | |||||||
|
| |||||||
| Consumer Staples — 9.5% | ||||||||
Aeon Co. Ltd. | 5,200 | 115,043 | ||||||
Ain Holdings, Inc. | 200 | 12,921 | ||||||
Ajinomoto Co., Inc. | 3,000 | 51,153 | ||||||
Ariake Japan Co. Ltd. | 100 | 6,943 | ||||||
Asahi Group Holdings Ltd. | 2,800 | 105,466 | ||||||
Calbee, Inc. | 600 | 17,348 | ||||||
Cosmos Pharmaceutical Corp. | 190 | 27,283 | ||||||
Create SD Holdings Co. Ltd. | 300 | 9,496 | ||||||
Ezaki Glico Co. Ltd. | 400 | 19,344 | ||||||
FamilyMart Co. Ltd. | 900 | 16,866 | ||||||
Japan Tobacco, Inc. | 7,700 | 152,771 | ||||||
Kao Corp. | 3,200 | 256,838 | ||||||
Kewpie Corp. | 800 | 15,661 | ||||||
Kikkoman Corp. | 1,000 | 50,309 | ||||||
| See Notes to Financial Statements. | 28 |
DBX ETF Trust
Schedule of Investments
Xtrackers Japan JPX-Nikkei 400 Equity ETF (Continued)
May 31, 2020
Number | Value | |||||||
| Consumer Staples (Continued) | ||||||||
Kirin Holdings Co. Ltd. | 5,700 | $ | 116,794 | |||||
Kobayashi Pharmaceutical Co. Ltd. | 400 | 35,643 | ||||||
Kobe Bussan Co. Ltd. | 400 | 20,717 | ||||||
Kose Corp. | 230 | 28,799 | ||||||
Kusuri no Aoki Holdings Co. Ltd. | 100 | 8,261 | ||||||
Lawson, Inc. | 300 | 16,596 | ||||||
Lion Corp. | 1,800 | 41,184 | ||||||
Maruha Nichiro Corp. | 300 | 6,491 | ||||||
Matsumotokiyoshi Holdings Co. Ltd. | 500 | 18,726 | ||||||
MEIJI Holdings Co. Ltd. | 900 | 67,750 | ||||||
Morinaga & Co. Ltd. | 300 | 12,879 | ||||||
NH Foods Ltd. | 500 | 18,471 | ||||||
Nichirei Corp. | 600 | 16,903 | ||||||
Nippon Suisan Kaisha Ltd. | 2,000 | 9,263 | ||||||
Nissin Foods Holdings Co. Ltd. | 600 | 50,123 | ||||||
Pigeon Corp. | 800 | 31,188 | ||||||
Pola Orbis Holdings, Inc. | 600 | 11,673 | ||||||
Seven & i Holdings Co. Ltd. | 5,200 | 177,959 | ||||||
Shiseido Co. Ltd. | 2,700 | 164,654 | ||||||
Sugi Holdings Co. Ltd. | 300 | 19,381 | ||||||
Sundrug Co. Ltd. | 500 | 16,847 | ||||||
Suntory Beverage & Food Ltd. | 900 | 36,757 | ||||||
Toyo Suisan Kaisha Ltd. | 700 | 36,580 | ||||||
Tsuruha Holdings, Inc. | 310 | 45,809 | ||||||
Unicharm Corp. | 2,600 | 96,774 | ||||||
Welcia Holdings Co. Ltd. | 400 | 33,601 | ||||||
Yakult Honsha Co. Ltd. | 900 | 55,135 | ||||||
Yaoko Co. Ltd. | 100 | 6,544 | ||||||
|
| |||||||
(Cost $2,166,214) | 2,058,944 | |||||||
|
| |||||||
| Energy — 0.8% | ||||||||
Cosmo Energy Holdings Co. Ltd. | 400 | 6,330 | ||||||
Idemitsu Kosan Co. Ltd. | 1,500 | 33,276 | ||||||
Inpex Corp. | 7,200 | 50,183 | ||||||
Iwatani Corp. | 300 | 10,582 | ||||||
JXTG Holdings, Inc. | 20,800 | 79,987 | ||||||
Modec, Inc. | 200 | 3,015 | ||||||
|
| |||||||
(Cost $343,376) | 183,373 | |||||||
|
| |||||||
| Financials — 9.1% | ||||||||
AEON Financial Service Co. Ltd. | 900 | 10,133 | ||||||
Aozora Bank Ltd. | 800 | 14,866 | ||||||
Chiba Bank Ltd. | 4,300 | 20,435 | ||||||
Concordia Financial Group Ltd. | 8,500 | 27,772 | ||||||
Dai-ichi Life Holdings, Inc. | 7,400 | 96,368 | ||||||
Daiwa Securities Group, Inc. | 10,000 | 41,463 | ||||||
Financial Products Group Co. Ltd. | 300 | 1,693 | ||||||
Fuyo General Lease Co. Ltd. | 200 | 11,473 | ||||||
Japan Exchange Group, Inc. | 3,800 | 81,725 | ||||||
Matsui Securities Co. Ltd. | 900 | 7,076 | ||||||
Mebuki Financial Group, Inc. | 6,900 | 15,627 | ||||||
Mitsubishi UFJ Financial Group, Inc. | 67,000 | 276,246 | ||||||
Mitsubishi UFJ Lease & Finance Co. Ltd. | 3,300 | 16,112 | ||||||
Mizuho Financial Group, Inc. | 180,000 | 224,718 | ||||||
MS&AD Insurance Group Holdings, Inc. | 3,600 | 105,759 | ||||||
Nomura Holdings, Inc. | 23,200 | 99,682 | ||||||
Orient Corp. | 3,600 | 4,277 | ||||||
ORIX Corp. | 8,400 | 111,418 | ||||||
Number | Value | |||||||
| Financials (Continued) | ||||||||
Resona Holdings, Inc. | 14,200 | $ | 51,114 | |||||
SBI Holdings, Inc. | 1,500 | 32,148 | ||||||
Seven Bank Ltd. | 3,900 | 11,113 | ||||||
Shinsei Bank Ltd. | 1,000 | 12,763 | ||||||
Sompo Holdings, Inc. | 2,500 | 88,922 | ||||||
Sony Financial Holdings, Inc. | 1,100 | 26,506 | ||||||
Sumitomo Mitsui Financial Group, Inc. | 8,800 | 254,766 | ||||||
Sumitomo Mitsui Trust Holdings, Inc. | 2,400 | 70,640 | ||||||
T&D Holdings, Inc. | 3,900 | 35,223 | ||||||
Tokio Marine Holdings, Inc. | 4,700 | 203,644 | ||||||
Tokyo Century Corp. | 300 | 13,046 | ||||||
Zenkoku Hosho Co. Ltd. | 400 | 15,390 | ||||||
|
| |||||||
(Cost $2,737,599) | 1,982,118 | |||||||
|
| |||||||
| Health Care — 12.0% | ||||||||
Alfresa Holdings Corp. | 1,500 | 30,255 | ||||||
Asahi Intecc Co. Ltd. | 1,500 | 45,946 | ||||||
Astellas Pharma, Inc. | 11,600 | 206,137 | ||||||
Chugai Pharmaceutical Co. Ltd. | 1,400 | 206,488 | ||||||
Daiichi Sankyo Co. Ltd. | 3,900 | 365,076 | ||||||
Eisai Co. Ltd. | 1,600 | 125,315 | ||||||
Hisamitsu Pharmaceutical Co., Inc. | 300 | 15,120 | ||||||
Hoya Corp. | 2,700 | 253,372 | ||||||
Japan Lifeline Co. Ltd. | 400 | 5,391 | ||||||
Kaken Pharmaceutical Co. Ltd. | 200 | 10,990 | ||||||
Kyowa Kirin Co. Ltd. | 1,300 | 35,259 | ||||||
M3, Inc. | 2,900 | 116,824 | ||||||
Medipal Holdings Corp. | 1,400 | 27,770 | ||||||
Nihon Kohden Corp. | 600 | 20,021 | ||||||
Nippon Shinyaku Co. Ltd. | 400 | 34,455 | ||||||
Olympus Corp. | 7,300 | 126,811 | ||||||
Ono Pharmaceutical Co. Ltd. | 3,000 | 85,682 | ||||||
Otsuka Holdings Co. Ltd. | 2,600 | 117,384 | ||||||
PeptiDream, Inc.* | 700 | 31,415 | ||||||
Santen Pharmaceutical Co. Ltd. | 2,500 | 46,178 | ||||||
Sawai Pharmaceutical Co. Ltd. | 300 | 16,541 | ||||||
Shionogi & Co. Ltd. | 1,700 | 100,373 | ||||||
Ship Healthcare Holdings, Inc. | 200 | 8,651 | ||||||
Sumitomo Dainippon Pharma Co. Ltd. | 800 | 11,309 | ||||||
Sysmex Corp. | 1,000 | 79,918 | ||||||
Takeda Pharmaceutical Co. Ltd. | 8,500 | 330,659 | ||||||
Terumo Corp. | 3,900 | 153,126 | ||||||
|
| |||||||
(Cost $2,112,890) | 2,606,466 | |||||||
|
| |||||||
| Industrials — 22.2% | ||||||||
AGC, Inc. | 1,400 | 39,634 | ||||||
Aica Kogyo Co. Ltd. | 400 | 11,918 | ||||||
Amada Co. Ltd. | 1,700 | 15,164 | ||||||
ANA Holdings, Inc.*(a) | 2,300 | 55,485 | ||||||
Benefit One, Inc. | 600 | 13,110 | ||||||
Central Japan Railway Co. | 1,130 | 193,359 | ||||||
COMSYS Holdings Corp. | 600 | 16,708 | ||||||
Daifuku Co. Ltd. | 700 | 54,448 | ||||||
Daikin Industries Ltd. | 1,740 | 255,989 | ||||||
DMG Mori Co. Ltd. | 900 | 10,935 | ||||||
East Japan Railway Co. | 2,400 | 188,240 | ||||||
en-japan, Inc. | 300 | 8,092 | ||||||
FANUC Corp. | 1,300 | 231,861 | ||||||
| See Notes to Financial Statements. | 29 |
DBX ETF Trust
Schedule of Investments
Xtrackers Japan JPX-Nikkei 400 Equity ETF (Continued)
May 31, 2020
Number | Value | |||||||
| Industrials (Continued) | ||||||||
Fuji Electric Co. Ltd. | 700 | $ | 18,706 | |||||
Furukawa Electric Co. Ltd. | 500 | 12,215 | ||||||
Hankyu Hanshin Holdings, Inc. | 1,700 | 62,802 | ||||||
Harmonic Drive Systems, Inc. | 300 | 17,320 | ||||||
Hazama Ando Corp. | 1,200 | 7,763 | ||||||
Hino Motors Ltd. | 1,700 | 11,503 | ||||||
Hitachi Construction Machinery Co. Ltd. | 500 | 13,134 | ||||||
Hitachi Transport System Ltd. | 200 | 5,501 | ||||||
IHI Corp. | 800 | 11,502 | ||||||
ITOCHU Corp. | 9,300 | 199,406 | ||||||
Japan Airlines Co. Ltd. | 2,100 | 41,265 | ||||||
Japan Airport Terminal Co. Ltd. | 400 | 17,599 | ||||||
Kajima Corp. | 3,400 | 38,565 | ||||||
Kanamoto Co. Ltd. | 300 | 6,466 | ||||||
Kanematsu Corp. | 500 | 6,205 | ||||||
Kawasaki Heavy Industries Ltd. | 900 | 14,252 | ||||||
Keihan Holdings Co. Ltd. | 700 | 33,267 | ||||||
Keio Corp. | 700 | 41,584 | ||||||
Keisei Electric Railway Co. Ltd. | 1,000 | 32,812 | ||||||
Kintetsu Group Holdings Co. Ltd. | 1,300 | 63,833 | ||||||
Komatsu Ltd. | 6,100 | 123,433 | ||||||
Kubota Corp. | 7,100 | 95,526 | ||||||
Kumagai Gumi Co. Ltd. | 300 | 7,332 | ||||||
Kyowa Exeo Corp. | 600 | 13,778 | ||||||
Kyudenko Corp. | 300 | 8,334 | ||||||
Maeda Corp. | 900 | 7,059 | ||||||
Makita Corp. | 1,800 | 60,983 | ||||||
Marubeni Corp. | 13,600 | 66,059 | ||||||
Meitec Corp. | 200 | 9,653 | ||||||
MINEBEA MITSUMI, Inc. | 2,500 | 43,881 | ||||||
MISUMI Group, Inc. | 1,600 | 42,504 | ||||||
Mitsubishi Corp. | 9,300 | 217,102 | ||||||
Mitsubishi Electric Corp. | 13,400 | 176,432 | ||||||
Mitsubishi Heavy Industries Ltd. | 2,200 | 56,922 | ||||||
Mitsui & Co. Ltd. | 11,300 | 171,543 | ||||||
MonotaRO Co. Ltd. | 900 | 32,705 | ||||||
Nabtesco Corp. | 800 | 24,839 | ||||||
Nagoya Railroad Co. Ltd. | 1,300 | 39,217 | ||||||
NGK Insulators Ltd. | 1,600 | 23,450 | ||||||
Nichias Corp. | 500 | 11,533 | ||||||
Nidec Corp. | 3,200 | 196,690 | ||||||
Nihon M&A Center, Inc. | 900 | 36,172 | ||||||
Nippo Corp. | 300 | 7,449 | ||||||
Nippon Express Co. Ltd. | 500 | 25,711 | ||||||
Nippon Steel Trading Corp. | 100 | 3,462 | ||||||
Nishimatsu Construction Co. Ltd. | 400 | 7,827 | ||||||
Nissin Electric Co. Ltd. | 300 | 3,124 | ||||||
NSK Ltd. | 2,600 | 19,017 | ||||||
Obara Group, Inc. | 100 | 2,970 | ||||||
Obayashi Corp. | 4,000 | 37,017 | ||||||
Odakyu Electric Railway Co. Ltd. | 2,100 | 52,415 | ||||||
OSG Corp. | 600 | 8,504 | ||||||
Outsourcing, Inc. | 500 | 2,938 | ||||||
Park24 Co. Ltd. | 700 | 13,586 | ||||||
Penta-Ocean Construction Co. Ltd. | 1,900 | 9,911 | ||||||
Persol Holdings Co. Ltd. | 1,200 | 15,872 | ||||||
Pilot Corp. | 200 | 6,841 | ||||||
Number | Value | |||||||
| Industrials (Continued) | ||||||||
Recruit Holdings Co. Ltd. | 9,200 | $ | 316,814 | |||||
Sankyu, Inc. | 400 | 16,318 | ||||||
Sanwa Holdings Corp. | 1,300 | 11,150 | ||||||
Secom Co. Ltd. | 1,400 | 121,294 | ||||||
Seibu Holdings, Inc. | 1,700 | 22,217 | ||||||
Shimizu Corp. | 4,200 | 35,554 | ||||||
SMC Corp. | 420 | 211,959 | ||||||
SMS Co. Ltd. | 400 | 9,939 | ||||||
Sohgo Security Services Co. Ltd. | 500 | 24,597 | ||||||
Sojitz Corp. | 6,800 | 15,843 | ||||||
Sotetsu Holdings, Inc. | 600 | 17,237 | ||||||
Sumitomo Corp. | 8,500 | 102,409 | ||||||
Sumitomo Heavy Industries Ltd. | 800 | 18,267 | ||||||
Sumitomo Mitsui Construction Co. Ltd. | 900 | 3,784 | ||||||
Taisei Corp. | 1,400 | 48,601 | ||||||
Takeuchi Manufacturing Co. Ltd. | 300 | 4,954 | ||||||
TechnoPro Holdings, Inc. | 300 | 17,961 | ||||||
THK Co. Ltd. | 800 | 20,792 | ||||||
Tobu Railway Co. Ltd. | 1,400 | 49,640 | ||||||
Toda Corp. | 1,800 | 11,094 | ||||||
TOKAI Holdings Corp. | 800 | 7,470 | ||||||
Tokyu Construction Co. Ltd. | 500 | 2,729 | ||||||
Tokyu Corp. | 3,500 | 55,488 | ||||||
TOTO Ltd. | 900 | 35,671 | ||||||
Toyota Tsusho Corp. | 1,400 | 35,476 | ||||||
UT Group Co. Ltd.* | 200 | 3,750 | ||||||
West Japan Railway Co. | 1,200 | 77,423 | ||||||
Yamato Holdings Co. Ltd. | 2,200 | 48,682 | ||||||
Yaskawa Electric Corp. | 1,400 | 50,290 | ||||||
|
| |||||||
(Cost $5,357,018) | 4,829,837 | |||||||
|
| |||||||
| Information Technology — 11.5% | ||||||||
Advantest Corp. | 900 | 44,442 | ||||||
Alps Alpine Co. Ltd. | 1,100 | 13,294 | ||||||
Azbil Corp. | 900 | 22,965 | ||||||
Brother Industries Ltd. | 1,600 | 30,133 | ||||||
Canon, Inc. | 7,200 | 148,297 | ||||||
Daiwabo Holdings Co. Ltd. | 100 | 6,711 | ||||||
Digital Garage, Inc. | 300 | 10,651 | ||||||
Disco Corp. | 200 | 44,665 | ||||||
Elecom Co. Ltd. | 200 | 9,486 | ||||||
Fujitsu Ltd. | 1,300 | 133,940 | ||||||
GMO Payment Gateway, Inc. | 300 | 33,777 | ||||||
Hamamatsu Photonics KK | 850 | 38,502 | ||||||
Hirose Electric Co. Ltd. | 165 | 19,711 | ||||||
Hitachi Ltd. | 6,400 | 205,244 | ||||||
Horiba Ltd. | 300 | 15,789 | ||||||
Itochu Techno-Solutions Corp. | 600 | 20,272 | ||||||
Keyence Corp. | 960 | 395,192 | ||||||
Konica Minolta, Inc. | 2,500 | 9,259 | ||||||
Kyocera Corp. | 1,900 | 102,835 | ||||||
Lasertec Corp. | 600 | 49,288 | ||||||
Murata Manufacturing Co. Ltd. | 3,900 | 217,743 | ||||||
NEC Corp. | 1,600 | 71,806 | ||||||
Nihon Unisys Ltd. | 500 | 15,455 | ||||||
Nomura Research Institute Ltd. | 1,900 | 50,227 | ||||||
NS Solutions Corp. | 200 | 5,480 | ||||||
| See Notes to Financial Statements. | 30 |
DBX ETF Trust
Schedule of Investments
Xtrackers Japan JPX-Nikkei 400 Equity ETF (Continued)
May 31, 2020
Number | Value | |||||||
| Information Technology (Continued) | ||||||||
NTT Data Corp. | 3,700 | $ | 42,758 | |||||
Obic Co. Ltd. | 500 | 86,694 | ||||||
Omron Corp. | 1,200 | 79,528 | ||||||
Oracle Corp. (a) | 300 | 35,030 | ||||||
Otsuka Corp. | 700 | 33,787 | ||||||
Renesas Electronics Corp.* | 6,300 | 32,688 | ||||||
SCREEN Holdings Co. Ltd. | 300 | 13,436 | ||||||
SCSK Corp. | 300 | 14,675 | ||||||
Seiko Epson Corp. | 1,700 | 19,156 | ||||||
Shimadzu Corp. | 1,600 | 43,291 | ||||||
SUMCO Corp. | 1,600 | 24,519 | ||||||
Taiyo Yuden Co. Ltd. | 600 | 16,708 | ||||||
TDK Corp. | 700 | 65,494 | ||||||
TIS, Inc. | 1,400 | 29,849 | ||||||
Tokyo Electron Ltd. | 865 | 172,623 | ||||||
Tokyo Seimitsu Co. Ltd. | 300 | 9,704 | ||||||
Toshiba TEC Corp. | 200 | 6,952 | ||||||
Trend Micro, Inc. | 500 | 27,475 | ||||||
Ulvac, Inc. | 300 | 9,008 | ||||||
V Technology Co. Ltd. | 100 | 3,801 | ||||||
Yokogawa Electric Corp. | 1,200 | 17,287 | ||||||
|
| |||||||
(Cost $2,154,507) | 2,499,627 | |||||||
|
| |||||||
| Materials — 5.3% | ||||||||
Air Water, Inc. | 1,200 | 17,432 | ||||||
Asahi Kasei Corp. | 8,600 | 67,852 | ||||||
Daicel Corp. | 2,000 | 16,930 | ||||||
Denka Co. Ltd. | 500 | 12,248 | ||||||
DIC Corp. | 700 | 18,264 | ||||||
Dowa Holdings Co. Ltd. | 400 | 12,846 | ||||||
Hitachi Chemical Co. Ltd. | 400 | 17,135 | ||||||
Hitachi Metals Ltd. | 1,200 | 13,834 | ||||||
JFE Holdings, Inc. | 3,800 | 27,935 | ||||||
JSR Corp. | 1,200 | 23,524 | ||||||
Kansai Paint Co. Ltd. | 1,500 | 31,076 | ||||||
Kuraray Co. Ltd. | 2,100 | 22,065 | ||||||
Mitsubishi Chemical Holdings Corp. | 8,500 | 50,045 | ||||||
Mitsubishi Gas Chemical Co., Inc. | 1,000 | 14,888 | ||||||
Mitsui Chemicals, Inc. | 1,200 | 24,950 | ||||||
Nippon Light Metal Holdings Co. Ltd. | 3,300 | 5,667 | ||||||
Nippon Paint Holdings Co. Ltd. | 1,100 | 76,679 | ||||||
Nippon Steel Corp. | 6,000 | 55,280 | ||||||
Nissan Chemical Corp. | 800 | 35,309 | ||||||
Nitto Denko Corp. | 900 | 48,703 | ||||||
NOF Corp. | 400 | 14,220 | ||||||
Oji Holdings Corp. | 5,600 | 28,121 | ||||||
Shin-Etsu Chemical Co. Ltd. | 2,250 | 263,563 | ||||||
Showa Denko KK | 800 | 19,121 | ||||||
Sumitomo Chemical Co. Ltd. | 10,000 | 31,002 | ||||||
Sumitomo Metal Mining Co. Ltd. | 1,700 | 47,354 | ||||||
Taiheiyo Cement Corp. | 800 | 18,913 | ||||||
Taiyo Nippon Sanso Corp. | 1,200 | 20,183 | ||||||
Teijin Ltd. | 1,000 | 16,374 | ||||||
Tokai Carbon Co. Ltd. | 1,300 | 11,813 | ||||||
Tokuyama Corp. | 500 | 11,955 | ||||||
Toray Industries, Inc. | 9,600 | 46,684 | ||||||
Tosoh Corp. | 2,100 | 29,199 | ||||||
Number | Value | |||||||
| Materials (Continued) | ||||||||
Ube Industries Ltd. | 700 | $ | 12,508 | |||||
|
| |||||||
(Cost $1,408,897) | 1,163,672 | |||||||
|
| |||||||
| Real Estate — 2.9% | ||||||||
Aeon Mall Co. Ltd. | 700 | 9,844 | ||||||
Daito Trust Construction Co. Ltd. | 500 | 52,838 | ||||||
Daiwa House Industry Co. Ltd. | 4,100 | 101,782 | ||||||
Hulic Co. Ltd. (a) | 2,600 | 26,305 | ||||||
Ichigo, Inc. | 1,700 | 4,844 | ||||||
Mitsubishi Estate Co. Ltd. | 9,300 | 147,871 | ||||||
Mitsui Fudosan Co. Ltd. | 6,600 | 127,025 | ||||||
Nomura Real Estate Holdings, Inc. | 700 | 12,956 | ||||||
Open House Co. Ltd. | 400 | 11,057 | ||||||
Relo Group, Inc. | 700 | 15,990 | ||||||
Sumitomo Realty & Development Co. Ltd. | 3,000 | 83,107 | ||||||
Tokyo Tatemono Co. Ltd. | 1,400 | 18,050 | ||||||
Tokyu Fudosan Holdings Corp. | 3,800 | 19,258 | ||||||
|
| |||||||
(Cost $735,637) | 630,927 | |||||||
|
| |||||||
| Utilities — 1.4% | ||||||||
Chubu Electric Power Co., Inc. | 4,100 | 55,220 | ||||||
Electric Power Development Co. Ltd. | 1,100 | 20,757 | ||||||
Kansai Electric Power Co., Inc. | 5,200 | 51,814 | ||||||
Kyushu Electric Power Co., Inc. | 2,800 | 23,287 | ||||||
Osaka Gas Co. Ltd. | 2,600 | 51,959 | ||||||
Tohoku Electric Power Co., Inc. | 3,400 | 35,220 | ||||||
Tokyo Gas Co. Ltd. | 2,600 | 62,035 | ||||||
|
| |||||||
(Cost $367,473) | 300,292 | |||||||
|
| |||||||
TOTAL COMMON STOCKS | 21,369,534 | |||||||
|
| |||||||
| SECURITIES LENDING COLLATERAL — 0.4% | ||||||||
DWS Government & Agency Securities Portfolio “DWS Government Cash Institutional Shares”, 0.07% (b)(c) | 76,899 | 76,899 | ||||||
|
| |||||||
| CASH EQUIVALENTS — 0.3% | ||||||||
DWS Government Money Market Series “Institutional Shares”, 0.12% (b) | 56,879 | 56,879 | ||||||
|
| |||||||
TOTAL INVESTMENTS — 98.9% (Cost $22,777,795) | $ | 21,503,312 | ||||||
Other assets and liabilities, net — 1.1% | 249,504 | |||||||
|
| |||||||
NET ASSETS — 100.0% | $ | 21,752,816 | ||||||
|
| |||||||
| See Notes to Financial Statements. | 31 |
DBX ETF Trust
Schedule of Investments
Xtrackers Japan JPX-Nikkei 400 Equity ETF (Continued)
May 31, 2020
A summary of the Fund’s transactions with affiliated investments during the year ended May 31, 2020 is as follows:
| Value ($) at 5/31/2019 | Purchases Cost ($) | Sales Proceeds ($) | Net Realized Gain/(Loss) ($) | Net Change in Unrealized Appreciation (Depreciation) ($) | Income ($) | Capital Gain Distributions ($) | Number of Shares at 5/31/2020 | Value ($) at 5/31/2020 | ||||||||||||||||||||||||||||
SECURITIES LENDING COLLATERAL — 0.4% |
| |||||||||||||||||||||||||||||||||||
DWS Government & Agency Securities Portfolio “DWS Government Cash Institutional Shares”, 0.07% (b)(c) |
| |||||||||||||||||||||||||||||||||||
| 90,435 | — | (13,536 | )(d) | — | — | 2,756 | — | 76,899 | 76,899 | |||||||||||||||||||||||||||
CASH EQUIVALENTS — 0.3% |
| |||||||||||||||||||||||||||||||||||
DWS Government Money Market Series “Institutional Shares”, 0.12% (b) |
| |||||||||||||||||||||||||||||||||||
| 2,441 | 1,162,873 | (1,108,435 | ) | — | — | 459 | — | 56,879 | 56,879 | |||||||||||||||||||||||||||
|
|
|
|
|
|
|
|
|
|
|
|
|
|
|
|
|
| |||||||||||||||||||
| 92,876 | 1,162,873 | (1,121,971 | ) | — | — | 3,215 | — | 133,778 | 133,778 | |||||||||||||||||||||||||||
|
|
|
|
|
|
|
|
|
|
|
|
|
|
|
|
|
| |||||||||||||||||||
| * | Non-income producing security. |
| (a) | All or a portion of these securities were on loan. In addition, “Other assets and liabilities, net” may include pending sales that are also on loan. The value of securities loaned at May 31, 2020 amounted to $111,465, which is 0.5% of net assets. |
| (b) | Affiliated fund managed by DWS Investment Management Americas, Inc. The rate shown is the annualized seven-day yield at period end. |
| (c) | Represents cash collateral held in connection with securities lending. Income earned by the Fund is net of borrower rebates. In addition, the Fund held non-cash U.S. Treasury securities collateral having a value of $40,446. |
| (d) | Represents the net increase (purchase cost) or decrease (sales proceeds) in the amount invested in cash collateral for the year ended May 31, 2020. |
At May 31, 2020, open futures contracts purchased were as follows:
Contract Description | Currency | Number of Contracts | Notional Amount | Contract Value | Expiration Date | Unrealized Appreciation | ||||||||||||
JPX-Nikkei 400 Index Futures | JPY | 28 | $ | 329,489 | $365,155 | 6/11/2020 | $ | 35,666 | ||||||||||
For information on the Fund’s policy and additional disclosures regarding open futures contracts, please refer to the Derivatives section of Note 2 in the accompanying Notes to Financial Statements.
Currency Abbreviations
| JPY | Japanese Yen |
Fair Value Measurements
Various inputs are used in determining the value of the Fund’s investments. These inputs are summarized in three broad levels. Level 1 includes quoted prices in active markets for identical securities. Level 2 includes other significant observable inputs (including quoted prices for similar securities, interest rates, prepayment speeds and credit risk). Level 3 includes significant unobservable inputs (including the Fund’s own assumptions in determining the fair value of investments). The level assigned to the securities valuations may not be an indication of the risk or liquidity associated with investing in those securities.
The following is a summary of the inputs used as of May 31, 2020 in valuing the Fund’s investments. For information on the Fund’s policy regarding the valuation of investments, please refer to the Security Valuation section of Note 2 in the accompanying Notes to Financial Statements.
Assets | Level 1 | Level 2 | Level 3 | Total | ||||||||||||
Common Stocks (e) | $ | 21,369,534 | $ | — | $ | — | $ | 21,369,534 | ||||||||
Short-Term Investments (e) | 133,778 | — | — | 133,778 | ||||||||||||
Derivatives (f) | ||||||||||||||||
Futures Contracts | 35,666 | — | — | 35,666 | ||||||||||||
|
|
|
|
|
|
|
| |||||||||
TOTAL | $ | 21,538,978 | $ | — | $ | — | $ | 21,538,978 | ||||||||
|
|
|
|
|
|
|
| |||||||||
| (e) | See Schedule of Investments for additional detailed categorizations. |
| (f) | Derivatives include unrealized appreciation (depreciation) on open futures contracts. |
| See Notes to Financial Statements. | 32 |
DBX ETF Trust
Schedule of Investments
Xtrackers MSCI Latin America Pacific Alliance ETF
May 31, 2020
Number | Value | |||||||
| COMMON STOCKS — 94.9% | ||||||||
| Canada (e) — 0.7% | ||||||||
Canacol Energy Ltd. | 1,451 | $ | 4,031 | |||||
Pan American Silver Corp. | 135 | 3,955 | ||||||
PetroTal Corp. | 4,311 | 546 | ||||||
Wheaton Precious Metals Corp. | 78 | 3,347 | ||||||
|
| |||||||
(Cost $9,388) | 11,879 | |||||||
|
| |||||||
| Chile — 15.2% | ||||||||
AES Gener SA | 23,861 | 3,259 | ||||||
Aguas Andinas SA, Class A | 18,984 | 5,543 | ||||||
Banco de Chile | 334,518 | 28,255 | ||||||
Banco de Credito e Inversiones SA | 363 | 12,217 | ||||||
Banco Santander Chile | 484,610 | 19,620 | ||||||
CAP SA* | 552 | 3,568 | ||||||
Cencosud SA | 10,462 | 12,148 | ||||||
Cencosud Shopping SA | 3,500 | 5,977 | ||||||
Cia Cervecerias Unidas SA | 1,077 | 7,742 | ||||||
Cia Sud Americana de Vapores SA* | 82,387 | 1,913 | ||||||
Colbun SA | 57,612 | 9,367 | ||||||
Empresa Nacional de Telecomunicaciones SA | 1,099 | 6,961 | ||||||
Empresas CMPC SA | 8,261 | 16,723 | ||||||
Empresas COPEC SA | 3,181 | 19,950 | ||||||
Enel Americas SA | 264,772 | 38,308 | ||||||
Enel Chile SA | 202,979 | 15,123 | ||||||
Engie Energia Chile SA | 3,807 | 4,468 | ||||||
Falabella SA | 6,973 | 16,151 | ||||||
Forus SA | 816 | 872 | ||||||
Grupo Security SA | 9,491 | 1,748 | ||||||
Inversiones Aguas Metropolitanas SA | 3,524 | 2,888 | ||||||
Inversiones La Construccion SA | 261 | 1,686 | ||||||
Itau CorpBanca Chile SA | 1,173,030 | 2,710 | ||||||
Parque Arauco SA | 6,562 | 11,002 | ||||||
Ripley Corp. SA | 6,537 | 1,697 | ||||||
SMU SA | 17,422 | 2,921 | ||||||
SONDA SA | 4,143 | 2,470 | ||||||
Vina Concha y Toro SA | 2,688 | 3,839 | ||||||
|
| |||||||
(Cost $421,999) | 259,126 | |||||||
|
| |||||||
| Colombia — 8.3% | ||||||||
Banco de Bogota SA | 238 | 3,718 | ||||||
Bancolombia SA | 2,513 | 16,920 | ||||||
Bolsa de Valores de Colombia | 457 | 1,258 | ||||||
Celsia SA ESP | 4,797 | 5,271 | ||||||
Cementos Argos SA | 4,643 | 4,377 | ||||||
CEMEX Latam Holdings SA* | 1,998 | 837 | ||||||
Construcciones El Condor SA | 1,815 | 429 | ||||||
Constructora Conconcreto SA* | 3,266 | 301 | ||||||
Corp. Financiera Colombiana SA* | 842 | 5,896 | ||||||
Ecopetrol SA | 50,186 | 26,898 | ||||||
Grupo Argos SA | 2,919 | 6,840 | ||||||
Grupo Aval Acciones y Valores SA | 2,411 | 587 | ||||||
Grupo de Inversiones Suramericana SA | 2,483 | 12,171 | ||||||
Grupo Energia Bogota SA ESP | 27,949 | 16,410 | ||||||
Grupo Nutresa SA | 2,097 | 12,515 | ||||||
Interconexion Electrica SA ESP | 4,503 | 23,770 | ||||||
Mineros SA | 1,054 | 954 | ||||||
Number | Value | |||||||
| Colombia (Continued) | ||||||||
Promigas SA ESP | 1,220 | $ | 2,267 | |||||
Tecnoglass, Inc. | 170 | 835 | ||||||
|
| |||||||
(Cost $192,597) | 142,254 | |||||||
|
| |||||||
| Mexico — 49.3% | ||||||||
Alfa SAB de CV, Class A | 22,066 | 11,706 | ||||||
Alpek SAB de CV | 3,120 | 2,187 | ||||||
Alsea SAB de CV* | 4,103 | 3,476 | ||||||
America Movil SAB de CV, Series L | 248,904 | 166,575 | ||||||
Arca Continental SAB de CV | 3,257 | 14,557 | ||||||
Axtel SAB de CV, Series CPO* | 5,401 | 849 | ||||||
Banco del Bajio SA, 144A* | 5,350 | 4,888 | ||||||
Becle SAB de CV* | 4,048 | 7,024 | ||||||
Bolsa Mexicana de Valores SAB de CV | 3,290 | 6,317 | ||||||
Cemex SAB de CV, Series CPO | 111,791 | 26,521 | ||||||
Coca-Cola Femsa SAB de CV | 3,879 | 16,966 | ||||||
Concentradora Fibra Danhos SA de CV REIT | 1,709 | 1,582 | ||||||
Concentradora Hipotecaria SAPI de CV REIT | 2,753 | 1,999 | ||||||
Controladora Vuela Cia de Aviacion SAB de CV, Class A* | 5,045 | 2,494 | ||||||
Corp. Inmobiliaria Vesta SAB de CV | 4,187 | 5,731 | ||||||
Fibra Uno Administracion SA de CV REIT | 23,304 | 17,807 | ||||||
Fomento Economico Mexicano SAB de CV | 14,364 | 97,336 | ||||||
Genomma Lab Internacional SAB de CV, Class B* | 5,805 | 5,302 | ||||||
Gentera SAB de CV | 7,084 | 2,932 | ||||||
Gruma SAB de CV, Class B | 1,668 | 16,588 | ||||||
Grupo Aeroportuario del Centro Norte SAB de CV* | 2,540 | 11,202 | ||||||
Grupo Aeroportuario del Pacifico SAB de CV, Class B | 2,817 | 18,635 | ||||||
Grupo Aeroportuario del Sureste SAB de CV, Class B | 1,537 | 15,874 | ||||||
Grupo Bimbo SAB de CV, Series A | 11,901 | 18,645 | ||||||
Grupo Carso SAB de CV, Series A1 | 3,124 | 7,057 | ||||||
Grupo Cementos de Chihuahua SAB de CV | 1,265 | 4,654 | ||||||
Grupo Comercial Chedraui SA de CV | 2,658 | 3,320 | ||||||
Grupo Financiero Banorte SAB de CV, | 19,195 | 58,332 | ||||||
Grupo Financiero Inbursa SAB de CV, | 17,113 | 11,754 | ||||||
Grupo Herdez SAB de CV | 1,766 | 2,802 | ||||||
Grupo Mexico SAB de CV, Series B | 22,950 | 49,240 | ||||||
Grupo Rotoplas SAB de CV* | 1,298 | 783 | ||||||
Grupo Televisa SAB, Series CPO* | 17,751 | 21,072 | ||||||
Industrias Penoles SAB de CV | 1,001 | 9,538 | ||||||
Infraestructura Energetica Nova SAB de CV | 3,809 | 10,833 | ||||||
Kimberly-Clark de Mexico SAB de CV, | 11,330 | 17,622 | ||||||
La Comer SAB de CV | 3,587 | 4,412 | ||||||
Macquarie Mexico Real Estate Management SA de CV REIT, 144A | 5,630 | 6,022 | ||||||
Megacable Holdings SAB de CV, Series CPO | 2,228 | 6,753 | ||||||
Orbia Advance Corp. SAB de CV | 7,621 | 11,206 | ||||||
| See Notes to Financial Statements. | 33 |
DBX ETF Trust
Schedule of Investments
Xtrackers MSCI Latin America Pacific Alliance ETF (Continued)
May 31, 2020
Number | Value | |||||||
| Mexico (Continued) | ||||||||
PLA Administradora Industrial S de RL de CV REIT | 5,877 | $ | 7,354 | |||||
Prologis Property Mexico SA de CV REIT | 3,437 | 6,550 | ||||||
Promotora y Operadora de Infraestructura SAB de CV* | 1,693 | 12,792 | ||||||
Qualitas Controladora SAB de CV | 1,225 | 4,880 | ||||||
Regional SAB de CV* | 1,704 | 4,742 | ||||||
Telesites SAB de CV* | 9,850 | 6,356 | ||||||
Unifin Financiera SAB de CV* | 1,041 | 757 | ||||||
Wal-Mart de Mexico SAB de CV | 38,686 | 96,760 | ||||||
|
| |||||||
(Cost $1,096,340) | 842,784 | |||||||
|
| |||||||
| Peru — 21.4% | ||||||||
Alicorp SAA* | 12,153 | 27,591 | ||||||
Banco BBVA Peru SA* | 7,309 | 5,680 | ||||||
Banco de Credito del Peru, Class C | 3,274 | 4,202 | ||||||
Casa Grande SAA | 388 | 327 | ||||||
Cementos Pacasmayo SAA | 3,337 | 4,614 | ||||||
Cia de Minas Buenaventura SAA, ADR | 3,650 | 28,653 | ||||||
Corp. Aceros Arequipa SA | 2,347 | 492 | ||||||
Credicorp Ltd. | 1,147 | 158,080 | ||||||
Enel Distribucion Peru SAA | 1,749 | 2,627 | ||||||
Ferreycorp SAA | 16,492 | 6,912 | ||||||
Grana y Montero SAA* | 9,560 | 4,174 | ||||||
Hochschild Mining PLC | 4,364 | 10,801 | ||||||
InRetail Peru Corp., 144A | 527 | 16,184 | ||||||
Intercorp Financial Services, Inc. | 582 | 14,911 | ||||||
Luz del Sur SAA | 1,649 | 12,719 | ||||||
Refineria La Pampilla SAA Relapasa* | 18,032 | 304 | ||||||
Sociedad Minera Cerro Verde SAA* | 357 | 5,566 | ||||||
Southern Copper Corp. (a) | 1,440 | 52,272 | ||||||
Union Andina de Cementos SAA | 12,293 | 5,009 | ||||||
Volcan Cia Minera SAA* | 41,334 | 3,994 | ||||||
|
| |||||||
(Cost $477,560) | 365,112 | |||||||
|
| |||||||
TOTAL COMMON STOCKS | 1,621,155 | |||||||
|
| |||||||
Number | Value | |||||||
| PREFERRED STOCKS — 4.9% | ||||||||
| Chile — 1.5% | ||||||||
Embotelladora Andina SA, Class B | 2,579 | $ | 6,153 | |||||
Sociedad Quimica y Minera de Chile SA, Class B | 840 | 20,498 | ||||||
|
| |||||||
(Cost $43,541) | 26,651 | |||||||
|
| |||||||
| Colombia — 3.4% | ||||||||
Banco Davivienda SA | 1,032 | 6,810 | ||||||
Bancolombia SA | 4,600 | 30,477 | ||||||
Cementos Argos SA | 2,412 | 1,855 | ||||||
Grupo Argos SA | 2,275 | 4,718 | ||||||
Grupo Aval Acciones y Valores SA | 43,259 | 9,798 | ||||||
Grupo de Inversiones Suramericana SA | 1,130 | 4,614 | ||||||
|
| |||||||
(Cost $91,012) | 58,272 | |||||||
|
| |||||||
TOTAL PREFERRED STOCKS | 84,923 | |||||||
|
| |||||||
| RIGHTS — 0.1% | ||||||||
| Canada (e) — 0.1% | ||||||||
| Pan American Silver Corp. CVR* (Cost $0) | 1,874 | 1,218 | ||||||
|
| |||||||
| CASH EQUIVALENTS — 0.2% | ||||||||
DWS Government Money Market Series “Institutional Shares”, 0.12% (b) | 2,630 | 2,630 | ||||||
|
| |||||||
TOTAL INVESTMENTS — 100.1% (Cost $2,335,067) | $ | 1,709,926 | ||||||
Other assets and liabilities, net — (0.1%) | (1,534 | ) | ||||||
|
| |||||||
NET ASSETS — 100.0% | $ | 1,708,392 | ||||||
|
| |||||||
A summary of the Fund’s transactions with affiliated investments during the year ended May 31, 2020 is as follows:
| Value ($) at 5/31/2019 | Purchases Cost ($) | Sales Proceeds ($) | Net Realized Gain/(Loss) ($) | Net Change in Unrealized Appreciation (Depreciation) ($) | Income ($) | Capital Gain Distributions ($) | Number of Shares at 5/31/2020 | Value ($) at 5/31/2020 | ||||||||||||||||||||||||||||
SECURITIES LENDING COLLATERAL — 0.0% |
| |||||||||||||||||||||||||||||||||||
DWS Government & Agency Securities Portfolio “DWS Government Cash Institutional Shares”, 0.07% (b)(c) |
| |||||||||||||||||||||||||||||||||||
| 1,320 | — | (1,320 | )(d) | — | — | 9 | — | — | — | |||||||||||||||||||||||||||
CASH EQUIVALENTS — 0.2% |
| |||||||||||||||||||||||||||||||||||
DWS Government Money Market Series “Institutional Shares”, 0.12% (b) |
| |||||||||||||||||||||||||||||||||||
| 4,441 | 198,569 | (200,380 | ) | — | — | 7 | — | 2,630 | 2,630 | |||||||||||||||||||||||||||
|
|
|
|
|
|
|
|
|
|
|
|
|
|
|
|
|
| |||||||||||||||||||
| 5,761 | 198,569 | (201,700 | ) | — | — | 16 | — | 2,630 | 2,630 | |||||||||||||||||||||||||||
|
|
|
|
|
|
|
|
|
|
|
|
|
|
|
|
|
| |||||||||||||||||||
| * | Non-income producing security. |
| (a) | All or a portion of these securities were on loan. In addition, “Other assets and liabilities, net” may include pending sales that are also on loan. The value of securities loaned at May 31, 2020 amounted to $43,451, which is 2.5% of net assets. |
| See Notes to Financial Statements. | 34 |
DBX ETF Trust
Schedule of Investments
Xtrackers MSCI Latin America Pacific Alliance ETF (Continued)
May 31, 2020
| (b) | Affiliated fund managed by DWS Investment Management Americas, Inc. The rate shown is the annualized seven-day yield at period end. |
| (c) | Represents cash collateral held in connection with securities lending. Income earned by the Fund is net of borrower rebates. In addition, the Fund held non-cash U.S. Treasury securities collateral having a value of $44,933. |
| (d) | Represents the net increase (purchase cost) or decrease (sales proceeds) in the amount invested in cash collateral for the year ended May 31, 2020. |
| (e) | Securities listed in country of domicile. |
| ADR: | American Depositary Receipt |
| CPO: | Ordinary Participation Certificates |
| CVR: | Contingent Value Rights |
| REIT: | Real Estate Investment Trust |
| 144A: | Security exempt from registration under Rule 144A of the Securities Act of 1933. These securities may be resold in transactions exempt from registration, normally to qualified institutional buyers. |
Fair Value Measurements
Various inputs are used in determining the value of the Fund’s investments. These inputs are summarized in three broad levels. Level 1 includes quoted prices in active markets for identical securities. Level 2 includes other significant observable inputs (including quoted prices for similar securities, interest rates, prepayment speeds and credit risk). Level 3 includes significant unobservable inputs (including the Fund’s own assumptions in determining the fair value of investments). The level assigned to the securities valuations may not be an indication of the risk or liquidity associated with investing in those securities.
The following is a summary of the inputs used as of May 31, 2020 in valuing the Fund’s investments. For information on the Fund’s policy regarding the valuation of investments, please refer to the Security Valuation section of Note 2 in the accompanying Notes to Financial Statements.
Assets | Level 1 | Level 2 | Level 3 | Total | ||||||||||||
Common Stocks (f) | $ | 1,621,155 | $ | — | $ | — | $ | 1,621,155 | ||||||||
Preferred Stocks (f) | 84,923 | — | — | 84,923 | ||||||||||||
Rights | 1,218 | — | — | 1,218 | ||||||||||||
Short-Term Investments (f) | 2,630 | — | — | 2,630 | ||||||||||||
|
|
|
|
|
|
|
| |||||||||
TOTAL | $ | 1,709,926 | $ | — | $ | — | $ | 1,709,926 | ||||||||
|
|
|
|
|
|
|
| |||||||||
| (f) | See Schedule of Investments for additional detailed categorizations. |
During the year ended May 31, 2020, the amount of transfers from Level 3 to Level 1 was $1,012. The investment was transferred from Level 3 to Level 1 due to the availability of a pricing source supported by observable inputs.
| See Notes to Financial Statements. | 35 |
DBX ETF Trust
May 31, 2020
| Xtrackers Eurozone Equity ETF | Xtrackers International Real Estate ETF | Xtrackers Japan JPX-Nikkei 400 Equity ETF | Xtrackers MSCI Latin America Pacific Alliance ETF | |||||||||||||
Assets | ||||||||||||||||
Investment in non-affiliated securities at value | $ | 3,867,212 | $ | 228,861,628 | $ | 21,369,534 | $ | 1,707,296 | ||||||||
Investment in affiliated securities at value | 16,067 | — | — | — | ||||||||||||
Investment in DWS Government Money Market Series | 187 | 643,631 | 56,879 | 2,630 | ||||||||||||
Investment in DWS Government & Agency Securities Portfolio* | 55,855 | 8,505,313 | 76,899 | — | ||||||||||||
Foreign currency at value | 479 | 489,748 | 132,889 | 3,803 | ||||||||||||
Deposit with broker for futures contracts | — | 191,196 | 14,019 | — | ||||||||||||
| Receivables: | ||||||||||||||||
Investment securities sold | — | — | 46,063 | 78,802 | ||||||||||||
Capital shares | — | 74,193 | — | — | ||||||||||||
Dividends | 2,475 | 707,429 | 245,382 | 2,197 | ||||||||||||
Interest | — | 29 | 4 | — | ||||||||||||
Securities lending income | 144 | 9,283 | 39 | 2 | ||||||||||||
Foreign tax reclaim | 1,456 | 52,569 | — | — | ||||||||||||
|
|
|
|
|
|
|
| |||||||||
Total assets | $ | 3,943,875 | $ | 239,535,019 | $ | 21,941,708 | $ | 1,794,730 | ||||||||
|
|
|
|
|
|
|
| |||||||||
Liabilities | ||||||||||||||||
Payable upon return of securities loaned | 55,855 | 8,505,313 | 76,899 | — | ||||||||||||
| Payables: | ||||||||||||||||
Investment securities purchased | — | 214,867 | 104,630 | 85,707 | ||||||||||||
Investment advisory fees | 276 | 18,639 | 1,605 | 631 | ||||||||||||
Variation margin on futures contracts | — | 18,316 | 5,758 | — | ||||||||||||
|
|
|
|
|
|
|
| |||||||||
Total liabilities | 56,131 | 8,757,135 | 188,892 | 86,338 | ||||||||||||
|
|
|
|
|
|
|
| |||||||||
Net Assets, at value | $ | 3,887,744 | $ | 230,777,884 | $ | 21,752,816 | $ | 1,708,392 | ||||||||
|
|
|
|
|
|
|
| |||||||||
Net Assets Consist of | ||||||||||||||||
Paid-in capital | $ | 4,847,856 | $ | 270,279,072 | $ | 24,982,043 | $ | 2,393,666 | ||||||||
Distributable earnings (loss) | (960,112 | ) | (39,501,188 | ) | (3,229,227 | ) | (685,274 | ) | ||||||||
|
|
|
|
|
|
|
| |||||||||
Net Assets, at value | $ | 3,887,744 | $ | 230,777,884 | $ | 21,752,816 | $ | 1,708,392 | ||||||||
|
|
|
|
|
|
|
| |||||||||
Number of Common Shares outstanding | 200,001 | 10,100,001 | 800,001 | 100,001 | ||||||||||||
|
|
|
|
|
|
|
| |||||||||
Net Asset Value | $ | 19.44 | $ | 22.85 | $ | 27.19 | $ | 17.08 | ||||||||
|
|
|
|
|
|
|
| |||||||||
Investment in non-affiliated securities at cost | $ | 4,450,748 | $ | 264,988,384 | $ | 22,644,017 | $ | 2,332,437 | ||||||||
|
|
|
|
|
|
|
| |||||||||
Investment in affiliated securities at cost | $ | 17,879 | $ | — | $ | — | $ | — | ||||||||
|
|
|
|
|
|
|
| |||||||||
Value of securities loaned | $ | 47,148 | $ | 11,148,133 | $ | 111,465 | $ | 43,451 | ||||||||
|
|
|
|
|
|
|
| |||||||||
Investment in DWS Government Money Market Series at cost | $ | 187 | $ | 643,631 | $ | 56,879 | $ | 2,630 | ||||||||
|
|
|
|
|
|
|
| |||||||||
Investment in DWS Government & Agency Securities Portfolio at cost* | $ | 55,855 | $ | 8,505,313 | $ | 76,899 | $ | — | ||||||||
|
|
|
|
|
|
|
| |||||||||
Non-cash collateral for securities on loan | $ | — | $ | 3,910,553 | $ | 40,446 | $ | 44,933 | ||||||||
|
|
|
|
|
|
|
| |||||||||
Foreign currency at cost | $ | 476 | $ | 481,272 | $ | 131,367 | $ | 3,763 | ||||||||
|
|
|
|
|
|
|
| |||||||||
| * | Represents collateral on securities loaned. |
| See Notes to Financial Statements. | 36 |
DBX ETF Trust
For the Year Ended May 31, 2020
| Xtrackers Eurozone Equity ETF | Xtrackers International Real Estate ETF | Xtrackers Japan JPX-Nikkei 400 Equity ETF | Xtrackers MSCI Latin America Pacific Alliance ETF | |||||||||||||
Investment Income | ||||||||||||||||
Unaffiliated dividend income* | $ | 71,648 | $ | 4,856,529 | $ | 605,961 | $ | 68,544 | ||||||||
Income distributions from affiliated funds | 28 | 4,723 | 459 | 7 | ||||||||||||
Affiliated securities lending income | 779 | 14,878 | 2,756 | 9 | ||||||||||||
Unaffiliated securities lending income, net of borrower rebates | 416 | 36,608 | 1,277 | 46 | ||||||||||||
|
|
|
|
|
|
|
| |||||||||
Total investment income | 72,871 | 4,912,738 | 610,453 | 68,606 | ||||||||||||
|
|
|
|
|
|
|
| |||||||||
Expenses | ||||||||||||||||
Investment advisory fees | 4,079 | 178,355 | 24,647 | 10,211 | ||||||||||||
Other expenses | 57 | 156 | 57 | 57 | ||||||||||||
|
|
|
|
|
|
|
| |||||||||
Total expenses | 4,136 | 178,511 | 24,704 | 10,268 | ||||||||||||
|
|
|
|
|
|
|
| |||||||||
Less fees waived (see note 3): | ||||||||||||||||
Waiver | — | (30,921 | ) | (22 | ) | (1 | ) | |||||||||
|
|
|
|
|
|
|
| |||||||||
Net expenses | 4,136 | 147,590 | 24,682 | 10,267 | ||||||||||||
|
|
|
|
|
|
|
| |||||||||
Net investment income (loss) | 68,735 | 4,765,148 | 585,771 | 58,339 | ||||||||||||
|
|
|
|
|
|
|
| |||||||||
Realized and Unrealized Gain (Loss) | ||||||||||||||||
Net realized gain (loss) from: | ||||||||||||||||
Investments | (39,904 | ) | (2,528,322 | ) | (152,758 | ) | (80,219 | ) | ||||||||
Investments in affiliates | (597 | ) | — | — | — | |||||||||||
In-kind redemptions | 90,418 | (83,514 | ) | (731,185 | ) | — | ||||||||||
In-kind redemptions in affiliates | 666 | — | — | — | ||||||||||||
Futures contracts | — | (90,276 | ) | (7,336 | ) | — | ||||||||||
Foreign currency transactions | (155 | ) | (40,878 | ) | 4,171 | (576 | ) | |||||||||
|
|
|
|
|
|
|
| |||||||||
Net realized gain (loss) | 50,428 | (2,742,990 | ) | (887,108 | ) | (80,795 | ) | |||||||||
Net change in unrealized appreciation (depreciation) on: | ||||||||||||||||
Investments** | (415,805 | ) | (35,140,827 | ) | 1,978,505 | (606,942 | ) | |||||||||
Investments in affiliates | 3,299 | — | — | — | ||||||||||||
Futures contracts | — | 115,965 | 59,206 | — | ||||||||||||
Foreign currency translations | 213 | 12,920 | (1,129 | ) | 68 | |||||||||||
|
|
|
|
|
|
|
| |||||||||
Net change in unrealized appreciation (depreciation) | (412,293 | ) | (35,011,942 | ) | 2,036,582 | (606,874 | ) | |||||||||
|
|
|
|
|
|
|
| |||||||||
Net realized and unrealized gain (loss) on investments, futures and foreign currency transactions | (361,865 | ) | (37,754,932 | ) | 1,149,474 | (687,669 | ) | |||||||||
|
|
|
|
|
|
|
| |||||||||
Net Increase (Decrease) in Net Assets Resulting from Operations | $ | (293,130 | ) | $ | (32,989,784 | ) | $ | 1,735,245 | $ | (629,330 | ) | |||||
|
|
|
|
|
|
|
| |||||||||
* Unaffiliated foreign tax withheld | $ | 15,306 | $ | 582,432 | $ | 67,337 | $ | 6,831 | ||||||||
** Net of change in deferred foreign taxes | $ | — | $ | (1,589 | ) | $ | — | $ | — | |||||||
| See Notes to Financial Statements. | 37 |
DBX ETF Trust
| Xtrackers Eurozone Equity ETF | Xtrackers International Real Estate ETF | |||||||||||||||
| Year Ended May 31, 2020 | Year Ended May 31, 2019 | Year Ended May 31, 2020 | Year Ended May 31, 2019 | |||||||||||||
Increase (Decrease) in Net Assets from Operations | ||||||||||||||||
Net investment income (loss) | $ | 68,735 | $ | 69,345 | $ | 4,765,148 | $ | 345,093 | ||||||||
Net realized gain (loss) | 50,428 | (349,399 | ) | (2,742,990 | ) | 261,023 | ||||||||||
Net change in net unrealized appreciation (depreciation) | (412,293 | ) | (140,920 | ) | (35,011,942 | ) | (1,466,969 | ) | ||||||||
|
|
|
|
|
|
|
| |||||||||
Net increase (decrease) in net assets resulting from operations | (293,130 | ) | (420,974 | ) | (32,989,784 | ) | (860,853 | ) | ||||||||
|
|
|
|
|
|
|
| |||||||||
Distributions to Shareholders | (78,087 | ) | (71,498 | ) | (5,184,811 | ) | (73,382 | ) | ||||||||
|
|
|
|
|
|
|
| |||||||||
Fund Shares Transactions | ||||||||||||||||
Proceeds from shares sold | 3,201,199 | 3,138,077 | 210,264,081 | 57,853,274 | ||||||||||||
Value of shares redeemed | (1,051,853 | ) | (2,896,381 | ) | (1,160,117 | ) | (1,445,829 | ) | ||||||||
|
|
|
|
|
|
|
| |||||||||
Net increase (decrease) in net assets resulting from fund share transactions | 2,149,346 | 241,696 | 209,103,964 | 56,407,445 | ||||||||||||
|
|
|
|
|
|
|
| |||||||||
Total net increase (decrease) in Net Assets | 1,778,129 | (250,776 | ) | 170,929,369 | 55,473,210 | |||||||||||
Net Assets | ||||||||||||||||
Beginning of year | 2,109,615 | 2,360,391 | 59,848,515 | 4,375,305 | ||||||||||||
|
|
|
|
|
|
|
| |||||||||
End of year | $ | 3,887,744 | $ | 2,109,615 | $ | 230,777,884 | $ | 59,848,515 | ||||||||
|
|
|
|
|
|
|
| |||||||||
Changes in Shares Outstanding | ||||||||||||||||
Shares outstanding, beginning of year | 100,001 | 100,001 | 2,150,001 | 150,001 | ||||||||||||
Shares sold | 150,000 | 150,000 | 8,000,000 | 2,050,000 | ||||||||||||
Shares redeemed | (50,000 | ) | (150,000 | ) | (50,000 | ) | (50,000 | ) | ||||||||
|
|
|
|
|
|
|
| |||||||||
Shares outstanding, end of year | 200,001 | 100,001 | 10,100,001 | 2,150,001 | ||||||||||||
|
|
|
|
|
|
|
| |||||||||
| See Notes to Financial Statements. | 38 |
DBX ETF Trust
Statements of Changes in Net Assets (Continued)
| Xtrackers Japan JPX-Nikkei 400 Equity ETF | Xtrackers MSCI Latin America Pacific Alliance ETF | |||||||||||||||
| Year Ended May 31, 2020 | Year Ended May 31, 2019 | Year Ended May 31, 2020 | For the Period October 30, 2018(1) to May 31, 2019 | |||||||||||||
Increase (Decrease) in Net Assets from Operations | ||||||||||||||||
Net investment income (loss) | $ | 585,771 | $ | 542,482 | $ | 58,339 | $ | 51,303 | ||||||||
Net realized gain (loss) | (887,108 | ) | (15,892,157 | ) | (80,795 | ) | 264,039 | |||||||||
Net change in net unrealized appreciation (depreciation) | 2,036,582 | (3,185,044 | ) | (606,874 | ) | (18,238 | ) | |||||||||
|
|
|
|
|
|
|
| |||||||||
Net increase (decrease) in net assets resulting from operations | 1,735,245 | (18,534,719 | ) | (629,330 | ) | 297,104 | ||||||||||
|
|
|
|
|
|
|
| |||||||||
Distributions to Shareholders | (744,817 | ) | (378,111 | ) | (156,653 | ) | (21,262 | ) | ||||||||
|
|
|
|
|
|
|
| |||||||||
Fund Shares Transactions | ||||||||||||||||
Proceeds from shares sold | — | 222,178,697 | — | 4,934,832 | ||||||||||||
Value of shares redeemed | (8,954,339 | ) | (301,398,584 | ) | — | (2,716,299 | ) | |||||||||
|
|
|
|
|
|
|
| |||||||||
Net increase (decrease) in net assets resulting from fund share transactions | (8,954,339 | ) | (79,219,887 | ) | — | 2,218,533 | ||||||||||
|
|
|
|
|
|
|
| |||||||||
Total net increase (decrease) in Net Assets | (7,963,911 | ) | (98,132,717 | ) | (785,983 | ) | 2,494,375 | |||||||||
Net Assets | ||||||||||||||||
Beginning of period | 29,716,727 | 127,849,444 | 2,494,375 | — | ||||||||||||
|
|
|
|
|
|
|
| |||||||||
End of period | $ | 21,752,816 | $ | 29,716,727 | $ | 1,708,392 | $ | 2,494,375 | ||||||||
|
|
|
|
|
|
|
| |||||||||
Changes in Shares Outstanding | ||||||||||||||||
Shares outstanding, beginning of period | 1,150,001 | 4,350,001 | 100,001 | — | ||||||||||||
Shares sold | — | 7,800,000 | — | 200,001 | ||||||||||||
Shares redeemed | (350,000 | ) | (11,000,000 | ) | — | (100,000 | ) | |||||||||
|
|
|
|
|
|
|
| |||||||||
Shares outstanding, end of period | 800,001 | 1,150,001 | 100,001 | 100,001 | ||||||||||||
|
|
|
|
|
|
|
| |||||||||
| (1) | Commencement of Operations. |
| See Notes to Financial Statements. | 39 |
DBX ETF Trust
| Xtrackers Eurozone Equity ETF Selected Per Share Data | Years Ended May 31, | Period Ended 5/31/2016(a) | ||||||||||||||||||
| 2020 | 2019 | 2018 | 2017 | |||||||||||||||||
Net Asset Value, beginning of period | $ | 21.10 | $ | 23.60 | $ | 23.94 | $ | 20.25 | $ | 25.00 | ||||||||||
|
|
|
|
|
|
|
|
|
| |||||||||||
| Income (loss) from investment operations: | ||||||||||||||||||||
Net investment income (loss)(b) | 0.32 | 0.65 | 0.73 | 0.74 | 0.53 | |||||||||||||||
Net realized and unrealized gain (loss) | (1.37 | ) | (2.52 | ) | (0.68 | ) | 3.74 | (4.99 | ) | |||||||||||
|
|
|
|
|
|
|
|
|
| |||||||||||
Total from investment operations | (1.05 | ) | (1.87 | ) | 0.05 | 4.48 | (4.46 | ) | ||||||||||||
|
|
|
|
|
|
|
|
|
| |||||||||||
| Less distributions from: |
| |||||||||||||||||||
Net investment income | (0.61 | ) | (0.63 | ) | (0.39 | ) | (0.79 | ) | (0.29 | ) | ||||||||||
|
|
|
|
|
|
|
|
|
| |||||||||||
Total distributions | (0.61 | ) | (0.63 | ) | (0.39 | ) | (0.79 | ) | (0.29 | ) | ||||||||||
|
|
|
|
|
|
|
|
|
| |||||||||||
Net Asset Value, end of period | $ | 19.44 | $ | 21.10 | $ | 23.60 | $ | 23.94 | $ | 20.25 | ||||||||||
|
|
|
|
|
|
|
|
|
| |||||||||||
Total Return (%) | (5.29 | ) | (8.09 | )(c) | 0.22 | (c) | 23.01 | (17.94 | )** | |||||||||||
Ratios to Average Net Assets and Supplemental Data | ||||||||||||||||||||
Net Assets, end of period ($ millions) | 4 | 2 | 2 | 2 | 2 | |||||||||||||||
Ratio of expenses before fee waiver (%) | 0.09 | 0.10 | 0.27 | 0.45 | 0.45 | * | ||||||||||||||
Ratio of expenses after fee waiver (%) | 0.09 | 0.09 | 0.26 | 0.45 | 0.45 | * | ||||||||||||||
Ratio of net investment income (loss) (%) | 1.52 | 3.00 | 3.01 | 3.62 | 3.18 | * | ||||||||||||||
Portfolio turnover rate (%)(d) | 9 | 14 | 93 | 20 | 20 | ** | ||||||||||||||
| Xtrackers International Real Estate ETF Selected Per Share Data | Years Ended May 31, | |||||||||||||||||||
| 2020 | 2019 | 2018 | 2017 | 2016 | ||||||||||||||||
Net Asset Value, beginning of year | $ | 27.84 | $ | 29.17 | $ | 26.22 | $ | 22.27 | $ | 27.90 | ||||||||||
|
|
|
|
|
|
|
|
|
| |||||||||||
| Income (loss) from investment operations: | ||||||||||||||||||||
Net investment income (loss)(b) | 0.84 | 1.14 | 0.68 | 0.56 | 0.63 | |||||||||||||||
Net realized and unrealized gain (loss) | (4.74 | ) | (1.98 | ) | 3.01 | 3.89 | (4.19 | ) | ||||||||||||
|
|
|
|
|
|
|
|
|
| |||||||||||
Total from investment operations | (3.90 | ) | (0.84 | ) | 3.69 | 4.45 | (3.56 | ) | ||||||||||||
|
|
|
|
|
|
|
|
|
| |||||||||||
| Less distributions from: |
| |||||||||||||||||||
Net investment income | (1.09 | ) | (0.49 | ) | (0.74 | ) | (0.50 | ) | (1.09 | ) | ||||||||||
Net realized gains | — | — | — | — | (0.98 | ) | ||||||||||||||
|
|
|
|
|
|
|
|
|
| |||||||||||
Total distributions | (1.09 | ) | (0.49 | ) | (0.74 | ) | (0.50 | ) | (2.07 | ) | ||||||||||
|
|
|
|
|
|
|
|
|
| |||||||||||
Net Asset Value, end of year | $ | 22.85 | $ | 27.84 | $ | 29.17 | $ | 26.22 | $ | 22.27 | ||||||||||
|
|
|
|
|
|
|
|
|
| |||||||||||
Total Return (%) | (14.80 | )(c) | (2.78 | )(c) | 14.20 | 20.34 | (12.98 | ) | ||||||||||||
Ratios to Average Net Assets and Supplemental Data | ||||||||||||||||||||
Net Assets, end of year ($ millions) | 231 | 60 | 4 | 4 | 4 | |||||||||||||||
Ratio of expenses before fee waiver (%) | 0.12 | 0.30 | 0.60 | 0.60 | 0.60 | |||||||||||||||
Ratio of expenses after fee waiver (%) | 0.10 | 0.28 | 0.60 | 0.60 | 0.60 | |||||||||||||||
Ratio of net investment income (loss) (%) | 3.21 | 4.25 | 2.40 | 2.34 | 2.64 | |||||||||||||||
Portfolio turnover rate (%)(d) | 12 | 43 | 24 | 14 | 34 | |||||||||||||||
| (a) | For the period August 19, 2015 (commencement of operations) through May 31, 2016. |
| (b) | Based on average shares outstanding during the period. |
| (c) | Total Return would have been lower if certain expenses had not been reimbursed by the Advisor. |
| (d) | Portfolio turnover rate does not include securities received or delivered from processing creations or redemptions. |
| * | Annualized. |
| ** | Not Annualized. |
| See Notes to Financial Statements. | 40 |
DBX ETF Trust
Financial Highlights (Continued)
| Xtrackers Japan JPX-Nikkei 400 Equity ETF Selected Per Share Data | Years Ended May 31, | Period Ended 5/31/2016(a) | ||||||||||||||||||
| 2020 | 2019 | 2018 | 2017 | |||||||||||||||||
Net Asset Value, beginning of period | $ | 25.84 | $ | 29.39 | $ | 26.24 | $ | 23.19 | $ | 25.00 | ||||||||||
|
|
|
|
|
|
|
|
|
| |||||||||||
| Income (loss) from investment operations: | ||||||||||||||||||||
Net investment income (loss)(c) | 0.58 | 0.28 | 0.40 | 0.35 | 0.28 | |||||||||||||||
Net realized and unrealized gain (loss) | 1.47 | (3.62 | ) | 3.30 | (d) | 3.04 | (1.97 | ) | ||||||||||||
|
|
|
|
|
|
|
|
|
| |||||||||||
Total from investment operations | 2.05 | (3.34 | ) | 3.70 | 3.39 | (1.69 | ) | |||||||||||||
|
|
|
|
|
|
|
|
|
| |||||||||||
| Less distributions from: |
| |||||||||||||||||||
Net investment income | (0.70 | ) | (0.21 | ) | (0.55 | ) | (0.34 | ) | (0.12 | ) | ||||||||||
|
|
|
|
|
|
|
|
|
| |||||||||||
Total distributions | (0.70 | ) | (0.21 | ) | (0.55 | ) | (0.34 | ) | (0.12 | ) | ||||||||||
|
|
|
|
|
|
|
|
|
| |||||||||||
Net Asset Value, end of period | $ | 27.19 | $ | 25.84 | $ | 29.39 | $ | 26.24 | $ | 23.19 | ||||||||||
|
|
|
|
|
|
|
|
|
| |||||||||||
Total Return (%) | 7.87 | (e) | (11.35 | )(e)(f) | 14.21 | (e) | 14.75 | (6.78 | )** | |||||||||||
Ratios to Average Net Assets and Supplemental Data | ||||||||||||||||||||
Net Assets, end of period ($ millions) | 22 | 30 | 128 | 10 | 19 | |||||||||||||||
Ratio of expenses before fee waiver (%) | 0.09 | 0.10 | 0.21 | 0.40 | 0.40 | * | ||||||||||||||
Ratio of expenses after fee waiver (%) | 0.09 | 0.09 | 0.18 | 0.40 | 0.40 | * | ||||||||||||||
Ratio of net investment income (loss) (%) | 2.14 | 1.00 | 1.39 | 1.46 | 1.31 | * | ||||||||||||||
Portfolio turnover rate (%)(g) | 12 | 149 | 78 | 22 | 8 | ** | ||||||||||||||
| Xtrackers MSCI Latin America Pacific Alliance ETF Selected Per Share Data | Year Ended 5/31/2020 | Period Ended 5/31/2019(b) | ||||||
Net Asset Value, beginning of period | $ | 24.94 | $ | 25.00 | ||||
|
|
|
| |||||
| Income (loss) from investment operations: | ||||||||
Net investment income (loss)(c) | 0.58 | 0.38 | ||||||
Net realized and unrealized gain (loss) | (6.87 | ) | (0.33 | )(d) | ||||
|
|
|
| |||||
Total from investment operations | (6.29 | ) | 0.05 | |||||
|
|
|
| |||||
| Less distributions from: |
| |||||||
Net investment income | (0.70 | ) | (0.11 | ) | ||||
Net realized gains | (0.87 | ) | — | |||||
|
|
|
| |||||
Total distributions | (1.57 | ) | (0.11 | ) | ||||
|
|
|
| |||||
Net Asset Value, end of period | $ | 17.08 | $ | 24.94 | ||||
|
|
|
| |||||
Total Return (%) | (27.01 | )(e) | 0.20 | **(e) | ||||
Ratios to Average Net Assets and Supplemental Data | ||||||||
Net Assets, end of period ($ millions) | 2 | 2 | ||||||
Ratio of expenses before fee waiver (%) | 0.45 | 0.45 | * | |||||
Ratio of expenses after fee waiver (%) | 0.45 | 0.45 | * | |||||
Ratio of net investment income (loss) (%) | 2.57 | 2.53 | * | |||||
Portfolio turnover rate (%)(g) | 18 | 44 | ** | |||||
| (a) | For the period June 24, 2015 (commencement of operations) through May 31, 2016. |
| (b) | For the period October 30, 2018 (commencement of operations) through May 31, 2019. |
| (c) | Based on average shares outstanding during the period. |
| (d) | Because of the timing of subscriptions and redemptions in relation to fluctuating markets at value, the amount shown may not agree with the change in aggregate gains and losses. |
| (e) | Total Return would have been lower if certain expenses had not been reimbursed by the Advisor. |
| (f) | The Fund’s total return includes a reimbursement by the Advisor for a realized loss on a trade executed incorrectly, which otherwise would have reduced total return by 0.22%. |
| (g) | Portfolio turnover rate does not include securities received or delivered from processing creations or redemptions. |
| * | Annualized. |
| ** | Not Annualized. |
| See Notes to Financial Statements. | 41 |
DBX ETF Trust
1. Organization
DBX ETF Trust (the “Trust”) is registered under the Investment Company Act of 1940, as amended (the “Act”), as an open-end registered management investment company organized as a Delaware statutory trust.
As of May 31, 2020, the Trust consists of thirty-four investment series of exchange-traded funds (“ETFs”) (each a “Fund” and collectively, the “Funds”) in operation and trading. These financial statements report on the Funds listed below:
| Xtrackers Eurozone Equity ETF |
| Xtrackers International Real Estate ETF |
| Xtrackers Japan JPX-Nikkei 400 Equity ETF |
| Xtrackers MSCI Latin America Pacific Alliance ETF |
DBX Advisors LLC (“DBX” or the “Advisor”), an indirect, wholly-owned subsidiary of DWS Group GmbH & Co. KGaA (“DWS Group”), serves as investment advisor to the Funds and has overall responsibility for the general management and administration of the Funds, subject to the supervision of the Funds’ Board of Trustees (“Board”).
Xtrackers Eurozone Equity ETF offers shares that are listed and traded on the Cboe BZX Exchange (“Cboe”). Xtrackers International Real Estate ETF, Xtrackers Japan JPX-Nikkei 400 Equity ETF and Xtrackers MSCI Latin America Pacific Alliance ETF offer shares that are listed and traded on the NYSE Arca, Inc. (“NYSE Arca”). Unlike conventional mutual funds, each Fund issues and redeems shares on a continuous basis, at net asset value (“NAV”), only in large specified lots consisting of 50,000 shares, each called a “Creation Unit”, to authorized participants who have entered into agreements with the Funds’ distributor. Shares are not individually redeemable securities of the Funds, and owners of the shares may acquire those shares from the Funds, or tender such shares for redemption to the Funds, in Creation Units only.
The investment objective of each Fund is to track the performance, before fees and expenses, of a particular index (the “Underlying Index”). The underlying indices for the Funds are:
Fund | Underlying Index | |
| Xtrackers Eurozone Equity ETF | NASDAQ Eurozone Large Mid Cap Index | |
| Xtrackers International Real Estate ETF | iSTOXX Developed and Emerging Markets ex USA PK VN Real Estate Index | |
| Xtrackers Japan JPX-Nikkei 400 Equity ETF | JPX-Nikkei 400 Net Total Return Index | |
| Xtrackers MSCI Latin America Pacific Alliance ETF | MSCI Latin America Pacific Alliance Capped Index |
The NASDAQ Eurozone Large Mid Cap Index is designed to track the performance of equity securities of large- and mid-capitalization companies based in the countries in the Economic and Monetary Union of the European Union. The NASDAQ Eurozone Large Mid Cap Index is rebalanced semi-annually in March and September.
The iSTOXX Developed and Emerging Markets ex USA PK VN Real Estate Index is a free-float capitalization weighted index that provides exposure to publicly traded real estate securities in countries outside the United States, excluding Pakistan and Vietnam. The iSTOXX Developed and Emerging Markets ex USA PK VN Real Estate Index is rebalanced quarterly.
The JPX-Nikkei Index 400 Net Total Return Index is designed to track the performance of equity securities of issuers that are primarily listed on the JASDAQ Stock Exchange (“JASDAQ”) or the following sections of the Tokyo Stock Exchange (“TSE”): the first section (for large companies), the second section (for middle-sized companies) and the “Mothers” (for high-growth and emerging stocks). The JPX-Nikkei Index 400 Total Return Index is rebalanced annually.
The MSCI Latin America Pacific Alliance Capped Index is designed to provide exposure to equity securities of issuers from Latin American member states of the Pacific Alliance, as well as securities of countries that are headquartered and carry out the majority of operations in these countries. The MSCI Latin America Pacific Alliance Capped Index is rebalanced quarterly.
Each Fund is entitled to use its respective Underlying Index pursuant to a licensing agreement between the Index Provider and DBX. There is no charge to the Funds in connection with these licensing agreements.
42
DBX ETF Trust
Notes to Financial Statements (Continued)
Each Fund, except Xtrackers International Real Estate ETF and Xtrackers Japan JPX-Nikkei 400 Equity ETF, is non-diversified and is not limited by the Act with regard to the percentage of its assets that may be invested in the securities of a single issuer. This means the securities of a particular issuer (or securities of issuers in particular industries) may dominate the Underlying Index of the Fund and, consequently, the Fund’s investment portfolio. This may adversely affect the Fund’s performance or subject the Fund’s shares to greater price volatility than that experienced by more diversified investment companies. In addition, each Fund, with the exception of Xtrackers International Real Estate ETF, may change its diversification status over time and then change it back again, without shareholder approval, solely as a result of a change in relative market capitalization or index weighting of one or more constituents of the index each Fund tracks.
Pursuant to the Trust’s organizational documents, the Trust’s officers and trustees are indemnified against certain liabilities that may arise out of the performance of their duties to the Funds. Additionally, in the normal course of business the Trust enters into contracts that contain a variety of representations that provide indemnification for certain liabilities. The Trust’s maximum exposure under these arrangements is unknown, as this would involve future claims that may be made against the Funds that have not yet occurred. However, the Trust expects the risk of loss to be remote.
2. Significant Accounting Policies
The financial statements have been prepared in conformity with U.S. generally accepted accounting principles (“U.S. GAAP”), which require management to make certain estimates and assumptions that affect the reported amounts and disclosures in the financial statements. Actual results could differ from those estimates. Each Fund qualifies as an investment company under Topic 946 of the Accounting Standards Codification of U.S. GAAP. The following is a summary of significant accounting policies followed by the Funds.
Security Valuation The NAV of each Fund’s shares is calculated each business day as of the close of regular trading on the New York Stock Exchange, generally 4:00 p.m. Eastern Time. NAV per share is calculated by dividing a Fund’s net assets by the number of Fund shares outstanding.
Various inputs are used in determining the value of the Funds’ investments. These inputs are summarized in three broad levels. Level 1 includes quoted prices in active markets for identical securities. Level 2 includes other significant observable inputs (including quoted prices for similar securities, interest rates, prepayment speeds, and credit risk). Level 3 includes significant unobservable inputs (including the Funds’ own assumptions in determining the fair value of investments). The level assigned to the securities valuations may not be an indication of the risk or liquidity associated with investing in those securities.
Equity securities and ETFs are valued at the most recent sale price or official closing price reported on the exchange (U.S. or foreign) or over-the-counter market on which they trade. Securities or ETFs for which no sales are reported are valued at the calculated mean between the most recent bid and asked quotations on the relevant market or, if a mean cannot be determined, at the most recent bid quotation. Equity securities and ETFs are generally categorized as Level 1.
Investments in open-end investment companies are valued at their NAV each business day and are categorized as Level 1.
Futures contracts are generally valued at the settlement prices established each day on the exchange on which they are traded and are categorized as Level 1.
Securities and other assets for which market quotations are not readily available or for which the above valuation procedures are deemed not to reflect fair value are valued in a manner that is intended to reflect their fair value as determined in accordance with procedures approved by the Board and are generally categorized as Level 3. In accordance with the Funds’ valuation procedures, factors considered in determining value may include, but are not limited to, the type of the security; the size of the holding; the initial cost of the security; the existence of any contractual restrictions on the security’s disposition; the price and extent of public trading in similar securities of the issuer or of comparable companies; quotations or evaluated prices from broker-dealers and/or pricing services; information obtained from the issuer, analysts, and/or the appropriate stock exchange (for exchange-traded securities); an analysis of the company’s or issuer’s financial statements; an evaluation of the forces that influence the issuer and the market(s) in which the security is purchased and sold; and with respect to debt
43
DBX ETF Trust
Notes to Financial Statements (Continued)
securities, the maturity, coupon, creditworthiness, currency denomination and the movement of the market in which the security is normally traded. The value determined under these procedures may differ from published values for the same securities.
Fair value pricing could result in a difference between the prices used to calculate a Fund’s NAV and the prices used by the Fund’s Underlying Index, which in turn could result in a difference between the Fund’s performance and the performance of the Fund’s Underlying Index.
Disclosure about the classification of the fair value measurements is included in a table following the Fund’s Schedule of Investments.
Cash Cash consists of cash held at banks and is on deposit with major financial institutions.
Investment Transactions and Investment Income Investment transactions are recorded as of the date that the securities are purchased or sold (trade date). Realized gains and losses from the sale or disposition of securities are calculated on the identified cost-method. Dividend income is net of any foreign taxes withheld at source. Certain dividends from foreign securities may be recorded subsequent to the ex-dividend date as soon as the Fund is informed of such dividends. Interest income is recorded on the accrual basis. Distributions received from foreign domiciled corporations, generally determined to be passive foreign investment companies for tax reporting purposes, are included in dividend income.
Tax Information and Dividends and Distributions to Shareholders It is each Fund’s policy to comply with all requirements of the Internal Revenue Code of 1986, as amended (“the Code”). Each Fund intends to qualify for and to elect treatment as a separate Regulated Investment Company (“RIC”) under Subchapter M of the Code. It is the policy of Xtrackers Eurozone Equity ETF, Xtrackers International Real Estate ETF, Xtrackers Japan JPX-Nikkei 400 Equity ETF and Xtrackers MSCI Latin America Pacific Alliance ETF to pay out dividends from its net investment income semi-annually. Taxable net realized gains from investment transactions, reduced by capital loss carryforwards, if any, are declared and distributed to shareholders at least annually. The capital loss carryforward amount, if any, is available to offset future net capital gains. The Funds may occasionally be required to make supplemental distributions at some other time during the year. The Funds reserve the right to declare special distributions if, in their reasonable discretion, such action is necessary or advisable to preserve the status of each Fund as a RIC or to avoid imposition of income or excise taxes on undistributed income. Dividends and distributions to shareholders, if any, are recorded on the ex-dividend date. The amount of dividends and distributions from net investment income and net realized capital gains are determined in accordance with Federal income tax regulations which may differ from U.S. GAAP. These “book/tax” differences are either considered temporary or permanent in nature. To the extent these differences are permanent in nature, such amounts are reclassified at the end of the year within the components of net assets based on their federal tax treatment; temporary differences do not require reclassification. Dividends and distributions, which exceed earnings and profits for the full year for tax purposes, are reported as a tax return of capital.
In accordance with U.S. GAAP requirements regarding accounting for uncertainties in income taxes, management has analyzed the Funds’ tax positions taken or expected to be taken on foreign, federal and state income tax returns for all open tax years and has concluded that no provision for income tax is required in the Funds’ financial statements.
The Funds recognize interest and penalties, if any, related to uncertain tax positions as income tax expense on the Statements of Operations. For the year ended May 31, 2020, the Funds did not incur any interest or penalties.
As of May 31, 2020, the components of accumulated earnings (losses) on a tax basis were as follows:
| Undistributed Ordinary Income | Capital and Other Gains (Losses) | Unrealized Appreciation (Depreciation) | Total Accumulated Earnings (Losses) | |||||||||||||
Xtrackers Eurozone Equity ETF | $ | 39,663 | $ | (391,239 | ) | $ | (608,536 | ) | $ | (960,112 | ) | |||||
Xtrackers International Real Estate ETF | 3,170,939 | (920,150 | ) | (41,751,977 | ) | (39,501,188 | ) | |||||||||
Xtrackers Japan JPX-Nikkei 400 Equity ETF | 223,133 | (1,940,748 | ) | (1,511,612 | ) | (3,229,227 | ) | |||||||||
Xtrackers MSCI Latin America Pacific Alliance ETF | 22,832 | (78,465 | ) | (629,641 | ) | (685,274 | ) | |||||||||
44
DBX ETF Trust
Notes to Financial Statements (Continued)
The tax character of dividends and distributions declared for the years ended May 31, 2020 and May 31, 2019 were as follows:
| Year Ended May 31, 2020 | ||||
| Ordinary Income* | ||||
Xtrackers Eurozone Equity ETF | $ | 78,087 | ||
Xtrackers International Real Estate ETF | 5,184,811 | |||
Xtrackers Japan JPX-Nikkei 400 Equity ETF | 744,817 | |||
Xtrackers MSCI Latin America Pacific Alliance ETF | 156,653 | |||
| Period Ended May 31, 2019 | ||||
| Ordinary Income* | ||||
Xtrackers Eurozone Equity ETF | $ | 71,498 | ||
Xtrackers International Real Estate ETF | 73,382 | |||
Xtrackers Japan JPX-Nikkei 400 Equity ETF | 378,111 | |||
Xtrackers MSCI Latin America Pacific Alliance ETF | 21,262 | |||
| * | For tax purposes short-term capital gain distributions are considered ordinary income distributions. |
At May 31, 2020, for Federal income tax purposes, the Funds have capital loss carryforwards available as shown in the table below, to the extent provided by regulations, to offset future capital gains for an unlimited period. To the extent that these capital loss carryforwards are used to offset future capital gains, it is probable that the capital gains so offset will not be distributed to shareholders.
| Short-Term | Long-Term | Total Amount | ||||||||||
Xtrackers Eurozone Equity ETF | $ | 108,073 | $ | 283,166 | $ | 391,239 | ||||||
Xtrackers International Real Estate ETF | 783,108 | 137,042 | 920,150 | |||||||||
Xtrackers Japan JPX-Nikkei 400 Equity ETF | 1,587,277 | 353,471 | 1,940,748 | |||||||||
Xtrackers MSCI Latin America Pacific Alliance ETF | 17,447 | 61,018 | 78,465 | |||||||||
For the fiscal year ended May 31, 2020, the effect of permanent “book/tax” reclassifications to the components of net assets are included below. These differences are primarily due to recognition of certain foreign currency gains (losses) as ordinary income (loss), return of capital distributions received, non-deductible excise tax paid, distribution re-classes, redemptions-in-kind, and passive foreign investment companies (“PFICs”).
| Distributable earnings (loss) | Paid-In Capital | |||||||
Xtrackers Eurozone Equity ETF | $ | (83,452 | ) | $ | 83,452 | |||
Xtrackers International Real Estate ETF | 142,223 | (142,223 | ) | |||||
Xtrackers Japan JPX-Nikkei 400 Equity ETF | 754,700 | (754,700 | ) | |||||
Xtrackers MSCI Latin America Pacific Alliance ETF | 422 | (422 | ) | |||||
As of May 31, 2020, the aggregate cost of investments for federal income tax purposes, the net unrealized appreciation or depreciation and the aggregated gross unrealized appreciation (depreciation) on investments were as follows:
| Aggregate Tax Cost | Net Unrealized Appreciation (Depreciation) | Aggregate Gross Unrealized Appreciation | Aggregate Gross Unrealized (Depreciation) | |||||||||||||
Xtrackers Eurozone Equity ETF | $ | 4,547,918 | $ | (608,597 | ) | $ | 231,441 | $ | (840,038 | ) | ||||||
Xtrackers International Real Estate ETF | 279,831,803 | (41,764,724 | ) | 4,764,563 | (46,529,287 | ) | ||||||||||
Xtrackers Japan JPX-Nikkei 400 Equity ETF | 23,053,365 | (1,514,387 | ) | 2,035,819 | (3,550,206 | ) | ||||||||||
Xtrackers MSCI Latin America Pacific Alliance ETF | 2,339,596 | (629,670 | ) | 29,331 | (659,001 | ) | ||||||||||
Foreign Taxes The Funds may be subject to foreign taxes (a portion of which may be reclaimable) on income, capital gains on investments, certain foreign currency transactions or other corporate events. All foreign taxes are recorded in accordance with the applicable foreign tax regulations and rates that exist in the foreign jurisdictions
45
DBX ETF Trust
Notes to Financial Statements (Continued)
in which the Funds invest. These foreign taxes, if any, are paid by the Funds and are reflected in their Statements of Operations as follows: foreign taxes withheld at source are presented as a reduction of income, foreign taxes on capital gains from sales of investments and foreign currency transactions are included in their respective net realized gain (loss) categories, and deferred foreign taxes on unrealized gains are included in net change in unrealized appreciation (depreciation). Receivables and payables related to foreign taxes as of May 31, 2020, if any, are disclosed in the Funds’ Statements of Assets and Liabilities.
Foreign Currency Translations The books and records of the Funds are maintained in U.S. dollars. Investment securities and other assets and liabilities denominated in a foreign currency are translated into U.S. dollars at the prevailing exchange rates at period end. Purchases and sales of investment securities, income and expenses are translated into U.S. dollars at the prevailing exchange rates on the respective dates of the transactions.
Net realized and unrealized gains and losses on foreign currency transactions represent net gains and losses between trade and settlement dates on securities transactions, the acquisition and disposition of foreign currencies, and the difference between the amount of net investment income accrued and the U.S. dollar amount actually received. The portion of both realized and unrealized gains and losses on investments that results from fluctuations in foreign currency exchange rates is not separately disclosed, but is included with net realized and unrealized gain/appreciation and loss/depreciation on investments.
Securities Lending The Funds may lend securities to certain financial institutions under the terms of their securities lending agreement. During the term of the loans, the Funds continue to receive interest and dividends generated by the securities and to participate in any changes in their market value. The Funds require the borrowers of the securities to maintain collateral with the Funds consisting of cash and/or securities issued or guaranteed by the U.S. Government, its agencies or instrumentalities having a value at least equal to the value of the securities loaned. When the collateral falls below specified amounts, the lending agent will use its best effort to obtain additional collateral on the next business day to meet required amounts under the securities lending agreement. During the year ended May 31, 2020, the Funds invested the cash collateral into a joint trading account in DWS Government & Agency Securities Portfolio, an affiliated money market fund managed by DWS Investment Management Americas, Inc. DWS Investment Management Americas, Inc. receives a management/administration fee (0.12% annualized effective rate as of May 31, 2020) on the cash collateral invested in DWS Government & Agency Securities Portfolio. The Funds receive compensation for lending their securities either in the form of fees or by earning interest on invested cash collateral net of borrower rebates and fees paid to a lending agent. Either the Fund or the borrower may terminate the loan at any time and the borrower, after notice, is required to return borrowed securities within a standard time period. There may be risks of delay and costs in recovery of securities or even loss of rights in the collateral should the borrower of the securities fail financially. If the Funds are not able to recover securities lent, the Funds may sell the collateral and purchase a replacement investment in the market, incurring the risk that the value of the replacement security is greater than the value of the collateral. The Funds are also subject to all investment risks associated with the reinvestment of any cash collateral received, including, but not limited to, interest rate, credit and liquidity risk associated with such investments.
As of May 31, 2020, the Funds listed below had securities on loan. The value of the related collateral exceeded the value of the securities loaned at period end.
Remaining Contractual Maturity of the Agreements, as of May 31, 2020 | ||||||||||||||||||||
| Securities Lending Transactions | Overnight and Continuous | <30 Days | Between 30 & 90 days | >90 days | Total | |||||||||||||||
Xtrackers Eurozone Equity ETF | ||||||||||||||||||||
Common Stocks | $ | 55,855 | $ | — | $ | — | $ | — | $ | 55,855 | ||||||||||
|
|
|
|
|
|
|
|
|
| |||||||||||
Gross amount of recognized liabilities and non-cash collateral for securities lending transactions |
| $ | 55,855 | |||||||||||||||||
Xtrackers International Real Estate ETF |
| |||||||||||||||||||
Common Stocks | $ | 8,505,313 | $ | — | $ | — | $ | 3,910,553 | $ | 12,415,866 | ||||||||||
|
|
|
|
|
|
|
|
|
| |||||||||||
Gross amount of recognized liabilities and non-cash collateral for securities lending transactions |
| $ | 12,415,866 | |||||||||||||||||
46
DBX ETF Trust
Notes to Financial Statements (Continued)
Remaining Contractual Maturity of the Agreements, as of May 31, 2020 | ||||||||||||||||||||
| Securities Lending Transactions | Overnight and Continuous | �� | <30 Days | Between 30 & 90 days | >90 days | Total | ||||||||||||||
Xtrackers Japan JPX-Nikkei 400 Equity ETF |
| |||||||||||||||||||
Common Stocks | $ | 76,899 | $ | — | $ | — | $ | 40,446 | $ | 117,345 | ||||||||||
|
|
|
|
|
|
|
|
|
| |||||||||||
Gross amount of recognized liabilities and non-cash collateral for securities lending transactions |
| $ | 117,345 | |||||||||||||||||
Xtrackers MSCI Latin America Pacific Alliance ETF |
| |||||||||||||||||||
Common Stocks | $ | — | | $ | — | $ | 227 | $ | 44,706 | $ | 44,933 | |||||||||
|
|
|
|
|
|
|
|
|
| |||||||||||
Gross amount of recognized liabilities and non-cash collateral for securities lending transactions |
| $ | 44,933 | |||||||||||||||||
Derivatives
Futures Contracts Each Fund may enter into futures contracts. These futures contracts will be used to simulate investment in the respective Underlying Index, to facilitate trading or to reduce transaction costs. Each Fund will enter into futures contracts that are traded on a U.S. or non-U.S. exchange. No Fund will use futures for speculative purposes. Futures contracts provide for the future sale by one party and purchase by another party of a specified amount of a specific instrument or index at a specified future time and at a specified price. For the year ended May 31, 2020, Xtrackers International Real Estate ETF and Xtrackers Japan JPX-Nikkei 400 Equity ETF utilized futures in order to simulate investment in the Funds’ Underlying Index. To the extent required by law, liquid assets committed to futures contracts will be maintained.
At the time each Fund enters into a futures contract, each Fund deposits and maintains as collateral an initial margin with the broker, as required by the exchange on which the transaction is affected. Pursuant to the contract, each Fund agrees to receive from or pay to the broker an amount of cash equal to the daily fluctuation in the value of the contract. Such receipts or payments are known as variation margin and are recorded by each Fund as unrealized gains or losses. Risks may arise from the potential inability of a counterparty to meet the terms of the contract. The credit/counterparty risk for exchange-traded futures contracts is generally less than privately negotiated futures contracts, since the clearinghouse, which is the issuer or counterparty to each exchange-traded future, provides a guarantee of performance. The guarantee is supported by a daily payment system (i.e., margin requirements).
Use of long futures contracts subjects each Fund to risk of loss in excess of the amounts shown on the Statement of Assets and Liabilities, up to the notional value of the futures contracts. Use of short futures contracts subjects each Fund to unlimited risk of loss. Under some circumstances, futures exchanges may establish daily limits on the amount that the price of a futures contract can vary from the previous day’s settlement price, which could effectively prevent liquidation of unfavorable positions.
A summary of the open futures contracts as of May 31, 2020 is included in a table following the Funds’ Schedule of Investments.
The following tables summarize the value of the Funds’ derivative instruments held as of May 31, 2020 and the related location in the accompanying Statement of Assets and Liabilities, presented by primary underlying risk exposure:
Asset Derivatives | Liability Derivatives | |||||||||||||
| Xtrackers International Real Estate ETF | ||||||||||||||
| Equity contracts | Unrealized appreciation on futures contracts* | $ | 112,865 | Unrealized depreciation on futures contracts* | $ | — | ||||||||
| Xtrackers Japan JPX-Nikkei 400 Equity ETF | ||||||||||||||
| Equity contracts | Unrealized appreciation on futures contracts* | $ | 35,666 | Unrealized depreciation on futures contracts* | $ | — | ||||||||
| * | Includes cumulative appreciation or cumulative depreciation on futures contracts as disclosed in the Schedule of Investments. Unsettled variation margin is disclosed separately within the Statement of Assets and Liabilities. |
47
DBX ETF Trust
Notes to Financial Statements (Continued)
Additionally, the amount of realized and unrealized gains and losses on derivative instruments recognized in the Funds’ earnings during the year ended May 31, 2020 and the related location in the accompanying Statement of Operations is summarized in the following tables by primary underlying risk exposure:
Net Realized Gain (Loss) from: | ||||
| Futures Contracts — Equity Contracts | ||||
Xtrackers International Real Estate ETF | $ | (90,276 | ) | |
Xtrackers Japan JPX-Nikkei 400 Equity ETF | (7,336 | ) | ||
Net Change in Unrealized Appreciation (Depreciation) on: | ||||
| Futures Contracts — Equity Contracts | ||||
Xtrackers International Real Estate ETF | $ | 115,965 | ||
Xtrackers Japan JPX-Nikkei 400 Equity ETF | 59,206 | |||
For the year ended May 31, 2020 the average monthly volume of derivatives was as follows:
| Futures Contracts (Contract Value) | ||||
Xtrackers International Real Estate ETF | $ | 585,081 | ||
Xtrackers Japan JPX-Nikkei 400 Equity ETF | 226,695 | |||
Affiliated Cash Management Vehicles The Funds may invest uninvested cash balances in DWS Government Money Market Series and DWS ESG Liquidity Fund, affiliated money market funds which are managed by DWS Investment Management Americas, Inc. (“DIMA”), also an indirect, wholly owned subsidiary of DWS Group GmbH & Co. KGaA. Each affiliated money market fund is managed in accordance with Rule 2a-7 under the 1940 Act, which governs the quality, maturity, diversity and liquidity of instruments in which a money market fund may invest. DWS Government Money Market Series seeks to maintain a stable NAV, and DWS ESG Liquidity Fund maintains a floating NAV. The Funds indirectly bear their proportionate share of the expenses of each affiliated money market fund in which they invest. The Advisor will waive an amount of the unitary management fee payable to the Advisor by the Funds equal to such acquired fund’s fees and expenses on the Funds’ assets invested in the affiliated money market funds.
3. Investment Advisory and Other Agreements
The Advisor has overall responsibility for the general management and administration of the Funds, subject to the supervision of the Funds’ Board of Trustees. Under an investment advisory agreement between the Trust, on behalf of the Funds, and the Advisor (the “Investment Advisory Agreement”), the Advisor is responsible for arranging sub-advisory, transfer agency, custody, fund administration, and all other non-distribution related services for the Funds to operate.
For its investment advisory services to the Funds below, the Advisor was entitled to receive a unitary management fee based on each Fund’s average daily net assets, computed and accrued daily and payable monthly, at an annual rate equal to:
| Unitary Management Fee | ||||
Xtrackers Eurozone Equity ETF | 0.09 | % | ||
Xtrackers International Real Estate ETF | 0.12 | % | ||
Xtrackers Japan JPX-Nikkei 400 Equity ETF | 0.09 | % | ||
Xtrackers MSCI Latin America Pacific Alliance ETF | 0.45 | % | ||
The Advisor for Xtrackers International Real Estate ETF has contractually agreed, until September 30, 2020, to waive a portion of its unitary management fee to the extent necessary to prevent the operating expenses of the Fund from exceeding 0.10% of the Fund’s average daily net assets. This agreement may only be terminated by the Fund’s Board (and may not be terminated by the Advisor) prior to that time. For the year ended May 31, 2020, the Advisor waived $30,675 of the expenses of the Fund.
48
DBX ETF Trust
Notes to Financial Statements (Continued)
The Advisor for the Funds below has contractually agreed to waive a portion of its management fees in an amount equal to the acquired fund’s fees and expenses attributable to the Funds’ investments in affiliated cash management vehicles. For the year ended May 31, 2020, the Advisor waived expenses of the Funds as follows:
| Expenses Waived | ||||
Xtrackers International Real Estate ETF | $ | 246 | ||
Xtrackers Japan JPX-Nikkei 400 Equity ETF | 22 | |||
Xtrackers MSCI Latin America Pacific Alliance ETF | 1 | |||
Out of the unitary management fee, the Advisor pays substantially all expenses of each Fund, including the cost of transfer agency, custody, fund administration, legal, audit and other services and expenses of the Independent Trustees. Each Fund is responsible for the payment of, interest expense, acquired fund fees and expenses, taxes, brokerage expenses, distribution fees or expenses, if any, litigation expenses and extraordinary expenses.
The Bank of New York Mellon, a wholly-owned subsidiary of The Bank of New York Mellon Corporation, serves as Administrator, Custodian, Accounting Agent, Lending Agent and Transfer Agent for each Fund.
ALPS Distributors, Inc. (the “Distributor”) serves as the distributor of Creation Units for each Fund on an agency basis. The Distributor does not maintain a secondary market in shares of the Funds.
The Board of Trustees is currently comprised of three Independent Trustees. The Advisor paid retainer fees and attendance fees to each Independent Trustee; retainer fees to the Chairman of the Board of Trustees and Chairman of the Audit Committee; and attendance fees to each member of the Audit Committee (which is comprised of all of the Funds’ Independent Trustees).
4. Investment Portfolio Transactions
For the year ended May 31, 2020, the cost of investments purchased and proceeds from sale of investments (excluding in-kind transactions and short-term investments) were as follows:
| Purchases | Sales | |||||||
Xtrackers Eurozone Equity ETF | $ | 388,156 | $ | 398,004 | ||||
Xtrackers International Real Estate ETF | 59,262,355 | 17,326,669 | ||||||
Xtrackers Japan JPX-Nikkei 400 Equity ETF | 3,140,422 | 3,343,746 | ||||||
Xtrackers MSCI Latin America Pacific Alliance ETF | 407,311 | 503,744 | ||||||
For the year ended May 31, 2020, the cost of in-kind purchases and proceeds from in-kind sales were as follows:
| Purchases | Sales | |||||||
Xtrackers Eurozone Equity ETF | $ | 3,200,126 | $ | 1,051,972 | ||||
Xtrackers International Real Estate ETF | 165,927,478 | 872,294 | ||||||
Xtrackers Japan JPX-Nikkei 400 Equity ETF | — | 8,856,650 | ||||||
5. Fund Share Transactions
As of May 31, 2020, there were unlimited Fund shares, no par value, authorized by the Trust. Fund shares are issued and redeemed by each Fund only in Creation Units or multiples thereof. Except when aggregated in Creation Units, shares of each Fund are not redeemable. Transactions in capital shares for each Fund are disclosed in detail in the Statements of Changes in Net Assets. The consideration for the purchase of Creation Units of a Fund generally consists of the in-kind contribution of a designated portfolio of securities constituting a portfolio sampling representation of the securities included in the respective Fund’s Underlying Index and an amount of cash, which under certain circumstances may include cash in lieu of portfolio securities. Investors purchasing and redeeming Creation Units pay a purchase transaction fee and a redemption transaction fee to offset transfer and other transaction costs associated with the issuance and redemption of Creation Units.
49
DBX ETF Trust
Notes to Financial Statements (Continued)
6. Concentration of Ownership
From time to time, the Funds may have a concentration of several shareholder accounts holding a significant percentage of shares outstanding. Investment activities of these shareholders could have a material impact on the Fund. At May 31, 2020, there was one affiliated shareholder account for the Fund listed below holding a significant percentage of the shares outstanding:
| Approximate Percent of Outstanding Shares Held | ||||
Xtrackers MSCI Latin America Pacific Alliance ETF | 95 | % | ||
7. Line of Credit
The Trust has entered into a senior unsecured credit facility with a syndication of banks which allows the Xtrackers International Real Estate ETF and certain other funds managed by the Advisor to borrow up to $105 million. The Fund may borrow money under this credit facility to the extent necessary for temporary or emergency purposes, including the funding of shareholder redemption requests, trade settlements, and as necessary to distribute to shareholders any income necessary to maintain the Fund’s status as a regulated investment company. Borrowings are charged an interest rate of 1.25% per annum plus the greater of the Federal Funds Effective Rate or the one-month LIBOR Rate. The Fund may borrow up to the lesser of a pro-rata share of the credit facility at the amount listed below or 33 percent of its net assets as permitted by the Act. The Fund had no outstanding loans at May 31, 2020.
| Pro-rata Share | ||||
Xtrackers International Real Estate ETF | $ | 525,000 | ||
8. Other
A novel strain of coronavirus (COVID-19) outbreak was declared a pandemic by the World Health Organization on March 11, 2020. The situation is evolving with various cities and countries around the world responding in different ways to address the pandemic. There are direct and indirect economic effects developing for various industries and individual companies throughout the world. The recent pandemic spread of the novel coronavirus and related geopolitical events could lead to increased financial market volatility, disruption to U.S. and world economies and markets and may have significant adverse effects on a Fund and its investments. A prolonged disruption may result in a Fund and its service providers experiencing operational difficulties in implementing their business continuity plans. Management will continue to monitor the impact COVID-19 has on the Funds and reflect the consequences as appropriate in each Fund’s accounting and financial reporting.
9. Fund Liquidation
On June 9, 2020, the Board of Trustees unanimously voted to close and liquidate Xtrackers Latin America Pacific Alliance ETF. After the close of business on June 26, 2020, creation orders were no longer accepted by the Fund and the final day of trading on the exchange was July 6, 2020. Proceeds of the liquidation were sent to shareholders on July 8, 2020.
10. Subsequent Event
On June 17, 2020, Deutsche Bank AG (“DB”), an affiliate of DWS Group, resolved with the Commodity Futures Trading Commission (“CFTC”) charges stemming from alleged violations of various swap data reporting requirements and corresponding supervision and other failures. The matter, which was resolved by the issuance of a federal court order (“Consent Order”), involved unintentional conduct that resulted from a system outage that prevented DB from reporting data in accordance with applicable CFTC requirements for a period of five days in April 2016.
The matter giving rise to the Consent Order did not arise out of any investment advisory, fund management activities or distribution activities of DBX Advisors LLC or their advisory affiliates (the “DWS Service Providers”). DWS Group, of which the DWS Service Providers are wholly-owned subsidiaries (except for Harvest Global Management Limited which is partially owned by DWS Group), is a separate publicly traded company but continues to be an affiliate of DB due to, among other things, DB’s 79.49% ownership interest in DWS Group.
50
DBX ETF Trust
Notes to Financial Statements (Continued)
Under the provisions of the Investment Company Act of 1940, as a result of the Consent Order, the DWS Service Providers would not be eligible to continue to provide investment advisory services to the Funds absent an order from the Securities and Exchange Commission (the “SEC”). DB and the DWS Service Providers are seeking temporary and permanent orders from the SEC to permit the DWS Service Providers to continue to provide investment advisory services to the Funds and other registered investment companies notwithstanding the Consent Order. While there can be no assurance that the requested exemptive orders will be granted, the SEC has granted this type of relief in the past. Consistent with their fiduciary and other relationships with the Funds, and in accordance with the desire of the Board of the Funds, the DWS Service Providers continue to provide investment advisory services to the Funds. Subject to the receipt of the temporary and permanent exemptive orders, the DWS Service Providers have informed the Funds that they do not believe the Consent Order will have any material impact on the Funds or the ability of the DWS Service Providers to provide services for the Funds.
51
DBX ETF Trust
To the Shareholders of Xtrackers Eurozone Equity ETF, Xtrackers International Real Estate ETF, Xtrackers Japan JPX-Nikkei 400 Equity ETF, Xtrackers MSCI Latin America Pacific Alliance ETF, and the Board of Trustees of DBX ETF Trust
Opinion on the Financial Statements
We have audited the accompanying statements of assets and liabilities of Xtrackers Eurozone Equity ETF, Xtrackers International Real Estate ETF, Xtrackers Japan JPX-Nikkei 400 Equity ETF, and Xtrackers MSCI Latin America Pacific Alliance ETF (collectively referred to as the “Funds”), (four of the funds constituting DBX ETF Trust (the “Trust”)), including the schedules of investments, as of May 31, 2020, and the related statements of operations and changes in net assets, and the financial highlights for each of the periods indicated in the table below and the related notes (collectively referred to as the “financial statements”). In our opinion, the financial statements present fairly, in all material respects, the financial position of each of the Funds (four of the funds constituting the DBX ETF Trust) at May 31, 2020, and the results of their operations, changes in net assets and financial highlights for each of the periods indicated in the table below, in conformity with U.S. generally accepted accounting principles.
Individual fund constituting the DBX ETF Trust | Statement of operations | Statements of changes in net assets | Financial highlights | |||
| Xtrackers Eurozone Equity ETF | For the year ended May 31, 2020 | For each of the two years in the period ended May 31, 2020 | For each of the four years in the period ended May 31, 2020 and the period from August 19, 2015 (commencement of operations) through May 31, 2016 | |||
| Xtrackers International Real Estate ETF | For the year ended May 31, 2020 | For each of the two years in the period ended May 31, 2020 | For each of the five years in the period ended May 31, 2020 | |||
| Xtrackers Japan JPX-Nikkei 400 Equity ETF | For the year ended May 31, 2020 | For each of the two years in the period ended May 31, 2020 | For each of the four years in the period ended May 31, 2020 and the period from June 24, 2015 (commencement of operations) through May 31, 2016 | |||
| Xtrackers MSCI Latin America Pacific Alliance ETF | For the year ended May 31, 2020 | For the year ended May 31, 2020 and the period from October 30, 2018 (commencement of operations) through May 31, 2019 | ||||
Basis for Opinion
These financial statements are the responsibility of the Trust’s management. Our responsibility is to express an opinion on each of the Funds’ financial statements based on our audits. We are a public accounting firm registered with the Public Company Accounting Oversight Board (United States) (“PCAOB”) and are required to be independent with respect to the Trust in accordance with the U.S. federal securities laws and the applicable rules and regulations of the Securities and Exchange Commission and the PCAOB.
We conducted our audits in accordance with the standards of the PCAOB. Those standards require that we plan and perform the audit to obtain reasonable assurance about whether the financial statements are free of material misstatement, whether due to error or fraud. The Trust is not required to have, nor were we engaged to perform, an audit of the Trust’s internal control over financial reporting. As part of our audits we are required to obtain an understanding of the internal control over financial reporting but not for the purpose of expressing an opinion on the effectiveness of the Trust’s internal control over financial reporting. Accordingly, we express no such opinion.
52
DBX ETF Trust
Report of Independent Registered Public Accounting Firm (Continued)
Our audits included performing procedures to assess the risks of material misstatement of the financial statements, whether due to error or fraud, and performing procedures that respond to those risks. Such procedures included examining, on a test basis, evidence regarding the amounts and disclosures in the financial statements. Our procedures included confirmation of securities owned as of May 31, 2020, by correspondence with the custodians and brokers or by other appropriate auditing procedures where replies from brokers were not received. Our audits also included evaluating the accounting principles used and significant estimates made by management, as well as evaluating the overall presentation of the financial statements. We believe that our audits provide a reasonable basis for our opinion.

We have served as the auditor of one or more investment companies in the DWS family of funds since at least 1979, but we are unable to determine the specific year.
New York, New York
July 27, 2020
53
DBX ETF Trust
All Funds
In accordance with Rule 22e-4 (the “Liquidity Rule”) under the Investment Company Act of 1940 (the “1940 Act”), your Fund has adopted a liquidity risk management program (the “Program”), and the Board has designated DBX Advisors LLC (“Advisors”) as Program administrator. The Program is designed to assess and manage your Fund’s liquidity risk (the risk that the Fund would be unable to meet requests to redeem shares of the Fund without significant dilution of remaining investors’ interests in the Fund). Advisors has designated a committee (the “Committee”) composed of personnel from multiple departments within an affiliate of Advisors that is responsible for the implementation and ongoing administration of the Program, which includes assessing the Fund’s liquidity risk under both normal and reasonably foreseeable stressed conditions. Under the Program, every investment held by a Fund is classified on a daily basis into one of four liquidity categories based on calculations of the investment’s ability to be sold during designated timeframes in current market conditions without significantly changing the investment’s market value.
Xtrackers Eurozone Equity ETF (EURZ) and Xtrackers MSCI Latin America Pacific Alliance ETF (PACA) only
In February 2020, as required by the Program and the Liquidity Rule, Advisors provided the Board with an annual written report (the “Report”) addressing the operation of the Program and assessing the adequacy and effectiveness of its implementation during the period from December 1, 2018 through November 30, 2019 (the “Reporting Period”). During the Reporting Period, your Fund was primarily invested in highly liquid investments (investments that the Fund anticipates can be converted to cash within three business days or less in current market conditions without significantly changing their market value). As a result, your Fund is not required to adopt, and has not adopted, a “Highly Liquid Investment Minimum” as defined in the Liquidity Rule. During the Reporting Period, the Fund did not approach the 15% limit imposed by the Liquidity Rule on holdings in illiquid investments (investments that cannot be sold or disposed of in seven days or less in current market conditions without the sale of the investment significantly changing the market value of the investment). Your Fund did not experience any issues meeting investor redemptions at any time during the Reporting Period. In the Report, Advisors stated that it believes the Program has operated adequately and effectively to manage the Fund’s liquidity risk during the Reporting Period. Advisors also reported on a material change made to the Program in May 2019 to address Securities and Exchange Commission guidance relating to extended foreign market holidays.
Xtrackers International Real Estate ETF (HAUZ) and Xtrackers Japan JPX-Nikkei 400 Equity ETF (JPN) only
In February 2020, as required by the Program and the Liquidity Rule, Advisors provided the Board with an annual written report (the “Report”) addressing the operation of the Program and assessing the adequacy and effectiveness of its implementation during the period from December 1, 2018 through November 30, 2019 (the “Reporting Period”). During the Reporting Period, your Fund was primarily invested in highly liquid investments (investments that the Fund anticipates can be converted to cash within three business days or less in current market conditions without significantly changing their market value). As a result, your Fund is not required to adopt, and has not adopted, a “Highly Liquid Investment Minimum” as defined in the Liquidity Rule. During the Reporting Period, the Fund did experience a temporary breach of the 15% limit imposed by the Liquidity Rule on holdings in illiquid investments (investments that cannot be sold or disposed of in seven days or less in current market conditions without the sale of the investment significantly changing the market value of the investment). The breach was caused by the temporary reclassification of Japanese securities as illiquid due to an extended Japanese holiday market closure. The temporary reclassification of Japanese securities caused the Fund to exceed the 15% limit on illiquid investments for a two day period. Because the holiday closure was anticipated in advance, no actions were needed to rebalance the Fund’s portfolio. Your Fund did not experience any issues meeting investor redemptions at any time during the Reporting Period. In the Report, Advisors stated that it believes the Program has operated adequately and effectively to manage the Fund’s liquidity risk during the Reporting Period. Advisors also reported on a material change made to the Program in May 2019 to address Securities and Exchange Commission guidance relating to extended foreign market holidays.
54
DBX ETF Trust
Identification and Background
The Board has responsibility for the overall management and operations of the funds, including general supervision of the duties performed by the Advisor and other service providers. Each Board Member serves until his or her successor is duly elected or appointed and qualified. Each officer serves until he or she resigns, is removed, dies, retires or becomes disqualified.
The Trust currently has three Board Members. The three Independent Board Members have no affiliation or business connection with the Advisor or any of its affiliated persons and do not own any stock or other securities issued by the Advisor.
The Independent Board Members of the Trust, their term of office and length of time served, their principal business occupations during the past five years, the number of portfolios in the fund complex (defined below) overseen by each Independent Board Member, and other directorships, if any, held by the Board Members are shown below. The fund complex includes all registered open- and closed-end funds (including all of their portfolios) advised by the Advisor and any registered funds that have an investment advisor that is an affiliated person of the Advisor. As of the date of this shareholder report, the fund complex consists of the funds in the Trust, as well as the registered funds advised by affiliates of the Advisor.
Shareholder Communications to the Board. Shareholders may send communications to the Trust’s Board by addressing the communications directly to the Board (or individual Board Members) and/or otherwise clearly indicating in the salutation that the communication is for the Board (or individual Board Members). The shareholder may send the communication to either the Trust’s office or directly to such Board members c/o 875 Third Avenue, New York, NY 10022. Other shareholder communications received by the Trust not directly addressed and sent to the Board will be reviewed and generally responded to by management. Such communications will be forwarded to the Board at management’s discretion based on the matters contained therein.
Independent Board Members | ||||||
| Name, Year of Birth, Position with the Trust and Length of Time Served(1) | Business Experience and Directorships During the Past 5 Years | Number of Portfolios in Fund Complex Overseen | Other Directorships Held by Board Member | |||
Stephen R. Byers (1953) Chairman since 2016, and Board Member since 2011 (formerly, Lead Independent Board Member, 2015-2016) | Independent Director (2011- present); Independent Consultant (2014-present); Director of Investment Management, the Dreyfus Corporation (2000-2006) and Vice Chairman and Chief Investment Officer, the Dreyfus Corporation (2002-2006). | 34 | The Arbitrage Funds, Sierra Income Corporation, Mutual Fund Directors Forum | |||
George O. Elston (1964) Board Member since 2011, Chairman of the Audit Committee since 2015 | Chief Financial Officer, Enzyvant (2018-present); Chief Executive Officer, 2X Oncology, Inc. (2017-2018); Senior Vice President and Chief Financial Officer, Juniper Pharmaceuticals, Inc. (2014-2016); Senior Vice President and Chief Financial Officer, KBI BioPharma Inc. (2013-2014); Managing Partner, Chatham Street Partners (2010-2013). | 34 | — | |||
J. David Officer (1948) Board Member since 2011, Chairman of the Nominating Committee since 2015 | Independent Director (2010-present); Vice Chairman, the Dreyfus Corporation (2006-2009); President, The Dreyfus Family of Funds, Inc. (2006-2009). | 34 | (Chairman of) Ilex Management Ltd; Old Westbury Funds | |||
55
DBX ETF Trust
Board Members and Officers (Unaudited) (Continued)
Officers(2) | ||
| Name, Year of Birth, Position with the Trust and Length of Time Served(4) | Business Experience and Directorships During the Past 5 Years | |
Freddi Klassen(5) (1975) President and Chief Executive Officer, 2016-present | Director(3) in DWS and Chief Operating Officer in the Americas for the Traditional Asset Classes Department (2014–present); Manager and Chief Operating Officer of DWS Investment Management Americas, Inc. (2018–present) and the Advisor (2016–present); Global Chief Operating Officer for Equities Technology in the Investment Bank Division at Deutsche Bank AG (2013-2014); Chief Operating Officer for Exchange Traded Funds and Systematic Funds in Europe (2008-2013). | |
Luke Oliver(5) (1980) Chief Operating Officer, 2019-present | Managing Director(3) in DWS (2017-present); Director(3) in DWS (2009-2017); Head of Passive Americas Asset Management Platform (2019-present); Manager, Chief Executive Officer and Chief Investment Officer of the Advisor (2019-present); Head of ETF Capital Markets, Americas (2012-2018); Lead Portfolio Manager of PowerShares DB ETFs (2009-2012). | |
Diane Kenneally(6) (1966) Treasurer, Chief Financial Officer and Controller, 2019-present | Director(3) in DWS; Chief Financial Officer and Treasurer for DWS US registered investment companies advised by DWS Investment Management Americas, Inc. (2018-present); Treasurer and Chief Financial Officer, The European Equity Fund, Inc., The New Germany Fund, Inc. and The Central and Eastern Europe Fund, Inc. (2018-present); formerly: Assistant Treasurer for the DWS funds (2007-2018). | |
Frank Gecsedi(5) (1967) Chief Compliance Officer, 2010-present | Director(3) in DWS Compliance Department (2016-present), Vice President in the Deutsche Asset Management Compliance Department at Deutsche Bank AG (2013-2016) and Chief Compliance Officer of the Advisor (2010-present); Chief Compliance Officer of DWS Distributors, Inc. (2019-present); Vice President in Deutsche Bank’s Global Markets Legal, Risk and Capital Division (2010-2012). | |
Bryan Richards(5) (1978) Vice President, 2016-present | Managing Director(3) in DWS (2018-present); Director(3) in DWS (2014-2018); Portfolio Manager in the Passive Asset Management Department at DWS (2011-present); Primary Portfolio Manager for the PowerShares DB Commodity ETFs (2011-2015). | |
John Millette(6) (1962) Secretary, 2020-present | Director(3) in DWS US Retail Legal (2003-present); Vice President and Secretary of DWS US registered investment companies advised by DWS Investment Management Americas, Inc. (1999-present); Chief Legal Officer, DWS Investment Management Americas, Inc. (2015-present); Director and Vice President of DWS Trust Company (2016-present); Secretary, The European Equity Fund, Inc., The New Germany Fund, Inc. and The Central and Eastern Europe Fund, Inc. (2011-present); formerly: Secretary of Deutsche Investment Management Americas Inc. (2015-2017); Assistant Secretary of DBX ETF Trust (2019-2020); Assistant Secretary (July 14, 2006-December 31, 2010) and Secretary (January 31, 2006-July 13, 2006), The European Equity Fund, Inc., The New Germany Fund, Inc. and The Central and Eastern Europe Fund, Inc. |
56
DBX ETF Trust
Board Members and Officers (Unaudited) (Continued)
| Name, Year of Birth, Position with the Trust and Length of Time Served(4) | Business Experience and Directorships During the Past 5 Years | |
Caroline Pearson(6) (1962) Assistant Secretary, 2020-present | Managing Director(3) in DWS US Retail Legal; Chief Legal Officer of DWS US registered investment companies advised by DWS Investment Management Americas, Inc. (2010-present); Chief Legal Officer, The European Equity Fund, Inc., The New Germany Fund, Inc. and The Central and Eastern Europe Fund, Inc. (2012-present); formerly: Secretary, Deutsche AM Distributors, Inc. (2002-2017); and Secretary, Deutsche AM Service Company (2010-2017). | |
Paul Antosca(6) (1957) Assistant Treasurer, 2019-present | Director(3) in DWS; Assistant Treasurer for DWS US registered investment companies advised by DWS Investment Management Americas, Inc. (2007-present). | |
Jeffrey Berry(6) (1959) Assistant Treasurer, 2019-present | Director(3) in DWS. | |
Sheila Cadogan(6) (1966) Assistant Treasurer, 2019-present | Director(3) in DWS; Assistant Treasurer for DWS US registered investment companies advised by DWS Investment Management Americas, Inc. (2017-present); Director and Vice President, DWS Trust Company (2018-present); Assistant Treasurer, The European Equity Fund, Inc., The New Germany Fund, Inc. and The Central and Eastern Europe Fund, Inc. (2018-present). | |
Christina A. Morse(7) (1964) Assistant Secretary, 2017-present | Vice President at BNY Mellon-Asset Servicing (2014-present); Vice President and Counsel at Lord Abbett & Co. LLC (2013-2014). | |
Michelle Goveia-Pine(5) (1970) Interim Anti-Money Laundering Compliance Officer, since July 9, 2020 | Director(3) in DWS; Interim AML Officer, DWS Trust Company (since July 28, 2020); and Interim AML Officer of DWS US registered investment companies advised by DWS Investment Management Americas, Inc. (since July 10, 2020); Interim AML Officer, The European Equity Fund, Inc., The New Germany Fund, Inc. and The Central and Eastern Europe Fund, Inc. (since July 24, 2020). |
| (1) | The length of time served is represented by the year in which the Board Member joined the Board. |
| (2) | As a result of their respective positions held with the Advisor and its affiliates, these individuals are considered “interested persons” of the Advisor within the meaning of the 1940 Act. Interested persons receive no compensation from the Funds. |
| (3) | Executive title, not a board directorship. |
| (4) | The length of time served is represented by the year in which the officer was first elected to the Trust in such capacity. |
| (5) | Address: 875 Third Avenue, New York, New York 10022. |
| (6) | Address: One International Place, Boston, Massachusetts 02110. |
| (7) | Address: BNY Mellon Asset Servicing, Atlantic Terminal Office Tower, 2 Hanson Place, Brooklyn, NY 11217. |
The Funds’ Statement of Additional Information (“SAI”) includes additional information about the Funds’ Board Members. The SAI is available by calling 855-329-3837, or on the Company’s website at www.Xtrackers.com.
57
DBX ETF Trust
After discussions at the meeting of the Board of Trustees (“Board” or “Trustees”) held on February 26-27, 2020 (the “Meeting”), the Trustees, all of whom are the Independent Trustees (those not affiliated with DBX ETF Trust (the “Trust”) or its service providers), unanimously approved the continuance of the Investment Advisory Agreement with respect to Xtrackers Eurozone Equity ETF, Xtrackers International Real Estate ETF, Xtrackers Japan JPX-Nikkei 400 Equity ETF, and Xtrackers MSCI Latin America Pacific Alliance ETF (each a “Fund,” and collectively, the “Funds”). The Independent Trustees were advised throughout the review and Meeting by K&L Gates LLP (“Independent Trustee Counsel”).
Before reaching their decision to approve the Investment Advisory Agreement for another annual period, the Independent Trustees evaluated the materials furnished to them in advance of the Meeting from DBX Advisors LLC (“DBX” or the “Advisor”) for purposes of reviewing the agreement’s terms, including statistical information prepared by Broadridge Financial Solutions Inc. (“Broadridge”) regarding (a) fee and expense information for each Fund (including the fee and expense components and any amounts waived or reimbursed) as compared to a peer group of other exchange-traded funds (“ETFs”) selected pursuant to Broadridge’s proprietary methodology (each, a “Peer Group”) and (b) each Fund’s tracking error as compared to its underlying index over the previous five years (or since inception, if shorter). The Independent Trustees also took into consideration the discussions they had with management during the Meeting and among themselves during their Executive Sessions held on February 26 and February 27, 2020. The Independent Trustees also noted that they had received and should take into consideration a substantial amount of information furnished throughout the year at regular Board meetings, which information included, among other things, an analysis of each Fund’s investment performance, tracking error and related financial information, presentations given by DBX, as well as its periodic reports on brokerage commissions, portfolio execution and other services provided to the Funds.
In reaching its decision to continue in effect the Investment Advisory Agreement for another annual period, the Board considered all factors it believed relevant, including (1) the nature, extent and quality of the services provided to the Funds and their shareholders; (2) the financial resources of DBX and its resulting ability to perform its obligations under the Investment Advisory Agreement; (3) the competitiveness of the advisory fee; (4) the total cost of the services provided by and the profits realized by the Advisor from its relationship with the Funds; (5) the extent to which economies of scale have been realized, and if the Funds’ shareholders have benefitted from those economies; and (6) fall out benefits, if any, enjoyed by the Advisor.
The Board reached a determination, with the assistance of Independent Trustee Counsel and Dechert LLP (“Trust Counsel”) and through the exercise of its business judgment, that approval of the Investment Advisory Agreement and the compensation to be received thereunder is in the best interests of each Fund and its shareholders as well as consistent with the Board’s duties under state and federal law. The Board reached this conclusion based on multiple factors.
The Board considered the following in determining whether to approve the Investment Advisory Agreement:
Nature, Extent and Quality of Services. The Board reviewed in detail the nature, extent and quality of services provided and the risks incurred by the Advisor under the Investment Advisory Agreement. In doing so, the Board considered the information it had received from and the discussions it had with the Advisor continuously during the prior year, in addition to the information the Advisor had provided in response to the Board’s requests prior to the Meeting. The Board considered that these services include, among other things, furnishing a continuous investment program for the Funds, including arranging for, or implementing, the purchase and sale of portfolio securities, the provision of general corporate services such as portfolio management compliance services and the preparation and filing of certain reports on behalf of the Trust. The Board also considered, among other things, the professional experience, qualifications and performance of the senior management and key professional personnel of the Advisor, including portfolio management.
The Board considered that the Advisor provides, at its own expense, office facilities and equipment for use by the Funds and supervisory persons responsible for supervising and monitoring the Trust’s service providers. The Board also considered that the Advisor pays or arranges for the compensation of officers of the Trust who are also officers or employees of the Advisor or one of its DWS Group affiliates, except as may otherwise be determined by the Board. In addition, the Board considered that the Advisor arranges for the provision of transfer
58
DBX ETF Trust
Board Approval of Investment Advisory Agreement with DBX Advisors LLC (Unaudited) (Continued)
agency, custody, fund administration and accounting, and other non-distribution services necessary for the Funds’ operations. The Board also considered that in addition to managing the Funds’ portfolios directly, the Advisor provides oversight of day-to-day operations, including monitoring tracking error, providing services in connection with the creation and redemption of creation units and assistance in meeting legal, compliance and regulatory requirements applicable to the Funds.
The Board considered the information regarding each Fund’s tracking error compared to its underlying index that had been provided by the Advisor and by Broadridge. The Board took note of the detailed information provided by the Advisor throughout the year with respect to each Fund’s tracking error and the sources thereof. The Trustees noted that tracking error for each Fund during the year was in an expected range.
Based on its review, the Board concluded that the nature, extent, and quality of services provided by the Advisor under the Investment Advisory Agreement are reasonable and appropriate in relation to the fees paid to the Advisor, taking special consideration of the fact that the advisory fee is a unitary fee and, as a result, a portion of the unitary advisory fee will be used to compensate the Funds’ service providers. The Board considered the staffing of the Advisor, including the training, qualifications and experience of investment personnel in managing the Funds. The Board also considered the expertise of the Advisor in supervising third party service providers to the Funds, such as the administrator and the custodian, noting the Advisor’s extensive work with these service providers (including onsite due diligence sessions) to conduct such supervision. The Board further considered the compliance program of the Advisor, which supports the Funds’ compliance program.
Advisor’s Financial Resources. In connection with the assessment of the ability of the Advisor to perform its duties under the Investment Advisory Agreement, the Board considered the Advisor’s financial condition and whether it has the resources necessary to carry out its functions. The Board concluded that the Advisor has the financial resources necessary to perform its obligations under the Investment Advisory Agreement.
Reasonableness of Advisory Fee. The Board compared each Fund’s advisory fee and total expenses to those of the other ETFs in its Peer Group. The Board noted that due to the special characteristics of certain Funds, there were limitations faced by Broadridge in providing comparable funds in the Peer Groups and the information in the Broadridge reports accordingly may or may not provide meaningful direct comparisons to the Funds. The Board also noted that the advisory fees and total expenses (after waivers/reimbursements) for the Funds were below or equal to the average and/or median of the ETFs in each Fund’s respective Peer Group compiled by Broadridge.
The Board accordingly noted that each Fund’s fee is competitive with the fees of applicable peer ETFs.
The Board considered that the fee for each of the Funds is a unitary fee pursuant to which the Advisor pays all of the Funds’ costs (subject to certain specified exceptions). The Board considered that each Fund’s fee had been priced to scale when it was established. The Board also considered that each Fund’s portfolio is managed on a day-to-day basis by the Advisor and that the Advisor also provides oversight of day-to-day operations, including monitoring tracking error, providing services in connection with creation and redemption units and assistance in meeting legal and regulatory requirements applicable to the Funds. Based on its review, the Board concluded that the advisory fee for each Fund is reasonable in light of the services provided.
Costs of Services and Profitability. The Board considered the expenses of the Advisor in developing and rendering services provided to the Funds and the information provided by the Advisor to the Board regarding the Funds’ profitability. The Board considered that the Advisor had provided extensive information about the Advisor’s profitability and the Advisor’s methodology in determining profitability. While the Advisor had provided information about the Advisor’s expenses relating to marketing the Funds, the Board considered the Advisor’s profitability without accounting for such expenses. The Board determined that, although only some of the Funds were profitable as of this time, the Advisor’s profitability with respect to each profitable Fund was not excessive. The Board considered whether the Advisor would benefit in other ways from its relationships with the Funds and concluded that there were no material fall-out benefits likely to accrue to the Advisor related to the operation of the Funds.
59
DBX ETF Trust
Board Approval of Investment Advisory Agreement with DBX Advisors LLC (Unaudited) (Continued)
Economies of Scale. The Board considered that certain Funds had attracted a substantial amount of assets, but determined that those Funds were not experiencing economies of scale beyond what was reflected in each Fund’s unitary fee, which the Board noted was very competitive. The Board considered that the other Funds were not experiencing economies of scale at this time and determined to revisit this matter after the Funds had attracted more assets.
Given all the information available to it and considering all material factors, the Board concluded that the Investment Advisory Agreement was fair and reasonable and it was unanimously approved.
60
DBX ETF Trust
Proxy Voting Policies and Procedures
The Funds’ policies and procedures for voting proxies for portfolio securities and information about how each Fund voted proxies related to its portfolio securities during the most recent 12-month period ended June 30 are available on our Web site — www.Xtrackers.com (click on “Resources” and “Proxy Voting” at the top of the page) — or on the SEC’s Web site — www.sec.gov. To obtain a written copy of the Funds’ policies and procedures without charge, upon request, call us toll free at (855) 329-3837.
Portfolio Holdings Information
The Funds are required to file their complete schedule of portfolio holdings with the SEC for their first and third fiscal quarters on Form N-PORT. Copies of the filings are available without charge, upon request on the SEC’s website at www.sec.gov and are available by calling the Trust at 855-329-3837.
Information about each Fund’s portfolio holdings is available daily at www.Xtrackers.com.
Discount & Premium Information
Information regarding how often shares of each Fund traded on NYSE Arca or Cboe, as applicable, at a price above (i.e., at a premium) or below (i.e., at a discount) the NAV of the Fund can be found at www.Xtrackers.com.
Tax Information
Form 1099-DIV and other year-end tax information provide shareholders with actual calendar year amounts that should be included in their tax returns. Shareholders should consult their tax advisors.
Each Fund designates the following amounts or, if subsequently determined to be different, the maximum allowable for its year ended May 31, 2020.
| Qualified Dividend Income* | ||||
Xtrackers Eurozone Equity ETF | 80% | |||
Xtrackers International Real Estate ETF | 49% | |||
Xtrackers Japan JPX-Nikkei 400 Equity ETF | 100% | |||
Xtrackers MSCI Latin America Pacific Alliance ETF | 46% | |||
* The above percentage is based on ordinary income dividends paid to shareholders during each Fund’s fiscal year.
Each Fund intends to elect to pass through to shareholders the credit for taxes paid to foreign countries. The gross foreign source income and foreign taxes paid are as follows:
| Gross Foreign Income | Foreign Taxes Paid | |||||||
Xtrackers Eurozone Equity ETF | $86,117 | $10,969 | ||||||
Xtrackers International Real Estate ETF | 5,403,340 | 440,548 | ||||||
Xtrackers Japan JPX-Nikkei 400 Equity ETF | 673,317 | 58,524 | ||||||
Xtrackers MSCI Latin America Pacific Alliance ETF | 75,076 | 6,829 | ||||||
61
DBX ETF Trust
DBX Advisors LLC (“Advisors”) collects non-public information about you from the following sources: (i) information received from you on applications or other forms; and (ii) information about your transactions with the Advisors, Advisors’ affiliates and third-party service providers and vendors. Advisors does not disclose any non-public personal information about you to anyone, other than as set forth below, as permitted by applicable law and regulation. Advisors may disclose non-public personal information about you to the funds in which you invest, to Advisors’ affiliates, and to non-affiliated companies that work with Advisors to service your account(s), or to provide services or process transactions that you have requested. Advisors may disclose non-public personal information in situations that may include, but are not limited to, in response to legal and/or regulatory inquiries and the proposed or actual sale, assignment merger or other transfer of all or a portion of Advisors’ business to another business entity. Advisors may also disclose non-public personal information about you to parties representing you, such as your investment representative, your accountant, your tax advisor, or to other third parties at your direction/consent. Advisors will not sell, rent, license or trade your personal and financial information to or with third parties for their own direct marketing use unless you give us general or specific consent to do so. If you decide to close your account(s) or become an inactive customer, Advisors will adhere to the privacy policies and practices as described in this notice. Advisors restricts access to your personal and account information to those employees who need to know that information to provide products and services to you. Advisors maintains reasonable and customary physical, electronic and procedural safeguards to guard your non-public personal information.
California residents may go to https://fundsus.dws.com/us/en-us/legal-resources/privacy-policy.html to obtain additional information relating to their rights under California state law.
Advisors reserves the right, at their discretion, to change, modify, add, or remove portions of this Privacy Policy Notice, and any of the policies described herein, at any time. Advisors will indicate any such changes to the Privacy Policy Notice at the privacy link which can be found at www.Xtrackers.com. At all times, you are bound by the then-current version of the Privacy Policy and all applicable laws. Advisors highly recommends that you review this Privacy Policy Notice from time to time to ensure that you are familiar with the most recent version. The examples contained in this Privacy Policy Notice are illustrations; they are not intended to be exclusive.
62
DBX ETF Trust
This report is intended for the shareholders of DBX ETF Trust.
This report must be preceded or accompanied by a prospectus.
Investing involves risk, including possible loss of principal. Stocks may decline in value. Foreign investing involves greater and different risks than investing in U.S. companies, including currency fluctuations, less liquidity, less developed or less efficient trading markets, lack of comprehensive company information, political instability and differing auditing and legal standards. There are special risks associated with an investments in real estate, including REITS. These risks include credit risk, interest rate fluctuations and the impact of varied economic conditions. Investing in foreign securities, particularly those of emerging markets, present certain risks such as currency fluctuations, political and economical changes, and market risks. Any fund that concentrates in a particular segment of the market will generally be more volatile than a fund that invests more broadly. Emerging markets tend to be more volatile and less liquid than the markets of more mature economies and generally have less diverse and less mature economic structures and less stable political systems than those of developed countries. Funds investing in a single industry, country or in a limited geographic region generally are more volatile than more diversified funds. The European financial markets have recently experienced volatility and adverse trends in recent years due to concerns about economic downturns or rising government debt levels in several European countries, including Greece, Ireland, Italy, Portugal and Spain. A default or debt restructuring by any European country would adversely impact holders of that country’s debt, and sellers of credit default swaps linked to that country’s creditworthiness (which may be located in countries other than those listed in the previous sentence). These events have adversely affected the exchange rate of the euro, the common currency of certain EU countries, and may continue to significantly affect every country in Europe, including countries that do not use the euro. Italy, Portugal and Spain currently have high levels of debt and public spending, which may stifle economic growth, contribute to prolonged periods of recession or lower sovereign debt ratings and adversely impact investments in the Funds. Investing in derivatives entails special risks relating to liquidity, leverage and credit that may reduce returns and/or increase volatility. Each Fund, except HUAZ and JPN, is currently non-diversified and can take larger positions in fewer issues, increasing each Fund’s potential risk. Performance of a Fund may diverge from that of an Underlying Index due to operating expenses, transaction costs, cash flows, use of sampling strategies or operational inefficiencies. A fund that focuses its investments in Japan can be impacted by the events and developments in Japan, which can adversely affect performance. An investment in any Fund should be considered only as a supplement to a complete investment program for those investors willing to accept the risks associated with that fund. Please read the prospectus for more information.
War, terrorism, economic uncertainty, trade disputes, public health crises (including the recent pandemic spread of the novel coronavirus) and related geopolitical events could lead to increased market volatility, disruption to U.S. and world economies and markets and may have significant adverse effects on the Funds and their investments.
Shares of the Funds are bought and sold at market price (not NAV) throughout the day on the NYSE Arca, Inc. or Cboe BZX Exchange, Inc., as applicable. Transactions in Fund shares may result in brokerage commissions and may generate tax consequences. There can be no assurance that an active trading market for shares of a Fund will develop or be maintained.
DBX ETF Trust Funds are distributed by ALPS Distributors, Inc. (“ALPS”). The Funds are managed by DBX Advisors LLC which is not affiliated with ALPS.
The brand DWS represents DWS Group GmbH & Co. KGaA and any of its subsidiaries such as DWS Distributors, Inc. which offers investment products or DWS Investment Management Americas, Inc. and RREEF America L.L.C. which offer advisory services.
Nasdaq® and NASDAQ Eurozone Large Mid Cap Index are registered trademarks of Nasdaq, Inc. (which with its affiliates is referred to as the “Corporations”) and are licensed for use by DBX Advisors LLC. The Product(s) have not been passed on by the Corporations as to their legality or suitability. The Product(s) are not issued, endorsed, sold, or promoted by the Corporations. THE CORPORATIONS MAKE NO WARRANTIES AND BEAR NO LIABILITY WITH RESPECT TO THE PRODUCT(S).
The iSTOXX Developed and Emerging Markets ex USA PK VN Real Estate Index is the intellectual property (including registered trademarks) of STOXX Limited, Zug, Switzerland (“STOXX”), Deutsche Börse Group or their licensors, which is used under license. Xtrackers International Real Estate ETF is neither sponsored nor promoted, distributed or in any other manner supported by STOXX, Deutsche Börse Group or their licensors, research partners or data providers and STOXX, Deutsche Börse Group and their licensors, research partners or data providers do not give any warranty, and exclude any liability (whether in negligence or otherwise) with respect thereto generally or specifically in relation to any errors, omissions or interruptions in the Index or its data.
The “JPX-Nikkei Index 400” is a copyrightable work calculated through such methodology as independently developed by Nikkei Inc. (hereinafter called “Nikkei”), and Tokyo Stock Exchange, Inc. (hereinafter called “TSE”) and Nikkei and TSE jointly own copyrights and any other intellectual property rights subsisting in the “JPX-Nikkei Index 400” itself and the methodology to calculate the “JPX-Nikkei Index 400.” The ownership of trademarks and any other intellectual property rights with respect to marks representing the “JPX-Nikkei Index 400 belong” to Nikkei, TSE and Japan Exchange Group, Inc. Nikkei and TSE have no obligation to publish the “JPX-Nikkei Index 400” continuously, and Nikkei and TSE shall not be liable for any errors, delays or suspension of the publication of the “JPXNikkei Index 400.” Nikkei and TSE shall have the right to make any changes in the “JPX-Nikkei Index 400” regarding the calculation methods, etc., and to discontinue the publication thereof.
The Funds or securities referred to herein are not sponsored, endorsed, issued, sold or promoted by MSCI, and MSCI bears no liability with respect to any such Funds or securities or any index on which such Funds or securities are based. The prospectus contains a more detailed description of the limited relationship MSCI has with DBX Advisors LLC and any related Funds.
Copyright © 2020 DWS Group. All rights reserved. XtrackersTM is a trademark of DWS Invesment GmbH. All other trademarks, servicemarks or registered trademarks are the property of their respective owners.
Not FDIC Insured | No Bank Guarantee | May Lose Value
DBX ETF Trust
Investment advisor DBX Advisors LLC 875 Third Avenue New York, NY 10022 | Administrator, custodian, The Bank of New York Mellon 240 Greenwich Street New York, NY 10286 | Distributor ALPS Distributors, Inc. 1290 Broadway Suite 1000 Denver, CO 80203 | ||
Independent registered public accounting firm Ernst & Young LLP 5 Times Square New York, NY 10036 | Legal counsel Dechert LLP 1095 Avenue of the Americas New York, NY 10036 | |||
R-38754-6 (7/20) DBX004445 (7/21)
| Item 2. | Code of Ethics. |
| (a) | The registrant, as of the end of the period covered by this report, has adopted a code of ethics that applies to the registrant’s principal executive officer, principal financial officer, principal accounting officer or controller, or persons performing similar functions, regardless of whether these individuals are employed by the registrant or a third party. |
| (c) | There have been no amendments, during the period covered by this report, to a provision of the code of ethics that applies to the registrant’s principal executive officer, principal financial officer, principal accounting officer or controller, or persons performing similar functions, regardless of whether these individuals are employed by the registrant or a third party, and that relates to any element of the code of ethics description. |
| (d) | The registrant has not granted any waivers, including an implicit waiver, from a provision of the code of ethics that applies to the registrant’s principal executive officer, principal financial officer, principal accounting officer or controller, or persons performing similar functions, regardless of whether these individuals are employed by the registrant or a third party, that relates to one or more of the items set forth in paragraph (b) of this item’s instructions. |
| Item 3. | Audit Committee Financial Expert. |
Stephen R. Byers, George O. Elston, and J. David Officer are the designated financial experts on the Audit Committee of DBX ETF Trust. With respect to DBX ETF Trust, Stephen Byers, George O. Elston, and J. David Officer are not “interested persons” as such terms are defined by Section 2(a)(19) of the Act (15 U.S.C. 80a-2(a)(19)).
| Item 4. | Principal Accountant Fees and Services. |
Audit Fees
| (a) | The aggregate fees billed for each of the last two fiscal years for professional services rendered by the principal accountant for the audit of the registrant’s annual financial statements or services that are normally provided by the accountant in connection with statutory and regulatory filings or engagements for those fiscal years are $476,065 for 2020 and $553,664 for 2019. |
Audit-Related Fees
| (b) | The aggregate fees billed in each of the last two fiscal years for assurance and related services by the principal accountant that are reasonably related to the performance of the audit of the registrant’s financial statements and are not reported under paragraph (a) of this Item are $0 for 2020 and $0 for 2019. These services consisted of security counts related to Rule 17f-2 under the Investment Company Act of 1940. |
Tax Fees
| (c) | The aggregate fees billed in each of the last two fiscal years for professional services rendered by the principal accountant for tax compliance, tax advice, and tax planning are $288,970 for 2020 and $304,417 for 2019. |
All Other Fees
| (d) | The aggregate fees billed in each of the last two fiscal years for products and services provided by the principal accountant, other than the services reported in paragraphs (a) through (c) of this Item are $0 for 2020 and $0 for 2019. |
| (e)(1) | Disclose the audit committee’s pre-approval policies and procedures described in paragraph (c)(7) of Rule 2-01 of Regulation S-X. |
In accordance with Rule 2-01(c)(7)(A), the Audit Committee pre-approves all of the audit and permissible non-audit services of the Registrant.
| (e)(2) | All of the services described in paragraphs (b) through (d) above were approved by the Audit Committee in accordance with paragraph (c) (7) (i) (c) of Rule 2-01 of Regulation S-X. |
| (f) | Not Applicable. |
| (g) | The aggregate non-audit fees billed by the registrant’s accountant for services rendered to the registrant, and rendered to the registrant’s investment adviser (not including any sub-adviser whose role is primarily portfolio management and is subcontracted with or overseen by another investment adviser), and any entity controlling, controlled by, or under common control with the adviser that provides ongoing services to the registrant for each of the last two fiscal years of the registrant was $0 for 2020 and $0 for 2019. |
| (h) | The registrant’s audit committee of the board of directors has considered whether the provision of non-audit services that were rendered to the registrant’s investment adviser (not including any sub-adviser whose role is primarily portfolio management and is subcontracted with or overseen by another investment adviser), and any entity controlling, controlled by, or under common control with the investment adviser that provides ongoing services to the registrant that were not pre-approved pursuant to paragraph (c)(7)(ii) of Rule 2-01 of Regulation S-X is compatible with maintaining the principal accountant’s independence. |
Item 5. Audit Committee of Listed Registrants.
The Registrant is a listed issuer as defined in Rule 10A-3 under the Exchange Act and has a separately-designated standing audit committee established in accordance with Section 3(a)(58)(A) of the Exchange Act. The Registrant’s audit committee members are Stephen R. Byers, George O. Elston, and J. David Officer.
| Item 6. | Investments. |
| (a) | Schedule of Investments in securities of unaffiliated issuers as of the close of the reporting period is included as part of the report to shareholders filed under Item 1 of this form. |
| (b) | Not applicable. |
| Item 7. | Disclosure of Proxy Voting Policies and Procedures for Closed-End Management Investment Companies. |
Not applicable.
| Item 8. | Portfolio Managers of Closed-End Management Investment Companies. |
Not applicable.
| Item 9. | Purchases of Equity Securities by Closed-End Management Investment Company and Affiliated Purchasers. |
Not applicable.
| Item 10. | Submission of Matters to a Vote of Security Holders. |
There were no material changes to the procedures by which shareholders may recommend nominees to the Registrant’s Board of Trustees.
Item 11. Controls and Procedures.
| (a) | The Chief Executive and Financial Officers concluded that the Registrant’s Disclosure Controls and Procedures are effective based on the evaluation of the Disclosure Controls and Procedures as of a date within 90 days of the filing date of this report. |
| (b) | There have been no changes in the registrant’s internal control over financial reporting that occurred during the period covered by this report that has materially affected, or is reasonably likely to materially affect, the registrant’s internal controls over financial reporting. |
| Item 12. | Disclosure of Securities Lending Activities for Closed-End Management Investment Companies. |
Not applicable.
| Item 13. | Exhibits. |
| (a)(1) |
| (a)(2) |
| (a)(3) | Not applicable. |
| (a)(4) | Not applicable. |
| (b) |
SIGNATURES
Pursuant to the requirements of the Securities Exchange Act of 1934 and the Investment Company Act of 1940, the registrant has duly caused this report to be signed on its behalf by the undersigned, thereunto duly authorized.
| (Registrant) | DBX ETF Trust | |
| By (Signature and Title) | /s/ Freddi Klassen | |
| Freddi Klassen | ||
| President and Chief Executive Officer | ||
| Date | August 6, 2020 | |
Pursuant to the requirements of the Securities Exchange Act of 1934 and the Investment Company Act of 1940, this report has been signed below by the following persons on behalf of the registrant and in the capacities and on the dates indicated.
| By (Signature and Title) | /s/ Freddi Klassen | |
| Freddi Klassen | ||
| President and Chief Executive Officer |
| Date | August 6, 2020 | |
| By (Signature and Title) | /s/ Diane Kenneally | |
| Diane Kenneally | ||
| Treasurer and Chief Financial Officer | ||
| Date | August 6, 2020 | |