During 2011, companies were positioned relatively strongly, having both built up significant cash balances and restructured costs to improve operating leverage. Rather than reflecting weakness at the company level, market volatility was driven by a number of macro events that can be traced back to the March tsunami and earthquake in Japan, which sparked concerns regarding the supply chain and general production. And while the US debt ceiling and downgrade of US debt also made headlines as the year unfolded, the resurgence of the European debt crisis was the tipping point for the downward change in market direction. The US stock market dropped precipitously beginning in July as concern about Europe led investors to seek the safety of US Treasuries in the late summer and early fall. Historically high levels of volatility continued through September.
Then, beginning October 3, the markets saw a rapid rebound with risk appetite taking off and fundamentals starting to be rewarded once again. However, it wasn’t all smooth sailing, as the last calendar quarter of 2011 also saw the market hesitate at points in time and pull back a little due to over-optimism before continuing to move upward with generally more positive economic reports. The labor market continued to improve as employers added more jobs and the unemployment rate steadily declined to 8.3% as of March 2012. Moreover, stocks generally responded favorably to the Federal Reserve’s comments and stance to keep interest rates at their current low levels through late 2014. Despite this more positive view on the economy overall, the Federal Reserve noted that the unemployment rate still stood at an “elevated” level, while risks remained in the global financial markets.
International stocks had a similar experience to that of US equities, but with a greater downswing and a more muted upswing leading to an overall negative return of -6.75% for the MSCI All Country World Index (ACWI) ex-US for the 12 months ended March 31, 2012. The MSCI All Country World Index (ACWI) ex-US returned -19.45% for the six months ended September 30, 2011, followed by a six-month return of 15.55% through the end of March 2012. The European region was a large driver of ongoing concerns globally about sovereign debt, Greek default and contagion effects into other southern European countries. Additionally, emerging markets faced higher inflation and slowing growth leading to weakness in the key markets of China, Russia and India. Emerging market central banks took policy action to curtail the high level of inflation, and the European Central Bank provided liquidity to European banks, alleviating the immediate concerns regarding the potential for a renewed financial crisis. While these risks have receded somewhat, slowing growth in both developed and emerging markets and austerity measures across a number of European countries suggest that some longer-term challenges remain.
Real estate, commodities and natural resources—similar to equities—all saw negative returns for the first six months of the reporting period due to flight-to-quality pressures, a potential real estate bust in China and slowing economic growth. Real estate, as represented by the FTSE NAREIT All Equity Index, rose by 27.35% in the subsequent six months helped by higher demand for apartment units and investor appetite for higher yields. For the full 12-month period the FTSE REITs Index rose 11.29%. Commodities didn’t see the same level of rebound, with the Dow Jones-UBS Commodity Index providing a 1.23% return for the six months ended March 2012, and
a 12-month return of -16.28%. The same held true for global natural resources, as the S&P Global Natural Resources Index delivered a return of 15.47% for the six months ended March 2012, and a 12-month return of -14.33%. The slowing of growth in emerging markets, and in China in particular, coincided with a lower demand for base metals and materials at the end of 2011 and more recently. At the same time, concerns over Iran’s weapons program drove oil prices higher, as natural gas prices dropped to historic lows on oversupply issues.
The fixed income markets saw a different pattern in returns, with strength being seen in the first half of the 12-month period. While the latter half of the reporting period saw positive returns, they were much lower than for the first half. The Barclays US Aggregate Bond Index garnered a return of 7.71% for the 12 months ended March 31, 2012, but it was frontloaded with a return of 6.26% recorded for the first six-month period. Investors favored the risk-off trade as growing concerns about the financial crisis in Europe and panic set into the market, seeking the perceived safety of US Treasuries and government-related securities, which together comprise over 50% of the index. But following the equity market low established on October 3, performance cooled in the bond markets and the Barclays US Aggregate Bond Index returned 1.43% over the six months ended March 31, 2012.
The Barclays US Treasury US TIPS Index ended the 12-month period with an impressive return of 12.20%. Much of this return was achieved during the first six months when investors sought the safety of US government securities. However, concerns about potential inflation with rising commodity prices also led to a positive return of 3.57% for the six months ended March 2012. As was the case with equity markets, international fixed income markets saw weaker returns. The Barclays Multiverse Index, which is inclusive of all fixed income markets including the US, returned 5.28% for the 12 months ended March 2012, with the majority of the return coming in the first six-month period when the index returned 3.72%. A key reason for the better relative returns in the US was the strength of the US dollar against most other currencies. While experiencing some weakness for the six months ended March 2012, the strength of the dollar during the summer of 2011-due to the flight to safety—softened the returns from international markets.
The municipal markets saw similar trends to those of the US taxable bond markets, with a stronger first six months than second. The Barclays Municipal Bond Index returned 12.07% for the full 12 months with the first six months providing a return of 7.49%. Despite concerns about state and local government budgets, limited issuance in the municipal market and growing demand boosted the returns in this market. Issuance increased in the latter part of 2011 and, with lower demand as investor risk appetite increased, the returns for the municipal market slowed and the Barclays Municipal Bond Index returned 3.91% for the second six-month period.
GuideMark and GuidePath Fund Review
In addition to the headwinds of a risk-off environment where macro events and political announcements drove the markets rather than company fundamentals, the sub-advisors in the GuideMark Funds also confronted unusually high levels of correlation between and within markets, little dispersion between individual security returns, and extreme volatility. This exceptional environment was not conducive to active management. Not surprisingly, Standard and Poor’s reported in its SPIVA US Scorecard Year-End 2011 (www.standardandpoors.com) that an unusually high 84% of actively managed domestic equity funds underperformed the broad US market as measured by the S&P Composite 1500 Index in 2011. However, as the market established a low on October 3 and macro concerns receded, correlations and volatility declined to more normal levels and strong company fundamentals were again rewarded.
As could be expected in the difficult environment for active managers during the first half of the reporting period, many of the GuideMark Funds lagged their benchmarks. However, for the six months ended March 31, 2012 nearly all of the GuideMark Funds outperformed their benchmarks as effective security selection became a strong driver of positive returns.
The GuidePath Funds also experienced some challenges over the past year with the strength of the US markets relative to international markets. The globally based mandates of the GuidePath Funds put them at a disadvantage when compared solely to a US-based Index. However, when compared to globally based indices, the Funds’ performance was more in line with expectations.
2
Looking Ahead
As we look ahead, we foresee a reasonable possibility that there may be a consolidation period for stocks. Previous cyclical bull market rallies have often been accompanied by pullbacks between six and nine months following a market upturn, and we feel that there are some indications that this could repeat. Given some elevated earnings targets, we anticipate that it is possible companies could guide expectations lower for the second half of the year in the near term, which could contribute to a correction. However, should there be a correction, we believe that it could eventually build strength for a longer-term bull market cycle, particularly if companies are able to deliver earnings-per-share growth—helped by some resilience in margins and share repurchases.
Whether the market rallies or experiences a correction, we continue to believe that a balanced approach to portfolio construction will allow you to not only benefit from positive market returns but, more importantly, allow you to limit the losses in falling markets.
Please contact your financial advisor to discuss any questions about your investment strategy or changes in your financial goals. We thank you for including the Funds in your portfolio and appreciate the trust you have placed in us.
|
Sincerely, |
|

|
|
Carrie E. Hansen |
President of the Funds |
The Genworth Financial Wealth Management platform provides fee-based investment advisory programs. Investors are advised to refer to the appropriate Disclosure Brochure, which can be obtained from your financial advisor, for a full description of services provided, including all applicable fees.
Genworth Financial Wealth Management, Inc. is an investment advisor registered with the Securities and Exchange Commission. Genworth Financial Wealth Management and Capital Brokerage Corporation are wholly owned subsidiaries of Genworth Financial, Inc.
Index Definitions
Barclays US Aggregate Bond Index: a broad-based index that measures the investment grade, US dollar-denominated, fixed rate taxable bond market, including Treasuries, government-related and corporate securities, MBS (agency fixed rate and hybrid ARM pass-throughs), ABSs, and CMBs.
Barclays Multiverse Index: provides a broad-based measure of the global fixed-income bond market. The index represents the union of the Barclays Global Aggregate Bond Index and the Barclays Global High-Yield Index and captures investment grade and high yield securities in all eligible currencies.
Barclays US TIPS Index: includes all publicly issued, US Treasury inflation-protected securities that have at least one year remaining to maturity, are rated investment grade, and have $250 million or more of outstanding face value.
Barclays Municipal Bond Index: an index that measures the performance of investment-grade, fixed-rate, tax-exempt bonds.
Dow Jones UBS Commodity Index: an index that is composed of futures contracts of 19 physical commodities traded on US exchanges, with the exception of aluminum, nickel and zinc, which trade on the London Metal Exchange (LME). The component weightings are also determined by several rules designed to insure diversified commodity exposure.
3
FTSE NAREIT All Equity REITs Index: an index of US publicly traded REITs. Equity REITs include those firms that own, manage and lease investment-grade commercial real estate. Specifically, a company is classified as an equity REIT if 75% or more of its gross invested book assets are invested in real property.
MSCI All Country World ex-US Index: a free-float-adjusted, market-capitalization-weighted index that is designed to measure the equity market performance of developed and emerging market countries, excluding the US.
S&P 500® Index: an index of 500 leading companies in leading industries of the US economy, capturing 75% coverage of US equities.
S&P Global Natural Resources Index: an index that includes 90 of the largest publicly-traded companies in natural resources and commodities businesses that meet specific investability requirements, offering investors diversified, liquid and investable equity exposure across three primary commodity-related sectors: Agribusiness, Energy, and Metals & Mining.
| | |
| | |
1 | All index returns are from Zephyr except the Barclays Multiverse and S&P Global Natural Resources, which are sourced from Morningstar. |
FX2012–0522–0099/E
4
|
GuideMarkSM Large Cap Growth Fund |
MANAGER’S DISCUSSION OF FUND PERFORMANCE (Unaudited) |
| |
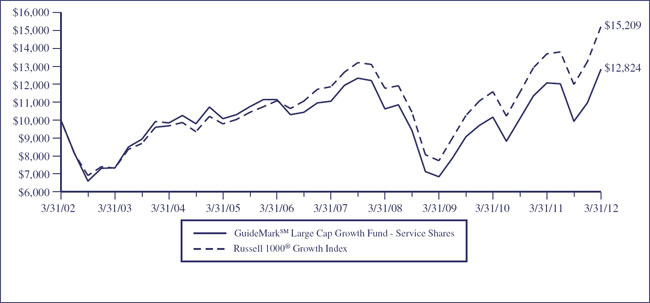
TOTAL RETURN BASED ON A $10,000 INVESTMENT
This chart assumes an initial gross investment of $10,000 made on March 31, 2002. Returns shown include the reinvestment of all dividends. Returns shown do not reflect the deduction of taxes that a shareholder would pay on Fund distributions or the redemption of Fund shares. In the absence of fee waivers and reimbursements, total return would be reduced. Past performance is not predictive of future performance. Investment return and principal value will fluctuate so that your shares, when redeemed, may be worth more or less than the original cost. Index returns do not reflect the effects of fees or expenses. It is not possible to invest directly in an index.
RUSSELL 1000® GROWTH INDEX – An unmanaged index which measures the performance of those Russell 1000® companies with higher price-to-book ratios and higher forecasted growth values. The Russell 1000® Index is an unmanaged index which measures the performance of the 1,000 largest companies in the Russell 3000® Index. The Russell 3000® Index is an unmanaged index which measures the performance of the 3,000 largest US Companies, based on total market capitalization, which represents approximately 98% of the investable US equity market.
| | | | | | | | | | | | | |
AVERAGE ANNUAL TOTAL RETURN (for periods ended March 31) |
| |
| | One Year | | Five Year | | Ten Year | | Since Inception1 | |
| | | | | | | | | |
| | | | | | | | | |
GuideMarkSM Large Cap Growth Fund | | | | | | | | | | | | | |
Service Shares | | 6.21 | % | | 3.01 | % | | 2.52 | % | | 1.27 | % | |
Institutional Shares | | N/A | | | N/A | | | N/A | | | 3.49 | % | |
Russell 1000® Growth Index | | 11.02 | % | | 5.10 | % | | 4.28 | % | | 3.01 | %2 | |
| |
1 | Inception date is 6/29/01 for Service Shares and 4/29/11 for Institutional Shares. |
| |
2 | The return shown for the Russell 1000® Growth Index is from the inception date of the Service Shares. The Russell 1000® Growth Index return from the inception date of the Institutional Shares is 7.43%. |
5
|
GuideMarkSM Large Cap Growth Fund |
MANAGER’S DISCUSSION OF FUND PERFORMANCE (Continued) (Unaudited) |
| |
| |
• | For the 12 months ended March 2012, the Fund returned 6.21%, underperforming the Russell 1000 Growth Index, which returned 11.02%. |
• | The relative underperformance was primarily due to security selection, which offset the modest gain from sector positioning. A bias to cyclical securities was a detractor for much of the first six months of the period as cyclical stocks sold off as a result of growing macro concerns. However, these positions rallied strongly in the last six months of the period against a more positive economic backdrop. |
• | Two of the three largest detractors were technology stocks - Oracle Corp. and Altera Corp. Oracle Corp. traded lower during the period due to fears that margins could be challenged based on lower enterprise spending. Altera Corp., a manufacturer of programmable logic devices, fell in sympathy with other semiconductor and semiconductor-related stocks that fell under pressure due to macro driven concerns. |
• | A relative overweight to technology contributed to absolute returns for the period as the sector rallied in the latter months of the period. An underweight to consumer staples dampened performance as the defensive sectors, including consumer staples and utilities, rallied significantly in the first half of the period as investors favored traditional defensive stocks against a backdrop of growing macroeconomic concerns. |
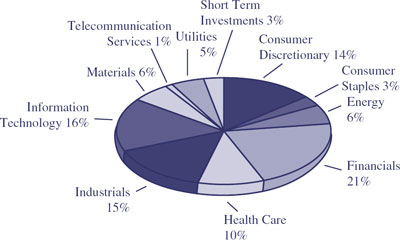
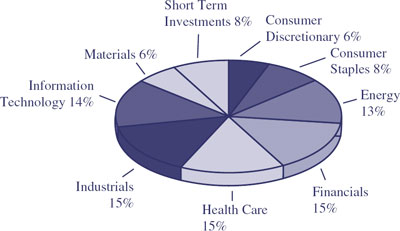
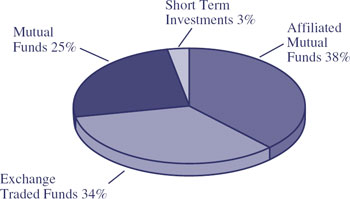
Components of Portfolio Holdings*
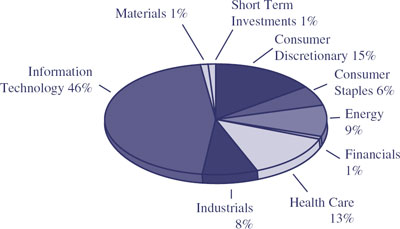
*Pie chart represents percentages of total portfolio, less securities lending collateral.
Top Ten Holdings
| | | | | | |
Rank | | Security/Holding | | % of Net
Assets |
1 | | | Apple, Inc. | | 8.12 | |
2 | | | Cisco Systems, Inc. | | 5.36 | |
3 | | | Microsoft Corp. | | 4.29 | |
4 | | | International Business Machines Corp. | | 3.71 | |
5 | | | EMC Corp. | | 3.63 | |
6 | | | Exxon Mobil Corp. | | 3.02 | |
7 | | | Altera Corp. | | 2.10 | |
8 | | | UnitedHealth Group, Inc. | | 2.00 | |
9 | | | Caterpillar, Inc. | | 1.98 | |
10 | | | The Coca-Cola Company | | 1.93 | |
The Global Industry Classification Standard (“GICS®”) was developed by and/or is the exclusive property of MSCI, Inc. (“MSCI”) and Standard & Poor Financial Services LLC (“S&P”). GICS is a service mark of MSCI and S&P and has been licensed for use by U.S. Bancorp Fund Services, LLC.
6
|
GuideMarkSM Large Cap Value Fund |
MANAGER’S DISCUSSION OF FUND PERFORMANCE (Unaudited) |
| |
TOTAL RETURN BASED ON A $10,000 INVESTMENT
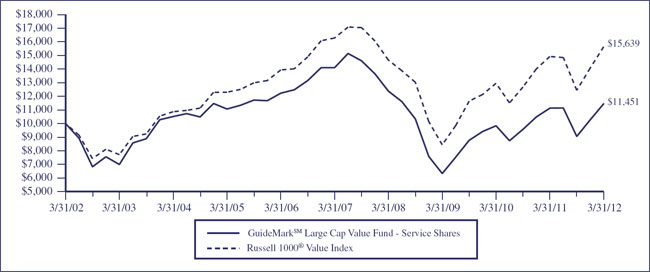
This chart assumes an initial gross investment of $10,000 made on March 31, 2002. Returns shown include the reinvestment of all dividends. Returns shown do not reflect the deduction of taxes that a shareholder would pay on Fund distributions or the redemption of Fund shares. In the absence of fee waivers and reimbursements, total return would be reduced. Past performance is not predictive of future performance. Investment return and principal value will fluctuate so that your shares, when redeemed, may be worth more or less than the original cost. Index returns do not reflect the effects of fees or expenses. It is not possible to invest directly in an index.
RUSSELL 1000® VALUE INDEX – An unmanaged index which measures the performance of those Russell 1000® companies with lower price-to-book ratios and lower forecasted growth values. The Russell 1000® Index is an unmanaged index which measures the performance of the 1,000 largest companies in the Russell 3000® Index. The Russell 3000® Index is an unmanaged index which measures the performance of the 3,000 largest US Companies, based on total market capitalization, which represents approximately 98% of the investable US equity market.
| | | | | | | | | | | | | |
AVERAGE ANNUAL TOTAL RETURN (for periods ended March 31) |
| |
| | One Year | | Five Year | | Ten Year | | Since Inception1 | |
| | | | | | | | | |
GuideMarkSM Large Cap Value Fund | | | | | | | | | | | | | |
Service Shares | | 2.87 | % | | -4.08 | % | | 1.36 | % | | 1.58 | % | |
Institutional Shares | | N/A | | | N/A | | | N/A | | | 0.70 | % | |
Russell 1000® Value Index | | 4.79 | % | | -0.81 | % | | 4.58 | % | | 4.20 | %2 | |
| |
1 | Inception date is 6/29/01 for Service Shares and 4/29/11 for Institutional Shares. |
| |
2 | The return shown for the Russell 1000® Value Index is from the inception date of the Service Shares. The Russell 1000® Value Index return from the inception date of the Institutional Shares is 2.07%. |
7
|
GuideMarkSM Large Cap Value Fund |
MANAGER’S DISCUSSION OF FUND PERFORMANCE (Continued) (Unaudited) |
| |
| |
• | For the 12 months ended March 2012, the Fund returned 2.87%, underperforming the Russell 1000 Value Index, which returned 4.79%. |
| |
• | Sector positioning and fundamental factors were the key detractors to performance, while security selection proved beneficial over the period. Relative to its benchmark, the Fund had a modestly lower average market capitalization and exposure to higher momentum securities and securities with higher relative volatility, which detracted from returns. |
| |
• | Underweight exposure to utilities detracted from performance as the sector rallied in the first half of the period. This was due to investors chasing more defensive equity stocks with higher yields as the growing macroeconomic concerns led to a more defensive market environment. Overweight exposure to technology also dampened performance for the full period but benefited the Fund in the latter half of the period. |
| |
• | Owning Goodrich Corp., an industrial stock that was acquired by United Technologies at a premium, was the largest contributor. Three consumer credit related companies - Discover Financial Services, American Express Co, and Capital One Financial Corp. - benefited from an improving consumer credit outlook and lifted returns. |
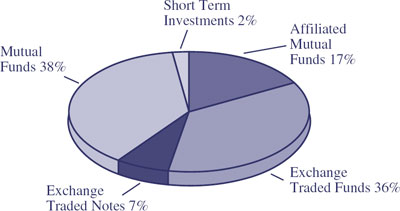
Components of Portfolio Holdings*
*Pie chart represents percentages of total portfolio, less securities lending collateral.
Top Ten Holdings
| | | | | | |
Rank | | Security/Holding | | % of Net
Assets |
1 | | | Capital One Financial Corp. | | 3.27 | |
2 | | | Stanley Black & Decker, Inc. | �� | 3.08 | |
3 | | | SLM Corp. | | 2.31 | |
4 | | | Philip Morris International, Inc. | | 2.01 | |
5 | | | PNC Financial Services Group, Inc. | | 1.99 | |
6 | | | UnitedHealth Group, Inc. | | 1.92 | |
7 | | | BP Plc | | 1.70 | |
8 | | | JPMorgan Chase & Co. | | 1.68 | |
9 | | | Pfizer, Inc. | | 1.67 | |
10 | | | American Express Co. | | 1.60 | |
8
|
GuideMarkSM Small/Mid Cap Core Fund |
MANAGER’S DISCUSSION OF FUND PERFORMANCE (Unaudited) |
| |
TOTAL RETURN BASED ON A $10,000 INVESTMENT
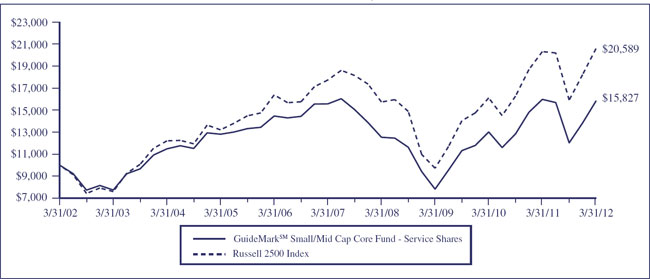
This chart assumes an initial gross investment of $10,000 made on March 31, 2002. Returns shown include the reinvestment of all dividends. Returns shown do not reflect the deduction of taxes that a shareholder would pay on Fund distributions or the redemption of Fund shares. In the absence of fee waivers and reimbursements, total return would be reduced. Past performance is not predictive of future performance. Investment return and principal value will fluctuate so that your shares, when redeemed, may be worth more or less than the original cost. Index returns do not reflect the effects of fees or expenses. It is not possible to invest directly in an index.
RUSSELL 2500 INDEX – Measures the performance of the small- to mid-cap segment of the US equity universe, commonly referred to as “smid” cap. The Russell 2500 Index is a subset of the Russell 3000® Index. The Russell 2500 Index includes approximately 2500 of the smallest securities based on a combination of their market cap and current index membership.
| | | | | | | | | | | | | |
AVERAGE ANNUAL TOTAL RETURN (for periods ended March 31) |
| |
| | One Year | | Five Year | | Ten Year | | Since Inception1 | |
| | | | | | | | | |
GuideMarkSM Small/Mid Cap Core Fund | | | | | | | | | | | | | |
Service Shares | | -0.95 | % | | 0.33 | % | | 4.70 | % | | 5.28 | % | |
Institutional Shares | | N/A | | | N/A | | | N/A | | | -3.59 | % | |
Russell 2500 Index | | 1.33 | % | | 3.03 | % | | 7.49 | % | | 7.06 | %2 | |
| |
1 | Inception date is 6/29/01 for Service Shares and 4/29/11 for Institutional Shares. |
| |
2 | The return shown for the Russell 2500 Index is from the inception date of the Service Shares. The Russell 2500 Index return from the inception date of the Institutional Shares is -1.51%. |
9
|
GuideMarkSM Small/Mid Cap Core Fund |
MANAGER’S DISCUSSION OF FUND PERFORMANCE (Continued) (Unaudited) |
| |
| |
• | For the 12 months ended March 2012, the Fund returned -0.95%, underperforming the Russell 2500 Index, which returned 1.33%. |
| |
• | Sector positioning was the primary driver of the relative underperformance for the period with, fundamental factors also detracting from returns while security selection proved beneficial. Exposure to securities with higher volatility and higher price-to-earnings ratios realtive to the index dampened performance for the period. |
| |
• | Underweight exposure to financials was the largest drag on returns as some of the smaller financial stocks performed relatively better versus the larger cap money center banks over the period. Additionally exposure to MF Global Holdings Ltd. within financials was the largest detractor at a security level for the period. |
| |
• | The top three holdings that contributed to returns were all acquition targets that were acquired at a premium. Pharmasset, Inc., a biotechnology company that was testing a promising new hepatitis-C drug, was acquired by Gilead Sciences, Inc. Petrohawk Energy Corp., an independent oil and gas company, was acquired by BHP Billiton Plc and Delphi Financial Group, Inc. was acquired by Tokio Marine Holdings, a large Japanese insurance company. |
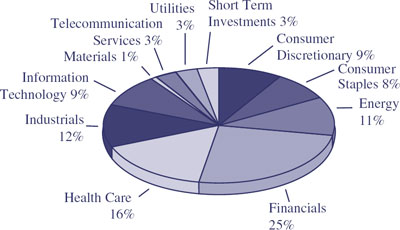
Components of Portfolio Holdings*
*Pie chart represents percentages of total portfolio, less securities lending collateral.
Top Ten Holdings
| | | | | | |
Rank | | Security/Holding | | % of Net
Assets |
1 | | | Douglas Emmett, Inc. | | 2.29 | |
2 | | | Post Properties, Inc. | | 2.09 | |
3 | | | Reinsurance Group of America | | 2.08 | |
4 | | | AMETEK, Inc. | | 1.88 | |
5 | | | IBERIABANK Corp. | | 1.77 | |
6 | | | Carlisle Companies, Inc. | | 1.68 | |
7 | | | KBR, Inc. | | 1.68 | |
8 | | | American Campus Communities, Inc. | | 1.62 | |
9 | | | DFC Global Corp. | | 1.54 | |
10 | | | Invesco Ltd. | | 1.54 | |
10
|
GuideMarkSM World ex-US Fund |
MANAGER’S DISCUSSION OF FUND PERFORMANCE (Unaudited) |
| |
TOTAL RETURN BASED ON A $10,000 INVESTMENT
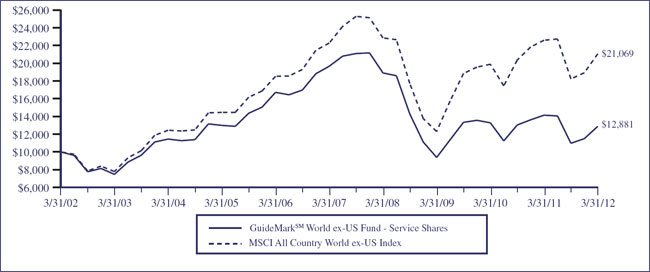
This chart assumes an initial gross investment of $10,000 made on March 31, 2002. Returns shown include the reinvestment of all dividends. Returns shown do not reflect the deduction of taxes that a shareholder would pay on Fund distributions or the redemption of Fund shares. In the absence of fee waivers and reimbursements, total return would be reduced. Past performance is not predictive of future performance. Investment return and principal value will fluctuate so that your shares, when redeemed, may be worth more or less than the original cost. Index returns do not reflect the effects of fees or expenses. It is not possible to invest directly in an index.
MSCI ALL COUNTRY WORLD EX-US INDEX – A free float-adjusted market capitalization weighted index that is designed to measure the equity market performance of developed and emerging markets. It consists of country indices comprising of developed and emerging market country indices. The developed market country indices included are: Australia, Austria, Belgium, Canada, Denmark, Finland, France, Germany, Greece, Hong Kong, Ireland, Israel, Italy, Japan, Netherlands, New Zealand, Norway, Portugal, Singapore, Spain, Sweden, Switzerland, and the United Kingdom. The emerging market country indices included are: Brazil, Chile, China, Colombia, Czech Republic, Egypt, Hungary, India, Indonesia, Korea, Malaysia, Mexico, Morocco, Peru, Philippines, Poland, Russia, South Africa, Taiwan, Thailand, and Turkey.
| | | | | | | | | | | | | |
AVERAGE ANNUAL TOTAL RETURN (for periods ended March 31) |
| |
| | One Year | | Five Year | | Ten Year | | Since Inception1 | |
| | | | | | | | | |
GuideMarkSM World ex-US Fund | | | | | | | | | | | | | |
Service Shares | | -8.92 | % | | -8.11 | % | | 2.57 | % | | 1.73 | % | |
Institutional Shares | | N/A | | | N/A | | | N/A | | | -12.34 | % | |
MSCI All Country World ex-US Index | | -6.75 | % | | -1.11 | % | | 7.74 | % | | 6.59 | %2 | |
| |
1 | Inception date is 6/29/01 for Service Shares and 4/29/11 for Institutional Shares. |
| |
2 | The return shown for the MSCI All Country World ex-US Index is from the inception date of the Service Shares. The MSCI All Country World ex-US Index return from the inception date of the Institutional Shares is -11.15%. |
11
|
GuideMarkSM World ex-US Fund |
MANAGER’S DISCUSSION OF FUND PERFORMANCE (Continued) (Unaudited) |
| |
| |
• | For the 12 months ended March 2012, the Fund returned -8.92%, underperforming the MSCI ACWI ex-US Index, which returned -6.75%. |
| |
• | Fundamental factor exposrue and security selection were the main detractors to performance while sector and and regional exposures proved beneficial. Exposure to securities with higher volatlity, smaller market capitalizations and higher price-to-book ratios negatively impacted returns. |
| |
• | Exposure to the PowerShares India Portfolio ETF was the biggest detractor within security selection due to weakness in the early part of the period. Owning BG Group Plc, an integrated natural gas company, was also a large detractor over the period as natural gas stocks traded lower based on pricing concerns. |
| |
• | Although security selection within energy was mixed, an underweight to the sector contributed to returns. An overweight to consumer discretionary was also additive to returns benefiting from owning European automakers including Volkswagen AG that saw significant demand for its Audi line of cars from China. |
Components of Portfolio Holdings*
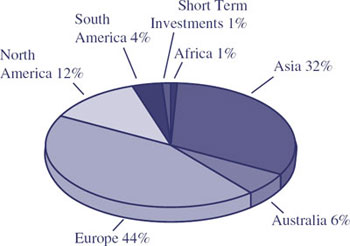
*Pie chart represents percentages of total portfolio, less securities lending collateral.
Top Ten Holdings
| | | | | | |
Rank | | Security/Holding | | % of Net
Assets |
1 | | | Nestle SA | | 1.86 | |
2 | | | PowerShares India Portfolio | | 1.78 | |
3 | | | Roche Holding AG | | 1.29 | |
4 | | | Royal Dutch Shell Plc | | 1.25 | |
5 | | | Samsung Electronics Co. Ltd. | | 1.20 | |
6 | | | British American Tobacco Plc | | 1.05 | |
7 | | | Vodafone Group Plc | | 1.03 | |
8 | | | Sanofi-Aventis SA | | 1.02 | |
9 | | | Novo Nordisk A/S | | 0.95 | |
10 | | | BP Plc | | 0.91 | |
12
|
GuideMarkSM Opportunistic Equity Fund |
MANAGER’S DISCUSSION OF FUND PERFORMANCE (Unaudited) |
| |
TOTAL RETURN BASED ON A $10,000 INVESTMENT
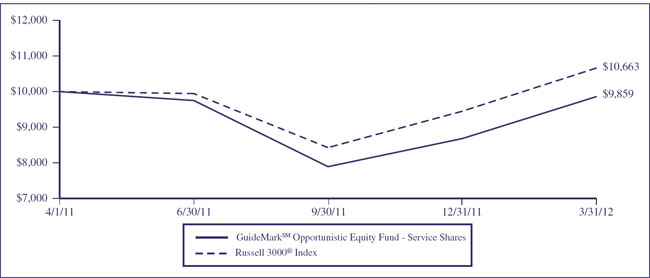
This chart assumes an initial gross investment of $10,000 made on April 1, 2011 (commencement of the Fund’s Service Shares operations). Returns shown include the reinvestment of all dividends. Returns shown do not reflect the deduction of taxes that a shareholder would pay on Fund distributions or the redemption of Fund shares. In the absence of fee waivers and reimbursements, total return would be reduced. Past performance is not predictive of future performance. Investment return and principal value will fluctuate so that your shares, when redeemed, may be worth more or less than the original cost. Index returns do not reflect the effects of fees or expenses. It is not possible to invest directly in an index.
RUSSELL 3000® INDEX – Measures the performance of the largest 3000 US companies representing approximately 98% of the investable US equity market.
| | | | |
CUMULATIVE TOTAL RETURN (for the period ended March 31) |
| |
| | Since Inception1 | |
| | | |
GuideMarkSM Opportunistic Equity Fund | | | |
Service Shares | | -1.40 | % |
Institutional Shares | | -2.94 | % |
Russell 3000® Index | | 6.64 | %2 |
| |
1 | Inception date is 4/1/11 for Service Shares and 4/29/11 for Institutional Shares. |
| |
2 | The return shown for the Russell 3000® Index is from the inception date of the Service Shares. The Russell 3000® Index return from the inception date of the Institutional Shares is 4.09%. |
13
|
GuideMarkSM Opportunistic Equity Fund |
MANAGER’S DISCUSSION OF FUND PERFORMANCE (Continued) (Unaudited) |
| |
| |
• | Since inception through the end of March 2012, the Fund returned -1.40%, underperforming the Russell 3000 Index, which returned 6.64%. |
| |
• | An overweight exposure to economically sensitive sectors in addition to exposure to securities with higher relative volatility, higher price-to-earnings ratios and smaller market capitalizations were the primary drivers of the lagging returns. The more defensive market environment in the first half of the period led to flight to safety and sell off within higher risk securities. |
| |
• | A bias to cyclical stocks levered to an improving economy detracted from performance as these economically sensitive stocks sold off due to broader macroeconomic concerns in the first half of the period. While the market recovered in the second half of the period and economically sensitive stocks rebounded on more positive macroeconomic views, it was not enough to offset the relative underperformance generated in the earlier months of the period. |
| |
• | Exposure to securities with commodities exposure negatively impacted performance. Owning Apache Corp, an oil and gas exploration and production company, dampened returns as it traded lower on concerns of continued pricing pressure. Newmont Mining Corp continued to lag due to fears of rising production costs. |
Components of Portfolio Holdings*
*Pie chart represents percentages of total portfolio, less securities lending collateral.
Top Ten Holdings
| | | | | | |
Rank | | Security/Holding | | % of Net
Assets |
1 | | | Devon Energy Corp. | | 2.38 | |
2 | | | Apple, Inc. | | 2.26 | |
3 | | | United Technologies Corp. | | 2.15 | |
4 | | | Wells Fargo & Co. | | 1.69 | |
5 | | | Sysco Corp. | | 1.58 | |
6 | | | General Electric Co. | | 1.58 | |
7 | | | Conagra Foods, Inc. | | 1.57 | |
8 | | | Prudential Financial, Inc. | | 1.57 | |
9 | | | Apache Corp. | | 1.56 | |
10 | | | Newmont Mining Corp. | | 1.53 | |
14
|
GuideMarkSM Global Real Return Fund |
MANAGER’S DISCUSSION OF FUND PERFORMANCE (Unaudited) |
| |
TOTAL RETURN BASED ON A $10,000 INVESTMENT
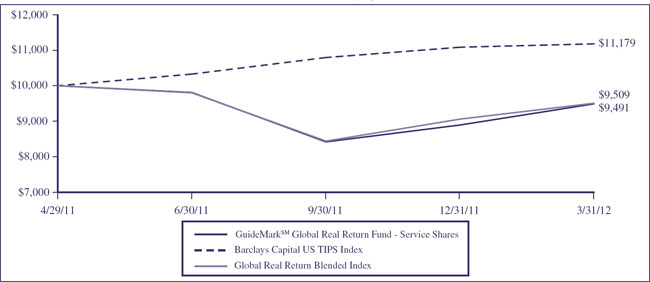
This chart assumes an initial gross investment of $10,000 made on April 1, 2011 (commencement of the Fund’s Service Shares operations). Returns shown include the reinvestment of all dividends. Returns shown do not reflect the deduction of taxes that a shareholder would pay on Fund distributions or the redemption of Fund shares. In the absence of fee waivers and reimbursements, total return would be reduced. Past performance is not predictive of future performance. Investment return and principal value will fluctuate so that your shares, when redeemed, may be worth more or less than the original cost. Index returns do not reflect the effects of fees or expenses. It is not possible to invest directly in an index.
BARCLAYS CAPITAL US TIPS INDEX – Includes all publicly-issued, US Treasury inflation-protected securities that have at least one year remaining to maturity, are rated investment grade, and have $250 million or more of outstanding face value.
GLOBAL REAL RETURN BLENDED INDEX – A weighted combination of 20% of the total return from the Dow Jones-UBS Commodities Index, 35% of the total return from the S&P Natural Resources North American Index, 20% of the total return from the Dow Jones Global Select RESI Index and 25% of the total return from the Barclays Global Inflation Linked Bond Index. Returns are weighted on a 20/35/20/25 basis for each historical month and then the longer-term Blended Index returns are geometrically combined from these historical monthly returns to create aggregate returns (1-year, 3-years, 5-years, etc.) for the Blended Index.
| | | | |
CUMULATIVE TOTAL RETURN (for the period ended March 31) |
| |
| | Since Inception1 | |
| | | |
GuideMarkSM Global Real Return Fund | | | |
Service Shares | | -5.09 | % |
Institutional Shares | | -7.48 | % |
Barclays Capital US TIPS Index | | 11.80 | %2 |
Global Real Return Blended Index | | -4.91 | %3 |
| |
1 | Inception date is 4/1/11 for Service Shares and 4/29/11 for Institutional Shares. |
| |
2 | The return shown for the Barclays Capital US TIPS Index is from the inception date of the Service Shares. The Barclays Capital US TIPS Index return from the inception date of the Institutional Shares is 9.45%. |
| |
3 | The return shown for the Global Real Return Blended Index is from the inception date of the Service Shares. The Global Real Return Blended Index return from the inception date of the Institutional Shares is -7.68%. |
15
|
GuideMarkSM Global Real Return Fund |
MANAGER’S DISCUSSION OF FUND PERFORMANCE (Continued) (Unaudited) |
| |
| |
• | Since inception through the end of March 2012, the Fund returned -5.09%, underperforming the Barclays Capital US TIPS Index, which returned 11.80%. The Fund was more in line with the blended benchmark of 20% Dow Jones-UBS Commodities Index, 35% S&P North American Natural Resources Sector Index, 20% Dow Jones Global Select RESI Index, and 25% Barclays Global Inflation Linked Bonds Index, which returned -4.91%. |
| |
• | The Fund’s relative underperformance for the period was primarily due to its exposure to real asset classes outside of the TIPS index, including commodities and natural resources in the earlier months of the period. |
| |
• | The relative return in the first half of the period underscores the “risk-off” trade that occurred as investors fled to US Treasuries and other defensive assets like gold. The underweight to TIPS and exposure to real assets including commodities, natural resources and REITs benefited relative returns during the latter part of the period. |
| |
• | Underweight exposure to US TIPS combined with exposure to the gold miners largely contributed to the underperformance of the Fund versus its blended benchmark over the period. |
Components of Portfolio Holdings*
*Pie chart represents percentages of total portfolio, less securities lending collateral.
Top Ten Holdings
| | | | | | |
Rank | | Security/Holding | | % of Net
Assets |
1 | | | SPDR S&P Global Natural Resources ETF | | 22.89 | |
2 | | | PowerShares DB Commodity Index Tracking Fund | | 14.81 | |
3 | | | SPDR Dow Jones International Real Estate ETF | | 12.00 | |
4 | | | SPDR Barclays Capital TIPS ETF | | 11.70 | |
5 | | | SPDR Dow Jones REIT ETF | | 10.21 | |
6 | | | SPDR DB International Government Inflation-Protected
Bond ETF | | 9.11 | |
7 | | | Energy Select Sector SPDR Fund | | 4.90 | |
8 | | | PowerShares Global Agriculture ETF | | 3.62 | |
9 | | | SPDR Metals and Mining ETF | | 3.50 | |
10 | | | PowerShares DB Gold Fund | | 2.02 | |
16
|
GuideMarkSM Core Fixed Income Fund |
MANAGER’S DISCUSSION OF FUND PERFORMANCE (Unaudited) |
| |
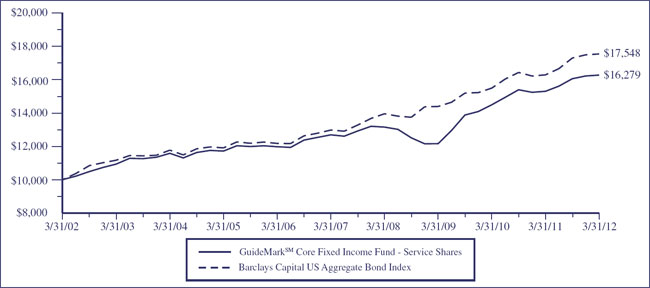
TOTAL RETURN BASED ON A $10,000 INVESTMENT
This chart assumes an initial gross investment of $10,000 made on March 31, 2002. Returns shown include the reinvestment of all dividends. Returns shown do not reflect the deduction of taxes that a shareholder would pay on Fund distributions or the redemption of Fund shares. In the absence of fee waivers and reimbursements, total return would be reduced. Past performance is not predictive of future performance. Investment return and principal value will fluctuate so that your shares, when redeemed, may be worth more or less than the original cost. Index returns do not reflect the effects of fees or expenses. It is not possible to invest directly in an index.
BARCLAYS CAPITAL US AGGREGATE BOND INDEX – A broad-based benchmark that measures the investment-grade, US dollar-denominated fixed-rate taxable bond market, including US Treasuries, government-related and corporate debt securities, and mortgage- and asset-backed securities. All securities contained in the Barclays Capital US Aggregate Bond Index have a minimum term to maturity of one year.
| | | | | | | | | | | | | |
AVERAGE ANNUAL TOTAL RETURN (for periods ended March 31) | |
| | |
| | One Year | | Five Year | | Ten Year | | Since Inception1 | |
| | | | | | | | | |
| | | | | | | | | | | | | |
GuideMarkSM Core Fixed Income Fund | | | | | | | | | | | | | |
Service Shares | | 6.35 | % | | 5.12 | % | | 5.00 | % | | 5.01 | % | |
Institutional Shares | | N/A | | | N/A | | | N/A | | | 5.56 | % | |
Barclays Capital US Aggregate Bond Index | | 7.71 | % | | 6.25 | % | | 5.80 | % | | 5.84 | %2 | |
| |
1 | Inception date is 6/29/01 for Service Shares and 4/29/11 for Institutional Shares. |
| |
2 | The return shown for the Barclays Capital US Aggregate Bond Index is from the inception date of the Service Shares. The Barclays Capital US Aggregate Bond Index return from the inception date of the Institutional Shares is 6.36%. |
17
|
GuideMarkSM Core Fixed Income Fund |
MANAGER’S DISCUSSION OF FUND PERFORMANCE (Continued) (Unaudited) |
| |
| |
• | For the 12 months ended March 2012, the Fund returned 6.35%, underperforming the Barclays Capital US Aggregate Bond Index, which returned 7.71%. |
| |
• | An overweight exposure to corporate credit and an underweight to Treasuries were the primary contributors to the unfavorable returns. Returns resulted from weakness in the first half of the period as the uncertainty over global growth rates and sovereign debt issues in the Euro-zone countries led to a flight to safety. Although risk appetites increased following the market low in October, it was not enough to offset the losses generated in the prior months. |
| |
• | Within corporate credit, an overweight exposure to financial and industrial bonds contributed negatively as these bonds trailed for much of the period. Financial companies traded lower due largely to the European debt crisis while fears of a slowdown in China’s growth rate caused concern for industrial companies. However, with the European Central Bank signaling a growing willingness to provide liquidity and an improving global growth outlook, both financial and industrials securities rebounded in the final months of the period. |
Components of Portfolio Holdings*
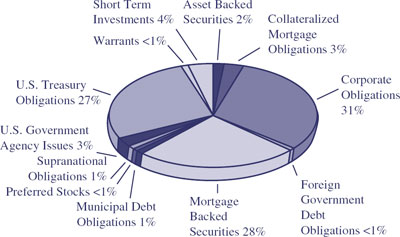
*Pie chart represents percentages of total portfolio, less securities lending collateral.
Top Ten Holdings
| | | | | | |
Rank | | Security/Holding | | % of Net
Assets |
1 | | | U.S. Treasury Note, 2.000%, 01/31/2016 | | 3.97 | |
2 | | | Federal Home Loan Mortgage Corp., Pool# TBA,
4.500%, 04/15/2041 | | 2.96 | |
3 | | | U.S. Treasury Note, 2.000%, 11/15/2021 | | 2.52 | |
4 | | | U.S. Treasury Bond, 3.750%, 08/15/2041 | | 2.41 | |
5 | | | U.S. Treasury Note, 2.000%, 02/15/2022 | | 2.18 | |
6 | | | U.S. Treasury Note, 2.000%, 04/30/2016 | | 1.85 | |
7 | | | U.S. Treasury Note, 0.250%, 10/31/2013 | | 1.69 | |
8 | | | U.S. Treasury Note, 0.375%, 11/15/2014 | | 1.47 | |
9 | | | Federal National Mortgage Association, Pool# AB0074,
5.000%, 02/01/2035 | | 1.47 | |
10 | | | U.S. Treasury Note, 0.875%, 11/30/2016 | | 1.41 | |
18
|
GuideMarkSM Tax-Exempt Fixed Income Fund |
MANAGER’S DISCUSSION OF FUND PERFORMANCE (Unaudited) |
| |
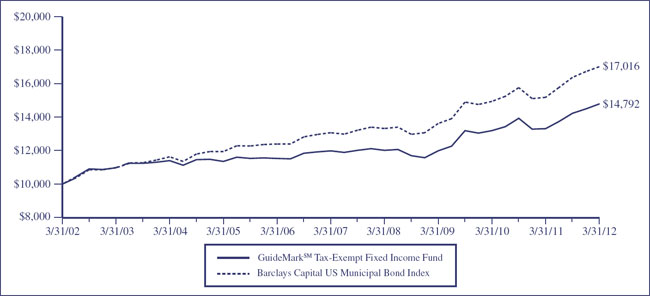
TOTAL RETURN BASED ON A $10,000 INVESTMENT
This chart assumes an initial gross investment of $10,000 made on March 31, 2002. Returns shown include the reinvestment of all dividends. Returns shown do not reflect the deduction of taxes that a shareholder would pay on Fund distributions or the redemption of Fund shares. In the absence of fee waivers and reimbursements, total return would be reduced. Past performance is not predictive of future performance. Investment return and principal value will fluctuate so that your shares, when redeemed, may be worth more or less than the original cost. Index returns do not reflect the effects of fees or expenses. It is not possible to invest directly in an index.
BARCLAYS CAPITAL US MUNICIPAL BOND INDEX – The Barclays Capital US Municipal Bond Index is a market-value-weighted index for the long-term tax-exempt bond market. The index has four main sectors: state and local general obligation bonds, revenue bonds, insured bonds, and pre-refunded bonds.
| | | | | | | | | | | | | |
AVERAGE ANNUAL TOTAL RETURN (for periods ended March 31) | |
| | |
| | One Year | | Five Year | | Ten Year | | Since Inception (6/29/01) | |
| | | | | | | | | |
| | | | | | | | | | | | | |
GuideMarkSM Tax-Exempt Fixed Income Fund | | 11.10 | % | | 4.30 | % | | 3.99 | % | | 3.90 | % | |
Barclays Capital US Municipal Bond Index | | 12.07 | % | | 5.42 | % | | 5.46 | % | | 5.37 | % | |
19
|
GuideMarkSM Tax-Exempt Fixed Income Fund |
MANAGER’S DISCUSSION OF FUND PERFORMANCE (Continued) (Unaudited) |
| |
| |
• | For the 12 months ended March 2012, the Fund returned 11.10%, underperforming the Barclays US Capital Municipal Index, which returned 12.07%. |
| |
• | A modest overweight exposure to BBB rated bonds dragged on returns due to weakness from lower rated credits in the first half of the period during the flight to safety. Following the market low in October, BBB and below investment grade bonds performed well in the second half of the period as investors’ risk appetite increased. |
| |
• | The total impact from duration and curve positioning was mixed for the period but the Fund’s overall duration positioning was close to the index over the entire period. |
Components of Portfolio Holdings*
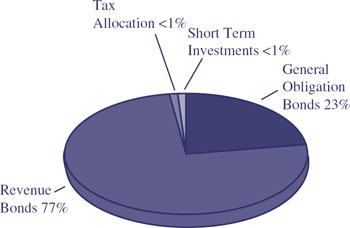
*Pie chart represents percentages of total portfolio.
Top Ten Holdings
| | | | | | |
Rank | | Security/Holding | | % of Net
Assets |
1 | | | Allegheny County Hospital Development Authority,
Series A, Revenue Bond, 5.000%, 09/01/2014 | | 1.69 | |
2 | | | Massachusetts Health & Educational Facilities Authority,
Revenue Bond, 5.500%, 07/01/2032 | | 1.67 | |
3 | | | California, GO, 6.500%, 04/01/2033 | | 1.49 | |
4 | | | Indiana State Finance Authority, Series A, Refunding,
Revenue Bond, 5.000%, 02/01/2021 | | 1.48 | |
5 | | | Henry County Public Service Authority Water & Sewer,
Refunding, Revenue Bond, FSA Insured, 5.500%, 11/15/2019 | | 1.48 | |
6 | | | Wisconsin, Series A, Refunding, Revenue Bond,
6.000%, 05/01/2033 | | 1.46 | |
7 | | | Utah Associated Municipal Power Systems San Juan Project,
Refunding, Revenue Bond, 5.500%, 06/01/2022 | | 1.46 | |
8 | | | Gilroy Unified School District, GO, Assured Guaranty Insured,
6.000%, 08/01/2025 | | 1.46 | |
9 | | | Salt River Project, Series A, Revenue Bond,
5.000%, 01/01/2021 | | 1.43 | |
10 | | | Connecticut Health & Educational Facilities Authority,
Series A, Refunding Bond, 5.000%, 07/01/2025 | | 1.43 | |
20
GuideMarkSM Opportunistic Fixed Income Fund |
MANAGER’S DISCUSSION OF FUND PERFORMANCE (Unaudited) |
| |
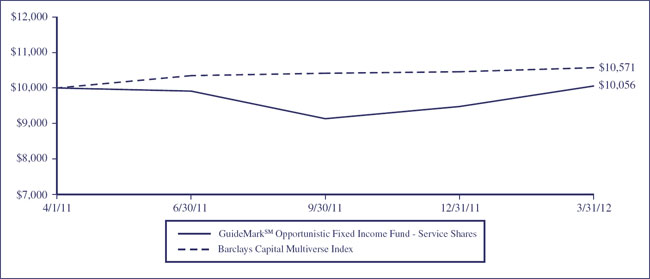
TOTAL RETURN BASED ON A $10,000 INVESTMENT
This chart assumes an initial gross investment of $10,000 made on April 1, 2011 (commencement of the Fund’s Service Shares operations). Returns shown include the reinvestment of all dividends. Returns shown do not reflect the deduction of taxes that a shareholder would pay on Fund distributions or the redemption of Fund shares. In the absence of fee waivers and reimbursements, total return would be reduced. Past performance is not predictive of future performance. Investment return and principal value will fluctuate so that your shares, when redeemed, may be worth more or less than the original cost. Index returns do not reflect the effects of fees or expenses. It is not possible to invest directly in an index.
BARCLAYS CAPITAL MULTIVERSE INDEX – The Barclays Capital Multiverse Index is a broad-based index that provides a measure of the global fixed income market.
| | | | |
CUMULATIVE TOTAL RETURN (for the period ended March 31) |
| |
| | Since Inception1 | |
| | | |
GuideMarkSM Opportunistic Fixed Income Fund | | | | |
Service Shares | | 0.56 | % | |
Institutional Shares | | 0.29 | % | |
Barclays Capital Multiverse Index | | 5.72 | %2 | |
| |
1 | Inception date is 4/1/11 for Service Shares and 4/29/11 for Institutional Shares. |
| |
2 | The return shown for the Barclays Capital Multiverse Index is from the inception date of the Service Shares. The Barclays Capital Multiverse Index return from the inception date of the Institutional Shares is 2.14%. |
21
|
GuideMarkSM Opportunistic Fixed Income Fund |
MANAGER’S DISCUSSION OF FUND PERFORMANCE (Continued) (Unaudited) |
| |
| |
• | Since inception through the end of March 2012, the Fund returned 0.56%, underperforming the Barclays Capital Multiverse Index, which returned 5.72%. |
| |
• | An underweight to US Treasuries, an overweight to credit and a bias to non-US currencies were the three primary drivers of the lagging returns. However, these positions were strong drivers of return in the latter months of the period. |
| |
• | Exposure to corporate credit, particularly lower rated corporate bonds, detracted from performance in the first half of the period. Investors fled to safety and favored Treasuries as fears rose over European sovereign debt and a deteriorating global economic outlook. Although the appetite for risk rallied in the second half of the period, lifting returns, it was not enough to offset the underperformance experienced in the first half of the period. |
| |
• | Relative overweight exposure to emerging market currencies, both Asian and Latin American, was a detractor to returns in the first part of the period. Investors traded out of higher volatility currencies in favor of the US dollar due to broader macroeconomic concerns and the increasing crisis in Europe. Continuing to see value in the currency positions there was little change in exposures and they benefited returns in the second half of the period. |
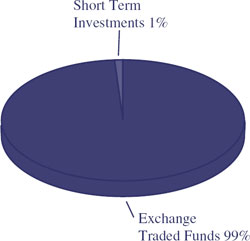
Components of Portfolio Holdings*
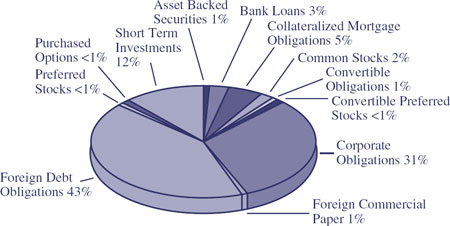
*Pie chart represents percentages of total portfolio.
Top Ten Holdings
| | | | | | |
Rank | | Security/Holding | | % of Net
Assets |
1 | | | Republic of Korea, 3.000%, 12/10/2013 | | 6.52 | |
2 | | | Malaysia Government Bond, 3.718%, 06/15/2012 | | 4.18 | |
3 | | | Poland Government Bond, 0.000%, 01/25/2013 | | 2.27 | |
4 | | | Mexican Bonos, 8.000%, 12/19/2013 | | 2.04 | |
5 | | | Republic of Indonesia, 12.500%, 03/15/2013 | | 1.90 | |
6 | | | Canadian Government Bond, 1.750%, 03/01/2013 | | 1.87 | |
7 | | | Petroleos de Venezuela SA, 4.900%, 10/29/2014 | | 1.85 | |
8 | | | Queensland Treasury Corp., 6.000%, 08/21/2013 | | 1.75 | |
9 | | | New South Wales Treasury Corp., 5.500%, 08/01/2013 | | 1.66 | |
10 | | | Mexican Bonos, 6.000%, 06/18/2015 | | 1.11 | |
22
|
GuidePathSM Strategic Asset Allocation Fund |
MANAGER’S DISCUSSION OF FUND PERFORMANCE (Unaudited) |
| |
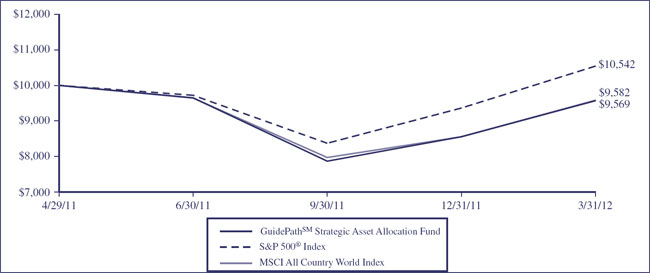
TOTAL RETURN BASED ON A $10,000 INVESTMENT
This chart assumes an initial gross investment of $10,000 made on April 29, 2011 (commencement of the Fund’s operations). Returns shown include the reinvestment of all dividends. Returns shown do not reflect the deduction of taxes that a shareholder would pay on Fund distributions or the redemption of Fund shares. In the absence of fee waivers and reimbursements, total return would be reduced. Past performance is not predictive of future performance. Investment return and principal value will fluctuate so that your shares, when redeemed, may be worth more or less than the original cost. Index returns do not reflect the effects of fees or expenses. It is not possible to invest directly in an index.
S&P 500® INDEX – Focuses on the large-cap segment of the US equities market. It includes 500 leading companies in leading industries of the US economy, capturing approximately 75% coverage of US equities.
MSCI ALL COUNTRY WORLD INDEX – A free float-adjusted market capitalization weighted index that is designed to measure the equity market performance of developed and emerging markets. It consists of 45 country indices comprising 24 developed and 21 emerging market country indices. The developed market country indices included are: Australia, Austria, Belgium, Canada, Denmark, Finland, France, Germany, Greece, Hong Kong, Ireland, Israel, Italy, Japan, Netherlands, New Zealand, Norway, Portugal, Singapore, Spain, Sweden, Switzerland, the United Kingdom and the United States. The emerging market country indices included are: Brazil, Chile, China, Colombia, Czech Republic, Egypt, Hungary, India, Indonesia, Korea, Malaysia, Mexico, Morocco, Peru, Philippines, Poland, Russia, South Africa, Taiwan, Thailand, and Turkey.
| | | | |
CUMULATIVE TOTAL RETURN (for the period ended March 31) |
| |
| | Since Inception (4/29/11) | |
| | | |
GuidePathSM Strategic Asset Allocation Fund | | -4.30 | % | |
S&P 500® Index | | 5.42 | % | |
MSCI All Country World Index | | -4.17 | % | |
23
|
GuidePathSM Strategic Asset Allocation Fund |
MANAGER’S DISCUSSION OF FUND PERFORMANCE (Continued) (Unaudited) |
| |
| |
• | Since inception to the period ended March 2012, the Fund returned -4.30% underperforming the S&P 500 Index, which returned 5.42%. The Fund marginally trailed the MSCI ACWI Index, which returned -4.17%. |
| |
• | Exposure to international equities was the largest driver of underperformance to the S&P 500 as the international markets experienced strong losses in the face of the European debt crisis, and in particular the uncertain outcome of Greece’s national debt. The strengthening of the US dollar also dampened returns from the international markets. However, relative to the global indices, performance was in line. |
| |
• | Exposure to real return assets negatively impacted performance over the period as positions in global natural resources and commodities fell significantly as investors’ shifted to other asset classes; initially defensively into US Treasuries and gold, and eventually into broad US equities as market sentiment improved. Fears of a slowdown in China further hurt performance in these asset classes as expectations for demand were cut back. |
| |
• | Exposure to large cap equities proved beneficial, however use of active managers dampened returns as they faced headwinds from the macro environment. Overweight exposure to the pro-cyclical sectors of financials, industrials and energy was a drag on returns as the debt crisis and global economic concerns placed downward pressure on stocks within these sectors. |
Components of Portfolio Holdings*
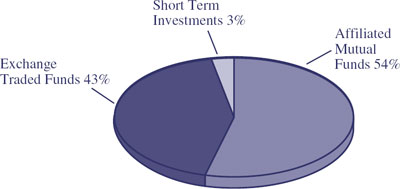
*Pie chart represents percentages of total portfolio, less securities lending collateral.
Top Ten Holdings
| | | | | | |
Rank | | Security/Holding | | % of Net
Assets |
1 | | | GuideMarkSM World ex-US Fund – Institutional Shares | | 16.63 | |
2 | | | Vanguard FTSE All-World ex-US Index Fund | | 16.28 | |
3 | | | SPDR S&P 500 ETF Trust | | 15.33 | |
4 | | | GuideMarkSM Small/Mid Cap Core Fund – Institutional Shares | | 9.30 | |
5 | | | GuideMarkSM Large Cap Value Fund – Institutional Shares | | 8.07 | |
6 | | | GuideMarkSM Opportunistic Equity Fund – Institutional Shares | | 7.99 | |
7 | | | GuideMarkSM Large Cap Growth Fund – Institutional Shares | | 7.77 | |
8 | | | GuideMarkSM Global Real Return Fund – Institutional Shares | | 4.77 | |
9 | | | Vanguard Small-Cap Growth ETF | | 2.58 | |
10 | | | iShares MSCI Canada Index Fund | | 2.13 | |
24
|
GuidePathSM Tactical Constrained Asset Allocation Fund |
MANAGER’S DISCUSSION OF FUND PERFORMANCE (Unaudited) |
| |
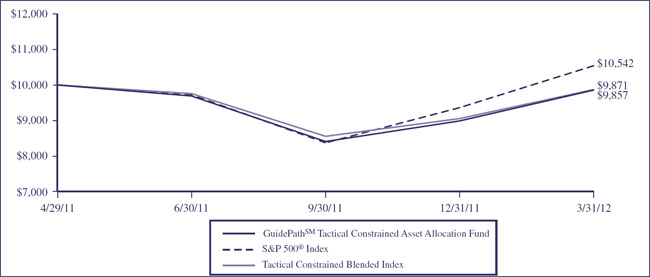
TOTAL RETURN BASED ON A $10,000 INVESTMENT
This chart assumes an initial gross investment of $10,000 made on April 29, 2011 (commencement of the Fund’s operations). Returns shown include the reinvestment of all dividends. Returns shown do not reflect the deduction of taxes that a shareholder would pay on Fund distributions or the redemption of Fund shares. In the absence of fee waivers and reimbursements, total return would be reduced. Past performance is not predictive of future performance. Investment return and principal value will fluctuate so that your shares, when redeemed, may be worth more or less than the original cost. Index returns do not reflect the effects of fees or expenses. It is not possible to invest directly in an index.
S&P 500® INDEX – Focuses on the large-cap segment of the US equities market. It includes 500 leading companies in leading industries of the US economy, capturing approximately 75% coverage of US equities.
TACTICAL CONSTRAINED BLENDED BENCHMARK – A weighted combination of 75% of the total return from the MSCI All Country World Index with 25% of the total return from the Barclays Capital US Aggregate Bond Index. Returns are weighted on a 75/25 basis for each historical month and then the longer-term Blended Index returns are geometrically combined from these historical monthly returns to create aggregate returns (1-year, 3-years, 5-years, etc.) for the Blended Index.
| | | | |
CUMULATIVE TOTAL RETURN (for the period ended March 31) |
| |
| | Since Inception (4/29/11) | |
| | | |
GuidePathSM Tactical Constrained Asset | | | | |
Allocation Fund | | -1.43 | % | |
S&P 500® Index | | 5.42 | % | |
Tactical Constrained Blended Index | | -1.29 | % | |
25
|
GuidePathSM Tactical Constrained Asset Allocation Fund |
MANAGER’S DISCUSSION OF FUND PERFORMANCE (Continued) (Unaudited) |
| |
| |
• | Since inception to the period ended March 2012, the Fund returned -1.43% underperforming the S&P 500 Index, which returned 5.42%. The fund outperformed the MSCI ACWI Index, which returned -4.17% and kept pace with the blended benchmark of 75% MSCI ACWI Index and 25% Barclays Capital US Aggregate Index, which returned -1.29%. |
| |
• | Exposure to international equities was the largest driver of underperformance to the S&P 500 as the international markets experienced strong losses in the face of the European debt crisis, and in particular the uncertain outcome of Greece’s national debt. The strengthening of the US dollar also dampened returns from the international markets. However relative to the global indices, performance was in line. |
| |
• | While exposure to fixed income generally proved beneficial over the year, an emphasis towards credit had mixed results. Over the summer of 2011 the exposure detracted from returns as the flight to safety took hold sending the treasury markets higher while from the market low in October 2011 through March 2012, the exposure strongly benefited as investors’ risk appetite returned. |
| |
• | Exposure to large cap equities proved beneficial, however use of active managers dampened returns as they faced headwinds from the macro environment. Overweight exposure to the pro-cyclical sectors of financials, industrials and energy was a drag on returns as the debt crisis and global economic concerns placed downward pressure on stocks within these sectors. |
Components of Portfolio Holdings*
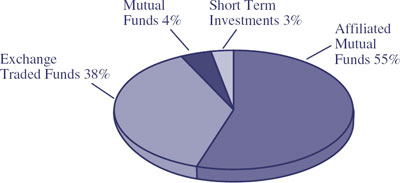
*Pie chart represents percentages of total portfolio, less securities lending collateral.
Top Ten Holdings
| | | | | | |
Rank | | Security/Holding | | % of Net
Assets |
1 | | | SPDR S&P 500 ETF Trust | | 16.23 | |
2 | | | GuideMarkSM Opportunistic Equity Fund – Institutional Shares | | 11.14 | |
3 | | | GuideMarkSM Large Cap Growth Fund – Institutional Shares | | 8.20 | |
4 | | | GuideMarkSM Large Cap Value Fund – Institutional Shares | | 8.16 | |
5 | | | GuideMarkSM World ex-US Fund – Institutional Shares | | 7.75 | |
6 | | | Vanguard FTSE All-World ex-US Index Fund | | 7.69 | |
7 | | | GuideMarkSM Core Fixed Income Fund – Institutional Shares | | 6.98 | |
8 | | | GuideMarkSM Opportunistic Fixed Income Fund – Institutional Shares | | 6.58 | |
9 | | | GuideMarkSM Small/Mid Cap Core Fund – Institutional Shares | | 4.25 | |
10 | | | Vanguard MSCI Emerging Markets ETF | | 2.99 | |
26
|
GuidePathSM Tactical Unconstrained Asset Allocation Fund |
MANAGER’S DISCUSSION OF FUND PERFORMANCE (Unaudited) |
| |
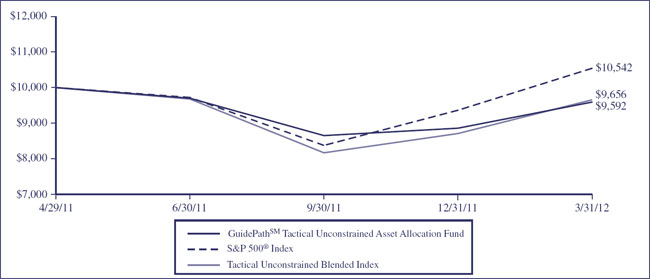
TOTAL RETURN BASED ON A $10,000 INVESTMENT
This chart assumes an initial gross investment of $10,000 made on April 29, 2011 (commencement of the Fund’s operations). Returns shown include the reinvestment of all dividends. Returns shown do not reflect the deduction of taxes that a shareholder would pay on Fund distributions or the redemption of Fund shares. In the absence of fee waivers and reimbursements, total return would be reduced. Past performance is not predictive of future performance. Investment return and principal value will fluctuate so that your shares, when redeemed, may be worth more or less than the original cost. Index returns do not reflect the effects of fees or expenses. It is not possible to invest directly in an index.
S&P 500® INDEX – Focuses on the large-cap segment of the US equities market. It includes 500 leading companies in leading industries of the US economy, capturing approximately 75% coverage of US equities.
TACTICAL UNCONSTRAINED BLENDED INDEX – A weighted combination of 90% of the total return from the MSCI All Country World Index with 10% of the total return from the Barclays Capital Multiverse Index. Returns are weighted on a 90/10 basis for each historical month and then the longer-term Blended Index returns are geometrically combined from these historical monthly returns to create aggregate returns (1-year, 3-years, 5-years, etc.) for the Blended Index.
| | | | |
CUMULATIVE TOTAL RETURN (for the period ended March 31) |
| |
| | Since Inception (4/29/11) | |
| | | |
GuidePathSM Tactical Unconstrained Asset | | | | |
Allocation Fund | | -4.09 | % | |
S&P 500® Index | | 5.42 | % | |
Tactical Unconstrained Blended Index | | -3.44 | % | |
27
|
GuidePathSM Tactical Unconstrained Asset Allocation Fund |
MANAGER’S DISCUSSION OF FUND PERFORMANCE (Continued) (Unaudited) |
| |
| |
• | Since inception to the period ended March 2012, the Fund returned -4.09% underperforming the S&P 500 Index, which returned 5.42%. The fund kept pace with the MSCI ACWI Index, which returned -4.17% and trailed the blended benchmark of 90% MSCI ACWI Index and 10% Barclays Multiverse Index, which returned -3.44%. |
| |
• | The biggest underperformance in the fund relative to the S&P 500 came from exposure to 1-3 Month T-Bills as the markets posted postive gains amid a period of high volatility. Positioning in the Stadion Managed Portfolio Trust dampened returns as the volatile market and rotating market leadership led to cash exposures being held amidst the short-term market rallies. |
| |
• | While exposure to fixed income generally proved beneficial over the year, an emphasis towards credit had mixed results. Over the summer of 2011 the exposure detracted from returns as the flight to safety took hold sending the treasury markets higher while from the market low in October 2011 through March 2012, the exposure strongly benefited as investors’ risk appetite returned. |
| |
• | Exposure to large cap equities proved beneficial, however use of active managers dampened returns as they faced headwinds from the macro environment. Overweight exposure to the pro-cyclical sectors of financials, industrials and energy was a drag on returns as the debt crisis and global economic concerns placed downward pressure on stocks within these sectors. |
Components of Portfolio Holdings*
*Pie chart represents percentages of total portfolio, less securities lending collateral.
Top Ten Holdings
| | | | | | |
Rank | | Security/Holding | | % of Net
Assets |
1 | | | SPDR S&P 500 ETF Trust | | 18.15 | |
2 | | | GuideMarkSM Opportunistic Equity Fund – Institutional Shares | | 10.15 | |
3 | | | Stadion Managed Portfolio Trust – Institutional Shares | | 9.66 | |
4 | | | GuideMarkSM Large Cap Value Fund – Institutional Shares | | 8.85 | |
5 | | | GuideMarkSM Small/Mid Cap Core Fund – Institutional Shares | | 5.72 | |
6 | | | Eaton Vance Global Macro Absolute Return Fund – Institutional Shares | | 5.67 | |
7 | | | GuideMarkSM Opportunistic Fixed Income Fund Institutional Shares | | 5.36 | |
8 | | | PowerShares QQQ Trust, Series 1 | | 4.75 | |
9 | | | GuideMarkSM Large Cap Growth Fund – Institutional Shares | | 4.53 | |
10 | | | SPDR Barclays Capital High Yield Bond ETF | | 4.40 | |
28
|
GuidePathSM Absolute Return Asset Allocation Fund |
MANAGER’S DISCUSSION OF FUND PERFORMANCE (Unaudited) |
| |
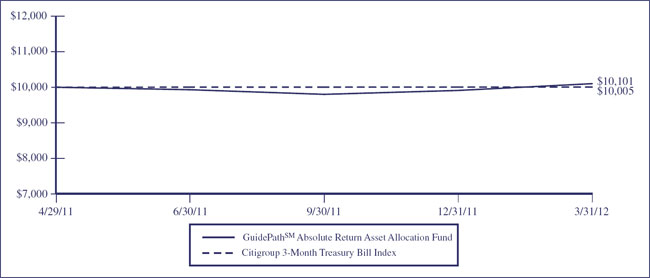
TOTAL RETURN BASED ON A $10,000 INVESTMENT
This chart assumes an initial gross investment of $10,000 made on April 29, 2011 (commencement of the Fund’s operations). Returns shown include the reinvestment of all dividends. Returns shown do not reflect the deduction of taxes that a shareholder would pay on Fund distributions or the redemption of Fund shares. In the absence of fee waivers and reimbursements, total return would be reduced. Past performance is not predictive of future performance. Investment return and principal value will fluctuate so that your shares, when redeemed, may be worth more or less than the original cost. Index returns do not reflect the effects of fees or expenses. It is not possible to invest directly in an index.
CITIGROUP 3-MONTH TREASURY BILL INDEX – Tracks the performance of US Treasury Bills with a remaining maturity of three months.
| | | | |
CUMULATIVE TOTAL RETURN (for the period ended March 31) |
| |
| | Since Inception (4/29/11) | |
| | | |
GuidePathSM Absolute Return Asset Allocation Fund | | 1.01 | % | |
Citigroup 3-Month Treasury Bill Index | | 0.04 | % | |
29
|
GuidePathSM Absolute Return Asset Allocation Fund |
MANAGER’S DISCUSSION OF FUND PERFORMANCE (Continued) (Unaudited) |
| |
| |
• | For the period since the Fund commenced operations on April 29, 2011 through March 31, 2012, the Fund returned 1.01% outperforming the Citi 3-month Treasury Bill Index, which returned 0.04%. |
| |
• | Core fixed income and a position in the iPath US Treasury Flattener ETN were primary contributors to performance as long-term treasuries rallied strongly as a result of a flight to safety during most of the period and the Federal Reserve started its Operation Twist purchase program of long-term treasuries. |
| |
• | Exposure to both credit and currency combined with a position in the iPath US Treasury 10-year Bear ETN were the largest detractors to performance coming from the six months ended September 2011. The flight to safety saw treasuries rally strongly during this time. However these positions were rewarded following the market low in October 2011 as investors’ risk appetite returned. |
| |
• | Absolute return and long-short strategies added to gains as exposure to non-correlated asset classes started to see positive traction in what remained a highly volatile market environment. |
Components of Portfolio Holdings*
*Pie chart represents percentages of total portfolio, less securities lending collateral.
Top Ten Holdings
| | | | | | |
Rank | | Security/Holding | | % of Net
Assets |
1 | | | Vanguard Total Bond Market Index Fund | | 10.52 | |
2 | | | iShares Barclays Credit Bond Fund | | 10.24 | |
3 | | | Pioneer Strategic Income Fund – Class Y | | 8.94 | |
4 | | | GuideMarkSM Core Fixed Income Fund – Institutional Shares | | 8.71 | |
5 | | | GuideMarkSM Opportunistic Fixed Income Fund – Institutional Shares | | 8.00 | |
6 | | | iShares Barclays MBS Bond Fund | | 7.01 | |
7 | | | Eaton Vance Multi-Strategy Absolute Return Fund – Institutional Shares | | 6.08 | |
8 | | | Highbridge Statistical Market Neutral Fund – Select Shares | | 3.99 | |
9 | | | Eaton Vance Global Macro Absolute Return Fund – Institutional Shares | | 3.94 | |
10 | | | iShares Floating Rate Note | | 3.67 | |
30
|
GuideMarkSM Funds & GuidePathSM Funds |
EXPENSE EXAMPLE (Unaudited) |
March 31, 2012 |
As a shareholder of the GuideMarkSM & GuidePathSM Funds (the “Funds”), you incur ongoing costs, including management fees, distribution and/or service fees, and other Fund expenses. The Expense Example shown in this section is intended to help you understand your ongoing costs (in dollars) of investing in the Funds and to compare these costs with the ongoing costs of investing in other mutual funds.
The Expense Example is based on an investment of $1,000 invested at the beginning of a six-month period and held for the entire period, which for all Funds is from October 1, 2011 to March 31, 2012.
Actual Expenses
The first line of the Expense Example table provides information about actual account values and actual expenses. You may use the information in this line, together with the amount you invested, to estimate the expenses that you paid over the period. Simply divide your account value by $1,000 (for example, an $8,600 account value divided by $1,000 = 8.6), then multiply the result by the number in the first line under the heading entitled “Expenses Paid During Period” to estimate the expenses you paid on your account during this period.
The example includes, but is not limited to, management fees, shareholder servicing fees, distribution fees, fund accounting fees, custody fees and transfer agent fees. However, the example below does not include portfolio trading commissions and related expenses, interest expense or dividends on short positions taken by a Fund and other extraordinary expenses as determined under generally accepted accounting principles. To the extent that a Fund invests in shares of other investment companies as part of its investment strategy, you will indirectly bear your proportionate share of any fees and expenses charged by the underlying funds in which a Fund invests in addition to the expenses of the Fund. Actual expenses of the underlying funds are expected to vary among the various underlying funds. These expenses are not included in the example below.
Hypothetical Example for Comparison Purposes
The second line of the table below provides information about hypothetical account values and hypothetical expenses based on each Fund’s actual expenses ratios and an assumed rate of return of 5% per year before expenses, which is not the Fund’s actual return. The hypothetical account values and expenses may not be used to estimate the actual ending account balance or expenses you paid for the period. You may use this information to compare the ongoing costs of investing in the Funds and other funds. To do so, compare this 5% hypothetical example with the 5% hypothetical examples that appear in the shareholder reports of the other funds.
31
|
GuideMarkSM Funds & GuidePathSM Funds |
EXPENSE EXAMPLE (Continued) (Unaudited) |
March 31, 2012 |
| | | | | | | | | | | | | | | | | | | | | |
Fund | | | | Beginning
Account
Value
October 1,
2011 | | Ending
Account
Value
March 31,
2012 | | Annualized
Expense Ratio1
based on
the period
October 1, 2011–
March 31, 2012 | | Expenses Paid
During Period2
October 1, 2011–
March 31,
2012 | |
INSTITUTIONAL SHARES | | | | | | | | | | | | | | | |
GuideMarkSM Large Cap | | Actual | | | $ | 1,000.00 | | | | $ | 1,294.50 | | | 0.93 | % | | | $ | 5.33 | | |
Growth Fund | | Hypothetical3 | | | $ | 1,000.00 | | | | $ | 1,020.35 | | | 0.93 | % | | | $ | 4.70 | | |
GuideMarkSM Large Cap | | Actual | | | $ | 1,000.00 | | | | $ | 1,266.50 | | | 0.93 | % | | | $ | 5.27 | | |
Value Fund | | Hypothetical3 | | | $ | 1,000.00 | | | | $ | 1,020.35 | | | 0.93 | % | | | $ | 4.70 | | |
GuideMarkSM Small/Mid Cap | | Actual | | | $ | 1,000.00 | | | | $ | 1,318.10 | | | 1.23 | % | | | $ | 7.13 | | |
Core Fund | | Hypothetical3 | | | $ | 1,000.00 | | | | $ | 1,018.85 | | | 1.23 | % | | | $ | 6.21 | | |
GuideMarkSM World | | Actual | | | $ | 1,000.00 | | | | $ | 1,176.40 | | | 1.04 | % | | | $ | 5.66 | | |
ex-US Fund | | Hypothetical3 | | | $ | 1,000.00 | | | | $ | 1,019.80 | | | 1.04 | % | | | $ | 5.25 | | |
GuideMarkSM Opportunistic | | Actual | | | $ | 1,000.00 | | | | $ | 1,252.80 | | | 1.04 | % | | | $ | 5.83 | | |
Equity Fund | | Hypothetical3 | | | $ | 1,000.00 | | | | $ | 1,019.83 | | | 1.04 | % | | | $ | 5.23 | | |
GuideMarkSM Global | | Actual | | | $ | 1,000.00 | | | | $ | 1,128.90 | | | 0.91 | % | | | $ | 4.84 | | |
Real Return Fund | | Hypothetical3 | | | $ | 1,000.00 | | | | $ | 1,020.45 | | | 0.91 | % | | | $ | 4.60 | | |
GuideMarkSM Core | | Actual | | | $ | 1,000.00 | | | | $ | 1,016.80 | | | 0.70 | % | | | $ | 3.53 | | |
Fixed Income Fund | | Hypothetical3 | | | $ | 1,000.00 | | | | $ | 1,021.50 | | | 0.70 | % | | | $ | 3.54 | | |
GuideMarkSM Opportunistic | | Actual | | | $ | 1,000.00 | | | | $ | 1,081.20 | | | 1.05 | % | | | $ | 5.46 | | |
Fixed Income Fund | | Hypothetical3 | | | $ | 1,000.00 | | | | $ | 1,019.75 | | | 1.05 | % | | | $ | 5.30 | | |
| |
1 | The expense ratio excludes the securities lending credit. |
| |
2 | Expenses are equal to the Fund’s annualized expense ratio, multiplied by the average account value over the period, multiplied by 183/366 to reflect the one-half year period. |
| |
3 | 5% return before expenses. |
32
|
GuideMarkSM Funds & GuidePathSM Funds |
EXPENSE EXAMPLE (Continued) (Unaudited) |
March 31, 2012 |
| | | | | | | | | | | | | | | | | | | | | |
Fund | | | | Beginning
Account
Value
October 1,
2011 | | Ending
Account
Value
March 31,
2012 | | Annualized
Expense Ratio1
based on
the period
October 1, 2011–
March 31, 2012 | | Expenses Paid
During Period2
October 1, 2011–
March 31,
2012 | |
SERVICE SHARES | | | | | | | | | | | | | | | | | | | | | |
GuideMarkSM Large Cap | | Actual | | | $ | 1,000.00 | | | | $ | 1,290.80 | | | 1.51 | % | | | $ | 8.65 | | |
Growth Fund | | Hypothetical3 | | | $ | 1,000.00 | | | | $ | 1,017.45 | | | 1.51 | % | | | $ | 7.62 | | |
GuideMarkSM Large Cap | | Actual | | | $ | 1,000.00 | | | | $ | 1,264.20 | | | 1.51 | % | | | $ | 8.55 | | |
Value Fund | | Hypothetical3 | | | $ | 1,000.00 | | | | $ | 1,017.45 | | | 1.51 | % | | | $ | 7.62 | | |
GuideMarkSM Small/Mid Cap | | Actual | | | $ | 1,000.00 | | | | $ | 1,315.80 | | | 1.72 | % | | | $ | 9.96 | | |
Core Fund | | Hypothetical3 | | | $ | 1,000.00 | | | | $ | 1,016.40 | | | 1.72 | % | | | $ | 8.67 | | |
GuideMarkSM World | | Actual | | | $ | 1,000.00 | | | | $ | 1,173.90 | | | 1.59 | % | | | $ | 8.64 | | |
ex-US Fund | | Hypothetical3 | | | $ | 1,000.00 | | | | $ | 1,017.05 | | | 1.59 | % | | | $ | 8.02 | | |
GuideMarkSM Opportunistic | | Actual | | | $ | 1,000.00 | | | | $ | 1,249.70 | | | 1.62 | % | | | $ | 9.11 | | |
Equity Fund | | Hypothetical3 | | | $ | 1,000.00 | | | | $ | 1,016.90 | | | 1.62 | % | | | $ | 8.17 | | |
GuideMarkSM Global | | Actual | | | $ | 1,000.00 | | | | $ | 1,127.10 | | | 1.47 | % | | | $ | 7.82 | | |
Real Return Fund | | Hypothetical3 | | | $ | 1,000.00 | | | | $ | 1,017.65 | | | 1.47 | % | | | $ | 7.41 | | |
GuideMarkSM Core | | Actual | | | $ | 1,000.00 | | | | $ | 1,013.60 | | | 1.28 | % | | | $ | 6.44 | | |
Fixed Income Fund | | Hypothetical3 | | | $ | 1,000.00 | | | | $ | 1,018.60 | | | 1.28 | % | | | $ | 6.46 | | |
GuideMarkSM Tax-Exempt | | Actual | | | $ | 1,000.00 | | | | $ | 1,039.40 | | | 1.29 | % | | | $ | 6.58 | | |
Fixed Income Fund | | Hypothetical3 | | | $ | 1,000.00 | | | | $ | 1,018.55 | | | 1.29 | % | | | $ | 6.51 | | |
GuideMarkSM Opportunistic | | Actual | | | $ | 1,000.00 | | | | $ | 1,079.50 | | | 1.55 | % | | | $ | 8.06 | | |
Fixed Income Fund | | Hypothetical3 | | | $ | 1,000.00 | | | | $ | 1,017.25 | | | 1.55 | % | | | $ | 7.82 | | |
GuidePathSM Strategic | | Actual | | | $ | 1,000.00 | | | | $ | 1,216.00 | | | 1.03 | % | | | $ | 5.71 | | |
Asset Allocation Fund | | Hypothetical3 | | | $ | 1,000.00 | | | | $ | 1,019.85 | | | 1.03 | % | | | $ | 5.20 | | |
GuidePathSM Tactical Constrained | | Actual | | | $ | 1,000.00 | | | | $ | 1,172.00 | | | 1.03 | % | | | $ | 5.59 | | |
Asset Allocation Fund | | Hypothetical3 | | | $ | 1,000.00 | | | | $ | 1,019.85 | | | 1.03 | % | | | $ | 5.20 | | |
GuidePathSM Tactical Unconstrained | | Actual | | | $ | 1,000.00 | | | | $ | 1,108.80 | | | 1.17 | % | | | $ | 6.17 | | |
Asset Allocation Fund | | Hypothetical3 | | | $ | 1,000.00 | | | | $ | 1,019.15 | | | 1.17 | % | | | $ | 5.91 | | |
GuidePathSM Absolute Return | | Actual | | | $ | 1,000.00 | | | | $ | 1,030.70 | | | 1.13 | % | | | $ | 5.74 | | |
Asset Allocation Fund | | Hypothetical3 | | | $ | 1,000.00 | | | | $ | 1,019.35 | | | 1.13 | % | | | $ | 5.70 | | |
| |
1 | The expense ratio excludes the securities lending credit. |
| |
2 | Expenses are equal to the Fund’s annualized expense ratio, multiplied by the average account value over the period, multiplied by 183/366 to reflect the one-half year period. |
| |
3 | 5% return before expenses. |
33
|
GuideMarkSM Large Cap Growth Fund |
SCHEDULE OF INVESTMENTS |
March 31, 2012 |
| | | | | | | |
Number of
Shares | | | | Value | |
| | | COMMON STOCKS - 99.15% | | | | |
| | | Aerospace & Defense - 2.18% | | | | |
| 29,438 | | Boeing Co. | | $ | 2,189,304 | |
| 35,726 | | Honeywell International, Inc. | | | 2,181,072 | |
| | | | | | 4,370,376 | |
| | | Beverages - 1.93% | | | | |
| 52,191 | | The Coca-Cola Company | | | 3,862,656 | |
| | | Biotechnology - 3.56% | | | | |
| 53,273 | | Amgen, Inc. | | | 3,622,031 | |
| 3,472 | | Biogen Idec, Inc. (b) | | | 437,368 | |
| 23,583 | | Celgene Corp. (b) | | | 1,828,154 | |
| 25,244 | | Gilead Sciences, Inc. (b) | | | 1,233,170 | |
| | | | | | 7,120,723 | |
| | | Chemicals - 0.53% | | | | |
| 5,830 | | CF Industries Holdings, Inc. | | | 1,064,849 | |
| | | Communications Equipment - 8.42% | | | | |
| 506,668 | | Cisco Systems, Inc. | | | 10,716,028 | |
| 11,842 | | F5 Networks, Inc. (b) | | | 1,598,196 | |
| 54,582 | | Qualcomm, Inc. | | | 3,712,668 | |
| 28,680 | | Riverbed Technology, Inc. (b) | | | 805,335 | |
| | | | | | 16,832,227 | |
| | | Computers & Peripherals - 19.13% | | | | |
| 27,077 | | Apple, Inc. (b) | | | 16,231,849 | |
| 99,659 | | Dell, Inc. (b) | | | 1,654,339 | |
| 242,727 | | EMC Corp. (b) | | | 7,252,683 | |
| 35,596 | | International Business Machines
Corp. | | | 7,427,105 | |
| 58,250 | | NetApp, Inc. (b) | | | 2,607,853 | |
| 131,601 | | QLogic Corp. (b) | | | 2,337,234 | |
| 15,011 | | SanDisk Corp. (b) | | | 744,395 | |
| | | | | | 38,255,458 | |
| | | Consumer Finance - 0.92% | | | | |
| 31,689 | | American Express Co. | | | 1,833,525 | |
| | | Diversified Consumer Services - 0.61% | | | | |
| 31,529 | | Apollo Group, Inc. (b) | | | 1,218,281 | |
| | | Energy Equipment & Services - 3.93% | | | | |
| 7,865 | | Cameron International Corp. (b) | | | 415,508 | |
| 13,528 | | Core Laboratories NV (a) | | | 1,779,879 | |
| 33,848 | | Diamond Offshore Drilling, Inc. (a) | | | 2,259,354 | |
| 20,146 | | National-Oilwell Varco, Inc. | | | 1,601,002 | |
| 33,475 | | Oceaneering International, Inc. | | | 1,803,968 | |
| | | | | | 7,859,711 | |
| | | | | | | |
Number of
Shares | | | | Value | |
| | | Food & Staples Retailing - 2.06% | | | | |
| 19,984 | | Costco Wholesale Corp. | | $ | 1,814,547 | |
| 37,644 | | Wal-Mart Stores, Inc. | | | 2,303,813 | |
| | | | | | 4,118,360 | |
| | | Food Products - 0.16% | | | | |
| 6,669 | | Green Mountain Coffee Roasters,
Inc. (a)(b) | | | 312,376 | |
| | | Health Care Equipment & Supplies - 2.19% | | | | |
| 11,588 | | Edwards Lifesciences Corp. (b) | | | 842,795 | |
| 83,332 | | Hologic, Inc. (b) | | | 1,795,805 | |
| 3,217 | | Intuitive Surgical, Inc. (b) | | | 1,742,810 | |
| | | | | | 4,381,410 | |
| | | Health Care Providers & Services - 3.50% | | | | |
| 24,370 | | Aetna, Inc. | | | 1,222,399 | |
| 24,064 | | AmerisourceBergen Corp. | | | 954,860 | |
| 18,687 | | Cardinal Health, Inc. | | | 805,597 | |
| 68,017 | | UnitedHealth Group, Inc. | | | 4,008,922 | |
| | | | | | 6,991,778 | |
| | | Hotels, Restaurants & Leisure - 1.88% | | | | |
| 39,516 | | Starbucks Corp. | | | 2,208,549 | |
| 21,772 | | Yum Brands, Inc. | | | 1,549,731 | |
| | | | | | 3,758,280 | |
| | | Industrial Conglomerates - 1.38% | | | | |
| 63,280 | | General Electric Co. | | | 1,270,030 | |
| 26,658 | | Tyco International Ltd. - ADR | | | 1,497,646 | |
| | | | | | 2,767,676 | |
| | | Internet & Catalog Retail - 1.47% | | | | |
| 5,117 | | Amazon.com, Inc. (b) | | | 1,036,244 | |
| 2,663 | | Priceline.com, Inc. (b) | | | 1,910,702 | |
| | | | | | 2,946,946 | |
| | | Internet Software & Services - 4.58% | | | | |
| 80,400 | | eBay, Inc. (b) | | | 2,965,956 | |
| 5,413 | | Google, Inc. (b) | | | 3,471,032 | |
| 55,298 | | IAC/InterActiveCorp | | | 2,714,579 | |
| | | | | | 9,151,567 | |
| | | IT Services - 0.16% | | | | |
| 4,066 | | Cognizant Technology Solutions
Corp. (b) | | | 312,879 | |
| | | Life Sciences Tools & Services - 2.17% | | | | |
| 54,214 | | Bruker Corp. (b) | | | 830,016 | |
| 17,759 | | Life Technologies Corp. (b) | | | 866,995 | |
| 28,644 | | Waters Corp. (b) | | | 2,654,153 | |
| | | | | | 4,351,164 | |
See notes to financial statements.
34
|
GuideMarkSM Large Cap Growth Fund |
SCHEDULE OF INVESTMENTS (Continued) |
March 31, 2012 |
| | | | | | | |
Number of
Shares | | | | Value | |
| | | COMMON STOCKS (Continued) | | | | |
| | | Machinery - 4.67% | | | | |
| 37,123 | | Caterpillar, Inc. | | $ | 3,954,342 | |
| 9,929 | | Cummins, Inc. | | | 1,191,877 | |
| 16,909 | | Dover Corp. | | | 1,064,253 | |
| 16,748 | | Joy Global, Inc. | | | 1,230,978 | |
| 22,455 | | Parker Hannifin Corp. | | | 1,898,570 | |
| | | | | | 9,340,020 | |
| | | Media - 2.48% | | | | |
| 69,475 | | News Corp. | | | 1,367,963 | |
| 52,333 | | Omnicom Group, Inc. | | | 2,650,666 | |
| 405,563 | | Sirius XM Radio, Inc. (b) | | | 936,851 | |
| | | | | | 4,955,480 | |
| | | Metals & Mining - 0.79% | | | | |
| 11,384 | | Cliffs Natural Resources, Inc. | | | 788,456 | |
| 20,662 | | Freeport-McMoRan Copper &
Gold, Inc. | | | 785,982 | |
| | | | | | 1,574,438 | |
| | | Multiline Retail - 0.67% | | | | |
| 14,157 | | Dollar Tree, Inc. (b) | | | 1,337,695 | |
| | | Oil & Gas - 5.43% | | | | |
| 7,389 | | Anadarko Petroleum Corp. | | | 578,854 | |
| 69,547 | | Exxon Mobil Corp. | | | 6,031,811 | |
| 22,228 | | Occidental Petroleum Corp. | | | 2,116,773 | |
| 71,467 | | Valero Energy Corp. | | | 1,841,705 | |
| 5,002 | | Walter Energy, Inc. | | | 296,168 | |
| | | | | | 10,865,311 | |
| | | Pharmaceuticals - 1.17% | | | | |
| 38,361 | | Abbott Laboratories | | | 2,351,146 | |
| | | Semiconductor & Semiconductor
Equipment - 4.47% | | | | |
| 105,314 | | Altera Corp. | | | 4,193,604 | |
| 40,061 | | Analog Devices, Inc. | | | 1,618,464 | |
| 30,303 | | Intersil Corp. | | | 339,394 | |
| 15,146 | | KLA-Tencor Corp. | | | 824,245 | |
| 54,008 | | Xilinx, Inc. | | | 1,967,511 | |
| | | | | | 8,943,218 | |
| | | Software - 9.03% | | | | |
| 33,432 | | Autodesk, Inc. (b) | | | 1,414,842 | |
| 18,111 | | BMC Software, Inc. (b) | | | 727,338 | |
| 30,278 | | Check Point Software Technologies
Ltd. - ADR (b) | | | 1,932,948 | |
| | | | | | | |
Number of
Shares | | | | Value | |
| | | Software (Continued) | | | | |
| 10,475 | | Citrix Systems, Inc. (b) | | $ | 826,582 | |
| 266,021 | | Microsoft Corp. | | | 8,579,177 | |
| 91,433 | | Oracle Corp. | | | 2,666,186 | |
| 20,826 | | Red Hat, Inc. (b) | | | 1,247,269 | |
| 35,234 | | Symantec Corp. (b) | | | 658,876 | |
| | | | | | 18,053,218 | |
| | | Specialty Retail - 5.81% | | | | |
| 18,054 | | Bed Bath & Beyond, Inc. (b) | | | 1,187,412 | |
| 43,317 | | Lowe’s Companies, Inc. | | | 1,359,287 | |
| 8,549 | | O’Reilly Automotive, Inc. (b) | | | 780,951 | |
| 31,471 | | PetSmart, Inc. | | | 1,800,771 | |
| 37,627 | | Ross Stores, Inc. | | | 2,186,129 | |
| 13,191 | | Sherwin Williams Co. | | | 1,433,466 | |
| 22,009 | | The Buckle, Inc. (a) | | | 1,054,231 | |
| 45,602 | | The TJX Companies, Inc. | | | 1,810,855 | |
| | | | | | 11,613,102 | |
| | | Textiles, Apparel & Luxury Goods - 2.02% | | | | |
| 28,157 | | Coach, Inc. | | | 2,175,973 | |
| 10,816 | | Lululemon Athletica, Inc. (b) | | | 807,739 | |
| 6,084 | | Polo Ralph Lauren Corp. | | | 1,060,624 | |
| | | | | | 4,044,336 | |
| | | Tobacco - 1.85% | | | | |
| 41,745 | | Philip Morris International, Inc. | | | 3,699,024 | |
| | | Total Common Stocks
(Cost $151,676,517) | | | 198,287,230 | |
| | | SHORT TERM INVESTMENTS - 0.96% | | | | |
| | | Money Market Funds - 0.96% | | | | |
| 1,913,212 | | Federated Prime Obligations Fund
Effective Yield, 0.20% | | | 1,913,212 | |
| | | Total Short Term Investments
(Cost $1,913,212) | | | 1,913,212 | |
| | | INVESTMENTS PURCHASED
AS SECURITIES LENDING
COLLATERAL - 1.52% | | | | |
| | | Money Market Funds - 1.50% | | | | |
| 3,009,888 | | First American Government
Obligations Fund
Effective Yield, 0.02% | | | 3,009,888 | |
| 20,508 | | Reserve Primary Fund (c) | | | 792 | |
| | | Total Money Market Funds
(Cost $3,027,580) | | | 3,010,680 | |
See notes to financial statements.
35
|
GuideMarkSM Large Cap Growth Fund |
SCHEDULE OF INVESTMENTS (Continued) |
March 31, 2012 |
| | | | | | | |
Principal
Amount | | | | Value | |
| | | Cash - 0.02% | | | | |
| $39,642 | | Cash | | $ | 39,642 | |
| | | Total Cash (Cost $39,642) | | | 39,642 | |
| | | Total Investments Purchased as
Securities Lending Collateral
(Cost $3,067,222) | | | 3,050,322 | |
| | | Total Investments
(Cost $156,656,951) - 101.63% | | | 203,250,764 | |
| | | Liabilities in Excess of
Other Assets - (1.63)% | | | (3,266,096 | ) |
| | | TOTAL NET
ASSETS - 100.00% | | $ | 199,984,668 | |
| |
Percentages are stated as a percent of net assets.
ADR - American Depositary Receipt |
(a) | All or portion of this security is on loan. |
(b) | Non-income producing security. |
(c) | As of March 31, 2012, the Fund has fair valued this security and deemed it illiquid. The value of this security was $792, which represents 0.00% of total net assets. |
See notes to financial statements.
36
|
GuideMarkSM Large Cap Value Fund |
SCHEDULE OF INVESTMENTS |
March 31, 2012 |
| | | | | | | |
Number of
Shares | | | | Value | |
| | | COMMON STOCKS - 95.49% | | | | |
| | | Aerospace & Defense - 4.14% | | | | |
| 28,400 | | Exelis, Inc. | | $ | 355,568 | |
| 41,800 | | Honeywell International, Inc. | | | 2,551,890 | |
| 43,200 | | L-3 Communications Holdings, Inc. | | | 3,057,264 | |
| 46,200 | | Raytheon Co. | | | 2,438,436 | |
| | | | | | 8,403,158 | |
| | | Building Products - 1.03% | | | | |
| 156,800 | | Masco Corp. | | | 2,096,416 | |
| | | Capital Markets - 1.76% | | | | |
| 31,400 | | Ameriprise Financial, Inc. | | | 1,793,882 | |
| 39,200 | | State Street Corp. | | | 1,783,600 | |
| | | | | | 3,577,482 | |
| | | Commercial Banks - 4.72% | | | | |
| 167,800 | | Fifth Third Bancorp | | | 2,357,590 | |
| 62,500 | | PNC Financial Services Group, Inc. | | | 4,030,625 | |
| 93,000 | | Wells Fargo & Co. | | | 3,175,020 | |
| | | | | | 9,563,235 | |
| | | Computers & Peripherals - 1.45% | | | | |
| 14,100 | | International Business Machines
Corp. | | | 2,941,965 | |
| | | Consumer Finance - 8.66% | | | | |
| 56,000 | | American Express Co. | | | 3,240,160 | |
| 118,800 | | Capital One Financial Corp. | | | 6,621,912 | |
| 90,500 | | Discover Financial Services | | | 3,017,270 | |
| 297,000 | | SLM Corp. | | | 4,680,720 | |
| | | | | | 17,560,062 | |
| | | Containers & Packaging - 0.95% | | | | |
| 58,300 | | Sonoco Products Co. | | | 1,935,560 | |
| | | Diversified Financial Services - 3.68% | | | | |
| 172,700 | | Bank of America Corp. | | | 1,652,739 | |
| 65,980 | | Citigroup, Inc. | | | 2,411,569 | |
| 74,000 | | JPMorgan Chase & Co. | | | 3,402,520 | |
| | | | | | 7,466,828 | |
| | | Diversified Telecommunication Services - 1.91% | | | | |
| 86,500 | | AT&T, Inc. | | | 2,701,395 | |
| 30,500 | | Verizon Communications, Inc. | | | 1,166,015 | |
| | | | | | 3,867,410 | |
| | | Electric Utilities - 0.84% | | | | |
| 35,700 | | Pinnacle West Capital Corp. | | | 1,710,030 | |
| | | | | | | |
Number of
Shares | | | | Value | |
| | | Electrical Equipment - 0.75% | | | | |
| 29,300 | | Emerson Electric Co. | | $ | 1,528,874 | |
| | | Electronic Equipment & Instruments - 1.80% | | | | |
| 71,000 | | Corning, Inc. | | | 999,680 | |
| 94,200 | | Molex, Inc. (a) | | | 2,648,904 | |
| | | | | | 3,648,584 | |
| | | Energy Equipment & Services - 1.29% | | | | |
| 69,600 | | SeaDrill Ltd. (a) | | | 2,610,696 | |
| | | Food & Staples Retailing - 2.56% | | | | |
| 71,000 | | CVS Caremark Corp. | | | 3,180,800 | |
| 60,200 | | Walgreen Co. | | | 2,016,098 | |
| | | | | | 5,196,898 | |
| | | Gas Utilities - 0.57% | | | | |
| 14,100 | | ONEOK, Inc. | | | 1,151,406 | |
| | | Health Care Equipment & Supplies - 3.14% | | | | |
| 39,300 | | Baxter International, Inc. | | | 2,349,354 | |
| 76,900 | | Medtronic, Inc. | | | 3,013,711 | |
| 22,600 | | St. Jude Medical, Inc. | | | 1,001,406 | |
| | | | | | 6,364,471 | |
| | | Health Care Providers & Services - 8.18% | | | | |
| 46,400 | | Cardinal Health, Inc. | | | 2,000,304 | |
| 43,000 | | CIGNA Corp. | | | 2,117,750 | |
| 79,600 | | Coventry Health Care, Inc. | | | 2,831,372 | |
| 72,300 | | Omnicare, Inc. | | | 2,571,711 | |
| 65,900 | | UnitedHealth Group, Inc. | | | 3,884,146 | |
| 43,100 | | WellPoint, Inc. | | | 3,180,780 | |
| | | | | | 16,586,063 | |
| | | Hotels, Restaurants & Leisure - 3.74% | | | | |
| 86,600 | | Carnival Corp. - ADR | | | 2,778,128 | |
| 144,000 | | International Game Technology | | | 2,417,760 | |
| 81,000 | | Royal Caribbean Cruises Ltd. | | | 2,383,830 | |
| | | | | | 7,579,718 | |
| | | Household Durables - 3.08% | | | | |
| 81,200 | | Stanley Black & Decker, Inc. | | | 6,249,152 | |
| | | Industrial Conglomerates - 1.80% | | | | |
| 123,400 | | General Electric Co. | | | 2,476,638 | |
| 20,900 | | Tyco International Ltd. - ADR | | | 1,174,162 | |
| | | | | | 3,650,800 | |
See notes to financial statements.
37
|
GuideMarkSM Large Cap Value Fund |
SCHEDULE OF INVESTMENTS (Continued) |
March 31, 2012 |
| | | | | | | |
Number of
Shares | | | | Value | |
| | | COMMON STOCKS (Continued) | | | | |
| | | Insurance - 3.33% | | | | |
| 19,200 | | Chubb Corp. | | $ | 1,326,912 | |
| 22,700 | | Travelers Companies, Inc. | | | 1,343,840 | |
| 61,600 | | Willis Group Holdings Plc | | | 2,154,768 | |
| 89,000 | | XL Group Plc | | | 1,930,410 | |
| | | | | | 6,755,930 | |
| | | IT Services - 0.72% | | | | |
| 83,100 | | The Western Union Co. | | | 1,462,560 | |
| | | Machinery - 3.98% | | | | |
| 42,400 | | Eaton Corp. | | | 2,112,792 | |
| 53,300 | | Illinois Tool Works, Inc. | | | 3,044,496 | |
| 14,250 | | ITT Corp. | | | 326,895 | |
| 23,100 | | SPX Corp. | | | 1,790,943 | |
| 28,500 | | Xylem, Inc. | | | 790,875 | |
| | | | | | 8,066,001 | |
| | | Multiline Retail - 1.05% | | | | |
| 36,600 | | Target Corp. | | | 2,132,682 | |
| | | Multi-Utilities - 1.79% | | | | |
| 93,800 | | CenterPoint Energy, Inc. | | | 1,849,736 | |
| 67,200 | | Xcel Energy, Inc. | | | 1,778,784 | |
| | | | | | 3,628,520 | |
| | | Office Electronics - 0.72% | | | | |
| 181,100 | | Xerox Corp. | | | 1,463,288 | |
| | | Oil & Gas - 9.40% | | | | |
| 76,600 | | BP Plc - ADR | | | 3,447,000 | |
| 15,600 | | Chevron Corp. | | | 1,672,944 | |
| 40,900 | | ConocoPhillips | | | 3,108,809 | |
| 68,300 | | Marathon Oil Corp. | | | 2,165,110 | |
| 29,000 | | Murphy Oil Corp. | | | 1,631,830 | |
| 32,600 | | Occidental Petroleum Corp. | | | 3,104,498 | |
| 21,400 | | Royal Dutch Shell Plc - ADR | | | 1,500,782 | |
| 77,300 | | Spectra Energy Corp. | | | 2,438,815 | |
| | | | | | 19,069,788 | |
| | | Pharmaceuticals - 4.29% | | | | |
| 46,800 | | Johnson & Johnson | | | 3,086,928 | |
| 149,100 | | Pfizer, Inc. | | | 3,378,606 | |
| 31,000 | | Sanofi Aventis - ADR | | | 1,201,250 | |
| 23,000 | | Teva Pharmaceutical Industries
Ltd. - ADR | | | 1,036,380 | |
| | | | | | 8,703,164 | |
| | | | | | | |
Number of
Shares | | | | Value | |
| | | Professional Services - 0.72% | | | | |
| 17,200 | | The Dun & Bradstreet Corp. | | $ | 1,457,356 | |
| | | Semiconductor & Semiconductor
Equipment - 3.04% | | | | |
| 91,400 | | Applied Materials, Inc. | | | 1,137,016 | |
| 59,700 | | Microchip Technology, Inc. (a) | | | 2,220,840 | |
| 83,400 | | Texas Instruments, Inc. | | | 2,803,074 | |
| | | | | | 6,160,930 | |
| | | Software - 1.85% | | | | |
| 30,800 | | CA, Inc. | | | 848,848 | |
| 90,100 | | Microsoft Corp. | | | 2,905,725 | |
| | | | | | 3,754,573 | |
| | | Specialty Retail - 0.65% | | | | |
| 35,100 | | Rent-A-Center, Inc. | | | 1,325,025 | |
| | | Textiles, Apparel & Luxury Goods - 0.99% | | | | |
| 67,600 | | Hanesbrands, Inc. (b) | | | 1,996,904 | |
| | | Thrifts & Mortgage Finance - 0.96% | | | | |
| 139,800 | | New York Community Bancorp,
Inc. (a) | | | 1,944,618 | |
| | | Tobacco - 5.19% | | | | |
| 62,000 | | Altria Group, Inc. | | | 1,913,940 | |
| 19,000 | | Lorillard, Inc. | | | 2,460,120 | |
| 45,900 | | Philip Morris International, Inc. | | | 4,067,199 | |
| 50,200 | | Reynolds American, Inc. | | | 2,080,288 | |
| | | | | | 10,521,547 | |
| | | Wireless Telecommunication Services - 0.76% | | | | |
| 55,300 | | Vodafone Group Plc - ADR | | | 1,530,151 | |
| | | Total Common Stocks
(Cost $169,065,505) | | | 193,661,845 | |
| | | REAL ESTATE INVESTMENT
TRUSTS - 1.69% | | | | |
| | | Real Estate Investment Trusts - 1.69% | | | | |
| 67,800 | | Annaly Capital Management,
Inc. (a) | | | 1,072,596 | |
| 15,500 | | Essex Property Trust, Inc. (a) | | | 2,348,405 | |
| | | Total Real Estate Investment Trusts
(Cost $2,904,161) | | | 3,421,001 | |
See notes to financial statements.
38
|
GuideMarkSM Large Cap Value Fund |
SCHEDULE OF INVESTMENTS (Continued) |
March 31, 2012 |
| | | | | | | |
Number of
Shares | | | | Value | |
| | | SHORT TERM INVESTMENTS - 2.98% | | | | |
| | | Money Market Funds - 2.98% | | | | |
| 6,045,167 | | Federated Prime Obligations Fund
Effective Yield, 0.20% | | $ | 6,045,167 | |
| | | Total Short Term Investments
(Cost $6,045,167) | | | 6,045,167 | |
| | | INVESTMENTS PURCHASED
AS SECURITIES LENDING
COLLATERAL - 4.31% | | | | |
| | | Money Market Funds - 4.25% | | | | |
| 8,629,085 | | First American Government
Obligations Fund
Effective Yield, 0.02% | | | 8,629,085 | |
| 23,460 | | Reserve Primary Fund (c) | | | 906 | |
| | | Total Money Market Funds
(Cost $8,649,328) | | | 8,629,991 | |
| | | | | | | |
Principal
Amount | | | | Value | |
| | | Cash - 0.06% | | | | |
| $113,651 | | Cash | | $ | 113,651 | |
| | | Total Cash (Cost $113,651) | | | 113,651 | |
| | | Total Investments Purchased as
Securities Lending Collateral
(Cost $8,762,979) | | | 8,743,642 | |
| | | Total Investments
(Cost $186,777,812) - 104.47% | | | 211,871,655 | |
| | | Liabilities in Excess of
Other Assets - (4.47)% | | | (9,072,877 | ) |
| | | TOTAL NET
ASSETS - 100.00% | | $ | 202,798,778 | |
| |
Percentages are stated as a percent of net assets. |
ADR - American Depositary Receipt |
(a) | All or portion of this security is on loan. |
(b) | Non-income producing security. |
(c) | As of March 31, 2012, the Fund has fair valued this security and deemed it illiquid. The value of this security was $906, which represents 0.00% of total net assets. |
See notes to financial statements.
39
|
GuideMarkSM Small/Mid Cap Core Fund |
SCHEDULE OF INVESTMENTS |
March 31, 2012 |
| |
| | | | | | | |
Number of
Shares | | | | Value | |
| | | | | | |
| | | | | | |
| | | COMMON STOCKS - 88.55% | | | | |
| | | Aerospace & Defense - 1.96% | | | | |
| 19,720 | | BE Aerospace, Inc. (b) | | $ | 916,388 | |
| 9,790 | | Triumph Group, Inc. | | | 613,442 | |
| | | | | | | |
| | | | | | 1,529,830 | |
| | | | | | | |
| | | Airlines - 0.81% | | | | |
| 8,000 | | Copa Holdings SA | | | 633,600 | |
| | | | | | | |
| | | Auto Components - 0.90% | | | | |
| 7,370 | | Tenneco, Inc. (b) | | | 273,796 | |
| 9,280 | | TRW Automotive Holdings | | | | |
| | | Corp. (b) | | | 431,056 | |
| | | | | | | |
| | | | | | 704,852 | |
| | | | | | | |
| | | Biotechnology - 3.15% | | | | |
| 33,000 | | Amarin Corp. Plc - ADR (b) | | | 373,560 | |
| 14,920 | | BioMarin Pharmaceutical, Inc. (b) | | | 511,010 | |
| 34,980 | | Chelsea Therapeutics International | | | | |
| | | Ltd. (a)(b) | | | 89,549 | |
| 53,920 | | Dendreon Corp. (a)(b) | | | 574,518 | |
| 6,010 | | Medivation, Inc. (a)(b) | | | 449,067 | |
| 12,150 | | Onyx Pharmaceuticals, Inc. (b) | | | 457,812 | |
| | | | | | | |
| | | | | | 2,455,516 | |
| | | | | | | |
| | | Capital Markets - 2.22% | | | | |
| 40,900 | | FXCM, Inc. | | | 531,291 | |
| 45,100 | | Invesco Ltd. | | | 1,202,817 | |
| | | | | | | |
| | | | | | 1,734,108 | |
| | | | | | | |
| | | Chemicals - 3.32% | | | | |
| 5,390 | | Airgas, Inc. | | | 479,548 | |
| 12,440 | | Ashland, Inc. | | | 759,586 | |
| 6,350 | | Cytec Industries, Inc. | | | 386,017 | |
| 11,580 | | Innospec, Inc. (b) | | | 351,800 | |
| 11,810 | | Rockwood Holdings, Inc. (b) | | | 615,892 | |
| | | | | | | |
| | | | | | 2,592,843 | |
| | | | | | | |
| | | Commercial Banks - 5.03% | | | | |
| 35,410 | | Comerica, Inc. | | | 1,145,868 | |
| 13,860 | | First Horizon National Corp. | | | 143,867 | |
| 48,380 | | FirstMerit Corp. | | | 815,687 | |
| 25,800 | | IBERIABANK Corp. | | | 1,379,526 | |
| 67,040 | | Regions Financial Corp. | | | 441,793 | |
| | | | | | | |
| | | | | | 3,926,741 | |
| | | | | | | |
| | | | | | | |
Number of
Shares | | | | Value | |
| | | | | | |
| | | Commercial Services & Supplies - 1.19% | | | | |
| 12,540 | | Multi-Color Corp. | | $ | 282,275 | |
| 19,860 | | Waste Connections, Inc. | | | 646,046 | |
| | | | | | | |
| | | | | | 928,321 | |
| | | | | | | |
| | | Communications Equipment - 3.91% | | | | |
| 20,110 | | Acme Packet, Inc. (a)(b) | | | 553,427 | |
| 24,910 | | ADTRAN, Inc. | | | 776,943 | |
| 42,650 | | Juniper Networks, Inc. (b) | | | 975,832 | |
| 19,450 | | NetGear, Inc. (b) | | | 742,990 | |
| | | | | | | |
| | | | | | 3,049,192 | |
| | | | | | | |
| | | Computers & Peripherals - 1.84% | | | | |
| 34,090 | | NCR Corp. (b) | | | 740,094 | |
| 16,760 | | Western Digital Corp. (b) | | | 693,696 | |
| | | | | | | |
| | | | | | 1,433,790 | |
| | | | | | | |
| | | Construction & Engineering - 1.68% | | | | |
| 36,870 | | KBR, Inc. | | | 1,310,728 | |
| | | | | | | |
| | | Consumer Finance - 1.54% | | | | |
| 63,760 | | DFC Global Corp. (b) | | | 1,203,151 | |
| | | | | | | |
| | | Containers & Packaging - 0.70% | | | | |
| 8,100 | | Rock-Tenn Co. | | | 547,236 | |
| | | | | | | |
| | | Diversified Financial Services - 0.89% | | | | |
| 40,930 | | Interactive Brokers Group, Inc. | | | 695,810 | |
| | | | | | | |
| | | Diversified Telecommunication Services - 0.23% | | | | |
| 3,840 | | Cogent Communications Group, | | | | |
| | | Inc. (b) | | | 73,267 | |
| 26,160 | | Frontier Communications | | | | |
| | | Corp. (a) | | | 109,087 | |
| | | | | | | |
| | | | | | 182,354 | |
| | | | | | | |
| | | Electric Utilities - 3.02% | | | | |
| 32,170 | | AES Corp. (b) | | | 420,462 | |
| 8,900 | | ITC Holdings Corp. | | | 684,766 | |
| 12,180 | | Northeast Utilities | | | 452,122 | |
| 11,180 | | Portland General Electric Co. | | | 279,276 | |
| 15,040 | | UIL Holdings Corp. | | | 522,790 | |
| | | | | | | |
| | | | | | 2,359,416 | |
| | | | | | | |
| | | Electrical Equipment - 2.56% | | | | |
| 30,300 | | AMETEK, Inc. | | | 1,469,853 | |
| 8,100 | | Regal Beloit Corp. | | | 530,955 | |
| | | | | | | |
| | | | | | 2,000,808 | |
| | | | | | | |
See notes to financial statements.
40
|
GuideMarkSM Small/Mid Cap Core Fund |
SCHEDULE OF INVESTMENTS (Continued) |
March 31, 2012 |
| |
| | | | | | | |
Number of
Shares | | | | Value | |
| | | | | | |
| | | COMMON STOCKS (Continued) | | | | |
| | | Energy Equipment & Services - 2.27% | | | | |
| 6,900 | | Oil States International, Inc. (b) | | $ | 538,614 | |
| 2,990 | | OYO Geospace Corp. (b) | | | 314,937 | |
| 10,200 | | Rowan Companies, Inc. (b) | | | 335,886 | |
| 10,790 | | Tidewater, Inc. | | | 582,876 | |
| | | | | | | |
| | | | | | 1,772,313 | |
| | | | | | | |
| | | Food & Staples Retailing - 0.29% | | | | |
| 4,830 | | United Natural Foods, Inc. (b) | | | 225,368 | |
| | | | | | | |
| | | Food Products - 1.83% | | | | |
| 38,640 | | Chiquita Brands International, | | | | |
| | | Inc. (b) | | | 339,646 | |
| 45,090 | | Flowers Foods, Inc. | | | 918,483 | |
| 3,680 | | Green Mountain Coffee Roasters, | | | | |
| | | Inc. (a)(b) | | | 172,371 | |
| | | | | | | |
| | | | | | 1,430,500 | |
| | | | | | | |
| | | Health Care Equipment & Supplies - 2.95% | | | | |
| 3,260 | | Analogic Corp. | | | 220,180 | |
| 13,970 | | Conceptus, Inc. (b) | | | 200,889 | |
| 4,930 | | DENTSPLY International, Inc. | | | 197,841 | |
| 6,760 | | Gen-Probe, Inc. (b) | | | 448,932 | |
| 16,320 | | Hologic, Inc. (b) | | | 351,696 | |
| 8,450 | | Meridian Bioscience, Inc. | | | 163,761 | |
| 6,190 | | Sirona Dental Systems, Inc. (b) | | | 319,032 | |
| 7,730 | | Thoratec Corp. (b) | | | 260,578 | |
| 7,330 | | Wright Medical Group, Inc. (a)(b) | | | 141,616 | |
| | | | | | | |
| | | | | | 2,304,525 | |
| | | | | | | |
| | | Health Care Providers & Services - 1.52% | | | | |
| 20,410 | | Hanger Orthopedic Group, Inc. (b) | | | 446,163 | |
| 9,910 | | Patterson Companies, Inc. | | | 330,994 | |
| 9,830 | | Universal Health Services, Inc. | | | 411,975 | |
| | | | | | | |
| | | | | | 1,189,132 | |
| | | | | | | |
| | | Hotels, Restaurants & Leisure - 1.66% | | | | |
| 42,510 | | International Game Technology | | | 713,743 | |
| 13,490 | | Penn National Gaming, Inc. (b) | | | 579,800 | |
| | | | | | | |
| | | | | | 1,293,543 | |
| | | | | | | |
| | | Industrial Conglomerates - 1.68% | | | | |
| 26,290 | | Carlisle Companies, Inc. | | | 1,312,397 | |
| | | | | | | |
| | | | | | | |
Number of
Shares | | | | Value | |
| | | | | | |
| | | Insurance - 3.16% | | | | |
| 2,380 | | Delphi Financial Group, Inc. | | $ | 106,553 | |
| 20,100 | | Platinum Underwriters Holdings | | | | |
| | | Ltd. | | | 733,650 | |
| 27,270 | | Reinsurance Group of America | | | 1,621,747 | |
| | | | | | | |
| | | | | | 2,461,950 | |
| | | | | | | |
| | | Internet Software & Services - 1.28% | | | | |
| 15,650 | | Akamai Technologies, Inc. (b) | | | 574,355 | |
| 35,610 | | Responsys, Inc. (b) | | | 426,252 | |
| | | | | | | |
| | | | | | 1,000,607 | |
| | | | | | | |
| | | IT Services - 1.41% | | | | |
| 38,600 | | Genpact Ltd. (b) | | | 629,180 | |
| 37,580 | | Sapient Corp. | | | 467,871 | |
| | | | | | | |
| | | | | | 1,097,051 | |
| | | | | | | |
| | | Life Sciences Tools & Services - 0.92% | | | | |
| 22,000 | | Qiagen NV (a)(b) | | | 342,540 | |
| 2,920 | | Sequenom, Inc. (b) | | | 11,884 | |
| 5,150 | | Techne Corp. | | | 361,015 | |
| | | | | | | |
| | | | | | 715,439 | |
| | | | | | | |
| | | Machinery - 5.13% | | | | |
| 13,560 | | AGCO Corp. (b) | | | 640,168 | |
| 32,750 | | Colfax Corp. (b) | | | 1,154,110 | |
| 30,410 | | Commercial Vehicle Group, Inc. (b) | | | 371,306 | |
| 6,550 | | Flowserve Corp. | | | 756,590 | |
| 19,870 | | Nordson Corp. (a) | | | 1,083,114 | |
| | | | | | | |
| | | | | | 4,005,288 | |
| | | | | | | |
| | | Media - 3.21% | | | | |
| 49,820 | | Cablevision Systems Corp. | | | 731,358 | |
| 69,480 | | Regal Entertainment Group (a) | | | 944,928 | |
| 16,980 | | Scripps Networks Interactive, Inc. | | | 826,756 | |
| | | | | | | |
| | | | | | 2,503,042 | |
| | | | | | | |
| | | Metals & Mining - 1.61% | | | | |
| 7,600 | | Compass Minerals International, | | | | |
| | | Inc. | | | 545,224 | |
| 12,540 | | Reliance Steel & Aluminum Co. | | | 708,259 | |
| | | | | | | |
| | | | | | 1,253,483 | |
| | | | | | | |
| | | Multiline Retail - 1.08% | | | | |
| 13,310 | | Family Dollar Stores, Inc. | | | 842,257 | |
| | | | | | | |
See notes to financial statements.
41
|
GuideMarkSM Small/Mid Cap Core Fund |
SCHEDULE OF INVESTMENTS (Continued) |
March 31, 2012 |
| |
| | | | | | | |
Number of
Shares | | | | Value | |
| | | | | | |
| | | COMMON STOCKS (Continued) | | | | |
| | | Multi-Utilities - 1.08% | | | | |
| 15,740 | | OGE Energy Corp. | | $ | 842,090 | |
| | | | | | | |
| | | Oil & Gas - 4.18% | | | | |
| 7,040 | | Berry Petroleum Co. | | | 331,795 | |
| 5,580 | | Concho Resources, Inc. (b) | | | 569,607 | |
| 30,080 | | Denbury Resources, Inc. (b) | | | 548,358 | |
| 5,480 | | Pioneer Natural Resources Co. | | | 611,513 | |
| 9,060 | | SM Energy Co. | | | 641,176 | |
| 9,500 | | Walter Energy, Inc. | | | 562,495 | |
| | | | | | | |
| | | | | | 3,264,944 | |
| | | | | | | |
| | | Personal Products - 1.07% | | | | |
| 14,380 | | Nu Skin Enterprises, Inc. | | | 832,746 | |
| | | | | | | |
| | | Pharmaceuticals - 1.41% | | | | |
| 11,290 | | Endo Pharmaceuticals Holdings, | | | | |
| | | Inc. (b) | | | 437,262 | |
| 17,580 | | Medicis Pharmaceutical Corp. | | | 660,832 | |
| | | | | | | |
| | | | | | 1,098,094 | |
| | | | | | | |
| | | Semiconductor & Semiconductor | | | | |
| | | Equipment - 2.96% | | | | |
| 12,000 | | Avago Technologies Ltd. | | | 467,640 | |
| 23,190 | | Cirrus Logic, Inc. (a)(b) | | | 551,922 | |
| 73,390 | | LSI Corp. (b) | | | 637,025 | |
| 9,150 | | M/A-Com Technology Solutions | | | | |
| | | Holdings (b) | | | 189,771 | |
| 17,300 | | NXP Semiconductors NV (b) | | | 460,353 | |
| | | | | | | |
| | | | | | 2,306,711 | |
| | | | | | | |
| | | Software - 4.16% | | | | |
| 29,700 | | Allot Communications Ltd (b) | | | 690,525 | |
| 29,460 | | Ariba, Inc. (b) | | | 963,636 | |
| 16,200 | | Check Point Software Technologies | | | | |
| | | Ltd. - ADR (b) | | | 1,034,208 | |
| 60,520 | | Compuware Corp. (b) | | | 556,179 | |
| | | | | | | |
| | | | | | 3,244,548 | |
| | | | | | | |
| | | Specialty Retail - 4.30% | | | | |
| 19,540 | | Abercrombie & Fitch Co. | | | 969,380 | |
| 16,110 | | PetSmart, Inc. | | | 921,814 | |
| 21,090 | | Urban Outfitters, Inc. (b) | | | 613,930 | |
| 19,320 | | Vitamin Shoppe, Inc. (b) | | | 854,137 | |
| | | | | | | |
| | | | | | 3,359,261 | |
| | | | | | | |
| | | | | | | |
Number of
Shares | | | | Value | |
| | | | | | |
| | | Textiles, Apparel & Luxury Goods - 2.59% | | | | |
| 12,490 | | Deckers Outdoor Corp. (b) | | $ | 787,494 | |
| 21,990 | | Hanesbrands, Inc. (b) | | | 649,585 | |
| 7,850 | | Lululemon Athletica, Inc. (b) | | | 586,238 | |
| | | | | | | |
| | | | | | 2,023,317 | |
| | | | | | | |
| | | Trading Companies & Distributors - 0.31% | | | | |
| 3,740 | | Wesco International, Inc. (b) | | | 244,259 | |
| | | | | | | |
| | | Water Utilities - 0.80% | | | | |
| 18,330 | | American Water Works Co., Inc. | | | 623,770 | |
| | | | | | | |
| | | Wireless Telecommunication Services - 0.74% | | | | |
| 4,140 | | NII Holdings, Inc. (b) | | | 75,803 | |
| 9,890 | | SBA Communications Corp. (b) | | | 502,511 | |
| | | | | | | |
| | | ` | | | 578,314 | |
| | | | | | | |
| | | Total Common Stocks | | | | |
| | | (Cost $61,805,510) | | | 69,113,245 | |
| | | | | | | |
| | | REAL ESTATE INVESTMENT TRUSTS - 8.38% | | | | |
| | | Real Estate Investment Trusts - 8.38% | | | | |
| 28,220 | | American Campus Communities, | | | | |
| | | Inc. | | | 1,261,999 | |
| 78,390 | | Douglas Emmett, Inc. (a) | | | 1,788,076 | |
| 5,530 | | Essex Property Trust, Inc. (a) | | | 837,850 | |
| 35,380 | | Extra Space Storage, Inc. | | | 1,018,590 | |
| 34,820 | | Post Properties, Inc. | | | 1,631,665 | |
| | | | | | | |
| | | Total Real Estate Investment Trusts | | | | |
| | | (Cost $5,699,146) | | | 6,538,180 | |
| | | | | | | |
| | | SHORT TERM INVESTMENTS - 2.95% | | | | |
| | | Money Market Funds - 2.95% | | | | |
| 2,305,953 | | Federated Prime Obligations Fund | | | | |
| | | Effective Yield, 0.20% | | | 2,305,953 | |
| | | | | | | |
| | | Total Short Term Investments | | | | |
| | | (Cost $2,305,953) | | | 2,305,953 | |
| | | | | | | |
| | | INVESTMENTS PURCHASED | | | | |
| | | AS SECURITIES LENDING | | | | |
| | | COLLATERAL - 5.68% | | | | |
| | | Money Market Funds - 5.61% | | | | |
| 4,378,694 | | First American Government | | | | |
| | | Obligations Fund | | | | |
| | | Effective Yield, 0.02% | | | 4,378,694 | |
| 6,386 | | Reserve Primary Fund (c) | | | 247 | |
| | | | | | | |
| | | Total Money Market Funds | | | | |
| | | (Cost $4,384,201) | | | 4,378,941 | |
| | | | | | | |
See notes to financial statements.
42
|
GuideMarkSM Small/Mid Cap Core Fund |
SCHEDULE OF INVESTMENTS (Continued) |
March 31, 2012 |
| |
| | | | | | | |
Principal
Amount | | | | Value | |
| | | | | | | | |
| | | Cash - 0.07% | | | | |
$ | 57,670 | | Cash | | $ | 57,670 | |
| | | | | | | |
| | | Total Cash (Cost $57,670) | | | 57,670 | |
| | | | | | | |
| | | Total Investments Purchased as | | | | |
| | | Securities Lending Collateral | | | | |
| | | (Cost $4,441,871) | | | 4,436,611 | |
| | | | | | | |
| | | Total Investments | | | | |
| | | (Cost $74,252,480)- 105.56% | | | 82,393,989 | |
| | | Liabilities in Excess | | | | |
| | | of Other Assets - (5.56)% | | | (4,343,232 | ) |
| | | | | | | |
| | | TOTAL NET | | | | |
| | | ASSETS - 100.00% | | $ | 78,050,757 | |
| | | | | | | |
Percentages are stated as a percent of net assets.
| |
ADR - American Depositary Receipt |
(a) | All or portion of this security is on loan. |
(b) | Non-income producing security. |
(c) | As of March 31, 2012, the Fund has fair valued this security and deemed it illiquid. The value of this security was $247, which represents 0.00% of total net assets. |
See notes to financial statements.
43
|
GuideMarkSM World ex-US Fund |
SCHEDULE OF INVESTMENTS |
March 31, 2012 |
| |
| | | | | | | |
Number of
Shares | | | | Value | |
| | | | | | |
| | | COMMON STOCKS - 94.91% | | | | |
| | | Australia - 5.59% | | | | |
| 5,700 | | ASX Ltd. | | $ | 196,012 | |
| 78,779 | | Australia and New Zealand | | | | |
| | | Banking Group Ltd. | | | 1,900,485 | |
| 40,618 | | BHP Billiton Ltd. | | | 1,464,266 | |
| 35,133 | | Commonwealth Bank of Australia | | | 1,823,161 | |
| 24,147 | | CSL Ltd. | | | 899,195 | |
| 89,072 | | Fortescue Metals Group Ltd. | | | 537,506 | |
| 298,700 | | Goodman Group (b) | | | 214,442 | |
| 26,700 | | Iluka Resources | | | 495,122 | |
| 15,888 | | Medusa Mining Ltd. | | | 82,787 | |
| 22,440 | | Newcrest Mining Ltd. | | | 690,181 | |
| 24,210 | | Oil Search Ltd. | | | 175,189 | |
| 61,264 | | Origin Energy Ltd. | | | 847,700 | |
| 63,020 | | Suncorp Group Ltd. | | | 549,661 | |
| 258,570 | | Sydney Airport (b) | | | 769,394 | |
| 131,160 | | Telstra Corp. Ltd. | | | 446,734 | |
| 126,670 | | Treasury Wine Estates Ltd. | | | 539,617 | |
| 77,330 | | Westfield Group (b) | | | 708,971 | |
| 9,899 | | Worleyparsons Ltd. | | | 293,286 | |
| | | | | | | |
| | | | | | 12,633,709 | |
| | | | | | | |
| | | Belgium - 0.70% | | | | |
| 14,654 | | KBC Groep NV | | | 368,567 | |
| 22,010 | | Umicore SA | | | 1,213,129 | |
| | | | | | | |
| | | | | | 1,581,696 | |
| | | | | | | |
| | | Bermuda - 0.27% | | | | |
| 403,000 | | COSCO Pacific Ltd. | | | 609,974 | |
| | | | | | | |
| | | Brazil - 2.31% | | | | |
| 900 | | Banco Bradesco SA | | | 13,386 | |
| 11,350 | | Banco do Estado do Rio | | | | |
| | | Grande do Sul | | | 122,550 | |
| 24,400 | | BM&FBovespa SA | | | 149,572 | |
| 26,200 | | Cia de Saneamento Basico do | | | | |
| | | Estado de Sau Paulo | | | 997,651 | |
| 44,500 | | Embraer SA | | | 352,499 | |
| 11,800 | | Iguatemi Empresa de Shopping | | | | |
| | | Centers SA | | | 270,848 | |
| 53,200 | | OGX Petroleo e Gas | | | | |
| | | Participacoes SA (b) | | | 440,650 | |
| 64,500 | | PDG Realty SA Empreendimentos e | | | | |
| | | Participacoes | | | 222,249 | |
| | | | | | | |
Number of
Shares | | | | Value | |
| | | | | | |
| | | Brazil (Continued) | | | | |
| 78,600 | | Petroleo Brasileiro SA | | $ | 1,041,570 | |
| 58,200 | | Raia Drogasil SA | | | 558,901 | |
| 120,490 | | Tim Participacoes SA | | | 765,666 | |
| 8,559 | | Tim Participacoes SA - ADR (a) | | | 276,113 | |
| | | | | | | |
| | | | | | 5,211,655 | |
| | | | | | | |
| | | Canada - 8.32% | | | | |
| 24,000 | | Alamos Gold, Inc. (b) | | | 440,563 | |
| 14,100 | | Alimentation Couche Tard, Inc. (b) | | | 462,956 | |
| 20,500 | | Bank of Montreal | | | 1,218,758 | |
| 69,500 | | Banro Corp. (b) | | | 321,911 | |
| 12,700 | | Barrick Gold Corp. (b) | | | 551,952 | |
| 10,500 | | Baytex Energy Corp. (b) | | | 545,185 | |
| 12,900 | | Brookfield Office Properties, | | | | |
| | | Inc. (b) | | | 224,387 | |
| 6,600 | | Canadian National Railway Co. (b) | | | 524,520 | |
| 28,700 | | Cenovus Energy, Inc. (b) | | | 1,032,964 | |
| 12,400 | | Crescent Point Energy Corp. (b) | | | 533,817 | |
| 20,100 | | Dollarama, Inc. (b) | | | 937,442 | |
| 47,620 | | Eldorado Gold Corp. (b) | | | 654,062 | |
| 29,900 | | First Quantum Minerals Ltd. | | | 570,152 | |
| 8,700 | | IESI BFC Ltd. | | | 189,011 | |
| 6,200 | | Imperial Oil Ltd. (b) | | | 281,702 | |
| 11,700 | | Intact Financial Corp. (b) | | | 704,147 | |
| 56,700 | | Manulife Financial Corp. | | | 767,975 | |
| 5,756 | | NovaTek OAO | | | 782,246 | |
| 10,800 | | Open Text Corp. (b) | | | 660,376 | |
| 25,700 | | Petrominerales Ltd. (b) | | | 477,954 | |
| 100 | | Potash Corp. of Saskatchewan, | | | | |
| | | Inc. (b) | | | 4,566 | |
| 16,600 | | Potash Corp. of Saskatchewan, | | | | |
| | | Inc. - ADR | | | 758,454 | |
| 6,000 | | Rogers Communications, Inc. | | | 238,200 | |
| 17,100 | | Royal Bank Of Canada (b) | | | 991,078 | |
| 18,400 | | Silver Wheaton Corp. (b) | | | 610,228 | |
| 22,900 | | Suncor Energy, Inc. (b) | | | 748,219 | |
| 22,600 | | Toronto-Dominion Bank (b) | | | 1,918,207 | |
| 20,800 | | TransCanada Corp. (b) | | | 893,142 | |
| 14,100 | | Valeant Pharmaceuticals | | | | |
| | | International, Inc. (b) | | | 756,137 | |
| | | | | | | |
| | | | | | 18,800,311 | |
| | | | | | | |
See notes to financial statements.
44
|
GuideMarkSM World ex-US Fund |
SCHEDULE OF INVESTMENTS (Continued) |
March 31, 2012 |
| |
| | | | | | | |
Number of
Shares | | | | Value | |
| | | | | | |
| | | COMMON STOCKS (Continued) | | | | |
| | | Cayman Islands - 1.48% | | | | |
| 4,100 | | Baidu, Inc. - ADR (b) | | $ | 597,657 | |
| 101,000 | | China Mengniu Dairy Co. Ltd. | | | 296,804 | |
| 305,000 | | China Shanshui Cement | | | | |
| | | Group Ltd. | | | 241,240 | |
| 102,000 | | Lifestyle International | | | | |
| | | Holdings Ltd. | | | 259,847 | |
| 168,600 | | Sands China Ltd. | | | 658,325 | |
| 4,000 | | Sina Corp. (a)(b) | | | 260,000 | |
| 37,000 | | Tencent Holdings Ltd. | | | 1,032,836 | |
| | | | | | | |
| | | | | | 3,346,709 | |
| | | | | | | |
| | | Chile - 0.07% | | | | |
| 35,200 | | Empresas CMPC SA | | | 150,749 | |
| | | | | | | |
| | | China - 1.63% | | | | |
| 941,000 | | Agricultural Bank of China Ltd. | | | 403,554 | |
| 1,618,000 | | China Construction Bank Corp. | | | 1,248,803 | |
| 342,000 | | China Oilfield Services, Ltd. | | | 491,886 | |
| 352,000 | | China Petroleum & Chemical Corp. | | | 383,251 | |
| 106,000 | | Jiangxi Copper Co. | | | 243,807 | |
| 112,000 | | Petrochina Co. | | | 157,712 | |
| 20,000 | | Ping An Insurance Group Co. | | | 151,161 | |
| 16,984 | | Yantai Changyu Pioneer Wine Co. | | | | |
| | | Ltd. - Class B (b) | | | 192,018 | |
| 246,000 | | Zhaojin Mining Industry Co. Ltd. | | | 413,793 | |
| | | | | | | |
| | | | | | 3,685,985 | |
| | | | | | | |
| | | Czech Republic - 0.13% | | | | |
| 1,400 | | Komercni Banka AS | | | 280,787 | |
| | | | | | | |
| | | Denmark - 1.49% | | | | |
| 43 | | A.P. Moller - Maersk Group | | | 333,105 | |
| 30,375 | | Danske Bank A/S (b) | | | 516,312 | |
| 15,387 | | Novo Nordisk A/S | | | 2,136,633 | |
| 4,000 | | William Demant Holding A/S (b) | | | 373,767 | |
| | | | | | | |
| | | | | | 3,359,817 | |
| | | | | | | |
| | | France - 5.66% | | | | |
| 7,395 | | Air Liquide SA | | | 986,188 | |
| 15,060 | | Alstom SA | | | 587,816 | |
| 6,400 | | Arkema SA | | | 596,862 | |
| 37,449 | | AXA SA | | | 621,466 | |
| 23,268 | | BNP Paribas SA | | | 1,106,869 | |
| 2,925 | | Christian Dior SA | | | 449,320 | |
| 3,709 | | DANONE | | | 258,725 | |
| 6,000 | | GDF Suez SA | | | 155,092 | |
| 3,151 | | Iliad SA | | | 434,427 | |
| | | | | | | |
Number of
Shares | | | | Value | |
| | | | | | |
| | | France (Continued) | | | | |
| 5,150 | | L’Oreal SA | | $ | 635,626 | |
| 6,330 | | LVMH Moet Hennessy Louis | | | | |
| | | Vuitton SA | | | 1,089,300 | |
| 4,650 | | PPR SA | | | 800,013 | |
| 18,330 | | Safran SA | | | 673,658 | |
| 7,800 | | Saint-Gobain SA | | | 348,014 | |
| 29,726 | | Sanofi-Aventis SA | | | 2,306,498 | |
| 10,120 | | Schneider Electric SA | | | 662,062 | |
| 22,313 | | Societe Generale SA | | | 654,730 | |
| 7,980 | | Vinci SA | | | 415,813 | |
| | | | | | | |
| | | | | | 12,782,479 | |
| | | | | | | |
| | | Germany - 6.48% | | | | |
| 6,300 | | Adidas AG | | | 492,289 | |
| 13,180 | | Allianz SE | | | 1,573,061 | |
| 9,876 | | Bayer AG | | | 694,572 | |
| 9,840 | | Bayerische Motoren Werke AG | | | 885,176 | |
| 7,600 | | Beiersdorf Ag | | | 495,833 | |
| 14,752 | | Deutsche Bank Ag | | | 734,493 | |
| 88,693 | | Deutsche Telekom AG | | | 1,068,594 | |
| 3,600 | | Fresenius SE & Co. KGaA | | | 369,164 | |
| 12,580 | | GEA Group AG | | | 433,943 | |
| 6,172 | | HeidelbergCement AG | | | 372,690 | |
| 4,400 | | Henkel AG & Co. KGaA | | | 322,450 | |
| 25,300 | | Infineon Technologies AG | | | 258,577 | |
| 10,720 | | Lanxess AG | | | 885,403 | |
| 19,900 | | ProSiebenSat.1 Media AG | | | 511,402 | |
| 21,917 | | RWE AG | | | 1,046,633 | |
| 26,462 | | SAP AG | | | 1,848,266 | |
| 13,947 | | Siemens AG | | | 1,406,479 | |
| 7,064 | | Volkswagen AG | | | 1,242,303 | |
| | | | | | | |
| | | | | | 14,641,328 | |
| | | | | | | |
| | | Hong Kong - 3.45% | | | | |
| 181,400 | | AIA Group Ltd. | | | 665,941 | |
| 55,000 | | Cheung Kong Holdings Ltd. | | | 711,260 | |
| 71,000 | | Cheung Kong Infrastructure | | | | |
| | | Holdings Ltd. | | | 432,176 | |
| 16,000 | | China Mobile Ltd | | | 176,185 | |
| 236,000 | | China Overseas Land and | | | | |
| | | Investment Limited | | | 447,526 | |
| 484,000 | | China Telecom Corp. | | | 267,078 | |
| 374,000 | | China Unicom Hong Kong Ltd. | | | 629,356 | |
| 346,000 | | CNOOC Ltd. | | | 708,253 | |
| 70,000 | | Henderson Land Development | | | | |
| | | Co. Ltd. | | | 386,780 | |
See notes to financial statements.
45
|
GuideMarkSM World ex-US Fund |
SCHEDULE OF INVESTMENTS (Continued) |
March 31, 2012 |
| |
| | | | | | | |
Number of
Shares | | | | Value | |
| | | | | | |
| | | COMMON STOCKS (Continued) | | | | |
| | | Hong Kong (Continued) | | | | |
| 29,000 | | Hengan International Group | | | | |
| | | Co. Ltd. | | $ | 292,540 | |
| 970,800 | | HKT Trust and HKT Ltd. (b) | | | 755,082 | |
| 60,000 | | Hongkong Electric Holdings Ltd. | | | 441,114 | |
| 51,000 | | Hutchison Whampoa Ltd. | | | 510,000 | |
| 802,000 | | Industrial & Commercial Bank | | | | |
| | | of China | | | 517,356 | |
| 138,000 | | Kunlun Energy Co. Ltd. | | | 249,097 | |
| 126,000 | | Sino Land Co. | | | 202,066 | |
| 72,000 | | Wharf Holdings Ltd. | | | 392,609 | |
| | | | | | | |
| | | | | | 7,784,419 | |
| | | | | | | |
| | | Hungary - 0.32% | | | | |
| 105,580 | | Magyar Telekom | | | 276,469 | |
| 5,400 | | MOL Hungarian Oil and | | | | |
| | | Gas Plc (b) | | | 450,514 | |
| | | | | | | |
| | | | | | 726,983 | |
| | | | | | | |
| | | Indonesia - 0.89% | | | | |
| 951,500 | | Bank Mandiri Tbk PT | | | 714,053 | |
| 727,000 | | Bank Rakyat Indonesia Persero | | | | |
| | | Tbk PT | | | 554,056 | |
| 660,000 | | Media Nusantara | | | 135,854 | |
| 1,383,000 | | Tower Bersama Infrastructure | | | | |
| | | Tbk PT | | | 447,033 | |
| 46,000 | | UTD Tractors | | | 166,319 | |
| | | | | | | |
| | | | | | 2,017,315 | |
| | | | | | | |
| | | Ireland - 0.09% | | | | |
| 10,400 | | CRH Plc | | | 212,686 | |
| | | | | | | |
| | | Israel - 0.24% | | | | |
| 36,700 | | Israel Chemicals Ltd. | | | 423,992 | |
| 13,540 | | Mizrahi Tefahot Bank Ltd. | | | 122,998 | |
| | | | | | | |
| | | | | | 546,990 | |
| | | | | | | |
| | | Italy - 1.83% | | | | |
| 34,900 | | Eni S.p.A. | | | 817,891 | |
| 70,140 | | Fiat Industrial S.p.A. | | | 748,475 | |
| 34,340 | | Saipem S.p.A. | | | 1,774,201 | |
| 322,400 | | Telecom Italia S.p.A. | | | 383,754 | |
| 85,500 | | Terna S.p.A. | | | 343,391 | |
| 15,820 | | UBI Banca S.p.A. | | | 67,053 | |
| | | | | | | |
| | | | | | 4,134,765 | |
| | | | | | | |
| | | | | | | |
Number of
Shares | | | | Value | |
| | | | | | |
| | | Japan - 14.52% | | | | |
| 7,600 | | ABC-Mart, Inc. | | $ | 286,427 | |
| 17,000 | | Air Water, Inc. | | | 220,671 | |
| 7,500 | | Aisin Seiki Co. Ltd. | | | 266,739 | |
| 29,000 | | Asahi Glass Co. Ltd. | | | 248,606 | |
| 52,000 | | Asahi Kasei Corp. | | | 322,767 | |
| 15,600 | | Astellas Pharma, Inc. | | | 642,549 | |
| 21,200 | | Bridgestone Corp. | | | 518,459 | |
| 17,000 | | Brother Industries | | | 232,262 | |
| 21,300 | | Canon, Inc. | | | 1,018,908 | |
| 24,000 | | Chiyoda Corp. | | | 307,534 | |
| 34,400 | | Chubu Electric Power Co., Inc. | | | 621,807 | |
| 8,700 | | Credit Saison Co. | | | 177,386 | |
| 104 | | CyberAgent, Inc. | | | 272,009 | |
| 11,000 | | Daihatsu Motor Co. | | | 202,957 | |
| 16,000 | | Daiichi Sankyo Company, Ltd. | | | 292,462 | |
| 12,100 | | Denso Corp. | | | 408,846 | |
| 5,000 | | FANUC Corp. | | | 895,576 | |
| 800 | | Fast Retailing Co. | | | 183,545 | |
| 31,000 | | Fuji Heavy Industries Ltd. | | | 253,181 | |
| 7,000 | | Hitachi High-Technologies Corp. | | | 168,144 | |
| 60,000 | | Hitachi Ltd. | | | 388,196 | |
| 15,000 | | Hitachi Metals Ltd. | | | 187,895 | |
| 28,900 | | Honda Motor Co. Ltd. | | | 1,113,060 | |
| 5,900 | | IBIDEN Co., Ltd. | | | 152,563 | |
| 55 | | Inpex Corp. | | | 373,973 | |
| 48,300 | | ITOCHU Corp. | | | 529,215 | |
| 246 | | Japan Tobacco, Inc. | | | 1,392,473 | |
| 18,000 | | JS Group Corp. | | | 378,942 | |
| 20,400 | | JSR Corp. | | | 413,922 | |
| 31,000 | | Kamigumi Co. Ltd. | | | 257,394 | |
| 57 | | KDDI Corp. | | | 370,873 | |
| 1,320 | | Keyence Corp. | | | 312,513 | |
| 6,700 | | Konami Corp. | | | 191,871 | |
| 11,000 | | Konica Minolta Holdings, Inc. | | | 96,088 | |
| 34,000 | | Kubota Corp. | | | 329,109 | |
| 4,600 | | Kyocera Corp. | | | 425,494 | |
| 2,600 | | Lawson, Inc. | | | 163,792 | |
| 5,800 | | Makita Corp. | | | 235,434 | |
| 45,000 | | Marubeni Corp. | | | 327,249 | |
| 26,900 | | Mitsubishi Corp. | | | 629,513 | |
| 34,000 | | Mitsubishi Estate Co. Ltd. | | | 611,391 | |
| 186,000 | | Mitsubishi UFJ Financial | | | | |
| | | Group, Inc. | | | 933,417 | |
See notes to financial statements.
46
|
GuideMarkSM World ex-US Fund |
SCHEDULE OF INVESTMENTS (Continued) |
March 31, 2012 |
| |
| | | | | | | |
Number of
Shares | | | | Value | |
| | | | | | |
| | | COMMON STOCKS (Continued) | | | | |
| | | Japan (Continued) | | | | |
| 2,850 | | Mitsubishi UFJ Lease & Finance | | | | |
| | | Co. Ltd. | | $ | 126,010 | |
| 43,400 | | Mitsui & Co. Ltd. | | | 716,286 | |
| 66,000 | | Mitsui Chemicals, Inc. | | | 201,291 | |
| 29,000 | | Mitsui Fudosan Co., Ltd. | | | 560,017 | |
| 8,300 | | MS&AD Insurance Group Holdings | | | 171,713 | |
| 4,700 | | Murata Manufacturing Co., Ltd. | | | 280,421 | |
| 70,000 | | NEC Corp. (b) | | | 147,228 | |
| 17,000 | | NHK Spring Co. Ltd. | | | 184,695 | |
| 9,000 | | Nikon Corp. | | | 276,423 | |
| 14,000 | | Nippon Shokubai Co. | | | 163,197 | |
| 6,400 | | Nippon Telegraph & Telephone | | | | |
| | | Corp. | | | 290,075 | |
| 20,000 | | Nissan Motor Co. | | | 215,041 | |
| 8,400 | | Nitto Denko Corp. | | | 342,546 | |
| 25,000 | | NSK Ltd. | | | 194,636 | |
| 223 | | NTT DoCoMo, Inc. | | | 370,871 | |
| 7,080 | | ORIX Corp. | | | 680,217 | |
| 362 | | Rakuten, Inc. | | | 379,449 | |
| 18,000 | | Rohto Pharmaceutical Co. Ltd. | | | 224,920 | |
| 40,000 | | Sekisui House Ltd. | | | 394,962 | |
| 8,300 | | Seven & I Holdings Co. Ltd. | | | 247,502 | |
| 15,000 | | Sharp Corp. | | | 110,484 | |
| 3,000 | | Shimano, Inc. | | | 181,393 | |
| 10,700 | | Shin-Etsu Chemical Co. Ltd. | | | 622,632 | |
| 126,000 | | Shinsei Bank | | | 165,869 | |
| 1,900 | | SMC Corp. | | | 304,058 | |
| 16,900 | | Softbank Corp. | | | 503,133 | |
| 24,700 | | Sony Financial Holdings, Inc. | | | 440,747 | |
| 46,000 | | Sumitomo Chemical Co. Ltd. | | | 197,442 | |
| 11,000 | | Sumitomo Electric | | | 152,315 | |
| 53,500 | | Sumitomo Mitsui Financial | | | | |
| | | Group, Inc. | | | 1,770,729 | |
| 18,100 | | Takeda Pharmaceutical Co., Ltd. | | | 797,550 | |
| 6,600 | | TDK Corp. | | | 378,247 | |
| 18,200 | | The Kansai Electrical Power | | | | |
| | | Company, Inc. | | | 282,175 | |
| 13,100 | | Tokio Marine Holdings, Inc. | | | 362,623 | |
| 5,200 | | Tokyo Electron Ltd. | | | 299,855 | |
| 77,000 | | Tokyu Corp. | | | 365,859 | |
| 35,000 | | Toray Industries, Inc. | | | 261,062 | |
| 32,300 | | Toyota Motor Corp. | | | 1,405,441 | |
| 7,100 | | West Japan Railway | | | 285,745 | |
| 421 | | Yahoo Japan Corp. | | | 136,726 | |
| | | | | | | |
Number of
Shares | | | | Value | |
| | | | | | |
| | | Japan (Continued) | | | | |
| 4,130 | | Yamada Denki Co. | | $ | 259,387 | |
| | | | | | | |
| | | | | | 32,806,184 | |
| | | | | | | |
| | | Jersey - 0.99% | | | | |
| 104,760 | | Resolution Ltd. | | | 437,673 | |
| 19,785 | | Shire Plc | | | 633,044 | |
| 27,740 | | United Business Media Ltd. | | | 277,872 | |
| 15,500 | | Wolseley Plc | | | 592,202 | |
| 22,292 | | WPP Plc | | | 304,799 | |
| | | | | | | |
| | | | | | 2,245,590 | |
| | | | | | | |
| | | Luxembourg - 0.46% | | | | |
| 22,700 | | ArcelorMittal | | | 434,558 | |
| 2,300 | | Millicom International | | | | |
| | | Cellular SA | | | 260,816 | |
| 14,280 | | Ternium SA - ADR | | | 338,150 | |
| | | | | | | |
| | | | | | 1,033,524 | |
| | | | | | | |
| | | Malaysia - 0.39% | | | | |
| 199,000 | | IJM Corp. Berhad | | | 366,655 | |
| 259,000 | | Maxis Communications Berhad | | | 515,225 | |
| | | | | | | |
| | | | | | 881,880 | |
| | | | | | | |
| | | Mexico - 1.18% | | | | |
| 496,800 | | America Movil SAB de CV | | | 618,194 | |
| 679,120 | | Cemex SA de CV (b) | | | 525,511 | |
| 19,406 | | Cemex SA de CV - ADR (a)(b) | | | 150,594 | |
| 22,100 | | Coca-Cola FEMSA, S.A.B. de C.V. | | | 234,771 | |
| 61,100 | | Grupo Modelo SAB de CV | | | 428,385 | |
| 209,800 | | Wal-Mart de Mexico SAB de CV | | | 703,991 | |
| | | | | | | |
| | | | | | 2,661,446 | |
| | | | | | | |
| | | Netherlands - 2.36% | | | | |
| 138,800 | | AEGON NV | | | 771,523 | |
| 9,300 | | Akzo Nobel NV | | | 549,356 | |
| 6,200 | | ASML Holding NV | | | 310,630 | |
| 6,660 | | Gemalto NV | | | 439,801 | |
| 21,200 | | Koninklijke Ahold NV | | | 293,750 | |
| 30,316 | | Koninklijke Philips Electronics NV | | | 615,296 | |
| 40,516 | | Reed Elsevier NV | | | 517,341 | |
| 54,049 | | Unilever NV | | | 1,838,995 | |
| | | | | | | |
| | | | | | 5,336,692 | |
| | | | | | | |
| | | New Zealand - 0.12% | | | | |
| 137,500 | | Telecom Corp of New Zealand | | | 273,414 | |
| | | | | | | |
| | | Nigeria - 0.09% | | | | |
| 39,265 | | Guaranty Trust Bank | | | | |
| | | Plc - ADR | | | 201,429 | |
| | | | | | | |
See notes to financial statements.
47
|
GuideMarkSM World ex-US Fund |
SCHEDULE OF INVESTMENTS (Continued) |
March 31, 2012 |
| |
| | | | | | | |
Number of
Shares | | | | Value | |
| | | | | | |
| | | COMMON STOCKS (Continued) | | | | |
| | | Norway - 1.08% | | | | |
| 23,280 | | Aker Solutions ASA | | $ | 394,241 | |
| 27,200 | | Orkla ASA | | | 215,307 | |
| 31,000 | | Statoil ASA | | | 841,406 | |
| 79,400 | | Storebrand ASA | | | 401,870 | |
| 31,520 | | Telenor ASA | | | 585,144 | |
| | | | | | | |
| | | | | | 2,437,968 | |
| | | | | | | |
| | | Republic of Korea - 4.13% | | | | |
| 4,400 | | Daelim Industrial (b) | | | 477,613 | |
| 3,300 | | Hyundai Department Store Co. Ltd. | | | 507,202 | |
| 7,554 | | Hyundai Motor Co. | | | 1,559,888 | |
| 9,510 | | Kia Motors Corp. | | | 624,047 | |
| 18,023 | | Korean Reinsurance Co. | | | 217,357 | |
| 1,300 | | LG Chemical | | | 425,606 | |
| 1,358 | | LG Household & Health Care Ltd. | | | 714,270 | |
| 2,028 | | POSCO | | | 680,066 | |
| 3,900 | | Samsung C&T Corp. | | | 273,546 | |
| 2,407 | | Samsung Electronics Co. Ltd. | | | 2,715,228 | |
| 3,100 | | Samsung Engineering Co. Ltd. | | | 662,538 | |
| 12,020 | | Shinhan Financial Group Co. Ltd. | | | 465,660 | |
| | | | | | | |
| | | | | | 9,323,021 | |
| | | | | | | |
| | | Russian Federation - 1.48% | | | | |
| 11,800 | | Gazprom OAO (b) | | | 143,960 | |
| 61,370 | | Gazprom OAO - ADR | | | 759,147 | |
| 4,510 | | Lukoil OAO (b) | | | 275,163 | |
| 9,700 | | Mobile TeleSystems OJSC - ADR | | | 177,898 | |
| 315,850 | | Sberbank of Russia (b) | | | 1,027,741 | |
| 11,490 | | Sistema JSFC | | | 226,384 | |
| 229,920 | | TNK-BP Holding (b) | | | 742,237 | |
| | | | | | | |
| | | | | | 3,352,530 | |
| | | | | | | |
| | | Singapore - 0.77% | | | | |
| 69,000 | | DBS Group Holdings Ltd. | | | 779,663 | |
| 47,500 | | Keppel Corp. Ltd. | | | 415,140 | |
| 36,581 | | United Overseas Bank Ltd. | | | 534,228 | |
| | | | | | | |
| | | | | | 1,729,031 | |
| | | | | | | |
| | | South Africa - 1.53% | | | | |
| 79,230 | | African Bank Investments Ltd. | | | 412,172 | |
| 28,860 | | AngloGold Ashanti Ltd. | | | 1,065,045 | |
| 8,490 | | Naspers Ltd. | | | 477,660 | |
| 6,000 | | Shoprite Holdings Ltd. | | | 107,532 | |
| 134,300 | | Steinhoff International Holdings | | | 481,981 | |
| | | | | | | |
Number of
Shares | | | | Value | |
| | | | | | |
| | | South Africa (Continued) | | | | |
| 30,100 | | The Foschini Group Ltd. | | $ | 485,853 | |
| 12,100 | | Tiger Brands Ltd. | | | 425,366 | |
| | | | | | | |
| | | | | | 3,455,609 | |
| | | | | | | |
| | | Spain - 1.41% | | | | |
| 18,100 | | Amadeus IT Holding SA | | | 341,911 | |
| 136,113 | | Banco Bilbao Vizcaya | | | | |
| | | Argentaria SA | | | 1,084,977 | |
| 52,140 | | Banco Santander Central | | | | |
| | | Hispano SA | | | 400,961 | |
| 7,440 | | Inditex SA | | | 712,004 | |
| 6,800 | | Red Electrica Corporacion SA | | | 332,807 | |
| 12,757 | | Repsol YPF SA | | | 320,691 | |
| | | | | | | |
| | | | | | 3,193,351 | |
| | | | | | | |
| | | Sweden - 0.83% | | | | |
| 18,500 | | Assa Abloy AB | | | 579,582 | |
| 5,200 | | Elekta AB | | | 263,224 | |
| 28,500 | | H & M Hennes & Mauritz AB | | | 1,030,255 | |
| | | | | | | |
| | | | | | 1,873,061 | |
| | | | | | | |
| | | Switzerland - 5.84% | | | | |
| 7,670 | | Adecco SA | | | 401,725 | |
| 5,330 | | Kuehne & Nagel International AG | | | 721,065 | |
| 66,814 | | Nestle SA | | | 4,203,708 | |
| 16,800 | | Roche Holding AG | | | 2,923,710 | |
| 3,885 | | Schindler Holding AG | | | 467,312 | |
| 1,010 | | Swatch Group Chf2.25(br) | | | 464,308 | |
| 1,877 | | Syngenta AG | | | 646,781 | |
| 10,510 | | Transocean Ltd. | | | 574,074 | |
| 135,153 | | UBS AG | | | 1,894,138 | |
| 3,349 | | Zurich Financial Services AG | | | 900,133 | |
| | | | | | | |
| | | | | | 13,196,954 | |
| | | | | | | |
| | | Taiwan - 1.77% | | | | |
| 498,359 | | Advanced Semiconductor | | | | |
| | | Engineering, Inc. | | | 505,768 | |
| 142,000 | | Catcher Technology Co. Ltd. | | | 1,006,595 | |
| 191,000 | | Formosa Plastics Corp. | | | 563,869 | |
| 80,500 | | Hon Hai Precision Industry Co. Ltd. | | | 313,400 | |
| 10,800 | | HTC Corp. | | | 220,533 | |
| 482,000 | | Taiwan Semiconductor | | | | |
| | | Manufacturing Co. Ltd. | | | 1,385,738 | |
| | | | | | | |
| | | | | | 3,995,903 | |
| | | | | | | |
See notes to financial statements.
48
|
GuideMarkSM World ex-US Fund |
SCHEDULE OF INVESTMENTS (Continued) |
March 31, 2012 |
| |
| | | | | | | |
Number of
Shares | | | | Value | |
| | | | | | |
| | | COMMON STOCKS (Continued) | | | | |
| | | Taiwan, Province of China - 0.24% | | | | |
| 264,000 | | Far Eastone Telecom | | $ | 542,614 | |
| | | | | | | |
| | | Thailand - 0.56% | | | | |
| 39,100 | | Bangkok Bank | | | 246,054 | |
| 94,090 | �� | PTT Chemical PCL | | | 216,414 | |
| 173,500 | | Siam Commercial Bank PCL | | | 808,233 | |
| | | | | | | |
| | | | | | 1,270,701 | |
| | | | | | | |
| | | Turkey - 0.42% | | | | |
| 19,700 | | Anadolu Efes | | | 275,795 | |
| 37,011 | | Aygaz AS | | | 190,731 | |
| 119,800 | | Turkiye Garanti Bankasi AS | | | 474,868 | |
| | | | | | | |
| | | | | | 941,394 | |
| | | | | | | |
| | | United Kingdom - 13.79% | | | | |
| 23,790 | | AMEC Plc | | | 422,051 | |
| 421,860 | | Barclays Plc | | | 1,589,750 | |
| 85,067 | | BG Group Plc | | | 1,972,406 | |
| 38,359 | | BHP Billiton Plc | | | 1,175,586 | |
| 275,946 | | BP Plc | | | 2,055,033 | |
| 46,883 | | British American Tobacco Plc | | | 2,361,695 | |
| 38,840 | | British Sky Broadcasting Group Plc | | | 420,180 | |
| 154,000 | | BT Group Plc | | | 557,849 | |
| 7,200 | | Bunzl Plc | | | 115,788 | |
| 20,780 | | Burberry Group Plc | | | 498,181 | |
| 14,800 | | Capita Plc | | | 173,579 | |
| 169,737 | | Centrica Plc | | | 859,291 | |
| 54,800 | | Diageo Plc | | | 1,319,345 | |
| 24,100 | | Experian Plc | | | 375,925 | |
| 56,460 | | GlaxoSmithKline Plc | | | 1,262,200 | |
| 212,800 | | HSBC Holdings Plc | | | 1,890,122 | |
| 8,960 | | IG Group Holdings Plc | | | 64,514 | |
| 116,890 | | International Power Plc | | | 757,202 | |
| 5,000 | | Intertek Group | | | 200,886 | |
| 223,100 | | ITV Plc | | | 315,565 | |
| 20,983 | | Johnson Matthey Plc | | | 791,449 | |
| 19,000 | | Kazakhmys Plc | | | 276,612 | |
| 215,135 | | Legal & General Group Plc | | | 449,958 | |
| 1,416,300 | | Lloyds Banking Group Plc | | | 762,152 | |
| 6,700 | | Next Plc | | | 319,433 | |
| 15,460 | | Pearson Plc | | | 288,161 | |
| 44,600 | | Rolls-Royce Holdings Plc | | | 579,393 | |
| 80,536 | | Royal Dutch Shell Plc | | | 2,824,331 | |
| | | | | | | |
Number of
Shares | | | | Value | |
| | | | | | |
| | | United Kingdom (Continued) | | | | |
| 18,389 | | SABMiller Plc | | $ | 738,447 | |
| 23,576 | | Serco Group | | | 204,772 | |
| 20,200 | | SSE Plc | | | 429,555 | |
| 19,024 | | Tullow Oil Plc | | | 464,974 | |
| 31,540 | | Unilever Plc | | | 1,040,573 | |
| 845,490 | | Vodafone Group Plc | | | 2,332,135 | |
| 48,200 | | William Hill Plc | | | 201,479 | |
| 62,119 | | Xstrata Plc | | | 1,064,206 | |
| | | | | | | |
| | | | | | 31,154,778 | |
| | | | | | | |
| | | Total Common Stocks | | | | |
| | | (Cost $209,827,888) | | | 214,415,431 | |
| | | | | | | |
| | | INVESTMENT COMPANIES - 1.77% | | | | |
| | | Exchange Traded Funds - 1.77% | | | | |
| 213,000 | | PowerShares India Portfolio | | | 4,012,920 | |
| | | | | | | |
| | | Total Investment Companies | | | | |
| | | (Cost $4,942,793) | | | 4,012,920 | |
| | | | | | | |
| | | PREFERRED STOCKS - 1.40% | | | | |
| | | Brazil - 1.20% | | | | |
| 27,300 | | Banco Bradesco SA | | | 475,576 | |
| 35,700 | | Itau Unibanco Holding SA | | | 682,533 | |
| 40,100 | | Petroleo Brasileiro SA | | | 510,737 | |
| 46,000 | | Vale SA | | | 1,040,730 | |
| | | | | | | |
| | | | | | 2,709,576 | |
| | | | | | | |
| | | Colombia - 0.20% | | | | |
| 7,038 | | Bancolombia SA | | | 455,077 | |
| | | | | | | |
| | | Total Preferred Stocks | | | | |
| | | (Cost $3,658,152) | | | 3,164,653 | |
| | | | | | | |
| | | REAL ESTATE INVESTMENT TRUSTS - 0.57% | | | | |
| | | Cayman Islands - 0.06% | | | | |
| 198,000 | | China Resources Cement | | | | |
| | | Holdings, Ltd. | | | 146,483 | |
| | | | | | | |
| | | France - 0.30% | | | | |
| 3,400 | | Unibail-Rodamco SE | | | 680,192 | |
| | | | | | | |
| | | United Kingdom - 0.21% | | | | |
| 39,675 | | British Land Co. Plc | | | 304,529 | |
| 30,900 | | Capital Shopping Centres | | | | |
| | | Group Plc | | | 163,807 | |
| | | | | | | |
| | | | | | 468,336 | |
| | | | | | | |
| | | Total Real Estate Investment Trusts | | | | |
| | | (Cost $1,327,684) | | | 1,295,011 | |
| | | | | | | |
See notes to financial statements.
49
|
GuideMarkSM World ex-US Fund |
SCHEDULE OF INVESTMENTS (Continued) |
March 31, 2012 |
| |
| | | | | | | |
Number of
Shares | | | | Value | |
| | | | | | |
| | | SHORT TERM INVESTMENTS - 0.57% | | | | |
| | | Money Market Funds - 0.57% | | | | |
| 1,281,924 | | Federated Prime Obligations Fund | | | | |
| | | Effective Yield, 0.20% | | $ | 1,281,924 | |
| | | | | | | |
| | | Total Short Term Investments | | | | |
| | | (Cost $1,281,924) | | | 1,281,924 | |
| | | | | | | |
| | | INVESTMENTS PURCHASED | | | | |
| | | AS SECURITIES LENDING | | | | |
| | | COLLATERAL - 0.26% | | | | |
| | | Money Market Funds - 0.26% | | | | |
| 589,055 | | First American Government | | | | |
| | | Obligations Fund | | | | |
| | | Effective Yield, 0.02% | | | 589,055 | |
| 5,588 | | Reserve Primary Fund (c) | | | 216 | |
| | | | | | | |
| | | Total Investments Purchased as | | | | |
| | | Securities Lending Collateral | | | | |
| | | (Cost $593,878) | | | 589,271 | |
| | | | | | | |
| | | Total Investments | | | | |
| | | (Cost $221,632,319) - 99.48% | | | 224,759,210 | |
| | | Other Assets in Excess | | | | |
| | | of Liabilities - 0.52% | | | 1,164,028 | |
| | | | | | | |
| | | TOTAL NET | | | | |
| | | ASSETS - 100.00% | | $ | 225,923,238 | |
| | | | | | | |
| |
Percentages are stated as a percent of net assets. |
ADR - American Depositary Receipt |
(a) | All or portion of this security is on loan. |
(b) | Non-income producing security. |
(c) | As of March 31, 2012, the Fund has fair valued this security and deemed it illiquid. The value of this security was $216, which represents 0.00% of total net assets. |
See notes to financial statements.
50
|
GuideMarkSM Opportunistic Equity Fund |
SCHEDULE OF INVESTMENTS |
March 31, 2012 |
| |
| | | | | | | |
Number of
Shares | | | | Value | |
| | | | | | |
| | | COMMON STOCKS - 91.79% | | | | |
| | | Aerospace & Defense - 4.56% | | | | |
| 20,460 | | BE Aerospace, Inc. (b) | | $ | 950,776 | |
| 175,000 | | Exelis, Inc. | | | 2,191,000 | |
| 29,860 | | Hexcel Corp. (b) | | | 716,939 | |
| 41,685 | | United Technologies Corp. | | | 3,457,354 | |
| | | | | | | |
| | | | | | 7,316,069 | |
| | | | | | | |
| | | Airlines - 1.34% | | | | |
| 261,105 | | Southwest Airlines Co. | | | 2,151,505 | |
| | | | | | | |
| | | Beverages - 0.93% | | | | |
| 22,475 | | PepsiCo, Inc. | | | 1,491,216 | |
| | | | | | | |
| | | Biotechnology - 2.23% | | | | |
| 26,490 | | Amgen, Inc. | | | 1,801,055 | |
| 16,820 | | Celgene Corp. (b) | | | 1,303,886 | |
| 11,660 | | Vertex Pharmaceuticals, Inc. (b) | | | 478,177 | |
| | | | | | | |
| | | | | | 3,583,118 | |
| | | | | | | |
| | | Capital Markets - 0.42% | | | | |
| 11,750 | | Ameriprise Financial, Inc. | | | 671,278 | |
| | | | | | | |
| | | Chemicals - 2.32% | | | | |
| 19,640 | | Air Products and Chemicals, Inc. | | | 1,802,952 | |
| 18,550 | | Celanese Corp. | | | 856,639 | |
| 16,280 | | Westlake Chemical Corp. (a) | | | 1,054,781 | |
| | | | | | | |
| | | | | | 3,714,372 | |
| | | | | | | |
| | | Commercial Banks - 3.17% | | | | |
| 11,765 | | PNC Financial Services
Group, Inc. | | | 758,725 | |
| 51,110 | | U.S. Bancorp | | | 1,619,165 | |
| 79,375 | | Wells Fargo & Co. | | | 2,709,862 | |
| | | | | | | |
| | | | | | 5,087,752 | |
| | | | | | | |
| | | Communications Equipment - 2.74% | | | | |
| 89,650 | | Cisco Systems, Inc. | | | 1,896,098 | |
| 31,000 | | Motorola Solutions, Inc. | | | 1,575,730 | |
| 13,510 | | Qualcomm, Inc. | | | 918,950 | |
| | | | | | | |
| | | | | | 4,390,778 | |
| | | | | | | |
| | | Computers & Peripherals - 2.93% | | | | |
| 6,040 | | Apple, Inc. (b) | | | 3,620,799 | |
| 36,190 | | EMC Corp. (b) | | | 1,081,357 | |
| | | | | | | |
| | | | | | 4,702,156 | |
| | | | | | | |
| | | Containers & Packaging - 1.19% | | | | |
| 99,000 | | Sealed Air Corp. | | | 1,911,690 | |
| | | | | | | |
| | | | | | | |
Number of
Shares | | | | Value | |
| | | | | | | | |
| | | Diversified Consumer Services - 0.02% | | | | |
| 5,830 | | Stewart Enterprises, Inc. | | $ | 35,388 | |
| | | | | | | |
| | | Diversified Financial Services - 3.57% | | | | |
| 153,000 | | Bank of America Corp. | | | 1,464,210 | |
| 65,730 | | Citigroup, Inc. | | | 2,402,432 | |
| 40,590 | | JPMorgan Chase & Co. | | | 1,866,328 | |
| | | | | | | |
| | | | | | 5,732,970 | |
| | | | | | | |
| | | Energy Equipment & Services - 2.33% | | | | |
| 18,900 | | Halliburton Co. | | | 627,291 | |
| 133,000 | | McDermott International, Inc. (b) | | | 1,703,730 | |
| 9,270 | | National Oilwell Varco, Inc. | | | 736,687 | |
| 44,780 | | Weatherford International Ltd. (b) | | | 675,730 | |
| | | | | | | |
| | | | | | 3,743,438 | |
| | | | | | | |
| | | Food & Staples Retailing - 1.58% | | | | |
| 85,060 | | Sysco Corp. | | | 2,539,892 | |
| | | | | | | |
| | | Food Products - 4.12% | | | | |
| 96,045 | | ConAgra Foods, Inc. | | | 2,522,142 | |
| 59,225 | | General Mills, Inc. | | | 2,336,426 | |
| 13,490 | | Hershey Co. | | | 827,342 | |
| 12,405 | | Ralcorp Holdings, Inc. (b) | | | 919,086 | |
| | | | | | | |
| | | | | | 6,604,996 | |
| | | | | | | |
| | | Health Care Equipment & Supplies - 4.50% | | | | |
| 36,310 | | Baxter International, Inc. | | | 2,170,612 | |
| 75,000 | | CareFusion Corp. (b) | | | 1,944,750 | |
| 23,710 | | DENTSPLY International, Inc. | | | 951,482 | |
| 55,090 | | Medtronic, Inc. | | | 2,158,977 | |
| | | | | | | |
| | | | | | 7,225,821 | |
| | | | | | | |
| | | Health Care Providers & Services - 1.43% | | | | |
| 38,860 | | UnitedHealth Group, Inc. | | | 2,290,408 | |
| | | | | | | |
| | | Hotels, Restaurants & Leisure - 2.50% | | | | |
| 63,000 | | Marriott Vacations Worldwide
Corp. (b) | | | 1,796,130 | |
| 14,785 | | McDonald’s Corp. | | | 1,450,408 | |
| 13,540 | | Starbucks Corp. | | | 756,751 | |
| | | | | | | |
| | | | | | 4,003,289 | |
| | | | | | | |
| | | Household Durables - 0.60% | | | | |
| 1,315 | | NVR, Inc. (a)(b) | | | 955,124 | |
| | | | | | | |
| | | Household Products - 1.12% | | | | |
| 26,785 | | Procter & Gamble Co. | | | 1,800,220 | |
| | | | | | | |
See notes to financial statements.
51
|
GuideMarkSM Opportunistic Equity Fund |
SCHEDULE OF INVESTMENTS (Continued) |
March 31, 2012 |
| |
| | | | | | | |
Number of
Shares | | | | Value | |
| | | | | | |
| | | COMMON STOCKS (Continued) | | | | |
| | | Industrial Conglomerates - 2.93% | | | | |
| 16,100 | | 3M Co. | | $ | 1,436,281 | |
| 126,330 | | General Electric Co. | | | 2,535,443 | |
| 13,110 | | Tyco International Ltd. | | | 736,520 | |
| | | | | | | |
| | | | | | 4,708,244 | |
| | | | | | | |
| | | Insurance - 6.29% | | | | |
| 72,000 | | American International Group,
Inc. | | | 2,219,760 | |
| 26,915 | | Assurant, Inc. | | | 1,090,058 | |
| 129,985 | | Assured Guaranty Ltd. | | | 2,147,352 | |
| 100,730 | | Hartford Financial Services
Group, Inc. | | | 2,123,388 | |
| 39,640 | | Prudential Financial, Inc. | | | 2,512,780 | |
| | | | | | | |
| | | | | | 10,093,338 | |
| | | | | | | |
| | | Internet & Catalog Retail - 0.32% | | | | |
| 2,535 | | Amazon.com, Inc. (b) | | | 513,363 | |
| | | | | | | |
| | | Internet Software & Services - 0.87% | | | | |
| 2,170 | | Google, Inc. (b) | | | 1,391,491 | |
| | | | | | | |
| | | IT Services - 3.12% | | | | |
| 9,790 | | Alliance Data Systems Corp. (a)(b) | | | 1,233,148 | |
| 10,465 | | International Business Machines
Corp. | | | 2,183,522 | |
| 2,310 | | MasterCard, Inc. | | | 971,448 | |
| 34,710 | | Moneygram International, Inc. (b) | | | 624,780 | |
| | | | | | | |
| | | | | | 5,012,898 | |
| | | | | | | |
| | | Life Sciences Tools & Services - 0.95% | | | | |
| 3,780 | | Mettler-Toledo International,
Inc. (b) | | | 698,355 | |
| 14,690 | | Thermo Fisher Scientific, Inc. (b) | | | 828,222 | |
| | | | | | | |
| | | | | | 1,526,577 | |
| | | | | | | |
| | | Machinery - 5.33% | | | | |
| 16,980 | | Danaher Corp. | | | 950,880 | |
| 33,400 | | Dover Corp. | | | 2,102,196 | |
| 22,100 | | Idex Corp. | | | 931,073 | |
| 24,800 | | Illinois Tool Works, Inc. | | | 1,416,576 | |
| 18,500 | | ITT Corp. | | | 424,390 | |
| 11,995 | | Parker Hannifin Corp. | | | 1,014,177 | |
| 8,980 | | Stanley Black & Decker, Inc. | | | 691,101 | |
| 37,000 | | Xylem, Inc. | | | 1,026,750 | |
| | | | | | | |
| | | | | | 8,557,143 | |
| | | | | | | |
| | | | | | | |
Number of
Shares | | | | Value | |
| | | | | | |
| | | Media - 0.98% | | | | |
| 46,000 | | The Madison Square Garden
Co. (b) | | $ | 1,573,200 | |
| | | | | | | |
| | | Metals & Mining - 2.39% | | | | |
| 37,000 | | AngloGold Ashanti Ltd. - ADR | | | 1,366,040 | |
| 48,000 | | Newmont Mining Corp. | | | 2,460,960 | |
| | | | | | | |
| | | | | | 3,827,000 | |
| | | | | | | |
| | | Multiline Retail - 0.53% | | | | |
| 15,320 | | Nordstrom, Inc. | | | 853,630 | |
| | | | | | | |
| | | Oil & Gas - 10.23% | | | | |
| 22,890 | | Alpha Natural Resources, Inc. (b) | | | 348,157 | |
| 17,080 | | Anadarko Petroleum Corp. | | | 1,338,047 | |
| 24,985 | | Apache Corp. | | | 2,509,494 | |
| 40,100 | | BP Plc - ADR | | | 1,804,500 | |
| 17,790 | | Cimarex Energy Co. | | | 1,342,611 | |
| 53,775 | | Devon Energy Corp. | | | 3,824,478 | |
| 21,670 | | Occidental Petroleum Corp. | | | 2,063,634 | |
| 53,000 | | QEP Resources, Inc. | | | 1,616,500 | |
| 13,700 | | Suncor Energy Inc. | | | 447,990 | |
| 18,600 | | Tesoro Corp. (b) | | | 499,224 | |
| 24,000 | | Valero Energy Corp. | | | 618,480 | |
| | | | | | | |
| | | | | | 16,413,115 | |
| | | | | | | |
| | | Paper & Forest Products - 0.45% | | | | |
| 20,690 | | International Paper Co. | | | 726,219 | |
| | | | | | | |
| | | Pharmaceuticals - 5.31% | | | | |
| 30,365 | | Abbott Laboratories | | | 1,861,071 | |
| 27,690 | | Johnson & Johnson | | | 1,826,433 | |
| 37,765 | | Merck & Co, Inc. | | | 1,450,176 | |
| 65,100 | | Mylan, Inc. (b) | | | 1,526,595 | |
| 81,790 | | Pfizer, Inc. | | | 1,853,361 | |
| | | | | | | |
| | | | | | 8,517,636 | |
| | | | | | | |
| | | Real Estate Management & Development - 1.05% | | | | |
| 36,590 | | CBRE Group, Inc. (b) | | | 730,336 | |
| 15,000 | | Howard Hughes Corp. (b) | | | 958,050 | |
| | | | | | | |
| | | | | | 1,688,386 | |
| | | | | | | |
| | | Road & Rail - 0.86% | | | | |
| 11,690 | | J.B. Hunt Transport Services, Inc. | | | 635,585 | |
| 12,940 | | Landstar Systems, Inc. | | | 746,897 | |
| | | | | | | |
| | | | | | 1,382,482 | |
| | | | | | | |
See notes to financial statements.
52
|
GuideMarkSM Opportunistic Equity Fund |
SCHEDULE OF INVESTMENTS (Continued) |
March 31, 2012 |
| |
| | | | | | | |
Number of
Shares | | | | Value | |
| | | | | | |
| | | COMMON STOCKS (Continued) | | | | |
| | | Semiconductor & Semiconductor | | | | |
| | | Equipment - 0.60% | | | | |
| 18,550 | | Broadcom Corp. | | $ | 729,015 | |
| 14,170 | | Teradyne, Inc. (b) | | | 239,331 | |
| | | | | | | |
| | | | | | 968,346 | |
| | | | | | | |
| | | Software - 4.13% | | | | |
| 14,740 | | Check Point Software Technologies
Ltd. (b) | | | 941,002 | |
| 65,950 | | Microsoft Corp. | | | 2,126,887 | |
| 19,800 | | NICE Systems Ltd. - ADR (b) | | | 778,140 | |
| 29,700 | | Nuance Communications, Inc. (b) | | | 759,726 | |
| 18,620 | | Red Hat, Inc. (b) | | | 1,115,152 | |
| 5,810 | | salesforce.com, Inc. (b) | | | 897,703 | |
| | | | | | | |
| | | | | | 6,618,610 | |
| | | | | | | |
| | | Specialty Retail - 1.07% | | | | |
| 9,780 | | Home Depot, Inc. | | | 492,032 | |
| 5,270 | | O’Reilly Automotive, Inc. (b) | | | 481,415 | |
| 19,690 | | Williams Sonoma, Inc. | | | 737,981 | |
| | | | | | | |
| | | | | | 1,711,428 | |
| | | | | | | |
| | | Thrifts & Mortgage Finance - 0.46% | | | | |
| 149,000 | | MGIC Investment Corp. (a)(b) | | | 739,040 | |
| | | | | | | |
| | | Trading Companies & Distributors - 0.32% | | | | |
| 7,890 | | Wesco International, Inc. (b) | | | 515,296 | |
| | | | | | | |
| | | Total Common Stocks
(Cost $136,693,441) | | | 147,288,922 | |
| | | | | | | |
| | | REAL ESTATE INVESTMENT TRUSTS - 0.45% | | | | |
| | | Real Estate Investment Trusts - 0.45% | | | | |
| 98,910 | | iStar Financial, Inc. (a)(b) | | | 717,097 | |
| | | | | | | |
| | | Total Real Estate Investment Trusts
(Cost $664,622) | | | 717,097 | |
| | | | | | | |
| | | SHORT TERM INVESTMENTS - 7.99% | | | | |
| | | Money Market Funds - 7.99% | | | | |
| 12,815,706 | | Federated Prime Obligations Fund
Effective Yield, 0.20% | | | 12,815,706 | |
| | | | | | | |
| | | Total Short Term Investments
(Cost $12,815,706) | | | 12,815,706 | |
| | | | | | | |
| | | | | | | |
Number of
Shares | | | | Value | |
| | | | | | |
| | | INVESTMENTS PURCHASED
AS SECURITIES LENDING
COLLATERAL - 1.54% | | | | |
| | | Money Market Funds - 1.54% | | | | |
| 2,467,655 | | First American Government
Obligations Fund
Effective Yield, 0.02% | | $ | 2,467,655 | |
| | | | | | | |
| | | Total Investments Purchased as
Securities Lending Collateral
(Cost $2,467,655) | | | 2,467,655 | |
| | | | | | | |
| | | Total Investments
(Cost $152,641,424) - 101.77% | | | 163,289,380 | |
| | | Liabilities in Excess of
Other Assets - (1.77)% | | | (2,833,981) | |
| | | | | | | |
| | | TOTAL NET
ASSETS - 100.00% | | $ | 160,455,399 | |
| | | | | | | |
| |
Percentages are stated as a percent of net assets. |
ADR - American Depositary Receipt |
(a) | All or portion of this security is on loan. |
(b) | Non-income producing security. |
See notes to financial statements.
53
|
GuideMarkSM Global Real Return Fund |
SCHEDULE OF INVESTMENTS |
March 31, 2012 |
| | | | | | | |
Number of
Shares | | | | Value | |
| | | | | | |
| | | INVESTMENT COMPANIES - 99.61% | | | | |
| | | Exchange Traded Funds - 99.61% | | | | |
| 77,953 | | Energy Select Sector SPDR
Fund (a) | | $ | 5,591,569 | |
| 32,480 | | Market Vectors Gold Miners ETF | | | 1,610,034 | |
| 19,175 | | PowerShares DB Agriculture
Fund (a)(b) | | | 538,818 | |
| 586,825 | | PowerShares DB Commodity Index
Tracking Fund (a)(b) | | | 16,888,823 | |
| 37,667 | | PowerShares DB Energy Fund (b) | | | 1,131,893 | |
| 39,825 | | PowerShares DB Gold Fund (a)(b) | | | 2,301,088 | |
| 136,741 | | PowerShares Global Agriculture
ETF (a) | | | 4,129,578 | |
| 228,641 | | SPDR Barclays Capital TIPS
ETF (a) | | | 13,341,202 | |
| 171,839 | | SPDR DB International Government
Inflation-Protected Bond ETF | | | 10,387,668 | |
| 371,647 | | SPDR Dow Jones International
Real Estate ETF (a) | | | 13,684,043 | |
| 164,356 | | SPDR Dow Jones REIT ETF | | | 11,641,335 | |
| 80,373 | | SPDR Metals and Mining ETF (a) | | | 3,994,538 | |
| 495,522 | | SPDR S&P Global Natural
Resources ETF (a) | | | 26,099,144 | |
| 85,367 | | SPDR S&P International Energy
Sector ETF (a) | | | 2,229,786 | |
| | | | | | | |
| | | | | | 113,569,519 | |
| | | | | | | |
| | | Total Investment Companies
(Cost $118,588,917) | | | 113,569,519 | |
| | | | | | | |
| | | | | | | |
Number of
Shares | | | | Value | |
| | | | | | |
| | | SHORT TERM INVESTMENTS - 0.53% | | | | |
| | | Money Market Funds - 0.53% | | | | |
| 600,268 | | Federated Prime Obligations Fund
Effective Yield, 0.20% | | $ | 600,268 | |
| | | | | | | |
| | | Total Short Term Investments
(Cost $600,268) | | | 600,268 | |
| | | | | | | |
| | | INVESTMENTS PURCHASED
AS SECURITIES LENDING
COLLATERAL - 20.34% | | | | |
| | | Money Market Funds - 20.34% | | | | |
| 23,182,671 | | First American Government
Obligations Fund
Effective Yield, 0.02% | | | 23,182,671 | |
| | | | | | | |
| | | Total Investments Purchased as
Securities Lending Collateral
(Cost $23,182,671) | | | 23,182,671 | |
| | | | | | | |
| | | Total Investments
(Cost $142,371,856) - 120.48% | | | 137,352,458 | |
| | | Liabilities in Excess of
Other Assets - (20.48)% | | | (23,349,121 | ) |
| | | | | | | |
| | | TOTAL NET ASSETS - 100.00% | | $ | 114,003,337 | |
| | | | | | | |
| |
Percentages are stated as a percent of net assets. |
(a) | All or portion of this security is on loan. |
(b) | Non-income producing security. |
See notes to financial statements.
54
|
GuideMarkSM Core Fixed Income Fund |
SCHEDULE OF INVESTMENTS |
March 31, 2012 |
| |
| | | | | | | |
Principal
Amount | | | | Value | |
| | | | | | |
| | | ASSET BACKED SECURITIES - 2.19% | | | | |
| 255,967 | | Accredited Mortgage Loan Trust | | | | |
| | | Series 2005-3, 0.482%, | | | | |
| | | 09/25/2035 (e) | | $ | 242,070 | |
| | | Brazos Higher Education Authority | | | | |
| 976,955 | | Series 2005-3, 0.684%, | | | | |
| | | 09/25/2023 (e) | | | 961,701 | |
| 800,000 | | Series A-2, 1.410%, | | | | |
| | | 07/25/2029 (e) | | | 781,792 | |
| | | CIT Mortgage Loan Trust | | | | |
| 129,755 | | Series 2007-1, 1.242%, 10/25/2037 | | | | |
| | | (Acquired 10/05/2007, | | | | |
| | | Cost $129,755) (c)(e) | | | 128,878 | |
| 550,000 | | Series 2007-1, 1.492%, 10/25/2037 | | | | |
| | | (Acquired 10/05/2007, | | | | |
| | | Cost $550,000) (c)(e) | | | 431,325 | |
| | | CNH Equipment Trust | | | | |
| 816,555 | | Series 2010-C, 1.170%, | | | | |
| | | 05/15/2015 | | | 818,288 | |
| 740,000 | | Series 2011-A, 2.040%, | | | | |
| | | 10/17/2016 | | | 760,930 | |
| 1,185,000 | | Series 2012-A, 0.940%, | | | | |
| | | 05/15/2017 (e) | | | 1,187,424 | |
| 72,976 | | Conseco Finance Securitizations Corp. | | | | |
| | | Series 2000-4, 8.310%, | | | | |
| | | 05/01/2032 | | | 50,492 | |
| 80,163 | | Countrywide Asset-Backed | | | | |
| | | Certificates | | | | |
| | | Series 2005-4, 4.456%, | | | | |
| | | 10/25/2035 (e) | | | 77,321 | |
| | | Countrywide Home Equity Loan | | | | |
| | | Trust | | | | |
| 177,937 | | Series 2004-R, 0.492%, | | | | |
| | | 03/15/2030 (e) | | | 105,866 | |
| 251,620 | | Series 2004-N, 0.522%, | | | | |
| | | 02/15/2034 (e) | | | 152,175 | |
| 281,442 | | Series 2004-O, 0.522%, | | | | |
| | | 02/15/2034 (e) | | | 174,114 | |
| 345,883 | | Education Funding Capital Trust I | | | | |
| | | Series 2004-1, 0.634%, | | | | |
| | | 12/15/2022 (e) | | | 343,329 | |
| 1,300,000 | | Educational Services of America, Inc. | | | | |
| | | Series 2012-1, 1.684%, 09/25/2040 | | | | |
| | | (Acquired 03/01/2012, | | | | |
| | | Cost $1,300,000) (c)(e) | | | 1,292,212 | |
| | | | | | | |
Principal
Amount | | | | Value | |
| | | | | | |
| | | ASSET BACKED SECURITIES (Continued) | | | | |
| | | GCO Education Loan Funding Trust | | | | |
| 100,000 | | Series 2006-1, 0.681%, | | | | |
| | | 02/25/2028 (e) | | $ | 85,789 | |
| 100,000 | | Series 2006-1, 0.721%, | | | | |
| | | 05/25/2036 (e) | | | 81,798 | |
| 423,218 | | Goal Capital Funding Trust | | | | |
| | | Series 2010-1, 1.191%, 08/25/2048 | | | | |
| | | (Acquired 05/17/2010, | | | | |
| | | Cost $416,275) (c)(e) | | | 407,593 | |
| 441,152 | | Knowledgeworks Foundation | | | | |
| | | Series 2010-1, 1.441%, | | | | |
| | | 02/25/2042 (e) | | | 426,892 | |
| 625,555 | | Morgan Stanley | | | | |
| | | Series 2003-N, 1.262%, | | | | |
| | | 10/25/2033 (e) | | | 483,659 | |
| 128,949 | | Northstar Education Finance, Inc. | | | | |
| | | Series 2005-1, 0.653%, | | | | |
| | | 10/28/2026 (e) | | | 125,438 | |
| 826,118 | | Panhandle-Plains Higher Education | | | | |
| | | Authority, Inc. | | | | |
| | | Series 2010-2, 1.711%, | | | | |
| | | 10/01/2035 (e) | | | 825,248 | |
| 148,046 | | Residential Asset Mortgage | | | | |
| | | Products, Inc. | | | | |
| | | Series 2004-R, 0.722%, | | | | |
| | | 03/25/2034 (e) | | | 99,774 | |
| 199,607 | | U.S. Education Loan Trust, LLC | | | | |
| | | Series 2006-1, 0.618%, 03/01/2025 | | | | |
| | | (Acquired 08/06/2010, | | | | |
| | | Cost $195,116) (c)(e) | | | 193,346 | |
| | | | | | | |
| | | Total Asset Backed Securities | | | | |
| | | (Cost $10,824,019) | | | 10,237,454 | |
| | | | | | | |
| | | COLLATERALIZED MORTGAGE | | | | |
| | | OBLIGATIONS - 3.32% | | | | |
| 110,000 | | Bank of America Corp. | | | | |
| | | Series 2007-5, 5.620%, | | | | |
| | | 02/10/2051 | | | 117,041 | |
| | | Bear Stearns Commercial Mortgage | | | | |
| | | Securities | | | | |
| 3,250,000 | | Series 2006-PW13, 5.540%, | | | | |
| | | 09/11/2041 | | | 3,696,378 | |
| 2,288,884 | | Series 2004-PWR5, 4.831%, | | | | |
| | | 07/11/2042 | | | 2,363,567 | |
See notes to financial statements.
55
|
GuideMarkSM Core Fixed Income Fund |
SCHEDULE OF INVESTMENTS (Continued) |
March 31, 2012 |
| |
| | | | | | | |
Principal
Amount | | | | Value | |
| | | | | | |
| | | COLLATERALIZED MORTGAGE | | | | |
| | | OBLIGATIONS (Continued) | | | | |
| 658,509 | | Bear Stearns Trust | | | | |
| | | Series 2005-2, 2.781%, | | | | |
| | | 04/25/2035 (e) | | $ | 496,080 | |
| | | Chase Mortgage Financial Trust | | | | |
| 201,912 | | Series 2007-A1, 2.831%, | | | | |
| | | 02/25/2037 (e) | | | 199,369 | |
| 515,943 | | Series 2007-A1, 2.718%, | | | | |
| | | 02/25/2037 (e) | | | 498,006 | |
| | | Countrywide Alternative Loan Trust | | | | |
| 1,101,694 | | Series 2005-27, 1.719%, | | | | |
| | | 08/25/2035 (e) | | | 693,524 | |
| 502,616 | | Series 2005-36, 2.729%, | | | | |
| | | 08/25/2035 (e) | | | 350,822 | |
| 1,846,634 | | Series 2007-16CB, 6.000%, | | | | |
| | | 08/25/2037 | | | 1,380,491 | |
| | | Countrywide Home Loans, Inc. | | | | |
| 97,027 | | Series 2003-52, 2.668%, | | | | |
| | | 02/19/2034 (e) | | | 87,026 | |
| 37,324 | | Series 2004-HYB6, 2.726%, | | | | |
| | | 11/20/2034 (e) | | | 30,494 | |
| 252,632 | | Series 2005-11, 0.542%, | | | | |
| | | 03/25/2035 (e) | | | 161,858 | |
| 578,608 | | Series 2005-R1, 0.602%, 03/25/2035 | | | | |
| | | (Acquired 03/04/2005, | | | | |
| | | Cost $578,608) (c)(e) | | | 455,404 | |
| 392,183 | | Series 2005-11, 2.917%, | | | | |
| | | 04/25/2035 (e) | | | 192,550 | |
| 21,830 | | First Horizon Mortgage Trust | | | | |
| | | Series 2004-AR6, 2.628%, | | | | |
| | | 12/25/2034 (e) | | | 20,582 | |
| 469,554 | | GS Mortgage Securities Corp. | | | | |
| | | Series 2005-GG4, 4.680%, | | | | |
| | | 07/10/2039 | | | 475,734 | |
| 439,609 | | IndyMac Mortgage Loan Trust | | | | |
| | | Series 2005-16IP, 0.562%, | | | | |
| | | 07/25/2045 (e) | | | 304,983 | |
| | | JPMorgan Mortgage Trust | | | | |
| 379,432 | | Series 2007-A1, 2.807%, | | | | |
| | | 07/25/2035 (e) | | | 361,552 | |
| 321,600 | | Series 2007-A1, 2.777%, | | | | |
| | | 07/25/2035 (e) | | | 310,658 | |
| 367,512 | | Series 2007-A1, 2.853%, | | | | |
| | | 07/25/2035 (e) | | | 341,827 | |
| | | | | | | |
Principal
Amount | | | | Value | |
| | | | | | |
| | | COLLATERALIZED MORTGAGE | | | | |
| | | OBLIGATIONS (Continued) | | | | |
| 377,243 | | Lehman Brothers-UBS Commercial | | | | |
| | | Mortgage Trust | | | | |
| | | Series 2005-C3, 4.664%, | | | | |
| | | 07/15/2030 | | $ | 384,230 | |
| 349,505 | | Master Reperforming Loan Trust | | | | |
| | | Series 2005-1, 7.000%, 08/25/2034 | | | | |
| | | (Acquired 03/09/2005, | | | | |
| | | Cost $360,378) (c) | | | 358,860 | |
| 309,456 | | MLCC Mortgage Investors, Inc. | | | | |
| | | Series 2004-A3, 5.005%, | | | | |
| | | 05/25/2034 (e) | | | 310,441 | |
| 1,792,475 | | Prime Mortgage Trust | | | | |
| | | Series 2006-DR1, 6.000%, | | | | |
| | | 05/25/2035 (Acquired 10/25/2006, | | | | |
| | | Cost $1,779,871) (c) | | | 1,430,423 | |
| 333,305 | | Residential Asset Mortgage | | | | |
| | | Products, Inc. | | | | |
| | | Series 2004-SL4, 7.500%, | | | | |
| | | 07/25/2032 | | | 317,947 | |
| 70,977 | | Structured Adjustable Rate | | | | |
| | | Mortgage Loan | | | | |
| | | Series 2004-5, 2.530%, | | | | |
| | | 05/25/2034 (e) | | | 68,205 | |
| 76,585 | | Washington Mutual | | | | |
| | | Series 2004-AR3, 2.550%, | | | | |
| | | 06/25/2034 (e) | | | 76,012 | |
| | | | | | | |
| | | Total Collateralized Mortgage | | | | |
| | | Obligations (Cost $16,818,507) | | | 15,484,064 | |
| | | | | | | |
| | | CORPORATE OBLIGATIONS - 31.88% | | | | |
| | | Agricultural Products - 0.15% | | | | |
| 575,000 | | Lorillard Tobacco Co. | | | | |
| | | 8.125%, 06/23/2019 | | | 714,932 | |
| | | | | | | |
| | | Auto Components - 0.30% | | | | |
| 1,375,000 | | Johnson Controls, Inc. | | | | |
| | | 1.750%, 03/01/2014 | | | 1,398,294 | |
| | | | | | | |
| | | Banks - 2.73% | | | | |
| 1,150,000 | | Canadian Imperial Bank of Commerce | | | | |
| | | 1.450%, 09/13/2013 | | | 1,161,967 | |
| 400,000 | | Capital One Capital III | | | | |
| | | 7.686%, 08/15/2036 (e) | | | 404,000 | |
| 250,000 | | Capital One Financial Corp. | | | | |
| | | 8.800%, 07/15/2019 | | | 306,099 | |
See notes to financial statements.
56
|
GuideMarkSM Core Fixed Income Fund |
SCHEDULE OF INVESTMENTS (Continued) |
March 31, 2012 |
| |
| | | | | | | |
Principal
Amount | | | | Value | |
| | | | | | |
| | | CORPORATE OBLIGATIONS (Continued) | | | | |
| | | Banks (Continued) | | | | |
| 755,000 | | Cooperatieve Centrale Raiffeisen- | | | | |
| | | Boerenleenbank BA | | | | |
| | | 2.125%, 10/13/2015 | | $ | 760,738 | |
| 760,000 | | Glitnir Bank | | | | |
| | | 6.693%, 06/15/2016 (e)(f) | | | 3,876 | |
| 800,000 | | HSBC Capital Funding LP (c)(e) | | | 772,076 | |
| 250,000 | | Kaupthing Bank Hf | | | | |
| | | 7.125%, 05/19/2016 (f)(i) | | | 1,275 | |
| 400,000 | | KeyCorp | | | | |
| | | 5.100%, 03/24/2021 | | | 441,682 | |
| 410,000 | | Lloyds TSB Bank PLC | | | | |
| | | 6.375%, 01/21/2021 | | | 440,840 | |
| 325,000 | | National City Preferred Capital | | | | |
| | | Trust I | | | | |
| | | 12.000%, 12/30/2049 (e) | | | 346,908 | |
| | | PNC Funding Corp. | | | | |
| 845,000 | | 4.250%, 09/21/2015 | | | 923,417 | |
| 905,000 | | 3.300%, 03/08/2022 | | | 897,187 | |
| 755,000 | | Royal Bank of Canada | | | | |
| | | 1.150%, 03/13/2015 | | | 755,195 | |
| | | Royal Bank of Scotland Group Plc | | | | |
| 140,000 | | 5.000%, 11/12/2013 | | | 140,658 | |
| 625,000 | | 4.875%, 08/25/2014 | | | | |
| | | (Acquired 08/18/2009 through | | | | |
| | | 08/19/2009, Cost $622,701) (c) | | | 649,880 | |
| 250,000 | | Sovereign Bank | | | | |
| | | 8.750%, 05/30/2018 | | | 293,962 | |
| 1,275,000 | | SunTrust Banks, Inc. | | | | |
| | | 3.500%, 01/20/2017 | | | 1,301,929 | |
| 2,075,000 | | U.S. Bancorp | | | | |
| | | 2.200%, 11/15/2016 | | | 2,117,562 | |
| 400,000 | | Union Bank, NA | | | | |
| | | 3.000%, 06/06/2016 | | | 414,351 | |
| 600,000 | | Westpac Banking Corp. | | | | |
| | | 2.250%, 11/19/2012 | | | 606,504 | |
| | | | | | | |
| | | | | | 12,740,106 | |
| | | | | | | |
| | | Beverages - 0.61% | | | | |
| 955,000 | | PepsiCo, Inc. | | | | |
| | | 2.500%, 05/10/2016 | | | 999,552 | |
| | | | | | | |
Principal
Amount | | | | Value | |
| | | | | | |
| | | Beverages (Continued) | | | | |
| 1,825,000 | | The Coca-Cola Co. | | | | |
| | | 0.750%, 11/15/2013 | | $ | 1,833,705 | |
| | | | | | | |
| | | | | | 2,833,257 | |
| | | | �� | | | |
| | | Biotechnology - 0.30% | | | | |
| 385,000 | | Genzyme Corp. | | | | |
| | | 5.000%, 06/15/2020 | | | 445,327 | |
| 920,000 | | Gilead Sciences, Inc. | | | | |
| | | 2.400%, 12/01/2014 | | | 952,397 | |
| | | | | | | |
| | | | | | 1,397,724 | |
| | | | | | | |
| | | Capital Markets - 2.52% | | | | |
| 1,955,000 | | Bear Stearns Companies, Inc. | | | | |
| | | 7.250%, 02/01/2018 | | | 2,360,262 | |
| 1,050,000 | | Goldman Sachs Group, Inc. | | | | |
| | | 5.950%, 01/18/2018 | | | 1,132,464 | |
| | | Merrill Lynch & Co, Inc. | | | | |
| 1,775,000 | | 6.400%, 08/28/2017 | | | 1,937,922 | |
| 800,000 | | 6.500%, 07/15/2018 | | | 870,795 | |
| | | Morgan Stanley | | | | |
| 600,000 | | 5.950%, 12/28/2017 | | | 618,501 | |
| 125,000 | | 6.625%, 04/01/2018 | | | 131,789 | |
| | | State Street Corp. | | | | |
| 595,000 | | 4.300%, 05/30/2014 | | | 638,045 | |
| 1,115,000 | | 2.875%, 03/07/2016 | | | 1,163,365 | |
| | | The Bank of New York Mellon Corp. | | | | |
| 740,000 | | 1.500%, 01/31/2014 (a) | | | 749,053 | |
| 760,000 | | 4.300%, 05/15/2014 | | | 814,262 | |
| 1,175,000 | | Wachovia Corp. | | | | |
| | | 5.750%, 02/01/2018 | | | 1,367,815 | |
| | | | | | | |
| | | | | | 11,784,273 | |
| | | | | | | |
| | | Chemicals - 0.59% | | | | |
| | | Dow Chemical Co. | | | | |
| 725,000 | | 7.600%, 05/15/2014 | | | 821,338 | |
| 700,000 | | 4.250%, 11/15/2020 | | | 735,114 | |
| | | Ecolab, Inc. | | | | |
| 335,000 | | 2.375%, 12/08/2014 | | | 347,202 | |
| 450,000 | | 3.000%, 12/08/2016 | | | 468,416 | |
| 375,000 | | 4.350%, 12/08/2021 | | | 398,331 | |
| | | | | | | |
| | | | | | 2,770,401 | |
| | | | | | | |
| | | Commercial Services & Supplies - 0.07% | | | | |
| 350,000 | | International Lease Finance Corp. | | | | |
| | | 5.750%, 05/15/2016 | | | 349,924 | |
| | | | | | | |
See notes to financial statements.
57
|
GuideMarkSM Core Fixed Income Fund |
SCHEDULE OF INVESTMENTS (Continued) |
March 31, 2012 |
| |
| | | | | | | |
Principal
Amount | | | | Value | |
| | | | | | |
| | | CORPORATE OBLIGATIONS (Continued) | | | | |
| | | Communications - 0.24% | | | | |
| 730,000 | | Rogers Cable, Inc. | | | | |
| | | 5.500%, 03/15/2014 | | $ | 791,397 | |
| 325,000 | | Telefonica Emisiones SAU | | | | |
| | | 3.992%, 02/16/2016 | | | 323,778 | |
| | | | | | | |
| | | | | | 1,115,175 | |
| | | | | | | |
| | | Computers & Peripherals - 0.14% | | | | |
| | | Hewlett Packard Co. | | | | |
| 250,000 | | 3.000%, 09/15/2016 | | | 257,067 | |
| 375,000 | | 2.600%, 09/15/2017 | | | 375,242 | |
| | | | | | | |
| | | | | | 632,309 | |
| | | | | | | |
| | | Consumer Finance - 2.03% | | | | |
| 650,000 | | American Express Co. | | | | |
| | | 8.150%, 03/19/2038 | | | 962,464 | |
| 1,405,000 | | American Express Credit Corp. | | | | |
| | | 5.125%, 08/25/2014 | | | 1,528,941 | |
| 820,000 | | Capital One Financial Corp. | | | | |
| | | 2.125%, 07/15/2014 | | | 825,132 | |
| 1,020,000 | | Caterpillar Financial Services Corp. | | | | |
| | | 6.125%, 02/17/2014 | | | 1,121,717 | |
| 1,350,000 | | John Deere Capital Corp. | | | | |
| | | 4.900%, 09/09/2013 | | | 1,433,500 | |
| | | SLM Corp. | | | | |
| 430,000 | | 5.000%, 10/01/2013 | | | 440,750 | |
| 1,140,000 | | 5.375%, 05/15/2014 | | | 1,177,754 | |
| 675,000 | | Total Capital International SA | | | | |
| | | 2.875%, 02/17/2022 | | | 648,614 | |
| 1,350,000 | | Toyota Motor Credit Corp. | | | | |
| | | 2.050%, 01/12/2017 | | | 1,371,743 | |
| | | | | | | |
| | | | | | 9,510,615 | |
| | | | | | | |
| | | Containers & Packaging - 0.02% | | | | |
| 75,000 | | Rock-Tenn Co. | | | | |
| | | 5.625%, 03/15/2013 | | | 77,250 | |
| | | | | | | |
| | | Diversified Financial | | | | |
| | | Services - 3.06% | | | | |
| | | Bank of America Corp. | | | | |
| 740,000 | | 6.500%, 08/01/2016 | | | 814,390 | |
| 175,000 | | 5.875%, 01/05/2021 | | | 185,439 | |
| 100,000 | | 5.000%, 05/13/2021 | | | 100,336 | |
| 1,200,000 | | 5.700%, 01/24/2022 | | | 1,272,695 | |
| 369,000 | | Citigroup Capital XXI | | | | |
| | | 8.300%, 12/21/2077 (e) | | | 373,428 | |
| | | | | | | |
Principal
Amount | | | | Value | |
| | | | | | |
| | | Diversified Financial Services (Continued) | | | | |
| | | Citigroup, Inc. | | | | |
| 450,000 | | 5.000%, 09/15/2014 | | $ | 466,301 | |
| 690,000 | | 6.010%, 01/15/2015 | | | 750,171 | |
| 350,000 | | 4.450%, 01/10/2017 | | | 367,020 | |
| 1,180,000 | | 6.125%, 11/21/2017 | | | 1,318,653 | |
| 250,000 | | 4.500%, 01/14/2022 | | | 251,472 | |
| 300,000 | | Discover Bank | | | | |
| | | 8.700%, 11/18/2019 | | | 373,860 | |
| 350,000 | | First Niagara Financial Group, Inc. | | | | |
| | | 6.750%, 03/19/2020 | | | 383,951 | |
| 300,000 | | FUEL Trust | | | | |
| | | 3.984%, 12/15/2022 | | | | |
| | | (Acquired 06/14/2011, | | | | |
| | | Cost $300,000) (c) | | | 304,656 | |
| | | General Electric Capital Corp. | | | | |
| 1,610,000 | | 5.625%, 05/01/2018 | | | 1,868,572 | |
| 370,000 | | 5.300%, 02/11/2021 | | | 401,436 | |
| 1,840,000 | | 5.875%, 01/14/2038 | | | 2,029,581 | |
| 1,400,000 | | JPMorgan Chase & Co. | | | | |
| | | 3.450%, 03/01/2016 | | | 1,461,057 | |
| 500,000 | | JPMorgan Chase Capital XXV | | | | |
| | | 6.800%, 10/01/2037 | | | 505,300 | |
| 750,000 | | National Rural Utilities Cooperative | | | | |
| | | Finance Corp. | | | | |
| | | 1.125%, 11/01/2013 | | | 755,537 | |
| 300,000 | | NCUA Guaranteed Notes | | | | |
| | | 3.000%, 06/12/2019 | | | 319,362 | |
| | | | | | | |
| | | | | | 14,303,217 | |
| | | | | | | |
| | | Diversified Manufacturing - 0.52% | | | | |
| | | Cooper U.S., Inc. | | | | |
| 780,000 | | 2.375%, 01/15/2016 | | | 799,854 | |
| 485,000 | | 3.875%, 12/15/2020 | | | 517,527 | |
| | | Tyco Electronics Group SA | | | | |
| 540,000 | | 1.600%, 02/03/2015 | | | 541,323 | |
| 500,000 | | 6.550%, 10/01/2017 | | | 592,675 | |
| | | | | | | |
| | | | | | 2,451,379 | |
| | | | | | | |
| | | Diversified Telecommunication | | | | |
| | | Services - 1.52% | | | | |
| | | AT&T, Inc. | | | | |
| 725,000 | | 2.950%, 05/15/2016 | | | 766,870 | |
| 25,000 | | 3.875%, 08/15/2021 | | | 26,495 | |
| 695,000 | | 5.350%, 09/01/2040 | | | 741,769 | |
| 525,000 | | France Telecom SA | | | | |
| | | 4.375%, 07/08/2014 | | | 560,933 | |
See notes to financial statements.
58
|
GuideMarkSM Core Fixed Income Fund |
SCHEDULE OF INVESTMENTS (Continued) |
March 31, 2012 |
| |
| | | | | | | |
Principal
Amount | | | | Value | |
| | | | | | |
| | | CORPORATE OBLIGATIONS (Continued) | | | | |
| | | Diversified Telecommunication | | | | |
| | | Services (Continued) | | | | |
| 425,000 | | Qwest Corp. | | | | |
| | | 8.375%, 05/01/2016 | | $ | 509,967 | |
| 1,610,000 | | SBC Communications, Inc. | | | | |
| | | 5.100%, 09/15/2014 | | | 1,773,177 | |
| 190,000 | | Telecom Italia Capital | | | | |
| | | 6.999%, 06/04/2018 | | | 203,300 | |
| 365,000 | | Verizon Communications, Inc. | | | | |
| | | 3.500%, 11/01/2021 | | | 374,175 | |
| 1,565,000 | | Verizon Wireless Capital LLC | | | | |
| | | 8.500%, 11/15/2018 | | | 2,151,667 | |
| | | | | | | |
| | | | | | 7,108,353 | |
| | | | | | | |
| | | Educational Services - 0.20% | | | | |
| 825,000 | | Rensselaer Polytechnic Institute | | | | |
| | | 5.600%, 09/01/2020 | | | 925,637 | |
| | | | | | | |
| | | Electric Utilities - 0.96% | | | | |
| | | Arizona Public Service Co. | | | | |
| 275,000 | | 8.750%, 03/01/2019 | | | 357,149 | |
| 175,000 | | 5.050%, 09/01/2041 | | | 187,088 | |
| 695,000 | | Columbus Southern Power Co. | | | | |
| | | 5.500%, 03/01/2013 | | | 724,103 | |
| 375,000 | | IPALCO Enterprises, Inc. | | | | |
| | | 5.000%, 05/01/2018 | | | 375,000 | |
| 375,000 | | Nevada Power Co. | | | | |
| | | 5.875%, 01/15/2015 | | | 421,903 | |
| 1,075,000 | | PSI Energy, Inc. | | | | |
| | | 6.050%, 06/15/2016 | | | 1,247,193 | |
| 700,000 | | Union Electric Co. | | | | |
| | | 6.700%, 02/01/2019 | | | 861,503 | |
| 300,000 | | Westar Energy, Inc. | | | | |
| | | 6.000%, 07/01/2014 | | | 329,271 | |
| | | | | | | |
| | | | | | 4,503,210 | |
| | | | | | | |
| | | Electrical Equipment - 0.03% | | | | |
| 137,000 | | L-3 Communications Holdings, Inc. | | | | |
| | | 6.375%, 10/15/2015 | | | 140,596 | |
| | | | | | | |
| | | Energy Equipment & Services - 0.35% | | | | |
| 340,000 | | Cameron International Corp. | | | | |
| | | 6.375%, 07/15/2018 | | | 402,084 | |
| 625,000 | | Halliburton Co. | | | | |
| | | 3.250%, 11/15/2021 (a) | | | 643,189 | |
| 480,000 | | Pride International, Inc. | | | | |
| | | 6.875%, 08/15/2020 | | | 586,307 | |
| | | | | | | |
| | | | | | 1,631,580 | |
| | | | | | | |
| | | | | | | |
Principal
Amount | | | | Value | |
| | | | | | |
| | | Environmental Services - 0.06% | | | | |
| 275,000 | | Xylem, Inc. | | | | |
| | | 3.550%, 09/20/2016 | | | | |
| | | (Acquired 09/15/2011, | | | | |
| | | Cost $274,475) (c) | | $ | 284,210 | |
| | | | | | | |
| | | Food Products - 0.10% | | | | |
| 375,000 | | Kraft Foods, Inc. | | | | |
| | | 6.500%, 02/09/2040 | | | 463,095 | |
| | | | | | | |
| | | Health Care Equipment & Supplies - 0.69% | | | | |
| 605,000 | | Baxter International, Inc. | | | | |
| | | 1.850%, 01/15/2017 | | | 613,407 | |
| 730,000 | | Becton Dickinson & Co. | | | | |
| | | 3.250%, 11/12/2020 | | | 758,185 | |
| 775,000 | | Covidien International Finance SA | | | | |
| | | 2.800%, 06/15/2015 | | | 808,031 | |
| 150,000 | | DENTSPLY International, Inc. | | | | |
| | | 2.750%, 08/15/2016 | | | 150,938 | |
| 825,000 | | Medtronic, Inc. | | | | |
| | | 3.000%, 03/15/2015 | | | 874,507 | |
| | | | | | | |
| | | | | | 3,205,068 | |
| | | | | | | |
| | | Health Care Providers & Services - 0.97% | | | | |
| 175,000 | | Cigna Corp. | | | | |
| | | 2.750%, 11/15/2016 | | | 177,374 | |
| | | Express Scripts, Inc. | | | | |
| 960,000 | | 6.250%, 06/15/2014 | | | 1,055,909 | |
| 325,000 | | 3.125%, 05/15/2016 | | | 338,751 | |
| 500,000 | | HCA, Inc. | | | | |
| | | 7.875%, 02/15/2020 | | | 551,875 | |
| 500,000 | | McKesson Corp. | | | | |
| | | 4.750%, 03/01/2021 | | | 566,148 | |
| | | UnitedHealth Group, Inc. | | | | |
| 1,150,000 | | 4.875%, 02/15/2013 | | | 1,191,749 | |
| 650,000 | | 2.875%, 03/15/2022 | | | 637,388 | |
| | | | | | | |
| | | | | | 4,519,194 | |
| | | | | | | |
| | | Independent Power Producers & | | | | |
| | | Energy Traders - 0.27% | | | | |
| | | Exelon Generation Co., LLC | | | | |
| 540,000 | | 5.200%, 10/01/2019 | | | 600,299 | |
| 550,000 | | 6.250%, 10/01/2039 | | | 645,868 | |
| | | | | | | |
| | | | | | 1,246,167 | |
| | | | | | | |
| | | Industrial Conglomerates - 0.29% | | | | |
| 1,145,000 | | Koninklijke Philips Electronics NV | | | | |
| | | 5.750%, 03/11/2018 | | | 1,339,650 | |
| | | | | | | |
See notes to financial statements.
59
|
GuideMarkSM Core Fixed Income Fund |
SCHEDULE OF INVESTMENTS (Continued) |
March 31, 2012 |
| | | | | | | |
Principal
Amount | | | | Value | |
| | | CORPORATE OBLIGATIONS (Continued) | | | | |
| | | Insurance - 1.24% | | | | |
| 425,000 | | CNA Financial Corp.
7.350%, 11/15/2019 | | $ | 496,862 | |
| 400,000 | | MetLife Capital Trust X
9.250%, 04/08/2068
(Acquired 04/26/2010,
Cost $471,499) (c)(e) | | | 484,000 | |
| 960,000 | | MetLife, Inc.
5.000%, 11/24/2013 | | | 1,019,773 | |
| 1,025,000 | | New York Life Global Funding
3.000%, 05/04/2015
(Acquired 03/19/2012,
Cost $1,078,487) (d) | | | 1,079,689 | |
| 525,000 | | Prudential Financial, Inc.
4.500%, 11/15/2020 | | | 557,991 | |
| 100,000 | | Reinsurance Group of America, Inc.
6.750%, 12/15/2065 (e) | | | 92,573 | |
| 200,000 | | Transatlantic Holdings, Inc.
8.000%, 11/30/2039 | | | 223,561 | |
| 1,240,000 | | Travelers Property Casualty Corp.
5.000%, 03/15/2013 | | | 1,292,817 | |
| 500,000 | | Willis North America, Inc.
6.200%, 03/28/2017 | | | 560,101 | |
| | | | | | 5,807,367 | |
| | | Life Sciences Tools & Services - 0.25% | | | | |
| | | Life Technologies Corp. | | | | |
| 150,000 | | 6.000%, 03/01/2020 | | | 171,879 | |
| 200,000 | | 5.000%, 01/15/2021 | | | 216,941 | |
| 350,000 | | PerkinElmer, Inc.
5.000%, 11/15/2021 | | | 366,161 | |
| 375,000 | | Thermo Fisher Scientific, Inc.
3.600%, 08/15/2021 | | | 396,602 | |
| | | | | | 1,151,583 | |
| | | Machinery - 0.16% | | | | |
| 650,000 | | Eaton Corp.
5.600%, 05/15/2018 | | | 767,727 | |
| | | Media - 1.82% | | | | |
| 1,385,000 | | CBS Corp.
3.375%, 03/01/2022 | | | 1,339,749 | |
| | | Comcast Corp. | | | | |
| 1,000,000 | | 6.300%, 11/15/2017 | | | 1,207,923 | |
| 670,000 | | 5.875%, 02/15/2018 | | | 793,927 | |
| | | | | | | |
Principal
Amount | | | | Value | |
| | | Media (Continued) | | | | |
| | | DIRECTV Holdings, LLC | | | | |
| 1,010,000 | | 3.500%, 03/01/2016 | | $ | 1,061,729 | |
| 425,000 | | 3.800%, 03/15/2022
(Acquired 03/05/2012,
Cost $424,822) (a)(c) | | | 420,026 | |
| 285,000 | | 6.350%, 03/15/2040 | | | 316,390 | |
| 500,000 | | Dish DBS Corp.
7.125%, 02/01/2016 | | | 555,625 | |
| 725,000 | | NBCUniversal Media LLC
2.875%, 04/01/2016 | | | 754,120 | |
| 375,000 | | News America, Inc.
6.150%, 02/15/2041 | | | 431,130 | |
| 1,120,000 | | Time Warner Cable, Inc.
6.750%, 07/01/2018 | | | 1,368,300 | |
| 225,000 | | WPP Finance UK
8.000%, 09/15/2014 | | | 258,113 | |
| | | | | | 8,507,032 | |
| | | Metals & Mining - 0.85% | | | | |
| 715,000 | | BHP Billiton Finance USA Ltd.
1.125%, 11/21/2014 | | | 720,420 | |
| 450,000 | | Cliffs Natural Resources, Inc.
4.875%, 04/01/2021 | | | 466,983 | |
| 965,000 | | Freeport-McMoRan Copper &
Gold, Inc.
3.550%, 03/01/2022 | | | 928,714 | |
| 475,000 | | Newmont Mining Corp.
3.500%, 03/15/2022 | | | 458,570 | |
| 765,000 | | Rio Tinto Finance USA Ltd.
2.500%, 05/20/2016 | | | 793,654 | |
| | | Teck Resources Ltd. | | | | |
| 112,000 | | 10.750%, 05/15/2019 | | | 139,306 | |
| 435,000 | | 6.000%, 08/15/2040 | | | 459,677 | |
| | | | | | 3,967,324 | |
| | | Multi-Utilities - 0.15% | | | | |
| 600,000 | | Sempra Energy
6.500%, 06/01/2016 | | | 709,912 | |
| | | Office Electronics - 0.18% | | | | |
| 775,000 | | Xerox Corp.
4.250%, 02/15/2015 | | | 823,709 | |
| | | Oil & Gas - 3.67% | | | | |
| | | Anadarko Petroleum Corp. | | | | |
| 400,000 | | 6.375%, 09/15/2017 | | | 475,845 | |
| 150,000 | | 8.700%, 03/15/2019 | | | 197,264 | |
See notes to financial statements.
60
|
GuideMarkSM Core Fixed Income Fund |
SCHEDULE OF INVESTMENTS (Continued) |
March 31, 2012 |
| | | | | | | |
Principal
Amount | | | | Value | |
| | | CORPORATE OBLIGATIONS (Continued)
Oil & Gas (Continued) | | | | |
| 200,000 | | 6.450%, 09/15/2036 | | $ | 232,280 | |
| 450,000 | | Apache Corp.
3.625%, 02/01/2021 (a) | | | 475,480 | |
| 630,000 | | BP Capital Markets Plc
3.561%, 11/01/2021 | | | 650,037 | |
| | | BP Capital Plc | | | | |
| 1,395,000 | | 3.200%, 03/11/2016 | | | 1,479,423 | |
| 350,000 | | 4.500%, 10/01/2020 | | | 385,156 | |
| 1,000,000 | | Canadian Natural Resources Ltd.
3.450%, 11/15/2021 | | | 1,016,128 | |
| | | Energy Transfer Partners LP | | | | |
| 613,000 | | 8.500%, 04/15/2014 | | | 693,037 | |
| 525,000 | | 9.000%, 04/15/2019 | | | 651,954 | |
| 300,000 | | 5.200%, 02/01/2022 | | | 314,439 | |
| 375,000 | | Enterprise Products Operating LP
8.375%, 08/01/2066 (e) | | | 409,122 | |
| | | Husky Energy, Inc. | | | | |
| 465,000 | | 5.900%, 06/15/2014 | | | 509,229 | |
| 995,000 | | 3.950%, 04/15/2022 | | | 1,003,754 | |
| 725,000 | | Marathon Oil Corp.
6.000%, 10/01/2017 | | | 848,489 | |
| | | Nexen, Inc. | | | | |
| 150,000 | | 5.875%, 03/10/2035 | | | 155,520 | |
| 175,000 | | 7.500%, 07/30/2039 | | | 215,572 | |
| 775,000 | | ONEOK Partners LP
6.125%, 02/01/2041 | | | 866,629 | |
| | | Petrobras International Finance Co. | | | | |
| 375,000 | | 3.500%, 02/06/2017 | | | 385,301 | |
| 610,000 | | 5.375%, 01/27/2021 | | | 659,861 | |
| 235,000 | | 6.875%, 01/20/2040 | | | 278,444 | |
| 460,000 | | Petroleos Mexicanos
8.000%, 05/03/2019 | | | 584,200 | |
| | | Phillips 66 Company | | | | |
| 520,000 | | 1.950%, 03/05/2015 | | | 523,968 | |
| 1,305,000 | | 4.300%, 04/01/2022
(Acquired 03/07/2012,
Cost $1,301,907) (c) | | | 1,330,130 | |
| 475,000 | | Schlumberger Investment SA
3.300%, 09/14/2021
(Acquired 09/07/2011 through
03/20/2012, Cost $476,811) (c) | | | 482,214 | |
| 405,000 | | Spectra Energy Partners LP
4.600%, 06/15/2021 | | | 420,584 | |
| | | | | | | |
Principal
Amount | | | | Value | |
| | | Oil & Gas (Continued) | | | | |
| 425,000 | | Transocean, Inc.
6.000%, 03/15/2018 | | $ | 471,076 | |
| | | Valero Energy Corp. | | | | |
| 275,000 | | 9.375%, 03/15/2019 | | | 360,690 | |
| 275,000 | | 6.625%, 06/15/2037 | | | 300,264 | |
| 275,000 | | Weatherford International Ltd.
9.625%, 03/01/2019 | | | 364,943 | |
| 375,000 | | Western Gas Partners, LP
5.375%, 06/01/2021 | | | 402,731 | |
| | | | | | 17,143,764 | |
| | | Pharmaceuticals - 1.14% | | | | |
| 325,000 | | Aristotle Holdings, Inc. | | | | |
| | | 3.500%, 11/15/2016 | | | | |
| | | (Acquired 11/14/2011, | | | | |
| | | Cost $324,912) (c) | | | 339,840 | |
| | | Novartis Capital Corp. | | | | |
| 1,225,000 | | 2.900%, 04/24/2015 | | | 1,306,291 | |
| 500,000 | | 4.400%, 04/24/2020 | | | 568,021 | |
| | | Sanofi-Aventis SA | | | | |
| 1,195,000 | | 1.625%, 03/28/2014 | | | 1,219,280 | |
| 795,000 | | 4.000%, 03/29/2021 | | | 867,487 | |
| 975,000 | | Teva Pharmaceutical Finance | | | | |
| | | 3.000%, 06/15/2015 | | | 1,027,014 | |
| | | | | | 5,327,933 | |
| | | Pipelines - 1.10% | | | | |
| 600,000 | | Duke Energy, Inc. | | | | |
| | | 5.668%, 08/15/2014 | | | 650,507 | |
| | | Enterprise Products Operating LLC | | | | |
| 1,000,000 | | 5.650%, 04/01/2013 | | | 1,044,637 | |
| 525,000 | | 6.125%, 10/15/2039 | | | 593,310 | |
| 575,000 | | Spectra Energy Capital LLC | | | | |
| | | 5.650%, 03/01/2020 | | | 646,927 | |
| | | TransCanada Pipelines Ltd. | | | | |
| 775,000 | | 7.625%, 01/15/2039 | | | 1,100,264 | |
| 300,000 | | 6.350%, 05/15/2067 (e) | | | 310,419 | |
| 700,000 | | Transocean, Inc. | | | | |
| | | 6.500%, 11/15/2020 | | | 783,997 | |
| | | | | | 5,130,061 | |
| | | Real Estate - 1.14% | | | | |
| | | Developers Diversified Realty Corp. | | | | |
| 145,000 | | 9.625%, 03/15/2016 | | | 175,701 | |
| 375,000 | | 7.500%, 04/01/2017 | | | 425,925 | |
| 350,000 | | ERP Operating LP | | | | |
| | | 4.625%, 12/15/2021 | | | 369,234 | |
See notes to financial statements.
61
|
GuideMarkSM Core Fixed Income Fund |
SCHEDULE OF INVESTMENTS (Continued) |
March 31, 2012 |
| | | | | | | |
Principal
Amount | | | | Value | |
| | | CORPORATE OBLIGATIONS (Continued) | | | | |
| | | Real Estate (Continued) | | | | |
| 775,000 | | HCP, Inc. | | | | |
| | | 5.375%, 02/01/2021 | | $ | 836,602 | |
| | | Health Care Property Investments, Inc. | | | | |
| 125,000 | | 6.300%, 09/15/2016 | | | 140,407 | |
| 200,000 | | 6.000%, 01/30/2017 | | | 222,495 | |
| | | Health Care REIT, Inc. | | | | |
| 475,000 | | 3.625%, 03/15/2016 | | | 482,476 | |
| 555,000 | | 5.250%, 01/15/2022 | | | 581,647 | |
| 250,000 | | Kilroy Realty Corp. | | | | |
| | | 5.000%, 11/03/2015 | | | 267,235 | |
| | | Simon Property Group LP | | | | |
| 315,000 | | 5.750%, 12/01/2015 | | | 355,499 | |
| 925,000 | | 2.800%, 01/30/2017 | | | 948,199 | |
| 500,000 | | 4.125%, 12/01/2021 | | | 525,693 | |
| | | | | | 5,331,113 | |
| | | Road & Rail - 0.24% | | | | |
| 500,000 | | Burlington Northern Santa Fe LLC | | | | |
| | | 7.950%, 08/15/2030 | | | 682,644 | |
| 425,000 | | Canadian Pacific Railway Ltd. | | | | |
| | | 4.500%, 01/15/2022 | | | 439,470 | |
| | | | | | 1,122,114 | |
| | | Semiconductor & Semiconductor | | | | |
| | | Equipment - 0.59% | | | | |
| 755,000 | | Analog Devices, Inc. | | | | |
| | | 3.000%, 04/15/2016 | | | 795,885 | |
| 955,000 | | Applied Materials, Inc. | | | | |
| | | 2.650%, 06/15/2016 | | | 991,708 | |
| | | Intel Corp. | | | | |
| 350,000 | | 1.950%, 10/01/2016 | | | 360,870 | |
| 580,000 | | 3.300%, 10/01/2021 | | | 600,446 | |
| | | | | | 2,748,909 | |
| | | Thrifts & Mortgage Finance - 0.02% | | | | |
| 85,000 | | Santander Holdings USA, Inc. | | | | |
| | | 4.625%, 04/19/2016 | | | 86,212 | |
| | | Tobacco - 0.31% | | | | |
| | | Altria Group, Inc. | | | | |
| 500,000 | | 9.700%, 11/10/2018 | | | 680,294 | |
| 240,000 | | 9.250%, 08/06/2019 | | | 323,193 | |
| 375,000 | | Philip Morris International, Inc. | | | | |
| | | 6.375%, 05/16/2038 | | | 467,713 | |
| | | | | | 1,471,200 | |
| | | | | | | |
Principal
Amount | | | | Value | |
| | | Wireless Telecommunication | | | | |
| | | Services - 0.30% | | | | |
| 1,435,000 | | Vodafone Group Plc | | | | |
| | | 1.625%, 03/20/2017 | | $ | 1,416,598 | |
| | | Total Corporate Obligations | | | | |
| | | (Cost $143,170,242) | | | 148,958,174 | |
| | | FOREIGN GOVERNMENT DEBT | | | | |
| | | OBLIGATIONS - 0.34% | | | | |
| 1,270,000 | | Colombia Republic | | | | |
| | | 4.375%, 07/12/2021 | | | 1,387,475 | |
| 156,000 | | United Mexican States | | | | |
| | | 6.750%, 09/27/2034 | | | 201,240 | |
| | | Total Foreign Government Debt | | | | |
| | | Obligations (Cost $1,475,038) | | | 1,588,715 | |
| | | MORTGAGE BACKED SECURITIES - 28.45% | | | | |
| | | Federal Home Loan Mortgage Corp. | | | | |
| 1,000,000 | | Series 2590, 5.000%, 03/15/2018 | | | 1,084,484 | |
| 800,000 | | Series K-703, | | | | |
| | | 2.699%, 05/25/2018 (e) | | | 831,038 | |
| 13,279 | | Pool #E9-9763, | | | | |
| | | 4.500%, 09/01/2018 | | | 14,507 | |
| 13,536 | | Pool #E9-9764, | | | | |
| | | 4.500%, 09/01/2018 | | | 14,788 | |
| 600,000 | | Series K-705, | | | | |
| | | 2.303%, 09/25/2018 (e) | | | 608,687 | |
| 900,000 | | Series K-706, | | | | |
| | | 2.323%, 10/25/2018 | | | 913,170 | |
| 1,000,000 | | Series K-005, | | | | |
| | | 4.317%, 11/25/2019 | | | 1,117,027 | |
| 271,114 | | Pool #D9-6291, | | | | |
| | | 4.500%, 09/01/2023 | | | 292,301 | |
| 671,881 | | Series 2329, | | | | |
| | | 6.500%, 06/15/2031 | | | 739,525 | |
| 367,950 | | Series 2338, | | | | |
| | | 6.500%, 07/15/2031 | | | 423,981 | |
| 585,425 | | Pool #78-0447, | | | | |
| | | 2.484%, 04/01/2033 (e) | | | 613,116 | |
| 1,414,860 | | Pool #G0-8085, | | | | |
| | | 5.000%, 10/01/2035 | | | 1,526,346 | |
| 620 | | Pool #A4-3129, | | | | |
| | | 5.500%, 02/01/2036 | | | 681 | |
| 736,641 | | Pool #G0-4585, | | | | |
| | | 5.500%, 02/01/2038 | | | 801,899 | |
See notes to financial statements.
62
|
GuideMarkSM Core Fixed Income Fund |
SCHEDULE OF INVESTMENTS (Continued) |
March 31, 2012 |
| |
| | | | | | | |
Principal
Amount | | | | Value | |
| | | | | | |
| | | MORTGAGE BACKED | | | | |
| | | SECURITIES (Continued) | | | | |
| 153,675 | | Pool #G0-4836, | | | | |
| | | 5.500%, 04/01/2038 | | $ | 167,289 | |
| 4,541,299 | | Pool #A8-9148, | | | | |
| | | 4.000%, 10/01/2039 | | | 4,754,356 | |
| | | Federal National Mortgage Association | | | | |
| 3,000,000 | | Pool #TBA, | | | | |
| | | 3.500%, 04/15/2041 (g) | | | 3,081,563 | |
| 13,000,000 | | Pool #TBA, | | | | |
| | | 4.500%, 04/15/2041 (g) | | | 13,830,782 | |
| 494,523 | | Pool #467626, | | | | |
| | | 3.740%, 05/01/2018 | | | 535,865 | |
| 4,231 | | Pool #685505, | | | | |
| | | 5.000%, 05/01/2018 | | | 4,629 | |
| 4,537 | | Pool #705709, | | | | |
| | | 5.000%, 05/01/2018 | | | 4,952 | |
| 1,700,000 | | Pool #958815, | | | | |
| | | 4.506%, 06/01/2019 | | | 1,891,956 | |
| 2,070,280 | | Pool #FN0001, | | | | |
| | | 3.763%, 12/01/2020 | | | 2,229,007 | |
| 1,539,114 | | Pool #AD3775, | | | | |
| | | 4.500%, 03/01/2025 | | | 1,667,024 | |
| 733,169 | | Pool #AD5693, | | | | |
| | | 4.500%, 05/01/2025 | | | 785,393 | |
| 3,312,666 | | Pool #AH6301, | | | | |
| | | 4.000%, 05/01/2026 | | | 3,520,162 | |
| 430,588 | | Pool #544859, | | | | |
| | | 2.978%, 08/01/2029 (e) | | | 450,658 | |
| 474,345 | | Pool #786848, | | | | |
| | | 7.000%, 10/01/2031 | | | 549,452 | |
| 29,173 | | Pool #727181, | | | | |
| | | 5.000%, 08/01/2033 | | | 31,984 | |
| 10,515 | | Pool #730727, | | | | |
| | | 5.000%, 08/01/2033 | | | 11,546 | |
| 2,657 | | Pool #741862, | | | | |
| | | 5.500%, 09/01/2033 | | | 2,920 | |
| 3,475 | | Pool #766197, | | | | |
| | | 5.500%, 02/01/2034 | | | 3,820 | |
| 591 | | Pool #776974, | | | | |
| | | 5.500%, 04/01/2034 | | | 654 | |
| 358,842 | | Pool #888504, | | | | |
| | | 2.317%, 04/01/2034 (e) | | | 373,169 | |
| 20,074 | | Pool #775776, | | | | |
| | | 5.500%, 05/01/2034 | | | 22,063 | |
| | | | | | | |
Principal
Amount | | | | Value | |
| | | | | | |
| | | MORTGAGE BACKED | | | | |
| | | SECURITIES (Continued) | | | | |
| 470,497 | | Pool #725705, | | | | |
| | | 5.000%, 08/01/2034 | | $ | 510,213 | |
| 382,545 | | Pool #802783, | | | | |
| | | 2.362%, 10/01/2034 (e) | | | 407,322 | |
| 33,642 | | Pool #781629, | | | | |
| | | 5.500%, 12/01/2034 | | | 36,976 | |
| 1,056 | | Pool #806098, | | | | |
| | | 6.000%, 12/01/2034 | | | 1,174 | |
| 3,197,497 | | Pool #735224, | | | | |
| | | 5.500%, 02/01/2035 | | | 3,514,378 | |
| 6,297,235 | | Pool #AB0074, | | | | |
| | | 5.000%, 02/01/2035 | | | 6,863,542 | |
| 407,934 | | Pool #735504, | | | | |
| | | 6.000%, 04/01/2035 | | | 455,792 | |
| 26,183 | | Pool #822815, | | | | |
| | | 5.500%, 04/01/2035 | | | 28,755 | |
| 26,830 | | Pool #357850, | | | | |
| | | 5.500%, 07/01/2035 | | | 29,489 | |
| 28,507 | | Pool #820242, | | | | |
| | | 5.000%, 07/01/2035 | | | 31,302 | |
| 2,288,820 | | Pool #820345, | | | | |
| | | 5.000%, 09/01/2035 | | | 2,475,340 | |
| 4,862 | | Pool #838452, | | | | |
| | | 5.500%, 09/01/2035 | | | 5,354 | |
| 1,492,222 | | Pool #844158, | | | | |
| | | 5.000%, 11/01/2035 | | | 1,613,826 | |
| 602,396 | | Pool #745755, | | | | |
| | | 5.000%, 12/01/2035 | | | 652,051 | |
| 62,595 | | Pool #848939, | | | | |
| | | 6.500%, 01/01/2036 | | | 70,658 | |
| 25,404 | | Pool #851639, | | | | |
| | | 6.500%, 01/01/2036 | | | 28,541 | |
| 279,697 | | Pool #888022, | | | | |
| | | 5.000%, 02/01/2036 | | | 302,491 | |
| 29,364 | | Pool #865854, | | | | |
| | | 6.000%, 03/01/2036 | | | 32,598 | |
| 44,859 | | Pool #891474, | | | | |
| | | 6.000%, 04/01/2036 | | | 49,799 | |
| 261,216 | | Pool #897776, | | | | |
| | | 6.500%, 09/01/2036 | | | 293,477 | |
| 197,521 | | Pool #897505, | | | | |
| | | 6.500%, 12/01/2036 | | | 221,915 | |
| 55,299 | | Pool #906000, | | | | |
| | | 6.000%, 01/01/2037 | | | 61,095 | |
See notes to financial statements.
63
|
GuideMarkSM Core Fixed Income Fund |
SCHEDULE OF INVESTMENTS (Continued) |
March 31, 2012 |
| |
| | | | | | | |
Principal
Amount | | | | Value | |
| | | | | | |
| | | MORTGAGE BACKED | | | | |
| | | SECURITIES (Continued) | | | | |
| 481 | | Pool #928062, | | | | |
| | | 5.500%, 02/01/2037 | | $ | 528 | |
| 774 | | Pool #899119, | | | | |
| | | 5.500%, 04/01/2037 | | | 851 | |
| 878 | | Pool #938488, | | | | |
| | | 5.500%, 05/01/2037 | | | 965 | |
| 1,198 | | Pool #970131, | | | | |
| | | 5.500%, 03/01/2038 | | | 1,317 | |
| 976 | | Pool #981313, | | | | |
| | | 5.500%, 06/01/2038 | | | 1,073 | |
| 1,240 | | Pool #985108, | | | | |
| | | 5.500%, 07/01/2038 | | | 1,362 | |
| 469 | | Pool #964930, | | | | |
| | | 5.500%, 08/01/2038 | | | 515 | |
| 700 | | Pool #987032, | | | | |
| | | 5.500%, 08/01/2038 | | | 769 | |
| 646 | | Pool #968371, | | | | |
| | | 5.500%, 09/01/2038 | | | 710 | |
| 350,042 | | Pool #AD0095, | | | | |
| | | 6.000%, 11/01/2038 | | | 386,077 | |
| 429 | | Pool #993050, | | | | |
| | | 5.500%, 12/01/2038 | | | 472 | |
| 277 | | Pool #MC0018, | | | | |
| | | 5.500%, 12/01/2038 | | | 303 | |
| 148,026 | | Pool #AA8715, | | | | |
| | | 4.000%, 06/01/2039 | | | 157,637 | |
| 20,699 | | Pool #AA9133, | | | | |
| | | 4.500%, 08/01/2039 | | | 22,514 | |
| 41,166 | | Pool #AC2861, | | | | |
| | | 4.500%, 08/01/2039 | | | 44,775 | |
| 84,183 | | Pool #AC6121, | | | | |
| | | 4.500%, 11/01/2039 | | | 91,564 | |
| 28,835 | | Pool #AC8372, | | | | |
| | | 4.500%, 12/01/2039 | | | 31,363 | |
| 753,941 | | Pool #AD0586, | | | | |
| | | 4.500%, 12/01/2039 | | | 820,044 | |
| 894,495 | | Pool #AD5574, | | | | |
| | | 5.000%, 04/01/2040 | | | 966,830 | |
| 3,455,023 | | Pool #AD5661, | | | | |
| | | 5.000%, 05/01/2040 | | | 3,768,205 | |
| 3,716,995 | | Pool #AD6949, | | | | |
| | | 5.500%, 06/01/2040 | | | 4,086,655 | |
| 4,304,197 | | Pool #AB1231, | | | | |
| | | 5.000%, 07/01/2040 | | | 4,695,785 | |
| | | | | | | |
Principal
Amount | | | | Value | |
| | | | | | |
| | | MORTGAGE BACKED | | | | |
| | | SECURITIES (Continued) | | | | |
| 1,648,547 | | Pool #AH1089, | | | | |
| | | 4.000%, 11/01/2040 | | $ | 1,730,085 | |
| 1,904,720 | | Pool #AA4757, | | | | |
| | | 4.000%, 12/01/2040 | | | 1,998,928 | |
| 357,067 | | Pool #AE8893, | | | | |
| | | 4.000%, 12/01/2040 | | | 374,728 | |
| 141,488 | | Pool #AE7893, | | | | |
| | | 4.000%, 01/01/2041 | | | 148,486 | |
| 334,358 | | Pool #AH2999, | | | | |
| | | 4.000%, 01/01/2041 | | | 350,896 | |
| 2,418,362 | | Pool #AH3373, | | | | |
| | | 5.000%, 01/01/2041 | | | 2,638,510 | |
| 370,216 | | Pool #AH4763, | | | | |
| | | 4.000%, 01/01/2041 | | | 388,527 | |
| 519,159 | | Pool #AB2265, | | | | |
| | | 4.000%, 02/01/2041 | | | 551,083 | |
| 263,395 | | Pool #AH5653, | | | | |
| | | 4.000%, 02/01/2041 | | | 278,874 | |
| 109,527 | | Pool #AH5783, | | | | |
| | | 4.000%, 02/01/2041 | | | 114,995 | |
| 555,294 | | Pool #AL0934, | | | | |
| | | 5.000%, 02/01/2041 | | | 600,199 | |
| 354,859 | | Pool #AL0146, | | | | |
| | | 4.000%, 03/01/2041 | | | 377,900 | |
| 5,075,902 | | Pool #AH8854, | | | | |
| | | 4.500%, 04/01/2041 | | | 5,452,663 | |
| 363,050 | | Pool #AL0215, | | | | |
| | | 4.500%, 04/01/2041 | | | 389,918 | |
| 3,501,289 | | Pool #AL0247, | | | | |
| | | 4.000%, 04/01/2041 | | | 3,716,590 | |
| 1,508,571 | | Pool #AI1856, | | | | |
| | | 4.500%, 05/01/2041 | | | 1,625,752 | |
| 471,803 | | Pool #AL0187, | | | | |
| | | 5.000%, 05/01/2041 | | | 509,956 | |
| 3,503,469 | | Pool #AL0208, | | | | |
| | | 4.500%, 05/01/2041 | | | 3,763,067 | |
| 69,069 | | Pool #AL0456, | | | | |
| | | 5.000%, 06/01/2041 | | | 74,654 | |
| 3,304,530 | | Pool #AB3395, | | | | |
| | | 4.500%, 08/01/2041 | | | 3,550,777 | |
| 311,326 | | Pool #AI8154, | | | | |
| | | 4.000%, 08/01/2041 | | | 326,870 | |
| 218,946 | | Pool #AI8842, | | | | |
| | | 4.500%, 08/01/2041 | | | 233,695 | |
See notes to financial statements.
64
|
GuideMarkSM Core Fixed Income Fund |
SCHEDULE OF INVESTMENTS (Continued) |
March 31, 2012 |
| |
| | | | | | | |
Principal
Amount | | | | Value | |
| | | | | | |
| | | MORTGAGE BACKED | | | | |
| | | SECURITIES (Continued) | | | | |
| 78,311 | | Pool #AL0815, | | | | |
| | | 4.000%, 09/01/2041 | | $ | 83,396 | |
| 25,701 | | Pool #AJ1562, | | | | |
| | | 4.000%, 10/01/2041 | | | 27,369 | |
| 30,085 | | Pool #AJ1972, | | | | |
| | | 4.000%, 10/01/2041 | | | 32,038 | |
| 5,048,540 | | Pool #AJ2212, | | | | |
| | | 4.500%, 10/01/2041 | | | 5,412,295 | |
| 55,470 | | Pool #AJ3146, | | | | |
| | | 4.500%, 10/01/2041 | | | 59,207 | |
| 280,609 | | Pool #AJ4044, | | | | |
| | | 4.000%, 10/01/2041 | | | 298,829 | |
| 41,122 | | Pool #AJ4756, | | | | |
| | | 4.000%, 10/01/2041 | | | 43,792 | |
| 3,194,095 | | Pool #AL0933, | | | | |
| | | 5.000%, 10/01/2041 | | | 3,459,379 | |
| 1,945,456 | | Pool #AB3876, | | | | |
| | | 4.000%, 11/01/2041 | | | 2,053,485 | |
| 30,895 | | Pool #AJ3330, | | | | |
| | | 4.000%, 11/01/2041 | | | 32,901 | |
| 35,287 | | Pool #AJ4549, | | | | |
| | | 4.000%, 11/01/2041 | | | 37,578 | |
| 25,168 | | Pool #AJ4698, | | | | |
| | | 4.000%, 11/01/2041 | | | 26,802 | |
| 55,260 | | Pool #AJ5424, | | | | |
| | | 4.000%, 11/01/2041 | | | 58,848 | |
| 33,508 | | Pool #AJ7840, | | | | |
| | | 4.000%, 11/01/2041 | | | 35,684 | |
| 33,166 | | Pool #AB3995, | | | | |
| | | 4.000%, 12/01/2041 | | | 35,319 | |
| 275,940 | | Pool #AB4054, | | | | |
| | | 4.000%, 12/01/2041 | | | 293,857 | |
| 34,220 | | Pool #AI0848, | | | | |
| | | 4.000%, 12/01/2041 | | | 36,442 | |
| 30,842 | | Pool #AJ4187, | | | | |
| | | 4.000%, 12/01/2041 | | | 32,845 | |
| 41,386 | | Pool #AJ5736, | | | | |
| | | 4.000%, 12/01/2041 | | | 44,073 | |
| 38,927 | | Pool #AJ6061, | | | | |
| | | 4.000%, 12/01/2041 | | | 41,454 | |
| 531,733 | | Pool #AJ7684, | | | | |
| | | 4.000%, 12/01/2041 | | | 566,258 | |
| | | | | | | |
Principal
Amount | | | | Value | |
| | | | | | |
| | | MORTGAGE BACKED | | | | |
| | | SECURITIES (Continued) | | | | |
| 28,278 | | Pool #AJ7868, | | | | |
| | | 4.000%, 12/01/2041 | | $ | 30,114 | |
| 58,355 | | Pool #AJ8104, | | | | |
| | | 4.000%, 12/01/2041 | | | 62,144 | |
| 34,001 | | Pool #AJ8109, | | | | |
| | | 4.000%, 12/01/2041 | | | 36,208 | |
| 24,914 | | Pool #AJ8171, | | | | |
| | | 4.000%, 12/01/2041 | | | 26,532 | |
| 44,515 | | Pool #AJ8341, | | | | |
| | | 4.000%, 12/01/2041 | | | 47,405 | |
| 65,645 | | Pool #AJ8436, | | | | |
| | | 4.000%, 12/01/2041 | | | 69,908 | |
| 26,584 | | Pool #AJ8912, | | | | |
| | | 4.000%, 12/01/2041 | | | 28,310 | |
| 33,197 | | Pool #AJ9248, | | | | |
| | | 4.000%, 12/01/2041 | | | 35,352 | |
| 39,673 | | Pool #AJ7538, | | | | |
| | | 4.000%, 01/01/2042 | | | 42,249 | |
| 44,606 | | Pool #AJ8369, | | | | |
| | | 4.000%, 01/01/2042 | | | 47,503 | |
| 36,186 | | Pool #AJ9162, | | | | |
| | | 4.000%, 01/01/2042 | | | 38,535 | |
| 198,926 | | Pool #AJ9330, | | | | |
| | | 4.000%, 01/01/2042 | | | 211,842 | |
| 25,640 | | Pool #AJ9779, | | | | |
| | | 4.000%, 01/01/2042 | | | 27,305 | |
| 31,980 | | Pool #AK0170, | | | | |
| | | 4.000%, 01/01/2042 | | | 34,057 | |
| 68,888 | | Pool #AK0543, | | | | |
| | | 4.000%, 01/01/2042 | | | 73,361 | |
| 27,587 | | Pool #AK0563, | | | | |
| | | 4.000%, 01/01/2042 | | | 29,378 | |
| 61,120 | | Pool #AK1827, | | | | |
| | | 4.000%, 01/01/2042 | | | 65,088 | |
| | | Government National Mortgage Association | | | | |
| 1,000,000 | | Pool #TBA, | | | | |
| | | 3.500%, 04/15/2041 (g) | | | 1,042,344 | |
| 274,144 | | Pool #752842X, | | | | |
| | | 3.950%, 07/15/2025 | | | 291,021 | |
| 48,486 | | Pool #614436X, | | | | |
| | | 5.000%, 08/15/2033 | | | 53,903 | |
| 773,495 | | Pool #618907X, | | | | |
| | | 5.000%, 09/15/2033 | | | 856,782 | |
See notes to financial statements.
65
|
GuideMarkSM Core Fixed Income Fund |
SCHEDULE OF INVESTMENTS (Continued) |
March 31, 2012 |
| |
| | | | | | | |
Principal
Amount | | | | Value | |
| | | | | | |
| | | MORTGAGE BACKED | | | | |
| | | SECURITIES (Continued) | | | | |
| 108,164 | | Pool #605098X, | | | | |
| | | 5.000%, 03/15/2034 | | $ | 119,811 | |
| 90,014 | | Pool #520279X, | | | | |
| | | 5.000%, 11/15/2034 | | | 99,791 | |
| 1,490,859 | | Pool #644812X, | | | | |
| | | 6.000%, 05/15/2035 | | | 1,695,499 | |
| 1,747,678 | | Pool #688021X, | | | | |
| | | 6.000%, 10/15/2038 | | | 1,973,370 | |
| 254,225 | | Pool #736686X, | | | | |
| | | 5.000%, 02/15/2039 | | | 281,123 | |
| 2,033,528 | | Pool #782858X, | | | | |
| | | 6.000%, 03/15/2039 | | | 2,296,134 | |
| 1,877,828 | | Pool #723248, | | | | |
| | | 5.000%, 10/15/2039 | | | 2,088,829 | |
| 703,532 | | Pool #726382, | | | | |
| | | 5.000%, 10/15/2039 | | | 782,584 | |
| 527,172 | | Pool #782916X, | | | | |
| | | 5.500%, 02/15/2040 | | | 590,635 | |
| 2,102,537 | | Pool #752631C, | | | | |
| | | 4.500%, 10/20/2040 | | | 2,304,843 | |
| | | | | | | |
| | | Total Mortgage Backed Securities | | | | |
| | | (Cost $128,919,620) | | | 132,958,160 | |
| | | | | | | |
| | | MUNICIPAL DEBT OBLIGATIONS - 0.72% | | | | |
| | | California, GO, | | | | |
| 230,000 | | 7.500%, 04/01/2034 | | | 292,431 | |
| 175,000 | | 7.950%, 03/31/2036 | | | 203,037 | |
| 315,000 | | Illinois, GO, | | | | |
| | | 7.350%, 07/01/2035 | | | 369,054 | |
| 942,379 | | Missouri Higher Education Loan | | | | |
| | | Authority, Series A-1, Revenue Bond, | | | | |
| | | 1.441%, 11/26/2032 (e) | | | 935,396 | |
| | | South Carolina Student Loan Corp., | | | | |
| | | Series A-1, Revenue Bond, | | | | |
| 609,549 | | 0.588%, 12/03/2018 (e) | | | 603,747 | |
| 1,000,000 | | 0.617%, 12/02/2019 (e) | | | 956,310 | |
| | | | | | | |
| | | Total Municipal Debt Obligations | | | | |
| | | (Cost $3,221,437) | | | 3,359,975 | |
| | | | | | | |
| | | | | | | |
Number
of Shares | | | | | | |
| | | | | | | |
| | | PREFERRED STOCKS - 0.10% | | | | |
| | | Diversified Financial Services - 0.10% | | | | |
| 14,200 | | Citigroup Capital XII | | | 363,520 | |
| 44,650 | | Federal Home Loan Mortgage | | | | |
| | | Corp. (b)(k) | | | 62,064 | |
| | | | | | | |
Number
of Shares | | | | Value | |
| | | | | | |
| | | Diversified Financial Services (Continued) | | | | |
| 32,350 | | Federal National Mortgage | | | | |
| | | Association (b)(k) | | $ | 44,643 | |
| 1,300 | | Federal National Mortgage | | | | |
| | | Association (b)(i)(k) | | | 2,353 | |
| | | | | | | |
| | | Total Preferred Stocks | | | | |
| | | (Cost $2,349,217) | | | 472,580 | |
| | | | | | | |
| | | | | | | |
Principal
Amount | | | | | | |
| | | | | | | |
| | | SUPRANATIONAL OBLIGATIONS - 1.06% | | | | |
| | | Banks - 1.06% | | | | |
| 4,000,000 | | Inter-American Development Bank | | | | |
| | | 0.500%, 05/29/2014 | | | 3,983,684 | |
| 900,000 | | North American Development Bank | | | | |
| | | 4.375%, 02/11/2020 | | | 986,495 | |
| | | | | | | |
| | | | | | 4,970,179 | |
| | | | | | | |
| | | Total Supranational Obligations | | | | |
| | | (Cost $4,547,830) | | | 4,970,179 | |
| | | | | | | |
| | | US GOVERNMENT AGENCY ISSUE - 2.83% | | | | |
| | | Federal Home Loan Banks | | | | |
| 2,700,000 | | 0.210%, 01/04/2013 | | | 2,700,470 | |
| 1,200,000 | | 5.625%, 06/11/2021(a) | | | 1,513,527 | |
| | | Federal Home Loan Mortgage Corp. | | | | |
| 300,000 | | 0.500%, 10/15/2013 | | | 300,132 | |
| 1,300,000 | | 1.000%, 03/08/2017 | | | 1,283,503 | |
| 1,400,000 | | 2.375%, 01/13/2022 | | | 1,377,333 | |
| | | Federal National Mortgage Association | | | | |
| 200,000 | | 4.125%, 04/15/2014 | | | 215,070 | |
| 1,700,000 | | 0.625%, 10/30/2014 | | | 1,707,895 | |
| 2,312,265 | | New Valley Generation | | | | |
| | | Series 2000-1, | | | | |
| | | 7.299%, 03/15/2019 | | | 2,786,280 | |
| 1,200,000 | | Tennessee Valley Authority | | | | |
| | | 4.375%, 06/15/2015 | | | 1,337,119 | |
| | | | | | | |
| | | Total US Government Agency Issue | | | | |
| | | (Cost $12,643,036) | | | 13,221,329 | |
| | | | | | | |
| | | U.S. TREASURY OBLIGATIONS - 27.10% | | | | |
| | | U.S. Treasury Bonds - 3.81% | | | | |
| 100,000 | | 5.000%, 05/15/2037 | | | 131,109 | |
| 700,000 | | 4.375%, 11/15/2039 | | | 841,203 | |
| 2,200,000 | | 4.375%, 05/15/2040 | | | 2,644,125 | |
| 1,200,000 | | 4.250%, 11/15/2040 | | | 1,413,376 | |
| 100,000 | | 4.750%, 02/15/2041 | | | 127,469 | |
| 500,000 | | 4.375%, 05/15/2041 | | | 601,172 | |
See notes to financial statements.
66
|
GuideMarkSM Core Fixed Income Fund |
SCHEDULE OF INVESTMENTS (Continued) |
March 31, 2012 |
| |
| | | | | | | |
Principal
Amount | | | | Value | |
| | | | | | |
| | | U.S. TREASURY OBLIGATIONS (Continued) | | | | |
| | | U.S. Treasury Bonds (Continued) | | | | |
| 10,420,000 | | 3.750%, 08/15/2041 | | $ | 11,266,625 | |
| 800,000 | | 3.125%, 02/15/2042 | | | 767,000 | |
| | | | | | | |
| | | U.S. Treasury Notes - 23.29% | | | | |
| 252,130 | | 3.000%, 07/15/2012 (h) | | | 257,960 | |
| 107,238 | | 0.625%, 04/15/2013 (h) | | | 110,103 | |
| 1,500,000 | | 0.375%, 07/31/2013 | | | 1,502,169 | |
| 7,900,000 | | 0.250%, 10/31/2013 (j) | | | 7,893,830 | |
| 4,400,000 | | 0.250%, 11/30/2013 | | | 4,396,049 | |
| 3,900,000 | | 0.125%, 12/31/2013 | | | 3,887,204 | |
| 122,671 | | 2.000%, 01/15/2014 (h) | | | 131,181 | |
| 2,400,000 | | 1.250%, 02/15/2014 | | | 2,440,970 | |
| 3,700,000 | | 0.625%, 07/15/2014 | | | 3,718,500 | |
| 6,900,000 | | 0.375%, 11/15/2014 | | | 6,883,826 | |
| 2,700,000 | | 0.250%, 12/15/2014 | | | 2,684,181 | |
| 1,068,363 | | 1.625%, 01/15/2015 (h) | | | 1,164,766 | |
| 900,000 | | 0.250%, 01/15/2015 | | | 894,235 | |
| 5,400,000 | | 0.250%, 02/15/2015 | | | 5,362,033 | |
| 5,100,000 | | 0.375%, 03/15/2015 | | | 5,081,074 | |
| 116,531 | | 1.875%, 07/15/2015 (h) | | | 130,078 | |
| 17,715,000 | | 2.000%, 01/31/2016 | | | 18,555,081 | |
| 8,245,000 | | 2.000%, 04/30/2016 | | | 8,638,575 | |
| 6,600,000 | | 0.875%, 11/30/2016 | | | 6,573,191 | |
| 5,240,000 | | 0.875%, 01/31/2017 | | | 5,208,481 | |
| 600,000 | | 0.875%, 02/28/2017 | | | 595,875 | |
| 800,000 | | 1.375%, 12/31/2018 | | | 791,688 | |
| 11,955,000 | | 2.000%, 11/15/2021 | | | 11,771,013 | |
| 10,375,000 | | 2.000%, 02/15/2022 | | | 10,177,232 | |
| | | | | | | |
| | | Total U.S. Treasury Obligations
(Cost $126,271,994) | | | 126,641,374 | |
| | | | | | | |
Number
of Shares | | | | | | |
| | | | | | | |
| | | WARRANTS - 0.00% | | | | |
| | | Warrant - 0.00% | | | | |
| 272 | | Semgroup Corp. (d)
Expiration: November, 2014
Exercise Price: $1.00 | | | 2,018 | |
| | | | | | | |
| | | Total Warrants (Cost $0) | | | 2,018 | |
| | | | | | | |
| | | SHORT TERM INVESTMENTS - 3.82% | | | | |
| | | Money Market Funds - 2.34% | | | | |
| 10,951,263 | | Federated Prime Obligations Fund
Effective Yield, 0.20% | | | 10,951,263 | |
| | | | | | | |
| | | | | | | |
Principal
Amount | | | | Value | |
| | | | | | |
| | | Repurchase Agreement - 1.48% | | | | |
| 6,900,000 | | Merrill Lynch Repurchase Agreement
0.140%, 04/02/2012 (Collateralized
by various U.S. Government Agency
Issues, value $7,005,387, 0.200%
to 5.000%, 10/05/12 to 01/13/22) | | $ | 6,900,000 | |
| | | | | | | |
| | | Total Short Term Investments
(Cost $17,851,263) | | | 17,851,263 | |
| | | | | | | |
Number
of Shares | | | | | | |
| | | | | | | |
| | | INVESTMENTS PURCHASED
AS SECURITIES LENDING
COLLATERAL - 0.47% | | | | |
| | | Money Market Funds - 0.46% | | | | |
| 2,166,596 | | First American Government
Obligations Fund
Effective Yield, 0.02% | | | 2,166,596 | |
| 4,931 | | Reserve Primary Fund (i) | | | 191 | |
| | | | | | | |
| | | Total Money Market Funds
(Cost $2,170,851) | | | 2,166,787 | |
| | | | | | | |
Principal
Amount | | | | | | |
| | | | | | | |
| | | Cash - 0.01% | | | | |
| 28,536 | | Cash | | | 28,536 | |
| | | | | | | |
| | | Total Cash (Cost $28,536) | | | 28,536 | |
| | | | | | | |
| | | Total Investments Purchased as
Securities Lending Collateral
(Cost $2,199,387) | | | 2,195,323 | |
| | | | | | | |
| | | Total Investments
(Cost $470,291,590) - 102.28% | | | 477,940,608 | |
| | | Liabilities in Excess
of Other Assets - (2.28)% | | | (10,659,507 | ) |
| | | | | | | |
| | | TOTAL NET
ASSETS - 100.00% | | $ | 467,281,101 | |
| | | | | | | |
See notes to financial statements.
67
|
GuideMarkSM Core Fixed Income Fund |
SCHEDULE OF INVESTMENTS (Continued) |
March 31, 2012 |
| |
Percentages are stated as a percent of net assets.
Principal Amounts are denominated in the currency in which the security was purchased.
| |
(a) | All or portion of this security is on loan. |
(b) | Non-income producing. |
(c) | Restricted securities as defined in Rule 144(a) under the Securities Act of 1933. Such securities are treated as liquid securities according to the Fund’s liquidity guidelines. The value of these securities total $9,765,073, which represents 2.09% of total net assets. |
(d) | Restricted securities as defined in Rule 144(a) under the Securities Act of 1933. Such securities are treated as illiquid securities according to the Fund’s liquidity guidelines. The value of these securities total $1,081,707, which represents 0.23% of total net assets. |
| |
(e) | Variable Rate Security. The rate shown is the rate in effect on March 31, 2012. |
(f) | Non-income producing. Security is treated as an illiquid security according to the Fund’s liquidity guidelines. Item identified as in default as to payment of interest. |
(g) | Security purchased on a when-issued basis. On March 31, 2012, the total value of investments purchased on a when-issued basis was $17,954,689, which represents 3.84% of total net assets. |
(h) | Represents a U.S. Treasury Inflation-Protected Security. |
(i) | As of March 31, 2012, the Fund has fair valued this security and deemed it illiquid. The value of these securities was $3,819, which represents 0.00% of total net assets. |
(j) | Partially assigned as collateral for certain futures contracts. |
(k) | Variable Rate Security. |
|
| |
GuideMarkSM Core Fixed Income Fund |
SCHEDULE OF FORWARD SALE COMMITMENTS |
March 31, 2012 |
| |
| | | | | | | | | | |
Description | | | Principal
Amount | | Settlement
Date | | Proceeds
Received | | Value | |
| | | | | | | | | | | |
Federal National Mortgage Association,
Pool #TBA, 5.500%, 04/15/2041 | | $1,000,000 | | 4/12/2012 | | $1,077,188 | | $1,080,313 | |
|
| |
GuideMarkSM Core Fixed Income Fund |
SCHEDULE OF OPEN FUTURES CONTRACTS |
March 31, 2012 |
| |
| | | | | | | | | | | | | | | | |
Description | | | Number of
Contracts
Purchased / (Sold) | | Notional
Value | | Settlement
Month | | Unrealized
Appreciation
(Depreciation) | |
| | | | | | | | | | | |
Eurodollar 90 Day Futures | | 134 | | | | 33,113,075 | | | Sep-14 | | | $ | (17,142 | ) | |
Eurodollar 90 Day Futures | | (134 | ) | | (32,868,525 | ) | | Sep-15 | | | | 28,645 | | |
U.S. Treasury 5 Year Note Futures | | 111 | | | | 13,601,836 | | | Jul-12 | | | | (28,016 | ) | |
U.S. Treasury 10 Year Note Futures | | 15 | | | | 1,942,266 | | | Jul-12 | | | | 925 | | |
U.S. Treasury Long Bond Futures | | 10 | | | | 1,377,780 | | | Jul-12 | | | | (16 | ) | |
U.S. Treasury Ultra Bond Futures | | 25 | | | | 3,774,219 | | | Jul-12 | | | | (182,965 | ) | |
| | | | | | | | | | | | | | | |
| | | | | | | | | | | | $ | (198,569 | ) | |
| | | | | | | | | | | | | | | |
See notes to financial statements.
68
|
GuideMarkSM Tax-Exempt Fixed Income Fund |
SCHEDULE OF INVESTMENTS |
March 31, 2012 |
| |
| | | | | | | |
Principal
Amount | | | | Value | |
| | | | | | |
| | | MUNICIPAL DEBT OBLIGATIONS - 99.48% | | | | |
| | | Alabama - 0.64% | | | | |
$ | 500,000 | | Mobile Industrial Development | | | | |
| | | Board Pollution Control, | | | | |
| | | Revenue Bond, | | | | |
| | | 4.875%, 06/01/2034 (a) | | $ | 520,100 | |
| | | | | | | |
| | | Arizona - 3.13% | | | | |
| 750,000 | | Phoenix Civic Improvement | | | | |
| | | Wastewater System, Refunding, | | | | |
| | | Revenue Bond, | | | | |
| | | 5.000%, 07/01/2020 | | | 859,005 | |
| 500,000 | | Pinal County Industrial Development | | | | |
| | | Authority Correctional Facilities, | | | | |
| | | Revenue Bond, ACA Insured, | | | | |
| | | 5.250%, 10/01/2015 | | | 524,330 | |
| 1,000,000 | | Salt River Project, Series A, | | | | |
| | | Revenue Bond, | | | | |
| | | 5.000%, 01/01/2021 | | | 1,163,700 | |
| | | | | | | |
| | | | | | 2,547,035 | |
| | | | | | | |
| | | Arkansas - 0.64% | | | | |
| 500,000 | | University of Arkansas, Series A, | | | | |
| | | Revenue Bond, | | | | |
| | | 4.125%, 11/01/2030 | | | 525,225 | |
| | | | | | | |
| | | California - 10.25% | | | | |
| 445,000 | | California Economic Recovery, | | | | |
| | | Series A, Refunding, GO, | | | | |
| | | 5.250%, 07/01/2021 | | | 529,804 | |
| 155,000 | | California Health Facilities | | | | |
| | | Financing Authority, Series A, | | | | |
| | | Revenue Bond, | | | | |
| | | 5.000%, 08/15/2051 | | | 163,061 | |
| 400,000 | | California Municipal Finance | | | | |
| | | Authority, Mobile Home Park, | | | | |
| | | Series A, Refunding, Revenue Bond, | | | | |
| | | 6.400%, 08/15/2045 | | | 425,772 | |
| 500,000 | | California Statewide Communities | | | | |
| | | Development Authority, Refunding, | | | | |
| | | Revenue Bond, | | | | |
| | | 6.125%, 07/01/2046 | | | 530,345 | |
| 400,000 | | California Statewide Communities | | | | |
| | | Development Authority, Series A, | | | | |
| | | Revenue Bond, ACA Insured, | | | | |
| | | 5.625%, 08/01/2034 | | | 407,020 | |
| | | | | | | |
Principal
Amount | | | | Value | |
| | | | | | |
| | | California (Continued) | | | | |
$ | 1,000,000 | | California, GO, | | | | |
| | | 6.500%, 04/01/2033 | | $ | 1,210,850 | |
| 1,000,000 | | Gilroy Unified School District, GO, | | | | |
| | | Assured Guaranty Insured, | | | | |
| | | 6.000%, 08/01/2025 | | | 1,185,080 | |
| | | Golden State Tobacco Securitization, | | | | |
| | | Series A, Refunding, Revenue Bond, | | | | |
| 175,000 | | 5.125%, 06/01/2047 | | | 120,878 | |
| 325,000 | | 5.750%, 06/01/2047 | | | 249,060 | |
| 700,000 | | Golden State Tobacco Securitization, | | | | |
| | | Series A, Revenue Bond, | | | | |
| | | 5.000%, 06/01/2017 | | | 701,274 | |
| 1,000,000 | | Los Angeles Department of Airports, | | | | |
| | | Series A, Refunding, Revenue Bond, | | | | |
| | | 5.250%, 05/15/2029 | | | 1,125,410 | |
| 580,000 | | Los Angeles Unified School District, | | | | |
| | | Series F, GO, FGIC Insured, | | | | |
| | | 5.000%, 07/01/2021 | | | 614,133 | |
| 500,000 | | San Francisco Steinhart Aquarium, | | | | |
| | | Series F, GO, | | | | |
| | | 5.000%, 06/15/2023 | | | 514,755 | |
| 500,000 | | San Mateo Joint Powers Financing | | | | |
| | | Authority, Series A, Refunding, | | | | |
| | | Revenue Bond, | | | | |
| | | 5.250%, 07/15/2025 | | | 568,970 | |
| | | | | | | |
| | | | | | 8,346,412 | |
| | | | | | | |
| | | Colorado - 0.95% | | | | |
| 700,000 | | Regional Transportation District, | | | | |
| | | Revenue Bond, | | | | |
| | | 6.000%, 01/15/2026 | | | 773,388 | |
| | | | | | | |
| | | Connecticut - 2.00% | | | | |
| | | Connecticut Health & Educational | | | | |
| | | Facilities Authority, Series A, | | | | |
| | | Refunding, Revenue Bond, | | | | |
| 1,000,000 | | 5.000%, 07/01/2025 | | | 1,161,800 | |
| 450,000 | | 4.000%, 07/01/2049 (a) | | | 464,566 | |
| | | | | | | |
| | | | | | 1,626,366 | |
| | | | | | | |
| | | Delaware - 0.59% | | | | |
| 500,000 | | New Castle County, Revenue Bond, | | | | |
| | | 5.000%, 09/01/2036 | | | 483,555 | |
| | | | | | | |
See notes to financial statements.
69
|
GuideMarkSM Tax-Exempt Fixed Income Fund |
SCHEDULE OF INVESTMENTS (Continued) |
March 31, 2012 |
| |
| | | | | | | |
Principal
Amount | | | | Value | |
| | | | | | |
| | | MUNICIPAL DEBT OBLIGATIONS (Continued) | | | | |
| | | Florida - 1.11% | | | | |
$ | 300,000 | | Brevard County Health Facilities | | | | |
| | | Authority, Revenue Bond, | | | | |
| | | 7.000%, 04/01/2039 | | $ | 348,072 | |
| 500,000 | | Miami-Dade County Health | | | | |
| | | Facilities, Series A, Refunding, | | | | |
| | | Revenue Bond, | | | | |
| | | 5.250%, 08/01/2021 | | | 553,935 | |
| | | | | | | |
| | | | | | 902,007 | |
| | | | | | | |
| | | Georgia - 2.45% | | | | |
| 500,000 | | Atlanta Water & Wastewater, | | | | |
| | | Revenue Bond, | | | | |
| | | 6.250%, 11/01/2039 | | | 573,935 | |
| 1,000,000 | | Fulton County School District, | | | | |
| | | Refunding, GO, | | | | |
| | | 5.250%, 01/01/2014 | | | 1,084,450 | |
| 325,000 | | Marietta Development Authority, | | | | |
| | | Revenue Bond, | | | | |
| | | 7.000%, 06/15/2039 | | | 332,475 | |
| | | | | | | |
| | | | | | 1,990,860 | |
| | | | | | | |
| | | Hawaii - 0.69% | | | | |
| 500,000 | | Hawaii, Series DJ, GO, | | | | |
| | | 5.000%, 04/01/2024 | | | 565,840 | |
| | | | | | | |
| | | Idaho - 2.10% | | | | |
| 500,000 | | Boise State University, Series A, | | | | |
| | | Refunding, Revenue Bond, | | | | |
| | | 4.000%, 04/01/2022 | | | 560,780 | |
| 1,000,000 | | Boise-Kuna District, Revenue Bond, | | | | |
| | | 7.375%, 06/01/2034 | | | 1,151,900 | |
| | | | | | | |
| | | | | | 1,712,680 | |
| | | | | | | |
| | | Illinois - 4.31% | | | | |
| 225,000 | | Illinois Financial Authority, | | | | |
| | | Revenue Bond, | | | | |
| | | 7.000%, 08/15/2044 | | | 251,831 | |
| 400,000 | | Markham, Series A, GO, | | | | |
| | | 6.000%, 02/01/2025 | | | 424,316 | |
| 445,000 | | Markham, Series C, GO, | | | | |
| | | 4.750%, 02/01/2017 | | | 450,950 | |
| 400,000 | | Northlake, GO, FGIC Insured, | | | | |
| | | 5.000%, 12/01/2029 | | | 423,976 | |
| | | | | | | |
Principal
Amount | | | | Value | |
| | | | | | |
| | | Illinois (Continued) | | | | |
| | | Railsplitter Tobacco Settlement | | | | |
| | | Authority, Revenue Bond, | | | | |
$ | 750,000 | | 5.000%, 06/01/2018 | | $ | 846,787 | |
| 500,000 | | 6.250%, 06/01/2024 | | | 551,940 | |
| 500,000 | | University of Illinois, Series C, | | | | |
| | | Revenue Bond, | | | | |
| | | 5.000%, 04/01/2026 | | | 557,985 | |
| | | | | | | |
| | | | | | 3,507,785 | |
| | | | | | | |
| | | Indiana - 3.43% | | | | |
| 500,000 | | Fishers Industry Redevelopment | | | | |
| | | District, Saxony Project, | | | | |
| | | Revenue Bond, | | | | |
| | | 5.250%, 07/15/2034 | | | 545,595 | |
| 1,000,000 | | Indiana State Finance Authority, | | | | |
| | | Series A, Refunding, | | | | |
| | | Revenue Bond, | | | | |
| | | 5.000%, 02/01/2021 | | | 1,205,820 | |
| 400,000 | | Sheridan Community School’s | | | | |
| | | Building Corporation, Revenue | | | | |
| | | Bond, FSA Insured, | | | | |
| | | 5.500%, 07/15/2020 | | | 468,316 | |
| 500,000 | | Tri-Creek Middle School Building | | | | |
| | | Corporation, Revenue Bond, | | | | |
| | | FSA Insured, | | | | |
| | | 5.250%, 07/15/2021 | | | 570,080 | |
| | | | | | | |
| | | | | | 2,789,811 | |
| | | | | | | |
| | | Iowa - 1.92% | | | | |
| 600,000 | | Iowa Finance Authority Pollution | | | | |
| | | Control, Revenue Bond, | | | | |
| | | FGIC Insured, | | | | |
| | | 5.000%, 07/01/2014 | | | 646,938 | |
| 750,000 | | Iowa Finance Authority, | | | | |
| | | Revenue Bond, | | | | |
| | | 5.000%, 08/01/2018 | | | 914,393 | |
| | | | | | | |
| | | | | | 1,561,331 | |
| | | | | | | |
| | | Kansas - 0.45% | | | | |
| 560,000 | | Wyandotte County/Kansas City | | | | |
| | | Unified Government, Series B, | | | | |
| | | Refunding, Revenue Bond, | | | | |
| | | 0.000%, 06/01/2021 (b) | | | 369,891 | |
| | | | | | | |
See notes to financial statements.
70
|
GuideMarkSM Tax-Exempt Fixed Income Fund |
SCHEDULE OF INVESTMENTS (Continued) |
March 31, 2012 |
| |
| | | | | | | |
Principal
Amount | | | | Value | |
| | | | | | |
| | | MUNICIPAL DEBT OBLIGATIONS (Continued) | | | | |
| | | Kentucky - 1.26% | | | | |
$ | 1,000,000 | | Pikeville Hospital, Revenue Bond, | | | | |
| | | 3.000%, 09/01/2013 | | $ | 1,022,510 | |
| | | | | | | |
| | | Louisiana - 1.94% | | | | |
| 800,000 | | Louisiana Citizens Property, | | | | |
| | | Revenue Bond, | | | | |
| | | 6.750%, 06/01/2026 | | | 939,960 | |
| 500,000 | | Louisiana Public Facilities Authority, | | | | |
| | | Revenue Bond, | | | | |
| | | 5.500%, 05/15/2032 | | | 639,625 | |
| | | | | | | |
| | | | | | 1,579,585 | |
| | | | | | | |
| | | Maryland - 2.34% | | | | |
| 325,000 | | Anne Arundel County, Tax Allocation, | | | | |
| | | 6.100%, 07/01/2040 | | | 335,189 | |
| 600,000 | | Maryland Department of | | | | |
| | | Transportation County T | | | | |
| | | Construction, Revenue Bond, | | | | |
| | | 5.500%, 02/01/2017 | | | 724,662 | |
| 400,000 | | Maryland Economic Development | | | | |
| | | Corporation, Series A, Revenue Bond, | | | | |
| | | 5.750%, 06/01/2035 | | | 422,884 | |
| 400,000 | | Maryland Student Housing | | | | |
| | | Economic Development, | | | | |
| | | Revenue Bond, | | | | |
| | | 5.750%, 06/01/2033 | | | 420,240 | |
| | | | | | | |
| | | | | | 1,902,975 | |
| | | | | | | |
| | | Massachusetts - 5.44% | | | | |
| 430,000 | | Massachusetts Development | | | | |
| | | Finance Agency, Series A, | | | | |
| | | Revenue Bond, | | | | |
| | | 5.450%, 04/15/2014 | | | 446,977 | |
| 1,000,000 | | Massachusetts Health & Educational | | | | |
| | | Facilities Authority, Revenue Bond, | | | | |
| | | 5.500%, 07/01/2032 | | | 1,356,960 | |
| | | Massachusetts Health & Educational | | | | |
| | | Facilities Authority, Series A, | | | | |
| | | Refunding, Revenue Bond, | | | | |
| 500,000 | | 5.000%, 12/15/2029 | | | 581,310 | |
| 785,000 | | 5.500%, 11/15/2036 | | | 937,753 | |
| 500,000 | | Massachusetts Health & Educational | | | | |
| | | Facilities Authority, Series B, | | | | |
| | | Revenue Bond, | | | | |
| | | 5.000%, 10/01/2038 | | | 559,140 | |
| | | | | | | |
Principal
Amount | | | | Value | |
| | | | | | |
| | | Massachusetts (Continued) | | | | |
$ | 500,000 | | Massachusetts, Series D, | | | | |
| | | Refunding, GO, | | | | |
| | | 4.250%, 10/01/2027 | | $ | 546,535 | |
| | | | | | | |
| | | | | | 4,428,675 | |
| | | | | | | |
| | | Michigan - 1.05% | | | | |
| 800,000 | | Lansing School District, Refunding, | | | | |
| | | GO, Q-SBLF Insured, | | | | |
| | | 5.000%, 05/01/2017 | | | 854,096 | |
| | | | | | | |
| | | Minnesota - 3.65% | | | | |
| 700,000 | | Minneapolis & St. Paul Housing | | | | |
| | | and Redevelopment Authority | | | | |
| | | Health Care, Revenue Bond, | | | | |
| | | 4.000%, 08/15/2015 | | | 750,512 | |
| 500,000 | | Minnesota, Series B, GO, | | | | |
| | | 5.000%, 08/01/2021 | | | 620,120 | |
| 560,000 | | Rochester Health Care Facilities | | | | |
| | | Mayo Clinic, Series C, | | | | |
| | | Revenue Bond, | | | | |
| | | 4.500%, 11/15/2038 (a) | | | 646,890 | |
| 410,000 | | St. Paul Housing & Redevelopment | | | | |
| | | Authority, Refunding, | | | | |
| | | Revenue Bond, | | | | |
| | | 5.700%, 11/01/2015 | | | 410,000 | |
| 500,000 | | Tobacco Securitization Authority, | | | | |
| | | Series B, Revenue Bond, | | | | |
| | | 5.250%, 03/01/2031 | | | 544,715 | |
| | | | | | | |
| | | | | | 2,972,237 | |
| | | | | | | |
| | | Missouri - 4.74% | | | | |
| 810,000 | | Hannibal Industrial Development | | | | |
| | | Authority, Hannibal Regional | | | | |
| | | Hospital, Refunding, Revenue Bond, | | | | |
| | | 5.250%, 09/01/2018 | | | 846,774 | |
| 700,000 | | Missouri Development Finance Board, | | | | |
| | | Revenue Bond, | | | | |
| | | 5.750%, 06/01/2034 | | | 729,316 | |
| 500,000 | | Missouri Health & Educational | | | | |
| | | Facilities Authority, Series A, | | | | |
| | | Revenue Bond, | | | | |
| | | 5.375%, 03/15/2039 | | | 570,370 | |
| 1,000,000 | | Missouri Highway & Transportation | | | | |
| | | Commission, Series B, | | | | |
| | | Revenue Bond, | | | | |
| | | 5.000%, 05/01/2024 | | | 1,132,750 | |
See notes to financial statements.
71
|
GuideMarkSM Tax-Exempt Fixed Income Fund |
SCHEDULE OF INVESTMENTS (Continued) |
March 31, 2012 |
| |
| | | | | | | |
Principal
Amount | | | | Value | |
| | | | | | |
| | | MUNICIPAL DEBT OBLIGATIONS (Continued) | | | | |
| | | Missouri (Continued) | | | | |
$ | 500,000 | | St. Louis Airport, Revenue Bond, | | | | |
| | | 6.625%, 07/01/2034 | | $ | 577,020 | |
| | | | | | | |
| | | | | | 3,856,230 | |
| | | | | | | |
| | | Nebraska - 0.71% | | | | |
| 500,000 | | Omaha Public Power Distributors, | | | | |
| | | Series B, Revenue Bond, | | | | |
| | | 5.000%, 02/01/2027 | | | 579,950 | |
| | | | | | | |
| | | New Jersey - 1.41% | | | | |
| 500,000 | | New Jersey State Transportation | | | | |
| | | Trust Fund Authority, Series A, | | | | |
| | | Refunding, Revenue Bond, | | | | |
| | | 5.500%, 12/15/2021 | | | 612,975 | |
| 500,000 | | New Jersey State Transportation | | | | |
| | | Trust Fund Authority, Series B, | | | | |
| | | Revenue Bond, | | | | |
| | | 5.000%, 06/15/2042 | | | 537,335 | |
| | | | | | | |
| | | | | | 1,150,310 | |
| | | | | | | |
| | | New York - 9.89% | | | | |
| 325,000 | | Brooklyn Arena Local Development | | | | |
| | | Corporation, Revenue Bond, | | | | |
| | | 6.500%, 07/15/2030 | | | 366,334 | |
| 480,000 | | Hudson Yards Infrastructure Corp., | | | | |
| | | Series A, Revenue Bond | | | | |
| | | 5.750%, 02/15/2047 | | | 536,822 | |
| 1,000,000 | | Metropolitan Transportation | | | | |
| | | Authority, Series F, | | | | |
| | | Revenue Bond, | | | | |
| | | 5.000%, 11/15/2014 | | | 1,106,770 | |
| | | New York Dormitory Authority, | | | | |
| | | Revenue Bond, | | | | |
| 325,000 | | 6.125%, 12/01/2029 | | | 343,769 | |
| 400,000 | | 5.000%, 10/01/2041 | | | 448,564 | |
| 250,000 | | New York Dormitory Authority, | | | | |
| | | Series 1, Refunding, | | | | |
| | | Revenue Bond, | | | | |
| | | 5.000%, 07/01/2024 | | | 293,108 | |
| 300,000 | | New York Dormitory Authority, | | | | |
| | | Series A, Refunding, | | | | |
| | | Revenue Bond, | | | | |
| | | 4.000%, 07/01/2037 | | | 298,098 | |
| | | | | | | |
Principal
Amount | | | | Value | |
| | | | | | |
| | | New York (Continued) | | | | |
$ | 250,000 | | New York Dormitory Authority, | | | | |
| | | Series B, Refunding, | | | | |
| | | Revenue Bond, | | | | |
| | | 5.000%, 07/01/2038 | | $ | 279,745 | |
| 500,000 | | New York Environmental Facilities, | | | | |
| | | Revenue Bond, | | | | |
| | | 5.500%, 10/15/2027 | | | 655,735 | |
| | | New York State Liberty | | | | |
| | | Development Corp., Refunding | | | | |
| | | Revenue Bond, | | | | |
| 180,000 | | 5.000%, 09/15/2040 | | | 196,657 | |
| 320,000 | | 5.000%, 09/15/2043 | | | 336,643 | |
| 500,000 | | New York State Liberty | | | | |
| | | Development Corp., | | | | |
| | | Revenue Bond, | | | | |
| | | 5.750%, 11/15/2051 | | | 560,340 | |
| 900,000 | | New York, GO, | | | | |
| | | 5.375%, 04/01/2036 | | | 1,007,406 | |
| 500,000 | | New York, Series E, GO, | | | | |
| | | 4.000%, 12/15/2027 | | | 541,345 | |
| 500,000 | | Sales Tax Asset Receivable Corp., | | | | |
| | | Series A, Revenue Bond, | | | | |
| | | 5.250%, 10/15/2019 | | | 558,975 | |
| 500,000 | | Tobacco Settlement Financing, | | | | |
| | | Revenue Bond, | | | | |
| | | 5.250%, 06/01/2021 | | | 524,940 | |
| | | | | | | |
| | | | | | 8,055,251 | |
| | | | | | | |
| | | North Carolina - 0.69% | | | | |
| 500,000 | | North Carolina Capital Facilities | | | | |
| | | Finance Agency, Series B, | | | | |
| | | Refunding, Revenue Bond, | | | | |
| | | 5.000%, 10/01/2038 | | | 561,040 | |
| | | | | | | |
| | | Ohio - 2.56% | | | | |
| 500,000 | | Buckeye Tobacco Settlement | | | | |
| | | Financial Authority, Series A, | | | | |
| | | Revenue Bond, | | | | |
| | | 5.875%, 06/01/2047 | | | 375,090 | |
| 500,000 | | Ohio Air Quality Development | | | | |
| | | Authority, Series A, | | | | |
| | | Revenue Bond, | | | | |
| | | 5.700%, 08/01/2020 | | | 564,940 | |
See notes to financial statements.
72
|
GuideMarkSM Tax-Exempt Fixed Income Fund |
SCHEDULE OF INVESTMENTS (Continued) |
March 31, 2012 |
| |
| | | | | | | |
Principal
Amount | | | | Value | |
| | | | | | |
| | | MUNICIPAL DEBT OBLIGATIONS (Continued) | | | | |
| | | Ohio (Continued) | | | | |
$ | 1,000,000 | | Ohio, Series A, GO, | | | | |
| | | 5.000%, 09/01/2015 | | $ | 1,141,290 | |
| | | | | | | |
| | | | | | 2,081,320 | |
| | | | | | | |
| | | Oregon - 0.56% | | | | |
| 400,000 | | Clackamas County School District, | | | | |
| | | GO, | | | | |
| | | 5.000%, 06/15/2021 (a) | | | 459,584 | |
| | | | | | | |
| | | Pennsylvania - 9.79% | | | | |
| 1,250,000 | | Allegheny County Hospital | | | | |
| | | Development Authority, | | | | |
| | | Series A, Revenue Bond, | | | | |
| | | 5.000%, 09/01/2014 | | | 1,374,337 | |
| 200,000 | | Allegheny County Industrial | | | | |
| | | Development Authority, | | | | |
| | | Refunding, Revenue Bond, | | | | |
| | | 6.500%, 05/01/2017 | | | 211,914 | |
| 880,000 | | Blair County, Series A, | | | | |
| | | Refunding, GO, | | | | |
| | | 5.375%, 08/01/2015 | | | 979,862 | |
| 500,000 | | Butler County Hospital Authority, | | | | |
| | | Revenue Bond, | | | | |
| | | 7.125%, 07/01/2029 | | | 602,940 | |
| 1,000,000 | | Lycoming County College, | | | | |
| | | Revenue Bond, | | | | |
| | | 5.500%, 07/01/2026 | | | 1,142,270 | |
| 200,000 | | Montgomery County Industrial | | | | |
| | | Development Authority, | | | | |
| | | Revenue Bond, | | | | |
| | | 6.000%, 02/01/2021 | | | 196,096 | |
| 400,000 | | Pennsylvania Economic Development | | | | |
| | | Financing Authority, Albert Einstein | | | | |
| | | Health Care, Series A, Refunding, | | | | |
| | | Revenue Bond, | | | | |
| | | 6.250%, 10/15/2023 | | | 446,992 | |
| 325,000 | | Pennsylvania Economic Development | | | | |
| | | Financing Authority, Allegheny | | | | |
| | | Energy Supply, Revenue Bond, | | | | |
| | | 7.000%, 07/15/2039 | | | 369,320 | |
| | | Pennsylvania Higher Educational | | | | |
| | | Facilities Authority, Revenue Bond, | | | | |
| 500,000 | | 5.250%, 07/01/2019 | | | 553,160 | |
| 400,000 | | 5.800%, 07/01/2030 | | | 426,368 | |
| | | | | | | |
Principal
Amount | | | | Value | |
| | | | | | |
| | | Pennsylvania (Continued) | | | | |
$ | 1,000,000 | | Pennsylvania, Refunding, GO, | | | | |
| | | 5.250%, 02/01/2014 | | $ | 1,087,900 | |
| 500,000 | | Philadelphia Gas Works, Refunding, | | | | |
| | | Revenue Bond, | | | | |
| | | 5.250%, 08/01/2017 | | | 575,950 | |
| | | | | | | |
| | | | | | 7,967,109 | |
| | | | | | | |
| | | Puerto Rico - 1.67% | | | | |
| | | Puerto Rico Aqueduct & Sewer | | | | |
| | | Authority, Series A, Refunding, | | | | |
| | | Revenue Bond, | | | | |
| 85,000 | | 5.250%, 07/01/2042 | | | 83,851 | |
| 120,000 | | 6.000%, 07/01/2047 | | | 126,464 | |
| 375,000 | | Puerto Rico Commonwealth, | | | | |
| | | Series A, Refunding, Revenue Bond, | | | | |
| | | Assured Guaranty Insured, | | | | |
| | | 5.000%, 07/01/2016 | | | 414,405 | |
| 620,000 | | Puerto Rico Commonwealth, | | | | |
| | | Series B, Prerefunded, | | | | |
| | | Refunding, GO, | | | | |
| | | 5.250%, 07/01/2032 | | | 733,975 | |
| | | | | | | |
| | | | | | 1,358,695 | |
| | | | | | | |
| | | South Dakota - 0.64% | | | | |
| 500,000 | | South Dakota Housing Development | | | | |
| | | Authority, Series A, Revenue Bond, | | | | |
| | | 4.250%, 05/01/2015 | | | 524,630 | |
| | | | | | | |
| | | Texas - 9.79% | | | | |
| 430,000 | | Central Texas Regional Mobility | | | | |
| | | Authority, Revenue Bond, | | | | |
| | | 6.000%, 01/01/2041 | | | 469,981 | |
| 635,000 | | Clifton Texas Higher Education | | | | |
| | | Finance Corporation, Series A, | | | | |
| | | Refunding, Revenue Bond, | | | | |
| | | 4.000%, 12/01/2015 | | | 658,165 | |
| 515,000 | | Frisco Texas Independent School | | | | |
| | | District, Series A, GO, | | | | |
| | | 6.000%, 08/15/2038 | | | 619,416 | |
| 425,000 | | Harris County Industrial | | | | |
| | | Development, Revenue Bond, | | | | |
| | | 5.000%, 02/01/2023 | | | 451,333 | |
| 500,000 | | Houston, GO, | | | | |
| | | 5.250%, 03/01/2028 | | | 570,655 | |
| 580,000 | | La Porte Independent School | | | | |
| | | District, GO, | | | | |
| | | 5.250%, 02/15/2024 | | | 640,013 | |
See notes to financial statements.
73
|
GuideMarkSM Tax-Exempt Fixed Income Fund |
SCHEDULE OF INVESTMENTS (Continued) |
March 31, 2012 |
| |
| | | | | | | |
Principal
Amount | | | | Value | |
| | | | | | |
| | | MUNICIPAL DEBT OBLIGATIONS (Continued) | | | | |
| | | Texas (Continued) | | | | |
$ | 200,000 | | Lower Colorado River Authority, | | | | |
| | | Series B, Refunding, | | | | |
| | | Revenue Bond, FSA Insured, | | | | |
| | | 6.000%, 05/15/2013 | | $ | 200,814 | |
| 500,000 | | Mansfield Independent | | | | |
| | | School District, GO, | | | | |
| | | 1.750%, 08/01/2042 | | | 505,345 | |
| 500,000 | | North Texas Tollway Authority, | | | | |
| | | Series A, Refunded, | | | | |
| | | Revenue Bond, | | | | |
| | | 6.000%, 01/01/2019 | | | 596,875 | |
| 250,000 | | North Texas Tollway Authority, | | | | |
| | | Series A, Revenue Bond, | | | | |
| | | 5.000%, 09/01/2020 | | | 295,462 | |
| 770,000 | | North Texas Tollway Authority, | | | | |
| | | Series E, Refunding, | | | | |
| | | Revenue Bond, | | | | |
| | | 5.750%, 01/01/2038 (a) | | | 885,893 | |
| 400,000 | | Texas Private Activity Surface | | | | |
| | | Transportation Corp., | | | | |
| | | LBJ Infrastructure, | | | | |
| | | Revenue Bond, | | | | |
| | | 7.500%, 06/30/2033 | | | 479,980 | |
| 445,000 | | Texas Private Activity Surface | | | | |
| | | Transportation Corp., | | | | |
| | | Revenue Bond, | | | | |
| | | 7.500%, 12/31/2031 | | | 532,376 | |
| 500,000 | | Texas Transportation Commission, | | | | |
| | | Revenue Bond, | | | | |
| | | 5.000%, 04/01/2018 | | | 592,855 | |
| 400,000 | | Texas, Series A, GO, | | | | |
| | | 5.000%, 04/01/2022 | | | 467,720 | |
| | | | | | | |
| | | | | | 7,966,883 | |
| | | | | | | |
| | | | | | | |
Principal
Amount | | | | Value | |
| | | | | | |
| | | Utah - 1.46% | | | | |
$ | 1,000,000 | | Utah Associated Municipal Power | | | | |
| | | Systems San Juan Project, | | | | |
| | | Refunding, Revenue Bond, | | | | |
| | | 5.500%, 06/01/2022 | | $ | 1,189,160 | |
| | | | | | | |
| | | Virginia - 2.13% | | | | |
| 1,000,000 | | Henry County Public Service | | | | |
| | | Authority Water & Sewer, | | | | |
| | | Refunding, Revenue Bond, | | | | |
| | | FSA Insured, | | | | |
| | | 5.500%, 11/15/2019 | | | 1,205,250 | |
| 400,000 | | Virginia College Building Authority | | | | |
| | | Educational Facilities, | | | | |
| | | Revenue Bond, | | | | |
| | | 5.750%, 01/01/2034 | | | 531,788 | |
| | | | | | | |
| | | | | | 1,737,038 | |
| | | | | | | |
| | | Washington - 0.68% | | | | |
| 500,000 | | King County Hospital, Refunding, | | | | |
| | | GO, MBIA Insured, | | | | |
| | | 5.000%, 12/01/2021 | | | 550,695 | |
| | | | | | | |
| | | Wisconsin - 2.42% | | | | |
| 195,000 | | Badger Tobacco Asset Securitization, | | | | |
| | | Revenue Bond, | | | | |
| | | 6.125%, 06/01/2027 | | | 196,837 | |
| 500,000 | | Southeast Wisconsin Professional | | | | |
| | | Baseball Park Sales Tax, Series A, | | | | |
| | | Revenue Bond, MBIA Insured, | | | | |
| | | 5.500%, 12/15/2026 | | | 580,365 | |
| 1,000,000 | | Wisconsin, Series A, Refunding, | | | | |
| | | Revenue Bond, | | | | |
| | | 6.000%, 05/01/2033 | | | 1,189,230 | |
| | | | | | | |
| | | | | | 1,966,432 | |
| | | | | | | |
| | | Total Municipal Debt Obligations | | | | |
| | | (Cost $74,503,619) | | | 80,986,691 | |
| | | | | | | |
See notes to financial statements.
74
|
GuideMarkSM Tax-Exempt Fixed Income Fund |
SCHEDULE OF INVESTMENTS (Continued) |
March 31, 2012 |
| |
| | | | | | | |
Number
of Shares | | | | Value | |
| | | | | | |
| | | SHORT TERM INVESTMENTS - 0.47% | | | | |
| | | Money Market Funds - 0.47% | | | | |
| 381,452 | | Fidelity Tax Exempt Portfolio | | | | |
| | | Effective Yield, 0.01% | | $ | 381,452 | |
| | | | | | | |
| | | Total Short Term Investments | | | | |
| | | (Cost $381,452) | | | 381,452 | |
| | | | | | | |
| | | Total Investments | | | | |
| | | (Cost $74,885,071) - 99.95% | | | 81,368,143 | |
| | | Other Assets in Excess | | | | |
| | | of Liabilities - 0.05% | | | 40,747 | |
| | | | | | | |
| | | TOTAL NET ASSETS - 100.00% | | $ | 81,408,890 | |
| | | | | | | |
| |
Percentages are stated as a percent of net assets. |
(a) | Variable Rate Security. The rate shown is the rate in effect on March 31, 2012. |
(b) | Zero coupon bond. |
| |
Glossary of Terms |
ACA | - American Capital Access |
FGIC | - Financial Guaranty Insurance Corp. |
FSA | - Financial Security Assurance, Inc. |
GO | - General Obligation |
MBIA | - Municipal Bond Investors Assurance Corp. |
Q-SBLF | - Qualified School Board Loan |
See notes to financial statements.
75
|
GuideMarkSM Opportunistic Fixed Income Fund |
SCHEDULE OF INVESTMENTS |
March 31, 2012 |
| |
| | | | | | | |
Principal
Amount | | | | Value | |
| | | | | | |
| | | ASSET BACKED SECURITIES - 0.87% | | | | |
| 892,323 | | Diamond Resorts Owner Trust | | | | |
| | | 2011-1A, 4.000%, 03/20/2023 | | | | |
| | | (Acquired 04/21/2011, | | | | |
| | | Cost $886,158) (b) | | $ | 900,487 | |
| | | GSAA Trust | | | | |
| 825,514 | | 2005-11, 0.522%, 10/25/2035 (d) | | | 629,274 | |
| 451,003 | | 2006-20, 0.312%, 01/25/2037 (d) | | | 206,570 | |
| 370,000 | | Sierra Receivables Funding | | | | |
| | | Company, LLC 2012-1A, | | | | |
| | | 2.840%, 11/20/2028 (Acquired | | | | |
| | | 03/14/2012, Cost $369,922) (b) | | | 371,545 | |
| | | | | | | |
| | | Total Asset Backed Securities | | | | |
| | | (Cost $2,153,379) | | | 2,107,876 | |
| | | | | | | |
| | | BANK LOANS - 2.73% | | | | |
| 284,508 | | Armstrong World Industries, Inc. | | | | |
| | | 4.000%, 03/10/2018 | | | 284,045 | |
| 125,000 | | Blackboard, Inc. | | | | |
| | | 7.500%, 09/23/2018 | | | 124,590 | |
| 295,000 | | Cequel Communication | | | | |
| | | Holdings I, LLC | | | | |
| | | 4.000%, 01/31/2019 | | | 292,695 | |
| 115,000 | | CommScope, Inc. | | | | |
| | | 4.250%, 01/14/2018 | | | 115,231 | |
| 714,173 | | CPG International, Inc. | | | | |
| | | 6.000%, 01/26/2017 | | | 689,177 | |
| 104,738 | | Crown Castle International Corp. | | | | |
| | | 4.000%, 01/25/2019 | | | 104,330 | |
| 80,000 | | DS Waters of America, Inc. | | | | |
| | | 10.500%, 07/20/2017 | | | 79,250 | |
| 184,938 | | Eastman Kodak Co. | | | | |
| | | 8.500%, 04/20/2013 | | | 187,250 | |
| 299,242 | | Edwards Extended | | | | |
| | | 5.500%, 05/31/2016 | | | 297,092 | |
| 205,000 | | Energy Transfer Equity, L.P. | | | | |
| | | 3.750%, 03/21/2017 | | | 201,370 | |
| | | Epicor Software Corp. | | | | |
| 160,202 | | 5.000%, 05/11/2018 | | | 159,176 | |
| 144,798 | | 5.000%, 05/16/2018 | | | 143,870 | |
| 269,126 | | Grifols, Inc. | | | | |
| | | 4.500%, 06/04/2017 | | | 269,799 | |
| 185,000 | | Health Management Associates Inc. | | | | |
| | | 3.250%, 11/18/2016 | | | 177,099 | |
| | | | | | | |
Principal
Amount | | | | Value | |
| | | | | | |
| | | BANK LOANS (Continued) | | | | |
| 140,000 | | Kabel Deutschland Holding AG | | | | |
| | | 4.250%, 02/01/2019 | | $ | 139,944 | |
| 125,000 | | Kindred Healthcare, Inc. | | | | |
| | | 5.250%, 02/07/2018 | | | 120,313 | |
| 105,000 | | Kronos Worldwide, Inc. | | | | |
| | | 6.250%, 12/12/2017 | | | 106,313 | |
| 70,000 | | Lawson Software, Inc. | | | | |
| | | 0.000%, 03/30/2018 (e) | | | 69,300 | |
| 290,000 | | Level 3 Financing | | | | |
| | | 5.750%, 09/01/2018 | | | 293,335 | |
| | | MetroPCS Communications, Inc. | | | | |
| 70,719 | | 4.000%, 05/18/2018 | | | 70,330 | |
| 95,798 | | 4.000%, 05/18/2018 | | | 95,272 | |
| 133,482 | | 4.000%, 05/18/2018 | | | 132,748 | |
| 150,000 | | Monitronics International, Inc. | | | | |
| | | 5.500%, 03/16/2018 | | | 150,312 | |
| 125,000 | | MultiPlan, Inc. | | | | |
| | | 4.750%, 08/26/2017 | | | 123,984 | |
| 300,000 | | NBTY, Inc. | | | | |
| | | 4.250%, 10/01/2017 | | | 300,750 | |
| | | Nortek, Inc. | | | | |
| 287,744 | | 5.250%, 04/12/2017 | | | 287,984 | |
| 832 | | 5.250%, 04/12/2017 | | | 832 | |
| 312 | | 6.250%, 04/12/2017 | | | 312 | |
| 115,000 | | NXP Semiconductors NV | | | | |
| | | 0.000%, 02/16/2019 (e) | | | 114,138 | |
| 125,000 | | PQ Corp. | | | | |
| | | 6.750%, 07/30/2015 (d) | | | 120,469 | |
| 288,713 | | Quintiles Corp. | | | | |
| | | 5.000%, 05/26/2018 | | | 289,796 | |
| 205,000 | | Rexnord Corp. | | | | |
| | | 5.000%, 04/01/2018 | | | 205,301 | |
| 75,000 | | The TriZetto Group, Inc. | | | | |
| | | 4.750%, 04/04/2018 | | | 75,000 | |
| 180,000 | | TI Automotive Ltd. | | | | |
| | | 6.750%, 03/07/2018 | | | 181,237 | |
| 124,684 | | Univar, Inc. | | | | |
| | | 5.000%, 06/30/2017 | | | 125,113 | |
| 114,711 | | Verint Systems, Inc. | | | | |
| | | 4.500%, 10/06/2017 | | | 114,568 | |
| 380,000 | | Visant Holding Corp. | | | | |
| | | 5.250%, 12/31/2016 | | | 370,104 | |
| | | | | | | |
| | | Total Bank Loans | | | | |
| | | (Cost $6,574,731) | | | 6,612,429 | |
| | | | | | | |
See notes to financial statements.
76
|
GuideMarkSM Opportunistic Fixed Income Fund |
SCHEDULE OF INVESTMENTS (Continued) |
March 31, 2012 |
| |
| | | | | | | |
Principal
Amount | | | | Value | |
| | | | | | |
| | | COLLATERALIZED MORTGAGE | | | | |
| | | OBLIGATIONS - 5.13% | | | | |
| | | American Home Mortgage Investment Trust | | | | |
| 394,015 | | 2005-2, 2.240%, 09/25/2045 (d) | | $ | 311,411 | |
| 295,142 | | 2005-2, 2.240%, 09/25/2045 (d) | | | 244,557 | |
| 238,482 | | 2005-4, 0.532%, 11/25/2045 (d) | | | 158,682 | |
| 217,803 | | 2006-1, 0.382%, 03/26/2046 (d) | | | 148,852 | |
| 188,611 | | Bank of America Mortgage Securities, Inc. | | | | |
| | | 2005-A, 2.990%, 02/25/2035 (d) | | | 166,132 | |
| 285,357 | | Bear Stearns Adjustable Rate | | | | |
| | | Mortgage Trust 2004-1, 2.825%, | | | | |
| | | 04/25/2034 (d) | | | 231,087 | |
| 240,000 | | Bear Stearns Commercial Mortgage | | | | |
| | | Securities 2003-PWR2, 5.810%, | | | | |
| | | 05/11/2039 (Acquired 03/06/2012, | | | | |
| | | Cost $246,862) (b)(d) | | | 241,882 | |
| 835,000 | | CFCRE Commercial Mortgage Trust | | | | |
| | | 2011-C1, 5.551%, | | | | |
| | | 04/15/2044 (Acquired | | | | |
| | | 04/19/2011 and 05/17/2011, | | | | |
| | | Cost $828,545) (b)(d) | | | 714,247 | |
| 626,319 | | Citigroup Mortgage Loan Trust, Inc. | | | | |
| | | 2005-11, 2.580%, 10/25/2035 (d) | | | 561,795 | |
| 229,619 | | Citimortgage Alternative Loan Trust | | | | |
| | | 6.000%, 07/25/2036 | | | 172,643 | |
| 115,131 | | Countrywide Home Loans | | | | |
| | | 2005-11, 0.512%, 04/25/2035 (d) | | | 74,016 | |
| 140,000 | | CW Capital Cobalt Ltd. | | | | |
| | | 2007-C2, 5.526%, 04/15/2047 (d) | | | 137,058 | |
| 1,255,000 | | DBUBS Mortgage Trust | | | | |
| | | 2011-LC1, 5.557%, | | | | |
| | | 11/13/2046 (Acquired | | | | |
| | | 04/15/2011 and 06/20/2011, | | | | |
| | | Cost $1,211,671) (b)(d) | | | 1,153,752 | |
| 612,872 | | GMAC Mortgage Corp. Loan Trust | | | | |
| | | 2005-AR3, 2.877%, | | | | |
| | | 06/19/2035 (d) | | | 572,319 | |
| 880,000 | | GS Mortgage Securities Corp. II | | | | |
| | | 2007-GG10, 5.787%, | | | | |
| | | 08/10/2045 (d) | | | 788,336 | |
| | | GSR Mortgage Loan Trust | | | | |
| 72,366 | | 2004-14, 2.893%, 12/25/2034 (d) | | | 54,080 | |
| 253,832 | | 2005-AR4, 5.396%, | | | | |
| | | 07/25/2035 (d) | | | 216,329 | |
| | | | | | | |
Principal
Amount | | | | Value | |
| | | | | | |
| | | COLLATERALIZED MORTGAGE | | | | |
| | | OBLIGATIONS (Continued) | | | | |
| 725,285 | | Impac Secured Assets CMN Owner Trust | | | | |
| | | 2007-2, 0.352%, 05/25/2037 (d) | | $ | 355,048 | |
| 66,527 | | IndyMac Index Mortgage Loan Trust | | | | |
| | | 2005-AR16IP, 0.562%, | | | | |
| | | 07/25/2045 (d) | | | 46,154 | |
| 1,100,000 | | JPMorgan Chase Commercial | | | | |
| | | Mortgage Securities Corp | | | | |
| | | 2010-C1, 6.314%, 06/17/2043 | | | | |
| | | (Acquired 04/12/2011, | | | | |
| | | Cost $1,121,547) (b)(d) | | | 1,090,070 | |
| 400,000 | | Morgan Stanley Capital I | | | | |
| | | 2011-C2, 5.318%, 06/17/2044 | | | | |
| | | (Acquired 06/22/2011, | | | | |
| | | Cost $339,143) (b)(d) | | | 347,552 | |
| 1,200,000 | | Morgan Stanley Re-REMIC Trust | | | | |
| | | 2010-GG10, 5.787%, | | | | |
| | | 08/15/2045 (Acquired | | | | |
| | | 04/01/2011 and 02/09/2012, | | | | |
| | | Cost 1,232,717) (b)(d) | | | 1,241,787 | |
| 153,076 | | New York Mortgage Trust | | | | |
| | | 2006-1, 2.906%, 05/25/2036 (d) | | | 124,782 | |
| | | Residential Accredit Loans, Inc. | | | | |
| 837,194 | | 2005-QA12, 4.053%, | | | | |
| | | 12/25/2035 (d) | | | 515,542 | |
| 695,415 | | 2006-QO7, 0.959%, | | | | |
| | | 09/25/2046 (d) | | | 312,895 | |
| | | Residential Funding Mortgage | | | | |
| | | Securities I | | | | |
| 240,367 | | FLT, 2.908%, 08/25/2035 (d) | | | 199,478 | |
| 161,129 | | 2006-S1, 5.750%, 01/25/2036 | | | 149,703 | |
| 464,837 | | Structured Adjustable Rate Mortgage | | | | |
| | | Loan Trust | | | | |
| | | 2005-14, 0.552%, 07/25/2035 (d) | | | 283,117 | |
| | | WaMu Mortgage Pass-Through Certificate | | | | |
| 60,616 | | 2006-AR17, 0.969%, | | | | |
| | | 12/25/2046 (d) | | | 44,247 | |
| 117,394 | | 2007-OA3, 0.919%, | | | | |
| | | 04/25/2047 (d) | | | 83,465 | |
| | | Wells Fargo Mortgage Backed | | | | |
| | | Securities Trust | | | | |
| 249,469 | | 2005-AR3, 2.711%, | | | | |
| | | 03/25/2035 (d) | | | 240,832 | |
| 233,453 | | 2005-11, 5.500%, 11/25/2035 | | | 238,709 | |
See notes to financial statements.
77
|
GuideMarkSM Opportunistic Fixed Income Fund |
SCHEDULE OF INVESTMENTS (Continued) |
March 31, 2012 |
| |
| | | | | | | |
Principal
Amount | | | | Value | |
| | | | | | |
| | | COLLATERALIZED MORTGAGE | | | | |
| | | OBLIGATIONS (Continued) | | | | |
| 1,350,000 | | WF-RBS Commercial Mortgage Trust | | | | |
| | | 2011-C2, 5.466%, 02/18/2044 | | | | |
| | | (Acquired 04/06/2011 | | | | |
| | | and 04/29/2011, | | | | |
| | | Cost $1,324,367) (b)(d) | | $ | 1,230,376 | |
| | | | | | | |
| | | Total Collateralized Mortgage Obligations | | | | |
| | | (Cost $12,867,793) | | | 12,450,935 | |
| | | | | | | |
| | | | | | | |
Number of
Shares | | | | | | |
| | | | | | | |
| | | COMMON STOCKS - 1.86% | | | | |
| | | Chemicals - 0.12% | | | | |
| 8,800 | | The Dow Chemical Co. | | | 304,832 | |
| | | | | | | |
| | | Diversified Telecommunication Services - 0.71% | | | | |
| 23,880 | | AT&T, Inc. | | | 745,772 | |
| 35,044 | | Telefonica SA - ADR | | | 575,072 | |
| 10,241 | | Verizon Communications, Inc. | | | 391,514 | |
| | | | | | | |
| | | | | | 1,712,358 | |
| | | | | | | |
| | | Oil & Gas - 0.59% | | | | |
| 2,800 | | Chevron Corp. | | | 300,272 | |
| 4,100 | | Exxon Mobil Corp. | | | 355,593 | |
| 5,000 | | Royal Dutch Shell Plc - ADR | | | 350,650 | |
| 8,220 | | Total SA - ADR | | | 420,206 | |
| | | | | | | |
| | | | | | 1,426,721 | |
| | | | | | | |
| | | Paper & Forest Products - 0.05% | | | | |
| 3,500 | | International Paper Co. | | | 122,850 | |
| | | | | | | |
| | | Pharmaceuticals - 0.10% | | | | |
| 3,700 | | Bristol Myers Squibb Co. | | | 124,875 | |
| 2,600 | | GlaxoSmithKline Plc - ADR | | | 116,766 | |
| | | | | | | |
| | | | | | 241,641 | |
| | | | | | | |
| | | Tobacco - 0.19% | | | | |
| 10,336 | | Altria Group, Inc. | | | 319,072 | |
| 1,600 | | Philip Morris International, Inc. | | | 141,776 | |
| | | | | | | |
| | | | | | 460,848 | |
| | | | | | | |
| | | Wireless Telecommunication Services - 0.10% | | | | |
| 8,535 | | Vodafone Group Plc - ADR | | | 236,164 | |
| | | | | | | |
| | | Total Common Stocks | | | | |
| | | (Cost $4,394,858) | | | 4,505,414 | |
| | | | | | | |
| | | | | | | |
Principal
Amount | | | | Value | |
| | | | | | |
| | | CONVERTIBLE OBLIGATIONS - 1.37% | | | | |
| | | Auto Components - 0.10% | | | | |
| 140,000 | | TRW Automotive, Inc. | | | | |
| | | 3.500%, 12/01/2015 | | $ | 245,350 | |
| | | | | | | |
| | | Automobiles - 0.23% | | | | |
| 355,000 | | Ford Motor Co. | | | | |
| | | 4.250%, 11/15/2016 | | | 564,450 | |
| | | | | | | |
| | | Biotechnology - 0.15% | | | | |
| 315,000 | | Vertex Pharmaceuticals, Inc. | | | | |
| | | 3.350%, 10/01/2015 | | | 362,644 | |
| | | | | | | |
| | | Communications Equipment - 0.13% | | | | |
| 280,000 | | Ciena Corp. | | | | |
| | | 3.750%, 10/15/2018 | | | | |
| | | (Acquired 01/17/2012, | | | | |
| | | Cost $291,194) (b) | | | 317,450 | |
| | | | | | | |
| | | Computers & Peripherals - 0.13% | | | | |
| 165,000 | | EMC Corp. | | | | |
| | | 1.750%, 12/01/2013 | | | 310,612 | |
| | | | | | | |
| | | Oil & Gas - 0.36% | | | | |
| 485,000 | | Alpha Natural Resources, Inc. | | | | |
| | | 2.375%, 04/15/2015 | | | 435,288 | |
| 460,000 | | Peabody Energy Corp. | | | | |
| | | 4.750%, 12/15/2066 | | | 439,300 | |
| | | | | | | |
| | | | | | 874,588 | |
| | | | | | | |
| | | Semiconductors & Semiconductor | | | | |
| | | Equipment - 0.27% | | | | |
| 215,000 | | Intel Corp. | | | | |
| | | 3.250%, 08/01/2039 | | | 303,419 | |
| 330,000 | | Micron Technology, Inc. | | | | |
| | | 1.875%, 08/01/2031 | | | | |
| | | (Acquired 10/17/2011, | | | | |
| | | 10/24/2011 and 10/31/2011, | | | | |
| | | Cost $273,926) (b) | | | 351,862 | |
| | | | | | | |
| | | | | | 655,281 | |
| | | | | | | |
| | | Total Convertible Obligations | | | | |
| | | (Cost $3,462,072) | | | 3,330,375 | |
| | | | | | | |
See notes to financial statements.
78
|
GuideMarkSM Opportunistic Fixed Income Fund |
SCHEDULE OF INVESTMENTS (Continued) |
March 31, 2012 |
| |
| | | | | | | |
Number of
Shares | | | | Value | |
| | | | | | |
| | | CONVERTIBLE PREFERRED STOCKS - 0.52% | | | | |
| | | Automobiles - 0.27% | | | | |
| 15,820 | | General Motors Co. | | $ | 662,067 | |
| | | | | | | |
| | | Banks - 0.25% | | | | |
| 540 | | Wells Fargo & Co. | | | 603,018 | |
| | | | | | | |
| | | Total Convertible Preferred Stocks
(Cost $1,279,379) | | | 1,265,085 | |
| | | | | | | |
| | | | | | | |
| | | | | | | |
| Principal
Amount | | | | | | |
| | | | | | |
| | | CORPORATE OBLIGATIONS - 30.47% | | | | |
| | | Aerospace & Defense - 0.31% | | | | |
| | | Meccanica Holdings USA, Inc. | | | | |
| 400,000 | | 6.250%, 07/15/2019
(Acquired 01/10/2012,
Cost $317,682) (b) | | | 357,946 | |
| 100,000 | | 7.375%, 07/15/2039
(Acquired 08/17/2011,
Cost $94,762) (b) | | | 83,839 | |
| 400,000 | | 6.250%, 01/15/2040
(Acquired 07/28/2011,
07/29/2011 and 09/20/2011,
Cost $335,038) (b) | | | 310,826 | |
| | | | | | | |
| | | | | | 752,611 | |
| | | | | | | |
| | | Airlines - 0.04% | | | | |
| 100,000 | | American Airlines, Inc.
7.500%, 03/15/2016
(Acquired 08/18/2011,
Cost $92,371) (b)(c) | | | 88,750 | |
| | | | | | | |
| | | Auto Components - 0.02% | | | | |
| 50,000 | | Goodyear Tire & Rubber Co.
8.250%, 08/15/2020 | | | 53,375 | |
| | | | | | | |
| | | Banks - 3.60% | | | | |
| 1,150,000 | | Banco Bradesco SA
4.500%, 01/12/2017
(Acquired 01/05/2012,
Cost $1,150,000) (b) | | | 1,212,675 | |
| 940,000 | | Banco Continental SA via Continental
Senior Trustees II Cayman Ltd.
5.750%, 01/18/2017
(Acquired 01/10/2012,
Cost $940,000) (b) | | | 991,700 | |
| | | | | | | |
Principal
Amount | | | | Value | |
| | | | | | |
| | | Banks (Continued) | | | | |
| 500,000 | | Banco Santander Brasil SA
4.625%, 02/13/2017
(Acquired 02/06/2012,
Cost $497,070) (b) | | $ | 502,479 | |
| 350,000 | | CIT Group, Inc.
7.000%, 05/02/2017
(Acquired 04/04/2011,
Cost $350,178) (b) | | | 351,312 | |
| 1,230,000 | | Cooperatieve Centrale Raiffeisen-
Boerenleenbank BA/Utrect
3.375%, 01/19/2017 | | | 1,258,862 | |
| | | Eksportfinans ASA | | | | |
| 340,000 | | 2.000%, 09/15/2015 | | | 301,907 | |
| 150,000 | | 2.375%, 05/25/2016 | | | 132,344 | |
| 335,000 | | 2.250%, 02/11/2021 | | | 291,321 | |
| 175,000 | | GMAC International Finance BV
7.500%, 04/21/2015 | | | 240,401 | |
| 1,000,000 | | Halyk Savings Bank of Kazakhstan JSC
7.250%, 01/28/2021
(Acquired 04/05/2011
and 04/11/2011,
Cost $1,018,956) (b) | | | 1,032,500 | |
| 1,030,000 | | Lloyds TSB Bank Plc
6.500%, 03/24/2020 | | | 1,202,874 | |
| | | Royal Bank of Scotland Plc | | | | |
| 450,000 | | 4.350%, 01/23/2017 | | | 524,846 | |
| 550,000 | | 6.934%, 04/09/2018 | | | 690,260 | |
| | | | | | | |
| | | | | | 8,733,481 | |
| | | | | | | |
| | | Business Services - 0.46% | | | | |
| 1,120,000 | | Alfa Bond Issuance Plc
7.750%, 04/28/2021
(Acquired 04/19/2011,
Cost $1,120,000) (b) | | | 1,106,000 | |
| | | | | | | |
| | | Capital Markets - 0.25% | | | | |
| 545,000 | | Merrill Lynch & Co, Inc.
6.875%, 11/15/2018 | | | 607,520 | |
| | | | | | | |
| | | Chemicals - 1.08% | | | | |
| 1,000,000 | | Braskem America Finance Co.
7.125%, 07/22/2041
(Acquired 02/09/2012,
02/15/2012 and 03/08/2012,
Cost $995,250) (b) | | | 1,008,500 | |
| 645,000 | | Hercules, Inc.
6.500%, 06/30/2029 | | | 516,000 | |
See notes to financial statements.
79
|
GuideMarkSM Opportunistic Fixed Income Fund |
SCHEDULE OF INVESTMENTS (Continued) |
March 31, 2012 |
| |
| | | | | | | |
| | | | | | | |
Principal
Amount | | | | Value | |
| | | | | | |
| | | CORPORATE OBLIGATIONS (Continued) | | | | |
| | | Chemicals (Continued) | | | | |
| | | Ineos Group Holdings Ltd. | | | | |
| 100,000 | | 8.500%, 02/15/2016
(Acquired 04/12/2011,
Cost $101,721) (b) | | $ | 95,000 | |
| 850,000 | | 7.875%, 02/15/2016
(Acquired 10/25/2011, 02/24/2012,
02/29/2012 and 03/01/2012,
Cost $1,001,329) (b) | | | 1,008,949 | |
| | | | | | | |
| | | | | | 2,628,449 | |
| | | | | | | |
| | | Commercial Services & Supplies - 0.89% | | | | |
| 200,000 | | Emergency Medical Services Corp.
8.125%, 06/01/2019 | | | 206,500 | |
| | | International Lease Finance Corp. | | | | |
| 550,000 | | 6.750%, 09/01/2016
(Acquired 03/07/2012 and
03/13/2012, Cost $601,013) (b) | | | 591,938 | |
| 100,000 | | 8.250%, 12/15/2020 | | | 110,271 | |
| 600,000 | | 6.250%, 05/15/2019 | | | 592,397 | |
| 650,000 | | Steelcase, Inc.
6.375%, 02/15/2021 | | | 668,704 | |
| | | | | | | |
| | | | | | 2,169,810 | |
| | | | | | | |
| | | Communications - 0.25% | | | | |
| 350,000 | | CCO Holdings LLC
8.125%, 04/30/2020 | | | 390,250 | |
| 200,000 | | Univision Communications, Inc.
7.875%, 11/01/2020
(Acquired 04/20/2011,
Cost $213,292) (b) | | | 211,000 | |
| | | | | | | |
| | | | | | 601,250 | |
| | | | | | | |
| | | Communications Equipment - 0.70% | | | | |
| 1,220,000 | | Alcatel-Lucent
8.500%, 01/15/2016 | | | 1,688,953 | |
| | | | | | | |
| | | Construction Materials - 0.08% | | | | |
| 200,000 | | Cemex S.A.B. de C.V.
9.000%, 01/11/2018
(Acquired 07/06/2011,
Cost $195,731) (b) | | | 189,500 | |
| | | | | | | |
| | | Consumer Finance - 0.13% | | | | |
| 300,000 | | Ally Financial, Inc.
7.500%, 09/15/2020 | | | 325,125 | |
| | | | | | | |
| | | | | | | |
Principal
Amount | | | | Value | |
| | | | | | |
| | | Containers & Packaging - 0.35% | | | | |
| 250,000 | | Reynolds Group Issuer LLC
8.250%, 02/15/2021
(Acquired 04/12/2011,
Cost $251,250) (b) | | $ | 236,250 | |
| 600,000 | | Rock-Tenn Co.
4.450%, 03/01/2019
(Acquired 02/29/2012,
Cost $616,630) (b) | | | 603,586 | |
| | | | | | | |
| | | | | | 839,836 | |
| | | | | | | |
| | | Diversified Business Services - 0.11% | | | | |
| 250,000 | | United Rentals, Inc.
8.375%, 09/15/2020 | | | 260,000 | |
| | | | | | | |
| | | Diversified Financial Services - 1.88% | | | | |
| 560,000 | | Banco Votorantim SA
6.250%, 05/16/2016
(Acquired 05/09/2011,
Cost $346,363) (b) | | | 336,684 | |
| 150,000 | | Expro Finance Luxembourg SCA
8.500%, 12/15/2016
(Acquired 04/04/2011,
Cost $149,625) (b) | | | 145,125 | |
| 1,065,000 | | Ford Credit Ltd.
4.875%, 03/17/2014 | | | 1,089,077 | |
| 300,000 | | Ford Motor Credit Co. LLC
5.750%, 02/01/2021 | | | 324,438 | |
| 200,000 | | Hyundai Capital America, Inc.
4.000%, 06/08/2017
(Acquired 12/01/2011,
Cost $199,102) (b) | | | 205,730 | |
| 200,000 | | Pinnacle Foods Finance LLC
8.250%, 09/01/2017 | | | 218,000 | |
| 200,000 | | Schahin II Finance Co SPV Ltd.
5.875%, 09/25/2022
(Acquired 03/21/2012,
Cost $200,000) (b) | | | 201,000 | |
| 1,000,000 | | SLM Corp.
5.190%, 04/24/2019 | | | 904,751 | |
| 1,450,000 | | Textron Financial Corp.
6.000%, 02/15/2067
(Acquired 02/23/2012, 03/05/2012,
03/09/2012 and 03/19/2012,
Cost $1,142,327) (b)(d) | | | 1,123,750 | |
| | | | | | | |
| | | | | | 4,548,555 | |
| | | | | | | |
See notes to financial statements.
80
|
GuideMarkSM Opportunistic Fixed Income Fund |
SCHEDULE OF INVESTMENTS (Continued) |
March 31, 2012 |
| |
| | | | | | | |
Principal
Amount | | | | Value | |
| | | | | | |
| | | CORPORATE OBLIGATIONS (Continued) | | | | |
| | | Diversified Manufacturing - 0.62% | | | | |
| 250,000 | | RBS Global, Inc.
8.500%, 05/01/2018 | | $ | 269,375 | |
| 1,200,000 | | Votorantim Cimentos SA
7.250%, 04/05/2041 (Acquired
04/06/2011 and 03/08/2012,
Cost $1,206,000) (b) | | | 1,230,000 | |
| | | | | | | |
| | | | | | 1,499,375 | |
| | | | | | | |
| | | Diversified Telecommunication Services - 2.92% | | | | |
| 2,000,000 | | Brasil Telecom SA
9.750%, 09/15/2016
(Acquired 09/08/2011,
Cost $1,199,349) (b) | | | 1,139,445 | |
| 200,000 | | CHC Helicopter SA
9.250%, 10/15/2020
(Acquired 04/07/2011,
Cost $197,750) (b) | | | 199,500 | |
| 414,000 | | Citizens Communications Co.
9.000%, 08/15/2031 | | | 403,650 | |
| 1,240,000 | | Clearwire Communications LLC
12.000%, 12/01/2015
(Acquired 04/01/2011, 06/06/2011,
02/03/2012 and 02/27/2012,
Cost $1,223,160) (b) | | | 1,227,600 | |
| 250,000 | | Cricket Communications, Inc.
7.750%, 10/15/2020 | | | 246,563 | |
| 250,000 | | Frontier Communications Corp.
8.500%, 04/15/2020 | | | 264,375 | |
| 540,000 | | Level 3 Financing, Inc.
8.750%, 02/15/2017 | | | 567,000 | |
| 200,000 | | MetroPCS Wireless, Inc.
7.875%, 09/01/2018 | | | 211,500 | |
| | | Portugal Telecom International
Finance BV | | | | |
| 100,000 | | 4.500%, 06/16/2025 | | | 95,693 | |
| 350,000 | | 5.000%, 11/04/2019 | | | 376,972 | |
| 1,100,000 | | Qwest Corp.
7.200%, 11/10/2026 | | | 1,113,750 | |
| 1,200,000 | | Telemar Norte Leste SA
5.500%, 10/23/2020
(Acquired 03/08/2012 and
03/14/2012, Cost $1,244,248) (b) | | | 1,239,600 | |
| | | | | | | |
| | | | | | 7,085,648 | |
| | | | | | | |
| | | | | | | |
Principal
Amount | | | | Value | |
| | | | | | |
| | | Electric Utilities - 0.82% | | | | |
| 1,000,000 | | Centrais Eletricas Brasileiras SA
5.750%, 10/27/2021
(Acquired 10/20/2011,
Cost $1,000,000) (b) | | $ | 1,099,500 | |
| 225,000 | | DPL, Inc.
7.250%, 10/15/2021
(Acquired 01/11/2012,
Cost $244,963) (b) | | | 250,875 | |
| 610,000 | | Southern California Edison Co.
6.250%, 08/01/2049 (d) | | | 625,492 | |
| | | | | | | |
| | | | | | 1,975,867 | |
| | | | | | | |
| | | Energy Equipment & Services - 0.60% | | | | |
| 1,080,000 | | Cia de Eletricidade do Estado da Bahia
11.750%, 04/27/2016
(Acquired 04/19/2011,
Cost $683,977) (b) | | | 636,008 | |
| 200,000 | | Cie Generale de Geophysique
7.750%, 05/15/2017 | | | 209,000 | |
| 610,000 | | Global Geophysical Services, Inc.
10.500%, 05/01/2017 | | | 610,000 | |
| | | | | | | |
| | | | | | 1,455,008 | |
| | | | | | | |
| | | Engineering Construction - 0.26% | | | | |
| 600,000 | | Odebrecht Finance Ltd.
6.000%, 04/05/2023
(Acquired 01/23/2012,
Cost $602,364) (b) | | | 626,580 | |
| | | | | | | |
| | | Food & Staples Retailing - 0.09% | | | | |
| | | Rite Aid Corp. | | | | |
| 100,000 | | 9.750%, 06/12/2016 | | | 111,250 | |
| 100,000 | | 8.000%, 08/15/2020 | | | 115,625 | |
| | | | | | | |
| | | | | | 226,875 | |
| | | | | | | |
| | | Food Products - 0.13% | | | | |
| 200,000 | | Del Monte Corp.
7.625%, 02/15/2019 | | | 200,000 | |
| 100,000 | | JBS USA, LLC/JBS USA Finance, Inc.
8.250%, 02/01/2020
(Acquired 01/25/2012,
Cost $98,569) (b) | | | 103,000 | |
| | | | | | | |
| | | | | | 303,000 | |
| | | | | | | |
See notes to financial statements.
81
|
GuideMarkSM Opportunistic Fixed Income Fund |
SCHEDULE OF INVESTMENTS (Continued) |
March 31, 2012 |
| |
| | | | | | | |
Principal
Amount | | | | Value | |
| | | | | | |
| | | CORPORATE OBLIGATIONS (Continued) | | | | |
| | | Gas Utilities - 0.17% | | | | |
| 410,000 | | China Resources Gas Group Limited
4.500%, 04/05/2022
(Acquired 03/29/2012,
Cost $401,595) (b) | | $ | 403,742 | |
| | | | | | | |
| | | Health Care Providers & Services - 0.40% | | | | |
| | | Community Health Systems, Inc. | | | | |
| 60,000 | | 8.875%, 07/15/2015 | | | 62,250 | |
| 200,000 | | 8.000%, 11/15/2019
(Acquired 03/07/2012,
Cost $204,991) (b) | | | 208,000 | |
| | | HCA, Inc. | | | | |
| 200,000 | | 7.875%, 02/15/2020 | | | 220,750 | |
| 335,000 | | 7.250%, 09/15/2020 | | | 366,406 | |
| 100,000 | | 7.500%, 02/15/2022 | | | 106,750 | |
| 4,000 | | Vanguard Health Systems, Inc.
0.000%, 02/01/2016 (e) | | | 2,660 | |
| | | | | | | |
| | | | | | 966,816 | |
| | | | | | | |
| | | Hotels, Restaurants & Leisure - 1.15% | | | | |
| 300,000 | | Caesars Entertainment Operating Co., Inc.
11.250%, 06/01/2017 | | | 328,500 | |
| 100,000 | | ClubCorp Club Operations, Inc.
10.000%, 12/01/2018 | | | 105,000 | |
| 1,105,000 | | Mandalay Resort Group
7.625%, 07/15/2013 | | | 1,127,100 | |
| | | MGM Resorts International | | | | |
| 60,000 | | 6.625%, 07/15/2015 | | | 61,950 | |
| 825,000 | | 7.625%, 01/15/2017 | | | 855,937 | |
| 310,000 | | 7.500%, 06/01/2016 | | | 320,850 | |
| | | | | | | |
| | | | | | 2,799,337 | |
| | | | | | | |
| | | Household Products - 0.48% | | | | |
| 1,150,000 | | Procter & Gamble Co.
0.457%, 02/06/2014 (d) | | | 1,152,152 | |
| | | | | | | |
| | | Independent Power Producers
& Energy Traders - 0.30% | | | | |
| 250,000 | | Calpine Corp.
7.500%, 02/15/2021
(Acquired 04/04/2011,
Cost $260,843) (b) | | | 268,125 | |
| | | Enel Finance International NV | | | | |
| 200,000 | | 6.800%, 09/15/2037
(Acquired 09/01/2011,
Cost $186,599) (b) | | | 195,313 | |
| | | | | | | |
Principal
Amount | | | | Value | |
| | | | | | |
| | | Independent Power Producers
& Energy Traders (Continued) | | | | |
| 300,000 | | 6.000%, 10/07/2039
(Acquired 09/01/2011,
09/09/2011 and 09/14/2011,
Cost $253,271) (b) | | $ | 273,142 | |
| | | | | | | |
| | | | | | 736,580 | |
| | | | | | | |
| | | Industrial Conglomerates - 0.04% | | | | |
| 100,000 | | PBF Holding Co. LLC / PBF Finance Corp.
8.250%, 02/15/2020
(Acquired 01/27/2012,
Cost $98,565) (b) | | | 102,500 | |
| | | | | | | |
| | | Insurance - 0.39% | | | | |
| 850,000 | | Metlife Capital Trust IV
7.875%, 12/15/2037
(Acquired 04/12/2011,
Cost $929,839) (b)(d) | | | 939,250 | |
| | | | | | | |
| | | IT Services - 0.09% | | | | |
| 200,000 | | SunGard Data Systems, Inc.
7.625%, 11/15/2020 | | | 214,500 | |
| | | | | | | |
| | | Machinery - 0.09% | | | | |
| 200,000 | | RSC Equipment Rental, Inc.
10.250%, 11/15/2019 | | | 225,000 | |
| | | | | | | |
| | | Media - 0.43% | | | | |
| 150,000 | | Clear Channel Communications, Inc.
9.000%, 03/01/2021 | | | 135,750 | |
| | | Clear Channel Worldwide Holdings, Inc. | | | | |
| 55,000 | | 7.625%, 03/15/2020
(Acquired 02/29/2012,
Cost $55,000) (b) | | | 53,350 | |
| 330,000 | | 7.625%, 03/15/2020
(Acquired 02/29/2012,
Cost $330,000) (b) | | | 325,050 | |
| 300,000 | | DISH DBS Corp.
7.125%, 02/01/2016 | | | 333,375 | |
| 200,000 | | Nara Cable Funding Ltd.
8.875%, 12/01/2018
(Acquired 01/30/2012,
Cost $187,305) (b) | | | 191,000 | |
| | | | | | | |
| | | | | | 1,038,525 | |
| | | | | | | |
See notes to financial statements.
82
|
GuideMarkSM Opportunistic Fixed Income Fund |
SCHEDULE OF INVESTMENTS (Continued) |
March 31, 2012 |
| |
| | | | | | | |
Principal
Amount | | | | Value | |
| | | | | | |
| | | CORPORATE OBLIGATIONS (Continued) | | | | |
| | | Metals & Mining - 1.53% | | | | |
| 300,000 | | Aperam SA
7.375%, 04/01/2016
(Acquired 03/20/2012,
Cost $294,788) (b) | | $ | 294,750 | |
| 1,100,000 | | Arcelormittal SA
5.500%, 03/01/2021 | | | 1,081,499 | |
| 1,195,000 | | Barrick Gold Corp.
5.250%, 04/01/2042
(Acquired 03/29/2012,
Cost $1,192,849) (b) | | | 1,183,877 | |
| 600,000 | | BHP Billiton Finance USA Ltd.
1.026%, 02/18/2014 (d) | | | 601,030 | |
| | | FMG Resources Ltd. | | | | |
| 250,000 | | 6.875%, 02/01/2018
(Acquired 04/26/2011,
Cost $263,252) (b) | | | 251,250 | |
| 50,000 | | 6.000%, 04/01/2017
(Acquired 03/14/2012,
Cost $50,000) (b) | | | 49,625 | |
| 275,000 | | Vedanta Resources Plc
8.250%, 06/07/2021
(Acquired 05/26/2011,
Cost $275,000) (b) | | | 257,813 | |
| | | | | | | |
| | | | | | 3,719,844 | |
| | | | | | | |
| | | Multi Utilities - 0.61% | | | | |
| 590,000 | | EDP Finance BV
6.000%, 02/02/2018
(Acquired 05/03/2011,
Cost $569,987) (b) | | | 522,051 | |
| 980,000,000 | | Empresas Publicas de Medellin ESP
8.375%, 02/01/2021
(Acquired 04/28/2011,
Cost $565,059) (b) | | | 583,920 | |
| 200,000 | | Intergen NV
9.000%, 06/30/2017
(Acquired 04/04/2011,
Cost $213,279) (b) | | | 211,500 | |
| 250,000 | | Texas Competitive Electric
Holdings Co. LLC
11.500%, 10/01/2020
(Acquired 04/14/2011 and
11/09/2011, Cost $241,444) (b) | | | 164,375 | |
| | | | | | | |
| | | | | | 1,481,846 | |
| | | | | | | |
| | | | | | | |
Principal
Amount | | | | Value | |
| | | | | | |
| | | Office Equipment - 0.09% | | | | |
| 200,000 | | CDW LLC / CDW Finance Corp.
8.500%, 04/01/2019 | | $ | 213,500 | |
| | | | | | | |
| | | Oil & Gas - 4.58% | | | | |
| | | Alpha Natural Resources, Inc. | | | | |
| 100,000 | | 6.000%, 06/01/2019 | | | 91,000 | |
| 100,000 | | 6.250%, 06/01/2021 | | | 90,750 | |
| | | Arch Coal, Inc. | | | | |
| 100,000 | | 7.000%, 06/15/2019
(Acquired 06/08/2011,
Cost $100,000) (b) | | | 92,750 | |
| 100,000 | | 7.250%, 06/15/2021
(Acquired 06/08/2011,
Cost $100,000) (b) | | | 92,750 | |
| 1,215,000 | | Canadian Oil Sands Ltd.
4.500%, 04/01/2022
(Acquired 03/26/2012,
Cost $1,205,535) (b) | | | 1,226,392 | |
| 250,000 | | Chesapeake Energy Corp.
6.125%, 02/15/2021 | | | 248,750 | |
| 320,000 | | Connacher Oil & Gas Ltd.
8.500%, 08/01/2019
(Acquired 02/23/2012, 03/02/2012,
03/12/2012 and 03/21/2012,
Cost $316,981) (b) | | | 321,600 | |
| 250,000 | | Linn Energy LLC
7.750%, 02/01/2021 | | | 260,625 | |
| 570,000 | | Nabors Industries, Inc.
9.250%, 01/15/2019 | | | 732,693 | |
| 400,000 | | OGX Petroleo & Gas Participacoes SA
8.375%, 04/01/2022
(Acquired 03/27/2012,
Cost $400,000) (b) | | | 405,000 | |
| 950,000 | | Petrobras International Finance Co.
5.375%, 01/27/2021 | | | 1,027,652 | |
| 5,000,000 | | Petroleos de Venezuela SA
4.900%, 10/28/2014 | | | 4,487,500 | |
| 150,000 | | Petroleos Mexicanos
7.650%, 11/24/2021
(Acquired 12/01/2011,
Cost $1,102,597) (b) | | | 1,200,699 | |
| 250,000 | | Plains Exploration & Production Co.
6.625%, 05/01/2021 | | | 266,250 | |
| 100,000 | | Quicksilver Resources, Inc.
9.125%, 08/15/2019 | | | 98,000 | |
See notes to financial statements.
83
|
GuideMarkSM Opportunistic Fixed Income Fund |
SCHEDULE OF INVESTMENTS (Continued) |
March 31, 2012 |
| |
| | | | | | | |
Principal
Amount | | | | Value | |
| | | | | | |
| | | CORPORATE OBLIGATIONS (Continued) | | | | |
| | | Oil & Gas (Continued) | | | | |
| 200,000 | | Samson Investment Co.
9.750%, 02/15/2020
(Acquired 02/06/2012,
Cost $200,000) (b) | | $ | 202,750 | |
| 250,000 | | SandRidge Energy, Inc.
8.000%, 06/01/2018
(Acquired 05/06/2011 and
05/13/2011, Cost $263,143) (b) | | | 256,250 | |
| | | | | | | |
| | | | | | 11,101,411 | |
| | | | | | | |
| | | Paper Products - 0.23% | | | | |
| 545,000 | | Celulosa Arauco y Constitucion S
4.750%, 01/11/2022
(Acquired 01/04/2012,
Cost $536,989) (b) | | | 560,616 | |
| | | | | | | |
| | | Pharmaceuticals - 0.22% | | | | |
| | | Valeant Pharmaceuticals International, Inc. | | | | |
| 75,000 | | 7.000%, 10/01/2020
(Acquired 07/28/2011,
Cost $72,758) (b) | | | 75,000 | |
| 420,000 | | 6.750%, 08/15/2021 (Acquired
07/01/2011, 07/11/2011, 07/15/2011,
07/19/2011, 07/27/2011, 07/28/2011,
07/29/2011 and 03/15/2012,
Cost $405,869) (b) | | | 410,550 | |
| 50,000 | | 7.250%, 07/15/2022
(Acquired 06/16/2011 and
06/23/2011, Cost $48,377) (b) | | | 49,750 | |
| | | | | | | |
| | | | | | 535,300 | |
| | | | | | | |
| | | Pipelines - 0.18% | | | | |
| 135,000 | | NGPL PipeCo LLC
6.514%, 12/15/2012
(Acquired 03/16/2012,
03/23/2012, 03/27/2012 and
03/29/2012, Cost $130,733) (b) | | | 130,295 | |
| 370,000 | | Rockies Express Pipeline LLC
6.875%, 04/15/2040 (Acquired
02/10/2012, 02/24/2012, 02/28/2012,
03/06/2012, 03/13/2012, 03/16/2012,
03/20/2012 and 03/29/2012,
Cost $300,902) (b) | | | 298,775 | |
| | | | | | | |
| | | | | | 429,070 | |
| | | | | | | |
| | | | | | | |
Principal
Amount | | | | Value | |
| | | | | | |
| | | Publishing - 0.20% | | | | |
| 515,000 | | Visant Corp.
10.000%, 10/01/2017 | | $ | 483,456 | |
| | | | | | | |
| | | Real Estate - 0.09% | | | | |
| 200,000 | | Prologis, Inc.
6.625%, 05/15/2018 | | | 227,959 | |
| | | | | | | |
| | | Semiconductors & Semiconductor
Equipment - 0.21% | | | | |
| 250,000 | | Abengoa Finance SAU
8.875%, 11/01/2017
(Acquired 04/12/2011,
Cost $253,888) (b) | | | 250,000 | |
| | | Freescale Semiconductor, Inc. | | | | |
| 50,000 | | 10.750%, 08/01/2020 | | | 56,375 | |
| 200,000 | | 8.050%, 02/01/2020 | | | 202,000 | |
| | | | | | | |
| | | | | | 508,375 | |
| | | | | | | |
| | | Software - 0.31% | | | | |
| 650,000 | | BMC Software, Inc.
4.250%, 02/15/2022 | | | 652,937 | |
| 100,000 | | First Data Corp.
8.250%, 01/15/2021
(Acquired 02/17/2012,
Cost $97,000) (b) | | | 98,250 | |
| | | | | | | |
| | | | | | 751,187 | |
| | | | | | | |
| | | Specialty Retail - 0.20% | | | | |
| 250,000 | | Michaels Stores, Inc.
7.750%, 11/01/2018 | | | 267,500 | |
| 200,000 | | PETCO Animal Supplies, Inc.
9.250%, 12/01/2018
(Acquired 04/21/2011,
Cost $214,978) (b) | | | 220,500 | |
| | | | | | | |
| | | | | | 488,000 | |
| | | | | | | |
| | | Telecommunication Services - 0.96% | | | | |
| 300,000 | | Intelsat Jackson Holdings SA
7.500%, 04/01/2021 | | | 316,875 | |
| | | Telecom Italia Capital SA | | | | |
| 205,000 | | 6.000%, 09/30/2034 | | | 181,425 | |
| 475,000 | | 7.200%, 07/18/2036 | | | 463,125 | |
| | | Telefonica Emisiones SAU | | | | |
| 75,000 | | 7.045%, 06/20/2036 | | | 73,936 | |
| 235,000 | | 5.877%, 07/15/2019 | | | 238,923 | |
| 225,000 | | 5.134%, 04/27/2020 | | | 215,545 | |
| 240,000 | | 5.462%, 02/16/2021 | | | 233,723 | |
See notes to financial statements.
84
|
GuideMarkSM Opportunistic Fixed Income Fund |
SCHEDULE OF INVESTMENTS (Continued) |
March 31, 2012 |
| |
| | | | | | | |
Principal
Amount | | | | Value | |
| | | | | | |
| | | CORPORATE OBLIGATIONS (Continued) | | | | |
| | | Telecommunication Services (Continued) | | | | |
| 150,000 | | UPCB Finance VI Ltd.
6.875%, 01/15/2022
(Acquired 01/31/2012,
Cost $150,000) (b) | | $ | 155,625 | |
| 200,000 | | West Corp.
7.875%, 01/15/2019 | | | 214,000 | |
| 250,000 | | Wind Acquisition Finance SA
11.750%, 07/15/2017
(Acquired 02/27/2012,
Cost $256,875) (b) | | | 247,500 | |
| | | | | | | |
| | | | | | 2,340,677 | |
| | | | | | | |
| | | Textiles, Apparel & Luxury Goods - 0.87% | | | | |
| | | Edcon (Pty) Ltd. | | | | |
| 1,120,000 | | 9.500%, 03/01/2018
(Acquired 04/05/2011 and 04/12/2011,
Cost $1,125,950) (b) | | | 1,019,200 | |
| 150,000 | | 6.926%, 06/15/2015
(Acquired 08/18/2011,
08/19/2011 and 08/24/2011,
Cost $152,037) (b)(d) | | | 167,047 | |
| 300,000 | | 9.500%, 03/01/2018
(Acquired 08/18/2011,
08/19/2011 and 08/24/2011,
Cost $342,590) (b) | | | 364,102 | |
| 500,000 | | Phillips Van Heusen Corp.
7.750%, 11/15/2023 | | | 570,125 | |
| | | | | | | |
| | | | | | 2,120,474 | |
| | | | | | | |
| | | Trading Companies & Distributors - 0.24% | | | | |
| 590,000 | | Air Lease Corp.
5.625%, 04/01/2017
(Acquired 03/13/2012,
Cost $590,000) (b) | | | 590,000 | |
| | | | | | | |
| | | Transportation - 0.19% | | | | |
| 200,000 | | CEVA Group PLC
8.375%, 12/01/2017
(Acquired 01/27/2012,
Cost $197,748) (b) | | | 199,000 | |
| 250,000 | | Energy XXI Gulf Coast, Inc.
9.250%, 12/15/2017 | | | 271,875 | |
| | | | | | | |
| | | | | | 470,875 | |
| | | | | | | |
| | | | | | | |
Principal
Amount | | | | Value | |
| | | | | | |
| | | Wireless Telecommunication Services - 0.63% | | | | |
| 1,200,000 | | Hutchison Whampoa International Ltd.
4.625%, 01/13/2022
(Acquired 01/10/2012,
Cost $1,191,000) (b) | | $ | 1,211,267 | |
| | | Sprint Nextel Corp. | | | | |
| 200,000 | | 9.000%, 11/15/2018
(Acquired 11/04/2011,
Cost $200,000) (b) | | | 220,000 | |
| 100,000 | | 7.000%, 03/01/2020
(Acquired 02/28/2012,
Cost $100,000) (b) | | | 101,750 | |
| | | Total Corporate Obligations
(Cost $73,315,702) | | | 73,899,577 | |
| | | | | | | |
| | | FOREIGN COMMERCIAL PAPER - 0.88% | | | | |
| 275,000 | | Eaccess Ltd.
8.375%, 04/01/2018
(Acquired 01/03/2012
and 01/06/2012,
Cost $320,005) (b) | | | 341,095 | |
| 400,000 | | Telefonica Emisiones SAU
5.597%, 03/12/2020 | | | 626,095 | |
| 1,080,000 | | Volkswagen Financial Services NV
6.250%, 07/15/2015 | | | 1,155,501 | |
| | | | | | | |
| | | Total Foreign Commercial
Paper (Cost $1,486,454) | | | 2,122,691 | |
| | | | | | | |
| | | FOREIGN DEBT OBLIGATIONS - 41.50% | | | | |
| 4,500,000 | | Canadian Government Bond
1.750%, 03/01/2013 | | | 4,539,024 | |
| | | Financing of Infrastructural Projects
State Enterprise | | | | |
| 100,000 | | 8.375%, 11/03/2017
(Acquired 05/10/2011,
Cost $105,335) (b) | | | 86,130 | |
| 1,180,000 | | 7.400%, 04/20/2018
(Acquired 04/15/2011,
Cost $1,180,000) (b) | | | 973,881 | |
| | | Ghana Government Bond | | | | |
| 2,530,000 | | 12.390%, 04/28/2014 | | | 1,387,288 | |
| 860,000 | | 13.000%, 06/02/2014 | | | 469,487 | |
| 1,470,000 | | 14.990%, 02/23/2015 | | | 826,219 | |
| 8,800,000 | | Israel Treasury Bill
0.000%, 04/04/2012 (e) | | | 2,371,851 | |
| 31,050,000 | | Malaysia Government Bond
3.718%, 06/15/2012 | | | 10,148,754 | |
See notes to financial statements.
85
|
GuideMarkSM Opportunistic Fixed Income Fund |
SCHEDULE OF INVESTMENTS (Continued) |
March 31, 2012 |
| | | | | | | |
Principal
Amount | | | | Value | |
| | | FOREIGN DEBT OBLIGATIONS (Continued) | | | | |
| | | Mexican Bonos | | | | |
| 600,000 | | 8.000%, 12/19/2013 | | $ | 4,945,135 | |
| 335,000 | | 6.000%, 06/18/2015 | | | 2,696,763 | |
| 60,000 | | 8.500%, 12/13/2018 | | | 544,945 | |
| | | Mexican Udibonos | | | | |
| 3,808 | | 3.500%, 12/14/2017 | | | 32,335 | |
| 4,760 | | 5.000%, 06/16/2016 | | | 42,002 | |
| 3,820,000 | | New South Wales Treasury Corp. | | | | |
| | | 5.500%, 08/01/2013 | | | 4,035,812 | |
| | | Poland Government Bond | | | | |
| 17,735,000 | | 0.000%, 01/25/2013 (e) | | | 5,502,925 | |
| 7,073,000 | | 0.000%, 07/25/2013 (e) | | | 2,152,354 | |
| 105,000 | | 0.000%, 01/25/2014 (e) | | | 31,173 | |
| 4,000,000 | | Queensland Treasury Corp. | | | | |
| | | 6.000%, 08/21/2013 | | | 4,247,796 | |
| | | Republic of Ghana | | | | |
| 80,000 | | 14.990%, 03/11/2013 | | | 45,675 | |
| 60,000 | | 14.250%, 07/29/2013 | | | 33,871 | |
| | | Republic of Hungary | | | | |
| 2,200,000 | | 6.750%, 02/12/2013 | | | 9,875 | |
| 314,600,000 | | 5.500%, 02/12/2014 | | | 1,361,375 | |
| 373,600,000 | | 6.750%, 08/22/2014 | | | 1,647,416 | |
| 1,800,000 | | 8.000%, 02/12/2015 | | | 8,035 | |
| 8,800,000 | | 5.500%, 02/12/2016 | | | 35,962 | |
| 632,400,000 | | 6.750%, 02/24/2017 | | | 2,641,036 | |
| 440,000 | | 4.375%, 07/04/2017 | | | 492,116 | |
| 58,700,000 | | 6.750%, 11/24/2017 | | | 242,221 | |
| 150,000 | | 5.750%, 06/11/2018 | | | 174,975 | |
| 2,700,000 | | 6.500%, 06/24/2019 | | | 10,717 | |
| 2,650,000 | | 6.375%, 03/29/2021 | | | 2,438,000 | |
| 2,290,000 | | Republic of Iceland
4.875%, 06/16/2016
(Acquired 06/09/2011 and
06/10/2011, Cost $2,278,203) (b) | | | 2,302,087 | |
| | | Republic of Indonesia | | | | |
| 19,983,000,000 | | 11.000%, 12/15/2012 | | | 2,293,519 | |
| 38,953,000,000 | | 12.500%, 03/15/2013 | | | 4,597,941 | |
| | | Republic of Ireland | | | | |
| 666,000 | | 4.600%, 04/18/2016 | | | 877,181 | |
| 790,000 | | 4.500%, 10/18/2018 | | | 960,838 | |
| 1,019,000 | | 4.400%, 06/18/2019 | | | 1,210,259 | |
| 397,000 | | 5.900%, 10/18/2019 | | | 506,470 | |
| | | | | | | |
Principal
Amount | | | | Value | |
| | | Republic of Ireland (Continued) | | | | |
| 750,000 | | 4.500%, 04/18/2020 | | $ | 870,282 | |
| 1,178,000 | | 5.000%, 10/18/2020 | | | 1,396,670 | |
| 1,563,000 | | 5.400%, 03/13/2025 | | | 1,820,467 | |
| 18,045,000,000 | | Republic of Korea
3.000%, 12/10/2013 | | | 15,803,712 | |
| 900,000 | | Republic of Latvia
5.250%, 02/22/2017
(Acquired 02/14/2012,
Cost $895,122) (b) | | | 929,250 | |
| 1,260,000 | | 5.250%, 06/16/2021
(Acquired 06/09/2011,
06/22/2011, 06/23/2011
and 07/19/2011,
Cost $1,235,656) (b) | | | 1,271,025 | |
| | | Republic of Poland | | | | |
| 121,000 | | 4.750%, 04/25/2012 | | | 38,928 | |
| 80,000 | | 0.000%, 07/25/2012 (e) | | | 25,380 | |
| 2,676,000 | | 0.000%, 10/25/2012 (e) | | | 838,838 | |
| 240,000 | | 5.250%, 04/25/2013 | | | 77,822 | |
| 465,000 | | 5.000%, 10/24/2013 | | | 150,648 | |
| 30,000 | | 5.500%, 04/25/2015 | | | 9,867 | |
| 45,000 | | 6.250%, 10/24/2015 | | | 15,171 | |
| 300,000 | | Republic of Portugal
4.950%, 10/25/2023 | | | 239,467 | |
| 1,060,000 | | Republic of Serbia
7.250%, 09/28/2021
(Acquired 09/21/2011,
Cost $1,041,588) (b) | | | 1,120,950 | |
| 55,000,000 | | Serbia Treasury Bonds
10.000%, 03/01/2015 | | | 585,714 | |
| 2,300,000 | | Ukraine Government International
Bond
7.950%, 02/23/2021
(Acquired 04/05/2011
and 04/11/2011,
Cost $2,408,226) (b) | | | 1,989,500 | |
| | | United Kingdom Gilt | | | | |
| 810,000 | | 4.250%, 09/07/2039 | | | 1,504,883 | |
| 135,000 | | United Mexican States
7.500%, 06/21/2012 | | | 1,064,626 | |
| 25,515,030 | | Uruguay Government
International Bond
4.375%, 12/15/2028 | | | 1,435,646 | |
See notes to financial statements.
86
|
GuideMarkSM Opportunistic Fixed Income Fund |
SCHEDULE OF INVESTMENTS (Continued) |
March 31, 2012 |
| | | | | | | |
Principal
Amount | | | | Value | |
| | | FOREIGN DEBT OBLIGATIONS (Continued) | | | | |
| | | Uruguay Notas del Tesoro | | | | |
| 16,480,000 | | 10.500%, 03/15/2015 | | $ | 851,467 | |
| 4,738,400 | | 4.000%, 06/10/2020 | | | 263,649 | |
| 1,300,000 | | Western Australia Treasury Corp.
8.000%, 06/15/2013 | | | 1,409,870 | |
| | | Total Foreign Debt Obligations
(Cost $104,913,222) | | | 100,637,275 | |
| | | | | | | |
Number of
Shares | | | | | | |
| | | PREFERRED STOCKS - 0.27% | | | | |
| | | Insurance - 0.27% | | | | |
| 24,000 | | Montpelier Re Holdings Ltd. (a) | | | 654,000 | |
| | | Total Preferred Stocks
(Cost $600,000) | | | 654,000 | |
| | | | | | | |
Notional
Amount | | | | | | |
| | | PURCHASED OPTIONS - 0.14% | | | | |
| | | Call Option | | | | |
| 5,600,000 | | U.S. Dollar - Australian Dollar
Expiration: August, 2012,
Exercise Price: $0.99 | | | 117,018 | |
| | | | | | | |
Number of
Contracts | | | | | | |
| | | Put Option | | | | |
| 1,600 | | Industrial Select Sector SPDR Fund | | | | |
| | | Expiration: September, 2012, | | | | |
| | | Exercise Price: $35.00 | | | 217,600 | |
| | | Total Purchased Options | | | | |
| | | (Cost $578,059) | | | 334,618 | |
| | | | | | | |
| | | | | | | |
Principal
Amount | | | | | | |
| | | SHORT TERM INVESTMENTS - 11.10% | | | | |
| | | Foreign Treasury Bill - 0.11% | | | | |
| 5,920,000 | | Uruguay Treasury Bill | | | | |
| | | 0.010%, 03/22/2013 (f) | | | 279,471 | |
| | | | | | | |
Number of
Shares | | | | | | |
| | | Money Market Funds - 6.87% | | | | |
| 16,655,762 | | Federated Prime Obligations Fund | | | | |
| | | Effective Yield, 0.20% | | | 16,655,762 | |
| | | | | | | |
Principal
Amount | | | | Value | |
| | | U.S. Treasury Bill - 4.12% | | | | |
| 10,000,000 | | United States Treasury Bill | | | | |
| | | 0.084%, 09/20/2012 (g) | | $ | 9,993,710 | |
| | | Total Short Term Investments | | | | |
| | | (Cost $26,929,626) | | | . 26,928,943 | |
| | | Total Investments | | | | |
| | | (Cost $238,555,275) - 96.84% | | | 234,849,218 | |
| | | Other Assets in Excess of | | | | |
| | | Liabilities - 3.16% | | | 7,658,559 | |
| | | TOTAL NET | | | | |
| | | ASSETS - 100.00% | | $ | 242,507,777 | |
Percentages are stated as a percent of net assets.
Principal Amounts are denominated in the currency in which the security was purchased.
ADR - American Depositary Receipt
| |
(a) | Non-income producing. |
(b) | Restricted securities as defined in Rule 144(a) under the Securities Act of 1933. Such securities are treated as liquid securities according to the Fund’s liquidity guidelines. The value of these securities total $53,368,126, which represents 22.01% of total net assets. |
(c) | Non-income producing. Item identified as in default as to payment of interest. |
(d) | Variable Rate Security. The rate shown is the rate in effect on March 31, 2012. |
(e) | Zero coupon bond. |
(f) | As of March 31, 2012, the Fund has fair valued this security and deemed it illquid. The value of this security was $279,471, which represents 0.12% of total net assets. |
(g) | Partially assigned as collateral for certain futures contracts. |
See notes to financial statements.
87
|
GuideMarkSM Opportunistic Fixed Income Fund |
SCHEDULE OF OPEN FORWARD CURRENCY CONTRACTS |
March 31, 2012 |
| |
| | | | | | | | | | | | | | | | | | |
Forward
expiration date | | Currency to be received | | Amount of
Currency to
be received | | Currency to
be delivered | | Amount of
Currency to
be delivered | | Unrealized
Appreciation
(Depreciation) | |
| | | | | | | | | | | |
4/11/2012 | | Australian Dollar | | | 2,300,000 | | | | U.S. Dollars | | | 2,438,575 | | | $ | (59,380 | ) | |
10/2/2012 | | Australian Dollar | | | 2,354,770 | | | | U.S. Dollars | | | 2,383,027 | | | | 7,967 | | |
4/10/2012 | | British Pound | | | 1,961,654 | | | | U.S. Dollars | | | 3,162,500 | | | | (25,058 | ) | |
4/13/2012 | | British Pound | | | 1,946,457 | | | | U.S. Dollars | | | 3,170,000 | | | | (56,918 | ) | |
7/3/2012 | | British Pound | | | 404,000 | | | | U.S. Dollars | | | 645,632 | | | | 560 | | |
4/10/2012 | | Chilean Peso | | | 1,899,012,500 | | | | U.S. Dollars | | | 3,850,000 | | | | 31,118 | | |
4/13/2012 | | Chilean Peso | | | 1,884,575,000 | | | | U.S. Dollars | | | 3,850,000 | | | | 16 | | |
4/23/2012 | | Chinese Yuan | | | 7,330,000 | | | | U.S. Dollars | | | 1,154,149 | | | | 9,267 | | |
4/10/2012 | | Euro | | | 414,729 | | | | Norwegian Krone | | | 3,300,000 | | | | (26,095 | ) | |
4/10/2012 | | Euro | | | 454,000 | | | | U.S. Dollars | | | 643,195 | | | | (37,669 | ) | |
4/30/2012 | | Euro | | | 242,000 | | | | U.S. Dollars | | | 320,333 | | | | 2,467 | | |
9/28/2012 | | Hungarian Forint | | | 35,900,000 | | | | U.S. Dollars | | | 163,734 | | | | (4,951 | ) | |
4/11/2012 | | Indian Rupee | | | 117,200,000 | | | | U.S. Dollars | | | 2,500,000 | | | | (206,199 | ) | |
4/16/2012 | | Indian Rupee | | | 117,575,000 | | | | U.S. Dollars | | | 2,500,000 | | | | (201,525 | ) | |
4/20/2012 | | Mexican Peso | | | 13,730,000 | | | | U.S. Dollars | | | 1,068,982 | | | | 1,998 | | |
8/6/2012 | | Mexican Peso | | | 1,597,390 | | | | U.S. Dollars | | | 130,180 | | | | (6,825 | ) | |
8/8/2012 | | Mexican Peso | | | 1,605,500 | | | | U.S. Dollars | | | 130,180 | | | | (6,222 | ) | |
10/3/2012 | | Mexican Peso | | | 22,740,000 | | | | U.S. Dollars | | | 1,636,501 | | | | 110,243 | | |
3/8/2013 | | Mexican Peso | | | 11,784,520 | | | | U.S. Dollars | | | 878,675 | | | | 14,451 | | |
6/18/2012 | | Malaysian Ringgit | | | 2,500,000 | | | | U.S. Dollars | | | 811,688 | | | | 70 | | |
6/21/2012 | | Malaysian Ringgit | | | 2,167,800 | | | | U.S. Dollars | | | 702,531 | | | | 1,250 | | |
9/26/2012 | | Malaysian Ringgit | | | 478,000 | | | | U.S. Dollars | | | 149,941 | | | | 4,417 | | |
10/3/2012 | | Malaysian Ringgit | | | 5,330,000 | | | | U.S. Dollars | | | 1,653,739 | | | | 66,956 | | |
3/11/2013 | | Malaysian Ringgit | | | 2,414,589 | | | | U.S. Dollars | | | 785,000 | | | | (10,529 | ) | |
3/12/2013 | | Malaysian Ringgit | | | 612,600 | | | | U.S. Dollars | | | 200,000 | | | | (3,519 | ) | |
3/15/2013 | | Malaysian Ringgit | | | 1,024,011 | | | | U.S. Dollars | | | 334,000 | | | | (5,605 | ) | |
3/18/2013 | | Malaysian Ringgit | | | 799,497 | | | | U.S. Dollars | | | 259,518 | | | | (3,155 | ) | |
3/26/2013 | | Malaysian Ringgit | | | 777,000 | | | | U.S. Dollars | | | 248,480 | | | | 1,512 | | |
4/10/2012 | | Norwegian Krone | | | 24,469,540 | | | | Euro | | | 3,100,000 | | | | 160,446 | | |
4/13/2012 | | Norwegian Krone | | | 23,850,939 | | | | Euro | | | 3,010,000 | | | | 171,358 | | |
4/10/2012 | | Philippine Peso | | | 144,452,000 | | | | U.S. Dollars | | | 3,350,000 | | | | 11,589 | | |
4/13/2012 | | Philippine Peso | | | 144,887,500 | | | | U.S. Dollars | | | 3,350,000 | | | | 20,997 | | |
4/10/2012 | | Polish Zloty | | | 4,746,256 | | | | Euro | | | 1,160,000 | | | | (22,243 | ) | |
4/13/2012 | | Polish Zloty | | | 4,578,308 | | | | Euro | | | 1,130,000 | | | | (36,707 | ) | |
8/6/2012 | | Polish Zloty | | | 963,300 | | | | Euro | | | 234,395 | | | | (7,199 | ) | |
8/8/2012 | | Polish Zloty | | | 497,150 | | | | Euro | | | 120,888 | | | | (3,642 | ) | |
8/9/2012 | | Polish Zloty | | | 350,574 | | | | Euro | | | 85,381 | | | | (2,761 | ) | |
3/8/2013 | | Polish Zloty | | | 4,450,638 | | | | Euro | | | 1,032,228 | | | | 5,013 | | |
4/10/2012 | | Swedish Krona | | | 44,055,858 | | | | Euro | | | 4,840,000 | | | | 200,768 | | |
4/13/2012 | | Swedish Krona | | | 43,466,148 | | | | Euro | | | 4,770,000 | | | | 204,141 | | |
10/3/2012 | | Swedish Krona | | | 7,620,000 | | | | Euro | | | 816,458 | | | | 53,452 | | |
See notes to financial statements.
88
|
GuideMarkSM Opportunistic Fixed Income Fund |
SCHEDULE OF OPEN FORWARD CURRENCY CONTRACTS (Continued) |
March 31, 2012 |
| |
| | | | | | | | | | | | | | | | | | |
Forward
expiration date | | Currency to be received | | Amount of
Currency to
be received | | Currency to
be delivered | | Amount of
Currency to
be delivered | | Unrealized
Appreciation
(Depreciation) | |
| | | | | | | | | | | |
3/8/2013 | | Swedish Krona | | | 1,010,000 | | | | Euro | | | 111,795 | | | $ | 1,314 | | |
3/28/2013 | | Serbian Dinar | | | 31,310,564 | | | | Euro | | | 264,895 | | | | (6,377 | ) | |
4/10/2012 | | Singapore Dollar | | | 3,114,788 | | | | U.S. Dollars | | | 2,475,000 | | | | 2,873 | | |
4/13/2012 | | Singapore Dollar | | | 3,120,095 | | | | U.S. Dollars | | | 2,490,000 | | | | (7,898 | ) | |
7/31/2012 | | Singapore Dollar | | | 1,428,700 | | | | U.S. Dollars | | | 1,193,069 | | | | (55,904 | ) | |
8/1/2012 | | Singapore Dollar | | | 1,145,260 | | | | U.S. Dollars | | | 954,487 | | | | (42,916 | ) | |
8/6/2012 | | Singapore Dollar | | | 1,834,763 | | | | U.S. Dollars | | | 1,531,279 | | | | (70,836 | ) | |
9/17/2012 | | Singapore Dollar | | | 1,411,379 | | | | U.S. Dollars | | | 1,120,000 | | | | 3,834 | | |
3/11/2013 | | Singapore Dollar | | | 1,387,980 | | | | U.S. Dollars | | | 1,102,000 | | | | 4,843 | | |
3/26/2013 | | Singapore Dollar | | | 637,800 | | | | U.S. Dollars | | | 505,553 | | | | 3,124 | | |
6/27/2012 | | South Korean Won | | | 606,000,000 | | | | U.S. Dollars | | | 518,790 | | | | 12,636 | | |
9/26/2012 | | South Korean Won | | | 608,000,000 | | | | U.S. Dollars | | | 514,835 | | | | 15,683 | | |
3/11/2013 | | South Korean Won | | | 1,286,797,500 | | | | U.S. Dollars | | | 1,125,000 | | | | (8,389 | ) | |
3/12/2013 | | South Korean Won | | | 636,720,000 | | | | U.S. Dollars | | | 560,000 | | | | (7,508 | ) | |
3/15/2013 | | South Korean Won | | | 636,801,620 | | | | U.S. Dollars | | | 559,000 | | | | (6,493 | ) | |
4/10/2012 | | U.S. Dollars | | | 1,177,792 | | | | Australian Dollar | | | 1,100,000 | | | | 39,788 | | |
4/11/2012 | | U.S. Dollars | | | 2,422,935 | | | | Australian Dollar | | | 2,300,000 | | | | 43,740 | | |
4/26/2012 | | U.S. Dollars | | | 4,698,694 | | | | Australian Dollar | | | 4,550,000 | | | | (50 | ) | |
4/23/2012 | | U.S. Dollars | | | 936,935 | | | | Brazilian Real | | | 1,710,000 | | | | 5,167 | | |
5/2/2012 | | U.S. Dollars | | | 1,504,109 | | | | British Pound | | | 945,000 | | | | (7,104 | ) | |
6/6/2012 | | U.S. Dollars | | | 637,446 | | | | British Pound | | | 400,000 | | | | (2,048 | ) | |
4/19/2012 | | U.S. Dollars | | | 2,107,222 | | | | Canadian Dollar | | | 2,095,000 | | | | 7,691 | | |
4/10/2012 | | U.S. Dollars | | | 1,143,502 | | | | Chilean Peso | | | 557,000,000 | | | | 5,130 | | |
4/23/2012 | | U.S. Dollars | | | 1,144,240 | | | | Chinese Yuan | | | 7,330,000 | | | | (19,176 | ) | |
5/2/2012 | | U.S. Dollars | | | 1,191,074 | | | | Columbian Peso | | | 2,135,000,000 | | | | 1,970 | | |
6/27/2012 | | U.S. Dollars | | | 619,794 | | | | Columbian Peso | | | 1,105,000,000 | | | | 7,753 | | |
4/5/2012 | | U.S. Dollars | | | 1,244,565 | | | | Euro | | | 935,000 | | | | (2,472 | ) | |
4/10/2012 | | U.S. Dollars | | | 4,046,896 | | | | Euro | | | 2,884,500 | | | | 199,670 | | |
4/12/2012 | | U.S. Dollars | | | 1,492,665 | | | | Euro | | | 1,138,000 | | | | (25,166 | ) | |
4/13/2012 | | U.S. Dollars | | | 4,932,310 | | | | Euro | | | 3,475,000 | | | | 297,435 | | |
4/16/2012 | | U.S. Dollars | | | 1,191,349 | | | | Euro | | | 900,000 | | | | (9,067 | ) | |
4/24/2012 | | U.S. Dollars | | | 234,170 | | | | Euro | | | 181,000 | | | | (7,256 | ) | |
4/27/2012 | | U.S. Dollars | | | 398,280 | | | | Euro | | | 300,000 | | | | (1,879 | ) | |
4/30/2012 | | U.S. Dollars | | | 1,450,528 | | | | Euro | | | 1,097,000 | | | | (12,742 | ) | |
5/16/2012 | | U.S. Dollars | | | 5,458,295 | | | | Euro | | | 3,891,000 | | | | 267,674 | | |
6/11/2012 | | U.S. Dollars | | | 1,252,535 | | | | Euro | | | 868,700 | | | | 93,499 | | |
6/13/2012 | | U.S. Dollars | | | 553,794 | | | | Euro | | | 386,000 | | | | 38,779 | | |
6/14/2012 | | U.S. Dollars | | | 118,595 | | | | Euro | | | 83,000 | | | | 7,853 | | |
7/16/2012 | | U.S. Dollars | | | 877,876 | | | | Euro | | | 627,000 | | | | 41,127 | | |
7/18/2012 | | U.S. Dollars | | | 604,032 | | | | Euro | | | 430,000 | | | | 30,178 | | |
7/19/2012 | | U.S. Dollars | | | 175,138 | | | | Euro | | | 125,000 | | | | 8,318 | | |
7/20/2012 | | U.S. Dollars | | | 306,699 | | | | Euro | | | 220,000 | | | | 13,095 | | |
7/23/2012 | | U.S. Dollars | | | 116,428 | | | | Euro | | | 83,000 | | | | 5,657 | | |
See notes to financial statements.
89
|
GuideMarkSM Opportunistic Fixed Income Fund |
SCHEDULE OF OPEN FORWARD CURRENCY CONTRACTS (Continued) |
March 31, 2012 |
| |
| | | | | | | | | | | | | | | | | | |
Forward
expiration date | | Currency to be received | | Amount of
Currency to
be received | | Currency to
be delivered | | Amount of
Currency to
be delivered | | Unrealized
Appreciation
(Depreciation) | |
| | | | | | | | | | | |
7/31/2012 | | U.S. Dollars | | | 985,289 | | | | Euro | | | 691,917 | | | $ | 61,814 | | |
8/1/2012 | | U.S. Dollars | | | 1,955,102 | | | | Euro | | | 1,379,553 | | | | 113,853 | | |
8/2/2012 | | U.S. Dollars | | | 762,370 | | | | Euro | | | 534,734 | | | | 48,671 | | |
8/3/2012 | | U.S. Dollars | | | 1,006,974 | | | | Euro | | | 715,023 | | | | 52,641 | | |
8/6/2012 | | U.S. Dollars | | | 788,388 | | | | Euro | | | 559,081 | | | | 42,174 | | |
8/20/2012 | | U.S. Dollars | | | 2,541,623 | | | | Euro | | | 1,770,000 | | | | 178,952 | | |
8/23/2012 | | U.S. Dollars | | | 167,068 | | | | Euro | | | 116,181 | | | | 11,982 | | |
8/24/2012 | | U.S. Dollars | | | 166,276 | | | | Euro | | | 115,904 | | | | 11,558 | | |
8/29/2012 | | U.S. Dollars | | | 166,685 | | | | Euro | | | 116,433 | | | | 11,256 | | |
9/24/2012 | | U.S. Dollars | | | 261,009 | | | | Euro | | | 191,000 | | | | 5,994 | | |
9/26/2012 | | U.S. Dollars | | | 120,407 | | | | Euro | | | 89,000 | | | | 1,577 | | |
10/31/2012 | | U.S. Dollars | | | 107,987 | | | | Euro | | | 76,597 | | | | 5,692 | | |
12/6/2012 | | U.S. Dollars | | | 1,107,749 | | | | Euro | | | 826,000 | | | | 4,344 | | |
1/7/2013 | | U.S. Dollars | | | 630,993 | | | | Euro | | | 485,308 | | | | (17,447 | ) | |
3/1/2013 | | U.S. Dollars | | | 226,815 | | | | Euro | | | 169,000 | | | | 923 | | |
3/7/2013 | | U.S. Dollars | | | 320,724 | | | | Euro | | | 241,782 | | | | (2,465 | ) | |
3/11/2013 | | U.S. Dollars | | | 511,944 | | | | Euro | | | 389,341 | | | | (8,500 | ) | |
3/15/2013 | | U.S. Dollars | | | 161,268 | | | | Euro | | | 122,880 | | | | (2,994 | ) | |
3/19/2013 | | U.S. Dollars | | | 107,144 | | | | Euro | | | 81,594 | | | | (1,932 | ) | |
3/21/2013 | | U.S. Dollars | | | 96,376 | | | | Euro | | | 72,605 | | | | (684 | ) | |
4/10/2012 | | U.S. Dollars | | | 8,250,000 | | | | Japanese Yen | | | 694,608,750 | | | | (142,766 | ) | |
4/13/2012 | | U.S. Dollars | | | 8,370,000 | | | | Japanese Yen | | | 706,185,270 | | | | (162,901 | ) | |
4/9/2012 | | U.S. Dollars | | | 1,165,927 | | | | Mexican Peso | | | 15,000,000 | | | | (5,347 | ) | |
4/20/2012 | | U.S. Dollars | | | 1,377,313 | | | | Mexican Peso | | | 17,500,000 | | | | 12,262 | | |
4/10/2012 | | U.S. Dollars | | | 591,007 | | | | Singapore Dollar | | | 715,000 | | | | 22,211 | | |
5/9/2012 | | U.S. Dollars | | | 255,796 | | | | Swiss Franc | | | 235,000 | | | | (4,663 | ) | |
| | | | | | | | | | | | | | | | | | |
| | | | | | | | | | | | | | | $ | 1,455,757 | | |
| | | | | | | | | | | | | | | | | | |
|
| |
GuideMarkSM Opportunistic Fixed Income Fund |
SCHEDULE OF OPEN FUTURES CONTRACTS |
March 31, 2012 |
| |
| | | | | | | | | | | | | | | | | |
Description | | | Number of
Contracts
Purchased (Sold) | | Notional
Value | | Settlement
Month | | Unrealized
Appreciation | |
| | | | | | | | | | | |
S&P 500 Index Mini Futures | | | (44 | ) | | $ | (3,087,040 | ) | Jun-12 | | | $ | (27,934 | ) | |
Long Gilt Futures | | | 8 | | | | 1,465,259 | | Jun-12 | | | | 879 | | |
| | | | | | | | | | | | | | | | |
| | | | | | | | | | | | | $ | (27,055 | ) | |
| | | | | | | | | | | | | | | | |
See notes to financial statements.
90
|
GuideMarkSM Opportunistic Fixed Income Fund |
SCHEDULE OF OPTIONS WRITTEN |
March 31, 2012 |
| |
| | | | | | | |
Notional
Amount | | | | Value | |
| | | | | | |
| | | OPTIONS ON CURRENCY
CONTRACTS | | | | |
| | | Call Option | | | | |
$ | 5,600,000 | | U.S. Dollar - Australian Dollar
Expiration: August, 2012,
Exercise Price: $0.85 | | $ | 19,628 | |
| | | | | | | |
Number of
Contracts | | | | | | |
| | | | | | | |
| | | OPTIONS ON EXCHANGE
TRADED FUNDS | | | | |
| | | Put Option | | | | |
| 1,600 | | Industrial Select Sector SPDR Fund
Expiration: September, 2012,
Exercise Price: $29.00 | | | 57,600 | |
| | | | | | | |
| | | Total Options Written (Premiums
Received $218,467) | | $ | 77,228 | |
| | | | | | | |
See notes to financial statements.
91
|
GuideMarkSM Opportunistic Fixed Income Fund |
CREDIT DEFAULT SWAPS ON CORPORATE, SOVEREIGN, AND U.S. MUNICIPAL ISSUES — BUY PROTECTION(1) |
March 31, 2012 |
| |
| | | | | | | | | | | | | | | | | | | | | | | | | | |
Reference
Obligation | | | Implied
Credit
Spread at
March 31,
2012(3) | | Fixed
Pay
Rate | | Maturity
Date | | Counterparty | | Notional
Amount(4) | | Fair
Value | | Upfront
Premiums
Paid
(Received) | | Unrealized
Appreciation/
(Depreciation) | |
| | | | | | | | | | | | | | | | | | | |
Aetna, Inc. | | 0.49% | | 1.000% | | 6/20/2017 | | Merrill Lynch | | $ | 1,200,000 | | $ | (31,428 | ) | | $ | (29,052 | ) | | | $ | (2,376 | ) | |
CDX EM 16 | | 2.37% | | 5.000% | | 12/20/2016 | | Morgan Stanley | | | 3,300,000 | | | (377,277 | ) | | | (289,098 | ) | | | | (88,179 | ) | |
CDX EM 16 | | 2.37% | | 5.000% | | 12/20/2016 | | Merrill Lynch / UBS | | | 2,200,000 | | | (251,518 | ) | | | (220,961 | ) | | | | (30,557 | ) | |
CDX HY 18 | | 5.69% | | 5.000% | | 6/20/2017 | | Merrill Lynch | | | 2,400,000 | | | 69,762 | | | | 65,896 | | | | | 3,866 | | |
CIGNA Corp. | | 0.73% | | 1.000% | | 6/20/2017 | | Merrill Lynch | | | 1,200,000 | | | (16,470 | ) | | | (14,376 | ) | | | | (2,094 | ) | |
Government of Spain | | 4.24% | | 1.000% | | 3/20/2017 | | UBS | | | 1,200,000 | | | 163,717 | | | | 140,083 | | | | | 23,634 | | |
Government of Spain | | 4.26% | | 1.000% | | 6/20/2017 | | Merrill Lynch | | | 1,200,000 | | | 171,314 | | | | 168,319 | | | | | 2,995 | | |
Government of Turkey | | 2.25% | | 1.000% | | 3/20/2017 | | Merrill Lynch | | | 1,200,000 | | | 69,356 | | | | 80,467 | | | | | (11,111 | ) | |
Government of Turkey | | 2.25% | | 1.000% | | 3/20/2017 | | Merrill Lynch | | | 1,200,000 | | | 69,356 | | | | 68,074 | | | | | 1,282 | | |
ITRX Eur Sub Fin S17 | | 3.60% | | 5.000% | | 6/20/2017 | | Merrill Lynch | | | 3,500,000 | | | (298,021 | ) | | | (357,487 | ) | | | | 59,466 | | |
J.C. Penney | | | | | | | | | | | | | | | | | | | | | | | | | |
Company, Inc. | | 3.57% | | 1.000% | | 3/20/2017 | | Deutsche Bank | | | 1,200,000 | | | 135,803 | | | | 123,248 | | | | | 12,555 | | |
J.C. Penney | | | | | | | | | | | | | | | | | | | | | | | | | |
Company, Inc. | | 3.57% | | 1.000% | | 3/20/2017 | | Merrill Lynch | | | 2,400,000 | | | 271,605 | | | | 249,809 | | | | | 21,796 | | |
Macy’s, Inc. | | 1.06% | | 1.000% | | 3/20/2017 | | Credit Suisse | | | 2,400,000 | | | 7,157 | | | | 11,279 | | | | | (4,122 | ) | |
Macy’s, Inc. | | 1.06% | | 1.000% | | 3/20/2017 | | Merrill Lynch | | | 2,400,000 | | | 7,157 | | | | (1,134 | ) | | | | 8,291 | | |
Marsh & McLennan | | | | | | | | | | | | | | | | | | | | | | | | | |
Companies, Inc. | | 0.48% | | 1.000% | | 3/20/2017 | | Morgan Stanley | | | 3,500,000 | | | (88,304 | ) | | | (84,515 | ) | | | | (3,789 | ) | |
MeadWestvaco Corp. | | 0.98% | | 1.000% | | 9/20/2016 | | Merrill Lynch | | | 1,200,000 | | | (894 | ) | | | 39,738 | | | | | (40,632 | ) | |
MeadWestvaco Corp. | | 1.11% | | 1.000% | | 6/20/2017 | | Merrill Lynch | | | 1,200,000 | | | 6,797 | | | | 5,906 | | | | | 891 | | |
MeadWestvaco Corp. | | 1.11% | | 1.000% | | 6/20/2017 | | Morgan Stanley | | | 1,200,000 | | | 6,797 | | | | 5,906 | | | | | 891 | | |
Safeway, Inc. | | 1.61% | | 1.000% | | 3/20/2017 | | Merrill Lynch | | | 500,000 | | | 14,370 | | | | 10,428 | | | | | 3,942 | | |
Safeway, Inc. | | 1.61% | | 1.000% | | 3/20/2017 | | Credit Suisse | | | 700,000 | | | 20,118 | | | | 14,281 | | | | | 5,837 | | |
Sprint Nextel Corp. | | 6.44% | | 5.000% | | 6/20/2015 | | Credit Suisse | | | 600,000 | | | 24,193 | | | | 23,777 | | | | | 416 | | |
Sprint Nextel Corp. | | 6.28% | | 5.000% | | 3/20/2015 | | Merrill Lynch | | | 600,000 | | | 20,148 | | | | 31,296 | | | | | (11,148 | ) | |
Textron, Inc. | | 0.28% | | 1.000% | | 3/20/2017 | | Merrill Lynch | | | 250,000 | | | (8,738 | ) | | | (7,642 | ) | | | | (1,096 | ) | |
Textron, Inc. | | 0.28% | | 1.000% | | 3/20/2017 | | Morgan Stanley | | | 500,000 | | | (17,476 | ) | | | (14,528 | ) | | | | (2,948 | ) | |
Textron, Inc. | | 0.28% | | 1.000% | | 3/20/2017 | | Morgan Stanley | | | 400,000 | | | (13,981 | ) | | | (11,641 | ) | | | | (2,340 | ) | |
Textron, Inc. | | 0.30% | | 1.000% | | 6/20/2017 | | Merrill Lynch | | | 300,000 | | | (10,818 | ) | | | (9,264 | ) | | | | (1,554 | ) | |
The New York Times | | | | | | | | | | | | | | | | | | | | | | | | | |
Company | | 2.88% | | 1.000% | | 6/20/2017 | | Morgan Stanley | | | 1,200,000 | | | 106,359 | | | | 103,932 | | | | | 2,427 | | |
| | | | | | | | | | | | | | | | | | | | | | | | | |
| | | | | | | | | | | | | $ | 49,084 | | | $ | 102,741 | | | | $ | (53,657 | ) | |
| | | | | | | | | | | | | | | | | | | | | | | | | |
See notes to financial statements.
92
|
GuideMarkSM Opportunistic Fixed Income Fund |
CREDIT DEFAULT SWAPS ON CORPORATE, SOVEREIGN, AND U.S. MUNICIPAL ISSUES — SELL PROTECTION(2) |
March 31, 2012 |
| |
| | | | | | | | | | | | | | | | | | | | | | | | | | |
Reference
Obligation | | | Implied
Credit
Spread at
March 31,
2012(3) | | Fixed
Receive
Rate | | Maturity
Date | | Counterparty | | Notional
Amount(4) | | Fair
Value | | Upfront
Premiums
Received | | Unrealized
Appreciation | |
| | | | | | | | | | | | | | | | | | | |
MGM Resorts | | | | | | | | | | | | | | | | | | | | | | | | | |
International | | 6.23% | | 5.000% | | 3/20/2017 | | Merrill Lynch | | $250,000 | | $ | (12,560 | ) | | $ | (15,874 | ) | | | $ | 3,314 | | |
| | | | | | | | | | | | | | | | | | | | | | | | | |
| | | | | | | | | | | | | $ | (12,560 | ) | | $ | (15,874 | ) | | | $ | 3,314 | | |
| | | | | | | | | | | | | | | | | | | | | | | | | |
| |
1) | If the Fund is a buyer of protection and a credit event occurs, as defined under the terms of that particular swap agreement, the Fund will either (i) receive from the seller of protection an amount equal to the notional amount of the swap and take delivery of the referenced obligation or underlying securities comprising the referenced index or (ii) receive a net settlement amount in the form of cash or securities equal to the notional amount of the swap less the recovery value of the referenced obligation or underlying securities comprising the referenced index |
|
2) | If the Fund is a seller of protection and a credit event occurs, as defined under the terms of that particular swap agreement, the Fund will either (i) pay to the buyer of protection an amount equal to the notional amount of the swap and take delivery of the referenced obligation or underlying securities comprising the referenced index or (ii) pay a net settlement amount in the form of cash or securities equal to the notional amount of the swap less the recovery value of the referenced obligation or underlying securities comprising the referenced index. |
|
3) | Implied credit spreads, represented in absolute terms, utilized in determining the market value of credit default swap agreements on U.S. municipal issues, corporate issues or sovereign issues of an emerging country as of period end serve as an indicator of the current status of the payment/performance risk and represent the likelihood or risk of default for the credit derivative. The implied credit spread of a particular referenced entity reflects the cost of buying/selling protection and may include upfront payments required to be made to enter into the agreement. Wider credit spreads represent a deterioration of the referenced entity’s credit soundness and a greater likelihood or risk of default or other credit event occurring as defined under the terms of the agreement. A credit spread identified as “Defaulted” indicates a credit event has occurred for the referenced entity or obligation. |
|
4) | The maximum potential amount the Fund could be required to pay as seller of credit protection or receive as a buyer of credit protection if a credit event occurs as defined under the terms of that particular swap agreement. |
See notes to financial statements.
93
|
GuidePathSM Strategic Asset Allocation Fund |
SCHEDULE OF INVESTMENTS |
March 31, 2012 |
| |
| | | | | | | |
Number of
Shares | | | | Value | |
| | | | | | |
| | | INVESTMENT COMPANIES - 97.53% | | | | |
| | | Affiliated Mutual Funds - 54.52% | | | | |
| 737,497 | | GuideMarkSM Global Real Return | | | | |
| | | Fund - Institutional Shares (a) | | $ | 6,895,598 | |
| 1,051,936 | | GuideMarkSM Large Cap Growth | | | | |
| | | Fund - Institutional Shares (a)(c) | | | 11,234,673 | |
| 1,390,577 | | GuideMarkSM Large Cap Value | | | | |
| | | Fund - Institutional Shares (a) | | | 11,666,944 | |
| 1,166,427 | | GuideMarkSM Opportunistic Equity | | | | |
| | | Fund - Institutional Shares (a)(c) | | | 11,559,292 | |
| 1,163,922 | | GuideMarkSM Small/Mid Cap Core | | | | |
| | | Fund - Institutional Shares (a)(c) | | | 13,454,938 | |
| 3,198,044 | | GuideMarkSM World ex-US | | | | |
| | | Fund - Institutional Shares (a) | | | 24,049,293 | |
| | | | | | | |
| | | | | | 78,860,738 | |
| | | | | | | |
| | | Exchange Traded Funds - 43.01% | | | | |
| 108,475 | | iShares MSCI Canada Index Fund | | | 3,074,182 | |
| 63,131 | | iShares MSCI Switzerland Index | | | | |
| | | Fund (b) | | | 1,580,169 | |
| 157,541 | | SPDR S&P 500 ETF Trust | | | 22,169,170 | |
| 39,902 | | SPDR S&P China ETF (b) | | | 2,728,100 | |
| 532,920 | | Vanguard FTSE All-World ex-US | | | | |
| | | Index Fund (b) | | | 23,555,064 | |
| 17,627 | | Vanguard Global ex-US Real Estate | | | | |
| | | ETF | | | 828,645 | |
| 61,035 | | Vanguard MSCI Emerging Markets | | | | |
| | | ETF | | | 2,653,191 | |
| 29,671 | | Vanguard REIT ETF (b) | | | 1,887,372 | |
| 42,919 | | Vanguard Small-Cap Growth | | | | |
| | | ETF (b) | | | 3,732,236 | |
| | | | | | | |
| | | | | | 62,208,129 | |
| | | | | | | |
| | | Total Investment Companies | | | | |
| | | (Cost $131,640,394) | | | 141,068,867 | |
| | | | | | | |
| | | | | | | |
Number of
Shares | | | | Value | |
| | | | | | |
| | | SHORT TERM INVESTMENTS - 3.02% | | | | |
| | | Money Market Funds - 3.02% | | | | |
| 4,366,931 | | Federated Prime Obligations Fund | | | | |
| | | Effective Yield, 0.20% | | $ | 4,366,931 | |
| | | | | | | |
| | | Total Short Term Investments | | | | |
| | | (Cost $4,366,931) | | | 4,366,931 | |
| | | | | | | |
| | | INVESTMENTS PURCHASED | | | | |
| | | AS SECURITIES LENDING | | | | |
| | | COLLATERAL - 0.71% | | | | |
| | | Money Market Funds - 0.71% | | | | |
| 1,034,110 | | First American Government | | | | |
| | | Obligations Fund | | | | |
| | | Effective Yield, 0.02% | | | 1,034,110 | |
| | | | | | | |
| | | Total Investments Purchased as | | | | |
| | | Securities Lending Collateral | | | | |
| | | (Cost $1,034,110) | | | 1,034,110 | |
| | | | | | | |
| | | Total Investments | | | | |
| | | (Cost $137,041,435) - 101.26% | | | 146,469,908 | |
| | | Liabilities in Excess of Other | | | | |
| | | Assets - (1.26)% | | | (1,820,674 | ) |
| | | | | | | |
| | | TOTAL NET ASSETS - 100.00% | | $ | 144,649,234 | |
| | | | | | | |
| |
Percentages are stated as a percent of net assets. |
(a) | Affiliated to the Fund. |
(b) | All or portion of this security is on loan. |
(c) | Non-income producing security. |
See notes to financial statements.
94
|
GuidePathSM Tactical Constrained Asset Allocation Fund |
SCHEDULE OF INVESTMENTS |
March 31, 2012 |
| |
| | | | | | | |
Number of
Shares | | | | Value | |
| | | | | | |
| | | INVESTMENT COMPANIES - 97.51% | | | | |
| | | Affiliated Mutual Funds - 55.53% | | | | |
| 1,022,482 | | GuideMarkSM Core Fixed Income | | | | |
| | | Fund - Institutional Shares (a) | | $ | 9,989,652 | |
| 376,929 | | GuideMarkSM Global Real Return | | | | |
| | | Fund - Institutional Shares (a) | | | 3,524,285 | |
| 1,099,038 | | GuideMarkSM Large Cap Growth | | | | |
| | | Fund - Institutional Shares (a)(c) | | | 11,737,728 | |
| 1,392,997 | | GuideMarkSM Large Cap Value | | | | |
| | | Fund - Institutional Shares (a) | | | 11,687,242 | |
| 1,609,588 | | GuideMarkSM Opportunistic Equity | | | | |
| | | Fund - Institutional Shares (a)(c) | | | 15,951,018 | |
| 969,804 | | GuideMarkSM Opportunistic Fixed | | | | |
| | | Income Fund - Institutional | | | | |
| | | Shares (a) | | | 9,416,796 | |
| 526,620 | | GuideMarkSM Small/Mid Cap Core | | | | |
| | | Fund - Institutional Shares (a)(c) | | | 6,087,730 | |
| 1,474,779 | | GuideMarkSM World ex-US | | | | |
| | | Fund - Institutional Shares (a) | | | 11,090,338 | |
| | | | | | | |
| | | | | | 79,484,789 | |
| | | | | | | |
| | | Exchange Traded Funds - 38.49% | | | | |
| 16,824 | | Energy Select Sector SPDR | | | | |
| | | Fund (b) | | | 1,206,786 | |
| 43,356 | | Industrial Select Sector SPDR | | | | |
| | | Fund (b) | | | 1,622,381 | |
| 138,815 | | iShares MSCI Italy Index Fund (b) | | | 1,815,700 | |
| 44,346 | | iShares MSCI Sweden Index Fund | | | 1,286,477 | |
| 37,046 | | PowerShares Asia Pacific ex-Japan | | | | |
| | | ETF | | | 1,923,428 | |
| 18,454 | | PowerShares DB Gold Fund | | | | |
| | | ETF (b)(c) | | | 1,066,272 | |
| 80,594 | | SPDR Barclays Capital High Yield | | | | |
| | | Bond ETF | | | 3,172,986 | |
| 165,130 | | SPDR S&P 500 ETF Trust | | | 23,237,094 | |
| 37,419 | | SPDR S&P Dividend ETF | | | 2,119,412 | |
| 7,517 | | SPDR S&P Emerging Markets | | | | |
| | | Small Cap ETF (b) | | | 345,256 | |
| 8,140 | | Technology Select Sector SPDR | | | | |
| �� | | Fund | | | 245,421 | |
| 249,097 | | Vanguard FTSE All-World ex-US | | | | |
| | | Index Fund (b) | | | 11,010,087 | |
| 14,774 | | Vanguard Global ex-US Real Estate | | | | |
| | | ETF (b) | | | 694,526 | |
| | | | | | | |
Number of
Shares | | | | Value | |
| | | | | | |
| | | Exchange Traded Funds (Continued) | | | | |
| 98,302 | | Vanguard MSCI Emerging Markets | | | | |
| | | ETF | | $ | 4,273,188 | |
| 16,970 | | Vanguard REIT ETF (b) | | | 1,079,462 | |
| | | | | | | |
| | | | | | 55,098,476 | |
| | | | | | | |
| | | Mutual Funds - 3.49% | | | | |
| 160,891 | | AQR Diversified Arbitrage | | | | |
| | | Fund - Institutional Shares | | | 1,784,286 | |
| 96,109 | | DoubleLine Total Return Bond | | | | |
| | | Fund - Institutional Shares | | | 1,073,543 | |
| 198,737 | | PIMCO Emerging Local Bond | | | | |
| | | Fund - Institutional Shares | | | 2,136,424 | |
| | | | | | | |
| | | | | | 4,994,253 | |
| | | | | | | |
| | | Total Investment Companies | | | | |
| | | (Cost $130,652,312) | | | 139,577,518 | |
| | | | | | | |
| | | SHORT TERM INVESTMENTS - 3.00% | | | | |
| | | Money Market Funds - 3.00% | | | | |
| 4,292,969 | | Federated Prime Obligations Fund | | | | |
| | | Effective Yield, 0.20% | | | 4,292,969 | |
| | | | | | | |
| | | Total Short Term Investments | | | | |
| | | (Cost $4,292,969) | | | 4,292,969 | |
| | | | | | | |
| | | INVESTMENTS PURCHASED | | | | |
| | | AS SECURITIES LENDING | | | | |
| | | COLLATERAL - 6.06% | | | | |
| | | Money Market Funds - 6.06% | | | | |
| 8,681,219 | | First American Government | | | | |
| | | Obligations Fund | | | | |
| | | Effective Yield, 0.02% | | | 8,681,219 | |
| | | | | | | |
| | | Total Investments Purchased as | | | | |
| | | Securities Lending Collateral | | | | |
| | | (Cost $8,681,219) | | | 8,681,219 | |
| | | | | | | |
| | | Total Investments | | | | |
| | | (Cost $143,626,500) - 106.57% | | | 152,551,706 | |
| | | Liabilities in Excess of Other | | | | |
| | | Assets - (6.57)% | | | (9,406,592 | ) |
| | | | | | | |
| | | TOTAL NET ASSETS - 100.00% | | $ | 143,145,114 | |
| | | | | | | |
| |
| Percentages are stated as a percent of net assets. |
(a) | Affiliated to the Fund. |
(b) | All or portion of this security is on loan. |
(c) | Non-income producing security. |
See notes to financial statements.
95
|
GuidePathSM Tactical Unconstrained Asset Allocation Fund |
SCHEDULE OF INVESTMENTS |
March 31, 2012 |
| |
| | | | | | | |
Number of
Shares | | | | Value | |
| | | | | | |
| | | INVESTMENT COMPANIES - 97.29% | | | | |
| | | Affiliated Mutual Funds - 38.23% | | | | |
| 125,077 | | GuideMarkSM Core Fixed Income | | | | |
| | | Fund - Institutional Shares (a) | | $ | 1,222,000 | |
| 783,132 | | GuideMarkSM Large Cap Growth | | | | |
| | | Fund - Institutional Shares (a)(c) | | | 8,363,853 | |
| 1,948,193 | | GuideMarkSM Large Cap Value | | | | |
| | | Fund - Institutional Shares (a) | | | 16,345,342 | |
| 1,891,291 | | GuideMarkSM Opportunistic Equity | | | | |
| | | Fund - Institutional Shares (a)(c) | | | 18,742,694 | |
| 1,020,341 | | GuideMarkSM Opportunistic Fixed | | | | |
| | | Income Fund - Institutional | | | | |
| | | Shares (a) | | | 9,907,513 | |
| 913,404 | | GuideMarkSM Small/Mid Cap Core | | | | |
| | | Fund - Institutional Shares (a)(c) | | | 10,558,946 | |
| 727,856 | | GuideMarkSM World ex-US | | | | |
| | | Fund - Institutional Shares (a) | | | 5,473,479 | |
| | | | | | | |
| | | | | | 70,613,827 | |
| | | | | | | |
| | | Exchange Traded Funds - 34.34% | | | | |
| 18,349 | | iShares Barclays MBS Bond | | | | |
| | | Fund | | | 1,980,774 | |
| 129,891 | | PowerShares QQQ Trust, Series 1 | | | 8,774,137 | |
| 206,610 | | SPDR Barclays Capital High Yield | | | | |
| | | Bond ETF (b) | | | 8,134,236 | |
| 42,141 | | SPDR Barclays Capital Short Term | | | | |
| | | International Treasury Bond ETF (b) | | | 1,541,518 | |
| 37,642 | | SPDR S&P Emerging Asia Pacific | | | | |
| | | ETF (b) | | | 2,791,154 | |
| 238,221 | | SPDR S&P 500 ETF Trust | | | 33,522,459 | |
| 125,646 | | Vanguard High Dividend Yield | | | | |
| | | ETF (b) | | | 6,090,062 | |
| 13,789 | | Vanguard MSCI Emerging Markets | | | | |
| | | ETF | | | 599,408 | |
| | | | | | | |
| | | | | | 63,433,748 | |
| | | | | | | |
| | | Mutual Funds - 24.72% | | | | |
| 630,335 | | Eaton Vance Floating-Rate | | | | |
| | | Fund - Institutional Shares | | | 5,673,010 | |
| 248,730 | | Eaton Vance Global Macro Absolute | | | | |
| | | Return Advantage Fund - Institutional | | | | |
| | | Shares | | | 2,492,274 | |
| 1,050,745 | | Eaton Vance Global Macro Absolute | | | | |
| | | Return Fund - Institutional Shares | | | 10,465,420 | |
| 49,249 | | Eaton Vance Government Obligations | | | | |
| | | Fund - Institutional Shares | | | 364,934 | |
| | | | | | | |
Number of
Shares | | | | Value | |
| | | | | | |
| | | Mutual Funds (Continued) | | | | |
| 622,809 | | Eaton Vance Income Fund of Boston - | | | | |
| | | Institutional Shares | | $ | 3,618,523 | |
| 204,567 | | Eaton Vance Multi-Strategy Absolute | | | | |
| | | Return Fund - Institutional Shares | | | 1,861,562 | |
| 55,773 | | Eaton Vance Parametric Option | | | | |
| | | Absolute Return Strategy Fund - | | | | |
| | | Institutional Shares (c) | | | 581,717 | |
| 64,144 | | Eaton Vance Worldwide Health | | | | |
| | | Sciences Fund - Institutional Shares | | | 631,174 | |
| 194,499 | | Pioneer Strategic Income Fund - | | | | |
| | | Class Y | | | 2,125,873 | |
| 1,841,076 | | Stadion Managed Portfolio Trust - | | | | |
| | | Institutional Shares | | | 17,840,022 | |
| | | | | | | |
| | | | | | 45,654,509 | |
| | | | | | | |
| | | Total Investment Companies | | | | |
| | | (Cost $168,692,448) | | | 179,702,084 | |
| | | | | | | |
| | | SHORT TERM INVESTMENTS - 2.74% | | | | |
| | | Money Market Funds - 2.74% | | | | |
| 5,061,066 | | Federated Prime Obligations Fund | | | | |
| | | Effective Yield, 0.20% | | | 5,061,066 | |
| | | | | | | |
| | | Total Short Term Investments | | | | |
| | | (Cost $5,061,066) | | | 5,061,066 | |
| | | | | | | |
| | | INVESTMENTS PURCHASED | | | | |
| | | AS SECURITIES LENDING | | | | |
| | | COLLATERAL -1.82% | | | | |
| | | Money Market Funds - 1.82% | | | | |
| 3,357,200 | | First American Government | | | | |
| | | Obligations Fund | | | | |
| | | Effective Yield, 0.02% | | | 3,357,200 | |
| | | | | | | |
| | | Total Investments Purchased as | | | | |
| | | Securities Lending Collateral | | | | |
| | | (Cost $3,357,200) | | | 3,357,200 | |
| | | | | | | |
| | | Total Investments | | | | |
| | | (Cost $177,110,714) - 101.85% | | | 188,120,350 | |
| | | Liabilities in Excess of Other | | | | |
| | | Assets - (1.85)% | | | (3,416,912 | ) |
| | | | | | | |
| | | TOTAL NET ASSETS - 100.00% | | $ | 184,703,438 | |
| | | | | | | |
| |
| Percentages are stated as a percent of net assets. |
(a) | Affiliated to the Fund. |
(b) | All or portion of this security is on loan. |
(c) | Non-income producing security. |
See notes to financial statements.
96
|
GuidePathSM Absolute Return Asset Allocation Fund |
SCHEDULE OF INVESTMENTS |
March 31, 2012 |
| |
| | | | | | | |
Number of
Shares | | | | Value | |
| | | | | | |
| | | INVESTMENT COMPANIES - 97.63% | | | | |
| | | Affiliated Mutual Funds - 16.72% | | | | |
| 2,128,638 | | GuideMarkSM Core Fixed Income | | | | |
| | | Fund - Institutional Shares (a) | | $ | 20,796,789 | |
| 1,967,092 | | GuideMarkSM Opportunistic Fixed | | | | |
| | | Income Fund - Institutional | | | | |
| | | Shares (a) | | | 19,100,466 | |
| | | | | | | |
| | | | | | 39,897,255 | |
| | | | | | | |
| | | Exchange Traded Funds - 35.81% | | | | |
| 28,224 | | iShares Barclays Agency Bond Fund | | | 3,178,869 | |
| 222,770 | | iShares Barclays Credit Bond | | | | |
| | | Fund (b) | | | 24,442,325 | |
| 154,970 | | iShares Barclays MBS Bond | | | | |
| | | Fund | | | 16,729,012 | |
| 174,808 | | iShares Floating Rate Note | | | | |
| | | Fund (b) | | | 8,756,133 | |
| 77,417 | | iShares MSCI ACWI Index | | | | |
| | | Fund (b) | | | 3,654,082 | |
| 68,723 | | PowerShares DB Gold Fund | | | | |
| | | ETF (c) | | | 3,970,815 | |
| 73,104 | | SPDR Barclays Capital 1-3 Month | | | | |
| | | T-Bill ETF | | | 3,349,625 | |
| 28,633 | | SPDR Barclays Capital Convertible | | | | |
| | | Securities ETF | | | 1,141,311 | |
| 47,984 | | Vanguard Short-Term Bond Index | | | | |
| | | Fund | | | 3,884,305 | |
| 301,524 | | Vanguard Total Bond Market Index | | | | |
| | | Fund (b) | | | 25,110,918 | |
| | | | | | | |
| | | | | | 94,217,395 | |
| | | | | | | |
| | | Exchange Traded Notes - 6.89% | | | | |
| 227,183 | | iPath U.S. Treasury 10-year Bear | | | | |
| | | ETN (c)(d) | | | 7,674,242 | |
| | | | | | | |
| | | Mutual Funds - 38.21% | | | | |
| 503,569 | | Aberdeen Equity Long Short Fund - | | | | |
| | | Institutional Shares | | | 5,906,865 | |
| 354,070 | | Eaton Vance Floating-Rate Fund - | | | | |
| | | Institutional Shares | | | 3,186,630 | |
| 943,846 | | Eaton Vance Global Macro Absolute | | | | |
| | | Return Fund - Institutional Shares | | | 9,400,711 | |
| 1,593,786 | | Eaton Vance Multi-Strategy Absolute | | | | |
| | | Return Fund - Institutional Shares | | | 14,503,451 | |
| 95,065 | | Eaton Vance Parametric Option | | | | |
| | | Absolute Return Strategy Fund - | | | | |
| | | Institutional Shares (c) | | | 991,525 | |
| 117,597 | | Gateway Fund - Class Y | | | 3,179,811 | |
| | | | | | | |
Number of
Shares | | | | Value | |
| | | | | | |
| | | Mutual Funds (Continued) | | | | |
| 630,803 | | Highbridge Statistical Market | | | | |
| | | Neutral Fund - Select Shares (c) | | $ | 9,525,132 | |
| 724,564 | | JPMorgan Floating Rate Note | | | 7,115,222 | |
| 838,310 | | JPMorgan Income Builder Fund - | | | | |
| | | Select Shares | | | 7,880,118 | |
| 80,208 | | JPMorgan Long/Short Fund - Select | | | | |
| | | Shares (c) | | | 1,226,380 | |
| 512,638 | | JPMorgan Strategic Income | | | | |
| | | Opportunities Fund - Select Shares | | | 5,920,969 | |
| 72,373 | | JPMorgan Strategic Preservation | | | | |
| | | Fund - Select Shares | | | 1,026,971 | |
| 1,951,987 | | Pioneer Strategic Income Fund - | | | | |
| | | Class Y | | | 21,335,215 | |
| | | | | | | |
| | | | | | 91,199,000 | |
| | | | | | | |
| | | Total Investment Companies | | | | |
| | | (Cost $230,427,109) | | | 232,987,892 | |
| | | | | | | |
| | | SHORT TERM INVESTMENTS - 2.24% | | | | |
| | | Money Market Funds - 2.24% | | | | |
| 5,340,847 | | Federated Prime Obligations Fund | | | | |
| | | Effective Yield, 0.20% | | | 5,340,847 | |
| | | | | | | |
| | | Total Short Term Investments | | | | |
| | | (Cost $5,340,847) | | | 5,340,847 | |
| | | | | | | |
| | | INVESTMENTS PURCHASED | | | | |
| | | AS SECURITIES LENDING | | | | |
| | | COLLATERAL - 8.98% | | | | |
| | | Money Market Funds - 8.98% | | | | |
| 21,436,500 | | First American Government | | | | |
| | | Obligations Fund | | | | |
| | | Effective Yield, 0.02% | | | 21,436,500 | |
| | | | | | | |
| | | Total Investments Purchased as | | | | |
| | | Securities Lending Collateral | | | | |
| | | (Cost $21,436,500) | | | 21,436,500 | |
| | | | | | | |
| | | Total Investments | | | | |
| | | (Cost $257,204,456) - 108.85% | | | 259,765,239 | |
| | | Liabilities in Excess of Other | | | | |
| | | Assets - (8.85)% | | | (21,110,542 | ) |
| | | | | | | |
| | | TOTAL NET ASSETS - 100.00% | | $ | 238,654,697 | |
| | | | | | | |
| |
| Percentages are stated as a percent of net assets. |
(a) | Affiliated to the Fund. |
(b) | All or portion of this security is on loan. |
(c) | Non-income producing security. |
(d) | The value of an exchange-traded note can be impacted by the credit quality of the issuer. The issuer for this exchange-traded note is Barclay’s Capital PLC. |
See notes to financial statements.
97
|
GuideMarkSM Funds & GuidePathSM Funds |
STATEMENTS OF ASSETS & LIABILITIES |
March 31, 2012 |
| |
| | | | | | | | | | |
| | Large Cap
Growth Fund | | Large Cap
Value Fund | | Small/Mid Cap
Core Fund | |
| | | | | | | |
ASSETS: | | | | | | | | | | |
Investments, at value (cost $156,656,951, $186,777,812 and $74,252,480, respectively)1 | | $ | 203,250,764 | | $ | 211,871,655 | | $ | 82,393,989 | |
Cash | | | — | | | 36,768 | | | 4,143 | |
Income receivable | | | 142,921 | | | 361,659 | | | 63,090 | |
Receivable for dividend reclaims | | | — | | | 5,537 | | | — | |
Receivable for investment securities sold | | | 895,287 | | | — | | | 2,170,694 | |
Receivable for fund shares sold | | | 228,313 | | | 269,547 | | | 176,974 | |
Receivable from securities lending agent (See Note 6) | | | — | | | 5,426 | | | 8,272 | |
Other assets | | | 27,600 | | | 19,920 | | | 25,273 | |
| | | | | | | | | | |
Total Assets | | | 204,544,885 | | | 212,570,512 | | | 84,842,435 | |
| | | | | | | | | | |
LIABILITIES: | | | | | | | | | | |
Payable for collateral on securities loaned | | | 3,059,606 | | | 8,771,622 | | | 4,451,022 | |
Payable to securities lending agent (See Note 6) | | | 10,432 | | | — | | | — | |
Payable for investment securities purchased | | | 994,710 | | | 511,982 | | | 2,149,815 | |
Payable for fund shares redeemed | | | 167,712 | | | 154,040 | | | 48,518 | |
Payable to Investment Advisor | | | 113,042 | | | 121,246 | | | 43,711 | |
Other accrued expenses | | | 214,715 | | | 212,844 | | | 98,612 | |
| | | | | | | | | | |
Total Liabilities | | | 4,560,217 | | | 9,771,734 | | | 6,791,678 | |
| | | | | | | | | | |
NET ASSETS | | $ | 199,984,668 | | $ | 202,798,778 | | $ | 78,050,757 | |
| | | | | | | | | | |
NET ASSETS CONSIST OF: | | | | | | | | | | |
Capital stock | | | 228,223,158 | | | 351,136,861 | | | 99,778,920 | |
Unrealized appreciation on investments | | | 46,593,813 | | | 25,093,843 | | | 8,141,509 | |
Accumulated undistributed net investment income (loss) | | | (71,022 | ) | | 561,303 | | | (34,662 | ) |
Accumulated undistributed net realized loss | | | (74,761,281 | ) | | (173,993,229 | ) | | (29,835,010 | ) |
| | | | | | | | | | |
Total Net Assets | | $ | 199,984,668 | | $ | 202,798,778 | | $ | 78,050,757 | |
| | | | | | | | | | |
| | | | | | | | | | |
Institutional Shares | | | | | | | | | | |
Shares outstanding (unlimited shares of no par value authorized) | | | 2,934,107 | | | 4,731,767 | | | 2,603,946 | |
Net assets | | | 31,330,264 | | | 39,721,680 | | | 30,106,471 | |
Net asset value, offering and redemption price per share | | $ | 10.68 | | $ | 8.39 | | $ | 11.56 | |
| | | | | | | | | | |
| | | | | | | | | | |
Service Shares | | | | | | | | | | |
Shares outstanding (unlimited shares of no par value authorized) | | | 15,888,773 | | | 19,254,562 | | | 4,168,354 | |
Net assets | | | 168,654,404 | | | 163,077,098 | | | 47,944,286 | |
Net asset value, offering and redemption price per share | | $ | 10.61 | | $ | 8.47 | | $ | 11.50 | |
| | | | | | | | | | |
1Includes loaned securities with a market value of: | | $ | 3,005,043 | | $ | 8,551,597 | | $ | 4,289,762 | |
| | | | | | | | | | |
See notes to financial statements.
98
|
GuideMarkSM Funds & GuidePathSM Funds |
STATEMENTS OF ASSETS & LIABILITIES (Continued) |
March 31, 2012 |
| |
| | | | | | | | | | |
| | World
ex-US Fund | | Opportunistic
Equity Fund | | Global
Real
Return Fund | |
| | | | | | | |
ASSETS: | | | | | | | | | | |
Investments, at value (cost $221,632,319, $152,641,424 and $142,371,856, respectively)1 | | $ | 224,759,210 | | $ | 163,289,380 | | $ | 137,352,458 | |
Foreign currencies (cost $1,842,039, $0, and $0, respectively) | | | 1,838,816 | | | — | | | — | |
Cash | | | 83,850 | | | 19,248 | | | 3,152 | |
Income receivable | | | 745,475 | | | 133,229 | | | 62 | |
Receivable for dividend reclaims | | | 284,616 | | | — | | | — | |
Receivable for investment securities and foreign currencies sold | | | 2,248,182 | | | — | | | — | |
Receivable for fund shares sold | | | 329,475 | | | 306,902 | | | 93,778 | |
Other assets | | | 30,528 | | | 30,551 | | | 41,108 | |
| | | | | | | | | | |
Total Assets | | | 230,320,152 | | | 163,779,310 | | | 137,490,558 | |
| | | | | | | | | | |
LIABILITIES: | | | | | | | | | | |
Payable for collateral on securities loaned | | | 589,055 | | | 2,467,655 | | | 23,182,671 | |
Payable to securities lending agent (See Note 6) | | | 5,588 | | | — | | | — | |
Payable for investment securities purchased | | | 3,163,896 | | | 477,501 | | | — | |
Payable for fund shares redeemed | | | 174,747 | | | 137,670 | | | 94,858 | |
Payable to Investment Advisor | | | 157,391 | | | 108,215 | | | 63,358 | |
Other accrued expenses | | | 306,237 | | | 132,870 | | | 146,334 | |
| | | | | | | | | | |
Total Liabilities | | | 4,396,914 | | | 3,323,911 | | | 23,487,221 | |
| | | | | | | | | | |
NET ASSETS | | $ | 225,923,238 | | $ | 160,455,399 | | $ | 114,003,337 | |
| | | | | | | | | | |
NET ASSETS CONSIST OF: | | | | | | | | | | |
Capital stock | | | 436,991,147 | | | 162,334,433 | | | 123,241,162 | |
Unrealized appreciation (depreciation) on: | | | | | | | | | | |
Investments | | | 3,096,018 | | | 10,647,956 | | | (5,019,398 | ) |
Foreign currencies | | | (3,223 | ) | | — | | | — | |
Accumulated undistributed net investment income (loss) | | | 2,015,901 | | | — | | | (52,927 | ) |
Accumulated undistributed net realized loss | | | (216,176,605 | ) | | (12,526,990 | ) | | (4,165,500 | ) |
| | | | | | | | | | |
Total Net Assets | | $ | 225,923,238 | | $ | 160,455,399 | | $ | 114,003,337 | |
| | | | | | | | | | |
Institutional Shares | | | | | | | | | | |
Shares outstanding (unlimited shares of no par value authorized) | | | 5,400,679 | | | 4,667,306 | | | 1,114,426 | |
Net assets | | | 40,623,156 | | | 46,233,165 | | | 10,423,221 | |
Net asset value, offering and redemption price per share | | $ | 7.52 | | $ | 9.91 | | $ | 9.35 | |
| | | | | | | | | | |
Service Shares | | | | | | | | | | |
Shares outstanding (unlimited shares of no par value authorized) | | | 24,574,054 | | | 11,588,326 | | | 11,019,719 | |
Net assets | | | 185,300,082 | | | 114,222,234 | | | 103,580,116 | |
Net asset value, offering and redemption price per share | | $ | 7.54 | | $ | 9.86 | | $ | 9.40 | |
| | | | | | | | | | |
1Includes loaned securities with a market value of: | | $ | 569,682 | | $ | 2,310,337 | | $ | 22,526,169 | |
| | | | | | | | | | |
See notes to financial statements.
99
|
GuideMarkSM Funds & GuidePathSM Funds |
STATEMENTS OF ASSETS & LIABILITIES (Continued) |
March 31, 2012 |
| |
| | | | | | | | | | |
| | Core
Fixed Income
Fund | | Tax-Exempt
Fixed Income
Fund | | Opportunistic
Fixed Income
Fund | |
| | | | | | | |
ASSETS: | | | | | | | | | | |
Investments, at value (cost $463,391,590, $74,885,071 and
$238,555,275, respectively)1 | | $ | 471,040,608 | | $ | 81,368,143 | | $ | 234,849,218 | |
Repurchase Agreements (cost $6,900,000, $0 and $0, respectively) | | | 6,900,000 | | | — | | | — | |
Appreciation of swap agreements | | | — | | | — | | | 151,603 | |
Foreign currencies (cost $0, $0, and $383,262, respectively) | | | — | | | — | | | 381,520 | |
Cash | | | — | | | — | | | 249,342 | |
Income receivable | | | 2,597,489 | | | 1,060,003 | | | 2,607,068 | |
Receivable for dividend reclaims | | | — | | | — | | | 1,224 | |
Receivable for investment securities and foreign currencies sold | | | 24,986,234 | | | — | | | 8,647,569 | |
Receivable for fund shares sold | | | 868,937 | | | 49,755 | | | 463,017 | |
Swap premiums paid | | | — | | | — | | | 1,142,439 | |
Appreciation of forward foreign currency contracts | | | — | | | — | | | 2,824,939 | |
Receivable from securities lending agent (See Note 6) | | | 2,322 | | | — | | | — | |
Other assets | | | 93,900 | | | 48,392 | | | 40,063 | |
| | | | | | | | | | |
Total Assets | | | 506,489,490 | | | 82,526,293 | | | 251,358,002 | |
| | | | | | | | | | |
LIABILITIES: | | | | | | | | | | |
Options written at value (Premium received $0, $0 and
$218,467, respectively) | | | — | | | — | | | 77,228 | |
Forward sale commitments (cost $1,077,188, $0 and $0, respectively) | | | 1,080,313 | | | — | | | — | |
Depreciation of forward foreign currency contracts | | | — | | | — | | | 1,369,182 | |
Depreciation on swap agreements | | | — | | | — | | | 201,946 | |
Payable for collateral on securities loaned | | | 2,202,385 | | | — | | | — | |
Payable for investment securities and foreign currencies purchased | | | 34,799,463 | | | 809,379 | | | 5,282,864 | |
Payable for fund shares redeemed | | | 381,641 | | | 136,115 | | | 191,954 | |
Payable for deposits with brokers for forwards, options and swaps | | | — | | | — | | | 234,502 | |
Payable to Investment Advisor | | | 197,442 | | | 38,049 | | | 131,126 | |
Swap premiums received | | | — | | | — | | | 1,055,572 | |
Variation margin on futures contracts | | | 47,290 | | | — | | | 9,817 | |
Other accrued expenses | | | 499,855 | | | 133,860 | | | 296,034 | |
| | | | | | | | | | |
Total Liabilities | | | 39,208,389 | | | 1,117,403 | | | 8,850,225 | |
| | | | | | | | | | |
NET ASSETS | | $ | 467,281,101 | | $ | 81,408,890 | | $ | 242,507,777 | |
| | | | | | | | | | |
NET ASSETS CONSIST OF: | | | | | | | | | | |
Capital stock | | | 461,378,075 | | | 81,180,075 | | | 249,431,458 | |
Unrealized appreciation (depreciation) on: | | | | | | | | | | |
Investments | | | 7,649,027 | | | 6,483,072 | | | (3,716,370 | ) |
Foreign currencies | | | — | | | — | | | (1,742 | ) |
Swaps | | | — | | | — | | | (50,343 | ) |
Forward currency exchange contracts | | | — | | | — | | | 1,455,757 | |
Forward sale commitments | | | (3,125 | ) | | — | | | — | |
Futures contracts | | | (198,569 | ) | | — | | | (27,055 | ) |
Written options | | | — | | | — | | | 141,239 | |
Accumulated undistributed net investment income | | | 920,261 | | | 66,460 | | | (1,703,352 | ) |
Accumulated undistributed net realized loss | | | (2,464,568 | ) | | (6,320,717 | ) | | (3,021,815 | ) |
| | | | | | | | | | |
Total Net Assets | | $ | 467,281,101 | | $ | 81,408,890 | | $ | 242,507,777 | |
| | | | | | | | | | |
Institutional Shares | | | | | | | | | | |
Shares outstanding (unlimited shares of no par value authorized) | | | 3,276,197 | | | — | | | 3,957,238 | |
Net assets | | | 31,999,581 | | | — | | | 38,403,168 | |
Net asset value, offering and redemption price per share | | $ | 9.77 | | $ | — | | $ | 9.70 | |
| | | | | | | | | | |
Service Shares | | | | | | | | | | |
Shares outstanding (unlimited shares of no par value authorized) | | | 44,503,603 | | | 7,100,198 | | | 21,031,180 | |
Net assets | | | 435,281,520 | | | 81,408,890 | | | 204,104,609 | |
Net asset value, offering and redemption price per share | | $ | 9.78 | | $ | 11.47 | | $ | 9.70 | |
| | | | | | | | | | |
1Includes loaned securities with a market value of: | | $ | 2,144,944 | | $ | — | | $ | — | |
| | | | | | | | | | |
See notes to financial statements.
100
|
GuideMarkSM Funds & GuidePathSM Funds |
STATEMENTS OF ASSETS & LIABILITIES (Continued) |
March 31, 2012 |
| |
| | | | | | | | | | | | | |
| | Strategic
Asset Allocation
Fund | | Tactical
Constrained
Asset Allocation
Fund | | Tactical
Unconstrained
Asset Allocation
Fund | | Absolute
Return
Asset Allocation
Fund | |
| | | | | | | | | |
ASSETS: | | | | | | | | | | | | | |
Investments, at value (cost $63,808,635,
$69,662,086, $112,525,175, and $218,144,651,
respectively)1 | | $ | 67,609,170 | | $ | 73,066,917 | | $ | 117,506,523 | | $ | 219,867,984 | |
Investments in affiliates, at value (cost $73,232,800,
$73,964,414, $64,585,539 and $39,059,805,
respectively) | | | 78,860,738 | | | 79,484,789 | | | 70,613,827 | | | 39,897,255 | |
Cash | | | 14,487 | | | 8,280 | | | 40,282 | | | — | |
Income receivable | | | 92,417 | | | 111,134 | | | 235,595 | | | 260,680 | |
Receivable for fund shares sold | | | 912,811 | | | 918,099 | | | 1,490,952 | | | 1,289,696 | |
Receivable from investment advisor | | | 45,871 | | | 49,104 | | | 31,975 | | | 39,899 | |
Other assets | | | 35,825 | | | 33,901 | | | 42,829 | | | 39,595 | |
| | | | | | | | | | | | | |
Total Assets | | | 147,571,319 | | | 153,672,224 | | | 189,961,983 | | | 261,395,109 | |
| | | | | | | | | | | | | |
LIABILITIES: | | | | | | | | | | | | | |
Payable for collateral on securities loaned | | | 1,034,110 | | | 8,681,219 | | | 3,357,200 | | | 21,436,500 | |
Payable for investment securities purchased | | | 1,503,750 | | | 1,464,417 | | | 1,468,867 | | | 662,458 | |
Payable for fund shares redeemed | | | 164,409 | | | 160,001 | | | 163,401 | | | 290,092 | |
Other accrued expenses | | | 219,816 | | | 221,473 | | | 269,077 | | | 351,362 | |
| | | | | | | | | | | | | |
Total Liabilities | | | 2,922,085 | | | 10,527,110 | | | 5,258,545 | | | 22,740,412 | |
| | | | | | | | | | | | | |
NET ASSETS | | $ | 144,649,234 | | $ | 143,145,114 | | $ | 184,703,438 | | $ | 238,654,697 | |
| | | | | | | | | | | | | |
NET ASSETS CONSIST OF: | | | | | | | | | | | | | |
Capital stock | | | 136,549,619 | | | 135,606,916 | | | 177,510,264 | | | 235,907,200 | |
Unrealized appreciation on: | | | | | | | | | | | | | |
Investments | | | 3,800,535 | | | 3,404,831 | | | 4,981,348 | | | 1,723,333 | |
Investments in affiliates | | | 5,627,938 | | | 5,520,375 | | | 6,028,288 | | | 837,450 | |
Accumulated undistributed net investment income
(loss) | | | (225,273 | ) | | 55,710 | | | 221,133 | | | 786,432 | |
Accumulated undistributed net realized loss | | | (1,103,585 | ) | | (1,442,718 | ) | | (4,037,595 | ) | | (599,718 | ) |
| | | | | | | | | | | | | |
Total Net Assets | | $ | 144,649,234 | | $ | 143,145,114 | | $ | 184,703,438 | | $ | 238,654,697 | |
| | | | | | | | | | | | | |
Service Shares | | | | | | | | | | | | | |
Shares outstanding (unlimited shares of no par
value authorized) | | | 15,292,958 | | | 14,661,199 | | | 19,363,344 | | | 23,773,891 | |
Net assets | | | 144,649,234 | | | 143,145,114 | | | 184,703,438 | | | 238,654,697 | |
Net asset value, offering and redemption price
per share | | $ | 9.46 | | $ | 9.76 | | $ | 9.54 | | $ | 10.04 | |
| | | | | | | | | | | | | |
1Includes loaned securities with a market value of: | | $ | 1,008,098 | | $ | 8,467,275 | | $ | 3,264,636 | | $ | 20,725,387 | |
| | | | | | | | | | | | | |
See notes to financial statements.
101
|
GuideMarkSM Funds & GuidePathSM Funds |
STATEMENTS OF OPERATIONS |
For the Year Ended March 31, 2012 |
| |
| | | | | | | | | | |
| | Large Cap
Growth Fund | | Large Cap
Value Fund | | Small/Mid Cap
Core Fund | |
| | | | | | | |
INVESTMENT INCOME: | | | | | | | | | | |
Dividend income (net of withholding tax of $7,185,
$21,839, and $115, respectively) | | $ | 2,340,101 | | $ | 5,046,368 | | $ | 648,183 | |
Interest income | | | 1,339 | | | 3,970 | | | 2,314 | |
| | | | | | | | | | |
Total investment income | | | 2,341,440 | | | 5,050,338 | | | 650,497 | |
| | | | | | | | | | |
EXPENSES: | | | | | | | | | | |
Investment advisory fees | | | 1,342,747 | | | 1,334,129 | | | 510,384 | |
Distribution (12b-1) fees – Service Shares | | | 450,497 | | | 439,299 | | | 140,336 | |
Administrative service fees – Service Shares | | | 450,497 | | | 439,299 | | | 140,336 | |
Custody fees | | | 127,622 | | | 76,059 | | | 88,569 | |
Shareholder servicing fees – Service Shares | | | 126,139 | | | 123,003 | | | 37,701 | |
Legal fees | | | 81,929 | | | 86,230 | | | 28,553 | |
Administration fees | | | 74,776 | | | 74,109 | | | 26,216 | |
Fund accounting fees | | | 43,105 | | | 42,730 | | | 18,515 | |
Reports to shareholders | | | 42,789 | | | 40,351 | | | 39,819 | |
Federal and state registration fees | | | 40,409 | | | 39,850 | | | 36,660 | |
Audit and tax fees | | | 32,988 | | | 32,988 | | | 29,974 | |
Directors’ fees and expenses | | | 24,319 | | | 24,726 | | | 9,861 | |
Transfer agent fees and expenses | | | 16,366 | | | 16,103 | | | 9,794 | |
Insurance fees | | | 10,949 | | | 10,812 | | | 3,607 | |
Compliance fees | | | 7,837 | | | 7,658 | | | 2,740 | |
| | | | | | | | | | |
Total expenses | | | 2,872,969 | | | 2,787,346 | | | 1,123,065 | |
| | | | | | | | | | |
Expense reimbursement by Advisor (See Note 3) | | | (47,832 | ) | | — | | | (41,272 | ) |
Less securities lending credit (See Note 6) | | | (34,127 | ) | | (35,454 | ) | | (59,722 | ) |
| | | | | | | | | | |
Net expenses | | | 2,791,010 | | | 2,751,892 | | | 1,022,071 | |
| | | | | | | | | | |
Net investment income (loss) | | | (449,570 | ) | | 2,298,446 | | | (371,574 | ) |
| | | | | | | | | | |
NET REALIZED AND UNREALIZED GAIN (LOSS) ON INVESTMENTS: | | | | | | | | | | |
Net realized gain on investments | | | 25,379,781 | | | 33,842,641 | | | 3,417,901 | |
Net change in unrealized depreciation on investments | | | (12,286,197 | ) | | (28,443,449 | ) | | (3,661,311 | ) |
| | | | | | | | | | |
Net realized and unrealized gain (loss) | | | 13,093,584 | | | 5,399,192 | | | (243,410 | ) |
| | | | | | | | | | |
NET INCREASE (DECREASE) IN NET ASSETS RESULTING FROM OPERATIONS | | $ | 12,644,014 | | $ | 7,697,638 | | $ | (614,984 | ) |
| | | | | | | | | | |
See notes to financial statements.
102
|
GuideMarkSM Funds & GuidePathSM Funds |
STATEMENTS OF OPERATIONS (Continued) |
For the Year Ended March 31, 2012 |
| |
| | | | | | | | | | |
| | World
ex-US Fund | | Opportunistic
Equity Fund | | Global
Real
Return Fund | |
| | | | | | | |
INVESTMENT INCOME: | | | | | | | | | | |
Dividend income (net of withholding tax of $701,915,
$2,867, and $0, respectively) | | $ | 6,115,182 | | $ | 2,079,959 | | $ | 2,771,940 | |
Interest income | | | 1,970 | | | 15,171 | | | 1,050 | |
| | | | | | | | | | |
Total investment income | | | 6,117,152 | | | 2,095,130 | | | 2,772,990 | |
| | | | | | | | | | |
EXPENSES | | | | | | | | | | |
Investment advisory fees | | | 1,569,464 | | | 1,153,311 | | | 826,249 | |
Distribution (12b-1) fees – Service Shares | | | 515,088 | | | 318,493 | | | 306,764 | |
Administrative service fees – Service Shares | | | 515,088 | | | 318,493 | | | 306,764 | |
Custody fees | | | 394,349 | | | 41,943 | | | 19,802 | |
Shareholder servicing fees – Service Shares | | | 144,225 | | | 89,178 | | | 85,894 | |
Legal fees | | | 92,967 | | | 81,289 | | | 69,342 | |
Administration fees | | | 88,686 | | | 53,007 | | | 29,201 | |
Fund accounting fees | | | 116,617 | | | 46,060 | | | 13,699 | |
Reports to shareholders | | | 36,965 | | | 36,630 | | | 25,016 | |
Federal and state registration fees | | | 41,891 | | | 42,617 | | | 71,017 | |
Audit and tax fees | | | 31,890 | | | 30,023 | | | 37,903 | |
Directors’ fees and expenses | | | 28,970 | | | 21,966 | | | 24,371 | |
Transfer agent fees and expenses | | | 18,098 | | | 12,625 | | | 11,572 | |
Insurance fees | | | 13,574 | | | 7,032 | | | 4,445 | |
Compliance fees | | | 9,074 | | | 5,864 | | | 7,587 | |
| | | | | | | | | | |
Total expenses | | | 3,616,946 | | | 2,258,531 | | | 1,839,626 | |
| | | | | | | | | | |
Expense recapture (reimbursement) by Advisor (See Note 3) | | | (142,535 | ) | | (1,804 | ) | | 45,837 | |
Less securities lending credit (See Note 6) | | | (2,463 | ) | | (38,620 | ) | | (87,420 | ) |
| | | | | | | | | | |
Net expenses | | | 3,471,948 | | | 2,218,107 | | | 1,798,043 | |
| | | | | | | | | | |
Net investment income (loss) | | | 2,645,204 | | | (122,977 | ) | | 974,947 | |
| | | | | | | | | | |
NET REALIZED AND UNREALIZED LOSS ON INVESTMENTS: | | | | | | | | | | |
Net realized loss on: | | | | | | | | | | |
Investments | | | (140,639 | ) | | (12,577,311 | ) | | (4,165,500 | ) |
Foreign currencies | | | (649,254 | ) | | — | | | — | |
| | | | | | | | | | |
Total | | | (789,893 | ) | | (12,577,311 | ) | | (4,165,500 | ) |
| | | | | | | | | | |
Net change in unrealized appreciation (depreciation) on: | | | | | | | | | | |
Investments | | | (23,501,261 | ) | | 10,647,956 | | | (5,019,398 | ) |
Foreign currencies | | | (3,170 | ) | | — | | | — | |
| | | | | | | | | | |
Total | | | (23,504,431 | ) | | 10,647,956 | | | (5,019,398 | ) |
| | | | | | | | | | |
Net realized and unrealized loss | | | (24,294,324 | ) | | (1,929,355 | ) | | (9,184,898 | ) |
| | | | | | | | | | |
NET DECREASE IN NET ASSETS RESULTING FROM OPERATIONS | | $ | (21,649,120 | ) | $ | (2,052,332 | ) | $ | (8,209,951 | ) |
| | | | | | | | | | |
See notes to financial statements.
103
|
GuideMarkSM Funds & GuidePathSM Funds |
STATEMENTS OF OPERATIONS (Continued) |
For the Year Ended March 31, 2012 |
| |
| | | | | | | | | | |
| | Core
Fixed Income
Fund | | Tax-Exempt
Fixed Income
Fund | | Opportunistic
Fixed Income
Fund | |
| | | | | | | |
INVESTMENT INCOME: | | | | | | | | | | |
Dividend income (net of withholding tax of $0, $0, $7,407) | | $ | 30,175 | | $ | — | | $ | 300,483 | |
Interest income | | | 12,776,882 | | | 4,177,339 | | | 11,304,328 | |
| | | | | | | | | | |
Total investment income | | | 12,807,057 | | | 4,177,339 | | | 11,604,811 | |
| | | | | | | | | | |
EXPENSES: | | | | | | | | | | |
Investment advisory fees | | | 2,164,062 | | | 466,920 | | | 1,579,451 | |
Distribution (12b-1) fees – Service Shares | | | 1,021,875 | | | 233,460 | | | 506,323 | |
Administrative service fees – Service Shares | | | 1,021,875 | | | 233,460 | | | 506,323 | |
Custody fees | | | 68,815 | | | 15,549 | | | 264,677 | |
Shareholder servicing fees – Service Shares | | | 306,563 | | | 74,707 | | | 146,547 | |
Legal fees | | | 239,074 | | | 38,246 | | | 154,999 | |
Administration fees | | | 167,883 | | | 37,234 | | | 57,877 | |
Fund accounting fees | | | 159,815 | | | 22,107 | | | 93,112 | |
Reports to shareholders | | | 40,579 | | | 1,802 | | | 49,363 | |
Federal and state registration fees | | | 43,236 | | | 39,254 | | | 78,799 | |
Audit and tax fees | | | 37,994 | | | 27,489 | | | 44,628 | |
Directors’ fees and expenses | | | 50,948 | | | 12,273 | | | 40,749 | |
Transfer agent fees and expenses | | | 28,093 | | | 8,706 | | | 13,000 | |
Insurance fees | | | 23,773 | | | 6,646 | | | 4,445 | |
Compliance fees | | | 17,997 | | | 3,651 | | | 12,857 | |
| | | | | | | | | | |
Total expenses | | | 5,392,582 | | | 1,221,504 | | | 3,553,150 | |
| | | | | | | | | | |
Expense recapture (reimbursement) by Advisor (See Note 3) | | | — | | | (16,850 | ) | | (171,817 | ) |
Less securities lending credit (See Note 6) | | | (64,603 | ) | | — | | | — | |
| | | | | | | | | | |
Net expenses | | | 5,327,979 | | | 1,204,654 | | | 3,381,333 | |
| | | | | | | | | | |
Net investment income | | | 7,479,078 | | | 2,972,685 | | | 8,223,478 | |
| | | | | | | | | | |
NET REALIZED AND UNREALIZED GAIN (LOSS) ON INVESTMENTS: | | | | | | | | | | |
Net realized gain (loss) on: | | | | | | | | | | |
Investments | | | 11,865,976 | | | 1,394,371 | | | (3,280,703 | ) |
Foreign currencies | | | 1,904 | | | — | | | (216,954 | ) |
Swaps | | | — | | | — | | | 86,614 | |
Forward currency exchange contracts | | | (161,263 | ) | | — | | | (65,785 | ) |
Forward sale commitments | | | (591,816 | ) | | — | | | — | |
Futures contracts | | | 424,439 | | | — | | | (1,553,363 | ) |
| | | | | | | | | | |
Total | | | 11,539,240 | | | 1,394,371 | | | (5,030,191 | ) |
| | | | | | | | | | |
Net change in unrealized appreciation (depreciation) on: | | | | | | | | | | |
Investments | | | 6,423,101 | | | 5,756,168 | | | (3,716,370 | ) |
Foreign currencies | | | — | | | — | | | (1,742 | ) |
Swaps | | | — | | | — | | | (50,343 | ) |
Forward currency contracts | | | 150,835 | | | — | | | 1,455,757 | |
Forward sale commitments | | | (3,125 | ) | | — | | | — | |
Futures contracts | | | 102,779 | | | — | | | (27,055 | ) |
Written options | | | — | | | — | | | 141,239 | |
| | | | | | | | | | |
Total | | | 6,673,590 | | | 5,756,168 | | | (2,198,514 | ) |
| | | | | | | | | | |
Net realized and unrealized gain (loss) | | | 18,212,830 | | | 7,150,539 | | | (7,228,705 | ) |
| | | | | | | | | | |
NET INCREASE IN NET ASSETS RESULTING FROM OPERATIONS | | $ | 25,691,908 | | $ | 10,123,224 | | $ | 994,773 | |
| | | | | | | | | | |
See notes to financial statements.
104
|
GuideMarkSM Funds & GuidePathSM Funds |
STATEMENTS OF OPERATIONS (Continued) |
For the Period April 29, 20111 through March 31, 2012 |
| |
| | | | | | | | | | | | | |
| | Strategic
Asset Allocation
Fund | | Tactical
Constrained
Asset Allocation
Fund | | Tactical
Unconstrained
Asset Allocation
Fund | | Absolute
Return
Asset Allocation
Fund | |
| | | | | | | | | |
INVESTMENT INCOME: | | | | | | | | | | | | | |
Dividend income (net of withholding tax of $0, $0,
$0 and $0, respectively) | | $ | 805,515 | | $ | 797,481 | | $ | 1,018,880 | | $ | 2,104,253 | |
Dividends from affiliate investments | | | 570,996 | | | 724,368 | | | 658,706 | | | 955,499 | |
Interest income | | | 3,656 | | | 3,575 | | | 4,996 | | | 7,047 | |
| | | | | | | | | | | | | |
Total investment income | | | 1,380,167 | | | 1,525,424 | | | 1,682,582 | | | 3,066,799 | |
| | | | | | | | | | | | | |
EXPENSES: | | | | | | | | | | | | | |
Investment advisory fees | | | 147,267 | | | 147,593 | | | 265,899 | | | 380,460 | |
Distribution (12b-1) fees – Service Shares | | | 147,267 | | | 147,593 | | | 189,929 | | | 271,757 | |
Administrative service fees – Service Shares | | | 147,267 | | | 147,593 | | | 189,929 | | | 271,757 | |
Custody fees | | | 31,082 | | | 49,153 | | | 57,487 | | | 65,371 | |
Shareholder servicing fees – Service Shares | | | 55,612 | | | 55,681 | | | 71,879 | | | 102,881 | |
Legal fees | | | 53,673 | | | 54,163 | | | 66,201 | | | 100,243 | |
Administration fees | | | 15,778 | | | 15,897 | | | 21,448 | | | 32,519 | |
Fund accounting fees | | | 7,818 | | | 8,290 | | | 10,068 | | | 14,647 | |
Reports to shareholders | | | 22,663 | | | 22,724 | | | 30,256 | | | 45,372 | |
Federal and state registration fees | | | 56,777 | | | 56,662 | | | 61,492 | | | 68,999 | |
Audit and tax fees | | | 14,323 | | | 14,323 | | | 14,323 | | | 14,323 | |
Directors’ fees and expenses | | | 6,750 | | | 6,859 | | | 8,636 | | | 13,102 | |
Transfer agent fees and expenses | | | 3,841 | | | 3,850 | | | 4,581 | | | 5,132 | |
Insurance fees | | | 3,968 | | | 3,968 | | | 3,968 | | | 3,968 | |
Compliance fees | | | 2,530 | | | 2,536 | | | 3,133 | | | 4,493 | |
| | | | | | | | | | | | | |
Total expenses | | | 716,616 | | | 736,885 | | | 999,229 | | | 1,395,024 | |
| | | | | | | | | | | | | |
Expense reimbursement by Advisor (See Note 3) | | | (109,544 | ) | | (129,239 | ) | | (116,347 | ) | | (169,190 | ) |
Less securities lending credit (See Note 6) | | | (18,004 | ) | | (17,274 | ) | | (47,197 | ) | | (30,105 | ) |
| | | | | | | | | | | | | |
Net expenses | | | 589,068 | | | 590,372 | | | 835,685 | | | 1,195,729 | |
| | | | | | | | | | | | | |
Net investment income | | | 791,099 | | | 935,052 | | | 846,897 | | | 1,871,070 | |
| | | | | | | | | | | | | |
NET REALIZED AND UNREALIZED GAIN ON INVESTMENTS: | | | | | | | | | | | | | |
Net realized gain (loss) on: | | | | | | | | | | | | | |
Investments | | | (470,405 | ) | | (597,131 | ) | | (1,906,041 | ) | | 230,279 | |
Investments in affiliates | | | (632,370 | ) | | (845,587 | ) | | (2,131,888 | ) | | (829,997 | ) |
| | | | | | | | | | | | | |
Total | | | (1,102,775 | ) | | (1,442,718 | ) | | (4,037,929 | ) | | (599,718 | ) |
| | | | | | | | | | | | | |
Net change in unrealized appreciation on: | | | | | | | | | | | | | |
Investments | | | 3,800,535 | | | 3,404,831 | | | 4,981,348 | | | 1,723,333 | |
Investments in affiliates | | | 5,627,938 | | | 5,520,375 | | | 6,028,288 | | | 837,450 | |
| | | | | | | | | | | | | |
Total | | | 9,428,473 | | | 8,925,206 | | | 11,009,636 | | | 2,560,783 | |
| | | | | | | | | | | | | |
Net realized and unrealized gain | | | 8,325,698 | | | 7,482,488 | | | 6,971,707 | | | 1,961,065 | |
| | | | | | | | | | | | | |
NET INCREASE IN NET ASSETS RESULTING FROM OPERATIONS | | $ | 9,116,797 | | $ | 8,417,540 | | $ | 7,818,604 | | $ | 3,832,135 | |
| | | | | | | | | | | | | |
| |
1 | Commencement of operations. |
See notes to financial statements.
105
|
GuideMarkSM Funds & GuidePathSM Funds |
STATEMENTS OF CHANGES IN NET ASSETS |
|
| |
| | | | | | | | | | | | | |
| | Large Cap Growth Fund | | Large Cap Value Fund | |
| | | | | |
| | Year Ended
March 31,
2012 | | Year Ended
March 31,
2011 | | Year Ended
March 31,
2012 | | Year Ended
March 31,
2011 | |
| | | | | | | | | |
OPERATIONS: | | | | | | | | | | | | | |
Net investment income (loss) | | $ | (449,570 | ) | $ | (210,844 | ) | $ | 2,298,446 | | $ | 2,170,622 | |
Net realized gain on investment transactions | | | 25,379,781 | | | 14,403,372 | | | 33,842,641 | | | 3,487,047 | |
Change in unrealized appreciation (depreciation)
on investments | | | (12,286,197 | ) | | 19,790,807 | | | (28,443,449 | ) | | 17,203,674 | |
| | | | | | | | | | | | | |
Net increase in net assets resulting from operations | | | 12,644,014 | | | 33,983,335 | | | 7,697,638 | | | 22,861,343 | |
| | | | | | | | | | | | | |
CAPITAL SHARE TRANSACTIONS: | | | | | | | | | | | | | |
Institutional Shares | | | | | | | | | | | | | |
Shares sold | | | 31,939,165 | | | — | | | 41,284,965 | | | — | |
Shares issued to holders in reinvestment of dividends | | | — | | | — | | | 559,662 | | | — | |
Shares redeemed | | | (3,895,350 | ) | | — | | | (5,173,389 | ) | | — | |
| | | | | | | | | | | | | |
Net increase | | | 28,043,815 | | | — | | | 36,671,238 | | | — | |
| | | | | | | | | | | | | |
Service Shares | | | | | | | | | | | | | |
Shares sold | | | 112,113,323 | | | 34,064,790 | | | 114,824,850 | | | 35,157,092 | |
Shares issued to holders in reinvestment of dividends | | | — | | | — | | | 1,676,458 | | | 2,263,928 | |
Shares redeemed | | | (163,945,672 | ) | | (64,847,160 | ) | | (155,967,475 | ) | | (58,513,846 | ) |
| | | | | | | | | | | | | |
Net decrease | | | (51,832,349 | ) | | (30,782,370 | ) | | (39,466,167 | ) | | (21,092,826 | ) |
| | | | | | | | | | | | | |
DIVIDENDS AND DISTRIBUTIONS TO SHAREHOLDERS: | | | | | | | | | | | | | |
Net investment income – Institutional Shares | | | — | | | — | | | (559,662 | ) | | — | |
Net investment income – Service Shares | | | — | | | — | | | (1,676,610 | ) | | (2,264,115 | ) |
| | | | | | | | | | | | | |
Total dividends and distributions | | | — | | | — | | | (2,236,272 | ) | | (2,264,115 | ) |
| | | | | | | | | | | | | |
INCREASE (DECREASE) IN NET ASSETS | | | (11,144,520 | ) | | 3,200,965 | | | 2,666,437 | | | (495,598 | ) |
NET ASSETS: | | | | | | | | | | | | | |
Beginning of year | | $ | 211,129,188 | | $ | 207,928,223 | | $ | 200,132,341 | | $ | 200,627,939 | |
| | | | | | | | | | | | | |
End of year (including undistributed net investment income (loss) of $(71,022), $1,129, $561,303 and $499,075, respectively) | | $ | 199,984,668 | | $ | 211,129,188 | | $ | 202,798,778 | | $ | 200,132,341 | |
| | | | | | | | | | | | | |
CHANGES IN SHARES OUTSTANDING | | | | | | | | | | | | | |
Institutional Shares | | | | | | | | | | | | | |
Shares sold | | | 3,362,999 | | | — | | | 5,351,797 | | | — | |
Shares issued to holders in reinvestment of dividends | | | — | | | — | | | 74,821 | | | — | |
Shares redeemed | | | (428,892 | ) | | — | | | (694,851 | ) | | — | |
| | | | | | | | | | | | | |
Net increase | | | 2,934,107 | | | — | | | 4,731,767 | | | — | |
| | | | | | | | | | | | | |
Service Shares | | | | | | | | | | | | | |
Shares sold | | | 11,684,957 | | | 3,927,474 | | | 14,492,557 | | | 4,692,536 | |
Shares issued to holders in reinvestment of dividends | | | — | | | — | | | 221,754 | | | 289,505 | |
Shares redeemed | | | (16,938,911 | ) | | (7,499,745 | ) | | (19,524,651 | ) | | (7,874,002 | ) |
| | | | | | | | | | | | | |
Net decrease | | | (5,253,954 | ) | | (3,572,271 | ) | | (4,810,340 | ) | | (2,891,961 | ) |
| | | | | | | | | | | | | |
See notes to financial statements.
106
|
GuideMarkSM Funds & GuidePathSM Funds |
STATEMENTS OF CHANGES IN NET ASSETS (Continued) |
|
| |
| | | | | | | | | | | | | |
| | Small/Mid Cap Core Fund | | World ex-US Fund | |
| | | | | |
| | Year Ended
March 31,
2012 | | Year Ended
March 31,
2011 | | Year Ended
March 31,
2012 | | Year Ended
March 31,
2011 | |
| | | | | | | | | |
OPERATIONS: | | | | | | | | | | | | | |
Net investment income (loss) | | $ | (371,574 | ) | $ | (216,673 | ) | $ | 2,645,204 | | $ | 3,415,506 | |
Net realized gain (loss) on investment transactions | | | 3,417,901 | | | 4,229,166 | | | (789,893 | ) | | 12,057,740 | |
Change in unrealized appreciation (depreciation)
on investments | | | (3,661,311 | ) | | 4,286,200 | | | (23,504,431 | ) | | (352,760 | ) |
| | | | | | | | | | | | | |
Net increase (decrease) in net assets resulting
from operations | | | (614,984 | ) | | 8,298,693 | | ($ | 21,649,120 | ) | | 15,120,486 | |
| | | | | | | | | | | | | |
CAPITAL SHARE TRANSACTIONS: | | | | | | | | | | | | | |
Institutional Shares | | | | | | | | | | | | | |
Shares sold | | | 35,637,119 | | | — | | | 47,752,548 | | | — | |
Shares issued to holders in reinvestment of dividends | | | — | | | — | | | 536,257 | | | — | |
Shares redeemed | | | (7,995,819 | ) | | — | | | (8,429,463 | ) | | — | |
| | | | | | | | | | | | | |
Net increase | | | 27,641,300 | | | — | | | 39,859,342 | | | — | |
| | | | | | | | | | | | | |
Service Shares | | | | | | | | | | | | | |
Shares sold | | | 55,798,047 | | | 6,604,384 | | | 54,279,153 | | | 66,226,573 | |
Shares issued to holders in reinvestment of dividends | | | — | | | — | | | 2,278,571 | | | 4,261,966 | |
Shares redeemed | | | (47,522,395 | ) | | (14,803,776 | ) | | (115,730,785 | ) | | (81,264,833 | ) |
| | | | | | | | | | | | | |
Net increase (decrease) | | | 8,275,652 | | | (8,199,392 | ) | | (59,173,061 | ) | | (10,776,294 | ) |
| | | | | | | | | | | | | |
DIVIDENDS AND DISTRIBUTIONS TO SHAREHOLDERS: | | | | | | | | | | | | | |
Net investment income – Institutional Shares | | | — | | | — | | | (536,257 | ) | | — | |
Net investment income – Service Shares | | | — | | | — | | | (2,279,735 | ) | | (4,263,692 | ) |
| | | | | | | | | | | | | |
Total dividends and distributions | | | — | | | — | | | (2,815,992 | ) | | (4,263,692 | ) |
| | | | | | | | | | | | | |
INCREASE (DECREASE) IN NET ASSETS | | | 35,301,968 | | | 99,301 | | | (43,778,831 | ) | | 80,500 | |
NET ASSETS: | | | | | | | | | | | | | |
Beginning of year | | $ | 42,748,789 | | $ | 42,649,488 | | $ | 269,702,069 | | $ | 269,621,569 | |
| | | | | | | | | | | | | |
End of year (including undistributed net investment
income (loss) of $(34,662), $54,113, $2,015,901
and $2,790,644, respectively) | | $ | 78,050,757 | | $ | 42,748,789 | | $ | 225,923,238 | | $ | 269,702,069 | |
| | | | | | | | | | | | | |
CHANGES IN SHARES OUTSTANDING | | | | | | | | | | | | | |
Institutional Shares | | | | | | | | | | | | | |
Shares sold | | | 3,418,942 | | | — | | | 6,489,227 | | | — | |
Shares issued to holders in reinvestment of dividends | | | — | | | — | | | 81,251 | | | — | |
Shares redeemed | | | (814,996 | ) | | — | | | (1,169,799 | ) | | — | |
| | | | | | | | | | | | | |
Net increase | | | 2,603,946 | | | — | | | 5,400,679 | | | — | |
| | | | | | | | | | | | | |
Service Shares | | | | | | | | | | | | | |
Shares sold | | | 4,905,502 | | | 662,601 | | | 7,284,429 | | | 8,486,413 | |
Shares issued to holders in reinvestment of dividends | | | — | | | — | | | 344,195 | | | 532,081 | |
Shares redeemed | | | (4,419,198 | ) | | (1,487,757 | ) | | (15,197,691 | ) | | (10,523,609 | ) |
| | | | | | | | | | | | | |
Net increase (decrease) | | | 486,304 | | | (825,156 | ) | | (7,569,067 | ) | | (1,505,115 | ) |
| | | | | | | | | | | | | |
See notes to financial statements.
107
|
GuideMarkSM Funds & GuidePathSM Funds |
STATEMENTS OF CHANGES IN NET ASSETS (Continued) |
|
| |
| | | | | | | | | | | |
| | Opportunistic Equity Fund | | Global Real Return Fund | |
| | | | | |
| | | Year Ended
March 31,
2012 | | | | Year Ended
March 31,
2012 | | |
| | | | | | | | | |
OPERATIONS: | | | | | | | | | | | |
Net investment income (loss) | | | $ | (122,977 | ) | | | $ | 974,947 | | |
Net realized loss on investment transactions | | | | (12,577,311 | ) | | | | (4,165,500 | ) | |
Change in unrealized appreciation (depreciation)
on investments | | | | 10,647,956 | | | | | (5,019,398 | ) | |
| | | | | | | | | | | |
Net decrease in net assets resulting from operations | | | | (2,052,332 | ) | | | | (8,209,951 | ) | |
| | | | | | | | | | | |
CAPITAL SHARE TRANSACTIONS: | | | | | | | | | | | |
Institutional Shares | | | | | | | | | | | |
Shares sold | | | | 52,372,060 | | | | | 10,727,543 | | |
Shares issued to holders in reinvestment of dividends | | | | — | | | | | 134,132 | | |
Shares redeemed | | | | (9,512,689 | ) | | | | (458,265 | ) | |
| | | | | | | | | | | |
Net increase | | | | 42,859,371 | | | | | 10,403,410 | | |
| | | | | | | | | | | |
Service Shares | | | | | | | | | | | |
Shares sold | | | | 182,674,884 | | | | | 169,097,947 | | |
Shares issued to holders in reinvestment of dividends | | | | — | | | | | 1,004,029 | | |
Shares redeemed | | | | (63,026,524 | ) | | | | (57,155,937 | ) | |
| | | | | | | | | | | |
Net increase | | | | 119,648,360 | | | | | 112,946,039 | | |
| | | | | | | | | | | |
DIVIDENDS AND DISTRIBUTIONS TO SHAREHOLDERS: | | | | | | | | | | | |
Net investment income – Institutional Shares | | | | — | | | | | (126,411 | ) | |
Net investment income – Service Shares | | | | — | | | | | (946,234 | ) | |
Return of capital – Institutional Shares | | | | — | | | | | (7,721 | ) | |
Return of capital – Service Shares | | | | — | | | | | (57,795 | ) | |
| | | | | | | | | | | |
Total dividends and distributions | | | | — | | | | | (1,138,161 | ) | |
| | | | | | | | | | | |
INCREASE IN NET ASSETS | | | | 160,455,399 | | | | | 114,001,337 | | |
NET ASSETS: | | | | | | | | | | | |
Beginning of year | | | | — | | | | | 2,000 | | |
| | | | | | | | | | | |
End of year (including undistributed net investment
loss of $0, and $(52,927), respectively) | | | $ | 160,455,399 | | | | $ | 114,003,337 | | |
| | | | | | | | | | | |
CHANGES IN SHARES OUTSTANDING | | | | | | | | | | | |
Institutional Shares | | | | | | | | | | | |
Shares sold | | | | 5,777,090 | | | | | 1,149,354 | | |
Shares issued to holders in reinvestment of dividends | | | | — | | | | | 15,418 | | |
Shares redeemed | | | | (1,109,784 | ) | | | | (50,346 | ) | |
| | | | | | | | | | | |
Net increase | | | | 4,667,306 | | | | | 1,114,426 | | |
| | | | | | | | | | | |
Institutional Shares | | | | | | | | | | | |
Shares sold | | | | 18,575,216 | | | | | 16,979,915 | | |
Shares issued to holders in reinvestment of dividends | | | | — | | | | | 114,746 | | |
Shares redeemed | | | | (6,986,890 | ) | | | | (6,075,142 | ) | |
| | | | | | | | | | | |
Net increase | | | | 11,588,326 | | | | | 11,019,519 | | |
| | | | | | | | | | | |
See notes to financial statements.
108
|
GuideMarkSM Funds & GuidePathSM Funds |
STATEMENTS OF CHANGES IN NET ASSETS (Continued) |
|
| |
| | | | | | | | | | | | | |
| | Core Fixed Income Fund | | Tax-Exempt Fixed Income Fund | |
| | | | | |
| | Year Ended
March 31,
2012 | | Year Ended
March 31,
2011 | | Year Ended
March 31,
2012 | | Year Ended
March 31,
2011 | |
| | | | | | | | | |
OPERATIONS: | | | | | | | | | | | | | |
Net investment income | | $ | 7,479,078 | | $ | 12,740,153 | | $ | 2,972,685 | | $ | 6,125,439 | |
Net realized gain (loss) on investment transactions | | | 11,539,240 | | | (9,073,100 | ) | | 1,394,371 | | | (116,442 | ) |
Change in unrealized appreciation (depreciation)
on investments | | | 6,673,590 | | | 26,814,898 | | | 5,756,168 | | | (4,266,163 | ) |
| | | | | | | | | | | | | |
Net increase in net assets resulting from operations | | | 25,691,908 | | | 30,481,951 | | | 10,123,224 | | | 1,742,834 | |
| | | | | | | | | | | | | |
CAPITAL SHARE TRANSACTIONS: | | | | | | | | | | | | | |
Institutional Shares | | | | | | | | | | | | | |
Shares sold | | | 68,940,739 | | | — | | | — | | | — | |
Shares issued to holders in reinvestment of dividends | | | 584,438 | | | — | | | — | | | — | |
Shares redeemed | | | (38,116,152 | ) | | — | | | — | | | — | |
| | | | | | | | | | | | | |
Net increase | | | 31,409,025 | | | — | | | — | | | — | |
| | | | | | | | | | | | | |
Service Shares | | | | | | | | | | | | | |
Shares sold | | | 229,985,171 | | | 187,560,080 | | | 24,438,594 | | | 51,372,371 | |
Shares issued to holders in reinvestment of dividends | | | 7,246,292 | | | 14,828,487 | | | 2,989,714 | | | 6,257,986 | |
Shares redeemed | | | (401,161,022 | ) | | (184,064,092 | ) | | (123,481,858 | ) | | (78,112,852 | ) |
| | | | | | | | | | | | | |
Net increase (decrease) | | | (163,929,559 | ) | | 18,324,475 | | | (96,053,550 | ) | | (20,482,495 | ) |
| | | | | | | | | | | | | |
DIVIDENDS AND DISTRIBUTIONS TO SHAREHOLDERS: | | | | | | | | | | | | | |
Net investment income – Institutional Shares | | | (584,438 | ) | | — | | | — | | | — | |
Net investment income – Service Shares | | | (7,246,797 | ) | | (14,829,215 | ) | | (2,990,928 | ) | | (6,259,146 | ) |
| | | | | | | | | | | | | |
Total dividends and distributions | | | (7,831,235 | ) | | (14,829,215 | ) | | (2,990,928 | ) | | (6,259,146 | ) |
| | | | | | | | | | | | | |
INCREASE (DECREASE) IN NET ASSETS | | | (114,659,861 | ) | | 33,977,211 | | | (88,921,254 | ) | | (24,998,807 | ) |
NET ASSETS: | | | | | | | | | | | | | |
Beginning of year | | $ | 581,940,962 | | $ | 547,963,751 | | $ | 170,330,144 | | $ | 195,328,951 | |
| | | | | | | | | | | | | |
End of year (including undistributed net investment
income of $920,261, $721,349, $66,460 and
$84,703, respectively) | | $ | 467,281,101 | | $ | 581,940,962 | | $ | 81,408,890 | | $ | 170,330,144 | |
| | | | | | | | | | | | | |
CHANGES IN SHARES OUTSTANDING | | | | | | | | | | | | | |
Institutional Shares | | | | | | | | | | | | | |
Shares sold | | | 7,100,674 | | | — | | | — | | | — | |
Shares issued to holders in reinvestment of dividends | | | 59,987 | | | — | | | — | | | — | |
Shares redeemed | | | (3,884,464 | ) | | — | | | — | | | — | |
| | | | | | | | | | | | | |
Net increase | | | 3,276,197 | | | — | | | — | | | — | |
| | | | | | | | | | | | | |
Service Shares | | | | | | | | | | | | | |
Shares sold | | | 23,714,369 | | | 19,988,828 | | | 2,176,388 | | | 4,655,458 | |
Shares issued to holders in reinvestment of dividends | | | 746,764 | | | 1,588,021 | | | 266,512 | | | 571,371 | |
Shares redeemed | | | (42,102,151 | ) | | (19,635,589 | ) | | (11,311,366 | ) | | (7,109,822 | ) |
| | | | | | | | | | | | | |
Net increase (decrease) | | | (17,641,018 | ) | | 1,941,260 | | | (8,868,466 | ) | | (1,882,993 | ) |
| | | | | | | | | | | | | |
See notes to financial statements.
109
|
GuideMarkSM Funds & GuidePathSM Funds |
STATEMENTS OF CHANGES IN NET ASSETS (Continued) |
|
| |
| | | | | | | | | | | |
| | Opportunistic Fixed
Income Fund | | Strategic Asset
Allocation Fund | |
| | | | | |
| | | Year Ended
March 31,
2012 | | | | April 29, 20111
Through
March 31,
2012 | | |
| | | | | | | | | |
OPERATIONS: | | | | | | | | | | | |
Net investment income | | | $ | 8,223,478 | | | | $ | 791,099 | | |
Net realized loss on investment transactions | | | | (5,030,191 | ) | | | | (1,102,775 | ) | |
Change in unrealized appreciation (depreciation)
on investments | | | | (2,198,514 | ) | | | | 9,428,473 | | |
| | | | | | | | | | | |
Net increase in net assets resulting from operations | | | | 994,773 | | | | | 9,116,797 | | |
| | | | | | | | | | | |
CAPITAL SHARE TRANSACTIONS: | | | | | | | | | | | |
Institutional Shares | | | | | | | | | | | |
Shares sold | | | | 64,598,842 | | | | | — | | |
Shares issued to holders in reinvestment of dividends | | | | 1,095,080 | | | | | — | | |
Shares redeemed | | | | (27,299,114 | ) | | | | — | | |
| | | | | | | | | | | |
Net increase | | | | 38,394,808 | | | | | — | | |
| | | | | | | | | | | |
Service Shares | | | | | | | | | | | |
Shares sold | | | | 307,026,836 | | | | | 147,611,371 | | |
Shares issued to holders in reinvestment of dividends | | | | 6,865,088 | | | | | 1,067,171 | | |
Shares redeemed | | | | (102,815,560 | ) | | | | (12,102,934 | ) | |
| | | | | | | | | | | |
Net increase | | | | 211,076,364 | | | | | 136,575,608 | | |
| | | | | | | | | | | |
DIVIDENDS AND DISTRIBUTIONS TO
SHAREHOLDERS: | | | | | | | | | | | |
Net investment income – Institutional Shares | | | | (1,095,080 | ) | | | | — | | |
Net investment income – Service Shares | | | | (6,865,088 | ) | | | | (1,058,402 | ) | |
Return of capital – Institutional Shares | | | | — | | | | | — | | |
Return of capital – Service Shares | | | | — | | | | | (8,769 | ) | |
| | | | | | | | | | | |
Total dividends and distributions | | | | (7,960,168 | ) | | | | (1,067,171 | ) | |
| | | | | | | | | | | |
INCREASE IN NET ASSETS | | | | 242,505,777 | | | | | 144,625,234 | | |
NET ASSETS: | | | | | | | | | | | |
Beginning of year | | | | 2,000 | | | | | 24,000 | | |
| | | | | | | | | | | |
End of year (including undistributed net investment
loss of $(1,703,352) and $(225,273), respectively) | | | $ | 242,507,777 | | | | $ | 144,649,234 | | |
| | | | | | | | | | | |
CHANGES IN SHARES OUTSTANDING | | | | | | | | | | | |
Institutional Shares | | | | | | | | | | | |
Shares sold | | | | 6,736,982 | | | | | — | | |
Shares issued to holders in reinvestment of dividends | | | | 115,534 | | | | | — | | |
Shares redeemed | | | | (2,895,278 | ) | | | | — | | |
| | | | | | | | | | | |
Net increase | | | | 3,957,238 | | | | | — | | |
| | | | | | | | | | | |
Service Shares | | | | | | | | | | | |
Shares sold | | | | 30,996,452 | | | | | 16,559,127 | | |
Shares issued to holders in reinvestment of dividends | | | | 721,132 | | | | | 126,143 | | |
Shares redeemed | | | | (10,686,604 | ) | | | | (1,394,712 | ) | |
| | | | | | | | | | | |
Net increase | | | | 21,030,980 | | | | | 15,290,558 | | |
| | | | | | | | | | | |
| | | | | | | | | | | | | | | | |
| |
1 | Commencement of operations. |
See notes to financial statements.
110
|
GuideMarkSM Funds & GuidePathSM Funds |
STATEMENTS OF CHANGES IN NET ASSETS (Continued) |
|
| |
| | | | | | | | | | | |
| | Tactical Constrained
Asset Allocation Fund | | Tactical Unconstrained
Asset Allocation Fund | |
| | | | | |
| | | April 29, 20111
Through
March 31,
2012 | | | | April 29, 20111
Through
March 31,
2012 | | |
| | | | | | | | | |
OPERATIONS: | | | | | | | | | | | |
Net investment income | | | $ | 935,052 | | | | $ | 846,897 | | |
Net realized loss on investment transactions | | | | (1,442,718 | ) | | | | (4,037,929 | ) | |
Change in unrealized appreciation on investments | | | | 8,925,206 | | | | | 11,009,636 | | |
| | | | | | | | | | | |
Net increase in net assets resulting from operations | | | | 8,417,540 | | | | | 7,818,604 | | |
| | | | | | | | | | | |
CAPITAL SHARE TRANSACTIONS: | | | | | | | | | | | |
Service Shares | | | | | | | | | | | |
Shares sold | | | | 147,249,517 | | | | | 195,854,836 | | |
Shares issued to holders in reinvestment of dividends | | | | 920,562 | | | | | 667,199 | | |
Shares redeemed | | | | (12,545,943 | ) | | | | (18,994,002 | ) | |
| | | | | | | | | | | |
Net increase | | | | 135,624,136 | | | | | 177,528,033 | | |
| | | | | | | | | | | |
DIVIDENDS AND DISTRIBUTIONS TO
SHAREHOLDERS: | | | | | | | | | | | |
Net investment income – Service Shares | | | | (920,562 | ) | | | | (667,199 | ) | |
| | | | | | | | | | | |
Total dividends and distributions | | | | (920,562 | ) | | | | (667,199 | ) | |
| | | | | | | | | | | |
INCREASE IN NET ASSETS | | | | 143,121,114 | | | | | 184,679,438 | | |
NET ASSETS: | | | | | | | | | | | |
Beginning of year | | | | 24,000 | | | | | 24,000 | | |
| | | | | | | | | | | |
End of year (including undistributed net investment
income of $55,710, and $221,133, respectively) | | | $ | 143,145,114 | | | | $ | 184,703,438 | | |
| | | | | | | | | | | |
CHANGES IN SHARES OUTSTANDING | | | | | | | | | | | |
Service Shares | | | | | | | | | | | |
Shares sold | | | | 15,938,306 | | | | | 21,367,013 | | |
Shares issued to holders in reinvestment of dividends | | | | 103,318 | | | | | 75,732 | | |
Shares redeemed | | | | (1,382,825 | ) | | | | (2,081,801 | ) | |
| | | | | | | | | | | |
Net increase | | | | 14,658,799 | | | | | 19,360,944 | | |
| | | | | | | | | | | |
| |
1 | Commencement of operations. |
See notes to financial statements.
111
|
GuideMarkSM Funds & GuidePathSM Funds |
STATEMENTS OF CHANGES IN NET ASSETS (Continued) |
|
|
| | | | | | |
| | Absolute Return
Asset Allocation Fund | |
| | | April 29, 20111
Through
March 31,
2012 | | |
| | | | | | |
OPERATIONS: | | | | | | |
Net investment income | | | $ | 1,871,070 | | |
Net realized loss on investment transactions | | | | (599,718 | ) | |
Change in unrealized appreciation on investments | | | | 2,560,783 | | |
Net increase in net assets resulting from operations | | | | 3,832,135 | | |
CAPITAL SHARE TRANSACTIONS: | | | | | | |
Service Shares | | | | | | |
Shares sold | | | | 259,307,338 | | |
Shares issued to holders in reinvestment of dividends | | | | 1,125,858 | | |
Shares redeemed | | | | (24,508,776 | ) | |
Net increase | | | | 235,924,420 | | |
| | | | | �� | |
DIVIDENDS AND DISTRIBUTIONS TO
SHAREHOLDERS: | | | | | | |
Net investment income – Service Shares | | | | (1,125,858 | ) | |
Total dividends and distributions | | | | (1,125,858 | ) | |
INCREASE IN NET ASSETS | | | | 238,630,697 | | |
NET ASSETS: | | | | | | |
Beginning of year | | | | 24,000 | | |
End of year (including undistributed net investment
income of $786,432) | | | $ | 238,654,697 | | |
| | | | | | |
CHANGES IN SHARES OUTSTANDING | | | | | | |
Service Shares | | | | | | |
Shares sold | | | | 26,122,395 | | |
Shares issued to holders in reinvestment of dividends | | | | 114,300 | | |
Shares redeemed | | | | (2,465,204 | ) | |
Net increase | | | | 23,771,491 | | |
| |
1 | Commencement of operations. |
See notes to financial statements.
112
|
GuideMarkSM Funds & GuidePathSM Funds
FINANCIAL HIGHLIGHTS |
|
|
| | | | | | | | | | | | | | | | | | | | | | | | | | | | | | | |
| | Large Cap Growth Fund | |
| | Institutional | | | | | | | | | | | | Service | | | | | | | | | | | |
| | April 29, 20111
Through
March 31,
2012 | | Year Ended
March 31,
2012 | | Year Ended
March 31,
2011 | | Year Ended
March 31,
2010 | | Year Ended
March 31,
2009 | | Year Ended
March 31,
2008 | |
Per share data for a share of capital stock
outstanding for the entire year and
selected information for the year are as
follows: | | | | | | | | | | | | | | | | | | | | | | | | | | | | | | | |
Net asset value, beginning of period | | | $ | 10.32 | | | | $ | 9.99 | | | | $ | 8.41 | | | | $ | 5.67 | | | | $ | 8.81 | | | | $ | 9.62 | | |
Income from investment operations: | | | | | | | | | | | | | | | | | | | | | | | | | | | | | | | |
Net investment income (loss) | | | | 0.01 | | | | | (0.03 | ) | | | (0.01 | ) | | | | 0.01 | | | | | — | | | | (0.01 | ) | |
Net realized and unrealized gains (losses)
on investments | | | | 0.35 | | | | | 0.65 | | | | | 1.59 | | | | | 2.75 | | | | (3.14 | ) | | | (0.30 | ) | |
Total from investment operations | | | | 0.36 | | | | | 0.62 | | | | | 1.58 | | | | | 2.76 | | | | (3.14 | ) | | | (0.31 | ) | |
Less distributions: | | | | | | | | | | | | | �� | | | | | | | | | | | | | | | | | | |
Dividends from net investment income | | | | — | | | | | — | | | | | — | | | | (0.01 | ) | | | | — | | | | | — | | |
Dividends from net realized gains | | | | — | | | | | — | | | | | — | | | | | — | | | | | — | * | | | (0.50 | ) | |
Return of capital | | | | — | | | | | — | | | | | — | | | | (0.01 | ) | | | | — | | | | | — | | |
Total distributions | | | | — | | | | | — | | | | | — | | | | (0.02 | ) | | | | — | | | | (0.50 | ) | |
Net asset value, end of period | | | $ | 10.68 | | | | $ | 10.61 | | | | $ | 9.99 | | | | $ | 8.41 | | | | $ | 5.67 | | | | $ | 8.81 | | |
| | | | | | | | | | | | | | | | | | | | | | | | | | | | | | | |
Total return | | | 3.49 | %2 | | | 6.21 | % | | | 18.79 | % | | | 48.60 | % | | -35.63 | % | | | -3.88 | % | |
Supplemental data and ratios: | | | | | | | | | | | | | | | | | | | | | | | | | | | | | | | |
Net assets, end of period | | $31,330,264 | | | $168,654,404 | | | $211,129,188 | | | $207,928,223 | | | $203,479,219 | | | $649,307,452 | | |
Ratio of expenses to average net assets | | | | | | | | | | | | | | | | | | | | | | | | | | | | | | |
Before expense reimbursement
(recapture) and securities lending
credit | | | 0.93 | %3 | | | | 1.54 | % | | | | 1.45 | % | | | | 1.46 | % | | | | 1.40 | % | | | | 1.33 | % | |
After expense reimbursement
(recapture) and securities lending
credit | | | | 0.92 | %3 | | | | 1.49 | % | | | | 1.43 | % | | | | 1.41 | % | | | | 1.27 | % | | | | 1.28 | % | |
Ratio of net investment income (loss) to
average net assets | | | | | | | | | | | | | | | | | | | | | | | | | | | | | | | |
Before expense reimbursement
(recapture) and securities lending
credit | | | | 0.33 | %3 | | | -0.32 | % | | | -0.13 | % | | | | 0.09 | % | | | -0.15 | % | | | -0.15 | % | |
After expense reimbursement
(recapture) and securities lending
credit | | | 0.34 | %3 | | | -0.27 | % | | | -0.11 | % | | | | 0.14 | % | | | -0.02 | % | | | -0.10 | % | |
Portfolio turnover rate | | | 126.61 | % | | | 126.61 | % | | | 63.33 | % | | | 69.83 | % | | | 98.67 | % | | | 62.86 | % | |
Portfolio turnover is calculated for the Fund as a whole.
| |
1 | Commencement of operations. |
2 | Not annualized. |
3 | Annualized. |
* | Amount represents less than $0.01 per share. |
See notes to financial statements.
113
|
GuideMarkSM Funds & GuidePathSM Funds
FINANCIAL HIGHLIGHTS |
|
|
| | | | | | | | | | | | | | | | | | | | | | | | | | | | | | | |
| | Large Cap Value Fund | |
| | Institutional | | Service | |
| | April 29, 20111
Through
March 31,
2012 | | Year Ended
March 31,
2012 | | Year Ended
March 31,
2011 | | Year Ended
March 31,
2010 | | Year Ended
March 31,
2009 | | Year Ended
March 31,
2008 | |
Per share data for a share of capital stock
outstanding for the entire year and
selected information for the year are as
follows: | | | | | | | | | | | | | | | | | | | | | | | | | | | | | | | |
Net asset value, beginning of period | | | $ | 8.54 | | | | $ | 8.32 | | | | $ | 7.44 | | | | $ | 4.85 | | | | $ | 9.85 | | | | $ | 12.34 | | |
Income from investment operations: | | | | | | | | | | | | | | | | | | | | | | | | | | | | | | | |
Net investment income | | | | 0.13 | | | | | 0.10 | | | | | 0.09 | | | | | 0.10 | | | | | 0.19 | | | | | 0.15 | | |
Net realized and unrealized gains (losses)
on investments | | | (0.09 | ) | | | | 0.13 | | | | | 0.88 | | | | | 2.60 | | | | (4.99 | ) | | | (1.55 | ) | |
Total from investment operations | | | | 0.04 | | | | | 0.23 | | | | | 0.97 | | | | | 2.70 | | | | (4.80 | ) | | | (1.40 | ) | |
Less distributions: | | | | | | | | | | | | | | | | | | | | | | | | | | | | | | | |
Dividends from net investment income | | | (0.19 | ) | | | (0.08 | ) | | | (0.09 | ) | | | (0.11 | ) | | | (0.20 | ) | | | (0.14 | ) | |
Dividends from net realized gains | | | | — | | | | | — | | | | | — | | | | | — | | | | | — | * | | | (0.95 | ) | |
Total distributions | | | (0.19 | ) | | | (0.08 | ) | | | (0.09 | ) | | | (0.11 | ) | | | (0.20 | ) | | | (1.09 | ) | |
Net asset value, end of period | | | $ | 8.39 | | | | $ | 8.47 | | | | $ | 8.32 | | | | $ | 7.44 | | | | $ | 4.85 | | | | $ | 9.85 | | |
Total return | | 0.70 | %2 | | | 2.87 | % | | | 13.15 | % | | 55.37 | % | | -48.85 | % | | -12.23 | % | |
Supplemental data and ratios: | | | | | | | | | | | | | | | | | | | | | | | | | | | | | | | |
Net assets, end of period | | $39,721,680 | | | $163,077,098 | | | $200,132,341 | | | $200,627,939 | | | $180,181,364 | | | $574,388,589 | | |
Ratio of expenses to average net assets | | | | | | | | | | | | | | | | | | | | | | | | | | | | | | | |
Before expense reimbursement
(recapture) and securities lending
credit | | | 0.93 | %3 | | | 1.51 | % | | | 1.44 | % | | | 1.44 | % | | | | 1.38 | % | | | 1.33 | % | |
After expense reimbursement
(recapture) and securities lending
credit | | | 0.92 | %3 | | | 1.49 | % | | | 1.42 | % | | | 1.40 | % | | | | 1.22 | % | | | 1.28 | % | |
Ratio of net investment income to average
net assets | | | | | | | | | | | | | | | | | | | | | | | | | | | | | | | |
Before expense reimbursement
(recapture) and securities lending
credit | | | 1.89 | %3 | | | 1.13 | % | | | 1.13 | % | | | 1.27 | % | | | | 1.60 | % | | | | 1.16 | % | |
After expense reimbursement
(recapture) and securities lending
credit | | | 1.90 | %3 | | | 1.15 | % | | | 1.15 | % | | | 1.31 | % | | | 1.76 | % | | | 1.21 | % | |
Portfolio turnover rate | | | 95.12 | % | | | 95.12 | % | | | 16.35 | % | | | 26.85 | % | | | 58.45 | % | | | 40.54 | % | |
| |
Portfolio turnover is calculated for the Fund as a whole. |
1 | Commencement of operations. |
2 | Not annualized. |
3 | Annualized. |
* | Amount represents less than $0.01 per share. |
| |
See notes to financial statements.
114
|
GuideMarkSM Funds & GuidePathSM Funds |
FINANCIAL HIGHLIGHTS |
|
| |
| | | | | | | | | | | | | | | | | | | | | | | | | | | | | | | |
| | Small/Mid Cap Core Fund | |
| | | |
| | Institutional | | | | | | | | Service | | | | | | | |
| | | | | | | | | | | | | | | | | |
| | April 29, 20111
Through
March 31,
2012 | | Year Ended
March 31,
2012 | | Year Ended
March 31,
2011 | | Year Ended
March 31,
2010 | | Year Ended
March 31,
2009 | | Year Ended
March 31,
2008 | |
| | | | | | | | | | | | | |
Per share data for a share of capital stock | | | | | | | | | | | | | | | | | | | | | | | | | | | | | | | |
outstanding for the entire year and | | | | | | | | | | | | | | | | | | | | | | | | | | | | | | | |
selected information for the year are as | | | | | | | | | | | | | | | | | | | | | | | | | | | | | | | |
follows: | | | | | | | | | | | | | | | | | | | | | | | | | | | | | | | |
Net asset value, beginning of period | | | $ | 11.99 | | | | $ | 11.61 | | | | $ | 9.46 | | | | $ | 5.69 | | | | $ | 9.24 | | | | $ | 11.95 | | |
Income from investment operations: | | | | | | | | | | | | | | | | | | | | | | | | | | | | | | | |
Net investment income (loss) | | | | — | | | | | (0.09 | ) | | | | (0.05 | ) | | | | 0.01 | | | | | 0.08 | | | | | 0.08 | | |
Net realized and unrealized gains (losses) | | | | | | | | | | | | | | | | | | | | | | | | | | | | | | | |
on investments | | | | (0.43 | ) | | | | (0.02 | ) | | | | 2.20 | | | | | 3.78 | | | | | (3.56 | ) | | | | (2.36 | ) | |
| | | | | | | | | | | | | | | | | | | | | | | | | | | | | | | |
Total from investment operations | | | | (0.43 | ) | | | | (0.11 | ) | | | | 2.15 | | | | | 3.79 | | | | | (3.48 | ) | | | | (2.28 | ) | |
| | | | | | | | | | | | | | | | | | | | | | | | | | | | | | | |
Less distributions: | | | | | | | | | | | | | | | | | | | | | | | | | | | | | | | |
Dividends from net investment income | | | | — | | | | | — | | | | | — | | | | | — | * | | | | (0.07 | ) | | | | (0.08 | ) | |
Dividends from net realized gains | | | | — | | | | | — | | | | | — | | | | | — | | | | | — | | | | | (0.35 | ) | |
Return of capital | | | | — | | | | | — | | | | | — | | | | | (0.02 | ) | | | | — | * | | | | — | * | |
| | | | | | | | | | | | | | | | | | | | | | | | | | | | | | | |
Total distributions | | | | — | | | | | — | | | | | — | | | | | (0.02 | ) | | | | (0.07 | ) | | | | (0.43 | ) | |
| | | | | | | | | | | | | | | | | | | | | | | | | | | | | | | |
Net asset value, end of period | | | $ | 11.56 | | | | $ | 11.50 | | | | $ | 11.61 | | | | $ | 9.46 | | | | $ | 5.69 | | | | $ | 9.24 | | |
| | | | | | | | | | | | | | | | | | | | | | | | | | | | | | | |
Total return | | | | -3.59 | %2 | | | | -0.95 | % | | | | 22.73 | % | | | 66.39 | % | | | -37.59 | % | | | -19.47 | % | |
Supplemental data and ratios: | | | | | | | | | | | | | | | | | | | | | | | | | | | | | | | |
Net assets, end of period | | $30,106,471 | | | $47,944,286 | | | $42,748,789 | | | $42,649,488 | | | $45,179,654 | | | $99,548,384 | | |
Ratio of expenses to average net assets | | | | | | | | | | | | | | | | | | | | | | | | | | | | | | | |
Before expense reimbursement | | | | | | | | | | | | | | | | | | | | | | | | | | | | | | | |
(recapture) and securities lending | | | | | | | | | | | | | | | | | | | | | | | | | | | | | | | |
credit | | | | 1.22 | %3 | | | | 1.74 | % | | | | 1.71 | % | | | | 1.67 | % | | | | 1.59 | % | | | | 1.48 | % | |
After expense reimbursement | | | | | | | | | | | | | | | | | | | | | | | | | | | | | | | |
(recapture) and securities lending | | | | | | | | | | | | | | | | | | | | | | | | | | | | | | | |
credit | | | | 1.09 | %3 | | | | 1.59 | % | | | | 1.59 | % | | | | 1.59 | % | | | | 1.28 | % | | | | 1.40 | % | |
Ratio of net investment income (loss) to | | | | | | | | | | | | | | | | | | | | | | | | | | | | | | | |
average net assets | | | | | | | | | | | | | | | | | | | | | | | | | | | | | | | |
Before expense reimbursement | | | | | | | | | | | | | | | | | | | | | | | | | | | | | | | |
(recapture) and securities lending | | | | | | | | | | | | | | | | | | | | | | | | | | | | | | | |
credit | | | -0.10 | %3 | | | | -0.82 | % | | | | -0.66 | % | | | | -0.06 | % | | | | 0.58 | % | | | | 0.61 | % | |
After expense reimbursement | | | | | | | | | | | | | | | | | | | | | | | | | | | | | | | |
(recapture) and securities lending | | | | | | | | | | | | | | | | | | | | | | | | | | | | | | | |
credit | | | | 0.03 | %3 | | | | -0.67 | % | | | | -0.54 | % | | | | 0.02 | % | | | | 0.89 | % | | | | 0.69 | % | |
Portfolio turnover rate | | 245.95 | % | | 245.95 | % | | 44.75 | % | | 52.31 | % | | 65.97 | % | | 127.62 | % | |
Portfolio turnover is calculated for the Fund as a whole.
| |
1 | Commencement of operations. |
2 | Not annualized. |
3 | Annualized. |
* | Amount represents less than $0.01 per share. |
See notes to financial statements.
115
|
GuideMarkSM Funds & GuidePathSM Funds |
FINANCIAL HIGHLIGHTS |
|
| |
| | | | | | | | | | | | | | | | | | | | | | | | | | | | | | | |
| | World ex-US Fund | |
| | | |
| | Institutional | | | | | Service | | | | |
| | | | | | | | | | | | | | | | |
| | April 29, 20111
Through
March 31,
2012 | | Year Ended
March 31,
2012 | | Year Ended
March 31,
2011 | | Year Ended
March 31,
2010 | | Year Ended
March 31,
2009 | | Year Ended
March 31,
2008 | |
| | | | | | | | | | | | | |
Per share data for a share of capital stock | | | | | | | | | | | | | | | | | | | | | | | | | | | | | | | |
outstanding for the entire year and | | | | | | | | | | | | | | | | | | | | | | | | | | | | | | | |
selected information for the year are as | | | | | | | | | | | | | | | | | | | | | | | | | | | | | | | |
follows: | | | | | | | | | | | | | | | | | | | | | | | | | | | | | | | |
Net asset value, beginning of period | | | $ | 8.75 | | | | $ | 8.39 | | | | $ | 8.01 | | | | $ | 5.80 | | | | $ | 11.96 | | | | $ | 14.73 | | |
Income from investment operations: | | | | | | | | | | | | | | | | | | | | | | | | | | | | | | | |
Net investment income | | | | 0.07 | | | | | 0.12 | | | | | 0.11 | | | | | 0.20 | | | | | 0.25 | | | | | 0.13 | | |
Net realized and unrealized gains (losses) | | | | | | | | | | | | | | | | | | | | | | | | | | | | | | | |
on investments | | | | (1.17 | ) | | | | (0.88 | ) | | | | 0.40 | | | | | 2.22 | | | | | (6.26 | ) | | | | (0.44 | ) | |
| | | | | | | | | | | | | | | | | | | | | | | | | | | | | | | |
Total from investment operations | | | | (1.10 | ) | | | | (0.76 | ) | | | | 0.51 | | | | | 2.42 | | | | | (6.01 | ) | | | | (0.31 | ) | |
| | | | | | | | | | | | | | | | | | | | | | | | | | | | | | | |
Less distributions: | | | | | | | | | | | | | | | | | | | | | | | | | | | | | | | |
Dividends from net investment income | | | | (0.13 | ) | | | | (0.09 | ) | | | | (0.13 | ) | | | | (0.21 | ) | | | | (0.07 | ) | | | | (0.14 | ) | |
Dividends from net realized gains | | | | — | | | | | — | | | | | — | | | | | — | | | | | (0.08 | ) | | | | (2.32 | ) | |
| | | | | | | | | | | | | | | | | | | | | | | | | | | | | | | |
Total distributions | | | | (0.13 | ) | | | | (0.09 | ) | | | | (0.13 | ) | | | | (0.21 | ) | | | | (0.15 | ) | | | | (2.46 | ) | |
| | | | | | | | | | | | | | | | | | | | | | | | | | | | | | | |
Net asset value, end of period | | | $ | 7.52 | | | | $ | 7.54 | | | | $ | 8.39 | | | | $ | 8.01 | | | | $ | 5.80 | | | | $ | 11.96 | | |
| | | | | | | | | | | | | | | | | | | | | | | | | | | | | | | |
Total return | | | -12.34 | %2 | | | | -8.92 | % | | | | 6.48 | % | | | | 41.68 | % | | | -50.42 | % | | | | -3.85 | % | |
Supplemental data and ratios: | | | | | | | | | | | | | | | | | | | | | | | | | | | | | | | |
Net assets, end of period | | $40,623,156 | | | $185,300,082 | | | $269,702,069 | | | $269,621,569 | | | $223,339,201 | | | $681,622,030 | | |
Ratio of expenses to average net assets | | | | | | | | | | | | | | | | | | | | | | | | | | | | | | | |
Before expense reimbursement | | | | | | | | | | | | | | | | | | | | | | | | | | | | | | | |
(recapture) and securities lending | | | | | | | | | | | | | | | | | | | | | | | | | | | | | | | |
credit | | | | 1.08 | %3 | | | | 1.66 | % | | | | 1.50 | % | | | | 1.53 | % | | | | 1.53 | % | | | | 1.43 | % | |
After expense reimbursement | | | | | | | | | | | | | | | | | | | | | | | | | | | | | | | |
(recapture) and securities lending | | | | | | | | | | | | | | | | | | | | | | | | | | | | | | | |
credit | | | | 1.08 | %3 | | | | 1.59 | % | | | | 1.50 | % | | | | 1.53 | % | | | | 1.52 | % | | | | 1.42 | % | |
Ratio of net investment income to average | | | | | | | | | | | | | | | | | | | | | | | | | | | | | | | |
net assets | | | | | | | | | | | | | | | | | | | | | | | | | | | | | | | |
Before expense reimbursement | | | | | | | | | | | | | | | | | | | | | | | | | | | | | | | |
(recapture) and securities lending | | | | | | | | | | | | | | | | | | | | | | | | | | | | | | | |
credit | | | | 1.13 | %3 | | | | 1.11 | % | | | | 1.34 | % | | | | 2.01 | % | | | | 1.94 | % | | | | 0.87 | % | |
After expense reimbursement | | | | | | | | | | | | | | | | | | | | | | | | | | | | | | | |
(recapture) and securities lending | | | | | | | | | | | | | | | | | | | | | | | | | | | | | | | |
credit | | | | 1.13 | %3 | | | | 1.18 | % | | | | 1.34 | % | | | | 2.01 | % | | | | 1.95 | % | | | | 0.88 | % | |
Portfolio turnover rate | | 164.90 | % | | 164.90 | % | | 47.34 | % | | 65.33 | % | | 144.98 | % | | 119.13 | % | |
| |
Portfolio turnover is calculated for the Fund as a whole. |
| |
1 | Commencement of operations. |
2 | Not annualized. |
3 | Annualized. |
See notes to financial statements.
116
|
GuideMarkSM Funds & GuidePathSM Funds |
FINANCIAL HIGHLIGHTS |
|
| |
| | | | | | | | | | | | | | | | | | | | | |
| | Opportunistic Equity Fund | | Global Real Return Fund | |
| | | | | |
| | Institutional | | Service | | Institutional | | Service | |
| | | | | | | | | |
| | April 29, 20111
Through
March 31,
2012 | | Year Ended
March 31,
2012 | | April 29, 20111
Through
March 31,
2012 | | Year Ended
March 31,
2012 | |
| | | | | | | | | |
Per share data for a share of capital stock | | | | | | | | | | | | | | | | | | | | | |
outstanding for the entire year and selected | | | | | | | | | | | | | | | | | | | | | |
information for the year are as follows: | | | | | | | | | | | | | | | | | | | | | |
Net asset value, beginning of period | | | $ | 10.21 | | | | $ | 10.00 | | | | $ | 10.31 | | | | $ | 10.00 | | |
Income from investment operations: | | | | | | | | | | | | | | | | | | | | | |
Net investment income (loss) | | | | 0.02 | | | | | (0.02 | ) | | | | 0.10 | | | | | 0.07 | | |
Net realized and unrealized losses on | | | | | | | | | | | | | | | | | | | | | |
investments | | | | (0.32 | ) | | | | (0.12 | ) | | | | (0.88 | ) | | | | (0.59 | ) | |
| | | | | | | | | | | | | | | | | | | | | |
Total from investment operations | | | | (0.30 | ) | | | | (0.14 | ) | | | | (0.78 | ) | | | | (0.52 | ) | |
| | | | | | | | | | | | | | | | | | | | | |
Less distributions: | | | | | | | | | | | | | | | | | | | | | |
Dividends from net investment income | | | | — | | | | | — | | | | | (0.17 | ) | | | | (0.08 | ) | |
Return of capital | | | | — | | | | | — | | | | | (0.01 | ) | | | | — | * | |
| | | | | | | | | | | | | | | | | | | | | |
Total distributions | | | | — | | | | | — | | | | | (0.18 | ) | | | | (0.08 | ) | |
| | | | | | | | | | | | | | | | | | | | | |
Net asset value, end of period | | | $ | 9.91 | | | | $ | 9.86 | | | | $ | 9.35 | | | | $ | 9.40 | | |
| | | | | | | | | | | | | | | | | | | | | |
Total return | | | | -2.94 | %2 | | | | -1.40 | % | | | | -7.48 | %2 | | | | -5.09 | % | |
Supplemental data and ratios: | | | | | | | | | | | | | | | | | | | | | |
Net assets, end of period | | $46,233,165 | | | $114,222,234 | | | $10,423,221 | | | $103,580,116 | | |
Ratio of expenses to average net assets | | | | | | | | | | | | | | | | | | | | | |
Before expense reimbursement (recapture) | | | | | | | | | | | | | | | | | | | | | |
and securities lending credit | | | | 1.05 | %3 | | | | 1.63 | % | | | | 0.89 | %3 | | | | 1.47 | % | |
After expense reimbursement (recapture) | | | | | | | | | | | | | | | | | | | | | |
and securities lending credit | | | | 1.03 | %3 | | | | 1.60 | % | | | | 0.82 | %3 | | | | 1.44 | % | |
Ratio of net investment income (loss) to | | | | | | | | | | | | | | | | | | | | | |
average net assets | | | | | | | | | | | | | | | | | | | | | |
Before expense reimbursement (recapture) | | | | | | | | | | | | | | | | | | | | | |
and securities lending credit | | | | 0.45 | %3 | | | | -0.19 | % | | | | 1.08 | %3 | | | | 0.72 | % | |
After expense reimbursement (recapture) | | | | | | | | | | | | | | | | | | | | | |
and securities lending credit | | | | 0.47 | %3 | | | | -0.16 | % | | | | 1.15 | %3 | | | | 0.75 | % | |
Portfolio turnover rate | | 91.59 | % | | 91.59 | % | | 55.11 | % | | 55.11 | % | |
| |
Portfolio turnover is calculated for the Fund as a whole. |
1 | Commencement of operations. |
2 | Not annualized. |
3 | Annualized. |
* | Amount represents less than $0.01 per share. |
See notes to financial statements.
117
|
GuideMarkSM Funds & GuidePathSM Funds |
FINANCIAL HIGHLIGHTS |
|
| |
| | | | | | | | | | | | | | | | | | | | | | | | | | | | | | | |
| | Core Fixed Income Fund | |
| | | |
| | Institutional | | Service | |
| | | | | |
| | April 29, 20111
Through
March 31,
2012 | | Year Ended
March 31,
2012 | | Year Ended
March 31,
2011 | | Year Ended
March 31,
2010 | | Year Ended
March 31,
2009 | | Year Ended
March 31,
2008 | |
| | | | | | | | | | | | | |
Per share data for a share of capital stock | | | | | | | | | | | | | | | | | | | | | | | | | | | | | | | |
outstanding for the entire year and | | | | | | | | | | | | | | | | | | | | | | | | | | | | | | | |
selected information for the year are as | | | | | | | | | | | | | | | | | | | | | | | | | | | | | | | |
follows: | | | | | | | | | | | | | | | | | | | | | | | | | | | | | | | |
Net asset value, beginning of period | | | $ | 9.48 | | | | $ | 9.36 | | | | $ | 9.10 | | | | $ | 7.92 | | | | $ | 9.20 | | | | $ | 9.27 | | |
Income from investment operations: | | | | | | | | | | | | | | | | | | | | | | | | | | | | | | | |
Net investment income | | | | 0.21 | | | | | 0.17 | | | | | 0.21 | | | | | 0.33 | | | | | 0.41 | | | | | 0.41 | | |
Net realized and unrealized gains (losses) | | | | | | | | | | | | | | | | | | | | | | | | | | | | | | | |
on investments | | | | 0.31 | | | | | 0.42 | | | | | 0.29 | | | | | 1.17 | | | | | (1.11 | ) | | | | (0.06 | ) | |
| | | | | | | | | | | | | | | | | | | | | | | | | | | | | | | |
Total from investment operations | | | | 0.52 | | | | | 0.59 | | | | | 0.50 | | | | | 1.50 | | | | | (0.70 | ) | | | | 0.35 | | |
| | | | | | | | | | | | | | | | | | | | | | | | | | | | | | | |
Less distributions: | | | | | | | | | | | | | | | | | | | | | | | | | | | | | | | |
Dividends from net investment income | | | | (0.23 | ) | | | | (0.17 | ) | | | | (0.24 | ) | | | | (0.32 | ) | | | | (0.40 | ) | | | | (0.41 | ) | |
Dividends from net realized gains | | | | — | | | | | — | | | | | — | | | | | — | | | | | (0.18 | ) | | | | (0.01 | ) | |
| | | | | | | | | | | | | | | | | | | | | | | | | | | | | | | |
Total distributions | | | | (0.23 | ) | | | | (0.17 | ) | | | | (0.24 | ) | | | | (0.32 | ) | | | | (0.58 | ) | | | | (0.42 | ) | |
| | | | | | | | | | | | | | | | | | | | | | | | | | | | | | | |
Net asset value, end of period | | | $ | 9.77 | | | | $ | 9.78 | | | | $ | 9.36 | | | | $ | 9.10 | | | | $ | 7.92 | | | | $ | 9.20 | | |
| | | | | | | | | | | | | | | | | | | | | | | | | | | | | | | |
Total return | | | | 5.56 | %2 | | | | 6.35 | % | | | | 5.58 | % | | | | 19.21 | % | | | | -7.57 | % | | | | 3.87 | % | |
Supplemental data and ratios: | | | | | | | | | | | | | | | | | | | | | | | | | | | | | | | |
Net assets, end of period | | $31,999,581 | | | $435,281,520 | | | $581,940,962 | | | $547,963,751 | | | $504,451,429 | | | $804,085,918 | | |
Ratio of expenses to average net assets | | | | | | | | | | | | | | | | | | | | | | | | | | | | | | | |
Before expense reimbursement | | | | | | | | | | | | | | | | | | | | | | | | | | | | | | | |
(recapture) and securities lending | | | | | | | | | | | | | | | | | | | | | | | | | | | | | | | |
credit | | | | 0.70 | %3 | | | | 1.28 | % | | | | 1.25 | % | | | | 1.28 | % | | | | 1.26 | % | | | | 1.18 | % | |
After expense reimbursement | | | | | | | | | | | | | | | | | | | | | | | | | | | | | | | |
(recapture) and securities lending | | | | | | | | | | | | | | | | | | | | | | | | | | | | | | | |
credit | | | | 0.69 | %3 | | | | 1.26 | % | | | | 1.24 | % | | | | 1.25 | % | | | | 1.18 | % | | | | 1.13 | % | |
Ratio of net investment income to average | | | | | | | | | | | | | | | | | | | | | | | | | | | | | | | |
net assets | | | | | | | | | | | | | | | | | | | | | | | | | | | | | | | |
Before expense reimbursement | | | | | | | | | | | | | | | | | | | | | | | | | | | | | | | |
(recapture) and securities lending | | | | | | | | | | | | | | | | | | | | | | | | | | | | | | | |
credit | | | | 2.14 | %3 | | | | 1.68 | % | | | | 2.23 | % | | | | 3.71 | % | | | | 4.54 | % | | | | 4.37 | % | |
After expense reimbursement | | | | | | | | | | | | | | | | | | | | | | | | | | | | | | | |
(recapture) and securities lending | | | | | | | | | | | | | | | | | | | | | | | | | | | | | | | |
credit | | | | 2.15 | %3 | | | | 1.70 | % | | | | 2.24 | % | | | | 3.74 | % | | | | 4.62 | % | | | | 4.42 | % | |
Portfolio turnover rate | | 427.36 | % | | 427.36 | % | | 485.40 | % | | 224.89 | % | | 261.77 | % | | 307.52 | % | |
| |
Portfolio turnover is calculated for the Fund as a whole. |
1 | Commencement of operations. |
2 | Not annualized. |
3 | Annualized. |
See notes to financial statements.
118
|
GuideMarkSM Funds & GuidePathSM Funds |
FINANCIAL HIGHLIGHTS |
|
| |
| | | | | | | | | | | | | | | | | | | | | | | | | | |
| | Tax-Exempt Fixed Income Fund | |
| | | |
| | Service | |
| | | |
| | Year Ended
March 31,
2012 | | Year Ended
March 31,
2011 | | Year Ended
March 31,
2010 | | Year Ended
March 31,
2009 | | Year Ended
March 31,
2008 | |
| | | | | | | | | | | |
Per share data for a share of capital stock | | | | | | | | | | | | | | | | | | | | | | | | | | |
outstanding for the entire year and | | | | | | | | | | | | | | | | | | | | | | | | | | |
selected information for the year are as | | | | | | | | | | | | | | | | | | | | | | | | | | |
follows: | | | | | | | | | | | | | | | | | | | | | | | | | | |
Net asset value, beginning of year | | | $ | 10.67 | | | | $ | 10.94 | | | | $ | 10.27 | | | | $ | 10.64 | | | | $ | 10.92 | | |
Income from investment operations: | | | | | | | | | | | | | | | | | | | | | | | | | | |
Net investment income | | | | 0.37 | | | | | 0.36 | | | | | 0.36 | | | | | 0.34 | | | | | 0.31 | | |
Net realized and unrealized gains (losses) | | | | | | | | | | | | | | | | | | | | | | | | | | |
on investments | | | | 0.80 | | | | | (0.26 | ) | | | | 0.66 | | | | | (0.37 | ) | | | | (0.28 | ) | |
| | | | | | | | | | | | | | | | | | | | | | | | | | |
Total from investment operations | | | | 1.17 | | | | | 0.10 | | | | | 1.02 | | | | | (0.03 | ) | | | | 0.03 | | |
| | | | | | | | | | | | | | | | | | | | | | | | | | |
Less distributions: | | | | | | | | | | | | | | | | | | | | | | | | | | |
Dividends from net investment income | | | | (0.37 | ) | | | | (0.37 | ) | | | | (0.35 | ) | | | | (0.34 | ) | | | | (0.31 | ) | |
| | | | | | | | | | | | | | | | | | | | | | | | | | |
Total distributions | | | | (0.37 | ) | | | | (0.37 | ) | | | | (0.35 | ) | | | | (0.34 | ) | | | | (0.31 | ) | |
| | | | | | | | | | | | | | | | | | | | | | | | | | |
Net asset value, end of year | | | $ | 11.47 | | | | $ | 10.67 | | | | $ | 10.94 | | | | $ | 10.27 | | | | $ | 10.64 | | |
| | | | | | | | | | | | | | | | | | | | | | | | | | |
Total return | | | | 11.10 | % | | | | 0.89 | % | | | | 10.06 | % | | | | -0.25 | % | | | | 0.28 | % | |
Supplemental data and ratios: | | | | | | | | | | | | | | | | | | | | | | | | | | |
Net assets, end of year | | $81,408,890 | | | $170,330,144 | | | $195,328,951 | | | $193,579,910 | | | $257,440,133 | | |
Ratio of expenses to average net assets | | | | | | | | | | | | | | | | | | | | | | | | | | |
Before expense reimbursement | | | | | | | | | | | | | | | | | | | | | | | | | | |
(recapture) | | | | 1.31 | % | | | | 1.29 | % | | | | 1.30 | % | | | | 1.30 | % | | | | 1.23 | % | |
After expense reimbursement | | | | | | | | | | | | | | | | | | | | | | | | | | |
(recapture) | | | | 1.29 | % | | | | 1.29 | % | | | | 1.29 | % | | | | 1.29 | % | | | | 1.23 | % | |
Ratio of net investment income to average | | | | | | | | | | | | | | | | | | | | | | | | | | |
net assets | | | | | | | | | | | | | | | | | | | | | | | | | | |
Before expense reimbursement | | | | | | | | | | | | | | | | | | | | | | | | | | |
(recapture) | | | | 3.16 | % | | | | 3.25 | % | | | | 3.30 | % | | | | 3.09 | % | | | | 2.93 | % | |
After expense reimbursement | | | | | | | | | | | | | | | | | | | | | | | | | | |
(recapture) | | | | 3.18 | % | | | | 3.25 | % | | | | 3.31 | % | | | | 3.10 | % | | | | 2.93 | % | |
Portfolio turnover rate | | 38.80 | % | | 38.01 | % | | 57.44 | % | | 44.37 | % | | 66.26 | % | |
See notes to financial statements.
119
|
GuideMarkSM Funds & GuidePathSM Funds |
FINANCIAL HIGHLIGHTS |
|
| |
| | | | | | | | | | | |
| | Opportunistic Fixed Income Fund | |
| | | |
| | Institutional | | Service | |
| | | | | |
| | April 29, 20111
Through
March 31,
2012 | | Year Ended
March 31,
2012 | |
| | | | | |
Per share data for a share of capital stock | | | | | | | | | | | |
outstanding for the entire year and selected | | | | | | | | | | | |
information for the year are as follows: | | | | | | | | | | | |
Net asset value, beginning of period | | | $ | 10.07 | | | | $ | 10.00 | | |
Income from investment operations: | | | | | | | | | | | |
Net investment income | | | | 0.35 | | | | | 0.34 | | |
Net realized and unrealized losses | | | | | | | | | | | |
on investments | | | | (0.34 | ) | | | | (0.31 | ) | |
| | | | | | | | | | | |
Total from investment operations | | | | 0.01 | | | | | 0.03 | | |
| | | | | | | | | | | |
Less distributions: | | | | | | | | | | | |
Dividends from net investment income | | | | (0.38 | ) | | | | (0.33 | ) | |
| | | | | | | | | | | |
Total distributions | | | | (0.38 | ) | | | | (0.33 | ) | |
| | | | | | | | | | | |
Net asset value, end of period | | | $ | 9.70 | | | | $ | 9.70 | | |
| | | | | | | | | | | |
Total return | | | | 0.29 | %2 | | | | 0.56 | % | |
Supplemental data and ratios: | | | | | | | | | | | |
Net assets, end of period | | $38,403,168 | | | $204,104,609 | | |
Ratio of expenses to average net assets | | | | | | | | | | | |
Before expense reimbursement (recapture) | | | | 1.13 | %3 | | | | 1.63 | % | |
After expense reimbursement (recapture) | | | | 1.05 | %3 | | | | 1.55 | % | |
Ratio of net investment income to average | | | | | | | | | | | |
net assets | | | | | | | | | | | |
Before expense reimbursement (recapture) | | | | 4.20 | %3 | | | | 3.49 | % | |
After expense reimbursement (recapture) | | | | 4.28 | %3 | | | | 3.57 | % | |
Portfolio turnover rate | | 86.54 | % | | 86.54 | % | |
| |
Portfolio turnover is calculated for the Fund as a whole. |
1 | Commencement of operations. |
2 | Not annualized. |
3 | Annualized. |
See notes to financial statements.
120
|
GuideMarkSM Funds & GuidePathSM Funds |
FINANCIAL HIGHLIGHTS |
|
| |
| | | | | | | | | | | | | | | | | | | | | |
| | Strategic
Asset Allocation
Fund | | Tactical
Constrained
Asset Allocation
Fund | | Tactical
Unconstrained
Asset Allocation
Fund | | Absolute
Return
Asset Allocation
Fund | |
| | | | | | | | | |
| | Service | |
| | | |
| | April 29, 20111
Through
March 31,
2012 | | April 29, 20111
Through
March 31,
2012 | | April 29, 20111
Through
March 31,
2012 | | April 29, 20111
Through
March 31,
2012 | |
| | | | | | | | | |
Per share data for a share of capital stock | | | | | | | | | | | | | | | | | | | | | |
outstanding for the entire year and selected | | | | | | | | | | | | | | | | | | | | | |
information for the year are as follows: | | | | | | | | | | | | | | | | | | | | | |
Net asset value, beginning of period | | | $ | 10.00 | | | | $ | 10.00 | | | | $ | 10.00 | | | | $ | 10.00 | | |
Income from investment operations: | | | | | | | | | | | | | | | | | | | | | |
Net investment income | | | | 0.08 | | | | | 0.09 | | | | | 0.06 | | | | | 0.09 | | |
Net realized and unrealized gains (losses) | | | | | | | | | | | | | | | | | | | | | |
on investments | | | | (0.52 | ) | | | | (0.24 | ) | | | | (0.47 | ) | | | | 0.01 | | |
| | | | | | | | | | | | | | | | | | | | | |
Total from investment operations | | | | (0.44 | ) | | | | (0.15 | ) | | | | (0.41 | ) | | | | 0.10 | | |
| | | | | | | | | | | | | | | | | | | | | |
Less distributions: | | | | | | | | | | | | | | | | | | | | | |
Dividends from net investment income | | | | (0.10 | ) | | | | (0.09 | ) | | | | (0.05 | ) | | | | (0.06 | ) | |
Return of capital | | | | — | * | | | | — | | | | | — | | | | | — | | |
| | | | | | | | | | | | | | | | | | | | | |
Total distributions | | | | (0.10 | ) | | | | (0.09 | ) | | | | (0.05 | ) | | | | (0.06 | ) | |
| | | | | | | | | | | | | | | | | | | | | |
Net asset value, end of period | | | $ | 9.46 | | | | $ | 9.76 | | | | $ | 9.54 | | | | $ | 10.04 | | |
| | | | | | | | | | | | | | | | | | | | | |
Total return | | | | -4.30 | %2 | | | | -1.43 | %2 | | | | -4.09 | %2 | | | | 1.01 | %2 | |
Supplemental data and ratios: | | | | | | | | | | | | | | | | | | | | | |
Net assets, end of period | | $144,649,234 | | | $143,145,114 | | | $184,703,438 | | | $238,654,697 | | |
Ratio of expenses to average net assets | | | | | | | | | | | | | | | | | | | | | |
Before expense reimbursement (recapture) | | | | | | | | | | | | | | | | | | | | | |
and securities lending credit | | | | 1.22 | %3 | | | | 1.25 | %3 | | | | 1.32 | %3 | | | | 1.28 | %3 | |
After expense reimbursement (recapture) | | | | | | | | | | | | | | | | | | | | | |
and securities lending credit | | | | 1.00 | %3 | | | | 1.00 | %3 | | | | 1.10 | %3 | | | | 1.10 | %3 | |
Ratio of net investment income to average | | | | | | | | | | | | | | | | | | | | | |
net assets | | | | | | | | | | | | | | | | | | | | | |
Before expense reimbursement (recapture) | | | | | | | | | | | | | | | | | | | | | |
and securities lending credit | | | | 1.12 | %3 | | | | 1.33 | %3 | | | | 0.90 | %3 | | | | 1.54 | %3 | |
After expense reimbursement (recapture) | | | | | | | | | | | | | | | | | | | | | |
and securities lending credit | | | | 1.34 | %3 | | | | 1.58 | %3 | | | | 1.12 | %3 | | | | 1.72 | %3 | |
Portfolio turnover rate | | 14.40 | %2 | | 50.86 | %2 | | 293.90 | %2 | | 136.33 | %2 | |
| |
1 | Commencement of operations. |
2 | Not annualized. |
3 | Annualized. |
* | Amount represents less than $0.01 per share. |
See notes to financial statements.
121
|
GuideMarkSM Funds & GuidePathSM Funds |
NOTES TO FINANCIAL STATEMENTS |
March 31, 2012 |
| |
| |
1. | Organization |
| |
| GPS Funds I (formerly, AssetMark Funds) and GPS Funds II (the “Trusts”) are organized as Delaware statutory trusts under Declarations of Trusts dated January 2, 2001 and October 20, 2010, respectively. The Trusts are registered under the Investment Company Act of 1940, as amended (the “1940 Act”), as open-end management investment companies. GPS Funds I is comprised of the following 7 funds: GuideMarkSM Large Cap Growth Fund, GuideMarkSM Large Cap Value Fund, GuideMarkSM Small/Mid Cap Core Fund, GuideMarkSM World ex-US Fund, GuideMarkSM Opportunistic Equity Fund, GuideMarkSM Core Fixed Income Fund, GuideMarkSM Tax-Exempt Fixed Income Fund and GPS II is comprised of the following 6 funds: GuideMarkSM Global Real Return Fund, GuideMarkSM Opportunistic Fixed Income Fund, GuidePathSM Strategic Asset Allocation Fund, GuidePathSM Tactical Constrained Asset Allocation Fund, GuidePathSM Tactical Unconstrained Asset Allocation Fund and GuidePathSM Absolute Return Asset Allocation Fund (collectively, the “Funds”). All of the Funds, except for the GuideMarkSM Opportunistic Fixed Income Fund, are classified and operate as diversified funds under the 1940 Act. The GuideMarkSM Opportunistic Fixed Income Fund is classified as non-diversified. Each Fund represents a distinct portfolio with its own investment objectives and policies. The assets of each Fund are segregated, and a shareholder’s interest is limited to the Fund in which shares are held. Effective April 1, 2011, the GuideMarkSM Large Cap Growth Fund, GuideMarkSM Large Cap Value Fund, GuideMarkSM Small/Mid Cap Core Fund, GuideMarkSM World ex-US Fund, GuideMarkSM Core Fixed Income Fund and GuideMarkSM Tax-Exempt Fixed Income Fund completed a restructuring to become the GuideMarkSM Funds. The GuideMarkSM Global Real Return Fund, GuideMarkSM Opportunistic Fixed Income Fund, GuidePathSM Strategic Asset Allocation Fund, GuidePathSM Tactical Constrained Asset Allocation Fund, GuidePathSM Tactical Unconstrained Asset Allocation Fund and GuidePathSM Absolute Return Asset Allocation Fund were seeded on March 4, 2011 |
| | |
| and the prospectus went effective on April 1, 2011. As of April 1, 2011, the GuideMarkSM Opportunistic Equity Fund, GuideMarkSM Global Real Return Fund and GuideMarkSM Opportunistic Fixed Income Fund commenced operations. As of April 29, 2011, the GuidePathSM Strategic Asset Allocation Fund, GuidePathSM Tactical Constrained Asset Allocation Fund, GuidePathSM Tactical Unconstrained Asset Allocation Fund and GuidePathSM Absolute Return Asset Allocation Fund commenced operations. Each Fund offers two classes of shares: Service Shares and Institutional Shares. |
| | |
2. | Significant Accounting Policies |
| | |
| The following is a summary of significant accounting policies consistently followed by the Funds in the preparation of the financial statements. These policies are in conformity with U.S. generally accepted accounting principals (“GAAP”). |
| | |
| (a) | Investment Valuation
Portfolio securities listed on a national or foreign securities exchange, except those listed on NASDAQ, for which market quotations are available are valued at the last quoted sale price on each business day. Portfolio securities traded on NASDAQ are valued at the NASDAQ Official Closing Price (“NOCP”) on each business day. If there is no reported sale on an exchange or NASDAQ, the portfolio security will be valued at the mean between the most recent quoted bid and asked price. Price information on listed securities is taken from the exchange where the security is primarily traded. |
| | |
| | All equity securities that are not traded on a listed exchange are valued at the last sale price in the over-the-counter market. If a non-exchange traded security does not trade on a particular day, then the mean between the last quoted closing bid and asked price will be used. Non-exchange traded ADRs are priced with an evaluated price as determined by the current evaluated pricing procedures of, and provided by, the pricing vendor.
Fixed income securities that have a maturity of greater than 60 days are generally valued on the basis |
122
|
GuideMarkSM Funds & GuidePathSM Funds |
NOTES TO FINANCIAL STATEMENTS (Continued) |
March 31, 2012 |
| |
| | |
| | of evaluations obtained from third party pricing services, which take into account appropriate factors such as institutional sized trading in similar groups of securities, yield, quality, coupon rate, maturity, type of issue, trading characteristics and other market data. Short term investments having a maturity of less than 60 days are valued at amortized cost. |
| | |
| | Investments in mutual funds are valued at the closing net asset value per share of each mutual fund on the day of valuation. |
| | |
| | Securities for which no market quotations are readily available or when a significant event has occurred between the time of the security’s last close and the time that a Fund next calculates its net asset value will be valued at their fair value as determined by the applicable Fund’s Valuation Committee. Securities for which no market prices are readily available will be valued at their fair value as determined by the Valuation Committee under procedures adopted by the applicable Board of Trustees. |
| | |
| Valuation Measurements |
| | |
| | The Funds have adopted authoritative fair valuation accounting standards that establish an authoritative definition of fair value and set out a hierarchy for measuring fair value. These standards require additional disclosures about the various inputs and valuation techniques used to develop the measurements of fair value and a discussion in changes in valuation techniques and related inputs, if any, during the period. In addition, these standards require expanded disclosure for each major category of assets. These inputs are summarized in the three broad levels listed below: |
| | |
| | Level 1 – Quoted prices in active markets for identical securities. |
| | |
| | Level 2 – Other significant observable inputs (including quoted prices for similar securities, interest rates, prepayment speeds, credit risk, etc.). |
| | |
| | Level 3 – Significant unobservable inputs (including the Fund’s own assumptions in determining the fair value of investments). |
| | |
| | During the period, certain of the securities and other instruments held by the Funds were categorized as Level 2 or Level 3 based upon the inputs and methodologies used to determine the fair value of the security or instrument. Descriptions of the inputs and valuation methodologies used to determine the fair values of each class of investments within Level 2 and Level 3 are set forth below. |
| | |
| | Level 2 Investments. The Funds’ investments that were categorized as Level 2 include: (1) certain fixed income securities, including asset backed securities, collateralized mortgage obligations, corporate obligations, U.S. and foreign government debt obligations, mortgage backed securities, municipal debt obligations, supranational obligations and U.S. treasuries; (2) certain common stocks, convertible preferred stocks and real estate investment trusts (“REIT”); and (3) certain over-the-counter derivative instruments, including forward currency contracts. |
| | |
| | Fixed income securities are normally valued by pricing vendors that use broker-dealer quotations, reported trades or valuation estimates from their internal pricing models. The service providers’ internal models typically use inputs that are observable such as institutional sized trading in similar groups of securities, yield, credit quality, coupon rate, maturity, type of issue, trading characteristics and other market data. |
| | |
| | Certain common stocks that trade on foreign exchanges are subject to valuation adjustments. These valuation adjustments are applied to the foreign exchange-traded common stocks to account for the market movement between the close of the foreign market in which the security is traded and the close of the New York Stock Exchange. These securities are valued using pricing vendors that consider the correlation patterns of price movements of the foreign security to the intraday trading in the U.S. markets. |
| | |
| | Foreign currency contracts derive their value from underlying asset prices, indices, reference rates, and other inputs or a combination of these factors. These |
123
|
GuideMarkSM Funds & GuidePathSM Funds |
NOTES TO FINANCIAL STATEMENTS (Continued) |
March 31, 2012 |
| |
|
| |
| instruments are normally valued using pricing vendors. Depending upon the instrument, its value may be provided by a pricing vendor using a series of techniques, including pricing models. The pricing models typically use inputs that are observed from active markets such as indices, spreads, interest rates, curves, dividends and exchange rates. |
| |
| Level 3 Investments. The Funds’ investments that were categorized as Level 3 include: (1) fair valued securities, including investments purchased as securities lending collateral and warrants. |
| |
| Certain of the Funds’ investments are normally valued by pricing vendors using relevant observable inputs, as described above. In certain circumstances, the types of observable inputs that are typically used by a pricing service may be unavailable or deemed by the pricing service to be unreliable. In these instances, the pricing vendor may value the security based upon significant unobservable inputs, or the pricing vendor may not provide a value for the security. To the extent that a pricing vendor does not provide a value for a particular security, or the pricing vendor provides a value that the Valuation Committee does not believe accurately reflects the value of the security, the security will be valued by the Valuation Committee based upon the information available to the Committee at the time of valuation and in accordance with procedures adopted by the Board. These methodologies may require subjective judgments and determinations about the value of a particular security. When significant unobservable inputs are used to value a security, the security is categorized as Level 3. |
| |
| The inputs or methodology used for valuing securities are not necessarily an indication of the risk associated with investing in those securities. The following is a summary of the inputs used to value the Funds’ net assets as of March 31, 2012: |
| |
| GuideMarkSM Large Cap Growth Fund |
| | | | | | | | | | | | | |
| | Level 1 | | Level 2 | | Level 3 | | Total | |
| | | | | | | | | |
Common Stocks | | $ | 198,287,230 | | $ | — | | $ | — | | $ | 198,287,230 | |
Short Term Investments | | | 1,913,212 | | | — | | | — | | | 1,913,212 | |
Investments Purchased as Securities
Lending Collateral | | | 3,049,530 | | | — | | | 792 | | | 3,050,322 | |
| | | | | | | | | | | | | |
Total Investments in Securities | | $ | 203,249,972 | | $ | — | | $ | 792 | | $ | 203,250,764 | |
| | | | | | | | | | | | | |
| |
| For further information regarding security characteristics, see the Schedule of Investments. There were no significant transfers in/out of Level 1 or 2. |
| |
| Level 3 Reconciliation Disclosure |
| |
| Following is a reconciliation of Level 3 assets for which significant unobservable inputs were used to determine fair value. |
| | | | | |
Description | | | Investments
in Securities | |
| | | | | |
Balance as of March 31, 2011 | | $ | 365 | |
Change in unrealized appreciation | | | 427 | |
| | | | |
Balance as of March 31, 2012 | | $ | 792 | |
| | | | |
Change in unrealized appreciation during the period
for Level 3 investments held at March 31, 2012. | | $ | 427 | |
| | | | |
124
|
GuideMarkSM Funds & GuidePathSM Funds |
NOTES TO FINANCIAL STATEMENTS (Continued) |
March 31, 2012 |
| |
| |
| GuideMarkSM Large Cap Value Fund |
| | | | | | | | | | | | | |
| | Level 1 | | Level 2 | | Level 3 | | Total | |
| | | | | | | | | |
Common Stocks | | $ | 193,661,845 | | $ | — | | $ | — | | $ | 193,661,845 | |
Real Estate Investment Trusts | | | 3,421,001 | | | — | | | — | | | 3,421,001 | |
Short Term Investments | | | 6,045,167 | | | — | | | — | | | 6,045,167 | |
Investments Purchased as Securities
Lending Collateral | | | 8,742,736 | | | — | | | 906 | | | 8,743,642 | |
| | | | | | | | | | | | | |
Total Investments in Securities | | $ | 211,870,749 | | $ | — | | $ | 906 | | $ | 211,871,655 | |
| | | | | | | | | | | | | |
| |
| For further information regarding security characteristics, see the Schedule of Investments. There were no significant transfers in/out of Level 1 or 2. |
| |
| Level 3 Reconciliation Disclosure |
| |
| Following is a reconciliation of Level 3 assets for which significant unobservable inputs were used to determine fair value. |
| | | | | |
Description | | | Investments
in Securities | |
| | | | | |
Balance as of March 31, 2011 | | $ | 418 | |
Change in unrealized appreciation | | | 488 | |
| | | | |
Balance as of March 31, 2012 | | $ | 906 | |
| | | | |
Change in unrealized appreciation during the period
for Level 3 investments held at March 31, 2012. | | $ | 488 | |
| | | | |
| |
| GuideMarkSM Small/Mid Cap Core Fund |
| | | | | | | | | | | | | |
| | Level 1 | | Level 2 | | Level 3 | | Total | |
| | | | | | | | | |
Common Stocks | | $ | 69,113,245 | | $ | — | | $ | — | | $ | 69,113,245 | |
Real Estate Investment Trusts | | | 6,538,180 | | | — | | | — | | | 6,538,180 | |
Short Term Investments | | | 2,305,953 | | | — | | | — | | | 2,305,953 | |
Investments Purchased as Securities
Lending Collateral | | | 4,436,364 | | | — | | | 247 | | | 4,436,611 | |
| | | | | | | | | | | | | |
Total Investments in Securities | | $ | 82,393,742 | | $ | — | | $ | 247 | | $ | 82,393,989 | |
| | | | | | | | | | | | | |
| |
| For further information regarding security characteristics, see the Schedule of Investments. There were no significant transfers in/out of Level 1 or 2. |
125
|
GuideMarkSM Funds & GuidePathSM Funds |
NOTES TO FINANCIAL STATEMENTS (Continued) |
March 31, 2012 |
| |
| |
| Level 3 Reconciliation Disclosure |
| |
| Following is a reconciliation of Level 3 assets for which significant unobservable inputs were used to determine fair value. |
| | | | | |
Description | | | Investments
in Securities | |
| | | | | |
Balance as of March 31, 2011 | | $ | 114 | |
Change in unrealized appreciation | | | 133 | |
| | | | |
Balance as of March 31, 2012 | | $ | 247 | |
| | | | |
Change in unrealized appreciation during the period
for Level 3 investments held at March 31, 2012. | | $ | 133 | |
| | | | |
| | | | | | | | | | | | | |
GuideMarkSM World ex-US Fund | |
| | Level 1 | | Level 2 | | Level 3 | | Total | |
| | | | | | | | | |
Common Stocks | | $ | 30,246,525 | | $ | 184,168,906 | | $ | — | | $ | 214,415,431 | |
Investment Companies | | | 4,012,920 | | | — | | | — | | | 4,012,920 | |
Preferred Stocks | | | 3,164,653 | | | — | | | — | | | 3,164,653 | |
Real Estate Investment Trusts | | | — | | | 1,295,011 | | | — | | | 1,295,011 | |
Short Term Investments | | | 1,281,924 | | | — | | | — | | | 1,281,924 | |
Investments Purchased as Securities
Lending Collateral | | | 589,055 | | | — | | | 216 | | | 589,271 | |
| | | | | | | | | | | | | |
Total Investments in Securities | | $ | 39,295,077 | | $ | 185,463,917 | | $ | 216 | | $ | 224,759,210 | |
| | | | | | | | | | | | | |
| |
| For further information regarding security characteristics, see the Schedule of Investments. There were no significant transfers in/out of Levels 1 or 2. |
| |
| Level 3 Reconciliation Disclosure |
| |
| Following is a reconciliation of Level 3 assets for which significant unobservable inputs were used to determine fair value. |
| | | | | |
Description | | | Investments
in Securities | |
| | | | | |
Balance as of March 31, 2011 | | $ | 100 | |
Change in unrealized appreciation | | | 116 | |
| | | | |
Balance as of March 31, 2012 | | $ | 216 | |
| | | | |
Change in unrealized appreciation during the period
for Level 3 investments held at March 31, 2012. | | $ | 116 | |
| | | | |
126
|
GuideMarkSM Funds & GuidePathSM Funds |
NOTES TO FINANCIAL STATEMENTS (Continued) |
March 31, 2012 |
| |
| | | | | | | | | | | | | |
GuideMarkSM Opportunistic Equity Fund | | | | | | | | | | | | | |
| | Level 1 | | Level 2 | | Level 3 | | Total | |
| | | | | | | | | |
Common Stocks | | $ | 147,288,922 | | $ | — | | $ | — | | $ | 147,288,922 | |
Real Estate Investment Trusts | | | 717,097 | | | — | | | — | | | 717,097 | |
Short Term Investments | | | 12,815,706 | | | — | | | — | | | 12,815,706 | |
Investments Purchased as Securities
Lending Collateral | | | 2,467,655 | | | — | | | — | | | 2,467,655 | |
| | | | | | | | | | | | | |
Total Investments in Securities | | $ | 163,289,380 | | $ | — | | $ | — | | $ | 163,289,380 | |
| | | | | | | | | | | | | |
| |
| For further information regarding security characteristics, see the Schedule of Investments. There were no significant transfers in/out of Level 1 or 2. |
| | | | | | | | | | | | | |
GuideMarkSM Global Real Return Fund | |
| | Level 1 | | Level 2 | | Level 3 | | Total | |
| | | | | | | | | |
Investment Companies | | $ | 113,569,519 | | $ | — | | $ | — | | $ | 113,569,519 | |
Short Term Investments | | | 600,268 | | | — | | | — | | | 600,268 | |
Investments Purchased as Securities
Lending Collateral | | | 23,182,671 | | | — | | | — | | | 23,182,671 | |
| | | | | | | | | | | | | |
Total Investments in Securities | | $ | 137,352,458 | | $ | — | | $ | — | | $ | 137,352,458 | |
| | | | | | | | | | | | | |
| |
| For further information regarding security characteristics, see the Schedule of Investments. There were no significant transfers in/out of Level 1 or 2. |
127
|
GuideMarkSM Funds & GuidePathSM Funds |
NOTES TO FINANCIAL STATEMENTS (Continued) |
March 31, 2012 |
| |
| | | | | | | | | | | | | |
GuideMarkSM Core Fixed Income Fund | | | | | | | | | | | | | |
| | Level 1 | | Level 2 | | Level 3 | | Total | |
| | | | | | | | | |
Fixed Income | | | | | | | | | | | | | |
Asset Backed Securities | | $ | — | | $ | 10,237,454 | | $ | — | | $ | 10,237,454 | |
Collateralized Mortgage Obligations | | | — | | | 15,484,064 | | | — | | | 15,484,064 | |
Corporate Obligations | | | — | | | 148,958,174 | | | — | | | 148,958,174 | |
Foreign Government Debt Obligations | | | — | | | 1,588,715 | | | — | | | 1,588,715 | |
Mortgage Backed Securities | | | — | | | 132,958,160 | | | — | | | 132,958,160 | |
Municipal Debt Obligations | | | — | | | 3,359,975 | | | — | | | 3,359,975 | |
Supranational Obligations | | | — | | | 4,970,179 | | | — | | | 4,970,179 | |
U.S. Government Agency Issues | | | — | | | 13,221,329 | | | — | | | 13,221,329 | |
U.S. Treasury Obligations | | | — | | | 126,641,374 | | | — | | | 126,641,374 | |
| | | | | | | | | | | | | |
Total Fixed Income | | | — | | | 457,419,424 | | | — | | | 457,419,424 | |
Preferred Stock | | | 470,227 | | | 2,353 | | | — | | | 472,580 | |
Warrants | | | — | | | 2,018 | | | — | | | 2,018 | |
Short Term Investments | | | 10,951,263 | | | 6,900,000 | | | — | | | 17,851,263 | |
Investments Purchased as Securities
Lending Collateral | | | 2,195,132 | | | — | | | 191 | | | 2,195,323 | |
| | | | | | | | | | | | | |
Total Investments in Securities | | $ | 13,616,622 | | $ | 464,323,795 | | $ | 191 | | $ | 477,940,608 | |
| | | | | | | | | | | | | |
| | | | | | | | | | | | | |
Other Financial Instruments* | | | | | | | | | | | | | |
Forward Sale Commitments | | $ | — | | $ | 1,080,313 | | $ | — | | $ | 1,080,313 | |
Futures | | | (198,569 | ) | | — | | | — | | | (198,569 | ) |
| | | | | | | | | | | | | |
Total | | $ | (198,569 | ) | $ | 1,080,313 | | $ | — | | $ | 881,744 | |
| | | | | | | | | | | | | |
| | |
| * | Other financial instruments are derivative instruments not reflected in the Schedule of Investments, such as forward sale commitments and futures. Futures are reflected at the unrealized appreciation (depreciation) on the instrument. Forward sale commitments are reflected at value. |
| |
| For further information regarding security characteristics, see the Schedule of Investments. There were no significant transfers in/out of Levels 1 or 2. |
| |
| Level 3 Reconciliation Disclosure |
| |
| Following is a reconciliation of Level 3 assets for which significant unobservable inputs were used to determine fair value. |
| | | | | |
Description | | | Investments
in Securities | |
| | | | | |
Balance as of March 31, 2011 | | $ | 88 | |
Change in unrealized appreciation | | | 103 | |
| | | | |
Balance as of March 31, 2012 | | $ | 191 | |
| | | | |
Change in unrealized appreciation during the period
for Level 3 investments held at March 31, 2012. | | $ | 103 | |
| | | | |
128
|
GuideMarkSM Funds & GuidePathSM Funds |
NOTES TO FINANCIAL STATEMENTS (Continued) |
March 31, 2012 |
| |
| | | | | | | | | | | | | |
GuideMarkSM Tax-Exempt Fixed Income Fund |
|
| | Level 1 | | Level 2 | | Level 3 | | Total | |
| | | | | | | | | |
Municipal Obligations | | $ | — | | $ | 80,986,691 | | $ | — | | $ | 80,986,691 | |
Short Term Investments | | | 381,452 | | | — | | | — | | | 381,452 | |
| | | | | | | | | | | | | |
Total Investments in Securities | | $ | 381,452 | | $ | 80,986,691 | | $ | — | | $ | 81,368,143 | |
| | | | | | | | | | | | | |
| |
| For further information regarding security characteristics, see the Schedule of Investments. There were no significant transfers in/out of Levels 1 or 2. |
| | | | | | | | | | | | | |
GuideMarkSM Opportunistic Fixed Income Fund |
|
| | Level 1 | | Level 2 | | Level 3 | | Total | |
| | | | | | | | | |
Equity | | | | | | | | | | | | | |
Common Stock | | $ | 4,505,414 | | $ | — | | $ | — | | $ | 4,505,414 | |
Convertible Preferred Stock | | | 1,265,085 | | | — | | | — | | | 1,265,085 | |
Preferred Stock | | | 654,000 | | | — | | | — | | | 654,000 | |
| | | | | | | | | | | | | |
Total Equity | | | 6,424,499 | | | — | | | — | | | 6,424,499 | |
| | | | | | | | | | | | | |
Fixed Income | | | | | | | | | | | | | |
Asset Backed Securities | | | — | | | 2,107,876 | | | — | | | 2,107,876 | |
Bank Loans | | | — | | | 6,612,429 | | | — | | | 6,612,429 | |
Collateralized Mortgage Obligations | | | — | | | 12,450,935 | | | — | | | 12,450,935 | |
Convertible Obligations | | | — | | | 3,330,375 | | | — | | | 3,330,375 | |
Corporate Obligations | | | — | | | 73,899,577 | | | — | | | 73,899,577 | |
Foreign Commercial Paper | | | — | | | 2,122,691 | | | — | | | 2,122,691 | |
Foreign Government Obligations | | | — | | | 100,637,275 | | | — | | | 100,637,275 | |
| | | | | | | | | | | | | |
Total Fixed Income | | | — | | | 201,161,158 | | | — | | | 201,161,158 | |
Purchased Options | | | 217,600 | | | 117,018 | | | — | | | 334,618 | |
Short Term Investments | | | 16,655,762 | | | 10,273,181 | | | — | | | 26,928,943 | |
| | | | | | | | | | | | | |
Total Investments in Securities | | $ | 23,297,861 | | $ | 211,551,357 | | $ | — | | $ | 234,849,218 | |
| | | | | | | | | | | | | |
| | | | | | | | | | | | | |
Other Financial Instruments* | | | | | | | | | | | | | |
Forward Currency Contracts | | $ | — | | $ | 1,455,757 | | $ | — | | $ | 1,455,757 | |
Futures | | | (27,055 | ) | | — | | | — | | | (27,055 | ) |
Options Written | | | 77,228 | | | — | | | — | | | 77,228 | |
Swaps | | | — | | | (50,343 | ) | | | | | (50,343 | ) |
| | | | | | | | | | | | | |
Total | | $ | 50,173 | | $ | 1,405,414 | | $ | — | | $ | 1,455,587 | |
| | | | | | | | | | | | | |
| | |
| * | Other financial instruments are derivative instruments not reflected in the Schedule of Investments, such as forward currency contracts, futures, swaps and options written. Forward currency contracts, futures and swaps are reflected at the unrealized appreciation (depreciation) on the instrument. Options written are reflected at value. |
| | |
| For further information regarding security characteristics, see the Schedule of Investments. There were no significant transfers in/out of Levels 1 or 2. |
129
|
GuideMarkSM Funds & GuidePathSM Funds |
NOTES TO FINANCIAL STATEMENTS (Continued) |
March 31, 2012 |
| |
| | | | | | | | | | | | | |
GuidePathSM Strategic Asset Allocation Fund |
| | | | | | | | | | | | | |
| | Level 1 | | Level 2 | | Level 3 | | Total | |
| | | | | | | | | |
Investment Companies | | $ | 141,068,867 | | $ | — | | $ | — | | $ | 141,068,867 | |
Short Term Investments | | | 4,366,931 | | | — | | | — | | | 4,366,931 | |
Investments Purchased as Securities | | | | | | | | | | | | | |
Lending Collateral | | | 1,034,110 | | | — | | | — | | | 1,034,110 | |
| | | | | | | | | | | | | |
Total Investments in Securities | | $ | 146,469,908 | | $ | — | | $ | — | | $ | 146,469,908 | |
| | | | | | | | | | | | | |
| |
| For further information regarding security characteristics, see the Schedule of Investments. There were no significant transfers in/out of Level 1 or 2. |
| | | | | | | | | | | | | |
GuidePathSM Tactical Constrained Asset Allocation Fund |
|
| | Level 1 | | Level 2 | | Level 3 | | Total | |
| | | | | | | | | |
Investment Companies | | $ | 139,577,518 | | $ | — | | $ | — | | $ | 139,577,518 | |
Short Term Investments | | | 4,292,969 | | | — | | | — | | | 4,292,969 | |
Investments Purchased as Securities | | | | | | | | | | | | | |
Lending Collateral | | | 8,681,219 | | | — | | | — | | | 8,681,219 | |
| | | | | | | | | | | | | |
Total Investments in Securities | | $ | 152,551,706 | | $ | — | | $ | — | | $ | 152,551,706 | |
| | | | | | | | | | | | | |
| |
| For further information regarding security characteristics, see the Schedule of Investments. There were no significant transfers in/out of Level 1 or 2. |
130
|
GuideMarkSM Funds & GuidePathSM Funds |
NOTES TO FINANCIAL STATEMENTS (Continued) |
March 31, 2012 |
| |
| | | | | | | | | | | | | |
GuidePathSM Tactical Unconstrained Asset Allocation Fund |
|
| | Level 1 | | Level 2 | | Level 3 | | Total | |
| | | | | | | | | |
Investment Companies | | $ | 179,702,084 | | $ | — | | $ | — | | $ | 179,702,084 | |
Short Term Investments | | | 5,061,066 | | | — | | | — | | | 5,061,066 | |
Investments Purchased as Securities | | | | | | | | | | | | | |
Lending Collateral | | | 3,357,200 | | | — | | | — | | | 3,357,200 | |
| | | | | | | | | | | | | |
Total Investments in Securities | | $ | 188,120,350 | | $ | — | | $ | — | | $ | 188,120,350 | |
| | | | | | | | | | | | | |
| |
| For further information regarding security characteristics, see the Schedule of Investments. There were no significant transfers in/out of Level 1 or 2. |
| | | | | | | | | | | | | |
GuidePathSM Absolute Return Asset Allocation Fund |
|
| | Level 1 | | Level 2 | | Level 3 | | Total | |
| | | | | | | | | |
Investment Companies | | $ | 232,987,892 | | $ | — | | $ | — | | $ | 232,987,892 | |
Short Term Investments | | | 5,340,847 | | | — | | | — | | | 5,340,847 | |
Investments Purchased as Securities | | | | | | | | | | | | | |
Lending Collateral | | | 21,436,500 | | | — | | | — | | | 21,436,500 | |
| | | | | | | | | | | | | |
Total Investments in Securities | | $ | 259,765,239 | | $ | — | | $ | — | | $ | 259,765,239 | |
| | | | | | | | | | | | | |
| |
| For further information regarding security characteristics, see the Schedule of Investments. There were no significant transfers in/out of Level 1 or 2. |
131
|
GuideMarkSM Funds & GuidePathSM Funds |
NOTES TO FINANCIAL STATEMENTS (Continued) |
March 31, 2012 |
| |
| |
| Recent Accounting Pronouncement |
| |
| In May 2011, the FASB issued ASU No. 2011-04 “Amendments to Achieve Common Fair Value Measurement and Disclosure Requirements” in GAAP and the International Financial Reporting Standards (“IFRSs”). ASU No. 2011-04 amends FASB ASC Topic 820, Fair Value Measurements and Disclosures, to establish common requirements for measuring fair value and for disclosing information about fair value measurements in accordance with GAAP and IFRSs. ASU No. 2011-04 is effective for fiscal years beginning after December 15, 2011 and for interim periods within those fiscal years. Management is currently evaluating the impact of these amendments and does not believe they will have a material impact on the Trusts’ financial statements. |
| |
| Derivative Instruments and Hedging Activities |
| |
| The Funds have adopted derivative instruments disclosure standards in order to enable the investor to understand how and why an entity used derivatives, how derivatives are accounted for, and how derivative instruments affect an entity’s results of operations and financial position. |
| |
| GuideMarkSM Core Fixed Income Fund |
| |
| During the period, the Fund used money market and fixed income derivatives, including futures and forwards, for both hedging and investment purposes: primarily duration management and the pursuit of relative value opportunities. Futures contracts used in the Fund during the period included those based on 90-day Eurodollars: short, medium, and long-term U.S. debt, medium and long-term German debt, long-term Australian debt, and long-term debt of the United Kingdom. Forward currency contracts were also used during the period. |
| |
| In general, the use of derivatives may increase risk within the Fund. The use of over-the-counter derivatives, such as forwards, involves the risk that the counterparty to the contract will fail to make required payments or otherwise comply with the terms of the contract. The results achieved by the use of derivatives in the Fund may not match or fully offset changes in the value of the underlying financial assets being hedged or the investment opportunity the Fund was pursuing, thereby failing to achieve, to an extent, the original purpose for using the derivatives. Certain types of derivatives may create leverage insofar as the Fund may receive returns (or suffer losses) exceeding the initial amounts the Fund committed in connection with the derivatives. The use of derivatives can result in losses or gains to the Fund exceeding the amount the Fund would have experienced in the absence of using derivatives. A relatively small price movement in a derivative may result in an immediate and substantial loss, or gain, to the Fund. |
| |
| The Fund used currency forwards during the period for the purpose of hedging exposures within the Fund to non-dollar-denominated assets. In general, the use of currency derivative contracts for hedging may reduce the overall risk level of the Fund, albeit at a cost that may lower overall performance. In general, the use of currency derivatives for hedging purposes will not lead to leverage within the Fund. There were no outstanding forward contracts at year end. |
132
|
GuideMarkSM Funds & GuidePathSM Funds |
NOTES TO FINANCIAL STATEMENTS (Continued) |
March 31, 2012 |
| |
| | | | | | | | | |
Balance Sheet — Values of Derivative Instruments as of March 31, 2012 | |
| | | | | |
| | Asset Derivatives | | Liability Derivatives | |
| | | | | |
| | Balance Sheet Location | | Value | | Balance Sheet Location | | Value | |
| | | | | | | | | | |
Interest Rate Contracts — Futures* | | Variation margin on | | | | Variation margin on | | | |
| | futures contracts | | $29,570 | | futures contracts | | $228,139 | |
| | | | | | | | | | |
Total | | | | $29,570 | | | | $228,139 | |
| | | | | | | | | | |
| | | | | | | | | |
* Includes cumulative appreciation/depreciation as reported in Schedule of Investments/footnotes. Only current day’s variation margin is reported within the Statement of Assets & Liabilities. |
| | | | | | | | | | |
The Effect of Derivative Instruments on the Statement of Operations for the Period Ended March 31, 2012 |
| |
Amount of Realized Loss on Derivatives Recognized in Income |
| |
| | | | Futures | | Forward Currency
Contracts | | Total | |
| | | | | | | | | | |
Interest Rate Contracts | | | | $424,439 | | — | | | $424,439 | |
Foreign Exchange Contracts | | | | — | | $(161,263 | ) | | (161,263 | ) |
| | | | | | | | | | | |
Total | | | | $424,439 | | $(161,263 | ) | | $263,176 | |
| | | | | | | | | | | |
| | | | | | | | | | |
Change in Unrealized Appreciation on Derivatives Recognized in Income | |
| | |
| | | | Futures | | Forward Currency
Contracts | | Total | |
| | | | | | | | | | |
Interest Rate Contracts | | | | $102,779 | | — | | | $102,779 | |
Foreign Exchange Contracts | | | | — | | $150,835 | | | 150,835 | |
| | | | | | | | | | | |
Total | | | | $102,779 | | $150,835 | | | $253,614 | |
| | | | | | | | | | | |
| |
| GuideMarkSM Opportunistic Fixed Income Fund |
| |
| The Fund invested in derivatives in order to manage risk or gain exposure to various other investments or markets. Derivatives may contain various risks, including the potential inability of the counterparty to fulfill their obligations under the terms of the contract, the potential for an illiquid secondary market, and the potential for market movements which may expose the Fund to gains or losses. |
| |
| The Fund seeks to maximize real returns through exposure to investments in fixed-income securities, equity securities, and currency instruments. The Fund expects that its exposure to these asset classes will often be obtained substantially through the use of swap agreements. The Fund entered into swap agreements to manage and/or gain exposures to credit risk. The Fund entered into financial futures contracts primarily to manage interest rate risk. The Fund entered into forward exchange contracts primarily to manage and/or gain exposure to certain foreign currencies. |
133
|
GuideMarkSM Funds & GuidePathSM Funds |
NOTES TO FINANCIAL STATEMENTS (Continued) |
March 31, 2012 |
| |
| | | | | | | | | | | |
Balance Sheet — Values of Derivative Instruments as of March 31, 2012 | |
| | | | | |
| | Asset Derivatives | | Liability Derivatives | |
| | | | | |
| | Balance Sheet Location | | Value | | Balance Sheet Location | | Value | |
| | | | | | | | | | | | |
| | Appreciation on Swap | | | | | Depreciation on Swap | | | | |
Credit Contracts — Swaps | | Agreements | | $ | 151,603 | | Agreements | | $ | 201,946 | |
Foreign Exchange Contracts — | | Appreciation of forward | | | | | Depreciation of forward | | | | |
Forward Currency Contracts | | currency contracts | | | 2,824,939 | | currency contracts | | | 1,369,182 | |
Foreign Exchange Contracts — Options | | Investments, at Value | | | 117,018 | | Options Written, at Value | | | 19,628 | |
| | Variation margin on | | | | | Variation margin on | | | | |
Equity Contracts — Futures* | | futures contracts | | | — | | futures contracts | | | 27,934 | |
Equity Contracts — Options | | Investments, at Value | | | 217,600 | | Options Written, at Value | | | 57,600 | |
| | Variation margin on | | | | | Variation margin on | | | | |
Interest Rate Contracts — Futures* | | futures contracts | | | 879 | | futures contracts | | | — | |
| | | | | | | | | | | | |
Total | | | | $ | 3,312,039 | | | | $ | 1,676,290 | |
| | | | | | | | | | | | |
|
* Includes cumulative appreciation/depreciation as reported in Schedule of Investments. |
| | | | | | | | | | | | | | | | | | | | | |
The Effect of Derivative Instruments on the Statement of Operations for the Period Ended March 31, 2012 | |
| | |
Amount of Realized Gain or (Loss) on Derivatives Recognized in Income | |
| | |
| | | | | Futures | | Forward Currency
Contracts | | Purchased
Options | | Swaps | | Total | |
| | | | | | | | | | | | | | | |
Interest Rate Contracts | | | | | $ | (1,100,831 | ) | | $ | — | | | $ | — | | $ | — | | $ | (1,100,831 | ) |
Foreign Exchange Contracts | | | | | | — | | | | (65,785 | ) | | | (61,468 | ) | | — | | | (127,253 | ) |
Equity Contracts | | | | | | (452,533 | ) | | | — | | | | — | | | — | | | (452,533 | ) |
Credit Contracts | | | | | | — | | | | — | | | | — | | | 86,614 | | | 86,614 | |
| | | | | | | | | | | | | | | | | | | | | | |
Total | | | | | $ | (1,553,364 | ) | | $ | (65,785 | ) | | $ | (61,468 | ) | $ | 86,614 | | $ | (1,594,003 | ) |
| | | | | | | | | | | | | | | | | | | | | | |
| | | | | | | | | | | | | | | | | | | | | |
Change in Unrealized Appreciation or (Depreciation) on Derivatives Recognized in Income | |
| | |
| | Futures | | Forward Currency
Contracts | | Options
Written | | Purchased
Options | | Swaps | | Total | |
| | | | | | | | | | | | | | |
Interest Rate Contracts | | $ | 879 | | | $ | — | | | $ | — | | $ | — | | $ | — | | $ | 879 | |
Foreign Exchange | | | | | | | | | | | | | | | | | | | | | |
Contracts | | | — | | | | 1,455,757 | | | | 141,680 | | | (238,218 | ) | | — | | | 1,359,219 | |
Equity Contracts | | | (27,934 | ) | | | — | | | | (441 | ) | | (5,223 | ) | | — | | | (33,598 | ) |
Credit Contracts | | | — | | | | — | | | | — | | | — | | | (50,343 | ) | | (50,343 | ) |
| | | | | | | | | | | | | | | | | | | | | | |
Total | | $ | (27,055 | ) | | $ | 1,455,757 | | | $ | 141,239 | | $ | (243,441 | ) | $ | (50,343 | ) | $ | 1,276,157 | |
| | | | | | | | | | | | | | | | | | | | | | |
134
|
GuideMarkSM Funds & GuidePathSM Funds |
NOTES TO FINANCIAL STATEMENTS (Continued) |
March 31, 2012 |
| |
The average monthly market value of purchased and written options during the year ended March 31, 2012 were as follows:
| | | | | | | |
| | GuideMarkSM
Core
Fixed Income
Fund | | GuideMarkSM
Opportunistic
Fixed Income
Fund | |
| | | | | | |
|
Purchased Options | | $ | — | | $ | 95,743 | |
Written Options | | $ | — | | $ | (29,920 | ) |
| | | | | | | | |
The average monthly notional amount of futures, forwards, and swaps during the year ended March 31, 2012 were as follows:
| | | | | | | |
Long Positions | | GuideMarkSM
Core
Fixed Income
Fund | | GuideMarkSM
Opportunistic
Fixed Income
Fund | |
| | | | | | |
|
Futures | | $ | 36,238,332 | | $ | 686,203 | |
Forwards | | $ | 306,432 | | $ | 65,600,091 | |
Swaps | | $ | — | | $ | 11,255,769 | |
| | | | | | | | |
| | | | | | | |
Short Positions | | GuideMarkSM
Core
Fixed Income
Fund | | GuideMarkSM
Opportunistic
Fixed Income
Fund | |
| | | | | | |
|
Futures | | $ | 4,187,600 | | $ | 14,531,253 | |
Forwards | | $ | 298,190 | | $ | 47,792,824 | |
| | | | | | | | |
| | | | | | | |
Cross | | GuideMarkSM
Core
Fixed Income
Fund | | GuideMarkSM
Opportunistic
Fixed Income
Fund | |
| | | | | | |
|
Forwards | | $ | — | | $ | 26,544,551 | |
| | | | | | | | |
| | |
| Derivative Risks |
| |
| The risks of using the various types of derivatives in which the Fund may engage include: the risk that movements in the value of the derivative may not fully offset or complement instruments currently held in the Fund in the manner intended by the Advisor; the risk that the counterparty to a derivative contract may fail to comply with its obligations to the Fund; the risk that there may not be a liquid secondary market for the derivative at a time when the Fund would look to disengage the position; the risk that additional capital from the Fund may be called upon to fulfill the conditions of the derivative contract; the risk that the use of derivatives in the Fund may induce leverage in the Fund, and the risk that the cost of the derivative contracts may reduce the overall returns experienced by the Fund. |
| |
| (b) | Subsequent Events Evaluation. |
| | In preparing these financial statements, the Funds have evaluated events and transactions for potential recognition or disclosure resulting from subsequent events. This evaluation did not result in any subsequent events that necessitated disclosures and/or adjustments. |
135
|
GuideMarkSM Funds & GuidePathSM Funds |
NOTES TO FINANCIAL STATEMENTS (Continued) |
March 31, 2012 |
| |
| | |
| (c) | Repurchase Agreements |
| | Each Fund may enter into repurchase agreements with banks and securities dealers. These transactions involve the purchase of securities with a simultaneous commitment to sell the securities to the bank or the dealer at an agreed-upon date and price. A repurchase agreement is accounted for as an investment by the Fund, collateralized by securities, which are delivered to the Fund’s Custodian or to an agent bank under a tri-party agreement. The securities are marked-to-market daily and additional securities are acquired as needed, to ensure that their value equals or exceeds the repurchase price plus accrued interest. |
| | |
| (d) | Federal Income Taxes |
| | The Funds intend to continue to comply with the requirements of sub-chapter M of the Internal Revenue Code necessary to qualify as regulated investment companies and to make the requisite distributions of income and capital gains to their shareholders sufficient to relieve the Funds from all or substantially all Federal income taxes. Therefore, no Federal income tax provision is required. |
| |
| | The Funds have adopted financial reporting rules regarding recognition and measurement of tax positions taken or expected to be taken on a tax return. The Funds have reviewed all open tax years and major jurisdictions and concluded that no provision for income tax would be required in the Funds’ financial statements. The Funds’ Federal and state income and Federal excise tax returns for tax years for which the applicable statutes of limitations have not expired are subject to examination by the Internal Revenue Service and state departments of revenue. |
| | |
| (e) | Use of Estimates |
| | The preparation of financial statements in conformity with GAAP requires management to make estimates and assumptions that affect the reported amounts of assets and liabilities and disclosure of contingent assets and liabilities at the date of the financial statements and the reported amounts of revenues and expenses during the reported period. Actual results could differ from those estimates. |
| | |
| (f) | Indemnifications |
| | Under each Trust’s organizational documents, its officers and trustees are indemnified against certain liability arising out of their performance of their duties to the Funds. In addition, in the normal course of business, the Funds enter into contracts that contain a variety of representations and warranties that provide general indemnifications. The Funds’ maximum exposure under these arrangements are unknown as this would involve future claims that may be made against the Funds that have not yet occurred. However, the Funds expect the risk of loss to be remote. |
| | |
| (g) | Expenses |
| | Many expenses of the Funds can be directly attributed to a specific Fund. Additionally, some expenses can be directly attributed to a specific Trust, in which case the expense is apportioned among the Funds within that Trust based on relative net assets. Expenses that cannot be directly attributed to a specific Fund or Trust are apportioned among all the Funds based on relative net assets. |
| | |
| (h) | Organization and Offering Costs |
| | Organization costs consist of costs incurred to establish the Trust and enable it legally to do business. The Fund expenses organizational costs as incurred. These expenses were advanced by the Advisor, and the Advisor has agreed to reimburse the Funds for these expenses, subject to potential recovery (see Note 3). Offering costs are accounted for as deferred costs until operations begin. Offering costs include legal fees regarding the preparation of the initial registration statement. Offering costs are then amortized to expense over twelve months on a straight-line basis. |
| | |
| (i) | Security Transactions and Income Recognition
Security transactions are accounted for on trade date. Dividend income is recognized on the ex-dividend date, and the interest income recorded using the effective yield method is accrued daily. Realized gains and losses on investment transactions are determined using the high cost method. Return of capital distributions received from REIT securities |
136
|
GuideMarkSM Funds & GuidePathSM Funds |
NOTES TO FINANCIAL STATEMENTS (Continued) |
March 31, 2012 |
| |
| | |
| | are recorded as an adjustment to the cost of the security and thus may impact unrealized or realized gains or losses on the security. Gains and losses from paydowns on mortgage and asset backed securities are recorded as adjustments to interest income. |
| | |
| (j) | Distributions to shareholders |
| | The Funds, with the exception of the Core Fixed Income Fund, Tax-Exempt Fixed Income Fund, and Opportunistic Fixed Income Fund, will distribute any net investment income at least annually. The Core Fixed Income Fund, Tax-Exempt Fixed Income Fund, and Opportunistic Fixed Income Fund will distribute any net investment income quarterly. All of the Funds will distribute any net realized long-or short-term capital gains at least annually. Distributions to shareholders are recorded on the ex-dividend date. The Funds may also pay a special distribution at the end of the calendar year to comply with Federal tax requirements. |
| | |
| (k) | Derivatives |
| | Each Fund may invest in derivative securities including call and put options, futures, forward currency contracts and swaps. These instruments may be used by a Fund for hedging purposes as well as direct investment. |
| | |
| | Forward Currency Contracts |
| | The Funds may enter into forward currency contracts, obligating the Funds to deliver and receive currency at a specified future date. Transactions involving forward currency contracts may serve as long hedges (for example, if a Fund seeks to buy a security denominated in a foreign security, it may purchase a forward currency contract to lock in the U.S. dollar price of the security) or as short hedges (if a Fund anticipates selling a security denominated in a foreign currency, it may sell a forward currency contract to lock in the U.S. dollar equivalent of the anticipated sales proceeds). Forward contracts are valued daily and unrealized appreciation or depreciation is recorded daily as the difference between the contract exchange rate and the closing forward rate applied to the face amount of the contract. |
| | |
| | Options |
| | Exchange-traded options are valued at the last reported sale price on the exchange on which the security underlying the option is principally traded. If no sales are reported on a particular day for exchange traded options, or the options are not exchange traded, the options are valued at the mean between the most recent quoted bid and asked quotations at the close of the exchange. |
| | |
| | The premium that a Fund pays when purchasing a call option or receives when writing a call option will reflect, among other things, the market price of the security, the relationship of the exercise price to the market price of the security, the relationship of the exercise price to the volatility of the security, the length of the option period and supply and demand factors. The premium is the value of an option at the date of purchase. A purchaser (holder) of a put option pays a non-refundable premium to the seller (writer) of a put option to obtain the right to sell a specified amount of a security at a fixed price (the exercise price) during a specified period (exercise period). Conversely, the seller (writer) of a put option, upon payment by the holder of the premium, has the obligation to buy the security from the holder of the put option at the exercise price during the exercise period. |
| | |
| | Futures |
| | Each Fund has the ability to buy and sell stock index futures contracts traded on domestic stock exchanges to hedge the value of its portfolio against changes in market conditions. A stock index futures contract is an agreement between two parties to take or make delivery of an amount of cash equal to a specified dollar amount, times the difference between stock index value at the close of the last trading day of the contract and the price at which the futures contract is originally struck. A stock index futures contract does not involve the physical delivery of the underlying stocks in the index. Although stock index futures contracts call for the actual taking of delivery of cash, in most cases a Fund expects to liquidate its stock index futures positions through offsetting |
137
|
GuideMarkSM Funds & GuidePathSM Funds |
NOTES TO FINANCIAL STATEMENTS (Continued) |
March 31, 2012 |
| |
| | |
| | transactions, which may result in a gain or loss, before cash settlement is required. |
| | |
| | The Core Fixed Income Fund and each of the GPS Funds II portfolios may purchase or sell other types of futures contracts, including those based on particular interest rates, securities, foreign currencies, securities indices and other financial instruments and indices. The Core Fixed Income Fund and each of the GPS Funds II portfolios may also purchase and write call and put options on such future contracts, in order to seek to increase total return or to hedge against changes in interest rates, securities prices, or currency exchange rates, or, to the extent permitted by its investment policies, to otherwise manage its portfolio of investments. |
| | |
| | Futures contracts are valued at the daily quoted settlement prices. |
| | |
| | Swaps |
| | The Core Fixed Income Fund and each of the GPS Funds II portfolios may enter into interest rate, mortgage, credit, currency and total return swaps, interest rate caps, floors and collars. The Core Fixed Income Fund and each of the GPS Funds II portfolios may also purchase and write (sell) options contracts on swaps, referred to as “swaptions”. The Funds may enter into swap transactions for hedging purposes or to seek to increase total return. Since interest rate, mortgage, credit and currency swaps and interest rate caps, floors and collars are individually negotiated, the Funds expect to achieve an acceptable degree of correlation between their portfolio investments and their swap, cap, floor and collar positions. |
| | |
| | Swap agreements are valued daily and unrealized appreciation or depreciation is recorded daily as the difference between the prior day and current day closing price. |
| | |
| (l) | Securities Purchased or Sold on a Forward-Commitment Basis |
| | The Funds may enter into when-issued or other purchase or sale transactions that specify forward |
| | |
| | delivery of a financial security. In connection with this ability, the Funds may enter into mortgage “dollar rolls” in which a Fund sells securities in the current month for delivery and simultaneously contracts with the same counterparty to repurchase similar (same type, coupon and maturity) but not identical securities on a specified future date. The party that is obligated to buy a security in the future will retain the use of their funds, and will benefit from any interest that is earned on those funds from the day that they enter into the forward contract until the day that they take delivery and pay for the security. |
| | |
| (m) | Foreign Currency Translation |
| | The accounting records of the Funds are maintained in U.S. dollars. Investment securities and all other assets and liabilities of the Funds denominated in a foreign currency are translated into U.S. dollars at current exchange rates. Purchases and sales of securities, income receipts, and expense payments are translated into U.S. dollars at the exchange rate in effect on the dates of the respected transactions. The Funds do not isolate the portion of the fluctuations on investments resulting from changes in foreign currency exchange rates from the fluctuations in market prices of investments held. Such fluctuations are included with the net realized and unrealized gain or loss from investments. |
| | |
| (n) | Restricted and Illiquid Securities |
| | Each Fund may invest up to 15% of its net assets in securities that are illiquid at the time of purchase, which includes securities with legal or contractual restrictions on their disposition, and securities for which there are no readily available market quotations. The Advisor, with the assistance of the sub-advisors and/or pricing services, will determine the value of such securities in good faith pursuant to procedures adopted by the applicable Board of Trustees. Illiquid securities present the risks that a Fund may have difficulty valuing these holdings and/or may be unable to sell these holdings at the time or price desired. There are no restrictions on each Fund’s ability to invest in restricted securities (that is, securities that are not registered pursuant to |
138
|
GuideMarkSM Funds & GuidePathSM Funds |
NOTES TO FINANCIAL STATEMENTS (Continued) |
March 31, 2012 |
| |
| | |
| | the Securities Act of 1933), except to the extent such securities may be considered illiquid. Securities issued pursuant to Rule 144A of the Securities Act of 1933 will be considered liquid if determined to be so under procedures adopted by the Board of Trustees. |
| | |
| (o) | Auction Rate Securities |
| | The Core Fixed Income Fund, Tax-Exempt Fixed Income Fund, and each of the GPS Funds II portfolios each may invest in auction rate municipal securities. Auction rate securities usually permit the holder to sell the securities in an auction at par value at specified intervals. The dividend is reset by “Dutch” auction in which bids are made by broker-dealers and other institutions for a certain amount of securities at a specified minimum yield. The dividend rate set by the auction is the lowest interest or dividend rate that covers all securities offered for sale. While this progress is designed to permit auction rate securities to be traded at par value, there is a risk that an auction will fail due to insufficient demand for the securities. |
| | |
| (p) | Short Sales |
| | Although not currently part of any Fund’s principal investment strategies, each Fund has the ability to make short sales. Short sales are transactions where a Fund sells securities it does not own in anticipation of a decline in the value of the securities. |
| | |
| (q) | Trustee Compensation |
| | Each Trust has its own Board of Trustees. For the services performed as Trustees of GPS Funds I, the Independent Trustees receive a retainer fee of $45,000 per year and $4,500 per in person meeting attended, as well as reimbursement for expenses incurred in connection with attendance at such meetings. The Lead Independent Trustee receives an additional retainer fee of $10,000 per year. The Audit Committee Chair receives an additional retainer fee of $5,000 per year. Telephonic meeting fees are determined according to the length of the meeting as follows: $2,000 for one to two hours, $3,000 for two to three hours and $4,000 for three hours or longer. For the services performed as Trustees of GPS Funds II the Independent Trustees |
| | |
| | receive a retainer fee of $50,000 per year, $2,500 per quarterly meeting attended in person, $2,500 per special meeting attended in person, and $1,000 per special meeting attended telephonically, as well as reimbursement for expenses incurred in connection with attendance at such meetings. The fees are allocated proportionally to each Fund within the Trust based on total assets under management. |
| | |
| | The “interested persons” who serve as Trustees of the Trusts receive no compensation from the Trusts for their services as Trustees. The Funds reimburse the Advisor an allocated amount for the compensation and related expenses of certain officers of the Trusts who provide compliance services to the Funds. The aggregate amount of all such reimbursements is determined by the Trustees. No other compensation or retirement benefits are received by any Trustee or officer from the Funds. |
| | |
3. | Investment Advisor |
| Each Trust has entered into an Investment Advisory Agreement (collectively, the “Agreement”) with Genworth Financial Wealth Management, Inc. (the “Advisor” or “GFWM”), with whom certain officers and trustees of the Trust are affiliated, to furnish investment advisory services to the Fund. Under the terms of the Agreement, the Funds compensate the Advisor for its management services at the following contractual rates, based on each Fund’s average daily net assets: |
| | | |
Large Cap Growth Fund | | 0.70 | % |
Large Cap Value Fund | | 0.70 | % |
Small/Mid Cap Core Fund | | 0.75 | % |
World ex-US Fund | | 0.70 | % |
Opportunistic Equity Fund | | 0.80 | % |
Global Real Return Fund | | 0.65 | % |
Core Fixed Income Fund | | 0.50 | % |
Tax-Exempt Fixed Income Fund | | 0.50 | % |
Opportunistic Fixed Income Fund | | 0.70 | % |
Strategic Asset Allocation Fund | | 0.25 | % |
Tactical Constrained Asset Allocation Fund | | 0.25 | % |
Tactical Unconstrained Asset Allocation Fund | | 0.35 | % |
Absolute Return Asset Allocation Fund | | 0.35 | % |
139
|
GuideMarkSM Funds & GuidePathSM Funds |
NOTES TO FINANCIAL STATEMENTS (Continued) |
March 31, 2012 |
| |
| |
| GFWM also provides certain administrative services to the Service Shares of the Funds, pursuant to Administrative Services Agreements between the Funds and GFWM, for which GFWM receives a fee of 0.25% of the average daily net assets of the Services Shares of the Funds. The administrative services may include development and maintenance of a web-based software platform for both investment advisers and shareholders; creation of a customized full-color client quarterly performance review for each individual client; facilitating the initiation and setup of new account and related asset transfers; reviewing and following up on custodial paperwork; attending to shareholder correspondence, requests and inquiries, and other communications with shareholders and their representatives; assisting with the processing of purchases and redemptions of shares; and monitoring and overseeing non-advisory relationships with entities providing services to the Service Shares; including the transfer agent and custodian. |
| |
| In addition, GPS Funds I and the Advisor have also entered into a Fee Waiver Agreement designed to provide Fund shareholders with the economic benefits of economies of scale that may be realized as Fund assets increase. Under the Fee Waiver Agreement, the Advisor has contractually agreed to: (1) waive 0.025% of each Fund’s annual advisory fee on assets in excess of $6 billion, and an additional 0.025% of each Fund’s annual advisory fee on assets in excess of $12 billion, and (2) waive portions of its advisory fee monthly on aggregate average assets of the Large Cap Growth Fund, Large Cap Value Fund, Small/Mid Cap Core Fund, World ex-US Fund, Tax-Exempt Fixed Income Fund and Core Fixed Income Fund in excess of $2.5 billion to pass on certain savings in the underlying sub-advisory fee arrangements. |
| |
| Each Fund and the Advisor have also entered into an Expense Waiver and Reimbursement Agreement under which the Advisor has agreed to waive, through July 31, 2013, its management fee and/or reimburse each Fund’s other expenses to the extent necessary to ensure that the Fund’s net annual operating expenses (excluding Distribution (12b-1) Fees, Administrative Service Fees, taxes, interest, trading costs, acquired fund expenses, expenses paid with securities lending expense offset credits and non-routine expenses) do not exceed the following rates, based on each Fund’s average daily net assets: |
| | | | |
| Large Cap Growth Fund | | 0.99 | % |
| Large Cap Value Fund | | 0.99 | % |
| Small/Mid Cap Core Fund | | 1.09 | % |
| World ex-US Fund | | 1.09 | % |
| Opportunistic Equity Fund | | 1.10 | % |
| Global Real Return Fund | | 1.05 | % |
| Core Fixed Income Fund | | 0.79 | % |
| Tax-Exempt Fixed Income Fund | | 0.79 | % |
| Opportunistic Fixed Income Fund | | 1.05 | % |
| Strategic Asset Allocation Fund | | 0.50 | % |
| Tactical Constrained Asset Allocation Fund | | 0.50 | % |
| Tactical Unconstrained Asset Allocation Fund | | 0.60 | % |
| Absolute Return Asset Allocation Fund | | 0.60 | % |
| |
| Any such waiver or reimbursement is subject to later adjustment to allow the Advisor to recoup amounts waived or reimbursed to the extent actual fees and expenses for a fiscal period are less than each Fund’s expense limitation cap, provided, however, that the Advisor shall only be entitled to recoup such amounts for a period of three years after the end of the fiscal year in which the fee or expense was waived or reimbursed. As of March 31, 2012, Large Cap Value Fund, Global Real Return Fund and Core Fixed Income Fund have recouped all potential recoverable waivers or reimbursed expenses. |
140
|
GuideMarkSM Funds & GuidePathSM Funds |
NOTES TO FINANCIAL STATEMENTS (Continued) |
March 31, 2012 |
| |
| |
| The Advisor is currently waiving fees and, in some cases, reimbursing expenses in the Funds listed below in order to keep these Funds at their expense cap. Waived expenses subject to potential recovery are as follows: |
| | | | | | | | | | | | | | | | |
| | Year of
Expiration
03/31/2013 | | Year of
Expiration
03/31/2014 | | Year of
Expiration
03/31/2015 | |
| | | | | | | |
Large Cap Growth | | | | — | | | | | — | | | | | 47,832 | | |
Small/Mid Cap Core Fund | | | | — | | | | | 22,257 | | | | | 51,207 | | |
World ex-US Fund | | | | — | | | | | — | | | | | 142,535 | | |
Opportunistic Equity Fund | | | | — | | | | | — | | | | | 1,804 | | |
Tax-Exempt Fixed Income Fund | | | | 32,625 | | | | | 21,611 | | | | | 26,492 | | |
Opportunistic Fixed Income Fund | | | | — | | | | | — | | | | | 218,356 | | |
Strategic Asset Allocation Fund | | | | — | | | | | 40,488 | | | | | 109,544 | | |
Tactical Constrained Asset Allocation Fund | | | | — | | | | | 40,488 | | | | | 129,239 | | |
Tactical Unconstrained Asset Allocation Fund | | | | — | | | | | 40,488 | | | | | 116,347 | | |
Absolute Return Asset Allocation Fund | | | | — | | | | | 40,488 | | | | | 169,190 | | |
| |
| Sub-advisory services are provided to the Funds, pursuant to agreements between the Advisor and various sub-advisors. Under the terms of these sub-advisory agreements, the Advisor compensates each sub-advisor based on the portion of each Fund’s average daily net assets that is allocated to the sub-advisor. |
| |
4. | Distribution Plan |
| |
| Each Trust, on behalf of the Service Shares class of its Funds, have adopted a distribution plan pursuant to Rule 12b-1 under the 1940 Act (the “12b-1 Plan”), which provides for each Fund to pay distribution fees at an annual rate of 0.25% of the average daily net assets of the Funds. Payments under the 12b-1 Plan shall be used to compensate persons (including affiliates of the Trust) who provide support services in connection with the distribution of the Funds’ Service Shares class and servicing of the Funds’ Service Shares class shareholders. For example, these amounts are paid to financial intermediaries that perform back office shareholder servicing and recordkeeping services that facilitate the operation of the Genworth Financial Wealth Management Program through which the Funds are primarily distributed. The Advisor (and its affiliates) similarly receive portions of such payments for their services provided that facilitate the operation of the program. These financial intermediaries and affiliates of the Trust also receive payments from the Trust outside of the 12b-1 Plan for shareholder services that are unrelated to distribution services. Capital Brokerage Corp., an affiliate of the Advisor, serves as principal |
| |
| underwriter and distributor for the Funds. Quasar Distributors, LLC serves as sub-distributor for the Funds. Quasar Distributors, LLC is an affiliated company of U.S. Bank, N.A. |
| |
5. | Service and Custody Agreements |
| |
| The Funds have entered into Service Agreements with U.S. Bancorp Fund Services, LLC (“USBFS”) and a Custody Agreement with U.S. Bank, N.A., an affiliate of USBFS. Under these agreements, USBFS and U.S. Bank, N.A. provide certain transfer agency, administrative, accounting and custody services. |
| |
| Additionally, the Opportunistic Fixed Income Fund has entered into a Custody Agreement with the Bank of New York Mellon for certain custody services. |
| |
6. | Securities Lending |
| |
| The Trusts, on behalf of certain of the Funds, entered into securities lending arrangements with U.S. Bank, N.A. (the “Custodian”). Under the term of the agreement, the Custodian is authorized to loan securities on behalf of the Funds to approved brokers. In exchange, under normal market conditions, the Funds receive cash collateral in the amount of at least 102% of the value of |
141
|
GuideMarkSM Funds & GuidePathSM Funds |
NOTES TO FINANCIAL STATEMENTS (Continued) |
March 31, 2012 |
| |
| |
| securities loaned. The cash collateral is invested in short term instruments as noted in the Schedule of Investments. Although risk is mitigated by the collateral, the Funds could experience a delay in recovering their securities and possible loss of income or value if the borrower fails to return the borrowed securities. In addition, the Funds bear the risk of loss associated with the investment of cash collateral received. After predetermined rebates to brokers, a percentage of the net securities lending revenue is credited to the Funds to be used as an offset against custody costs and other charges incurred by the Funds. The Custodian is paid a fee for administering a securities lending program for the Funds, equal to the remaining percentage of the net |
| |
| securities lending revenues generated under the agreement. |
| |
| As of March 31, 2012, the Funds (excluding the Tax-Exempt Fixed Income Fund and Opportunistic Fixed Income Fund) had loaned securities that were collateralized by cash. The cash collateral received was invested in securities as listed in each Fund’s Schedule of Investments. Income earned from these investments is allocated to each Fund based on each Fund’s portion of total cash collateral received. Securities lending income is disclosed in each Fund’s Statement of Operations as a securities lending offset. |
| |
As of March 31, 2012, the values of securities loaned and collateral received were as follows: |
| | | | | | | | | | | | | | | | | | | | | | | | | | | | | | | |
| | Value of
Securities
Loaned | | Payable for
Collateral
on Securities
Loaned | | Collateral
Excess
(Deficit) due
to (from)
Securities
Lending
Agent | | Cost of
Securities
Purchased
as Securities
Lending
Collateral | | Unrealized
Depreciation | | Value
of Securities
Purchased
as Securities
Lending
Collateral | |
| | | | | | | | | | | | | |
Large Cap
Growth Fund | | | $ | 3,005,043 | | | | $ | 3,059,606 | | | | $ | 10,432 | | | | $ | 3,067,222 | | | | $ | (16,900 | ) | | | $ | 3,050,322 | | |
Large Cap
Value Fund | | | | 8,551,597 | | | | | 8,771,622 | | | | | (5,426 | ) | | | | 8,762,979 | | | | | (19,337 | ) | | | | 8,743,642 | | |
Small/Mid Cap
Core Fund | | | | 4,289,762 | | | | | 4,451,022 | | | | | (8,272 | ) | | | | 4,441,871 | | | | | (5,260 | ) | | | | 4,436,611 | | |
World ex-US Fund | | | | 569,682 | | | | | 589,055 | | | | | 5,588 | | | | | 593,878 | | | | | (4,607 | ) | | | | 589,271 | | |
Opportunistic
Equity Fund | | | | 2,310,337 | | | | | 2,467,655 | | | | | — | | | | | 2,467,655 | | | | | — | | | | | 2,467,655 | | |
Global Real
Return Fund | | | | 22,526,169 | | | | | 23,182,671 | | | | | — | | | | | 23,182,671 | | | | | — | | | | | 23,182,671 | | |
Core Fixed
Income Fund | | | | 2,144,944 | | | | | 2,202,385 | | | | | (2,322 | ) | | | | 2,199,387 | | | | | (4,064 | ) | | | | 2,195,323 | | |
Strategic Asset
Allocation Fund | | | | 1,008,098 | | | | | 1,034,110 | | | | | — | | | | | 1,034,110 | | | | | — | | | | | 1,034,110 | | |
Tactical Constrained
Asset Allocation Fund | | | | 8,467,275 | | | | | 8,681,219 | | | | | — | | | | | 8,681,219 | | | | | — | | | | | 8,681,219 | | |
Tactical Unconstrained
Asset Allocation Fund | | | | 3,264,636 | | | | | 3,357,200 | | | | | — | | | | | 3,357,200 | | | | | — | | | | | 3,357,200 | | |
Absolute Return Asset
Allocation Fund | | | | 20,725,387 | | | | | 21,436,500 | | | | | — | | | | | 21,436,500 | | | | | — | | | | | 21,436,500 | | |
| | | | | | | | | | | | | | | | | | | | | | | | | | | | | | | |
| | | $ | 76,862,930 | | | | $ | 79,233,045 | | | | $ | — | | | | $ | 79,224,692 | | | | $ | (50,168 | ) | | | $ | 79,174,524 | | |
| | | | | | | | | | | | | | | | | | | | | | | | | | | | | | | |
142
|
GuideMarkSM Funds & GuidePathSM Funds |
NOTES TO FINANCIAL STATEMENTS (Continued) |
March 31, 2012 |
| |
| |
7. | Investment Transactions |
| |
| The aggregate purchases and sales of securities, excluding short-term investments, for the period ended March 31, 2012 are summarized below. |
| | | | | | | |
| | Purchases | | Sales | |
| | | | | |
Large Cap Growth Fund | | $ | 242,963,145 | | $ | 266,856,102 | |
Large Cap Value Fund | | | 180,917,684 | | | 187,528,526 | |
Small/Mid Cap Core Fund | | | 196,463,292 | | | 162,709,770 | |
World ex-US Fund | | | 373,310,433 | | | 395,171,862 | |
Opportunistic Equity
Fund | | | 267,839,921 | | | 117,854,243 | |
Global Real Return Fund | | | 188,073,398 | | | 65,316,318 | |
Core Fixed Income Fund* | | | 1,781,302,299 | | | 1,801,540,604 | |
Tax-Exempt Fixed
Income Fund | | | 35,111,481 | | | 76,083,482 | |
Opportunistic Fixed | | | | | | | |
Income Fund | | | 366,166,729 | | | 152,273,255 | |
Strategic Asset
Allocation Fund | | | 141,861,899 | | | 9,104,324 | |
Tactical Constrained | | | | | | | |
Asset Allocation Fund | | | 164,283,402 | | | 32,170,120 | |
Tactical Unconstrained
Asset Allocation Fund | | | 410,147,548 | | | 237,320,912 | |
Absolute Return Asset
Allocation Fund | | | 388,076,901 | | | 156,893,709 | |
| |
* | Included in these amounts were $353,823,379 of purchases and $334,683,321 of sales of U.S. Government Securities. |
| |
8. | Option Contracts Written |
| |
The premium amount and number of option contracts written during the period ended March 31, 2012 in the Opportunistic Fixed Income Fund, were as follows: |
| | | | | | | | | | | | | | |
| | Amount of
Premiums | | Number of
Contracts | | Notional
Amount | |
| | | | | | | |
| | | | | | | |
Outstanding at 3/31/11 | | | $ | — | | | | | — | | | $ | — | |
Options written | | | | 218,467 | | | | | 1,600 | | | | 5,600,000 | |
Options expired | | | | — | | | | | — | | | | — | |
Options exercised | | | | — | | | | | — | | | | — | |
Options closed | | | | — | | | | | — | | | | — | |
| | | | | | | | | | | | | | |
Outstanding at 3/31/12 | | | $ | 218,467 | | | | | 1,600 | | | $ | 5,600,000 | |
| | | | | | | | | | | | | | |
| |
9. | Other Tax Information |
| |
| The Regulated Investment Company Modernization Act of 2010 (the “Act”) was enacted on December 22, 2010. The Act modified several tax rules impacting the Funds. In general, the provisions of the Act are effective for the Funds’ fiscal year ending March 31, 2012. Although the Act provides several benefits, including the unlimited carryover of future capital losses, there may be a greater likelihood that all or a portion of each Fund’s pre-enactment capital loss carryovers may expire without being utilized due to the fact that post-enactment capital losses get utilized before pre-enactment capital loss carryovers. |
| |
| Net Investment Income and realized gains and losses for Federal income tax purposes may differ from that reported on the financial statements because of permanent book-to-tax differences. GAAP requires that permanent differences between financial reporting and tax reporting be reclassified between various components of net assets. |
143
|
GuideMarkSM Funds & GuidePathSM Funds |
NOTES TO FINANCIAL STATEMENTS (Continued) |
March 31, 2012 |
| |
| |
| These differences are primarily due to net operating losses, foreign currency and nondeductible stock issuance costs. On the Statement of Assets and Liabilities, the following adjustments were made: |
| | | | | | | | | | |
| | Accumulated
Net
Investment
Income
or (Loss) | | Accumulated
Realized
Gain or
(Loss) | | Capital
Stock | |
| | | | | | | |
Large Cap Growth Fund | | $ | 377,419 | | $ | (436 | ) | $ | (376,983 | ) |
Large Cap Value Fund | | | 54 | | | (54 | ) | | — | |
Small/Mid Cap Core Fund | | | 282,799 | | | (282,666 | ) | | (133 | ) |
World ex-US Fund | | | (603,955 | ) | | 603,955 | | | — | |
Opportunistic Equity Fund | | | 122,977 | | | 50,321 | | | (173,298 | ) |
Global Real Return Fund | | | 110,287 | | | — | | | (110,287 | ) |
Core Fixed Income Fund | | | 551,069 | | | (551,069 | ) | | — | |
Tax-Exempt Fixed Income Fund | | | — | | | — | | | — | |
Opportunistic Fixed Income Fund | | | (1,966,662 | ) | | 2,008,376 | | | (41,714 | ) |
Strategic Asset Allocation Fund | | | 50,799 | | | (810 | ) | | (49,989 | ) |
Tactical Constrained Asset Allocation Fund | | | 41,220 | | | — | | | (41,220 | ) |
Tactical Unconstrained Asset Allocation Fund | | | 41,435 | | | 334 | | | (41,769 | ) |
Absolute Return Asset Allocation Fund | | | 41,220 | | | — | | | (41,220 | ) |
| |
| The Funds intend to utilize provisions of the Federal income tax laws which allow the Funds to carry realized capital losses forward for eight years following the year of loss and offset such losses against any future realized capital gains. Capital loss carryforwards available for Federal income tax purposes are as follows: |
| | | | | | | | | | | | | | | | | | | |
| | Capital losses expiring: | |
| | | |
| | | | | | | | | | | | | | Indefinite | |
| | | | | | | | | | | | | | | |
| | 3/31/16 | | 3/31/17 | | 3/31/18 | | 3/31/19 | | Short Term | | Long Term | |
| | | | | | | | | | | | | |
Large Cap Growth Fund | | | — | | $ | 7,713,666 | | $ | 59,171,144 | | | — | | | — | | | — | |
Large Cap Value Fund | | | — | | | 24,185,255 | | | 146,948,668 | | | — | | | — | | | — | |
Small/Mid Cap Core Fund | | | — | | | 15,554,992 | | | 12,866,943 | | | — | | | — | | | — | |
World ex-US Fund | | | — | | | 63,053,726 | | | 139,582,037 | | | — | | | — | | | — | |
Opportunistic Equity Fund | | | — | | | — | | | — | | | — | | $ | 10,122,916 | | | — | |
Global Real Return Fund | | | — | | | — | | | — | | | — | | | 1,370,744 | | | — | |
Core Fixed Income Fund | | | — | | | — | | | 1,028,334 | | | — | | | 870,945 | | $ | 514,683 | |
Tax-Exempt Fixed
Income Fund | | $ | 640,702 | | | 3,325,230 | | | 2,354,785 | | | — | | | — | | | — | |
Opportunistic Fixed Income Fund | | | — | | | — | | | — | | | — | | | 978,032 | | | 639,974 | |
Strategic Asset Allocation Fund | | | — | | | — | | | — | | | — | | | — | | | — | |
Tactical Constrained Asset
Allocation Fund | | | — | | | — | | | — | | | — | | | — | | | — | |
Tactical Unconstrained Asset
Allocation Fund | | | — | | | — | | | — | | | — | | | 649,769 | | | — | |
Absolute Return Asset
Allocation Fund | | | — | | | — | | | — | | | — | | | — | | | — | |
144
|
GuideMarkSM Funds & GuidePathSM Funds |
NOTES TO FINANCIAL STATEMENTS (Continued) |
March 31, 2012 |
| |
| |
| Additionally, at March 31, 2012, the Funds deferred on a tax basis post-October losses as follows: |
| | | | | | | | | |
| | Ordinary Late Year Loss* | | Capital Loss | |
| | | | | |
|
Large Cap Growth Fund | | | $ | 71,022 | | | $ | 4,708,286 | |
Large Cap Value Fund | | | | — | | | | 365,180 | |
Small/Mid Cap Core Fund | | | | — | | | | — | |
World ex-US Fund | | | | — | | | | 11,164,793 | |
Opportunistic Equity Fund | | | | — | | | | 949,795 | |
Global Real Return Fund | | | | 181,548 | | | | 3,047,910 | |
Core Fixed Income Fund | | | | — | | | | — | |
Tax-Exempt Fixed Income Fund | | | | — | | | | — | |
Opportunistic Fixed Income Fund | | | | — | | | | 1,387,898 | |
Strategic Asset Allocation Fund | | | | 191,954 | | | | — | |
Tactical Constrained Asset Allocation Fund | | | | — | | | | 24,118 | |
Tactical Unconstrained Asset Allocation Fund | | | | — | | | | 842,306 | |
Absolute Return Asset Allocation Fund | | | | — | | | | — | |
| | |
| * | The qualified late year ordinary loss is the excess of the sum of the specified losses attributable to the portion of the taxable year after October 31, and the ordinary losses attributable to the portion of the taxable year after December 31, over the sum of the specified gains attributable to the portion of the taxable year after October 31, and other ordinary income attributable to the portion of the taxable year after December 31. |
| | |
| The tax components of distributions paid during the fiscal years ended March 31, 2012 and March 31, 2011 are as follows: |
| | | | | | | | | | |
| | Year Ended March 31, 2012 | |
| | | |
| | Ordinary
Income
Distributions | | Long-Term
Capital Gain
Distributions | | Return of
Capital | |
| | | | | | | |
Large Cap Growth Fund | | | $— | | | $— | | | $— | |
Large Cap Value Fund | | | 2,236,272 | | | — | | | — | |
Small/Mid Cap Core Fund | | | — | | | — | | | — | |
World ex-US Fund | | | 2,815,992 | | | — | | | — | |
Opportunistic Equity Fund | | | — | | | — | | | — | |
Global Real Return Fund | | | 1,072,645 | | | — | | | 65,516 | |
Core Fixed Income Fund | | | 7,831,235 | | | — | | | — | |
Tax-Exempt Fixed Income Fund* | | | 2,990,928 | | | — | | | — | |
Opportunistic Fixed Income Fund | | | 7,960,168 | | | — | | | — | |
Strategic Asset Allocation Fund | | | 1,058,402 | | | — | | | 8,769 | |
Tactical Constrained Asset Allocation Fund | | | 920,562 | | | — | | | — | |
Tactical Unconstrained Asset Allocation Fund | | | 667,199 | | | — | | | — | |
Absolute Return Asset Allocation Fund | | | 1,125,858 | | | — | | | — | |
|
* Contains $2,931,871 of tax-exempt income for year ended 3/31/2012. |
145
|
GuideMarkSM Funds & GuidePathSM Funds |
NOTES TO FINANCIAL STATEMENTS (Continued) |
March 31, 2012 |
| |
| | | | | | | | | | |
| | Year Ended March 31, 2011 | |
| | | |
| | Ordinary
Income
Distributions | | Long-Term
Capital Gain
Distributions | | Return of
Capital | |
| | | | | | | |
Large Cap Growth Fund | | | — | | | $— | | | $— | |
Large Cap Value Fund | | | $2,264,115 | | | — | | | — | |
Small/Mid Cap Core Fund | | | — | | | — | | | — | |
World ex-US Fund | | | 4,263,692 | | | — | | | — | |
Core Fixed Income Fund | | | 14,829,215 | | | — | | | — | |
Tax-Exempt Fixed Income Fund* | | | 6,259,146 | | | — | | | — | |
| | | | | | | | | | |
* Contains $6,135,871 of tax-exempt income for year ended 3/31/2011. |
| |
| At March 31, 2012, the components of accumulated earnings (losses) on a tax basis were as follows: |
| | | | | | | | | | | | | | | | | | | |
| | Large Cap
Growth
Fund | | Large Cap
Value
Fund | | Small/Mid
Cap Core
Fund | | World
ex-US
Fund | | Opportunistic
Equity
Fund | | Global
Real Return
Fund | |
| | | | | | | | | | | | | |
Cost of | | | | | | | | | | | | | | | | | | | |
Investments | | $ | 159,825,136 | | $ | 189,271,938 | | $ | 75,783,993 | | $ | 224,078,025 | | $ | 154,095,703 | | $ | 141,951,967 | |
Gross Unrealized | | | | | | | | | | | | | | | | | | | |
Appreciation | | | 49,347,598 | | | 32,255,021 | | | 9,612,530 | | | 17,753,158 | | | 16,085,885 | | | 3,404,093 | |
Gross Unrealized | | | | | | | | | | | | | | | | | | | |
Depreciation | | | (5,921,970 | ) | | (9,655,304 | ) | | (3,002,534 | ) | | (17,071,973 | ) | | (6,892,208 | ) | | (8,003,602 | ) |
| | | | | | | | | | | | | | | | | | | |
Net Unrealized | | | | | | | | | | | | | | | | | | | |
Appreciation | | | | | | | | | | | | | | | | | | | |
(Depreciation) | | | 43,425,628 | | | 22,599,717 | | | 6,609,996 | | | 681,185 | | | 9,193,677 | | | (4,599,509 | ) |
| | | | | | | | | | | | | | | | | | | |
Undistributed | | | | | | | | | | | | | | | | | | | |
Tax-Exempt | | | | | | | | | | | | | | | | | | | |
Ordinary Income | | | — | | | — | | | — | | | — | | | — | | | — | |
Undistributed | | | | | | | | | | | | | | | | | | | |
Ordinary Income | | | — | | | 561,303 | | | 83,776 | | | 2,085,558 | | | — | | | — | |
Undistributed | | | | | | | | | | | | | | | | | | | |
Long-Term | | | | | | | | | | | | | | | | | | | |
Capital Gains | | | — | | | — | | | — | | | — | | | — | | | — | |
| | | | | | | | | | | | | | | | | | | |
Total Distributable | | | | | | | | | | | | | | | | | | | |
Earnings | | | — | | | 561,303 | | | 83,776 | | | 2,085,558 | | | — | | | — | |
| | | | | | | | | | | | | | | | | | | |
Other Accumulated | | | | | | | | | | | | | | | | | | | |
Losses | | | (71,664,118 | ) | | (171,499,103 | ) | | (28,421,935 | ) | | (213,834,652 | ) | | (11,072,711 | ) | | (4,638,316 | ) |
| | | | | | | | | | | | | | | | | | | |
Total Accumulated | | | | | | | | | | | | | | | | | | | |
Earnings (Losses) | | $ | (28,238,490 | ) | $ | (148,338,083 | ) | $ | (21,728,163 | ) | $ | (211,067,909 | ) | $ | (1,879,034 | ) | $ | (9,237,825 | ) |
| | | | | | | | | | | | | | | | | | | |
146
|
GuideMarkSM Funds & GuidePathSM Funds |
NOTES TO FINANCIAL STATEMENTS (Continued) |
March 31, 2012 |
| |
| | | | | | | | | | | | | | | | | | | | | | |
| | Core
Fixed Income
Fund | | Tax-Exempt
Fixed Income
Fund | | Opportunistic
Fixed Income
Fund | | Strategic
Asset
Allocation
Fund | | Tactical
Constrained
Asset
Allocation
Fund | | Tactical
Unconstrained
Asset
Allocation
Fund | | Absolute
Return
Asset
Allocation
Fund | |
| | | | | | | | | | | | | | | |
Cost of | | | | | | | | | | | | | | | | | | | | | | |
Investments | | $ | 463,640,765 | | $ | 74,885,071 | | $ | 238,598,241 | | $ | 138,145,020 | | $ | 145,104,211 | | $ | 179,656,234 | | $ | 258,103,315 | |
Gross Unrealized | | | | | | | | | | | | | | | | | | | | | | |
Appreciation | | | 14,257,152 | | | 6,530,510 | | | 4,227,821 | | | 10,611,136 | | | 9,260,191 | | | 11,276,250 | | | 3,450,047 | |
Gross Unrealized | | | | | | | | | | | | | | | | | | | | | | |
Depreciation | | | (6,857,309 | ) | | (47,438 | ) | | (7,976,844 | ) | | (2,286,248 | ) | | (1,812,696 | ) | | (2,812,134 | ) | | (1,788,123 | ) |
| | | | | | | | | | | | | | | | | | | | | | |
Net Unrealized | | | | | | | | | | | | | | | | | | | | | | |
Appreciation | | | | | | | | | | | | | | | | | | | | | | |
(Depreciation) | | | 7,399,843 | | | 6,483,072 | | | (3,749,023 | ) | | 8,324,888 | | | 7,447,495 | | | 8,464,116 | | | 1,661,924 | |
| | | | | | | | | | | | | | | | | | | | | | |
Undistributed | | | | | | | | | | | | | | | | | | | | | | |
Tax-Exempt | | | | | | | | | | | | | | | | | | | | | | |
Ordinary Income | | | — | | | 40,602 | | | — | | | — | | | — | | | — | | | — | |
Undistributed | | | | | | | | | | | | | | | | | | | | | | |
Ordinary Income | | | 920,490 | | | 25,858 | | | 150,544 | | | — | | | 148,140 | | | 254,452 | | | 1,037,242 | |
Undistributed | | | | | | | | | | | | | | | | | | | | | | |
Long-Term | | | | | | | | | | | | | | | | | | | | | | |
Capital Gains | | | — | | | — | | | — | | | — | | | — | | | — | | | 81,650 | |
| | | | | | | | | | | | | | | | | | | | | | |
Total Distributable | | | | | | | | | | | | | | | | | | | | | | |
Earnings | | | 920,490 | | | 66,460 | | | 150,544 | | | — | | | 148,140 | | | 254,452 | | | 1,118,892 | |
| | | | | | | | | | | | | | | | | | | | | | |
Other Accumulated | | | | | | | | | | | | | | | | | | | | | | |
Losses | | | (2,417,307 | ) | | (6,320,717 | ) | | (3,325,202 | ) | | (225,273 | ) | | (57,437 | ) | | (1,525,394 | ) | | (33,319 | ) |
| | | | | | | | | | | | | | | | | | | | | | |
Total Accumulated | | | | | | | | | | | | | | | | | | | | | | |
Earnings | | | | | | | | | | | | | | | | | | | | | | |
(Losses) | | $ | 5,903,026 | | $ | 228,815 | | $ | (6,923,681 | ) | $ | 8,099,615 | | $ | 7,538,198 | | $ | 7,193,174 | | $ | 2,747,497 | |
| | | | | | | | | | | | | | | | | | | | | | |
147
|
GuideMarkSM Funds & GuidePathSM Funds |
REPORT OF INDEPENDENT REGISTERED PUBLIC ACCOUNTING FIRM |
|
| |
The Shareholders and Boards of Trustees of the GuideMark Funds & GuidePath Funds
We have audited the accompanying statements of assets and liabilities of the GuideMark Large Cap Growth Fund, GuideMark Large Cap Value Fund, GuideMark Small/Mid Cap Core Fund, GuideMark World ex-US Fund, GuideMark Opportunistic Equity Fund, GuideMark Global Real Return Fund, GuideMark Core Fixed Income Fund, GuideMark Tax-Exempt Fixed Income Fund, GuideMark Opportunistic Fixed Income Fund, GuidePath Strategic Asset Allocation Fund, GuidePath Tactical Constrained Asset Allocation Fund, GuidePath Tactical Unconstrained Asset Allocation Fund, and GuidePath Absolute Return Asset Allocation Fund (collectively referred to as the Funds), including the schedules of investments, as of March 31, 2012, and the related statements of operations for the period then ended, the statements of changes in net assets for each of the periods in the two-year period then ended, and the financial highlights for each of the periods in the five-year period then ended. These financial statements and financial highlights are the responsibility of the Funds’ management. Our responsibility is to express an opinion on these financial statements and financial highlights based on our audits.
We conducted our audits in accordance with the standards of the Public Company Accounting Oversight Board (United States). Those standards require that we plan and perform the audit to obtain reasonable assurance about whether the financial statements and financial highlights are free of material misstatement. An audit includes examining, on a test basis, evidence supporting the amounts and disclosures in the financial statements. Our procedures included confirmation of securities owned as of March 31, 2012, by correspondence with the custodian and brokers. An audit also includes assessing the accounting principles used and significant estimates made by management, as well as evaluating the overall financial statement presentation. We believe that our audits provide a reasonable basis for our opinion.
In our opinion, the financial statements and financial highlights referred to above present fairly, in all material respects, the financial position of each of the Funds as of March 31, 2012, the results of their operations, the changes in its net assets, and the financial highlights for the periods described in the first paragraph above, in conformity with accounting principles generally accepted in the United States of America.
[Signed] KPMG LLP
Milwaukee, WI
May 30, 2012
148
|
GuideMarkSM Funds & GuidePathSM Funds |
ADDITIONAL INFORMATION |
March 31, 2012 |
| |
| |
| Additional Information |
| |
| 1. Shareholder Notification of Federal Tax Status (Unaudited) |
| |
| The Large Cap Value Fund, World ex-US Fund, Global Real Return Fund, Core Fixed Income Fund, Tax-Exempt Fixed Income Fund, Opportunistic Fixed Income Fund, Strategic Asset Allocation Fund, Tactical Constrained Asset Allocation Fund, Tactical Unconstrained Asset Allocation Fund and Absolute Return Asset Allocation Fund designated 100.00%, 0.00%, 100.00%, 0.37%, 0.00%, 2.09%, 38.96%, 56.04%, 54.86% and 15.91%, respectively, of dividends during the fiscal year ended March 31, 2012 as dividends qualifying for the dividends received deduction available to corporate shareholders. |
| |
| The Large Cap Value Fund, World ex-US Fund, Global Real Return Fund, Core Fixed Income Fund, Tax-Exempt Fixed Income Fund, Opportunistic Fixed Income Fund, Strategic Asset Allocation Fund, Tactical Constrained Asset Allocation Fund, Tactical Unconstrained Asset Allocation Fund and Absolute Return Asset Allocation Fund designated 100.00%, 100.00%, 100.00%, 0.37%, 0.00%, 3.74%, 100.00%, 100.00%, 73.85% and 17.22%, respectively, of dividends declared from net investment income during the fiscal year ended March 31, 2012 as qualified income under the Jobs and Growth Tax Relief Reconciliation Act of 2003. |
| |
| 2. Foreign Tax Credit Pass Through (Unaudited) |
| |
| Pursuant to Section 853 of the Internal Revenue Code, the GuideMarkSM World ex-US Fund and GuideMarkSM Opportunistic Fixed Income Fund designate the following amounts as foreign taxes paid for the year ended March 31, 2012. Foreign taxes paid for purposes of Section 853 may be less than actual foreign taxes paid for financial statement purposes. |
| | | | | | | | | | | | |
| | Creditable Foreign
Taxes Paid | | Per Share
Amount | | Portion of Ordinary Income Distribution
Derived from Foreign Sourced Income* | |
| | | | | | | |
|
GuideMarkSM World ex-US Fund | | $ | 501,682 | | | $ | 0.0167 | | | 99.94 | % | |
GuideMarkSM Opportunistic | | | | | | | | | | | | |
Fixed Income Fund | | $ | 129,311 | | | $ | 0.0052 | | | 59.72 | % | |
| | |
| * | None of the Funds listed above derived any income from “ineligible foreign sources” as defined under Section 901(j) of the Internal Revenue Code. |
| | |
| Foreign taxes paid or withheld should be included in taxable income with an offsetting deduction from gross income or as a credit for taxes paid to foreign governments. |
| | |
| Above figures may differ from those cited elsewhere in this report due to differences in the calculation of income and gains under U.S. generally accepted accounting principles (book) purposes and Internal Revenue Service (tax) purposes. |
| | |
| Shareholders are strongly advised to consult their own tax advisers with respect to the tax consequences of their investments in the Funds. In January, shareholders, excluding corporate shareholders, receive an IRS 1099-DIV regarding the Federal tax status of the dividends and distributions they received in the calendar year. |
149
|
GuideMarkSM Funds & GuidePathSM Funds |
ADDITIONAL INFORMATION (Continued) |
March 31, 2012 |
| |
3. Disclosure Regarding Fund Trustees and Officers (Unaudited)
| | | | | | | | | | |
Name, Address
and Year of Birth | | Position(s)
Held with
the Trust | | Term of Office
and Length of
Time Served | | Principal
Occupation During Past Five Years | | # of
Portfolios
in Fund
Complex
Overseen
by Trustee | | Other
Director/
Trustee
Positions |
| | | | | | | | | | |
GPS Funds I | | | | | | | | | | |
Independent Trustees | | | | | | | | | | |
| | | | | | | | | | |
R. Thomas DeBerry
c/o Genworth Financial
Wealth Management, Inc.
2300 Contra Costa
Boulevard Ste 600
Pleasant Hill, CA
94523-3967
Year of Birth: 1941 | | Trustee | | Indefinite Term
since 2001. | | Retired; Forty years of experience in securities operations and consulting for financial services firms. | | 7 | | None. |
| | | | | | | | | | |
William J. Klipp
c/o Genworth Financial
Wealth Management, Inc.
2300 Contra Costa
Boulevard Ste 600
Pleasant Hill, CA
94523-3967
Year of Birth: 1955 | | Lead
Independent
Trustee | | Indefinite Term
since 2001. Lead
Independent
Trustee since
2007. | | Retired (1990-present). Formerly, President and Chief Operating Officer, Charles Schwab Investment Management, Inc. (registered investment advisor) and Executive Vice President, Schwab Funds (1993-1999). | | 7 | | Adelante Funds. |
| | | | | | | | | | |
Dennis G. Schmal
c/o Genworth Financial
Wealth Management, Inc.
2300 Contra Costa
Boulevard Ste 600
Pleasant Hill, CA
94523-3967
Year of Birth: 1947 | | Trustee | | Indefinite Term
since 2007. | | Self-employed board director and consultant (1999-present). Formerly, Partner, Arthur Andersen LLP (audit services) (1972-1999). | | 7 | | Grail Advisors ETF Trust; Wells Fargo ASGI Hedge Funds (closed-end hedge funds); Chairman, Pacific Metrics Corp. (educational services); Varian Semiconductor Equipment Associates, Inc., Merriman Holdings, Inc. (financial services); Director, NorthBay Bancorp. |
150
|
GuideMarkSM Funds & GuidePathSM Funds |
ADDITIONAL INFORMATION (Continued) |
March 31, 2012 |
| |
| | | | | | | | | | |
Name, Address
and Year of Birth | | Position(s)
Held with
the Trust | | Term of Office
and Length of
Time Served | | Principal
Occupation During Past Five Years | | # of
Portfolios
in Fund
Complex
Overseen
by Trustee | | Other
Director/
Trustee
Positions |
| | | | | | | | | | |
Interested Trustees | | | | | | | | | | |
| | | | | | | | | | |
Ronald Cordes*
Genworth Financial
Wealth Management, Inc.
2300 Contra Costa
Boulevard Ste 600
Pleasant Hill, CA
94523-3967
Year of Birth: 1959 | | Chairman of
the Board,
Trustee | | Indefinite Term
since 2001. | | Co-Chairman, Genworth Financial Wealth Management (“GFWM”) (formerly, AssetMark Investment Services) (2006-present); Principal, GFWM (1994-present); President, GPS Funds I (formerly) AssetMark Funds) (2001-2008); President, GFWM (1994-2008); President, Chairman and Chief Compliance Officer, AssetMark Capital Corporation (1994-2008). | | 7 | | ThinkImpact (non-profit organization); Transfair, USA (non-profit organization); Sarona Frontier General Partner, Inc. (investment fund); Microvest Fund I, Investment Committee (investment fund); Board of Regents University of the Pacific; Vice Chairman, East Bay Community Foundation; Katalysis Bootstrap Fund (non-profit organization); Advisory Board, Boys and Girls Clubs of Oakland. |
| | | | | | | | | | |
GPS Funds II | | | | | | | | | | |
Independent Trustees | | | | | | | | | | |
| | | | | | | | | | |
David M. Dunford
c/o Genworth Financial
Wealth Management, Inc.
2300 Contra Costa
Boulevard Ste 600
Pleasant Hill, CA
94523-3967
Year of Birth: 1949 | | Trustee | | Indefinite Term
since 2011. | | Retired (2001-present). Formerly, Senior Vice President, Merrill Lynch Insurance Group (insurance agency) (1989-2001). | | 6 | | New England Bancorp. |
| | | | | | | | | | |
Paul S. Feinberg
c/o Genworth Financial
Wealth Management, Inc.
2300 Contra Costa
Boulevard Ste 600
Pleasant Hill, CA
94523-3967
Year of Birth: 1942 | | Trustee | | Indefinite Term
since 2011. | | Retired (2005-present). Formerly, Executive Vice President and General Counsel, CitiStreet Associates LLC (insurance agency), CitiStreet Equities LLC (broker-dealer), CitiStreet Financial Services LLC (registered investment advisor) and CitiStreet Funds Management LLC (registered investment advisor) (1990-2005) and President, CitiStreet Funds, Inc. (2000-2005). | | 6 | | Blue Fund Group. |
151
|
GuideMarkSM Funds & GuidePathSM Funds |
ADDITIONAL INFORMATION (Continued) |
March 31, 2012 |
| |
| | | | | | | | | | |
Name, Address
and Year of Birth | | Position(s)
Held with
the Trust | | Term of Office
and Length of
Time Served | | Principal
Occupation During Past Five Years | | # of
Portfolios
in Fund
Complex
Overseen
by Trustee | | Other
Director/
Trustee
Positions |
| | | | | | | | | | |
John A. Fibiger
c/o Genworth Financial
Wealth Management, Inc.
2300 Contra Costa
Boulevard Ste 600
Pleasant Hill, CA
94523-3967
Year of Birth: 1932 | | Lead
Independent
Trustee | | Indefinite Term
since 2011. | | Retired (1997 to present). Formerly, Chairman, TransAmerica Life Companies (“TransAmerica”) (insurance company) (1994-1997), President, TransAmerica (1993-1994), CFO, TransAmerica (1990-1993); Executive Vice President, New England Mutual Life Insurance Company (life insurance company) (1974-1990). | | 7 | | Genworth Financial Asset Management Funds; Association (life insurance company); Members Mutual Holding Co.; Member, Executive Committee, Austin Symphony Orchestra Board of Directors; Life Trustee, Museum of Science, Boston, Massachusetts. |
| | | | | | | | | | |
Interested Trustees | | | | | | | | | | |
| | | | | | | | | | |
Gurinder S. Ahluwalia**
c/o Genworth Financial
Wealth Management, Inc.
2300 Contra Costa
Boulevard Ste 600
Pleasant Hill, CA
94523-3967
Year of Birth: 1965 | | Chairman of
the Board,
Trustee | | Indefinite Term
since 2011. | | President and CEO of GFWM (2009-present); Co-Chairman, GFWM (2008-2009); Vice-Chairman, AssetMark Investment Services, Inc. (2006-2008); President, CEO, (2004-2008); President and Chairman, Genworth Financial Asset Management, Inc. (“GFAM”). | | 7 | | Genworth Financial Asset Management Funds; Centurion Capital Group Inc.; Centurion Financial Advisers Inc.; GFAM and GFWM; formerly AssetMark Investment Services, Inc. |
152
|
GuideMarkSM Funds & GuidePathSM Funds |
ADDITIONAL INFORMATION (Continued) |
March 31, 2012 |
| |
| | | | | | |
Name, Address
and Year of Birth | | Position(s)
Held with
the Trust | | Term of Office
and Length of
Time Served | | Principal Occupation During Past Five Years |
| | | | | | |
| | | | | | |
Officers | | | | | | |
| | | | | | |
Carrie E. Hansen
Genworth Financial
Wealth Management, Inc.
2300 Contra Costs
Boulevard Ste 600
Pleasant Hill, CA
94523-3967
Year of Birth: 1970 | | President | | Renewed
1-Year Term
since 2007. | | President, GPS Funds I (2007-present), GPS Funds II (2011-present), Genworth Financial Asset Management Funds (“GFAM”) (2008-present) and Genworth Variable Insurance Trust (“GVIT”) (2008-2012); Senior Vice President and Chief Operations Officer, GFWM (2008-present); Chairman, Genworth Financial Trust Company (2008-present); Senior Vice President and Managing Director, GPS Funds I, Formerly, AssetMark Funds, (2007-2008); Treasurer and Chief Compliance Officer, Genworth Financial Asset Management Funds (2007-2008); Chief Compliance Officer, GPS Funds I, Formerly, AssetMark Funds, (2005-2008); Treasurer, GPS Funds I, Formerly, AssetMark Funds, (2001- 2008): Senior Vice President, Chief Financial Officer and Chief Compliance Officer, GFWM, Formerly, AssetMark Investment Services, Inc., (2004-2007). |
| | | | | | |
Deborah Djeu
Genworth Financial
Wealth Management, Inc.
2300 Contra Costa
Boulevard Ste 600
Pleasant Hill, CA
94523-3967
Year of Birth: 1962 | | Vice
President,
Chief
Compliance
Officer and
AML
Compliance
Officer | | Renewed
1-Year Term
since 2008. | | Vice President, Chief Compliance Officer and AML Compliance Officer, GPS Funds I (2008-present), GPS Funds II (2011-present), GFAM (2008-present) and GVIT (2008-2012): Deputy Chief Compliance Officer, GPS Funds I, Formerly, AssetMark Funds, (2007-2008); Compliance Manager, GE Money (2006-2007); Vice President, Wells Fargo Investments LLC (2004-2006). |
| | | | | | |
Starr E. Frohlich
Genworth Financial
Wealth Management, Inc.
2300 Contra Costa
Boulevard Ste 600
Pleasant Hill, CA
94523-3967
Year of Birth: 1972 | | Vice
President,
Treasurer | | Since 2010. | | Vice President and Treasurer, GPS Funds I (2010-present), GPS Funds II (2011-present), GFAM (2010-present) and GVIT (2010-2012); Director of Fund Administration, GFWM (2010-present); Vice President, U.S. Bancorp Fund Services, LLC (1997-2010). |
| | | | | | |
Christine Villas-Chernak
Genworth Financial
Wealth Management, Inc.
2300 Contra Costa
Boulevard Ste 600
Pleasant Hill, CA
94523-3967
Year of Birth: 1968 | | Deputy
Chief
Compliance
Officer;
Secretary | | Renewed
1-Year Term
since 2009.
Since 2006. | | Deputy Chief Compliance Officer, GPS Funds I (2009-present), GPS Funds II (2011-present) and GVIT (2009-2012); Secretary, GPS Funds I (2006-present), GPS Funds II (2011-present), GFAM (2009-2010) and GVIT (2008-2010); Senior Compliance Officer, GFWM (2005-2009); Fund Administration & Compliance Manager, GFWM, Formerly, AssetMark Investment Services, Inc., (2004-2005); Fund Administration & Compliance Specialist, GFWM, Formerly, AssetMark Investment Services, Inc., (2002-2004). |
| | | | | | |
Robert J. Bannon
Genworth Financial
Wealth Management, Inc.
2300 Contra Costa
Boulevard Ste 600
Pleasant Hill, CA
94523-3967
Year of Birth: 1957 | | Vice
President,
Chief Risk
Officer | | Since 2010. | | Chief Risk Officer, GFAM Funds (2010-present); GVIT Funds (2010-2012); Senior Vice President and Chief Risk Officer, GFWM (2007-present); Senior Vice President and Chief Investment Officer, Bank of the West (formerly Sanwa Bank California) (2000-2005). |
| |
* | Ronald Cordes is an “interested person” of the Trust as defined in the 1940 Act because he is the Chairman of the Board for GFWM and serves as Director for GFWM and Quanturis. |
| |
** | Mr. Ahluwalia is an “interested person” of the Trust as defined in the 1940 Act because he is an officer of GFWM or certain of its affiliates. |
| |
The Statement of Additional Information includes additional information about the Funds’ Trustees and is available free of charge upon request by calling the Funds toll free at (888) 278-5809. |
153
|
GuideMarkSM Funds & GuidePathSM Funds |
ADDITIONAL INFORMATION (Continued) |
March 31, 2012 |
| |
| |
4. | Proxy Voting Policies and Procedures and Proxy Voting Record (Unaudited) |
| A description of the policies and procedures that the Funds use to determine how to vote proxies related to the Funds’ portfolio securities as well as information regarding how the Funds voted proxies relating to portfolio securities during the most recent 12-month period ended June 30 is available without charge, upon request, by calling (888) 278-5809. Furthermore, you can obtain the Fund’s proxy voting records on the SEC’s website at http://www.sec.gov. |
| |
5. | Availability of Quarterly Portfolio Holdings Schedules (Unaudited) |
| The Funds file their complete schedules of portfolio holdings with the SEC for their first and third fiscal quarters on Form N-Q. Once filed, the Funds’ Form N-Q is available without charge, upon request on the SEC’s website (http://www.sec.gov) and is available by calling (888) 278-5809. You can also obtain copies of Form N-Q by (i) visiting the SEC’s Public Reference Room in Washington, D.C. (information on the operation of the Public Reference Room may be obtained by calling 1-800-SEC-0330); (ii) sending your request and a duplicating fee to the SEC’s Public Reference Room, Washington, D.C. 20549-0102; or (iii) sending your request electronically to publicinfo@sec.gov. |
| |
6. | Statement Regarding the Basis for Approval of Investment Advisory Agreement and Sub-Advisory Agreements (Unaudited). |
| During the six-month period ended March 31, 2012, the Board of Trustees (the “Board” or the “Trustees”) of GPS Funds I (the “Trust”) conducted its review and renewal of the investment advisory agreement between Genworth Financial Wealth Management, Inc. (“GFWM”) and the Trust, on behalf of each series of the Trust (collectively, the “Funds”) (the “Advisory Agreement”). Additionally, the Board considered the renewal of the investment sub-advisory agreements between (i) Delaware Management Company (“Delaware”) and GFWM, on behalf of the GuideMarkSM Tax-Exempt Fixed Income Fund; (ii) Nuveen Asset Management (“Nuveen”) and GFWM, on behalf of the GuideMarkSM Tax-Exempt Fixed Income Fund; (iii) Goldman Sachs Asset Management (“Goldman”) and GFWM, on behalf of the GuideMarkSM Core Fixed Income Fund; and (iv) Barrow, Hanley, Mewhinney & Strauss (“Barrow Hanley”) and GFWM, on behalf of the GuideMarkSM Core Fixed Income Fund (collectively, the “Sub-Advisory Agreements”). Hereinafter, Delaware, Nuveen, Goldman, and Barrow Hanley are collectively referred to as the “Sub-Advisors” and the GuideMarkSM Tax-Exempt Fixed Income Fund and GuideMarkSM Core Fixed Income Fund are collectively referred to as the “Sub-Advised Funds.” The Advisory Agreement and Sub-Advisory Agreements are collectively referred to herein as the “Agreements.” |
| |
| The Funds are managed using a “manager-of-managers” structure that generally involves the use of one or more sub-advisors to manage allocated portions of the Funds’ portfolios. Under this structure, the Advisor is responsible for evaluating and selecting sub-advisors on an ongoing basis and making any decisions to recommend hiring, retaining, or replacing sub-advisors. The Board is engaged in monitoring this process in connection with its meetings held throughout the year and, under the manager-of-managers structure, all parties understand that sub-advisors are being monitored and evaluated, and are subject to replacement, at all times. |
| |
| The Board – including a majority of the independent Trustees – determined to approve the continuance of the Advisory Agreement and the Sub-Advisory Agreements. The material factors considered and the conclusions that formed the bases of the Board’s renewal of the Agreements are described below. This summary describes the most significant, but not all, of the factors evaluated by the Board. In preparation for their meeting, the Trustees requested, received, and reviewed information relevant to their consideration of the Agreements. The Trustees also received assistance and advice regarding legal and industry standards from independent counsel to the independent Trustees. In deciding to approve each of the Agreements, the Board did not identify any particular information or any single factor or conclusion that was controlling. |
154
|
GuideMarkSM Funds & GuidePathSM Funds |
ADDITIONAL INFORMATION (Continued) |
March 31, 2012 |
| |
| |
| The Advisory Agreement |
| |
| Materials Reviewed and the Review Process |
| |
| The Trustees – assisted by independent legal counsel – specifically requested and were furnished with materials for purposes of their review. The materials provided to the Board with regard to the Funds related to, among other things: (a) the terms and conditions of the Advisory Agreement; (b) information describing the nature, extent, and quality of the services that GFWM provides to the Funds, the fees that GFWM charges to the Funds for these services, and a comparison of those fees to the fees paid by a peer group of other investment companies having investment objectives similar to the investment objectives of the Funds and that were identified as competitors; (c) information regarding GFWM’s business and operations, financial position, investment team, and compliance program; (d) information describing each Fund’s operating expenses compared to the Fund’s peer group of other registered investment companies with investment objectives similar to the investment objectives of that Fund; (e) information describing each Fund’s performance compared to the Fund’s peer group of other investment companies with investment objectives similar to the investment objective of the Fund; and (f) information regarding GFWM’s profitability in managing each Fund. |
| |
| The Trustees also considered presentations made by and discussions held with representatives of GFWM throughout the course of the year at regularly scheduled Board meetings, including: (a) reports on the Funds’ investment performance; (b) reports on GFWM’s deliberations and consultations regarding the evaluation of sub-advisors; (c) information relating to the monitoring of the sub-advisors’ portfolio securities trading and brokerage practices; (d) information relating to the distribution, sales, and redemptions of Fund shares and related shareholder services; (e) information relating to the monitoring of the other service providers; (f) compliance reports; and (g) other information relating to the nature, extent and quality of services provided by GFWM to the Funds. |
| |
| The Trustees received assistance and advice regarding legal and industry standards from both independent counsel to the independent Trustees and from counsel to the Trust, which included detailed memoranda that described the Trustees’ legal duties and obligations in considering whether to approve the Agreements. The independent Trustees discussed the Agreements in communications prior to their meeting and during the course of their meeting in several private sessions with independent counsel, at which no representatives of GFWM were present. |
| |
| Factors Considered |
| |
| The Trustees considered and reached conclusions on a number of factors in making the decision to approve the Advisory Agreement. These factors and conclusions are described below. |
| |
| Nature, Extent and Quality of Services Provided |
| |
| With respect to the nature, extent, and quality of services provided by GFWM, the Board considered the fact that, as an investment advisor operating within a manager-of-managers structure, GFWM maintains a primary focus on the selection, evaluation, and oversight of the Funds’ various sub-advisors and considered the Advisory Agreement in this context. |
| |
| The Trustees considered GFWM’s process for managing the Funds’ sub-advisors, including: (a) GFWM’s ability to select, monitor, and evaluate the sub-advisors of the various Funds; (b) GFWM’s ability and willingness to identify instances when there may be a need to replace a sub-advisor and accomplish any such changes; and (c) GFWM’s use of one or more third-party investment consultants as needed from time to time. The Trustees also considered (a) the experience, capability, and integrity of GFWM’s management and other personnel; (b) the financial position of GFWM; (c) the quality of GFWM’s regulatory and legal compliance policies, procedures, and systems; (d) the nature, extent, and quality of administrative and shareholder services provided by GFWM to the Funds; and (e) GFWM’s supervision of the Funds’ third-party service providers. |
155
|
GuideMarkSM Funds & GuidePathSM Funds |
ADDITIONAL INFORMATION (Continued) |
March 31, 2012 |
| |
| |
| The Board evaluated GFWM’s capabilities in providing the administrative and compliance services needed to support the management of the Funds. In this regard, the Board considered the information provided to them throughout the course of the year, as well as information gathered at visits the Trustees have paid to GFWM’s offices and at regular meetings with the Trust’s Chief Compliance Officer at which she provides the Trustees with details regarding GFWM’s compliance functions. The Board also considered the roles of GFWM’s senior management and the extent of their involvement with the Funds as well as GFWM’s willingness to add personnel over time in order to ensure that appropriate staffing levels are maintained. |
| |
| In connection with its approval of the Advisory Agreement on behalf of the Funds, the Board considered the services to be provided to such Funds. The Trustees discussed their experience in dealing with GFWM in its role as investment advisor to the Funds in the time since their inception. The Trustees considered the breadth and quality of services that GFWM provides to the Funds, particularly with respect to monitoring sub-advisors. The Trustees also considered that the Funds are an integral part of GFWM’s program of asset allocation and shareholder services. Additionally, the Trustees considered GFWM’s ability to provide administrative and compliance-related services in connection with GFWM’s oversight of the sub-advisors’ compliance with the Funds’ respective investment objectives, policies, and restrictions; review of trading and brokerage matters; and other oversight activities. |
| |
| Based on the factors described above, among others, as well as the information provided to the Board in advance of their meeting and throughout the past year, the Trustees concluded that the nature, extent, and quality of the services to be provided by GFWM to each Fund will benefit the Fund and its shareholders. |
| |
| Investment Performance of the Funds |
| |
| The Board considered the overall investment performance of the Funds and evaluated the Funds’ performance in the context of the manager-of-managers structure and the special considerations that such a structure requires. The Board also considered that GFWM continued to be proactive in seeking to replace and/or add sub-advisors, to reallocate assets among sub-advisors, and to implement new investment strategies with a view toward improving Fund performance over the long-term. |
| |
| The Trustees considered whether the Funds operated within their investment objectives and styles and considered each Fund’s record of compliance with its respective investment restrictions. The Trustees also considered each Fund’s investment performance relative to its respective benchmark index. The Trustees concluded that GFWM’s performance record in managing each of the Funds indicates that its continued management will benefit each Fund and its shareholders. |
| |
| Advisory Fees and Total Expenses |
| |
| The Board considered a detailed analysis of the Funds’ fees and expenses. The Trustees compared the advisory fees and total expenses of each Fund (as a percentage of average net assets) with the fees and expenses of a group of funds selected by a third-party information provider. These materials included comparisons of each Fund’s expenses to industry averages; expense ratios of sub-advised fund families; income statement data for other investment managers; and fee schedules for the Funds’ sub-advisors. |
| |
| The Trustees considered GFWM’s continuing commitment to limit each Fund’s total expenses. The Trustees considered the expense limitation arrangement under which GFWM had agreed to limit the Funds’ expenses since their inception, as well as GFWM’s other efforts to reduce overall Fund expenses. The Trustees also considered GFWM’s agreement, when Trust assets are above certain levels, to waive a portion of its advisory fee received from the Funds so as to pass on to shareholders a portion of the economies of scale that may result from breakpoints in certain of the sub-advisory fee schedules. After comparing each Fund’s proposed fees with those of other comparable funds, and in light of the nature, extent, and quality of services provided to the Funds by GFWM, as well as the costs incurred by GFWM in rendering those services, the Trustees concluded that the level of fees paid to GFWM with respect to each Fund was fair and reasonable and that this factor supported the Board’s determination to approve the Advisory Agreement on behalf of each Fund. |
156
|
GuideMarkSM Funds & GuidePathSM Funds |
ADDITIONAL INFORMATION (Continued) |
March 31, 2012 |
| |
| |
| The Trustees considered each of these factors in light of the benefits to the Funds of being offered through financial professionals using GFWM’s various investment programs. The Trustees concluded that the level of the fees charged by GFWM to each Fund was reasonable in relation to the services provided by GFWM. |
| |
| Advisor Costs, Level of Profits, and Economies of Scale |
| |
| The Board also reviewed the financial information relating to GFWM and detailing GFWM’s profitability with respect to its management of the Funds. The Board considered the allocation methods used by GFWM to allocate expenses to the Funds under its profitability analysis and the individual profitability to GFWM of each of the Funds under this methodology. |
| |
| The Trustees considered GFWM’s agreement to waive advisory fees received from the Funds to the extent necessary to reflect: (1) potential economies of scale and (2) reductions in fees that may occur as a result of certain contractual breakpoints in the schedules of fees paid by GFWM to Sub-Advisors of the Funds under the Sub-Advisory Agreements. The Trustees considered the effect that the fee waiver arrangement could have on GFWM’s profitability. The Trustees also considered other benefits received by GFWM as a result of its relationship with the Funds, including the benefits of offering an integrated set of investment options as an integral part of GFWM’s asset allocation investment programs and the related marketing rebates received by GFWM. |
| |
| The Trustees concluded that GFWM’s cost structure was reasonable and that GFWM is sharing – and would continue to share – potential economies of scale with each Fund and its shareholders to their benefit. |
| |
| Conclusion |
| |
| The Trustees indicated that, while the consideration of the continuance of the Advisory Agreement is an annual exercise, the Board engages in a detailed analysis of each of these factors throughout the course of the year. Based upon all of the foregoing factors and such other matters as were deemed relevant, the Trustees concluded that each factor supported the Board’s decision to approve the Advisory Agreement on behalf of the Funds. No single factor was determinative to the decisions of the Trustees. |
| |
| The Sub-Advisory Agreements |
| |
| Materials Reviewed and the Review Process |
| |
| Assisted by independent legal counsel, the Trustees specifically requested and were furnished with materials for purposes of their review. The materials provided to the Board related to, among other things: (a) the terms and conditions of the Sub-Advisory Agreements; (b) the nature, quality, and scope of the services to be provided by the Sub-Advisors, as well as the schedule of fees charged for such services; (c) each Sub-Advisor’s investment performance compared to an industry peer group as well as other sub-advisor client accounts; (d) comparative sub-advisory fee information; (e) information regarding each Sub-Advisor’s personnel, operations, financial position, and business operations; (f) information regarding each Sub-Advisor’s brokerage and compliance practices; and (g) information regarding each Sub-Advisor’s interactions with the Advisor regarding management of the Sub-Advised Funds. |
| |
| Additionally, during the course of the year, the Trustees received information relating to, among other things: (a) the quantitative performance of each Sub-Advisor; (b) GFWM’s evaluation, in accordance with its role as a “manager-of-managers,” of the nature, extent, and quality of the services provided by each Sub-Advisor; (c) GFWM’s profitability in managing each Fund and other information that might suggest the potential for realizing economies of scale that could be shared with Fund shareholders; and (d) benefits to each Sub-Advisor, such as receipt of research from brokers, that might result from the Sub-Advisor’s relationship with a Sub-Advised Fund. The Trustees considered and evaluated this information for purposes of determining whether to approve the Sub-Advisory Agreements. |
157
|
GuideMarkSM Funds & GuidePathSM Funds |
ADDITIONAL INFORMATION (Continued) |
March 31, 2012 |
| |
| |
| The Trustees received assistance and advice regarding legal and industry standards from both independent counsel and from counsel to the Trust, which included detailed memoranda that described the Trustees’ legal duties and obligations in considering the renewal of the Sub-Advisory Agreements. The Trustees discussed the approval of the Sub-Advisory Agreements in communications prior to their meeting and, during the course of their meeting, in private sessions with independent counsel at which no representatives of GFWM or the Sub-Advisors were present. |
| |
| Factors Considered |
| |
| The Trustees considered and reached conclusions on a number of factors in making the decision to approve the Sub-Advisory Agreements. In so doing, the Trustees considered the Advisor’s active role as a “manager-of-managers,” which includes, among other functions, monitoring and evaluating the performance of the Sub-Advisors, recommending that any sub-advisor not performing as expected be replaced, and negotiating advantageous fee arrangements that could permit the Funds to realize economies of scale without compromising the quality of services. These factors and the Board’s conclusions are set forth below. |
| |
| Nature, Extent and Quality of Services Provided |
| |
| The Trustees considered each Sub-Advisor’s investment management process, including (a) the experience, capability, and integrity of the Sub-Advisor’s management, investment professionals, and other personnel; (b) the financial position of the Sub-Advisor; (c) the quality and commitment of the Sub-Advisor’s regulatory and legal compliance policies, procedures, and systems; and (d) the Sub-Advisor’s brokerage and trading practices. The Trustees concluded that the nature, extent, and quality of the services provided by each Sub-Advisor has benefited – and will continue to benefit – each Sub-Advised Fund and its shareholders and that these factors supported the Board’s determination to approve each Sub-Advisory Agreement. |
| |
| Investment Performance of the Funds |
| |
| The Trustees considered whether each Sub-Advisor operated within its respective Sub-Advised Fund’s investment objective and style and considered each Sub-Advisor’s record of compliance with applicable investment restrictions. The Trustees also considered each Sub-Advisor’s investment performance relative to benchmark indices. The Trustees concluded that each Sub-Advisor’s performance record in managing its relevant Sub-Advised Fund indicates that its continued management will benefit the Sub-Advised Funds and their shareholders. |
| |
| Sub-Advisory Fees and Economies of Scale |
| |
| The Trustees considered each Sub-Advisor’s fee schedule for providing services to its relevant Sub-Advised Fund. The Trustees also considered individual reports prepared with regard to each Sub-Advisor containing comparative information regarding fees. The Trustees considered that breakpoints in certain of the Sub-Advisory Agreements’ fee schedules represented potential economies of scale that could be shared with the Sub-Advised Funds’ shareholders. |
| |
| Conclusion |
| |
| Based on their evaluation of the relevant factors, the Board – including the independent Trustees – concluded that each of the factors discussed above favored renewal of each Sub-Advisory Agreement. The Board also concluded that the fees to be paid to each Sub-Advisor are reasonable and that renewal of the Sub-Advisory Agreements is in the best interests of the Sub-Advised Funds and their shareholders. |
158
GuideMarkSM Funds
GuidePathSM Funds
| | | |
GUIDEMARKSM FUNDS & GUIDEPATHSM FUNDS |
|
| GuideMarkSM Large Cap Growth Fund | | |
| GuideMarkSM Large Cap Value Fund | | |
| GuideMarkSM Small/Mid Cap Core Fund | | |
| GuideMarkSM World ex-US Fund | | |
| GuideMarkSM Opportunistic Equity Fund | | |
| GuideMarkSM Global Real Return Fund | | |
| GuideMarkSM Core Fixed Income Fund | | |
| GuideMarkSM Tax-Exempt Fixed Income Fund | | �� |
| GuideMarkSM Opportunistic Fixed Income Fund | | |
| GuidePathSM Strategic Asset Allocation Fund | | |
| GuidePathSM Tactical ConstrainedSM Asset Allocation Fund | | |
| GuidePathSM Tactical UnconstrainedSM Asset Allocation Fund | | |
| GuidePathSM Absolute Return Asset Allocation Fund | | |
| Investment Advisor | | |
| Genworth Financial Wealth Management, Inc. | | |
| 2300 Contra Costa Blvd., Suite 600 | | |
| Pleasant Hill, CA 94523 | | |
| Legal Counsel | | |
| Stradley Ronon Stevens & Young, LLP | | This document must be preceded or accompanied by a free prospectus. Investors should consider the Fund’s investment objectives, risks, charges and expenses carefully before investing. The prospectus contains this and other important information about the Fund. Please read the prospectus carefully before you invest or send money. |
| 2600 One Commerce Square | |
| Philadelphia, PA 19103 | |
| Independent Registered Public Accounting Firm | |
| KPMG LLP | |
| 777 East Wisconsin Avenue | |
| Milwaukee, WI 53202 | |
| Transfer Agent, Fund Accountant | |
| and Fund Administrator | |
| U.S. Bancorp Fund Services, LLC | |
| 615 East Michigan Street | |
| Milwaukee, WI 53202 | |
| Custodian | | |
| U.S. Bank, N.A. | | |
| 1555 North RiverCenter Drive, Suite 302 | | |
| Milwaukee, WI 53212 | | |
| Distributor | | Annual Report |
| Capital Brokerage Corporation | |
| (dba Genworth Financial Brokerage Corporation in Indiana) | | March 31, 2012 |
| 6620 West Broad Street Building 2 | | |
| Richmond, VA 23230 | | |
| Member FINRA | | |
Item 2. Code of Ethics.
The registrant has adopted a code of ethics that applies to the registrant’s principal executive officer and principal financial officer. The registrant has not made any amendments to its code of ethics during the period covered by this report. The registrant has not granted any waivers from any provisions of the code of ethics during the period covered by this report.
A copy of the registrant’s Code of Ethics is filed herewith.
Item 3. Audit Committee Financial Expert.
The registrant’s board of trustees has determined that there is at least one audit committee financial expert serving on its audit committee. John Fibiger is the “audit committee financial expert” and is considered to be “independent” as each term is defined in Item 3 of Form N-CSR.
Item 4. Principal Accountant Fees and Services.
(a) Audit Fees
For the fiscal year ended March 31, 2012, the registrant’s principal accountant billed the registrant $0 for professional services rendered for the audit of the registrant’s annual financial statements or services that are normally provided by the principal accountant in connection with statutory and regulatory filings or engagements.
(b) Audit-Related Fees
None.
c) Tax Fees
For the fiscal year ended March 31, 2012, the registrant’s principal accountant billed the registrant $8,000 for professional services rendered for tax compliance, tax advice and tax planning.
(d) All Other Fees
None.
| |
(e)(1) | The registrant’s audit committee charter provides that the audit committee is responsible for the approval, prior to appointment, of the engagement of auditors annually to audit and to provide their opinion on the registrant’s financial statements. The audit committee charter also provides that the audit committee is responsible for the approval, prior to appointment, of the engagement of the auditor to provide other audit services to the registrant or to provide non-audit services to the registrant, its investment adviser or any entity controlling, controlled by, or under common control with the investment |
1
| |
| adviser that provides ongoing services to the registrant, if the engagement relates directly to the operations and financial reporting of the registrant. |
| |
| |
(e)(2) | There were no services in paragraphs (b) through (d) above (including services required to be approved by the audit committee pursuant to paragraph (c)(7)(ii) of Rule 2-01 of Regulation S-X) that were approved pursuant to the waiver provision of paragraph (c)(7)(i)(C) of Rule 2-01 of Regulation S-X. |
| |
(f) | None of the hours expended on the principal accountant’s engagement to audit the registrant’s financial statements for the fiscal year ended March 31, 2012 were attributable to work performed by persons other than the principal accountant’s full-time, permanent employees. |
| |
(g) | The aggregate non-audit fees billed by the registrant’s principal accountant for services rendered to the registrant’s investment adviser and any entity controlling, controlled by, or under common control with the investment adviser that provides ongoing services to the registrant for the fiscal year ended March 31, 2012 were $0. |
| |
(h) | The registrant’s audit committee has considered whether the provision of non-audit services that were rendered to the registrant’s investment adviser, and any entity controlling, controlled by, or under common control with the investment adviser that provides ongoing services to the registrant, that were not pre-approved pursuant to paragraph (c)(7)(ii) of Rule 2-01 of Regulation S-X is compatible with maintaining the principal accountant’s independence. |
Item 5. Audit Committee of Listed Registrants.
Not applicable to registrants who are not listed issuers (as defined in Rule 10A-3 under the Securities Exchange Act of 1934).
Item 6. Investments.
Schedule of Investments is included as part of the report to shareholders filed under Item 1 of this Form.
Item 7. Disclosure of Proxy Voting Policies and Procedures for Closed-End Management Investment Companies.
Not applicable to open-end investment companies.
Item 8. Portfolio Managers of Closed-End Management Investment Companies.
Not applicable to open-end investment companies.
Item 9. Purchases of Equity Securities by Closed-End Management Investment Company and Affiliated Purchasers.
Not applicable to open-end investment companies.
Item 10. Submission of Matters to a Vote of Security Holders.
2
None.
Item 11. Controls and Procedures.
| |
(a) | The Registrant’s President/Principal Executive Officer and Treasurer/Principal Financial Officer have reviewed the Registrant’s disclosure controls and procedures (as defined in Rule 30a-3(c) under the Investment Company Act of 1940 (the “Act”)) as of a date within 90 days of the filing of this report, as required by Rule 30a-3(b) under the Act and Rules 13a-15(b) or 15d-15(b) under the Securities Exchange Act of 1934. Based on their review, such officers have concluded that the disclosure controls and procedures are effective in ensuring that information required to be disclosed in this report is appropriately recorded, processed, summarized and reported and made known to them by others within the Registrant and by the Registrant’s service provider. |
| |
(b) | There were no changes in the Registrant’s internal control over financial reporting (as defined in Rule 30a-3(d) under the Act) that occurred during the second fiscal quarter of the period covered by this report that has materially affected, or is reasonably likely to materially affect, the Registrant’s internal control over financial reporting. |
Item 12. Exhibits.
| |
(a) | (1) Any code of ethics or amendment thereto, that is the subject of the disclosure required by Item 2, to the extent that the registrant intends to satisfy Item 2 requirements through filing an exhibit. Filed herewith |
| |
| (2) A separate certification for each principal executive and principal financial officer pursuant to Section 302 of the Sarbanes-Oxley Act of 2002. Filed herewith. |
| |
(b) | Certifications pursuant to Section 906 of the Sarbanes-Oxley Act of 2002. Furnished herewith. |
3
SIGNATURES
Pursuant to the requirements of the Securities Exchange Act of 1934 and the Investment Company Act of 1940, the registrant has duly caused this report to be signed on its behalf by the undersigned, thereunto duly authorized.
| |
By (Signature and Title) | /s/ Carrie E. Hansen |
|
|
Carrie E. Hansen, Principal Executive Officer/President |
Pursuant to the requirements of the Securities Exchange Act of 1934 and the Investment Company Act of 1940, this report has been signed below by the following persons on behalf of the registrant and in the capacities and on the dates indicated.
| |
By (Signature and Title) | /s/ Carrie E. Hansen |
|
|
Carrie E. Hansen, Principal Executive Officer/President |
| |
By (Signature and Title) | /s/ Starr E. Frohlich |
|
|
Starr E. Frohlich, Principal Financial Officer/Treasurer |
4