As filed with the Securities and Exchange Commission on June 3, 2015
UNITED STATES
SECURITIES AND EXCHANGE COMMISSION
Washington, D.C. 20549
FORM N-CSR
CERTIFIED SHAREHOLDER REPORT OF REGISTERED
MANAGEMENT INVESTMENT COMPANIES
Investment Company Act file number 811-22486
GPS Funds II
(Exact name of registrant as specified in charter)
1655 Grant Street, 10th Floor
Concord, CA 94520
(Address of principal executive offices) (Zip code)
Patrick Young
AssetMark, Inc.
1655 Grant Street, 10th Floor
Concord, CA 94520
(Name and address of agent for service)
800-664-5345
Registrant’s telephone number, including area code
Date of fiscal year end: March 31, 2015
Date of reporting period: April 1, 2014 through March 31, 2015
Item 1. Report to Stockholders.
| | | GuideMark® Funds | |
| | | GuidePath® Funds | |
| | | | Investment Advisor | |
| | | | AssetMark, Inc. | |
| | | | | |
| | | | | |
| | Annual Report | | | |
| | | | | |
| | | | | |
| | March 31, 2015 | | | |
| | | | | |
| | | | | |
| | | | | |
| | GUIDEMARK® LARGE CAP GROWTH FUND | | | |
| | | | | |
| | GUIDEMARK® LARGE CAP VALUE FUND | | | |
| | | | | |
| | GUIDEMARK® SMALL/MID CAP CORE FUND | | | |
| | | | | |
| | GUIDEMARK® WORLD EX-US FUND | | | |
| | | | | |
| | GUIDEMARK® OPPORTUNISTIC EQUITY FUND | | | |
| | | | | |
| | GUIDEMARK® GLOBAL REAL RETURN FUND | | | |
| | | | | |
| | GUIDEMARK® CORE FIXED INCOME FUND | | | |
| | | | | |
| | GUIDEMARK® TAX-EXEMPT FIXED INCOME FUND | | | |
| | | | | |
| | GUIDEMARK® OPPORTUNISTIC FIXED INCOME FUND | | | |
| | | | | |
| | GUIDEPATH® STRATEGIC ASSET ALLOCATION FUND | | | |
| | | | | |
| | GUIDEPATH® TACTICAL CONSTRAINED® ASSET ALLOCATION FUND | | | |
| | | | | |
| | GUIDEPATH® TACTICAL UNCONSTRAINED® ASSET ALLOCATION FUND | | | |
| | | | | |
| | GUIDEPATH® ABSOLUTE RETURN ASSET ALLOCATION FUND | | | |
| | | | | |
| | GUIDEPATH® MULTI-ASSET INCOME ASSET ALLOCATION FUND | | | |
| | | | | |
| | GUIDEPATH® FIXED INCOME ALLOCATION FUND | | | |
| | | | | |
| | GUIDEPATH® ALTEGRIS® DIVERSIFIED ALTERNATIVES ALLOCATION FUND | | | |
| | | | | |
| | | | | |
| | | | | |
May 29, 2015
Dear Shareholder:
Enclosed is the Annual Report for the GuideMark® and GuidePath® Funds covering the period April 1, 2014 through March 31, 2015.
Market Review
Central banks around the world maintained prominent roles in the markets during 2014 and this stance continues in 2015. Much of the activity had the effect of strengthening the US dollar.
While the US Federal Reserve (the Fed) officially wound down its bond purchase program (quantitative easing) in October 2014, other major central banks moved in the other direction. The Bank of Japan, which already conducted significant bond purchases in 2013 and 2014, announced in late October 2014 that it would significantly increase its bond purchases. These actions weakened the Japanese yen versus the US dollar by a little more than 15% during the 12 month period ended March 31, 2015.1
Likewise, the European Central Bank launched its own version of quantitative easing this year, with its first bond purchases occurring in January 2015. Like the Japanese yen, the euro weakened relative to the US dollar by about 20% in the 12 month period ended March 31, 2015.2
Another noteworthy event that contributed to the strengthening of the US dollar was a collapse in the price of most of the commodities complex, including oil. The S&P® Goldman Sachs Commodity Index dropped 40.3% during the 12 month period ended March 31, 2015. This had a profound effect on the currencies of countries whose economies are tied to the commodities. Canadian, Australian, Brazilian and Russian currencies declined sharply as commodity prices weakened. The Brazilian real declined more than 40% versus the US dollar, while the Russian ruble dropped nearly 50% at one point before ending the period down 39% against the US dollar.3
While the stimulus by the larger central banks boosted equities markets in Canada, Australia, Brazil and Russia, the decrease in value of their currencies against the US dollar tempered actual gains. The MSCI EAFE Index, which represents a large portion of the non-US developed countries markets, returned –0.5% for the 12 months ended March 31, 2015. Emerging markets experienced more mixed results. Some countries like Brazil and Russia suffered large declines in the value of their respective currencies, but the currencies of other countries like China and India either maintained their value or increased slightly. Due in part to these factors, the MSCI Emerging Markets Index returned 0.8% for the 12-month period ended March 31, 2015.
In stark contrast to global markets, US markets rallied significantly during the 12-month period ended March 31, 2015, with the S&P 500® Index returning 12.7%. Growth-based sectors experienced the most substantial gains, as a premium was placed on businesses that could grow with little support from the economy. Healthcare and consumer sectors lifted the growth indices, contributing to a return of 16.1% for the Russell 1000® Growth Index relative to a return of 9.3% for the Russell 1000® Value Index.
The impact of currency exchange rates was also prevalent in the fixed income markets. The Barclays US Aggregate Bond Index returned 5.7% for the 12-month period ended March 31, 2015, while the Barclays Capital Global Aggregate ex-US Bond Index returned –10.1%. US bond markets were in high demand among foreign investors, who not only sought the benefit of the strengthening dollar, but also the higher yields offered by US Treasuries. As of March 31, 2015, the spread between 10-year US Treasury yields and 10-year German bund yields was 1.75%—the highest seen in history.4
| 1 | Source: OANDA, http://www.oanda.com. |
| 2 | Ibid. |
| 3 | Ibid. | |
| 4 | Source: Trading Economics, http://www.tradingeconomics.com. |
GuideMark® Funds Review
As investors paid a premium for high growth companies, most of the GuideMark® equity funds trailed their benchmarks due to their emphasis on high quality and their investment in the financial sector. However, the Small/Mid Cap Core Fund and Opportunistic Equity Fund benefited from exposure to higher growth companies and some of the stocks with smaller market capitalizations that rallied respectively. Within the fixed income funds, a general underweight exposure to longer-dated maturities dragged on returns while the Opportunistic Fixed Income Fund benefited from currency positioning. With pressure on commodity prices, the Global Real Return Fund trailed due to an overweight exposure to global natural resources.
GuidePath® Funds Review
Considering global market performance, the GuidePath® Funds generally achieved returns in line with expectations and had mixed results relative to their benchmarks. Any underweight positioning to equities, as seen in the Strategic Asset Allocation Fund and the Tactical Unconstrained Asset Allocation Fund, led to weaker relative returns. Most of the funds’ equity investments tended to be globally diversified, which dampened returns during the period ended March 31, 2015. When funds such as the Tactical Constrained Asset Allocation Fund and the Multi-Asset Income Asset Allocation Fund increased their exposure to US markets during the year, the funds benefited. Within fixed income, most exposure was weighted heavily toward US markets, which provided stronger relative returns, as seen in the Absolute Return Asset Allocation Fund. However, any exposure to high yield bonds, as in the Fixed Income Allocation Fund, tempered returns. Alternative investments were an area of strength for the period, as the large persistent moves in the euro and the yen, together with the drop in oil prices, created an opportunity for trend following managers to show their value. The GuidePath® Altegris® Diversified Alternatives Allocation Fund had exposure to the Altegris Macro Strategy Fund, which held short currency positions to the euro and yen as those currencies fell approximately –20% and –15% respectively against the strong US dollar. The fund also held short Energy future positions as the Energy sector declined approximately –47% for the period under review.
Looking Ahead
US equity markets have had one of their longest cyclical bull markets in history. We have had nearly seven years of economic expansion in the US as well, though it has been uneven and not as strong by some measures of previous market cycles. In the first quarter of 2015, economic data was disappointing. While US corporations have never been more profitable, the impact of the US dollar’s strength on multinationals resulted in analysts’ earnings estimates falling 4.8% from one year ago.5
Amid the divergence of global central bank policies, the benefit of international diversification was apparent in the first quarter of 2015 and the market leadership rotation could continue. International equity markets benefited from favorable central bank policies, particularly in Japan and Europe. In Europe, there are some early signs of increased economic activity and market valuations appear more attractive. Although still muted compared to historical levels, it has given rise to the hope that Europe can continue to increase its growth rate after lagging the US for many years.
In the next year, all eyes will likely remain on the Fed and the potential interest rate hike. The general expectation is that the Fed will raise interest rates, but will seek to do so it in the gentlest fashion possible, due to softer-than-expected economic numbers and an inflation rate that is slightly lower than the Fed’s target. However, any unexpected action taken by the Fed could lead to additional market volatility, which could benefit tactical strategies. Rising interest rate environments historically have seen a greater dispersion of returns and lower correlations across asset classes, sectors and individual securities. We believe this supports having a broadly diversified portfolio, with core exposure to equity and fixed income markets, complemented by diversifying allocations to more flexible strategies.
| 5 | Source: Standard & Poor’s®. Standard & Poor’s®, S&P® and S&P 500® are registered trademarks or Standard and Poor’s Financial Services LLC. |
Please contact your financial advisor to discuss any questions about your investment strategy or changes in your financial goals. We thank you for including our funds in your portfolio and appreciate the trust you have placed in us.
Sincerely,

Carrie E. Hansen
Trustee, Chairperson and President of the Funds
Index Definitions
Barclays US Aggregate Bond Index is a broad-based index that measures the investment grade, US dollar-denominated, fixed rate taxable bond market, including Treasuries, government-related and corporate securities, mortgage- and asset-backed securities. All securities contained in the Barclays US Aggregate Bond Index have a minimum term to maturity of one year.
Barclays Capital Global Aggregate ex-US Bond Index is designed to be a broad-based measure of the global investment-grade, fixed rate, fixed income corporate markets outside the United States.
MSCI EAFE (Europe, Australasia, Far East) Index measures the equity market performance of countries considered to represent developed markets, excluding the U.S. and Canada.
MSCI Emerging Markets Index measures the equity market performance of countries considered to represent emerging markets.
Russell 1000® Growth Index measures the performance of those Russell 1000 companies with higher price-to-book ratios and higher forecasted growth values. The Russell 1000 Index consists of the 1,000 largest securities in the Russell 3000 Index. The Russell 3000 Index is composed of the 3,000 largest U.S. securities, as determined by total market capitalization.
Russell 1000® Value Index measures the performance of those Russell 1000 companies with lower price-to-book ratios and lower forecasted growth values. The Russell 1000 Index consists of the 1,000 largest securities in the Russell 3000 Index. The Russell 3000 Index is composed of the 3,000 largest U.S. securities, as determined by total market capitalization.
S&P 500® Index focuses on the large cap segment of the US equity market. It includes 500 leading companies in leading industries of the US economy, capturing approximately 75% coverage of US equities.
S&P Goldman Sachs Commodity Index (S&P GSCI®) is a broad-based, production-weighted index that aims to represent the global commodity market beta and measure commodity prices. It consists of 24 commodity futures on commodities across five sectors: energy, agriculture, livestock, industrial metals and precious metals.
All index returns are sourced from Morningstar. It is not possible to make an investment in any index.
FX 2015-0501-0336
GuideMark® Large Cap Growth Fund
MANAGER’S DISCUSSION OF FUND PERFORMANCE (Unaudited)
TOTAL RETURN BASED ON A $10,000 INVESTMENT
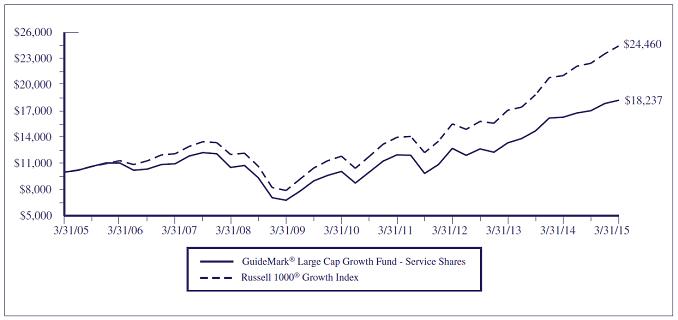
This chart assumes an initial gross investment of $10,000 made on March 31, 2005. Returns shown include the reinvestment of all dividends. Returns shown do not reflect the deduction of taxes that a shareholder would pay on Fund distributions or the redemption of Fund shares. In the absence of fee waivers and reimbursements, when they are necessary to keep expenses at the expense cap, total return would be reduced. Past performance is not predictive of future performance. Investment return and principal value will fluctuate so that your shares, when redeemed, may be worth more or less than the original cost. Index returns do not reflect the effects of fees or expenses. It is not possible to invest directly in an index.
RUSSELL 1000® GROWTH INDEX – The Russell 1000® Growth Index measures the performance of the large-cap growth segment of the U.S. equity universe. It includes those Russell 1000® Index companies with higher price-to-book ratios and higher forecasted growth rates.
| AVERAGE ANNUAL TOTAL RETURN (for periods ended March 31) | | | | | | | |
| | | One Year | | Five Year | | Ten Year | | Since Inception(1) | | |
| GuideMark® Large Cap Growth Fund | | | | | | | | | | | | | | | | | | |
| Service Shares | | | 11.87 | % | | | 12.58 | % | | | 6.19 | % | | | 3.67 | % | | |
| Institutional Shares | | | 12.51 | % | | | N/A | | | | N/A | | | | 11.07 | % | | |
| Russell 1000® Growth Index | | | 16.09 | % | | | 15.63 | % | | | 9.36 | % | | | 5.78 | %(2) | | |
| (1) | Inception date is 6/29/01 for Service Shares and 4/29/11 for Institutional Shares. |
| | |
| (2) | The return shown for the Russell 1000® Growth Index is from the inception date of the Service Shares. The Russell 1000® Growth Index return from the inception date of the Institutional Shares is 14.34%. |
GuideMark® Large Cap Growth Fund
MANAGER’S DISCUSSION OF FUND PERFORMANCE (Unaudited) (Continued)
| • | For the 12 months ended March 2015, the Fund returned 11.87%, underperforming the Russell 1000® Growth Index at 16.09%. |
| • | Security selection was the main driver of the unfavorable returns as the high quality bias was a headwind with higher growth companies gaining momentum over the period. |
| • | While holding an overweight to the information technology sector benefited the Fund, owning higher quality technology stocks with sustainable cash flows detracted from performance as the market favored higher beta technology stocks. |
| • | Emphasizing restructuring banks within the financials sector led to weaker relative returns. Financial companies with higher growth and higher valuations were rewarded in the market. |
Components of Portfolio Holdings*
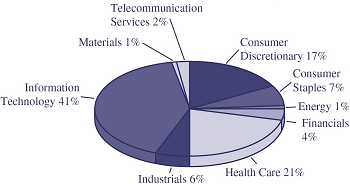
*Pie chart represents percentages of total portfolio, less securities lending collateral.
Top Ten Holdings
| | | | | | % of Net |
| Rank | | Security/Holding | | Assets |
| 1 | | | Apple, Inc. | | 7.73 | |
| 2 | | | Oracle Corp. | | 3.56 | |
| 3 | | | Microsoft Corp. | | 3.06 | |
| 4 | | | Google, Inc. – Class C | | 2.49 | |
| 5 | | | Home Depot, Inc. | | 2.37 | |
| 6 | | | Gilead Sciences, Inc. | | 2.12 | |
| 7 | | | Cisco Systems, Inc. | | 2.01 | |
| 8 | | | Facebook, Inc. – Class A | | 1.96 | |
| 9 | | | Altera, Corp. | | 1.95 | |
| 10 | | | QUALCOMM, Inc. | | 1.94 | |
The Global Industry Classification Standard (“GICS®”) was developed by and/or is the exclusive property of MSCI, Inc. (“MSCI”) and Standard & Poor’s Financial Services LLC (“S&P”). GICS is a service mark of MSCI and S&P, and has been licensed for use by U.S. Bancorp Fund Services, LLC.
GuideMark® Large Cap Value Fund
MANAGER’S DISCUSSION OF FUND PERFORMANCE (Unaudited)
TOTAL RETURN BASED ON A $10,000 INVESTMENT
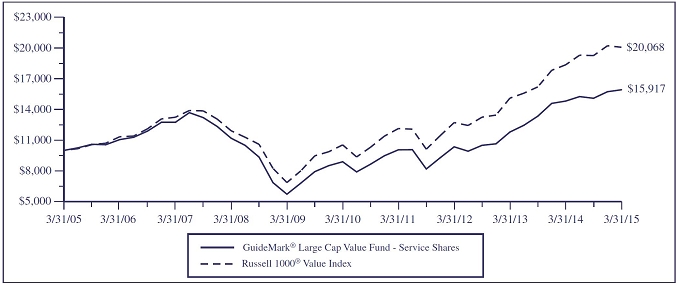
This chart assumes an initial gross investment of $10,000 made on March 31, 2005. Returns shown include the reinvestment of all dividends. Returns shown do not reflect the deduction of taxes that a shareholder would pay on Fund distributions or the redemption of Fund shares. In the absence of fee waivers and reimbursements, when they are necessary to keep expenses at the expense cap, total return would be reduced. Past performance is not predictive of future performance. Investment return and principal value will fluctuate so that your shares, when redeemed, may be worth more or less than the original cost. Index returns do not reflect the effects of fees or expenses. It is not possible to invest directly in an index.
RUSSELL 1000® VALUE INDEX – The Russell 1000® Value Index measures the performance of the large-cap value segment of the U.S. equity universe. It includes the Russell 1000® Index companies with lower price-to-book ratios and lower expected growth values.
| AVERAGE ANNUAL TOTAL RETURN (for periods ended March 31) | | | | | | |
| | | One Year | | Five Year | | Ten Year | | Since Inception(1) | | |
| GuideMark® Large Cap Value Fund | | | | | | | | | | | | | | | | | | |
| Service Shares | | | 7.46 | % | | | 12.36 | % | | | 4.76 | % | | | 4.45 | % | | |
| Institutional Shares | | | 8.08 | % | | | N/A | | | | N/A | | | | 12.34 | % | | |
| Russell 1000® Value Index | | | 9.33 | % | | | 13.75 | % | | | 7.21 | % | | | 6.76 | %(2) | | |
| (1) | Inception date is 6/29/01 for Service Shares and 4/29/11 for Institutional Shares. |
| | |
| (2) | The return shown for the Russell 1000® Value Index is from the inception date of the Service Shares. The Russell 1000® Value Index return from the inception date of the Institutional Shares is 12.93%. |
GuideMark® Large Cap Value Fund
MANAGER’S DISCUSSION OF FUND PERFORMANCE (Unaudited) (Continued)
| • | For the 12 months ended March 2015, the Fund returned 7.46%, underperforming the Russell 1000® Value Index at 9.33%. |
| • | Security selection was the main driver of the unfavorable returns, as the emphasis on companies that pay higher dividends harmed Fund performance. These stocks dramatically underperformed those with lower or no dividends. |
| • | Security selection within the financials sector was the largest driver of the Fund’s relative underperformance. Exposure to interest rate sensitive financials was a detractor over the period, as interest rates unexpectedly decreased. |
| • | While holding an underweight to the energy sector benefited the Fund, security selection tempered returns due to an emphasis on drilling services companies. |
Components of Portfolio Holdings*
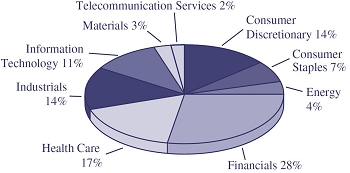
*Pie chart represents percentages of total portfolio, less securities lending collateral.
Top Ten Holdings
| | | | | | % of Net |
| Rank | | Security/Holding | | Assets |
| 1 | | | Citigroup, Inc. | | 2.38 | |
| 2 | | | Capital One Financial Corp. | | 2.22 | |
| 3 | | | Wells Fargo & Co. | | 2.16 | |
| 4 | | | Medtronic Plc | | 2.12 | |
| 5 | | | JPMorgan Chase & Co. | | 2.04 | |
| 6 | | | Hanesbrands, Inc. | | 1.91 | |
| 7 | | | Carnival Corp. - ADR | | 1.89 | |
| 8 | | | Bank of America Corp. | | 1.89 | |
| 9 | | | Delphi Automotive Plc | | 1.87 | |
| 10 | | | Texas Instruments, Inc. | | 1.82 | |
GuideMark® Small/Mid Cap Core Fund
MANAGER’S DISCUSSION OF FUND PERFORMANCE (Unaudited)
TOTAL RETURN BASED ON A $10,000 INVESTMENT
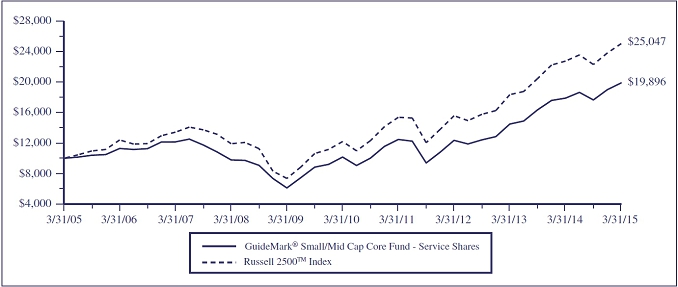
This chart assumes an initial gross investment of $10,000 made on March 31, 2005. Returns shown include the reinvestment of all dividends. Returns shown do not reflect the deduction of taxes that a shareholder would pay on Fund distributions or the redemption of Fund shares. In the absence of fee waivers and reimbursements, when they are necessary to keep expenses at the expense cap, total return would be reduced. Past performance is not predictive of future performance. Investment return and principal value will fluctuate so that your shares, when redeemed, may be worth more or less than the original cost. Index returns do not reflect the effects of fees or expenses. It is not possible to invest directly in an index.
RUSSELL 2500TM INDEX – Measures the performance of the small- to mid-cap segment of the US equity universe, commonly referred to as “smid” cap. The Russell 2500TM Index includes approximately 2,500 of the smallest securities based on a combination of their market cap and current index membership.
AVERAGE ANNUAL TOTAL RETURN (for periods ended March 31)
| | | One Year | | Five Year | | Ten Year | | Since Inception(1) |
| GuideMark® Small/Mid Cap Core Fund | | | | | | | | | | | | | | | | |
| Service Shares | | | 11.19 | % | | | 14.39 | % | | | 7.12 | % | | | 7.77 | % |
| Institutional Shares | | | 11.99 | % | | | N/A | | | | N/A | | | | 12.40 | % |
| Russell 2500TM Index | | | 10.07 | % | | | 15.48 | % | | | 9.62 | % | | | 9.18 | %(2) |
| (1) | Inception date is 6/29/01 for Service Shares and 4/29/11 for Institutional Shares. |
| | |
| (2) | The return shown for the Russell 2500TM Index is from the inception date of the Service Shares. The Russell 2500TM Index return from the inception date of the Institutional Shares is 12.42%. |
GuideMark® Small/Mid Cap Core Fund
MANAGER’S DISCUSSION OF FUND PERFORMANCE (Unaudited) (Continued)
| | • | For the 12 months ended March 2015, the Fund returned 11.19%, outperforming the Russell 2500TM Index at 10.07%. |
| | | |
| | • | Exposure to higher growth companies contributed to relative returns, as higher growth and momentum stocks outperformed companies with slower earnings growth. |
| | | |
| | • | Security selection within the energy sector was the largest contributor to returns. Holdings in low-cost oil and gas producers declined less sharply than other stocks in the sector. |
| | | |
| | • | Security selection in real estate, banking, and insurance within the financials sector was additive to returns. |
Components of Portfolio Holdings*
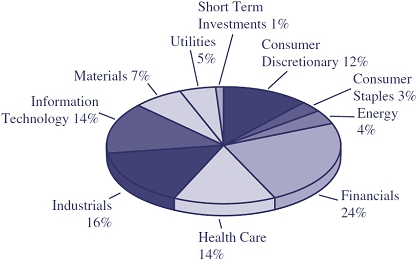
*Pie chart represents percentages of total portfolio, less securities lending collateral.
Top Ten Holdings
| Rank | | Security/Holding | | % of Net
Assets |
| 1 | | | Freescale Semiconductor Ltd. | | 1.27 | |
| 2 | | | iShares Russell 2000 Index Fund | | 1.24 | |
| 3 | | | Graphic Packaging Holding Co. | | 1.19 | |
| 4 | | | Owens Corning, Inc. | | 1.17 | |
| 5 | | | XL Group Plc | | 1.09 | |
| 6 | | | Assured Guaranty Ltd. | | 1.04 | |
| 7 | | | Clean Harbors, Inc. | | 1.01 | |
| 8 | | | GoPro, Inc. – Class A | | 0.99 | |
| 9 | | | Signet Jewelers Ltd. | | 0.98 | |
| 10 | | | Genpact Ltd. | | 0.95 | |
GuideMark® World ex-US Fund
MANAGER’S DISCUSSION OF FUND PERFORMANCE (Unaudited)
TOTAL RETURN BASED ON A $10,000 INVESTMENT

This chart assumes an initial gross investment of $10,000 made on March 31, 2005. Returns shown include the reinvestment of all dividends. Returns shown do not reflect the deduction of taxes that a shareholder would pay on Fund distributions or the redemption of Fund shares. In the absence of fee waivers and reimbursements, when they are necessary to keep expenses at the expense cap, total return would be reduced. Past performance is not predictive of future performance. Investment return and principal value will fluctuate so that your shares, when redeemed, may be worth more or less than the original cost. Index returns do not reflect the effects of fees or expenses. It is not possible to invest directly in an index.
MSCI ALL COUNTRY WORLD EX-US INDEX – The MSCI All Country World ex-USA index measures the equity market performance of developed and emerging markets excluding the United States. The MSCI ACWI ex US consists of 45 country indices comprising 22 developed and 23 emerging market country indices. The developed market country indices included are: Australia, Austria, Belgium, Canada, Denmark, Finland, France, Germany, Hong Kong, Ireland, Israel, Italy, Japan, Netherlands, New Zealand, Norway, Portugal, Singapore, Spain, Sweden, Switzerland, and the United Kingdom. The emerging market country indices included are: Brazil, Chile, China, Columbia, Czech Republic, Egypt, Greece, Hungary, India, Indonesia, Korea, Malaysia, Mexico, Peru, Philippines, Poland, Russia, Qatar, South Africa, Taiwan, Thailand, Turkey and United Arab Emirates.
AVERAGE ANNUAL TOTAL RETURN (for periods ended March 31)
| | | One Year | | Five Year | | Ten Year | | Since Inception(1) |
| GuideMark® World ex-US Fund | | | | | | | | | | | | | | | | |
| Service Shares | | | -0.68 | % | | | 2.92 | % | | | 1.67 | % | | | 2.64 | % |
| Institutional Shares | | | -0.10 | % | | | N/A | | | | N/A | | | | 1.52 | % |
| MSCI All Country World ex-US Index | | | -0.57 | % | | | 5.29 | % | | | 5.93 | % | | | 6.66 | %(2) |
| (1) | Inception date is 6/29/01 for Service Shares and 4/29/11 for Institutional Shares. |
| | |
| (2) | The return shown for the MSCI All Country World ex-US Index is from the inception date of the Service Shares. The MSCI All Country World ex-US Index return from the inception date of the Institutional Shares is 2.10%. |
GuideMark® World ex-US Fund
MANAGER’S DISCUSSION OF FUND PERFORMANCE (Unaudited) (Continued)
| | • | For the 12 months ended March 2015, the Fund returned -0.68%, underperforming the MSCI ACWI ex-US Index at -0.57%. |
| | | |
| | • | Security selection within the Emerging Market Asia region detracted, specifically holding gaming stocks in China. |
| | | |
| | • | Financials and consumer related sector exposure in Europe hurt returns. Sensitivity to interest rates presented challenges for the Fund’s investment in the financials sector. Automobile manufactures faced a slowdown in demand from China and other emerging market countries. |
| | | |
| | • | Exposure to gold mining company Anglo American negatively impacted returns, as gold miners continued to trade under pressure. |
Components of Portfolio Holdings*
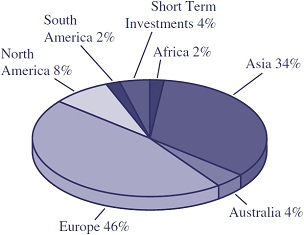
*Pie chart represents percentages of total portfolio, less securities lending collateral.
Top Ten Holdings
| Rank | | Security/Holding | | % of Net
Assets |
| 1 | | | Toyota Motor Corp. | | 1.36 | |
| 2 | | | Roche Holding AG | | 1.36 | |
| 3 | | | Novartis AG | | 1.19 | |
| 4 | | | Total SA | | 1.16 | |
| 5 | | | Samsung Electronics Co., Ltd. | | 1.01 | |
| 6 | | | Royal Dutch Shell Plc – Class A | | 0.96 | |
| 7 | | | Anheuser-Busch InBev SA | | 0.91 | |
| 8 | | | Nestle SA | | 0.87 | |
| 9 | | | Australia and New Zealand Banking Group Ltd. | | 0.87 | |
| 10 | | | Mitsubishi UFJ Financial Group, Inc. | | 0.83 | |
GuideMark® Opportunistic Equity Fund
MANAGER’S DISCUSSION OF FUND PERFORMANCE (Unaudited)
TOTAL RETURN BASED ON A $10,000 INVESTMENT
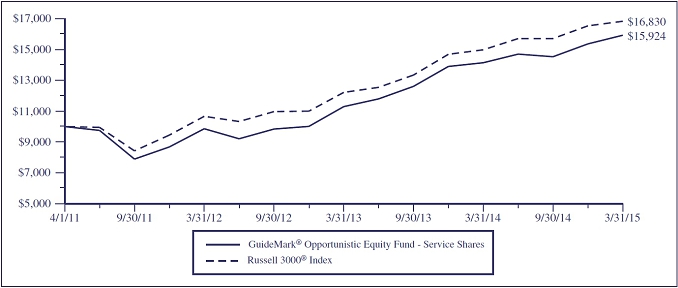
This chart assumes an initial gross investment of $10,000 made on April 1, 2011. Returns shown include the reinvestment of all dividends. Returns shown do not reflect the deduction of taxes that a shareholder would pay on Fund distributions or the redemption of Fund shares. In the absence of fee waivers and reimbursements, when they are necessary to keep expenses at the expense cap, total return would be reduced. Past performance is not predictive of future performance. Investment return and principal value will fluctuate so that your shares, when redeemed, may be worth more or less than the original cost. Index returns do not reflect the effects of fees or expenses. It is not possible to invest directly in an index.
RUSSELL 3000® INDEX – The Russell 3000® Index is an unmanaged index which measures the performance of the 3,000 largest US Companies, based on total market capitalization, which represents approximately 98% of the investable US equity market.
AVERAGE ANNUAL TOTAL RETURN (for periods ended March 31)
| | | One Year | | Since Inception(1) | |
| GuideMark® Opportunistic Equity Fund | | | | | | | |
| Service Shares | | 12.61 | % | | 12.34 | % | |
| Institutional Shares | | 13.26 | % | | 12.64 | % | |
| Russell 3000® Index | | 12.37 | % | | 13.90 | %(2) | |
| (1) | Inception date is 4/1/11 for Service Shares and 4/29/11 for Institutional Shares. |
| | |
| (2) | The return shown for the Russell 3000® Index is from the inception date of the Service Shares. The Russell 3000® Index return from the inception date of the Institutional Shares is 13.49%. |
GuideMark® Opportunistic Equity Fund
MANAGER’S DISCUSSION OF FUND PERFORMANCE (Unaudited) (Continued)
| | • | For the 12 months ended March 2015, the Fund returned 12.61%, outperforming the Russell 3000® Index at 12.37%. |
| | | |
| | • | Security selection was the primary driver of relative performance. Investments in stocks with higher market capitalizations benefited returns, as large cap stocks outperformed smaller cap stocks over the period. |
| | | |
| | • | While the energy sector was the worst performing sector, security selection proved beneficial. Exposure to oil and gas refining companies that benefited from falling oil prices contributed to relative performance. |
| | | |
| | • | Security selection within the consumer discretionary sector was additive to returns, as consumer stocks rallied with better than expected earnings growth. |
Components of Portfolio Holdings*

*Pie chart represents percentages of total portfolio, less securities lending collateral.
Top Ten Holdings
| Rank | | Security/Holding | | % of Net
Assets |
| 1 | | | Apple, Inc. | | 3.06 | |
| 2 | | | Valeant Pharmaceuticals International, Inc. | | 2.72 | |
| 3 | | | Willis Group Holdings Plc | | 2.49 | |
| 4 | | | Microsoft Corp. | | 2.37 | |
| 5 | | | Whirlpool Corp. | | 2.28 | |
| 6 | | | Twenty-First Century Fox, Inc. – Class B | | 2.24 | |
| 7 | | | Hub Group, Inc. – Class A | | 2.02 | |
| 8 | | | Teva Pharmaceutical Industries Ltd. – ADR | | 2.02 | |
| 9 | | | Jarden Corp. | | 2.01 | |
| 10 | | | United Technologies Corp. | | 1.84 | |
GuideMark® Global Real Return Fund
MANAGER’S DISCUSSION OF FUND PERFORMANCE (Unaudited)
TOTAL RETURN BASED ON A $10,000 INVESTMENT

This chart assumes an initial gross investment of $10,000 made on April 1, 2011. Returns shown include the reinvestment of all dividends. Returns shown do not reflect the deduction of taxes that a shareholder would pay on Fund distributions or the redemption of Fund shares. In the absence of fee waivers and reimbursements, when they are necessary to keep expenses at the expense cap, total return would be reduced. Past performance is not predictive of future performance. Investment return and principal value will fluctuate so that your shares, when redeemed, may be worth more or less than the original cost. Index returns do not reflect the effects of fees or expenses. It is not possible to invest directly in an index.
BARCLAYS U.S. TIPS INDEX – The Barclays U.S. TIPS Index includes all publicly-issued, U.S. Treasury inflation protected securities that have at least one year remaining to maturity, are rated investment grade, and have $250 million or more of outstanding face value.
GLOBAL REAL RETURN BLENDED INDEX – The Global Real Return Blended Index is a weighted combination of 20% of the total return from the Bloomberg Commodity Index, 35% of the total return from the S&P Global Natural Resources Index, 15% of the total return from the Dow Jones Global Select RESI Index and 30% of the total return from the Barclays Global Inflation Linked Bond Index. Returns are weighted on a 20/35/15/30 basis for each historical month and then the longer-term returns are geometrically combined from these historical monthly returns to create aggregate returns (1-year, 3-years, 5-years, etc.) for the Global Real Return Blended Index. Effective July 1, 2014, the Dow Jones-UBS Commodity Index changed its name to the Bloomberg Commodity Index. Prior to July 31, 2014, the Global Real Return Blended Index was comprised of the Bloomberg Commodity Index, the S&P Global Natural Resources Index, the Dow Jones Global Select RESI Index, and the Barclays Global Inflation Linked Bond Index and was weighted 20/35/20/25 basis for each historical month.
AVERAGE ANNUAL TOTAL RETURN (for periods ended March 31)
| | | One Year | | Since Inception(1) |
| GuideMark® Global Real Return Fund | | | | | | | | |
| Service Shares | | | -9.95 | % | | | -3.89 | % |
| Institutional Shares | | | -9.43 | % | | | -4.15 | % |
| Barclays U.S. TIPS Index | | | 3.11 | % | | | 3.31 | %(2) |
| Global Real Return Blended Index | | | -6.64 | % | | | -0.35 | %(3) |
| (1) | Inception date is 4/1/11 for Service Shares and 4/29/11 for Institutional Shares. |
| (2) | The return shown for the Barclays U.S. TIPS Index is from the inception date of the Service Shares. The Barclays U.S. TIPS Index return from the inception date of the Institutional Shares is 2.82%. |
| (3) | The return shown for the Global Real Return Blended Index is from the inception date of the Service Shares. The Global Real Return Blended Index return from the inception date of the Institutional Shares is (1.11)%. |
GuideMark® Global Real Return Fund
MANAGER’S DISCUSSION OF FUND PERFORMANCE (Unaudited) (Continued)
| • | For the 12 months ended March 2015, the Fund returned -9.95%, underperforming the Barclays U.S. TIPS Index at 3.11%, and underperforming its blended benchmark which returned -6.64%. |
| • | Non-benchmark exposure specifically to both global natural resources and commodities detracted from returns relative to the Fund’s primary benchmark index. These sectors experienced relative weakness with slow economic growth and a strengthening US dollar. |
| • | Tactical overweight exposure to global natural resources detracted from returns. Global natural resources fell under pressure based on expected slowdown in the Emerging Market countries, including China. |
| • | Tactical overweight exposure to real estate contributed to relative performance. However, the allocation was not large enough to offset the negative impact of a tactical underweight to TIPS and overweight to global natural resources. |
Components of Portfolio Holdings*
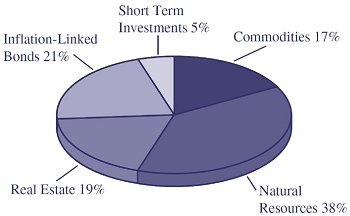
*Pie chart represents percentages of total portfolio, less securities lending collateral.
Top Ten Holdings
| | | | | % of Net |
| Rank | | Security/Holding | | Assets |
| 1 | | | SPDR S&P Global Natural Resources ETF | | 28.91 | |
| 2 | | | PowerShares DB Commodity Index Tracking Fund | | 16.83 | |
| 3 | | | SPDR Barclays TIPS ETF | | 15.30 | |
| 4 | | | SPDR Dow Jones REIT ETF | | 11.02 | |
| 5 | | | SPDR Dow Jones International Real Estate ETF | | 8.07 | |
| 6 | | | SPDR DB International Government Inflation-Protected Bond ETF | | 5.38 | |
| 7 | | | Energy Select Sector SPDR Fund | | 4.06 | |
| 8 | | | PowerShares Global Agriculture Portfolio | | 2.02 | |
| 9 | | | SPDR S&P International Energy Sector ETF | | 2.00 | |
| 10 | | | SPDR S&P Metals and Mining ETF | | 1.08 | |
GuideMark® Core Fixed Income Fund
MANAGER’S DISCUSSION OF FUND PERFORMANCE (Unaudited)
TOTAL RETURN BASED ON A $10,000 INVESTMENT
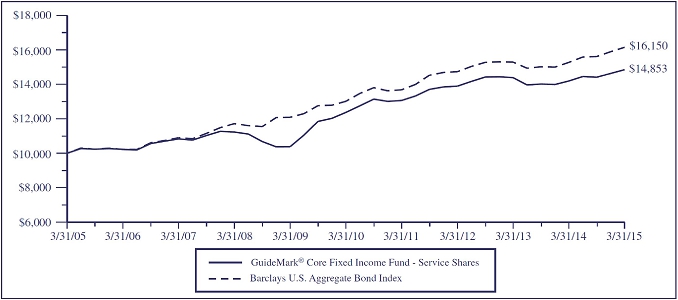
This chart assumes an initial gross investment of $10,000 made on March 31, 2005. Returns shown include the reinvestment of all dividends. Returns shown do not reflect the deduction of taxes that a shareholder would pay on Fund distributions or the redemption of Fund shares. In the absence of fee waivers and reimbursements, when they are necessary to keep expenses at the expense cap, total return would be reduced. Past performance is not predictive of future performance. Investment return and principal value will fluctuate so that your shares, when redeemed, may be worth more or less than the original cost. Index returns do not reflect the effects of fees or expenses. It is not possible to invest directly in an index.
BARCLAYS U.S. AGGREGATE BOND INDEX – The Barclays U.S. Aggregate Bond Index is a broad-based benchmark that measures the investment-grade, U.S. dollar-denominated, fixed-rate taxable bond market, including Treasuries government-related and corporate debt securities, mortgage- and asset-backed securities. All securities contained in the Barclays U.S. Aggregate Bond Index have a minimum term to maturity of one year.
AVERAGE ANNUAL TOTAL RETURN (for periods ended March 31)
| | | One Year | | Five Year | | Ten Year | | Since Inception(1) |
| GuideMark® Core Fixed Income Fund | | | | | | | | | | | | | | | | |
| Service Shares | | | 4.64 | % | | | 3.72 | % | | | 4.04 | % | | | 4.40 | % |
| Institutional Shares | | | 5.25 | % | | | N/A | | | N/A | | | 3.59 | % |
| Barclays U.S. Aggregate Bond Index | | | 5.72 | % | | | 4.41 | % | | | 4.93 | % | | | 5.24 | %(2) |
| (1) | Inception date is 6/29/01 for Service Shares and 4/29/11 for Institutional Shares. |
| | |
| (2) | The return shown for the Barclays U.S. Aggregate Bond Index is from the inception date of the Service Shares. The Barclays U.S. Aggregate Bond Index return from the inception date of the Institutional Shares is 3.99%. |
GuideMark® Core Fixed Income Fund
MANAGER’S DISCUSSION OF FUND PERFORMANCE (Unaudited) (Continued)
| • | For the 12 months ended March 2015, the Fund returned 4.64%, underperforming the Barclays U.S. Aggregate Bond Index at 5.72%. |
| • | An underweight allocation to longer dated U.S. Treasury bonds in favor of investment grade corporate bonds was the primary driver of the Fund’s relative underperformance. |
| • | Investment grade corporate bonds continued to be favored due to better yields and relative valuations. Continued foreign investor demand for longer dated securities led to a decline in rates providing a tailwind for longer term U.S. bonds. |
| • | Emphasis to shorter duration bonds within the collateralized mortgage obligations, asset-backed securities and mortgage-backed securities sectors harmed returns as a result of the decline in rates. |
Components of Portfolio Holdings*

*Pie chart represents percentages of total portfolio, less securities lending collateral.
Top Ten Holdings
| | | | | % of Net |
| Rank | | Security/Holding | | Assets |
| 1 | | | U.S. Treasury Bond, 3.125%, 11/15/2041 | | 2.99 | |
| 2 | | | Federal National Mortgage Association, Pool # TBA,
3.500%, 04/15/2041 | | 2.54 | |
| 3 | | | U.S. Treasury Note, 2.000%, 02/15/2022 | | 1.93 | |
| 4 | | | Federal National Mortgage Association, Pool # TBA,
3.000%, 04/15/2043 | | 1.83 | |
| 5 | | | U.S. Treasury Note, 2.000%, 11/15/2021 | | 1.37 | |
| 6 | | | Government National Mortgage Association, Pool # TBA,
4.000%, 04/15/2042 | | 1.30 | |
| 7 | | | U.S. Treasury Note, 2.375%, 08/15/2024 | | 1.25 | |
| 8 | | | Federal Home Loan Mortgage Corp., Pool # J2-5769,
3.500%, 09/01/2028 | | 1.16 | |
| 9 | | | Federal Home Loan Mortgage Corp., Pool # U8-9032,
3.000%, 07/01/2033 | | 1.10 | |
| 10 | | | Bear Stearns Commercial Mortgage Securities Trust, Series
2006-PW13, 5.540%, 09/11/2041 | | 0.99 | |
GuideMark® Tax-Exempt Fixed Income Fund
MANAGER’S DISCUSSION OF FUND PERFORMANCE (Unaudited)
TOTAL RETURN BASED ON A $10,000 INVESTMENT
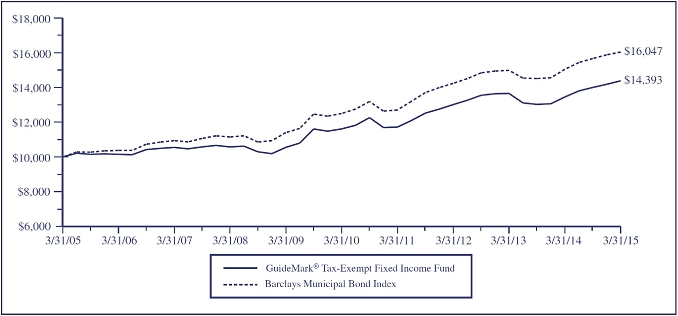
This chart assumes an initial gross investment of $10,000 made on March 31, 2005. Returns shown include the reinvestment of all dividends. Returns shown do not reflect the deduction of taxes that a shareholder would pay on Fund distributions or the redemption of Fund shares. In the absence of fee waivers and reimbursements, when they are necessary to keep expenses at the expense cap, total return would be reduced. Past performance is not predictive of future performance. Investment return and principal value will fluctuate so that your shares, when redeemed, may be worth more or less than the original cost. Index returns do not reflect the effects of fees or expenses. It is not possible to invest directly in an index.
BARCLAYS MUNICIPAL BOND INDEX – The Barclays Municipal Bond Index is a market-value-weighted index for the long-term tax-exempt bond market. The index has four main sectors: state and local general obligation bonds, revenue bonds, insured bonds, and pre-refunded bonds.
AVERAGE ANNUAL TOTAL RETURN (for periods ended March 31)
| | | One Year | | Five Year | | Ten Year | | Since Inception(1) |
| GuideMark® Tax-Exempt Fixed Income Fund | | | 6.45 | % | | | 4.29 | % | | | 3.67 | % | | | 3.76 | % |
| Barclays Municipal Bond Index | | | 6.62 | % | | | 5.11 | % | | | 4.85 | % | | | 5.08 | % |
| (1) | Inception date is 6/29/01. |
GuideMark® Tax-Exempt Fixed Income Fund
MANAGER’S DISCUSSION OF FUND PERFORMANCE (Unaudited) (Continued)
| • | For the 12 months ended March 2015, the Fund returned 6.45%, underperforming the Barclays Municipal Bond Index at 6.62%. |
| • | An overweight exposure to AA rated securities harmed returns, as investors generally sought the higher yields offered by lower rated securities. |
| • | A modest underweight exposure to maturities of over 30 years tempered returns. The long end of the yield curve outperformed the shorter end, as interest rates unexpectedly declined. |
| • | With increased investor risk appetite, an overweight exposure to BBB-rated securities benefited relative returns. |
Components of Portfolio Holdings*

*Pie chart represents percentages of total portfolio.
Top Ten Holdings
| | | | | | % of Net |
| Rank | | Security/Holding | | Assets |
| 1 | | | California, GO, 6.500%, 04/01/2033 | | 1.85 | |
| 2 | | | Wisconsin, Series A, Refunding, Revenue Bond, 6.000%, 05/01/2033 | | 1.79 | |
| 3 | | | Los Angeles Department of Airports, Series A, Refunding, Revenue Bond, 5.250%, 05/15/2029 | | 1.76 | |
| 4 | | | Henry County Public Service Authority Water & Sewer, Refunding, Revenue Bond, AGM Insured, 5.500%, 11/15/2019 | | 1.70 | |
| 5 | | | New York City, GO, 5.375%, 04/01/2036 | | 1.57 | |
| 6 | | | Louisiana Citizens Property, Revenue Bond, AGM Insured, 6.750%, 06/01/2026 | | 1.42 | |
| 7 | | | Massachusetts Health & Educational Facilities Authority, Series A, Refunding, Revenue Bond, 5.500%, 11/15/2036 | | 1.38 | |
| 8 | | | Regional Transportation District, Series A, Revenue Bond, 5.000%, 11/01/2027 | | 1.37 | |
| 9 | | | Regional Transportation District, Revenue Bond, 6.000%, 01/15/2026 | | 1.23 | |
| 10 | | | North Texas Tollway Authority, Series E, Prerefunded, Revenue Bond, 5.750%, 01/01/2038 | | 1.22 | |
GuideMark® Opportunistic Fixed Income Fund
MANAGER’S DISCUSSION OF FUND PERFORMANCE (Unaudited)
TOTAL RETURN BASED ON A $10,000 INVESTMENT

This chart assumes an initial gross investment of $10,000 made on April 1, 2011 (commencement of the Fund’s Service Shares operations). Returns shown include the reinvestment of all dividends. Returns shown do not reflect the deduction of taxes that a shareholder would pay on Fund distributions or the redemption of Fund shares. In the absence of fee waivers and reimbursements, when they are necessary to keep expenses at the expense cap, total return would be reduced. Past performance is not predictive of future performance. Investment return and principal value will fluctuate so that your shares, when redeemed, may be worth more or less than the original cost. Index returns do not reflect the effects of fees or expenses. It is not possible to invest directly in an index.
BARCLAYS MULTIVERSE INDEX – The Barclays Multiverse Index provides a broad-based measure of the global fixed-income bond market, and captures investment grade and high yield securities in all eligible currencies.
AVERAGE ANNUAL TOTAL RETURN (for periods ended March 31)
| | | One Year | | Since Inception(1) |
| GuideMark® Opportunistic Fixed Income Fund | | | | | | | | |
| Service Shares | | | 0.33 | % | | | 2.37 | % |
| Institutional Shares | | | 0.88 | % | | | 2.79 | % |
| Barclays Multiverse Index | | | -3.76 | % | | | 1.40 | %(2) |
| (1) | Inception date is 4/1/11 for Service Shares and 4/29/11 for Institutional Shares. |
| | |
| (2) | The return shown for the Barclays Multiverse Index is from the inception date of the Service Shares. The Barclays Multiverse Index return from the inception date of the Institutional Shares is 0.54%. |
GuideMark® Opportunistic Fixed Income Fund
MANAGER’S DISCUSSION OF FUND PERFORMANCE (Unaudited) (Continued)
| • | For the 12 months ended March 2015, the Fund returned 0.33%, outperforming the Barclays Multiverse Index at -3.76%. |
| • | Currency positioning, including an overweight exposure to the U.S. dollar relative to the Japanese yen and the Euro, contributed to the Fund’s outperformance. The U.S. dollar remained strong over the period against all other currencies as the U.S. economy continued to strengthen. |
| • | Security selection within both investment grade and high yield debt securities, and structured products, especially mortgage-backed securities, contributed to the Fund’s relative returns. |
| • | A shorter relative duration position detracted from returns. |
Components of Portfolio Holdings*
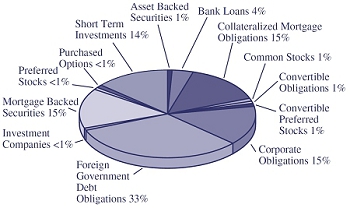
*Pie chart represents percentages of total portfolio.
Top Ten Holdings
| | | | | | % of Net |
| Rank | | Security/Holding | | Assets |
| 1 | | | Korea Monetary Stabilization Bond, 2.900%, 12/02/2015 | | 2.56 | |
| 2 | | | Malaysia Government Bond, 4.720%, 09/30/2015 | | 1.63 | |
| 3 | | | Hungary Government International Bond, 6.375%, 03/29/2021 | | 1.52 | |
| 4 | | | Mexican Bonos, 6.000%, 06/18/2015 | | 1.49 | |
| 5 | | | Portugal Government International Bond, 5.125%, 10/15/2024 | | 1.33 | |
| 6 | | | Federal National Mortgage Association, Pool #1200,
3.000%, 10/01/2032 | | 1.21 | |
| 7 | | | Korea Treasury Bond, 2.750%, 12/10/2015 | | 1.20 | |
| 8 | | | Ireland Government Bond, 5.400%, 03/13/2025 | | 1.20 | |
| 9 | | | Federal National Mortgage Association, Pool #2011-131,
4.500%, 12/25/2041 | | 1.16 | |
| 10 | | | Federal Home Loan Mortgage Corp., Pool #4097, 3.500%, 08/15/2042 | | 1.12 | |
GuidePath® Strategic Asset Allocation Fund
MANAGER’S DISCUSSION OF FUND PERFORMANCE (Unaudited)
TOTAL RETURN BASED ON A $10,000 INVESTMENT
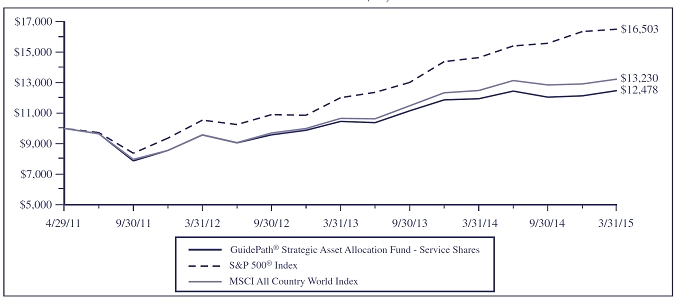
This chart assumes an initial gross investment of $10,000 made on April 29, 2011 (commencement of the Fund’s Service Shares operations). Returns shown include the reinvestment of all dividends. Returns shown do not reflect the deduction of taxes that a shareholder would pay on Fund distributions or the redemption of Fund shares. In the absence of fee waivers and reimbursements, when they are necessary to keep expenses at the expense cap, total return would be reduced. Past performance is not predictive of future performance. Investment return and principal value will fluctuate so that your shares, when redeemed, may be worth more or less than the original cost. Index returns do not reflect the effects of fees or expenses. It is not possible to invest directly in an index.
MSCI ALL COUNTRY WORLD INDEX – The MSCI All Country World Index measures the equity market performance of developed and emerging markets. The MSCI consisted of 46 country indices comprising 23 developed and 23 emerging market country indices. The developed market country indices included are: Australia, Austria, Belgium, Canada, Denmark, Finland, France, Germany, Hong Kong, Ireland, Israel, Italy, Japan, Netherlands, New Zealand, Norway, Portugal, Singapore, Spain, Sweden, Switzerland, the United Kingdom, and the United States. The emerging market country indices included are: Brazil, Chile, China, Colombia, Czech Republic, Egypt, Greece, Hungary, India, Indonesia, Korea, Malaysia, Mexico, Peru, Philippines, Poland, Russia, Qatar, South Africa, Taiwan, Thailand, Turkey and United Arab Emirates.
S&P 500® INDEX – The S&P 500® Index focuses on the large-cap segment of the U.S. equities market. It includes 500 leading companies in leading industries of the U.S. economy, capturing approximately 75% coverage of U.S. equities.
AVERAGE ANNUAL TOTAL RETURN (for periods ended March 31)
| | | One Year | | Since Inception(1) |
| GuidePath® Strategic Asset Allocation Fund | | | | | | | | |
| Service Shares | | | 4.47 | % | | | 5.81 | % |
| Institutional Shares | | | 5.04 | % | | | 10.88 | % |
| MSCI All Country World Index | | | 5.97 | % | | | 7.39 | %(2)(4) |
| S&P 500® Index | | | 12.73 | % | | | 13.62 | %(3)(4) |
| (1) | Inception date is 4/29/11 for Service Shares and 9/13/12 for Institutional Shares. |
| (2) | The return shown for the MSCI All Country World Index is annualized from the inception date of the Service Shares. The MSCI All Country World Index cumulative return from the inception date of the Institutional Shares is 12.62%. |
| (3) | The return shown for the S&P 500® Index is annualized from the inception date of the Service Shares. The S&P 500® Index cumulative return from the inception date of the Institutional Shares is 17.10%. |
| (4) | The Fund has elected to use the MSCI All Country World Index to represent its broad based benchmark rather than the S&P 500® Index because the MSCI All Country World Index more accurately reflects the Fund’s holdings. |
GuidePath® Strategic Asset Allocation Fund
MANAGER’S DISCUSSION OF FUND PERFORMANCE (Unaudited) (Continued)
| • | For the 12 months ended March 2015, the Fund returned 4.47%, underperforming the MSCI ACWI Index at 5.97%. |
| • | Exposure to global real return assets, specifically commodities and natural resources, dampened performance due to the steep price declines in the energy and agriculture sub-sectors. |
| • | Repositioning within international markets, reducing emerging markets in favor of developed markets harmed returns, as developed markets were dragged lower by concerns in Europe. |
| • | Security selection within the GuideMark® Small-Mid Cap Core Fund holding benefited returns, especially within the energy sector, and a general bias towards higher growth stocks. Security selection within the GuideMark® Opportunistic Equity Fund holding helped returns especially within the energy, consumer and real estate sectors along with exposure to smaller cap stocks. |
Components of Portfolio Holdings*
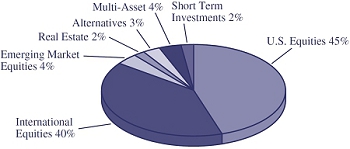
*Pie chart represents percentages of total portfolio, less securities lending collateral.
Top Ten Holdings
| | | | | | % of Net |
| Rank | | Security/Holding | | Assets |
| 1 | | | GuideMark® World ex-US Fund – Institutional Shares | | 18.32 | |
| 2 | | | Vanguard FTSE All-World ex-US Fund | | 18.03 | |
| 3 | | | SPDR S&P 500 ETF Trust | | 14.08 | |
| 4 | | | GuideMark® Small/Mid Cap Core Fund – Institutional Shares | | 9.28 | |
| 5 | | | GuideMark® Large Cap Value Fund – Institutional Shares | | 7.45 | |
| 6 | | | GuideMark® Large Cap Growth Fund – Institutional Shares | | 6.99 | |
| 7 | | | GuideMark® Opportunistic Equity Fund – Institutional Shares | | 5.31 | |
| 8 | | | GuideMark® Global Real Return Fund – Institutional Shares | | 4.00 | |
| 9 | | | SPDR S&P 600 Small Cap Growth ETF | | 2.21 | |
| 10 | | | iShares Core MSCI Emerging Markets ETF | | 2.13 | |
GuidePath® Tactical Constrained® Asset Allocation Fund
MANAGER’S DISCUSSION OF FUND PERFORMANCE (Unaudited)
TOTAL RETURN BASED ON A $10,000 INVESTMENT

This chart assumes an initial gross investment of $10,000 made on April 29, 2011 (commencement of the Fund’s Service Shares operations). Returns shown include the reinvestment of all dividends. Returns shown do not reflect the deduction of taxes that a shareholder would pay on Fund distributions or the redemption of Fund shares. In the absence of fee waivers and reimbursements, when they are necessary to keep expenses at the expense cap, total return would be reduced. Past performance is not predictive of future performance. Investment return and principal value will fluctuate so that your shares, when redeemed, may be worth more or less than the original cost. Index returns do not reflect the effects of fees or expenses. It is not possible to invest directly in an index.
MSCI ALL COUNTRY WORLD INDEX – The MSCI All Country World Index measures the equity market performance of developed and emerging markets. The MSCI consisted of 46 country indices comprising 23 developed and 23 emerging market country indices. The developed market country indices included are: Australia, Austria, Belgium, Canada, Denmark, Finland, France, Germany, Hong Kong, Ireland, Israel, Italy, Japan, Netherlands, New Zealand, Norway, Portugal, Singapore, Spain, Sweden, Switzerland, the United Kingdom, and the United States. The emerging market country indices included are: Brazil, Chile, China, Colombia, Czech Republic, Egypt, Greece, Hungary, India, Indonesia, Korea, Malaysia, Mexico, Peru, Philippines, Poland, Russia, Qatar, South Africa, Taiwan, Thailand, Turkey and United Arab Emirates.
S&P 500® INDEX – The S&P 500® Index focuses on the large-cap segment of the U.S. equities market. It includes 500 leading companies in leading industries of the U.S. economy, capturing approximately 75% coverage of U.S. equities.
TACTICAL CONSTRAINED BLENDED INDEX – The Tactical Constrained Blended Index is a weighted combination of 75% of the total return of the MSCI All Country World Index with 25% of the total return from the BofA Merrill Lynch Global Broad Market Index. Returns are weighted on a 75/25 basis for each historical month and then the longer-term returns are geometrically combined from these historical monthly returns to create aggregate returns (1-year, 3-years, 5-years, etc.) for the Tactical Constrained Blended Benchmark Index
GuidePath® Tactical Constrained® Asset Allocation Fund
MANAGER’S DISCUSSION OF FUND PERFORMANCE (Unaudited) (Continued)
AVERAGE ANNUAL TOTAL RETURN (for periods ended March 31)
| | | One Year | | Since Inception(1) |
| GuidePath® Tactical Constrained® Asset Allocation Fund | | | | | | | | |
| Service Shares | | | 5.42 | % | | | 5.68 | % |
| Institutional Shares | | | 6.01 | % | | | 9.24 | % |
| MSCI All Country World Index | | | 5.97 | % | | | 7.39 | %(2)(5) |
| S&P 500® Index | | | 12.73 | % | | | 13.62 | %(3)(5) |
| Tactical Constrained Blended Index | | | 3.76 | % | | | 5.83 | %(4) |
| (1) | Inception date is 4/29/11 for Service Shares and 9/13/12 for Institutional Shares. |
| | |
| (2) | The return shown for the MSCI All Country World Index is annualized from the inception date of the Service Shares. The MSCI All Country World Index cumulative return from the inception date of the Institutional Shares is 12.62%. |
| | |
| (3) | The return shown for the S&P 500® Index is annualized from the inception date of the Service Shares. The S&P 500® Index cumulative return from the inception date of the Institutional Shares is 17.10%. |
| | |
| (4) | The return shown for the Tactical Constrained Blended Index is annualized from the inception date of the Service Shares. The Tactical Constrained Blended Index cumulative return from the inception date of the Institutional Shares is 9.05%. |
| | |
| (5) | The Fund has elected to use the MSCI All Country World Index to represent its broad based benchmark rather than the S&P 500® Index because the MSCI All Country World Index more accurately reflects the Fund’s holdings. |
GuidePath® Tactical Constrained® Asset Allocation Fund
MANAGER’S DISCUSSION OF FUND PERFORMANCE (Unaudited) (Continued)
| • | For the 12 months ended March 2015, the Fund returned 5.42% underperforming the MSCI ACWI Index at 5.97%. The Fund outperformed the blended benchmark of 75% MSCI ACWI Index and 25% BofA Merrill Lynch Global Broad Market Index at 3.76%. |
| | | |
| • | Increasing exposure to US fixed income relative to international equities and fixed income benefited returns, with the outperformance of the US fixed income market based, in part, on the strength in the US dollar. Fund performance further benefited from exposure to investment grade corporate bonds. |
| | | |
| • | Security selection within the GuideMark® Opportunistic Equity Fund holding helped returns, especially within the energy, consumer and real estate sectors. A small exposure to global REITS added to gains as continued economic progress supported REIT valuations. |
| | | |
| • | Exposure to opportunistic fixed income benefited returns. This was due, in part, to foreign exchange trades within the GuideMark® Opportunistic Fixed Income Fund that overweighted the US dollar relative to the Yen and Euro. The exposure also benefited from credit selection and an overweight to US high yield fixed income. |
Components of Portfolio Holdings*
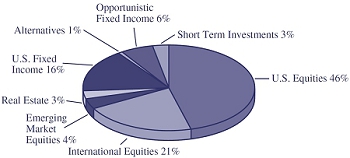
*Pie chart represents percentages of total portfolio, less securities lending collateral.
Top Ten Holdings
| | | | | | % of Net |
| Rank | | Security/Holding | | Assets |
| 1 | | | GuideMark® World ex-US Fund – Institutional Shares | | 18.50 | |
| 2 | | | SPDR S&P 500 ETF Trust | | 13.26 | |
| 3 | | | GuideMark® Core Fixed Income Fund – Institutional Shares | | 11.39 | |
| 4 | | | GuideMark® Opportunistic Equity Fund – Institutional Shares | | 10.63 | |
| 5 | | | GuideMark® Large Cap Value Fund – Institutional Shares | | 6.69 | |
| 6 | | | GuideMark® Large Cap Growth Fund – Institutional Shares | | 6.65 | |
| 7 | | | GuideMark® Small/Mid Cap Core Fund – Institutional Shares | | 5.93 | |
| 8 | | | GuideMark® Opportunistic Fixed Income Fund – Institutional Shares | | 5.11 | |
| 9 | | | iShares Core MSCI Emerging Markets ETF | | 3.60 | |
| 10 | | | Vanguard REIT ETF | | 2.76 | |
GuidePath® Tactical Unconstrained® Asset Allocation Fund
MANAGER’S DISCUSSION OF FUND PERFORMANCE (Unaudited)
TOTAL RETURN BASED ON A $10,000 INVESTMENT

This chart assumes an initial gross investment of $10,000 made on April 29, 2011 (commencement of the Fund’s Service Shares operations). Returns shown include the reinvestment of all dividends. Returns shown do not reflect the deduction of taxes that a shareholder would pay on Fund distributions or the redemption of Fund shares. In the absence of fee waivers and reimbursements, when they are necessary to keep expenses at the expense cap, total return would be reduced. Past performance is not predictive of future performance. Investment return and principal value will fluctuate so that your shares, when redeemed, may be worth more or less than the original cost. Index returns do not reflect the effects of fees or expenses. It is not possible to invest directly in an index.
S&P 500® INDEX – The S&P 500® Index focuses on the large-cap segment of the U.S. equities market. It includes 500 leading companies in leading industries of the U.S. economy, capturing approximately 75% coverage of U.S. equities.
TACTICAL UNCONSTRAINED BLENDED INDEX – The Tactical Unconstrained Blended Index is a weighted combination of 90% of the total return from the MSCI All Country World Index with 10% of the total return from the Barclays Multiverse Index. Returns are weighted on a 90/10 basis for each historical month and then the longer-term Blended Index returns are geometrically combined from these historical monthly returns to create aggregate returns (1-year, 3-years, 5-years, etc.) for the Tactical Unconstrained Blended Index.
AVERAGE ANNUAL TOTAL RETURN (for periods ended March 31)
| | | One Year | | Since Inception(1) |
| GuidePath® Tactical Unconstrained® Asset Allocation Fund | | | | | | | | |
| Service Shares | | | 3.08 | % | | | 3.80 | % |
| Institutional Shares | | | 3.63 | % | | | 7.39 | % |
| S&P 500® Index | | | 12.73 | % | | | 13.62 | %(2) |
| Tactical Unconstrained Blended Index | | | 4.98 | % | | | 6.76 | %(3) |
| (1) | Inception date is 4/29/11 for Service Shares and 9/13/12 for Institutional Shares. |
| | |
| (2) | The return shown for the S&P 500® Index is annualized from the inception date of the Service Shares. The S&P 500® Index cumulative return from the inception date of the Institutional Shares is 17.10%. |
| | |
| (3) | The return shown for the Tactical Unconstrained Blended Index is annualized from the inception date of the Service Shares. The Tactical Unconstrained Blended Index cumulative return from the inception date of the Institutional Shares is 11.17%. |
GuidePath® Tactical Unconstrained® Asset Allocation Fund
MANAGER’S DISCUSSION OF FUND PERFORMANCE (Unaudited) (Continued)
| • | For the 12 months ended March 2015, the Fund returned 3.08%, underperforming the S&P 500 Index at 12.73%. The Fund lagged the blended benchmark of 90% MSCI ACWI Index and 10% Barclays Multiverse Index at 4.98%. |
| | | |
| • | Defensive positioning and higher cash allocations within the Fund were the largest detractor to returns, as market reversals impacted trend following strategies. |
| | | |
| • | In international markets, both equities and fixed income harmed returns given the strength of the U.S. dollar. Underweight exposure to commodities dampened performance due to steep price declines in the energy and agriculture sub-sectors. |
| | | |
| • | Security selection within the GuideMark® Opportunistic Equity Fund holding benefited returns, especially within the energy, consumer and real estate sectors. |
Components of Portfolio Holdings*
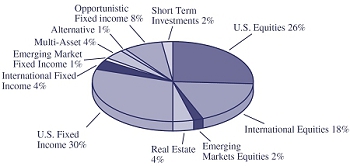
*Pie chart represents percentages of total portfolio, less securities lending collateral.
Top Ten Holdings
| | | | | | % of Net |
| Rank | | Security/Holding | | Assets |
| 1 | | | SPDR S&P 500 ETF Trust | | 9.27 | |
| 2 | | | iShares Core U.S. Credit Bond ETF | | 7.77 | |
| 3 | | | GuideMark® Opportunistic Equity Fund – Institutional Shares | | 6.22 | |
| 4 | | | Vanguard FTSE Europe ETF | | 5.19 | |
| 5 | | | GuideMark® Large Cap Value Fund – Institutional Shares | | 5.01 | |
| 6 | | | GuideMark® World ex-US Fund – Institutional Shares | | 4.95 | |
| 7 | | | Vanguard Short-Term Bond Fund | | 4.30 | |
| 8 | | | GuideMark® Opportunistic Fixed Income Fund – Institutional Shares | | 4.21 | |
| 9 | | | William Blair Macro Allocation Fund – Class I | | 4.00 | |
| 10 | | | Vanguard REIT ETF | | 3.97 | |
GuidePath® Absolute Return Asset Allocation Fund
MANAGER’S DISCUSSION OF FUND PERFORMANCE (Unaudited)
TOTAL RETURN BASED ON A $10,000 INVESTMENT

This chart assumes an initial gross investment of $10,000 made on April 29, 2011 (commencement of the Fund’s Service Shares operations). Returns shown include the reinvestment of all dividends. Returns shown do not reflect the deduction of taxes that a shareholder would pay on Fund distributions or the redemption of Fund shares. In the absence of fee waivers and reimbursements, when they are necessary to keep expenses at the expense cap, total return would be reduced. Past performance is not predictive of future performance. Investment return and principal value will fluctuate so that your shares, when redeemed, may be worth more or less than the original cost. Index returns do not reflect the effects of fees or expenses. It is not possible to invest directly in an index.
CITIGROUP 3-MONTH TREASURY BILL INDEX – The Citigroup 3-month Treasury Bill Index tracks the performance of US Treasury Bills with a remaining maturity of three months.
AVERAGE ANNUAL TOTAL RETURN (for periods ended March 31)
| | | One Year | | Since Inception(1) | |
| GuidePath® Absolute Return Asset Allocation Fund | | | | | | | |
| Service Shares | | 2.47 | % | | 1.68 | % | |
| Institutional Shares | | 3.05 | % | | 2.22 | % | |
| Citigroup 3-Month Treasury Bill Index | | 0.03 | % | | 0.05 | %(2) | |
| (1) | Inception date is 4/29/11 for Service Shares and 9/13/12 for Institutional Shares. |
| | |
| (2) | The return shown for the Citigroup 3-Month Treasury Bill Index is annualized from the inception date of the Service Shares. The Citigroup 3-Month Treasury Bill Index cumulative return from the inception date of the Institutional Shares is 0.05%. |
GuidePath® Absolute Return Asset Allocation Fund
MANAGER’S DISCUSSION OF FUND PERFORMANCE (Unaudited) (Continued)
| • | For the 12 months ended March 2015, the Fund returned 2.47%, outperforming the Citigroup 3-month Treasury Bill Index at 0.03%. |
| • | Fixed income exposure favoring credit and long-dated maturities proved beneficial to Fund performance. |
| • | A relatively small exposure to domestic equities was beneficial as the US market posted strong gains. |
| • | Repositioning within fixed income, moving out of emerging markets and into US fixed income in the latter part of the period benefited Fund returns. |
Components of Portfolio Holdings*

*Pie chart represents percentages of total portfolio, less securities lending collateral.
Top Ten Holdings
| Rank | | Security/Holding | | % of Net
Assets |
| 1 | | | Pioneer Strategic Income Fund – Class Y | | 14.63 | |
| 2 | | | Vanguard Mortgage-Backed Securities ETF | | 7.95 | |
| 3 | | | Vanguard Total Bond Market ETF | | 6.48 | |
| 4 | | | iShares Core U.S. Credit Bond ETF | | 5.93 | |
| 5 | | | DoubleLine Total Return Bond Fund – Institutional Shares | | 5.35 | |
| 6 | | | Vanguard Intermediate – Term Corporate Bond ETF | | 4.41 | |
| 7 | | | GuideMark® Core Fixed Income Fund – Institutional Shares | | 3.36 | |
| 8 | | | John Hancock Funds II - Alternative Asset Allocation Fund –
Institutional Shares | | 3.27 | |
| 9 | | | iShares 7-10 Year Treasury Bond ETF | | 3.08 | |
| 10 | | | JPMorgan Unconstrained Debt Fund – Select Shares | | 2.98 | |
GuidePath® Multi-Asset Income Asset Allocation Fund
MANAGER’S DISCUSSION OF FUND PERFORMANCE (Unaudited)
TOTAL RETURN BASED ON A $10,000 INVESTMENT
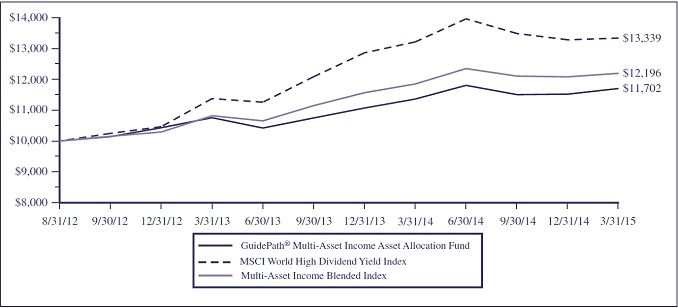
This chart assumes an initial gross investment of $10,000 made on August 31, 2012 (commencement of the Fund’s operations). Returns shown include the reinvestment of all dividends. Returns shown do not reflect the deduction of taxes that a shareholder would pay on Fund distributions or the redemption of Fund shares. In the absence of fee waivers and reimbursements, when they are necessary to keep expenses at the expense cap, total return would be reduced. Past performance is not predictive of future performance. Investment return and principal value will fluctuate so that your shares, when redeemed, may be worth more or less than the original cost. Index returns do not reflect the effects of fees or expenses. It is not possible to invest directly in an index.
MSCI WORLD HIGH DIVIDEND YIELD INDEX – The MSCI World High Dividend Yield Index is based on the MSCI World Index, its parent index, and includes large and mid cap stocks across 23 developed market countries. The Index is designed to reflect the performance of equities (excluding REITs) with higher than average dividend yields that are both sustainable and persistent.
MULTI-ASSET INCOME BLENDED INDEX – The Multi-Asset Income Blended Index is a weighted combination of 60% of the total return from the MSCI World High Dividend Yield Index with 40% of the total return from the Barclays US Aggregate Bond Index. Returns are weighted on a 60/40 basis for each historical month and then the longer-term Blended Index returns are geometrically combined from these historical monthly returns to create aggregate returns (1-year, 3-years, 5-years, etc.) for the Blended Index.
AVERAGE ANNUAL TOTAL RETURN (for periods ended March 31)
| | | One Year | | Since Inception(1) | |
| GuidePath® Multi-Asset Income Asset | | | | | | | |
| Allocation Fund | | 3.01 | % | | 6.28 | % | |
| MSCI World High Dividend Yield Index | | 0.94 | % | | 11.81 | % | |
| Multi-Asset Income Blended Index | | 2.91 | % | | 8.00 | % | |
| (1) | Inception date is 8/31/12. |
GuidePath® Multi-Asset Income Asset Allocation Fund
MANAGER’S DISCUSSION OF FUND PERFORMANCE (Unaudited) (Continued)
| • | For the 12 months ended March 2015, the Fund returned 3.01%, outperforming the MSCI World High Dividend Yield Index at 0.94%. The Fund outperformed the blended benchmark of 60% MSCI World High Dividend Yield Index and 40% Barclays US Aggregate Index at 2.91%. |
| • | Exposure to US preferred stocks, REITs and dividend equities benefited performance. |
| • | A general bias towards US dividend equities, which increased during the period, coupled with a reduction in international dividend equities, lifted returns given the strength of the US markets and strengthening US dollar. |
| • | Within fixed income, relatively small exposures to long maturity bonds helped performance. Exposure to emerging market debt dampened performance, with weakness in global currencies; although exposure to US dollar denominated debt was beneficial. |
Components of Portfolio Holdings*

*Pie chart represents percentages of total portfolio, less securities lending collateral.
Top Ten Holdings
| Rank | | Security/Holding | | % of Net
Assets |
| 1 | | | BlackRock Multi-Asset Income Fund – Institutional Shares | | 24.41 | |
| 2 | | | WisdomTree Equity Income Fund | | 11.16 | |
| 3 | | | Forward Select Income Fund – Institutional Shares | | 5.48 | |
| 4 | | | iShares iBoxx $ High Yield Corporate Bond ETF | | 5.05 | |
| 5 | | | iShares JPMorgan USD Emerging Markets Bond ETF | | 4.99 | |
| 6 | | | JPMorgan Income Builder Fund – Select Shares | | 3.75 | |
| 7 | | | JPMorgan International Equity Income Fund – Select Shares | | 3.37 | |
| 8 | | | WisdomTree International SmallCap Dividend Fund | | 2.94 | |
| 9 | | | Forward International Dividend Fund – Institutional Shares | | 2.93 | |
| 10 | | | GuideMark® World ex-US Fund – Institutional Shares | | 2.72 | |
GuidePath® Fixed Income Allocation Fund
MANAGER’S DISCUSSION OF FUND PERFORMANCE (Unaudited)
TOTAL RETURN BASED ON A $10,000 INVESTMENT
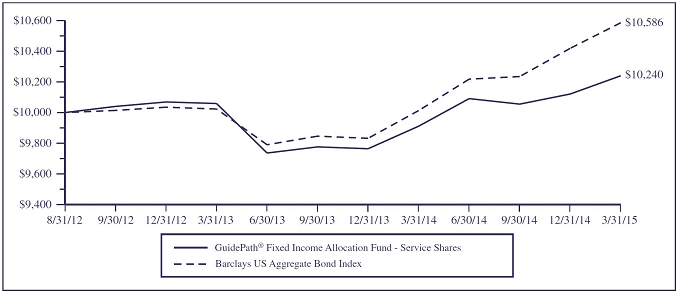
This chart assumes an initial gross investment of $10,000 made on August 31, 2012 (commencement of the Fund’s Service Shares operations). Returns shown include the reinvestment of all dividends. Returns shown do not reflect the deduction of taxes that a shareholder would pay on Fund distributions or the redemption of Fund shares. In the absence of fee waivers and reimbursements, when they are necessary to keep expenses at the expense cap, total return would be reduced. Past performance is not predictive of future performance. Investment return and principal value will fluctuate so that your shares, when redeemed, may be worth more or less than the original cost. Index returns do not reflect the effects of fees or expenses. It is not possible to invest directly in an index.
BARCLAYS US AGGREGATE BOND INDEX – The Barclays U.S. Aggregate Bond Index is a broad-based benchmark that measures the investment-grade U.S. dollar-denominated, fixed-rate taxable bond market, including Treasuries, government-related and corporate debt securities, and mortgage- and asset-backed securities. All securities contained in the Barclays U.S. Aggregate Bond Index have a minimum term to maturity of one year.
AVERAGE ANNUAL TOTAL RETURN (for periods ended March 31)
| | | One Year | | Since Inception(1) | |
| GuidePath® Fixed Income Allocation Fund | | | | | | | |
| Service Shares | | 3.32 | % | | 0.92 | % | |
| Institutional Shares | | 3.75 | % | | 1.48 | % | |
| Barclays US Aggregate Bond Index | | 5.72 | % | | 2.23 | %(2) | |
| (1) | Inception date is 8/31/12 for Service Shares and 9/13/12 for Institutional Shares. |
| | |
| (2) | The return shown for the Barclays US Aggregate Bond Index is from the inception date of the Service Shares. The Barclays US Aggregate Bond Index return from the inception date of the Institutional Shares is 2.42%. |
GuidePath® Fixed Income Allocation Fund
MANAGER’S DISCUSSION OF FUND PERFORMANCE (Unaudited) (Continued)
| • | For the 12 months ended March 2015, the Fund returned 3.32%, underperforming the Barclays US Aggregate Index at 5.72%. |
| | | |
| • | Non-benchmark exposure in high yield through direct exposures and indirect through actively managed opportunistic fixed income exposures harmed returns. |
| | | |
| • | International TIPS and local currency emerging market bond exposures dampened performance. |
| | | |
| • | Exposure to long maturity bonds provided a positive lift to returns, as long-term yields declined on continued high demand for U.S. fixed income securities from foreign investors. |
Components of Portfolio Holdings*
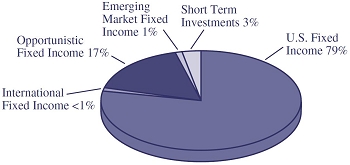
*Pie chart represents percentages of total portfolio, less securities lending collateral.
Top Ten Holdings
| | | | | | % of Net |
| Rank | | Security/Holding | | Assets |
| 1 | | | Vanguard Total Bond Market ETF | | 21.81 | |
| 2 | | | GuideMark® Core Fixed Income Fund – Institutional Shares | | 21.76 | |
| 3 | | | GuideMark® Opportunistic Fixed Income Fund – | | | |
| | | | Institutional Shares | | 13.89 | |
| 4 | | | iShares 7-10 Year Treasury Bond ETF | | 6.11 | |
| 5 | | | Vanguard Mortgage-Backed Securities ETF | | 6.00 | |
| 6 | | | iShares 1-3 Year Treasury Bond ETF | | 4.73 | |
| 7 | | | iShares Core U.S. Credit Bond ETF | | 3.21 | |
| 8 | | | Loomis Sayles Bond Fund – Institutional Shares | | 2.81 | |
| 9 | | | SPDR Barclays TIPS ETF | | 2.79 | |
| 10 | | | SPDR Barclays High Yield Bond ETF | | 2.61 | |
GuidePath® Altegris® Diversified Alternatives Allocation Fund
MANAGER’S DISCUSSION OF FUND PERFORMANCE (Unaudited)
TOTAL RETURN BASED ON A $10,000 INVESTMENT
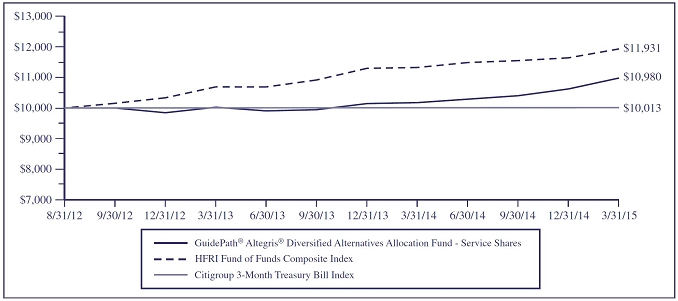
This chart assumes an initial gross investment of $10,000 made on August 31, 2012 (commencement of the Fund’s Service Shares operations). Returns shown include the reinvestment of all dividends. Returns shown do not reflect the deduction of taxes that a shareholder would pay on Fund distributions or the redemption of Fund shares. In the absence of fee waivers and reimbursements, when they are necessary to keep expenses at the expense cap, total return would be reduced. Past performance is not predictive of future performance. Investment return and principal value will fluctuate so that your shares, when redeemed, may be worth more or less than the original cost. Index returns do not reflect the effects of fees or expenses. It is not possible to invest directly in an index.
HFRI FUND OF FUNDS COMPOSITE INDEX – The HFRI Fund of Funds Composite Index is an equally weighted hedge fund index including over 650 domestic and off-shore funds of funds.
CITIGROUP 3-MONTH TREASURY BILL INDEX – The Citigroup 3-month Treasury Bill Index tracks the performance of US Treasury Bills with a remaining maturity of three months.
AVERAGE ANNUAL TOTAL RETURN (for periods ended March 31)
| | | One Year | | Since Inception(1) | |
| GuidePath® Altegris® Diversified Alternatives Allocation Fund | | | | | | | |
| Service Shares | | 7.91 | % | | 3.69 | % | |
| Institutional Shares | | 8.34 | % | | 3.83 | % | |
| HFRI Fund of Funds Composite Index | | 5.37 | % | | 6.62 | %(2) | |
| Citigroup 3-Month Treasury Bill Index | | 0.03 | % | | 0.05 | %(3) | |
| (1) | Inception date is 8/31/12 for Service Shares and 9/13/12 for Institutional Shares. |
| | |
| (2) | Reflects index performance since the date closest to the Class’ inception for which data is available. The HFRI Fund of Funds Composite Index is calculated from August 31, 2012, the inception date of the Service Shares. |
| | |
| (3) | The return shown for the Citigroup 3-Month Treasury Bill Index is annualized from the inception date of the Service Shares. The Citigroup 3-Month Treasury Bill Index cumulative return from the inception date of the Institutional Shares is 0.05%. |
GuidePath® Altegris® Diversified Alternatives Allocation Fund
MANAGER’S DISCUSSION OF FUND PERFORMANCE (Unaudited) (Continued)
| • | For the 12 months ended March 2015, the Fund returned 7.91%, outperforming the HFRI Fund of Funds Composite Index at 5.37%. |
| | | |
| • | The macro strategy contributed to more than half the Fund’s return. The strongest drivers of return being long fixed income futures positions, short non-US currencies and short energy futures positions. |
| | | |
| • | Within the alternative equity strategy, long consumer (cyclical and non-cyclical) positions led gains. Long positions across sectors such as communications, industrials and technology also benefited as stock dispersion increased during the time period. Long energy positions were the largest detractor within the alternative equity strategy. |
| | | |
| • | Within the alternative fixed income strategy, convertible bond holdings led the gains by capitalizing on idiosyncratic, company-specific events. |
Components of Portfolio Holdings*

*Pie chart represents percentages of total portfolio.
Top Ten Holdings
| | | | | | % of Net |
| Rank | | Security/Holding | | Assets |
| 1 | | | Altegris® Equity Long Short Fund - Institutional Shares | | 47.31 | |
| 2 | | | Altegris® Fixed Income Long Short Fund – | | | |
| | | | Institutional Shares | | 27.56 | |
| 3 | | | Altegris® Futures Evolution Strategy Fund – | | | |
| | | | Institutional Shares | | 8.12 | |
| 4 | | | Altegris® Macro Strategy Fund – Institutional Shares | | 7.52 | |
| 5 | | | Altegris® Managed Futures Strategy Fund – | | | |
| | | | Institutional Shares | | 4.98 | |
| 6 | | | Altegris®/AACA Real Estate Long Short Fund – | | | |
| | | | Institutional Shares | | 2.61 | |
GuideMark® Funds & GuidePath® Funds
EXPENSE EXAMPLE (Unaudited)
March 31, 2015
As a shareholder of the GuideMark® & GuidePath® Funds (the “Funds”), you incur ongoing costs, including management fees, distribution and/or service fees, and other Fund expenses. The Expense Example shown in this section is intended to help you understand your ongoing costs (in dollars) of investing in the Funds and to compare these costs with the ongoing costs of investing in other mutual funds.
The Expense Examples are based on an investment of $1,000 invested at the beginning of a six-month period and held for the entire period, which for all Funds is from October 1, 2014 to March 31, 2015.
Actual Expenses
The first line of the Expense Example table provides information about actual account values and actual expenses. You may use the information in this line, together with the amount you invested, to estimate the expenses that you paid over the period. Simply divide your account value by $1,000 (for example, an $8,600 account value divided by $1,000 = 8.6), then multiply the result by the number in the first line under the heading entitled “Expenses Paid During Period” to estimate the expenses you paid on your account during this period.
The example includes, but is not limited to, management fees, shareholder servicing fees, distribution fees, fund accounting fees, custody fees and transfer agent fees. However, the example below does not include portfolio trading commissions and related expenses, interest expense or dividends on short positions taken by a Fund and other extraordinary expenses as determined under U.S. generally accepted accounting principles. To the extent that a Fund invests in shares of other investment companies as part of its investment strategy, you will indirectly bear your proportionate share of any fees and expenses charged by the underlying funds in which a Fund invests in addition to the expenses of the Fund. Actual expenses of the underlying funds are expected to vary among the various underlying funds. These expenses are not included in the example below.
Hypothetical Example for Comparison Purposes
The second line of the table below provides information about hypothetical account values and hypothetical expenses based on each Fund’s actual expenses ratios and an assumed rate of return of 5% per year before expenses, which is not the Fund’s actual return. The hypothetical account values and expenses may not be used to estimate the actual ending account balance or expenses you paid for the period. You may use this information to compare the ongoing costs of investing in the Funds and other funds. To do so, compare this 5% hypothetical example with the 5% hypothetical examples that appear in the shareholder reports of the other funds.
GuideMark® Funds & GuidePath® Funds
EXPENSE EXAMPLE (Unaudited) (Continued)
March 31, 2015
| Fund | | | | Beginning
Account
Value
October 1,
2014 | | Ending
Account
Value
March 31,
2015 | | Annualized
Expense Ratio(1)
based on
the period
October 1, 2014–
March 31, 2015 | | Expenses Paid
During Period(2)
October 1, 2014–
March 31, 2015 | |
| INSTITUTIONAL SHARES | | | | | | | | | | | | | | | | | | | | | |
| GuideMark® Large Cap | | Actual | | | $ | 1,000.00 | | | $ | 1,072.60 | | | | 0.86% | | | $ | 4.44 | | | |
| Growth Fund | | Hypothetical(3) | | | $ | 1,000.00 | | | $ | 1,020.64 | | | | 0.86% | | | $ | 4.33 | | | |
| GuideMark® Large Cap | | Actual | | | $ | 1,000.00 | | | $ | 1,059.20 | | | | 0.85% | | | $ | 4.36 | | | |
| Value Fund | | Hypothetical(3) | | | $ | 1,000.00 | | | $ | 1,020.69 | | | | 0.85% | | | $ | 4.28 | | | |
| GuideMark® Small/Mid Cap | | Actual | | | $ | 1,000.00 | | | $ | 1,131.30 | | | | 1.02% | | | $ | 5.42 | | | |
| Core Fund | | Hypothetical(3) | | | $ | 1,000.00 | | | $ | 1,019.85 | | | | 1.02% | | | $ | 5.14 | | | |
| GuideMark® World | | Actual | | | $ | 1,000.00 | | | $ | 1,005.80 | | | | 0.98% | | | $ | 4.90 | | | |
| ex-US Fund | | Hypothetical(3) | | | $ | 1,000.00 | | | $ | 1,020.04 | | | | 0.98% | | | $ | 4.94 | | | |
| GuideMark® Opportunistic | | Actual | | | $ | 1,000.00 | | | $ | 1,099.20 | | | | 1.01% | | | $ | 5.29 | | | |
| Equity Fund | | Hypothetical(3) | | | $ | 1,000.00 | | | $ | 1,019.90 | | | | 1.01% | | | $ | 5.09 | | | |
| GuideMark® Global | | Actual | | | $ | 1,000.00 | | | $ | 929.90 | | | | 0.89% | | | $ | 4.28 | | | |
| Real Return Fund(4) | | Hypothetical(3) | | | $ | 1,000.00 | | | $ | 1,020.49 | | | | 0.89% | | | $ | 4.48 | | | |
| GuideMark® Core | | Actual | | | $ | 1,000.00 | | | $ | 1,033.70 | | | | 0.70% | | | $ | 3.55 | | | |
| Fixed Income Fund | | Hypothetical(3) | | | $ | 1,000.00 | | | $ | 1,021.44 | | | | 0.70% | | | $ | 3.53 | | | |
| GuideMark® Opportunistic | | Actual | | | $ | 1,000.00 | | | $ | 992.60 | | | | 1.05% | | | $ | 5.22 | | | |
| Fixed Income Fund | | Hypothetical(3) | | | $ | 1,000.00 | | | $ | 1,019.70 | | | | 1.05% | | | $ | 5.29 | | | |
| GuidePath® Strategic | | Actual | | | $ | 1,000.00 | | | $ | 1,038.60 | | | | 0.42% | | | $ | 2.13 | | | |
| Asset Allocation Fund | | Hypothetical(3) | | | $ | 1,000.00 | | | $ | 1,022.84 | | | | 0.42% | | | $ | 2.12 | | | |
| GuidePath® Tactical Constrained® | | Actual | | | $ | 1,000.00 | | | $ | 1,042.70 | | | | 0.42% | | | $ | 2.14 | | | |
| Asset Allocation Fund | | Hypothetical(3) | | | $ | 1,000.00 | | | $ | 1,022.84 | | | | 0.42% | | | $ | 2.12 | | | |
| GuidePath® Tactical Unconstrained® | | Actual | | | $ | 1,000.00 | | | $ | 1,027.80 | | | | 0.52% | | | $ | 2.63 | | | |
| Asset Allocation Fund | | Hypothetical(3) | | | $ | 1,000.00 | | | $ | 1,022.34 | | | | 0.52% | | | $ | 2.62 | | | |
| GuidePath® Absolute Return | | Actual | | | $ | 1,000.00 | | | $ | 1,015.20 | | | | 0.50% | | | $ | 2.51 | | | |
| Asset Allocation Fund | | Hypothetical(3) | | | $ | 1,000.00 | | | $ | 1,022.44 | | | | 0.50% | | | $ | 2.52 | | | |
| GuidePath® Fixed Income | | Actual | | | $ | 1,000.00 | | | $ | 1,021.50 | | | | 0.41% | | | $ | 2.07 | | | |
| Allocation Fund | | Hypothetical(3) | | | $ | 1,000.00 | | | $ | 1,022.89 | | | | 0.41% | | | $ | 2.07 | | | |
| GuidePath® Altegris® Diversified | | Actual | | | $ | 1,000.00 | | | $ | 1,057.80 | | | | 0.17% | | | $ | 0.87 | | | |
| Alternatives Allocation Fund | | Hypothetical(3) | | | $ | 1,000.00 | | | $ | 1,024.08 | | | | 0.17% | | | $ | 0.86 | | | |
| (1) | The expense ratio excludes the securities lending credit. |
| (2) | Expenses are equal to the Fund’s annualized expense ratio, multiplied by the average account value over the period, multiplied by 182/365 to reflect the one-half year period. |
| (3) | 5% return before expenses. |
| (4) | Excluding voluntary waiver. |
GuideMark® Funds & GuidePath® Funds
EXPENSE EXAMPLE (Unaudited) (Continued)
March 31, 2015
| Fund | | | | Beginning
Account
Value
October 1,
2014 | | Ending
Account
Value
March 31,
2015 | | Annualized
Expense Ratio(1)
based on
the period
October 1, 2014–
March 31, 2015 | | Expenses Paid
During Period(2)
October 1, 2014–
March 31, 2015 | |
| SERVICE SHARES | | | | | | | | | | | |
| GuideMark® Large Cap | | Actual | | | $ | 1,000.00 | | | $ | 1,069.80 | | | | 1.43% | | | $ | 7.38 | | |
| Growth Fund | | Hypothetical(3) | | | $ | 1,000.00 | | | $ | 1,017.80 | | | | 1.43% | | | $ | 7.19 | | |
| GuideMark® Large Cap | | Actual | | | $ | 1,000.00 | | | $ | 1,055.00 | | | | 1.43% | | | $ | 7.33 | | |
| Value Fund | | Hypothetical(3) | | | $ | 1,000.00 | | | $ | 1,017.80 | | | | 1.43% | | | $ | 7.19 | | |
| GuideMark® Small/Mid Cap | | Actual | | | $ | 1,000.00 | | | $ | 1,126.80 | | | | 1.72% | | | $ | 9.12 | | |
| Core Fund | | Hypothetical(3) | | | $ | 1,000.00 | | | $ | 1,016.36 | | | | 1.72% | | | $ | 8.65 | | |
| GuideMark® World | | Actual | | | $ | 1,000.00 | | | $ | 1,003.30 | | | | 1.59% | | | $ | 7.94 | | |
| ex-US Fund | | Hypothetical(3) | | | $ | 1,000.00 | | | $ | 1,017.00 | | | | 1.59% | | | $ | 8.00 | | |
| GuideMark® Opportunistic | | Actual | | | $ | 1,000.00 | | | $ | 1,095.90 | | | | 1.58% | | | $ | 8.26 | | |
| Equity Fund | | Hypothetical(3) | | | $ | 1,000.00 | | | $ | 1,017.05 | | | | 1.58% | | | $ | 7.95 | | |
| GuideMark® Global | | Actual | | | $ | 1,000.00 | | | $ | 927.60 | | | | 1.46% | | | $ | 7.02 | | |
| Real Return Fund(4) | | Hypothetical(3) | | | $ | 1,000.00 | | | $ | 1,017.65 | | | | 1.46% | | | $ | 7.34 | | |
| GuideMark® Core | | Actual | | | $ | 1,000.00 | | | $ | 1,030.60 | | | | 1.30% | | | $ | 6.58 | | |
| Fixed Income Fund | | Hypothetical(3) | | | $ | 1,000.00 | | | $ | 1,018.45 | | | | 1.30% | | | $ | 6.54 | | |
| GuideMark® Tax-Exempt | | Actual | | | $ | 1,000.00 | | | $ | 1,022.80 | | | | 1.29% | | | $ | 6.51 | | |
| Fixed Income Fund | | Hypothetical(3) | | | $ | 1,000.00 | | | $ | 1,018.50 | | | | 1.29% | | | $ | 6.49 | | |
| GuideMark® Opportunistic | | Actual | | | $ | 1,000.00 | | | $ | 989.70 | | | | 1.55% | | | $ | 7.69 | | |
| Fixed Income Fund | | Hypothetical(3) | | | $ | 1,000.00 | | | $ | 1,017.20 | | | | 1.55% | | | $ | 7.80 | | |
| GuidePath® Strategic | | Actual | | | $ | 1,000.00 | | | $ | 1,035.60 | | | | 1.01% | | | $ | 5.13 | | |
| Asset Allocation Fund | | Hypothetical(3) | | | $ | 1,000.00 | | | $ | 1,019.90 | | | | 1.01% | | | $ | 5.09 | | |
| GuidePath® Tactical Constrained® | | Actual | | | $ | 1,000.00 | | | $ | 1,038.70 | | | | 1.05% | | | $ | 5.34 | | |
| Asset Allocation Fund | | Hypothetical(3) | | | $ | 1,000.00 | | | $ | 1,019.70 | | | | 1.05% | | | $ | 5.29 | | |
| GuidePath® Tactical Unconstrained® | | Actual | | | $ | 1,000.00 | | | $ | 1,024.20 | | | | 1.12% | | | $ | 5.65 | | |
| Asset Allocation Fund | | Hypothetical(3) | | | $ | 1,000.00 | | | $ | 1,019.35 | | | | 1.12% | | | $ | 5.64 | | |
| GuidePath® Absolute Return | | Actual | | | $ | 1,000.00 | | | $ | 1,012.60 | | | | 1.10% | | | $ | 5.52 | | |
| Asset Allocation Fund | | Hypothetical(3) | | | $ | 1,000.00 | | | $ | 1,019.45 | | | | 1.10% | | | $ | 5.54 | | |
| GuidePath® Multi-Asset Income | | Actual | | | $ | 1,000.00 | | | $ | 1,017.20 | | | | 1.15% | | | $ | 5.78 | | |
| Asset Allocation Fund | | Hypothetical(3) | | | $ | 1,000.00 | | | $ | 1,020.09 | | | | 1.15% | | | $ | 5.79 | | |
| | | | | | | | | | | | | | | | | | | | | | |
GuideMark® Funds & GuidePath® Funds
EXPENSE EXAMPLE (Unaudited) (Continued)
March 31, 2015
| Fund | | | | | Beginning
Account
Value
October 1,
2014 | | | Ending
Account
Value
March 31,
2015 | | | Annualized
Expense Ratio(1)
based on
the period
October 1, 2014–
March 31, 2015 | | Expenses Paid
During Period(2)
October 1, 2014–
March 31, 2015 | |
| SERVICE SHARES (Continued) | | | | | | | | | | | | | | | | | | | | | |
| GuidePath® Fixed Income | | Actual | | | $ | 1,000.00 | | | $ | 1,018.40 | | | | 1.01% | | | $ | 5.08 | | |
| Allocation Fund | | Hypothetical(3) | | | $ | 1,000.00 | | | $ | 1,019.90 | | | | 1.01% | | | $ | 5.09 | | |
| GuidePath® Altegris® Diversified | | Actual | | | $ | 1,000.00 | | | $ | 1,055.60 | | | | 0.52% | | | $ | 2.66 | | |
| Alternatives Allocation Fund | | Hypothetical(3) | | | $ | 1,000.00 | | | $ | 1,022.34 | | | | 0.52% | | | $ | 2.62 | | |
| | | | | | | | | | | | | | | | | | | | | | |
| (1) | The expense ratio excludes the securities lending credit. |
| | |
| (2) | Expenses are equal to the Fund’s annualized expense ratio, multiplied by the average account value over the period, multiplied by 182/365 to reflect the one-half year period. |
| | |
| (3) | 5% return before expenses. |
| | |
| (4) | Excluding voluntary waiver. |
GuideMark® Large Cap Growth Fund
SCHEDULE OF INVESTMENTS
March 31, 2015
| Number of | | | | | | |
| Shares | | | | | Value | |
| | | | | COMMON STOCKS - 99.40% | | | | |
| | | | | Aerospace & Defense - 2.73% | | | | |
| | 19,329 | | | Boeing Co. | | $ | 2,900,896 | |
| | 27,978 | | | Honeywell International, Inc. | | | 2,918,385 | |
| | | | | | | | 5,819,281 | |
| | | | | Air Freight & Logistics - 1.21% | | | | |
| | 26,584 | | | United Parcel Service, Inc. - Class B | | | 2,577,053 | |
| | | | | Banks - 0.85% | | | | |
| | 114,396 | | | Bank of America Corp. | | | 1,760,554 | |
| | 1,010 | | | JPMorgan Chase & Co. | | | 61,186 | |
| | | | | | | | 1,821,740 | |
| | | | | Beverages - 2.02% | | | | |
| | 18,504 | | | Anheuser-Busch InBev NV - ADR | | | 2,255,823 | |
| | 14,843 | | | Monster Beverage Corp. (a) | | | 2,054,197 | |
| | | | | | | | 4,310,020 | |
| | | | | Biotechnology - 7.85% | | | | |
| | 22,177 | | | Amgen, Inc. | | | 3,544,993 | |
| | 6,857 | | | Biogen, Inc. (a) | | | 2,895,300 | |
| | 28,752 | | | Celgene Corp. (a) | | | 3,314,531 | |
| | 46,154 | | | Gilead Sciences, Inc. (a) | | | 4,529,092 | |
| | 20,690 | | | Vertex Pharmaceuticals, Inc. (a) | | | 2,440,799 | |
| | | | | | | | 16,724,715 | |
| | | | | Capital Markets - 0.31% | | | | |
| | 13,403 | | | Waddell & Reed Financial, Inc. - Class A | | | 663,985 | |
| | | | | Communications Equipment - 5.32% | | | | |
| | 68,319 | | | Brocade Communications Systems, Inc. | | | 810,605 | |
| | 155,420 | | | Cisco Systems, Inc. | | | 4,277,935 | |
| | 18,352 | | | F5 Networks, Inc. (a) | | | 2,109,379 | |
| | 59,690 | | | QUALCOMM, Inc. | | | 4,138,905 | |
| | | | | | | | 11,336,824 | |
| | | | | Consumer Finance - 0.73% | | | | |
| | 19,820 | | | American Express Co. | | | 1,548,338 | |
| | | | | Diversified Financial Services - 1.41% | | | | |
| | 6,962 | | | Intercontinental Exchange, Inc. | | | 1,624,026 | |
| | 13,299 | | | Moody’s Corp. | | | 1,380,436 | |
| | | | | | | | 3,004,462 | |
| Number of | | | | | | |
| Shares | | | | | Value | |
| | | | | Diversified Telecommunication Services - 1.56% | | | | |
| | 68,171 | | | Verizon Communications, Inc. | | $ | 3,315,156 | |
| | | | | Electrical Equipment - 0.99% | | | | |
| | 29,330 | | | Agilent Technologies, Inc. | | | 1,218,661 | |
| | 7,648 | | | Rockwell Automation, Inc. (b) | | | 887,092 | |
| | | | | | | | 2,105,753 | |
| | | | | Electronic Equipment, Instruments & | | | | |
| | | | | Components - 0.12% | | | | |
| | 6,864 | | | CDW Corp. | | | 255,615 | |
| | | | | Energy Equipment & Services - 0.44% | | | | |
| | 14,671 | | | Baker Hughes, Inc. | | | 932,782 | |
| | | | | Food & Staples Retailing - 3.26% | | | | |
| | 20,544 | | | Costco Wholesale Corp. | | | 3,112,313 | |
| | 31,426 | | | CVS Caremark Corp. | | | 3,243,478 | |
| | 15,912 | | | SYSCO Corp. (b) | | | 600,360 | |
| | | | | | | | 6,956,151 | |
| | | | | Food Products - 1.12% | | | | |
| | 66,111 | | | Mondelez International, Inc. - Class A (b) | | | 2,385,946 | |
| | | | | Health Care Equipment & Supplies - 4.71% | | | | |
| | 16,020 | | | Becton, Dickinson & Co. | | | 2,300,312 | |
| | 14,128 | | | C.R. Bard, Inc. | | | 2,364,321 | |
| | 33,868 | | | Medtronic Plc | | | 2,641,365 | |
| | 7,560 | | | Varian Medical Systems, Inc. (a)(b) | | | 711,321 | |
| | 17,216 | | | Zimmer Holdings, Inc. | | | 2,023,224 | |
| | | | | | | | 10,040,543 | |
| | | | | Health Care Providers & Services - 2.85% | | | | |
| | 32,393 | | | Aetna, Inc. | | | 3,450,826 | |
| | 6,916 | | | Anthem, Inc. | | | 1,067,900 | |
| | 6,849 | | | Cardinal Health, Inc. | | | 618,259 | |
| | 12,434 | | | HCA Holdings, Inc. (a) | | | 935,410 | |
| | | | | | | | 6,072,395 | |
| | | | | Hotels, Restaurants & Leisure - 2.81% | | | | |
| | 2,822 | | | Chipotle Mexican Grill, Inc. (a)(b) | | | 1,835,824 | |
| | 47,521 | | | Hilton Worldwide Holdings, Inc. (a) | | | 1,407,572 | |
| | 24,163 | | | Wyndham Worldwide Corp. | | | 2,186,027 | |
| | 4,413 | | | Wynn Resorts Ltd. | | | 555,508 | |
| | | | | | | | 5,984,931 | |
See notes to financial statements.
GuideMark® Large Cap Growth Fund
SCHEDULE OF INVESTMENTS (Continued)
March 31, 2015
| Number of | | | | | | |
| Shares | | | | | Value | |
| | | | | COMMON STOCKS (Continued) | | | | |
| | | | | Household Durables - 1.35% | | | | |
| | 87,919 | | | Pulte Homes, Inc. | | $ | 1,954,439 | |
| | 4,541 | | | Whirlpool Corp. | | | 917,555 | |
| | | | | | | | 2,871,994 | |
| | | | | Household Products - 0.50% | | | | |
| | 15,465 | | | Colgate-Palmolive Co. | | | 1,072,343 | |
| | | | | Industrial Conglomerates - 0.58% | | | | |
| | 7,503 | | | 3M Co. | | | 1,237,620 | |
| | | | | Insurance - 0.21% | | | | |
| | 8,292 | | | American International Group, Inc. | | | 454,319 | |
| | | | | Internet & Catalog Retail - 3.32% | | | | |
| | 10,697 | | | Amazon.com, Inc. (a) | | | 3,980,354 | |
| | 12,924 | | | Expedia, Inc. | | | 1,216,536 | |
| | 1,615 | | | The Priceline Group, Inc. (a) | | | 1,880,102 | |
| | | | | | | | 7,076,992 | |
| | | | | Internet Software & Services - 5.04% | | | | |
| | 15,200 | | | Alibaba Group Holdings Ltd. - ADR (a) | | | 1,265,248 | |
| | 50,862 | | | Facebook, Inc. - Class A (a) | | | 4,181,619 | |
| | 9,684 | | | Google, Inc. - Class C (a) | | | 5,306,832 | |
| | | | | | | | 10,753,699 | |
| | | | | IT Services - 3.56% | | | | |
| | 3,960 | | | Alliance Data Systems Corp. (a) | | | 1,173,150 | |
| | 12,872 | | | Amdocs Ltd. | | | 700,237 | |
| | 44,625 | | | Paychex, Inc. | | | 2,214,069 | |
| | 53,364 | | | Visa, Inc. - Class A (b) | | | 3,490,539 | |
| | | | | | | | 7,577,995 | |
| | | | | Machinery - 1.56% | | | | |
| | 23,743 | | | Danaher Corp. | | | 2,015,781 | |
| | 13,572 | | | Illinois Tool Works, Inc. (b) | | | 1,318,384 | |
| | | | | | | | 3,334,165 | |
| | | | | Media - 2.10% | | | | |
| | 59,322 | | | Comcast Corp. - Class A (b) | | | 3,349,913 | |
| | 9,941 | | | Discovery Communications, Inc. - Series A (a)(b) | | | 305,785 | |
| | 12,007 | | | Scripps Networks Interactive, Inc. - Class A (b) | | | 823,200 | |
| | | | | | | | 4,478,898 | |
| | | | | Oil & Gas - 0.38% | | | | |
| | 27,460 | | | Cabot Oil & Gas Corp. | | | 810,894 | |
| Number of | | | | | | |
| Shares | | | | | Value | |
| | | | | Personal Products - 0.56% | | | | |
| | 14,423 | | | The Estee Lauder Cos., Inc. - Class A (b) | | $ | 1,199,417 | |
| | | | | Pharmaceuticals - 5.43% | | | | |
| | 3,902 | | | Actavis Plc (a) | | | 1,161,313 | |
| | 19,293 | | | AstraZeneca Plc - ADR | | | 1,320,220 | |
| | 36,577 | | | Bristol-Myers Squibb Co. | | | 2,359,217 | |
| | 38,691 | | | Eli Lilly & Co. | | | 2,810,901 | |
| | 20,499 | | | Johnson & Johnson | | | 2,062,199 | |
| | 32,195 | | | Merck & Co., Inc. | | | 1,850,569 | |
| | | | | | | | 11,564,419 | |
| | | | | Semiconductor & Semiconductor
Equipment - 6.59% | | | | |
| | 96,789 | | | Altera Corp. | | | 4,153,216 | |
| | 51,425 | | | Broadcom Corp. - Class A | | | 2,226,445 | |
| | 35,551 | | | Linear Technology Corp. (b) | | | 1,663,787 | |
| | 36,754 | | | Marvell Technology Group Ltd. - ADR | | | 540,284 | |
| | 62,723 | | | Maxim Integrated Products, Inc. | | | 2,183,388 | |
| | 22,867 | | | Microchip Technology, Inc. (b) | | | 1,118,196 | |
| | 16,638 | | | Skyworks Solutions, Inc. | | | 1,635,349 | |
| | 12,241 | | | Xilinx, Inc. (b) | | | 517,794 | |
| | | | | | | | 14,038,459 | |
| | | | | Software - 9.84% | | | | |
| | 54,241 | | | Activision Blizzard, Inc. | | | 1,232,627 | |
| | 30,586 | | | Check Point Software Technologies Ltd. (a)(b) | | | 2,507,134 | |
| | 2,812 | | | FactSet Research Systems, Inc. | | | 447,670 | |
| | 27,601 | | | Intuit, Inc. | | | 2,676,193 | |
| | 160,302 | | | Microsoft Corp. | | | 6,517,078 | |
| | 176,086 | | | Oracle Corp. | | | 7,598,111 | |
| | | | | | | | 20,978,813 | |
| | | | | Specialty Retail - 8.29% | | | | |
| | 9,761 | | | Advance Auto Parts, Inc. | | | 1,461,124 | |
| | 44,545 | | | Home Depot, Inc. | | | 5,060,757 | |
| | 40,125 | | | Lowe’s Companies, Inc. | | | 2,984,899 | |
| | 12,368 | | | O’Reilly Automotive, Inc. (a) | | | 2,674,456 | |
| | 10,045 | | | Sherwin-Williams Co. | | | 2,857,803 | |
| | 37,703 | | | The TJX Companies, Inc. | | | 2,641,095 | |
| | | | | | | | 17,680,134 | |
See notes to financial statements.
GuideMark® Large Cap Growth Fund
SCHEDULE OF INVESTMENTS (Continued)
March 31, 2015
| Number of | | | | | | |
| Shares | | | | | Value | |
| | | | | COMMON STOCKS (Continued) | | | | |
| | | | | Technology Hardware, Storage &
Peripherals - 9.80% | | | | |
| | 132,399 | | | Apple, Inc. | | $ | 16,474,408 | |
| | 58,870 | | | NetApp, Inc. (b) | | | 2,087,530 | |
| | 6,231 | | | SanDisk Corp. | | | 396,416 | |
| | 21,146 | | | Western Digital Corp. | | | 1,924,497 | |
| | | | | | | | 20,882,851 | |
| | | | | Total Common Stocks
(Cost $154,504,994) | | | 211,868,702 | |
| | | | | REAL ESTATE INVESTMENT TRUSTS - 0.76% | | | | |
| | | | | Real Estate Investment Trusts - 0.76% | | | | |
| | 8,212 | | | Public Storage | | | 1,618,914 | |
| | | | | Total Real Estate Investment Trusts
(Cost $1,520,740) | | | 1,618,914 | |
| Number of | | | | | | |
| Shares | | | | | Value | |
| | | | | INVESTMENTS PURCHASED AS SECURITIES LENDING COLLATERAL - 5.02% | | | | |
| | | | | Money Market Funds - 5.02% | | | | |
| | 10,704,466 | | | Mount Vernon Prime Portfolio
Effective Yield, 0.22% | | $ | 10,704,466 | |
| | | | | Total Investments Purchased as Securities Lending Collateral
(Cost $10,704,466) | | | 10,704,466 | |
| | | | | Total Investments
(Cost $166,730,200) - 105.18% | | | 224,192,082 | |
| | | | | Liabilities in Excess of Other Assets - (5.18)% | | | (11,047,766 | ) |
| | | | | TOTAL NET ASSETS - 100.00% | | $ | 213,144,316 | |
Percentages are stated as a percent of net assets.
ADR - American Depositary Receipt
(a) Non-income producing security.
(b) All or portion of this security is on loan.
See notes to financial statements.
GuideMark® Large Cap Value Fund
SCHEDULE OF INVESTMENTS
March 31, 2015
Number of
Shares | | | | | Value | |
| | | | | COMMON STOCKS - 97.09% | | | | |
| | | | | Aerospace & Defense - 5.80% | | | | |
| | 17,700 | | | General Dynamics Corp. | | $ | 2,402,421 | |
| | 22,600 | | | Honeywell International, Inc. | | | 2,357,406 | |
| | 20,000 | | | Raytheon Co. | | | 2,185,000 | |
| | 31,500 | | | Rolls Royce Holdings Plc - ADR | | | 2,223,900 | |
| | 70,600 | | | Spirit AeroSystems Holdings, Inc. - Class A (a) | | | 3,686,026 | |
| | | | | | | | 12,854,753 | |
| | | | | Auto Components - 3.58% | | | | |
| | 51,900 | | | Delphi Automotive Plc | | | 4,138,506 | |
| | 75,300 | | | Johnson Controls, Inc. | | | 3,798,132 | |
| | | | | | | | 7,936,638 | |
| | | | | Banks - 11.50% | | | | |
| | 271,800 | | | Bank of America Corp. | | | 4,183,002 | |
| | 102,480 | | | Citigroup, Inc. | | | 5,279,770 | |
| | 141,100 | | | Fifth Third Bancorp | | | 2,659,735 | |
| | 61,600 | | | First Niagara Financial Group, Inc. | | | 544,544 | |
| | 74,800 | | | JPMorgan Chase & Co. | | | 4,531,384 | |
| | 37,900 | | | PNC Financial Services Group, Inc. | | | 3,533,796 | |
| | 88,000 | | | Wells Fargo & Co. | | | 4,787,200 | |
| | | | | | | | 25,519,431 | |
| | | | | Building Products - 1.79% | | | | |
| | 91,300 | | | Owens Corning, Inc. | | | 3,962,420 | |
| | | | | Capital Markets - 3.85% | | | | |
| | 28,700 | | | Ameriprise Financial, Inc. | | | 3,755,108 | |
| | 48,800 | | | E*TRADE Financial Corp. (a)(b) | | | 1,393,484 | |
| | 46,000 | | | State Street Corp. | | | 3,382,380 | |
| | | | | | | | 8,530,972 | |
| | | | | Chemicals - 1.17% | | | | |
| | 45,500 | | | FMC Corp. (b) | | | 2,604,875 | |
| | | | | Communications Equipment - 1.49% | | | | |
| | 47,800 | | | QUALCOMM, Inc. | | | 3,314,452 | |
| | | | | Construction & Engineering - 0.67% | | | | |
| | 102,300 | | | KBR, Inc. | | | 1,481,304 | |
| | | | | Construction Materials - 1.55% | | | | |
| | 131,500 | | | CRH Plc - ADR | | | 3,443,985 | |
Number of
Shares | | | | | Value | |
| | | | | Consumer Finance - 7.80% | | | | |
| | 42,100 | | | American Express Co. | | $ | 3,288,852 | |
| | 62,400 | | | Capital One Financial Corp. | | | 4,918,368 | |
| | 45,900 | | | Discover Financial Services | | | 2,586,465 | |
| | 186,400 | | | Navient Corp. | | | 3,789,512 | |
| | 293,900 | | | SLM Corp. (a) | | | 2,727,392 | |
| | | | | | | | 17,310,589 | |
| | | | | Diversified Telecommunication Services - 1.07% | | | | |
| | 48,970 | | | Verizon Communications, Inc. | | | 2,381,411 | |
| | | | | Electrical Equipment - 2.24% | | | | |
| | 41,400 | | | Eaton Corp. Plc | | | 2,812,716 | |
| | 38,000 | | | Emerson Electric Co. | | | 2,151,560 | |
| | | | | | | | 4,964,276 | |
| | | | | Energy Equipment & Services - 0.65% | | | | |
| | 101,900 | | | FMSA Holdings, Inc. (a)(b) | | | 737,756 | |
| | 75,200 | | | Seadrill Ltd. (b) | | | 703,120 | |
| | | | | | | | 1,440,876 | |
| | | | | Food & Staples Retailing - 2.37% | | | | |
| | 17,400 | | | CVS Caremark Corp. | | | 1,795,854 | |
| | 42,100 | | | Wal-Mart Stores, Inc. | | | 3,462,725 | |
| | | | | | | | 5,258,579 | |
| | | | | Health Care Equipment & Supplies - 2.12% | | | | |
| | 60,400 | | | Medtronic Plc | | | 4,710,596 | |
| | | | | Health Care Providers & Services - 7.25% | | | | |
| | 15,100 | | | Anthem, Inc. | | | 2,331,591 | |
| | 43,600 | | | Cardinal Health, Inc. | | | 3,935,772 | |
| | 22,500 | | | CIGNA Corp. | | | 2,912,400 | |
| | 49,600 | | | Omnicare, Inc. (b) | | | 3,822,176 | |
| | 26,100 | | | UnitedHealth Group, Inc. | | | 3,087,369 | |
| | | | | | | | 16,089,308 | |
| | | | | Hotels, Restaurants & Leisure - 5.48% | | | | |
| | 87,600 | | | Carnival Corp. - ADR | | | 4,190,784 | |
| | 32,200 | | | Norwegian Cruise Line Holdings Ltd. (a) | | | 1,739,122 | |
| | 39,200 | | | Royal Caribbean Cruises Ltd. | | | 3,208,520 | |
| | 156,900 | | | SeaWorld Entertainment, Inc. | | | 3,025,032 | |
| | | | | | | | 12,163,458 | |
| | | | | Household Durables - 1.58% | | | | |
| | 2,637 | | | NVR, Inc. (a) | | | 3,503,677 | |
See notes to financial statements.
GuideMark® Large Cap Value Fund
SCHEDULE OF INVESTMENTS (Continued)
March 31, 2015
Number of
Shares | | | | | Value | |
| | | | | COMMON STOCKS (Continued) | | | | |
| | | | | Insurance - 1.27% | | | | |
| | 51,600 | | | American International Group, Inc. | | $ | 2,827,164 | |
| | | | | Machinery - 3.37% | | | | |
| | 51,400 | | | Joy Global, Inc. (b) | | | 2,013,852 | |
| | 23,400 | | | SPX Corp. | | | 1,986,660 | |
| | 36,500 | | | Stanley Black & Decker, Inc. (b) | | | 3,480,640 | |
| | | | | | | | 7,481,152 | |
| | | | | Multiline Retail - 1.51% | | | | |
| | 40,677 | | | Target Corp. | | | 3,338,361 | |
| | | | | Oil & Gas - 3.48% | | | | |
| | 55,700 | | | BP Plc - ADR | | | 2,178,427 | |
| | 27,500 | | | ConocoPhillips | | | 1,712,150 | |
| | 20,800 | | | Occidental Petroleum Corp. | | | 1,518,400 | |
| | 29,300 | | | Phillips 66 | | | 2,302,980 | |
| | | | | | | | 7,711,957 | |
| | | | | Pharmaceuticals - 7.00% | | | | |
| | 27,200 | | | Johnson & Johnson | | | 2,736,320 | |
| | 43,700 | | | Merck & Co., Inc. | | | 2,511,876 | |
| | 89,200 | | | Pfizer, Inc. | | | 3,103,268 | |
| | 71,400 | | | Sanofi Aventis - ADR | | | 3,530,016 | |
| | 58,600 | | | Teva Pharmaceutical Industries Ltd. - ADR | | | 3,650,780 | |
| | | | | | | | 15,532,260 | |
| | | | | Semiconductor & Semiconductor Equipment - 5.60% | | | | |
| | 184,300 | | | Fairchild Semiconductor International, Inc. (a) | | | 3,350,574 | |
| | 57,200 | | | Intel Corp. | | | 1,788,644 | |
| | 66,300 | | | Microchip Technology, Inc. (b) | | | 3,242,070 | |
| | 70,600 | | | Texas Instruments, Inc. | | | 4,037,261 | |
| | | | | | | | 12,418,549 | |
| | | | | Software - 3.67% | | | | |
| | 51,200 | | | CA, Inc. (b) | | | 1,669,632 | |
| | 79,800 | | | Microsoft Corp. | | | 3,244,269 | |
| | 74,800 | | | Oracle Corp. | | | 3,227,620 | |
| | | | | | | | 8,141,521 | |
Number of
Shares | | | | | Value | |
| | | | | Textiles, Apparel & Luxury Goods - 1.91% | |
| | 126,700 | | | Hanesbrands, Inc. | | $ | 4,245,717 | |
| | | | | Thrifts & Mortgage Finance - 2.39% | |
| | 145,000 | | | New York Community Bancorp, Inc. (b) | | | 2,425,850 | |
| | 188,600 | | | People’s United Financial, Inc. (b) | | | 2,866,720 | |
| | | | | | | | 5,292,570 | |
| | | | | Tobacco - 4.22% | | | | |
| | 79,100 | | | Altria Group, Inc. | | | 3,956,582 | |
| | 41,400 | | | Lorillard, Inc. | | | 2,705,490 | |
| | 35,700 | | | Philip Morris International, Inc. | | | 2,689,281 | |
| | | | | | | | 9,351,353 | |
| | | | | Wireless Telecommunication Services - 0.71% | |
| | 48,018 | | | Vodafone Group Plc - ADR | | | 1,569,228 | |
| | | | | Total Common Stocks
(Cost $153,192,303) | | | 215,381,432 | |
| | | | | INVESTMENTS PURCHASED AS SECURITIES LENDING COLLATERAL - 5.67% | | | | |
| | | | | Money Market Funds - 5.67% | | | | |
| | 12,589,606 | | | Mount Vernon Prime Portfolio
Effective Yield, 0.22% | | | 12,589,606 | |
| | | | | Total Investments Purchased as Securities Lending Collateral
(Cost $12,589,606) | | | 12,589,606 | |
| | | | | Total Investments
(Cost $165,781,909) - 102.76% | | | 227,971,038 | |
| | | | | Liabilities in Excess of Other Assets - (2.76)% | | | (6,131,246 | ) |
| | | | | TOTAL NET ASSETS - 100.00% | | $ | 221,839,792 | |
Percentages are stated as a percent of net assets.
ADR - American Depositary Receipt
(a) Non-income producing security.
(b) All or portion of this security is on loan.
See notes to financial statements.
GuideMark® Small/Mid Cap Core Fund
SCHEDULE OF INVESTMENTS
March 31, 2015
Number of
Shares | | | | | Value | |
| | | | | COMMON STOCKS - 90.07% | | | | |
| | | | | Aerospace & Defense - 2.37% | | | | |
| | 3,970 | | | Curtiss Wright Corp. | | $ | 293,542 | |
| | 5,878 | | | DigitalGlobe, Inc. (a) | | | 200,263 | |
| | 2,560 | | | Esterline Technologies Corp. (a) | | | 292,915 | |
| | 6,435 | | | HEICO Corp. - Class A | | | 318,790 | |
| | 3,750 | | | Moog, Inc. - Class A (a) | | | 281,438 | |
| | 4,345 | | | Teledyne Technologies, Inc. (a) | | | 463,742 | |
| | | | | | | | 1,850,690 | |
| | | | | Air Freight & Logistics - 0.17% | | | | |
| | 695 | | | Hub Group, Inc. - Class A (a) | | | 27,307 | |
| | 2,250 | | | XPO Logistics, Inc. (a)(b) | | | 102,307 | |
| | | | | | | | 129,614 | |
| | | | | Airlines - 0.32% | | | | |
| | 13,045 | | | JetBlue Airways Corp. (a) | | | 251,116 | |
| | | | | Banks - 7.34% | | | | |
| | 6,570 | | | BOK Financial Corp. (b) | | | 402,215 | |
| | 13,580 | | | Boston Private Financial Holdings, Inc. | | | 164,997 | |
| | 21,200 | | | Cascade Bancorp (a) | | | 101,760 | |
| | 23,800 | | | CoBiz Financial, Inc. | | | 293,216 | |
| | 60,481 | | | First Busey Corp. | | | 404,618 | |
| | 7,155 | | | IBERIABANK Corp. | | | 450,980 | |
| | 11,245 | | | International Bancshares Corp. | | | 292,707 | |
| | 44,413 | | | Lakeland Bancorp, Inc. | | | 510,750 | |
| | 16,300 | | | Metro Bancorp, Inc. | | | 449,391 | |
| | 1,900 | | | National Commerce Corp. (a) | | | 41,705 | |
| | 14,365 | | | PacWest Bancorp (b) | | | 673,575 | |
| | 5,400 | | | Peapack-Gladstone Financial Corp. | | | 116,640 | |
| | 9,485 | | | South State Corp. | | | 648,679 | |
| | 13,162 | | | TriCo Bancshares | | | 317,599 | |
| | 26,350 | | | United Community Banks, Inc. | | | 497,488 | |
| | 555 | | | Wintrust Financial Corp. (b) | | | 26,462 | |
| | 12,525 | | | Zions Bancorporation | | | 338,175 | |
| | | | | | | | 5,730,957 | |
| | | | | Beverages - 0.18% | | | | |
| | 15,415 | | | Cott Corp. | | | 144,439 | |
| | | | | Biotechnology - 5.11% | | | | |
| | 10,806 | | | Achillion Pharmaceuticals, Inc. (a)(b) | | | 106,547 | |
| | 10,065 | | | Affimed Therapeutics B.V. (a) | | | 63,409 | |
| | 1,720 | | | Agios Pharmaceuticals, Inc. (a)(b) | | | 162,196 | |
Number of
Shares | | | | | Value | |
| | | | | Biotechnology (Continued) | | | | |
| | 4,115 | | | Alkermes Plc (a) | | $ | 250,891 | |
| | 2,530 | | | Alnylam Pharmaceuticals, Inc. (a) | | | 264,183 | |
| | 2,196 | | | Anacor Pharmaceuticals, Inc. (a) | | | 127,039 | |
| | 19,400 | | | BioCryst Pharmaceuticals, Inc. (a)(b) | | | 175,182 | |
| | 6,740 | | | Cepheid, Inc. (a) | | | 383,506 | |
| | 7,700 | | | Dicerna Pharmaceuticals, Inc. (a) | | | 185,031 | |
| | 2,120 | | | Epizyme, Inc. (a)(b) | | | 39,814 | |
| | 4,935 | | | Five Prime Therapeutics, Inc. (a) | | | 112,765 | |
| | 9,055 | | | Foundation Medicine, Inc. (a) | | | 435,636 | |
| | 9,230 | | | GlycoMimetics, Inc. (a) | | | 76,794 | |
| | 2,920 | | | Incyte Corp. (a) | | | 267,647 | |
| | 900 | | | Invitae Corp. (a) | | | 15,084 | |
| | 5,295 | | | Ironwood Pharmaceuticals, Inc. - Class A (a) | | | 84,720 | |
| | 17,060 | | | Novavax, Inc. (a)(b) | | | 141,086 | |
| | 3,373 | | | Otonomy, Inc. (a)(b) | | | 119,269 | |
| | 4,210 | | | Portola Pharmaceuticals, Inc. (a) | | | 159,812 | |
| | 1,940 | | | PTC Therapeutics, Inc. (a) | | | 118,049 | |
| | 345 | | | Puma Biotechnology, Inc. (a)(b) | | | 81,458 | |
| | 7,165 | | | Regulus Therapeutics, Inc. (a)(b) | | | 121,375 | |
| | 880 | | | Synageva BioPharma Corp. (a)(b) | | | 85,826 | |
| | 4,670 | | | TESARO, Inc. (a)(b) | | | 268,058 | |
| | 9,700 | | | Trevena, Inc. (a) | | | 63,244 | |
| | 1,300 | | | Ultragenyx Pharmaceutical, Inc. (a) | | | 80,717 | |
| | | | | | | | 3,989,338 | |
| | | | | Building Products - 2.48% | | | | |
| | 3,945 | | | A. O. Smith Corp. | | | 259,029 | |
| | 7,900 | | | Advanced Drain Systems, Inc. (b) | | | 236,526 | |
| | 5,590 | | | Masonite International Corp. (a) | | | 375,983 | |
| | 8,830 | | | NCI Building Systems, Inc. (a) | | | 152,582 | |
| | 21,087 | | | Owens Corning, Inc. | | | 915,176 | |
| | | | | | | | 1,939,296 | |
| | | | | Capital Markets - 1.43% | | | | |
| | 10,710 | | | Janus Capital Group, Inc. (b) | | | 184,105 | |
| | 4,870 | | | Lazard Ltd. - Class A - ADR (b) | | | 256,113 | |
| | 3,935 | | | Legg Mason, Inc. | | | 217,212 | |
| | 3,660 | | | Raymond James Financial, Inc. | | | 207,815 | |
| | 11,875 | | | WisdomTree Investments, Inc. | | | 254,838 | |
| | | | | | | | 1,120,083 | |
See notes to financial statements.
GuideMark® Small/Mid Cap Core Fund
SCHEDULE OF INVESTMENTS (Continued)
March 31, 2015
Number of
Shares | | | | | Value | |
| | | | | COMMON STOCKS (Continued) | | | | |
| | | | | Chemicals - 1.39% | | | | |
| | 8,200 | | | Advanced Emissions Solutions, Inc. (a) | | $ | 140,220 | |
| | 9,295 | | | Cabot Corp. | | | 418,275 | |
| | 9,385 | | | Celanese Corp. - Series A | | | 524,246 | |
| | | | | | | | 1,082,741 | |
| | | | | Commercial Services & Supplies - 1.14% | |
| | 13,930 | | | Clean Harbors, Inc. (a)(b) | | | 790,945 | |
| | 8,510 | | | Heritage-Crystal Clean, Inc. (a) | | | 99,567 | |
| | | | | | | | 890,512 | |
| | | | | Communications Equipment - 1.88% | |
| | 8,700 | | | Arista Networks, Inc. (a) | | | 613,611 | |
| | 4,380 | | | ARRIS Group, Inc. (a) | | | 126,560 | |
| | 23,440 | | | Ciena Corp. (a) | | | 452,626 | |
| | 35,242 | | | Sonus Networks, Inc. (a) | | | 277,707 | |
| | | | | | | | 1,470,504 | |
| | | | | Computers & Peripherals - 0.08% | | | | |
| | 4,300 | | | QLogic Corp. (a) | | | 63,382 | |
| | | | | Construction & Engineering - 0.32% | | | | |
| | 8,182 | | | AECOM Technology Corp. (a)(b) | | | 252,169 | |
| | | | | Construction Materials - 1.57% | | | | |
| | 2,620 | | | Eagle Materials, Inc. | | | 218,927 | |
| | 24,972 | | | Headwaters, Inc. (a) | | | 457,986 | |
| | 2,661 | | | Martin Marietta Materials, Inc. | | | 372,008 | |
| | 7,830 | | | Summit Materials, Inc. - Class A (a) | | | 173,435 | |
| | | | | | | | 1,222,356 | |
| | | | | Containers & Packaging - 3.11% | | | | |
| | 6,270 | | | Ball Corp. | | | 442,913 | |
| | 10,735 | | | Crown Holdings, Inc. (a) | | | 579,905 | |
| | 63,745 | | | Graphic Packaging Holding Co. | | | 926,852 | |
| | 12,730 | | | Owens-Illinois, Inc. (a) | | | 296,864 | |
| | 2,290 | | | Packaging Corp. of America | | | 179,055 | |
| | | | | | | | 2,425,589 | |
| | | | | Diversified Financial Services - 0.33% | |
| | 4,150 | | | MSCI, Inc. | | | 254,437 | |
| | | | | Electric Utilities - 2.48% | | | | |
| | 6,795 | | | IDACORP, Inc. | | | 427,202 | |
| | 6,210 | | | NRG Yield, Inc. - Class A (b) | | | 315,033 | |
| | 17,330 | | | OGE Energy Corp. | | | 547,801 | |
Number of
Shares | | | | | Value | |
| | | | | Electric Utilities (Continued) | | | | |
| | 6,385 | | | Pinnacle West Capital Corp. | | $ | 407,044 | |
| | 4,660 | | | UIL Holdings Corp. | | | 239,617 | |
| | | | | | | | 1,936,697 | |
| | | | | Electrical Equipment - 2.00% | | | | |
| | 2,886 | | | Acuity Brands, Inc. | | | 485,310 | |
| | 13,773 | | | Generac Holdings, Inc. (a)(b) | | | 670,607 | |
| | 3,700 | | | Hubbell, Inc. - Class B | | | 405,594 | |
| | | | | | | | 1,561,511 | |
| | | | | Electronic Equipment & Instruments - 0.86% | |
| | 8,135 | | | Rogers Corp. (a) | | | 668,778 | |
| | | | | Energy Equipment & Services - 1.58% | |
| | 31,575 | | | Aspen Aerogels, Inc. (a) | | | 229,866 | |
| | 35,010 | | | Patterson-UTI Energy, Inc. | | | 657,313 | |
| | 5,745 | | | RPC, Inc. | | | 73,593 | |
| | 23,875 | | | Tesco Corp. | | | 271,459 | |
| | | | | | | | 1,232,231 | |
| | | | | Food & Staples Retailing - 0.15% | | | | |
| | 3,345 | | | Diplomat Pharmacy, Inc. (a) | | | 115,670 | |
| | | | | Food Products - 1.96% | | | | |
| | 9,990 | | | Freshpet, Inc. (a)(b) | | | 194,106 | |
| | 13,087 | | | Post Holdings, Inc. (a)(b) | | | 612,995 | |
| | 18,970 | | | SunOpta, Inc. (a) | | | 201,461 | |
| | 6,172 | | | TreeHouse Foods, Inc. (a) | | | 524,744 | |
| | | | | | | | 1,533,306 | |
| | | | | Gas Utilities - 0.28% | | | | |
| | 3,750 | | | Southwest Gas Corp. | | | 218,138 | |
| | | | | Health Care Equipment & Supplies - 2.80% | |
| | 18,895 | | | AtriCure, Inc. (a)(b) | | | 387,159 | |
| | 11,250 | | | Endologix, Inc. (a)(b) | | | 192,037 | |
| | 13,760 | | | Globus Medical, Inc. - Class A (a)(b) | | | 347,302 | |
| | 4,700 | | | HeartWare International, Inc. (a)(b) | | | 412,519 | |
| | 5,010 | | | Ocular Therapeutix, Inc. (a) | | | 210,345 | |
| | 17,370 | | | Quidel Corp. (a) | | | 468,643 | |
| | 16,115 | | | TriVascular Technologies, Inc. (a)(b) | | | 169,046 | |
| | | | | | | | 2,187,051 | |
See notes to financial statements.
GuideMark® Small/Mid Cap Core Fund
SCHEDULE OF INVESTMENTS (Continued)
March 31, 2015
Number of
Shares | | | | | Value | |
| | | | | COMMON STOCKS (Continued) | | | |
| | | | | Health Care Providers & Services - 2.15% |
| | 6,033 | | | Acadia Healthcare Co., Inc. (a)(b) | | $ | 431,963 | |
| | 17,425 | | | Envision Healthcare Holdings, Inc. (a) | | | 668,249 | |
| | 6,119 | | | LifePoint Hospitals, Inc. (a) | | | 449,440 | |
| | 1,380 | | | WellCare Health Plans, Inc. (a) | | | 126,215 | |
| | | | | | | | 1,675,867 | |
| | | | | Health Care Technology - 1.49% |
| | 11,237 | | | Allscripts Healthcare Solutions, Inc. (a) | | | 134,395 | |
| | 4,780 | | | athenahealth, Inc. (a)(b) | | | 570,684 | |
| | 10,100 | | | Castlight Health, Inc. - Class B (a)(b) | | | 78,376 | |
| | 14,059 | | | IMS Health Holdings, Inc. (a) | | | 380,577 | |
| | | | | | | | 1,164,032 | |
| | | | | Hotels, Restaurants & Leisure - 2.36% |
| | 1,135 | | | Buffalo Wild Wings, Inc. (a)(b) | | | 205,707 | |
| | 5,044 | | | Cheesecake Factory, Inc. | | | 248,821 | |
| | 1,635 | | | Churchill Downs, Inc. (b) | | | 187,976 | |
| | 1,500 | | | DineEquity, Inc. | | | 160,515 | |
| | 5,382 | | | Dunkin’ Brands Group, Inc. | | | 255,968 | |
| | 4,030 | | | El Pollo Loco Holdings, Inc. (a)(b) | | | 103,208 | |
| | 5,250 | | | Monarch Casino & Resort, Inc. (a) | | | 100,485 | |
| | 9,170 | | | Norwegian Cruise Line Holdings Ltd. (a) | | | 495,272 | |
| | 1,354 | | | Papa John’s International, Inc. (b) | | | 83,691 | |
| | | | | | | | 1,841,643 | |
| | | | | Household Durables - 1.68% |
| | 17,785 | | | GoPro, Inc. - Class A (a)(b) | | | 772,047 | |
| | 8,355 | | | M/I Homes, Inc. (a) | | | 199,183 | |
| | 6,459 | | | Standard Pacific Corp. (a) | | | 58,131 | |
| | 13,409 | | | Taylor Morrison Home Corp. - Class A (a) | | | 279,578 | |
| | | | | | | | 1,308,939 | |
| | | | | Independent Power and Renewable
Electricity Producers - 0.28% |
| | 1,320 | | | Dynegy, Inc. (a) | | | 41,488 | |
| | 6,160 | | | Pattern Energy Group, Inc. - Class A | | | 174,451 | |
| | | | | | | | 215,939 | |
Number of
Shares | | | | | Value | |
| | | | | Insurance - 4.80% |
| | 12,311 | | | Argo Group International Holdings Ltd. | | $ | 617,397 | |
| | 6,930 | | | Arthur J. Gallagher & Co. | | | 323,977 | |
| | 30,804 | | | Assured Guaranty Ltd. | | | 812,918 | |
| | 8,290 | | | Brown & Brown, Inc. | | | 274,482 | |
| | 7,205 | | | Fidelity & Guaranty Life | | | 152,746 | |
| | 7,935 | | | James River Group Holdings Ltd. | | | 186,710 | |
| | 10,430 | | | Primerica, Inc. | | | 530,887 | |
| | 23,035 | | | XL Group Plc | | | 847,688 | |
| | | | | | | | 3,746,805 | |
| | | | | Internet & Catalog Retail - 1.12% |
| | 18,855 | | | Wayfair, Inc. - Class A (a)(b) | | | 605,622 | |
| | 20,540 | | | Zulily, Inc. - Class A (a) | | | 266,815 | |
| | | | | | | | 872,437 | |
| | | | | Internet Software & Services - 1.42% |
| | 4,995 | | | Benefitfocus, Inc. (a)(b) | | | 183,766 | |
| | 2,190 | | | Envestnet, Inc. (a) | | | 122,815 | |
| | 3,315 | | | GrubHub, Inc. (a) | | | 150,468 | |
| | 11,390 | | | Marketo, Inc. (a)(b) | | | 291,812 | |
| | 3,605 | | | Zillow Group, Inc. - Class A (a)(b) | | | 361,581 | |
| | | | | | | | 1,110,442 | |
| | | | | IT Services - 3.52% |
| | 1,403 | | | CACI International, Inc. - Class A (a) | | | 126,158 | |
| | 5,979 | | | Cardtronics, Inc. (a) | | | 224,810 | |
| | 31,790 | | | Genpact Ltd. (a) | | | 739,118 | |
| | 4,025 | | | Global Payments, Inc. (b) | | | 369,012 | |
| | 6,745 | | | Heartland Payment Systems, Inc. | | | 316,003 | |
| | 8,675 | | | VeriFone Holdings, Inc. (a) | | | 302,671 | |
| | 6,215 | | | WEX, Inc. (a) | | | 667,242 | |
| | | | | | | | 2,745,014 | |
| | | | | Leisure Products - 0.36% |
| | 7,735 | | | Arctic Cat, Inc. | | | 280,935 | |
| | | | | Life Sciences Tools & Services - 1.13% |
| | 2,145 | | | Bio-Techne Corp. (b) | | | 215,122 | |
| | 13,525 | | | PRA Health Sciences, Inc. (a) | | | 390,061 | |
| | 10,735 | | | VWR Corp. (a)(b) | | | 279,003 | |
| | | | | | | | 884,186 | |
See notes to financial statements.
GuideMark® Small/Mid Cap Core Fund
SCHEDULE OF INVESTMENTS (Continued)
March 31, 2015
Number of
Shares | | | | | Value | |
| | | | | COMMON STOCKS (Continued) |
| | | | | Machinery - 1.22% |
| | 5,395 | | | Colfax Corp. (a)(b) | | $ | 257,503 | |
| | 5,065 | | | IDEX Corp. | | | 384,079 | |
| | 9,605 | | | Luxfer Holdings Plc - ADR | | | 128,419 | |
| | 3,260 | | | Watts Water Technologies, Inc. - Class A | | | 179,398 | |
| | | | | | | | 949,399 | |
| | | | | Media - 1.90% |
| | 3,300 | | | DreamWorks Animation SKG, Inc. - Class A (a) | | | 79,860 | |
| | 12,180 | | | IMAX Corp. (a)(b) | | | 410,588 | |
| | 28,520 | | | Interpublic Group of Cos., Inc. | | | 630,862 | |
| | 4,848 | | | Markit Ltd. (a) | | | 130,411 | |
| | 15,425 | | | National CineMedia, Inc. | | | 232,918 | |
| | | | | | | | 1,484,639 | |
| | | | | Metals & Mining - 0.87% |
| | 2,555 | | | Allegheny Technologies, Inc. | | | 76,676 | |
| | 10,875 | | | Commercial Metals Co. | | | 176,066 | |
| | 2,325 | | | Reliance Steel & Aluminum Co. | | | 142,011 | |
| | 14,115 | | | Steel Dynamics, Inc. | | | 283,711 | |
| | | | | | | | 678,464 | |
| | | | | Multi-Utilities - 1.01% |
| | 6,895 | | | Alliant Energy Corp. | | | 434,385 | |
| | 8,355 | | | Ameren Corp. | | | 352,581 | |
| | | | | | | | 786,966 | |
| | | | | Oil & Gas - 2.89% |
| | 20,540 | | | Callon Petroleum Co. (a) | | | 153,434 | |
| | 11,180 | | | CONSOL Energy, Inc. | | | 311,810 | |
| | 5,255 | | | Diamondback Energy, Inc. (a) | | | 403,794 | |
| | 11,205 | | | Eclipse Resources Corp. (a)(b) | | | 62,972 | |
| | 2,740 | | | Energen Corp. | | | 180,840 | |
| | 11,110 | | | Laredo Petroleum, Inc. (a)(b) | | | 144,874 | |
| | 8,660 | | | Memorial Resource Development Corp. (a) | | | 153,628 | |
| | 6,525 | | | QEP Resources, Inc. | | | 136,046 | |
| | 6,000 | | | Rice Energy, Inc. (a) | | | 130,560 | |
| | 5,525 | | | SemGroup Corp. - Class A | | | 449,404 | |
| | 4,115 | | | Whiting Petroleum Corp. (a) | | | 127,154 | |
| | | | | | | | 2,254,516 | |
Number of
Shares | | | | | Value | |
| | | | | Paper & Forest Products - 0.50% |
| | 10,390 | | | Boise Cascade Co. (a) | | $ | 389,209 | |
| | | | | Personal Products - 1.09% |
| | 35,151 | | | Avon Products, Inc. (b) | | | 280,856 | |
| | 11,125 | | | Coty, Inc. - Class A | | | 270,004 | |
| | 5,025 | | | Nu Skin Enterprises, Inc. - Class A (b) | | | 302,555 | |
| | | | | | | | 853,415 | |
| | | | | Pharmaceuticals - 1.00% |
| | 7,761 | | | Aerie Pharmaceuticals, Inc. (a) | | | 243,230 | |
| | 5,365 | | | Prestige Brands Holdings, Inc. (a) | | | 230,105 | |
| | 4,390 | | | Relypsa, Inc. (a)(b) | | | 158,347 | |
| | 4,140 | | | Tetraphase Pharmaceuticals, Inc. (a) | | | 151,690 | |
| | | | | | | | 783,372 | |
| | | | | Professional Services - 3.31% |
| | 5,715 | | | Equifax, Inc. | | | 531,495 | |
| | 7,675 | | | Huron Consulting Group, Inc. (a) | | | 507,701 | |
| | 6,905 | | | ManpowerGroup, Inc. | | | 594,866 | |
| | 8,105 | | | Robert Half International, Inc. | | | 490,515 | |
| | 4,735 | | | TriNet Group, Inc. (a) | | | 166,814 | |
| | 5,530 | | | WageWorks, Inc. (a) | | | 294,915 | |
| | | | | | | | 2,586,306 | |
| | | | | Real Estate Management & Development - 1.26% |
| | 3,490 | | | Jones Lang LaSalle, Inc. | | | 594,696 | |
| | 14,805 | | | Kennedy-Wilson Holdings, Inc. | | | 387,003 | |
| | | | | | | | 981,699 | |
| | | | | Road & Rail - 1.41% |
| | 7,585 | | | Celadon Group, Inc. | | | 206,464 | |
| | 865 | | | Genesee & Wyoming, Inc. - Class A (a) | | | 83,420 | |
| | 1,665 | | | J.B. Hunt Transport Services, Inc. | | | 142,183 | |
| | 1,395 | | | Knight Transportation, Inc. (b) | | | 44,989 | |
| | 5,630 | | | Landstar System, Inc. | | | 373,269 | |
| | 9,705 | | | Swift Transportation Co. - Class A (a) | | | 252,524 | |
| | | | | | | | 1,102,849 | |
See notes to financial statements.
GuideMark® Small/Mid Cap Core Fund
SCHEDULE OF INVESTMENTS (Continued)
March 31, 2015
Number of
Shares | | | | | | Value | |
| | | | | COMMON STOCKS (Continued) |
| | | | | Semiconductor & Semiconductor
Equipment - 4.21% |
| | 15,970 | | | Cypress Semiconductor Corp. | | $ | 225,337 | |
| | 3,415 | | | First Solar, Inc. (a) | | | 204,183 | |
| | 24,400 | | | Freescale Semiconductor Ltd. (a) | | | 994,544 | |
| | 12,935 | | | Lattice Semiconductor Corp. (a) | | | 82,008 | |
| | 4,600 | | | Microsemi Corp. (a) | | | 162,840 | |
| | 13,055 | | | MKS Instrument, Inc. | | | 441,389 | |
| | 6,680 | | | Power Integrations, Inc. | | | 347,894 | |
| | 3,690 | | | Skyworks Solutions, Inc. | | | 362,690 | |
| | 6,400 | | | SunEdison Semiconductor Ltd. (a) | | | 165,248 | |
| | 4,745 | | | SunEdison, Inc. (a)(b) | | | 113,880 | |
| | 2,165 | | | SunPower Corp. (a)(b) | | | 67,786 | |
| | 6,690 | | | Ultratech, Inc. (a) | | | 116,005 | |
| | | | | | | | 3,283,804 | |
| | | | | Software - 1.71% |
| | 425 | | | Cadence Design System, Inc. (a)(b) | | | 7,837 | |
| | 13,795 | | | Fleetmatics Group Plc (a) | | | 618,706 | |
| | 5,000 | | | Globant SA (a) | | | 105,300 | |
| | 5,200 | | | HubSpot, Inc. (a)(b) | | | 207,480 | |
| | 3,860 | | | Imperva, Inc. (a) | | | 164,822 | |
| | 3,735 | | | Verint Systems, Inc. (a) | | | 231,308 | |
| | | | | | | | 1,335,453 | |
| | | | | Specialty Retail - 3.15% |
| | 3,865 | | | Advance Auto Parts, Inc. | | | 578,552 | |
| | 10,355 | | | Chico’s FAS, Inc. | | | 183,180 | |
| | 13,095 | | | CST Brands, Inc. | | | 573,954 | |
| | 9,668 | | | DSW, Inc. - Class A | | | 356,556 | |
| | 5,501 | | | Signet Jewelers Ltd. (b) | | | 763,483 | |
| | | | | | | | 2,455,725 | |
| | | | | Textiles, Apparel & Luxury Goods - 1.48% |
| | 1,835 | | | Carter, Inc. | | | 169,682 | |
| | 9,470 | | | Gildan Activewear, Inc. | | | 279,554 | |
| | 10,245 | | | Hanesbrands, Inc. | | | 343,310 | |
| | 2,670 | | | Skechers U.S.A., Inc. - Class A (a) | | | 192,000 | |
| | 5,032 | | | Tumi Holdings, Inc. (a) | | | 123,083 | |
| | 2,605 | | | Vince Holding Corp. (a) | | | 48,323 | |
| | | | | | | | 1,155,952 | |
Number of
Shares | | | | | | Value | |
| | | | | Trading Companies & Distributors - 0.71% |
| | 7,085 | | | Air Lease Corp. | | $ | 267,388 | |
| | 4,075 | | | WESCO International, Inc. (a)(b) | | | 284,802 | |
| | | | | | | | 552,190 | |
| | | | | Water Utilities - 0.71% |
| | 10,225 | | | American Water Works Co., Inc. | | | 554,297 | |
| | | | | Total Common Stocks
(Cost $61,777,724) | | 70,305,099 | |
| | | | | INVESTMENT COMPANIES - 1.45% |
| | | | | Capital Markets - 0.21% |
| | 16,755 | | | GSV Capital Corp. (a)(b) | | | 164,199 | |
| | | | | Exchange Traded Funds - 1.24% |
| | 7,810 | | | iShares Russell 2000 Index Fund (b) | | | 971,174 | |
| | | | | Total Investment Companies
(Cost $1,115,655) | | 1,135,373 | |
| | | | | REAL ESTATE INVESTMENT TRUSTS - 7.66% |
| | | | | Real Estate Investment Trusts - 7.66% |
| | 930 | | | Alexander’s, Inc. | | | 424,619 | |
| | 10,100 | | | Chatham Lodging Trust | | | 297,041 | |
| | 12,085 | | | CoreSite Realty Corp. | | | 588,298 | |
| | 18,405 | | | Douglas Emmett, Inc. | | | 548,653 | |
| | 11,185 | | | Equity Lifestyle Properties, Inc. | | | 614,616 | |
| | 7,135 | | | Extra Space Storage, Inc. (b) | | | 482,112 | |
| | 4,695 | | | Federal Realty Investment Trust | | | 691,151 | |
| | 1,655 | | | Hannon Armstrong Sustainable Infrastructure Capital, Inc. | | | 30,253 | |
| | 1,300 | | | InfraREIT, Inc. | | | 37,167 | |
| | 13,380 | | | Kite Realty Group Trust | | | 376,915 | |
| | 19,325 | | | Paramount Group, Inc. (b) | | | 372,972 | |
| | 13,335 | | | Pebblebrook Hotel Trust | | | 621,011 | |
| | 26,255 | | | Physicians Realty Trust | | | 462,351 | |
| | 3,345 | | | SL Green Realty Corp. | | | 429,431 | |
| | | | | Total Real Estate Investment Trusts
(Cost $4,595,980) | | 5,976,590 | |
| | | | | SHORT TERM INVESTMENTS - 0.43% |
| | | | | Money Market Funds - 0.43% |
| | 332,483 | | | Federated Prime Obligations Fund Effective
Yield, 0.05% | | | 332,483 | |
| | | | | Total Short Term Investments
(Cost $332,483) | | 332,483 | |
See notes to financial statements.
GuideMark® Small/Mid Cap Core Fund
SCHEDULE OF INVESTMENTS (Continued)
March 31, 2015
Number of
Shares | | | | | Value | |
| | | | | INVESTMENTS PURCHASED AS
SECURITIES LENDING
COLLATERAL - 15.30% |
| | | | | Money Market Funds - 15.30% |
| | 11,945,175 | | | Mount Vernon Prime Portfolio
Effective Yield, 0.22% | | $ | 11,945,175 | |
| | | | | Total Investments Purchased as Securities Lending Collateral
(Cost $11,945,175) | | 11,945,175 | |
| | | | | Total Investments
(Cost $79,767,017) - 114.91% | | 89,694,720 | |
| | | | | Liabilities in Excess of Other Assets - (14.91)% | | (11,640,679 | ) |
| | | | | TOTAL NET ASSETS - 100.00% | $ | 78,054,041 | |
Percentages are stated as a percent of net assets.
ADR - American Depositary Receipt
(a) Non-income producing security.
(b) All or portion of this security is on loan.
See notes to financial statements.
GuideMark® World ex-US Fund
SCHEDULE OF INVESTMENTS
March 31, 2015
| Number of | | | | | | |
| Shares | | | | | Value | |
| | | | | COMMON STOCKS - 93.71% | | | | |
| | | | | Australia - 3.80% | | | | |
| | 173,992 | | | AMP Limited | | $ | 849,229 | |
| | 30,606 | | | Ansell Ltd. | | | 640,674 | |
| | 106,437 | | | Australia and New Zealand Banking Group Ltd. | | | 2,961,095 | |
| | 20,190 | | | BHP Billiton, Ltd. | | | 469,297 | |
| | 23,449 | | | Commonwealth Bank of Australia | | | 1,663,252 | |
| | 21,033 | | | Flight Centre Travel Group Ltd. | | | 633,044 | |
| | 103,275 | | | Incitec Pivot Ltd. | | | 318,990 | |
| | 54,103 | | | Lend Lease Group | | | 683,352 | |
| | 32,173 | | | Macquarie Group Ltd. | | | 1,870,100 | |
| | 34,904 | | | Oil Search Ltd. | | | 190,443 | |
| | 48,362 | | | Seek Ltd. | | | 627,049 | |
| | 333,244 | | | Telstra Corp. Ltd. | | | 1,599,723 | |
| | 18,541 | | | Woodside Petroleum Ltd. | | | 485,754 | |
| | | | | | | | 12,992,002 | |
| | | | | Austria - 0.16% | | | | |
| | 9,200 | | | Andritz AG | | | 549,303 | |
| | | | | Belgium - 1.27% | | | | |
| | 25,434 | | | Anheuser-Busch InBev SA | | | 3,107,142 | |
| | 14,692 | | | KBC Groep NV | | | 907,996 | |
| | 4,489 | | | UCB SA | | | 324,289 | |
| | | | | | | | 4,339,427 | |
| | | | | Brazil - 0.96% | | | | |
| | 97,800 | | | Ambev SA | | | 565,065 | |
| | 45,700 | | | BB Seguridade Participacoes SA | | | 468,377 | |
| | 29,000 | | | CETIP SA | | | 289,405 | |
| | 24,700 | | | Cielo SA | | | 353,603 | |
| | 76,600 | | | Cosan SA Industria e Comercio | | | 665,304 | |
| | 19,400 | | | Natura Cosmeticos SA | | | 164,911 | |
| | 33,700 | | | Smiles SA | | | 530,596 | |
| | 26,230 | | | WEG SA | | | 262,748 | |
| | | | | | | | 3,300,009 | |
| | | | | Canada - 7.02% | | | | |
| | 6,200 | | | Agrium, Inc. | | | 646,165 | |
| | 18,700 | | | Alimentation Couche-Tard, Inc. | | | 745,165 | |
| | 21,600 | | | Brookfield Asset Management, Inc. - Class A | | | 1,155,252 | |
| | 34,200 | | | Canadian Natural Resources Ltd. | | | 1,048,237 | |
| | 5,600 | | | Canadian Pacific Railway Ltd. | | | 1,025,337 | |
| | 13,000 | | | Catamaran Corp. (a) | | | 773,913 | |
| | 1,600 | | | Constellation Software, Inc. | | | 553,011 | |
| Number of | | | | | | |
| Shares | | | | | Value | |
| | | | | Canada (Continued) | | | | |
| | 7,000 | | | Franco Nevada Corp. | | $ | 339,236 | |
| | 23,200 | | | Gildan Activewear, Inc. | | | 683,975 | |
| | 8,300 | | | Imperial Oil Ltd. | | | 331,266 | |
| | 9,200 | | | Intact Financial Corp. | | | 693,114 | |
| | 11,700 | | | Keyera Corp. | | | 778,276 | |
| | 25,200 | | | Magna International, Inc. | | | 1,347,197 | |
| | 5,700 | | | Methanex Corp. | | | 305,173 | |
| | 7,072 | | | NovaTek OAO | | | 527,878 | |
| | 30,500 | | | Peyto Exploration & Development Corp. | | | 817,796 | |
| | 32,000 | | | Potash Corp. of Saskatchewan, Inc. | | | 1,031,590 | |
| | 22,000 | | | Quebecor, Inc. - Class B | | | 588,496 | |
| | 18,900 | | | Rogers Communications, Inc. - Class B | | | 632,711 | |
| | 44,100 | | | Royal Bank of Canada | | | 2,654,600 | |
| | 30,700 | | | Sun Life Financial, Inc. | | | 946,051 | |
| | 56,300 | | | Suncor Energy, Inc. | | | 1,645,149 | |
| | 60,500 | | | Toronto-Dominion Bank | | | 2,589,479 | |
| | 11,000 | | | Tourmaline Oil Corp. (a) | | | 332,896 | |
| | 5,700 | | | Valeant Pharmaceuticals International, Inc. (a) | | | 1,126,049 | |
| | 8,800 | | | Vermilion Energy, Inc. | | | 369,981 | |
| | 6,300 | | | West Fraser Timber Co., Ltd. | | | 322,324 | |
| | | | | | | | 24,010,317 | |
| | | | | Cayman Islands - 0.73% | | | | |
| | 6,700 | | | Alibaba Group Holdings Ltd. - ADR (a)(b) | | | 557,708 | |
| | 810,000 | | | China Modern Dairy Holdings Ltd. | | | 269,622 | |
| | 66,000 | | | ENN Energy Holdings Ltd. | | | 405,265 | |
| | 169,500 | | | Lifestyle International Holdings Ltd. | | | 302,153 | |
| | 33,000 | | | Vipshop Holdings Ltd. - ADR (a)(b) | | | 971,520 | |
| | | | | | | | 2,506,268 | |
| | | | | Chile - 0.16% | | | | |
| | 1,965,776 | | | Banco de Chile | | | 220,312 | |
| | 123,798 | | | Empresas CMPC SA | | | 339,299 | |
| | | | | | | | 559,611 | |
| | | | | China - 2.00% | | | | |
| | 352,000 | | | Angang Steel Co., Ltd. | | | 259,036 | |
| | 1,618,000 | | | Bank of China Ltd. | | | 935,327 | |
| | 1,334,000 | | | Beijing Jingneng Clean Energy Co., Ltd. | | | 561,163 | |
See notes to financial statements.
GuideMark® World ex-US Fund
SCHEDULE OF INVESTMENTS (Continued)
March 31, 2015
| Number of | | | | | | |
| Shares | | | | | Value | |
| | | | | COMMON STOCKS (Continued) | | | | |
| | | | | China (Continued) | | | | |
| | 2,000 | | | China Biologic Products, Inc. (a) | | $ | 191,020 | |
| | 1,470,000 | | | China Construction Bank Corp. | | | 1,220,081 | |
| | 248,400 | | | China Pacific Insurance Group Co., Ltd. | | | 1,181,551 | |
| | 285,700 | | | China Vanke Co., Ltd. (a) | | | 677,097 | |
| | 40,000 | | | Great Wall Motor Co., Ltd. | | | 281,986 | |
| | 386,000 | | | PetroChina Co. | | | 428,653 | |
| | 234,000 | | | PICC Property & Casualty Co., Ltd. | | | 461,996 | |
| | 51,500 | | | Ping An Insurance Group Co. of China, Ltd. | | | 617,826 | |
| | | | | | | | 6,815,736 | |
| | | | | Czech Republic - 0.16% | | | | |
| | 2,515 | | | Komercni Banka AS | | | 542,482 | |
| | | | | Denmark - 1.22% | | | | |
| | 37,466 | | | Danske Bank AS | | | 987,722 | |
| | 39,222 | | | Novo Nordisk AS - Series B | | | 2,093,819 | |
| | 26,400 | | | Vestas Wind Systems AS | | | 1,088,496 | |
| | | | | | | | 4,170,037 | |
| | | | | Egypt - 0.08% | | | | |
| | 29,300 | | | Commercial International Bank Egypt SAE | | | 206,121 | |
| | 4,400 | | | Edita Food Industries SAE (a) | | | 54,032 | |
| | | | | | | | 260,153 | |
| | | | | Finland - 0.75% | | | | |
| | 32,493 | | | Fortum OYJ | | | 680,732 | |
| | 120,276 | | | Nokia OYJ | | | 917,072 | |
| | 19,100 | | | Sampo OYJ - Series A | | | 963,369 | |
| | | | | | | | 2,561,173 | |
| | | | | France - 7.29% | | | | |
| | 13,724 | | | Accor SA | | | 715,650 | |
| | 10,357 | | | Air Liquide SA | | | 1,333,349 | |
| | 70,100 | | | AXA SA | | | 1,764,353 | |
| | 22,126 | | | BNP Paribas SA | | | 1,346,274 | |
| | 27,551 | | | Compagnie de Saint-Gobain SA | | | 1,209,685 | |
| | 20,333 | | | Danone SA | | | 1,370,598 | |
| | 52,436 | | | GDF Suez SA | | | 1,035,241 | |
| | 2,650 | | | Kering SA | | | 517,328 | |
| | 16,200 | | | Legrand SA | | | 877,514 | |
| | 8,766 | | | L’Oreal SA | | | 1,614,609 | |
| Number of | | | | | | |
| Shares | | | | | Value | |
| | | | | France (Continued) | | | | |
| | 3,452 | | | LVMH Moet Hennessy Louis Vuitton SA | | $ | 607,491 | |
| | 77,700 | | | Orange SA | | | 1,247,823 | |
| | 11,223 | | | Renault SA | | | 1,019,381 | |
| | 31,495 | | | Rexel SA | | | 593,861 | |
| | 18,252 | | | Safran SA | | | 1,275,291 | |
| | 25,367 | | | Sanofi-Aventis SA | | | 2,505,211 | |
| | 29,237 | | | Societe Generale SA | | | 1,411,616 | |
| | 30,597 | | | Suez Environnement Co. SA | | | 526,772 | |
| | 79,638 | | | Total SA | | | 3,958,551 | |
| | | | | | | | 24,930,598 | |
| | | | | Germany - 5.11% | | | | |
| | 4,300 | | | adidas AG | | | 339,541 | |
| | 13,600 | | | Altice SA (a) | | | 1,474,764 | |
| | 19,013 | | | Bayer AG | | | 2,844,636 | |
| | 12,136 | | | Beiersdorf AG | | | 1,052,303 | |
| | 5,212 | | | Continental AG | | | 1,227,403 | |
| | 23,516 | | | Deutsche Annington Immobilien SE | | | 792,430 | |
| | 7,551 | | | Deutsche Boerse AG | | | 616,227 | |
| | 118,844 | | | Deutsche Telekom AG | | | 2,173,698 | |
| | 13,282 | | | Drillisch AG | | | 518,099 | |
| | 17,700 | | | Fresenius SE & Co. KGaA | | | 1,055,208 | |
| | 14,279 | | | GEA Group AG | | | 686,408 | |
| | 39,989 | | | K&S AG | | | 1,302,919 | |
| | 25,145 | | | Osram Licht AG | | | 1,244,747 | |
| | 15,262 | | | ProSiebenSat.1 Media AG | | | 746,506 | |
| | 9,992 | | | Rocket Internet AG (a) | | | 495,131 | |
| | 34,300 | | | RWE AG | | | 873,272 | |
| | 711 | | | United Internet AG | | | 32,419 | |
| | | | | | | | 17,475,711 | |
| | | | | Greece - 0.22% | | | | |
| | 2,557,074 | | | Eurobank Ergasias SA (a) | | | 288,547 | |
| | 51,207 | | | OPAP SA | | | 477,943 | |
| | | | | | | | 766,490 | |
| | | | | Hong Kong - 5.02% | | | | |
| | 348,800 | | | AIA Group Ltd. | | | 2,189,936 | |
| | 172,500 | | | BOC Hong Kong Holdings Ltd. | | | 615,215 | |
| | 190,000 | | | Brilliance China Automotive Holdings Ltd. | | | 365,769 | |
| | 397,500 | | | BYD Electronic International Co., Ltd. | | | 502,103 | |
See notes to financial statements.
GuideMark® World ex-US Fund
SCHEDULE OF INVESTMENTS (Continued)
March 31, 2015
| Number of | | | | | | |
| Shares | | | | | Value | |
| | | | | COMMON STOCKS (Continued) | | | | |
| | | | | Hong Kong (Continued) | | | | |
| | 57,500 | | | China Mobile Ltd. | | $ | 749,363 | |
| | 614,000 | | | CNOOC Ltd. | | | 866,554 | |
| | 624,000 | | | CSR Corp. Ltd. | | | 824,203 | |
| | 684,000 | | | CT Environmental Group Ltd. | | | 736,831 | |
| | 30,400 | | | Hang Seng Bank Ltd. | | | 550,205 | |
| | 461,380 | | | HKT Trust and HKT Ltd. | | | 594,258 | |
| | 94,000 | | | Hongkong Land Holdings Ltd. | | | 709,700 | |
| | 720,000 | | | Huadian Fuxin Energy Corp. Ltd. | | | 352,070 | |
| | 81,000 | | | Hutchison Whampoa Ltd. | | | 1,122,729 | |
| | 73,000 | | | Hysan Development Co., Ltd. | | | 319,981 | |
| | 1,058,000 | | | Industrial & Commercial Bank of China | | | 782,584 | |
| | 338,000 | | | Lenovo Group Ltd. | | | 492,537 | |
| | 773,754 | | | Noble Group Ltd. | | | 518,289 | |
| | 499,000 | | | PCCW Ltd. | | | 304,926 | |
| | 63,500 | | | Phoenix Healthcare Group Co., Ltd. | | | 112,280 | |
| | 244,000 | | | Sino Land Co. | | | 397,874 | |
| | 50,000 | | | Sun Hung Kai Properties Ltd. | | | 770,975 | |
| | 245,000 | | | Techtronic Industries Co., Ltd. | | | 825,993 | |
| | 130,600 | | | Tencent Holdings, Ltd. | | | 2,480,083 | |
| | | | | | | | 17,184,458 | |
| | | | | India - 1.73% | | | | |
| | 170,000 | | | Bharti Infratel, Ltd. | | | 1,045,203 | |
| | 17,507 | | | HDFC Bank Ltd. | | | 286,445 | |
| | 29,374 | | | Housing Development Finance Corp. Ltd. | | | 617,593 | |
| | 148,000 | | | ITC Ltd. | | | 769,389 | |
| | 25,521 | | | Lupin Ltd. | | | 819,856 | |
| | 107,678 | | | Motherson Sumi Systems Ltd. | | | 885,042 | |
| | 96,438 | | | Oil & Natural Gas Corp. Ltd. | | | 472,055 | |
| | 141,121 | | | Petronet LNG Ltd. | | | 386,897 | |
| | 49,844 | | | YES BANK Ltd. | | | 650,587 | |
| | | | | | | | 5,933,067 | |
| | | | | Indonesia - 0.63% | | | | |
| | 4,026,700 | | | PT Ace Hardware Indonesia Tbk | | | 226,262 | |
| | 594,300 | | | PT Astra International Tbk | | | 389,249 | |
| | 1,502,100 | | | PT Bank Rakyat Indonesia (Persero) Tbk | | | 1,523,603 | |
| | | | | | | | 2,139,114 | |
| Number of | | | | | | |
| Shares | | | | | Value | |
| | | | | Ireland - 0.50% | | | | |
| | 1,355,500 | | | Bank of Ireland (a) | | | 512,508 | |
| | 104,844 | | | James Hardie Industries Plc | | | 1,212,816 | |
| | | | | | | | 1,725,324 | |
| | | | | Israel - 0.79% | | | | |
| | 184,100 | | | Bezeq the Israel Telecommunication Corp. Ltd. | | | 342,821 | |
| | 1,300 | | | Teva Pharmaceutical Industries Ltd. | | | 81,246 | |
| | 36,698 | | | Teva Pharmaceutical Industries Ltd. - ADR | | | 2,286,285 | |
| | | | | | | | 2,710,352 | |
| | | | | Italy - 1.96% | | | | |
| | 53,839 | | | Assicurazioni Generali SpA | | | 1,058,587 | |
| | 35,045 | | | Banco Popolare Societa Cooperativa (a) | | | 545,549 | |
| | 111,100 | | | Finmeccanica SpA (a) | | | 1,319,655 | |
| | 632,573 | | | Intesa Sanpaolo SpA | | | 2,146,946 | |
| | 925,145 | | | Telecom Italia SpA (a) | | | 1,083,250 | |
| | 70,647 | | | UBI Banca SpA | | | 550,980 | |
| | | | | | | | 6,704,967 | |
| | | | | Japan - 15.22% | | | | |
| | 128,300 | | | Acom Co., Ltd. (a) | | | 444,907 | |
| | 18,410 | | | AEON Mall Co., Ltd. | | | 364,575 | |
| | 18,900 | | | Asahi Group Holdings, Ltd. | | | 599,290 | |
| | 129,400 | | | Astellas Pharma, Inc. | | | 2,120,206 | |
| | 24,300 | | | Bridgestone Corp. | | | 972,970 | |
| | 45,200 | | | Daicel Corporation | | | 538,762 | |
| | 12,900 | | | Dentsu, Inc. | | | 551,844 | |
| | 9,100 | | | Don Quijote Co., Ltd. | | | 739,723 | |
| | 21,800 | | | East Japan Railway Co. | | | 1,746,922 | |
| | 18,100 | | | Fuji Heavy Industries Ltd. | | | 600,852 | |
| | 32,300 | | | Fuji Media Holdings, Inc. | | | 457,834 | |
| | 118,000 | | | Fujitsu Ltd. | | | 804,717 | |
| | 172,000 | | | Hitachi Ltd. | | | 1,174,735 | |
| | 41,000 | | | Hitachi Metals Ltd. | | | 628,389 | |
| | 21,000 | | | Hoya Corp. | | | 840,721 | |
| | 173,000 | | | IHI Corp. | | | 808,901 | |
| | 48,300 | | | Isuzu Motors | | | 640,819 | |
| | 50,100 | | | Japan Tobacco, Inc. | | | 1,583,905 | |
| | 35,200 | | | JSR Corp. | | | 609,565 | |
| | 21,200 | | | JTEKT Corp. | | | 330,539 | |
| | 132,000 | | | Kawasaki Heavy Industries Ltd. | | | 665,943 | |
| | 87,000 | | | KDDI Corp. | | | 1,965,550 | |
See notes to financial statements.
GuideMark® World ex-US Fund
SCHEDULE OF INVESTMENTS (Continued)
March 31, 2015
| Number of | | | | | | |
| Shares | | | | | Value | |
| | | | | COMMON STOCKS (Continued) | | | | |
| | | | | Japan (Continued) | | | | |
| | 1,000 | | | Keyence Corp. | | $ | 545,697 | |
| | 10,900 | | | Makita Corp. | | | 564,842 | |
| | 22,400 | | | Mazda Motor Corp. | | | 453,865 | |
| | 10,700 | | | Miraca Holdings, Inc. | | | 491,911 | |
| | 38,900 | | | Mitsubishi Corp. | | | 781,650 | |
| | 36,000 | | | Mitsubishi Electric Corp. | | | 427,373 | |
| | 460,600 | | | Mitsubishi UFJ Financial Group, Inc. | | | 2,852,686 | |
| | 76,600 | | | Mitsubishi UFJ Lease & Finance Co., Ltd. | | | 378,542 | |
| | 40,000 | | | Mitsui Fudosan Co., Ltd. | | | 1,174,721 | |
| | 6,000 | | | Murata Manufacturing Co., Ltd. | | | 824,035 | |
| | 228,000 | | | NEC Corp. | | | 669,733 | |
| | 40,000 | | | NGK Insulators Ltd. | | | 852,262 | |
| | 11,200 | | | Nidec Corp. | | | 743,475 | |
| | 2,500 | | | Nintendo Co., Ltd. | | | 366,812 | |
| | 11,700 | | | Nitori Holdings Co., Ltd. | | | 792,015 | |
| | 27,200 | | | Olympus Corp. | | | 1,008,456 | |
| | 15,800 | | | OMRON Corp. | | | 711,777 | |
| | 86,400 | | | ORIX Corp. | | | 1,214,018 | |
| | 14,200 | | | Osaka Securities Exchange Co., Ltd. | | | 411,130 | |
| | 23,500 | | | Santen Pharmaceutical Co., Ltd. | | | 342,767 | |
| | 28,200 | | | Seiko Epson Corp. | | | 499,460 | |
| | 32,100 | | | Seven & I Holdings Co., Ltd. | | | 1,348,947 | |
| | 136,100 | | | Seven Bank Ltd. | | | 671,073 | |
| | 6,200 | | | Shin-Etsu Chemical Co., Ltd. | | | 404,786 | |
| | 1,700 | | | SMC Corp. | | | 506,199 | |
| | 24,200 | | | SoftBank Corp. | | | 1,409,395 | |
| | 44,800 | | | Sony Corp. | | | 1,198,114 | |
| | 38,200 | | | Sony Financial Holdings, Inc. | | | 614,485 | |
| | 142,000 | | | Sumitomo Chemical Co., Ltd. | | | 728,808 | |
| | 20,700 | | | Sumitomo Mitsui Financial Group, Inc. | | | 792,905 | |
| | 171,000 | | | Sumitomo Mitsui Trust Holdings, Inc. | | | 710,347 | |
| | 26,600 | | | Suzuki Motor Corp. | | | 798,910 | |
| | 71,000 | | | TAISEI Corp. | | | 400,745 | |
| | 13,000 | | | TDK Corp. | | | 920,497 | |
| | 27,200 | | | Tohoku Electric Power Co., Inc. | | | 308,949 | |
| | 10,300 | | | Tokio Marine Holdings, Inc. | | | 388,792 | |
| Number of | | | | | | |
| Shares | | | | | Value | |
| | | | | Japan (Continued) | | | | |
| | 219,000 | | | Toshiba Corp. | | $ | 917,624 | |
| | 66,900 | | | Toyota Motor Corp. | | | 4,669,869 | |
| | | | | | | | 52,089,341 | |
| | | | | Jersey - 0.77% | | | | |
| | 23,737 | | | Shire Plc | | | 1,892,379 | |
| | 12,831 | | | Wolseley Plc | | | 758,367 | |
| | | | | | | | 2,650,746 | |
| | | | | Malaysia - 0.34% | | | | |
| | 482,500 | | | Gamuda Bhd | | | 665,095 | |
| | 1,135,400 | | | YTL Corp. | | | 511,980 | |
| | | | | | | | 1,177,075 | |
| | | | | Mexico - 1.14% | | | | |
| | 703,700 | | | America Movil SAB de CV - Series L | | | 720,147 | |
| | 276,100 | | | Bolsa Mexicana de Valores SA - Series A | | | 470,620 | |
| | 52,000 | | | Fomento Economico Mexicano SAB de CV | | | 486,097 | |
| | 31,300 | | | Gentera SAB de CV (a) | | | 56,101 | |
| | 12,700 | | | Gruma SAB de CV - Series B | | | 161,598 | |
| | 110,700 | | | Grupo Aeroportuario del Pacifico SAB de CV - Series B | | | 727,404 | |
| | 79,200 | | | Grupo Financiero Banorte SAB de CV - Series O | | | 459,203 | |
| | 203,100 | | | Grupo Mexico SAB de CV - Series B | | | 598,908 | |
| | 41,700 | | | Infraestructura Energetica Nova SAB de CV | | | 227,753 | |
| | | | | | | | 3,907,831 | |
| | | | | Netherlands - 1.90% | | | | |
| | 130,019 | | | AEGON NV | | | 1,026,582 | |
| | 119,400 | | | ING Groep NV (a) | | | 1,748,962 | |
| | 273,380 | | | Koninklijke KPN NV | | | 926,659 | |
| | 21,650 | | | Reed Elsevier NV | | | 539,464 | |
| | 53,668 | | | Unilever NV | | | 2,242,646 | |
| | | | | | | | 6,484,313 | |
| | | | | Norway - 0.46% | | | | |
| | 37,368 | | | Statoil ASA | | | 660,719 | |
| | 18,302 | | | Yara International ASA | | | 929,246 | |
| | | | | | | | 1,589,965 | |
See notes to financial statements.
GuideMark® World ex-US Fund
SCHEDULE OF INVESTMENTS (Continued)
March 31, 2015
Number of
Shares | | | | | Value | |
| | | | | COMMON STOCKS (Continued) | | | | |
| | | | | Philippines - 0.35% | | | | |
| | 1,530,900 | | | Alliance Global Group, Inc. | | $ | 905,600 | |
| | 126,799 | | | Metropolitan Bank & Trust Co. | | | 276,235 | |
| | | | | | | | 1,181,835 | |
| | | | | Poland - 0.11% | | | | |
| | 13,647 | | | Bank Handlowy w Warszawie SA | | | 389,813 | |
| | | | | Republic of Korea - 3.00% | | | | |
| | 401 | | | Amorepacific Corp. | | | 1,211,615 | |
| | 6,760 | | | Coway Co., Ltd. | | | 556,381 | |
| | 7,327 | | | Daewoo International Corp. | | | 174,956 | |
| | 6,716 | | | Dongbu Insurance Co., Ltd. | | | 299,041 | |
| | 4,606 | | | KEPCO Plant Service & Engineering Co., Ltd. | | | 404,629 | |
| | 4,827 | | | LG Chemical Ltd. | | | 979,842 | |
| | 988 | | | LG Household & Health Care Ltd. | | | 748,937 | |
| | 2,175 | | | Medy-Tox, Inc. | | | 642,878 | |
| | 858 | | | Naver Corp. | | | 517,634 | |
| | 3,363 | | | POSCO | | | 735,044 | |
| | 2,669 | | | Samsung Electronics Co., Ltd. | | | 3,461,035 | |
| | 2,159 | | | SK Telecom Co., Ltd. | | | 531,258 | |
| | | | | | | | 10,263,250 | |
| | | | | Russian Federation - 0.53% | | | | |
| | 27,990 | | | Eurasia Drilling Co., Ltd. | | | 537,408 | |
| | 11,800 | | | Gazprom OAO | | | 55,546 | |
| | 46,891 | | | Gazprom OAO - ADR | | | 221,091 | |
| | 1,335 | | | Magnit | | | 260,414 | |
| | 22,120 | | | MMC Norilsk Nickel OJSC - ADR | | | 394,301 | |
| | 324,440 | | | Sberbank Of Russia | | | 349,847 | |
| | | | | | | | 1,818,607 | |
| | | | | Singapore - 0.70% | | | | |
| | 170,500 | | | CapitaLand Ltd. | | | 444,421 | |
| | 83,400 | | | DBS Group Holdings Ltd. | | | 1,236,643 | |
| | 42,081 | | | United Overseas Bank Ltd. | | | 705,369 | |
| | | | | | | | 2,386,433 | |
| | | | | South Africa - 1.69% | | | | |
| | 26,784 | | | AngloGold Ashanti Ltd. (a) | | | 252,530 | |
| | 47,415 | | | Barclays Africa Group Ltd. | | | 722,615 | |
| | 48,400 | | | MTN Group Ltd. | | | 815,886 | |
| | 129,100 | | | Nampak Ltd. | | | 432,497 | |
| | 11,390 | | | Naspers Ltd. | | | 1,747,124 | |
| | 62,823 | | | Netcare Ltd. | | | 215,438 | |
Number of
Shares | | | | | Value | |
| | | | | South Africa (Continued) | | | | |
| | 12,300 | | | Sasol Ltd. | | $ | 415,292 | |
| | 20,500 | | | Standard Bank Group Ltd. | | | 283,288 | |
| | 136,900 | | | Telkom SA SOC Ltd. (a) | | | 892,934 | |
| | | | | | | | 5,777,604 | |
| | | | | Spain - 2.00% | | | | |
| | 38,787 | | | Amadeus IT Holding SA | | | 1,662,291 | |
| | 205,020 | | | CaixaBank SA | | | 972,294 | |
| | 155,520 | | | Iberdrola SA | | | 1,002,875 | |
| | 30,890 | | | Inditex de Diseno Textil SA | | | 991,741 | |
| | 119,542 | | | International Consolidated Airlines Group SA (a) | | | 1,071,079 | |
| | 6,783 | | | Red Electrica Corporacion SA | | | 551,546 | |
| | 42,196 | | | Telefonica SA | | | 600,426 | |
| | | | | | | | 6,852,252 | |
| | | | | Sweden - 2.17% | | | | |
| | 73,445 | | | Alfa Laval AB | | | 1,442,487 | |
| | 41,347 | | | Hennes & Mauritz AB - Series B | | | 1,675,287 | |
| | 162,200 | | | Nordea Bank AB | | | 1,975,674 | |
| | 33,689 | | | Svenska Cellulosa AB - Series B | | | 774,135 | |
| | 16,200 | | | Svenska Handelsbanken AB - Series A | | | 729,592 | |
| | 34,200 | | | Swedbank AB - Series A | | | 816,481 | |
| | | | | | | | 7,413,656 | |
| | | | | Switzerland - 6.02% | | | | |
| | 12,147 | | | Adecco SA | | | 1,009,701 | |
| | 15,487 | | | Cie Financiere Richemont SA | | | 1,244,394 | |
| | 50,072 | | | Clariant AG | | | 999,147 | |
| | 14,898 | | | Julius Baer Group Ltd. | | | 744,660 | |
| | 39,581 | | | Nestle SA | | | 2,980,546 | |
| | 41,178 | | | Novartis AG | | | 4,064,289 | |
| | 16,974 | | | Roche Holding AG | | | 4,664,321 | |
| | 4,243 | | | Syngenta AG | | | 1,441,468 | |
| | 73,392 | | | UBS Group AG | | | 1,376,182 | |
| | 6,178 | | | Zurich Financial Services AG | | | 2,088,178 | |
| | | | | | | | 20,612,886 | |
| | | | | Taiwan - 2.42% | | | | |
| | 96,000 | | | Advantech Co., Ltd. | | | 729,991 | |
| | 759,056 | | | Cathay Financial Holding Co., Ltd. | | | 1,209,413 | |
| | 38,000 | | | Eclat Textile Co., Ltd. | | | 497,943 | |
| | 76,000 | | | Far EasTone Telecommunications Co., Ltd. | | | 183,346 | |
See notes to financial statements.
GuideMark® World ex-US Fund
SCHEDULE OF INVESTMENTS (Continued)
March 31, 2015
Number of
Shares | | | | | Value | |
| | | | | COMMON STOCKS (Continued)
Taiwan (Continued) | | | | |
| | 306,000 | | | Fubon Financial Holding Co., Ltd. | | $ | 548,518 | |
| | 12,000 | | | Hermes Microvision, Inc. | | | 690,384 | |
| | 231,000 | | | Hon Hai Precision Industry Co., Ltd. | | | 676,169 | |
| | 57,750 | | | Merida Industry Co., Ltd. | | | 453,375 | |
| | 587,000 | | | Taiwan Semiconductor Manufacturing Co., Ltd. | | | 2,728,119 | |
| | 331,000 | | | Vanguard International Semiconductor Corp. | | | 561,863 | |
| | | | | | | | 8,279,121 | |
| | | | | Thailand - 0.31% | | | | |
| | 82,700 | | | Intouch Holdings Plc | | | 196,205 | |
| | 123,900 | | | Kasikornbank Public Co., Ltd. | | | 875,644 | |
| | | | | | | | 1,071,849 | |
| | | | | Turkey - 0.25% | | | | |
| | 74,811 | | | Aygaz AS | | | 272,830 | |
| | 17,149 | | | Tupras Turkiye Petroleum Rafinerileri AS | | | 406,288 | |
| | 33,081 | | | Turkiye Halk Bankasi AS | | | 162,905 | |
| | | | | | | | 842,023 | |
| | | | | United Kingdom - 12.77% | | | | |
| | 28,107 | | | AstraZeneca Plc | | | 1,928,651 | |
| | 112,675 | | | Aviva Plc | | | 901,721 | |
| | 26,398 | | | Babcock International Group Plc | | | 385,089 | |
| | 79,200 | | | BAE Systems Plc | | | 613,763 | |
| | 269,430 | | | Barclays Plc | | | 972,511 | |
| | 83,146 | | | Barratt Developments Plc | | | 650,095 | |
| | 172,333 | | | BG Group Plc | | | 2,115,161 | |
| | 233,503 | | | BP Plc | | | 1,513,598 | |
| | 222,179 | | | BT Group Plc | | | 1,443,679 | |
| | 19,200 | | | Burberry Group Plc | | | 493,063 | |
| | 34,621 | | | Capita Plc | | | 572,310 | |
| | 8,564 | | | Croda International Plc | | | 347,338 | |
| | 88,053 | | | Diageo Plc | | | 2,433,275 | |
| | 77,978 | | | Direct Line Insurance Group Plc | | | 367,976 | |
| | 62,901 | | | GlaxoSmithKline Plc | | | 1,447,971 | |
| | 23,246 | | | Hikma Pharmaceuticals Plc | | | 731,636 | |
| | 44,390 | | | Imperial Tobacco Group Plc | | | 1,947,215 | |
| | 13,846 | | | InterContinental Hotels Group Plc | | | 540,042 | |
| | 514,300 | | | ITV Plc | | | 1,925,555 | |
Number of
Shares | | | | | Value | |
| | | | | United Kingdom (Continued) | | | | |
| | 11,564 | | | Johnson Matthey Plc | | $ | 579,392 | |
| | 2,390,677 | | | Lloyds Banking Group Plc | | | 2,771,111 | |
| | 23,653 | | | London Stock Exchange Group Plc | | | 860,256 | |
| | 46,042 | | | Meggitt Plc | | | 374,258 | |
| | 34,730 | | | Mondi Plc | | | 667,404 | |
| | 93,873 | | | National Grid Plc | | | 1,206,831 | |
| | 57,784 | | | Prudential Plc | | | 1,433,929 | |
| | 9,588 | | | Randgold Resources Ltd. | | | 664,659 | |
| | 31,509 | | | Rolls-Royce Holdings Plc (a) | | | 444,399 | |
| | 110,585 | | | Royal Dutch Shell Plc - Class A | | | 3,288,462 | |
| | 26,889 | | | SABMiller Plc | | | 1,408,488 | |
| | 14,460 | | | Schroders Plc | | | 684,988 | |
| | 72,604 | | | St. James’s Place Plc | | | 1,004,196 | |
| | 41,072 | | | Standard Chartered Plc | | | 665,228 | |
| | 412,700 | | | Taylor Wimpey Plc | | | 946,060 | |
| | 313,117 | | | Tesco Plc | | | 1,117,684 | |
| | 16,700 | | | Travis Perkins Plc | | | 482,178 | |
| | 42,270 | | | Tullow Oil Plc | | | 177,204 | |
| | 25,465 | | | Unilever Plc | | | 1,062,483 | |
| | 576,814 | | | Vodafone Group Plc | | | 1,887,515 | |
| | 7,961 | | | Whitbread Plc | | | 618,168 | |
| | | | | | | | 43,675,542 | |
| | | | | Total Common Stocks
(Cost $284,324,549) | | | 320,640,741 | |
| | | | | PREFERRED STOCKS - 1.39%
Brazil - 0.47% | | | | |
| | 18,684 | | | Banco Bradesco SA | | | 173,460 | |
| | 100,000 | | | Braskem SA | | | 347,480 | |
| | 19,800 | | | Cia Brasileira de Distribuicao Grupo Pao de Acucar | | | 592,161 | |
| | 45,999 | | | Itau Unibanco Holding SA | | | 510,499 | |
| | | | | | | | 1,623,600 | |
| | | | | Colombia - 0.15% | | | | |
| | 13,380 | | | Bancolombia SA - ADR | | | 526,236 | |
| | | | | Germany - 0.77% | | | | |
| | 9,883 | | | Volkswagen AG | | | 2,620,986 | |
| | | | | Total Preferred Stocks
(Cost $4,858,993) | | | 4,770,822 | |
See notes to financial statements.
GuideMark® World ex-US Fund
SCHEDULE OF INVESTMENTS (Continued)
March 31, 2015
Number of
Shares | | | | | Value | |
| | | | | REAL ESTATE INVESTMENT TRUSTS - 0.89% Australia - 0.26% | | | | |
| | 1 | | | SCA Property Group | | $ | 2 | |
| | 122,587 | | | Westfield Corp. | | | 888,401 | |
| | | | | | | | 888,403 | |
| | | | | France - 0.14% | | | | |
| | 1,809 | | | Unibail-Rodamco SE | | | 488,493 | |
| | | | | Japan - 0.22% | | | | |
| | 150 | | | Nippon Prologis REIT, Inc. | | | 330,206 | |
| | 88 | | | Nomura Real Estate Office Fund, Inc. | | | 427,426 | |
| | | | | | | | 757,632 | |
| | | | | United Kingdom - 0.27% | | | | |
| | 73,626 | | | British Land Co. Plc | | | 907,428 | |
| | | | | Total Real Estate Investment Trusts
(Cost $2,350,618) | | | | |
| | | | | | | | 3,041,956 | |
| | | | | SHORT TERM INVESTMENTS - 3.49% | | | | |
| | | | | Money Market Funds - 3.37% | | | | |
| | 11,524,291 | | | Federated Prime Obligations Fund Effective Yield, 0.05% | | | 11,524,291 | |
Principal
Amount | | | | | | | |
| | | | | U.S. Treasury Bill - 0.12% | | | | |
| | | | | United States Treasury Bills | | | | |
| | $340,000 | | | 0.053%, 04/02/2015 (c) | | | 340,000 | |
| | 20,000 | | | 0.038%, 04/30/2015 (c) | | | 20,000 | |
| | 50,000 | | | 0.023%, 05/21/2015 (c) | | | 49,999 | |
| | | | | | | | 409,999 | |
| | | | | Total Short Term Investments
(Cost $11,934,290) | | | 11,934,290 | |
Number of
Shares | | | | | Value | |
| | | | | INVESTMENTS PURCHASED AS SECURITIES LENDING COLLATERAL - 0.17% | | | | |
| | | | | Money Market Funds - 0.17% | | | | |
| | 577,042 | | | Mount Vernon Prime Portfolio
Effective Yield, 0.22% | | $ | 577,042 | |
| | | | | Total Investments Purchased as Securities Lending Collateral
(Cost $577,042) | | | 577,042 | |
| | | | | Total Investments
(Cost $304,045,492) - 99.65% | | | 340,964,851 | |
| | | | | Other Assets in Excess of Liabilities - 0.35% | | | 1,183,809 | |
| | | | | TOTAL NET ASSETS - 100.00% | | $ | 342,148,660 | |
Percentages are stated as a percent of net assets.
ADR - American Depositary Receipt
| (a) | Non-income producing security. |
| (b) | All or portion of this security is on loan. |
| (c) | Completely or partially assigned as collateral for certain futures contracts. |
GuideMark® World ex-US Fund
SCHEDULE OF OPEN FUTURES CONTRACTS
March 31, 2015
| Description | | Number of Contracts
Purchased | | | Notional Value | | | | Settlement Month | | | Unrealized
Appreciation
(Depreciation) | |
| mini MSCI EAFE Index Futures | | | 54 | | | | 4,940,730 | | | | Jun-15 | | | | $ | (45,051 | ) | |
| mini MSCI Emerging Markets Index Futures | | | 32 | | | | 1,555,840 | | | | Jun-15 | | | | | 28,218 | | |
| S&P / TSX 60 Index Futures | | | 4 | | | | 546,556 | | | | Jun-15 | | | | | 1,931 | | |
| | | | | | | | | | | | | | | | $ | (14,902 | ) | |
See notes to financial statements.
GuideMark® Opportunistic Equity Fund
SCHEDULE OF INVESTMENTS
March 31, 2015
Number of
Shares | | | | | Value | |
| | | | | COMMON STOCKS - 93.80% | | | | |
| | | | | Aerospace & Defense - 1.84% | | | | |
| | 21,585 | | | United Technologies Corp. | | $ | 2,529,762 | |
| | | | | Air Freight & Logistics - 2.50% | | | | |
| | 70,805 | | | Hub Group, Inc. - Class A (a) | | | 2,781,928 | |
| | 6,786 | | | United Parcel Service, Inc. - Class B | | | 657,835 | |
| | | | | | | | 3,439,763 | |
| | | | | Airlines - 0.54% | | | | |
| | 11,130 | | | United Continental Holdings, Inc. (a) | | | 748,493 | |
| | | | | Automobiles - 0.26% | | | | |
| | 22,063 | | | Ford Motor Co. | | | 356,097 | |
| | | | | Banks - 5.36% | | | | |
| | 24,840 | | | BankUnited, Inc. | | | 813,262 | |
| | 36,925 | | | Citigroup, Inc. | | | 1,902,376 | |
| | 11,723 | | | PNC Financial Services Group, Inc. | | | 1,093,053 | |
| | 54,690 | | | Popular, Inc. (a) | | | 1,880,789 | |
| | 19,070 | | | U.S. Bancorp | | | 832,787 | |
| | 15,606 | | | Wells Fargo & Co. | | | 848,966 | |
| | | | | | | | 7,371,233 | |
| | | | | Beverages - 0.75% | | | | |
| | 8,904 | | | Molson Coors Brewing Co. - Class B | | | 662,903 | |
| | 3,876 | | | PepsiCo, Inc. | | | 370,623 | |
| | | | | | | | 1,033,526 | |
| | | | | Biotechnology - 2.90% | | | | |
| | 28,360 | | | ARIAD Pharmaceuticals, Inc. (a)(b) | | | 233,686 | |
| | 1,600 | | | Biogen, Inc. (a) | | | 675,584 | |
| | 15,535 | | | Celgene Corp. (a) | | | 1,790,875 | |
| | 11,110 | | | PTC Therapeutics, Inc. (a) | | | 676,043 | |
| | 3,530 | | | United Therapeutics Corp. (a)(b) | | | 608,696 | |
| | | | | | | | 3,984,884 | |
| | | | | Capital Markets - 1.28% | | | | |
| | 34,180 | | | Franklin Resources, Inc. | | | 1,754,118 | |
| | | | | Chemicals - 1.02% | | | | |
| | 7,400 | | | Eastman Chemical Co. | | | 512,524 | |
| | 2,754 | | | Innophos Holdings, Inc. | | | 155,216 | |
| | 6,530 | | | Monsanto Co. | | | 734,886 | |
| | | | | | | | 1,402,626 | |
Number of
Shares | | | | | Value | |
| | | | | Commercial Services & Supplies - 1.77% | | | | |
| | 5,714 | | | ABM Industries, Inc. | | $ | 182,048 | |
| | 15,040 | | | Copart, Inc. (a) | | | 565,053 | |
| | 14,343 | | | Republic Services, Inc. | | | 581,752 | |
| | 26,572 | | | The ADT Corp. (b) | | | 1,103,269 | |
| | | | | | | | 2,432,122 | |
| | | | | Communications Equipment - 3.67% | | | | |
| | 12,020 | | | Finisar Corp. (a)(b) | | | 256,507 | |
| | 82,480 | | | Juniper Networks, Inc. | | | 1,862,398 | |
| | 12,030 | | | Motorola Solutions, Inc. | | | 802,040 | |
| | 6,230 | | | Palo Alto Networks, Inc. (a) | | | 910,078 | |
| | 17,440 | | | QUALCOMM, Inc. | | | 1,209,290 | |
| | | | | | | | 5,040,313 | |
| | | | | Construction Materials - 0.34% | | | | |
| | 5,560 | | | Vulcan Materials Co. | | | 468,708 | |
| | | | | Consumer Finance - 0.30% | | | | |
| | 7,330 | | | Discover Financial Services | | | 413,045 | |
| | | | | Containers & Packaging - 0.24% | | | | |
| | 7,059 | | | Bemis Company, Inc. | | | 326,902 | |
| | | | | Diversified Financial Services - 0.37% | | | | |
| | 5,380 | | | CME Group, Inc. | | | 509,540 | |
| | | | | Diversified Telecommunication Services - 0.70% | | | | |
| | 19,739 | | | Verizon Communications, Inc. | | | 959,908 | |
| | | | | Electrical Equipment - 0.46% | | | | |
| | 11,215 | | | Emerson Electric Co. | | | 634,993 | |
| | | | | Energy Equipment & Services - 0.53% | | | | |
| | 16,610 | | | Halliburton Co. | | | 728,847 | |
| | | | | Food & Staples Retailing - 0.78% | | | | |
| | 19,404 | | | SYSCO Corp. | | | 732,113 | |
| | 4,117 | | | Wal-Mart Stores, Inc. | | | 338,623 | |
| | | | | | | | 1,070,736 | |
| | | | | Food Products - 1.62% | | | | |
| | 36,140 | | | Post Holdings, Inc. (a) | | | 1,692,797 | |
| | 12,660 | | | Unilever Plc - ADR | | | 528,049 | |
| | | | | | | | 2,220,846 | |
| | | | | Gas Utilities - 1.01% | | | | |
| | 9,685 | | | AmeriGas Partners, L.P. | | | 462,362 | |
| | 15,266 | | | National Fuel Gas Co. (b) | | | 920,998 | |
| | | | | | | | 1,383,360 | |
See notes to financial statements.
GuideMark® Opportunistic Equity Fund
SCHEDULE OF INVESTMENTS (Continued)
March 31, 2015
Number of
Shares | | | | | Value | |
| | | | | COMMON STOCKS (Continued) | | | | |
| | | | | Health Care Equipment & Supplies - 2.96% | | | | |
| | 25,800 | | | Alere, Inc. (a) | | $ | 1,261,620 | |
| | 69,325 | | | Boston Scientific Corp. (a) | | | 1,230,519 | |
| | 12,390 | | | Steris Corp. (b) | | | 870,645 | |
| | 3,750 | | | The Cooper Companies, Inc. | | | 702,825 | |
| | | | | | | | 4,065,609 | |
| | | | | Health Care Providers & Services - 2.53% | | | | |
| | 27,550 | | | LifePoint Hospitals, Inc. (a) | | | 2,023,547 | |
| | 13,069 | | | Owens & Minor, Inc. | | | 442,255 | |
| | 13,083 | | | Quest Diagnostics, Inc. (b) | | | 1,005,429 | |
| | | | | | | | 3,471,231 | |
| | | | | Hotels, Restaurants & Leisure - 1.16% | | | | |
| | 8,075 | | | Bob Evans Farms, Inc. (b) | | | 373,550 | |
| | 5,360 | | | Jack in the Box, Inc. | | | 514,131 | |
| | 7,400 | | | Starbucks Corp. | | | 700,780 | |
| | | | | | | | 1,588,461 | |
| | | | | Household Durables - 4.30% | | | | |
| | 52,302 | | | Jarden Corp. (a)(b) | | | 2,766,776 | |
| | 15,525 | | | Whirlpool Corp. | | | 3,136,981 | |
| | | | | | | | 5,903,757 | |
| | | | | Household Products - 0.45% | | | | |
| | 5,758 | | | Kimberly-Clark Corp. | | | 616,739 | |
| | | | | Insurance - 8.27% | | | | |
| | 33,510 | | | American International Group, Inc. | | | 1,836,013 | |
| | 46,240 | | | Brown & Brown, Inc. | | | 1,531,006 | |
| | 3,998 | | | CNA Financial Corp. | | | 165,637 | |
| | 9,815 | | | Endurance Specialty Holdings Ltd. | | | 600,089 | |
| | 35,605 | | | MetLife, Inc. | | | 1,799,833 | |
| | 18,340 | | | Navigators Group, Inc. (a)(b) | | | 1,427,586 | |
| | 5,142 | | | PartnerRe Ltd. | | | 587,885 | |
| | 70,930 | | | Willis Group Holdings Plc (b) | | | 3,417,407 | |
| | | | | | | | 11,365,456 | |
| | | | | Internet & Catalog Retail - 0.53% | | | | |
| | 625 | | | The Priceline Group, Inc. (a) | | | 727,594 | |
| | | | | Internet Software & Services - 3.51% | | | | |
| | 1,755 | | | Baidu, Inc. - ADR (a)(b) | | | 365,742 | |
| | 8,370 | | | Facebook, Inc. - Class A (a) | | | 688,140 | |
| | 4,371 | | | Google, Inc. - Class A (a) | | | 2,424,594 | |
| | 1,419 | | | Google, Inc. - Class C (a) | | | 777,612 | |
| | 8,602 | | | J2 Global, Inc. | | | 564,979 | |
| | | | | | | | 4,821,067 | |
Number of
Shares | | | | | Value | |
| | | | | IT Services - 3.53% | | | | |
| | 2,400 | | | Alliance Data Systems Corp. (a) | | $ | 711,000 | |
| | 7,400 | | | MasterCard, Inc. - Class A | | | 639,286 | |
| | 34,200 | | | The Western Union Co. (b) | | | 711,702 | |
| | 41,530 | | | Vantiv, Inc. - Class A (a) | | | 1,565,681 | |
| | 15,600 | | | VeriFone Holdings, Inc. (a) | | | 544,284 | |
| | 10,380 | | | Visa, Inc. - Class A (b) | | | 678,956 | |
| | | | | | | | 4,850,909 | |
| | | | | Leisure Products - 1.01% | | | | |
| | 11,350 | | | Brunswick Corp. | | | 583,957 | |
| | 12,804 | | | Hasbro, Inc. (b) | | | 809,725 | |
| | | | | | | | 1,393,682 | |
| | | | | Life Sciences Tools & Services - 0.34% | | | | |
| | 3,535 | | | Thermo Fisher Scientific, Inc. | | | 474,892 | |
| | | | | Machinery - 2.38% | | | | |
| | 7,530 | | | Caterpillar, Inc. | | | 602,626 | |
| | 7,700 | | | Danaher Corp. | | | 653,730 | |
| | 8,200 | | | Paccar, Inc. | | | 517,748 | |
| | 12,604 | | | Parker Hannifin Corp. (b) | | | 1,497,103 | |
| | | | | | | | 3,271,207 | |
| | | | | Media - 6.19% | | | | |
| | 11,656 | | | Cinemark Holdings, Inc. | | | 525,336 | |
| | 15,440 | | | Comcast Corp. - Class A (b) | | | 871,897 | |
| | 14,130 | | | Liberty Global Plc - Class C (a) | | | 703,815 | |
| | 11,014 | | | Omnicom Group, Inc. (b) | | | 858,872 | |
| | 18,050 | | | Shaw Communications, Inc. - Class B (b) | | | 404,862 | |
| | 7,605 | | | The Walt Disney Co. | | | 797,688 | |
| | 15,413 | | | Thomson Reuters Corp. | | | 625,151 | |
| | 19,150 | | | Twenty-First Century Fox, Inc. - Class A | | | 648,036 | |
| | 93,520 | | | Twenty-First Century Fox, Inc. - Class B | | | | |
| | | | | | | | 3,074,938 | |
| | | | | | | | 8,510,595 | |
| | | | | Metals & Mining - 0.57% | | | | |
| | 5,066 | | | Compass Minerals International, Inc. | | | 472,202 | |
| | 6,651 | | | Nucor Corp. (b) | | | 316,122 | |
| | | | | | | | 788,324 | |
See notes to financial statements.
GuideMark® Opportunistic Equity Fund
SCHEDULE OF INVESTMENTS (Continued)
March 31, 2015
Number of
Shares | | | | | Value | |
| | | | | COMMON STOCKS (Continued) | | | | |
| | | | | Multiline Retail - 1.13% | | | | |
| | 12,240 | | | Kohl’s Corp. (b) | | $ | 957,780 | |
| | 7,306 | | | Target Corp. | | | 599,603 | |
| | | | | | | | 1,557,383 | |
| | | | | Oil & Gas - 3.71% | | | | |
| | 6,066 | | | Chevron Corp. | | | 636,809 | |
| | 17,545 | | | Cimarex Energy Co. | | | 2,019,254 | |
| | 179 | | | Martin Midstream Partners LP | | | 6,344 | |
| | 9,898 | | | Memorial Production Partners LP | | | 160,446 | |
| | 11,488 | | | Occidental Petroleum Corp. | | | 838,624 | |
| | 9,610 | | | Tesoro Corp. | | | 877,297 | |
| | 11,267 | | | Williams Partners LP | | | 554,562 | |
| | | | | | | | 5,093,336 | |
| | | | | Personal Products - 0.44% | | | | |
| | 5,960 | | | Mead Johnson Nutrition Co. | | | 599,159 | |
| | | | | | | | | |
| | | | | Pharmaceuticals - 6.55% | | | | |
| | 4,675 | | | Actavis Plc (a) | | | 1,391,374 | |
| | 6,360 | | | Jazz Pharmaceuticals Plc (a) | | | 1,098,944 | |
| | 44,485 | | | Teva Pharmaceutical Industries Ltd. - ADR | | | 2,771,415 | |
| | 18,825 | | | Valeant Pharmaceuticals International, Inc. (a)(b) | | | 3,739,022 | |
| | | | | | | | 9,000,755 | |
| | | | | Real Estate Management & Development - 0.82% | | | | |
| | 10,450 | | | Alexander & Baldwin, Inc. | | | 451,231 | |
| | 17,510 | | | CBRE Group, Inc. - Class A (a) | | | 677,812 | |
| | | | | | | | 1,129,043 | |
| | | | | Semiconductor & Semiconductor Equipment - 1.06% | | | | |
| | 30,789 | | | Intel Corp. | | | 962,772 | |
| | 40,620 | | | ON Semiconductor Corp. (a) | | | 491,908 | |
| | | | | | | | 1,454,680 | |
| | | | | Software - 4.55% | | | | |
| | 9,110 | | | Autodesk, Inc. (a) | | | 534,210 | |
| | 80,149 | | | Microsoft Corp. (b) | | | 3,258,458 | |
| | 8,370 | | | Red Hat, Inc. (a) | | | 634,028 | |
| | 9,640 | | | salesforce.com, Inc. (a) | | | 644,048 | |
| | 8,990 | | | ServiceNow, Inc. (a) | | | 708,232 | |
| | 8,070 | | | Splunk, Inc. (a) | | | 477,744 | |
| | | | | | | | 6,256,720 | |
Number of
Shares | | | | | Value | |
| | | | | Specialty Retail - 1.87% | | | | |
| | 6,330 | | | Home Depot, Inc. | | $ | 719,151 | |
| | 4,440 | | | Signet Jewelers Ltd. | | | 616,228 | |
| | 17,545 | | | The TJX Companies, Inc. | | | 1,229,027 | |
| | | | | | | | 2,564,406 | |
| | | | | Technology Hardware, Storage & Peripherals - 4.82% | | | | |
| | 33,775 | | | Apple, Inc. | | | 4,202,623 | |
| | 23,570 | | | EMC Corp. | | | 602,449 | |
| | 11,375 | | | International Business Machines Corp. | | | 1,825,688 | |
| | | | | | | | 6,630,760 | |
| | | | | Textiles, Apparel & Luxury Goods - 0.77% | | | | |
| | 14,095 | | | VF Corp. | | | 1,061,494 | |
| | | | | Tobacco - 0.93% | | | | |
| | 16,915 | | | Philip Morris International, Inc. | | | 1,274,207 | |
| | | | | Trading Companies & Distributors - 0.74% | | | | |
| | 15,101 | | | Aircastle Ltd. | | | 339,169 | |
| | 16,375 | | | Fastenal Co. | | | 678,498 | |
| | | | | | | | 1,017,667 | |
| | | | | Wireless Telecommunication Services - 0.44% | | | | |
| | 18,196 | | | Rogers Communications, Inc. - Class B | | | 609,202 | |
| | | | | Total Common Stocks
(Cost $100,312,474) | | | 128,908,157 | |
| | | | | REAL ESTATE INVESTMENT TRUSTS - 2.91% | | | | |
| | | | | Real Estate Investment Trusts - 2.91% | | | | |
| | 6,141 | | | CyrusOne, Inc. | | | 191,108 | |
| | 31,375 | | | Iron Mountain, Inc. | | | 1,144,560 | |
| | 118,120 | | | iStar Financial, Inc. (a) | | | 1,535,560 | |
| | 21,030 | | | Starwood Property Trust, Inc. | | | 511,029 | |
| | 13,941 | | | The Geo Group, Inc. | | | 609,779 | |
| | | | | Total Real Estate Investment Trusts
(Cost $3,010,382) | | | 3,992,036 | |
| | | | | SHORT TERM INVESTMENTS - 3.24% | | | | |
| | | | | Money Market Funds - 3.24% | | | | |
| | 4,456,400 | | | Federated Prime Obligations Fund
Effective Yield, 0.05% | | | 4,456,400 | |
| | | | | Total Short Term Investments
(Cost $4,456,400) | | | 4,456,400 | |
See notes to financial statements.
GuideMark® Opportunistic Equity Fund
SCHEDULE OF INVESTMENTS (Continued)
March 31, 2015
Number of
Shares | | | | | Value | |
| | | | | INVESTMENTS PURCHASED AS SECURITIES LENDING COLLATERAL - 8.25% | | | | |
| | | | | Money Market Funds - 8.25% | | | | |
| | 11,333,137 | | | Mount Vernon Prime Portfolio | | | | |
| | | | | Effective Yield, 0.22% | | $ | 11,333,137 | |
| | | | | Total Investments Purchased as Securities Lending Collateral
(Cost $11,333,137) | | | 11,333,137 | |
| | | | | Total Investments
(Cost $119,112,393) - 108.20% | | | 148,689,730 | |
| | | | | Liabilities in Excess of Other Assets - (8.20)% | | | (11,263,489 | ) |
| | | | | TOTAL NET ASSETS - 100.00% | | $ | 137,426,241 | |
| Percentages are stated as a percent of net assets. |
| ADR - American Depositary Receipt |
| (a) | Non-income producing security. |
| (b) | All or portion of this security is on loan. |
See notes to financial statements.
GuideMark® Global Real Return Fund
SCHEDULE OF INVESTMENTS
March 31, 2015
Number of
Shares | | | | | Value | |
| | | | | INVESTMENT COMPANIES - 94.67% | | | | |
| | | | | Exchange Traded Funds - 94.67% | | | | |
| | 33,812 | | | Energy Select Sector SPDR Fund (a) | | $ | 2,623,135 | |
| | 636,892 | | | PowerShares DB Commodity Index Tracking Fund (a)(b) | | | 10,871,746 | |
| | 45,270 | | | PowerShares Global Agriculture Portfolio (a) | | | 1,302,870 | |
| | 174,268 | | | SPDR Barclays TIPS ETF | | | 9,880,996 | |
| | 63,649 | | | SPDR DB International Government Inflation-Protected Bond ETF | | | 3,472,689 | |
| | 120,391 | | | SPDR Dow Jones International Real Estate ETF (a) | | | 5,215,338 | |
| | 75,305 | | | SPDR Dow Jones REIT ETF (a) | | | 7,121,594 | |
| | 435,076 | | | SPDR S&P Global Natural Resources ETF (a)(c) | | | 18,677,813 | |
| | 66,906 | | | SPDR S&P International Energy Sector ETF (a) | | | 1,293,962 | |
| | 25,621 | | | SPDR S&P Metals and Mining ETF | | | 696,635 | |
| | | | | | | | 61,156,778 | |
| | | | | Total Investment Companies
(Cost $64,768,544) | | | 61,156,778 | |
Number of
Shares | | | | | Value |
| | | | | SHORT TERM INVESTMENTS - 5.31% | | | | |
| | | | | Money Market Funds - 5.31% | | | | |
| | 3,428,156 | | | Federated Prime Obligations Fund
Effective Yield, 0.05% | | $ | 3,428,156 | |
| | | | | Total Short Term Investments
(Cost $3,428,156) | | | 3,428,156 | |
| | | | | INVESTMENTS PURCHASED AS SECURITIES LENDING COLLATERAL - 29.02% | | | | |
| | | | | Money Market Funds - 29.02% | | | | |
| | 18,747,590 | | | Mount Vernon Prime Portfolio Effective Yield, 0.22% | | | 18,747,590 | |
| | | | | Total Investments Purchased as Securities Lending Collateral
(Cost $18,747,590) | | | 18,747,590 | |
| | | | | Total Investments
(Cost $86,944,290) - 129.00% | | | 83,332,524 | |
| | | | | Liabilities in Excess of Other Assets - (29.00)% | | | (18,731,223 | ) |
| | | | | TOTAL NET ASSETS - 100.00% | | $ | 64,601,301 | |
| Percentages are stated as a percent of net assets. |
| (a) | All or portion of this security is on loan. |
| (b) | Non-income producing security. |
| (c) | Fair value of this security exceeds 25% of the Fund’s net assets. Additional information for this security, including the financial statements, is available from the SEC’s EDGAR database at www.sec.gov. |
See notes to financial statements.
GuideMark® Core Fixed Income Fund
SCHEDULE OF INVESTMENTS
March 31, 2015
| Principal | | | | |
| Amount | | | | Value |
| | | | | ASSET BACKED SECURITIES - 10.78% | | | | |
| | 54,901 | | | Accredited Mortgage Loan Trust
Series 2005-3, 0.390%,
09/25/2035 (a) | | $ | 54,871 | |
| | | | | Ally Master Owner Trust | | | | |
| | 365,000 | | | Series 2012-5, 1.540%,
09/15/2019 | | | 366,563 | |
| | 305,000 | | | Series 2014-5, 1.600%,
10/15/2019 | | | 306,572 | |
| | | | | American Credit Acceptance | | | | |
| | | | | Receivables Trust | | | | |
| | 16,440 | | | Series 2012-3, 1.640%, 11/15/2016
(Acquired 11/27/2012 and 06/21/2013,
Cost $16,440) (b) | | | 16,442 | |
| | 34,399 | | | Series 2013-2, 1.320%, 02/15/2017
(Acquired 07/31/2013 and 05/21/2014,
Cost $34,402) (b) | | | 34,412 | |
| | 26,438 | | | Series 2014-1, 1.140%, 03/12/2018
(Acquired 01/07/2014,
Cost $26,436) (b) | | | 26,449 | |
| | 70,359 | | | Series 2013-1, 1.450%, 04/16/2018
(Acquired 03/20/2013 and 02/27/2014,
Cost $70,358) (b) | | | 70,392 | |
| | 1,125,000 | | | American Express Credit Account
Master Trust
Series 2014-2, 1.260%,
01/15/2020 | | | 1,128,715 | |
| | | | | AmeriCredit Automobile
Receivables Trust | | | | |
| | 315,000 | | | Series 2012-5, 1.120%,
11/08/2017 | | | 315,872 | |
| | 845,000 | | | Series 2014-3, 1.150%, 06/10/2019 | | | 845,210 | |
| | 305,000 | | | AMMC CDO
Series 2014-14A, 1.706%, 07/27/2026
(Acquired 06/12/2014,
Cost $304,372) (a)(b) | | | 303,628 | |
| | 500,000 | | | Apidos CLO XII
Series 2013-12A, 1.331%,
04/15/2025 (Acquired 03/15/2013,
Cost $500,000) (a)(b) | | | 492,350 | |
| | 320,000 | | | Apidos CLO XX
Series 2015-20, 1.803%, 01/16/2027
(Acquired 01/15/2015,
Cost $320,000) (a)(b) | | | 321,088 | |
Principal
Amount | | | | | Value | |
| | | | | ASSET BACKED SECURITIES (Continued) | | | | |
| | 295,594 | | | Ares XXX CLO Ltd. | | | | |
| | | | | Series 2014-30A, 1.107%, | | | | |
| | | | | 04/20/2023 (Acquired 05/08/2014, | | | | |
| | | | | Cost $293,051) (a)(b) | | $ | 294,470 | |
| | | | | ARI Fleet Lease Trust | | | | |
| | 78,781 | | | Series 2012-B, 0.461%, 01/15/2021 | | | | |
| | | | | (Acquired 10/16/2012, | | | | |
| | | | | Cost $78,781) (a)(b) | | | 78,653 | |
| | 260,000 | | | Series 2014-A, 1.550%, 11/15/2022 | | | | |
| | | | | (Acquired 04/01/2014, | | | | |
| | | | | Cost $259,927) (b) | | | 260,888 | |
| | 270,000 | | | Atlas Senior Loan Fund Ltd.
Series 2014-6A, 1.778%, 10/15/2026
(Acquired 08/28/2014,
Cost $269,865) (a)(b) | | | 269,865 | |
| | 260,157 | | | Atrium VII
Series 7-AR, 1.332%, 11/16/2022
(Acquired 08/06/2014,
Cost $260,157) (a)(b) | | | 260,027 | |
| | 500,000 | | | Atrium IX
Series 9-A, 1.536%, 02/28/2024
(Acquired 01/24/2013,
Cost $500,000) (a)(b) | | | 497,150 | |
| | 500,000 | | | Atrium X
Series 10-A, 1.349%, 07/16/2025
(Acquired 04/25/2013,
Cost $499,250) (a)(b) | | | 493,100 | |
| | 260,000 | | | Avalon IV Capital Ltd.
Series 2012-1AR, 1.398%,
04/17/2023 (Acquired 04/02/2014,
Cost $260,000) (a)(b) | | | 259,948 | |
| | 360,000 | | | Avery Point CLO Ltd.
Series 2014-1A, 1.754%,
04/25/2026 (Acquired 03/19/2014,
Cost $360,000) (a)(b) | | | 358,308 | |
| | 825,000 | | | Babson CLO Ltd.
Series 2013-IA, 1.331%, 04/20/2025
(Acquired 05/03/2013,
Cost $825,000) (a)(b) | | | 814,935 | |
| | | | | Capital Auto Receivables Asset Trust | | | | |
| | 1,240,000 | | | Series 2013-4, 1.090%,
03/20/2018 | | | 1,240,413 | |
| | 315,000 | | | Series 2014-1, 1.320%,
06/20/2018 | | | 316,302 | |
See notes to financial statements.
GuideMark® Core Fixed Income Fund
SCHEDULE OF INVESTMENTS (Continued)
March 31, 2015
Principal
Amount | | | | | Value | |
| | | | | ASSET BACKED SECURITIES (Continued) | |
| | 1,225,000 | | | Capital One Multi-Asset
Execution Trust
Series 2014-5A, 1.480%,
07/15/2020 | | $ | 1,234,671 | |
| | 7,890 | | | CarFinance Capital LLC
Series 2013-1A, 1.650%,
07/17/2017 (Acquired 05/21/2013,
Cost $7,890) (b) | | | 7,894 | |
| | | | | Carlyle Global Market Strategies | | | | |
| | 555,000 | | | Series 2013-3A, 1.351%,
07/15/2025 (Acquired 06/10/2013,
Cost $553,834) (a)(b) | | | 547,230 | |
| | 250,000 | | | Series 2014-4B, 2.700%, 10/15/2026
(Acquired 03/05/2015,
Cost $251,552) (a)(b) | | | 251,725 | |
| | 235,000 | | | CarMax Auto Owner Trust
Series 2013-3, 1.490%,
01/15/2019 | | | 236,712 | |
| | | | | Cent CLO LP | | | | |
| | 325,000 | | | Series 2013-20A, 1.724%,
01/25/2026 (Acquired 12/18/2013,
Cost $325,000) (a)(b) | | | 324,870 | |
| | 325,000 | | | Series 2015-23A, 1.760%,
04/17/2026 (Acquired 03/19/2015,
Cost $325,000) (a)(b)(h) | | | 325,000 | |
| | 345,000 | | | Chase Issuance Trust
Series 2007-B1, 0.411%,
04/15/2019 (a) | | | 343,260 | |
| | | | | CIFC Funding Ltd. | | | | |
| | 365,000 | | | Series 2013-1A, 1.379%,
04/16/2025 (Acquired 02/22/2013,
Cost $365,000) (a)(b) | | | 360,000 | |
| | 295,000 | | | Series 2014-2A, 1.713%,
05/24/2026 (Acquired 07/02/2014,
Cost $294,911) (a)(b) | | | 294,085 | |
| | 1,060,000 | | | Citibank Credit Card Issuance Trust
Series 2013-A3, 1.110%,
07/23/2018 | | | 1,064,528 | |
| | 64,633 | | | Conseco Finance Securitizations Corp.
Series 2000-4, 8.310%,
05/01/2032 (a) | | | 44,172 | |
Principal
Amount | | | | Value |
| | | | | |
| | | | | ASSET BACKED SECURITIES (Continued) | |
| | 12,720 | | | Countrywide Asset-Backed Certificates
Series 2005-4, 4.456%,
10/25/2035 (a) | | $ | 12,736 | |
| | | | | CPS Auto Receivables Trust | | | | |
| | 181,789 | | | Series 2013-C, 1.640%, 04/16/2018
(Acquired 09/24/2013,
Cost $181,767) (b) | | | 182,003 | |
| | 66,130 | | | Series 2013-D, 1.540%,
07/16/2018 (Acquired 12/10/2013,
Cost $66,124) (b) | | | 66,119 | |
| | 73,773 | | | Series 2014-A, 1.210%, 08/15/2018
(Acquired 03/10/2014,
Cost $73,766) (b) | | | 73,516 | |
| | 53,175 | | | Series 2012-C, 1.820%, 12/16/2019
(Acquired 09/11/2012,
Cost $53,173) (b) | | | 53,343 | |
| | 83,935 | | | Series 2012-D, 1.480%, 03/16/2020
(Acquired 12/07/2012,
Cost $83,924) (b) | | | 83,972 | |
| | 111,658 | | | Series 2013-A, 1.310%, 06/15/2020
(Acquired 03/12/2013,
Cost $111,644) (b) | | | 110,910 | |
| | | | | Credit Acceptance Auto Loan Trust | | | | |
| | 132,697 | | | Series 2012-2A, 1.520%,
03/16/2020 (Acquired 09/11/2012,
Cost $132,674) (b) | | | 133,003 | |
| | 250,000 | | | Series 2014-2A, 1.880%,
03/15/2022 (Acquired 09/18/2014,
Cost $249,955) (b) | | | 251,003 | |
| | 425,000 | | | Dryden XXVI Senior Loan Fund
Series 2013-26A, 1.331%,
07/15/2025 (Acquired 02/20/2013,
Cost $425,000) (a)(b) | | | 419,093 | |
| | 390,000 | | | Dryden 33 Senior Loan Fund
Series 2014-33A, 1.711%,
07/15/2026 (Acquired 04/09/2014,
Cost $390,000) (a)(b) | | | 390,000 | |
| | 270,000 | | | Dryden 38 Senior Loan Fund
Series 2015-3A, 1.730%,
07/15/2027 (Acquired 03/25/2015,
Cost $270,000) (b)(h) | | | 270,000 | |
See notes to financial statements.
GuideMark® Core Fixed Income Fund
SCHEDULE OF INVESTMENTS (Continued)
March 31, 2015
Principal
Amount | | | | Value |
| | | ASSET BACKED SECURITIES (Continued) |
| | | | | DT Auto Owner Trust | | | | |
| | 31,778 | | | Series 2014-1A, 0.660%,
07/17/2017 (Acquired 01/14/2014,
Cost $31,777) (b) | | $ | 31,774 | |
| | 362,158 | | | Series 2015-1A, 1.060%,
09/17/2018 (Acquired 02/18/2015,
Cost $362,155) (b) | | | 362,329 | |
| | 203,162 | | | Enterprise Fleet Financing LLC
Series 2012-1, 1.410%, 11/20/2017 (Acquired 11/02/2012,
Cost $203,707) (b) | | | 203,219 | |
| | 196,841 | | | First Investors Auto Owner Trust
Series 2013-2A, 1.230%,
03/15/2019 (Acquired 06/13/2013,
Cost $196,818) (b) | | | 197,184 | |
| | 415,000 | | | Flatiron CLO Ltd.
Series 2014-1A, 1.607%,
07/17/2026 (Acquired 06/05/2014,
Cost $414,585) (a)(b) | | | 414,046 | |
| | 580,000 | | | Ford Credit Auto Lease Trust
Series 2014-A, 0.900%,
06/15/2017 | | | 579,899 | |
| | 965,000 | | | Ford Credit Auto Owner Trust
Series 2015-A, 2.030%,
08/15/2020 | | | 970,224 | |
| | 1,585,000 | | | Ford Credit Floorplan Master
Owner Trust A
Series 2014-4, 1.400%,
08/15/2019 | | | 1,589,906 | |
| | 370,000 | | | Galaxy XIX CLO Ltd.
Series 2015-19, 1.806%,
01/24/2027 (Acquired 01/29/2015,
Cost $369,441) (a)(b) | | | 369,445 | |
| | 100,000 | | | GCO Education Loan Funding Trust
Series 2006-1, 0.463%,
05/25/2036 (a) | | | 92,561 | |
| | 200,000 | | | GE Equipment Small Ticket LLC
Series 2014-1A, 1.440%,
10/25/2021 (Acquired 04/02/2014,
Cost $199,963) (b) | | | 201,540 | |
| | 305,000 | | | Gramercy Park CLO Ltd.
Series 2012-1AR, 1.528%,
07/17/2023 (Acquired 07/10/2014,
Cost $305,000) (a)(b) | | | 306,068 | |
Principal
Amount | | | | Value |
| | | ASSET BACKED SECURITIES (Continued) |
| | | | | HLSS Servicer Advance Receivables Backed Note | | | | |
| | 370,000 | | | Series 2013-T1, 1.495%, 01/16/2046
(Acquired 01/16/2013 through
01/29/2014,
Cost $370,777) (b) | | $ | 368,044 | |
| | 435,000 | | | Series 2013-T3, 1.793%, 05/15/2046
(Acquired 05/17/2013 and 08/28/2013,
Cost $431,753) (b) | | | 431,588 | |
| | 175,000 | | | Series 2013-T1, 2.289%, 01/15/2048
(Acquired 01/16/2013,
Cost $175,000) (a)(b) | | | 172,078 | |
| | 585,000 | | | Hyundai Auto Receivables Trust
Series 2014-A, 0.790%,
07/16/2018 | | | 584,906 | |
| | 390,000 | | | Limerock CLO
Series 2014-2A, 1.731%, 04/18/2026
(Acquired 02/26/2014,
Cost $389,581) (a)(b) | | | 389,337 | |
| | 247,665 | | | M&T Bank Auto Receivables Trust
Series 2013-1A, 1.060%, 11/15/2017
(Acquired 06/10/2014,
Cost $248,425) (b) | | | 248,368 | |
| | 575,000 | | | Madison Park Funding XI Ltd.
Series 2013-11A, 1.531%,
10/23/2025 (Acquired 08/16/2013,
Cost $574,425) (a)(b) | | | 570,400 | |
| | 250,000 | | | Madison Park Funding XII Ltd.
Series 2014-12A, 1.731%,
07/20/2026 (Acquired 05/08/2014,
Cost $250,000) (a)(b) | | | 249,675 | |
| | 280,000 | | | Magnetite CLO Ltd.
Series 2014-9A, 1.676%,
07/25/2026 (Acquired 06/13/2014,
Cost $279,857) (a)(b) | | | 279,244 | |
| | | | | Mercedes Benz Auto Lease Trust | | | | |
| | 525,000 | | | Series 2013-B, 0.760%,
07/15/2019 | | | 525,216 | |
| | 1,420,000 | | | Series 2014-A, 0.900%,
12/16/2019 | | | 1,420,964 | |
| | 395,811 | | | Morgan Stanley Capital I, Inc. Trust
Series 2003-NC10, 1.190%,
10/25/2033 (a) | | | 376,038 | |
See notes to financial statements.
GuideMark® Core Fixed Income Fund
SCHEDULE OF INVESTMENTS (Continued)
March 31, 2015
Principal
Amount | | | | Value |
| | | ASSET BACKED SECURITIES (Continued) |
| | | | | Neuberger Berman CLO Ltd. | | | | |
| | 275,000 | | | Series 2014-17A, 1.626%,
08/04/2025 (Acquired 06/19/2014,
Cost $275,000) (a)(b) | | $ | 274,010 | |
| | 285,000 | | | Series 2014-16A, 1.701%,
04/15/2026 (Acquired 02/11/2014,
Cost $283,803) (a)(b) | | | 284,516 | |
| | 280,000 | | | Oak Hill Credit Partners
Series 2013-8A, 1.351%,
04/20/2025 (Acquired 04/17/2013,
Cost $280,000) (a)(b) | | | 276,500 | |
| | 325,000 | | | Oaktree EIF II Series A1 Ltd.
Series 2015-B1A, 1.811%,
02/15/2026 (Acquired 02/20/2015,
Cost $325,000) (a)(b) | | | 325,000 | |
| | 410,000 | | | Octagon Investment Partners XVI Ltd.
Series 2013-1A, 1.348%, 07/17/2025
(Acquired 05/15/2013,
Cost $409,344) (a)(b) | | | 404,137 | |
| | 450,000 | | | OZLM Funding Ltd.
Series 2013-5A, 1.728%,
01/20/2026 (Acquired 11/22/2013,
Cost $449,775) (a)(b) | | | 447,660 | |
| | | | | Prestige Auto Receivables Trust | | | | |
| | 220,000 | | | Series 2013-1A, 1.330%,
05/15/2019 (Acquired 04/03/2013,
Cost $219,948) (b) | | | 220,574 | |
| | 120,000 | | | Series 2014-1A, 1.520%,
04/15/2020 (Acquired 03/18/2014,
Cost $119,993) (b) | | | 120,215 | |
| | 135,000 | | | Series 2014-1A, 1.910%,
04/15/2020 (Acquired 06/25/2014,
Cost $135,033) (b) | | | 135,141 | |
| | 695,000 | | | Race Point VIII CLO Ltd.
Series 2013-8A, 1.482%,
02/20/2025 (Acquired 02/06/2013,
Cost $695,000) (a)(b) | | | 686,869 | |
| | 119,792 | | | Residential Asset Mortgage
Products, Inc.
Series 2004-RZ1, 0.650%,
03/25/2034 (a) | | | 119,133 | |
Principal
Amount | | | | Value |
| | | ASSET BACKED SECURITIES (Continued) |
| | | | | Santander Drive Auto | | | | |
| | | | | Receivables Trust | | | | |
| | 42,660 | | | Series 2012-4, 1.830%,
03/15/2017 | | $ | 42,705 | |
| | 193,312 | | | Series 2012-5, 1.560%,
08/15/2018 | | | 193,640 | |
| | 250,000 | | | Seneca Park CLO Ltd.
Series 2014-1A, 1.737%,
07/17/2026 (Acquired 05/09/2014,
Cost $249,866) (a)(b) | | | 251,000 | |
| | 250,000 | | | Shackleton CLO Ltd.
Series 2014-6A, 1.737%,
07/17/2026 (Acquired 06/12/2014,
Cost $248,475) (a)(b) | | | 248,875 | |
| | 3,687 | | | SNAAC Auto Receivables Trust
Series 2013-1A, 1.140%,
07/16/2018 (Acquired 04/02/2013,
Cost $3,687) (b) | | | 3,688 | |
| | 257,000 | | | Sound Point CLO IV Ltd.
Series 2013-3A, 1.626%,
01/21/2026 (Acquired 03/27/2015,
Cost $255,586) (a)(b) | | | 255,098 | |
| | 315,000 | | | Sound Point CLO VIII Ltd.
Series 2015-1A, 1.830%,
03/13/2027 (Acquired 03/05/2015,
Cost $314,213) (b)(h) | | | 314,213 | |
| | 225,000 | | | Springleaf Funding Trust
Series 2014-AA, 2.410%,
12/15/2022 (Acquired 03/19/2014,
Cost $224,963) (b) | | | 225,092 | |
| | 325,000 | | | Treman Park CLO LLC
Series 2015-1A, 1.761%,
04/20/2027 (Acquired 03/05/2015,
Cost $325,000) (a)(b)(h) | | | 325,000 | |
| | 29,354 | | | U.S. Education Loan Trust, LLC
Series 2006-1, 0.364%, 03/01/2025
(Acquired 08/06/2010,
Cost $28,693) (a)(b) | | | 29,314 | |
| | 620,000 | | | Volkswagen Auto Lease Trust
Series 2015-A3, 1.250%,
12/20/2017 | | | 621,189 | |
See notes to financial statements.
GuideMark® Core Fixed Income Fund
SCHEDULE OF INVESTMENTS (Continued)
March 31, 2015
| Principal | | | | | | |
| Amount | | | | | Value | |
| | | | | ASSET BACKED SECURITIES (Continued) | | | | |
| | 305,000 | | | Voya CLO Ltd. | | | | |
| | | | | Series 2015-1A, 1.742%,
04/18/2027 (Acquired 03/03/2015,
Cost $304,688) (a)(b)(h) | | $ | 304,688 | |
| | | | | Westlake Automobile
Receivables Trust | | | | |
| | 89,066 | | | Series 2014-1A, 0.700%,
05/15/2017 (Acquired 05/20/2014,
Cost $89,059) (b) | | | 89,018 | |
| | 74,143 | | | Series 2013-1A, 1.120%,
01/15/2018 (Acquired 09/18/2013,
Cost $74,135) (b) | | | 74,182 | |
| | | | | Total Asset Backed Securities
(Cost $33,748,644) | | | 33,711,978 | |
| | | | | COLLATERALIZED MORTGAGE
OBLIGATIONS - 5.80% | | | | |
| | 160,000 | | | Aventura Mall Trust | | | | |
| | | | | Series 2013-AVM, 3.743%,
12/07/2032 (Acquired 12/10/2013,
Cost $164,644) (a)(b) | | | 172,905 | |
| | | | | Banc of America Commercial
Mortgage Trust | | | | |
| | 230,000 | | | Series 2006-2, 5.728%,
05/10/2045 (a) | | | 236,848 | |
| | 2,603 | | | Series 2007-5, 5.620%,
02/10/2051 | | | 2,600 | |
| | 150,000 | | | BB-UBS Trust | | | | |
| | | | | Series 2012-SHOW, 3.430%,
11/07/2036 (Acquired 12/05/2012,
Cost $155,324) (b) | | | 156,728 | |
| | | | | Bear Stearns Commercial Mortgage
Securities Trust | | | | |
| | 160,000 | | | Series 2006-PW14, 5.201%,
12/11/2038 | | | 168,557 | |
| | 173,377 | | | Series 2005-PW10, 5.405%,
12/11/2040 (a) | | | 176,209 | |
| | 2,952,576 | | | Series 2006-PW13, 5.540%,
09/11/2041 | | | 3,083,179 | |
| | 181,302 | | | Series 2007-PW15, 5.331%,
02/11/2044 | | | 193,033 | |
| | | | | CD Commercial Mortgage Trust | | | | |
| | 284,468 | | | Series 2005-CD1, 5.226%,
07/15/2044 (a) | | | 285,911 | |
| Principal | | | | | | |
| Amount | | | | | Value | |
| | | | | COLLATERALIZED MORTGAGE
OBLIGATIONS (Continued) | | | | |
| | 295,000 | | | Series 2007-CD4, 5.322%,
12/11/2049 | | $ | 310,812 | |
| | 107,632 | | | Chase Mortgage Financial Trust | | | | |
| | | | | Series 2007-A1, 2.543%,
02/25/2037 (a) | | | 103,662 | |
| | | | | Citigroup Commercial
Mortgage Trust | | | | |
| | 150,000 | | | Series 2014-GC19, 4.023%,
03/12/2047 | | | 165,525 | |
| | 145,000 | | | Series 2014-GC21, 3.855%,
05/10/2047 | | | 158,209 | |
| | 78,134 | | | Series 2006-C4, 5.771%,
03/17/2049 (a) | | | 80,795 | |
| | 84,909 | | | COBALT CMBS Commercial
Mortgage Trust | | | | |
| | | | | Series 2007-C2, 5.484%,
04/15/2047 (a) | | | 90,673 | |
| | | | | COMM Mortgage Trust | | | | |
| | 120,000 | | | Series 2013-300P, 4.353%,
08/12/2030 (Acquired 08/15/2013,
Cost $122,373) (b) | | | 134,438 | |
| | 110,000 | | | Series 2013-CR9, 4.235%,
07/12/2045 (a) | | | 123,937 | |
| | 110,000 | | | Series 2013-LC6, 2.941%,
01/12/2046 (a) | | | 113,379 | |
| | 95,000 | | | Series 2013-CR8, 3.612%,
06/12/2046 (a) | | | 102,452 | |
| | 160,000 | | | Series 2014-UBS2, 3.961%,
03/10/2047 | | | 175,431 | |
| | 115,000 | | | Series 2014-LC15, 4.006%,
04/12/2047 | | | 126,604 | |
| | 145,000 | | | Series 2014-CR17, 3.977%,
05/10/2047 | | | 159,735 | |
| | 235,000 | | | Series 2014-CR18, 3.828%,
07/17/2047 | | | 255,335 | |
| | 120,000 | | | Series 2014-UBS4, 3.694%,
08/12/2047 | | | 128,591 | |
| | 221,763 | | | Commercial Mortgage Loan Trust | | | | |
| | | | | Series 2008-LS1, 6.040%,
12/10/2049 (a) | | | 237,453 | |
| | | | | Countrywide Home Loans, Inc. | | | | |
| | 24,256 | | | Series 2004-HYB6, 2.418%,
11/20/2034 (a) | | | 23,354 | |
See notes to financial statements.
GuideMark® Core Fixed Income Fund
SCHEDULE OF INVESTMENTS (Continued)
March 31, 2015
| Principal | | | | | | |
| Amount | | | | | Value | |
| | | | | COLLATERALIZED MORTGAGE OBLIGATIONS (Continued) | | | | |
| | 121,118 | | | Series 2005-11, 0.770%,
03/25/2035 (a) | | $ | 109,540 | |
| | 107,049 | | | Credit Suisse Commercial
Mortgage Trust | | | | |
| | | | | Series 2006-C4, 5.467%,
09/15/2039 | | | 111,957 | |
| | 140,000 | | | DBUBS Mortgage Trust | | | | |
| | | | | Series 2011-LC2A, 4.537%,
07/12/2044 (Acquired 06/16/2014,
Cost $152,884) (b) | | | 157,366 | |
| | 400,000 | | | Four Times Square Trust | | | | |
| | | | | Series 2006-4TS, 5.401%,
12/13/2028 (Acquired 11/06/2012,
Cost $450,790) (b) | | | 459,565 | |
| | 145,000 | | | GS Mortgage Securities Corp. II | | | | |
| | | | | Series 2012-BWTR, 2.954%,
11/07/2034 (Acquired 12/11/2012,
Cost $147,726) (b) | | | 148,721 | |
| | 145,000 | | | GS Mortgage Securities Corp. Trust | | | | |
| | | | | Series 2012-ALOH, 3.551%,
04/12/2034 (Acquired 03/08/2013,
Cost $149,915) (b) | | | 155,262 | |
| | | | | GS Mortgage Securities Trust | | | | |
| | 150,000 | | | Series 2014-GC20, 3.998%,
04/12/2047 | | | 165,277 | |
| | 175,000 | | | Series 2014-GC22, 3.862%,
06/10/2047 | | | 191,094 | |
| | 300,000 | | | Hilton USA Trust | | | | |
| | | | | Series 2013-HLT, 2.662%,
11/07/2030 (Acquired 11/22/2013
and 07/22/2014,
Cost $301,656) (b) | | | 301,283 | |
| | | | | JP Morgan Chase Commercial
Mortgage Securities Trust | | | | |
| | 145,000 | | | Series 2012-WLDN, 3.905%,
05/07/2030 (Acquired 05/07/2013 and 06/25/2013,
Cost $146,101) (b) | | | 154,641 | |
| | 125,310 | | | Series 2005-LDP2, 4.738%,
07/15/2042 | | | 125,130 | |
| | 235,000 | | | Series 2006-LDP7, 5.865%,
04/15/2045 (a) | | | 242,981 | |
| Principal | | | | | | |
| Amount | | | | | Value | |
| | | | | COLLATERALIZED MORTGAGE OBLIGATIONS (Continued) | | | | |
| | 343,182 | | | Series 2006-LDP9, 5.336%,
05/15/2047 | | $ | 361,758 | |
| | 235,000 | | | Series 2007-CB19, 5.698%,
02/12/2049 (a) | | | 253,283 | |
| | | | | JPMBB Commercial Mortgage
Securities Trust | | | | |
| | 1,205,000 | | | Series 2013-C12, 3.157%,
07/17/2045 | | | 1,261,243 | |
| | 145,000 | | | Series 2014-C19, 3.997%,
04/17/2047 | | | 159,686 | |
| | 120,000 | | | Series 2014-C21, 3.775%,
08/16/2047 | | | 129,975 | |
| | 120,000 | | | Series 2014-C22, 3.801%,
09/17/2047 | | | 129,875 | |
| | 265,000 | | | Series 2014-C26, 3.494%,
01/17/2048 | | | 280,633 | |
| | 180,058 | | | JPMorgan Commercial Mortgage
Securities Corp. | | | | |
| | | | | Series 2012-LC9, 2.840%,
12/17/2047 | | | 184,548 | |
| | | | | Lehman Brothers-UBS Commercial
Mortgage Trust | | | | |
| | 233,891 | | | Series 2006-C4, 5.833%,
06/15/2038 (a) | | | 243,803 | |
| | 604,359 | | | Series 2007-C1, 5.424%,
02/15/2040 | | | 643,183 | |
| | 285,698 | | | Series 2007-C2, 5.430%,
02/15/2040 | | | 304,935 | |
| | 225,896 | | | Series 2007-C6, 5.858%,
07/15/2040 (a) | | | 237,321 | |
| | 280,000 | | | Merrill Lynch Mortgage Trust | | | | |
| | | | | Series 2006-C1, 5.677%,
05/12/2039 (a) | | | 288,937 | |
| | | | | ML-CFC Commercial
Mortgage Trust | | | | |
| | 284,880 | | | Series 2007-5, 5.378%,
08/14/2048 | | | 301,312 | |
| | 165,000 | | | Series 2007-9, 5.700%,
09/12/2049 | | | 177,081 | |
| | | | | Morgan Stanley Bank of America
Merrill Lynch Trust | | | | |
| | 35,000 | | | Series 2014-C14, 4.064%,
02/15/2047 | | | 38,734 | |
See notes to financial statements.
GuideMark® Core Fixed Income Fund
SCHEDULE OF INVESTMENTS (Continued)
March 31, 2015
| Principal | | | | | | |
| Amount | | | | | Value | |
| | | | | COLLATERALIZED MORTGAGE
OBLIGATIONS (Continued) | | | | |
| | 175,000 | | | Series 2014-C17, 3.741%,
08/16/2047 | | $ | 188,776 | |
| | | | | Morgan Stanley Capital I Trust | | | | |
| | 185,000 | | | Series 2014-MP, 3.469%,
08/11/2033 (Acquired 11/13/2014,
Cost $190,287) (b) | | | 194,823 | |
| | 220,000 | | | Series 2007-IQ14, 5.692%,
04/15/2049 (a) | | | 236,158 | |
| | 161,825 | | | Series 2007-IQ16, 5.809%,
12/12/2049 | | | 175,622 | |
| | 130,000 | | | OBP Depositor LLC Trust | | | | |
| | | | | Series 2010-OBP, 4.646%,
07/17/2045 (Acquired 08/15/2012,
Cost $146,796) (b) | | | 146,139 | |
| | | | | Springleaf Mortgage Loan Trust | | | | |
| | 131,246 | | | Series 2013-1A, 1.270%,
06/25/2058 (Acquired 04/03/2013,
Cost $131,236) (a)(b) | | | 131,404 | |
| | 254,145 | | | Series 2013-2A, 1.780%,
12/25/2065 (Acquired 07/03/2013,
Cost $251,567) (a)(b) | | | 254,341 | |
| | 155,171 | | | Series 2013-2A, 3.520%,
12/25/2065 (Acquired 07/03/2013,
Cost $149,465) (b) | | | 158,743 | |
| | 250,000 | | | Symphony CLO VIII LP | | | | |
| | | | | Series 2012-8AR, 1.352%,
01/09/2023 (Acquired 09/15/2014,
Cost $250,000) (a)(b) | | | 248,150 | |
| | 295,000 | | | Symphony CLO XIV Ltd. | | | | |
| | | | | Series 2014-14A, 1.733%,
07/14/2026 (Acquired 05/06/2014,
Cost $295,000) (a)(b) | | | 295,944 | |
| | 17,175 | | | TIAA Seasoned Commercial
Mortgage Trust | | | | |
| | | | | Series 2007-C4, 5.560%,
08/15/2039 (a) | | | 17,170 | |
| | 228,304 | | | Wachovia Bank Commercial
Mortgage Trust | | | | |
| | | | | Series 2006-C29, 5.308%,
11/15/2048 | | | 239,965 | |
| | | | | Wells Fargo-RBS Commercial
Mortgage Trust | | | | |
| Principal | | | | | | |
| Amount | | | | | Value | |
| | | | | COLLATERALIZED MORTGAGE
OBLIGATIONS (Continued) | | | | |
| | 805,000 | | | Series 2014-C19, 3.660%,
03/15/2047 | | $ | 860,580 | |
| | 175,000 | | | Series 2014-LC14, 4.045%,
03/15/2047 | | | 193,570 | |
| | 175,000 | | | Series 2014-C20, 3.995%,
05/17/2047 | | | 192,949 | |
| | 175,000 | | | Series 2014-C21, 3.678%,
08/16/2047 | | | 188,482 | |
| | 120,000 | | | Series 2014-LC16, 3.817%,
08/17/2050 | | | 130,539 | |
| | | | | Total Collateralized Mortgage Obligations
(Cost $17,967,091) | | | 18,138,834 | |
| | | | | CORPORATE OBLIGATIONS - 39.36% | | | | |
| | | | | Aerospace & Defense - 0.59% | | | | |
| | 315,000 | | | L-3 Communications Corp. | | | | |
| | | | | 3.950%, 05/28/2024 | | | 323,905 | |
| | 625,000 | | | Northrop Grumman Corp. | | | | |
| | | | | 3.850%, 04/15/2045 | | | 617,958 | |
| | | | | Raytheon Co. | | | | |
| | 75,000 | | | 3.125%, 10/15/2020 | | | 79,209 | |
| | 70,000 | | | 3.150%, 12/15/2024 | | | 72,762 | |
| | 740,000 | | | United Technologies Corp. | | | | |
| | | | | 1.800%, 06/01/2017 | | | 754,020 | |
| | | | | | | | 1,847,854 | |
| | | | | Air Freight & Logistics - 0.02% | | | | |
| | | | | FedEx Corp. | | | | |
| | 25,000 | | | 3.200%, 02/01/2025 | | | 25,391 | |
| | 50,000 | | | 4.100%, 02/01/2045 | | | 50,139 | |
| | | | | | | | 75,530 | |
| | | | | Auto Parts & Equipment - 0.21% | | | | |
| | 610,000 | | | Delphi Corp. | | | | |
| | | | | 4.150%, 03/15/2024 | | | 649,661 | |
| | | | | Banks - 6.42% | | | | |
| | 275,000 | | | Abbey National Treasury
Services PLC/London | | | | |
| | | | | 2.350%, 09/10/2019 | | | 279,634 | |
| | | | | Bank of America Corp. | | | | |
| | 1,170,000 | | | 2.600%, 01/15/2019 | | | 1,191,458 | |
| | 340,000 | | | 4.100%, 07/24/2023 | | | 363,180 | |
| | 115,000 | | | 4.200%, 08/26/2024 | | | 119,113 | |
See notes to financial statements.
GuideMark® Core Fixed Income Fund
SCHEDULE OF INVESTMENTS (Continued)
March 31, 2015
| Principal | | | | | | |
| Amount | | | | | Value | |
| | | | | CORPORATE OBLIGATIONS (Continued) | | | | |
| | | | | Banks (Continued) | | | | |
| | 350,000 | | | 4.000%, 01/22/2025 | | $ | 353,544 | |
| | 200,000 | | | 6.110%, 01/29/2037 | | | 244,329 | |
| | 110,000 | | | 7.750%, 05/14/2038 | | | 158,913 | |
| | 935,000 | | | 5.000%, 01/21/2044 | | | 1,077,550 | |
| | 860,000 | | | Bank of New York Mellon Corp. | | | | |
| | | | | 1.300%, 01/25/2018 | | | 857,669 | |
| | 200,000 | | | Barclays Bank Plc | | | | |
| | | | | 3.750%, 05/15/2024 | | | 210,824 | |
| | | | | BPCE SA | | | | |
| | 415,000 | | | 2.500%, 12/10/2018 | | | 425,306 | |
| | 220,000 | | | 5.150%, 07/21/2024
(Acquired 01/13/2014,
Cost $219,593) (b) | | | 235,505 | |
| | 805,000 | | | Branch Banking & Trust Co. | | | | |
| | | | | 1.450%, 10/03/2016 | | | 813,063 | |
| | | | | Capital One NA | | | | |
| | 250,000 | | | 1.500%, 09/05/2017 | | | 249,565 | |
| | 400,000 | | | 1.650%, 02/05/2018 | | | 398,691 | |
| | | | | Citigroup, Inc. | | | | |
| | 180,000 | | | 4.450%, 01/10/2017 | | | 189,792 | |
| | 25,000 | | | 8.500%, 05/22/2019 | | | 31,163 | |
| | 1,570,000 | | | 2.500%, 07/29/2019 | | | 1,593,358 | |
| | 130,000 | | | 2.400%, 02/18/2020 | | | 130,613 | |
| | 675,000 | | | 4.300%, 11/20/2026 | | | 699,744 | |
| | 125,000 | | | 6.125%, 08/25/2036 | | | 151,859 | |
| | 135,000 | | | 6.675%, 09/13/2043 | | | 180,679 | |
| | 385,000 | | | Deutsche Bank AG | | | | |
| | | | | 1.350%, 05/30/2017 | | | 384,762 | |
| | 760,000 | | | Glitnir Bank | | | | |
| | | | | 6.693%, 06/15/2016 (Acquired
06/14/2006 and 06/21/2006,
Cost $758,848) (a)(c)(d) | | | 15,329 | |
| | | | | HSBC Holdings Plc | | | | |
| | 115,000 | | | 2.350%, 03/05/2020 | | | 115,655 | |
| | 200,000 | | | 6.800%, 06/01/2038 | | | 263,870 | |
| | | | | JPMorgan Chase & Co. | | | | |
| | 135,000 | | | 4.250%, 10/15/2020 | | | 147,326 | |
| | 350,000 | | | 4.500%, 01/24/2022 | | | 387,440 | |
| | 60,000 | | | 3.375%, 05/01/2023 | | | 60,467 | |
| | 70,000 | | | 3.625%, 05/13/2024 | | | 72,870 | |
| | 580,000 | | | 3.875%, 09/10/2024 | | | 595,719 | |
| | 30,000 | | | 5.600%, 07/15/2041 | | | 36,844 | |
| Principal | | | | | | |
| Amount | | | | | Value | |
| | | | | Banks (Continued) | | | | |
| | 180,000 | | | 5.625%, 08/16/2043 | | $ | 216,735 | |
| | 140,000 | | | 4.850%, 02/01/2044 | | | 160,154 | |
| | 250,000 | | | Kaupthing Bank Hf | | | | |
| | | | | 7.125%, 05/19/2016
(Acquired 05/12/2006,
Cost $248,680) (c)(d) | | | 5,002 | |
| | 230,000 | | | KeyCorp | | | | |
| | | | | 5.100%, 03/24/2021 | | | 261,564 | |
| | | | | PNC Bank NA | | | | |
| | 350,000 | | | 1.500%, 02/23/2018 | | | 351,447 | |
| | 300,000 | | | 2.400%, 10/18/2019 | | | 305,937 | |
| | 535,000 | | | PNC Funding Corp. | | | | |
| | | | | 3.300%, 03/08/2022 | | | 564,401 | |
| | 120,000 | | | Royal Bank of Scotland Plc | | | | |
| | | | | 5.125%, 05/28/2024 | | | 126,123 | |
| | 625,000 | | | SunTrust Banks, Inc. | | | | |
| | | | | 3.500%, 01/20/2017 | | | 650,924 | |
| | 380,000 | | | The Huntington National Bank | | | | |
| | | | | 1.700%, 02/26/2018 | | | 380,277 | |
| | 875,000 | | | Toronto-Dominion Bank | | | | |
| | | | | 2.625%, 09/10/2018 | | | 904,757 | |
| | 1,410,000 | | | U.S. Bancorp | | | | |
| | | | | 1.950%, 11/15/2018 | | | 1,433,217 | |
| | | | | Wells Fargo & Co. | | | | |
| | 400,000 | | | 2.150%, 01/15/2019 | | | 406,598 | |
| | 155,000 | | | 3.450%, 02/13/2023 | | | 158,760 | |
| | 140,000 | | | 4.125%, 08/15/2023 | | | 149,594 | |
| | 250,000 | | | 3.300%, 09/09/2024 | | | 258,521 | |
| | 115,000 | | | 3.000%, 02/19/2025 | | | 115,642 | |
| | 80,000 | | | 4.100%, 06/03/2026 | | | 84,519 | |
| | 216,000 | | | 5.606%, 01/15/2044 | | | 262,573 | |
| | 85,000 | | | 4.650%, 11/04/2044 | | | 91,391 | |
| | 1,155,000 | | | Westpac Banking Corp. | | | | |
| | | | | 1.500%, 12/01/2017 (e) | | | 1,161,503 | |
| | | | | | | | 20,085,473 | |
| | | | | Beverages - 0.36% | | | | |
| | | | | Anheuser-Busch InBev Worldwide, Inc. | | | | |
| | 120,000 | | | 0.800%, 07/15/2015 | | | 120,161 | |
| | 150,000 | | | 8.200%, 01/15/2039 | | | 235,223 | |
| | 770,000 | | | Diageo Capital Plc | | | | |
| | | | | 1.500%, 05/11/2017 | | | 777,605 | |
| | | | | | | | 1,132,989 | |
See notes to financial statements.
GuideMark® Core Fixed Income Fund
SCHEDULE OF INVESTMENTS (Continued)
March 31, 2015
Principal
Amount | | | | | Value | |
| | | | | CORPORATE OBLIGATIONS (Continued) | | | | |
| | | | | Biotechnology - 0.43% | | | | |
| | | | | Amgen, Inc. | | | | |
| | 150,000 | | | 3.625%, 05/22/2024 | | $ | 158,047 | |
| | 375,000 | | | 4.950%, 10/01/2041 | | | 422,714 | |
| | 270,000 | | | Celgene Corp. | | | | |
| | | | | 5.250%, 08/15/2043 | | | 314,073 | |
| | 230,000 | | | Genzyme Corp. | | | | |
| | | | | 5.000%, 06/15/2020 | | | 263,374 | |
| | | | | Gilead Sciences, Inc. | | | | |
| | 100,000 | | | 3.500%, 02/01/2025 | | | 105,582 | |
| | 70,000 | | | 4.500%, 02/01/2045 | | | 77,506 | |
| | | | | | | | 1,341,296 | |
| | | | | Capital Markets - 2.81% | | | | |
| | 880,000 | | | Bear Stearns Companies, Inc. | | | | |
| | | | | 7.250%, 02/01/2018 | | | 1,013,769 | |
| | | | | Goldman Sachs Group, Inc. | | | | |
| | 835,000 | | | 5.950%, 01/18/2018 | | | 930,354 | |
| | 145,000 | | | 2.600%, 04/23/2020 (e) | | | 146,713 | |
| | 460,000 | | | 4.000%, 03/03/2024 | | | 486,700 | |
| | 55,000 | | | 3.850%, 07/08/2024 | | | 57,627 | |
| | 290,000 | | | 3.500%, 01/23/2025 | | | 295,687 | |
| | 290,000 | | | 6.750%, 10/01/2037 | | | 381,525 | |
| | 100,000 | | | 6.250%, 02/01/2041 | | | 130,817 | |
| | | | | Morgan Stanley | | | | |
| | 350,000 | | | 5.950%, 12/28/2017 | | | 388,289 | |
| | 200,000 | | | 1.875%, 01/05/2018 | | | 201,503 | |
| | 275,000 | | | 2.500%, 01/24/2019 | | | 280,340 | |
| | 880,000 | | | 2.650%, 01/27/2020 | | | 893,256 | |
| | 70,000 | | | 4.875%, 11/01/2022 | | | 76,573 | |
| | 125,000 | | | 3.700%, 10/23/2024 | | | 130,585 | |
| | 770,000 | | | 4.350%, 09/08/2026 | | | 808,255 | |
| | 160,000 | | | 4.300%, 01/27/2045 | | | 166,501 | |
| | | | | The Bank of New York Mellon Corp. | | | | |
| | 880,000 | | | 2.200%, 03/04/2019 (e) | | | 894,556 | |
| | 610,000 | | | 2.150%, 02/24/2020 | | | 615,398 | |
| | 805,000 | | | Wachovia Corp. | | | | |
| | | | | 5.750%, 02/01/2018 | | | 900,774 | |
| | | | | | | | 8,799,222 | |
| | | | | Chemicals - 0.86% | | | | |
| | 445,000 | | | Dow Chemical Co. | | | | |
| | | | | 4.250%, 11/15/2020 | | | 489,378 | |
| | 595,000 | | | LYB International Finance BV | | | | |
| | | | | 4.000%, 07/15/2023 | | | 631,378 | |
Principal
Amount | | | | | | Value | |
| | | | | Chemicals (Continued) | | | | |
| | | | | Monsanto Co. | | | | |
| | 915,000 | | | 1.150%, 06/30/2017 | | $ | 919,151 | |
| | 605,000 | | | 4.400%, 07/15/2044 | | | 653,347 | |
| | | | | | | | 2,693,254 | |
| | | | | Commercial Services & Supplies - 0.45% | | | | |
| | 650,000 | | | International Lease Finance Corp. | | | | |
| | | | | 5.750%, 05/15/2016 | | | 676,487 | |
| | 210,000 | | | Republic Services, Inc. | | | | |
| | | | | 4.750%, 05/15/2023 | | | 237,009 | |
| | | | | Waste Management, Inc. | | | | |
| | 475,000 | | | 2.900%, 09/15/2022 | | | 479,185 | |
| | 20,000 | | | 3.125%, 03/01/2025 (e) | | | 20,235 | |
| | | | | | | | 1,412,916 | |
| | | | | Consumer Finance - 2.28% | | | | |
| | | | | American Express Co. | | | | |
| | 325,000 | | | 3.625%, 12/05/2024 | | | 334,437 | |
| | 457,000 | | | 4.050%, 12/03/2042 | | | 467,477 | |
| | | | | American Express Credit Corp. | | | | |
| | 535,000 | | | 1.300%, 07/29/2016 | | | 538,249 | |
| | 775,000 | | | 2.125%, 03/18/2019 | | | 785,426 | |
| | 580,000 | | | Capital One Financial Corp. | | | | |
| | | | | 2.450%, 04/24/2019 | | | 587,450 | |
| | | | | Caterpillar Financial Services Corp. | | | | |
| | 715,000 | | | 1.625%, 06/01/2017 | | | 725,041 | |
| | 390,000 | | | 2.250%, 12/01/2019 | | | 396,103 | |
| | | | | John Deere Capital Corp. | | | | |
| | 565,000 | | | 1.050%, 10/11/2016 | | | 568,204 | |
| | 675,000 | | | 1.300%, 03/12/2018 | | | 677,740 | |
| | | | | PACCAR Financial Corp. | | | | |
| | 565,000 | | | 1.150%, 08/16/2016 | | | 569,379 | |
| | 290,000 | | | 1.100%, 06/06/2017 | | | 290,474 | |
| | | | | Toyota Motor Credit Corp. | | | | |
| | 605,000 | | | 2.050%, 01/12/2017 (e) | | | 618,112 | |
| | 565,000 | | | 2.125%, 07/18/2019 | | | 574,363 | |
| | | | | | | | 7,132,455 | |
| | | | | Diversified Financial Services - 1.69% | | | | |
| | 380,000 | | | Credit Suisse | | | | |
| | | | | 1.375%, 05/26/2017 | | | 380,805 | |
| | | | | Ford Motor Credit Co. LLC | | | | |
| | 325,000 | | | 2.750%, 05/15/2015 | | | 325,000 | |
| | 200,000 | | | 1.461%, 03/27/2017 | | | 200,146 | |
| | 200,000 | | | 5.875%, 08/02/2021 | | | 235,757 | |
See notes to financial statements.
GuideMark® Core Fixed Income Fund
SCHEDULE OF INVESTMENTS (Continued)
March 31, 2015
Principal
Amount | | | | | Value | |
| | | | | CORPORATE OBLIGATIONS (Continued) | | | | |
| | | | | Diversified Financial Services (Continued) | | | | |
| | | | | General Electric Capital Corp. | | | | |
| | 575,000 | | | 0.532%, 01/09/2017 (a) | | $ | 575,955 | |
| | 210,000 | | | 5.300%, 02/11/2021 | | | 242,763 | |
| | 950,000 | | | 3.150%, 09/07/2022 | | | 984,114 | |
| | 550,000 | | | 5.875%, 01/14/2038 (e) | | | 712,581 | |
| | | | | Hutchison Whampoa International Ltd. | | | | |
| | 450,000 | | | 3.500%, 01/13/2017 | | | | |
| | | | | (Acquired 09/06/2012, | | | | |
| | | | | Cost $460,647) (b) | | | 465,964 | |
| | 200,000 | | | 1.625%, 10/31/2017 | | | | |
| | | | | (Acquired 10/28/2014, | | | | |
| | | | | Cost $199,540) (b) | | | 199,304 | |
| | 585,000 | | | National Rural Utilities Cooperative Finance Corp. | | | | |
| | | | | 5.450%, 04/10/2017 | | | 636,914 | |
| | 300,000 | | | NCUA Guaranteed Notes | | | | |
| | | | | 3.000%, 06/12/2019 | | | 318,642 | |
| | | | | | | | 5,277,945 | |
| | | | | Diversified Manufacturing - 0.35% | | | | |
| | 575,000 | | | Cooper U.S., Inc. | | | | |
| | | | | 3.875%, 12/15/2020 | | | 624,311 | |
| | 405,000 | | | Tyco Electronics Group SA | | | | |
| | | | | 6.550%, 10/01/2017 | | | 454,321 | |
| | | | | | | | 1,078,632 | |
| | | | | Diversified Telecommunication Services - 0.97% | | | | |
| | 95,000 | | | AT&T, Inc. | | | | |
| | | | | 4.800%, 06/15/2044 | | | 97,668 | |
| | | | | Verizon Communications, Inc. | | | | |
| | 252,000 | | | 2.625%, 02/21/2020 | | | 256,667 | |
| | 185,000 | | | 3.000%, 11/01/2021 | | | 188,971 | |
| | 475,000 | | | 5.150%, 09/15/2023 | | | 544,959 | |
| | 250,000 | | | 3.500%, 11/01/2024 | | | 256,360 | |
| | 780,000 | | | 6.400%, 09/15/2033 | | | 975,250 | |
| | 375,000 | | | 4.272%, 01/15/2036 (Acquired | | | | |
| | | | | 09/17/2013 through 10/03/2013, | | | | |
| | | | | Cost $343,847) (b) | | | 373,406 | |
| | 10,000 | | | 6.550%, 09/15/2043 | | | 13,041 | |
| | 335,000 | | | 4.672%, 03/15/2055 (Acquired | | | | |
| | | | | 09/11/2013 and 10/14/2014, | | | | |
| | | | | Cost $261,988) (b) | | | 329,545 | |
| | | | | | | | 3,035,867 | |
Principal
Amount | | | | | Value | |
| | | | | Electric Utilities - 1.44% | | | | |
| | 100,000 | | | American Electric Power Co., Inc. | | | | |
| | | | | 1.650%, 12/15/2017 | | $ | 100,647 | |
| | | | | Consolidated Edison Company of New York, Inc. | | | | |
| | 85,000 | | | 3.300%, 12/01/2024 | | | 89,423 | |
| | 300,000 | | | 4.625%, 12/01/2054 | | | 337,869 | |
| | 355,000 | | | Duke Energy Corp. | | | | |
| | | | | 3.550%, 09/15/2021 | | | 379,983 | |
| | 160,000 | | | Duke Energy Indiana, Inc. | | | | |
| | | | | 4.900%, 07/15/2043 | | | 194,011 | |
| | 460,000 | | | Duke Energy Progress, Inc. | | | | |
| | | | | 4.150%, 12/01/2044 | | | 503,787 | |
| | 300,000 | | | Edison International | | | | |
| | | | | 3.750%, 09/15/2017 | | | 317,712 | |
| | 100,000 | | | Massachusetts Electric Co. | | | | |
| | | | | 5.900%, 11/15/2039 | | | | |
| | | | | (Acquired 07/09/2013, | | | | |
| | | | | Cost $114,148) (b) | | | 131,391 | |
| | 325,000 | | | Northeast Utilities | | | | |
| | | | | 2.800%, 05/01/2023 | | | 322,807 | |
| | 115,000 | | | Pacific Gas & Electric Co. | | | | |
| | | | | 4.750%, 02/15/2044 | | | 133,081 | |
| | 150,000 | | | Progress Energy, Inc. | | | | |
| | | | | 3.150%, 04/01/2022 | | | 154,858 | |
| | 535,000 | | | PSI Energy, Inc. | | | | |
| | | | | 6.050%, 06/15/2016 | | | 568,553 | |
| | 285,000 | | | Sierra Pacific Power Co. | | | | |
| | | | | 3.375%, 08/15/2023 | | | 300,752 | |
| | 395,000 | | | The Southern Co. | | | | |
| | | | | 2.150%, 09/01/2019 | | | 397,633 | |
| | 485,000 | | | Union Electric Co. | | | | |
| | | | | 6.700%, 02/01/2019 | | | 573,055 | |
| | | | | | | | 4,505,562 | |
| | | | | Energy Equipment & Services - 0.26% | | | | |
| | 770,000 | | | Halliburton Co. | | | | |
| | | | | 3.250%, 11/15/2021 | | | 803,266 | |
| | | | | Engineering Construction - 0.13% | | | | |
| | 400,000 | | | ABB Finance USA, Inc. | | | | |
| | | | | 2.875%, 05/08/2022 | | | 408,789 | |
| | | | | Food & Staples Retailing - 0.42% | | | | |
| | 250,000 | | | CVS Health Corp. | | | | |
| | | | | 2.750%, 12/01/2022 | | | 251,600 | |
See notes to financial statements.
GuideMark® Core Fixed Income Fund
SCHEDULE OF INVESTMENTS (Continued)
March 31, 2015
Principal
Amount | | | | | Value | |
| | | | | CORPORATE OBLIGATIONS (Continued) | | | | |
| | | | | Food & Staples Retailing (Continued) | | | | |
| | 165,000 | | | Sysco Corp. | | | | |
| | | | | 2.350%, 10/02/2019 | | $ | 168,922 | |
| | 580,000 | | | Walgreens Boots Alliance, Inc. | | | | |
| | | | | 2.700%, 11/18/2019 | | | 593,157 | |
| | | | | Wal-Mart Stores, Inc. | | | | |
| | 40,000 | | | 1.000%, 04/21/2017 | | | 40,191 | |
| | 175,000 | | | 6.500%, 08/15/2037 | | | 245,299 | |
| | | | | | | | 1,299,169 | |
| | | | | Food Products - 0.05% | | | | |
| | 85,000 | | | ConAgra Foods, Inc. | | | | |
| | | | | 1.350%, 09/10/2015 | | | 85,184 | |
| | 80,000 | | | The J.M. Smucker Co. | | | | |
| | | | | 3.500%, 03/15/2025 | | | | |
| | | | | (Acquired 03/12/2015, | | | | |
| | | | | Cost $79,980) (b) | | | 82,413 | |
| | | | | | | | 167,597 | |
| | | | | Health Care Equipment & Supplies - 0.97% | | | | |
| | 630,000 | | | Baxter International, Inc. | | | | |
| | | | | 1.850%, 06/15/2018 | | | 634,508 | |
| | 480,000 | | | Becton, Dickinson & Co. | | | | |
| | | | | 3.250%, 11/12/2020 | | | 499,800 | |
| | 465,000 | | | CareFusion Corp. | | | | |
| | | | | 3.875%, 05/15/2024 | | | 490,729 | |
| | | | | Medtronic, Inc. | | | | |
| | 195,000 | | | 2.500%, 03/15/2020 | | | | |
| | | | | (Acquired 12/01/2014, | | | | |
| | | | | Cost $195,120) (b) | | | 199,456 | |
| | 175,000 | | | 3.150%, 03/15/2022 | | | | |
| | | | | (Acquired 12/01/2014, | | | | |
| | | | | Cost $174,712) (b) | | | 181,883 | |
| | 115,000 | | | 3.500%, 03/15/2025 | | | | |
| | | | | (Acquired 12/01/2014, | | | | |
| | | | | Cost $113,898) (b) | | | 120,372 | |
| | 475,000 | | | 4.375%, 03/15/2035 (Acquired | | | | |
| | | | | 12/01/2014 and 02/02/2015, | | | | |
| | | | | Cost $489,258) (b) | | | 517,586 | |
| | 85,000 | | | 4.625%, 03/15/2045 | | | | |
| | | | | (Acquired 12/01/2014, | | | | |
| | | | | Cost $84,772) (b) | | | 96,591 | |
| | 295,000 | | | Zimmer Holdings, Inc. | | | | |
| | | | | 3.550%, 04/01/2025 | | | 301,490 | |
| | | | | | | | 3,042,415 | |
Principal
Amount | | | | | Value | |
| | | | | Health Care Providers & Services - 1.56% | | | | |
| | 445,000 | | | Aetna, Inc. | | | | |
| | | | | 4.750%, 03/15/2044 | | $ | 522,985 | |
| | | | | Anthem, Inc. | | | | |
| | 150,000 | | | 5.850%, 01/15/2036 | | | 183,044 | |
| | 25,000 | | | 4.625%, 05/15/2042 | | | 27,207 | |
| | 125,000 | | | 5.100%, 01/15/2044 | | | 143,946 | |
| | | | | Cardinal Health, Inc. | | | | |
| | 240,000 | | | 2.400%, 11/15/2019 | | | 243,135 | |
| | 550,000 | | | 3.200%, 03/15/2023 | | | 561,850 | |
| | 325,000 | | | Express Scripts Holding Co. | | | | |
| | | | | 3.125%, 05/15/2016 | | | 332,998 | |
| | | | | Humana, Inc. | | | | |
| | 730,000 | | | 3.150%, 12/01/2022 | | | 735,807 | |
| | 375,000 | | | 3.850%, 10/01/2024 | | | 392,709 | |
| | 120,000 | | | Laboratory Corp. of America Holdings | | | | |
| | | | | 2.625%, 02/01/2020 | | | 120,887 | |
| | | | | McKesson Corp. | | | | |
| | 320,000 | | | 1.292%, 03/10/2017 | | | 320,477 | |
| | 160,000 | | | 1.400%, 03/15/2018 | | | 159,937 | |
| | 200,000 | | | Roche Holdings, Inc. | | | | |
| | | | | 3.350%, 09/30/2024 | | | | |
| | | | | (Acquired 02/09/2015, | | | | |
| | | | | Cost $210,525) (b) | | | 209,993 | |
| | | | | UnitedHealth Group, Inc. | | | | |
| | 125,000 | | | 1.400%, 10/15/2017 | | | 126,294 | |
| | 490,000 | | | 1.625%, 03/15/2019 | | | 491,380 | |
| | 305,000 | | | 3.950%, 10/15/2042 | | | 313,554 | |
| | | | | | | | 4,886,203 | |
| | | | | Industrial - 0.13% | | | | |
| | 420,000 | | | Pentair Finance SA | | | | |
| | | | | 3.150%, 09/15/2022 | | | 417,397 | |
| | | | | Industrial Conglomerates - 0.38% | | | | |
| | | | | General Electric Co. | | | | |
| | 380,000 | | | 5.250%, 12/06/2017 | | | 419,634 | |
| | 125,000 | | | 4.500%, 03/11/2044 | | | 140,907 | |
| | 555,000 | | | Koninklijke Philips Electronics NV | | | | |
| | | | | 5.750%, 03/11/2018 | | | 620,697 | |
| | | | | | | | 1,181,238 | |
| | | | | Insurance - 1.27% | | | | |
| | | | | American International Group, Inc. | | | | |
| | 225,000 | | | 4.125%, 02/15/2024 | | | 244,023 | |
| | 400,000 | | | 4.500%, 07/16/2044 | | | 431,161 | |
See notes to financial statements.
GuideMark® Core Fixed Income Fund
SCHEDULE OF INVESTMENTS (Continued)
March 31, 2015
Principal
Amount | | | | | Value | |
| | | | | CORPORATE OBLIGATIONS (Continued) | | | | |
| | | | | Insurance (Continued) | | | | |
| | 565,000 | | | Berkshire Hathaway Finance Corp. | | | | |
| | | | | 0.950%, 08/15/2016 | | $ | 567,716 | |
| | 605,000 | | | CNA Financial Corp. | | | | |
| | | | | 7.350%, 11/15/2019 | | | 729,210 | |
| | 420,000 | | | Liberty Mutual Group, Inc. | | | | |
| | | | | 4.250%, 06/15/2023 | | | | |
| | | | | (Acquired 07/22/2014, | | | | |
| | | | | Cost $434,355) (b) | | | 448,132 | |
| | | | | Marsh & McLennan Cos., Inc. | | | | |
| | 100,000 | | | 2.300%, 04/01/2017 | | | 102,051 | |
| | 200,000 | | | 4.050%, 10/15/2023 | | | 215,228 | |
| | 95,000 | | | 3.500%, 03/10/2025 | | | 97,722 | |
| | | | | New York Life Global Funding | | | | |
| | 425,000 | | | 3.000%, 05/04/2015 | | | | |
| | | | | (Acquired 03/19/2012, | | | | |
| | | | | Cost $425,665) (b) | | | 425,665 | |
| | 400,000 | | | 1.950%, 02/11/2020 | | | | |
| | | | | (Acquired 02/04/2015, | | | | |
| | | | | Cost $399,924) (b) | | | 400,347 | |
| | 285,000 | | | Trinity Acquisition Plc | | | | |
| | | | | 4.625%, 08/15/2023 | | | 301,811 | |
| | | | | | | | 3,963,066 | |
| | | | | Internet & Catalog Retail - 0.07% | | | | |
| | 185,000 | | | Amazon.com, Inc. | | | | |
| | | | | 4.950%, 12/05/2044 | | | 202,637 | |
| | | | | Internet Software & Services - 0.17% | | | | |
| | 520,000 | | | eBay, Inc. | | | | |
| | | | | 1.350%, 07/15/2017 | | | 519,666 | |
| | | | | IT Services - 0.17% | | | | |
| | 495,000 | | | MasterCard, Inc. | | | | |
| | | | | 3.375%, 04/01/2024 | | | 521,735 | |
| | | | | Machinery - 0.34% | | | | |
| | 255,000 | | | Cummins, Inc. | | | | |
| | | | | 3.650%, 10/01/2023 | | | 273,876 | |
| | | | | Eaton Corp. | | | | |
| | 450,000 | | | 5.600%, 05/15/2018 | | | 501,910 | |
| | 290,000 | | | 2.750%, 11/02/2022 | | | 291,098 | |
| | | | | | | | 1,066,884 | |
| | | | | Media - 1.26% | | | | |
| | | | | Comcast Corp. | | | | |
| | 900,000 | | | 5.875%, 02/15/2018 (e) | | | 1,014,639 | |
| | 115,000 | | | 4.750%, 03/01/2044 (e) | | | 132,656 | |
Principal
Amount | | | | | Value | |
| | | | | Media (Continued) | | | | |
| | | | | Cox Communications, Inc. | | | | |
| | 195,000 | | | 2.950%, 06/30/2023 | | | | |
| | | | | (Acquired 04/24/2013, | | | | |
| | | | | Cost $194,142) (b) | | $ | 192,405 | |
| | 125,000 | | | 3.850%, 02/01/2025 | | | | |
| | | | | (Acquired 12/01/2014, | | | | |
| | | | | Cost $124,784) (b) | | | 128,994 | |
| | | | | DIRECTV Holdings, LLC | | | | |
| | 325,000 | | | 1.750%, 01/15/2018 (e) | | | 325,271 | |
| | 30,000 | | | 3.950%, 01/15/2025 | | | 30,971 | |
| | 285,000 | | | 6.350%, 03/15/2040 | | | 338,419 | |
| | 175,000 | | | News America, Inc. | | | | |
| | | | | 4.500%, 02/15/2021 | | | 194,092 | |
| | | | | Time Warner Cable, Inc. | | | | |
| | 246,000 | | | 5.850%, 05/01/2017 | | | 267,700 | |
| | 250,000 | | | 6.750%, 07/01/2018 | | | 287,457 | |
| | 100,000 | | | 5.500%, 09/01/2041 | | | 115,298 | |
| | | | | Time Warner, Inc. | | | | |
| | 225,000 | | | 4.700%, 01/15/2021 | | | 250,815 | |
| | 225,000 | | | 7.625%, 04/15/2031 | | | 315,414 | |
| | 135,000 | | | 6.500%, 11/15/2036 | | | 175,763 | |
| | 120,000 | | | 4.500%, 09/15/2042 (e) | | | 123,580 | |
| | 45,000 | | | Viacom, Inc. | | | | |
| | | | | 5.850%, 09/01/2043 | | | 50,842 | |
| | | | | | | | 3,944,316 | |
| | | | | Metals & Mining - 0.58% | | | | |
| | 420,000 | | | BHP Billiton Finance USA Ltd. | | | | |
| | | | | 1.625%, 02/24/2017 | | | 425,956 | |
| | 70,000 | | | Freeport-McMoRan Copper & Gold, Inc. | | | | |
| | | | | 3.550%, 03/01/2022 | | | 64,852 | |
| | | | | Nucor Corp. | | | | |
| | 285,000 | | | 4.125%, 09/15/2022 | | | 305,088 | |
| | 285,000 | | | 4.000%, 08/01/2023 | | | 299,563 | |
| | 430,000 | | | Rio Tinto Finance USA Ltd. | | | | |
| | | | | 2.500%, 05/20/2016 | | | 438,226 | |
| | | | | Xstrata Finance Canada Ltd. | | | | |
| | 140,000 | | | 2.700%, 10/25/2017 | | | | |
| | | | | (Acquired 10/18/2012, | | | | |
| | | | | Cost $139,765) (a)(b)(e) | | | 142,136 | |
| | 135,000 | | | 4.250%, 10/25/2022 | | | | |
| | | | | (Acquired 10/18/2012, | | | | |
| | | | | Cost $134,658) (b) | | | 139,006 | |
| | | | | | | | 1,814,827 | |
See notes to financial statements.
GuideMark® Core Fixed Income Fund
SCHEDULE OF INVESTMENTS (Continued)
March 31, 2015
| Principal | | | | | | |
| Amount | | | | | Value | |
| | | | | CORPORATE OBLIGATIONS (Continued) | | | | |
| | | | | Multi-Utilities - 0.87% | | | | |
| | 430,000 | | | Delmarva Power & Light Co. | | | | |
| | | | | 3.500%, 11/15/2023 | | $ | 457,816 | |
| | 550,000 | | | Dominion Resources, Inc. | | | | |
| | | | | 1.400%, 09/15/2017 | | | 550,999 | |
| | 395,000 | | | Sempra Energy | | | | |
| | | | | 6.500%, 06/01/2016 | | | 420,348 | |
| | 1,175,000 | | | Xcel Energy, Inc. | | | | |
| | | | | 5.613%, 04/01/2017 | | | 1,281,143 | |
| | | | | | | | 2,710,306 | |
| | | | | Oil & Gas - 3.72% | | | | |
| | | | | Anadarko Petroleum Corp. | | | | |
| | 150,000 | | | 8.700%, 03/15/2019 | | | 183,529 | |
| | 25,000 | | | 3.450%, 07/15/2024 | | | 25,088 | |
| | | | | BP Capital Markets Plc | | | | |
| | 350,000 | | | 1.674%, 02/13/2018 (e) | | | 351,802 | |
| | 85,000 | | | 2.521%, 01/15/2020 (e) | | | 86,512 | |
| | 290,000 | | | Buckeye Partners LP | | | | |
| | | | | 4.875%, 02/01/2021 | | | 307,828 | |
| | | | | Canadian Natural Resources Ltd. | | | | |
| | 690,000 | | | 3.450%, 11/15/2021 | | | 701,385 | |
| | 105,000 | | | 3.800%, 04/15/2024 | | | 105,284 | |
| | 100,000 | | | Cenovus Energy, Inc. | | | | |
| | | | | 5.200%, 09/15/2043 | | | 101,278 | |
| | 395,000 | | | Chevron Corp. | | | | |
| | | | | 1.365%, 03/02/2018 (e) | | | 397,094 | |
| | | | | ConocoPhillips | | | | |
| | 910,000 | | | 6.650%, 07/15/2018 | | | 1,057,335 | |
| | 125,000 | | | 3.350%, 11/15/2024 | | | 128,968 | |
| | 55,000 | | | Continental Resources, Inc. | | | | |
| | | | | 5.000%, 09/15/2022 | | | 54,313 | |
| | 450,000 | | | Enable Midstream Partners LP | | | | |
| | | | | 3.900%, 05/15/2024
(Acquired 05/19/2014,
Cost $449,492) (b) | | | 434,421 | |
| | | | | Energy Transfer Partners LP | | | | |
| | 505,000 | | | 4.150%, 10/01/2020 | | | 530,789 | |
| | 175,000 | | | 5.200%, 02/01/2022 | | | 190,938 | |
| | | | | Hess Corp. | | | | |
| | 120,000 | | | 1.300%, 06/15/2017 | | | 119,038 | |
| | 45,000 | | | 5.600%, 02/15/2041 | | | 49,318 | |
| | 690,000 | | | Husky Energy, Inc. | | | | |
| | | | | 3.950%, 04/15/2022 | | | 702,110 | |
| Principal | | | | | | |
| Amount | | | | | Value | |
| | | | | Oil & Gas (Continued) | | | | |
| | 125,000 | | | Kerr-McGee Corp. | | | | |
| | | | | 6.950%, 07/01/2024 | | $ | 156,704 | |
| | | | | Kinder Morgan, Inc. | | | | |
| | 75,000 | | | 6.000%, 01/15/2018
(Acquired 01/08/2015,
Cost $81,174) (b) | | | 82,248 | |
| | 55,000 | | | 3.050%, 12/01/2019 | | | 55,605 | |
| | 125,000 | | | 4.300%, 06/01/2025 | | | 128,563 | |
| | 125,000 | | | 5.300%, 12/01/2034 (e) | | | 129,526 | |
| | 365,000 | | | LUKOIL International Finance B.V. | | | | |
| | | | | 3.416%, 04/24/2018
(Acquired 04/17/2013,
Cost $365,000) (b) | | | 336,986 | |
| | 295,000 | | | Marathon Petroleum Corp. | | | | |
| | | | | 3.625%, 09/15/2024 | | | 298,943 | |
| | | | | Nexen, Inc. | | | | |
| | 100,000 | | | 5.875%, 03/10/2035 | | | 118,943 | |
| | 100,000 | | | 7.500%, 07/30/2039 | | | 141,922 | |
| | 150,000 | | | Petroleos Mexicanos | | | | |
| | | | | 5.500%, 06/27/2044 | | | 152,063 | |
| | | | | Phillips 66 | | | | |
| | 480,000 | | | 2.950%, 05/01/2017 | | | 496,703 | |
| | 265,000 | | | 4.300%, 04/01/2022 | | | 289,373 | |
| | 960,000 | | | Schlumberger Investment SA | | | | |
| | | | | 3.650%, 12/01/2023 | | | 1,024,257 | |
| | 1,150,000 | | | Shell International Finance BV | | | | |
| | | | | 1.125%, 08/21/2017 (e) | | | 1,154,062 | |
| | 230,000 | | | Spectra Energy Partners LP | | | | |
| | | | | 4.600%, 06/15/2021 | | | 252,823 | |
| | 125,000 | | | Statoil ASA | | | | |
| | | | | 3.950%, 05/15/2043 | | | 128,582 | |
| | | | | Williams Partners LP | | | | |
| | 400,000 | | | 3.600%, 03/15/2022 | | | 399,359 | |
| | 180,000 | | | 4.300%, 03/04/2024 | | | 179,938 | |
| | 575,000 | | | 3.900%, 01/15/2025 (e) | | | 563,326 | |
| | | | | | | | 11,616,956 | |
| | | | | Pharmaceuticals - 1.60% | | | | |
| | | | | AbbVie, Inc. | | | | |
| | 455,000 | | | 1.750%, 11/06/2017 | | | 456,901 | |
| | 330,000 | | | 2.900%, 11/06/2022 | | | 327,900 | |
| | | | | Actavis Funding SCS | | | | |
| | 205,000 | | | 1.850%, 03/01/2017 | | | 206,575 | |
| | 500,000 | | | 2.350%, 03/12/2018 | | | 507,121 | |
| | 420,000 | | | 3.000%, 03/12/2020 | | | 430,179 | |
See notes to financial statements.
GuideMark® Core Fixed Income Fund
SCHEDULE OF INVESTMENTS (Continued)
March 31, 2015
| Principal | | | | | | |
| Amount | | | | | Value | |
| | | | | CORPORATE OBLIGATIONS (Continued) | | | | |
| | | | | Pharmaceuticals (Continued) | | | | |
| | 280,000 | | | 3.800%, 03/15/2025 | | $ | 289,553 | |
| | 175,000 | | | 4.550%, 03/15/2035 | | | 182,999 | |
| | 200,000 | | | Bayer US Finance LLC | | | | |
| | | | | 2.375%, 10/08/2019
(Acquired 10/01/2014,
Cost $199,084) (b) | | | 203,547 | |
| | 150,000 | | | EMD Finance LLC | | | | |
| | | | | 2.950%, 03/19/2022
(Acquired 03/16/2015,
Cost $149,736) (b) | | | 151,992 | |
| | 895,000 | | | GlaxoSmithKline Capital Plc | | | | |
| | | | | 1.500%, 05/08/2017 | | | 904,637 | |
| | 375,000 | | | Merck & Co., Inc. | | | | |
| | | | | 0.631%, 02/10/2020 (a) | | | 376,961 | |
| | 260,000 | | | Perrigo Co. PLC | | | | |
| | | | | 1.300%, 11/08/2016 | | | 259,942 | |
| | | | | Sanofi-Aventis SA | | | | |
| | 200,000 | | | 1.250%, 04/10/2018 (e) | | | 200,420 | |
| | 445,000 | | | 4.000%, 03/29/2021 | | | 489,613 | |
| | | | | | | | 4,988,340 | |
| | | | | Pipelines - 0.75% | | | | |
| | 490,000 | | | Enterprise Products Operating LLC | | | | |
| | | | | 6.125%, 10/15/2039 | | | 604,312 | |
| | | | | Plains All American Pipeline L.P. / PAA Finance Corp. | | | | |
| | 300,000 | | | 2.600%, 12/15/2019 | | | 301,739 | |
| | 300,000 | | | 4.700%, 06/15/2044 | | | 306,020 | |
| | 305,000 | | | Sunoco Logistics Partners Operations LP | | | | |
| | | | | 4.250%, 04/01/2024 | | | 313,777 | |
| | 560,000 | | | TransCanada Pipelines Ltd. | | | | |
| | | | | 7.625%, 01/15/2039 | | | 809,243 | |
| | | | | | | | 2,335,091 | |
| | | | | Real Estate - 1.60% | | | | |
| | | | | American Tower Corp. | | | | |
| | 70,000 | | | 3.400%, 02/15/2019 | | | 72,353 | |
| | 170,000 | | | 3.450%, 09/15/2021 | | | 173,780 | |
| | 110,000 | | | 5.000%, 02/15/2024 | | | 120,502 | |
| | 135,000 | | | Brandywine Operating Partnership LP | | | | |
| | | | | 4.100%, 10/01/2024 | | | 137,562 | |
| | 145,000 | | | Duke Realty LP | | | | |
| | | | | 3.875%, 02/15/2021 | | | 153,188 | |
| Principal | | | | | | |
| Amount | | | | | Value | |
| | | | | Real Estate (Continued) | | | | |
| | 285,000 | | | ERP Operating LP | | | | |
| | | | | 3.000%, 04/15/2023 | | $ | 286,102 | |
| | 75,000 | | | Health Care Property Investments, Inc. | | | | |
| | | | | 6.000%, 01/30/2017 | | | 81,033 | |
| | | | | Health Care REIT, Inc. | | | | |
| | 440,000 | | | 4.125%, 04/01/2019 | | | 472,447 | |
| | 455,000 | | | 5.250%, 01/15/2022 | | | 513,565 | |
| | 190,000 | | | Kimco Realty Corp. | | | | |
| | | | | 3.200%, 05/01/2021 | | | 195,078 | |
| | | | | Liberty Property LP | | | | |
| | 275,000 | | | 5.500%, 12/15/2016 | | | 292,422 | |
| | 25,000 | | | 4.125%, 06/15/2022 | | | 26,200 | |
| | 25,000 | | | 3.375%, 06/15/2023 | | | 24,947 | |
| | 500,000 | | | ProLogis LP | | | | |
| | | | | 4.250%, 08/15/2023 | | | 538,559 | |
| | 161,000 | | | Realty Income Corp. | | | | |
| | | | | 3.250%, 10/15/2022 | | | 161,686 | |
| | 950,000 | | | Simon Property Group LP | | | | |
| | | | | 2.200%, 02/01/2019 | | | 965,369 | |
| | 65,000 | | | UDR, Inc. | | | | |
| | | | | 3.700%, 10/01/2020 | | | 68,741 | |
| | | | | Ventas Realty LP | | | | |
| | 260,000 | | | 2.000%, 02/15/2018 | | | 262,678 | |
| | 150,000 | | | 2.700%, 04/01/2020 | | | 151,798 | |
| | 250,000 | | | 5.700%, 09/30/2043 | | | 308,369 | |
| | | | | | | | 5,006,379 | |
| | | | | Road & Rail - 0.47% | | | | |
| | 355,000 | | | Burlington Northern Santa Fe LLC | | | | |
| | | | | 7.950%, 08/15/2030 | | | 525,502 | |
| | 309,000 | | | Canadian Pacific Railway Ltd. | | | | |
| | | | | 4.500%, 01/15/2022 | | | 342,928 | |
| | 275,000 | | | CSX Corp. | | | | |
| | | | | 6.150%, 05/01/2037 | | | 361,450 | |
| | 235,000 | | | Union Pacific Corp. | | | | |
| | | | | 3.375%, 02/01/2035 | | | 230,049 | |
| | | | | | | | 1,459,929 | |
| | | | | Semiconductor & Semiconductor
Equipment - 0.78% | | | | |
| | | | | Altera Corp. | | | | |
| | 245,000 | | | 1.750%, 05/15/2017 | | | 246,631 | |
| | 300,000 | | | 2.500%, 11/15/2018 | | | 308,245 | |
| | 430,000 | | | Analog Devices, Inc. | | | | |
| | | | | 3.000%, 04/15/2016 | | | 439,013 | |
See notes to financial statements.
GuideMark® Core Fixed Income Fund
SCHEDULE OF INVESTMENTS (Continued)
March 31, 2015
| Principal | | | | | | |
| Amount | | | | | Value | |
| | | | | CORPORATE OBLIGATIONS (Continued) | | | | |
| | | | | Semiconductor & Semiconductor
Equipment (Continued) | | | | |
| | 480,000 | | | Applied Materials, Inc. | | | | |
| | | | | 2.650%, 06/15/2016 | | $ | 490,222 | |
| | 400,000 | | | Intel Corp. | | | | |
| | | | | 3.300%, 10/01/2021 | | | 426,430 | |
| | 225,000 | | | TSMC Global Ltd. | | | | |
| | | | | 1.625%, 04/03/2018 | | | | |
| | | | | (Acquired 03/27/2013, | | | | |
| | | | | Cost $224,849) (b) | | | 223,217 | |
| | 315,000 | | | Xilinx, Inc. | | | | |
| | | | | 2.125%, 03/15/2019 | | | 318,027 | |
| | | | | | | | 2,451,785 | |
| | | | | Software - 0.71% | | | | |
| | | | | Microsoft Corp. | | | | |
| | 210,000 | | | 2.375%, 02/12/2022 | | | 211,714 | |
| | 585,000 | | | 3.750%, 02/12/2045 | | | 588,793 | |
| | | | | Oracle Corp. | | | | |
| | 600,000 | | | 2.250%, 10/08/2019 | | | 612,242 | |
| | 150,000 | | | 2.800%, 07/08/2021 | | | 155,501 | |
| | 600,000 | | | 4.300%, 07/08/2034 (e) | | | 652,318 | |
| | | | | | | | 2,220,568 | |
| | | | | Specialty Retail - 0.37% | | | | |
| | 260,000 | | | AutoZone, Inc. | | | | |
| | | | | 4.000%, 11/15/2020 | | | 280,684 | |
| | | | | Home Depot, Inc. | | | | |
| | 285,000 | | | 2.700%, 04/01/2023 | | | 289,611 | |
| | 200,000 | | | 5.875%, 12/16/2036 | | | 265,439 | |
| | 290,000 | | | Lowe’s Cos., Inc. | | | | |
| | | | | 4.250%, 09/15/2044 | | | 315,287 | |
| | | | | | | | 1,151,021 | |
| | | | | Technology Hardware, Storage &
Peripherals - 0.87% | | | | |
| | | | | Apple, Inc. | | | | |
| | 1,075,000 | | | 2.400%, 05/03/2023 | | | 1,062,962 | |
| | 230,000 | | | 2.500%, 02/09/2025 (e) | | | 225,375 | |
| | 275,000 | | | 3.450%, 02/09/2045 (e) | | | 261,755 | |
| | 800,000 | | | EMC Corp. | | | | |
| | | | | 1.875%, 06/01/2018 | | | 809,723 | |
| | | | | Hewlett-Packard Co. | | | | |
| | 200,000 | | | 3.000%, 09/15/2016 | | | 205,349 | |
| | 150,000 | | | 3.300%, 12/09/2016 | | | 155,171 | |
| | | | | | | | 2,720,335 | |
| Principal | | | | | | | |
| Amount | | | | | Value | |
| | | | | Telecommunications - 0.12% | | | | |
| | | | | SBA Tower Trust | | | | |
| | 210,000 | | | 3.598%, 04/15/2043 | | | | |
| | | | | (Acquired 04/04/2013, | | | | |
| | | | | Cost $210,000) (b) | | | 210,470 | |
| | 155,000 | | | 2.898%, 10/15/2044 | | | | |
| | | | | (Acquired 10/07/2014, | | | | |
| | | | | Cost $155,000) (b) | | | 157,245 | |
| | | | | | | | 367,715 | |
| | | | | Thrifts & Mortgage Finance - 0.02% | | | | |
| | 60,000 | | | Santander Holdings USA, Inc. | | | | |
| | | | | 4.625%, 04/19/2016 | | | 62,157 | |
| | | | | Transportation - 0.17% | | | | |
| | 275,000 | | | Kansas City Southern de Mexico SA de CV | | | | |
| | | | | 3.000%, 05/15/2023 | | | 271,787 | |
| | 250,000 | | | Ryder Systems, Inc. | | | | |
| | | | | 2.450%, 09/03/2019 | | | 250,695 | |
| | | | | | | | 522,482 | |
| | | | | Trucking - 0.14% | | | | |
| | | | | Penske Truck Leasing Co., L.P. | | | | |
| | 400,000 | | | 3.125%, 05/11/2015 | | | | |
| | | | | (Acquired 05/08/2012, | | | | |
| | | | | Cost $399,721) (b) | | | 399,721 | |
| | 35,000 | | | 4.875%, 07/11/2022 | | | | |
| | | | | (Acquired 07/16/2013, | | | | |
| | | | | Cost $35,842) (b) | | | 37,923 | |
| | | | | | | | 437,644 | |
| | | | | Wireless Telecommunication Services - 0.53% | | | | |
| | 680,000 | | | Rogers Communications, Inc. | | | | |
| | | | | 5.000%, 03/15/2044 (e) | | | 752,501 | |
| | 915,000 | | | Vodafone Group Plc | | | | |
| | | | | 1.500%, 02/19/2018 | | | 915,027 | |
| | | | | | | | 1,667,528 | |
| | | | | Total Corporate Obligations | | | | |
| | | | | (Cost $119,015,524) | | | 123,026,097 | |
| | | | | FOREIGN GOVERNMENT
DEBT OBLIGATIONS - 0.32% | | | | |
| | 275,000 | | | Brazilian Government International Bond | | | | |
| | | | | 5.875%, 01/15/2019 | | | 303,875 | |
| | | | | Mexico Government International Bond | | | | |
See notes to financial statements.
GuideMark® Core Fixed Income Fund
SCHEDULE OF INVESTMENTS (Continued)
March 31, 2015
| Principal | | | | | | |
| Amount | | | | | Value | |
| | | | | FOREIGN GOVERNMENT
DEBT OBLIGATIONS (Continued) | | | | |
| | 96,000 | | | 4.750%, 03/08/2044 | | $ | 101,280 | |
| | 300,000 | | | 5.750%, 10/12/2110 | | | 328,500 | |
| | 250,000 | | | Republic of Colombia | | | | |
| | | | | 4.375%, 07/12/2021 | | | 265,625 | |
| | | | | Total Foreign Government Debt
Obligations (Cost $904,821) | | | 999,280 | |
| | | | | MORTGAGE BACKED SECURITIES -
U.S. GOVERNMENT AGENCY - 33.39% | | | | |
| | | | | Federal Home Loan Mortgage Corp. | | | | |
| | 256,746 | | | Series 2590, 5.000%, | | | | |
| | | | | 03/15/2018 | | | 268,150 | |
| | 800,000 | | | Series K-703, 2.699%, | | | | |
| | | | | 05/25/2018 (a) | | | 834,491 | |
| | 4,174 | | | Pool #E9-9763 | | | | |
| | | | | 4.500%, 09/01/2018 | | | 4,379 | |
| | 4,007 | | | Pool #E9-9764 | | | | |
| | | | | 4.500%, 09/01/2018 | | | 4,203 | |
| | 600,000 | | | Series K-705, 2.303%, | | | | |
| | | | | 09/25/2018 (a) | | | 619,018 | |
| | 900,000 | | | Series K-706, 2.323%, | | | | |
| | | | | 10/25/2018 | | | 929,207 | |
| | 600,000 | | | Series K-709, 2.086%, | | | | |
| | | | | 03/25/2019 | | | 614,039 | |
| | 107,166 | | | Pool #D9-6291 | | | | |
| | | | | 4.500%, 09/01/2023 | | | 116,587 | |
| | 249,589 | | | Pool #G1-3624 | | | | |
| | | | | 5.000%, 08/01/2024 | | | 271,526 | |
| | 223,445 | | | Series 2014-HQ1, 1.824%, | | | | |
| | | | | 08/26/2024 (a) | | | 225,123 | |
| | 3,374,823 | | | Pool #J2-5769 | | | | |
| | | | | 3.500%, 09/01/2028 | | | 3,625,203 | |
| | 335,889 | | | Series 2329, 6.500%, | | | | |
| | | | | 06/15/2031 | | | 395,424 | |
| | 162,655 | | | Series 2338, 6.500%, | | | | |
| | | | | 07/15/2031 | | | 186,508 | |
| | 315,834 | | | Pool #78-0447 | | | | |
| | | | | 2.375%, 04/01/2033 (a) | | | 335,653 | |
| | 3,320,269 | | | Pool #U8-9032 | | | | |
| | | | | 3.000%, 07/01/2033 | | | 3,444,281 | |
| | 559,106 | | | Pool #MA1870 | | | | |
| | | | | 4.500%, 04/01/2034 | | | 615,718 | |
| Principal | | | | | | | |
| Amount | | | | | Value | |
| | | | | MORTGAGE BACKED SECURITIES -
U.S. GOVERNMENT AGENCY
(Continued) | | | | |
| | 226 | | | Pool #A4-3129 | | | | |
| | | | | 5.500%, 02/01/2036 | | $ | 255 | |
| | 1,088,816 | | | Pool #C0-3815 | | | | |
| | | | | 3.500%, 03/01/2042 | | | 1,145,559 | |
| | 1,900,000 | | | Pool #TBA | | | | |
| | | | | 3.500%, 04/15/2042 (g) | | | 1,991,400 | |
| | 853,213 | | | Pool #U9-0688 | | | | |
| | | | | 4.000%, 05/01/2042 | | | 929,338 | |
| | 1,924,529 | | | Pool #Q0-9949 | | | | |
| | | | | 3.000%, 08/01/2042 | | | 1,965,897 | |
| | 1,600,000 | | | Pool #TBA | | | | |
| | | | | 3.000%, 04/15/2043 (g) | | | 1,632,375 | |
| | | | | Federal National Mortgage Association | | | | |
| | 528,000 | | | Pool #468123 | | | | |
| | | | | 3.840%, 05/01/2018 | | | 567,740 | |
| | 1,239 | | | Pool #685505 | | | | |
| | | | | 5.000%, 05/01/2018 | | | 1,302 | |
| | 1,378 | | | Pool #705709 | | | | |
| | | | | 5.000%, 05/01/2018 | | | 1,448 | |
| | 151,500 | | | Series 2014-C02, 1.124%, | | | | |
| | | | | 05/28/2024 (a) | | | 150,677 | |
| | 150,194 | | | Series 2014-C03, 1.374%, | | | | |
| | | | | 07/25/2024 (a) | | | 150,331 | |
| | 144,965 | | | Series 2014-C04, 2.124%, | | | | |
| | | | | 11/25/2024 (a) | | | 146,418 | |
| | 1,265,093 | | | Pool #AI4868 | | | | |
| | | | | 4.000%, 06/01/2026 | | | 1,365,285 | |
| | 1,075,511 | | | Pool #AJ8325 | | | | |
| | | | | 3.000%, 12/01/2026 | | | 1,131,893 | |
| | 305,000 | | | Pool #AM8035 | | | | |
| | | | | 2.660%, 03/01/2027 | | | 308,793 | |
| | 310,000 | | | Pool #AM8036 | | | | |
| | | | | 2.660%, 03/01/2027 | | | 313,855 | |
| | 142,000 | | | Pool #AM8141 | | | | |
| | | | | 2.780%, 03/01/2027 | | | 145,354 | |
| | 1,151,533 | | | Pool #AB5907 | | | | |
| | | | | 3.000%, 08/01/2027 | | | 1,211,178 | |
| | 1,443,051 | | | Pool #AQ5095 | | | | |
| | | | | 3.000%, 11/01/2027 | | | 1,521,339 | |
| | 843,038 | | | Pool #AL2877 | | | | |
| | | | | 3.500%, 01/01/2028 | | | 896,115 | |
See notes to financial statements.
GuideMark® Core Fixed Income Fund
SCHEDULE OF INVESTMENTS (Continued)
March 31, 2015
Principal
Amount | | | | | Value | |
| | | | | MORTGAGE BACKED SECURITIES -
U.S. GOVERNMENT AGENCY
(Continued) | | | | |
| | 300,000 | | | Pool #TBA | | | | |
| | | | | 2.500%, 04/15/2028 (g) | | $ | 308,133 | |
| | 134,830 | | | Pool #544859 | | | | |
| | | | | 2.422%, 08/01/2029 (a) | | | 140,185 | |
| | 248,610 | | | Pool #786848 | | | | |
| | | | | 7.000%, 10/01/2031 | | | 288,481 | |
| | 8,685 | | | Pool #727181 | | | | |
| | | | | 5.000%, 08/01/2033 | | | 9,724 | |
| | 4,086 | | | Pool #730727 | | | | |
| | | | | 5.000%, 08/01/2033 | | | 4,575 | |
| | 1,194 | | | Pool #741862 | | | | |
| | | | | 5.500%, 09/01/2033 | | | 1,362 | |
| | 1,636 | | | Pool #766197 | | | | |
| | | | | 5.500%, 02/01/2034 | | | 1,841 | |
| | 271 | | | Pool #776974 | | | | |
| | | | | 5.500%, 04/01/2034 | | | 311 | |
| | 251,994 | | | Pool #888504 | | | | |
| | | | | 2.197%, 04/01/2034 (a) | | | 270,413 | |
| | 10,910 | | | Pool #775776 | | | | |
| | | | | 5.500%, 05/01/2034 | | | 12,429 | |
| | 259,737 | | | Pool #802783 | | | | |
| | | | | 2.112%, 10/01/2034 (a) | | | 276,481 | |
| | 9,809 | | | Pool #781629 | | | | |
| | | | | 5.500%, 12/01/2034 | | | 11,166 | |
| | 349 | | | Pool #806098 | | | | |
| | | | | 6.000%, 12/01/2034 | | | 397 | |
| | 10,737 | | | Pool #822815 | | | | |
| | | | | 5.500%, 04/01/2035 | | | 12,233 | |
| | 9,511 | | | Pool #357850 | | | | |
| | | | | 5.500%, 07/01/2035 | | | 10,831 | |
| | 8,412 | | | Pool #820242 | | | | |
| | | | | 5.000%, 07/01/2035 | | | 9,391 | |
| | 1,906 | | | Pool #838452 | | | | |
| | | | | 5.500%, 09/01/2035 | | | 2,164 | |
| | 9,060 | | | Pool #865854 | | | | |
| | | | | 6.000%, 03/01/2036 | | | 10,448 | |
| | 17,467 | | | Pool #891474 | | | | |
| | | | | 6.000%, 04/01/2036 | | | 20,143 | |
| | 12,822 | | | Pool #906000 | | | | |
| | | | | 6.000%, 01/01/2037 | | | 14,634 | |
| | 119 | | | Pool #928062 | | | | |
| | | | | 5.500%, 02/01/2037 | | | 134 | |
Principal
Amount | | | | | Value | |
| | | | | MORTGAGE BACKED SECURITIES -
U.S. GOVERNMENT AGENCY
(Continued) | | | | |
| | 207 | | | Pool #899119 | | | | |
| | | | | 5.500%, 04/01/2037 | | $ | 236 | |
| | 160 | | | Pool #938488 | | | | |
| | | | | 5.500%, 05/01/2037 | | | 180 | |
| | 353 | | | Pool #970131 | | | | |
| | | | | 5.500%, 03/01/2038 | | | 402 | |
| | 229 | | | Pool #981313 | | | | |
| | | | | 5.500%, 06/01/2038 | | | 259 | |
| | 300 | | | Pool #985108 | | | | |
| | | | | 5.500%, 07/01/2038 | | | 340 | |
| | 152 | | | Pool #964930 | | | | |
| | | | | 5.500%, 08/01/2038 | | | 171 | |
| | 190 | | | Pool #987032 | | | | |
| | | | | 5.500%, 08/01/2038 | | | 217 | |
| | 283 | | | Pool #968371 | | | | |
| | | | | 5.500%, 09/01/2038 | | | 322 | |
| | 110 | | | Pool #993050 | | | | |
| | | | | 5.500%, 12/01/2038 | | | 124 | |
| | 43,677 | | | Pool #993579 | | | | |
| | | | | 4.000%, 05/01/2039 | | | 46,710 | |
| | 10,278 | | | Pool #AA5840 | | | | |
| | | | | 4.000%, 06/01/2039 | | | 10,992 | |
| | 128,852 | | | Pool #AA7670 | | | | |
| | | | | 4.500%, 06/01/2039 | | | 140,877 | |
| | 99,639 | | | Pool #AA8715 | | | | |
| | | | | 4.000%, 06/01/2039 | | | 108,695 | |
| | 12,026 | | | Pool #AA9133 | | | | |
| | | | | 4.500%, 08/01/2039 | | | 13,354 | |
| | 26,153 | | | Pool #AC2861 | | | | |
| | | | | 4.500%, 08/01/2039 | | | 29,037 | |
| | 55,946 | | | Pool #AC6121 | | | | |
| | | | | 4.500%, 11/01/2039 | | | 62,106 | |
| | 10,556 | | | Pool #AC8372 | | | | |
| | | | | 4.500%, 12/01/2039 | | | 11,679 | |
| | 400,541 | | | Pool #AD0586 | | | | |
| | | | | 4.500%, 12/01/2039 | | | 444,668 | |
| | 354,030 | | | Pool #AD5574 | | | | |
| | | | | 5.000%, 04/01/2040 | | | 393,876 | |
| | 1,209,534 | | | Pool #AD4062 | | | | |
| | | | | 5.000%, 05/01/2040 | | | 1,354,230 | |
| | 2,233,465 | | | Pool #AD6929 | | | | |
| | | | | 5.000%, 06/01/2040 | | | 2,495,245 | |
See notes to financial statements.
GuideMark® Core Fixed Income Fund
SCHEDULE OF INVESTMENTS (Continued)
March 31, 2015
Principal
Amount | | | | | Value | |
| | | | | MORTGAGE BACKED SECURITIES -
U.S. GOVERNMENT AGENCY
(Continued) | | | | |
| | 72,170 | | | Pool #AD7793 | | | | |
| | | | | 4.500%, 07/01/2040 | | $ | 79,046 | |
| | 26,221 | | | Pool #AD9896 | | | | |
| | | | | 4.000%, 08/01/2040 | | | 28,122 | |
| | 792,845 | | | Pool #AE0217 | | | | |
| | | | | 4.500%, 08/01/2040 | | | 867,735 | |
| | 31,189 | | | Pool #AB1500 | | | | |
| | | | | 4.000%, 09/01/2040 | | | 33,447 | |
| | 25,876 | | | Pool #AD9856 | | | | |
| | | | | 4.000%, 09/01/2040 | | | 27,751 | |
| | 23,905 | | | Pool #AE2559 | | | | |
| | | | | 4.000%, 09/01/2040 | | | 25,564 | |
| | 7,952 | | | Pool #AE2562 | | | | |
| | | | | 4.000%, 09/01/2040 | | | 8,525 | |
| | 10,356 | | | Pool #AE2566 | | | | |
| | | | | 4.000%, 09/01/2040 | | | 11,099 | |
| | 63,000 | | | Pool #AE4124 | | | | |
| | | | | 4.000%, 10/01/2040 | | | 67,548 | |
| | 34,484 | | | Pool #AE4888 | | | | |
| | | | | 4.000%, 10/01/2040 | | | 36,973 | |
| | 43,351 | | | Pool #AE3916 | | | | |
| | | | | 4.000%, 11/01/2040 | | | 46,487 | |
| | 6,787 | | | Pool #AE5147 | | | | |
| | | | | 4.000%, 11/01/2040 | | | 7,274 | |
| | 80,483 | | | Pool #AE8715 | | | | |
| | | | | 4.000%, 11/01/2040 | | | 86,320 | |
| | 819,425 | | | Pool #AE0698 | | | | |
| | | | | 4.500%, 12/01/2040 | | | 897,640 | |
| | 8,531 | | | Pool #AH0006 | | | | |
| | | | | 4.000%, 12/01/2040 | | | 9,146 | |
| | 24,937 | | | Pool #AH0020 | | | | |
| | | | | 4.000%, 12/01/2040 | | | 26,751 | |
| | 50,400 | | | Pool #AH0599 | | | | |
| | | | | 4.000%, 12/01/2040 | | | 54,050 | |
| | 20,032 | | | Pool #AH0601 | | | | |
| | | | | 4.000%, 12/01/2040 | | | 21,458 | |
| | 34,552 | | | Pool #AH1263 | | | | |
| | | | | 4.000%, 01/01/2041 | | | 37,051 | |
| | 138,868 | | | Pool #AL5233 | | | | |
| | | | | 4.000%, 01/01/2041 | | | 148,510 | |
| | 10,644 | | | Pool #AH4659 | | | | |
| | | | | 4.000%, 02/01/2041 | | | 11,415 | |
Principal
Amount | | | | | Value | |
| | | | | MORTGAGE BACKED SECURITIES -
U.S. GOVERNMENT AGENCY
(Continued) | | | | |
| | 155,183 | | | Pool #AH5653 | | | | |
| | | | | 4.000%, 02/01/2041 | | $ | 166,898 | |
| | 250,831 | | | Pool #AL0934 | | | | |
| | | | | 5.000%, 02/01/2041 | | | 279,293 | |
| | 1,213,107 | | | Pool #AB2537 | | | | |
| | | | | 5.000%, 03/01/2041 | | | 1,352,277 | |
| | 359,136 | | | Pool #AD1889 | | | | |
| | | | | 4.500%, 03/01/2041 | | | 393,275 | |
| | 17,547 | | | Pool #AH6150 | | | | |
| | | | | 4.000%, 03/01/2041 | | | 18,776 | |
| | 1,131,656 | | | Pool #AH8854 | | | | |
| | | | | 4.500%, 04/01/2041 | | | 1,240,608 | |
| | 190,275 | | | Pool #AL0215 | | | | |
| | | | | 4.500%, 04/01/2041 | | | 208,583 | |
| | 1,589,528 | | | Pool #AL0247 | | | | |
| | | | | 4.000%, 04/01/2041 | | | 1,728,917 | |
| | 7,550,000 | | | Pool #TBA | | | | |
| | | | | 3.500%, 04/15/2041 (g) | | | 7,930,449 | |
| | 183,602 | | | Pool #AL0187 | | | | |
| | | | | 5.000%, 05/01/2041 | | | 204,223 | |
| | 2,083,727 | | | Pool #AL0208 | | | | |
| | | | | 4.500%, 05/01/2041 | | | 2,284,820 | |
| | 2,400,000 | | | Pool #TBA | | | | |
| | | | | 3.500%, 05/15/2041 (g) | | | 2,514,844 | |
| | 30,196 | | | Pool #AL0456 | | | | |
| | | | | 5.000%, 06/01/2041 | | | 33,605 | |
| | 1,098,856 | | | Pool #AB3395 | | | | |
| | | | | 4.500%, 08/01/2041 | | | 1,205,278 | |
| | 142,081 | | | Pool #AI8842 | | | | |
| | | | | 4.500%, 08/01/2041 | | | 155,742 | |
| | 36,022 | | | Pool #AJ1080 | | | | |
| | | | | 4.500%, 09/01/2041 | | | 39,410 | |
| | 54,410 | | | Pool #AL0815 | | | | |
| | | | | 4.000%, 09/01/2041 | | | 59,379 | |
| | 19,896 | | | Pool #AJ1562 | | | | |
| | | | | 4.000%, 10/01/2041 | | | 21,711 | |
| | 21,004 | | | Pool #AJ1972 | | | | |
| | | | | 4.000%, 10/01/2041 | | | 22,920 | |
| | 2,743,643 | | | Pool #AJ2212 | | | | |
| | | | | 4.500%, 10/01/2041 | | | 3,033,664 | |
| | 37,345 | | | Pool #AJ3146 | | | | |
| | | | | 4.500%, 10/01/2041 | | | 40,950 | |
See notes to financial statements.
GuideMark® Core Fixed Income Fund
SCHEDULE OF INVESTMENTS (Continued)
March 31, 2015
Principal
Amount | | | | | Value | |
| | | | | MORTGAGE BACKED SECURITIES -
U.S. GOVERNMENT AGENCY
(Continued) | | | | |
| | 28,285 | | | Pool #AJ4756 | | | | |
| | | | | 4.000%, 10/01/2041 | | $ | 30,857 | |
| | 1,108,766 | | | Pool #AB3876 | | | | |
| | | | | 4.000%, 11/01/2041 | | | 1,188,872 | |
| | 22,965 | | | Pool #AJ3330 | | | | |
| | | | | 4.000%, 11/01/2041 | | | 25,066 | |
| | 25,994 | | | Pool #AJ4549 | | | | |
| | | | | 4.000%, 11/01/2041 | | | 28,370 | |
| | 19,150 | | | Pool #AJ4698 | | | | |
| | | | | 4.000%, 11/01/2041 | | | 20,899 | |
| | 40,327 | | | Pool #AJ5424 | | | | |
| | | | | 4.000%, 11/01/2041 | | | 44,010 | |
| | 19,974 | | | Pool #AJ7840 | | | | |
| | | | | 4.000%, 11/01/2041 | | | 21,797 | |
| | 24,631 | | | Pool #AB3995 | | | | |
| | | | | 4.000%, 12/01/2041 | | | 26,885 | |
| | 25,530 | | | Pool #AI0848 | | | | |
| | | | | 4.000%, 12/01/2041 | | | 27,867 | |
| | 22,671 | | | Pool #AJ4187 | | | | |
| | | | | 4.000%, 12/01/2041 | | | 24,743 | |
| | 28,872 | | | Pool #AJ5736 | | | | |
| | | | | 4.000%, 12/01/2041 | | | 31,511 | |
| | 21,027 | | | Pool #AJ5968 | | | | |
| | | | | 4.000%, 12/01/2041 | | | 22,532 | |
| | 30,957 | | | Pool #AJ6061 | | | | |
| | | | | 4.000%, 12/01/2041 | | | 33,779 | |
| | 21,225 | | | Pool #AJ7868 | | | | |
| | | | | 4.000%, 12/01/2041 | | | 23,166 | |
| | 42,456 | | | Pool #AJ8104 | | | | |
| | | | | 4.000%, 12/01/2041 | | | 46,325 | |
| | 25,633 | | | Pool #AJ8109 | | | | |
| | | | | 4.000%, 12/01/2041 | | | 27,980 | |
| | 20,404 | | | Pool #AJ8171 | | | | |
| | | | | 4.000%, 12/01/2041 | | | 22,270 | |
| | 31,803 | | | Pool #AJ8341 | | | | |
| | | | | 4.000%, 12/01/2041 | | | 34,715 | |
| | 49,983 | | | Pool #AJ8436 | | | | |
| | | | | 4.000%, 12/01/2041 | | | 54,559 | |
| | 21,723 | | | Pool #AJ8912 | | | | |
| | | | | 4.000%, 12/01/2041 | | | 23,711 | |
| | 25,790 | | | Pool #AJ9248 | | | | |
| | | | | 4.000%, 12/01/2041 | | | 28,148 | |
Principal
Amount | | | | | Value | |
| | | | | MORTGAGE BACKED SECURITIES -
U.S. GOVERNMENT AGENCY
(Continued) | | | | |
| | 31,877 | | | Pool #AJ2446 | | | | |
| | | | | 4.000%, 01/01/2042 | | $ | 34,165 | |
| | 30,508 | | | Pool #AJ7538 | | | | |
| | | | | 4.000%, 01/01/2042 | | | 33,301 | |
| | 11,824 | | | Pool #AJ8001 | | | | |
| | | | | 4.000%, 01/01/2042 | | | 12,645 | |
| | 29,460 | | | Pool #AJ8369 | | | | |
| | | | | 4.000%, 01/01/2042 | | | 32,151 | |
| | 28,523 | | | Pool #AJ9162 | | | | |
| | | | | 4.000%, 01/01/2042 | | | 31,132 | |
| | 154,820 | | | Pool #AJ9330 | | | | |
| | | | | 4.000%, 01/01/2042 | | | 168,999 | |
| | 18,401 | | | Pool #AJ9779 | | | | |
| | | | | 4.000%, 01/01/2042 | | | 19,868 | |
| | 25,313 | | | Pool #AK0170 | | | | |
| | | | | 4.000%, 01/01/2042 | | | 27,630 | |
| | 53,944 | | | Pool #AK0543 | | | | |
| | | | | 4.000%, 01/01/2042 | | | 58,872 | |
| | 20,136 | | | Pool #AK0563 | | | | |
| | | | | 4.000%, 01/01/2042 | | | 21,980 | |
| | 44,614 | | | Pool #AK1827 | | | | |
| | | | | 4.000%, 01/01/2042 | | | 48,699 | |
| | 807,383 | | | Pool #AL2752 | | | | |
| | | | | 5.000%, 03/01/2042 | | | 906,439 | |
| | 160,511 | | | Pool #AB5529 | | | | |
| | | | | 4.000%, 07/01/2042 | | | 175,031 | |
| | 294,168 | | | Pool #AB6228 | | | | |
| | | | | 3.500%, 09/01/2042 | | | 309,619 | |
| | 258,413 | | | Pool #AL3896 | | | | |
| | | | | 4.500%, 01/01/2043 | | | 283,413 | |
| | 542,712 | | | Pool #AQ9316 | | | | |
| | | | | 2.500%, 01/01/2043 | | | 537,417 | |
| | 2,056,419 | | | Pool #AQ9345 | | | | |
| | | | | 3.500%, 01/01/2043 | | | 2,164,406 | |
| | 5,600,000 | | | Pool #TBA | | | | |
| | | | | 3.000%, 04/15/2043 (g) | | | 5,725,563 | |
| | 1,615,701 | | | Pool #AT2720 | | | | |
| | | | | 3.000%, 05/01/2043 | | | 1,656,542 | |
| | 1,192,499 | | | Pool #AT5900 | | | | |
| | | | | 3.000%, 06/01/2043 | | | 1,221,772 | |
| | 661,236 | | | Pool #AU1625 | | | | |
| | | | | 3.500%, 07/01/2043 | | | 696,757 | |
See notes to financial statements.
GuideMark® Core Fixed Income Fund
SCHEDULE OF INVESTMENTS (Continued)
March 31, 2015
Principal
Amount | | | | | Value | |
| | | | | MORTGAGE BACKED SECURITIES -
U.S. GOVERNMENT AGENCY
(Continued) | | | | |
| | 1,713,546 | | | Pool #AS3135 | | | | |
| | | | | 3.500%, 08/01/2044 | | $ | 1,802,087 | |
| | 2,201,775 | | | Pool #AL5844 | | | | |
| | | | | 4.000%, 09/01/2044 | | | 2,382,962 | |
| | | | | Government National Mortgage Association | | | | |
| | 30,391 | | | Pool #614436X | | | | |
| | | | | 5.000%, 08/15/2033 | | | 33,898 | |
| | 399,466 | | | Pool #618907X | | | | |
| | | | | 5.000%, 09/15/2033 | | | 449,092 | |
| | 47,397 | | | Pool #605098X | | | | |
| | | | | 5.000%, 03/15/2034 | | | 53,273 | |
| | 58,152 | | | Pool #520279X | | | | |
| | | | | 5.000%, 11/15/2034 | | | 65,471 | |
| | 63,847 | | | Pool #736686X | | | | |
| | | | | 5.000%, 02/15/2039 | | | 71,303 | |
| | 1,150,551 | | | Pool #723248 | | | | |
| | | | | 5.000%, 10/15/2039 | | | 1,307,303 | |
| | 262,624 | | | Pool #782916X | | | | |
| | | | | 5.500%, 02/15/2040 | | | 296,509 | |
| | 724,801 | | | Pool #733724X | | | | |
| | | | | 4.500%, 06/15/2040 | | | 811,299 | |
| | 969,879 | | | Pool #752599C | | | | |
| | | | | 4.000%, 10/20/2040 | | | 1,051,322 | |
| | 1,395,115 | | | Pool #752631C | | | | |
| | | | | 4.500%, 10/20/2040 | | | 1,547,092 | |
| | 1,100,000 | | | Pool #TBA | | | | |
| | | | | 3.500%, 04/15/2041 (g) | | | 1,158,523 | |
| | 1,397,281 | | | Pool #783403X | | | | |
| | | | | 3.500%, 09/15/2041 | | | 1,474,792 | |
| | 3,800,000 | | | Pool #TBA | | | | |
| | | | | 4.000%, 04/15/2042 (g) | | | 4,048,930 | |
| | 1,903,843 | | | Pool #AD8801X | | | | |
| | | | | 3.500%, 03/15/2043 | | | 2,014,257 | |
| | 1,745,494 | | | Pool #MA2522M | | | | |
| | | | | 4.000%, 01/20/2045 | | | 1,872,640 | |
| | 2,639,264 | | | Pool #MA2602M | | | | |
| | | | | 4.000%, 02/20/2045 | | | 2,831,500 | |
| | 2,660,000 | | | Pool #AL9364C | | | | |
| | | | | 3.500%, 03/20/2045 | | | 2,824,507 | |
Principal
Amount | | | | | Value | |
| | | | | MORTGAGE BACKED SECURITIES -
U.S. GOVERNMENT AGENCY
(Continued) | | | | |
| | 600,000 | | | Pool #TBA | | | | |
| | | | | 3.000%, 04/15/2045 (g) | | $ | 617,848 | |
| | 1,100,000 | | | Pool #TBA | | | | |
| | | | | 3.500%, 04/15/2045 (g) | | | 1,157,535 | |
| | 500,000 | | | Pool #TBA | | | | |
| | | | | 3.500%, 05/15/2045 (g) | | | 524,902 | |
| | | | | Total Mortgage Backed Securities -
U.S. Government Agency
(Cost $101,734,560) | | | 104,404,300 | |
| | | | | MUNICIPAL DEBT OBLIGATIONS - 0.47% | |
| | | | | California, GO, | | | | |
| | 175,000 | | | 7.950%, 03/01/2036 | | | 215,778 | |
| | 300,000 | | | 7.550%, 04/01/2039 | | | 470,424 | |
| | 125,000 | | | 7.600%, 11/01/2040 | | | 196,933 | |
| | 145,000 | | | Chicago Transit Authority Sales & | | | | |
| | | | | Transfer Tax Receipts, Series B, | | | | |
| | | | | Revenue Bond, | | | | |
| | | | | 6.899%, 12/01/2040 | | | 187,063 | |
| | 75,000 | | | Illinois, GO, | | | | |
| | | | | 5.100%, 06/01/2033 | | | 75,937 | |
| | 70,000 | | | New Jersey State Turnpike Authority, | | | | |
| | | | | Series F, Revenue, | | | | |
| | | | | 7.414%, 01/01/2040 | | | 105,244 | |
| | 205,000 | | | University of California, Refunding, | | | | |
| | | | | Revenue Bond, | | | | |
| | | | | 4.601%, 05/15/2031 | | | 229,766 | |
| | | | | Total Municipal Debt Obligations
(Cost $1,334,798) | | | 1,481,145 | |
| | | | | U.S. TREASURY OBLIGATIONS - 9.40% | |
| | | | | U.S. Treasury Bonds - 3.60% | | | | |
| | 8,370,000 | | | 3.125%, 11/15/2041 | | | 9,357,400 | |
| | 1,902,000 | | | 2.500%, 02/15/2045 (e)(i) | | | 1,884,764 | |
| | | | | U.S. Treasury Notes - 5.80% | | | | |
| | 2,215,000 | | | 0.875%, 01/31/2017 | | | 2,229,710 | |
| | 4,195,000 | | | 2.000%, 11/15/2021 | | | 4,289,387 | |
| | 5,910,000 | | | 2.000%, 02/15/2022 | | | 6,032,355 | |
| | 3,755,000 | | | 2.375%, 08/15/2024 | | | 3,903,732 | |
| | 1,647,806 | | | 0.250%, 01/15/2025 (f) | | | 1,661,710 | |
| | | | | Total U.S. Treasury Obligations
(Cost $27,343,954) | | | 29,359,058 | |
See notes to financial statements.
GuideMark® Core Fixed Income Fund
SCHEDULE OF INVESTMENTS (Continued)
March 31, 2015
Number of
Shares | | | | | Value | |
| | | | | SHORT TERM INVESTMENTS - 10.26% | |
| | | | | Money Market Funds - 10.26% | | | | |
| | 32,092,188 | | | Federated Prime Obligations Fund | | | | |
| | | | | Effective Yield, 0.05% | | $ | 32,092,188 | |
| | | | | Total Short Term Investments
(Cost $32,092,188) | | | 32,092,188 | |
| | | | | INVESTMENTS PURCHASED AS SECURITIES LENDING COLLATERAL - 2.02% | | | | |
| | | | | Money Market Funds - 2.02% | | | | |
| | 6,327,571 | | | Mount Vernon Prime Portfolio | | | | |
| | | | | Effective Yield, 0.22% | | | 6,327,571 | |
| | | | | Total Investments Purchased as Securities Lending Collateral
(Cost $6,327,571) | | | 6,327,571 | |
| | | | | Total Investments
(Cost $340,469,151) - 111.80% | | | 349,540,451 | |
| | | | | Liabilities in Excess of Other Assets - (11.80)% | | | (36,887,981 | ) |
| | | | | TOTAL NET ASSETS - 100.00% | | $ | 312,652,470 | |
Percentages are stated as a percent of net assets.
Principal amounts are denominated in the currency in which the security was purchased.
| (a) | Variable Rate Security. The rate shown is the rate in effect on March 31, 2015. |
| (b) | Restricted securities as defined in Rule 144(a) under the Securities Act of 1933. Such securities are treated as liquid securities according to the Fund’s liquidity guidelines. The value of these securities total $29,613,317, which represents 9.47% of total net assets. |
| (c) | Non-income producing. Item identified as in default as to payment of interest. |
| (d) | Restricted securities as defined in Rule 144(a) under the Securities Act of 1933. Such securities are treated as illiquid securities according to the Fund’s liquidity guidelines. The value of these securities total $20,331, which represents 0.01% of total net assets. |
| (e) | All or portion of this security is on loan. |
| (f) | Represents a U.S. Treasury Inflation Protected Security. |
| (g) | Security purchased on a when-issued basis. On March 31, 2015, the total value of investments purchased on a when-issued basis was $27,610,502 or 8.83% of total net assets. |
| (h) | As of March 31, 2015, the Fund has fair valued these securities. The value of these securities were $1,538,901, which represents 0.49% of total net assets. |
| (i) | Partially assigned as collateral for certain swap contracts. |
See notes to financial statements.
GuideMark® Core Fixed Income Fund
SCHEDULE OF OPEN FUTURES CONTRACTS
March 31, 2015
| | | Number of | | | | | | | Unrealized |
| | | Contracts | | Notional | | | Settlement | | Appreciation |
| Description | | Purchased / (Sold) | | Value | | | Month | | (Depreciation) |
| U.S. Treasury 2-Year Note Futures | | | 20 | | | | | 4,383,125 | | | Jun-15 | | | $ | 764 | | |
| U.S. Treasury 5-Year Note Futures | | | 37 | | | | | 4,447,805 | | | Jun-15 | | | | 1,663 | | |
| U.S. Treasury 10-Year Note Futures | | | (52 | ) | | | | (6,703,125 | ) | | Jun-15 | | | | 4,233 | | |
| U.S. Treasury Long Bond Futures | | | 3 | | | | | 491,625 | | | Jun-15 | | | | (4,131 | ) | |
| U.S. Treasury Ultra Bond Futures | | | 29 | | | | | 4,926,375 | | | Jun-15 | | | | (26,174 | ) | |
| | | | | | | | | | | | | | | $ | (23,645 | ) | |
GuideMark® Core Fixed Income Fund
CENTRALLY CLEARED CREDIT DEFAULT SWAPS ON CREDIT INDICES — BUY PROTECTION(1)
March 31, 2015
| | | Implied | | | | | | | | | | | | | | | | | | | | |
| | | Credit | | | | | | | | | | | | | | Upfront | | | | |
| | | Spread at | | Fixed | | | | | | | | | | | | Premiums | | Unrealized |
| Reference | | March 31, | | Pay | | Maturity | | | | Notional | | Fair | | Paid | | Appreciation |
| Obligation | | 2015(2) | | Rate | | Date | | Clearing Agent | | Amount(3) | | Value | | (Received) | | (Depreciation) |
| CDX.NA.IG.24 Index | | 0.64% | | 1.000% | | 6/20/2020 | | Morgan Stanley | | 615,000 | | | $ | (11,019 | ) | | | $ | (10,962 | ) | | | $ | (57 | ) |
| | | | | | | | | | | | | | $ | (11,019 | ) | | | $ | (10,962 | ) | | | $ | (57 | ) |
| | |
| 1) | If the Fund is a buyer of protection and a credit event occurs, as defined under the terms of that particular swap agreement, the Fund will either (i) receive from the seller of protection an amount equal to the notional amount of the swap and take delivery of the referenced obligation or underlying securities comprising the referenced index or (ii) pay a net settlement amount in the form of cash or securities equal to the notional amount of the swap less the recovery value of the referenced obligation or underlying securities comprising the referenced index. |
| 2) | Implied credit spreads, represented in absolute terms, utilized in determining the market value of credit default swap agreements on U.S. municipal issues, corporate issues or sovereign issues of an emerging country as of period end serve as an indicator of the current status of the payment/performance risk and represent the likelihood or risk of default for the credit derivative. The implied credit spread of a particular referenced entity reflects the cost of buying/selling protection and may include upfront payments required to be made to enter into the agreement. Wider credit spreads represent a deterioration of the referenced entity’s credit soundness and a greater likelihood or risk of default or other credit event occurring as defined under the terms of the agreement. A credit spread identified as “Defaulted” indicates a credit event has occurred for the referenced entity or obligation. |
| 3) | The maximum potential amount the Fund could be required to pay as seller of credit protection or receive as a buyer of credit protection if a credit event occurs as defined under the terms of that particular swap agreement. |
See notes to financial statements.
GuideMark® Tax-Exempt Fixed Income Fund
SCHEDULE OF INVESTMENTS
March 31, 2015
Principal
Amount | | | | | Value | |
| | | | | MUNICIPAL DEBT OBLIGATIONS - 97.40% | | | | |
| | | | | Arizona - 2.65% | | | | |
| $ | 590,000 | | | Arizona University System Board of | | | | |
| | | | | Regents, Series A, Refunding, | | | | |
| | | | | Revenue Bond, | | | | |
| | | | | 5.000%, 07/01/2028 | | $ | 692,713 | |
| | 450,000 | | | Phoenix Civic Improvement | | | | |
| | | | | Wastewater System, Refunding, | | | | |
| | | | | Revenue Bond, NATL-RE Insured, | | | | |
| | | | | 5.000%, 07/01/2020 | | | 492,903 | |
| | 500,000 | | | Salt River Project, Series A, | | | | |
| | | | | Revenue Bond, | | | | |
| | | | | 5.000%, 01/01/2021 | | | 556,020 | |
| | | | | | | | 1,741,636 | |
| | | | | Arkansas - 0.81% | | | | |
| | 500,000 | | | University of Arkansas, Series A, | | | | |
| | | | | Revenue Bond, | | | | |
| | | | | 4.125%, 11/01/2030 | | | 535,195 | |
| | | | | California - 11.19% | | | | |
| | 40,000 | | | California Department of Water | | | | |
| | | | | Resources Power Supply, Series L, | | | | |
| | | | | Revenue Bond, | | | | |
| | | | | 5.000%, 05/01/2017 | | | 43,724 | |
| | 285,000 | | | California Economic Recovery Bonds, | | | | |
| | | | | Series A, Prerefunded, GO, | | | | |
| | | | | 5.250%, 07/01/2021 | | | 334,428 | |
| | 160,000 | | | California Economic Recovery Bonds, | | | | |
| | | | | Series A, Refunding, GO, | | | | |
| | | | | 5.250%, 07/01/2021 | | | 187,696 | |
| | 390,000 | | | California Municipal Finance | | | | |
| | | | | Authority, Mobile Home Park, | | | | |
| | | | | Series A, Refunding, Revenue Bond, | | | | |
| | | | | 6.400%, 08/15/2045 | | | 433,391 | |
| | 500,000 | | | California State University, Series A, | | | | |
| | | | | Refunding, Revenue Bond, | | | | |
| | | | | 5.000%, 11/01/2031 | | | 595,080 | |
| | 350,000 | | | California Statewide Community | | | | |
| | | | | Development Authority, Refunding, | | | | |
| | | | | Revenue Bond, | | | | |
| | | | | 6.125%, 07/01/2046 | | | 369,988 | |
| | 160,000 | | | California Statewide Community | | | | |
| | | | | Development Authority, Series A, | | | | |
| | | | | Revenue Bond, | | | | |
| | | | | 6.125%, 11/01/2033 | | | 181,002 | |
Principal
Amount | | | | | Value | |
| | | | | California (Continued) | | | | |
| $ | 500,000 | | | California Statewide Community | | | | |
| | | | | Development Authority, Series A, | | | | |
| | | | | Revenue Bond, CMI Insured, | | | | |
| | | | | 5.000%, 08/01/2034 | | $ | 568,745 | |
| | 1,000,000 | | | California, GO, | | | | |
| | | | | 6.500%, 04/01/2033 | | | 1,213,520 | |
| | | | | California, Refunding, GO, | | | | |
| | 100,000 | | | 5.000%, 09/01/2022 | | | 121,697 | |
| | 500,000 | | | 5.000%, 11/01/2043 | | | 573,435 | |
| | 100,000 | | | Golden State Tobacco Securitization | | | | |
| | | | | Corp., Series A, Revenue Bond, | | | | |
| | | | | 4.000%, 06/01/2031 | | | 104,498 | |
| | 250,000 | | | Golden State Tobacco Securitization | | | | |
| | | | | Corp., Series A, Refunding, | | | | |
| | | | | Revenue Bond, | | | | |
| | | | | 5.000%, 06/01/2045 | | | 251,965 | |
| | 100,000 | | | Los Angeles County Regional | | | | |
| | | | | Financing Authority, Series B-3, | | | | |
| | | | | Revenue Bond, CMI Insured, | | | | |
| | | | | 2.500%, 11/15/2020 | | | 101,001 | |
| | 1,000,000 | | | Los Angeles Department of Airports, | | | | |
| | | | | Series A, Refunding, Revenue Bond, | | | | |
| | | | | 5.250%, 05/15/2029 | | | 1,157,380 | |
| | 500,000 | | | San Mateo Joint Powers Financing | | | | |
| | | | | Authority, Series A, Refunding, | | | | |
| | | | | Revenue Bond, | | | | |
| | | | | 5.250%, 07/15/2025 | | | 584,205 | |
| | 250,000 | | | Southern California Public Power | | | | |
| | | | | Authority, Revenue Bond, | | | | |
| | | | | 5.250%, 07/01/2028 | | | 298,438 | |
| | 200,000 | | | University of California, Series G, | | | | |
| | | | | Refunding, Revenue Bond, | | | | |
| | | | | 5.000%, 05/15/2037 | | | 228,622 | |
| | | | | | | | 7,348,815 | |
| | | | | Colorado - 3.59% | | | | |
| | 350,000 | | | Castle Pines North Metropolitan | | | | |
| | | | | District, Refunding, Revenue Bond, | | | | |
| | | | | 4.000%, 12/01/2044 | | | 352,632 | |
| | 130,000 | | | Colorado Health Facilities Authority, | | | | |
| | | | | Revenue Bond, | | | | |
| | | | | 8.000%, 08/01/2043 | | | 155,086 | |
| | 125,000 | | | Colorado Health Facilities Authority, | | | | |
| | | | | Series A, Revenue Bond, | | | | |
| | | | | 5.750%, 02/01/2044 | | | 142,725 | |
See notes to financial statements.
GuideMark® Tax-Exempt Fixed Income Fund
SCHEDULE OF INVESTMENTS (Continued)
March 31, 2015
Principal
Amount | | | | | Value | |
| | | | | MUNICIPAL DEBT OBLIGATIONS (Continued) |
| | | | | Colorado (Continued) | | | | |
| $ | 750,000 | | | Regional Transportation District, | | | | |
| | | | | Series A, Revenue Bond, | | | | |
| | | | | 5.000%, 11/01/2027 | | $ | 896,985 | |
| | 700,000 | | | Regional Transportation District, | | | | |
| | | | | Revenue Bond, | | | | |
| | | | | 6.000%, 01/15/2026 | | | 810,012 | |
| | | | | | | | 2,357,440 | |
| | | | | Connecticut - 0.86% | | | | |
| | 500,000 | | | Connecticut Health & Educational | | | | |
| | | | | Facilities Authority, Series A, | | | | |
| | | | | Refunding, Revenue Bond, | | | | |
| | | | | 5.000%, 07/01/2025 | | | 562,315 | |
| | | | | Florida - 1.82% | | | | |
| | 300,000 | | | Brevard County Health Facilities | | | | |
| | | | | Authority, Prerefunded, | | | | |
| | | | | Revenue Bond, | | | | |
| | | | | 7.000%, 04/01/2039 | | | 367,401 | |
| | 120,000 | | | Celebration Pointe Community | | | | |
| | | | | Development District No. 1, Special | | | | |
| | | | | Assessment Revenue Bond, | | | | |
| | | | | 5.000%, 05/01/2034 | | | 123,256 | |
| | 65,000 | | | Halifax Hospital Medical Center, | | | | |
| | | | | Series A, Refunding, Revenue Bond, | | | | |
| | | | | 5.250%, 06/01/2015 | | | 65,461 | |
| | 500,000 | | | Miami-Dade County Health Facilities, | | | | |
| | | | | Series A, Refunding, Revenue Bond, | | | | |
| | | | | 5.250%, 08/01/2021 | | | 584,475 | |
| | 10,000 | | | Palm Beach County Florida Health | | | | |
| | | | | Facilities Authority, Revenue Bond, | | | | |
| | | | | 7.250%, 06/01/2034 | | | 11,415 | |
| | 40,000 | | | Palm Beach County Florida Health | | | | |
| | | | | Facilities Authority, Series A, | | | | |
| | | | | Refunding, Revenue Bond, | | | | |
| | | | | 7.500%, 06/01/2049 | | | 45,862 | |
| | | | | | | | 1,197,870 | |
| | | | | Georgia - 1.18% | | | | |
| | 350,000 | | | Atlanta Water & Wastewater, | | | | |
| | | | | Revenue Bond, | | | | |
| | | | | 6.250%, 11/01/2039 | | | 428,323 | |
| | 325,000 | | | Marietta Development Authority, | | | | |
| | | | | Revenue Bond, | | | | |
| | | | | 7.000%, 06/15/2039 | | | 346,541 | |
| | | | | | | | 774,864 | |
Principal
Amount | | | | | Value | |
| | | | | Hawaii - 0.86% | | | | |
| $ | 85,000 | | | Hawaii, Series DJ, Prerefunded, | | | | |
| | | | | GO, AMBAC Insured, | | | | |
| | | | | 5.000%, 04/01/2024 | | $ | 92,511 | |
| | 400,000 | | | Hawaii, Series DZ, GO, | | | | |
| | | | | 5.000%, 12/01/2030 | | | 469,220 | |
| | | | | | | | 561,731 | |
| | | | | Illinois - 3.41% | | | | |
| | | | | Illinois Finance Authority, | | | | |
| | | | | Revenue Bond, | | | | |
| | 500,000 | | | 5.000%, 10/01/2019 | | | 562,635 | |
| | 225,000 | | | 7.000%, 08/15/2044 | | | 280,242 | |
| | 200,000 | | | Illinois State Toll Highway Authority, | | | | |
| | | | | Series D, Refunding, Revenue Bond, | | | | |
| | | | | 5.000%, 01/01/2025 | | | 244,546 | |
| | 250,000 | | | Metropolitan Pier & Exposition | | | | |
| | | | | Authority, Series B, Refunding, | | | | |
| | | | | Revenue Bond, | | | | |
| | | | | 5.000%, 06/15/2023 | | | 297,285 | |
| | 150,000 | | | O’Hare International Airport, | | | | |
| | | | | Series D, Refunding, Revenue Bond, | | | | |
| | | | | 5.250%, 01/01/2030 | | | 173,499 | |
| | 500,000 | | | Railsplitter Tobacco Settlement | | | | |
| | | | | Authority, Revenue Bond, | | | | |
| | | | | 6.250%, 06/01/2024 | | | 531,545 | |
| | 120,000 | | | Southwestern Illinois Development | | | | |
| | | | | Authority Health Care Facilities, | | | | |
| | | | | Refunding, Revenue Bond, | | | | |
| | | | | 7.125%, 11/01/2043 | | | 147,292 | |
| | | | | | | | 2,237,044 | |
| | | | | Indiana - 3.31% | | | | |
| | 500,000 | | | Fishers Industry Redevelopment | | | | |
| | | | | District, Revenue Bond, | | | | |
| | | | | 5.250%, 07/15/2034 | | | 578,210 | |
| | 250,000 | | | Indiana Municipal Power Agency, | | | | |
| | | | | Series A, Refunding, Revenue Bond, | | | | |
| | | | | 5.250%, 01/01/2032 | | | 290,012 | |
| | 400,000 | | | Sheridan Community School’s | | | | |
| | | | | Building Corporation, Revenue | | | | |
| | | | | Bond, AGM Insured, | | | | |
| | | | | 5.500%, 07/15/2020 | | | 456,176 | |
| | 125,000 | | | Shoals Exempt Facilities, | | | | |
| | | | | Revenue Bond, | | | | |
| | | | | 7.250%, 11/01/2043 | | | 142,824 | |
See notes to financial statements.
GuideMark® Tax-Exempt Fixed Income Fund
SCHEDULE OF INVESTMENTS (Continued)
March 31, 2015
Principal
Amount | | | | | Value | |
| | | | | MUNICIPAL DEBT OBLIGATIONS (Continued) | |
| | | | | Indiana (Continued) | | | | |
| $ | 500,000 | | | Tri-Creek Middle School Building | | | | |
| | | | | Corp., Revenue Bond, AGM Insured, | | | | |
| | | | | 5.250%, 07/15/2021 | | $ | 565,340 | |
| | 115,000 | | | Valparaiso Exempt Facilities, | | | | |
| | | | | Revenue Bond, | | | | |
| | | | | 7.000%, 01/01/2044 | | | 141,574 | |
| | | | | | | | 2,174,136 | |
| | | | | Iowa - 0.41% | | | | |
| | 225,000 | | | Des Moines Iowa Independent | | | | |
| | | | | Community School District, | | | | |
| | | | | Revenue Bond, BAM Insured, | | | | |
| | | | | 5.000%, 06/01/2022 | | | 269,822 | |
| | | | | Kansas - 1.79% | | | | |
| | 500,000 | | | Kansas Department of Transportation | | | | |
| | | | | Highway Revenue, Series A, | | | | |
| | | | | Revenue Bond, | | | | |
| | | | | 5.000%, 09/01/2029 | | | 607,040 | |
| | 350,000 | | | Kansas Development Finance | | | | |
| | | | | Authority, Series A, Revenue Bond, | | | | |
| | | | | 5.000%, 05/01/2026 | | | 413,353 | |
| | 215,000 | | | Wyandotte County/Kansas City | | | | |
| | | | | Unified Government, Series B, | | | | |
| | | | | Refunding, Revenue Bond, | | | | |
| | | | | 6.269%, 06/01/2021 (a) | | | 152,205 | |
| | | | | | | | 1,172,598 | |
| | | | | Kentucky - 0.17% | | | | |
| | 100,000 | | | Kentucky Public Transportation | | | | |
| | | | | Infrastructure Authority, Series A, | | | | |
| | | | | Revenue Bond, | | | | |
| | | | | 5.000%, 07/01/2017 | | | 108,948 | |
| | | | | Louisiana - 2.21% | | | | |
| | 800,000 | | | Louisiana Citizens Property, | | | | |
| | | | | Revenue Bond, AGM Insured, | | | | |
| | | | | 6.750%, 06/01/2026 | | | 931,064 | |
| | 200,000 | | | Louisiana Highway Improvement, | | | | |
| | | | | Series A, Revenue Bond, | | | | |
| | | | | 5.000%, 06/15/2029 | | | 237,602 | |
| | 125,000 | | | Louisiana Public Facilities Authority, | | | | |
| | | | | Series A, Revenue Bond, | | | | |
| | | | | 8.375%, 12/15/2043 | | | 151,305 | |
Principal
Amount | | | | | Value | |
| | | | | Louisiana (Continued) | | | | |
| $ | 125,000 | | | Saint John Baptist Parish Louisiana | | | | |
| | | | | Revenue Marathon Oil Corp., | | | | |
| | | | | Series A, Revenue Bond, | | | | |
| | | | | 5.125%, 06/01/2037 | | $ | 131,939 | |
| | | | | | | | 1,451,910 | |
| | | | | Maryland - 4.00% | | | | |
| | 325,000 | | | Anne Arundel County, Tax Allocation, | | | | |
| | | | | 6.100%, 07/01/2040 | | | 350,337 | |
| | | | | Maryland Department of | | | | |
| | | | | Transportation, Revenue Bond, | | | | |
| | 600,000 | | | 5.500%, 02/01/2017 | | | 654,492 | |
| | 400,000 | | | 5.000%, 02/15/2026 | | | 473,152 | |
| | 180,000 | | | Maryland Economic Development | | | | |
| | | | | Corporation, Refunding, | | | | |
| | | | | Revenue Bond, | | | | |
| | | | | 5.750%, 09/01/2025 | | | 200,459 | |
| | 400,000 | | | Maryland Student Housing Economic | | | | |
| | | | | Development, Revenue Bond, | | | | |
| | | | | 5.750%, 06/01/2033 | | | 424,596 | |
| | 250,000 | | | Maryland, Series 2, Refunding, GO, | | | | |
| | | | | 5.000%, 08/01/2023 | | | 311,767 | |
| | 200,000 | | | Westminster Project Revenue, | | | | |
| | | | | Lutheran Village at Miller’s Grant, | | | | |
| | | | | Series A, Revenue Bond, | | | | |
| | | | | 6.000%, 07/01/2034 | | | 215,564 | |
| | | | | | | | 2,630,367 | |
| | | | | Massachusetts - 2.97% | | | | |
| | 785,000 | | | Massachusetts Health & Educational | | | | |
| | | | | Facilities Authority, Series A, | | | | |
| | | | | Refunding, Revenue Bond, | | | | |
| | | | | 5.500%, 11/15/2036 | | | 909,250 | |
| | 500,000 | | | Massachusetts Health & Educational | | | | |
| | | | | Facilities Authority, Series B, | | | | |
| | | | | Revenue Bond, | | | | |
| | | | | 5.000%, 10/01/2038 | | | 555,045 | |
| | 450,000 | | | Massachusetts, Series F, GO, | | | | |
| | | | | 4.000%, 11/01/2029 | | | 488,515 | |
| | | | | | | | 1,952,810 | |
| | | | | Michigan - 0.72% | | | | |
| | 100,000 | | | Grand Valley State University, | | | | |
| | | | | Series B, Refunding, Revenue Bond, | | | | |
| | | | | 5.000%, 12/01/2024 | | | 122,008 | |
See notes to financial statements.
GuideMark® Tax-Exempt Fixed Income Fund
SCHEDULE OF INVESTMENTS (Continued)
March 31, 2015
Principal
Amount | | | | | Value | |
| | | | | MUNICIPAL DEBT OBLIGATIONS (Continued) | |
| | | | | Michigan (Continued) | | | | |
| $ | 300,000 | | | Michigan Hospital Finance Authority, | | | | |
| | | | | Series A, Refunding, Revenue Bond, | | | | |
| | | | | 5.000%, 06/01/2021 | | $ | 353,250 | |
| | | | | | | | 475,258 | |
| | | | | Minnesota - 1.54% | | | | |
| | 160,000 | | | Minneapolis-St. Paul Metropolitan | | | | |
| | | | | Airports Commission, Series A, | | | | |
| | | | | Refunding, Revenue Bond, | | | | |
| | | | | 5.000%, 01/01/2030 | | | 185,512 | |
| | 150,000 | | | Rochester Health Care & Housing | | | | |
| | | | | Facility, Series A, Refunding, | | | | |
| | | | | Revenue Bond, | | | | |
| | | | | 6.875%, 12/01/2048 | | | 168,441 | |
| | 560,000 | | | Rochester Health Care Facilities | | | | |
| | | | | Mayo Clinic, Series C, | | | | |
| | | | | Revenue Bond, | | | | |
| | | | | 4.500%, 11/15/2038 (b) | | | 654,287 | |
| | | | | | | | 1,008,240 | |
| | | | | Missouri - 2.48% | | | | |
| | 200,000 | | | Kansas City Missouri Special | | | | |
| | | | | Obligation, Series B, Refunding, | | | | |
| | | | | Revenue Bond, | | | | |
| | | | | 5.000%, 08/01/2022 | | | 234,304 | |
| | 500,000 | | | Missouri Health & Educational | | | | |
| | | | | Facilities Authority, Series A, | | | | |
| | | | | Revenue Bond, | | | | |
| | | | | 5.375%, 03/15/2039 | | | 556,315 | |
| | 400,000 | | | Missouri Highway & Transportation | | | | |
| | | | | Commission, Series B, | | | | |
| | | | | Revenue Bond, | | | | |
| | | | | 5.000%, 05/01/2024 | | | 420,036 | |
| | 350,000 | | | St. Louis Airport, Revenue Bond, | | | | |
| | | | | 6.625%, 07/01/2034 | | | 420,287 | |
| | | | | | | | 1,630,942 | |
| | | | | Nebraska - 0.89% | | | | |
| | 500,000 | | | Omaha Public Power Distributors, | | | | |
| | | | | Series B, Revenue Bond, | | | | |
| | | | | 5.000%, 02/01/2027 | | | 586,620 | |
Principal
Amount | | | | | Value | |
| | | | | Nevada - 0.10% | | | | |
| $ | 60,000 | | | Henderson Nevada Public | | | | |
| | | | | Improvement Trust, Refunding, | | | | |
| | | | | Revenue Bond, | | | | |
| | | | | 5.500%, 01/01/2039 | | $ | 67,985 | |
| | | | | New Hampshire - 0.20% | | | | |
| | 120,000 | | | New Hampshire Health & | | | | |
| | | | | Educational Facilities Authority, | | | | |
| | | | | Refunding, Revenue Bond, | | | | |
| | | | | 5.000%, 07/01/2027 | | | 133,370 | |
| | | | | New Jersey - 2.40% | | | | |
| | 55,000 | | | Gloucester County New Jersey | | | | |
| | | | | Pollution Authority, Series A, | | | | |
| | | | | Refunding, Revenue Bond, | | | | |
| | | | | 5.000%, 12/01/2024 | | | 62,386 | |
| | 90,000 | | | New Jersey Economic Development | | | | |
| | | | | Authority, Series B, Revenue Bond, | | | | |
| | | | | 5.625%, 11/15/2030 | | | 102,605 | |
| | 250,000 | | | New Jersey Transportation Trust Fund | | | | |
| | | | | Authority, Series A, Revenue Bond, | | | | |
| | | | | 5.750%, 06/15/2018 | | | 278,665 | |
| | 500,000 | | | New Jersey Turnpike Authority, | | | | |
| | | | | Series A, Revenue Bond, | | | | |
| | | | | 5.000%, 01/01/2032 | | | 576,695 | |
| | 300,000 | | | New Jersey Turnpike Authority, | | | | |
| | | | | Series B, Refunding, Revenue Bond, | | | | |
| | | | | 5.000%, 01/01/2022 | | | 358,392 | |
| | 255,000 | | | Tobacco Settlement Financing Corp., | | | | |
| | | | | Series 1A, Refunding, | | | | |
| | | | | Revenue Bond, | | | | |
| | | | | 5.000%, 06/01/2041 | | | 195,909 | |
| | | | | | | | 1,574,652 | |
| | | | | New York - 9.01% | | | | |
| | 325,000 | | | Brooklyn Arena Local Development | | | | |
| | | | | Corp., Revenue Bond, | | | | |
| | | | | 6.500%, 07/15/2030 | | | 390,234 | |
| | 100,000 | | | Nassau County Tobacco Settlement | | | | |
| | | | | Corp., Series A-2, Revenue Bond, | | | | |
| | | | | 5.250%, 06/01/2026 | | | 99,742 | |
| | 40,000 | | | New York City Industrial | | | | |
| | | | | Development Agency, Series A, | | | | |
| | | | | Refunding, Revenue Bond, | | | | |
| | | | | 5.000%, 07/01/2022 | | | 44,212 | |
See notes to financial statements.
GuideMark® Tax-Exempt Fixed Income Fund
SCHEDULE OF INVESTMENTS (Continued)
March 31, 2015
| Principal | | | | | | |
| Amount | | | | | Value | |
| | | | | MUNICIPAL DEBT OBLIGATIONS (Continued) | |
| | | | | New York (Continued) | | | | |
| $ | 250,000 | | | New York City Municipal Water | | | | |
| | | | | Finance Authority, Series BB, | | | | |
| | | | | Refunding, Revenue Bond | | | | |
| | | | | 5.000%, 06/15/2046 | | $ | 283,957 | |
| | | | | New York City Transitional Finance | | | | |
| | | | | Authority, Series A-1, | | | | |
| | | | | Revenue Bond, | | | | |
| | 470,000 | | | 5.000%, 08/01/2031 | | | 552,659 | |
| | 500,000 | | | 5.000%, 11/01/2042 | | | 572,685 | |
| | 900,000 | | | New York City, GO, | | | | |
| | | | | 5.375%, 04/01/2036 | | | 1,032,948 | |
| | 125,000 | | | New York City, Series E, | | | | |
| | | | | Refunding, GO, | | | | |
| | | | | 5.000%, 08/01/2020 | | | 146,726 | |
| | 250,000 | | | New York City, Series F, | | | | |
| | | | | Refunding, GO, | | | | |
| | | | | 5.000%, 08/01/2025 | | | 296,530 | |
| | 325,000 | | | New York Dormitory Authority, | | | | |
| | | | | Revenue Bond, | | | | |
| | | | | 6.125%, 12/01/2029 | | | 358,572 | |
| | 170,000 | | | New York Dormitory Authority, | | | | |
| | | | | Series A, Revenue Bond, | | | | |
| | | | | 5.500%, 01/01/2039 | | | 194,766 | |
| | 250,000 | | | New York Dormitory Authority, | | | | |
| | | | | Series B, Refunding, | | | | |
| | | | | Revenue Bond, | | | | |
| | | | | 5.000%, 07/01/2038 | | | 287,063 | |
| | 500,000 | | | New York Environmental Facilities | | | | |
| | | | | Corporation, Revenue Bond, | | | | |
| | | | | 5.500%, 10/15/2027 | | | 667,550 | |
| | 500,000 | | | New York Environmental Facilities | | | | |
| | | | | Corporation, Series A, | | | | |
| | | | | Revenue Bond, | | | | |
| | | | | 5.000%, 06/15/2034 | | | 570,090 | |
| | 200,000 | | | New York, Series E, GO, | | | | |
| | | | | 4.000%, 12/15/2027 | | | 222,150 | |
| | 200,000 | | | Niagara Tobacco Asset Securitization | | | | |
| | | | | Corporation, Asset Backed Bonds, | | | | |
| | | | | Refunding, Revenue Bond, | | | | |
| | | | | 4.000%, 05/15/2029 | | | 200,452 | |
| | | | | | | | 5,920,336 | |
| Principal | | | | | | |
| Amount | | | | | Value | |
| | | | | North Carolina - 2.17% | | | | |
| $ | 115,000 | | | Gaston County Industrial Facilities | | | | |
| | | | | & Pollution Control Financing | | | | |
| | | | | Authority, Revenue Bond, | | | | |
| | | | | 5.750%, 08/01/2035 | | $ | 115,034 | |
| | 500,000 | | | North Carolina Capital Facilities | | | | |
| | | | | Finance Agency, Series B, | | | | |
| | | | | Refunding, Revenue Bond, | | | | |
| | | | | 5.000%, 10/01/2038 | | | 563,870 | |
| | 320,000 | | | North Carolina Eastern Municipal | | | | |
| | | | | Power Agency Power Systems, | | | | |
| | | | | Series A, Revenue Bond, | | | | |
| | | | | 5.000%, 01/01/2025 | | | 371,088 | |
| | 305,000 | | | North Carolina, Series C, | | | | |
| | | | | Refunding, GO, | | | | |
| | | | | 5.000%, 05/01/2022 | | | 373,595 | |
| | | | | | | | 1,423,587 | |
| | | | | North Dakota - 0.17% | | | | |
| | 110,000 | | | Williston Multi-Family Housing, | | | | |
| | | | | Revenue Bond, | | | | |
| | | | | 7.750%, 09/01/2038 | | | 114,809 | |
| | | | | Ohio - 2.93% | | | | |
| | 925,000 | | | Buckeye Tobacco Settlement | | | | |
| | | | | Financial Authority, Series A, | | | | |
| | | | | Revenue Bond, | | | | |
| | | | | 5.875%, 06/01/2047 | | | 761,368 | |
| | 500,000 | | | Ohio Air Quality Development | | | | |
| | | | | Authority, Series A, Revenue Bond, | | | | |
| | | | | 5.700%, 08/01/2020 | | | 573,950 | |
| | 500,000 | | | Ohio Higher Education Facilities | | | | |
| | | | | Commission, Refunding, | | | | |
| | | | | Revenue Bond, | | | | |
| | | | | 5.000%, 01/01/2026 | | | 587,975 | |
| | | | | | | | 1,923,293 | |
| | | | | Oregon - 1.01% | | | | |
| | 175,000 | | | Oregon Department Administrative | | | | |
| | | | | Lottery Services, Series A, | | | | |
| | | | | Prerefunded, Revenue Bond, | | | | |
| | | | | 5.250%, 04/01/2024 | | | 212,487 | |
| | 25,000 | | | Oregon Department Administrative | | | | |
| | | | | Lottery Services, Series A, | | | | |
| | | | | Unrefunded, Revenue Bond, | | | | |
| | | | | 5.250%, 04/01/2024 | | | 29,912 | |
See notes to financial statements.
GuideMark® Tax-Exempt Fixed Income Fund
SCHEDULE OF INVESTMENTS (Continued)
March 31, 2015
| Principal | | | | | | |
| Amount | | | | | Value | |
| | | | | MUNICIPAL DEBT OBLIGATIONS (Continued) | |
| | | | | Oregon (Continued) | | | | |
| $ | 350,000 | | | Oregon Facilities Authority | | | | |
| | | | | Peacehealth Project, Series A, | | | | |
| | | | | Refunding, Revenue Bond, | | | | |
| | | | | 5.000%, 11/15/2021 | | $ | 417,634 | |
| | | | | | | | 660,033 | |
| | | | | Pennsylvania - 5.72% | | | | |
| | 350,000 | | | Butler County Hospital Authority, | | | | |
| | | | | Revenue Bond, | | | | |
| | | | | 7.125%, 07/01/2029 | | | 435,393 | |
| | 250,000 | | | Chester County, GO, | | | | |
| | | | | 5.000%, 11/15/2033 | | | 291,732 | |
| | 250,000 | | | Delaware Valley Pennsylvania | | | | |
| | | | | Regional Finance Authority, | | | | |
| | | | | Series A, Revenue Bond, | | | | |
| | | | | AMBAC Insured, | | | | |
| | | | | 5.500%, 08/01/2028 | | | 298,745 | |
| | 150,000 | | | Montgomery County Industrial | | | | |
| | | | | Development Authority, | | | | |
| | | | | Revenue Bond, | | | | |
| | | | | 5.250%, 01/01/2040 | | | 152,504 | |
| | 400,000 | | | Pennsylvania Economic Development | | | | |
| | | | | Financing Authority, Series A, | | | | |
| | | | | Refunding, Revenue Bond, | | | | |
| | | | | 6.250%, 10/15/2023 | | | 472,372 | |
| | | | | Pennsylvania Higher Educational | | | | |
| | | | | Facilities Authority, Revenue Bond, | | | | |
| | 500,000 | | | 5.250%, 07/01/2019 | | | 554,385 | |
| | 400,000 | | | 5.800%, 07/01/2030 | | | 437,092 | |
| | 350,000 | | | Pennsylvania Turnpike Commission, | | | | |
| | | | | Series A-1, Revenue Bond, | | | | |
| | | | | 5.000%, 12/01/2038 | | | 392,095 | |
| | 500,000 | | | Philadelphia Gas Works, Refunding, | | | | |
| | | | | Revenue Bond, | | | | |
| | | | | 5.250%, 08/01/2017 | | | 550,840 | |
| | 150,000 | | | University of Pittsburgh of the | | | | |
| | | | | Commonwealth System of Higher | | | | |
| | | | | Education, Series B, Revenue Bond, | | | | |
| | | | | 5.000%, 09/15/2028 | | | 170,061 | |
| | | | | | | | 3,755,219 | |
| Principal | | | | | | |
| Amount | | | | | Value | |
| | | | | Puerto Rico - 1.00% | | | | |
| $ | 620,000 | | | Puerto Rico Commonwealth, | | | | |
| | | | | Series B, Prerefunded, GO, | | | | |
| | | | | 5.250%, 07/01/2032 | | $ | 658,328 | |
| | | | | Rhode Island - 0.91% | | | | |
| | 500,000 | | | Narragansett Commission Wastewater | | | | |
| | | | | System, Series B, Refunding, | | | | |
| | | | | Revenue Bond, | | | | |
| | | | | 5.000%, 09/01/2030 | | | 594,995 | |
| | | | | South Carolina - 1.64% | | | | |
| | 400,000 | | | Charleston Educational Excellence | | | | |
| | | | | Financing Corp., Refunding, | | | | |
| | | | | Revenue Bond, | | | | |
| | | | | 5.000%, 12/01/2025 | | | 487,092 | |
| | 500,000 | | | South Carolina Public Service | | | | |
| | | | | Authority, Series C, Refunding, | | | | |
| | | | | Revenue Bond, | | | | |
| | | | | 5.000%, 12/01/2028 | | | 588,820 | |
| | | | | | | | 1,075,912 | |
| | | | | Texas - 11.62% | | | | |
| | 430,000 | | | Central Texas Regional Mobility | | | | |
| | | | | Authority, Series A, Refunding, | | | | |
| | | | | Revenue Bond, | | | | |
| | | | | 6.000%, 01/01/2041 | | | 514,117 | |
| | 325,000 | | | Clifton Texas Higher Education | | | | |
| | | | | Finance Corp., Series A, Refunding, | | | | |
| | | | | Revenue Bond, | | | | |
| | | | | 4.000%, 12/01/2015 | | | 331,513 | |
| | 200,000 | | | Dallas-Fort Worth International Airport, | | | | |
| | | | | Series B, Revenue Bond, | | | | |
| | | | | 5.000%, 11/01/2026 | | | 235,830 | |
| | 515,000 | | | Frisco Texas Independent School | | | | |
| | | | | District, Series A, GO, | | | | |
| | | | | PSF-GTD Insured, | | | | |
| | | | | 6.000%, 08/15/2038 | | | 594,655 | |
| | 425,000 | | | Harris County Industrial | | | | |
| | | | | Development, Revenue Bond, | | | | |
| | | | | 5.000%, 02/01/2023 | | | 478,235 | |
| | 100,000 | | | Harris County-Houston Sports | | | | |
| | | | | Authority, Refunding, | | | | |
| | | | | Revenue Bond, | | | | |
| | | | | 5.000%, 11/15/2027 | | | 115,333 | |
See notes to financial statements.
GuideMark® Tax-Exempt Fixed Income Fund
SCHEDULE OF INVESTMENTS (Continued)
March 31, 2015
| Principal | | | | | | |
| Amount | | | | | Value | |
| | | | | MUNICIPAL DEBT OBLIGATIONS (Continued) | |
| | | | | Texas (Continued) | | | | |
| $ | 250,000 | | | Houston Texas Airport System, | | | | |
| | | | | Refunding, Revenue Bond, | | | | |
| | | | | 5.000%, 07/01/2029 | | $ | 269,547 | |
| | 500,000 | | | Houston, GO, | | | | |
| | | | | 5.250%, 03/01/2028 | | | 558,660 | |
| | 250,000 | | | North Texas Tollway Authority, | | | | |
| | | | | Series A, Revenue Bond, | | | | |
| | | | | 5.000%, 09/01/2020 | | | 294,740 | |
| | 770,000 | | | North Texas Tollway Authority, | | | | |
| | | | | Series E, Prerefunded, | | | | |
| | | | | Revenue Bond, | | | | |
| | | | | 5.750%, 01/01/2038 (b) | | | 801,239 | |
| | 445,000 | | | North Texas Tollway Authority, | | | | |
| | | | | Series F, Refunding, | | | | |
| | | | | Revenue Bond, | | | | |
| | | | | 5.750%, 01/01/2038 | | | 491,850 | |
| | 260,000 | | | Texas Municipal Gas Acquisition, | | | | |
| | | | | Series D, Revenue Bond, | | | | |
| | | | | 6.250%, 12/15/2026 | | | 322,169 | |
| | | | | Texas Private Activity Surface | | | | |
| | | | | Transportation Corp., Revenue Bond, | | | | |
| | 445,000 | | | 7.500%, 12/31/2031 | | | 548,195 | |
| | 400,000 | | | 7.500%, 06/30/2033 | | | 497,440 | |
| | 85,000 | | | 7.000%, 12/31/2038 | | | 106,370 | |
| | 115,000 | | | 6.750%, 06/30/2043 | | | 140,896 | |
| | 100,000 | | | Texas Transportation Commission | | | | |
| | | | | Turnpike, Second Tier, Series C, | | | | |
| | | | | Refunding Bond, | | | | |
| | | | | 5.000%, 08/15/2029 | | | 113,684 | |
| | 500,000 | | | Texas Transportation Commission, | | | | |
| | | | | Revenue Bond, | | | | |
| | | | | 5.000%, 04/01/2018 | | | 543,240 | |
| | 200,000 | | | Texas, GO, | | | | |
| | | | | 5.000%, 04/01/2029 | | | 239,662 | |
| | 400,000 | | | Texas, Series A, Prerefunded, GO, | | | | |
| | | | | 5.000%, 04/01/2022 | | | 434,508 | |
| | | | | | | | 7,631,883 | |
| | | | | Utah - 1.14% | | | | |
| | 500,000 | | | Utah Associated Municipal Power | | | | |
| | | | | Systems San Juan Project, | | | | |
| | | | | Refunding, Revenue Bond, | | | | |
| | | | | 5.500%, 06/01/2022 | | | 593,935 | |
| Principal | | | | | | |
| Amount | | | | | Value | |
| | | | | Utah (Continued) | | | | |
| $ | 155,000 | | | Utah Transit Authority Sales Tax, | | | | |
| | | | | Series B, Refunding, Revenue Bond, | | | | |
| | | | | 1.600%, 06/15/2018 | | $ | 156,931 | |
| | | | | | | | 750,866 | |
| | | | | Virginia - 2.53% | | | | |
| | 1,000,000 | | | Henry County Public Service | | | | |
| | | | | Authority Water & Sewer, | | | | |
| | | | | Refunding, Revenue Bond, | | | | |
| | | | | AGM Insured, | | | | |
| | | | | 5.500%, 11/15/2019 | | | 1,115,680 | |
| | 400,000 | | | Virginia College Building Authority | | | | |
| | | | | Educational Facilities, | | | | |
| | | | | Revenue Bond, | | | | |
| | | | | 5.750%, 01/01/2034 | | | 543,612 | |
| | | | | | | | 1,659,292 | |
| | | | | Washington - 3.09% | | | | |
| | 325,000 | | | Central Puget Sound Regional | | | | |
| | | | | Transit Authority, Series P-1, | | | | |
| | | | | Refunding, Revenue Bond, | | | | |
| | | | | 5.000%, 02/01/2027 | | | 385,106 | |
| | 500,000 | | | Energy Northwest Washington | | | | |
| | | | | Electric, Series D, Revenue Bond, | | | | |
| | | | | 5.000%, 07/01/2035 | | | 573,770 | |
| | 500,000 | | | King County Hospital, Refunding, | | | | |
| | | | | GO, NATL-RE Insured, | | | | |
| | | | | 5.000%, 12/01/2021 | | | 537,430 | |
| | 210,000 | | | King County Washington Sewer, | | | | |
| | | | | Series B, Refunding, Revenue Bond, | | | | |
| | | | | 5.000%, 01/01/2031 | | | 242,663 | |
| | 250,000 | | | Washington Health Care Facilities | | | | |
| | | | | Authority, Refunding, Revenue Bond, | | | | |
| | | | | 6.375%, 10/01/2036 | | | 289,950 | |
| | | | | | | | 2,028,919 | |
| | | | | Wisconsin - 4.90% | | | | |
| | 500,000 | | | Southeast Wisconsin Professional | | | | |
| | | | | Baseball Park Sales Tax, Series A, | | | | |
| | | | | Revenue Bond, NATL-RE Insured, | | | | |
| | | | | 5.500%, 12/15/2026 | | | 623,385 | |
| | | | | Wisconsin Health & Educational | | | | |
| | | | | Facilities Authority, Refunding, | | | | |
| | | | | Revenue Bond, | | | | |
| | 100,000 | | | 5.000%, 05/01/2025 | | | 112,654 | |
| | 200,000 | | | 5.000%, 08/15/2030 | | | 230,154 | |
See notes to financial statements.
GuideMark® Tax-Exempt Fixed Income Fund
SCHEDULE OF INVESTMENTS (Continued)
March 31, 2015
| Principal | | | | | | |
| Amount | | | | | Value | |
| | | | | MUNICIPAL DEBT OBLIGATIONS (Continued) | |
| | | | | Wisconsin (Continued) | | | | |
| $ | 100,000 | | | Wisconsin Health & Educational | | | | |
| | | | | Facilities Authority, Series B-1, | | | | |
| | | | | Revenue Bond, | | | | |
| | | | | 1.250%, 08/15/2025 (b) | | $ | 100,888 | |
| | | | | Wisconsin Public Finance Authority, | | | | |
| | | | | Refunding, Revenue Bond, | | | | |
| | 200,000 | | | 5.000%, 07/01/2022 | | | 221,060 | |
| | 150,000 | | | 5.750%, 10/01/2031 | | | 153,284 | |
| | 500,000 | | | Wisconsin, Series 2, Refunding, GO, | | | | |
| | | | | 5.000%, 05/01/2025 | | | 601,710 | |
| | 1,000,000 | | | Wisconsin, Series A, Refunding, | | | | |
| | | | | Revenue Bond, | | | | |
| | | | | 6.000%, 05/01/2033 | | | 1,176,560 | |
| | | | | | | | 3,219,695 | |
| | | | | Total Municipal Debt Obligations | | | | |
| | | | | (Cost $58,897,651) | | | 63,971,735 | |
| Number of | | | | | | |
| Shares | | | | | Value | |
| | | | | SHORT TERM INVESTMENTS - 1.51% | | | | |
| | | | | Money Market Funds - 1.51% | | | | |
| | 991,579 | | | Fidelity Tax Exempt Portfolio | | | | |
| | | | | Effective Yield, 0.01% (b) | | $ | 991,579 | |
| | | | | Total Short Term Investments | | | | |
| | | | | (Cost $991,579) | | | 991,579 | |
| | | | | Total Investments | | | | |
| | | | | (Cost $59,889,230) - 98.91% | | | 64,963,314 | |
| | | | | Other Assets in Excess of Liabilities - 1.09% | | | 718,855 | |
| | | | | TOTAL NET ASSETS - 100.00% | | $ | 65,682,169 | |
Percentages are stated as a percent of net assets.
| (a) | Zero coupon bond. The effective yield is listed. |
| (b) | Variable Rate Security. The rate shown is the rate in effect on March 31, 2015. |
| | |
| Glossary of Terms |
| AGM | - Assured Guaranty Municipal Corp. |
| AMBAC | - Ambac Financial Group, Inc. |
| BAM | - Build America Mutual |
| CMI | - California Mortgage Insurance |
| GO | - General Obligation |
| NATL-RE | - National Public Finance Guarantee Corp. |
| PSF-GTD | - Texas Permanent School Fund |
See notes to financial statements.
GuideMark® Opportunistic Fixed Income Fund
SCHEDULE OF INVESTMENTS
March 31, 2015
Principal
Amount | | | | | Value | |
| | | | | ASSET BACKED SECURITIES - 1.23% | | | | |
| | 248,512 | | | AIM Aviation Finance Ltd. | | | | |
| | | | | Series 2015-1A, 5.072%, | | | | |
| | | | | 02/15/2040 (Acquired 02/13/2015, | | | | |
| | | | | Cost $248,512) (a) | | $ | 250,823 | |
| | | | | American Express Credit Account | | | | |
| | | | | Master Trust | | | | |
| | 100,000 | | | Series 2013-3A, 0.980%, | | | | |
| | | | | 05/15/2019 | | | 100,209 | |
| | 200,000 | | | Series 2013-1A, 0.595%, | | | | |
| | | | | 02/16/2021 (b) | | | 200,618 | |
| | 95,000 | | | BMW Vehicle Owner Trust | | | | |
| | | | | Series 2014-A, 0.970%, | | | | |
| | | | | 11/26/2018 | | | 95,146 | |
| | | | | Capital One Multi-Asset | | | | |
| | | | | Execution Trust | | | | |
| | 125,000 | | | Series 2013-A3, 0.960%, | | | | |
| | | | | 09/16/2019 | | | 125,256 | |
| | 115,000 | | | Series 2014-A5, 1.480%, | | | | |
| | | | | 07/15/2020 | | | 115,908 | |
| | 150,000 | | | Chase Issuance Trust | | | | |
| | | | | Series 2015-A2, 1.590%, | | | | |
| | | | | 02/18/2020 | | | 151,155 | |
| | 100,000 | | | Colony American Homes | | | | |
| | | | | Series 2014-1A, 2.027%, | | | | |
| | | | | 05/17/2031 (Acquired 04/02/2014, | | | | |
| | | | | Cost $99,268) (a)(b) | | | 99,982 | |
| | 125,000 | | | Invitation Homes Trust | | | | |
| | | | | Series 2014-SFR1, 1.677%, | | | | |
| | | | | 06/17/2031 (Acquired 05/22/2014, | | | | |
| | | | | Cost $125,000) (a)(b) | | | 124,825 | |
| | 80,000 | | | Nissan Auto Lease Trust | | | | |
| | | | | Series 2014-B, 1.120%, | | | | |
| | | | | 09/15/2017 | | | 80,030 | |
| | | | | OneMain Financial Issuance Trust | | | | |
| | 100,000 | | | Series 2014-1A, 2.430%, | | | | |
| | | | | 06/18/2024 (Acquired 04/09/2014, | | | | |
| | | | | Cost $99,998) (a) | | | 100,291 | |
| | 260,000 | | | Series 2014-2A, 5.310%, | | | | |
| | | | | 09/18/2024 (Acquired 09/12/2014, | | | | |
| | | | | Cost $261,111) (a) | | | 258,050 | |
| | 125,000 | | | Series 2015-1A, 3.190%, | | | | |
| | | | | 03/18/2026 (Acquired 03/17/2015, | | | | |
| | | | | Cost $125,567) (a) | | | 126,133 | |
Principal
Amount | | | | | Value | |
| | | | | ASSET BACKED SECURITIES (Continued) | | | | |
| | | | | Sierra Receivables Funding Co. LLC | | | | |
| | 32,038 | | | Series 2013-1A, 1.590%, | | | | |
| | | | | 11/20/2029 (Acquired 10/22/2013, | | | | |
| | | | | Cost $31,967) (a) | | $ | 32,014 | |
| | 134,315 | | | Series 2013-3A, 2.200%, | | | | |
| | | | | 10/20/2030 (Acquired 10/29/2013 | | | | |
| | | | | and 03/12/2014, | | | | |
| | | | | Cost $134,543) (a) | | | 135,511 | |
| | 100,000 | | | Springleaf Funding Trust | | | | |
| | | | | Series 2014-A, 2.410%, | | | | |
| | | | | 12/15/2022 (Acquired 03/19/2014, | | | | |
| | | | | Cost $99,984) (a) | | | 100,041 | |
| | 151,667 | | | TAL Advantage V LLC | | | | |
| | | | | Series 2013-2A, 3.550%, | | | | |
| | | | | 11/20/2038 (Acquired 10/31/2013, | | | | |
| | | | | Cost $151,602) (a) | | | 155,260 | |
| | 98,958 | | | U.S. Residential Opportunity | | | | |
| | | | | Fund Trust | | | | |
| | | | | Series 2015-1III, 3.721%, | | | | |
| | | | | 01/27/2035 (Acquired 02/06/2015, | | | | |
| | | | | Cost $98,958) (a) | | | 99,535 | |
| | 147,105 | | | VOLT XXII LLC | | | | |
| | | | | Series 2015-NPL4, 3.500%, | | | | |
| | | | | 02/25/2055 (Acquired 02/25/2015, | | | | |
| | | | | Cost $146,950) (a) | | | 147,393 | |
| | | | | Total Asset Backed Securities | | | | |
| | | | | (Cost $2,488,750) | | | 2,498,180 | |
| | | | | BANK LOANS - 3.91% | | | | |
| | 17,733 | | | Allison Transmission, Inc. | | | | |
| | | | | 0.000%, 08/23/2019 (b)(c) | | | 17,689 | |
| | 81,432 | | | Altice S.A. | | | | |
| | | | | 5.250%, 02/04/2022 (b) | | | 82,368 | |
| | | | | American Beacon Advisors, Inc. | | | | |
| | 73,130 | | | 4.750%, 11/22/2019 (b) | | | 73,679 | |
| | 73,387 | | | 4.734%, 03/06/2022 (b) | | | 73,938 | |
| | 129,018 | | | American Builders & Contractors | | | | |
| | | | | Supply Co., Inc. | | | | |
| | | | | 3.500%, 04/16/2020 (b) | | | 128,735 | |
| | | | | American Tire Distributors, Inc. | | | | |
| | 32,991 | | | 7.000%, 06/01/2018 (b) | | | 33,073 | |
| | 33,074 | | | 4.484%, 10/01/2021 (b) | | | 33,260 | |
| | 98,213 | | | Amneal Pharmaceuticals, LLC | | | | |
| | | | | 5.009%, 11/01/2019 (b) | | | 98,785 | |
| | 123,750 | | | Aptean Holdings, Inc. | | | | |
| | | | | 5.250%, 02/26/2020 (b) | | | 121,584 | |
See notes to financial statements.
GuideMark® Opportunistic Fixed Income Fund
SCHEDULE OF INVESTMENTS (Continued)
March 31, 2015
Principal
Amount | | | | | Value | |
| | | | | BANK LOANS (Continued) | | | | |
| | 113,850 | | | Aramark Corp. | | | | |
| | | | | 3.250%, 02/24/2021 (b) | | $ | 113,822 | |
| | 154,122 | | | Ardagh Group S.A. | | | | |
| | | | | 4.000%, 12/17/2019 (b) | | | 154,828 | |
| | 126,019 | | | Asurion Corp. | | | | |
| | | | | 5.000%, 05/24/2019 (b) | | | 126,604 | |
| | 42,113 | | | Awas Aviation Capital Ltd. | | | | |
| | | | | 3.500%, 07/16/2018 (b) | | | 42,218 | |
| | 70,090 | | | Axalta Coatings Systems, LLC | | | | |
| | | | | 3.750%, 02/01/2020 (b) | | | 69,772 | |
| | | | | BMC Software Finance, Inc. | | | | |
| | 176,608 | | | 5.000%, 09/10/2020 (b) | | | 171,199 | |
| | 91,369 | | | 5.000%, 09/10/2020 (b) | | | 91,141 | |
| | 139,891 | | | Cable & Wireless Communications Plc | | | | |
| | | | | 5.500%, 04/28/2017 (b) | | | 140,239 | |
| | 87,247 | | | Calpine Corp. | | | | |
| | | | | 4.000%, 10/09/2019 (b) | | | 87,598 | |
| | 42,231 | | | Charter Communications, Inc. | | | | |
| | | | | 4.250%, 09/12/2021 (b) | | | 42,624 | |
| | 49,253 | | | Coinmach Corp. | | | | |
| | | | | 4.250%, 11/14/2019 (b) | | | 49,099 | |
| | 98,705 | | | Continental Building Products, Inc. | | | | |
| | | | | 4.000%, 08/28/2020 (b) | | | 98,396 | |
| | 97,336 | | | Creative Artists Agency, LLC | | | | |
| | | | | 5.500%, 12/17/2021 (b) | | | 98,522 | |
| | 98,750 | | | Crosby Worldwide Ltd. | | | | |
| | | | | 3.750%, 11/23/2020 (b) | | | 91,591 | |
| | 38,948 | | | DealerTrack Technologies, Inc. | | | | |
| | | | | 2.775%, 02/28/2021 (b) | | | 38,838 | |
| | 23,319 | | | Dematic Corp. | | | | |
| | | | | 4.250%, 12/28/2019 (b) | | | 23,295 | |
| | 25,346 | | | Doncasters Group Ltd. | | | | |
| | | | | 4.500%, 04/09/2020 (b) | | | 25,406 | |
| | 17,910 | | | Emerald Performance Materials, LLC | | | | |
| | | | | 4.500%, 08/01/2021 (b) | | | 17,947 | |
| | | | | Energy Transfer Equity, L.P. | | | | |
| | 80,000 | | | 3.250%, 12/02/2019 (b) | | | 79,067 | |
| | 30,740 | | | 4.000%, 12/02/2019 (b) | | | 30,682 | |
| | 45,895 | | | Entegris, Inc. | | | | |
| | | | | 3.500%, 04/30/2021 (b) | | | 45,852 | |
| | 68,425 | | | FleetPride Corp. | | | | |
| | | | | 5.250%, 11/19/2019 (b) | | | 68,147 | |
Principal
Amount | | | | | Value | |
| | | | | BANK LOANS (Continued) | | | | |
| | 32,143 | | | Fogo de Chão Churrascaria | | | | |
| | | | | Holdings, LLC | | | | |
| | | | | 11.000%, 01/20/2020 (b) | | $ | 32,096 | |
| | 66,665 | | | Gates Global LLC | | | | |
| | | | | 4.250%, 07/05/2021 (b) | | | 66,493 | |
| | 122,720 | | | Generac Power Systems, Inc. | | | | |
| | | | | 3.250%, 05/31/2020 (b) | | | 122,592 | |
| | 95,814 | | | Goodpack Ltd. | | | | |
| | | | | 4.750%, 09/09/2021 (b) | | | 96,009 | |
| | 138,600 | | | Grifols, S.A. | | | | |
| | | | | 3.178%, 02/27/2021 (b) | | | 138,626 | |
| | 48,513 | | | Grosvenor Capital Management, L.P. | | | | |
| | | | | 3.750%, 01/04/2021 (b) | | | 48,149 | |
| | 24,926 | | | HarbourVest Partners, LLC | | | | |
| | | | | 3.250%, 02/04/2021 (b) | | | 24,707 | |
| | 129,668 | | | HD Supply Holdings, Inc. | | | | |
| | | | | 4.000%, 06/28/2018 (b) | | | 130,057 | |
| | 225,946 | | | Hilton Worldwide Holdings, Inc. | | | | |
| | | | | 3.500%, 10/26/2020 (b) | | | 226,491 | |
| | 128,700 | | | HUB International Ltd. | | | | |
| | | | | 4.000%, 10/02/2020 (b) | | | 127,842 | |
| | 50,000 | | | Hyperion Insurance Group Limited | | | | |
| | | | | 4.734%, 03/25/2022 (b) | | | 50,313 | |
| | 39,600 | | | IMS Health Holdings, Inc. | | | | |
| | | | | 3.500%, 03/17/2021 (b) | | | 39,557 | |
| | 137,853 | | | Infor Global Solutions, Inc. | | | | |
| | | | | 3.750%, 06/03/2020 (b) | | | 136,831 | |
| | 132,629 | | | iQor, Inc. | | | | |
| | | | | 6.000%, 04/01/2021 (b) | | | 126,329 | |
| | 83,916 | | | Level 3 Communications, Inc. | | | | |
| | | | | 4.500%, 01/31/2022 (b) | | | 84,463 | |
| | 18,089 | | | Libbey, Inc. | | | | |
| | | | | 3.750%, 04/09/2021 (b) | | | 18,044 | |
| | 90,857 | | | Lightower Fiber Networks, LLC | | | | |
| | | | | 4.000%, 04/13/2020 (b) | | | 90,667 | |
| | 128,700 | | | Mallinckrodt, LLC | | | | |
| | | | | 3.250%, 03/19/2021 (b) | | | 128,551 | |
| | 125,019 | | | Micro Focus International plc | | | | |
| | | | | 5.250%, 11/19/2021 (b) | | | 125,357 | |
| | 32,712 | | | Microsemi Corporation | | | | |
| | | | | 3.500%, 02/19/2020 (b) | | | 32,704 | |
| | 132,495 | | | Millennium Laboratories, LLC | | | | |
| | | | | 5.250%, 04/16/2021 (b) | | | 133,709 | |
See notes to financial statements.
GuideMark® Opportunistic Fixed Income Fund
SCHEDULE OF INVESTMENTS (Continued)
March 31, 2015
Principal
Amount | | | | | Value | |
| | | | | BANK LOANS (Continued) | | | | |
| | 59,100 | | | NXP Semiconductors N.V. | | | | |
| | | | | 3.250%, 01/11/2020 (b) | | $ | 58,952 | |
| | 59,550 | | | Ortho-Clinical Diagnostics, Inc. | | | | |
| | | | | 4.750%, 06/30/2021 (b) | | | 59,099 | |
| | 20,797 | | | Overseas Shipholding Group, Inc. | | | | |
| | | | | 5.250%, 08/05/2019 (b) | | | 20,745 | |
| | 69,475 | | | Patheon, Inc. | | | | |
| | | | | 4.250%, 03/11/2021 (b) | | | 69,258 | |
| | 27,352 | | | Performance Sports Group Ltd. | | | | |
| | | | | 4.000%, 04/15/2021 (b) | | | 27,347 | |
| | 117,012 | | | Pinnacle Agriculture Holdings, LLC | | | | |
| | | | | 4.750%, 11/15/2018 (b) | | | 117,305 | |
| | 88,425 | | | Platform Specialty Products Corporation | | | | |
| | | | | 4.500%, 06/07/2020 (b) | | | 88,907 | |
| | | | | PowerTeam Services, LLC | | | | |
| | 122,470 | | | 4.250%, 05/06/2020 (b) | | | 121,858 | |
| | 6,556 | | | 4.250%, 05/06/2020 (b) | | | 6,523 | |
| | 188,424 | | | Quintiles Transnational Holdings, Inc. | | | | |
| | | | | 3.750%, 06/08/2018 (b) | | | 188,952 | |
| | 126,878 | | | Realogy Holdings Corp. | | | | |
| | | | | 3.750%, 03/05/2020 (b) | | | 126,941 | |
| | 34,288 | | | Reddy Ice Holdings, Inc. | | | | |
| | | | | 6.750%, 05/01/2019 (b) | | | 30,227 | |
| | 73,431 | | | Renaissance Learning | | | | |
| | | | | 4.500%, 04/09/2021 (b) | | | 72,054 | |
| | 59,550 | | | SBA Communications Corp. | | | | |
| | | | | 3.250%, 03/24/2021 (b) | | | 59,321 | |
| | 133,891 | | | Sedgwick CMS Holdings, Inc. | | | | |
| | | | | 3.750%, 03/01/2021 (b) | | | 132,468 | |
| | | | | Service King | | | | |
| | 32,181 | | | 4.750%, 08/18/2021 (b) | | | 32,402 | |
| | 3,626 | | | 4.750%, 08/18/2021 (b) | | | 3,651 | |
| | 92,036 | | | Signode Packaging Systems | | | | |
| | | | | 3.750%, 05/01/2021 (b) | | | 91,518 | |
| | 34,912 | | | Southcross Energy Partners, L.P. | | | | |
| | | | | 5.250%, 08/04/2021 (b) | | | 34,170 | |
| | 66,279 | | | Sprouts Farmers Market, Inc. | | | | |
| | | | | 4.000%, 04/23/2020 (b) | | | 66,555 | |
| | 81,001 | | | Talbots, Inc. | | | | |
| | | | | 4.750%, 03/19/2020 (b) | | | 79,988 | |
| | 47,904 | | | Targa Resources Corp. | | | | |
| | | | | 5.750%, 02/25/2022 (b) | | | 48,144 | |
Principal
Amount | | | | | Value | |
| | | | | BANK LOANS (Continued) | | | | |
| | 49,376 | | | The Brickman Group, Ltd. | | | | |
| | | | | 4.000%, 12/18/2020 (b) | | $ | 49,177 | |
| | 77,730 | | | The Hillman Group, Inc. | | | | |
| | | | | 4.500%, 06/30/2021 (b) | | | 78,410 | |
| | 133,635 | | | The QUIKRETE Companies, Inc. | | | | |
| | | | | 4.000%, 09/28/2020 (b) | | | 133,718 | |
| | 206,178 | | | The ServiceMaster Company | | | | |
| | | | | 4.250%, 07/01/2021 (b) | | | 206,735 | |
| | 79,400 | | | Time, Inc. | | | | |
| | | | | 4.250%, 04/26/2021 (b) | | | 79,648 | |
| | 23,180 | | | Townsquare Media, Inc. | | | | |
| | | | | 3.484%, 03/27/2022 (b) | | | 23,252 | |
| | | | | TransDigm, Inc. | | | | |
| | 95,460 | | | 3.750%, 02/28/2020 (b) | | | 95,453 | |
| | 225,541 | | | 3.750%, 06/04/2021 (b) | | | 225,494 | |
| | 110,654 | | | Tribune Media Company | | | | |
| | | | | 4.000%, 12/27/2020 (b) | | | 110,889 | |
| | | | | Valeant Pharmaceuticals | | | | |
| | | | | International, Inc. | | | | |
| | 86,926 | | | 3.484%, 03/10/2022 (b) | | | 87,429 | |
| | 66,581 | | | 3.484%, 03/10/2022 (b) | | | 66,966 | |
| | 33,931 | | | VAT Vakuumventile AG | | | | |
| | | | | 4.750%, 02/11/2021 (b) | | | 33,862 | |
| | 129,425 | | | Vertafore, Inc. | | | | |
| | | | | 4.250%, 10/03/2019 (b) | | | 129,627 | |
| | 129,367 | | | Visteon Corporation | | | | |
| | | | | 3.500%, 04/09/2021 (b) | | | 129,347 | |
| | 12,482 | | | WESCO International, Inc. | | | | |
| | | | | 3.750%, 12/12/2019 (b) | | | 12,519 | |
| | 84,785 | | | Western Refining, Inc. | | | | |
| | | | | 4.250%, 11/12/2020 (b) | | | 84,361 | |
| | 215,295 | | | Wilsonart International, Inc. | | | | |
| | | | | 4.000%, 10/31/2019 (b) | | | 215,026 | |
| | 132,146 | | | Zayo Group, LLC | | | | |
| | | | | 4.000%, 07/02/2019 (b) | | | 132,508 | |
| | 128,401 | | | Zebra Technologies Corporation | | | | |
| | | | | 4.750%, 10/27/2021 (b) | | | 130,059 | |
| | | | | Total Bank Loans | | | | |
| | | | | (Cost $7,870,909) | | | 7,910,450 | |
| | | | | COLLATERALIZED MORTGAGE | | | | |
| | | | | OBLIGATIONS - 14.48% | | | | |
| | | | | Adjustable Rate Mortgage | | | | |
| | 45,880 | | | Series 2004-4, 2.677%, | | | | |
| | | | | 03/25/2035 (b) | | | 44,964 | |
See notes to financial statements.
GuideMark® Opportunistic Fixed Income Fund
SCHEDULE OF INVESTMENTS (Continued)
March 31, 2015
Principal
Amount | | | | | Value | |
| | | | | COLLATERALIZED MORTGAGE | | | | |
| | | | | OBLIGATIONS (Continued) | | | | |
| | 97,113 | | | Series 2004-5, 2.563%, | | | | |
| | | | | 04/25/2035 (b) | | $ | 96,434 | |
| | 55,661 | | | Series 2004-5, 2.583%, | | | | |
| | | | | 04/25/2035 (b) | | | 54,553 | |
| | | | | Alternative Loan Trust | | | | |
| | 95,362 | | | Series 2005-J1, 5.500%, | | | | |
| | | | | 02/25/2025 | | | 97,447 | |
| | 35,346 | | | Series 2003-9T1, 5.500%, | | | | |
| | | | | 07/25/2033 | | | 35,654 | |
| | 45,915 | | | Series 2003-20CB, 5.750%, | | | | |
| | | | | 10/25/2033 | | | 48,597 | |
| | 76,280 | | | Series 2004-14T2, 5.500%, | | | | |
| | | | | 08/25/2034 | | | 81,233 | |
| | 26,115 | | | Series 2004-28CB, 5.750%, | | | | |
| | | | | 01/25/2035 | | | 26,654 | |
| | 76,339 | | | Series 2006-4CB, 5.500%, | | | | |
| | | | | 04/25/2036 | | | 74,541 | |
| | 201,300 | | | Series 2006-J4, 6.250%, | | | | |
| | | | | 07/25/2036 | | | 137,589 | |
| | 187,175 | | | Series 2007-4CB, 5.750%, | | | | |
| | | | | 04/25/2037 | | | 170,168 | |
| | 1,162,640 | | | Series 2007-15CB, 6.000%, | | | | |
| | | | | 07/25/2037 | | | 1,097,205 | |
| | | | | Banc of America Alternative | | | | |
| | | | | Loan Trust | | | | |
| | 57,289 | | | Series 2003-8, 5.500%, | | | | |
| | | | | 10/25/2033 | | | 61,093 | |
| | 123,163 | | | Series 2003-10, 5.500%, | | | | |
| | | | | 12/25/2033 | | | 126,513 | |
| | 70,903 | | | Series 2013-10, 5.500%, | | | | |
| | | | | 12/25/2033 | | | 73,252 | |
| | 68,379 | | | Series 2005-6, 5.250%, | | | | |
| | | | | 07/25/2035 | | | 62,015 | |
| | | | | Banc of America Funding Corp. | | | | |
| | 169,827 | | | Series 2004-B, 2.501%, | | | | |
| | | | | 11/20/2034 (b) | | | 165,679 | |
| | 34,793 | | | Series 2005-5, 5.500%, | | | | |
| | | | | 09/25/2035 | | | 36,532 | |
| | 1,586,861 | | | Series 2006-3, 5.750%, | | | | |
| | | | | 03/25/2036 | | | 1,497,416 | |
| | 1,196,999 | | | Series 2007-3, 5.831%, | | | | |
| | | | | 04/25/2037 (b) | | | 1,055,612 | |
Principal
Amount | | | | | Value | |
| | | | | COLLATERALIZED MORTGAGE | | | | |
| | | | | OBLIGATIONS (Continued) | | | | |
| | 107,975 | | | Series 2008-R4, 0.618%, | | | | |
| | | | | 07/25/2037 (Acquired 10/17/2012, | | | | |
| | | | | Cost $79,670) (a)(b) | | $ | 77,164 | |
| | 108,166 | | | Banc of America Mortgage Trust | | | | |
| | | | | Series 2005-A, 2.663%, | | | | |
| | | | | 02/25/2035 (b) | | | 105,366 | |
| | 240,000 | | | Bear Stearns Commercial Mortgage | | | | |
| | | | | Securities Trust | | | | |
| | | | | Series 2003-PWR2, 6.872%, | | | | |
| | | | | 05/11/2039 (Acquired 03/06/2012, | | | | |
| | | | | Cost $245,178) (a)(b) | | | 244,537 | |
| | 100,000 | | | BLCP Hotel Trust | | | | |
| | | | | Series 2014-CLRN, 3.845%, | | | | |
| | | | | 08/15/2029 (Acquired 10/01/2014, | | | | |
| | | | | Cost $99,625) (a)(b) | | | 100,274 | |
| | 835,000 | | | CFCRE Commercial Mortgage Trust | | | | |
| | | | | Series 2011-C1, 5.537%, | | | | |
| | | | | 04/15/2044 (Acquired 04/19/2011 | | | | |
| | | | | and 05/17/2011, | | | | |
| | | | | Cost $828,080) (a)(b) | | | 945,809 | |
| | 1,127,637 | | | Chase Mortgage Finance Trust | | | | |
| | | | | Series 2007-S3, 6.000%, | | | | |
| | | | | 05/25/2037 | | | 962,919 | |
| | | | | CHL Mortgage Pass-Through Trust | | | | |
| | 54,778 | | | Series 2004-12, 2.593%, | | | | |
| | | | | 08/25/2034 (b) | | | 51,378 | |
| | 58,072 | | | Series 2004-HYB4, 2.420%, | | | | |
| | | | | 09/20/2034 (b) | | | 55,725 | |
| | 240,652 | | | Series 2004-HYB8, 3.247%, | | | | |
| | | | | 01/20/2035 (b) | | | 235,544 | |
| | 89,518 | | | Series 2005-11, 0.444%, | | | | |
| | | | | 04/25/2035 (b) | | | 78,117 | |
| | 69,234 | | | Series 2005-21, 5.500%, | | | | |
| | | | | 10/25/2035 | | | 65,304 | |
| | 85,602 | | | Citicorp Mortgage Securities Trust | | | | |
| | | | | Series 2006-4, 6.000%, | | | | |
| | | | | 08/25/2036 | | | 87,212 | |
| | | | | Citigroup Mortgage Loan Trust | | | | |
| | 41,531 | | | Series 2005-2, 2.568%, | | | | |
| | | | | 05/25/2035 (b) | | | 40,211 | |
| | 314,007 | | | Series 2010-8, 4.000%, | | | | |
| | | | | 11/25/2036 (Acquired 11/01/2012, | | | | |
| | | | | Cost $320,058) (a) | | | 319,995 | |
See notes to financial statements.
GuideMark® Opportunistic Fixed Income Fund
SCHEDULE OF INVESTMENTS (Continued)
March 31, 2015
Principal
Amount | | | | | Value | |
| | | | | COLLATERALIZED MORTGAGE
OBLIGATIONS (Continued) | | | | |
| | | | | CitiMortgage Alternative Loan Trust | | | | |
| | 139,291 | | | Series 2006-A3, 6.000%, | | | | |
| | | | | 07/25/2036 | | $ | 122,924 | |
| | 116,043 | | | Series 2006-A4, 6.000%, | | | | |
| | | | | 09/25/2036 | | | 104,938 | |
| | 125,791 | | | Series 2007-A6, 6.000%, | | | | |
| | | | | 06/25/2037 | | | 112,197 | |
| | 100,000 | | | COMM Mortgage Trust | | | | |
| | | | | Series 2014-SAVA, 2.575%, | | | | |
| | | | | 06/15/2034 (Acquired 06/26/2014, | | | | |
| | | | | Cost $100,000) (a)(b) | | | 100,093 | |
| | | | | Credit Suisse First Boston Mortgage Securities Corp. | | | | |
| | 24,355 | | | Series 2005-1, 5.250%, | | | | |
| | | | | 05/25/2028 | | | 24,579 | |
| | 37,674 | | | Series 2003-AR26, 2.516%, | | | | |
| | | | | 11/25/2033 (b) | | | 36,426 | |
| | 27,398 | | | Series 2003-AR28, 2.544%, | | | | |
| | | | | 12/25/2033 (b) | | | 27,245 | |
| | 102,181 | | | Series 2004-AR4, 2.624%, | | | | |
| | | | | 05/25/2034 (b) | | | 101,359 | |
| | 148,177 | | | Series 2005-10, 5.500%, | | | | |
| | | | | 11/25/2035 | | | 134,910 | |
| | 156,653 | | | Credit Suisse Mortgage Capital Certificates | | | | |
| | | | | Series 2006-8, 6.500%, | | | | |
| | | | | 10/25/2021 | | | 136,585 | |
| | | | | Credit Suisse Mortgage Capital Mortgage-Backed Securities | | | | |
| | 574,957 | | | Series 2006-9, 6.000%, | | | | |
| | | | | 11/25/2036 | | | 555,882 | |
| | 654,640 | | | Series 2007-1, 6.000%, | | | | |
| | | | | 02/25/2037 | | | 589,682 | |
| | 100,000 | | | Del Coronado Trust | | | | |
| | | | | Series 2013-HDMZ, 5.175%, | | | | |
| | | | | 03/15/2018 (Acquired 04/01/2013, | | | | |
| | | | | Cost $100,000) (a)(b) | | | 100,250 | |
| | | | | Deutsche Alt-A Securities, Inc. | | | | |
| | 44,555 | | | Series 2005-3, 5.250%, | | | | |
| | | | | 06/25/2035 | | | 45,173 | |
| | 51,260 | | | Series 2005-5, 5.500%, | | | | |
| | | | | 11/25/2035 (b) | | | 48,785 | |
| | 548,871 | | | Series 2006-AR1, 4.908%, | | | | |
| | | | | 02/25/2036 (b) | | | 458,340 | |
| Principal | | | | | | | |
| Amount | | | | | | Value | |
| | | | | COLLATERALIZED MORTGAGE
OBLIGATIONS (Continued) | | | | |
| | 381,000 | | | Extended Stay America Trust | | | | |
| | | | | Series 2013-ESH, 5.053%, | | | | |
| | | | | 12/05/2031 (Acquired 01/31/2013, | | | | |
| | | | | Cost $394,948) (a)(b) | | $ | 397,308 | |
| | 41,018 | | | FDIC Trust | | | | |
| | | | | Series 2013-N1, 4.500%, | | | | |
| | | | | 10/25/2018 (Acquired 11/8/2013, | | | | |
| | | | | Cost $41,222) (a)(b) | | | 41,396 | |
| | 573,935 | | | First Horizon Alternative Mortgage Securities | | | | |
| | | | | Series 2007-FA4, 6.250%, | | | | |
| | | | | 08/25/2037 | | | 467,422 | |
| | 686,808 | | | First Horizon Mortgage Pass-Through Trust | | | | |
| | | | | Series 2007-4, 6.000%, | | | | |
| | | | | 08/25/2037 | | | 609,006 | |
| | 15,807 | | | GMAC Mortgage Loan Trust | | | | |
| | | | | Series 2003-J7, 5.000%, | | | | |
| | | | | 11/25/2033 | | | 15,919 | |
| | | | | GSR Mortgage Loan Trust | | | | |
| | 129,197 | | | Series 2004-14, 2.735%, | | | | |
| | | | | 12/25/2034 (b) | | | 128,529 | |
| | 49,993 | | | Series 2004-14, 2.815%, | | | | |
| | | | | 12/25/2034 (b) | | | 48,456 | |
| | 142,441 | | | Series 2005-AR4, 2.468%, | | | | |
| | | | | 07/25/2035 (b) | | | 135,226 | |
| | 207,592 | | | Series 2006-8F, 6.000%, | | | | |
| | | | | 09/25/2036 | | | 176,408 | |
| | 1,093,090 | | | Series 2006-9F, 6.500%, | | | | |
| | | | | 10/25/2036 | | | 978,047 | |
| | 506,533 | | | Series 2007-4F, 6.000%, | | | | |
| | | | | 07/25/2037 | | | 460,192 | |
| | | | | Hilton USA Trust | | | | |
| | 100,000 | | | Series 2013-HLT, 4.407%, | | | | |
| | | | | 11/05/2030 (Acquired 11/22/2013, | | | | |
| | | | | Cost $100,415) (a) | | | 103,194 | |
| | 100,000 | | | Series 2013-HLT, 5.222%, | | | | |
| | | | | 11/05/2030 (Acquired 11/22/2013, | | | | |
| | | | | Cost $100,416) (a)(b) | | | 103,051 | |
| | 100,000 | | | Series 2013-HLT, 3.714%, | | | | |
| | | | | 11/05/2030 (Acquired 11/22/2013, | | | | |
| | | | | Cost $100,415) (a) | | | 102,351 | |
| | 812,928 | | | IndyMac IMJA Mortgage Loan Trust | | | | |
| | | | | Series 2007-A3, 6.250%, | | | | |
| | | | | 11/25/2037 | | | 701,164 | |
See notes to financial statements.
GuideMark® Opportunistic Fixed Income Fund
SCHEDULE OF INVESTMENTS (Continued)
March 31, 2015
| Principal | | | | | | | |
| Amount | | | | | Value | |
| | | | | COLLATERALIZED MORTGAGE
OBLIGATIONS (Continued) | | | | |
| | | | | IndyMac INDX Mortgage Loan Trust | | | | |
| | 789,967 | | | Series 2005-AR1, 2.462%, | | | | |
| | | | | 03/25/2035 (b) | | $ | 792,003 | |
| | 47,686 | | | Series 2005-AR16IP, 0.814%, | | | | |
| | | | | 07/25/2045 (b) | | | 42,238 | |
| | 132,961 | | | JPMorgan Alternative Loan Trust | | | | |
| | | | | Series 2006-A1, 2.939%, | | | | |
| | | | | 03/25/2036 (b) | | | 114,649 | |
| | | | | JPMorgan Chase Commercial Mortgage Securities Trust | | | | |
| | 94,282 | | | Series 2013-JWMZ, 6.175%, | | | | |
| | | | | 04/15/2018 (Acquired 05/23/2013, | | | | |
| | | | | Cost $94,646) (a)(b) | | | 94,291 | |
| | 8,474,419 | | | Series 2012-C8, 2.116%, | | | | |
| | | | | 10/17/2045 (b)(g) | | | 837,260 | |
| | | | | JPMorgan Mortgage Trust | | | | |
| | 45,945 | | | Series 2003-A2, 1.990%, | | | | |
| | | | | 11/25/2033 (b) | | | 45,430 | |
| | 34,490 | | | Series 2005-A3, 2.659%, | | | | |
| | | | | 06/25/2035 (b) | | | 34,935 | |
| | 66,049 | | | Series 2006-A1, 2.404%, | | | | |
| | | | | 02/25/2036 (b) | | | 59,085 | |
| | 134,978 | | | Series 2006-A7, 2.539%, | | | | |
| | | | | 01/25/2037 (b) | | | 123,656 | |
| | 159,896 | | | Series 2007-S1, 5.750%, | | | | |
| | | | | 03/25/2037 | | | 135,747 | |
| | 843,699 | | | Lehman Mortgage Trust | | | | |
| | | | | Series 2006-2, 5.750%, | | | | |
| | | | | 04/25/2036 | | | 849,728 | |
| | | | | MASTR Adjustable Rate Mortgages Trust | | | | |
| | 125,858 | | | Series 2004-7, 2.500%, | | | | |
| | | | | 07/25/2034 (b) | | | 126,104 | |
| | 767,196 | | | Series 2006-2, 2.470%, | | | | |
| | | | | 01/25/2036 (b) | | | 765,730 | |
| | | | | MASTR Alternative Loan Trust | | | | |
| | 52,989 | | | Series 2003-9, 5.250%, | | | | |
| | | | | 11/25/2033 | | | 55,208 | |
| | 55,773 | | | Series 2004-5, 5.500%, | | | | |
| | | | | 06/25/2034 | | | 58,553 | |
| | 65,000 | | | Series 2004-5, 6.000%, | | | | |
| | | | | 06/25/2034 | | | 67,928 | |
| | 148,045 | | | Series 2004-8, 6.000%, | | | | |
| | | | | 09/25/2034 | | | 152,171 | |
| Principal | | | | | | | |
| Amount | | | | | Value | |
| | | | | COLLATERALIZED MORTGAGE
OBLIGATIONS (Continued) | | | | |
| | 10,898 | | | Series 2004-12, 5.250%, | | | | |
| | | | | 12/25/2034 | | $ | 10,947 | |
| | 101,051 | | | Merrill Lynch Mortgage Investors Trust | | | | |
| | | | | Series 2006-2, 2.117%, | | | | |
| | | | | 05/25/2036 (b) | | | 100,459 | |
| | 400,000 | | | Morgan Stanley Capital I Trust | | | | |
| | | | | Series 2011-C2, 5.304%, | | | | |
| | | | | 06/15/2044 (Acquired 06/22/2011, | | | | |
| | | | | Cost $352,773) (a)(b) | | | 432,140 | |
| | | | | Morgan Stanley Mortgage Loan Trust | | | | |
| | 1,256,084 | | | Series 2005-10, 6.000%, | | | | |
| | | | | 12/25/2035 | | | 1,057,519 | |
| | 1,030,276 | | | Series 2007-12, 6.250%, | | | | |
| | | | | 08/25/2037 | | | 940,967 | |
| | 93,493 | | | New York Mortgage Trust | | | | |
| | | | | Series 2006-1, 2.878%, | | | | |
| | | | | 05/25/2036 (b) | | | 85,228 | |
| | | | | Residential Asset Securitization Trust | | | | |
| | 1,074,067 | | | Series 2007-A2, 6.000%, | | | | |
| | | | | 04/25/2037 | | | 931,441 | |
| | 855,904 | | | Series 2007-A6, 6.000%, | | | | |
| | | | | 06/25/2037 | | | 781,821 | |
| | 1,147,645 | | | Series 2007-A7, 6.000%, | | | | |
| | | | | 07/25/2037 | | | 847,657 | |
| | 134,413 | | | Residential Funding Mortgage Securities I | | | | |
| | | | | Series 2006-S1, 5.750%, | | | | |
| | | | | 01/25/2036 | | | 138,546 | |
| | | | | SCG Trust | | | | |
| | 100,000 | | | Series 2013-SRP1, 2.656%, | | | | |
| | | | | 11/15/2026 (Acquired 05/02/2014, | | | | |
| | | | | Cost $100,275) (a)(b) | | | 100,023 | |
| | 100,000 | | | Series 2013-SRP1, 3.406%, | | | | |
| | | | | 11/15/2026 (Acquired 05/05/2014, | | | | |
| | | | | Cost $100,316) (a)(b) | | | 100,496 | |
| | 1,243,092 | | | Sequoia Mortgage Trust | | | | |
| | | | | Series 2013-3, 2.500%, | | | | |
| | | | | 03/25/2043 (b) | | | 1,199,337 | |
| | | | | Structured Adjustable Rate Mortgage Loan Trust | | | | |
| | 70,004 | | | Series 2004-6, 2.354%, | | | | |
| | | | | 06/25/2034 (b) | | | 69,086 | |
See notes to financial statements.
GuideMark® Opportunistic Fixed Income Fund
SCHEDULE OF INVESTMENTS (Continued)
March 31, 2015
| Principal | | | | | | | |
| Amount | | | | | Value | |
| | | | | COLLATERALIZED MORTGAGE | | | | |
| | | | | OBLIGATIONS (Continued) | | | | |
| | 88,894 | | | Series 2005-14, 0.484%, | | | | |
| | | | | 07/25/2035 (b) | | $ | 66,196 | |
| | 26,221 | | | Structured Asset Securities Corp. Trust | | | | |
| | | | | Series 2005-1, 5.500%, | | | | |
| | | | | 02/25/2035 | | | 26,857 | |
| | 1,159,831 | | | TBW Mortgage-Backed Trust | | | | |
| | | | | Series 2006-6, 5.630%, | | | | |
| | | | | 01/25/2037 (b) | | | 766,851 | |
| | | | | Washington Mutual Mortgage Pass-Through Certificates | | | | |
| | 40,467 | | | Series 2004-CB2, 5.500%, | | | | |
| | | | | 07/25/2034 | | | 42,320 | |
| | 250,000 | | | Series 2005-AR7, 2.358%, | | | | |
| | | | | 08/25/2035 (b) | | | 249,871 | |
| | 327,123 | | | Series 2006-5, 6.000%, | | | | |
| | | | | 07/25/2036 | | | 272,205 | |
| | 235,203 | | | Series 2006-AR19, 1.942%, | | | | |
| | | | | 01/25/2047 (b) | | | 213,326 | |
| | 84,329 | | | Series 2007-OA3, 0.888%, | | | | |
| | | | | 04/25/2047 (b) | | | 74,027 | |
| | 424,493 | | | Wells Fargo Alternative Loan Trust | | | | |
| | | | | Series 2007-PA1, 6.000%, | | | | |
| | | | | 03/25/2037 | | | 366,915 | |
| | | | | Wells Fargo Mortgage Backed Securities Trust | | | | |
| | 42,259 | | | Series 2003-J, 2.612%, | | | | |
| | | | | 10/25/2033 (b) | | | 42,511 | |
| | 104,886 | | | Series 2004-A, 2.638%, | | | | |
| | | | | 02/25/2034 (b) | | | 105,229 | |
| | 25,195 | | | Series 2004-O, 2.615%, | | | | |
| | | | | 08/25/2034 (b) | | | 25,101 | |
| | 39,004 | | | Series 2005-AR10, 2.618%, | | | | |
| | | | | 06/25/2035 (b) | | | 39,358 | |
| | 117,243 | | | Series 2005-11, 5.500%, | | | | |
| | | | | 11/25/2035 | | | 122,380 | |
| | 77,025 | | | Series 2005-17, 5.500%, | | | | |
| | | | | 01/25/2036 | | | 78,654 | |
| | 93,383 | | | Series 2005-16, 6.000%, | | | | |
| | | | | 01/25/2036 | | | 92,502 | |
| | | | | Total Collateralized Mortgage Obligations
(Cost $29,622,367) | | | 29,314,429 | |
| Number of | | | | | | |
| Shares | | | | | Value | |
| | | | | COMMON STOCKS - 0.44% | | | | |
| | | | | Communications Equipment - 0.06% | | | | |
| | 4,606 | | | Cisco Systems, Inc. | | $ | 126,780 | |
| | | | | Energy Equipment & Services - 0.03% | | | | |
| | 1,224 | | | Halliburton Co. | | | 53,709 | |
| | | | | Oil & Gas - 0.23% | | | | |
| | 614 | | | Anadarko Petroleum Corp. | | | 50,845 | |
| | 1,642 | | | Canadian Natural Resources Ltd. | | | 50,426 | |
| | 6,366 | | | Kinder Morgan, Inc. | | | 267,754 | |
| | 323 | | | Pioneer Natural Resources Co. | | | 52,814 | |
| | 1,627 | | | Suncor Energy Inc. | | | 47,590 | |
| | | | | | | | 469,429 | |
| | | | | Specialty Retail - 0.11% | | | | |
| | 983 | | | Home Depot, Inc. | | | 111,678 | |
| | 1,502 | | | Lowe’s Companies, Inc. | | | 111,734 | |
| | | | | | | | 223,412 | |
| | | | | Transportation - 0.01% | | | | |
| | 22 | | | CEVA Holdings LLC (d) | | | 22,430 | |
| | | | | Total Common Stocks | | | | |
| | | | | (Cost $808,016) | | | 895,760 | |
| Principal | | | | | | | |
| Amount | | | | | | | |
| | | | | CONVERTIBLE OBLIGATIONS - 1.40% | | | | |
| | | | | Auto Components - 0.05% | | | | |
| | 30,000 | | | TRW Automotive, Inc. | | | | |
| | | | | 3.500%, 12/01/2015 | | | 106,275 | |
| | | | | Biotechnology - 0.19% | | | | |
| | | | | BioMarin Pharmaceutical, Inc. | | | | |
| | 20,000 | | | 0.750%, 10/15/2018 | | | 29,863 | |
| | 48,000 | | | 1.500%, 10/15/2020 | | | 72,930 | |
| | 65,000 | | | Emergent Biosolutions, Inc. | | | | |
| | | | | 2.875%, 01/15/2021 | | | 75,278 | |
| | 50,000 | | | Gilead Sciences, Inc. | | | | |
| | | | | 1.625%, 05/01/2016 | | | 215,500 | |
| | | | | | | | 393,571 | |
| | | | | Communications Equipment - 0.15% | | | | |
| | 25,000 | | | Brocade Communications Systems, Inc. | | | | |
| | | | | 1.375%, 01/01/2020 | | | | |
| | | | | (Acquired 01/09/2015, | | | | |
| | | | | Cost $25,000) (a) | | | 26,359 | |
See notes to financial statements.
GuideMark® Opportunistic Fixed Income Fund
SCHEDULE OF INVESTMENTS (Continued)
March 31, 2015
| Principal | | | | | | | |
| Amount | | | | | Value | |
| | | | | CONVERTIBLE OBLIGATIONS (Continued) | | | | |
| | | | | Communications Equipment (Continued) | | | | |
| | 75,000 | | | Ciena Corp. | | | | |
| | | | | 3.750%, 10/15/2018 (Acquired | | | | |
| | | | | 01/17/2012 and 11/04/2013, | | | | |
| | | | | Cost $83,038) (a) | | $ | 92,297 | |
| | 125,000 | | | Palo Alto Networks, Inc. | | | | |
| | | | | (8.185)%, 07/01/2019 (Acquired | | | | |
| | | | | 06/25/2014 and 07/11/2014, | | | | |
| | | | | Cost $124,894) (a)(e) | | | 179,825 | |
| | | | | | | | 298,481 | |
| | | | | Homebuilders - 0.03% | | | | |
| | 30,000 | | | Lennar Corp. | | | | |
| | | | | 3.250%, 11/15/2021 (Acquired | | | | |
| | | | | 09/22/2014 through 10/13/2014, | | | | |
| | | | | Cost $45,802) (a) | | | 66,994 | |
| | | | | Household Durables - 0.07% | | | | |
| | 115,000 | | | Jarden Corp. | | | | |
| | | | | 1.125%, 03/15/2034 | | | 137,137 | |
| | | | | Internet & Catalog Retail - 0.08% | | | | |
| | 136,000 | | | Priceline.com, Inc. | | | | |
| | | | | 0.350%, 06/15/2020 | | | 155,890 | |
| | | | | Internet Software & Services - 0.05% | | | | |
| | 80,000 | | | MercadoLibre, Inc. | | | | |
| | | | | 2.250%, 07/01/2019 | | | | |
| | | | | (Acquired 06/25/2014, | | | | |
| | | | | Cost $80,000) (a) | | | 93,358 | |
| | | | | Metals & Mining - 0.34% | | | | |
| | 780,000 | | | B2Gold Corp. | | | | |
| | | | | 3.250%, 10/01/2018 | | | 685,854 | |
| | | | | Oil & Gas - 0.16% | | | | |
| | 50,000 | | | Chesapeake Energy Corp. | | | | |
| | | | | 2.750%, 11/15/2035 | | | 50,375 | |
| | 55,000 | | | Peabody Energy Corp. | | | | |
| | | | | 4.750%, 12/15/2066 | | | 19,697 | |
| | 250,000 | | | Whiting Petroleum Corp. | | | | |
| | | | | 1.250%, 04/01/2020 | | | | |
| | | | | (Acquired 03/24/2015, | | | | |
| | | | | Cost $250,000) (a) | | | 265,156 | |
| | | | | | | | 335,228 | |
| | | | | Pharmaceuticals - 0.14% | | | | |
| | 65,000 | | | Mylan, Inc. | | | | |
| | | | | 3.750%, 09/15/2015 | | | 289,291 | |
| Principal | | | | | | | |
| Amount | | | | | Value | |
| | | | | | | | | |
| | | | | Semiconductor & Semiconductor
Equipment - 0.02% | | | | |
| | 30,000 | | | SunEdison, Inc. | | | | |
| | | | | 2.375%, 04/15/2022 (Acquired | | | | |
| | | | | 03/02/2015 through 03/10/2015, | | | | |
| | | | | Cost $33,722) (a) | | $ | 35,325 | |
| | | | | Software - 0.12% | | | | |
| | 90,000 | | | Nuance Communications, Inc. | | | | |
| | | | | 2.750%, 11/01/2031 | | | 89,775 | |
| | 155,000 | | | Rovi Corp. | | | | |
| | | | | 0.500%, 03/01/2020 (Acquired | | | | |
| | | | | 02/27/2015 through 03/31/2015, | | | | |
| | | | | Cost $153,338) (a) | | | 148,509 | |
| | | | | | | | 238,284 | |
| | | | | Total Convertible Obligations | | | | |
| | | | | (Cost $2,498,096) | | | 2,835,688 | |
| Number of | | | | | | | |
| Shares | | | | | | | |
| | | | | CONVERTIBLE PREFERRED
STOCKS - 1.07% | | |
| | | | | Electric Utilities - 0.01% | | | | |
| | 400 | | | NextEra Energy, Inc. | | | | |
| | | | | 5.889% | | | 26,172 | |
| | | | | Food Products - 0.18% | | | | |
| | 7,382 | | | Tyson Foods, Inc. | | | | |
| | | | | 4.750% | | | 357,879 | |
| | | | | Metals & Mining - 0.17% | | | | |
| | 5,443 | | | Alcoa, Inc. | | | | |
| | | | | 5.375% | | | 238,621 | |
| | 7,595 | | | ArcelorMittal SA | | | | |
| | | | | 6.000% | | | 114,077 | |
| | | | | | | | 352,698 | |
| | | | | Multi-Utilities - 0.05% | | | | |
| | 466 | | | Dominion Resources, Inc. | | | | |
| | | | | 6.375% | | | 22,554 | |
| | 698 | | | Dominion Resources, Inc. - Series A | | | | |
| | | | | 6.125% | | | 39,200 | |
| | 547 | | | Dominion Resources, Inc. - Series B | | | | |
| | | | | 6.000% | | | 30,851 | |
| | | | | | | | 92,605 | |
| | | | | Oil & Gas - 0.04% | | | | |
| | 91 | | | Chesapeake Energy Corp. | | | | |
| | | | | (Acquired 10/19/2012, | | | | |
| | | | | Cost $91,288) (a) | | | | |
| | | | | 5.750% | | | 78,829 | |
See notes to financial statements.
GuideMark® Opportunistic Fixed Income Fund
SCHEDULE OF INVESTMENTS (Continued)
March 31, 2015
| Number of | | | | | | | |
| Shares | | | | | Value | |
| | | | | CONVERTIBLE PREFERRED STOCKS | |
| | | | | (Continued) | | | | |
| | | | | Pharmaceuticals - 0.23% | | | | |
| | 461 | | | Actavis Plc (d) | | | | |
| | | | | 5.500% | | $ | 466,532 | |
| | | | | Real Estate - 0.29% | | | | |
| | 3,046 | | | iStar Financial, Inc. | | | | |
| | | | | 4.500% | | | 173,622 | |
| | 7,500 | | | Weyerhaeuser Co. | | | | |
| | | | | 6.375% | | | 410,400 | |
| | | | | | | | 584,022 | |
| | | | | Wireless Telecommunication Services - 0.10% | | | | |
| | 1,920 | | | Crown Castle International Corp. | | | | |
| | | | | 4.500% | | | 201,274 | |
| | | | | Total Convertible Preferred Stocks | | | | |
| | | | | (Cost $2,158,114) | | | 2,160,011 | |
| Principal | | | | | | |
| Amount | | | | | | |
| | | | | CORPORATE OBLIGATIONS - 14.04% | | | | |
| | | | | Aerospace & Defense - 0.34% | | | | |
| | 90,000 | | | KLX, Inc. | | | | |
| | | | | 5.875%, 12/01/2022 | | | | |
| | | | | (Acquired 11/21/2014, | | | | |
| | | | | Cost $90,000) (a) | | | 90,000 | |
| | 305,000 | | | Meccanica Holdings USA, Inc. | | | | |
| | | | | 6.250%, 01/15/2040 (Acquired | | | | |
| | | | | 11/29/2012 and 12/07/2012, | | | | |
| | | | | Cost $268,695) (a) | | | 312,625 | |
| | 35,000 | | | Rockwell Collins, Inc. | | | | |
| | | | | 0.621%, 12/15/2016 (b) | | | 35,048 | |
| | 40,000 | | | Textron, Inc. | | | | |
| | | | | 3.875%, 03/01/2025 | | | 41,405 | |
| | | | | TransDigm, Inc. | | | | |
| | 100,000 | | | 6.000%, 07/15/2022 | | | 100,500 | |
| | 100,000 | | | 6.500%, 07/15/2024 | | | 101,000 | |
| | | | | | | | 680,578 | |
| | | | | Automobiles - 0.11% | | | | |
| | 205,000 | | | General Motors Co. | | | | |
| | | | | 5.200%, 04/01/2045 | | | 223,370 | |
| | | | | Banks - 1.59% | | | | |
| | 280,000 | | | Bank of America Corp. | | | | |
| | | | | 4.200%, 08/26/2024 | | | 290,015 | |
| Principal | | | | | | |
| Amount | | | | | Value | |
| | | | | Banks (Continued) | | | | |
| | | | | CIT Group, Inc. | | | | |
| | 100,000 | | | 5.375%, 05/15/2020 | | $ | 105,500 | |
| | 100,000 | | | 5.000%, 08/15/2022 | | | 102,875 | |
| | 100,000 | | | Citigroup, Inc. | | | | |
| | | | | 6.300%, 12/29/2049 (b) | | | 102,375 | |
| | 375,000 | | | Intesa Sanpaolo SpA | | | | |
| | | | | 5.017%, 06/26/2024 | | | | |
| | | | | (Acquired 06/19/2014, | | | | |
| | | | | Cost $375,000) (a) | | | 384,515 | |
| | | | | JPMorgan Chase & Co. | | | | |
| | 800,000 | | | 4.250%, 11/02/2018 | | | 600,952 | |
| | 100,000 | | | 5.000%, 12/29/2049 (b) | | | 98,745 | |
| | 100,000 | | | 6.000%, 12/29/2049 (b) | | | 101,750 | |
| | 200,000 | | | Lloyds Banking Group Plc | | | | |
| | | | | 4.500%, 11/04/2024 | | | 208,141 | |
| | | | | Royal Bank of Scotland Group Plc | | | | |
| | 200,000 | | | 6.934%, 04/09/2018 | | | 247,296 | |
| | 675,000 | | | 6.125%, 12/15/2022 | | | 761,298 | |
| | 200,000 | | | Societe Generale SA | | | | |
| | | | | 7.875%, 12/29/2049 (b)(h) | | | 207,000 | |
| | | | | | | | 3,210,462 | |
| | | | | Building Products - 0.21% | | | | |
| | 155,000 | | | Atrium Windows & Doors, Inc. | | | | |
| | | | | 7.750%, 05/01/2019 | | | | |
| | | | | (Acquired 04/11/2014, | | | | |
| | | | | Cost $153,410) (a) | | | 130,975 | |
| | 170,000 | | | Masco Corp. | | | | |
| | | | | 4.450%, 04/01/2025 | | | 175,950 | |
| | 33,000 | | | NCI Building Systems, Inc. | | | | |
| | | | | 8.250%, 01/15/2023 | | | | |
| | | | | (Acquired 01/09/2015, | | | | |
| | | | | Cost $33,000) (a) | | | 35,063 | |
| | 70,000 | | | Owens Corning | | | | |
| | | | | 4.200%, 12/01/2024 | | | 72,331 | |
| | | | | | | | 414,319 | |
| | | | | Business Services - 0.55% | | | | |
| | 1,120,000 | | | Alfa Bond OJSC Via Alfa Bond | | | | |
| | | | | Issuance Plc | | | | |
| | | | | 7.750%, 04/28/2021 | | | | |
| | | | | (Acquired 04/19/2011, | | | | |
| | | | | Cost $1,120,000) (a) | | | 1,104,925 | |
See notes to financial statements.
GuideMark® Opportunistic Fixed Income Fund
SCHEDULE OF INVESTMENTS (Continued)
March 31, 2015
| Principal | | | | | | |
| Amount | | | | | Value | |
| | | | CORPORATE OBLIGATIONS (Continued) |
| | | | | Capital Markets - 0.15% | | | | |
| | 285,000 | | | Morgan Stanley | | | | |
| | | | | 4.350%, 09/08/2026 | | $ | 299,159 | |
| | | | | Chemicals - 0.35% | | | | |
| | 100,000 | | | Albemarle Corp. | | | | |
| | | | | 4.150%, 12/01/2024 | | | 103,914 | |
| | 660,000 | | | Hercules, Inc. | | | | |
| | | | | 6.500%, 06/30/2029 | | | 611,325 | |
| | | | | | | | 715,239 | |
| | | | | Commercial Services & Supplies - 0.23% | | | | |
| | 100,000 | | | Jaguar Holding Co. I | | | | |
| | | | | 9.375%, 10/15/2017 | | | | |
| | | | | (Acquired 07/01/2014, | | | | |
| | | | | Cost $101,274) (a)(b) | | | 102,500 | |
| | 330,000 | | | ServiceMaster Co. | | | | |
| | | | | 7.000%, 08/15/2020 | | | 352,275 | |
| | | | | | | | 454,775 | |
| | | | | Construction & Engineering - 0.03% | | | | |
| | 300,000 | | | Odebrecht Finance Ltd. | | | | |
| | | | | 8.250%, 04/25/2018 | | | | |
| | | | | (Acquired 04/17/2013, | | | | |
| | | | | Cost $149,348) (a) | | | 70,029 | |
| | | | | Construction Materials - 0.11% | | | | |
| | 220,000 | | | Cemex SAB de CV | | | | |
| | | | | 6.125%, 05/05/2025 | | | | |
| | | | | (Acquired 02/26/2015, | | | | |
| | | | | Cost $219,956) (a) | | | 222,684 | |
| | | | | Consumer Finance - 0.36% | | | | |
| | | | | Ally Financial, Inc. | | | | |
| | 85,000 | | | 8.000%, 03/15/2020 | | | 101,575 | |
| | 255,000 | | | 4.125%, 03/30/2020 | | | 254,044 | |
| | 150,000 | | | Caterpillar Financial Services Corp. | | | | |
| | | | | 0.492%, 03/03/2017 (b) | | | 150,234 | |
| | | | | SLM Corp. | | | | |
| | 100,000 | | | 8.450%, 06/15/2018 | | | 111,250 | |
| | 100,000 | | | 5.500%, 01/15/2019 | | | 102,250 | |
| | | | | | | | 719,353 | |
| Principal | | | | | | |
| Amount | | | | | Value | |
| | | | | Diversified Financial Services - 0.64% | | | | |
| | 200,000 | | | Corporacion Financiera de | | | | |
| | | | | Desarrollo SA | | | | |
| | | | | 5.250%, 07/15/2029 | | | | |
| | | | | (Acquired 07/08/2014, | | | | |
| | | | | Cost $199,732) (a)(b) | | $ | 208,470 | |
| | 750,000,000 | | | Financiera de Desarrollo Territorial | | | | |
| | | | | SA Findeter | | | | |
| | | | | 7.875%, 08/12/2024 | | | | |
| | | | | (Acquired 08/06/2014, | | | | |
| | | | | Cost $389,710) (a) | | | 291,663 | |
| | 300,000 | | | General Electric Capital Corp. | | | | |
| | | | | 7.125%, 06/15/2022 (b) | | | 353,250 | |
| | 465,000 | | | Ladder Capital Finance Holdings | | | | |
| | | | | LLLP / Ladder Capital Finance Corp. | | | | |
| | | | | 5.875%, 08/01/2021 | | | | |
| | | | | (Acquired 07/29/2014, | | | | |
| | | | | Cost $465,000) (a) | | | 441,169 | |
| | | | | | | | 1,294,552 | |
| | | | | Diversified Telecommunication Services - 0.09% | | | | |
| | 100,000 | | | Frontier Communications Corp. | | | | |
| | | | | 7.875%, 01/15/2027 | | | 102,250 | |
| | 300,000 | | | Oi SA | | | | |
| | | | | 9.750%, 09/15/2016 | | | | |
| | | | | (Acquired 09/09/2014, | | | | |
| | | | | Cost $123,626) (a) | | | 84,598 | |
| | | | | | | | 186,848 | |
| | | | | Electric Utilities - 0.65% | | | | |
| | 580,000 | | | Cia de Eletricidade do Estado da Bahia | | | | |
| | | | | 11.750%, 04/27/2016 | | | | |
| | | | | (Acquired 04/19/2011, | | | | |
| | | | | Cost $367,321) (a) | | | 173,098 | |
| | 60,000 | | | Duke Energy Progress, Inc. | | | | |
| | | | | 0.464%, 03/06/2017 (b) | | | 60,002 | |
| | 200,000 | | | EDP Finance BV | | | | |
| | | | | 4.125%, 01/15/2020 | | | | |
| | | | | (Acquired 11/13/2014, | | | | |
| | | | | Cost $199,578) (a) | | | 207,325 | |
| | 500,000 | | | Enel SpA | | | | |
| | | | | 8.750%, 09/24/2073 (Acquired | | | | |
| | | | | 09/17/2013 and 01/27/2014, | | | | |
| | | | | Cost $514,460) (a) | | | 604,237 | |
See notes to financial statements.
GuideMark® Opportunistic Fixed Income Fund
SCHEDULE OF INVESTMENTS (Continued)
March 31, 2015
| Principal | | | | | | |
| Amount | | | | | Value | |
| | | | | CORPORATE OBLIGATIONS (Continued) | | | | |
| | | | | Electric Utilities (Continued) | | | | |
| | 200,000 | | | InterGen NV | | | | |
| | | | | 7.000%, 06/30/2023 | | | | |
| | | | | (Acquired 06/07/2013, | | | | |
| | | | | Cost $196,463) (a) | | $ | 194,500 | |
| | 75,000 | | | TerraForm Power Operating LLC | | | | |
| | | | | 5.875%, 02/01/2023 | | | | |
| | | | | (Acquired 01/23/2015, | | | | |
| | | | | Cost $74,411) (a) | | | 78,000 | |
| | | | | | | | 1,317,162 | |
| | | | | Electronic Equipment, Instruments | | | | |
| | | | | & Components - 0.21% | | | | |
| | 430,000 | | | Keysight Technologies, Inc. | | | | |
| | | | | 4.550%, 10/30/2024 | | | | |
| | | | | (Acquired 10/06/2014, | | | | |
| | | | | Cost $429,854) (a) | | | 434,096 | |
| | | | | Energy Equipment & Services - 0.04% | | | | |
| | 78,000 | | | CGG SA | | | | |
| | | | | 7.750%, 05/15/2017 | | | 74,490 | |
| | | | | Food Products - 0.16% | | | | |
| | 445,000 | | | BRF SA | | | | |
| | | | | 7.750%, 05/22/2018 | | | | |
| | | | | (Acquired 05/15/2013, | | | | |
| | | | | Cost $219,889) (a) | | | 114,682 | |
| | 200,000 | | | JBS USA, LLC / JBS USA Finance, Inc. | | | | |
| | | | | 8.250%, 02/01/2020 (Acquired | | | | |
| | | | | 01/25/2012 and 05/17/2012, | | | | |
| | | | | Cost $197,069) (a) | | | 213,500 | |
| | | | | | | | 328,182 | |
| | | | | Health Care Providers & Services - 0.21% | | | | |
| | 200,000 | | | CHS/Community Health Systems, Inc. | | | | |
| | | | | 8.000%, 11/15/2019 | | | 213,000 | |
| | 100,000 | | | HCA, Inc. | | | | |
| | | | | 5.000%, 03/15/2024 | | | 106,250 | |
| | 100,000 | | | Tenet Healthcare Corp. | | | | |
| | | | | 8.125%, 04/01/2022 | | | 110,500 | |
| | | | | | | | 429,750 | |
| | | | | Holding Companies-Diversified - 0.06% | | | | |
| | 100,000 | | | CeramTec Group GmbH | | | | |
| | | | | 8.250%, 08/15/2021 | | | | |
| | | | | (Acquired 07/25/2013, | | | | |
| | | | | Cost $132,850) (a) | | | 118,815 | |
| Principal | | | | | | |
| Amount | | | | | Value | |
| | | | | Hotels, Restaurants & Leisure - 0.34% | | | | |
| | 100,000 | | | Caesars Entertainment Operating Co., Inc. | | | | |
| | | | | 11.250%, 06/01/2017 (f) | | $ | 73,000 | |
| | | | | MGM Resorts International | | | | |
| | 100,000 | | | 7.500%, 06/01/2016 | | | 105,320 | |
| | 395,000 | | | 6.000%, 03/15/2023 | | | 407,838 | |
| | 100,000 | | | Pinnacle Entertainment, Inc. | | | | |
| | | | | 6.375%, 08/01/2021 | | | 106,500 | |
| | | | | | | | 692,658 | |
| | | | | Household Products - 0.13% | | | | |
| | 250,000 | | | Reynolds Group Issuer LLC | | | | |
| | | | | 8.250%, 02/15/2021 | | | 268,750 | |
| | | | | Independent Power & Renewable | | | | |
| | | | | Electricity Producers - 0.11% | | | | |
| | | | | Calpine Corp. | | | | |
| | 100,000 | | | 6.000%, 01/15/2022 | | | | |
| | | | | (Acquired 10/17/2013, | | | | |
| | | | | Cost $99,193) (a) | | | 107,500 | |
| | 100,000 | | | 5.875%, 01/15/2024 | | | | |
| | | | | (Acquired 10/29/2013, | | | | |
| | | | | Cost $100,000) (a) | | | 108,550 | |
| | | | | | | | 216,050 | |
| | | | | Insurance - 0.60% | | | | |
| | 700,000 | | | Assicurazioni Generali SpA | | | | |
| | | | | 7.750%, 12/12/2042 (b)(h) | | | 978,921 | |
| | 215,000 | | | Old Republic International Corp. | | | | |
| | | | | 4.875%, 10/01/2024 | | | 229,120 | |
| | | | | | | | 1,208,041 | |
| | | | | Internet Software & Services - 0.05% | | | | |
| | 100,000 | | | Equinix, Inc. | | | | |
| | | | | 5.375%, 04/01/2023 | | | 104,300 | |
| | | | | Machinery - 0.05% | | | | |
| | 100,000 | | | Navistar International Corp. | | | | |
| | | | | 8.250%, 11/01/2021 | | | 97,625 | |
| | | | | Media - 0.91% | | | | |
| | 100,000 | | | CCO Holdings LLC / CCO Holdings | | | | |
| | | | | Capital Corp. | | | | |
| | | | | 5.250%, 09/30/2022 | | | 102,625 | |
| | | | | CCOH Safari LLC | | | | |
| | 125,000 | | | 5.500%, 12/01/2022 | | | 128,125 | |
| | 220,000 | | | 5.750%, 12/01/2024 | | | 227,150 | |
See notes to financial statements.
GuideMark® Opportunistic Fixed Income Fund
SCHEDULE OF INVESTMENTS (Continued)
March 31, 2015
| Principal | | | | | | |
| Amount | | | | | Value | |
| | | | | CORPORATE OBLIGATIONS (Continued) | | | | |
| | | | | Media (Continued) | | | | |
| | 100,000 | | | Clear Channel Worldwide | | | | |
| | | | | Holdings, Inc. | | | | |
| | | | | 6.500%, 11/15/2022 | | $ | 105,750 | |
| | | | | DISH DBS Corp. | | | | |
| | 130,000 | | | 5.875%, 07/15/2022 | | | 132,438 | |
| | 220,000 | | | 5.875%, 11/15/2024 | | | 220,825 | |
| | 100,000 | | | Gannett Co, Inc. | | | | |
| | | | | 5.125%, 07/15/2020 | | | 104,625 | |
| | | | | iHeartCommunications, Inc. | | | | |
| | 150,000 | | | 9.000%, 03/01/2021 | | | 144,187 | |
| | 50,000 | | | 9.000%, 09/15/2022 | | | 48,000 | |
| | | | | Sirius XM Radio, Inc. | | | | |
| | 100,000 | | | 6.000%, 07/15/2024 | | | | |
| | | | | (Acquired 05/01/2014, | | | | |
| | | | | Cost $100,000) (a) | | | 105,250 | |
| | 100,000 | | | 5.375%, 04/15/2025 | | | | |
| | | | | (Acquired 03/03/2015, | | | | |
| | | | | Cost $100,000) (a) | | | 100,750 | |
| | 200,000 | | | Unitymedia KabelBW GmbH | | | | |
| | | | | 6.125%, 01/15/2025 | | | | |
| | | | | (Acquired 10/07/2014, | | | | |
| | | | | Cost $200,000) (a) | | | 212,000 | |
| | 200,000 | | | VTR Finance BV | | | | |
| | | | | 6.875%, 01/15/2024 | | | | |
| | | | | (Acquired 01/17/2014, | | | | |
| | | | | Cost $200,000) (a) | | | 208,000 | |
| | | | | | | | 1,839,725 | |
| | | | | Metals & Mining - 0.26% | | | | |
| | | | | ArcelorMittal SA | | | | |
| | 200,000 | | | 6.250%, 03/01/2021 | | | 213,250 | |
| | 70,000 | | | 7.500%, 10/15/2039 | | | 73,850 | |
| | | | | First Quantum Minerals Ltd. | | | | |
| | 50,000 | | | 6.750%, 02/15/2020 | | | | |
| | | | | (Acquired 05/15/2012, | | | | |
| | | | | Cost $43,913) (a) | | | 46,500 | |
| | 115,000 | | | 7.000%, 02/15/2021 | | | | |
| | | | | (Acquired 05/15/2012, | | | | |
| | | | | Cost $100,552) (a) | | | 106,663 | |
| | 88,889 | | | FMG Resources Ltd. | | | | |
| | | | | 6.875%, 02/01/2018 | | | | |
| | | | | (Acquired 04/26/2011, | | | | |
| | | | | Cost $91,699) (a) | | | 87,333 | |
| | | | | | | | 527,596 | |
| Principal | | | | | | |
| Amount | | | | | Value | |
| | | | | Multi-Utilities - 0.06% | | | | |
| | 200,000 | | | Texas Competitive Electric | | | | |
| | | | | Holdings Co., LLC | | | | |
| | | | | 11.500%, 10/01/2020 (Acquired | | | | |
| | | | | 04/14/2011 and 11/09/2011, | | | | |
| | | | | Cost $193,097) (a)(f) | | $ | 126,000 | |
| | | | | Oil & Gas - 1.69% | | | | |
| | 20,000 | | | Antero Resources Corp. | | | | |
| | | | | 5.125%, 12/01/2022 | | | 19,300 | |
| | | | | Baytex Energy Corp. | | | | |
| | 5,000 | | | 5.125%, 06/01/2021 | | | | |
| | | | | (Acquired 11/06/2014, | | | | |
| | | | | Cost $4,763) (a) | | | 4,612 | |
| | 10,000 | | | 5.625%, 06/01/2024 (Acquired | | | | |
| | | | | 11/19/2014 and 12/03/2014, | | | | |
| | | | | Cost $8,548) (a) | | | 9,188 | |
| | | | | Bonanza Creek Energy, Inc. | | | | |
| | 10,000 | | | 6.750%, 04/15/2021 | | | 9,775 | |
| | 35,000 | | | 5.750%, 02/01/2023 | | | 32,375 | |
| | 220,000 | | | California Resources Corp. | | | | |
| | | | | 6.000%, 11/15/2024 (Acquired | | | | |
| | | | | 09/11/2014 through 12/08/2014, | | | | |
| | | | | Cost $214,652) (a) | | | 194,150 | |
| | 200,000 | | | Chaparral Energy, Inc. | | | | |
| | | | | 8.250%, 09/01/2021 | | | 140,000 | |
| | | | | Chesapeake Energy Corp. | | | | |
| | 5,000 | | | 6.625%, 08/15/2020 | | | 5,187 | |
| | 200,000 | | | 6.125%, 02/15/2021 | | | 203,500 | |
| | 115,000 | | | 4.875%, 04/15/2022 | | | 108,388 | |
| | 95,000 | | | Cimarex Energy Co. | | | | |
| | | | | 4.375%, 06/01/2024 | | | 94,762 | |
| | | | | Concho Resources, Inc. | | | | |
| | 15,000 | | | 5.500%, 10/01/2022 | | | 15,187 | |
| | 30,000 | | | 5.500%, 04/01/2023 | | | 30,372 | |
| | 100,000 | | | CONSOL Energy, Inc. | | | | |
| | | | | 5.875%, 04/15/2022 | | | 91,000 | |
| | | | | Continental Resources, Inc. | | | | |
| | 5,000 | | | 4.500%, 04/15/2023 | | | 4,861 | |
| | 15,000 | | | 3.800%, 06/01/2024 | | | 13,852 | |
| | 200,000 | | | Energy Transfer Equity, L.P. | | | | |
| | | | | 5.875%, 01/15/2024 | | | 212,000 | |
| | 100,000 | | | Halcon Resources Corp. | | | | |
| | | | | 9.250%, 02/15/2022 | | | 69,500 | |
See notes to financial statements.
GuideMark® Opportunistic Fixed Income Fund
SCHEDULE OF INVESTMENTS (Continued)
March 31, 2015
| Principal | | | | | | |
| Amount | | | | | Value | |
| | | | | CORPORATE OBLIGATIONS (Continued) | | | | |
| | | | | Oil & Gas (Continued) | | | | |
| | | | | Linn Energy LLC / Linn Energy | | | | |
| | | | | Finance Corp. | | | | |
| | 150,000 | | | 7.750%, 02/01/2021 | | $ | 120,000 | |
| | 50,000 | | | 6.500%, 09/15/2021 | | | 39,781 | |
| | | | | MEG Energy Corp. | | | | |
| | 5,000 | | | 6.500%, 03/15/2021 | | | | |
| | | | | (Acquired 12/02/2014, | | | | |
| | | | | Cost $4,427) (a) | | | 4,650 | |
| | 30,000 | | | 6.375%, 01/30/2023 (Acquired | | | | |
| | | | | 11/04/2014 through 12/08/2014, | | | | |
| | | | | Cost $28,137) (a) | | | 27,750 | |
| | 25,000 | | | 7.000%, 03/31/2024 (Acquired | | | | |
| | | | | 11/17/2014 through 12/08/2014, | | | | |
| | | | | Cost $22,796) (a) | | | 23,687 | |
| | 50,000 | | | Oasis Petroleum, Inc. | | | | |
| | | | | 6.875%, 03/15/2022 | | | 49,000 | |
| | 200,000 | | | Offshore Group Investment Ltd. | | | | |
| | | | | 7.500%, 11/01/2019 | | | 115,000 | |
| | | | | OGX Austria GmbH | | | | |
| | 200,000 | | | 8.500%, 06/01/2018 | | | | |
| | | | | (Acquired 04/17/2013, | | | | |
| | | | | Cost $117,896) (a)(f) | | | 1,100 | |
| | 800,000 | | | 8.375%, 04/01/2022 (Acquired | | | | |
| | | | | 03/27/2012 through 06/29/2012, | | | | |
| | | | | Cost $770,692) (a)(f) | | | 4,241 | |
| | 100,000 | | | Pacific Rubiales Energy Corp. | | | | |
| | | | | 5.125%, 03/28/2023 | | | | |
| | | | | (Acquired 03/19/2015, | | | | |
| | | | | Cost $56,224) (a) | | | 58,750 | |
| | 100,000 | | | Penn Virginia Corporation | | | | |
| | | | | 8.500%, 05/01/2020 | | | 94,500 | |
| | 490,000 | | | Petrobras Global Finance BV | | | | |
| | | | | 5.625%, 05/20/2043 | | | 399,301 | |
| | 250,000 | | | Petroleos de Venezuela SA | | | | |
| | | | | 5.500%, 04/12/2037 (h) | | | 78,125 | |
| | 43,000 | | | Petroleos Mexicanos | | | | |
| | | | | 7.650%, 11/24/2021 | | | | |
| | | | | (Acquired 12/01/2011, | | | | |
| | | | | Cost $316,078) (a) | | | 291,777 | |
| | 125,000 | | | QEP Resources, Inc. | | | | |
| | | | | 5.250%, 05/01/2023 | | | 123,125 | |
| Principal | | | | | | |
| Amount | | | | | Value | |
| | | | | Oil & Gas (Continued) | | | | |
| | | | | Rosetta Resources, Inc. | | | | |
| | 10,000 | | | 5.625%, 05/01/2021 | | $ | 9,450 | |
| | 5,000 | | | 5.875%, 06/01/2022 | | | 4,738 | |
| | 10,000 | | | 5.875%, 06/01/2024 | | | 9,350 | |
| | 100,000 | | | Samson Investment Co. | | | | |
| | | | | 9.750%, 02/15/2020 | | | 28,000 | |
| | | | | SM Energy Co. | | | | |
| | 65,000 | | | 6.125%, 11/15/2022 (Acquired | | | | |
| | | | | 11/12/2014 and 12/02/2014, | | | | |
| | | | | Cost $64,642) (a) | | | 64,838 | |
| | 50,000 | | | 5.000%, 01/15/2024 | | | 47,325 | |
| | 25,000 | | | Ultra Petroleum Corp. | | | | |
| | | | | 6.125%, 10/01/2024 (Acquired | | | | |
| | | | | 11/06/2014 through 11/18/2014, | | | | |
| | | | | Cost $23,201) (a) | | | 21,563 | |
| | 50,000 | | | Western Refining Logistics LP / | | | | |
| | | | | WNRL Finance Corp. | | | | |
| | | | | 7.500%, 02/15/2023 | | | | |
| | | | | (Acquired 02/06/2015, | | | | |
| | | | | Cost $50,000) (a) | | | 51,125 | |
| | | | | Whiting Petroleum Corp. | | | | |
| | 125,000 | | | 6.500%, 10/01/2018 | | | 125,625 | |
| | 15,000 | | | 5.000%, 03/15/2019 | | | 14,813 | |
| | 110,000 | | | 5.750%, 03/15/2021 | | | 109,725 | |
| | 255,000 | | | Williams Partners LP | | | | |
| | | | | 4.000%, 09/15/2025 | | | 250,624 | |
| | | | | | | | 3,425,972 | |
| | | | | Pharmaceuticals - 0.34% | | | | |
| | | | | Valeant Pharmaceuticals | | | | |
| | | | | International, Inc. | | | | |
| | 130,000 | | | 6.375%, 10/15/2020 (Acquired | | | | |
| | | | | 10/20/2014 and 10/22/2014, | | | | |
| | | | | Cost $133,575) (a) | | | 135,525 | |
| | 200,000 | | | 7.500%, 07/15/2021 | | | | |
| | | | | (Acquired 06/27/2013, | | | | |
| | | | | Cost $200,000) (a) | | | 217,062 | |
| | 75,000 | | | 5.500%, 03/01/2023 | | | | |
| | | | | (Acquired 01/15/2015, | | | | |
| | | | | Cost $75,000) (a) | | | 75,937 | |
| | 240,000 | | | VRX Escrow Corp. | | | | |
| | | | | 4.500%, 05/15/2023 (Acquired | | | | |
| | | | | 03/13/2015 and 03/17/2015, | | | | |
| | | | | Cost $253,027) (a) | | | 260,059 | |
| | | | | | | | 688,583 | |
See notes to financial statements.
GuideMark® Opportunistic Fixed Income Fund
SCHEDULE OF INVESTMENTS (Continued)
March 31, 2015
Principal
Amount | | | | | Value | |
| | | | | CORPORATE OBLIGATIONS (Continued) | | | | |
| | | | | Pipelines - 0.55% | | | | |
| | 180,000 | | | MarkWest Energy Partners LP / | | | | |
| | | | | MarkWest Energy Finance Corp. | | | | |
| | | | | 4.875%, 12/01/2024 | | $ | 184,932 | |
| | | | | Regency Energy Partners LP /
Regency Energy Finance Corp. | | | | |
| | 125,000 | | | 5.750%, 09/01/2020 | | | 135,625 | |
| | 100,000 | | | 5.875%, 03/01/2022 | | | 109,000 | |
| | 100,000 | | | 5.000%, 10/01/2022 | | | 104,500 | |
| | | | | Sabine Pass Liquefaction LLC | | | | |
| | 100,000 | | | 5.625%, 02/01/2021 (b) | | | 101,156 | |
| | 100,000 | | | 5.625%, 04/15/2023 | | | 100,250 | |
| | 180,000 | | | 5.625%, 03/01/2025 | | | | |
| | | | | (Acquired 02/26/2015, | | | | |
| | | | | Cost $180,000) (a) | | | 178,650 | |
| | | | | Targa Resources Partners LP / Targa
Resources Partners Finance Corp. | | | | |
| | 120,000 | | | 5.000%, 01/15/2018 | | | | |
| | | | | (Acquired 01/15/2015, | | | | |
| | | | | Cost $120,000) (a) | | | 123,900 | |
| | 45,000 | | | 6.375%, 08/01/2022 | | | 47,362 | |
| | 30,000 | | | 5.250%, 05/01/2023 | | | 30,300 | |
| | 5,000 | | | 4.250%, 11/15/2023 | | | 4,838 | |
| | | | | | | | 1,120,513 | |
| | | | | Professional Services - 0.02% | | | | |
| | 45,000 | | | IHS, Inc. | | | | |
| | | | | 5.000%, 11/01/2022 | | | | |
| | | | | (Acquired 10/21/2014, | | | | |
| | | | | Cost $45,000) (a) | | | 45,423 | |
| | | | | Publishing - 0.04% | | | | |
| | 100,000 | | | Visant Corp. | | | | |
| | | | | 10.000%, 10/01/2017 | | | 90,000 | |
| | | | | Real Estate - 0.58% | | | | |
| | 150,000 | | | Host Hotels & Resorts LP | | | | |
| | | | | 5.250%, 03/15/2022 | | | 167,109 | |
| | 505,000 | | | iStar Financial, Inc. | | | | |
| | | | | 4.000%, 11/01/2017 | | | 500,581 | |
| | 115,000 | | | Realogy Group LLC / Realogy | | | | |
| | | | | Co-Issuer Corp. | | | | |
| | | | | 5.250%, 12/01/2021 | | | | |
| | | | | (Acquired 11/14/2014, | | | | |
| | | | | Cost $115,000) (a) | | | 117,156 | |
Principal
Amount | | | | | Value | |
| | | | | Real Estate (Continued) | | | | |
| | 375,000 | | | Rialto Holdings LLC / Rialto Corp. | | | | |
| | | | | 7.000%, 12/01/2018 (Acquired | | | | |
| | | | | 11/08/2013 through 03/06/2014, | | | | |
| | | | | Cost $377,700) (a) | | $ | 390,938 | |
| | | | | | | | 1,175,784 | |
| | | | | Road & Rail - 0.05% | | | | |
| | 100,000 | | | PBF Holding Co. LLC / PBF | | | | |
| | | | | Finance Corp. | | | | |
| | | | | 8.250%, 02/15/2020 | | | 106,125 | |
| | | | | Semiconductor & Semiconductor | | | | |
| | | | | Equipment - 0.32% | | | | |
| | 250,000 | | | Abengoa Finance SAU | | | | |
| | | | | 8.875%, 11/01/2017 | | | | |
| | | | | (Acquired 04/12/2011, | | | | |
| | | | | Cost $252,024) (a) | | | 256,250 | |
| | 299,000 | | | KLA-Tencor Corp. | | | | |
| | | | | 4.650%, 11/01/2024 | | | 314,613 | |
| | 40,000 | | | Novellus Systems, Inc. | | | | |
| | | | | 2.625%, 05/15/2041 | | | 81,875 | |
| | | | | | | | 652,738 | |
| | | | | Software - 0.33% | | | | |
| | 100,000 | | | BMC Software Finance, Inc. | | | | |
| | | | | 8.125%, 07/15/2021 | | | | |
| | | | | (Acquired 08/07/2013, | | | | |
| | | | | Cost $100,000) (a) | | | 92,000 | |
| | | | | First Data Corp. | | | | |
| | 100,000 | | | 8.250%, 01/15/2021 | | | | |
| | | | | (Acquired 02/17/2012, | | | | |
| | | | | Cost $98,144) (a) | | | 107,500 | |
| | 100,000 | | | 12.625%, 01/15/2021 | | | 118,750 | |
| | 145,000 | | | Open Text Corp. | | | | |
| | | | | 5.625%, 01/15/2023 | | | | |
| | | | | (Acquired 01/12/2015, | | | | |
| | | | | Cost $145,000) (a) | | | 150,800 | |
| | 200,000 | | | Rolta Americas LLC | | | | |
| | | | | 8.875%, 07/24/2019 | | | | |
| | | | | (Acquired 07/17/2014, | | | | |
| | | | | Cost $199,010) (a) | | | 192,000 | |
| | | | | | | | 661,050 | |
See notes to financial statements.
GuideMark® Opportunistic Fixed Income Fund
SCHEDULE OF INVESTMENTS (Continued)
March 31, 2015
Principal
Amount | | | | | Value | |
| | | | | CORPORATE OBLIGATIONS (Continued) | | | | |
| | | | | Telecommunication Services - 0.43% | | | | |
| | 200,000 | | | Digicel Group Ltd. | | | | |
| | | | | 8.250%, 09/30/2020 | | | | |
| | | | | (Acquired 09/05/2012, | | | | |
| | | | | Cost $200,000) (a) | | $ | 201,300 | |
| | 250,000 | | | Intelsat Jackson Holdings SA | | | | |
| | | | | 7.500%, 04/01/2021 | | | 258,125 | |
| | | | | T Mobile USA, Inc. | | | | |
| | 100,000 | | | 6.542%, 04/28/2020 | | | 105,625 | |
| | 100,000 | | | 6.500%, 01/15/2024 | | | 104,750 | |
| | 200,000 | | | Wind Acquisition Finance SA | | | | |
| | | | | 7.375%, 04/23/2021 | | | | |
| | | | | (Acquired 04/08/2014, | | | | |
| | | | | Cost $200,000) (a) | | | 208,000 | |
| | | | | | | | 877,800 | |
| | | | | Textiles, Apparel & Luxury Goods - 0.66% | | | | |
| | | | | Edcon Limited | | | | |
| | 1,120,000 | | | 9.500%, 03/01/2018 (Acquired | | | | |
| | | | | 04/05/2011 and 04/12/2011, | | | | |
| | | | | Cost $1,123,840) (a) | | | 865,312 | |
| | 300,000 | | | 9.500%, 03/01/2018 (Acquired | | | | |
| | | | | 08/18/2011 through 08/24/2011, | | | | |
| | | | | Cost $398,925) (a) | | | 246,478 | |
| | 860,000 | | | 13.375%, 06/30/2019 (Acquired | | | | |
| | | | | 11/08/2013 through 03/10/2015, | | | | |
| | | | | Cost $456,491) (a) | | | 226,647 | |
| | | | | | | | 1,338,437 | |
| | | | | Trading Companies & Distributors - 0.21% | | | | |
| | 15,000 | | | Aircastle Ltd. | | | | |
| | | | | 5.500%, 02/15/2022 | | | 15,994 | |
| | | | | Air Lease Corp. | | | | |
| | 75,000 | | | 3.750%, 02/01/2022 | | | 76,327 | |
| | 330,000 | | | 4.250%, 09/15/2024 | | | 340,725 | |
| | | | | | | | 433,046 | |
| | | | | Transportation - 0.08% | | | | |
| | 180,000 | | | CHC Helicopter SA | | | | |
| | | | | 9.250%, 10/15/2020 | | | 153,900 | |
| | | | | Wireless Telecommunication Services - 0.14% | | | | |
| | | | | Sprint Communications, Inc. | | | | |
| | 150,000 | | | 9.000%, 11/15/2018 | | | | |
| | | | | (Acquired 11/04/2011, | | | | |
| | | | | Cost $150,000) (a) | | | 172,500 | |
Principal
Amount | | | | | Value | |
| | | | | Wireless Telecommunication Services (Continued) | |
| | 100,000 | | | 7.000%, 03/01/2020 | | | | |
| | | | | (Acquired 02/28/2012, | | | | |
| | | | | Cost $100,000) (a) | | $ | 110,750 | |
| | | | | | | | 283,250 | |
| | | | | Total Corporate Obligations | | | | |
| | | | | (Cost $30,248,822) | | | 28,432,154 | |
| | | | | FOREIGN GOVERNMENT DEBT | | | | |
| | | | | OBLIGATIONS - 31.00% | | | | |
| | | | | Bank Negara Malaysia Monetary Notes | | | | |
| | 60,000 | | | 3.116%, 06/18/2015 (e) | | | 16,094 | |
| | 710,000 | | | 3.117%, 06/30/2015 (e) | | | 190,219 | |
| | 440,000 | | | 3.120%, 07/16/2015 (e) | | | 117,718 | |
| | 130,000 | | | 3.148%, 11/03/2015 (e) | | | 34,441 | |
| | 120,000 | | | 3.154%, 11/24/2015 (e) | | | 31,736 | |
| | | | | Brazil Letras do Tesouro Nacional | | | | |
| | 590,000 | | | 13.480%, 10/01/2015 (e) | | | 173,583 | |
| | 1,470,000 | | | 13.490%, 01/01/2016 (e) | | | 418,733 | |
| | 180,000 | | | 13.490%, 07/01/2016 (e) | | | 48,143 | |
| | 560,000 | | | 13.395%, 10/01/2016 (e) | | | 144,931 | |
| | 1,673,000 | | | Brazil Notas do Tesouro Nacional | | | | |
| | | | | 10.000%, 01/01/2025 | | | 455,155 | |
| | | | | Financing of Infrastructural Projects | | | | |
| | | | | State Enterprise | | | | |
| | 100,000 | | | 8.375%, 11/03/2017 | | | | |
| | | | | (Acquired 05/10/2011, | | | | |
| | | | | Cost $102,733) (a) | | | 38,704 | |
| | 1,180,000 | | | 7.400%, 04/20/2018 | | | | |
| | | | | (Acquired 04/15/2011, | | | | |
| | | | | Cost $1,180,000) (a) | | | 463,152 | |
| | | | | Ghana Government Bond | | | | |
| | 1,780,000 | | | 24.000%, 05/25/2015 | | | 465,052 | |
| | 100,000 | | | 21.000%, 10/26/2015 | | | 25,597 | |
| | 60,000 | | | 16.900%, 03/07/2016 | | | 14,892 | |
| | 85,000 | | | 19.240%, 05/30/2016 | | | 21,463 | |
| | 1,550,000 | | | 23.000%, 02/13/2017 | | | 416,517 | |
| | 30,000 | | | 25.480%, 04/24/2017 | | | 8,407 | |
| | 2,220,000 | | | 24.440%, 05/29/2017 | | | 614,778 | |
| | 50,000 | | | 26.000%, 06/05/2017 | | | 14,104 | |
| | 520,000 | | | 25.400%, 07/31/2017 | | | 146,917 | |
| | 516,000 | | | 23.000%, 08/21/2017 | | | 139,900 | |
| | 1,560,000 | | | 23.230%, 02/19/2018 | | | 424,953 | |
| | 990,000 | | | 19.040%, 09/24/2018 | | | 248,556 | |
See notes to financial statements.
GuideMark® Opportunistic Fixed Income Fund
SCHEDULE OF INVESTMENTS (Continued)
March 31, 2015
Principal
Amount | | | | | Value | |
| | | | | FOREIGN GOVERNMENT DEBT | | | | |
| | | | | OBLIGATIONS (Continued) | | | | |
| | | | | Hungary Government Bond | | | | |
| | 246,080,000 | | | 6.750%, 02/24/2017 | | $ | 962,881 | |
| | 227,610,000 | | | 6.750%, 11/24/2017 | | | 918,860 | |
| | 116,260,000 | | | 4.000%, 04/25/2018 | | | 438,252 | |
| | 22,680,000 | | | 5.500%, 12/20/2018 | | | 90,491 | |
| | 172,490,000 | | | 6.500%, 06/24/2019 | | | 717,631 | |
| | 4,380,000 | | | 7.500%, 11/12/2020 | | | 19,538 | |
| | 39,320,000 | | | 7.000%, 06/24/2022 | | | 175,614 | |
| | 82,300,000 | | | 6.000%, 11/24/2023 | | | 356,303 | |
| | 59,170,000 | | | 5.500%, 06/24/2025 | | | 251,755 | |
| | | | | Hungary Government International | | | | |
| | | | | Bond | | | | |
| | 440,000 | | | 4.375%, 07/04/2017 (h) | | | 510,957 | |
| | 150,000 | | | 5.750%, 06/11/2018 (h) | | | 186,267 | |
| | 2,650,000 | | | 6.375%, 03/29/2021 | | | 3,085,660 | |
| | 200,000 | | | Iceland Government International | | | | |
| | | | | Bond | | | | |
| | | | | 5.875%, 05/11/2022 | | | | |
| | | | | (Acquired 05/03/2012, | | | | |
| | | | | Cost $198,140) (a) | | | 231,312 | |
| | 1,454,000,000 | | | Indonesia Treasury Bill | | | | |
| | | | | 6.311%, 02/04/2016 (e) | | | 105,500 | |
| | | | | Indonesia Treasury Bond | | | | |
| | 10,120,000,000 | | | 8.375%, 03/15/2024 | | | 824,499 | |
| | 7,580,000,000 | | | 8.375%, 03/15/2034 | | | 618,089 | |
| | 1,563,000 | | | Ireland Government Bond | | | | |
| | | | | 5.400%, 03/13/2025 | | | 2,426,984 | |
| | | | | Korea Monetary Stabilization Bond | | | | |
| | 5,714,800,000 | | | 2.900%, 12/02/2015 | | | 5,191,714 | |
| | 92,000,000 | | | 2.800%, 04/02/2016 | | | 83,822 | |
| | 239,800,000 | | | 2.790%, 06/02/2016 | | | 218,869 | |
| | 325,800,000 | | | 2.460%, 08/02/2016 | | | 296,580 | |
| | | | | Korea Treasury Bond | | | | |
| | 2,684,400,000 | | | 2.750%, 12/10/2015 | | | 2,437,334 | |
| | 2,058,200,000 | | | 2.750%, 06/10/2016 | | | 1,878,085 | |
| | 1,846,100,000 | | | 3.000%, 12/10/2016 | | | 1,699,399 | |
| | | | | Malaysia Government Bond | | | | |
| | 4,935,000 | | | 3.835%, 08/12/2015 | | | 1,336,551 | |
| | 12,134,000 | | | 4.720%, 09/30/2015 | | | 3,303,990 | |
| | 3,290,000 | | | 3.197%, 10/15/2015 | | | 889,221 | |
| | 100,000 | | | 3.172%, 07/15/2016 | | | 26,977 | |
Principal
Amount | | | | | Value | |
| | | | | FOREIGN GOVERNMENT DEBT | | | | |
| | | | | OBLIGATIONS (Continued) | | | | |
| | | | | Mexican Bonos | | | | |
| | 456,290 | | | 6.000%, 06/18/2015 | | $ | 3,016,554 | |
| | 23,460 | | | 8.000%, 12/17/2015 | | | 158,874 | |
| | 72,100 | | | 6.250%, 06/16/2016 | | | 487,624 | |
| | 220,660 | | | 7.250%, 12/15/2016 | | | 1,529,213 | |
| | 115,000 | | | 4.750%, 06/14/2018 | | | 755,261 | |
| | | | | Mexican Udibonos | | | | |
| | 27,340 | | | 5.000%, 06/16/2016 (j) | | | 188,278 | |
| | 23,366 | | | 3.500%, 12/14/2017 (j) | | | 161,388 | |
| | 14,041 | | | 4.000%, 06/13/2019 (j) | | | 98,800 | |
| | 11,603 | | | 2.500%, 12/10/2020 (j) | | | 76,289 | |
| | | | | Mexico Cetes | | | | |
| | 142,960 | | | 0.001%, 04/01/2015 (e) | | | 93,723 | |
| | 111,340 | | | 3.479%, 05/28/2015 (e) | | | 72,649 | |
| | 47,800,000 | | | Philippine Government Bond | | | | |
| | | | | 1.625%, 04/25/2016 | | | 1,060,960 | |
| | 6,783,000 | | | Poland Government Bond | | | | |
| | | | | 2.010%, 01/25/2021 (b) | | | 1,788,095 | |
| | 2,430,000 | | | Portugal Government International Bond | | | | |
| | | | | 5.125%, 10/15/2024 | | | | |
| | | | | (Acquired 07/02/2014, | | | | |
| | | | | Cost $2,411,070) (a) | | | 2,690,690 | |
| | 700,000 | | | Republic of Ecuador | | | | |
| | | | | 7.950%, 06/20/2024 | | | | |
| | | | | (Acquired 06/17/2014, | | | | |
| | | | | Cost $700,000) (a) | | | 621,250 | |
| | 400,000 | | | Republic of Ghana | | | | |
| | | | | 7.875%, 08/07/2023 | | | | |
| | | | | (Acquired 07/25/2013, | | | | |
| | | | | Cost $396,604) (a) | | | 381,248 | |
| | 270,000 | | | Republic of Kenya | | | | |
| | | | | 6.875%, 06/24/2024 | | | | |
| | | | | (Acquired 06/16/2014, | | | | |
| | | | | Cost $270,000) (a) | | | 283,298 | |
| | | | | Republic of Serbia | | | | |
| | 760,000 | | | 10.000%, 05/08/2017 | | | 6,954 | |
| | 890,000 | | | 10.000%, 11/21/2018 | | | 8,094 | |
| | 1,800,000 | | | 10.000%, 03/20/2021 | | | 15,802 | |
| | 1,060,000 | | | 7.250%, 09/28/2021 | | | | |
| | | | | (Acquired 09/21/2011, | | | | |
| | | | | Cost $1,041,588) (a) | | | 1,225,519 | |
| | 17,000,000 | | | Serbia Treasury Bills | | | | |
| | | | | 7.103%, 07/24/2015 (e) | | | 149,640 | |
See notes to financial statements.
GuideMark® Opportunistic Fixed Income Fund
SCHEDULE OF INVESTMENTS (Continued)
March 31, 2015
| Number of | | | | | |
| Shares | | | | | Value | |
| | | | | FOREIGN GOVERNMENT DEBT | | | | |
| | | | | OBLIGATIONS (Continued) | | | | |
| | | | | Serbia Treasury Bonds | | | | |
| | 20,200,000 | | | 10.000%, 04/27/2015 | | $ | 180,109 | |
| | 2,320,000 | | | 10.000%, 01/30/2016 | | | 21,165 | |
| | 2,090,000 | | | 10.000%, 05/22/2016 | | | 19,081 | |
| | 4,330,000 | | | 10.000%, 06/27/2016 | | | 39,296 | |
| | 1,700,000 | | | 10.000%, 08/15/2016 | | | 15,444 | |
| | 990,000 | | | 10.000%, 10/17/2016 | | | 9,007 | |
| | 10,400,000 | | | 10.000%, 12/19/2016 | | | 94,787 | |
| | 1,110,000 | | | 8.000%, 01/12/2017 | | | 9,808 | |
| | 3,290,000 | | | 8.000%, 03/23/2017 | | | 28,974 | |
| | 61,290,000 | | | 10.000%, 07/10/2017 | | | 562,711 | |
| | 18,170,000 | | | 10.000%, 11/08/2017 | | | 167,056 | |
| | 54,350,000 | | | 10.000%, 03/02/2018 | | | 498,198 | |
| | 100,510,000 | | | 10.000%, 08/21/2019 | | | 895,320 | |
| | 5,860,000 | | | 10.000%, 09/11/2021 | | | 51,340 | |
| | 62,780,000 | | | 10.000%, 02/05/2022 | | | 544,386 | |
| | 610,000 | | | Slovenia Government International Bond | | | | |
| | | | | 5.850%, 05/10/2023 | | | | |
| | | | | (Acquired 05/02/2013 | | | | |
| | | | | and 08/02/2013, | | | | |
| | | | | Cost $595,406) (a) | | | 724,375 | |
| | | | | Sri Lanka Government Bonds | | | | |
| | 37,900,000 | | | 11.000%, 09/01/2015 | | | 296,218 | |
| | 1,900,000 | | | 8.500%, 11/01/2015 | | | 14,397 | |
| | 132,300,000 | | | 8.000%, 06/01/2016 | | | 1,006,468 | |
| | 430,000 | | | 8.000%, 06/15/2017 | | | 3,247 | |
| | 16,500,000 | | | 5.800%, 07/15/2017 | | | 120,096 | |
| | 11,550,000 | | | 8.500%, 04/01/2018 | | | 87,132 | |
| | 140,000 | | | 8.500%, 06/01/2018 | | | 1,050 | |
| | 2,750,000 | | | 7.500%, 08/15/2018 | | | 20,024 | |
| | 8,660,000 | | | 8.000%, 11/15/2018 | | | 63,570 | |
| | 8,660,000 | | | 10.600%, 07/01/2019 | | | 68,989 | |
| | 3,160,000 | | | 10.600%, 09/15/2019 | | | 25,237 | |
| | 430,000 | | | 8.000%, 11/01/2019 | | | 3,169 | |
| | 340,000 | | | 9.000%, 05/01/2021 | | | 2,557 | |
| | 1,900,000 | | | 11.200%, 07/01/2022 | | | 15,931 | |
| | | | | Ukraine Government International Bond | | | | |
| | 620,000 | | | 9.250%, 07/24/2017 | | | | |
| | | | | (Acquired 07/17/2012, | | | | |
| | | | | Cost $620,000) (a) | | | 249,457 | |
| | 200,000 | | | 9.250%, 07/24/2017 | | | | |
| | | | | (Acquired 02/06/2014, | | | | |
| | | | | Cost $189,326) (a) | | | 80,470 | |
| Principal | | | | | |
| Amount | | | | | Value | |
| | | | | FOREIGN GOVERNMENT DEBT | | | | |
| | | | | OBLIGATIONS (Continued) | | | | |
| | 2,300,000 | | | 7.950%, 02/23/2021 | | | | |
| | | | | (Acquired 04/05/2011 | | | | |
| | | | | and 04/11/2011, | | | | |
| | | | | Cost $2,379,064) (a) | | $ | 916,918 | |
| | 1,200,000 | | | 7.500%, 04/17/2023 | | | | |
| | | | | (Acquired 07/18/2013 | | | | |
| | | | | through 07/29/2013, | | | | |
| | | | | Cost $1,081,687) (a) | | | 507,240 | |
| | | | | Uruguay Government International Bond | | | | |
| | 3,731,842 | | | 5.000%, 09/14/2018 (j) | | | 149,012 | |
| | 6,437,305 | | | 4.250%, 04/05/2027 (j) | | | 247,010 | |
| | 41,774,833 | | | 4.375%, 12/15/2028 (j) | | | 1,616,802 | |
| | 2,399,447 | | | 4.000%, 07/10/2030 (j) | | | 90,902 | |
| | 1,083,676 | | | 3.700%, 06/26/2037 (j) | | | 37,213 | |
| | | | | Uruguay Notas del Tesoro | | | | |
| | 1,150,103 | | | 4.000%, 06/14/2015 (j) | | | 45,016 | |
| | 3,485,000 | | | 10.250%, 08/22/2015 | | | 135,232 | |
| | 282,000 | | | 9.500%, 01/27/2016 | | | 11,031 | |
| | 3,578,098 | | | 2.750%, 06/16/2016 (j) | | | 134,824 | |
| | 517,242 | | | 4.250%, 01/05/2017 (j) | | | 19,692 | |
| | 2,200,000 | | | 11.000%, 03/21/2017 | | | 80,990 | |
| | 15,499,004 | | | 2.250%, 08/23/2017 (j) | | | 565,735 | |
| | 18,256 | | | 3.250%, 01/27/2019 (j) | | | 675 | |
| | 10,874,252 | | | 4.000%, 06/10/2020 (j) | | | 408,780 | |
| | 1,332,659 | | | 2.500%, 09/27/2022 (j) | | | 45,898 | |
| | 760,650 | | | 4.000%, 05/25/2025 (j) | | | 27,857 | |
| | | | | Uruguay Treasury Bills | | | | |
| | 5,471,000 | | | 11.050%, 05/14/2015 (e) | | | 211,006 | |
| | 8,688,000 | | | 12.300%, 07/02/2015 (e) | | | 330,996 | |
| | 26,039,000 | | | 12.720%, 08/20/2015 (e) | | | 962,033 | |
| | 2,850,000 | | | 11.440%, 10/08/2015 (e) | | | 103,583 | |
| | 1,070,000 | | | 11.820%, 11/26/2015 (e) | | | 38,198 | |
| | 457,000 | | | 12.090%, 01/14/2016 (e) | | | 16,053 | |
| | 10,009,000 | | | 12.300%, 03/03/2016 (e) | | | 344,856 | |
| | 7,392,000 | | | 12.540%, 04/21/2016 (e) | | | 250,614 | |
| | 8,002,000 | | | 12.850%, 06/09/2016 (e) | | | 304,120 | |
| | 5,336,000 | | | 13.140%, 07/28/2016 (e) | | | 175,206 | |
| | 2,870,000 | | | 13.410%, 09/15/2016 (e) | | | 92,786 | |
| | 4,520,000 | | | 13.680%, 11/03/2016 (e) | | | 143,814 | |
| | | | | Total Foreign Government Debt | | | | |
| | | | | Obligations | | | | |
| | | | | (Cost $70,367,788) | | | 62,760,244 | |
See notes to financial statements.
GuideMark® Opportunistic Fixed Income Fund
SCHEDULE OF INVESTMENTS (Continued)
March 31, 2015
| Number of | | | | |
| Shares | | | | Value |
| | | | | INVESTMENT COMPANIES - 0.07% | | | | |
| | | | | Exchange Traded Funds - 0.07% | | | | |
| | 895 | | | iShares Core S&P Mid-Cap ETF | | $ | 136,022 | |
| | | | | Total Investment Companies | | | | |
| | | | | (Cost $130,103) | | | 136,022 | |
| Principal | | | | | | | |
| Amount | | | | | | | |
| | | | | MORTGAGE BACKED SECURITIES - | | | | |
| | | | | U.S. GOVERNMENT AGENCY - 14.21% | | | | |
| | | | | Federal Home Loan Mortgage Corp. | | | | |
| | 697,000 | | | Pool #4050, | | | | |
| | | | | 3.500%, 05/15/2032 | | | 730,921 | |
| | 946,757 | | | Pool #4062, | | | | |
| | | | | 3.500%, 06/15/2042 | | | 988,376 | |
| | 1,731,607 | | | Pool #274, | | | | |
| | | | | 3.000%, 08/15/2042 | | | 1,775,766 | |
| | 2,188,972 | | | Pool #4097, | | | | |
| | | | | 3.500%, 08/15/2042 | | | 2,273,808 | |
| | 2,136,812 | | | Pool #T60853, | | | | |
| | | | | 3.500%, 09/01/2042 | | | 2,209,267 | |
| | 1,918,594 | | | Pool #T60854, | | | | |
| | | | | 3.500%, 09/01/2042 | | | 1,983,044 | |
| | 2,187,704 | | | Pool #284, | | | | |
| | | | | 3.000%, 10/15/2042 | | | 2,237,135 | |
| | 948,607 | | | Pool #4171, | | | | |
| | | | | 3.000%, 02/15/2043 | | | 929,371 | |
| | 1,131,295 | | | Pool #4413, | | | | |
| | | | | 3.500%, 11/15/2044 | | | 1,155,791 | |
| | | | | Federal National Mortgage Association | | | | |
| | 2,363,354 | | | Pool #1200, | | | | |
| | | | | 3.000%, 10/01/2032 | | | 2,450,627 | |
| | 1,096,132 | | | Pool #1201, | | | | |
| | | | | 3.500%, 10/01/2032 | | | 1,159,591 | |
| | 665,417 | | | Pool #2005-56, | | | | |
| | | | | 6.000%, 08/25/2033 (b) | | | 734,103 | |
| | 513,304 | | | Pool #2011-113, | | | | |
| | | | | 4.000%, 03/25/2040 | | | 535,914 | |
| | 1,278,801 | | | Pool #2012-63, | | | | |
| | | | | 2.000%, 08/25/2040 | | | 1,259,550 | |
| | 1,949,371 | | | Pool #2014-95, | | | | |
| | | | | 3.000%, 04/25/2041 | | | 2,052,426 | |
| | 2,000,000 | | | Pool #2011-131, | | | | |
| | | | | 4.500%, 12/25/2041 | | | 2,345,839 | |
| | | | | | |
| | | | | | | |
| | | | | MORTGAGE BACKED SECURITIES - | | | | |
| | | | | U.S. GOVERNMENT AGENCY (Continued) | | | | |
| | 1,755,882 | | | Pool #2012-125, | | | | |
| | | | | 3.000%, 11/25/2042 | | $ | 1,773,030 | |
| | 275,295 | | | Pool #2013-6, | | | | |
| | | | | 1.500%, 02/25/2043 | | | 260,278 | |
| | | | | Government National Mortgage | | | | |
| | | | | Association | | | | |
| | 1,492,979 | | | Pool #2010-62, | | | | |
| | | | | 5.585%, 05/20/2040 (b)(g) | | | 239,546 | |
| | 1,564,784 | | | Pool #2011-72, | | | | |
| | | | | 5.215%, 05/20/2041 (b)(g) | | | 196,082 | |
| | 700,000 | | | Pool #2012-40, | | | | |
| | | | | 4.000%, 01/20/2042 | | | 770,178 | |
| | 3,078,792 | | | Pool #2013-113, | | | | |
| | | | | 6.077%, 03/20/2043 (b)(g) | | | 470,349 | |
| | 3,471,345 | | | Pool #2012-135, | | | | |
| | | | | 2.363%, 01/16/2053 (b)(g) | | | 232,276 | |
| | | | | Total Mortgage Backed Securities - | | | | |
| | | | | U.S. Government Agency | | | | |
| | | | | (Cost $28,322,258) | | | 28,763,268 | |
| Number of | | | | | | | |
| Shares | | | | | | | |
| | | | | PREFERRED STOCKS - 0.16% | | | | |
| | | | | Consumer Finance - 0.14% | | | | |
| | 289 | | | Ally Financial, Inc. | | | | |
| | | | | 7.000%, (Acquired 05/03/2012 | | | | |
| | | | | through 06/20/2012, | | | | |
| | | | | Cost $248,598) (a) | | | 296,631 | |
| | | | | Transportation - 0.02% | | | | |
| | 49 | | | CEVA Holdings LLC (d) | | | 35,199 | |
| | | | | Total Preferred Stocks | | | | |
| | | | | (Cost $313,080) | | | 331,830 | |
| Notional | | | | | | | |
| Amount | | | | | | | |
| | | | | PURCHASED OPTIONS - 0.07% | | | | |
| | | | | Options on Currency Contracts | | | | |
| | | | | Put Options | | | | |
| | | | | U.S. Dollar - Indian Rupee | | | | |
| | 1,040,000 | | | Expiration: July, 2015 | | | | |
| | | | | Exercise Price: $61.500 | | | 5,428 | |
| | 1,620,000 | | | Expiration: August, 2015 | | | | |
| | | | | Exercise Price: $61.500 | | | 7,966 | |
See notes to financial statements.
GuideMark® Opportunistic Fixed Income Fund
SCHEDULE OF INVESTMENTS (Continued)
March 31, 2015
| Number of | | | | | | | |
| Contracts | | | | | Value | |
| | | | | PURCHASED OPTIONS (Continued) | | | | |
| | | | | Options on Common Stock | | | | |
| | | | | Put Options | | | | |
| | 48 | | | Schlumberger Limited | | | | |
| | | | | Expiration: May, 2015 | | | | |
| | | | | Exercise Price: $85.000 | | $ | 16,704 | |
| | | | | Options on Exchange Traded Funds | | | | |
| | | | | Call Options | | | | |
| | 108 | | | Consumer Discretionary Select | | | | |
| | | | | Sector SPDR® Fund | | | | |
| | | | | Expiration: June, 2015 | | | | |
| | | | | Exercise Price: $77.000 | | | 15,660 | |
| | | | | Put Options | | | | |
| | 200 | | | iShares China Large-Cap ETF | | | | |
| | | | | Expiration: May, 2015 | | | | |
| | | | | Exercise Price: $41.000 | | | 4,800 | |
| | 115 | | | iShares Russell 2000 ETF | | | | |
| | | | | Expiration: June, 2015 | | | | |
| | | | | Exercise Price: $113.000 | | | 17,135 | |
| | 96 | | | SPDR S&P 500 ETF Trust | | | | |
| | | | | Expiration: June, 2015 | | | | |
| | | | | Exercise Price: $195.000 | | | 28,512 | |
| | | | | Options on Indices | | | | |
| | | | | Call Options | | | | |
| | 5 | | | EURO STOXX 50® Index | | | | |
| | | | | Expiration: September, 2015 | | | | |
| | | | | Exercise Price: $3,850.000 | | | 5,011 | |
| Principal | | | | |
| Amount | | | | | |
| | | | | Interest Rate Swaptions | | | | |
| | 54,000,000 | | | 1-Year Interest Rate Swap, | | | | |
| | | | | 28 Day TIIE (Equilibrium Interbank | | | | |
| | | | | Interest Rate), Pay Floating Rate | | | | |
| | | | | Expiration: October 23, 2015 | | | | |
| | | | | Exercise Rate: 4.260% | | | 7,218 | |
| | 2,400,000 | | | 10-Year Interest Rate Swap, 3-Month | | | | |
| | | | | USD-LIBOR, Receive Floating Rate | | | | |
| | | | | Expiration: May 26, 2015 | | | | |
| | | | | Exercise Rate: 2.183% | | | 16,032 | |
| | 3,900,000 | | | 10-Year Interest Rate Swap, 3-Month | | | | |
| | | | | USD-LIBOR, Receive Floating Rate | | | | |
| | | | | Expiration: July 22, 2015 | | | | |
| | | | | Exercise Rate: 2.390% | | | 26,894 | |
| | | | | Total Purchased Options | | | | |
| | | | | (Cost $304,589) | | | 151,360 | |
| Principal | | | | | | | |
| Amount | | | | | Value | |
| | | SHORT TERM INVESTMENTS - 13.09% |
| | | Foreign Government Debt Obligation - 3.30% |
| | | | | Bank Negara Malaysia Monetary Notes |
| | 1,120,000 | | | 2.606%, 04/16/2015 (e) | | $ | 302,066 | |
| | 340,000 | | | 3.050%, 04/23/2015 (e) | | | 91,621 | |
| | 180,000 | | | 3.109%, 04/28/2015 (e) | | | 48,495 | |
| | 1,530,000 | | | 3.110%, 05/05/2015 (e) | | | 412,000 | |
| | 350,000 | | | 3.112%, 05/19/2015 (e) | | | 94,116 | |
| | 800,000 | | | 3.112%, 05/28/2015 (e) | | | 214,902 | |
| | 190,000 | | | 3.114%, 06/03/2015 (e) | | | 51,023 | |
| | 470,000 | | | 3.113%, 06/04/2015 (e) | | | 126,205 | |
| | 330,000 | | | 3.114%, 06/16/2015 (e) | | | 88,520 | |
| | 80,000 | | | 3.124%, 08/04/2015 (e) | | | 21,367 | |
| | 500,000 | | | 3.126%, 08/11/2015 (e) | | | 133,465 | |
| | 2,080,000 | | | 3.128%, 08/18/2015 (e) | | | 554,869 | |
| | 300,000 | | | 3.132%, 09/08/2015 (e) | | | 79,880 | |
| | 50,000 | | | 3.165%, 11/12/2015 (e) | | | 13,238 | |
| | | | | Indonesia Treasury Bill | | | | |
| | 74,000,000 | | | 5.656%, 05/04/2015 (e) | | | 5,631 | |
| | 2,360,000,000 | | 6.085%, 01/07/2016 (e) | | | 172,557 | |
| | | | | Malaysia Treasury Bill | | | | |
| | 10,000 | | | 3.110%, 05/13/2015 (e) | | | 2,690 | |
| | 50,000 | | | 3.113%, 06/05/2015 (e) | | | 13,425 | |
| | 70,000 | | | 3.117%, 06/26/2015 (e)(i) | | | 18,765 | |
| | 70,000 | | | 3.122%, 07/24/2015 (e) | | | 18,716 | |
| | 150,000 | | | 3.127%, 08/14/2015 (e) | | | 40,031 | |
| | 80,000 | | | 3.133%, 09/11/2015 (e) | | | 21,295 | |
| | 90,000 | | | 3.136%, 09/25/2015 (e)(i) | | | 23,944 | |
| | 80,000 | | | 3.192%, 03/18/2016 (e) | | | 20,931 | |
| | | | | Mexico Cetes | | | | |
| | 217,120 | | | 3.139%, 04/16/2015 (e) | | | 142,163 | |
| | 81,110 | | | 3.267%, 06/25/2015 (e) | | | 52,792 | |
| | 1,861,830 | | | 3.367%, 09/17/2015 (e) | | | 1,201,978 | |
| | 124,070 | | | 3.414%, 10/01/2015 (e) | | | 79,997 | |
| | 1,474,290 | | | 3.530%, 02/04/2016 (e)(i) | | | 939,081 | |
| | 2,462,090 | | | 3.563%, 03/03/2016 (e) | | | 1,564,063 | |
| | 39,450 | | | 3.594%, 03/31/2016 (e) | | | 24,935 | |
| | | | | Philippine Treasury Bill | | | | |
| | 180,000 | | | 2.667%, 08/05/2015 (e) | | | 4,001 | |
| | 250,000 | | | 2.765%, 02/03/2016 (e) | | | 5,463 | |
| | 190,000 | | | 2.969%, 03/02/2016 (e) | | | 4,164 | |
| | 3,610,000 | | | Serbia Treasury Bills | | | | |
| | | | | 7.163%, 06/25/2015 (e) | | | 31,954 | |
See notes to financial statements.
GuideMark® Opportunistic Fixed Income Fund
SCHEDULE OF INVESTMENTS (Continued)
March 31, 2015
| Principal | | | | | | | |
| Amount | | | | | Value | |
| | | | | SHORT TERM INVESTMENTS (Continued) | | | | |
| | | | | Foreign Government Debt | | | | |
| | | | | Obligations (Continued) | | | | |
| | | | | Uruguay Treasury Bills | | | | |
| | 1,214,000 | | | 10.400%, 05/04/2015 (e) | | $ | 46,710 | |
| | 10,000 | | | 12.390%, 07/10/2015 (e) | | | 375 | |
| | 430,000 | | | 11.580%, 10/23/2015 (e) | | | 15,517 | |
| | | | | | | | 6,682,945 | |
| Number of | | | | | | | |
| Shares | | | | | | | |
| | | | | Money Market Funds - 9.13% | | | | |
| | 18,478,884 | | | Federated Prime Obligations Fund | | | 18,478,884 | |
| | | | | Effective Yield, 0.05% | | | | |
| Principal | | | | | | | |
| Amount | | | | | | | |
| | | | | U.S. Government Agency Issue - 0.17% |
| | 340,000 | | | Federal Home Loan Bank Discount Note |
| | | | | 0.000%, 04/01/2015 (e) | | | 340,000 | |
| | | | | U.S. Treasury Bill - 0.49% | | | | |
| | 1,000,000 | | | United States Treasury Bill | | | | |
| | | | | 0.068%, 08/20/2015 (e)(k) | | | 999,775 | |
| | | | | Total Short Term Investments | | | | |
| | | | | (Cost $26,864,728) | | | 26,501,604 | |
| | | | | Total Investments | | | | |
| | | | | (Cost $201,997,620) - 95.17% | | | 192,691,000 | |
| | | | | Other Assets in Excess | | | | |
| | | | | of Liabilities - 4.83% | | | 9,785,214 | |
| | | | | TOTAL NET | | | | |
| | | | | ASSETS - 100.00% | | $ | 202,476,214 | |
Percentages are stated as a percent of net assets.
Principal amounts are denominated in the currency in which the security was purchased.
| (a) | Restricted securities as defined in Rule 144(a) under the Securities Act of 1933. Such securities are treated as liquid securities according to the Fund’s liquidity guidelines. The value of these securities total $26,646,779, which represents 13.16% of total net assets. |
| (b) | Variable Rate Security. The rate shown is the rate in effect on March 31, 2015. |
| (c) | Zero coupon security. |
| (d) | Non-income producing. |
| (e) | Zero coupon bond. The effective yield is listed. |
| (f) | Non-income producing. Item identified as in default as to payment of interest. |
| (g) | Represents an interest-only security that entitles holders to receive only interest payments on the underlying mortgages. The yield-to-maturity of an interest-only security is extremely sensitive to the rate of principal payments on the underlying mortgage assets. A rapid (slow) rate of principal repayments may have an adverse (positive) effect on yield to maturity. The principal amount shown is the notional amount of the underlying mortgages. Interest rate disclosed represents yield upon the estimated timing and amount of future cash flows at March 31, 2015. The securities are liquid and the value of these securities total $1,975,513, which represents 0.98% of total net assets. |
| (h) | Restricted securities as defined in Regulation S under the Securities Act of 1933. Such securities are treated as liquid securities according to the Fund’s liquidity guidelines. The value of these securities total $1,961,270 which represents 0.97% of total net assets. |
| (i) | As of March 31, 2015, the Fund has fair valued these securities. The value of these securities was $981,790, which represents 0.48% of total net assets. |
| (j) | Represents an inflation protected security. |
| (k) | Partially assigned as collateral for certain futures contracts. |
See notes to financial statements.
GuideMark® Opportunistic Fixed Income Fund
SCHEDULE OF OPEN FORWARD CURRENCY CONTRACTS
March 31, 2015
| | | | | | | Amount of | | | | | Amount of | | Unrealized |
| Forward | | | | Currency to | | Currency to | | | Currency to | | Currency to | | Appreciation |
| expiration date | | Counterparty | | be received | | be received | | | be delivered | | be delivered | | (Depreciation) |
| 11/20/2015 | | HSBC | | Brazilian Real | | | 1,440,000 | | | U.S. Dollars | | | 504,520 | | | $ | (84,163 | ) |
| 3/29/2016 | | Citibank | | Brazilian Real | | | 3,300,000 | | | Euro | | | 866,233 | | | | (7,665 | ) |
| 9/17/2015 | | Deutsche Bank | | British Pound | | | 100,000 | | | U.S. Dollars | | | 147,625 | | | | 560 | |
| 4/27/2015 | | Credit Suisse | | Canadian Dollar | | | 952,148 | | | Australian Dollar | | | 970,000 | | | | 13,938 | |
| 4/13/2015 | | Credit Suisse | | Chilean Peso | | | 485,000,000 | | | U.S. Dollars | | | 766,193 | | | | 9,589 | |
| 4/16/2015 | | Deutsche Bank | | Chilean Peso | | | 2,556,587,500 | | | U.S. Dollars | | | 4,499,054 | | | | (410,732 | ) |
| 4/9/2015 | | Deutsche Bank | | Euro | | | 876,239 | | | Swedish Krona | | | 8,075,858 | | | | 4,444 | |
| 4/15/2015 | | Deutsche Bank | | Euro | | | 4,595,702 | | | Swedish Krona | | | 43,466,148 | | | | (105,648 | ) |
| 4/7/2015 | | Credit Suisse | | Euro | | | 1,877,000 | | | U.S. Dollars | | | 2,031,023 | | | | (12,602 | ) |
| 4/15/2015 | | Deutsche Bank | | Euro | | | 810,000 | | | U.S. Dollars | | | 1,006,263 | | | | (135,135 | ) |
| 5/7/2015 | | Deutsche Bank | | Euro | | | 100,000 | | | U.S. Dollars | | | 106,404 | | | | 1,174 | |
| 5/21/2015 | | Goldman Sachs | | Euro | | | 2,380,000 | | | U.S. Dollars | | | 2,957,793 | | | | (396,930 | ) |
| 7/13/2015 | | Deutsche Bank | | Euro | | | 500,000 | | | U.S. Dollars | | | 593,630 | | | | (55,195 | ) |
| 7/15/2015 | | Deutsche Bank | | Euro | | | 470,000 | | | U.S. Dollars | | | 584,492 | | | | (78,345 | ) |
| 7/16/2015 | | Barclays | | Euro | | | 426,000 | | | U.S. Dollars | | | 504,767 | | | | (45,997 | ) |
| 7/23/2015 | | Deutsche Bank | | Euro | | | 14,338 | | | U.S. Dollars | | | 15,272 | | | | 170 | |
| 7/31/2015 | | JP Morgan Chase | | Euro | | | 145,000 | | | U.S. Dollars | | | 172,342 | | | | (16,147 | ) |
| 8/4/2015 | | Barclays | | Euro | | | 1,914,287 | | | U.S. Dollars | | | 2,268,889 | | | | (206,671 | ) |
| 8/4/2015 | | HSBC | | Euro | | | 392,000 | | | U.S. Dollars | | | 465,559 | | | | (43,266 | ) |
| 8/21/2015 | | Deutsche Bank | | Euro | | | 827,220 | | | U.S. Dollars | | | 1,029,310 | | | | (137,904 | ) |
| 8/27/2015 | | Deutsche Bank | | Euro | | | 200,000 | | | U.S. Dollars | | | 214,500 | | | | 1,041 | |
| 6/10/2015 | | Barclays | | Ghanaian Cedi | | | 120,000 | | | U.S. Dollars | | | 31,894 | | | | (2,014 | ) |
| 4/27/2015 | | Merrill Lynch | | Hungarian Forint | | | 279,000,000 | | | U.S. Dollars | | | 1,024,771 | | | | (26,961 | ) |
| 10/5/2015 | | Deutsche Bank | | Hungarian Forint | | | 35,900,000 | | | U.S. Dollars | | | 144,886 | | | | (16,925 | ) |
| 4/15/2015 | | JP Morgan Chase | | Indian Rupee | | | 117,200,000 | | | U.S. Dollars | | | 1,860,551 | | | | 5,725 | |
| 4/20/2015 | | HSBC | | Indian Rupee | | | 117,575,000 | | | U.S. Dollars | | | 1,872,711 | | | | (2,374 | ) |
| 6/25/2015 | | JP Morgan Chase | | Indian Rupee | | | 96,000,000 | | | Euro | | | 1,401,460 | | | | (2,926 | ) |
| 4/10/2015 | | Deutsche Bank | | Japanese Yen | | | 162,000,000 | | | U.S. Dollars | | | 1,517,308 | | | | (166,375 | ) |
| 4/20/2015 | | Merrill Lynch | | Japanese Yen | | | 118,000,000 | | | U.S. Dollars | | | 974,076 | | | | 10,100 | |
| 4/17/2015 | | Credit Suisse | | Japanese Yen | | | 90,826,019 | | | South Korea Won | | | 854,800,000 | | | | (12,528 | ) |
| 4/2/2015 | | JP Morgan Chase | | Malaysian Ringgit | | | 3,532,500 | | | U.S. Dollars | | | 1,067,923 | | | | (114,276 | ) |
| 5/29/2015 | | JP Morgan Chase | | Malaysian Ringgit | | | 2,827,440 | | | U.S. Dollars | | | 860,319 | | | | (100,808 | ) |
| 7/2/2015 | | JP Morgan Chase | | Malaysian Ringgit | | | 1,177,500 | | | U.S. Dollars | | | 359,498 | | | | (44,114 | ) |
| 9/28/2015 | | HSBC | | Malaysian Ringgit | | | 377,000 | | | U.S. Dollars | | | 113,756 | | | | (13,403 | ) |
| 10/5/2015 | | Deutsche Bank | | Malaysian Ringgit | | | 1,845,500 | | | U.S. Dollars | | | 551,472 | | | | (60,408 | ) |
| 4/14/2015 | | Deutsche Bank | | Malaysian Ringgit | | | 2,108,500 | | | Euro | | | 496,426 | | | | 34,680 | |
| 4/14/2015 | | HSBC | | Malaysian Ringgit | | | 1,652,011 | | | Euro | | | 388,937 | | | | 27,186 | |
| 7/14/2015 | | JP Morgan Chase | | Malaysian Ringgit | | | 612,600 | | | Euro | | | 142,681 | | | | 10,290 | |
| 3/29/2016 | | JP Morgan Chase | | Malaysian Ringgit | | | 13,200,000 | | | Euro | | | 3,180,723 | | | | 10,225 | |
| 10/8/2015 | | JP Morgan Chase | | Malaysian Ringgit | | | 4,732,700 | | | Japanese Yen | | | 154,505,144 | | | | (33,190 | ) |
| 10/13/2015 | | JP Morgan Chase | | Malaysian Ringgit | | | 5,242,029 | | | Japanese Yen | | | 169,190,260 | | | | (21,092 | ) |
| 4/6/2015 | | Credit Suisse | | Mexican Peso | | | 7,010,000 | | | U.S. Dollars | | | 460,977 | | | | (1,596 | ) |
| 4/7/2015 | | Credit Suisse | | Mexican Peso | | | 32,875,000 | | | U.S. Dollars | | | 2,178,961 | | | | (24,734 | ) |
| 5/15/2015 | | Citibank | | Mexican Peso | | | 9,743,382 | | | U.S. Dollars | | | 731,677 | | | | (94,909 | ) |
See notes to financial statements.
GuideMark® Opportunistic Fixed Income Fund
SCHEDULE OF OPEN FORWARD CURRENCY CONTRACTS (Continued)
March 31, 2015
| | | | | | | | Amount of | | | | | | Amount of | | Unrealized |
| Forward | | | | Currency to | | | Currency to | | | Currency to | | | Currency to | | Appreciation |
| expiration date | | Counterparty | | be received | | | be received | | | be delivered | | | be delivered | | (Depreciation) |
| 8/6/2015 | | Morgan Stanley | | Mexican Peso | | | 1,597,390 | | | U.S. Dollars | | | 118,115 | | | $ | (14,323 | ) |
| 8/7/2015 | | Morgan Stanley | | Mexican Peso | | | 1,605,500 | | | U.S. Dollars | | | 118,167 | | | | (13,855 | ) |
| 10/14/2015 | | Deutsche Bank | | Mexican Peso | | | 18,798,000 | | | U.S. Dollars | | | 1,374,525 | | | | (159,470 | ) |
| 12/18/2015 | | Citibank | | Mexican Peso | | | 9,598,100 | | | U.S. Dollars | | | 632,078 | | | | (14,832 | ) |
| 2/16/2016 | | Citibank | | Mexican Peso | | | 67,745,080 | | | U.S. Dollars | | | 4,396,319 | | | | (60,018 | ) |
| 3/11/2016 | | HSBC | | Mexican Peso | | | 11,784,520 | | | U.S. Dollars | | | 740,885 | | | | 12,026 | |
| 4/10/2015 | | Credit Suisse | | New Zealand Dollar | | | 1,035,000 | | | U.S. Dollars | | | 792,717 | | | | (19,720 | ) |
| 4/9/2015 | | Deutsche Bank | | Polish Zloty | | | 4,746,256 | | | Euro | | | 1,111,275 | | | | 57,050 | |
| 4/15/2015 | | Deutsche Bank | | Polish Zloty | | | 4,578,308 | | | Euro | | | 1,069,174 | | | | 57,656 | |
| 5/26/2015 | | Deutsche Bank | | Polish Zloty | | | 2,950,000 | | | Euro | | | 703,000 | | | | 20,509 | |
| 6/11/2015 | | Deutsche Bank | | Polish Zloty | | | 847,724 | | | Euro | | | 205,012 | | | | 2,504 | |
| 6/12/2015 | | Deutsche Bank | | Polish Zloty | | | 4,450,638 | | | Euro | | | 1,070,843 | | | | 19,002 | |
| 8/6/2015 | | Deutsche Bank | | Polish Zloty | | | 963,300 | | | Euro | | | 226,021 | | | | 9,635 | |
| 9/30/2015 | | Deutsche Bank | | Serbian Dinar | | | 31,310,564 | | | Euro | | | 251,289 | | | | (172 | ) |
| 4/13/2015 | | Deutsche Bank | | Singapore Dollar | | | 2,419,882 | | | U.S. Dollars | | | 1,938,387 | | | | (175,626 | ) |
| 5/29/2015 | | Barclays | | Singapore Dollar | | | 1,411,379 | | | U.S. Dollars | | | 1,124,874 | | | | (97,986 | ) |
| 6/5/2015 | | JP Morgan Chase | | Singapore Dollar | | | 405,248 | | | U.S. Dollars | | | 322,688 | | | | (27,889 | ) |
| 7/27/2015 | | JP Morgan Chase | | Singapore Dollar | | | 1,428,700 | | | U.S. Dollars | | | 1,065,319 | | | | (27,277 | ) |
| 8/6/2015 | | Deutsche Bank | | Singapore Dollar | | | 917,603 | | | U.S. Dollars | | | 736,971 | | | | (70,427 | ) |
| 8/12/2015 | | Barclays | | Singapore Dollar | | | 917,160 | | | U.S. Dollars | | | 676,771 | | | | (10,640 | ) |
| 9/8/2015 | | Citibank | | Singapore Dollar | | | 1,387,980 | | | U.S. Dollars | | | 1,015,199 | | | | (7,737 | ) |
| 9/9/2015 | | JP Morgan Chase | | Singapore Dollar | | | 2,188,625 | | | U.S. Dollars | | | 1,599,171 | | | | (10,599 | ) |
| 4/9/2015 | | Deutsche Bank | | South African Rand | | | 12,290,000 | | | U.S. Dollars | | | 1,017,932 | | | | (6,185 | ) |
| 4/15/2015 | | JP Morgan Chase | | South Korean Won | | | 636,801,620 | | | U.S. Dollars | | | 604,405 | | | | (30,720 | ) |
| 6/29/2015 | | Deutsche Bank | | South Korean Won | | | 606,000,000 | | | U.S. Dollars | | | 585,281 | | | | (40,611 | ) |
| 9/30/2015 | | HSBC | | South Korean Won | | | 608,000,000 | | | U.S. Dollars | | | 578,167 | | | | (32,771 | ) |
| 10/14/2015 | | JP Morgan Chase | | South Korean Won | | | 536,797,500 | | | U.S. Dollars | | | 496,483 | | | | (15,032 | ) |
| 6/29/2015 | | Deutsche Bank | | South Korean Won | | | 606,000,000 | | | Euro | | | 468,807 | | | | 39,947 | |
| 9/30/2015 | | HSBC | | South Korean Won | | | 1,244,720,000 | | | Euro | | | 960,469 | | | | 80,823 | |
| 10/14/2015 | | JP Morgan Chase | | South Korean Won | | | 1,173,599,120 | | | Euro | | | 907,025 | | | | 74,145 | |
| 4/9/2015 | | Deutsche Bank | | Swedish Krona | | | 8,075,858 | | | Euro | | | 894,961 | | | | (24,577 | ) |
| 4/15/2015 | | Deutsche Bank | | Swedish Krona | | | 43,466,148 | | | Euro | | | 4,770,366 | | | | (82,198 | ) |
| 4/13/2015 | | Credit Suisse | | Turkish Lira | | | 1,100,000 | | | U.S. Dollars | | | 424,924 | | | | (3,239 | ) |
| 4/13/2015 | | Merrill Lynch | | Turkish Lira | | | 605,000 | | | U.S. Dollars | | | 233,798 | | | | (1,872 | ) |
| 4/23/2015 | | Credit Suisse | | U.S. Dollars | | | 878,272 | | | Brazilian Real | | | 2,899,000 | | | | (24,592 | ) |
| 9/17/2015 | | Deutsche Bank | | U.S. Dollars | | | 154,400 | | | British Pound | | | 100,000 | | | | 6,215 | |
| 4/13/2015 | | Credit Suisse | | U.S. Dollars | | | 759,593 | | | Chilean Peso | | | 485,000,000 | | | | (16,189 | ) |
| 4/16/2015 | | Deutsche Bank | | U.S. Dollars | | | 3,026,442 | | | Chilean Peso | | | 1,900,000,000 | | | | (11,910 | ) |
| 4/17/2015 | | Merrill Lynch | | U.S. Dollars | | | 280,449 | | | Columbian Peso | | | 735,000,000 | | | | (1,613 | ) |
| 4/7/2015 | | Credit Suisse | | U.S. Dollars | | | 2,098,762 | | | Euro | | | 1,877,000 | | | | 80,341 | |
| 4/15/2015 | | Deutsche Bank | | U.S. Dollars | | | 1,123,632 | | | Euro | | | 810,000 | | | | 252,504 | |
| 4/17/2015 | | Deutsche Bank | | U.S. Dollars | | | 253,371 | | | Euro | | | 240,000 | | | | (4,748 | ) |
| 4/23/2015 | | Credit Suisse | | U.S. Dollars | | | 856,408 | | | Euro | | | 802,000 | | | | (6,215 | ) |
| 4/27/2015 | | Merrill Lynch | | U.S. Dollars | | | 1,020,064 | | | Euro | | | 930,000 | | | | 19,709 | |
See notes to financial statements.
GuideMark® Opportunistic Fixed Income Fund
SCHEDULE OF OPEN FORWARD CURRENCY CONTRACTS (Continued)
March 31, 2015
| | | | | | | Amount of | | | | | Amount of | | Unrealized |
| Forward | | | | Currency to | | Currency to | | | Currency to | | Currency to | | Appreciation |
| expiration date | | Counterparty | | be received | | be received | | | be delivered | | be delivered | | (Depreciation) |
| 4/30/2015 | | Deutsche Bank | | U.S. Dollars | | | 564,590 | | | Euro | | | 408,000 | | | $ | 125,706 | |
| 5/5/2015 | | Barclays | | U.S. Dollars | | | 283,124 | | | Euro | | | 204,295 | | | | 63,350 | |
| 5/7/2015 | | Deutsche Bank | | U.S. Dollars | | | 267,472 | | | Euro | | | 200,331 | | | | 51,957 | |
| 5/18/2015 | | Barclays | | U.S. Dollars | | | 388,480 | | | Euro | | | 283,000 | | | | 83,986 | |
| 5/21/2015 | | Deutsche Bank | | U.S. Dollars | | | 219,765 | | | Euro | | | 175,000 | | | | 31,466 | |
| 5/21/2015 | | Goldman Sachs | | U.S. Dollars | | | 3,267,288 | | | Euro | | | 2,380,000 | | | | 706,426 | |
| 6/10/2015 | | Deutsche Bank | | U.S. Dollars | | | 593,452 | | | Euro | | | 434,350 | | | | 125,962 | |
| 6/15/2015 | | Deutsche Bank | | U.S. Dollars | | | 635,669 | | | Euro | | | 469,000 | | | | 130,845 | |
| 7/13/2015 | | Deutsche Bank | | U.S. Dollars | | | 724,868 | | | Euro | | | 531,000 | | | | 153,050 | |
| 7/15/2015 | | Deutsche Bank | | U.S. Dollars | | | 640,751 | | | Euro | | | 470,000 | | | | 134,605 | |
| 7/16/2015 | | Barclays | | U.S. Dollars | | | 581,856 | | | Euro | | | 426,000 | | | | 123,086 | |
| 7/16/2015 | | Morgan Stanley | | U.S. Dollars | | | 157,016 | | | Euro | | | 115,000 | | | | 33,170 | |
| 7/17/2015 | | Deutsche Bank | | U.S. Dollars | | | 290,986 | | | Euro | | | 214,000 | | | | 60,520 | |
| 7/20/2015 | | Barclays | | U.S. Dollars | | | 409,430 | | | Euro | | | 302,000 | | | | 84,176 | |
| 7/20/2015 | | Deutsche Bank | | U.S. Dollars | | | 182,965 | | | Euro | | | 134,950 | | | | 37,624 | |
| 7/22/2015 | | Deutsche Bank | | U.S. Dollars | | | 162,342 | | | Euro | | | 119,730 | | | | 33,388 | |
| 7/22/2015 | | Morgan Stanley | | U.S. Dollars | | | 174,632 | | | Euro | | | 129,000 | | | | 35,695 | |
| 7/23/2015 | | Deutsche Bank | | U.S. Dollars | | | 361,575 | | | Euro | | | 278,745 | | | | 61,351 | |
| 7/27/2015 | | Deutsche Bank | | U.S. Dollars | | | 246,786 | | | Euro | | | 183,000 | | | | 49,672 | |
| 7/27/2015 | | Goldman Sachs | | U.S. Dollars | | | 246,894 | | | Euro | | | 183,000 | | | | 49,780 | |
| 7/29/2015 | | Barclays | | U.S. Dollars | | | 931,527 | | | Euro | | | 691,917 | | | | 186,218 | |
| 7/31/2015 | | JP Morgan Chase | | U.S. Dollars | | | 548,540 | | | Euro | | | 408,000 | | | | 109,041 | |
| 8/3/2015 | | Deutsche Bank | | U.S. Dollars | | | 207,917 | | | Euro | | | 155,000 | | | | 40,942 | |
| 8/4/2015 | | Barclays | | U.S. Dollars | | | 2,567,700 | | | Euro | | | 1,914,287 | | | | 505,482 | |
| 8/4/2015 | | HSBC | | U.S. Dollars | | | 548,888 | | | Euro | | | 409,000 | | | | 108,282 | |
| 8/4/2015 | | UBS AG | | U.S. Dollars | | | 548,878 | | | Euro | | | 409,000 | | | | 108,272 | |
| 8/5/2015 | | Barclays | | U.S. Dollars | | | 274,232 | | | Euro | | | 204,000 | | | | 54,464 | |
| 8/5/2015 | | Morgan Stanley | | U.S. Dollars | | | 960,955 | | | Euro | | | 715,023 | | | | 190,664 | |
| 8/6/2015 | | Goldman Sachs | | U.S. Dollars | | | 751,673 | | | Euro | | | 559,081 | | | | 149,367 | |
| 8/11/2015 | | Deutsche Bank | | U.S. Dollars | | | 107,196 | | | Euro | | | 80,000 | | | | 21,004 | |
| 8/14/2015 | | Morgan Stanley | | U.S. Dollars | | | 110,533 | | | Euro | | | 88,500 | | | | 15,178 | |
| 8/17/2015 | | Morgan Stanley | | U.S. Dollars | | | 118,813 | | | Euro | | | 88,500 | | | | 23,453 | |
| 8/18/2015 | | Barclays | | U.S. Dollars | | | 428,103 | | | Euro | | | 319,000 | | | | 84,369 | |
| 8/20/2015 | | Deutsche Bank | | U.S. Dollars | | | 240,097 | | | Euro | | | 179,000 | | | | 47,212 | |
| 8/20/2015 | | JP Morgan Chase | | U.S. Dollars | | | 475,024 | | | Euro | | | 354,000 | | | | 93,563 | |
| 8/21/2015 | | Deutsche Bank | | U.S. Dollars | | | 1,102,932 | | | Euro | | | 827,220 | | | | 211,527 | |
| 8/26/2015 | | Barclays | | U.S. Dollars | | | 308,818 | | | Euro | | | 232,085 | | | | 58,704 | |
| 8/27/2015 | | Deutsche Bank | | U.S. Dollars | | | 229,020 | | | Euro | | | 200,000 | | | | 13,479 | |
| 8/31/2015 | | HSBC | | U.S. Dollars | | | 38,857 | | | Euro | | | 34,118 | | | | 2,085 | |
| 9/8/2015 | | Deutsche Bank | | U.S. Dollars | | | 573,003 | | | Euro | | | 434,350 | | | | 104,806 | |
| 9/17/2015 | | Deutsche Bank | | U.S. Dollars | | | 113,680 | | | Euro | | | 100,000 | | | | 5,871 | |
| 9/23/2015 | | Deutsche Bank | | U.S. Dollars | | | 246,667 | | | Euro | | | 191,000 | | | | 40,730 | |
| 9/28/2015 | | Deutsche Bank | | U.S. Dollars | | | 114,617 | | | Euro | | | 89,000 | | | | 18,648 | |
| 10/30/2015 | | Deutsche Bank | | U.S. Dollars | | | 97,811 | | | Euro | | | 76,597 | | | | 15,148 | |
See notes to financial statements.
GuideMark® Opportunistic Fixed Income Fund
SCHEDULE OF OPEN FORWARD CURRENCY CONTRACTS (Continued)
March 31, 2015
| | | | | | | Amount of | | | | | Amount of | | Unrealized |
| Forward | | | | Currency to | | Currency to | | | Currency to | | Currency to | | Appreciation |
| expiration date | | Counterparty | | be received | | be received | | | be delivered | | be delivered | | (Depreciation) |
| 11/12/2015 | | Deutsche Bank | | U.S. Dollars | | | 165,751 | | | Euro | | | 133,000 | | | $ | 22,171 | |
| 11/16/2015 | | Barclays | | U.S. Dollars | | | 187,730 | | | Euro | | | 150,000 | | | | 25,781 | |
| 11/16/2015 | | Deutsche Bank | | U.S. Dollars | | | 125,145 | | | Euro | | | 100,000 | | | | 17,179 | |
| 12/9/2015 | | Deutsche Bank | | U.S. Dollars | | | 1,025,231 | | | Euro | | | 826,000 | | | | 132,908 | |
| 12/15/2015 | | Citibank | | U.S. Dollars | | | 170,366 | | | Euro | | | 137,000 | | | | 22,343 | |
| 1/7/2016 | | Deutsche Bank | | U.S. Dollars | | | 409,372 | | | Euro | | | 341,308 | | | | 40,384 | |
| 1/15/2016 | | JP Morgan Chase | | U.S. Dollars | | | 2,043,704 | | | Euro | | | 1,728,000 | | | | 175,183 | |
| 1/19/2016 | | JP Morgan Chase | | U.S. Dollars | | | 2,033,620 | | | Euro | | | 1,721,000 | | | | 172,477 | |
| 1/19/2016 | | Barclays | | U.S. Dollars | | | 2,045,041 | | | Euro | | | 1,728,000 | | | | 176,329 | |
| 1/20/2016 | | Citibank | | U.S. Dollars | | | 77,844 | | | Euro | | | 66,791 | | | | 5,613 | |
| 1/21/2016 | | Barclays | | U.S. Dollars | | | 145,888 | | | Euro | | | 125,000 | | | | 10,702 | |
| 1/25/2016 | | JP Morgan Chase | | U.S. Dollars | | | 2,033,383 | | | Euro | | | 1,737,000 | | | | 154,648 | |
| 2/4/2016 | | Deutsche Bank | | U.S. Dollars | | | 236,600 | | | Euro | | | 208,000 | | | | 11,570 | |
| 2/5/2016 | | Deutsche Bank | | U.S. Dollars | | | 299,628 | | | Euro | | | 261,000 | | | | 17,251 | |
| 2/22/2016 | | Barclays | | U.S. Dollars | | | 324,366 | | | Euro | | | 283,000 | | | | 18,054 | |
| 2/29/2016 | | Deutsche Bank | | U.S. Dollars | | | 75,349 | | | Euro | | | 65,866 | | | | 4,044 | |
| 3/9/2016 | | Barclays | | U.S. Dollars | | | 703,096 | | | Euro | | | 631,123 | | | | 19,704 | |
| 3/16/2016 | | Citibank | | U.S. Dollars | | | 87,428 | | | Euro | | | 81,594 | | | | (940 | ) |
| 3/16/2016 | | Barclays | | U.S. Dollars | | | 131,499 | | | Euro | | | 122,880 | | | | (1,582 | ) |
| 3/23/2016 | | Barclays | | U.S. Dollars | | | 78,008 | | | Euro | | | 72,605 | | | | (639 | ) |
| 3/29/2016 | | Deutsche Bank | | U.S. Dollars | | | 7,147,958 | | | Euro | | | 6,492,000 | | | | 114,234 | |
| 4/10/2015 | | Deutsche Bank | | U.S. Dollars | | | 4,836,457 | | | Japanese Yen | | | 493,608,750 | | | | 720,205 | |
| 4/15/2015 | | Deutsche Bank | | U.S. Dollars | | | 6,968,888 | | | Japanese Yen | | | 706,185,270 | | | | 1,079,455 | |
| 4/17/2015 | | Barclays | | U.S. Dollars | | | 295,548 | | | Japanese Yen | | | 30,030,000 | | | | 45,096 | |
| 4/21/2015 | | JP Morgan Chase | | U.S. Dollars | | | 176,927 | | | Japanese Yen | | | 18,040,000 | | | | 26,462 | |
| 4/22/2015 | | JP Morgan Chase | | U.S. Dollars | | | 201,780 | | | Japanese Yen | | | 20,570,000 | | | | 30,211 | |
| 6/3/2015 | | Deutsche Bank | | U.S. Dollars | | | 795,175 | | | Japanese Yen | | | 80,680,000 | | | | 121,885 | |
| 6/4/2015 | | JP Morgan Chase | | U.S. Dollars | | | 335,898 | | | Japanese Yen | | | 34,284,478 | | | | 49,784 | |
| 6/9/2015 | | Citibank | | U.S. Dollars | | | 251,635 | | | Japanese Yen | | | 25,700,000 | | | | 37,143 | |
| 6/9/2015 | | HSBC | | U.S. Dollars | | | 376,923 | | | Japanese Yen | | | 38,500,000 | | | | 55,601 | |
| 6/10/2015 | | Barclays | | U.S. Dollars | | | 436,403 | | | Japanese Yen | | | 44,560,000 | | | | 64,498 | |
| 6/10/2015 | | Citibank | | U.S. Dollars | | | 566,975 | | | Japanese Yen | | | 57,980,000 | | | | 83,065 | |
| 6/10/2015 | | HSBC | | U.S. Dollars | | | 464,977 | | | Japanese Yen | | | 47,460,000 | | | | 68,869 | |
| 6/11/2015 | | JP Morgan Chase | | U.S. Dollars | | | 430,395 | | | Japanese Yen | | | 43,970,000 | | | | 63,409 | |
| 6/11/2015 | | Deutsche Bank | | U.S. Dollars | | | 153,711 | | | Japanese Yen | | | 15,700,000 | | | | 22,674 | |
| 6/17/2015 | | JP Morgan Chase | | U.S. Dollars | | | 181,871 | | | Japanese Yen | | | 18,500,000 | | | | 27,449 | |
| 6/22/2015 | | Deutsche Bank | | U.S. Dollars | | | 872,238 | | | Japanese Yen | | | 88,820,000 | | | | 130,786 | |
| 7/24/2015 | | JP Morgan Chase | | U.S. Dollars | | | 553,825 | | | Japanese Yen | | | 56,000,000 | | | | 86,094 | |
| 7/24/2015 | | Citibank | | U.S. Dollars | | | 359,275 | | | Japanese Yen | | | 36,309,000 | | | | 56,010 | |
| 7/27/2015 | | JP Morgan Chase | | U.S. Dollars | | | 192,955 | | | Japanese Yen | | | 19,500,000 | | | | 30,076 | |
| 8/17/2015 | | Citibank | | U.S. Dollars | | | 98,928 | | | Japanese Yen | | | 11,790,000 | | | | 414 | |
| 10/22/2015 | | Barclays | | U.S. Dollars | | | 184,193 | | | Japanese Yen | | | 19,600,000 | | | | 20,195 | |
| 12/21/2015 | | HSBC | | U.S. Dollars | | | 759,299 | | | Japanese Yen | | | 88,800,000 | | | | 15,077 | |
| 12/21/2015 | | Deutsche Bank | | U.S. Dollars | | | 758,945 | | | Japanese Yen | | | 88,660,000 | | | | 15,897 | |
| 12/22/2015 | | Barclays | | U.S. Dollars | | | 316,554 | | | Japanese Yen | | | 37,430,000 | | | | 2,849 | |
See notes to financial statements.
GuideMark® Opportunistic Fixed Income Fund
SCHEDULE OF OPEN FORWARD CURRENCY CONTRACTS (Continued)
March 31, 2015
| | | | | | | Amount of | | | | | Amount of | | Unrealized |
| Forward | | | | Currency to | | Currency to | | | Currency to | | Currency to | | Appreciation |
| expiration date | | Counterparty | | be received | | be received | | | be delivered | | be delivered | | (Depreciation) |
| 12/22/2015 | | Citibank | | U.S. Dollars | | | 494,495 | | | Japanese Yen | | | 58,390,000 | | | $ | 5,122 | |
| 1/8/2016 | | Goldman Sachs | | U.S. Dollars | | | 166,634 | | | Japanese Yen | | | 19,732,000 | | | | 1,182 | |
| 1/15/2016 | | Barclays | | U.S. Dollars | | | 584,120 | | | Japanese Yen | | | 68,630,000 | | | | 8,549 | |
| 1/15/2016 | | JP Morgan Chase | | U.S. Dollars | | | 378,256 | | | Japanese Yen | | | 44,610,000 | | | | 4,131 | |
| 2/12/2016 | | HSBC | | U.S. Dollars | | | 151,275 | | | Japanese Yen | | | 17,820,000 | | | | 1,712 | |
| 2/12/2016 | | JP Morgan Chase | | U.S. Dollars | | | 151,218 | | | Japanese Yen | | | 17,813,000 | | | | 1,715 | |
| 2/16/2016 | | Citibank | | U.S. Dollars | | | 198,589 | | | Japanese Yen | | | 23,610,000 | | | | 409 | |
| 2/16/2016 | | JP Morgan Chase | | U.S. Dollars | | | 99,749 | | | Japanese Yen | | | 11,820,000 | | | | 533 | |
| 2/17/2016 | | Goldman Sachs | | U.S. Dollars | | | 100,399 | | | Japanese Yen | | | 11,840,000 | | | | 1,013 | |
| 2/17/2016 | | JP Morgan Chase | | U.S. Dollars | | | 100,137 | | | Japanese Yen | | | 11,830,000 | | | | 834 | |
| 2/25/2016 | | Barclays | | U.S. Dollars | | | 50,075 | | | Japanese Yen | | | 5,910,000 | | | | 455 | |
| 2/26/2016 | | Barclays | | U.S. Dollars | | | 99,499 | | | Japanese Yen | | | 11,810,000 | | | | 340 | |
| 2/29/2016 | | Deutsche Bank | | U.S. Dollars | | | 33,316 | | | Japanese Yen | | | 3,936,000 | | | | 266 | |
| 3/9/2016 | | Barclays | | U.S. Dollars | | | 269,577 | | | Japanese Yen | | | 32,151,400 | | | | (459 | ) |
| 3/22/2016 | | Citibank | | U.S. Dollars | | | 296,568 | | | Japanese Yen | | | 35,670,000 | | | | (3,127 | ) |
| 3/24/2016 | | Deutsche Bank | | U.S. Dollars | | | 147,689 | | | Japanese Yen | | | 17,733,000 | | | | (1,310 | ) |
| 3/28/2016 | | Barclays | | U.S. Dollars | | | 152,884 | | | Japanese Yen | | | 18,110,000 | | | | 694 | |
| 4/2/2015 | | JP Morgan Chase | | U.S. Dollars | | | 1,075,113 | | | Malaysian Ringgit | | | 3,532,500 | | | | 121,466 | |
| 4/9/2015 | | Credit Suisse | | U.S. Dollars | | | 509,364 | | | Malaysian Ringgit | | | 1,875,000 | | | | 3,519 | |
| 5/29/2015 | | JP Morgan Chase | | U.S. Dollars | | | 852,409 | | | Malaysian Ringgit | | | 2,827,440 | | | | 92,897 | |
| 7/2/2015 | | JP Morgan Chase | | U.S. Dollars | | | 356,505 | | | Malaysian Ringgit | | | 1,177,500 | | | | 41,121 | |
| 9/28/2015 | | HSBC | | U.S. Dollars | | | 103,731 | | | Malaysian Ringgit | | | 377,000 | | | | 3,377 | |
| 10/5/2015 | | Deutsche Bank | | U.S. Dollars | | | 507,535 | | | Malaysian Ringgit | | | 1,845,500 | | | | 16,471 | |
| 4/6/2015 | | Credit Suisse | | U.S. Dollars | | | 467,442 | | | Mexican Peso | | | 7,010,000 | | | | 8,062 | |
| 4/7/2015 | | Credit Suisse | | U.S. Dollars | | | 2,461,744 | | | Mexican Peso | | | 36,920,000 | | | | 42,457 | |
| 4/23/2015 | | Credit Suisse | | U.S. Dollars | | | 13,377 | | | Mexican Peso | | | 205,200 | | | | (55 | ) |
| 5/6/2015 | | Credit Suisse | | U.S. Dollars | | | 299,636 | | | Mexican Peso | | | 4,597,000 | | | | (992 | ) |
| 5/15/2015 | | Citibank | | U.S. Dollars | | | 650,826 | | | Mexican Peso | | | 9,743,382 | | | | 14,058 | |
| 12/18/2015 | | Citibank | | U.S. Dollars | | | 631,143 | | | Mexican Peso | | | 9,598,100 | | | | 13,897 | |
| 2/16/2016 | | Citibank | | U.S. Dollars | | | 261,866 | | | Mexican Peso | | | 4,000,000 | | | | 5,829 | |
| 4/10/2015 | | Credit Suisse | | U.S. Dollars | | | 761,294 | | | New Zealand Dollar | | | 1,035,000 | | | | (11,703 | ) |
| 4/20/2015 | | Citibank | | U.S. Dollars | | | 559,865 | | | New Zealand Dollar | | | 765,000 | | | | (10,878 | ) |
| 4/9/2015 | | Deutsche Bank | | U.S. Dollars | | | 1,029,700 | | | South African Rand | | | 12,290,000 | | | | 17,954 | |
| 4/15/2015 | | JP Morgan Chase | | U.S. Dollars | | | 586,725 | | | South Korea Won | | | 636,801,620 | | | | 13,040 | |
| 6/29/2015 | | Deutsche Bank | | U.S. Dollars | | | 556,474 | | | South Korea Won | | | 606,000,000 | | | | 11,804 | |
| 9/30/2015 | | HSBC | | U.S. Dollars | | | 557,660 | | | South Korea Won | | | 608,000,000 | | | | 12,264 | |
| 10/14/2015 | | JP Morgan Chase | | U.S. Dollars | | | 492,610 | | | South Korea Won | | | 536,797,500 | | | | 11,159 | |
| 4/9/2015 | | Merrill Lynch | | U.S. Dollars | | | 508,372 | | | Taiwan Dollar | | | 16,000,000 | | | | (2,983 | ) |
| 4/13/2015 | | Merrill Lynch | | U.S. Dollars | | | 228,018 | | | Turkish Lira | | | 605,000 | | | | (3,909 | ) |
| 4/13/2015 | | Credit Suisse | | U.S. Dollars | | | 415,220 | | | Turkish Lira | | | 1,100,000 | | | | (6,465 | ) |
| 11/12/2015 | | Citibank | | Uruguayan Peso | | | 2,200,000 | | | U.S. Dollars | | | 84,227 | | | | (4,468 | ) |
| 11/20/2015 | | Citibank | | Uruguayan Peso | | | 2,200,000 | | | U.S. Dollars | | | 83,873 | | | | (4,310 | ) |
| 12/1/2015 | | Citibank | | Uruguayan Peso | | | 3,240,000 | | | U.S. Dollars | | | 125,972 | | | | (9,190 | ) |
| | | | | | | | | | | | | | | | | $ | 6,144,535 | |
See notes to financial statements.
GuideMark® Opportunistic Fixed Income Fund
SCHEDULE OF OPEN FUTURES CONTRACTS
March 31, 2015
| | | Number of | | | | | | | Unrealized |
| | | Contracts | | Notional | | | Settlement | | Appreciation |
| Description | | Purchased Sold | | Value | | | Month | | (Depreciation) |
| E-mini S&P 500 Futures | | | (26 | ) | | | (2,679,040 | ) | | Jun-15 | | | $ | 9,557 | |
| EURO STOXX 50® Index | | | 17 | | | | 663,717 | | | Jun-15 | | | | 7,602 | |
| Eurodollar 90 Day Futures | | | 32 | | | | 7,947,600 | | | Dec-15 | | | | (480 | ) |
| Eurodollar 90 Day Futures | | | (32 | ) | | | (7,887,600 | ) | | Dec-16 | | | | 1,484 | |
| Sterling LIBOR 90 Day Futures | | | (40 | ) | | | (7,333,897 | ) | | Dec-16 | | | | 2,899 | |
| | | | | | | | | | | | | | $ | 21,062 | |
GuideMark® Opportunistic Fixed Income Fund
SCHEDULE OF OPTIONS WRITTEN
March 31, 2015
| Number of | | | | | |
| Contracts | | | Value |
| | | | | Options on Exchange Traded Funds | | | | |
| | | | | Put Options | | | | |
| | 200 | | | iShares China Large-Cap ETF | | | | |
| | | | | Expiration: May, 2015 | | | | |
| | | | | Exercise Price: $37.500 | | $ | 1,000 | |
| | 115 | | | iShares Russell 2000 ETF | | | | |
| | | | | Expiration: June, 2015 | | | | |
| | | | | Exercise Price: $102.000 | | | 5,808 | |
| | 96 | | | SPDR S&P 500 ETF Trust | | | | |
| | | | | Expiration: June, 2015 | | | | |
| | | | | Exercise Price: $180.000 | | | 10,176 | |
| | | | | Total Options Written (Premiums Received $59,769) | | $ | 16,984 | |
GuideMark® Opportunistic Fixed Income Fund
CREDIT DEFAULT SWAPS ON CORPORATE, INDICES, AND SOVEREIGN — BUY PROTECTION(1)
March 31, 2015
| | | Implied | | | | | | | | | | | | | | | | | | | | |
| | | Credit | | | | | | | | | | | | | | Upfront | | | | |
| | | Spread at | | Fixed | | | | | | | | | | | | Premiums | | Unrealized |
| Reference | | March 31, | | Pay | | Maturity | | | | Notional | | Fair | | Paid | | Appreciation |
| Obligation | | 2015(3) | | Rate | | Date | | Counterparty | | Amount(4) | | Value | | (Received) | | (Depreciation) |
| Federative Republic | | | | | | | | | | | | | | | | | | | | | | | | | |
| of Brazil | | 2.68% | | 1.000% | | 12/20/2019 | | Bank of America | | | 200,000 | | | $ | 14,561 | | | | $ | 6,294 | | | | $ | 8,267 | |
| Federative Republic | | | | | | | | | | | | | | | | | | | | | | | | | |
| of Brazil | | 2.68% | | 1.000% | | 12/20/2019 | | Bank of America | | | 65,000 | | | | 4,732 | | | | | 2,128 | | | | | 2,604 | |
| Federative Republic | | | | | | | | | | | | | | | | | | | | | | | | | |
| of Brazil | | 2.68% | | 1.000% | | 12/20/2019 | | Citibank | | | 125,000 | | | | 9,100 | | | | | 3,400 | | | | | 5,700 | |
| Federative Republic | | | | | | | | | | | | | | | | | | | | | | | | | |
| of Brazil | | 2.68% | | 1.000% | | 12/20/2019 | | Bank of America | | | 100,000 | | | | 7,280 | | | | | 2,592 | | | | | 4,688 | |
| | | | | | | | | | | | | | | $ | 35,673 | | | | $ | 14,414 | | | | $ | 21,259 | |
See notes to financial statements.
GuideMark® Opportunistic Fixed Income Fund
CREDIT DEFAULT SWAPS ON CORPORATE, INDICES, AND SOVEREIGN — SELL PROTECTION(2)
March 31, 2015
| | | Implied | | | | | | | | | | | | | | | | | | | | |
| | | Credit | | | | | | | | | | | | | | Upfront | | | | |
| | | Spread at | | Fixed | | | | | | | | | | | | Premiums | | Unrealized |
| Reference | | March 31, | | Pay | | Maturity | | | | Notional | | Fair | | Paid | | Appreciation |
| Obligation | | 2015(3) | | Rate | | Date | | Counterparty | | Amount(4) | | Value | | (Received) | | (Depreciation) |
| Transocean Ltd. | | 7.74% | | 1.000% | | 12/20/2019 | | Merrill Lynch / Citibank | | | 175,000 | | | $ | (43,387 | ) | | | $ | (20,595 | ) | | | $ | (22,792 | ) |
| Transocean Ltd. | | 7.74% | | 1.000% | | 12/20/2019 | | Deutsche Bank | | | 100,000 | | | | (24,792 | ) | | | | (12,951 | ) | | | | (11,841 | ) |
| Transocean Ltd. | | 7.74% | | 1.000% | | 12/20/2019 | | JP Morgan Chase | | | 150,000 | | | | (37,188 | ) | | | | (22,717 | ) | | | | (14,471 | ) |
| Transocean Ltd. | | 7.74% | | 1.000% | | 12/20/2019 | | JP Morgan Chase | | | 75,000 | | | | (18,594 | ) | | | | (11,834 | ) | | | | (6,760 | ) |
| Transocean Ltd. | | 7.74% | | 1.000% | | 12/20/2019 | | Citibank | | | 25,000 | | | | (6,198 | ) | | | | (4,044 | ) | | | | (2,154 | ) |
| Transocean Ltd. | | 7.74% | | 1.000% | | 12/20/2019 | | JP Morgan Chase | | | 55,000 | | | | (13,636 | ) | | | | (9,199 | ) | | | | (4,437 | ) |
| Transocean Ltd. | | 7.74% | | 1.000% | | 12/20/2019 | | Morgan Stanley | | | 35,000 | | | | (8,677 | ) | | | | (5,901 | ) | | | | (2,776 | ) |
| | | | | | | | | | | | | | | $ | (152,472 | ) | | | $ | (87,241 | ) | | | $ | (65,231 | ) |
GuideMark® Opportunistic Fixed Income Fund
CENTRALLY CLEARED CREDIT DEFAULT SWAPS ON CREDIT INDICES — BUY PROTECTION(1)
March 31, 2015
| | | Implied | | | | | | | | | | | | | | | | | | | | |
| | | Credit | | | | | | | | | | | | | | Upfront | | | | |
| | | Spread at | | Fixed | | | | | | | | | | | | Premiums | | Unrealized |
| Reference | | March 31, | | Pay | | Maturity | | | | Notional | | Fair | | Paid | | Appreciation |
| Obligation | | 2015(3) | | Rate | | Date | | Clearing Agent | | Amount(4) | | Value | | (Received) | | (Depreciation) |
| CDX.NA.HY.24 Index | | 3.43% | | 5.000% | | 6/20/2020 | | Intercontinental
Exchange | | | 2,550,000 | | | $ | (181,612 | ) | | | $ | (174,183 | ) | | | $ | (7,429 | ) |
| | | | | | | | | | | | | | | $ | (181,612 | ) | | | $ | (174,183 | ) | | | $ | (7,429 | ) |
See notes to financial statements.
GuideMark® Opportunistic Fixed Income Fund
OVER-THE-COUNTER INTEREST RATE SWAPS
March 31, 2015
| | | | | | | | | | | | | | | | | Upfront | | | |
| | | | | Fixed | | | | | | | | | | | Premiums | | Unrealized |
| Pay/Receive | | Floating | | Pay | | Maturity | | | | Notional | | Fair | | | Paid | | Appreciation |
| Floating Rate | | Rate Index | | Rate | | Date | | Counterparty | | Amount(4) | | Value | | | (Received) | | (Depreciation) |
| Receive | | 3-MO-USD-LIBOR | | 0.926 | % | | 10/17/2017 | | Citibank | | 5,190,000 | | $ | 7,945 | | | $ | 0 | | | $ | 7,945 | |
| Receive | | 3-MO-USD-LIBOR | | 3.018 | % | | 8/22/2023 | | JP Morgan Chase | | 7,290,000 | | | (633,031 | ) | | | 0 | | | | (633,031 | ) |
| Receive | | 3-MO-USD-LIBOR | | 1.914 | % | | 1/22/2025 | | Citibank | | 490,000 | | | 4,710 | | | | 0 | | | | 4,710 | |
| Receive | | 3-MO-USD-LIBOR | | 1.970 | % | | 1/23/2025 | | Citibank | | 610,000 | | | 2,802 | | | | 0 | | | | 2,802 | |
| Receive | | 3-MO-USD-LIBOR | | 1.973 | % | | 1/27/2025 | | Citibank | | 360,000 | | | 1,563 | | | | 0 | | | | 1,563 | |
| Receive | | 3-MO-USD-LIBOR | | 1.937 | % | | 1/29/2025 | | Citibank | | 90,000 | | | 688 | | | | 0 | | | | 688 | |
| Receive | | 3-MO-USD-LIBOR | | 1.942 | % | | 1/30/2025 | | Citibank | | 80,000 | | | 578 | | | | 0 | | | | 578 | |
| Receive | | 3-MO-USD-LIBOR | | 1.817 | % | | 2/3/2025 | | Citibank | | 120,000 | | | 2,255 | | | | 0 | | | | 2,255 | |
| Receive | | 3-MO-USD-LIBOR | | 1.978 | % | | 3/27/2025 | | Citibank | | 1,200,000 | | | 5,686 | | | | 0 | | | | 5,686 | |
| Receive | | 3-MO-USD-LIBOR | | 1.985 | % | | 3/27/2025 | | Citibank | | 1,200,000 | | | 4,875 | | | | 0 | | | | 4,875 | |
| Receive | | 3-MO-USD-LIBOR | | 3.848 | % | | 8/22/2043 | | JP Morgan Chase | | 4,170,000 | | | (1,308,649 | ) | | | 0 | | | | (1,308,649 | ) |
| | | | | | | | | | | | | | $ | (1,910,578 | ) | | $ | 0 | | | $ | (1,910,578 | ) |
| | |
| 1) | If the Fund is a buyer of protection and a credit event occurs, as defined under the terms of that particular swap agreement, the Fund will either (i) receive from the seller of protection an amount equal to the notional amount of the swap and take delivery of the referenced obligation or underlying securities comprising the referenced index or (ii) pay a net settlement amount in the form of cash or securities equal to the notional amount of the swap less the recovery value of the referenced obligation or underlying securities comprising the referenced index. |
| 2) | If the Fund is a seller of protection and a credit event occurs, as defined under the terms of that particular swap agreement, the Fund will either (i) pay to the buyer of protection an amount equal to the notional amount of the swap and take delivery of the referenced obligation or underlying securities comprising the referenced index or (ii) pay a net settlement amount in the form of cash or securities equal to the notional amount of the swap less the recovery value of the referenced obligation or underlying securities comprising the referenced index. |
| 3) | Implied credit spreads, represented in absolute terms, utilized in determining the market value of credit default swap agreements on U.S. municipal issues, corporate issues or sovereign issues of an emerging country as of period end serve as an indicator of the current status of the payment/performance risk and represent the likelihood or risk of default for the credit derivative. The implied credit spread of a particular referenced entity reflects the cost of buying/selling protection and may include upfront payments required to be made to enter into the agreement. Wider credit spreads represent a deterioration of the referenced entity’s credit soundness and a greater likelihood or risk of default or other credit event occurring as defined under the terms of the agreement. A credit spread identified as “Defaulted” indicates a credit event has occurred for the referenced entity or obligation. |
| 4) | The maximum potential amount the Fund could be required to pay as seller of credit protection or receive as a buyer of credit protection if a credit event occurs as defined under the terms of that particular swap agreement. |
See notes to financial statements.
GuidePath® Strategic Asset Allocation Fund
SCHEDULE OF INVESTMENTS
March 31, 2015
| Number of | | | | | | |
| Shares | | | | | Value | |
| | | | | INVESTMENT COMPANIES - 97.86% | | | | |
| | | | | Affiliated Mutual Funds - 54.39% | | | | |
| | 305,699 | | | Altegris® Macro Strategy Fund - | | | | |
| | | | | Institutional Shares (a) | | $ | 2,751,295 | |
| | 510,598 | | | Altegris® Multi-Strategy Alternatives | | | | |
| | | | | Fund - Institutional Shares | | | 5,361,279 | |
| | 1,301,374 | | | GuideMark® Global Real Return | | | | |
| | | | | Fund - Institutional Shares | | | 10,710,311 | |
| | 1,223,084 | | | GuideMark® Large Cap Growth | | | | |
| | | | | Fund - Institutional Shares | | | 18,700,947 | |
| | 1,600,622 | | | GuideMark® Large Cap Value | | | | |
| | | | | Fund - Institutional Shares | | | 19,943,752 | |
| | 1,106,932 | | | GuideMark® Opportunistic Equity | | | | |
| | | | | Fund - Institutional Shares | | | 14,201,932 | |
| | 1,408,994 | | | GuideMark® Small/Mid Cap Core | | | | |
| | | | | Fund - Institutional Shares | | | 24,826,478 | |
| | 5,603,058 | | | GuideMark® World ex-US Fund - | | | | |
| | | | | Institutional Shares | | | 49,026,755 | |
| | | | | | | | 145,522,749 | |
| | | | | Exchange Traded Funds - 43.47% | | | | |
| | 118,199 | | | iShares Core MSCI Emerging Markets ETF (b) | | | 5,712,558 | |
| | 157,468 | | | iShares MSCI Canada ETF (b) | | | 4,279,980 | |
| | 123,454 | | | iShares MSCI Switzerland Capped ETF | | | 4,099,907 | |
| | 182,448 | | | SPDR S&P 500 ETF Trust | | | 37,662,741 | |
| | 31,250 | | | SPDR S&P 600 Small Cap Growth ETF (b) | | | 5,904,375 | |
| | 57,627 | | | SPDR S&P China ETF | | | 4,877,549 | |
| | 990,137 | | | Vanguard FTSE All-World ex-US Fund (b) | | | 48,249,376 | |
| | 27,291 | | | Vanguard Global ex-U.S. Real Estate ETF | | | 1,535,665 | |
| | 47,598 | | | Vanguard REIT ETF (b) | | | 4,001,564 | |
| | | | | | | | 116,323,715 | |
| | | | | Total Investment Companies
(Cost $200,997,335) | | | 261,846,464 | |
| Number of | | | | | | |
| Shares | | | | | Value | |
| | | | | SHORT TERM INVESTMENTS - 1.85% | | | | |
| | | | | Money Market Funds - 1.85% | | | | |
| | 4,950,790 | | | Federated Prime Obligations Fund | | | | |
| | | | | Effective Yield, 0.05% | | $ | 4,950,790 | |
| | | | | Total Short Term Investments
(Cost $4,950,790) | | | 4,950,790 | |
| | | | | INVESTMENTS PURCHASED | | | | |
| | | | | AS SECURITIES LENDING | | | | |
| | | | | COLLATERAL - 23.47% | | | | |
| | | | | Money Market Funds - 23.47% | | | | |
| | 62,810,051 | | | Mount Vernon Prime Portfolio | | | | |
| | | | | Effective Yield, 0.22% | | | 62,810,051 | |
| | | | | Total Investments Purchased as | | | | |
| | | | | Securities Lending Collateral | | | | |
| | | | | (Cost $62,810,051) | | | 62,810,051 | |
| | | | | Total Investments
(Cost $268,758,176) - 123.18% | | | 329,607,305 | |
| | | | | Liabilities in Excess of | | | | |
| | | | | Other Assets - (23.18)% | | | (62,030,934 | ) |
| | | | | TOTAL NET ASSETS - 100.00% | | $ | 267,576,371 | |
Percentages are stated as a percent of net assets.
| (a) | Non-income producing security. |
| (b) | All or portion of this security is on loan. |
See notes to financial statements.
GuidePath® Tactical Constrained® Asset Allocation Fund
SCHEDULE OF INVESTMENTS
March 31, 2015
| Number of | | | | | | |
| Shares | | | | | Value | |
| | | | | INVESTMENT COMPANIES - 96.93% | | | | |
| | | | | Affiliated Mutual Funds - 64.91% | | | | |
| | 2,124,697 | | | GuideMark® Core Fixed Income | | | | |
| | | | | Fund - Institutional Shares | | $ | 20,545,824 | |
| | 784,709 | | | GuideMark® Large Cap Growth | | | | |
| | | | | Fund - Institutional Shares | | | 11,998,193 | |
| | 968,299 | | | GuideMark® Large Cap Value | | | | |
| | | | | Fund - Institutional Shares | | | 12,065,006 | |
| | 1,494,135 | | | GuideMark® Opportunistic Equity | | | | |
| | | | | Fund - Institutional Shares | | | 19,169,749 | |
| | 966,806 | | | GuideMark® Opportunistic Fixed | | | | |
| | | | | Income Fund - Institutional Shares | | | 9,213,659 | |
| | 606,851 | | | GuideMark® Small/Mid Cap Core | | | | |
| | | | | Fund - Institutional Shares | | | 10,692,707 | |
| | 3,813,221 | | | GuideMark® World ex-US Fund - | | | | |
| | | | | Institutional Shares | | | 33,365,682 | |
| | | | | | | | 117,050,820 | |
| | | | | Exchange Traded Funds - 28.91% | | | | |
| | 36,281 | | | iShares 10+Year Credit Bond ETF (a) | | | 2,271,191 | |
| | 3,455 | | | iShares 20+Year Treasury Bond ETF (a) | | | 451,534 | |
| | 134,480 | | | iShares Core MSCI Emerging | | | | |
| | | | | Markets ETF (a) | | | 6,499,418 | |
| | 12,020 | | | iShares Core U.S. Credit Bond ETF | | | 1,362,707 | |
| | 65,537 | | | iShares Global Infrastructure ETF | | | 2,743,379 | |
| | 19,563 | | | iShares International Select Dividend ETF | | | 658,099 | |
| | 60,643 | | | iShares U.S. Home Construction ETF (a) | | | 1,711,952 | |
| | 119,391 | | | Market Vectors Unconventional Oil | | | | |
| | | | | & Gas ETF (a) | | | 2,565,713 | |
| | 57,744 | | | SPDR Barclays High Yield Bond ETF (a) | | | 2,264,720 | |
| | 115,787 | | | SPDR S&P 500 ETF Trust | | | 23,901,910 | |
| | 2,989 | | | SPDR S&P Dividend ETF (a) | | | 233,740 | |
| | 16,349 | | | Vanguard Global ex-U.S. Real Estate ETF | | | 919,958 | |
| | 59,270 | | | Vanguard REIT ETF (a) | | | 4,982,829 | |
| | 6,730 | | | WisdomTree Europe Hedged Equity Fund | | | 445,122 | |
| | 20,151 | | | WisdomTree Japan Hedged Equity Fund | | | 1,110,723 | |
| | | | | | | | 52,122,995 | |
| Number of | | | | | | |
| Shares | | | | | Value | |
| | | | | Mutual Funds - 3.11% | | | | |
| | 110,627 | | | AQR Diversified Arbitrage Fund - | | | | |
| | | | | Institutional Shares | | $ | 1,123,969 | |
| | 114,002 | | | Arbitrage Event Driven Fund - | | | | |
| | | | | Institutional Shares | | | 1,118,356 | |
| | 122,460 | | | DoubleLine Total Return Bond Fund - | | | | |
| | | | | Institutional Shares | | | 1,351,962 | |
| | 183,940 | | | Iron Strategic Income Fund - | | | | |
| | | | | Institutional Shares | | | 2,006,790 | |
| | | | | | | | 5,601,077 | |
| | | | | Total Investment Companies | | | | |
| | | | | (Cost $137,368,880) | | | 174,774,892 | |
| | | | | SHORT TERM INVESTMENTS - 2.83% | | | | |
| | | | | Money Market Funds - 2.83% | | | | |
| | 5,104,616 | | | Federated Prime Obligations Fund | | | | |
| | | | | Effective Yield, 0.05% | | | 5,104,616 | |
| | | | | Total Short Term Investments | | | | |
| | | | | (Cost $5,104,616) | | | 5,104,616 | |
| | | | | INVESTMENTS PURCHASED | | | | |
| | | | | AS SECURITIES LENDING | | | | |
| | | | | COLLATERAL - 9.15% | | | | |
| | | | | Money Market Funds - 9.15% | | | | |
| | 16,506,270 | | | Mount Vernon Prime Portfolio | | | | |
| | | | | Effective Yield, 0.22% | | | 16,506,270 | |
| | | | | Total Investments Purchased as | | | | |
| | | | | Securities Lending Collateral | | | | |
| | | | | (Cost $16,506,270) | | | 16,506,270 | |
| | | | | Total Investments | | | | |
| | | | | (Cost $158,979,766) - 108.91% | | | 196,385,778 | |
| | | | | Liabilities in Excess of | | | | |
| | | | | Other Assets - (8.91)% | | | (16,074,193 | ) |
| | | | | TOTAL NET ASSETS - 100.00% | | $ | 180,311,585 | |
Percentages are stated as a percent of net assets.
| (a) | All or portion of this security is on loan. |
See notes to financial statements.
GuidePath® Tactical Unconstrained® Asset Allocation Fund
SCHEDULE OF INVESTMENTS
March 31, 2015
| Number of | | | | | | |
| Shares | | | | | Value | |
| | | | | INVESTMENT COMPANIES - 97.92% | | | | |
| | | | | Affiliated Mutual Funds - 26.01% | | | | |
| | 906,090 | | | GuideMark® Core Fixed Income | | | | |
| | | | | Fund - Institutional Shares | | $ | 8,761,895 | |
| | 914,346 | | | GuideMark® Large Cap Growth | | | | |
| | | | | Fund - Institutional Shares | | | 13,980,356 | |
| | 1,957,974 | | | GuideMark® Large Cap Value | | | | |
| | | | | Fund - Institutional Shares | | | 24,396,358 | |
| | 2,358,179 | | | GuideMark® Opportunistic Equity | | | | |
| | | | | Fund - Institutional Shares | | | 30,255,430 | |
| | 2,150,569 | | | GuideMark® Opportunistic Fixed | | | | |
| | | | | Income Fund - Institutional Shares | | | 20,494,921 | |
| | 258,994 | | | GuideMark®Small/Mid Cap Core | | | | |
| | | | | Fund - Institutional Shares | | | 4,563,468 | |
| | 2,749,603 | | | GuideMark® World ex-US Fund - | | | | |
| | | | | Institutional Shares | | | 24,059,028 | |
| | | | | | | | 126,511,456 | |
| | | | | Exchange Traded Funds - 60.24% | | | | |
| | 144,724 | | | iShares Asia 50 ETF (a) | | | 7,233,291 | |
| | 25,915 | | | iShares CMBS ETF (a) | | | 1,351,726 | |
| | 13,684 | | | iShares Core MSCI EAFE ETF (a) . | | | 800,377 | |
| | 197,041 | | | iShares Core MSCI Emerging | | | | |
| | | | | Markets ETF (a) | | | 9,522,992 | |
| | 333,304 | | | iShares Core U.S. Credit Bond ETF (a) | | | 37,786,674 | |
| | 205,270 | | | iShares Floating Rate Bond ETF (a) | | | 10,394,873 | |
| | 34,222 | | | iShares JPMorgan USD Emerging | | | | |
| | | | | Markets Bond ETF (a) | | | 3,836,971 | |
| | 158,947 | | | iShares MSCI ACWI ETF | | | 9,539,999 | |
| | 39,646 | | | iShares MSCI India ETF | | | 1,272,240 | |
| | 152,169 | | | iShares TIPS Bond ETF (a)(b) | | | 17,284,877 | |
| | 45,926 | | | PowerShares DB Gold Fund (b) | | | 1,793,410 | |
| | 156,577 | | | PowerShares Senior Loan Portfolio (a) | | | 3,771,940 | |
| | 235,663 | | | SPDR Barclays International Treasury | | | | |
| | | | | Bond ETF (a) | | | 12,518,419 | |
| | 64,491 | | | SPDR Barclays Short Term | | | | |
| | | | | International Treasury Bond ETF (a) | | | 1,956,657 | |
| | 136,843 | | | SPDR EURO STOXX 50 ETF (a) | | | 5,312,245 | |
| | 218,447 | | | SPDR S&P 500 ETF Trust | | | 45,094,014 | |
| | 68,118 | | | SPDR S&P Emerging Asia Pacific ETF (a) | | | 5,995,746 | |
| | 465,380 | | | Vanguard FTSE Europe ETF | | | 25,232,904 | |
| | 85,338 | | | Vanguard FTSE Pacific ETF (a) | | | 5,229,513 | |
| Number of | | | | | | |
| Shares | | | | | Value | |
| | | | | Exchange Traded Funds (Continued) | | | | |
| | 137,759 | | | Vanguard High Dividend Yield ETF | | $ | 9,408,940 | |
| | 188,645 | | | Vanguard Intermediate-Term | | | | |
| | | | | Government Bond ETF (a) | | | 12,341,156 | |
| | 229,461 | | | Vanguard REIT ETF (a) | | | 19,290,786 | |
| | 259,621 | | | Vanguard Short-Term Bond Fund (a) | | | 20,904,683 | |
| | 194,430 | | | Vanguard Total Bond Market ETF . | | | 16,209,629 | |
| | 122,798 | | | Vanguard Total International Bond ETF | | | 6,642,144 | |
| | 17,789 | | | WisdomTree Europe Hedged Equity Fund | | | 1,176,564 | |
| | 21,231 | | | WisdomTree Japan Hedged Equity Fund | | | 1,170,253 | |
| | | | | | | | 293,073,023 | |
| | | | | Mutual Funds - 11.67% | | | | |
| | 1,270,964 | | | Eaton Vance Floating-Rate Fund - | | | | |
| | | | | Institutional Shares | | | 11,425,967 | |
| | 948,938 | | | Eaton Vance Global Macro Absolute | | | | |
| | | | | Return Advantage Fund - Institutional Shares | | | 9,736,100 | |
| | 607,186 | | | Eaton Vance Income Fund of Boston - | | | | |
| | | | | Institutional Shares | | | 3,594,541 | |
| | 47,527 | | | Eaton Vance Multi-Strategy Absolute | | | | |
| | | | | Return Fund - Institutional Shares . | | | 415,382 | |
| | 299,704 | | | Parametric Absolute Return Fund - | | | | |
| | | | | Institutional Shares (b) | | | 2,922,117 | |
| | 53,363 | | | Parametric Emerging Markets Fund - | | | | |
| | | | | Institutional Shares | | | 742,817 | |
| | 658,317 | | | PIMCO CommoditiesPLUS Strategy | | | | |
| | | | | Fund - Institutional Shares | | | 4,759,631 | |
| | 344,459 | | | Pioneer Strategic Income Fund - | | | | |
| | | | | Class Y | | | 3,709,821 | |
| | 1,507,860 | | | William Blair Macro Allocation Fund - | | | | |
| | | | | Class I (c) | | | 19,481,556 | |
| | | | | | | | 56,787,932 | |
| | | | | Total Investment Companies | | | | |
| | | | | (Cost $449,299,773) | | | 476,372,411 | |
| | | | | SHORT TERM INVESTMENTS - 1.78% | | | | |
| | | | | Money Market Funds - 1.78% | | | | |
| | 8,663,476 | | | Federated Prime Obligations Fund | | | | |
| | | | | Effective Yield, 0.05% | | | 8,663,476 | |
| | | | | Total Short Term Investments | | | | |
| | | | | (Cost $8,663,476) | | | 8,663,476 | |
See notes to financial statements.
GuidePath® Tactical Unconstrained® Asset Allocation Fund
SCHEDULE OF INVESTMENTS (Continued)
March 31, 2015
| Number of | | | | | | |
| Shares | | | | | Value | |
| | | | | INVESTMENTS PURCHASED | | | | |
| | | | | AS SECURITIES LENDING | | | | |
| | | | | COLLATERAL - 12.71% | | | | |
| | | | | Money Market Funds - 12.71% | | | | |
| | 61,819,802 | | | Mount Vernon Prime Portfolio | | | | |
| | | | | Effective Yield, 0.22% | | $ | 61,819,802 | |
| | | | | Total Investments Purchased as | | | | |
| | | | | Securities Lending Collateral | | | | |
| | | | | (Cost $61,819,802) | | | 61,819,802 | |
| | | | | Total Investments | | | | |
| | | | | (Cost $519,783,051) - 112.41% | | | 546,855,689 | |
| | | | | Liabilities in Excess of Other Assets - (12.41)% | | | (60,386,034 | ) |
| | | | | TOTAL NET ASSETS - 100.00% | | $ | 486,469,655 | |
| | Percentages are stated as a percent of net assets. |
| (a) | All or portion of this security is on loan. |
| (b) | Non-income producing security. |
| (c) | Certain GPS Funds invest in securities of unaffiliated underlying funds in accordance with Section 12(d)(1)(F) of the Investment Company Act of 1940. Such investments are potentially illiquid, because an unaffiliated underlying fund, under the terms of Section 12(d)(1)(F), is not obligated to redeem its shares in an amount exceeding 1% of its total outstanding shares during any period of less than thirty days. Investments made in accordance with Section 12(d)(1)(F) that exceed 1% of the outstanding shares of each underlying fund, and therefore are potentially illiquid, amount to 4.00% of total net assets as of March 31, 2015. |
See notes to financial statements.
GuidePath® Absolute Return Asset Allocation Fund
SCHEDULE OF INVESTMENTS
March 31, 2015
| Number of | | | | | | |
| Shares | | | | | Value | |
| | | | | INVESTMENT COMPANIES - 98.01% | | | | |
| | | | | Affiliated Mutual Funds - 5.30% | | | | |
| | 1,283,660 | | | GuideMark® Core Fixed Income
Fund - Institutional Shares | | $ | 12,412,994 | |
| | 337,528 | | | GuideMark® Large Cap Value
Fund - Institutional Shares | | | 4,205,601 | |
| | 340,049 | | | GuideMark® World ex-US Fund -
Institutional Shares | | | 2,975,427 | |
| | | | | | | | 19,594,022 | |
| | | | | Exchange Traded Funds - 49.06% | | | | |
| | 75,870 | | | iShares 3-7 Year Treasury Bond ETF | | | 9,420,778 | |
| | 105,002 | | | iShares 7-10 Year Treasury Bond
ETF (a) | | | 11,381,167 | |
| | 63,360 | | | iShares Agency Bond Fund (a) | | | 7,254,720 | |
| | 17,876 | | | iShares Core MSCI Emerging
Markets ETF (a) | | | 863,947 | |
| | 193,203 | | | iShares Core U.S. Credit Bond
ETF (a) | | | 21,903,424 | |
| | 77,591 | | | iShares JPMorgan USD Emerging
Markets Bond ETF (a) | | | 8,699,503 | |
| | 33,486 | | | iShares MBS ETF (a) | | | 3,694,845 | |
| | 120,569 | | | iShares MSCI ACWI ETF | | | 7,236,551 | |
| | 7,658 | | | PowerShares DB Agriculture
Fund (b) | | | 169,548 | |
| | 4,952 | | | PowerShares DB Base Metals
Fund (a)(b) | | | 75,072 | |
| | 22,252 | | | PowerShares DB Energy
Fund (a)(b) | | | 353,362 | |
| | 11,579 | | | PowerShares DB Precious Metals
Fund (b) | | | 427,728 | |
| | 105,490 | | | SPDR Barclays 1-3 Month T-Bill
ETF (a)(b) | | | 4,824,058 | |
| | 113,686 | | | SPDR Barclays High Yield Bond
ETF (a) | | | 4,458,765 | |
| | 278,488 | | | SPDR Barclays Short Term
Corporate Bond ETF (a) | | | 8,563,506 | |
| | 26,721 | | | SPDR S&P 500 ETF Trust | | | 5,516,016 | |
| | 48,567 | | | Vanguard FTSE All-World ex-US
Fund (a) | | | 2,366,670 | |
| | 133,526 | | | Vanguard FTSE Europe ETF | | | 7,239,780 | |
| | 185,682 | | | Vanguard Intermediate-Term
Corporate Bond ETF (a) | | | 16,284,311 | |
| | 51,374 | | | Vanguard Long-Term Corporate
Bond ETF | | | 4,834,037 | |
| Number of | | | | | | |
| Shares | | | | | Value | |
| | | | | Exchange Traded Funds (Continued) | | | | |
| | 22,212 | | | Vanguard Mid-Cap Value ETF (a) | | $ | 2,041,505 | |
| | 550,132 | | | Vanguard Mortgage-Backed
Securities ETF | | | 29,399,054 | |
| | 3,665 | | | Vanguard Small-Cap Value ETF (a) | | | 400,951 | |
| | 287,430 | | | Vanguard Total Bond Market ETF | | | 23,963,039 | |
| | | | | | | | 181,372,337 | |
| | | | | Mutual Funds - 43.65% | | | | |
| | 357,850 | | | Aberdeen Equity Long-Short Fund -
Institutional Shares (c) | | | 3,746,691 | |
| | 378,658 | | | BlackRock Low Duration Bond
Portfolio - Institutional Shares | | | 3,684,340 | |
| | 161,930 | | | Boston Partners Long/Short Research
Fund - Institutional Shares | | | 2,488,862 | |
| | 282,384 | | | DoubleLine Core Fixed Income
Fund - Institutional Shares | | | 3,134,461 | |
| | 546,872 | | | DoubleLine Emerging Markets Fixed
Income Bond Fund - Institutional
Shares | | | 5,594,501 | |
| | 727,297 | | | DoubleLine Low Duration Bond
Fund - Institutional Shares | | | 7,374,788 | |
| | 180,094 | | | DoubleLine Multi-Asset Growth
Fund - Institutional Shares (c) | | | 1,766,724 | |
| | 1,791,966 | | | DoubleLine Total Return Bond
Fund - Institutional Shares | | | 19,783,307 | |
| | 900,769 | | | Eaton Vance Floating-Rate Fund -
Institutional Shares | | | 8,097,915 | |
| | 784,568 | | | Eaton Vance Global Macro Absolute
Return Advantage Fund - Institutional
Shares | | | 8,049,663 | |
| | 231,378 | | | Eaton Vance Multi-Strategy Absolute
Return Fund - Institutional
Shares (c) | | | 2,022,240 | |
| | 839,228 | | | John Hancock Funds II - Alternative
Asset Allocation Fund - Institutional
Shares (c) | | | 12,076,487 | |
| | 1,087,808 | | | JPMorgan Unconstrained Debt
Fund - Select Shares | | | 11,030,373 | |
| | 364,883 | | | JPMorgan Research Equity
Long/Short Fund - Select Shares | | | 6,181,117 | |
| | 78,125 | | | JPMorgan Systematic Alpha Fund - Institutional Shares | | | 1,177,338 | |
| | 190,115 | | | Parametric Absolute Return Fund -
Institutional Shares (b) | | | 1,853,621 | |
See notes to financial statements.
GuidePath® Absolute Return Asset Allocation Fund
SCHEDULE OF INVESTMENTS (Continued)
March 31, 2015
| Number of | | | | | | |
| Shares | | | | | Value | |
| | | | | INVESTMENT COMPANIES (Continued) | | | | |
| | | | | Mutual Funds (Continued) | | | | |
| | 5,019,990 | | | Pioneer Strategic Income Fund - Class Y | | $ | 54,065,289 | |
| | 907,398 | | | T. Rowe Price Institutional Floating
Rate Fund | | | 9,210,087 | |
| | | | | | | | 161,337,804 | |
| | | | | Total Investment Companies
(Cost $356,999,552) | | | 362,304,163 | |
| | | | | SHORT TERM INVESTMENTS - 1.87% | | | | |
| | | | | Money Market Funds - 1.87% | | | | |
| | 6,894,864 | | | Federated Prime Obligations Fund
Effective Yield, 0.05% | | | 6,894,864 | |
| | | | | Total Short Term Investments
(Cost $6,894,864) | | | 6,894,864 | |
| | | | | INVESTMENTS PURCHASED
AS SECURITIES LENDING
COLLATERAL - 9.49% | | | | |
| | | | | Money Market Funds - 9.49% | | | | |
| | 35,062,476 | | | Mount Vernon Prime Portfolio
Effective Yield, 0.22% | | | 35,062,476 | |
| | | | | Total Investments Purchased as
Securities Lending Collateral
(Cost $35,062,476) | | | 35,062,476 | |
| | | | | Total Investments
(Cost $398,956,892) - 109.37% | | | 404,261,503 | |
| | | | | Liabilities in Excess of Other Assets - (9.37)% | | | (34,617,291 | ) |
| | | | | TOTAL NET ASSETS - 100.00% | | $ | 369,644,212 | |
Percentages are stated as a percent of net assets.
| (a) | All or portion of this security is on loan. |
| (b) | Non-income producing security. |
| (c) | Certain GPS Funds invest in securities of unaffiliated underlying funds in accordance with Section 12(d)(1)(F) of the Investment Company Act of 1940. Such investments are potentially illiquid, because an unaffiliated underlying fund, under the terms of Section 12(d)(1)(F), is not obligated to redeem its shares in an amount exceeding 1% of its total outstanding shares during any period of less than thirty days. Investments made in accordance with Section 12(d)(1)(F) that exceed 1% of the outstanding shares of each underlying fund, and therefore are potentially illiquid, amount to 5.31% of total net assets as of March 31, 2015. |
See notes to financial statements.
GuidePath® Multi-Asset Income Asset Allocation Fund
SCHEDULE OF INVESTMENTS
March 31, 2015
| Number of | | | | | | |
| Shares | | | | | Value | |
| | | | | INVESTMENT COMPANIES - 97.85% | | | | |
| | | | | Affiliated Mutual Funds - 4.57% | | | | |
| | 241,699 | | | GuideMark® Core Fixed Income
Fund - Institutional Shares | | $ | 2,337,228 | |
| | 27,612 | | | GuideMark® Opportunistic Fixed
Income Fund - Institutional Shares | | | 263,145 | |
| | 437,242 | | | GuideMark® World ex-US Fund -
Institutional Shares | | | 3,825,867 | |
| | | | | | | | 6,426,240 | |
| | | | | Exchange Traded Funds - 43.14% | | | | |
| | 17,811 | | | iShares 7-10 Year Treasury Bond ETF (a) | | | 1,930,534 | |
| | 10,073 | | | iShares 10+ Year Credit Bond ETF (a) | | | 630,570 | |
| | 21,834 | | | iShares 20+ Year Treasury Bond ETF (a) | | | 2,853,485 | |
| | 61,044 | | | iShares Global Infrastructure ETF (a) | | | 2,555,302 | |
| | 78,332 | | | iShares iBoxx $ High Yield Corporate
Bond ETF (a) | | | 7,097,663 | |
| | 3,360 | | | iShares iBoxx $ Investment Grade
Corporate Bond ETF | | | 408,946 | |
| | 102,098 | | | iShares International Select Dividend ETF | | | 3,434,577 | |
| | 62,561 | | | iShares JPMorgan USD Emerging
Markets Bond ETF (a) | | | 7,014,339 | |
| | 35,391 | | | iShares MSCI Australia ETF (a) | | | 809,038 | |
| | 53,647 | | | iShares U.S. Preferred Stock ETF (a) | | | 2,151,781 | |
| | 34,946 | | | SPDR Barclays High Yield Bond ETF (a) | | | 1,370,582 | |
| | 56,448 | | | SPDR Barclays Short Term High
Yield Bond ETF | | | 1,648,282 | |
| | 27,890 | | | SPDR Dow Jones International Real
Estate ETF (a) | | | 1,208,195 | |
| | 44,823 | | | Vanguard REIT ETF (a) | | | 3,768,270 | |
| | 32,533 | | | WisdomTree Emerging Markets
Equity Income Fund | | | 1,382,653 | |
| | 19,982 | | | WisdomTree Emerging Markets
SmallCap Dividend Fund | | | 883,804 | |
| | 258,335 | | | WisdomTree Equity Income Fund (a) | | | 15,673,183 | |
| | 69,772 | | | WisdomTree International SmallCap
Dividend Fund (a) | | | 4,134,689 | |
| | 23,080 | | | WisdomTree SmallCap Dividend
Fund (a) | | | 1,663,606 | |
| | | | | | | | 60,619,499 | |
| | | | | Mutual Funds - 50.14% | | | | |
| | 3,035,258 | | | BlackRock Multi-Asset Income
Fund - Institutional Shares | | $ | 34,298,415 | |
| | 414,622 | | | Forward EM Corporate Debt
Fund - Institutional Shares | | | 3,536,729 | |
| Number of | | | | | | |
| Shares | | | | | Value | |
| | | | | Mutual Funds (Continued) | | | | |
| | 554,304 | | | Forward International Dividend
Fund - Institutional Shares | | $ | 4,118,481 | |
| | 423,692 | | | Forward Long/Short Credit Analysis
Fund - Institutional Shares | | | 3,164,981 | |
| | 44,406 | | | Forward Select EM Dividend Fund -
Institutional Shares | | | 862,355 | |
| | 296,717 | | | Forward Select Income Fund -
Institutional Shares | | | 7,702,777 | |
| | 290,899 | | | JPMorgan International Equity
Income Fund - Select Shares | | | 4,738,739 | |
| | 468,641 | | | JPMorgan High Yield Fund -
Select Shares | | | 3,594,480 | |
| | 508,026 | | | JPMorgan Income Builder Fund -
Select Shares | | | 5,263,151 | |
| | 225,061 | | | JPMorgan Unconstrained Debt
Fund - Select Shares | | | 2,282,114 | |
| | 86,817 | | | T. Rowe Price Institutional Floating
Rate Fund | | | 881,196 | |
| | | | | | | | 70,443,418 | |
| | | | | Total Investment Companies
(Cost $133,301,124) | | | 137,489,157 | |
| | | | | SHORT TERM INVESTMENTS - 1.93% | | | | |
| | | | | Money Market Funds - 1.93% | | | | |
| | 2,708,204 | | | Federated Prime Obligations Fund
Effective Yield, 0.05% | | | 2,708,204 | |
| | | | | Total Short Term Investments
(Cost $2,708,204) | | | 2,708,204 | |
| | | | | INVESTMENTS PURCHASED
AS SECURITIES LENDING
COLLATERAL - 12.73% | | | | |
| | | | | Money Market Funds - 12.73% | | | | |
| | 17,880,139 | | | Mount Vernon Prime Portfolio
Effective Yield, 0.22% | | | 17,880,139 | |
| | | | | Total Investments Purchased as
Securities Lending Collateral
(Cost $17,880,139) | | | 17,880,139 | |
| | | | | Total Investments
(Cost $153,889,467) - 112.51% | | | 158,077,500 | |
| | | | | Liabilities in Excess of Other Assets - (12.51)% | | | (17,579,563 | ) |
| | | | | TOTAL NET ASSETS - 100.00% | | $ | 140,497,937 | |
Percentages are stated as a percent of net assets.
| (a) | All or portion of this security is on loan. |
See notes to financial statements.
GuidePath® Fixed Income Allocation Fund
SCHEDULE OF INVESTMENTS
March 31, 2015
| Number of | | | | | | |
| Shares | | | | | Value | |
| | | | | INVESTMENT COMPANIES - 97.09% | | | | |
| | | | | Affiliated Mutual Funds - 35.65% | | | | |
| | 3,289,684 | | | GuideMark® Core Fixed Income
Fund - Institutional Shares | | $ | 31,811,248 | |
| | 2,129,846 | | | GuideMark® Opportunistic Fixed
Income Fund - Institutional Shares | | | 20,297,432 | |
| | | | | | | | 52,108,680 | |
| | | | | Exchange Traded Funds - 56.04% | | | | |
| | 81,451 | | | iShares 1-3 Year Treasury Bond ETF (a) | | | 6,913,561 | |
| | 82,336 | | | iShares 7-10 Year Treasury Bond ETF (a) | | | 8,924,399 | |
| | 35,322 | | | iShares 10+ Year Credit Bond ETF | | | 2,211,157 | |
| | 13,719 | | | iShares 20+ Year Treasury Bond ETF (a) | | | 1,792,936 | |
| | 41,363 | | | iShares Core U.S. Credit Bond ETF | | | 4,689,323 | |
| | 9,896 | | | iShares JPMorgan USD Emerging
Markets Bond ETF (a) | | | 1,109,540 | |
| | 155,895 | | | PowerShares Senior Loan Portfolio (a) | | | 3,755,511 | |
| | 97,138 | | | SPDR Barclays High Yield Bond ETF (a) | | | 3,809,752 | |
| | 95,479 | | | SPDR Barclays Short Term High
Yield Bond ETF | | | 2,787,987 | |
| | 71,942 | | | SPDR Barclays TIPS ETF (a) | | | 4,079,111 | |
| | 13,318 | | | SPDR DB International Government
Inflation-Protected Bond ETF | | | 726,630 | |
| | 164,182 | | | Vanguard Mortgage-Backed
Securities ETF | | | 8,773,886 | |
| | 382,303 | | | Vanguard Total Bond Market ETF | | | 31,872,602 | |
| | 11,688 | | | WisdomTree Emerging Markets
Local Debt Fund (a) | | | 464,598 | |
| | | | | | | | 81,910,993 | |
| Number of | | | | | | |
| Shares | | | | | Value | |
| | | | | Mutual Funds - 5.40% | | | | |
| | 343,105 | | | DoubleLine Total Return Bond
Fund - Institutional Shares | | $ | 3,787,880 | |
| | 282,051 | | | Loomis Sayles Bond Fund -
Institutional Shares | | | 4,106,659 | |
| | | | | | | | 7,894,539 | |
| | | | | Total Investment Companies
(Cost $140,300,867) | | | 141,914,212 | |
| | | | | SHORT TERM INVESTMENTS - 2.79% | | | | |
| | | | | Money Market Funds - 2.79% | | | | |
| | 4,074,667 | | | Federated Prime Obligations Fund
Effective Yield, 0.05% | | | 4,074,667 | |
| | | | | Total Short Term Investments
(Cost $4,074,667) | | | 4,074,667 | |
| | | | | INVESTMENTS PURCHASED
AS SECURITIES LENDING
COLLATERAL - 17.15% | | | | |
| | | | | Money Market Funds - 17.15% | | | | |
| | 25,070,590 | | | Mount Vernon Prime Portfolio | | | | |
| | | | | Effective Yield, 0.22% | | | 25,070,590 | |
| | | | | Total Investments Purchased as
Securities Lending Collateral
(Cost $25,070,590) | | | 25,070,590 | |
| | | | | Total Investments
(Cost $169,446,124) - 117.03% | | | 171,059,469 | |
| | | | | Liabilities in Excess of Other Assets - (17.03)% | | | (24,897,638 | ) |
| | | | | TOTAL NET ASSETS - 100.00% | | $ | 146,161,831 | |
Percentages are stated as a percent of net assets.
| (a) | All or portion of this security is on loan. |
See notes to financial statements.
GuidePath® Altegris® Diversified Alternatives Allocation Fund
SCHEDULE OF INVESTMENTS
March 31, 2015
| Number of | | | | | | |
| Shares | | | | | Value | |
| | | | | INVESTMENT COMPANIES - 98.10% | | | | |
| | | | | Affiliated Mutual Funds - 98.10% | | | | |
| | 208,908 | | | Altegris®/AACA Real Estate Long
Short Fund - Institutional Shares | | $ | 2,667,754 | |
| | 4,324,270 | | | Altegris® Equity Long Short Fund -
Institutional Shares (a) | | | 48,345,338 | |
| | 2,682,567 | | | Altegris® Fixed Income Long Short
Fund - Institutional Shares (a) | | | 28,166,956 | |
| | 702,874 | | | Altegris® Futures Evolution Strategy
Fund - Institutional Shares | | | 8,300,938 | |
| | 854,143 | | | Altegris® Macro Strategy Fund -
Institutional Shares (b) | | | 7,687,287 | |
| | 496,702 | | | Altegris® Managed Futures Strategy
Fund - Institutional Shares (b) | | | 5,091,193 | |
| | | | | | | | 100,259,466 | |
| | | | | Total Investment Companies
(Cost $91,233,254) | | | 100,259,466 | |
| Number of | | | | | | | |
| Shares | | | | | Value | |
| | | | | SHORT TERM INVESTMENTS - 1.83% | | | | |
| | | | | Money Market Funds - 1.83% | | | | |
| | 1,873,592 | | | Federated Prime Obligations Fund
Effective Yield, 0.05% | | $ | 1,873,592 | |
| | | | | | | | | |
| | | | | Total Short Term Investments
(Cost $1,873,592) | | | 1,873,592 | |
| | | | | Total Investments
(Cost $93,106,846) - 99.93% | | | 102,133,058 | |
| | | | | Other Assets in Excess of Liabilities - 0.07% | | | 70,114 | |
| | | | | TOTAL NET ASSETS - 100.00% | | $ | 102,203,172 | |
Percentages are stated as a percent of net assets.
| (a) | Fair value of this security exceeds 25% of the Fund’s net assets. Additional information for this security, including the financial statements, is available from the SEC’s EDGAR database at www.sec.gov. |
| (b) | Non-income producing security. |
See notes to financial statements.
GuideMark® Funds & GuidePath® Funds
STATEMENTS OF ASSETS & LIABILITIES
March 31, 2015
| | | Large Cap
Growth Fund | | | Large Cap
Value Fund | | | Small/Mid Cap
Core Fund | |
| ASSETS: | | | | | | | | | | | | | |
| Investments, at value (cost $166,730,200, $165,781,909, and $79,767,017, respectively)1 | | $ | 224,192,082 | | | $ | 227,971,038 | | | | $ | 89,694,720 | |
| Cash | | | — | | | | — | | | | | 8,123 | |
| Income receivable | | | 148,993 | | | | 374,627 | | | | | 52,775 | |
| Receivable for dividend reclaims | | | 2,066 | | | | 52,954 | | | | | 119 | |
| Receivable for investment securities sold | | | 3,252,497 | | | | 6,818,015 | | | | | 1,263,022 | |
| Receivable for fund shares sold | | | 231,287 | | | | 238,819 | | | | | 39,271 | |
| Other assets | | | 24,525 | | | | 29,586 | | | | | 25,551 | |
| Total Assets | | | 227,851,450 | | | | 235,485,039 | | | | | 91,083,581 | |
| LIABILITIES: | | | | | | | | | | | | | |
| Payable for collateral on securities loaned | | | 10,704,466 | | | | 12,589,606 | | | | | 11,945,175 | |
| Payable for investment securities purchased | | | 3,017,398 | | | | — | | | | | 850,679 | |
| Payable for fund shares redeemed | | | 563,983 | | | | 626,339 | | | | | 110,818 | |
| Payable to Investment Advisor | | | 163,605 | | | | 166,937 | | | | | 62,786 | |
| Payable to Custodian | | | 130,315 | | | | 133,595 | | | | | — | |
| Other accrued expenses | | | 127,367 | | | | 128,770 | | | | | 60,082 | |
| Total Liabilities | | | 14,707,134 | | | | 13,645,247 | | | | | 13,029,540 | |
| NET ASSETS | | $ | 213,144,316 | | | $ | 221,839,792 | | | | $ | 78,054,041 | |
| NET ASSETS CONSIST OF: | | | | | | | | | | | | | |
| Capital stock | | | 177,092,440 | | | | 293,900,882 | | | | | 67,527,364 | |
| Unrealized appreciation on investments | | | 57,461,882 | | | | 62,189,129 | | | | | 9,927,703 | |
| Accumulated undistributed net investment income (loss) | | | 280,153 | | | | 565,345 | | | | | (6,128 | ) |
| Accumulated undistributed net realized gain (loss) | | | (21,690,159 | ) | | | (134,815,564 | ) | | | | 605,102 | |
| Total Net Assets | | $ | 213,144,316 | | | $ | 221,839,792 | | | | $ | 78,054,041 | |
| Institutional Shares | | | | | | | | | | | | | |
| Shares outstanding (unlimited shares of no par value authorized) | | | 2,922,138 | | | | 4,864,423 | | | | | 2,274,838 | |
| Net assets | | | 44,686,597 | | | | 60,596,893 | | | | | 40,075,963 | |
| Net asset value, offering and redemption price per share | | $ | 15.29 | | | $ | 12.46 | | | | $ | 17.62 | |
| Service Shares | | | | | | | | | | | | | |
| Shares outstanding (unlimited shares of no par value authorized) | | | 11,126,557 | | | | 12,822,706 | | | | | 2,193,798 | |
| Net assets | | | 168,457,719 | | | | 161,242,899 | | | | | 37,978,078 | |
| Net asset value, offering and redemption price per share | | $ | 15.14 | | | $ | 12.57 | | | | $ | 17.31 | |
| 1Includes loaned securities with a value of: | | $ | 10,378,972 | | | $ | 11,958,323 | | | | $ | 11,470,146 | |
See notes to financial statements.
GuideMark® Funds & GuidePath® Funds
STATEMENTS OF ASSETS & LIABILITIES (Continued)
March 31, 2015
| | | World
ex-US Fund | | | Opportunistic
Equity Fund | | | Global Real
Return Fund | |
| ASSETS: | | | | | | | | | | | | |
| Investments, at value (cost $304,045,492, $119,112,393, and $86,944,290, respectively)1 | | $ | 340,964,851 | | | $ | 148,689,730 | | | $ | 83,332,524 | |
| Foreign currencies (cost $873,637, $0, and $0, respectively) | | | 874,102 | | | | — | | | | — | |
| Cash | | | 232,910 | | | | 16,111 | | | | 6,517 | |
| Income receivable | | | 947,166 | | | | 145,819 | | | | 28,481 | |
| Receivable for dividend reclaims | | | 518,889 | | | | 5,094 | | | | — | |
| Receivable for investment securities and foreign currencies sold | | | 319,222 | | | | 413,990 | | | | 70,752 | |
| Receivable for fund shares sold | | | 387,910 | | | | 165,935 | | | | 31,992 | |
| Other assets | | | 33,202 | | | | 33,219 | | | | 37,657 | |
| Total Assets | | | 344,278,252 | | | | 149,469,898 | | | | 83,507,923 | |
| LIABILITIES: | | | | | | | | | | | | |
| Payable for collateral on securities loaned | | | 577,042 | | | | 11,333,137 | | | | 18,747,590 | |
| Payable for investment securities and foreign currencies purchased | | | 199,407 | | | | 192,848 | | | | — | |
| Payable for fund shares redeemed | | | 785,606 | | | | 316,594 | | | | 68,388 | |
| Payable to Investment Advisor | | | 215,244 | | | | 110,072 | | | | 30,698 | |
| Variation margin on futures contracts | | | 42,158 | | | | — | | | | — | |
| Other accrued expenses | | | 310,135 | | | | 91,006 | | | | 59,946 | |
| Total Liabilities | | | 2,129,592 | | | | 12,043,657 | | | | 18,906,622 | |
| NET ASSETS | | $ | 342,148,660 | | | $ | 137,426,241 | | | $ | 64,601,301 | |
| NET ASSETS CONSIST OF: | | | | | | | | | | | | |
| Capital stock | | | 503,541,372 | | | | 102,643,407 | | | | 83,105,946 | |
| Unrealized appreciation (depreciation) on: | | | | | | | | | | | | |
| Investments | | | 36,919,359 | | | | 29,577,343 | | | | (3,611,766 | ) |
| Foreign currencies | | | (69,443 | ) | | | — | | | | — | |
| Futures contracts | | | (14,902 | ) | | | — | | | | — | |
| Accumulated undistributed net investment income (loss) | | | 4,973,786 | | | | (9,579 | ) | | | (9,263 | ) |
| Accumulated undistributed net realized gain (loss) | | | (203,201,512 | ) | | | 5,215,070 | | | | (14,883,616 | ) |
| Total Net Assets | | $ | 342,148,660 | | | $ | 137,426,241 | | | $ | 64,601,301 | |
| Institutional Shares | | | | | | | | | | | | |
| Shares outstanding (unlimited shares of no par value authorized) | | | 12,943,173 | | | | 4,959,245 | | | | 1,301,374 | |
| Net assets | | | 113,316,485 | | | | 63,622,473 | | | | 10,708,053 | |
| Net asset value, offering and redemption price per share | | $ | 8.75 | | | $ | 12.83 | | | $ | 8.23 | |
| Service Shares | | | | | | | | | | | | |
| Shares outstanding (unlimited shares of no par value authorized) | | | 26,294,289 | | | | 5,786,441 | | | | 6,539,499 | |
| Net assets | | | 228,832,175 | | | | 73,803,768 | | | | 53,893,248 | |
| Net asset value, offering and redemption price per share | | $ | 8.70 | | | $ | 12.75 | | | $ | 8.24 | |
| 1Includes loaned securities with a value of: | | $ | 563,203 | | | $ | 11,025,036 | | | $ | 17,875,908 | |
See notes to financial statements.
GuideMark® Funds & GuidePath® Funds
STATEMENTS OF ASSETS & LIABILITIES (Continued)
March 31, 2015
| | | Core
Fixed Income
Fund | | | Tax-Exempt
Fixed Income
Fund | | | Opportunistic
Fixed Income
Fund | |
| ASSETS: | | | | | | | | | | | | | | | |
| Investments, at value (cost $340,469,151, $59,889,230, and $201,997,620, respectively)1 | | | $ | 349,540,451 | | | | $ | 64,963,314 | | | | $ | 192,691,000 | |
| Foreign currencies (cost $0, $0, and $2,546,049, respectively) | | | | — | | | | | — | | | | | 2,521,144 | |
| Cash | | | | — | | | | | 126 | | | | | 3,675 | |
| Variation margin on futures | | | | 54,310 | | | | | — | | | | | 16,840 | |
| Variation margin on swaps | | | | — | | | | | — | | | | | 440,440 | |
| Income receivable | | | | 1,539,963 | | | | | 906,360 | | | | | 1,643,351 | |
| Receivable for dividend reclaims | | | | — | | | | | — | | | | | 391 | |
| Receivable for investment securities and foreign currencies sold | | | | 2,917,101 | | | | | 18 | | | | | 976,369 | |
| Receivable for fund shares sold | | | | 422,372 | | | | | 34,547 | | | | | 282,288 | |
| Swap premiums paid | | | | — | | | | | — | | | | | 14,414 | |
| Deposits with brokers for forwards, futures and swaps | | | | 105,282 | | | | | — | | | | | 1,690,000 | |
| Appreciation of forward foreign currency contracts | | | | — | | | | | — | | | | | 9,695,622 | |
| Appreciation of swap agreements | | | | — | | | | | — | | | | | 52,361 | |
| Other assets | | | | 40,552 | | | | | 16,837 | | | | | 24,582 | |
| Total Assets | | | | 354,620,031 | | | | | 65,921,202 | | | | | 210,052,477 | |
| LIABILITIES: | | | | | | | | | | | | | | | |
| Options written at value (Premium received $0, $0 and $59,769, respectively) | | | | — | | | | | — | | | | | 16,984 | |
| Depreciation of forward foreign currency contracts | | | | — | | | | | — | | | | | 3,551,087 | |
| Depreciation on swap agreements | | | | 57 | | | | | — | | | | | 2,014,340 | |
| Payable for collateral on securities loaned | | | | 6,327,571 | | | | | — | | | | | — | |
| Payable for investment securities and foreign currencies purchased | | | | 34,216,970 | | | | | 104,847 | | | | | 733,906 | |
| Payable for fund shares redeemed | | | | 998,157 | | | | | 26,215 | | | | | 662,461 | |
| Payable to Investment Advisor | | | | 140,197 | | | | | 19,922 | | | | | 96,897 | |
| Payable to Custodian | | | | 25,420 | | | | | — | | | | | — | |
| Swap premiums received | | | | 10,962 | | | | | — | | | | | 261,424 | |
| Other accrued expenses | | | | 248,227 | | | | | 88,049 | | | | | 239,164 | |
| Total Liabilities | | | | 41,967,561 | | | | | 239,033 | | | | | 7,576,263 | |
| NET ASSETS | | | $ | 312,652,470 | | | | $ | 65,682,169 | | | | $ | 202,476,214 | |
| NET ASSETS CONSIST OF: | | | | | | | | | | | | | | | |
| Capital stock | | | | 302,788,057 | | | | | 64,471,477 | | | | | 212,579,618 | |
| Unrealized appreciation (depreciation) on: | | | | | | | | | | | | | | | |
| Investments | | | | 9,071,309 | | | | | 5,074,084 | | | | | (9,306,620 | ) |
| Foreign currencies | | | | — | | | | | — | | | | | (85,552 | ) |
| Swaps | | | | (57 | ) | | | | — | | | | | (1,961,979 | ) |
| Forward currency exchange contracts | | | | — | | | | | — | | | | | 6,144,535 | |
| Futures contracts | | | | (23,645 | ) | | | | — | | | | | 21,062 | |
| Written options | | | | — | | | | | — | | | | | 42,785 | |
| Accumulated undistributed net investment income (loss) | | | | 136,072 | | | | | 58,200 | | | | | (3,057,437 | ) |
| Accumulated undistributed net realized gain (loss) | | | | 680,734 | | | | | (3,921,592 | ) | | | | (1,900,198 | ) |
| Total Net Assets | | | $ | 312,652,470 | | | | $ | 65,682,169 | | | | $ | 202,476,214 | |
| Institutional Shares | | | | | | | | | | | | | | | |
| Shares outstanding (unlimited shares of no par value authorized) | | | | 7,845,831 | | | | | — | | | | | 5,307,823 | |
| Net assets | | | | 75,832,786 | | | | | — | | | | | 50,593,107 | |
| Net asset value, offering and redemption price per share | | | $ | 9.67 | | | | $ | — | | | | $ | 9.53 | |
| Service Shares | | | | | | | | | | | | | | | |
| Shares outstanding (unlimited shares of no par value authorized) | | | | 24,447,261 | | | | | 5,671,461 | | | | | 15,895,473 | |
| Net assets | | | | 236,819,684 | | | | | 65,682,169 | | | | | 151,883,107 | |
| Net asset value, offering and redemption price per share | | | $ | 9.69 | | | | $ | 11.58 | | | | $ | 9.55 | |
| 1Includes loaned securities with a value of: | | | $ | 6,191,060 | | | | $ | — | | | | $ | — | |
See notes to financial statements.
GuideMark® Funds & GuidePath® Funds
STATEMENTS OF ASSETS & LIABILITIES (Continued)
March 31, 2015
| | | Strategic
Asset Allocation
Fund | | | Tactical
Constrained®
Asset Allocation
Fund | | | Tactical
Unconstrained®
Asset Allocation
Fund | | | Absolute
Return
Asset Allocation
Fund | |
| ASSETS: | | | | | | | | | | | | | | | | | | | | |
| Investments, at value (cost $158,801,920, $68,247,463, $412,927,655, and $380,978,516, respectively)1 | | | $ | 184,084,556 | | | | $ | 79,334,958 | | | | $ | 420,344,233 | | | | $ | 384,667,481 | |
| Investments in affiliates, at value (cost $109,956,256, $90,732,303, $106,855,396 and $17,978,376, respectively) | | | | 145,522,749 | | | | | 117,050,820 | | | | | 126,511,456 | | | | | 19,594,022 | |
| Cash | | | | 186,498 | | | | | 36,874 | | | | | 286,497 | | | | | 51,289 | |
| Income receivable | | | | 170,864 | | | | | 114,418 | | | | | 274,757 | | | | | 269,890 | |
| Receivable for investment securities sold | | | | 436,670 | | | | | 333,617 | | | | | 1,097,733 | | | | | 495,927 | |
| Receivable for fund shares sold | | | | 608,566 | | | | | 425,639 | | | | | 805,384 | | | | | 688,449 | |
| Other assets | | | | 40,107 | | | | | 29,126 | | | | | 107,265 | | | | | 73,301 | |
| Total Assets | | | | 331,050,010 | | | | | 197,325,452 | | | | | 549,427,325 | | | | | 405,840,359 | |
| LIABILITIES: | | | | | | | | | | | | | | | | | | | | |
| Payable for collateral on securities loaned | | | | 62,810,051 | | | | | 16,506,270 | | | | | 61,819,802 | | | | | 35,062,476 | |
| Payable for investment securities purchased | | | | — | | | | | 4,731 | | | | | — | | | | | — | |
| Payable for fund shares redeemed | | | | 388,807 | | | | | 301,540 | | | | | 605,691 | | | | | 709,314 | |
| Payable to Investment Advisor | | | | 57,148 | | | | | 41,121 | | | | | 144,248 | | | | | 110,198 | |
| Other accrued expenses | | | | 217,633 | | | | | 160,205 | | | | | 387,929 | | | | | 314,159 | |
| Total Liabilities | | | | 63,473,639 | | | | | 17,013,867 | | | | | 62,957,670 | | | | | 36,196,147 | |
| NET ASSETS | | | $ | 267,576,371 | | | | $ | 180,311,585 | | | | $ | 486,469,655 | | | | $ | 369,644,212 | |
| NET ASSETS CONSIST OF: | | | | | | | | | | | | | | | | | | | | |
| Capital stock | | | | 205,256,676 | | | | | 139,575,587 | | | | | 460,393,951 | | | | | 368,182,656 | |
| Unrealized appreciation on: | | | | | | | | | | | | | | | | | | | | |
| Investments | | | | 25,282,636 | | | | | 11,087,495 | | | | | 7,416,578 | | | | | 3,688,965 | |
| Investments in affiliates | | | | 35,566,493 | | | | | 26,318,517 | | | | | 19,656,060 | | | | | 1,615,646 | |
| Accumulated undistributed net investment income (loss) | | | | (177,911 | ) | | | | (26,221 | ) | | | | 46,193 | | | | | 1,349,692 | |
| Accumulated undistributed net realized gain (loss) | | | | 1,648,477 | | | | | 3,356,207 | | | | | (1,043,127 | ) | | | | (5,192,747 | ) |
| Total Net Assets | | | $ | 267,576,371 | | | | $ | 180,311,585 | | | | $ | 486,469,655 | | | | $ | 369,644,212 | |
| Institutional Shares | | | | | | | | | | | | | | | | | | | | |
| Shares outstanding (unlimited shares of no par value authorized) | | | | 664,486 | | | | | 548,459 | | | | | 577,968 | | | | | 266,673 | |
| Net assets | | | | 7,737,997 | | | | | 6,173,168 | | | | | 5,977,217 | | | | | 2,673,347 | |
| Net asset value, offering and redemption price per share | | | $ | 11.65 | | | | $ | 11.26 | | | | $ | 10.34 | | | | $ | 10.02 | |
| Service Shares | | | | | | | | | | | | | | | | | | | | |
| Shares outstanding (unlimited shares of no par value authorized) | | | | 22,368,981 | | | | | 15,424,710 | | | | | 46,541,214 | | | | | 36,551,547 | |
| Net assets | | | | 259,838,374 | | | | | 174,138,417 | | | | | 480,492,438 | | | | | 366,970,865 | |
| Net asset value, offering and redemption price per share | | | $ | 11.62 | | | | $ | 11.29 | | | | $ | 10.32 | | | | $ | 10.04 | |
| 1Includes loaned securities with a value of: | | | $ | 60,186,270 | | | | $ | 15,949,488 | | | | $ | 59,717,452 | | | | $ | 34,053,281 | |
See notes to financial statements.
GuideMark® Funds & GuidePath® Funds
STATEMENTS OF ASSETS & LIABILITIES (Continued)
March 31, 2015
| | | Multi-Asset
Income
Asset Allocation
Fund | | | Fixed Income
Allocation
Fund | | | Altegris®
Diversified
Alternatives
Allocation Fund | |
| ASSETS: | | | | | | | | | | | | | | | |
| Investments, at value (cost $147,639,334, $117,307,018, and $1,873,592, respectively)1 | | | $ | 151,651,260 | | | | $ | 118,950,789 | | | | $ | 1,873,592 | |
| Investments in affiliates, at value (cost $6,250,133, $52,139,106, and $91,233,254, respectively) | | | | 6,426,240 | | | | | 52,108,680 | | | | | 100,259,466 | |
| Cash | | | | 46,028 | | | | | 11,851 | | | | | 208 | |
| Income receivable | | | | 180,152 | | | | | 13,410 | | | | | 75 | |
| Receivable for investment securities sold | | | | 162,412 | | | | | 294,376 | | | | | 171,263 | |
| Receivable for fund shares sold | | | | 409,092 | | | | | 306,362 | | | | | 135,673 | |
| Other assets | | | | 27,860 | | | | | 27,664 | | | | | 11,568 | |
| Total Assets | | | | 158,903,044 | | | | | 171,713,132 | | | | | 102,451,845 | |
| LIABILITIES: | | | | | | | | | | | | | | | |
| Payable for collateral on securities loaned | | | | 17,880,139 | | | | | 25,070,590 | | | | | — | |
| Payable for investment securities purchased | | | | 53,495 | | | | | 13,252 | | | | | — | |
| Payable for fund shares redeemed | | | | 302,212 | | | | | 295,159 | | | | | 161,798 | |
| Payable to Investment Advisor | | | | 41,843 | | | | | 31,264 | | | | | — | |
| Other accrued expenses | | | | 127,418 | | | | | 141,036 | | | | | 86,875 | |
| Total Liabilities | | | | 18,405,107 | | | | | 25,551,301 | | | | | 248,673 | |
| NET ASSETS | | | $ | 140,497,937 | | | | $ | 146,161,831 | | | | $ | 102,203,172 | |
| NET ASSETS CONSIST OF: | | | | | | | | | | | | | | | |
| Capital stock | | | | 137,134,180 | | | | | 152,206,603 | | | | | 97,867,010 | |
| Unrealized appreciation (depreciation) on: | | | | | | | | | | | | | | | |
| Investments | | | | 4,011,926 | | | | | 1,643,771 | | | | | — | |
| Investments in affiliates | | | | 176,107 | | | | | (30,426 | ) | | | | 9,026,212 | |
| Accumulated undistributed net investment income | | | | 356,882 | | | | | 187,986 | | | | | 157,617 | |
| Accumulated undistributed net realized loss | | | | (1,181,158 | ) | | | | (7,846,103 | ) | | | | (4,847,667 | ) |
| Total Net Assets | | | $ | 140,497,937 | | | | $ | 146,161,831 | | | | $ | 102,203,172 | |
| Institutional Shares | | | | | | | | | | | | | | | |
| Shares outstanding (unlimited shares of no par value authorized) | | | | — | | | | | 231,254 | | | | | 183,562 | |
| Net assets | | | | — | | | | | 2,257,327 | | | | | 1,922,961 | |
| Net asset value, offering and redemption price per share | | | $ | — | | | | $ | 9.76 | | | | $ | 10.48 | |
| Service Shares | | | | | | | | | | | | | | | |
| Shares outstanding (unlimited shares of no par value authorized) | | | | 13,231,506 | | | | | 14,735,792 | | | | | 9,572,497 | |
| Net assets | | | | 140,497,937 | | | | | 143,904,504 | | | | | 100,280,211 | |
| Net asset value, offering and redemption price per share | | | $ | 10.62 | | | | $ | 9.77 | | | | $ | 10.48 | |
| 1Includes loaned securities with a value of: | | | $ | 17,366,566 | | | | $ | 24,357,653 | | | | $ | — | |
See notes to financial statements.
GuideMark® Funds & GuidePath® Funds
STATEMENTS OF OPERATIONS
For the Year Ended March 31, 2015
| | | Large Cap
Growth Fund | | | Large Cap
Value Fund | | | Small/Mid Cap
Core Fund | |
| INVESTMENT INCOME: | | | | | | | | | | | | | | | |
| Dividend income (net of withholding tax of $25,119, $40,095, and $597, respectively) | | | $ | 3,554,639 | | | | $ | 5,748,478 | | | | $ | 691,000 | |
| Interest income | | | | 503 | | | | | 1,287 | | | | | 23,640 | |
| Total investment income | | | | 3,555,142 | | | | | 5,749,765 | | | | | 714,640 | |
| EXPENSES: | | | | | | | | | | | | | | | |
| Investment advisory fees | | | | 1,415,553 | | | | | 1,473,887 | | | | | 562,381 | |
| Distribution (12b-1) fees – Service Shares | | | | 397,735 | | | | | 383,601 | | | | | 86,344 | |
| Administrative service fees – Service Shares | | | | 396,091 | | | | | 382,909 | | | | | 86,058 | |
| Shareholder servicing fees – Service Shares | | | | 124,170 | | | | | 122,752 | | | | | 19,809 | |
| Administration fees | | | | 77,789 | | | | | 81,059 | | | | | 30,504 | |
| Custody fees | | | | 43,957 | | | | | 24,053 | | | | | 22,591 | |
| Legal fees | | | | 42,721 | | | | | 49,949 | | | | | 36,227 | |
| Fund accounting fees | | | | 39,435 | | | | | 39,389 | | | | | 26,022 | |
| Federal and state registration fees | | | | 34,480 | | | | | 33,678 | | | | | 32,488 | |
| Reports to shareholders | | | | 22,651 | | | | | 23,220 | | | | | 13,090 | |
| Directors’ fees and expenses | | | | 21,978 | | | | | 21,989 | | | | | 8,196 | |
| Audit and tax fees | | | | 19,332 | | | | | 19,344 | | | | | 19,250 | |
| Transfer agent fees and expenses | | | | 14,016 | | | | | 14,159 | | | | | 8,879 | |
| Compliance fees | | | | 8,577 | | | | | 8,879 | | | | | 3,063 | |
| Insurance fees | | | | 8,370 | | | | | 9,071 | | | | | 3,513 | |
| Miscellaneous expenses | | | | 2,677 | | | | | 3,634 | | | | | 2,630 | |
| Total expenses | | | | 2,669,532 | | | | | 2,691,573 | | | | | 961,045 | |
| Net expense recapture by Advisor (See Note 3) | | | | 23,714 | | | | | — | | | | | 41,586 | |
| Less securities lending credit (See Note 6) | | | | (24,084 | ) | | | | (44,018 | ) | | | | (83,455 | ) |
| Net expenses | | | | 2,669,162 | | | | | 2,647,555 | | | | | 919,176 | |
| Net investment income (loss) | | | | 885,980 | | | | | 3,102,210 | | | | | (204,536 | ) |
| NET REALIZED AND UNREALIZED GAIN ON INVESTMENTS: | | | | | | | | | | | | | | | |
| Net realized gain on investments | | | | 19,070,457 | | | | | 15,657,616 | | | | | 2,154,490 | |
| Net change in unrealized appreciation (depreciation) on investments | | | | 3,081,794 | | | | | (3,081,642 | ) | | | | 6,204,595 | |
| Net realized and unrealized gain | | | | 22,152,251 | | | | | 12,575,974 | | | | | 8,359,085 | |
| NET INCREASE IN NET ASSETS | | | | | | | | | | | | | | | |
| RESULTING FROM OPERATIONS | | | $ | 23,038,231 | | | | $ | 15,678,184 | | | | $ | 8,154,549 | |
See notes to financial statements.
GuideMark® Funds & GuidePath® Funds
STATEMENTS OF OPERATIONS (Continued)
For the Year Ended March 31, 2015
| | | World
ex-US Fund | | | Opportunistic
Equity Fund | | | Global
Real
Return Fund | |
| INVESTMENT INCOME: | | | | | | | | | | | | | | | |
| Dividend income (net of withholding tax of $1,045,309, $21,249, and $0), respectively) | | | $ | 12,688,443 | | | | $ | 2,346,238 | | | | $ | 1,389,076 | |
| Interest income | | | | 5,831 | | | | | 1,063 | | | | | 25,674 | |
| Total investment income | | | | 12,694,274 | | | | | 2,347,301 | | | | | 1,414,750 | |
| EXPENSES: | | | | | | | | | | | | | | | |
| Investment advisory fees | | | | 2,459,341 | | | | | 1,040,360 | | | | | 479,046 | |
| Distribution (12b-1) fees – Service Shares | | | | 583,586 | | | | | 182,450 | | | | | 153,851 | |
| Administrative service fees – Service Shares | | | | 582,603 | | | | | 181,980 | | | | | 153,432 | |
| Shareholder servicing fees – Service Shares | | | | 173,834 | | | | | 50,360 | | | | | 45,335 | |
| Administration fees | | | | 150,807 | | | | | 50,278 | | | | | 28,726 | |
| Custody fees | | | | 399,230 | | | | | 24,311 | | | | | 8,703 | |
| Legal fees | | | | 83,145 | | | | | 53,499 | | | | | 27,488 | |
| Fund accounting fees | | | | 162,234 | | | | | 29,129 | | | | | 12,952 | |
| Federal and state registration fees | | | | 37,213 | | | | | 33,410 | | | | | 32,206 | |
| Reports to shareholders | | | | 33,297 | | | | | 16,459 | | | | | 7,027 | |
| Directors’ fees and expenses | | | | 37,655 | | | | | 14,383 | | | | | 8,400 | |
| Audit and tax fees | | | | 27,226 | | | | | 21,337 | | | | | 14,040 | |
| Transfer agent fees and expenses | | | | 20,041 | | | | | 11,088 | | | | | 8,905 | |
| Compliance fees | | | | 14,802 | | | | | 5,384 | | | | | 2,179 | |
| Insurance fees | | | | 15,473 | | | | | 6,298 | | | | | 1,870 | |
| Miscellaneous expenses | | | | 2,798 | | | | | 2,649 | | | | | 4,371 | |
| Total expenses | | | | 4,783,285 | | | | | 1,723,375 | | | | | 988,531 | |
| Net expense recapture by Advisor (See Note 3) | | | | 85,773 | | | | | — | | | | | — | |
| Fees waived by Advisor (See Note 3) | | | | — | | | | | — | | | | | (68,991 | ) |
| Less securities lending credit (See Note 6) | | | | (3,284 | ) | | | | (21,027 | ) | | | | (293,194 | ) |
| Net expenses | | | | 4,865,774 | | | | | 1,702,348 | | | | | 626,346 | |
| Net investment income | | | | 7,828,500 | | | | | 644,953 | | | | | 788,404 | |
| NET REALIZED AND UNREALIZED GAIN (LOSS) ON INVESTMENTS: | | | | | | | | | | | | | | | |
| Net realized gain (loss) on: | | | | | | | | | | | | | | | |
| Investments | | | | 6,765,553 | | | | | 14,849,050 | | | | | (1,880,184 | ) |
| Foreign currencies | | | | (310,102 | ) | | | | — | | | | | — | |
| Futures contracts | | | | 61,560 | | | | | — | | | | | — | |
| Total | | | | 6,517,011 | | | | | 14,849,050 | | | | | (1,880,184 | ) |
| Net change in unrealized appreciation (depreciation) on: | | | | | | | | | | | | | | | |
| Investments | | | | (15,327,447 | ) | | | | 711,689 | | | | | (6,154,898 | ) |
| Foreign currencies | | | | (79,309 | ) | | | | — | | | | | — | |
| Futures contracts | | | | (364,452 | ) | | | | — | | | | | — | |
| Total | | | | (15,771,208 | ) | | | | 711,689 | | | | | (6,154,898 | ) |
| Net realized and unrealized gain (loss) | | | | (9,254,197 | ) | | | | 15,560,739 | | | | | (8,035,082 | ) |
| NET INCREASE (DECREASE) IN NET ASSETS | | | | | | | | | | | | | | | |
| RESULTING FROM OPERATIONS | | | $ | (1,425,697 | ) | | | $ | 16,205,692 | | | | $ | (7,246,678 | ) |
See notes to financial statements.
GuideMark® Funds & GuidePath® Funds
STATEMENTS OF OPERATIONS (Continued)
For the Year Ended March 31, 2015
| | | Core
Fixed Income
Fund | | | Tax-Exempt
Fixed Income
Fund | | | Opportunistic
Fixed Income
Fund | |
| INVESTMENT INCOME: | | | | | | | | | | | | | | | |
| Dividend income (net of withholding tax of $0, $0, $3,700) | | | $ | — | | | | $ | — | | | | $ | 199,747 | |
| Interest income (net of withholding tax of $0, $0, $69,100) | | | | 7,344,011 | | | | | 2,755,673 | | | | | 9,969,241 | |
| Total investment income | | | | 7,344,011 | | | | | 2,755,673 | | | | | 10,168,988 | |
| EXPENSES: | | | | | | | | | | | | | | | |
| Investment advisory fees | | | | 1,527,897 | | | | | 342,953 | | | | | 1,442,739 | |
| Distribution (12b-1) fees – Service Shares | | | | 577,512 | | | | | 171,476 | | | | | 385,047 | |
| Administrative service fees – Service Shares | | | | 575,036 | | | | | 169,858 | | | | | 384,549 | |
| Shareholder servicing fees – Service Shares | | | | 206,208 | | | | | 68,591 | | | | | 120,135 | |
| Administration fees | | | | 77,349 | | | | | 26,325 | | | | | 80,837 | |
| Custody fees | | | | 51,530 | | | | | 7,498 | | | | | 248,100 | |
| Legal fees | | | | 114,746 | | | | | 29,515 | | | | | 61,120 | |
| Fund accounting fees | | | | 196,214 | | | | | 43,848 | | | | | 258,685 | |
| Federal and state registration fees | | | | 37,372 | | | | | 34,237 | | | | | 38,388 | |
| Reports to shareholders | | | | 24,399 | | | | | 2,089 | | | | | 20,706 | |
| Directors’ fees and expenses | | | | 32,914 | | | | | 7,375 | | | | | 23,232 | |
| Audit and tax fees | | | | 24,361 | | | | | 24,023 | | | | | 31,433 | |
| Transfer agent fees and expenses | | | | 17,984 | | | | | 6,902 | | | | | 14,110 | |
| Compliance fees | | | | 12,674 | | | | | 3,078 | | | | | 6,017 | |
| Insurance fees | | | | 16,238 | | | | | 3,135 | | | | | 5,017 | |
| Miscellaneous expenses | | | | 2,798 | | | | | 2,630 | | | | | 2,650 | |
| Total expenses | | | | 3,495,232 | | | | | 943,533 | | | | | 3,122,765 | |
| Net expense recapture (reimbursement) by Advisor (See Note 3) | | | | 26,147 | | | | | (58,715 | ) | | | | (188,562 | ) |
| Less securities lending credit (See Note 6) | | | | (26,285 | ) | | | | — | | | | | — | |
| Net expenses | | | | 3,495,094 | | | | | 884,818 | | | | | 2,934,203 | |
| Net investment income | | | | 3,848,917 | | | | | 1,870,855 | | | | | 7,234,785 | |
| NET REALIZED AND UNREALIZED GAIN (LOSS) ON INVESTMENTS: | | | | | | | | | | | | | | | |
| Net realized gain (loss) on: | | | | | | | | | | | | | | | |
| Investments | | | | 4,569,020 | | | | | 527,118 | | | | | (1,892,737 | ) |
| Foreign currencies | | | | — | | | | | — | | | | | (381,209 | ) |
| Forward currency exchange contracts | | | | — | | | | | — | | | | | 1,483,937 | |
| Swaps | | | | (3,295 | ) | | | | — | | | | | (597,255 | ) |
| Futures contracts | | | | — | | | | | — | | | | | (871,761 | ) |
| Written Options | | | | — | | | | | — | | | | | 11,719 | |
| Total | | | | 4,565,725 | | | | | 527,118 | | | | | (2,247,306 | ) |
| Net change in unrealized appreciation (depreciation) on: | | | | | | | | | | | | | | | |
| Investments | | | | 5,837,756 | | | | | 1,897,086 | | | | | (9,445,548 | ) |
| Foreign currencies | | | | — | | | | | — | | | | | (81,128 | ) |
| Forward currency contracts | | | | — | | | | | — | | | | | 6,981,181 | |
| Swaps | | | | (57 | ) | | | | — | | | | | (1,405,834 | ) |
| Futures contracts | | | | (23,645 | ) | | | | — | | | | | 42,000 | |
| Written Options | | | | — | | | | | — | | | | | 42,785 | |
| Total | | | | 5,814,054 | | | | | 1,897,086 | | | | | (3,866,544 | ) |
| Net realized and unrealized gain (loss) | | | | 10,379,779 | | | | | 2,424,204 | | | | | (6,113,850 | ) |
| NET INCREASE IN NET ASSETS RESULTING FROM OPERATIONS | | | $ | 14,228,696 | | | | $ | 4,295,059 | | | | $ | 1,120,935 | |
See notes to financial statements.
GuideMark® Funds & GuidePath® Funds
STATEMENTS OF OPERATIONS (Continued)
For the Year Ended March 31, 2015
| | | Strategic
Asset Allocation
Fund | | | Tactical
Constrained®
Asset Allocation
Fund | | | Tactical
Unconstrained®
Asset Allocation
Fund | | | Absolute
Return
Asset Allocation
Fund | |
| INVESTMENT INCOME: | | | | | | | | | | | | | | | | | | | | |
| Dividend income | | | $ | 2,946,285 | | | | $ | 1,414,328 | | | | $ | 8,170,943 | | | | $ | 11,306,008 | |
| Dividends from affiliate investments | | | | 2,459,530 | | | | | 2,655,054 | | | | | 3,050,034 | | | | | 540,145 | |
| Interest income | | | | 1,420 | | | | | 1,193 | | | | | 9,168 | | | | | 2,010 | |
| Total investment income | | | | 5,407,235 | | | | | 4,070,575 | | | | | 11,230,145 | | | | | 11,848,163 | |
| EXPENSES: | | | | | | | | | | | | | | | | | | | | |
| Investment advisory fees | | | | 693,353 | | | | | 464,400 | | | | | 1,638,297 | | | | | 1,367,726 | |
| Distribution (12b-1) fees – Service Shares | | | | 679,130 | | | | | 453,209 | | | | | 1,160,045 | | | | | 972,550 | |
| Administrative service fees – Service Shares | | | | 679,108 | | | | | 453,194 | | | | | 1,160,005 | | | | | 972,519 | |
| Shareholder servicing fees – Service Shares | | | | 258,709 | | | | | 172,649 | | | | | 450,098 | | | | | 376,308 | |
| Administration fees | | | | 108,567 | | | | | 70,983 | | | | | 182,953 | | | | | 150,722 | |
| Custody fees | | | | 59,173 | | | | | 55,908 | | | | | 131,484 | | | | | 133,979 | |
| Legal fees | | | | 70,416 | | | | | 46,896 | | | | | 120,395 | | | | | 97,218 | |
| Fund accounting fees | | | | 48,013 | | | | | 31,410 | | | | | 80,771 | | | | | 67,246 | |
| Federal and state registration fees | | | | 39,983 | | | | | 32,869 | | | | | 36,765 | | | | | 33,721 | |
| Reports to shareholders | | | | 30,988 | | | | | 19,284 | | | | | 49,963 | | | | | 37,471 | |
| Directors’ fees and expenses | | | | 31,592 | | | | | 20,595 | | | | | 50,647 | | | | | 42,659 | |
| Audit and tax fees | | | | 14,175 | | | | | 14,175 | | | | | 14,175 | | | | | 14,175 | |
| Transfer agent fees and expenses | | | | 17,244 | | | | | 13,281 | | | | | 24,105 | | | | | 21,822 | |
| Compliance fees | | | | 8,364 | | | | | 5,154 | | | | | 14,014 | | | | | 11,535 | |
| Insurance fees | | | | 6,938 | | | | | 4,677 | | | | | 10,851 | | | | | 9,934 | |
| Miscellaneous expenses | | | | 2,662 | | | | | 2,638 | | | | | 2,698 | | | | | 3,683 | |
| Total expenses | | | | 2,748,415 | | | | | 1,861,322 | | | | | 5,127,266 | | | | | 4,313,268 | |
| Net expense recapture by Advisor (See Note 3) | | | | 56,738 | | | | | 61,651 | | | | | 12,143 | | | | | — | |
| Less securities lending credit (See Note 6) | | | | (205,800 | ) | | | | (93,531 | ) | | | | (643,577 | ) | | | | (692,217 | ) |
| Net expenses | | | | 2,599,353 | | | | | 1,829,442 | | | | | 4,495,832 | | | | | 3,621,051 | |
| Net investment income | | | | 2,807,882 | | | | | 2,241,133 | | | | | 6,734,313 | | | | | 8,227,112 | |
| NET REALIZED AND UNREALIZED GAIN ON INVESTMENTS: | | | | | | | | | | | | | | | | | | | | |
| Net realized gain on: | | | | | | | | | | | | | | | | | | | | |
| Investments | | | | 2,828,310 | | | | | 1,822,959 | | | | | 13,856,827 | | | | | 3,706,756 | |
| Investments in affiliates | | | | 4,559,106 | | | | | 6,831,639 | | | | | 9,913,674 | | | | | 816,965 | |
| Total | | | | 7,387,416 | | | | | 8,654,598 | | | | | 23,770,501 | | | | | 4,523,721 | |
| Net change in unrealized appreciation (depreciation) on: | | | | | | | | | | | | | | | | | | | | |
| Investments | | | | 1,110,679 | | | | | 1,121,720 | | | | | (10,038,774 | ) | | | | (2,696,636 | ) |
| Investments in affiliates | | | | 812,163 | | | | | (2,330,866 | ) | | | | (6,110,223 | ) | | | | (139,651 | ) |
| Total | | | | 1,922,842 | | | | | (1,209,146 | ) | | | | (16,148,997 | ) | | | | (2,836,287 | ) |
| Net realized and unrealized gain | | | | 9,310,258 | | | | | 7,445,452 | | | | | 7,621,504 | | | | | 1,687,434 | |
| NET INCREASE IN NET ASSETS RESULTING FROM OPERATIONS | | | $ | 12,118,140 | | | | $ | 9,686,585 | | | | $ | 14,355,817 | | | | $ | 9,914,546 | |
See notes to financial statements.
GuideMark® Funds & GuidePath® Funds
STATEMENTS OF OPERATIONS (Continued)
For the Year Ended March 31, 2015
| | | Multi-Asset
Income
Asset Allocation
Fund | | | Fixed Income
Allocation
Fund | | | Altegris®
Diversified
Alternatives
Allocation Fund | |
| INVESTMENT INCOME: | | | | | | | | | | | | | | | |
| Dividend income | | | $ | 5,827,681 | | | | $ | 2,775,693 | | | | $ | — | |
| Dividends from affiliate investments | | | | 120,921 | | | | | 1,704,120 | | | | | 2,649,946 | |
| Interest income | | | | 793 | | | | | 991 | | | | | 565 | |
| Total investment income | | | | 5,949,395 | | | | | 4,480,804 | | | | | 2,650,511 | |
| EXPENSES: | | | | | | | | | | | | | | | |
| Investment advisory fees | | | | 476,443 | | | | | 408,535 | | | | | 169,568 | |
| Distribution (12b-1) fees – Service Shares | | | | 340,317 | | | | | 405,028 | | | | | 279,251 | |
| Administrative service fees – Service Shares | | | | 340,305 | | | | | 405,016 | | | | | 279,242 | |
| Shareholder servicing fees – Service Shares | | | | 128,993 | | | | | 157,151 | | | | | 108,349 | |
| Administration fees | | | | 53,365 | | | | | 63,640 | | | | | 42,731 | |
| Custody fees | | | | 68,409 | | | | | 39,470 | | | | | 26,962 | |
| Legal fees | | | | 32,873 | | | | | 42,857 | | | | | 34,019 | |
| Fund accounting fees | | | | 20,547 | | | | | 36,724 | | | | | 18,372 | |
| Federal and state registration fees | | | | 36,275 | | | | | 34,446 | | | | | 35,276 | |
| Reports to shareholders | | | | 12,903 | | | | | 12,754 | | | | | 10,909 | |
| Directors’ fees and expenses | | | | 14,839 | | | | | 19,602 | | | | | 12,755 | |
| Audit and tax fees | | | | 14,137 | | | | | 14,137 | | | | | 13,970 | |
| Transfer agent fees and expenses | | | | 7,800 | | | | | 12,744 | | | | | 10,403 | |
| Compliance fees | | | | 4,148 | | | | | 4,822 | | | | | 3,108 | |
| Insurance fees | | | | 3,192 | | | | | 4,315 | | | | | 2,968 | |
| Miscellaneous expenses | | | | 2,638 | | | | | 2,638 | | | | | 2,626 | |
| Total expenses | | | | 1,557,184 | | | | | 1,663,879 | | | | | 1,050,509 | |
| Fees waived by Advisor (See Note 3) | | | | — | | | | | — | | | | | (448,810 | ) |
| Less securities lending credit (See Note 6) | | | | (355,090 | ) | | | | (168,125 | ) | | | | — | |
| Net expenses | | | | 1,202,094 | | | | | 1,495,754 | | | | | 601,699 | |
| Net investment income | | | | 4,747,301 | | | | | 2,985,050 | | | | | 2,048,812 | |
| NET REALIZED AND UNREALIZED GAIN (LOSS) ON INVESTMENTS: | | | | | | | | | | | | | | | |
| Net realized gain (loss) on: | | | | | | | | | | | | | | | |
| Investments | | | | 460,501 | | | | | (1,310,960 | ) | | | | — | |
| Investments in affiliates | | | | (9,726 | ) | | | | (953,481 | ) | | | | (735,324 | ) |
| Total | | | | 450,775 | | | | | (2,264,441 | ) | | | | (735,324 | ) |
| Net change in unrealized appreciation (depreciation) on: | | | | | | | | | | | | | | | |
| Investments | | | | (1,267,449 | ) | | | | 3,378,697 | | | | | — | |
| Investments in affiliates | | | | (100,344 | ) | | | | 1,302,332 | | | | | 6,895,502 | |
| Total | | | | (1,367,793 | ) | | | | 4,681,029 | | | | | 6,895,502 | |
| Net realized and unrealized gain (loss) | | | | (917,018 | ) | | | | 2,416,588 | | | | | 6,160,178 | |
| NET INCREASE IN NET ASSETS RESULTING FROM OPERATIONS | | | $ | 3,830,283 | | | | $ | 5,401,638 | | | | $ | 8,208,990 | |
See notes to financial statements.
GuideMark® Funds & GuidePath® Funds
STATEMENTS OF CHANGES IN NET ASSETS
| | | Large Cap Growth Fund | | | Large Cap Value Fund | |
| | | Year Ended
March 31,
2015 | | | Year Ended
March 31,
2014 | | | Year Ended
March 31,
2015 | | | Year Ended
March 31,
2014 | |
| OPERATIONS: | | | | | | | | | | | | | | | | | | | | |
| Net investment income | | | $ | 885,980 | | | | $ | 352,491 | | | | $ | 3,102,210 | | | | $ | 2,374,704 | |
| Net realized gain on investment transactions | | | | 19,070,457 | | | | | 21,092,764 | | | | | 15,657,616 | | | | | 22,276,535 | |
| Change in unrealized appreciation (depreciation) on investments | | | | 3,081,794 | | | | | 13,913,996 | | | | | (3,081,642 | ) | | | | 20,243,163 | |
| Net increase in net assets resulting from operations | | | | 23,038,231 | | | | | 35,359,251 | | | | | 15,678,184 | | | | | 44,894,402 | |
| CAPITAL SHARE TRANSACTIONS: | | | | | | | | | | | | | | | | | | | | |
| Institutional Shares | | | | | | | | | | | | | | | | | | | | |
| Shares sold | | | | 12,995,189 | | | | | 12,335,208 | | | | | 20,224,717 | | | | | 19,156,635 | |
| Shares issued to holders in reinvestment of dividends | | | | 269,226 | | | | | 291,957 | | | | | 1,084,756 | | | | | 1,001,117 | |
| Shares redeemed | | | | (18,111,679 | ) | | | | (22,023,140 | ) | | | | (26,104,631 | ) | | | | (32,457,127 | ) |
| Net decrease | | | | (4,847,264 | ) | | | | (9,395,975 | ) | | | | (4,795,158 | ) | | | | (12,299,375 | ) |
| Service Shares | | | | | | | | | | | | | | | | | | | | |
| Shares sold | | | | 57,876,616 | | | | | 38,921,597 | | | | | 58,097,132 | | | | | 39,000,087 | |
| Shares issued to holders in reinvestment of dividends | | | | 173,764 | | | | | 71,448 | | | | | 977,308 | | | | | 813,710 | |
| Shares redeemed | | | | (46,214,878 | ) | | | | (62,008,635 | ) | | | | (44,879,756 | ) | | | | (69,734,060 | ) |
| Net increase (decrease) | | | | 11,835,502 | | | | | (23,015,590 | ) | | | | 14,194,684 | | | | | (29,920,263 | ) |
| DIVIDENDS AND DISTRIBUTIONS TO SHAREHOLDERS: | | | | | | | | | | | | | | | | | | | | |
| Net investment income – Institutional Shares | | | | (269,226 | ) | | | | (291,957 | ) | | | | (1,084,756 | ) | | | | (1,001,117 | ) |
| Net investment income – Service Shares | | | | (343,474 | ) | | | | (115,775 | ) | | | | (1,996,865 | ) | | | | (1,354,660 | ) |
| Total dividends and distributions | | | | (612,700 | ) | | | | (407,732 | ) | | | | (3,081,621 | ) | | | | (2,355,777 | ) |
| INCREASE IN NET ASSETS | | | | 29,413,769 | | | | | 2,539,954 | | | | | 21,996,089 | | | | | 318,987 | |
| NET ASSETS: | | | | | | | | | | | | | | | | | | | | |
| Beginning of year | | | | 183,730,547 | | | | | 181,190,593 | | | | | 199,843,703 | | | | | 199,524,716 | |
| End of year (including accumulated undistributed net investment income of $280,153, $6,873, $565,345 and $544,756, respectively) | | | $ | 213,144,316 | | | | $ | 183,730,547 | | | | $ | 221,839,792 | | | | $ | 199,843,703 | |
| CHANGES IN SHARES OUTSTANDING | | | | | | | | | | | | | | | | | | | | |
| Institutional Shares | | | | | | | | | | | | | | | | | | | | |
| Shares sold | | | | 899,178 | | | | | 994,052 | | | | | 1,665,154 | | | | | 1,813,516 | |
| Shares issued to holders in reinvestment of dividends | | | | 17,724 | | | | | 21,642 | | | | | 87,199 | | | | | 87,281 | |
| Shares redeemed | | | | (1,274,596 | ) | | | | (1,751,779 | ) | | | | (2,175,147 | ) | | | | (3,023,543 | ) |
| Net decrease | | | | (357,694 | ) | | | | (736,085 | ) | | | | (422,794 | ) | | | | (1,122,746 | ) |
| Service Shares | | | | | | | | | | | | | | | | | | | | |
| Shares sold | | | | 4,056,642 | | | | | 3,101,659 | | | | | 4,768,938 | | | | | 3,573,671 | |
| Shares issued to holders in reinvestment of dividends | | | | 11,538 | | | | | 5,328 | | | | | 77,749 | | | | | 70,148 | |
| Shares redeemed | | | | (3,186,451 | ) | | | | (5,108,167 | ) | | | | (3,661,928 | ) | | | | (6,610,413 | ) |
| Net increase (decrease) | | | | 881,729 | | | | | (2,001,180 | ) | | | | 1,184,759 | | | | | (2,966,594 | ) |
See notes to financial statements.
GuideMark® Funds & GuidePath® Funds
STATEMENTS OF CHANGES IN NET ASSETS (Continued)
| | | Small/Mid Cap Core Fund | | | World ex-US Fund | |
| | | Year Ended
March 31,
2015 | | | Year Ended
March 31,
2014 | | | Year Ended
March 31,
2015 | | | Year Ended
March 31,
2014 | |
| OPERATIONS: | | | | | | | | | | | | | | | | | | | | |
| Net investment income (loss) | | | $ | (204,536 | ) | | | $ | (204,887 | ) | | | $ | 7,828,500 | | | | $ | 3,745,379 | |
| Net realized gain on investment transactions | | | | 2,154,490 | | | | | 28,603,873 | | | | | 6,517,011 | | | | | 10,334,774 | |
| Change in unrealized appreciation (depreciation) on investments | | | | 6,204,595 | | | | | (11,964,634 | ) | | | | (15,771,208 | ) | | | | 23,695,388 | |
| Net increase (decrease) in net assets resulting from operations | | | | 8,154,549 | | | | | 16,434,352 | | | | | (1,425,697 | ) | | | | 37,775,541 | |
| CAPITAL SHARE TRANSACTIONS: | | | | | | | | | | | | | | | | | | | | |
| Institutional Shares | | | | | | | | | | | | | | | | | | | | |
| Shares sold | | | | 8,982,059 | | | | | 21,158,768 | | | | | 30,662,054 | | | | | 69,617,181 | |
| Shares issued to holders in reinvestment of dividends | | | | 2,599,477 | | | | | 23,111 | | | | | 2,286,480 | | | | | 1,297,000 | |
| Shares redeemed | | | | (17,923,650 | ) | | | | (30,790,156 | ) | | | | (47,962,031 | ) | | | | (36,583,493 | ) |
| Net increase (decrease) | | | | (6,342,114 | ) | | | | (9,608,277 | ) | | | | (15,013,497 | ) | | | | 34,330,688 | |
| Service Shares | | | | | | | | | | | | | | | | | | | | |
| Shares sold | | | | 12,569,491 | | | | | 8,445,132 | | | | | 70,956,132 | | | | | 94,242,807 | |
| Shares issued to holders in reinvestment of dividends | | | | 2,310,740 | | | | | — | | | | | 1,887,436 | | | | | 1,431,722 | |
| Shares redeemed | | | | (11,014,799 | ) | | | | (22,944,161 | ) | | | | (77,276,368 | ) | | | | (78,040,049 | ) |
| Net increase (decrease) | | | | 3,865,432 | | | | | (14,499,029 | ) | | | | (4,432,800 | ) | | | | 17,634,480 | |
| DIVIDENDS AND DISTRIBUTIONS TO SHAREHOLDERS: | | | | | | | | | | | | | | | | | | | | |
| Net investment income – Institutional Shares | | | | — | | | | | (23,111 | ) | | | | (2,286,480 | ) | | | | (1,297,000 | ) |
| Net investment income – Service Shares | | | | — | | | | | — | | | | | (3,379,936 | ) | | | | (2,167,000 | ) |
| Net realized gains – Institutional Shares | | | | (2,599,476 | ) | | | | — | | | | | — | | | | | — | |
| Net realized gains – Service Shares | | | | (2,311,353 | ) | | | | — | | | | | — | | | | | — | |
| Total dividends and distributions | | | | (4,910,829 | ) | | | | (23,111 | ) | | | | (5,666,416 | ) | | | | (3,464,000 | ) |
| INCREASE (DECREASE) IN NET ASSETS | | | | 767,038 | | | | | (7,696,065 | ) | | | | (26,538,410 | ) | | | | 86,276,709 | |
| NET ASSETS: | | | | | | | | | | | | | | | | | | | | |
| Beginning of year | | | | 77,287,003 | | | | | 84,983,068 | | | | | 368,687,070 | | | | | 282,410,361 | |
| End of year (including accumulated undistributed net investment income (loss) of $(6,128), $(88,635), $4,973,786 and $3,150,602, respectively) | | | $ | 78,054,041 | | | | $ | 77,287,003 | | | | $ | 342,148,660 | | | | $ | 368,687,070 | |
| CHANGES IN SHARES OUTSTANDING | | | | | | | | | | | | | | | | | | | | |
| Institutional Shares | | | | | | | | | | | | | | | | | | | | |
| Shares sold | | | | 525,839 | | | | | 1,390,413 | | | | | 3,469,455 | | | | | 8,180,960 | |
| Shares issued to holders in reinvestment of dividends | | | | 152,731 | | | | | 1,413 | | | | | 269,315 | | | | | 145,404 | |
| Shares redeemed | | | | (1,068,600 | ) | | | | (2,010,523 | ) | | | | (5,395,194 | ) | | | | (4,292,169 | ) |
| Net increase (decrease) | | | | (390,030 | ) | | | | (618,697 | ) | | | | (1,656,424 | ) | | | | 4,034,195 | |
| Service Shares | | | | | | | | | | | | | | | | | | | | |
| Shares sold | | | | 749,912 | | | | | 554,743 | | | | | 8,073,448 | | | | | 11,329,390 | |
| Shares issued to holders in reinvestment of dividends | | | | 137,954 | | | | | — | | | | | 223,101 | | | | | 161,049 | |
| Shares redeemed | | | | (656,431 | ) | | | | (1,612,743 | ) | | | | (8,786,736 | ) | | | | (9,210,010 | ) |
| Net increase (decrease) | | | | 231,435 | | | | | (1,058,000 | ) | | | | (490,187 | ) | | | | 2,280,429 | |
See notes to financial statements.
GuideMark® Funds & GuidePath® Funds
STATEMENTS OF CHANGES IN NET ASSETS (Continued)
| | | Opportunistic Equity Fund | | | Global Real Return Fund | |
| | | Year Ended | | | Year Ended | | | Year Ended | | | Year Ended | |
| | | March 31, | | | March 31, | | | March 31, | | | March 31, | |
| | | 2015 | | | 2014 | | | 2015 | | | 2014 | |
| OPERATIONS: | | | | | | | | | | | | | | | | |
| Net investment income | | $ | 644,953 | | | $ | 732,141 | | | $ | 788,404 | | | $ | 832,674 | |
| Net realized gain (loss) on investment transactions | | | 14,849,050 | | | | 25,954,638 | | | | (1,880,184 | ) | | | (4,526,174 | ) |
Change in unrealized appreciation (depreciation)
on investments | | | 711,689 | | | | 5,016,555 | | | | (6,154,898 | ) | | | 2,683,251 | |
Net increase (decrease) in net assets resulting
from operations | | | 16,205,692 | | | | 31,703,334 | | | | (7,246,678 | ) | | | (1,010,249 | ) |
| CAPITAL SHARE TRANSACTIONS: | | | | | | | | | | | | | | | | |
| Institutional Shares | | | | | | | | | | | | | | | | |
| Shares sold | | | 20,661,131 | | | | 12,740,679 | | | | 909,494 | | | | 4,555,454 | |
| Shares issued to holders in reinvestment of dividends | | | 10,335,439 | | | | 3,505,113 | | | | 162,317 | | | | 147,042 | |
| Shares redeemed | | | (24,275,124 | ) | | | (34,980,702 | ) | | | (2,291,470 | ) | | | (3,027,315 | ) |
| Net increase (decrease) | | | 6,721,446 | | | | (18,734,910 | ) | | | (1,219,659 | ) | | | 1,675,181 | |
| Service Shares | | | | | | | | | | | | | | | | |
| Shares sold | | | 18,008,040 | | | | 12,445,930 | | | | 16,250,482 | | | | 18,626,087 | |
| Shares issued to holders in reinvestment of dividends | | | 11,942,760 | | | | 3,535,605 | | | | 354,979 | | | | 343,729 | |
| Shares redeemed | | | (25,292,833 | ) | | | (44,363,925 | ) | | | (20,402,867 | ) | | | (23,902,642 | ) |
| Net increase (decrease) | | | 4,657,967 | | | | (28,382,390 | ) | | | (3,797,406 | ) | | | (4,932,826 | ) |
DIVIDENDS AND DISTRIBUTIONS TO
SHAREHOLDERS: | | | | | | | | | | | | | | | | |
| Net investment income – Institutional Shares | | | (612,215 | ) | | | (554,826 | ) | | | (143,792 | ) | | | (147,042 | ) |
| Net investment income – Service Shares | | | (326,935 | ) | | | (137,451 | ) | | | (456,154 | ) | | | (469,321 | ) |
| Net realized gains – Institutional Shares | | | (9,723,224 | ) | | | (2,950,288 | ) | | | — | | | | — | |
| Net realized gains – Service Shares | | | (11,725,936 | ) | | | (3,431,406 | ) | | | — | | | | — | |
| Return of capital – Institutional Shares | | | — | | | | — | | | | (18,525 | ) | | | — | |
| Return of capital – Service Shares | | | — | | | | — | | | | (93,398 | ) | | | — | |
| Total dividends and distributions | | | (22,388,310 | ) | | | (7,073,971 | ) | | | (711,869 | ) | | | (616,363 | ) |
INCREASE (DECREASE) IN NET ASSETS
NET ASSETS: | | | 5,196,795 | | | | (22,487,937 | ) | | | (12,975,612 | ) | | | (4,884,257 | ) |
| Beginning of year | | | 132,229,446 | | | | 154,717,383 | | | | 77,576,913 | | | | 82,461,170 | |
End of year (including accumulated undistributed net
investment income (loss) of $(9,579), $169,134,
$(9,263), and $245,321, respectively) | | $ | 137,426,241 | | | $ | 132,229,446 | | | $ | 64,601,301 | | | $ | 77,576,913 | |
| CHANGES IN SHARES OUTSTANDING | | | | | | | | | | | | | | | | |
| Institutional Shares | | | | | | | | | | | | | | | | |
| Shares sold | | | 1,499,655 | | | | 1,020,666 | | | | 102,358 | | | | 503,548 | |
| Shares issued to holders in reinvestment of dividends | | | 826,835 | | | | 265,740 | | | | 19,278 | | | | 16,284 | |
| Shares redeemed | | | (1,806,654 | ) | | | (2,808,384 | ) | | | (252,691 | ) | | | (331,558 | ) |
| Net increase (decrease) | | | 519,836 | | | | (1,521,978 | ) | | | (131,055 | ) | | | 188,274 | |
| Service Shares | | | | | | | | | | | | | | | | |
| Shares sold | | | 1,352,423 | | | | 981,103 | | | | 1,835,721 | | | | 2,046,056 | |
| Shares issued to holders in reinvestment of dividends | | | 959,258 | | | | 269,072 | | | | 42,059 | | | | 37,897 | |
| Shares redeemed | | | (1,916,041 | ) | | | (3,592,246 | ) | | | (2,303,651 | ) | | | (2,628,584 | ) |
| Net increase (decrease) | | | 395,640 | | | | (2,342,071 | ) | | | (425,871 | ) | | | (544,631 | ) |
See notes to financial statements.
GuideMark® Funds & GuidePath® Funds
STATEMENTS OF CHANGES IN NET ASSETS (Continued)
| | | Core Fixed Income Fund | | | Tax-Exempt Fixed Income Fund | |
| | | Year Ended | | | Year Ended | | | Year Ended | | | Year Ended | |
| | | March 31, | | | March 31, | | | March 31, | | | March 31, | |
| | | 2015 | | | 2014 | | | 2015 | | | 2014 | |
| OPERATIONS: | | | | | | | | | | | | | | | | |
| Net investment income | | $ | 3,848,917 | | | $ | 4,648,545 | | | $ | 1,870,855 | | | $ | 1,922,850 | |
| Net realized gain (loss) on investment transactions | | | 4,565,725 | | | | (2,082,111 | ) | | | 527,118 | | | | (120,481 | ) |
Change in unrealized appreciation (depreciation)
on investments | | | 5,814,054 | | | | (8,003,981 | ) | | | 1,897,086 | | | | (3,026,236 | ) |
Net increase (decrease) in net assets resulting
from operations | | | 14,228,696 | | | | (5,437,547 | ) | | | 4,295,059 | | | | (1,223,867 | ) |
| CAPITAL SHARE TRANSACTIONS: | | | | | | | | | | | | | | | | |
| Institutional Shares | | | | | | | | | | | | | | | | |
| Shares sold | | | 29,269,274 | | | | 99,243,948 | | | | — | | | | — | |
| Shares issued to holders in reinvestment of dividends | | | 1,443,335 | | | | 4,131,927 | | | | — | | | | — | |
| Shares redeemed | | | (45,960,884 | ) | | | (143,287,217 | ) | | | — | | | | — | |
| Net decrease | | | (15,248,275 | ) | | | (39,911,342 | ) | | | — | | | | — | |
| Service Shares | | | | | | | | | | | | | | | | |
| Shares sold | | | 76,679,121 | | | | 82,207,966 | | | | 21,259,677 | | | | 21,167,435 | |
| Shares issued to holders in reinvestment of dividends | | | 1,891,851 | | | | 5,662,109 | | | | 1,197,171 | | | | 1,305,670 | |
| Shares redeemed | | | (80,224,850 | ) | | | (125,108,533 | ) | | | (22,627,865 | ) | | | (31,627,332 | ) |
| Net decrease | | | (1,653,878 | ) | | | (37,238,458 | ) | | | (171,017 | ) | | | (9,154,227 | ) |
| DIVIDENDS AND DISTRIBUTIONS TO SHAREHOLDERS: | | | | | | | | | | | | | | | | |
| Net investment income – Institutional Shares | | | (1,340,513 | ) | | | (2,106,585 | ) | | | — | | | | — | |
| Net investment income – Service Shares | | | (2,879,875 | ) | | | (3,464,351 | ) | | | (1,871,450 | ) | | | (1,932,202 | ) |
| Net realized gains – Institutional Shares | | | (102,823 | ) | | | (329,777 | ) | | | — | | | | — | |
| Net realized gains – Service Shares | | | (338,606 | ) | | | (873,296 | ) | | | — | | | | — | |
| Return of capital – Institutional Shares | | | — | | | | (1,695,565 | ) | | | — | | | | — | |
| Return of capital – Service Shares | | | — | | | | (4,498,324 | ) | | | — | | | | — | |
| Total dividends and distributions | | | (4,661,817 | ) | | | (12,967,898 | ) | | | (1,871,450 | ) | | | (1,932,202 | ) |
| INCREASE (DECREASE) IN NET ASSETS | | | (7,335,274 | ) | | | (95,555,245 | ) | | | 2,252,592 | | | | (12,310,296 | ) |
| NET ASSETS: | | | | | | | | | | | | | | | | |
| Beginning of year | | | 319,987,744 | | | | 415,542,989 | | | | 63,429,577 | | | | 75,739,873 | |
End of year (including accumulated undistributed net
investment income (loss) of $136,072, $(1,950),
$58,200 and $58,795, respectively) | | $ | 312,652,470 | | | $ | 319,987,744 | | | $ | 65,682,169 | | | $ | 63,429,577 | |
| CHANGES IN SHARES OUTSTANDING | | | | | | | | | | | | | | | | |
| Institutional Shares | | | | | | | | | | | | | | | | |
| Shares sold | | | 3,056,805 | | | | 10,359,602 | | | | — | | | | — | |
| Shares issued to holders in reinvestment of dividends | | | 151,867 | | | | 439,400 | | | | — | | | | — | |
| Shares redeemed | | | (4,831,019 | ) | | | (14,958,623 | ) | | | — | | | | — | |
| Net decrease | | | (1,622,347 | ) | | | (4,159,621 | ) | | | — | | | | — | |
| Service Shares | | | | | | | | | | | | | | | | |
| Shares sold | | | 8,012,446 | | | | 8,539,880 | | | | 1,853,681 | | | | 1,888,895 | |
| Shares issued to holders in reinvestment of dividends | | | 198,540 | | | | 601,091 | | | | 104,386 | | | | 118,057 | |
| Shares redeemed | | | (8,389,708 | ) | | | (12,966,663 | ) | | | (1,962,618 | ) | | | (2,805,719 | ) |
| Net decrease | | | (178,722 | ) | | | (3,825,692 | ) | | | (4,551 | ) | | | (798,767 | ) |
See notes to financial statements.
GuideMark® Funds & GuidePath® Funds
STATEMENTS OF CHANGES IN NET ASSETS (Continued)
| | | Opportunistic Fixed Income Fund | | | Strategic Asset Allocation Fund | |
| | | Year Ended | | | Year Ended | | | Year Ended | | | Year Ended | |
| | | March 31, | | | March 31, | | | March 31, | | | March 31, | |
| | | 2015 | | | 2014 | | | 2015 | | | 2014 | |
| OPERATIONS: | | | | | | | | | | | | | | | | |
| Net investment income | | $ | 7,234,785 | | | $ | 8,990,479 | | | $ | 2,807,882 | | | $ | 1,607,039 | |
| Net realized gain (loss) on investment transactions | | | (2,247,306 | ) | | | (1,568,782 | ) | | | 7,387,416 | | | | 4,893,226 | |
Change in unrealized appreciation (depreciation)
on investments | | | (3,866,544 | ) | | | (10,293,292 | ) | | | 1,922,842 | | | | 29,033,060 | |
Net increase (decrease) in net assets resulting
from operations | | | 1,120,935 | | | | (2,871,595 | ) | | | 12,118,140 | | | | 35,533,325 | |
| CAPITAL SHARE TRANSACTIONS: | | | | | | | | | | | | | | | | |
| Institutional Shares | | | | | | | | | | | | | | | | |
| Shares sold | | | 22,406,610 | | | | 40,385,667 | | | | 5,544,617 | | | | 3,468,920 | |
| Shares issued to holders in reinvestment of dividends | | | 2,616,279 | | | | 3,161,115 | | | | 180,659 | | | | 56,529 | |
| Shares redeemed | | | (37,551,593 | ) | | | (78,137,254 | ) | | | (1,635,806 | ) | | | (1,062,912 | ) |
| Net increase (decrease) | | | (12,528,704 | ) | | | (34,590,472 | ) | | | 4,089,470 | | | | 2,462,537 | |
| Service Shares | | | | | | | | | | | | | | | | |
| Shares sold | | | 61,731,494 | | | | 68,707,575 | | | | 96,769,485 | | | | 144,347,332 | |
| Shares issued to holders in reinvestment of dividends | | | 3,574,928 | | | | 2,709,952 | | | | 4,551,419 | | | | 5,261,997 | |
| Shares redeemed | | | (54,949,826 | ) | | | (68,566,490 | ) | | | (134,652,525 | ) | | | (138,207,839 | ) |
| Net increase (decrease) | | | 10,356,596 | | | | 2,851,037 | | | | (33,331,621 | ) | | | 11,401,490 | |
| DIVIDENDS AND DISTRIBUTIONS TO SHAREHOLDERS: | | | | | | | | | | | | | | | | |
| Net investment income – Institutional Shares | | | (2,616,279 | ) | | | (2,977,841 | ) | | | (92,168 | ) | | | (18,875 | ) |
| Net investment income – Service Shares | | | (6,531,339 | ) | | | (3,814,577 | ) | | | (2,997,989 | ) | | | (1,395,712 | ) |
| From net realized gains – Institutional Shares | | | — | | | | (183,274 | ) | | | (88,491 | ) | | | (37,654 | ) |
| From net realized gains – Service Shares | | | — | | | | (373,401 | ) | | | (4,056,584 | ) | | | (5,016,550 | ) |
| Total dividends and distributions | | | (9,147,618 | ) | | | (7,349,093 | ) | | | (7,235,232 | ) | | | (6,468,791 | ) |
| INCREASE (DECREASE) IN NET ASSETS | | | (10,198,791 | ) | | | (41,960,123 | ) | | | (24,359,243 | ) | | | 42,928,561 | |
| NET ASSETS: | | | | | | | | | | | | | | | | |
| Beginning of year | | | 212,675,005 | | | | 254,635,128 | | | | 291,935,614 | | | | 249,007,053 | |
End of year (including undistributed net investment
income (loss) of $(3,057,437), $2,378,876,
$(177,911), and $(28,587), respectively) | | $ | 202,476,214 | | | $ | 212,675,005 | | | $ | 267,576,371 | | | $ | 291,935,614 | |
| CHANGES IN SHARES OUTSTANDING | | | | | | | | | | | | | | | | |
| Institutional Shares | | | | | | | | | | | | | | | | |
| Shares sold | | | 2,288,907 | | | | 4,033,572 | | | | 480,347 | | | | 313,095 | |
| Shares issued to holders in reinvestment of dividends | | | 268,451 | | | | 322,958 | | | | 15,861 | | | | 4,998 | |
| Shares redeemed | | | (3,809,619 | ) | | | (7,938,298 | ) | | | (140,505 | ) | | | (95,592 | ) |
| Net increase (decrease) | | | (1,252,261 | ) | | | (3,581,768 | ) | | | 355,703 | | | | 222,501 | |
| Service Shares | | | | | | | | | | | | | | | | |
| Shares sold | | | 6,280,659 | | | | 6,865,249 | | | | 8,378,419 | | | | 13,277,241 | |
| Shares issued to holders in reinvestment of dividends | | | 365,905 | | | | 276,273 | | | | 400,301 | | | | 464,841 | |
| Shares redeemed | | | (5,611,798 | ) | | | (6,919,201 | ) | | | (11,641,467 | ) | | | (12,692,004 | ) |
| Net increase (decrease) | | | 1,034,766 | | | | 222,321 | | | | (2,862,747 | ) | | | 1,050,078 | |
See notes to financial statements.
GuideMark® Funds & GuidePath® Funds
STATEMENTS OF CHANGES IN NET ASSETS (Continued)
| | | Tactical Constrained® | | | Tactical Unconstrained® | |
| | | Asset Allocation Fund | | | Asset Allocation Fund | |
| | | Year Ended | | | Year Ended | | | Year Ended | | | Year Ended | |
| | | March 31, | | | March 31, | | | March 31, | | | March 31, | |
| | | 2015 | | | 2014 | | | 2015 | | | 2014 | |
| OPERATIONS: | | | | | | | | | | | | | | | | |
| Net investment income | | $ | 2,241,133 | | | $ | 1,617,584 | | | $ | 6,734,313 | | | $ | 1,796,829 | |
| Net realized gain on investment transactions | | | 8,654,598 | | | | 5,240,965 | | | | 23,770,501 | | | | 9,735,582 | |
Change in unrealized appreciation (depreciation)
on investments | | | (1,209,146 | ) | | | 15,305,680 | | | | (16,148,997 | ) | | | 12,960,967 | |
| Net increase in net assets resulting from operations | | | 9,686,585 | | | | 22,164,229 | | | | 14,355,817 | | | | 24,493,378 | |
| CAPITAL SHARE TRANSACTIONS: | | | | | | | | | | | | | | | | |
| Institutional Shares | | | | | | | | | | | | | | | | |
| Shares sold | | | 4,357,046 | | | | 2,761,832 | | | | 5,157,199 | | | | 1,261,607 | |
| Shares issued to holders in reinvestment of dividends | | | 311,379 | | | | 34,002 | | | | 335,851 | | | | 28,934 | |
| Shares redeemed | | | (1,129,481 | ) | | | (1,120,373 | ) | | | (821,300 | ) | | | (659,809 | ) |
| Net increase | | | 3,538,944 | | | | 1,675,461 | | | | 4,671,750 | | | | 630,732 | |
| Service Shares | | | | | | | | | | | | | | | | |
| Shares sold | | | 64,025,958 | | | | 84,656,660 | | | | 268,621,196 | | | | 177,825,472 | |
| Shares issued to holders in reinvestment of dividends | | | 8,647,854 | | | | 1,537,801 | | | | 28,737,599 | | | | 6,278,348 | |
| Shares redeemed | | | (92,851,692 | ) | | | (138,713,361 | ) | | | (174,474,930 | ) | | | (133,748,253 | ) |
| Net increase (decrease) | | | (20,177,880 | ) | | | (52,518,900 | ) | | | 122,883,865 | | | | 50,355,567 | |
DIVIDENDS AND DISTRIBUTIONS
TO SHAREHOLDERS: | | | | | | | | | | | | | | | | |
| Net investment income – Institutional Shares | | | (97,053 | ) | | | (23,970 | ) | | | (80,235 | ) | | | (9,973 | ) |
| Net investment income – Service Shares | | | (2,331,588 | ) | | | (1,634,037 | ) | | | (6,572,570 | ) | | | (1,652,507 | ) |
| Net realized gains – Institutional Shares | | | (214,326 | ) | | | (10,033 | ) | | | (255,617 | ) | | | (18,961 | ) |
| Net realized gains – Service Shares | | | (8,272,419 | ) | | | (1,258,199 | ) | | | (27,498,611 | ) | | | (5,959,556 | ) |
| Total dividends and distributions | | | (10,915,386 | ) | | | (2,926,239 | ) | | | (34,407,033 | ) | | | (7,640,997 | ) |
| INCREASE (DECREASE) IN NET ASSETS | | | (17,867,737 | ) | | | (31,605,449 | ) | | | 107,504,399 | | | | 67,838,680 | |
| NET ASSETS: | | | | | | | | | | | | | | | | |
| Beginning of year | | | 198,179,322 | | | | 229,784,771 | | | | 378,965,256 | | | | 311,126,576 | |
End of year (including undistributed net investment
income (loss) of $(26,221), $17,673, $46,193,
and $(28,587), respectively) | | $ | 180,311,585 | | | $ | 198,179,322 | | | $ | 486,469,655 | | | $ | 378,965,256 | |
| CHANGES IN SHARES OUTSTANDING | | | | | | | | | | | | | | | | |
| Institutional Shares | | | | | | | | | | | | | | | | |
| Shares sold | | | 382,632 | | | | 249,754 | | | | 482,233 | | | | 118,987 | |
| Shares issued to holders in reinvestment of dividends | | | 28,179 | | | | 3,017 | | | | 33,089 | | | | 2,682 | |
| Shares redeemed | | | (97,745 | ) | | | (101,714 | ) | | | (75,898 | ) | | | (62,213 | ) |
| Net increase | | | 313,066 | | | | 151,057 | | | | 439,424 | | | | 59,456 | |
| CHANGES IN SHARES OUTSTANDING | | | | | | | | | | | | | | | | |
| Service Shares | | | | | | | | | | | | | | | | |
| Shares sold | | | 5,577,951 | | | | 7,801,114 | | | | 25,032,796 | | | | 16,793,957 | |
| Shares issued to holders in reinvestment of dividends | | | 779,086 | | | | 136,209 | | | | 2,831,291 | | | | 580,791 | |
| Shares redeemed | | | (8,089,460 | ) | | | (12,703,740 | ) | | | (16,291,449 | ) | | | (12,632,765 | ) |
| Net increase (decrease) | | | (1,732,423 | ) | | | (4,766,417 | ) | | | 11,572,638 | | | | 4,741,983 | |
See notes to financial statements.
GuideMark® Funds & GuidePath® Funds
STATEMENTS OF CHANGES IN NET ASSETS (Continued)
| | | Absolute Return | | | Multi-Asset Income | |
| | | Asset Allocation Fund | | | Asset Allocation Fund | |
| | | Year Ended | | | Year Ended | | | Year Ended | | | Year Ended | |
| | | March 31, | | | March 31, | | | March 31, | | | March 31, | |
| | | 2015 | | | 2014 | | | 2015 | | | 2014 | |
| OPERATIONS: | | | | | | | | | | | | | | | | |
| Net investment income | | $ | 8,227,112 | | | $ | 8,361,929 | | | $ | 4,747,301 | | | $ | 3,723,672 | |
| Net realized gain (loss) on investment transactions | | | 4,523,721 | | | | (6,857,236 | ) | | | 450,775 | | | | (653,711 | ) |
Change in unrealized appreciation (depreciation)
on investments | | | (2,836,287 | ) | | | (641,506 | ) | | | (1,367,793 | ) | | | 2,712,206 | |
| Net increase in net assets resulting from operations | | | 9,914,546 | | | | 863,187 | | | | 3,830,283 | | | | 5,782,167 | |
| CAPITAL SHARE TRANSACTIONS: | | | | | | | | | | | | | | | | |
| Institutional Shares | | | | | | | | | | | | | | | | |
| Shares sold | | | 2,263,376 | | | | 910,116 | | | | — | | | | — | |
| Shares issued to holders in reinvestment of dividends | | | 58,698 | | | | 19,543 | | | | — | | | | — | |
| Shares redeemed | | | (658,627 | ) | | | (478,434 | ) | | | — | | | | — | |
| Net increase | | | 1,663,447 | | | | 451,225 | | | | — | | | | — | |
| Service Shares | | | | | | | | | | | | | | | | |
| Shares sold | | | 124,982,977 | | | | 197,736,481 | | | | 76,836,223 | | | | 84,116,586 | |
| Shares issued to holders in reinvestment of dividends | | | 1,363,844 | | | | 1,562,579 | | | | 1,869,462 | | | | 859,152 | |
| Shares redeemed | | | (210,436,216 | ) | | | (251,559,445 | ) | | | (51,749,737 | ) | | | (44,766,891 | ) |
| Net increase (decrease) | | | (84,089,395 | ) | | | (52,260,385 | ) | | | 26,955,948 | | | | 40,208,847 | |
DIVIDENDS AND DISTRIBUTIONS
TO SHAREHOLDERS: | | | | | | | | | | | | | | | | |
| Net investment income – Institutional Shares | | | (58,698 | ) | | | (19,543 | ) | | | — | | | | — | |
| Net investment income – Service Shares | | | (7,986,974 | ) | | | (9,107,855 | ) | | | (4,820,654 | ) | | | (3,670,842 | ) |
| Net realized gains – Service Shares | | | — | | | | — | | | | (945,416 | ) | | | (112,018 | ) |
| Total dividends and distributions | | | (8,045,672 | ) | | | (9,127,398 | ) | | | (5,766,070 | ) | | | (3,782,860 | ) |
| INCREASE (DECREASE) IN NET ASSETS | | | (80,557,074 | ) | | | (60,073,371 | ) | | | 25,020,161 | | | | 42,208,154 | |
| NET ASSETS: | | | | | | | | | | | | | | | | |
| Beginning of year | | | 450,201,286 | | | | 510,274,657 | | | | 115,477,776 | | | | 73,269,622 | |
End of year (including undistributed accumulated
net investment income of $1,349,692, $1,183,290,
$356,882, and $430,235, respectively) | | $ | 369,644,212 | | | $ | 450,201,286 | | | $ | 140,497,937 | | | $ | 115,477,776 | |
| CHANGES IN SHARES OUTSTANDING | | | | | | | | | | | | | | | | |
| Institutional Shares | | | | | | | | | | | | | | | | |
| Shares sold | | | 224,543 | | | | 91,636 | | | | — | | | | — | |
| Shares issued to holders in reinvestment of dividends | | | 5,929 | | | | 1,986 | | | | — | | | | — | |
| Shares redeemed | | | (65,305 | ) | | | (48,184 | ) | | | — | | | | — | |
| Net increase | | | 165,167 | | | | 45,438 | | | | — | | | | — | |
| CHANGES IN SHARES OUTSTANDING | | | | | | | | | | | | | | | | |
| Service Shares | | | | | | | | | | | | | | | | |
| Shares sold | | | 12,383,339 | | | | 19,735,570 | | | | 7,089,209 | | | | 7,984,824 | |
| Shares issued to holders in reinvestment of dividends | | | 137,346 | | | | 158,316 | | | | 175,834 | | | | 81,731 | |
| Shares redeemed | | | (20,851,688 | ) | | | (25,137,707 | ) | | | (4,770,244 | ) | | | (4,252,068 | ) |
| Net increase (decrease) | | | (8,331,003 | ) | | | (5,243,821 | ) | | | 2,494,799 | | | | 3,814,487 | |
See notes to financial statements.
GuideMark® Funds & GuidePath® Funds
STATEMENTS OF CHANGES IN NET ASSETS (Continued)
| | | Fixed Income | | | Altegris® Diversified | |
| | | Allocation Fund | | | Alternatives Allocation Fund | |
| | | Year Ended | | | Year Ended | | | Year Ended | | | Year Ended | |
| | | March 31, | | | March 31, | | | March 31, | | | March 31, | |
| | | 2015 | | | 2014 | | | 2015 | | | 2014 | |
| OPERATIONS: | | | | | | | | | | | | | | | | |
| Net investment income | | $ | 2,985,050 | | | $ | 3,268,718 | | | $ | 2,048,812 | | | $ | 4,096,095 | |
| Net realized loss on investment transactions | | | (2,264,441 | ) | | | (5,378,361 | ) | | | (735,324 | ) | | | (3,921,888 | ) |
| Change in unrealized appreciation (depreciation) on investments | | | 4,681,029 | | | | (1,638,528 | ) | | | 6,895,502 | | | | 1,864,478 | |
| Net increase in net assets resulting from operations | | | 5,401,638 | | | | 3,748,171 | | | | 8,208,990 | | | | 2,038,685 | |
| CAPITAL SHARE TRANSACTIONS: | | | | | | | | | | | | | | | | |
| Institutional Shares | | | | | | | | | | | | | | | | |
| Shares sold | | | 1,891,627 | | | | 915,879 | | | | 1,417,500 | | | | 689,003 | |
| Shares issued to holders in reinvestment of dividends | | | 40,268 | | | | 17,674 | | | | 31,117 | | | | 20,739 | |
| Shares redeemed | | | (647,991 | ) | | | (458,138 | ) | | | (353,220 | ) | | | (478,352 | ) |
| Net increase | | | 1,283,904 | | | | 475,415 | | | | 1,095,397 | | | | 231,390 | |
| Service Shares | | | | | | | | | | | | | | | | |
| Shares sold | | | 53,014,274 | | | | 115,835,263 | | | | 21,398,303 | | | | 57,897,860 | |
| Shares issued to holders in reinvestment of dividends | | | 448,807 | | | | 1,080,786 | | | | 322,069 | | | | 707,742 | |
| Shares redeemed | | | (125,427,632 | ) | | | (123,305,671 | ) | | | (56,163,401 | ) | | | (89,214,319 | ) |
| Net decrease | | | (71,964,551 | ) | | | (6,389,622 | ) | | | (34,443,029 | ) | | | (30,608,717 | ) |
| DIVIDENDS AND DISTRIBUTIONS TO SHAREHOLDERS: | | | | | | | | | | | | | | | | |
| Net investment income – Institutional Shares | | | (40,268 | ) | | | (16,037 | ) | | | (31,117 | ) | | | (20,512 | ) |
| Net investment income – Service Shares | | | (2,978,470 | ) | | | (3,627,266 | ) | | | (1,885,195 | ) | | | (4,068,805 | ) |
| Net realized gains – Institutional Shares | | | — | | | | (1,637 | ) | | | — | | | | (227 | ) |
| Net realized gains – Service Shares | | | — | | | | (552,887 | ) | | | — | | | | (51,242 | ) |
| Total dividends and distributions | | | (3,018,738 | ) | | | (4,197,827 | ) | | | (1,916,312 | ) | �� | | (4,140,786 | ) |
| DECREASE IN NET ASSETS | | | (68,297,747 | ) | | | (13,860,205 | ) | | | (27,054,954 | ) | | | (32,479,428 | ) |
| NET ASSETS: | | | | | | | | | | | | | | | | |
| Beginning of year | | | 214,459,578 | | | | 228,319,783 | | | | 129,258,126 | | | | 161,737,554 | |
| End of year (including accumulated undistributed net investment income of $187,986, $221,674, $157,617, and $25,117, respectively) | | $ | 146,161,831 | | | $ | 214,459,578 | | | $ | 102,203,172 | | | $ | 129,258,126 | |
| CHANGES IN SHARES OUTSTANDING | | | | | | | | | | | | | | | | |
| Institutional Shares | | | | | | | | | | | | | | | | |
| Shares sold | | | 194,201 | | | | 94,769 | | | | 140,819 | | | | 69,757 | |
| Shares issued to holders in reinvestment of dividends | | | 4,150 | | | | 1,846 | | | | 3,072 | | | | 2,105 | |
| Shares redeemed | | | (66,643 | ) | | | (47,460 | ) | | | (34,864 | ) | | | (48,709 | ) |
| Net increase | | | 131,708 | | | | 49,155 | | | | 109,027 | | | | 23,153 | |
| CHANGES IN SHARES OUTSTANDING | | | | | | | | | | | | | | | | |
| Service Shares | | | | | | | | | | | | | | | | |
| Shares sold | | | 5,444,190 | | | | 11,927,709 | | | | 2,134,237 | | | | 5,820,067 | |
| Shares issued to holders in reinvestment of dividends | | | 46,242 | | | | 113,096 | | | | 31,762 | | | | 71,779 | |
| Shares redeemed | | | (12,893,404 | ) | | | (12,722,815 | ) | | | (5,590,790 | ) | | | (9,017,243 | ) |
| Net decrease | | | (7,402,972 | ) | | | (682,010 | ) | | | (3,424,791 | ) | | | (3,125,397 | ) |
See notes to financial statements.
GuideMark® Funds & GuidePath® Funds
FINANCIAL HIGHLIGHTS
| | | Large Cap Growth Fund | |
| | | Institutional | |
| | | Year Ended | | | Year Ended | | | Year Ended | | | April 29, 20111
Through | |
| | | March 31, | | | March 31, | | | March 31, | | | March 31, | |
| | | 2015 | | | 2014 | | | 2013 | | | 2012 | |
| Per share data for a share of capital stock outstanding for the entire year and selected information for the year are as follows: | | | | | | | | | | | | | | | | |
| Net asset value, beginning of year | | | | $13.67 | | | | | $11.20 | | | | | $10.68 | | | | | $10.32 | |
| Income from investment operations: | | | | | | | | | | | | | | | | | | | | |
| Net investment income | | | | 0.14 | | | | | 0.09 | | | | | 0.08 | | | | | 0.01 | |
| Net realized and unrealized gains on investments | | | | 1.57 | | | | | 2.46 | | | | | 0.51 | | | | | 0.35 | |
| Total from investment operations | | | | 1.71 | | | | | 2.55 | | | | | 0.59 | | | | | 0.36 | |
| Less distributions: | | | | | | | | | | | | | | | | | | | | |
| Dividends from net investment income | | | | (0.09 | ) | | | | (0.08 | ) | | | | (0.07 | ) | | | | — | |
| Total distributions | | | | (0.09 | ) | | | | (0.08 | ) | | | | (0.07 | ) | | | | — | |
| Net asset value, end of year | | | | $15.29 | | | | | $13.67 | | | | | $11.20 | | | | | $10.68 | |
| Total return | | | | 12.51 | % | | | | 22.81 | % | | | | 5.54 | % | | | | 3.49 | %2 |
| Supplemental data and ratios: | | | | | | | | | | | | | | | | | | | | |
| Net assets, end of year | | $44,686,597 | | | $44,827,864 | | | $44,994,114 | | | $31,330,264 | |
| Ratio of expenses to average net assets | | | | | | | | | | | | | | | | | | | | |
| Before expense reimbursement (recapture) and securities lending credit | | | | 0.87 | % | | | | 0.90 | % | | | | 0.92 | % | | | | 0.93 | %3 |
| After expense reimbursement (recapture) and securities lending credit | | | | 0.85 | % | | | | 0.89 | % | | | | 0.89 | % | | | | 0.92 | %3 |
| Ratio of net investment income to average net assets | | | | | | | | | | | | | | | | | | | | |
| Before expense reimbursement (recapture) and securities lending credit | | | | 0.88 | % | | | | 0.63 | % | | | | 0.81 | % | | | | 0.33 | %3 |
| After expense reimbursement (recapture) and securities lending credit | | | | 0.90 | % | | | | 0.64 | % | | | | 0.84 | % | | | | 0.34 | %3 |
| Portfolio turnover rate | | | | 53.23 | % | | | | 55.81 | % | | | | 60.92 | % | | | | 126.61 | % |
Portfolio Turnover is calculated for the Fund as a whole.
| 1 | Commencement of operations. |
| 2 | Not annualized. |
| 3 | Annualized. |
See notes to financial statements.
GuideMark® Funds & GuidePath® Funds
FINANCIAL HIGHLIGHTS
| | | Large Cap Growth Fund | |
| | | Service | |
| | | Year Ended | | | Year Ended | | | Year Ended | | | Year Ended | | | Year Ended | |
| | | March 31, | | | | March 31, | | | March 31, | | | March 31, | | | March 31, | |
| | | 2015 | | | 2014 | | | 2013 | | | 2012 | | | 2011 | |
| Per share data for a share of capital stock outstanding for the entire year and selected information for the year are as follows: | | | | | | | | | | | | | | | | | | | | | | | | | |
| Net asset value, beginning of year | | | | $13.56 | | | | | $11.12 | | | | | $10.61 | | | | | $9.99 | | | | | $8.41 | |
| Income from investment operations: | | | | | | | | | | | | | | | | | | | | | | | | | |
| Net investment income (loss) | | | | 0.05 | | | | | — | | | | | 0.02 | | | | | (0.03 | ) | | | | (0.01 | ) |
| Net realized and unrealized gains on investments | | | | 1.56 | | | | | 2.45 | | | | | 0.51 | | | | | 0.65 | | | | | 1.59 | |
| Total from investment operations | | | | 1.61 | | | | | 2.45 | | | | | 0.53 | | | | | 0.62 | | | | | 1.58 | |
| Less distributions: | | | | | | | | | | | | | | | | | | | | | | | | | |
| Dividends from net investment income | | | | (0.03 | ) | | | | (0.01 | ) | | | | (0.02 | ) | | | | — | | | | | — | |
| Total distributions | | | | (0.03 | ) | | | | (0.01 | ) | | | | (0.02 | ) | | | | — | | | | | — | |
| Net asset value, end of year | | | | $15.14 | | | | | $13.56 | | | | | $11.12 | | | | | $10.61 | | | | | $9.99 | |
| Total return | | | | 11.87 | % | | | | 22.04 | % | | | | 5.00 | % | | | | 6.21 | % | | | | 18.79 | % |
| Supplemental data and ratios: | | | | | | | | | | | | | | | | | | | | | | | | | |
| Net assets, end of year | | $168,457,719 | | | $138,902,683 | | | $136,196,479 | | | $168,654,404 | | | $211,129,188 | |
| Ratio of expenses to average net assets | | | | | | | | | | | | | | | | | | | | | | | | | |
| Before expense reimbursement (recapture) and securities lending credit | | | | 1.44 | % | | | | 1.48 | % | | | | 1.52 | % | | | | 1.54 | % | | | | 1.45 | % |
| After expense reimbursement (recapture) and securities lending credit | | | | 1.45 | % | | | | 1.49 | % | | | | 1.49 | % | | | | 1.49 | % | | | | 1.43 | % |
| Ratio of net investment income (loss) to average net assets | | | | | | | | | | | | | | | | | | | | | | | | | |
| Before expense reimbursement (recapture) and securities lending credit | | | | 0.32 | % | | | | 0.05 | % | | | | 0.18 | % | | | | -0.32 | % | | | | -0.13 | % |
| After expense reimbursement (recapture) and securities lending credit | | | | 0.31 | % | | | | 0.04 | % | | | | 0.21 | % | | | | -0.27 | % | | | | -0.11 | % |
| Portfolio turnover rate | | | | 53.23 | % | | | | 55.81 | % | | | | 60.92 | % | | | | 126.61 | % | | | | 63.33 | % |
Portfolio Turnover is calculated for the Fund as a whole.
See notes to financial statements.
GuideMark® Funds & GuidePath® Funds
FINANCIAL HIGHLIGHTS
| | | Large Cap Value Fund | |
| | | Institutional | |
| | | | | | | | | April 29, 20111 | |
| | | Year Ended | | Year Ended | | Year Ended | | Through | |
| | | March 31, | | March 31, | | March 31, | | March 31, | |
| | | 2015 | | 2014 | | 2013 | | 2012 | |
| Per share data for a share of capital stock outstanding for the entire year and selected information for the year are as follows: | | | | | | | | | | | | | |
| Net asset value, beginning of year | | | $11.73 | | | $ 9.43 | | | $ 8.39 | | | $ 8.54 | |
| Income from investment operations: | | | | | | | | | | | | | |
| Net investment income | | | 0.21 | | | 0.17 | | | 0.18 | | | 0.13 | |
| Net realized and unrealized gains (losses) on investments | | | 0.74 | | | 2.31 | | | 1.03 | | | (0.09 | ) |
| Total from investment operations | | | 0.95 | | | 2.48 | | | 1.21 | | | 0.04 | |
| Less distributions: | | | | | | | | | | | | | |
| Dividends from net investment income | | | (0.22 | ) | | (0.18 | ) | | (0.17 | ) | | (0.19 | ) |
| Total distributions | | | (0.22 | ) | | (0.18 | ) | | (0.17 | ) | | (0.19 | ) |
| Net asset value, end of year | | | $12.46 | | | $11.73 | | | $ 9.43 | | | $ 8.39 | |
| Total return | | | 8.08 | % | | 26.38 | % | | 14.70 | % | | 0.70 | %2 |
| Supplemental data and ratios: | | | | | | | | | | | | | |
| Net assets, end of year | | | $60,596,893 | | | $62,007,800 | | | $60,452,681 | | | $39,721,680 | |
| Ratio of expenses to average net assets | | | | | | | | | | | | | |
| Before expense reimbursement (recapture) and securities lending credit | | | 0.86 | % | | 0.89 | % | | 0.92 | % | | 0.93 | %3 |
| After expense reimbursement (recapture) and securities lending credit | | | 0.84 | % | | 0.88 | % | | 0.91 | % | | 0.92 | %3 |
| Ratio of net investment income to average net assets | | | | | | | | | | | | | |
| Before expense reimbursement (recapture) and securities lending credit | | | 1.87 | % | | 1.57 | % | | 1.89 | % | | 1.89 | %3 |
| After expense reimbursement (recapture) and securities lending credit | | | 1.89 | % | | 1.58 | % | | 1.90 | % | | 1.90 | %3 |
| Portfolio turnover rate | | | 31.33 | % | | 29.10 | % | | 27.02 | % | | 95.12 | % |
Portfolio Turnover is calculated for the Fund as a whole.
| 1 | Commencement of operations. |
| 2 | Not annualized. |
| 3 | Annualized. |
See notes to financial statements.
GuideMark® Funds & GuidePath® Funds
FINANCIAL HIGHLIGHTS
| | | Large Cap Value Fund | |
| | | Service | |
| | | Year Ended | | Year Ended | | Year Ended | | Year Ended | | Year Ended | |
| | | March 31, | | March 31, | | March 31, | | March 31, | | March 31, | |
| | | 2015 | | 2014 | | 2013 | | 2012 | | 2011 | |
| Per share data for a share of capital stock outstanding for the entire year and selected information for the year are as follows: | | | | | | | | | | | | | | | | |
| Net asset value, beginning of year | | | $11.84 | | | $ 9.52 | | | $ 8.47 | | | $ 8.32 | | | $ 7.44 | |
| Income from investment operations: | | | | | | | | | | | | | | | | |
| Net investment income | | | 0.15 | | | 0.13 | | | 0.14 | | | 0.10 | | | 0.09 | |
| Net realized and unrealized gains on investments | | | 0.73 | | | 2.31 | | | 1.03 | | | 0.13 | | | 0.88 | |
| Total from investment operations | | | 0.88 | | | 2.44 | | | 1.17 | | | 0.23 | | | 0.97 | |
| Less distributions: | | | | | | | | | | | | | | | | |
| Dividends from net investment income | | | (0.15 | ) | | (0.12 | ) | | (0.12 | ) | | (0.08 | ) | | (0.09 | ) |
| Total distributions | | | (0.15 | ) | | (0.12 | ) | | (0.12 | ) | | (0.08 | ) | | (0.09 | ) |
| Net asset value, end of year | | | $12.57 | | | $11.84 | | | $ 9.52 | | | $ 8.47 | | | $ 8.32 | |
| Total return | | | 7.46 | % | | 25.63 | % | | 13.96 | % | | 2.87 | % | | 13.15 | % |
| Supplemental data and ratios: | | | | | | | | | | | | | | | | |
| Net assets, end of year | | $161,242,899 | | $137,835,903 | | $139,072,035 | | $163,077,098 | | $200,132,341 | |
| Ratio of expenses to average net assets | | | | | | | | | | | | | | | | |
| Before expense reimbursement (recapture) and securities lending credit | | | 1.43 | % | | 1.46 | % | | 1.49 | % | | 1.51 | % | | 1.44 | % |
| After expense reimbursement (recapture) and securities lending credit | | | 1.41 | % | | 1.45 | % | | 1.49 | % | | 1.49 | % | | 1.42 | % |
| Ratio of net investment income to average net assets | | | | | | | | | | | | | | | | |
| Before expense reimbursement (recapture) and securities lending credit | | | 1.30 | % | | 1.01 | % | | 1.33 | % | | 1.13 | % | | 1.13 | % |
| After expense reimbursement (recapture) and securities lending credit | | | 1.32 | % | | 1.02 | % | | 1.33 | % | | 1.15 | % | | 1.15 | % |
| Portfolio turnover rate | | | 31.33 | % | | 29.10 | % | | 27.02 | % | | 95.12 | % | | 16.35 | % |
Portfolio Turnover is calculated for the Fund as a whole.
See notes to financial statements.
GuideMark® Funds & GuidePath® Funds
FINANCIAL HIGHLIGHTS
| | | Small/Mid Cap Core Fund | |
| | | Institutional | |
| | | | | | | | | April 29, 20111 | |
| | | Year Ended | | Year Ended | | Year Ended | | Through | |
| | | March 31, | | March 31, | | March 31, | | March 31, | |
| | | 2015 | | 2014 | | 2013 | | 2012 | |
| Per share data for a share of capital stock outstanding for the entire year and selected information for the year are as follows: | | | | | | | | | | | | | |
| Net asset value, beginning of year | | | $16.77 | | | $13.51 | | | $11.56 | | | $11.99 | |
| Income from investment operations: | | | | | | | | | | | | | |
| Net investment income | | | 0.01 | | | — | | | 0.07 | | | — | |
| Net realized and unrealized gains (losses) on investments | | | 1.96 | | | 3.27 | | | 1.99 | | | (0.43 | ) |
| Total from investment operations | | | 1.97 | | | 3.27 | | | 2.06 | | | (0.43 | ) |
| Less distributions: | | | | | | | | | | | | | |
| Dividends from net investment income | | | — | | | (0.01 | ) | | (0.11 | ) | | — | |
| Dividends from net realized gains | | | (1.12 | ) | | — | | | — | | | — | |
| Total distributions | | | (1.12 | ) | | (0.01 | ) | | (0.11 | ) | | — | |
| Net asset value, end of year | | | $17.62 | | | $16.77 | | | $13.51 | | | $11.56 | |
| Total return | | | 11.99 | % | | 24.19 | % | | 17.95 | % | | -3.59 | %2 |
| Supplemental data and ratios: | | | | | | | | | | | | | |
| Net assets, end of year | | | $40,075,963 | | | $44,695,002 | | | $44,361,656 | | | $30,106,471 | |
| Ratio of expenses to average net assets | | | | | | | | | | | | | |
| Before expense reimbursement (recapture) and securities lending credit | | | 1.02 | % | | 1.05 | % | | 1.09 | % | | 1.22 | %3 |
| After expense reimbursement (recapture) and securities lending credit | | | 0.91 | % | | 1.02 | % | | 1.05 | % | | 1.09 | %3 |
| Ratio of net investment income (loss) to average net assets | | | | | | | | | | | | | |
| Before expense reimbursement (recapture) and securities lending credit | | | -0.08 | % | | -0.04 | % | | 0.61 | % | | -0.10 | %3 |
| After expense reimbursement (recapture) and securities lending credit | | | 0.03 | % | | -0.01 | % | | 0.65 | % | | 0.03 | %3 |
| Portfolio turnover rate | | | 96.24 | % | | 241.55 | % | | 143.14 | % | | 245.95 | % |
Portfolio Turnover is calculated for the Fund as a whole.
| 1 | Commencement of operations. |
| 2 | Not annualized. |
| 3 | Annualized. |
See notes to financial statements.
GuideMark® Funds & GuidePath® Funds
FINANCIAL HIGHLIGHTS
| | | Small/Mid Cap Core Fund | |
| | | Service | |
| | | Year Ended
March 31,
2015 | | Year Ended
March 31,
2014 | | Year Ended
March 31,
2013 | | Year Ended
March 31,
2012 | | Year Ended
March 31,
2011 | |
| Per share data for a share of capital stock outstanding for the entire year and selected information for the year are as follows: | | | | | | | | | | | | | | | | |
| Net asset value, beginning of year | | | $16.61 | | | $13.45 | | | $11.50 | | | $11.61 | | | $9.46 | |
| Income from investment operations: | | | | | | | | | | | | | | | | |
| Net investment loss | | | (0.09 | ) | | (0.12 | ) | | — | | | (0.09 | ) | | (0.05 | ) |
| Net realized and unrealized gains (losses) on investments | | | 1.91 | | | 3.28 | | | 1.99 | | | (0.02 | ) | | 2.20 | |
| Total from investment operations | | | 1.82 | | | 3.16 | | | 1.99 | | | (0.11 | ) | | 2.15 | |
| Less distributions: | | | | | | | | | | | | | | | | |
| Dividends from net investment income | | | — | | | — | | | (0.04 | ) | | — | | | — | |
| Dividends from net realized gains | | | (1.12 | ) | | — | | | — | | | — | | | — | |
| Total distributions | | | (1.12 | ) | | — | | | (0.04 | ) | | — | | | — | |
| Net asset value, end of year | | | $17.31 | | | $16.61 | | | $13.45 | | | $11.50 | | | $11.61 | |
| Total return | | | 11.19 | % | | 23.49 | % | | 17.32 | % | | -0.95 | % | | 22.73 | % |
| Supplemental data and ratios: | | | | | | | | | | | | | | | | |
| Net assets, end of year | | $37,978,078 | | $32,592,001 | | $40,621,412 | | $47,944,286 | | $42,748,789 | |
| Ratio of expenses to average net assets | | | | | | | | | | | | | | | | |
| Before expense reimbursement (recapture) and securities lending credit | | | 1.58 | % | | 1.60 | % | | 1.66 | % | | 1.74 | % | | 1.71 | % |
| After expense reimbursement (recapture) and securities lending credit | | | 1.59 | % | | 1.59 | % | | 1.59 | % | | 1.59 | % | | 1.59 | % |
| Ratio of net investment income (loss) to average net assets | | | | | | | | | | | | | | | | |
| Before expense reimbursement (recapture) and securities lending credit | | | -0.62 | % | | -0.62 | % | | 0.01 | % | | -0.82 | % | | -0.66 | % |
| After expense reimbursement (recapture) and securities lending credit | | | -0.63 | % | | -0.61 | % | | 0.08 | % | | -0.67 | % | | -0.54 | % |
| Portfolio turnover rate | | | 96.24 | % | | 241.55 | % | | 143.14 | % | | 245.95 | % | | 44.75 | % |
Portfolio Turnover is calculated for the Fund as a whole.
See notes to financial statements.
GuideMark® Funds & GuidePath® Funds
FINANCIAL HIGHLIGHTS
| | | World ex-US Fund | |
| | | Institutional | |
| | | | | | | | | | | | | | | April 29, 20111 | |
| | | Year Ended
March 31,
2015 | | Year Ended
March 31,
2014 | | Year Ended
March 31,
2013 | | Through
March 31,
2012 | |
| Per share data for a share of capital stock outstanding for the entire year and selected information for the year are as follows: | | | | | | | | | | | | | | | | | |
| Net asset value, beginning of year | | | | $ 8.94 | | | | $ 8.06 | | | | $ 7.52 | | | | $ 8.75 | |
| Income from investment operations: | | | | | | | | | | | | | | | | | |
| Net investment income | | | | 0.25 | | | | 0.11 | | | | 0.13 | | | | 0.07 | |
| Net realized and unrealized gains (losses) on investments | | | | (0.26 | ) | | | 0.86 | | | | 0.48 | | | | (1.17 | ) |
| Total from investment operations | | | | (0.01 | ) | | | 0.97 | | | | 0.61 | | | | (1.10 | ) |
| Less distributions: | | | | | | | | | | | | | | | | | |
| Dividends from net investment income | | | | (0.18 | ) | | | (0.09 | ) | | | (0.07 | ) | | | (0.13 | ) |
| Total distributions | | | | (0.18 | ) | | | (0.09 | ) | | | (0.07 | ) | | | (0.13 | ) |
| Net asset value, end of year | | | | $ 8.75 | | | | $ 8.94 | | | | $ 8.06 | | | | $ 7.52 | |
| Total return | | | | -0.10 | % | | | 12.09 | % | | | 8.09 | % | | | -12.34 | %2 |
| Supplemental data and ratios: | | | | | | | | | | | | | | | | | |
| Net assets, end of year | | $113,316,485 | | $130,537,695 | | $85,157,441 | | $40,623,156 | |
| Ratio of expenses to average net assets | | | | | | | | | | | | | | | | | |
| Before expense reimbursement (recapture) and securities lending credit | | | | 0.98 | % | | | 1.03 | % | | | 1.09 | % | | | 1.08 | %3 |
| After expense reimbursement (recapture) and securities lending credit | | | | 0.98 | % | | | 1.03 | % | | | 1.09 | % | | | 1.08 | %3 |
| Ratio of net investment income to average net assets | | | | | | | | | | | | | | | | | |
| Before expense reimbursement (recapture) and securities lending credit | | | | 2.68 | % | | | 1.44 | % | | | 1.44 | % | | | 1.13 | %3 |
| After expense reimbursement (recapture) and securities lending credit | | | | 2.68 | % | | | 1.44 | % | | | 1.44 | % | | | 1.13 | %3 |
| Portfolio turnover rate | | | | 61.84 | % | | | 75.22 | % | | | 75.34 | % | | | 164.90 | % |
| Portfolio Turnover is calculated for the Fund as a whole. |
| 1 | Commencement of operations. |
| 2 | Not annualized. |
| 3 | Annualized. |
See notes to financial statements.
GuideMark® Funds & GuidePath® Funds
FINANCIAL HIGHLIGHTS
| | | World ex-US Fund | |
| | | Service | |
| | | Year Ended
March 31,
2015 | | | Year Ended
March 31,
2014 | | | Year Ended
March 31,
2013 | | | Year Ended
March 31,
2012 | | | Year Ended
March 31,
2011 | |
| Per share data for a share of capital stock outstanding for the entire year and selected information for the year are as follows: | | | | | | | | | | | | | | | | | | | | | | | | | |
| Net asset value, beginning of year | | | | $ 8.89 | | | | | $ 8.05 | | | | | $7.54 | | | | | $8.39 | | | | | $8.01 | |
| Income from investment operations: | | | | | | | | | | | | | | | | | | | | | | | | | |
| Net investment income | | | | 0.18 | | | | | 0.07 | | | | | 0.08 | | | | | 0.12 | | | | | 0.11 | |
| Net realized and unrealized gains (losses) on investments | | | | (0.24 | ) | | | | 0.85 | | | | | 0.49 | | | | | (0.88 | ) | | | | 0.40 | |
| Total from investment operations | | | | (0.06 | ) | | | | 0.92 | | | | | 0.57 | | | | | (0.76 | ) | | | | 0.51 | |
| Less distributions: | | | | | | | | | | | | | | | | | | | | | | | | | |
| Dividends from net investment income | | | | (0.13 | ) | | | | (0.08 | ) | | | | (0.06 | ) | | | | (0.09 | ) | | | | (0.13 | ) |
| Total distributions | | | | (0.13 | ) | | | | (0.08 | ) | | | | (0.06 | ) | | | | (0.09 | ) | | | | (0.13 | ) |
| Net asset value, end of year | | | | $ 8.70 | | | | | $ 8.89 | | | | | $8.05 | | | | | $7.54 | | | | | $8.39 | |
| Total return | | | | -0.68 | % | | | | 11.47 | % | | | | 7.53 | % | | | | -8.92 | % | | | | 6.48 | % |
| Supplemental data and ratios: | | | | | | | | | | | | | | | | | | | | | | | | | |
| Net assets, end of year | | $228,832,175 | | | $238,149,375 | | | $197,252,920 | | | $185,300,082 | | | $269,702,069 | |
| Ratio of expenses to average net assets | | | | | | | | | | | | | | | | | | | | | | | | | |
| Before expense reimbursement (recapture) and securities lending credit | | | | 1.55 | % | | | | 1.60 | % | | | | 1.66 | % | | | | 1.66 | % | | | | 1.50 | % |
| After expense reimbursement (recapture) and securities lending credit | | | | 1.59 | % | | | | 1.59 | % | | | | 1.59 | % | | | | 1.59 | % | | | | 1.50 | % |
| Ratio of net investment income to average net assets | | | | | | | | | | | | | | | | | | | | | | | | | |
| Before expense reimbursement (recapture) and securities lending credit | | | | 2.04 | % | | | | 0.94 | % | | | | 0.93 | % | | | | 1.11 | % | | | | 1.34 | % |
| After expense reimbursement (recapture) and securities lending credit | | | | 2.00 | % | | | | 0.95 | % | | | | 1.00 | % | | | | 1.18 | % | | | | 1.34 | % |
| Portfolio turnover rate | | | | 61.84 | % | | | | 75.22 | % | | | | 75.34 | % | | | | 164.90 | % | | | | 47.34 | % |
Portfolio Turnover is calculated for the Fund as a whole.
See notes to financial statements.
GuideMark® Funds & GuidePath® Funds
FINANCIAL HIGHLIGHTS
| | | Opportunistic Equity Fund | |
| | | Institutional | |
| | | Year Ended
March 31,
2015 | | Year Ended
March 31,
2014 | | Year Ended
March 31,
2013 | | April 29, 20111
Through
March 31,
2012 | |
| Per share data for a share of capital stock outstanding for the entire year and selected information for the year are as follows: | | | | | | | | | | | | | |
| Net asset value, beginning of year | | | $13.49 | | | $11.34 | | | $ 9.91 | | | $10.21 | |
| Income from investment operations: | | | | | | | | | | | | | |
| Net investment income | | | 0.11 | | | 0.13 | | | 0.08 | | | 0.02 | |
| Net realized and unrealized gains (losses) on investments | | | 1.62 | | | 2.79 | | | 1.42 | | | (0.32 | ) |
| Total from investment operations | | | 1.73 | | | 2.92 | | | 1.50 | | | (0.30 | ) |
| Less distributions: | | | | | | | | | | | | | |
| Dividends from net investment income | | | (0.14 | ) | | (0.12 | ) | | (0.07 | ) | | — | |
| Dividends from net realized gains | | | (2.25 | ) | | (0.65 | ) | | — | | | — | |
| Total distributions | | | (2.39 | ) | | (0.77 | ) | | (0.07 | ) | | — | |
| Net asset value, end of year | | | $12.83 | | | $13.49 | | | $11.34 | | | $ 9.91 | |
| Total return | | | 13.26 | % | | 25.92 | % | | 15.22 | % | | -2.94 | %2 |
| Supplemental data and ratios: | | | | | | | | | | | | | |
| Net assets, end of year | | $63,622,473 | | $59,877,468 | | $67,574,510 | | $46,233,165 | |
| Ratio of expenses to average net assets | | | | | | | | | | | | | |
| Before expense reimbursement (recapture) and securities lending credit | | | 1.01 | % | | 1.02 | % | | 1.06 | % | | 1.05 | %3 |
| After expense reimbursement (recapture) and securities lending credit | | | 0.99 | % | | 1.01 | % | | 1.05 | % | | 1.03 | %3 |
| Ratio of net investment income to average net assets | | | | | | | | | | | | | |
| Before expense reimbursement (recapture) and securities lending credit | | | 0.78 | % | | 0.82 | % | | 0.86 | % | | 0.45 | %3 |
| After expense reimbursement (recapture) and securities lending credit | | | 0.80 | % | | 0.83 | % | | 0.87 | % | | 0.47 | %3 |
| Portfolio turnover rate | | | 59.70 | % | | 59.12 | % | | 78.58 | % | | 91.59 | % |
| Portfolio Turnover is calculated for the Fund as a whole. |
| 1 | Commencement of operations. |
| 2 | Not annualized. |
| 3 | Annualized. |
See notes to financial statements.
GuideMark® Funds & GuidePath® Funds
FINANCIAL HIGHLIGHTS
| | | Opportunistic Equity Fund | |
| | | Service | |
| | | Year Ended
March 31,
2015 | | Year Ended
March 31,
2014 | | Year Ended
March 31,
2013 | | Year Ended
March 31,
2012 | |
| Per share data for a share of capital stock outstanding for the entire year and selected information for the year are as follows: | | | | | | | | | | | | | |
| Net asset value, beginning of year | | | $13.42 | | | $11.27 | | | $ 9.86 | | | $10.00 | |
| Income from investment operations: | | | | | | | | | | | | | |
| Net investment income (loss) | | | 0.04 | | | 0.04 | | | 0.03 | | | (0.02 | ) |
| Net realized and unrealized gains (losses) on investments | | | 1.60 | | | 2.79 | | | 1.40 | | | (0.12 | ) |
| Total from investment operations | | | 1.64 | | | 2.83 | | | 1.43 | | | (0.14 | ) |
| Less distributions: | | | | | | | | | | | | | |
| Dividends from net investment income | | | (0.06 | ) | | (0.03 | ) | | (0.02 | ) | | — | |
| Dividends from net realized gains | | | (2.25 | ) | | (0.65 | ) | | — | | | — | |
| Total distributions | | | (2.31 | ) | | (0.68 | ) | | (0.02 | ) | | — | |
| Net asset value, end of year | | | $12.75 | | | $13.42 | | | $11.27 | | | $ 9.86 | |
| Total return | | | 12.61 | % | | 25.20 | % | | 14.56 | % | | -1.40 | % |
| Supplemental data and ratios: | | | | | | | | | | | | | |
| Net assets, end of year | | $73,803,768 | | $72,351,978 | | $87,142,873 | | $114,222,234 | |
| Ratio of expenses to average net assets | | | | | | | | | | | | | |
| Before expense reimbursement (recapture) and securities lending credit | | | 1.57 | % | | 1.58 | % | | 1.63 | % | | 1.63 | % |
| After expense reimbursement (recapture) and securities lending credit | | | 1.56 | % | | 1.59 | % | | 1.60 | % | | 1.60 | % |
| Ratio of net investment income (loss) to average net assets | | | | | | | | | | | | | |
| Before expense reimbursement (recapture) and securities lending credit | | | 0.25 | % | | 0.27 | % | | 0.26 | % | | -0.19 | % |
| After expense reimbursement (recapture) and securities lending credit | | | 0.26 | % | | 0.26 | % | | 0.29 | % | | -0.16 | % |
| Portfolio turnover rate | | | 59.70 | % | | 59.12 | % | | 78.58 | % | | 91.59 | % |
Portfolio Turnover is calculated for the Fund as a whole.
See notes to financial statements.
GuideMark® Funds & GuidePath® Funds
FINANCIAL HIGHLIGHTS
| | | Global Real Return Fund | |
| | | Institutional | |
| | | Year Ended
March 31,
2015 | | Year Ended
March 31,
2014 | | Year Ended
March 31,
2013 | | April 29, 20111
Through
March 31,
2012 | |
| Per share data for a share of capital stock outstanding for the entire year and selected information for the year are as follows: | | | | | | | | | | | | | |
| Net asset value, beginning of year | | | $ 9.22 | | | $ 9.39 | | | $ 9.35 | | | $10.31 | |
| Income from investment operations: | | | | | | | | | | | | | |
| Net investment income | | | 0.14 | | | 0.14 | | | 0.14 | | | 0.10 | |
| Net realized and unrealized gains (losses) on investments | | | (1.01 | ) | | (0.20 | ) | | 0.02 | | | (0.88 | ) |
| Total from investment operations | | | (0.87 | ) | | (0.06 | ) | | 0.16 | | | (0.78 | ) |
| Less distributions: | | | | | | | | | | | | | |
| Dividends from net investment income | | | (0.11 | ) | | (0.11 | ) | | (0.12 | ) | | (0.17 | ) |
| Return of capital | | | (0.01 | ) | | — | | | — | | | (0.01 | ) |
| Total distributions | | | (0.12 | ) | | (0.11 | ) | | (0.12 | ) | | (0.18 | ) |
| Net asset value, end of year | | | $ 8.23 | | | $ 9.22 | | | $ 9.39 | | | $ 9.35 | |
| Total return | | | -9.43 | % | | -0.66 | % | | 1.73 | % | | -7.48 | %2 |
| Supplemental data and ratios: | | | | | | | | | | | | | |
| Net assets, end of year | | $10,708,053 | | $13,204,913 | | $11,681,383 | | $10,423,221 | |
| Ratio of expenses to average net assets4 | | | | | | | | | | | | | |
| Before expense reimbursement (recapture) and securities lending credit | | | 0.86 | % | | 0.85 | % | | 0.88 | % | | 0.89 | %3 |
| After expense reimbursement (recapture) and securities lending credit | | | 0.37 | % | | 0.61 | % | | 0.80 | % | | 0.82 | %3 |
| Ratio of net investment income to average net assets5 | | | | | | | | | | | | | |
| Before expense reimbursement (recapture) and securities lending credit | | | 1.06 | % | | 1.30 | % | | 1.22 | % | | 1.08 | %3 |
| After expense reimbursement (recapture) and securities lending credit | | | 1.55 | % | | 1.54 | % | | 1.30 | % | | 1.15 | %3 |
| Portfolio turnover rate | | | 33.46 | % | | 36.72 | % | | 35.26 | % | | 55.11 | % |
| Portfolio Turnover is calculated for the Fund as a whole. |
| 1 | Commencement of operations. |
| 2 | Not annualized. |
| 3 | Annualized. |
| 4 | These ratios exclude the impact of the expenses of the underlying investment companies and exchange-traded funds in which the Fund invests. |
| 5 | Recognition of the net investment income by the Fund is affected by the timing of the declaration of dividends by the underlying investment companies and exchange-traded funds in which the Fund invests. |
See notes to financial statements.
GuideMark® Funds & GuidePath® Funds
FINANCIAL HIGHLIGHTS
| | | Global Real Return Fund | |
| | | Service | |
| | | Year Ended
March 31,
2015 | | Year Ended
March 31,
2014 | | Year Ended
March 31,
2013 | | Year Ended
March 31,
2012 | |
| Per share data for a share of capital stock outstanding for the entire year and selected information for the year are as follows: | | | | | | | | | | | | | |
| Net asset value, beginning of year | | | $ 9.24 | | | $ 9.42 | | | $ 9.40 | | | $10.00 | |
| Income from investment operations: | | | | | | | | | | | | | |
| Net investment income | | | 0.09 | | | 0.09 | | | 0.08 | | | 0.07 | |
| Net realized and unrealized gains (losses) on investments | | | (1.01 | ) | | (0.20 | ) | | 0.02 | | | (0.59 | ) |
| Total from investment operations | | | (0.92 | ) | | (0.11 | ) | | 0.10 | | | (0.52 | ) |
| Less distributions: | | | | | | | | | | | | | |
| Dividends from net investment income | | | (0.07 | ) | | (0.07 | ) | | (0.08 | ) | | (0.08 | ) |
| Return of capital | | | (0.01 | ) | | — | | | — | | | — | * |
| Total distributions | | | (0.08 | ) | | (0.07 | ) | | (0.08 | ) | | (0.08 | ) |
| Net asset value, end of year | | | $ 8.24 | | | $ 9.24 | | | $ 9.42 | | | $ 9.40 | |
| Total return | | | -9.95 | % | | -1.19 | % | | 1.05 | % | | -5.09 | % |
| Supplemental data and ratios: | | | | | | | | | | | | | |
| Net assets, end of year | | $53,893,248 | | $64,372,000 | | $70,779,787 | | $103,580,116 | |
| Ratio of expenses to average net assets1 | | | | | | | | | | | | | |
| Before expense reimbursement (recapture) and securities lending credit | | | 1.44 | % | | 1.41 | % | | 1.45 | % | | 1.47 | % |
| After expense reimbursement (recapture) and securities lending credit | | | 0.94 | % | | 1.18 | % | | 1.37 | % | | 1.44 | % |
| Ratio of net investment income to average net assets2 | | | | | | | | | | | | | |
| Before expense reimbursement (recapture) and securities lending credit | | | 0.48 | % | | 0.75 | % | | 0.76 | % | | 0.72 | % |
| After expense reimbursement (recapture) and securities lending credit | | | 0.98 | % | | 0.98 | % | | 0.84 | % | | 0.75 | % |
| Portfolio turnover rate | | | 33.46 | % | | 36.72 | % | | 35.26 | % | | 55.11 | % |
| Portfolio Turnover is calculated for the Fund as a whole. |
| 1 | These ratios exclude the impact of the expenses of the underlying investment companies and exchange-traded funds in which the Fund invests. |
| 2 | Recognition of the net investment income by the Fund is affected by the timing of the declaration of dividends by the underlying investment companies and exchange-traded funds in which the Fund invests. |
| * | Amount represents less than $0.01 per share. |
See notes to financial statements.
GuideMark® Funds & GuidePath® Funds
FINANCIAL HIGHLIGHTS
| | | Core Fixed Income Fund | |
| | | Institutional | |
| | | Year Ended
March 31,
2015 | | Year Ended
March 31,
2014 | | Year Ended
March 31,
2013 | | April 29, 20111
Through
March 31,
2012 | |
| Per share data for a share of capital stock outstanding for the entire year and selected information for the year are as follows: | | | | | | | | | | | | | |
| Net asset value, beginning of year | | | $ 9.37 | | | $ 9.86 | | | $ 9.77 | | | $ 9.48 | |
| Income from investment operations: | | | | | | | | | | | | | |
| Net investment income | | | 0.15 | | | 0.16 | | | 0.17 | | | 0.21 | |
| Net realized and unrealized gains (losses) on investments | | | 0.33 | | | (0.24 | ) | | 0.23 | | | 0.31 | |
| Total from investment operations | | | 0.48 | | | (0.08 | ) | | 0.40 | | | 0.52 | |
| Less distributions: | | | | | | | | | | | | | |
| Dividends from net investment income | | | (0.17 | ) | | (0.20 | ) | | (0.21 | ) | | (0.23 | ) |
| Dividends from net realized gains | | | (0.01 | ) | | (0.03 | ) | | (0.10 | ) | | — | |
| Return of capital | | | — | | | (0.18 | ) | | — | | | — | |
| Total distributions | | | (0.18 | ) | | (0.41 | ) | | (0.31 | ) | | (0.23 | ) |
| Net asset value, end of year | | | $ 9.67 | | | $ 9.37 | | | $ 9.86 | | | $ 9.77 | |
| Total return | | | 5.25 | % | | -0.72 | % | | 4.12 | % | | 5.56 | %2 |
| Supplemental data and ratios: | | | | | | | | | | | | | |
| Net assets, end of year | | $75,832,786 | | $88,702,582 | | $134,362,492 | | $31,999,581 | |
| Ratio of expenses to average net assets | | | | | | | | | | | | | |
| Before expense reimbursement (recapture) and securities lending credit | | | 0.70 | % | | 0.70 | % | | 0.72 | % | | 0.70 | %3 |
| After expense reimbursement (recapture) and securities lending credit | | | 0.69 | % | | 0.70 | % | | 0.72 | % | | 0.69 | %3 |
| Ratio of net investment income to average net assets | | | | | | | | | | | | | |
| Before expense reimbursement (recapture) and securities lending credit | | | 1.71 | % | | 1.68 | % | | 1.53 | % | | 2.14 | %3 |
| After expense reimbursement (recapture) and securities lending credit | | | 1.72 | % | | 1.68 | % | | 1.53 | % | | 2.15 | %3 |
| Portfolio turnover rate | | | 185.11 | % | | 112.86 | % | | 213.80 | % | | 427.36 | % |
| Portfolio Turnover is calculated for the Fund as a whole. |
| 1 | Commencement of operations. |
| 2 | Not annualized. |
| 3 | Annualized. |
See notes to financial statements.
GuideMark® Funds & GuidePath® Funds
FINANCIAL HIGHLIGHTS
| | | Core Fixed Income Fund |
| | | Service |
| | | Year Ended
March 31,
2015 | | | Year Ended
March 31,
2014 | | | Year Ended
March 31,
2013 | | | Year Ended
March 31,
2012 | | | Year Ended
March 31,
2011 | |
| Per share data for a share of capital stock outstanding for the entire year and selected information for the year are as follows: | | | | | | | | | | | | | | | | | | | | |
| Net asset value, beginning of year | | | $ 9.39 | | | | $ 9.88 | | | | $ 9.78 | | | | $ 9.36 | | | | $ 9.10 | |
| Income from investment operations: | | | | | | | | | | | | | | | | | | | | |
| Net investment income | | | 0.10 | | | | 0.11 | | | | 0.11 | | | | 0.17 | | | | 0.21 | |
| Net realized and unrealized gains (losses) on investments | | | 0.33 | | | | (0.25 | ) | | | 0.24 | | | | 0.42 | | | | 0.29 | |
| Total from investment operations | | | 0.43 | | | | (0.14 | ) | | | 0.35 | | | | 0.59 | | | | 0.50 | |
| Less distributions: | | | | | | | | | | | | | | | | | | | | |
| Dividends from net investment income | | | (0.12 | ) | | | (0.14 | ) | | | (0.15 | ) | | | (0.17 | ) | | | (0.24 | ) |
| Dividends from net realized gains | | | (0.01 | ) | | | (0.03 | ) | | | (0.10 | ) | | | — | | | | — | |
| Return of capital | | | — | | | | (0.18 | ) | | | — | | | | — | | | | — | |
| Total distributions | | | (0.13 | ) | | | (0.35 | ) | | | (0.25 | ) | | | (0.17 | ) | | | (0.24 | ) |
| Net asset value, end of year | | | $ 9.69 | | | | $ 9.39 | | | | $ 9.88 | | | | $ 9.78 | | | | $ 9.36 | |
| Total return | | | 4.64 | % | | | -1.33 | % | | | 3.55 | % | | | 6.35 | % | | | 5.58 | % |
| Supplemental data and ratios: | | | | | | | | | | | | | | | | | | | | |
| Net assets, end of year | | $236,819,684 | | | $231,285,162 | | | $281,180,497 | | | $435,281,520 | | | $581,940,962 | |
| Ratio of expenses to average net assets | | | | | | | | | | | | | | | | | | | | |
| Before expense reimbursement (recapture) and securities lending credit | | | 1.29 | % | | | 1.29 | % | | | 1.30 | % | | | 1.28 | % | | | 1.25 | % |
| After expense reimbursement (recapture) and securities lending credit | | | 1.29 | % | | | 1.29 | % | | | 1.29 | % | | | 1.26 | % | | | 1.24 | % |
| Ratio of net investment income to average net assets | | | | | | | | | | | | | | | | | | | | |
| Before expense reimbursement (recapture) and securities lending credit | | | 1.11 | % | | | 1.10 | % | | | 1.02 | % | | | 1.68 | % | | | 2.23 | % |
| After expense reimbursement (recapture) and securities lending credit | | | 1.11 | % | | | 1.10 | % | | | 1.03 | % | | | 1.70 | % | | | 2.24 | % |
| Portfolio turnover rate | | | 185.11 | % | | | 112.86 | % | | | 213.80 | % | | | 427.36 | % | | | 485.40 | % |
Portfolio Turnover is calculated for the Fund as a whole.
See notes to financial statements.
GuideMark® Funds & GuidePath® Funds
FINANCIAL HIGHLIGHTS
| | | Tax-Exempt Fixed Income Fund |
| | | Service |
| | | Year Ended
March 31,
2015 | | | Year Ended
March 31,
2014 | | | Year Ended
March 31,
2013 | | | Year Ended
March 31,
2012 | | | Year Ended
March 31,
2011 | |
| Per share data for a share of capital stock outstanding for the entire year and selected information for the year are as follows: | | | | | | | | | | | | | | | | | | | | |
| Net asset value, beginning of year | | | $11.18 | | | | $11.70 | | | | $11.47 | | | | $10.67 | | | | $10.94 | |
| Income from investment operations: | | | | | | | | | | | | | | | | | | | | |
| Net investment income | | | 0.32 | | | | 0.34 | | | | 0.33 | | | | 0.37 | | | | 0.36 | |
| Net realized and unrealized gains (losses) on investments | | | 0.40 | | | | (0.52 | ) | | | 0.23 | | | | 0.80 | | | | (0.26 | ) |
| Total from investment operations | | | 0.72 | | | | (0.18 | ) | | | 0.56 | | | | 1.17 | | | | 0.10 | |
| Less distributions: | | | | | | | | | | | | | | | | | | | | |
| Dividends from net investment income | | | (0.32 | ) | | | (0.34 | ) | | | (0.33 | ) | | | (0.37 | ) | | | (0.37 | ) |
| Total distributions | | | (0.32 | ) | | | (0.34 | ) | | | (0.33 | ) | | | (0.37 | ) | | | (0.37 | ) |
| Net asset value, end of year | | | $11.58 | | | | $11.18 | | | | $11.70 | | | | $11.47 | | | | $10.67 | |
| Total return | | | 6.45 | % | | | -1.48 | % | | | 4.93 | % | | | 11.10 | % | | | 0.89 | % |
| Supplemental data and ratios: | | | | | | | | | | | | | | | | | | | | |
| Net assets, end of year | | $65,682,169 | | | $63,429,577 | | | $75,739,873 | | | $81,408,890 | | | $170,330,144 | |
| Ratio of expenses to average net assets | | | | | | | | | | | | | | | | | | | | |
| Before expense reimbursement (recapture) | | | 1.38 | % | | | 1.38 | % | | | 1.36 | % | | | 1.31 | % | | | 1.29 | % |
| After expense reimbursement (recapture) | | | 1.29 | % | | | 1.29 | % | | | 1.29 | % | | | 1.29 | % | | | 1.29 | % |
| Ratio of net investment income to average net assets | | | | | | | | | | | | | | | | | | | | |
| Before expense reimbursement (recapture) | | | 2.64 | % | | | 2.90 | % | | | 2.72 | % | | | 3.16 | % | | | 3.25 | % |
| After expense reimbursement (recapture) | | | 2.73 | % | | | 2.99 | % | | | 2.79 | % | | | 3.18 | % | | | 3.25 | % |
| Portfolio turnover rate | | | 33.29 | % | | | 35.08 | % | | | 30.36 | % | | | 38.80 | % | | | 38.01 | % |
See notes to financial statements.
GuideMark® Funds & GuidePath® Funds
FINANCIAL HIGHLIGHTS
| | | Opportunistic Fixed Income Fund |
| | | Institutional |
| | | Year Ended
March 31,
2015 | | | Year Ended
March 31,
2014 | | | Year Ended
March 31,
2013 | | | April 29, 20111
Through
March 31,
2012 | |
| Per share data for a share of capital stock outstanding for the entire year and selected information for the year are as follows: | | | | | | | | | | | | | | | | |
| Net asset value, beginning of year | | | $ 9.94 | | | | $10.27 | | | | $ 9.70 | | | | $10.07 | |
| Income from investment operations: | | | | | | | | | | | | | | | | |
| Net investment income | | | 0.41 | | | | 0.34 | | | | 0.42 | | | | 0.35 | |
| Net realized and unrealized gains (losses) on investments | | | (0.32 | ) | | | (0.37 | ) | | | 0.57 | | | | (0.34 | ) |
| Total from investment operations | | | 0.09 | | | | (0.03 | ) | | | 0.99 | | | | 0.01 | |
| Less distributions: | | | | | | | | | | | | | | | | |
| Dividends from net investment income | | | (0.50 | ) | | | (0.28 | ) | | | (0.42 | ) | | | (0.38 | ) |
| Dividends from net realized gains | | | — | | | | (0.02 | ) | | | — | | | | — | |
| Total distributions | | | (0.50 | ) | | | (0.30 | ) | | | (0.42 | ) | | | (0.38 | ) |
| Net asset value, end of year | | | $ 9.53 | | | | $ 9.94 | | | | $10.27 | | | | $ 9.70 | |
| Total return | | | 0.88 | % | | | -0.21 | % | | | 10.33 | % | | | 0.29 | %2 |
| Supplemental data and ratios: | | | | | | | | | | | | | | | | |
| Net assets, end of year | | | $50,593,107 | | | | $65,181,311 | | | | $104,141,739 | | | | $38,403,168 | |
| Ratio of expenses to average net assets | | | | | | | | | | | | | | | | |
| Before expense reimbursement (recapture) | | | 1.08 | % | | | 1.01 | % | | | 1.03 | % | | | 1.13 | %3 |
| After expense reimbursement (recapture) | | | 1.05 | % | | | 1.01 | % | | | 1.05 | % | | | 1.05 | %3 |
| Ratio of net investment income to average net assets | | | | | | | | | | | | | | | | |
| Before expense reimbursement (recapture) | | | 3.84 | % | | | 4.10 | % | | | 4.17 | % | | | 4.20 | %3 |
| After expense reimbursement (recapture) | | | 3.87 | % | | | 4.10 | % | | | 4.15 | % | | | 4.28 | %3 |
| Portfolio turnover rate | | | 39.66 | % | | | 66.49 | % | | | 101.49 | % | | | 86.54 | % |
Portfolio Turnover is calculated for the Fund as a whole.
| 1 | Commencement of operations. |
| 2 | Not annualized. |
| 3 | Annualized. |
See notes to financial statements.
GuideMark® Funds & GuidePath® Funds
FINANCIAL HIGHLIGHTS
| | | Opportunistic Fixed Income Fund |
| | | Service |
| | | Year Ended
March 31,
2015 | | | Year Ended
March 31,
2014 | | | Year Ended
March 31,
2013 | | | Year Ended
March 31,
2012 | |
| Per share data for a share of capital stock outstanding for the entire year and selected information for the year are as follows: | | | | | | | | | | | | | | | | |
| Net asset value, beginning of year | | | $ 9.93 | | | | $10.28 | | | | $ 9.70 | | | | $10.00 | |
| Income from investment operations: | | | | | | | | | | | | | | | | |
| Net investment income | | | 0.33 | | | | 0.35 | | | | 0.36 | | | | 0.34 | |
| Net realized and unrealized gains (losses) on investments | | | (0.29 | ) | | | (0.43 | ) | | | 0.58 | | | | (0.31 | ) |
| Total from investment operations | | | 0.04 | | | | (0.08 | ) | | | 0.94 | | | | 0.03 | |
| Less distributions: | | | | | | | | | | | | | | | | |
| Dividends from net investment income | | | (0.42 | ) | | | (0.25 | ) | | | (0.36 | ) | | | (0.33 | ) |
| Dividends from net realized gains | | | — | | | | (0.02 | ) | | | — | | | | — | |
| Total distributions | | | (0.42 | ) | | | (0.27 | ) | | | (0.36 | ) | | | (0.33 | ) |
| Net asset value, end of year | | | $ 9.55 | | | | $ 9.93 | | | | $10.28 | | | | $ 9.70 | |
| Total return | | | 0.33 | % | | | -0.71 | % | | | 9.64 | % | | | 0.56 | % |
| Supplemental data and ratios: | | | | | | | | | | | | | | | | |
| Net assets, end of year | | $151,883,107 | | | $147,493,694 | | | $150,493,389 | | | $204,104,609 | |
| Ratio of expenses to average net assets | | | | | | | | | | | | | | | | |
| Before expense reimbursement (recapture) | | | 1.66 | % | | | 1.59 | % | | | 1.61 | % | | | 1.63 | % |
| After expense reimbursement (recapture) | | | 1.55 | % | | | 1.55 | % | | | 1.55 | % | | | 1.55 | % |
| Ratio of net investment income to average net assets | | | | | | | | | | | | | | | | |
| Before expense reimbursement (recapture) | | | 3.28 | % | | | 3.51 | % | | | 3.52 | % | | | 3.49 | % |
| After expense reimbursement (recapture) | | | 3.39 | % | | | 3.55 | % | | | 3.58 | % | | | 3.57 | % |
| Portfolio turnover rate | | | 39.66 | % | | | 66.49 | % | | | 101.49 | % | | | 86.54 | % |
Portfolio Turnover is calculated for the Fund as a whole.
See notes to financial statements.
GuideMark® Funds & GuidePath® Funds
FINANCIAL HIGHLIGHTS
| | | Strategic Asset Allocation Fund |
| | | Institutional |
| | | Year Ended
March 31,
2015 | | | Year Ended
March 31,
2014 | | | September 13,
20121
Through
March 31,
2013 | |
| Per share data for a share of capital stock outstanding for the entire year and selected information for the year are as follows: | | | | | | | | | | | | |
| Net asset value, beginning of year | | | $11.45 | | | | $10.25 | | | | $ 9.63 | |
| Income from investment operations: | | | | | | | | | | | | |
| Net investment income (loss) | | | 0.16 | | | | (0.03 | ) | | | 0.11 | |
| Net realized and unrealized gains on investments | | | 0.41 | | | | 1.56 | | | | 0.62 | |
| Total from investment operations | | | 0.57 | | | | 1.53 | | | | 0.73 | |
| Less distributions: | | | | | | | | | | | | |
| Dividends from net investment income | | | (0.19 | ) | | | (0.11 | ) | | | (0.11 | ) |
| Dividends from net realized gains | | | (0.18 | ) | | | (0.22 | ) | | | — | |
| Total distributions | | | (0.37 | ) | | | (0.33 | ) | | | (0.11 | ) |
| Net asset value, end of year | | | $11.65 | | | | $11.45 | | | | $10.25 | |
| Total return | | | 5.04 | % | | | 15.00 | % | | | 7.68 | %2 |
| Supplemental data and ratios: | | | | | | | | | | | | |
| Net assets, end of year | | | $7,737,997 | | | | $3,534,178 | | | | $884,658 | |
| Ratio of expenses to average net assets4 | | | | | | | | | | | | |
| Before expense reimbursement (recapture) and securities lending credit | | | 0.41 | % | | | 0.40 | % | | | 0.42 | %3 |
| After expense reimbursement (recapture) and securities lending credit | | | 0.34 | % | | | 0.36 | % | | | 0.40 | %3 |
| Ratio of net investment income to average net assets5 | | | | | | | | | | | | |
| Before expense reimbursement (recapture) and securities lending credit | | | 1.63 | % | | | 1.42 | % | | | 1.84 | %3 |
| After expense reimbursement (recapture) and securities lending credit | | | 1.70 | % | | | 1.46 | % | | | 1.86 | %3 |
| Portfolio turnover rate | | | 11.96 | % | | | 30.35 | % | | | 18.44 | % |
Portfolio Turnover is calculated for the Fund as a whole.
| 1 | Commencement of operations. |
| 2 | Not annualized. |
| 3 | Annualized. |
| 4 | These ratios exclude the impact of the expenses of the underlying investment companies and exchange-traded funds in which the Fund invests. |
| 5 | Recognition of the net investment income by the Fund is affected by the timing of the declaration of dividends by the underlying investment companies and exchange-traded funds in which the Fund invests. |
See notes to financial statements.
GuideMark® Funds & GuidePath® Funds
FINANCIAL HIGHLIGHTS
| | | | | | | | | | | | | | | | | |
| | | Strategic Asset Allocation Fund | |
| | | Service | |
| | | Year Ended
March 31,
2015 | | | Year Ended
March 31,
2014 | | | Year Ended
March 31,
2013 | | | April 29, 20111
Through
March 31,
2012 | |
| Per share data for a share of capital stock outstanding for the entire year and selected information for the year are as follows: | | | | | | | | | | | | | | | | |
| Net asset value, beginning of year | | | $11.43 | | | | $10.26 | | | | $ 9.46 | | | | $10.00 | |
| Income from investment operations: | | | | | | | | | | | | | | | | |
| Net investment income | | | 0.12 | | | | 0.07 | | | | 0.07 | | | | 0.08 | |
| Net realized and unrealized gains (losses) on investments | | | 0.38 | | | | 1.38 | | | | 0.80 | | | | (0.52 | ) |
| Total from investment operations | | | 0.50 | | | | 1.45 | | | | 0.87 | | | | (0.44 | ) |
| Less distributions: | | | | | | | | | | | | | | | | |
| Dividends from net investment income | | | (0.13 | ) | | | (0.06 | ) | | | (0.07 | ) | | | (0.10 | ) |
| Dividends from net realized gains | | | (0.18 | ) | | | (0.22 | ) | | | — | | | | — | |
| Return of capital | | | — | | | | — | | | | — | | | | — | * |
| Total distributions | | | (0.31 | ) | | | (0.28 | ) | | | (0.07 | ) | | | (0.10 | ) |
| Net asset value, end of year | | | $11.62 | | | | $11.43 | | | | $10.26 | | | | $ 9.46 | |
| Total return | | | 4.47 | % | | | 14.20 | % | | | 9.30 | % | | | -4.30 | %2 |
| Supplemental data and ratios: | | | | | | | | | | | | | | | | |
| Net assets, end of year | | $259,838,374 | | | $288,401,436 | | | $248,122,395 | | | $144,649,234 | |
| Ratio of expenses to average net assets4 | | | | | | | | | | | | | | | | |
| Before expense reimbursement (recapture) and securities lending credit | | | 1.00 | % | | | 1.00 | % | | | 1.04 | % | | | 1.22 | %3 |
| After expense reimbursement (recapture) and securities lending credit | | | 0.95 | % | | | 1.00 | % | | | 1.00 | % | | | 1.00 | %3 |
| Ratio of net investment income to average net assets5 | | | | | | | | | | | | | | | | |
| Before expense reimbursement (recapture) and securities lending credit | | | 0.94 | % | | | 0.61 | % | | | 0.76 | % | | | 1.12 | %3 |
| After expense reimbursement (recapture) and securities lending credit | | | 0.99 | % | | | 0.61 | % | | | 0.80 | % | | | 1.34 | %3 |
| Portfolio turnover rate | | | 11.96 | % | | | 30.35 | % | | | 18.44 | % | | | 14.40 | %2 |
Portfolio Turnover is calculated for the Fund as a whole.
| 1 | Commencement of operations. |
| 2 | Not annualized. |
| 3 | Annualized. |
| 4 | These ratios exclude the impact of the expenses of the underlying investment companies and exchange-traded funds in which the Fund invests. |
| 5 | Recognition of the net investment income by the Fund is affected by the timing of the declaration of dividends by the underlying investment companies and exchange-traded funds in which the Fund invests. |
| * | Amount represents less than $0.01 per share. |
See notes to financial statements.
GuideMark® Funds & GuidePath® Funds
FINANCIAL HIGHLIGHTS
| | | | | | | | | | | | | |
| | | Tactical Constrained® Asset Allocation Fund | |
| | | Institutional | |
| | | Year Ended
March 31,
2015 | | | Year Ended
March 31,
2014 | | | September 13,
20121
Through
March 31,
2013 | |
| Per share data for a share of capital stock outstanding for the entire year and selected information for the year are as follows: | | | | | | | | | | | | |
| Net asset value, beginning of year | | | $11.39 | | | | $10.43 | | | | $ 9.98 | |
| Income from investment operations: | | | | | | | | | | | | |
| Net investment income | | | 0.26 | | | | 0.18 | | | | 0.14 | |
| Net realized and unrealized gains on investments | | | 0.41 | | | | 0.98 | | | | 0.48 | |
| Total from investment operations | | | 0.67 | | | | 1.16 | | | | 0.62 | |
| Less distributions: | | | | | | | | | | | | |
| Dividends from net investment income | | | (0.25 | ) | | | (0.14 | ) | | | (0.14 | ) |
| Dividends from net realized gains | | | (0.55 | ) | | | (0.06 | ) | | | (0.03 | ) |
| Total distributions | | | (0.80 | ) | | | (0.20 | ) | | | (0.17 | ) |
| Net asset value, end of year | | | $11.26 | | | | $11.39 | | | | $10.43 | |
| Total return | | | 6.01 | % | | | 11.13 | % | | | 6.29 | %2 |
| Supplemental data and ratios: | | | | | | | | | | | | |
| Net assets, end of year | | $6,173,168 | | | $2,680,327 | | | $879,348 | |
| Ratio of expenses to average net assets4 | | | | | | | | | | | | |
| Before expense reimbursement (recapture) and securities lending credit | | | 0.42 | % | | | 0.43 | % | | | 0.43 | %3 |
| After expense reimbursement (recapture) and securities lending credit | | | 0.37 | % | | | 0.38 | % | | | 0.38 | %3 |
| Ratio of net investment income to average net assets5 | | | | | | | | | | | | |
| Before expense reimbursement (recapture) and securities lending credit | | | 1.96 | % | | | 1.42 | % | | | 2.10 | %3 |
| After expense reimbursement (recapture) and securities lending credit | | | 2.01 | % | | | 1.47 | % | | | 2.15 | %3 |
| Portfolio turnover rate | | | 38.36 | % | | | 69.17 | % | | | 67.22 | % |
Portfolio Turnover is calculated for the Fund as a whole.
| 1 | Commencement of operations. |
| 2 | Not annualized. |
| 3 | Annualized. |
| 4 | These ratios exclude the impact of the expenses of the underlying investment companies and exchange-traded funds in which the Fund invests. |
| 5 | Recognition of the net investment income by the Fund is affected by the timing of the declaration of dividends by the underlying investment companies and exchange-traded funds in which the Fund invests. |
See notes to financial statements.
GuideMark® Funds & GuidePath® Funds
FINANCIAL HIGHLIGHTS
| | | | | | | | | | | | | | | | | |
| | | Tactical Constrained® Asset Allocation Fund | |
| | | Service | |
| | | Year Ended
March 31,
2015 | | | Year Ended
March 31,
2014 | | | Year Ended
March 31,
2013 | | | April 29, 20111
Through
March 31,
2012 | |
| Per share data for a share of capital stock outstanding for the entire year and selected information for the year are as follows: | | | | | | | | | | | | | | | | |
| Net asset value, beginning of year | | | $11.39 | | | | $10.44 | | | | $ 9.76 | | | | $10.00 | |
| Income from investment operations: | | | | | | | | | | | | | | | | |
| Net investment income | | | 0.15 | | | | 0.08 | | | | 0.09 | | | | 0.09 | |
| Net realized and unrealized gains (losses) on investments | | | 0.46 | | | | 1.01 | | | | 0.71 | | | | (0.24 | ) |
| Total from investment operations | | | 0.61 | | | | 1.09 | | | | 0.80 | | | | (0.15 | ) |
| Less distributions: | | | | | | | | | | | | | | | | |
| Dividends from net investment income | | | (0.16 | ) | | | (0.08 | ) | | | (0.09 | ) | | | (0.09 | ) |
| Dividends from net realized gains | | | (0.55 | ) | | | (0.06 | ) | | | (0.03 | ) | | | — | |
| Total distributions | | | (0.71 | ) | | | (0.14 | ) | | | (0.12 | ) | | | (0.09 | ) |
| Net asset value, end of year | | | $11.29 | | | | $11.39 | | | | $10.44 | | | | $ 9.76 | |
| Total return | | | 5.42 | % | | | 10.40 | % | | | 8.25 | % | | | -1.43 | %2 |
| Supplemental data and ratios: | | | | | | | | | | | | | | | | |
| Net assets, end of year | | $174,138,417 | | | $195,498,995 | | | $228,905,423 | | | $143,145,114 | |
| Ratio of expenses to average net assets4 | | | | | | | | | | | | | | | | |
| Before expense reimbursement (recapture) and securities lending credit | | | 1.01 | % | | | 1.02 | % | | | 1.05 | % | | | 1.25 | %3 |
| After expense reimbursement (recapture) and securities lending credit | | | 1.00 | % | | | 1.00 | % | | | 1.00 | % | | | 1.00 | %3 |
| Ratio of net investment income to average net assets5 | | | | | | | | | | | | | | | | |
| Before expense reimbursement (recapture) and securities lending credit | | | 1.17 | % | | | 0.67 | % | | | 0.94 | % | | | 1.33 | %3 |
| After expense reimbursement (recapture) and securities lending credit | | | 1.18 | % | | | 0.69 | % | | | 0.99 | % | | | 1.58 | %3 |
| Portfolio turnover rate | | | 38.36 | % | | | 69.17 | % | | | 67.22 | % | | | 50.86 | %2 |
Portfolio Turnover is calculated for the Fund as a whole.
| 1 | Commencement of operations. |
| 2 | Not annualized. |
| 3 | Annualized. |
| 4 | These ratios exclude the impact of the expenses of the underlying investment companies and exchange-traded funds in which the Fund invests. |
| 5 | Recognition of the net investment income by the Fund is affected by the timing of the declaration of dividends by the underlying investment companies and exchange-traded funds in which the Fund invests. |
See notes to financial statements.
GuideMark® Funds & GuidePath® Funds
FINANCIAL HIGHLIGHTS
| | | | | | | | | | | | | |
| | | Tactical Unconstrained® Asset Allocation Fund | |
| | | Institutional | |
| | | Year Ended
March 31,
2015 | | | Year Ended
March 31,
2014 | | | September 13, 20121
Through
March 31,
2013 | |
| Per share data for a share of capital stock outstanding for the entire year and selected information for the year are as follows: | | | | | | | | | | | | |
| Net asset value, beginning of year | | | $10.80 | | | | $10.25 | | | | $ 9.75 | |
| Income from investment operations: | | | | | | | | | | | | |
| Net investment income | | | 0.17 | | | | 0.07 | | | | 0.13 | |
| Net realized and unrealized gains on investments | | | 0.21 | | | | 0.75 | | | | 0.55 | |
| Total from investment operations | | | 0.38 | | | | 0.82 | | | | 0.68 | |
| Less distributions: | | | | | | | | | | | | |
| Dividends from net investment income | | | (0.20 | ) | | | (0.09 | ) | | | (0.14 | ) |
| Dividends from net realized gains | | | (0.64 | ) | | | (0.18 | ) | | | (0.04 | ) |
| Total distributions | | | (0.84 | ) | | | (0.27 | ) | | | (0.18 | ) |
| Net asset value, end of year | | | $10.34 | | | | $10.80 | | | | $10.25 | |
| Total return | | | 3.63 | % | | | 8.01 | % | | | 7.11 | %2 |
| Supplemental data and ratios: | | | | | | | | | | | | |
| Net assets, end of year | | $5,977,217 | | | $1,496,066 | | | $810,333 | |
| Ratio of expenses to average net assets4 | | | | | | | | | | | | |
| Before expense reimbursement (recapture) and securities lending credit | | | 0.51 | % | | | 0.51 | % | | | 0.52 | %3 |
| After expense reimbursement (recapture) and securities lending credit | | | 0.36 | % | | | 0.46 | % | | | 0.46 | %3 |
| Ratio of net investment income to average net assets5 | | | | | | | | | | | | |
| Before expense reimbursement (recapture) and securities lending credit | | | 2.01 | % | | | 1.14 | % | | | 1.89 | %3 |
| After expense reimbursement (recapture) and securities lending credit | | | 2.16 | % | | | 1.19 | % | | | 1.95 | %3 |
| Portfolio turnover rate | | | 214.84 | % | | | 244.90 | % | | | 195.89 | % |
Portfolio Turnover is calculated for the Fund as a whole.
| 1 | Commencement of operations. |
| 2 | Not annualized. |
| 3 | Annualized. |
| 4 | These ratios exclude the impact of the expenses of the underlying investment companies and exchange-traded funds in which the Fund invests. |
| 5 | Recognition of the net investment income by the Fund is affected by the timing of the declaration of dividends by the underlying investment companies and exchange-traded funds in which the Fund invests. |
See notes to financial statements.
GuideMark® Funds & GuidePath® Funds
FINANCIAL HIGHLIGHTS
| | | | | | | | | | | | | | | | | |
| | | Tactical Unconstrained® Asset Allocation Fund | |
| | | Service | |
| | | Year Ended
March 31,
2015 | | | Year Ended
March 31,
2014 | | | Year Ended
March 31,
2013 | | | April 29, 20111
Through
March 31,
2012 | |
| Per share data for a share of capital stock outstanding for the entire year and selected information for the year are as follows: | | | | | | | | | | | | | | | | |
| Net asset value, beginning of year | | | $10.79 | | | | $10.27 | | | | $ 9.54 | | | | $10.00 | |
| Income from investment operations: | | | | | | | | | | | | | | | | |
| Net investment income | | | 0.15 | | | | 0.05 | | | | 0.09 | | | | 0.06 | |
| Net realized and unrealized gains (losses) on investments | | | 0.17 | | | | 0.70 | | | | 0.78 | | | | (0.47 | ) |
| Total from investment operations | | | 0.32 | | | | 0.75 | | | | 0.87 | | | | (0.41 | ) |
| Less distributions: | | | | | | | | | | | | | | | | |
| Dividends from net investment income | | | (0.15 | ) | | | (0.05 | ) | | | (0.10 | ) | | | (0.05 | ) |
| Dividends from net realized gains | | | (0.64 | ) | | | (0.18 | ) | | | (0.04 | ) | | | — | |
| Total distributions | | | (0.79 | ) | | | (0.23 | ) | | | (0.14 | ) | | | (0.05 | ) |
| Net asset value, end of year | | | $10.32 | | | | $10.79 | | | | $10.27 | | | | $ 9.54 | |
| Total return | | | 3.08 | % | | | 7.27 | % | | | 9.15 | % | | | -4.09 | %2 |
| Supplemental data and ratios: | | | | | | | | | | | | | | | | |
| Net assets, end of year | | $480,492,438 | | | $377,469,190 | | | $310,316,243 | | | $184,703,438 | |
| Ratio of expenses to average net assets4 | | | | | | | | | | | | | | | | |
| Before expense reimbursement (recapture) and securities lending credit | | | 1.10 | % | | | 1.10 | % | | | 1.15 | % | | | 1.32 | %3 |
| After expense reimbursement (recapture) and securities lending credit | | | 0.97 | % | | | 1.10 | % | | | 1.10 | % | | | 1.10 | %3 |
| Ratio of net investment income to average net assets5 | | | | | | | | | | | | | | | | |
| Before expense reimbursement (recapture) and securities lending credit | | | 1.30 | % | | | 0.51 | % | | | 0.90 | % | | | 0.90 | %3 |
| After expense reimbursement (recapture) and securities lending credit | | | 1.43 | % | | | 0.51 | % | | | 0.95 | % | | | 1.12 | %3 |
| Portfolio turnover rate | | | 214.84 | % | | | 244.90 | % | | | 195.89 | % | | | 293.90 | %2 |
Portfolio Turnover is calculated for the Fund as a whole.
| 1 | Commencement of operations. |
| 2 | Not annualized. |
| 3 | Annualized. |
| 4 | These ratios exclude the impact of the expenses of the underlying investment companies and exchange-traded funds in which the Fund invests. |
| 5 | Recognition of the net investment income by the Fund is affected by the timing of the declaration of dividends by the underlying investment companies and exchange-traded funds in which the Fund invests. |
See notes to financial statements.
GuideMark® Funds & GuidePath® Funds
FINANCIAL HIGHLIGHTS
| | | Absolute Return Asset Allocation Fund | |
| | | Institutional | |
| | | Year Ended
March 31,
2015 | | | Year Ended
March 31,
2014 | | | September 13,
20121
Through
March 31,
2013 | |
| Per share data for a share of capital stock outstanding for the entire year and selected information for the year are as follows: | | | | | | | | | | | | | | | |
| Net asset value, beginning of year | | | | $10.00 | | | | | $10.16 | | | | | $10.19 | |
| Income from investment operations: | | | | | | | | | | | | | | | |
| Net investment income | | | | 0.40 | | | | | 0.41 | | | | | 0.18 | |
| Net realized and unrealized losses on investments | | | | (0.10 | )6 | | | | (0.31 | ) | | | | (0.02 | ) |
| Total from investment operations | | | | 0.30 | | | | | 0.10 | | | | | 0.16 | |
| Less distributions: | | | | | | | | | | | | | | | |
| Dividends from net investment income | | | | (0.28 | ) | | | | (0.26 | ) | | | | (0.18 | ) |
| Dividends from net realized gains | | | | — | | | | | — | | | | | (0.01 | ) |
| Total distributions | | | | (0.28 | ) | | | | (0.26 | ) | | | | (0.19 | ) |
| Net asset value, end of year | | | | $10.02 | | | | | $10.00 | | | | | $10.16 | |
| Total return | | | | 3.05 | % | | | | 1.08 | % | | | | 1.53 | %2 |
| Supplemental data and ratios: | | | | | | | | | | | | | | | |
| Net assets, end of year | | $2,673,347 | | | $1,014,889 | | | $569,773 | |
| Ratio of expenses to average net assets4 | | | | | | | | | | | | | | | |
| Before expense reimbursement (recapture) and securities lending credit | | | | 0.51 | % | | | | 0.51 | % | | | | 0.51 | %3 |
| After expense reimbursement (recapture) and securities lending credit | | | | 0.34 | % | | | | 0.36 | % | | | | 0.47 | %3 |
| Ratio of net investment income to average net assets5 | | | | | | | | | | | | | | | |
| Before expense reimbursement (recapture) and securities lending credit | | | | 2.64 | % | | | | 2.24 | % | | | | 2.59 | %3 |
| After expense reimbursement (recapture) and securities lending credit | | | | 2.81 | % | | | | 2.39 | % | | | | 2.63 | %3 |
| Portfolio turnover rate | | | | 91.93 | % | | | | 134.44 | % | | | | 64.86 | % |
Portfolio Turnover is calculated for the Fund as a whole.
| 1 | Commencement of operations. |
| 2 | Not annualized. |
| 3 | Annualized. |
| 4 | These ratios exclude the impact of the expenses of the underlying investment companies and exchange-traded funds in which the Fund invests. |
| 5 | Recognition of the net investment income by the Fund is affected by the timing of the declaration of dividends by the underlying investment companies and exchange-traded funds in which the Fund invests. |
| 6 | Realized and unrealized gains and losses per share in this caption are balancing amounts necessary to reconcile the change in net asset value per share for the year, and may not reconcile with the aggregate gains and losses in the Statement of Operations due to share transactions for the period. |
See notes to financial statements.
GuideMark® Funds & GuidePath® Funds
FINANCIAL HIGHLIGHTS
| | | Absolute Return Asset Allocation Fund | |
| | | Service | |
| | | Year Ended
March 31,
2015 | | | Year Ended
March 31,
2014 | | | Year Ended
March 31,
2013 | | | April 29, 20111
Through
March 31,
2012 | |
| Per share data for a share of capital stock outstanding for the entire year and selected information for the year are as follows: | | | | | | | | | | | | | | | | | | | | |
| Net asset value, beginning of year | | | | $10.01 | | | | | $10.17 | | | | | $10.04 | | | | | $10.00 | |
| Income from investment operations: | | | | | | | | | | | | | | | | | | | | |
| Net investment income | | | | 0.23 | | | | | 0.19 | | | | | 0.14 | | | | | 0.09 | |
| Net realized and unrealized gains (losses) on investments | | | | 0.02 | | | | | (0.15 | ) | | | | 0.13 | | | | | 0.01 | |
| Total from investment operations | | | | 0.25 | | | | | 0.04 | | | | | 0.27 | | | | | 0.10 | |
| Less distributions: | | | | | | | | | | | | | | | | | | | | |
| Dividends from net investment income | | | | (0.22 | ) | | | | (0.20 | ) | | | | (0.13 | ) | | | | (0.06 | ) |
| Dividends from net realized gains | | | | — | | | | | — | | | | | (0.01 | ) | | | | — | |
| Total distributions | | | | (0.22 | ) | | | | (0.20 | ) | | | | (0.14 | ) | | | | (0.06 | ) |
| Net asset value, end of year | | | | $10.04 | | | | | $10.01 | | | | | $10.17 | | | | | $10.04 | |
| Total return | | | | 2.47 | % | | | | 0.43 | % | | | | 2.71 | % | | | | 1.01 | %2 |
| Supplemental data and ratios: | | | | | | | | | | | | | | | | | | | | |
| Net assets, end of year | | $366,970,865 | | | $449,186,398 | | | $509,704,884 | | | $238,654,697 | |
| Ratio of expenses to average net assets4 | | | | | | | | | | | | | | | | | | | | |
| Before expense reimbursement (recapture) and securities lending credit | | | | 1.11 | % | | | | 1.10 | % | | | | 1.13 | % | | | | 1.28 | %3 |
| After expense reimbursement (recapture) and securities lending credit | | | | 0.93 | % | | | | 1.00 | % | | | | 1.10 | % | | | | 1.10 | %3 |
| Ratio of net investment income to average net assets5 | | | | | | | | | | | | | | | | | | | | |
| Before expense reimbursement (recapture) and securities lending credit | | | | 1.92 | % | | | | 1.64 | % | | | | 1.80 | % | | | | 1.54 | %3 |
| After expense reimbursement (recapture) and securities lending credit | | | | 2.10 | % | | | | 1.74 | % | | | | 1.83 | % | | | | 1.72 | %3 |
| Portfolio turnover rate | | | | 91.93 | % | | | | 134.44 | % | | | | 64.86 | % | | | | 136.33 | %2 |
Portfolio Turnover is calculated for the Fund as a whole.
| 1 | Commencement of operations. |
| 2 | Not annualized. |
| 3 | Annualized. |
| 4 | These ratios exclude the impact of the expenses of the underlying investment companies and exchange-traded funds in which the Fund invests. |
| 5 | Recognition of the net investment income by the Fund is affected by the timing of the declaration of dividends by the underlying investment companies and exchange-traded funds in which the Fund invests. |
See notes to financial statements.
GuideMark® Funds & GuidePath® Funds
FINANCIAL HIGHLIGHTS
| | | Multi-Asset Income Asset Allocation Fund | |
| | | Service | |
| | | Year Ended
March 31,
2015 | | | Year Ended
March 31,
2014 | | | August 31, 20121
Through
March 31,
2013 | |
| Per share data for a share of capital stock outstanding for the entire year and selected information for the year are as follows: | | | | | | | | | | | | | | | |
| Net asset value, beginning of year | | | | $10.76 | | | | | $10.58 | | | | | $10.00 | |
| Income from investment operations: | | | | | | | | | | | | | | | |
| Net investment income | | | | 0.36 | | | | | 0.38 | | | | | 0.22 | |
| Net realized and unrealized gains (losses) on investments | | | | (0.05 | ) | | | | 0.21 | | | | | 0.53 | |
| Total from investment operations | | | | 0.31 | | | | | 0.59 | | | | | 0.75 | |
| Less distributions: | | | | | | | | | | | | | | | |
| Dividends from net investment income | | | | (0.38 | ) | | | | (0.40 | ) | | | | (0.17 | ) |
| Dividends from net realized gains | | | | (0.07 | ) | | | | (0.01 | ) | | | | — | |
| Total distributions | | | | (0.45 | ) | | | | (0.41 | ) | | | | (0.17 | ) |
| Net asset value, end of year | | | | $10.62 | | | | | $10.76 | | | | | $10.58 | |
| Total return | | | | 3.01 | % | | | | 5.63 | % | | | | 7.55 | %2 |
| Supplemental data and ratios: | | | | | | | | | | | | | | | |
| Net assets, end of year | | $140,497,937 | | | $115,477,776 | | | $73,269,622 | |
| Ratio of expenses to average net assets4 | | | | | | | | | | | | | | | |
| Before expense reimbursement (recapture) and securities lending credit | | | | 1.14 | % | | | | 1.18 | % | | | | 1.33 | %3 |
| After expense reimbursement (recapture) and securities lending credit | | | | 0.88 | % | | | | 0.88 | % | | | | 1.10 | %3 |
| Ratio of net investment income to average net assets5 | | | | | | | | | | | | | | | |
| Before expense reimbursement (recapture) and securities lending credit | | | | 3.23 | % | | | | 3.66 | % | | | | 3.66 | %3 |
| After expense reimbursement (recapture) and securities lending credit | | | | 3.49 | % | | | | 3.96 | % | | | | 3.89 | %3 |
| Portfolio turnover rate | | | | 66.76 | % | | | | 100.40 | % | | | | 21.35 | %2 |
Portfolio Turnover is calculated for the Fund as a whole.
| 1 | Commencement of operations. |
| 2 | Not annualized. |
| 3 | Annualized. |
| 4 | These ratios exclude the impact of the expenses of the underlying investment companies and exchange-traded funds in which the Fund invests. |
| 5 | Recognition of the net investment income by the Fund is affected by the timing of the declaration of dividends by the underlying investment companies and exchange-traded funds in which the Fund invests. |
See notes to financial statements.
GuideMark® Funds & GuidePath® Funds
FINANCIAL HIGHLIGHTS
| | | Fixed Income Allocation Fund | |
| | | Institutional | | | Service | |
| | | Year Ended
March 31,
2015 | | | Year Ended
March 31,
2014 | | | September 13,
20121
Through
March 31,
2013 | | | Year Ended
March 31,
2015 | | | Year Ended
March 31,
2014 | | | August 31,
20121
Through
March 31,
2013 | |
| Per share data for a share of capital stock outstanding for the entire year and selected information for the year are as follows: | | | | | | | | | | | | | | | | | | | | | | | | | | | | | | |
| Net asset value, beginning of year | | | | $ 9.65 | | | | | $10.00 | | | | | $10.01 | | | | | $ 9.64 | | | | | $ 9.98 | | | | | $10.00 | |
| Income from investment operations: | | | | | | | | | | | | | | | | | | | | | | | | | | | | | | |
| Net investment income | | | | 0.25 | | | | | 0.19 | | | | | 0.13 | | | | | 0.19 | | | | | 0.15 | | | | | 0.10 | |
| Net realized and unrealized gains (losses) on investments | | | | 0.11 | | | | | (0.27 | ) | | | | (0.04 | ) | | | | 0.13 | | | | | (0.30 | ) | | | | (0.04 | ) |
| Total from investment operations | | | | 0.36 | | | | | (0.08 | ) | | | | 0.09 | | | | | 0.32 | | | | | (0.15 | ) | | | | 0.06 | |
| Less distributions: | | | | | | | | | | | | | | | | | | | | | | | | | | | | | | |
| Dividends from net investment income | | | | (0.25 | ) | | | | (0.24 | ) | | | | (0.10 | ) | | | | (0.19 | ) | | | | (0.16 | ) | | | | (0.08 | ) |
| Dividends from net realized gains | | | | — | | | | | (0.03 | ) | | | | — | * | | | | — | | | | | (0.03 | ) | | | | — | * |
| Total distributions | | | | (0.25 | ) | | | | (0.27 | ) | | | | (0.10 | ) | | | | (0.19 | ) | | | | (0.19 | ) | | | | (0.08 | ) |
| Net asset value, end of year | | | | $ 9.76 | | | | | $ 9.65 | | | | | $10.00 | | | | | $ 9.77 | | | | | $ 9.64 | | | | | $ 9.98 | |
| Total return | | | | 3.75 | % | | | | -0.83 | % | | | | 0.88 | %2 | | | | 3.32 | % | | | | -1.47 | % | | | | 0.59 | %2 |
| Supplemental data and ratios: | | | | | | | | | | | | | | | | | | | | | | | | | | | | | | |
| Net assets, end of year | | $2,257,327 | | | $960,185 | | | $503,918 | | | $143,904,504 | | | $213,499,393 | | | $227,815,865 | |
| Ratio of expenses to average net assets4 | | | | | | | | | | | | | | | | | | | | | | | | | | | | | | |
| Before expense reimbursement (recapture) and securities lending credit | | | | 0.42 | % | | | | 0.41 | % | | | | 0.50 | %3 | | | | 1.02 | % | | | | 1.01 | % | | | | 1.09 | %3 |
| After expense reimbursement (recapture) and securities lending credit | | | | 0.31 | % | | | | 0.32 | % | | | | 0.43 | %3 | | | | 0.92 | % | | | | 0.92 | % | | | | 1.03 | %3 |
| Ratio of net investment income to average net assets5 | | | | | | | | | | | | | | | | | | | | | | | | | | | | | | |
| Before expense reimbursement (recapture) and securities lending credit | | | | 2.66 | % | | | | 1.98 | % | | | | 2.44 | %3 | | | | 1.72 | % | | | | 1.40 | % | | | | 1.78 | %3 |
| After expense reimbursement (recapture) and securities lending credit | | | | 2.77 | % | | | | 2.07 | % | | | | 2.51 | %3 | | | | 1.82 | % | | | | 1.49 | % | | | | 1.84 | %3 |
| Portfolio turnover rate | | | | 22.67 | % | | | | 67.82 | % | | | | 18.75 | %2 | | | | 22.67 | % | | | | 67.82 | % | | | | 18.75 | %2 |
Portfolio Turnover is calculated for the Fund as a whole.
| 1 | Commencement of operations. |
| 2 | Not annualized. |
| 3 | Annualized. |
| 4 | These ratios exclude the impact of the expenses of the underlying investment companies and exchange-traded funds in which the Fund invests. |
| 5 | Recognition of the net investment income by the Fund is affected by the timing of the declaration of dividends by the underlying investment companies and exchange-traded funds in which the Fund invests. |
| * | Amount represents less than $0.01 per share. |
See notes to financial statements.
GuideMark® Funds & GuidePath® Funds
FINANCIAL HIGHLIGHTS
| | | Altegris® Diversified Alternatives Allocation Fund | |
| | | Institutional | | | Service | |
| | | Year Ended
March 31,
2015 | | | Year Ended
March 31,
2014 | | | September 13,
20121
Through
March 31,
2013 | | | Year Ended
March 31,
2015 | | | Year Ended
March 31,
2014 | | | August 31,
20121
Through
March 31,
2013 | |
| Per share data for a share of capital stock outstanding for the entire year and selected information for the year are as follows: | | | | | | | | | | | | | | | | | | | | | | | | | | | | | | |
| Net asset value, beginning of year | | | | $ 9.89 | | | | | $10.01 | | | | | $10.07 | | | | | $ 9.89 | | | | | $10.00 | | | | | $10.00 | |
| Income from investment operations: | | | | | | | | | | | | | | | | | | | | | | | | | | | | | | |
| Net investment income | | | | 0.24 | | | | | 0.28 | | | | | 0.05 | | | | | 0.20 | | | | | 0.26 | | | | | 0.03 | |
| Net realized and unrealized gains (losses) on investments | | | | 0.58 | | | | | (0.11 | ) | | | | (0.07 | ) | | | | 0.58 | | | | | (0.11 | ) | | | | — | |
| Total from investment operations | | | | 0.82 | | | | | 0.17 | | | | | (0.02 | ) | | | | 0.78 | | | | | 0.15 | | | | | 0.03 | |
| Less distributions: | | | | | | | | | | | | | | | | | | | | | | | | | | | | | | |
| Dividends from net investment income | | | | (0.23 | ) | | | | (0.29 | ) | | | | (0.04 | ) | | | | (0.19 | ) | | | | (0.26 | ) | | | | (0.03 | ) |
| Dividends from net realized gains | | | | — | | | | | — | * | | | | — | | | | | — | | | | | — | * | | | | — | |
| Total distributions | | | | (0.23 | ) | | | | (0.29 | ) | | | | (0.04 | ) | | | | (0.19 | ) | | | | (0.26 | ) | | | | (0.03 | ) |
| Net asset value, end of year | | | | $10.48 | | | | | $ 9.89 | | | | | $10.01 | | | | | $10.48 | | | | | $ 9.89 | | | | | $10.00 | |
| Total return | | | | 8.34 | % | | | | 1.76 | % | | | | -0.19 | %2 | | | | 7.91 | % | | | | 1.50 | % | | | | 0.26 | %2 |
| Supplemental data and ratios: | | | | | | | | | | | | | | | | | | | | | | | | | | | | | | |
| Net assets, end of year | | $1,922,961 | | | $737,302 | | | $514,104 | | | $100,280,211 | | | $128,520,824 | | | $161,223,450 | |
| Ratio of expenses to average net assets4 | | | | | | | | | | | | | | | | | | | | | | | | | | | | | | |
| Before expense reimbursement (recapture), fees waived and securities lending credit | | | | 0.34 | % | | | | 0.33 | % | | | | 0.30 | %3 | | | | 0.94 | % | | | | 0.93 | % | | | | 0.72 | %3 |
| After expense reimbursement (recapture), fees waived and securities lending credit | | | | 0.19 | % | | | | 0.18 | % | | | | 0.30 | %3 | | | | 0.54 | % | | | | 0.53 | % | | | | 0.72 | %3 |
| Ratio of net investment income to average net assets5 | | | | | | | | | | | | | | | | | | | | | | | | | | | | | | |
| Before expense reimbursement (recapture), fees waived and securities lending credit | | | | 2.30 | % | | | | 3.10 | % | | | | 0.84 | %3 | | | | 1.40 | % | | | | 2.18 | % | | | | 0.47 | %3 |
| After expense reimbursement (recapture), fees waived and securities lending credit | | | | 2.45 | % | | | | 3.25 | % | | | | 0.84 | %3 | | | | 1.80 | % | | | | 2.58 | % | | | | 0.47 | %3 |
| Portfolio turnover rate | | | | 19.66 | % | | | | 40.26 | % | | | | 16.16 | %2 | | | | 19.66 | % | | | | 40.26 | % | | | | 16.16 | %2 |
Portfolio Turnover is calculated for the Fund as a whole.
| 1 | Commencement of operations. |
| 2 | Not annualized. |
| 3 | Annualized. |
| 4 | These ratios exclude the impact of the expenses of the underlying investment companies and exchange-traded funds in which the Fund invests. |
| 5 | Recognition of the net investment income by the Fund is affected by the timing of the declaration of dividends by the underlying investment companies and exchange-traded funds in which the Fund invests. |
| * | Amount represents less than $0.01 per share. |
See notes to financial statements.
GuideMark® Funds & GuidePath® Funds
NOTES TO FINANCIAL STATEMENTS
March 31, 2015
1. Organization
GPS Funds I and GPS Funds II (the “Trusts”) are organized as Delaware statutory trusts under Declarations of Trust dated January 2, 2001 and October 20, 2010, respectively. The Trusts are registered under the Investment Company Act of 1940, as amended (the “1940 Act”), as open-end management investment companies. GPS Funds I is comprised of the following 7 funds: GuideMark® Large Cap Growth Fund, GuideMark® Large Cap Value Fund, GuideMark® Small/Mid Cap Core Fund, GuideMark® World ex-US Fund, GuideMark® Opportunistic Equity Fund, GuideMark® Core Fixed Income Fund, and GuideMark® Tax-Exempt Fixed Income Fund. GPS Funds II is comprised of the following 9 funds: GuideMark® Global Real Return Fund, GuideMark® Opportunistic Fixed Income Fund, GuidePath® Strategic Asset Allocation Fund, GuidePath® Tactical Constrained® Asset Allocation Fund, GuidePath® Tactical Unconstrained® Asset Allocation Fund, GuidePath® Absolute Return Asset Allocation Fund, GuidePath® Multi-Asset Income Asset Allocation Fund, GuidePath® Fixed Income Allocation Fund and GuidePath® Altegris® Diversified Alternatives Allocation Fund (collectively, the “Funds”). All of the Funds, except for the GuideMark® Opportunistic Equity Fund and GuideMark® Opportunistic Fixed Income Fund are classified and operate as diversified funds under the 1940 Act. The GuideMark® Opportunistic Equity Fund and GuideMark® Opportunistic Fixed Income Fund are classified as non-diversified. Each Fund represents a distinct portfolio with its own investment objectives and policies. The assets of each Fund are segregated, and a shareholder’s interest is limited to the Fund in which shares are held. The GuideMark® Global Real Return Fund, GuideMark® Opportunistic Fixed Income Fund, GuidePath® Strategic Asset Allocation Fund, GuidePath® Tactical Constrained® Asset Allocation Fund, GuidePath® Tactical Unconstrained® Asset Allocation Fund and GuidePath® Absolute Return Asset Allocation Fund were seeded on March 4, 2011 and the prospectus went effective on April 1, 2011. The GuideMark® Opportunistic Equity Fund, GuideMark® Global Real Return Fund and GuideMark® Opportunistic Fixed Income Fund commenced operations on April 1, 2011. The GuidePath® Strategic Asset Allocation Fund, GuidePath® Tactical Constrained® Asset Allocation Fund, GuidePath® Tactical Unconstrained® Asset Allocation Fund and GuidePath® Absolute Return Asset Allocation Fund
commenced operations on April 29, 2011. The GuidePath® Multi-Asset Income Asset Allocation Fund, GuidePath® Fixed Income Allocation Fund and GuidePath® Altegris® Diversified Alternatives Allocation Fund commenced operations on August 31, 2012. Each Fund offers two classes of shares: Service Shares and Institutional Shares.
2. Significant Accounting Policies
The following is a summary of significant accounting policies consistently followed by the Funds in the preparation of the financial statements. These policies are in conformity with U.S. generally accepted accounting principals (“GAAP”).
Portfolio securities listed on a national or foreign securities exchange, except those listed on NASDAQ, for which market quotations are available are valued at the last quoted sale price on each business day. Portfolio securities traded on NASDAQ are valued at the NASDAQ Official Closing Price (“NOCP”) on each business day. If there is no reported sale on an exchange or NASDAQ, the portfolio security will be valued at the mean between the most recent quoted bid and asked price. Price information on listed securities is taken from the exchange where the security is primarily traded.
All equity securities that are not traded on a listed exchange are valued at the last sale price in the over-the-counter market. If a non-exchange traded security does not trade on a particular day, then the mean between the last quoted closing bid and asked price will be used. Non-exchange traded ADRs are priced with an evaluated price as determined by the current evaluated pricing procedures of, and provided by, the pricing vendor.
Fixed income securities that have a maturity of greater than 60 days are generally valued on the basis of evaluations obtained from third party pricing services, which take into account appropriate factors such as institutional-sized trading in similar groups of securities, yield, quality, coupon rate, maturity, type of issue, trading characteristics and other market data. Short term investments having a maturity of less than 60 days are generally valued at amortized cost.
GuideMark® Funds & GuidePath® Funds
NOTES TO FINANCIAL STATEMENTS (Continued)
March 31, 2015
Investments in mutual funds are valued at the closing net asset value per share of each mutual fund on the day of valuation.
To assess the continuing appropriateness of security valuation, the Advisor regularly compares prior day prices with current day prices and transaction prices. When the comparison results exceed pre-defined thresholds, the Advisor challenges the prices exceeding tolerance levels with the pricing service or broker. Securities for which no market quotations are readily available or when a significant event has occurred between the time of the security’s last close and the time that a Fund next calculates its net asset value will be valued at their fair value as determined by the applicable Fund’s Valuation Committee. Securities for which no market prices are readily available will be valued at their fair value as determined by the Valuation Committee under procedures adopted by the applicable Board of Trustees (the “Board”).
The Funds have adopted authoritative fair valuation accounting standards which establish an authoritative definition of fair value and set out a hierarchy for measuring fair value. These standards require additional disclosures about the various inputs and valuation techniques used to develop the measurements of fair value and a discussion in changes in valuation techniques and related inputs, if any, during the period. In addition, these standards require expanded disclosure for each major category of assets. These inputs are summarized in the three broad levels listed below:
Level 1 – Quoted prices in active markets for identical securities.
Level 2 – Other significant observable inputs (including quoted prices for similar securities, interest rates, prepayment speeds, credit risk, etc.).
Level 3 – Significant unobservable inputs (including the Fund’s own assumptions in determining the fair value of investments).
During the year, certain of the securities and other instruments held by the Funds were categorized as Level 2 or Level 3 based upon the inputs and methodologies used to determine the fair value of the security or instrument. Descriptions of the inputs and valuation methodologies used to determine the fair values of each class of investments within Level 2 and Level 3 are set forth below.
Level 2 Investments. The Funds’ investments that were categorized as Level 2 include: (1) certain fixed income securities, including asset-backed securities, bank loans, collateralized mortgage obligations, convertible obligations, corporate obligations, U.S. and foreign government obligations, mortgage-backed securities and municipal bonds; (2) certain common stocks, convertible preferred stocks, preferred stocks, and real estate investment trusts; and (3) certain over-the-counter derivative instruments, including forward currency contracts, futures, swaps and options.
Fixed income securities are normally valued by pricing vendors that use broker-dealer quotations, reported trades or valuation estimates from their internal pricing models. The service providers’ internal models typically use inputs that are observable such as institutional-sized trading in similar groups of securities, yield, credit quality, coupon rate, maturity, type of issue, trading characteristics and other market data.
Certain common stocks that trade on foreign exchanges are subject to valuation adjustments. These valuation adjustments are applied to the foreign exchange-traded common stocks to account for the market movement between the close of the foreign market in which the security is traded and the close of the New York Stock Exchange. These securities are valued using pricing vendors that consider the correlation patterns of price movements of the foreign security to the intraday trading in the U.S. markets.
Foreign currency contracts, futures, swaps and options derive their value from underlying asset prices, indices, reference rates, and other inputs or a combination of these factors. These instruments are
GuideMark® Funds & GuidePath® Funds
NOTES TO FINANCIAL STATEMENTS (Continued)
March 31, 2015
normally valued using pricing vendors. Depending upon the instrument, its value may be provided by a pricing vendor using a series of techniques, including pricing models. The pricing models typically use inputs that are observed from active markets such as indices, spreads, interest rates, curves, dividends and exchange rates.
Level 3 Investments. The Funds’ investments that were categorized as Level 3 include: fair valued securities.
Fair valued securities are normally valued by pricing vendors using relevant observable inputs, as described above. In certain circumstances, the types of observable inputs that are typically used by a pricing service may be unavailable or deemed by the pricing service to be unreliable. In these instances, the pricing vendor may value the security based upon significant unobservable inputs, or the pricing vendor may not provide a value for the security. To the extent that a pricing vendor does not provide a value for a particular security, or the pricing vendor provides a value that the Valuation Committee does not believe accurately reflects the value of the security, the security will be valued by the Valuation Committee based upon the information available to the Committee at the time of valuation and in accordance with procedures adopted by the Board. These methodologies may require subjective judgments and determinations about the value of a particular security. When significant unobservable inputs are used to value a security, the security is categorized as Level 3.
To verify Level 3 unobservable inputs, the Valuation Committee uses a variety of techniques as appropriate to substantiate these valuation approaches including a regular review of key inputs and assumptions, transaction back-testing or disposition analysis and review of related market activity.
The inputs or methodology used for valuing securities are not an indication of the risk associated with investing in those securities.
The following is a summary of the inputs used to value the Funds’ net assets as of March 31, 2015:
GuideMark® Large Cap Growth Fund
| | | | | | | | | |
| | | Level 1 | | | Level 2 | | | Level 3 | | | Total | |
| Common Stocks | | $ | 211,868,702 | | | $ | — | | | $ | — | | | $ | 211,868,702 | |
| Short Term Investments | | | 1,618,914 | | | | — | | | | — | | | | 1,618,914 | |
| Investments Purchased as Securities Lending Collateral | | | 10,704,466 | | | | — | | | | — | | | | 10,704,466 | |
| Total Investments in Securities | | $ | 224,192,082 | | | $ | — | | | $ | — | | | $ | 224,192,082 | |
For further information regarding security characteristics, see the Schedule of Investments. There were no transfers in or out of Levels 1 or 2. Transfers between levels are recognized at the end of the reporting period.
Below is a reconciliation that details the activity of Level 3 securities for which significant unobservable inputs were used to determine fair value during the reporting period.
| Beginning Balance — April 1, 2014 | | $ | 792 | |
| Accreted discounts, net | | | — | |
| Purchases | | | — | |
| Sales | | | — | |
| Transfers into level 3 | | | — | |
| Transfers out of level 3 | | | — | |
| Realized loss | | | (85,191 | )* |
| Change in unrealized depreciation | | | 84,399 | |
| Ending Balance — March 31, 2015 | | $ | — | |
* This realized loss is related to securities lending collateral, see note 6.
GuideMark® Funds & GuidePath® Funds
NOTES TO FINANCIAL STATEMENTS (Continued)
March 31, 2015
| GuideMark® Large Cap Value Fund | | | | | | | | | |
| | | | | | | | | | |
| | | Level 1 | | Level 2 | | Level 3 | | Total | |
| Common Stocks | | $ | 215,381,432 | | $ | — | | $ | — | | $ | 215,381,432 | |
| Investments Purchased as Securities Lending Collateral | | | 12,589,606 | | | — | | | — | | | 12,589,606 | |
| Total Investments in Securities | | $ | 227,971,038 | | $ | — | | $ | — | | $ | 227,971,038 | |
For further information regarding security characteristics, see the Schedule of Investments. There were no transfers in or out of Levels 1 or 2. Transfers between levels are recognized at the end of the reporting period.
Below is a reconciliation that details the activity of Level 3 securities for which significant unobservable inputs were used to determine fair value during the reporting period.
| Beginning Balance — April 1, 2014 | | $ | 906 | |
| Accreted discounts, net | | | — | |
| Purchases | | | — | |
| Sales | | | — | |
| Transfers into level 3 | | | — | |
| Transfers out of level 3 | | | — | |
| Realized loss | | | (97,459 | )* |
| Change in unrealized depreciation | | | 96,553 | |
| Ending Balance — March 31, 2015 | | $ | — | |
* This realized loss is related to securities lending collateral, see note 6.
GuideMark® Small/Mid Cap Core Fund
| | | Level 1 | | | Level 2 | | | Level 3 | | | Total | |
| Common Stocks | | $ | 70,305,099 | | | $ | — | | | $ | — | | | $ | 70,305,099 | |
| Investment Companies | | | 1,135,373 | | | | — | | | | — | | | | 1,135,373 | |
| Real Estate Investment Trusts | | | 5,976,590 | | | | — | | | | — | | | | 5,976,590 | |
| Short Term Investments | | | 332,483 | | | | — | | | | — | | | | 332,483 | |
| Investments Purchased as Securities Lending Collateral | | | 11,945,175 | | | | — | | | | — | | | | 11,945,175 | |
| Total Investments in Securities | | $ | 89,694,720 | | | $ | — | | | $ | — | | | $ | 89,694,720 | |
For further information regarding security characteristics, see the Schedule of Investments. There were no transfers in or out of Levels 1 or 2. Transfers between levels are recognized at the end of the reporting period.
GuideMark® Funds & GuidePath® Funds
NOTES TO FINANCIAL STATEMENTS (Continued)
March 31, 2015
Below is a reconciliation that details the activity of Level 3 securities for which significant unobservable inputs were used to determine fair value during the reporting period.
| Beginning Balance — April 1, 2014 | | $ | 247 | |
| Accreted discounts, net | | | — | |
| Purchases | | | — | |
| Sales | | | — | |
| Transfers into level 3 | | | — | |
| Transfers out of level 3 | | | — | |
| Realized loss | | | (26,523 | )* |
| Change in unrealized depreciation | | | 26,276 | |
| Ending Balance — March 31, 2015 | | $ | — | |
* This realized loss is related to securities lending collateral, see note 6.
GuideMark® World ex-US Fund
| | | Level 1 | | | Level 2 | | | Level 3 | | | Total | |
| Common Stocks | | | | | | | | | | | | | | | | |
| Consumer Discretionary | | $ | 6,643,867 | | | $ | 34,014,096 | | | $ | — | | | $ | 40,657,963 | |
| Consumer Staples | | | 2,126,608 | | | | 26,434,204 | | | | — | | | | 28,560,812 | |
| Energy | | | 6,747,404 | | | | 15,949,054 | | | | — | | | | 22,696,458 | |
| Financials | | | 10,712,214 | | | | 75,130,062 | | | | — | | | | 85,842,276 | |
| Health Care | | | 4,377,268 | | | | 27,183,486 | | | | — | | | | 31,560,754 | |
| Industrials | | | 2,015,489 | | | | 29,987,617 | | | | — | | | | 32,003,106 | |
| Information Technology | | | 1,959,453 | | | | 22,809,884 | | | | — | | | | 24,769,337 | |
| Materials | | | 3,582,696 | | | | 19,848,355 | | | | — | | | | 23,431,051 | |
| Telecommunication Services | | | 1,352,858 | | | | 20,512,017 | | | | — | | | | 21,864,875 | |
| Utilities | | | 739,733 | | | | 8,514,376 | | | | — | | | | 9,254,109 | |
| Total Common Stocks | | | 40,257,590 | | | | 280,383,151 | | | | — | | | | 320,640,741 | |
| Preferred Stocks | | | 2,149,836 | | | | 2,620,986 | | | | — | | | | 4,770,822 | |
| Real Estate Investment Trusts | | | 2 | | | | 3,041,954 | | | | — | | | | 3,041,956 | |
| Short Term Investments | | | 11,524,291 | | | | 409,999 | | | | — | | | | 11,934,290 | |
| Investments Purchased as Securities Lending Collateral | | | 577,042 | | | | — | | | | — | | | | 577,042 | |
| Total Investments in Securities | | $ | 54,508,761 | | | $ | 286,456,090 | | | $ | — | | | $ | 340,964,851 | |
| Other Financial Instruments* | | | | | | | | | | | | | | | | |
| Futures | | $ | (14,902 | ) | | $ | — | | | $ | — | | | $ | (14,902 | ) |
| * | Other financial instruments are derivative instruments not reflected in the Schedule of Investments, such as futures. These instruments are reflected at the unrealized appreciation (depreciation) on the instrument. |
For further information regarding security characteristics, see the Schedule of Investments.
GuideMark® Funds & GuidePath® Funds
NOTES TO FINANCIAL STATEMENTS (Continued)
March 31, 2015
Below is a reconciliation that details the transfer of securities between Level 1 and Level 2 during the reporting period:
| | | Investments | |
| Description | | in Securities | |
| Transfers into Level 1 | | $ | 1,760,790 | |
| Transfers out of Level 1 | | | (526,772 | ) |
| Net Transfers into/(out of) Level 1 | | $ | 1,234,018 | |
| Transfers into Level 2 | | $ | 526,772 | |
| Transfers out of Level 2 | | | (1,760,790 | ) |
| Net Transfers into/(out of) Level 2 | | $ | (1,234,018 | ) |
Transfers were made due to an increase or decrease in the level of inputs utilized for such securities in accordance with the fair value hierarchy.
Below is a reconciliation that details the activity of Level 3 securities for which significant unobservable inputs were used to determine fair value during the reporting period.
| Beginning Balance — April 1, 2014 | | $ | 216 | |
| Accreted discounts, net | | | — | |
| Purchases | | | — | |
| Sales | | | — | |
| Transfers into level 3 | | | — | |
| Transfers out of level 3 | | | — | |
| Realized loss | | | (23,215 | )* |
| Change in unrealized depreciation | | | 22,999 | |
| Ending Balance — March 31, 2015 | | $ | — | |
* This realized loss is related to securities lending collateral, see note 6.
Transfers between levels are recognized at the end of the reporting period.
GuideMark® Opportunistic Equity Fund
| | | Level 1 | | | Level 2 | | | Level 3 | | | Total | |
| Common Stocks | | $ | 128,908,157 | | | $ | — | | | $ | — | | | $ | 128,908,157 | |
| Real Estate Investment Trusts | | | 3,992,036 | | | | — | | | | — | | | | 3,992,036 | |
| Short Term Investments | | | 4,456,400 | | | | — | | | | — | | | | 4,456,400 | |
| Investments Purchased as Securities Lending Collateral | | | 11,333,137 | | | | — | | | | — | | | | 11,333,137 | |
| Total Investments in Securities | | $ | 148,689,730 | | | $ | — | | | $ | — | | | $ | 148,689,730 | |
For further information regarding security characteristics, see the Schedule of Investments. There were no transfers in or out of Levels 1, 2 or 3. Transfers between levels are recognized at the end of the reporting period.
GuideMark® Funds & GuidePath® Funds
NOTES TO FINANCIAL STATEMENTS (Continued)
March 31, 2015
GuideMark® Global Real Return Fund
| | | Level 1 | | | Level 2 | | | Level 3 | | | Total | |
| Investment Companies | | $ | 61,156,778 | | | $ | — | | | $ | — | | | $ | 61,156,778 | |
| Short Term Investments | | | 3,428,156 | | | | — | | | | — | | | | 3,428,156 | |
| Investments Purchased as Securities Lending Collateral | | | 18,747,590 | | | | — | | | | — | | | | 18,747,590 | |
| Total Investments in Securities | | $ | 83,332,524 | | | $ | — | | | $ | — | | | $ | 83,332,524 | |
For further information regarding security characteristics, see the Schedule of Investments. There were no transfers in or out of Levels 1, 2 or 3. Transfers between levels are recognized at the end of the reporting period.
GuideMark® Core Fixed Income Fund
| | | Level 1 | | | Level 2 | | | Level 3 | | | Total | |
| Fixed Income | | | | | | | | | | | | | | | | |
| Asset Backed Securities | | $ | — | | | $ | 33,711,978 | | | $ | — | | | $ | 33,711,978 | |
| Collateralized Mortgage Obligations | | | — | | | | 18,138,834 | | | | — | | | | 18,138,834 | |
| Corporate Obligations | | | — | | | | 123,026,097 | | | | — | | | | 123,026,097 | |
| Foreign Government Debt Obligations | | | — | | | | 999,280 | | | | — | | | | 999,280 | |
| Mortgage Backed Securities | | | — | | | | 104,404,300 | | | | — | | | | 104,404,300 | |
| Municipal Debt Obligations | | | — | | | | 1,481,145 | | | | — | | | | 1,481,145 | |
| U.S. Treasury Obligations | | | — | | | | 29,359,058 | | | | — | | | | 29,359,058 | |
| Total Fixed Income | | | — | | | | 311,120,692 | | | | — | | | | 311,120,692 | |
| Short Term Investments | | | 32,092,188 | | | | — | | | | — | | | | 32,092,188 | |
| Investments Purchased as Securities Lending Collateral | | | 6,327,571 | | | | — | | | | — | | | | 6,327,571 | |
| Total Investments in Securities | | $ | 38,419,759 | | | $ | 311,120,692 | | | $ | — | | | $ | 349,540,451 | |
| Other Financial Instruments* | | | | | | | | | | | | | | | | |
| Futures | | $ | (23,645 | ) | | $ | — | | | $ | — | | | $ | (23,645 | ) |
| Swaps | | | — | | | | (57 | ) | | | — | | | | (57 | ) |
For further information regarding security characteristics, see the Schedule of Investments. There were no transfers in or out of Levels 1 or 2. Transfers between levels are recognized at the end of the reporting period.
Below is a reconciliation that details the activity of Level 3 securities for which significant unobservable inputs were used to determine fair value during the reporting period.
| Beginning Balance — April 1, 2014 | | $ | 191 | |
| Accreted discounts, net | | | — | |
| Purchases | | | — | |
| Sales | | | — | |
| Transfers into level 3 | | | — | |
| Transfers out of level 3 | | | — | |
| Realized loss | | | (20,484 | )* |
| Change in unrealized depreciation | | | 20,293 | |
| Ending Balance — March 31, 2015 | | $ | — | |
* This realized loss is related to securities lending collateral, see note 6.
GuideMark® Funds & GuidePath® Funds
NOTES TO FINANCIAL STATEMENTS (Continued)
March 31, 2015
GuideMark® Tax-Exempt Fixed Income Fund
| | | Level 1 | | | Level 2 | | | Level 3 | | | Total | |
| Municipal Obligations | | $ | — | | | $ | 63,971,735 | | | $ | — | | | $ | 63,971,735 | |
| Short Term Investments | | | 991,579 | | | | — | | | | — | | | | 991,579 | |
| Total Investments in Securities | | $ | 991,579 | | | $ | 63,971,735 | | | $ | — | | | $ | 64,963,314 | |
For further information regarding security characteristics, see the Schedule of Investments. There were no transfers in or out of Levels 1, 2 or 3. Transfers between levels are recognized at the end of the reporting period.
GuideMark® Opportunistic Fixed Income Fund
| | | Level 1 | | | Level 2 | | | Level 3 | | | Total | |
| Equity | | | | | | | | | | | | | | | | |
| Common Stock | | $ | 873,330 | | | $ | 22,430 | | | $ | — | | | $ | 895,760 | |
| Convertible Preferred Stock | | | 1,907,560 | | | | 252,451 | | | | — | | | | 2,160,011 | |
| Investment Companies | | | 136,022 | | | | — | | | | — | | | | 136,022 | |
| Preferred Stock | | | — | | | | 331,830 | | | | — | | | | 331,830 | |
| Total Equity | | | 2,916,912 | | | | 606,711 | | | | — | | | | 3,523,623 | |
| Fixed Income | | | | | | | | | | | | | | | | |
| Asset Backed Securities | | | — | | | | 2,498,180 | | | | — | | | | 2,498,180 | |
| Bank Loans | | | — | | | | 7,910,450 | | | | — | | | | 7,910,450 | |
| Collateralized Mortgage Obligations | | | — | | | | 29,314,429 | | | | — | | | | 29,314,429 | |
| Convertible Obligations | | | — | | | | 2,835,688 | | | | — | | | | 2,835,688 | |
| Corporate Obligations | | | — | | | | 28,432,154 | | | | — | | | | 28,432,154 | |
| Foreign Government Obligations | | | — | | | | 62,760,244 | | | | — | | | | 62,760,244 | |
| Mortgage Backed Securities | | | — | | | | 28,763,268 | | | | — | | | | 28,763,268 | |
| Total Fixed Income | | | — | | | | 162,514,413 | | | | — | | | | 162,514,413 | |
| Purchased Options | | | 87,822 | | | | 63,538 | | | | — | | | | 151,360 | |
| Short Term Investments | | | 18,478,884 | | | | 8,022,720 | | | | — | | | | 26,501,604 | |
| Total Investments in Securities | | $ | 21,483,618 | | | $ | 171,207,382 | | | $ | — | | | $ | 192,691,000 | |
| Other Financial Instruments* | | | | | | | | | | | | | | | | |
| Forward Currency Contracts | | $ | — | | | $ | 6,144,535 | | | $ | — | | | $ | 6,144,535 | |
| Futures | | | 21,062 | | | | — | | | | — | | | | 21,062 | |
| Options Written | | | 16,984 | | | | — | | | | — | | | | 16,984 | |
| Swaps | | | — | | | | (1,961,979 | ) | | | — | | | | (1,961,979 | ) |
| * | Other financial instruments are derivative instruments not reflected in the Schedule of Investments, such as forward currency contracts, futures, swaps and written options. Forward currency contracts, futures and swaps are reflected at the unrealized appreciation (depreciation) on the instrument, while written options are reflected at value. |
For further information regarding security characteristics, see the Schedule of Investments. There were no transfers in or out of level 3.
GuideMark® Funds & GuidePath® Funds
NOTES TO FINANCIAL STATEMENTS (Continued)
March 31, 2015
Below is a reconciliation that details the transfer of securities between Level 1 and Level 2 during the reporting period:
| Description | | Investments
in Securities | |
| Transfers into Level 1 | | $ | — | |
| Transfers out of Level 1 | | | (57,629 | ) |
| Net Transfers into/(out of) Level 1 | | $ | (57,629 | ) |
| Transfers into Level 2 | | $ | 57,629 | |
| Transfers out of Level 2 | | | — | |
| Net Transfers into/(out of) Level 2 | | $ | 57,629 | |
Transfers were made due to a decrease in the level of inputs utilized for such securities in accordance with the fair value hierarchy. Transfers between levels are recognized at the end of the reporting period.
GuidePath® Strategic Asset Allocation Fund
| | | Level 1 | | | Level 2 | | | Level 3 | | | Total | |
| Investment Companies | | $ | 261,846,464 | | | $ | — | | | $ | — | | | $ | 261,846,464 | |
| Short Term Investments | | | 4,950,790 | | | | — | | | | — | | | | 4,950,790 | |
| Investments Purchased as Securities Lending Collateral | | | 62,810,051 | | | | — | | | | — | | | | 62,810,051 | |
| Total Investments in Securities | | $ | 329,607,305 | | | $ | — | | | $ | — | | | $ | 329,607,305 | |
For further information regarding security characteristics, see the Schedule of Investments. There were no transfers in or out of Levels 1, 2 or 3. Transfers between levels are recognized at the end of the reporting period.
GuidePath® Tactical Constrained® Asset Allocation Fund
| | | Level 1 | | | Level 2 | | | Level 3 | | | Total | |
| Investment Companies | | $ | 174,774,892 | | | $ | — | | | $ | — | | | $ | 174,774,892 | |
| Short Term Investments | | | 5,104,616 | | | | — | | | | — | | | | 5,104,616 | |
| Investments Purchased as Securities Lending Collateral | | | 16,506,270 | | | | — | | | | — | | | | 16,506,270 | |
| Total Investments in Securities | | $ | 196,385,778 | | | $ | — | | | $ | — | | | $ | 196,385,778 | |
For further information regarding security characteristics, see the Schedule of Investments. There were no transfers in or out of Levels 1, 2 or 3. Transfers between levels are recognized at the end of the reporting period.
GuidePath® Tactical Unconstrained® Asset Allocation Fund
| | | Level 1 | | | Level 2 | | | Level 3 | | | Total | |
| Investment Companies | | $ | 476,372,411 | | | $ | — | | | $ | — | | | $ | 476,372,411 | |
| Short Term Investments | | | 8,663,476 | | | | — | | | | — | | | | 8,663,476 | |
| Investments Purchased as Securities Lending Collateral | | | 61,819,802 | | | | — | | | | — | | | | 61,819,802 | |
| Total Investments in Securities | | $ | 546,855,689 | | | $ | — | | | $ | — | | | $ | 546,855,689 | |
For further information regarding security characteristics, see the Schedule of Investments. There were no transfers in or out of Levels 1, 2 or 3. Transfers between levels are recognized at the end of the reporting period.
GuideMark® Funds & GuidePath® Funds
NOTES TO FINANCIAL STATEMENTS (Continued)
March 31, 2015
GuidePath® Absolute Return Asset Allocation Fund
| | | Level 1 | | | Level 2 | | | Level 3 | | | Total | |
| Investment Companies | | $ | 362,304,163 | | | $ | — | | | $ | — | | | $ | 362,304,163 | |
| Short Term Investments | | | 6,894,864 | | | | — | | | | — | | | | 6,894,864 | |
| Investments Purchased as Securities Lending Collateral | | | 35,062,476 | | | | — | | | | — | | | | 35,062,476 | |
| Total Investments in Securities | | $ | 404,261,503 | | | $ | — | | | $ | — | | | $ | 404,261,503 | |
For further information regarding security characteristics, see the Schedule of Investments. There were no transfers in or out of Levels 1, 2 or 3. Transfers between levels are recognized at the end of the reporting period.
GuidePath® Multi-Asset Income Asset Allocation Fund
| | | Level 1 | | | Level 2 | | | Level 3 | | | Total | |
| Investment Companies | | $ | 137,489,157 | | | $ | — | | | $ | — | | | $ | 137,489,157 | |
| Short Term Investments | | | 2,708,204 | | | | — | | | | — | | | | 2,708,204 | |
| Investments Purchased as Securities Lending Collateral | | | 17,880,139 | | | | — | | | | — | | | | 17,880,139 | |
| Total Investments in Securities | | $ | 158,077,500 | | | $ | — | | | $ | — | | | $ | 158,077,500 | |
For further information regarding security characteristics, see the Schedule of Investments. There were no transfers in or out of Levels 1, 2 or 3. Transfers between levels are recognized at the end of the reporting period.
GuidePath® Fixed Income Allocation Fund
| | | Level 1 | | | Level 2 | | | Level 3 | | | Total | |
| Investment Companies | | $ | 141,914,212 | | | $ | — | | | $ | — | | | $ | 141,914,212 | |
| Short Term Investments | | | 4,074,667 | | | | — | | | | — | | | | 4,074,667 | |
| Investments Purchased as Securities Lending Collateral | | | 25,070,590 | | | | — | | | | — | | | | 25,070,590 | |
| Total Investments in Securities | | $ | 171,059,469 | | | $ | — | | | $ | — | | | $ | 171,059,469 | |
For further information regarding security characteristics, see the Schedule of Investments. There were no transfers in or out of Levels 1, 2 or 3. Transfers between levels are recognized at the end of the reporting period.
GuidePath® Altegris® Diversified Alternatives Allocation Fund
| | | Level 1 | | | Level 2 | | | Level 3 | | | Total | |
| Investment Companies | | $ | 100,259,466 | | | $ | — | | | $ | — | | | $ | 100,259,466 | |
| Short Term Investments | | | 1,873,592 | | | | — | | | | — | | | | 1,873,592 | |
| Total Investments in Securities | | $ | 102,133,058 | | | $ | — | | | $ | — | | | $ | 102,133,058 | |
For further information regarding security characteristics, see the Schedule of Investments. There were no transfers in or out of Levels 1, 2 or 3. Transfers between levels are recognized at the end of the reporting period.
GuideMark® Funds & GuidePath® Funds
NOTES TO FINANCIAL STATEMENTS (Continued)
March 31, 2015
| | (b) | Subsequent Events Evaluation |
In preparing these financial statements, the Funds have evaluated events and transactions through the date of issuance for potential recognition or disclosure resulting from subsequent events. This evaluation did not result in any subsequent events that necessitated disclosures and/or adjustments to the financial statements.
Each Fund may enter into repurchase agreements with banks and securities dealers. These transactions involve the purchase of securities with a simultaneous commitment to sell the securities to the bank or the dealer at an agreed-upon date and price. A repurchase agreement is accounted for as an investment by the Fund, collateralized by securities, which are delivered to the Fund’s Custodian or to an agent bank under a tri-party agreement. The securities are marked-to-market daily and additional securities are acquired as needed, to ensure that their value equals or exceeds the repurchase price plus accrued interest.
The Funds intend to continue to comply with the requirements of sub-chapter M of the Internal Revenue Code necessary to qualify as regulated investment companies and to make the requisite distributions of income and capital gains to shareholders sufficient to relieve the Funds from all or substantially all Federal income taxes. Therefore, no Federal income tax provision is required.
The Funds have adopted financial reporting rules regarding recognition and measurement of tax positions taken or expected to be taken on a tax return. The Funds have reviewed all open tax years and major jurisdictions and concluded that no provision for income tax is required in the Funds’ financial statements. The Funds recognize interest and penalties, if any, related to unrecognized tax benefits as income tax expense on the Statement of Operations. During the fiscal year ended March 31, 2015, the Funds did not incur any interest or penalties. The Funds’ Federal and state income and Federal excise tax returns for tax years for which the applicable
statutes of limitations have not expired are subject to examination by the Internal Revenue Service and state departments of revenue. The Funds are not subject to examination for tax years prior to 2011.
The preparation of financial statements in conformity with GAAP requires management to make estimates and assumptions that affect the reported amounts of assets and liabilities and disclosure of contingent assets and liabilities at the date of the financial statements and the reported amounts of revenues and expenses during the reported period. Actual results could differ from those estimates.
Under each Trust’s organizational documents, its officers and trustees are indemnified against certain liability arising out of their performance of their duties to the Funds. In addition, in the normal course of business, the Funds enter into contracts that contain a variety of representations and warranties that provide general indemnifications. The Funds’ maximum exposure under these arrangements is unknown as this would involve future claims that may be made against the Funds that have not yet occurred. However, the Funds expect the risk of loss to be remote.
Many expenses of the Funds can be directly attributed to a specific Fund. Additionally, some expenses can be directly attributed to a specific Trust, in which case the expense is apportioned among the Funds within that Trust based on relative net assets. Expenses that cannot be directly attributed to a specific Fund or Trust are apportioned among all the Funds based on relative net assets.
| | (h) | Organization and Offering Costs |
Organization costs consist of costs incurred to establish a Trust and enable it legally to do business. The Fund expenses organizational costs as incurred. These expenses were advanced by the Advisor, and the Advisor has agreed to reimburse the Funds for these expenses, subject to potential recovery (see Note 3). Offering costs are accounted for as deferred costs
GuideMark® Funds & GuidePath® Funds
NOTES TO FINANCIAL STATEMENTS (Continued)
March 31, 2015
until operations begin. Offering costs include legal fees regarding the preparation of the initial registration statement. Offering costs are then amortized to expense over twelve months on a straight-line basis.
| | (i) | Security Transactions and Income Recognition
Security transactions are accounted for on trade date. Dividend income is recognized on the ex-dividend date, and the interest income recorded using the effective yield method is accrued daily. Realized gains and losses on investment transactions are determined using the high cost method. Return of capital distributions received from REIT securities are recorded as an adjustment to the cost of the security and thus may impact unrealized or realized gains or losses on the security. Gains and losses from paydowns on mortgage and asset backed securities are recorded as adjustments to interest income. Distributions from underlying investment companies are classified as investment income or realized gains based on the U.S. income tax characteristics of the distribution. |
| | (j) | Distributions to Shareholders |
The Funds, with the exception of the Core Fixed Income Fund, Tax-Exempt Fixed Income Fund, Opportunistic Fixed Income Fund, Multi-Asset Income Asset Allocation Fund, and Fixed Income Allocation Fund will distribute any net investment income at least annually. The Core Fixed Income Fund, Tax-Exempt Fixed Income Fund, Opportunistic Fixed Income Fund, Multi-Asset Income Asset Allocation Fund, and Fixed Income Allocation Fund will distribute any net investment income quarterly. All of the Funds will distribute any net realized long or short-term capital gains at least annually. Certain Funds also utilize earnings and profits distributed to shareholders on redemptions of shares as part of the dividends paid deduction. Distributions to shareholders are recorded on the ex-dividend date. The Funds may also pay a special distribution at the end of the calendar year to comply with Federal tax requirements.
Each Fund may invest in derivative securities including call and put options, futures, forward
currency contracts and swaps. These instruments may be used by a Fund for hedging purposes as well as direct investment.
Forward Currency Contracts
The Funds may enter into forward currency contracts, obligating the Funds to deliver and receive currency at a specified future date. Transactions involving forward currency contracts may serve as long hedges (for example, if a Fund seeks to buy a security denominated in a foreign security, it may purchase a forward currency contract to lock in the U.S. dollar price of the security) or as short hedges (if a Fund anticipates selling a security denominated in a foreign currency, it may sell a forward currency contract to lock in the U.S. dollar equivalent of the anticipated sales proceeds). Forward contracts are valued daily and unrealized appreciation or depreciation is recorded daily as the difference between the contract exchange rate and the closing forward rate applied to the face amount of the contract.
Options
Exchange-traded options are valued at the last reported sale price on the exchange on which the security underlying the option is principally traded. If no sales are reported on a particular day for exchange-traded options, or the options are not exchange-traded, the options are valued at the mean between the most recent quoted bid and asked quotations at the close of the exchange.
The premium that a Fund pays when purchasing a call option or receives when writing a call option will reflect, among other things, the market price of the security, the relationship of the exercise price to the market price of the security, the relationship of the exercise price to the volatility of the security, the length of the option period and supply and demand factors. The premium is the value of an option at the date of purchase. A purchaser (holder) of a put option pays a non-refundable premium to the seller (writer) of a put option to obtain the right to sell a specified amount of a security at a fixed price (the exercise price) during a specified period (exercise period). Conversely, the
GuideMark® Funds & GuidePath® Funds
NOTES TO FINANCIAL STATEMENTS (Continued)
March 31, 2015
seller (writer) of a put option, upon payment by the holder of the premium, has the obligation to buy the security from the holder of the put option at the exercise price during the exercise period.
Futures
Each Fund has the ability to buy and sell stock index futures contracts traded on domestic stock exchanges to hedge the value of its portfolio against changes in market conditions. A stock index futures contract is an agreement between two parties to take or make delivery of an amount of cash equal to a specified dollar amount, times the difference between stock index value at the close of the last trading day of the contract and the price at which the futures contract is originally struck. A stock index futures contract does not involve the physical delivery of the underlying stocks in the index. Although stock index futures contracts call for the actual taking of delivery of cash, in most cases a Fund expects to liquidate its stock index futures positions through offsetting transactions, which may result in a gain or loss, before cash settlement is required.
The World ex-US Fund, Core Fixed Income Fund and each of the GPS Funds II portfolios may purchase or sell other types of futures contracts, including those based on particular interest rates, securities, foreign currencies, securities indices and other financial instruments and indices. The Core Fixed Income Fund and each of the GPS Funds II portfolios may also
purchase and write call and put options on such future contracts, in order to seek to increase total return or to hedge against changes in interest rates, securities prices, or currency exchange rates, or, to the extent permitted by its investment policies, to otherwise manage its portfolio of investments.
Futures contracts are valued at the daily quoted settlement prices.
Swaps
The Core Fixed Income Fund and each of the GPS Funds II portfolios may enter into interest rate, mortgage, credit, currency and total return swaps, interest rate caps, floors and collars. The Core Fixed Income Fund and each of the GPS Funds II portfolios may also purchase and write (sell) options contracts on swaps, referred to as “swaptions”. The Funds may enter into swap transactions for hedging purposes or to seek to increase total return. Since interest rate, mortgage, credit and currency swaps and interest rate caps, floors and collars are individually negotiated, the Funds expect to achieve an acceptable degree of correlation between their portfolio investments and their swap, cap, floor and collar positions.
Swap agreements are valued using the daily mean and unrealized appreciation or depreciation is recorded daily as the difference between the prior day and current day closing price.
GuideMark® Funds & GuidePath® Funds
NOTES TO FINANCIAL STATEMENTS (Continued)
March 31, 2015
Derivative Instruments and Hedging Activities
Each Trust has adopted derivative instruments disclosure standards, in order to enable the investor to understand how and why an entity used derivatives, how derivatives are accounted for, and how derivative instruments affect an entity’s results of operations and financial position.
In general, the use of derivatives may increase the risk within the Fund. The use of over-the-counter derivatives involves the risk that the counterparty to the contract will fail to make required payments or otherwise comply with the terms of the contract. The results achieved by the use of derivatives in the Fund may not match or fully offset changes in the value of the underlying financial assets being hedged or the investment opportunity the Fund was pursuing, thereby failing to achieve, to an extent, the original purpose for using the derivatives. Certain types of derivatives may create leverage insofar as a Fund may receive returns (or suffer losses) exceeding the initial amounts the Fund committed in connection with the derivatives. The use of derivatives can result in losses or gains to a Fund exceeding the amount the Fund would have experienced in the absence of using derivatives. A relatively small price movement in a derivative may result in an immediate and substantial loss, or gain, to the Fund.
GuideMark® World ex-US Fund
During the year the Fund utilized exchange traded equity index futures in order to equitize cash. At year end the portfolio had approximately 2.1% invested in these instruments.
Balance Sheet — Values of Derivative Instruments as of March 31, 2015
| | | Asset Derivatives | | | Liability Derivatives | |
| | | Balance Sheet Location | | | Value | | | Balance Sheet Location | | | Value | |
| | | | | | | | | | | | | |
| Equity Contracts — Futures* | | Unrealized appreciation on futures contracts | | | $30,149 | | | Unrealized depreciation on futures contracts | | | $45,051 | |
| Total | | | | | $30,149 | | | | | | $45,051 | |
* Includes cumulative appreciation/depreciation as reported on the Schedule of Investments.
The Effect of Derivative Instruments on the Statement of Operations for the Year Ended March 31, 2015
Amount of Realized Gain on Derivatives
Recognized in Income | | | Change in Unrealized Depreciation on Derivatives
Recognized in Income | |
| | | | Futures Contracts | | | | | | Futures Contracts | |
| Equity Contracts | | | $61,560 | | | Equity Contracts | | | $(364,452) | |
| Total | | | $61,560 | | | Total | | | $(364,452) | |
GuideMark® Core Fixed Income Fund
During the period, the Fund used fixed income derivatives including U.S. Treasury futures and credit default swaps on investment grade fixed income indices (CDX), for both hedging and investment purposes, primarily duration management, risk management, and the pursuit of relative value opportunities. Futures contracts used in the Fund during the period included those based on short, medium, and long-term U.S. Treasury debt.
The Fund used futures contracts during the period primarily to manage interest rate risk. The Fund used investment grade CDX to efficiently manage investment grade credit exposure.
GuideMark® Funds & GuidePath® Funds
NOTES TO FINANCIAL STATEMENTS (Continued)
March 31, 2015
Balance Sheet — Values of Derivative Instruments as of March 31, 2015
| | | Asset Derivatives | | | Liability Derivatives | |
| | | Balance Sheet Location | | Value | | | Balance Sheet Location | | Value | |
| | | | | | | | | | | | | |
| Credit Contracts — Swaps | | Appreciation on Swap Agreements | | $ | — | | | Depreciation on Swap Agreements | | $ | 57 | |
| Interest Rate Contracts — Futures* | | Unrealized appreciation on futures contracts | | | 6,660 | | | Unrealized depreciation on futures contracts | | | 30,305 | |
| Total | | | | $ | 6,660 | | | | | $ | 30,305 | |
* Includes cumulative appreciation/depreciation as reported on the Schedule of Investments.
The Effect of Derivative Instruments on the Statement of Operations for the Year Ended March 31, 2015
| Amount of Realized Loss on Derivatives Recognized in Income |
| | | Futures Contracts | | Swaps | | | | | |
| | | | | | | | | | | | | |
| Interest Rate Contracts | | $ | — | | | $ | — | | | | | |
| Credit Contracts | | | — | | | | (3,295 | ) | | | | |
| Total | | $ | — | | | $ | (3,295 | ) | | | | |
| | | | | | | | | | | | | |
| Change in Unrealized Depreciation on Derivatives Recognized in Income |
| | | Futures Contracts | | Swaps | | | | | |
| | | | | | | | | | | | | |
| Interest Rate Contracts | | $ | (23,645 | ) | | $ | — | | | | | |
| Credit Contracts | | | — | | | | (57 | ) | | | | |
| Total | | $ | (23,645 | ) | | $ | — | | | | | |
GuideMark® Opportunistic Fixed Income Fund
The Fund invested in derivatives in order to manage risk or gain exposure to various other investments or markets. Derivatives may contain various risks, including the potential inability of the counterparty to fulfill their obligations under the terms of the contract, the potential for an illiquid secondary market, and the potential for market movements which may expose the Fund to gains or losses.
The Fund seeks to maximize total investment returns through exposure to investments in fixed-income securities, equity securities, and currency instruments. The Fund expects that its exposure to these asset classes will often be obtained substantially through the use of swap agreements. The Fund entered into swap agreements to manage and/or gain exposures to credit risk. The Fund entered into financial futures contracts primarily to manage interest rate risk. The Fund entered into forward exchange contracts primarily to manage and/or gain exposure to certain foreign currencies. The Fund entered into option contracts to gain investment exposures in accordance with its objective.
The Fund used currency forwards during the period for the purpose of hedging exposures within the Fund to non-dollar-denominated assets. In general, the use of currency derivative contracts for hedging may reduce the overall risk level of the Fund, albeit at a cost that may lower overall performance. In general, the use of currency derivatives for hedging purposes will not lead to leverage within the Fund.
GuideMark® Funds & GuidePath® Funds
NOTES TO FINANCIAL STATEMENTS (Continued)
March 31, 2015
Balance Sheet — Values of Derivative Instruments as of March 31, 2015
| | | | | | | | | | |
| | | Asset Derivatives | | Liability Derivatives | |
| | | Balance Sheet Location | | Value | | Balance Sheet Location | | Value | |
| Credit Contracts — Swaps | | Appreciation on Swap Agreements | $ | 21,259 | | Depreciation on Swap Agreements | $ | 72,660 | |
| Interest Rate Contracts — Swaps | | Appreciation on Swap Agreements | | 31,102 | | Depreciation on Swap Agreements | | 1,941,680 | |
Foreign Exchange Contracts —
Forward Currency Contracts | | Appreciation of forward
currency contracts | | 9,695,622 | | Depreciation of forward
currency contracts | | 3,551,087 | |
| Equity Contracts — Options | | Investments, at Value | | 87,822 | | Options Written, at Value | | 16,984 | |
Foreign Exchange Contracts —
Options | | Investments, at Value | | 13,394 | | Options Written, at Value | | — | |
| Interest Rate Contracts — Options | | Investments, at Value | | 50,144 | | Options Written, at Value | | — | |
| Equity Contracts — Futures* | | Unrealized appreciation on futures contracts | | 17,159 | | Unrealized depreciation on futures contracts | | — | |
| Interest Rate Contracts — Futures* | | Unrealized appreciation on futures contracts | | 4,383 | | Unrealized depreciation on futures contracts | | 480 | |
| Total | | | $ | 9,920,885 | | | $ | 5,582,891 | |
* Includes cumulative appreciation/depreciation as reported on the Schedule of Investments.
The Effect of Derivative Instruments on the Statement of Operations for the Year Ended March 31, 2015
| | | | | | | | | | | | | |
| Amount of Realized Gain or (Loss) on Derivatives Recognized in Income |
| | | Futures
Contracts | | Forward Currency
Contracts | | Written
Options | | Purchased
Options* | | Swaps | | Total |
| Interest Rate Contracts | | $ | (523,581 | ) | | $ | — | | | $ | — | | | $ | 8,317 | | | | $(337,313 | ) | | $ | (852,577 | ) |
| Foreign Exchange Contracts | | | — | | | | 1,483,937 | | | | 9,880 | | | | 237,827 | | | | — | | | | 1,731,644 | |
| Equity Contracts | | | (348,180 | ) | | | — | | | | 1,839 | | | | 28,510 | | | | — | | | | (317,831 | ) |
| Credit Contracts | | | — | | | | — | | | | — | | | | — | | | | (259,942 | ) | | | (259,942 | ) |
| Total | | $ | (871,761 | ) | | $ | 1,483,937 | | | $ | 11,719 | | | $ | 274,654 | | | | $(597,255 | ) | | $ | 301,294 | |
| * Included in net realized gain (loss) on investments as reported on the Statement of Operations. | |
| | |
| Change in Unrealized Appreciation or (Depreciation) on Derivatives Recognized in Income | |
| | | Futures | | Forward Currency
Contracts | | Written
Options | | Purchased
Options* | | Swaps | | Total |
| Interest Rate Contracts | | | $10,335 | | | $ | — | | | $ | — | | | $ | (49,923 | ) | | $ | (1,502,820 | ) | | $ | (1,542,408 | ) |
| Foreign Exchange Contracts | | | — | | | | 6,981,181 | | | | — | | | | (19,854 | ) | | | — | | | | 6,961,327 | |
| Equity Contracts | | | 31,665 | | | | — | | | | 42,785 | | | | (87,858 | ) | | | — | | | | (13,408 | ) |
| Credit Contracts | | | — | | | | — | | | | — | | | | — | | | | 96,986 | | | | 96,986 | |
| Total | | | $42,000 | | | $ | 6,981,181 | | | $ | 42,785 | | | $ | (157,635 | ) | | $ | (1,405,834 | ) | | $ | 5,502,497 | |
* Included in net change in unrealized appreciation (depreciation) on investments as reported on the Statement of Operations.
GuideMark® Funds & GuidePath® Funds
NOTES TO FINANCIAL STATEMENTS (Continued)
March 31, 2015
| | | | | | | | | | | | | |
The average monthly value outstanding of purchased and written options during the year ended March 31, 2015 were as follows: |
| | | | | | | | | | | | | |
| | | GuideMark®
World
ex-US
Fund | | GuideMark®
Core
Fixed Income
Fund | | GuideMark®
Opportunistic
Fixed Income
Fund |
| Purchased Options | | | $— | | | | $— | | | | $80,817 | |
| Written Options | | | $— | | | | $— | | | | $(7,271) | |
| | | | | | | | | | | | |
| The average monthly notional amount outstanding of futures, forwards, and swaps during the year ended March 31, 2015 were as follows: |
| |
| Long Positions | | GuideMark®
World
ex-US
Fund | | GuideMark®
Core
Fixed Income
Fund | | GuideMark®
Opportunistic
Fixed Income
Fund |
| | | | | | | | | | | | | |
| Futures | | $ | 12,129,537 | | | $ | 1,096,072 | | | $ | 1,934,741 | |
| Forwards | | $ | — | | | $ | — | | | $ | 70,509,502 | |
| Swaps | | $ | — | | | $ | 47,308 | | | $ | 17,947,492 | |
| | | | | | | | | | | | | |
| Short Positions | | GuideMark®
World
ex-US
Fund | | GuideMark®
Core
Fixed Income
Fund | | GuideMark®
Opportunistic
Fixed Income
Fund |
| Futures | | | $— | | | $ | (515,625 | ) | | $ | (13,152,162 | ) |
| Forwards | | | $— | | | $ | — | | | $ | (42,913,010 | ) |
| | | | | | | | | | | | | |
| Cross | | GuideMark®
World
ex-US
Fund | | GuideMark®
Core
Fixed Income
Fund | | GuideMark®
Opportunistic
Fixed Income
Fund |
| Forwards | | | $— | | | | $— | | | $20,064,717 | |
Derivative Risks
The risks of using the various types of derivatives in which the Funds may engage include: the risk that movements in the value of the derivative may not fully offset or complement instruments currently held in the Fund in the manner intended by the Advisor or sub-advisor; the risk that the counterparty to a derivative contract may fail to comply with its obligations to the Fund; the risk that there may not be a liquid secondary market for the derivative at a time when the Fund would look to disengage the position; the risk that additional capital from the Fund may be called upon to fulfill the conditions of the derivative contract; the risk that the use of derivatives in the Fund may induce leverage in the Fund, and the risk that the cost of the derivative contracts may reduce the overall returns experienced by the Fund.
Offsetting Assets and Liabilities
GuideMark® World ex-US Fund
The Fund is subject to various Master Netting Arrangements, which govern the terms of certain transactions with select counterparties. The Master Netting Arrangements allow the Fund to close out and net its total exposure to a counterparty in the event of a default with respect to all the transactions governed under a single agreement with a counterparty. The Master Netting Arrangements also specify collateral posting arrangements at pre-arranged exposure levels. Under the Master Netting Arrangements, collateral is routinely transferred if the total net exposure to certain transactions (net of existing collateral already in place) governed under the relevant Master Netting Arrangement with a counterparty in a given account exceeds a specified threshold depending on the counterparty and the type of Master Netting Arrangement.
GuideMark® Funds & GuidePath® Funds
NOTES TO FINANCIAL STATEMENTS (Continued)
March 31, 2015
The table below, as of March 31, 2015, discloses both gross information and net information about instruments and transactions eligible for offset in the Statements of Assets and Liabilities and instruments and transactions that are subject to an agreement similar to a master netting agreement as well as amounts related to collateral held at clearing brokers and counterparties. For financial reporting purposes, the Fund does not offset derivative assets and liabilities, and any related collateral received or pledged, on the Statements of Assets and Liabilities, except in the case of futures contracts.
| | | | | | | | | | | | | | | | | | | | | | | | | |
| Assets | | | | | | | | | | Gross Amounts not offset in the
Statement of Assets and Liabilities |
| | | Gross Amounts
of Recognized
Assets | | Gross Amounts
Offset in the
Statement of
Assets and
Liabilities | | Net Amounts
Presented in the
Statement of
Assets and
Liabilities | | Financial
Instruments | | Collateral
Received | | Net Amount |
| Description / Counterparty | | | | | | | | | | | | | | | | | | | | | |
| Futures | | | | | | | | | | | | | | | | | | | | | | | | |
| Goldman Sachs | | | $30,149 | | | | $(30,149) | | | | $ — | | | | $ — | | | | $ — | | | $ — |
| | | | | | | | | | | | | | | | | |
| Liabilities | | | | | | | | | | Gross Amounts not offset in the
Statement of Assets and Liabilities |
| | | Gross Amounts
of Recognized
Liabilities | | Gross Amounts
Offset in the
Statement of
Assets and
Liabilities | | Net Amounts
Presented in the
Statement of
Assets and
Liabilities | | Financial
Instruments | | Collateral
Pledged | | Net Amount |
| Description / Counterparty | | | | | | | | | | | | | | | | | | | | | |
| Futures | | | | | | | | | | | | | | | | | | | | | | | | |
| Goldman Sachs | | | $45,051 | | | | $(30,149) | | | | $ 14,902 | | | | $ (14,902) | | | | $ — | | | $ — |
GuideMark® Core Fixed Income Fund
The Fund is subject to various Master Netting Arrangements, which govern the terms of certain transactions with select counterparties. The Master Netting Arrangements allow the Fund to close out and net its total exposure to a counterparty in the event of a default with respect to all the transactions governed under a single agreement with a counterparty. The Master Netting Arrangements also specify collateral posting arrangements at pre-arranged exposure levels. Under the Master Netting Arrangements, collateral is routinely transferred if the total net exposure to certain transactions (net of existing collateral already in place) governed under the relevant Master Netting Arrangement with a counterparty in a given account exceeds a specified threshold depending on the counterparty and the type of Master Netting Arrangement.
GuideMark® Funds & GuidePath® Funds
NOTES TO FINANCIAL STATEMENTS (Continued)
March 31, 2015
The table below, as of March 31, 2015, discloses both gross information and net information about instruments and transactions eligible for offset in the Statements of Assets and Liabilities’ and instruments and transactions that are subject to an agreement similar to a master netting agreement as well as amounts related to collateral held at clearing brokers and counterparties. For financial reporting purposes, the Fund does not offset derivative assets and liabilities, and any related collateral received or pledged, on the Statements of Assets and Liabilities, except in the case of futures contracts.
| Assets | | | | | | | | Gross Amounts not offset in the
Statement of Assets and Liabilities |
| | | Gross Amounts
of Recognized
Assets | | Gross Amounts
Offset in the
Statement of
Assets and
Liabilities | | Net Amounts
Presented in the
Statement of
Assets and
Liabilities | | Financial
Instruments | | Collateral
Received | | Net Amount |
| Description / Counterparty | | | | | | | | | | | | | | | | | | | | | | | | | | | | | | |
| Futures | | | | | | | | | | | | | | | | | | | | | | | | | | | | | | |
| Credit Suisse | | | $ | 6,660 | | | | $ | (6,660 | ) | | | $ | — | | | | $ | — | | | | $ | — | | | | $ | — | |
| Swaps | | | | | | | | | | | | | | | | | | | | | | | | | | | | | | |
| Morgan Stanley | | | | — | | | | | — | | | | | — | | | | | — | | | | | — | | | | | — | |
| | | | $ | 6,660 | | | | $ | (6,660 | ) | | | $ | — | | | | $ | — | | | | $ | — | | | | $ | — | |
| | | | | | | | | | | | | | | | | | | | | | | | | | | | | | | |
| Liabilities | | | | | | | | | | Gross Amounts not offset in the
Statement of Assets and Liabilities |
| | | Gross Amounts
of Recognized
Liabilities | | Gross Amounts
Offset in the
Statement of
Assets and
Liabilities | | Net Amounts
Presented in the
Statement of
Assets and
Liabilities | | Financial
Instruments | | Collateral
Pledged | | Net Amount |
| Description / Counterparty | | | | | | | | | | | | | | | | | | | | | | | | | | | | | | |
| Futures | | | | | | | | | | | | | | | | | | | | | | | | | | | | | | |
| Credit Suisse | | | $ | 30,305 | | | | $ | (6,660 | ) | | | $ | 23,645 | | | | $ | — | | | | $ | (23,645 | ) | | | $ | — | |
| Swaps | | | | | | | | | | | | | | | | | | | | | | | | | | | | | | |
| Morgan Stanley | | | | 57 | | | | | — | | | | | 57 | | | | | (57 | ) | | | | — | | | | | — | |
| | | | $ | 30,362 | | | | $ | (6,660 | ) | | | $ | 23,702 | | | | $ | (57 | ) | | | $ | (23,645 | ) | | | $ | — | |
GuideMark® Opportunistic Fixed Income Fund
The Fund attempts to reduce its exposure to counterparty credit risk on over-the counter (“OTC”) derivatives, whenever possible, by entering into International Swaps and Derivatives Association, Inc. (“ISDA”) agreements with certain counterparties. These agreements typically contain various provisions, including but not limited to, collateral requirements and master netting provisions in the event of a default or other termination event. Collateral is posted by the Fund or the counterparty to the extent of the net mark-to-market exposure to the other party of all open contracts under the agreement, subject to minimum transfer requirements. The Fund is required to deposit financial collateral in the form of cash and/or securities at the clearing brokers and counterparties to continually meet the original and maintenance requirement established by the clearing brokers and counterparties. Master netting provisions allow the Fund and the counterparty, in the event of a default or other termination event, to offset amounts owed by each related to derivative contracts, including any posted collateral, to one net amount payable by either the Fund or the counterparty. The Fund’s ISDA agreements typically contain provisions that allow a counterparty to terminate open contracts early if the net asset value of a Fund declines beyond a certain threshold. For financial reporting purposes, the Fund does not offset derivative assets and liabilities, and any related collateral received or pledged, on the Statements of Assets and Liabilities, except in the case of futures contracts.
GuideMark® Funds & GuidePath® Funds
NOTES TO FINANCIAL STATEMENTS (Continued)
March 31, 2015
The table below, as of March 31, 2015, discloses both gross information and net information about instruments and transactions eligible for offset in the Statements of Assets and Liabilities’ and instruments and transactions that are subject to an agreement similar to a master netting agreement as well as amounts related to collateral held at clearing brokers and counterparties.
| Assets | | | | | | Gross Amounts not offset in the
Statement of Assets and Liabilities | |
| | | Gross Amounts
of Recognized
Assets | | Gross Amounts
Offset in the
Statement of
Assets and
Liabilities | | Net Amounts
Presented in the
Statement of
Assets and
Liabilities | | Financial
Instruments | | Collateral
Received | | Net Amount | |
| Description / Counterparty | | | | | | | | | | | | | | | | | | | | | | | | | | | | | | |
| Forward Currency Contracts | | | | | | | | | | | | | | | | | | | | | | | | | | | | | | |
| Barclays | | | $ | 1,637,081 | | | | $ | — | | | | $ | 1,637,081 | | | | $ | (365,988 | ) | | | $ | — | | | | $ | 1,271,093 | |
| Citibank | | | | 243,903 | | | | | — | | | | | 243,903 | | | | | (218,074 | ) | | | | — | | | | | 25,829 | |
| Credit Suisse | | | | 157,906 | | | | | — | | | | | 157,906 | | | | | (140,630 | ) | | | | — | | | | | 17,276 | |
| Deutsche Bank | | | | 4,519,743 | | | | | — | | | | | 4,519,743 | | | | | (1,743,901 | ) | | | | — | | | | | 2,775,842 | |
| Goldman Sachs | | | | 907,768 | | | | | — | | | | | 907,768 | | | | | (396,930 | ) | | | | — | | | | | 510,838 | |
| HSBC | | | | 387,302 | | | | | — | | | | | 387,302 | | | | | (175,977 | ) | | | | — | | | | | 211,325 | |
| JP Morgan Chase | | | | 1,405,678 | | | | | — | | | | �� | 1,405,678 | | | | | (444,071 | ) | | | | — | | | | | 961,607 | |
| Merrill Lynch | | | | 29,809 | | | | | — | | | | | 29,809 | | | | | (29,809 | ) | | | | — | | | | | — | |
| Morgan Stanley | | | | 298,160 | | | | | — | | | | | 298,160 | | | | | (28,178 | ) | | | | — | | | | | 269,982 | |
| UBS | | | | 108,272 | | | | | — | | | | | 108,272 | | | | | — | | | | | — | | | | | 108,272 | |
| | | | | | | | | | | | | | | | | | | | | | | | | | | | | | | |
| Futures | | | | | | | | | | | | | | | | | | | | | | | | | | | | | | |
| JP Morgan Chase | | | | 21,542 | | | | | (480 | ) | | | | 21,062 | | | | | — | | | | | — | | | | | 21,062 | |
| | | | | | | | | | | | | | | | | | | | | | | | | | | | | | | |
| Options Written | | | | | | | | | | | | | | | | | | | | | | | | | | | | | | |
| Morgan Stanley | | | | — | | | | | — | | | | | — | | | | | — | | | | | — | | | | | — | |
| | | | | | | | | | | | | | | | | | | | | | | | | | | | | | | |
| Swaps | | | | | | | | | | | | | | | | | | | | | | | | | | | | | | |
| Citibank | | | | 36,802 | | | | | — | | | | | 36,802 | | | | | (18,434 | ) | | | | — | | | | | 18,368 | |
| Citigroup | | | | — | | | | | — | | | | | — | | | | | — | | | | | — | | | | | — | |
| Deutsche Bank | | | | — | | | | | — | | | | | — | | | | | — | | | | | — | | | | | — | |
| JP Morgan Chase | | | | — | | | | | — | | | | | — | | | | | — | | | | | — | | | | | — | |
| Merrill Lynch | | | | 15,559 | | | | | — | | | | | 15,559 | | | | | (6,512 | ) | | | | — | | | | | 9,047 | |
| Morgan Stanley | | | | — | | | | | — | | | | | — | | | | | — | | | | | — | | | | | — | |
| | | | $ | 9,769,525 | | | | $ | (480 | ) | | | $ | 9,769,045 | | | | $ | (3,568,504 | ) | | | $ | — | | | | $ | 6,200,541 | |
GuideMark® Funds & GuidePath® Funds
NOTES TO FINANCIAL STATEMENTS (Continued)
March 31, 2015
| Liabilities | | | | | | | | | | Gross Amounts not offset in the
Statement of Assets and Liabilities | |
| | | Gross Amounts
of Recognized
Liabilities | | Gross Amounts
Offset in the
Statement of
Assets and
Liabilities | | Net Amounts
Presented in the
Statement of
Assets and
Liabilities | | Financial
Instruments | | Collateral
Pledged | | Net Amount | |
| Description / Counterparty | | | | | | | | | | | | | | | | | | | | | | | | | | | | | | |
| Forward Currency Contracts | | | | | | | | | | | | | | | | | | | | | | | | | | | | | | |
| Barclays | | | $ | 365,988 | | | | $ | — | | | | $ | 365,988 | | | | $ | (365,988 | ) | | | $ | — | | | | $ | — | |
| Citibank | | | | 218,074 | | | | | — | | | | | 218,074 | | | | | (218,074 | ) | | | | — | | | | | — | |
| Credit Suisse | | | | 140,630 | | | | | — | | | | | 140,630 | | | | | (140,630 | ) | | | | — | | | | | — | |
| Deutsche Bank | | | | 1,743,901 | | | | | — | | | | | 1,743,901 | | | | | (1,743,901 | ) | | | | — | | | | | — | |
| Goldman Sachs | | | | 396,930 | | | | | — | | | | | 396,930 | | | | | (396,930 | ) | | | | — | | | | | — | |
| HSBC | | | | 175,977 | | | | | — | | | | | 175,977 | | | | | (175,977 | ) | | | | — | | | | | — | |
| JP Morgan Chase | | | | 444,071 | | | | | — | | | | | 444,071 | | | | | (444,071 | ) | | | | — | | | | | — | |
| Merrill Lynch | | | | 37,338 | | | | | — | | | | | 37,338 | | | | | (29,809 | ) | | | | — | | | | | 7,529 | |
| Morgan Stanley | | | | 28,178 | | | | | — | | | | | 28,178 | | | | | (28,178 | ) | | | | — | | | | | — | |
| UBS | | | | — | | | | | — | | | | | — | | | | | — | | | | | — | | | | | — | |
| | | | | | | | | | | | | | | | | | | | | | | | | | | | | | | |
| Futures | | | | | | | | | | | | | | | | | | | | | | | | | | | | | | |
| JP Morgan Chase | | | | 480 | | | | | (480 | ) | | | | — | | | | | — | | | | | — | | | | | — | |
| | | | | | | | | | | | | | | | | | | | | | | | | | | | | | | |
| Options Written | | | | | | | | | | | | | | | | | | | | | | | | | | | | | | |
| Morgan Stanley | | | | 16,984 | | | | | — | | | | | 16,984 | | | | | — | | | | | (16,984 | ) | | | | — | |
| | | | | | | | | | | | | | | | | | | | | | | | | | | | | | | |
| Swaps | | | | | | | | | | | | | | | | | | | | | | | | | | | | | | |
| Citibank | | | | 18,434 | | | | | — | | | | | 18,434 | | | | | (18,434 | ) | | | | — | | | | | — | |
| Citigroup | | | | 7,429 | | | | | — | | | | | 7,429 | | | | | — | | | | | (7,429 | ) | | | | — | |
| Deutsche Bank | | | | 11,841 | | | | | — | | | | | 11,841 | | | | | — | | | | | — | | | | | 11,841 | |
| JP Morgan Chase | | | | 1,967,348 | | | | | — | | | | | 1,967,348 | | | | | — | | | | | (1,010,000 | ) | | | | 957,348 | |
| Merrill Lynch | | | | 6,512 | | | | | — | | | | | 6,512 | | | | | (6,512 | ) | | | | — | | | | | — | |
| Morgan Stanley | | | | 2,776 | | | | | — | | | | | 2,776 | | | | | — | | | | | (2,776 | ) | | | | — | |
| | | | $ | 5,582,891 | | | | $ | (480 | ) | | | $ | 5,582,411 | | | | $ | (3,568,504 | ) | | | $ | (1,037,189 | ) | | | $ | 976,718 | |
In some instances, the collateral amounts disclosed in the tables were adjusted due to the requirement to limit the collateral amounts to avoid the effect of overcollateralization. Actual collateral received/pledged may be more than the amounts disclosed herein.
Due to the absence of a master netting agreement relating to the Funds’ participation in securities lending, no additional disclosures have been made on behalf of the Funds. Please reference Note 6 for collateral related to securities on loan.
GuideMark® Funds & GuidePath® Funds
NOTES TO FINANCIAL STATEMENTS (Continued)
March 31, 2015
| | (l) | Securities Purchased or Sold on a Forward-Commitment Basis |
| | | The Funds may enter into when-issued or other purchase or sale transactions that specify forward delivery of a financial security. In connection with this ability, the Funds may enter into mortgage “dollar rolls” in which a Fund sells securities in the current month for delivery and simultaneously contracts with the same counterparty to repurchase similar (same type, coupon and maturity) but not identical securities on a specified future date. The party that is obligated to buy a security in the future will retain the use of their funds, and will benefit from any interest that is earned on those funds from the day that they enter into the forward contract until the day that they take delivery and pay for the security. |
| | | |
| | (m) | Foreign Currency Translation |
| | | The accounting records of the Funds are maintained in U.S. dollars. Investment securities and all other assets and liabilities of the Funds denominated in a foreign currency are translated into U.S. dollars at current exchange rates. Purchases and sales of securities, income receipts, and expense payments are translated into U.S. dollars at the exchange rate in effect on the dates of the respective transactions. The Funds do not isolate the portion of the fluctuations on investments resulting from changes in foreign currency exchange rates from the fluctuations in market prices of investments held. Such fluctuations are included with the net realized and unrealized gain or loss from investments. |
| | | |
| | (n) | Restricted and Illiquid Securities |
| | | Each Fund may invest up to 15% of its net assets in securities that are illiquid, which includes securities with legal or contractual restrictions on their disposition, and securities for which there are no readily available market quotations. The Advisor, with the assistance of the sub-advisors and/or pricing services, will determine the value of such securities in good faith pursuant to procedures adopted by the applicable Board of Trustees. Illiquid securities present the risks that a Fund may have difficulty valuing these holdings and/or may be unable to sell these holdings |
| | | at the time or price desired. There are no restrictions on each Fund’s ability to invest in restricted securities (that is, securities that are not registered pursuant to the Securities Act of 1933), except to the extent such securities may be considered illiquid. Securities issued pursuant to Rule 144A of the Securities Act of 1933 will be considered liquid if determined to be so under procedures adopted by the Board of Trustees. |
| | | |
| | (o) | Auction Rate Securities |
| | | The Core Fixed Income Fund, Tax-Exempt Fixed Income Fund, and each of the GPS Funds II portfolios may invest in auction rate municipal securities. Auction rate securities usually permit the holder to sell the securities in an auction at par value at specified intervals. The dividend is reset by “Dutch” auction in which bids are made by broker-dealers and other institutions for a certain amount of securities at a specified minimum yield. The dividend rate set by the auction is the lowest interest or dividend rate that covers all securities offered for sale. While this process is designed to permit auction rate securities to be traded at par value, there is a risk that an auction will fail due to insufficient demand for the securities. |
| | | |
| | (p) | Short Sales |
| | | Although not currently part of any Fund’s principal investment strategy, each Fund has the ability to make equity short sales. Short sales are transactions where a Fund sells securities it does not own in anticipation of a decline in the value of the securities. |
| | | |
| | (q) | Trustee Compensation |
| | | Effective July 11, 2013, for the services performed as Trustees of the consolidated Board of Trustees of GPS Funds I and GPS Funds II, the Independent Trustees receive a retainer fee of $65,000 per year, $4,500 per in-person meeting attended, and $2,000 per telephonic meeting attended, as well as reimbursement for expenses incurred in connection with attendance at such meetings. Effective April 1, 2015, the Independent Trustees will also receive $4,500 per annual agreement renewal review meeting, whether it is held in-person or telephonically. The fees are allocated proportionally to each Fund within the Trusts based on total assets under management. |
GuideMark® Funds & GuidePath® Funds
NOTES TO FINANCIAL STATEMENTS (Continued)
March 31, 2015
| | | The “interested persons” who serve as Trustees of the Trusts receive no compensation from the Trusts for their services as Trustees. The Funds reimburse the Advisor an allocated amount for the compensation and related expenses of certain officers of the Trusts who provide compliance services to the Funds. The aggregate amount of all such reimbursements is determined by the Trustees. No other compensation or retirement benefits are received by any Trustee or officer from the Funds. |
| | | |
| | (r) | Pending Litigation |
| | | The Funds are subject to claims and suits that arise from time to time in the ordinary course of business (for example, in The Tribune Company Bankruptcy, certain creditors have filed actions against all shareholders of The Tribune Company, which included the GuideMark® Large Cap Value Fund, who tendered shares when the Tribune Company went private in 2007 in a leveraged buy-out transaction, seeking the return of proceeds received by the shareholders). Although management currently believes that resolving claims against us, individually or in aggregate, will not have a material adverse impact on financial position, results of operations, or cash flows, these matters are subject to inherent uncertainties and management’s view of these matters may change in the future. |
| | | |
| 3. | Investment Advisor |
| |
| | Each Trust has an Investment Advisory Agreement (the “Agreement”) with AssetMark, Inc. (the “Advisor” or “AssetMark”), with whom certain officers and trustees of the Trust are affiliated, to furnish investment advisory services to the Funds. Under the terms of the Agreement, the Funds compensate the Advisor for its management services at the following contractual rates, based on each Fund’s average daily net assets: |
| | Large Cap Growth Fund | 0.70% |
| | Large Cap Value Fund | 0.70% |
| | Small/Mid Cap Core Fund | 0.75% |
| | World ex-US Fund | 0.70% |
| | Opportunistic Equity Fund | 0.80% |
| | Global Real Return Fund | 0.65% |
| | Core Fixed Income Fund | 0.50% |
| | Tax-Exempt Fixed Income Fund | 0.50% |
| | Opportunistic Fixed Income Fund | 0.70% |
| | Strategic Asset Allocation Fund | 0.25% |
| | Tactical Constrained® Asset Allocation Fund | 0.25% |
| | Tactical Unconstrained® Asset Allocation Fund | 0.35% |
| | Absolute Return Asset Allocation Fund | 0.35% |
| | Multi-Asset Income Asset Allocation Fund | 0.35% |
| | Fixed Income Allocation Fund | 0.25% |
| | Altegris® Diversified Alternatives Allocation Fund | 0.15% |
| | AssetMark also provides certain administrative services to the Service Shares of the Funds, pursuant to Administrative Services Agreements between the Funds and AssetMark, for which AssetMark receives a fee of 0.25% of the average daily net assets of the Service Shares of the Funds. The GuidePath® Altegris® Diversified Alternatives Allocation Fund and the Advisor have entered into a Fee Waiver Agreement under which the Advisor has agreed to waive, through July 31, 2016, the Investment Advisory Fee and Administrative Services Fee. These waived fees are not subject to recovery. Additionally, the Advisor voluntarily waived 0.10% of the Investment Advisory Fee for the GuideMark® Global Real Return Fund for a portion of the period ended March 31, 2015. Due to this waiver not being contractual, the waived Advisory Fees cannot later be recouped and the Advisory Fees stated in the prospectus will not be charged. The administrative services may include development and maintenance of a web-based software platform for both investment advisers and shareholders; creation of a customized full-color client quarterly performance review for each individual client; facilitating the initiation and setup of new account and related asset transfers; reviewing and following up on custodial paperwork; attending to shareholder correspondence, requests and inquiries, and other communications with shareholders and their representatives; assisting with the processing of purchases and redemptions of shares; and monitoring and overseeing non-advisory relationships with entities providing services to the Service Shares; including the transfer agent and custodian. |
GuideMark® Funds & GuidePath® Funds
NOTES TO FINANCIAL STATEMENTS (Continued)
March 31, 2015
| | In addition, GPS Funds I and the Advisor have also entered into a Fee Waiver Agreement designed to provide Fund shareholders with the economic benefits of economies of scale that may be realized as Fund assets increase. Under the Fee Waiver Agreement, the Advisor has contractually agreed to waive 0.025% of each Fund’s annual advisory fee on assets in GPS Funds I collectively in excess of $6 billion, and an additional 0.025% of each Fund’s annual advisory fee on assets in GPS Funds I collectively in excess of $12 billion. |
| | |
| | Each Fund and the Advisor have also entered into an Expense Waiver and Reimbursement Agreement under which the Advisor has agreed to waive, through July 31, 2016, its management fee and/or reimburse each Fund’s other expenses to the extent necessary to ensure that the Fund’s net annual operating expenses (excluding Distribution (12b-1) Fees, Administrative Service Fees, taxes, interest, trading costs, acquired fund expenses, expenses paid with securities lending expense offset credits |
| | and non-routine expenses) do not exceed the following rates, based on each Fund’s average daily net assets: |
| | Large Cap Growth Fund | 0.99% |
| | Large Cap Value Fund | 0.99% |
| | Small/Mid Cap Core Fund | 1.09% |
| | World ex-US Fund | 1.09% |
| | Opportunistic Equity Fund | 1.10% |
| | Global Real Return Fund | 1.05% |
| | Core Fixed Income Fund | 0.79% |
| | Tax-Exempt Fixed Income Fund | 0.79% |
| | Opportunistic Fixed Income Fund | 1.05% |
| | Strategic Asset Allocation Fund | 0.50% |
| | Tactical Constrained® Asset Allocation Fund | 0.50% |
| | Tactical Unconstrained® Asset Allocation Fund | 0.60% |
| | Absolute Return Asset Allocation Fund | 0.60% |
| | Multi-Asset Income Asset Allocation Fund | 0.60% |
| | Fixed Income Allocation Fund | 0.55% |
| | Altegris® Diversified Alternatives Allocation Fund | 0.50% |
| | Any such contractual waiver or reimbursement is subject to later adjustment to allow the Advisor to recoup amounts waived or reimbursed to the extent actual fees and expenses for a fiscal period are less than each Fund’s expense limitation cap at the time of the waiver, provided, however, that the Advisor shall only be entitled to recoup such amounts for a period of three years after the end of the fiscal year in which the fee or expense was waived or reimbursed. As of March 31, 2015, Large Cap Growth Fund, Large Cap Value Fund, Opportunistic Equity Fund, Global Real Return Fund, Strategic Asset Allocation Fund, Tactical Unconstrained® Asset Allocation Fund, Absolute Return Asset Allocation Fund, Multi-Asset Income Asset Allocation Fund, Fixed Income Allocation Fund and Altegris® Diversified Alternatives Allocation Fund have recouped all potential recoverable waivers or reimbursed expenses. |
| | |
| | The Advisor is currently waiving fees and, in some cases, reimbursing expenses in the Funds listed below in order to keep these Funds at their expense cap. Waived expenses subject to potential recovery are as follows: |
| | | | Year of
Expiration
03/31/2016 | | Year of
Expiration
03/31/2017 | | Year of
Expiration
03/31/2018 |
| | Small/Mid Cap Core Fund | | | $ | 15,486 | | | | $ | 2,363 | | | | $ | — | |
| | World ex-US Fund | | | | 141,168 | | | | | 64,077 | | | | | — | |
| | Core Fixed Income Fund | | | | — | | | | | — | | | | | 596 | |
| | Tax-Exempt Fixed Income Fund | | | | 53,717 | | | | | 66,988 | | | | | 58,715 | |
| | Opportunistic Fixed Income Fund | | | | 100,926 | | | | | 77,167 | | | | | 188,562 | |
| | Tactical Constrained® Asset Allocation Fund | | | | 33,542 | | | | | 7,034 | | | | | — | |
GuideMark® Funds & GuidePath® Funds
NOTES TO FINANCIAL STATEMENTS (Continued)
March 31, 2015
| | Sub-advisory services are provided to certain of the Funds, pursuant to agreements between the Advisor and various sub-advisors. Under the terms of these sub-advisory agreements, the Advisor compensates each sub-advisor based on the portion of each Fund’s average daily net assets that is allocated to the sub-advisor. |
| | |
| 4. | Distribution Plan |
| |
| | Each Trust, on behalf of the Service Shares class of its Funds, has adopted a distribution plan pursuant to Rule 12b-1 under the 1940 Act (the “12b-1 Plan”), which provides for each Fund to pay distribution fees at an annual rate of 0.25% of the average daily net assets of the Funds. Payments under the 12b-1 Plan shall be used to compensate persons (including affiliates of the Trust) who provide support services in connection with the distribution of the Funds’ Service Shares class and servicing of the Funds’ Service Shares class shareholders. For example, these amounts are paid to financial intermediaries that perform back office shareholder servicing and recordkeeping services that facilitate the operation of the AssetMark Program through which the Funds are primarily distributed. The Advisor (and its affiliates) similarly receive portions of such payments for their services provided to facilitate the operation of the program. These financial intermediaries and affiliates of the Trust also receive payments from the Trust outside of the 12b-1 Plan for shareholder services that are unrelated to distribution services. AssetMark BrokerageTM, LLC (“Distributor”), an affiliate of the Advisor, serves as the Funds principal underwriter and distributor. The Funds did not pay any commissions or other compensation, other than 12b-1 fees, to the Distributor during the Funds’ most recent fiscal year ended March 31, 2015. |
| | |
| 5. | Service and Custody Agreements |
| |
| | The Funds have entered into Service Agreements with U.S. Bancorp Fund Services, LLC (“USBFS”) and a Custody Agreement with U.S. Bank, N.A., an affiliate of USBFS. Under these agreements, USBFS and U.S. Bank, N.A. provide certain transfer agency, administrative, accounting and custody services. |
| | Additionally, the Opportunistic Fixed Income Fund has entered into a Custody Agreement with the Bank of New York Mellon for certain custody services. |
| | |
| 6. | Securities Lending |
| |
| | The Trusts, on behalf of certain of the Funds, entered into securities lending arrangements with U.S. Bank, N.A. (the “Custodian”). Under the term of the agreement, the Custodian is authorized to loan securities on behalf of the Funds to approved brokers. In exchange, under normal market conditions, the Funds receive cash collateral in the amount of at least 102% of the value of securities loaned for domestic securities, and 105% of the value of securities loaned with respect to foreign securities. The cash collateral is invested in short term instruments as noted in the Schedule of Investments. Although risk is mitigated by the collateral, the Funds could experience a delay in recovering their securities and possible loss of income or value if the borrower fails to return the borrowed securities. In addition, the Funds bear the risk of loss associated with the investment of cash collateral received. After predetermined rebates to brokers, a percentage of the net securities lending revenue is credited to the Funds to be used as an offset against custody costs and other charges incurred by the Funds. The Custodian is paid a fee for administering a securities lending program for the Funds, equal to the remaining percentage of the net securities lending revenues generated under the agreement. |
| | |
| | As of March 31, 2015, the Funds (excluding the Tax-Exempt Fixed Income Fund, Opportunistic Fixed Income Fund and Altegris® Diversified Alternatives Allocation Fund) had loaned securities that were collateralized by cash. The cash collateral received was invested in securities as listed in each Fund’s Schedule of Investments. Income earned from these investments is allocated to each Fund based on each Fund’s portion of total cash collateral received. Securities lending income is disclosed in each Fund’s Statement of Operations as a securities lending credit. |
GuideMark® Funds & GuidePath® Funds
NOTES TO FINANCIAL STATEMENTS (Continued)
March 31, 2015
During September 2008 the Large Cap Growth Fund, Large Cap Value Fund, Small/Mid Cap Core Fund, World ex-US Fund and Core Fixed Income Fund, as well as two funds managed within the GPS Funds I that have since closed, had loaned securities that were collateralized by cash, and where a portion of that cash collateral was invested in shares of the Primary Fund, a series of the Reserve Fund. Subsequent to potential redemption of shares of the Primary Fund and before any redemption proceeds were paid, the Primary Fund’s net asset value per share dropped below $1.00 and the SEC granted an order permitting the Primary Fund to postpone the payment of redemption proceeds. Since that time, the collateral account for these Funds has received periodic payments from the Primary Fund. On December 31, 2014, these Funds received a final payment. Any uncollected amounts were recorded to realized loss.
| 7. | | Investment Transactions |
The aggregate purchases and sales of securities, excluding short-term investments, for the year ended March 31, 2015 are summarized below.
| | | Purchases | | | Sales | |
| Large Cap Growth Fund | | $ | 117,113,657 | | | $ | 106,501,675 | |
| Large Cap Value Fund | | | 68,704,997 | | | | 64,306,490 | |
| Small/Mid Cap Core Fund | | | 71,950,489 | | | | 79,039,927 | |
| World ex-US Fund | | | 206,882,526 | | | | 216,232,186 | |
| Opportunistic Equity Fund | | | 75,678,920 | | | | 86,608,316 | |
| Global Real Return Fund | | | 24,051,489 | | | | 31,984,896 | |
| Core Fixed Income Fund* | | | 551,731,688 | | | | 562,382,209 | |
| Tax-Exempt Fixed Income Fund | | | 22,653,866 | | | | 22,114,110 | |
| Opportunistic Fixed Income Fund | | | 69,727,145 | | | | 80,537,374 | |
| Strategic Asset Allocation Fund | | | 32,520,384 | | | | 62,390,653 | |
| Tactical Constrained® Asset Allocation Fund | | | 69,608,269 | | | | 92,829,829 | |
| | | Purchases | | | Sales | |
| Tactical Unconstrained® Asset Allocation Fund | | $ | 1,111,065,757 | | | $ | 915,374,787 | |
| Absolute Return Asset Allocation Fund | | | 352,230,347 | | | | 430,792,645 | |
| Multi-Asset Income Asset Allocation Fund | | | 114,473,454 | | | | 88,066,315 | |
| Fixed Income Allocation Fund | | | 36,127,720 | | | | 107,004,889 | |
| Altegris® Diversified Alternatives Allocation Fund | | | 21,830,803 | | | | 53,954,021 | |
| * | Included in these amounts were $216,890,622 of purchases and $244,590,687 of sales of U.S. Government Securities. |
GuideMark® Funds & GuidePath® Funds
NOTES TO FINANCIAL STATEMENTS (Continued)
March 31, 2015
| 8. | Transactions with Affiliates |
The Funds’ transactions with affiliates represent holdings for which the respective Fund and the underlying investee fund have the same investment advisor or where the investee fund’s investment advisor is under common control with the Fund’s investment advisor.
The GuidePath® Funds had the following transactions during the year ended March 31, 2015, with affiliates:
| | | Share Activity | | Year Ended March 31, 2015 |
| Security Name | | Balance
March 31, 2014 | | Purchases | | Sales | | | Balance
March 31, 2015 | | Fair
Value | | Dividends
Credited to
Income | | Amount of Gain
(Loss) realized on
Sale of Shares |
| Strategic Asset Allocation Fund | | | | | | | | | | | | | | | | | | | | | | | | | | | | | | |
| Altegris® Macro Strategy Fund - Institutional Shares | | | 352,945 | | | | 40,153 | | | | 87,399 | | | | 305,699 | | | $ | 2,751,295 | | | $ | — | | | | $ | (44,259 | ) | |
| Altegris® Multi-Strategy Alternatives Fund - Institutional Shares | | | 584,654 | | | | 56,848 | | | | 130,904 | | | | 510,598 | | | | 5,361,279 | | | | 95,208 | | | | | 7,551 | | |
| GuideMark® Global Real Return Fund - Institutional Shares | | | 1,432,429 | | | | 121,636 | | | | 252,691 | | | | 1,301,374 | | | | 10,710,311 | | | | 162,317 | | | | | (86,382 | ) | |
| GuideMark® Large Cap Growth Fund - Institutional Shares | | | 1,384,954 | | | | 152,472 | | | | 314,342 | | | | 1,223,084 | | | | 18,700,947 | | | | 112,254 | | | | | 454,896 | | |
| GuideMark® Large Cap Value Fund - Institutional Shares | | | 1,864,665 | | | | 126,426 | | | | 390,469 | | | | 1,600,622 | | | | 19,943,752 | | | | 351,784 | | | | | 651,395 | | |
| GuideMark® Opportunistic Equity Fund - Institutional Shares | | | 1,087,491 | | | | 237,948 | | | | 218,507 | | | | 1,106,932 | | | | 14,201,932 | | | | 498,308 | | | | | 1,992,555 | | |
| GuideMark® Small/Mid Cap Core Fund - Institutional Shares | | | 1,318,004 | | | | 341,129 | | | | 250,139 | | | | 1,408,994 | | | | 24,826,478 | | | | 249,451 | | | | | 1,261,467 | | |
| GuideMark® World ex-US Fund - Institutional Shares | | | 6,133,056 | | | | 587,119 | | | | 1,117,117 | | | | 5,603,058 | | | | 49,026,755 | | | | 990,208 | | | | | 321,883 | | |
| | | | | | | | | | | | | | | | | | | $ | 145,522,749 | | | $ | 2,459,530 | | | | $ | 4,559,106 | | |
| Tactical Constrained® Asset Allocation Fund | | | | | | | | | | | | | | | | | | | | | | | | | | | | | | |
| GuideMark® Core Fixed Income Fund - Institutional Shares | | | 1,752,287 | | | | 1,240,680 | | | | 868,270 | | | | 2,124,697 | | | $ | 20,545,824 | | | $ | 318,118 | | | | $ | 51,411 | | |
| GuideMark® Large Cap Growth Fund - Institutional Shares | | | 951,143 | | | | 264,809 | | | | 431,243 | | | | 784,709 | | | | 11,998,193 | | | | 74,877 | | | | | 772,217 | | |
| GuideMark® Large Cap Value Fund - Institutional Shares | | | 1,137,975 | | | | 255,807 | | | | 425,483 | | | | 968,299 | | | | 12,065,006 | | | | 218,994 | | | | | 678,748 | | |
| GuideMark® Opportunistic Equity Fund - Institutional Shares | | | 1,550,382 | | | | 445,833 | | | | 502,080 | | | | 1,494,135 | | | | 19,169,749 | | | | 697,212 | | | | | 3,497,588 | | |
| GuideMark® Opportunistic Fixed Income Fund - Institutional Shares | | | 1,125,032 | | | | 449,118 | | | | 607,344 | | | | 966,806 | | | | 9,213,659 | | | | 549,379 | | | | | (72,228 | ) | |
GuideMark® Funds & GuidePath® Funds
NOTES TO FINANCIAL STATEMENTS (Continued)
March 31, 2015
| | | Share Activity | | Year Ended March 31, 2015 |
| Security Name | | Balance
March 31, 2014 | | Purchases | | Sales | | | Balance
March 31, 2015 | | Fair
Value | | Dividends
Credited to
Income | | Amount of Gain
(Loss) realized on
Sale of Shares |
| Tactical Constrained® Asset Allocation Fund (continued) | | | | | | | | | | | | | | | | | | | | | | | |
| GuideMark® Small/Mid Cap Core Fund - Institutional Shares | | | 902,101 | | | | 140,944 | | | | 436,194 | | | | 606,851 | | | $ | 10,692,707 | | | $ | 120,723 | | | | $ | 1,010,331 | | |
| GuideMark® World ex-US Fund - Institutional Shares | | | 4,465,174 | | | | 1,076,104 | | | | 1,728,057 | | | | 3,813,221 | | | | 33,365,682 | | | | 675,751 | | | | | 893,572 | | |
| | | | | | | | | | | | | | | | | | | $ | 117,050,820 | | | $ | 2,655,054 | | | | $ | 6,831,639 | | |
| Tactical Unconstrained® Asset Allocation Fund | | | | | | | | | | | | | | | | | | | | | | | | | | | | | | |
| GuideMark® Core Fixed Income Fund - Institutional Shares | | | 1,005,157 | | | | 551,323 | | | | 650,390 | | | | 906,090 | | | $ | 8,761,895 | | | $ | 139,339 | | | | $ | 75,221 | | |
| GuideMark® Large Cap Growth Fund - Institutional Shares | | | 943,735 | | | | 498,953 | | | | 528,342 | | | | 914,346 | | | | 13,980,356 | | | | 82,095 | | | | | 975,805 | | |
| GuideMark® Large Cap Value Fund - Institutional Shares | | | 1,831,514 | | | | 1,162,414 | | | | 1,035,954 | | | | 1,957,974 | | | | 24,396,358 | | | | 420,952 | | | | | 2,093,043 | | |
| GuideMark® Opportunistic Equity Fund - Institutional Shares | | | 1,801,537 | | | | 1,641,383 | | | | 1,084,741 | | | | 2,358,179 | | | | 30,255,430 | | | | 1,067,692 | | | | | 5,269,976 | | |
| GuideMark® Opportunistic Fixed Income Fund - Institutional Shares | | | 2,002,358 | | | | 1,365,642 | | | | 1,217,431 | | | | 2,150,569 | | | | 20,494,921 | | | | 806,805 | | | | | 14,977 | | |
| GuideMark® Small/Mid Cap Core Fund - Institutional Shares | | | 444,762 | | | | 196,148 | | | | 381,916 | | | | 258,994 | | | | 4,563,468 | | | | 56,534 | | | | | 1,622,747 | | |
| GuideMark® World ex-US Fund - Institutional Shares | | | 3,316,549 | | | | 1,576,425 | | | | 2,143,371 | | | | 2,749,603 | | | | 24,059,028 | | | | 476,617 | | | | | (138,095 | ) | |
| | | | | | | | | | | | | | | | | | | $ | 126,511,456 | | | $ | 3,050,034 | | | | $ | 9,913,674 | | |
| Absolute Return Asset Allocation Fund | | | | | | | | | | | | | | | | | | | | | | | | | | | | | | |
| GuideMark® Core Fixed Income Fund - Institutional Shares | | | 1,495,920 | | | | 497,145 | | | | 709,405 | | | | 1,283,660 | | | $ | 12,412,994 | | | $ | 226,302 | | | | $ | 106,359 | | |
| GuideMark® Large Cap Value Fund - Institutional Shares | | | 453,064 | | | | 206,294 | | | | 321,830 | | | | 337,528 | | | | 4,205,601 | | | | 93,027 | | | | | 190,515 | | |
| GuideMark® Opportunistic Fixed Income Fund - Institutional Shares | | | 690,445 | | | | 22,686 | | | | 713,131 | | | | — | | | | — | | | | 144,434 | | | | | 415,665 | | |
| GuideMark® World ex-US Fund - Institutional Shares | | | 512,410 | | | | 122,457 | | | | 294,818 | | | | 340,049 | | | | 2,975,427 | | | | 76,382 | | | | | 104,426 | | |
| | | | | | | | | | | | | | | | | | | $ | 19,594,022 | | | $ | 540,145 | | | | $ | 816,965 | | |
GuideMark® Funds & GuidePath® Funds
NOTES TO FINANCIAL STATEMENTS (Continued)
March 31, 2015
| | | Share Activity | | | Year Ended March 31, 2015 | |
| Security Name | | Balance
March 31, 2014 | | Purchases | | Sales | | | Balance
March 31, 2015 | | Fair
Value | | Dividends
Credited to
Income | | Amount of Gain
(Loss) realized on
Sale of Shares |
| Multi-Asset Income Asset Allocation Fund | | | | | | | | | | | | | | | | | | |
| GuideMark® Core Fixed Income Fund - Institutional Shares | | | — | | | | 594,235 | | | | 352,536 | | | | 241,699 | | | $ | 2,337,228 | | | $ | 24,196 | | | $ | (8,489 | ) |
| GuideMark® Opportunistic Fixed Income Fund - Institutional Shares | | | — | | | | 73,379 | | | | 45,767 | | | | 27,612 | | | | 263,145 | | | | 29,205 | | | | (20,589 | ) |
| GuideMark® World ex-US Fund - Institutional Shares | | | 172,407 | | | | 372,635 | | | | 107,800 | | | | 437,242 | | | | 3,825,867 | | | | 67,520 | | | | 19,352 | |
| | | | | | | | | | | | | | | | | | | $ | 6,426,240 | | | $ | 120,921 | | | $ | (9,726 | ) |
| Fixed Income Allocation Fund | | | | | | | | | | | | | | | | | | |
| GuideMark® Core Fixed Income Fund - Institutional Shares | | | 5,214,813 | | | | 323,971 | | | | 2,249,100 | | | | 3,289,684 | | | $ | 31,811,248 | | | $ | 632,559 | | | $ | (862,907 | ) |
| GuideMark® Opportunistic Fixed Income Fund - Institutional Shares | | | 2,720,118 | | | | 626,910 | | | | 1,217,182 | | | | 2,129,846 | | | | 20,297,432 | | | | 1,071,561 | | | | (90,574 | ) |
| | | | | | | | | | | | | | | | | | | $ | 52,108,680 | | | $ | 1,704,120 | | | $ | (953,481 | ) |
| Altegris® Diversified Alternatives Allocation Fund | | | | | | | | | | | | | | | | | | |
| Altegris®/AACA Real Estate Long Short Fund - Institutional Shares | | | — | | | | 287,672 | | | | 78,764 | | | | 208,908 | | | $ | 2,667,754 | | | $ | 98,857 | | | $ | 90,607 | |
| Altegris® Equity Long Short Fund - Institutional Shares | | | 5,052,277 | | | | 1,096,509 | | | | 1,824,516 | | | | 4,324,270 | | | | 48,345,338 | | | | 502,979 | | | | 1,503,056 | |
| Altegris® Fixed Income Long Short Fund - Institutional Shares | | | 3,644,281 | | | | 131,934 | | | | 1,093,648 | | | | 2,682,567 | | | | 28,166,956 | | | | 1,191,193 | | | | 331,672 | |
| Altegris® Futures Evolution Strategy Fund - Institutional Shares | | | 985,558 | | | | 277,483 | | | | 560,167 | | | | 702,874 | | | | 8,300,938 | | | | 856,917 | | | | 28,156 | |
| Altegris® Macro Strategy Fund - Institutional Shares | | | 2,278,428 | | | | 330,874 | | | | 1,755,159 | | | | 854,143 | | | | 7,687,287 | | | | — | | | | (2,580,909 | ) |
| Altegris® Managed Futures Strategy Fund - Institutional Shares | | | 710,954 | | | | 3,494 | | | | 217,746 | | | | 496,702 | | | | 5,091,193 | | | | — | | | | (107,906 | ) |
| | | | | | | | | | | | | | | | | | | $ | 100,259,466 | | | $ | 2,649,946 | | | $ | (735,324 | ) |
GuideMark® Funds & GuidePath® Funds
NOTES TO FINANCIAL STATEMENTS (Continued)
March 31, 2015
9. Option Contracts Written
The premium amount and number of option contracts written during the year ended March 31, 2015 in the Opportunistic Fixed Income Fund, were as follows:
| | | Amount of
Premiums | | | Number of
Contracts | | Notional
Amount | |
| Outstanding at 3/31/14 | | $ | — | | | | — | | | | — | |
| Options written | | | 143,350 | | | | 1,848 | | | | 2,600,000 | |
| Options expired | | | (9,880 | ) | | | — | | | | (2,600,000 | ) |
| Options exercised | | | (1,147 | ) | | | (16 | ) | | | — | |
| Options closed | | | (72,554 | ) | | | (1,421 | ) | | | — | |
| Outstanding at 3/31/15 | | $ | 59,769 | | | | 411 | | | | — | |
No other Fund held written option contracts at any time during the year ended March 31, 2015.
10. New Accounting Pronouncements
In June 2014, the Financial Accounting Standard Board issued ASU No. 2014-11 “Repurchase-to-Maturity Transactions, Repurchase Financings, and Disclosures.” ASU No. 2014-11 makes limited changes to the accounting for repurchase agreements, clarifies when repurchase agreements and securities lending transactions should be accounted for as secured borrowings, and requires additional disclosures regarding these types of transactions. The guidance is effective for fiscal years beginning on or after December 15, 2014, and for interim periods within those fiscal years. Management is currently evaluating the impact these changes will have on the Fund’s financial statement disclosures.
GuideMark® Funds & GuidePath® Funds
NOTES TO FINANCIAL STATEMENTS (Continued)
March 31, 2015
11. Other Tax Information
Net investment income and realized gains and losses for Federal income tax purposes may differ from that reported on the financial statements because of permanent book-to-tax differences. GAAP requires that permanent differences between financial reporting and tax reporting be reclassified between various components of net assets.
These differences are primarily due to foreign currency, Passive Foreign Investment Companies, Partnerships and paydown reclassifications. On the Statement of Assets and Liabilities, the following adjustments were made:
| | | Accumulated
Net
Investment
Income
or (Loss) | | Accumulated
Realized
Gain or
(Loss) | | Capital
Stock |
| Large Cap Growth Fund | | $ | — | | | $ | — | | | $ | — | |
| Large Cap Value Fund | | | — | | | | — | | | | — | |
| Small/Mid Cap Core Fund | | | 287,043 | | | | (287,043 | ) | | | — | |
| World ex-US Fund | | | (338,900 | ) | | | 338,713 | | | | 187 | |
| Opportunistic Equity Fund | | | 115,484 | | | | (115,475 | ) | | | (9 | ) |
| Global Real Return Fund | | | (331,119 | ) | | | 443,932 | | | | (112,813 | ) |
| Core Fixed Income Fund | | | 509,493 | | | | (509,493 | ) | | | — | |
| Tax-Exempt Fixed Income Fund | | | — | | | | — | | | | — | |
| Opportunistic Fixed Income Fund | | | (3,523,480 | ) | | | 3,523,480 | | | | — | |
| Strategic Asset Allocation Fund | | | 132,951 | | | | (132,951 | ) | | | — | |
| Tactical Constrained® Asset Allocation Fund | | | 143,614 | | | | (143,614 | ) | | | — | |
| Tactical Unconstrained® Asset Allocation Fund | | | (6,728 | ) | | | 6,728 | | | | — | |
| Absolute Return Asset Allocation Fund | | | (15,038 | ) | | | 15,038 | | | | — | |
| Multi-Asset Income Asset Allocation Fund | | | — | | | | — | | | | — | |
| Fixed Income Allocation Fund | | | — | | | | — | | | | — | |
| Altegris® Diversified Alternatives Allocation Fund | | | — | | | | — | | | | — | |
GuideMark® Funds & GuidePath® Funds
NOTES TO FINANCIAL STATEMENTS (Continued)
March 31, 2015
The Funds intend to utilize capital loss carryforwards to offset future realized capital gains. Indefinite carryovers must be used first, resulting in a greater likelihood that pre-enactment losses may expire. Capital loss carryforwards available for Federal income tax purposes, as well as those utilized during the year ended March 31, 2015, are as follows:
| | | Capital losses expiring: | | | Utilized | |
| | | | | | | | | Indefinite* | | | | |
| | | 3/31/2017 | | | 3/31/2018 | | | Short Term | | | Long Term | | | | |
| Large Cap Growth Fund | | $ | — | | | $ | 20,896,224 | | | $ | — | | | $ | — | | | $ | 18,545,829 | |
| Large Cap Value Fund | | | — | | | | 133,344,461 | | | | — | | | | — | | | | 15,184,865 | |
| Small/Mid Cap Core Fund | | | — | | | | — | | | | — | | | | — | | | | — | |
| World ex-US Fund | | | 62,607,085 | | | | 139,582,037 | | | | — | | | | — | | | | 5,736,571 | |
| Opportunistic Equity Fund | | | — | | | | — | | | | — | | | | — | | | | — | |
| Global Real Return Fund | | | — | | | | — | | | | 2,876,650 | | | | 6,633,937 | | | | — | |
| Core Fixed Income Fund | | | — | | | | — | | | | — | | | | — | | | | 2,005,368 | |
| Tax-Exempt Fixed Income Fund | | | 1,566,807 | | | | 2,354,785 | | | | — | | | | — | | | | 527,118 | |
| Opportunistic Fixed Income Fund | | | — | | | | — | | | | 1,877,343 | | | | — | | | | 1,193,355 | |
| Strategic Asset Allocation Fund | | | — | | | | — | | | | — | | | | — | | | | — | |
| Tactical Constrained® Asset Allocation Fund | | | — | | | | — | | | | — | | | | — | | | | — | |
| Tactical Unconstrained® Asset Allocation Fund | | | — | | | | — | | | | — | | | | — | | | | — | |
| Absolute Return Asset Allocation Fund | | | — | | | | — | | | | — | | | | — | | | | 6,373,055 | |
| Multi-Asset Income Asset Allocation Fund | | | — | | | | — | | | | — | | | | — | | | | — | |
| Fixed Income Allocation Fund | | | — | | | | — | | | | 68,541 | | | | 2,435,785 | | | | — | |
| Altegris® Diversified Alternatives Allocation Fund | | | — | | | | — | | | | — | | | | 4,012,889 | | | | — | |
| * | The Regulated Investment Company Modernization Act of 2010 (the “Act”) provides an unlimited carryforward period for newly generated capital losses and their character is retained as short-term or long-term losses. |
Additionally, at March 31, 2015, the Funds deferred on a tax basis losses as follows:
| | | Ordinary Late Year Loss* | | Capital Loss | |
| Large Cap Growth Fund | | | $ | — | | | | $ | — | |
| Large Cap Value Fund | | | | — | | | | | — | |
| Small/Mid Cap Core Fund | | | | — | | | | | — | |
| World ex-US Fund | | | | — | | | | | — | |
| Opportunistic Equity Fund | | | | — | | | | | — | |
| Global Real Return Fund | | | | 76,721 | | | | | 3,012,139 | |
| Core Fixed Income Fund | | | | — | | | | | — | |
| Tax-Exempt Fixed Income Fund | | | | — | | | | | — | |
| Opportunistic Fixed Income Fund | | | | — | | | | | — | |
| Strategic Asset Allocation Fund | | | | 151,690 | | | | | — | |
| Tactical Constrained® Asset Allocation Fund | | | | — | | | | | — | |
| Tactical Unconstrained® Asset Allocation Fund | | | | — | | | | | — | |
| Absolute Return Asset Allocation Fund | | | | — | | | | | 2,102,472 | |
| Multi-Asset Income Asset Allocation Fund | | | | — | | | | | 229,954 | |
| Fixed Income Allocation Fund | | | | — | | | | | 2,337,494 | |
| Altegris® Diversified Alternatives Allocation Fund | | | | — | | | | | — | |
GuideMark® Funds & GuidePath® Funds
NOTES TO FINANCIAL STATEMENTS (Continued)
March 31, 2015
A regulated investment company may elect for any taxable year to treat any portion of any qualified late year loss as arising on the first day of the next taxable year. Qualified late year losses are certain capital and ordinary losses which occur during the portion of the taxable year subsequent to October 31 and December 31, respectively.
The tax components of distributions paid during the fiscal years ended March 31, 2015 and March 31, 2014 are as follows:
| | | | Year Ended March 31, 2015 | |
| | | Ordinary | | Long-Term | | | | |
| | | Income | | Capital Gain | | | Return of | |
| | | Distributions | | | Distributions | | | | Capital | |
| Large Cap Growth Fund | | | $ | 612,700 | | | | $ | — | | | | $ | — | |
| Large Cap Value Fund | | | | 3,081,621 | | | | | — | | | | | — | |
| Small/Mid Cap Core Fund | | | | 806,119 | | | | | 4,104,710 | | | | | — | |
| World ex-US Fund | | | | 5,666,416 | | | | | — | | | | | — | |
| Opportunistic Equity Fund | | | | 4,581,200 | | | | | 17,807,110 | | | | | — | |
| Global Real Return Fund | | | | 599,946 | | | | | — | | | | | 111,923 | |
| Core Fixed Income Fund | | | | 4,220,388 | | | | | 441,429 | | | | | — | |
| Tax-Exempt Fixed Income Fund* | | | | 1,871,450 | | | | | — | | | | | — | |
| Opportunistic Fixed Income Fund | | | | 9,147,618 | | | | | — | | | | | — | |
| Strategic Asset Allocation Fund | | | | 4,680,370 | | | | | 2,554,862 | | | | | — | |
| Tactical Constrained® Asset Allocation Fund | | | | 2,728,561 | | | | | 8,186,825 | | | | | — | |
| Tactical Unconstrained® Asset Allocation Fund | | | | 8,230,196 | | | | | 26,176,837 | | | | | — | |
| Absolute Return Asset Allocation Fund | | | | 8,045,672 | | | | | — | | | | | — | |
| Multi-Asset Income Asset Allocation Fund | | | | 5,287,667 | | | | | 478,403 | | | | | — | |
| Fixed Income Allocation Fund | | | | 3,018,738 | | | | | — | | | | | — | |
| Altegris® Diversified Alternatives Allocation Fund | | | | 1,916,312 | | | | | — | | | | | — | |
* Contains $1,812,715 of tax-exempt income for year ended 3/31/2015.
GuideMark® Funds & GuidePath® Funds
NOTES TO FINANCIAL STATEMENTS (Continued)
March 31, 2015
| | | | Year Ended March 31, 2014 | |
| | | Ordinary | | | Long-Term | | | | | |
| | | Income | | | Capital Gain | | | | Return of | |
| | | Distributions | | | Distributions | | | | Capital | |
| Large Cap Growth Fund | | | $ | 407,732 | | | | $ | — | | | | $ | — | |
| Large Cap Value Fund | | | | 2,355,777 | | | | | — | | | | | — | |
| Small/Mid Cap Core Fund | | | | — | | | | | 23,111 | | | | | — | |
| World ex-US Fund | | | | 3,464,000 | | | | | — | | | | | — | |
| Opportunistic Equity Fund | | | | 692,277 | | | | | 6,381,694 | | | | | — | |
| Global Real Return Fund | | | | 601,351 | | | | | — | | | | | 15,012 | |
| Core Fixed Income Fund | | | | 5,638,679 | | | | | 1,135,333 | | | | | 6,193,886 | |
| Tax-Exempt Fixed Income Fund* | | | | 1,932,202 | | | | | — | | | | | — | |
| Opportunistic Fixed Income Fund | | | | 7,025,818 | | | | | 323,275 | | | | | — | |
| Strategic Asset Allocation Fund | | | | 3,262,576 | | | | | 3,206,215 | | | | | — | |
| Tactical Constrained® Asset Allocation Fund | | | | 2,608,371 | | | | | 317,868 | | | | | — | |
| Tactical Unconstrained® Asset Allocation Fund | | | | 7,263,491 | | | | | 377,506 | | | | | — | |
| Absolute Return Asset Allocation Fund | | | | 9,127,398 | | | | | — | | | | | — | |
| Multi-Asset Income Asset Allocation Fund | | | | 3,768,827 | | | | | 14,033 | | | | | — | |
| Fixed Income Allocation Fund | | | | 3,801,218 | | | | | 396,609 | | | | | — | |
| Altegris® Diversified Alternatives Allocation Fund | | | | 4,140,786 | | | | | — | | | | | — | |
* Contains $1,880,729 of tax-exempt income for year ended 3/31/2014.
GuideMark® Funds & GuidePath® Funds
NOTES TO FINANCIAL STATEMENTS (Continued)
March 31, 2015
At March 31, 2015, the components of accumulated earnings (losses) on a tax basis were as follows:
| | | Large Cap | | | Large Cap | | | Small/Mid | | | World | | | Opportunistic | | | Global | |
| | | Growth | | | Value | | | Cap Core | | | ex-US | | | Equity | | | Real Return | |
| | | Fund | | | Fund | | | Fund | | | Fund | | | Fund | | | Fund | |
| Cost of Investments | | $ | 167,524,135 | | | $ | 167,253,012 | | | $ | 80,105,516 | | | $ | 305,938,893 | | | $ | 120,157,693 | | | $ | 89,207,777 | |
| Gross Unrealized Appreciation | | | 59,105,108 | | | | 70,335,703 | | | | 12,584,155 | | | | 52,719,678 | | | | 30,962,617 | | | | 3,893,760 | |
| Gross Unrealized Depreciation | | | (2,437,161 | ) | | | (9,617,677 | ) | | | (2,994,951 | ) | | | (17,693,720 | ) | | | (2,430,580 | ) | | | (9,769,013 | ) |
| Net Unrealized Appreciation/(Depreciation) | | | 56,667,947 | | | | 60,718,026 | | | | 9,589,204 | | | | 35,025,958 | | | | 28,532,037 | | | | (5,875,253 | ) |
| Tax-Exempt Ordinary Income | | | — | | | | — | | | | — | | | | — | | | | — | | | | — | |
| Undistributed Ordinary Income | | | 280,153 | | | | 565,345 | | | | 224,202 | | | | 5,839,895 | | | | 514,141 | | | | — | |
| Undistributed Long-Term Cap Gains | | | — | | | | — | | | | 713,271 | | | | — | | | | 5,736,650 | | | | — | |
| Total Distributable Earnings | | | 280,153 | | | | 565,345 | | | | 937,473 | | | | 5,839,895 | | | | 6,250,791 | | | | — | |
| Other Accumulated Gains/(Losses) | | | (20,896,224 | ) | | | (133,344,461 | ) | | | — | | | | (202,258,565 | ) | | | 6 | | | | (12,629,392 | ) |
| Total Accumulated Earnings/(Losses) | | | 36,051,876 | | | | (72,061,090 | ) | | | 10,526,677 | | | | (161,392,712 | ) | | | 34,782,834 | | | | (18,504,645 | ) |
The differences between book-basis and tax-basis unrealized appreciation and depreciation is primarily attributable to the tax deferral of losses on wash sales and other temporary differences.
GuideMark® Funds & GuidePath® Funds
NOTES TO FINANCIAL STATEMENTS (Continued)
March 31, 2015
| | | | | | | | | | | | | | | Tactical | | | Tactical | |
| | | | | | | | | | | | Strategic | | | Constrained® | | | Unconstrained® | |
| | | Core | | | Tax-Exempt | | | Opportunistic | | | Asset | | | Asset | | | Asset | |
| | | Fixed Income | | | Fixed Income | | | Fixed Income | | | Allocation | | | Allocation | | | Allocation | |
| | | Fund | | | Fund | | | Fund | | | Fund | | | Fund | | | Fund | |
| Cost of Investments | | $ | 341,278,260 | | | $ | 59,889,230 | | | $ | 202,035,813 | | | $ | 271,412,569 | | | $ | 161,419,709 | | | $ | 525,180,754 | |
| Gross Unrealized Appreciation | | | 10,563,077 | | | | 5,121,498 | | | | 5,111,121 | | | | 62,160,115 | | | | 38,353,390 | | | | 31,354,149 | |
| Gross Unrealized Depreciation | | | (2,300,886 | ) | | | (47,414 | ) | | | (14,455,934 | ) | | | (3,965,379 | ) | | | (3,387,321 | ) | | | (9,679,214 | ) |
| Net Unrealized Appreciation/(Depreciation) | | | 8,262,191 | | | | 5,074,084 | | | | (9,344,813 | ) | | | 58,194,736 | | | | 34,966,069 | | | | 21,674,935 | |
| Undistributed Tax-Exempt Ordinary Income | | | — | | | | 27,243 | | | | — | | | | — | | | | — | | | | — | |
| Undistributed Ordinary Income | | | 743,574 | | | | 30,957 | | | | 1,670,971 | | | | — | | | | 119,107 | | | | 658,294 | |
| Undistributed Long-Term Cap Gains | | | 858,639 | | | | — | | | | — | | | | 4,302,870 | | | | 5,677,043 | | | | 3,768,696 | |
| Total Distributable Earnings | | | 1,602,213 | | | | 58,200 | | | | 1,670,971 | | | | 4,302,870 | | | | 5,796,150 | | | | 4,426,990 | |
| Other Accumulated Gains/(Losses) | | | 9 | | | | (3,921,592 | ) | | | (2,429,562 | ) | | | (177,911 | ) | | | (26,221 | ) | | | (26,221 | ) |
| Total Accumulated Earnings/(Losses) | | | 9,864,413 | | | | 1,210,692 | | | | (10,103,404 | ) | | | 62,319,695 | | | | 40,735,998 | | | | 26,075,704 | |
The differences between book-basis and tax-basis unrealized appreciation and depreciation is primarily attributable to the tax deferral of losses on wash sales and other temporary differences.
GuideMark® Funds & GuidePath® Funds
NOTES TO FINANCIAL STATEMENTS (Continued)
March 31, 2015
| | | Absolute | | | | | | | | | Altegris® | |
| | | Return | | | Multi-Asset | | | | | | Diversified | |
| | | Asset | | | Income Asset | | | Fixed Income | | | Alternatives | |
| | | Allocation | | | Allocation | | | Allocation | | | Allocation | |
| | | Fund | | | Fund | | | Fund | | | Fund | |
| Cost of Investments | | $ | 402,047,167 | | | $ | 155,274,910 | | | $ | 172,450,407 | | | $ | 93,941,624 | |
| Gross Unrealized Appreciation | | | 7,546,452 | | | | 5,545,613 | | | | 2,955,361 | | | | 9,026,212 | |
| Gross Unrealized Depreciation | | | (5,332,116 | ) | | | (2,743,023 | ) | | | (4,346,299 | ) | | | (834,778 | ) |
| Net Unrealized Appreciation/(Depreciation) | | | 2,214,336 | | | | 2,802,590 | | | | (1,390,938 | ) | | | 8,191,434 | |
| Undistributed Tax-Exempt Ordinary Income | | | — | | | | — | | | | — | | | | — | |
| Undistributed Ordinary Income | | | 1,375,913 | | | | 356,882 | | | | 187,986 | | | | 157,617 | |
| Undistributed Long-Term Cap Gains | | | — | | | | 434,239 | | | | — | | | | — | |
| Total Distributable Earnings | | | 1,375,913 | | | | 791,121 | | | | 187,986 | | | | 157,617 | |
| Other Accumulated Gains/(Losses) | | | (2,128,693 | ) | | | (229,954 | ) | | | (4,841,820 | ) | | | (4,012,889 | ) |
| Total Accumulated Earnings/(Losses) | | | 1,461,556 | | | | 3,363,757 | | | | (6,044,772 | ) | | | 4,336,162 | |
The differences between book-basis and tax-basis unrealized appreciation and depreciation is primarily attributable to the tax deferral of losses on wash sales and other temporary differences.
GuideMark® Funds & GuidePath® Funds
REPORT OF INDEPENDENT REGISTERED PUBLIC ACCOUNTING FIRM
To the Shareholders and Board of Trustees of GPS Funds I and GPS Funds II
We have audited the accompanying statements of assets and liabilities, including the schedules of investments, of GPS Funds I and GPS Funds II comprising GuideMark Large Cap Growth Fund, GuideMark Large Cap Value Fund, GuideMark Small/Mid Cap Core Fund, GuideMark World ex-US Fund, GuideMark Opportunistic Equity Fund, GuideMark Global Real Return Fund, GuideMark Core Fixed Income Fund, GuideMark Tax-Exempt Fixed Income Fund, GuideMark Opportunistic Fixed Income Fund, GuidePath Strategic Asset Allocation Fund, GuidePath Tactical Constrained Asset Allocation Fund, GuidePath Tactical Unconstrained Asset Allocation Fund, GuidePath Absolute Return Asset Allocation Fund, GuidePath Multi-Asset Income Asset Allocation Fund, GuidePath Fixed Income Allocation Fund, and GuidePath Altegris Diversified Alternatives Allocation Fund (the “Funds”) as of March 31, 2015, and the related statements of operations for the year then ended, and the statements of changes in net assets and the financial highlights for each of the two years in the period then ended. These financial statements and financial highlights are the responsibility of the Funds’ management. Our responsibility is to express an opinion on these financial statements and financial highlights based on our audits. The financial highlights for the periods ended prior to March 31, 2014, were audited by other auditors whose report dated May 30, 2013, expressed an unqualified opinion on those highlights.
We conducted our audits in accordance with the standards of the Public Company Accounting Oversight Board (United States). Those standards require that we plan and perform the audit to obtain reasonable assurance about whether the financial statements and financial highlights are free of material misstatement. An audit includes examining, on a test basis, evidence supporting the amounts and disclosures in the financial statements. Our procedures included confirmation of securities owned as of March 31, 2015, by correspondence with the custodian and brokers, or by other appropriate auditing procedures where replies from brokers or counterparties were not received. An audit also includes assessing the accounting principles used and significant estimates made by management, as well as evaluating the overall financial statement presentation. We believe that our audits provide a reasonable basis for our opinion.
In our opinion, the financial statements and financial highlights referred to above present fairly, in all material respects, the financial position of each of the Funds constituting GPS Funds I and GPS Funds II as of March 31, 2015, the results of their operations for the year then ended, and the changes in their net assets and the financial highlights for each of the two years in the period then ended, in conformity with accounting principles generally accepted in the United States of America.
COHEN FUND AUDIT SERVICES, LTD.
Cleveland, Ohio
May 29, 2015
GuideMark® Funds & GuidePath® Funds
ADDITIONAL INFORMATION
March 31, 2015
Additional Information
1. Shareholder Notification of Federal Tax Status (Unaudited)
The Funds designated the following percentages of dividends during the fiscal year 2015 as dividends qualifying for the dividends received deduction available to corporate shareholders and as dividends from net investment income that are qualifying income under the Jobs and Growth Tax Relief Reconciliation Act of 2003, respectively:
| | | Dividends received
deduction % for
corporate shareholders | | % of dividends as
qualified income |
| Large Cap Growth Fund | | | 100.00 | % | | | 100.00 | % |
| Large Cap Value Fund | | | 100.00 | % | | | 100.00 | % |
| Small/Mid Cap Core Fund | | | 46.35 | % | | | 48.31 | % |
| World ex-US Fund | | | 0.29 | % | | | 84.09 | % |
| Opportunistic Equity Fund | | | 57.23 | % | | | 61.66 | % |
| Global Real Return Fund | | | 33.17 | % | | | 93.19 | % |
| Core Fixed Income Fund | | | 0.00 | % | | | 0.00 | % |
| Tax-Exempt Fixed Income Fund | | | 0.00 | % | | | 0.00 | % |
| Opportunistic Fixed Income Fund | | | 1.32 | % | | | 2.67 | % |
| Strategic Asset Allocation Fund | | | 37.27 | % | | | 93.18 | % |
| Tactical Constrained® Asset Allocation Fund | | | 58.59 | % | | | 75.81 | % |
| Tactical Unconstrained® Asset Allocation Fund | | | 30.00 | % | | | 59.15 | % |
| Absolute Return Asset Allocation Fund | | | 4.82 | % | | | 8.71 | % |
| Multi-Asset Income Asset Allocation Fund | | | 3.19 | % | | | 26.96 | % |
| Fixed Income Allocation Fund | | | 0.74 | % | | | 1.26 | % |
| Altegris® Diversified Alternatives Allocation Fund | | | 0.01 | % | | | 0.01 | % |
2. Foreign Tax Credit Pass Through (Unaudited)
Pursuant to Section 853 of the Internal Revenue Code, the following Funds designate the following amounts as foreign taxes paid for the year ended March 31, 2015. Foreign taxes paid for purposes of Section 853 may be less than actual foreign taxes paid for financial statement purposes.
GuideMark® Funds & GuidePath® Funds
ADDITIONAL INFORMATION (Continued)
March 31, 2015
| | | Creditable Foreign
Taxes Paid | | Per Share
Amount | | Portion of Ordinary Income Distribution
Derived from Foreign Sourced Income* |
| World ex-US Fund | | | $663,487 | | | | $0.0169 | | | | 99.44 | % |
| Strategic Asset Allocation Fund | | | 95,165 | | | | 0.0041 | | | | 2.16 | % |
| Tactical Constrained® Asset Allocation Fund | | | 64,944 | | | | 0.0041 | | | | 2.36 | % |
| Tactical Unconstrained® Asset Allocation Fund | | | 45,806 | | | | 0.0010 | | | | 0.55 | % |
| Absolute Return Asset Allocation Fund | | | 7,341 | | | | 0.0002 | | | | 0.11 | % |
| Multi-Asset Income Asset Allocation Fund | | | 6,489 | | | | 0.0005 | | | | 0.13 | % |
* The Funds listed above did not derive any income from “ineligible foreign sources” as defined under Section 901(j) of the Internal Revenue Code.
Foreign taxes paid or withheld should be included in taxable income with an offsetting deduction from gross income or as a credit for taxes paid to foreign governments.
Above figures may differ from those cited elsewhere in this report due to differences in the calculation of income and gains under U.S. generally accepted accounting principles (book) purposes and Internal Revenue Service (tax) purposes.
Shareholders are strongly advised to consult their own tax advisers with respect to the tax consequences of their investments in the Funds. In January, shareholders, excluding corporate shareholders, receive an IRS 1099-DIV regarding the Federal tax status of the dividends and distributions they received in the calendar year.
GuideMark® Funds & GuidePath® Funds
ADDITIONAL INFORMATION (Continued)
March 31, 2015
3. Disclosure Regarding Fund Trustees and Officers (Unaudited)
| | | | | | | | | | | |
Name, Address
and Year of Birth | | Position(s)
Held with
the Trusts | | Term of Office
and Length of
Time Served | | Principal
Occupation During Past Five Years | | # of
Portfolios
in Fund
Complex
Overseen
by Trustee | | Other
Director/
Trustee
Positions |
| GPS Funds I and GPS Funds II | | | | | | | |
| Independent Trustees | | | | | | | |
David M. Dunford
Year of Birth: 1949
c/o AssetMark, Inc.
1655 Grant Street
10th Floor
Concord, CA 94520 | | Independent Trustee | | Indefinite Term (since 2013 for GPS Funds I and since 2011 for GPS Funds II). | | Retired; formerly, Senior Vice President, Merrill Lynch Insurance Group (1989-2001). | | 16 | | Director, New England Bancorp (2006-present); Trustee, Genworth Variable Insurance Trust (“GVIT”) (2008-2012); Director, Hospice and Palliative Care of Cape Cod (2006-2011). |
Paul S. Feinberg
Year of Birth: 1942
c/o AssetMark, Inc.
1655 Grant Street
10th Floor
Concord, CA 94520 | | Independent Trustee | | Indefinite Term (since 2013 for GPS Funds I and since 2011 for GPS Funds II). | | Retired; formerly, President, CitiStreet Funds, Inc. (2000-2005); Executive Vice President and General Counsel, CitiStreet Associates LLC (insurance agency), CitiStreet Equities LLC (broker-dealer), CitiStreet Financial Services LLC (registered investment advisor) and CitiStreet Funds Management LLC (registered investment advisor) (1990-2005) | | 16 | | Trustee, GVIT (2008-2012) |
Dennis G. Schmal
Year of Birth: 1947
c/o AssetMark, Inc.
1655 Grant Street
10th Floor
Concord, CA 94520 | | Independent Trustee | | Indefinite Term (since 2007 for GPS Funds I and since 2013 for GPS Funds II). | | Self-employed consultant (1999-present); formerly, Partner, Arthur Andersen LLP (audit services) (1972-1999). | | 16 | | Director, Owens Realty Mortgage Inc. (2013- present); Director, Cambria ETF Series Trust (2013-present) Director, Sitoa Global Inc. (2011-2013); Director, Wells Fargo ASGI Hedge Funds (closed-end hedge funds) (2008-present); Director/Chairman, Pacific Metrics Corp. (educational services) (2005-2014); Director, Merriman Holdings, Inc. (financial services) (2003-present); Director, Grail Advisors ETF Trust (2009-2011); Director, Varian Semiconductor Equipment Associates, Inc. (2004-2011); Director, North Bay Bancorp (2006-2007). |
GuideMark® Funds & GuidePath® Funds
ADDITIONAL INFORMATION (Continued)
March 31, 2015
Name, Address
and Year of Birth | | Position(s)
Held with
the Trusts | | Term of Office
and Length of
Time Served | | Principal
Occupation During Past Five Years | | # of
Portfolios
in Fund
Complex
Overseen
by Trustee | | Other
Director/
Trustee
Positions |
| Interested Trustee | | | | | | | |
Carrie E. Hansen*
Year of Birth: 1970
c/o AssetMark, Inc.
1655 Grant
Street 10th Floor | | Interested Trustee and Chairman | | Indefinite Term since 2014 | | President, GPS Funds I (2007-present) and GPS Funds II (2011-present); President, Savos Investments Trust (“Savos”) (2008-present); and President, GVIT (2008-2012); Executive Vice President and Chief Operations Officer, AssetMark (2008-present); President, AssetMark BrokerageTM, LLC (2014-present). | | 17 | | Trustee, Savos Investments Trust (2014-present); Chairman, AssetMark Trust Co. (2008- present); Director, Lamorinda Soccer Club (2011-2013) |
| Concord, CA 94520 | | President | | Renewed 1-Year Term since 2007 | | | |
Name, Address
and Year of Birth | | Position(s)
Held with
the Trusts | | Term of Office
and Length of
Time Served | | Principal Occupation During Past Five Years |
| Officers of the Trusts** | | | |
John Koval
Year of Birth: 1966
c/o AssetMark, Inc.
1655 Grant Street
10th Floor
Concord, CA 94520 | | Chief Compliance Officer and AML Compliance Officer | | Renewed 1-Year Term since January 2013 | | Chief Compliance Officer, GPS Funds I, GPS Funds II, and Savos (2013- present); Interim Chief Compliance Officer, GPS Funds I, GPS Funds II, and Savos (September 2012-January 2013); Senior Compliance Officer, AssetMark (2011-2012); Chief Operating Officer, SEAL Capital, Inc. (2009-2010); Chief Compliance Officer, Cliffwood Partners LLC (2004-2009). |
Patrick R. Young
Year of Birth: 1982
c/o AssetMark, Inc.
1655 Grant Street
10th Floor
Concord, CA 94520 | | Treasurer | | Renewed 1-Year Term since 2014 | | Treasurer, GPS Funds I, GPS Funds II, and Savos (May 2014-present); Manager of Fund Administration, AssetMark (May 2014-present); Senior Fund Administration Officer, AssetMark (2008-May 2014). |
Christine Villas-Chernak
Year of Birth: 1968
c/o AssetMark, Inc.
1655 Grant Street
10th Floor
Concord, CA 94520 | | Deputy Chief Compliance Officer | | Renewed 1-Year Term Since 2009 | | Secretary, GPS Funds I (2006-2013 and May 2014-present), GPS Funds II (2011-2013 and May 2014-present), Savos (2009-2010 and May 2014-present) and GVIT (2008-2010); Director of Compliance (June 2014-present); Deputy Chief Compliance Officer, GPS Funds I (2009-present), GPS Funds II (2011- present) and GVIT (2009-2012); Senior Compliance Officer, AssetMark (2005-2009). |
| | Secretary | | Renewed 1-Year Term since 2014 | |
| * | | Ms. Hansen is a Trustee who is an “interested person” of the Trust as defined in the 1940 Act because she is an officer of AssetMark or certain of its affiliates. |
| | | |
| ** | | Each Officer of the Trust serves at the pleasure of the Board. |
The Statement of Additional Information includes additional information about the Funds’ Trustees and is available free of charge upon request by calling the Funds toll free at (888) 278-5809.
GuideMark® Funds & GuidePath® Funds
ADDITIONAL INFORMATION (Continued)
March 31, 2015
4. Proxy Voting Policies and Procedures and Proxy Voting Record (Unaudited)
A description of the policies and procedures that the Funds use to determine how to vote proxies related to the Funds’ portfolio securities as well as information regarding how the Funds voted proxies relating to portfolio securities during the most recent 12-month period ended June 30 is available without charge, upon request, by calling (888) 278-5809. Furthermore, you can obtain the Fund’s proxy voting records on the SEC’s website at http://www.sec.gov.
5. Availability of Quarterly Portfolio Holdings Schedules (Unaudited)
The Funds file their complete schedules of portfolio holdings with the SEC for their first and third fiscal quarters on Form N-Q. Once filed, the Funds’ Form N-Q is available without charge, upon request on the SEC’s website (http://www.sec.gov) and is available by calling (888) 278-5809. You can also obtain copies of Form N-Q by (i) visiting the SEC’s Public Reference Room in Washington, D.C. (information on the operation of the Public Reference Room may be obtained by calling 1-800-SEC-0330); (ii) sending your request and a duplicating fee to the SEC’s Public Reference Room, Washington, D.C. 20549-0102; or (iii) sending your request electronically to publicinfo@sec.gov.
| 6. | Statement Regarding the Basis for Approval of Investment Advisory Agreement and Sub-Advisory Agreements (Unaudited) |
GPS FUNDS I and GPS FUNDS II:
At the meeting of the Board of Trustees (the “Board” or the “Trustees”) of GPS Funds I and GPS Funds II (collectively, the “Trusts”) held on December 2, 2014 (the “Meeting”), the Board considered the renewal of the investment advisory agreements between AssetMark, Inc. (the “Advisor” or “AssetMark”) and each Trust on behalf of the series of each Trust (collectively, the “Funds”) (the “Advisory Agreements”). Additionally, the Board considered the renewal of the investment sub-advisory agreements between (i) Wellington Management Company (“Wellington”) and AssetMark, on behalf of the GuideMarkSM Large Cap Growth Fund, GuideMarkSM Small/Mid Cap Core Fund, and GuideMarkSM Core Fixed Income Fund; (ii) Barrow, Hanley, Mewhinney & Strauss, LLC (“Barrow Hanley”) and AssetMark, on behalf of the GuideMarkSM Large Cap Value Fund and GuideMarkSM Core Fixed Income Fund; (iii) Pyramis Global Advisers, LLC (“Pyramis”) and AssetMark, on behalf of the GuideMarkSM World ex-US Fund; (iv) Diamond Hill Capital Management, Inc. (“Diamond Hill”) and AssetMark, on behalf of the GuideMarkSM Opportunistic Equity Fund; (v) River Road Asset Management, LLC (“River Road”) and AssetMark, on behalf of the GuideMarkSM Opportunistic Equity Fund; (vi) Westfield Capital Management, L.P. (“Westfield”) and AssetMark, on behalf of the GuideMarkSM Opportunistic Equity Fund; (vii) Delaware Management Company (“Delaware”) and AssetMark, on behalf of the GuideMarkSM Tax-Exempt Fixed Income Fund; (viii) SSgA Funds Management, Inc. (“SSgA”) and AssetMark, on behalf of the GuideMarkSM Global Real Return Fund; (ix) Franklin Advisers, Inc. (“Franklin Advisers”) and AssetMark, on behalf of the GuideMarkSM Opportunistic Fixed Income Fund; (x) Loomis, Sayles and Company, L.P. (“Loomis Sayles”) and AssetMark, on behalf of the GuideMarkSM Opportunistic Fixed Income Fund; (xi) DoubleLine Capital LP (“DoubleLine”) and AssetMark, on behalf of the GuideMarkSM Opportunistic Fixed Income Fund; and (xii) Altegris Advisors, LLC (“Altegris”) and AssetMark, on behalf of the GuidePathSM Altegris Diversified Alternatives Allocation Fund (collectively, the “Sub-Advisory Agreements”). Hereinafter, Wellington, Barrow Hanley, Pyramis, Diamond Hill, River Road, Westfield, Delaware, SSgA, Franklin, Loomis Sayles, DoubleLine, and Altegris are collectively referred to as the “Sub-Advisors” and the above-listed Funds are collectively referred to as the “Sub-Advised Funds.” The Advisory Agreements and Sub-Advisory Agreements are collectively referred to herein as the “Agreements.”
The Sub-Advised Funds are managed using a “manager-of-managers” structure that generally involves the use of one or more sub-advisors to manage allocated portions of the Sub-Advised Funds’ portfolios. For those Sub-Advised Funds, AssetMark is responsible for evaluating and selecting sub-advisors on an ongoing basis and making any decisions to recommend hiring,
GuideMark® Funds & GuidePath® Funds
ADDITIONAL INFORMATION (Continued)
March 31, 2015
retaining, or replacing sub-advisors. The Board is engaged in monitoring this process in connection with its meetings held throughout the year, and under the manager-of-managers structure, all parties understand that sub-advisors are being monitored and evaluated, and are subject to replacement, at all times.
The Board – including a majority of the independent Trustees – determined to approve the continuance of the Advisory Agreements and the Sub-Advisory Agreements. The material factors considered and the conclusions that formed the basis of the Board’s approval of the renewal of the Agreements are described below. This summary describes the most significant, but not all, of the factors evaluated by the Board. Prior to considering the approval of the renewal of the Agreements, the Trustees requested, received, and reviewed information relevant to their consideration of the Agreements. The Trustees also received assistance and advice regarding legal and industry standards from independent legal counsel to the independent Trustees (“Independent Counsel”). The determination to approve the renewal of the Agreements was based on a comprehensive evaluation of all of the information available to the Trustees and was not the result of any particular information or any single factor. Moreover, each Trustee may have afforded different weight to various information and factors in reaching his conclusions with respect to the renewal of the Agreements.
The Advisory Agreements
Materials Reviewed and the Review Process
Prior to voting to approve the renewal of the Agreements, the Trustees – assisted by Independent Counsel – specifically requested and were furnished with materials for purposes of their review of each Advisory Agreement. The materials provided to the Board with regard to the Funds related to, among other things: (l) the terms and conditions of each Advisory Agreement, including confirmation from the Advisor that no change to the existing terms of any Advisory Agreement were proposed; (2) a copy of the Advisor’s Form ADV disclosure document; (3) information describing each Fund’s performance compared to the Fund’s peer group of other investment companies with investment objectives similar to the investment objective(s) of the Fund; (4) information describing the nature, quality and extent of the services that the Advisor provides to the Funds, and the fees the Advisor charges to the Funds for such services, and a comparison of those fees to the fees paid by a peer group of other investment companies having investment objectives similar to the investment objectives of the Funds and that were identified as competitors; (5) information regarding the Advisor’s business and operations, investment team, compliance program and internal procedures; (6) information describing each Fund’s expense ratios compared to the Fund’s peer group of other registered investment companies with investment objectives similar to the investment objective(s) of the Fund; (7) information regarding the financial condition of the Advisor and its parent company; (8) information regarding the Advisor’s profitability in managing each Fund; (9) reports on AssetMark’s evaluation of Sub-Advisors, including reports relating to the monitoring of each Sub?Advisor’s trading and brokerage practices; (10) reports relating to the distribution, sales and redemptions of Fund shares and related shareholder services; (11) reports relating to the monitoring of the other service providers: and (12) other information relevant to an evaluation of the nature, extent and quality of the services provided by the Advisor in response to a series of detailed questions posed by Independent Counsel. The Trustees met with representatives of the Advisor. The Trustees also considered their discussions with representatives of the Advisor throughout the course of the Meeting, at other meetings of the Board and its committees and other communications throughout the year.
The Trustees received assistance and advice regarding legal and industry standards from both Independent Counsel and from counsel to the Trusts, which included detailed memoranda that described the Trustees’ legal duties and obligations in considering whether to approve the Advisory Agreements. The independent Trustees discussed the Advisory Agreements in communications prior to their meeting and during the course of their meeting in executive session with Independent Counsel, at which no representatives of the Advisor were present.
GuideMark® Funds & GuidePath® Funds
ADDITIONAL INFORMATION (Continued)
March 31, 2015
Factors Considered
The Trustees considered and reached conclusions on a number of factors in making the decision to approve the Advisory Agreement. These factors and conclusions are described below.
Nature, Quality and Extent of Services
The Trustees considered the nature, extent and quality of the services that the Advisor provides to the Funds. With respect to the Sub-Advised Funds, the Board considered the fact that, as an investment advisor operating within a manager-of-managers structure, the Advisor maintains a primary focus on the selection, evaluation and oversight of the Funds’ various Sub-Advisors and considered the Advisory Agreements in this context. In this regard, the Trustees considered the information provided to them throughout the course of the year during regular meetings of the Board, which included meetings with the Trust’s CCO at which the Trustees are provided with details regarding the Advisor’s compliance functions.
The Trustees considered the Advisor’s investment team and its capabilities, including with respect to the responsibilities that the Advisor has for the Funds that pursue their investment objectives through investments in other funds (each a “Fund-of-Funds”). The Trustees also considered the Advisor’s capabilities with respect to the administrative and compliance services provided to the Funds. The Trustees considered the experience, capability and integrity of the Advisor’s management and other personnel, the role of the Advisor’s senior management and the extent of its involvement with the Funds, and the Advisor’s willingness to add personnel over time in order to ensure that appropriate staffing levels are maintained. With respect to the Sub-Advised Funds, the Trustees noted the responsibilities that the Advisor has under the Trusts’ manager-of-managers structure, including: selecting and oversight of the Funds’ Sub-Advisors; maintaining a comprehensive compliance and administration program; and implementing Fund policies.
The Trustees also considered (a) the financial position of the Advisor; (b) the quality of the Advisor’s regulatory and legal compliance policies, procedures and systems; (c) the nature, extent and quality of administrative and shareholder services provided by the Advisor to the Funds; and (d) the Advisor’s supervision of the Funds’ third-party service providers.
The Board considered the breadth and quality of services that the Advisor provides to the Funds. The Trustees also considered that the Funds are an integral part of the Advisor’s program of asset allocation and shareholder services. Additionally, with respect to the Sub-Advised Funds, the Trustees considered AssetMark’s ability to provide administrative and compliance-related services in connection with the Advisor’s (a) oversight of the Sub-Advisors’ compliance with the Funds’ respective investment objectives, policies, and restrictions; (b) review of trading and brokerage matters; and (c) other oversight activities.
Based on the factors described above, among other factors, as well as the information provided to the Board throughout the year, the Trustees concluded that it was satisfied with the nature, extent and quality of the services provided by the Advisor, which will continue to be provided to each Fund.
Investment Performance of the Funds
The Trustees considered the overall investment performance of the Funds, and, with respect to the Sub-Advised Funds, evaluated the Funds’ performance in the context of the manager-of-managers structure. The Trustees considered whether the Funds operated within their investment objectives and styles and considered each Fund’s record of compliance with its respective investment restrictions.
The Trustees also considered each Fund’s investment performance relative to its respective benchmark index and relative to the performance of funds with comparable investment strategies selected by a third-party information provider. The Trustees also considered performance-related data received throughout the past year at and in connection with meetings of the Board. With respect to each Fund-of-Funds, the Trustees reviewed the performance of the Advisor in selecting the underlying funds for the Fund.
GuideMark® Funds & GuidePath® Funds
ADDITIONAL INFORMATION (Continued)
March 31, 2015
The Trustees considered that, as applicable, the Advisor continued to be proactive in seeking to replace and/or add sub-advisors or underlying funds, to reallocate assets among sub-advisors or underlying funds and to implement new investment strategies, with a view to improving Fund performance over the long term.
The Trustees concluded that AssetMark’s performance record in managing each of the Funds was satisfactory and supported a decision to approve the renewal of the Advisory Agreements.
Advisory Fees and Total Expenses
The Trustees considered a detailed analysis of each Fund’s fees and expenses. The materials provided to the Board included (i) a comparison of the advisory fees and total expenses of each Fund (as a percentage of average net assets) with the fees and expenses of a group of funds selected by a third-party information provider; (ii) comparisons of each Fund’s expenses to industry averages; and (iii) fee schedules for the Funds’ Sub-Advisors, as applicable.
The Trustees considered expense limitation arrangements under which AssetMark has agreed to limit the Funds’ expenses. With respect to each Fund-of-Funds, the Trustees considered the indirect expenses borne by the Funds as shareholders of certain underlying funds. The Trustees also considered other efforts by the Advisor to reduce overall Fund expenses, including attempts to improve asset flows, implementing programs such as securities lending and negotiating strategic contracts with service providers.
In analyzing the Funds’ fee levels as compared to other similar funds, the Trustees considered the Funds’ fee levels in light of the Funds’ special distribution structure, under which the Funds were distributed as part of a suite of products and services with asset allocation modeling, full performance reporting and other services that are not typically provided with mutual funds.
After comparing each Fund’s anticipated fees with other comparable funds and industry averages, and in light of the nature, extent and quality of services provided to the Funds by AssetMark, as well as the costs incurred by AssetMark in rendering those services, the Trustees concluded that the level of fees paid to AssetMark with respect to each Fund was reasonable.
Profitability, Economies of Scale and Ancillary Benefits
The Trustees reviewed and discussed the financial information presented by the Advisor, including information relating to the financial stability of the Advisor and its historical and anticipated profitability with respect to its management of the Funds. The Trustees discussed the methods used by the Advisor to allocate expenses to the Funds under its profitability analysis, and the Trustees considered the individual profitability of the Advisor with respect to each Fund under this methodology.
In evaluating the Advisor’s profitability, the Trustees acknowledged that the Funds are distributed connection with the Advisor providing a package of administrative and other services as the sponsor of the Advisor’s investment platform and considered the benefits that flow to Fund shareholders as a result of these services. Additionally, the Trustees considered the Advisor’s existing agreements to waive advisory fees received from certain Funds and/or pay certain Fund expenses to the extent necessary to ensure that the Funds’ overall expenses do not exceed certain levels.
The Trustees considered ancillary benefits received by the Advisor as a result of its relationship with the Funds, including the benefits of offering an integrated set of investment options as an integral part of the Advisor’s asset allocation investment programs and the related marketing rebates received by the Advisor. The Trustees concluded that these benefits were reasonable.
The Trustees considered AssetMark’s profitability in managing each Fund, the anticipated effect of asset growth on each Fund’s expenses, and other information that might suggest the potential for realizing economies of scale that could be shared with Fund shareholders. The Trustees considered the fee waiver agreement under which AssetMark had agreed to waive expenses based upon the achievement of certain breakpoints listed in the agreement.
GuideMark® Funds & GuidePath® Funds
ADDITIONAL INFORMATION (Continued)
March 31, 2015
The Trustees concluded, in light of the foregoing factors, that the Advisor’s level of profitability is reasonable. Additionally, the Trustees concluded that the economies of scale being realized by AssetMark, if any, do not mandate the implementation of new or amended breakpoints or other changes in the fee structure for any Fund at this time.
Conclusion
After consideration of the foregoing factors, and such other matters as were deemed relevant, and with no single factor being determinative to their decision, the Trustees, including all of the independent Trustees, concluded to approve the renewal of the Advisory Agreements with, and the fee to be paid to, the Advisor for each of the Funds.
The Sub-Advisory Agreements
Materials Reviewed and the Review Process
Assisted by Independent Counsel, the Trustees specifically requested and were furnished with materials for purposes of their review of each Sub-Advisory Agreement. The materials provided to the Board related to, among other things: (1) the terms and conditions of each Sub-Advisory Agreement, including confirmation from the Advisor that no change to the existing terms of any Sub-Advisory Agreement were proposed; (2) a copy of each Sub-Advisor’s Form ADV disclosure document; (3) the nature, quality and scope of the services to be provided by the Sub-Advisors, as well as the schedule of fees charged for such services; (4) the investment performance of each Sub-Advisor in managing their respective Fund compared to an industry peer group as well as other sub-advisor client accounts; (5) the fee paid to each Sub-Advisor by AssetMark; (6) AssetMark’s evaluation of the nature, extent and quality of the services provided by each Sub-Advisor; (7) benefits to each Sub-Advisor, such as receipt of research from brokers, that might result from the Sub-Advisor’s relationship with a Fund; (8) information concerning each Sub-Advisor’s personnel, business, operations and investment team, including biographical information for the investment professionals that are responsible for the day-to-day management of the applicable Fund’s portfolio; (9) information regarding each Sub-Advisor’s compliance policies and other internal procedures, including the Sub-Advisor’s brokerage procedures and practices; (10) information regarding the financial condition of each Sub-Advisor or its parent company; and (11) other information relevant to an evaluation of the nature, extent and quality of the services provided by each Sub-Advisor in response to a series of detailed questions posed by Independent Counsel on behalf of the independent Trustees. The Trustees also considered the recommendations of the Advisor with respect to each Sub-Advisor and the methods and resources the Advisor utilized in its efforts to identify and engage Sub-Advisors for the Funds.
The Trustees received assistance and advice regarding legal and industry standards from both Independent Counsel and from counsel to the Trusts, which included detailed memoranda that described the Trustees’ legal duties and obligations in considering the renewal of the Sub-Advisory Agreements. The Trustees discussed the approval of the Sub-Advisory Agreements in communications prior to their meeting and, during the course of their meeting, in executive session with Independent Counsel at which no representatives of AssetMark or the Sub-Advisors were present.
Factors Considered
The Trustees considered and reached conclusions on a number of factors in making the decision to approve the Sub-Advisory Agreements. In so doing, the Trustees considered AssetMark’s role as a “manager-of-managers,” which includes, among other functions, monitoring and evaluating the performance of the Sub-Advisors, recommending that any Sub-Advisor not performing as expected be replaced, and negotiating advantageous fee arrangements that could permit the Funds to realize economies of scale without compromising the quality of services. These factors and the Board’s conclusions are set forth below.
GuideMark® Funds & GuidePath® Funds
ADDITIONAL INFORMATION (Continued)
March 31, 2015
Nature, Quality and Extent of Services
The Trustees considered each Sub-Advisor’s investment management process, including (a) the experience, capability and integrity of the Sub-Advisor’s management, investment professionals and other personnel; (b) the financial position of the Sub-Advisor; (c) the quality and commitment of the Sub-Advisor’s regulatory and legal compliance policies, procedures and systems; (d) the Sub-Advisor’s brokerage and trading practices; and (e) and AssetMark’s evaluation of the nature, quality and extent of services performed by each Sub-Advisor.
The Trustees specifically considered the qualifications, experience and track record of the individuals and portfolio management teams at each Sub-Advisor that are responsible for the day-to-day management of each Fund’s portfolio. The Trustees also considered, with respect to each Sub-Advisor, the specific investment approach and level of expertise within its particular asset class. The Trustees considered whether each Sub-Advisor operated within its respective Fund’s investment objective and style and considered each Sub-Advisor’s record of compliance with applicable investment restrictions. The Trustees also considered each Sub-Advisor’s performance record with respect to the relevant benchmark(s).
The Trustees concluded that the nature, extent and quality of the services provided by each Sub-Advisor to its respective Sub-Advised Fund is satisfactory.
Sub-Advisor Investment Performance
The Trustees considered whether each Sub-Advisor operated within its respective Sub?Advised Fund’s investment objective and style and considered each Sub-Advisor’s record of compliance with applicable investment restrictions. The Trustees also considered each Sub-Advisor’s investment performance relative to benchmark indices.
The Trustees considered that they had reviewed each Sub-Advisor, including the primary contributors to and detractors from performance, with the Advisor and concluded that each Sub-Advisor’s performance record is satisfactory.
Sub-Advisory Fees, Economies of Scale, Profitability and Ancillary Benefits
The Trustees considered the fee paid to each Sub-Advisor by the Advisor for providing services to its relevant Sub-Advised Fund. The Trustees considered management’s representation that AssetMark’s focus in negotiating sub-advisory arrangements is on negotiating the best possible fee structures for each Fund, and that the sub-advisory fees are paid by the Advisor out of the investment advisory fees received. The Trustees also considered individual reports prepared with regard to each Sub-Advisor, containing comparative information regarding fees. The Trustees noted that each Sub-Advisor’s fees were generally similar to the fees charged by each Sub-Advisor to other comparable funds and accounts.
The Trustees considered each Sub-Advisor’s fee schedule, the anticipated effect of asset growth on each Fund’s expenses, and other information that might suggest the potential for realizing economies of scale that could be shared with Fund shareholders. In this regard, the Trustees noted that certain of the Sub-Advisory Agreements’ fee schedules contain breakpoints that present potential economies of scale that could be shared with the Sub-Advised Funds’ shareholders as assets of the Sub-Advised Fund grow.
The Trustees concluded that the fees to be paid to each Sub-Advisor by the Advisor are reasonable in light of the services performed for the Sub-Advised Funds by the Sub-Advisors and that the economies of scale being realized by the Sub-Advisors, if any, do not mandate the implementation of any new or amended breakpoints or other changes in the fee structure for any Sub-Advised Fund at this time.
The Trustees did not consider the profitability of the Sub-Advisors to be a material factor based on representations from AssetMark that it negotiates sub-advisory fees with the Sub-Advisors on an arm’s-length basis.
GuideMark® Funds & GuidePath® Funds
ADDITIONAL INFORMATION (Continued)
March 31, 2015
The Trustees considered the allocation (if any) of Fund brokerage to brokers affiliated with a Sub-Advisor and benefits to the Sub-Advisors from the use of “soft dollar” commissions (if any) to pay for research and brokerage services. The Trustees also considered any other ancillary benefits that accrue to a Sub-Advisor or any affiliate by virtue of the Sub-Advisor’s relationship with the Fund, and concluded that such benefits, if any, were reasonable.
Conclusion
After consideration of the foregoing factors, and such other matters as were deemed relevant, and with no single factor being determinative to their decision, the Trustees, including all of the independent Trustees, concluded to approve the renewal of the Sub-Advisory Agreements with, and the fees to be paid to, each of the Sub-Advisors for each of the relevant Sub-Advised Funds.
GuideMark® Funds
GuidePath® Funds
| | | |
| GuideMark® Funds & GuidePath® Funds |
| |
| |
| GuideMark® Large Cap Growth Fund |
| GuideMark® Large Cap Value Fund |
| GuideMark® Small/Mid Cap Core Fund |
| GuideMark® World ex-US Fund |
| GuideMark® Opportunistic Equity Fund |
| GuideMark® Global Real Return Fund |
| GuideMark® Core Fixed Income Fund |
| GuideMark® Tax-Exempt Fixed Income Fund |
| GuideMark® Opportunistic Fixed Income Fund |
| GuidePath® Strategic Asset Allocation Fund |
| GuidePath® Tactical Constrained® Asset Allocation Fund |
| GuidePath® Tactical Unconstrained® Asset Allocation Fund |
| GuidePath® Absolute Return Asset Allocation Fund |
| GuidePath® Multi-Asset Income Asset Allocation Fund |
| GuidePath® Fixed Income Allocation Fund |
| GuidePath® Altegris® Diversified Alternatives Allocation Fund |
| Investment Advisor | | |
| AssetMark, Inc. | | |
| 1655 Grant Street, 10th Floor | | |
| Concord, CA 94520 | | |
| Legal Counsel | | |
| Stradley Ronon Stevens & Young, LLP | | This document must be |
| 2005 Market Street, Suite 2600 | | preceded or accompanied by a |
| Philadelphia, PA 19103 | | free prospectus. Investors should |
| Independent Registered Public Accounting Firm | consider the Fund’s investment |
| Cohen Fund Audit Services, Ltd. | | objectives, risks, charges and |
| 1350 Euclid Avenue, Suite 800 | | expenses carefully before |
| Cleveland, OH 44115 | | investing. The prospectus |
| Transfer Agent, Fund Accountant | | contains this and other |
| and Fund Administrator | | important information about |
| U.S. Bancorp Fund Services, LLC | | the Fund. Please read the |
| 615 East Michigan Street | | prospectus carefully before you |
| Milwaukee, WI 53202 | | invest or send money. |
| Custodians | | |
| U.S. Bank, N.A. | BNY Mellon Asset Servicing | |
| 1555 North RiverCenter Drive, Suite 302 | One Wall Street | |
| Milwaukee, WI 53212 | New York, NY 10286 | |
| Distributor | | |
| AssetMark BrokerageTM, LLC | | |
| 1655 Grant Street, 10th Floor | | |
| Concord, CA 94520 | | Annual Report |
| | | March 31, 2015 |
| | | |
Item 2. Code of Ethics.
The registrant has adopted a code of ethics that applies to the registrant’s principal executive officer and principal financial officer. The registrant has not made any amendments to its code of ethics during the period covered by this report. The registrant has not granted any waivers from any provisions of the code of ethics during the period covered by this report.
A copy of the registrant’s Code of Ethics is filed herewith.
Item 3. Audit Committee Financial Expert.
The registrant’s board of trustees has determined that there is at least one audit committee financial expert serving on its audit committee. Dennis Schmal is the “audit committee financial expert” and is considered to be “independent” as each term is defined in Item 3 of Form N-CSR.
Item 4. Principal Accountant Fees and Services.
(a) Audit Fees
For the fiscal year ended March 31, 2015, the registrant’s principal accountant billed the registrant $113,000 for professional services rendered for the audit of the registrant’s annual financial statements or services that are normally provided by the principal accountant in connection with statutory and regulatory filings or engagements.
For the fiscal year ended March 31, 2014, the registrant’s principal accountant billed the registrant $132,585 for professional services rendered for the audit of the registrant’s annual financial statements or services that are normally provided by the principal accountant in connection with statutory and regulatory filings or engagements.
(b) Audit-Related Fees
None.
c) Tax Fees
For the fiscal year ended March 31, 2015, the registrant’s principal accountant billed the registrant $29,000 for professional services rendered for tax compliance, tax advice and tax planning.
For the fiscal year ended March 31, 2014, the registrant’s principal accountant billed the registrant $39,794 for professional services rendered for tax compliance, tax advice and tax planning.
(d) All Other Fees
None.
| (e)(1) | The registrant’s audit committee charter provides that the audit committee is responsible for the approval, prior to appointment, of the engagement of auditors annually to audit and to provide their opinion on the registrant’s financial statements. The audit committee charter also provides that the audit committee is responsible for the approval, prior to appointment, of the engagement of the auditor to provide other audit services to the registrant or to provide non-audit services to the registrant, its investment adviser or any entity controlling, controlled by, or under common control with the investment adviser that provides ongoing services to the registrant, if the engagement relates directly to the operations and financial reporting of the registrant. |
| (e)(2) | There were no services in paragraphs (b) through (d) above (including services required to be approved by the audit committee pursuant to paragraph (c)(7)(ii) of Rule 2-01 of Regulation S-X) that were approved pursuant to the waiver provision of paragraph (c)(7)(i)(C) of Rule 2-01 of Regulation S-X. |
| (f) | None of the hours expended on the principal accountant’s engagement to audit the registrant’s financial statements for the fiscal year ended March 31, 2015 were attributable to work performed by persons other than the principal accountant’s full-time, permanent employees. |
| (g) | The aggregate non-audit fees billed by the registrant’s principal accountant for services rendered to the registrant’s investment adviser and any entity controlling, controlled by, or under common control with the investment adviser that provides ongoing services to the registrant for the fiscal year ended March 31, 2015 and March 31, 2014 were $0 and $0, respectively. |
| (h) | The registrant’s audit committee has considered whether the provision of non-audit services that were rendered to the registrant’s investment adviser, and any entity controlling, controlled by, or under common control with the investment adviser that provides ongoing services to the registrant, that were not pre-approved pursuant to paragraph (c)(7)(ii) of Rule 2-01 of Regulation S-X is compatible with maintaining the principal accountant’s independence. |
Item 5. Audit Committee of Listed Registrants.
Not applicable to registrants who are not listed issuers (as defined in Rule 10A-3 under the Securities Exchange Act of 1934).
Item 6. Investments.
Schedule of Investments is included as part of the report to shareholders filed under Item 1 of this Form.
Item 7. Disclosure of Proxy Voting Policies and Procedures for Closed-End Management Investment Companies.
Not applicable to open-end investment companies.
Item 8. Portfolio Managers of Closed-End Management Investment Companies.
Not applicable to open-end investment companies.
Item 9. Purchases of Equity Securities by Closed-End Management Investment Company and Affiliated Purchasers.
Not applicable to open-end investment companies.
Item 10. Submission of Matters to a Vote of Security Holders.
None.
Item 11. Controls and Procedures.
| (a) | The Registrant’s President/Principal Executive Officer and Treasurer/Principal Financial Officer have reviewed the Registrant’s disclosure controls and procedures (as defined in Rule 30a-3(c) under the Investment Company Act of 1940 (the “Act”)) as of a date within 90 days of the filing of this report, as required by Rule 30a-3(b) under the Act and Rules 13a-15(b) or 15d-15(b) under the Securities Exchange Act of 1934. Based on their review, such officers have concluded that the disclosure controls and procedures are effective in ensuring that information required to be disclosed in this report is appropriately recorded, processed, summarized and reported and made known to them by others within the Registrant and by the Registrant’s service provider. |
| (b) | There were no changes in the Registrant’s internal control over financial reporting (as defined in Rule 30a-3(d) under the Act) that occurred during the second fiscal quarter of the period covered by this report that has materially affected, or is reasonably likely to materially affect, the Registrant’s internal control over financial reporting. |
Item 12. Exhibits.
| (a) | (1) Any code of ethics or amendment thereto, that is the subject of the disclosure required by Item 2, to the extent that the registrant intends to satisfy Item 2 requirements through filing an exhibit. Filed herewith. |
(2) A separate certification for each principal executive and principal financial officer pursuant to Section 302 of the Sarbanes-Oxley Act of 2002. Filed herewith.
(3) Any written solicitation to purchase securities under Rule 23c-1 under the Investment Company Act of 1940 sent or given during the period covered by the report by or on behalf of the registrant to 10 or more persons. Not applicable.
| (b) | Certifications pursuant to Section 906 of the Sarbanes-Oxley Act of 2002. Furnished herewith. |
SIGNATURES
Pursuant to the requirements of the Securities Exchange Act of 1934 and the Investment Company Act of 1940, the registrant has duly caused this report to be signed on its behalf by the undersigned, thereunto duly authorized.
(Registrant) GPS Funds II
By (Signature and Title) /s/ Carrie E. Hansen
Carrie E. Hansen, Principal Executive Officer/President
Date 05/28/2015
Pursuant to the requirements of the Securities Exchange Act of 1934 and the Investment Company Act of 1940, this report has been signed below by the following persons on behalf of the registrant and in the capacities and on the dates indicated.
By (Signature and Title) /s/ Carrie E. Hansen
Carrie E. Hansen, Principal Executive Officer/President
Date 05/28/2015
By (Signature and Title) /s/ Patrick R. Young
Patrick R. Young, Principal Financial Officer/Treasurer
Date 05/28/2015