Small capitalization companies trailed their larger capitalization counterparts over the six-month period, with the Russell 2000 Index returning 1.6%, and the large cap Russell 1000 Index rising 3.0% for the six months ended September 2012. Although both capitalization ranges benefited from the risk-taking environment of the last four months of the period, June through September, it appeared that investors favored the larger capitalization companies that tend to better withstand economic downturns during the flight to safety that took place in April and May.
The broad fixed income markets marginally outperformed equities, as the Barclays US Aggregate Bond Index returned 3.7% relative to the S&P 500® Index, which returned 3.4% for the six-month period. In the flight to safety during the spring, Treasury bonds were the best performing sector, and had particularly longer-term maturities, as yields fell to historic lows with investors seeking a safe haven from global market risks. This performance benefited the Barclays US Aggregate Bond Index in April and May due to the large exposure to government-related bonds but went on to temper returns in the last four months of the period as low yields and less demand for safe-haven assets were headwinds. Spread compression in the credit markets boosted the returns of corporate bonds, with the lower credit quality securities seeing the greatest benefit based on strong momentum. The Barclays US Treasury Inflation Protected Securities (TIPS) Index returned 5.3% for the six-month period. This asset class benefited from the flight-to-safety trade during the first two months of the period, then rose in the following months based on the Federal Reserve’s quantitative easing announcement, with markets anticipating potential inflation risks over the longer term.
Similar to international equities, international fixed income markets were significantly impacted by currency moves. In April and May, European bonds saw a drag on returns as the euro hit a low point against the dollar, while exposure to Japanese bonds and the stronger yen provided some benefits. Over the subsequent four months of the period, appreciation in international currencies relative to the US dollar was a strong driver of returns for international bonds. Emerging market bonds, with their less debt-laden balance sheets, fared even better. For the full six-month period, the Barclays Multiverse Index returned 4.0%, outpacing the US fixed income market.
The municipal market outperformed the taxable fixed income market by 50 basis points, with the Barclays Municipal Bond Index returning 4.2% for the six months ended September 30, 2012. Even with the challenging environment, the continued demand and lower supply due to limited issuance in the municipal market drove municipal bond prices higher.
GuideMark and GuidePath Fund Review
GuideMark Fund performance followed a pattern similar to the markets and performance continued to be driven by security selection across the board. Fundamentals started to matter again, although the overhang of macro headwinds remained. While the perceived potential for a significant systemic shock lessened, the market moved in brief bursts, with over 200% of the year-to-date return of the US equity market (S&P 500® Index) attained during short, sharp upward movements over the last four months of the period, typically on the heels of a central bank announcement. Funds that were defensively positioned and favored low beta securities performed well in the first two months of the period but went on to trail their benchmarks over the subsequent four months as the market rallied. Conversely, funds that had more cyclically sensitive exposures trailed their benchmarks in the first two months before rallying and outperforming their benchmarks in the subsequent four months of the period. In many cases, the outperformance in the last four months of the period was not enough to erase the losses experienced at the start of the period.
The GuidePath Funds, which contain international exposures, continued to struggle against their domestic benchmarks due to the headwinds from international equity markets that trailed US equities as a result of the strengthening of the dollar in April and May. For the six-month period, the MSCI All Country World ex-US Index returned -0.44%, trailing the S&P 500® by three percentage points. In addition, similar trends to those experienced by the GuidePath Funds were seen by the GuideMark Funds: the more defensively positioned funds excelled in April and May but experienced weak performance from June through September 2012, and funds with greater equity sensitivity experienced weakness in the first two months but rallied in the subsequent four months of the period.
Looking Ahead
Even with the strong run for equity markets so far in 2012, few would argue that the future will be clear sailing for stocks. The situation in Europe continues to weigh heavily on investors’ minds, and other risks, such as slowing growth in China and the looming US fiscal cliff, also present potential uncertainty. Nonetheless, volatility measures such as the Chicago Board Options Exchange Volatility Index® (VIX®) (a measure of expected volatility on the S&P 500®) have surprisingly reflected a calm market environment. With the many uncertainties, a balanced approach to portfolio construction may allow you to not only benefit from positive market returns but, more importantly, allow you to limit losses in falling markets.
2
Please contact your financial advisor to discuss any questions about your investment strategy or changes in your financial goals. We thank you for including the Funds in your portfolio and appreciate the trust you have placed in us.
Sincerely,

Carrie E. Hansen
President of the GPS Funds
The Genworth Financial Wealth Management platform provides fee-based investment advisory programs. Investors are advised to refer to the appropriate Disclosure Brochure, which can be obtained from your financial advisor, for a full description of services provided, including all applicable fees.
Genworth Financial Wealth Management, Inc. (“GFWM”) is an investment advisor registered with the Securities and Exchange Commission. GFWM and Capital Brokerage Corporation are wholly owned subsidiaries of Genworth Financial, Inc.
Index Definitions
Barclays US Aggregate Bond Index: a broad-based index that measures the investment grade, US dollar-denominated, fixed rate taxable bond market, including Treasuries, government-related and corporate securities, MBS (agency fixed rate and hybrid ARM pass-throughs), ABSs, and CMBs.
Barclays Multiverse Index: provides a broad-based measure of the global fixed-income bond market. The index represents the union of the Barclays Global Aggregate Bond Index and the Barclays Global High-Yield Index and captures investment grade and high yield securities in all eligible currencies.
Barclays US Treasury Inflation Protected Securities (TIPS) Index: includes all publicly issued, US Treasury inflation-protected securities that have at least one year remaining to maturity, are rated investment grade, and have $250 million or more of outstanding face value.
Barclays Municipal Bond Index: an index that measures the performance of investment-grade, fixed-rate, tax-exempt bonds.
Dow Jones UBS Commodity Index: an index that is composed of futures contracts of 19 physical commodities traded on US exchanges, with the exception of aluminum, nickel and zinc, which trade on the London Metal Exchange (LME). The component weightings are also determined by several rules designed to insure diversified commodity exposure.
FTSE NAREIT All Equity REITs Index: an index of US publicly traded REITs. Equity REITs include those firms that own, manage and lease investment-grade commercial real estate. Specifically, a company is classified as an equity REIT if 75% or more of its gross invested book assets are invested in real property.
MSCI All Country World ex-US Index: a free-float-adjusted, market-capitalization-weighted index that is designed to measure the equity market performance of developed and emerging market countries, excluding the US.
MSCI EAFE Index (Europe, Australasia, Far East) is a free float-adjusted market capitalization index that is designed to measure the equity market performance of developed markets, excluding the US & Canada.
MSCI Emerging Markets Index is a free float-adjusted market capitalization index that is designed to measure equity market performance of emerging markets.
S&P 500® Index: an index of 500 leading companies in leading industries of the US economy, capturing 75% coverage of US equities.
3
S&P Global Natural Resources Index: an index that includes 90 of the largest publicly-traded companies in natural resources and commodities businesses that meet specific investability requirements, offering investors diversified, liquid and investable equity exposure across three primary commodity-related sectors: Agribusiness, Energy, and Metals & Mining.
| | |
| | |
1 | All index returns are from Zephyr except the Barclays Capital Multiverse and S&P Global Natural Resources, which are sourced from Morningstar. |
FX2012-1113-0215/E
4
|
GuideMarkSM Large Cap Growth Fund |
MANAGER’S DISCUSSION OF FUND PERFORMANCE (Unaudited) |
| |
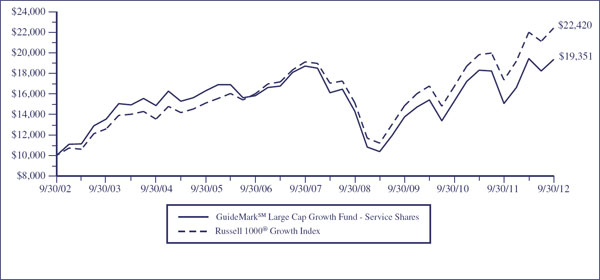
TOTAL RETURN BASED ON A $10,000 INVESTMENT
This chart assumes an initial gross investment of $10,000 made on September 30, 2002. Returns shown include the reinvestment of all dividends. Returns shown do not reflect the deduction of taxes that a shareholder would pay on Fund distributions or the redemption of Fund shares. In the absence of fee waivers and reimbursements, when they are necessary to keep expenses at the expense cap, total return would be reduced. Past performance is not predictive of future performance. Investment return and principal value will fluctuate so that your shares, when redeemed, may be worth more or less than the original cost. Index returns do not reflect the effects of fees or expenses. It is not possible to invest directly in an index.
RUSSELL 1000® GROWTH INDEX – An unmanaged index which measures the performance of those Russell 1000® companies with higher price-to-book ratios and higher forecasted growth values. The Russell 1000® Index is an unmanaged index which measures the performance of the 1,000 largest companies in the Russell 3000® Index. The Russell 3000® Index is an unmanaged index which measures the performance of the 3,000 largest US Companies, based on total market capitalization, which represents approximately 98% of the investable US equity market.
| | | | | | | | | | | | | |
AVERAGE ANNUAL TOTAL RETURN (for periods ended September 30) |
| |
| | One Year | | Five Year | | Ten Year | | Since Inception(1) | |
| | | | | | | | | |
GuideMarkSM Large Cap Growth Fund | | | | | | | | | | | | | |
Service Shares | | 28.47 | % | | 0.67 | % | | 6.82 | % | | 1.17 | % | |
Institutional Shares | | 29.09 | % | | N/A | | | N/A | | | 2.24 | % | |
Russell 1000® Growth Index | | 29.19 | % | | 3.24 | % | | 8.41 | % | | 3.04 | %(2) | |
| |
(1) | Inception date is 6/29/01 for Service Shares and 4/29/11 for Institutional Shares. |
| |
(2) | The return shown for the Russell 1000® Growth Index is from the inception date of the Service Shares. The Russell 1000® Growth Index return from the inception date of the Institutional Shares is 6.52%. |
5
|
GuideMarkSM Large Cap Growth Fund |
MANAGER’S DISCUSSION OF FUND PERFORMANCE (Continued) (Unaudited) |
| |
| |
• | For the 6 months ended September 2012, the Fund returned -0.47%, underperforming the Russell 1000 Growth Index at 1.84%. |
| |
• | The Fund trailed the benchmark for the period due to weak security selection and sector allocation primarily in April and May as the market declined on global macro worries. In the market rally that followed beginning in June, the Fund outperformed its benchmark. |
| |
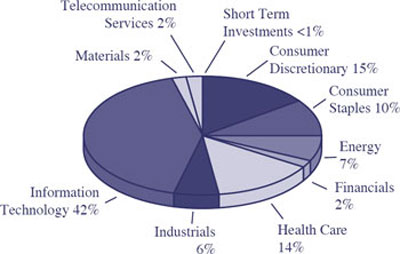
• | Security selection within the technology sector, in addition to an overweight allocation to the sector, was a large contributor to the relative underperformance over the period. Although owning Apple benefited the Fund on an absolute basis, exposure to slower growth securities within the sector, including Cisco and EMC detracted from relative performance. |
| |
• | Security selection within the industrials sector detracted from performance for the period. Industrial related stocks, including Caterpillar, traded lower largely due to fears that a slowdown in China could negatively impact future growth. |
Components of Portfolio Holdings*
*Pie chart represents percentages of total portfolio, less securities lending collateral.
| | | | | | |
Top Ten Holdings |
| | | | | | |
Rank | | Security/Holding | | % of Net
Assets | |
1 | | | Apple, Inc. | | 9.36 | |
2 | | | Cisco Systems, Inc. | | 4.88 | |
3 | | | Microsoft Corp. | | 4.33 | |
4 | | | Google, Inc. | | 3.26 | |
5 | | | International Business Machines Corp. | | 3.03 | |
6 | | | The Coca-Cola Company | | 2.77 | |
7 | | | Philip Morris International, Inc. | | 2.65 | |
8 | | | Amgen, Inc. | | 2.40 | |
9 | | | Verizon Communications, Inc. | | 2.26 | |
10 | | | Wal-Mart Stores, Inc. | | 2.20 | |
The Global Industry Classification Standard (“GICS®”) was developed by and/or is the exclusive property of MSCI, Inc. (“MSCI”) and Standard & Poor’s Financial Services LLC (“S&P”). GICS is a service mark of MSCI and S&P, and has been licensed for use by U.S. Bancorp Fund Services, LLC.
6
|
GuideMarkSM Large Cap Value Fund |
MANAGER’S DISCUSSION OF FUND PERFORMANCE (Unaudited) |
| |
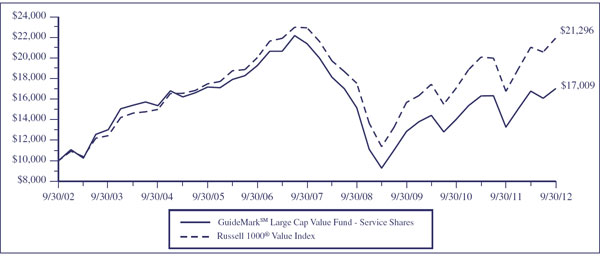
TOTAL RETURN BASED ON A $10,000 INVESTMENT
This chart assumes an initial gross investment of $10,000 made on September 30, 2002. Returns shown include the reinvestment of all dividends. Returns shown do not reflect the deduction of taxes that a shareholder would pay on Fund distributions or the redemption of Fund shares. In the absence of fee waivers and reimbursements, when they are necessary to keep expenses at the expense cap, total return would be reduced. Past performance is not predictive of future performance. Investment return and principal value will fluctuate so that your shares, when redeemed, may be worth more or less than the original cost. Index returns do not reflect the effects of fees or expenses. It is not possible to invest directly in an index.
RUSSELL 1000® VALUE INDEX – An unmanaged index which measures the performance of those Russell 1000® companies with lower price-to-book ratios and lower forecasted growth values. The Russell 1000® Index is an unmanaged index which measures the performance of the 1,000 largest companies in the Russell 3000® Index. The Russell 3000® Index is an unmanaged index which measures the performance of the 3,000 largest US Companies, based on total market capitalization, which represents approximately 98% of the investable US equity market.
| | | | | | | | | | | | | |
AVERAGE ANNUAL TOTAL RETURN (for periods ended September 30) |
| |
| | One Year | | Five Year | | Ten Year | | Since Inception(1) | |
| | | | | | | | | |
GuideMarkSM Large Cap Value Fund | | | | | | | | | | | | | |
Service Shares | | 28.21 | % | | -4.49 | % | | 5.45 | % | | 1.64 | % | |
Institutional Shares | | 28.77 | % | | N/A | | | N/A | | | 1.67 | % | |
Russell 1000® Value Index | | 30.92 | % | | -0.90 | % | | 8.17 | % | | 4.39 | %(2) | |
| |
(1) | Inception date is 6/29/01 for Service Shares and 4/29/11 for Institutional Shares. |
|
(2) | The return shown for the Russell 1000® Value Index is from the inception date of the Service Shares. The Russell 1000® Value Index return from the inception date of the Institutional Shares is 4.41%. |
7
|
GuideMarkSM Large Cap Value Fund |
MANAGER’S DISCUSSION OF FUND PERFORMANCE (Continued) (Unaudited) |
| |
| | |
| • | For the 6 months ended September 2012, the Fund returned 1.42%, underperforming the Russell 1000 Value Index at 4.16%. |
| | |
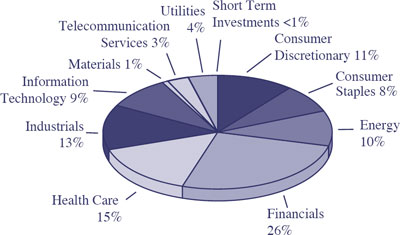
| • | The Fund trailed the benchmark for the period due primarily to relative sector positioning combined with weak security selection within the health care and telecom services sectors. Relative sector exposures are not targeted, but are a result of security selection while portfolio characteristics are held similar to the benchmark. |
| | |
| • | Underweight exposure to telecom services and utilities sectors detracted in the earlier months of the period, while an underweight exposure to more cyclical sectors including financials, consumer discretionary and energy negatively impacted performance in the second half of the period as the market rallied. |
| | |
| • | Within health care, managed care companies including Wellpoint, United Healthcare and Cigna sold off during the period as a result of increased regulatory uncertainty. |
Components of Portfolio Holdings*
*Pie chart represents percentages of total portfolio, less securities lending collateral.
| | | | | | |
Top Ten Holdings |
| | | | | | |
Rank | | Security/Holding | | % of Net
Assets | |
1 | | | Capital One Financial Corp. | | 3.30 | |
2 | | | Stanley Black & Decker, Inc. | | 3.01 | |
3 | | | SLM Corp. | | 2.33 | |
4 | | | Pfizer, Inc. | | 1.82 | |
5 | | | Philip Morris International, Inc. | | 1.81 | |
6 | | | Medtronic, Inc. | | 1.79 | |
7 | | | UnitedHealth Group, Inc. | | 1.79 | |
8 | | | Carnival Corp. – ADR | | 1.71 | |
9 | | | AT&T, Inc. | | 1.68 | |
10 | | | JPMorgan Chase & Co. | | 1.63 | |
8
|
GuideMarkSM Small/Mid Cap Core Fund |
MANAGER’S DISCUSSION OF FUND PERFORMANCE (Unaudited) |
| |
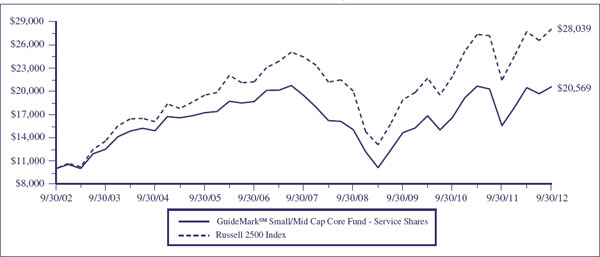
TOTAL RETURN BASED ON A $10,000 INVESTMENT
This chart assumes an initial gross investment of $10,000 made on September 30, 2002. Returns shown include the reinvestment of all dividends. Returns shown do not reflect the deduction of taxes that a shareholder would pay on Fund distributions or the redemption of Fund shares. In the absence of fee waivers and reimbursements, when they are necessary to keep expenses at the expense cap, total return would be reduced. Past performance is not predictive of future performance. Investment return and principal value will fluctuate so that your shares, when redeemed, may be worth more or less than the original cost. Index returns do not reflect the effects of fees or expenses. It is not possible to invest directly in an index.
RUSSELL 2500TM INDEX – Measures the performance of the small- to mid-cap segment of the US equity universe, commonly referred to as “smid” cap. The Russell 2500 Index is a subset of the Russell 3000® Index. The Russell 2500 Index includes approximately 2,500 of the smallest securities based on a combination of their market cap and current index membership.
| | | | | | | | | | | | | |
AVERAGE ANNUAL TOTAL RETURN (for periods ended September 30) |
| |
| | One Year | | Five Year | | Ten Year | | Since Inception(1) | |
| | | | | | | | | |
GuideMarkSM Small/Mid Cap Core Fund | | | | | | | | | | | | | |
Service Shares | | 32.27 | % | | 1.12 | % | | 7.48 | % | | 5.08 | % | |
Institutional Shares | | 32.84 | % | | N/A | | | N/A | | | -2.01 | % | |
Russell 2500TM Index | | 30.93 | % | | 2.80 | % | | 10.86 | % | | 6.84 | %(2) | |
| |
(1) | Inception date is 6/29/01 for Service Shares and 4/29/11 for Institutional Shares. |
| |
(2) | The return shown for the Russell 2500TM Index is from the inception date of the Service Shares. The Russell 2500 Index return from the inception date of the Institutional Shares is -0.24%. |
9
|
GuideMarkSM Small/Mid Cap Core Fund |
MANAGER’S DISCUSSION OF FUND PERFORMANCE (Continued) (Unaudited) |
| |
| | |
| • | For the 6 months ended September 2012, the Fund returned 0.52%, underperforming the Russell 2500 Index at 1.19%. |
| | |
| • | The Fund trailed the benchmark due to its exposure to lower beta securities during the market rally in the last four months of the period. This exposure had benefited the Fund in the first two months of the period. |
| | |
| • | Security selection in the financials and technology sectors were the largest detractors from performance, and offset the positive contribution from sector positioning including an underweight to consumer discretionary. |
| | |
| • | Within the financials sector, owning bank holding company First Merit and online foreign exchange service provider FXCM detracted from performance. First Merit fell more than 10% after it announced plans to acquire Citizens Republic Bancorp. FXCM traded lower after it reported weaker than expected quarterly earnings. |
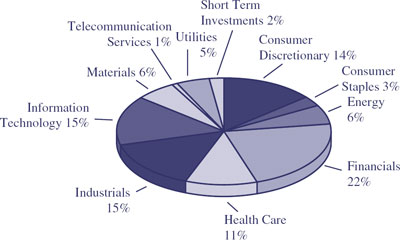
Components of Portfolio Holdings*
*Pie chart represents percentages of total portfolio, less securities lending collateral.
Top Ten Holdings
| | | | | | |
Rank | | Security/Holding | | % of Net
Assets | |
1 | | | Douglas Emmett, Inc. | | 2.41 | |
2 | | | Huntington Bancshares, Inc. | | 1.99 | |
3 | | | Reinsurance Group of America | | 1.87 | |
4 | | | Axis Capital Holdings Ltd. | | 1.87 | |
5 | | | Post Properties, Inc. | | 1.62 | |
6 | | | FirstMerit Corp. | | 1.60 | |
7 | | | American Campus Communities, Inc. | | 1.59 | |
8 | | | Extra Space Storage, Inc. | | 1.58 | |
9 | | | Colfax Corp. | | 1.54 | |
10 | | | AMETEK, Inc. | | 1.49 | |
10
|
GuideMarkSM World ex-US Fund |
MANAGER’S DISCUSSION OF FUND PERFORMANCE (Unaudited) |
| |
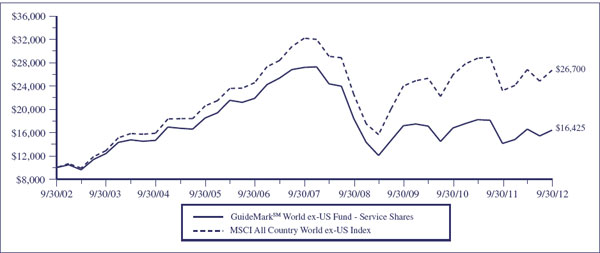
TOTAL RETURN BASED ON A $10,000 INVESTMENT
This chart assumes an initial gross investment of $10,000 made on September 30, 2002. Returns shown include the reinvestment of all dividends. Returns shown do not reflect the deduction of taxes that a shareholder would pay on Fund distributions or the redemption of Fund shares. In the absence of fee waivers and reimbursements, when they are necessary to keep expenses at the expense cap, total return would be reduced. Past performance is not predictive of future performance. Investment return and principal value will fluctuate so that your shares, when redeemed, may be worth more or less than the original cost. Index returns do not reflect the effects of fees or expenses. It is not possible to invest directly in an index.
MSCI ALL COUNTRY WORLD EX-US INDEX – A free float-adjusted market capitalization weighted index that is designed to measure the equity market performance of developed and emerging markets. It consists of country indices comprising of developed and emerging market country indices. The developed market country indices included are: Australia, Austria, Belgium, Canada, Denmark, Finland, France, Germany, Greece, Hong Kong, Ireland, Israel, Italy, Japan, Netherlands, New Zealand, Norway, Portugal, Singapore, Spain, Sweden, Switzerland, and the United Kingdom. The emerging market country indices included are: Brazil, Chile, China, Colombia, Czech Republic, Egypt, Hungary, India, Indonesia, Korea, Malaysia, Mexico, Morocco, Peru, Philippines, Poland, Russia, South Africa, Taiwan, Thailand, and Turkey.
| | | | | | | | | | | | | |
AVERAGE ANNUAL TOTAL RETURN (for periods ended September 30) |
| |
| | One Year | | Five Year | | Ten Year | | Since Inception(1) | |
| | | | | | | | | |
GuideMarkSM World ex-US Fund | | | | | | | | | | | | | |
Service Shares | | 16.14 | % | | -9.59 | % | | 5.09 | % | | 1.55 | % | |
Institutional Shares | | 16.70 | % | | N/A | | | N/A | | | -9.36 | % | |
MSCI All Country World ex-US Index | | 15.04 | % | | -3.67 | % | | 10.32 | % | | 6.25 | %(2) | |
| |
(1) | Inception date is 6/29/01 for Service Shares and 4/29/11 for Institutional Shares. |
| |
(2) | The return shown for the MSCI All Country World ex-US Index is from the inception date of the Service Shares. The MSCI All Country World ex-US Index return from the inception date of the Institutional Shares is -8.26%. |
11
|
GuideMarkSM World ex-US Fund |
MANAGER’S DISCUSSION OF FUND PERFORMANCE (Continued) (Unaudited) |
| |
| | |
| • | For the 6 months ended September 2012, the Fund returned -1.06%, underperforming the MSCI All Country World ex-US Index at -0.44%. |
| | |
| • | The Fund trailed the benchmark for the period, due primarily to its exposure to Asia Pacific-ex Japan and modest exposure to developed Europe. This offset the positive impact from security selection. |
| | |
| • | An overweight exposure to Asia Pacific ex Japan detracted from performance for the period as the fears of an economic slowdown in China weighed heavily on the region. A modest exposure to Europe also detracted from overall performance, as the European markets continued to experience significant volatility as a result of the ongoing sovereign debt crisis. |
| | |
| • | An overweight to the telecom services sector was positive over the period as telecom stock performed well given their solid cash flow streams but it was more than offset by an overweight allocation to the materials sector. Materials related stocks, especially gold miners, sold off as investors worried that rising production costs would negatively impact future earnings. |
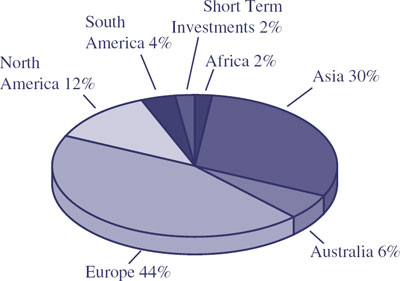
Components of Portfolio Holdings*
*Pie chart represents percentages of total portfolio, less securities lending collateral.
Top Ten Holdings
| | | | | | |
Rank | | Security/Holding | | % of Net
Assets | |
1 | | | Nestle SA | | 1.90 | |
2 | | | Vodafone Group Plc | | 1.38 | |
3 | | | PowerShares India Portfolio | | 1.36 | |
4 | | | Sanofi-Aventis SA | | 1.31 | |
5 | | | Samsung Electronics Co. Ltd. | | 1.29 | |
6 | | | British American Tobacco Plc | | 1.07 | |
7 | | | Novo Nordisk A/S | | 1.01 | |
8 | | | HSBC Holdings Plc | | 0.95 | |
9 | | | BP Plc | | 0.93 | |
10 | | | Commonwealth Bank of Australia | | 0.91 | |
12
|
GuideMarkSM Opportunistic Equity Fund |
MANAGER’S DISCUSSION OF FUND PERFORMANCE (Unaudited) |
| |
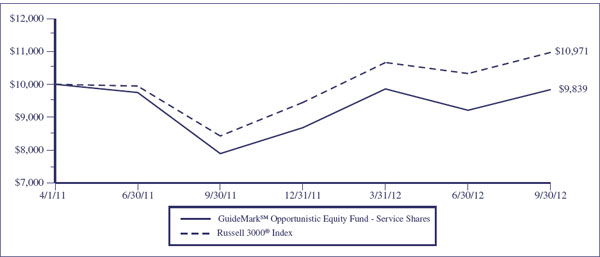
TOTAL RETURN BASED ON A $10,000 INVESTMENT
This chart assumes an initial gross investment of $10,000 made on April 1, 2011 (commencement of the Fund’s Service Shares operations). Returns shown include the reinvestment of all dividends. Returns shown do not reflect the deduction of taxes that a shareholder would pay on Fund distributions or the redemption of Fund shares. In the absence of fee waivers and reimbursements, when they are necessary to keep expenses at the expense cap, total return would be reduced. Past performance is not predictive of future performance. Investment return and principal value will fluctuate so that your shares, when redeemed, may be worth more or less than the original cost. Index returns do not reflect the effects of fees or expenses. It is not possible to invest directly in an index.
RUSSELL 3000® INDEX – Measures the performance of the largest 3,000 US companies representing approximately 98% of the investable US equity market.
| | | | | | | |
AVERAGE ANNUAL TOTAL RETURN (for the period ended September 30) |
| |
| | One Year | | Since Inception(1) | |
| | | | | |
GuideMarkSM Opportunistic Equity Fund | | | | | | | |
Service Shares | | 24.71 | % | | -1.07 | % | |
Institutional Shares | | 25.28 | % | | -2.08 | % | |
Russell 3000® Index | | 30.20 | % | | 6.38 | %(2) | |
| |
(1) | Inception date is 4/1/11 for Service Shares and 4/29/11 for Institutional Shares. |
| |
(2) | The return shown for the Russell 3000® Index is from the inception date of the Service Shares. The Russell 3000® Index return from the inception date of the Institutional Shares is 4.94%. |
13
|
GuideMarkSM Opportunistic Equity Fund |
MANAGER’S DISCUSSION OF FUND PERFORMANCE (Continued) (Unaudited) |
| |
| | |
| • | For the 6 months ended September 2012, the Fund returned -0.20%, underperforming the Russell 3000 Index at 2.89%. |
| | |
| • | The Fund trailed the benchmark for the period due to weak security selection and sector allocation primarily in April and May as the market declined on global macro worries. In the market rally that followed, beginning in June, the Fund outperformed its benchmark. |
| | |
| • | Two of the five largest detractors to performance were energy related stocks. Both Devon and Apache traded lower due to negative investor sentiment as a result of lower oil and natural gas prices. |
| | |
| • | An underweight to the telecom services sector dampened returns, as the sector benefited from takeover rumors as well as investors’ desire for higher dividend stocks in the earlier months of the period. |
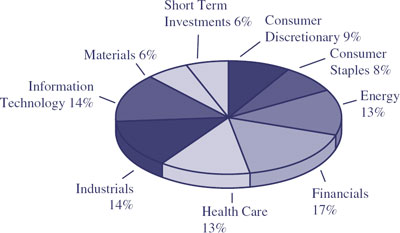
Components of Portfolio Holdings*
*Pie chart represents percentages of total portfolio, less securities lending collateral.
Top Ten Holdings
| | | | | | |
Rank | | Security/Holding | | % of Net
Assets | |
1 | | | Devon Energy Corp. | | 2.38 | |
2 | | | General Electric Co. | | 2.34 | |
3 | | | Apple, Inc. | | 2.25 | |
4 | | | Newmont Mining Corp. | | 1.87 | |
5 | | | JPMorgan Chase & Co. | | 1.80 | |
6 | | | BP Plc | | 1.77 | |
7 | | | The Charles Schwab Corp. | | 1.76 | |
8 | | | ConAgra Foods, Inc. | | 1.64 | |
9 | | | American International Group, Inc. | | 1.64 | |
10 | | | H&R Block, Inc. | | 1.61 | |
14
|
GuideMarkSM Global Real Return Fund |
MANAGER’S DISCUSSION OF FUND PERFORMANCE (Unaudited) |
| |
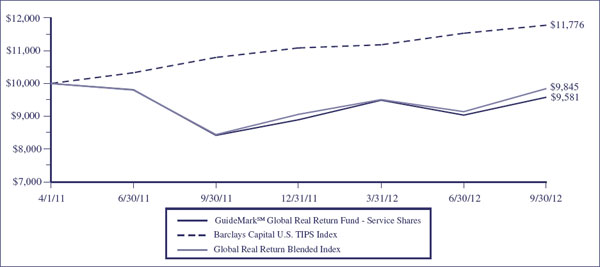
TOTAL RETURN BASED ON A $10,000 INVESTMENT
This chart assumes an initial gross investment of $10,000 made on April 1, 2011 (commencement of the Fund’s Service Shares operations). Returns shown include the reinvestment of all dividends. Returns shown do not reflect the deduction of taxes that a shareholder would pay on Fund distributions or the redemption of Fund shares. In the absence of fee waivers and reimbursements, when they are necessary to keep expenses at the expense cap, total return would be reduced. Past performance is not predictive of future performance. Investment return and principal value will fluctuate so that your shares, when redeemed, may be worth more or less than the original cost. Index returns do not reflect the effects of fees or expenses. It is not possible to invest directly in an index.
BARCLAYS CAPITAL US TIPS INDEX – Includes all publicly-issued, US Treasury inflation-protected securities that have at least one year remaining to maturity, are rated investment grade, and have $250 million or more of outstanding face value.
GLOBAL REAL RETURN BLENDED INDEX – A weighted combination of 20% of the total return from the Dow Jones-UBS Commodities Index, 35% of the total return from the S&P Natural Resources North American Index, 20% of the total return from the Dow Jones Global Select RESI Index and 25% of the total return from the Barclays Global Inflation Linked Bond Index. Returns are weighted on a 20/35/20/25 basis for each historical month and then the longer-term Blended Index returns are geometrically combined from these historical monthly returns to create aggregate returns (1-year, 3-years, 5-years, etc.) for the Blended Index.
| | | | | | | |
AVERAGE ANNUAL TOTAL RETURN (for the period ended September 30) |
| |
| | One Year | | Since Inception(1) | |
| | | | | |
GuideMarkSM Global Real Return Fund | | | | | | | |
Service Shares | | 13.79 | % | | -2.81 | % | |
Institutional Shares | | 14.34 | % | | -4.46 | % | |
Barclays Capital US TIPS Index | | 9.10 | % | | 11.53 | %(2) | |
Global Real Return Blended Index | | 16.61 | % | | -1.04 | %(3) | |
| |
(1) | Inception date is 4/1/11 for Service Shares and 4/29/11 for Institutional Shares. |
| |
(2) | The return shown for the Barclays Capital US TIPS Index is from the inception date of the Service Shares. The Barclays Capital US TIPS Index return from the inception date of the Institutional Shares is 10.53%. |
| |
(3) | The return shown for the Global Real Return Blended Index is from the inception date of the Service Shares. The Global Real Return Blended Index return from the inception date of the Institutional Shares is -3.13%. |
15
|
GuideMarkSM Global Real Return Fund |
MANAGER’S DISCUSSION OF FUND PERFORMANCE (Continued) (Unaudited) |
| |
| | |
| • | For the 6 months ended September 2012, the Fund returned 0.96%, underperforming the Barclays Capital U.S. TIPS Index and the Blended Index at 5.34% and 3.53%, respectively. |
| | |
| • | The Fund trailed the benchmark for the period due to weakness in April and May as the market declined on global macro worries leading to negative returns for commodities and global natural resources. In the market rally that followed beginning in June, the Fund outperformed its benchmark. |
| | |
| • | The Fund outperformed the Barclays Capital U.S. TIPS Index in the second half of the period as investors grew less defensive and risk assets mounted a rally but it was not enough to offset the trailing returns generated in the first few months of the period. |
| | |
| • | An overweight exposure to natural resources and underweight exposure to commodities was a large driver of the underperformance relative to the Blended Benchmark. Energy fell due to falling oil prices and gold miners continued to trade lower due to concerns over rising production costs dampening future growth. |
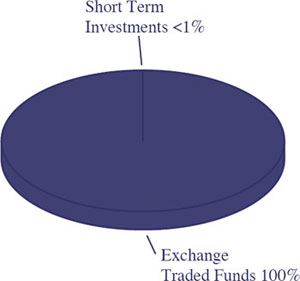
Components of Portfolio Holdings*
*Pie chart represents percentages of total portfolio, less securities lending collateral.
Top Ten Holdings
| | | | | | |
Rank | | Security/Holding | | % of Net
Assets | |
1 | | | SPDR S&P Global Natural Resources ETF | | 25.44 | |
2 | | | PowerShares DB Commodity Index Tracking Fund | | 13.42 | |
3 | | | SPDR Barclays Capital TIPS ETF | | 12.74 | |
4 | | | SPDR Dow Jones International Real Estate ETF | | 11.04 | |
5 | | | SPDR Dow Jones REIT ETF | | 10.68 | |
6 | | | SPDR DB International Government Inflation-Protected
Bond ETF | | 7.09 | |
7 | | | Energy Select Sector SPDR Fund | | 5.07 | |
8 | | | PowerShares Global Agriculture ETF | | 3.56 | |
9 | | | SPDR Metals and Mining ETF | | 3.50 | |
10 | | | PowerShares DB Gold Fund | | 2.18 | |
16
|
GuideMarkSM Core Fixed Income Fund |
MANAGER’S DISCUSSION OF FUND PERFORMANCE (Unaudited) |
| |
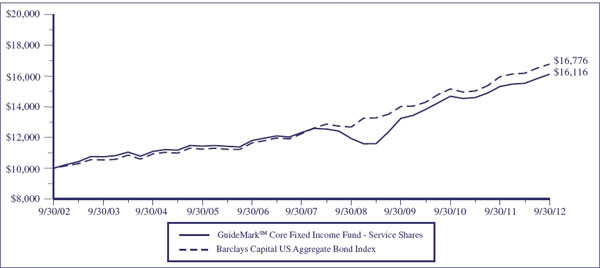
TOTAL RETURN BASED ON A $10,000 INVESTMENT
This chart assumes an initial gross investment of $10,000 made on September 30, 2002. Returns shown include the reinvestment of all dividends. Returns shown do not reflect the deduction of taxes that a shareholder would pay on Fund distributions or the redemption of Fund shares. In the absence of fee waivers and reimbursements, when they are necessary to keep expenses at the expense cap, total return would be reduced. Past performance is not predictive of future performance. Investment return and principal value will fluctuate so that your shares, when redeemed, may be worth more or less than the original cost. Index returns do not reflect the effects of fees or expenses. It is not possible to invest directly in an index.
BARCLAYS CAPITAL US AGGREGATE BOND INDEX – A broad-based benchmark that measures the investment-grade, US dollar-denominated fixed-rate taxable bond market, including US Treasuries, government-related and corporate debt securities, and mortgage- and asset-backed securities. All securities contained in the Barclays Capital US Aggregate Bond Index have a minimum term to maturity of one year.
| | | | | | | | | | | | | |
AVERAGE ANNUAL TOTAL RETURN (for periods ended September 30) |
| |
| | One Year | | Five Year | | Ten Year | | Since Inception(1) | |
| | | | | | | | | |
GuideMarkSM Core Fixed Income Fund | | | | | | | | | | | | | |
Service Shares | | 5.22 | % | | 5.53 | % | | 4.90 | % | | 5.13 | % | |
Institutional Shares | | 5.81 | % | | N/A | | | N/A | | | 6.84 | % | |
Barclays Capital US Aggregate Bond Index | | 5.16 | % | | 6.53 | % | | 5.32 | % | | 5.91 | %(2) | |
| |
(1) | Inception date is 6/29/01 for Service Shares and 4/29/11 for Institutional Shares. |
| |
(2) | The return shown for the Barclays Capital US Aggregate Bond Index is from the inception date of the Service Shares. The Barclays Capital US Aggregate Bond Index return from the inception date of the Institutional Shares is 7.12%. |
17
|
GuideMarkSM Core Fixed Income Fund |
MANAGER’S DISCUSSION OF FUND PERFORMANCE (Continued) (Unaudited) |
| |
| | |
| • | For the 6 months ended September 2012, the Fund returned 3.81%, outperforming the Barclays Capital Aggregate Bond Index at 3.68%. |
| | |
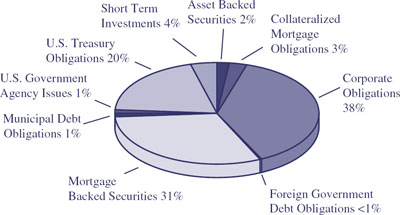
| • | The Fund outperformed the benchmark for the period as a result of its exposure to mortgage backed securities and overweight to investment grade corporate bonds. |
| | |
| • | Exposure to non-agency mortgage-backed securities aided returns as the sector rallied based on expectations that the U.S. housing market was poised for a recovery. An overweight to agency mortgage-backed securities benefited the Fund as the securities traded higher after the announcement of a third round of quantitative easing. |
| | |
| • | Although the overweight exposure to investment grade corporate bonds detracted from performance in the first two months of the period, this exposure benefitted the Fund in the second half of the period due to quantitative easing both in the U.S. and in Europe. |
Components of Portfolio Holdings*
*Pie chart represents percentages of total portfolio, less securities lending collateral.
Top Ten Holdings
| | | | | | |
Rank | | Security/Holding | | % of Net
Assets | |
1 | | | U.S. Treasury Bond, 3.125%, 11/15/2041 | | 2.70 | |
2 | | | U.S. Treasury Note, 0.250%, 07/15/2015 | | 2.55 | |
3 | | | U.S. Treasury Note, 0.875%, 01/31/2017 | | 2.10 | |
4 | | | Federal National Mortgage Association,
Pool# AJ0130, 3.500%, 05/01/2042 | | 1.97 | |
5 | | | U.S. Treasury Note, 2.000%, 02/15/2022 | | 1.77 | |
6 | | | U.S. Treasury Note, 0.625%, 07/15/2014 | | 1.39 | |
7 | | | Federal National Mortgage Association,
Pool #AP1651, 3.000%, 08/01/2042 | | 1.29 | |
8 | | | U.S. Treasury Note, 2.000%, 11/15/2021 | | 1.25 | |
9 | | | Federal National Mortgage Association,
Pool# AB0074, 5.000%, 02/01/2035 | | 1.23 | |
10 | | | Federal National Mortgage Association, Pool
#AH8854, 4.500%, 04/01/2041 | | 1.11 | |
18
|
GuideMarkSM Tax-Exempt Fixed Income Fund |
MANAGER’S DISCUSSION OF FUND PERFORMANCE (Unaudited) |
| |
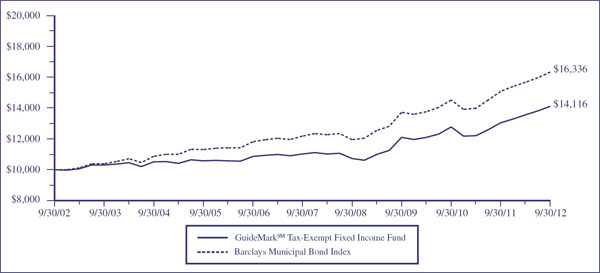
TOTAL RETURN BASED ON A $10,000 INVESTMENT
This chart assumes an initial gross investment of $10,000 made on September 30, 2002. Returns shown include the reinvestment of all dividends. Returns shown do not reflect the deduction of taxes that a shareholder would pay on Fund distributions or the redemption of Fund shares. In the absence of fee waivers and reimbursements, when they are necessary to keep expenses at the expense cap, total return would be reduced. Past performance is not predictive of future performance. Investment return and principal value will fluctuate so that your shares, when redeemed, may be worth more or less than the original cost. Index returns do not reflect the effects of fees or expenses. It is not possible to invest directly in an index.
BARCLAYS MUNICIPAL BOND INDEX – The Barclays Capital US Municipal Bond Index is a market-value-weighted index for the long-term tax-exempt bond market. The index has four main sectors: state and local general obligation bonds, revenue bonds, insured bonds, and pre-refunded bonds.
| | | | | | | | | | | | | |
AVERAGE ANNUAL TOTAL RETURN (for periods ended September 30) |
| |
| | One Year | | Five Year | | Ten Year | | Since Inception (6/29/01) | |
| | | | | | | | | |
GuideMarkSM Tax-Exempt Fixed Income Fund | | 8.21 | % | | 5.08 | % | | 3.51 | % | | 4.10 | % | |
| | | | | | | | | | | | | |
Barclays Municipal Bond Index | | 8.32 | % | | 6.06 | % | | 5.03 | % | | 5.51 | % | |
19
|
GuideMarkSM Tax-Exempt Fixed Income Fund |
MANAGER’S DISCUSSION OF FUND PERFORMANCE (Continued) (Unaudited) |
| |
| | |
| • | For the 6 months ended September 2012, the Fund returned 4.11%, underperforming the Barclays Municipal Bond Index at 4.24%. |
| | |
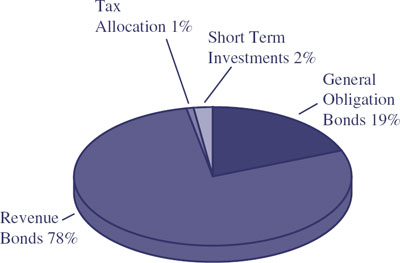
| • | The Fund trailed the benchmark for the period as a result of its lower exposure to the longest maturities of the yield curve. Additionally, the Fund’s higher quality bias was also a slight detractor from performance. |
| | |
| • | Exposure to lower-rated investment grade bonds benefited the Fund in the latter part of the period as investors reached for yield. However, the contribution was offset by the Fund’s bias to higher-rated bonds. |
| | |
| • | The Fund’s slight underweight exposure to the intermediate and longest end of the maturity range dampened relative performance. |
Components of Portfolio Holdings*
*Pie chart represents percentages of total portfolio.
Top Ten Holdings
| | | | | | |
Rank | | Security/Holding | | % of Net
Assets | |
1 | | | Allegheny County Hospital Development
Authority, Series A, Revenue Bond, 5.000%, 09/01/2014 | | 1.65 | |
2 | | | California, GO, 6.500%, 04/01/2033 | | 1.54 | |
3 | | | Wisconsin, Series A, Refunding, Revenue Bond,
6.000%, 05/01/2033 | | 1.50 | |
4 | | | Indiana State Finance Authority, Series A,
Refunding, Revenue Bond, 5.000%, 02/01/2021 | | 1.50 | |
5 | | | Henry County Public Service Authority Water & Sewer,
Refunding, Revenue Bond, FSA Insured, 5.500%, 11/15/2019 | | 1.49 | |
6 | | | Gilroy Unified School District, GO, Assured Guaranty
Insured, 6.000%, 08/01/2025 | | 1.48 | |
7 | | | Utah Associated Municipal Power Systems San Juan
Project, Refunding, Revenue Bond, 5.500%, 06/01/2022 | | 1.48 | |
8 | | | Lycoming County College, Revenue Bond, 5.500%, 07/01/2026 | | 1.45 | |
9 | | | Boise-Kuna District, Revenue Bond, 7.375%, 06/01/2034 | | 1.43 | |
10 | | | Los Angeles Department of Airports, Series A, Refunding,
Revenue Bond, 5.250%, 05/15/2029 | | 1.43 | |
20
|
GuideMarkSM Opportunistic Fixed Income Fund |
MANAGER’S DISCUSSION OF FUND PERFORMANCE (Unaudited) |
| |
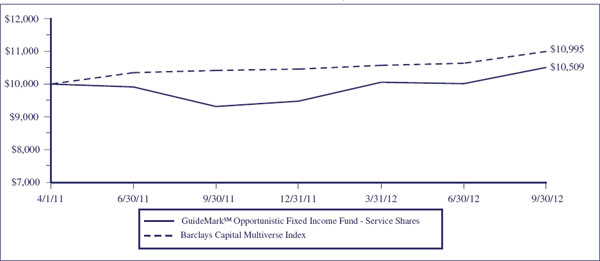
TOTAL RETURN BASED ON A $10,000 INVESTMENT
This chart assumes an initial gross investment of $10,000 made on April 1, 2011 (commencement of the Fund’s Service Shares operations). Returns shown include the reinvestment of all dividends. Returns shown do not reflect the deduction of taxes that a shareholder would pay on Fund distributions or the redemption of Fund shares. In the absence of fee waivers and reimbursements, when they are necessary to keep expenses at the expense cap, total return would be reduced. Past performance is not predictive of future performance. Investment return and principal value will fluctuate so that your shares, when redeemed, may be worth more or less than the original cost. Index returns do not reflect the effects of fees or expenses. It is not possible to invest directly in an index.
BARCLAYS CAPITAL MULTIVERSE INDEX – The Barclays Capital Multiverse Index is a broad-based index that provides a measure of the global fixed income market.
| | | | | | | |
AVERAGE ANNUAL TOTAL RETURN (for the period ended September 30) |
| |
| | One Year | | Since Inception(1) | |
| | | | | |
GuideMarkSM Opportunistic Fixed Income Fund | | | | | | | |
Service Shares | | 12.82 | % | | 3.37 | % | |
Institutional Shares | | 13.37 | % | | 3.61 | % | |
Barclays Capital Multiverse Index | | 5.57 | % | | 6.54 | %(2) | |
| |
(1) | Inception date is 4/1/11 for Service Shares and 4/29/11 for Institutional Shares. |
|
(2) | The return shown for the Barclays Capital Multiverse Index is from the inception date of the Service Shares. The Barclays Capital Multiverse Index return from the inception date of the Institutional Shares is 4.34%. |
21
|
GuideMarkSM Opportunistic Fixed Income Fund |
MANAGER’S DISCUSSION OF FUND PERFORMANCE (Continued) (Unaudited) |
| |
| | |
| • | For the 6 months ended September 2012, the Fund returned 4.51%, outperforming the Barclays Capital Multiverse Index at 4.01%. |
| | |
| • | The Fund outperformed the benchmark for the period as a result of its currency positions and credit exposures as global macroeconomic headwinds began to wane and investors’ risk appetite increased. |
| | |
| • | Exposure to a basket of emerging market currencies including Asia ex-Japan and Latin America was beneficial as these mounted a rally later in the period versus the U.S. dollar. The Fund’s exposure to peripheral European currencies including the Polish Zloty also contributed to performance in the second half of the period as these currencies outperformed the Euro. |
| | |
| • | The Fund’s sovereign credit exposure also contributed to performance as fears of a European debt crisis began to subside in the second half of the period. |
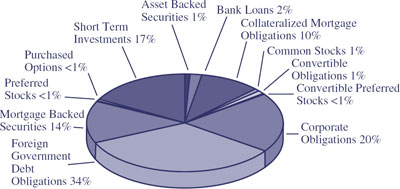
Components of Portfolio Holdings*
*Pie chart represents percentages of total portfolio.
Top Ten Holdings
| | | | | | |
Rank | | Security/Holding | | % of Net
Assets | |
1 | | | Republic of Korea, 3.000%, 12/10/2013 | | 7.70 | |
2 | | | Petroleos de Venezuela SA, 4.900%, 10/28/2014 | | 3.56 | |
3 | | | Republic of Indonesia, 12.500%, 03/15/2013 | | 3.31 | |
4 | | | Federal National Mortgage Association, Series #1209,
3.500%, 10/01/2042 | | 2.87 | |
5 | | | Republic of Ireland, 5.000%, 10/18/2020 | | 2.25 | |
6 | | | Poland Government Bond, 0.000%, 01/25/2013 | | 2.15 | |
7 | | | Federal Home Loan Mortgage Corp., Series #280,
3.000%, 09/15/2042 | | 2.02 | |
8 | | | Republic of Iceland, 4.875%, 06/16/2016 | | 1.88 | |
9 | | | Ukraine Government International Bond, 7.950%, 02/23/2021 | | 1.81 | |
10 | | | Republic of Hungary, 6.750%, 08/22/2014 | | 1.34 | |
22
|
GuidePathSM Strategic Asset Allocation Fund |
MANAGER’S DISCUSSION OF FUND PERFORMANCE (Unaudited) |
| |
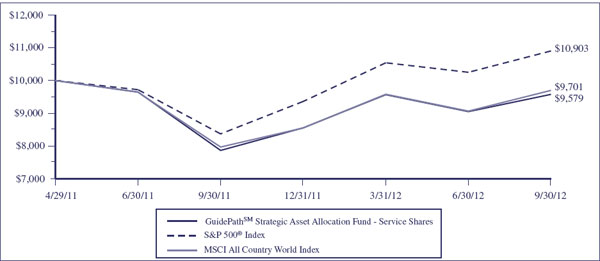
TOTAL RETURN BASED ON A $10,000 INVESTMENT
This chart assumes an initial gross investment of $10,000 made on April 29, 2011 (commencement of the Fund’s operations). Returns shown include the reinvestment of all dividends. Returns shown do not reflect the deduction of taxes that a shareholder would pay on Fund distributions or the redemption of Fund shares. In the absence of fee waivers and reimbursements, when they are necessary to keep expenses at the expense cap, total return would be reduced. Past performance is not predictive of future performance. Investment return and principal value will fluctuate so that your shares, when redeemed, may be worth more or less than the original cost. Index returns do not reflect the effects of fees or expenses. It is not possible to invest directly in an index.
S&P 500® INDEX – An index of 500 stocks chosen for market size, liquidity and industry grouping, among other factors. It is designed to be a leading indicator of U.S. equities and is meant to reflect the risk/return characteristics of the large cap universe.
MSCI ALL COUNTRY WORLD INDEX – A free float-adjusted market capitalization weighted index that is designed to measure the equity market performance of developed and emerging markets. It consists of 45 country indices comprising 24 developed and 21 emerging market country indices. The developed market country indices included are: Australia, Austria, Belgium, Canada, Denmark, Finland, France, Germany, Greece, Hong Kong, Ireland, Israel, Italy, Japan, Netherlands, New Zealand, Norway, Portugal, Singapore, Spain, Sweden, Switzerland, the United Kingdom and the United States. The emerging market country indices included are: Brazil, Chile, China, Colombia, Czech Republic, Egypt, Hungary, India, Indonesia, Korea, Malaysia, Mexico, Morocco, Peru, Philippines, Poland, Russia, South Africa, Taiwan, Thailand, and Turkey.
| | | | | | | |
AVERAGE ANNUAL TOTAL RETURN (for the period ended September 30) |
| |
| | One Year | | Since Inception(1) | |
| | | | | |
GuidePathSM Strategic Asset Allocation Fund | | | | | | | |
Service Shares | | 21.72 | % | | -2.97 | % | |
Institutional Shares | | N/A | | | -1.66 | %(2) | |
S&P 500® Index | | 30.20 | % | | 6.27 | %(3) | |
MSCI All Country World Index | | 21.67 | % | | -2.11 | %(4) | |
| |
(1) | Inception date is 4/29/11 for Service Shares and 9/13/12 for Institutional Shares. |
| |
(2) | The return shown is cumulative from the inception date. |
| |
(3) | The return shown for the S&P 500® Index is annualized from the inception date of the Service Shares. The S&P 500® Index cumulative return from the inception date of the Institutional Shares is -1.26%. |
| |
(4) | The return shown for the MSCI All Country World Index is annualized from the inception date of the Service Shares. The MSCI All Country World Index cumulative return from the inception date of the Institutional Shares is -0.78%. |
23
|
GuidePathSM Strategic Asset Allocation Fund |
MANAGER’S DISCUSSION OF FUND PERFORMANCE (Continued) (Unaudited) |
| |
| | |
| • | For the 6 months ended September 2012, the Fund returned 0.11% underperforming the S&P 500 Index at 3.43%. The Fund trailed the MSCI All Country World Index at 1.23%. |
| | |
| • | Exposure to international equities was the largest driver of the Fund’s underperformance relative to the S&P 500 Index. International markets faced headwinds as investors awaited resolution of the European debt crisis and fears of an economic slowdown in China prevailed. |
| | |
| • | International exposure helped lift returns in the period from June to September relative to the S&P 500 Index. However, relative to the MSCI All Country World Index the Fund trailed due to an emphasis towards lower beta small and mid capitalization domestic equities and weakness from security selection within US large cap healthcare. |
| | |
| • | Exposure to domestic and international REITs proved beneficial as real estate markets saw marginal improvement. |
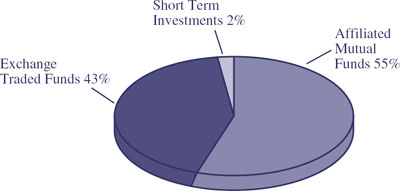
Components of Portfolio Holdings*
*Pie chart represents percentages of total portfolio, less securities lending collateral.
Top Ten Holdings
| | | | | | |
Rank | | Security/Holding | | % of Net
Assets | |
1 | | | GuideMarkSM World ex-US Fund – Institutional Shares | | 16.45 | |
2 | | | Vanguard FTSE All-World ex-US Index Fund | | 15.78 | |
3 | | | SPDR S&P 500 ETF Trust | | 15.63 | |
4 | | | GuideMarkSM Small/Mid Cap Core Fund – Institutional Shares | | 9.35 | |
5 | | | GuideMarkSM Large Cap Value Fund – Institutional Shares | | 8.18 | |
6 | | | GuideMarkSM Opportunistic Equity Fund – Institutional Shares | | 7.97 | |
7 | | | GuideMarkSM Large Cap Growth Fund – Institutional Shares | | 7.73 | |
8 | | | GuideMarkSM Global Real Return Fund – Institutional Shares | | 4.82 | |
9 | | | Vanguard Small-Cap Growth ETF | | 2.61 | |
10 | | | iShares MSCI Canada Index Fund | | 2.13 | |
24
|
GuidePathSM Tactical Constrained Asset Allocation Fund |
MANAGER’S DISCUSSION OF FUND PERFORMANCE (Unaudited) |
| |
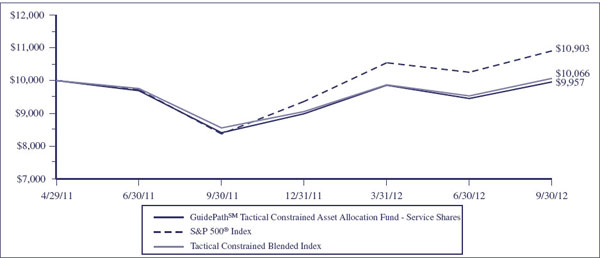
TOTAL RETURN BASED ON A $10,000 INVESTMENT
This chart assumes an initial gross investment of $10,000 made on April 29, 2011 (commencement of the Fund’s operations). Returns shown include the reinvestment of all dividends. Returns shown do not reflect the deduction of taxes that a shareholder would pay on Fund distributions or the redemption of Fund shares. In the absence of fee waivers and reimbursements, when they are necessary to keep expenses at the expense cap, total return would be reduced. Past performance is not predictive of future performance. Investment return and principal value will fluctuate so that your shares, when redeemed, may be worth more or less than the original cost. Index returns do not reflect the effects of fees or expenses. It is not possible to invest directly in an index.
S&P 500® INDEX – An index of 500 stocks chosen for market size, liquidity and industry grouping, among other factors. It is designed to be a leading indicator of U.S. equities and is meant to reflect the risk/return characteristics of the large cap universe.
TACTICAL CONSTRAINED BLENDED INDEX – A weighted combination of 75% of the total return from the MSCI All Country World Index with 25% of the total return from the Barclays Capital US Aggregate Bond Index. Returns are weighted on a 75/25 basis for each historical month and then the longer-term Blended Index returns are geometrically combined from these historical monthly returns to create aggregate returns (1-year, 3-years, 5-years, etc.) for the Blended Index.
| | | | | | | |
AVERAGE ANNUAL TOTAL RETURN (for the period ended September 30) |
| |
| | One Year | | Since Inception(1) | |
| | | | | |
GuidePathSM Tactical Constrained Asset Allocation Fund | | | | | | | |
Service Shares | | 18.41 | % | | -0.30 | % | |
Institutional Shares | | N/A | | | -1.20 | %(2) | |
S&P 500® Index | | 30.20 | % | | 6.27 | %(3) | |
Tactical Constrained Blended Index | | 17.65 | % | | 0.47 | %(4) | |
| |
(1) | Inception date is 4/29/11 for Service Shares and 9/13/12 for Institutional Shares. |
| |
(2) | The return shown is cumulative from the inception date. |
| |
(3) | The return shown for the S&P 500® Index is annualized from the inception date of the Service Shares. The S&P 500® Index cumulative return from the inception date of the Institutional Shares is -1.26%. |
| |
(4) | The return shown for the Tactical Constrained Blended Index is annualized from the inception date of the Service Shares. The Tactical Constrained Blended Index cumulative return from the inception date of the Institutional Shares is -0.45%. |
25
|
GuidePathSM Tactical Constrained Asset Allocation Fund |
MANAGER’S DISCUSSION OF FUND PERFORMANCE (Continued) (Unaudited) |
| |
|
| | |
| • | For the 6 months ended September 2012, the Fund returned 1.02% underperforming the S&P 500 Index at 3.43%. The Fund trailed the blended benchmark of 75% MSCI All Country World Index and 25% Barclays US Aggregate Bond Index at 1.98%. |
| | |
| • | Exposure to international equities was the largest driver of underperformance relative to the S&P 500 Index driven by negative returns seen in the first two months of the period. International markets faced headwinds as they awaited resolute action to the European debt crisis and fears of an economic slowdown in China prevailed. |
| | |
| • | International exposure helped lift returns in the period June-September relative to the S&P 500 Index. However relative to the MSCI ACWI Index the fund trailed due to an emphasis towards lower beta securities within US small and mid cap equities and weakness from security selection within US large cap healthcare. |
| | |
| • | Relative to the S&P 500 index, fixed income proved beneficial in the first two months, but tempered returns in the latter part of the period. However, within fixed income, exposure to mortgage-backed securities, high yield bonds and emerging market currencies benefited performance in absolute terms, as the market rallied beginning in June. |
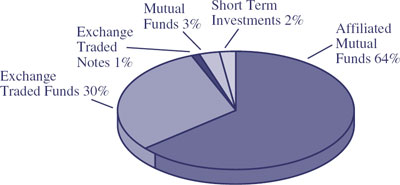
Components of Portfolio Holdings*
*Pie chart represents percentages of total portfolio, less securities lending collateral.
Top Ten Holdings
| | | | | | |
Rank | | Security/Holding | | % of Net
Assets | |
1 | | | GuideMarkSM World ex-US Fund - Institutional Shares | | 15.63 | |
2 | | | SPDR S&P 500 ETF Trust | | 13.79 | |
3 | | | GuideMarkSM Core Fixed Income Fund – Institutional Shares | | 11.53 | |
4 | | | GuideMarkSM Opportunistic Equity Fund – Institutional Shares | | 10.50 | |
5 | | | GuideMarkSM Large Cap Value Fund – Institutional Shares | | 6.95 | |
6 | | | GuideMarkSM Large Cap Growth Fund – Institutional Shares | | 6.91 | |
7 | | | GuideMarkSM Opportunistic Fixed Income Fund –
Institutional Shares | | 6.10 | |
8 | | | Vanguard MSCI Emerging Markets ETF | | 3.09 | |
9 | | | GuideMarkSM Small/Mid Cap Core Fund – Institutional Shares | | 3.07 | |
10 | | | GuideMarkSM Global Real Return Fund – Institutional Shares | | 2.49 | |
26
|
GuidePathSM Tactical Unconstrained Asset Allocation Fund |
MANAGER’S DISCUSSION OF FUND PERFORMANCE (Unaudited) |
| |
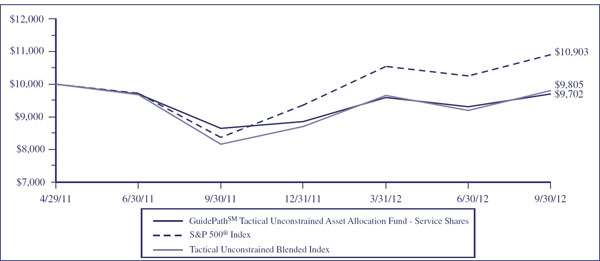
TOTAL RETURN BASED ON A $10,000 INVESTMENT
This chart assumes an initial gross investment of $10,000 made on April 29, 2011 (commencement of the Fund’s operations). Returns shown include the reinvestment of all dividends. Returns shown do not reflect the deduction of taxes that a shareholder would pay on Fund distributions or the redemption of Fund shares. In the absence of fee waivers and reimbursements, when they are necessary to keep expenses at the expense cap, total return would be reduced. Past performance is not predictive of future performance. Investment return and principal value will fluctuate so that your shares, when redeemed, may be worth more or less than the original cost. Index returns do not reflect the effects of fees or expenses. It is not possible to invest directly in an index.
S&P 500® INDEX – An index of 500 stocks chosen for market size, liquidity and industry grouping, among other factors. It is designed to be a leading indicator of U.S. equities and is meant to reflect the risk/return characteristics of the large cap universe.
TACTICAL UNCONSTRAINED BLENDED INDEX – A weighted combination of 90% of the total return from the MSCI All Country World Index with 10% of the total return from the Barclays Capital Multiverse Index. Returns are weighted on a 90/10 basis for each historical month and then the longer-term Blended Index returns are geometrically combined from these historical monthly returns to create aggregate returns (1-year, 3-years, 5-years, etc.) for the Blended Index.
| | | | | | | |
AVERAGE ANNUAL TOTAL RETURN (for the period ended September 30) |
| |
| | One Year | | Since Inception(1) | |
| | | | | |
GuidePathSM Tactical Unconstrained Asset Allocation Fund | | | | | | | |
Service Shares | | 12.16 | % | | -2.11 | % | |
Institutional Shares | | N/A | | | -0.92 | %(2) | |
S&P 500® Index | | 30.20 | % | | 6.27 | %(3) | |
Tactical Unconstrained Blended Index | | 20.07 | % | | -1.37 | %(4) | |
| |
(1) | Inception date is 4/29/11 for Service Shares and 9/13/12 for Institutional Shares. |
|
(2) | The return shown is cumulative from the inception date. |
|
(3) | The return shown for the S&P 500® Index is annualized from the inception date of the Service Shares. The S&P 500® Index cumulative return from the inception date of the Institutional Shares is -1.26%. |
|
(4) | The return shown for the Tactical Unconstrained Blended Index is annualized from the inception date of the Service Shares. The Tactical Unconstrained Blended Index cumulative return from the inception date of the Institutional Shares is -0.65%. |
27
|
GuidePathSM Tactical Unconstrained Asset Allocation Fund |
MANAGER’S DISCUSSION OF FUND PERFORMANCE (Continued) (Unaudited) |
| |
| | |
| • | For the 6 months ended September 2012, the Fund returned 1.15% underperforming the S&P 500 Index at 3.43%. The Fund trailed the blended benchmark of 90% MSCI ACWI Index and 10% Barclays Multiverse Index at 1.55%. |
| | |
| • | Defensive positioning and higher cash allocations within the Fund were the main driver of the lagging returns, especially during the market rally beginning in June. For the first two months of the period, the Fund outperformed both its benchmarks by at least 200 basis points. |
| | |
| • | Domestically biased exposure dampened returns in the period from June through September due to an emphasis towards lower beta securities within US small and mid cap equities and weakness from security selection within US large cap healthcare. |
| | |
| • | Relative to the S&P 500 index, fixed income proved beneficial in the first two months, but tempered returns in the latter part of the period. However, within fixed income, exposure to high yield bonds, floating rate notes and emerging market currencies benefited performance in absolute terms, as the market rallied beginning in June. |
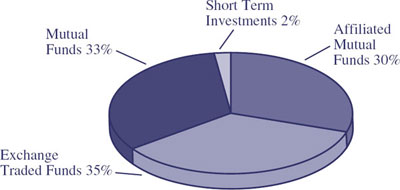
Components of Portfolio Holdings*
*Pie chart represents percentages of total portfolio, less securities lending collateral.
Top Ten Holdings
| | | | | | |
Rank | | Security/Holding | | % of Net
Assets | |
1 | | | SPDR S&P 500 ETF Trust | | 14.67 | |
2 | | | Virtus Premium AlphaSector Fund – Institutional Shares | | 12.33 | |
3 | | | GuideMarkSM Opportunistic Equity Fund – Institutional Shares | | 7.64 | |
4 | | | GuideMarkSM Large Cap Value Fund – Institutional Shares | | 6.61 | |
5 | | | Stadion Managed Portfolio Trust – Institutional Shares | | 5.21 | |
6 | | | Eaton Vance Floating-Rate Fund – Institutional Shares | | 5.00 | |
7 | | | GuideMarkSM Opportunistic Fixed Income Fund –
Institutional Shares | | 4.90 | |
8 | | | GuideMarkSM Small/Mid Cap Core Fund – Institutional Shares | | 4.23 | |
9 | | | Vanguard MSCI Emerging Markets ETF | | 3.97 | |
10 | | | Vangard MSCI EAFE ETF | | 3.59 | |
28
|
GuidePathSM Absolute Return Asset Allocation Fund |
MANAGER’S DISCUSSION OF FUND PERFORMANCE (Unaudited) |
| |
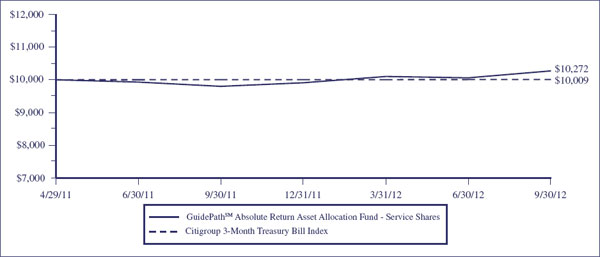
TOTAL RETURN BASED ON A $10,000 INVESTMENT
This chart assumes an initial gross investment of $10,000 made on April 29, 2011 (commencement of the Fund’s operations). Returns shown include the reinvestment of all dividends. Returns shown do not reflect the deduction of taxes that a shareholder would pay on Fund distributions or the redemption of Fund shares. In the absence of fee waivers and reimbursements, when they are necessary to keep expenses at the expense cap, total return would be reduced. Past performance is not predictive of future performance. Investment return and principal value will fluctuate so that your shares, when redeemed, may be worth more or less than the original cost. Index returns do not reflect the effects of fees or expenses. It is not possible to invest directly in an index.
CITIGROUP 3-MONTH TREASURY BILL INDEX – Tracks the performance of US Treasury Bills with a remaining maturity of three months.
| | | | | | | |
AVERAGE ANNUAL TOTAL RETURN (for the period ended September 30) |
| |
| | One Year | | Since Inception(1) | |
| | | | | |
GuidePathSM Absolute Return Asset Allocation Fund | | | | | | | |
Service Shares | | 4.81 | % | | 1.90 | % | |
Institutional Shares | | N/A | | | 0.20 | %(2) | |
Citigroup 3-Month Treasury Bill Index | | 0.05 | % | | 0.06 | %(3) | |
| |
(1) | Inception date is 4/29/11 for Service Shares and 9/13/12 for Institutional Shares. |
| |
(2) | The return shown is cumulative from the inception date. |
| |
(3) | The return shown for the Citigroup 3-Month Treasury Bill Index is annualized from the inception date of the Service Shares. The Citigroup 3-Month Treasury Bill Index cumulative return from the inception date of the Institutional Shares is 0.00%. |
29
|
GuidePathSM Absolute Return Asset Allocation Fund |
MANAGER’S DISCUSSION OF FUND PERFORMANCE (Continued) (Unaudited) |
| |
| | |
| • | For the 6 months ended September 2012, the Fund returned 1.69% outperforming the Citi 3-month Treasury Bill Index at 0.04%. |
| | |
| • | Within fixed income, exposure to corporate bonds, global high yield bonds, and mortgage-backed securities were the primary contributors to performance especially in the June to September period as risk taking was rewarded in the markets. |
| | |
| • | The iPath US Treasury 10-year Bear ETN was the largest detractor to returns as the flight to safety in the first part of the period caused yields fall as demand for treasuries renewed, especially in the first two months of the period. |
| | |
| • | Exposure to emerging market currencies was beneficial during the latter four months of the period as the US dollar weakened against other currencies as the markets rallied. |
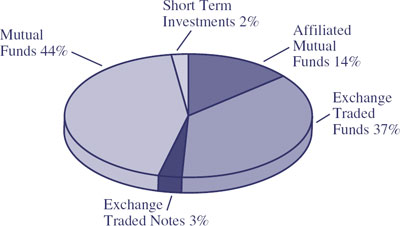
Components of Portfolio Holdings*
*Pie chart represents percentages of total portfolio, less securities lending collateral.
Top Ten Holdings
| | | | | | |
Rank | | Security/Holding | | % of Net
Assets | |
1 | | | Vanguard Total Bond Market Index Fund | | 9.04 | |
2 | | | BlackRock Low Duration Bond Portfolio – Institutional Shares | | 8.06 | |
3 | | | iShares Barclays Credit Bond Fund | | 7.92 | |
4 | | | GuideMarkSM Opportunistic Fixed Income Fund –
Institutional Shares | | 7.56 | |
5 | | | Pioneer Strategic Income Fund – Class Y | | 7.55 | |
6 | | | GuideMarkSM Core Fixed Income Fund – Institutional Shares | | 6.44 | |
7 | | | iShares Barclays MBS Bond Fund | | 5.25 | |
8 | | | SPDR Barclays Capital 1-3 Month T-Bill ETF | | 4.57 | |
9 | | | DoubleLine Total Return Bond Fund – Institutional Shares | | 3.99 | |
10 | | | Eaton Vance Multi-Strategy Absolute Return Fund –
Institutional Shares | | 3.26 | |
30
|
GuideMarkSM Funds & GuidePathSM Funds |
EXPENSE EXAMPLE (Unaudited) |
September 30, 2012 |
| |
As a shareholder of the GuideMarkSM & GuidePathSM Funds (the “Funds”), you incur ongoing costs, including management fees, distribution and/or service fees, and other Fund expenses. The Expense Example shown in this section is intended to help you understand your ongoing costs (in dollars) of investing in the Funds and to compare these costs with the ongoing costs of investing in other mutual funds.
The Expense Examples are based on an investment of $1,000 invested at the beginning of a six-month period and held for the entire period, which for both classes of the GuideMarkSM Large Cap Growth Fund, GuideMarkSM Large Cap Value Fund, GuideMarkSM Small/Mid Cap Core Fund, GuideMarkSM World ex-US Fund, GuideMarkSM Opportunistic Equity Fund, GuideMarkSM Global Real Return Fund, GuideMarkSM Core Fixed Income Fund, GuideMarkSM Tax-Exempt Fixed Income Fund and GuideMarkSM Opportunistic Fixed Income Fund, along with the GuidePathSM Strategic Asset Allocation Fund –Service Shares, GuidePathSM Tactical Constrained Asset Allocation Fund – Service Shares, GuidePathSM Tactical Unconstrained Asset Allocation Fund – Service Shares, and GuidePathSM Absolute Return Asset Allocation Fund – Service Shares was from April 1, 2012 to September 30, 2012, for the GuidePathSM Multi-Asset Income Asset Allocation Fund –Service Shares, GuidePathSM Fixed Income Allocation Fund – Service Shares, and GuidePathSM Altegris® Multi-Strategy Alternative Allocation Fund – Service Shares was from August 31, 2012 to September 30, 2012, and for the GuidePathSM Strategic Asset Allocation Fund – Institutional Shares, GuidePathSM Tactical Constrained Asset Allocation Fund – Institutional Shares, GuidePathSM Tactical Unconstrained Asset Allocation Fund – Institutional Shares, GuidePathSM Absolute Return Asset Allocation Fund – Institutional Shares, GuidePathSM Fixed Income Allocation Fund – Institutional Shares, and GuidePathSM Altegris® Multi-Strategy Alternative Allocation Fund – Institutional Shares was from September 13, 2012 to September 30, 2012.
Actual Expenses
The first line of the Expense Example table provides information about actual account values and actual expenses. You may use the information in this line, together with the amount you invested, to estimate the expenses that you paid over the period. Simply divide your account value by $1,000 (for example, an $8,600 account value divided by $1,000 = 8.6), then multiply the result by the number in the first line under the heading entitled “Expenses Paid During Period” to estimate the expenses you paid on your account during this period.
The example includes, but is not limited to, management fees, shareholder servicing fees, distribution fees, fund accounting fees, custody fees and transfer agent fees. However, the example below does not include portfolio trading commissions and related expenses, interest expense or dividends on short positions taken by a Fund and other extraordinary expenses as determined under generally accepted accounting principles. To the extent that a Fund invests in shares of other investment companies as part of its investment strategy, you will indirectly bear your proportionate share of any fees and expenses charged by the underlying funds in which a Fund invests in addition to the expenses of the Fund. Actual expenses of the underlying funds are expected to vary among the various underlying funds. These expenses are not included in the example below.
Hypothetical Example for Comparison Purposes
The second line of the table below provides information about hypothetical account values and hypothetical expenses based on each Fund’s actual expenses ratios and an assumed rate of return of 5% per year before expenses, which is not the Fund’s actual return. The hypothetical account values and expenses may not be used to estimate the actual ending account balance or expenses you paid for the period. You may use this information to compare the ongoing costs of investing in the Funds and other funds. To do so, compare this 5% hypothetical example with the 5% hypothetical examples that appear in the shareholder reports of the other funds.
31
|
GuideMarkSM & GuidePathSM Funds |
EXPENSE EXAMPLE (Continued) (Unaudited) |
September 30, 2012 |
| |
| | | | | | | | | | | | | | |
Fund | | | | Beginning
Account
Value
April 1,
2012 | | Ending
Account
Value
September 30,
2012 | | Annualized
Expense Ratio1
based on
the period
April 1, 2012–
September 30, 2012 | | Expenses Paid
During Period2
April 1, 2012–
September 30,
2012 | |
| | | | | | | | | | | | |
INSTITUTIONAL SHARES | | | | | | | | | | | | | | |
| | | | | | | | | | | | | | | |
GuideMarkSM Large Cap | | Actual | | $1,000.00 | | | $ | 997.20 | | | 0.92% | | $4.61 | |
Growth Fund | | Hypothetical3 | | $1,000.00 | | | $ | 1,020.46 | | | 0.92% | | $4.66 | |
| | | | | | | | | | | | | | | |
GuideMarkSM Large Cap | | Actual | | $1,000.00 | | | $ | 1,016.70 | | | 0.92% | | $4.65 | |
Value Fund | | Hypothetical3 | | $1,000.00 | | | $ | 1,020.46 | | | 0.92% | | $4.66 | |
| | | | | | | | | | | | | | | |
GuideMarkSM Small/Mid Cap | | Actual | | $1,000.00 | | | $ | 1,007.80 | | | 1.08% | | $5.44 | |
Core Fund | | Hypothetical3 | | $1,000.00 | | | $ | 1,019.65 | | | 1.08% | | $5.47 | |
| | | | | | | | | | | | | | | |
GuideMarkSM World | | Actual | | $1,000.00 | | | $ | 992.00 | | | 1.08% | | $5.39 | |
ex-US Fund | | Hypothetical3 | | $1,000.00 | | | $ | 1,019.65 | | | 1.08% | | $5.47 | |
| | | | | | | | | | | | | | | |
GuideMarkSM Opportunistic | | Actual | | $1,000.00 | | | $ | 1,000.00 | | | 1.06% | | $5.31 | |
Equity Fund | | Hypothetical3 | | $1,000.00 | | | $ | 1,019.75 | | | 1.06% | | $5.37 | |
| | | | | | | | | | | | | | | |
GuideMarkSM Global | | Actual | | $1,000.00 | | | $ | 1,012.80 | | | 0.92% | | $4.64 | |
Real Return Fund | | Hypothetical3 | | $1,000.00 | | | $ | 1,020.46 | | | 0.92% | | $4.66 | |
| | | | | | | | | | | | | | | |
GuideMarkSM Core | | Actual | | $1,000.00 | | | $ | 1,040.70 | | | 0.71% | | $3.63 | |
Fixed Income Fund | | Hypothetical3 | | $1,000.00 | | | $ | 1,021.51 | | | 0.71% | | $3.60 | |
| | | | | | | | | | | | | | | |
GuideMarkSM Opportunistic | | Actual | | $1,000.00 | | | $ | 1,048.60 | | | 1.05% | | $5.39 | |
Fixed Income Fund | | Hypothetical3 | | $1,000.00 | | | $ | 1,019.80 | | | 1.05% | | $5.32 | |
| | | | | | | | | | | | | | | |
| |
1 | The expense ratio excludes the securities lending credit. |
2 | Expenses are equal to the Fund’s annualized expense ratio, multiplied by the average account value over the period, multiplied by 183/365 to reflect the one-half year period. |
3 | 5% return before expenses. |
32
|
GuideMarkSM & GuidePathSM Funds |
EXPENSE EXAMPLE (Continued) (Unaudited) |
September 30, 2012 |
| |
| | | | | | | | | | | | | | |
Fund | | | | Beginning
Account
Value
September 13,
2012 | | Ending
Account
Value
September 30,
2012 | | Annualized
Expense Ratio1
based on
the period
September 13, 2012–
September 30, 2012 | | Expenses Paid
During Period2
September 13, 2012–
September 30,
2012 | |
| | | | | | | | | | | | | | | |
INSTITUTIONAL SHARES | | | | | | | | | | | | | | |
| | | | | | | | | | | | | | | |
GuidePathSM Strategic | | Actual | | $1,000.00 | | | $ | 983.40 | | | 0.40% | | $0.18 | |
Asset Allocation Fund | | Hypothetical3 | | $1,000.00 | | | $ | 1,002.14 | | | 0.40% | | $0.19 | |
| | | | | | | | | | | | | | | |
GuidePathSM Tactical | | Actual | | $1,000.00 | | | $ | 988.00 | | | 0.43% | | $0.20 | |
Constrained Asset Allocation Fund | | Hypothetical3 | | $1,000.00 | | | $ | 1,002.13 | | | 0.43% | | $0.20 | |
| | | | | | | | | | | | | | | |
GuidePathSM Tactical | | Actual | | $1,000.00 | | | $ | 990.80 | | | 0.49% | | $0.23 | |
Unconstrained Asset Allocation Fund | | Hypothetical3 | | $1,000.00 | | | $ | 1,002.10 | | | 0.49% | | $0.23 | |
| | | | | | | | | | | | | | | |
GuidePathSM Absolute Return | | Actual | | $1,000.00 | | | $ | 1,002.00 | | | 0.50% | | $0.23 | |
Asset Allocation Fund | | Hypothetical3 | | $1,000.00 | | | $ | 1,002.10 | | | 0.50% | | $0.23 | |
| | | | | | | | | | | | | | | |
GuidePathSM Fixed Income | | Actual | | $1,000.00 | | | $ | 1,004.00 | | | 0.47% | | $0.22 | |
Allocation Fund | | Hypothetical3 | | $1,000.00 | | | $ | 1,002.11 | | | 0.47% | | $0.22 | |
| | | | | | | | | | | | | | | |
GuidePathSM Altegris® | | Actual | | $1,000.00 | | | $ | 993.00 | | | 0.37% | | $0.17 | |
Multi-Strategy Alternative Allocation Fund | | Hypothetical3 | | $1,000.00 | | | $ | 1,002.16 | | | 0.37% | | $0.17 | |
| | | | | | | | | | | | | | | |
| |
1 | The expense ratio excludes the securities lending credit. |
2 | Expenses are equal to the Fund’s annualized expense ratio, multiplied by the average account value over the period, multiplied by 17/365 to reflect the one-half year period. |
3 | 5% return before expenses. |
33
|
GuideMarkSM & GuidePathSM Funds |
EXPENSE EXAMPLE (Continued) (Unaudited) |
September 30, 2012 |
| |
| | | | | | | | | | | | | | |
Fund | | | | Beginning
Account
Value
April 1,
2012 | | Ending
Account
Value
September 30,
2012 | | Annualized
Expense Ratio1
based on
the period
April 1, 2012–
September 30, 2012 | | Expenses Paid
During Period2
April 1, 2012–
September 30,
2012 | |
| | | | | | | | | | | | |
SERVICE SHARES | | | | | | | | | | | | | | |
| | | | | | | | | | | | | | | |
GuideMarkSM Large Cap | | Actual | | $1,000.00 | | | $ | 995.30 | | | 1.51% | | $7.55 | |
Growth Fund | | Hypothetical3 | | $1,000.00 | | | $ | 1,017.50 | | | 1.51% | | $7.64 | |
| | | | | | | | | | | | | | | |
GuideMarkSM Large Cap | | Actual | | $1,000.00 | | | $ | 1,014.20 | | | 1.49% | | $7.52 | |
Value Fund | | Hypothetical3 | | $1,000.00 | | | $ | 1,017.60 | | | 1.49% | | $7.54 | |
| | | | | | | | | | | | | | | |
GuideMarkSM Small/Mid Cap | | Actual | | $1,000.00 | | | $ | 1,005.20 | | | 1.63% | | $8.19 | |
Core Fund | | Hypothetical3 | | $1,000.00 | | | $ | 1,016.90 | | | 1.63% | | $8.24 | |
| | | | | | | | | | | | | | | |
GuideMarkSM World | | Actual | | $1,000.00 | | | $ | 989.40 | | | 1.59% | | $7.93 | |
ex-US Fund | | Hypothetical3 | | $1,000.00 | | | $ | 1,017.10 | | | 1.59% | | $8.04 | |
| | | | | | | | | | | | | | | |
GuideMarkSM Opportunistic | | Actual | | $1,000.00 | | | $ | 998.00 | | | 1.60% | | $8.01 | |
Equity Fund | | Hypothetical3 | | $1,000.00 | | | $ | 1,017.05 | | | 1.60% | | $8.09 | |
| | | | | | | | | | | | | | | |
GuideMarkSM Global | | Actual | | $1,000.00 | | | $ | 1,009.60 | | | 1.49% | | $7.51 | |
Real Return Fund | | Hypothetical3 | | $1,000.00 | | | $ | 1,017.60 | | | 1.49% | | $7.54 | |
| | | | | | | | | | | | | | | |
GuideMarkSM Core | | Actual | | $1,000.00 | | | $ | 1,038.10 | | | 1.28% | | $6.54 | |
Fixed Income Fund | | Hypothetical3 | | $1,000.00 | | | $ | 1,018.65 | | | 1.28% | | $6.48 | |
| | | | | | | | | | | | | | | |
GuideMarkSM Tax-Exempt | | Actual | | $1,000.00 | | | $ | 1,041.10 | | | 1.29% | | $6.60 | |
Fixed Income Fund | | Hypothetical3 | | $1,000.00 | | | $ | 1,018.60 | | | 1.29% | | $6.53 | |
| | | | | | | | | | | | | | | |
GuideMarkSM Opportunistic | | Actual | | $1,000.00 | | | $ | 1,045.10 | | | 1.55% | | $7.95 | |
Fixed Income Fund | | Hypothetical3 | | $1,000.00 | | | $ | 1,017.30 | | | 1.55% | | $7.84 | |
| | | | | | | | | | | | | | | |
GuidePathSM Strategic | | Actual | | $1,000.00 | | | $ | 1,001.10 | | | 1.03% | | $5.17 | |
Asset Allocation Fund | | Hypothetical3 | | $1,000.00 | | | $ | 1,019.90 | | | 1.03% | | $5.22 | |
| | | | | | | | | | | | | | | |
GuidePathSM Tactical Constrained | | Actual | | $1,000.00 | | | $ | 1,010.20 | | | 1.05% | | $5.29 | |
Asset Allocation Fund | | Hypothetical3 | | $1,000.00 | | | $ | 1,019.80 | | | 1.05% | | $5.32 | |
| | | | | | | | | | | | | | | |
GuidePathSM Tactical Unconstrained | | Actual | | $1,000.00 | | | $ | 1,011.50 | | | 1.12% | | $5.65 | |
Asset Allocation Fund | | Hypothetical3 | | $1,000.00 | | | $ | 1,019.45 | | | 1.12% | | $5.67 | |
| | | | | | | | | | | | | | | |
GuidePathSM Absolute Return | | Actual | | $1,000.00 | | | $ | 1,016.90 | | | 1.14% | | $5.76 | |
Asset Allocation Fund | | Hypothetical3 | | $1,000.00 | | | $ | 1,019.35 | | | 1.14% | | $5.77 | |
| | | | | | | | | | | | | | | |
| |
1 | The expense ratio excludes the securities lending credit. |
2 | Expenses are equal to the Fund’s annualized expense ratio, multiplied by the average account value over the period, multiplied by 183/365 to reflect the one-half year period. |
3 | 5% return before expenses. |
34
|
GuideMarkSM & GuidePathSM Funds |
EXPENSE EXAMPLE (Continued) (Unaudited) |
September 30, 2012 |
| |
| | | | | | | | | | | | | | |
Fund | | | | Beginning
Account
Value
August 31,
2012 | | Ending
Account
Value
September 30,
2012 | | Annualized
Expense Ratio1
based on
the period
August 31, 2012–
September 30, 2012 | | Expenses Paid
During Period2
August 31, 2012–
September 30,
2012 | |
| | | | | | | | | | | | |
SERVICE SHARES | | | | | | | | | | | | | | |
| | | | | | | | | | | | | | | |
GuidePathSM Multi-Asset Income | | Actual | | $1,000.00 | | | $ | 1,014.00 | | | 1.10% | | $0.91 | |
Asset Allocation Fund | | Hypothetical3 | | $1,000.00 | | | $ | 1,003.21 | | | 1.10% | | $0.91 | |
| | | | | | | | | | | | | | | |
GuidePathSM Fixed Income | | Actual | | $1,000.00 | | | $ | 1,004.00 | | | 1.05% | | $0.86 | |
Allocation Fund | | Hypothetical3 | | $1,000.00 | | | $ | 1,003.25 | | | 1.05% | | $0.86 | |
| | | | | | | | | | | | | | | |
GuidePathSM Altegris® Multi-Strategy | | Actual | | $1,000.00 | | | $ | 1,000.00 | | | 0.98% | | $0.81 | |
Alternative Allocation Fund | | Hypothetical3 | | $1,000.00 | | | $ | 1,003.30 | | | 0.98% | | $0.81 | |
| | | | | | | | | | | | | | | |
| |
1 | The expense ratio excludes the securities lending credit. |
2 | Expenses are equal to the Fund’s annualized expense ratio, multiplied by the average account value over the period, multiplied by 30/365 to reflect the one-half year period. |
3 | 5% return before expenses. |
35
|
GuideMarkSM Large Cap Growth Fund |
SCHEDULE OF INVESTMENTS (Unaudited) |
September 30, 2012 |
| |
| | | | | | | | |
Number of
Shares | | | | | | Value | |
| | | | | | | | |
| | | COMMON STOCKS - 100.14% | | | | |
| | | Aerospace & Defense - 2.19% | | | | |
| 29,510 | | Boeing Co. | | $ | 2,054,486 | |
| 30,935 | | Honeywell International, Inc. | | | 1,848,366 | |
| | | | | | | |
| | | | | | 3,902,852 | |
| | | | | | | |
| | | Beverages - 2.77% | | | | |
| 129,972 | | The Coca-Cola Company | | | 4,929,838 | |
| | | | | | | |
| | | Biotechnology - 6.78% | | | | |
| 50,626 | | Amgen, Inc. | | | 4,268,784 | |
| 19,319 | | Biogen Idec, Inc. (b) | | | 2,882,974 | |
| 33,056 | | Celgene Corp. (b) | | | 2,525,479 | |
| 36,257 | | Gilead Sciences, Inc. (b) | | | 2,404,927 | |
| | | | | | | |
| | | | | | 12,082,164 | |
| | | | | | | |
| | | Chemicals - 2.33% | | | | |
| 10,020 | | CF Industries Holdings, Inc. | | | 2,226,845 | |
| 21,085 | | Monsanto Co. | | | 1,919,156 | |
| | | | | | | |
| | | | | | 4,146,001 | |
| | | | | | | |
| | | Communications Equipment - 7.51% | | | | |
| 454,968 | | Cisco Systems, Inc. | | | 8,685,339 | |
| 8,906 | | F5 Networks, Inc. (b) | | | 932,458 | |
| 48,581 | | Qualcomm, Inc. | | | 3,035,827 | |
| 31,174 | | Riverbed Technology, Inc. (b) | | | 725,419 | |
| | | | | | | |
| | | | | | 13,379,043 | |
| | | | | | | |
| | | Computers & Peripherals - 15.53% | | | | |
| 24,971 | | Apple, Inc. | | | 16,662,150 | |
| 124,131 | | EMC Corp. (b) | | | 3,385,052 | |
| 26,005 | | International Business Machines Corp. | | | 5,394,737 | |
| 41,987 | | NetApp, Inc. (b) | | | 1,380,533 | |
| 72,560 | | QLogic Corp. (b) | | | 828,635 | |
| | | | | | | |
| | | | | | 27,651,107 | |
| | | | | | | |
| | | Consumer Finance - 0.98% | | | | |
| 30,771 | | American Express Co. | | | 1,749,639 | |
| | | | | | | |
| | | Diversified Financial Services - 0.69% | | | | |
| 138,413 | | Bank of America Corp. | | | 1,222,187 | |
| | | | | | | |
| | | Diversified Telecommunication Services - 2.26% | | | | |
| 88,480 | | Verizon Communications, Inc. | | | 4,032,034 | |
| | | | | | | |
| | | Energy Equipment & Services - 4.14% | | | | |
| 8,083 | | Core Laboratories NV | | | 981,923 | |
| 26,781 | | Diamond Offshore Drilling, Inc. (a) | | | 1,762,458 | |
| 25,999 | | National-Oilwell Varco, Inc. | | | 2,082,780 | |
| 26,493 | | Oceaneering International, Inc. | | | 1,463,738 | |
| 24,217 | | Transocean Ltd. - ADR | | | 1,087,101 | |
| | | | | | | |
| | | | | | 7,378,000 | |
| | | | | | | |
| | | | | | | | |
Number of
Shares | | | | | | Value | |
| | | | | | | | |
| | | Food & Staples Retailing - 4.37% | | | | |
| 21,533 | | Costco Wholesale Corp. | | $ | 2,155,992 | |
| 35,053 | | CVS Caremark Corp. | | | 1,697,266 | |
| 53,147 | | Wal-Mart Stores, Inc. | | | 3,922,248 | |
| | | | | | | |
| | | | | | 7,775,506 | |
| | | | | | | |
| | | Food Products - 0.20% | | | | |
| 14,973 | | Green Mountain Coffee Roasters, | | | | |
| | | Inc. (b)(a) | | | 355,609 | |
| | | | | | | |
| | | Health Care Equipment & Supplies - 2.22% | | | | |
| 12,065 | | Edwards Lifesciences Corp. (b) | | | 1,295,419 | |
| 60,528 | | Hologic, Inc. (b) | | | 1,225,087 | |
| 766 | | Intuitive Surgical, Inc. (b) | | | 379,653 | |
| 15,465 | | Zimmer Holdings, Inc. | | | 1,045,743 | |
| | | | | | | |
| | | | | | 3,945,902 | |
| | | | | | | |
| | | Health Care Providers & Services - 2.46% | | | | |
| 28,427 | | Aetna, Inc. | | | 1,125,709 | |
| 58,747 | | UnitedHealth Group, Inc. | | | 3,255,171 | |
| | | | | | | |
| | | | | | 4,380,880 | |
| | | | | | | |
| | | Hotels, Restaurants & Leisure - 0.27% | | | | |
| 7,341 | | Yum Brands, Inc. | | | 487,002 | |
| | | | | | | |
| | | Industrial Conglomerates - 1.65% | | | | |
| 68,544 | | General Electric Co. | | | 1,556,634 | |
| 24,574 | | Tyco International Ltd. - ADR | | | 1,382,533 | |
| | | | | | | |
| | | | | | 2,939,167 | |
| | | | | | | |
| | | Internet & Catalog Retail - 1.92% | | | | |
| 10,304 | | Amazon.com, Inc. (b) | | | 2,620,513 | |
| 1,302 | | Priceline.com, Inc. (b) | | | 805,587 | |
| | | | | | | |
| | | | | | 3,426,100 | |
| | | | | | | |
| | | Internet Software & Services - 6.28% | | | | |
| 1,850 | | Baidu, Inc. - ADR (b) | | | 216,117 | |
| 55,706 | | eBay, Inc. (b) | | | 2,696,727 | |
| 7,697 | | Google, Inc. (b) | | | 5,807,387 | |
| 47,382 | | IAC/InterActiveCorp | | | 2,466,707 | |
| | | | | | | |
| | | | | | 11,186,938 | |
| | | | | | | |
| | | IT Services - 0.79% | | | | |
| 10,520 | | Visa, Inc. | | | 1,412,626 | |
| | | | | | | |
| | | Life Sciences Tools & Services - 0.76% | | | | |
| 44,817 | | Bruker Corp. (b) | | | 586,654 | |
| 12,510 | | Life Technologies Corp. (b) | | | 611,489 | |
| 1,952 | | Waters Corp. (b) | | | 162,660 | |
| | | | | | | |
| | | | | | 1,360,803 | |
| | | | | | | |
See notes to financial statements.
36
|
GuideMarkSM Large Cap Growth Fund |
SCHEDULE OF INVESTMENTS (Unaudited) (Continued) |
September 30, 2012 |
| |
| | | | | | | | |
Number of
Shares | | | | | | Value | |
| | | | | | | | |
| | | COMMON STOCKS (Continued) | | | | |
| | | Machinery - 1.62% | | | | |
| 11,931 | | Caterpillar, Inc. | | $ | 1,026,543 | |
| 8,704 | | Dover Corp. | | | 517,801 | |
| 16,105 | | Parker Hannifin Corp. | | | 1,346,056 | |
| | | | | | | |
| | | | | | 2,890,400 | |
| | | | | | | |
| | | Media - 4.13% | | | | |
| 73,254 | | Comcast Corp. | | | 2,620,296 | |
| 65,405 | | News Corp. | | | 1,604,385 | |
| 40,832 | | Omnicom Group, Inc. | | | 2,105,298 | |
| 397,379 | | Sirius XM Radio, Inc. (b) | | | 1,033,185 | |
| | | | | | | |
| | | | | | 7,363,164 | |
| | | | | | | |
| | | Metals & Mining - 0.10% | | | | |
| 4,657 | | Allied Nevada Gold Corp. (b) | | | 181,902 | |
| | | | | | | |
| | | Multiline Retail - 0.66% | | | | |
| 24,231 | | Dollar Tree, Inc. (b) | | | 1,169,751 | |
| | | | | | | |
| | | Oil & Gas - 3.13% | | | | |
| 34,264 | | Exxon Mobil Corp. | | | 3,133,443 | |
| 8,756 | | Occidental Petroleum Corp. | | | 753,541 | |
| 53,377 | | Valero Energy Corp. | | | 1,690,983 | |
| | | | | | | |
| | | | | | 5,577,967 | |
| | | | | | | |
| | | Pharmaceuticals - 2.19% | | | | |
| 37,878 | | Abbott Laboratories | | | 2,596,916 | |
| 28,929 | | Merck & Co., Inc. | | | 1,304,698 | |
| | | | | | | |
| | | | | | 3,901,614 | |
| | | | | | | |
| | | Semiconductor & Semiconductor | | | | |
| | | Equipment - 2.46% | | | | |
| 63,641 | | Altera Corp. | | | 2,162,840 | |
| 16,885 | | KLA-Tencor Corp. | | | 805,499 | |
| 42,418 | | Xilinx, Inc. | | | 1,417,185 | |
| | | | | | | |
| | | | | | 4,385,524 | |
| | | | | | | |
| | | Software - 9.43% | | | | |
| 8,777 | | Autodesk, Inc. (b) | | | 292,888 | |
| 15,846 | | BMC Software, Inc. (b) | | | 657,450 | |
| 27,324 | | Check Point Software Technologies | | | | |
| | | Ltd. - ADR (b) | | | 1,315,924 | |
| 8,692 | | Citrix Systems, Inc. (b) | | | 665,546 | |
| 259,052 | | Microsoft Corp. | | | 7,714,569 | |
| 7,721 | | NetSuite, Inc. (b) | | | 492,600 | |
| 124,051 | | Oracle Corp. | | | 3,906,366 | |
| | | | | | | | |
Number of
Shares | | | | | | Value | |
| | | | | | | | |
| | | Software (Continued) | | | | |
| 27,274 | | Red Hat, Inc. (b) | | $ | 1,552,982 | |
| 10,876 | | Symantec Corp. (b) | | | 195,768 | |
| | | | | | | |
| | | | | | 16,794,093 | |
| | | | | | | |
| | | Specialty Retail - 6.84% | | | | |
| 16,231 | | Bed Bath & Beyond, Inc. (b) | | | 1,022,553 | |
| 25,050 | | Home Depot, Inc. | | | 1,512,268 | |
| 59,937 | | Lowe’s Companies, Inc. | | | 1,812,495 | |
| 12,322 | | O’Reilly Automotive, Inc. (b) | | | 1,030,366 | |
| 26,599 | | PetSmart, Inc. | | | 1,834,799 | |
| 18,214 | | Ross Stores, Inc. | | | 1,176,624 | |
| 8,971 | | Sherwin Williams Co. | | | 1,335,872 | |
| 23,483 | | The Buckle, Inc. (a) | | | 1,066,833 | |
| 30,823 | | The TJX Companies, Inc. | | | 1,380,562 | |
| | | | | | | |
| | | | | | 12,172,372 | |
| | | | | | | |
| | | Textiles, Apparel & Luxury Goods - 0.83% | | | | |
| 11,061 | | Coach, Inc. | | | 619,637 | |
| 11,507 | | Lululemon Athletica, Inc. (a)(b) | | | 850,828 | |
| | | | | | | |
| | | | | | 1,470,465 | |
| | | | | | | |
| | | Tobacco - 2.65% | | | | |
| 52,385 | | Philip Morris International, Inc. | | | 4,711,507 | |
| | | | | | | |
| | | Total Common Stocks | | | | |
| | | (Cost $134,294,173) | | | 178,362,157 | |
| | | | | | | |
| | | SHORT TERM INVESTMENTS - 0.03% | | | | |
| | | Money Market Funds - 0.03% | | | | |
| | | Federated Prime Obligations Fund | | | | |
| 55,269 | | 0.15%, 01/01/2050 | | | 55,269 | |
| | | | | | | |
| | | Total Short Term Investments | | | | |
| | | (Cost $55,269) | | | 55,269 | |
| | | | | | | |
| | | INVESTMENTS PURCHASED | | | | |
| | | AS SECURITIES LENDING | | | | |
| | | COLLATERAL - 2.28% | | | | |
| | | Money Market Funds - 2.25% | | | | |
| 4,009,540 | | First American Government | | | | |
| | | Obligations Fund | | | 4,009,540 | |
| | | Effective Yield, 0.02% | | | | |
| 20,508 | | Reserve Primary Fund (c) | | | 792 | |
| | | | | | | |
| | | Total Money Market Funds | | | | |
| | | (Cost $4,027,232) | | | 4,010,332 | |
| | | | | | | |
See notes to financial statements.
37
|
GuideMarkSM Large Cap Growth Fund |
SCHEDULE OF INVESTMENTS (Unaudited) (Continued) |
September 30, 2012 |
| |
| | | | | | | | |
Principal
Amount | | | | | | Value | |
| | | | | | | | |
| | | Cash - 0.03% | | | | |
$ | 47,631 | | Cash | | $ | 47,631 | |
| | | | | | | |
| | | Total Cash (Cost $47,631) | | | 47,631 | |
| | | | | | | |
| | | Total Investments Purchased as | | | | |
| | | Securities Lending Collateral | | | | |
| | | (Cost $4,074,863) | | | 4,057,963 | |
| | | | | | | |
| | | Total Investments | | | | |
| | | (Cost $138,424,305) - 102.45% | | | 182,475,389 | |
| | | Liabilities in Excess of | | | | |
| | | Other Assets - (2.45)% | | | (4,366,860 | ) |
| | | | | | | |
| | | TOTAL NET | | | | |
| | | ASSETS - 100.00% | | $ | 178,108,529 | |
| | | | | | | |
| |
Percentages are stated as a percent of net assets. |
ADR - American Depositary Receipt |
(a) | All or portion of this security is on loan. |
(b) | Non-income producing security. |
(c) | As of September 30, 2012, the Fund has fair valued this security and deemed it illiquid. The value of this security was $792, which represents 0.00% of total net assets. |
See notes to financial statements.
38
|
GuideMarkSM Large Cap Value Fund |
SCHEDULE OF INVESTMENTS (Unaudited) |
September 30, 2012 |
| |
| | | | | | | | |
Number of
Shares | | | | | | Value | |
| | | | | | | | |
| | | COMMON STOCKS - 97.89% | | | | |
| | | Aerospace & Defense - 3.48% | | | | |
| 37,900 | | Exelis, Inc. | | $ | 391,886 | |
| 38,000 | | Honeywell International, Inc. | | | 2,270,500 | |
| 19,100 | | L-3 Communications Holdings, Inc. | | | 1,369,661 | |
| 42,000 | | Raytheon Co. | | | 2,400,720 | |
| | | | | | | |
| | | | | | 6,432,767 | |
| | | | | | | |
| | | Building Products - 1.21% | | | | |
| 148,600 | | Masco Corp. | | | 2,236,430 | |
| | | | | | | |
| | | Capital Markets - 1.72% | | | | |
| 29,800 | | Ameriprise Financial, Inc. | | | 1,689,362 | |
| 35,700 | | State Street Corp. | | | 1,497,972 | |
| | | | | | | |
| | | | | | 3,187,334 | |
| | | | | | | |
| | | Commercial Banks - 4.11% | | | | |
| 173,500 | | Fifth Third Bancorp | | | 2,690,985 | |
| 31,400 | | PNC Financial Services Group, Inc. | | | 1,981,340 | |
| 84,700 | | Wells Fargo & Co. | | | 2,924,691 | |
| | | | | | | |
| | | | | | 7,597,016 | |
| | | | | | | |
| | | Computers & Peripherals - 1.43% | | | | |
| 12,800 | | International Business Machines Corp. | | | 2,655,360 | |
| | | | | | | |
| | | Consumer Finance - 8.41% | | | | |
| 51,000 | | American Express Co. | | | 2,899,860 | |
| 107,100 | | Capital One Financial Corp. | | | 6,105,771 | |
| 56,300 | | Discover Financial Services | | | 2,236,799 | |
| 274,800 | | SLM Corp. | | | 4,319,856 | |
| | | | | | | |
| | | | | | 15,562,286 | |
| | | | | | | |
| | | Containers & Packaging - 0.93% | | | | |
| 55,300 | | Sonoco Products Co. | | | 1,713,747 | |
| | | | | | | |
| | | Diversified Financial Services - 3.47% | | | | |
| 164,700 | | Bank of America Corp. | | | 1,454,301 | |
| 60,080 | | Citigroup, Inc. | | | 1,965,818 | |
| 74,300 | | JPMorgan Chase & Co. | | | 3,007,664 | |
| | | | | | | |
| | | | | | 6,427,783 | |
| | | | | | | |
| | | Diversified Telecommunication Services - 2.40% | | | | |
| 82,700 | | AT&T, Inc. | | | 3,117,790 | |
| 29,200 | | Verizon Communications, Inc. | | | 1,330,644 | |
| | | | | | | |
| | | | | | 4,448,434 | |
| | | | | | | |
| | | Electric Utilities - 1.02% | | | | |
| 35,700 | | Pinnacle West Capital Corp. | | | 1,884,960 | |
| | | | | | | |
| | | | | | | | |
Number of
Shares | | | | | | Value | |
| | | | | | | | |
| | | Electrical Equipment - 0.92% | | | | |
| 35,100 | | Emerson Electric Co. | | $ | 1,694,277 | |
| | | | | | | |
| | | Electronic Equipment & Instruments - 1.73% | | | | |
| 64,700 | | Corning, Inc. | | | 850,805 | |
| 89,300 | | Molex, Inc. (a) | | | 2,346,804 | |
| | | | | | | |
| | | | | | 3,197,609 | |
| | | | | | | |
| | | Energy Equipment & Services - 1.40% | | | | |
| 66,000 | | SeaDrill Ltd. (a) | | | 2,588,520 | |
| | | | | | | |
| | | Food & Staples Retailing - 2.64% | | | | |
| 51,500 | | CVS Caremark Corp. | | | 2,493,630 | |
| 65,600 | | Walgreen Co. | | | 2,390,464 | |
| | | | | | | |
| | | | | | 4,884,094 | |
| | | | | | | |
| | | Gas Utilities - 0.74% | | | | |
| 28,200 | | ONEOK, Inc. | | | 1,362,342 | |
| | | | | | | |
| | | Health Care Equipment & Supplies - 3.44% | | | | |
| 35,800 | | Baxter International, Inc. | | | 2,157,308 | |
| 76,800 | | Medtronic, Inc. | | | 3,311,616 | |
| 21,400 | | St. Jude Medical, Inc. | | | 901,582 | |
| | | | | | | |
| | | | | | 6,370,506 | |
| | | | | | | |
| | | Health Care Providers & Services - 6.77% | | | | |
| 44,000 | | Cardinal Health, Inc. | | | 1,714,680 | |
| 48,800 | | CIGNA Corp. | | | 2,301,896 | |
| 19,100 | | Coventry Health Care, Inc. | | | 796,279 | |
| 70,700 | | Omnicare, Inc. | | | 2,401,679 | |
| 59,700 | | UnitedHealth Group, Inc. | | | 3,307,977 | |
| 34,400 | | WellPoint, Inc. | | | 1,995,544 | |
| | | | | | | |
| | | | | | 12,518,055 | |
| | | | | | | |
| | | Hotels, Restaurants & Leisure - 3.96% | | | | |
| 86,600 | | Carnival Corp. - ADR | | | 3,155,704 | |
| 136,500 | | International Game Technology | | | 1,786,785 | |
| 79,000 | | Royal Caribbean Cruises Ltd. | | | 2,386,590 | |
| | | | | | | |
| | | | | | 7,329,079 | |
| | | | | | | |
| | | Household Durables - 3.01% | | | | |
| 73,100 | | Stanley Black & Decker, Inc. | | | 5,573,875 | |
| | | | | | | |
| | | Industrial Conglomerates - 2.54% | | | | |
| 112,400 | | General Electric Co. | | | 2,552,604 | |
| 38,300 | | Tyco International Ltd. - ADR | | | 2,154,758 | |
| | | | | | | |
| | | | | | 4,707,362 | |
| | | | | | | |
See notes to financial statements.
39
|
GuideMarkSM Large Cap Value Fund |
SCHEDULE OF INVESTMENTS (Unaudited) (Continued) |
September 30, 2012 |
| |
| | | | | | | | |
Number of
Shares | | | | | | Value | |
| | | | | | | | |
| | | COMMON STOCKS (Continued) | | | | |
| | | Insurance - 4.21% | | | | |
| 18,200 | | Chubb Corp. | | $ | 1,388,296 | |
| 32,500 | | Travelers Companies, Inc. | | | 2,218,450 | |
| 58,400 | | Willis Group Holdings Plc | | | 2,156,128 | |
| 84,400 | | XL Group Plc | | | 2,028,132 | |
| | | | | | | |
| | | | | | 7,791,006 | |
| | | | | | | |
| | | IT Services - 0.71% | | | | |
| 71,700 | | The Western Union Co. | | | 1,306,374 | |
| | | | | | | |
| | | Leisure Equipment & Products - 0.96% | | | | |
| 46,400 | | Hasbro, Inc. (a) | | | 1,771,088 | |
| | | | | | | |
| | | Machinery - 4.97% | | | | |
| 40,200 | | Eaton Corp. (a) | | | 1,899,852 | |
| 48,500 | | Illinois Tool Works, Inc. | | | 2,884,295 | |
| 14,250 | | ITT Corp. | | | 287,137 | |
| 45,100 | | Pentair, Inc. (a) | | | 2,007,401 | |
| 21,900 | | SPX Corp. | | | 1,432,479 | |
| 27,000 | | Xylem, Inc. | | | 679,050 | |
| | | | | | | |
| | | | | | 9,190,214 | |
| | | | | | | |
| | | Multiline Retail - 1.61% | | | | |
| 46,800 | | Target Corp. | | | 2,970,396 | |
| | | | | | | |
| | | Multi-Utilities - 2.09% | | | | |
| 93,800 | | CenterPoint Energy, Inc. | | | 1,997,940 | |
| 67,200 | | Xcel Energy, Inc. | | | 1,862,112 | |
| | | | | | | |
| | | | | | 3,860,052 | |
| | | | | | | |
| | | Oil & Gas - 8.81% | | | | |
| 69,800 | | BP Plc - ADR | | | 2,956,728 | |
| 14,300 | | Chevron Corp. | | | 1,666,808 | |
| 46,800 | | ConocoPhillips | | | 2,676,024 | |
| 91,800 | | Marathon Oil Corp. | | | 2,714,526 | |
| 29,700 | | Occidental Petroleum Corp. | | | 2,555,982 | |
| 34,850 | | Phillips 66 | | | 1,615,994 | |
| 71,900 | | Spectra Energy Corp. | | | 2,110,984 | |
| | | | | | | |
| | | | | | 16,297,046 | |
| | | | | | | |
| | | Pharmaceuticals - 4.54% | | | | |
| 42,600 | | Johnson & Johnson | | | 2,935,566 | |
| 135,800 | | Pfizer, Inc. | | | 3,374,630 | |
| 28,200 | | Sanofi Aventis - ADR | | | 1,214,292 | |
| 21,000 | | Teva Pharmaceutical Industries | | | | |
| | | Ltd. - ADR | | | 869,610 | |
| | | | | | | |
| | | | | | 8,394,098 | |
| | | | | | | |
| | | | | | | | |
Number of
Shares | | | | | | Value | |
| | | | | | | | |
| | | Semiconductor & Semiconductor | | | | |
| | | Equipment - 2.29% | | | | |
| 56,600 | | Microchip Technology, Inc. | | $ | 1,853,084 | |
| 86,800 | | Texas Instruments, Inc. | | | 2,391,340 | |
| | | | | | | |
| | | | | | 4,244,424 | |
| | | | | | | |
| | | Software - 2.60% | | | | |
| 91,800 | | CA, Inc. | | | 2,365,227 | |
| 82,100 | | Microsoft Corp. | | | 2,444,938 | |
| | | | | | | |
| | | | | | 4,810,165 | |
| | | | | | | |
| | | Specialty Retail - 0.63% | | | | |
| 33,200 | | Rent-A-Center, Inc. | | | 1,164,656 | |
| | | | | | | |
| | | Textiles, Apparel & Luxury Goods - 1.10% | | | | |
| 64,100 | | Hanesbrands, Inc. (b) | | | 2,043,508 | |
| | | | | | | |
| | | Thrifts & Mortgage Finance - 2.21% | | | | |
| 175,300 | | New York Community Bancorp, | | | | |
| | | Inc. (a) | | | 2,482,248 | |
| 131,900 | | People’s United Financial, Inc. | | | 1,601,266 | |
| | | | | | | |
| | | | | | 4,083,514 | |
| | | | | | | |
| | | Tobacco - 5.02% | | | | |
| 56,500 | | Altria Group, Inc. | | | 1,886,535 | |
| 17,100 | | Lorillard, Inc. | | | 1,991,295 | |
| 37,200 | | Philip Morris International, Inc. | | | 3,345,768 | |
| 47,600 | | Reynolds American, Inc. | | | 2,062,984 | |
| | | | | | | |
| | | | | | 9,286,582 | |
| | | | | | | |
| | | Wireless Telecommunication Services - 0.81% | | | | |
| 52,800 | | Vodafone Group Plc - ADR | | | 1,504,536 | |
| | | | | | | |
| | | Total Common Stocks | | | | |
| | | (Cost $155,632,420) | | | 181,089,495 | |
| | | | | | | |
| | | REAL ESTATE INVESTMENT TRUSTS - 1.80% | | | | |
| | | Real Estate Investment Trusts - 1.80% | | | | |
| 67,800 | | Annaly Capital Management, Inc. | | | 1,141,752 | |
| 14,700 | | Essex Property Trust, Inc. | | | 2,179,128 | |
| | | | | | | |
| | | Total Real Estate Investment Trusts | | | | |
| | | (Cost $2,794,794) | | | 3,320,880 | |
| | | | | | | |
See notes to financial statements.
40
|
GuideMarkSM Large Cap Value Fund |
SCHEDULE OF INVESTMENTS (Unaudited) (Continued) |
September 30, 2012 |
| |
| | | | | | | | |
Number of
Shares | | | | | | Value | |
| | | | | | | | |
| | | SHORT TERM INVESTMENTS - 0.26% | | | | |
| | | Money Market Funds - 0.26% | | | | |
| | | Federated Prime Obligations Fund | | | | |
| 489,683 | | 0.15%, 01/01/2050 | | $ | 489,683 | |
| | | | | | | |
| | | Total Short Term Investments | | | | |
| | | (Cost $489,683) | | | 489,683 | |
| | | | | | | |
| | | INVESTMENTS PURCHASED | | | | |
| | | AS SECURITIES LENDING | | | | |
| | | COLLATERAL - 4.74% | | | | |
| | | Money Market Funds - 4.68% | | | | |
| 8,664,586 | | First American Government Prime | | | | |
| | | Obligations Fund | | | 8,664,586 | |
| | | Effective Yield, 0.02% | | | | |
| 23,460 | | Reserve Primary Fund (c) | | | 906 | |
| | | | | | | |
| | | Total Money Market Funds | | | | |
| | | (Cost $8,684,829) | | | 8,665,492 | |
| | | | | | | |
| | | | | | | | |
Principal
Amount | | | | | | Value | |
| | | | | | | | |
| | | Cash - 0.06% | | | | |
$ | 102,931 | | Cash | | $ | 102,931 | |
| | | | | | | |
| | | Total Cash (Cost $102,931) | | | 102,931 | |
| | | | | | | |
| | | Total Investments Purchased as | | | | |
| | | Securities Lending Collateral | | | | |
| | | (Cost $8,787,760) | | | 8,768,423 | |
| | | | | | | |
| | | Total Investments | | | | |
| | | (Cost $167,704,657) - 104.69% | | | 193,668,481 | |
| | | Liabilities in Excess of | | | | |
| | | Other Assets - (4.69)% | | | (8,671,194) | |
| | | | | | | |
| | | TOTAL NET | | | | |
| | | ASSETS - 100.00% | | $ | 184,997,287 | |
| | | | | | | |
| |
Percentages are stated as a percent of net assets. |
ADR - American Depositary Receipt |
(a) | All or portion of this security is on loan. |
(b) | Non-income producing security. |
(c) | As of September 30, 2012, the Fund has fair valued this security and deemed it illiquid. The value of this security was $906, which represents 0.00% of total net assets. |
See notes to financial statements.
41
|
GuideMarkSM Small/Mid Cap Core Fund |
SCHEDULE OF INVESTMENTS (Unaudited) |
September 30, 2012 |
| |
| | | | | | | | |
Number of
Shares | | | | | | Value | |
| | | | | | | | |
| | | COMMON STOCKS - 89.79% | | | | |
| | | Aerospace & Defense - 1.69% | | | | |
| 11,590 | | BE Aerospace, Inc. (b) | | $ | 487,939 | |
| 13,060 | | Triumph Group, Inc. | | | 816,642 | |
| | | | | | | |
| | | | | | 1,304,581 | |
| | | | | | | |
| | | Airlines - 1.23% | | | | |
| 11,700 | | Copa Holdings SA | | | 950,859 | |
| | | | | | | |
| | | Auto Components - 2.56% | | | | |
| 8,290 | | BorgWarner, Inc. (b) | | | 572,922 | |
| 23,690 | | Cooper Tire & Rubber Co. | | | 454,374 | |
| 31,800 | | Dana Holding Corp. | | | 391,140 | |
| 12,800 | | TRW Automotive Holdings | | | | |
| | | Corp. (b) | | | 559,488 | |
| | | | | | | |
| | | | | | 1,977,924 | |
| | | | | | | |
| | | Beverages - 0.63% | | | | |
| 15,130 | | Constellation Brands, Inc. (b) | | | 489,456 | |
| | | | | | | |
| | | Biotechnology - 4.05% | | | | |
| 22,300 | | Amarin Corp. Plc - ADR (a)(b) | | | 280,980 | |
| 12,430 | | BioMarin Pharmaceutical, Inc. (b) | | | 500,556 | |
| 12,210 | | Genomic Health, Inc. (b) | | | 423,565 | |
| 11,970 | | Medivation, Inc. (b) | | | 674,629 | |
| 10,430 | | Onyx Pharmaceuticals, Inc. (b) | | | 881,335 | |
| 31,680 | | Spectrum Pharmaceuticals, | | | | |
| | | Inc. (a)(b) | | | 370,656 | |
| | | | | | | |
| | | | | | 3,131,721 | |
| | | | | | | |
| | | Building Products - 0.77% | | | | |
| 22,060 | | Fortune Brands Home & Security, | | | | |
| | | Inc. (b) | | | 595,841 | |
| | | | | | | |
| | | Capital Markets - 2.12% | | | | |
| 71,890 | | FXCM, Inc. (a) | | | 686,550 | |
| 18,700 | | Invesco Ltd. | | | 467,313 | |
| 13,190 | | Raymond James Financial, Inc. | | | 483,413 | |
| | | | | | | |
| | | | | | 1,637,276 | |
| | | | | | | |
| | | Chemicals - 2.45% | | | | |
| 10,670 | | Ashland, Inc. | | | 763,972 | |
| 2,100 | | Innophos Holdings, Inc. | | | 101,829 | |
| 18,370 | | Innospec, Inc. (b) | | | 623,110 | |
| 8,780 | | Rockwood Holdings, Inc. | | | 409,148 | |
| | | | | | | |
| | | | | | 1,898,059 | |
| | | | | | | |
| | | | | | | | |
Number of
Shares | | | | | | Value | |
| | | | | | | | |
| | | Commercial Banks - 4.36% | | | | |
| 84,110 | | FirstMerit Corp. | | $ | 1,238,940 | |
| 222,970 | | Huntington Bancshares, Inc. | | | 1,538,493 | |
| 13,040 | | IBERIABANK Corp. | | | 597,232 | |
| | | | | | | |
| | | | | | 3,374,665 | |
| | | | | | | |
| | | Commercial Services & Supplies - 0.83% | | | | |
| 9,420 | | Multi-Color Corp. | | | 218,167 | |
| 13,960 | | Waste Connections, Inc. | | | 422,290 | |
| | | | | | | |
| | | | | | 640,457 | |
| | | | | | | |
| | | Communications Equipment - 3.05% | | | | |
| 29,120 | | Acme Packet, Inc. (a)(b) | | | 497,952 | |
| 33,320 | | ADTRAN, Inc. (a) | | | 575,769 | |
| 37,900 | | Juniper Networks, Inc. (b) | | | 648,469 | |
| 16,620 | | NetGear, Inc. (b) | | | 633,887 | |
| | | | | | | |
| | | | | | 2,356,077 | |
| | | | | | | |
| | | Computers & Peripherals - 0.97% | | | | |
| 32,330 | | NCR Corp. (b) | | | 753,612 | |
| | | | | | | |
| | | Construction & Engineering - 1.15% | | | | |
| 29,910 | | KBR, Inc. | | | 891,916 | |
| | | | | | | |
| | | Construction Materials - 0.76% | | | | |
| 7,140 | | Martin Marietta Materials, Inc. (a) | | | 591,692 | |
| | | | | | | |
| | | Consumer Finance - 1.38% | | | | |
| 62,390 | | DFC Global Corp. (b) | | | 1,069,988 | |
| | | | | | | |
| | | Containers & Packaging - 1.86% | | | | |
| 18,100 | | AptarGroup, Inc. | | | 935,951 | |
| 6,990 | | Rock-Tenn Co. (a) | | | 504,538 | |
| | | | | | | |
| | | | | | 1,440,489 | |
| | | | | | | |
| | | Diversified Financial Services - 2.07% | | | | |
| 48,070 | | Interactive Brokers Group, Inc. | | | 673,942 | |
| 26,730 | | NASDAQ OMX Group, Inc. | | | 622,675 | |
| 9,100 | | Nationstar Mortgage Holdings, Inc. (b) | | | 301,938 | |
| | | | | | | |
| | | | | | 1,598,555 | |
| | | | | | | |
| | | Diversified Telecommunication Services - 0.71% | | | | |
| 11,770 | | Cogent Communications Group, | | | | |
| | | Inc. (b) | | | 270,592 | |
| 57,190 | | Frontier Communications Corp. (a) | | | 280,231 | |
| | | | | �� | | |
| | | | | | 550,823 | |
| | | | | | | |
| | | Electric Utilities - 2.42% | | | | |
| 8,750 | | ITC Holdings Corp. | | | 661,325 | |
| 22,150 | | Portland General Electric Co. | | | 598,936 | |
| 16,960 | | UIL Holdings Corp. | | | 608,186 | |
| | | | | | | |
| | | | | | 1,868,447 | |
| | | | | | | |
See notes to financial statements.
42
|
GuideMarkSM Small/Mid Cap Core Fund |
SCHEDULE OF INVESTMENTS (Unaudited) (Continued) |
September 30, 2012 |
| |
| | | | | | | | |
Number of
Shares | | | | | | Value | |
| | | | | | | | |
| | | COMMON STOCKS (Continued) | | | | |
| | | Electrical Equipment - 2.07% | | | | |
| 32,520 | | AMETEK, Inc. | | $ | 1,152,834 | |
| 6,390 | | Regal Beloit Corp. | | | 450,367 | |
| | | | | | | |
| | | | | | 1,603,201 | |
| | | | | | | |
| | | Energy Equipment & Services - 3.48% | | | | |
| 12,700 | | Forum Energy Technologies, nc. (b) | | | 308,864 | |
| 4,850 | | Oil States International, Inc. (a)(b) | | | 385,381 | |
| 4,070 | | OYO Geospace Corp. (b) | | | 498,209 | |
| 40,900 | | Pacific Drilling SA (b) | | | 407,773 | |
| 13,120 | | Rowan Companies, Inc. (b) | | | 443,062 | |
| 13,350 | | Tidewater, Inc. | | | 647,876 | |
| | | | | | | |
| | | | | | 2,691,165 | |
| | | | | | | |
| | | Food & Staples Retailing - 0.95% | | | | |
| 12,510 | | United Natural Foods, Inc. (b) | | | 731,209 | |
| | | | | | | |
| | | Food Products - 0.34% | | | | |
| 9,690 | | Hillshire Brands Co. | | | 259,498 | |
| | | | | | | |
| | | Gas Utilities - 0.80% | | | | |
| 17,230 | | Atmos Energy Corp. | | | 616,662 | |
| | | | | | | |
| | | Health Care Equipment & Supplies - 2.60% | | | | |
| 10,420 | | Hospira, Inc. (b) | | | 341,984 | |
| 20,860 | | Mako Surgical Corp. (a)(b) | | | 363,173 | |
| 10,970 | | Sirona Dental Systems, Inc. (b) | | | 624,851 | |
| 13,010 | | Thoratec Corp. (b) | | | 450,146 | |
| 10,300 | | Wright Medical Group, Inc. (a)(b) | | | 227,733 | |
| | | | | | | |
| | | | | | 2,007,887 | |
| | | | | | | |
| | | Health Care Providers & Services - 1.82% | | | | |
| 3,530 | | MEDNAX, Inc. (b) | | | 262,809 | |
| 13,980 | | Patterson Companies, Inc. | | | 478,675 | |
| 14,600 | | Universal Health Services, Inc. | | | 667,658 | |
| | | | | | | |
| | | | | | 1,409,142 | |
| | | | | | | |
| | | Hotels, Restaurants & Leisure - 1.83% | | | | |
| 22,360 | | Hyatt Hotels Corp. (b) | | | 897,754 | |
| 11,990 | | Penn National Gaming, Inc. (b) | | | 516,769 | |
| | | | | | | |
| | | | | | 1,414,523 | |
| | | | | | | |
| | | Household Durables - 0.76% | | | | |
| 11,200 | | Jarden Corp. | | | 591,808 | |
| | | | | | | |
| | | Household Products - 0.66% | | | | |
| 6,890 | | Energizer Holdings, Inc. (b) | | | 514,063 | |
| | | | | | | |
| | | Industrial Conglomerates - 1.39% | | | | |
| 20,690 | | Carlisle Companies, Inc. | | | 1,074,225 | |
| | | | | | | |
| | | | | | | | |
Number of
Shares | | | | | | Value | |
| | | | | | | | |
| | | Insurance - 4.55% | | | | |
| 41,400 | | Axis Capital Holdings Ltd. | | $ | 1,445,688 | |
| 15,300 | | Platinum Underwriters Holdings Ltd. | | | 625,311 | |
| 25,010 | | Reinsurance Group of America | | | 1,447,329 | |
| | | | | | | |
| | | | | | 3,518,328 | |
| | | | | | | |
| | | Internet Software & Services - 1.05% | | | | |
| 5,590 | | Broadsoft, Inc. (b) | | | 229,302 | |
| 57,210 | | Responsys, Inc. (b) | | | 585,258 | |
| | | | | | | |
| | | | | | 814,560 | |
| | | | | | | |
| | | IT Services - 2.82% | | | | |
| 14,590 | | ExlService Holdings, Inc. (b) | | | 430,405 | |
| 45,400 | | Genpact Ltd. (b) | | | 757,272 | |
| 12,630 | | Global Paynments, Inc. | | | 528,313 | |
| 43,380 | | Sapient Corp. (b) | | | 462,431 | |
| | | | | | | |
| | | | | | 2,178,421 | |
| | | | | | | |
| | | Life Sciences Tools & Services - 1.10% | | | | |
| 9,660 | | Charles River Laboratories (b) | | | 382,536 | |
| 6,470 | | Techne Corp. | | | 465,452 | |
| | | | | | | |
| | | | | | 847,988 | |
| | | | | | | |
| | | Machinery - 3.79% | | | | |
| 32,430 | | Colfax Corp. (a)(b) | | | 1,189,208 | |
| 2,360 | | Commercial Vehicle Group, Inc. (b) | | | 17,346 | |
| 4,970 | | Flowserve Corp. | | | 634,868 | |
| 18,640 | | Nordson Corp. | | | 1,092,677 | |
| | | | | | | |
| | | | | | 2,934,099 | |
| | | | | | | |
| | | Media - 2.42% | | | | |
| 54,960 | | Cablevision Systems Corp. | | | 871,116 | |
| 71,390 | | Regal Entertainment Group (a) | | | 1,004,457 | |
| | | | | | | |
| | | | | | 1,875,573 | |
| | | | | | | |
| | | Metals & Mining - 0.84% | | | | |
| 6,520 | | Royal Gold, Inc. | | | 651,087 | |
| | | | | | | |
| | | Multi-Utilities - 0.97% | | | | |
| 13,520 | | OGE Energy Corp. | | | 749,819 | |
| | | | | | | |
| | | Oil & Gas - 2.92% | | | | |
| 11,970 | | Berry Petroleum Co. | | | 486,341 | |
| 5,210 | | Concho Resources, Inc. (b) | | | 493,648 | |
| 29,800 | | Denbury Resources, Inc. (b) | | | 481,568 | |
| 21,200 | | Nordic American Tanker Shipping | | | | |
| | | Ltd. (a) | | | 213,696 | |
| 22,400 | | Western Refining, Inc. | | | 586,432 | |
| | | | | | | |
| | | | | | 2,261,685 | |
| | | | | | | |
See notes to financial statements.
43
|
GuideMarkSM Small/Mid Cap Core Fund |
SCHEDULE OF INVESTMENTS (Unaudited) (Continued) |
September 30, 2012 |
| |
| | | | | | | | |
Number of
Shares | | | | | | Value | |
| | | | | | | | |
| | | COMMON STOCKS (Continued) | | | | |
| | | Personal Products - 0.27% | | | | |
| 5,290 | | Nu Skin Enterprises, Inc. | | $ | 205,411 | |
| | | | | | | |
| | | Pharmaceuticals - 1.20% | | | | |
| 3,410 | | Medicis Pharmaceutical Corp. | | | 147,551 | |
| 4,870 | | Par Pharmaceutical Companies, | | | | |
| | | Inc. (b) | | | 243,403 | |
| 36,520 | | Synta Pharmaceuticals Corp. (a)(b) | | | 278,282 | |
| 9,890 | | Theravance, Inc. (a)(b) | | | 256,250 | |
| | | | | | | |
| | | | | | 925,486 | |
| | | | | | | |
| | | Retail - Apparel - 1.35% | | | | |
| 11,110 | | PVH Corp. | | | 1,041,229 | |
| | | | | | | |
| | | Road & Rail - 0.63% | | | | |
| 7,240 | | Genesee & Wyoming, Inc. (a)(b) | | | 484,066 | |
| | | | | | | |
| | | Semiconductor & Semiconductor | | | | |
| | | Equipment - 2.51% | | | | |
| 9,900 | | Cirrus Logic, Inc. (b) | | | 380,061 | |
| 18,430 | | M/A-Com Technology Solutions | | | | |
| | | Holdings (b) | | | 234,061 | |
| 31,480 | | Monolithic Power Systems (b) | | | 621,730 | |
| 28,100 | | NXP Semiconductors NV (b) | | | 702,781 | |
| | | | | | | |
| | | | | | 1,938,633 | |
| | | | | | | |
| | | Software - 4.50% | | | | |
| 15,200 | | Allot Communications Ltd. (b) | | | 403,104 | |
| 25,300 | | Aspen Technology, Inc. (b) | | | 654,005 | |
| 13,900 | | BMC Software, Inc. (b) | | | 576,711 | |
| 23,560 | | Bottomline Technologies, Inc. (b) | | | 581,696 | |
| 14,700 | | Check Point Software Technologies | | | | |
| | | Ltd. - ADR (b) | | | 707,952 | |
| 16,340 | | Opnet Technologies, Inc. | | | 556,704 | |
| | | | | | | |
| | | | | | 3,480,172 | |
| | | | | | | |
| | | Specialty Retail - 3.03% | | | | |
| 24,650 | | GNC Holdings, Inc. | | | 960,610 | |
| 34,900 | | Sally Beauty Holdings, Inc. (b) | | | 875,641 | |
| 43,740 | | Staples, Inc. | | | 503,885 | |
| | | | | | | |
| | | | | | 2,340,136 | |
| | | | | | | |
| | | Textiles, Apparel & Luxury Goods - 1.49% | | | | |
| 22,290 | | Hanesbrands, Inc. (b) | | | 710,605 | |
| 5,970 | | Lululemon Athletica, Inc. (a)(b) | | | 441,422 | |
| | | | | | | |
| | | | | | 1,152,027 | |
| | | | | | | |
| | | | | | | | |
Number of
Shares | | | | | | Value | |
| | | | | | | | |
| | | Trading Companies & Distributors - 0.99% | | | | |
| 13,450 | | Wesco International, Inc. (b) | | $ | 769,340 | |
| | | | | | | |
| | | Water Utilities - 0.97% | | | | |
| 20,260 | | American Water Works Co., Inc. | | | 750,836 | |
| | | | | | | |
| | | Wireless Telecommunication Services - 0.63% | | | | |
| 5,780 | | Leap Wireless International, | | | | |
| | | Inc. (b) | | | 39,420 | |
| 7,150 | | SBA Communications Corp. (b) | | | 449,735 | |
| | | | | | | |
| | | | | | 489,155 | |
| | | | | | | |
| | | Total Common Stocks | | | | |
| | | (Cost $62,048,612) | | | 69,443,872 | |
| | | | | | | |
| | | REAL ESTATE INVESTMENT TRUSTS - 7.72% | | | | |
| | | Real Estate Investment Trusts - 7.72% | | | | |
| 27,960 | | American Campus | | | | |
| | | Communities, Inc. | | | 1,226,885 | |
| 80,810 | | Douglas Emmett, Inc. | | | 1,864,287 | |
| 36,760 | | Extra Space Storage, Inc. | | | 1,222,270 | |
| 26,120 | | Post Properties, Inc. | | | 1,252,715 | |
| 28,040 | | Redwood Trust, Inc. | | | 405,458 | |
| | | | | | | |
| | | Total Real Estate Investment Trusts | | | | |
| | | (Cost $5,092,975) | | | 5,971,615 | |
| | | | | | | |
| | | SHORT TERM INVESTMENTS - 1.53% | | | | |
| | | Money Market Funds - 1.53% | | | | |
| | | Federated Prime Obligations Fund | | | | |
| 1,183,067 | | 0.15%, 01/01/2050 | | | 1,183,067 | |
| | | | | | | |
| | | Total Short Term Investments | | | | |
| | | (Cost $1,183,067) | | | 1,183,067 | |
| | | | | | | |
| | | INVESTMENTS PURCHASED | | | | |
| | | AS SECURITIES LENDING | | | | |
| | | COLLATERAL - 7.11% | | | | |
| | | Money Market Funds - 7.03% | | | | |
| 5,435,318 | | First American Government | | | | |
| | | Obligations Fund | | | 5,435,318 | |
| | | Effective Yield, 0.02% | | | | |
| 6,386 | | Reserve Primary Fund (c) | | | 247 | |
| | | | | | | |
| | | Total Money Market Funds | | | | |
| | | (Cost $5,440,825) | | | 5,435,565 | |
| | | | | | | |
See notes to financial statements.
44
|
GuideMarkSM Small/Mid Cap Core Fund |
SCHEDULE OF INVESTMENTS (Unaudited) (Continued) |
September 30, 2012 |
| |
| | | | | | | | |
Principal
Amount | | | | | | Value | |
| | | | | | | | |
| | | Cash - 0.08% | | | | |
$ | 64,569 | | Cash | | $ | 64,569 | |
| | | | | | | |
| | | Total Cash (Cost $64,569) | | | 64,569 | |
| | | | | | | |
| | | Total Investments Purchased as | | | | |
| | | Securities Lending Collateral | | | | |
| | | (Cost $5,505,394) | | | 5,500,134 | |
| | | | | | | |
| | | Total Investments | | | | |
| | | (Cost $73,830,048) - 106.15% | | | 82,098,688 | |
| | | Liabilities in Excess of | | | | |
| | | Other Assets - (6.15)% | . | | (4,759,766) | |
| | | | | | | |
| | | TOTAL NET | | | | |
| | | ASSETS - 100.00% | | $ | 77,338,922 | |
| | | | | | | |
| |
Percentages are stated as a percent of net assets. |
ADR - American Depositary Receipt |
(a) | All or portion of this security is on loan. |
(b) | Non-income producing security. |
(c) | As of September 30, 2012, the Fund has fair valued this security and deemed it illiquid. The value of this security was $247, which represents 0.00% of total net assets. |
See notes to financial statements.
45
|
GuideMarkSM World ex-US Fund |
SCHEDULE OF INVESTMENTS (Unaudited) |
September 30, 2012 |
| |
| | | | | | | | |
Number of
Shares | | | | | | Value | |
| | | | | | | | |
| | | COMMON STOCKS - 94.09% | | | | |
| | | Australia - 6.05% | | | | |
| 95,579 | | Australia and New Zealand Banking | | | | |
| | | Group Ltd. | | $ | 2,442,582 | |
| 42,774 | | BHP Billiton Ltd. | | | 1,461,540 | |
| 42,484 | | Commonwealth Bank of Australia | | | 2,446,150 | |
| 32,801 | | CSL Ltd. | | | 1,560,141 | |
| 128,723 | | Fortescue Metals Group Ltd. | | | 461,481 | |
| 89,380 | | Goodman Group | | | 365,318 | |
| 34,300 | | Iluka Resources Ltd. | | | 350,613 | |
| 19,888 | | Medusa Mining Ltd. | | | 124,012 | |
| 149,344 | | Mirvac Group | | | 220,869 | |
| 32,412 | | Newcrest Mining Ltd. | | | 974,341 | |
| 30,610 | | Oil Search Ltd. | | | 234,475 | |
| 74,364 | | Origin Energy Ltd. | | | 871,328 | |
| 150,161 | | SP AusNet (b) | | | 162,793 | |
| 197,506 | | Spark Infrastructure Group | | | 333,234 | |
| 308,170 | | Sydney Airport (b) | | | 1,008,654 | |
| 69,236 | | Transurban Group | | | 429,283 | |
| 108,496 | | Treasury Wine Estates Ltd. | | | 563,982 | |
| 105,701 | | Westfield Group (b) | | | 1,110,749 | |
| 11,673 | | Woodside Petroleum Ltd. | | | 399,317 | |
| 26,150 | | Woolworths Ltd. | | | 778,669 | |
| | | | | | | |
| | | | | | 16,299,531 | |
| | | | | | | |
| | | Belgium - 1.18% | | | | |
| 9,706 | | Anheuser-Busch InBev NV | | | 830,335 | |
| 25,773 | | KBC Groep NV | | | 618,962 | |
| 6,400 | | UCB SA | | | 352,183 | |
| 26,510 | | Umicore SA | | | 1,387,766 | |
| | | | | | | |
| | | | | | 3,189,246 | |
| | | | | | | |
| | | Bermuda - 0.36% | | | | |
| 543,000 | | COSCO Pacific Ltd. | | | 755,423 | |
| 192,000 | | Noble Group Ltd. | | | 206,078 | |
| | | | | | | |
| | | | | | 961,501 | |
| | | | | | | |
| | | Brazil - 1.82% | | | | |
| 31,700 | | Banco do Brasil SA | | | 387,796 | |
| 54,200 | | BM&FBovespa SA | | | 326,443 | |
| 22,300 | | Cia de Saneamento Basico do | | | | |
| | | Estado de Sau Paulo | | | 907,400 | |
| 26,700 | | Cia Hering | | | 596,758 | |
| 55,400 | | Embraer SA | | | 369,197 | |
| 110,000 | | Petroleo Brasileiro SA | | | 1,258,848 | |
| 35,900 | | Qualicorp SA (b) | | | 345,320 | |
| | | | | | | | |
Number of
Shares | | | | | | Value | |
| | | | | | | | |
| | | Brazil (Continued) | | | | |
| 34,400 | | Raia Drogasil SA | | $ | 391,131 | |
| 14,000 | | Ultrapar Participacoes SA | | | 313,252 | |
| | | | | | | |
| | | | | | 4,896,145 | |
| | | | | | | |
| | | Canada - 8.44% | | | | |
| 2,900 | | Agrium, Inc. (b) | | | 300,885 | |
| 30,100 | | Alamos Gold, Inc. (b) | | | 585,099 | |
| 13,500 | | Alimentation Couche Tard, Inc. (b) | | | 620,415 | |
| 13,600 | | Bank of Montreal (b) | | | 803,743 | |
| 12,600 | | Baytex Energy Corp. (b) | | | 598,792 | |
| 16,400 | | Brookfield Asset Management, | | | | |
| | | Inc. - Class A (b) | | | 566,185 | |
| 8,000 | | Canadian National Railway Co. (b) | | | 707,883 | |
| 38,600 | | Cenovus Energy, Inc. (b) | | | 1,347,133 | |
| 15,100 | | Crescent Point Energy Corp. (b) | | | 668,602 | |
| 18,600 | | Dollarama, Inc. (b) | | | 1,187,214 | |
| 65,920 | | Eldorado Gold Corp. (b) | | | 1,005,127 | |
| 35,400 | | First Quantum Minerals Ltd. | | | 754,379 | |
| 4,400 | | Franco Nevada Corp. | | | 259,363 | |
| 14,400 | | Goldcorp, Inc. (b) | | | 661,190 | |
| 10,000 | | Imperial Oil Ltd. (b) | | | 460,279 | |
| 13,900 | | Intact Financial Corp. (b) | | | 845,509 | |
| 68,600 | | Manulife Financial Corp. (b) | | | 826,884 | |
| 5,516 | | NovaTek OAO (b) | | | 654,851 | |
| 13,100 | | Open Text Corp. (b) | | | 722,359 | |
| 31,600 | | Petrominerales Ltd. (b) | | | 255,860 | |
| 15,600 | | Potash Corp. of Saskatchewan, | | | | |
| | | Inc. - ADR | | | 677,352 | |
| 33,500 | | Royal Bank Of Canada (b) | | | 1,926,650 | |
| 26,300 | | Silver Wheaton Corp. (b) | | | 1,045,473 | |
| 27,800 | | Suncor Energy, Inc. (b) | | | 914,507 | |
| 22,800 | | Toronto-Dominion Bank (b) | | | 1,901,508 | |
| 24,700 | | TransCanada Corp. (b) | | | 1,124,075 | |
| 24,200 | | Valeant Pharmaceuticals | | | | |
| | | International, Inc. (b) | | | 1,335,665 | |
| | | | | | | |
| | | | | | 22,756,982 | |
| | | | | | | |
| | | Cayman Islands - 0.96% | | | | |
| 4,500 | | Baidu, Inc. - ADR (b) | | | 525,690 | |
| 166,000 | | Lifestyle International Holdings Ltd. | | | 342,168 | |
| 147,800 | | Sands China Ltd. | | | 547,211 | |
| 250,000 | | Soho China Ltd. | | | 153,871 | |
| 30,000 | | Tencent Holdings Ltd. | | | 1,015,671 | |
| | | | | | | |
| | | | | | 2,584,611 | |
| | | | | | | |
See notes to financial statements.
46
|
GuideMarkSM World ex-US Fund |
SCHEDULE OF INVESTMENTS (Unaudited) (Continued) |
September 30, 2012 |
| |
|
| | | | | | | | |
Number of
Shares | | | | | | Value | |
| | | | | | | | |
| | | COMMON STOCKS (Continued) | | | | |
| | | Chile - 0.06% | | | | |
| 42,800 | | Empresas CMPC SA | | $ | 168,529 | |
| | | | | | | |
| | | China - 1.78% | | | | |
| 416,000 | | Bank of China Ltd. | | | 157,468 | |
| 1,949,000 | | China Construction Bank Corp. | | | 1,344,207 | |
| 534,000 | | China Oilfield Services, Ltd. | | | 967,048 | |
| 573,000 | | China Railway Construction Corp. | | | | |
| | | Ltd. | | | 510,089 | |
| 294,000 | | Jiangxi Copper Co. | | | 738,040 | |
| 522,000 | | Petrochina Co. | | | 674,854 | |
| 56,000 | | Tsingtao Brewery | | | 307,827 | |
| 22,079 | | Yantai Changyu Pioneer Wine Co. | | | | |
| | | Ltd. - Class B (b) | | | 108,773 | |
| | | | | | | |
| | | | | | 4,808,306 | |
| | | | | | | |
| | | Colombia - 0.07% | | | | |
| 12,610 | | Bancolombia SA | | | 184,970 | |
| | | | | | | |
| | | Czech Republic - 0.26% | | | | |
| 3,550 | | Komercni Banka AS | | | 704,692 | |
| | | | | | | |
| | | Denmark - 1.53% | | | | |
| 86 | | A.P. Moller - Maersk Group | | | 614,836 | |
| 44,725 | | Danske Bank A/S (b) | | | 806,023 | |
| 17,212 | | Novo Nordisk A/S | | | 2,708,721 | |
| | | | | | | |
| | | | | | 4,129,580 | |
| | | | | | | |
| | | France - 5.91% | | | | |
| 3,204 | | Air Liquide SA | | | 397,139 | |
| 11,840 | | Alstom SA | | | 414,490 | |
| 7,700 | | Arkema SA | | | 720,738 | |
| 4,015 | | AtoS | | | 279,351 | |
| 40,448 | | BNP Paribas SA | | | 1,917,683 | |
| 3,525 | | Christian Dior SA | | | 472,183 | |
| 3,299 | | Cie Generale des Etablissements | | | | |
| | | Michelin | | | 258,317 | |
| 5,250 | | Cie Generale d’Optique Essilor | | | | |
| | | International SA | | | 491,274 | |
| 4,800 | | Eutelsat Communications SA | | | 154,222 | |
| 22,300 | | GDF Suez SA | | | 497,112 | |
| 1,283 | | Iliad SA | | | 208,799 | |
| 6,185 | | L’Oreal SA | | | 764,720 | |
| 6,926 | | LVMH Moet Hennessy Louis | | | | |
| | | Vuitton SA | | | 1,039,718 | |
| 4,950 | | PPR SA | | | 759,728 | |
| 6,600 | | Renault SA | | | 309,251 | |
| 17,530 | | Safran SA | | | 630,547 | |
| | | | | | | | |
Number of
Shares | | | | | | Value | |
| | | | | | | | |
| | | France (Continued) | | | | |
| 17,511 | | Saint-Gobain SA | | $ | 612,922 | |
| 41,328 | | Sanofi-Aventis SA | | | 3,536,705 | |
| 18,363 | | Schneider Electric SA | | | 1,085,683 | |
| 20,619 | | Societe Generale SA (b) | | | 584,300 | |
| 9,580 | | Vinci SA | | | 407,610 | |
| 19,246 | | Vivendi SA | | | 375,047 | |
| | | | | | | |
| | | | | | 15,917,539 | |
| | | | | | | |
| | | Germany - 5.86% | | | | |
| 7,700 | | Adidas AG | | | 631,872 | |
| 16,258 | | Allianz SE | | | 1,938,986 | |
| 14,715 | | Bayer AG | | | 1,265,338 | |
| 11,840 | | Bayerische Motoren Werke AG | | | 868,223 | |
| 5,540 | | Beiersdorf AG | | | 406,884 | |
| 2,600 | | Brenntag AG | | | 333,160 | |
| 2,253 | | Continental AG (b) | | | 220,962 | |
| 8,874 | | Deutsche Boerse AG | | | 491,067 | |
| 15,131 | | Deutsche Post AG | | | 295,595 | |
| 40,579 | | Deutsche Telekom AG | | | 499,031 | |
| 17,949 | | GEA Group AG | | | 544,192 | |
| 7,272 | | HeidelbergCement AG | | | 381,953 | |
| 10,193 | | Henkel AG & Co. KGaA | | | 778,962 | |
| 13,558 | | Lanxess AG | | | 1,126,206 | |
| 3,287 | | Linde AG | | | 566,547 | |
| 26,100 | | ProSiebenSat.1 Media AG | | | 657,998 | |
| 35,880 | | RWE AG | | | 1,605,560 | |
| 27,634 | | SAP AG | | | 1,966,529 | |
| 6,668 | | Volkswagen AG | | | 1,219,212 | |
| | | | | | | |
| | | | | | 15,798,277 | |
| | | | | | | |
| | | Hong Kong - 3.75% | | | | |
| 338,400 | | AIA Group Ltd. | | | 1,253,918 | |
| 67,000 | | Beijing Enterprises Holdings Ltd. | | | 445,784 | |
| 146,000 | | BOC Hong Kong Holdings Ltd. | | | 461,739 | |
| 25,000 | | China Mobile Ltd | | | 277,148 | |
| 216,000 | | China Resources Gas Group Ltd. | | | 439,849 | |
| 82,000 | | China Resources Power Holdings | | | | |
| | | Co. Ltd. | | | 179,342 | |
| 228,000 | | China Unicom Hong Kong Ltd. | | | 371,551 | |
| 518,000 | | CNOOC Ltd. | | | 1,051,716 | |
| 130,000 | | Galaxy Entertainment Group Ltd. (b) | | | 431,911 | |
| 88,000 | | Henderson Land Development | | | | |
| | | Co. Ltd. | | | 630,208 | |
| 52,000 | | Hengan International Group Co. Ltd. | | | 489,892 | |
| 782,800 | | HKT Trust And HKT Ltd. (b) | | | 663,791 | |
See notes to financial statements.
47
|
GuideMarkSM World ex-US Fund |
SCHEDULE OF INVESTMENTS (Unaudited) (Continued) |
September 30, 2012 |
| |
| | | | | | | | |
Number of
Shares | | | | | | Value | |
| | | | | | | | |
| | | COMMON STOCKS (Continued) | | | | |
| | | Hong Kong (Continued) | | | | |
| 723,000 | | Industrial & Commercial Bank | | | | |
| | | of China | | $ | 424,242 | |
| 170,000 | | Kunlun Energy Co. Ltd. | | | 296,425 | |
| 612,000 | | Lenovo Group Ltd. | | | 504,533 | |
| 50,500 | | Orient Overseas International Ltd. | | | 276,755 | |
| 14,000 | | Shangri-La Asia Ltd. | | | 27,076 | |
| 69,000 | | Sun Hung Kai Properties Ltd. | | | 1,003,981 | |
| 89,000 | | Wharf Holdings Ltd. | | | 615,417 | |
| 28,000 | | Wing Hang Bank Ltd. | | | 262,172 | |
| | | | | | | |
| | | | | | 10,107,450 | |
| | | | | | | |
| | | Hungary - 0.09% | | | | |
| 127,880 | | Magyar Telekom | | | 245,540 | |
| | | | | | | |
| | | Indonesia - 1.02% | | | | |
| 742,500 | | Bank Mandiri Tbk PT | | | 633,583 | |
| 1,444,000 | | Bank Rakyat Indonesia Persero | | | | |
| | | Tbk PT | | | 1,119,200 | |
| 2,007,000 | | Media Nusantara Citra Tbk PT | | | 543,702 | |
| 161,500 | | Telekomunikasi Indonesia Persero | | | | |
| | | Tbk PT | | | 158,532 | |
| 642,000 | | Tower Bersama Infrastructure | | | | |
| | | Tbk PT (b) | | | 298,141 | |
| | | | | | | |
| | | | | | 2,753,158 | |
| | | | | | | |
| | | Ireland - 0.17% | | | | |
| 23,600 | | Elan Corp. (b) | | | 253,539 | |
| 23,111 | | James Hardie Industries Plc | | | 207,571 | |
| | | | | | | |
| | | | | | 461,110 | |
| | | | | | | |
| | | Israel - 0.20% | | | | |
| 45,000 | | Israel Chemicals Ltd. | | | 546,557 | |
| | | | | | | |
| | | Italy - 1.91% | | | | |
| 92,699 | | Eni S.p.A. | | | 2,032,284 | |
| 85,940 | | Fiat Industrial S.p.A. | | | 841,627 | |
| 34,286 | | Saipem S.p.A. | | | 1,652,254 | |
| 427,800 | | Telecom Italia S.p.A. | | | 429,748 | |
| 227,400 | | Telecom Italia S.p.A. | | | 199,199 | |
| | | | | | | |
| | | | | | 5,155,112 | |
| | | | | | | |
| | | Japan - 13.16% | | | | |
| 14,000 | | Air Water, Inc. | | | 171,340 | |
| 9,400 | | Aisin Seiki Co. Ltd. | | | 267,706 | |
| 19,000 | | Ajinomoto Co, Inc. | | | 297,603 | |
| 56,000 | | Asahi Kasei Corp. | | | 288,660 | |
| 16,800 | | Astellas Pharma, Inc. | | | 851,423 | |
| | | | | | | | |
Number of
Shares | | | | | | Value | |
| | | | | | | | |
| | | Japan (Continued) | | | | |
| 28,200 | | Bridgestone Corp. | | $ | 654,022 | |
| 24,200 | | Canon, Inc. | | | 776,764 | |
| 30,000 | | Chiyoda Corp. | | | 466,077 | |
| 21,200 | | Chubu Electric Power Co., Inc. | | | 275,279 | |
| 10,800 | | Credit Saison Co. | | | 260,926 | |
| 17,000 | | Daihatsu Motor Co. | | | 283,247 | |
| 19,000 | | Daiichi Sankyo Company, Ltd. | | | 312,972 | |
| 4,100 | | Daito Trust Construction Co. Ltd. | | | 411,575 | |
| 5,500 | | Dena Co. Ltd. | | | 182,451 | |
| 14,500 | | Denso Corp. | | | 455,597 | |
| 8,900 | | East Japan Railway Co. | | | 588,869 | |
| 1,700 | | Fast Retailing Co. | | | 394,805 | |
| 49,000 | | Fuji Heavy Industries Ltd. | | | 408,243 | |
| 9,300 | | Hitachi High-Technologies Corp. | | | 224,521 | |
| 110,000 | | Hitachi Ltd. | | | 610,842 | |
| 15,000 | | Hitachi Metals Ltd. | | | 133,637 | |
| 30,000 | | Honda Motor Co. Ltd. | | | 927,161 | |
| 98 | | Inpex Corp. | | | 582,585 | |
| 45,800 | | ITOCHU Corp. | | | 462,365 | |
| 2,000 | | Japan Airlines Co. Ltd. | | | 93,542 | |
| 46,900 | | Japan Tobacco, Inc. | | | 1,403,893 | |
| 24,200 | | JS Group Corp. | | | 576,689 | |
| 15,500 | | JSR Corp. | | | 253,662 | |
| 40,800 | | JX Holdings, Inc. | | | 222,873 | |
| 6,700 | | Kakaku.com, Inc. | | | 251,138 | |
| 26,000 | | Kamigumi Co. Ltd. | | | 214,837 | |
| 12,200 | | Kao Corp. | | | 358,696 | |
| 2,220 | | Keyence Corp. | | | 568,502 | |
| 23,500 | | Konica Minolta Holdings, Inc. | | | 180,778 | |
| 55,000 | | Kubota Corp. | | | 555,077 | |
| 5,100 | | Kyocera Corp. | | | 441,910 | |
| 4,100 | | Lawson, Inc. | | | 314,734 | |
| 8,800 | | Makita Corp. | | | 340,638 | |
| 32,900 | | Mitsubishi Corp. | | | 595,913 | |
| 41,000 | | Mitsubishi Estate Co. Ltd. | | | 783,925 | |
| 95,000 | | Mitsubishi Heavy Industries Ltd. | | | 410,843 | |
| 315,300 | | Mitsubishi UFJ Financial Group, Inc. | | | 1,475,463 | |
| 4,580 | | Mitsubishi UFJ Lease & Finance | | | | |
| | | Co. Ltd. | | | 192,823 | |
| 64,200 | | Mitsui & Co. Ltd. | | | 900,705 | |
| 11,000 | | Mitsui Fudosan Co., Ltd. | | | 219,809 | |
| 10,300 | | MS&AD Insurance Group Holdings | | | 177,803 | |
| 8,800 | | Murata Manufacturing Co. Ltd. | | | 468,482 | |
| 21,000 | | NHK Spring Co. Ltd. | | | 180,444 | |
See notes to financial statements.
48
|
GuideMarkSM World ex-US Fund |
SCHEDULE OF INVESTMENTS (Unaudited) (Continued) |
September 30, 2012 |
| |
| | | | | | | | |
Number of
Shares | | | | | | Value | |
| | | | | | | | |
| | | COMMON STOCKS (Continued) | | | | |
| | | Japan (Continued) | | | | |
| 13,000 | | Nippon Shokubai Co. | | $ | 145,394 | |
| 56,800 | | Nissan Motor Co. | | | 483,408 | |
| 14,400 | | Nitto Denko Corp. | | | 685,438 | |
| 10,600 | | Nomura Research Institute Ltd. | | | 218,450 | |
| 42,000 | | NSK Ltd. | | | 243,931 | |
| 277 | | NTT DoCoMo, Inc. | | | 447,542 | |
| 8,700 | | Olympus Corp. | | | 169,857 | |
| 9,170 | | ORIX Corp. | | | 918,464 | |
| 44,600 | | Rakuten, Inc. | | | 453,495 | |
| 9,000 | | Ricoh Co. | | | 76,003 | |
| 23,000 | | Rohto Pharmaceutical Co. Ltd. | | | 347,811 | |
| 28,000 | | Sekisui House Ltd. | | | 277,968 | |
| 25,000 | | Shimadzu Corp. | | | 175,467 | |
| 7,900 | | Shin-Etsu Chemical Co. Ltd. | | | 443,973 | |
| 239,000 | | Shinsei Bank | | | 308,735 | |
| 2,200 | | SMC Corp. | | | 354,054 | |
| 33,200 | | Softbank Corp. | | | 1,342,327 | |
| 26,500 | | Sony Financial Holdings, Inc. | | | 451,819 | |
| 57,000 | | Sumitomo Chemical Co. Ltd. | | | 145,209 | |
| 22,300 | | Sumitomo Electric Industries Ltd. | | | 235,837 | |
| 41,800 | | Sumitomo Mitsui Financial | | | | |
| | | Group, Inc. | | | 1,302,412 | |
| 3,900 | | Sysmex Corp. | | | 187,529 | |
| 17,500 | | Takeda Pharmaceutical Co., Ltd. | | | 805,133 | |
| 9,700 | | TDK Corp. | | | 360,706 | |
| 16,300 | | Tokio Marine Holdings, Inc. | | | 414,779 | |
| 50,000 | | Tokyo Tatemono Co. | | | 195,103 | |
| 42,000 | | Toray Industries, Inc. | | | 248,474 | |
| 46,600 | | Toyota Motor Corp. | | | 1,827,154 | |
| 12,000 | | West Japan Railway | | | 512,463 | |
| 5,130 | | Yamada Denki Co. | | | 225,038 | |
| | | | | | | |
| | | | | | 35,475,822 | |
| | | | | | | |
| | | Jersey - 0.57% | | | | |
| 34,140 | | United Business Media Ltd. | | | 386,710 | |
| 16,100 | | Wolseley Plc | | | 688,695 | |
| 34,069 | | WPP Plc | | | 464,051 | |
| | | | | | | |
| | | | | | 1,539,456 | |
| | | | | | | |
| | | Luxembourg - 0.15% | | | | |
| 27,600 | | ArcelorMittal | | | 397,287 | |
| | | | | | | |
| | | | | | | | |
Number of
Shares | | | | | | Value | |
| | | | | | | | |
| | | Malaysia - 0.39% | | | | |
| 101,000 | | CIMB Group Holdings Bhd | | $ | 247,380 | |
| 167,000 | | IJM Corp. Bhd | | | 257,444 | |
| 242,000 | | Maxis Communications Bhd | | | 547,450 | |
| | | | | | | |
| | | | | | 1,052,274 | |
| | | | | | | |
| | | Mexico - 0.91% | | | | |
| 886,600 | | America Movil SAB de CV | | | 1,129,624 | |
| 53,600 | | Arca Continental SAB de CV | | | 379,563 | |
| 35,500 | | Fomento Economico Mexicano | | | | |
| | | SAB de CV | | | 326,903 | |
| 124,900 | | Grupo Mexico SAB de CV | | | 412,784 | |
| 76,200 | | Wal-Mart de Mexico SAB de CV | | | 214,598 | |
| | | | | | | |
| | | | | | 2,463,472 | |
| | | | | | | |
| | | Netherlands - 2.12% | | | | |
| 171,700 | | AEGON NV | | | 892,632 | |
| 4,321 | | Akzo Nobel NV | | | 243,993 | |
| 7,700 | | ASML Holding NV | | | 411,861 | |
| 7,269 | | Gemalto NV | | | 639,301 | |
| 30,316 | | Koninklijke Philips Electronics NV | | | 707,802 | |
| 40,863 | | Reed Elsevier NV | | | 545,020 | |
| 59,300 | | STMicroelectronics NV | | | 320,055 | |
| 54,849 | | Unilever NV | | | 1,945,276 | |
| | | | | | | |
| | | | | | 5,705,940 | |
| | | | | | | |
| | | New Zealand - 0.12% | | | | |
| 54,850 | | Fletcher Building Ltd. | | | 315,728 | |
| | | | | | | |
| | | Nigeria - 0.09% | | | | |
| 38,345 | | Guaranty Trust Bank Plc - ADR (b) | | | 237,739 | |
| | | | | | | |
| | | Norway - 0.64% | | | | |
| 28,580 | | Aker Solutions ASA | | | 544,439 | |
| 17,400 | | DnB ASA | | | 213,149 | |
| 43,800 | | Orkla ASA | | | 333,719 | |
| 32,520 | | Telenor ASA | | | 634,715 | |
| | | | | | | |
| | | | | | 1,726,022 | |
| | | | | | | |
| | | Philippines - 0.06% | | | | |
| 44,000 | | Security Bank Corp. | | | 172,693 | |
| | | | | | | |
| | | Republic of Korea - 4.38% | | | | |
| 5,600 | | Daelim Industrial | | | 474,126 | |
| 12,200 | | Hana Financial Group, Inc. | | | 372,085 | |
| 6,354 | | Hyundai Motor Co. | | | 1,433,190 | |
| 10,900 | | KB Financial Group, Inc. | | | 386,355 | |
| 6,910 | | Kia Motors Corp. (b) | | | 429,342 | |
| 600 | | Korea Zinc Co. Ltd. | | | 261,132 | |
See notes to financial statements.
49
|
GuideMarkSM World ex-US Fund |
SCHEDULE OF INVESTMENTS (Unaudited) (Continued) |
September 30, 2012 |
| |
| | | | | | | | |
Number of
Shares | | | | | | Value | |
| | | | | | | | |
| | | COMMON STOCKS (Continued) | | | | |
| | | Republic of Korea (Continued) | | | | |
| 52,223 | | Korean Reinsurance Co. | | $ | 554,070 | |
| 2,900 | | LG Chemical Ltd. | | | 857,272 | |
| 1,158 | | LG Household & Health Care Ltd. | | | 659,486 | |
| 67,900 | | LG Uplus Corp. | | | 443,039 | |
| 1,900 | | NcSoft Corp. | | | 405,840 | |
| 500 | | Orion Corp. | | | 436,486 | |
| 2,728 | | POSCO | | | 892,758 | |
| 4,900 | | Samsung C&T Corp. | | | 289,059 | |
| 2,887 | | Samsung Electronics Co. Ltd. | | | 3,479,119 | |
| 8,020 | | Shinhan Financial Group Co. Ltd. | | | 272,588 | |
| 1,200 | | SK Telecom Co. Ltd. | | | 157,628 | |
| | | | | | | |
| | | | | | 11,803,575 | |
| | | | | | | |
| | | Russian Federation - 1.61% | | | | |
| 95,835 | | Gazprom OAO - ADR (b) | | | 931,864 | |
| 18,330 | | Lukoil OAO (b) | | | 1,154,790 | |
| 37,540 | | Mobile TeleSystems OJSC - ADR | | | 657,701 | |
| 447,990 | | Sberbank of Russia (b) | | | 1,311,218 | |
| 14,300 | | Sistema JSFC (b) | | | 291,970 | |
| | | | | | | |
| | | | | | 4,347,543 | |
| | | | | | | |
| | | Singapore - 0.95% | | | | |
| 81,000 | | DBS Group Holdings Ltd. | | | 946,100 | |
| 162,000 | | Global Logistic Properties Ltd. | | | 330,223 | |
| 193,000 | | Singapore Telecommunications Ltd. | | | 502,562 | |
| 49,581 | | United Overseas Bank Ltd. | | | 790,668 | |
| | | | | | | |
| | | | | | 2,569,553 | |
| | | | | | | |
| | | South Africa - 1.66% | | | | |
| 14,960 | | AngloGold Ashanti Ltd. | | | 521,488 | |
| 34,100 | | Aspen Pharmacare Holdings Ltd. | | | 586,794 | |
| 44,800 | | AVI Ltd. | | | 321,274 | |
| 10,400 | | Bidvest Group Ltd. | | | 257,280 | |
| 131,600 | | Firstrand Ltd. | | | 441,084 | |
| 10,300 | | MTN Group Ltd. | | | 198,843 | |
| 266,900 | | Nampak Ltd. | | | 917,138 | |
| 17,090 | | Naspers Ltd. | | | 1,059,956 | |
| 10,500 | | The Foschini Group Ltd. | | | 159,556 | |
| | | | | | | |
| | | | | | 4,463,413 | |
| | | | | | | |
| | | Spain - 1.53% | | | | |
| 17,500 | | Amadeus IT Holding SA | | | 407,994 | |
| 233,783 | | Banco Bilbao Vizcaya | | | | |
| | | Argentaria SA | | | 1,839,372 | |
| | | | | | | | |
Number of
Shares | | | | | | Value | |
| | | | | | | | |
| | | Spain (Continued) | | | | |
| 22,600 | | Gas Natural SDG SA | | $ | 319,805 | |
| 16,086 | | Grifols SA - ADR (a)(b) | | | 367,243 | |
| 264,100 | | Iberdrola SA | | | 1,197,432 | |
| | | | | | | |
| | | | | | 4,131,846 | |
| | | | | | | |
| | | Sweden - 1.42% | | | | |
| 22,200 | | Assa Abloy AB | | | 720,770 | |
| 27,295 | | ForeningsSparbank AB (b) | | | 513,391 | |
| 36,800 | | H & M Hennes & Mauritz AB | | | 1,280,757 | |
| 23,200 | | Sandvik AB | | | 315,543 | |
| 20,400 | | Svenska Cellulosa AB | | | 379,274 | |
| 15,200 | | Swedish Match AB | | | 615,321 | |
| | | | | | | |
| | | | | | 3,825,056 | |
| | | | | | | |
| | | Switzerland - 5.51% | | | | |
| 14,033 | | Adecco SA | | | 669,849 | |
| 34,534 | | Credit Suisse Group AG | | | 730,195 | |
| 81,208 | | Nestle SA | | | 5,124,012 | |
| 1,030 | | Partners Group Holding AG | | | 214,434 | |
| 11,648 | | Roche Holding AG | | | 2,178,720 | |
| 4,835 | | Schindler Holding AG | | | 595,296 | |
| 192 | | SGS SA | | | 394,835 | |
| 1,009 | | Swisscom AG | | | 406,204 | |
| 2,242 | | Syngenta AG | | | 838,693 | |
| 1,194 | | The Swatch Group AG | | | 476,829 | |
| 12,770 | | Transocean Ltd. | | | 571,706 | |
| 120,144 | | UBS AG | | | 1,462,965 | |
| 4,741 | | Zurich Financial Services AG | | | 1,181,966 | |
| | | | | | | |
| | | | | | 14,845,704 | |
| | | | | | | |
| | | Taiwan - 1.70% | | | | |
| 74,328 | | Advanced Semiconductor | | | | |
| | | Engineering, Inc. | | | 56,875 | |
| 23,000 | | Asustek Computer, Inc. | | | 248,984 | |
| 321,000 | | Far EasTone Telecommunications | | | | |
| | | Co. Ltd. | | | 792,139 | |
| 61,000 | | Giant Manufacturing Co. Ltd. | | | 322,856 | |
| 166,500 | | Hon Hai Precision Industry Co. Ltd. | | | 521,319 | |
| 47,000 | | Mediatek, Inc. | | | 494,865 | |
| 112,000 | | Novatek Microelectronics Corp. | | | 403,296 | |
| 45,000 | | Taiwan Mobile Co. | | | 164,103 | |
| 513,000 | | Taiwan Semiconductor | | | | |
| | | Manufacturing Co. Ltd. | | | 1,578,129 | |
| | | | | | | |
| | | | | | 4,582,566 | |
| | | | | | | |
See notes to financial statements.
50
|
GuideMarkSM World ex-US Fund |
SCHEDULE OF INVESTMENTS (Unaudited) (Continued) |
September 30, 2012 |
| |
| | | | | | | | |
Number of
Shares | | | | | | Value | |
| | | | | | | | |
| | | Thailand - 0.60% | | | | |
| 149,700 | | Bangkok Bank PCL | | $ | 964,090 | |
| 108,100 | | Kasikornbank PCL | | | 638,969 | |
| | | | | | | |
| | | | | | 1,603,059 | |
| | | | | | | |
| | | Turkey - 0.33% | | | | |
| 12,100 | | Anadolu Efes Biracilik Ve Malt | | | | |
| | | Sanayii AS | | | 179,775 | |
| 45,011 | | Aygaz AS | | | 191,683 | |
| 66,600 | | Turkiye Halk Bankasi AS | | | 519,234 | |
| | | | | | | |
| | | | | | 890,692 | |
| | | | | | | |
| | | United Kingdom - 14.77% | | | | |
| 8,472 | | Anglo American Plc | | | 249,402 | |
| 35,177 | | Aviva Plc | | | 181,772 | |
| 533,656 | | Barclays Plc | | | 1,853,182 | |
| 87,930 | | BG Group Plc | | | 1,779,244 | |
| 72,299 | | BHP Billiton Plc | | | 2,257,764 | |
| 355,446 | | BP Plc | | | 2,505,858 | |
| 56,283 | | British American Tobacco Plc | | | 2,892,021 | |
| 93,400 | | BT Group Plc | | | 348,172 | |
| 13,500 | | Bunzl Plc | | | 242,095 | |
| 22,180 | | Burberry Group Plc | | | 359,141 | |
| 22,400 | | Capita Plc | | | 280,541 | |
| 258,201 | | Centrica Plc | | | 1,366,303 | |
| 64,120 | | Diageo Plc | | | 1,805,506 | |
| 29,900 | | Experian Plc | | | 497,858 | |
| 76,133 | | GlaxoSmithKline Plc | | | 1,757,354 | |
| 17,116 | | Hikma Pharmaceuticals Plc | | | 200,947 | |
| 276,830 | | HSBC Holdings Plc | | | 2,571,691 | |
| 17,800 | | IMI Plc | | | 259,305 | |
| 6,200 | | Intertek Group | | | 274,877 | |
| 37,300 | | Investec Plc | | | 230,924 | |
| 280,700 | | ITV Plc | | | 401,271 | |
| 26,316 | | Johnson Matthey Plc | | | 1,027,893 | |
| 71,000 | | Kingfisher Plc | | | 303,524 | |
| 310,930 | | Legal & General Group Plc | | | 663,808 | |
| 1,348,300 | | Lloyds Banking Group Plc (b) | | | 848,969 | |
| 8,000 | | Next Plc | | | 446,313 | |
| 39,000 | | Ophir Energy Plc (b) | | | 383,163 | |
| 19,860 | | Pearson Plc | | | 388,236 | |
| 2,900 | | Randgold Resources | | | 356,737 | |
| 54,000 | | Rolls-Royce Holdings Plc (b) | | | 736,654 | |
| 77,649 | | Royal Dutch Shell Plc | | | 2,712,348 | |
| 29,689 | | SABMiller Plc | | | 1,306,322 | |
| 64,800 | | Sage Group Plc | | | 328,350 | |
| | | | | | | | |
Number of
Shares | | | | | | Value | |
| | | | | | | | |
| | | United Kingdom (Continued) | | | | |
| 14,738 | | Serco Group | | $ | 138,217 | |
| 52,000 | | SSE Plc | | | 1,170,143 | |
| 25,672 | | Standard Chartered PLC | | | 581,701 | |
| 42,027 | | Tullow Oil Plc | | | 932,336 | |
| 33,440 | | Unilever Plc | | | 1,220,963 | |
| 1,309,678 | | Vodafone Group Plc | | | 3,721,635 | |
| 43,000 | | William Hill Plc | | | 220,302 | |
| | | | | | | |
| | | | | | 39,802,842 | |
| | | | | | | |
| | | Total Common Stocks | | | | |
| | | (Cost $241,634,289) | | | 253,621,118 | |
| | | | | | | |
| | | INVESTMENT COMPANIES - 1.35% | | | | |
| | | India - 1.35% | | | | |
| 194,800 | | PowerShares India Portfolio (a) | | | 3,656,396 | |
| | | | | | | |
| | | Total Investment Companies | | | | |
| | | (Cost $4,406,954) | | | 3,656,396 | |
| | | | | | | |
| | | PREFERRED STOCKS - 1.74% | | | | |
| | | Brazil - 1.56% | | | | |
| 34,700 | | Banco Bradesco SA | | | 556,124 | |
| 20,900 | | Cia de Bebidas das Americas | | | 796,412 | |
| 40,900 | | Gerdau SA | | | 387,161 | |
| 60,900 | | Itau Unibanco Holding SA | | | 922,249 | |
| 50,900 | | Petroleo Brasileiro SA | | | 561,162 | |
| 56,100 | | Vale SA | | | 974,918 | |
| | | | | | | |
| | | | | | 4,198,026 | |
| | | | | | | |
| | | Colombia - 0.18% | | | | |
| 8,078 | | Bancolombia SA (a) | | | 482,337 | |
| | | | | | | |
| | | Total Preferred Stocks | | | | |
| | | (Cost $5,565,617) | | | 4,680,363 | |
| | | | | | | |
| | | REAL ESTATE INVESTMENT TRUSTS - 0.48% | | | | |
| | | France - 0.31% | | | | |
| 4,100 | | Unibail-Rodamco SE | | | 816,989 | |
| | | | | | | |
| | | United Kingdom - 0.17% | | | | |
| 55,200 | | British Land Co. Plc | | | 466,230 | |
| | | | | | | |
| | | Total Real Estate Investment Trusts | | | | |
| | | (Cost $1,261,166) | | | 1,283,219 | |
| | | | | | | |
| | | SHORT TERM INVESTMENTS - 1.62% | | | | |
| | | Money Market Funds - 1.62% | | | | |
| | | Federated Prime Obligations Fund | | | | |
| 4,372,258 | | 0.15%, 01/01/2050 | | | 4,372,258 | |
| | | | | | | |
| | | Total Short Term Investments | | | | |
| | | (Cost $4,372,258) | | | 4,372,258 | |
| | | | | | | |
See notes to financial statements.
51
|
GuideMarkSM World ex-US Fund |
SCHEDULE OF INVESTMENTS (Unaudited) (Continued) |
September 30, 2012 |
| |
| | | | | | | | |
Number of
Shares | | | | | | Value | |
| | | | | | | | |
| | | INVESTMENTS PURCHASED | | | | |
| | | AS SECURITIES LENDING | | | | |
| | | COLLATERAL - 0.51% | | | | |
| | | Money Market Funds - 0.51% | | | | |
| 1,387,400 | | First American Government | | | | |
| | | Obligations Fund | | $ | 1,387,400 | |
| | | Effective Yield, 0.02% | | | | |
| 5,588 | | Reserve Primary Fund (c) | | | 216 | |
| | | | | | | |
| | | Total Investments Purchased as | | | | |
| | | Securities Lending Collateral | | | | |
| | | (Cost $1,392,223) | | | 1,387,616 | |
| | | | | | | |
| | | Total Investments | | | | |
| | | (Cost $258,632,507) - 99.79% | | | 269,000,970 | |
| | | Other Assets in Excess | | | | |
| | | of Liabilities - 0.21% | | | 556,025 | |
| | | | | | | |
| | | TOTAL NET | | | | |
| | | ASSETS - 100.00% | | $ | 269,556,995 | |
| | | | | | | |
| |
Percentages are stated as a percent of net assets. |
ADR - American Depositary Receipt |
(a) | All or portion of this security is on loan. |
(b) | Non-income producing security. |
(c) | As of September 30, 2012, the Fund has fair valued this security and deemed it illiquid. The value of this security was $216, which represents 0.00% of total net assets. |
See notes to financial statements.
52
|
GuideMarkSM Opportunistic Equity Fund |
SCHEDULE OF INVESTMENTS (Unaudited) |
September 30, 2012 |
| |
| | | | | | | | |
Number of
Shares | | | | | | Value | |
| | | | | | | | |
| | | COMMON STOCKS - 93.00% | | | | |
| | | Aerospace & Defense - 3.55% | | | | |
| 10,820 | | BE Aerospace, Inc. (b) | | $ | 455,522 | |
| 175,000 | | Exelis, Inc. | | | 1,809,500 | |
| 26,600 | | Hexcel Corp. (b) | | | 638,932 | |
| 28,145 | | United Technologies Corp. | | | 2,203,472 | |
| | | | | | | |
| | | | | | 5,107,426 | |
| | | | | | | |
| | | Airlines - 1.28% | | | | |
| 210,510 | | Southwest Airlines Co. | | | 1,846,173 | |
| | | | | | | |
| | | Beverages - 0.86% | | | | |
| 17,395 | | PepsiCo, Inc. | | | 1,231,044 | |
| | | | | | | |
| | | Biotechnology - 1.23% | | | | |
| 18,270 | | Celgene Corp. (b) | | | 1,395,828 | |
| 6,710 | | Medivation, Inc. (b) | | | 378,176 | |
| | | | | | | |
| | | | | | 1,774,004 | |
| | | | | | | |
| | | Capital Markets - 2.18% | | | | |
| 10,460 | | Ameriprise Financial, Inc. | | | 592,977 | |
| 198,115 | | The Charles Schwab Corp. | | | 2,533,891 | |
| | | | | | | |
| | | | | | 3,126,868 | |
| | | | | | | |
| | | Chemicals - 2.27% | | | | |
| 19,160 | | Air Products & Chemicals, Inc. | | | 1,584,532 | |
| 4,900 | | Monsanto Co. | | | 445,998 | |
| 6,360 | | PPG Industries, Inc. | | | 730,383 | |
| 6,840 | | Westlake Chemical Corp. (a) | | | 499,730 | |
| | | | | | | |
| | | | | | 3,260,643 | |
| | | | | | | |
| | | Commercial Banks - 1.33% | | | | |
| 55,410 | | Wells Fargo & Co. | | | 1,913,307 | |
| | | | | | | |
| | | Communications Equipment - 1.92% | | | | |
| 33,105 | | Cisco Systems, Inc. | | | 631,975 | |
| 31,000 | | Motorola Solutions, Inc. | | | 1,567,050 | |
| 8,960 | | Qualcomm, Inc. | | | 559,910 | |
| | | | | | | |
| | | | | | 2,758,935 | |
| | | | | | | |
| | | Computers & Peripherals - 4.11% | | | | |
| 4,845 | | Apple, Inc. | | | 3,232,874 | |
| 24,100 | | EMC Corp. (b) | | | 657,207 | |
| 9,755 | | International Business Machines | | | | |
| | | Corp. | | | 2,023,675 | |
| | | | | | | |
| | | | | | 5,913,756 | |
| | | | | | | |
| | | Containers & Packaging - 1.32% | | | | |
| 123,000 | | Sealed Air Corp. | | | 1,901,580 | |
| | | | | | | |
| | | | | | | | |
Number of
Shares | | | | | | Value | |
| | | | | | | | |
| | | Diversified Consumer Services - 1.62% | | | | |
| 134,000 | | H&R Block, Inc. | | $ | 2,322,220 | |
| | | | | | | |
| | | Diversified Financial Services - 4.01% | | | | |
| 153,000 | | Bank of America Corp. | | | 1,350,990 | |
| 56,215 | | Citigroup, Inc. | | | 1,839,355 | |
| 63,760 | | JPMorgan Chase & Co. | | | 2,581,005 | |
| | | | | | | |
| | | | | | 5,771,350 | |
| | | | | | | |
| | | Energy Equipment & Services - 0.73% | | | | |
| 13,330 | | Halliburton Co. | | | 449,088 | |
| 7,480 | | National-Oilwell Varco, Inc. | | | 599,223 | |
| | | | | | | |
| | | | | | 1,048,311 | |
| | | | | | | |
| | | Food & Staples Retailing - 1.58% | | | | |
| 72,435 | | SYSCO Corp. | | | 2,265,042 | |
| | | | | | | |
| | | Food Products - 4.89% | | | | |
| 85,580 | | ConAgra Foods, Inc. | | | 2,361,152 | |
| 32,005 | | General Mills, Inc. | | | 1,275,399 | |
| 12,040 | | Hershey Co. | | | 853,516 | |
| 33,790 | | Kraft Foods, Inc. | | | 1,397,217 | |
| 15,695 | | Ralcorp Holdings, Inc. (b) | | | 1,145,735 | |
| | | | | | | |
| | | | | | 7,033,019 | |
| | | | | | | |
| | | Health Care Equipment & Supplies - 5.51% | | | | |
| 28,950 | | Arthrocare Corp. (b) | | | 937,980 | |
| 32,310 | | Baxter International, Inc. | | | 1,947,001 | |
| 228,035 | | Boston Scientific Corp. (b) | | | 1,308,921 | |
| 37,000 | | CareFusion Corp. (b) | | | 1,050,430 | |
| 45,795 | | Medtronic, Inc. | | | 1,974,680 | |
| 7,470 | | The Cooper Companies, Inc. | | | 705,616 | |
| | | | | | | |
| | | | | | 7,924,628 | |
| | | | | | | |
| | | Health Care Providers & Services - 0.88% | | | | |
| 22,910 | | UnitedHealth Group, Inc. | | | 1,269,443 | |
| | | | | | | |
| | | Hotels, Restaurants & Leisure - 2.80% | | | | |
| 63,000 | | Marriott Vacations Worldwide (b) | | | 2,269,260 | |
| 14,050 | | McDonald’s Corp. | | | 1,289,087 | |
| 9,240 | | Starbucks Corp. | | | 468,930 | |
| | | | | | | |
| | | | | | 4,027,277 | |
| | | | | | | |
| | | Household Durables - 1.20% | | | | |
| 807 | | NVR, Inc. (b) | | | 681,512 | |
| 13,670 | | Stanley Black & Decker, Inc. | | | 1,042,337 | |
| | | | | | | |
| | | | | | 1,723,849 | |
| | | | | | | |
| | | Household Products - 1.12% | | | | |
| 18,855 | | Kimberly-Clark Corp. | | | 1,617,382 | |
| | | | | | | |
See notes to financial statements.
53
|
GuideMarkSM Opportunistic Equity Fund |
SCHEDULE OF INVESTMENTS (Unaudited) (Continued) |
September 30, 2012 |
| |
| | | | | | | | |
Number of
Shares | | | | | | Value | |
| | | | | | | | |
| | | COMMON STOCKS (Continued) | | | | |
| | | Industrial Conglomerates - 4.34% | | | | |
| 13,665 | | 3M Co. | | $ | 1,262,919 | |
| 147,870 | | General Electric Co. | | | 3,358,128 | |
| 133,000 | | McDermott International, Inc. (b) | | | 1,625,260 | |
| | | | | | | |
| | | | | | 6,246,307 | |
| | | | | | | |
| | | Insurance - 6.54% | | | | |
| 72,000 | | American International Group, | | | | |
| | | Inc. (b) | | | 2,360,880 | |
| 26,590 | | Assurant, Inc. | | | 991,807 | |
| 136,015 | | Assured Guaranty Ltd. | | | 1,852,524 | |
| 103,345 | | Hartford Financial Services | | | | |
| | | Group, Inc. | | | 2,009,027 | |
| 40,100 | | Prudential Financial, Inc. | | | 2,185,851 | |
| | | | | | | |
| | | | | | 9,400,089 | |
| | | | | | | |
| | | Internet & Catalog Retail - 0.44% | | | | |
| 2,470 | | Amazon.com, Inc. (b) | | | 628,170 | |
| | | | | | | |
| | | Internet Software & Services - 1.02% | | | | |
| 1,940 | | Google, Inc. (b) | | | 1,463,730 | |
| | | | | | | |
| | | IT Services - 2.17% | | | | |
| 7,260 | | Alliance Data Systems Corp. (b) | | | 1,030,557 | |
| 10,400 | | Cognizant Technology Solutions | | | | |
| | | Corp. (b) | | | 727,168 | |
| 2,070 | | Mastercard, Inc. | | | 934,564 | |
| 28,750 | | Moneygram International, Inc. (b) | | | 429,525 | |
| | | | | | | |
| | | | | | 3,121,814 | |
| | | | | | | |
| | | Life Sciences Tools & Services - 0.66% | | | | |
| 16,180 | | Thermo Fisher Scientific, Inc. | | | 951,869 | |
| | | | | | | |
| | | Machinery - 3.95% | | | | |
| 15,100 | | Danaher Corp. | | | 832,765 | |
| 21,730 | | Dover Corp. | | | 1,292,718 | |
| 21,245 | | Illinois Tool Works, Inc. | | | 1,263,440 | |
| 18,500 | | ITT Corp. | | | 372,775 | |
| 11,735 | | Parker Hannifin Corp. | | | 980,811 | |
| 37,000 | | Xylem, Inc. | | | 930,550 | |
| | | | | | | |
| | | | | | 5,673,059 | |
| | | | | | | |
| | | Media - 1.25% | | | | |
| 24,110 | | Gannett Co., Inc. | | | 427,953 | |
| 23,000 | | Madison Square Garden, Inc. (b) | | | 926,210 | |
| 8,440 | | The Walt Disney Co. | | | 441,243 | |
| | | | | | | |
| | | | | | 1,795,406 | |
| | | | | | | |
| | | Metals & Mining - 1.87% | | | | |
| 48,000 | | Newmont Mining Corp. | | | 2,688,480 | |
| | | | | | | |
| | | | | | | | |
Number of
Shares | | | | | | Value | |
| | | | | | | | |
| | | Multiline Retail - 0.52% | | | | |
| 13,620 | | Nordstrom, Inc. | | $ | 751,552 | |
| | | | | | | |
| | | Oil & Gas - 12.07% | | | | |
| 26,025 | | Apache Corp. | | | 2,250,382 | |
| 60,000 | | BP Plc - ADR | | | 2,541,600 | |
| 79,000 | | Chesapeake Energy Corp. (a) | | | 1,490,730 | |
| 16,465 | | Cimarex Energy Co. | | | 964,025 | |
| 56,570 | | Devon Energy Corp. | | | 3,422,485 | |
| 22,470 | | Occidental Petroleum Corp. | | | 1,933,768 | |
| 53,000 | | QEP Resources, Inc. | | | 1,677,980 | |
| 33,890 | | Tesoro Corp. (b) | | | 1,419,991 | |
| 30,010 | | Valero Energy Corp. | | | 950,717 | |
| 55,310 | | Weatherford International Ltd. (b) | | | 701,331 | |
| | | | | | | |
| | | | | | 17,353,009 | |
| | | | | | | |
| | | Paper & Forest Products - 0.33% | | | | |
| 12,930 | | International Paper Co. | | | 469,618 | |
| | | | | | | |
| | | Pharmaceuticals - 4.76% | | | | |
| 23,875 | | Abbott Laboratories | | | 1,636,870 | |
| 23,200 | | Johnson & Johnson | | | 1,598,712 | |
| 28,920 | | Merck & Co., Inc. | | | 1,304,292 | |
| 65,590 | | Pfizer, Inc. | | | 1,629,911 | |
| 7,980 | | Watson Pharmaceuticals, Inc. (b) | | | 679,577 | |
| | | | | | | |
| | | | | | 6,849,362 | |
| | | | | | | |
| | | Real Estate - 1.23% | | | | |
| 37,990 | | CBRE Group, Inc. (b) | | | 699,396 | |
| 15,000 | | Howard Hughes Corp. (b) | | | 1,065,750 | |
| | | | | | | |
| | | | | | 1,765,146 | |
| | | | | | | |
| | | Road & Rail - 0.56% | | | | |
| 8,080 | | J.B. Hunt Transport Services, Inc. | | | 420,483 | |
| 7,990 | | Landstar Systems, Inc. | | | 377,767 | |
| | | | | | | |
| | | | | | 798,250 | |
| | | | | | | |
| | | Software - 4.82% | | | | |
| 13,070 | | Check Point Software Technologies | | | | |
| | | Ltd. - ADR (b) | | | 629,451 | |
| 9,830 | | Citrix Systems, Inc. (b) | | | 752,683 | |
| 61,885 | | Microsoft Corp. | | | 1,842,935 | |
| 17,610 | | NICE Systems Ltd. - ADR (b) | | | 585,004 | |
| 28,620 | | Nuance Communications, Inc. (b) | | | 712,352 | |
| 26,350 | | Oracle Corp. | | | 829,762 | |
| 13,800 | | Red Hat, Inc. (b) | | | 785,772 | |
| 5,200 | | Salesforce.com, Inc. (a)(b) | | | 793,988 | |
| | | | | | | |
| | | | | | 6,931,947 | |
| | | | | | | |
See notes to financial statements.
54
|
GuideMarkSM Opportunistic Equity Fund |
SCHEDULE OF INVESTMENTS (Unaudited) (Continued) |
September 30, 2012 |
| |
| | | | | | | | |
Number of
Shares | | | | | | Value | |
| | | | | | | | |
| | | COMMON STOCKS (Continued) | | | | |
| | | Specialty Retail - 1.35% | | | | |
| 10,720 | | Home Depot, Inc. | | $ | 647,166 | |
| 4,690 | | O’Reilly Automotive, Inc. (b) | | | 392,178 | |
| 20,400 | | Williams Sonoma, Inc. | | | 896,988 | |
| | | | | | | |
| | | | | | 1,936,332 | |
| | | | | | | |
| | | Thrifts & Mortgage Finance - 0.16% | | | | |
| 149,000 | | MGIC Investment Corp. (a)(b) | | | 227,970 | |
| | | | | | | |
| | | Trading Companies & Distributors - 0.57% | | | | |
| 14,260 | | Wesco International, Inc. (a)(b) | | | 815,672 | |
| | | | | | | |
| | | Total Common Stocks | | | | |
| | | (Cost $124,414,205) | | | 133,704,039 | |
| | | | | | | |
| | | REAL ESTATE INVESTMENT TRUSTS - 1.21% | | | | |
| | | Real Estate Investment Trusts - 1.21% | | | | |
| 55,000 | | Getty Realty Corp. (a) | | | 987,250 | |
| 90,550 | | iStar Financial, Inc. (a)(b) | | | 749,754 | |
| | | | | | | |
| | | Total Real Estate Investment Trusts | | | | |
| | | (Cost $1,407,200) | | | 1,737,004 | |
| | | | | | | |
| | | SHORT TERM INVESTMENTS - 6.00% | | | | |
| | | Money Market Funds - 6.00% | | | | |
| | | Federated Prime Obligations Fund | | | | |
| 8,618,769 | | 0.15%, 01/01/2050 | | | 8,618,769 | |
| | | | | | | |
| | | Total Short Term Investments | | | | |
| | | (Cost $8,618,769) | | | 8,618,769 | |
| | | | | | | |
| | | | | | | | |
Number of
Shares | | | | | | Value | |
| | | | | | | | |
| | | INVESTMENTS PURCHASED | | | | |
| | | AS SECURITIES LENDING | | | | |
| | | COLLATERAL - 2.98% | | | | |
| | | Money Market Funds - 2.98% | | | | |
| 4,281,286 | | First American Government | | | | |
| | | Obligations Fund | | | | |
| | | Effective Yield, 0.02% | | $ | 4,281,286 | |
| | | | | | | |
| | | Total Investments Purchased as | | | | |
| | | Securities Lending Collateral | | | | |
| | | (Cost $4,281,286) | | | 4,281,286 | |
| | | | | | | |
| | | Total Investments | | | | |
| | | (Cost $138,721,460) - 103.19% | | | 148,341,098 | |
| | | Liabilities in Excess of | | | | |
| | | Other Assets - (3.19)% | | | (4,582,083 | ) |
| | | | | | | |
| | | TOTAL NET | | | | |
| | | ASSETS - 100.00% | | $ | 143,759,015 | |
| | | | | | | |
| |
Percentages are stated as a percent of net assets. |
ADR - American Depositary Receipt |
(a) | All or portion of this security is on loan. |
(b) | Non-income producing security. |
See notes to financial statements.
55
|
GuideMarkSM Global Real Return Fund |
SCHEDULE OF INVESTMENTS (Unaudited) |
September 30, 2012 |
| |
| | | | | | | | |
Number of
Shares | | | | | | Value | |
| | | | | | | | |
| | | INVESTMENT COMPANIES - 99.90% | | | | |
| | | Exchange Traded Funds - 99.90% | | | | |
| 74,184 | | Energy Select Sector SPDR Fund (a) | | $ | 5,451,040 | |
| 32,277 | | Market Vectors Gold Miners ETF (a) | | | 1,733,598 | |
| 11 | | PowerShares DB Agriculture | | | | |
| | | Fund (b) | | | 324 | |
| 503,496 | | PowerShares DB Commodity Index | | | | |
| | | Tracking Fund (a)(b) | | | 14,440,265 | |
| 58,210 | | PowerShares DB Energy Fund (a)(b) | | | 1,654,910 | |
| 38,466 | | PowerShares DB Gold Fund (a)(b) | | | 2,349,503 | |
| 127,741 | | PowerShares Global Agriculture | | | | |
| | | Portfolio (a) | | | 3,833,507 | |
| 225,876 | | SPDR Barclays Capital TIPS | | | | |
| | | ETF (a) | | | 13,706,156 | |
| 123,008 | | SPDR DB International Government | | | | |
| | | Inflation-Protected Bond ETF (a) | | | 7,621,576 | |
| 302,681 | | SPDR Dow Jones International | | | | |
| | | Real Estate ETF (a) | | | 11,880,229 | |
| 159,691 | | SPDR Dow Jones REIT ETF (a) | | | 11,491,364 | |
| 86,597 | | SPDR S&P Metals and Mining | | | | |
| | | ETF (a) | | | 3,768,702 | |
| 538,939 | | SPDR S&P Global Natural | | | | |
| | | Resources ETF (a) | | | 27,361,933 | |
| 86,982 | | SPDR S&P International Energy | | | | |
| | | Sector ETF (a) | | | 2,180,639 | |
| | | | | | | |
| | | | | | 107,473,746 | |
| | | | | | | |
| | | Total Investment Companies | | | | |
| | | (Cost $110,138,502) | | | 107,473,746 | |
| | | | | | | |
| | | | | | | | |
Number of
Shares | | | | | | Value | |
| | | | | | | | |
| | | SHORT TERM INVESTMENTS - 0.11% | | | | |
| | | Money Market Funds - 0.11% | | | | |
| 113,963 | | Federated Prime Obligations Fund | | | | |
| | | Effective Yield, 0.15% | | $ | 113,963 | |
| | | | | | | |
| | | Total Short Term Investments | | | | |
| | | (Cost $113,963) | | | 113,963 | |
| | | | | | | |
| | | INVESTMENTS PURCHASED | | | | |
| | | AS SECURITIES LENDING | | | | |
| | | COLLATERAL - 25.78% | | | | |
| | | Money Market Funds - 25.78% | | | | |
| 27,733,915 | | First American Government | | | | |
| | | Obligations Fund | | | | |
| | | Effective Yield, 0.02% | | | 27,733,915 | |
| | | | | | | |
| | | Total Investments Purchased as | | | | |
| | | Securities Lending Collateral | | | | |
| | | (Cost $27,733,915) | | | 27,733,915 | |
| | | | | | | |
| | | Total Investments | | | | |
| | | (Cost $137,986,380) - 125.79% | | | 135,321,624 | |
| | | Liabilities in Excess of | | | | |
| | | Other Assets - (25.79)% | | | (27,745,346 | ) |
| | | | | | | |
| | | TOTAL NET | | | | |
| | | ASSETS - 100.00% | | $ | 107,576,278 | |
| | | | | | | |
| |
Percentages are stated as a percent of net assets. |
(a) | All or portion of this security is on loan. |
(b) | Non-income producing security. |
See notes to financial statements.
56
|
GuideMarkSM Core Fixed Income Fund |
SCHEDULE OF INVESTMENTS (Unaudited) |
September 30, 2012 |
| |
| | | | | | | | |
Principal
Amount | | | | | | Value | |
| | | | | | | | |
| | | ASSET BACKED SECURITIES - 1.89% | | | | |
$ | 223,751 | | Accredited Mortgage Loan Trust | | | | |
| | | Series 2005-3, 0.460%, | | | | |
| | | 09/25/2035 (d) | | $ | 219,542 | |
| 732,140 | | Brazos Higher Education Authority | | | | |
| | | Series 2005-3, 0.479%, | | | | |
| | | 09/25/2023 (d) | | | 729,828 | |
| | | CNH Equipment Trust | | | | |
| 497,912 | | Series 2010-C, 1.170%, | | | | |
| | | 05/15/2015 | | | 499,814 | |
| 740,000 | | Series 2011-A, 2.040%, | | | | |
| | | 10/17/2016 | | | 762,634 | |
| 1,185,000 | | Series 2012-A, 0.940%, | | | | |
| | | 05/15/2017 (d) | | | 1,195,837 | |
| 71,279 | | Conseco Finance Securitizations Corp. | | | | |
| | | Series 2000-4, 8.310%, | | | | |
| | | 05/01/2032 | | | 53,288 | |
| 65,123 | | Countrywide Asset-Backed Certificates | | | | |
| | | Series 2005-4, 4.456%, | | | | |
| | | 10/25/2035 (d) | | | 65,476 | |
| 175,000 | | CPS Auto Trust | | | | |
| | | Series 2012-C, 1.820%, 12/16/2019 | | | | |
| | | (Acquired 09/11/2012, | | | | |
| | | Cost $174,994) (b) | | | 175,155 | |
| 356,000 | | Credit Acceptance Auto Loan Trust | | | | |
| | | Series 2012-2, 1.520%, 03/16/2020 | | | | |
| | | (Acquired 09/11/2012, | | | | |
| | | Cost $355,938) (b) | | | 355,938 | |
| 257,054 | | Education Funding Capital Trust I | | | | |
| | | Series 2004-1, 0.549%, | | | | |
| | | 12/15/2022 (d) | | | 255,451 | |
| 100,000 | | GCO Education Loan Funding Trust | | | | |
| | | Series 2006-1, 0.657%, | | | | |
| | | 05/25/2036 (d) | | | 86,165 | |
| 586,890 | | Morgan Stanley | | | | |
| | | Series 2003-N, 1.237%, | | | | |
| | | 10/25/2033 (d) | | | 486,501 | |
| 105,748 | | Northstar Education Finance, Inc. | | | | |
| | | Series 2005-1, 0.547%, | | | | |
| | | 10/28/2026 (d) | | | 105,555 | |
| 758,679 | | Panhandle-Plains Higher Education | | | | |
| | | Authority, Inc. | | | | |
| | | Series 2010-2, 1.490%, | | | | |
| | | 10/01/2035 (d) | | | 770,605 | |
| | | | | | | | |
Principal
Amount | | | | | | Value | |
| | | | | | | | |
| | | ASSET BACKED SECURITIES (Continued) | | | | |
$ | 145,691 | | Residential Asset Mortgage | | | | |
| | | Products, Inc. | | | | |
| | | Series 2004-R, 0.697%, | | | | |
| | | 03/25/2034 (d) | | $ | 117,117 | |
| 290,000 | | Santander Drive Auto Receivables | | | | |
| | | Trust | | | | |
| | | Series 2012-5, 1.560%, | | | | |
| | | 08/15/2018 | | | 290,956 | |
| 172,764 | | U.S. Education Loan Trust, LLC | | | | |
| | | Series 2006-1, 0.551%, 03/01/2025 | | | | |
| | | (Acquired 08/06/2010, | | | | |
| | | Cost $168,877) (b)(d) | | | 171,422 | |
| 1,310,000 | | Volkswagen Auto Lease Trust | | | | |
| | | Series 2012-A, 0.870%, | | | | |
| | | 07/20/2015 | | | 1,322,014 | |
| 155,000 | | Westlake Automobile Receivables | | | | |
| | | Trust | | | | |
| | | Series 2012-1, 1.030%, 03/15/2016 | | | | |
| | | (Acquired 09/19/2012, | | | | |
| | | Cost $154,999) (b) | | | 155,018 | |
| | | | | | | |
| | | Total Asset Backed Securities | | | | |
| | | (Cost $7,842,419) | | | 7,818,316 | |
| | | | | | | |
| | | COLLATERALIZED MORTGAGE | | | | |
| | | OBLIGATIONS - 3.43% | | | | |
| | | Bank of America Commercial | | | | |
| | | Mortgage Trust | | | | |
| 610,000 | | Series 2007-4, 5.729%, | | | | |
| | | 02/10/2051 (d) | | | 725,964 | |
| 110,000 | | Series 2007-5, 5.620%, | | | | |
| | | 02/10/2051 | | | 116,842 | |
| | | Bear Stearns Commercial Mortgage | | | | |
| | | Securities | | | | |
| 3,250,000 | | Series 2006-PW13, 5.540%, | | | | |
| | | 09/11/2041 | | | 3,765,470 | |
| 1,762,697 | | Series 2004-PWR5, 4.831%, | | | | |
| | | 07/11/2042 | | | 1,803,045 | |
| 193,817 | | Chase Mortgage Financial Trust | | | | |
| | | Series 2007-A1, 2.969%, | | | | |
| | | 02/25/2037 (d) | | | 195,932 | |
| 560,000 | | COMM Mortgage Trust | | | | |
| | | Series 2010-C1, 4.205%, 07/12/2046 | | | | |
| | | (Acquired 08/14/2012 through | | | | |
| | | 08/17/2012, Cost $619,217) (b) | | | 642,409 | |
See notes to financial statements.
57
|
GuideMarkSM Core Fixed Income Fund |
SCHEDULE OF INVESTMENTS (Unaudited) (Continued) |
September 30, 2012 |
| |
| | | | | | | | |
Principal
Amount | | | | | | Value | |
| | | | | | | | |
| | | COLLATERALIZED MORTGAGE | | | | |
| | | OBLIGATIONS (Continued) | | | | |
| | | Countrywide Home Loans, Inc. | | | | |
$ | 34,054 | | Series 2004-HYB6, 2.801%, | | | | |
| | | 11/20/2034 (d) | | $ | 30,452 | |
| 249,396 | | Series 2005-11, 0.517%, | | | | |
| | | 03/25/2035 (d) | | | 181,439 | |
| | | GS Mortgage Securities Corp. | | | | |
| 680,000 | | Series 2012-ALOH, 3.551%, | | | | |
| | | 04/12/2034 (Acquired 08/15/2012, | | | | |
| | | Cost $713,417) (a)(b) | | | 739,095 | |
| 398,324 | | Series 2005-GG4, 4.680%, | | | | |
| | | 07/10/2039 | | | 399,022 | |
| 685,000 | | Series 2012-GCJ7, 3.377%, | | | | |
| | | 06/12/2045 | | | 744,145 | |
| 411,582 | | IndyMac Mortgage Loan Trust | | | | |
| | | Series 2005-16IP, 0.537%, | | | | |
| | | 07/25/2045 (d) | | | 316,064 | |
| 635,000 | | LB-UBS Commercial Mortgage | | | | |
| | | Trust | | | | |
| | | Series 2007-C2, 5.430%, | | | | |
| | | 02/15/2040 | | | 730,512 | |
| | | Lehman Brothers-UBS Commercial | | | | |
| | | Mortgage Trust | | | | |
| 324,110 | | Series 2005-C3, 4.664%, | | | | |
| | | 07/15/2030 | | | 326,575 | |
| 625,000 | | Series 2007-C1, 5.424%, | | | | |
| | | 2/15/2040 | | | 726,296 | |
| | | Morgan Stanley Capital I Trust | | | | |
| 470,000 | | Series 2007-T27, 5.653%, | | | | |
| | | 06/11/2042 (d) | | | 558,832 | |
| 600,000 | | Series 2008-T29, 6.278%, | | | | |
| | | 01/11/2043 (d) | | | 739,267 | |
| 615,000 | | OBP Depositor LLC Trust | | | | |
| | | Series 2010-OBP, 4.646%, | | | | |
| | | 07/15/2045 (Acquired 06/25/2010, | | | | |
| | | Cost $714,698) (b) | | | 728,740 | |
| 600,000 | | WF-RBS Commercial Mortgage Trust | | | | |
| | | Series 2011-C2, 4.869%, | | | | |
| | | 02/18/2044 (Acquired 02/17/2011, | | | | |
| | | Cost $690,043) (b)(d) | | | 709,173 | |
| | | | | | | |
| | | Total Collateralized Mortgage | | | | |
| | | Obligations (Cost $13,701,729) | | | 14,179,274 | |
| | | | | | | |
| | | | | | | | |
Principal
Amount | | | | | | Value | |
| | | | | | | | |
| | | CORPORATE OBLIGATIONS - 37.75% | | | | |
| | | Aerospace & Defense - 0.42% | | | | |
| | | United Technologies Corp. | | | | |
$ | 730,000 | | 1.200%, 06/01/2015 | | $ | 743,627 | |
| 945,000 | | 1.800%, 06/01/2017 | | | 981,226 | |
| | | | | | | |
| | | | | | 1,724,853 | |
| | | | | | | |
| | | Agricultural Products - 0.19% | | | | |
| 605,000 | | Lorillard Tobacco Co. | | | | |
| | | 8.125%, 06/23/2019 | | | 781,262 | |
| | | | | | | |
| | | Air Freight & Logistics - 0.08% | | | | |
| 345,000 | | United Parcel Service, Inc. | | | | |
| | | 1.125%, 10/01/2017 | | | 346,978 | |
| | | | | | | |
| | | Auto Components - 0.18% | | | | |
| 740,000 | | Johnson Controls, Inc. | | | | |
| | | 1.750%, 03/01/2014 | | | 752,832 | |
| | | | | | | |
| | | Banks - 2.44% | | | | |
| 400,000 | | Barclays Bank Plc | | | | |
| | | 5.140%, 10/14/2020 | | | 408,801 | |
| 250,000 | | Capital One Financial Corp. | | | | |
| | | 8.800%, 07/15/2019 | | | 330,399 | |
| 745,000 | | Cooperatieve Centrale Raiffeisen- | | | | |
| | | Boerenleenbank BA | | | | |
| | | 2.125%, 10/13/2015 | | | 769,640 | |
| 760,000 | | Glitnir Bank | | | | |
| | | 6.693%, 06/15/2016 | | | | |
| | | (Acquired 06/14/2006, | | | | |
| | | Cost $758,848) (c)(d)(e) | | | 9,500 | |
| | | HSBC Holdings Plc | | | | |
| 400,000 | | 4.000%, 03/30/2022 | | | 430,019 | |
| 250,000 | | 6.800%, 06/01/2038 | | | 306,255 | |
| 250,000 | | Kaupthing Bank Hf | | | | |
| | | 7.125%, 05/19/2016 | | | | |
| | | (Acquired 05/12/2006, | | | | |
| | | Cost $248,680) (c)(e) | | | 3,125 | |
| 325,000 | | KeyCorp | | | �� | |
| | | 5.100%, 03/24/2021 | | | 380,725 | |
| | | PNC Funding Corp. | | | | |
| 810,000 | | 4.250%, 09/21/2015 | | | 888,431 | |
| 735,000 | | 3.300%, 03/08/2022 | | | 789,327 | |
| 615,000 | | Royal Bank of Canada | | | | |
| | | 1.150%, 03/13/2015 | | | 624,624 | |
See notes to financial statements.
58
|
GuideMarkSM Core Fixed Income Fund |
SCHEDULE OF INVESTMENTS (Unaudited) (Continued) |
September 30, 2012 |
| |
| | | | | | | | |
Principal
Amount | | | | | | Value | |
| | | | | | | | |
| | | CORPORATE OBLIGATIONS (Continued) | | | | |
| | | Banks (Continued) | | | | |
| | | Royal Bank of Scotland Group Plc | | | | |
$ | 115,000 | | 5.000%, 11/12/2013 | | $ | 118,484 | |
| 625,000 | | 4.875%, 08/25/2014 | | | | |
| | | (Acquired 08/18/2009 through | | | | |
| | | 08/19/2009, Cost $622,701) (b) | | | 664,365 | |
| 230,000 | | 2.550%, 09/18/2015 | | | 232,933 | |
| 1,040,000 | | SunTrust Banks, Inc. | | | | |
| | | 3.500%, 01/20/2017 | | | 1,117,376 | |
| | | U.S. Bancorp | | | | |
| 1,735,000 | | 1.650%, 05/15/2017 | | | 1,778,092 | |
| 300,000 | | 4.125%, 05/24/2021 | | | 343,641 | |
| 300,000 | | Wachovia Bank NA | | | | |
| | | 6.600%, 01/15/2038 | | | 418,473 | |
| 490,000 | | Westpac Banking Corp. | | | | |
| | | 2.250%, 11/19/2012 | | | 490,640 | |
| | | | | | | |
| | | | | | 10,104,850 | |
| | | | | | | |
| | | Beverages - 0.93% | | | | |
| 1,005,000 | | Diageo Capital Plc | | | | |
| | | 1.500%, 05/11/2017 | | | 1,023,592 | |
| 215,000 | | Molson Coors Brewing Co. | | | | |
| | | 3.500%, 05/01/2022 | | | 228,270 | |
| 930,000 | | PepsiCo, Inc. | | | | |
| | | 2.500%, 05/10/2016 | | | 982,391 | |
| 1,610,000 | | The Coca-Cola Co. | | | | |
| | | 0.750%, 11/15/2013 | | | 1,618,700 | |
| | | | | | | |
| | | | | | 3,852,953 | |
| | | | | | | |
| | | Biotechnology - 0.43% | | | | |
| 450,000 | | Amgen, Inc. | | | | |
| | | 4.950%, 10/01/2041 | | | 476,498 | |
| 415,000 | | Genzyme Corp. | | | | |
| | | 5.000%, 06/15/2020 | | | 495,518 | |
| 780,000 | | Gilead Sciences, Inc. | | | | |
| | | 2.400%, 12/01/2014 | | | 806,937 | |
| | | | | | | |
| | | | | | 1,778,953 | |
| | | | | | | |
| | | Capital Markets - 3.28% | | | | |
| 1,575,000 | | Bear Stearns Companies, Inc. | | | | |
| | | 7.250%, 02/01/2018 | | | 1,967,611 | |
| | | Goldman Sachs Group, Inc. | | | | |
| 400,000 | | 5.625%, 01/15/2017 | | | 441,264 | |
| 1,125,000 | | 5.950%, 01/18/2018 | | | 1,307,910 | |
| 175,000 | | 7.500%, 02/15/2019 | | | 217,318 | |
| | | | | | | | |
Principal
Amount | | | | | | Value | |
| | | | | | | | |
| | | Capital Markets (Continued) | | | | |
$ | 125,000 | | 5.750%, 01/24/2022 | | $ | 144,250 | |
| 400,000 | | 6.750%, 10/01/2037 | | | 429,847 | |
| | | Merrill Lynch & Co., Inc. | | | | |
| 2,145,000 | | 6.400%, 08/28/2017 | | | 2,498,086 | |
| 650,000 | | 6.500%, 07/15/2018 | | | 768,150 | |
| 625,000 | | 6.110%, 01/29/2037 | | | 665,192 | |
| | | Morgan Stanley | | | | |
| 600,000 | | 5.950%, 12/28/2017 | | | 674,714 | |
| 300,000 | | 5.625%, 09/23/2019 | | | 328,219 | |
| 100,000 | | 6.375%, 07/24/2042 | | | 110,523 | |
| | | State Street Corp. | | | | |
| 485,000 | | 4.300%, 05/30/2014 | | | 514,855 | |
| 910,000 | | 2.875%, 03/07/2016 | | | 975,860 | |
| 1,310,000 | | The Bank of New York Mellon Corp. | | | | |
| | | 2.300%, 07/28/2016 | | | 1,374,309 | |
| 955,000 | | Wachovia Corp. | | | | |
| | | 5.750%, 02/01/2018 | | | 1,154,598 | |
| | | | | | | |
| | | | | | 13,572,706 | |
| | | | | | | |
| | | Chemicals - 0.56% | | | | |
| | | Dow Chemical Co. | | | | |
| 685,000 | | 7.600%, 05/15/2014 | | | 757,135 | |
| 670,000 | | 4.250%, 11/15/2020 | | | 739,723 | |
| | | Ecolab, Inc. | | | | |
| 275,000 | | 2.375%, 12/08/2014 | | | 285,345 | |
| 450,000 | | 4.350%, 12/08/2021 | | | 511,492 | |
| | | | | | | |
| | | | | | 2,293,695 | |
| | | | | | | |
| | | Commercial Banks - 0.24% | | | | |
| 955,000 | | Canadian Imperial Bank of Commerce | | | | |
| | | 2.350%, 12/11/2015 | | | 1,005,129 | |
| | | | | | | |
| | | Commercial Services & Supplies - 0.17% | | | | |
| 650,000 | | International Lease Finance Corp. | | | | |
| | | 5.750%, 05/15/2016 | | | 692,407 | |
| | | | | | | |
| | | Communications - 0.15% | | | | |
| 595,000 | | Rogers Cable, Inc. | | | | |
| | | 5.500%, 03/15/2014 | | | 636,263 | |
| | | | | | | |
| | | Computers & Peripherals - 0.15% | | | | |
| | | Hewlett Packard Co. | | | | |
| 250,000 | | 3.000%, 09/15/2016 | | | 258,610 | |
| 375,000 | | 2.600%, 09/15/2017 | | | 376,611 | |
| | | | | | | |
| | | | | | 635,221 | |
| | | | | | | |
See notes to financial statements.
59
|
GuideMarkSM Core Fixed Income Fund |
SCHEDULE OF INVESTMENTS (Unaudited) (Continued) |
September 30, 2012 |
| |
| | | | | | | | |
Principal
Amount | | | | | | Value | |
| | | | | | | | |
| | | CORPORATE OBLIGATIONS (Continued) | | | | |
| | | Consumer Finance - 2.10% | | | | |
$ | 650,000 | | American Express Co. | | | | |
| | | 8.150%, 03/19/2038 | | $ | 1,046,135 | |
| 2,430,000 | | American Express Credit Corp. | | | | |
| | | 1.750%, 06/12/2015 | | | 2,487,214 | |
| 670,000 | | Capital One Financial Corp. | | | | |
| | | 2.125%, 07/15/2014 | | | 683,944 | |
| | | Caterpillar Financial Services Corp. | | | | |
| 705,000 | | 1.100%, 05/29/2015 | | | 714,029 | |
| 960,000 | | 1.625%, 06/01/2017 (a) | | | 980,765 | |
| | | John Deere Capital Corp. | | | | |
| 600,000 | | 4.900%, 09/09/2013 | | | 625,801 | |
| 350,000 | | 0.950%, 06/29/2015 | | | 353,389 | |
| 430,000 | | SLM Corp. | | | | |
| | | 5.000%, 10/01/2013 | | | 447,738 | |
| 200,000 | | Total Capital International SA | | | | |
| | | 2.875%, 02/17/2022 | | | 208,413 | |
| 1,100,000 | | Toyota Motor Credit Corp. | | | | |
| | | 2.050%, 01/12/2017 | | | 1,145,063 | |
| | | | | | | |
| | | | | | 8,692,491 | |
| | | | | | | |
| | | Diversified Financial Services - 3.81% | | | | |
| | | Bank of America Corp. | | | | |
| 200,000 | | 3.875%, 03/22/2017 | | | 215,449 | |
| 700,000 | | 6.000%, 09/01/2017 | | | 810,551 | |
| 175,000 | | 5.875%, 01/05/2021 | | | 202,231 | |
| 75,000 | | 5.000%, 05/13/2021 | | | 82,584 | |
| 700,000 | | 5.700%, 01/24/2022 | | | 823,715 | |
| | | Citigroup, Inc. | | | | |
| 450,000 | | 5.000%, 09/15/2014 | | | 474,845 | |
| 560,000 | | 6.010%, 01/15/2015 | | | 614,048 | |
| 550,000 | | 4.450%, 01/10/2017 | | | 604,700 | |
| 960,000 | | 6.125%, 11/21/2017 | | | 1,130,846 | |
| 175,000 | | 4.500%, 01/14/2022 | | | 192,515 | |
| 150,000 | | 5.875%, 01/30/2042 | | | 181,410 | |
| | | Ford Motor Credit Co. LLC | | | | |
| 325,000 | | 2.750%, 05/15/2015 | | | 331,656 | |
| 200,000 | | 3.984%, 06/15/2016 | | | 210,982 | |
| | | General Electric Capital Corp. | | | | |
| 1,245,000 | | 6.000%, 08/07/2019 | | | 1,516,467 | |
| 350,000 | | 4.375%, 09/16/2020 | | | 386,636 | |
| 720,000 | | 5.300%, 02/11/2021 | | | 827,667 | |
| 380,000 | | 3.150%, 09/07/2022 | | | 382,514 | |
| 1,505,000 | | 5.875%, 01/14/2038 | | | 1,799,806 | |
| | | | | | | | |
Principal
Amount | | | | | | Value | |
| | | | | | | | |
| | | Diversified Financial Services (Continued) | | | | |
$ | 450,000 | | Hutchison Whampoa International Ltd. | | | | |
| | | 3.500%, 01/13/2017 | | | | |
| | | (Acquired 01/10/2012, | | | | |
| | | Cost $474,897) (b) | | $ | 478,430 | |
| | | JPMorgan Chase & Co. | | | | |
| 1,140,000 | | 3.450%, 03/01/2016 | | | 1,216,508 | |
| 625,000 | | 4.250%, 10/15/2020 | | | 684,041 | |
| 600,000 | | 4.500%, 01/24/2022 | | | 666,830 | |
| 125,000 | | 3.250%, 09/23/2022 | | | 127,006 | |
| | | National Rural Utilities Cooperative | | | | |
| | | Finance Corp. | | | | |
| 735,000 | | 1.125%, 11/01/2013 | | | 741,003 | |
| 600,000 | | 5.450%, 04/10/2017 | | | 715,729 | |
| 300,000 | | NCUA Guaranteed Notes | | | | |
| | | 3.000%, 06/12/2019 | | | 331,722 | |
| | | | | | | |
| | | | | | 15,749,891 | |
| | | | | | | |
| | | Diversified Manufacturing - 0.59% | | | | |
| | | Cooper U.S., Inc. | | | | |
| 725,000 | | 2.375%, 01/15/2016 | | | 749,089 | |
| 675,000 | | 3.875%, 12/15/2020 | | | 740,154 | |
| | | Tyco Electronics Group SA | | | | |
| 440,000 | | 1.600%, 02/03/2015 | | | 446,838 | |
| 405,000 | | 6.550%, 10/01/2017 | | | 490,308 | |
| | | | | | | |
| | | | | | 2,426,389 | |
| | | | | | | |
| | | Diversified Telecommunication Services - 1.78% | | | | |
| | | AT&T, Inc. | | | | |
| 725,000 | | 2.950%, 05/15/2016 | | | 779,727 | |
| 695,000 | | 5.350%, 09/01/2040 | | | 839,788 | |
| 470,000 | | France Telecom SA | | | | |
| | | 4.375%, 07/08/2014 | | | 497,532 | |
| 1,325,000 | | SBC Communications, Inc. | | | | |
| | | 5.100%, 09/15/2014 | | | 1,441,363 | |
| | | Verizon Communications, Inc. | | | | |
| 800,000 | | 1.950%, 03/28/2014 | | | 818,535 | |
| 795,000 | | 3.500%, 11/01/2021 | | | 878,787 | |
| 150,000 | | 6.400%, 02/15/2038 | | | 202,888 | |
| 1,355,000 | | Verizon Wireless Capital LLC | | | | |
| | | 8.500%, 11/15/2018 | | | 1,900,859 | |
| | | | | | | |
| | | | | | 7,359,479 | |
| | | | | | | |
See notes to financial statements.
60
|
GuideMarkSM Core Fixed Income Fund |
SCHEDULE OF INVESTMENTS (Unaudited) (Continued) |
September 30, 2012 |
| |
| | | | | | | | |
Principal
Amount | | | | | | Value | |
| | | | | | | | |
| | | CORPORATE OBLIGATIONS (Continued) | | | | |
| | | Electric Utilities - 1.00% | | | | |
$ | 695,000 | | Columbus Southern Power Co. | | | | |
| | | 5.500%, 03/01/2013 | | $ | 709,101 | |
| 360,000 | | Georgia Power Co. | | | | |
| | | 4.300%, 03/15/2042 | | | 385,670 | |
| 375,000 | | Nevada Power Co. | | | | |
| | | 5.875%, 01/15/2015 | | | 417,037 | |
| 875,000 | | PSI Energy, Inc. | | | | |
| | | 6.050%, 06/15/2016 | | | 1,021,640 | |
| | | Union Electric Co. | | | | |
| 570,000 | | 6.700%, 02/01/2019 | | | 729,952 | |
| 350,000 | | 3.900%, 09/15/2042 | | | 356,787 | |
| 470,000 | | Westar Energy, Inc. | | | | |
| | | 6.000%, 07/01/2014 | | | 512,118 | |
| | | | | | | |
| | | | | | 4,132,305 | |
| | | | | | | |
| | | Energy Equipment & Services - 0.39% | | | | |
| 275,000 | | Cameron International Corp. | | | | |
| | | 6.375%, 07/15/2018 | | | 334,400 | |
| 605,000 | | Halliburton Co. | | | | |
| | | 3.250%, 11/15/2021 (a) | | | 657,853 | |
| 480,000 | | Pride International, Inc. | | | | |
| | | 6.875%, 08/15/2020 | | | 608,606 | |
| | | | | | | |
| | | | | | 1,600,859 | |
| | | | | | | |
| | | Engineering Construction - 0.12% | | | | |
| 495,000 | | ABB Finance USA, Inc. | | | | |
| | | 2.875%, 05/08/2022 | | | 512,802 | |
| | | | | | | |
| | | Food & Staples Retailing - 0.40% | | | | |
| | | CVS Caremark Corp. | | | | |
| 200,000 | | 4.750%, 05/18/2020 | | | 234,360 | |
| 300,000 | | 6.250%, 06/01/2027 | | | 394,292 | |
| 355,000 | | Walgreen Co. | | | | |
| | | 3.100%, 09/15/2022 | | | 361,033 | |
| 450,000 | | Wal-Mart Stores, Inc. | | | | |
| | | 6.500%, 08/15/2037 | | | 647,011 | |
| | | | | | | |
| | | | | | 1,636,696 | |
| | | | | | | |
| | | Food Products - 0.26% | | | | |
| 110,000 | | Conagra Foods, Inc. | | | | |
| | | 1.350%, 09/10/2015 | | | 110,846 | |
| | | Kraft Foods Group, Inc. | | | | |
| 380,000 | | 1.625%, 06/04/2015 | | | | |
| | | (Acquired 08/01/2012, | | | | |
| | | Cost $379,016) (b) | | | 386,007 | |
| | | | | | | | |
Principal
Amount | | | | | | Value | |
| | | | | | | | |
| | | Food Products (Continued) | | | | |
$ | 75,000 | | 2.250%, 06/05/2017 | | | | |
| | | (Acquired 05/30/2012, | | | | |
| | | Cost $74,863) (b) | | $ | 77,299 | |
| 375,000 | | Mondelez International, Inc. | | | | |
| | | 6.500%, 02/09/2040 | | | 509,825 | |
| | | | | | | |
| | | | | | 1,083,977 | |
| | | | | | | |
| | | Health Care Equipment & Supplies - 1.10% | | | | |
| 495,000 | | Baxter International, Inc. | | | | |
| | | 1.850%, 01/15/2017 | | | 512,871 | |
| 725,000 | | Becton Dickinson & Co. | | | | |
| | | 3.250%, 11/12/2020 | | | 783,368 | |
| 630,000 | | Covidien International Finance SA | | | | |
| | | 2.800%, 06/15/2015 | | | 663,359 | |
| 1,575,000 | | Medtronic, Inc. | | | | |
| | | 3.000%, 03/15/2015 | | | 1,666,674 | |
| 865,000 | | St. Jude Medical, Inc. | | | | |
| | | 2.500%, 01/15/2016 | | | 903,538 | |
| | | | | | | |
| | | | | | 4,529,810 | |
| | | | | | | |
| | | Health Care Providers & Services - 0.94% | | | | |
| | | Cigna Corp. | | | | |
| 175,000 | | 2.750%, 11/15/2016 | | | 184,727 | |
| 175,000 | | 4.000%, 02/15/2022 | | | 188,984 | |
| | | Express Scripts, Inc. | | | | |
| 810,000 | | 6.250%, 06/15/2014 | | | 882,715 | |
| 325,000 | | 3.125%, 05/15/2016 | | | 346,873 | |
| 250,000 | | McKesson Corp. | | | | |
| | | 4.750%, 03/01/2021 | | | 291,765 | |
| | | UnitedHealth Group, Inc. | | | | |
| 435,000 | | 4.875%, 02/15/2013 | | | 441,887 | |
| 735,000 | | 5.375%, 03/15/2016 | | | 842,669 | |
| | | WellPoint, Inc. | | | | |
| 125,000 | | 1.250%, 09/10/2015 | | | 125,963 | |
| 425,000 | | 3.125%, 05/15/2022 | | | 425,095 | |
| 150,000 | | 5.850%, 01/15/2036 | | | 174,457 | |
| | | | | | | |
| | | | | | 3,905,135 | |
| | | | | | | |
| | | Independent Power Producers & Energy | | | | |
| | | Traders - 0.32% | | | | |
| | | Exelon Generation Co., LLC | | | | |
| 540,000 | | 5.200%, 10/01/2019 | | | 614,016 | |
| 605,000 | | 6.250%, 10/01/2039 | | | 702,351 | |
| | | | | | | |
| | | | | | 1,316,367 | |
| | | | | | | |
See notes to financial statements.
61
|
GuideMarkSM Core Fixed Income Fund |
SCHEDULE OF INVESTMENTS (Unaudited) (Continued) |
September 30, 2012 |
| |
| | | | | | | | |
Principal
Amount | | | | | | Value | |
| | | | | | | | |
| | | CORPORATE OBLIGATIONS (Continued) | | | | |
| | | Industrial Conglomerates - 0.27% | | | | |
$ | 930,000 | | Koninklijke Philips Electronics NV | | | | |
| | | 5.750%, 03/11/2018 | | $ | 1,133,133 | |
| | | | | | | |
| | | Insurance - 1.11% | | | | |
| | | American International Group, Inc. | | | | |
| 100,000 | | 8.250%, 08/15/2018 | | | 128,903 | |
| 30,000 | | 4.875%, 06/01/2022 | | | 33,875 | |
| 540,000 | | CNA Financial Corp. | | | | |
| | | 7.350%, 11/15/2019 | | | 671,016 | |
| 615,000 | | Liberty Mutual Group, Inc. | | | | |
| | | 5.000%, 06/01/2021 | | | | |
| | | (Acquired 05/18/2011, | | | | |
| | | Cost $622,636) (b) | | | 651,204 | |
| 965,000 | | MetLife, Inc. | | | | |
| | | 5.000%, 11/24/2013 | | | 1,014,198 | |
| 500,000 | | New York Life Global Funding | | | | |
| | | 3.000%, 05/04/2015 | | | | |
| | | (Acquired 03/09/2012, | | | | |
| | | Cost $521,962) (b) | | | 529,513 | |
| 375,000 | | Prudential Financial, Inc. | | | | |
| | | 4.500%, 11/15/2020 | | | 417,761 | |
| 510,000 | | Travelers Property Casualty Corp. | | | | |
| | | 5.000%, 03/15/2013 | | | 520,768 | |
| 560,000 | | Willis North America, Inc. | | | | |
| | | 6.200%, 03/28/2017 | | | 638,804 | |
| | | | | | | |
| | | | | | 4,606,042 | |
| | | | | | | |
| | | Internet Software & Services - 0.17% | | | | |
| 700,000 | | eBay, Inc. | | | | |
| | | 1.350%, 07/15/2017 | | | 709,212 | |
| | | | | | | |
| | | Life Sciences Tools & Services - 0.04% | | | | |
| 150,000 | | Life Technologies Corp. | | | | |
| | | 6.000%, 03/01/2020 | | | 178,689 | |
| | | | | | | |
| | | Machinery - 0.15% | | | | |
| 530,000 | | Eaton Corp. | | | | |
| | | 5.600%, 05/15/2018 | | | 631,280 | |
| | | | | | | |
| | | Media - 2.43% | | | | |
| | | CBS Corp. | | | | |
| 965,000 | | 3.375%, 03/01/2022 | | | 1,010,206 | |
| 100,000 | | 4.850%, 07/01/2042 | | | 106,312 | |
| | | Comcast Corp. | | | | |
| 1,345,000 | | 5.875%, 02/15/2018 | | | 1,638,227 | |
| 250,000 | | 6.400%, 05/15/2038 | | | 321,283 | |
| | | | | | | | |
Principal
Amount | | | | | | Value | |
| | | | | | | | |
| | | Media (Continued) | | | | |
| | | DIRECTV Holdings, LLC | | | | |
$ | 815,000 | | 2.400%, 03/15/2017 | | $ | 837,687 | |
| 475,000 | | 3.800%, 03/15/2022 | | | 489,774 | |
| 375,000 | | 6.350%, 03/15/2040 | | | 438,205 | |
| 550,000 | | NBCUniversal Media LLC | | | | |
| | | 2.875%, 04/01/2016 | | | 583,046 | |
| | | News America, Inc. | | | | |
| 275,000 | | 4.500%, 02/15/2021 | | | 310,917 | |
| 250,000 | | 6.150%, 02/15/2041 | | | 312,380 | |
| | | Time Warner, Inc. | | | | |
| 1,105,000 | | 6.750%, 07/01/2018 | | | 1,391,396 | |
| 400,000 | | 4.700%, 01/15/2021 | | | 460,226 | |
| 750,000 | | 4.125%, 02/15/2021 | | | 830,607 | |
| 225,000 | | 3.400%, 06/15/2022 | | | 238,119 | |
| 225,000 | | 7.625%, 04/15/2031 | | | 315,193 | |
| 200,000 | | 4.500%, 09/15/2042 | | | 200,273 | |
| 250,000 | | Viacom, Inc. | | | | |
| | | 5.625%, 09/15/2019 | | | 301,111 | |
| 225,000 | | WPP Finance UK | | | | |
| | | 8.000%, 09/15/2014 | | | 252,697 | |
| | | | | | | |
| | | | | | 10,037,659 | |
| | | | | | | |
| | | Metals & Mining - 0.61% | | | | |
| 495,000 | | BHP Billiton Finance USA Ltd. | | | | |
| | | 1.625%, 02/24/2017 | | | 505,960 | |
| 780,000 | | Freeport-McMoRan Copper & Gold, Inc. | | | | |
| | | 3.550%, 03/01/2022 | | | 782,340 | |
| 735,000 | | Rio Tinto Finance USA Ltd. | | | | |
| | | 2.500%, 05/20/2016 | | | 768,154 | |
| 435,000 | | Teck Resources Ltd. | | | | |
| | | 6.000%, 08/15/2040 | | | 459,942 | |
| | | | | | | |
| | | | | | 2,516,396 | |
| | | | | | | |
| | | Multi-Utilities - 0.72% | | | | |
| 650,000 | | Dominion Resources, Inc. | | | | |
| | | 1.400%, 09/15/2017 | | | 652,575 | |
| 580,000 | | Sempra Energy | | | | |
| | | 6.500%, 06/01/2016 | | | 691,221 | |
| 1,380,000 | | Xcel Energy, Inc. | | | | |
| | | 5.613%, 04/01/2017 | | | 1,624,026 | |
| | | | | | | |
| | | | | | 2,315,247 | |
| | | | | | | |
| | | Office Electronics - 0.20% | | | | |
| 780,000 | | Xerox Corp. | | | | |
| | | 4.250%, 02/15/2015 | | | 828,872 | |
| | | | | | | |
See notes to financial statements.
62
|
GuideMarkSM Core Fixed Income Fund |
SCHEDULE OF INVESTMENTS (Unaudited) (Continued) |
September 30, 2012 |
| |
| | | | | | | | |
Principal
Amount | | | | | | Value | |
| | | | | | | | |
| | | CORPORATE OBLIGATIONS (Continued) | | | | |
| | | Oil & Gas - 3.70% | | | | |
$ | 150,000 | | Anadarko Petroleum Corp. | | | | |
| | | 8.700%, 03/15/2019 | | $ | 201,449 | |
| | | Apache Corp. | | | | |
| 375,000 | | 3.625%, 02/01/2021 (a) | | | 414,790 | |
| 590,000 | | 3.250%, 04/15/2022 | | | 635,494 | |
| | | BP Capital Markets Plc | | | | |
| 1,295,000 | | 3.200%, 03/11/2016 | | | 1,391,204 | |
| 350,000 | | 4.500%, 10/01/2020 | | | 406,991 | |
| 945,000 | | Canadian Natural Resources Ltd. | | | | |
| | | 3.450%, 11/15/2021 | | | 1,018,406 | |
| | | Energy Transfer Partners LP | | | | |
| 943,000 | | 8.500%, 04/15/2014 | | | 1,039,409 | |
| 570,000 | | 9.000%, 04/15/2019 | | | 735,767 | |
| 225,000 | | 5.200%, 02/01/2022 | | | 250,050 | |
| | | Husky Energy, Inc. | | | | |
| 465,000 | | 5.900%, 06/15/2014 | | | 504,998 | |
| 810,000 | | 3.950%, 04/15/2022 | | | 869,072 | |
| 675,000 | | Kinder Morgan Energy Partners LP | | | | |
| | | 3.450%, 02/15/2023 | | | 696,447 | |
| 800,000 | | Marathon Oil Corp. | | | | |
| | | 6.000%, 10/01/2017 | | | 979,647 | |
| 360,000 | | Murphy Oil Corp. | | | | |
| | | 4.000%, 06/01/2022 | | | 382,878 | |
| | | Nexen, Inc. | | | | |
| 150,000 | | 5.875%, 03/10/2035 | | | 177,969 | |
| 150,000 | | 7.500%, 07/30/2039 | | | 214,506 | |
| 780,000 | | ONEOK Partners LP | | | | |
| | | 6.125%, 02/01/2041 | | | 940,317 | |
| | | Petrobras International Finance Co. | | | | |
| 130,000 | | 3.875%, 01/27/2016 | | | 138,165 | |
| 305,000 | | 3.500%, 02/06/2017 | | | 319,742 | |
| 570,000 | | 5.375%, 01/27/2021 | | | 645,109 | |
| 250,000 | | 6.875%, 01/20/2040 | | | 315,486 | |
| 375,000 | | Petroleos Mexicanos | | | | |
| | | 8.000%, 05/03/2019 | | | 492,562 | |
| | | Phillips 66 Company | | | | |
| 425,000 | | 1.950%, 03/05/2015 | | | | |
| | | (Acquired 03/07/2012, | | | | |
| | | Cost $424,805) (b) | | | 435,121 | |
| 845,000 | | 4.300%, 04/01/2022 | | | | |
| | | (Acquired 03/07/2012, | | | | |
| | | Cost $842,997) (b) | | | 926,972 | |
| | | | | | | | |
Principal
Amount | | | | | | Value | |
| | | | | | | | |
| | | Oil & Gas (Continued) | | | | |
$ | 300,000 | | Schlumberger Investment SA | | | | |
| | | 3.300%, 09/14/2021 | | | | |
| | | (Acquired 09/07/2011, | | | | |
| | | Cost $300,314) (b) | | $ | 320,075 | |
| 405,000 | | Spectra Energy Partners LP | | | | |
| | | 4.600%, 06/15/2021 | | | 439,349 | |
| 295,000 | | Valero Energy Corp. | | | | |
| | | 9.375%, 03/15/2019 | | | 401,178 | |
| | | | | | | |
| | | | | | 15,293,153 | |
| | | | | | | |
| | | Pharmaceuticals - 1.49% | | | | |
| 125,000 | | Aristotle Holdings, Inc. | | | | |
| | | 3.500%, 11/15/2016 | | | | |
| | | (Acquired 11/14/2011, | | | | |
| | | Cost $124,966) (b) | | | 135,271 | |
| 1,640,000 | | GlaxoSmithKline Capital PLC | | | | |
| | | 1.500%, 05/08/2017 | | | 1,670,288 | |
| 1,210,000 | | Novartis Capital Corp. | | | | |
| | | 2.900%, 04/24/2015 | | | 1,285,817 | |
| | | Sanofi-Aventis SA | | | | |
| 560,000 | | 1.625%, 03/28/2014 | | | 570,113 | |
| 780,000 | | 4.000%, 03/29/2021 | | | 892,591 | |
| 920,000 | | Teva Pharmaceutical Finance | | | | |
| | | 3.000%, 06/15/2015 | | | 978,456 | |
| | | Watson Pharmaceuticals, Inc. | | | | |
| 85,000 | | 1.875%, 10/01/2017 | | | 86,048 | |
| 550,000 | | 3.250%, 10/01/2022 | | | 558,203 | |
| | | | | | | |
| | | | | | 6,176,787 | |
| | | | | | | |
| | | Pipelines - 1.19% | | | | |
| 490,000 | | Duke Energy, Inc. | | | | |
| | | 5.668%, 08/15/2014 | | | 530,618 | |
| | | Enterprise Products Operating LLC | | | | |
| 815,000 | | 5.650%, 04/01/2013 | | | 833,378 | |
| 680,000 | | 6.125%, 10/15/2039 | | | 820,199 | |
| 86,000 | | 4.450%, 02/15/2043 | | | 85,414 | |
| 470,000 | | Spectra Energy Capital LLC | | | | |
| | | 5.650%, 03/01/2020 | | | 555,213 | |
| | | TransCanada Pipelines Ltd. | | | | |
| 660,000 | | 7.625%, 01/15/2039 | | | 1,024,689 | |
| 300,000 | | 6.350%, 05/15/2067 (d) | | | 321,119 | |
| | | Transocean, Inc. | | | | |
| 155,000 | | 2.500%, 10/15/2017 | | | 156,042 | |
| 500,000 | | 6.500%, 11/15/2020 | | | 598,058 | |
| | | | | | | |
| | | | | | 4,924,730 | |
| | | | | | | |
See notes to financial statements.
63
|
GuideMarkSM Core Fixed Income Fund |
SCHEDULE OF INVESTMENTS (Unaudited) (Continued) |
September 30, 2012 |
| |
| | | | | | | | |
Principal
Amount | | | | | | Value | |
| | | | | | | | |
| | | CORPORATE OBLIGATIONS (Continued) | | | | |
| | | Real Estate - 1.48% | | | | |
$ | 405,000 | | Developers Diversified Realty Corp. | | | | |
| | | 7.500%, 04/01/2017 | | $ | 485,109 | |
| 250,000 | | Duke Realty LP | | | | |
| | | 4.375%, 06/15/2022 | | | 264,127 | |
| 250,000 | | ERP Operating LP | | | | |
| | | 4.625%, 12/15/2021 | | | 288,637 | |
| 955,000 | | HCP, Inc. | | | | |
| | | 5.375%, 02/01/2021 | | | 1,091,344 | |
| | | Health Care Property Investments, Inc. | | | | |
| 125,000 | | 6.300%, 09/15/2016 | | | 143,332 | |
| 200,000 | | 6.000%, 01/30/2017 | | | 230,407 | |
| | | Health Care REIT, Inc. | | | | |
| 385,000 | | 3.625%, 03/15/2016 | | | 406,708 | |
| 675,000 | | 5.250%, 01/15/2022 | | | 761,510 | |
| 250,000 | | Kilroy Realty Corp. | | | | |
| | | 5.000%, 11/03/2015 | | | 272,251 | |
| 325,000 | | Liberty Property LP | | | | |
| | | 5.500%, 12/15/2016 | | | 363,811 | |
| 400,000 | | Simon Property Group LP | | | | |
| | | 4.125%, 12/01/2021 | | | 444,474 | |
| 1,105,000 | | Simon Property Group, Inc. | | | | |
| | | 6.125%, 05/30/2018 | | | 1,351,185 | |
| | | | | | | |
| | | | | | 6,102,895 | |
| | | | | | | |
| | | Road & Rail - 0.28% | | | | |
| 565,000 | | Burlington Northern Santa Fe LLC | | | | |
| | | 7.950%, 08/15/2030 | | | 807,710 | |
| 309,000 | | Canadian Pacific Railway Ltd. | | | | |
| | | 4.500%, 01/15/2022 | | | 341,761 | |
| | | | | | | |
| | | | | | 1,149,471 | |
| | | | | | | |
| | | Semiconductor & Semiconductor | | | | |
| | | Equipment - 0.69% | | | | |
| 340,000 | | Altera Corp. | | | | |
| | | 1.750%, 05/15/2017 | | | 349,346 | |
| 725,000 | | Analog Devices, Inc. | | | | |
| | | 3.000%, 04/15/2016 | | | 781,853 | |
| 780,000 | | Applied Materials, Inc. | | | | |
| | | 2.650%, 06/15/2016 | | | 825,548 | |
| | | Intel Corp. | | | | |
| 350,000 | | 1.950%, 10/01/2016 | | | 367,813 | |
| 470,000 | | 3.300%, 10/01/2021 | | | 511,500 | |
| | | | | | | |
| | | | | | 2,836,060 | |
| | | | | | | |
| | | | | | | | |
Principal
Amount | | | | | | Value | |
| | | | | | | | |
| | | Specialty Retail - 0.25% | | | | |
$ | 475,000 | | Autozone, Inc. | | | | |
| | | 4.000%, 11/15/2020 | | $ | 519,293 | |
| 375,000 | | Home Depot, Inc. | | | | |
| | | 5.875%, 12/16/2036 | | | 495,907 | |
| | | | | | | |
| | | | | | 1,015,200 | |
| | | | | | | |
| | | Thrifts & Mortgage Finance - 0.02% | | | | |
| 60,000 | | Santander Holdings USA, Inc. | | | | |
| | | 4.625%, 04/19/2016 | | | 62,908 | |
| | | | | | | |
| | | Tobacco - 0.53% | | | | |
| | | Altria Group, Inc. | | | | |
| 306,000 | | 9.700%, 11/10/2018 | | | 438,826 | |
| 81,000 | | 9.250%, 08/06/2019 | | | 115,169 | |
| 1,200,000 | | 2.850%, 08/09/2022 | | | 1,199,770 | |
| 300,000 | | Philip Morris International, Inc. | | | | |
| | | 6.375%, 05/16/2038 | | | 417,094 | |
| | | | | | | |
| | | | | | 2,170,859 | |
| | | | | | | |
| | | Trucking - 0.10% | | | | |
| 400,000 | | Penske Truck Leasing Co., L.P. | | | | |
| | | 3.125%, 05/11/2015 | | | | |
| | | (Acquired 05/08/2012, | | | | |
| | | Cost $399,980) (b) | | | 409,488 | |
| | | | | | | |
| | | Wireless Telecommunication Services - 0.29% | | | | |
| 1,165,000 | | Vodafone Group Plc | | | | |
| | | 1.625%, 03/20/2017 | | | 1,189,675 | |
| | | | | | | |
| | | Total Corporate Obligations | | | | |
| | | (Cost $147,516,733) | | | 156,064,634 | |
| | | | | | | |
| | | FOREIGN GOVERNMENT DEBT | | | | |
| | | OBLIGATIONS - 0.12% | | | | |
| 250,000 | | Republic of Columbia | | | | |
| | | 4.375%, 07/12/2021 | | | 289,125 | |
| 196,000 | | Federal Government of Mexico | | | | |
| | | 4.750%, 03/08/2044 | | | 218,540 | |
| | | | | | | |
| | | Total Foreign Government Debt | | | | |
| | | Obligations (Cost $393,480) | | | 507,665 | |
| | | | | | | |
See notes to financial statements.
64
|
GuideMarkSM Core Fixed Income Fund |
SCHEDULE OF INVESTMENTS (Unaudited) (Continued) |
September 30, 2012 |
| |
| | | | | | | | |
Principal
Amount | | | | | | Value | |
| | | | | | | | |
| | | MORTGAGE BACKED SECURITIES - 31.52% | | | | |
| | | Federal Home Loan Mortgage Corp. | | | | |
$ | 887,737 | | Series 2590, | | | | |
| | | 5.000%, 03/15/2018 | | $ | 953,786 | |
| 800,000 | | Series K-703, | | | | |
| | | 2.699%, 05/25/2018 (d) | | | 869,331 | |
| 11,725 | | Pool #E9-9763, | | | | |
| | | 4.500%, 09/01/2018 | | | 12,891 | |
| 10,985 | | Pool #E9-9764, | | | | |
| | | 4.500%, 09/01/2018 | | | 12,077 | |
| 600,000 | | Series K-705, | | | | |
| | | 2.303%, 09/25/2018 (d) | | | 638,189 | |
| 900,000 | | Series K-706, | | | | |
| | | 2.323%, 10/25/2018 | | | 957,617 | |
| 600,000 | | Series K-709, | | | | |
| | | 2.086%, 03/25/2019 | | | 630,719 | |
| 221,253 | | Pool #D9-6291, | | | | |
| | | 4.500%, 09/01/2023 | | | 242,430 | |
| 655,313 | | Pool #G1-3624, | | | | |
| | | 5.000%, 08/01/2024 | | | 706,948 | |
| 595,839 | | Series 2329, | | | | |
| | | 6.500%, 06/15/2031 | | | 686,546 | |
| 313,567 | | Series 2338, | | | | |
| | | 6.500%, 07/15/2031 | | | 362,948 | |
| 521,430 | | Pool #78-0447, | | | | |
| | | 2.375%, 04/01/2033 (d) | | | 556,383 | |
| 520 | | Pool #A4-3129, | | | | |
| | | 5.500%, 02/01/2036 | | | 574 | |
| 3,522,275 | | Pool #A8-9148, | | | | |
| | | 4.000%, 10/01/2039 | | | 3,789,158 | |
| 1,468,939 | | Pool #C0-3815, | | | | |
| | | 3.500%, 03/01/2042 | | | 1,580,830 | |
| 2,133,933 | | Pool #C0-3830, | | | | |
| | | 4.000%, 03/01/2042 | | | 2,298,289 | |
| 993,766 | | Pool #U9-0688, | | | | |
| | | 4.000%, 05/01/2042 | | | 1,108,349 | |
| 372,460 | | Pool #Q0-9530, | | | | |
| | | 3.500%, 07/01/2042 | | | 400,248 | |
| 2,260,592 | | Pool #Q0-9949, | | | | |
| | | 3.000%, 08/01/2042 | | | 2,386,085 | |
| | | Federal National Mortgage Association | | | | |
| 491,189 | | Pool #467626, | | | | |
| | | 3.740%, 05/01/2018 | | | 556,485 | |
| 3,678 | | Pool #685505, | | | | |
| | | 5.000%, 05/01/2018 | | | 4,065 | |
| | | | | | | | |
Principal
Amount | | | | | | Value | |
| | | | | | | | |
| | | MORTGAGE BACKED | | | | |
| | | SECURITIES (Continued) | | | | |
$ | 3,703 | | Pool #705709, | | | | |
| | | 5.000%, 05/01/2018 | | $ | 4,058 | |
| 1,304,527 | | Pool #AD3775, | | | | |
| | | 4.500%, 03/01/2025 | | | 1,429,360 | |
| 2,616,469 | | Pool #AH6301, | | | | |
| | | 4.000%, 05/01/2026 | | | 2,801,024 | |
| 377,447 | | Pool #544859, | | | | |
| | | 2.849%, 08/01/2029 (d) | | | 400,304 | |
| 421,388 | | Pool #786848, | | | | |
| | | 7.000%, 10/01/2031 | | | 506,005 | |
| 23,202 | | Pool #727181, | | | | |
| | | 5.000%, 08/01/2033 | | | 25,949 | |
| 9,032 | | Pool #730727, | | | | |
| | | 5.000%, 08/01/2033 | | | 10,101 | |
| 2,423 | | Pool #741862, | | | | |
| | | 5.500%, 09/01/2033 | | | 2,705 | |
| 3,151 | | Pool #766197, | | | | |
| | | 5.500%, 02/01/2034 | | | 3,518 | |
| 527 | | Pool #776974, | | | | |
| | | 5.500%, 04/01/2034 | | | 600 | |
| 337,789 | | Pool #888504, | | | | |
| | | 2.194%, 04/01/2034 (d) | | | 360,382 | |
| 18,346 | | Pool #775776, | | | | |
| | | 5.500%, 05/01/2034 | | | 20,483 | |
| 374,098 | | Pool #802783, | | | | |
| | | 2.487%, 10/01/2034 (d) | | | 399,750 | |
| 27,881 | | Pool #781629, | | | | |
| | | 5.500%, 12/01/2034 | | | 31,128 | |
| 722 | | Pool #806098, | | | | |
| | | 6.000%, 12/01/2034 | | | 812 | |
| 4,628,561 | | Pool #AB0074, | | | | |
| | | 5.000%, 02/01/2035 | | | 5,106,208 | |
| 345,541 | | Pool #735504, | | | | |
| | | 6.000%, 04/01/2035 | | | 391,140 | |
| 21,267 | | Pool #822815, | | | | |
| | | 5.500%, 04/01/2035 | | | 23,744 | |
| 21,883 | | Pool #357850, | | | | |
| | | 5.500%, 07/01/2035 | | | 24,432 | |
| 22,032 | | Pool #820242, | | | | |
| | | 5.000%, 07/01/2035 | | | 24,580 | |
| 4,328 | | Pool #838452, | | | | |
| | | 5.500%, 09/01/2035 | | | 4,877 | |
| 225,221 | | Pool #888022, | | | | |
| | | 5.000%, 02/01/2036 | | | 246,837 | |
See notes to financial statements.
65
|
GuideMarkSM Core Fixed Income Fund |
SCHEDULE OF INVESTMENTS (Unaudited) (Continued) |
September 30, 2012 |
| |
| | | | | | | | |
Principal
Amount | | | | | | Value | |
| | | | | | | | |
| | | MORTGAGE BACKED | | | | |
| | | SECURITIES (Continued) | | | | |
$ | 25,043 | | Pool #865854, | | | | |
| | | 6.000%, 03/01/2036 | | $ | 28,152 | |
| 39,669 | | Pool #891474, | | | | |
| | | 6.000%, 04/01/2036 | | | 44,594 | |
| 48,484 | | Pool #906000, | | | | |
| | | 6.000%, 01/01/2037 | | | 53,670 | |
| 378 | | Pool #928062, | | | | |
| | | 5.500%, 02/01/2037 | | | 421 | |
| 534 | | Pool #899119, | | | | |
| | | 5.500%, 04/01/2037 | | | 595 | |
| 729 | | Pool #938488, | | | | |
| | | 5.500%, 05/01/2037 | | | 814 | |
| 965 | | Pool #970131, | | | | |
| | | 5.500%, 03/01/2038 | | | 1,075 | |
| 781 | | Pool #981313, | | | | |
| | | 5.500%, 06/01/2038 | | | 872 | |
| 1,074 | | Pool #985108, | | | | |
| | | 5.500%, 07/01/2038 | | | 1,199 | |
| 435 | | Pool #964930, | | | | |
| | | 5.500%, 08/01/2038 | | | 486 | |
| 472 | | Pool #987032, | | | | |
| | | 5.500%, 08/01/2038 | | | 522 | |
| 577 | | Pool #968371, | | | | |
| | | 5.500%, 09/01/2038 | | | 645 | |
| 275,346 | | Pool #AD0095, | | | | |
| | | 6.000%, 11/01/2038 | | | 304,798 | |
| 383 | | Pool #993050, | | | | |
| | | 5.500%, 12/01/2038 | | | 428 | |
| 275 | | Pool #MC0018, | | | | |
| | | 5.500%, 12/01/2038 | | | 278 | |
| 108,482 | | Pool #993579, | | | | |
| | | 4.000%, 05/01/2039 | | | 117,028 | |
| 23,637 | | Pool #AA5840, | | | | |
| | | 4.000%, 06/01/2039 | | | 25,499 | |
| 263,561 | | Pool #AA7670, | | | | |
| | | 4.500%, 06/01/2039 | | | 291,044 | |
| 141,176 | | Pool #AA8715, | | | | |
| | | 4.000%, 06/01/2039 | | | 157,458 | |
| 19,754 | | Pool #AA9133, | | | | |
| | | 4.500%, 08/01/2039 | | | 22,252 | |
| 39,144 | | Pool #AC2861, | | | | |
| | | 4.500%, 08/01/2039 | | | 44,094 | |
| 80,541 | | Pool #AC6121, | | | | |
| | | 4.500%, 11/01/2039 | | | 90,727 | |
| | | | | | | | |
Principal
Amount | | | | | | Value | |
| | | | | | | | |
| | | MORTGAGE BACKED | | | | |
| | | SECURITIES (Continued) | | | | |
$ | 21,622 | | Pool #AC8372, | | | | |
| | | 4.500%, 12/01/2039 | | $ | 24,263 | |
| 686,370 | | Pool #AD0586, | | | | |
| | | 4.500%, 12/01/2039 | | | 773,170 | |
| 758,370 | | Pool #AD5574, | | | | |
| | | 5.000%, 04/01/2040 | | | 831,312 | |
| 2,759,465 | | Pool #AD5661, | | | | |
| | | 5.000%, 05/01/2040 | | | 3,049,886 | |
| 2,833,982 | | Pool #AD6949, | | | | |
| | | 5.500%, 06/01/2040 | | | 3,129,495 | |
| 3,769,466 | | Pool #AB1231, | | | | |
| | | 5.000%, 07/01/2040 | | | 4,172,075 | |
| 147,234 | | Pool #AD7793, | | | | |
| | | 4.500%, 07/01/2040 | | | 159,918 | |
| 49,599 | | Pool #AD9896, | | | | |
| | | 4.000%, 08/01/2040 | | | 53,522 | |
| 1,706,050 | | Pool #AE0217, | | | | |
| | | 4.500%, 08/01/2040 | | | 1,847,084 | |
| 58,959 | | Pool #AB1500, | | | | |
| | | 4.000%, 09/01/2040 | | | 63,621 | |
| 40,455 | | Pool #AD9856, | | | | |
| | | 4.000%, 09/01/2040 | | | 43,655 | |
| 59,552 | | Pool #AE2559, | | | | |
| | | 4.000%, 09/01/2040 | | | 64,261 | |
| 20,220 | | Pool #AE2562, | | | | |
| | | 4.000%, 09/01/2040 | | | 21,819 | |
| 23,295 | | Pool #AE2566, | | | | |
| | | 4.000%, 09/01/2040 | | | 25,137 | |
| 135,289 | | Pool #AE4124, | | | | |
| | | 4.000%, 10/01/2040 | | | 145,989 | |
| 79,280 | | Pool #AE4888, | | | | |
| | | 4.000%, 10/01/2040 | | | 85,550 | |
| 82,415 | | Pool #AE3916, | | | | |
| | | 4.000%, 11/01/2040 | | | 88,932 | |
| 14,742 | | Pool #AE5147, | | | | |
| | | 4.000%, 11/01/2040 | | | 15,908 | |
| 166,196 | | Pool #AE8715, | | | | |
| | | 4.000%, 11/01/2040 | | | 179,339 | |
| 1,493,514 | | Pool #AH1089, | | | | |
| | | 4.000%, 11/01/2040 | | | 1,618,132 | |
| 1,761,702 | | Pool #AA4757, | | | | |
| | | 4.000%, 12/01/2040 | | | 1,901,026 | |
| 1,529,631 | | Pool #AE0698, | | | | |
| | | 4.500%, 12/01/2040 | | | 1,661,408 | |
See notes to financial statements.
66
|
GuideMarkSM Core Fixed Income Fund |
SCHEDULE OF INVESTMENTS (Unaudited) (Continued) |
September 30, 2012 |
| |
| | | | | | | | |
Principal
Amount | | | | | | Value | |
| | | | | | | | |
| | | MORTGAGE BACKED | | | | |
| | | SECURITIES (Continued) | | | | |
$ | 304,610 | | Pool #AE8893, | | | | |
| | | 4.000%, 12/01/2040 | | $ | 328,700 | |
| 17,375 | | Pool #AH0006, | | | | |
| | | 4.000%, 12/01/2040 | | | 18,750 | |
| 49,275 | | Pool #AH0020, | | | | |
| | | 4.000%, 12/01/2040 | | | 53,172 | |
| 96,462 | | Pool #AH0599, | | | | |
| | | 4.000%, 12/01/2040 | | | 104,091 | |
| 40,707 | | Pool #AH0601, | | | | |
| | | 4.000%, 12/01/2040 | | | 43,926 | |
| 130,264 | | Pool #AE7893, | | | | |
| | | 4.000%, 01/01/2041 | | | 140,565 | |
| 67,023 | | Pool #AH1263, | | | | |
| | | 4.000%, 01/01/2041 | | | 72,323 | |
| 313,959 | | Pool #AH2999, | | | | |
| | | 4.000%, 01/01/2041 | | | 338,789 | |
| 2,190,688 | | Pool #AH3373, | | | | |
| | | 5.000%, 01/01/2041 | | | 2,424,671 | |
| 339,375 | | Pool #AH4763, | | | | |
| | | 4.000%, 01/01/2041 | | | 366,215 | |
| 488,699 | | Pool #AB2265, | | | | |
| | | 4.000%, 02/01/2041 | | | 544,146 | |
| 19,429 | | Pool #AH4659, | | | | |
| | | 4.000%, 02/01/2041 | | | 20,971 | |
| 244,199 | | Pool #AH5653, | | | | |
| | | 4.000%, 02/01/2041 | | | 268,434 | |
| 105,838 | | Pool #AH5783, | | | | |
| | | 4.000%, 02/01/2041 | | | 114,241 | |
| 484,824 | | Pool #AL0934, | | | | |
| | | 5.000%, 02/01/2041 | | | 531,455 | |
| 603,421 | | Pool #AD1889, | | | | |
| | | 4.500%, 03/01/2041 | | | 655,406 | |
| 32,157 | | Pool #AH6150, | | | | |
| | | 4.000%, 03/01/2041 | | | 34,710 | |
| 119,877 | | Pool #AH6583, | | | | |
| | | 4.000%, 03/01/2041 | | | 129,395 | |
| 335,978 | | Pool #AL0146, | | | | |
| | | 4.000%, 03/01/2041 | | | 374,727 | |
| 938,906 | | Pool #AH4246, | | | | |
| | | 4.500%, 04/01/2041 | | | 1,021,552 | |
| 4,144,331 | | Pool #AH8854, | | | | |
| | | 4.500%, 04/01/2041 | | | 4,576,480 | |
| | | | | | | | |
Principal
Amount | | | | | | Value | |
| | | | | | | | |
| | | MORTGAGE BACKED | | | | |
| | | SECURITIES (Continued) | | | | |
$ | 327,451 | | Pool #AL0215, | | | | |
| | | 4.500%, 04/01/2041 | | $ | 361,595 | |
| 3,337,358 | | Pool #AL0247, | | | | |
| | | 4.000%, 04/01/2041 | | | 3,716,014 | |
| 1,363,809 | | Pool #AI1856, | | | | |
| | | 4.500%, 05/01/2041 | | | 1,517,527 | |
| 395,168 | | Pool #AL0187, | | | | |
| | | 5.000%, 05/01/2041 | | | 431,200 | |
| 3,236,109 | | Pool #AL0208, | | | | |
| | | 4.500%, 05/01/2041 | | | 3,573,553 | |
| 58,592 | | Pool #AL0456, | | | | |
| | | 5.000%, 06/01/2041 | | | 63,935 | |
| 879,200 | | Pool #AI7368, | | | | |
| | | 4.500%, 07/01/2041 | | | 956,591 | |
| 2,992,621 | | Pool #AB3395, | | | | |
| | | 4.500%, 08/01/2041 | | | 3,304,675 | |
| 1,036,907 | | Pool #AI7913, | | | | |
| | | 4.500%, 08/01/2041 | | | 1,128,181 | |
| 283,754 | | Pool #AI8154, | | | | |
| | | 4.000%, 08/01/2041 | | | 306,283 | |
| 209,507 | | Pool #AI8842, | | | | |
| | | 4.500%, 08/01/2041 | | | 227,949 | |
| 38,821 | | Pool #AJ1080, | | | | |
| | | 4.500%, 09/01/2041 | | | 42,238 | |
| 74,940 | | Pool #AL0815, | | | | |
| | | 4.000%, 09/01/2041 | | | 83,583 | |
| 25,049 | | Pool #AJ1562, | | | | |
| | | 4.000%, 10/01/2041 | | | 27,937 | |
| 29,088 | | Pool #AJ1972, | | | | |
| | | 4.000%, 10/01/2041 | | | 32,442 | |
| 4,130,724 | | Pool #AJ2212, | | | | |
| | | 4.500%, 10/01/2041 | | | 4,561,454 | |
| 54,201 | | Pool #AJ3146, | | | | |
| | | 4.500%, 10/01/2041 | | | 58,972 | |
| 271,947 | | Pool #AJ4044, | | | | |
| | | 4.000%, 10/01/2041 | | | 303,311 | |
| 39,674 | | Pool #AJ4756, | | | | |
| | | 4.000%, 10/01/2041 | | | 44,249 | |
| 2,752,507 | | Pool #AL0933, | | | | |
| | | 5.000%, 10/01/2041 | | | 3,020,691 | |
| 1,769,894 | | Pool #AB3876, | | | | |
| | | 4.000%, 11/01/2041 | | | 1,934,755 | |
See notes to financial statements.
67
|
GuideMarkSM Core Fixed Income Fund |
SCHEDULE OF INVESTMENTS (Unaudited) (Continued) |
September 30, 2012 |
| |
| | | | | | | | |
Principal
Amount | | | | | | Value | |
| | | | | | | | |
| | | MORTGAGE BACKED | | | | |
| | | SECURITIES (Continued) | | | | |
$ | 30,264 | | Pool #AJ3330, | | | | |
| | | 4.000%, 11/01/2041 | | $ | 33,755 | |
| 34,053 | | Pool #AJ4549, | | | | |
| | | 4.000%, 11/01/2041 | | | 37,981 | |
| 24,850 | | Pool #AJ4698, | | | | |
| | | 4.000%, 11/01/2041 | | | 27,716 | |
| 52,400 | | Pool #AJ5424, | | | | |
| | | 4.000%, 11/01/2041 | | | 58,443 | |
| 31,970 | | Pool #AJ7840, | | | | |
| | | 4.000%, 11/01/2041 | | | 35,658 | |
| 31,971 | | Pool #AB3995, | | | | |
| | | 4.000%, 12/01/2041 | | | 35,659 | |
| 267,829 | | Pool #AB4054, | | | | |
| | | 4.000%, 12/01/2041 | | | 298,719 | |
| 33,288 | | Pool #AI0848, | | | | |
| | | 4.000%, 12/01/2041 | | | 37,127 | |
| 30,191 | | Pool #AJ4187, | | | | |
| | | 4.000%, 12/01/2041 | | | 33,673 | |
| 40,405 | | Pool #AJ5736, | | | | |
| | | 4.000%, 12/01/2041 | | | 45,065 | |
| 41,354 | | Pool #AJ5968, | | | | |
| | | 4.000%, 12/01/2041 | | | 44,637 | |
| 37,856 | | Pool #AJ6061, | | | | |
| | | 4.000%, 12/01/2041 | | | 42,222 | |
| 513,717 | | Pool #AJ7684, | | | | |
| | | 4.000%, 12/01/2041 | | | 572,967 | |
| 26,954 | | Pool #AJ7868, | | | | |
| | | 4.000%, 12/01/2041 | | | 30,062 | |
| 56,353 | | Pool #AJ8104, | | | | |
| | | 4.000%, 12/01/2041 | | | 62,853 | |
| 32,663 | | Pool #AJ8109, | | | | |
| | | 4.000%, 12/01/2041 | | | 36,431 | |
| 24,517 | | Pool #AJ8171, | | | | |
| | | 4.000%, 12/01/2041 | | | 27,345 | |
| 42,653 | | Pool #AJ8341, | | | | |
| | | 4.000%, 12/01/2041 | | | 47,573 | |
| 63,512 | | Pool #AJ8436, | | | | |
| | | 4.000%, 12/01/2041 | | | 70,837 | |
| 26,177 | | Pool #AJ8912, | | | | |
| | | 4.000%, 12/01/2041 | | | 29,196 | |
| 31,741 | | Pool #AJ9248, | | | | |
| | | 4.000%, 12/01/2041 | | | 35,402 | |
| | | | | | | | |
Principal
Amount | | | | | | Value | |
| | | | | | | | |
| | | MORTGAGE BACKED | | | | |
| | | SECURITIES (Continued) | | | | |
$ | 54,263 | | Pool #AJ2446, | | | | |
| | | 4.000%, 01/01/2042 | | $ | 58,571 | |
| 38,898 | | Pool #AJ7538, | | | | |
| | | 4.000%, 01/01/2042 | | | 43,384 | |
| 24,423 | | Pool #AJ8001, | | | | |
| | | 4.000%, 01/01/2042 | | | 26,537 | |
| 42,798 | | Pool #AJ8369, | | | | |
| | | 4.000%, 01/01/2042 | | | 47,734 | |
| 35,826 | | Pool #AJ9162, | | | | |
| | | 4.000%, 01/01/2042 | | | 39,958 | |
| 193,729 | | Pool #AJ9330, | | | | |
| | | 4.000%, 01/01/2042 | | | 216,073 | |
| 24,495 | | Pool #AJ9779, | | | | |
| | | 4.000%, 01/01/2042 | | | 27,321 | |
| 31,361 | | Pool #AK0170, | | | | |
| | | 4.000%, 01/01/2042 | | | 34,978 | |
| 66,531 | | Pool #AK0543, | | | | |
| | | 4.000%, 01/01/2042 | | | 74,205 | |
| 27,013 | | Pool #AK0563, | | | | |
| | | 4.000%, 01/01/2042 | | | 30,128 | |
| 58,630 | | Pool #AK1827, | | | | |
| | | 4.000%, 01/01/2042 | | | 65,392 | |
| 3,874,704 | | Pool #AB4438, | | | | |
| | | 3.500%, 02/01/2042 | | | 4,180,009 | |
| 7,588,146 | | Pool #AJ0130, | | | | |
| | | 3.500%, 05/01/2042 | | | 8,149,296 | |
| 397,609 | | Pool #AO4164, | | | | |
| | | 4.000%, 06/01/2042 | | | 442,597 | |
| 199,354 | | Pool #AB5529, | | | | |
| | | 4.000%, 07/01/2042 | | | 221,910 | |
| 2,762,969 | | Pool #AB6012, | | | | |
| | | 3.000%, 08/01/2042 | | | 2,920,575 | |
| 5,064,867 | | Pool #AP1651, | | | | |
| | | 3.000%, 08/01/2042 | | | 5,353,779 | |
| 357,426 | | Pool #AB6228, | | | | |
| | | 3.500%, 09/01/2042 | | | 383,858 | |
| 3,235,747 | | Pool #AP4786, | | | | |
| | | 3.000%, 09/01/2042 | | | 3,420,322 | |
| | | Government National Mortgage | | | | |
| | | Association | | | | |
| 262,667 | | Pool #752842X, | | | | |
| | | 3.950%, 07/15/2025 | | | 287,820 | |
See notes to financial statements.
68
|
GuideMarkSM Core Fixed Income Fund |
SCHEDULE OF INVESTMENTS (Unaudited) (Continued) |
September 30, 2012 |
| |
| | | | | | | | |
Principal
Amount | | | | | | Value | |
| | | | | | | | |
| | | MORTGAGE BACKED | | | | |
| | | SECURITIES (Continued) | | | | |
$ | 33,223 | | Pool #614436X, | | | | |
| | | 5.000%, 08/15/2033 | | $ | 36,633 | |
| 691,354 | | Pool #618907X, | | | | |
| | | 5.000%, 09/15/2033 | | | 767,866 | |
| 93,208 | | Pool #605098X, | | | | |
| | | 5.000%, 03/15/2034 | | | 103,407 | |
| 88,766 | | Pool #520279X, | | | | |
| | | 5.000%, 11/15/2034 | | | 98,590 | |
| 1,342,846 | | Pool #644812X, | | | | |
| | | 6.000%, 05/15/2035 | | | 1,529,555 | |
| 1,498,674 | | Pool #688021X, | | | | |
| | | 6.000%, 10/15/2038 | | | 1,694,405 | |
| 226,969 | | Pool #736686X, | | | | |
| | | 5.000%, 02/15/2039 | | | 251,166 | |
| 1,758,364 | | Pool #723248, | | | | |
| | | 5.000%, 10/15/2039 | | | 1,950,763 | |
| 667,370 | | Pool #726382, | | | | |
| | | 5.000%, 10/15/2039 | | | 740,394 | |
| 483,080 | | Pool #782916X, | | | | |
| | | 5.500%, 02/15/2040 | | | 537,580 | |
| 2,013,692 | | Pool #752631C, | | | | |
| | | 4.500%, 10/20/2040 | | | 2,248,233 | |
| 1,821,864 | | Pool #005176M, | | | | |
| | | 5.000%, 09/20/2041 | | | 2,026,865 | |
| 955,441 | | Pool #783511M, | | | | |
| | | 4.000%, 12/20/2041 | | | 1,053,033 | |
| | | | | | | |
| | | Total Mortgage Backed Securities | | | | |
| | | (Cost $125,195,342) | | | 130,280,210 | |
| | | | | | | |
| | | MUNICIPAL DEBT OBLIGATIONS - 0.64% | | | | |
| | | California, GO, | | | | |
| 230,000 | | 7.500%, 04/01/2034 | | | 303,384 | |
| 175,000 | | 7.950%, 03/01/2036 | | | 209,268 | |
| 425,000 | | 7.550%, 04/01/2039 | | | 576,942 | |
| 315,000 | | Illinois, GO, | | | | |
| | | 7.350%, 07/01/2035 | | | 371,401 | |
| | | South Carolina Student Loan Corp., | | | | |
| | | Series A-1, Revenue Bond, | | | | |
| 396,011 | | 0.518%, 12/03/2018(d) | | | 396,011 | |
| 806,372 | | 0.557%, 12/02/2019(d) | | | 800,381 | |
| | | | | | | |
| | | Total Municipal Debt Obligations | | | | |
| | | (Cost $2,454,482) | | | 2,657,387 | |
| | | | | | | |
| | | | | | | | |
Principal
Amount | | | | | | Value | |
| | | | | | | | |
| | | U.S. GOVERNMENT AGENCY ISSUES - 1.25% | | | | |
| | | Federal Home Loan Mortgage Corp. | | | | |
$ | 300,000 | | 0.500%, 10/15/2013 | | $ | 300,966 | |
| 1,300,000 | | 1.000%, 03/08/2017 | | | 1,318,034 | |
| 400,000 | | 1.250%, 05/12/2017 | | | 409,949 | |
| 1,200,000 | | 1.000%, 06/29/2017 | | | 1,215,077 | |
| | | Federal National Mortgage Association | | | | |
| 200,000 | | 4.125%, 04/15/2014 | | | 211,932 | |
| 1,700,000 | | 0.625%, 10/30/2014 | | | 1,711,907 | |
| | | | | | | |
| | | Total U.S. Government Agency Issues | | | | |
| | | (Cost $5,101,877) | | | 5,167,865 | |
| | | | | | | |
| | | U.S. TREASURY OBLIGATIONS - 19.99% | | | | |
| | | U.S. Treasury Bonds - 4.99% | | | | |
| 2,900,000 | | 4.250%, 11/15/2014 | | | 3,144,688 | |
| 650,000 | | 5.375%, 02/15/2031 | | | 940,266 | |
| 1,525,000 | | 4.375%, 11/15/2039 | | | 2,015,859 | |
| 1,200,000 | | 4.250%, 11/15/2040 | | | 1,558,313 | |
| 500,000 | | 4.375%, 05/15/2041 | | | 662,578 | |
| 500,000 | | 3.750%, 08/15/2041 | | | 597,890 | |
| 10,490,000 | | 3.125%, 11/15/2041 | | | 11,176,770 | |
| 500,000 | | 3.125%, 02/15/2042 | | | 531,953 | |
| | | U.S. Treasury Notes - 15.00% | | | | |
| 2,750,000 | | 0.250%, 11/30/2013 | | | 2,751,826 | |
| 3,600,000 | | 0.250%, 05/31/2014 | | | 3,601,688 | |
| 5,700,000 | | 0.625%, 07/15/2014 | | | 5,739,632 | |
| 3,225,000 | | 0.375%, 03/15/2015 | | | 3,233,314 | |
| 10,550,000 | | 0.250%, 07/15/2015 | | | 10,535,990 | |
| 4,000,000 | | 1.750%, 07/31/2015 | | | 4,163,124 | |
| 2,890,000 | | 2.000%, 04/30/2016 | | | 3,055,048 | |
| 8,550,000 | | 0.875%, 01/31/2017 | | | 8,682,260 | |
| 675,000 | | 0.750%, 06/30/2017 | | | 680,221 | |
| 3,000,000 | | 2.375%, 07/31/2017 | | | 3,254,532 | |
| 3,575,000 | | 1.875%, 09/30/2017 | | | 3,794,248 | |
| 4,955,000 | | 2.000%, 11/15/2021 | | | 5,173,719 | |
| 7,035,000 | | 2.000%, 02/15/2022 | | | 7,318,053 | |
| | | | | | | |
| | | Total U.S. Treasury Obligations | | | | |
| | | (Cost $80,657,013) | | | 82,611,972 | |
| | | | | | | |
|
Number of
Shares | | | | | | | |
| | | | | | | | |
| | | SHORT TERM INVESTMENTS - 3.98% | | | | | |
| | | Money Market Funds - 3.98% | | | | | |
| 16,440,043 | | Federated Prime Obligations Fund | | | | | |
| | | Effective Yield, 0.15%, | | | | | |
| | | 01/01/2050 (d) | | | 16,440,043 | |
| | | | | | | |
| | | Total Short Term Investments | | | | | |
| | | (Cost $16,440,043) | | | 16,440,043 | |
| | | | | | | |
See notes to financial statements.
69
|
GuideMarkSM Core Fixed Income Fund |
SCHEDULE OF INVESTMENTS (Unaudited) (Continued) |
September 30, 2012 |
| |
| | | | | | | | |
Number of
Shares | | | | | | Value | |
| | | | | | | | |
| | | INVESTMENTS PURCHASED | | | | |
| | | AS SECURITIES LENDING | | | | |
| | | COLLATERAL - 0.50% | | | | |
| | | Money Market Funds - 0.50% | | | | |
| 2,051,002 | | First American Government | | | | |
| | | Obligations Fund | | | | |
| | | Effective Yield, 0.02% | | $ | 2,051,002 | |
| 4,931 | | Reserve Primary Fund (f) | | | 191 | |
| | | | | | | |
| | | Total Money Market Funds | | | | |
| | | (Cost $2,055,257) | | | 2,051,193 | |
| | | | | | | |
| | | | | | | | |
Principal
Amount | | | | | | Value | |
| | | | | | | | |
| | | Cash - 0.00% | | | | |
$ | 24,365 | | Cash | | $ | 24,365 | |
| | | | | | | |
| | | Total Cash (Cost $24,365) | | | 24,365 | |
| | | | | | | |
| | | Total Investments Purchased as | | | | |
| | | Securities Lending Collateral | | | | |
| | | (Cost $2,079,622) | | | 2,075,558 | |
| | | | | | | |
| | | Total Investments | | | | |
| | | (Cost $401,382,740) - 101.07% | | | 417,802,924 | |
| | | Liabilities in Excess of | | | | |
| | | Other Assets - (1.07)% | | | (4,434,400 | ) |
| | | | | | | |
| | | TOTAL NET | | | | |
| | | ASSETS - 100.00% | | $ | 413,368,524 | |
| | | | | | | |
| |
Percentages are stated as a percent of net assets. |
(a) | All or portion of this security is on loan. |
(b) | Restricted securities as defined in Rule 144(d) under the Securities Act of 1933. Such securities are treated as liquid securities according to the Fund’s liquidity guidelines. The value of these securities total $8,690,695, which represents 2.10% of total net assets. |
(c) | Restricted securities as defined in Rule 144(d) under the Securities Act of 1933. Such securities are treated as illiquid securities according to the Fund’s liquidity guidelines. The value of thses securities total $12,625, which represents 0.00% of total net assets. |
(d) | Variable Rate Security. The rate shown is the rate in effect on September 30, 2012. |
(e) | Non-income producing. Security is treated as an illiquid security according to the Fund’s liquidity guidelines. Item identified as in default as to payment of interest. |
(f) | As of September 30, 2012, the Fund has fair valued this security and deemed it illiquid. The value of this security was $191, which represents 0.00% of total net assets. |
See notes to financial statements.
70
|
GuideMarkSM Tax-Exempt Fixed Income Fund |
SCHEDULE OF INVESTMENTS (Unaudited) |
September 30, 2012 |
| |
| | | | | | | | |
Principal
Amount | | | | | | Value | |
| | | | | | | | |
| | | MUNICIPAL DEBT OBLIGATIONS - 98.41% | | | | |
| | | Alaska - 0.73% | | | | |
$ | 500,000 | | Valdez Marine Terminal - BP Pipelines, | | | | |
| | | Series B, Refunding, Revenue Bond, | | | | |
| | | BP Plc Insured, | | | | |
| | | 5.000%, 01/01/2021 | | $ | 598,765 | |
| | | | | | | |
| | | Arizona - 3.13% | | | | |
| 750,000 | | Phoenix Civic Improvement | | | | |
| | | Wastewater System, Refunding, | | | | |
| | | Revenue Bond, | | | | |
| | | 5.000%, 07/01/2020 | | | 868,642 | |
| 500,000 | | Pinal County Industrial Development | | | | |
| | | Authority Correctional Facilities, | | | | |
| | | Revenue Bond, ACA Insured, | | | | |
| | | 5.250%, 10/01/2015 | | | 536,440 | |
| 1,000,000 | | Salt River Project, Series A, | | | | |
| | | Revenue Bond, | | | | |
| | | 5.000%, 01/01/2021 | | | 1,167,620 | |
| | | | | | | |
| | | | | | 2,572,702 | |
| | | | | | | |
| | | Arkansas - 0.93% | | | | |
| 210,000 | | Springdale School District, | | | | |
| | | Refunding, GO, | | | | |
| | | 3.000%, 06/01/2024 | | | 210,449 | |
| 500,000 | | University of Arkansas, Series A, | | | | |
| | | Revenue Bond, | | | | |
| | | 4.125%, 11/01/2030 | | | 551,930 | |
| | | | | | | |
| | | | | | 762,379 | |
| | | | | | | |
| | | California - 9.66% | | | | |
| 445,000 | | California Economic Recovery, | | | | |
| | | Series A, Refunding, GO, | | | | |
| | | 5.250%, 07/01/2021 | | | 549,081 | |
| 400,000 | | California Municipal Finance Authority, | | | | |
| | | Mobile Home Park, Series A, | | | | |
| | | Refunding, Revenue Bond, | | | | |
| | | 6.400%, 08/15/2045 | | | 441,772 | |
| 500,000 | | California Statewide Communities | | | | |
| | | Development Authority, Refunding, | | | | |
| | | Revenue Bond, | | | | |
| | | 6.125%, 07/01/2046 | | | 520,560 | |
| 500,000 | | California Statewide Community | | | | |
| | | Development Authority, Series A, | | | | |
| | | Revenue Bond, | | | | |
| | | 5.000%, 04/01/2042 | | | 549,960 | |
| | | | | | | | |
Principal
Amount | | | | | | Value | |
| | | | | | | | |
| | | California (Continued) | | | | |
$ | 1,000,000 | | California, GO, | | | | |
| | | 6.500%, 04/01/2033 | | $ | 1,264,440 | |
| 100,000 | | California, Refunding, GO, | | | | |
| | | 5.000%, 09/01/2022 | | | 123,108 | |
| 1,000,000 | | Gilroy Unified School District, GO, | | | | |
| | | Assured Guaranty Insured, | | | | |
| | | 6.000%, 08/01/2025 | | | 1,216,300 | |
| | | Golden State Tobacco Securitization, | | | | |
| | | Series A, Refunding, Revenue Bond, | | | | |
| 175,000 | | 5.125%, 06/01/2047 | | | 134,809 | |
| 325,000 | | 5.750%, 06/01/2047 | | | 277,079 | |
| 700,000 | | Golden State Tobacco Securitization, | | | | |
| | | Series A, Revenue Bond, | | | | |
| | | 5.000%, 06/01/2017 | | | 701,568 | |
| 1,000,000 | | Los Angeles Department of Airports, | | | | |
| | | Series A, Refunding, Revenue Bond, | | | | |
| | | 5.250%, 05/15/2029 | | | 1,173,380 | |
| 500,000 | | San Mateo Joint Powers Financing | | | | |
| | | Authority, Series A, Refunding, | | | | |
| | | Revenue Bond, | | | | |
| | | 5.250%, 07/15/2025 | | | 587,020 | |
| 345,000 | | University of California, Series G, | | | | |
| | | Refunding, Revenue Bond, | | | | |
| | | 5.000%, 05/15/2042 | | | 396,661 | |
| | | | | | | |
| | | | | | 7,935,738 | |
| | | | | | | |
| | | Colorado - 1.01% | | | | |
| 700,000 | | Regional Transportation District, | | | | |
| | | Revenue Bond, | | | | |
| | | 6.000%, 01/15/2026 | | | 834,057 | |
| | | | | | | |
| | | Connecticut - 1.29% | | | | |
| | | Connecticut Health & Educational | | | | |
| | | Facilities Authority, Series A, | | | | |
| | | Refunding, Revenue Bond, | | | | |
| 500,000 | | 5.000%, 07/01/2025 | | | 603,920 | |
| 450,000 | | 4.000%, 07/01/2049 (a) | | | 455,981 | |
| | | | | | | |
| | | | | | 1,059,901 | |
| | | | | | | |
| | | Delaware - 0.61% | | | | |
| 500,000 | | New Castle County, Revenue Bond, | | | | |
| | | 5.000%, 09/01/2036 | | | 504,750 | |
| | | | | | | |
| | | Florida - 2.55% | | | | |
| 300,000 | | Brevard County Health Facilities | | | | |
| | | Authority, Revenue Bond, | | | | |
| | | 7.000%, 04/01/2039 | | | 369,339 | |
See notes to financial statements.
71
|
GuideMarkSM Tax-Exempt Fixed Income Fund |
SCHEDULE OF INVESTMENTS (Unaudited) (Continued) |
September 30, 2012 |
| |
| | | | | | | | |
Principal
Amount | | | | | | Value | |
| | | | | | | | |
| | | MUNICIPAL DEBT OBLIGATIONS (Continued) | | | | |
| | | Florida (Continued) | | | | |
$ | 500,000 | | Florida Board of Education, Series C, | | | | |
| | | Refunding, GO, | | | | |
| | | 4.000%, 06/01/2025 | | $ | 571,850 | |
| 500,000 | | Miami-Dade County Health Facilities, | | | | |
| | | Series A, Refunding, Revenue Bond, | | | | |
| | | 5.250%, 08/01/2021 | | | 565,650 | |
| 500,000 | | Miami-Dade County Transit Sales | | | | |
| | | Surtax, Revenue Bond, | | | | |
| | | 5.000%, 07/01/2031 | | | 585,310 | |
| | | | | | | |
| | | | | | 2,092,149 | |
| | | | | | | |
| | | Georgia - 2.45% | | | | |
| 500,000 | | Atlanta Water & Wastewater, | | | | |
| | | Revenue Bond, | | | | |
| | | 6.250%, 11/01/2039 | | | 610,405 | |
| 1,000,000 | | Fulton County School District, | | | | |
| | | Refunding, GO, | | | | |
| | | 5.250%, 01/01/2014 | | | 1,061,300 | |
| 325,000 | | Marietta Development Authority, | | | | |
| | | Revenue Bond, | | | | |
| | | 7.000%, 06/15/2039 | | | 344,955 | |
| | | | | | | |
| | | | | | 2,016,660 | |
| | | | | | | |
| | | Hawaii - 0.71% | | | | |
| 500,000 | | Hawaii, Series DJ, GO, | | | | |
| | | 5.000%, 04/01/2024 | | | 584,565 | |
| | | | | | | |
| | | Idaho - 1.43% | | | | |
| 1,000,000 | | Boise-Kuna District, Revenue Bond, | | | | |
| | | 7.375%, 06/01/2034 | | | 1,173,810 | |
| | | | | | | |
| | | Illinois - 3.30% | | | | |
| 225,000 | | Illinois Financial Authority, | | | | |
| | | Revenue Bond, | | | | |
| | | 7.000%, 08/15/2044 | | | 270,403 | |
| 400,000 | | Northlake, GO, FGIC Insured, | | | | |
| | | 5.000%, 12/01/2029 | | | 435,968 | |
| | | Railsplitter Tobacco Settlement | | | | |
| | | Authority, Revenue Bond, | | | | |
| 750,000 | | 5.000%, 06/01/2018 | | | 859,035 | |
| 500,000 | | 6.250%, 06/01/2024 | | | 557,025 | |
| 500,000 | | University of Illinois, Series C, | | | | |
| | | Revenue Bond, | | | | |
| | | 5.000%, 04/01/2026 | | | 588,235 | |
| | | | | | | |
| | | | | | 2,710,666 | |
| | | | | | | |
| | | | | | | | |
Principal
Amount | | | | | | Value | |
| | | | | | | | |
| | | Indiana - 3.47% | | | | |
$ | 500,000 | | Fishers Industry Redevelopment | | | | |
| | | District, Saxony Project, Revenue Bond, | | | | |
| | | 5.250%, 07/15/2034 | | $ | 563,675 | |
| 1,000,000 | | Indiana State Finance Authority, Series A, | | | | |
| | | Refunding, Revenue Bond, | | | | |
| | | 5.000%, 02/01/2021 | | | 1,233,410 | |
| 400,000 | | Sheridan Community School’s | | | | |
| | | Building Corporation, Revenue Bond, | | | | |
| | | FSA Insured, | | | | |
| | | 5.500%, 07/15/2020 | | | 473,928 | |
| 500,000 | | Tri-Creek Middle School Building | | | | |
| | | Corporation, Revenue Bond, | | | | |
| | | FSA Insured, | | | | |
| | | 5.250%, 07/15/2021 | | | 578,550 | |
| | | | | | | |
| | | | | | 2,849,563 | |
| | | | | | | |
| | | Iowa - 1.28% | | | | |
| 400,000 | | Iowa Board of Regents, Revenue Bond, | | | �� | |
| | | 4.000%, 09/01/2034 | | | 414,240 | |
| 600,000 | | Iowa Finance Authority Pollution | | | | |
| | | Control, Revenue Bond, FGIC Insured, | | | | |
| | | 5.000%, 07/01/2014 | | | 637,944 | |
| | | | | | | |
| | | | | | 1,052,184 | |
| | | | | | | |
| | | Kansas - 0.48% | | | | |
| 560,000 | | Wyandotte County/Kansas City | | | | |
| | | Unified Government, Series B, | | | | |
| | | Refunding, Revenue Bond, | | | | |
| | | 0.000%, 06/01/2021 (b) | | | 396,374 | |
| | | | | | | |
| | | Kentucky - 1.23% | | | | |
| 1,000,000 | | Pikeville Hospital, Revenue Bond, | | | | |
| | | 3.000%, 09/01/2013 | | | 1,014,980 | |
| | | | | | | |
| | | Louisiana - 2.40% | | | | |
| 800,000 | | Louisiana Citizens Property, | | | | |
| | | Revenue Bond, | | | | |
| | | 6.750%, 06/01/2026 | | | 967,128 | |
| 500,000 | | Louisiana Public Facilities Authority, | | | | |
| | | Revenue Bond, | | | | |
| | | 5.500%, 05/15/2032 | | | 676,340 | |
| 300,000 | | St. Charles Parish Louisana Gulf, | | | | |
| | | Revenue Bond, | | | | |
| | | 4.000%, 12/01/2040 (a) | | | 326,565 | |
| | | | | | | |
| | | | | | 1,970,033 | |
| | | | | | | |
See notes to financial statements.
72
|
GuideMarkSM Tax-Exempt Fixed Income Fund |
SCHEDULE OF INVESTMENTS (Unaudited) (Continued) |
September 30, 2012 |
| |
| | | | | | | | |
Principal
Amount | | | | | | Value | |
| | | | | | | | |
| | | MUNICIPAL DEBT OBLIGATIONS (Continued) | | | | |
| | | Maryland - 2.37% | | | | |
$ | 325,000 | | Anne Arundel County, Tax Allocation, | | | | |
| | | 6.100%, 07/01/2040 | | $ | 352,625 | |
| 600,000 | | Maryland Department of Transportation | | | | |
| | | County T Construction, Revenue Bond, | | | | |
| | | 5.500%, 02/01/2017 | | | 726,840 | |
| 400,000 | | Maryland Economic Development | | | | |
| | | Corporation, Series A, Revenue Bond, | | | | |
| | | 5.750%, 06/01/2035 | | | 434,772 | |
| 400,000 | | Maryland Student Housing Economic | | | | |
| | | Development, Revenue Bond, | | | | |
| | | 5.750%, 06/01/2033 | | | 432,180 | |
| | | | | | | |
| | | | | | 1,946,417 | |
| | | | | | | |
| | | Massachusetts - 3.84% | | | | |
| 430,000 | | Massachusetts Development Finance | | | | |
| | | Agency, Series A, Revenue Bond, | | | | |
| | | 5.450%, 04/15/2014 | | | 445,798 | |
| | | Massachusetts Health & Educational | | | | |
| | | Facilities Authority, Series A, | | | | |
| | | Refunding, Revenue Bond, | | | | |
| 500,000 | | 5.000%, 12/15/2029 | | | 600,475 | |
| 785,000 | | 5.500%, 11/15/2036 | | | 955,549 | |
| 500,000 | | Massachusetts Health & Educational | | | | |
| | | Facilities Authority, Series B, | | | | |
| | | Revenue Bond, | | | | |
| | | 5.000%, 10/01/2038 | | | 582,860 | |
| 500,000 | | Massachusetts, Series D, | | | | |
| | | Refunding, GO, | | | | |
| | | 4.250%, 10/01/2027 | | | 568,365 | |
| | | | | | | |
| | | | | | 3,153,047 | |
| | | | | | | |
| | | Michigan - 1.04% | | | | |
| 800,000 | | Lansing School District, Refunding, | | | | |
| | | GO, Q-SBLF Insured, | | | | |
| | | 5.000%, 05/01/2017 | | | 859,008 | |
| | | | | | | |
| | | Minnesota - 2.73% | | | | |
| 700,000 | | Minneapolis & St. Paul Housing and | | | | |
| | | Redevolpment Authority Health Care, | | | | |
| | | Revenue Bond, | | | | |
| | | 4.000%, 08/15/2015 | | | 747,691 | |
| 250,000 | | Rochester Health Care Facilities | | | | |
| | | Mayo Clinic, Revenue Bond, | | | | |
| | | 4.000%, 11/15/2041 | | | 262,732 | |
| | | | | | | | |
Principal
Amount | | | | | | Value | |
| | | | | | | | |
| | | Minnesota (Continued) | | | | |
$ | 560,000 | | Rochester Health Care Facilities Mayo | | | | |
| | | Clinic, Series C, Revenue Bond, | | | | |
| | | 4.500%, 11/15/2038 (a) | | $ | 675,097 | |
| 500,000 | | Tobacco Securitization Authority, | | | | |
| | | Series B, Revenue Bond, | | | | |
| | | 5.250%, 03/01/2031 | | | 560,680 | |
| | | | | | | |
| | | | | | 2,246,200 | |
| | | | | | | |
| | | Missouri - 5.08% | | | | |
| 810,000 | | Hannibal Industrial Development | | | | |
| | | Authority, Hannibal Regional | | | | |
| | | Hospital, Refunding, Revenue Bond, | | | | |
| | | 5.250%, 09/01/2018 | | | 844,935 | |
| 700,000 | | Missouri Development Finance Board, | | | | |
| | | Revenue Bond, | | | | |
| | | 5.750%, 06/01/2034 | | | 730,009 | |
| 500,000 | | Missouri Health & Educational | | | | |
| | | Facilities Authority, Series A, | | | | |
| | | Revenue Bond, | | | | |
| | | 5.375%, 03/15/2039 | | | 576,110 | |
| 1,000,000 | | Missouri Highway & Transportation | | | | |
| | | Commission, Series B, Revenue Bond, | | | | |
| | | 5.000%, 05/01/2024 | | | 1,144,790 | |
| 250,000 | | Sikeston Electric, Refunding, | | | | |
| | | Revenue Bond, | | | | |
| | | 5.000%, 06/01/2018 | | | 289,223 | |
| 500,000 | | St. Louis Airport, Revenue Bond, | | | | |
| | | 6.625%, 07/01/2034 | | | 588,510 | |
| | | | | | | |
| | | | | | 4,173,577 | |
| | | | | | | |
| | | Nebraska - 0.73% | | | | |
| 500,000 | | Omaha Public Power Distributors, | | | | |
| | | Series B, Revenue Bond, | | | | |
| | | 5.000%, 02/01/2027 | | | 601,770 | |
| | | | | | | |
| | | New Jersey - 2.58% | | | | |
| 500,000 | | New Jersey Economic Development | | | | |
| | | Authority, Refunding, Revenue Bond, | | | | |
| | | 5.000%, 06/15/2026 | | | 550,830 | |
| 500,000 | | New Jersey State Transportation Trust | | | | |
| | | Fund Authority, Series A, Refunding, | | | | |
| | | Revenue Bond, | | | | |
| | | 5.500%, 12/15/2021 | | | 637,205 | |
| 500,000 | | New Jersey State Transportation Trust | | | | |
| | | Fund Authority, Series B, Revenue Bond, | | | | |
| | | 5.000%, 06/15/2042 | | | 566,635 | |
See notes to financial statements.
73
|
GuideMarkSM Tax-Exempt Fixed Income Fund |
SCHEDULE OF INVESTMENTS (Unaudited) (Continued) |
September 30, 2012 |
| |
| | | | | | | | |
Principal
Amount | | | | | | Value | |
| | | | | | | | |
| | | MUNICIPAL DEBT OBLIGATIONS (Continued) | | | | |
| | | New Jersey (Continued) | | | | |
$ | 300,000 | | New Jersey Turnpike Authority, | | | | |
| | | Series B, Refunding, Revenue Bond, | | | | |
| | | 5.000%, 01/01/2022 | | $ | 369,345 | |
| | | | | | | |
| | | | | | 2,124,015 | |
| | | | | | | |
| | | New York - 9.95% | | | | |
| 325,000 | | Brooklyn Arena Local Development | | | | |
| | | Corporation, Revenue Bond, | | | | |
| | | 6.500%, 07/15/2030 | | | 392,759 | |
| 500,000 | | Build NYC Resource Corp., | | | | |
| | | Refunding, Revenue Bond, | | | | |
| | | 5.000%, 08/01/2020 | | | 595,005 | |
| 480,000 | | Hudson Yards Infrastructure Corp., | | | | |
| | | Series A, Revenue Bond | | | | |
| | | 5.750%, 02/15/2047 | | | 567,269 | |
| 1,000,000 | | Metropolitan Transportation | | | | |
| | | Authority, Series F, Revenue Bond, | | | | |
| | | 5.000%, 11/15/2014 | | | 1,094,850 | |
| 40,000 | | New York City Industrial Development | | | | |
| | | Agency, Series A, Refunding, | | | | |
| | | Revenue Bond, | | | | |
| | | 5.000%, 07/01/2022 | | | 43,065 | |
| 325,000 | | New York Dormitory Authority, | | | | |
| | | Revenue Bond, | | | | |
| | | 6.125%, 12/01/2029 | | | 359,187 | |
| 300,000 | | New York Dormitory Authority, | | | | |
| | | Series A, Refunding, Revenue Bond, | | | | |
| | | 4.000%, 07/01/2037 | | | 321,762 | |
| 250,000 | | New York Dormitory Authority, | | | | |
| | | Series B, Refunding, Revenue Bond, | | | | |
| | | 5.000%, 07/01/2038 | | | 290,817 | |
| 500,000 | | New York Environmental Facilities, | | | | |
| | | Revenue Bond, | | | | |
| | | 5.500%, 10/15/2027 | | | 697,720 | |
| | | New York State Liberty Development | | | | |
| | | Corp., Refunding, Revenue Bond, | | | | |
| 180,000 | | 5.000%, 09/15/2040 | | | 204,981 | |
| 320,000 | | 5.000%, 09/15/2043 | | | 352,915 | |
| 500,000 | | New York State Liberty Development | | | | |
| | | Corp., Revenue Bond, | | | | |
| | | 5.750%, 11/15/2051 | | | 589,710 | |
| 900,000 | | New York, GO, | | | | |
| | | 5.375%, 04/01/2036 | | | 1,032,714 | |
| | | | | | | | |
Principal
Amount | | | | | | Value | |
| | | | | | | | |
| | | New York (Continued) | | | | |
$ | 500,000 | | New York, Series E, GO, | | | | |
| | | 4.000%, 12/15/2027 | | $ | 566,115 | |
| 500,000 | | Sales Tax Asset Receivable Corp., | | | | |
| | | Series A, Revenue Bond, | | | | |
| | | 5.250%, 10/15/2019 | | | 549,060 | |
| 500,000 | | Tobacco Settlement Financing, | | | | |
| | | Revenue Bond, | | | | |
| | | 5.250%, 06/01/2021 | | | 516,535 | |
| | | | | | | |
| | | | | | 8,174,464 | |
| | | | | | | |
| | | North Carolina - 0.71% | | | | |
| 500,000 | | North Carolina Capital Facilities | | | | |
| | | Finance Agency, Series B, | | | | |
| | | Refunding, Revenue Bond, | | | | |
| | | 5.000%, 10/01/2038 | | | 581,335 | |
| | | | | | | |
| | | North Dakota - 0.71% | | | | |
| 500,000 | | University of North Dakota, | | | | |
| | | Refunding, Revenue, | | | | |
| | | 5.000%, 04/01/2032 | | | 585,695 | |
| | | | | | | |
| | | Ohio - 3.30% | | | | |
| 500,000 | | Buckeye Tobacco Settlement | | | | |
| | | Financial Authority, Series A, | | | | |
| | | Revenue Bond, | | | | |
| | | 5.875%, 06/01/2047 | | | 403,645 | |
| 500,000 | | Ohio Air Quality Development | | | | |
| | | Authority, Series A, Revenue Bond, | | | | |
| | | 5.700%, 08/01/2020 | | | 585,170 | |
| 500,000 | | Ohio Higher Education Facilities | | | | |
| | | Commission, Refunding, | | | | |
| | | Revenue Bond, | | | | |
| | | 5.000%, 01/01/2026 | | | 591,710 | |
| 1,000,000 | | Ohio, Series A, GO, | | | | |
| | | 5.000%, 09/01/2015 | | | 1,130,510 | |
| | | | | | | |
| | | | | | 2,711,035 | |
| | | | | | | |
| | | Oregon - 0.57% | | | | |
| 400,000 | | Clackamas County School District, GO, | | | | |
| | | 5.000%, 06/15/2021 (a) | | | 465,272 | |
| | | | | | | |
| | | Pennsylvania - 8.95% | | | | |
| 1,250,000 | | Allegheny County Hospital | | | | |
| | | Development Authority, Series A, | | | | |
| | | Revenue Bond, | | | | |
| | | 5.000%, 09/01/2014 | | | 1,356,850 | |
See notes to financial statements.
74
|
GuideMarkSM Tax-Exempt Fixed Income Fund |
SCHEDULE OF INVESTMENTS (Unaudited) (Continued) |
September 30, 2012 |
| |
| | | | | | | | |
Principal
Amount | | | | | | Value | |
| | | | | | | | |
| | MUNICIPAL DEBT OBLIGATIONS (Continued) | | | | |
| | | Pennsylvania (Continued) | | | | |
$ | 180,000 | | Allegheny County Industrial | | | | |
| | | Development Authority, Refunding, | | | | |
| | | Revenue Bond, | | | | |
| | | 6.500%, 05/01/2017 | | $ | 194,737 | |
| 500,000 | | Butler County Hospital Authority, | | | | |
| | | Revenue Bond, | | | | |
| | | 7.125%, 07/01/2029 | | | 621,260 | |
| 1,000,000 | | Lycoming County College, | | | | |
| | | Revenue Bond, | | | | |
| | | 5.500%, 07/01/2026 | | | 1,190,140 | |
| 200,000 | | Montgomery County Industrial | | | | |
| | | Development Authority, | | | | |
| | | Revenue Bond, | | | | |
| | | 6.000%, 02/01/2021 | | | 204,196 | |
| 400,000 | | Pennsylvania Economic Development | | | | |
| | | Financing Authority, Albert Einstein | | | | |
| | | Health Care, Series A, Refunding, | | | | |
| | | Revenue Bond, | | | | |
| | | 6.250%, 10/15/2023 | | | 468,592 | |
| 325,000 | | Pennsylvania Economic Development | | | | |
| | | Financing Authority, Allegheny | | | | |
| | | Energy Supply, Revenue Bond, | | | | |
| | | 7.000%, 07/15/2039 | | | 389,444 | |
| | | Pennsylvania Higher Educational | | | | |
| | | Facilities Authority, Revenue Bond, | | | | |
| 500,000 | | 5.250%, 07/01/2019 | | | 573,135 | |
| 400,000 | | 5.800%, 07/01/2030 | | | 453,212 | |
| 1,000,000 | | Pennsylvania, Refunding, GO, | | | | |
| | | 5.250%, 02/01/2014 | | | 1,064,990 | |
| 500,000 | | Philadelphia Gas Works, Refunding, | | | | |
| | | Revenue Bond, | | | | |
| | | 5.250%, 08/01/2017 | | | 580,915 | |
| 250,000 | | Tioga County Industrial Development | | | | |
| | | Authority Student Housing, | | | | |
| | | Series C-1, Revenue Bond, | | | | |
| | | 3.000%, 03/01/2014 | | | 254,335 | |
| | | | | | | |
| | | | | | 7,351,806 | |
| | | | | | | |
| | | Puerto Rico - 2.01% | | | | |
| 120,000 | | Puerto Rico Aqueduct & Sewer | | | | |
| | | Authority, Series A, Refunding, | | | | |
| | | Revenue Bond, | | | | |
| | | 6.000%, 07/01/2047 | | | 127,255 | |
| | | | | | | | |
Principal
Amount | | | | | | Value | |
| | | | | | | | |
| | | Puerto Rico (Continued) | | | | |
$ | 375,000 | | Puerto Rico Commonwealth, | | | | |
| | | Series A, Refunding, Revenue Bond, | | | | |
| | | Assured Guaranty Insured, | | | | |
| | | 5.000%, 07/01/2016 | | $ | 414,952 | |
| 620,000 | �� | Puerto Rico Commonwealth, Series B, | | | | |
| | | Prerefunded, Refunding, GO, | | | | |
| | | 5.250%, 07/01/2032 | | | 729,864 | |
| 380,000 | | Puerto Rico Electric Power Authority, | | | | |
| | | Series A, Revenue Bond, | | | | |
| | | 5.000%, 07/01/2042 | | | 379,970 | |
| | | | | | | |
| | | | | | 1,652,041 | |
| | | | | | | |
| | | South Dakota - 0.64% | | | | |
| 500,000 | | South Dakota Housing Development | | | | |
| | | Authority, Series A, Revenue Bond, | | | | |
| | | 4.250%, 05/01/2015 | | | 522,560 | |
| | | | | | | |
| | | Texas - 8.93% | | | | |
| 430,000 | | Central Texas Regional Mobility | | | | |
| | | Authority, Revenue Bond, | | | | |
| | | 6.000%, 01/01/2041 | | | 502,356 | |
| 635,000 | | Clifton Texas Higher Education | | | | |
| | | Finance Corporation, Series A, | | | | |
| | | Refunding, Revenue Bond, | | | | |
| | | 4.000%, 12/01/2015 | | | 662,184 | |
| 515,000 | | Frisco Texas Independent School | | | | |
| | | District, Series A, GO, | | | | |
| | | 6.000%, 08/15/2038 | | | 629,124 | |
| 425,000 | | Harris County Industrial | | | | |
| | | Development, Revenue Bond, | | | | |
| | | 5.000%, 02/01/2023 | | | 472,447 | |
| 500,000 | | Houston, GO, | | | | |
| | | 5.250%, 03/01/2028 | | | 585,735 | |
| 580,000 | | La Porte Independent School | | | | |
| | | District, GO, | | | | |
| | | 5.250%, 02/15/2024 | | | 647,611 | |
| 500,000 | | Mansfield Independent School | | | | |
| | | District, GO, | | | | |
| | | 1.750%, 08/01/2042 | | | 516,910 | |
| 250,000 | | North Texas Tollway Authority, | | | | |
| | | Series A, Revenue Bond, | | | | |
| | | 5.000%, 09/01/2020 | | | 305,235 | |
| 770,000 | | North Texas Tollway Authority, | | | | |
| | | Series E, Refunding, Revenue Bond, | | | | |
| | | 5.750%, 01/01/2038 (a) | | | 880,610 | |
See notes to financial statements.
75
|
GuideMarkSM Tax-Exempt Fixed Income Fund |
SCHEDULE OF INVESTMENTS (Unaudited) (Continued) |
September 30, 2012 |
| |
| | | | | | | | |
Principal
Amount | | | | | | Value | |
| | | | | | | | |
| | | MUNICIPAL DEBT OBLIGATIONS (Continued) | | | | |
| | | Texas (Continued) | | | | |
$ | 400,000 | | Texas Private Activity Surface | | | | |
| | | Transportation Corp., | | | | |
| | | LBJ Infrastructure, Revenue Bond, | | | | |
| | | 7.500%, 06/30/2033 | | $ | 507,652 | |
| 445,000 | | Texas Private Activity Surface | | | | |
| | | Transportation Corp., Revenue Bond, | | | | |
| | | 7.500%, 12/31/2031 | | | 560,923 | |
| 500,000 | | Texas Transportation Commission, | | | | |
| | | Revenue Bond, | | | | |
| | | 5.000%, 04/01/2018 | | | 598,640 | |
| 400,000 | | Texas, Series A, GO, | | | | |
| | | 5.000%, 04/01/2022 | | | 472,080 | |
| | | | | | | |
| | | | | | 7,341,507 | |
| | | | | | | |
| | | Utah - 1.48% | | | | |
| 1,000,000 | | Utah Associated Municipal Power | | | | |
| | | Systems San Juan Project, | | | | |
| | | Refunding, Revenue Bond, | | | | |
| | | 5.500%, 06/01/2022 | | | 1,214,060 | |
| | | | | | | |
| | | Virginia - 2.19% | | | | |
| 1,000,000 | | Henry County Public Service | | | | |
| | | Authority Water & Sewer, Refunding, | | | | |
| | | Revenue Bond, FSA Insured, | | | | |
| | | 5.500%, 11/15/2019 | | | 1,224,380 | |
| 400,000 | | Virginia College Building Authority | | | | |
| | | Educational Facilities, Revenue Bond, | | | | |
| | | 5.750%, 01/01/2034 | | | 576,636 | |
| | | | | | | |
| | | | | | 1,801,016 | |
| | | | | | | |
| | | Washington - 1.40% | | | | |
| 500,000 | | Energy Northwest Washington | | | | |
| | | Electric, Series D, Revenue Bond, | | | | |
| | | 5.000%, 07/01/2035 | | | 586,235 | |
| 500,000 | | King County Hospital, Refunding, GO, | | | | |
| | | MBIA Insured, | | | | |
| | | 5.000%, 12/01/2021 | | | 566,005 | |
| | | | | | | |
| | | | | | 1,152,240 | |
| | | | | | | |
| | | Wisconsin - 2.54% | | | | |
| 500,000 | | Southeast Wisconsin Professional | | | | |
| | | Baseball Park Sales Tax, Series A, | | | | |
| | | Revenue Bond, MBIA Insured, | | | | |
| | | 5.500%, 12/15/2026 | | | 612,960 | |
| | | | | | | | |
Principal
Amount | | | | | | Value | |
| | | | | | | | |
| | | Wisconsin (Continued) | | | | |
$ | 220,000 | | Wisconsin Public Finance Authority, | | | | |
| | | Refunding, Revenue Bond, | | | | |
| | | 5.000%, 07/01/2022 | | $ | 235,761 | |
| 1,000,000 | | Wisconsin, Series A, Refunding, | | | | |
| | | Revenue Bond, | | | | |
| | | 6.000%, 05/01/2033 | | | 1,236,340 | |
| | | | | | | |
| | | | | | 2,085,061 | |
| | | | | | | |
| | | Total Municipal Debt Obligations | | | | |
| | | (Cost $72,934,245) | | | 80,871,402 | |
| | | | | | | |
| | | | | | | |
Number of
Shares | | | | | | |
| | | | | | | |
| | | SHORT TERM INVESTMENTS - 1.93% | | | | |
| | | Money Market Funds - 1.93% | | | | |
| 1,588,494 | | Fidelity Tax Exempt Portfolio | | | | |
| | | Effective Yield, 0.01% (a) | | | 1,588,494 | |
| | | | | | | |
| | | Total Short Term Investments | | | | |
| | | (Cost $1,588,494) | | | 1,588,494 | |
| | | | | | | |
| | | Total Investments | | | | |
| | | (Cost $74,522,739) - 100.34% | | | 82,459,896 | |
| | | Liabilities in Excess of | | | | |
| | | Other Assets - (0.34)% | | | (277,527 | ) |
| | | | | | | |
| | | TOTAL NET ASSETS - 100.00% | | $ | 82,182,369 | |
| | | | | | | |
| |
Percentages are stated as a percent of net assets. |
(a) | Variable Rate Security. The rate shown is the rate in effect on September 30, 2012. |
(b) | Zero coupon bond. |
| |
Glossary of Terms |
ACA | - American Capital Access |
FGIC | - Financial Guaranty Insurance Corp. |
FSA | - Financial Security Assurance, Inc. |
GO | - General Obligation |
MBIA | - Municipal Bond Investors Assurance Corp. |
Q-SBLF | - Qualified School Board Loan |
See notes to financial statements.
76
|
GuideMarkSM Opportunistic Fixed Income Fund |
SCHEDULE OF INVESTMENTS (Unaudited) |
September 30, 2012 |
| |
| | | | | | | | |
Principal
Amount | | | | | | Value | |
| | | | | | | | |
| | | ASSET BACKED SECURITIES - 0.69% | | | | |
$ | 754,872 | | Diamond Resorts Owner Trust | | | | |
| | | 2011-1A, 4.000%, 03/20/2023 | | | | |
| | | (Acquired 04/21/2011, | | | | |
| | | Cost $749,657) (b) | | $ | 768,503 | |
| 800,246 | | GSAA Trust | | | | |
| | | 2005-11, 0.497%, 10/25/2035 (c) | | | 704,601 | |
| 270,013 | | Sierra Receivables Funding Co. LLC | | | | |
| | | 2012-1A, 2.840%, 11/20/2028 | | | | |
| | | (Acquired 03/14/2012, | | | | |
| | | Cost $269,956) (b) | | | 273,388 | |
| | | | | | | |
| | | Total Asset Backed Securities | | | | |
| | | (Cost $1,673,905) | | | 1,746,492 | |
| | | | | | | |
| | | BANK LOANS - 2.49% | | | | |
| 85,000 | | Acosta | | | | |
| | | 0.350%, 03/02/2018 | | | 85,531 | |
| 65,000 | | ADS Waste Holding, Inc. | | | | |
| | | 4.364%, 09/25/2019 | | | 65,542 | |
| | | AmWINS Group, Inc. | | | | |
| 23,000 | | 10.250%, 11/23/2019 | | | 23,067 | |
| 92,000 | | 9.250%, 12/06/2019 | | | 92,268 | |
| 125,000 | | AOT Bedding Super Holdings, LLC | | | | |
| | | 4.126%, 09/19/2019 | | | 124,676 | |
| | | Applied Systems | | | | |
| 30,102 | | 5.500%, 12/08/2016 | | | 30,177 | |
| 114,173 | | 5.500%, 12/08/2016 | | | 114,459 | |
| 194,513 | | Ascena Retail Group, Inc. | | | | |
| | | 4.750%, 06/14/2018 | | | 196,296 | |
| 238,800 | | Ascend Performance Materials | | | | |
| | | 6.750%, 04/10/2018 | | | 239,695 | |
| 55,000 | | BJ’s Wholesale Club | | | | |
| | | 5.750%, 03/29/2019 | | | 55,963 | |
| 337,985 | | Blackboard, Inc. | | | | |
| | | 7.500%, 10/04/2018 | | | 340,182 | |
| 85,000 | | Calpine Corporation | | | | |
| | | 3.608%, 09/28/2019 | | | 84,575 | |
| 45,000 | | CPG International, Inc. | | | | |
| | | 5.750%, 09/18/2019 | | | 45,169 | |
| 79,600 | | DS Waters of America, Inc. | | | | |
| | | 10.500%, 08/29/2017 | | | 82,486 | |
| 260,549 | | Edwards Extended | | | | |
| | | 5.500%, 05/31/2016 | | | 262,991 | |
| 302,701 | | Epicor Software Corp. | | | | |
| | | 5.000%, 05/16/2018 | | | 305,047 | |
| | | | | | | | |
Principal
Amount | | | | | | Value | |
| | | | | | | | |
| | | BANK LOANS (Continued) | | | | |
$ | 55,000 | | Essar Steel Algoma, Inc. | | | | |
| | | 8.750%, 09/07/2014 | | $ | 55,550 | |
| 105,000 | | First Data Corporation | | | | |
| | | 5.389%, 09/13/2018 | | | 103,338 | |
| 60,000 | | Frac Tech Services, Ltd. | | | | |
| | | 6.250%, 05/06/2016 | | | 57,919 | |
| | | Kindred Healthcare, Inc. | | | | |
| 30,000 | | 4.126%, 06/01/2018 | | | 29,634 | |
| 124,058 | | 5.250%, 06/01/2018 | | | 122,544 | |
| 104,213 | | Kronos Worldwide, Inc. | | | | |
| | | 6.250%, 12/28/2017 | | | 105,776 | |
| 195,000 | | Level 3 Financing, Inc. | | | | |
| | | 3.608%, 08/01/2019 | | | 195,000 | |
| 114,942 | | MultiPlan, Inc. | | | | |
| | | 4.750%, 08/26/2017 | | | 115,493 | |
| 340,000 | | NGPL PipeCo LLC | | | | |
| | | 6.750%, 09/15/2017 | | | 347,367 | |
| | | Nortek, Inc. | | | | |
| 286,081 | | 5.252%, 04/26/2017 | | | 288,345 | |
| 624 | | 5.252%, 04/26/2017 | | | 629 | |
| | | Nuveen Investments, Inc. | | | | |
| 14,373 | | 5.898%, 05/13/2017 | | | 14,283 | |
| 10,627 | | 5.898%, 05/13/2017 | | | 10,574 | |
| | | P.F. Chang’s China Bistro, Inc. | | | | |
| 1,197 | | 6.250%, 06/21/2019 | | | 1,210 | |
| 71,803 | | 6.250%, 07/02/2019 | | | 72,611 | |
| 85,000 | | Par Pharmaceutical Companies, Inc. | | | | |
| | | 4.129%, 09/18/2019 | | | 84,947 | |
| | | Paradigm | | | | |
| 84,867 | | 10.500%, 07/24/2020 | | | 86,140 | |
| 5,133 | | 10.500%, 07/24/2020 | | | 5,210 | |
| | | Patriot Coal Corporation (DIP) | | | | |
| 160,000 | | 9.250%, 10/03/2013 | | | 161,400 | |
| 80,000 | | 9.250%, 10/03/2013 | | | 80,700 | |
| 287,262 | | Quintiles Corp. | | | | |
| | | 5.000%, 06/08/2018 | | | 289,345 | |
| 105,000 | | Sensus Metering Systems | | | | |
| | | 8.500%, 05/09/2018 | | | 105,000 | |
| 79,000 | | Six3 Systems, Inc. | | | | |
| | | 0.575%, 09/28/2019 | | | 78,210 | |
| 180,000 | | SRA International | | | | |
| | | 6.500%, 07/20/2018 | | | 178,875 | |
| | | The TriZetto Group, Inc. | | | | |
| 139,271 | | 4.750%, 05/02/2018 | | | 138,879 | |
See notes to financial statements.
77
|
GuideMarkSM Opportunistic Fixed Income Fund |
SCHEDULE OF INVESTMENTS (Unaudited) (Continued) |
September 30, 2012 |
| |
| | | | | | | | |
Principal
Amount | | | | | | Value | |
| | | | | | | | |
| | | BANK LOANS (Continued) | | | | |
$ | 35,000 | | 7.610%, 03/27/2019 | | $ | 34,783 | |
| | | TricorBraun, Inc. | | | | |
| 154,613 | | 5.500%, 05/03/2018 | | | 155,772 | |
| 388 | | 5.500%, 05/03/2018 | | | 390 | |
| | | Tronox, Inc. | | | | |
| 69,825 | | 4.250%, 02/08/2018 | | | 70,523 | |
| 254,363 | | 4.250%, 02/08/2018 | | | 256,906 | |
| | | Valeant Pharmaceuticals International, Inc. | | | | |
| 140,000 | | 0.358%, 02/08/2019 | | | 140,000 | |
| 195,000 | | 3.608%, 02/08/2019 | | | 195,331 | |
| 180,000 | | Visant Holding Corp. | | | | |
| | | 5.250%, 12/22/2016 | | | 174,311 | |
| 180,000 | | West Corporation | | | | |
| | | 5.750%, 06/01/2018 | | | 181,912 | |
| 245,000 | | Wolverine Healthcare | | | | |
| | | 6.750%, 05/25/2019 | | | 247,144 | |
| | | | | | | |
| | | Total Bank Loans | | | | |
| | | (Cost $6,207,243) | | | 6,334,175 | |
| | | | | | | |
| | | COLLATERALIZED MORTGAGE | | | | |
| | | OBLIGATIONS - 13.06% | | | | |
| | | American Home Mortgage Investment | | | | |
| | | Trust | | | | |
| 273,531 | | 2005-2, 2.155%, 09/25/2045 (c) | | | 256,298 | |
| 209,114 | | 2006-1, 0.357%, 03/26/2046 (c) | | | 157,087 | |
| 1,280,047 | | Banc of America Funding Corp | | | | |
| | | 2007-8, 6.000%, 08/25/2037 | | | 1,148,366 | |
| 173,604 | | Bank of America Mortgage Securities, Inc. | | | | |
| | | 2005-A, 3.003%, 02/25/2035 (c) | | | 167,007 | |
| 273,956 | | Bear Stearns Adjustable Rate | | | | |
| | | Mortgage Trust | | | | |
| | | 2004-1, 2.870%, 04/25/2034 (c) | | | 258,113 | |
| 240,000 | | Bear Stearns Commercial Mortgage | | | | |
| | | Securities | | | | |
| | | 2003-PWR2, 5.813%, 05/11/2039 | | | | |
| | | (Acquired 03/06/2012, | | | | |
| | | Cost $246,552) (b)(c) | | | 243,236 | |
| 835,000 | | CFCRE Commercial Mortgage Trust | | | | |
| | | 2011-C1, 5.549%, 04/15/2044 | | | | |
| | | (Acquired 04/19/2011 and 05/17/2011, | | | | |
| | | Cost $828,461) (b)(c) | | | 833,571 | |
| 1,847,018 | | Chase Mortgage Finance Corp. | | | | |
| | | 2007-S3, 6.000%, 05/25/2037 | | | 1,616,065 | |
| 211,423 | | Citimortgage Alternative Loan Trust | | | | |
| | | 2006-A3, 6.000%, 07/25/2036 | | | 161,400 | |
| | | | | | | | |
Principal
Amount | | | | | | Value | |
| | | | | | | | |
| | | COLLATERALIZED MORTGAGE | | | | |
| | | OBLIGATIONS (Continued) | | | | |
$ | 385,366 | | 2007-A6, 6.000%, 06/25/2037 | | $ | 313,639 | |
| | | Citi-Sturcture LLC | | | | |
| 2,544,225 | | 3127, 3.000%, 09/01/2042 (e) | | | 2,665,076 | |
| 2,000,000 | | 3147, 3.000%, 10/01/2042 | | | 2,097,500 | |
| | | Countrywide Alternative Loan Trust | | | | |
| 287,455 | | 2006-J4, 6.250%, 07/25/2036 | | | 196,344 | |
| 281,539 | | 2007-4CB, 5.750%, 04/25/2037 | | | 225,038 | |
| | | Countrywide Home Loans | | | | |
| 83,443 | | 2004-HYB4, 2.775%, 09/20/2034 (c) | | | 76,102 | |
| 406,273 | | 2004-HYB8, 3.687%, 01/20/2035 (c) | | | 353,651 | |
| 109,895 | | 2005-11, 0.487%, 04/25/2035 (c) | | | 79,939 | |
| 206,999 | | Credit Suisse First Boston Mortgage | | | | |
| | | Securities Corp. | | | | |
| | | 2005-10, 5.500%, 11/25/2035 | | | 176,582 | |
| 271,174 | | Credit Suisse Mortgage Capital | | | | |
| | | Certificates | | | | |
| | | 2006-8, 6.500%, 10/25/2021 | | | 211,029 | |
| 1,102,137 | | CSMC Mortgage-Backed Trust | | | | |
| | | 2006-9, 6.000%, 11/25/2036 | | | 1,020,482 | |
| 1,255,000 | | DBUBS Mortgage Trust | | | | |
| | | 2011-LC1, 5.557%, 11/13/2046 | | | | |
| | | (Acquired 04/15/2011 and 06/20/2011, | | | | |
| | | Cost $1,212,398) (b)(c) | | | 1,252,769 | |
| 796,314 | | First Horizon Alternative Mortgage | | | | |
| | | Securities | | | | |
| | | 2007-FA4, 6.250%, 08/25/2037 | | | 638,953 | |
| 1,134,900 | | First Horizon Mortgage Pass-Through | | | | |
| | | Trust | | | | |
| | | 2007-4, 6.000%, 08/25/2037 | | | 1,068,745 | |
| 339,969 | | GMAC Mortgage Corp Loan Trust | | | | |
| | | 2005-AR4, 3.586%, 07/19/2035 (c) | | | 311,292 | |
| | | GSR Mortgage Loan Trust | | | | |
| 63,816 | | 2004-14, 2.893%, 12/25/2034 (c) | | | 54,857 | |
| 235,713 | | 2005-AR4, 3.134%, 07/25/2035 (c) | | | 216,481 | |
| 1,762,351 | | 2006-9F, 6.500%, 10/25/2036 | | | 1,598,913 | |
| 947,675 | | 2007-4F, 6.000%, 07/25/2037 | | | 883,758 | |
| 695,572 | | Impac Secured Assets CMN Owner | | | | |
| | | Trust | | | | |
| | | 2007-2, 0.327%, 05/25/2037 (c) | | | 423,573 | |
| | | IndyMac Index Mortgage Loan Trust | | | | |
| 1,152,967 | | 2005-AR1, 2.737%, 03/25/2035 (c) | | | 1,063,254 | |
| 62,286 | | 2005-AR16IP, 0.537%, | | | | |
| | | 07/25/2045 (c) | | | 47,831 | |
See notes to financial statements.
78
|
GuideMarkSM Opportunistic Fixed Income Fund |
SCHEDULE OF INVESTMENTS (Unaudited) (Continued) |
September 30, 2012 |
| |
| | | | | | | | |
Principal
Amount | | | | | | Value | |
| | | | | | | | |
| | | COLLATERALIZED MORTGAGE | | | | |
| | | OBLIGATIONS (Continued) | | | | |
$ | 1,205,974 | | IndyMac IMJA Mortgage Loan Trust | | | | |
| | | 2007-A-1, 6.250%, 11/25/2037 | | $ | 1,079,181 | |
| 9,000,000 | | JP Morgan Chase Commercial | | | | |
| | | Mortgage Services | | | | |
| | | 2012-C8, 2.380%, 10/15/2045 (c) | | | 1,228,599 | |
| 545,606 | | Master Adjustable Rate Mortgages Trust | | | | |
| | | 2006-2, 2.920%, 04/25/2036 (c) | | | 472,691 | |
| 1,245,719 | | MASTR Adjustable Rate Mortgages Trust | | | | |
| | | 2006-2, 2.873%, 01/25/2036 (c) | | | 1,145,701 | |
| 160,753 | | MLCC Mortgage Investors, Inc. | | | | |
| | | 2006-2, 2.348%, 05/25/2036 (c) | | | 159,597 | |
| 400,000 | | Morgan Stanley Capital I | | | | |
| | | 2011-C2, 5.317%, 06/17/2044 | | | | |
| | | (Acquired 06/22/2011, | | | | |
| | | Cost $341,597) (b)(c) | | | 381,725 | |
| | | Morgan Stanley Mortgage Loan Trust | | | | |
| 1,669,727 | | 2005-10, 6.000%, 12/25/2035 | | | 1,403,827 | |
| 405,347 | | 2006-11, 6.000%, 08/25/2036 | | | 331,126 | |
| 141,781 | | New York Mortgage Trust | | | | |
| | | 2006-1, 2.951%, 05/25/2036 (c) | | | 118,233 | |
| 804,774 | | Residential Accredit Loans, Inc. | | | | |
| | | 2005-QA12, 4.107%, 12/25/2035 (c) | | | 586,649 | |
| | | Residential Asset Securitization Trust | | | | |
| 457,000 | | 2005-A8CB, 5.375%, 07/25/2035 | | | 382,271 | |
| 1,625,142 | | 2007-A2, 6.000%, 04/25/2037 | | | 1,412,419 | |
| 1,264,427 | | 2007-A6, 6.000%, 06/25/2037 | | | 1,105,796 | |
| 1,511,016 | | 2007-A7, 6.000%, 07/25/2037 | | | 1,208,051 | |
| 149,278 | | Residential Funding Mortgage Securities I | | | | |
| | | 2006-S1, 5.750%, 01/25/2036 | | | 149,785 | |
| | | WaMu Mortgage Pass-Through Certificate | | | | |
| 57,234 | | 2006-AR17, 0.958%, 12/25/2046 (c) | | | 49,167 | |
| 110,191 | | 2007-OA3, 0.908%, 04/25/2047 (c) | | | 91,075 | |
| 653,385 | | Wells Fargo Alternative Loan Trust | | | | |
| | | 2007-PA1, 6.000%, 03/25/2037 | | | 517,880 | |
| 216,499 | | Wells Fargo Mortgage Backed Securities | | | | |
| | | Trust | | | | |
| | | 2005-11, 5.500%, 11/25/2035 | | | 230,114 | |
| 1,350,000 | | WF-RBS Commercial Mortgage Trust | | | | |
| | | 2011-C2, 5.465%, 02/18/2044 | | | | |
| | | (Acquired 04/06/2011 and 04/29/2011, | | | | |
| | | Cost $1,324,367) (b)(c) | | | 1,320,314 | |
| | | | | | | |
| | | Total Collateralized Mortgage Obligations | | | | |
| | | (Cost $32,466,233) | | | 33,191,152 | |
| | | | | | | |
| | | | | | | | |
Number of
Shares | | | | | | Value | |
| | | | | | | | |
| | | COMMON STOCKS - 1.39% | | | | |
| | | Chemicals - 0.10% | | | | |
| 10,808 | | Tronox Ltd. | | $ | 244,801 | |
| | | | | | | |
| | | Diversified Financial Services - 0.06% | | | | |
| 3,797 | | JPMorgan Chase & Co. | | | 153,703 | |
| | | | | | | |
| | | Diversified Telecommunication Services - 0.34% | | | | |
| 5,886 | | AT&T, Inc. | | | 221,902 | |
| 11,942 | | Deutsche Telekom AG - ADR | | | 147,245 | |
| 5,482 | | France Telecom SA - ADR | | | 66,990 | |
| 11,285 | | Telefonica SA - ADR | | | 149,865 | |
| 5,918 | | Verizon Communications, Inc. | | | 269,683 | |
| | | | | | | |
| | | | | | 855,685 | |
| | | | | | | |
| | | Industrial Conglomerates - 0.03% | | | | |
| 762 | | Siemens AG - ADR | | | 76,314 | |
| | | | | | | |
| | | Metals & Mining - 0.09% | | | | |
| 1,884 | | Barrick Gold Corp. | | | 78,676 | |
| 1,743 | | Goldcorp, Inc. | | | 79,917 | |
| 1,443 | | Newmont Mining Corp. | | | 80,822 | |
| | | | | | | |
| | | | | | 239,415 | |
| | | | | | | |
| | | Oil & Gas - 0.36% | | | | |
| 1,625 | | Chevron Corp. | | | 189,410 | |
| 2,477 | | Exxon Mobil Corp. | | | 226,522 | |
| 3,106 | | Royal Dutch Shell Plc - ADR | | | 215,587 | |
| 2,856 | | Statoil ASA - ADR | | | 73,656 | |
| 4,315 | | Total SA - ADR | | | 216,182 | |
| | | | | | | |
| | | | | | 921,357 | |
| | | | | | | |
| | | Pharmaceuticals - 0.11% | | | | |
| 2,193 | | Bristol Myers Squibb Co. | | | 74,014 | |
| 2,838 | | GlaxoSmithKline Plc - ADR | | | 131,229 | |
| 3,017 | | Pfizer, Inc. | | | 74,972 | |
| | | | | | | |
| | | | | | 280,215 | |
| | | | | | | |
| | | Software - 0.05% | | | | |
| 4,283 | | Microsoft Corp. | | | 127,548 | |
| | | | | | | |
| | | Textiles, Apparel & Luxury Goods - 0.03% | | | | |
| 739 | | NIKE, Inc. | | | 70,139 | |
| | | | | | | |
| | | Tobacco - 0.11% | | | | |
| 4,248 | | Altria Group, Inc. | | | 141,841 | |
| 1,483 | | Philip Morris International, Inc. | | | 133,381 | |
| | | | | | | |
| | | | | | 275,222 | |
| | | | | | | |
| | | Wireless Telecommunication Services - 0.11% | | | | |
| 9,708 | | Vodafone Group Plc - ADR | | | 276,629 | |
| | | | | | | |
| | | Total Common Stocks | | | | |
| | | (Cost $3,319,376) | | | 3,521,028 | |
| | | | | | | |
See notes to financial statements.
79
|
GuideMarkSM Opportunistic Fixed Income Fund |
SCHEDULE OF INVESTMENTS (Unaudited) (Continued) |
September 30, 2012 |
| |
| | | | | | | | |
Principal
Amount | | | | | | Value | |
| | | | | | | | |
| | | CONVERTIBLE OBLIGATIONS - 0.77% | | | | |
| | | Auto Components - 0.09% | | | | |
$ | 140,000 | | TRW Automotive, Inc. | | | | |
| | | 3.500%, 12/01/2015 | | $ | 231,350 | |
| | | | | | | |
| | | Automobiles - 0.11% | | | | |
| 205,000 | | Ford Motor Co. | | | | |
| | | 4.250%, 11/15/2016 | | | 283,797 | |
| | | | | | | |
| | | Biotechnology - 0.09% | | | | |
| 170,000 | | Vertex Pharmaceuticals, Inc. | | | | |
| | | 3.350%, 10/01/2015 | | | 219,194 | |
| | | | | | | |
| | | Communications Equipment - 0.12% | | | | |
| 280,000 | | Ciena Corp. | | | | |
| | | 3.750%, 10/15/2018 | | | | |
| | | (Acquired 01/17/2012, | | | | |
| | | Cost $290,416) (b) | | | 295,400 | |
| | | | | | | |
| | | Computers & Peripherals - 0.11% | | | | |
| 85,000 | | EMC Corp. | | | | |
| | | 1.750%, 12/01/2013 | | | 146,359 | |
| 125,000 | | SanDisk Corp. | | | | |
| | | 1.500%, 08/15/2017 | | | 142,110 | |
| | | | | | | |
| | | | | | 288,469 | |
| | | | | | | |
| | | Oil & Gas - 0.15% | | | | |
| 105,000 | | Chesapeake Energy Corp. | | | | |
| | | 2.750%, 11/15/2035 | | | 100,472 | |
| 335,000 | | Peabody Energy Corp. | | | | |
| | | 4.750%, 12/15/2066 | | | 283,912 | |
| | | | | | | |
| | | | | | 384,384 | |
| | | | | | | |
| | | Semiconductor & Semiconductor | | | | |
| | | Equipment - 0.10% | | | | |
| 215,000 | | Intel Corp. | | | | |
| | | 3.250%, 08/01/2039 | | | 266,062 | |
| | | | | | | |
| | | Total Convertible Obligations | | | | |
| | | (Cost $2,095,688) | | | 1,968,656 | |
| | | | | | | |
| | | | | | | | |
Number
of Shares | | | | | | | |
| | | | | | | | |
| | | CONVERTIBLE PREFERRED STOCKS - 0.43% | | | | |
| | | Automobiles - 0.14% | | | | |
| 9,570 | | General Motors Co. | | | 356,770 | |
| | | Banks - 0.19% | | | | |
| 112 | | Bank of America Corporation | | | 122,080 | |
| 305 | | Wells Fargo & Co. | | | 377,590 | |
| | | | | | | |
| | | | | | 499,670 | |
| | | | | | | |
| | | | | | | | |
Number
of Shares | | | | | | Value | |
| | | | | | | | |
| | | Oil & Gas - 0.10% | | | | |
| 5,100 | | Apache Corp. | | $ | 248,115 | |
| | | | | | | |
| | | Total Convertible Preferred Stocks | | | | |
| | | (Cost $1,102,994) | | | 1,104,555 | |
| | | | | | | |
| | | | | | | | |
Principal
Amount | | | | | | | |
| | | | | | | | |
| | | CORPORATE OBLIGATIONS - 21.88% | | | | |
| | | Aerospace & Defense - 0.18% | | | | |
$ | 400,000 | | Meccanica Holdings USA, Inc. | | | | |
| | | 6.250%, 07/15/2019 | | | | |
| | | (Acquired 01/10/2012, | | | | |
| | | Cost $321,633) (b) | | | 377,515 | |
| 100,000 | | 7.375%, 07/15/2039 | | | | |
| | | (Acquired 08/17/2011, | | | | |
| | | Cost $94,762) (b) | | | 88,732 | |
| | | | | | | |
| | | | | | 466,247 | |
| | | | | | | |
| | | Airlines - 0.50% | | | | |
| 269,684 | | Delta Air Lines, Inc. | | | | |
| | | 2007-1, 6.821%, 08/10/2022 | | | 298,001 | |
| 415,000 | | US Airways Group, Inc. | | | | |
| | | 5.900%, 10/01/2024 | | | 438,863 | |
| | | Continental Airlines, Inc. | | | | |
| 85,000 | | 4.000%, 04/29/2026 | | | 87,235 | |
| 70,000 | | 5.500%, 04/29/2022 | | | 71,925 | |
| 335,856 | | 6.545%, 02/02/2019 | | | 367,762 | |
| | | | | | | |
| | | | | | 1,263,786 | |
| | | | | | | |
| | | Auto Components - 0.11% | | | | |
| 260,000 | | Visteon Corp. | | | | |
| | | 6.750%, 04/15/2019 | | | 274,300 | |
| | | | | | | |
| | | Banks - 2.20% | | | | |
| 705,000 | | Capital One Capital VI | | | | |
| | | 8.875%, 05/15/2040 | | | 720,342 | |
| 700,000 | | Cooperatieve Centrale Raiffeisen- | | | | |
| | | Boerenleenbank BA | | | | |
| | | 3.375%, 01/19/2017 | | | 743,732 | |
| 1,000,000 | | Halyk Savings Bank of Kazakhstan JSC | | | | |
| | | 7.250%, 01/28/2021 | | | | |
| | | (Acquired 04/05/2011 and 04/11/2011, | | | | |
| | | Cost $1,017,908) (b) | | | 1,041,250 | |
| 630,000 | | Lloyds TSB Bank Plc | | | | |
| | | 6.500%, 03/24/2020 | | | 817,908 | |
| | | CIT Group, Inc. | | | | |
| 100,000 | | 5.375%, 05/15/2020 | | | 108,750 | |
| 100,000 | | 5.000%, 08/15/2022 | | | 104,541 | |
See notes to financial statements.
80
|
GuideMarkSM Opportunistic Fixed Income Fund |
SCHEDULE OF INVESTMENTS (Unaudited) (Continued) |
September 30, 2012 |
| |
| | | | | | | | |
Principal
Amount | | | | | | Value | |
| | | | | | | | |
| | | CORPORATE OBLIGATIONS (Continued) | | | | |
| | | Banks (Continued) | | | | |
| | | Eksportfinans ASA | | | | |
$ | 545,000 | | 2.000%, 09/15/2015 | | $ | 509,934 | |
| 160,000 | | 2.375%, 05/25/2016 | | | 148,127 | |
| 335,000 | | 2.250%, 02/11/2021 | | | 309,888 | |
| | | Royal Bank of Scotland Plc | | | | |
| 450,000 | | 4.350%, 01/23/2017 | | | 552,149 | |
| 400,000 | | 6.934%, 04/09/2018 | | | 524,908 | |
| | | | | | | |
| | | | | | 5,581,529 | |
| | | | | | | |
| | | Biotechnology - 0.29% | | | | |
| 645,000 | | Amgen, Inc. | | | | |
| | | 5.375%, 05/15/2043 | | | 750,434 | |
| | | | | | | |
| | | Business Services - 0.47% | | | | |
| 1,120,000 | | Alfa Bond Issuance Plc | | | | |
| | | 7.750%, 04/28/2021 | | | | |
| | | (Acquired 04/19/2011, | | | | |
| | | Cost $1,120,000) (b) | | | 1,191,456 | |
| | | | | | | |
| | | Capital Markets - 0.15% | | | | |
| 315,000 | | Merrill Lynch & Co, Inc. | | | | |
| | | 6.875%, 11/15/2018 | | | 380,837 | |
| | | | | | | |
| | | Chemicals - 0.40% | | | | |
| 645,000 | | Hercules, Inc. | | | | |
| | | 6.500%, 06/30/2029 | | | 590,175 | |
| 200,000 | | Mexichem SAB de CV | | | | |
| | | 6.750%, 09/19/2042 | | | | |
| | | (Acquired 09/12/2012, | | | | |
| | | Cost $200,000) (b) | | | 208,040 | |
| 100,000 | | Ineos Group Holdings Ltd. | | | | |
| | | 8.500%, 02/15/2016 | | | | |
| | | (Acquired 04/12/2011, | | | | |
| | | Cost $101,283) (b) | | | 95,000 | |
| 100,000 | | 7.875%, 02/15/2016 | | | | |
| | | (Acquired 10/25/2011, | | | | |
| | | Cost $115,544) (b) | | | 119,831 | |
| | | | | | | |
| | | | | | 1,013,046 | |
| | | | | | | |
| | | Commercial Services & Supplies - 0.61% | | | | |
| 200,000 | | Emergency Medical Services Corp. | | | | |
| | | 8.125%, 06/01/2019 | | | 213,000 | |
| 515,000 | | Steelcase, Inc. | | | | |
| | | 6.375%, 02/15/2021 | | | 554,225 | |
| | | | | | | | |
Principal
Amount | | | | | | Value | |
| | | | | | | | |
| | | Commercial Services & Supplies (Continued) | | | | |
$ | 550,000 | | International Lease Finance Corp. | | | | |
| | | 6.750%, 09/01/2016 | | | | |
| | | (Acquired 03/07/2012 and 03/13/2012, | | | | |
| | | Cost $595,747) (b) | | $ | 620,812 | |
| 100,000 | | 8.250%, 12/15/2020 | | | 119,250 | |
| 30,000 | | 5.875%, 04/01/2019 | | | 31,959 | |
| | | | | | | |
| | | | | | 1,539,246 | |
| | | | | | | |
| | | Communications - 0.15% | | | | |
| 150,000 | | CCO Holdings LLC | | | | |
| | | 8.125%, 04/30/2020 | | | 170,250 | |
| 200,000 | | Univision Communications, Inc. | | | | |
| | | 7.875%, 11/01/2020 | | | | |
| | | (Acquired 04/20/2011, | | | | |
| | | Cost $212,614) (b) | | | 215,000 | |
| | | | | | | |
| | | | | | 385,250 | |
| | | | | | | |
| | | Computers & Peripherals - 0.26% | | | | |
| 380,000 | | Hewlett Packard Co. | | | | |
| | | 4.650%, 12/09/2021 | | | 396,964 | |
| 255,000 | | NCR Corp. | | | | |
| | | 5.000%, 07/15/2022 | | | | |
| | | (Acquired 09/12/2012, | | | | |
| | | Cost $255,000) (b) | | | 258,825 | |
| | | | | | | |
| | | | | | 655,789 | |
| | | | | | | |
| | | Construction Materials - 0.08% | | | | |
| 200,000 | | Cemex S.A.B. de C.V. | | | | |
| | | 9.000%, 01/11/2018 | | | | |
| | | (Acquired 07/06/2011 and 07/13/2012, | | | | |
| | | Cost $189,617) (b) | | | 201,000 | |
| | | | | | | |
| | | Consumer Finance - 0.11% | | | | |
| 250,000 | | Ally Financial, Inc. | | | | |
| | | 7.500%, 09/15/2020 | | | 287,812 | |
| | | | | | | |
| | | Diversified Business Services - 0.11% | | | | |
| 250,000 | | United Rentals, Inc. | | | | |
| | | 8.375%, 09/15/2020 | | | 268,750 | |
| | | | | | | |
| | | Diversified Financial Services - 1.18% | | | | |
| 630,000 | | Doric Nimrod Air Finance Alpha Ltd. | | | | |
| | | 5.125%, 11/30/2024 | | | | |
| | | (Acquired 06/28/2012, | | | | |
| | | Cost $630,000) (b) | | | 655,200 | |
| 100,000 | | Ford Motor Credit Co. LLC | | | | |
| | | 5.750%, 02/01/2021 | | | 112,257 | |
See notes to financial statements.
81
|
GuideMarkSM Opportunistic Fixed Income Fund |
SCHEDULE OF INVESTMENTS (Unaudited) (Continued) |
September 30, 2012 |
| |
| | | | | | | | |
Principal
Amount | | | | | | Value | |
| | | | | | | | |
| | | CORPORATE OBLIGATIONS (Continued) | | | | |
| | | Diversified Financial Services (Continued) | | | | |
$ | 900,000 | | General Electric Capital Corp. | | | | |
| | | 7.125%, 06/15/2022 (c) | | $ | 1,006,894 | |
| 100,000 | | Nuveen Investments, Inc. | | | | |
| | | 9.500%, 10/15/2020 | | | | |
| | | (Acquired 09/12/2012, | | | | |
| | | Cost $100,000) (b) | | | 100,000 | |
| 100,000 | | Pinnacle Foods Finance LLC | | | | |
| | | 8.250%, 09/01/2017 | | | 108,875 | |
| 400,000 | | Schahin II Finance Co SPV Ltd. | | | | |
| | | 5.875%, 09/25/2022 | | | | |
| | | (Acquired 03/21/2012 and 04/25/2012, | | | | |
| | | Cost $400,461) (b) | | | 420,000 | |
| 715,000 | | Textron Financial Corp. | | | | |
| | | 6.000%, 02/15/2067 | | | | |
| | | (Acquired 02/23/2012, 03/09/2012, | | | | |
| | | 03/19/2012, and 04/24/2012 | | | | |
| | | Cost $573,583) (b)(c) | | | 607,750 | |
| | | | | | | |
| | | | | | 3,010,976 | |
| | | | | | | |
| | | Diversified Manufacturing - 0.26% | | | | |
| 600,000 | | Votorantim Cimentos SA | | | | |
| | | 7.250%, 04/05/2041 | | | | |
| | | (Acquired 04/06/2011, | | | | |
| | | Cost $594,000) (b) | | | 652,500 | |
| | | Diversified Telecommunication Services - 0.93% | | | | |
| 1,705,000 | | Brasil Telecom SA | | | | |
| | | 9.750%, 09/15/2016 | | | | |
| | | (Acquired 09/08/2011 and 04/19/2012, | | | | |
| | | Cost $1,009,269) (b) | | | 887,298 | |
| 190,000 | | Clearwire Communications LLC | | | | |
| | | 12.000%, 12/01/2015 | | | | |
| | | (Acquired 02/03/2012, | | | | |
| | | Cost $180,241) (b) | | | 189,050 | |
| 250,000 | | Cricket Communications, Inc. | | | | |
| | | 7.750%, 10/15/2020 | | | 245,000 | |
| 150,000 | | Frontier Communications Corp. | | | | |
| | | 8.500%, 04/15/2020 | | | 170,250 | |
| 145,000 | | Level 3 Communications, Inc. | | | | |
| | | 8.875%, 06/01/2019 | | | | |
| | | (Acquired 07/18/2012, | | | | |
| | | Cost $145,000) (b) | | | 152,794 | |
| 710,000 | | Qwest Corp. | | | �� | |
| | | 7.200%, 11/10/2026 | | | 719,762 | |
| | | | | | | |
| | | | | | 2,364,154 | |
| | | | | | | |
| | | | | | | | |
Principal
Amount | | | | | | Value | |
| | | | | | | | |
| | | Electric Utilities - 0.34% | | | | |
$ | 600,000 | | Centrais Eletricas Brasileiras SA | | | | |
| | | 5.750%, 10/27/2021 | | | | |
| | | (Acquired 09/04/2012, | | | | |
| | | Cost $676,053) (b) | | $ | 670,500 | |
| | | EDP Finance BV | | | | |
| 150,000 | | 5.750%, 09/21/2017 | | | 190,668 | |
| | | | | | | |
| | | | | | 861,168 | |
| | | | | | | |
| | | Electrical Equipment, Instruments | | | | |
| | | & Components - 0.30% | | | | |
| 740,000 | | Ingram Micro, Inc. | | | | |
| | | 5.000%, 08/10/2022 | | | 767,264 | |
| | | | | | | |
| | | Energy Equipment & Services - 0.66% | | | | |
| 330,000 | | Basic Energy Services, Inc. | | | | |
| | | 7.750%, 02/15/2019 | | | 339,900 | |
| 200,000 | | Cie Generale de Geophysique - Veritas | | | | |
| | | 7.750%, 05/15/2017 | | | 208,125 | |
| 580,000 | | Cia de Eletricidade do Estado da Bahia | | | | |
| | | 11.750%, 04/27/2016 | | | | |
| | | (Acquired 04/19/2011, | | | | |
| | | Cost $367,321) (b) | | | 311,136 | |
| 380,000 | | Global Geophysical Services, Inc. | | | | |
| | | 10.500%, 05/01/2017 | | | 364,800 | |
| 400,000 | | Odebrecht Finance Ltd. | | | | |
| | | 7.125%, 06/26/2042 | | | | |
| | | (Acquired 06/21/2012, | | | | |
| | | Cost $393,916) (b) | | | 446,600 | |
| | | | | | | |
| | | | | | 1,670,561 | |
| | | | | | | |
| | | Food & Staples Retailing - 0.04% | | | | |
| 115,000 | | Delhaize Group SA | | | | |
| | | 5.700%, 10/01/2040 | | | 102,653 | |
| | | | | | | |
| | | Food Products - 0.46% | | | | |
| 700,000 | | BRF-Brasil Foods SA | | | | |
| | | 5.875%, 06/06/2022 | | | | |
| | | (Acquired 05/31/2012, | | | | |
| | | Cost $693,490) (b) | | | 766,500 | |
| 200,000 | | Del Monte Corp. | | | | |
| | | 7.625%, 02/15/2019 | | | 206,750 | |
| 200,000 | | JBS USA, LLC/JBS USA Finance, Inc. | | | | |
| | | 8.250%, 02/01/2020 | | | | |
| | | (Acquired 01/25/2012 and 05/17/2012, | | | | |
| | | Cost $197,069) (b) | | | 200,500 | |
| | | | | | | |
| | | | | | 1,173,750 | |
| | | | | | | |
See notes to financial statements.
82
|
GuideMarkSM Opportunistic Fixed Income Fund |
SCHEDULE OF INVESTMENTS (Unaudited) (Continued) |
September 30, 2012 |
| |
| | | | | | | | |
Principal
Amount | | | | | | Value | |
| | | | | | | | |
| | | CORPORATE OBLIGATIONS (Continued) | | | | |
| | | Health Care Equipment & Supplies - 0.04% | | | | |
$ | 100,000 | | Hologic, Inc. | | | | |
| | | 6.250%, 08/01/2020 | | | | |
| | | (Acquired 07/19/2012, | | | | |
| | | Cost $100,000) (b) | | $ | 106,500 | |
| | | | | | | |
| | | Health Care Providers & Services - 0.22% | | | | |
| 200,000 | | Community Health Systems, Inc. | | | | |
| | | 8.000%, 11/15/2019 | | | 220,500 | |
| 100,000 | | DaVita, Inc. | | | | |
| | | 5.750%, 08/15/2022 | | | 104,500 | |
| 200,000 | | HCA, Inc. | | | | |
| | | 7.875%, 02/15/2020 | | | 225,750 | |
| 4,000 | | Vanguard Health Systems, Inc. | | | | |
| | | 0.000%, 02/01/2016 (d) | | | 2,840 | |
| | | | | | | |
| | | | | | 553,590 | |
| | | | | | | |
| | | Hotels, Restaurants & Leisure - 0.40% | | | | |
| 405,000 | | Mandalay Resort Group | | | | |
| | | 7.625%, 07/15/2013 | | | 417,150 | |
| 100,000 | | ClubCorp Club Operations, Inc. | | | | |
| | | 10.000%, 12/01/2018 | | | 110,250 | |
| 250,000 | | Caesars Entertainment Operating Co., Inc. | | | | |
| | | 11.250%, 06/01/2017 | | | 270,000 | |
| 200,000 | | MGM Resorts International | | | | |
| | | 7.500%, 06/01/2016 | | | 215,000 | |
| | | | | | | |
| | | | | | 1,012,400 | |
| | | | | | | |
| | | Household Products - 0.10% | | | | |
| 250,000 | | Reynolds Group Issuer LLC | | | | |
| | | 8.250%, 02/15/2021 (c) | | | 249,375 | |
| | | | | | | |
| | | Independent Power Producers & | | | | |
| | | Energy Traders - 0.60% | | | | |
| 150,000 | | Calpine Corp. | | | | |
| | | 7.500%, 02/15/2021 | | | | |
| | | (Acquired 04/04/2011, | | | | |
| | | Cost $156,365) (b) | | | 162,750 | |
| 335,000 | | Energy Future Holdings Corp. | | | | |
| | | 10.000%, 01/15/2020 | | | 371,013 | |
| 335,000 | | Energy Future Intermediate Holding | | | | |
| | | Co. LLC | | | | |
| | | 11.750%, 03/01/2022 | | | | |
| | | (Acquired 06/05/2012, | | | | |
| | | Cost $339,187) (b) | | | 357,612 | |
| | | | | | | | |
Principal
Amount | | | | | | Value | |
| | | | | | | | |
| | | Independent Power Producers & | | | | |
| | | Energy Traders (Continued) | | | | |
| | | Enel Finance International NV | | | | |
$ | 200,000 | | 6.800%, 09/15/2037 | | | | |
| | | (Acquired 09/01/2011, | | | | |
| | | Cost $186,691) (b) | | $ | 194,362 | |
| 500,000 | | 6.000%, 10/07/2039 | | | | |
| | | (Acquired 09/01/2011, 09/09/2011, | | | | |
| | | 09/14/2011, 05/17/2012, and | | | | |
| | | 05/22/2012, | | | | |
| | | Cost $417,292) (b) | | | 451,020 | |
| | | | | | | |
| | | | | | 1,536,757 | |
| | | | | | | |
| | | Insurance - 0.30% | | | | |
| 650,000 | | Metlife Capital Trust IV | | | | |
| | | 7.875%, 12/15/2037 | | | | |
| | | (Acquired 04/12/2011, | | | | |
| | | Cost $710,619) (b)(c) | | | 770,250 | |
| | | | | | | |
| | | Investment Companies - 0.04% | | | | |
| 100,000 | | PBF Holding Co. LLC / PBF Finance Corp. | | | | |
| | | 8.250%, 02/15/2020 | | | | |
| | | (Acquired 01/27/2012, | | | | |
| | | Cost $98,565) (b) | | | 105,500 | |
| | | | | | | |
| | | IT Services - 0.27% | | | | |
| 675,000 | | Lender Processing Services, Inc. | | | | |
| | | 5.750%, 04/15/2023 | | | 675,000 | |
| | | | | | | |
| | | Machinery - 0.04% | | | | |
| 100,000 | | Navistar International Corp. | | | | |
| | | 8.250%, 11/01/2021 | | | 95,375 | |
| | | | | | | |
| | | Media - 0.50% | | | | |
| 200,000 | | Clear Channel Communications, Inc. | | | | |
| | | 9.000%, 03/01/2021 | | | 179,000 | |
| 760,000 | | Clear Channel Worldwide | | | | |
| | | Holdings, Inc. | | | | |
| | | 7.625%, 03/15/2020 | | | 744,800 | |
| 150,000 | | DISH DBS Corp. | | | | |
| | | 7.125%, 02/01/2016 | | | 166,500 | |
| 200,000 | | Nara Cable Funding Ltd. | | | | |
| | | 8.875%, 12/01/2018 | | | | |
| | | (Acquired 01/30/2012, | | | | |
| | | Cost $188,371) (b) | | | 183,500 | |
| | | | | | | |
| | | | | | 1,273,800 | |
| | | | | | | |
See notes to financial statements.
83
|
GuideMarkSM Opportunistic Fixed Income Fund |
SCHEDULE OF INVESTMENTS (Unaudited) (Continued) |
September 30, 2012 |
| |
| | | | | | | | |
Principal
Amount | | | | | | Value | |
| | | | | | | | |
| | | CORPORATE OBLIGATIONS (Continued) | | | | |
| | | Metals & Mining - 1.31% | | | | |
$ | 760,000 | | Anglo American Capital PLC | | | | |
| | | 4.125%, 09/27/2022 | | | | |
| | | (Acquired 09/20/2012, | | | | |
| | | Cost $754,285) (b) | | $ | 764,513 | |
| 270,000 | | AngloGold Ashanti Holdings PLC | | | | |
| | | 5.125%, 08/01/2022 | | | 275,477 | |
| 200,000 | | Inmet Mining Corp. | | | | |
| | | 8.750%, 06/01/2020 | | | | |
| | | (Acquired 05/15/2012, | | | | |
| | | Cost $197,168) (b) | | | 208,000 | |
| 380,000 | | Newcrest Finance Ltd. | | | | |
| | | 4.200%, 10/01/2022 | | | | |
| | | (Acquired 09/24/2012, | | | | |
| | | Cost $377,792) (b) | | | 383,338 | |
| 575,000 | | Teck Resources Ltd. | | | | |
| | | 5.400%, 02/01/2043 | | | 563,120 | |
| | | Arcelormittal SA | | | | |
| 275,000 | | 7.000%, 03/01/2041 | | | 247,936 | |
| 440,000 | | 5.750%, 03/01/2021 | | | 419,886 | |
| | | FMG Resources Ltd. | | | | |
| 200,000 | | 7.000%, 11/01/2015 | | | | |
| | | (Acquired 08/29/2012, | | | | |
| | | Cost $198,559) (b) | | | 200,000 | |
| 250,000 | | 6.875%, 02/01/2018 | | | | |
| | | (Acquired 04/26/2011, | | | | |
| | | Cost $263,037) (b) | | | 233,437 | |
| 50,000 | | 6.000%, 04/01/2017 | | | | |
| | | (Acquired 03/14/2012, | | | | |
| | | Cost $50,000) (b) | | | 46,750 | |
| | | | | | | |
| | | | | | 3,342,457 | |
| | | | | | | |
| | | Multi Utilities - 0.39% | | | | |
| 980,000,000 | | Empresas Publicas de Medellin ESP | | | | |
| | | 8.375%, 02/01/2021 | | | | |
| | | (Acquired 04/28/2011, | | | | |
| | | Cost $564,639) (b) | | | 611,270 | |
| 200,000 | | Intergen NV | | | | |
| | | 9.000%, 06/30/2017 | | | | |
| | | (Acquired 04/04/2011, | | | | |
| | | Cost $211,412) (b) | | | 193,500 | |
| | | | | | | | |
Principal
Amount | | | | | | Value | |
| | | | | | | | |
| | | Multi Utilities (Continued) | | | | |
$ | 250,000 | | Texas Competitive Electric | | | | |
| | | Holdings Co. LLC | | | | |
| | | 11.500%, 10/01/2020 | | | | |
| | | (Acquired 04/14/2011 and | | | | |
| | | 11/09/2011, | | | | |
| | | Cost $241,751) (b) | | $ | 196,875 | |
| | | | | | | |
| | | | | | 1,001,645 | |
| | | | | | | |
| | | Office Equipment - 0.09% | | | | |
| 200,000 | | CDW LLC / CDW Finance Corp. | | | | |
| | | 8.500%, 04/01/2019 | | | 218,500 | |
| | | | | | | |
| | | Oil & Gas - 3.95% | | | | |
| 305,000 | | Connacher Oil & Gas Ltd. | | | | |
| | | 8.500%, 08/01/2019 | | | | |
| | | (Acquired 05/22/2012, 05/29/2012, | | | | |
| | | 05/30/2012, 06/05/2012, 06/12/2012, | | | | |
| | | 06/25/2012, and 06/26/2012), | | | | |
| | | Cost $285,370) (b) | | | 263,825 | |
| 700,000 | | Eni SpA | | | | |
| | | 4.150%, 10/01/2020 | | | | |
| | | (Acquired 09/24/2012 and 09/25/2012, | | | | |
| | | Cost $701,750) (b) | | | 706,021 | |
| 375,000 | | Halcon Resources Corp. | | | | |
| | | 9.750%, 07/15/2020 | | | | |
| | | (Acquired 06/29/2012 and 08/22/2012, | | | | |
| | | Cost $373,391) (b) | | | 384,375 | |
| 250,000 | | Linn Energy LLC | | | | |
| | | 7.750%, 02/01/2021 | | | 265,625 | |
| 800,000 | | OGX Petroleo & Gas Participacoes SA | | | | |
| | | 8.375%, 04/01/2022 | | | | |
| | | (Acquired 03/27/2012, 05/22/2012, | | | | |
| | | and 06/29/2012, Cost $768,605) (b) | | | 698,000 | |
| 88,000 | | Petroleos Mexicanos | | | | |
| | | 7.650%, 11/24/2021 | | | | |
| | | (Acquired 12/01/2011, | | | | |
| | | Cost $646,857) (b) | | | 747,591 | |
| 250,000 | | Plains Exploration & Production Co. | | | | |
| | | 6.625%, 05/01/2021 | | | 255,000 | |
| 200,000 | | Quicksilver Resources, Inc. | | | | |
| | | 9.125%, 08/15/2019 | | | 191,000 | |
| 200,000 | | Samson Investment Co. | | | | |
| | | 9.750%, 02/15/2020 | | | | |
| | | (Acquired 02/06/2012, | | | | |
| | | Cost $200,000) (b) | | | 206,250 | |
See notes to financial statements.
84
|
GuideMarkSM Opportunistic Fixed Income Fund |
SCHEDULE OF INVESTMENTS (Unaudited) (Continued) |
September 30, 2012 |
| |
| | | | | | | | |
Principal
Amount | | | | | | Value | |
| | | | | | | | |
| | | CORPORATE OBLIGATIONS (Continued) | | | | |
| | | Oil & Gas (Continued) | | | | |
$ | 250,000 | | SandRidge Energy, Inc. | | | | |
| | | 8.000%, 06/01/2018 | | | | |
| | | (Acquired 05/06/2011 and 05/13/2011, | | | | |
| | | Cost $261,744) (b) | | $ | 263,750 | |
| 280,000 | | Sinopec Group Overseas | | | | |
| | | Development Ltd. | | | | |
| | | 3.900%, 05/17/2022 | | | | |
| | | (Acquired 05/10/2012, | | | | |
| | | Cost $279,152) (b) | | | 300,724 | |
| 605,000 | | Petrobras Global Finance BV | | | | |
| | | 4.250%, 10/01/2023 | | | 793,564 | |
| 5,000,000 | | Petroleos de Venezuela SA | | | | |
| | | 4.900%, 10/28/2014 | | | 4,527,500 | |
| | | Alpha Natural Resources, Inc. | | | | |
| 100,000 | | 6.000%, 06/01/2019 | | | 84,000 | |
| 50,000 | | 6.250%, 06/01/2021 | | | 41,875 | |
| | | Chesapeake Energy Corp. | | | | |
| 50,000 | | 6.625%, 08/15/2020 | | | 51,812 | |
| 250,000 | | 6.125%, 02/15/2021 | | | 253,125 | |
| | | | | | | |
| | | | | | 10,034,037 | |
| | | | | | | |
| | | Pharmaceuticals - 0.27% | | | | |
| 550,000 | | VPI Escrow Corp. | | | | |
| | | 6.375%, 10/15/2020 | | | | |
| | | (Acquired 09/20/2012, | | | | |
| | | Cost $550,000) (b) | | | 563,750 | |
| 115,000 | | Valeant Pharmaceuticals International, Inc. | | | | |
| | | 6.375%, 10/15/2020 | | | | |
| | | (Acquired 09/20/2012, | | | | |
| | | Cost $115,000) (b) | | | 117,588 | |
| | | | | | | |
| | | | | | 681,338 | |
| | | | | | | |
| | | Pipelines - 0.22% | | | | |
| 500,000 | | IFM US Colonial Pipeline 2 LLC | | | | |
| | | 6.450%, 05/01/2021 | | | | |
| | | (Acquired 08/24/2012 and 09/06/2012, | | | | |
| | | Cost $549,587) (b) | | | 558,843 | |
| | | | | | | |
| | | Publishing - 0.25% | | | | |
| 630,000 | | Visant Corp. | | | | |
| | | 10.000%, 10/01/2017 | | | 626,850 | |
| | | | | | | |
| | | | | | | | |
Principal
Amount | | | | | | Value | |
| | | | | | | | |
| | | Semiconductor & Semiconductor | | | | |
| | | Equipment - 0.41% | | | | |
$ | 250,000 | | Abengoa Finance SAU | | | | |
| | | 8.875%, 11/01/2017 | | | | |
| | | (Acquired 04/12/2011, | | | | |
| | | Cost $253,610) (b) | | $ | 232,500 | |
| 375,000 | | Advanced Micro Devices, Inc. | | | | |
| | | 7.500%, 08/15/2022 | | | | |
| | | (Acquired 09/12/2012, | | | | |
| | | Cost $372,187) (b) | | | 363,750 | |
| | | Freescale Semiconductor, Inc. | | | | |
| 50,000 | | 10.750%, 08/01/2020 | | | 54,375 | |
| 200,000 | | 8.050%, 02/01/2020 | | | 198,000 | |
| | | Micron Technology, Inc. | | | | |
| 20,000 | | 3.125%, 05/01/2032 | | | | |
| | | (Acquired 09/28/2012, | | | | |
| | | Cost $18,724) (b) | | | 18,575 | |
| 205,000 | | 1.875%, 08/01/2031 | | | 181,553 | |
| | | | | | | |
| | | | | | 1,048,753 | |
| | | | | | | |
| | | Software - 0.10% | | | | |
| | | First Data Corp. | | | | |
| 150,000 | | 8.250%, 01/15/2021 | | | | |
| | | Acquired 02/17/2012 and 04/24/2012, | | | | |
| | | Cost $146,272) (b) | | | 150,375 | |
| 100,000 | | 12.625%, 01/15/2021 | | | 104,125 | |
| | | | | | | |
| | | | | | 254,500 | |
| | | | | | | |
| | | Specialty Retail - 0.15% | | | | |
| 250,000 | | Michaels Stores, Inc. | | | | |
| | | 7.750%, 11/01/2018 | | | 269,375 | |
| 100,000 | | PETCO Animal Supplies, Inc. | | | | |
| | | 9.250%, 12/01/2018 | | | | |
| | | (Acquired 04/21/2011, | | | | |
| | | Cost $107,331) (b) | | | 111,500 | |
| | | | | | | |
| | | | | | 380,875 | |
| | | | | | | |
| | | Telecommunication Services - 0.95% | | | | |
| 300,000 | | Colombia Telecomunicaciones SA ESP | | | | |
| | | 5.375%, 09/27/2022 | | | | |
| | | (Acquired 09/20/2012, | | | | |
| | | Cost $300,000) (b) | | | 305,250 | |
| 200,000 | | Digicel Group Ltd. | | | | |
| | | 8.250%, 09/30/2020 | | | | |
| | | (Acquired 09/05/2012, | | | | |
| | | Cost $200,000) (b) | | | 211,000 | |
See notes to financial statements.
85
|
GuideMarkSM Opportunistic Fixed Income Fund |
SCHEDULE OF INVESTMENTS (Unaudited) (Continued) |
September 30, 2012 |
| |
| | | | | | | | |
Principal
Amount | | | | | | Value | |
| | | | | | | | |
| | | CORPORATE OBLIGATIONS (Continued) | | | | |
| | | Telecommunication Services (Continued) | | | | |
$ | 250,000 | | Intelsat Jackson Holdings SA | | | | |
| | | 7.500%, 04/01/2021 | | $ | 271,875 | |
| 135,000 | | Alcatel-Lucent USA, Inc. | | | | |
| | | 6.450%, 03/15/2029 | | | 89,100 | |
| 375,000 | | Telecom Italia Capital SA | | | | |
| | | 6.000%, 09/30/2034 | | | 333,750 | |
| 150,000 | | UPCB Finance VI Ltd. | | | | |
| | | 6.875%, 01/15/2022 | | | | |
| | | (Acquired 01/31/2012, | | | | |
| | | Cost $150,000) (b) | | | 159,750 | |
| 100,000 | | West Corp. | | | | |
| | | 7.875%, 01/15/2019 | | | 103,500 | |
| 250,000 | | Wind Acquisition Finance SA | | | | |
| | | 11.750%, 07/15/2017 | | | | |
| | | (Acquired 02/27/2012, | | | | |
| | | Cost $256,875) (b) | | | 236,875 | |
| | | Telefonica Emisiones SAU | | | | |
| 75,000 | | 7.045%, 06/20/2036 | | | 73,500 | |
| 400,000 | | 5.597%, 03/12/2020 | | | 637,069 | |
| | | | | | | |
| | | | | | 2,421,669 | |
| | | | | | | |
| | | Textiles, Apparel & Luxury Goods - 0.63% | | | | |
| | | Edcon Holdings (Proprietary) Limited | | | | |
| 150,000 | | 6.162%, 06/15/2015 | | | | |
| | | (Acquired 08/18/2012, 08/19/2012, | | | | |
| | | and 08/24/2012, | | | | |
| | | Cost $158,665) (b)(c) | | | 165,772 | |
| 1,120,000 | | 9.500%, 03/01/2018 | | | | |
| | | (Acquired 04/05/2012 and 04/12/2012, | | | | |
| | | Cost $1,125,950) (b) | | | 1,080,800 | |
| 300,000 | | 9.500%, 03/01/2018 | | | | |
| | | (Acquired 08/18/2012, 08/19/2012, | | | | |
| | | and 08/24/2012, | | | | |
| | | Cost $349,985) (b) | | | 366,239 | |
| | | | | | | |
| | | | | | 1,612,811 | |
| | | | | | | |
| | | Transportation - 0.22% | | | | |
| 200,000 | | CHC Helicopter SA | | | | |
| | | 9.250%, 10/15/2020 | | | 206,500 | |
| 150,000 | | Energy XXI Gulf Coast, Inc. | | | | |
| | | 9.250%, 12/15/2017 | | | 169,125 | |
| | | | | | | | |
Principal
Amount | | | | | | Value | |
| | | | | | | | |
| | | Transportation (Continued) | | | | |
| | | CEVA Group PLC | | | | |
$ | 100,000 | | 11.500%, 04/01/2018 | | | | |
| | | (Acquired 07/13/2012, | | | | |
| | | Cost $94,341) (b) | | $ | 89,000 | |
| 100,000 | | 8.375%, 12/01/2017 | | | | |
| | | (Acquired 01/27/2012, | | | | |
| | | Cost $98,874) (b) | | | 97,375 | |
| | | | | | | |
| | | | | | 562,000 | |
| | | | | | | |
| | | Wireless Telecommunication Services - 0.64% | | | | |
| 650,000 | | America Movil SAB de CV | | | | |
| | | 3.125%, 07/16/2022 | | | 671,438 | |
| | | Hutchison Whampoa International Ltd. | | | | |
| 600,000 | | 4.625%, 01/13/2022 | | | | |
| | | (Acquired 01/10/2012, | | | | |
| | | Cost $595,500) (b) | | | 659,187 | |
| | | Sprint Nextel Corp. | | | | |
| 150,000 | | 9.000%, 11/15/2018 | | | | |
| | | (Acquired 11/04/2011, | | | | |
| | | Cost $150,000) (b) | | | 180,375 | |
| 100,000 | | 7.000%, 03/01/2020 | | | | |
| | | (Acquired 02/28/2012, | | | | |
| | | Cost $100,000) (b) | | | 112,250 | |
| | | | | | | |
| | | | | | 1,623,250 | |
| | | | | | | |
| | | Total Corporate Obligations | | | | |
| | | (Cost $53,589,801) | | | 55,608,583 | |
| | | | | | | |
| | | FOREIGN DEBT OBLIGATIONS - 30.36% | | | | |
| | | Bank Negara Malaysia Monetary Note | | | | |
| 930,000 | | 0.000%, 12/04/2012 (d) | | | 302,721 | |
| 1,000,000 | | 0.000%, 01/10/2013 (d) | | | 324,531 | |
| 2,870,000 | | 0.000%, 05/23/2013 (d) | | | 921,488 | |
| 690,000 | | 0.000%, 06/11/2013 (d) | | | 221,242 | |
| 7,170,000 | | 0.000%, 06/20/2013 (d) | | | 2,297,435 | |
| 350,000 | | Brazilian Government International Bond | | | | |
| | | 8.500%, 01/05/2024 | | | 202,861 | |
| 3,300,000 | | Canadian Government Bond | | | | |
| | | 1.750%, 03/01/2013 | | | 3,367,000 | |
| | | Financing of Infrastructural Projects | | | | |
| | | State Enterprise | | | | |
| 100,000 | | 8.375%, 11/03/2017 | | | | |
| | | (Acquired 05/10/2011, | | | | |
| | | Cost $104,940) (b) | | | 93,000 | |
See notes to financial statements.
86
|
GuideMarkSM Opportunistic Fixed Income Fund |
SCHEDULE OF INVESTMENTS (Unaudited) (Continued) |
September 30, 2012 |
| |
| | | | | | | | |
Principal
Amount | | | | | | Value | |
| | | | | | | | |
| | | FOREIGN DEBT OBLIGATIONS (Continued) | | | | |
$ | 1,180,000 | | 7.400%, 04/20/2018 | | | | |
| | | (Acquired 04/15/2011, | | | | |
| | | Cost $1,180,000) (b) | | $ | 1,055,464 | |
| | | Ghana Government Bond | | | | |
| 2,530,000 | | 12.390%, 04/28/2014 | | | 1,267,013 | |
| 860,000 | | 13.000%, 06/02/2014 | | | 429,929 | |
| 1,470,000 | | 14.990%, 02/23/2015 | | | 746,469 | |
| 1,630,000 | | 24.000%, 05/25/2015 | | | 995,635 | |
| | | Malaysia | | | | |
| 470,000 | | 3.210%, 05/31/2013 | | | 153,990 | |
| 280,000 | | 3.461%, 07/31/2013 | | | 91,962 | |
| 3,410,000 | | 5.094%, 04/30/2014 | | | 1,150,729 | |
| | | Mexican Bonos | | | | |
| 36,060 | | 9.000%, 06/20/2013 | | | 289,084 | |
| 214,500 | | 8.000%, 12/19/2013 | | | 1,734,762 | |
| 185,000 | | 6.000%, 06/18/2015 | | | 1,488,096 | |
| 20,000 | | 7.750%, 12/14/2017 | | | 175,246 | |
| 40,000 | | 8.500%, 12/13/2018 | | | 367,052 | |
| | | Mexican Udibonos | | | | |
| 9,709 | | 4.500%, 12/18/2014 | | | 82,284 | |
| 24,800 | | 5.000%, 06/16/2016 | | | 223,841 | |
| 21,195 | | 3.500%, 12/14/2017 | | | 187,389 | |
| 12,736 | | 4.000%, 06/13/2019 | | | 118,371 | |
| 10,526 | | 2.500%, 12/10/2020 | | | 90,259 | |
| | | Poland Government Bond | | | | |
| 17,735,000 | | 0.000%, 01/25/2013 (d) | | | 5,465,861 | |
| 473,000 | | 0.000%, 07/25/2013 (d) | | | 143,089 | |
| 180,000 | | 0.000%, 07/25/2014 (d) | | | 52,354 | |
| | | Republic of Ghana | | | | |
| 80,000 | | 14.990%, 03/11/2013 | | | 42,187 | |
| 60,000 | | 14.250%, 07/29/2013 | | | 31,148 | |
| | | Republic of Hungary | | | | |
| 2,200,000 | | 6.750%, 02/12/2013 | | | 9,908 | |
| 314,600,000 | | 5.500%, 02/12/2014 | | | 1,404,132 | |
| 373,600,000 | | 6.750%, 08/22/2014 | | | 1,699,404 | |
| 1,800,000 | | 8.000%, 02/12/2015 | | | 8,371 | |
| 8,800,000 | | 5.500%, 02/12/2016 | | | 38,476 | |
| 632,400,000 | | 6.750%, 02/24/2017 | | | 2,855,856 | |
| 440,000 | | 4.375%, 07/04/2017 | | | 536,325 | |
| 58,700,000 | | 6.750%, 11/24/2017 | | | 264,866 | |
| 150,000 | | 5.750%, 06/11/2018 | | | 192,397 | |
| 2,700,000 | | 6.500%, 06/24/2019 | | | 11,910 | |
| 2,650,000 | | 6.375%, 03/29/2021 | | | 2,898,570 | |
| | | | | | | | |
Principal
Amount | | | | | | Value | |
| | | | | | | | |
| | | FOREIGN DEBT OBLIGATIONS (Continued) | | | | |
| | | Republic of Iceland | | | | |
$ | 2,290,000 | | 4.875%, 06/16/2016 | | | | |
| | | (Acquired 06/09/2011 and 06/10/2011, | | | | |
| | | Cost $2,278,203) (b) | | $ | 2,388,793 | |
| 200,000 | | 5.875%, 05/11/2022 | | | | |
| | | (Acquired 05/03/2012, | | | | |
| | | Cost $198,140) (b) | | | 218,404 | |
| | | Republic of Indonesia | | | | |
| 5,683,000,000 | | 11.000%, 12/15/2012 | | | 600,942 | |
| 38,953,000,000 | | 12.500%, 03/15/2013 | | | 4,210,738 | |
| | | Republic of Ireland | | | | |
| 1,046,000 | | 5.500%, 10/18/2017 | | | 1,456,194 | |
| 790,000 | | 4.500%, 10/18/2018 | | | 1,017,829 | |
| 1,019,000 | | 4.400%, 06/18/2019 | | | 1,283,316 | |
| 397,000 | | 5.900%, 10/18/2019 | | | 541,563 | |
| 750,000 | | 4.500%, 04/18/2020 | | | 936,768 | |
| 2,224,000 | | 5.000%, 10/18/2020 | | | 2,860,780 | |
| 1,563,000 | | 5.400%, 03/13/2025 | | | 2,011,791 | |
| | | Republic of Korea | | | | |
| 1,310,000,000 | | 3.750%, 06/10/2013 | | | 1,186,425 | |
| 10,845,000,000 | | 3.000%, 12/10/2013 | | | 9,783,738 | |
| | | Republic of Latvia | | | | |
| 900,000 | | 5.250%, 02/22/2017 | | | | |
| | | (Acquired 02/14/2012, | | | | |
| | | Cost $895,122) (b) | | | 992,250 | |
| 1,260,000 | | 5.250%, 06/16/2021 | | | | |
| | | (Acquired 06/09/2011, 06/22/2011, | | | | |
| | | 06/23/2011, and 07/19/2011, | | | | |
| | | Cost $1,235,837) (b) | | | 1,422,225 | |
| | | Republic of Poland | | | | |
| 1,996,000 | | 0.000%, 10/25/2012 (d) | | | 621,204 | |
| 520,000 | | 5.250%, 04/25/2013 | | | 163,256 | |
| 465,000 | | 5.000%, 10/24/2013 | | | 146,586 | |
| 325,000 | | 5.750%, 04/25/2014 | | | 104,080 | |
| 40,000 | | 5.500%, 04/25/2015 | | | 12,909 | |
| 45,000 | | 6.250%, 10/24/2015 | | | 14,902 | |
| 1,005,000 | | Republic of Portugal | | | | |
| | | 3.850%, 04/15/2021 | | | 921,926 | |
| 1,060,000 | | Republic of Serbia | | | | |
| | | 7.250%, 09/28/2021 | | | | |
| | | (Acquired 09/21/2011, | | | | |
| | | Cost $1,041,588) (b) | | | 1,128,900 | |
See notes to financial statements.
87
|
GuideMarkSM Opportunistic Fixed Income Fund |
SCHEDULE OF INVESTMENTS (Unaudited) (Continued) |
September 30, 2012 |
| |
| | | | | | | | |
| Principal
Amount | | | | | | Value | |
| | | | | | | | |
| | | FOREIGN DEBT OBLIGATIONS (Continued) | | | | |
| | | Serbia Treasury Bonds | | | | |
$ | 55,000,000 | | 10.000%, 03/01/2015 | | $ | 547,861 | |
| 20,200,000 | | 10.000%, 04/27/2015 | | | 199,896 | |
| 170,000 | | Spanish Government Bond | | | | |
| | | 4.650%, 07/30/2025 | | | 186,153 | |
| | | Sri Lanka Government Bond | | | | |
| 37,900,000 | | 11.000%, 09/01/2015 | | | 275,845 | |
| 132,300,000 | | 8.000%, 06/01/2016 | | | 861,154 | |
| 16,500,000 | | 5.800%, 07/15/2017 | | | 92,849 | |
| | | Ukraine Government International Bond | | | | |
| 620,000 | | 9.250%, 07/24/2017 | | | | |
| | | (Acquired 07/17/2012, | | | | |
| | | Cost $620,000) (b) | | | 654,385 | |
| 2,300,000 | | 7.950%, 02/23/2021 | | | | |
| | | (Acquired 04/05/2011 and 04/11/2011, | | | | |
| | | Cost $2,403,768) (b) | | | 2,302,691 | |
| | | Uruguay Government International Bond | | | | |
| 26,467,953 | | 4.375%, 12/15/2028 | | | 1,531,360 | |
| | | Uruguay Notas del Tesoro | | | | |
| 16,480,000 | | 10.500%, 03/15/2015 | | | 796,533 | |
| 4,915,400 | | 4.000%, 06/10/2020 | | | 266,836 | |
| 1,300,000 | | Western Australia Treasury Corp. | | | | |
| | | 8.000%, 06/15/2013 | | | 1,397,060 | |
| | | | | | | |
| | | Total Foreign Debt Obligations | | | | |
| | | (Cost $77,971,384) | | | 77,170,849 | |
| | | | | | | |
| | | MORTGAGE BACKED SECURITIES - 17.81% | | | | |
| | | Federal Home Loan Mortgage Corp. | | | | |
| 697,000 | | 4050, 3.500%, 05/15/2032 | | | 745,208 | |
| 867,547 | | 4062, 3.500%, 06/15/2042 | | | 881,981 | |
| 2,992,764 | | 267, 3.000%, 08/15/2042 | | | 3,140,835 | |
| 1,997,240 | | 274, 3.000%, 08/15/2042 | | | 2,093,893 | |
| 2,005,833 | | 4097, 3.500%, 08/15/2042 | | | 2,049,506 | |
| 3,000,000 | | T60853, 3.500%, 09/01/2042 | | | 3,146,953 | |
| 3,000,000 | | T60854, 3.500%, 09/01/2042 | | | 3,146,953 | |
| 5,000,000 | | 280, 3.000%, 09/15/2042 (e) | | | 5,146,094 | |
| | | Federal National Mortgage Association | | | | |
| 3,000,000 | | 1200, 3.000%, 10/01/2032 | | | 3,188,940 | |
| 3,000,000 | | Pool #TBA, 3.000%, | | | | |
| | | 10/01/2032 (e) (h) | | | 3,177,891 | |
| 1,500,000 | | 1201, 3.500%, 10/01/2032 | | | 1,608,633 | |
| 1,216,671 | | 2005-56, 6.000%, 08/25/2033 (c) | | | 1,368,050 | |
| 2,465,603 | | 2012-63, 2.000%, 08/25/2040 | | | 2,509,368 | |
| 2,690,613 | | 1179, 3.500%, 09/01/2042 | | | 2,823,582 | |
| | | | | | | | |
Principal
Amount | | | | | | Value | |
| | | | | | | | |
| | | MORTGAGE BACKED | | | | |
| | | SECURITIES (Continued) | | | | |
$ | 1,255,000 | | 4787, 3.500%, 09/01/2042 | | $ | 1,317,021 | |
| 7,000,000 | | 1209, 3.500%, 10/01/2042 | | | 7,305,703 | |
| | | Government National Mortgage Association | | | | |
| 2,927,179 | | 2010-62, 5.532%, 05/20/2040 (c)(g) | | | 424,830 | |
| 3,033,130 | | 2011-72, 5.162%, 05/20/2041 (c)(g) | | | 437,990 | |
| 700,000 | | 2012-40, 4.000%, 01/20/2042 | | | 760,748 | |
| | | | | | | |
| | | Total Mortgage Backed Securities | | | | |
| | | (Cost $44,985,734) | | | 45,274,179 | |
| | | | | | | |
| | | | | | | |
Number of
Shares | | | | | | |
| | | | | | | |
| | | PREFERRED STOCKS - 0.30% | | | | |
| | | Consumer Finance - 0.15% | | | | |
| 415 | | Ally Financial, Inc. | | | | |
| | | (Acquired 05/03/2012, 05/29/2012, | | | | |
| | | 05/30/2012, 05/31/2012, 06/01/2012, | | | | |
| | | 06/11/2012, and 06/20/2012, | | | | |
| | | Cost $359,163) (b) | | | 388,245 | |
| | | | | | | |
| | | Insurance - 0.15% | | | | |
| 13,755 | | Montpelier Re Holdings Ltd. (a) | | | 367,259 | |
| | | | | | | |
| | | Total Preferred Stocks | | | | |
| | | (Cost $703,038) | | | 755,504 | |
| | | | | | | |
| | | | | | | |
Notional
Amount | | | | | | |
| | | | | | | |
| | | PURCHASED OPTIONS - 0.04% | | | | |
| 8,800,000 | | U.S. Dollar - Australian Dollar | | | | |
| | | Expiration: February, 2013, | | | | |
| | | Exercise Price: $0.97 | | | 82,773 | |
| | | | | | | |
| | | | | | | |
Number of
Contracts | | | | | | |
| | | | | | | |
| 242 | | iShares MSCI Brazil Index Fund | | | | |
| | | Expiration: December, 2012, | | | | |
| | | Exercise Price: $57.00 | | | 32,186 | |
| | | | | | | |
| | | Total Purchased Options | | | | |
| | | (Cost $206,115) | | | 114,959 | |
| | | | | | | |
| | | | | | | |
Principal
Amount | | | | | | |
| | | | | | | |
| | | SHORT TERM INVESTMENTS - 20.70% | | | | |
| | | Foreign Treasury Bill - 1.80% | | | | |
| | | Malaysia Treasury Bill | | | | |
$ | 380,000 | | 2.952%, 01/25/2013 | | | 123,168 | |
| 430,000 | | 2.907%, 03/22/2013 | | | 138,729 | |
| 190,000 | | 2.926%, 05/31/2013 | | | 60,967 | |
See notes to financial statements.
88
|
GuideMarkSM Opportunistic Fixed Income Fund |
SCHEDULE OF INVESTMENTS (Unaudited) (Continued) |
September 30, 2012 |
| |
| | | | | | | | |
Principal
Amount | | | | | | Value | |
| | | | | | | | |
| | | SHORT TERM INVESTMENTS (Continued) | | | | |
| | | Foreign Treasury Bill (Continued) | | | | |
$ | 11,400,000 | | Serbia Treasury Bill | | | | |
| | | 12.481%, 12/12/2013 | | $ | 108,294 | |
| | | Uruguay Treasury Bill | | | | |
| 830,000 | | 0.039%, 01/02/2013 | | | 38,599 | |
| 1,736,000 | | 0.032%, 01/23/2013 | | | 80,392 | |
| 37,610,000 | | 0.021%, 03/22/2013 | | | 1,721,689 | |
| 23,827,000 | | 0.018%, 04/26/2013 | | | 1,081,911 | |
| 770,000 | | 0.017%, 05/09/2013 | | | 34,704 | |
| 6,625,000 | | 0.015%, 05/31/2013 | | | 296,924 | |
| 1,160,000 | | 0.014%, 06/27/2013 | | | 51,653 | |
| 6,809,000 | | 0.013%, 07/05/2013 | | | 300,907 | |
| 8,171,000 | | 1.136%, 08/09/2013 | | | 360,797 | |
| 2,390,000 | | 0.011%, 09/09/2013 | | | 104,422 | |
| 1,410,000 | | 0.070%, 11/21/2012 | | | 66,282 | |
| | | | | | | |
| | | | | | 4,569,438 | |
| | | | | | | |
| | | | | | | |
Number of
Shares | | | | | | |
| | | | | | | |
| | | Money Market Funds - 17.92% | | | | |
| 45,553,161 | | Federated Prime Obligations Fund | | | | |
| | | Effective Yield, 0.15% | | | 45,553,161 | |
| | | | | | | |
| | | | | | | | |
Principal
Amount | | | | | | Value | |
| | | | | | | | |
| | | U.S. Treasury Bill - 0.98% | | | | |
$ | 2,500,000 | | United States Treasury Bill | | | | |
| | | 0.132%, 03/21/2013 (f) | | $ | 2,498,457 | |
| | | | | | | |
| | | Total Short Term Investments | | | | |
| | | (Cost $52,781,778) | | | 52,621,056 | |
| | | | | | | |
| | | Total Investments | | | | |
| | | (Cost $277,103,289) - 109.92% | | | 279,411,188 | |
| | | Liabilities in Excess of | | | | |
| | | Other Assets - (9.92)% | | | (25,223,870 | ) |
| | | | | | | |
| | | TOTAL NET | | | | |
| | | ASSETS - 100.00% | | $ | 254,187,318 | |
| | | | | | | |
| |
Percentages are stated as a percent of net assets. |
Principal Amounts are denominated in the currency in which the security was purchased. |
ADR - American Depositary Receipt |
(a) | Non-income producing. |
(b) | Restricted securities as defined in Rule 144(a) under the Securities Act of 1933. Such securities are treated as liquid securities according to the Fund’s liquidity guidelines. The value of these securities total $41,011,019, which represents 16.13% of total net assets. |
(c) | Variable Rate Security. The rate shown is the rate in effect on September 30, 2012. |
(d) | Zero coupon bond. |
(e) | As of September 30, 2012, the Fund has fair valued this security and deemed it illiquid. The value of this security was $10,989,061, which represents 4.32% of total net assets. |
(f) | Partially assigned as collateral for certain futures contracts |
(g) | Represents an interest-only security that entitles holders to receive only interest payments on the underlying mortgages. The yield-to-maturity of an interest-only security is extremely sensitive to the rate of principal payments on the underlying mortgage assets. A rapid (slow) rate of principal repayments may have an adverse (positive) effect on yield to maturity. The principal amount shown is the notional amount of the underlying mortgages. Interest rate disclosed represents yield upon the estimated timing and amount of future cash flows at September 30, 2012. The securities are liquid and the value of these securities total $862,820, which represents 0.34% of total net assets. |
(h) | Security purchased on a when-issued basis. On September 30, 2012, the total value of investments purchased on a when-issued basis was $3,177,891, which represents 1.25% of total net assets. |
See notes to financial statements.
89
|
GuideMarkSM Opportunistic Fixed Income Fund |
SCHEDULE OF OPEN FORWARD CURRENCY CONTRACTS (Unaudited) |
September 30, 2012 |
| |
| | | | | | | | | | | | | | | | |
| | | | | | | | | | | | | | | | |
Forward
expiration date | | Currency to
be received | | Amount of
Currency to
be received | | Currency to
be delivered | | Amount of
Currency to
be delivered | | Unrealized
Appreciation
(Depreciation) | |
| | | | | | | | | | | | |
10/2/2012 | | Australian Dollar | | $ | 2,354,770 | | U.S. Dollars | | $ | 2,383,027 | | | $ | 58,710 | | |
10/2/2012 | | Australian Dollar | | | 5,349,562 | | U.S. Dollars | | | 5,414,196 | | | | 77,298 | | |
10/18/2012 | | Brazilian Real | | | 1,515,000 | | Japanese Yen | | | 58,766,850 | | | | (8,089 | ) | |
10/15/2012 | | Brazilian Real | | | 580,000 | | U.S. Dollars | | | 284,928 | | | | 433 | | |
11/5/2012 | | Brazilian Real | | | 3,000,000 | | U.S. Dollars | | | 1,504,023 | | | | (31,876 | ) | |
4/12/2013 | | Chilean Peso | | | 1,342,012,500 | | U.S. Dollars | | | 2,675,997 | | | | 76,310 | | |
4/17/2013 | | Chilean Peso | | | 1,884,575,000 | | U.S. Dollars | | | 3,713,448 | | | | 149,619 | | |
10/29/2012 | | Colombian Peso | | | 1,105,000,000 | | U.S. Dollars | | | 612,528 | | | | (1,519 | ) | |
11/2/2012 | | Colombian Peso | | | 2,375,000,000 | | U.S. Dollars | | | 1,315,789 | | | | (3,145 | ) | |
11/6/2012 | | Colombian Peso | | | 2,385,000,000 | | U.S. Dollars | | | 1,320,525 | | | | (2,965 | ) | |
4/10/2013 | | Euro | | | 2,080,610 | | Swedish Krona | | | 17,350,000 | | | | 52,274 | | |
10/10/2012 | | Euro | | | 130,000 | | U.S. Dollars | | | 168,349 | | | | (1,272 | ) | |
4/11/2013 | | Euro | | | 2,430,500 | | U.S. Dollars | | | 3,066,732 | | | | 63,354 | | |
6/5/2013 | | Euro | | | 3,021,000 | | U.S. Dollars | | | 3,815,130 | | | | 77,790 | | |
4/2/2013 | | Hungarian Forint | | | 35,900,000 | | U.S. Dollars | | | 158,779 | | | | (479 | ) | |
10/18/2012 | | Indonesian Rupiah | | | 3,600,000,000 | | U.S. Dollars | | | 380,349 | | | | (5,123 | ) | |
4/12/2013 | | Indian Rupee | | | 117,200,000 | | U.S. Dollars | | | 2,159,314 | | | | (12,412 | ) | |
4/16/2013 | | Indian Rupee | | | 117,575,000 | | U.S. Dollars | | | 2,156,865 | | | | (4,352 | ) | |
4/10/2013 | | Japanese Yen | | | 201,000,000 | | U.S. Dollars | | | 2,567,706 | | | | 13,564 | | |
10/3/2012 | | Mexican Peso | | | 22,740,000 | | U.S. Dollars | | | 1,636,501 | | | | 129,286 | | |
10/11/2012 | | Mexican Peso | | | 18,798,000 | | U.S. Dollars | | | 1,422,507 | | | | 35,873 | | |
12/5/2012 | | Mexican Peso | | | 15,200,710 | | U.S. Dollars | | | 1,036,000 | | | | 136,810 | | |
3/8/2013 | | Mexican Peso | | | 11,784,520 | | U.S. Dollars | | | 878,675 | | | | 22,245 | | |
8/6/2013 | | Mexican Peso | | | 1,597,390 | | U.S. Dollars | | | 115,456 | | | | 4,841 | | |
8/8/2013 | | Mexican Peso | | | 1,605,500 | | U.S. Dollars | | | 118,877 | | | | 2,007 | | |
10/3/2012 | | Malaysian Ringgit | | | 5,330,000 | | U.S. Dollars | | | 1,653,739 | | | | 89,414 | | |
12/5/2012 | | Malaysian Ringgit | | | 2,827,440 | | U.S. Dollars | | | 880,000 | | | | 40,413 | | |
3/11/2013 | | Malaysian Ringgit | | | 2,414,589 | | U.S. Dollars | | | 785,000 | | | | (3,488 | ) | |
3/12/2013 | | Malaysian Ringgit | | | 612,600 | | U.S. Dollars | | | 200,000 | | | | (1,736 | ) | |
3/15/2013 | | Malaysian Ringgit | | | 1,024,011 | | U.S. Dollars | | | 334,000 | | | | (2,643 | ) | |
3/18/2013 | | Malaysian Ringgit | | | 799,497 | | U.S. Dollars | | | 259,518 | | | | (856 | ) | |
3/26/2013 | | Malaysian Ringgit | | | 777,000 | | U.S. Dollars | | | 248,480 | | | | 2,788 | | |
6/18/2013 | | Malaysian Ringgit | | | 2,500,000 | | U.S. Dollars | | | 773,898 | | | | 31,089 | | |
6/21/2013 | | Malaysian Ringgit | | | 2,167,800 | | U.S. Dollars | | | 676,888 | | | | 21,026 | | |
9/26/2013 | | Malaysian Ringgit | | | 478,000 | | U.S. Dollars | | | 153,312 | | | | (31 | ) | |
11/5/2012 | | Norwegian Krone | | | 21,630,000 | | Euro | | | 2,836,238 | | | | 123,978 | | |
4/10/2013 | | Philippine Peso | | | 144,452,000 | | U.S. Dollars | | | 3,337,076 | | | | 110,213 | | |
4/15/2013 | | Philippine Peso | | | 144,887,500 | | U.S. Dollars | | | 3,356,441 | | | | 100,532 | | |
3/8/2013 | | Polish Zloty | | | 4,450,638 | | Euro | | | 1,032,228 | | | | 36,446 | | |
4/10/2013 | | Polish Zloty | | | 4,746,256 | | Euro | | | 1,104,012 | | | | 29,780 | | |
4/15/2013 | | Polish Zloty | | | 4,578,308 | | Euro | | | 1,052,146 | | | | 44,553 | | |
8/6/2013 | | Polish Zloty | | | 963,300 | | Euro | | | 224,792 | | | | 1,875 | | |
8/8/2013 | | Polish Zloty | | | 497,150 | | Euro | | | 117,939 | | | | (1,545 | ) | |
8/9/2013 | | Polish Zloty | | | 350,574 | | Euro | | | 82,996 | | | | (878 | ) | |
See notes to financial statements.
90
|
GuideMarkSM Opportunistic Fixed Income Fund |
SCHEDULE OF OPEN FORWARD CURRENCY CONTRACTS (Unaudited) (Continued) |
September 30, 2012 |
| |
| | | | | | | | | | | | | | | | |
Forward
expiration date | | Currency to
be received | | Amount of
Currency to
be received | | Currency to
be delivered | | Amount of
Currency to
be delivered | | Unrealized
Appreciation
(Depreciation) | |
| | | | | | | | | | | | |
10/9/2012 | | Russian Ruble | | $ | 46,800,000 | | U.S. Dollars | | $ | 1,445,221 | | | $ | 52,175 | | |
10/3/2012 | | Swedish Krona | | | 7,620,000 | | Euro | | | 816,458 | | | | 110,619 | | |
3/8/2013 | | Swedish Krona | | | 1,010,000 | | Euro | | | 111,795 | | | | 9,144 | | |
4/10/2013 | | Swedish Krona | | | 44,055,858 | | Euro | | | 4,916,290 | | | | 339,744 | | |
4/15/2013 | | Swedish Krona | | | 43,466,148 | | Euro | | | 4,812,727 | | | | 382,667 | | |
3/28/2013 | | Serbian Dinar | | | 31,310,564 | | Euro | | | 264,895 | | | | (8,027 | ) | |
3/11/2013 | | Singapore Dollar | | | 1,387,980 | | U.S. Dollars | | | 1,102,000 | | | | 29,085 | | |
3/26/2013 | | Singapore Dollar | | | 637,800 | | U.S. Dollars | | | 505,553 | | | | 14,209 | | |
10/11/2012 | | Singapore Dollar | | | 5,519,882 | | U.S. Dollars | | | 4,379,816 | | | | 117,908 | | |
12/5/2012 | | Singapore Dollar | | | 405,248 | | U.S. Dollars | | | 315,000 | | | | 15,200 | | |
7/31/2013 | | Singapore Dollar | | | 1,428,700 | | U.S. Dollars | | | 1,145,251 | | | | 19,737 | | |
8/1/2013 | | Singapore Dollar | | | 1,145,260 | | U.S. Dollars | | | 920,627 | | | | 13,243 | | |
8/6/2013 | | Singapore Dollar | | | 917,603 | | U.S. Dollars | | | 736,912 | | | | 11,339 | | |
2/13/2013 | | Singapore Dollar | | | 917,160 | | U.S. Dollars | | | 740,093 | | | | 7,293 | | |
3/18/2013 | | Singapore Dollar | | | 1,411,379 | | U.S. Dollars | | | 1,148,677 | | | | 1,486 | | |
10/12/2012 | | South African Rand | | | 6,000,000 | | U.S. Dollars | | | 730,194 | | | | (10,707 | ) | |
10/18/2012 | | South Korean Won | | | 419,000,000 | | U.S. Dollars | | | 375,112 | | | | 1,476 | | |
3/11/2013 | | South Korean Won | | | 1,286,797,500 | | U.S. Dollars | | | 1,125,000 | | | | 23,705 | | |
3/12/2013 | | South Korean Won | | | 636,720,000 | | U.S. Dollars | | | 560,000 | | | | 8,365 | | |
3/15/2013 | | South Korean Won | | | 636,801,620 | | U.S. Dollars | | | 559,000 | | | | 9,360 | | |
6/27/2013 | | South Korean Won | | | 606,000,000 | | U.S. Dollars | | | 514,890 | | | | 24,016 | | |
8/27/2013 | | South Korean Won | | | 1,900,000,000 | | U.S. Dollars | | | 1,655,918 | | | | 30,266 | | |
9/26/2013 | | South Korean Won | | | 608,000,000 | | U.S. Dollars | | | 535,306 | | | | 2,793 | | |
10/2/2012 | | U.S. Dollars | | | 2,459,693 | | Australian Dollar | | | 2,354,770 | | | | 17,955 | | |
1/29/2013 | | U.S. Dollars | | | 1,817,254 | | Australian Dollar | | | 1,760,000 | | | | 10,558 | | |
10/15/2012 | | U.S. Dollars | | | 196,464 | | Brazilian Real | | | 400,000 | | | | (337 | ) | |
4/23/2012 | | U.S. Dollars | | | 1,431,298 | | Brazilian Real | | | 3,000,000 | | | | (40,849 | ) | |
12/4/2012 | | U.S. Dollars | | | 632,264 | | British Pound | | | 400,000 | | | | (13,528 | ) | |
10/22/2012 | | U.S. Dollars | | | 1,903,022 | | Canadian Dollar | | | 1,860,000 | | | | 12,041 | | |
4/12/2013 | | U.S. Dollars | | | 1,348,089 | | Chilean Peso | | | 670,000,000 | | | | (26,001 | ) | |
10/29/2012 | | U.S. Dollars | | | 605,728 | | Colombian Peso | | | 1,105,000,000 | | | | (5,280 | ) | |
11/2/2012 | | U.S. Dollars | | | 1,306,201 | | Colombian Peso | | | 2,375,000,000 | | | | (6,443 | ) | |
11/6/2012 | | U.S. Dollars | | | 1,317,607 | | Colombian Peso | | | 2,385,000,000 | | | | 47 | | |
10/4/2012 | | U.S. Dollars | | | 914,220 | | Euro | | | 718,000 | | | | (8,502 | ) | |
10/10/2012 | | U.S. Dollars | | | 164,025 | | Euro | | | 130,000 | | | | (3,052 | ) | |
10/11/2012 | | U.S. Dollars | | | 772,047 | | Euro | | | 611,000 | | | | (13,222 | ) | |
10/18/2012 | | U.S. Dollars | | | 196,677 | | Euro | | | 150,000 | | | | 3,880 | | |
10/22/2012 | | U.S. Dollars | | | 803,116 | | Euro | | | 615,000 | | | | 12,616 | | |
10/26/2012 | | U.S. Dollars | | | 780,307 | | Euro | | | 605,000 | | | | 2,628 | | |
10/30/2012 | | U.S. Dollars | | | 1,543,236 | | Euro | | | 1,200,000 | | | | 667 | | |
10/31/2012 | | U.S. Dollars | | | 107,987 | | Euro | | | 76,597 | | | | 9,523 | | |
11/14/2012 | | U.S. Dollars | | | 217,264 | | Euro | | | 177,000 | | | | (10,301 | ) | |
11/20/2012 | | U.S. Dollars | | | 215,811 | | Euro | | | 175,000 | | | | (9,198 | ) | |
12/6/2012 | | U.S. Dollars | | | 1,107,749 | | Euro | | | 826,000 | | | | 45,506 | | |
12/10/2012 | | U.S. Dollars | | | 378,411 | | Euro | | | 300,000 | | | | (7,411 | ) | |
See notes to financial statements.
91
|
GuideMarkSM Opportunistic Fixed Income Fund |
SCHEDULE OF OPEN FORWARD CURRENCY CONTRACTS (Unaudited) (Continued) |
September 30, 2012 |
| |
| | | | | | | | | | | | | | | | |
Forward
expiration date | | Currency to
be received | | Amount of
Currency to
be received | | Currency to
be delivered | | Amount of
Currency to
be delivered | | Unrealized
Appreciation
(Depreciation) | |
| | | | | | | | | | | | |
1/7/2013 | | U.S. Dollars | | $ | 630,993 | | Euro | | $ | 485,308 | | | $ | 6,639 | | |
2/4/2013 | | U.S. Dollars | | | 503,744 | | Euro | | | 408,295 | | | | (21,693 | ) | |
3/1/2013 | | U.S. Dollars | | | 226,815 | | Euro | | | 169,000 | | | | 9,269 | | |
3/7/2013 | | U.S. Dollars | | | 320,724 | | Euro | | | 241,782 | | | | 9,468 | | |
3/11/2013 | | U.S. Dollars | | | 511,944 | | Euro | | | 389,341 | | | | 10,708 | | |
3/15/2013 | | U.S. Dollars | | | 161,268 | | Euro | | | 122,880 | | | | 3,065 | | |
3/19/2013 | | U.S. Dollars | | | 107,144 | | Euro | | | 81,594 | | | | 2,090 | | |
3/21/2013 | | U.S. Dollars | | | 96,376 | | Euro | | | 72,605 | | | | 2,894 | | |
4/11/2013 | | U.S. Dollars | | | 3,187,990 | | Euro | | | 2,430,500 | | | | 57,904 | | |
4/15/2013 | | U.S. Dollars | | | 4,260,047 | | Euro | | | 3,230,000 | | | | 100,152 | | |
5/17/2013 | | U.S. Dollars | | | 5,003,048 | | Euro | | | 3,891,000 | | | | (9,918 | ) | |
6/5/2013 | | U.S. Dollars | | | 3,761,547 | | Euro | | | 3,021,000 | | | | (131,373 | ) | |
6/11/2013 | | U.S. Dollars | | | 550,973 | | Euro | | | 434,350 | | | | (8,776 | ) | |
6/13/2013 | | U.S. Dollars | | | 591,606 | | Euro | | | 469,000 | | | | (12,810 | ) | |
7/16/2013 | | U.S. Dollars | | | 794,025 | | Euro | | | 648,000 | | | | (41,380 | ) | |
7/18/2013 | | U.S. Dollars | | | 503,368 | | Euro | | | 409,000 | | | | (23,929 | ) | |
7/19/2013 | | U.S. Dollars | | | 154,375 | | Euro | | | 125,000 | | | | (6,781 | ) | |
7/22/2013 | | U.S. Dollars | | | 271,143 | | Euro | | | 220,000 | | | | (12,501 | ) | |
7/23/2013 | | U.S. Dollars | | | 220,270 | | Euro | | | 178,745 | | | | (10,186 | ) | |
7/30/2013 | | U.S. Dollars | | | 855,323 | | Euro | | | 691,917 | | | | (36,837 | ) | |
7/31/2013 | | U.S. Dollars | | | 1,013,798 | | Euro | | | 816,000 | | | | (38,367 | ) | |
8/1/2013 | | U.S. Dollars | | | 3,049,429 | | Euro | | | 2,478,287 | | | | (146,155 | ) | |
8/2/2013 | | U.S. Dollars | | | 506,076 | | Euro | | | 409,000 | | | | (21,308 | ) | |
8/5/2013 | | U.S. Dollars | | | 884,841 | | Euro | | | 715,023 | | | | (37,174 | ) | |
8/6/2013 | | U.S. Dollars | | | 683,197 | | Euro | | | 559,081 | | | | (37,740 | ) | |
8/9/2013 | | U.S. Dollars | | | 99,760 | | Euro | | | 80,000 | | | | (3,404 | ) | |
8/16/2013 | | U.S. Dollars | | | 351,278 | | Euro | | | 283,000 | | | | (13,692 | ) | |
8/19/2013 | | U.S. Dollars | | | 393,415 | | Euro | | | 319,000 | | | | (17,996 | ) | |
8/20/2013 | | U.S. Dollars | | | 1,012,006 | | Euro | | | 816,000 | | | | (40,393 | ) | |
8/23/2013 | | U.S. Dollars | | | 290,617 | | Euro | | | 232,085 | | | | (8,714 | ) | |
9/4/2013 | | U.S. Dollars | | | 126,768 | | Euro | | | 100,331 | | | | (2,651 | ) | |
9/11/2013 | | U.S. Dollars | | | 557,879 | | Euro | | | 434,350 | | | | (2,440 | ) | |
9/24/2013 | | U.S. Dollars | | | 248,084 | | Euro | | | 191,000 | | | | 1,655 | | |
9/26/2013 | | U.S. Dollars | | | 115,300 | | Euro | | | 89,000 | | | | 470 | | |
10/18/2012 | | U.S. Dollars | | | 374,026 | | Indonesian Rupiah | | | 3,600,000,000 | | | | (1,200 | ) | |
4/10/2013 | | U.S. Dollars | | | 8,474,973 | | Japanese Yen | | | 694,608,750 | | | | (445,290 | ) | |
4/15/2013 | | U.S. Dollars | | | 8,759,430 | | Japanese Yen | | | 706,185,270 | | | | (310,211 | ) | |
10/9/2012 | | U.S. Dollars | | | 1,968,145 | | Mexican Peso | | | 25,600,000 | | | | (18,407 | ) | |
10/18/2012 | | U.S. Dollars | | | 372,693 | | South Korean Won | | | 419,000,000 | | | | (3,895 | ) | |
10/9/2012 | | U.S. Dollars | | | 727,737 | | Russian Ruble | | | 22,800,000 | | | | (1,764 | ) | |
10/11/2012 | | U.S. Dollars | | | 2,472,484 | | Singapore Dollar | | | 3,100,000 | | | | (53,466 | ) | |
10/12/2012 | | U.S. Dollars | | | 723,737 | | South African Rand | | | 6,000,000 | | | | 4,251 | | |
11/9/2012 | | U.S. Dollars | | | 243,400 | | Swiss Franc | | | 235,000 | | | | (6,670 | ) | |
| | | | | | | | | | | | | | | | |
| | | | | | | | | | | | | $ | 1,307,949 | | |
| | | | | | | | | | | | | | | | |
See notes to financial statements.
92
|
GuideMarkSM Opportunistic Fixed Income Fund |
SCHEDULE OF OPEN FUTURES CONTRACTS (Unaudited) |
September 30, 2012 |
| |
| | | | | | | | | | | | | | | |
Description | | | Number of
Contracts
Purchased (Sold) | | Notional
Value | | Settlement
Month | | Unrealized
Appreciation
(Depreciation) | |
| | | | | | | | | | | |
Euro-OATS Futures | | (8 | ) | | $ | (1,377,059 | ) | Dec-12 | | | $ | (10,437 | ) | |
Euro Stoxx Futures | | (17 | ) | | | (536,316 | ) | Dec-12 | | | | 26,179 | | |
S&P 500 Index Mini Futures | | (26 | ) | | | (1,864,460 | ) | Dec-12 | | | | 32,177 | | |
U.S. Treasury 10-Year Note Futures | | (12 | ) | | | (1,601,813 | ) | Dec-12 | | | | (8,366 | ) | |
U.S. Treasury Long Bond Futures | | (6 | ) | | | (896,250 | ) | Dec-12 | | | | 2,755 | | |
| | | | | | | | | | | | | | |
| | | | | | | | | | | $ | 42,308 | | |
| | | | | | | | | | | | | | |
| |
GuideMarkSM Opportunistic Fixed Income Fund |
SCHEDULE OF OPTIONS WRITTEN (Unaudited) |
September 30, 2012 |
| |
| | | | | | | | |
Number of
Contracts | | | | | | Value | |
| | | | | | | | |
| | | OPTIONS ON EXCHANGE | | | | |
| | | TRADED FUNDS | | | | |
| | | Call Option | | | | |
| 242 | | iShares MSCI Brazil Index Fund | | | | |
| | | Expiration: December, 2012, | | | | |
| | | Exercise Price: $62.00 | | $ | 6,776 | |
| | | | | | | |
| | | Total Options Written | | | | |
| | | (Premiums Received $20,744) | | $ | 6,776 | |
| | | | | | | |
See notes to financial statements.
93
|
GuideMarkSM Opportunistic Fixed Income Fund |
CREDIT DEFAULT SWAPS ON CORPORATE, INDICES, SOVEREIGN, AND U.S. MUNICIPAL ISSUES — BUY PROTECTION(1) (Unaudited) |
September 30, 2012 |
| |
| | | | | | | | | | | | | | | | | | | | | | | | | | | |
Reference
Obligation | | | | Implied
Credit
Spread at
September 30,
2012(3) | | | Fixed
Pay
Rate | | | Maturity
Date | | Counterparty | | | Notional
Amount(4) | | | Fair
Value | | | Upfront
Premiums
Paid
(Received) | | Unrealized
Appreciation/
(Depreciation) | |
| | | | | | | | | | | | | | | | | | | | | | | | | |
Bank of Scotland | | | 1.14% | | | 1.000% | | | 6/20/2017 | | Merrill Lynch | | | $600,000 | | | $4,873 | | | $28,164 | | | $ | (23,291 | ) | |
Boston Scientific Corp. | | | 1.06% | | | 1.000% | | | 9/20/2017 | | Credit Suisse / | | | 725,000 | | | 2,096 | | | 10,871 | | | | (8,775 | ) | |
| | | | | | | | | | | Deutsche Bank | | | | | | | | | | | | | | | |
Burlington Northern | | | | | | | | | | | | | | | | | | | | | | | | | | |
Santa Fe, LLC | | | 0.16% | | | 1.000% | | | 9/20/2017 | | Deutsche Bank | | | 325,000 | | | (13,477 | ) | | (13,096 | ) | | | (381 | ) | |
Burlington Northern | | | | | | | | | | | | | | | | | | | | | | | | | | |
Santa Fe, LLC | | | 0.16% | | | 1.000% | | | 9/20/2017 | | Morgan Stanley | | | 650,000 | | | (26,955 | ) | | (26,522 | ) | | | (433 | ) | |
Burlington Northern | | | | | | | | | | | | | | | | | | | | | | | | | | |
Santa Fe, LLC | | | 0.16% | | | 1.000% | | | 9/20/2017 | | Morgan Stanley | | | 150,000 | | | (6,220 | ) | | (6,123 | ) | | | (97 | ) | |
Burlington Northern | | | | | | | | | | | | | | | | | | | | | | | | | | |
Santa Fe, LLC | | | 0.16% | | | 1.000% | | | 9/20/2017 | | Credit Suisse | | | 750,000 | | | (31,102 | ) | | (30,287 | ) | | | (815 | ) | |
Burlington Northern | | | | | | | | | | | | | | | | | | | | | | | | | | |
Santa Fe, LLC | | | 0.16% | | | 1.000% | | | 9/20/2017 | | Credit Suisse | | | 325,000 | | | (13,477 | ) | | (13,126 | ) | | | (351 | ) | |
Carnival Corp. | | | 0.96% | | | 1.000% | | | 6/20/2017 | | Merrill Lynch | | | 725,000 | | | (1,504 | ) | | 16,747 | | | | (18,251 | ) | |
| | | | | | | | | | | Credit Suisse / | | | | | | | | | | | | | | | |
CDX HY 18 | | | 4.84% | | | 5.000% | | | 6/20/2017 | | Merrill Lynch | | | 5,420,250 | | | (33,545 | ) | | 115,587 | | | | (149,132 | ) | |
Dillard’s, Inc. | | | 2.60% | | | 5.000% | | | 9/20/2017 | | Credit Suisse | | | 800,000 | | | (88,973 | ) | | (71,355 | ) | | | (17,618 | ) | |
Government of Poland | | | 1.15% | | | 1.000% | | | 9/20/2017 | | Citigroup / UBS | | | 1,450,000 | | | 10,292 | | | 39,433 | | | | (29,141 | ) | |
Government of | | | | | | | | | | | | | | | | | | | | | | | | | | |
South Africa | | | 1.37% | | | 1.000% | | | 6/20/2017 | | Merrill Lynch / UBS | | | 875,000 | | | 14,815 | | | 36,812 | | | | (21,997 | ) | |
Government of Turkey | | | 1.42% | | | 1.000% | | | 3/20/2017 | | Merrill Lynch / UBS | | | 975,000 | | | 17,925 | | | 58,784 | | | | (40,859 | ) | |
Government of Turkey | | | 1.42% | | | 1.000% | | | 3/20/2017 | | Merrill Lynch | | | 1,200,000 | | | 22,062 | | | 61,207 | | | | (39,145 | ) | |
Government of Turkey | | | 1.49% | | | 1.000% | | | 6/20/2017 | | Merrill Lynch / UBS | | | 1,200,000 | | | 26,905 | | | 76,688 | | | | (49,783 | ) | |
iTraxx Europe Series 18 | | | 1.36% | | | 1.000% | | | 12/20/2017 | | Merrill Lynch | | | 350,000 | | | 8,032 | | | 8,964 | | | | (932 | ) | |
Macy’s, Inc. | | | 1.03% | | | 1.000% | | | 3/20/2017 | | Merrill Lynch | | | 1,450,000 | | | 2,058 | | | (616 | ) | | | 2,674 | | |
MeadWestvaco Corp. | | | 0.88% | | | 1.000% | | | 9/20/2016 | | Merrill Lynch | | | 1,200,000 | | | (5,783 | ) | | 35,285 | | | | (41,068 | ) | |
MeadWestvaco Corp. | | | 1.06% | | | 1.000% | | | 9/20/2017 | | Merrill Lynch | | | 300,000 | | | 846 | | | 3,804 | | | | (2,958 | ) | |
National Australia | | | | | | | | | | | | | | | | | | | | | | | | | | |
Bank, Ltd. | | | 1.39% | | | 1.000% | | | 9/20/2017 | | UBS | | | 800,000 | | | 15,057 | | | 25,484 | | | | (10,427 | ) | |
Sprint Nextel Corp. | | | 2.30% | | | 5.000% | | | 6/20/2015 | | Credit Suisse | | | 200,000 | | | (14,317 | ) | | 6,691 | | | | (21,008 | ) | |
Sprint Nextel Corp. | | | 4.59% | | | 5.000% | | | 9/20/2017 | | Credit Suisse | | | 350,000 | | | (6,288 | ) | | 8,475 | | | | (14,763 | ) | |
Stanley Black & | | | | | | | | | | | | | | | | | | | | | | | | | | |
Decker, Inc. | | | 0.80% | | | 1.000% | | | 9/20/2017 | | Merrill Lynch | | | 725,000 | | | (7,137 | ) | | (5,889 | ) | | | (1,248 | ) | |
Tesoro Corp. | | | 1.95% | | | 5.000% | | | 9/20/2017 | | Credit Suisse | | | 650,000 | | | (93,331 | ) | | (80,467 | ) | | | (12,864 | ) | |
Textron, Inc. | | | 0.35% | | | 1.000% | | | 3/20/2017 | | Merrill Lynch | | | 250,000 | | | (7,270 | ) | | (6,871 | ) | | | (399 | ) | |
Textron, Inc. | | | 0.35% | | | 1.000% | | | 3/20/2017 | | Morgan Stanley | | | 400,000 | | | (11,631 | ) | | (10,467 | ) | | | (1,164 | ) | |
Textron, Inc. | | | 0.38% | | | 1.000% | | | 6/20/2017 | | Merrill Lynch | | | 300,000 | | | (8,769 | ) | | (8,374 | ) | | | (395 | ) | |
The New York Times | | | | | | | | | | | Morgan Stanley / | | | | | | | | | | | | | | | |
Company | | | 2.42% | | | 1.000% | | | 6/20/2017 | | Citigroup | | | 725,000 | | | 45,870 | | | 56,763 | | | | (10,893 | ) | |
Westpac Banking Corp. | | | 1.37% | | | 1.000% | | | 9/20/2017 | | Credit Suisse | | | 440,000 | | | 7,757 | | | 11,245 | | | | (3,488 | ) | |
| | | | | | | | | | | | | | | | | | | | | | | | | | |
| | | | | | | | | | | | | | | | $ | (191,191 | ) | $ | 327,811 | | | $ | (519,002 | ) | |
| | | | | | | | | | | | | | | | | | | | | | | | | | |
See notes to financial statements.
94
|
GuideMarkSM Opportunistic Fixed Income Fund |
CREDIT DEFAULT SWAPS ON CORPORATE, SOVEREIGN, AND U.S. MUNICIPAL ISSUES — SELL PROTECTION(2) (Unaudited) |
September 30, 2012 |
| |
| | | | | | | | | | | | | | | | | | | | | | | | | | | |
Reference
Obligation | | | | Implied
Credit
Spread at
September 30,
2012(3) | | | Fixed
Receive
Rate | | | Maturity
Date | | Counterparty | | | Notional
Amount(4) | | | Fair
Value | | | Upfront
Premiums
Received | | Unrealized
Appreciation | |
| | | | | | | | | | | | | | | | | | | | | | | | | |
Avon Products, Inc. | | | 4.96% | | | 5.000% | | | 9/20/2017 | | Credit Suisse | | | $175,000 | | | $282 | | | $(6,853 | ) | | | $7,135 | | |
Avon Products, Inc. | | | 4.96% | | | 5.000% | | | 9/20/2017 | | Credit Suisse | | | 175,000 | | | 282 | | | (6,856 | ) | | | 7,138 | | |
Chesapeake Energy, Inc. | | | 5.68% | | | 5.000% | | | 6/20/2017 | | Merrill Lynch | | | 600,000 | | | (15,721 | ) | | (27,051 | ) | | | 11,330 | | |
Chesapeake Energy, Inc. | | | 5.68% | | | 5.000% | | | 6/20/2017 | | Credit Suisse | | | 225,000 | | | (5,896 | ) | | (10,316 | ) | | | 4,420 | | |
Chesapeake Energy, Inc. | | | 5.68% | | | 5.000% | | | 6/20/2017 | | Credit Suisse | | | 450,000 | | | (11,791 | ) | | (28,962 | ) | | | 17,171 | | |
Chesapeake Energy, Inc. | | | 5.68% | | | 5.000% | | | 6/20/2017 | | Merrill Lynch | | | 150,000 | | | (3,930 | ) | | (9,999 | ) | | | 6,069 | | |
Clear Channel | | | | | | | | | | | | | | | | | | | | | | | | | | |
Communications, Inc. | | | 10.99% | | | 5.000% | | | 9/20/2014 | | Credit Suisse | | | 200,000 | | | (21,889 | ) | | (28,953 | ) | | | 7,064 | | |
MGM Resorts | | | | | | | | | | | | | | | | | | | | | | | | | | |
International | | | 5.80% | | | 5.000% | | | 3/20/2017 | | Merrill Lynch | | | 250,000 | | | (7,784 | ) | | (14,272 | ) | | | 6,488 | | |
MGM Resorts | | | | | | | | | | | | | | | | | | | | | | | | | | |
International | | | 6.21% | | | 5.000% | | | 9/20/2017 | | Credit Suisse | | | 650,000 | | | (33,008 | ) | | (81,449 | ) | | | 48,441 | | |
Nokia Corp. | | | 8.99% | | | 5.000% | | | 9/20/2017 | | Credit Suisse | | | 500,000 | | | (94,657 | ) | | (123,827 | ) | | | 29,170 | | |
SUPERVALU, Inc. | | | 11.89% | | | 5.000% | | | 9/20/2017 | | Credit Suisse | | | 125,000 | | | (29,166 | ) | | (26,510 | ) | | | (2,656 | ) | |
SUPERVALU, Inc. | | | 11.89% | | | 5.000% | | | 9/20/2017 | | Citigroup | | | 175,000 | | | (40,833 | ) | | (35,407 | ) | | | (5,426 | ) | |
SUPERVALU, Inc. | | | 12.01% | | | 5.000% | | | 12/20/2017 | | Citigroup | | | 475,000 | | | (115,690 | ) | | (94,209 | ) | | | (21,481 | ) | |
| | | | | | | | | | | | | | | | | | | | | | | | | | |
| | | | | | | | | | | | | | | | $ | (379,801 | ) | $ | (494,664 | ) | | | $114,863 | | |
| | | | | | | | | | | | | | | | | | | | | | | | | | |
| |
1) | If the Fund is a buyer of protection and a credit event occurs, as defined under the terms of that particular swap agreement, the Fund will either (i) receive from the seller of protection an amount equal to the notional amount of the swap and take delivery of the referenced obligation or underlying securities comprising the referenced index or (ii) pay a net settlement amount in the form of cash or securities equal to the notional amount of the swap less the recovery value of the referenced obligation or underlying securities comprising the referenced index. |
2) | If the Fund is a seller of protection and a credit event occurs, as defined under the terms of that particular swap agreement, the Fund will either (i) pay to the buyer of protection an amount equal to the notional amount of the swap and take delivery of the referenced obligation or underlying securities comprising the referenced index or (ii) pay a net settlement amount in the form of cash or securities equal to the notional amount of the swap less the recovery value of the referenced obligation or underlying securities comprising the referenced index. |
3) | Implied credit spreads, represented in absolute terms, utilized in determining the market value of credit default swap agreements on U.S. municipal issues, corporate issues or sovereign issues of an emerging country as of period end serve as an indicator of the current status of the payment/performance risk and represent the likelihood or risk of default for the credit derivative. The implied credit spread of a particular referenced entity reflects the cost of buying/selling protection and may include upfront payments required to be made to enter into the agreement. Wider credit spreads represent a deterioration of the referenced entity’s credit soundness and a greater likelihood or risk of default or other credit event occurring as defined under the terms of the agreement. A credit spread identified as “Defaulted” indicates a credit event has occurred for the referenced entity or obligation. |
4) | The maximum potential amount the Fund could be required to pay as seller of credit protection or receive as a buyer of credit protection if a credit event occurs as defined under the terms of that particular swap agreement. |
See notes to financial statements.
95
|
GuidePathSM Strategic Asset Allocation Fund |
SCHEDULE OF INVESTMENTS (Unaudited) |
September 30, 2012 |
| |
| | | | | | | | |
Number of
Shares | | | | | | Value | |
| | | | | | | | |
| | | INVESTMENT COMPANIES - 97.22% | | | | |
| | | Affiliated Mutual Funds - 54.50% | | | | |
| 997,593 | | GuideMarkSM Global Real Return | | | | |
| | | Fund - Institutional Shares (a) | | $ | 9,447,204 | |
| 1,423,457 | | GuideMarkSM Large Cap Growth | | | | |
| | | Fund - Institutional Shares (a)(b) | | | 15,159,815 | |
| 1,881,389 | | GuideMarkSM Large Cap Value | | | | |
| | | Fund - Institutional Shares (a) | | | 16,048,252 | |
| 1,578,129 | | GuideMarkSM Opportunistic Equity | | | | |
| | | Fund - Institutional Shares (a)(b) | | | 15,639,258 | |
| 1,575,513 | | GuideMarkSM Small/Mid Cap Core | | | | |
| | | Fund - Institutional Shares (a)(b) | | | 18,354,722 | |
| 4,326,612 | | GuideMarkSM World ex-US Fund - | | | | |
| | | Institutional Shares (a) | | | 32,276,522 | |
| | | | | | | |
| | | | | | 106,925,773 | |
| | | | | | | |
| | | Exchange Traded Funds - 42.72% | | | | |
| 146,730 | | iShares MSCI Canada Index | | | | |
| | | Fund (c) | | | 4,175,936 | |
| 85,391 | | iShares MSCI Switzerland Index | | | | |
| | | Fund (c) | | | 2,099,765 | |
| 213,084 | | SPDR S&P 500 ETF Trust | | | 30,669,180 | |
| 53,969 | | SPDR S&P China ETF (c) | | | 3,513,922 | |
| 720,866 | | Vanguard FTSE All-World | | | | |
| | | ex-US Index Fund (c) | | | 30,968,403 | |
| 23,839 | | Vanguard Global | | | | |
| | | ex-US Real Estate ETF | | | 1,226,040 | |
| 82,557 | | Vanguard MSCI Emerging | | | | |
| | | Markets ETF | | | 3,446,755 | |
| 40,127 | | Vanguard REIT ETF | | | 2,607,051 | |
| 58,052 | | Vanguard Small-Cap Growth | | | | |
| | | ETF (c) | | | 5,122,508 | |
| | | | | | | |
| | | | | | 83,829,560 | |
| | | | | | | |
| | | Total Investment Companies | | | | |
| | | (Cost $178,340,377) | | | 190,755,333 | |
| | | | | | | |
| | | | | | | | |
Number of
Shares | | | | | | Value | |
| | | | | | | | |
| | | SHORT TERM INVESTMENTS - 1.96% | | | | |
| | | Money Market Funds - 1.96% | | | | |
| 3,851,492 | | Federated Prime Obligations Fund | | | | |
| | | Effective Yield, 0.15% | | $ | 3,851,492 | |
| | | | | | | |
| | | Total Short Term Investments | | | | |
| | | (Cost $3,851,492) | | | 3,851,492 | |
| | | | | | | |
| | | INVESTMENTS PURCHASED | | | | |
| | | AS SECURITIES LENDING | | | | |
| | | COLLATERAL - 8.70% | | | | |
| | | Money Market Funds - 8.70% | | | | |
| 17,068,200 | | First American Government | | | | |
| | | Obligations Fund | | | | |
| | | Effective Yield, 0.02% | | | 17,068,200 | |
| | | | | | | |
| | | Total Investments Purchased as | | | | |
| | | Securities Lending Collateral | | | | |
| | | (Cost $17,068,200) | | | 17,068,200 | |
| | | | | | | |
| | | Total Investments | | | | |
| | | (Cost $199,260,069) - 107.88% | | | 211,675,025 | |
| | | Liabilities in Excess of Other | | | | |
| | | Assets - (7.88)% | | | (15,468,407 | ) |
| | | | | | | |
| | | TOTAL NET ASSETS - 100.00% | | $ | 196,206,618 | |
| | | | | | | |
| |
Percentages are stated as a percent of net assets. |
(a) | Affiliated to the Fund. |
(b) | Non-income producing security. |
(c) | All or portion of this security is on loan. |
See notes to financial statements.
96
|
GuidePathSM Tactical Constrained Asset Allocation Fund |
SCHEDULE OF INVESTMENTS (Unaudited) |
September 30, 2012 |
| |
| | | | �� | | | | |
Number of
Shares | | | | | | Value | |
| | | | | | | | |
| | | INVESTMENT COMPANIES - 97.44% | | | | |
| | | Affiliated Mutual Funds - 63.18% | | | | |
| 2,108,851 | | GuideMarkSM Core Fixed Income | | | | |
| | | Fund - Institutional Shares (a) | | $ | 21,215,041 | |
| 482,955 | | GuideMarkSM Global Real Return | | | | |
| | | Fund - Institutional Shares (a) | | | 4,573,584 | |
| 1,194,061 | | GuideMarkSM Large Cap Growth | | | | |
| | | Fund - Institutional Shares (a)(b) | | | 12,716,746 | |
| 1,498,701 | | GuideMarkSM Large Cap Value | | | | |
| | | Fund - Institutional Shares (a) | | | 12,783,921 | |
| 1,949,305 | | GuideMarkSM Opportunistic Equity | | | | |
| | | Fund - Institutional Shares (a)(b) | | | 19,317,615 | |
| 1,125,448 | | GuideMarkSM Opportunistic Fixed | | | | |
| | | Income Fund - Institutional | | | | |
| | | Shares (a) | | | 11,231,970 | |
| 485,315 | | GuideMarkSM Small/Mid Cap Core | | | | |
| | | Fund - Institutional Shares (a)(b) | | | 5,653,924 | |
| 3,855,701 | | GuideMarkSM World ex-US Fund - | | | | |
| | | Institutional Shares (a) | | | 28,763,530 | |
| | | | | | | |
| | | | | | 116,256,331 | |
| | | | | | | |
| | | Exchange Traded Funds - 30.03% | | | | |
| 15,685 | | Energy Select Sector SPDR | | | | |
| | | Fund (c) | | | 1,152,534 | |
| 102,820 | | Guggenheim China Small Cap | | | | |
| | | ETF (c) | | | 2,031,723 | |
| 39,518 | | iShares MSCI Sweden Index Fund | | | 1,116,779 | |
| 31,765 | | Market Vectors Steel Index Fund (c) | | | 1,393,530 | |
| 48,355 | | PowerShares FTSE RAFI Asia | | | | |
| | | Pacific ex-Japan Portfolio ETF (c) | | | 2,567,167 | |
| 95,951 | | SPDR Barclays Capital 1-3 Month | | | | |
| | | T-Bill ETF (b) | | | 4,395,515 | |
| 74,187 | | SPDR Barclays Capital High Yield | | | | |
| | | Bond ETF (c) | | | 2,983,801 | |
| 176,264 | | SPDR S&P 500 ETF Trust | | | 25,369,678 | |
| 47,109 | | SPDR S&P Dividend ETF | | | 2,737,033 | |
| 19,592 | | SPDR S&P International | | | | |
| | | Dividend ETF (c) | | | 886,146 | |
| 30,894 | | Technology Select Sector SPDR | | | | |
| | | Fund | | | 952,462 | |
| 17,419 | | Utilities Select Sector SPDR Fund | | | 634,052 | |
| 17,728 | | Vanguard Global ex-US Real | | | | |
| | | Estate ETF (c) | | | 911,751 | |
| 136,003 | | Vanguard MSCI Emerging | | | | |
| | | Markets ETF | | | 5,678,125 | |
| 24,189 | | Vanguard MSCI European ETF (c) | | | 1,094,794 | |
| 20,863 | | Vanguard REIT ETF | | | 1,355,469 | |
| | | | | | | |
| | | | | | 55,260,559 | |
| | | | | | | |
| | | | | | | | |
Number of
Shares | | | | | | Value | |
| | | | | | | | |
| | | Exchange Traded Notes - 0.96% | | | | |
| 67,497 | | iPath U.S. Treasury 10-year | | | | |
| | | Bear ETN (b)(d) | | $ | 1,760,322 | |
| | | Mutual Funds - 3.27% | | | | |
| 208,043 | | AQR Diversified Arbitrage Fund - | | | | |
| | | Institutional Shares | | | 2,315,522 | |
| 122,006 | | DoubleLine Total Return Bond Fund - | | | | |
| | | Institutional Shares | | | 1,390,867 | |
| 213,610 | | PIMCO Emerging Local Bond Fund - | | | | |
| | | Institutional Shares | | | 2,319,808 | |
| | | | | | | |
| | | | | | 6,026,197 | |
| | | | | | | |
| | | Total Investment Companies | | | | |
| | | (Cost $167,124,092) | | | 179,303,409 | |
| | | | | | | |
| | | SHORT TERM INVESTMENTS - 1.92% | | | | |
| | | Money Market Funds - 1.92% | | | | |
| 3,523,906 | | Federated Prime Obligations Fund | | | | |
| | | Effective Yield, 0.15% | | | 3,523,906 | |
| | | | | | | |
| | | Total Short Term Investments | | | | |
| | | (Cost $3,523,906) | | | 3,523,906 | |
| | | | | | | |
| | | INVESTMENTS PURCHASED | | | | |
| | | AS SECURITIES LENDING | | | | |
| | | COLLATERAL - 1.79% | | | | |
| | | Money Market Funds - 1.79% | | | | |
| 3,290,308 | | First American Government | | | | |
| | | Obligations Fund | | | | |
| | | Effective Yield, 0.02% | | | 3,290,308 | |
| | | | | | | |
| | | Total Investments Purchased as | | | | |
| | | Securities Lending Collateral | | | | |
| | | (Cost $3,290,308) | | | 3,290,308 | |
| | | | | | | |
| | | Total Investments | | | | |
| | | (Cost $173,938,306) - 101.15% | | | 186,117,623 | |
| | | Liabilities in Excess of Other | | | | |
| | | Assets - (1.15)% | | | (2,115,117 | ) |
| | | | | | | |
| | | TOTAL NET ASSETS - 100.00% | | $ | 184,002,506 | |
| | | | | | | |
| |
Percentages are stated as a percent of net assets. |
(a) | Affiliated to the Fund. |
(b) | Non-income producing security. |
(c) | All or portion of this security is on loan. |
(d) | The value of an exchange-traded note can be impacted by the credit quality of the issuer. The issuer for this exchange-traded note is Barclay’s Capital PLC. |
See notes to financial statements.
97
|
GuidePathSM Tactical Unconstrained Asset Allocation Fund |
SCHEDULE OF INVESTMENTS (Unaudited) |
September 30, 2012 |
| |
| | | | | | | | |
Number of
Shares | | | | | | Value | |
| | | | | | | | |
| | | INVESTMENT COMPANIES - 97.37% | | | | |
| | | Affiliated Mutual Funds - 29.48% | | | | |
| 123,784 | | GuideMarkSM Core Fixed Income | | | | |
| | | Fund - Institutional Shares (a) | | $ | 1,245,270 | |
| 788,249 | | GuideMarkSM Large Cap Growth | | | | |
| | | Fund - Institutional Shares (a)(b) | | | 8,394,849 | |
| 1,928,140 | | GuideMarkSM Large Cap Value | | | | |
| | | Fund - Institutional Shares (a) | | | 16,447,032 | |
| 1,918,707 | | GuideMarkSM Opportunistic Equity | | | | |
| | | Fund - Institutional Shares (a)(b) | | | 19,014,384 | |
| 1,221,612 | | GuideMarkSM Opportunistic Fixed | | | | |
| | | Income Fund - Institutional | | | | |
| | | Shares (a) | | | 12,191,688 | |
| 903,206 | | GuideMarkSM Small/Mid Cap Core | | | | |
| | | Fund - Institutional Shares (a)(b) | | | 10,522,355 | |
| 741,951 | | GuideMarkSM World ex-US Fund - | | | | |
| | | Institutional Shares (a) | | | 5,534,958 | |
| | | | | | | |
| | | | | | 73,350,536 | |
| | | | | | | |
| | | Exchange Traded Funds - 34.97% | | | | |
| 17,039 | | iShares Barclays MBS Bond | | | | |
| | | Fund (c) | | | 1,859,977 | |
| 3,069 | | PowerShares DB Gold Fund (b)(c) | | | 187,455 | |
| 40,592 | | PowerShares DB Precious Metals | | | | |
| | | Fund (b)(c) | | | 2,502,903 | |
| 35,521 | | PowerShares QQQ Trust Series 1 | | | 2,436,030 | |
| 133,061 | | SPDR Barclays Capital 1-3 Month | | | | |
| | | T-Bill ETF (b) | | | 6,095,525 | |
| 83,733 | | SPDR Barclays Capital High Yield | | | | |
| | | Bond ETF | | | 3,367,741 | |
| 41,861 | | SPDR Barclays Capital Short Term | | | | |
| | | International Treasury | | | | |
| | | Bond ETF (b)(c) | | | 1,546,345 | |
| 253,545 | | SPDR S&P 500 ETF Trust | | | 36,492,732 | |
| 40,927 | | SPDR S&P Emerging Asia | | | | |
| | | Pacific ETF (c) | | | 2,979,895 | |
| 122,606 | | Vanguard High Dividend Yield | | | | |
| | | ETF (c) | | | 6,179,342 | |
| 271,851 | | Vanguard MSCI EAFE ETF (c) | | | 8,935,742 | |
| 236,857 | | Vanguard MSCI Emerging | | | | |
| | | Markets ETF | | | 9,888,780 | |
| 53,300 | | Vanguard Total Bond Market | | | | |
| | | Index Fund | | | 4,538,495 | |
| | | | | | | |
| | | | | | 87,010,962 | |
| | | | | | | |
| | | | | | | | |
Number of
Shares | | | | | | Value | |
| | | | | | | | |
| | | Mutual Funds - 32.92% | | | | |
| 1,367,264 | | Eaton Vance Floating-Rate Fund - | | | | |
| | | Institutional Shares | | $ | 12,428,433 | |
| 634,485 | | Eaton Vance Global Macro Absolute | | | | |
| | | Return Advantage Fund - | | | | |
| | | Institutional Shares | | | 6,573,268 | |
| 237,099 | | Eaton Vance Global Macro Absolute | | | | |
| | | Return Fund - Institutional Shares | | | 2,361,506 | |
| 103,689 | | Eaton Vance Government Obligations | | | | |
| | | Fund - Institutional Shares | | | 767,295 | |
| 662,917 | | Eaton Vance Income Fund of Boston - | | | | |
| | | Institutional Shares | | | 3,917,838 | |
| 145,951 | | Eaton Vance Multi-Strategy Absolute | | | | |
| | | Return Fund - Institutional Shares | | | 1,329,616 | |
| 23,102 | | Eaton Vance Parametric Option | | | | |
| | | Absolute Return Strategy Fund - | | | | |
| | | Institutional Shares (b) | | | 253,893 | |
| 58,767 | | Eaton Vance Worldwide Health | | | | |
| | | Sciences Fund - Institutional | | | | |
| | | Shares | | | 627,636 | |
| 275,475 | | Pioneer Strategic Income Fund - | | | | |
| | | Class Y | | | 3,090,827 | |
| 1,336,000 | | Stadion Managed Portfolio Trust - | | | | |
| | | Institutional Shares | | | 12,959,197 | |
| 520,558 | | Virtus Allocator Premium AlphaSector | | | | |
| | | Fund - Institutional Shares | | | 5,564,763 | |
| 128,483 | | Virtus Global Premium AlphaSector | | | | |
| | | Fund - Institutional Shares | | | 1,359,353 | |
| 2,280,064 | | Virtus Premium AlphaSector Fund - | | | | |
| | | Institutional Shares | | | 30,666,858 | |
| | | | | | | |
| | | | | | 81,900,483 | |
| | | | | | | |
| | | Total Investment Companies | | | | |
| | | (Cost $227,382,428) | | | 242,261,981 | |
| | | | | | | |
See notes to financial statements.
98
|
GuidePathSM Tactical Unconstrained Asset Allocation Fund |
SCHEDULE OF INVESTMENTS (Unaudited) (Continued) |
September 30, 2012 |
| |
| | | | | | | | |
Number of
Shares | | | | | | Value | |
| | | | | | | | |
| | | SHORT TERM INVESTMENTS - 2.12% | | | | |
| | | Money Market Funds - 2.12% | | | | |
| 5,277,715 | | Federated Prime Obligations Fund | | | | |
| | | Effective Yield, 0.15% | | $ | 5,277,715 | |
| | | | | | | |
| | | Total Short Term Investments | | | | |
| | | (Cost $5,277,715) | | | 5,277,715 | |
| | | | | | | |
| | | INVESTMENTS PURCHASED | | | | |
| | | AS SECURITIES LENDING | | | | |
| | | COLLATERAL - 5.05% | | | | |
| | | Money Market Funds - 5.05% | | | | |
| 12,556,232 | | First American Government | | | | |
| | | Obligations Fund | | | | |
| | | Effective Yield, 0.02% | | | 12,556,232 | |
| | | | | | | |
| | | Total Investments Purchased as | | | | |
| | | Securities Lending Collateral | | | | |
| | | (Cost $12,556,232) | | | 12,556,232 | |
| | | | | | | |
| | | Total Investments | | | | |
| | | (Cost $245,216,375) - 104.54% | | | 260,095,928 | |
| | | Liabilities in Excess of Other | | | | |
| | | Assets - (4.54)% | | | (11,291,669 | ) |
| | | | | | | |
| | | TOTAL NET ASSETS - 100.00% | | $ | 248,804,259 | |
| | | | | | | |
| |
Percentages are stated as a percent of net assets. |
(a) | Affiliated to the Fund. |
(b) | Non-income producing security. |
(c) | All or portion of this security is on loan. |
See notes to financial statements.
99
|
GuidePathSM Absolute Return Asset Allocation Fund |
SCHEDULE OF INVESTMENTS (Unaudited) |
September 30, 2012 |
| |
| | | | | | | | |
Number of
Shares | | | | | | Value | |
| | | | | | | | |
| | | INVESTMENT COMPANIES - 97.21% | | | | |
| | | Affiliated Mutual Funds - 14.00% | | | | |
| 2,671,071 | | GuideMarkSM Core Fixed Income | | | | |
| | | Fund - Institutional Shares (a) | | $ | 26,870,975 | |
| 3,159,648 | | GuideMarkSM Opportunistic Fixed | | | | |
| | | Income Fund - Institutional | | | | |
| | | Shares (a) | | | 31,533,287 | |
| | | | | | | |
| | | | | | 58,404,262 | |
| | | | | | | |
| | | Exchange Traded Funds - 36.95% | | | | |
| 36,318 | | iShares Barclays Agency Bond | | | | |
| | | Fund (b) | | | 4,140,978 | |
| 289,983 | | iShares Barclays Credit Bond | | | | |
| | | Fund (b) | | | 33,034,863 | |
| 200,710 | | iShares Barclays MBS Bond | | | | |
| | | Fund (b) | | | 21,909,504 | |
| 225,192 | | iShares Floating Rate Note | | | | |
| | | Fund (b) | | | 11,363,189 | |
| 42,773 | | iShares JPMorgan USD Emerging | | | | |
| | | Markets Bond Fund (b) | | | 5,186,654 | |
| 85,091 | | iShares MSCI ACWI Index | | | | |
| | | Fund (b) | | | 3,972,899 | |
| 24,117 | | PowerShares DB Agriculture | | | | |
| | | Fund (b)(c) | | | 709,281 | |
| 18,157 | | PowerShares DB Base Metals | | | | |
| | | Fund (c) | | | 359,509 | |
| 36,225 | | PowerShares DB Energy | | | | |
| | | Fund (b)(c) | | | 1,029,877 | |
| 39,743 | | PowerShares DB Precious Metals | | | | |
| | | Fund (c) | | | 2,450,553 | |
| 26,428 | | PowerShares International Corporate | | | | |
| | | Bond Portfolio (b) | | | 759,541 | |
| 415,969 | | SPDR Barclays Capital 1-3 Month | | | | |
| | | T-Bill ETF (c) | | | 19,055,540 | |
| 40,651 | | SPDR Barclays Capital Convertible | | | | |
| | | Securities ETF (b) | | | 1,608,966 | |
| 17,671 | | SPDR S&P 500 ETF Trust | | | 2,543,387 | |
| 101,555 | | Vanguard Short-Term Bond | | | | |
| | | ETF (b) | | | 8,271,655 | |
| 442,998 | | Vanguard Total Bond Market ETF | | | 37,721,280 | |
| | | | | | | |
| | | | | | 154,117,676 | |
| | | | | | | |
| | | Exchange Traded Notes - 2.36% | | | | |
| 376,665 | | iPath U.S. Treasury 10-year Bear | | | | |
| | | ETN (b)(c)(d) | | | 9,823,423 | |
| | | | | | | |
| | | | | | 9,823,423 | |
| | | | | | | |
| | | | | | | | |
Number of
Shares | | | | | | Value | |
| | | | | | | | |
| | | Mutual Funds - 43.90% | | | | |
| 706,743 | | Aberdeen Equity Long Short Fund - | | | | |
| | | Institutional Shares | | $ | 8,106,340 | |
| 3,421,617 | | BlackRock Low Duration Bond | | | | |
| | | Portfolio - Institutional Shares | | | 33,634,496 | |
| 1,047,696 | | DoubleLine Core Fixed Income | | | | |
| | | Fund - Institutional Shares | | | 11,943,734 | |
| 556,785 | | DoubleLine Low Duration Bond | | | | |
| | | Fund - Institutional Shares | | | 5,684,777 | |
| 254,849 | | DoubleLine Multi-Asset Growth | | | | |
| | | Fund - Institutional Shares | | | 2,579,070 | |
| 1,457,911 | | DoubleLine Total Return Bond | | | | |
| | | Fund - Institutional Shares | | | 16,620,190 | |
| 342,110 | | Eaton Vance Floating-Rate Fund - | | | | |
| | | Institutional Shares | | | 3,109,779 | |
| 1,021,259 | | Eaton Vance Global Macro Absolute | | | | |
| | | Return Fund - Institutional Shares | | | 10,171,744 | |
| 1,491,474 | | Eaton Vance Multi-Strategy Absolute | | | | |
| | | Return Fund - Institutional Shares | | | 13,587,328 | |
| 48,453 | | Eaton Vance Parametric Option | | | | |
| | | Absolute Return Strategy Fund - | | | | |
| | | Institutional Shares (c) | | | 532,504 | |
| 159,816 | | Gateway Fund - Class Y | | | 4,396,545 | |
| 829,585 | | Highbridge Statistical Market | | | | |
| | | Neutral Fund - Select Shares (c) | | | 12,369,106 | |
| 928,618 | | JPMorgan Floating Rate Income | | | | |
| | | Fund - Select Shares | | | 9,249,033 | |
| 1,056,058 | | JPMorgan Income Builder Fund - | | | | |
| | | Select Shares | | | 10,222,645 | |
| 56,613 | | JPMorgan Research Equity | | | | |
| | | Long/Short Fund - Select | | | | |
| | | Shares (c) | | | 879,193 | |
| 655,902 | | JPMorgan Strategic Income | | | | |
| | | Opportunities Fund - Select | | | | |
| | | Shares | | | 7,700,288 | |
| 57,980 | | JPMorgan Strategic Preservation | | | | |
| | | Fund - Select Shares | | | 827,378 | |
| 2,806,652 | | Pioneer Strategic Income Fund - | | | | |
| | | Class Y | | | 31,490,636 | |
| | | | | | | |
| | | | | | 183,104,786 | |
| | | | | | | |
| | | Total Investment Companies | | | | |
| | | (Cost $397,208,375) | | | 405,450,147 | |
| | | | | | | |
See notes to financial statements.
100
|
GuidePathSM Absolute Return Asset Allocation Fund |
SCHEDULE OF INVESTMENTS (Unaudited) (Continued) |
September 30, 2012 |
| |
| | | | | | | | |
Number of
Shares | | | | | | Value | |
| | | | | | | | |
| | | SHORT TERM INVESTMENTS - 2.18% | | | | |
| | | Money Market Funds - 2.18% | | | | |
| 9,102,966 | | Federated Prime Obligations | | | | |
| | | Fund, 0.15% | | | | |
| | | Effictive Yield, 0.15% | | $ | 9,102,966 | |
| | | | | | | |
| | | Total Short Term Investments | | | | |
| | | (Cost $9,102,966) | | | 9,102,966 | |
| | | | | | | |
| | | INVESTMENTS PURCHASED | | | | |
| | | AS SECURITIES LENDING | | | | |
| | | COLLATERAL - 4.80% | | | | |
| | | Money Market Funds - 4.80% | | | | |
| 20,028,677 | | First American Government | | | | |
| | | Obligations Fund | | | | |
| | | Effective Yield, 0.02% | | | 20,028,677 | |
| | | | | | | |
| | | Total Investments Purchased as | | | | |
| | | Securities Lending Collateral | | | | |
| | | (Cost $20,028,677) | | | 20,028,677 | |
| | | | | | | |
| | | Total Investments | | | | |
| | | (Cost $426,340,018) - 104.19% | | | 434,581,790 | |
| | | Liabilities in Excess of Other | | | | |
| | | Assets - (4.19)% | | | (17,490,294 | ) |
| | | | | | | |
| | | TOTAL NET ASSETS - 100.00% | | $ | 417,091,496 | |
| | | | | | | |
| |
Percentages are stated as a percent of net assets. |
(a) | Affiliated to the Fund. |
(b) | All or portion of this security is on loan. |
(c) | Non-income producing security. |
(d) | The value of an exchange-traded note can be impacted by the credit quality of the issuer. The issuer for this exchange-traded note is Barclay’s Capital PLC. |
See notes to financial statements.
101
|
GuidePathSM Multi-Asset Income Asset Allocation Fund |
SCHEDULE OF INVESTMENTS (Unaudited) |
September 30, 2012 |
| |
| | | | | | | | |
Number of
Shares | | | | | | Value | |
| | | | | | | | |
| | | INVESTMENT COMPANIES - 97.41% | | | | |
| | | Affiliated Mutual Funds - 8.04% | | | | |
| 260,803 | | GuideMarkSM Core Fixed Income | | | | |
| | | Fund - Institutional Shares (a) | | $ | 2,623,680 | |
| 204,854 | | GuideMarkSM World ex-US Fund - | | | | |
| | | Institutional Shares (a) | | | 1,528,208 | |
| | | | | | | |
| | | | | | 4,151,888 | |
| | | | | | | |
| | | Exchange Traded Funds - 58.22% | | | | |
| 580 | | iShares Barclays Agency Bond | | | | |
| | | Fund (b) | | | 66,132 | |
| 3,793 | | iShares Barclays TIP Bond Fund | | | 461,836 | |
| 11,061 | | iShares Barclays 20+ Year Treasury | | | | |
| | | Bond Fund (b) | | | 1,374,108 | |
| 6,991 | | iShares Barclays 7-10 Year Treasury | | | | |
| | | Bond Fund (b) | | | 758,244 | |
| 60,093 | | iShares iBoxx $ High Yield | | | | |
| | | Corporate Bond Fund (b) | | | 5,550,791 | |
| 137 | | iShares iBoxx Investment Grade | | | | |
| | | Corporate Bond Fund | | | 16,682 | |
| 30,818 | | iShares JPMorgan USD Emerging | | | | |
| | | Markets Bond Fund (b) | | | 3,736,991 | |
| 65,088 | | iShares S&P Global Infrastructure | | | | |
| | | Index Fund | | | 2,294,352 | |
| 18,516 | | iShares S&P US Preferred Stock | | | | |
| | | Index Fund | | | 738,048 | |
| 28,412 | | SPDR Barclays Capital High Yield | | | | |
| | | Bond ETF (b) | | | 1,142,730 | |
| 2,797 | | SPDR Barclays Capital International | | | | |
| | | Treasury Bond ETF | | | 172,155 | |
| 119,713 | | SPDR S&P International Dividend | | | | |
| | | ETF (b) | | | 5,414,619 | |
| 10,028 | | Vanguard Global ex-US Real | | | | |
| | | Estate ETF (b) | | | 515,740 | |
| 10,414 | | Vanguard REIT ETF | | | 676,598 | |
| 8,253 | | WisdomTree Australia Dividend | | | | |
| | | Fund | | | 434,190 | |
| 9,910 | | WisdomTree Emerging Markets | | | | |
| | | Equity Income Fund (b) | | | 531,870 | |
| 102,955 | | WisdomTree Equity Income Fund | | | 4,871,831 | |
| 11,935 | | WisdomTree Europe SmallCap | | | | |
| | | Dividend Fund (b) | | | 440,631 | |
| 17,600 | | WisdomTree SmallCap Dividend | | | | |
| | | Fund (b) | | | 889,328 | |
| | | | | | | |
| | | | | | 30,086,876 | |
| | | | | | | |
| | | | | | | | |
Number of
Shares | | | | | | Value | |
| | | | | | | | |
| | | Mutual Funds - 31.15% | | | | |
| 146,884 | | Forward International Dividend | | | | |
| | | Fund - Institutional Shares | | $ | 1,097,226 | |
| 213,943 | | Forward EM Corporate Debt | | | | |
| | | Fund - Institutional Shares | | | 2,088,087 | |
| 171,586 | | Forward Select Income Fund - | | | | |
| | | Institutional Shares | | | 4,126,647 | |
| 363,691 | | Henderson Global Equity Income | | | | |
| | | Fund - Institutional Shares | | | 2,651,304 | |
| 39,764 | | JPMorgan Global Equity Income | | | | |
| | | Fund - Select Shares | | | 565,052 | |
| 369,828 | | JPMorgan High Yield Fund - | | | | |
| | | Select Shares | | | 2,988,214 | |
| 266,819 | | JPMorgan Income Builder Fund - | | | | |
| | | Select Shares | | | 2,582,812 | |
| | | | | | | |
| | | | | | 16,099,342 | |
| | | | | | | |
| | | Total Investment Companies | | | | |
| | | (Cost $49,860,427) | | | 50,338,106 | |
| | | | | | | |
| | | SHORT TERM INVESTMENTS - 2.32% | | | | |
| | | Money Market Funds - 2.32% | | | | |
| 1,198,804 | | Federated Prime Obligations Fund | | | | |
| | | Effictive Yield, 0.15% | | | 1,198,804 | |
| | | | | | | |
| | | Total Short Term Investments | | | | |
| | | (Cost $1,198,804) | | | 1,198,804 | |
| | | | | | | |
| | | INVESTMENTS PURCHASED | | | | |
| | | AS SECURITIES LENDING | | | | |
| | | COLLATERAL - 19.41% | | | | |
| | | Money Market Funds - 19.41% | | | | |
| 10,032,164 | | First American Government | | | | |
| | | Obligations Fund | | | | |
| | | Effective Yield, 0.02% | | | 10,032,164 | |
| | | | | | | |
| | | Total Investments Purchased as | | | | |
| | | Securities Lending Collateral | | | | |
| | | (Cost $10,032,164) | | | 10,032,164 | |
| | | | | | | |
| | | Total Investments | | | | |
| | | (Cost $61,091,395) - 119.14% | | | 61,569,074 | |
| | | Liabilities in Excess of Other | | | | |
| | | Assets - (19.14)% | | | (9,889,988 | ) |
| | | | | | | |
| | | TOTAL NET ASSETS - 100.00% | | $ | 51,679,086 | |
| | | | | | | |
| |
Percentages are stated as a percent of net assets. |
(a) | Affiliated to the Fund. |
(b) | All or portion of this security is on loan. |
See notes to financial statements.
102
|
GuidePathSM Fixed Income Allocation Fund |
SCHEDULE OF INVESTMENTS (Unaudited) |
September 30, 2012 |
| |
| | | | | | | | |
Number of
Shares | | | | | | Value | |
| | | | | | | | |
| | | INVESTMENT COMPANIES - 97.08% | | | | |
| | | Affiliated Mutual Funds - 31.76% | | | | |
| 4,821,531 | | GuideMarkSM Core Fixed Income | | | | |
| | | Fund - Institutional Shares (a) | | $ | 48,504,604 | |
| 1,657,531 | | GuideMarkSM Opportunistic Fixed | | | | |
| | | Income Fund - Institutional | | | | |
| | | Shares (a) | | | 16,542,163 | |
| | | | | | | |
| | | | | | 65,046,767 | |
| | | | | | | |
| | | Exchange Traded Funds - 56.87% | | | | |
| 49,092 | | iShares Barclays Agency Bond | | | | |
| | | Fund (b) | | | 5,597,470 | |
| 113,309 | | iShares Barclays Credit Bond | | | | |
| | | Fund (b) | | | 12,908,161 | |
| 136,301 | | iShares Barclays 1-3 Year Treasury | | | | |
| | | Bond Fund (b) | | | 11,517,435 | |
| 7,143 | | iShares Barclays 20+ Year Treasury | | | | |
| | | Bond Fund (b) | | | 887,375 | |
| 105,989 | | iShares Barclays 7-10 Year Treasury | | | | |
| | | Bond Fund (b) | | | 11,495,567 | |
| 10,339 | | iShares JPMorgan USD Emerging | | | | |
| | | Markets Bond Fund | | | 1,253,707 | |
| 91,891 | | PowerShares Senior Loan Portfolio | | | 2,292,680 | |
| 50,670 | | SPDR Barclays Capital 1-3 Month | | | | |
| | | T-Bill ETF (c) | | | 2,321,193 | |
| 165,626 | | SPDR Barclays Capital High Yield | | | | |
| | | Bond ETF | | | 6,661,478 | |
| 115,462 | | SPDR Barclays Capital TIPS ETF | | | 7,006,234 | |
| 184,460 | | Vanguard Mortgage-Backed | | | | |
| | | Securities ETF (b) | | | 9,752,400 | |
| 525,839 | | Vanguard Total Bond Market ETF | | | 44,775,190 | |
| | | | | | | |
| | | | | | 116,468,890 | |
| | | | | | | |
| | | Exchange Traded Notes - 1.39% | | | | |
| 109,310 | | iPath U.S. Treasury 10-year Bear | | | | |
| | | ETN (c)(d) | | | 2,850,805 | |
| | | | | | | |
| | | Mutual Funds - 7.06% | | | | |
| 362,209 | | DoubleLine Total Return Bond | | | | |
| | | Fund - Institutional Shares | | | 4,129,187 | |
| 127,440 | | JPMorgan Strategic Income | | | | |
| | | Opportunities Fund - Select Shares | | | 1,496,146 | |
| | | | | | | | |
Number of
Shares | | | | | | Value | |
| | | | | | | | |
| | | Mutual Funds (Continued) | | | | |
| 185,484 | | Loomis Sayles Bond Fund - | | | | |
| | | Institutional Shares | | $ | 2,780,411 | |
| 106,229 | | PIMCO Emerging Local Bond | | | | |
| | | Fund - Institutional Shares | | | 1,153,642 | |
| 420,860 | | PIMCO Unconstrained Bond | | | | |
| | | Fund - Institutional Shares | | | 4,898,815 | |
| | | | | | | |
| | | | | | 14,458,201 | |
| | | | | | | |
| | | Total Investment Companies | | | | |
| | | (Cost $198,318,118) | | | 198,824,663 | |
| | | | | | | |
| | | SHORT TERM INVESTMENTS - 2.33% | | | | |
| | | Money Market Funds - 2.33% | | | | |
| 4,773,670 | | Federated Prime Obligations Fund | | | | |
| | | Effective Yield, 0.15% | | | 4,773,670 | |
| | | | | | | |
| | | Total Short Term Investments | | | | |
| | | (Cost $4,773,670) | | | 4,773,670 | |
| | | | | | | |
| | | INVESTMENTS PURCHASED | | | | |
| | | AS SECURITIES LENDING | | | | |
| | | COLLATERAL - 7.12% | | | | |
| | | Money Market Funds - 7.12% | | | | |
| 14,579,236 | | First American Government | | | | |
| | | Obligations Fund | | | | |
| | | Effective Yield, 0.02% | | | 14,579,236 | |
| | | | | | | |
| | | Total Investments Purchased as | | | | |
| | | Securities Lending Collateral | | | | |
| | | (Cost $14,579,236) | | | 14,579,236 | |
| | | | | | | |
| | | Total Investments | | | | |
| | | (Cost $217,671,024) - 106.53% | | | 218,177,569 | |
| | | Liabilities in Excess of Other | | | | |
| | | Assets - (6.53)% | | | (13,379,346 | ) |
| | | | | | | |
| | | TOTAL NET ASSETS - 100.00% | | $ | 204,798,223 | |
| | | | | | | |
| |
Percentages are stated as a percent of net assets. |
(a) | Affiliated to the Fund. |
(b) | All or portion of this security is on loan. |
(c) | Non-income producing security. |
(d) | The value of an exchange-traded note can be impacted by the credit quality of the issuer. The issuer for this exchange-traded note is Barclay’s Capital PLC. |
See notes to financial statements.
103
|
GuidePathSM Altegris® Multi-Strategy Alternative Allocation Fund |
SCHEDULE OF INVESTMENTS (Unaudited) |
September 30, 2012 |
| |
| | | | | | | | |
Number of
Shares | | | | | | Value | |
| | | | | | | | |
| | | INVESTMENT COMPANIES - 97.21% | | | | |
| | | Affiliated Mutual Funds - 97.21% | | | | |
| 1,440,809 | | Altegris® Managed Futures | | | | |
| | | Strategy Fund - Institutional | | | | |
| | | Shares (a)(b) | | $ | 13,947,028 | |
| 4,825,231 | | Altegris® Equity Long Short | | | | |
| | | Fund - Institutional Shares (a)(b) | | | 48,734,833 | |
| 3,570,002 | | Altegris® Macro Strategy Fund - | | | | |
| | | Institutional Shares (a)(b) | | | 34,164,919 | |
| 1,415,540 | | Altegris® Futures Evolution | | | | |
| | | Strategy Fund - Institutional | | | | |
| | | Shares (a) | | | 13,985,537 | |
| 2,830,544 | | GuideMarkSM Opportunistic Fixed | | | | |
| | | Income Fund - Institutional | | | | |
| | | Shares (a) | | | 28,248,831 | |
| | | | | | | |
| | | | | | 139,081,148 | |
| | | | | | | |
| | | Total Investment Companies | | | | |
| | | (Cost $139,249,028) | | | 139,081,148 | |
| | | | | | | |
| | | SHORT TERM INVESTMENTS - 2.12% | | | | |
| | | Money Market Funds - 2.12% | | | | |
| 3,030,883 | | Federated Prime Obligations Fund | | | | |
| | | Effective Yield, 0.15% | | | 3,030,883 | |
| | | | | | | |
| | | Total Short Term Investments | | | | |
| | | (Cost $3,030,883) | | | 3,030,883 | |
| | | | | | | |
| | | Total Investments | | | | |
| | | (Cost $142,279,911) - 99.33% | | | 142,112,031 | |
| | | Other Assets in Excess of | | | | |
| | | Liabilities - 0.67% | | | 953,829 | |
| | | | | | | |
| | | TOTAL NET ASSETS - 100.00% | | $ | 143,065,860 | |
| | | | | | | |
| |
Percentages are stated as a percent of net assets. |
(a) | Affiliated to the Fund |
(b) | Non-income producing security. |
See notes to financial statements.
104
|
GuideMarkSM Funds & GuidePathSM Funds |
STATEMENTS OF ASSETS & LIABILITIES |
September 30, 2012 (Unaudited) |
| |
| | | | | | | | | | |
| |
Large Cap
Growth Fund
| | Large Cap
Value Fund | | Small/Mid Cap
Core Fund | |
| | | | | | | |
ASSETS: | | | | | | | | | | |
Investments, at value (cost $138,424,305, $167,704,657, | | | | | | | | | | |
and $73,830,048, respectively)1 | | $ | 182,475,389 | | $ | 193,668,481 | | $ | 82,098,688 | |
Cash | | | 89,377 | | | — | | | 1,304 | |
Income receivable | | | 136,730 | | | 361,000 | | | 70,339 | |
Receivable for dividend reclaims | | | — | | | 13,392 | | | — | |
Receivable for investment securities sold | | | 1,596,982 | | | 158,056 | | | 1,939,855 | |
Receivable for fund shares sold | | | 108,139 | | | 106,135 | | | 22,179 | |
Receivable from securities lending agent (See Note 6) | | | — | | | 2,702 | | | 10,025 | |
Other assets | | | 37,983 | | | 37,533 | | | 43,568 | |
| | | | | | | | | | |
Total Assets | | | 184,444,600 | | | 194,347,299 | | | 84,185,958 | |
| | | | | | | | | | |
LIABILITIES: | | | | | | | | | | |
Payable for collateral on securities loaned | | | 4,069,278 | | | 8,793,679 | | | 5,516,298 | |
Payable to securities lending agent (See Note 6) | | | 8,401 | | | — | | | — | |
Payable for investment securities purchased | | | 1,691,861 | | | — | | | 1,047,073 | |
Payable for fund shares redeemed | | | 266,583 | | | 274,712 | | | 148,976 | |
Payable to Investment Advisor | | | 110,718 | | | 107,905 | | | 50,860 | |
Other accrued expenses | | | 189,230 | | | 173,716 | | | 83,829 | |
| | | | | | | | | | |
Total Liabilities | | | 6,336,071 | | | 9,350,012 | | | 6,847,036 | |
| | | | | | | | | | |
NET ASSETS | | $ | 178,108,529 | | $ | 184,997,287 | | $ | 77,338,922 | |
| | | | | | | | | | |
NET ASSETS CONSIST OF: | | | | | | | | | | |
Capital stock | | | 208,397,497 | | | 331,545,227 | | | 98,490,310 | |
Unrealized appreciation on investments | | | 44,051,084 | | | 25,963,824 | | | 8,268,640 | |
Accumulated undistributed net investment income (loss) | | | (40,620 | ) | | 2,023,672 | | | 68,865 | |
Accumulated undistributed net realized loss | | | (74,299,432 | ) | | (174,535,436 | ) | | (29,488,893 | ) |
| | | | | | | | | | |
Total Net Assets | | $ | 178,108,529 | | $ | 184,997,287 | | $ | 77,338,922 | |
| | | | | | | | | | |
Institutional Shares | | | | | | | | | | |
Shares outstanding (unlimited shares of no par value authorized) | | | 3,405,766 | | | 5,308,230 | | | 2,964,034 | |
Net assets | | | 36,274,829 | | | 45,300,895 | | | 34,532,776 | |
Net asset value, offering and redemption price per share | | $ | 10.65 | | $ | 8.53 | | $ | 11.65 | |
| | | | | | | | | | |
Service Shares | | | | | | | | | | |
Shares outstanding (unlimited shares of no par value authorized) | | | 13,435,575 | | | 16,271,061 | | | 3,703,815 | |
Net assets | | | 141,833,700 | | | 139,696,392 | | | 42,806,146 | |
Net asset value, offering and redemption price per share | | $ | 10.56 | | $ | 8.59 | | $ | 11.56 | |
| | | | | | | | | | |
| | | | | | | | | | |
1Includes loaned securities with a market value of: | | $ | 3,921,228 | | $ | 8,489,101 | | $ | 5,164,440 | |
| | | | | | | | | | |
See notes to financial statements.
105
|
GuideMarkSM Funds & GuidePathSM Funds |
STATEMENTS OF ASSETS & LIABILITIES (Continued) |
September 30, 2012 (Unaudited) |
| |
| | | | | | | | | | |
| |
World
ex-US Fund
| | Opportunistic
Equity Fund | | Global Real
Return Fund | |
| | | | | | | |
ASSETS: | | | | | | | | | | |
Investments, at value (cost $258,632,507, $138,721,460, | | | | | | | | | | |
and $137,986,380, respectively)1 | | $ | 269,000,970 | | $ | 148,341,098 | | $ | 135,321,624 | |
Foreign currencies (cost $1,700,320, $0, and $0, respectively) | | | 1,695,357 | | | — | | | — | |
Cash | | | — | | | — | | | 70,423 | |
Income receivable | | | 912,147 | | | 181,850 | | | 256,631 | |
Receivable for dividend reclaims | | | 263,076 | | | — | | | — | |
Receivable for investment securities and foreign currencies sold | | | 2,491,778 | | | 1,314,481 | | | — | |
Receivable for fund shares sold | | | 147,195 | | | 46,497 | | | 98,584 | |
Other assets | | | 30,614 | | | 37,811 | | | 26,525 | |
| | | | | | | | | | |
Total Assets | | | 274,541,137 | | | 149,921,737 | | | 135,773,787 | |
| | | | | | | | | | |
LIABILITIES: | | | | | | | | | | |
Payable for collateral on securities loaned | | | 1,387,400 | | | 4,281,286 | | | 27,733,915 | |
Payable to securities lending agent (See Note 6) | | | 5,588 | | | — | | | — | |
Payable for investment securities purchased | | | 2,707,131 | | | 1,464,831 | | | — | |
Payable for fund shares redeemed | | | 434,405 | | | 201,728 | | | 286,599 | |
Payable to Investment Advisor | | | 144,304 | | | 93,518 | | | 58,218 | |
Other accrued expenses | | | 305,314 | | | 121,359 | | | 118,777 | |
| | | | | | | | | | |
Total Liabilities | | | 4,984,142 | | | 6,162,722 | | | 28,197,509 | |
| | | | | | | | | | |
NET ASSETS | | $ | 269,556,995 | | $ | 143,759,015 | | $ | 107,576,278 | |
| | | | | | | | | | |
NET ASSETS CONSIST OF: | | | | | | | | | | |
Capital stock | | | 478,978,040 | | | 147,230,498 | | | 116,097,530 | |
Unrealized appreciation (depreciation) on: | | | | | | | | | | |
Investments | | | 10,368,463 | | | 9,619,638 | | | (2,664,756 | ) |
Foreign currencies | | | (17,935 | ) | | — | | | — | |
Accumulated undistributed net investment income (loss) | | | 4,512,313 | | | 229,307 | | | 319,639 | |
Accumulated undistributed net realized loss | | | (224,283,886 | ) | | (13,320,428 | ) | | (6,176,135 | ) |
| | | | | | | | | | |
Total Net Assets | | $ | 269,556,995 | | $ | 143,759,015 | | $ | 107,576,278 | |
| | | | | | | | | | |
Institutional Shares | | | | | | | | | | |
Shares outstanding (unlimited shares of no par value authorized) | | | 9,129,118 | | | 5,446,141 | | | 1,480,548 | |
Net assets | | | 68,124,588 | | | 53,992,396 | | | 14,015,160 | |
Net asset value, offering and redemption price per share | | $ | 7.46 | | $ | 9.91 | | $ | 9.47 | |
| | | | | | | | | | |
Service Shares | | | | | | | | | | |
Shares outstanding (unlimited shares of no par value authorized) | | | 26,997,936 | | | 9,124,551 | | | 9,862,785 | |
Net assets | | | 201,432,407 | | | 89,766,619 | | | 93,561,118 | |
Net asset value, offering and redemption price per share | | $ | 7.46 | | $ | 9.84 | | $ | 9.49 | |
| | | | | | | | | | |
1Includes loaned securities with a market value of: | | $ | 1,355,236 | | $ | 4,054,250 | | $ | 26,813,990 | |
| | | | | | | | | | |
See notes to financial statements.
106
|
GuideMarkSM Funds & GuidePathSM Funds |
STATEMENTS OF ASSETS & LIABILITIES (Continued) |
September 30, 2012 (Unaudited) |
| |
| | | | | | | | | | |
| |
Core
Fixed Income
Fund
| | Tax-Exempt
Fixed Income
Fund | | Opportunistic
Fixed Income
Fund | |
| | | | | | | |
ASSETS: | | | | | | | | | | |
Investments, at value (cost $401,382,740, $74,522,739, | | | | | | | | | | |
and $277,103,289, respectively)1 | | $ | 417,802,924 | | $ | 82,459,896 | | $ | 279,411,188 | |
Appreciation of swap agreements | | | — | | | — | | | 147,100 | |
Foreign currencies (cost $0, $0, and $1,364,130, respectively) | | | — | | | — | | | 1,355,081 | |
Cash | | | 530,488 | | | — | | | 11,406,152 | |
Variation margin on futures contracts | | | — | | | — | | | 15,934 | |
Income receivable | | | 2,447,316 | | | 1,031,328 | | | 2,739,965 | |
Receivable for dividend reclaims | | | — | | | — | | | 2,979 | |
Receivable for investment securities and foreign currencies sold | | | 19,549 | | | — | | | 3,112,414 | |
Receivable for fund shares sold | | | 773,463 | | | 189,551 | | | 321,036 | |
Swap premiums paid | | | — | | | — | | | 601,004 | |
Deposits with brokers for forwards, options and swaps | | | — | | | — | | | 280,000 | |
Appreciation of forward foreign currency contracts | | | — | | | — | | | 3,080,337 | |
Receivable from securities lending agent (See Note 6) | | | 1,262 | | | — | | | — | |
Other assets | | | 89,176 | | | 52,375 | | | 37,396 | |
| | | | | | | | | | |
Total Assets | | | 421,664,178 | | | 83,733,150 | | | 302,510,586 | |
| | | | | | | | | | |
LIABILITIES: | | | | | | | | | | |
Options written at value (Premium received $0, $0 and | | | | | | | | | | |
$20,744, respectively) | | | — | | | — | | | 6,776 | |
Depreciation of forward foreign currency contracts | | | — | | | — | | | 1,772,388 | |
Depreciation on swap agreements | | | — | | | — | | | 551,239 | |
Payable for collateral on securities loaned | | | 2,081,560 | | | — | | | — | |
Payable for investment securities and foreign currencies purchased | | | 5,032,266 | | | 1,102,259 | | | 44,593,733 | |
Payable for fund shares redeemed | | | 566,868 | | | 300,242 | | | 224,253 | |
Payable to Investment Advisor | | | 172,987 | | | 30,309 | | | 137,810 | |
Swap premiums received | | | — | | | — | | | 767,857 | |
Other accrued expenses | | | 441,973 | | | 117,971 | | | 269,212 | |
| | | | | | | | | | |
Total Liabilities | | | 8,295,654 | | | 1,550,781 | | | 48,323,268 | |
| | | | | | | | | | |
NET ASSETS | | $ | 413,368,524 | | $ | 82,182,369 | | $ | 254,187,318 | |
| | | | | | | | | | |
See notes to financial statements.
107
|
GuideMarkSM Funds & GuidePathSM Funds |
STATEMENTS OF ASSETS & LIABILITIES (Continued) |
September 30, 2012 (Unaudited) |
| |
| | | | | | | | | | |
| |
Core
Fixed Income
Fund
| | Tax-Exempt
Fixed Income
Fund | | Opportunistic
Fixed Income
Fund | |
| | | | | | | |
NET ASSETS CONSIST OF: | | | | | | | | | | |
Capital stock | | $ | 392,546,453 | | $ | 79,794,519 | | $ | 253,577,936 | |
Unrealized appreciation (depreciation) on: | | | | | | | | | | |
Investments | | | 16,420,192 | | | 7,937,157 | | | 2,307,899 | |
Foreign currencies | | | — | | | — | | | 8,127 | |
Swaps | | | — | | | — | | | (404,139 | ) |
Forward currency exchange contracts | | | — | | | — | | | 1,307,949 | |
Futures contracts | | | — | | | — | | | 42,308 | |
Written options | | | — | | | — | | | 13,968 | |
Accumulated undistributed net investment income | | | 175,001 | | | 69,909 | | | (1,601,209 | ) |
Accumulated undistributed net realized loss | | | 4,226,878 | | | (5,619,216 | ) | | (1,065,521 | ) |
| | | | | | | | | | |
Total Net Assets | | $ | 413,368,524 | | $ | 82,182,369 | | $ | 254,187,318 | |
| | | | | | | | | | |
Institutional Shares | | | | | | | | | | |
Shares outstanding (unlimited shares of no par value authorized) | | | 9,986,041 | | | — | | | 9,994,783 | |
Net assets | | | 100,479,015 | | | — | | | 99,807,566 | |
Net asset value, offering and redemption price per share | | $ | 10.06 | | | — | | $ | 9.99 | |
| | | | | | | | | | |
Service Shares | | | | | | | | | | |
Shares outstanding (unlimited shares of no par value authorized) | | | 31,028,537 | | | 6,981,669 | | | 15,447,056 | |
Net assets | | | 312,889,509 | | | 82,182,369 | | | 154,379,752 | |
Net asset value, offering and redemption price per share | | $ | 10.08 | | $ | 11.77 | | $ | 9.99 | |
| | | | | | | | | | |
1Includes loaned securities with a market value of: | | $ | 2,027,394 | | $ | — | | $ | — | |
| | | | | | | | | | |
See notes to financial statements.
108
|
GuideMarkSM Funds & GuidePathSM Funds |
STATEMENTS OF ASSETS & LIABILITIES (Continued) |
September 30, 2012 (Unaudited) |
| |
| | | | | | | | | | | | | |
| |
Strategic
Asset Allocation
Fund
| |
Tactical
Constrained
Asset Allocation
Fund
| | Tactical
Unconstrained
Asset Allocation
Fund | | Absolute
Return
Asset Allocation
Fund | |
| | | | | | | | | |
ASSETS: | | | | | | | | | | | | | |
Investments, at value (cost $99,891,158, | | | | | | | | | | | | | |
$65,684,679, $179,420,855, and $370,404,871, | | | | | | | | | | | | | |
respectively)1 | | $ | 104,749,252 | | $ | 69,861,292 | | $ | 186,745,392 | | $ | 376,177,528 | |
Investments in affiliates, at value (cost $99,368,911, | | | | | | | | | | | | | |
$108,253,627, $65,795,520 and $55,935,147, | | | | | | | | | | | | | |
respectively) | | | 106,925,773 | | | 116,256,331 | | | 73,350,536 | | | 58,404,262 | |
Cash | | | 574,836 | | | 42,435 | | | 315,033 | | | 172,312 | |
Income receivable | | | 165,880 | | | 217,896 | | | 238,888 | | | 334,170 | |
Receivable for investment securities sold | | | 465,635 | | | 446,467 | | | 6,105,838 | | | 356,187 | |
Receivable for fund shares sold | | | 1,198,757 | | | 1,138,242 | | | 1,652,113 | | | 4,245,722 | |
Receivable from investment advisor | | | 621 | | | 4,156 | | | — | | | — | |
Other assets | | | 27,387 | | | 28,871 | | | 30,587 | | | 38,730 | |
| | | | | | | | | | | | | |
Total Assets | | | 214,108,141 | | | 187,995,690 | | | 268,438,387 | | | 439,728,911 | |
| | | | | | | | | | | | | |
LIABILITIES: | | | | | | | | | | | | | |
Payable for collateral on securities loaned | | | 17,068,200 | | | 3,290,308 | | | 12,556,232 | | | 20,028,677 | |
Payable for investment securities purchased | | | 313,389 | | | 210,665 | | | 6,358,560 | | | 1,403,136 | |
Payable for fund shares redeemed | | | 218,783 | | | 194,819 | | | 325,268 | | | 562,993 | |
Payable to Investment Advisor | | | — | | | — | | | 24,629 | | | 83,596 | |
Other accrued expenses | | | 301,151 | | | 297,392 | | | 369,439 | | | 559,013 | |
| | | | | | | | | | | | | |
Total Liabilities | | | 17,901,523 | | | 3,993,184 | | | 19,634,128 | | | 22,637,415 | |
| | | | | | | | | | | | | |
NET ASSETS | | $ | 196,206,618 | | $ | 184,002,506 | | $ | 248,804,259 | | $ | 417,091,496 | |
| | | | | | | | | | | | | |
NET ASSETS CONSIST OF: | | | | | | | | | | | | | |
Capital stock | | | 185,811,508 | | | 173,235,898 | | | 237,136,718 | | | 407,398,913 | |
Unrealized appreciation on: | | | | | | | | | | | | | |
Investments | | | 4,858,094 | | | 4,176,613 | | | 7,324,537 | | | 5,772,657 | |
Investments in affiliates | | | 7,556,862 | | | 8,002,704 | | | 7,555,016 | | | 2,469,115 | |
Accumulated undistributed net investment | | | | | | | | | | | | | |
income (loss) | | | 30,386 | | | 401,461 | | | 874,579 | | | 3,698,415 | |
Accumulated undistributed net realized loss | | | (2,050,232 | ) | | (1,814,170 | ) | | (4,086,591 | ) | | (2,247,604 | ) |
| | | | | | | | | | | | | |
Total Net Assets | | $ | 196,206,618 | | $ | 184,002,506 | | $ | 248,804,259 | | $ | 417,091,496 | |
| | | | | | | | | | | | | |
Institutional Shares | | | | | | | | | | | | | |
Shares outstanding (unlimited shares of no par | | | | | | | | | | | | | |
value authorized) | | | 28,609 | | | 27,611 | | | 26,021 | | | 15,653 | |
Net assets | | | 270,859 | | | 272,342 | | | 251,251 | | | 159,842 | |
Net asset value, offering and redemption price | | | | | | | | | | | | | |
per share | | $ | 9.47 | | $ | 9.86 | | $ | 9.66 | | $ | 10.21 | |
| | | | | | | | | | | | | |
Service Shares | | | | | | | | | | | | | |
Shares outstanding (unlimited shares of no par | | | | | | | | | | | | | |
value authorized) | | | 20,696,686 | | | 18,634,565 | | | 25,743,113 | | | 40,842,515 | |
Net assets | | | 195,935,759 | | | 183,730,164 | | | 248,553,008 | | | 416,931,654 | |
Net asset value, offering and redemption price | | | | | | | | | | | | | |
per share | | $ | 9.47 | | $ | 9.86 | | $ | 9.66 | | $ | 10.21 | |
| | | | | | | | | | | | | |
1Includes loaned securities with a market value of: | | $ | 16,275,100 | | $ | 3,177,643 | | $ | 12,060,893 | | $ | 19,517,465 | |
| | | | | | | | | | | | | |
See notes to financial statements.
109
|
GuideMarkSM Funds & GuidePathSM Funds |
STATEMENTS OF ASSETS & LIABILITIES (Continued) |
September 30, 2012 (Unaudited) |
| |
| | | | | | | | | | |
| | Multi-Asset
Income
Asset Allocation
Fund | | Fixed Income
Allocation
Fund | | Altegris®
Multi-Strategy
Alternative
Allocation Fund | |
| | | | | | | |
ASSETS: | | | | | | | | | | |
Investments, at value (cost $56,990,761, $152,755,685, | | | | | | | | | | |
and $3,030,883, respectively)1 | | $ | 57,417,186 | | $ | 153,130,802 | | $ | 3,030,883 | |
Investments in affiliates, at value (cost $4,100,634, | | | | | | | | | | |
$64,915,339, and $139,249,028, respectively) | | | 4,151,888 | | | 65,046,767 | | | 139,081,148 | |
Cash | | | 53,895 | | | 5,844 | | | — | |
Income receivable | | | 101,599 | | | 31,943 | | | 302 | |
Receivable for investment securities sold | | | 28,774 | | | — | | | — | |
Receivable for fund shares sold | | | 289,027 | | | 2,330,643 | | | 1,490,359 | |
| | | | | | | | | | |
Total Assets | | | 62,042,369 | | | 220,545,999 | | | 143,602,692 | |
| | | | | | | | | | |
LIABILITIES: | | | | | | | | | | |
Payable for collateral on securities loaned | | | 10,032,164 | | | 14,579,236 | | | — | |
Payable for investment securities purchased | | | 171,382 | | | 732,173 | | | 189,668 | |
Payable for fund shares redeemed | | | 114,386 | | | 265,728 | | | 234,905 | |
Payable to Investment Advisor | | | 6,339 | | | 36,296 | | | 17,309 | |
Other accrued expenses | | | 39,012 | | | 134,343 | | | 94,950 | |
| | | | | | | | | | |
Total Liabilities | | | 10,363,283 | | | 15,747,776 | | | 536,832 | |
| | | | | | | | | | |
NET ASSETS | | $ | 51,679,086 | | $ | 204,798,223 | | $ | 143,065,860 | |
| | | | | | | | | | |
NET ASSETS CONSIST OF: | | | | | | | | | | |
Capital stock | | | 50,972,819 | | | 203,992,786 | | | 143,049,681 | |
Unrealized appreciation (depreciation) on: | | | | | | | | | | |
Investments | | | 426,425 | | | 375,117 | | | — | |
Investments in affiliates | | | 51,254 | | | 131,428 | | | (167,880 | ) |
Accumulated undistributed net investment income | | | 229,617 | | | 291,903 | | | 185,119 | |
Accumulated undistributed net realized gain (loss) | | | (1,029 | ) | | 6,989 | | | (1,060 | ) |
| | | | | | | | | | |
Total Net Assets | | $ | 51,679,086 | | $ | 204,798,223 | | $ | 143,065,860 | |
| | | | | | | | | | |
Institutional Shares | | | | | | | | | | |
Shares outstanding (unlimited shares of no par value authorized) | | | — | | | 11,449 | | | 15,119 | |
Net assets | | | — | | | 115,026 | | | 151,224 | |
Net asset value, offering and redemption price per share | | $ | — | | $ | 10.05 | | $ | 10.00 | |
| | | | | | | | | | |
Service Shares | | | | | | | | | | |
Shares outstanding (unlimited shares of no par value authorized) | | | 5,095,401 | | | 20,386,822 | | | 14,289,105 | |
Net assets | | | 51,679,086 | | | 204,683,197 | | | 142,914,636 | |
Net asset value, offering and redemption price per share | | $ | 10.14 | | $ | 10.04 | | $ | 10.00 | |
| | | | | | | | | | |
1Includes loaned securities with a market value of: | | $ | 9,744,306 | | $ | 14,236,877 | | $ | — | |
| | | | | | | | | | |
See notes to financial statements.
110
|
GuideMarkSM Funds & GuidePathSM Funds |
STATEMENTS OF OPERATIONS |
For the Period Ended September 30, 2012 (Unaudited) |
| |
| | | | | | | | | | |
| | Large Cap
Growth Fund | | Large Cap
Value Fund | |
Small/Mid Cap
Core Fund
| |
| | | | | | | |
INVESTMENT INCOME: | | | | | | | | | | |
Dividend income (net of withholding tax of $(232), | | | | | | | | | | |
$12,987, and $0, respectively) | | $ | 1,293,272 | | $ | 2,742,392 | | $ | 632,746 | |
Interest income | | | 2,834 | | | 1,887 | | | 1,299 | |
| | | | | | | | | | |
Total investment income | | | 1,296,106 | | | 2,744,279 | | | 634,045 | |
| | | | | | | | | | |
EXPENSES | | | | | | | | | | |
Investment advisory fees | | | 644,172 | | | 665,551 | | | 296,336 | |
Distribution (12b-1) fees – Service Shares | | | 185,409 | | | 181,519 | | | 54,847 | |
Administrative service fees – Service Shares | | | 185,409 | | | 181,519 | | | 54,847 | |
Shareholder servicing fees – Service Shares | | | 53,107 | | | 51,995 | | | 15,357 | |
Legal fees | | | 39,745 | | | 44,926 | | | 18,576 | |
Custody fees | | | 36,276 | | | 12,685 | | | 26,808 | |
Administration fees | | | 35,974 | | | 36,418 | | | 14,004 | |
Federal and state registration fees | | | 25,551 | | | 24,634 | | | 23,143 | |
Fund accounting fees | | | 20,331 | | | 20,522 | | | 9,728 | |
Directors’ fees and expenses | | | 18,994 | | | 19,539 | | | 7,841 | |
Audit and tax fees | | | 16,500 | | | 16,473 | | | 15,006 | |
Reports to shareholders | | | 10,683 | | | 14,093 | | | 4,996 | |
Transfer agent fees and expenses | | | 7,280 | | | 7,491 | | | 4,784 | |
Insurance fees | | | 4,758 | | | 4,880 | | | 1,787 | |
Compliance fees | | | 3,748 | | | 3,900 | | | 1,616 | |
| | | | | | | | | | |
Total expenses | | | 1,287,937 | | | 1,286,145 | | | 549,676 | |
| | | | | | | | | | |
Expense reimbursement by Advisor (See Note 3) | | | (7,093 | ) | | — | | | (1,213 | ) |
Less securities lending credit (See Note 6) | | | (15,140 | ) | | (4,235 | ) | | (17,945 | ) |
| | | | | | | | | | |
Net expenses | | | 1,265,704 | | | 1,281,910 | | | 530,518 | |
| | | | | | | | | | |
Net investment income | | | 30,402 | | | 1,462,369 | | | 103,527 | |
| | | | | | | | | | |
NET REALIZED AND UNREALIZED GAIN (LOSS) | | | | | | | | | | |
ON INVESTMENTS: | | | | | | | | | | |
Net realized gain (loss) on investments | | | 461,849 | | | (542,207 | ) | | 346,117 | |
Net change in unrealized appreciation (depreciation) | | | | | | | | | | |
on investments | | | (2,542,729 | ) | | 869,981 | | | 127,131 | |
| | | | | | | | | | |
Net realized and unrealized gain (loss) | | | (2,080,880 | ) | | 327,774 | | | 473,248 | |
| | | | | | | | | | |
NET INCREASE (DECREASE) IN NET ASSETS | | | | | | | | | | |
RESULTING FROM OPERATIONS | | $ | (2,050,478 | ) | $ | 1,790,143 | | $ | 576,775 | |
| | | | | | | | | | |
See notes to financial statements.
111
|
GuideMarkSM Funds & GuidePathSM Funds |
STATEMENTS OF OPERATIONS (Continued) |
For the Period Ended September 30, 2012 (Unaudited) |
| |
| | | | | | | | | | |
| | World
ex-US Fund | | Opportunistic
Equity Fund | |
Global
Real
Return Fund
| |
| | | | | | | |
INVESTMENT INCOME: | | | | | | | | | | |
Dividend income (net of withholding tax of $540,057, $655, | | | | | | | | | | |
and $0, respectively) | | $ | 4,311,253 | | $ | 1,262,848 | | $ | 1,104,929 | |
Interest income | | | 1,731 | | | 6,853 | | | 294 | |
| | | | | | | | | | |
Total investment income | | | 4,312,984 | | | 1,269,701 | | | 1,105,223 | |
| | | | | | | | | | |
EXPENSES: | | | | | | | | | | |
Investment advisory fees | | | 864,059 | | | 590,374 | | | 349,811 | |
Distribution (12b-1) fees – Service Shares | | | 236,547 | | | 119,808 | | | 119,144 | |
Administrative service fees – Service Shares | | | 236,547 | | | 119,808 | | | 119,144 | |
Shareholder servicing fees – Service Shares | | | 66,233 | | | 33,546 | | | 33,360 | |
Legal fees | | | 49,166 | | | 41,219 | | | 24,114 | |
Custody fees | | | 215,974 | | | 16,504 | | | 8,804 | |
Administration fees | | | 42,480 | | | 27,274 | | | 21,361 | |
Federal and state registration fees | | | 27,264 | | | 30,661 | | | 30,336 | |
Fund accounting fees | | | 66,744 | | | 21,221 | | | 11,106 | |
Directors’ fees and expenses | | | 24,046 | | | 15,236 | | | 13,579 | |
Audit and tax fees | | | 15,953 | | | 15,006 | | | 17,792 | |
Reports to shareholders | | | 15,137 | | | 12,052 | | | 9,079 | |
Transfer agent fees and expenses | | | 8,270 | | | 6,417 | | | 5,922 | |
Insurance fees | | | 6,130 | | | 3,419 | | | 2,299 | |
Compliance fees | | | 4,859 | | | 3,015 | | | 1,541 | |
| | | | | | | | | | |
Total expenses | | | 1,879,409 | | | 1,055,560 | | | 767,392 | |
| | | | | | | | | | |
Expense reimbursement by Advisor (See Note 3) | | | (62,186 | ) | | (13,531 | ) | | — | |
Less securities lending credit (See Note 6) | | | (651 | ) | | (1,635 | ) | | (34,735 | ) |
| | | | | | | | | | |
Net expenses | | | 1,816,572 | | | 1,040,394 | | | 732,657 | |
| | | | | | | | | | |
Net investment income | | | 2,496,412 | | | 229,307 | | | 372,566 | |
| | | | | | | | | | |
NET REALIZED AND UNREALIZED GAIN (LOSS) | | | | | | | | | | |
ON INVESTMENTS: | | | | | | | | | | |
Net realized loss on: | | | | | | | | | | |
Investments | | | (8,033,420 | ) | | (793,438 | ) | | (2,010,635 | ) |
Foreign currencies | | | (73,861 | ) | | — | | | — | |
| | | | | | | | | | |
Total | | | (8,107,281 | ) | | (793,438 | ) | | (2,010,635 | ) |
| | | | | | | | | | |
Net change in unrealized appreciation (depreciation) on: | | | | | | | | | | |
Investments | | | 7,272,445 | | | (1,028,318 | ) | | 2,354,642 | |
Foreign currencies | | | (14,712 | ) | | — | | | — | |
| | | | | | | | | | |
Total | | | 7,257,733 | | | (1,028,318 | ) | | 2,354,642 | |
| | | | | | | | | | |
Net realized and unrealized gain (loss) | | | (849,548 | ) | | (1,821,756 | ) | | 344,007 | |
| | | | | | | | | | |
NET INCREASE (DECREASE) IN NET ASSETS | | | | | | | | | | |
RESULTING FROM OPERATIONS | | $ | 1,646,864 | | $ | (1,592,449 | ) | $ | 716,573 | |
| | | | | | | | | | |
See notes to financial statements.
112
|
GuideMarkSM Funds & GuidePathSM Funds |
STATEMENTS OF OPERATIONS (Continued) |
For the Period Ended September 30, 2012 (Unaudited) |
| |
| | | | | | | | | | |
| | Core
Fixed Income
Fund | | Tax-Exempt
Fixed Income
Fund | | Opportunistic
Fixed Income
Fund | |
| | | | | | | |
INVESTMENT INCOME: | | | | | | | | | | |
Dividend income (net of withholding tax of $0, $0, $11,170) | | $ | 9,053 | | $ | — | | $ | 196,619 | |
Interest income (net of withholding tax of $0, $0, $109,969) | | | 5,817,614 | | | 1,707,282 | | | 6,293,146 | |
| | | | | | | | | | |
Total investment income | | | 5,826,667 | | | 1,707,282 | | | 6,489,765 | |
| | | | | | | | | | |
EXPENSES: | | | | | | | | | | |
Investment advisory fees | | | 1,215,327 | | | 205,110 | | | 900,004 | |
Distribution (12b-1) fees – Service Shares | | | 547,352 | | | 102,555 | | | 250,739 | |
Administrative service fees – Service Shares | | | 547,352 | | | 102,555 | | | 250,739 | |
Shareholder servicing fees – Service Shares | | | 174,250 | | | 32,817 | | | 78,366 | |
Legal fees | | | 109,853 | | | 15,626 | | | 58,490 | |
Custody fees | | | 38,495 | | | 5,619 | | | 97,370 | |
Administration fees | | | 87,962 | | | 16,813 | | | 47,689 | |
Federal and state registration fees | | | 23,270 | | | 24,070 | | | 38,237 | |
Fund accounting fees | | | 91,833 | | | 16,703 | | | 80,232 | |
Directors’ fees and expenses | | | 50,470 | | | 8,358 | | | 29,171 | |
Audit and tax fees | | | 19,032 | | | 13,757 | | | 22,278 | |
Reports to shareholders | | | 34,708 | | | 1,098 | | | 21,061 | |
Transfer agent fees and expenses | | | 14,324 | | | 3,747 | | | 9,359 | |
Insurance fees | | | 12,235 | | | 2,710 | | | 4,758 | |
Compliance fees | | | 10,003 | | | 1,647 | | | 3,653 | |
| | | | | | | | | | |
Total expenses | | | 2,976,466 | | | 553,185 | | | 1,892,146 | |
| | | | | | | | | | |
Expense reimbursement by Advisor (See Note 3) | | | — | | | (24,002 | ) | | (41,385 | ) |
Less securities lending credit (See Note 6) | | | (920 | ) | | — | | | — | |
| | | | | | | | | | |
Net expenses | | | 2,975,546 | | | 529,183 | | | 1,850,761 | |
| | | | | | | | | | |
Net investment income | | | 2,851,121 | | | 1,178,099 | | | 4,639,004 | |
| | | | | | | | | | |
NET REALIZED AND UNREALIZED GAIN (LOSS) | | | | | | | | | | |
ON INVESTMENTS: | | | | | | | | | | |
Net realized gain on: | | | | | | | | | | |
Investments | | | 6,645,563 | | | 701,501 | | | 73,748 | |
Foreign currencies | | | — | | | — | | | (196,129 | ) |
Forward currency exchange contracts | | | — | | | — | | | 3,006,559 | |
Forward sale commitments | | | (414,221 | ) | | — | | | — | |
Swaps | | | — | | | — | | | (806,318 | ) |
Futures contracts | | | 460,104 | | | — | | | (287,368 | ) |
Written Options | | | — | | | — | | | 165,802 | |
| | | | | | | | | | |
Total | | | 6,691,446 | | | 701,501 | | | 1,956,294 | |
| | | | | | | | | | |
Net change in unrealized appreciation (depreciation) on: | | | | | | | | | | |
Investments | | | 8,771,165 | | | 1,454,085 | | | 6,041,445 | |
Foreign currencies | | | — | | | — | | | (7,307 | ) |
Forward currency contracts | | | — | | | — | | | (147,808 | ) |
Forward sale commitments | | | 3,125 | | | — | | | — | |
Swaps | | | — | | | — | | | (353,796 | ) |
Futures contracts | | | 198,569 | | | — | | | 69,363 | |
Written Options | | | — | | | — | | | (127,271 | ) |
| | | | | | | | | | |
Total | | | 8,972,859 | | | 1,454,085 | | | 5,474,626 | |
| | | | | | | | | | |
Net realized and unrealized gain | | | 15,664,305 | | | 2,155,586 | | | 7,430,920 | |
| | | | | | | | | | |
NET INCREASE IN NET ASSETS | | | | | | | | | | |
RESULTING FROM OPERATIONS | | $ | 18,515,426 | | $ | 3,333,685 | | $ | 12,069,924 | |
| | | | | | | | | | |
See notes to financial statements.
113
|
GuideMarkSM Funds & GuidePathSM Funds |
STATEMENTS OF OPERATIONS (Continued) |
For the Period Ended September 30, 2012 (Unaudited) |
| |
| | | | | | | | | | | | | |
| | Strategic
Asset Allocation
Fund | | Tactical
Constrained
Asset Allocation
Fund | | Tactical
Unconstrained
Asset Allocation
Fund | | Absolute
Return
Asset Allocation
Fund | |
| | | | | | | | | |
INVESTMENT INCOME: | | | | | | | | | | | | | |
Dividend income | | $ | 1,106,342 | | $ | 833,217 | | $ | 1,600,889 | | $ | 3,814,517 | |
Dividends from affiliate investments | | | — | | | 355,114 | | | 269,744 | | | 929,485 | |
Interest income | | | 3,439 | | | 3,252 | | | 4,309 | | | 7,292 | |
| | | | | | | | | | | | | |
Total investment income | | | 1,109,781 | | | 1,191,583 | | | 1,874,942 | | | 4,751,294 | |
| | | | | | | | | | | | | |
EXPENSES: | | | | | | | | | | | | | |
Investment advisory fees | | | 213,551 | | | 211,479 | | | 388,683 | | | 585,252 | |
Distribution (12b-1) fees – Service Shares | | | 213,520 | | | 211,447 | | | 277,601 | | | 418,019 | |
Administrative service fees – Service Shares | | | 213,520 | | | 211,447 | | | 277,601 | | | 418,019 | |
Shareholder servicing fees – Service Shares | | | 85,408 | | | 84,579 | | | 111,040 | | | 167,208 | |
Legal fees | | | 33,377 | | | 33,371 | | | 44,501 | | | 64,074 | |
Custody fees | | | 26,221 | | | 37,286 | | | 47,386 | | | 54,253 | |
Administration fees | | | 28,877 | | | 28,797 | | | 37,636 | | | 52,945 | |
Federal and state registration fees | | | 31,408 | | | 31,140 | | | 36,402 | | | 47,019 | |
Fund accounting fees | | | 12,230 | | | 12,354 | | | 15,910 | | | 21,994 | |
Directors’ fees and expenses | | | 14,782 | | | 14,725 | | | 19,209 | | | 27,015 | |
Audit and tax fees | | | 7,217 | | | 7,217 | | | 7,217 | | | 7,217 | |
Reports to shareholders | | | 12,749 | | | 12,708 | | | 16,730 | | | 24,370 | |
Transfer agent fees and expenses | | | 4,078 | | | 4,078 | | | 4,501 | | | 5,213 | |
Insurance fees | | | 2,321 | | | 2,254 | | | 3,027 | | | 4,209 | |
Compliance fees | | | 2,247 | | | 2,231 | | | 2,963 | | | 4,270 | |
| | | | | | | | | | | | | |
Total expenses | | | 901,506 | | | 905,113 | | | 1,290,407 | | | 1,901,077 | |
| | | | | | | | | | | | | |
Expense reimbursement by Advisor | | | | | | | | | | | | | |
(See Note 3) | | | (18,644 | ) | | (19,131 | ) | | (43,496 | ) | | (2,596 | ) |
Less securities lending credit (See Note 6) | | | (28,740 | ) | | (40,150 | ) | | (25,415 | ) | | (59,170 | ) |
| | | | | | | | | | | | | |
Net expenses | | | 854,122 | | | 845,832 | | | 1,221,496 | | | 1,839,311 | |
| | | | | | | | | | | | | |
Net investment income | | | 255,659 | | | 345,751 | | | 653,446 | | | 2,911,983 | |
| | | | | | | | | | | | | |
NET REALIZED AND UNREALIZED GAIN (LOSS) | | | | | | | | | | | | | |
ON INVESTMENTS: | | | | | | | | | | | | | |
Net realized loss on: | | | | | | | | | | | | | |
Investments | | | (480,153 | ) | | (9,699 | ) | | 927,096 | | | (1,630,553 | ) |
Investments in affiliates | | | (466,494 | ) | | (361,753 | ) | | (976,092 | ) | | (17,333 | ) |
| | | | | | | | | | | | | |
Total | | | (946,647 | ) | | (371,452 | ) | | (48,996 | ) | | (1,647,886 | ) |
| | | | | | | | | | | | | |
Net change in unrealized appreciation on: | | | | | | | | | | | | | |
Investments | | | 1,057,559 | | | 771,782 | | | 2,343,189 | | | 4,049,324 | |
Investments in affiliates | | | 1,928,924 | | | 2,482,329 | | | 1,526,728 | | | 1,631,665 | |
| | | | | | | | | | | | | |
Total | | | 2,986,483 | | | 3,254,111 | | | 3,869,917 | | | 5,680,989 | |
| | | | | | | | | | | | | |
Net realized and unrealized gain | | | 2,039,836 | | | 2,882,659 | | | 3,820,921 | | | 4,033,103 | |
| | | | | | | | | | | | | |
NET INCREASE IN NET ASSETS | | | | | | | | | | | | | |
RESULTING FROM OPERATIONS | | $ | 2,295,495 | | $ | 3,228,410 | | $ | 4,474,367 | | $ | 6,945,086 | |
| | | | | | | | | | | | | |
See notes to financial statements.
114
|
GuideMarkSM Funds & GuidePathSM Funds |
STATEMENTS OF OPERATIONS (Continued) |
For the Period August 31, 20121 through September 30, 2012 (Unaudited) |
| |
| | | | | | | | | | |
| | Multi-Asset
Income
Asset Allocation
Fund | | Fixed Income
Allocation
Fund | | Altegris®
Multi-Strategy
Alternative
Allocation Fund | |
| | | | | | | |
INVESTMENT INCOME: | | | | | | | | | | |
Dividend income | | $ | 262,812 | | $ | 54,958 | | $ | — | |
Dividends from affiliate investments | | | 12,635 | | | 407,933 | | | 298,388 | |
Interest income | | | 319 | | | 1,297 | | | 302 | |
| | | | | | | | | | |
Total investment income | | | 275,766 | | | 464,188 | | | 298,690 | |
| | | | | | | | | | |
EXPENSES: | | | | | | | | | | |
Investment advisory fees | | | 14,684 | | | 41,028 | | | 17,309 | |
Distribution (12b-1) fees – Service Shares | | | 10,488 | | | 41,014 | | | 28,831 | |
Administrative service fees – Service Shares | | | 10,488 | | | 41,014 | | | 28,831 | |
Shareholder servicing fees – Service Shares | | | 4,195 | | | 16,406 | | | 11,532 | |
Legal fees | | | 1,340 | | | 5,119 | | | 3,542 | |
Custody fees | | | 2,250 | | | 6,750 | | | 3,450 | |
Administration fees | | | 1,500 | | | 5,850 | | | 4,050 | |
Federal and state registration fees | | | 4,728 | | | 11,378 | | | 9,040 | |
Directors’ fees and expenses | | | 1,182 | | | 2,632 | | | 1,984 | |
Audit and tax fees | | | 2,095 | | | 2,094 | | | 2,094 | |
Reports to shareholders | | | 1,170 | | | 3,042 | | | 2,250 | |
Transfer agent fees and expenses | | | 120 | | | 150 | | | 210 | |
Insurance fees | | | 150 | | | 150 | | | 150 | |
Compliance fees | | | 104 | | | 390 | | | 298 | |
| | | | | | | | | | |
Total expenses | | | 54,494 | | | 177,017 | | | 113,571 | |
| | | | | | | | | | |
Expense reimbursement by Advisor (See Note 3) | | | (8,345 | ) | | (4,732 | ) | | — | |
| | | | | | | | | | |
Net expenses | | | 46,149 | | | 172,285 | | | 113,571 | |
| | | | | | | | | | |
Net investment income | | | 229,617 | | | 291,903 | | | 185,119 | |
| | | | | | | | | | |
NET REALIZED AND UNREALIZED GAIN (LOSS) | | | | | | | | | | |
ON INVESTMENTS: | | | | | | | | | | |
Net realized gain (loss) on: | | | | | | | | | | |
Investments | | | (985 | ) | | 11,552 | | | — | |
Investments in affiliates | | | (44 | ) | | (4,563 | ) | | (1,060 | ) |
| | | | | | | | | | |
Total | | | (1,029 | ) | | 6,989 | | | (1,060 | ) |
| | | | | | | | | | |
Net change in unrealized appreciation (depreciation) on: | | | | | | | | | | |
Investments | | | 426,425 | | | 375,117 | | | — | |
Investments in affiliates | | | 51,254 | | | 131,428 | | | (167,880 | ) |
| | | | | | | | | | |
Total | | | 477,679 | | | 506,545 | | | (167,880 | ) |
| | | | | | | | | | |
Net realized and unrealized gain (loss) | | | 476,650 | | | 513,534 | | | (168,940 | ) |
| | | | | | | | | | |
NET INCREASE IN NET ASSETS | | | | | | | | | | |
RESULTING FROM OPERATIONS | | $ | 706,267 | | $ | 805,437 | | $ | 16,179 | |
| | | | | | | | | | |
| | | | | | | | | | |
1 Date of inception. | | | | | | | | | | |
See notes to financial statements.
115
|
GuideMarkSM Funds & GuidePathSM Funds |
STATEMENTS OF CHANGES IN NET ASSETS |
|
| |
| | | | | | | | | | | | | |
| | Large Cap Growth Fund | | Large Cap Value Fund | |
| | | | | |
| | Period Ended
September 30,
2012 | | Year Ended
March 31,
2012 | | Period Ended
September 30,
2012 | | Year Ended
March 31,
2012 | |
| | | | | | | | | |
| | (Unaudited) | | | | (Unaudited) | | | |
OPERATIONS: | | | | | | | | | | | | | |
Net investment income (loss) | | $ | 30,402 | | $ | (449,570 | ) | $ | 1,462,369 | | $ | 2,298,446 | |
Net realized gain (loss) on investment transactions | | | 461,849 | | | 25,379,781 | | | (542,207 | ) | | 33,842,641 | |
Change in unrealized appreciation (depreciation) | | | | | | | | | | | | | |
on investments | | | (2,542,729 | ) | | (12,286,197 | ) | | 869,981 | | | (28,443,449 | ) |
| | | | | | | | | | | | | |
Net increase (decrease) in net assets resulting | | | | | | | | | | | | | |
from operations | | | (2,050,478 | ) | | 12,644,014 | | $ | 1,790,143 | | | 7,697,638 | |
| | | | | | | | | | | | | |
CAPITAL SHARE TRANSACTIONS: | | | | | | | | | | | | | |
Institutional Shares | | | | | | | | | | | | | |
Shares sold | | | 13,509,607 | | | 31,939,165 | | | 16,808,020 | | | 41,284,965 | |
Shares issued to holders in reinvestment of dividends | | | — | | | — | | | — | | | 559,662 | |
Shares redeemed | | | (8,808,519 | ) | | (3,895,350 | ) | | (12,295,538 | ) | | (5,173,389 | ) |
| | | | | | | | | | | | | |
Net increase | | | 4,701,088 | | | 28,043,815 | | | 4,512,482 | | | 36,671,238 | |
| | | | | | | | | | | | | |
Service Shares | | | | | | | | | | | | | |
Shares sold | | | 7,686,062 | | | 112,113,323 | | | 7,851,429 | | | 114,824,850 | |
Shares issued to holders in reinvestment of dividends | | | — | | | — | | | — | | | 1,676,458 | |
Shares redeemed | | | (32,212,811 | ) | | (163,945,672 | ) | | (31,955,545 | ) | | (155,967,475 | ) |
| | | | | | | | | | | | | |
Net decrease | | | (24,526,749 | ) | | (51,832,349 | ) | | (24,104,116 | ) | | (39,466,167 | ) |
| | | | | | | | | | | | | |
DIVIDENDS AND DISTRIBUTIONS TO | | | | | | | | | | | | | |
SHAREHOLDERS: | | | | | | | | | | | | | |
Net investment income – Institutional Shares | | | — | | | — | | | — | | | (559,662 | ) |
Net investment income – Service Shares | | | — | | | — | | | — | | | (1,676,610 | ) |
| | | | | | | | | | | | | |
Total dividends and distributions | | | — | | | — | | | — | | | (2,236,272 | ) |
| | | | | | | | | | | | | |
INCREASE (DECREASE) IN NET ASSETS | | | (21,876,139 | ) | | (11,144,520 | ) | | (17,801,491 | ) | | 2,666,437 | |
NET ASSETS: | | | | | | | | | | | | | |
Beginning of year | | | 199,984,668 | | | 211,129,188 | | | 202,798,778 | | | 200,132,341 | |
| | | | | | | | | | | | | |
End of year (including undistributed net investment | | | | | | | | | | | | | |
income (loss) of $(40,620), $(71,022), $2,023,672 | | | | | | | | | | | | | |
and $561,303, respectively) | | $ | 178,108,529 | | $ | 199,984,668 | | $ | 184,997,287 | | $ | 202,798,778 | |
| | | | | | | | | | | | | |
CHANGES IN SHARES OUTSTANDING | | | | | | | | | | | | | |
Institutional Shares | | | | | | | | | | | | | |
Shares sold | | | 1,326,427 | | | 3,362,999 | | | 2,079,099 | | | 5,351,797 | |
Shares issued to holders in reinvestment of dividends | | | — | | | — | | | — | | | 74,821 | |
Shares redeemed | | | (854,768 | ) | | (428,892 | ) | | (1,502,636 | ) | | (694,851 | ) |
| | | | | | | | | | | | | |
Net increase | | | 471,659 | | | 2,934,107 | | | 576,463 | | | 4,731,767 | |
| | | | | | | | | | | | | |
Service Shares | | | | | | | | | | | | | |
Shares sold | | | 757,872 | | | 11,684,957 | | | 957,975 | | | 14,492,557 | |
Shares issued to holders in reinvestment of dividends | | | — | | | — | | | — | | | 221,754 | |
Shares redeemed | | | (3,211,070 | ) | | (16,938,911 | ) | | (3,941,476 | ) | | (19,524,651 | ) |
| | | | | | | | | | | | | |
Net decrease | | | (2,453,198 | ) | | (5,253,954 | ) | | (2,983,501 | ) | | (4,810,340 | ) |
| | | | | | | | | | | | | |
See notes to financial statements.
116
|
GuideMarkSM Funds & GuidePathSM Funds |
STATEMENTS OF CHANGES IN NET ASSETS (Continued) |
|
| |
| | | | | | | | | | | | | |
| | Small/Mid Cap Core Fund | | World ex-US Fund | |
| | | | | |
| | Period Ended
September 30,
2012 | | Year Ended
March 31,
2012 | | Period Ended
September 30,
2012 | | Year Ended
March 31,
2012 | |
| | | | | | | | | |
| | (Unaudited) | | | | (Unaudited) | | | |
OPERATIONS: | | | | | | | | | | | | | |
Net investment income (loss) | | $ | 103,527 | | $ | (371,574 | ) | $ | 2,496,412 | | $ | 2,645,204 | |
Net realized gain (loss) on investment transactions | | | 346,117 | | | 3,417,901 | | | (8,107,281 | ) | | (789,893 | ) |
Change in unrealized appreciation (depreciation) | | | | | | | | | | | | | |
on investments | | | 127,131 | | | (3,661,311 | ) | | 7,257,733 | | | (23,504,431 | ) |
Net increase (decrease) in net assets resulting | | | | | | | | | | | | | |
| | | | | | | | | | | | | |
from operations | | | 576,775 | | | (614,984 | ) | $ | 1,646,864 | | | (21,649,120 | ) |
| | | | | | | | | | | | | |
CAPITAL SHARE TRANSACTIONS: | | | | | | | | | | | | | |
Institutional Shares | | | | | | | | | | | | | |
Shares sold | | | 15,069,678 | | | 35,637,119 | | | 36,793,409 | | | 47,752,548 | |
Shares issued to holders in reinvestment of dividends | | | — | | | — | | | — | | | 536,257 | |
Shares redeemed | | | (11,209,383 | ) | | (7,995,819 | ) | | (9,951,265 | ) | | (8,429,463 | ) |
| | | | | | | | | | | | | |
Net increase | | | 3,860,295 | | | 27,641,300 | | | 26,842,144 | | | 39,859,342 | |
| | | | | | | | | | | | | |
Service Shares | | | | | | | | | | | | | |
Shares sold | | | 2,328,542 | | | 55,798,047 | | | 49,327,588 | | | 54,279,153 | |
Shares issued to holders in reinvestment of dividends | | | — | | | — | | | — | | | 2,278,571 | |
Shares redeemed | | | (7,477,447 | ) | | (47,522,395 | ) | | (34,182,839 | ) | | (115,730,785 | ) |
| | | | | | | | | | | | | |
Net increase (decrease) | | | (5,148,905 | ) | | 8,275,652 | | | 15,144,749 | | | (59,173,061 | ) |
| | | | | | | | | | | | | |
DIVIDENDS AND DISTRIBUTIONS TO | | | | | | | | | | | | | |
SHAREHOLDERS: | | | | | | | | | | | | | |
Net investment income – Institutional Shares | | | — | | | — | | | — | | | (536,257 | ) |
Net investment income – Service Shares | | | — | | | — | | | — | | | (2,279,735 | ) |
| | | | | | | | | | | | | |
Total dividends and distributions | | | — | | | — | | | — | | | (2,815,992 | ) |
| | | | | | | | | | | | | |
INCREASE (DECREASE) IN NET ASSETS | | | (711,835 | ) | | 35,301,968 | | | 43,633,757 | | | (43,778,831 | ) |
NET ASSETS: | | | | | | | | | | | | | |
Beginning of year | | | 78,050,757 | | | 42,748,789 | | | 225,923,238 | | | 269,702,069 | |
| | | | | | | | | | | | | |
End of year (including undistributed net investment | | | | | | | | | | | | | |
income (loss) of $68,865, $(34,662), $4,512,313 | | | | | | | | | | | | | |
and $2,015,901, respectively) | | $ | 77,338,922 | | $ | 78,050,757 | | $ | 269,556,995 | | $ | 225,923,238 | |
| | | | | | | | | | | | | |
CHANGES IN SHARES OUTSTANDING | | | | | | | | | | | | | |
Institutional Shares | | | | | | | | | | | | | |
Shares sold | | | 1,343,207 | | | 3,418,942 | | | 5,119,414 | | | 6,489,227 | |
Shares issued to holders in reinvestment of dividends | | | — | | | — | | | — | | | 81,251 | |
Shares redeemed | | | (983,119 | ) | | (814,996 | ) | | (1,390,975 | ) | | (1,169,799 | ) |
| | | | | | | | | | | | | |
Net increase | | | 360,088 | | | 2,603,946 | | | 3,728,439 | | | 5,400,679 | |
| | | | | | | | | | | | | |
Service Shares | | | | | | | | | | | | | |
Shares sold | | | 208,655 | | | 4,905,502 | | | 7,239,938 | | | 7,284,429 | |
Shares issued to holders in reinvestment of dividends | | | — | | | — | | | — | | | 344,195 | |
Shares redeemed | | | (673,194 | ) | | (4,419,198 | ) | | (4,816,056 | ) | | (15,197,691 | ) |
| | | | | | | | | | | | | |
Net increase (decrease) | | | (464,539 | ) | | 486,304 | | | 2,423,882 | | | (7,569,067 | ) |
| | | | | | | | | | | | | |
See notes to financial statements.
117
|
GuideMarkSM Funds & GuidePathSM Funds |
STATEMENTS OF CHANGES IN NET ASSETS (Continued) |
|
| |
| | | | | | | | | | | | | |
| | Opportunistic Equity Fund | | Global Real Return Fund | |
| | | | | |
| | Period Ended
September 30,
2012 | | Year Ended
Ended March 31,
2012 | | Period Ended
September 30,
2012 | | Year Ended
Ended March 31,
2012 | |
| | | | | | | | | |
| | (Unaudited) | | | | (Unaudited) | | | |
OPERATIONS: | | | | | | | | | | | | | |
Net investment income (loss) | | $ | 229,307 | | $ | (122,977 | ) | $ | 372,566 | | $ | 974,947 | |
Net realized loss on investment transactions | | | (793,438 | ) | | (12,577,311 | ) | | (2,010,635 | ) | | (4,165,500 | ) |
Change in unrealized appreciation (depreciation) | | | | | | | | | | | | | |
on investments | | | (1,028,318 | ) | | 10,647,956 | | | 2,354,642 | | | (5,019,398 | ) |
| | | | | | | | | | | | | |
Net increase (decrease) in net assets resulting | | | | | | | | | | | | | |
from operations | | | (1,592,449 | ) | | (2,052,332 | ) | | 716,573 | | | (8,209,951 | ) |
| | | | | | | | | | | | | |
CAPITAL SHARE TRANSACTIONS: | | | | | | | | | | | | | |
Institutional Shares | | | | | | | | | | | | | |
Shares sold | | | 20,031,006 | | | 52,372,060 | | | 5,627,680 | | | 10,727,543 | |
Shares issued to holders in reinvestment of dividends | | | — | | | — | | | — | | | 134,132 | |
Shares redeemed | | | (12,640,760 | ) | | (9,512,689 | ) | | (2,302,269 | ) | | (458,265 | ) |
| | | | | | | | | | | | | |
Net increase | | | 7,390,246 | | | 42,859,371 | | | 3,325,411 | | | 10,403,410 | |
| | | | | | | | | | | | | |
Service Shares | | | | | | | | | | | | | |
Shares sold | | | 3,737,761 | | | 182,674,884 | | | 4,810,365 | | | 169,097,947 | |
Shares issued to holders in reinvestment of dividends | | | — | | | — | | | — | | | 1,004,029 | |
Shares redeemed | | | (26,231,942 | ) | | (63,026,524 | ) | | (15,279,408 | ) | | (57,155,937 | ) |
| | | | | | | | | | | | | |
Net increase (decrease) | | | (22,494,181 | ) | | 119,648,360 | | | (10,469,043 | ) | | 112,946,039 | |
| | | | | | | | | | | | | |
DIVIDENDS AND DISTRIBUTIONS TO | | | | | | | | | | | | | |
SHAREHOLDERS: | | | | | | | | | | | | | |
Net investment income – Institutional Shares | | | — | | | — | | | — | | | (126,411 | ) |
Net investment income – Service Shares | | | — | | | — | | | — | | | (946,234 | ) |
Return of capital – Institutional Shares | | | — | | | — | | | — | | | (7,721 | ) |
Return of capital – Service Shares | | | — | | | — | | | — | | | (57,795 | ) |
| | | | | | | | | | | | | |
Total dividends and distributions | | | — | | | — | | | — | | | (1,138,161 | ) |
| | | | | | | | | | | | | |
INCREASE (DECREASE) IN NET ASSETS | | | (16,696,384 | ) | | 160,455,399 | | | (6,427,059 | ) | | 114,001,337 | |
NET ASSETS: | | | | | | | | | | | | | |
Beginning of year | | | 160,455,399 | | | 0 | | | 114,003,337 | | | 2,000 | |
| | | | | | | | | | | | | |
End of year (including undistributed net investment | | | | | | | | | | | | | |
income (loss) of $229,307, $0, $319,639 and | | | | | | | | | | | | | |
$(52,927), respectively) | | $ | 143,759,015 | | $ | 160,455,399 | | $ | 107,576,278 | | $ | 114,003,337 | |
| | | | | | | | | | | | | |
CHANGES IN SHARES OUTSTANDING | | | | | | | | | | | | | |
Institutional Shares | | | | | | | | | | | | | |
Shares sold | | | 2,137,212 | | | 5,777,090 | | | 621,828 | | | 1,149,354 | |
Shares issued to holders in reinvestment of dividends | | | — | | | — | | | — | | | 15,418 | |
Shares redeemed | | | (1,358,377 | ) | | (1,109,784 | ) | | (255,706 | ) | | (50,346 | ) |
| | | | | | | | | | | | | |
Net increase | | | 778,835 | | | 4,667,306 | | | 366,122 | | | 1,114,426 | |
| | | | | | | | | | | | | |
Service Shares | | | | | | | | | | | | | |
Shares sold | | | 399,554 | | | 18,575,216 | | | 528,074 | | | 16,979,915 | |
Shares issued to holders in reinvestment of dividends | | | — | | | — | | | — | | | 114,746 | |
Shares redeemed | | | (2,863,329 | ) | | (6,986,890 | ) | | (1,685,008 | ) | | (6,075,142 | ) |
| | | | | | | | | | | | | |
Net increase (decrease) | | | (2,463,775 | ) | | 11,588,326 | | | (1,156,934 | ) | | 11,019,519 | |
| | | | | | | | | | | | | |
See notes to financial statements.
118
|
GuideMarkSM Funds & GuidePathSM Funds |
STATEMENTS OF CHANGES IN NET ASSETS (Continued) |
|
| |
| | | | | | | | | | | | | |
| | Core Fixed Income Fund | | Tax-Exempt Fixed Income Fund | |
| | | | | |
| | Period Ended
September 30,
2012 | | Year Ended
March 31,
2012 | | Period Ended
September 30,
2012 | | Year Ended
March 31,
2012 | |
| | | | | | | | | |
| | (Unaudited) | | | | (Unaudited) | | | |
OPERATIONS: | | | | | | | | | | | | | |
Net investment income | | $ | 2,851,121 | | $ | 7,479,078 | | $ | 1,178,099 | | $ | 2,972,685 | |
Net realized gain on investment transactions | | | 6,691,446 | | | 11,539,240 | | | 701,501 | | | 1,394,371 | |
Change in unrealized appreciation on investments | | | 8,972,859 | | | 6,673,590 | | | 1,454,085 | | | 5,756,168 | |
| | | | | | | | | | | | | |
Net increase in net assets resulting from operations | | | 18,515,426 | | | 25,691,908 | | | 3,333,685 | | | 10,123,224 | |
| | | | | | | | | | | | | |
CAPITAL SHARE TRANSACTIONS: | | | | | | | | | | | | | |
Institutional Shares | | | | | | | | | | | | | |
Shares sold | | | 82,081,318 | | | 68,940,739 | | | — | | | — | |
Shares issued to holders in reinvestment of dividends | | | 710,037 | | | 584,438 | | | — | | | — | |
Shares redeemed | | | (15,460,047 | ) | | (38,116,152 | ) | | — | | | — | |
| | | | | | | | | | | | | |
Net increase | | | 67,331,308 | | | 31,409,025 | | | — | | | — | |
| | | | | | | | | | | | | |
Service Shares | | | | | | | | | | | | | |
Shares sold | | | 85,034,684 | | | 229,985,171 | | | 9,199,312 | | | 24,438,594 | |
Shares issued to holders in reinvestment of dividends | | | 2,886,231 | | | 7,246,292 | | | 1,174,097 | | | 2,989,714 | |
Shares redeemed | | | (224,083,845 | ) | | (401,161,022 | ) | | (11,758,965 | ) | | (123,481,858 | ) |
| | | | | | | | | | | | | |
Net decrease | | | (136,162,930 | ) | | (163,929,559 | ) | | (1,385,556 | ) | | (96,053,550 | ) |
| | | | | | | | | | | | | |
DIVIDENDS AND DISTRIBUTIONS TO | | | | | | | | | | | | | |
SHAREHOLDERS: | | | | | | | | | | | | | |
Net investment income – Institutional Shares | | | (710,037 | ) | | (584,438 | ) | | — | | | — | |
Net investment income – Service Shares | | | (2,886,344 | ) | | (7,246,797 | ) | | (1,174,650 | ) | | (2,990,928 | ) |
| | | | | | | | | | | | | |
Total dividends and distributions | | | (3,596,381 | ) | | (7,831,235 | ) | | (1,174,650 | ) | | (2,990,928 | ) |
| | | | | | | | | | | | | |
INCREASE (DECREASE) IN NET ASSETS | | | (53,912,577 | ) | | (114,659,861 | ) | | 773,479 | | | (88,921,254 | ) |
NET ASSETS: | | | | | | | | | | | | | |
Beginning of year | | | 467,281,101 | | | 581,940,962 | | | 81,408,890 | | | 170,330,144 | |
| | | | | | | | | | | | | |
End of year (including undistributed net investment | | | | | | | | | | | | | |
income of $175,001, $920,261, $69,909 and | | | | | | | | | | | | | |
$66,460, respectively) | | $ | 413,368,524 | | $ | 467,281,101 | | $ | 82,182,369 | | $ | 81,408,890 | |
| | | | | | | | | | | | | |
CHANGES IN SHARES OUTSTANDING | | | | | | | | | | | | | |
Institutional Shares | | | | | | | | | | | | | |
Shares sold | | | 8,182,491 | | | 7,100,674 | | | — | | | — | |
Shares issued to holders in reinvestment of dividends | | | 71,184 | | | 59,987 | | | — | | | — | |
Shares redeemed | | | (1,543,831 | ) | | (3,884,464 | ) | | — | | | — | |
| | | | | | | | | | | | | |
Net increase | | | 6,709,844 | | | 3,276,197 | | | — | | | — | |
| | | | | | | | | | | | | |
Service Shares | | | | | | | | | | | | | |
Shares sold | | | 8,543,970 | | | 23,714,369 | | | 786,197 | | | 2,176,388 | |
Shares issued to holders in reinvestment of dividends | | | 289,681 | | | 746,764 | | | 100,747 | | | 266,512 | |
Shares redeemed | | | (22,308,717 | ) | | (42,102,151 | ) | | (1,005,473 | ) | | (11,311,366 | ) |
| | | | | | | | | | | | | |
Net decrease | | | (13,475,066 | ) | | (17,641,018 | ) | | (118,529 | ) | | (8,868,466 | ) |
| | | | | | | | | | | | | |
See notes to financial statements.
119
|
GuideMarkSM Funds & GuidePathSM Funds |
STATEMENTS OF CHANGES IN NET ASSETS (Continued) |
|
| |
| | | | | | | | | | | | | |
| | Opportunistic Fixed
Income Fund | | Strategic Asset
Allocation Fund | |
| | | | | |
| | Period Ended
September 30,
2012 | | Year Ended
Ended March 31,
2012 | | Period Ended
September 30,
2012 | | April 29, 20111
Ended March 31,
2012 | |
| | | | | | | | | |
| | (Unaudited) | | | | (Unaudited) | | | |
OPERATIONS: | | | | | | | | | | | | | |
Net investment income | | $ | 4,639,004 | | $ | 8,223,478 | | $ | 255,659 | | $ | 791,099 | |
Net realized gain (loss) on investment transactions | | | 1,956,294 | | | (5,030,191 | ) | | (946,647 | ) | | (1,102,775 | ) |
Change in unrealized appreciation (depreciation) | | | | | | | | | | | | | |
on investments | | | 5,474,626 | | | (2,198,514 | ) | | 2,986,483 | | | 9,428,473 | |
| | | | | | | | | | | | | |
Net increase in net assets resulting from operations | | | 12,069,924 | | | 994,773 | | | 2,295,495 | | | 9,116,797 | |
| | | | | | | | | | | | | |
CAPITAL SHARE TRANSACTIONS: | | | | | | | | | | | | | |
Institutional Shares | | | | | | | | | | | | | |
Shares sold | | | 75,698,832 | | | 64,598,842 | | | 275,508 | | | — | |
Shares issued to holders in reinvestment of dividends | | | 1,557,264 | | | 1,095,080 | | | — | | | — | |
Shares redeemed | | | (17,916,612 | ) | | (27,299,114 | ) | | — | | | — | |
| | | | | | | | | | | | | |
Net increase | | | 59,339,484 | | | 38,394,808 | | | 275,508 | | | — | |
| | | | | | | | | | | | | |
Service Shares | | | | | | | | | | | | | |
Shares sold | | | 34,457,501 | | | 307,026,836 | | | 77,393,185 | | | 147,611,371 | |
Shares issued to holders in reinvestment of dividends | | | 2,979,597 | | | 6,865,088 | | | — | | | 1,067,171 | |
Shares redeemed | | | (92,630,104 | ) | | (102,815,560 | ) | | (28,406,804 | ) | | (12,102,934 | ) |
| | | | | | | | | | | | | |
Net increase (decrease) | | | (55,193,006 | ) | | 211,076,364 | | | 48,986,381 | | | 136,575,608 | |
| | | | | | | | | | | | | |
DIVIDENDS AND DISTRIBUTIONS TO | | | | | | | | | | | | | |
SHAREHOLDERS: | | | | | | | | | | | | | |
Net investment income – Institutional Shares | | | (1,557,264 | ) | | (1,095,080 | ) | | — | | | — | |
Net investment income – Service Shares | | | (2,979,597 | ) | | (6,865,088 | ) | | — | | | (1,058,402 | ) |
Return of capital – Service Shares | | | — | | | — | | | — | | | (8,769 | ) |
| | | | | | | | | | | | | |
Total dividends and distributions | | | (4,536,861 | ) | | (7,960,168 | ) | | — | | | (1,067,171 | ) |
| | | | | | | | | | | | | |
INCREASE IN NET ASSETS | | | 11,679,541 | | | 242,505,777 | | | 51,557,384 | | | 144,625,234 | |
NET ASSETS: | | | | | | | | | | | | | |
Beginning of year | | | 242,507,777 | | | 2,000 | | | 144,649,234 | | | 24,000 | |
| | | | | | | | | | | | | |
End of year (including undistributed net investment | | | | | | | | | | | | | |
income (loss) of $(1,601,209), $(1,703,352), | | | | | | | | | | | | | |
$30,386 and $(225,273), respectively) | | $ | 254,187,318 | | $ | 242,507,777 | | $ | 196,206,618 | | $ | 144,649,234 | |
| | | | | | | | | | | | | |
CHANGES IN SHARES OUTSTANDING | | | | | | | | | | | | | |
Institutional Shares | | | | | | | | | | | | | |
Shares sold | | | 7,723,303 | | | 6,736,982 | | | 28,609 | | | — | |
Shares issued to holders in reinvestment of dividends | | | 158,802 | | | 115,534 | | | — | | | — | |
Shares redeemed | | | (1,844,560 | ) | | (2,895,278 | ) | | — | | | — | |
| | | | | | | | | | | | | |
Net increase | | | 6,037,545 | | | 3,957,238 | | | 28,609 | | | — | |
| | | | | | | | | | | | | |
Service Shares | | | | | | | | | | | | | |
Shares sold | | | 3,553,280 | | | 30,996,452 | | | 8,530,867 | | | 16,559,127 | |
Shares issued to holders in reinvestment of dividends | | | 306,766 | | | 721,132 | | | — | | | 126,143 | |
Shares redeemed | | | (9,444,171 | ) | | (10,686,604 | ) | | (3,127,139 | ) | | (1,394,712 | ) |
| | | | | | | | | | | | | |
Net increase (decrease) | | | (5,584,125 | ) | | 21,030,980 | | | 5,403,728 | | | 15,290,558 | |
| | | | | | | | | | | | | |
1 Date of inception. | | | | | | | | | | | | | |
See notes to financial statements.
120
|
GuideMarkSM Funds & GuidePathSM Funds |
STATEMENTS OF CHANGES IN NET ASSETS (Continued) |
|
| |
| | | | | | | | | | | | | |
| | Tactical Constrained
Asset Allocation Fund | |
Tactical Unconstrained
Asset Allocation Fund
| |
| | | | | |
| | Period Ended
September 30,
2012 | | April 29, 20111
Ended March 31,
2012 | | Period Ended
September 30,
2012 | | April 29, 20111
Ended March 31,
2012 | |
| | | | | | | | | |
| | (Unaudited) | | | | | (Unaudited) | | | | |
OPERATIONS: | | | | | | | | | | | | | |
Net investment income | | $ | 345,751 | | $ | 935,052 | | $ | 653,446 | | $ | 846,897 | |
Net realized loss on investment transactions | | | (371,452 | ) | | (1,442,718 | ) | | (48,996 | ) | | (4,037,929 | ) |
Change in unrealized appreciation on investments | | | 3,254,111 | | | 8,925,206 | | | 3,869,917 | | | 11,009,636 | |
| | | | | | | | | | | | | |
Net increase in net assets resulting from operations | | | 3,228,410 | | | 8,417,540 | | | 4,474,367 | | | 7,818,604 | |
| | | | | | | | | | | | | |
CAPITAL SHARE TRANSACTIONS: | | | | | | | | | | | | | |
Institutional Shares | | | | | | | | | | | | | |
Shares sold | | | 275,554 | | | — | | | 253,702 | | | — | |
Shares issued to holders in reinvestment of dividends | | | — | | | — | | | — | | | — | |
Shares redeemed | | | — | | | — | | | — | | | — | |
| | | | | | | | | | | | | |
Net increase | | | 275,554 | | | — | | | 253,702 | | | — | |
| | | | | | | | | | | | | |
Service Shares | | | | | | | | | | | | | |
Shares sold | | | 76,370,498 | | | 147,249,517 | | | 102,812,722 | | | 195,854,836 | |
Shares issued to holders in reinvestment of dividends | | | — | | | 920,562 | | | — | | | 667,199 | |
Shares redeemed | | | (39,017,070 | ) | | (12,545,943 | ) | | (43,439,970 | ) | | (18,994,002 | ) |
| | | | | | | | | | | | | |
Net increase | | | 37,353,428 | | | 135,624,136 | | | 59,372,752 | | | 177,528,033 | |
| | | | | | | | | | | | | |
DIVIDENDS AND DISTRIBUTIONS TO | | | | | | | | | | | | | |
SHAREHOLDERS: | | | | | | | | | | | | | |
Net investment income – Service Shares | | | — | | | (920,562 | ) | | — | | | (667,199 | ) |
| | | | | | | | | | | | | |
Total dividends and distributions | | | — | | | (920,562 | ) | | — | | | (667,199 | ) |
| | | | | | | | | | | | | |
INCREASE IN NET ASSETS | | | 40,857,392 | | | 143,121,114 | | | 64,100,821 | | | 184,679,438 | |
NET ASSETS: | | | | | | | | | | | | | |
Beginning of year | | | 143,145,114 | | | 24,000 | | | 184,703,438 | | | 24,000 | |
| | | | | | | | | | | | | |
End of year (including undistributed net investment
income of $401,461, $55,710, $874,579 and
$221,133, respectively) | | $ | 184,002,506 | | $ | 143,145,114 | | $ | 248,804,259 | | $ | 184,703,438 | |
| | | | | | | | | | | | | |
CHANGES IN SHARES OUTSTANDING | | | | | | | | | | | | | |
Institutional Shares | | | | | | | | | | | | | |
Shares sold | | | 27,611 | | | — | | | 26,021 | | | — | |
Shares issued to holders in reinvestment of dividends | | | — | | | — | | | — | | | — | |
Shares redeemed | | | — | | | — | | | — | | | — | |
| | | | | | | | | | | | | |
Net increase | | | 27,611 | | | — | | | 26,021 | | | — | |
| | | | | | | | | | | | | |
Service Shares | | | | | | | | | | | | | |
Shares sold | | | 8,071,227 | | | 15,938,306 | | | 11,016,048 | | | 21,367,013 | |
Shares issued to holders in reinvestment of dividends | | | — | | | 103,318 | | | — | | | 75,732 | |
Shares redeemed | | | (4,097,861 | ) | | (1,382,825 | ) | | (4,636,280 | ) | | (2,081,801 | ) |
| | | | | | | | | | | | | |
Net increase | | | 3,973,366 | | | 14,658,799 | | | 6,379,768 | | | 19,360,944 | |
| | | | | | | | | | | | | |
See notes to financial statements.
121
|
GuideMarkSM Funds & GuidePathSM Funds |
STATEMENTS OF CHANGES IN NET ASSETS (Continued) |
|
| |
| | | | | | | | | | |
| | Absolute Return
Asset Allocation Fund | |
Multi-Asset Income
Asset Allocation Fund
| |
| | | | | |
| | Period Ended
September 30,
2012 | | April 29, 20111
Ended March 31,
2012 | | August 31, 20121
Ended September 30,
2012 | |
| | | | | | | |
| | (Unaudited) | | | | | (Unaudited) | |
OPERATIONS: | | | | | | | | | | |
Net investment income | | $ | 2,911,983 | | $ | 1,871,070 | | $ | 229,617 | |
Net realized loss on investment transactions | | | (1,647,886 | ) | | (599,718 | ) | | (1,029 | ) |
Change in unrealized appreciation on investments | | | 5,680,989 | | | 2,560,783 | | | 477,679 | |
| | | | | | | | | | |
Net increase in net assets resulting from operations | | | 6,945,086 | | | 3,832,135 | | | 706,267 | |
| | | | | | | | | | |
CAPITAL SHARE TRANSACTIONS: | | | | | | | | | | |
Institutional Shares | | | | | | | | | | |
Shares sold | | | 159,502 | | | — | | | — | |
Shares issued to holders in reinvestment of dividends | | | — | | | — | | | — | |
Shares redeemed | | | — | | | — | | | — | |
| | | | | | | | | | |
Net increase | | | 159,502 | | | — | | | — | |
| | | | | | | | | | |
Service Shares | | | | | | | | | | |
Shares sold | | | 225,152,188 | | | 259,307,338 | | | 51,998,697 | |
Shares issued to holders in reinvestment of dividends | | | — | | | 1,125,858 | | | — | |
Shares redeemed | | | (53,819,977 | ) | | (24,508,776 | ) | | (1,025,878 | ) |
| | | | | | | | | | |
Net increase | | | 171,332,211 | | | 235,924,420 | | | 50,972,819 | |
| | | | | | | | | | |
DIVIDENDS AND DISTRIBUTIONS TO | | | | | | | | | | |
SHAREHOLDERS: | | | | | | | | | | |
Net investment income – Service Shares | | | — | | | (1,125,858 | ) | | — | |
| | | | | | | | | | |
Total dividends and distributions | | | — | | | (1,125,858 | ) | | — | |
| | | | | | | | | | |
INCREASE IN NET ASSETS | | | 178,436,799 | | | 238,630,697 | | | 51,679,086 | |
NET ASSETS: | | | | | | | | | | |
Beginning of year | | | 238,654,697 | | | 24,000 | | | 0 | |
| | | | | | | | | | |
End of year (including undistributed net investment
income of $3,698,415, $786,432, and $229,617,
respectively) | | $ | 417,091,496 | | $ | 238,654,697 | | $ | 51,679,086 | |
| | | | | | | | | | |
CHANGES IN SHARES OUTSTANDING | | | | | | | | | | |
Institutional Shares | | | | | | | | | | |
Shares sold | | | 15,653 | | | — | | | — | |
Shares issued to holders in reinvestment of dividends | | | — | | | — | | | — | |
Shares redeemed | | | — | | | — | | | — | |
| | | | | | | | | | |
Net increase | | | 15,653 | | | — | | | — | |
| | | | | | | | | | |
Service Shares | | | | | | | | | | |
Shares sold | | | 22,416,732 | | | 26,122,395 | | | 5,196,377 | |
Shares issued to holders in reinvestment of dividends | | | — | | | 114,300 | | | — | |
Shares redeemed | | | (5,348,108 | ) | | (2,465,204 | ) | | (100,976 | ) |
| | | | | | | | | | |
Net increase | | | 17,068,624 | | | 23,771,491 | | | 5,095,401 | |
| | | | | | | | | | |
See notes to financial statements.
122
|
GuideMarkSM Funds & GuidePathSM Funds |
STATEMENTS OF CHANGES IN NET ASSETS (Continued) |
|
| |
| | | | | | | |
| |
Fixed Income
Allocation Fund
| | Altegris® Multi-Strategy
Alternative Allocation Fund | |
| | | | | |
| | August 31, 20121
Ended September 30,
2012 | | August 31, 20121
Ended September 30,
2012 | |
| | | | | |
| | (Unaudited) | | (Unaudited) | |
OPERATIONS: | | | | | | | |
Net investment income | | $ | 291,903 | | $ | 185,119 | |
Net realized gain (loss) on investment transactions | | | 6,989 | | | (1,060 | ) |
Change in unrealized appreciation (depreciation)
on investments | | | 506,545 | | | (167,880 | ) |
| | | | | | | |
Net increase in net assets resulting from operations | | | 805,437 | | | 16,179 | |
| | | | | | | |
CAPITAL SHARE TRANSACTIONS: | | | | | | | |
Institutional Shares | | | | | | | |
Shares sold | | | 114,604 | | | 152,248 | |
Shares issued to holders in reinvestment of dividends | | | — | | | — | |
Shares redeemed | | | — | | | — | |
| | | | | | | |
Net increase | | | 114,604 | | | 152,248 | |
| | | | | | | |
Service Shares | | | | | | | |
Shares sold | | | 208,823,024 | | | 145,750,507 | |
Shares issued to holders in reinvestment of dividends | | | — | | | — | |
Shares redeemed | | | (4,944,842 | ) | | (2,853,074 | ) |
| | | | | | | |
Net increase | | | 203,878,182 | | | 142,897,433 | |
| | | | | | | |
INCREASE IN NET ASSETS | | | 204,798,223 | | | 143,065,860 | |
NET ASSETS: | | | | | | | |
Beginning of year | | | 0 | | | 0 | |
| | | | | | | |
End of year (including undistributed net investment
income of $291,903 and $185,119, respectively) | | $ | 204,798,223 | | $ | 143,065,860 | |
| | | | | | | |
CHANGES IN SHARES OUTSTANDING | | | | | | | |
Institutional Shares | | | | | | | |
Shares sold | | | 11,449 | | | 15,119 | |
Shares issued to holders in reinvestment of dividends | | | — | | | — | |
Shares redeemed | | | — | | | — | |
| | | | | | | |
Net increase | | | 11,449 | | | 15,119 | |
| | | | | | | |
Service Shares | | | | | | | |
Shares sold | | | 20,880,725 | | | 14,574,082 | |
Shares issued to holders in reinvestment of dividends | | | — | | | — | |
Shares redeemed | | | (493,903 | ) | | (284,977 | ) |
| | | | | | | |
Net increase | | | 20,386,822 | | | 14,289,105 | |
| | | | | | | |
See notes to financial statements.
123
|
GuideMarkSM Funds & GuidePathSM Funds |
FINANCIAL HIGHLIGHTS |
|
| |
| | | | | | | |
| |
Large Cap Growth Fund
| |
| | | |
| | Institutional | |
| | | |
| | Period Ended
September 30,
2012 | | April 29, 20111
Through
March 31,
2012 | |
| | | | | |
Per share data for a share of capital stock
outstanding for the entire period and
selected information for the period are
as follows: | | | | | | | |
Net asset value, beginning of period | | | $10.68 | | | $10.32 | |
Income from investment operations: | | | | | | | |
Net investment income | | | 0.02 | | | 0.01 | |
Net realized and unrealized gains (losses)
on investments | | | (0.05 | ) | | 0.35 | |
| | | | | | | |
Total from investment operations | | | (0.03 | ) | | 0.36 | |
| | | | | | | |
Net asset value, end of period | | | $10.65 | | | $10.68 | |
| | | | | | | |
| | | | | | | |
Total return | | | -0.28 | %2 | | 3.49 | %2 |
Supplemental data and ratios: | | | | | | | |
Net assets, end of period | | | $36,274,829 | | | $31,330,264 | |
Ratio of expenses to average net assets | | | | | | | |
Before expense reimbursement
(recapture) and securities lending
credit | | | 0.92 | %3 | | 0.93 | %3 |
After expense reimbursement
(recapture) and securities lending
credit | | | 0.90 | %3 | | 0.92 | %3 |
Ratio of net investment income (loss) to
average net assets | | | | | | | |
Before expense reimbursement
(recapture) and securities lending
credit | | | 0.50 | %3 | | 0.33 | %3 |
After expense reimbursement
(recapture) and securities lending
credit | | | 0.52 | %3 | | 0.34 | %3 |
Portfolio turnover rate | | | 25.33 | %2 | | 126.61 | % |
| |
Portfolio Turnover is calculated for the Fund as a whole. |
1 | Commencement of operations. |
2 | Not annualized. |
3 | Annualized. |
See notes to financial statements.
124
|
GuideMarkSM Funds & GuidePathSM Funds |
FINANCIAL HIGHLIGHTS |
|
| |
| | | | | | | | | | | | | | | | | | | |
| | Large Cap Growth Fund | |
| | | |
| | Service | |
| | | |
| | Period Ended
September 30,
2012 | | Year Ended
March 31,
2012 | | Year Ended
March 31,
2011 | | Year Ended
March 31,
2010 | | Year Ended
March 31,
2009 | | Year Ended
March 31,
2008 | |
| | | | | | | | | | | | | |
Per share data for a share of capital stock outstanding for the entire period and selected information for the period are as follows: | | | | | | | | | | | | | | | | | | | |
Net asset value, beginning of period | | | $10.61 | | | $9.99 | | | $8.41 | | | $5.67 | | | $8.81 | | | $9.62 | |
Income from investment operations: | | | | | | | | | | | | | | | | | | | |
Net investment income (loss) | | | (0.01 | ) | | (0.03 | ) | | (0.01 | ) | | 0.01 | | | — | | | (0.01 | ) |
Net realized and unrealized gains (losses)
on investments | | | (0.04 | ) | | 0.65 | | | 1.59 | | | 2.75 | | | (3.14 | ) | | (0.30 | ) |
| | | | | | | | | | | | | | | | | | | |
Total from investment operations | | | (0.05 | ) | | 0.62 | | | 1.58 | | | 2.76 | | | (3.14 | ) | | (0.31 | ) |
| | | | | | | | | | | | | | | | | | | |
Less distributions: | | | | | | | | | | | | | | | | | | | |
Dividends from net investment income | | | — | | | — | | | — | | | (0.01 | ) | | — | | | — | |
Dividends from net realized gains | | | — | | | — | | | — | | | — | | | — | * | | (0.50 | ) |
Return of capital | | | — | | | — | | | — | | | (0.01 | ) | | — | | | — | |
| | | | | | | | | | | | | | | | | | | |
Total distributions | | | — | | | — | | | — | | | (0.02 | ) | | — | | | (0.50 | ) |
| | | | | | | | | | | | | | | | | | | |
Net asset value, end of period | | | $10.56 | | | $10.61 | | | $9.99 | | | $8.41 | | | $5.67 | | | $8.81 | |
| | | | | | | | | | | | | | | | | | | |
Total return | | | -0.47 | %1 | | 6.21 | % | | 18.79 | % | | 48.60 | % | | -35.63 | % | | -3.88 | % |
Supplemental data and ratios: | | | | | | | | | | | | | | | | | | | |
Net assets, end of period | | | $141,833,700 | | | $168,654,404 | | | $211,129,188 | | | $207,928,223 | | | $203,479,219 | | | $649,307,452 | |
Ratio of expenses to average net assets | | | | | | | | | | | | | | | | | | | |
Before expense reimbursement
(recapture) and securities lending
credit | | | 1.52 | %2 | | 1.54 | % | | 1.45 | % | | 1.46 | % | | 1.40 | % | | 1.33 | % |
After expense reimbursement
(recapture) and securities lending
credit | | | 1.49 | %2 | | 1.49 | % | | 1.43 | % | | 1.41 | % | | 1.27 | % | | 1.28 | % |
Ratio of net investment income (loss) to
average net assets | | | | | | | | | | | | | | | | | | | |
Before expense reimbursement
(recapture) and securities lending
credit | | | -0.11 | %2 | | -0.32 | % | | -0.13 | % | | 0.09 | % | | -0.15 | % | | -0.15 | % |
After expense reimbursement
(recapture) and securities lending
credit | | | -0.08 | %2 | | -0.27 | % | | -0.11 | % | | 0.14 | % | | -0.02 | % | | -0.10 | % |
Portfolio turnover rate | | | 25.33 | %1 | | 126.61 | % | | 63.33 | % | | 69.83 | % | | 98.67 | % | | 62.86 | % |
| |
Portfolio Turnover is calculated for the Fund as a whole. |
1 | Not annualized. |
2 | Annualized. |
* | Amount represents less than $0.01 per share. |
See notes to financial statements.
125
|
GuideMarkSM Funds & GuidePathSM Funds |
FINANCIAL HIGHLIGHTS |
|
| |
| | | | | | | |
| | Large Cap Value Fund | |
| | | |
| | Institutional | |
| | | |
| | Period Ended
September 30,
2012 | | April 29, 20111
Through
March 31,
2012 | |
| | | | | |
Per share data for a share of capital stock
outstanding for the entire period and
selected information for the period are
as follows: | | | | | | | |
Net asset value, beginning of period | | | $8.39 | | | $8.54 | |
Income from investment operations: | | | | | | | |
Net investment income | | | 0.09 | | | 0.13 | |
Net realized and unrealized gains (losses)
on investments | | | 0.05 | | | (0.09 | ) |
| | | | | | | |
Total from investment operations | | | 0.14 | | | 0.04 | |
| | | | | | | |
Less distributions: | | | | | | | |
Dividends from net investment income | | | — | | | (0.19 | ) |
| | | | | | | |
Total distributions | | | — | | | (0.19 | ) |
| | | | | | | |
Net asset value, end of period | | | $8.53 | | | $8.39 | |
| | | | | | | |
Total return | | | 1.67 | %2 | | 0.70 | %2 |
Supplemental data and ratios: | | | | | | | |
Net assets, end of period | | | $45,300,895 | | | $39,721,680 | |
Ratio of expenses to average net assets | | | | | | | |
Before expense reimbursement
(recapture) and securities lending
credit | | | 0.92 | %3 | | 0.93 | %3 |
After expense reimbursement
(recapture) and securities lending
credit | | | 0.91 | %3 | | 0.92 | %3 |
Ratio of net investment income to
average net assets | | | | | | | |
Before expense reimbursement
(recapture) and securities lending
credit | | | 1.98 | %3 | | 1.89 | %3 |
After expense reimbursement
(recapture) and securities lending
credit | | | 1.99 | %3 | | 1.90 | %3 |
Portfolio turnover rate | | | 7.55 | %2 | | 95.12 | % |
| |
Portfolio Turnover is calculated for the Fund as a whole. |
1 | Commencement of operations. |
2 | Not annualized. |
3 | Annualized. |
See notes to financial statements.
126
|
GuideMarkSM Funds & GuidePathSM Funds |
FINANCIAL HIGHLIGHTS |
|
| |
| | | | | | | | | | | | | | | | | | | |
| | Large Cap Value Fund | |
| | | |
| | Service | |
| | | |
| | Period Ended
September 30,
2012 | | Year Ended
March 31,
2012 | | Year Ended
March 31,
2011 | | Year Ended
March 31,
2010 | | Year Ended
March 31,
2009 | | Year Ended
March 31,
2008 | |
| | | | | | | | | | | | | |
Per share data for a share of capital stock
outstanding for the entire period and
selected information for the period are
as follows: | | | | | | | | | | | | | | | | | | | |
Net asset value, beginning of period | | | $8.47 | | | $8.32 | | | $7.44 | | | $4.85 | | | $9.85 | | | $12.34 | |
Income from investment operations: | | | | | | | | | | | | | | | | | | | |
Net investment income | | | 0.07 | | | 0.10 | | | 0.09 | | | 0.10 | | | 0.19 | | | 0.15 | |
Net realized and unrealized gains (losses)
on investments | | | 0.05 | | | 0.13 | | | 0.88 | | | 2.60 | | | (4.99 | ) | | (1.55 | ) |
| | | | | | | | | | | | | | | | | | | |
Total from investment operations | | | 0.12 | | | 0.23 | | | 0.97 | | | 2.70 | | | (4.80 | ) | | (1.40 | ) |
| | | | | | | | | | | | | | | | | | | |
Less distributions: | | | | | | | | | | | | | | | | | | | |
Dividends from net investment income | | | — | | | (0.08 | ) | | (0.09 | ) | | (0.11 | ) | | (0.20 | ) | | (0.14 | ) |
Dividends from net realized gains | | | — | | | — | | | — | | | — | | | — | * | | (0.95 | ) |
| | | | | | | | | | | | | | | | | | | |
Total distributions | | | — | | | (0.08 | ) | | (0.09 | ) | | (0.11 | ) | | (0.20 | ) | | (1.09 | ) |
| | | | | | | | | | | | | | | | | | | |
Net asset value, end of period | | | $8.59 | | | $8.47 | | | $8.32 | | | $7.44 | | | $4.85 | | | $9.85 | |
| | | | | | | | | | | | | | | | | | | |
Total return | | | 1.42 | %1 | | 2.87 | % | | 13.15 | % | | 55.37 | % | | -48.85 | % | | -12.23 | % |
Supplemental data and ratios: | | | | | | | | | | | | | | | | | | | |
Net assets, end of period | | | $139,696,392 | | | $163,077,098 | | | $200,132,341 | | | $200,627,939 | | | $180,181,364 | | | $574,388,589 | |
Ratio of expenses to average net assets | | | | | | | | | | | | | | | | | | | |
Before expense reimbursement
(recapture) and securities lending
credit | | | 1.49 | %2 | | 1.51 | % | | 1.44 | % | | 1.44 | % | | 1.38 | % | | 1.33 | % |
After expense reimbursement
(recapture) and securities lending
credit | | | 1.48 | %2 | | 1.49 | % | | 1.42 | % | | 1.40 | % | | 1.22 | % | | 1.28 | % |
Ratio of net investment income to
average net assets | | | | | | | | | | | | | | | | | | | |
Before expense reimbursement
(recapture) and securities lending
credit | | | 1.39 | %2 | | 1.13 | % | | 1.13 | % | | 1.27 | % | | 1.60 | % | | 1.16 | % |
After expense reimbursement
(recapture) and securities lending
credit | | | 1.40 | %2 | | 1.15 | % | | 1.15 | % | | 1.31 | % | | 1.76 | % | | 1.21 | % |
Portfolio turnover rate | | | 7.55 | %1 | | 95.12 | % | | 16.35 | % | | 26.85 | % | | 58.45 | % | | 40.54 | % |
| |
Portfolio Turnover is calculated for the Fund as a whole. |
1 | Not annualized. |
2 | Annualized. |
* | Amount represents less than $0.01 per share. |
See notes to financial statements.
127
|
GuideMarkSM Funds & GuidePathSM Funds |
FINANCIAL HIGHLIGHTS |
|
| |
| | | | | | | |
| | Small/Mid Cap Core Fund | |
| | | |
| | Institutional | |
| | | |
| | Period Ended
September 30,
2012 | | April 29, 20111
Through
March 31,
2012 | |
| | | | | |
Per share data for a share of capital stock
outstanding for the entire period and
selected information for the period are
as follows: | | | | | | | |
Net asset value, beginning of period | | | $11.56 | | | $11.99 | |
Income from investment operations: | | | | | | | |
Net investment income | | | 0.03 | | | 0.00 | |
Net realized and unrealized gains (losses)
on investments | | | 0.06 | | | (0.43 | ) |
| | | | | | | |
Total from investment operations | | | 0.09 | | | (0.43 | ) |
| | | | | | | |
Net asset value, end of period | | | $11.65 | | | $11.56 | |
| | | | | | | |
| | | | | | | |
Total return | | | 0.78 | %2 | | -3.59 | %2 |
Supplemental data and ratios: | | | | | | | |
Net assets, end of period | | | $34,532,776 | | | $30,106,471 | |
Ratio of expenses to average net assets | | | | | | | |
Before expense reimbursement
(recapture) and securities lending
credit | | | 1.07 | %3 | | 1.22 | %3 |
After expense reimbursement
(recapture) and securities lending
credit | | | 1.03 | %3 | | 1.09 | %3 |
Ratio of net investment income (loss) to
average net assets | | | | | | | |
Before expense reimbursement
(recapture) and securities lending
credit | | | 0.56 | %3 | | -0.10 | %3 |
After expense reimbursement
(recapture) and securities lending
credit | | | 0.60 | %3 | | 0.03 | %3 |
Portfolio turnover rate | | | 85.51 | %2 | | 245.95 | % |
| |
Portfolio Turnover is calculated for the Fund as a whole. |
1 | Commencement of operations. |
2 | Not annualized. |
3 | Annualized. |
See notes to financial statements.
128
|
GuideMarkSM Funds & GuidePathSM Funds |
FINANCIAL HIGHLIGHTS |
| |
| | | | | | | | | | | | | | | | | | | |
| |
Small/Mid Cap Core Fund
| |
| | | |
| | Service | |
| | | |
| | Period Ended
September 30,
2012 | | Year Ended
March 31,
2012 | | Year Ended
March 31,
2011 | | Year Ended
March 31,
2010 | | Year Ended
March 31,
2009 | | Year Ended
March 31,
2008 | |
| | | | | | | | | | | | | |
Per share data for a share of capital stock
outstanding for the entire period and
selected information for the period are
as follows: | | | | | | | | | | | | | | | | | | | |
Net asset value, beginning of year | | | $11.50 | | | $11.61 | | | $9.46 | | | $5.69 | | | $9.24 | | | $11.95 | |
Income from investment operations: | | | | | | | | | | | | | | | | | | | |
Net investment income (loss) | | | — | | | (0.09 | ) | | (0.05 | ) | | 0.01 | | | 0.08 | | | 0.08 | |
Net realized and unrealized gains (losses)
on investments | | | 0.06 | | | (0.02 | ) | | 2.20 | | | 3.78 | | | (3.56 | ) | | (2.36 | ) |
| | | | | | | | | | | | | | | | | | | |
Total from investment operations | | | 0.06 | | | (0.11 | ) | | 2.15 | | | 3.79 | | | (3.48 | ) | | (2.28 | ) |
| | | | | | | | | | | | | | | | | | | |
Less distributions: | | | | | | | | | | | | | | | | | | | |
Dividends from net investment income | | | — | | | — | | | — | | | — | * | | (0.07 | ) | | (0.08 | ) |
Dividends from net realized gains | | | — | | | — | | | — | | | — | | | — | | | (0.35 | ) |
Return of capital | | | — | | | — | | | — | | | (0.02 | ) | | — | * | | — | * |
| | | | | | | | | | | | | | | | | | | |
Total distributions | | | — | | | — | | | — | | | (0.02 | ) | | (0.07 | ) | | (0.43 | ) |
| | | | | | | | | | | | | | | | | | | |
Net asset value, end of period | | | $11.56 | | | $11.50 | | | $11.61 | | | $9.46 | | | $5.69 | | | $9.24 | |
| | | | | | | | | | | | | | | | | | | |
Total return | | | 0.52 | %1 | | -0.95 | % | | 22.73 | % | | 66.39 | % | | -37.59 | % | | -19.47 | % |
Supplemental data and ratios: | | | | | | | | | | | | | | | | | | | |
Net assets, end of period | | | $42,806,146 | | | $47,944,286 | | | $42,748,789 | | | $42,649,488 | | | $45,179,654 | | | $99,548,384 | |
Ratio of expenses to average net assets | | | | | | | | | | | | | | | | | | | |
Before expense reimbursement(recapture) and securities lending credit | | | 1.64 | %2 | | 1.74 | % | | 1.71 | % | | 1.67 | % | | 1.59 | % | | 1.48 | % |
After expense reimbursement (recapture) and securities lending credit | | | 1.59 | %2 | | 1.59 | % | | 1.59 | % | | 1.59 | % | | 1.28 | % | | 1.40 | % |
Ratio of net investment income (loss) to average net assets | | | | | | | | | | | | | | | | | | | |
Before expense reimbursement (recapture) and securities lending credit | | | -0.06 | %2 | | -0.82 | % | | -0.66 | % | | -0.06 | % | | 0.58 | % | | 0.61 | % |
After expense reimbursement (recapture) and securities lending credit | | | -0.01 | %2 | | -0.67 | % | | -0.54 | % | | 0.02 | % | | 0.89 | % | | 0.69 | % |
Portfolio turnover rate | | | 85.51 | %1 | | 245.95 | % | | 44.75 | % | | 52.31 | % | | 65.97 | % | | 127.62 | % |
| |
Portfolio Turnover is calculated for the Fund as a whole. |
1 | Not annualized. |
2 | Annualized. |
* | Amount represents less than $0.01 per share. |
See notes to financial statements.
129
|
GuideMarkSM Funds & GuidePathSM Funds |
FINANCIAL HIGHLIGHTS |
| |
| | | | | | | |
| | World ex-US Fund | |
| | | |
| | Institutional | |
| | | |
| | Period Ended
September 30,
2012 | | April 29, 20111
Through
March 31,
2012 | |
| | | | | |
Per share data for a share of capital stock
outstanding for the entire period and
selected information for the period are
as follows: | | | | | | | |
Net asset value, beginning of period | | | $7.52 | | | $8.75 | |
Income from investment operations: | | | | | | | |
Net investment income | | | 0.11 | | | 0.07 | |
Net realized and unrealized losses on investments | | | (0.17 | ) | | (1.17 | ) |
| | | | | | | |
Total from investment operations | | | (0.06 | ) | | (1.10 | ) |
| | | | | | | |
Less distributions: | | | | | | | |
Dividends from net investment income | | | — | | | (0.13 | ) |
| | | | | | | |
Total distributions | | | — | | | (0.13 | ) |
| | | | | | | |
Net asset value, end of period | | | $7.46 | | | $7.52 | |
| | | | | | | |
Total return | | | -0.80 | %2 | | -12.34 | %2 |
Supplemental data and ratios: | | | | | | | |
Net assets, end of period | | | $68,124,588 | | | $40,623,156 | |
Ratio of expenses to average net assets | | | | | | | |
Before expense reimbursement (recapture) and securities lending credit | | | 1.08 | %3 | | 1.08 | %3 |
After expense reimbursement (recapture) and securities lending credit | | | 1.08 | %3 | | 1.08 | %3 |
Ratio of net investment income to average net assets | | | | | | | |
Before expense reimbursement (recapture) and securities lending credit | | | 2.43 | %3 | | 1.13 | %3 |
After expense reimbursement (recapture) and securities lending credit | | | 2.43 | %3 | | 1.13 | %3 |
Portfolio turnover rate | | | 35.33 | %2 | | 164.90 | % |
| |
Portfolio Turnover is calculated for the Fund as a whole. |
1 | Commencement of operations. |
2 | Not annualized. |
3 | Annualized. |
See notes to financial statements.
130
|
GuideMarkSM Funds & GuidePathSM Funds |
FINANCIAL HIGHLIGHTS |
|
| |
| | | | | | | | | | | | | | | | | | | |
| | World ex-US Fund | |
| | | |
| | Service | |
| | | |
| | Period Ended
September 30,
2012 | | Year Ended
March 31,
2012 | | Year Ended
March 31,
2011 | | Year Ended
March 31,
2010 | | Year Ended
March 31,
2009 | | Year Ended
March 31,
2008 | |
| | | | | | | | | | | | | |
Per share data for a share of capital stock
outstanding for the entire period and
selected information for the period are
as follows: | | | | | | | | | | | | | | | | | | | |
Net asset value, beginning of period | | | $7.54 | | | $8.39 | | | $8.01 | | | $5.80 | | | $11.96 | | | $14.73 | |
Income from investment operations: | | | | | | | | | | | | | | | | | | | |
Net investment income | | | 0.06 | | | 0.12 | | | 0.11 | | | 0.20 | | | 0.25 | | | 0.13 | |
Net realized and unrealized gains (losses)
on investments | | | (0.14 | ) | | (0.88 | ) | | 0.40 | | | 2.22 | | | (6.26 | ) | | (0.44 | ) |
| | | | | | | | | | | | | | | | | | | |
Total from investment operations | | | (0.08 | ) | | (0.76 | ) | | 0.51 | | | 2.42 | | | (6.01 | ) | | (0.31 | ) |
| | | | | | | | | | | | | | | | | | | |
Less distributions: | | | | | | | | | | | | | | | | | | | |
Dividends from net investment income | | | — | | | (0.09 | ) | | (0.13 | ) | | (0.21 | ) | | (0.07 | ) | | (0.14 | ) |
Dividends from net realized gains | | | — | | | — | | | — | | | — | | | (0.08 | ) | | (2.32 | ) |
| | | | | | | | | | | | | | | | | | | |
Total distributions | | | — | | | (0.09 | ) | | (0.13 | ) | | (0.21 | ) | | (0.15 | ) | | (2.46 | ) |
| | | | | | | | | | | | | | | | | | | |
Net asset value, end of period | | | $7.46 | | | $7.54 | | | $8.39 | | | $8.01 | | | $5.80 | | | $11.96 | |
| | | | | | | | | | | | | | | | | | | |
| | | | | | | | | | | | | | | | | | | |
Total return | | | -1.06 | %1 | | -8.92 | % | | 6.48 | % | | 41.68 | % | | -50.42 | % | | -3.85 | % |
Supplemental data and ratios: | | | | | | | | | | | | | | | | | | | |
Net assets, end of period | | | $201,432,407 | | | $185,300,082 | | | $269,702,069 | | | $269,621,569 | | | $223,339,201 | | | $681,622,030 | |
|
Ratio of expenses to average net assets
Before expense reimbursement
(recapture) and securities lending
credit | | | 1.66 | %2 | | 1.66 | % | | 1.50 | % | | 1.53 | % | | 1.53 | % | | 1.43 | % |
After expense reimbursement
(recapture) and securities lending
credit | | | 1.59 | %2 | | 1.59 | % | | 1.50 | % | | 1.53 | % | | 1.52 | % | | 1.42 | % |
Ratio of net investment income to
average net assets | | | | | | | | | | | | | | | | | | | |
Before expense reimbursement
(recapture) and securities lending
credit | | | 1.83 | %2 | | 1.11 | % | | 1.34 | % | | 2.01 | % | | 1.94 | % | | 0.87 | % |
After expense reimbursement
(recapture) and securities lending
credit | | | 1.90 | %2 | | 1.18 | % | | 1.34 | % | | 2.01 | % | | 1.95 | % | | 0.88 | % |
Portfolio turnover rate | | | 35.33 | %1 | | 164.90 | % | | 47.34 | % | | 65.33 | % | | 144.98 | % | | 119.13 | % |
| |
Portfolio Turnover is calculated for the Fund as a whole. |
1 | Not annualized. |
2 | Annualized. |
See notes to financial statements.
131
|
GuideMarkSM Funds & GuidePathSM Funds |
FINANCIAL HIGHLIGHTS |
|
| |
| | | | | | | | | | | | | |
| | Opportunistic Equity Fund | |
| | | |
| | Institutional | | Service | |
| | | | | |
| | Period Ended
September 30,
2012 | | April 29, 20111
Through
March 31,
2012 | | Period Ended
September 30,
2012 | | Year Ended
March 31,
2012 | |
| | | | | | | | | |
Per share data for a share of capital stock
outstanding for the entire period and
selected information for the period are
as follows: | | | | | | | | | | | | | |
Net asset value, beginning of period | | | $9.91 | | | $10.21 | | | $9.86 | | | $10.00 | |
Income from investment operations: | | | | | | | | | | | | | |
Net investment income (loss) | | | 0.03 | | | 0.02 | | | 0.00 | | | (0.02 | ) |
Net realized and unrealized losses
on investments | | | (0.03 | ) | | (0.32 | ) | | (0.02 | ) | | (0.12 | ) |
| | | | | | | | | | | | | |
Total from investment operations | | | 0.00 | | | (0.30 | ) | | (0.02 | ) | | (0.14 | ) |
| | | | | | | | | | | | | |
Net asset value, end of period | | | $9.91 | | | $9.91 | | | $9.84 | | | $9.86 | |
| | | | | | | | | | | | | |
| | | | | | | | | | | | | |
Total return | | | 0.00 | %2 | | -2.94 | %2 | | -0.20 | %2 | | -1.40 | % |
Supplemental data and ratios: | | | | | | | | | | | | | |
Net assets, end of period | | | $53,992,396 | | | $46,233,165 | | | $89,766,619 | | | $114,222,234 | |
Ratio of expenses to average net assets | | | | | | | | | | | | | |
Before expense reimbursement
(recapture) and securities lending
credit | | | 1.06 | %3 | | 1.05 | %3 | | 1.63 | %3 | | 1.63 | % |
After expense reimbursement
(recapture) and securities lending
credit | | | 1.06 | %3 | | 1.03 | %3 | | 1.60 | %3 | | 1.60 | % |
Ratio of net investment income (loss) to
average net assets | | | | | | | | | | | | | |
Before expense reimbursement
(recapture) and securities lending
credit | | | 0.67 | %3 | | 0.45 | %3 | | 0.08 | %3 | | -0.19 | % |
After expense reimbursement
(recapture) and securities lending
credit | | | 0.67 | %3 | | 0.47 | %3 | | 0.11 | %3 | | -0.16 | % |
Portfolio turnover rate | | | 24.87 | %2 | | 91.59 | % | | 24.87 | %2 | | 91.59 | % |
| |
Portfolio Turnover is calculated for the Fund as a whole. |
1 | Commencement of operations. |
2 | Not annualized. |
3 | Annualized. |
See notes to financial statements.
132
|
GuideMarkSM Funds & GuidePathSM Funds |
FINANCIAL HIGHLIGHTS |
|
| |
| | | | | | | | | | | | | |
| | Global Real Return Fund | |
| | | |
| | Institutional | | Service | |
| | | | | |
| | Period Ended
September 30,
2012 | | April 29, 20111
Through
March 31,
2012 | | Period Ended
September 30,
2012 | | Year Ended
March 31,
2012 | |
| | | | | | | | | |
Per share data for a share of capital stock
outstanding for the entire period and
selected information for the period are
as follows: | | | | | | | | | | | | | |
Net asset value, beginning of period | | | $9.35 | | | $10.31 | | | $9.40 | | | $10.00 | |
Income from investment operations: | | | | | | | | | | | | | |
Net investment income | | | 0.07 | | | 0.10 | | | 0.03 | | | 0.07 | |
Net realized and unrealized gains (losses)
on investments | | | 0.05 | | | (0.88 | ) | | 0.06 | | | (0.59 | ) |
| | | | | | | | | | | | | |
Total from investment operations | | | 0.12 | | | (0.78 | ) | | 0.09 | | | (0.52 | ) |
| | | | | | | | | | | | | |
Less distributions: | | | | | | | | | | | | | |
Dividends from net investment income | | | — | | | (0.17 | ) | | — | | | (0.08 | ) |
Return of capital | | | — | | | (0.01 | ) | | — | | | — | * |
| | | | | | | | | | | | | |
Total distributions | | | — | | | (0.18 | ) | | — | | | (0.08 | ) |
| | | | | | | | | | | | | |
Net asset value, end of period | | | $9.47 | | | $9.35 | | | $9.49 | | | $9.40 | |
| | | | | | | | | | | | | |
Total return | | | 1.28 | %2 | | -7.48 | %2 | | 0.96 | %2 | | -5.09 | % |
Supplemental data and ratios: | | | | | | | | | | | | | |
Net assets, end of period | | | $14,015,160 | | | $10,423,221 | | | $93,561,118 | | | $103,580,116 | |
Ratio of expenses to average net assets | | | | | | | | | | | | | |
Before expense reimbursement
(recapture) and securities lending
credit | | | 0.91 | %3 | | 0.89 | %3 | | 1.49 | %3 | | 1.47 | % |
After expense reimbursement
(recapture) and securities lending
credit | | | 0.85 | %3 | | 0.82 | %3 | | 1.43 | %3 | | 1.44 | % |
Ratio of net investment income (loss) to
average net assets | | | | | | | | | | | | | |
Before expense reimbursement
(recapture) and securities lending
credit | | | 1.14 | %3 | | 1.08 | %3 | | 0.57 | %3 | | 0.72 | % |
After expense reimbursement
(recapture) and securities lending
credit | | | 1.20 | %3 | | 1.15 | %3 | | 0.63 | %3 | | 0.75 | % |
Portfolio turnover rate | | | 15.50 | %2 | | 55.11 | % | | 15.50 | %2 | | 55.11 | % |
| |
Portfolio Turnover is calculated for the Fund as a whole. |
1 | Commencement of operations. |
2 | Not annualized. |
3 | Annualized. |
* | Amount represents less than $0.01 per share. |
See notes to financial statements.
133
|
GuideMarkSM Funds & GuidePathSM Funds |
FINANCIAL HIGHLIGHTS |
|
| |
| | | | | | | |
| | Core Fixed Income Fund | |
| | | |
| | Institutional | |
| | | |
| | Period Ended
September 30,
2012 | | April 29, 20111
Through
March 31,
2012 | |
| | | | | |
Per share data for a share of capital stock
outstanding for the entire period and
selected information for the period are
as follows: | | | | | | | |
Net asset value, beginning of period | | | $9.77 | | | $9.48 | |
Income from investment operations: | | | | | | | |
Net investment income (loss) | | | 0.08 | | | 0.21 | |
Net realized and unrealized gains
on investments | | | 0.32 | | | 0.31 | |
| | | | | |
Total from investment operations | | | 0.40 | | | 0.52 | |
| | | | | |
Less distributions: | | | | | | | |
Dividends from net investment income | | | (0.11 | ) | | (0.23 | ) |
| | | | | |
Total distributions | | | (0.11 | ) | | (0.23 | ) |
| | | | | |
Net asset value, end of period | | | $10.06 | | | $9.77 | |
| | | | | |
Total return | | | 4.07 | %2 | | 5.56 | %2 |
Supplemental data and ratios: | | | | | | | |
Net assets, end of period | | | $100,479,015 | | | $31,999,581 | |
Ratio of expenses to average net assets | | | | | | | |
Before expense reimbursement
(recapture) and securities lending
credit | | | 0.71 | %3 | | 0.70 | %3 |
After expense reimbursement
(recapture) and securities lending
credit | | | 0.71 | %3 | | 0.69 | %3 |
Ratio of net investment income to
average net assets | | | | | | | |
Before expense reimbursement
(recapture) and securities lending
credit | | | 1.68 | %3 | | 2.14 | %3 |
After expense reimbursement
(recapture) and securities lending
credit | | | 1.68 | %3 | | 2.15 | %3 |
Portfolio turnover rate | | | 170.22 | %2 | | 427.36 | % |
| |
Portfolio Turnover is calculated for the Fund as a whole. |
1 | Commencement of operations. |
2 | Not annualized. |
3 | Annualized. |
See notes to financial statements.
134
|
GuideMarkSM Funds & GuidePathSM Funds |
FINANCIAL HIGHLIGHTS |
|
| |
| | | | | | | | | | | | | | | | | | | |
| | Core Fixed Income Fund | |
| | | |
| | Service | |
| | | |
| | Period Ended
September 30,
2012 | | Year Ended
March 31,
2012 | | Year Ended
March 31,
2011 | | Year Ended
March 31,
2010 | | Year Ended
March 31,
2009 | | Year Ended
March 31,
2008 | |
| | | | | | | | | | | | | |
Per share data for a share of capital stock
outstanding for the entire period and
selected information for the period are
as follows: | | | | | | | | | | | | | | | | | | | |
Net asset value, beginning of period | | | $9.78 | | | $9.36 | | | $9.10 | | | $7.92 | | | $9.20 | | | $9.27 | |
Income from investment operations: | | | | | | | | | | | | | | | | | | | |
Net investment income | | | 0.07 | | | 0.17 | | | 0.21 | | | 0.33 | | | 0.41 | | | 0.41 | |
Net realized and unrealized gains (losses)
on investments | | | 0.30 | | | 0.42 | | | 0.29 | | | 1.17 | | | (1.11 | ) | | (0.06 | ) |
| | | | | | | | | | | | | | | | | | | |
Total from investment operations | | | 0.37 | | | 0.59 | | | 0.50 | | | 1.50 | | | (0.70 | ) | | 0.35 | |
| | | | | | | | | | | | | | | | | | | |
Less distributions: | | | | | | | | | | | | | | | | | | | |
Dividends from net investment income | | | (0.07 | ) | | (0.17 | ) | | (0.24 | ) | | (0.32 | ) | | (0.40 | ) | | (0.41 | ) |
Dividends from net realized gains | | | — | | | — | | | — | | | — | | | (0.18 | ) | | (0.01 | ) |
| | | | | | | | | | | | | | | | | | | |
Total distributions | | | (0.07 | ) | | (0.17 | ) | | (0.24 | ) | | (0.32 | ) | | (0.58 | ) | | (0.42 | ) |
| | | | | | | | | | | | | | | | | | | |
Net asset value, end of period | | | $10.08 | | | $9.78 | | | $9.36 | | | $9.10 | | | $7.92 | | | $9.20 | |
| | | | | | | | | | | | | | | | | | | |
Total return | | | 3.81 | %1 | | 6.35 | % | | 5.58 | % | | 19.21 | % | | -7.57 | % | | 3.87 | % |
Supplemental data and ratios: | | | | | | | | | | | | | | | | | | | |
Net assets, end of period | | | $312,889,509 | | | $435,281,520 | | | $581,940,962 | | | $547,963,751 | | | $504,451,429 | | | $804,085,918 | |
Ratio of expenses to average net assets | | | | | | | | | | | | | | | | | | | |
Before expense reimbursement
(recapture) and securities lending
credit | | | 1.28 | %2 | | 1.28 | % | | 1.25 | % | | 1.28 | % | | 1.26 | % | | 1.18 | % |
After expense reimbursement
(recapture) and securities lending
credit | | | 1.28 | %2 | | 1.26 | % | | 1.24 | % | | 1.25 | % | | 1.18 | % | | 1.13 | % |
Ratio of net investment income to
average net assets | | | | | | | | | | | | | | | | | | | |
Before expense reimbursement
(recapture) and securities lending
credit | | | 1.12 | %2 | | 1.68 | % | | 2.23 | % | | 3.71 | % | | 4.54 | % | | 4.37 | % |
After expense reimbursement
(recapture) and securities lending
credit | | | 1.12 | %2 | | 1.70 | % | | 2.24 | % | | 3.74 | % | | 4.62 | % | | 4.42 | % |
Portfolio turnover rate | | | 170.22 | %1 | | 427.36 | % | | 485.40 | % | | 224.89 | % | | 261.77 | % | | 307.52 | % |
| |
Portfolio Turnover is calculated for the Fund as a whole. |
1 | Not annualized. |
2 | Annualized. |
See notes to financial statements.
135
|
GuideMarkSM Funds & GuidePathSM Funds |
FINANCIAL HIGHLIGHTS |
|
| |
| | | | | | | | | | | | | | | | | | | |
| | Tax-Exempt Fixed Income Fund | |
| | | |
| | Service | |
| | | |
| | Period Ended
September 30,
2012 | | Year Ended
March 31,
2012 | | Year Ended
March 31,
2011 | | Year Ended
March 31,
2010 | | Year Ended
March 31,
2009 | | Year Ended
March 31,
2008 | |
| | | | | | | | | | | | | |
Per share data for a share of capital stock
outstanding for the entire period and
selected information for the period are
as follows: | | | | | | | | | | | | | | | | | | | |
Net asset value, beginning of period | | | $11.47 | | | $10.67 | | | $10.94 | | | $10.27 | | | $10.64 | | | $10.92 | |
Income from investment operations: | | | | | | | | | | | | | | | | | | | |
Net investment income | | | 0.17 | | | 0.37 | | | 0.36 | | | 0.36 | | | 0.34 | | | 0.31 | |
Net realized and unrealized gains (losses)
on investments | | | 0.30 | | | 0.80 | | | (0.26 | ) | | 0.66 | | | (0.37 | ) | | (0.28 | ) |
| | | | | | | | | | | | | | | | | | | |
Total from investment operations | | | 0.47 | | | 1.17 | | | 0.10 | | | 1.02 | | | (0.03 | ) | | 0.03 | |
| | | | | | | | | | | | | | | | | | | |
Less distributions: | | | | | | | | | | | | | | | | | | | |
Dividends from net investment income | | | (0.17 | ) | | (0.37 | ) | | (0.37 | ) | | (0.35 | ) | | (0.34 | ) | | (0.31 | ) |
| | | | | | | | | | | | | | | | | | | |
Total distributions | | | (0.17 | ) | | (0.37 | ) | | (0.37 | ) | | (0.35 | ) | | (0.34 | ) | | (0.31 | ) |
| | | | | | | | | | | | | | | | | | | |
Net asset value, end of period | | | $11.77 | | | $11.47 | | | $10.67 | | | $10.94 | | | $10.27 | | | $10.64 | |
| | | | | | | | | | | | | | | | | | | |
Total return | | | 4.11 | %1 | | 11.10 | % | | 0.89 | % | | 10.06 | % | | -0.25 | % | | 0.28 | % |
Supplemental data and ratios: | | | | | | | | | | | | | | | | | | | |
Net assets, end of period | | | $82,182,369 | | | $81,408,890 | | | $170,330,144 | | | $195,328,951 | | | $193,579,910 | | | $257,440,133 | |
Ratio of expenses to average net assets | | | | | | | | | | | | | | | | | | | |
Before expense reimbursement
(recapture) | | | 1.35 | %2 | | 1.31 | % | | 1.29 | % | | 1.30 | % | | 1.30 | % | | 1.23 | % |
After expense reimbursement
(recapture) | | | 1.29 | %2 | | 1.29 | % | | 1.29 | % | | 1.29 | % | | 1.29 | % | | 1.23 | % |
Ratio of net investment income to
average net assets | | | | | | | | | | | | | | | | | | | |
Before expense reimbursement
(recapture) | | | 2.81 | %2 | | 3.16 | % | | 3.25 | % | | 3.30 | % | | 3.09 | % | | 2.93 | % |
After expense reimbursement
(recapture) | | | 2.87 | %2 | | 3.18 | % | | 3.25 | % | | 3.31 | % | | 3.10 | % | | 2.93 | % |
Portfolio turnover rate | | | 12.48 | %1 | | 38.80 | % | | 38.01 | % | | 57.44 | % | | 44.37 | % | | 66.26 | % |
| |
1 | Not annualized. |
2 | Annualized. |
See notes to financial statements.
136
|
GuideMarkSM Funds & GuidePathSM Funds |
FINANCIAL HIGHLIGHTS |
|
| |
| | | | | | | | | | | | | |
| | Opportunistic Fixed Income Fund | |
| | | |
| | Institutional | | Service | |
| | | | | |
| | Period Ended
September 30,
2012 | | April 29, 20111
Through
March 31,
2012 | | Period Ended
September 30,
2012 | | Year Ended
March 31,
2012 | |
| | | | | | | | | |
Per share data for a share of capital stock
outstanding for the entire period and
selected information for the period are
as follows: | | | | | | | | | | | | | |
Net asset value, beginning of period | | | $9.70 | | | $10.07 | | | $9.70 | | | $10.00 | |
Income from investment operations: | | | | | | | | | | | | | |
Net investment income (loss) | | | 0.20 | | | 0.35 | | | 0.17 | | | 0.34 | |
Net realized and unrealized gains (losses)
on investments | | | 0.29 | | | (0.34 | ) | | 0.28 | | | (0.31 | ) |
| | | | | | | | | | | | | |
Total from investment operations | | | 0.49 | | | 0.01 | | | 0.45 | | | 0.03 | |
| | | | | | | | | | | | | |
Less distributions: | | | | | | | | | | | | | |
Dividends from net investment income | | | (0.20 | ) | | (0.38 | ) | | (0.16 | ) | | (0.33 | ) |
| | | | | | | | | | | | | |
Total distributions | | | (0.20 | ) | | (0.38 | ) | | (0.16 | ) | | (0.33 | ) |
| | | | | | | | | | | | | |
Net asset value, end of period | | | $9.99 | | | $9.70 | | | $9.99 | | | $9.70 | |
| | | | | | | | | | | | | |
Total return | | | 4.86 | %2 | | 0.29 | %2 | | 4.51 | %2 | | 0.56 | % |
Supplemental data and ratios: | | | | | | | | | | | | | |
Net assets, end of period | | | $99,807,566 | | | $38,403,168 | | | $154,379,752 | | | $204,104,609 | |
Ratio of expenses to average net assets | | | | | | | | | | | | | |
Before expense reimbursement
(recapture) | | | 1.02 | %3 | | 1.13 | %3 | | 1.60 | %3 | | 1.63 | % |
After expense reimbursement
(recapture) | | | 1.05 | %3 | | 1.05 | %3 | | 1.55 | %3 | | 1.55 | % |
Ratio of net investment income to
average net assets | | | | | | | | | | | | | |
Before expense reimbursement
(recapture) | | | 3.95 | %3 | | 4.20 | %3 | | 3.47 | %3 | | 3.49 | % |
After expense reimbursement
(recapture) | | | 3.92 | %3 | | 4.28 | %3 | | 3.52 | %3 | | 3.57 | % |
Portfolio turnover rate | | | 68.84 | %2 | | 86.54 | % | | 68.84 | %2 | | 86.54 | % |
| |
Portfolio Turnover is calculated for the Fund as a whole. |
1 | Commencement of operations. |
2 | Not annualized. |
3 | Annualized. |
See notes to financial statements.
137
|
GuideMarkSM Funds & GuidePathSM Funds |
FINANCIAL HIGHLIGHTS |
|
| |
| | | | | | | | | | | | | | | | | | | |
| | Strategic Asset Allocation Fund | | Tactical Constrained Asset Allocation Fund | |
| | | | | |
| | Institutional | | Service | | Institutional | | Service | |
| | | | | | | | | |
| | September 13,
20121 Through
September 30,
2012 | | Period Ended
September 30,
2012 | | April 29, 20111
Through
March 31,
2012 | | September 13,
20121 Through
March 31,
2012 | | Period Ended
September 30,
2012 | | April 29, 20111
Through
September 30,
2012 | |
| | | | | | | | | | | | | |
Per share data for a share of capital stock
outstanding for the entire period and
selected information for the period are
as follows: | | | | | | | | | | | | | | | | | | | |
Net asset value, beginning of period | | | $9.63 | | | $9.46 | | | $10.00 | | | $9.98 | | | $9.76 | | | $10.00 | |
Income from investment operations: | | | | | | | | | | | | | | | | | | | |
Net investment income | | | 0.04 | | | 0.02 | | | 0.08 | | | 0.03 | | | 0.02 | | | 0.09 | |
Net realized and unrealized gains (losses)
on investments | | | (0.20 | ) | | (0.01 | ) | | (0.52 | ) | | (0.15 | ) | | 0.08 | | | (0.24 | ) |
| | | | | | | | | | | | | | | | | | | |
Total from investment operations | | | (0.16 | ) | | 0.01 | | | (0.44 | ) | | (0.12 | ) | | 0.10 | | | (0.15 | ) |
| | | | | | | | | | | | | | | | | | | |
Less distributions: | | | | | | | | | | | | | | | | | | | |
Dividends from net investment income | | | — | | | — | | | (0.10 | ) | | — | | | — | | | (0.09 | ) |
Return of capital | | | — | | | — | | | —* | | | — | | | — | | | — | |
| | | | | | | | | | | | | | | | | | | |
Total distributions | | | — | | | — | | | (0.10 | ) | | — | | | — | | | (0.09 | ) |
| | | | | | | | | | | | | | | | | | | |
Net asset value, end of period | | | $9.47 | | | $9.47 | | | $9.46 | | | $9.86 | | | $9.86 | | | $9.76 | |
| | | | | | | | | | | | | | | | | | | |
Total return | | | -1.66 | %2 | | 0.11 | %2 | | -4.30 | %2 | | -1.20 | %2 | | 1.02 | %2 | | -1.43 | %2 |
Supplemental data and ratios: | | | | | | | | | | | | | | | | | | | |
Net assets, end of period | | | $270,859 | | | $195,935,759 | | | $144,649,234 | | | $272,342 | | | $183,730,164 | | | $143,145,114 | |
Ratio of expenses to average net assets | | | | | | | | | | | | | | | | | | | |
Before expense reimbursement
(recapture) and securities lending
credit | | | 0.41 | %3 | | 1.06 | %3 | | 1.29 | %3 | | 0.43 | %3 | | 1.07 | %3 | | 1.25 | %3 |
After expense reimbursement
(recapture) and securities lending
credit | | | 0.38 | %3 | | 1.00 | %3 | | 1.00 | %3 | | 0.38 | %3 | | 1.00 | %3 | | 1.00 | %3 |
Ratio of net investment income to
average net assets | | | | | | | | | | | | | | | | | | | |
Before expense reimbursement
(recapture) and securities lending
credit | | | 8.00 | %3 | | 0.24 | %3 | | 1.12 | %3 | | 5.35 | %3 | | 0.34 | %3 | | 1.33 | %3 |
After expense reimbursement
(recapture) and securities lending
credit | | | 8.03 | %3 | | 0.30 | %3 | | 1.34 | %3 | | 5.40 | %3 | | 0.41 | %3 | | 1.58 | %3 |
Portfolio turnover rate | | | 6.90 | %2 | | 6.90 | %2 | | 14.40 | % | | 44.48 | %2 | | 44.48 | %2 | | 50.86 | % |
| |
1 | Commencement of operations. |
2 | Not annualized. |
3 | Annualized. |
* | Amount represents less than $0.01 per share. |
See notes to financial statements.
138
|
GuideMarkSM Funds & GuidePathSM Funds |
FINANCIAL HIGHLIGHTS |
|
| |
| | | | | | | | | | | | | | | | | | | |
| | Tactical Unconstrained Asset Allocation Fund | | Absolute Return Asset Allocation Fund | |
| | | | | |
| | Institutional | | Service | | Institutional | | Service | |
| | | | | | | | | |
| | September 13,
20121 Through
September 30,
2012 | | Period Ended
September 30,
2012 | | April 29, 20111
Through
March 31,
2012 | | September 13,
20121 Through
March 31,
2012 | | Period Ended
September 30,
2012 | | April 29, 20111
Through
September 30,
2012 | |
| | | | | | | | | | | | | |
Per share data for a share of capital stock
outstanding for the entire period and
selected information for the period are
as follows: | | | | | | | | | | | | | | | | | | | |
Net asset value, beginning of period | | | $9.75 | | | $9.54 | | | $10.00 | | | $10.19 | | | $10.04 | | | $10.00 | |
Income from investment operations: | | | | | | | | | | | | | | | | | | | |
Net investment income | | | 0.03 | | | 0.02 | | | 0.06 | | | 0.02 | | | 0.06 | | | 0.09 | |
Net realized and unrealized gains (losses)
on investments | | | (0.12 | ) | | 0.10 | | | (0.47 | ) | | 0.00 | | | 0.11 | | | 0.01 | |
| | | | | | | | | | | | | | | | | | | |
Total from investment operations | | | (0.09 | ) | | 0.12 | | | (0.41 | ) | | 0.02 | | | 0.17 | | | 0.10 | |
| | | | | | | | | | | | | | | | | | | |
Less distributions: | | | | | | | | | | | | | | | | | | | |
Dividends from net investment income | | | — | | | — | | | (0.05 | ) | | — | | | — | | | (0.06 | ) |
| | | | | | | | | | | | | | | | | | | |
Total distributions | | | — | | | — | | | (0.05 | ) | | — | | | — | | | (0.06 | ) |
| | | | | | | | | | | | | | | | | | | |
Net asset value, end of period | | | $9.66 | | | $9.66 | | | $9.54 | | | $10.21 | | | $10.21 | | | $10.04 | |
| | | | | | | | | | | | | | | | | | | |
Total return | | | -0.92 | %2 | | 1.15 | %2 | | -4.09 | %2 | | 0.20 | %2 | | 1.69 | %2 | | 1.01 | %2 |
Supplemental data and ratios: | | | | | | | | | | | | | | | | | | | |
Net assets, end of period | | | $251,251 | | | $248,553,008 | | | $184,703,438 | | | $159,842 | | | $416,931,654 | | | $238,654,697 | |
Ratio of expenses to average net assets | | | | | | | | | | | | | | | | | | | |
Before expense reimbursement
(recapture) and securities lending
credit | | | 0.50 | %3 | | 1.16 | %3 | | 1.32 | %3 | | 0.51 | %3 | | 1.14 | %3 | | 1.28 | %3 |
After expense reimbursement
(recapture) and securities lending
credit | | | 0.48 | %3 | | 1.10 | %3 | | 1.10 | %3 | | 0.42 | %3 | | 1.10 | %3 | | 1.10 | %3 |
Ratio of net investment income to
average net assets | | | | | | | | | | | | | | | | | | | |
Before expense reimbursement
(recapture) and securities lending
credit | | | 5.94 | %3 | | 0.53 | %3 | | 0.90 | %3 | | 3.97 | %3 | | 1.70 | %3 | | 1.54 | %3 |
After expense reimbursement
(recapture) and securities lending
credit | | | 5.96 | %3 | | 0.59 | %3 | | 1.12 | %3 | | 4.06 | %3 | | 1.74 | %3 | | 1.72 | %3 |
Portfolio turnover rate | | | 122.68 | %2 | | 122.68 | %2 | | 293.90 | % | | 39.95 | %2 | | 39.95 | %2 | | 136.33 | % |
| |
1 | Commencement of operations. |
2 | Not annualized. |
3 | Annualized. |
See notes to financial statements.
139
|
GuideMarkSM Funds & GuidePathSM Funds |
FINANCIAL HIGHLIGHTS |
|
| |
| | | | | | | | | | | | | | | | |
| | Multi-Asset
Income Asset
Allocation
Fund | | Fixed Income
Allocation Fund | | Altegris® Multi-Strategy
Alternative Allocation Fund | |
| | | | | | | |
| | Service | | Institutional | | Service | | Institutional | | Service | |
| | | | | | | | | | | |
| | August 31,
20121
Through
September 30,
2012 | | September 13,
20121
Through
September 30,
2012 | | August 31,
20121
Through
September 30,
2012 | | September 13,
20121
Through`
September 30,
2012 | | August 31,
20121
Through
September 30,
2012 | |
| | | | | | | | | | | |
Per share data for a share of capital stock
outstanding for the entire period and
selected information for the period are
as follows: | | | | | | | | | | | | | | | | |
Net asset value, beginning of period | | | $10.00 | | | $10.01 | | | $10.00 | | | $10.07 | | | $10.00 | |
Income from investment operations: | | | | | | | | | | | | | | | | |
Net investment income | | | 0.05 | | | 0.02 | | | 0.01 | | | 0.02 | | | 0.01 | |
Net realized and unrealized gains (losses)
on investments | | | 0.09 | | | 0.02 | | | 0.03 | | | (0.09 | ) | | (0.01 | ) |
| | | | | | | | | | | | | | | | |
Total from investment operations | | | 0.14 | | | 0.04 | | | 0.04 | | | (0.07 | ) | | 0.00 | |
| | | | | | | | | | | | | | | | |
Net asset value, end of period | | | $10.14 | | | $10.05 | | | $10.04 | | | $10.00 | | | $10.00 | |
| | | | | | | | | | | | | | | | |
Total return | | | 1.40 | %2 | | 0.40 | %2 | | 0.40 | %2 | | -0.70 | %2 | | 0.00 | %2 |
Supplemental data and ratios: | | | | | | | | | | | | | | | | |
Net assets, end of period | | | $51,679,086 | | | $115,026 | | | $204,683,197 | | | $151,224 | | | $142,914,636 | |
Ratio of expenses to average net assets | | | | | | | | | | | | | | | | |
Before expense reimbursement
(recapture) and securities lending
credit | | | 1.30 | %3 | | 0.47 | %3 | | 1.08 | %3 | | 0.37 | %3 | | 0.98 | %3 |
After expense reimbursement
(recapture) and securities lending
credit | | | 1.10 | %3 | | 0.47 | %3 | | 1.05 | %3 | | 0.37 | %3 | | 0.98 | %3 |
Ratio of net investment income to
average net assets | | | | | | | | | | | | | | | | |
Before expense reimbursement
(recapture) and securities lending
credit | | | 5.27 | %3 | | 4.31 | %3 | | 1.75 | %3 | | 4.05 | %3 | | 1.60 | %3 |
After expense reimbursement
(recapture) and securities lending
credit | | | 5.47 | %3 | | 4.31 | %3 | | 1.78 | %3 | | 4.05 | %3 | | 1.60 | %3 |
Portfolio turnover rate | | | 0.10 | %2 | | 2.91 | %2 | | 2.91 | %2 | | 0.04 | %2 | | 0.04 | %2 |
| |
1 | Commencement of operations. |
2 | Not annualized. |
3 | Annualized. |
See notes to financial statements.
140
|
GuideMarkSM Funds |
NOTES TO FINANCIAL STATEMENTS (Unaudited) |
September 30, 2012 |
| |
| | |
1. | Organization |
| | |
| | GPS Funds I (formerly, AssetMark Funds) and GPS Funds II (the “Trusts”) are organized as Delaware statutory trusts under Declarations of Trusts dated January 2, 2001 and October 20, 2010, respectively. The Trusts are registered under the Investment Company Act of 1940, as amended (the “1940 Act”), as open-end management investment companies. GPS Funds I is comprised of the following 7 funds: GuideMarkSM Large Cap Growth Fund, GuideMarkSM Large Cap Value Fund, GuideMarkSM Small/Mid Cap Core Fund, GuideMarkSM World ex-US Fund, GuideMarkSM Opportunistic Equity Fund, GuideMarkSM Core Fixed Income Fund and GuideMarkSM Tax-Exempt Fixed Income Fund. GPS II is comprised of the following 9 funds: GuideMarkSM Global Real Return Fund, GuideMarkSM Opportunistic Fixed Income Fund, GuidePathSM Strategic Asset Allocation Fund, GuidePathSM Tactical Constrained Asset Allocation Fund, GuidePathSM Tactical Unconstrained Asset Allocation Fund, GuidePathSM Absolute Return Asset Allocation Fund, GuidePathSM Multi-Asset Income Asset Allocation Fund, GuidePathSM Fixed Income Allocation Fund and GuidePathSM Altegris® Multi-Strategy Alternative Asset Allocation Fund (collectively, the “Funds”). All of the Funds, except for the GuideMarkSM Opportunistic Equity Fund, GuideMarkSM Opportunistic Fixed Income Fund, GuidePathSM Multi-Asset Income Asset Allocation Fund, GuidePathSM Fixed Income Allocation Fund, and GuidePathSM Altegris® Multi-Strategy Alternative Asset Allocation Fund, are classified and operate as diversified funds under the 1940 Act. The GuideMarkSM Opportunistic Equity Fund, GuideMarkSM Opportunistic Fixed Income Fund, GuidePathSM Multi-Asset Income Asset Allocation Fund, GuidePathSM Fixed Income Allocation Fund, and GuidePathSM Altegris® Multi-Strategy Alternative Asset Allocation Fund are classified as non-diversified. Each Fund represents a distinct portfolio with its own investment objectives and policies. The assets of each Fund are segregated, and a shareholder’s interest is limited to the Fund in which shares are held. The GuideMarkSM Global Real Return Fund, GuideMarkSM Opportunistic Fixed Income Fund, |
| | |
| | GuidePathSM Strategic Asset Allocation Fund, GuidePathSM Tactical Constrained Asset Allocation Fund, GuidePathSM Tactical Unconstrained Asset Allocation Fund and GuidePathSM Absolute Return Asset Allocation Fund were seeded on March 4, 2011 and the prospectus went effective on April 1, 2011. As of April 1, 2011, the GuideMarkSM Opportunistic Equity Fund, GuideMarkSM Global Real Return Fund and GuideMarkSM Opportunistic Fixed Income Fund commenced operations. As of April 29, 2011, the GuidePathSM Strategic Asset Allocation Fund, GuidePathSM Tactical Constrained Asset Allocation Fund, GuidePathSM Tactical Unconstrained Asset Allocation Fund and GuidePathSM Absolute Return Asset Allocation Fund commenced operations. As of August 31, 2012, the GuidePathSM Absolute Return Asset Allocation Fund, GuidePathSM Multi-Asset Income Asset Allocation Fund, GuidePathSM Fixed Income Allocation Fund and GuidePathSM Altegris Multi-Strategy Alternative Asset Allocation Fund commenced operations. Each Fund offers two classes of shares: Service Shares and Institutional Shares. |
| |
2. | Significant Accounting Policies |
| |
| | The following is a summary of significant accounting policies consistently followed by the Funds in the preparation of the financial statements. These policies are in conformity with U.S. generally accepted accounting principals (“GAAP”). |
| | |
| | (a) Investment Valuation |
| | |
| | Portfolio securities listed on a national or foreign securities exchange, except those listed on NASDAQ, for which market quotations are available are valued at the last quoted sale price on each business day. Portfolio securities traded on NASDAQ are valued at the NASDAQ Official Closing Price (“NOCP”) on each business day. If there is no reported sale on an exchange or NASDAQ, the portfolio security will be valued at the mean between the most recent quoted bid and asked price. Price information on listed securities is taken from the exchange where the security is primarily traded. |
141
|
GuideMarkSM Funds |
NOTES TO FINANCIAL STATEMENTS (Unaudited) (Continued) |
September 30, 2012 |
| |
| | |
| | All equity securities that are not traded on a listed exchange are valued at the last sale price in the over-the-counter market. If a non-exchange traded security does not trade on a particular day, then the mean between the last quoted closing bid and asked price will be used. Non-exchange traded ADRs are priced with an evaluated price as determined by the current evaluated pricing procedures of, and provided by, the pricing vendor. |
| | |
| | Fixed income securities that have a maturity of greater than 60 days are generally valued on the basis of evaluations obtained from third party pricing services, which take into account appropriate factors such as institutional sized trading in similar groups of securities, yield, quality, coupon rate, maturity, type of issue, trading characteristics and other market data. Short term investments having a maturity of less than 60 days are valued at amortized cost. |
| | |
| | Investments in mutual funds are valued at the closing net asset value per share of each mutual fund on the day of valuation. |
| | |
| | Securities for which no market quotations are readily available or when a significant event has occurred between the time of the security’s last close and the time that a Fund next calculates its net asset value will be valued at their fair value as determined by the applicable Fund’s Valuation Committee. Securities for which no market prices are readily available will be valued at their fair value as determined by the Valuation Committee under procedures adopted by the applicable Board of Trustees. |
| | |
| Security Valuation |
| | |
| | The Funds have adopted authoritative fair valuation accounting standards which establish an authoritative definition of fair value and set out a hierarchy for measuring fair value. These standards require additional disclosures about the various inputs and valuation techniques used to develop the measurements of fair value and a discussion in |
| | |
| | changes in valuation techniques and related inputs, if any, during the period. In addition, these standards require expanded disclosure for each major category of assets. These inputs are summarized in the three broad levels listed below: |
| | |
| | Level 1 – Quoted prices in active markets for identical securities. |
| | |
| | Level 2 – Other significant observable inputs (including quoted prices for similar securities, interest rates, prepayment speeds, credit risk, etc.). |
| | |
| | Level 3 – Significant unobservable inputs (including the Fund’s own assumptions in determining the fair value of investments). |
| | |
| | During the period, certain of the securities and other instruments held by the Funds were categorized as Level 2 or Level 3 based upon the inputs and methodologies used to determine the fair value of the security or instrument. Descriptions of the inputs and valuation methodologies used to determine the fair values of each class of investments within Level 2 and Level 3 are set forth below. |
| | |
| | Level 2 Investments. The Funds’ investments that were categorized as Level 2 include: (1) certain fixed income securities, including asset-backed securities, collateralized mortgage obligations, corporate bonds, U.S. and foreign government obligations, mortgage-backed securities and municipal bonds; (2) certain common stocks and convertible preferred stocks; and (3) certain over-the-counter derivative instruments, including forward currency contracts. |
| | |
| | Fixed income securities are normally valued by pricing vendors that use broker-dealer quotations, reported trades or valuation estimates from their internal pricing models. The service providers’ internal models typically use inputs that are observable such as institutional sized trading in similar groups of securities, yield, credit quality, coupon rate, maturity, type of issue, trading characteristics and other market data. |
142
|
GuideMarkSM Funds |
NOTES TO FINANCIAL STATEMENTS (Unaudited) (Continued) |
September 30, 2012 |
| |
| |
| Certain common stocks that trade on foreign exchanges are subject to valuation adjustments. These valuation adjustments are applied to the foreign exchange-traded common stocks to account for the market movement between the close of the foreign market in which the security is traded and the close of the New York Stock Exchange. These securities are valued using pricing vendors that consider the correlation patterns of price movements of the foreign security to the intraday trading in the U.S. markets. |
| |
| Foreign currency contracts derive their value from underlying asset prices, indices, reference rates, and other inputs or a combination of these factors. These instruments are normally valued using pricing vendors. Depending upon the instrument, its value may be provided by a pricing vendor using a series of techniques, including pricing models. The pricing models typically use inputs that are observed from active markets such as indices, spreads, interest rates, curves, dividends and exchange rates. |
| |
| Level 3 Investments. The Funds’ investments that were categorized as Level 3 include: (1) fair valued securities and investments purchased as securities lending collateral. |
| |
| Investments purchased as securities lending collateral and warrants are normally valued by pricing vendors using relevant observable inputs, as described above. Fair valued securities are normally valued by pricing vendors using relevant observable inputs, as described above. In certain circumstances, the types of observable inputs that are typically used by a pricing service may be unavailable or deemed by the pricing service to be unreliable. In these instances, the pricing vendor may value the security based upon significant unobservable inputs, or the pricing vendor may not provide a value for the security. To the extent that a pricing vendor does not provide a value for a particular security, or the pricing vendor provides a value that the Valuation Committee does not believe accurately reflects the value of the security, the security will be valued by the Valuation Committee based upon the information available to the Committee at the time of valuation and in accordance with procedures adopted by the Board. These methodologies may require subjective judgments and determinations about the value of a particular security. When significant unobservable inputs are used to value a security, the security is categorized as Level 3. |
| |
| The inputs or methodology used for valuing securities are not an indication of the risk associated with investing in those securities. The following is a summary of the inputs used to value the Funds’ net assets as of September 30, 2012: |
| |
| GuideMarkSM Large Cap Growth Fund |
| | | | | | | | | | | | | |
| | Level 1 | | Level 2 | | Level 3 | | Total | |
| | | | | | | | | |
Common Stocks | | $ | 178,362,157 | | $ | — | | $ | — | | $ | 178,362,157 | |
Short Term Investments | | | 55,269 | | | — | | | — | | | 55,269 | |
Investments Purchased as Securities Lending Collateral | | | 4,057,171 | | | — | | | 792 | | | 4,057,963 | |
| | | | | | | | | | | | | |
Total Investments in Securities | | $ | 182,474,597 | | $ | — | | $ | 792 | | $ | 182,475,389 | |
| | | | | | | | | | | | | |
| |
| For further information regarding security characteristics, see the Schedule of Investments. There were no transfers in or out of Levels 1 and 2 during the period ended September 30, 2012. |
143
|
GuideMarkSM Funds |
NOTES TO FINANCIAL STATEMENTS (Unaudited) (Continued) |
September 30, 2012 |
| |
| |
| Level 3 Reconciliation Disclosure |
| |
| Following is a reconciliation of Level 3 assets for which significant unobservable inputs were used to determine fair value. |
| | | | | |
Description | | | Investments
in Securities | |
| | | | | |
Balance as of March 31, 2012 | | $ | 792 | |
Change in unrealized appreciation | | | — | |
| | | | |
Balance as of September 30, 2012 | | $ | 792 | |
| | | | |
Change in unrealized appreciation during the period
for Level 3 investments held at September 30, 2012. | | $ | — | |
| | | | |
| |
| Significant Unobservable Inputs |
| |
| Significant unobservable valuation inputs developed by the Board of Trustees for material Level 3 investments as of September 30, 2012, are as follows: |
| | | | | | | | | |
| Description | | Fair Value
at 09/30/12 | | Valuation Techniques | | Unobservable Input | | Range |
| |
| Investments Purchased as Securities Lending Collateral | | $792 | | Conservative value assigned pending litigation proceedings | | Allocation model of the potential remaining assets to be distributed | | $792-$792 |
| |
| |
| GuideMarkSM Large Cap Value Fund |
| | | | | | | | | | | | | |
| | Level 1 | | Level 2 | | Level 3 | | Total | |
| | | | | | | | | |
Common Stocks | | $ | 181,089,495 | | $ | — | | $ | — | | $ | 181,089,495 | |
Real Estate Investment Trusts | | | 3,320,880 | | | — | | | — | | | 3,320,880 | |
Short Term Investments | | | 489,683 | | | — | | | — | | | 489,683 | |
Investments Purchased as Securities Lending
Collateral | | | 8,767,517 | | | — | | | 906 | | | 8,768,423 | |
| | | | | | | | | | | | | |
Total Investments in Securities | | $ | 193,667,575 | | $ | — | | $ | 906 | | $ | 193,668,481 | |
| | | | | | | | | | | | | |
| |
| For further information regarding security characteristics, see the Schedule of Investments. There were no transfers in or out of Levels 1 and 2 during the period ended September 30, 2012. |
144
|
GuideMarkSM Funds |
NOTES TO FINANCIAL STATEMENTS (Unaudited) (Continued) |
September 30, 2012 |
| |
| |
| Level 3 Reconciliation Disclosure |
|
| Following is a reconciliation of Level 3 assets for which significant unobservable inputs were used to determine fair value. |
| | | | | |
Description | | | Investments
in Securities | |
| | | | | |
Balance as of March 31, 2012 | | $ | 906 | |
Change in unrealized appreciation | | | — | |
| | | | |
Balance as of September 30, 2012 | | $ | 906 | |
| | | | |
Change in unrealized appreciation during the period
for Level 3 investments held at September 30, 2012. | | $ | — | |
| | | | |
| |
| Significant Unobservable Inputs |
| |
| Significant unobservable valuation inputs developed by the Board of Trustees for material Level 3 investments as of September 30, 2012, are as follows: |
| | | | | | | | | |
| Description | | Fair Value
at 09/30/12 | | Valuation Techniques | | Unobservable Input | | Range |
| |
| | | | | | | | | |
| Investments Purchased as Securities Lending Collateral | | $906 | | Conservative value assigned pending litigation proceedings | | Allocation model of the potential remaining assets to be distributed | | $906-$906 |
| |
| |
| GuideMarkSM Small/Mid Cap Core Fund |
| | | | | | | | | | | | | |
| | Level 1 | | Level 2 | | Level 3 | | Total | |
| | | | | | | | | |
Common Stocks | | $ | 69,443,872 | | $ | — | | $ | — | | $ | 69,443,872 | |
Real Estate Investment Trusts | | | 5,971,615 | | | — | | | — | | | 5,971,615 | |
Short Term Investments | | | 1,183,067 | | | — | | | — | | | 1,183,067 | |
Investments Purchased as Securities
Lending Collateral | | | 5,499,887 | | | — | | | 247 | | | 5,500,134 | |
| | | | | | | | | | | | | |
Total Investments in Securities | | $ | 82,098,441 | | $ | — | | $ | 247 | | $ | 82,098,688 | |
| | | | | | | | | | | | | |
| |
| For further information regarding security characteristics, see the Schedule of Investments. There were no transfers in or out of Levels 1 and 2 during the period ended September 30, 2012. |
145
|
GuideMarkSM Funds |
NOTES TO FINANCIAL STATEMENTS (Unaudited) (Continued) |
September 30, 2012 |
| |
| |
| Level 3 Reconciliation Disclosure |
| |
| Following is a reconciliation of Level 3 assets for which significant unobservable inputs were used to determine fair value. |
| | | | |
Description | | | Investments
in Securities | |
| | | | | |
Balance as of March 31, 2012 | | $ | 247 | |
Change in unrealized appreciation | | | — | |
| | | | |
Balance as of September 30, 2012 | | $ | 247 | |
| | | | |
Change in unrealized appreciation during the period
for Level 3 investments held at September 30, 2012. | | $ | — | |
| | | | |
| |
| Significant Unobservable Inputs |
| |
| Significant unobservable valuation inputs developed by the Board of Trustees for material Level 3 investments as of September 30, 2012, are as follows: |
| | | | | | | | | |
| Description | | Fair Value
at 09/30/12 | | Valuation Techniques | | Unobservable Input | | Range |
| |
| Investments Purchased as Securities Lending Collateral | | $247 | | Conservative value assigned pending litigation proceedings | | Allocation model of the potential remaining assets to be distributed | | $247-$247 |
| |
| |
| GuideMarkSM World ex-US Fund |
| | | Level 1 | | | Level 2 | | | Level 3 | | | Total | |
| | | | | | | | | | | | | |
Common Stocks | | $ | 33,392,591 | | $ | 220,228,527 | | $ | — | | $ | 253,621,118 | |
Investment Companies | | | 3,656,396 | | | — | | | — | | | 3,656,396 | |
Preferred Stocks | | | 4,680,363 | | | — | | | — | | | 4,680,363 | |
Real Estate Investment Trusts | | | — | | | 1,283,219 | | | — | | | 1,283,219 | |
Short Term Investments | | | 4,372,258 | | | — | | | — | | | 4,372,258 | |
Investments Purchased as Securities
Lending Collateral | | | 1,387,400 | | | — | | | 216 | | | 1,387,616 | |
| | | | | | | | | | | | | |
Total Investments in Securities | | $ | 47,489,008 | | $ | 221,511,746 | | $ | 216 | | $ | 269,000,970 | |
| | | | | | | | | | | | | |
| |
| For further information regarding security characteristics, see the Schedule of Investments. There were no transfers in or out of Levels 1 and 2 during the period ended September 30, 2012. |
146
| |
GuideMarkSM Funds |
NOTES TO FINANCIAL STATEMENTS (Unaudited) (Continued) |
September 30, 2012 |
| |
| |
| Level 3 Reconciliation Disclosure |
| |
| Following is a reconciliation of Level 3 assets for which significant unobservable inputs were used to determine fair value. |
| | | | | |
Description | | | Investments
in Securities | |
| | | | | |
Balance as of March 31, 2012 | | $ | 216 | |
Change in unrealized depreciation | | | — | |
| | | | |
Balance as of September 30, 2012 | | $ | 216 | |
| | | | |
Change in unrealized appreciation during the period | | | | |
for Level 3 investments held at September 30, 2012. | | $ | — | |
| | | | |
| |
| Significant Unobservable Inputs |
| |
| Significant unobservable valuation inputs developed by the Board of Trustees for material Level 3 investments as of September 30, 2012, are as follows: |
| | | | | | | | | | | | | |
Description | | Fair Value
at 09/30/12 | | Valuation Techniques | | Unobservable Input | | Range | |
| | | | | | | | | | |
Investments Purchased
as Securities Lending
Collateral | | $216 | | Conservative value assigned
pending litigation proceedings | | Allocation model of
the potential remaining
assets to be distributed | | $216-$216 | |
| | | | | | | | | | | | |
| |
| GuideMarkSM Opportunistic Equity Fund |
| | | | | | | | | | | | | |
| | Level 1 | | Level 2 | | Level 3 | | Total | |
| | | | | | | | | |
Common Stocks | | $ | 133,704,039 | | $ | — | | $ | — | | $ | 133,704,039 | |
Real Estate Investment Trusts | | | 1,737,004 | | | — | | | — | | | 1,737,004 | |
Short Term Investments | | | 8,618,769 | | | — | | | — | | | 8,618,769 | |
Investments Purchased as Securities | | | | | | | | | | | | | |
Lending Collateral | | | 4,281,286 | | | — | | | — | | | 4,281,286 | |
| | | | | | | | | | | | | |
Total Investments in Securities | | $ | 148,341,098 | | $ | — | | $ | — | | $ | 148,341,098 | |
| | | | | | | | | | | | | |
| |
| For further information regarding security characteristics, see the Schedule of Investments. There were no transfers in or out of Levels 1 and 2 during the period ended September 30, 2012. |
| |
| GuideMarkSM Global Real Return Fund |
| | | | | | | | | | | | | |
| | Level 1 | | Level 2 | | Level 3 | | Total | |
| | | | | | | | | |
Investment Companies | | $ | 107,473,746 | | $ | — | | $ | — | | $ | 107,473,746 | |
Short Term Investments | | | 113,963 | | | — | | | — | | | 113,963 | |
Investments Purchased as Securities | | | | | | | | | | | | | |
Lending Collateral | | | 27,733,915 | | | — | | | — | | | 27,733,915 | |
| | | | | | | | | | | | | |
Total Investments in Securities | | $ | 135,321,624 | | $ | — | | $ | — | | $ | 135,321,624 | |
| | | | | | | | | | | | | |
| |
| For further information regarding security characteristics, see the Schedule of Investments. There were no transfers in or out of Levels 1 and 2 during the period ended September 30, 2012. |
147
| |
GuideMarkSM Funds |
NOTES TO FINANCIAL STATEMENTS (Unaudited) (Continued) |
September 30, 2012 |
| |
| |
| GuideMarkSM Core Fixed Income Fund |
| | | | | | | | | | | | | |
| | Level 1 | | Level 2 | | Level 3 | | Total | |
| | | | | | | | | |
Fixed Income | | | | | | | | | | | | | |
Asset Backed Securities | | $ | — | | $ | 7,818,316 | | $ | — | | $ | 7,818,316 | |
Collateralized Mortgage Obligations | | | — | | | 14,179,274 | | | — | | | 14,179,274 | |
Corporate Obligations | | | — | | | 156,064,634 | | | — | | | 156,064,634 | |
Foreign Government Debt Obligations | | | — | | | 507,665 | | | — | | | 507,665 | |
Mortgage Backed Securities | | | — | | | 130,280,210 | | | — | | | 130,280,210 | |
Municipal Debt Obligations | | | — | | | 2,657,387 | | | — | | | 2,657,387 | |
U.S. Government Agency Issues | | | — | | | 5,167,865 | | | — | | | 5,167,865 | |
U.S. Treasury Obligations | | | — | | | 82,611,972 | | | — | | | 82,611,972 | |
| | | | | | | | | | | | | |
Total Fixed Income | | | — | | | 399,287,323 | | | — | | | 399,287,323 | |
Short Term Investments | | | 16,440,043 | | | — | | | — | | | 16,440,043 | |
Investments Purchased as Securities | | | | | | | | | | | | | |
Lending Collateral | | | 2,075,367 | | | — | | | 191 | | | 2,075,558 | |
| | | | | | | | | | | | | |
Total Investments in Securities | | $ | 18,515,410 | | $ | 399,287,323 | | $ | 191 | | $ | 417,802,924 | |
| | | | | | | | | | | | | |
| |
| For further information regarding security characteristics, see the Schedule of Investments. There were no transfers in or out of Levels 1 and 2 during the period ended September 30, 2012. |
| |
| Level 3 Reconciliation Disclosure |
| |
| Following is a reconciliation of Level 3 assets for which significant unobservable inputs were used to determine fair value. |
| | | | | |
Description | | | Investments
in Securities | |
| | | | | |
Balance as of March 31, 2012 | | $ | 191 | |
Change in unrealized appreciation | | | — | |
| | | | |
Balance as of September 30, 2012 | | $ | 191 | |
| | | | |
Change in unrealized appreciation during the period | | | | |
for Level 3 investments held at September 30, 2012. | | $ | — | |
| | | | |
| |
| Significant Unobservable Inputs |
| |
| Significant unobservable valuation inputs developed by the Board of Trustees for material Level 3 investments as of September 30, 2012, are as follows: |
| | | | | | | | | | | | | |
Description | | Fair Value
at 09/30/12 | | Valuation Techniques | | Unobservable Input | | Range | |
| | | | | | | | | | |
Investments Purchased
as Securities Lending
Collateral | | $191 | | Conservative value assigned
pending litigation proceedings | | Allocation model of
the potential remaining
assets to be distributed | | $191-$191 | |
| | | | | | | | | | | | |
148
| |
GuideMarkSM Funds |
NOTES TO FINANCIAL STATEMENTS (Unaudited) (Continued) |
September 30, 2012 |
| |
| |
| GuideMarkSM Tax-Exempt Fixed Income Fund |
| | | | | | | | | | | | | |
| | Level 1 | | Level 2 | | Level 3 | | Total | |
| | | | | | | | | |
Municipal Obligations | | $ | — | | $ | 80,871,402 | | $ | — | | $ | 80,871,402 | |
Short Term Investments | | | 1,588,494 | | | — | | | — | | | 1,588,494 | |
| | | | | | | | | | | | | |
Total Investments in Securities | | $ | 1,588,494 | | $ | 80,871,402 | | $ | — | | $ | 82,459,896 | |
| | | | | | | | | | | | | |
| |
| For further information regarding security characteristics, see the Schedule of Investments. There were no transfers in or out of Levels 1 and 2 during the period ended September 30, 2012. |
| |
| GuideMarkSM Opportunistic Fixed Income Fund |
| | | | | | | | | | | | | |
| | Level 1 | | Level 2 | | Level 3 | | Total | |
| | | | | | | | | |
Equity | | | | | | | | | | | | | |
Common Stock | | $ | 3,521,028 | | $ | — | | $ | — | | $ | 3,521,028 | |
Convertible Preferred Stock | | | 1,104,555 | | | — | | | — | | | 1,104,555 | |
Preferred Stock | | | 755,504 | | | — | | | — | | | 755,504 | |
| | | | | | | | | | | | | |
Total Equity | | | 5,381,087 | | | — | | | — | | | 5,381,087 | |
Fixed Income | | | | | | | | | | | | | |
Asset Backed Securities | | | — | | | 1,746,492 | | | — | | | 1,746,492 | |
Bank Loans | | | — | | | 6,334,175 | | | — | | | 6,334,175 | |
Collateralized Mortgage Obligations | | | — | | | 33,191,152 | | | — | | | 33,191,152 | |
Convertible Obligations | | | — | | | 1,968,656 | | | — | | | 1,968,656 | |
Corporate Obligations | | | — | | | 55,608,583 | | | — | | | 55,608,583 | |
Foreign Government Obligations | | | — | | | 77,170,849 | | | — | | | 77,170,849 | |
Mortgage Backed Securities | | | — | | | 45,274,179 | | | — | | | 45,274,179 | |
| | | | | | | | | | | | | |
Total Fixed Income | | | — | | | 221,294,086 | | | — | | | 221,294,086 | |
Purchased Options | | | 32,186 | | | 82,773 | | | — | | | 114,959 | |
Short Term Investments | | | 45,553,161 | | | 7,067,895 | | | — | | | 52,621,056 | |
| | | | | | | | | | | | | |
Total Investments in Securities | | $ | 50,966,434 | | $ | 228,444,754 | | $ | — | | $ | 279,411,188 | |
| | | | | | | | | | | | | |
| | | | | | | | | | | | | |
Other Financial Instruments* | | | | | | | | | | | | | |
Forward Currency Contracts | | $ | — | | $ | 1,307,949 | | $ | — | | $ | 1,307,949 | |
Futures | | | 42,308 | | | — | | | — | | | 42,308 | |
Options Written | | | 6,776 | | | — | | | — | | | 6,776 | |
Swaps | | | — | | | (404,139 | ) | | — | | | (404,139 | ) |
| | | | | | | | | | | | | |
Total | | $ | 49,084 | | $ | 903,810 | | $ | — | | $ | 952,894 | |
| | | | | | | | | | | | | |
| | |
| * | Other financial instruments are derivative instruments not reflected in the Schedule of Investments, such as forward currency contracts, futures, and swaps. Forward currency contracts, futures and swaps are reflected at the unrealized appreciation (depreciation) on the instrument. |
| | |
| For further information regarding security characteristics, see the Schedule of Investments. There were no transfers in or out of Levels 1 and 2 during the period ended September 30, 2012. |
149
| |
GuideMarkSM Funds |
NOTES TO FINANCIAL STATEMENTS (Unaudited) (Continued) |
September 30, 2012 |
| |
| |
| GuidePathSM Strategic Asset Allocation Fund |
| | | | | | | | | | | | | |
| | Level 1 | | Level 2 | | Level 3 | | Total | |
| | | | | | | | | |
Investment Companies | | $ | 190,755,333 | | $ | — | | $ | — | | $ | 190,755,333 | |
Short Term Investments | | | 3,851,492 | | | — | | | — | | | 3,851,492 | |
Investments Purchased as Securities | | | | | | | | | | | | | |
Lending Collateral | | | 17,068,200 | | | — | | | — | | | 17,068,200 | |
| | | | | | | | | | | | | |
Total Investments in Securities | | $ | 211,675,025 | | $ | — | | $ | — | | $ | 211,675,025 | |
| | | | | | | | | | | | | |
| |
| For further information regarding security characteristics, see the Schedule of Investments. There were no transfers in or out of Levels 1 and 2 during the period ended September 30, 2012. |
| |
| GuidePathSM Tactical Constrained Asset Allocation Fund |
| | | | | | | | | | | | | |
| | Level 1 | | Level 2 | | Level 3 | | Total | |
| | | | | | | | | |
Investment Companies | | $ | 179,303,409 | | $ | — | | $ | — | | $ | 179,303,409 | |
Short Term Investments | | | 3,523,906 | | | — | | | — | | | 3,523,906 | |
Investments Purchased as Securities | | | | | | | | | | | | | |
Lending Collateral | | | 3,290,308 | | | — | | | — | | | 3,290,308 | |
| | | | | | | | | | | | | |
Total Investments in Securities | | $ | 186,117,623 | | $ | — | | $ | — | | $ | 186,117,623 | |
| | | | | | | | | | | | | |
| |
| For further information regarding security characteristics, see the Schedule of Investments. There were no transfers in or out of Levels 1 and 2 during the period ended September 30, 2012. |
| |
| GuidePathSM Tactical Unconstrained Asset Allocation Fund |
| | | | | | | | | | | | | |
| | Level 1 | | Level 2 | | Level 3 | | Total | |
| | | | | | | | | |
Investment Companies | | $ | 242,261,981 | | $ | — | | $ | — | | $ | 242,261,981 | |
Short Term Investments | | | 5,277,715 | | | — | | | — | | | 5,277,715 | |
Investments Purchased as Securities | | | | | | | | | | | | | |
Lending Collateral | | | 12,556,232 | | | — | | | — | | | 12,556,232 | |
| | | | | | | | | | | | | |
Total Investments in Securities | | $ | 260,095,928 | | $ | — | | $ | — | | $ | 260,095,928 | |
| | | | | | | | | | | | | |
| |
| For further information regarding security characteristics, see the Schedule of Investments. There were no transfers in or out of Levels 1 and 2 during the period ended September 30, 2012. |
| |
| GuidePathSM Absolute Return Asset Allocation Fund |
| | | | | | | | | | | | | |
| | Level 1 | | Level 2 | | Level 3 | | Total | |
| | | | | | | | | |
Investment Companies | | $ | 405,450,147 | | $ | — | | $ | — | | $ | 405,450,147 | |
Short Term Investments | | | 9,102,966 | | | — | | | — | | | 9,102,966 | |
Investments Purchased as Securities | | | | | | | | | | | | | |
Lending Collateral | | | 20,028,677 | | | — | | | — | | | 20,028,677 | |
| | | | | | | | | | | | | |
Total Investments in Securities | | $ | 434,581,790 | | $ | — | | $ | — | | $ | 434,581,790 | |
| | | | | | | | | | | | | |
150
| |
GuideMarkSM Funds |
NOTES TO FINANCIAL STATEMENTS (Unaudited) (Continued) |
September 30, 2012 |
| |
| |
| For further information regarding security characteristics, see the Schedule of Investments. There were no transfers in or out of Levels 1 and 2 during the period ended September 30, 2012. |
| |
| GuidePathSM Multi-Asset Income Asset Allocation Fund |
| | | | | | | | | | | | | |
| | Level 1 | | Level 2 | | Level 3 | | Total | |
| | | | | | | | | |
Investment Companies | | $ | 50,338,106 | | $ | — | | $ | — | | $ | 50,338,106 | |
Short Term Investments | | | 1,198,804 | | | — | | | — | | | 1,198,804 | |
Investments Purchased as Securities | | | | | | | | | | | | | |
Lending Collateral | | | 10,032,164 | | | — | | | — | | | 10,032,164 | |
| | | | | | | | | | | | | |
Total Investments in Securities | | $ | 61,569,074 | | $ | — | | $ | — | | $ | 61,569,074 | |
| | | | | | | | | | | | | |
| |
| For further information regarding security characteristics, see the Schedule of Investments. There were no transfers in or out of Levels 1 and 2 during the period ended September 30, 2012. |
| |
| GuidePathSM Fixed Income Allocation Fund |
| | | | | | | | | | | | | |
| | Level 1 | | Level 2 | | Level 3 | | Total | |
| | | | | | | | | |
Investment Companies | | $ | 198,824,663 | | $ | — | | $ | — | | $ | 198,824,663 | |
Short Term Investments | | | 4,773,670 | | | — | | | — | | | 4,773,670 | |
Investments Purchased as Securities | | | | | | | | | | | | | |
Lending Collateral | | | 14,579,236 | | | — | | | — | | | 14,579,236 | |
| | | | | | | | | | | | | |
Total Investments in Securities | | $ | 218,177,569 | | $ | — | | $ | — | | $ | 218,177,569 | |
| | | | | | | | | | | | | |
| |
| For further information regarding security characteristics, see the Schedule of Investments. There were no transfers in or out of Levels 1 and 2 during the period ended September 30, 2012. |
| |
| GuidePathSM Altegris® Multi-Strategy Alternative Allocation Fund |
| | | | | | | | | | | | | |
| | Level 1 | | Level 2 | | Level 3 | | Total | |
| | | | | | | | | |
Investment Companies | | $ | 139,081,148 | | $ | — | | $ | — | | $ | 139,081,148 | |
Short Term Investments | | | 3,030,883 | | | — | | | — | | | 3,030,883 | |
| | | | | | | | | | | | | |
Total Investments in Securities | | $ | 142,112,031 | | $ | — | | $ | — | | $ | 142,112,031 | |
| | | | | | | | | | | | | |
| |
| For further information regarding security characteristics, see the Schedule of Investments. There were no transfers in or out of Levels 1 and 2 during the period ended September 30, 2012. |
151
|
GuideMarkSM Funds |
NOTES TO FINANCIAL STATEMENTS (Unaudited) (Continued) |
September 30, 2012 |
| |
Derivative Instruments and Hedging Activities
The Trust has adopted derivative instruments disclosure standards, in order to enable the investor to understand how and why an entity used derivatives, how derivatives are accounted for, and how derivative instruments affect an entity’s results of operations and financial position.
GuideMarkSM Core Fixed Income Fund
During the period, the Fund used money market and fixed income derivatives including futures for both hedging and investment purposes, primarily duration management and the pursuit of relative value opportunities. Futures contracts used in the Fund during the period included those based on 90-day Eurodollars: short, medium, and long-term U.S. debt, medium and long-term German debt, long-term Australian debt, and long-term debt of the United Kingdom.
In general, the use of derivatives may increase the risk within the Fund. The use of over-the-counter derivatives involves the risk that the counterparty to the contract will fail to make required payments or otherwise comply with the terms of the contract. The results achieved by the use of derivatives in the Fund may not match or fully offset changes in the value of the underlying financial assets being hedged or the investment opportunity the Fund was pursuing, thereby failing to achieve, to an extent, the original purpose for using the derivatives. Certain types of derivatives may create leverage insofar as a Fund may receive returns (or suffer losses) exceeding the initial amounts the Fund committed in connection with the derivatives. The use of derivatives can result in losses or gains to a Fund exceeding the amount the Fund would have experienced in the absence of using derivatives. A relatively small price movement in a derivative may result in an immediate and substantial loss, or gain, to the Fund.
The Fund used futures contracts during the period primarily to manage interest rate risk.
There were no derivatives held at September 30, 2012.
| | |
The Effect of Derivative Instruments on the Statement of Operations for the Period Ended September 30, 2012 |
| |
Amount of Realized Loss on Derivatives Recognized in Income |
| | |
| Futures | |
| |
Interest Rate Contracts | $460,104 | |
| | | |
Total | $460,104 | |
| |
Change in Unrealized Appreciation on Derivatives Recognized in Income |
| |
| Futures | |
| |
Interest Rate Contracts | $198,569 | |
| | | |
Total | $198,569 | |
| | | |
152
|
GuideMarkSM Funds |
NOTES TO FINANCIAL STATEMENTS (Unaudited) (Continued) |
September 30, 2012 |
| |
GuideMarkSM Opportunistic Fixed Income Fund
The Trust has adopted derivative instruments disclosure standards, in order to enable the investor to understand how and why an entity used derivatives, how derivatives are accounted for, and how derivative instruments affect an entity’s results of operations and financial position.
The Fund invested in derivatives in order to manage risk or gain exposure to various other investments or markets. Derivatives may contain various risks, including the potential inability of the counterparty to fulfill their obligations under the terms of the contract, the potential for an illiquid secondary market, and the potential for market movements which may expose the Fund to gains or losses.
The Fund seeks to maximize real returns through exposure to investments in fixed-income securities, equity securities, and currency instruments. The Fund expects that its exposure to these asset classes will often be obtained substantially through the use of swap agreements. The Fund entered into swap agreements to manage and/or gain exposures to credit risk. The Fund entered into financial futures contracts primarily to manage interest rate risk. The Fund entered into forward exchange contracts primarily to manage and/or gain exposure to certain foreign currencies.
The Fund used currency forwards during the period for the purpose of hedging exposures within the Fund to non-dollar-denominated assets. In general, the use of currency derivative contracts for hedging may reduce the overall risk level of the Fund, albeit at a cost that may lower overall performance. In general, the use of currency derivatives for hedging purposes will not lead to leverage within the Fund.
Balance Sheet — Values of Derivative Instruments as of September 30, 2012
| | | | | | | | | | | |
| | Asset Derivatives | | Liability Derivatives | |
| | | | | |
| | Balance Sheet Location | | Value | | Balance Sheet Location | | Value | |
| | | | | | | | | | |
Credit Contracts — Swaps | | Appreciation on Swap | | | | | Depreciation on Swap | | | | |
| | Agreements | | $ | 147,100 | | Agreements | | $ | 551,239 | |
Foreign Exchange Contracts — Forward | | Appreciation of forward | | | | | Depreciation of forward | | | | |
Currency Contracts | | currency contracts | | | 3,080,337 | | currency contracts | | | 1,772,388 | |
Foreign Exchange Contracts — Options | | Investments, at Value | | | 82,773 | | Options Written, at Value | | | — | |
| | Variation margin on | | | | | Variation margin on | | | | |
Equity Contracts — Futures* | | futures contracts | | | 32,177 | | futures contracts | | | — | |
Equity Contracts — Options | | Investments, at Value | | | 32,186 | | Options Written, at Value | | | 6,776 | |
Interest Rate Contracts - Futures* | | Variation margin on | | | | | Variation margin on | | | | |
| | futures contracts | | | 28,934 | | futures contracts | | | 18,803 | |
| | | | | | | | | | | | |
Total | | | | $ | 3,403,507 | | | | $ | 2,349,206 | |
| | | | | | | | | | | | |
* Includes cumulative appreciation/depreciation as reported in Schedule of Investments.
153
|
GuideMarkSM Funds |
NOTES TO FINANCIAL STATEMENTS (Unaudited) (Continued) |
September 30, 2012 |
| |
| | | | | | | | | | | | | | | | | | | |
The Effect of Derivative Instruments on the Statement of Operations for the Period Ended September 30, 2012 |
| |
Amount of Realized Gain or (Loss) on Derivatives Recognized in Income |
| |
| | Futures | | Forward
Currency
Contracts | | Options
Written | | Purchased
Options | | Swaps | | Total | |
| | | | | | | | | | | | | | |
Interest Rate Contracts | | $ | (20,215 | ) | $ | — | | $ | — | | $ | — | | $ | — | | $ | (20,215 | ) |
Foreign Exchange Contracts | | | — | | | 3,006,559 | | | 144,323 | | | (190,411 | ) | | — | | | 2,960,471 | |
Equity Contracts | | | (267,153 | ) | | — | | | 21,479 | | | (60,449 | ) | | — | | | (306,123 | ) |
Credit Contracts | | | — | | | — | | | — | | | — | | | (806,318 | ) | | (806,318 | ) |
| | | | | | | | | | | | | | | | | | | | |
Total | | $ | (287,368 | ) | $ | 3,006,559 | | $ | 165,802 | | $ | (250,860 | ) | $ | (806,318 | ) | $ | 1,827,815 | |
| | | | | | | | | | | | | | | | | | | | |
| | | | | | | | | | | | | | | | | | | |
Change in Unrealized Appreciation or (Depreciation) on Derivatives Recognized in Income |
| | | | | | | | | | | | | | | | | | | | |
| | Futures | | Forward
Currency
Contracts | | Options
Written | | Purchased
Options | | Swaps | | Total | |
| | | | | | | | | | | | | | | | | | | | |
Interest Rate Contracts | | $ | 9,252 | | $ | — | | $ | — | | $ | — | | $ | — | | $ | 9,252 | |
Foreign Exchange Contracts | | | — | | | (147,808 | ) | | (141,680 | ) | | 173,503 | | | — | | | (115,985 | ) |
Equity Contracts | | | 60,111 | | | — | | | 14,409 | | | (21,218 | ) | | — | | | 53,302 | |
Credit Contracts | | | — | | | — | | | — | | | — | | | (353,796 | ) | | (353,796 | ) |
| | | | | | | | | | | | | | | | | | | | |
Total | | $ | 69,363 | | $ | (147,808 | ) | $ | (127,271 | ) | $ | 152,285 | | $ | (353,796 | ) | $ | (407,227 | ) |
| | | | | | | | | | | | | | | | | | | | |
The average monthly market value of purchased and written options during the period ended September 30, 2012 were as follows:
| | | | | | | |
| | GuideMarkSM
Core
Fixed Income
Fund | | GuideMarkSM
Opportunistic
Fixed Income
Fund | |
| | | | | | |
Purchased Options | | $ | — | | $ | 216,332 | |
Written Options | | $ | — | | $ | 41,698 | |
| | | | | | | | |
154
|
GuideMarkSM Funds |
NOTES TO FINANCIAL STATEMENTS (Unaudited) (Continued) |
September 30, 2012 |
| |
The average monthly notional amount of futures, forwards, and swaps during the period ended September 30, 2012 were as follows:
| | | | | | | |
Long Positions | | GuideMarkSM
Core
Fixed Income
Fund | | GuideMarkSM
Opportunistic
Fixed Income
Fund | |
| | | | | | |
Futures | | $ | 36,607,636 | | $ | 209,323 | |
Forwards | | $ | — | | $ | 73,778,266 | |
Swaps | | $ | — | | $ | 39,982,036 | |
| | | | | | | | |
| | | | | | | |
Short Positions | | GuideMarkSM
Core
Fixed Income
Fund | | GuideMarkSM
Opportunistic
Fixed Income
Fund | |
| | | | | | |
Futures | | $ | 22,728,218 | | $ | 8,581,808 | |
Forwards | | $ | — | | $ | 62,513,702 | |
| | | | | | | | |
| | | | | | | |
Cross | | GuideMarkSM
Core
Fixed Income
Fund | | GuideMarkSM
Opportunistic
Fixed Income
Fund | |
| | | | | | |
Forwards | | $ | — | | $ | 28,763,879 | |
| | | | | | | | |
Derivative Risks
The risks of using the various types of derivatives in which the Fund may engage include: the risk that movements in the value of the derivative may not fully offset or complement instruments currently held in the Fund in the manner intended by the Advisor; the risk that the counterparty to a derivative contract may fail to comply with its obligations to the Fund; the risk that there may not be a liquid secondary market for the derivative at a time when the Fund would look to disengage the position; the risk that additional capital from the Fund may be called upon to fulfill the conditions of the derivative contract; the risk that the use of derivatives in the Fund may induce leverage in the Fund, and the risk that the cost of the derivative contracts may reduce the overall returns experienced by the Fund.
| | |
| (b) | Subsequent Events Evaluation. |
| | In preparing these financial statements, the Funds have evaluated events and transactions for potential recognition or disclosure resulting from subsequent events. This evaluation did not result in any subsequent events that necessitated disclosures and/or adjustments other than the below. |
| | |
| | The Portfolios are subject to claims and suits that arise from time to time in the ordinary course of business (for example, in The Tribune Company Bankruptcy, certain creditors have filed actions against all shareholders of The Tribune Company, which included the GuideMarkSM Large Cap Value Fund, who tendered shares when the Tribune |
| | |
| | Company went private in 2007 in a leveraged buy-out transaction, seeking the return of proceeds received by the shareholders). Although management currently believes that resolving claims against us, individually or in aggregate, will not have a material adverse impact on our financial position, our results of operations, or our cash flows, these matters are subject to inherent uncertainties and management’s view of these matters may change in the future. |
| | |
| (c) | Repurchase Agreements |
| | Each Fund may enter into repurchase agreements with banks and securities dealers. These transactions involve the purchase of securities with |
155
|
GuideMarkSM Funds |
NOTES TO FINANCIAL STATEMENTS (Unaudited) (Continued) |
September 30, 2012 |
| |
| | |
| | a simultaneous commitment to sell the securities to the bank or the dealer at an agreed-upon date and price. A repurchase agreement is accounted for as an investment by the Fund, collateralized by securities, which are delivered to the Fund’s Custodian or to an agent bank under a tri-party agreement. The securities are marked-to-market daily and additional securities are acquired as needed, to ensure that their value equals or exceeds the repurchase price plus accrued interest. |
| | |
| (d) | Federal Income Taxes |
| | The Funds intend to continue to comply with the requirements of sub-chapter M of the Internal Revenue Code necessary to qualify as regulated investment companies and to make the requisite distributions of income and capital gains to their shareholders sufficient to relieve the Funds from all or substantially all Federal income taxes. Therefore, no Federal income tax provision is required. |
| | |
| | The Funds have adopted financial reporting rules regarding recognition and measurement of tax positions taken or expected to be taken on a tax return. The Funds have reviewed all open tax years and major jurisdictions and concluded that no provision for income tax would be required in the Funds’ financial statements. The Funds’ Federal and state income and Federal excise tax returns for tax years for which the applicable statutes of limitations have not expired are subject to examination by the Internal Revenue Service and state departments of revenue. |
| | |
| (e) | Use of Estimates |
| | The preparation of financial statements in conformity with GAAP requires management to make estimates and assumptions that affect the reported amounts of assets and liabilities and disclosure of contingent assets and liabilities at the date of the financial statements and the reported amounts of revenues and expenses during the reported period. Actual results could differ from those estimates. |
| | |
| (f) | Indemnifications |
| | Under each Trust’s organizational documents, its officers and trustees are indemnified against certain liability arising out of their performance of their duties to the Funds. In addition, in the normal course of business, the Funds enter into contracts that contain a variety of representations and warranties that provide general indemnifications. The Funds’ maximum exposure under these arrangements are unknown as this would involve future claims that may be made against the Funds that have not yet occurred. However, the Funds expect the risk of loss to be remote. |
| | |
| (g) | Expenses |
| | Many expenses of the Funds can be directly attributed to a specific Fund. Additionally, some expenses can be directly attributed to a specific Trust, in which case the expense is apportioned among the Funds within that Trust based on relative net assets. Expenses that cannot be directly attributed to a specific Fund or Trust are apportioned among all the Funds based on relative net assets. |
| | |
| (h) | Organization and Offering Costs |
| | Organization costs consist of costs incurred to establish the Trust and enable it legally to do business. The Fund expenses organizational costs as incurred. These expenses were advanced by the Advisor, and the Advisor has agreed to reimburse the Funds for these expenses, subject to potential recovery (see Note 3). Offering costs are accounted for as deferred costs until operations begin. Offering costs include legal fees regarding the preparation of the initial registration statement. Offering costs are then amortized to expense over twelve months on a straight-line basis. |
| | |
| (i) | Security Transactions and Income Recognition
Security transactions are accounted for on trade date. Dividend income is recognized on the ex-dividend date, and the interest income recorded using the effective yield method is accrued daily. Realized gains and losses on investment |
156
|
GuideMarkSM Funds |
NOTES TO FINANCIAL STATEMENTS (Unaudited) (Continued) |
September 30, 2012 |
| |
| | |
| | transactions are determined using the high cost method. Return of capital distributions received from REIT securities are recorded as an adjustment to the cost of the security and thus may impact unrealized or realized gains or losses on the security. Gains and losses from paydowns on mortgage and asset backed securities are recorded as adjustments to interest income. |
| | |
| (j) | Distributions to shareholders |
| | The Funds, with the exception of the Core Fixed Income Fund, Tax-Exempt Fixed Income Fund, and Opportunistic Fixed Income Fund, will distribute any net investment income at least annually. The Core Fixed Income Fund, Tax-Exempt Fixed Income Fund, and Opportunistic Fixed Income Fund will distribute any net investment income quarterly. All of the Funds will distribute any net realized long or short-term capital gains at least annually. Distributions to shareholders are recorded on the ex-dividend date. The Funds may also pay a special distribution at the end of the calendar year to comply with Federal tax requirements. |
| | |
| (k) | Derivatives |
| | Each Fund may invest in derivative securities including call and put options, futures, forward currency contracts and swaps. These instruments may be used by a Fund for hedging purposes as well as direct investment. |
| | |
| | Forward Currency Contracts |
| | The Funds may enter into forward currency contracts, obligating the Funds to deliver and receive currency at a specified future date. Transactions involving forward currency contracts may serve as long hedges (for example, if a Fund seeks to buy a security denominated in a foreign security, it may purchase a forward currency contract to lock in the U.S. dollar price of the security) or as short hedges (if a Fund anticipates selling a security denominated in a foreign currency, it may sell a forward currency contract to lock in the U.S. dollar equivalent of the anticipated sales proceeds). Forward contracts are valued daily |
| | |
| | and unrealized appreciation or depreciation is recorded daily as the difference between the contract exchange rate and the closing forward rate applied to the face amount of the contract. |
| | |
| | Options |
| | Exchange-traded options are valued at the last reported sale price on the exchange on which the security underlying the option is principally traded. If no sales are reported on a particular day for exchange traded options, or the options are not exchange traded, the options are valued at the mean between the most recent quoted bid and asked quotations at the close of the exchange. |
| | |
| | The premium that a Fund pays when purchasing a call option or receives when writing a call option will reflect, among other things, the market price of the security, the relationship of the exercise price to the market price of the security, the relationship of the exercise price to the volatility of the security, the length of the option period and supply and demand factors. The premium is the value of an option at the date of purchase. A purchaser (holder) of a put option pays a non-refundable premium to the seller (writer) of a put option to obtain the right to sell a specified amount of a security at a fixed price (the exercise price) during a specified period (exercise period). Conversely, the seller (writer) of a put option, upon payment by the holder of the premium, has the obligation to buy the security from the holder of the put option at the exercise price during the exercise period. |
| | |
| | Futures |
| | Each Fund has the ability to buy and sell stock index futures contracts traded on domestic stock exchanges to hedge the value of its portfolio against changes in market conditions. A stock index futures contract is an agreement between two parties to take or make delivery of an amount of cash equal to a specified dollar amount, times the difference between stock index value at the close of the last trading day of the contract and the price at which the futures contract is originally struck. A stock |
157
|
GuideMarkSM Funds |
NOTES TO FINANCIAL STATEMENTS (Unaudited) (Continued) |
September 30, 2012 |
| |
| | |
| | index futures contract does not involve the physical delivery of the underlying stocks in the index. Although stock index futures contracts call for the actual taking of delivery of cash, in most cases a Fund expects to liquidate its stock index futures positions through offsetting transactions, which may result in a gain or loss, before cash settlement is required. |
| | |
| | The Core Fixed Income Fund and each of the GPS Funds II portfolios may purchase or sell other types of futures contracts, including those based on particular interest rates, securities, foreign currencies, securities indices and other financial instruments and indices. The Core Fixed Income Fund and each of the GPS Funds II portfolios may also purchase and write call and put options on such future contracts, in order to seek to increase total return or to hedge against changes in interest rates, securities prices, or currency exchange rates, or, to the extent permitted by its investment policies, to otherwise manage its portfolio of investments. |
| | |
| | Futures contracts are valued at the daily quoted settlement prices. |
| | |
| | Swaps |
| | The Core Fixed Income Fund and each of the GPS Funds II portfolios may enter into interest rate, mortgage, credit, currency and total return swaps, interest rate caps, floors and collars. The Core Fixed Income Fund and each of the GPS Funds II portfolios may also purchase and write (sell) options contracts on swaps, referred to as “swaptions.” The Funds may enter into swap transactions for hedging purposes or to seek to increase total return. Since interest rate, mortgage, credit and currency swaps and interest rate caps, floors and collars are individually negotiated, the Funds expect to achieve an acceptable degree of correlation between their portfolio investments and their swap, cap, floor and collar positions. |
| | |
| | Swap agreements are valued daily and unrealized appreciation or depreciation is recorded daily as the |
| | |
| | difference between the prior day and current day closing price. |
| | |
| (l) | Securities Purchased or Sold on a Forward-Commitment Basis |
| | The Funds may enter into when-issued or other purchase or sale transactions that specify forward delivery of a financial security. In connection with this ability, the Funds may enter into mortgage “dollar rolls” in which a Fund sells securities in the current month for delivery and simultaneously contracts with the same counterparty to repurchase similar (same type, coupon and maturity) but not identical securities on a specified future date. The party that is obligated to buy a security in the future will retain the use of their funds, and will benefit from any interest that is earned on those funds from the day that they enter into the forward contract until the day that they take delivery and pay for the security. |
| | |
| (m) | Foreign Currency Translation |
| | The accounting records of the Funds are maintained in U.S. dollars. Investment securities and all other assets and liabilities of the Funds denominated in a foreign currency are translated into U.S. dollars at current exchange rates. Purchases and sales of securities, income receipts, and expense payments are translated into U.S. dollars at the exchange rate in effect on the dates of the respected transactions. The Funds do not isolate the portion of the fluctuations on investments resulting from changes in foreign currency exchange rates from the fluctuations in market prices of investments held. Such fluctuations are included with the net realized and unrealized gain or loss from investments. |
| | |
| (n) | Restricted and Illiquid Securities |
| | Each Fund may invest up to 15% of its net assets in securities that are illiquid at the time of purchase, which includes securities with legal or contractual restrictions on their disposition, and securities for which there are no readily available market quotations. The Advisor, with the assistance of the sub-advisors and/or pricing services, will determine the value of such securities in good faith pursuant to |
158
|
GuideMarkSM Funds |
NOTES TO FINANCIAL STATEMENTS (Unaudited) (Continued) |
September 30, 2012 |
| |
| | |
| | procedures adopted by the applicable Board of Trustees. Illiquid securities present the risks that a Fund may have difficulty valuing these holdings and/or may be unable to sell these holdings at the time or price desired. There are no restrictions on each Fund’s ability to invest in restricted securities (that is, securities that are not registered pursuant to the Securities Act of 1933), except to the extent such securities may be considered illiquid. Securities issued pursuant to Rule 144A of the Securities Act of 1933 will be considered liquid if determined to be so under procedures adopted by the Board of Trustees. |
| | |
| (o) | Auction Rate Securities |
| | The Core Fixed Income Fund, Tax-Exempt Fixed Income Fund, and each of the GPS Funds II portfolios each may invest in auction rate municipal securities. Auction rate securities usually permit the holder to sell the securities in an auction at par value at specified intervals. The dividend is reset by “Dutch” auction in which bids are made by broker-dealers and other institutions for a certain amount of securities at a specified minimum yield. The dividend rate set by the auction is the lowest interest or dividend rate that covers all securities offered for sale. While this progress is designed to permit auction rate securities to be traded at par value, there is a risk that an auction will fail due to insufficient demand for the securities. |
| | |
| (p) | Short Sales |
| | Although not currently part of any Fund’s principal investment strategies, each Fund has the ability to make short sales. Short sales are transactions where a Fund sells securities it does not own in anticipation of a decline in the value of the securities. |
| | |
| (q) | Trustee Compensation |
| | Each Trust has its own Board of Trustees. For the services performed as Trustees of GPS Funds I, the Independent Trustees receive a retainer fee of $45,000 per year and $4,500 per in person meeting attended, as well as reimbursement for expenses incurred in connection with attendance at such meetings. The Lead Independent Trustee receives an |
| | |
| | additional retainer fee of $10,000 per year. The Audit Committee Chair receives an additional retainer fee of $5,000 per year. Telephonic meeting fees are determined according to the length of the meeting as follows: $2,000 for one to two hours, $3,000 for two to three hours and $4,000 for three hours or longer. For the services performed as Trustees of GPS Funds II the Independent Trustees receive a retainer fee of $50,000 per year, $2,500 per quarterly meeting attended in person, $2,500 per special meeting attended in person, and $1,000 per special meeting attended telephonically, as well as reimbursement for expenses incurred in connection with attendance at such meetings. The fees are allocated proportionally to each Fund within the Trust based on total assets under management. |
| | |
| | The “interested persons” who serve as Trustees of the Trusts receive no compensation from the Trusts for their services as Trustees. The Funds reimburse the Advisor an allocated amount for the compensation and related expenses of certain officers of the Trusts who provide compliance services to the Funds. The aggregate amount of all such reimbursements is determined by the Trustees. No other compensation or retirement benefits are received by any Trustee or officer from the Funds. |
| | |
3. | Investment Advisor |
| | |
| Each Trust has entered into an Investment Advisory Agreement (collectively, the “Agreement”) with Genworth Financial Wealth Management, Inc. (the “Advisor” or “GFWM”), with whom certain officers and trustees of the Trust are affiliated, to furnish investment advisory services to the Fund. Under the terms of the Agreement, the Funds compensate the Advisor for its management services at the following contractual rates, based on each Fund’s average daily net assets: |
| | | | |
Large Cap Growth Fund | | | 0.70 | % |
Large Cap Value Fund | | | 0.70 | % |
Small/Mid Cap Core Fund | | | 0.75 | % |
World ex-US Fund | | | 0.70 | % |
Opportunistic Equity Fund | | | 0.80 | % |
Global Real Return Fund | | | 0.65 | % |
159
|
GuideMarkSM Funds |
NOTES TO FINANCIAL STATEMENTS (Unaudited) (Continued) |
September 30, 2012 |
| |
| | | | |
Core Fixed Income Fund | | | 0.50 | % |
Tax-Exempt Fixed Income Fund | | | 0.50 | % |
Opportunistic Fixed Income Fund | | | 0.70 | % |
Strategic Asset Allocation Fund | | | 0.25 | % |
Tactical Constrained Asset Allocation Fund | | | 0.25 | % |
Tactical Unconstrained Asset Allocation Fund | | | 0.35 | % |
Absolute Return Asset Allocation Fund | | | 0.35 | % |
Multi-Asset Income Asset Allocation Fund | | | 0.35 | % |
Fixed Income Allocation Fund | | | 0.25 | % |
Altegris® Multi-Strategy Alternative
Allocation Fund | | | 0.15 | % |
| |
| GFWM also provides certain administrative services to the Service Shares of the Funds, pursuant to Administrative Services Agreements between the Funds and GFWM, for which GFWM receives a fee of 0.25% of the average daily net assets of the Services Shares of the Funds. Effective October 26, 2012, GFWM is voluntarily waiving the Investment Advisory fee and Administrative Services fee in the GuidePathSM Altegris® Multi-Strategy Alternative Allocation Fund. The administrative services may include development and maintenance of a web-based software platform for both investment advisers and shareholders; creation of a customized full-color client quarterly performance review for each individual client; facilitating the initiation and setup of new account and related asset transfers; reviewing and following up on custodial paperwork; attending to shareholder correspondence, requests and inquiries, and other communications with shareholders and their representatives; assisting with the processing of purchases and redemptions of shares; and monitoring and overseeing non-advisory relationships with entities providing services to the Service Shares; including the transfer agent and custodian. |
| |
| In addition, GPS Funds I and the Advisor have also entered into a Fee Waiver Agreement designed to provide Fund shareholders with the economic benefits of economies of scale that may be realized as Fund assets increase. Under the Fee Waiver Agreement, the Advisor has contractually agreed to waive 0.025% of each Fund’s annual advisory fee on assets in excess of $6 billion, and an additional 0.025% of each Fund’s annual advisory fee on assets in excess of $12 billion. |
| |
| Each Fund and the Advisor have also entered into an Expense Waiver and Reimbursement Agreement under which the Advisor has agreed to waive, through July 31, 2013, its management fee and/or reimburse each Fund’s other expenses to the extent necessary to ensure that the Fund’s net annual operating expenses (excluding Distribution (12b-1) Fees, Administrative Service Fees, taxes, interest, trading costs, acquired fund expenses, expenses paid with securities lending expense offset credits and non-routine expenses) do not exceed the following rates, based on each Fund’s average daily net assets: |
| | | | |
Large Cap Growth Fund | | | 0.99 | % |
Large Cap Value Fund | | | 0.99 | % |
Small/Mid Cap Core Fund | | | 1.09 | % |
World ex-US Fund | | | 1.09 | % |
Opportunistic Equity Fund | | | 1.10 | % |
Global Real Return Fund | | | 1.05 | % |
Core Fixed Income Fund | | | 0.79 | % |
Tax-Exempt Fixed Income Fund | | | 0.79 | % |
Opportunistic Fixed Income Fund | | | 1.05 | % |
Strategic Asset Allocation Fund | | | 0.50 | % |
Tactical Constrained Asset Allocation Fund | | | 0.50 | % |
Tactical Unconstrained Asset Allocation Fund | | | 0.60 | % |
Absolute Return Asset Allocation Fund | | | 0.60 | % |
Multi-Asset Income Asset Allocation Fund | | | 0.60 | % |
Fixed Income Allocation Fund | | | 0.55 | % |
Altegris® Multi-Strategy Alternative
Allocation Fund | | | 0.50 | % |
| |
| Any such waiver or reimbursement is subject to later adjustment to allow the Advisor to recoup amounts waived or reimbursed to the extent actual fees and expenses for a fiscal period are less than each Fund’s expense limitation cap, provided, however, that the Advisor shall only be entitled to recoup such amounts for a period of three years after the end of the fiscal year in which the fee or expense was waived or reimbursed. As of September 30, 2012, Large Cap Value Fund, Global Real Return Fund, Core Fixed Income Fund and Altegris® Multi-Strategy Alternative Allocation Fund have recouped all potential recoverable waivers or reimbursed expenses. |
160
|
GuideMarkSM Funds |
NOTES TO FINANCIAL STATEMENTS (Unaudited) (Continued) |
September 30, 2012 |
| |
The Advisor is currently waiving fees and, in some cases, reimbursing expenses in the Funds listed below in order to keep these Funds at their expense cap. Waived expenses subject to potential recovery are as follows:
| | | | | | | | | | | | | |
| | Year of
Expiration
03/31/2013 | | Year of
Expiration
03/31/2014 | | Year of
Expiration
03/31/2015 | | Year of
Expiration
03/31/2016 | |
| | | | | | | | | |
Large Cap Growth | | | — | | | — | | | 41,601 | | | 13,325 | |
Small/Mid Cap Core Fund | | | — | | | 25,201 | | | 46,007 | | | 3,468 | |
World ex-US Fund | | | — | | | — | | | 142,535 | | | 62,186 | |
Opportunistic Equity Fund | | | — | | | — | | | 1,804 | | | 13,531 | |
Tax-Exempt Fixed Income Fund | | | 32,625 | | | 21,611 | | | 26,492 | | | 24,002 | |
Opportunistic Fixed Income Fund | | | — | | | — | | | 209,491 | | | 50,250 | |
Strategic Asset Allocation Fund | | | — | | | 40,488 | | | 109,544 | | | 18,644 | |
Tactical Constrained Asset
Allocation Fund | | | — | | | 39,991 | | | 129,239 | | | 19,628 | |
Tactical Unconstrained Asset
Allocation Fund | | | — | | | 40,488 | | | 116,347 | | | 43,496 | |
Absolute Return Asset
Allocation Fund | | | — | | | 12,739 | | | 169,190 | | | 30,344 | |
Multi-Asset Income Asset
Allocation Fund | | | — | | | — | | | — | | | 8,345 | |
Fixed Income Allocation Fund | | | — | | | — | | | — | | | 4,731 | |
Sub-advisory services are provided to certain of the Funds, pursuant to agreements between the Advisor and various sub-advisors. Under the terms of these sub-advisory agreements, the Advisor compensates each sub-advisor based on the portion of each Fund’s average daily net assets that is allocated to the sub-advisor.
161
|
GuideMarkSM Funds |
NOTES TO FINANCIAL STATEMENTS (Unaudited) (Continued) |
September 30, 2012 |
| |
| |
4. | Distribution Plan |
| |
| Each Trust, on behalf of the Service Shares class of its Funds, has adopted a distribution plan pursuant to Rule 12b-1 under the 1940 Act (the “12b-1 Plan”), which provides for each Fund to pay distribution fees at an annual rate of 0.25% of the average daily net assets of the Funds. Payments under the 12b-1 Plan shall be used to compensate persons (including affiliates of the Trust) who provide support services in connection with the distribution of the Funds’ Service Shares class and servicing of the Funds’ Service Shares class shareholders. For example, these amounts are paid to financial intermediaries that perform back office shareholder servicing and recordkeeping services that facilitate the operation of the Genworth Financial Wealth Management Program through which the Funds are primarily distributed. The Advisor (and its affiliates) similarly receive portions of such payments for their services provided that facilitate the operation of the program. These financial intermediaries and affiliates of the Trust also receive payments from the Trust outside of the 12b-1 Plan for shareholder services that are unrelated to distribution services. Capital Brokerage Corp., an affiliate of the Advisor, serves as principal underwriter and distributor for the Funds. |
| |
5. | Service and Custody Agreements |
| |
| The Funds have entered into Service Agreements with U.S. Bancorp Fund Services, LLC (“USBFS”) and a Custody Agreement with U.S. Bank, N.A., an affiliate of USBFS. Under these agreements, USBFS and U.S. Bank, N.A. provide certain transfer agency, administrative, accounting and custody services. |
| |
| Additionally, the Opportunistic Fixed Income Fund has entered into a Custody Agreement with the Bank of New York Mellon for certain custody services. |
| |
6. | Securities Lending |
| |
| The Trusts, on behalf of certain of the Funds, entered into securities lending arrangements with U.S. Bank, N.A. (the “Custodian”). Under the term of the agreement, the Custodian is authorized to loan securities on behalf of the Funds to approved brokers. In exchange, under normal market conditions, the Funds receive cash collateral in the amount of at least 102% of the value of securities loaned. The cash collateral is invested in short term instruments as noted in the Schedule of Investments. Although risk is mitigated by the collateral, the Funds could experience a delay in recovering their securities and possible loss of income or value if the borrower fails to return the borrowed securities. In addition, the Funds bear the risk of loss associated with the investment of cash collateral received. After predetermined rebates to brokers, a percentage of the net securities lending revenue is credited to the Funds to be used as an offset against custody costs and other charges incurred by the Funds. The Custodian is paid a fee for administering a securities lending program for the Funds, equal to the remaining percentage of the net securities lending revenues generated under the agreement. |
| |
| As of September 30, 2012, the Funds (excluding the Tax-Exempt Fixed Income Fund, Opportunistic Fixed Income Fund and Altegris Multi-Strategy Alternative Allocation Fund) had loaned securities that were collateralized by cash. The cash collateral received was invested in securities as listed in each Fund’s Schedule of Investments. Income earned from these investments is allocated to each Fund based on each Fund’s portion of total cash collateral received. Securities lending income is disclosed in each Fund’s Statement of Operations as a securities lending offset. |
162
|
GuideMarkSM Funds |
NOTES TO FINANCIAL STATEMENTS (Unaudited) (Continued) |
September 30, 2012 |
| |
As of September 30, 2012, the values of securities loaned and collateral received were as follows:
| | | | | | | | | | | | | | | | | | | |
| | Value of
Securities
Loaned | | Payable for
Collateral
on Securities
Loaned | | Collateral
Excess
(Deficit) due
to (from)
Securities
Lending
Agent | | Cost of
Securities
Purchased
as Securities
Lending
Collateral | | Unrealized
Depreciation | | Value
of Securities
Purchased
as Securities
Lending
Collateral | |
| | | | | | | | | | | | | |
Large Cap
Growth Fund | | $ | 3,921,228 | | $ | 4,069,278 | | $ | 8,401 | | $ | 4,074,863 | | $ | (16,900 | ) | $ | 4,057,963 | |
Large Cap
Value Fund | | | 8,489,101 | | | 8,793,679 | | | (2,702 | ) | | 8,787,760 | | | (19,337 | ) | | 8,768,423 | |
Small/Mid Cap
Core Fund | | | 5,164,440 | | | 5,516,298 | | | (10,025 | ) | | 5,505,394 | | | (5,260 | ) | | 5,500,134 | |
World ex-US Fund | | | 1,355,236 | | | 1,387,400 | | | 5,588 | | | 1,392,223 | | | (4,607 | ) | | 1,387,616 | |
Opportunistic
Equity Fund | | | 4,054,250 | | | 4,281,286 | | | — | | | 4,281,286 | | | — | | | 4,281,286 | |
Global Real
Return Fund | | | 26,813,990 | | | 27,733,915 | | | — | | | 27,733,915 | | | — | | | 27,733,915 | |
Core Fixed
Income Fund | | | 2,027,394 | | | 2,081,560 | | | (1,262 | ) | | 2,079,622 | | | (4,064 | ) | | 2,075,558 | |
Strategic Asset
Allocation Fund | | | 16,275,100 | | | 17,068,200 | | | — | | | 17,068,200 | | | — | | | 17,068,200 | |
Tactical Constrained
Asset Allocation Fund | | | 3,177,643 | | | 3,290,308 | | | — | | | 3,290,308 | | | — | | | 3,290,308 | |
Tactical Unconstrained
Asset Allocation Fund | | | 12,060,893 | | | 12,556,232 | | | — | | | 12,556,232 | | | — | | | 12,556,232 | |
Absolute Return Asset
Allocation Fund | | | 19,517,465 | | | 20,028,677 | | | — | | | 20,028,677 | | | — | | | 20,028,677 | |
Multi-Asset Income
Asset Allocation Fund | | | 9,744,306 | | | 10,032,164 | | | — | | | 10,032,164 | | | — | | | 10,032,164 | |
Fixed Income
Allocation Fund | | | 14,236,877 | | | 14,579,236 | | | — | | | 14,579,236 | | | — | | | 14,579,236 | |
| | | | | | | | | | | | | | | | | | | |
| | $ | 126,837,923 | | $ | 131,418,233 | | $ | — | | $ | 131,409,880 | | $ | (50,168 | ) | $ | 131,359,712 | |
| | | | | | | | | | | | | | | | | | | |
163
|
GuideMarkSM Funds |
NOTES TO FINANCIAL STATEMENTS (Unaudited) (Continued) |
September 30, 2012 |
| |
| |
7. | Investment Transactions |
| |
| The aggregate purchases and sales of securities, excluding short-term investments, for the period ended September 30, 2012 are summarized below. |
| | | | | | | |
| | Purchases | | Sales | |
| | | | | |
Large Cap Growth Fund | | $ | 46,063,192 | | $ | 63,901,693 | |
Large Cap Value Fund | | | 14,123,587 | | | 27,114,522 | |
Small/Mid Cap Core Fund | | | 66,048,367 | | | 66,664,309 | |
World ex-US Fund | | | 126,382,848 | | | 85,127,043 | |
Opportunistic Equity Fund | | | 34,826,836 | | | 45,567,736 | |
Global Real Return
Fund | | | 16,706,485 | | | 23,146,265 | |
Core Fixed Income
Fund* | | | 794,522,082 | | | 866,936,805 | |
Tax-Exempt Fixed
Income Fund | | | 10,049,134 | | | 12,158,085 | |
Opportunistic Fixed
Income Fund | | | 152,836,015 | | | 137,774,372 | |
Strategic Asset
Allocation Fund | | | 59,135,049 | | | 11,488,419 | |
Tactical Constrained
Asset Allocation Fund | | | 110,159,896 | | | 73,316,664 | |
Tactical Unconstrained
Asset Allocation Fund | | | 323,615,643 | | | 264,876,667 | |
Absolute Return Asset
Allocation Fund | | | 297,990,824 | | | 129,549,111 | |
Multi-Asset Income
Asset Allocation Fund | | | 49,908,972 | | | 47,516 | |
Fixed Income
Allocation Fund | | | 203,998,055 | | | 5,686,926 | |
Altegris® Multi-Strategy
Alternative Allocation
Fund | | | 139,303,582 | | | 53,924 | |
| |
* | Included in these amounts were $163,035,574 of purchases and $208,328,478 of sales of U.S. Government Securities. |
| |
| |
8. | Option Contracts Written |
| |
| The premium amount and number of option contracts written during the period ended September 30, 2012 in the Opportunistic Fixed Income Fund, were as follows: |
| | | | | | | | | | |
| | Amount of
Premiums | | Number of
Contracts | | Notional
Amount | |
| | | | | | | |
Outstanding
at 3/31/12 | | $ | 218,467 | | | 1,600 | | | 5,600,000 | |
Options written | | | 25,276 | | | 484 | | | — | |
Options expired | | | — | | | — | | | — | |
Options exercised | | | — | | | — | | | — | |
Options closed | | | (222,999 | ) | | (1,842 | ) | | (5,600,000 | ) |
| | | | | | | | | | |
Outstanding
at 9/30/12 | | $ | 20,744 | | | 242 | | | — | |
| | | | | | | | | | |
| |
9. | Other Tax Information |
| |
| The Regulated Investment Company Modernization Act of 2010 (the “Act”) was enacted on December 22, 2010. The Act modified several tax rules impacting the Funds. In general, the provisions of the Act are effective for the Funds’ fiscal year ending March 31, 2012. Although the Act provides several benefits, including the unlimited carryover of future capital losses, there may be a greater likelihood that all or a portion of each fund’s pre-enactment capital loss carryovers may expire without being utilized due to the fact that post-enactment capital losses get utilized before pre-enactment capital loss carryovers. |
| |
| Net Investment Income and realized gains and losses for Federal income tax purposes may differ from that reported on the financial statements because of permanent book-to-tax differences. GAAP requires that permanent differences between financial reporting and tax reporting be reclassified between various components of net assets. |
164
|
GuideMarkSM Funds |
NOTES TO FINANCIAL STATEMENTS (Unaudited) (Continued) |
September 30, 2012 |
| |
| |
| These differences are primarily due to net operating losses, foreign currency and nondeductible stock issuance costs. On the Statement of Assets and Liabilities, the following adjustments were made: |
| | | | | | | | | | | |
| | | Accumulated
Net
Investment
Income
or (Loss) | | Accumulated
Realized
Gain or
(Loss) | | Capital
Stock | |
| | | | | | | | |
| Large Cap Growth Fund | | $ | 377,419 | | $ | (436 | ) | $ | (376,983 | ) |
| Large Cap Value Fund | | | 54 | | | (54 | ) | | — | |
| Small/Mid Cap Core Fund | | | 282,799 | | | (282,666 | ) | | (133 | ) |
| World ex-US Fund | | | (603,955 | ) | | 603,955 | | | — | |
| Opportunistic Equity Fund | | | 122,977 | | | 50,321 | | | (173,298 | ) |
| Global Real Return Fund | | | 110,287 | | | — | | | (110,287 | ) |
| Core Fixed Income Fund | | | 551,069 | | | (551,069 | ) | | — | |
| Tax-Exempt Fixed Income Fund | | | — | | | — | | | — | |
| Opportunistic Fixed Income Fund | | | (1,966,662 | ) | | 2,008,376 | | | (41,714 | ) |
| Strategic Asset Allocation Fund | | | 50,799 | | | (810 | ) | | (49,989 | ) |
| Tactical Constrained Asset Allocation Fund | | | 41,220 | | | — | | | (41,220 | ) |
| Tactical Unconstrained Asset Allocation Fund | | | 41,435 | | | 334 | | | (41,769 | ) |
| Absolute Return Asset Allocation Fund | | | 41,220 | | | — | | | (41,220 | ) |
| |
| The Funds intend to utilize provisions of the Federal income tax laws which allow the Funds to carry realized capital losses forward for eight years following the year of loss and offset such losses against any future realized capital gains. Capital loss carryforwards available for Federal income tax purposes are as follows: |
| | | | | | | | | | | | | | | | | | | |
| | Capital losses expiring: | |
| | | |
| | | | | | | | | | | | | | Indefinite | |
| | | | | | | | | | | | | | | |
| | 3/31/16 | | 3/31/17 | | 3/31/18 | | 3/31/19 | | Short Term | | Long Term | |
| | | | | | | | | | | | | |
Large Cap Growth Fund | | $ | — | | $ | 7,713,666 | | $ | 59,171,144 | | $ | — | | $ | — | | $ | — | |
Large Cap Value Fund | | | — | | | 24,185,255 | | | 146,948,668 | | | — | | | — | | | — | |
Small/Mid Cap Core Fund | | | — | | | 15,554,992 | | | 12,866,943 | | | — | | | — | | | — | |
World ex-US Fund | | | — | | | 63,053,726 | | | 139,582,037 | | | — | | | — | | | — | |
Opportunistic Equity Fund | | | — | | | — | | | — | | | — | | | 10,122,916 | | | — | |
Global Real Return Fund | | | — | | | — | | | — | | | — | | | 1,370,744 | | | — | |
Core Fixed Income Fund | | | — | | | — | | | 1,028,334 | | | — | | | 870,945 | | | 514,683 | |
Tax-Exempt Fixed Income Fund | | | 640,702 | | | 3,325,230 | | | 2,354,785 | | | — | | | — | | | — | |
Opportunistic Fixed Income Fund | | | — | | | — | | | — | | | — | | | 978,032 | | | 639,974 | |
Strategic Asset Allocation Fund | | | — | | | — | | | — | | | — | | | — | | | — | |
Tactical Constrained Asset
Allocation Fund | | | — | | | — | | | — | | | — | | | — | | | — | |
Tactical Unconstrained Asset
Allocation Fund | | | — | | | — | | | — | | | — | | | 649,769 | | | — | |
Absolute Return Asset
Allocation Fund | | | — | | | — | | | — | | | — | | | — | | | — | |
165
|
GuideMarkSM Funds |
NOTES TO FINANCIAL STATEMENTS (Unaudited) (Continued) |
September 30, 2012 |
| |
| |
| Additionally, at March 31, 2012, the Funds deferred on a tax basis post-October losses as follows: |
| | | | | | | |
| | Ordinary Late
Year Loss* | | Capital Loss | |
| | | | | |
Large Cap Growth Fund | | $ | 71,022 | | $ | 4,708,286 | |
Large Cap Value Fund | | | — | | | 365,180 | |
Small/Mid Cap Core Fund | | | — | | | — | |
World ex-US Fund | | | — | | | 11,164,793 | |
Opportunistic Equity Fund | | | — | | | 949,795 | |
Global Real Return Fund | | | 181,548 | | | 3,047,910 | |
Core Fixed Income Fund | | | — | | | — | |
Tax-Exempt Fixed Income Fund | | | — | | | — | |
Opportunistic Fixed Income Fund | | | — | | | 1,387,898 | |
Strategic Asset Allocation Fund | | | 191,954 | | | — | |
Tactical Constrained Asset Allocation Fund | | | — | | | 24,118 | |
Tactical Unconstrained Asset Allocation Fund | | | — | | | 842,306 | |
Absolute Return Asset Allocation Fund | | | — | | | — | |
| |
| The qualified late year ordinary loss is the excess of the sum of the specified losses attributable to the portion of the taxable year after October 31, and the ordinary losses attributable to the portion of the taxable year after December 31, over the sum of the specified gains attributable to the portion of the taxable year after October 31, and other ordinary income attributable to the portion of the taxable year after December 31. |
| |
| The tax components of distributions paid during the fiscal years ended March 31, 2012 and March 31, 2011 are as follows: |
| | | | | | | | | | |
| | Year Ended March 31, 2012 | |
| | | |
| | Ordinary
Income
Distributions | | Long-Term
Capital Gain
Distributions | | Return of
Capital | |
| | | | | | | |
Large Cap Growth Fund | | $ | — | | $ | — | | $ | — | |
Large Cap Value Fund | | | 2,236,272 | | | — | | | — | |
Small/Mid Cap Core Fund | | | — | | | — | | | — | |
World ex-US Fund | | | 2,815,992 | | | — | | | — | |
Opportunistic Equity Fund | | | — | | | — | | | — | |
Global Real Return Fund | | | 1,072,645 | | | — | | | 65,516 | |
Core Fixed Income Fund | | | 7,831,235 | | | — | | | — | |
Tax-Exempt Fixed Income Fund* | | | 2,990,928 | | | — | | | — | |
Opportunistic Fixed Income Fund | | | 7,960,168 | | | — | | | — | |
Strategic Asset Allocation Fund | | | 1,058,402 | | | — | | | 8,769 | |
Tactical Constrained Asset Allocation Fund | | | 920,562 | | | — | | | — | |
Tactical Unconstrained Asset Allocation Fund | | | 667,199 | | | — | | | — | |
Absolute Return Asset Allocation Fund | | | 1,125,858 | | | — | | | — | |
| | | | | | | | | | |
* Contains $2,931,871 of tax-exempt income for year ended 3/31/2012. |
166
|
GuideMarkSM Funds |
NOTES TO FINANCIAL STATEMENTS (Unaudited) (Continued) |
September 30, 2012 |
| |
| | | | | | | | | | |
| | Year Ended March 31, 2011 | |
| | | |
| | Ordinary
Income
Distributions | | Long-Term
Capital Gain
Distributions | | Return of
Capital | |
| | | | | | | |
Large Cap Growth Fund | | $ | — | | $ | — | | $ | — | |
Large Cap Value Fund | | | 2,264,115 | | | — | | | — | |
Small/Mid Cap Core Fund | | | — | | | — | | | — | |
World ex-US Fund | | | 4,263,692 | | | — | | | — | |
Core Fixed Income Fund | | | 14,829,215 | | | — | | | — | |
Tax-Exempt Fixed Income Fund* | | | 6,259,146 | | | — | | | — | |
| | | | | | | | | | |
* Contains $6,135,871 of tax-exempt income for year ended 3/31/2011. |
|
At March 31, 2012, the components of accumulated earnings (losses) on a tax basis were as follows: |
| | | | | | | | | | | | | | | | | | | |
| | Large Cap
Growth
Fund | | Large Cap
Value
Fund | | Small/Mid
Cap Core
Fund | | World
ex-US
Fund | | Opportunistic
Equity
Fund | | Global
Real Return
Fund | |
| | | | | | | | | | | | | |
Cost of Investments | | | 159,825,136 | | | 189,271,938 | | | 75,783,993 | | | 224,078,025 | | | 154,095,703 | | | 141,951,967 | |
Gross Unrealized
Appreciation | | | 49,347,598 | | | 32,255,021 | | | 9,612,530 | | | 17,753,158 | | | 16,085,885 | | | 3,404,093 | |
Gross Unrealized
Depreciation | | | (5,921,970 | ) | | (9,655,304 | ) | | (3,002,534 | ) | | (17,071,973 | ) | | (6,892,208 | ) | | (8,003,602 | ) |
| | | | | | | | | | | | | | | | | | | |
Net Unrealized
Appreciation | | | 43,425,628 | | | 22,599,717 | | | 6,609,996 | | | 681,185 | | | 9,193,677 | | | (4,599,509 | ) |
| | | | | | | | | | | | | | | | | | | |
Undistributed
Tax-Exempt
Ordinary Income | | | — | | | — | | | — | | | — | | | — | | | — | |
Undistributed
Ordinary Income | | | — | | | 561,303 | | | 83,776 | | | 2,085,558 | | | — | | | — | |
Undistributed
Long-Term
Cap Gains | | | — | | | — | | | — | | | — | | | — | | | — | |
| | | | | | | | | | | | | | | | | | | |
Total Distributable
Earnings | | | — | | | 561,303 | | | 83,776 | | | 2,085,558 | | | — | | | — | |
| | | | | | | | | | | | | | | | | | | |
Other Accumulated
Losses | | | (71,664,118 | ) | | (171,499,103 | ) | | (28,421,935 | ) | | (213,834,652 | ) | | (11,072,711 | ) | | (4,638,316 | ) |
| | | | | | | | | | | | | | | | | | | |
Total Accumulated
Losses | | | (28,238,490 | ) | | (148,338,083 | ) | | (21,728,163 | ) | | (211,067,909 | ) | | (1,879,034 | ) | | (9,237,825 | ) |
| | | | | | | | | | | | | | | | | | | |
167
|
GuideMarkSM Funds |
NOTES TO FINANCIAL STATEMENTS (Unaudited) (Continued) |
September 30, 2012 |
| |
| | | | | | | | | | | | | | | | | | | | | | |
| | Core
Fixed Income
Fund | | Tax-Exempt
Fixed Income
Fund | | Opportunistic
Fixed Income
Fund | | Strategic
Asset
Allocation
Fund | | Tactical
Constrained
Asset
Allocation
Fund | | Tactical
Unconstrained
Asset
Allocation
Fund | | Absolute
Return
Asset
Allocation
Fund | |
| | | | | | | | | | | | | | | |
Cost of Investments | | | 463,640,765 | | | 74,885,071 | | | 238,598,241 | | | 138,145,020 | | | 145,104,211 | | | 179,656,234 | | | 258,103,315 | |
Gross Unrealized | | | | | | | | | | | | | | | | | | | | | | |
Appreciation | | | 14,257,152 | | | 6,530,510 | | | 4,227,821 | | | 10,611,136 | | | 9,260,191 | | | 11,276,250 | | | 3,450,047 | |
Gross Unrealized | | | | | | | | | | | | | | | | | | | | | | |
Depreciation | | | (6,857,309 | ) | | (47,438 | ) | | (7,976,844 | ) | | (2,286,248 | ) | | (1,812,696 | ) | | (2,812,134 | ) | | (1,788,123 | ) |
| | | | | | | | | | | | | | | | | | | | | | |
Net Unrealized | | | | | | | | | | | | | | | | | | | | | | |
Appreciation | | | 7,399,843 | | | 6,483,072 | | | (3,749,023 | ) | | 8,324,888 | | | 7,447,495 | | | 8,464,116 | | | 1,661,924 | |
| | | | | | | | | | | | | | | | | | | | | | |
| | | | | | | | | | | | | | | | | | | | | | |
Undistributed | | | | | | | | | | | | | | | | | | | | | | |
Tax-Exempt | | | | | | | | | | | | | | | | | | | | | | |
Ordinary Income | | | — | | | 40,602 | | | — | | | — | | | — | | | — | | | — | |
Undistributed | | | | | | | | | | | | | | | | | | | | | | |
Ordinary Income | | | 920,490 | | | 25,858 | | | 150,544 | | | — | | | 148,140 | | | 254,452 | | | 1,037,242 | |
Undistributed | | | | | | | | | | | | | | | | | | | | | | |
Long-Term | | | | | | | | | | | | | | | | | | | | | | |
Cap Gains | | | — | | | — | | | — | | | — | | | — | | | — | | | 81,650 | |
| | | | | | | | | | | | | | | | | | | | | | |
Total Distributable | | | | | | | | | | | | | | | | | | | | | | |
Earnings | | | 920,490 | | | 66,460 | | | 150,544 | | | — | | | 148,140 | | | 254,452 | | | 1,118,892 | |
| | | | | | | | | | | | | | | | | | | | | | |
| | | | | | | | | | | | | | | | | | | | | | |
Other Accumulated | | | | | | | | | | | | | | | | | | | | | | |
Losses | | | (2,417,307 | ) | | (6,320,717 | ) | | (3,325,202 | ) | | (225,273 | ) | | (57,437 | ) | | (1,525,394 | ) | | (33,319 | ) |
| | | | | | | | | | | | | | | | | | | | | | |
Total Accumulated | | | | | | | | | | | | | | | | | | | | | | |
Losses | | | 5,903,026 | | | 228,815 | | | (6,923,681 | ) | | 8,099,615 | | | 7,538,198 | | | 7,193,174 | | | 2,747,497 | |
| | | | | | | | | | | | | | | | | | | | | | |
| |
Additional Information |
| |
1. | Shareholder Notification of Federal Tax Status (Unaudited) |
| The Large Cap Value Fund, World ex-US Fund, Global Real Return Fund, Core Fixed Income Fund, Tax-Exempt Fixed Income Fund, Opportunistic Fixed Income Fund, Strategic Asset Allocation Fund, Tactical Constrained Asset Allocation Fund, Tactical Unconstrained Asset Allocation Fund and Absolute Return Asset Allocation Fund designated 100.00%, 0.00%,100.00%, 0.37%, 0.00%, 2.09%, 38.96%, 56.04%, 54.86% and 15.91%, respectively, of dividends during the fiscal year ended March 31, 2012 as dividends qualifying for the dividends received deduction available to corporate shareholders. |
| |
| The Large Cap Value Fund, World ex-US Fund, Global Real Return Fund, Core Fixed Income Fund, Tax-Exempt Fixed Income Fund, Opportunistic Fixed Income Fund, Strategic Asset Allocation Fund, Tactical Constrained Asset Allocation Fund, Tactical Unconstrained Asset Allocation Fund and Absolute Return Asset Allocation Fund designated 100.00%, 100.00%, 100.00%, 0.37%, 0.00%, 3.74%, 100.00%, 100.00%, 73.85% and 17.22%, respectively, of dividends declared from net investment income during the fiscal year ended March 31, 2012 as qualified income under the Jobs and Growth Tax Relief Reconciliation Act of 2003. |
168
|
GuideMarkSM Funds |
NOTES TO FINANCIAL STATEMENTS (Unaudited) (Continued) |
September 30, 2012 |
| |
| |
2. | Foreign Tax Credit Pass Through (Unaudited) |
| Pursuant to Section 853 of the Internal Revenue Code, the GuideMarkSM World ex-US Fund and GuideMarkSM Opportunistic Fixed Income Fund designate the following amounts as foreign taxes paid for the year ended March 31, 2012. Foreign taxes paid for purposes of Section 853 may be less than actual foreign taxes paid for financial statement purposes. |
| | | | | | | |
| | Creditable Foreign
Taxes Paid | | Per Share
Amount | | Portion of Ordinary Income Distribution
Derived from Foreign Sourced Income* | |
| | | | | | | |
GuideMarkSM World ex-US Fund | | $501,682 | | $0.0167 | | 99.94% | |
GuideMarkSM Opportunistic | | | | | | | |
Fixed Income Fund | | $129,311 | | $0.0052 | | 59.72% | |
| | |
| * | None of the Funds listed above derived any income from “ineligible foreign sources” as defined under Section 901(j) of the Internal Revenue Code. |
| | |
| Foreign taxes paid or withheld should be included in taxable income with an offsetting deduction from gross income or as a credit for taxes paid to foreign governments. |
| | |
| Above figures may differ from those cited elsewhere in this report due to differences in the calculation of income and gains under U.S. generally accepted accounting principles (book) purposes and Internal Revenue Service (tax) purposes. |
| | |
| Shareholders are strongly advised to consult their own tax advisers with respect to the tax consequences of their investments in the Funds. In January, shareholders, excluding corporate shareholders, receive an IRS 1099-DIV regarding the Federal tax status of the dividends and distributions they received in the calendar year. |
169
|
GuideMarkSM Funds |
NOTES TO FINANCIAL STATEMENTS (Unaudited) (Continued) |
September 30, 2012 |
| |
| |
3. | Disclosure Regarding Fund Trustees and Officers (Unaudited) |
| | | | | | | | | | |
Name, Address
and Year of Birth | | Position(s)
Held with
the Trust | | Term of Office
and Length of
Time Served | | Principal
Occupation During Past Five Years | | # of
Portfolios
in Fund
Complex
Overseen
by Trustee | | Other
Director/
Trustee
Positions |
| | | | | | | | | | | |
| | | | | | | | | | |
GPS Funds I | | | | | | | | | | |
Independent Trustees | | | | | | | | | | |
| | | | | | | | | | |
William J. Klipp
Year of Birth: 1955
c/o Genworth Financial
Wealth Management, Inc.
2300 Contra Costa
Boulevard Ste 600
Pleasant Hill, CA
94523-3967 | | Lead Independent Trustee | | Indefinite Term since January 2001. Lead Independent Trustee since May 2007. | | Retired (1990-present). Formerly, President and Chief Operating Officer, Charles Schwab Investment Management, Inc. and Executive Vice President, Schwab Funds (1993-1999). | | 7 | | Trustee, Adelante Real Estate Fund (2000 to 2010). |
| | | | | | | | | | |
R. Thomas DeBerry
Year of Birth: 1941
c/o Genworth Financial
Wealth Management, Inc.
2300 Contra Costa
Boulevard Ste 600
Pleasant Hill, CA
94523-3967 | | Independent Trustee | | Indefinite Term since January 2001. | | Retired; President, DeBerry Consulting (a securities consulting firm) (1988 to present). | | 7 | | None |
| | | | | | | | | | |
Dennis G. Schmal
Year of Birth: 1947
c/o Genworth Financial
Wealth Management, Inc.
2300 Contra Costa
Boulevard Ste 600
Pleasant Hill, CA
94523-3967 | | Independent Trustee | | Indefinite Term since July 2007. | | Self-employed consultant (1999-present); formerly, Partner, Arthur Andersen LLP (audit services) (1972-1999). | | 7 | | Director, Sitoa Global Inc. (2011 to present); Director, Wells Fargo ASGI Hedge Funds (closed-end hedge funds) (2008 to present); Director/ Chairman, Pacific Metrics Corp. (educational services) (2005 to present); Director, Merriman Holdings, Inc. (financial services) (2003 to present); Director, Grail Advisers ETF Trust (2009 to 2011); Director, Varian Semi-conductor Equipment Associates, Inc. (2004 to 2011); Director, North Bay Bancorp (2006 to 2007). |
170
|
GuideMarkSM Funds |
NOTES TO FINANCIAL STATEMENTS (Unaudited) (Continued) |
September 30, 2012 |
| |
| | | | | | | | | | |
Name, Address
and Year of Birth | | Position(s)
Held with
the Trust | | Term of Office
and Length of
Time Served | | Principal
Occupation During Past Five Years | | # of
Portfolios
in Fund
Complex
Overseen
by Trustee | | Other
Director/
Trustee
Positions |
| | | | | | | | | | | |
| | | | | | | | | | |
Interested Trustee | | | | | | | | | | |
|
Ronald Cordes*
Year of Birth: 1959
Genworth Financial
Wealth Management, Inc.
2300 Contra Costa
Boulevard Ste 600
Pleasant Hill, CA
94523-3967 | | Chairman of the Board and Trustee | | Indefinite Term since January 2001. | | Co-Chairman, Genworth Financial Wealth Management (“GFWM”) (formerly, AssetMark Investment Services) (2006-present); President, GPS Funds I (formerly AssetMark Funds) (2001-2008); Principal, AssetMark Investment Services (1994 to 2008); President, Chairman and Chief Compliance Officer, AssetMark Capital Corporation (1994-2008). | | 7 | | Director, Microvest Capital Management, (investment company) (2012 to present); Director, Encore.org (nonprofit organization) (2012 to present); Director, US Global Leadership Coalition (nonprofit organization) (2012 to present); Managing Member, Opportunity Collaboration, LLC (conference convener) (2012 to present); Director, ImpactAssets, (nonprofit organization) (2012 to present); Chairman, FairTrade USA (nonprofit organization) (2010 to present); Vice Chairman, Sarona Frontier General Partner, Inc. (investment fund) (2010 to present); Board of Regents, University of the Pacific (2009 to present); Director, East Bay Community Foundation (2007 to present); Director, ThinkImpact (nonprofit organization) (2010 to 2012); Katalysis Bootstrap Fund (nonprofit organization) (2005 to 2012); Investment Committee Member, Microvest Fund I (investment fund) (2009 to 2011). |
171
|
GuideMarkSM Funds |
NOTES TO FINANCIAL STATEMENTS (Unaudited) (Continued) |
September 30, 2012 |
| |
| | | | | | | | | | |
Name, Address
and Year of Birth | | Position(s)
Held with
the Trust | | Term of Office
and Length of
Time Served | | Principal
Occupation During Past Five Years | | # of
Portfolios
in Fund
Complex
Overseen
by Trustee | | Other
Director/
Trustee
Positions |
| | | | | | | | | | | |
| | | | | | | | | | |
GPS Funds II | | | | | | | | | | |
Independent Trustees | | | | | | | | | | |
| | | | | | | | | | |
David M. Dunford
Year of Birth: 1949
c/o Genworth Financial
Wealth Management, Inc.
2300 Contra Costa
Boulevard Ste 600
Pleasant Hill, CA
94523-3967 | | Independent Trustee | | Indefinite Term since 2011. | | Retired; formerly, Senior Vice President, Merrill Lynch Insurance Group (1989-2001). | | 9 | | Director, New England Bancorp (2006-present); Trustee, Genworth Variable Insurance Trust (“GVIT”) (2008-2012); Director, Hospice and Palliative Care of Cape Cod (2006-2011). |
| | | | | | | | | | |
Paul S. Feinberg
Year of Birth: 1942
c/o Genworth Financial
Wealth Management, Inc.
2300 Contra Costa
Boulevard Ste 600
Pleasant Hill, CA
94523-3967 | | Independent Trustee | | Indefinite Term since 2011. | | Retired; formerly, President, CitiStreet Funds, Inc. (2000-2005); Executive Vice President and General Counsel, CitiStreet Associates LLC (insurance agency), CitiStreet Equities LLC (broker-dealer), CitiStreet Financial Services LLC (registered investment advisor) and CitiStreet Funds Management LLC (registered investment advisor) (1990-2005). | | 9 | | Trustee, GVIT (2008-2012); Trustee, Blue Fund Group (2006-2008). |
| | | | | | | | | | |
John A. Fibiger
Year of Birth: 1932
c/o Genworth Financial
Wealth Management, Inc.
2300 Contra Costa
Boulevard Ste 600
Pleasant Hill, CA
94523-3967 | | Independent Trustee | | Indefinite Term since 2011. | | Retired; formerly, Chairman, TransAmerica Life Companies (“TransAmerica”) (insurance company) (1994-1997); President, TransAmerica (1993-1994); Chief Financial Officer, TransAmerica (1990-1993); President, New England Mutual Life Insurance Company (life insurance company) (1981-1989); New England Mutual Life Insurance Company (1974-1980). | | 10 | | Director, Members Mutual Holding Co. (2008-present); Trustee, Genworth Financial Asset Management Funds (“GFAM”) (2006- present); Director, Fidelity Life Association (life insurance company) (2006-present); Trustee, GVIT (2008-2012); Member, Executive Committee, Austin Symphony Orchestra Board of Directors; Life Trustee, Museum of Science, Boston, Massachusetts. |
172
|
GuideMarkSM Funds |
NOTES TO FINANCIAL STATEMENTS (Unaudited) (Continued) |
September 30, 2012 |
| |
| | | | | | | | | | |
Name, Address
and Year of Birth | | Position(s)
Held with
the Trust | | Term of Office
and Length of
Time Served | | Principal
Occupation During Past Five Years | | # of
Portfolios
in Fund
Complex
Overseen
by Trustee | | Other
Director/
Trustee
Positions |
| | | | | | | | | | | |
| | | | | | | | | | |
Interested Trustee | | | | | | | | | | |
| | | | | | | | | | |
Gurinder S. Ahluwalia**
Year of Birth: 1965
c/o Genworth Financial
Wealth Management, Inc.
2300 Contra Costa
Boulevard Ste 600
Pleasant Hill, CA
94523-3967 | | Interested Trustee | | Indefinite Term since 2011. | | President and CEO of Genworth Financial Wealth Management (“GFWM”) (2009-present); Co-Chairman, GFWM (2008-2009); Vice-Chairman, AssetMark Investment Services, Inc. (2006-2008); President, GFAM (2004-2008); President and Chairman, Genworth Financial Asset Management, Inc. (2004-2008). | | 10 | | Trustee, GFAM (2005-present); Genworth Financial Trust Company (2004-present); Altegris Investment, Inc. (2011-present); Altegris Portfolio Management, Inc. (d/b/a Altegris Funds) (2011-present); Ensaaf (nonprofit organization) (2011- present); Quantuvis Consulting, Inc. (2008- present); Trustee, GVIT (2008-2012); Centurion Capital Group Inc., Centurion Financial Advisers Inc.; GFWM, formerly AssetMark Investment Services, Inc.; Genworth Financial Asset Management, Inc. |
173
|
GuideMarkSM Funds |
NOTES TO FINANCIAL STATEMENTS (Unaudited) (Continued) |
September 30, 2012 |
| |
| | | | | | |
Name, Address
and Year of Birth | | Position(s)
Held with
the Trust | | Term of Office
and Length of
Time Served | | Principal Occupation During Past Five Years |
| | | | | | | |
| | | | | | |
Officers | | | | | | |
| | | | | | |
Carrie E. Hansen
Year of Birth: 1970
Genworth Financial
Wealth Management, Inc.
2300 Contra Costa
Boulevard Ste 600
Pleasant Hill, CA
94523-3967 | | President | | Renewed 1-Year Term since May 2007. | | President, GPS Funds I (formerly, AssetMark Funds) (2007-present) and GPS Funds II (2011-present); President, Genworth Financial Asset Management Funds (“GFAM”) and Genworth Variable Insurance Trust (“GVIT”) (2008-2012); Senior Vice President and Chief Operations Officer, GFWM (2008-present); Chairman, Genworth Financial Trust Company (2008-present); Senior Vice President and Managing Director of the Trust (2007-2008); Treasurer and Chief Compliance Officer, GFAM (2007-2008); Chief Compliance Officer of the Trust (2005-2008); Treasurer of the Trust, (2001-2008); Senior Vice President, Chief Financial Officer and Chief Compliance Officer, GFWM, formerly, AssetMark Investment Services, Inc., (2004-2007). |
| | | | | | |
John Koval
Year of Birth: 1966
Genworth Financial
Wealth Management, Inc.
2300 Contra Costa
Boulevard Ste 600
Pleasant Hill, CA
94523-3967 | | Interim Chief Compliance Officer and AML Compliance Officer | | Since 2012. | | Senior Compliance Officer, Genworth Financial Wealth Management (2011 to present); Chief Operating Officer, SEAL Capital, Inc. (2009 to 2010); Chief Compliance Officer, Cliffwood Partners LLC (2004 to 2009). |
| | | | | | |
Starr E. Frohlich
Year of Birth: 1972
Genworth Financial
Wealth Management, Inc.
2300 Contra Costa
Boulevard Ste 600
Pleasant Hill, CA
94523-3967 | | Vice President and Treasurer | | 1-Year Term since March 2010. | | Vice President and Treasurer, GPS Funds I (formerly, AssetMark Funds) (2010-present), GPS Funds II (2011-present) and GFAM (2010-present); Director of Fund Administration, GFWM (2010-present); Vice President, U.S. Bancorp Fund Services, LLC (1997-2010). |
| | | | | | |
Christine Villas-Chernak
Year of Birth: 1968
Genworth Financial
Wealth Management, Inc.
2300 Contra Costa
Boulevard Ste 600
Pleasant Hill, CA
94523-3967 | | Deputy Chief Compliance Officer; Secretary | | Since 2009. Renewed 1-Year term since September 2006. | | Deputy Chief Compliance Officer, GPS Funds I (formerly, AssetMark Funds) (2009-present) and GPS Funds II (2011-present); Secretary, GPS Funds I (2006-present), GPS Funds II (2011-present), GFAM (2009-2010) and GVIT (2008-2010); Senior Compliance Officer, GFWM (2005-2009). |
174
|
GuideMarkSM Funds |
NOTES TO FINANCIAL STATEMENTS (Unaudited) (Continued) |
September 30, 2012 |
| |
| | | | | | |
Name, Address
and Year of Birth | | Position(s)
Held with
the Trust | | Term of Office
and Length of
Time Served | | Principal Occupation During Past Five Years |
| | | | | | | |
| | | | | | |
Robert J. Bannon
Year of Birth: 1957
Genworth Financial
2300 Contra Costa
Boulevard Ste 600
Pleasant Hill, CA
94523-3967 | | Vice President and Chief Risk Officer | | Since 2010. | | Vice President and Chief Risk Officer, GPS Funds I (formerly, AssetMark Funds) (2010 to present), GPS Funds II (2011 to present) and GFAM (2010 to present); Senior Vice President and Chief Risk Officer, GFWM (2007-present). |
| |
* | Ronald Cordes is an “interested person” of the Trust as defined in the 1940 Act because he is the Chairman of the Board for GFWM and serves as Director for GFWM and Quantuvis. |
| |
** | Mr. Ahluwalia is a Trustee who is an “interested person” of the Trust as defined in the 1940 Act because he is an officer of GFWM or certain of its affiliates. |
The Statement of Additional Information includes additional information about the Funds’ Trustees and is available free of charge upon request by calling the Funds toll free at (888) 278-5809.
| |
4. | Proxy Voting Policies and Procedures and Proxy Voting Record (Unaudited) |
| A description of the policies and procedures that the Funds use to determine how to vote proxies related to the Funds’ portfolio securities as well as information regarding how the Funds voted proxies relating to portfolio securities during the most recent 12-month period ended June 30 is available without charge, upon request, by calling (888) 278-5809. Furthermore, you can obtain the Fund’s proxy voting records on the SEC’s website at http://www.sec.gov. |
| |
5. | Availability of Quarterly Portfolio Holdings Schedules (Unaudited) |
| The Funds file their complete schedules of portfolio holdings with the SEC for their first and third fiscal quarters on Form N-Q. Once filed, the Funds’ Form N-Q is available without charge, upon request on the SEC’s website (http://www.sec.gov) and is available by calling (888) 278-5809. You can also obtain copies of Form N-Q by (i) visiting the SEC’s Public Reference Room in Washington, D.C. (information on the operation of the Public Reference Room may be obtained by calling 1-800-SEC-0330); (ii) sending your request and a duplicating fee to the SEC’s Public Reference Room, Washington, D.C. 20549-0102; or (iii) sending your request electronically to publicinfo@sec.gov. |
| |
6. | Statement Regarding the Basis for Approval of Investment Sub-Advisory Agreements (Unaudited) |
| |
| GPS Funds I: Board of Trustees’ Consideration and Approval of a New Sub-Advisory Agreement for the GuideMark Core Fixed Income Fund (Unaudited) |
| |
| At a meeting held on June 19, 2012, the Board of Trustees (the “Board” or the “Trustees”) of GPS Funds I (the “Trust”) approved a new sub-advisory agreement (the “Wellington Sub-Advisory Agreement”) between Wellington Management Company, LLP (“Wellington Management”) and Genworth Financial Wealth Management, Inc. (the “Advisor”), on behalf of one of the Trust’s series, the GuideMark Core Fixed Income Fund (the “Fund”). |
| |
| The Fund is managed using a “manager of managers” structure that generally involves the use of one or more sub-advisors to manage allocated portions of the Fund’s portfolio. In accordance with the terms of an exemptive order that the Advisor and the Trust have received from the U.S. Securities and Exchange Commission, the Wellington Sub-Advisory Agreement was not submitted to a vote of shareholders. |
175
|
GuideMarkSM Funds |
NOTES TO FINANCIAL STATEMENTS (Unaudited) (Continued) |
September 30, 2012 |
| |
| |
| The Board, including a majority of the independent Trustees, determined to approve the Wellington Sub-Advisory Agreement. The material factors considered and the conclusions that formed the bases of the Board’s approval of the Wellington Sub-Advisory Agreement are described below. This summary describes the most significant, but not all, of the factors evaluated by the Board. In preparation for their meeting, the Trustees requested, received, and reviewed information relevant to their consideration of the Wellington Sub-Advisory Agreement. The Trustees also received assistance and advice regarding legal and industry standards from independent counsel to the independent Trustees. |
| |
| The Wellington Sub-Advisory Agreement |
| |
| Materials Reviewed and the Review Process |
| |
| The Board reviewed various materials requested by counsel on behalf of the independent Trustees related to the Wellington Sub-Advisory Agreement that included, among other things: (1) a copy of the proposed form of sub-advisory agreement between Wellington Management and the Advisor, on behalf of the Fund; (2) Wellington Management’s responses to the Advisor’s due diligence questionnaire; (3) Wellington Management’s Form ADV disclosures; (4) a description of the Advisor’s selection and recommendation process with respect to Wellington Management and the reasons for such recommendation; (5) information regarding the amount of the proposed sub-advisory fee payable to Wellington Management and a comparison to Wellington Management’s standard fee schedule for accounts managed using the same investment strategy as the one to be used for Wellington Management’s allocated portion of the Fund; (6) biographical information for the investment professionals who would be responsible for the day-to-day management of Wellington Management’s allocated portion of the Fund’s portfolio; (7) information regarding Wellington Management’s financial condition; and (8) information regarding Wellington Management’s compliance policies and other internal procedures. The Trustees also considered the recommendations of the Advisor with respect to Wellington Management and the methods and resources the Advisor utilizes in its efforts to identify and engage sub-advisors for the Fund. |
| |
| Prior to approving the Wellington Sub-Advisory Agreement, the independent Trustees met in executive session with independent counsel without representatives of the Advisor or its affiliates. The independent Trustees were assisted by independent counsel throughout the review process. The independent Trustees relied upon the advice of independent counsel and their own business judgment in determining the material factors to be considered in evaluating the Wellington Advisory Agreement and the weight to be given to each such factor. The conclusions reached by the independent Trustees were based on a comprehensive evaluation of all the information provided and were not the result of any one factor. Moreover, each independent Trustee may have afforded different weight to the various factors in reaching his conclusions with respect to the Wellington Sub-Advisory Agreement. |
| |
| Factors Considered |
| |
| In considering the Wellington Sub-Advisory Agreement, the Board considered several factors that it deemed relevant, to the extent they were applicable: (1) the nature, extent, and quality of the services to be provided by Wellington Management; (2) the investment performance of Wellington Management; (3) the costs of the services to be provided and profits to be realized by Wellington Management and its affiliates from the relationship with the Fund, including any “fallout” benefits; (4) the extent to which economies of scale would be realized as the Fund grows; and (5) whether fee levels reflect those economies of scale for the benefit of Fund investors. |
| |
| Nature, Quality and Extent of Services |
| |
| The Trustees considered the nature, quality, and extent of services that Wellington Management would provide to the Fund. The Trustees considered the specific investment process to be employed by Wellington Management in managing the Fund. The Trustees reviewed the qualifications, experience, and track record of the portfolio management team that |
176
|
GuideMarkSM Funds |
NOTES TO FINANCIAL STATEMENTS (Unaudited) (Continued) |
September 30, 2012 |
| |
| |
| would be responsible for day-to-day management of Wellington Management’s allocated portion of the Fund’s portfolio. The Trustees also considered the Advisor’s review and selection process with respect to Wellington Management and the Advisor’s favorable assessment as to the nature and quality of the sub-advisory services expected to be provided by Wellington Management. |
| |
| Based on their consideration of the foregoing information, the Trustees concluded that the nature, quality, and extent of the sub-advisory services to be provided by Wellington Management were appropriate for the Fund in light of the Fund’s investment objective, policies, and strategies. |
| |
| Sub-Advisory Fees |
| |
| The Trustees considered the services to be rendered by Wellington Management and the compensation to be paid to Wellington Management by the Advisor. The Trustees considered comparisons of the fees to be paid with the fees charged by Wellington Management to other clients. The Trustees considered that the sub-advisory fees would be paid by the Advisor to Wellington Management and would not be additional fees borne by the Fund. The Trustees then considered any “fall-out” benefits-including the receipt by Wellington Management of research services paid for using soft dollars generated through trades in the Fund’s securities-that Wellington Management may receive as a result of its relationship with the Fund. The Trustees considered, however, that soft dollars generally were not used in fixed income funds. The Trustees also considered whether the fee schedule of Wellington Management included breakpoints that would reduce Wellington Management’s fees as assets in the Fund increased. The Trustees did not consider the profitability of Wellington Management to be a material factor based on representations from the Advisor that it negotiated the Wellington Sub-Advisory Agreement, including the sub-advisory fees, with Wellington Management on an arm’s-length basis. |
| |
| Based on their discussion and the information provided to them in advance of the meeting, the Trustees concluded that, in light of the quality and extent of the services to be provided, the fees payable to Wellington Management were reasonable. |
| |
| Investment Performance |
| |
| Because Wellington Management had not commenced providing sub-advisory services to the Fund at the time of the Trustees’ consideration of the Wellington Sub-Advisory Agreement, the Trustees could not consider Wellington Management’s investment performance with respect to its management of the Fund as a factor in evaluating the Wellington Sub-Advisory Agreement. However, the Trustees did consider Wellington Management’s specific investment approach and level of expertise within the core fixed income asset class in addition to its historical performance record with regard to pooled investment products similar to the Fund; the Trustees compared this historical performance to a relevant benchmark. |
| |
| The Trustees concluded that the historical performance record for Wellington Management, viewed together with the other relevant factors considered by the Trustees, supported a decision to approve the Wellington Sub-Advisory Agreement. |
| |
| Conclusion |
| |
| After consideration of the factors discussed above, with no single factor identified as being determinative to its decision, the Board, including a majority of the independent Board members with the assistance of independent counsel, concluded that the approval of the Wellington Sub-Advisory Agreement was in the best interests of the Fund. Accordingly, the Board approved the Wellington Sub-Advisory Agreement, and the fees to be paid thereunder to Wellington Management, on behalf of the Fund. |
177
|
GuideMarkSM Funds |
NOTES TO FINANCIAL STATEMENTS (Unaudited) (Continued) |
September 30, 2012 |
| |
| |
| GPS Funds II: Board of Trustees’ Consideration and Approval of a New Sub-Advisory Agreement for the GuideMark Opportunistic Fixed Income Fund (Unaudited) |
| |
| At a meeting held on June 28, 2012, the Board of Trustees (the “Board” or the “Trustees”) of GPS Funds II (the “Trust”) approved a new sub-advisory agreement (the “DoubleLine Sub-Advisory Agreement”) between DoubleLine Capital LP (“DoubleLine”) and Genworth Financial Wealth Management, Inc. (the “Advisor”), on behalf of one of the Trust’s series, the GuideMark Opportunistic Fixed Income Fund (the “Fund”). |
| |
| The Fund is managed using a “manager of managers” structure that generally involves the use of one or more sub-advisors to manage allocated portions of the Fund’s portfolio. In accordance with the terms of an exemptive order that the Advisor and the Trust have received from the U.S. Securities and Exchange Commission, the DoubleLine Sub-Advisory Agreement was not submitted to a vote of shareholders. |
| |
| The Board, including a majority of the independent Trustees, determined to approve the DoubleLine Sub-Advisory Agreement. The material factors considered and the conclusions that formed the bases of the Board’s approval of the DoubleLine Sub-Advisory Agreement are described below. This summary describes the most significant, but not all, of the factors evaluated by the Board. In preparation for their meeting, the Trustees requested, received, and reviewed information relevant to their consideration of the DoubleLine Sub-Advisory Agreement. The Trustees also received assistance and advice regarding legal and industry standards from independent counsel to the independent Trustees. |
| |
| The DoubleLine Sub-Advisory Agreement |
| |
| Materials Reviewed and the Review Process |
| |
| The Board reviewed various materials requested by counsel on behalf of the independent Trustees related to the DoubleLine Sub-Advisory Agreement that included, among other things: (1) a copy of the proposed form of sub-advisory agreement between DoubleLine and the Advisor, on behalf of the Fund; (2) DoubleLine’s responses to the Advisor’s due diligence questionnaire, including information on DoubleLine’s investment process; (3) DoubleLine’s Form ADV disclosures; (4) a description of the Advisor’s selection and recommendation process with respect to DoubleLine and the Advisor’s reasons for such recommendation; (5) information describing the nature, quality, and extent of services that DoubleLine would provide to the Fund and the proposed sub-advisory fee payable to each sub-advisor; (6) information concerning DoubleLine’s business and operations, investment team, compliance program, and internal procedures, including biographical information for the investment professionals who would be responsible for the day-to-day management of the Fund’s portfolio; and (7) information regarding the financial condition of DoubleLine. The Trustees also considered the recommendations of the Advisor with respect to DoubleLine and the methods and resources the Advisor utilizes in its efforts to identify and engage sub-advisors for the Fund. |
| |
| Prior to approving the DoubleLine Sub-Advisory Agreement, the independent Trustees met in executive session with independent counsel without representatives of the Advisor or its affiliates. The independent Trustees were assisted by independent counsel throughout the review process. The independent Trustees relied upon the advice of independent counsel and their own business judgment in determining the material factors to be considered in evaluating the DoubleLine Advisory Agreement and the weight to be given to each such factor. The conclusions reached by the independent Trustees were based on a comprehensive evaluation of all the information provided and were not the result of any one factor. Moreover, each independent Trustee may have afforded different weight to the various factors in reaching his conclusions with respect to the DoubleLine Sub-Advisory Agreement. |
178
|
GuideMarkSM Funds |
NOTES TO FINANCIAL STATEMENTS (Unaudited) (Continued) |
September 30, 2012 |
| |
| |
| Factors Considered |
| |
| In considering the DoubleLine Sub-Advisory Agreement, the Board considered several factors that it deemed relevant, to the extent they were applicable: (1) the nature, quality, and extent of the services to be provided by DoubleLine; (2) the investment performance of DoubleLine; (3) the costs of the services to be provided and profits to be realized by DoubleLine and its affiliates from the relationship with the Fund, including any “fall-out” benefits; (4) the extent to which economies of scale would be realized as the Fund grows; and (5) whether fee levels reflect those economies of scale for the benefit of Fund investors |
| |
| Nature, Quality, and Extent of Services |
| |
| The Trustees considered the nature, quality, and extent of services that DoubleLine would provide to the Fund. The Trustees considered the specific investment process to be employed by DoubleLine in managing the Fund and the qualifications of DoubleLine’s portfolio management team with regard to implementing the Fund’s investment mandate. The Trustees considered DoubleLine’s organization, personnel, and operations. The Trustees also considered the Advisor’s review and selection process with respect to DoubleLine and the Advisor’s favorable assessment as to the nature and quality of the sub-advisory services expected to be provided by DoubleLine. Based on their consideration and review of the foregoing factors, the Trustees concluded that the nature, quality, and extent of the sub-advisory services to be provided by DoubleLine, as well as DoubleLine’s ability to render such services based on its experience, organization, and resources, were appropriate for the Fund in light of the Fund’s investment objective, policies, and strategies. |
| |
| Sub-Advisory Fees and Expenses |
| |
| The Trustees considered the compensation to be paid to DoubleLine by the Advisor in conjunction with the services that would be rendered to the Fund. The Trustees also considered comparisons of the fees to be paid by the Advisor to DoubleLine with fees charged by DoubleLine to its other clients. The Trustees considered that the sub-advisory fees would be paid by the Advisor to DoubleLine and would not be additional fees borne by the Fund. The Trustees also considered whether the fee schedule of DoubleLine included breakpoints that would reduce DoubleLine’s fees as assets in the Fund increased. The Trustees did not consider the profitability of DoubleLine to be a material factor based on representations from the Advisor that it negotiated the DoubleLine Sub-Advisory Agreement, including the sub-advisory fees, with DoubleLine on an arm’s-length basis. The Trustees concluded that, in light of the quality and extent of the services to be provided, the proposed fees to be paid to DoubleLine were reasonable. |
| |
| The Trustees also considered “fall-out” or ancillary benefits that may potentially accrue to DoubleLine or its affiliates in the future because of its relationship with the Fund. The Trustees concluded that the benefits that might accrue to DoubleLine or its affiliates were reasonable. |
| |
| Investment Performance |
| |
| Because DoubleLine had not commenced providing sub-advisory services to the Fund at the time of the Trustees’ consideration of the sub-advisory agreement, the Trustees could not consider DoubleLine’s investment performance with respect to its management of the Fund as a factor in evaluating the DoubleLine Sub-Advisory Agreement. However, the Trustees did consider DoubleLine’s historical performance record in managing other funds and accounts with investment strategies similar to those of the Fund, and the Trustees also considered DoubleLine’s historical performance records compared to a relevant benchmark. |
| |
| The Trustees concluded that the historical performance record for DoubleLine, viewed together with the other relevant factors considered by the Trustees, supported a decision to approve the DoubleLine Sub-Advisory Agreement. |
179
|
GuideMarkSM Funds |
NOTES TO FINANCIAL STATEMENTS (Unaudited) (Continued) |
September 30, 2012 |
| |
| |
| Conclusion |
| |
| After consideration of the factors discussed above, with no single factor identified as being determinative to its decision, the Board, including a majority of the independent Board members with the assistance of independent counsel, concluded that the approval of the DoubleLine Sub-Advisory Agreement was in the best interests of the Fund. Accordingly, the Board approved the DoubleLine Sub-Advisory Agreement, and the fees to be paid thereunder to DoubleLine, on behalf of the Fund. |
180
GuideMarkSM Funds
GuidePathSM Funds
| |
| |
GUIDEMARKSM FUNDS & GUIDEPATHSM FUNDS |
| |
| |
GuideMarkSM Large Cap Growth Fund | |
GuideMarkSM Large Cap Value Fund | |
GuideMarkSM Small/Mid Cap Core Fund | |
GuideMarkSM World ex-US Fund | |
GuideMarkSM Opportunistic Equity Fund | |
GuideMarkSM Global Real Return Fund | |
GuideMarkSM Core Fixed Income Fund | |
GuideMarkSM Tax-Exempt Fixed Income Fund | |
GuideMarkSM Opportunistic Fixed Income Fund | |
GuidePathSM Strategic Asset Allocation Fund | |
GuidePathSM Tactical ConstrainedSM Asset Allocation Fund | |
GuidePathSM Tactical UnconstrainedSM Asset Allocation Fund | |
GuidePathSM Absolute Return Asset Allocation Fund | |
GuidePathSM Multi-Asset Income Asset Allocation Fund | |
GuidePathSM Fixed Income Allocation Fund | |
GuidePathSM Altegris® Multi-Strategy Alternative Allocation Fund | |
| |
Investment Advisor | |
Genworth Financial Wealth Management, Inc. | |
2300 Contra Costa Blvd., Suite 600 | |
Pleasant Hill, CA 94523 | |
| |
Legal Counsel | |
Stradley Ronon Stevens & Young, LLP | This document must be
preceded or accompanied by a
free prospectus. Investors should
consider the Fund’s investment
objectives, risks, charges and
expenses carefully before
investing. The prospectus
contains this and other
important information about
the Fund. Please read the
prospectus carefully before you
invest or send money. |
2005 Market Street, Suite 2600 |
Philadelphia, PA 19103 |
|
Independent Registered Public Accounting Firm |
KPMG LLP |
777 East Wisconsin Avenue |
Milwaukee, WI 53202 |
|
Transfer Agent, Fund Accountant |
and Fund Administrator |
U.S. Bancorp Fund Services, LLC |
615 East Michigan Street |
Milwaukee, WI 53202 |
| |
Custodians | |
U.S. Bank, N.A. BNY Mellon Asset Servicing | |
1555 North RiverCenter Drive, Suite 302 One Wall Street | |
Milwaukee, WI 53212 New York, NY 10286 | |
| |
Distributor | Semi-Annual Report
September 30, 2012 |
Capital Brokerage Corporation |
(dba Genworth Financial Brokerage Corporation in Indiana) |
6620 West Broad Street Building 2 |
Richmond, VA 23230 |
Member FINRA |
| |
Item 2. Code of Ethics.
Not applicable for semi-annual reports.
Item 3. Audit Committee Financial Expert.
Not applicable for semi-annual reports.
Item 4. Principal Accountant Fees and Services.
Not applicable for semi-annual reports.
Item 5. Audit Committee of Listed Registrants.
Not applicable to registrants who are not listed issuers (as defined in Rule 10A-3 under the Securities Exchange Act of 1934).
Item 6. Investments.
Schedule of Investments is included as part of the report to shareholders filed under Item 1 of this Form.
Item 7. Disclosure of Proxy Voting Policies and Procedures for Closed-End Management Investment Companies.
Not applicable to open-end management investment companies.
Item 8. Portfolio Managers of Closed-End Management Investment Companies.
Not applicable to open-end management investment companies.
Item 9. Purchases of Equity Securities by Closed-End Management Investment Company and Affiliated Purchasers.
Not applicable to open-end management investment companies.
Item 10. Submission of Matters to a Vote of Security Holders.
None.
Item 11. Controls and Procedures.
| |
(a) | Based on their evaluation of the registrant’s disclosure controls and procedures as of a date within 90 days of the filing date of this Form N-CSR (the “Report”), the registrant’s President/Principal Executive Officer and Treasurer/Principal Financial Officer believe that |
| |
| the disclosure controls and procedures (as defined in Rule 30a-3(c) under the Investment Company Act of 1940, as amended (the “1940 Act”)) are effectively designed to ensure that information required to be disclosed by the registrant in the Report is recorded, processed, summarized and reported by the filing date, including ensuring that information required to be disclosed in the Report is accumulated and communicated to the registrant’s officers who are making certifications in the Report, as appropriate, to allow timely decisions regarding required disclosure. |
| |
(b) | There were no changes in the registrant’s internal control over financial reporting (as defined in Rule 30a-3(d) under the 1940 Act) that occurred during the registrant’s second fiscal quarter of the period covered by this report that have materially affected, or are reasonably likely to materially affect, the registrant’s internal control over financial reporting. |
Item 12. Exhibits.
| |
(a) | (1) Any code of ethics or amendment thereto, that is the subject of the disclosure required by Item 2, to the extent that the registrant intends to satisfy Item 2 requirements through filing an exhibit. Not applicable for semi-annual reports. |
| |
| (2) A separate certification for each principal executive and principal financial officer pursuant to Section 302 of the Sarbanes-Oxley Act of 2002. Filed herewith. |
| |
(b) | Certifications pursuant to Section 906 of the Sarbanes-Oxley Act of 2002. Furnished herewith. |
SIGNATURES
Pursuant to the requirements of the Securities Exchange Act of 1934 and the Investment Company Act of 1940, the registrant has duly caused this report to be signed on its behalf by the undersigned, thereunto duly authorized.
| | | | |
| (Registrant) | GPS Funds II | |
| | | |
|
| By | /s/ Carrie E. Hansen | |
| | | |
| | Carrie E. Hansen, Principal Executive Officer/President | |
| | | |
| Date | 11/19/12 | |
| | | |
Pursuant to the requirements of the Securities Exchange Act of 1934 and the Investment Company Act of 1940, this report has been signed below by the following persons on behalf of the registrant and in the capacities and on the dates indicated.
| | | |
| By | /s/ Carrie E. Hansen | |
| | | |
| | Carrie E. Hansen, Principal Executive Officer/President | |
| | | |
| Date | 11/19/12 | |
| | | |
| | | |
| By | /s/ Starr E. Frohlich | |
| | | |
| | Starr E. Frohlich, Principal Financial Officer/Treasurer | |
| | | |
| Date | 11/19/12 | |
| | | |