UNITED STATES
SECURITIES AND EXCHANGE COMMISSION
Washington, D.C. 20549
FORM 6-K
Report Of Foreign Private Issuer
Pursuant To Rule 13a-16 Or 15d-16 Of
The Securities Exchange Act Of 1934
For the month of May 2020
Commission File Number: 000-54290
Grupo Aval Acciones y Valores S.A.
(Exact name of registrant as specified in its charter)
Carrera 13 No. 26A - 47
Bogotá D.C., Colombia
(Address of principal executive office)
Indicate by check mark whether the registrant files or will file annual reports under cover of Form 20-F or Form 40-F:
| Form 20-F | X | Form 40-F |
Indicate by check mark if the registrant is submitting the Form 6-K in paper as permitted by Regulation S-T Rule 101(b)(1):
| Yes | No | X |
Indicate by check mark if the registrant is submitting the Form 6-K in paper as permitted by Regulation S-T Rule 101(b)(7):
| Yes | No | X |
GRUPO AVAL ACCIONES Y VALORES S.A.
TABLE OF CONTENTS
| ITEM | |
| 1. | Report of First Quarter 2020 Consolidated Results |
| 2. | First Quarter 2020 Consolidated Earnings Results Presentation |
Item 1

Report of 1Q2020 consolidated results
Information reported in Ps billions(1)and under IFRS
(1) We refer to billions as thousands of millions.


Grupo Aval Acciones y Valores S.A. (“Grupo Aval”) is an issuer of securities in Colombia and in the United States.. As such, it is subject to compliance with securities regulation in Colombia and applicable U.S. securities regulation. Grupo Aval is also subject to the inspection and supervision of the Superintendency of Finance as holding company of the Aval financial conglomerate.
The consolidated financial information included in this document is presented in accordance with IFRS as currently issued by the IASB. Details of the calculations of non-GAAP measures such as ROAA and ROAE, among others, are explained when required in this report.
This report includes forward-looking statements. In some cases, you can identify these forward-looking statements by words such as “may,” “will,” “should,” “expects,” “plans,” “anticipates,” “believes,” “estimates,” “predicts,” “potential,” or “continue,” or the negative of these and other comparable words. Actual results and events may differ materially from those anticipated herein as a consequence of changes in general, economic and business conditions, changes in interest and currency rates and other risk described from time to time in our filings with the Registro Nacional de Valores y Emisores and the SEC.
Recipients of this document are responsible for the assessment and use of the information provided herein. Matters described in this presentation and our knowledge of them may change extensively and materially over time but we expressly disclaim any obligation to review, update or correct the information provided in this report, including any forward looking statements, and do not intend to provide any update for such material developments prior to our next earnings report.
The content of this document and the figures included herein are intended to provide a summary of the subjects discussed rather than a comprehensive description.
When applicable, in this document we refer to billions as thousands of millions.

1

Bogotá, May 19th, 2020. Grupo Aval S.A. (NYSE:AVAL) reported a consolidated attributable net income for 1Q2020 of Ps 700.2 billion or $31.4 pesos per share. ROAE was 14.2% and ROAA was 1.8% for the quarter, slightly lower than 4Q 2019.
Key results of the quarter:
| • | 1Q 2020 was a quarter of contrasts marked by strong growth in January and February and by an abrupt deceleration during March due to the global pandemic and the oil war. As a result, GDP growth for the quarter was only 0.4% (seasonally adjusted) and devaluation rose to 23.7%, both concentrated in the last few weeks of March. |
| • | Since March, Grupo Aval has deployed strategies to safeguard its employees’ health and to alleviate debt payments mostly to clients who request it. |
| • | During the quarter, in part driven by devaluation, Aval´s Consolidated Assets grew by 24.1% vs 1Q 2019 and 14.9% vs 4Q 2019, Consolidated Gross Loans grew by 19.1% vs 1Q 2019 and 11.8% vs 4Q 2019 and Consolidated Deposits grew by 24.5% vs 1Q 2019 and 15.8% vs 4Q 2019. |
| • | The quality of the loan portfolio showed a slight improvement aided by the Superintendence of Finance’s new regulation mandating banks to classify refinanced loans (due to the pandemic) as current. |
| • | Cost of Risk increased slightly vs 4Q 2019 (2.15% vs 2.07%) due in part to provisions for the banks’ exposure to Avianca. |
| • | Total NIM suffered a sharp decrease vs 4Q 2019, from 5.63% to 4.78%, driven mostly by a 364 bps drop in NIM on Investments. |
| • | Corficolombiana’s Non-Financial Sector Investments contributed strongly to the quarter´s result especially from its toll road concessions and Promigas. |
| • | Aval’s consolidated Cost to Income efficiency ratio improved to 47.1% from 52.1% a quarter earlier and the Cost to Assets ratio improved to 3.4% from 4.1%. |
| • | The quarter ended with strong funding and liquidity positions, as evidenced by the Deposits/Net Loans ratio of 1.04x up from 1.01x in 4Q 2019, and the Cash/Deposits ratio of 19.8% up from 17.2% in 4Q19. |
Gross loans excludes interbank and overnight funds.PDLs 90+defined as loans more than 90 days past due.Net Interest Margin includes net interest income plus net trading income from debt and equity investments at FVTPL divided by total average interest-earning assets.Fee income ratiois calculated as net income from commissions and fees divided by net interest income plus net income from commissions and fees, gross profit from sales of goods and services, net trading income, net income from other financial instruments mandatory at FVTPL and total other income.Efficiency Ratiois calculated as total other expenses divided by net interest income plus net income from commissions and fees, gross profit from sales of goods and services, net trading income, net income from other financial instruments mandatory at FVTPL and total other income.ROAA is calculated as annualized Net Income divided by average of total assets.ROAE is calculated as Net Income attributable to Aval's shareholders divided by average attributable shareholders' equity.NS refers to non-significant figures.
2

Grupo Aval Acciones y Valores S.A.
Consolidated Financial Statements Under IFRS
Information in Ps. Billions
| Consolidated Statement of Financial Position | 1Q19 | 4Q19 | 1Q20 | D | |||||
| 1Q20 vs. 4Q19 | 1Q20 vs. 1Q19 | ||||||||
| Cash and cash equivalents | 26,918.5 | 30,117.2 | 40,136.8 | 33.3% | 49.1% | ||||
| Trading assets | 6,936.9 | 9,113.7 | 11,478.9 | 26.0% | 65.5% | ||||
| Investment securities | 24,758.9 | 26,000.3 | 28,999.9 | 11.5% | 17.1% | ||||
| Hedging derivatives assets | 25.3 | 166.6 | 206.0 | 23.6% | N.A. | ||||
| Total loans and receivables, net | 164,738.1 | 173,942.3 | 195,066.3 | 12.1% | 18.4% | ||||
| Tangible assets | 8,699.8 | 8,950.4 | 9,295.5 | 3.9% | 6.8% | ||||
| Goodwill | 7,200.8 | 7,348.6 | 8,571.5 | 16.6% | 19.0% | ||||
| Concession arrangement rights | 5,874.3 | 7,521.5 | 8,068.4 | 7.3% | 37.3% | ||||
| Other assets | 13,110.3 | 15,672.0 | 18,604.4 | 18.7% | 41.9% | ||||
| Total assets | 258,263.0 | 278,832.6 | 320,427.8 | 14.9% | 24.1% | ||||
| Trading liabilities | 522.5 | 962.4 | 3,016.1 | N.A. | N.A. | ||||
| Hedging derivatives liabilities | 85.1 | 94.3 | 770.9 | N.A. | N.A. | ||||
| Customer deposits | 163,255.1 | 175,491.4 | 203,221.5 | 15.8% | 24.5% | ||||
| Interbank borrowings and overnight funds | 7,298.0 | 9,240.5 | 7,768.2 | -15.9% | 6.4% | ||||
| Borrowings from banks and others | 21,347.8 | 19,803.3 | 25,511.2 | 28.8% | 19.5% | ||||
| Bonds issued | 19,979.8 | 21,918.3 | 28,684.4 | 30.9% | 43.6% | ||||
| Borrowings from development entities | 3,409.3 | 3,882.5 | 3,799.6 | -2.1% | 11.4% | ||||
| Other liabilities | 13,326.9 | 14,091.6 | 14,625.6 | 3.8% | 9.7% | ||||
| Total liabilities | 229,224.5 | 245,484.3 | 287,397.4 | 17.1% | 25.4% | ||||
| Equity attributable to owners of the parent | 17,334.9 | 19,850.6 | 19,472.2 | -1.9% | 12.3% | ||||
| Non-controlling interest | 11,703.6 | 13,497.7 | 13,558.1 | 0.4% | 15.8% | ||||
| Total equity | 29,038.5 | 33,348.3 | 33,030.3 | -1.0% | 13.7% | ||||
| Total liabilities and equity | 258,263.0 | 278,832.6 | 320,427.8 | 14.9% | 24.1% | ||||
| Consolidated Statement of Income | 1Q19 | 4Q19 | 1Q20 | D | |||||
| Interest income | 4,669.2 | 5,055.7 | 5,097.5 | 0.8% | 9.2% | ||||
| Interest expense | 1,939.7 | 2,160.3 | 2,172.0 | 0.5% | 12.0% | ||||
| Net interest income | 2,729.5 | 2,895.4 | 2,925.5 | 1.0% | 7.2% | ||||
| Loans and other accounts receivable | 933.2 | 1,030.6 | 1,101.4 | 6.9% | 18.0% | ||||
| Other financial assets | (22.9) | (5.3) | 14.8 | N.A | -164.8% | ||||
| Recovery of charged-off financial assets | (77.2) | (103.3) | (79.7) | -22.8% | 3.3% | ||||
| Net impairment loss on financial assets | 833.1 | 922.1 | 1,036.5 | 12.4% | 24.4% | ||||
| Net interest income, after impairment losses | 1,896.4 | 1,973.3 | 1,889.0 | -4.3% | -0.4% | ||||
| Net income from commissions and fees | 1,259.0 | 1,494.0 | 1,345.8 | -9.9% | 6.9% | ||||
| Gross profit from sales of goods and services | 574.5 | 539.0 | 833.7 | 54.7% | 45.1% | ||||
| Net trading income | 108.2 | (36.2) | 1,101.2 | N.A | N.A. | ||||
| Net income from other financial instruments mandatory at FVTPL | 53.7 | 55.2 | 73.3 | 32.6% | 36.4% | ||||
| Total other income | 385.9 | 526.2 | (804.3) | N.A | N.A | ||||
| Total other expenses | 2,286.5 | 2,849.7 | 2,576.4 | -9.6% | 12.7% | ||||
| Net income before income tax expense | 1,991.2 | 1,701.9 | 1,862.3 | 9.4% | -6.5% | ||||
| Income tax expense | 634.6 | 418.8 | 516.4 | 23.3% | -18.6% | ||||
| Net income for the period | 1,356.6 | 1,283.1 | 1,345.8 | 4.9% | -0.8% | ||||
| Non-controlling interest | 593.8 | 568.0 | 645.6 | 13.7% | 8.7% | ||||
| Net income attributable to owners of the parent | 762.9 | 715.1 | 700.2 | -2.1% | -8.2% | ||||
| Key ratios | 1Q19 | 4Q19 | 1Q20 | ||||||
| Net Interest Margin(1) | 5.5% | 5.6% | 5.3% | ||||||
| Net Interest Margin (including net trading income)(1) | 5.7% | 5.6% | 4.8% | ||||||
| Efficiency ratio(2) | 44.7% | 52.1% | 47.1% | ||||||
| ROAA(3) | 2.1% | 1.9% | 1.8% | ||||||
| ROAE(4) | 17.4% | 14.6% | 14.2% | ||||||
| 90 days PDL / Total loans and leases (5) | 3.1% | 3.3% | 3.1% | ||||||
| Provision expense / Average loans and leases (6) | 2.0% | 2.1% | 2.2% | ||||||
| Allowance / 90 days PDL (5) | 1.59 | 1.40 | 1.41 | ||||||
| Allowance / Total loans and leases | 4.8% | 4.6% | 4.4% | ||||||
| Charge-offs / Average loans and leases (6) | 2.4% | 4.1% | 1.9% | ||||||
| Total loans and leases, net / Total assets | 63.8% | 62.4% | 60.9% | ||||||
| Deposits / Total loans and leases, net | 99.1% | 100.9% | 104.2% | ||||||
| Equity / Assets | 11.2% | 12.0% | 10.3% | ||||||
| Tangible equity ratio (7) | 8.3% | 9.2% | 7.5% | ||||||
| Shares outstanding (EoP) | 22,281,017,159 | 22,281,017,159 | 22,281,017,159 | ||||||
| Shares outstanding (Average) | 22,281,017,159 | 22,281,017,159 | 22,281,017,159 | ||||||
| Common share price (EoP) | 1,220.0 | 1,465.0 | 1,100.0 | ||||||
| Preferred share price (EoP) | 1,235.0 | 1,460.0 | 897.0 | ||||||
| BV/ EoP shares in Ps. | 778.0 | 890.9 | 873.9 | ||||||
| EPS | 34.2 | 32.1 | 31.4 | ||||||
| P/E (8) | 9.0 | 11.4 | 7.1 | ||||||
| P/BV (8) | 1.6 | 1.6 | 1.0 | ||||||
(1) NIM is calculated as Net Interest Income divided by the average of Interest Earning Assets; (2) Efficiency Ratio is calculated as total other expenses divided by net interest income plus net income from commissions and fees, gross profit from sales of goods and services, net trading income, net income from other financial instruments mandatory at FVTPL and total other income; (3) ROAA is calculated as Income before Minority Interest divided by the average of total assets for each quarter; (4) ROAE is calculated as Net Income attributable to Grupo Aval’s shareholders divided by the average of shareholders´ attributable equity for each quarter; (5) PDLs 90+ defined as loans more than 90 days past due include interest accounts receivables. Total loans excluding interbank and overnight funds; (6) Refers to average gross loans for the period; (7) Tangible Equity Ratio is calculated as Total Equity minus Intangibles (excluding those related to concessions) divided by Total Assets minus Intangibles (excluding those related to concessions); (8) Based on Preferred share prices.
3

Statement of Financial Position Analysis
1. Assets
Total assets as of March 31st, 2020 totaled Ps 320,427.8 billion showing an increase of 24.1% versus March 31st, 2019 and of 14.9% versus December 31st, 2019. Growth in assets was mainly driven by (i) an 18.4% year over year growth in total loans and receivables, net to Ps 195,066.3 billion,(ii) a 49.1% year over year growth in cash and cash equivalents to Ps 40,136.8 billion and (iii) a 65.5% yearly growth in trading assets to Ps 11,478.9 billion. When excluding FX movement in our Central American operation (“excluding FX”), asset growth would have been 14.6% versus March 31st, 2019 and 7.3% versus December 31st, 2019; for total loans and receivables, net growth would have been 8.9% versus March 31st, 2019 and 4.3% versus December 31st, 2019; for cash and cash equivalents 34.5% and 21.8%; and for trading assets growth would have been 64.6% versus March 31st, 2019 and 25.5% versus December 31st, 2019.
1.1 Loans and receivables
Total gross loans and receivables (excluding interbank and overnight funds) increased by 19.1% between March 31st, 2019 and March 31st, 2020 to Ps 200,668.0 billion (9.9% excluding FX) mainly driven by (i) a 19.2% increase in Commercial loans and leases to Ps 111,830.7 billion (12.0% excluding FX), (ii) a 17.3% increase in Consumer loans and leases to Ps 65,205.6 billion (7.2% excluding FX), and (iii) a 24.7% increase Mortgages and housing leases to Ps 23,228.4 billion (8.0% excluding FX).
Interbank & overnight funds decreased by 26.4% to Ps 3,282.2 billion (-35.3% excluding FX) during the last twelve months.
Allowance for impairment of loans and receivables was Ps 8,883.9 billion as of March 31st, 2020 taking net loans and receivables to Ps 195,066.3 billion.
| Total loans and receivables, net | 1Q19 | 4Q19 | 1Q20 | D | |||||
1Q20 vs. 4Q19 | 1Q20 vs. 1Q19 | ||||||||
| Loans and receivables | |||||||||
| Commercial loans and leases | 93,805.1 | 98,936.7 | 111,830.7 | 13.0% | 19.2% | ||||
| Consumer loans and leases | 55,607.6 | 59,840.5 | 65,205.6 | 9.0% | 17.3% | ||||
| Mortgages and housing leases | 18,620.9 | 20,221.7 | 23,228.4 | 14.9% | 24.7% | ||||
| Microcredit loans and leases | 412.8 | 410.3 | 403.4 | -1.7% | -2.3% | ||||
| Loans and receivables | 168,446.4 | 179,409.2 | 200,668.0 | 11.8% | 19.1% | ||||
| Interbank & overnight funds | 4,460.7 | 2,719.0 | 3,282.2 | 20.7% | -26.4% | ||||
| Total loans and leases | 172,907.1 | 182,128.1 | 203,950.2 | 12.0% | 18.0% | ||||
| Loss allowance | (8,169.0) | (8,185.8) | (8,883.9) | 8.5% | 8.8% | ||||
| Allowance for impairment of commercial loans | (4,284.9) | (4,189.4) | (4,601.8) | 9.8% | 7.4% | ||||
| Allowance for impairment of consumer loans | (3,480.9) | (3,555.0) | (3,783.5) | 6.4% | 8.7% | ||||
| Allowance for impairment of mortgages | (318.7) | (351.6) | (406.5) | 15.6% | 27.6% | ||||
| Allowance for impairment of microcredit loans | (84.6) | (89.8) | (92.1) | 2.5% | 8.9% | ||||
| Total loans and receivables, net | 164,738.1 | 173,942.3 | 195,066.3 | 12.1% | 18.4% | ||||
4

The following table shows the gross loan composition per product of each of our loan categories.
| Gross loans | 1Q19 | 4Q19 | 1Q20 | D | |||||
1Q20 vs. 4Q19 | 1Q20 vs. 1Q19 | ||||||||
| General purpose | 65,053.4 | 68,814.0 | 77,982.4 | 13.3% | 19.9% | ||||
| Working capital | 15,035.8 | 15,476.3 | 18,611.7 | 20.3% | 23.8% | ||||
| Financial leases | 9,806.8 | 10,348.9 | 10,838.2 | 4.7% | 10.5% | ||||
| Funded by development banks | 3,053.9 | 3,547.0 | 3,497.7 | -1.4% | 14.5% | ||||
| Overdrafts | 496.0 | 470.0 | 544.3 | 15.8% | 9.7% | ||||
| Credit cards | 359.1 | 280.5 | 356.3 | 27.0% | -0.8% | ||||
| Commercial loans and leases | 93,805.1 | 98,936.7 | 111,830.6 | 13.0% | 19.2% | ||||
| Personal loans | 34,429.6 | 36,998.7 | 39,508.3 | 6.8% | 14.8% | ||||
| Credit cards | 14,933.8 | 16,610.8 | 18,770.1 | 13.0% | 25.7% | ||||
| Automobile and vehicle | 5,767.8 | 5,759.6 | 6,399.2 | 11.1% | 10.9% | ||||
| Financial leases | 247.1 | 252.5 | 302.3 | 19.7% | 22.3% | ||||
| Overdrafts | 95.6 | 83.7 | 89.7 | 7.1% | -6.1% | ||||
| Other | 133.9 | 135.1 | 136.0 | 0.7% | 1.6% | ||||
| Consumer loans and leases | 55,607.7 | 59,840.5 | 65,205.6 | 9.0% | 17.3% | ||||
| Mortgages | 17,259.7 | 18,661.4 | 21,602.7 | 15.8% | 25.2% | ||||
| Housing leases | 1,361.1 | 1,560.3 | 1,625.6 | 4.2% | 19.4% | ||||
| Mortgages and housing leases | 18,620.9 | 20,221.7 | 23,228.4 | 14.9% | 24.7% | ||||
| Microcredit loans and leases | 412.8 | 410.3 | 403.4 | -1.7% | -2.3% | ||||
| Loans and receivables | 168,446.4 | 179,409.2 | 200,668.0 | 11.8% | 19.1% | ||||
| Interbank & overnight funds | 4,460.7 | 2,719.0 | 3,282.2 | 20.7% | -26.4% | ||||
| Total loans and leases | 172,907.2 | 182,128.1 | 203,950.2 | 12.0% | 18.0% | ||||
Over the last twelve months, commercial general purpose loans and personal loans (mainly in payrolls) have driven our loan portfolio growth in accordance with our banks’ strategies.
In Colombia, loans and receivables increased by 11.9% during the last twelve months and 5.8% during the quarter. As for Central America, loans and receivables grew by 35.7% between March 31st, 2019 and March 31st, 2020 and 25.4% in the last quarter; when excluding FX, growth would have been 6.2% and 1.3%, respectively.
Commercial loans grew by 19.2% over the year and 13.0% in the last quarter. In Colombia, commercial loans increased by 12.6% annually and 7.9% over the quarter. As for Central America, commercial loans grew by 41.2% over the year and 29.4% in the last quarter; when excluding FX, growth in Central America would have been 10.6% and 4.6%, respectively.
Consumer loans growth over the last year and quarter was mainly driven by personal loans and credit cards. In Colombia, Consumer loans grew by 10.3% during the last twelve months and 2.6% between December 31st, 2019 and March 31st, 2020 mainly in payroll lending. Growth of our Central American operations was 30.9% over the year and 21.3% in the last quarter, excluding FX, growth would have been 2.5% during the last twelve months and -2.0% in the quarter.
5

The following table shows the loans and receivables composition per entity. During the last twelve months, Banco de Bogotá showed the highest growth rate within our banking operation in Colombia, driven by a strong performance in all loan categories (commercial loans grew 14.4%, consumer loans grew 13.6% and mortgages grew 16.9%.
| Gross loans / Bank ($) | 1Q19 | 4Q19 | 1Q20 | D | |||||
1Q20 vs. 4Q19 | 1Q20 vs. 1Q19 | ||||||||
| Banco de Bogotá | 108,401.7 | 116,483.7 | 134,807.7 | 15.7% | 24.4% | ||||
| Domestic | 57,359.1 | 61,247.9 | 65,554.2 | 7.0% | 14.3% | ||||
| Central America | 51,042.6 | 55,235.8 | 69,253.5 | 25.4% | 35.7% | ||||
| Banco de Occidente | 28,774.5 | 30,372.8 | 32,260.5 | 6.2% | 12.1% | ||||
| Banco Popular | 19,272.2 | 20,234.2 | 20,767.5 | 2.6% | 7.8% | ||||
| Banco AV Villas | 11,645.7 | 12,165.1 | 12,435.3 | 2.2% | 6.8% | ||||
| Corficolombiana | 1,677.2 | 1,709.2 | 2,000.4 | 17.0% | 19.3% | ||||
| Eliminations | (1,324.9) | (1,555.8) | (1,603.5) | 3.1% | 21.0% | ||||
| Loans and receivables | 168,446.4 | 179,409.2 | 200,668.0 | 11.8% | 19.1% | ||||
| Interbank & overnight funds | 4,460.7 | 2,719.0 | 3,282.2 | 20.7% | -26.4% | ||||
| Total loans and receivables portfolio | 172,907.1 | 182,128.1 | 203,950.2 | 12.0% | 18.0% | ||||
| Gross loans / Bank (%) | 1Q19 | 4Q19 | 1Q20 | ||||||
| Banco de Bogotá | 64.4% | 64.9% | 67.2% | ||||||
| Domestic | 34.1% | 34.1% | 32.7% | ||||||
| Central America | 30.3% | 30.8% | 34.5% | ||||||
| Banco de Occidente | 17.1% | 16.9% | 16.1% | ||||||
| Banco Popular | 11.4% | 11.3% | 10.3% | ||||||
| Banco AV Villas | 6.9% | 6.8% | 6.2% | ||||||
| Corficolombiana | 1.0% | 1.0% | 1.0% | ||||||
| Eliminations | -0.8% | -0.9% | -0.8% | ||||||
| Loans and receivables | 100% | 100% | 100% | ||||||
Of the total loans and receivables, 65.2% are domestic and 34.8% are foreign. In terms of gross loans (excluding interbank and overnight funds), 65.5% are domestic and 34.5% are foreign (reflecting the Central American operations).
| Gross loans | 1Q19 | 4Q19 | 1Q20 | D | |||||
1Q20 vs. 4Q19 | 1Q20 vs. 1Q19 | ||||||||
| Domestic | |||||||||
| Commercial loans and leases | 72,052.0 | 75,191.5 | 81,115.8 | 7.9% | 12.6% | ||||
| Consumer loans and leases | 36,729.8 | 39,463.0 | 40,497.7 | 2.6% | 10.3% | ||||
| Mortgages and housing leases | 8,209.2 | 9,108.4 | 9,397.6 | 3.2% | 14.5% | ||||
| Microcredit loans and leases | 412.8 | 410.3 | 403.4 | -1.7% | -2.3% | ||||
| Interbank & overnight funds | 2,255.9 | 1,256.9 | 1,611.9 | 28.2% | -28.5% | ||||
| Total domestic loans | 119,659.7 | 125,430.2 | 133,026.3 | 6.1% | 11.2% | ||||
| Foreign | |||||||||
| Commercial loans and leases | 21,753.1 | 23,745.2 | 30,714.9 | 29.4% | 41.2% | ||||
| Consumer loans and leases | 18,877.8 | 20,377.4 | 24,707.9 | 21.3% | 30.9% | ||||
| Mortgages and housing leases | 10,411.7 | 11,113.2 | 13,830.7 | 24.5% | 32.8% | ||||
| Microcredit loans and leases | - | - | - | - | - | ||||
| Interbank & overnight funds | 2,204.8 | 1,462.1 | 1,670.3 | 14.2% | -24.2% | ||||
| Total foreign loans | 53,247.5 | 56,697.9 | 70,923.9 | 25.1% | 33.2% | ||||
| Total loans and leases | 172,907.1 | 182,128.1 | 203,950.2 | 12.0% | 18.0% | ||||
6

The quality of our loan portfolio improved during the quarter.
Our 30 days PDL to total loans closed 1Q20 in 4.2%, compared to 4.4% in 4Q19 and 1Q19. The ratio of 90 days PDL to total loans was 3.1% for 1Q20 and 1Q19 compared to 3.3% in 4Q19. Finally, the ratio of CDE Loans to total loans was 6.9% in 1Q20, 6.7% in 4Q19, 7.0% in 1Q19.
Commercial loans’ 30 days PDL ratio was 4.1% for 1Q20, 3.9% for 4Q19 and 4.0% for 1Q19; 90 days PDL ratio was 3.5%, 3.6% and 3.4%, respectively. Consumer loans’ 30 days PDL ratio was 4.1% for 1Q20, 4.8% for 4Q19 and 4.9% for 1Q19; 90 days PDL ratio was 2.6%, 2.8% and 2.6%, respectively. Mortgages’ 30 days PDL ratio was 4.4% for 1Q20, 4.8% for 4Q19, and 4.6% for 1Q19; 90 days PDL ratio was 3.0%, 3.0% and 2.4%, respectively.
| Total loans and leases | 1Q19 | 4Q19 | 1Q20 | D | |||||
1Q20 vs. 4Q19 | 1Q20 vs. 1Q19 | ||||||||
| ''A'' normal risk | 151,790.4 | 162,373.9 | 181,576.2 | 11.8% | 19.6% | ||||
| ''B'' acceptable risk | 4,800.9 | 4,963.7 | 5,305.3 | 6.9% | 10.5% | ||||
| ''C'' appreciable risk | 5,439.6 | 4,915.6 | 6,253.8 | 27.2% | 15.0% | ||||
| ''D'' significant risk | 3,555.4 | 3,860.1 | 3,886.3 | 0.7% | 9.3% | ||||
| ''E'' unrecoverable | 2,860.1 | 3,295.8 | 3,646.3 | 10.6% | 27.5% | ||||
| Loans and receivables | 168,446.4 | 179,409.2 | 200,668.0 | 11.8% | 19.1% | ||||
| Interbank and overnight funds | 4,460.7 | 2,719.0 | 3,282.2 | 20.7% | -26.4% | ||||
| Total loans and leases | 172,907.1 | 182,128.1 | 203,950.2 | 12.0% | 18.0% | ||||
| CDE loans / Total loans (*) | 7.0% | 6.7% | 6.9% | ||||||
| Past due loans | 1Q19 | 4Q19 | 1Q20 | D | |||||
1Q20 vs. 4Q19 | 1Q20 vs. 1Q19 | ||||||||
| Performing | 90,017.0 | 95,035.0 | 107,237.1 | 12.8% | 19.1% | ||||
| Between 31 and 90 days past due | 594.0 | 364.3 | 734.4 | 101.6% | 23.6% | ||||
| +90 days past due | 3,194.1 | 3,537.4 | 3,859.2 | 9.1% | 20.8% | ||||
| Commercial loans and leases | 93,805.1 | 98,936.7 | 111,830.7 | 13.0% | 19.2% | ||||
| Performing | 52,889.8 | 56,968.0 | 62,523.2 | 9.8% | 18.2% | ||||
| Between 31 and 90 days past due | 1,272.6 | 1,223.8 | 987.1 | -19.3% | -22.4% | ||||
| +90 days past due | 1,445.3 | 1,648.6 | 1,695.3 | 2.8% | 17.3% | ||||
| Consumer loans and leases | 55,607.6 | 59,840.5 | 65,205.6 | 9.0% | 17.3% | ||||
| Performing | 17,768.0 | 19,242.6 | 22,212.5 | 15.4% | 25.0% | ||||
| Between 31 and 90 days past due | 398.6 | 379.1 | 323.3 | -14.7% | -18.9% | ||||
| +90 days past due | 454.2 | 600.0 | 692.6 | 15.4% | 52.5% | ||||
| Mortgages and housing leases | 18,620.9 | 20,221.7 | 23,228.4 | 14.9% | 24.7% | ||||
| Performing | 346.1 | 336.1 | 342.3 | 1.8% | -1.1% | ||||
| Between 31 and 90 days past due | 17.6 | 18.5 | 3.1 | -83.0% | -82.2% | ||||
| +90 days past due | 49.1 | 55.8 | 58.0 | 3.9% | 18.1% | ||||
| Microcredit loans and leases | 412.8 | 410.3 | 403.4 | -1.7% | -2.3% | ||||
| Loans and receivables | 168,446.4 | 179,409.2 | 200,668.0 | 11.8% | 19.1% | ||||
| Interbank & overnight funds | 4,460.7 | 2,719.0 | 3,282.2 | 20.7% | -26.4% | ||||
| Allowance for impairment of commercial loans | 172,907.1 | 182,128.1 | 203,950.2 | 12.0% | 18.0% | ||||
| 30 Days PDL / Total loans (*) | 4.4% | 4.4% | 4.2% | |||||
| 90 Days PDL / Total loans (*) | 3.1% | 3.3% | 3.1% |
(*) Total loans excluding interbank and overnight funds. 30 days past due and 90 days past due are calculated on a capital plus interest accounts receivable basis.
7

Grupo Aval’s coverage over its 90 days PDL was 1.4x for 1Q20 and 4Q19 and 1.6x for 1Q19. Allowance to CDE Loans was 0.6x for 1Q20 and 0.7x for 4Q19 and 1Q19, and allowance to 30 days PDL was 1.1x for 1Q20 and 1Q19 and 1.0x for 4Q19. Impairment loss, net of recoveries of charged off assets to average total loans was 2.2% in 1Q20, 2.1% in 4Q19 and 2.0% in 1Q19. Charge-offs to average total loans was 1.9% in 1Q20, 4.1% in 4Q19 and 2.4% in 1Q19.
| Total loans and leases | 1Q19 | 4Q19 | 1Q20 | |||||
| Allowance for impairment / CDE loans | 0.7 | 0.7 | 0.6 | |||||
| Allowance for impairment / 30 Days PDL | 1.1 | 1.0 | 1.1 | |||||
| Allowance for impairment / 90 Days PDL | 1.6 | 1.4 | 1.4 | |||||
| Allowance for impairment / Total loans (*) | 4.8% | 4.6% | 4.4% | |||||
| Impairment loss / CDE loans | 0.3 | 0.3 | 0.3 | |||||
| Impairment loss / 30 Days PDL | 0.5 | 0.5 | 0.5 | |||||
| Impairment loss / 90 Days PDL | 0.7 | 0.7 | 0.7 | |||||
| Impairment loss / Average total loans (*) | 2.2% | 2.3% | 2.3% | |||||
| Impairment loss, net of recoveries of charged-off assets / Average total loans (*) | 2.0% | 2.1% | 2.2% | |||||
| Charge-offs / Average total loans (*) | 2.4% | 4.1% | 1.9% | |||||
(*) Total loans excluding interbank and overnight funds. 30 days past due and 90 days past due are calculated on a capital plus interest accounts receivable basis.
1.2 Investment securities and trading assets
Total investment securities and trading assets increased 27.7% to Ps 40,478.8 billion between March 31st, 2019 and March 31st, 2020 and 15.3% versus December 31st, 2019. Ps 32,552.3 billion of our total portfolio is invested in debt securities, which increased by 21.7% between March 31st, 2019 and March 31st, 2020 and by 10.9% since December 31st, 2019. Ps 5,038.8 billion of our total investment securities is invested in equity securities, which increased by 11.6% between March 31st, 2019 and March 31st, 2020 and by 3.9% versus December 31st, 2019.
| Investment and trading assets | 1Q19 | 4Q19 | 1Q20 | D | |||||
1Q20 vs. 4Q19 | 1Q20 vs. 1Q19 | ||||||||
| Debt securities | 3,243.6 | 4,673.1 | 4,883.0 | 4.5% | 50.5% | ||||
| Equity securities | 3,266.3 | 3,523.1 | 3,708.1 | 5.2% | 13.5% | ||||
| Derivative assets | 427.0 | 917.4 | 2,887.8 | N.A. | N.A. | ||||
| Trading assets | 6,936.9 | 9,113.7 | 11,478.9 | 26.0% | 65.5% | ||||
| Investments in debt securities at FVTPL (non compliant with SPPI test) | 27.7 | 10.1 | 9.3 | -8.4% | -66.6% | ||||
| Debt securities at FVOCI | 20,476.1 | 21,609.0 | 24,426.3 | 13.0% | 19.3% | ||||
| Equity securities at FVOCI | 1,248.4 | 1,328.1 | 1,330.7 | 0.2% | 6.6% | ||||
| Investments in securities at FVOCI | 21,724.5 | 22,937.1 | 25,757.0 | 12.3% | 18.6% | ||||
| Investments in debt securities at AC | 3,006.6 | 3,053.1 | 3,233.7 | 5.9% | 7.6% | ||||
| Investment and trading assets | 31,695.8 | 35,114.0 | 40,478.8 | 15.3% | 27.7% | ||||
8

The average yield on our debt and equity investment securities (trading assets, investments in debt securities at FVTPL, investments in securities at FVOCI and investments in debt securities at AC) was 1.4% for 1Q20, 4.7% for 4Q19 and 6.2% in 1Q19.
1.3 Cash and Cash Equivalents
As of March 31st, 2020 cash and cash equivalents had a balance of Ps 40,136.8 billion showing an increase of 49.1% versus March 31st, 2019 and a increase of 33.3% versus December 31st, 2019 (34.5% and 21.8% excluding FX).
The ratio of cash and cash equivalents to customer deposits was 19.8% at March 31st, 2020, 17.2% at December 31st, 2019, and 16.5% at March 31st, 2020.
1.4 Goodwill and Other Intangibles
Goodwill and other intangibles as of March 31st, 2020 reached Ps 17,914.0 billion, increasing by 27.0% versus March 31st, 2019 and 11.4% versus December 31st, 2019.
Goodwill as of March 31st, 2020 was Ps 8,571.5 billion, increasing by 19.0% versus March 31st, 2019 and 16.6% versus December 31st, 2019, explained by fluctuations in the exchange rate.
Other intangibles, which include “concession arrangement rights” and other intangibles, mainly reflect the value of road concessions recorded for the most part at Corficolombiana. Other intangibles as of March 31st, 2020 reached Ps 9,342.5 billion and grew by 35.2% versus March 31st, 2019 and 7.0% versus December 31st, 2019.
2. Liabilities
As of March 31st, 2020 funding represented 93.6% of total liabilities and other liabilities represented 6.4%.
2.1 Funding
Total Funding (Total financial liabilities at amortized cost) which includes (i) Customer deposits, (ii) Interbank borrowings and overnight funds, (iii) Borrowings from banks and others, (iv) Bonds issued, and (v) Borrowing from development entities had a balance of Ps 268,984.9 billion as of March 31st, 2020 showing an increase of 24.9% versus March 31st, 2019 and of 16.8% versus December 31st, 2019 (15.7% and 9.3% increase excluding FX). Total customer deposits represented 75.6% of total funding as of the end of 1Q20, 76.2% for 4Q19 and 75.8% for 1Q19.
Average cost of funds was 3.5% for 1Q20, 3.8% for 4Q19 and 3.6% for 1Q19.
9

2.1.1 Customer deposits
| Customer deposits | 1Q19 | 4Q19 | 1Q20 | D | |||||
1Q20 vs. 4Q19 | 1Q20 vs. 1Q19 | ||||||||
| Checking accounts | 15,811.1 | 16,812.8 | 18,843.7 | 12.1% | 19.2% | ||||
| Other deposits | 512.3 | 463.8 | 388.6 | -16.2% | -24.1% | ||||
| Non-interest bearing | 16,323.4 | 17,276.6 | 19,232.3 | 11.3% | 17.8% | ||||
| Checking accounts | 21,932.2 | 25,636.9 | 34,215.8 | 33.5% | 56.0% | ||||
| Time deposits | 68,362.5 | 73,225.2 | 81,071.4 | 10.7% | 18.6% | ||||
| Savings deposits | 56,637.0 | 59,352.8 | 68,701.9 | 15.8% | 21.3% | ||||
| Interest bearing | 146,931.7 | 158,214.8 | 183,989.2 | 16.3% | 25.2% | ||||
| Customer deposits | 163,255.1 | 175,491.4 | 203,221.5 | 15.8% | 24.5% | ||||
Of our total customer deposits as of March 31st, 2020 checking accounts represented 26.1%, time deposits 39.9%, savings accounts 33.8%, and other deposits 0.2%.
The following table shows the customer deposits composition by bank. During the last twelve months, Banco de Bogotá showed the highest growth rate in customer deposits within our banking operation in Colombia.
| Deposits / Bank ($) | 1Q19 | 4Q19 | 1Q20 | D | |||||
1Q20 vs. 4Q19 | 1Q20 vs. 1Q19 | ||||||||
| Banco de Bogotá | 106,409.5 | 117,795.0 | 143,581.6 | 21.9% | 34.9% | ||||
| Domestic | 56,819.1 | 61,515.3 | 72,181.8 | 17.3% | 27.0% | ||||
| Central America | 49,590.4 | 56,279.7 | 71,399.8 | 26.9% | 44.0% | ||||
| Banco de Occidente | 26,511.5 | 28,726.4 | 31,476.6 | 9.6% | 18.7% | ||||
| Banco Popular | 17,867.4 | 16,988.9 | 18,516.9 | 9.0% | 3.6% | ||||
| Banco AV Villas | 11,259.6 | 11,851.4 | 12,694.2 | 7.1% | 12.7% | ||||
| Corficolombiana | 3,617.1 | 4,067.5 | 4,671.5 | 14.9% | 29.2% | ||||
| Eliminations | (2,409.9) | (3,937.8) | (7,719.5) | 96.0% | N.A. | ||||
| Total Grupo Aval | 163,255.1 | 175,491.4 | 203,221.5 | 15.8% | 24.5% | ||||
| Deposits / Bank (%) | 1Q19 | 4Q19 | 1Q20 | ||||||
| Banco de Bogotá | 65.2% | 67.1% | 70.7% | ||||||
| Domestic | 34.8% | 35.1% | 35.5% | ||||||
| Central America | 30.4% | 32.1% | 35.1% | ||||||
| Banco de Occidente | 16.2% | 16.4% | 15.5% | ||||||
| Banco Popular | 10.9% | 9.7% | 9.1% | ||||||
| Banco AV Villas | 6.9% | 6.8% | 6.2% | ||||||
| Corficolombiana | 2.2% | 2.3% | 2.3% | ||||||
| Eliminations | -1.5% | -2.2% | -3.8% | ||||||
| Total Grupo Aval | 100.0% | 100.0% | 100.0% | ||||||
10

2.1.2 Borrowings from Banks and Other (includes borrowings from development entities)
As of March 31st, 2020 borrowings from banks and other totaled Ps 29,310.8 billion, showing an increase of 18.4% versus March 31st, 2019 and of 23.7% versus December 31st, 2019. Excluding FX, borrowings from banks and other increased 5.7% versus March 31st, 2019 and 14.1% versus December 31st, 2019.
2.1.3 Bonds issued
On January, Grupo Aval held a Senior Notes issuance in the international capital markets for US $ 1 billion. As a result, total bonds issued as of March 31st, 2020 totaled Ps 28,684.4 billion showing increases of 43.6% versus March 31st, 2019 and of 30.9% versus December 31st, 2019. Excluding FX, bonds increased 41.5% versus March 31st, 2019 and 29.4% versus December 31st, 2019.
3. Non-controlling Interest
Non-controlling Interest in Grupo Aval reflects: (i) the minority stakes that third party shareholders hold in each of its direct consolidated subsidiaries (Banco de Bogotá, Banco de Occidente, Banco Popular, Banco AV Villas and Corficolombiana), and (ii) the minority stakes that third party shareholders hold in the consolidated subsidiaries at the bank level (mainly Porvenir). As of March 31st, 2020 non-controlling interest was Ps 13,558.1 billion which increased by 15.8% versus March 31st, 2019 and 0.4% versus December 31st, 2019. Total non-controlling interest represents 41.0% of total equity as of 1Q20, compared to 40.5% in 4Q19 and 40.3% in 1Q19. Total non-controlling interest derives from the sum of the combined minority interests of our banks and of Grupo Aval, applying eliminations associated with the consolidation process of Grupo Aval.
| Direct & indirect ownership of main subsidiaries | 1Q19 | 4Q19 | 1Q20 | D | |||||
1Q20 vs. 4Q19 | 1Q20 vs. 1Q19 | ||||||||
| Banco de Bogotá | 68.7% | 68.7% | 68.7% | - | - | ||||
| Banco de Occidente | 72.3% | 72.3% | 72.3% | - | - | ||||
| Banco Popular | 93.7% | 93.7% | 93.7% | - | - | ||||
| Banco AV Villas | 79.9% | 79.9% | 79.9% | - | - | ||||
| BAC Credomatic(1) | 68.7% | 68.7% | 68.7% | - | - | ||||
| Porvenir(2) | 75.7% | 75.7% | 75.7% | - | 0 | ||||
| Corficolombiana | 38.2% | 38.6% | 38.6% | - | 40 | ||||
(1) BAC Credomatic is fully owned by Banco de Bogotá; (2) Grupo Aval indirectly owns a 100% of Porvenir as follows: 20.0% in Grupo Aval, 46.9% in Banco de Bogotá and 33.1% in Banco de Occidente. Porvenir's results consolidate into Banco de Bogotá.
4. Attributable Shareholders’ Equity
Attributable shareholders’ equity as of March 31st, 2020 was Ps 19,472.2 billion, showing an increase of 12.3% versus March 31st, 2019 and a decrease of 1.9% versus December 31st, 2019.
11

Income Statement Analysis
Our net income attributable to the owners of the parent company for 1Q20 of Ps 700.2 billion showed an 8.2% decrease versus 1Q19 and a 2.1% decrease versus 4Q19.
| Consolidated Statement of Income | 1Q19 | 4Q19 | 1Q20 | D | |||||
1Q20 vs. 4Q19 | 1Q20 vs. 1Q19 | ||||||||
| Interest income | 4,669.2 | 5,055.7 | 5,097.5 | 0.8% | 9.2% | ||||
| Interest expense | 1,939.7 | 2,160.3 | 2,172.0 | 0.5% | 12.0% | ||||
| Net interest income | 2,729.5 | 2,895.4 | 2,925.5 | 1.0% | 7.2% | ||||
| Loans and other accounts receivable | 933.2 | 1,030.6 | 1,101.4 | 6.9% | 18.0% | ||||
| Other financial assets | (22.9) | (5.3) | 14.8 | N.A | -164.8% | ||||
| Recovery of charged-off financial assets | (77.2) | (103.3) | (79.7) | -22.8% | 3.3% | ||||
| Net impairment loss on financial assets | 833.1 | 922.1 | 1,036.5 | 12.4% | 24.4% | ||||
| Net income from commissions and fees | 1,259.0 | 1,494.0 | 1,345.8 | -9.9% | 6.9% | ||||
| Gross profit from sales of goods and services | 574.5 | 539.0 | 833.7 | 54.7% | 45.1% | ||||
| Net trading income | 108.2 | (36.2) | 1,101.2 | N.A | N.A. | ||||
| Net income from other financial instruments mandatory at FVTPL | 53.7 | 55.2 | 73.3 | 32.6% | 36.4% | ||||
| Total other income | 385.9 | 526.2 | (804.3) | N.A | N.A | ||||
| Total other expenses | 2,286.5 | 2,849.7 | 2,576.4 | -9.6% | 12.7% | ||||
| Net income before income tax expense | 1,991.2 | 1,701.9 | 1,862.3 | 9.4% | -6.5% | ||||
| Income tax expense | 634.6 | 418.8 | 516.4 | 23.3% | -18.6% | ||||
| Net income for the period | 1,356.6 | 1,283.1 | 1,345.8 | 4.9% | -0.8% | ||||
| Non-controlling interest | 593.8 | 568.0 | 645.6 | 13.7% | 8.7% | ||||
| Net income attributable to owners of the parent | 762.9 | 715.1 | 700.2 | -2.1% | -8.2% | ||||
1. Net Interest Income
| Net interest income | 1Q19 | 4Q19 | 1Q20 | D | |||||
1Q20 vs. 4Q19 | 1Q20 vs. 1Q19 | ||||||||
| Interest income | |||||||||
| Commercial | 1,693.4 | 1,875.1 | 1,889.1 | 0.7% | 11.6% | ||||
| Interbank and overnight funds | 113.3 | 156.4 | 81.9 | -47.6% | -27.7% | ||||
| Consumer | 2,170.7 | 2,303.4 | 2,322.9 | 0.8% | 7.0% | ||||
| Mortgages and housing leases | 393.7 | 446.8 | 455.2 | 1.9% | 15.6% | ||||
| Microcredit | 27.7 | 26.5 | 25.7 | -2.8% | -7.1% | ||||
| Loan portfolio | 4,398.9 | 4,808.3 | 4,774.8 | -0.7% | 8.5% | ||||
| Interests on investments in debt securities | 270.3 | 247.4 | 322.6 | 30.4% | 19.4% | ||||
| Total interest income | 4,669.2 | 5,055.7 | 5,097.5 | 0.8% | 9.2% | ||||
| Interest expense | |||||||||
| Checking accounts | 103.2 | 98.7 | 93.7 | -5.1% | -9.3% | ||||
| Time deposits | 838.9 | 937.2 | 948.4 | 1.2% | 13.1% | ||||
| Savings deposits | 362.5 | 392.5 | 427.1 | 8.8% | 17.8% | ||||
| Total interest expenses on deposits | 1,304.7 | 1,428.4 | 1,469.2 | 2.9% | 12.6% | ||||
| Interbank borrowings and overnight funds | 77.6 | 123.1 | 84.5 | -31.4% | 8.8% | ||||
| Borrowings from banks and others | 234.5 | 238.9 | 220.4 | -7.7% | -6.0% | ||||
| Bonds issued | 287.5 | 332.8 | 359.4 | 8.0% | 25.0% | ||||
| Borrowings from development entities | 35.4 | 37.1 | 38.5 | 3.9% | 8.9% | ||||
| Total interest expenses on financial obligations | 635.0 | 731.9 | 702.7 | -4.0% | 10.7% | ||||
| Total interest expense | 1,939.7 | 2,160.3 | 2,172.0 | 0.5% | 12.0% | ||||
| Net interest income | 2,729.5 | 2,895.4 | 2,925.5 | 1.0% | 7.2% | ||||
12

Our net interest income increased by 7.2% to Ps 2,925.5 billion for 1Q20 versus 1Q19 and increased 1.0% versus 4Q19. The increase versus 1Q19 was derived from a 9.2% increase in total interest income that was partially offset by a 12.0% increase in total interest expense.
Our Net Interest Margin(1)was 4.8% for 1Q20, 5.6% in 4Q19 and 5.7% in 1Q19. Net Interest Margin on Loans was 6.1% for 1Q20 and 6.4% for 4Q19 and 1Q19. On the other hand, our Net Investments Margin was -1.7% in 1Q20 versus 2.0% in 4Q19 and 2.6% in 1Q19.
In our Colombian operations, our Net Interest Margin was 4.0% for 1Q20, 5.0% for 4Q19, and 5.4% for 1Q19. Net Interest Margin on Loans was 5.6% for 1Q20, 5.7% in 4Q19 and 6.1% in 1Q19. On the other hand, our Net Investments Margin was -3.3% in 1Q20 versus 1.6% in 4Q19 and 2.6% in 1Q19.
In our Central American operations, our Net Interest Margin was 6.4% for 1Q20, 7.1% in 4Q19 and 6.4% in 1Q19. Net Interest Margin on Loans was 7.0% for 1Q20, 7.8% in 4Q19 and 7.0% in 1Q19. On the other hand, our Net Investments Margin was 2.7% for 1Q20 and 4Q19 versus 2.8% in 1Q19.
2. Impairment loss on financial assets, net
Our impairment loss on financial assets, net increased by 24.4% to Ps 1,036.5 billion for 1Q20 versus 1Q19 and 12.4% versus 4Q19.
| Net impairment loss on financial assets | 1Q19 | 4Q19 | 1Q20 | D | |||||
1Q20 vs. 4Q19 | 1Q20 vs. 1Q19 | ||||||||
| Loans and other accounts receivable | 933.2 | 1,030.6 | 1,101.4 | 6.9% | 18.0% | ||||
| Other financial assets | (22.9) | (5.3) | 14.8 | N.A | -164.8% | ||||
| Recovery of charged-off financial assets | (77.2) | (103.3) | (79.7) | -22.8% | 3.3% | ||||
| Net impairment loss on financial assets | 833.1 | 922.1 | 1,036.5 | 12.4% | 24.4% | ||||
Our annualized gross cost of risk was 2.3% for 1Q20 and 4Q19 versus 2.2% for 1Q19. Net of recoveries of charged-off assets our ratio was 2.2% for 1Q20, 2.1% for 4Q19 and 2.0% for 1Q19.
| (1) | Grupo Aval’s NIM without income from trading securities and investment in debt securities designated at fair value through profit and loss (non compliant with SPPI test) was 5.3% for 1Q20, 5.6% for 4Q19 and 5.5% for 1Q19. |
13

3. Non-interest income
| Total non-interest income | 1Q19 | 4Q19 | 1Q20 | D | |||||
| 1Q20 vs. 4Q19 | 1Q20 vs. 1Q19 | ||||||||
| Income from commissions and fees | |||||||||
| Banking fees(1) | 1,028.0 | 1,242.0 | 1,109.0 | -10.7% | 7.9% | ||||
| Trust activities | 80.7 | 82.7 | 81.4 | -1.6% | 0.8% | ||||
| Pension and severance fund management | 255.5 | 293.2 | 307.7 | 5.0% | 20.4% | ||||
| Bonded warehouse services | 41.0 | 40.4 | 36.7 | -9.1% | -10.5% | ||||
| Total income from commissions and fees | 1,405.2 | 1,658.3 | 1,534.8 | -7.4% | 9.2% | ||||
| Expenses from commissions and fees | 146.2 | 164.4 | 189.0 | 15.0% | 29.2% | ||||
| Net income from commissions and fees | 1,259.0 | 1,494.0 | 1,345.8 | -9.9% | 6.9% | ||||
| Income from sales of goods and services | 1,923.5 | 2,774.3 | 2,463.6 | -11.2% | 28.1% | ||||
| Costs and expenses from sales of goods and services | 1,348.9 | 2,235.2 | 1,629.9 | -27.1% | 20.8% | ||||
| Gross profit from sales of goods and services | 574.5 | 539.0 | 833.7 | 54.7% | 45.1% | ||||
| Net trading income | 108.2 | (36.2) | 1,101.2 | N.A | N.A. | ||||
| Net income from other financial instruments mandatory at FVTPL | 53.7 | 55.2 | 73.3 | 32.6% | 36.4% | ||||
| Other income | |||||||||
| Foreign exchange gains (losses), net | 166.1 | 337.4 | (1,147.8) | N.A | N.A | ||||
| Net gain on sale of investments and OCI realization | 5.9 | 8.6 | 94.3 | N.A. | N.A. | ||||
| Gain on the sale of non-current assets held for sale | 6.0 | 5.2 | 28.6 | N.A. | N.A. | ||||
| Income from non-consolidated investments(2) | 123.2 | 56.9 | 148.2 | 160.4% | 20.2% | ||||
| Net gains on asset valuations | 4.6 | 12.2 | 3.3 | -72.5% | -26.7% | ||||
| Other income from operations | 80.1 | 105.9 | 69.1 | -34.7% | -13.7% | ||||
| Total other income | 385.9 | 526.2 | (804.3) | N.A | N.A | ||||
| Total non-interest income | 2,381.3 | 2,578.3 | 2,549.6 | -1.1% | 7.1% | ||||
(1)Includes commissions on banking services, office network services, credit and debit card fees, fees on drafts, checks and checkbooks and other fees.
(2) Includes share of profit of equity accounted investees, net of tax, and dividend income.
3.1 Net income from commissions and fees
Net Income from commissions and fees increased by 6.9% to Ps 1,345.8 billion for 1Q20 versus 1Q19 and decreased 9.9% in the quarter. Income from commissions and fees increased by 9.2% to Ps 1,534.8 billion in 1Q20 versus 1Q19 and decreased 7.4% in the quarter. Excluding FX, net income from commissions increased 1.3% and decreased 11.3%, respectively. In Colombia, net income from commissions and fees increased by 4.2% over the last year and decreased 8.5% over the quarter. In Central America, net income from commissions and fees increased by 10.3% over the last year and decreased 11.5% over the quarter; excluding FX, net income decreased by 1.8% over the last year and 14.3% during the quarter.
3.2 Gross profit from sales of goods and services
Gross profit from sales of goods and services (non-financial sector) increased by 45.1% to Ps 833.7 billion for 1Q20 versus 1Q19 and increased 54.7% during the quarter. The increase versus 4Q19 and 1Q19 is mainly explained by the higher income from investments in toll road concessions and in Promigas.
14

3.3 Net trading income
| Net trading income | 1Q19 | 4Q19 | 1Q20 | D | |||||
1Q20 vs. 4Q19 | 1Q20 vs. 1Q19 | ||||||||
| Trading investment income | 183.2 | 131.3 | (204.2) | N.A | N.A | ||||
| Net income (loss) on financial derivatives | (82.3) | (179.3) | 1,160.5 | N.A | N.A | ||||
| Other trading income on derivatives | 7.2 | 11.9 | 144.8 | N.A. | N.A. | ||||
| Net trading income | 108.2 | (36.2) | 1,101.2 | N.A | N.A. | ||||
Net trading income for Grupo Aval should be analyzed in conjunction with the foreign exchange gains (losses).
3.4 Other income
Total other income for 1Q20 totaled Ps - 804.3 billion mainly driven by a loss from foreign exchange which was partially offset by positive results of derivative in net trading income.
4. Other expenses
Total other expenses for 1Q20 totaled Ps 2,576.4 billion increasing by 12.7% versus 1Q19 and decreasing 9.6% versus 4Q19 (7.4% and -10.8% excluding FX). Our efficiency ratio measured as total other expenses to total income was 47.1% in 1Q20, 52.1% in 4Q19 and 44.7% in 1Q19. The ratio of annualized total other expenses as a percentage of average total assets was 3.4% in 1Q20, 4.1% in 4Q19 and 3.5% in 1Q19.
In Colombia, our efficiency ratio measured as total other expenses to total income, was 42.7% in 1Q20, 49.5% in 4Q19 and 39.6% in 1Q19. The ratio of annualized total other expenses as a percentage of average total assets was 2.9% in 1Q20, 3.6% in 4Q19 and 3.1% in 1Q19.
In Central America, our efficiency ratio measured as total other expenses to total income, was 54.7% in 1Q20, 56.6% in 4Q19 and 56.0% in 1Q19. The ratio of annualized total other expenses as a percentage of average total assets was 4.7% in 1Q20, 5.3% in 4Q19 and 4.6% in 1Q19.
5. Non-controlling Interest
Non-controlling interest in Grupo Aval reflects: (i) the minority stakes that third party shareholders hold in each of its direct consolidated subsidiaries (Banco de Bogotá, Banco de Occidente, Banco Popular, Banco AV Villas and Corficolombiana), and (ii) the minority stakes that third party shareholders hold in the consolidated subsidiaries at the bank level (mainly Porvenir). For 1Q20, non-controlling interest in the income statement was Ps 645.6 billion, showing an 8.7% increase versus 1Q19 and an increase of 13.7% versus 4Q19. The ratio of non-controlling interest to income before non-controlling interest was 48.0% in 1Q20, 44.3% in 4Q19 and 43.8% in 1Q19.
15

Information related to Grupo Aval’s consolidated financial statements by geography
Grupo Aval Acciones y Valores S.A. - Colombian Operation
Financial Statements Under Full IFRS
Information in Ps. Billions
| 1Q19 | 4Q19 | 1Q20 | D | |||||||
| 1Q20 vs. 4Q19 | 1Q20 vs. 1Q19 | |||||||||
| Gross loans and receivables | 117,403.8 | 124,173.3 | 131,414.5 | 5.8% | 11.9% | |||||
| Total assets | 181,198.4 | 195,940.5 | 215,714.4 | 10.1% | 19.0% | |||||
| Customer deposits | 113,664.7 | 119,211.7 | 131,821.7 | 10.6% | 16.0% | |||||
| Total liabilities | 165,048.5 | 177,203.4 | 200,921.0 | 13.4% | 21.7% | |||||
| Net income for the period | 1,059.9 | 873.5 | 901.9 | 3.3% | -14.9% | |||||
| Net income attributable to owners of the parent | 558.9 | 433.6 | 395.2 | -8.9% | -29.3% | |||||
| YTD 2019 | YTD 2020 | D | ||||||||
| 2020 vs. 2019 | ||||||||||
| Net income for the period | 1,059.9 | 901.9 | -14.9% | |||||||
| A | Net income attributable to owners of the parent | 558.9 | 395.2 | -29.3% | ||||||
Leasing Bogotá Panamá S.A.(1)
Financial Statements Under IFRS
Information in Ps. Billions
| 1Q19 | 4Q19 | 1Q20 | D | |||||||
1Q20 vs. 4Q19 | 1Q20 vs. 1Q19 | |||||||||
| Gross loans and receivables | 51,042.6 | 55,235.8 | 69,253.5 | 25.4% | 35.7% | |||||
| Total assets | 77,064.6 | 82,892.1 | 104,713.3 | 26.3% | 35.9% | |||||
| Customer deposits | 49,590.4 | 56,279.7 | 71,399.8 | 26.9% | 44.0% | |||||
| Total liabilities | 64,176.0 | 68,281.0 | 86,476.4 | 26.6% | 34.7% | |||||
| Net income for the period | 296.8 | 409.6 | 443.9 | 8.4% | 49.6% | |||||
| Net income attributable to owners of the parent | 204.0 | 281.6 | 305.1 | 8.4% | 49.6% | |||||
| YTD 2019 | YTD 2020 | D | ||||||||
| 2020 vs. 2019 | ||||||||||
| Net income for the period | 296.8 | 443.9 | 49.6% | |||||||
| B | Net income attributable to owners of the parent | 204.0 | 305.1 | 49.6% | ||||||
| A+B | Net income attributable to owners of the parent | 762.9 | 700.2 | -8.2% | ||||||
(1) Leasing Bogotá Panamá is the holding company that consolidates our Central American operations.
16

Information related to Grupo Aval Acciones y Valores S.A. (Holding Company) and Grupo Aval Limited
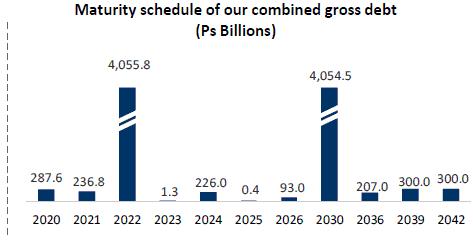
The holding company recorded a total gross indebtedness of Ps 1,661.8 billion (Ps 430.3 billion of bank debt and Ps 1,231.5 billion of bonds denominated in Colombian pesos) as of March 31st 2020. It also guarantees irrevocably and unconditionally Grupo Aval Limited’s (144A / Reg S) 2022 (USD 1.0 billion) bonds and Grupo Aval Limited’s (144A / Reg S) 2030 (USD 1.0 billion) bonds under its respective indentures. As of March 31st, 2020 the total amount outstanding (including interests payable) of such bonds was USD 2.0 billion, or Ps 8,101.7 billion when translated into pesos.
The debt at Grupo Aval Limited is serviced with interest income on loans to subsidiaries and cash & cash equivalents. Grupo Aval Limited has not required, to this date, cash from Grupo Aval Acciones y Valores S.A. to fulfill its obligations. The main sources of cash to pay the debt and debt service at Grupo Aval Acciones y Valores S.A. have been the dividend income from its subsidiaries and the returns on its cash & cash equivalents.
When combined, Grupo Aval Acciones y Valores S.A. and Grupo Aval Ltd. had Ps 5,561.8 billion of total liquid assets, a total gross indebtedness of Ps 9,763.5 billion and a net indebtedness (including callable senior loans to subsidiaries) of Ps 4,201.7 billion as of March 31st, 2020. In addition to liquid assets, Grupo Aval Ltd. has Ps 1,987.6 billion in other loans to subsidiaries.
| Total liquid assets as of March 31, 2020 | |
| Cash and cash equivalents | 4,636.9 |
| Fixed income investments | 158.6 |
| Callable Senior loans to subsidiaries | 766.3 |
| Total liquid assets | 5,561.8 |
As of March 31st, 2020 our combined double leverage (calculated as investments in subsidiaries at book value, subordinated loans to subsidiaries and goodwill as a percentage of shareholders' equity) was 1.15x. Finally, we present an evolution of our key ratios on a combined basis:
| Debt service coverage and leverage ratios | 1Q19 | 4Q19 | 1Q20 | D | |||||
1Q20 vs. 4Q19 | 1Q20 vs. 1Q19 | ||||||||
| Double leverage (1) | 1.15x | 1.14x | 1.15x | 0.01 | 0.00 | ||||
| Net debt / Core earnings (2)(3) | 2.8x | 2.2x | 3.2x | 0.9 | 0.4 | ||||
| Net debt / Cash dividends (2)(3) | 3.9x | 3.0x | 3.7x | 0.7 | -0.2 | ||||
| Core Earnings / Interest Expense (2) | 5.4x | 6.1x | 4.0x | -2.1 | -1.4 | ||||
(1) Double leverage is calculated as investments in subsidiaries at book value (excluding revaluations), subordinated loans to subsidiaries and goodwill as a percentage of shareholders' equity; (2) Core earnings are defined as annualized recurring cash flow from dividends, investments and net operating income; (3) Net debt is calculated as total gross debt minus cash and cash equivalents and fixed income investments
17
Recent Developments
On May 11, 2020 Grupo Aval informed that its subsidiary Banco de Bogotá (through its subsidiary Leasing Bogotá S.A. Panamá) has agreed to amend the purchase agreement for up to 100% of the outstanding common shares (the “SPA”) of Multi Financial Group, Inc. (“MFG”), parent company of Panamanian bank Multibank. The parties mutually agreed to amend the SPA after certain conditions precedent were not met in a timely manner before the originally scheduled closing on April 28, 2020. The transaction has obtained the required regulatory approvals and is now expected to close before the end of May, 2020.
In addition to the amendment of the closing date of the transaction, the agreed price was reduced by 39%, from 1.3 times MFG’s Total Shareholders’ Equity at closing (which includes $110 million dollars represented in preferred shares) to approximately 0.85 times the estimated Total Shareholders’ Equity at closing (including the $110 million dollars in preferred shares).
As of March 31, 2020, BAC Credomatic had a USD 16.6 billion loan portfolio, USD 17.7 billion in deposits and USD 3.0 billion in total shareholders’ equity. As of the same date, MFG had a USD 3.4 billion loan portfolio, USD 2.8 billion in deposits and USD 576 million in total shareholders’ equity.
18
ABOUT GRUPO AVAL
Grupo Aval is Colombia’s largest banking group, and through our BAC Credomatic operations it is also the largest and the most profitable banking group in Central America. Grupo Aval currently operates through four commercial banks in Colombia (Banco de Bogotá, Banco de Occidente, Banco Popular and Banco AV Villas). It manages pension and severance funds through the largest pension and severance fund manager in Colombia (Porvenir) and owns the largest merchant bank in Colombia (Corficolombiana), each of which Aval controls and consolidates into its results.
Investor Relations Contact
Alejo Sánchez García
Strategic Planning and Investor Relations Manager
Tel: +571 241 9700 x23422
E-mail: asanchez@grupoaval.com
19
Grupo Aval Acciones y Valores S.A.
Consolidated Financial Statements Under IFRS
Financial Statements Under IFRS
Information in Ps. Billions
| Consolidated Statement of Financial Position | 1Q19 | 4Q19 | 1Q20 | D | |||||
1Q20 vs. 4Q19 | 1Q20 vs. 1Q19 | ||||||||
| Cash and cash equivalents | 26,918.5 | 30,117.2 | 40,136.8 | 33.3% | 49.1% | ||||
| Investment and trading assets | |||||||||
| Debt securities | 3,243.6 | 4,673.1 | 4,883.0 | 4.5% | 50.5% | ||||
| Equity securities | 3,266.3 | 3,523.1 | 3,708.1 | 5.2% | 13.5% | ||||
| Derivative assets | 427.0 | 917.4 | 2,887.8 | N.A. | N.A. | ||||
| Trading assets | 6,936.9 | 9,113.7 | 11,478.9 | 26.0% | 65.5% | ||||
| Investments in debt securities at FVTPL (non compliant with SPPI test) | 27.7 | 10.1 | 9.3 | -8.4% | -66.6% | ||||
| Investments in securities at FVOCI | 21,724.5 | 22,937.1 | 25,757.0 | 12.3% | 18.6% | ||||
| Investments in debt securities at AC | 3,006.6 | 3,053.1 | 3,233.7 | 5.9% | 7.6% | ||||
| Investment securities | 24,758.9 | 26,000.3 | 28,999.9 | 11.5% | 17.1% | ||||
| Hedging derivatives assets | 25.3 | 166.6 | 206.0 | 23.6% | N.A. | ||||
| Loans and receivables | |||||||||
| Commercial loans and leases | 98,265.9 | 101,655.7 | 115,112.9 | 13.2% | 17.1% | ||||
| Commercial loans and leases | 93,805.1 | 98,936.7 | 111,830.7 | 13.0% | 19.2% | ||||
| Interbank & overnight funds | 4,460.7 | 2,719.0 | 3,282.2 | 20.7% | -26.4% | ||||
| Consumer loans and leases | 55,607.6 | 59,840.5 | 65,205.6 | 9.0% | 17.3% | ||||
| Mortgages and housing leases | 18,620.9 | 20,221.7 | 23,228.4 | 14.9% | 24.7% | ||||
| Microcredit loans and leases | 412.8 | 410.3 | 403.4 | -1.7% | -2.3% | ||||
| Total loans and leases | 172,907.1 | 182,128.1 | 203,950.2 | 12.0% | 18.0% | ||||
| Loss allowance | (8,169.0) | (8,185.8) | (8,883.9) | 8.5% | 8.8% | ||||
| Total loans and receivables, net | 164,738.1 | 173,942.3 | 195,066.3 | 12.1% | 18.4% | ||||
| Other accounts receivable, net | 9,644.2 | 11,702.3 | 13,340.9 | 14.0% | 38.3% | ||||
| Non-current assets held for sale | 179.6 | 206.2 | 284.1 | 37.8% | 58.1% | ||||
| Investments in associates and joint ventures | 879.9 | 988.0 | 996.5 | 0.9% | 13.3% | ||||
| Own-use property, plant and equipment for own-use and given in operating lease, net | 5,590.6 | 5,783.2 | 5,886.3 | 1.8% | 5.3% | ||||
| Right-of-use assets | 2,118.8 | 2,125.6 | 2,379.8 | 12.0% | 12.3% | ||||
| Investment properties | 899.0 | 936.8 | 921.0 | -1.7% | 2.4% | ||||
| Biological assets | 91.4 | 104.9 | 108.4 | 3.4% | 18.6% | ||||
| Tangible assets | 8,699.8 | 8,950.4 | 9,295.5 | 3.9% | 6.8% | ||||
| Goodwill | 7,200.8 | 7,348.6 | 8,571.5 | 16.6% | 19.0% | ||||
| Concession arrangement rights | 5,874.3 | 7,521.5 | 8,068.4 | 7.3% | 37.3% | ||||
| Other intangible assets | 1,034.7 | 1,206.5 | 1,274.1 | 5.6% | 23.1% | ||||
| Intangible assets | 14,109.9 | 16,076.6 | 17,914.0 | 11.4% | 27.0% | ||||
| Current | 654.3 | 895.2 | 923.9 | 3.2% | 41.2% | ||||
| Deferred | 245.7 | 246.6 | 1,286.1 | N.A. | N.A. | ||||
| Income tax assets | 900.1 | 1,141.8 | 2,210.1 | 93.6% | 145.5% | ||||
| Other assets | 471.7 | 427.2 | 498.7 | 16.7% | 5.7% | ||||
| Total assets | 258,263.0 | 278,832.6 | 320,427.8 | 14.9% | 24.1% | ||||
| Trading liabilities | 522.5 | 962.4 | 3,016.1 | N.A. | N.A. | ||||
| Hedging derivatives liabilities | 85.1 | 94.3 | 770.9 | N.A. | N.A. | ||||
| Customer deposits | 163,255.1 | 175,491.4 | 203,221.5 | 15.8% | 24.5% | ||||
| Checking accounts | 37,743.2 | 42,449.7 | 53,059.5 | 25.0% | 40.6% | ||||
| Time deposits | 68,362.5 | 73,225.2 | 81,071.4 | 10.7% | 18.6% | ||||
| Savings deposits | 56,637.0 | 59,352.8 | 68,701.9 | 15.8% | 21.3% | ||||
| Other deposits | 512.3 | 463.8 | 388.6 | -16.2% | -24.1% | ||||
| Financial obligations | 52,034.9 | 54,844.6 | 65,763.4 | 19.9% | 26.4% | ||||
| Interbank borrowings and overnight funds | 7,298.0 | 9,240.5 | 7,768.2 | -15.9% | 6.4% | ||||
| Borrowings from banks and others | 21,347.8 | 19,803.3 | 25,511.2 | 28.8% | 19.5% | ||||
| Bonds issued | 19,979.8 | 21,918.3 | 28,684.4 | 30.9% | 43.6% | ||||
| Borrowings from development entities | 3,409.3 | 3,882.5 | 3,799.6 | -2.1% | 11.4% | ||||
| Total financial liabilities at amortized cost | 215,290.0 | 230,336.0 | 268,984.9 | 16.8% | 24.9% | ||||
| Legal related | 125.2 | 194.7 | 196.6 | 1.0% | 57.0% | ||||
| Other provisions | 604.0 | 674.0 | 700.4 | 3.9% | 16.0% | ||||
| Provisions | 729.2 | 868.6 | 897.1 | 3.3% | 23.0% | ||||
| Current | 434.6 | 387.3 | 466.5 | 20.4% | 7.3% | ||||
| Deferred | 2,345.4 | 2,871.3 | 2,645.2 | -7.9% | 12.8% | ||||
| Income tax liabilities | 2,779.9 | 3,258.6 | 3,111.7 | -4.5% | 11.9% | ||||
| Employee benefits | 1,262.2 | 1,235.0 | 1,295.7 | 4.9% | 2.7% | ||||
| Other liabilities | 8,555.7 | 8,729.4 | 9,321.2 | 6.8% | 8.9% | ||||
| Total liabilities | 229,224.5 | 245,484.3 | 287,397.4 | 17.1% | 25.4% | ||||
| Equity attributable to owners of the parent | 17,334.9 | 19,850.6 | 19,472.2 | -1.9% | 12.3% | ||||
| Non-controlling interest | 11,703.6 | 13,497.7 | 13,558.1 | 0.4% | 15.8% | ||||
| Total equity | 29,038.5 | 33,348.3 | 33,030.3 | -1.0% | 13.7% | ||||
| Total liabilities and equity | 258,263.0 | 278,832.6 | 320,427.8 | 14.9% | 24.1% | ||||
20
Grupo Aval Acciones y Valores S.A.
Consolidated Financial Statements Under Full IFRS
Financial Statements Under IFRS
Information in Ps. Billions
| Consolidated Statement of income | 1Q19 | 4Q19 | 1Q20 | D | |||||
1Q20 vs. 4Q19 | 1Q20 vs. 1Q19 | ||||||||
| Interest income | |||||||||
| Loan portfolio | 4,398.9 | 4,808.3 | 4,774.8 | -0.7% | 8.5% | ||||
| Interests on investments in debt securities | 270.3 | 247.4 | 322.6 | 30.4% | 19.4% | ||||
| Total interest income | 4,669.2 | 5,055.7 | 5,097.5 | 0.8% | 9.2% | ||||
| Interest expense | |||||||||
| Checking accounts | 103.2 | 98.7 | 93.7 | -5.1% | -9.3% | ||||
| Time deposits | 838.9 | 937.2 | 948.4 | 1.2% | 13.1% | ||||
| Savings deposits | 362.5 | 392.5 | 427.1 | 8.8% | 17.8% | ||||
| Total interest expenses on deposits | 1,304.7 | 1,428.4 | 1,469.2 | 2.9% | 12.6% | ||||
| Interbank borrowings and overnight funds | 77.6 | 123.1 | 84.5 | -31.4% | 8.8% | ||||
| Borrowings from banks and others | 234.5 | 238.9 | 220.4 | -7.7% | -6.0% | ||||
| Bonds issued | 287.5 | 332.8 | 359.4 | 8.0% | 25.0% | ||||
| Borrowings from development entities | 35.4 | 37.1 | 38.5 | 3.9% | 8.9% | ||||
| Total interest expenses on financial obligations | 635.0 | 731.9 | 702.7 | -4.0% | 10.7% | ||||
| Total interest expense | 1,939.7 | 2,160.3 | 2,172.0 | 0.5% | 12.0% | ||||
| Net interest income | 2,729.5 | 2,895.4 | 2,925.5 | 1.0% | 7.2% | ||||
| Impairment losses (recoveries) on financial assets | |||||||||
| Loans and other accounts receivable | 933.2 | 1,030.6 | 1,101.4 | 6.9% | 18.0% | ||||
| Other financial assets | (22.9) | (5.3) | 14.8 | N.A | -164.8% | ||||
| Recovery of charged-off financial assets | (77.2) | (103.3) | (79.7) | -22.8% | 3.3% | ||||
| Net impairment loss on financial assets | 833.1 | 922.1 | 1,036.5 | 12.4% | 24.4% | ||||
| Net interest income, after impairment losses | 1,896.4 | 1,973.3 | 1,889.0 | -4.3% | -0.4% | ||||
| Income from commissions and fees | |||||||||
| Banking fees(1) | 1,028.0 | 1,242.0 | 1,109.0 | -10.7% | 7.9% | ||||
| Trust activities | 80.7 | 82.7 | 81.4 | -1.6% | 0.8% | ||||
| Pension and severance fund management | 255.5 | 293.2 | 307.7 | 5.0% | 20.4% | ||||
| Bonded warehouse services | 41.0 | 40.4 | 36.7 | -9.1% | -10.5% | ||||
| Total income from commissions and fees | 1,405.2 | 1,658.3 | 1,534.8 | -7.4% | 9.2% | ||||
| Expenses from commissions and fees | 146.2 | 164.4 | 189.0 | 15.0% | 29.2% | ||||
| Net income from commissions and fees | 1,259.0 | 1,494.0 | 1,345.8 | -9.9% | 6.9% | ||||
| Income from sales of goods and services | 1,923.5 | 2,774.3 | 2,463.6 | -11.2% | 28.1% | ||||
| Costs and expenses from sales of goods and services | 1,348.9 | 2,235.2 | 1,629.9 | -27.1% | 20.8% | ||||
| Gross profit from sales of goods and services | 574.5 | 539.0 | 833.7 | 54.7% | 45.1% | ||||
| Net trading income | 108.2 | (36.2) | 1,101.2 | N.A | N.A. | ||||
| Net income from other financial instruments mandatory at FVTPL | 53.7 | 55.2 | 73.3 | 32.6% | 36.4% | ||||
| Other income | |||||||||
| Foreign exchange gains (losses), net | 166.1 | 337.4 | (1,147.8) | N.A | N.A | ||||
| Net gain on sale of investments and OCI realization | 5.9 | 8.6 | 94.3 | N.A. | N.A. | ||||
| Gain on the sale of non-current assets held for sale | 6.0 | 5.2 | 28.6 | N.A. | N.A. | ||||
| Income from non-consolidated investments(2) | 123.2 | 56.9 | 148.2 | 160.4% | 20.2% | ||||
| Net gains on asset valuations | 4.6 | 12.2 | 3.3 | -72.5% | -26.7% | ||||
| Other income from operations | 80.1 | 105.9 | 69.1 | -34.7% | -13.7% | ||||
| Total other income | 385.9 | 526.2 | (804.3) | N.A | N.A | ||||
| Other expenses | |||||||||
| Loss on the sale of non-current assets held for sale | 1.6 | 0.8 | 1.8 | 124.2% | 17.6% | ||||
| Personnel expenses | 965.2 | 1,061.5 | 1,087.0 | 2.4% | 12.6% | ||||
| General and administrative expenses | 1,086.5 | 1,424.6 | 1,221.6 | -14.2% | 12.4% | ||||
| Depreciation and amortization | 207.9 | 229.8 | 235.2 | 2.3% | 13.1% | ||||
| Impairment loss on other assets | 3.8 | 1.2 | 3.7 | N.A. | -1.2% | ||||
| Other operating expenses | 21.5 | 131.8 | 27.0 | -79.5% | 26.0% | ||||
| Total other expenses | 2,286.5 | 2,849.7 | 2,576.4 | -9.6% | 12.7% | ||||
| Net income before income tax expense | 1,991.2 | 1,701.9 | 1,862.3 | 9.4% | -6.5% | ||||
| Income tax expense | 634.6 | 418.8 | 516.4 | 23.3% | -18.6% | ||||
| Net income for the period | 1,356.6 | 1,283.1 | 1,345.8 | 4.9% | -0.8% | ||||
| Net income for the period attibutable to: | |||||||||
| Non-controlling interest | 593.8 | 568.0 | 645.6 | 13.7% | 8.7% | ||||
| Net income attributable to owners of the parent | 762.9 | 715.1 | 700.2 | -2.1% | -8.2% | ||||
(1)Includes commissions on banking services, office network services, credit and debit card fees, fees on drafts, checks and checkbooks and other fees.
(2) Includes share of profit of equity accounted investees, net of tax, and dividend income.
21
Item 2
1 IFRS 1Q20 Consolidated Earnings Results
2 Disclaimer Grupo Aval Acciones y Valores S . A . (“Grupo Aval”) is an issuer of securities in Colombia and in the United States .. As such, it is subject to compliance with securities regulation in Colombia and applicable U . S . securities regulation . Grupo Aval is also subject to the inspection and supervision of the Superintendency of Finance as holding company of the Aval financial conglomerate . The consolidated financial information included in this document is presented in accordance with IFRS as currently issued by the IASB . Details of the calculations of non - GAAP measures such as ROAA and ROAE, among others, are explained when required in this report . This report includes forward - looking statements . In some cases, you can identify these forward - looking statements by words such as “may,” “will,” “should,” “expects,” “plans,” “anticipates,” “believes,” “estimates,” “predicts,” “potential,” or “continue,” or the negative of these and other comparable words . Actual results and events may differ materially from those anticipated herein as a consequence of changes in general, economic and business conditions, changes in interest and currency rates and other risk described from time to time in our filings with the Registro Nacional de Valores y Emisores and the SEC . Recipients of this document are responsible for the assessment and use of the information provided herein . Matters described in this presentation and our knowledge of them may change extensively and materially over time but we expressly disclaim any obligation to review, update or correct the information provided in this report, including any forward looking statements, and do not intend to provide any update for such material developments prior to our next earnings report . The content of this document and the figures included herein are intended to provide a summary of the subjects discussed rather than a comprehensive description . When applicable, in this document we refer to billions as thousands of millions .

3 Consolidated key results for the quarter Gross loans e xcludes interbank and overnight funds. PDLs 90+ defined as loans more than 90 days past due. Net Interest Margin includes net interest income plus net trading income from debt and equity investments at FVTPL divided by total average interest - earning assets. Fee income ratio is calculated as net income from commissions and fees divided by net interest income plus net income from commissions and fees, gross profit from sales of goods and services, net trading income, net income from other financial inst rum ents mandatory at FVTPL and total other income . Efficiency Ratio is calculated as total other expenses divided by net interest income plus net income from commissions and fees, gross profit from sales of goo ds and services, net trading income, net income from other financial instruments mandatory at FVTPL and total other income. ROAA is calculated as annualized Net Income divided by average of total assets. ROA E is calculated as Net Income attributable to Aval's shareholders divided by average attributable shareholders' equity. NS refers to non - significant figures. COP $tn 1Q19 4Q19 1Q20 1Q20 vs 1Q19 1Q20 vs 4Q19 Gross Loans $ 168.4 $ 179.4 $ 200.7 19.1% 11.8% Deposits $ 163.3 $ 175.5 $ 203.2 24.5% 15.8% Deposits/Net Loans 0.99 x 1.01 x 1.04 x 0.05 x 0.03 x 90 days PDLs / Total loans 3.1% 3.3% 3.1% 9 bps (11) bps Allowance/90 days PDLs 1.59 x 1.40 x 1.41 x -0.18 x 0.01 x Cost of risk 2.0% 2.1% 2.2% 12 bps 8 bps Net interest margin 5.7% 5.6% 4.8% (93) bps (85) bps Fee income Ratio 24.6% 27.3% 24.6% (5) bps (271) bps Efficiency Ratio 44.7% 52.1% 47.1% 232 bps (501) bps Attributable net income $ 0.76 $ 0.72 $ 0.70 -8.2% -2.1% ROAA 2.1% 1.9% 1.8% (30) bps (6) bps ROAE 17.4% 14.6% 14.2% (313) bps (36) bps Balance Sheet Loan Quality Profitability • 1Q 2020 was a quarter of contrasts marked by strong growth in January and February and by an abrupt deceleration during March due to the global pandemic and the oil war. As a result, GDP growth for the quarter was only 0.4% (seasonally adjusted) and devaluation rose to 23.7%, both concentrated in the last few weeks of March. • Since March, Grupo Aval has deployed strategies to safeguard its employees’ health and to alleviate debt payments mostly to clients who request it. • During the quarter, in part driven by devaluation, Aval ´ s Consolidated Assets grew by 24.1% vs 1Q 2019 and 14.9% vs 4Q 2019, Consolidated Gross Loans grew by 19.1% vs 1Q 2019 and 11.8% vs 4Q 2019 and Consolidated Deposits grew by 24.5% vs 1Q 2019 and 15.8% vs 4Q 2019. • The quality of the loan portfolio showed a slight improvement aided by the Superintendence of Finance’s new regulation mandating banks to classify refinanced loans (due to the pandemic) as current. • Cost of Risk increased slightly vs 4Q 2019 (2.15% vs 2.07%) due in part to provisions for the banks’ exposure to Avianca. • Total NIM suffered a sharp decrease vs 4Q 2019, from 5.63% to 4.78%, driven mostly by a 364 bps drop in NIM on Investments. • Corficolombiana’s Non - Financial Sector Investments contributed strongly to the quarter ´ s result especially from its toll road concessions and Promigas . • Aval’s consolidated Cost to Income efficiency ratio improved to 47.1% from 52.1% a quarter earlier and the Cost to Assets ratio improved to 3.4% from 4.1%. • The quarter ended with strong funding and liquidity positions, as evidenced by the Deposits /Net Loans ratio of 1.04x up from 1.01x in 4Q 2019, and the Cash/Deposits ratio of 19.8% up from 17.2% in 4Q19. • Net Income for the quarter was 700.2 billion pesos or 31.4 pesos per share, and our ROAE was 14.2%, slightly lower than 4Q 2019.

4 1Q19 4Q19 1Q20 1Q20 vs 1Q19 1Q20 vs 4Q19 1Q19 4Q19 1Q20 1Q20 vs 1Q19 1Q20 vs 4Q19 Gross Loans $ 117.4 $ 124.2 $ 131.4 11.9% 5.8% $ 51.0 $ 55.2 $ 69.3 35.7% 25.4% Deposits $ 113.7 $ 119.2 $ 131.8 16.0% 10.6% $ 49.6 $ 56.3 $ 71.4 44.0% 26.9% Deposits/Net Loans 1.01 x 1.00 x 1.05 x 0.04 x 0.04 x 0.96 x 1.02 x 1.04 x 0.08 x 0.01 x 90 days PDLs / Total loans 3.7% 4.0% 4.0% 27 bps 3 bps 1.5% 1.6% 1.5% 2 bps (13) bps Allowance/90 days PDLs 1.49 x 1.31 x 1.31 x -0.19 x -0.01 x 2.15 x 1.90 x 1.94 x -0.20 x 0.05 x Cost of risk 1.9% 2.0% 2.4% 41 bps 38 bps 2.2% 2.3% 1.7% (48) bps (54) bps Net interest margin 5.4% 5.0% 4.0% (137) bps (97) bps 6.4% 7.1% 6.4% (4) bps (66) bps Fee income Ratio 19.8% 22.6% 20.9% 108 bps (171) bps 35.3% 35.7% 31.0% (430) bps (470) bps Efficiency Ratio 39.6% 49.5% 42.7% 305 bps (686) bps 56.0% 56.6% 54.7% (136) bps (192) bps Attributable net income $ 0.56 $ 0.43 $ 0.40 -29.3% -8.9% $ 0.20 $ 0.28 $ 0.31 49.6% 8.4% ROAA 2.3% 1.8% 1.8% (59) bps (6) bps 1.5% 2.0% 1.9% 37 bps (6) bps ROAE 25.6% 18.4% 18.9% (673) bps 46 bps 9.2% 11.1% 10.8% 157 bps (27) bps Balance Sheet Loan Quality Profitability Key results per region for the quarter 67.3% of Assets 32.7% of Assets ( 1 ) Central America refers to Leasing Bogotá Panamá (LBP) operation expressed in Colombian Pesos, at the exchange rate of each period . ( 2 ) Attributable net income for Grupo Aval of Ps 700 . 2 bn for 1 Q 20 corresponds to the Ps 395 . 2 bn of our Colombian operation plus Ps 443 . 9 bn of our Central American operation multiplied by 68 . 7 % , our stake in Banco de Bogotá . Gross loans e xcludes interbank and overnight funds . PDLs 90 + defined as loans more than 90 days past due . Net Interest Margin includes net interest income plus net trading income from investment securities held for trading through profit or loss divided by total average interest - earning assets . Fee income ratio is calculated as net income from commissions and fees divided by net interest income plus net income from commissions and fees, gross profit from sales of goods and services, net trading income, net income from other financial instruments mandatory at FVTPL and total other income . Efficiency Ratio is calculated as total other expenses divided by net interest income plus net income from commissions and fees, gross profit from sales of goods and services, net trading income, net income from other financial instruments mandatory at FVTPL and total other income . ROAA is calculated as annualized Net Income divided by average of total assets . ROA E is calculated as Net Income attributable to Aval's shareholders divided by average attributable shareholders' equity . NS refers to non - significant figures . Equity for Central America is calculated as LBP multiplied by our 68 . 7 % stake in the company . Equity for Colombia is calculated as the difference between our consolidated attributable equity and the equity in Central America . Colombia Central America (1) (2)

5 Covid - 19 Response: As of May 15, 2020 Types of Relief offered to customers Risk management Care of employees and support of suppliers Contributions in Colombia and Central America Grupo Aval and its Subsidiaries have deployed actions that benefit more than 2.8MM people and we are looking continuously into solutions to support our stakeholders.

6 Types of Relief offered to customers Costumers Wholesale banking Retail banking Fees waived on transfers to non - Aval banks originated in our digital channels and in our call centers 94,788 retirees have opened digital saving accounts Strengthening our digital channels • 24% monthly growth (3) in transactions in our Mobile Banking apps • 56% monthly growth (3) in Aval Pay Center and in our retail transactional webpages As of May 15, 2020 (1) Loan portfolio at March 31, 2020 (2) FNG: Fondo Nacional de Garantias (3) Monetary transactions in Colombia. Growth calculed as April transactions vs. average transactions between December 2019 - March 2020 • We disbursed: Ps 2.5 trillion in loans for payroll payments and working capital loans for SMEs and microenterprises guaranteed by the FNG (2) Ps 77 billion in a special line for direct payroll payment loans Ps 133 billion from the Bancoldex line to companies in the Orange Economy +Ps 32.5 trillion 26% of the total gross portfolio (1) Reliefs + USD 7.8 billion 46% of total loan portfolio (1)
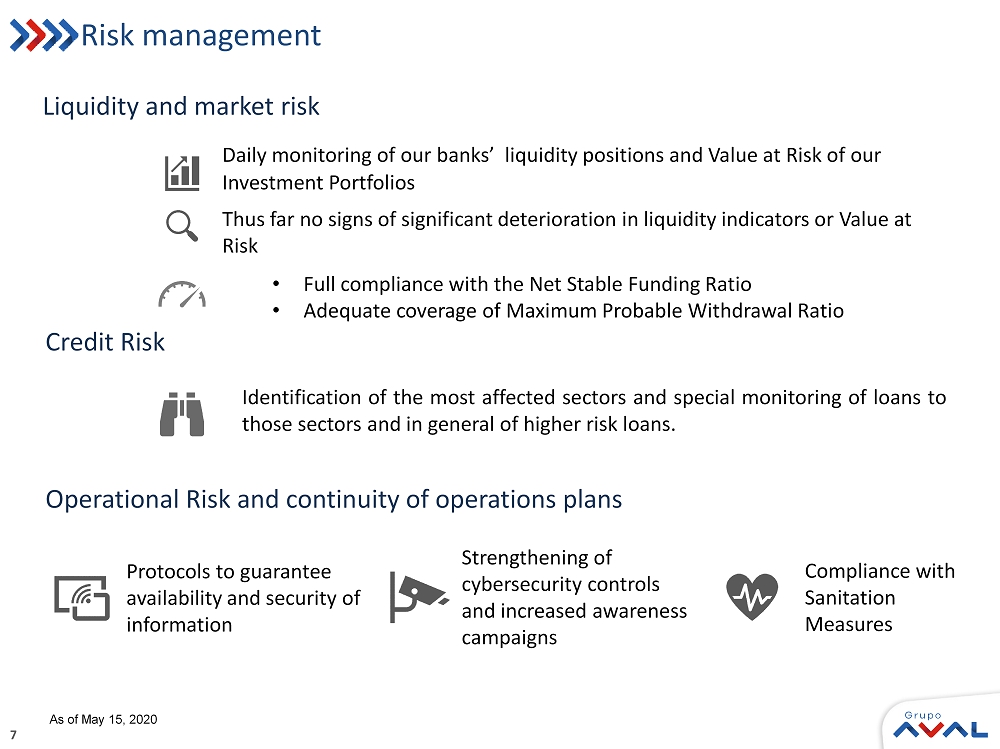
7 Risk management Identification of the most affected sectors and special monitoring of loans to those sectors and in general of higher risk loans . Daily m onitoring of our banks’ liquidity positions and Value at Risk of our Investment Portfolios Thus far no signs of significant deterioration in liquidity indicators or Value at Risk • Full compliance with the Net Stable Funding Ratio • Adequate coverage of Maximum Probable Withdrawal Ratio Liquidity and market risk Credit Risk Operational Risk and continuity of operations plans Protocols to guarantee availability and security of information Compliance with Sanitation Measures Strengthening of cybersecurity controls and increased awareness campaigns As of May 15, 2020
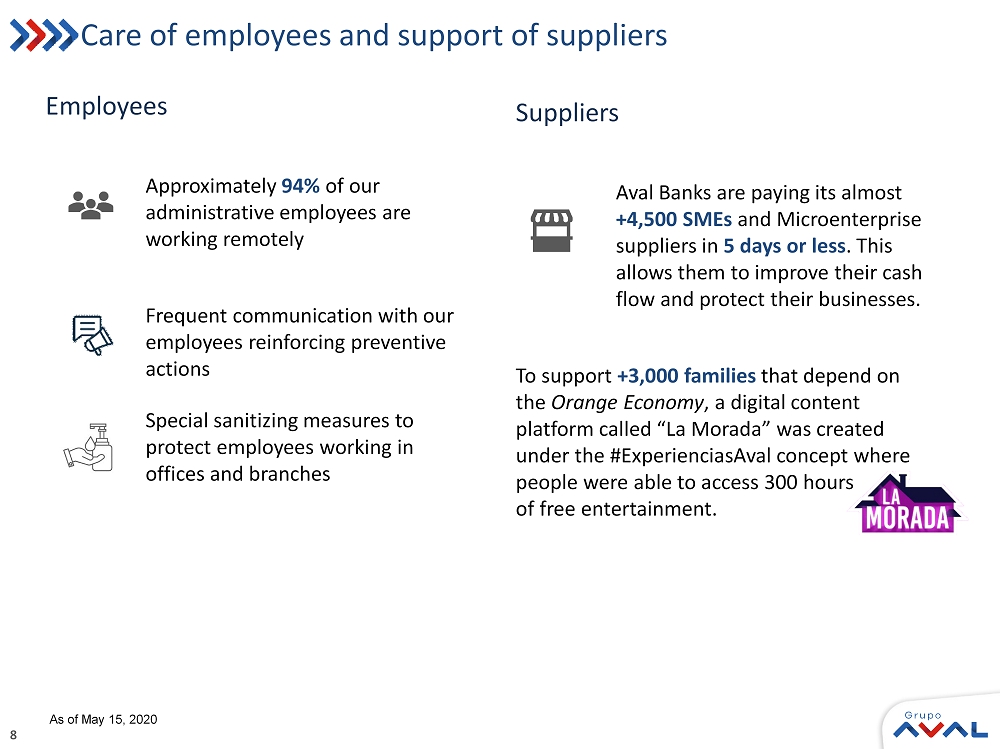
8 Care of employees and support of suppliers Employees Approximately 94% of our administrative employees are working remotely Frequent communication with our employees reinforcing preventive actions Special sanitizing measures to protect employees working in offices and branches Suppliers Aval Banks are paying its almost +4,500 SMEs and Microenterprise suppliers in 5 days or less . This allows them to improve their cash flow and protect their businesses. To support +3,000 families that depend on the Orange Economy , a digital content platform called “La Morada” was created under the # ExperienciasAval concept where people were able to access 300 hours of free entertainment. As of May 15, 2020
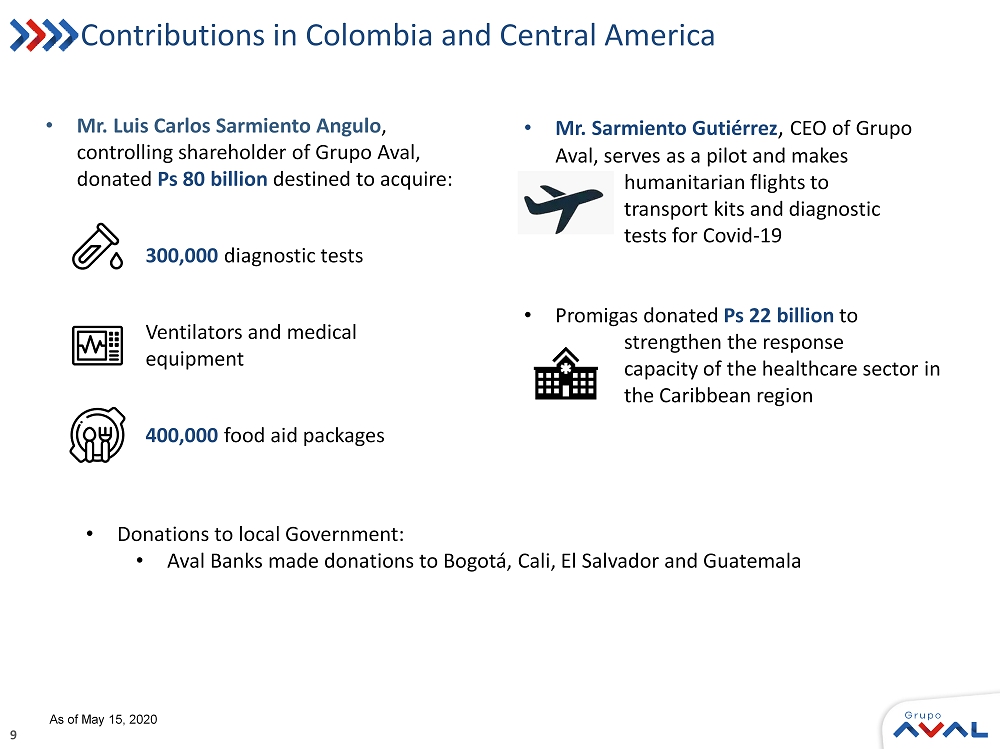
9 Contributions in Colombia and Central America • Mr. Luis Carlos Sarmiento Angulo , controlling shareholder of Grupo Aval, donated Ps 80 billion destined to acquire: 300,000 diagnostic tests Ventilators and medical equipment 400,000 food aid packages • Mr. Sarmiento Gutiérrez , CEO of Grupo Aval, serves as a pilot and makes humanitarian flights to transport kits and diagnostic tests for Covid - 19 • Promigas donated Ps 22 billion to strengthen the response capacity of the healthcare sector in the Caribbean region As of May 15, 2020 • Donations to local Government: • Aval Banks made donations to Bogotá, Cali, El Salvador and Guatemala

10 0% 3% 5% 8% 10% Dec-14 Dec-15 Dec-16 Dec-17 Dec-18 Dec-19 Real GDP growth Inflation Colombian Central Bank's Interest rate 3.25% 3.51% 0.41% Source: Banco de la República de Colombia and DANE. Source: DANE. Seasonally adjusted , constant prices of 2015 GDP Macroeconomic context - Colombia ( 1 | 2 ) Oil Exports/Total Exports 2014: 52.8% 2015: 40.4% 2016: 34.0% 2017: 35.0% 2018: 40.2% Source : Banco de la República de Colombia . (3.6%) (4.2%) (8.0%) (6.0%) (4.0%) (2.0%) 0.0% 2.0% Dec-14 Jun-15 Dec-15 Jun-16 Dec-16 Jun-17 Dec-17 Jun-18 Dec-18 Jun-19 Dec-19 Trade balance Current Account Deficit 2018 2019 (2.7%) (3.8%) 2019: 40.4% 2018 2019 (3.9%) (4.3%) Source: Banco de la República de Colombia and DANE. GDP as of December 2019. GDP Seasonally - adjusted, constant prices (2015 basis) FY GDP 4.5% 3.0% 2.1% 1.4% 2.5% 3.3% May - 20 3.86% 0.0% 2.0% 4.0% 6.0% 8.0% 10.0% Dec-14 Mar-15 Jun-15 Sep-15 Dec-15 Mar-16 Jun-16 Sep-16 Dec-16 Mar-17 Jun-17 Sep-17 Dec-17 Mar-18 Jun-18 Sep-18 Dec-18 Mar-19 Jun-19 Sep-19 Dec-19 Mar-20 12-Month inflation Lower target range Upper target range 3.51% Apr - 20: Inflation (%) Central Bank’s Monetary Policy GDP Growth (%) Current Account ( % GDP, quarterly) 6.1 4.2 4.1 3.7 3.0 2.9 3.8 2.2 2.2 2.2 1.5 2.4 1.3 1.6 1.1 1.4 2.3 2.2 2.8 2.8 2.6 3.6 3.4 3.4 0.4 I II III IV I II III IV I II III IV I II III IV I II III IV I II III IV I II III IV 2014 2015 2016 2017 2018 2019 2020 4.5 3.0 2.1 1.4 2.5 3.3 -

11 Macroeconomic context – Colombia ( 2 | 2 ) Source: Banco de la República de Colombia. Urban unemployment defined as unemployment of 13 cities and their metropolitan areas. * Last twelve months average from April 2019 to March 2020. 12.9% 13.0% Jan - 20 13.7% 12.8% Jan - 19 Source: Ministry of Finance. Projections start in 2020. Real and Projected Fiscal Deficit Fiscal Rule (% of GDP) ) 9.1% 8.9% 9.2% 9.4% 9.7% 10.5% 10.7% 9.9% 9.8% 10.0% 10.6% 10.8% 11.2% 11.2% 2014 2015 2016 2017 2018 2019 Mar-20 LTM average national unemployment LTM average urban unemployment * Mar - 19 Mar - 20 Urban 12.0% 13.4% National 10.8% 12.6% Unemployment (%) (2.4) (3.0) (4.0) (3.6) (3.1) (2.5) (6.1) (2.2) (1.8) (1.6) (1.5) (1.4) (1.3) (1.2) (1.1) 2014 2015 2016 2017 2018 2019 2020 2021 2022 2023 2024 2025 2026 2027 Real fiscal deficit Projected fiscal deficit (Jun - 2019) Projected fiscal deficit (May - 2020) Colombian Peso Exchange Rate Source: Banco de la República de Colombia. 1Q20 vs. 1Q19 1Q20 vs. 4Q19 27.7% 23.7% 12.7% 3.6%
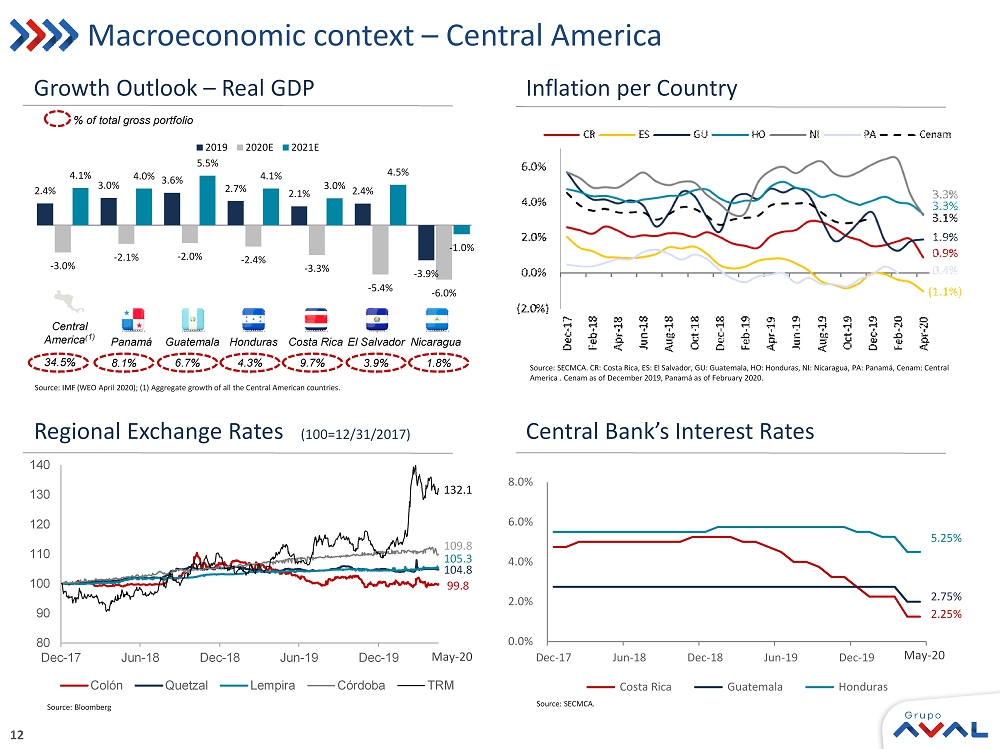
12 Macroeconomic context – Central America Panamá Nicaragua Costa Rica Honduras Guatemala El Salvador Central America ( 1) Source: IMF (WEO April 2020); (1) Aggregate growth of all the Central American countries. Source: SECMCA. CR: Costa Rica, ES: El Salvador, GU: Guatemala, HO: Honduras, NI: Nicaragua, PA: Panamá, Cenam : Central America . Cenam as of December 2019, Panamá as of February 2020. Source: SECMCA. Source: Bloomberg 0.0% 2.0% 4.0% 6.0% 8.0% Dec-17 Jun-18 Dec-18 Jun-19 Dec-19 Costa Rica Guatemala Honduras 5.25% 2.25% 2.75% May - 20 2.4% 3.0% 3.6% 2.7% 2.1% 2.4% - 3.9% - 3.0% - 2.1% - 2.0% - 2.4% - 3.3% - 5.4% - 6.0% 4.1% 4.0% 5.5% 4.1% 3.0% 4.5% - 1.0% 2019 2020E 2021E 1.8% 9.7% 4.3% 6.7 % 3.9% 8.1% 34.5% Regional Exchange Rates (100=12/31/2017) Central Bank’s Interest Rates Growth Outlook – Real GDP Inflation per Country % of total gross portfolio 80 90 100 110 120 130 140 Dec-17 Jun-18 Dec-18 Jun-19 Dec-19 Colón Quetzal Lempira Córdoba TRM 132.1 105.3 109.8 104.8 99.8 May - 20
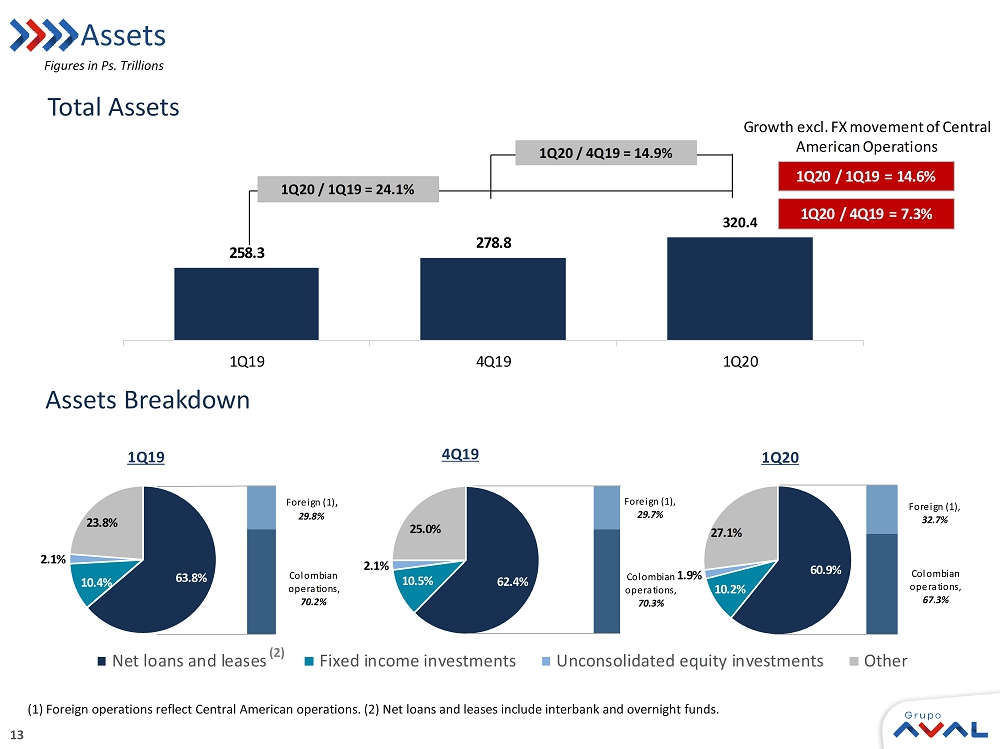
13 63.8% 10.4% 2.1% 23.8% 1Q19 60.9% 10.2% 1.9% 27.1% 1Q20 Colombian operations , 70.2% Foreign (1) , 29.8% Colombian operations , 70.3% Foreign (1) , 29.7% Colombian operations , 67.3% Foreign (1) , 32.7% 62.4% 10.5% 2.1% 25.0% 4Q19 Net loans and leases Fixed income investments Unconsolidated equity investments Other Assets Assets Breakdown Total Assets Figures in Ps. Trillions (1) Foreign operations reflect Central American operations. (2) Net loans and leases include interbank and overnight funds. (2) 258.3 278.8 320.4 1Q19 4Q19 1Q20 1Q20 / 1Q19 = 24.1% 1Q20 / 4Q19 = 14.9% 1Q20 / 1Q19 = 14.6% 1Q20 / 4Q19 = 7.3% Growth excl. FX movement of Central American Operations
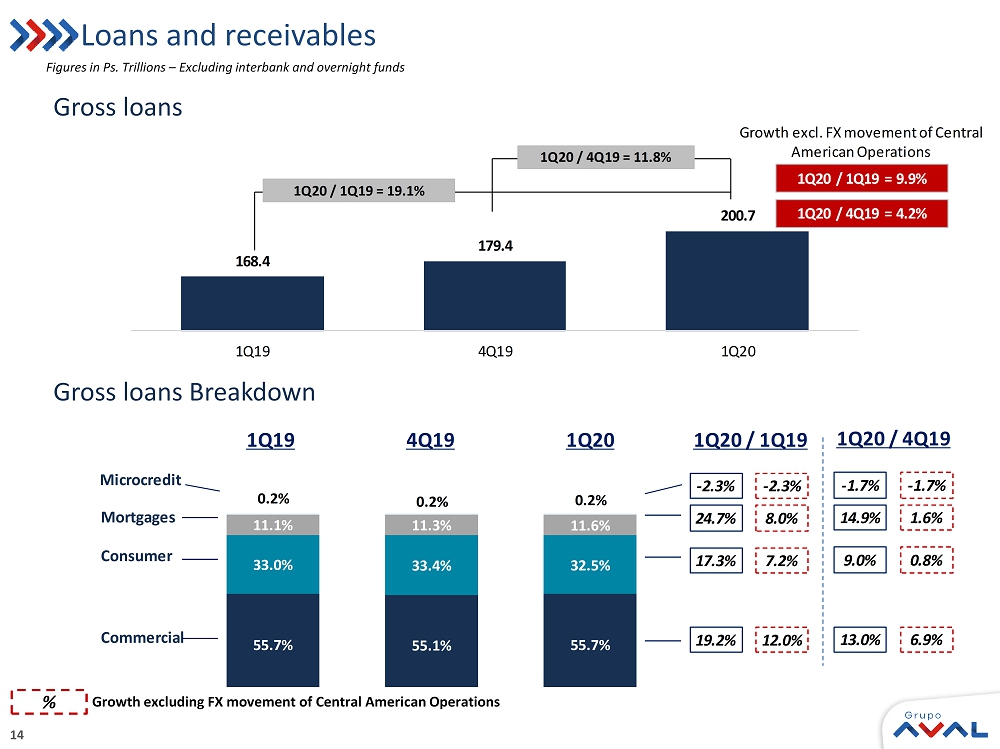
14 168.4 179.4 200.7 1Q19 4Q19 1Q20 1Q20 / 1Q19 = 19.1% 1Q20 / 4Q19 = 11.8% 1Q20 / 1Q19 = 9.9% 1Q20 / 4Q19 = 4.2% Growth excl. FX movement of Central American Operations 55.7% 55.1% 55.7% 33.0% 33.4% 32.5% 11.1% 11.3% 11.6% 0.2% 0.2% 0.2% Commercial Consumer Mortgages Microcredit 19.2% 17.3% 24.7% - 2.3% 12.0% 7.2% 8.0% - 2.3% 1Q20 / 1Q19 1Q19 4Q19 1Q20 1Q20 / 4Q19 13.0% 9.0% 14.9% - 1.7% 6.9% 0.8% 1.6% - 1.7% Loans and receivables Gross loans Gross loans Breakdown Figures in Ps. Trillions – Excluding interbank and overnight funds % Growth excluding FX movement of Central American Operations
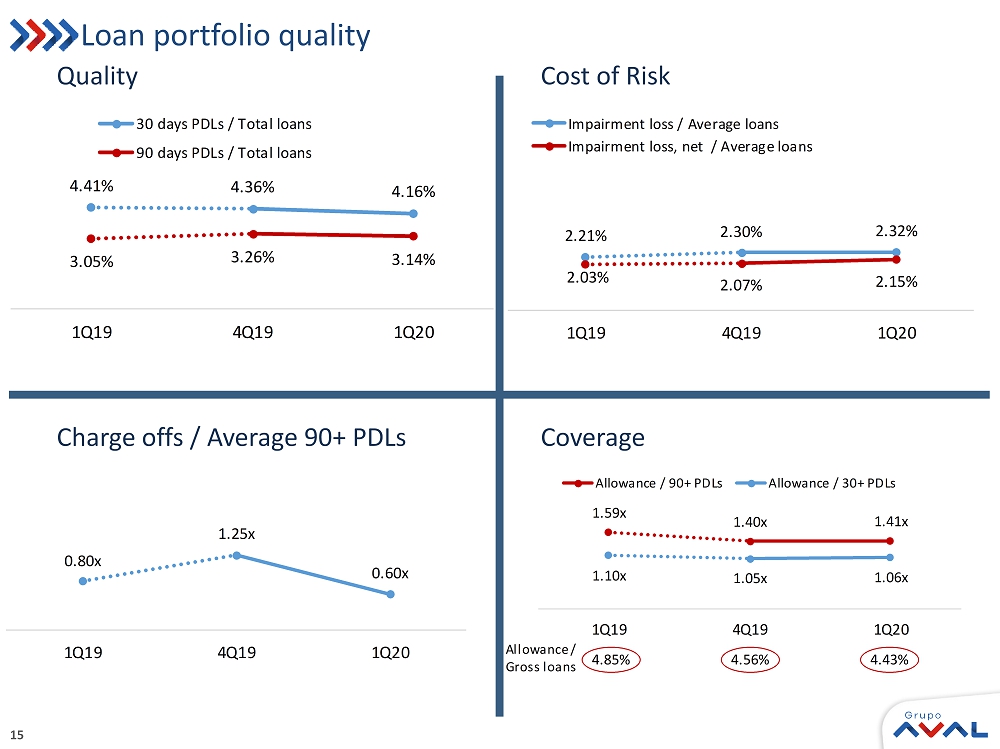
15 2.21% 2.30% 2.32% 2.03% 2.07% 2.15% 1Q19 4Q19 1Q20 Impairment loss / Average loans Impairment loss, net / Average loans Loan portfolio quality Charge offs / Average 90+ PDLs Cost of Risk 4.41% 4.36% 4.16% 3.05% 3.26% 3.14% 1Q19 4Q19 1Q20 30 days PDLs / Total loans 90 days PDLs / Total loans 0.80x 1.25x 0.60x 1Q19 4Q19 1Q20 4.85% 1.59x 1.40x 1.41x 1.10x 1.05x 1.06x 1Q19 4Q19 1Q20 Allowance / 90+ PDLs Allowance / 30+ PDLs 4.56% 4.43% Allowance / Gross loans Quality Coverage

16 Loan portfolio quality 1Q19 4Q19 1Q20 1Q19 4Q19 1Q20 Commercial 4.04% 3.94% 4.11% 3.41% 3.58% 3.45% Consumer 4.89% 4.80% 4.11% 2.60% 2.76% 2.60% Mortgages 4.58% 4.84% 4.37% 2.44% 2.97% 2.98% Microcredit 16.16% 18.09% 15.15% 11.89% 13.60% 14.37% Total loans 4.41% 4.36% 4.16% 3.05% 3.26% 3.14% 30 days past due loans 90 days past due loans (1) Past Due Loans + 30 / Total Loans including interest accounts receivable (2) Past Due Loans + 90 / Total Loans including interest accounts receivable. PDLs 90+ defined as loans more than 90 days pas t d ue. Figures in Ps. Billions 30 days past due formation 90 days past due formation (1) (2) 1Q19 2Q19 3Q19 4Q19 1Q20 Initial PDLs 7,195 7,426 7,716 8,155 7,827 New PDLs 1,264 1,252 1,331 1,502 1,433 Charge-offs (1,034) (961) (892) (1,829) (907) Final PDLs 7,426 7,716 8,155 7,827 8,353 1Q19 2Q19 3Q19 4Q19 1Q20 Initial PDLs 5,188 5,143 5,491 5,846 5,842 New PDLs 988 1,309 1,247 1,826 1,371 Charge-offs (1,034) (961) (892) (1,829) (907) Final PDLs 5,143 5,491 5,846 5,842 6,305 30 days past due loans (1) 90 days past due loans (2)
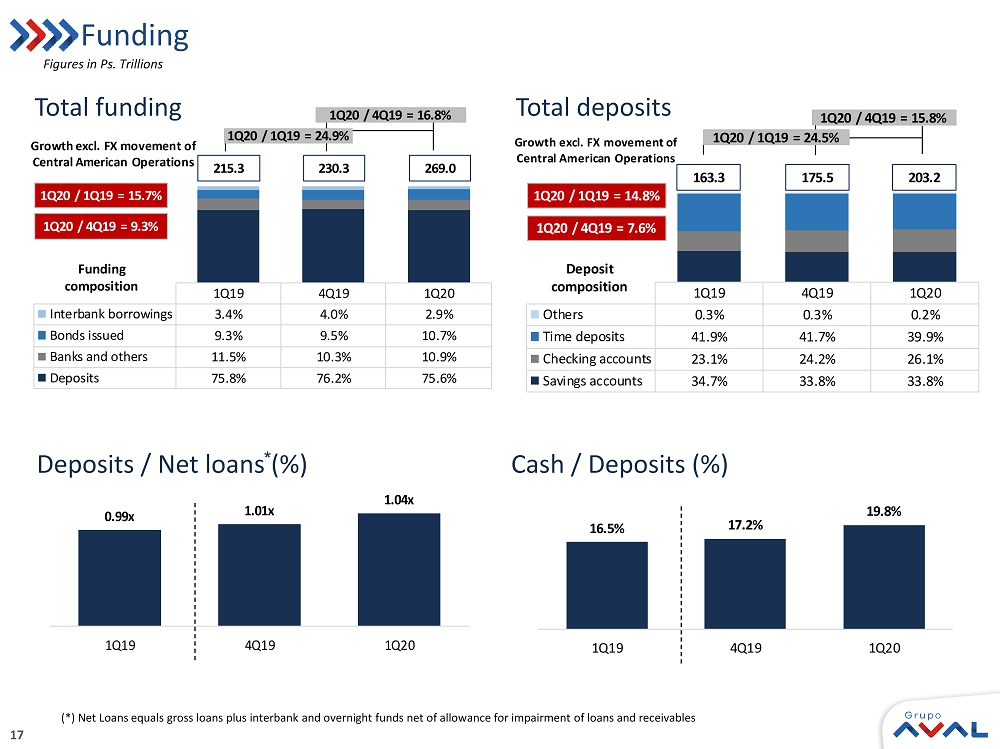
17 0.99x 1.01x 1.04x 1Q19 4Q19 1Q20 Deposits / Net loans (%) 16.5% 17.2% 19.8% 1Q19 4Q19 1Q20 Cash / Deposits (%) 1Q19 4Q19 1Q20 Others 0.3% 0.3% 0.2% Time deposits 41.9% 41.7% 39.9% Checking accounts 23.1% 24.2% 26.1% Savings accounts 34.7% 33.8% 33.8% Total deposits 1Q20 / 1Q19 = 24.5% 1Q20 / 4Q19 = 15.8% 163.3 175.5 203.2 Deposit composition 1Q20 / 1Q19 = 14.8% 1Q20 / 4Q19 = 7.6% Growth excl. FX movement of Central American Operations Funding Figures in Ps. Trillions 1Q19 4Q19 1Q20 Interbank borrowings 3.4% 4.0% 2.9% Bonds issued 9.3% 9.5% 10.7% Banks and others 11.5% 10.3% 10.9% Deposits 75.8% 76.2% 75.6% Total funding 215.3 230.3 269.0 Funding composition 1Q20 / 1Q19 = 24.9% 1Q20 / 4Q19 = 16.8% 1Q20 / 1Q19 = 15.7% 1Q20 / 4Q19 = 9.3% Growth excl. FX movement of Central American Operations (*) Net Loans equals gross loans plus interbank and overnight funds net of allowance for impairment of loans and receivables Total deposits Total funding Cash / Deposits (%) Deposits / Net loans (%) *

18 Capital Attributable Shareholders Equity Attributable Equity + Minority Interest Figures in Ps. Trillions Consolidated Capital Adequacy of our Banks (%) 1Q19 4Q19 1Q20 Minority interest 11.7 13.5 13.6 Attributable equity 17.3 19.9 19.5 1Q20 / 1Q19 = 13.7% 1Q20 / 4Q19 = - 1.0% 29.0 33.3 33.0 17.3 19.9 19.5 1Q19 4Q19 1Q20 Attributable shareholders equity 1Q20 / 4Q19 = - 1.9% 1Q20 / 1Q19 = 12.3% Total equity / Assets Tangible equity ratio (1) 11.2% 12.0% 10.3% 8.3% 9.2% 7.5% (1) Tangible Equity Ratio is calculated as Total Equity minus Goodwill and other Intangibles divided by Total Assets minus Go odw ill and other Intangibles. 1Q19 4Q19 1Q20 1Q194Q19 1Q20 1Q194Q191Q20 1Q194Q191Q20 Primary capital (Tier 1) 9.6 9.1 9.6 10.3 9.6 9.1 9.8 8.5 8.4 9.8 9.7 11.0 Solvency Ratio 13.0 12.8 12.3 12.5 11.8 10.4 11.2 10.6 9.6 10.0 10.7 11.1

19 6.35% 6.36% 6.06% 1Q19 4Q19 1Q20 10.15% 10.38% 9.88% Avg. Yield on loans NIM – Net Interest Margin Net Interest Margin (1) Loans Interest Margin (2) Net Investments Margin (3) 1Q19 4Q19 1Q20 1Q20 / 1Q19 1Q20 / 4Q19 2.9 3.0 2.7 -6.6% -10.1% Net interest income(1) (trillions) (1) Net Interest Income and Net Interest Margin: Includes net interest income plus net trading income from investment securities hel d for trading through profit or loss divided by total average interest - earning assets. NIM without income from investment securities held for trading through profit or loss was 5.3% for 1Q20, 5.6% for 4Q19 and 5. 5% for 1Q19. (2) Loans Interest Margin: Net Interest Income on Loans to Average loans and financial leases. (3) Net Investments Margin: Net Interest income on fixed income securities, net trading income from equity and fixed income inves tme nt securities held for trading through profit and on interbank and overnight funds to Average securities and Interbank and overnight funds. 5.71% 5.63% 4.78% 1Q19 4Q19 1Q20 3.61% 3.78% 3.49% Cost of funds 2.63% 1.96% - 1.68% 1Q19 4Q19 1Q20 6.43% 5.98% 2.13% Avg. Yield on fixed income and interbank & overnight funds
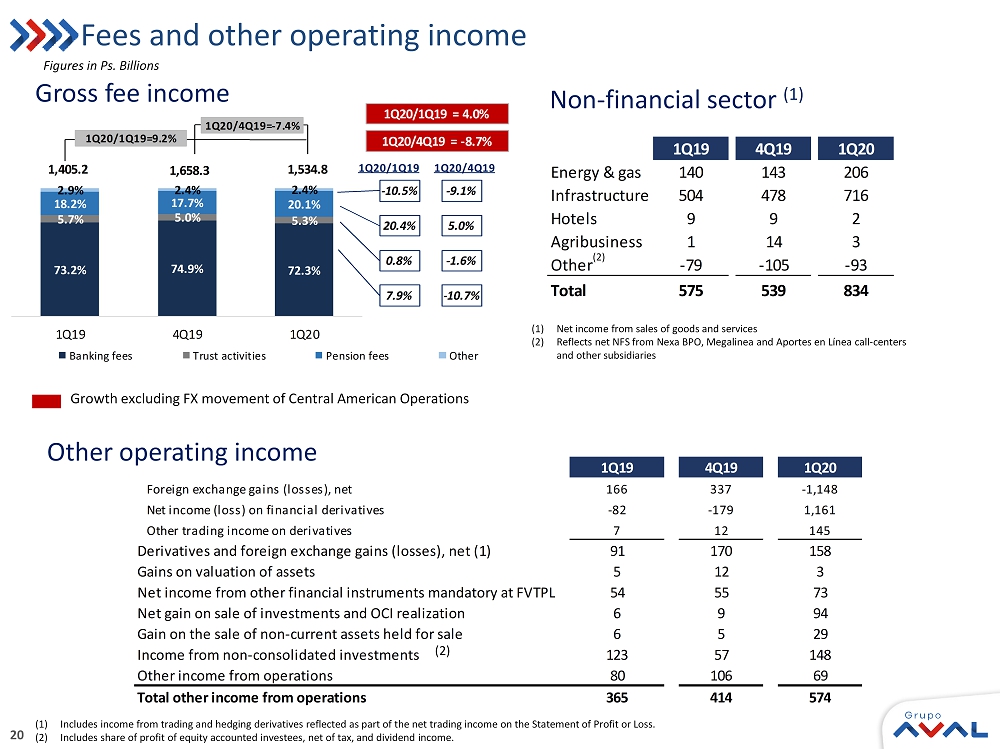
20 Fees and other operating income Figures in Ps. Billions (1) Includes income from trading and hedging derivatives reflected as part of the net trading income on the Statement of Profit or L oss. (2) Includes share of profit of equity accounted investees, net of tax, and dividend income. Gross fee income Other operating income Growth excluding FX movement of Central American Operations Non - financial sector (1) 1Q19 4Q19 1Q20 Foreign exchange gains (losses), net 166 337 -1,148 Net income (loss) on financial derivatives -82 -179 1,161 Other trading income on derivatives 7 12 145 Derivatives and foreign exchange gains (losses), net (1) 91 170 158 Gains on valuation of assets 5 12 3 Net income from other financial instruments mandatory at FVTPL 54 55 73 Net gain on sale of investments and OCI realization 6 9 94 Gain on the sale of non-current assets held for sale 6 5 29 Income from non-consolidated investments 123 57 148 Other income from operations 80 106 69 Total other income from operations 365 414 574 (1) Net income from sales of goods and services (2) Reflects net NFS from Nexa BPO, Megalinea and Aportes en L ínea call - centers and other subsidiaries (2) 73.2% 74.9% 72.3% 5.7% 5.0% 5.3% 18.2% 17.7% 20.1% 2.9% 2.4% 2.4% 1Q19 4Q19 1Q20 Banking fees Trust activities Pension fees Other 1,405.2 1,658.3 1,534.8 1Q20/1Q19=9.2% 1Q20/4Q19= - 7.4% 7.9% 0.8% 20.4% - 10.5% 1Q20/4Q19 1Q20/1Q19 - 10.7% - 1.6% 5.0% - 9.1% 1Q20/4Q19 = - 8.7% 1Q20/1Q19 = 4.0% (2) 1Q19 4Q19 1Q20 Energy & gas 140 143 206 Infrastructure 504 478 716 Hotels 9 9 2 Agribusiness 1 14 3 Other -79 -105 -93 Total 575 539 834
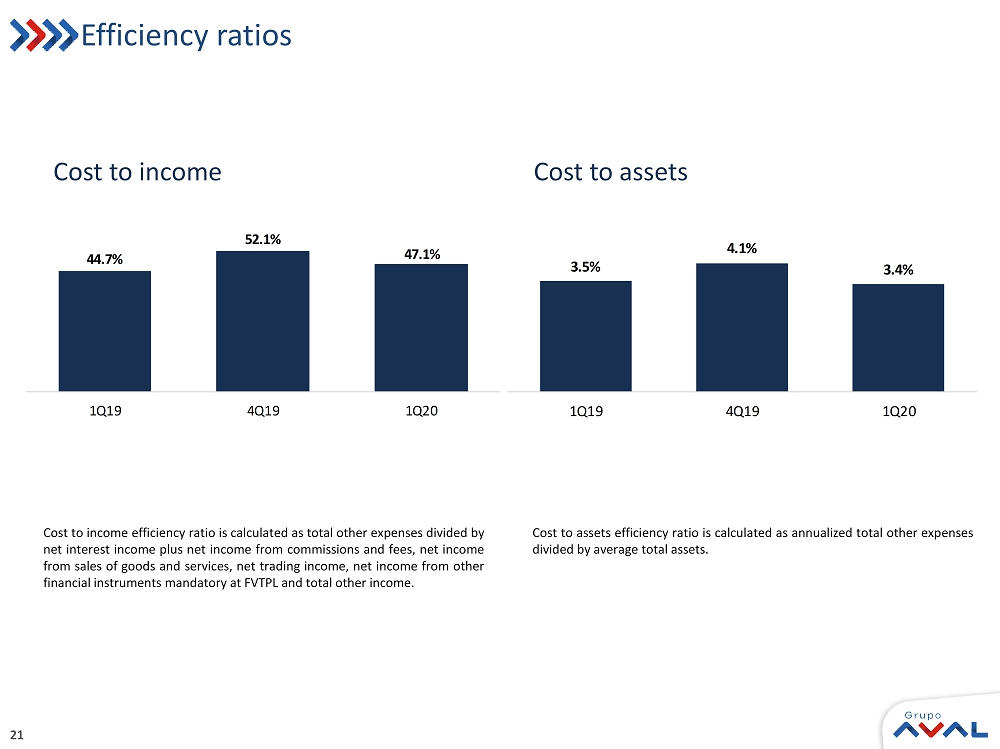
21 Efficiency ratios Cost to income efficiency ratio is calculated as total other expenses divided by net interest income plus net income from commissions and fees, net income from sales of goods and services, net trading income, net income from other financial instruments mandatory at FVTPL and total other income . Cost to income Cost to assets Cost to assets efficiency ratio is calculated as annualized total other expenses divided by average total assets . 44.7% 52.1% 47.1% 1Q19 4Q19 1Q20 3.5% 4.1% 3.4% 1Q19 4Q19 1Q20

22 762.9 715.1 700.2 1Q19 4Q19 1Q20 Net income attributable to controlling interest $34.2 $32.1 $31.4 EPS $29.0 Profitability (1) ROAA for each quarter is calculated as annualized Net Income divided by average of total assets. (2) ROAE for each quarter is calculated as annualized Net Income attributable to Aval's shareholders divided by average attributa ble shareholders' equity. Figures in Ps. Billions 2.1% 1.9% 1.8% 1Q19 4Q19 1Q20 ROAA (1) 2.0% 17.4% 14.6% 14.2% 1Q19 4Q19 1Q20 ROAE (2) 14.6% ROAE (2) Net income attributable to controlling interest ROAA (1)
23
SIGNATURE
Pursuant to the requirements of the Securities Exchange Act of 1934, the registrant has duly caused this report to be signed on its behalf by the undersigned, thereunto duly authorized.
Date: May 20, 2020
| GRUPO AVAL ACCIONES Y VALORES S.A. | ||||
| By: | /s/ Jorge Adrián Rincón Plata | |||
| Name: | Jorge Adrián Rincón Plata | |||
| Title: | Chief Legal Counsel | |||