UNITED STATES
SECURITIES AND EXCHANGE COMMISSION
Washington, D.C. 20549
FORM 6-K
Report Of Foreign Private Issuer
Pursuant To Rule 13a-16 Or 15d-16 Of
The Securities Exchange Act Of 1934
For the month of March 2022
Commission File Number: 000-54290
Grupo Aval Acciones y Valores S.A.
(Exact name of registrant as specified in its charter)
Carrera 13 No. 26A - 47
Bogotá D.C., Colombia
(Address of principal executive office)
Indicate by check mark whether the registrant files or will file annual reports under cover of Form 20-F or Form 40-F:
| Form 20-F | X | Form 40-F |
Indicate by check mark if the registrant is submitting the Form 6-K in paper as permitted by Regulation S-T Rule 101(b)(1):
| Yes | No | X |
Indicate by check mark if the registrant is submitting the Form 6-K in paper as permitted by Regulation S-T Rule 101(b)(7):
| Yes | No | X |
GRUPO AVAL ACCIONES Y VALORES S.A.
TABLE OF CONTENTS
| ITEM | |
| 1. | Report of Fourth Quarter and Full Year 2021 Consolidated Results |
| 2. | Fourth Quarter and Full Year 2021 Consolidated Earnings Results Presentation |
Item 1

Report of 4Q2021 and FY 2021
consolidated results
Information reported in Ps billions(1) and under IFRS
(1) We refer to billions as thousands of millions.

 | Disclaimer |
Grupo Aval Acciones y Valores S.A. (“Grupo Aval”) is an issuer of securities in Colombia and in the United States. As such, it is subject to compliance with securities regulation in Colombia and applicable U.S. securities regulation. Grupo Aval is also subject to the inspection and supervision of the Superintendency of Finance as holding company of the Aval financial conglomerate.
The consolidated financial information included in this document is presented in accordance with IFRS as currently issued by the IASB. Details of the calculations of non-GAAP measures such as ROAA and ROAE, among others, are explained when required in this report.
This report includes forward-looking statements. In some cases, you can identify these forward-looking statements by words such as “may,” “will,” “should,” “expects,” “plans,” “anticipates,” “believes,” “estimates,” “predicts,” “potential,” or “continue,” or the negative of these and other comparable words. Actual results and events may differ materially from those anticipated herein as a consequence of changes in general, economic and business conditions, changes in interest and currency rates and other risk described from time to time in our filings with the Registro Nacional de Valores y Emisores and the SEC.
Recipients of this document are responsible for the assessment and use of the information provided herein. Matters described in this presentation and our knowledge of them may change extensively and materially over time but we expressly disclaim any obligation to review, update or correct the information provided in this report, including any forward looking statements, and do not intend to provide any update for such material developments prior to our next earnings report.
The content of this document and the figures included herein are intended to provide a summary of the subjects discussed rather than a comprehensive description.
When applicable, in this document we refer to billions as thousands of millions.
| 1 |  |
| Report of 4Q2021 and FY 2021 consolidated results Information reported in Ps billions and under IFRS, except per share information |
Bogotá, March 16th, 2022. Grupo Aval S.A. (NYSE:AVAL) reported a consolidated attributable net income of Ps 3,297.7 billion (Ps 148.0 pesos per share) for 2021 versus a Ps 2,349.5 billion (Ps 105.4 pesos per share) figure reported for 2020. ROAE was 15.3% and ROAA was 1.6% for 2021.
Key results of the quarter:
| • | 2021 was an impressive year of recovery. Not only did the economy roared back to growth when compared to 2020, but also Colombia’s GDP, at the end of the year, surpassed in real terms by approximately 3% the size of the country’s GDP at the end of 2019. Growth recovery in Central America was also robust. |
| • | Once again, Grupo Aval set a historical high record in attributable net income, which reached Ps 3,298 billion (Ps 148.0 pesos per share) during 2021, an increase of 40.4% versus attributable net income during 2020 (Ps 2,350 billion) and of almost 9% versus the previous all-time high in 2019 (Ps 3,034.4 billion). |
| • | ROAE was 15.3% and ROAA was 1.65% for 2021. |
| • | Consolidated assets grew 13.6% year-on-year, to Ps 367 trillion, consolidated gross loans grew 13.2% year-on-year, to Ps 228 trillion and consolidated deposits grew 10.7% year on year, to Ps 235 trillion. |
| • | At the beginning of the pandemic in 2020, Aval’s banks deployed debtor relief programs that benefitted over 30% of the Colombian loan portfolio and approximately 50% of Central America’s loan portfolio. As of December, active debt reliefs amounted to approximately 5.3% of the Colombian loan portfolio and 16% of Central America’s loan portfolio. Of all loans that have concluded their relief periods, 1% are currently past due 90 days or more (1.6% are currently past due 30 days or more). |
| • | The quality of Aval’s loan portfolios continues to materially improve following the relatively high indices caused by the pandemic. The ratio of +30 days past due loans improved by 90 basis points, from 4.9% at the end of 2020 to 4% at the end of 2021. +30 day past due loans for our commercial and consumer loan portfolios improved by 100 basis points. +90 day past due loans improved by 70 basis points during 2021. Additionally, IFRS Stage 1 loans increased by 150 basis points, while Stage 2 loans decreased by 140 basis points and Stage 3 loans basically unchanged. |
| • | Cost of risk for 2021 was 1.87% a significant 110 basis points improvement versus cost of risk during 2020 (2.97%) and a 33 basis points improvement versus cost of risk in 2019 (2.2%) |
| • | Aval’s banks ended 2021 with strong Tier 1 ratios ranging between 11.1% (Banco de Occidente) and 13.5% (Banco Popular). |
| • | As in most economies, Colombia’s Central bank held interest rates unchanged until October of 2021, and then, as it became evident that inflation was accelerating, increased rates by 125 bps during the last three months of the year. This monetary policy should extend well into 2022. |
| • | Aval’s consolidated NIM on loans decreased 7 basis points in the last quarter to 5.75% and 17 basis points for the year (from 5.95% in 2020 to 5.78% in 2021). NIM on investments decreased by 64 basis points during 2021. Total NIM decreased by 36 bps from 5.17% in 2020 to 4.81% in 2021. |
| • | Aval’s consolidated Fee Income Ratio improved by 142 basis points, gross fee income grew by 10.6% and net fee income grew by 10.2% during 2021. |
| • | Income from our non-financial sector operations grew 9.8% when compared to 2020, mainly due to better performance from the infrastructure and agribusiness sectors. |
| • | Our funding and liquidity positions continued strong, as evidenced by the Deposits/Net Loans ratio of 1.06x and the Cash/Deposits ratio of 15.6% at year end. |
| 2 | |
| Report of 4Q2021 and FY 2021 consolidated results Information reported in Ps billions and under IFRS, except per share information |
Bogotá, March 16th, 2022. Grupo Aval S.A. (NYSE:AVAL) reported a consolidated attributable net income of Ps 3,297.7 billion (Ps 148.0 pesos per share) for 2021 versus a Ps 2,349.5 billion (Ps 105.4 pesos per share) figure reported for 2020. ROAE was 15.3% and ROAA was 1.6% for 2021.
| COP $tn | 4Q20 | 3Q21 | 4Q21 | 4Q21 vs 4Q20 | 4Q21 vs 3Q21 | ||||||||||||||
| Balance Sheet | Gross Loans | $ 201.8 | $ 219.0 | $ 228.4 | 13.2% | 4.3% | |||||||||||||
| Deposits | $ 211.8 | $ 225.2 | $ 234.5 | 10.7% | 4.1% | ||||||||||||||
| Deposits/Net Loans | 1.08 x | 1.07 x | 1.06 x | NS | 0.00 x | ||||||||||||||
| Loan Quality | 90 days PDLs / Gross Loans | 3.6% | 3.1% | 2.9% | (66) bps | (19) bps | 2020 | 2021 | 21 vs 20 | ||||||||||
| Allowance/90 days PDLs | 1.52 x | 1.64 x | 1.70 x | 0.18 x | 0.06 x | ||||||||||||||
| Cost of risk | 3.5% | 1.5% | 1.8% | (171) bps | 28 bps | 3.0% | 1.9% | (109) bps | |||||||||||
| Profitability | Net interest margin | 5.3% | 4.9% | 4.8% | (48) bps | (12) bps | 5.2% | 4.8% | (36) bps | ||||||||||
| Fee income Ratio | 21.0% | 23.6% | 25.1% | 410 bps | 154 bps | 22.0% | 23.4% | 142 bps | |||||||||||
| Efficiency Ratio | 42.9% | 47.1% | 52.9% | 998 bps | 584 bps | 46.0% | 47.6% | 155 bps | |||||||||||
| Attributable net income | $ 0.64 | $ 0.78 | $ 0.78 | 22.3% | -0.4% | $ 2.35 | $ 3.30 | 40.4% | |||||||||||
| ROAA | 1.7% | 1.4% | 1.4% | (27) bps | 5 bps | 1.5% | 1.6% | 19 bps | |||||||||||
| ROAE | 12.3% | 14.2% | 13.7% | 145 bps | (54) bps | 11.7% | 15.3% | 363 bps |
Gross loans excludes interbank and overnight funds. PDLs 90+ defined as loans more than 90 days past due. Cost of Risk calculated as Impairment loss on loans and other accounts receivable net of recov eries of charged-off assets divided by average gross loans. Net Interest Margin includes net interest income plus net trading income from debt and equity investments at FVTPL divided by total average interest-earning assets. Fee income ratio is calculated as net income from commissions and fees divided by net interest income plus net income from commissions and fees, gross profit from sales of goods and services, net trading income, net income from other financial instruments mandatory at FVTPL and total other income. Efficiency Ratio is calculated as total other expenses divided by net interest income plus net income from commissions and fees, gross profit from sales of goods and services, net trading income, net income from other financial instruments mandatory at FVTPL and total other income. ROAA is calculated as annualized Net Income divided by average of total assets. ROAE is calculated as Net Income attributable to Aval's shareholders divided by average attributable shareholders' equity. NS refers to non-significant figures.
| 3 | |
| Report of 4Q2021 and FY 2021 consolidated results Information reported in Ps billions and under IFRS |
Grupo Aval Acciones y Valores S.A.
Consolidated Financial Statements Under IFRS
Information in Ps. Billions
| Consolidated Statement of Financial Position | 4Q20 | 3Q21 | 4Q21 | D | |||||
| 4Q21 vs. 3Q21 | 4Q21 vs. 4Q20 | ||||||||
| Cash and cash equivalents | 34,025.5 | 35,892.4 | 36,642.8 | 2.1% | 7.7% | ||||
| Trading assets | 11,038.9 | 10,820.0 | 10,986.8 | 1.5% | -0.5% | ||||
| Investment securities | 36,061.8 | 42,844.9 | 44,664.4 | 4.2% | 23.9% | ||||
| Hedging derivatives assets | 156.2 | 40.5 | 44.2 | 9.2% | -71.7% | ||||
| Total loans, net | 195,542.0 | 210,730.5 | 220,297.8 | 4.5% | 12.7% | ||||
| Tangible assets | 8,974.0 | 8,833.7 | 9,100.6 | 3.0% | 1.4% | ||||
| Goodwill | 7,713.8 | 8,325.2 | 8,486.6 | 1.9% | 10.0% | ||||
| Concession arrangement rights | 9,187.6 | 10,470.7 | 11,098.1 | 6.0% | 20.8% | ||||
| Other assets | 20,196.2 | 23,747.2 | 25,582.7 | 7.7% | 26.7% | ||||
| Total assets | 322,895.9 | 351,705.2 | 366,903.9 | 4.3% | 13.6% | ||||
| Trading liabilities | 1,452.6 | 762.4 | 1,049.9 | 37.7% | -27.7% | ||||
| Hedging derivatives liabilities | 56.6 | 49.8 | 55.8 | 12.0% | -1.4% | ||||
| Customer deposits | 211,841.6 | 225,160.9 | 234,470.4 | 4.1% | 10.7% | ||||
| Interbank borrowings and overnight funds | 7,179.6 | 14,965.7 | 10,672.4 | -28.7% | 48.6% | ||||
| Borrowings from banks and others | 19,654.5 | 21,282.4 | 27,124.7 | 27.5% | 38.0% | ||||
| Bonds issued | 27,760.8 | 30,629.7 | 32,257.9 | 5.3% | 16.2% | ||||
| Borrowings from development entities | 4,029.8 | 3,512.0 | 3,227.3 | -8.1% | -19.9% | ||||
| Other liabilities | 15,480.7 | 16,941.4 | 18,573.8 | 9.6% | 20.0% | ||||
| Total liabilities | 287,456.3 | 313,304.3 | 327,432.3 | 4.5% | 13.9% | ||||
| Equity attributable to owners of the parent | 20,657.3 | 22,338.8 | 23,013.7 | 3.0% | 11.4% | ||||
| Non-controlling interest | 14,782.3 | 16,062.0 | 16,458.0 | 2.5% | 11.3% | ||||
| Total equity | 35,439.6 | 38,400.8 | 39,471.6 | 2.8% | 11.4% | ||||
| Total liabilities and equity | 322,895.9 | 351,705.2 | 366,903.9 | 4.3% | 13.6% | ||||
| Consolidated Statement of Income | 4Q20 | 3Q21 | 4Q21 | D | |||||
| Interest income | 4,816.6 | 4,973.5 | 5,173.3 | 4.0% | 7.4% | ||||
| Interest expense | 1,764.4 | 1,726.8 | 1,889.5 | 9.4% | 7.1% | ||||
| Net interest income | 3,052.1 | 3,246.7 | 3,283.8 | 1.1% | 7.6% | ||||
| Loans and other accounts receivable | 1,908.5 | 941.6 | 1,154.0 | 22.6% | -39.5% | ||||
| Other financial assets | 3.6 | 6.2 | 2.7 | -57.2% | -25.4% | ||||
| Recovery of charged-off financial assets | (103.0) | (122.1) | (149.0) | 22.0% | 44.6% | ||||
| Net impairment loss on financial assets | 1,809.1 | 825.7 | 1,007.7 | 22.0% | -44.3% | ||||
| Net interest income, after impairment losses | 1,243.0 | 2,421.0 | 2,276.1 | -6.0% | 83.1% | ||||
| Net income from commissions and fees | 1,385.8 | 1,419.7 | 1,540.0 | 8.5% | 11.1% | ||||
| Gross profit from sales of goods and services | 1,016.0 | 710.8 | 676.6 | -4.8% | -33.4% | ||||
| Net trading income | 86.5 | 243.2 | 238.9 | -1.8% | 176.1% | ||||
| Net income from other financial instruments mandatory at FVTPL | 59.7 | 62.8 | 62.8 | 0.0% | 5.2% | ||||
| Total other income | 988.5 | 333.7 | 325.6 | -2.4% | -67.1% | ||||
| Total other expenses | 2,829.4 | 2,833.2 | 3,243.2 | 14.5% | 14.6% | ||||
| Net income before income tax expense | 1,950.2 | 2,358.1 | 1,876.7 | -20.4% | -3.8% | ||||
| Income tax expense | 547.1 | 1,147.8 | 585.0 | -49.0% | 6.9% | ||||
| Net income for the period | 1,403.1 | 1,210.3 | 1,291.6 | 6.7% | -7.9% | ||||
| Non-controlling interest | 768.0 | 430.5 | 514.9 | 19.6% | -33.0% | ||||
| Net income attributable to owners of the parent | 635.1 | 779.7 | 776.8 | -0.4% | 22.3% | ||||
| Key ratios | 4Q20 | 3Q21 | 4Q21 | YTD 2020 | YTD 2021 | ||||
| Net Interest Margin(1) | 5.0% | 5.0% | 4.9% | 5.1% | 4.9% | ||||
| Net Interest Margin (including net trading income)(1) | 5.3% | 4.9% | 4.8% | 5.2% | 4.8% | ||||
| Efficiency ratio(2) | 42.9% | 47.1% | 52.9% | 46.0% | 47.6% | ||||
| ROAA(3) | 1.7% | 1.4% | 1.4% | 1.5% | 1.6% | ||||
| ROAE(4) | 12.3% | 14.2% | 13.7% | 11.7% | 15.3% | ||||
| 90 days PDL / Gross loans (5) | 3.6% | 3.1% | 2.9% | 3.6% | 2.9% | ||||
| Provision expense / Average gross loans (6) | 3.5% | 1.5% | 1.8% | 3.0% | 1.9% | ||||
| Allowance / 90 days PDL (5) | 1.52 | 1.64 | 1.70 | 1.52 | 1.70 | ||||
| Allowance / Gross loans | 5.4% | 5.1% | 4.9% | 5.4% | 4.9% | ||||
| Charge-offs / Average gross loans (6) | 1.5% | 2.2% | 2.2% | 2.0% | 2.3% | ||||
| Total loans, net / Total assets | 60.6% | 59.9% | 60.0% | 60.6% | 60.0% | ||||
| Deposits / Total loans, net | 108.3% | 106.8% | 106.4% | 108.3% | 106.4% | ||||
| Equity / Assets | 11.0% | 10.9% | 10.8% | 11.0% | 10.8% | ||||
| Tangible equity ratio (7) | 8.3% | 8.3% | 8.2% | 8.3% | 8.2% | ||||
| Shares outstanding (EoP) | 22,281,017,159 | 22,281,017,159 | 22,281,017,159 | 22,281,017,159 | 22,281,017,159 | ||||
| Shares outstanding (Average) | 22,281,017,159 | 22,281,017,159 | 22,281,017,159 | 22,281,017,159 | 22,281,017,159 | ||||
| Common share price (EoP) | 1,155.0 | 1,090.0 | 1,054.0 | 1,155.0 | 1,054.0 | ||||
| Preferred share price (EoP) | 1,194.0 | 1,119.0 | 1,059.0 | 1,194.0 | 1,059.0 | ||||
| BV/ EoP shares in Ps. | 927.1 | 1,002.6 | 1,032.9 | 927.1 | 1,032.9 | ||||
| EPS | 28.5 | 35.0 | 34.9 | 105.4 | 148.0 | ||||
| P/E (8) | 10.5 | 8.0 | 7.6 | 11.3 | 7.2 | ||||
| P/BV (8) | 1.3 | 1.1 | 1.0 | 1.3 | 1.0 | ||||
(1) NIM is calculated as Net Interest Income divided by the average of Interest Earning Assets; (2) Efficiency Ratio is calculated as total other expenses divided by net interest income plus net income from commissions and fees, gross profit from sales of goods and services, net trading income, net income from other financial instruments mandatory at FVTPL and total other income; (3) ROAA is calculated as Income before Minority Interest divided by the average of total assets for each quarter; (4) ROAE is calculated as Net Income attributable to Grupo Aval’s shareholders divided by the average of shareholders´ attributable equity for each quarter; (5) PDLs 90+ defined as loans more than 90 days past due include interest accounts receivables. Gross loans excluding interbank and overnight funds; (6) Refers to average gross loans for the period; (7) Tangible Equity Ratio is calculated as Total Equity minus Intangibles (excluding those related to concessions) divided by Total Assets minus Intangibles (excluding those related to concessions); (8) Based on Preferred share prices.
| 4 | |
| Report of 4Q2021 and FY 2021 consolidated results Information reported in Ps billions and under IFRS |
Statement of Financial Position Analysis
1. Assets
Total assets as of December 31st, 2021 totaled Ps 366,903.9 billion showing an increase of 13.6% versus December 31st, 2020 and of 4.3% versus September 30th, 2021. Growth in assets was mainly driven by (i) a 12.7% year over year growth in total loans, net to Ps 220,297.8 billion, (ii) a 23.9% yearly growth for investment securities to Ps 44,6644.4 billion and (iii) a 26.7% year over year growth in other assets, net to Ps 25,582.7 billion. When excluding FX movement in our Central American operation (“excluding FX”), asset growth would have been 7.6% versus December 31st, 2020 and 2.7% versus September 30th, 2021; for total loans, net growth would have been 6.5% versus December 31st, 2020 and 2.8% versus September 30th, 2021; for investment securities growth would have been 16.9% versus December 31st, 2020 and 2.5% versus September 30th, 2021; and for other assets 24.5% versus December 31st, 2020 and 7.3% versus September 30th, 2021.
1.1 Loan portfolio
Gross loans (excluding interbank and overnight funds) increased by 13.2% between December 31st, 2020 and December 31st, 2021 to Ps 228,355.0 billion (7.2% excluding FX) mainly driven by (i) a 16.8% increase in Consumer loans to Ps 76,889.1 billion (10.6% excluding FX), (ii) a 9.9% increase in Commercial loans to Ps 122,027.8 billion (5.0% excluding FX) and (iii) a 18.6% increase in Mortgages loans to Ps 29,120.3 billion (8.4% excluding FX).
Interbank & overnight funds decreased by 31.4% to Ps 3,218.4 billion (-36.1% excluding FX) during the last twelve months.
Loss allowance was Ps 11,275.6 billion as of December 31st, 2021 taking net loans to Ps 220,297.8 billion.
| Total loans, net | 4Q20 | 3Q21 | 4Q21 | D | |||||
| 4Q21 vs. 3Q21 | 4Q21 vs. 4Q20 | ||||||||
| Gross loans | |||||||||
| Commercial loans | 110,986.9 | 117,827.5 | 122,027.8 | 3.6% | 9.9% | ||||
| Consumer loans | 65,835.5 | 73,160.1 | 76,889.1 | 5.1% | 16.8% | ||||
| Mortgages loans | 24,558.8 | 27,690.2 | 29,120.3 | 5.2% | 18.6% | ||||
| Microcredit loans | 372.3 | 328.0 | 317.7 | -3.1% | -14.7% | ||||
| Gross loans | 201,753.5 | 219,005.8 | 228,355.0 | 4.3% | 13.2% | ||||
| Interbank & overnight funds | 4,693.7 | 2,877.1 | 3,218.4 | 11.9% | -31.4% | ||||
| Total gross loans | 206,447.2 | 221,882.9 | 231,573.4 | 4.4% | 12.2% | ||||
| Loss allowance | (10,905.2) | (11,152.5) | (11,275.6) | 1.1% | 3.4% | ||||
| Allowance for impairment of commercial loans | (5,281.3) | (5,531.4) | (5,857.1) | 5.9% | 10.9% | ||||
| Allowance for impairment of consumer loans | (4,939.0) | (4,775.5) | (4,581.0) | -4.1% | -7.2% | ||||
| Allowance for impairment of mortgages | (560.9) | (728.7) | (732.4) | 0.5% | 30.6% | ||||
| Allowance for impairment of microcredit loans | (124.0) | (117.0) | (105.1) | -10.2% | -15.3% | ||||
| Total loans, net | 195,542.0 | 210,730.5 | 220,297.8 | 4.5% | 12.7% | ||||
| 5 | |
| Report of 4Q2021 and FY 2021 consolidated results Information reported in Ps billions and under IFRS |
The following table shows the gross loan composition per product of each of our loan categories.
| Gross loans | 4Q20 | 3Q21 | 4Q21 | D | |||||
| 4Q21 vs. 3Q21 | 4Q21 vs. 4Q20 | ||||||||
| General purpose | 79,451.5 | 84,067.0 | 87,484.0 | 4.1% | 10.1% | ||||
| Working capital | 16,164.8 | 18,579.8 | 19,410.3 | 4.5% | 20.1% | ||||
| Financial leases | 10,636.6 | 10,916.2 | 11,108.7 | 1.8% | 4.4% | ||||
| Funded by development banks | 3,900.2 | 3,398.2 | 3,198.6 | -5.9% | -18.0% | ||||
| Overdrafts | 562.7 | 571.7 | 535.9 | -6.3% | -4.8% | ||||
| Credit cards | 271.1 | 294.5 | 290.4 | -1.4% | 7.1% | ||||
| Commercial loans | 110,986.9 | 117,827.5 | 122,027.8 | 3.6% | 9.9% | ||||
| Payroll loans | 30,603.7 | 34,698.4 | 35,666.3 | 2.8% | 16.5% | ||||
| Personal loans | 11,210.1 | 11,768.6 | 12,356.2 | 5.0% | 10.2% | ||||
| Credit cards | 16,336.8 | 18,185.3 | 19,891.8 | 9.4% | 21.8% | ||||
| Automobile and vehicle | 7,116.0 | 7,909.1 | 8,353.7 | 5.6% | 17.4% | ||||
| Financial leases | 338.8 | 357.2 | 362.0 | 1.4% | 6.9% | ||||
| Overdrafts | 78.9 | 103.7 | 90.4 | -12.8% | 14.7% | ||||
| Other | 151.2 | 137.9 | 168.7 | 22.3% | 11.5% | ||||
| Consumer loans | 65,835.5 | 73,160.1 | 76,889.1 | 5.1% | 16.8% | ||||
| Mortgages | 22,757.6 | 25,704.0 | 27,058.6 | 5.3% | 18.9% | ||||
| Housing leases | 1,801.1 | 1,986.2 | 2,061.7 | 3.8% | 14.5% | ||||
| Mortgages loans | 24,558.8 | 27,690.2 | 29,120.3 | 5.2% | 18.6% | ||||
| Microcredit loans | 372.3 | 328.0 | 317.7 | -3.1% | -14.7% | ||||
| Gross loans | 201,753.5 | 219,005.8 | 228,355.0 | 4.3% | 13.2% | ||||
| Interbank & overnight funds | 4,693.7 | 2,877.1 | 3,218.4 | 11.9% | -31.4% | ||||
| Total gross loans | 206,447.2 | 221,882.9 | 231,573.4 | 4.4% | 12.2% | ||||
Over the last twelve months, our retail products have driven our loan portfolio growth.
In Colombia, gross loans increased by 6.6% during the last twelve months and 2.2% during the quarter. As for Central America, gross loans grew by 25.5% between December 31st, 2020 and December 31st, 2021 and 7.7% in the last quarter; when excluding FX, growth would have been 8.2% and 3.1%, respectively.
Commercial loans increased by 9.9% over the year and grew 3.6% in the last quarter. In Colombia, commercial loans increased by 2.9% annually and 1.3% over the quarter. As for Central America, commercial loans grew by 26.6% over the year and 8.2% in the last quarter; when excluding FX, growth in Central America would have been 9.2% and 3.7%, respectively.
Consumer loans growth over the last year and quarter was mainly driven by payrolls loans and credit cards. In Colombia, Consumer loans grew by 11.5% during the last twelve months and 3.2% between September 30th, 2021 and December 31st, 2021. Growth of our Central American operations was 26.5% over the year and 8.3% in the last quarter, excluding FX, growth would have been 9.1% during the last twelve months and 3.7% in the quarter.
| 6 | |
| Report of 4Q2021 and FY 2021 consolidated results Information reported in Ps billions and under IFRS |
The following table shows the loans and receivables composition per entity. During the last twelve months, Banco de Occidente showed the highest growth rate within our banking operation in Colombia, driven by a strong performance in all types of loans with consumer loans growing 12.4%, mortgages growing 11.9% and commercial loans 11.8%.
| Gross loans / Bank ($) | 4Q20 | 3Q21 | 4Q21 | D | |||||
| 4Q21 vs. 3Q21 | 4Q21 vs. 4Q20 | ||||||||
| Banco de Bogotá | 135,845.5 | 149,513.0 | 156,219.1 | 4.5% | 15.0% | ||||
| Domestic | 65,258.7 | 67,282.7 | 67,658.2 | 0.6% | 3.7% | ||||
| Central America | 70,586.8 | 82,230.3 | 88,560.9 | 7.7% | 25.5% | ||||
| Banco de Occidente | 32,679.9 | 34,666.2 | 36,599.2 | 5.6% | 12.0% | ||||
| Banco Popular | 21,484.9 | 22,298.5 | 22,617.6 | 1.4% | 5.3% | ||||
| Banco AV Villas | 11,885.6 | 12,775.7 | 13,114.5 | 2.7% | 10.3% | ||||
| Corficolombiana | 1,633.7 | 1,812.8 | 1,912.8 | 5.5% | 17.1% | ||||
| Eliminations | (1,776.0) | (2,060.5) | (2,108.2) | 2.3% | 18.7% | ||||
| Gross loans | 201,753.5 | 219,005.8 | 228,355.0 | 4.3% | 13.2% | ||||
| Interbank & overnight funds | 4,693.7 | 2,877.1 | 3,218.4 | 11.9% | -31.4% | ||||
| Total gross loans | 206,447.2 | 221,882.9 | 231,573.4 | 4.4% | 12.2% | ||||
| Gross loans / Bank (%) | 4Q20 | 3Q21 | 4Q21 | ||||||
| Banco de Bogotá | 67.3% | 68.3% | 68.4% | ||||||
| Domestic | 32.3% | 30.7% | 29.6% | ||||||
| Central America | 35.0% | 37.5% | 38.8% | ||||||
| Banco de Occidente | 16.2% | 15.8% | 16.0% | ||||||
| Banco Popular | 10.6% | 10.2% | 9.9% | ||||||
| Banco AV Villas | 5.9% | 5.8% | 5.7% | ||||||
| Corficolombiana | 0.8% | 0.8% | 0.8% | ||||||
| Eliminations | -0.9% | -0.9% | -0.9% | ||||||
| Gross loans | 100% | 100% | 100% | ||||||
Of the total gross loans, 61.1% are domestic and 38.9% are foreign. In terms of gross loans (excluding interbank and overnight funds), 61.2% are domestic and 38.8% are foreign (reflecting the Central American operations).
| Gross loans | 4Q20 | 3Q21 | 4Q21 | D | |||||
| 4Q21 vs. 3Q21 | 4Q21 vs. 4Q20 | ||||||||
| Domestic | |||||||||
| Commercial loans | 78,031.8 | 79,272.7 | 80,300.8 | 1.3% | 2.9% | ||||
| Consumer loans | 42,602.2 | 46,008.6 | 47,488.4 | 3.2% | 11.5% | ||||
| Mortgages loans | 10,160.4 | 11,166.2 | 11,687.2 | 4.7% | 15.0% | ||||
| Microcredit loans | 372.3 | 328.0 | 317.7 | -3.1% | -14.7% | ||||
| Interbank & overnight funds | 2,553.1 | 1,742.6 | 1,707.5 | -2.0% | -33.1% | ||||
| Total domestic loans | 133,719.8 | 138,518.1 | 141,501.6 | 2.2% | 5.8% | ||||
| Foreign | |||||||||
| Commercial loans | 32,955.1 | 38,554.7 | 41,727.0 | 8.2% | 26.6% | ||||
| Consumer loans | 23,233.3 | 27,151.5 | 29,400.7 | 8.3% | 26.5% | ||||
| Mortgages loans | 14,398.4 | 16,524.0 | 17,433.2 | 5.5% | 21.1% | ||||
| Microcredit loans | - | - | - | - | - | ||||
| Interbank & overnight funds | 2,140.6 | 1,134.5 | 1,510.9 | 33.2% | -29.4% | ||||
| Total foreign loans | 72,727.4 | 83,364.8 | 90,071.8 | 8.0% | 23.8% | ||||
| Total gross loans | 206,447.2 | 221,882.9 | 231,573.4 | 4.4% | 12.2% | ||||
| 7 | |
| Report of 4Q2021 and FY 2021 consolidated results Information reported in Ps billions and under IFRS |
The quality of our loan portfolio improved during the quarter.
Our 30 days PDL to total loans closed in 4.0% for 4Q21, 4.4% for 3Q21, and 4.9% in 4Q20. The ratio of 90 days PDL to total loans was 2.9% for 4Q21, 3.1% for 3Q21 and 3.6% for 4Q20.
Commercial loans 30 days PDL ratio was 3.6% for 4Q21, 3.7% for 3Q21 and 4.5% for 4Q20; 90 days PDL ratio was 3.1%, 3.2% and 4.0%, respectively. Consumer loans 30 days PDL ratio was 4.4% for 4Q21, 5.1% for 3Q21 and 5.4% for 4Q20; 90 days PDL ratio was 2.6% for 4Q21, 2.9% for 3Q21 and 3.0% for 4Q20. Mortgages’ 30 days PDL ratio was 4.7% for 4Q21, 5.1% for 3Q21 and 5.0% for 4Q20; 90 days PDL ratio was 2.8%, 2.8% and 2.9%, respectively.
| Total gross loans | 4Q20 | 3Q21 | 4Q21 | D | |||||
| 4Q21 vs. 3Q21 | 4Q21 vs. 4Q20 | ||||||||
| ''A'' normal risk | 178,344.7 | 191,096.9 | 200,094.6 | 4.7% | 12.2% | ||||
| ''B'' acceptable risk | 7,117.3 | 9,232.0 | 9,407.9 | 1.9% | 32.2% | ||||
| ''C'' appreciable risk | 7,112.9 | 8,955.5 | 8,876.4 | -0.9% | 24.8% | ||||
| ''D'' significant risk | 5,746.5 | 5,744.5 | 5,681.5 | -1.1% | -1.1% | ||||
| ''E'' unrecoverable | 3,432.0 | 3,977.0 | 4,294.6 | 8.0% | 25.1% | ||||
| Gross loans | 201,753.5 | 219,005.8 | 228,355.0 | 4.3% | 13.2% | ||||
| Interbank and overnight funds | 4,693.7 | 2,877.1 | 3,218.4 | 11.9% | -31.4% | ||||
| Total gross loans | 206,447.2 | 221,882.9 | 231,573.4 | 4.4% | 12.2% | ||||
| CDE loans / gross loans (*) | 8.1% | 8.5% | 8.3% | ||||||
| Past due loans | 4Q20 | 3Q21 | 4Q21 | D | |||||
| 4Q21 vs. 3Q21 | 4Q21 vs. 4Q20 | ||||||||
| Performing | 105,939.4 | 113,466.0 | 117,662.4 | 3.7% | 11.1% | ||||
| Between 31 and 90 days past due | 586.5 | 587.8 | 628.8 | 7.0% | 7.2% | ||||
| +90 days past due | 4,461.0 | 3,773.7 | 3,736.6 | -1.0% | -16.2% | ||||
| Commercial loans | 110,986.9 | 117,827.5 | 122,027.8 | 3.6% | 9.9% | ||||
| Performing | 62,309.1 | 69,393.4 | 73,495.8 | 5.9% | 18.0% | ||||
| Between 31 and 90 days past due | 1,571.7 | 1,627.5 | 1,404.1 | -13.7% | -10.7% | ||||
| +90 days past due | 1,954.7 | 2,139.2 | 1,989.3 | -7.0% | 1.8% | ||||
| Consumer loans | 65,835.5 | 73,160.1 | 76,889.1 | 5.1% | 16.8% | ||||
| Performing | 23,325.5 | 26,280.9 | 27,758.9 | 5.6% | 19.0% | ||||
| Between 31 and 90 days past due | 511.3 | 628.5 | 543.5 | -13.5% | 6.3% | ||||
| +90 days past due | 722.0 | 780.7 | 817.9 | 4.8% | 13.3% | ||||
| Mortgages loans | 24,558.8 | 27,690.2 | 29,120.3 | 5.2% | 18.6% | ||||
| Performing | 296.6 | 224.3 | 217.3 | -3.2% | -26.7% | ||||
| Between 31 and 90 days past due | 26.0 | 15.2 | 13.5 | -10.9% | -47.8% | ||||
| +90 days past due | 49.8 | 88.4 | 86.9 | -1.7% | 74.6% | ||||
| Microcredit loans | 372.3 | 328.0 | 317.7 | -3.1% | -14.7% | ||||
| Gross loans | 201,753.5 | 219,005.8 | 228,355.0 | 4.3% | 13.2% | ||||
| Interbank & overnight funds | 4,693.7 | 2,877.1 | 3,218.4 | 11.9% | -31.4% | ||||
| Total gross loans | 206,447.2 | 221,882.9 | 231,573.4 | 4.4% | 12.2% | ||||
| 30 Days PDL / gross loans (*) | 4.9% | 4.4% | 4.0% | ||||||
| 90 Days PDL / gross loans (*) | 3.6% | 3.1% | 2.9% |
| Loans by stages (%) | 4Q20 | 3Q21 | 4Q21 | ||||||
| Loans classified as Stage 2 / gross loans | 13.2% | 12.5% | 11.8% | ||||||
| Loans classified as Stage 3 / gross loans | 6.1% | 6.3% | 6.1% | ||||||
| Loans classified as Stage 2 and 3 / gross loans | 19.3% | 18.8% | 17.8% | ||||||
| Allowance for Stage 1 loans / Stage 1 loans | 1.1% | 1.0% | 1.0% | ||||||
| Allowance for Stage 2 loans / Stage 2 loans | 11.4% | 10.0% | 10.0% | ||||||
| Allowance for Stage 3 loans / Stage 3 loans | 49.4% | 48.4% | 48.7% | ||||||
| Allowance for Stage 2 y 3 loans / Stage 2 y 3 loans | 23.5% | 22.8% | 23.2% |
(*) Gross loans exclude interbank and overnight funds. 30 days past due and 90 days past due are calculated on a capital plus interest accounts receivable basis.
| 8 | |
| Report of 4Q2021 and FY 2021 consolidated results Information reported in Ps billions and under IFRS |
Grupo Aval’s coverage over its 90 days PDL was 1.7x for 4Q21, 1.6x for 3Q21, and 1.5x for 4Q20. Allowance to CDE Loans was 0.6x for 4Q21 and 3Q21, and 0.7x for 4Q20, allowance to 30 days PDL was 1.2x in 4Q21 and 3Q21, and 1.1x in 4Q20. Impairment loss, net of recoveries of charged off assets to average gross loans was 1.8% in 4Q21, 1.5% in 3Q21 and 3.5% in 4Q20. Charge-offs to average gross loans was 2.2% in 4Q21 and 3Q21, and 1.5% in 4Q20.
| Total gross loans | 4Q20 | 3Q21 | 4Q21 | ||||||
| Allowance for impairment / CDE loans | 0.7 | 0.6 | 0.6 | ||||||
| Allowance for impairment / 30 days PDL | 1.1 | 1.2 | 1.2 | ||||||
| Allowance for impairment / 90 days PDL | 1.5 | 1.6 | 1.7 | ||||||
| Allowance for impairment / gross loans (*) | 5.4% | 5.1% | 4.9% | ||||||
| Impairment loss / CDE loans | 0.5 | 0.2 | 0.2 | ||||||
| Impairment loss / 30 days PDL | 0.8 | 0.4 | 0.5 | ||||||
| Impairment loss / 90 days PDL | 1.1 | 0.6 | 0.7 | ||||||
| Impairment loss / average gross loans (*) | 3.7% | 1.7% | 2.1% | ||||||
| Impairment loss, net of recoveries of charged-off assets / average gross loans (*) | 3.5% | 1.5% | 1.8% | ||||||
| Charge-offs / average gross loans (*) | 1.5% | 2.2% | 2.2% | ||||||
(*) Gross loans exclude interbank and overnight funds. 30 days past due and 90 days past due are calculated on a capital plus interest accounts receivable basis.
1.2 Investment securities and trading assets
Total investment securities and trading assets increased 18.2% to Ps 55,651.1 billion between December 31st, 2020 and December 31st, 2021 and 3.7% versus September 30th , 2021. Ps 47,999.5 billion of our total portfolio is invested in debt securities, which increased by 22.1% between December 31st, 2020 and December 31st, 2021 and by 3.9% since September 30th , 2021. Ps 6,488.7 billion of our total investment securities is invested in equity securities, which decreased by 2.3% between December 31st, 2020 and December 31st, 2021 and decreased by 4.0% versus September 30th , 2021.
| Investment and trading assets | 4Q20 | 3Q21 | 4Q21 | D | |||||
| 4Q21 vs. 3Q21 | 4Q21 vs. 4Q20 | ||||||||
| Debt securities | 4,781.0 | 4,923.6 | 4,741.3 | -3.7% | -0.8% | ||||
| Equity securities | 5,123.9 | 5,199.3 | 5,082.6 | -2.2% | -0.8% | ||||
| Derivative assets | 1,133.9 | 697.2 | 1,162.9 | 66.8% | 2.6% | ||||
| Trading assets | 11,038.9 | 10,820.0 | 10,986.8 | 1.5% | -0.5% | ||||
| Investments in debt securities at FVTPL (non compliant with SPPI test) | 7.4 | 5.3 | - | -100.0% | -100.0% | ||||
| Debt securities at FVOCI | 28,966.4 | 35,656.0 | 37,493.9 | 5.2% | 29.4% | ||||
| Equity securities at FVOCI | 1,515.1 | 1,559.2 | 1,406.1 | -9.8% | -7.2% | ||||
| Investments in securities at FVOCI | 30,481.4 | 37,215.2 | 38,900.0 | 4.5% | 27.6% | ||||
| Investments in debt securities at AC | 5,572.9 | 5,624.4 | 5,764.4 | 2.5% | 3.4% | ||||
| Investment and trading assets | 47,100.6 | 53,665.0 | 55,651.1 | 3.7% | 18.2% | ||||
| 9 | |
| Report of 4Q2021 and FY 2021 consolidated results Information reported in Ps billions and under IFRS |
The average yield on our debt and equity investment securities (trading assets, investments in debt securities at FVTPL, investments in securities at FVOCI and investments in debt securities at AC) was 3.6% for 4Q21, 3.8% for 3Q21 and 5.6% in 4Q20.
1.3 Cash and Cash Equivalents
As of December 31st, 2021 cash and cash equivalents had a balance of Ps 36,642.8 billion showing an increase of 7.7% versus December 31st, 2020 and increasing 2.1% versus September 30th, 2021 (-0.8% and -0.1% excluding FX).
The ratio of cash and cash equivalents to customer deposits was 15.6% at December 31st, 2021, 15.9% at September 30th , 2021, and 16.1% at December 31st, 2020.
1.4 Goodwill and Other Intangibles
Goodwill and other intangibles as of December 31st, 2021 reached Ps 21,470.7 billion, increasing by 15.9% versus December 31st, 2020 and 4.4% versus September 30th, 2021.
Goodwill as of December 31st, 2021 was Ps 8,486.6 billion, increasing by 10.0% versus December 31st, 2020 and increasing 1.9% versus September 30th, 2021.
Other intangibles, which include “concession arrangement rights” and other intangibles, mainly reflect the value of road concessions recorded for the most part at Corficolombiana. Other intangibles as of December 31st, 2021 reached Ps 12,984.2 billion and grew by 20.1% versus December 31st, 2020 and 6.0% versus September 30th, 2021.
2. Liabilities
As of December 31st, 2021 Total Funding represented 94.0% of total liabilities and other liabilities represented 6.0%.
2.1 Funding
Total Funding (Total financial liabilities at amortized cost) which includes (i) Customer deposits, (ii) Interbank borrowings and overnight funds, (iii) Borrowings from banks and others, (iv) Bonds issued, and (v) Borrowing from development entities had a balance of Ps 307,752.7 billion as of December 31st, 2021 showing an increase of 13.8% versus December 31st, 2020 and 4.1% versus September 30th, 2021 (7.7% and 2.5% excluding FX). Total customer deposits represented 76.2% of total funding as of the end of 4Q21 and 3Q21, and 78.3% for 4Q20.
Average cost of funds was 2.5% for 4Q21, 2.4% for 3Q21 and 2.6% for 4Q20.
| 10 | |
| Report of 4Q2021 and FY 2021 consolidated results Information reported in Ps billions and under IFRS |
2.1.1 Customer deposits
| Customer deposits | 4Q20 | 3Q21 | 4Q21 | D | |||||
| 4Q21 vs. 3Q21 | 4Q21 vs. 4Q20 | ||||||||
| Checking accounts | 20,928.6 | 23,034.5 | 25,166.1 | 9.3% | 20.2% | ||||
| Other deposits | 532.7 | 642.4 | 617.2 | -3.9% | 15.9% | ||||
| Non-interest bearing | 21,461.2 | 23,676.9 | 25,783.3 | 8.9% | 20.1% | ||||
| Checking accounts | 30,269.7 | 33,613.0 | 34,059.8 | 1.3% | 12.5% | ||||
| Time deposits | 83,559.2 | 86,244.0 | 85,530.2 | -0.8% | 2.4% | ||||
| Savings deposits | 76,551.5 | 81,627.0 | 89,097.1 | 9.2% | 16.4% | ||||
| Interest bearing | 190,380.4 | 201,484.0 | 208,687.2 | 3.6% | 9.6% | ||||
| Customer deposits | 211,841.6 | 225,160.9 | 234,470.4 | 4.1% | 10.7% | ||||
Of our total customer deposits as of December 31st, 2021 checking accounts represented 25.3%, time deposits 36.5%, savings accounts 38.0%, and other deposits 0.3%.
The following table shows the customer deposits composition by bank. During the last twelve months, Banco de Occidente showed the highest growth rate in customer deposits within our banking operation in Colombia.
| Deposits / Bank ($) | 4Q20 | 3Q21 | 4Q21 | D | |||||
| 4Q21 vs. 3Q21 | 4Q21 vs. 4Q20 | ||||||||
| Banco de Bogotá | 147,287.5 | 158,356.1 | 163,733.6 | 3.4% | 11.2% | ||||
| Domestic | 67,488.1 | 66,579.8 | 64,692.9 | -2.8% | -4.1% | ||||
| Central America | 79,799.4 | 91,776.4 | 99,040.7 | 7.9% | 24.1% | ||||
| Banco de Occidente | 30,970.7 | 31,964.0 | 36,340.3 | 13.7% | 17.3% | ||||
| Banco Popular | 20,611.8 | 21,095.3 | 20,868.6 | -1.1% | 1.2% | ||||
| Banco AV Villas | 13,966.8 | 13,169.5 | 13,408.9 | 1.8% | -4.0% | ||||
| Corficolombiana | 4,926.7 | 5,505.4 | 5,330.9 | -3.2% | 8.2% | ||||
| Eliminations | (5,921.9) | (4,929.4) | (5,211.7) | 5.7% | -12.0% | ||||
| Total Grupo Aval | 211,841.6 | 225,160.9 | 234,470.4 | 4.1% | 10.7% | ||||
| Deposits / Bank (%) | 4Q20 | 3Q21 | 4Q21 | ||||||
| Banco de Bogotá | 69.5% | 70.3% | 69.8% | ||||||
| Domestic | 31.9% | 29.6% | 27.6% | ||||||
| Central America | 37.7% | 40.8% | 42.2% | ||||||
| Banco de Occidente | 14.6% | 14.2% | 15.5% | ||||||
| Banco Popular | 9.7% | 9.4% | 8.9% | ||||||
| Banco AV Villas | 6.6% | 5.8% | 5.7% | ||||||
| Corficolombiana | 2.3% | 2.4% | 2.3% | ||||||
| Eliminations | -2.8% | -2.2% | -2.2% | ||||||
| Total Grupo Aval | 100.0% | 100.0% | 100.0% |
| 11 | |
| Report of 4Q2021 and FY 2021 consolidated results Information reported in Ps billions and under IFRS |
2.1.2 Borrowings from Banks and Other (includes borrowings from development entities)
As of December 31st, 2021 borrowings from banks and other totaled Ps 30,352.0 billion, increasing 28.2% annually and 22.4% versus September 30th, 2021. Excluding FX, borrowings from banks and other increased 19.6% versus December 31st, 2020 and 20.3% versus September 30th, 2021.
2.1.3 Bonds issued
Total bonds issued as of December 31st, 2021 totaled Ps 32,257.9 billion and increased 16.2% versus December 31st, 2020 and 5.3% versus September 30th, 2021. Excluding FX, bonds increased 13.4% versus December 31st, 2020 and 4.7% versus September 30th, 2021.
3. Non-controlling Interest
Non-controlling Interest in Grupo Aval reflects the minority stakes that third party shareholders hold in each of its direct consolidated subsidiaries (Banco de Bogotá, Banco de Occidente, Banco Popular, Banco AV Villas, Corficolombiana and Porvenir). As of December 31st, 2021 non-controlling interest was Ps 16,458.0 billion which increased by 11.3% versus December 31st, 2020 and 2.5% versus September 30th, 2021. Total non-controlling interest represents 41.7% of total equity as of 4Q21, compared to 41.8% in 3Q21 and 41.7% in 4Q20. Total non- controlling interest derives from the sum of the combined minority interests of our banks and of Grupo Aval, applying eliminations associated with the consolidation process of Grupo Aval.
| Percentage consolidated by Aval | 4Q20 | 3Q21 | 4Q21 | D | |||||
| 4Q21 vs. 3Q21 | 4Q21 vs. 4Q20 | ||||||||
| Banco de Bogotá | 68.7% | 68.7% | 68.7% | - | - | ||||
| Banco de Occidente | 72.3% | 72.3% | 72.3% | - | - | ||||
| Banco Popular | 93.7% | 93.7% | 93.7% | - | - | ||||
| Banco AV Villas | 79.9% | 79.9% | 79.9% | - | - | ||||
| BAC Credomatic (1) | 68.7% | 68.7% | 68.7% | - | - | ||||
| Porvenir (2) | 75.7% | 75.7% | 75.7% | - | 0 | ||||
| Corficolombiana | 39.6% | 40.0% | 40.0% | - | 40 | ||||
(1) BAC Credomatic is fully owned by Banco de Bogotá; (2) Grupo Aval is the direct controlling entity of Porvenir.
4. Attributable Shareholders’ Equity
Attributable shareholders’ equity as of December 31st, 2021 was Ps 23,013.7 billion, showing an increase of 11.4% versus December 31st, 2020 and of 3.0% versus September 30th, 2021.
| 12 | |
| Report of 4Q2021 and FY 2021 consolidated results Information reported in Ps billions and under IFRS |
Income Statement Analysis
Our net income attributable to the owners of the parent company for 4Q21 of Ps 776.8 billion showed a 22.3% increase versus 4Q20 and a 0.4% decrease versus 3Q21.
| Consolidated Statement of Income | 4Q20 | 3Q21 | 4Q21 | D | |||||
| 4Q21 vs. 3Q21 | 4Q21 vs. 4Q20 | ||||||||
| Interest income | 4,816.6 | 4,973.5 | 5,173.3 | 4.0% | 7.4% | ||||
| Interest expense | 1,764.4 | 1,726.8 | 1,889.5 | 9.4% | 7.1% | ||||
| Net interest income | 3,052.1 | 3,246.7 | 3,283.8 | 1.1% | 7.6% | ||||
| Loans and other accounts receivable | 1,908.5 | 941.6 | 1,154.0 | 22.6% | -39.5% | ||||
| Other financial assets | 3.6 | 6.2 | 2.7 | -57.2% | -25.4% | ||||
| Recovery of charged-off financial assets | (103.0) | (122.1) | (149.0) | 22.0% | 44.6% | ||||
| Net impairment loss on financial assets | 1,809.1 | 825.7 | 1,007.7 | 22.0% | -44.3% | ||||
| Net income from commissions and fees | 1,385.8 | 1,419.7 | 1,540.0 | 8.5% | 11.1% | ||||
| Gross profit from sales of goods and services | 1,016.0 | 710.8 | 676.6 | -4.8% | -33.4% | ||||
| Net trading income | 86.5 | 243.2 | 238.9 | -1.8% | 176.1% | ||||
| Net income from other financial instruments mandatory at FVTPL | 59.7 | 62.8 | 62.8 | 0.0% | 5.2% | ||||
| Total other income | 988.5 | 333.7 | 325.6 | -2.4% | -67.1% | ||||
| Total other expenses | 2,829.4 | 2,833.2 | 3,243.2 | 14.5% | 14.6% | ||||
| Net income before income tax expense | 1,950.2 | 2,358.1 | 1,876.7 | -20.4% | -3.8% | ||||
| Income tax expense | 547.1 | 1,147.8 | 585.0 | -49.0% | 6.9% | ||||
| Net income for the period | 1,403.1 | 1,210.3 | 1,291.6 | 6.7% | -7.9% | ||||
| Non-controlling interest | 768.0 | 430.5 | 514.9 | 19.6% | -33.0% | ||||
| Net income attributable to owners of the parent | 635.1 | 779.7 | 776.8 | -0.4% | 22.3% | ||||
1. Net Interest Income
| Net interest income | 4Q20 | 3Q21 | 4Q21 | D | |||||
| 4Q21 vs. 3Q21 | 4Q21 vs. 4Q20 | ||||||||
| Interest income | |||||||||
| Commercial | 1,695.2 | 1,657.5 | 1,721.1 | 3.8% | 1.5% | ||||
| Interbank and overnight funds | 40.5 | 41.7 | 49.3 | 18.3% | 21.9% | ||||
| Consumer | 2,269.5 | 2,334.4 | 2,462.3 | 5.5% | 8.5% | ||||
| Mortgages and housing leases | 468.2 | 517.7 | 527.9 | 2.0% | 12.7% | ||||
| Microcredit | 23.4 | 18.3 | 17.3 | -5.9% | -26.1% | ||||
| Loan portfolio | 4,496.8 | 4,569.6 | 4,777.9 | 4.6% | 6.3% | ||||
| Interests on investments in debt securities | 319.7 | 404.0 | 395.3 | -2.1% | 23.6% | ||||
| Total interest income | 4,816.6 | 4,973.5 | 5,173.3 | 4.0% | 7.4% | ||||
| Interest expense | |||||||||
| Checking accounts | 71.6 | 61.5 | 62.2 | 1.1% | -13.2% | ||||
| Time deposits | 802.1 | 771.6 | 788.4 | 2.2% | -1.7% | ||||
| Savings deposits | 266.5 | 262.5 | 311.2 | 18.6% | 16.8% | ||||
| Total interest expenses on deposits | 1,140.2 | 1,095.5 | 1,161.8 | 6.0% | 1.9% | ||||
| Interbank borrowings and overnight funds | 37.5 | 39.8 | 81.4 | 104.5% | 117.1% | ||||
| Borrowings from banks and others | 175.7 | 147.1 | 167.6 | 13.9% | -4.6% | ||||
| Bonds issued | 387.4 | 423.1 | 454.8 | 7.5% | 17.4% | ||||
| Borrowings from development entities | 23.7 | 21.2 | 23.9 | 12.6% | 1.0% | ||||
| Total interest expenses on financial obligations | 624.2 | 631.3 | 727.7 | 15.3% | 16.6% | ||||
| Total interest expense | 1,764.4 | 1,726.8 | 1,889.5 | 9.4% | 7.1% | ||||
| Net interest income | 3,052.1 | 3,246.7 | 3,283.8 | 1.1% | 7.6% | ||||
| 13 | |
| Report of 4Q2021 and FY 2021 consolidated results Information reported in Ps billions and under IFRS |
Our net interest income increased by 7.6% to Ps 3,283.8 billion for 4Q21 versus 4Q20 and by 1.1% versus 3Q21.The increase versus 4Q20 was derived mainly from a 7.4% increase in total interest income.
Our Net Interest Margin(1) was 4.8% for 4Q21, 4.9% in 3Q21, and 5.3% in 4Q20. Net Interest Margin on Loans was 5.7% for 4Q21, 5.8% for 3Q21, and 5.9% in 4Q20. On the other hand, our Net Investments Margin was 1.0% for 4Q21, 1.4% in 3Q21 and 2.8% in 4Q20.
In our Colombian operations, our Net Interest Margin was 4.5% for 4Q21, 4.6% in 3Q21, and 5.3% in 4Q20. Net Interest Margin on Loans was 5.4% for 4Q21, 5.5% in 3Q21 and 5.8% in 4Q20. On the other hand, our Net Investments Margin was 0.8% in 4Q21 versus 1.3% in 3Q21 and 3.6% in 4Q20.
In our Central American operations, our Net Interest Margin was 5.4% for 4Q21 and 3Q21, and 5.2% in 4Q20. Net Interest Margin on Loans was 6.2% for 4Q21, 6.3% in 3Q21 and 6.1% in 4Q20. On the other hand, our Net Investments Margin was 1.4% in 4Q21 versus 1.6% in 3Q21 and 1.2% in 4Q20.
Net Interest Margin (1) was 4.8% for full year 2021 and 5.2% for full year 2020. Net Interest Margin on Loans was 5.8% for full year 2021 and 6.0% for full year 2020. Net Investments Margin was 0.9% for full year 2021 and 1.5% for full year 2020.
2. Impairment loss on financial assets, net
Our impairment loss on financial assets, net decreased by 44.3% to Ps 1,007.7 billion for 4Q21 versus 4Q20 and increased by 22.0% versus 3Q21.
| Net impairment loss on financial assets | 4Q20 | 3Q21 | 4Q21 | D | |||||
| 4Q21 vs. 3Q21 | 4Q21 vs. 4Q20 | ||||||||
| Loans and other accounts receivable | 1,908.5 | 941.6 | 1,154.0 | 22.6% | -39.5% | ||||
| Other financial assets | 3.6 | 6.2 | 2.7 | -57.2% | -25.4% | ||||
| Recovery of charged-off financial assets | (103.0) | (122.1) | (149.0) | 22.0% | 44.6% | ||||
| Net impairment loss on financial assets | 1,809.1 | 825.7 | 1,007.7 | 22.0% | -44.3% | ||||
Our annualized gross cost of risk was 2.1% for 4Q21, 1.7% for 3Q21 and 3.7% for 4Q20. Net of recoveries of charged-off assets our ratio was 1.8% for 4Q21, 1.5% 3Q21 and 3.5% for for 4Q20.
For the full year, gross cost of risk was 2.1% for 2021 and 3.1% for 2020. Net of recoveries of charged-off assets, cost of risk was 1.9% for 2021 and 3.0% for 2020.
| (1) | Grupo Aval’s NIM without income from trading securities and investment in debt securities designated at fair value through profit and loss (non compliant with SPPI test) was 4.9% for 4Q21, and 5.0% for 3Q21 and 4Q20. 4.9% for FY21 and 5.1% for FY20. |
| 14 | |
| Report of 4Q2021 and FY 2021 consolidated results Information reported in Ps billions and under IFRS |
3. Non-interest income
| Total non-interest income | 4Q20 | 3Q21 | 4Q21 | D | |||||
| 4Q21 vs. 3Q21 | 4Q21 vs. 4Q20 | ||||||||
| Income from commissions and fees | |||||||||
| Banking fees(1) | 1,147.1 | 1,181.6 | 1,325.4 | 12.2% | 15.5% | ||||
| Trust activities | 91.8 | 85.2 | 81.3 | -4.5% | -11.4% | ||||
| Pension and severance fund management | 302.1 | 323.3 | 318.3 | -1.5% | 5.3% | ||||
| Bonded warehouse services | 45.8 | 45.0 | 47.6 | 5.9% | 3.9% | ||||
| Total income from commissions and fees | 1,586.9 | 1,635.0 | 1,772.6 | 8.4% | 11.7% | ||||
| Expenses from commissions and fees | 201.1 | 215.3 | 232.6 | 8.1% | 15.7% | ||||
| Net income from commissions and fees | 1,385.8 | 1,419.7 | 1,540.0 | 8.5% | 11.1% | ||||
| Income from sales of goods and services | 2,884.9 | 2,520.7 | 2,888.3 | 14.6% | 0.1% | ||||
| Costs and expenses from sales of goods and services | 1,868.9 | 1,809.8 | 2,211.7 | 22.2% | 18.3% | ||||
| Gross profit from sales of goods and services | 1,016.0 | 710.8 | 676.6 | -4.8% | -33.4% | ||||
| Net trading income | 86.5 | 243.2 | 238.9 | -1.8% | 176.1% | ||||
| Net income from other financial instruments mandatory at FVTPL | 59.7 | 62.8 | 62.8 | 0.0% | 5.2% | ||||
| Other income | |||||||||
| Foreign exchange gains (losses), net | 731.3 | 25.5 | 84.6 | 231.3% | -88.4% | ||||
| Net gain on sale of investments and OCI realization | 100.0 | 77.8 | 33.4 | -57.1% | -66.6% | ||||
| Gain on the sale of non-current assets held for sale | 68.0 | 9.1 | 7.7 | -15.4% | -88.6% | ||||
| Income from non-consolidated investments(2) | 64.9 | 127.7 | 80.6 | -36.9% | 24.1% | ||||
| Net gains on asset valuations | (47.5) | 5.8 | 13.2 | 125.7% | -127.8% | ||||
| Other income from operations | 71.7 | 87.7 | 106.1 | 21.0% | 48.0% | ||||
| Total other income | 988.5 | 333.7 | 325.6 | -2.4% | -67.1% | ||||
| Total non-interest income | 3,536.6 | 2,770.3 | 2,843.8 | 2.7% | -19.6% | ||||
(1) Includes commissions on banking services, office network services, credit and debit card fees, fees on drafts, checks and checkbooks and other fees
(2) Includes share of profit of equity accounted investees, net of tax, and dividend income.
3.1 Net income from commissions and fees
Net income from commissions and fees for 4Q21 totaled Ps 1,540.0 billion and increased by 11.1% annually and 8.5% in the quarter. Income from commissions and fees increased by 11.7% to Ps 1,772.6 billion in 4Q21 versus 4Q20 and 8.4% in the quarter. Excluding FX, net income from commissions increased 8.0% and 8.0%, respectively. In Colombia, net income from commissions and fees increased by 3.0% over the last year and 3.5% over the quarter. In Central America, net income from commissions and fees increased by 20.9% over the last year and 14.0% over the quarter; excluding FX, net income increased by 13.6% over the last year and increased 12.8% during the quarter.
3.2 Gross profit from sales of goods and services
Gross profit from sales of goods and services (non-financial sector) decreased by 4.8% to Ps 676.6 billion for 4Q21 versus 3Q21 and decreased 33.4% annually, due to a lower contribution from energy & gas and infrastructure sectors.
| 15 | |
| Report of 4Q2021 and FY 2021 consolidated results Information reported in Ps billions and under IFRS |
3.3 Net trading income
| Net trading income | 4Q20 | 3Q21 | 4Q21 | D | |||||
| 4Q21 vs. 3Q21 | 4Q21 vs. 4Q20 | ||||||||
| Trading investment income | 302.1 | 87.2 | 70.4 | -19.3% | -76.7% | ||||
| Net income (loss) on financial derivatives | (216.5) | 135.7 | 151.4 | 11.6% | -170.0% | ||||
| Other trading income on derivatives | 0.9 | 20.3 | 17.0 | -16.2% | N.A. | ||||
| Net trading income | 86.5 | 243.2 | 238.9 | -1.8% | 176.1% | ||||
Net trading income for Grupo Aval should be analyzed in conjunction with the foreign exchange gains (losses).
3.4 Other income
Total other income for 4Q21 totaled Ps 325.6 billion decreasing by 67.1% versus 4Q20 and decreasing 2.4% versus 3Q21. The yearly decrease was mainly driven lower foreign exchange gains, net in our Colombia operations and lower gains on sale of investments and OCI realization. The quarterly decrease can be explained by lower income from non-consolidated investments.
4. Other expenses
Total other expenses for 4Q21 totaled Ps 3,243.2 billion and increased 14.6% annually and 14.5% quarterly (11.6% and 14.0% excluding FX). Our efficiency ratio measured as total other expenses to total income was 52.9% in 4Q21, 47.1% in 3Q21 and 42.9% in 4Q20. The ratio of annualized total other expenses as a percentage of average total assets was 3.6% in 4Q21, 3.3% in 3Q21, and 3.4% in 4Q20.
In Colombia, our efficiency ratio measured as total other expenses to total income, was 51.0% in 4Q21, 41.0% in 3Q21 and 35.8% in 4Q20. The ratio of annualized total other expenses as a percentage of average total assets was 3.3% in 4Q21, 2.7% in 3Q21, and 3.1% in 4Q20.
In Central America, our efficiency ratio measured as total other expenses to total income, was 55.8% in 4Q21, 57.0% in 3Q21 and 58.5% in 4Q20. The ratio of annualized total other expenses as a percentage of average total assets was 4.2% in 4Q21 and 3Q21, and 4.1% in 4Q20.
For full year, our efficiency ratio measured as operating expenses to total income was 47.6% for FY21 and 46.0% for FY20. The ratio of operating expenses as a percentage of average total assets was 3.3% for FY21 and 3.4% for FY20.
5. Non-controlling Interest
Non-controlling interest in Grupo Aval mainly reflects the minority stakes that third party shareholders hold in each of its direct consolidated subsidiaries (Banco de Bogotá, Banco de Occidente, Banco Popular, Banco AV Villas, Corficolombiana and Porvenir). For 4Q21, non-controlling interest in the income statement was Ps 514.9 billion, showing a 33.0% decrease versus 4Q20 and a 19.6% increase versus 3Q21. The ratio of non-controlling interest to income before non-controlling interest was 39.9% in 4Q21, 35.6% in 3Q21 and 54.7% in 4Q20.
| 16 | |
| Report of 4Q2021 and FY 2021 consolidated results Information reported in Ps billions and under IFRS |
Information related to Grupo Aval’s consolidated financial statements by geography
| Grupo Aval Acciones y Valores S.A. - Colombian Operation | ||||||||||
| Financial Statements Under Full IFRS | ||||||||||
| Information in Ps. Billions | 4Q20 | 3Q21 | 4Q21 | 4Q20 | 4Q21 | |||||
| 4Q20 | 3Q21 | 4Q21 | D | |||||||
| 4Q21 vs. 3Q21 | 4Q21 vs. 4Q20 | |||||||||
| Gross loans and receivables | 131,166.7 | 136,775.5 | 139,794.1 | 2.2% | 6.6% | |||||
| Total assets | 210,669.6 | 225,471.8 | 230,220.2 | 2.1% | 9.3% | |||||
| Customer deposits | 132,042.2 | 133,384.5 | 135,429.7 | 1.5% | 2.6% | |||||
| Total liabilities | 190,049.8 | 201,568.3 | 206,075.7 | 2.2% | 8.4% | |||||
| Net income for the period | 1,190.1 | 760.3 | 817.2 | 7.5% | -31.3% | |||||
| Net income attributable to owners of the parent | 488.7 | 470.6 | 450.7 | -4.2% | -7.8% | |||||
| YTD 2020 | YTD 2021 | D | ||||||||
| 2021 vs. 2020 | ||||||||||
| Net income for the period | 3,462.1 | 3,927.7 | 13.4% | |||||||
| A | Net income attributable to owners of the parent | 1,545.8 | 2,101.5 | 35.9% | ||||||
| Grupo Aval Acciones y Valores S.A. - Central American Operation (1) | ||||||||||
| Financial Statements Under IFRS | ||||||||||
| Information in Ps. Billions | 3Q18 | 4Q18 | 2Q18 | 3Q18 | 2Q18 | |||||
| 4Q20 | 3Q21 | 4Q21 | D | |||||||
| 4Q21 vs. 3Q21 | 4Q21 vs. 4Q20 | |||||||||
| Gross loans and receivables | 70,586.8 | 82,230.3 | 88,560.9 | 7.7% | 25.5% | |||||
| Total assets | 112,226.3 | 126,233.4 | 136,683.7 | 8.3% | 21.8% | |||||
| Customer deposits | 79,799.4 | 91,776.4 | 99,040.7 | 7.9% | 24.1% | |||||
| Total liabilities | 97,406.5 | 111,736.1 | 121,356.6 | 8.6% | 24.6% | |||||
| Net income for the period | 213.1 | 449.9 | 474.5 | 5.5% | 122.7% | |||||
| Net income attributable to owners of the parent | 146.4 | 309.2 | 326.1 | 5.5% | 122.7% | |||||
| YTD 2020 | YTD 2021 | D | ||||||||
| 2021 vs. 2020 | ||||||||||
| Net income for the period | 1,169.5 | 1,740.8 | 48.9% | |||||||
| B | Net income attributable to owners of the parent | 803.7 | 1,196.2 | 48.8% | ||||||
| A+B | Net income attributable to owners of the parent | 2,349.5 | 3,297.7 | 40.4% | ||||||
(1) Corresponds to the operations of BAC Holding International Corporation (“BHI”, formerly Leasing Bogotá Panamá S.A.) holding company of BAC Credomatic operation, and Multi Financial Holding, Inc. holding company of MFG’s operation.
| 17 | |
| Report of 4Q2021 and FY 2021 consolidated results Information reported in Ps billions and under IFRS |
Information related to Grupo Aval Acciones y Valores S.A. (Holding Company) and Grupo Aval Limited
The holding company recorded a total gross indebtedness of Ps 1,664.5 billion (Ps 532.0 billion of bank debt and Ps 1,132.6 billion of bonds denominated in Colombian pesos) as of December 31st 2021. It also guarantees irrevocably and unconditionally Grupo Aval Limited’s (144A / Reg S) 2022 (USD 1.0 billion) bonds and Grupo Aval Limited’s (144A / Reg S) 2030 (USD 1.0 billion) bonds under its respective indentures. As of December 31st, 2021 the total amount outstanding (including interests payable) of such bonds was USD 2.0 billion, or Ps 8,050.0 billion when translated into pesos.
The debt at Grupo Aval Limited is serviced with interest income on loans to subsidiaries and cash & cash equivalents. Grupo Aval Limited has not required, to this date, cash from Grupo Aval Acciones y Valores S.A. to fulfill its obligations. The main sources of cash to pay the debt and debt service at Grupo Aval Acciones y Valores S.A. have been the dividend income from its subsidiaries and the returns on its cash & cash equivalents.
When combined, Grupo Aval Acciones y Valores S.A. and Grupo Aval Ltd. had Ps 3,427.3 billion of total liquid assets, a total gross indebtedness of Ps 9,714.5 billion and a net indebtedness (including callable senior loans to subsidiaries) of Ps 6,287.2 billion as of December 31st, 2021. In addition to liquid assets, Grupo Aval Ltd. has Ps 2,185.5 billion in other loans to subsidiaries and investments in AT1 instruments of Ps 2,070.2 billion.
| Total liquid assets as of December 31, 2021 | |
| Cash and cash equivalents | 2,071.1 |
| Fixed income investments | 325.1 |
| Callable Senior loans to subsidiaries | 1,031.1 |
| Total liquid assets | 3,427.3 |
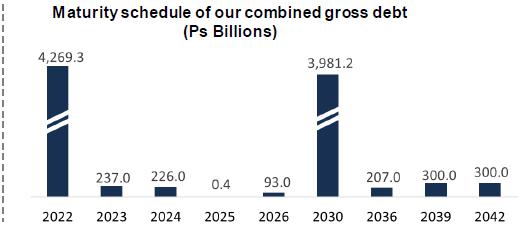
As of December 31st, 2021 our combined double leverage (calculated as investments in subsidiaries at book value, subordinated loans to subsidiaries and goodwill as a percentage of shareholders' equity) was 1.18x. Finally, we present an evolution of our key ratios on a combined basis:
| Debt service coverage and leverage ratios | 4Q20 | 3Q21 | 4Q21 | D | |||||
| 4Q21 vs. 3Q21 | 4Q21 vs. 4Q20 | ||||||||
| Double leverage (1) | 1.18x | 1.18x | 1.18x | 0.00 | 0.00 | ||||
| Net debt / Core earnings (2)(3) | 3.2x | 4.2x | 3.1x | -1.15 | -0.15 | ||||
| Net debt / Cash dividends (2)(3) | 4.3x | 5.9x | 4.5x | -1.37 | 0.23 | ||||
| Core Earnings / Interest Expense (2) | 4.3x | 3.5x | 5.0x | 1.49 | 0.67 | ||||
(1) Double leverage is calculated as investments in subsidiaries at book value (excluding revaluations), subordinated loans to subsidiaries and goodwill as a percentage of shareholders' equity; (2) Core earnings are defined as annualized recurring cash flow from dividends, investments and net operating income; (3) Net debt is calculated as total gross debt minus cash and cash equivalents and fixed income investments
| 18 | |
| Report of 4Q2021 and FY 2021 consolidated results Information reported in Ps billions and under IFRS |
ABOUT GRUPO AVAL
Grupo Aval is Colombia’s largest banking group, and through our BAC Credomatic and Multi Financial Group operations it is also the largest and one of the most profitable banking groups in Central America. Grupo Aval currently operates through four commercial banks in Colombia (Banco de Bogotá, Banco de Occidente, Banco Popular and Banco AV Villas). It manages pension and severance funds through the largest pension and severance fund manager in Colombia (Porvenir) and owns the largest merchant bank in Colombia (Corficolombiana), each of which Aval controls and consolidates into its results.
Investor Relations Contact
Alejo Sánchez García
Strategic Planning and Investor Relations Manager
Tel: +571 743 32 22 x 23422
E-mail: asanchez@grupoaval.com
| 19 | |
| Report of 4Q2021 and FY 2021 consolidated results Information reported in Ps billions and under IFRS |
Grupo Aval Acciones y Valores S.A.
Consolidated Financial Statements Under IFRS
Financial Statements Under IFRS
Information in Ps. Billions
| Consolidated Statement of Financial Position | 4Q20 | 3Q21 | 4Q21 | D | |||||
| 4Q21 vs. 3Q21 | 4Q21 vs. 4Q20 | ||||||||
| Cash and cash equivalents | 34,025.5 | 35,892.4 | 36,642.8 | 2.1% | 7.7% | ||||
| Investment and trading assets | |||||||||
| Debt securities | 4,781.0 | 4,923.6 | 4,741.3 | -3.7% | -0.8% | ||||
| Equity securities | 5,123.9 | 5,199.3 | 5,082.6 | -2.2% | -0.8% | ||||
| Derivative assets | 1,133.9 | 697.2 | 1,162.9 | 66.8% | 2.6% | ||||
| Trading assets | 11,038.9 | 10,820.0 | 10,986.8 | 1.5% | -0.5% | ||||
| Investments in debt securities at FVTPL (non compliant with SPPI test) | 7.4 | 5.3 | - | -100.0% | -100.0% | ||||
| Investments in securities at FVOCI | 30,481.4 | 37,215.2 | 38,900.0 | 4.5% | 27.6% | ||||
| Investments in debt securities at AC | 5,572.9 | 5,624.4 | 5,764.4 | 2.5% | 3.4% | ||||
| Investment securities | 36,061.8 | 42,844.9 | 44,664.4 | 4.2% | 23.9% | ||||
| Hedging derivatives assets | 156.2 | 40.5 | 44.2 | 9.2% | -71.7% | ||||
| Gross loans | |||||||||
| Commercial loans | 115,680.6 | 120,704.6 | 125,246.2 | 3.8% | 8.3% | ||||
| Commercial loans | 110,986.9 | 117,827.5 | 122,027.8 | 3.6% | 9.9% | ||||
| Interbank & overnight funds | 4,693.7 | 2,877.1 | 3,218.4 | 11.9% | -31.4% | ||||
| Consumer loans | 65,835.5 | 73,160.1 | 76,889.1 | 5.1% | 16.8% | ||||
| Mortgages loans | 24,558.8 | 27,690.2 | 29,120.3 | 5.2% | 18.6% | ||||
| Microcredit loans | 372.3 | 328.0 | 317.7 | -3.1% | -14.7% | ||||
| Total gross loans | 206,447.2 | 221,882.9 | 231,573.4 | 4.4% | 12.2% | ||||
| Loss allowance | (10,905.2) | (11,152.5) | (11,275.6) | 1.1% | 3.4% | ||||
| Total loans, net | 195,542.0 | 210,730.5 | 220,297.8 | 4.5% | 12.7% | ||||
| Other accounts receivable, net | 14,996.3 | 17,633.8 | 19,027.2 | 7.9% | 26.9% | ||||
| Non-current assets held for sale | 240.4 | 144.3 | 208.4 | 44.4% | -13.3% | ||||
| Investments in associates and joint ventures | 1,029.3 | 1,077.0 | 1,172.8 | 8.9% | 13.9% | ||||
| Own-use property, plant and equipment for own-use and given in operating lease, net | 5,998.3 | 6,002.9 | 6,154.2 | 2.5% | 2.6% | ||||
| Right-of-use assets | 2,035.5 | 1,893.2 | 1,900.4 | 0.4% | -6.6% | ||||
| Investment properties | 817.5 | 800.2 | 891.0 | 11.3% | 9.0% | ||||
| Biological assets | 122.7 | 137.4 | 155.0 | 12.8% | 26.3% | ||||
| Tangible assets | 8,974.0 | 8,833.7 | 9,100.6 | 3.0% | 1.4% | ||||
| Goodwill | 7,713.8 | 8,325.2 | 8,486.6 | 1.9% | 10.0% | ||||
| Concession arrangement rights | 9,187.6 | 10,470.7 | 11,098.1 | 6.0% | 20.8% | ||||
| Other intangible assets | 1,623.7 | 1,778.6 | 1,886.0 | 6.0% | 16.2% | ||||
| Intangible assets | 18,525.1 | 20,574.5 | 21,470.7 | 4.4% | 15.9% | ||||
| Current | 936.2 | 871.3 | 842.4 | -3.3% | -10.0% | ||||
| Deferred | 861.7 | 1,543.3 | 1,765.3 | 14.4% | 104.9% | ||||
| Income tax assets | 1,797.9 | 2,414.7 | 2,607.7 | 8.0% | 45.0% | ||||
| Other assets | 508.5 | 698.9 | 680.5 | -2.6% | 33.8% | ||||
| Total assets | 322,895.9 | 351,705.2 | 366,903.9 | 4.3% | 13.6% | ||||
| Trading liabilities | 1,452.6 | 762.4 | 1,049.9 | 37.7% | -27.7% | ||||
| Hedging derivatives liabilities | 56.6 | 49.8 | 55.8 | 12.0% | -1.4% | ||||
| Customer deposits | 211,841.6 | 225,160.9 | 234,470.4 | 4.1% | 10.7% | ||||
| Checking accounts | 51,198.3 | 56,647.5 | 59,225.8 | 4.6% | 15.7% | ||||
| Time deposits | 83,559.2 | 86,244.0 | 85,530.2 | -0.8% | 2.4% | ||||
| Savings deposits | 76,551.5 | 81,627.0 | 89,097.1 | 9.2% | 16.4% | ||||
| Other deposits | 532.7 | 642.4 | 617.2 | -3.9% | 15.9% | ||||
| Financial obligations | 58,624.8 | 70,389.7 | 73,282.3 | 4.1% | 25.0% | ||||
| Interbank borrowings and overnight funds | 7,179.6 | 14,965.7 | 10,672.4 | -28.7% | 48.6% | ||||
| Borrowings from banks and others | 19,654.5 | 21,282.4 | 27,124.7 | 27.5% | 38.0% | ||||
| Bonds issued | 27,760.8 | 30,629.7 | 32,257.9 | 5.3% | 16.2% | ||||
| Borrowings from development entities | 4,029.8 | 3,512.0 | 3,227.3 | -8.1% | -19.9% | ||||
| Total financial liabilities at amortized cost | 270,466.4 | 295,550.7 | 307,752.7 | 4.1% | 13.8% | ||||
| Legal related | 241.8 | 211.6 | 247.5 | 17.0% | 2.4% | ||||
| Other provisions | 671.1 | 679.8 | 902.7 | 32.8% | 34.5% | ||||
| Provisions | 912.9 | 891.4 | 1,150.3 | 29.0% | 26.0% | ||||
| Current | 406.2 | 279.3 | 382.3 | 36.9% | -5.9% | ||||
| Deferred | 3,182.0 | 4,178.2 | 4,332.4 | 3.7% | 36.2% | ||||
| Income tax liabilities | 3,588.2 | 4,457.5 | 4,714.7 | 5.8% | 31.4% | ||||
| Employee benefits | 1,201.9 | 1,354.9 | 1,163.1 | -14.2% | -3.2% | ||||
| Other liabilities | 9,777.9 | 10,237.6 | 11,545.8 | 12.8% | 18.1% | ||||
| Total liabilities | 287,456.3 | 313,304.3 | 327,432.3 | 4.5% | 13.9% | ||||
| Equity attributable to owners of the parent | 20,657.3 | 22,338.8 | 23,013.7 | 3.0% | 11.4% | ||||
| Non-controlling interest | 14,782.3 | 16,062.0 | 16,458.0 | 2.5% | 11.3% | ||||
| Total equity | 35,439.6 | 38,400.8 | 39,471.6 | 2.8% | 11.4% | ||||
| Total liabilities and equity | 322,895.9 | 351,705.2 | 366,903.9 | 4.3% | 13.6% | ||||
| 20 | |
| Report of 4Q2021 and FY 2021 consolidated results Information reported in Ps billions and under IFRS |
Grupo Aval Acciones y Valores S.A.
Consolidated Financial Statements Under Full IFRS
Financial Statements Under IFRS
Information in Ps. Billions
| Consolidated Statement of income | YTD 2020 | YTD 2021 | D | 4Q20 | 3Q21 | 4Q21 | D | ||||||||
| 2021 vs. 2020 | 4Q21 vs. 3Q21 | 4Q21 vs. 4Q20 | |||||||||||||
| Interest income | |||||||||||||||
| Loan portfolio | 18,947.0 | 18,115.7 | -4.4% | 4,496.8 | 4,569.6 | 4,777.9 | 4.6% | 6.3% | |||||||
| Interests on investments in debt securities | 1,275.8 | 1,531.8 | 20.1% | 319.7 | 404.0 | 395.3 | -2.1% | 23.6% | |||||||
| Total interest income | 20,222.8 | 19,647.5 | -2.8% | 4,816.6 | 4,973.5 | 5,173.3 | 4.0% | 7.4% | |||||||
| Interest expense | |||||||||||||||
| Checking accounts | 328.1 | 261.3 | -20.4% | 71.6 | 61.5 | 62.2 | 1.1% | -13.2% | |||||||
| Time deposits | 3,663.4 | 3,068.7 | -16.2% | 802.1 | 771.6 | 788.4 | 2.2% | -1.7% | |||||||
| Savings deposits | 1,467.6 | 1,066.8 | -27.3% | 266.5 | 262.5 | 311.2 | 18.6% | 16.8% | |||||||
| Total interest expenses on deposits | 5,459.1 | 4,396.8 | -19.5% | 1,140.2 | 1,095.5 | 1,161.8 | 6.0% | 1.9% | |||||||
| Interbank borrowings and overnight funds | 284.0 | 185.8 | -34.6% | 37.5 | 39.8 | 81.4 | 104.5% | 117.1% | |||||||
| Borrowings from banks and others | 860.5 | 631.3 | -26.6% | 175.7 | 147.1 | 167.6 | 13.9% | -4.6% | |||||||
| Bonds issued | 1,531.6 | 1,614.7 | 5.4% | 387.4 | 423.1 | 454.8 | 7.5% | 17.4% | |||||||
| Borrowings from development entities | 127.1 | 90.0 | -29.2% | 23.7 | 21.2 | 23.9 | 12.6% | 1.0% | |||||||
| Total interest expenses on financial obligations | 2,803.1 | 2,521.8 | -10.0% | 624.2 | 631.3 | 727.7 | 15.3% | 16.6% | |||||||
| Total interest expense | 8,262.3 | 6,918.7 | -16.3% | 1,764.4 | 1,726.8 | 1,889.5 | 9.4% | 7.1% | |||||||
| Net interest income | 11,960.5 | 12,728.9 | 6.4% | 3,052.1 | 3,246.7 | 3,283.8 | 1.1% | 7.6% | |||||||
| Impairment losses (recoveries) on financial assets | |||||||||||||||
| Loans and other accounts receivable | 6,267.2 | 4,500.1 | -28.2% | 1,908.5 | 941.6 | 1,154.0 | 22.6% | -39.5% | |||||||
| Other financial assets | 74.8 | 16.2 | -78.3% | 3.6 | 6.2 | 2.7 | -57.2% | -25.4% | |||||||
| Recovery of charged-off financial assets | (328.1) | (481.2) | 46.7% | (103.0) | (122.1) | (149.0) | 22.0% | 44.6% | |||||||
| Net impairment loss on financial assets | 6,013.9 | 4,035.1 | -32.9% | 1,809.1 | 825.7 | 1,007.7 | 22.0% | -44.3% | |||||||
| Net interest income, after impairment losses | 5,946.6 | 8,693.8 | 46.2% | 1,243.0 | 2,421.0 | 2,276.1 | -6.0% | 83.1% | |||||||
| Income from commissions and fees | |||||||||||||||
| Banking fees(1) | 4,178.9 | 4,693.5 | 12.3% | 1,147.1 | 1,181.6 | 1,325.4 | 12.2% | 15.5% | |||||||
| Trust activities | 343.3 | 336.6 | -1.9% | 91.8 | 85.2 | 81.3 | -4.5% | -11.4% | |||||||
| Pension and severance fund management | 1,158.5 | 1,253.7 | 8.2% | 302.1 | 323.3 | 318.3 | -1.5% | 5.3% | |||||||
| Bonded warehouse services | 155.3 | 169.4 | 9.1% | 45.8 | 45.0 | 47.6 | 5.9% | 3.9% | |||||||
| Total income from commissions and fees | 5,835.9 | 6,453.2 | 10.6% | 1,586.9 | 1,635.0 | 1,772.6 | 8.4% | 11.7% | |||||||
| Expenses from commissions and fees | 742.5 | 841.8 | 13.4% | 201.1 | 215.3 | 232.6 | 8.1% | 15.7% | |||||||
| Net income from commissions and fees | 5,093.4 | 5,611.4 | 10.2% | 1,385.8 | 1,419.7 | 1,540.0 | 8.5% | 11.1% | |||||||
| Income from sales of goods and services | 9,144.8 | 10,450.9 | 14.3% | 2,884.9 | 2,520.7 | 2,888.3 | 14.6% | 0.1% | |||||||
| Costs and expenses from sales of goods and services | 6,321.5 | 7,352.0 | 16.3% | 1,868.9 | 1,809.8 | 2,211.7 | 22.2% | 18.3% | |||||||
| Gross profit from sales of goods and services | 2,823.3 | 3,098.9 | 9.8% | 1,016.0 | 710.8 | 676.6 | -4.8% | -33.4% | |||||||
| Net trading income | 1,295.4 | 948.7 | -26.8% | 86.5 | 243.2 | 238.9 | -1.8% | 176.1% | |||||||
| Net income from other financial instruments mandatory at FVTPL | 252.4 | 270.1 | 7.0% | 59.7 | 62.8 | 62.8 | 0.0% | 5.2% | |||||||
| Other income | |||||||||||||||
| Foreign exchange gains (losses), net | 363.0 | 87.2 | -76.0% | 731.3 | 25.5 | 84.6 | N.A. | -88.4% | |||||||
| Net gain on sale of investments and OCI realization | 613.2 | 315.0 | -48.6% | 100.0 | 77.8 | 33.4 | -57.1% | -66.6% | |||||||
| Gain on the sale of non-current assets held for sale | 112.0 | 36.2 | -67.7% | 68.0 | 9.1 | 7.7 | -15.4% | -88.6% | |||||||
| Income from non-consolidated investments(2) | 311.7 | 459.3 | 47.4% | 64.9 | 127.7 | 80.6 | -36.9% | 24.1% | |||||||
| Net gains on asset valuations | (50.3) | 21.0 | -141.7% | (47.5) | 5.8 | 13.2 | 125.7% | -127.8% | |||||||
| Other income from operations | 367.2 | 375.3 | 2.2% | 71.7 | 87.7 | 106.1 | 21.0% | 48.0% | |||||||
| Total other income | 1,716.9 | 1,294.0 | -24.6% | 988.5 | 333.7 | 325.6 | -2.4% | -67.1% | |||||||
| Other expenses | |||||||||||||||
| Loss on the sale of non-current assets held for sale | 3.4 | 3.2 | -7.0% | 0.8 | (0.1) | 1.2 | N.A | 53.3% | |||||||
| Personnel expenses | 4,400.5 | 4,513.0 | 2.6% | 1,087.7 | 1,163.4 | 1,161.3 | -0.2% | 6.8% | |||||||
| General and administrative expenses | 4,966.4 | 5,467.4 | 10.1% | 1,366.0 | 1,362.0 | 1,590.0 | 16.7% | 16.4% | |||||||
| Depreciation and amortization | 1,015.4 | 1,031.0 | 1.5% | 268.3 | 259.2 | 271.5 | 4.8% | 1.2% | |||||||
| Impairment loss on other assets | 7.1 | 72.2 | N.A. | 1.8 | 6.6 | 59.4 | N.A. | N.A. | |||||||
| Other operating expenses | 260.0 | 309.9 | 19.2% | 104.8 | 42.1 | 159.7 | N.A. | 52.4% | |||||||
| Total other expenses | 10,652.7 | 11,396.7 | 7.0% | 2,829.4 | 2,833.2 | 3,243.2 | 14.5% | 14.6% | |||||||
| Net income before income tax expense | 6,475.3 | 8,520.3 | 31.6% | 1,950.2 | 2,358.1 | 1,876.7 | -20.4% | -3.8% | |||||||
| Income tax expense | 1,843.7 | 2,851.8 | 54.7% | 547.1 | 1,147.8 | 585.0 | -49.0% | 6.9% | |||||||
| Net income for the period | 4,631.6 | 5,668.5 | 22.4% | 1,403.1 | 1,210.3 | 1,291.6 | 6.7% | -7.9% | |||||||
| Net income for the period attibutable to: | |||||||||||||||
| Non-controlling interest | 2,282.1 | 2,370.8 | 3.9% | 768.0 | 430.5 | 514.9 | 19.6% | -33.0% | |||||||
| Net income attributable to owners of the parent | 2,349.5 | 3,297.7 | 40.4% | 635.1 | 779.7 | 776.8 | -0.4% | 22.3% | |||||||
(1) Includes commissions on banking services, office network services, credit and debit card fees, fees on drafts, checks and checkbooks and other fees
(2) Includes share of profit of equity accounted investees, net of tax, and dividend income.
| 21 | |
Item 2
1 4Q21 and FY2021 Consolidated Earnings Results IFRS
2 Disclaimer Grupo Aval Acciones y Valores S . A . (“Grupo Aval”) is an issuer of securities in Colombia and in the United States .. As such, it is subject to compliance with securities regulation in Colombia and applicable U . S . securities regulation . Grupo Aval is also subject to the inspection and supervision of the Superintendency of Finance as holding company of the Aval financial conglomerate . The consolidated financial information included in this document is presented in accordance with IFRS as currently issued by the IASB . Details of the calculations of non - GAAP measures such as ROAA and ROAE, among others, are explained when required in this report . This report includes forward - looking statements . In some cases, you can identify these forward - looking statements by words such as “may,” “will,” “should,” “expects,” “plans,” “anticipates,” “believes,” “estimates,” “predicts,” “potential,” or “continue,” or the negative of these and other comparable words . Actual results and events may differ materially from those anticipated herein as a consequence of changes in general, economic and business conditions, changes in interest and currency rates and other risk described from time to time in our filings with the Registro Nacional de Valores y Emisores and the SEC . Recipients of this document are responsible for the assessment and use of the information provided herein . Matters described in this presentation and our knowledge of them may change extensively and materially over time but we expressly disclaim any obligation to review, update or correct the information provided in this report, including any forward looking statements, and do not intend to provide any update for such material developments prior to our next earnings report . The content of this document and the figures included herein are intended to provide a summary of the subjects discussed rather than a comprehensive description . When applicable, in this document we refer to billions as thousands of millions .
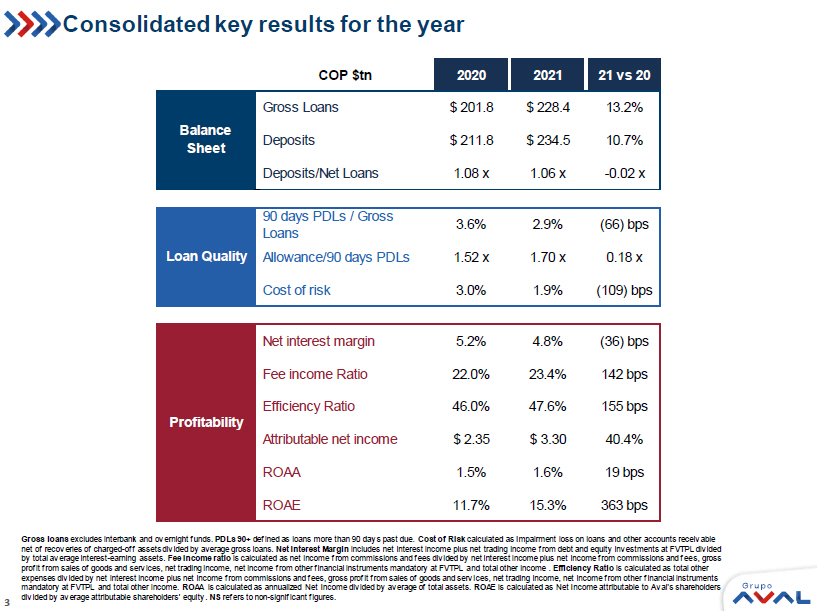
3 Consolidated key results for the year Gross loans e xcludes interbank and overnight funds. PDLs 90+ defined as loans more than 90 days past due. Cost of Risk c alculated as Impairment loss on loans and other accounts receivable net of recoveries of charged - off assets divided by average gross loans. Net Interest Margin includes net interest income plus net trading income from debt and equity investments at FVTPL divided by total average interest - earning assets. Fee income ratio is calculated as net income from commissions and fees divided by net interest income plus net income from commissions and fee s, gross profit from sales of goods and services, net trading income, net income from other financial instruments mandatory at FVTPL a nd total other income . Efficiency Ratio is calculated as total other expenses divided by net interest income plus net income from commissions and fees, gross profit from sales of goods and servi ces , net trading income, net income from other financial instruments mandatory at FVTPL and total other income. ROAA is calculated as annualized Net Income divided by average of total assets. ROA E is calculated as Net Income attributable to Aval's shareholders divided by average attributable shareholders' equity. NS refers to non - significant figures. COP $tn 2020 2021 21 vs 20 Gross Loans $ 201.8 $ 228.4 13.2% Deposits $ 211.8 $ 234.5 10.7% Deposits/Net Loans 1.08 x 1.06 x -0.02 x 90 days PDLs / Gross Loans 3.6% 2.9% (66) bps Allowance/90 days PDLs 1.52 x 1.70 x 0.18 x Cost of risk 3.0% 1.9% (109) bps Net interest margin 5.2% 4.8% (36) bps Fee income Ratio 22.0% 23.4% 142 bps Efficiency Ratio 46.0% 47.6% 155 bps Attributable net income $ 2.35 $ 3.30 40.4% ROAA 1.5% 1.6% 19 bps ROAE 11.7% 15.3% 363 bps Balance Sheet Loan Quality Profitability
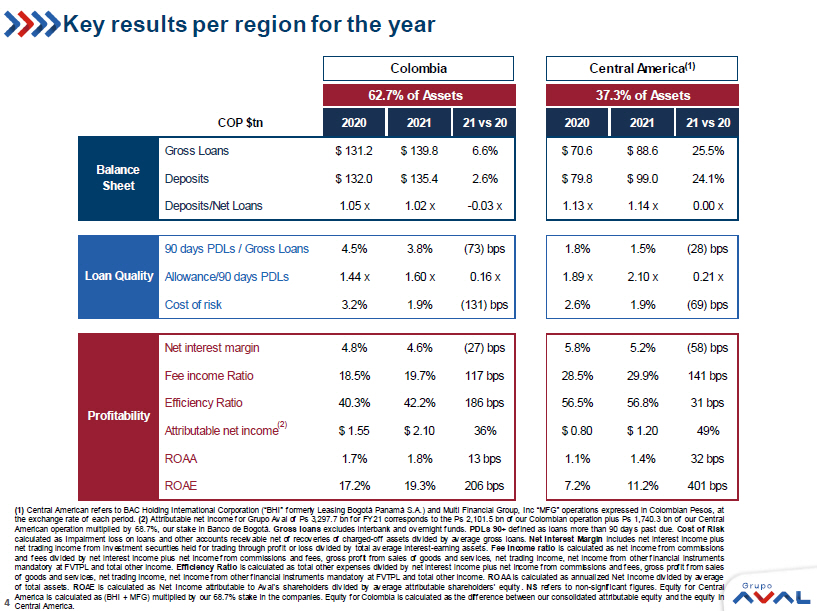
4 Key results per region for the year ( 1 ) Central American refers to BAC Holding International Corporation (“BHI” formerly Leasing Bogotá Panamá S . A . ) and Multi Financial Group, Inc “MFG” operations expressed in Colombian Pesos, at the exchange rate of each period . ( 2 ) Attributable net income for Grupo Aval of Ps 3 , 297 . 7 bn for FY 21 corresponds to the Ps 2 , 101 . 5 bn of our Colombian operation plus Ps 1 , 740 . 3 bn of our Central American operation multiplied by 68 . 7 % , our stake in Banco de Bogotá . Gross loans e xcludes interbank and overnight funds . PDLs 90 + defined as loans more than 90 days past due . Cost of Risk c alculated as Impairment loss on loans and other accounts receivable net of recoveries of charged - off assets divided by average gross loans . Net Interest Margin includes net interest income plus net trading income from investment securities held for trading through profit or loss divided by total average interest - earning assets . Fee income ratio is calculated as net income from commissions and fees divided by net interest income plus net income from commissions and fees, gross profit from sales of goods and services, net trading income, net income from other financial instruments mandatory at FVTPL and total other income . Efficiency Ratio is calculated as total other expenses divided by net interest income plus net income from commissions and fees, gross profit from sales of goods and services, net trading income, net income from other financial instruments mandatory at FVTPL and total other income . ROAA is calculated as annualized Net Income divided by average of total assets . ROA E is calculated as Net Income attributable to Aval's shareholders divided by average attributable shareholders' equity . NS refers to non - significant figures . Equity for Central America is calculated as (BHI + MFG) multiplied by our 68 . 7 % stake in the companies . Equity for Colombia is calculated as the difference between our consolidated attributable equity and the equity in Central America . Colombia Central America (1) (2) COP $tn 2020 2021 21 vs 20 2020 2021 21 vs 20 Gross Loans $ 131.2 $ 139.8 6.6% $ 70.6 $ 88.6 25.5% Deposits $ 132.0 $ 135.4 2.6% $ 79.8 $ 99.0 24.1% Deposits/Net Loans 1.05 x 1.02 x -0.03 x 1.13 x 1.14 x 0.00 x 90 days PDLs / Gross Loans 4.5% 3.8% (73) bps 1.8% 1.5% (28) bps Allowance/90 days PDLs 1.44 x 1.60 x 0.16 x 1.89 x 2.10 x 0.21 x Cost of risk 3.2% 1.9% (131) bps 2.6% 1.9% (69) bps Net interest margin 4.8% 4.6% (27) bps 5.8% 5.2% (58) bps Fee income Ratio 18.5% 19.7% 117 bps 28.5% 29.9% 141 bps Efficiency Ratio 40.3% 42.2% 186 bps 56.5% 56.8% 31 bps Attributable net income $ 1.55 $ 2.10 36% $ 0.80 $ 1.20 49% ROAA 1.7% 1.8% 13 bps 1.1% 1.4% 32 bps ROAE 17.2% 19.3% 206 bps 7.2% 11.2% 401 bps Balance Sheet Loan Quality Profitability 62.7% of Assets 37.3% of Assets
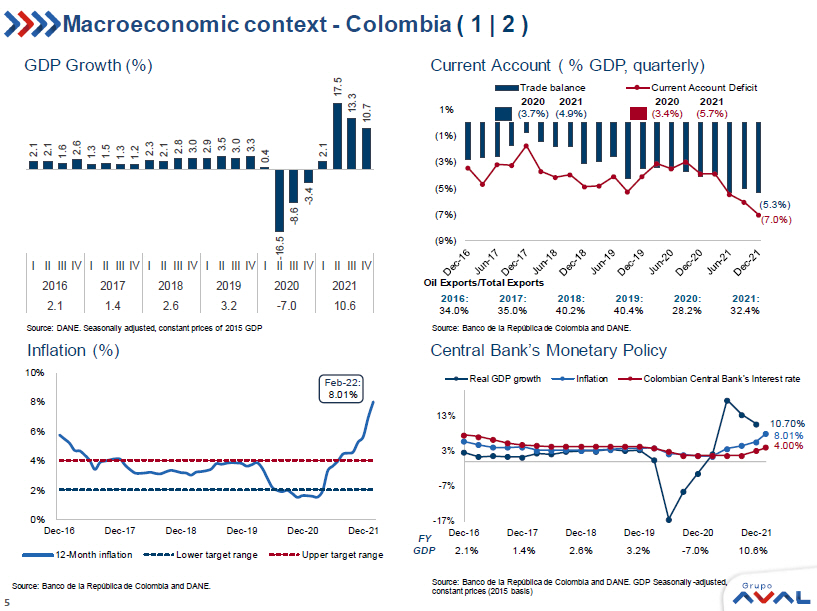
5 2.1 2.1 1.6 2.6 1.3 1.5 1.3 1.2 2.3 2.1 2.8 3.0 2.9 3.5 3.0 3.3 0.4 - 16.5 - 8.6 - 3.4 2.1 17.5 13.3 10.7 I II III IV I II III IV I II III IV I II III IV I II III IV I II III IV 2016 2017 2018 2019 2020 2021 2.1 1.4 2.6 3.2 -7.0 10.6 (5.3%) (7.0%) (9%) (7%) (5%) (3%) (1%) 1% Trade balance Current Account Deficit -17% -7% 3% 13% Dec-16 Dec-17 Dec-18 Dec-19 Dec-20 Dec-21 Real GDP growth Inflation Colombian Central Bank's Interest rate 4.00% 8.01% 10.70% 0% 2% 4% 6% 8% 10% Dec-16 Dec-17 Dec-18 Dec-19 Dec-20 Dec-21 12-Month inflation Lower target range Upper target range 8.01% Feb - 22: Source: Banco de la República de Colombia and DANE. Source: DANE. Seasonally adjusted, constant prices o f 2015 GDP Oil Exports/Total Exports Source : Banco de la República de Colombia and DANE. Source: Banco de la República de Colombia and DANE. GDP Seasonally - adjusted, constant prices (2015 basis) FY GDP 2.1% 1.4% 2.6% 3.2% - 7.0% 10.6% 2016: 34.0% 2017: 35.0% 2018: 40.2% 2019: 40.4% 2020: 28.2% 2021: 32.4% Macroeconomic context - Colombia ( 1 | 2 ) Inflation (%) Central Bank’s Monetary Policy GDP Growth (%) Current Account ( % GDP, quarterly) 2020 2021 2020 2021(3.7%) (4.9%) (3.4%) (5.7%)
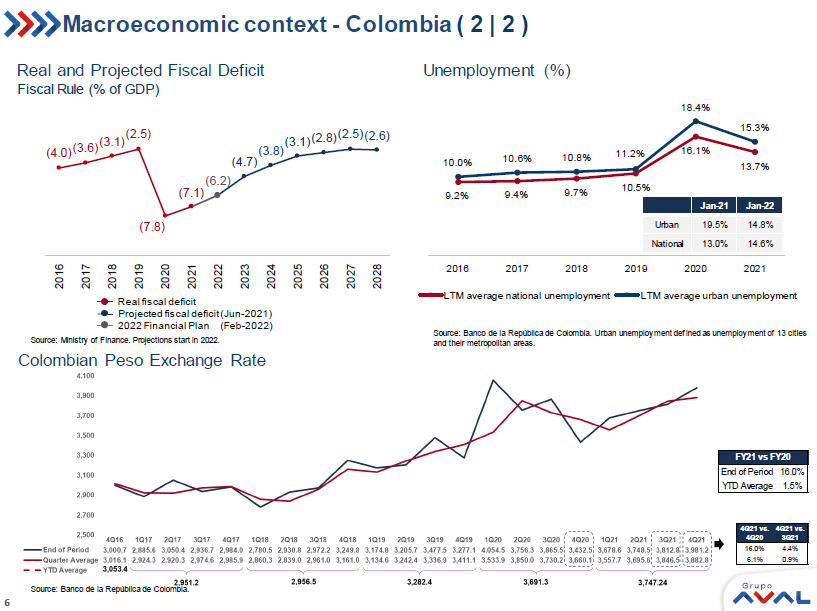
6 (4.0) (3.6) (3.1) (2.5) (7.8) (7.1) (6.2) (4.7) (3.8) (3.1) (2.8) (2.5) (2.6) 2016 2017 2018 2019 2020 2021 2022 2023 2024 2025 2026 2027 2028 Real fiscal deficit Projected fiscal deficit (Jun - 2021) 2022 Financial Plan (Feb - 2022) 9.2% 9.4% 9.7% 10.5% 16.1% 13.7% 10.0% 10.6% 10.8% 11.2% 18.4% 15.3% 2016 2017 2018 2019 2020 2021 LTM average national unemployment LTM average urban unemployment Source: Ministry of Finance. Projections start in 2022. Source: Banco de la República de Colombia. Source: Banco de la República de Colombia. Urban unemployment defined as unemployment of 13 cities and their metropolitan areas. Jan - 21 Jan - 22 Urban 19.5% 14.8% National 13.0% 14.6% End of Period 16.0% YTD Average 1.5% FY21 vs FY20 Macroeconomic context - Colombia ( 2 | 2 ) Real and Projected Fiscal Deficit Fiscal Rule (% of GDP) Colombian Peso Exchange Rate Unemployment (%)
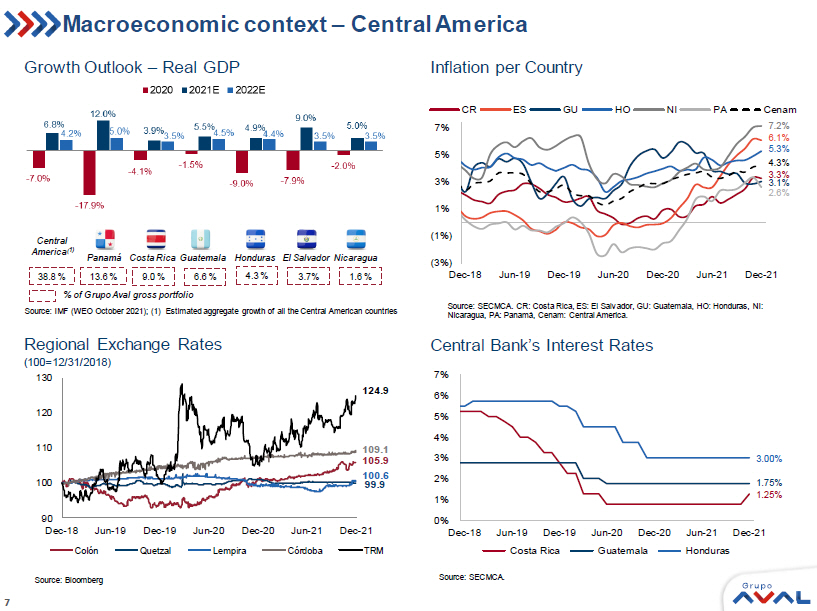
7 90 100 110 120 130 Dec-18 Jun-19 Dec-19 Jun-20 Dec-20 Jun-21 Dec-21 Colón Quetzal Lempira Córdoba TRM 124.9 100.6 109.1 99.9 105.9 0% 1% 2% 3% 4% 5% 6% 7% Dec-18 Jun-19 Dec-19 Jun-20 Dec-20 Jun-21 Dec-21 Costa Rica Guatemala Honduras 3.00% 1.25% 1.75% (3%) (1%) 1% 3% 5% 7% Dec-18 Jun-19 Dec-19 Jun-20 Dec-20 Jun-21 Dec-21 CR ES GU HO NI PA Cenam 7.2% 5.3% 3.1% 4.3% 3.3% 6.1% 2.6% Source: IMF (WEO October 2021); (1) Estimated aggregate growth of all the Central American countries Source: SECMCA. CR: Costa Rica, ES: El Salvador, GU: Guatemala, HO: Honduras, NI: Nicaragua, PA: Panamá, Cenam : Central America . Source: SECMCA. Source: Bloomberg Panamá Nicaragua Costa Rica Honduras Guatemala El Salvador Central America ( 1) % of Grupo Aval gross portfolio 38.8 % 13.6 % 6.6 % 4.3 % 9.0 % 3.7% 1.6 % Macroeconomic context – Central America Regional Exchange Rates (100=12/31/2018) Central Bank’s Interest Rates Growth Outlook – Real GDP Inflation per Country
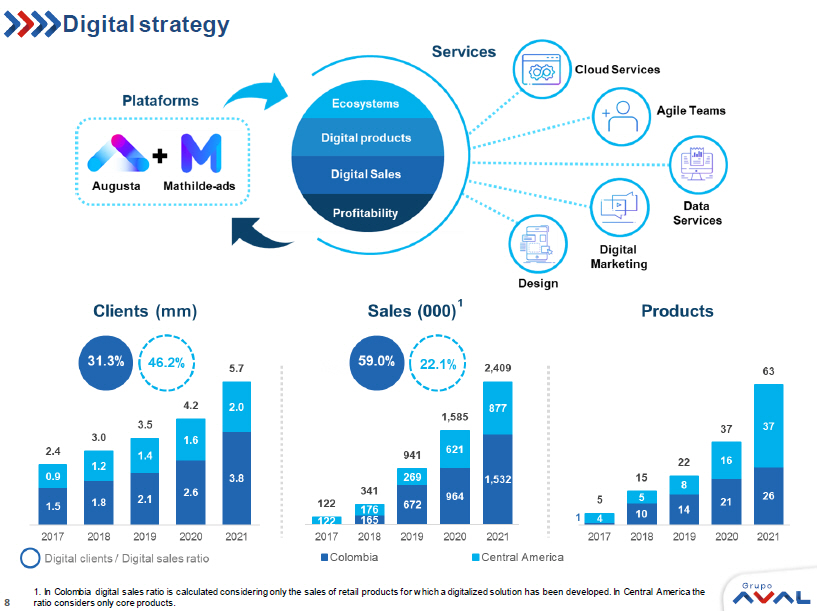
8 Digital strategy 1. In Colombia digital sales ratio is calculated considering only the sales of retail products for which a digitalized soluti on has been developed. In Central America the ratio considers only core products.

9 ESG Highlights Corporate Governance & Risk Management Corporate Efficiencies Economic Impact Social & Environmental Human Capital ESRA implementation in some of our subisidiaries We adhered to the United Nations Global Compact We built our Corporate Diversity and Inclusion policy Banco de Bogotá, Banco de Occidente, Banco Popular and Porvenir received the Great Place to Work Certification Corficolombiana issued a 500 billion pesos social bonds New products with parterships with Unicef and Saving The Amazon We start disclosing Cybersecurity and Fraud information Banco de Bogotá and Corficolombiana were included in the Dow Jones Sustainability Index . 2022 Goals Carbon footprint measurement at Grupo Aval Opening of CTIC during the second semester 2022 Develop our corporate Human Rights policy We implement initiatives to mitigate the effects of climate change: Amazon reforestation Use of renewable energies Strengthening our Corporate Procurement Policy to include ESG Standards ESG PILLARS
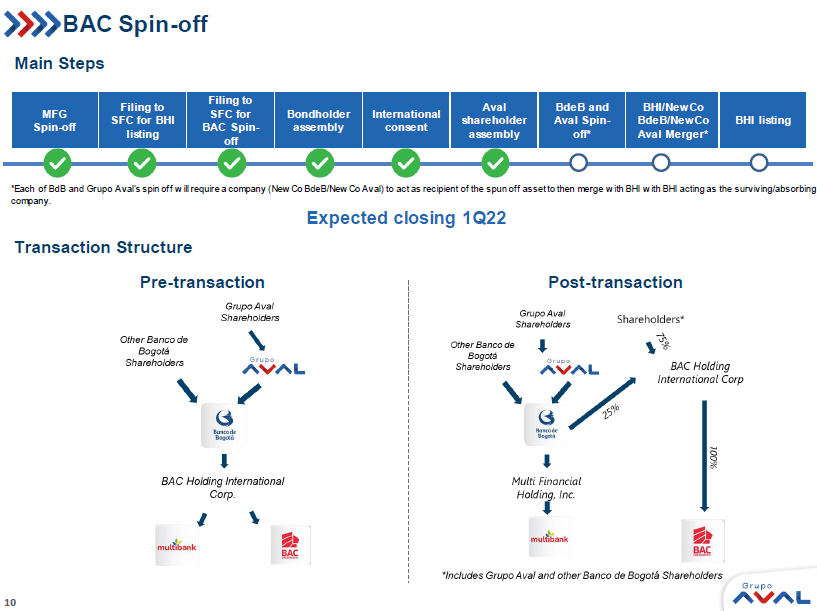
10 BAC Spin - off Pre - transaction Post - transaction Main Steps Filing to SFC for BHI listing International consent Filing to SFC for BAC Spin - off Bondholder assembly BHI/ NewCo BdeB / NewCo Aval Merger * MFG Spin - off BdeB and Aval Spin - off* BHI listing Expected closing 1Q22 Transaction Structure Aval shareholder assembly *Each of BdB and Grupo Aval’s spin off will require a company ( NewCo BdeB / NewCo Aval) to act as recipient of the spun off asset to then merge with BHI with BHI acting as the surviving/absorbing company.
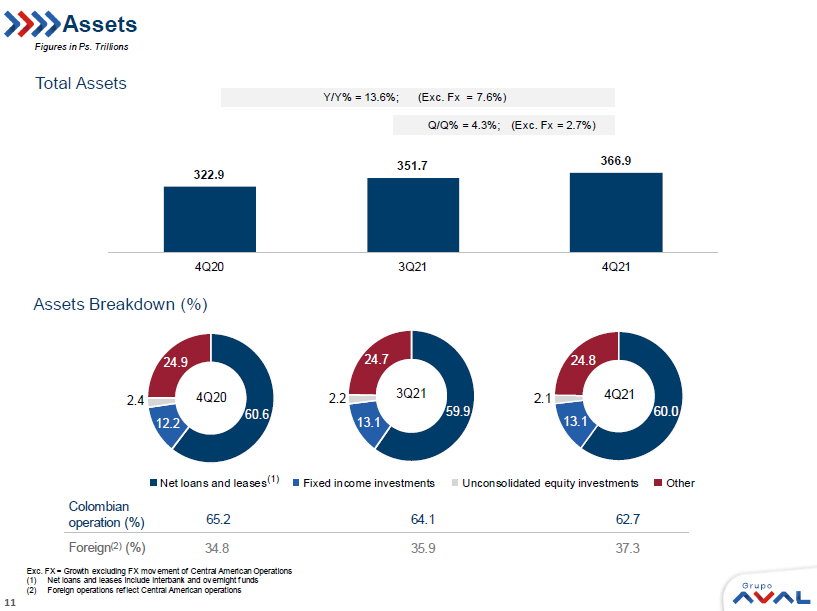
11 Net loans and leases Fixed income investments Unconsolidated equity investments Other Assets Assets Breakdown (%) Total Assets Exc. FX = Growth excluding FX movement of Central American Operations (1) Net loans and leases include interbank and overnight funds (2) Foreign operations reflect Central American operations (1) Colombian operation (%) Foreign (2) (%) 322.9 351.7 366.9 4Q20 3Q21 4Q21 Y/Y% = 13.6%; (Exc. Fx = 7.6%) Q/Q% = 4.3%; (Exc. Fx = 2.7%) Figures in Ps. Trillions 60.6 12.2 2.4 24.9 4Q20 59.9 13.1 2.2 24.7 3Q21 60.0 13.1 2.1 24.8 4Q21 65.2 34.8 64.1 35.9 37.3 62.7
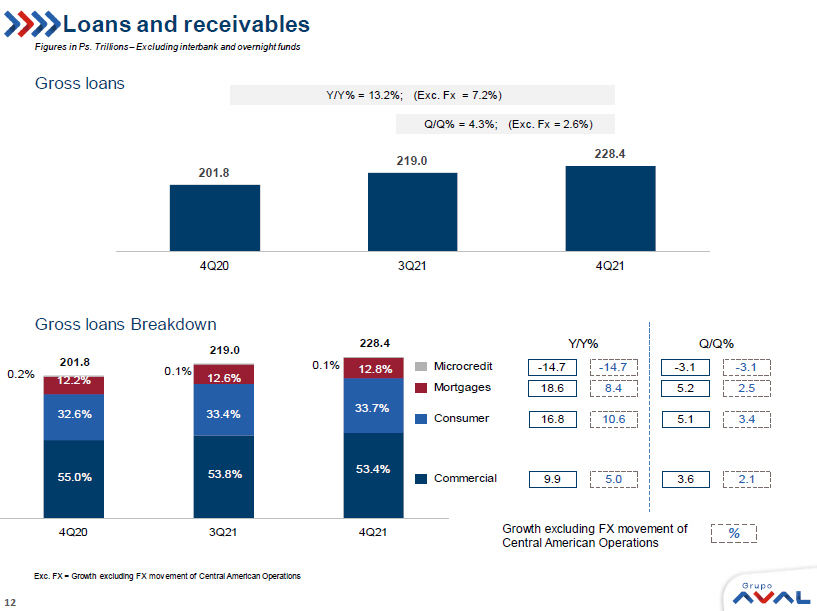
12 Loans and receivables Gross loans Gross loans Breakdown % Growth excluding FX movement of Central American Operations Exc. FX = Growth excluding FX movement of Central American Operations 201.8 219.0 228.4 4Q20 3Q21 4Q21 9.9 16.8 5.0 10.6 3.6 5.1 2.1 3.4 18.6 - 14.7 8.4 - 14.7 5.2 - 3.1 2.5 - 3.1 55.0% 53.8% 53.4% 32.6% 33.4% 33.7% 12.2% 12.6% 12.8% 0.2% 0.1% 0.1% Y/Y% Q/Q% Commercial Consumer Mortgages Microcredit 201.8 219.0 228.4 4Q20 3Q21 4Q21 Y/Y% = 13.2%; (Exc. Fx = 7.2%) Q/Q% = 4.3%; (Exc. Fx = 2.6%) Figures in Ps. Trillions – Excluding interbank and overnight funds
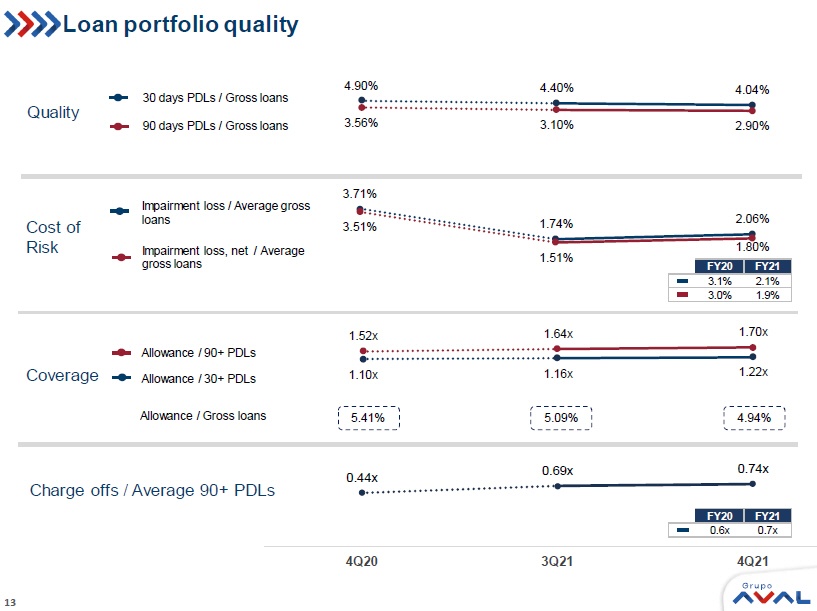
13 Loan portfolio quality Charge offs / Average 90+ PDLs Cost of Risk Quality Coverage 4.90% 4.40% 4.04% 3.56% 3.10% 2.90% 30 days PDLs / Gross loans 90 days PDLs / Gross loans 3.71% 1.74% 2.06% 3.51% 1.51% 1.80% Impairment loss / Average gross loans Impairment loss, net / Average gross loans 1.52x 1.64x 1.70x 1.10x 1.16x 1.22x 5.41% 5.09% 4.94% Allowance / Gross loans Allowance / 90+ PDLs Allowance / 30+ PDLs 0.44x 0.69x 0.74x 4Q20 3Q21 4Q21 FY20 FY21 0.6x 0.7x FY20 FY21 3.1% 2.1% 3.0% 1.9%
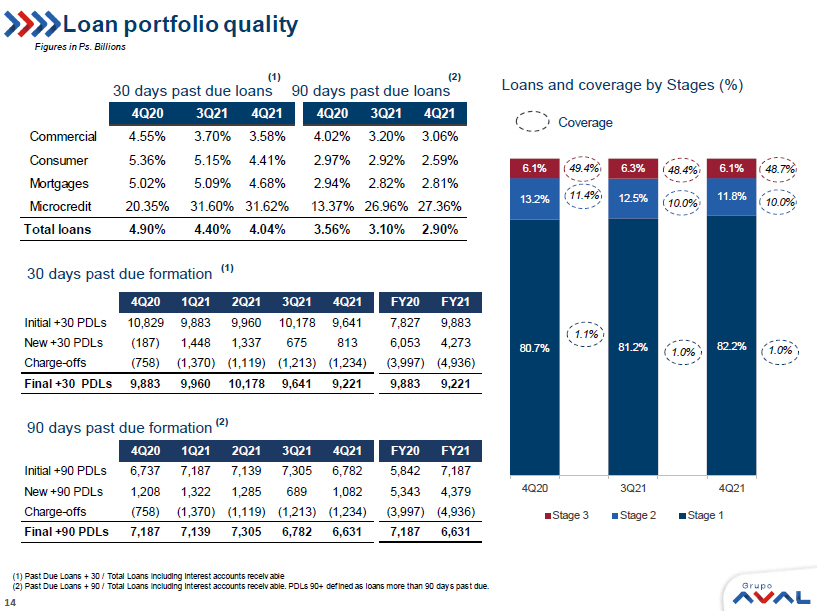
14 Loan portfolio quality 30 days past due formation 90 days past due formation (1) (2) 30 days past due loans 90 days past due loans Loans and coverage by Stages (%) (1) Past Due Loans + 30 / Total Loans including interest accounts receivable (2) Past Due Loans + 90 / Total Loans including interest accounts receivable. PDLs 90+ defined as loans more than 90 days pas t d ue. Figures in Ps. Billions (1) (2) 4Q20 3Q21 4Q21 4Q20 3Q21 4Q21 Commercial 4.55% 3.70% 3.58% 4.02% 3.20% 3.06% Consumer 5.36% 5.15% 4.41% 2.97% 2.92% 2.59% Mortgages 5.02% 5.09% 4.68% 2.94% 2.82% 2.81% Microcredit 20.35% 31.60% 31.62% 13.37% 26.96% 27.36% Total loans 4.90% 4.40% 4.04% 3.56% 3.10% 2.90% 80.7% 81.2% 82.2% 13.2% 12.5% 11.8% 6.1% 6.3% 6.1% 4Q20 3Q21 4Q21 Stage 3 Stage 2 Stage 1 49.4% 48.4% 48.7% 11.4% 10.0% 10.0% 1.1% 1.0% 1.0% Coverage 4Q20 1Q21 2Q21 3Q21 4Q21 FY20 FY21 Initial +30 PDLs 10,829 9,883 9,960 10,178 9,641 7,827 9,883 New +30 PDLs (187) 1,448 1,337 675 813 6,053 4,273 Charge-offs (758) (1,370) (1,119) (1,213) (1,234) (3,997) (4,936) Final +30 PDLs 9,883 9,960 10,178 9,641 9,221 9,883 9,221 4Q20 1Q21 2Q21 3Q21 4Q21 FY20 FY21 Initial +90 PDLs 6,737 7,187 7,139 7,305 6,782 5,842 7,187 New +90 PDLs 1,208 1,322 1,285 689 1,082 5,343 4,379 Charge-offs (758) (1,370) (1,119) (1,213) (1,234) (3,997) (4,936) Final +90 PDLs 7,187 7,139 7,305 6,782 6,631 7,187 6,631
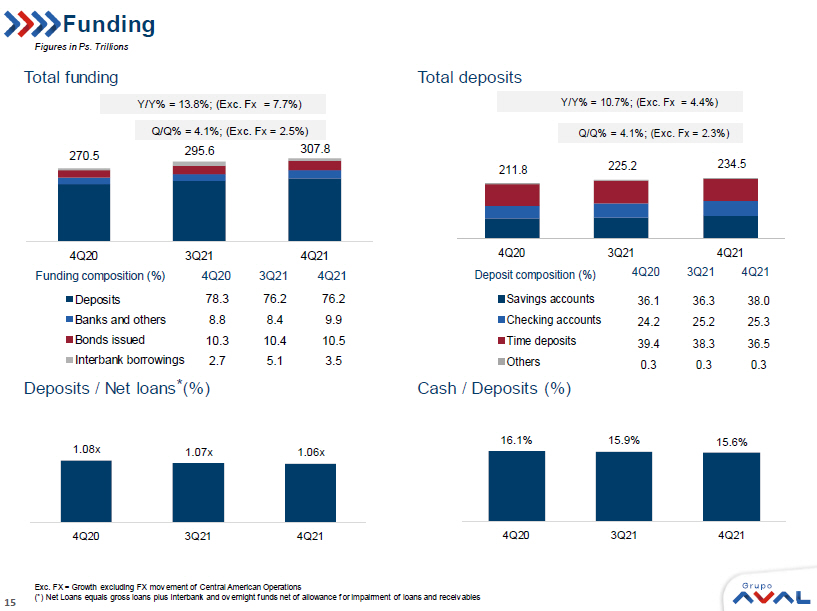
15 270.5 295.6 307.8 4Q20 3Q21 4Q21 Deposits Banks and others Bonds issued Interbank borrowings Funding composition (%) 4Q20 3Q21 4Q21 9.9 76.2 8.4 76.2 8.8 78.3 3.5 10.5 5.1 10.4 2.7 10.3 Q/Q% = 4.1%; (Exc. Fx = 2.5%) Y/Y% = 13.8%; (Exc. Fx = 7.7%) 16.1% 15.9% 15.6% 4Q20 3Q21 4Q21 1.08x 1.07x 1.06x 4Q20 3Q21 4Q21 Funding Deposits / Net loans (%) * Deposit composition (%) Exc. FX = Growth excluding FX movement of Central American Operations (*) Net Loans equals gross loans plus interbank and overnight funds net of allowance for impairment of loans and receivables 211.8 225.2 234.5 4Q20 3Q21 4Q21 Savings accounts Checking accounts Time deposits Others 0.3 25.3 38.0 36.5 Deposit composition (%) 4Q20 3Q21 4Q21 0.3 25.2 36.3 38.3 0.3 24.2 36.1 39.4 Y/Y% = 10.7%; (Exc. Fx = 4.4%) Q/Q% = 4.1%; (Exc. Fx = 2.3%) Total deposits Total funding Figures in Ps. Trillions Cash / Deposits (%)
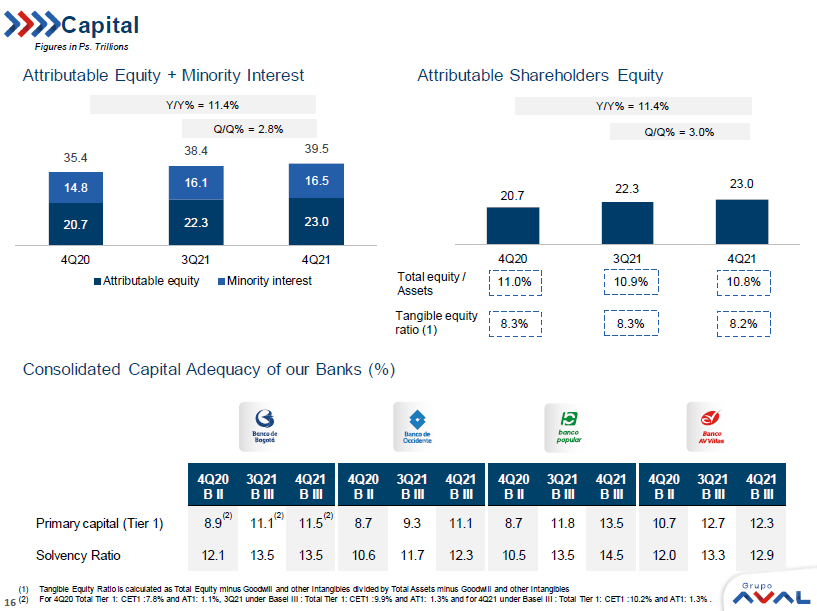
16 4Q20 B II 3Q21 B III 4Q21 B III 4Q20 B II 3Q21 B III 4Q21 B III 4Q20 B II 3Q21 B III 4Q21 B III 4Q20 B II 3Q21 B III 4Q21 B III Primary capital (Tier 1) 8.9 11.1 11.5 8.7 9.3 11.1 8.7 11.8 13.5 10.7 12.7 12.3 Solvency Ratio 12.1 13.5 13.5 10.6 11.7 12.3 10.5 13.5 14.5 12.0 13.3 12.9 20.7 22.3 23.0 14.8 16.1 16.5 35.4 38.4 39.5 4Q20 3Q21 4Q21 Attributable equity Minority interest Q/Q% = 2.8% Y/Y% = 11.4% 20.7 22.3 23.0 4Q20 3Q21 4Q21 Q/Q% = 3.0% Y/Y% = 11.4% Total equity / Assets 8.2% 8.3% 10.8% 10.9% 11.0% 8.3% Tangible equity ratio (1) Attributable Shareholders Equity Attributable Equity + Minority Interest Figures in Ps. Trillions Consolidated Capital Adequacy of our Banks (%) Capital (1) Tangible Equity Ratio is calculated as Total Equity minus Goodwill and other Intangibles divided by Total Assets minus Goodwi ll and other Intangibles (2) For 4Q20 Total Tier 1: CET1 :7.8% and AT1: 1.1%, 3Q21 under Basel III : Total Tier 1: CET1 :9.9% and AT1: 1.3% and for 4Q21 u nde r Basel III : Total Tier 1: CET1 :10.2% and AT1: 1.3% . (2) (2) (2)
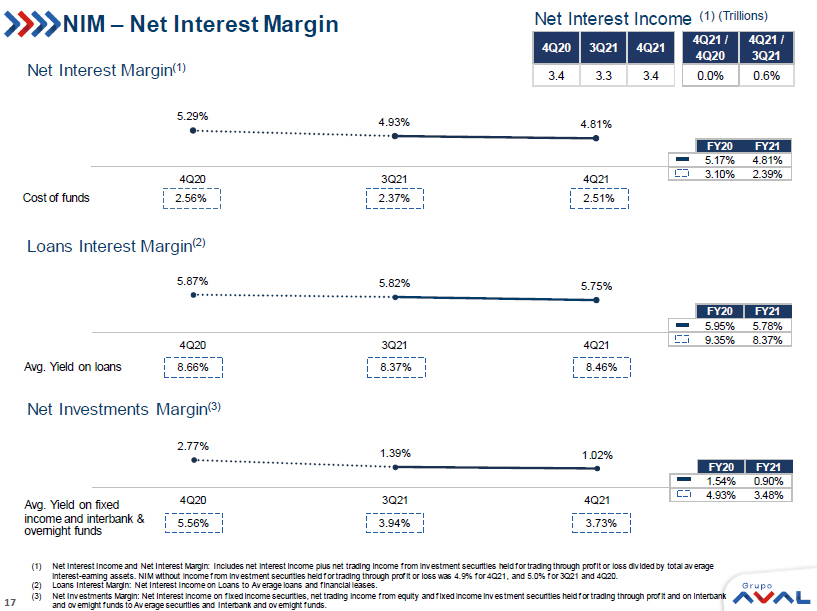
17 5.29% 4.93% 4.81% 4Q20 3Q21 4Q21 2.51% 2.37% 2.56% Cost of funds NIM – Net Interest Margin Net Interest Margin (1) Loans Interest Margin (2) Net Investments Margin (3) Net Interest Income (1) (Trillions) (1) Net Interest Income and Net Interest Margin: Includes net interest income plus net trading income from investment securities hel d for trading through profit or loss divided by total average interest - earning assets. NIM without income from investment securities held for trading through profit or loss was 4.9% for 4Q21 , and 5.0% for 3Q21 and 4Q20. (2) Loans Interest Margin: Net Interest Income on Loans to Average loans and financial leases. (3) Net Investments Margin: Net Interest income on fixed income securities, net trading income from equity and fixed income inves tme nt securities held for trading through profit and on interbank and overnight funds to Average securities and Interbank and overnight funds. 5.87% 5.82% 5.75% 4Q20 3Q21 4Q21 Avg. Yield on loans 8.66% 8.37% 8.46% 2.77% 1.39% 1.02% 4Q20 3Q21 4Q21 Avg. Yield on fixed income and interbank & overnight funds 3.73% 3.94% 5.56% 4Q20 3Q21 4Q21 4Q21 / 4Q20 4Q21 / 3Q21 3.4 3.3 3.4 0.0% 0.6% FY20 FY21 5.17% 4.81% 3.10% 2.39% FY20 FY21 5.95% 5.78% 9.35% 8.37% FY20 FY21 1.54% 0.90% 4.93% 3.48%
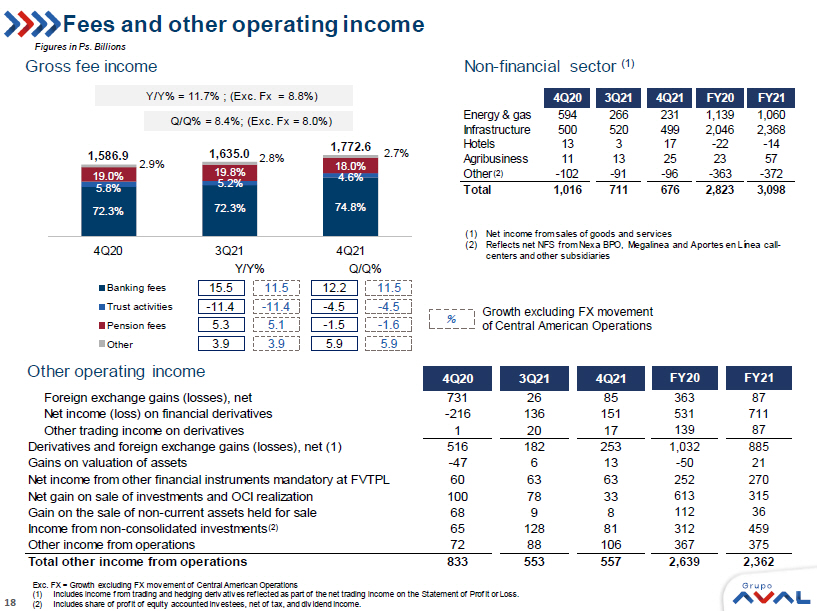
18 Fees and other operating income Gross fee income Other operating income Non - financial sector (1) (1) Net income from sales of goods and services (2) Reflects net NFS from Nexa BPO, Megalinea and Aportes en L ínea call - centers and other subsidiaries (2) (2) Exc. FX = Growth excluding FX movement of Central American Operations (1) Includes income from trading and hedging derivatives reflected as part of the net trading income on the Statement of Profit or L oss. (2) Includes share of profit of equity accounted investees, net of tax, and dividend income. 1,586.9 1,635.0 1,772.6 4Q20 3Q21 4Q21 Banking fees Trust activities Pension fees Other 72.3% 72.3% 74.8% 19.0% 19.8% 18.0% 5.8% 5.2% 4.6% 2.9% 2.8% 2.7% Y/Y% Q/Q% 15.5 - 11.4 5.3 3.9 12.2 - 4.5 - 1.5 5.9 11.5 - 4.5 - 1.6 5.9 11.5 - 11.4 5.1 3.9 Y/Y% = 11.7% ; (Exc. Fx = 8.8%) Q/Q% = 8.4%; (Exc. Fx = 8.0%) % Growth excluding FX movement of Central American Operations Figures in Ps. Billions 4Q20 3Q21 4Q21 Foreign exchange gains (losses), net 731 26 85 Net income (loss) on financial derivatives -216 136 151 Other trading income on derivatives 1 20 17 Derivatives and foreign exchange gains (losses), net (1) 516 182 253 Gains on valuation of assets -47 6 13 Net income from other financial instruments mandatory at FVTPL 60 63 63 Net gain on sale of investments and OCI realization 100 78 33 Gain on the sale of non-current assets held for sale 68 9 8 Income from non-consolidated investments 65 128 81 Other income from operations 72 88 106 Total other income from operations 833 553 557 FY20 FY21 363 87 531 711 139 87 1,032 885 -50 21 252 270 613 315 112 36 312 459 367 375 2,639 2,362 4Q20 3Q21 4Q21 FY20 FY21 Energy & gas 594 266 231 1,139 1,060 Infrastructure 500 520 499 2,046 2,368 Hotels 13 3 17 -22 -14 Agribusiness 11 13 25 23 57 Other -102 -91 -96 -363 -372 Total 1,016 711 676 2,823 3,098
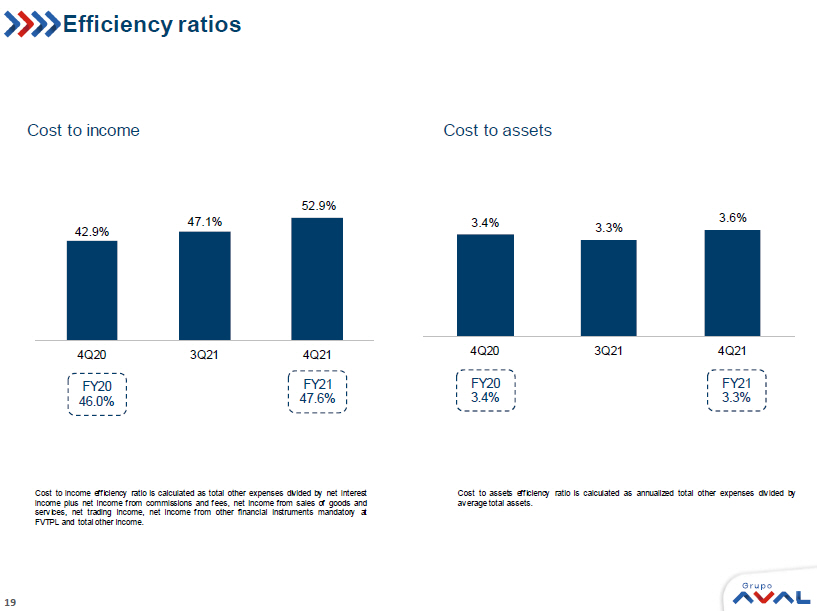
19 3.4% 3.3% 3.6% 4Q20 3Q21 4Q21 FY20 3.4% FY21 3.3% Efficiency ratios Cost to income efficiency ratio is calculated as total other expenses divided by net interest income plus net income from commissions and fees, net income from sales of goods and services, net trading income, net income from other financial instruments mandatory at FVTPL and total other income . Cost to income Cost to assets Cost to assets efficiency ratio is calculated as annualized total other expenses divided by average total assets . 42.9% 47.1% 52.9% 4Q20 3Q21 4Q21 FY20 46.0% FY21 47.6%
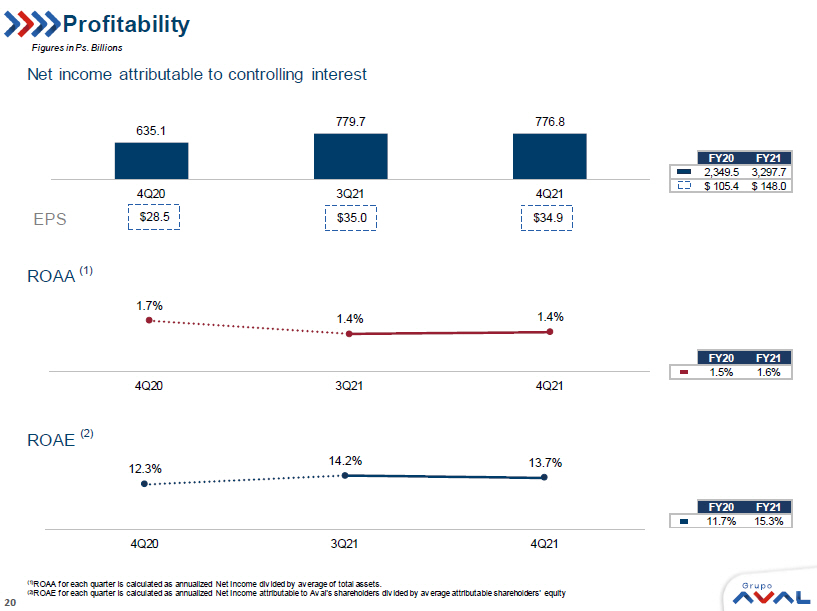
20 635.1 779.7 776.8 4Q20 3Q21 4Q21 $34.9 $35.0 $28.5 Profitability Figures in Ps. Billions Net income attributable to controlling interest ROAA (1) ROAE (2) (1) ROAA for each quarter is calculated as annualized Net Income divided by average of total assets. (2) ROAE for each quarter is calculated as annualized Net Income attributable to Aval's shareholders divided by average attributa ble shareholders' equity 1.7% 1.4% 1.4% 4Q20 3Q21 4Q21 12.3% 14.2% 13.7% 4Q20 3Q21 4Q21 EPS FY20 FY21 2,349.5 3,297.7 $ 105.4 $ 148.0 FY20 FY21 1.5% 1.6% FY20 FY21 11.7% 15.3%
21
SIGNATURE
Pursuant to the requirements of the Securities Exchange Act of 1934, the registrant has duly caused this report to be signed on its behalf by the undersigned, thereunto duly authorized.
Date: March 17, 2022
| GRUPO AVAL ACCIONES Y VALORES S.A. | |||
| By: | /s/ Jorge Adrián Rincón Plata | ||
| Name: | Jorge Adrián Rincón Plata | ||
| Title: | Chief Legal Counsel | ||