UNITED STATES
SECURITIES AND EXCHANGE COMMISSION
Washington, D.C. 20549
FORM 6-K
Report Of Foreign Private Issuer
Pursuant To Rule 13a-16 Or 15d-16 Of
The Securities Exchange Act Of 1934
For the month of March 2022
Commission File Number: 000-54290
Grupo Aval Acciones y Valores S.A.
(Exact name of registrant as specified in its charter)
Carrera 13 No. 26A - 47
Bogotá D.C., Colombia
(Address of principal executive office)
Indicate by check mark whether the registrant files or will file annual reports under cover of Form 20-F or Form 40-F:
| Form 20-F | X | Form 40-F |
Indicate by check mark if the registrant is submitting the Form 6-K in paper as permitted by Regulation S-T Rule 101(b)(1):
| Yes | No | X |
Indicate by check mark if the registrant is submitting the Form 6-K in paper as permitted by Regulation S-T Rule 101(b)(7):
| Yes | No | X |
GRUPO AVAL ACCIONES Y VALORES S.A.
TABLE OF CONTENTS
| ITEM | |
| 1. | Information Statement Regarding Spinoff of BAC Holding International Corp., dated March 18, 2022 |
| 2. | Notice Regarding Availability of Information Statement |
Item 1
INFORMATION STATEMENT
BAC Holding International Corp.
Grupo Aval Acciones y Valores S.A. (“Grupo Aval”), a company domiciled in Bogotá, Colombia and organized under Colombian laws and regulations, and BAC Holding International Corp. (“BHI”), a holding company organized under Panamanian law (formerly, Leasing Bogotá S.A. Panamá), are furnishing this information statement in connection with the demerger (escisión) of Grupo Aval’s indirect majority ownership stake in BHI and the distribution, through a series of transactions described in this information statement under the caption “The Spinoff,” of 43,220,189,095 common shares of BHI (par value $0.0662975983446469 per share) (each a “BHI Share” and collectively, the “BHI Shares”) to (i) the shareholders of Grupo Aval’s consolidated subsidiary, Banco de Bogotá S.A. (“Banco de Bogotá”), a bank organized under Colombian laws and regulations, which, prior to the Spinoff, was BHI’s sole shareholder, and (ii) in turn, the distribution of the BHI Shares received by Grupo Aval from Banco de Bogotá to its own shareholders, in each case on a pro rata basis, proportionally to such shareholders’ ownership stakes in Banco de Bogotá and Grupo Aval, respectively. The aforementioned transactions, which along with certain related transactions described in greater detail under the caption “The Spinoff” are referred to herein as the “Spinoff.”
Grupo Aval’s shareholders will receive an aggregate of 22,281,017,159 BHI Shares in the Spinoff. You are receiving this information statement because Grupo Aval believes that you are a resident of the United States and own its common or preferred shares, including preferred shares represented by American Depositary Shares (“ADSs”), each of which represents 20 Grupo Aval preferred shares.
To the extent you hold Grupo Aval’s common or preferred shares, you will receive one BHI Share for each one Grupo Aval common or preferred share that you own of record immediately prior to the open of business (Bogotá, Colombia time) on March 28, 2022 (the “Colombian Record Date”).
If you own Grupo Aval ADSs, you will be entitled to elect to take delivery in your Colombian brokerage account of 20 BHI Shares for each Grupo Aval ADS that you own of record at the close of business (New York City time) on March 28, 2022 (the “ADS Record Date” and the Colombian Record Date, each a “Record Date”). If you hold Grupo Aval’s ADSs and do not timely or properly elect to receive BHI Shares in the manner described in this information statement, you will automatically receive the net cash proceeds from the sale of the BHI Shares to which you would otherwise have been entitled. See the section of this information statement titled “Questions and Answers About the Spinoff and Your BHI Securities—I am an ADS holder. How do I elect to receive BHI common shares?”
Except as set forth in the preceding paragraph, you are not required to take any action to receive the BHI Shares. The BHI Shares will be registered in each holder’s name with Depósito Centralizado de Valores, “DECEVAL”, in Colombia and Central Latinoamericana de Valores, or “Latinex,” in Panamá; both BHI’s registrars and custodian agents.
In reviewing this information statement, you should carefully consider the matters described under the caption “Risk Factors” beginning on page 20.
Neither the U.S. Securities and Exchange Commission (“SEC”) nor any state securities commission or regulator in any other jurisdiction has approved or disapproved the securities described in this information statement or determined if this information statement is truthful or complete. Any representation to the contrary is a criminal offense.
This information statement does not constitute an offer to sell or the solicitation of an offer to buy any securities.
Grupo Aval is not soliciting a proxy or consent authority in connection with the Spinoff. The Spinoff has been approved by Grupo Aval’s common shareholders and has received all requisite regulatory approvals.
The date of this information statement is March 18, 2022.
1
table of contents
| i. NOTE REGARDING THE USE OF CERTAIN TERMS | 7 |
| ii. AVAILABLE INFORMATION | 8 |
| Grupo Aval | 8 |
| BAC Holding International Corp. | 8 |
| iii. SPECIAL NOTE REGARDING FORWARD-LOOKING STATEMENTS | 9 |
| 1. SUMMARY | 10 |
| Overview | 10 |
| The Spinoff | 10 |
| The Banco de Bogotá Demerger | 10 |
| The Grupo Aval Demerger | 10 |
| The BHI Listing and Mergers | 10 |
| Effect of the Spinoff | 11 |
| Corporate Information | 11 |
| 2. THE SPINOFF | 12 |
| Summary of the Spinoff | 12 |
| The Spinoff | 13 |
| Effect of the Spinoff | 13 |
| Listing and Trading of Our Common Shares | 14 |
| 3. QUESTIONS AND ANSWERS ABOUT THE SPINOFF AND YOUR BHI SECURITIES | 15 |
| 4. RISK FACTORS | 20 |
| Summary | 20 |
| Risks Relating to the Spinoff | 22 |
| Risks relating to the countries in which we operate | 23 |
| Risks relating to our businesses and industry | 26 |
| Risks relating to our banking business | 27 |
| Other risks relating to our businesses | 32 |
| Risks Relating to Our Common Shares | 37 |
| 5. Dividend policy of BHI | 40 |
| Net Income and Declared Dividends Corresponding to the Past Three (3) Years | 40 |
| 6. CAPITALIZATION | 41 |
| 7. UNAUDITED CONDENSED PRO FORMA FINANCIAL INFORMATION | 42 |
| Overview | 42 |
| Unaudited Pro Forma Income Statement Information | 42 |
| 8. STATISTICAL BANK INFORMATION | 45 |
| Selected Statistical Data | 45 |
2
| Distribution of Assets, Liabilities and Shareholders' Equity; Interest Rates and Interest Differential | 45 |
| Average Statement of Financial Position | 45 |
| Analysis of Changes in Volume and Rate on Interest Income and Interest Expense | 47 |
| Interest-earning assets – net interest margin and spread | 48 |
| Investment Portfolio | 49 |
| Loan Portfolio | 49 |
| Maturity Profile of the Loan Portfolio | 49 |
| Credit Ratios | 51 |
| Deposits | 52 |
| Uninsured deposits | 53 |
| 9. MANAGEMENT’S DISCUSSION AND ANALYSIS OF FINANCIAL CONDITION AND RESULTS OF OPERATIONS | 54 |
| Overview: BAC Holding International Corp. | 54 |
| Principal factors affecting our financial condition and results of operations | 54 |
| International context | 54 |
| Inflation and Interest Rates | 56 |
| Central American Economic Conditions | 56 |
| Critical Accounting Policies | 58 |
| Results of Operations for the Nine Months Ended September 30, 2021 Compared to the Nine Months Ended September 30, 2020 | 59 |
| Net interest income | 59 |
| Net impairment loss on financial assets | 61 |
| Service charges and Commissions and other fees, net | 64 |
| Other income | 65 |
| General and administrative expenses | 65 |
| Tax expense | 66 |
| Net income attributable to non-controlling interest | 66 |
| Net income (loss) from discontinued operations | 66 |
| Results of Operations for the Year Ended December 31, 2020 Compared to the Year Ended December 31, 2019 | 67 |
| Net interest income | 67 |
| Net impairment loss on financial assets | 69 |
| Service Charges and Commissions and other fees, net | 71 |
| Other income | 72 |
| General and administrative expenses | 72 |
| Tax expense | 73 |
| Net income attributable to non-controlling interest | 73 |
| Results of Operations for the Year Ended December 31, 2019 Compared to the Year Ended December 31, 2018 | 74 |
| Net interest income | 74 |
| Net impairment loss on financial assets | 75 |
| Service charges and Commissions and other fees, net | 77 |
| Other income | 78 |
| General and administrative expenses | 78 |
| Tax expense | 79 |
| Net income attributable to non-controlling interest | 79 |
| B. Liquidity and capital resources | 79 |
| Capitalization ratios | 80 |
| Funding | 80 |
| Capital Expenditures | 83 |
3
| C. Research and development, patents and licenses, etc. | 83 |
| D. Trend Information | 83 |
| E. Off-balance sheet arrangements | 85 |
| F. Other Commitments and Obligations | 84 |
| 10. QUANTITATIVE AND QUALITATIVE DISCLOSURES ABOUT RISK | 86 |
| Risk Management | 86 |
| Control Environment | 86 |
| Lines of defense | 86 |
| Risk Culture | 86 |
| Risk Management Systems | 87 |
| Credit Risk | 87 |
| Commercial Lending | 88 |
| Consumer Lending | 89 |
| Mortgage Lending | 89 |
| COVID-19 Event: Main government measures in Central America | 89 |
| Credit Classification and Provisioning | 90 |
| Loss allowance | 90 |
| Liquidity Risk | 91 |
| Market Risk Management | 92 |
| Investment Securities | 92 |
| Consolidated Statement of Financial Position | 93 |
| Non-Financial Risk Review | 93 |
| Operational Risk Management | 94 |
| Anti-money laundering, terrorist financing and the proliferation of weapons of mass destruction financing | 95 |
| Anti-Bribery and Anti-corruption Program | 95 |
| Legal Risk | 95 |
| 11. BUSINESS OVERVIEW | 96 |
| Overview | 96 |
| History and Development of the Company | 96 |
| Corporate Structure | 97 |
| Business Overview | 98 |
| Strategic Overview | 98 |
| Regional Strategy | 98 |
| Payment Chain Strategy | 99 |
| Digital Strategy | 100 |
| ESG Strategy | 101 |
| Central American Financial System | 102 |
| Our Operations | 103 |
| Corporate customers | 103 |
| Individual customers | 103 |
| Lending activities | 104 |
| Mortgages portfolio | 105 |
| Treasury operations | 105 |
| Deposits | 105 |
| Distribution channels | 105 |
4
| Competition | 107 |
| Property, plant and equipment | 108 |
| Human Capital | 108 |
| Legal Proceedings | 108 |
| 12. MANAGEMENT | 109 |
| Identity of Directors, Senior Management and Advisers | 109 |
| Directors | 109 |
| Executive Officers | 111 |
| Important employees and advisors | 114 |
| External Auditors | 114 |
| Legal Advisors | 114 |
| Executive Compensation | 114 |
| Board Practices | 114 |
| Meetings, voting and responsibilities of the Board of Directors | 115 |
| Mechanisms Adopted to Guarantee the Independence of Members of the Board of Directors | 116 |
| Indemnification Obligations to D&Os / Limitations | 116 |
| Audit Committee | 117 |
| 13. CERTAIN RELATIONSHIPS AND RELATED PARTY TRANSACTIONS | 118 |
| Relationship of the Members of the Board of Directors with the Company or its Related Companies | 118 |
| Loans or Deposits Involving Related Parties | 118 |
| Loans Granted to Related Parties by our banking subsidiaries | 119 |
| Financial liabilities issued by BHI and its subsidiaries with Grupo Aval and its subsidiaries | 119 |
| Other Financial Obligations | 119 |
| 14. BENEFICIAL OWNERSHIP BY CERTAIN SHAREHOLDERS | 120 |
| Shareholding Composition and Information on Main Shareholders | 120 |
| Beneficial ownership | 120 |
| 15. MATERIAL TAX CONSEQUENCES | 121 |
| Applicable Tax Regime to Shares | 121 |
| General Description of the Tax Regime Applicable to Shares that are Traded Through the Colombian Stock Exchange | 121 |
| Profits from the sale of shares in Colombia | 121 |
| Special income tax on dividends | 122 |
| General Description of the Tax Regime of the Panamanian Law Applicable to Shares | 122 |
| Profits from the sale of shares in Panama | 122 |
| Income Tax on Dividends | 123 |
| “Stamp” tax | 123 |
| Material Tax Consequences to U.S. Persons Resulting from the Spinoff or the Holding of BHI Shares | 123 |
| United States Federal Income Taxation Considerations for U.S. Holders | 123 |
| Tax Treatment of the Spinoff | 124 |
| Taxation of Dividends | 124 |
| Sale or Other Taxable Disposition of Common Shares | 125 |
| Passive Foreign Investment Company Rules | 125 |
| Information Reporting and Backup Withholding | 125 |
5
| 16. DESCRIPTION OF CAPITAL STOCK | 126 |
| Share Capital | 126 |
| Information Related to Equity Accounts | 126 |
| Convertible Obligations | 126 |
| Memorandum and Articles of Incorporation | 126 |
| Rights granted by the Shares | 126 |
| Obligations of the Shareholders | 127 |
| Process for changing the shareholder´s rights over their shares | 128 |
| Shares Available for Future Sale Under U.S. Securities Laws | 128 |
| 17. FINANCIAL STATEMENTS OF BHI | 129 |
| INDEX TO CONSOLIDATED FINANCIAL STATEMENTS | 129 |
| Exhibit A | A-1 |
| Form of DR Market Announcement with ADS Holder Election Instructions | A-1 |
| ¹Investor Disclosures | A-2 |
| Exhibit B | B-1 |
| Form of Share Delivery Instruction Form | B-1 |
6
i. NOTE REGARDING THE USE OF CERTAIN TERMS
We frequently use the following terms in this information statement to refer to the items indicated (this is not an exhaustive list of definitions used in this information statement, and certain terms are defined elsewhere in this information statement):
The terms “BAC,” “BAC Holding,” the “Company,” “BHI”,” “we,” “us” and “our” refer, unless the context otherwise specifies, to BAC Holding International Corp., a holding company organized under Panamanian law (formerly Leasing Bogotá S.A. Panamá), and the entity in which you are receiving shares in connection with the Spinoff.
BAC Credomatic Group ("BAC Credomatic" or the "Group") refers generally to BAC Credomatic Inc., the main and direct subsidiary of BHI, and the remaining regulated and/or operating subsidiaries that operate under the BAC Credomatic trademark as a single institution throughout Central America, whose shares are held directly and indirectly by BAC Credomatic Inc.
The term “BHI Listing” is defined in this information statement under the caption “The Spinoff” starting on page 12.
The term “Banco de Bogotá” and “BdB”, refers to Banco de Bogotá S.A., a bank organized under Colombian laws and regulations, and a majority-owned subsidiary of Grupo Aval.
The term “BdB Demerger” is defined in this information statement under the caption “The Spinoff” starting on page 12.
The term “BVC” refers to Bolsa de Valores de Colombia, the Colombian stock exchange.
The term “Deceval” refers to Depósito Centralizado de Valores, the Colombian central deposit for securities.
The term “Depositary” refers to JPMorgan Chase Bank, N.A., as depositary for the ADSs, each ADS representing 20 preferred shares of Grupo Aval.
The term “Distribution” means the completion of the Grupo Aval Distribution, as such term is defined in this information statement under the caption “The Spinoff” starting on page 12.
The term “Grupo Aval” refers to Grupo Aval Acciones y Valores S.A. (“Grupo Aval”), a company domiciled in Bogotá, Colombia and organized under Colombian laws and regulations.
The term “Grupo Aval Demerger” is defined in this information statement under the caption “The Spinoff” starting on page 12.
The term “Spinoff” is defined in this information statement under the caption “The Spinoff” starting on page 12.
The term “Transactions” is defined in this information statement under the caption “The Spinoff” starting on page 12.
The term “Latinclear” refers to Central Latinoamericana de Valores, the Panamanian central deposit for securities.
The term “Latinex” refers to Bolsa Latinoamericana de Valores, the Panamanian stock exchange.
The term “Newco BdB” refers to Sociedad Beneficiaria Bogotá S.A.S., a company organized under Colombian laws and regulations
The term “Newco Aval” refers to Sociedad Beneficiaria Aval S.A.S., a company organized under Colombian laws and regulations.
The term “RNVE” refers to Registro Nacional de Valores y Emisores, an entity attached by the SFC and in which the shares and issuers are registered.
The term “SBP” refers to Superintendencia de Bancos de Panamá, the Panamanian Bank Superintendency.
The term “SEC” refers to the United States of America Securities and Exchange Commission.
The term “SFC” refers to Superintendencia Financiera de Colombia, the financial Superintendency of Colombia.
The term “SVM” refers to Superintendencia del Mercado de Valores, the stock market Superintendency in Panama.
The terms “U.S. dollar”, “USD”, “U.S.$” and “$”, refers to the lawful currency of the United States of America.
7
ii. AVAILABLE INFORMATION
Grupo Aval
Grupo Aval is the holding company to Colombia’s largest banking group (based on total assets as of December 31, 2020). Through its subsidiaries, Grupo Aval provides a comprehensive range of financial services and products from traditional banking services, such as making loans and taking deposits, to pension and severance fund management.
Grupo Aval files or furnishes annual, quarterly and other reports and other relevant information with the Registro Nacional de Valores y Emisores (“RNVE”), a registration system of the Superintendencia Financiera de Colombia (“SFC”), Colombia’s principal financial markets regulator, pursuant to Colombian securities laws and regulations as amended, and with the SEC, pursuant to the U.S. Securities Exchange Act of 1934, as amended. The documents filed or furnished by Grupo Aval with the SEC are available to the public at the SEC’s website at http://www.sec.gov. Certain of these documents and certain other information is also available for download free of charge on Grupo Aval’s investor relations website at https://www.grupoaval.com/investor-relations. Statements made in this information statement concerning the provisions of any contract, agreement, indenture, or other document referred to herein are not necessarily complete. With respect to each such statement concerning a contract, agreement, indenture or other document filed with the SEC, reference is made to such filing for a more complete description of the matter involved.
Grupo Aval’s website, the information contained therein or linked thereto and the information on the SEC’s website is not incorporated by reference into and should not be deemed part of this information statement.
BAC Holding International Corp.
BHI is a financial entity in the Republic of Panama, with a leasing license and, therefore, supervised and regulated by the General Direction of Financial Entities of the Ministry of Commerce and Industries of the Republic of Panama. BHI is the holding company of BAC Credomatic Inc, the leading private bank in Central America (based on total assets as of September 30, 2021). As of September 30, 2021, BHI had more than 4.1 million clients and 18,947 direct employees in the region.
Those Banking Groups over which SBP exercises a supervision of origin are subject to the consolidated supervision of banking groups, pursuant to the applicable provisions of Accord 7-2014.
Banking Group is defined, pursuant to Executive Decree No. 52 of April 30, 2008, whereby the Sole Text of Decree Law 9 dated 26 February 1998, modified by Decree Law 2 dated 22 February 2008 is adopted (“Banking Law”), as one constituted by a bank holding company and its subsidiaries at any level, whose activities consist, predominantly, of providing services in the banking or financial sectors, including nonbanking subsidiaries of the latter which, in the opinion of the SBP, operate under common management, either through the bank holding company or through different holdings or agreements.
As of the date of this information statement, BHI is not supervised, nor regulated by the SBP. However, BAC Holding International Corp. is the controlling entity of BAC International Bank Inc, a general license bank in Panama, supervised and regulated by the SBP.
As a listed issuer in the Colombian and Panamanian stock exchange, BHI will be required to keep up-to-date information with the RNVE and Latinex, and provide periodic information to the SFC and the SMV such as annual, quarterly, and other reports and relevant information pursuant to Colombian and Panamanian securities laws and regulations. Certain of these documents and other information will also be made available for download on BHI’s website at www.bac-holding.com.
The documents referred to in this information statement and the information accessible through the Company website are not incorporated by reference in and should not be deemed part of this information statement.
8
iii. SPECIAL NOTE REGARDING FORWARD-LOOKING STATEMENTS
We have made statements under the captions “Summary,” “Risk Factors,” “Management’s Discussion and Analysis of Financial Condition and Results of Operations,” “Business” and in other sections of this information statement that are forward-looking statements. In some cases, you can identify these statements by forward-looking words such as “may,” “might,” “will,” “should,” “expects,” “plans,” “anticipates,” “believes,” “estimates,” “predicts,” “potential” or “continue,” the negative of these terms and other comparable terminology. These forward-looking statements, which are subject to risks, uncertainties and assumptions about us, may include projections, forecasts or assumptions of our future financial performance, our anticipated growth strategies and anticipated trends in our business. These statements are only predictions based on our current expectations and projections about future events. There are important factors that could cause our actual results, level of activity, performance or achievements to differ materially from the results, level of activity, performance or achievements expressed or implied by the forward-looking statements, including the numerous risks discussed under the caption entitled “Risk Factors.”
Although we believe the expectations reflected in the forward-looking statements are reasonable, we cannot guarantee future results, level of activity, performance or achievements. Moreover, neither we nor any other person assumes responsibility for the accuracy and completeness of any of these forward-looking statements. Except as required by law, neither Grupo Aval nor BHI are under any duty to update any of these forward-looking statements after the date of this information statement to conform our prior statements to actual results or revised expectations.
9
1. SUMMARY
This summary highlights information contained elsewhere in this information statement. This summary does not contain all of the information that you should consider. You should read this entire information statement carefully, especially the risks of owning our common stock discussed under “Risk Factors” and our audited and unaudited financial statements and our unaudited condensed pro forma financial information, and the respective notes thereto, appearing elsewhere in this information statement. Except as otherwise indicated or unless the context otherwise requires, the information included in this information statement assumes the completion of all the transactions referred to in this information statement in connection with the Spinoff.
Overview
Prior to the Spinoff (as defined hereunder), BAC Holding International Corp. was a wholly owned subsidiary of Banco de Bogotá, a consolidated subsidiary of Grupo Aval. BHI is holding company whose only material tangible assets are its 100% equity ownership stake in BAC Credomatic Inc. and its 9.46% direct participation in BAC International Bank Inc. and its subsidiaries. BHI has a single class of ordinary shares outstanding with equal voting and economic rights.
BHI, through its subsidiary BAC International Bank, Inc. (a bank organized under the laws of Panama), is a full-service Central American financial institution with leading credit card issuance and merchant-acquiring franchises and operations in Costa Rica, El Salvador, Guatemala, Honduras, Nicaragua, and Panama.
Until September 30, 2021, BHI also owned an approximate 99.6% equity stake in Multi Financial Group, Inc., a company organized under Panamanian law (“MFG”), which provides financial services, mainly commercial, investment, mortgage and consumer banking, insurance, factoring and leasing, in Panama. MFG was acquired by Banco de Bogotá through BHI on May 22, 2020, and was demerged from BHI on September 30, 2021, and retained by Banco de Bogotá (the “MFG Demerger”). BHI’s audited financial statements for the year ended December 31, 2020, include eight months of MFG’s results within continuing operations, while BHI’s unaudited interim financial statements for the nine-month periods ended September 30, 2021 and 2020 reflect MFG’s results as discontinued operations. To facilitate comparability of the financial information included in this information statement, we have prepared unaudited pro forma income statement information for the nine-month period ended September 30, 2021, and the year ended December 31, 2020, which assume that MFG Demerger and the Spinoff occurred on January 1, 2020. For additional information see Section 7. “Unaudited Condensed Pro Forma Financial Information”.
The Spinoff
Grupo Aval has entered and caused certain of its direct and indirect subsidiaries, including Banco de Bogotá and BHI, to enter into a series of transactions, as follows:
The Banco de Bogotá Demerger
Grupo Aval (A) created a new Colombian corporation, Newco BdB, a wholly-owned subsidiary of Grupo Aval, and (B) on January 18, 2022, caused Banco de Bogotá to obtain authorization by the Superintendence of Finance of Colombia to execute an escisión, or demerger, under Colombian law, pursuant to which Banco de Bogotá will transfer to Newco BdB a 75% ownership stake in the share capital of BHI, and 100% of the share capital of Newco BdB will be issued pro rata to Banco de Bogotá’s shareholders (the “BdB Distribution”), resulting in both Banco de Bogotá and Newco BdB being owned by the shareholders of Banco de Bogotá (including Grupo Aval) pro rata to their respective ownership interests in Banco de Bogotá immediately prior to the BdB Demerger (as defined below).
The Grupo Aval Demerger
Grupo Aval (A) has created a new Colombian corporation, Newco Aval, a wholly-owned subsidiary of Grupo Aval, and (B) will execute an escisión, or demerger, under Colombian law pursuant to which Grupo Aval will transfer to Newco Aval the approximately 68.7% ownership stake in the share capital of Newco BdB that Grupo Aval received in the BdB Demerger, and 100% of the share capital of Newco Aval will be issued pro rata to Grupo Aval’s shareholders (the “Grupo Aval Distribution”), resulting in both Grupo Aval and Newco Aval being owned by the shareholders of Grupo Aval pro rata to their respective ownership interests in Grupo Aval immediately prior to the Grupo Aval Demerger (as defined below).
The BHI Listing and Mergers
Grupo Aval (A) caused BHI to submit an application to list its shares on the Bolsa de Valores de Panamá, the Panamanian stock exchange and the Colombian stock exchange, and has taken and will take other necessary actions to list the BHI Shares on these stock exchanges (as described under “The Spinoff” below) and (B) will cause Newco Aval and Newco BdB to merge with and into BHI, with BHI as the surviving company.
10
Effect of the Spinoff
The Transactions, as summarized in subsections (i) through (iii) above (collectively, the “Spinoff”), are expected to occur within a short period of each other, except for the BHI Listing on the Latinex, which became effective in Panamá on February 24, 2022.
The transactions, as summarized in subsections (i) through (iii) above will result in the share capital of BHI being publicly traded on the Latinex (the Panamanian stock exchange) and the BVC (Colombian stock exchange) and 75% of that share capital being owned by the shareholders of Grupo Aval and Banco de Bogotá (other than Grupo Aval, which will have spun off its direct interest) on a pro rata basis to their respective beneficial ownership stakes in BHI’s share capital immediately prior to the Spinoff. Immediately following the Spinoff, Grupo Aval’s shareholders will own approximately 51.5%, Banco de Bogotá’s shareholders (other than Grupo Aval) will own approximately 23.5% and Banco de Bogotá will continue to directly own 25% of the share capital of BHI. BHI’s only material asset is its ownership of 100% of the share capital of BAC Credomatic Inc. and its subsidiaries.
For more information, see Section 4. “Risk Factors—Risks Relating to the Spinoff” and Section 2. “The Spinoff” included elsewhere in this information statement.
Corporate Information
BAC Holding International Corp. is a company incorporated under the laws of the Republic of Panama, in the form of a corporation and existing in accordance with the laws of the Republic of Panama, through Public Deed No. 5,700 of August 30, 1972 of the Second Notary of the Circuit of Panama, registered in File 11657 of the Microfilm Section (Mercantile) of the Public Registry of the Republic of Panama, Volume 902, Folio 0070, Seat 104403, Roll 492, Image 90, since September 14, 1972. Its operation and extinction are governed by Panamanian law, which is, therefore, that of its nationality.
The main offices of BAC Holding International Corp. are located in Calle 26 #92-32, Bogotá D.C., Colombia; our secondary offices are located in Aquilino de la Guardia with Calle 49, PH B. Bogotá, Local No.1, Panama City, Republic of Panama. Their contact information is detailed below:
Phone:
In Panama: (507) 306-1100 ext. 110
Email: notificaciones@bac-holding.com
Website: www.bac-holding.com
Our website and the information contained therein or connected thereto is not incorporated into this information statement.
11
2. THE SPINOFF
Summary of the Spinoff
The following is a summary of the material terms of the Spinoff.
| Distributing Company | Grupo Aval Acciones y Valores S.A., a company domiciled in Bogotá, Colombia and organized under Colombian laws and regulations.
After the Spinoff, Grupo Aval will beneficially own approximately 17.2% of BHI’s equity and BAC’s assets indirectly, through its equity stake in Banco de Bogotá, which will continue to directly own 25% of BHI’s equity. |
| Distributed Company | BAC Holding International Corp. (hereinafter “BHI”), is a Panamanian corporation and, following the Spinoff, will be a publicly traded company. |
| Distributed Company Structure | BHI is a holding company whose only material tangible assets are its beneficial 100% equity ownership stake in BAC Credomatic Inc. and its subsidiaries. |
| Colombian Record Date | The record date for the entitlement to a distribution of BHI Shares to holders of Grupo Aval’s common or preferred shares prior to the open of business (Bogotá, Colombia time) on March 28, 2022 (the “Colombian Record Date”). |
| ADS Record Date | The record date for the entitlement to a distribution of BHI Shares to holders of Grupo Aval’s ADSs (each ADS representing 20 Grupo Aval preferred shares), or the net proceeds of the sale thereof, is on the close of business (New York City time) on March 28, 2022 (the “ADS Record Date”). |
| Distributed Securities | BHI’s 43,220,189,095 common shares, par value $ 0.0662975983446469 per share (each, a “BHI Share” and together the “BHI Shares”) |
| Distribution Ratio | Holders of Grupo Aval’s common and preferred shares (including the Depositary for Grupo Aval’s ADSs) are each entitled to receive one BHI Share for each one common and preferred shares of Grupo Aval that they own.
Holders of Grupo Aval’s ADSs will be entitled to elect to take delivery in their brokerage account in Colombia of 20 BHI Shares for each one Grupo Aval ADS that they own on the ADS Record Date. See “Questions and Answers About the Spinoff and Your BHI Securities—I am an ADS holder. How do I elect to receive BHI common shares?”
Alternatively, holders of Grupo Aval’s ADSs that do nothing or fail to validly make an election will receive the net cash proceeds from the sale of the BHI Shares they would otherwise have been entitled to receive. |
| Fractional Shares | There will be no fractional BHI Shares distributed in the Spinoff. |
| Stock Exchange Listing | The BHI Shares are listed on the Latinex under the ticker symbol BHOL. The BHI Shares are expected to be listed and to commence trading on the BVC under the (ticker symbol not yet available) on or around March 30, 2022. |
| Dividend Policy | For more information, see “Dividend Policy.” |
| Registrar | Depósito Centralizado de Valores (“Deceval”), the Colombian central deposit for securities. |
12
The Spinoff
Grupo Aval has entered and caused certain of its direct and indirect subsidiaries, including Banco de Bogotá and BHI, to enter into a series of transactions, as follows (the “Transactions”):
(i) The Banco de Bogotá Demerger
Grupo Aval (A) created a new Colombian corporation Sociedad Beneficiaria Banco de Bogotá S.A.S. (“Newco BdB”), a wholly-owned subsidiary of Grupo Aval, and (B) on January 18, 2022, caused Banco de Bogotá to approve an escisión, or demerger, under Colombian law, pursuant to which Banco de Bogotá will transfer to Newco BdB a 75% ownership stake in the share capital of BHI, and 100% of the share capital of Newco BdB will be issued pro rata to Banco de Bogotá’s shareholders (the “BdB Distribution”), resulting in both Banco de Bogotá and Newco BdB being owned by the shareholders of Banco de Bogotá (including Grupo Aval) pro rata to their respective ownership interests in Banco de Bogotá immediately prior to such demerger (the “BdB Demerger”).
The Banco de Bogotá Demerger is expected to be completed on or around March 25, 2022.
(ii) The Grupo Aval Demerger
Grupo Aval (A) has created a new Colombian corporation Sociedad Beneficiaria Aval S.A.S. (“Newco Aval”), a wholly-owned subsidiary of Grupo Aval, and (B) on February 4, 2022 obtained approval from its shareholders to execute an escisión, or demerger, under Colombian law pursuant to which Grupo Aval will transfer to Newco Aval the approximately 68.7% ownership stake in the share capital of Newco BdB that Grupo Aval received in the BdB Demerger, and 100% of the share capital of Newco Aval will be issued pro rata to Grupo Aval’s shareholders (the “Grupo Aval Distribution”), resulting in both Grupo Aval and Newco Aval being owned by the shareholders of Grupo Aval pro rata to their respective ownership interests in Grupo Aval immediately prior to such demerger (the “Grupo Aval Demerger”).
The Grupo Aval Demerger is expected to be completed on or around March 28, 2022.
(iii) The BHI Listing and Mergers
Grupo Aval (A) caused BHI to submit an application to list its shares on the Bolsa de Valores de Panamá, the Panamanian stock exchange (the “Latinex”), which became effective on February 24, 2022, and the Bolsa de Valores de Colombia S.A. (the “BVC”), which is expected to become effective on or around March 30, 2022, and has taken and will take other necessary actions to list the BHI Shares on these stock exchanges (the “BHI Listing”) and (B) will cause Newco Aval and Newco BdB to merge with and into BHI, with BHI as the surviving company (the “Mergers”).
The Mergers are expected to be completed on or around March 29, 2022.
Effect of the Spinoff
The Transactions, as summarized in subsections (i) through (iii) above (collectively, the “Spinoff”), are expected to occur within a short period of each other, except for the BHI Listing on the Latinex, which became effective in Panamá on February 24, 2022.
The transactions, as summarized in subsections (i) through (iii) above will result in the share capital of BHI being publicly traded on the Latinex (the Panamanian stock exchange) and the BVC (Colombian stock exchange) and 75% of that share capital being owned by the shareholders of Grupo Aval and Banco de Bogotá (other than Grupo Aval, which will have spun off its direct interest) on a pro rata basis to their respective beneficial ownership stakes in BHI’s share capital immediately prior to the Spinoff. Immediately following the Spinoff, Grupo Aval’s shareholders will own approximately 51.5%, Banco de Bogotá’s shareholders (other than Grupo Aval) will own approximately 23.5% and Banco de Bogotá will continue to directly own 25% of the share capital of BHI. BHI’s only material asset is its ownership of 100% of the share capital of BAC Credomatic Inc. and its subsidiaries.
In anticipation of the Spinoff, in order to avoid the issuance of fractional shares to Grupo Aval’s shareholders, BHI split its 77,443,101 common shares outstanding as of September 30, 2021 into 43,220,189,095 common shares, reflecting a stock split ratio of approximately 558.09 to 1, which will be outstanding immediately prior to the Spinoff.
For more information, see Section 4. “Risk Factors—Risks Relating to the Spinoff” and Section 2. “The Spinoff” included elsewhere in this information statement. The Spinoff resulted in the share capital of BHI being publicly traded on the Latinex and the BVC and 75% of that share capital being owned by the shareholders of Grupo Aval and Banco de Bogotá (other than Grupo Aval, which has spun off its direct interest) on a pro rata basis to their respective beneficial ownership stakes in BHI’s share capital immediately prior to the Spinoff. Immediately following the Spinoff, Grupo Aval’s shareholders will beneficially own approximately 51.5%, Banco de Bogotá’s minority shareholders (other than Grupo Aval) will own approximately 23.5% and Banco de Bogotá will continue to directly own 25% of the share capital of BHI. BHI’s only material asset is its ownership of 100% of the share capital of BAC Credomatic Inc. and its subsidiaries.
13
Listing and Trading of Our Common Shares
The Superintendencia del Mercado de Valores de Panama authorized the registration of the BHI shares, under resolution number smv-531-21, dated December 13, 2021; BHI is also listed in the Latinex as of February 24, 2020.
In addition, BHI’s shares are expected to be registered in the RNVE and listed for trading on the BVC on or around March 30, 2022.
In relation to the operational processes to allow the simultaneous trading of the shares in both Exchanges, Latinex and the BVC, as well as the Central Latinoamericana de Valores, S.A. and the Depósito Centralizado de Valores de Colombia S.A. ("DECEVAL"), established procedures for the regulation of simultaneous trading of shares on both stock exchanges; the purpose is to have an orderly and transparent process for investors to decide where to acquire their shares: in Colombia or in Panama.
14
3. QUESTIONS AND ANSWERS ABOUT THE SPINOFF AND YOUR BHI SECURITIES
| Why am I receiving this document? | Grupo Aval is distributing, through several steps in the Spinoff, its equity stake in BHI to its shareholders on a pro rata basis. See Section 1. “Summary—The Spinoff.”
BHI is delivering this document to you because it believes you are resident in the United States or are a “U.S. person” (as defined under U.S. securities laws) and that you are a holder of Grupo Aval’s common or preferred shares Grupo Aval’s preferred shares in the form or ADSs (a “U.S. shareholder”). As a U.S. shareholder of Grupo Aval, you are entitled to receive this English-language information statement, in compliance with the requirements of the U.S. Securities and Exchange Commission’s Staff Legal Bulletin No. 4. |
| What are the reasons for the Spinoff? | The main objectives of the Spinoff are to simplify Banco de Bogotá’s and Grupo Aval´s corporate structure, to allow for a more efficient use of capital and to simplify the decision-making processes throughout the regions in which they operate. Also, Grupo Aval believes that the proposed spin-off would allow Grupo Aval, Banco de Bogotá, and BHI to improve their respective strategic positions to capture future growth and to enhance adaptability to their local market dynamics. Here are some of the Spinoff’s drivers:
· Since the BAC acquisition, Grupo Aval has experienced a material increase in exposure to i) non-Colombian assets, ii) non-Colombian sovereign risks, and iii) exchange rate (FX) fluctuations.
· Banco de Bogotá and Grupo Aval’s decrease in its ownership in BAC would eliminate current multi-jurisdictional complexities, potentially unlocking value for their respective shareholders.
· As a result of the Spinoff, Banco de Bogotá’s management team would be mainly focused on the Colombian market, allowing the company to execute its business plan with reduced capital requirements. Both management teams at Banco de Bogotá and BAC would work independently in their own markets towards their strategic objectives: digital transformation, operational excellence, risk control and the best human talent. This would greatly simplify the execution of the strategies in both markets.
· Grupo Aval would continue to operate as a financial holding with equity controlling positions in banks, in its pension fund manager, and in the non-financial sector, mainly in oil and gas and infrastructure. It would continue focusing on maximizing returns to its shareholders, leading the strategic planning and sharing best practices among portfolio companies, receiving dividends from its subsidiaries, analyzing opportunities to optimize its portfolio, and identifying avenues for growth across markets.
· Grupo Aval, Banco de Bogotá and BAC would have a cleaner story for the market and ease the understanding of the performance and potential of both operations for investors, lenders, regulators, research analysts and others.
· Grupo Aval would strengthen its strategic focus in Colombia and improve its capacity to compete.
· Grupo Aval’s and Banco de Bogotá’s shareholders, as direct shareholders of BAC, would continue to benefit from the high performance and growth potential of BAC throughout Central America.
· Because Banco de Bogotá would reduce its equity ownership in BAC to 25% as a result of the Spinoff, each of Banco de Bogotá and Grupo Aval would cease to consolidate BAC in its financial statements, including BAC’s risk assets and BAC’s goodwill. This would in turn eliminate the impact of FX volatility and several important current capital restrictions.
· Banco de Bogotá would strengthen its capital level supporting its transition to Basel III.
· The Spinoff would grant stakeholders flexibility to choose in which markets they wish to participate.
· Investors would have direct access to the only listed regional bank in Central America with a strong presence in the region and significant U.S. dollar exposure.
· The Spinoff would not affect the scope of the services provided to clients and account holders in Colombia or Central America. Clients are at the center of our strategy; therefore, Banco de Bogotá and BAC would continue to serve them through top-notch customer experiences and product offerings.
The ultimate controlling shareholder (i.e., majority shareholder) of Grupo Aval, Banco de Bogotá and BAC would not change as a result of the Spinoff. |
15
| How is the Spinoff of BHI structured and why? | The Spinoff is structured as a demerger (“escisión” under Colombian law). Under Colombian law and practice, spin-offs are not effected as share dividends but rather through demerger transactions. Further, under Colombian law, an escisión is the only way that a regulated financial entity, such as Banco de Bogotá, is permitted to spin-off a subsidiary (as Colombian law imposes limitations on in-kind dividends that may be distributed by a regulated financial entity). An escisión is also the only way a regulated non-financial entity, such as Grupo Aval, is permitted to effectively distribute assets with a value in excess of its distributable income. As a result of these Colombian law requirements, the Spinoff must be effected through a series of demerger and merger transactions described below. The end result of these transactions is a distribution of BHI shares to Banco de Bogotá’s and Grupo Aval’s shareholders, identical to what would have resulted from a simple dividend in kind of BHI shares by each of Banco de Bogotá and Grupo Aval |
| What will I receive in the Spinoff? | If you are a holder of record date of Grupo Aval’s common or preferred shares immediately prior to the open of business (Bogotá, Colombia time) on March 28, 2022 (the “Colombian Record Date”), you will receive one BHI common share for each Grupo Aval common or preferred share that you own.
If you are a holder of record of Grupo Aval’s ADSs (each of which represents 20 Grupo Aval preferred shares) as of the close of business (New York City time) on March 28, 2022 (the “ADS Record Date”), you are entitled to elect to receive either:
(1) 20 BHI common shares for each Grupo Aval ADS that you own (provided that you follow the instructions described below under “How do I elect to elect to receive BHI common shares?”; or
(2) The net cash proceeds from the sale of the BHI common shares you would have been entitled to receive had you made the election and followed the instructions set forth in the preceding bullet. |
| Is the Spinoff subject to approval? Do I have a vote on the Spinoff? | All of the conditions to the Spinoff have been met.
The Spinoff has been approved by Grupo Aval’s common shareholders and has received all other requisite corporate and regulatory approvals. Accordingly, Grupo Aval is not seeking your approval for the Spinoff. Grupo Aval is not asking for a proxy to vote on the Spinoff or the distribution to you of BHI’s common shares or cash in lieu thereof, and requests that you do not send Grupo Aval a proxy.
|
16
| What do I have to do to participate in the Spinoff? | You are not required to take any action to participate in the Spinoff or, if you own Grupo Aval common or preferred shares, to receive BHI Shares in the Distribution.
If you own Grupo Aval ADSs, and wish to take delivery of the BHI preferred shares to which you are entitled, you are required to take action to receive BHI common shares, as described under “How do I elect to elect to receive BHI common shares?” below. You are urged to read this entire document carefully. If you are unable to take delivery of the BHI Shares in Colombia, no action is required on your part and you will receive the net cash proceeds from the Depositary’s sale of the BHI Shares that you would otherwise have been entitled to receive. |
| I am an ADS holder. How do I elect to receive BHI common shares? | In order to elect to receive BHI Shares you will need to have an account with a bank or broker located in Colombia. You will then need to instruct the bank or broker with whom you hold your Grupo Aval ADSs that you wish to elect to take delivery of the BHI Shares, have such bank or broker make the election through the Elective Dividends System function at The Depository Trust Company (“DTC”) and provide such bank or broker with a properly completed “Instruction Form for Delivery of Spun-Off Shares in the Colombian Local Market” (the form of which is available as an attachment to the market announcement made by the Depositary to DTC). |
| I am an ADS holder. How do I elect to receive cash instead of the BHI common shares to which I am entitled? | You do not need to make any election to receive an entitlement to the net cash proceeds from the sale of the BHI Shares received on account of your Grupo Aval ADSs.
The Depositary will also automatically sell any and all BHI Shares not delivered to ADS holders who elect to receive the BHI Shares they are entitled to in Colombia, whether as a result of improper instructions, failure by the receiving institution to take necessary action, or for any other reason. |
| How will fractional shares be treated in the Spinoff? | As the distribution ratio is one-to-one, no fractional BHI shares will be issued in the Spinoff.
|
| Will the number of Grupo Aval shares I own change as a result of the distribution? | No, the number of Grupo Aval shares you own will not change as a result of the distribution. Immediately following the Spinoff, you will hold the same number of shares or ADSs of Grupo Aval that you held immediately prior to the Spinoff. Your proportionate interest will also not change, so you will own the same proportionate amount of Grupo Aval immediately following the Spinoff that you owned of Grupo Aval immediately prior to the Spinoff. |
| When will the Spinoff occur? | The Spinoff is being completed in steps. The last step, which is expected to be the listing and commencement of trading of BHI Shares on the BVC, is expected to be completed on or around March 30, 2022. |
If I sell my shares of Grupo Aval common shares, preferred shares or ADSs on or before the Spinoff date, will I still be entitled to receive shares of BHI common stock in the Spinoff?
| You will be entitled to receive BHI Shares in the Spinoff only if you held of record (or are a beneficial owner holding through a nominee who held of record) Grupo Aval common or preferred shares on the Colombian Record Date or Grupo Aval ADSs on the ADS Record Date. |
17
How will I receive my shares of BHI common stock?
| If you hold Grupo Aval common or preferred shares through Deceval or through a Colombian broker or nominee who holds such shares through Deceval, the BHI shares to which you are entitled will be delivered to you through the facilities of Deceval or will be deposited in book-entry form in your brokerage account, as applicable.
If you hold Grupo Aval ADSs and wish to receive the BHI Shares to which you are entitled, you must:
(1) procure that the broker through which you own such ADSs makes or procures a proper and timely election on your behalf;
(2) if you do not have a Colombian brokerage account, establish an account with a bank or broker in Colombia (or make arrangements with your current broker for establishing a correspondent account); and
(3) properly complete and timely deliver (or have your broker properly complete and timely deliver on your behalf) the “Spin-Off Share Delivery Instruction Form” to the Depositary.
The instructions and deadlines for completing the “Spin-Off Share Delivery Instruction Form”, in the form of a “DR Market Announcement” that was sent to DTC participants for transmission to brokers, is attached as Exhibit A to this information statement. The “Spin-Off Share Delivery Instruction Form” is attached as Exhibit B to this information statement.
The Depositary will attempt to deliver any BHI Shares to which you are entitled to the account set forth in such instruction form. The Depositary will only attempt delivery once. If delivery fails for any reason, the BHI Shares for which you sought delivery will be sold and you will receive the net cash proceeds to which you would have been entitled as if no election were made. |
| What are the conditions to the Spinoff? | There are no conditions to the distribution; all regulatory and other requisite approvals have been obtained, and the record date has been established. |
Can Grupo Aval decide to cancel the Spinoff even if all the conditions have been met? | No. As of the date of this information statement, Grupo Aval is not entitled to, nor does it intend to, cancel the Spinoff. |
What are the U.S. federal income tax consequences of the Spinoff to me?
| The Spinoff is not expected to qualify for tax-free treatment for U.S. federal income tax purposes. Accordingly, the receipt of our common shares will be taxable to you as a dividend to the extent of Grupo Aval’s current and accumulated earnings and profits, as determined under U.S. federal income tax principles. For a more detailed description, see the section entitled “Material Tax Consequences—United States Federal Income Taxation Considerations for U.S. Holders.” |
Will my Grupo Aval common or preferred shares continue to trade before and following the Spinoff?
| Your Grupo Aval common and preferred shares will temporarily cease trading on the BVC starting on March 22, 2022 and will resume trading on the BVC on March 30, 2022.
The last day to trade your Grupo Aval common and preferred shares on the BVC prior to the trading stoppage is March 18, 2022 (as March 21, 2022 is a holiday in Colombia).
This temporary trading stoppage is necessary to effect the corporate formalities and register the BHI shares in the correct account, It is also customary in Colombia for effecting a demerger (escisión). The duration of the trading stoppage is necessary to complete the multiple steps of the Spinoff. |
| Will my shares of Grupo Aval ADSs continue to trade before and following the Spinoff? | Your Grupo Aval ADSs will continue to trade on the New York Stock Exchange (the “NYSE”) as normal, without interruption. |
| Can I cancel my ADSs for Grupo Aval’s preferred shares, or deposit my Grupo Aval preferred shares for ADSs? | The Depositary’s books for issuances and cancellations of Grupo Aval ADSs will be closed starting on the close of business (New York City time) on March 18, 2022 through the close of business (New York City time) on March 29, 2022.
During this period you will not be able to “exchange” Grupo Aval’s preferred shares for its ADSs, or vice versa. |
| How will BHI common stock trade? | BHI’s shares of common stock will commence trading on the Latinex under the ticker symbol BHOL as soon as you receive the shares and the BVC (ticker symbol not yet available) on or around March 30, 2022.
We expect the principal trading market for the BHI shares to be the BVC, although we cannot guarantee that a liquid trading market will develop on either the BVC or the Latinex. |
18
| Are there risks associated with owning shares of BHI common stock? | Yes. BHI’s business is subject to both general and specific risks, including risks relating to BHI’s business, BHI’s relationship with Grupo Aval and Banco de Bogota following the Spinoff and of BHI being a separate, publicly traded company. Accordingly, you should read carefully the information set forth in the section entitled “Risk Factors.” |
| Does BHI intend to pay cash dividends? | The General Shareholders' Meeting of BHI, which will first occur only some time after the Spinoff, has not determined a general policy for the payment of future dividends other than as described under the caption “Description of Capital Stock.” While BHI has in the past paid dividends, as described under “Dividend Policy,” there is no assurance that we will do so in the future. |
| What will BHI’s relationship be with Grupo Aval and Banco de Bogotá following the Spinoff? | BHI has certain relationships with Banco de Bogotá and Grupo Aval whereby BHI and its subsidiaries have obtained loans from Grupo Aval and its subsidiaries in the ordinary course of business, and may enter into certain other agreements with Banco de Bogotá and Grupo Aval in future. For more information on this and other transactions with related parties see Section 13. “Certain Relationships and Related Party Transactions”. |
| Do I have appraisal or similar rights in connection with the Spinoff? | Grupo Aval shareholders are not entitled to appraisal rights, or “withdrawal rights” as similar rights are referred to under Colombian law, in connection with the Spinoff. |
| Who is the registrar for BHI common shares? | The registrar for BHI common shares is Deceval, the entity that operates the Colombian national stockholder registry. |
| Where can I get more information? | If you hold Grupo Aval ADSs, and have questions about your rights to receive BHI Shares or cash in the Spinoff, you may contact the Depositary at:
JPMorgan Service Center Toll Free: +1 800-990-1135 Toll: +1 651-453-2128
If you hold Grupo Aval common or preferred shares or have other questions about the Spinoff, you may contact Grupo Aval’s Investor Relations department at:
Grupo Aval Investor Relations Phone: +571-743-3222 ext. 23350 Email: investorrelations@grupoaval.com |
19
4. RISK FACTORS
Our business, financial condition and results of operations could be materially and adversely affected if any of the risks described below occur. In such an event, the market price of our common shares could decline, and you could lose all or part of your investment. We may face additional risks and uncertainties that are not presently known to us, or that we currently deem immaterial, which may also impair our business.
Summary
The following summarizes some, but not all, of the risks provided below. Please carefully consider all of the information discussed in this Section 4. “Risk Factors” in this information statement for a more thorough description of these and other risks:
Risks relating to the Spinoff
| · | BHI has never operated as a standalone public company and the resulting obligations including the process of compliance with the issuer’s duties to the public according to the rules of two different national securities regulators, including the Superintendencia Financiera de Colombia, the Bolsa de Valores de Colombia, the Latinex and the Superintendencia de Valores de Panama, may be costly and cumbersome and can represent challenges for BHI. |
| · | As result of the Spinoff, Bolsa de Valores de Panamá, Bolsa de Valores de Colombia and their respective clearing houses have entered into an agreement related to the operative procedures that are required for this dual listing. For that reason, all the operations related to dividend payments in the Colombian jurisdiction, including Tax and Foreign Exchange Matters, may take some time for the issuer to process without delay or error. |
| · | Grupo Aval and BHI may be unable to achieve some or all of the benefits that they expect to achieve from BHI’s separation from Grupo Aval. |
| · | Following the Spinoff, BHI will need to provide for or arrange for certain services to be provided in order to function as a public Company. |
| · | Neither BHI’s historical financial information nor BHI’s unaudited pro forma financial information included in this information statement are necessarily representative of the results BHI would have achieved as an independent, publicly traded company and may not be a reliable indicator of BHI’s future results. |
Risks relating to the countries in which we operate
| · | We are exposed to adverse economic and political conditions in the Central American countries in which BAC Credomatic Group operates (Guatemala, Honduras, El Salvador, Honduras, Nicaragua, Costa Rica and Panama), including variations in the exchange rates or downgrades in credit ratings of sovereign debt securities. |
| · | We are exposed to the vulnerability to external shocks of the Central American economies; |
| · | We are exposed to internal security issues that have had or could have a negative effect on the Central American economies; |
| · | We are exposed to political and economic instability in the Central American region; |
| · | We are exposed to changes in Government policies and actions, as well as judicial decisions in the countries in which we operate that could significantly affect the local economy; |
| · | We are exposed to claims related to violations of anti-corruption laws and other laws in the jurisdictions in which we operate; |
| · | We are exposed to significant compliance risks in connection with a multi-jurisdictional regulatory regime in the countries which we operate; |
| · | We are exposed to changes in tax regulations or the interpretation thereof that could result in new or higher taxes; |
| · | We are exposed to natural disasters, acts of war or terrorism, rioting or other external events; |
| · | We are exposed to public health threats such as the coronavirus outbreak and other pandemic diseases; and |
| · | We are exposed to risks related to global climate change and environmental requirements; |
Risks relating to our businesses and industry
| · | Risks relating to our banking business |
| o | we are exposed to a deterioration in asset quality, including the loan portfolios of our banking subsidiaries; |
| o | we are exposed to the inability of our banking subsidiaries to realize on collateral or guarantees of secured loans; |
| o | we are exposed to limitations on the ability of our banking subsidiaries to collect on monetary obligations and enforce rights against collateral or under guarantees imposed by Central American insolvency laws; |
| o | we are exposed to failures of our risk management processes, including credit and market risk; |
| o | we are exposed to declines in the value of our banks’ fixed income portfolios; |
| o | we are exposed to counterparty risk; |
20
| o | we are exposed to liquidity risk; |
| o | we are exposed to defaults by one or more of our largest borrowers; |
| o | we are exposed to downgrades in our long-term credit ratings or in the credit ratings of our banking subsidiaries; |
| o | we are exposed to prepayment risk; |
| o | we are exposed to high competition in the credit card industry; |
| o | we are exposed to fraud related the collateral and guaranties granted by clients in secured loans; |
| o | we are exposed to changes in banking and financial services laws and regulations in the countries in which we operate; |
| o | we are exposed to changes in accounting standards; |
| o | we are exposed to regulatory actions that may result in fines, penalties or restrictions, including the closure of an operation; |
| o | we are exposed to legal and other challenges to maximize revenue from credit card fees and other fees from customers; |
| o | we are exposed to the failure to protect personal information; |
| · | Other risks relating to our businesses |
| o | we are exposed to fluctuations in interest rates and other market risks; |
| o | we are exposed to our inability to effectively manage risks associated with the replacement of benchmark indices; |
| o | we are exposed to fluctuations between the local currencies where we operate, and the U.S. dollar; |
| o | we are exposed to risks derived from acquisitions and strategic partnerships not performing in accordance with expectations, failing to receive required regulatory approvals or disrupting our operations; |
| o | we are exposed to risks derived from our inability to manage our growth successfully; |
| o | we are exposed to operational risks; |
| o | we are exposed to risks derived from the failure of our information systems; |
| o | we are exposed to cybersecurity threats; |
| o | we are exposed to risks derived from our inability to detect money laundering and other illegal or improper activities fully or on a timely basis; |
| o | we are exposed to competition and consolidation in the Central American banking and financial industry; |
| o | we are exposed to risks derived from our dependency on our senior management and Board of Directors; |
| o | we are exposed to reputational risk; |
| o | we are exposed to risks derived from conflicting interests between our controlling shareholder and other common shareholders; |
| o | we are exposed to risks relating to the different processes of reorganization, insolvency, and liquidation to which the Company may be subjected; and |
| o | we are exposed to new incumbent risks related to countries changing its currencies and declaring crypto assets as the legal tender currency. |
| o | we are exposed to Public Purchase Operations (OPA´s) that may result in an attempt of a hostile takeover and the entering of new unknown partners into the structure of the Company, as the Company becomes publicly traded. |
Risks Relating to Our Common Shares
| · | There is currently no market and historically has not been a market for BHI’s securities, and upon commencement of trading, the price of BHI’s securities may be volatile until and to the extent a market develops for such securities. |
| · | The relative illiquidity of the Colombian and Panamanian securities markets may impair the ability of shareholders to sell common stock. |
| · | An active market for our securities may never develop or be maintained and the market price of our common stock may fluctuate in response to numerous factors. |
| · | We are subject to different corporate rules and regulations than those available in other jurisdictions which may make it more difficult to holders of our securities to protect their interests. |
| · | We are traded on more than one market and this may result in price variations; in addition, investors may not be able to easily move shares for trading between such markets. |
| · | Banking regulations, accounting standards and corporate disclosure applicable to us differ from those in the United States and other countries. |
| · | U.S. investors in our securities may find it difficult or impossible to enforce service of process and enforcement of judgments against us and our officers and directors. |
| · | Our shareholders are exposed to a risk that the Company will not generate profits in one or more financial years and may affect the production, decree and/or distribution of profits. |
| · | Our shareholders are exposed to a risk related to the collection of dividends by judicial means. |
21
Risks Relating to the Spinoff
BHI has never operated as a standalone public company and the resulting obligations including the process of compliance with the issuer’s duties to the public according to the rules of two different national securities regulators, including the Superintendencia Financiera de Colombia, the Bolsa de Valores de Colombia, the Latinex and the Superintendencia de Valores de Panama, may be costly and cumbersome and can represent challenges for BHI.
As a listed company on both the Latinex, the Panamanian stock exchange, and the Bolsa de Valores de Colombia (BVC), the Colombian Stock Exchange, BHI will be subject to a series of new compliance duties pursuant to the Panamanian and Colombian securities laws and regulations established by the Superintendencia de Valores de Panama (SBP) and the Superintendencia Financiera de Colombia (SFC), the principal financial regulators in each of those countries, respectively. These duties and obligations include, but are not limited to, periodic reporting of annual, quarterly and other periodic financial information, relevant regulatory communications for investors and the general public, and any additional current or future reporting and disclosure requirements established by the relevant regulatory authorities for publicly listed companies in Colombia and Panama. Having never operated as a standalone public company, these obligations represent new processes and requirements that BHI will need to fully integrate into its internal processes and operations to ensure compliance. This integration may pose challenges as well as additional costs to the Company as any necessary changes are implemented over time and in areas across the organization such as finance, technology, legal, and human resources, among others, to effectively manage the additional obligations resulting from being a public company. Furthermore, and as an example of potential additional costs, senior management may have limited experience in operating a standalone public company and may need to hire additional resources to efficiently execute additional duties. To the extent that all requirements are not fulfilled completely or in a timely manner, the Company may be subject to and incur in sanctions and fines according to the disciplinary actions established by the relevant regulatory authorities which may impact the Company’s results of operations in the future. Additionally, as a consequence of the Spinoff, BHI amended and restated its by-laws, including several provisions, as described elsewhere in this information statement, that are advised and required for any issuer trading shares in the Bolsa de Valores de Colombia. These changes will result in new procedures, duties and corporate government instances that may take time to be fully implemented by the Company. For more information on provisions included in the Articles of Incorporation see Section 16. “Description of Capital Stock”.
As result of the Spinoff, Bolsa de Valores de Panamá, Bolsa de Valores de Colombia and their respective clearing houses have entered into an agreement related to the operative procedures that are required for this dual listing. For that reason, all the operations related to dividend payments in the Colombian jurisdiction, including Tax and Foreign Exchange Matters, may take some time for the issuer to process without delay or error.
As a result of the dual listing, the Panamanian and Colombian stock exchanges have adopted an agreement that will regulate BHI´s shareholders activities, including stock trading and dividend payment process. For the dividend payment process, once the Shareholders Meeting agrees to a dividend payment, BHI will communicate to both stock exchanges the amount and payment dates and will proceed to deposit the corresponding amount directly to Deceval in Colombia and to Latinclear in Panamá. BHI will declare its dividend in U.S. dollars, and it will be paid in U.S. dollars for all the shareholders listed in Panamá and in Colombian Pesos, at the market exchange rate at that date, for the shareholders listed in Colombia, such that these shareholders will bear the risk of foreign exchange fluctuations between the date of payment to Deceval and the date of dividend payment to the shareholders. Additionally, before the payment BHI will coordinate with each stock exchange the final amount to be paid to each shareholder net of any applicable tax deductions, considering the personal data base that will include the corresponding tax rate to be applied in each jurisdiction. Due to the complexity of payments in two separate jurisdictions, as well as foreign exchange considerations in Colombia and different tax treatments in each jurisdiction, it may take some time for BHI to process without delay or error operations related to dividend payments.
Grupo Aval and BHI may be unable to achieve some or all of the benefits that they expect to achieve from BHI’s separation from Grupo Aval.
Grupo Aval believes that, with BHI as an independent, publicly traded company, Grupo Aval and BHI will both be better positioned to, among other things, work independently in their own markets towards their strategic objectives; digital transformation, operational excellence, risk control and the best human talent. However, BHI and Grupo Aval may be unable to achieve some or all of these benefits. For example, in order to position BHI for the Spinoff, BHI is undertaking a series of strategic, structural, process and system realignment and restructuring actions within its operations. These actions may not provide the benefits BHI and Grupo Aval currently expect, and could lead to disruption of BHI’s operations, loss of, or inability to recruit, key personnel needed to operate and grow BHI’s businesses following the separation, weakening of BHI’s system of internal controls or procedures and impairment of BHI’s key customer and supplier relationships. In addition, completion of the separation will require significant amounts of management’s time and effort, which may divert management’s attention from operating and growing BHI’s and Aval’s respective businesses. If BHI and Aval fail to achieve some or all of the benefits that they to achieve from the Spinoff, or does not achieve them in the time BHI and Aval expect, BHI and Aval’s respective business, financial condition and results of operations could be materially and adversely affected.
22
Following the Spinoff, BHI will need to provide for or arrange for certain services to be provided in order to function as a public Company.
Following the separation and distribution, BHI will need to provide internally or obtain from unaffiliated third parties certain services in order to function as a public company. These services include certain information technology, finance, legal, insurance and human resources activities, the effective and appropriate performance of which is critical to BHI’s operations. BHI may be unable to obtain these services in a timely manner or on favorable terms and conditions. In particular, the information technology networks and systems that BHI will require in order to function as a public company are challenging, and arranging for these networks and systems will be challenging. BHI may be unable to successfully establish the infrastructure or implement the changes necessary to effectively perform these activities within the context of BHI’s consolidated business, or BHI may incur additional costs in doing so that could adversely affect its business. If BHI fails to obtain the quality of administrative services necessary to operate effectively or incurs greater costs in obtaining these services, BHI’s profitability, financial condition and results of operations may be materially and adversely affected.
In connection with the Spinoff, trading in Grupo Aval’s common and preferred shares will be temporarily suspended starting on March 22, 2022 through the close of business (Bogotá, Colombia time) on March 29, 2022 and exchanges of preferred shares for ADSs, and vice versa, will not be permitted during a similar period. This could have a material adverse effect on the liquidity of Grupo Aval’s shares and could cause the market prices of its securities to decline once trading resumes.
To facilitate the Spinoff in compliance with Colombian law and practice, Grupo Aval’s common and preferred shares will be suspended from trading on the BVC starting on March 22, 2022 through close of business (Bogotá, Colombia time) on March 29, 2022, and will resume trading on March 30, 2022. During this time, there will not be a liquid market for your Grupo Aval common or preferred shares. Any private sale of Grupo Aval common or preferred shares during this period will not be based on a quoted market price and therefore may not reflect the underlying value of such securities. In addition, once trading of Grupo Aval common or preferred shares on the BVC reopens, it may take time for the market to absorb recent developments, including the Spinoff, and such trading could result in substantial price fluctuations or declines in the market price of some or all of Grupo Aval’s outstanding securities.
While Grupo Aval’s ADSs will continue to trade on the New York Stock Exchange, the deposit of preferred shares in exchange for the issuance of ADSs and the redemption of ADSs for preferred shares will be prohibited from the close of business (New York City time) on March 18, 2022 through close of business (New York City time) on March 29, 2022. This could cause a decline in market liquidity for Grupo Aval’s ADSs, which in turn could result in substantial price fluctuations or declines in their market price.
Neither BHI’s historical financial information nor BHI’s unaudited pro forma financial information included in this information statement are necessarily representative of the results BHI would have achieved as an independent, publicly traded company and may not be a reliable indicator of BHI’s future results.
The financial information of BHI included in this information statement, and accompanying notes thereto, and BHI’s unaudited pro forma financial information included herein may not reflect what BHI’s financial condition, results of operations and cash flows would have been had BHI been an independent, publicly traded company during the periods presented or what BHI’s financial condition, results of operations and cash flows will be in the future when BHI is an independent public company. This is primarily because:
| · | The historical financial information included in this information statement (except for the consolidated balance sheet as of September 30, 2021) includes the results of MFG, which was spun off by BHI on September 30, 2021, in contemplation of the Spin-off; |
| · | The historical financial information included in this information statement does not reflect certain changes that BHI intends to make or is likely to experience in connection with the Spin-off, including the establishment of new functions, such as investor relations, and the compliance and other costs of being a public company; |
| · | BHI’s has previously obtained capital for its general corporate purposes, including working capital, acquisitions and capital expenditures, as part of Banco de Bogotá’s and/or Grupo Aval’s enterprise-wide cash management policies, and while existing lending and similar arrangements will not be unwound as a result of the Spin-off, there is no guarantee that Banco de Bogotá and/or Grupo Aval will be willing to provide such funding in the future on similar terms, if at all; and |
| · | Other significant changes may occur in BHI’s cost structure, management, financing and business operations as a result of the Spin-off and BHI operating as a company separate from Banco de Bogotá and Grupo Aval. |
Risks relating to the countries in which we operate
Adverse economic and political conditions in Central American countries in which BAC Credomatic Group operates (Guatemala, Honduras, El Salvador, Honduras, Nicaragua, Costa Rica y Panama), including variations in the exchange rates or downgrades in credit ratings of sovereign debt securities, may have an adverse effect on our results of operations and financial condition.
23
Our principal subsidiaries are financial institutions, and the majority of our operations, properties and customers are located in Central America (Guatemala, Honduras, El Salvador, Nicaragua, Costa Rica and Panamá). Consequently, our results of operations and financial condition may be materially affected by economic and political conditions in these countries.
Our results of operations and financial condition depend on economic, political and social conditions in the countries in which we operate located in Central America. The political, economic and social environments in the countries in which we operate are affected by many different factors, including significant governmental influence over local economies, substantial fluctuations in economic growth, high levels of inflation, exchange rate movements and volatility, exchange controls or restrictions on expatriation of earnings, high domestic interest rates, civil strife, political instability, drug trafficking and other forms of organized crime, wage and price controls, changes in tax policies, imposition of trade barriers, changes in the prices of commodities and unexpected changes in regulations. The results of operations and financial condition of our Central American subsidiaries could be affected by changes in economic and other policies of each country’s government, which have exercised and continue to exercise substantial influence over many aspects of the private sector, and by other social and political developments in each country. For instance, an enactment of exchange controls may negatively impact our clients, investments and/or our assets denominated in US Dollars or other currencies and, similarly, enactment of new (or amendment of existing) usury laws and/or other regulations aimed at imposing caps or other limitations to banking, acquiring, service, interchange or other fees would have a significant impact on our results and projections.
Adverse economic, political and social developments, including allegations of corruption against the governments of the countries in which we operate, may adversely affect demand for banking services and create uncertainty regarding our operating environment, which could have a material adverse effect on our subsidiaries and, consequently, on our company.
The Central American economies remain vulnerable to external shocks.
A significant decline in economic growth of Central America’s major trading partners could have a material adverse effect on the trade balance and economic growth of the countries where we operate. In addition, a “contagion” effect, where an entire region or asset class becomes less attractive to, or subject to outflows of funds by, international investors could negatively affect Central American countries in which we operate. Lower than expected economic growth may result in asset quality deterioration and could negatively affect our business.
A low rate of growth of the Central American economy, a reduction in tourism, a slowdown in the growth of customer demand, an increase in market competition, or changes in governmental regulations, could adversely affect the rate of growth of our loan portfolio and our cost of risk and, accordingly, increase our required loss allowances for loans. All these conditions could lead to a general decrease in demand for borrowings. In addition, the effect on consumer confidence of any actual or perceived deterioration of household incomes in the Central American economies may have a material adverse effect on our results of operations and financial condition.
Certain Central America countries have experienced and continue to experience internal security issues that have had or could have a negative effect on the Central America economy.
Central America has experienced internal security issues, primarily due to the activities of the armed gangs’ groups, such as the “Mara Salvatrucha”, urban militias, and of drug cartels. These groups have exerted influence over the local population and funded their activities by the commission of offences against the private property, drug trafficking and rendering services to drug traffickers. Any breakdown in peace, renewed or continuing drug-related crime and gangs’ activities may have a negative impact on the Central America economy in the future. Our business or financial condition could be adversely affected by rapidly changing economic or social conditions, which may result in legislation that increases our tax burden, or that of other Central America companies, which could, in turn, impact the overall economy.
Political and economic instability in the Central American region may adversely affect our results of operations and financial condition.
Economic and political instability in Central American countries or any future deterioration in relations between countries in the region may result in the closing of borders, the imposition of trade barriers and a breakdown of diplomatic ties, or a negative effect on Central America’s trade balance, economy and general security situation, all of which may adversely affect our results of operations and financial condition.
Finally, political conditions such as changes in United States’ policies related to immigration and remittances and/or in the status of the NAFTA agreement, could affect the countries in which we operate, and could therefore impact adversely the household income of Central American families, and the commission business of the bank as well. There is a high dependency of these remittances specially in Honduras, Guatemala, El Salvador and Nicaragua; as of 2020 they represented more than 14% of the respective GDP (according to the SECMCA).
24
Changes in Government policies and actions, as well as judicial decisions in the countries in which we operate, could affect the local economy and, as a result, our results of operations and financial condition.
Our results of operations and financial condition may be adversely affected by changes in the Central American governmental policies and actions, and by changes in judicial precedents, involving a broad range of matters, including interest rates, fees, exchange rates, exchange controls, inflation rates, taxation and banking regulations, free zone (“zona franca”) regulations and other political or economic developments affecting the countries in which we operate.
Central American governments have historically exercised substantial influence over their economies and their policies are likely to continue having significant effects on companies, including us.
Moreover, regulatory uncertainty, public dialogue regarding bills and/or approval of regulatory reforms, may be disruptive to our business or to the economy as a whole and may result in material and adverse effects on our financial condition and results of operations.
We and our subsidiaries are subject to anti-corruption laws and other laws in the jurisdictions in which we operate, and violation of these regulations could harm our business.
We and our subsidiaries are subject to numerous, and sometimes conflicting, legal regimes on matters as diverse as anti-corruption, taxation, internal and disclosure control obligations, securities and derivatives regulation, antitrust regulations, data privacy and labor relations. Compliance with diverse legal requirements is costly, time-consuming and requires significant resources. Alleged violations to one or more of these regulations in the conduct of our business or the business of our subsidiaries could result in significant fines, criminal sanctions against us or our officers, prohibitions on doing business and reputational damage. Violations of laws or regulations in connection with the performance of our obligations to our customers, as well as in connection with the performance of our subsidiaries’ obligations, could also result in liability for significant monetary damages, fines and/or criminal prosecution, unfavorable publicity and other reputational damage, restrictions on our ability to process information and/or breach of contract or tort claims. Because of the varying degrees of development of the legal systems in the countries in which we operate, local laws might be insufficient to protect our rights due, in part, to a lack of appeals, legal defenses and/or other deficiencies in the rule of law or the access to justice.
Despite our Company has policies, procedures, controls and made other efforts to procure strict compliance with anti-corruption laws, regulations and standards, certain employees, joint venture partners, and/or other third parties with whom we associate, could take actions that violate such policies or procedures designed to promote legal and regulatory compliance of all applicable anti-corruption laws and regulations. Violations of these laws or regulations by us or our subsidiaries, our employees or any of these third parties could subject us to criminal or civil enforcement actions (whether or not we participated or knew about such actions leading to the violations), including fines or penalties, disgorgement of profits and suspension or disqualification from work, including governmental contracting, any of which could materially adversely affect our business, including our results of operations and our reputation.
Central American operations are subject to significant compliance risks in connection with a multi-jurisdictional regulatory regime.
Our subsidiaries are subject to regulation under Costa Rican, Guatemalan, Honduran, Nicaraguan, Panamanian, Salvadoran, Grand Cayman’s, British Virgin Islands’, Bahamian and/or U.S. federal, state and other foreign laws, regulations and policies. BHI thus is subject to a multi-jurisdictional regulatory regime. In addition, any changes to the regulatory regime of any of the Central American countries in which we operate may lead to corresponding changes to the regulatory regime of other countries in the region. BHI´s businesses are regularly reviewed or investigated by regulators, which could lead to enforcement actions, fines and penalties or the assertion of private litigation claims and damages.
Regulation of financial institutions varies across the different Central American jurisdictions in which we operate. These differences are particularly pronounced in the assessment of credit risk and investments. These asymmetries may affect the expected results of our operations in each jurisdiction, and therefore could adversely affect our consolidated results of operations in Central America.
New or higher taxes resulting from changes in tax regulations or the interpretation thereof the countries in which we operate could adversely affect our results of operations and financial condition or generate burdens to our shareholders or lenders.
New tax laws and regulations and uncertainties with respect to future tax policies, pose risks in the countries in which we operate. An increase in fiscal deficit and pressure from rating agencies, could lead to higher taxation rates on our business and that of our borrowers. Changes in tax-related laws and regulations and interpretations thereof, can impact tax burdens by increasing tax rates and fees, creating new taxes or withholdings, limiting tax deductions, and eliminating tax-based incentives and non-taxed income. In addition, tax authorities or courts may interpret tax regulations differently than we do, which could result in tax litigation with the associated costs and potential penalties.
25
Natural disasters, acts of war or terrorism, rioting or other external events could disrupt our businesses and affect our results of operations and financial condition.
We are exposed to natural disasters, such as earthquakes, volcanic eruptions, tornadoes, tropical storms and hurricanes. Heavy rains or abnormally low rainfall in the countries in which we operate, attributable in part to the La Niña and El Niño weather patterns, have resulted in severe flooding, mudslides and/or prolonged droughts. These are recurring weather phenomena that may occur on an equal or greater scale in the future. In addition to severe weather and natural disasters, acts of war or terrorism, rioting and other adverse external events could have a significant impact on our ability to conduct business and may, among other things, affect the stability of our deposit base, impair the ability of borrowers to repay outstanding loans, impair the value of collateral of secured loans, cause significant property damage, cause us to incur additional expenses and/or result in loss of revenue. In the event of such circumstances, our disaster recovery plans may prove to be ineffective, which could have a material adverse effect on our ability to conduct our businesses, particularly if such an occurrence affects computer-based data processing, transmission, storage and retrieval systems or destroys customer or other data. In addition, if a significant number of our employees and senior managers were to become unavailable because of a natural disaster, our ability to conduct our businesses could be compromised. Natural disasters, acts of war or similar events could also result in substantial volatility in our results of operations for any fiscal quarter or year.
Our operations and results may be negatively impacted by public health threats such as the coronavirus outbreak or other pandemic diseases
Global and local health concerns, including the outbreak of pandemic or contagious disease, such as the recent coronavirus (COVID-19) outbreak, may disrupt economic activity and adversely affect us.
Since December 2019, COVID-19 began to spread in China and promptly expanded to Europe, the United States and more than 200 countries, including the countries in which we operate. Such events have been causing disruption of regional and global economic activity, which has affected and may continue to affect our operations, financial results and the quality of our loan portfolio due to long periods of quarantines, unemployment, reduced household and corporate income, laws or regulations that have impaired our ability to operate, charge fees or interests or collect debt service, aggregated demand and limitations in the production and trade of goods and services. The extent to which COVID-19 might continue to affect our future results will depend on several uncertain and unpredictable developments, including information which may emerge concerning the severity of future COVID-19 waves or new strains, and the actions to contain it, among others.
To address the COVID-19 crisis and prevent its spread, governments in the countries in which we operate have issued sanitary restrictions designed to reduce the spread of the virus and COVID-19 infections, such as preventive quarantines, business closures, suspension of on-site lectures, border restrictions, lockdowns as well as the suspension of public events and the installment of mandatory social distancing regulations; with the exception of the Nicaraguan Government, which has not taken such measures and has opted to instead maintain basic epidemiological surveillance and hygiene controls. In the case of Costa Rica, Honduras, El Salvador, Panama and Guatemala, partial curfews have been established, to further restrict citizens’ exposure to the virus, along with public and private vehicle circulation restriction policies and massive vaccination campaigns.
See Section 9. “Management’s Discussion and Analysis of Financial Condition and Results of Operations” and Section 10. “Quantitative and Qualitative Disclosures About Risk” for further information on credit risk management, relief measures available for customers, additional measures taken by Governments and central banks, and an overall analysis of the negative impacts of coronavirus on our business, financial condition and results of operations including the line items referenced above.
Risks related to global climate change and environmental requirements
Climate change initiatives, laws or regulations seeking to protect and adapt the companies to environment challenges, could be applicable to us in a non-material way. However, even if the impacts of such provisions are not related specifically to BHI’s core business, they could still impact some of our affiliates’ financing products and/or business models. Furthermore, the occurrence of environmental changes in dry seasons, floods, droughts, and others climate variations or changes in the local environmental legislation, could result in decreases of business operations for some of our banking customers due to lower revenues and slower business production or in asset impairment. Clients whose productivity and financial conditions could be affected by climate change policies could experience delays on repayment of obligations to our banking subsidiaries or lower credit profiles susceptible to downturns in the economy. We might not be able to continue providing services to customers that participate in businesses with an adverse environmental impact. We could also be subject to reputational risk as a result of shifting sentiment among customers and increasing attention and scrutiny from other stakeholders on our response to climate change. As part of our strategy and compromise with the environmental, BAC Group is a Signatory to the Principles for Responsible Banking and member of UNEP FI since February 2021, for the transition to a low-carbon, sustainable, inclusive economy as an important step towards aligning our business with the UN Paris Agreement on Climate Change and Sustainable Development Goals. In October 2021 BAC signed the Net-Zero Banking Alliance in supporting the transition of the real economy to net-zero emissions.
Risks relating to our businesses and industry
26
Risks relating to our banking business
A deterioration in asset quality, including the loan portfolios of our banking subsidiaries, may have an adverse effect on our results of operations and financial condition.
Changes in the financial condition or credit profiles of customers of our banking subsidiaries and increases in inflation or interest rates and foreign exchange volatility could have a negative effect on the quality of our banks’ loan portfolios, potentially requiring them to increase impairment losses on loans and accounts receivable or resulting in reduced profitability. In particular, the percentage of past due or impaired loans may increase in the future as a result of factors beyond our control, such as economic conditions and political events affecting the countries in which we operate generally or specific sectors of the economy.
A substantial number of our banks’ customers are individuals and small and medium sized enterprises, or “SMEs”, and these customers are potentially more susceptible to downturns in the economy than large corporations and high-income individuals. In addition, some corporate clients could suffer the effects of economic downturns. Consequently, our banking subsidiaries may experience higher levels of past due or impaired loans, which could result in increased impairment losses on loans and other accounts receivable due to defaults by, or deterioration in the credit profiles of, individual borrowers. Past due or impaired loans and resulting impairment losses may increase materially in the future and adversely affect our results of operations and financial condition.
Existing loan loss allowances may not be adequate to cover any increases in past due or impaired loans or a deterioration in the credit quality of loan portfolios. As a result, our banking subsidiaries may be required to increase impairment losses on loans and accounts receivables, which may adversely affect our results of operations and financial condition. Our exposure is concentrated in certain economic sectors and large corporations that could also increase our impairment losses.
Default rates generally increase with the age of loans, the level of past due or impaired loans may lag behind the rate of growth in loans but may increase when growth slows, or the loan portfolios become more mature. As a result, historic loan loss experience may not necessarily be indicative of future loan loss experience.
Our banking subsidiaries may be unable to realize on collateral or guarantees of secured loans, which may adversely affect their results of operations and financial condition.
Our banking subsidiaries originate loans that are secured by collateral, including real estate and other assets that are generally located in the countries where we operate. The value of collateral may significantly fluctuate or decline due to factors beyond the control of our subsidiaries, including, for example, prevailing economic and political conditions in the relevant jurisdiction. An economic slowdown may lead to a downturn in the Central American real estate markets, which may, in turn, result in declines in the value of real estate securing loans to levels below the principal balances of these loans. Any decline in the value of the collateral securing these loans or any other collateral securing these loans may result in reduced recoveries from collateral realization and have an adverse effect on our results of operations and financial condition. We may also not have sufficiently recent information on the value of collateral, which may result in an inaccurate assessment for loss allowance of our loans secured by such collateral. If this were to occur, we may need to incur additional impairments to cover actual losses of our loans, which may materially and adversely affect our results of operations and financial condition.
Our banking subsidiaries also make loans on the basis of guarantees from relatives, affiliates or associated persons of their principal borrowers. To the extent that guarantors encounter financial difficulties due to economic conditions, personal or business circumstances, or otherwise, the ability of our banks to enforce such guarantees may be impaired.
In addition, our banking subsidiaries may face difficulties in enforcing their rights as secured creditors against borrowers, collateral or guarantees. In particular, timing delays, documentary and procedural problems in realizing against collateral, as well as debtor-protective or other judicial interpretations of the law, may make it difficult to foreclose on collateral, realize against guarantees or enforce judgments in our favor, which could materially and adversely affect our results of operations and financial condition.
Central American insolvency laws may limit the ability of our banking subsidiaries to collect on monetary obligations and enforce rights against collateral or under guarantees.
Insolvency laws in certain countries in which we operate provide that creditor of an insolvent debtor are prohibited from initiating collection proceedings outside the bankruptcy or reorganization process of such debtor. In addition, all collection proceedings outstanding at the beginning of the bankruptcy or reorganization process must be suspended and such creditors are prevented from enforcing their rights against the collateral and other assets of the insolvent debtor.
In some countries in which we operate once a non-merchant individual has ceased paying his or her debts, such individual can initiate a voluntary insolvency proceeding before a notary public or mediator to reach an out-of-court agreement with creditors. The terms of any agreement reached in accordance with the respective law and with a group (two or more) of creditors that represent the majority of the total amount of the claims will be mandatorily applicable to all relevant creditors. Such insolvency laws also provide other protections to debtors. A perception that loans to individuals may be difficult or impossible to recover could cause our banking subsidiaries to enhance credit requirements and result in decreased lending to individuals by making access to credit more expensive. In addition, increased difficulties in enforcing debt and other monetary obligations due to insolvency laws in countries in which we operate, could have an adverse effect on our results of operations and financial condition.
27
Any failure of risk management processes, including credit and market risk, could materially and adversely affect our banking businesses, results of operations and financial condition.
Credit risk is the principal risk inherent in the business of our banks. Although we have corporate risk management guidelines, each banking subsidiary is responsible for managing its own risk. Each banking subsidiary’s policies and procedures, which are designed to identify, monitor and manage risk, may prove to be insufficient. Furthermore, our banks may not be able to upgrade risk management systems on a timely basis. Due to limitations in the availability of information, our assessment of credit risk associated with a particular customer may not be based on complete, accurate or reliable information. Personnel of our banking subsidiaries may fail to detect risks before they occur, or may not effectively implement their risk management systems, which may increase exposure to credit risk. As a result, any failure by our banking subsidiaries to effectively implement or consistently follow or refine risk management systems may result in higher risk exposures for our banking subsidiaries, which could materially and adversely affect our results of operations and financial condition.
Declines in the value of our banks’ sovereign debt portfolios could have an adverse effect on our results of operations.
Our banking subsidiaries’ securities portfolio primarily consists of debt securities issued or guaranteed by their respective government and/or central bank. We are exposed to significant credit, market and liquidity risks associated with debt securities. A significant decline in the value of these government securities could materially and adversely affect our debt securities portfolio and, consequently, our financial condition and results of operations.
See Section 9. “Management’s Discussion and Analysis of Financial Condition and Results of Operations” and Section 10. “Quantitative and Qualitative Disclosures About Risk” for further information on market and liquidity risk management and impacts on our business, financial condition and results of operations.
We are subject to counterparty risk in our banking business.
Our banks are exposed to counterparty risks in addition to credit risks associated with lending activities. Counterparty risk may arise from, for example, investing in securities of third parties, entering into derivative contracts under which counterparties have obligations to make payments to us, or executing securities, futures, and currency from proprietary trading activities that fail to settle at the required time due to non-delivery by the counterparty or systems failure by clearing agents, exchanges, clearing houses or other financial intermediaries. These risks could materially and adversely affect our results of operations and financial condition.
Our banking subsidiaries are subject to liquidity risk, which may result in increases in funding costs.
The principal sources of funding for our banking subsidiaries are demand deposits, saving deposits, and time deposits, which together represented 84.8% and 81.9% of our consolidated total liabilities at September 30, 2021 and December 31, 2020, respectively. Because our banking subsidiaries rely primarily on deposits for funding, a sudden or unexpected shortage of funds in the banking systems in which we operate or overnight money markets may prevent our banking subsidiaries from meeting their obligations or obtaining necessary funding without incurring higher costs or selling certain assets at prices below prevailing market values, which could materially and adversely affect our results of operations and financial condition. The liquidity of our financial entities could also be impacted by reputational events affecting our entities as well as systemic events.
Default by one or more of our largest borrowers could adversely affect our results of operations and financial condition.
Our exposure is concentrated in certain economic sectors and large corporations that could increase our impairment losses. Default on loans by one or more of these borrowers may materially adversely affect our results of operations and financial condition.
For a summary of our largest impaired exposures, see Section 9. “Management’s Discussion and Analysis of Financial Condition and Results of Operations”.
Downgrades in our long-term credit ratings or in the credit ratings of our banking subsidiaries would increase the cost of, or impair access to, funding and may impact our ability to maintain regulatory capital ratios.
Our credit ratings and those of our banking subsidiaries are an important component of our and their ability to obtain funding. Rating agencies regularly evaluate us, and their ratings of our debt are based on numerous dynamic, complex and inter-related factors and assumptions, including our financial strength, conditions affecting the overall financial services industry and the sovereign credit rating of the jurisdictions we operate in.
Our banking subsidiaries may be required to raise additional capital in the future to maintain regulatory capital ratios and provide liquidity to meet commitments and business needs, particularly if asset quality or earnings were to deteriorate.
28
Adverse changes in credit ratings or outlooks could increase the cost of funding in the capital markets or borrowings or reduce the feasibility of refinancing existing debt or issue new debt required to finance our future projects. Our ability to raise deposits may also be impacted by a change in credit ratings or outlooks, which could make us less successful when competing for deposits or preclude us or our subsidiaries from receiving funds from institutional investors, governments, governmental entities, or other providers of deposits and other funding.
Any occurrence that may limit our and our banking subsidiaries’ access to funding, such as a downgrade in credit ratings or outlook, or a decline in the confidence of debt purchasers, depositors, or counterparties in the capital markets may adversely affect capital costs, ability to raise capital, and liquidity. Moreover, we and our banking subsidiaries may need to raise capital when many other financial institutions are also seeking to raise capital which, in turn, would require us to compete with numerous other institutions for investors. An inability to raise additional capital on acceptable terms, when needed, or a downgrade in our or our banking subsidiaries’ credit ratings or outlook could have a materially adverse effect on our and our banking subsidiaries’ financial conditions and results of operations.
Our banking subsidiaries’ loan portfolios are subject to risk of prepayment, which may result in reinvestment of assets on less profitable terms.
The loan portfolios of our banking subsidiaries are subject to prepayment risk, which results from the ability of a borrower to pay a loan prior to maturity. Generally, in a declining interest rate environment, prepayment activity increases with the effect of reducing weighted average lives of interest-earning assets and adversely affecting results. Prepayment risk also has an adverse effect on credit card and collateralized mortgage obligations, since prepayments could shorten the weighted average life of these portfolios, which may result in a mismatch in funding or in reinvestment at lower yields.
The credit card industry is highly competitive and entails significant risks, including the possibility of over indebtedness of customers, which could have a material adverse effect on us.
The credit card business is subject to a number of risks and uncertainties, including the possibility of over indebtedness of our customers, despite our focus on low-risk, middle- and high-income customers.
The credit card industry is characterized by higher consumer default than other segments of the credit markets, and defaults are highly related to macroeconomic indicators that are beyond our control. If Central American economic growth rate slows or turns negative, or if we fail to effectively analyze the creditworthiness of our customers (including the targeting of certain sectors), we may be faced with unexpected losses that could have an adverse effect on our results of operations and financial condition.
Changes in banking and financial services laws and regulations in the countries in which we operate could adversely affect our consolidated results.
Banking and financial services laws and regulations are subject to ongoing review and revision, including changes in response to global regulatory trends. As a result, governments have been actively considering new banking laws, regulations, reviewing and revising existing laws and regulations, particularly in relation to capital adequacy and accounting standards that may change the perceived strength on our banks, our credit ratings or our ability to grow or pay dividends. In addition, various international developments, will continue to impact us in the coming years. The implementation of Basel III principles in the various Central America jurisdictions, may result in increases of the solvency ratio requirements, capital adequacy dispositions, increase of the Tier 1 admissible assets rules, among others, could increase the cost of the banking activity in those countries.
Central America has been impacted by regulatory changes that have impacted both banking and corporate laws and regulations. In general terms, the COVID-19 pandemic has resulted in an array of special laws and regulations that have had a direct and/or indirect impact over our business in in Central America; these rules have spanned from declaring national emergencies (i.e. establishing lockdowns, requiring business closures, restricted mobility, mandatory quarantines, curfews and/or public transportation limitations, allowing delays in judicial proceedings, etc.) to diverse labor-related regulations (e.g. suspension of work agreements); furthermore certain countries declared mandatory deferrals and other regulatory measures aimed at providing relief to clients impacted by the economic challenges resulting from the multiple health-related measures that were enacted.
In Honduras, banks are required to maintain certain minimum capital adequacy ratios, as fixed by the Comisión Nacional de Bancos y Seguros (CNBS). Currently, the capital adequacy ratio must be held at a minimum of 10%, measured as a percentage of adjusted capital to risk-weighted assets; this requirement resulted from reforms enacted in 2017 and 2018 with respect to capital adequacy, capital conservation buffer and leverage ratio requirements applicable to Honduran financial institutions. The 2017 regulation required, among other things, that in a given period (originally three-year-period but subsequently extended to December 2023) financial institutions maintain a capital conservation buffer ratio of 2.5% above the minimum capital adequacy ratio of 10% or above the minimum capital adequacy ratio defined by the CNBS for a financial institution in an individual basis. Financial institutions are also required to maintain a minimum leverage ratio of 4%.
29
On December 2020, CNBS issued exceptional measures to develop prudential regulatory mechanisms for the treatment that financial institutions must give to the loan portfolio susceptible to be directly or indirectly impacted by Covid-19 and the two tropical storms that affected the country. Pursuant to such measures financial institutions were required to create a “Restricted Non-Distributable Capital Reserve”, which must be used exclusively to cover the deterioration of the loan portfolio affected by the pandemic and those natural phenomena; this reserve needs to be constituted by the total balance in the “Profits From Previous Years” account and the profits recorded as of the end of the financial year 2020 and transfer of said values is to be made no later than January 31, 2021. Upon the loan portfolio´s effective impairment, financial institutions are required to proportionally take amounts from the “Restricted Non-Distributable Capital Reserve” and charge them as Provision for Losses in the statement of income. The “Restricted Non-Distributable Capital Reserve” is meant to be temporary and last until December 31st, 2025; furthermore, financial institutions may request the CNBS the reclassification of any remnants of the “Profits From Previous Years” account, as long as it can provide sufficient evidence that it has create provision for 100% of the impaired loan portfolio. The balance of the “Restricted Non-Distributable Capital Reserve” account will be considered: (i) as part of the sum of Own Resources as “Complementary Capital” for the purpose of calculating the capital adequacy ratio and (ii) up to a 50%, for the purposes of calculating the default coverage ratio, and this 50% percentage will gradually diminish according to the conditions of each financial institution.
In August 2021, the National Congress reformed “The Complimentary Optional Regimen for the Administration of Pension Funds Act”, by which: a) the minimum capital required for Pension Funds is now 150,000,000.00 Lempiras and the capital ratio calculation could never be below 1% of the total funds administrated o any other percentage defined by the CNBS; and b) the Pension Funds shall constitute a reserve for losses equivalent to 10% of its capital and capital reserves that must be invested following the required guidelines. This reserve will be used to absorb losses caused by inadequate administration and may not be considered for the capital ratio calculation.
Costa Rica experienced legislative changes that have negatively impacted fees and interest rate income. On June 20, 2020, law No 9859 (popularly known as the Usury Law or “Ley contra la Usura Crediticia”) modified the Antitrust and Consumer Protection Law (No 7472) and established, among other provisions, a maximum allowed interest rate for local credit operations. Furthermore, on December 16th, 2021, the Ministry of Economy, Industry and Commerce issued and officially published the executive rule number 43270-MEIC (known in Spanish as “Reglamento de las Operaciones Financieras, Comerciales y Microcréditos que se ofrezcan al Consumidor”) which develops law number 9859. This executive rule will have a relevant impact in our business model and on to the organization’s income, due to the maximum interest rate it establishes for local credit facilities. Additionally, on March 24, 2020, Congress enacted Law No 9831 (in Spanish “Ley de Comisiones Máximas del Sistema de Tarjetas”) which, among other matters, regulates and establishes limits to card acquiring and interchange fees and to other fees related to card and electronic payments. Moreover, on January 12th, 2022, the Costa Rican Central Bank, issued and published and amendment to Regulation of the Payment Card System (in Spanish “Reglamento del Sistema de Tarjetas de Pago”) that establishes the new fee limit for the payment card system, which will come into force until March 14th, 2022. This regulation will also have a significant impact in the organization’s income.
Costa Rica has also experienced changes regarding capital requirements. On June 2, 2021, the Central Bank of Costa Rica increased the minimum capital requirement for commercial private banks to ¢17,121 million Colones (equivalent to U.S.$28.5 million). The Superintendency of Securities also increased such requirement on March 29, 2021 for securities brokers and investment fund management companies, to ¢208 million Colones (equivalent to U.S.$346,600) and ¢142 million Colones (equivalent to U.S.$236,600), respectively. Even though our subsidiaries were already in compliance with these increased requirements, these recent changes evidence a growing focus of the Costa Rican authorities to regulate capital requirements.
In Guatemala, as a response to the adverse impact that COVID-19 related measures (Decrees 5-2020 and 6-2020) were having on the economy, the Monetary Board issued the temporary administrative dispositions: i) JM 32-2020; ii) JM 34-2020; iii) JM 63-2020, to alleviate the situation with credit card consumers and other debtors. These provisions allowed financial institutions to review terms and conditions of loans that were not in arrears for more than a month without affecting the credit ratings and to grant deferrals. The process for consumers to apply for these benefits was also simplified. The use of generic reserves was allowed, and the Regulations on Liquidity Risk Management (regarding policies, procedures, systems and calculations of liquidity coverage) were updated and revised. These dispositions were later ratified by the Congress of the Republic of Guatemala through Decree 12-2020 that enacted a national emergency law to protect Guatemalans from de effects caused by the COVID-19 pandemic.
Also, the Guatemalan Congress approved the Monetary Board Resolution: JM-105-202 that issue temporary provisions to the Banking Reserve Requirement Regulation authorizing that the legal reserve computable in foreign currency, applicable to the deposits that are transferred from the offshore entities to the bank that is part of the same financial group, may be constituted by Treasury Bonds of the Republic of Guatemala and/or certificate of deposits constituted in the Bank of Guatemala.
In Nicaragua, the Law of Public Registries (“Ley General de los Registros Públicos”) and the Commercial Code (“Código de Comercio”) were amended in August 2020 in order to include important changes to corporate law. Some of the main amendments were the creation of a Registry of Final Beneficiaries of Corporations with an obligation that all legal entities must register information identifying their shareholders and ultimate beneficiaries. This Registry is meant to guarantee the integrity, confidentiality and traceability of the information contained therein, and it will be accessed only by authorized authorities. Furthermore, in February 2021, the National Assembly approved an amendment to its Consumer Protection Law (“Ley de Protección de los Derechos de las Personas Consumidoras y Usuarias”) in order to regulate the process that a financial institution must follow when closing bank accounts or denying the opening of such accounts or the provision of other financial services to existing (or prospective) clients, establishing that such actions should be taken with sound legal ground and should be notified to the client. Finally, in August 2021, the National Assembly approved an amendment to the General Law of Banks, Non-Banking Financial Institutions and Financial Groups (“Ley General de Bancos, Instituciones Financieras No Bancarias y Grupos Financieros”) that modifies the sanctioning regime related to breaches of the law in terms of money laundry, terrorism funds and proliferation of weapons of mass destruction.
30
In El Salvador, Congress passed reforms to the “Ley de Regulación de los Servicios de Información sobre el Historial Crediticio de las Personas” reducing the time to delete negative client information (e.g. negative credit history) from the records administered by credit bureaus and financial institutions. Congress also enacted an Electronic Securities Law (“Ley de Valores Electrónicos”) which came into effect in January 2021 and is expected to substantially assist our digital transformation efforts by allowing online loan origination using notes and other securities executed electronically using “simple” electronic signatures. Congress also approved reforms to the Credit Card Law (“Ley del Sistema de Tarjetas de Crédito”) in order to prohibit membership fees in credit cards under a US$2,000.00 limit and certain marketing activities. These reforms have not been sanctioned by the President yet and thus its effectiveness is still pending. Similarly, the Salvadorian Commercial Code was temporarily amended to facilitate the use of videoconferences applications for general shareholders’ and partners’ meetings. Finally, Congress approved the Bitcoin Law (“Ley del Bitcoin”) which made bitcoin legal tender in El Salvador, allowing persons to settle debts in bitcoins.
In light of the impact that the COVID-19 pandemic has had in Panamá, the Panamanian Government, at the beginning of the pandemic, established a state of emergency through the Cabinet Resolution 11 of March 13, 2020 which set the legal framework to further adopt measures and legal provisions to mitigate the increase of infection rate of the virus.
On that note, to alleviate the impact in the economy, the Panamanian Banking Regulator (Superintendencia de Bancos de Panama) issued the Regulation 2-2020 dated March 16, 2020, authorizing banks to defer and/or otherwise modify the terms of loans in connection the debtors that could demonstrate an impairment in their payment capacity caused by the pandemic. The Regulation No. 2-2020 was further amended and complemented by the Panamanian Banking Regulator and was eventually repealed and superseded by means of the Regulation No. 02-2021 dated June 11, 2021, that established the parameters and framework applicable to modified credits.
The Panamanian Government also enacted Executive Decree 81 dated March 20, 2020, which allowed companies that downsized their operations, due to the pandemic, to temporarily suspend their work contracts with employees and, therefore, the payment of salaries. This Executive Decree was further modified and complemented by additional decrees periodically issued by the Ministry of Work as the pandemic progressed.
The Ministry of Work, through the Law No. 201 dated February 15, 2021, established temporary provisions to preserve jobs, normalize work relationships and dictate other provisions. The Law No. 201 established specific dates for companies, based on the industry / business activity, to either reactive or terminate their work contracts, ultimately establishing November 1st, 2021, the final date to do so. If the companies opted to terminate a worker, they were obliged to pay full compensation.
On a separate note, the Panamanian National Assembly endorsed in “first debate” the approval of the Bill No 420. This Bill seeks to set a maximum interest rate of 1.25% per month to banking operations and to amend the criminal code to penalize lending at a superior rate a criminal offense punishable with three to five years in prison. At its current stage, this bill needs to be approved in second and third debate, approval before the plenary of the National Assembly and, if approved, it would also need to receive the approval from the President (as head of the Executive Branch) for this Bill can formally become law. While discussion of this bill has been suspended for several months, these may be reactivated, and it may eventually receive the necessary approvals to become law.
The adoption of new laws or regulations, or changes in the interpretations or enforcement of existing laws or regulations may have an adverse effect on our results of operations and financial condition.
Our financial results may be negatively affected by changes to accounting standards.
We report our results and financial position in accordance with IFRS as issued by the IASB. Changes to IFRS or interpretations thereof may cause our future reported results and financial position to differ from current expectations, or historical results to differ from those previously reported due to the adoption of accounting standards on a retrospective basis. Such changes may also affect our regulatory capital and ratios. We monitor potential accounting changes and when possible, we determine their potential impact and disclose significant future changes in our audited consolidated financial statements that we expect as a result of those changes. Currently, there are a number of issued but not yet effective IFRS standards, as well as potential IFRS changes. For further information about developments in financial accounting and reporting standards, see Note 2 to our audited consolidated financial statements.
Regulatory actions may result in fines, penalties or restrictions that could materially and adversely affect our businesses and financial performance.
Our banking operations are subject to regulation and supervision by financial authorities. These regulatory authorities have broad powers to adopt regulations and other requirements affecting or restricting virtually all aspects of our subsidiaries’ organization and operations, including, for example, the imposition of anti-money laundering measures and the authority to regulate the terms and conditions of credit transactions. Failure to comply with applicable regulations could subject our banking subsidiaries to fines or sanctions or even revocation of licenses or permits to operate. In the event that any of these subsidiaries encounter significant financial problems, is in risk of insolvency or becomes insolvent, or is otherwise deemed as non-viable, the financial authorities would have broad powers to intervene in our management and operations, including suspending or removing management and, in extreme circumstances, putting our banks’ operations, into conservatorship or receivership or taking control of our banks.
31
We may face legal and other challenges to maximizing revenue from credit card fees and other fees from customers.
As part of their credit card business, our banking subsidiaries face pressures related to the fees and commissions charged to merchants (merchant acquiring fees) and the pricing of bank interchange fees charged by issuer banks to acquiring banks. Among other things, banks and card processors in the countries in which we operate, have been subject to administrative investigations regarding the fees and commissions that are charged to the merchants by the acquiring banks and in respect to the banking interchange fees. Furthermore, as it was previously explained, Costa Rica enacted legislation capping such acquiring and interchange fees to a maximum amount to be determined by the central bank from time to time. Also, the allowance of the use of international credit card franchises may result in certain fees related to the use of such franchises in the issuances of Credit Cards.
Similar measures may be taken in other countries and also similar investigations may be carried out by the relevant authorities in the future which may result in penalties, lower fees charged to merchants and lower bank interchange fees that may lead to changes in commercial strategies and/or may adversely affect our results of operations and financial condition. In addition, fees charged for other banking services may continue to be reduced in the future as a result of regulatory measures and/or pressure from retailers and other interest groups.
Failure to protect personal information could adversely affect our reputation and our business.
Our subsidiaries manage and hold confidential personal information of customers in the normal course of their banking operations. Although our banks have procedures and controls to adequately safeguard such personal information in our possession, unauthorized disclosures or unauthorized access to privileged information, fraud or events that interfere with regular banking and other services could subject our banks and us to legal actions, administrative sanctions and/or damages.
Although we work to develop secure data and information processing, storage and transmission capabilities to enhance information security, we face risks related to security breaches in connection with debit and credit card transactions that typically involve the transmission of personal information of our customers through various third parties, including retailers and payment processors. We and some of these parties have in the past been the target of security breaches and because the transactions involve third parties and environments, where we do not control the processing, storage or transmission of such information or the security protocols enacted by such third parties or in such environments, security breaches affecting any of these third parties could affect us, and in some cases we may have exposure and suffer losses for breaches relating to them, including costs to replace compromised debit and credit cards and address fraudulent transactions.
Although we employ a variety of physical, procedural and technological safeguards to protect personal information from mishandling, misuse or loss, these safeguards do not provide absolute assurance that mishandling, misuse or loss of the information will not occur, and that if mishandling, misuse or loss of information does occur, those events will be promptly detected and addressed. It is not always possible to deter or prevent employee misconduct, and the precautions we take to detect and prevent this activity may not always be effective. Similarly, when personal information is collected, compiled, processed, transmitted or stored by third parties on our behalf, our policies and procedures require that the third party agrees to maintain the confidentiality of the information, establish and maintain policies and procedures designed to preserve the confidentiality of the information, and permit us to confirm the third party’s compliance with the terms of the agreement. Any failure to protect personal information could result in reputational damage and have a material adverse effect on our results of operations and financial condition.
Other risks relating to our businesses
We are subject to fluctuations in interest rates and other market risks, which may materially and adversely affect our results of operations and financial condition.
Market risk refers to the probability of variations in income or in the market value of assets and liabilities due to changes in markets, including variations in market rates of interest and foreign currency exchange rates. Changes in interest rates affect the following areas, among others, of our banks’ businesses: net interest income, the volume of loans originated, market value of securities holdings, asset quality, and gains from sales of loans and securities. BHI, as a financial holding company, does not have material market risk but it monitors and oversees market risk at a consolidated level through reports received from its financial subsidiaries, who in turn, are in charge of managing their own market risk. The financial subsidiaries are subject to market risk, primarily as a result of banks’ lending businesses and investment portfolios. For further information on management of market risk See Section 10. “Quantitative and Qualitative Disclosures About Risk”.
32
Changes in short-term interest rates may affect interest margins quickly and, therefore, net interest income, which is the most important component of our revenue. Increases in interest rates may reduce the volume of loans originated by our banking subsidiaries. Sustained high interest rates may discourage customers from borrowing and may result in increased delinquencies in outstanding loans and deterioration in the quality of assets. Increases in interest rates may reduce the value of our assets, including the financial assets of our banks. Our banking subsidiaries hold a substantial portfolio of loans and debt securities that have both fixed and floating interest rates. In addition, we may incur costs (which, in turn, will affect our results of operations) if our banking subsidiaries implement strategies to reduce future interest rate exposure. Increases in interest rates may reduce gains or require our banking subsidiaries to record losses on sales of their loans or securities.
We have regional exposure to fluctuations in interest rates. If there are significant increases in such rates in any of the countries in which we operate, our operating margins may be adversely affected, and our results of operations may experience significant adverse consequences.
We may not effectively manage risks associated with the replacement of benchmark indices.
Interest rate, equity, foreign exchange rate and other types of indices which are deemed to be “benchmarks,” including those in widespread and long-standing use, have been the subject of ongoing international, national and other regulatory scrutiny and initiatives and proposals for reform. Some of these reforms are already effective while others are still to be implemented or are under consideration. These reforms may cause benchmarks to perform differently than in the past, or to disappear entirely, or have other consequences, which cannot be fully anticipated.
Any of the benchmark reforms which have been proposed or implemented, or the general increased regulatory scrutiny of benchmarks, could also increase the costs and risks of administering or otherwise participating in the setting of benchmarks and complying with regulations or requirements relating to benchmarks. Such factors may have the effect of discouraging market participants from continuing to administer or contribute to certain benchmarks, trigger changes in the rules or methodologies used in certain benchmarks or lead to the disappearance of certain benchmarks.
Any of these developments, and any future initiatives to regulate, reform or change the administration of benchmarks, could result in adverse consequences to the return on, value of and market for loans, mortgages, securities, derivatives and other financial instruments whose returns are linked to any such benchmark, including those issued, funded or held by us or our banking subsidiaries.
Various regulators, industry bodies and other market participants in the U.S. and other countries are engaged in initiatives to develop, introduce and encourage the use of alternative rates to replace certain benchmarks. There is no assurance that these new rates will be accepted or widely used by market participants, or that the characteristics of any of these new rates will be similar to, or produce the economic equivalent of, the benchmarks that they seek to replace. If a particular benchmark were to be discontinued and an alternative rate has not been successfully introduced to replace that benchmark, this could result in widespread dislocation in the financial markets, engender volatility in the pricing of securities, derivatives and other instruments, and suppress capital markets activities, all of which could have adverse effects on our results of operations. In addition, the transition of a particular benchmark to a replacement rate could affect hedge accounting relationships between financial instruments linked to that benchmark and any related derivatives, which could adversely affect our results.
However, BHI, as a financial holding company, monitors and oversees at a consolidated level through reports received from its financial subsidiaries We established a multifunctional IBOR Committee to manage its transition to alternative reference rates. The objectives of the IBOR Committee include assessing whether financial assets and/or liabilities should be amended as a result of IBOR reform, and how to manage communication about IBOR reform with counterparties. The IBOR Committee reports to the Executive Committee on a regular basis and collaborates with other business functions as needed. Additionally, it provides periodic reports to the Asset and Liabilities Committees and the treasuries on the Company's operations to support interest rate risk management and works closely with the Risk Committee to identify the operational and regulatory risks arising from the IBOR reform
In the medium term, the Company expects to originate loan operations referenced to the TERM SOFR, published by the Chicago Mercantile Exchange (CME). The Company opted for this rate in light of the recommendation made to the market by the Alternative Reference Rates Committee, a technical entity made up of different market participants and regulators to lead this transition process. The Company constantly monitors the TERM SOFR and estimates to migrate and/or originate loan operations with reference to said rate before June 2023.
Changes related to monetary policies may cause benchmarks to perform differently than in the past, or to disappear entirely, or have other consequences which cannot be fully anticipated which introduces a number of risks for BHI. These risks include (i) legal risks arising from potential changes required to documentation for new and existing transactions; (ii) risk management, financial and accounting risks arising from market risk models and from valuation, hedging, discontinuation and recognition of financial instruments linked to benchmark rates; (iii) business risk that the revenues of products linked to LIBOR (in particular those indices that will be replaced) decrease; (iv) pricing risks arising from how changes to benchmark indices could impact pricing mechanisms on some instruments; (v) operational risks arising from the potential requirement to adapt IT systems, trade reporting infrastructure and operational processes; (vi) conduct risks arising from the potential impact of communication with customers and engagement during the transition period; and (vii) litigation risks regarding our existing products and services, which could adversely impact our profitability.
33
To mitigate impacts, BHI has been applying a policy to manage that consumer loans, such as mortgages, personal loans, and cars, are modified in a uniform manner, and tailored products, such as corporate loans, are modified in bilateral negotiations with counterparties. Our Executive Committee approved a policy requiring that, beginning in the first half of 2021, all newly originated variable rate loans to clients incorporate fallback clauses for when an IBOR ceases to exist. The provisions of these clauses provide for a transition to the applicable alternative benchmark rate, which varies by jurisdiction.
Also, we monitor the progress of the transition from IBOR to new reference rates by reviewing the total amounts of contracts that have yet to transition to an alternative reference rate and the amount of such contracts that include an adequate fallback clause. The Company ceased to originate loan operations referenced to LIBOR rates in the fourth quarter of 2021. Likewise, it has initiated the modification of financial asset contracts associated with the LIBOR rate and incorporated fallback clauses in some existing contracts. Likewise, it temporarily opted to originate loan operations based on the New York Prime Rate. The main risks to which the Company has been exposed as a result of the IBOR reform are operational. For example, the renegotiation of loan contracts through bilateral negotiation with corporate clients, updating of contractual terms in corporate and consumer clients, updating of systems that use IBOR curves and review of operational controls related to reform and regulatory risks. Financial risk is predominantly limited to interest rate risk
We may be adversely affected by fluctuations between the value of the local currencies where we operate, and the U.S. dollar as a result of U.S. dollar-denominated indebtedness and assets, and as a result of our Central American operations.
We face exposure to fluctuations in the rate of exchange between local currencies and the U.S. dollar, particularly given the fact that the currencies in countries where we operate have historically experienced significant devaluations and depreciations. Fluctuations in the exchange rate between the value of the local currencies where we operate, and the U.S. dollar, may also negatively affect our leverage and capitalization ratios as measured by regulators or by rating agencies.
We are subject to impacts on our statement of income and/or statement of financial position derived from fluctuations between the U.S. dollar and each of the currencies in our Central American operations; a substantial portion of BHIʼs earnings, assets and liabilities are in Costa Rican Colones, Guatemalan Quetzals, Honduran Lempiras, Nicaraguan Córdobas, Panamanian Balboas (1 Balboa is equivalent to 1 U.S. dollars) and U.S. dollars.
In accordance with its market risk policies, BHI maintains a U.S. dollar net asset position (long U.S. dollar position) which is intended to hedge its shareholders’ equity against possible devaluations of each of the local currencies in the countries where it operates against the U.S. dollar. Nevertheless, if exchange controls were to be enacted in some of the jurisdictions where we operate, this risk mitigation strategy would be significantly undermined.
Finally, on June 8, 2021, El Salvador enacted a law “Decreto No. 57”1 that makes Bitcoin legal tender in El Salvador along with the US Dollars and requiring for every merchant in said country to implement means to receive payments in Bitcoins (Section 7): thus becoming the first country in the world in imposing such regulations. Matters related with the applicable exchange rate and the practical application of this regulations may result difficult to prevent.
Acquisitions and strategic partnerships may not perform in accordance with expectations, may fail to receive required regulatory approvals or may disrupt our operations and adversely affect our credit rating and profitability.
A component of our strategy is to identify and pursue growth-enhancing strategic opportunities, such as acquisitions and alliances. As part of that strategy, we have acquired interests in various financial institutions in recent years. Strategic acquisitions and alliances could expose us to risks with which we have limited or no experience. In addition, potential acquisitions may be subject to regulatory approval. We may be unsuccessful in obtaining any such approval or we may not obtain approvals on terms that are acceptable for us particularly in view of our subsidiaries’ and our combined significant market share in the Central American banking industry.
We must necessarily base any assessment of potential acquisitions and alliances on assumptions with respect to operations, profitability and other matters that may subsequently prove to be incorrect. Future acquisitions and alliances, as well as other investments, may not produce anticipated synergies or perform in accordance with our expectations and could adversely affect our operations and profitability. In addition, new demands on our existing organization and personnel resulting from the integration of new acquisitions could disrupt our operations and adversely affect our operations and profitability.
_______________
1 E75F3.PDF (jurisprudencia.gob.sv)
34
We may not be able to manage our growth successfully.
BHI is a holding company that incorporates the banking operation in Central America. Therefore, our subsidiaries will be exposed to develop the operations independently in order to maintain the growth of our business in the region. Furthermore, our managers will be in charge to develop growth and sustainability plans to meet the expectations of our stakeholders. We must improve our operational, technical and managerial knowledge and compliance systems in order to effectively manage our operations across. Failure to successfully develop, monitor and manage the operations could have a material adverse effect on our reputation, stock price and financial results.
We are subject to operational risks.
Our business depends on the ability of our banking subsidiaries to process large numbers of transactions efficiently and accurately. Operational risks and losses can result from fraud, employee error, failure to properly document transactions or to obtain proper internal authorization, failure to comply with regulatory requirements, breaches of conduct of business rules, equipment failures, natural disasters or the failure of external systems, among others. BHI subsidiaries’ currently adopted procedures that may not be effective in controlling each of the possible operational risks faced.
As a result of the COVID-19 pandemic, our subsidiaries adopted remote work as part of the strategy to ensure, the health of their collaborators and the adequate operation and provision of services. In addition to adapting the technological requirements, their respective risk matrices were updated to identify the changes that the remote environment could imply.
The implementation of Operative Risk rules of Pilar 3 of Basel II may result in the imposition of capital requirement pillows regarding the materialization of Operative Risk Events in order to absorb such loses.
Failure of our information systems could materially and adversely affect the effectiveness of our risk management and internal control processes as well as our results of operations and financial condition.
We and our subsidiaries are highly dependent on the ability to collect and process, on a timely basis, a large amount of financial and other information, and services and products, at a time when transaction processes have become more complex with increasing volumes. A partial or complete failure of any of these systems could materially and adversely affect our decision-making process, risk management and internal control systems as well as our ability to respond on a timely basis to changing market conditions. Additionally, increased dependency on communications as well as the migration of processes to cloud operations can increase our exposure to IT failures and cybersecurity threats. See Section 4. “Risk Factors—We are subject to cybersecurity threats”.
In addition, our subsidiaries’ ability to remain competitive will depend in part on our ability to upgrade our IT infrastructure and implement digitalization of products and services on a timely and cost-effective basis. We and our subsidiaries must continually make significant investments and improvements in our and their IT infrastructure in order to ensure the proper functioning of financial control, accounting and other data collection and processing systems and to remain competitive. Furthermore, as our banking subsidiaries open new branches and channels, they will need to improve their IT infrastructure, including maintaining and upgrading their software and hardware systems and their back-office operations. If there are technological impediments, unforeseen complications, errors or breakdowns in implementing new systems, our business, financial condition or results of operations may be adversely affected.
We are subject to cybersecurity threats
Our subsidiaries are highly dependent on information systems to process transactions, respond to customer queries in a timely manner, operate our technological infrastructure and maintain profitable operations across the jurisdictions in which we operate.
Our subsidiaries dedicate significant resources to maintaining the cybersecurity risks under the approved level of tolerance and regularly review the processes, technology and human element required to identify risks un current and new infrastructure before it is deployed, protect those systems with a world class cybersecurity technology stack , detect threats in our infrastructure leveraged in tools with machine learning capabilities and threat hunting processes and Response if those events in a timely manner if an event occurs. For example, we continuously receive notifications from several providers regarding threats and attacks around the world with this, we feed our tools to proactively detect any anomalous behavior monitoring the systems and network traffic and apply measures to respond if any indicator of compromise is detected. Although we have experienced events in the past such as malware or ransomware, our processes have contained them in a small subset of machines and the remediation have occur in an adequate timeframe. None of the events have had a material impact on our business. Depending on the events relevance, they have been reported to the corresponding high-level committee. We guide ourselves by the concept of the three lines of defense in order to have the appropriate oversight of our security posture, each line of defense is accountable for reporting their performance in a specific committee, Technology, Information Security/ Risks or Audit. On top of that on a yearly manner we have our infrastructure check by known third party providers in order to identify proactively weakness and present the appropriate countermeasures to mitigate them. No organization is risk free a no organization is exempt of having a future more elaborated attack, BAC invests reasonable time and effort in prevent adverse effect to its business.
If a security incident occurs, it might have impact in our systems and jeopardize ours of our subsidiaries, stored, processed of transmitted, data in our systems, furthermore such events might cause system malfunction or interruptions, even though we have business and it continuity processes in place, which could cause unintended reputational damage to us or any of our subsidiaries, additional costs to us (such as repairing systems, adding new personnel or technologies), regulatory investigations, litigation or enforcement, or regulatory fines or penalties, all or any of which could adversely affect our business, financial condition or results of operation.
35
Given the increasing sophistication of cyber-attacks, incidents could occur and persist for an extended period without us being able to detect them. Investigations of cyber-attacks can be unpredictable and take time to complete. The time to detect an advanced persistent threat could be longer than desired. During such time we may not know the extent of the harm caused by or how best to remediate such cyber-attack until the anomalous behavior is detected and properly contained.
Our policies and procedures may not be able to detect money laundering and other illegal or improper activities fully or on a timely basis, which could expose us to fines and other liabilities.
Our subsidiaries are required to comply with applicable anti-money laundering laws, anti-terrorism financing laws, anti-bribery and other regulations. These laws and regulations require us, among other things, to adopt and enforce “know your customer” policies and procedures, and to report suspicious or large transactions to the applicable regulatory authorities. While we and our financial institutions have adopted policies and procedures aimed at detecting and preventing the use of banking networks for money laundering activities and by terrorists and terrorist-related organizations and individuals generally, such policies and procedures may not completely eliminate instances where they may be used by other parties to engage in money laundering and other illegal or improper activities. If we or any of our subsidiaries, joint ventures or other affiliates fail to fully comply with applicable laws and regulations, the relevant Government authorities to which they report have the power and authority to impose fines and other penalties. In addition, due to the COVID-19 pandemic, some warning signs have been adjusted to further identify unusual behavior in certain operations, such as the import of medical equipment and medicine acquisitions. Additionally, the frequency of monitoring was changed especially for medical import transactions, donations and foundation transactions, and awareness efforts were increased.
Competition and consolidation in the Central American banking and financial industry could adversely affect our market position.
We operate in a competitive market; our banking subsidiaries may face challenges as new competitors enter the market or existing competitors may adjust their services with unique product or service offerings or approaches to providing banking services. New entrants could take advantage of regulatory arbitrage to compete with substantially lower cost structures. Non-traditional providers of banking services may offer and/or increase their offerings of financial products and services directly to customers. Several of these competitors may have long operating histories, large customer bases, strong brand recognition and significant financial, marketing and other resources. Technological advances and heightened e-commerce activities have increased consumers’ access to products and services, which has in turn intensified competition among banks and nonbanks in offering loans. Existing competitors and market entrants may adopt more aggressive pricing and rates and devote more resources to technology, infrastructure, and marketing. If we are unable to successfully compete with current and new competitors, or if we are unable to anticipate and adapt our offerings to changing banking industry trends, including innovation, digitalization and technological changes, our business may be adversely affected.
Our ability to maintain our competitive position depends mainly on our ability to anticipate and fulfill the needs of new and current customers through the development of innovative services and products, and our ability to offer adequate services and strengthen our customer base through cross-selling. Our failure to effectively anticipate or adapt to emerging technologies or changes in customer behavior, including among younger customers, could delay or prevent our access to new digital-based markets which would in turn have an adverse effect on our competitive position and business.
Our efforts to offer new services and products may not succeed if product or market opportunities develop more slowly than expected or if the profitability of these opportunities is undermined by competitive pressures. As we expand the range of our products and services, some of which may be at an early stage of development in the Central American market, we will be exposed to new and potentially increasingly complex risks and development expenses. Our employees and our risk management systems may not be adequate to handle such risks. In addition, the cost of developing products that are not launched is likely to affect our results of operations. Any or all these factors, individually or collectively, could have a material adverse effect on us.
We depend on our senior management and our Board of Directors, and the loss of their services could have an adverse effect on our business.
We are highly dependent on our senior management teams and Board of Directors both at the holding and subsidiary levels, all of whom possess considerable experience and expertise and have strong relationships with customers and participants in Central America.
The loss of the services of any of these members of our, or our subsidiaries’, senior management and members of the Board of Directors, could have an adverse effect on our business. Accordingly, our success is dependent on appropriately managing the risks related to executing a succession plan for senior management and members of the Board of Directors on a timely basis.
36
We are subject to reputational risk, and our reputation is closely tied to that of our controlling shareholder, our senior management and members of the Board of Directors, and that of our subsidiaries.
Damage to our reputation may limit our ability to attract customers, employees, and investors. Harm to our reputation can arise from our controlling shareholder, our senior management, members of the Board of Directors, employees or former employees misconduct, legal and regulatory non-compliance, ethical issues, allegations of money laundering, and failing to deliver minimum standards of service and quality, among others. Reputation plays an integral role in our business operations, which are based on customer confidence and trust. If the public image or reputation of any of the foregoing is damaged as a result of negative publicity or otherwise, business relationships with customers of our subsidiaries may deteriorate, which would adversely affect our results of operations and financial condition. Any perceived or real difficulties experienced by any one of our subsidiaries would harm the reputation of BHI, which would also have an adverse effect on our results of operations and financial condition.
The controlling shareholder interests could differ from the interests of other common shareholders
Circumstances may occur in which the controlling shareholder may have an interest in pursuing transactions that, in their judgment, enhance the value of their investments in the financial sector. These transactions may not necessarily be in BHI´s interest or its other shareholders even if they disagree. Due to their control, the controlling shareholder will have, the power to:
· elect a majority of our directors and appoint our executive officers, set our management policies and exercise overall control over our company and subsidiaries;
· agree to sell or otherwise transfer their controlling stake in our Company; and
· determine the outcome of substantially all actions requiring shareholder approval, including transactions with related parties, corporate reorganizations, acquisitions and dispositions of assets, and dividends.
In addition, the concentration of ownership may have the effect of delaying, preventing or deterring a change of control of our Company, could deprive our shareholders of an opportunity to receive a premium for the underlying common shares as part of a sale of our company and might ultimately affect the market price of the common shares.
Risk relating to the different processes of reorganization, insolvency, and liquidation to which the company may be subjected
If the Issuer petitions for or is subjected to any of the insolvency processes provided for in Panamanian law: (i) the bankruptcy process of reorganization, (ii) the bankruptcy process of liquidation, and (iii) process of cross-border insolvency, the shareholders will be paid only when all the assets and liabilities of the company are liquidated. To ensure that their investment is recognized in the Issuer's records, shareholders may make representations to the liquidator or to the Issuer and may even go to the bankruptcy process if these efforts are unsuccessful. The attendance to the process must be made through a lawyer with suitability for the practice of law in Panama and this can generate costs for the shareholder.
We may engage in additional transactions with our controlling shareholder in the future.
In the future we may engage, in business and financial transactions with our controlling shareholder and other shareholders that may present potential conflicts of interest between our company and these shareholders. While we believe that these transactions will be carried out on an arm’s-length basis, commercial and financial transactions between us and our controlling shareholder could create the potential for, or could result in, conflicts of interests between us and our other shareholders. To the extent that the price we pay for any assets acquired from our controlling shareholder exceeds the market value of such assets or is not as productive a use of our cash as other uses, our results of operations and financial condition could be adversely affected.
We are exposed to Public Purchase Operations (OPA´s) that may result in an attempt of a hostile takeover
As we are a publicly traded Company, we are exposed to an acquisition of a large of shares by another corporation (even a competitor), an investor or a group of investors; this may result in the entering of new unknown partners into our structure, who may want to take control of the Company, make major changes in the Board of Directors, management and our business strategy.
Risks Relating to Our Common Shares
There is currently no market and historically has not been a market for BHI’s securities, and upon commencement of trading, the price of BHI’s securities may be volatile until and to the extent a market develops for such securities.
There is currently no market for our securities. Shareholders therefore have no access to information about prior market history on which to base their investment decision. Upon commencement of trading, the price of our securities may vary significantly due to general market or economic conditions. Furthermore, an active trading market for our securities may never develop or, if developed, it may not be sustained. Shareholders may be unable to sell their securities unless a market can be established and sustained.
37
The relative illiquidity of the Colombian and Panamanian securities markets may impair the ability of shareholders to sell common stock.
Our common stock is listed on the Colombian Stock Exchange and the Panamanian stock exchange, which are small and illiquid compared to securities exchanges in major financial centers. In addition, a small number of issuers represent a disproportionately large percentage of the market capitalization and trading volume on the Colombian Stock Exchange and the Panamanian Stock Exchange respectively. A liquid trading market for BHI’s common stock may not develop on the Colombian Stock Exchange or the Panamanian Stock Exchange. A limited trading market could impair the ability of shareholders to sell common stock on the Colombian Stock Exchange or the Panamanian Stock Exchange in the amount and at the price and time desired by such holder, and could increase the volatility of the market price of the common stock.
An active market for our securities may never develop or be maintained and the market price of our common stock may fluctuate in response to numerous factors.
The market price of our common stock may fluctuate significantly in response to numerous factors, many of which are beyond our control, including actual or anticipated fluctuations in our operating results, economic downturns, political events in Colombia, Panama, Central America or other areas or jurisdictions where we operate, developments affecting the banking industry, exchange rates, changes in financial estimates by securities analysts or our failure to perform in line with such estimates, departures of key personnel, and sales of our common stock in the future.
We are subject to different corporate rules and regulations than those available in other jurisdictions which may make it more difficult to holders of our securities to protect their interests.
Under Colombian law, holders of our common shares may have fewer rights than shareholders of a corporation incorporated in the United States. A holder of our common shares under Colombian law may have fewer alternatives to protect its interests relative to actions by our board of directors or executive officers, and these alternatives may be less well-defined than under the laws of those other jurisdictions.
The Colombian securities markets are not as highly regulated or supervised as the U.S. securities markets or the markets in some other jurisdictions. In addition, rules and policies against self-dealing or for preserving shareholder interests may be less well-defined and enforced in Colombia than in the United States and certain other countries, which may put holders of our common shares at a potential disadvantage. Corporate disclosures also may be less complete or informative than for a public company in the United States or in certain other countries. See Section 14— “Description of Capital Stock—Memorandum and Articles of Association—Rights granted by the Shares” for more information.
We are traded on more than one market and this may result in price variations; in addition, investors may not be able to easily move shares for trading between such markets.
Trading in our common shares on the Panamanian Stock Exchange and the Colombian Stock Exchange takes place in different currencies (Balboas on the Panamanian Stock Exchange and pesos on the Colombian Stock Exchange), and at different times (resulting from different trading days and different public holidays in Panama and Colombia). The trading prices of our shares on these two markets may differ due to these and other factors. Any decrease in the price of our common shares on the Colombian Stock Exchange could cause a decrease in the trading price of our common shares on the Panamanian stock exchange. Investors could seek to sell or buy our shares to take advantage of any price differences between the markets through a practice referred to as arbitrage. Any arbitrage activity could create unexpected volatility in both our share prices on one exchange, and the shares available for trading on the other exchange.
Banking regulations, accounting standards and corporate disclosure applicable to us differ from those in the United States and other countries.
Banking regulations in the Central American countries in which we operate may differ in material respects from regulations applicable to banks in other countries, including those in the U.S. The Central American countries in which we operate have different corporate disclosure and accounting standards for our industry than those applicable in the United States. Financial reporting disclosure requirements in the jurisdictions in which we operate differ in certain significant respects from those required in the United States. Accordingly, our separate financial statements may not be the same as the information available to holders of shares issued by a U.S. company. Furthermore, since January 1, 2015, we began preparing our financial statements in accordance with IFRS as issued by the IASB and, as a result, some of our financial data may not be easily comparable from period to period.
U.S. investors in our securities may find it difficult or impossible to enforce service of process and enforcement of judgments against us and our officers and directors
We are incorporated under the laws of Panama and all of our subsidiaries are incorporated in jurisdictions outside the United States. In addition, our executive offices are located outside of the U.S. All of our directors and officers reside outside of the United States, and all or a substantial portion of our assets and the assets of most of our officers and directors are, and will most likely continue to be, located outside of the United States. As a result, it may be difficult or impossible for U.S. investors to serve legal process within the United States upon us or any of these persons or to enforce a judgment against us for civil liabilities in U.S. courts. In addition, you should not assume that courts in the countries where we or our subsidiaries are incorporated or where our or our subsidiaries’ assets are located (i) would enforce judgments of U.S. courts obtained in actions against us or our subsidiaries based upon the civil liability provisions of applicable U.S. federal and state securities laws or (ii) would enforce, in original actions, liabilities against us or our subsidiaries based on those laws.
38
We have been advised by our Panamanian counsel that no treaty exists between the United States and Panama for the reciprocal enforcement of foreign judgments and that there is doubt as to the enforceability, in original actions in Panamanian courts, of liabilities predicated solely on the U.S. federal securities laws and as to the enforceability in Panamanian courts of judgments of U.S. courts obtained in actions predicated upon the civil liability provisions of the federal securities laws of the U.S. We have also been advised by our Panamanian counsel that a judgment of a court outside Panama, including but not limited to judgments of U. S. courts, may only be recognized and enforced by the courts of Panama if the Supreme Court of Panama validates the judgment by the issuance of a writ of exequatur. Subject to a writ of exequatur, any final money judgment rendered by any foreign court will be recognized, conclusive and enforceable in the courts of Panama without reconsideration of the merits, if (i) such foreign court grants reciprocity to the enforcement of judgments of courts of Panama, that is, the foreign court would in similar circumstances recognize a final judgment of the courts of the Republic of Panama, (ii) such judgment was issued by a competent court of the foreign jurisdiction (Panamanian courts have exclusive jurisdiction on matters of real estate located in Panama), (iii) the party against whom the judgment was rendered, or its agent, was personally served (service by mail not being sufficient) in such action within such foreign jurisdiction, (iv) the judgment arises out of a personal action against the defendant, (v) the obligation in respect of which the judgment was rendered is lawful in Panama and does not contradict the public policy of Panama, (vi) the judgment, in accordance with the laws of the country where it was rendered, is final and not subject to appeal, (vii) the judgment is properly authenticated by diplomatic or consular officers of Panama or pursuant to the 1961 Hague Convention Abolishing the Requirement of Legalization of Foreign Public Documents and (viii) a copy of the final judgment is translated into Spanish by a licensed translator in Panama.
We are exposed to a risk that the Company will not generate profits in one or more financial years and may affect the production, decree and/or distribution of profits.
Shares are equity securities. As in any commercial company, there is a risk that the Company will not generate profits in one or more financial years. This risk may affect the production, decree and/or distribution of profits. The return that can be generated from holding a share is a product of the level of dividends paid by that share, and of the gains or losses that the price of that share experiences while holding it. In equity investments, such as Equities, future earnings are uncertain to the extent that it may be affected by the performance of the economy and the behavior of the public stock market. Before making an investment in equity securities, you should be aware that you can win or lose the invested capital The investor in the shares can exceed the expectations of profit, via dividends or via the valuation of the share price, but it may also be that due to various circumstances the initially calculated profit is not accrued and, eventually, a loss is generated. It is important to note that investing in equities is considered high risk.
Investing in stocks is considered medium and long term. This situation extends to the Shares to the extent that the profit received depends on the Issuer generating profits, and on the General Shareholders' Meeting decreeing the distribution of dividends in favor of the Company's shareholders. Investing in stocks carries an investment risk that can lead to the loss of invested capital. The return on investment in the shares will be subject to the company's results and market factors.
The Colombian and Panamanian stock market are smaller, more concentrated and more volatile than other stock markets. Investments in the stock market of an emerging country such as Colombia and Panama involve a greater risk than investments in stock markets of more developed countries. Likewise, the concentration is higher in the Colombian and the Panamanian stock market compared to the main world markets, so the Company cannot guarantee that there will be a liquid market for the Shares, which could materially limit the ability of investors to sell the Shares at the price and time they decide.
Risk related to the collection of dividends by judicial means
In the event that the payment of dividends does not occur, and it is necessary to make a judicial claim in the applicable jurisdiction, the judicial proceedings, the appointment of a judicial representative in said jurisdiction, and in general any cost or expense generated by this process will be borne and decided by each of the shareholders who must individually assume said cost, which could be higher than the amount to be claimed. Likewise, there could be a risk for shareholders of ignorance of the applicable jurisdiction. Shareholders may go to the venue provided by the Creditors’ Committee or any other bankruptcy organization body to make a joint decision and facilitating the payment process. Any judicial procedure in order to collect dividends in Panama, may represent legal fees and judicial costs of advisory that will be assumed by each investor, BHI will not provide such legal advisors and will not provide any collective instrument in order to group investors in order to initiate such legal procedures. There is no certainty regarding the length and the final results of such legal procedures before the Panamanian jurisdiction.
39
5. Dividend policy of BHI
The General Shareholders' Meeting of BHI has not determined a general policy for the payment of future dividends other than the provisions indicated by the Articles of Incorporation. See “Description of Capital Stock.” However, the amount of dividends, if any, that BHI will pay will depend on many factors, such as the results of operations and financial condition of our Company and our subsidiaries’ earnings, growth prospects, cash requirements, other uses of cash, funding requirements, applicable law and other factors deemed relevant by our board of directors and shareholders. While BHI has in the past paid dividends, as described below, there is no assurance that we will do so in the future.
In accordance with the provisions of the Articles of Incorporation, in a General Shareholders' Meeting, the shareholders will decide on the distribution of profits. Profits, if any, will be distributed in proportion to the number of shares that each shareholder has in the Company. The payment of the dividend will be made in cash at the times and under the conditions determined and decreed by the General Shareholders' Meeting.
Note that the dividends to be distributed may be paid from the latest period earnings as well as retained earnings from previous periods. In the General Shareholders’ Meeting, shareholders will determine the amount of dividends declared, the effective date, and the method and place for payment of dividends.
Notwithstanding the foregoing, as long as the Company's shares are listed in the Panamanian and Colombian stock market, the applicable provisions regarding the ex-dividend period will be considered. Dividends may be paid in the form of stock dividends of the same Company if determined by the General Shareholders' Meeting. The General Shareholders' Meeting may declare the payment of dividends with respect to shares that are issued and placed in a given year and charged to profits from previous years, as long as there are reserves that allow for such payment.
Since BHI is a Company registered on the Panamanian stock exchange; following its official listing, shareholders registered in this exchange shall receive dividend payments through Central Latinoamericana de Valores, S.A. (Latinclear). Similarly, since the Company’s common shares are register in the Colombian stock exchange, dividend payments for shareholders registered on this exchange shall be paid through Depósito Centralizado de Valores de Colombia (Deceval).
For more information on the provisions of BHI’s Articles of Incorporation refer to Section 16. “Description of Capital Stock – Memorandum and Articles of Incorporation”.
Net Income and Declared Dividends Corresponding to the Past Three (3) Years
The following table presents the net income and dividends declared by BHI and its subsidiaries for the past three years and as of September 30, 2021:
| For the year ended December 31, | For the period ended September 30, | |||||||
| 2018 | 2019 | 2020 | 2021 | |||||
| BAC Holding International Corp. | (U.S.$ millions) | |||||||
| Net Income for the period | 390.8 | 401.9 | 310.8 | 334.4 | ||||
| Dividends declared and paid per period | 378.3 | 828.2 | ||||||
| Outstanding shares (millions) | 77.4 | 77.4 | 77.4 | 77.4 | ||||
| Earnings per share | 5.0 | 5.2 | 4.0 | 4.3 | ||||
| Dividend per share | 4.9 | 10.7 | ||||||
| Percentage of income distributed as dividends | 0.0% | 0.0% | 121.7% | 247.7% | ||||
On September 29th, 2021, the shareholders of BHI, through an Extraordinary Shareholder´s Meeting, declared an extraordinary dividend based on non-distributed retained earnings to be paid through a 10-year payment plan which resulted in a long-term financial obligation for the Company with related parties. For more information on this and other transactions with related parties refer to Section 13. “Certain Relationships and Related Party Transactions”.
40
6. CAPITALIZATION
The following table sets forth our cash and equivalents and our capitalization, as of September 30, 2021. The Spinoff had no impact on our capitalization.
You should read the information in the following table together with Section 9. “Management’s Discussion and Analysis of Financial Condition and Results of Operations,” Section 7. “Unaudited Condensed Pro Forma Financial Information” and our historical combined financial statements and the related notes included in the other sections of this information statement.
The capitalization table gives to a stock split completed in anticipation of the Spinoff, pursuant to which we split our 77,443,101 common shares outstanding as of September 30, 2021 into 43,220,189,095 of our common shares, reflected in the table below.
We are providing the capitalization table for information purposes only.
As of September 30, 2021 | ||||
| (U.S. dollars in millions) | ||||
| Cash and equivalents | $ | 605.9 | ||
| Indebtedness: | ||||
| Total deposits from customers | 21,078.1 | |||
| Financial obligations(1) | 2,106.8 | |||
| Other financial obligations | 753.8 | |||
| Total indebtedness | $ | 23,938.7 | ||
| Equity: | ||||
| Common shares, par value $0.0662975983446469 per share; 44,197,377,192 shares authorized, 43,220,189,095 shares issued and outstanding (2) | 2,865.4 | |||
| Retained earnings | 712.6 | |||
| Other comprehensive loss | (270.2 | ) | ||
| Total equity | $ | 3,308.3 | ||
| Total capitalization | $ | 27,247.0 | ||
| (1) | Includes U.S.$677.9 million of dividends payable registered as other liabilities in interim consolidated statement of financial position at September 30, 2021. |
| (2) | Reflects the BHI Shares issued in the Spinoff, after giving effect to the Mergers. See “The Spinoff.” |
A U.S.$750 million dividend was approved by an Extraordinary Shareholders Meeting on September 29th, 2021, further amended by Extraordinary Shareholders Meeting on December 17th, 2021; the agreement taken in said meeting, set a 10-year payment plan to complete the agreed amount of the extraordinary dividend. In the interim consolidated financial statements as of September 30, 2021, the extraordinary dividend is registered at present value under other liabilities. However, as of December 31, 2021, U.S.$375 million have been paid and the remaining amount is registered as financial obligations, in accordance with IFRS rules. For more information on this and other transactions with related parties refer to Section 13. “Certain Relationships and Related Party Transactions”.
41
7. UNAUDITED CONDENSED PRO FORMA FINANCIAL INFORMATION
Overview
The following unaudited pro forma income statement information is presented for the nine months ended September 30, 2021, and the year ended December 31, 2020, to reflect the impact of the MFG Demerger and the Spinoff, assuming in the case of the MFG Demerger, that it had never occurred (as MFG was initially acquired by BHI on May 22, 2020), and in the case of the Spinoff, that it occurred on January 1, 2020.
BHI and its subsidiaries, many of which are regulated financial entities in the jurisdictions in which they are domiciled, have historically been operated as a standalone business, with a dedicated management structure and support services. The Spinoff is not expected to have a material impact on BHI’s historical financial position or results of operations (except with respect to earnings per share). Accordingly, the unaudited pro forma income statement information does not reflect any autonomous entity adjustments as contemplated under Article 11 of Regulation S-X.
For the foregoing reasons and due to the fact that the MFG Demerger was completed on September 29, 2021 and is reflected in BHI’s historical balance sheet as of September 30, 2022, a pro forma balance sheet is not presented.
As the MFG Demerger was completed on September 29, 2021, MFG was accounted for as a discontinued operation in the nine months ended September 30, 2021, but not in the year ended December 31, 2020. Accordingly, our unaudited pro forma income statement information for the nine months ended September 30, 2021, contains minimal adjustments for the MFG Demerger, as shown in the table below.
Unaudited Pro Forma Income Statement Information
The following table presents our unaudited pro forma income statement information for the nine-month period ended September 30, 2021, reflecting the impact of the MFG Demerger and the Spinoff.
| Pro forma income statement for the nine-month period ended September 30, 2021 | ||||||||||||
BHI Historical (MFG as discontinued operation) (Unaudited interim) (1) | Transaction Accounting Adjustments for MFG Demerger (2) | BHI Pro Forma (without MFG) (Unaudited pro forma) (3) | ||||||||||
| (U.S.$ millions, except earnings per share and share data) | ||||||||||||
| Interest income: | ||||||||||||
| Deposits in banks | 7.8 | - | 7.8 | |||||||||
| Investments at amortized cost | 123.9 | - | 123.9 | |||||||||
| Loans | 1,249.8 | - | 1,249.8 | |||||||||
| Total interest income | 1,381.4 | - | 1,381.4 | |||||||||
| Interest expense: | ||||||||||||
| Deposits from customers | 358.5 | - | 358.5 | |||||||||
| Financial obligations | 42.5 | - | 42.5 | |||||||||
| Other financial obligations | 49.4 | - | 49.4 | |||||||||
| Securities sold under repurchase agreements | 0.7 | - | 0.7 | |||||||||
| Lease liabilities | 6.8 | - | 6.8 | |||||||||
| Total interest expense | 457.8 | - | 457.8 | |||||||||
| Interest income, net | 923.6 | - | 923.6 | |||||||||
| Provision for loan and interest losses | 252.3 | - | 252.3 | |||||||||
| Credit risk of investments and interest bearing deposits | 3.6 | - | 3.6 | |||||||||
| Provision for account receivable losses | 1.9 | - | 1.9 | |||||||||
| Interest income, net after provisions | 665.8 | - | 665.8 | |||||||||
| Other income (expenses): | ||||||||||||
| Gains in financial instruments, net | 57.2 | - | 57.2 | |||||||||
| Service charges | 295.8 | - | 295.8 | |||||||||
| Commissions and other fees, net | 136.8 | - | 136.8 | |||||||||
| Gain on foreign currency exchange, net | 101.5 | - | 101.5 | |||||||||
| Impairment of assets held for sale | (0.2 | ) | - | (0.2 | ) | |||||||
| Other income | 40.2 | - | 40.2 | |||||||||
| Total other income, net | 631.3 | - | 631.3 | |||||||||
42
| General and administrative expenses: | ||||||||||||
| Salaries and employee benefits | 379.0 | - | 379.0 | |||||||||
| Depreciation and amortization | 88.0 | - | 88.0 | |||||||||
| Administrative | 59.0 | - | 59.0 | |||||||||
| Occupancy and related expenses | 23.0 | - | 23.0 | |||||||||
| Other operating expenses | 335.3 | - | 335.3 | |||||||||
| Total general and administrative expenses | 884.3 | - | 884.3 | |||||||||
| Income before income tax | 412.8 | - | 412.8 | |||||||||
| Income tax | (95.7 | ) | - | (95.7 | ) | |||||||
| Net income continued operations | 317.1 | - | 317.1 | |||||||||
| Gains from discontinued activities, net of income tax | 17.3 | (17.3 | ) | - | ||||||||
| Net income | 334.4 | (17.3 | ) | 317.1 | ||||||||
| Earnings per share data: | ||||||||||||
| Earnings per share from continuing operations (basic and diluted): | $ | 4.09 | $ | 0.01 | (4) | |||||||
| Shares outstanding (actual, basic and diluted): | 77,443,101 | |||||||||||
| Shares outstanding (pro forma, basic and diluted): | 43,220,189,095 |
| (1) | BHI’s unaudited interim financial statements for the nine-month periods ended September 30, 2021, and 2020 reflect MFG’s results as a discontinued operation, meaning that our historical financial statements for these periods have been adjusted to remove MFG’s revenues and expenses, and instead MFG’s results for such periods (prior to the MFG Demerger) have been reflected on a net basis, under the caption “Gains from discontinued activities, net of income tax.” |
| (2) | Reflects transaction accounting adjustments for the impact of the MFG Demerger and eliminates the impact of gains from discontinued operations from MFG, purchase accounting impacts (such as depreciation and amortization) related to the acquisition of MFG in May 2020, and intercompany transactions and balances. BHI did not incur material costs in connection with the May 2020 acquisition of MFG or the Spinoff and, accordingly, no transaction cost adjustments are reflected. |
| (3) | Reflects (1) the impact of the MFG Demerger, by eliminating MFG’s results reported under the caption “Gains from discontinued activities, net of income tax” and (2) the Spinoff, by reflecting the impact on earnings per share of BHI’s stock split of approximately 558.09 to 1 in contemplation of the Spinoff. |
| (4) | Reflects the impact, in connection with the Spinoff, of BHI’s approximately 558.09 to 1 stock split, after which BHI’s authorized stock will consist of 44,197,377,192 shares and its issued and outstanding share capital will consist of 43,220,189,095 shares, with a nominal value of $0.0662975983446469 per share. Pro forma earnings per share from continuing operations (basic and diluted), adjusted for the stock split, was $0.00733722009644530 for the nine-month period ended September 30, 2021. |
43
The following table presents our unaudited pro forma income statement information for the year ended December 31, 2020, giving effect to the MFG Demerger and the Spinoff.
| Pro forma income statement for the year ended December 31, 2020 | ||||||||||||
BHI Historical (including MFG) (1) | Transaction Accounting Adjustments for MFG Demerger (2) | BHI Pro Forma (without MFG) (Unaudited pro forma) (3) | ||||||||||
| (U.S.$ millions, except earnings per share and share data) | ||||||||||||
| Interest income: | ||||||||||||
| Deposits in banks | 17.9 | 1.6 | 19.4 | |||||||||
| Investments at amortized cost | 150.9 | (12.3 | ) | 138.6 | ||||||||
| Loans | 1,906.0 | (136.8 | ) | 1,769.2 | ||||||||
| Total interest income | 2,074.8 | (147.5 | ) | 1,927.2 | ||||||||
| Interest expense: | ||||||||||||
| Deposits from customers | 556.8 | (45.8 | ) | 511.0 | ||||||||
| Financial obligations | 102.8 | (7.7 | ) | 95.1 | ||||||||
| Other financial obligations | 67.4 | (17.6 | ) | 49.8 | ||||||||
| Securities sold under repurchase agreements | 0.2 | 0.8 | 1.0 | |||||||||
| Lease liabilities | 11.8 | (0.7 | ) | 11.1 | ||||||||
| Total interest expense | 739.0 | (71.1 | ) | 667.9 | ||||||||
| Interest income, net | 1,335.7 | (76.4 | ) | 1,259.3 | ||||||||
| Provision for loan and interest losses | 486.4 | (34.8 | ) | 451.6 | ||||||||
| Credit risk of investments and interest bearing deposits | 18.4 | (2.8 | ) | 15.6 | ||||||||
| Provision for account receivable losses | 2.8 | 0.2 | 3.0 | |||||||||
| Interest income, net after provisions | 828.1 | (39.0 | ) | 789.1 | ||||||||
| Other income (expenses): | ||||||||||||
| Gains in financial instruments, net | 48.2 | (8.2 | ) | 40.0 | ||||||||
| Service charges | 404.2 | (13.9 | ) | 390.3 | ||||||||
| Commissions and other fees, net | 178.1 | (2.0 | ) | 176.1 | ||||||||
| Gain on foreign currency exchange, net | 167.1 | (0.0 | ) | 167.1 | ||||||||
| Impairment of assets held for sale | (0.3 | ) | 0.2 | (0.1 | ) | |||||||
| Other income | 54.7 | (4.3 | ) | 50.4 | ||||||||
| Total other income, net | 852.0 | (28.1 | ) | 823.8 | ||||||||
| General and administrative expenses: | ||||||||||||
| Salaries and employee benefits | 547.9 | (28.3 | ) | 519.5 | ||||||||
| Depreciation and amortization | 135.2 | (7.6 | ) | 127.6 | ||||||||
| Administrative | 85.6 | (4.8 | ) | 80.8 | ||||||||
| Occupancy and related expenses | 36.1 | (1.6 | ) | 34.5 | ||||||||
| Other operating expenses | 429.7 | (16.3 | ) | 413.4 | ||||||||
| Total general and administrative expenses | 1,234.4 | (58.6 | ) | 1,175.8 | ||||||||
| Income before income tax | 445.7 | (8.5 | ) | 437.2 | ||||||||
| Income tax | (134.8 | ) | 3.0 | (131.8 | ) | |||||||
| Net income continued operations | 310.9 | (5.5 | ) | 305.4 | ||||||||
| Earnings per share data: | ||||||||||||
| Earnings per share from continuing operations (basic and diluted): | $ | 4.01 | $ | 0.01 | (4) | |||||||
| Shares outstanding (actual, basic and diluted): | 77,443,101 | |||||||||||
| Shares outstanding (pro forma, basic and diluted): | 43,220,189,095 | |||||||||||
| (1) | Elaborated from audited historical financial statements as of December 31, 2020 reflect MFG as a continuing operation, including the impact of purchase accounting adjustments related to the acquisition of MFG in May 2020. |
| (2) | Reflects the impact of the MFG Demerger and eliminates the results of operations of MFG and its subsidiaries, the impacts of purchase accounting related to the acquisition of MFG, and elimination of intercompany transactions and balances. Purchase price allocation adjustments consist mainly of fair value adjustments of acquired assets and liabilities and their corresponding impacts on the income statement. BHI did not incur material costs in connection with the May 2020 acquisition of MFG or the Spinoff and, accordingly, no transaction cost adjustments are reflected. |
| (3) | Reflects (1) the impact of the MFG Demerger, by eliminating MFG’s results for the eight months following its acquisition in May 2020 and (2) the Spinoff, by reflecting the impact on earnings per share of BHI’s stock split of approximately 558.09 to 1 in contemplation of the Spinoff. |
| (4) | Reflects the impact, in connection with the Spinoff, of BHI’s approximately 558.09 to 1 stock split, after which BHI’s authorized stock will consist of 44,197,377,192 shares and its issued and outstanding share capital will consist of 43,220,189,095 shares, with a nominal value of $0.0662975983446469 per share. Pro forma earnings per share from continuing operations (basic and diluted), adjusted for the stock split, was $0.0070659794969599 for the year ended December 31, 2020. |
44
8. STATISTICAL BANK INFORMATION
Selected Statistical Data
The following information is included for analytical purposes and should be read in conjunction with our audited consolidated financial statements included in this information statement. This information has been presented based on our financial records, which are prepared in accordance with IFRS. The selected statistical data of BHI at September 30, 2021 have been derived from our interim consolidated financial statements and for the years ended December 31, 2020, 2019 and 2018, as applicable, have been derived from our audited consolidated financial statements, prepared in accordance with IFRS that are included in this information statement. We believe that the average data set forth herein accurately reflects in all material aspects our financial condition and results of operation at the date and for the periods specified.
Distribution of Assets, Liabilities and Shareholders' Equity; Interest Rates and Interest Differential
• average statement of financial position for the nine-month period ended September 30, 2021, has been calculated as follows: the 10-point monthly average of balances between December 31, 2020, and September 30, 2021, excluding MFG (assumes the Spinoff is effective from January 1, 2021).
• average statement of financial position for 2020, 2019, and 2018 have been calculated as follows: the 13-point monthly average balances between December 31 of the previous year and December 31 of the corresponding year.
Average Statement of Financial Position
For the period ended September 30, 2021, and years ended December 31, 2020, 2019, and 2018, the following table presents:
• average balances for 2021 calculated using the average balances for our assets and liabilities (based on a ten-period average) according with the paragraph above;
• average balances for 2020, 2019 and 2018 calculated using the average balances for our assets and liabilities (based on a thirteen-period average) according with the paragraph above;
• interest income earned on assets and interest expense on liabilities; and
• average yield and interest rate for our interest-earning assets and interest-bearing liabilities, respectively.
Average balances of assets and liabilities, interest income and average yield, and interest expense and average rates are shown separated into domestic, referring to Panama-based assets and liabilities, and foreign, referring to non-Panama based assets and liabilities.
| Average statement of financial position and income from interest-earning and non-interest-earning assets | |||||||||||||||
| For the nine months ended September 30, | For the year ended December 31 | ||||||||||||||
| 2021 | 2020 | 2019 | 2018 | ||||||||||||
| Average balance | Interest income | Average yield (1) | Average balance | Interest income | Average yield | Average balance | Interest income | Average yield | Average balance | Interest income | Average yield | ||||
| (in U.S.$ millions, except percentages) | |||||||||||||||
| ASSETS | |||||||||||||||
| Interest-earning assets | |||||||||||||||
| Deposits in banks | |||||||||||||||
| Domestic | 625.8 | 0.4 | 0.1% | 856.6 | 0.3 | 0.0% | 315.3 | 4.9 | 1.6% | 465.0 | 5.4 | 1.2% | |||
| Foreign | 1,557.9 | 7.4 | 0.6% | 1,565.7 | 17.6 | 1.1% | 1,313.4 | 42.4 | 3.2% | 1,312.7 | 34.0 | 2.6% | |||
| Total | 2,183.7 | 7.8 | 0.5% | 2,422.3 | 17.9 | 0.7% | 1,628.7 | 47.3 | 2.9% | 1,777.7 | 39.4 | 2.2% | |||
| Investments in debt securities | |||||||||||||||
| Domestic | 911.9 | 24.5 | 3.6% | 1,287.1 | 39.9 | 3.1% | 754.8 | 24.9 | 3.3% | 620.8 | 14.5 | 2.3% | |||
| Foreign | 2,449.4 | 99.4 | 5.4% | 1,801.1 | 111.0 | 6.2% | 1,324.3 | 76.7 | 5.8% | 1,139.3 | 54.5 | 4.8% | |||
| Total | 3,361.3 | 123.9 | 4.9% | 3,088.2 | 150.9 | 4.9% | 2,079.2 | 101.6 | 4.9% | 1,760.1 | 68.9 | 3.9% | |||
| Corporate | |||||||||||||||
| Domestic | 1,419.7 | 58.0 | 5.4% | 2,402.8 | 144.7 | 6.0% | 1,423.0 | 81.9 | 5.8% | 1,439.2 | 80.5 | 5.6% | |||
| Foreign | 5,584.7 | 315.1 | 7.5% | 5,295.2 | 431.9 | 8.2% | 4,750.1 | 416.0 | 8.8% | 4,525.6 | 389.8 | 8.6% | |||
| Total | 7,004.5 | 373.1 | 7.1% | 7,698.0 | 576.6 | 7.5% | 6,173.2 | 497.9 | 8.1% | 5,964.9 | 470.3 | 7.9% | |||
| Small Company | |||||||||||||||
| Domestic | 28.4 | 0.1 | 0.6% | 76.4 | 0.3 | 0.3% | 37.2 | 0.5 | 1.2% | 40.8 | - | 0.0% | |||
| Foreign | 740.3 | 4.4 | 0.8% | 737.2 | 7.0 | 0.9% | 721.8 | 8.6 | 1.2% | 639.8 | - | 0.0% | |||
| Total | 768.7 | 4.5 | 0.8% | 813.6 | 7.2 | 0.9% | 759.0 | 9.1 | 1.2% | 680.6 | - | 0.0% | |||
| Mortgage | |||||||||||||||
| Domestic | 755.3 | 36.0 | 6.4% | 1,171.3 | 68.0 | 5.8% | 729.3 | 49.4 | 6.8% | 720.8 | 46.7 | 6.5% | |||
| Foreign | 2,720.4 | 175.4 | 8.6% | 2,646.7 | 232.6 | 8.8% | 2,561.7 | 246.0 | 9.6% | 2,475.7 | 237.4 | 9.6% | |||
| Total | 3,475.7 | 211.4 | 8.1% | 3,818.0 | 300.5 | 7.9% | 3,291.0 | 295.4 | 9.0% | 3,196.4 | 284.1 | 8.9% | |||
| Personal | |||||||||||||||
| Domestic | 871.6 | 45.9 | 7.0% | 1,117.8 | 82.6 | 7.4% | 845.9 | 60.8 | 7.2% | 808.5 | 58.5 | 7.2% | |||
| Foreign | 1,166.3 | 110.7 | 12.7% | 1,169.0 | 145.0 | 12.4% | 1,246.7 | 167.3 | 13.4% | 1,316.8 | 189.1 | 14.4% | |||
| Total | 2,037.9 | 156.6 | 10.2% | 2,286.8 | 227.5 | 9.9% | 2,092.5 | 228.1 | 10.9% | 2,125.2 | 247.6 | 11.7% | |||
45
| Vehicles | |||||||||||||||
| Domestic | 314.5 | 15.7 | 6.6% | 520.4 | 38.2 | 7.3% | 327.2 | 23.7 | 7.3% | 324.2 | 23.4 | 7.2% | |||
| Foreign | 587.3 | 37.9 | 8.6% | 536.2 | 46.2 | 8.6% | 554.3 | 49.4 | 8.9% | 597.6 | 50.7 | 8.5% | |||
| Total | 901.9 | 53.6 | 7.9% | 1,056.6 | 84.4 | 8.0% | 881.5 | 73.1 | 8.3% | 921.8 | 74.0 | 8.0% | |||
| Credit Cards | |||||||||||||||
| Domestic | 627.7 | 78.5 | 16.7% | 638.9 | 110.3 | 17.3% | 585.1 | 96.5 | 16.5% | 542.9 | 90.2 | 16.6% | |||
| Foreign | 2,471.1 | 372.1 | 20.1% | 2,441.8 | 599.5 | 24.6% | 2,440.0 | 606.5 | 24.9% | 2,278.0 | 569.4 | 25.0% | |||
| Total | 3,098.8 | 450.6 | 19.4% | 3,080.7 | 709.8 | 23.0% | 3,025.0 | 702.9 | 23.2% | 2,820.9 | 659.6 | 23.4% | |||
| Total loans and leases | |||||||||||||||
| Domestic | 4,017.3 | 234.2 | 7.8% | 5,927.6 | 443.9 | 7.5% | 3,947.7 | 312.7 | 7.9% | 3,876.4 | 299.3 | 7.7% | |||
| Foreign | 13,270.2 | 1,015.6 | 10.2% | 12,826.1 | 1,462.1 | 11.4% | 12,274.6 | 1,493.8 | 12.2% | 11,833.5 | 1,436.4 | 12.1% | |||
| Total | 17,287.5 | 1,249.8 | 9.6% | 18,753.7 | 1,906.0 | 10.2% | 16,222.2 | 1,806.6 | 11.1% | 15,709.9 | 1,735.7 | 11.0% | |||
| Total interest-earning assets | |||||||||||||||
| Domestic | 5,555.0 | 259.1 | 6.2% | 8,071.3 | 484.1 | 6.0% | 5,017.8 | 342.5 | 6.8% | 4,962.1 | 319.2 | 6.4% | |||
| Foreign | 17,277.4 | 1,122.3 | 8.7% | 16,192.9 | 1,590.7 | 9.8% | 14,912.3 | 1,613.0 | 10.8% | 14,285.5 | 1,524.9 | 10.7% | |||
| Total | 22,832.4 | 1,381.4 | 8.1% | 24,264.2 | 2,074.8 | 8.6% | 19,930.1 | 1,955.5 | 9.8% | 19,247.7 | 1,844.1 | 9.6% | |||
| Total non-interest-earning assets | |||||||||||||||
| Domestic | 506.0 | - | n.a | 475.2 | - | n.a | 201.2 | - | n.a | 158.1 | - | n.a | |||
| Foreign | 4,698.4 | - | n.a | 4,760.6 | - | n.a | 4,261.2 | - | n.a | 4,036.3 | - | n.a | |||
| Total | 5,204.4 | - | 0.0% | 5,235.8 | - | 0.0% | 4,462.4 | - | 0.0% | 4,194.4 | - | 0.0% | |||
| Total interest-earning and non-interest-earning assets | |||||||||||||||
| Domestic | 6,060.9 | 259.1 | 5.7% | 8,546.5 | 484.1 | 5.7% | 5,219.0 | 342.5 | 6.6% | 5,120.2 | 319.2 | 6.2% | |||
| Foreign | 21,975.9 | 1,122.3 | 6.8% | 20,953.5 | 1,590.7 | 7.6% | 19,173.5 | 1,613.0 | 8.4% | 18,321.8 | 1,524.9 | 8.3% | |||
| Total assets | 28,036.8 | 1,381.4 | 6.6% | 29,500.0 | 2,074.8 | 9.4% | 24,392.6 | 1,955.5 | 10.7% | 23,442.1 | 1,844.1 | 10.5% |
| Average statement of financial position and expense from interest-bearing and non-interest-bearing liabilities and equity | |||||||||||||||
| For the nine months ended September 30, | For the year ended December 31 | ||||||||||||||
| 2021 | 2020 | 2019 | 2018 | ||||||||||||
| Average balance | Interest expense | Average rate (1) | Average balance | Interest expense | Average rate | Average balance | Interest expense | Average rate | Average balance | Interest expense | Average rate | ||||
| (in U.S.$ millions, except percentages) | |||||||||||||||
| LIABILITIES | |||||||||||||||
| Interest-bearing liabilities | |||||||||||||||
| Interest-bearing demand deposits | |||||||||||||||
| Domestic | 890.8 | 0.3 | 0.0% | 866.9 | 0.8 | 0.1% | 750.7 | 0.7 | 0.1% | 773.5 | 0.8 | 0.1% | |||
| Foreign | 5,762.0 | 41.1 | 1.0% | 4,845.5 | 57.7 | 1.2% | 3,861.7 | 40.2 | 1.0% | 3,598.2 | 35.6 | 1.0% | |||
| Total | 6,652.8 | 41.4 | 0.8% | 5,712.4 | 58.5 | 1.0% | 4,612.4 | 40.9 | 0.9% | 4,371.7 | 36.4 | 0.8% | |||
| Interest-bearing saving accounts | |||||||||||||||
| Domestic | 547.3 | 2.1 | 0.5% | 760.2 | 8.5 | 1.1% | 453.3 | 5.0 | 1.1% | 426.7 | 4.6 | 1.1% | |||
| Foreign | 3,922.9 | 35.6 | 1.2% | 3,225.5 | 43.9 | 1.4% | 2,665.6 | 38.0 | 1.4% | 2,505.7 | 35.0 | 1.4% | |||
| Total | 4,470.2 | 37.7 | 1.1% | 3,985.7 | 52.4 | 1.3% | 3,118.9 | 43.0 | 1.4% | 2,932.4 | 39.7 | 1.4% | |||
| Interest-bearing time deposit accounts | |||||||||||||||
| Domestic | 4,168.0 | 123.9 | 4.0% | 4,886.7 | 187.0 | 3.8% | 3,100.6 | 126.6 | 4.1% | 2,941.9 | 117.3 | 4.0% | |||
| Foreign | 4,284.3 | 155.5 | 4.8% | 4,474.6 | 259.0 | 5.8% | 4,350.2 | 270.3 | 6.2% | 4,122.9 | 252.4 | 6.1% | |||
| Total | 8,452.3 | 279.4 | 4.4% | 9,361.3 | 446.0 | 4.8% | 7,450.9 | 396.9 | 5.3% | 7,064.8 | 369.7 | 5.2% | |||
| Total interest-bearing deposits | |||||||||||||||
| Domestic | 5,606.1 | 126.3 | 3.0% | 6,513.9 | 196.3 | 3.0% | 4,304.7 | 132.3 | 3.1% | 4,142.1 | 122.7 | 3.0% | |||
| Foreign | 13,969.2 | 232.2 | 2.2% | 12,545.5 | 360.5 | 2.9% | 10,877.6 | 348.5 | 3.2% | 10,226.8 | 323.0 | 3.2% | |||
| Total | 19,575.3 | 358.5 | 2.4% | 19,059.4 | 556.8 | 2.9% | 15,182.3 | 480.8 | 3.2% | 14,368.9 | 445.8 | 3.1% | |||
| Borrowings from banks and other | |||||||||||||||
| Domestic | 284.0 | 4.8 | 2.2% | 1,103.5 | 42.4 | 3.8% | 831.0 | 38.1 | 4.6% | 771.6 | 34.2 | 4.4% | |||
| Foreign | 1,308.7 | 37.7 | 3.8% | 1,558.2 | 60.4 | 3.9% | 1,944.4 | 103.7 | 5.3% | 2,430.4 | 124.0 | 5.1% | |||
| Total | 1,592.6 | 42.5 | 3.6% | 2,661.7 | 102.8 | 3.9% | 2,775.4 | 141.8 | 5.1% | 3,202.1 | 158.2 | 4.9% | |||
| Bonds issued | |||||||||||||||
| Domestic | 519.5 | 39.4 | 10.1% | 631.3 | 50.3 | 8.0% | - | - | 0.0% | - | - | 0.0% | |||
| Foreign | 222.9 | 9.9 | 5.9% | 270.1 | 17.1 | 6.3% | 321.4 | 20.1 | 6.3% | 310.1 | 19.6 | 6.3% | |||
| Total | 742.4 | 49.4 | 8.9% | 901.3 | 67.4 | 7.5% | 321.4 | 20.1 | 6.3% | 310.1 | 19.6 | 6.3% | |||
| Securities sold under repurchase agreements | |||||||||||||||
| Domestic | - | - | 0.0% | 24.0 | -0.8 | -3.3% | - | - | 0.0% | - | - | 0.0% | |||
| Foreign | 39.0 | 0.7 | 2.5% | 27.3 | 1.0 | 3.5% | 43.2 | 2.5 | 5.7% | 66.4 | 2.8 | 4.2% | |||
| Total | 39.0 | 0.7 | 2.5% | 51.3 | 0.2 | 0.3% | 43.2 | 2.5 | 5.7% | 66.4 | 2.8 | 4.2% | |||
| Lease liabilities | |||||||||||||||
| Domestic | 27.1 | 1.0 | 4.8% | 46.8 | 2.6 | 5.6% | 36.9 | 2.0 | 5.5% | - | - | 0.0% | |||
| Foreign | 150.8 | 5.8 | 5.1% | 183.4 | 9.2 | 5.0% | 175.8 | 9.9 | 5.6% | - | - | 0.0% | |||
| Total | 177.9 | 6.8 | 5.1% | 230.2 | 11.8 | 5.1% | 212.6 | 11.9 | 5.6% | - | - | 0.0% | |||
| Total interest-bearing liabilities | |||||||||||||||
| Domestic | 6,436.6 | 171.5 | 3.6% | 8,319.5 | 290.9 | 3.5% | 5,172.6 | 172.4 | 3.3% | 4,913.8 | 156.9 | 3.2% | |||
| Foreign | 15,690.6 | 286.4 | 2.4% | 14,584.5 | 448.2 | 3.1% | 13,362.4 | 484.7 | 3.6% | 13,033.8 | 469.4 | 3.6% | |||
| Total interest-bearing liabilities | 22,127.3 | 457.8 | 2.8% | 22,903.9 | 739.0 | 3.2% | 18,535.0 | 657.1 | 3.5% | 17,947.6 | 626.3 | 3.5% | |||
| Total non-interest-bearing liabilities | |||||||||||||||
| Domestic | 475.8 | - | n.a. | 724.2 | - | n.a. | 410.7 | - | n.a. | 438.2 | - | n.a. | |||
| Foreign | 1,551.9 | - | n.a. | 1,449.1 | - | n.a. | 1,299.5 | - | n.a. | 1,270.6 | - | n.a. | |||
| Total non-interest-bearing liabilities | 2,027.7 | - | 0.0% | 2,173.4 | - | 0.0% | 1,710.3 | - | 0.0% | 1,708.8 | - | 0.0% | |||
| Total liabilities | |||||||||||||||
| Domestic | 6,912.4 | 171.5 | 3.3% | 9,043.7 | 290.9 | 3.2% | 5,583.3 | 172.4 | 3.1% | 5,351.9 | 156.9 | 2.9% | |||
| Foreign | 17,242.6 | 286.4 | 2.2% | 16,033.6 | 448.2 | 2.8% | 14,662.0 | 484.7 | 3.3% | 14,304.4 | 469.4 | 3.3% | |||
| Total liabilities | 24,155.0 | 457.8 | 2.5% | 25,077.3 | 739.0 | 2.9% | 20,245.3 | 657.1 | 3.2% | 19,656.3 | 626.3 | 3.2% | |||
| SHAREHOLDERS EQUITY | 3,881.9 | n.a | n.a | 4,422.7 | n.a | n.a | 4,147.3 | n.a | n.a | 3,785.7 | n.a | n.a | |||
| Total liabilities and shareholders equity | 28,036.8 | 457.8 | 2.2% | 29,500.0 | 739.0 | 2.9% | 24,392.6 | 657.1 | 3.2% | 23,442.1 | 626.3 | 3.2% | |||
| (1) | Average yield/rate for the nine months ended September 30, 2021, calculated as annualized interest income (expense) divided by average interest-earning (bearing) assets (liabilities). |
| (2) | Includes non-interest bearing demand deposits and other non-interest bearing liabilities. |
46
For comparative purposes, as of December 31, 2020, the average balance of interest-earning assets excluding MFG was U.S.$21,541.1 million with an average yield of was 8.9% and the average balance of interest-bearing liabilities excluding MFG was U.S.$20,552.2 million with an average rate paid of 3.2%.
Analysis of Changes in Volume and Rate on Interest Income and Interest Expense
The following tables allocate by foreign and domestic, the changes in our interest income (interest-earning assets) and interest expense (interest bearing liabilities) between changes in average volume and changes in average yield (interest-earning assets) and average rate (interest-bearing liabilities) for the year ended December 31, 2020, compared to December 31, 2019, and for the year ended December 31, 2019, compared to December 31, 2018. Volume and rate variances have been calculated based on variances in average balances over the period and changes in interest rates on average interest-earning assets and average interest-bearing funding as follows: (a) changes in volume (change in volume times new rate) and (b) changes in rates (change in rate times old volume). Net changes attributable to changes in both volume and interest rate have been allocated to changes in volume. You should read the following tables and the footnotes thereto in conjunction to our observations noted in Section 8. “Statistical Bank Information—Average statement of financial position”.
| 2020-2019 | 2019-2018 | ||||||
| Increase (decrease) due to changes in | Increase (decrease) due to changes in | ||||||
| Volume | Rate | Net change | Volume | Rate | Net change | ||
| (in U.S.$ millions, except percentages) | |||||||
| Interest-earning assets | |||||||
| Deposits in banks | |||||||
| Domestic | 0.2 | (4.8) | (4.6) | (2.3) | 1.9 | (0.5) | |
| Foreign | 2.8 | (27.7) | (24.8) | 0.0 | 8.4 | 8.4 | |
| Sum | 3.0 | (32.5) | (29.5) | (2.3) | 10.2 | 7.9 | |
| Investments in debt securities | |||||||
| Domestic | 16.5 | (1.5) | 15.0 | 4.4 | 6.0 | 10.4 | |
| Foreign | 29.4 | 4.9 | 34.3 | 10.7 | 11.6 | 22.3 | |
| Sum | 45.9 | 3.4 | 49.3 | 15.1 | 17.5 | 32.7 | |
| Total loans and leases | |||||||
| Domestic | 148.3 | (17.1) | 131.2 | 5.6 | 7.8 | 13.5 | |
| Foreign | 62.9 | (94.6) | (31.7) | 53.7 | 3.7 | 57.4 | |
| Sum | 211.2 | (111.7) | 99.5 | 59.3 | 11.5 | 70.9 | |
| Sum interest-earning assets | |||||||
| Domestic | 165.0 | (23.4) | 141.6 | 7.7 | 15.7 | 23.4 | |
| Foreign | 95.1 | (117.4) | (22.3) | 64.4 | 23.6 | 88.1 | |
| Sum interest-earning assets | 260.0 | (140.8) | 119.3 | 72.1 | 39.3 | 111.4 | |
| Interest-bearing liabilities | |||||||
| Demand deposits | |||||||
| Domestic | 0.1 | 0.0 | 0.1 | (0.0) | (0.1) | (0.1) | |
| Foreign | 11.7 | 5.7 | 17.5 | 2.7 | 1.9 | 4.6 | |
| Sum | 11.8 | 5.8 | 17.6 | 2.7 | 1.8 | 4.5 | |
| Savings deposits | |||||||
| Domestic | 3.4 | 0.0 | 3.4 | 0.3 | 0.1 | 0.4 | |
| Foreign | 7.6 | (1.7) | 5.9 | 2.3 | 0.6 | 2.9 | |
| Sum | 11.0 | (1.7) | 9.4 | 2.6 | 0.8 | 3.3 | |
| Time deposits | |||||||
| Domestic | 68.4 | (7.9) | 60.4 | 6.5 | 2.8 | 9.3 | |
| Foreign | 7.2 | (18.5) | (11.3) | 14.1 | 3.8 | 17.9 | |
| Sum | 75.5 | (26.4) | 49.1 | 20.6 | 6.6 | 27.2 | |
| Borrowings from banks and other | |||||||
| Domestic | 10.5 | (6.2) | 4.3 | 2.7 | 1.2 | 3.9 | |
| Foreign | (15.0) | (28.3) | (43.3) | (25.9) | 5.7 | (20.3) | |
| Sum | (4.5) | (34.5) | (39.0) | (23.2) | 6.9 | (16.3) | |
| Bonds issued | |||||||
| Domestic | 50.3 | — | 50.3 | — | — | — | |
| Foreign | (3.3) | 0.3 | (3.0) | 0.7 | (0.2) | 0.5 | |
| Sum | 47.0 | 0.3 | 47.3 | 0.7 | (0.2) | 0.5 | |
| Securities sold under repurchase agreements | |||||||
| Domestic | (0.8) | — | (0.8) | — | — | — | |
| Foreign | (0.6) | (1.0) | (1.5) | (1.3) | 1.0 | (0.3) | |
| Sum | (1.3) | (1.0) | (2.3) | (1.3) | 1.0 | (0.3) | |
| Lease liabilities | |||||||
| Domestic | 0.6 | 0.0 | 0.6 | 2.0 | — | 2.0 | |
| Foreign | 0.4 | (1.1) | (0.7) | 9.9 | — | 9.9 | |
| Sum | 0.9 | (1.1) | (0.1) | 11.9 | — | 11.9 | |
| Sum interest-bearing liabilities | |||||||
| Domestic | 132.4 | (14.0) | 118.4 | 11.5 | 4.0 | 15.5 | |
| Foreign | 8.1 | (44.6) | (36.5) | 2.5 | 12.8 | 15.3 | |
| Sum interest-bearing liabilities | 140.5 | (58.6) | 81.9 | 14.0 | 16.8 | 30.8 | |
| Sum change in net interest income | 119.5 | (82.2) | 37.3 | 58.1 | 22.5 | 80.6 | |
47
Interest-earning assets – net interest margin and spread
The following table presents average balances of interest-earning assets as well as our yields on our average interest-earning assets, net interest earned, net interest margin and interest spread for the period indicated:
| For the nine months ended September 30, | At and for the year ended December 31, | ||||||
| 2021 (1) | 2020 | 2019 | 2018 | ||||
| (in U.S.$ millions, except percentages) | |||||||
| Interest-earning assets | |||||||
| Deposits in banks | |||||||
| Domestic | 625.8 | 856.6 | 315.3 | 465.0 | |||
| Foreign | 1,557.9 | 1,565.7 | 1,313.4 | 1,312.7 | |||
| Total | 2,183.7 | 2,422.3 | 1,628.7 | 1,777.7 | |||
| Investments in debt securities | |||||||
| Domestic | 911.9 | 1,287.1 | 754.8 | 620.8 | |||
| Foreign | 2,449.4 | 1,801.1 | 1,324.3 | 1,139.3 | |||
| Total | 3,361.3 | 3,088.2 | 2,079.2 | 1,760.1 | |||
| Total loans and leases | |||||||
| Domestic | 4,017.3 | 5,927.6 | 3,947.7 | 3,876.4 | |||
| Foreign | 13,270.2 | 12,826.1 | 12,274.6 | 11,833.5 | |||
| Total | 17,287.5 | 18,753.7 | 16,222.2 | 15,709.9 | |||
| Total average interest-earning assets | |||||||
| Domestic | 5,555.0 | 8,071.3 | 5,017.8 | 4,962.1 | |||
| Foreign | 17,277.4 | 16,192.9 | 14,912.3 | 14,285.5 | |||
| Total | 22,832.4 | 24,264.2 | 19,930.1 | 19,247.7 | |||
| Gross interest earned | |||||||
| Domestic | 259.1 | 484.1 | 342.5 | 319.2 | |||
| Foreign | 1,122.3 | 1,590.7 | 1,613.0 | 1,524.9 | |||
| Total | 1,381.4 | 2,074.8 | 1,955.5 | 1,844.1 | |||
| Net interest income (2) | |||||||
| Domestic | 87.7 | 193.2 | 170.1 | 162.2 | |||
| Foreign | 835.9 | 1,142.5 | 1,128.3 | 1,055.5 | |||
| Total | 923.6 | 1,335.7 | 1,298.4 | 1,217.8 | |||
| Average yield on interest earning assets | |||||||
| Domestic | 6.2% | 6.0% | 6.8% | 6.4% | |||
| Foreign | 8.7% | 9.8% | 10.8% | 10.7% | |||
| Total | 8.1% | 8.6% | 9.8% | 9.6% | |||
| Net interest margin (3) | |||||||
| Domestic | 2.1% | 2.4% | 3.4% | 3.3% | |||
| Foreign | 6.5% | 7.1% | 7.6% | 7.4% | |||
| Total | 5.4% | 5.5% | 6.5% | 6.3% | |||
| Interest spread on loans and leases (4) | |||||||
| Domestic | 4.8% | 4.5% | 4.8% | 4.8% | |||
| Foreign | 8.0% | 8.5% | 9.0% | 9.0% | |||
| Total | 7.2% | 7.2% | 8.0% | 7.9% | |||
| Interest spread on total interest-earning assets (5) | |||||||
| Domestic | 2.7% | 2.5% | 3.5% | 3.2% | |||
| Foreign | 6.2% | 6.8% | 7.2% | 7.1% | |||
| Total | 5.3% | 5.3% | 6.3% | 6.1% | |||
| (1) | Average yield for the nine months ended September 30, 2021, calculated as annualized interest income divided by average interest-earning assets. |
| (2) | Net interest income is calculated as interest income from interest-earning assets less interest paid on interest-bearing liabilities. |
| (3) | Net interest margin is calculated as net interest income divided by total average interest-earning assets, determined based on monthly ending balances during the applicable period. For the nine months ended September 30, 2021, net interest margin is calculated using annualized net interest income for the period. |
| (4) | Interest spread on loans and leases is calculated as the difference between the average yield on interest-earning loans and leases and the average rate paid on interest-bearing deposits. |
| (5) | Net interest spread is calculated as the difference between the average yield on interest-earning assets and the average rate paid on interest-bearing liabilities. |
48
Investment Portfolio
We acquire and hold fixed income debt securities as part of our treasury management operations for liquidity and other strategic purposes. The following table presents an analysis of the weighted average yields for interest bearing debt securities that are not held at fair value through P&L as of December 31, 2020:
| Remaining term to maturity | |||||||||
| Within 1 year | 1 to 5 years | After 5 through 10 years | After 10 years | Total | |||||
| (in percentages) | |||||||||
| Fair Value through OCI | |||||||||
| US government and agencies | 0.05% | 0.21% | 0.56% | 1.71% | 0.27% | ||||
| Non-US governments and agencies | 3.85% | 5.26% | 6.18% | 5.80% | 5.10% | ||||
| Corporate bonds | 3.80% | 2.42% | 3.51% | 5.36% | 3.51% | ||||
| Weighted average yield | 2.80% | 3.94% | 5.12% | 5.10% | 3.98% | ||||
| Amortized cost | |||||||||
| Corporate bonds (1) | 10.40% | 7.60% | 5.93% | 8.12% | 6.92% | ||||
| Weighted average yield | 10.40% | 7.60% | 5.93% | 8.12% | 6.92% | ||||
| Total Weighted average yield (2) | 2.84% | 3.99% | 5.16% | 5.19% | 4.04% | ||||
| (1) | Corporate bonds held by MFG at amortized cost with an average yield of 6.92%. |
| (2) | Weighted average yield is calculated using the asset's face value and yield to maturity, segregated by category and remaining term to maturity, and weighted based on the face value. |
For comparative purposes, as of December 31, 2020, and excluding MFG, the weighted average yield for interest bearing debt securities held at fair value through OCI was 3.66%. Excluding MFG, there are no interest-bearing debt securities held at amortized cost. In 2020, MFG’s holdings of debt securities at amortized cost are primarily local debt securities issued in Panama.
The following table presents an analysis of the weighted average yields for interest bearing debt securities that are not held at fair value through P&L as of September 30, 2021:
| Remaining term to maturity | |||||||||
| Within 1 year | 1 to 5 years | After 5 through 10 years | After 10 years | Total | |||||
| (in percentages) | |||||||||
| Fair Value through OCI | |||||||||
| US government and agencies | 0.00% | 0.74% | 4.09% | 0.00% | 0.74% | ||||
| Non-US governments and agencies | 3.65% | 3.57% | 4.55% | 5.02% | 3.93% | ||||
| Corporate bonds | 2.16% | 1.87% | 3.82% | 5.26% | 3.07% | ||||
| Weighted average yield | 3.56% | 3.25% | 4.34% | 5.07% | 3.77% | ||||
| Amortized cost | |||||||||
| Corporate bonds (1) | 0.00% | 0.00% | 0.00% | 0.00% | 0.00% | ||||
| Weighted average yield | 0.00% | 0.00% | 0.00% | 0.00% | 0.00% | ||||
| Total Weighted average yield (2) | 3.56% | 3.25% | 4.34% | 5.07% | 3.77% | ||||
49
Loan Portfolio
Maturity Profile of the Loan Portfolio
The following table presents certain items in our loan portfolio by contractual maturity as of December 31, 2020:
| As of December 31, 2020 | |||||||||
| Remaining term to average contractual maturity | |||||||||
| Within 1 year | 1 to 5 years | After 5 years through 15 years | After 15 years | Total | |||||
| (in U.S.$ millions) | |||||||||
| Corporate loans | |||||||||
| Corporate loans (1) | 2,693.5 | 2,563.5 | 3,156.7 | 132.4 | 8,546.1 | ||||
| Total Corporate loans | 2,693.5 | 2,563.5 | 3,156.7 | 132.4 | 8,546.1 | ||||
| Small company loans | |||||||||
| Small company loans (1) | 270.6 | 257.5 | 317.1 | 13.3 | 858.5 | ||||
| Total small company loans | 270.6 | 257.5 | 317.1 | 13.3 | 858.5 | ||||
| Consumer loans | |||||||||
| Mortgage | 2.5 | 58.6 | 707.0 | 3,422.7 | 4,190.7 | ||||
| Personal (1) | 175.9 | 450.9 | 1,170.2 | 554.2 | 2,351.1 | ||||
| Vehicles | 29.9 | 717.2 | 529.1 | 0.0 | 1,276.2 | ||||
| Credit cards | 2,862.0 | 87.9 | 181.6 | 0.0 | 3,131.5 | ||||
| Total consumer loans | 3,070.3 | 1,314.6 | 2,587.8 | 3,976.8 | 10,949.5 | ||||
| Total loans | 6,034.4 | 4,135.7 | 6,061.6 | 4,122.5 | 20,354.2 | ||||
| (1) | Includes leases. |
The following table presents our loan portfolio by maturity and type of interest as of December 31, 2020:
| As of December 31, 2020 | |||||||||
| Remaining term to average contractual maturity | |||||||||
| Within 1 year | 1 to 5 years | After 5 years through 15 years | After 15 years | Total | |||||
| (in U.S.$ millions) | |||||||||
| Loans with fixed interest rates: | |||||||||
| Corporate loans | 36.2 | 34.4 | 42.4 | 1.8 | 114.8 | ||||
| Small company loans | 3.6 | 3.5 | 4.3 | 0.2 | 11.5 | ||||
| Mortgage | 0.7 | 17.4 | 210.4 | 1,018.9 | 1,247.5 | ||||
| Personal | 52.4 | 134.2 | 348.3 | 165.0 | 699.9 | ||||
| Vehicles | 8.9 | 213.5 | 157.5 | 0.0 | 379.9 | ||||
| Credit cards | 2,862.0 | 87.9 | 181.6 | 0.0 | 3,131.5 | ||||
| Total Loans with fixed interest rates | 2,963.9 | 490.9 | 944.5 | 1,185.8 | 5,585.1 | ||||
| Loans with floating or adjustable interest rates: | |||||||||
| Corporate loans | 2,657.4 | 2,529.1 | 3,114.3 | 130.6 | 8,431.3 | ||||
| Small company loans | 267.0 | 254.1 | 312.9 | 13.1 | 847.0 | ||||
| Mortgage | 1.8 | 41.2 | 496.5 | 2,403.8 | 2,943.2 | ||||
| Personal | 123.5 | 316.7 | 821.8 | 389.2 | 1,651.2 | ||||
| Vehicles | 21.0 | 503.7 | 371.6 | 0.0 | 896.3 | ||||
| Credit cards | 0.0 | 0.0 | 0.0 | 0.0 | 0.0 | ||||
| Total loans with floating or adjustable interest rates | 3,070.6 | 3,644.7 | 5,117.1 | 2,936.7 | 14,769.1 | ||||
| Total loans | 6,034.4 | 4,135.7 | 6,061.6 | 4,122.5 | 20,354.2 | ||||
For comparative purposes, excluding MFG, total loans as of December 31, 2020, were U.S.$17,153.7 million composed of U.S.$6,877.0 million of corporate loans, U.S.$781.5 million of small company loans, U.S.$3,487.9 million of mortgage loans, U.S.$1,938.9 million of personal loans, U.S.$990.2 million of vehicle loans, and U.S.$3,078.3 million of credit card loans. By type of interest, in 2020, excluding MFG, the loan portfolio was composed of U.S.$5,091.4 million of loans with fixed interest rates and U.S.$12,062.4 million of loans with floating or adjustable interest rates.
The following table presents our loan portfolio by contractual maturity as of September 30, 2021, after the spinoff of MFG:
| As of September 30, 2021 | |||||||||
| Remaining term to average contractual maturity | |||||||||
| Within 1 year | 1 to 5 years | After 5 years through 15 years | After 15 years | Total | |||||
| (in U.S.$ millions) | |||||||||
| Corporate loans | |||||||||
| Corporate loans (1) | 2,324.5 | 2,203.2 | 2,639.3 | 163.4 | 7,330.4 | ||||
| Total Corporate loans | 2,324.5 | 2,203.2 | 2,639.3 | 163.4 | 7,330.4 | ||||
| Small company loans | |||||||||
| Small company loans (1) | 250.4 | 237.4 | 284.4 | 17.6 | 789.8 | ||||
| Total small company loans | 250.4 | 237.4 | 284.4 | 17.6 | 789.8 | ||||
| Consumer loans | |||||||||
| Mortgage | 2.0 | 48.4 | 579.5 | 2,968.4 | 3,598.3 | ||||
| Personal (1) | 180.6 | 366.9 | 965.6 | 491.0 | 2,004.1 | ||||
| Vehicles | 23.2 | 497.6 | 502.8 | 0.0 | 1,023.6 | ||||
| Credit cards | 3,022.8 | 88.8 | 160.9 | 0.0 | 3,272.6 | ||||
| Total consumer loans | 3,228.6 | 1,001.7 | 2,208.9 | 3,459.4 | 9,898.6 | ||||
| Total loans | 5,803.5 | 3,442.3 | 5,132.6 | 3,640.4 | 18,018.7 | ||||
| (1) | Includes leases. |
50
The following table presents our loan portfolio by maturity and type of interest as of September 30, 2021, after the spinoff of MFG:
| As of September 30, 2021 | |||||||||
| Remaining term to average contractual maturity | |||||||||
| Within 1 year | 1 to 5 years | After 5 years through 15 years | After 15 years | Total | |||||
| (in U.S.$ millions) | |||||||||
| Loans with fixed interest rates: | |||||||||
| Corporate loans | 23.1 | 21.9 | 26.2 | 1.6 | 72.8 | ||||
| Small company loans | 2.5 | 2.4 | 2.8 | 0.2 | 7.8 | ||||
| Mortgage | 0.6 | 14.8 | 177.6 | 909.7 | 1,102.8 | ||||
| Personal | 55.4 | 112.4 | 295.9 | 150.5 | 614.2 | ||||
| Vehicles | 7.1 | 152.5 | 154.1 | 0.0 | 313.7 | ||||
| Credit cards | 3,022.8 | 88.8 | 160.9 | 0.0 | 3,272.6 | ||||
| Total Loans with fixed interest rates | 3,111.4 | 392.8 | 817.6 | 1,062.0 | 5,383.8 | ||||
| Loans with floating or adjustable interest rates: | |||||||||
| Corporate loans | 2,301.4 | 2,181.4 | 2,613.1 | 161.7 | 7,257.6 | ||||
| Small company loans | 248.0 | 235.0 | 281.5 | 17.4 | 782.0 | ||||
| Mortgage | 1.4 | 33.5 | 401.9 | 2,058.7 | 2,495.5 | ||||
| Personal | 125.3 | 254.5 | 669.7 | 340.5 | 1,389.9 | ||||
| Vehicles | 16.1 | 345.1 | 348.7 | 0.0 | 709.9 | ||||
| Credit cards | 0.0 | 0.0 | 0.0 | 0.0 | 0.0 | ||||
| Total loans with floating or adjustable interest rates | 2,692.1 | 3,049.5 | 4,315.0 | 2,578.3 | 12,634.9 | ||||
| Total loans | 5,803.5 | 3,442.3 | 5,132.6 | 3,640.4 | 18,018.7 | ||||
Credit Ratios
The following table presents our credit ratios for the years indicated:
| For the nine months ended September 30, | For the year ended December 31, | ||||||
| 2021 | 2020 | 2019 | 2018 | ||||
| (in U.S.$ millions, except percentages) | |||||||
| Allowance for credit losses to total loan outstanding: | |||||||
| Allowance for credit losses | 659.6 | 697.8 | 509.7 | 482.1 | |||
| Total loans outstanding | 18,018.7 | 20,354.2 | 16,835.6 | 16,223.6 | |||
| 3.66% | 3.43% | 3.03% | 2.97% | ||||
| Net charge-offs (recoveries) during the period to average loans outstanding: | |||||||
| Corporate | |||||||
| Net charge-offs (recoveries) during the period | 43.5 | 25.3 | 29.6 | 21.7 | |||
| Average amount outstanding | 7,004.5 | 7,698.0 | 6,173.2 | 5,964.9 | |||
| 0.62% | 0.33% | 0.48% | 0.36% | ||||
| Small company | |||||||
| Net charge-offs (recoveries) during the period | 4.8 | 2.9 | 3.6 | 2.5 | |||
| Average amount outstanding | 768.7 | 813.6 | 759.0 | 680.6 | |||
| 0.62% | 0.36% | 0.48% | 0.36% | ||||
| Mortgage | |||||||
| Net charge-offs (recoveries) during the period | 6.9 | 20.6 | 18.9 | 13.0 | |||
| Average amount outstanding | 3,475.7 | 3,818.0 | 3,291.0 | 3,196.4 | |||
| 0.20% | 0.54% | 0.57% | 0.41% | ||||
| Personal | |||||||
| Net charge-offs (recoveries) during the period | 29.2 | 51.2 | 78.6 | 77.7 | |||
| Average amount outstanding | 2,037.9 | 2,286.8 | 2,092.5 | 2,125.2 | |||
| 1.43% | 2.24% | 3.76% | 3.66% | ||||
| Vehicle | |||||||
| Net charge-offs (recoveries) during the period | 10.9 | 14.0 | 13.5 | 10.5 | |||
| Average amount outstanding | 901.9 | 1,056.6 | 881.5 | 921.8 | |||
| 1.21% | 1.33% | 1.54% | 1.14% | ||||
| Credit card | |||||||
| Net charge-offs (recoveries) during the period | 166.2 | 175.2 | 211.1 | 184.3 | |||
| Average amount outstanding | 3,098.8 | 3,080.7 | 3,025.0 | 2,820.9 | |||
| 5.36% | 5.69% | 6.98% | 6.53% | ||||
| Total loans | |||||||
| Net charge-offs (recoveries) during the period | 261.6 | 289.2 | 355.4 | 309.6 | |||
| Average amount outstanding | 17,287.5 | 18,753.7 | 16,222.2 | 15,709.9 | |||
| 1.51% | 1.54% | 2.19% | 1.97% | ||||
51
Allowance for credit losses to loans outstanding increased to 3.66% for the nine months ended September 30, 2021, from 3.43% in the year ended December 31, 2020, due to additional provisions allocated in Panamá from the culmination of relief initiatives. The Acuerdo No.2-2021 issued by the Superintendency of Banks in Panamá marked the end of the relief period and instructed banks to settle one last relief period (or structural arrangement) no later than September 30, 2021. BHI’s subsidiaries not only complied with the instruction, but also recorded additional loan loss allowances in these cases. Allowance for credit losses to loans outstanding increased to 3.43% in 2020 from 3.03% in 2019, largely due to the impacts of the coronavirus pandemic on the loan portfolio. Finally, allowance for credit losses to loans outstanding increased to 3.03% in 2019 from 2.97% in 2018 due to a weaker credit quality in personal loan portfolios, particularly related to consumer loans to non-public workers, self-employed credit card holders and LIBOR indexed mortgage loans.
Net charge-off (recoveries) ratio decreased slightly to 1.51% for the nine months ended September 30, 2021, from 1.54% in the year ended December 31, 2020. Excluding MFG, net charge-off (recoveries) ratio in 2020 was 1.68% given that MFG operations are concentrated in Panama, where more comprehensive COVID-19 reliefs were granted during 2020. Furthermore, these payment holidays momentarily contained the flows of loans into charge-off status that year, a situation which was normalized during 2021. Net charge-off (recoveries) ratio decreased to 1.54% in 2020 from 2.19% in 2019 mainly due to the relief programs cited above. Net charge-off (recoveries) ratio increased to 2.19% in 2019 from 1.97% in 2018 mainly due to the deterioration in the credit cards and consumer loan portfolios cited above.
Deposits
The following table presents our deposits by category for the periods indicated:
| For the nine months ended September 30 | For the year ended December 31 | ||||||||||||||
| 2021 | 2020 | 2019 | 2018 | ||||||||||||
| Average balance | Average rate | Average balance | Average rate | Average balance | Average rate | Average balance | Average rate | ||||||||
| (in U.S.$ millions, except percentages) | |||||||||||||||
| Interest bearing deposits | |||||||||||||||
| Panamá | |||||||||||||||
| Demand | 890.8 | 0.0% | 866.9 | 0.1% | 750.7 | 0.1% | 773.5 | 0.1% | |||||||
| Savings | 547.3 | 0.5% | 760.2 | 1.1% | 453.3 | 1.1% | 426.7 | 1.1% | |||||||
| Time | 4,168.0 | 4.0% | 4,886.7 | 3.8% | 3,100.6 | 4.1% | 2,941.9 | 4.0% | |||||||
| Total Panamá | 5,606.1 | 3.0% | 6,513.9 | 3.0% | 4,304.7 | 3.1% | 4,142.1 | 3.0% | |||||||
| Non-Panamá | |||||||||||||||
| Demand | 5,762.0 | 1.0% | 4,845.5 | 1.2% | 3,861.7 | 1.0% | 3,598.2 | 1.0% | |||||||
| Savings | 3,922.9 | 1.2% | 3,225.5 | 1.4% | 2,665.6 | 1.4% | 2,505.7 | 1.4% | |||||||
| Time | 4,284.3 | 4.8% | 4,474.6 | 5.8% | 4,350.2 | 6.2% | 4,122.9 | 6.1% | |||||||
| Non-Panamá | 13,969.2 | 2.2% | 12,545.5 | 2.9% | 10,877.6 | 3.2% | 10,226.8 | 3.2% | |||||||
| Total interest bearing deposits | 19,575.3 | 2.4% | 19,059.4 | 2.9% | 15,182.3 | 3.2% | 14,368.9 | 3.1% | |||||||
| Non-interest bearing demand deposits (1) | |||||||||||||||
| Panamá | 336.4 | n.a. | 462.0 | n.a. | 265.4 | n.a. | 278.9 | n.a. | |||||||
| Non-Panamá | 874.7 | n.a. | 746.0 | n.a. | 652.3 | n.a. | 650.2 | n.a. | |||||||
| Total non-interest bearing deposits | 1,211.0 | n.a. | 1,208.0 | n.a. | 917.7 | n.a. | 929.1 | n.a. | |||||||
| (1) | Non-interest bearing deposits refer to demand deposits in transaction accounts for clients that make daily deposits and transactions; these accounts do not bear interest on deposited funds. |
52
For comparative purposes, in 2020, excluding MFG, the average balance of interest-bearing deposits was U.S.$17,440.4 million, with an average rate paid of 2.9%, and the average balance of non-interest-bearing deposits was U.S.$1,031.9 million.
Uninsured deposits
Except for Panama and until 2020 Costa Rica, every country in Central America where we operate has local regulations establishing deposit insurance funds providing coverage to customer deposits up to a specified limit. In Costa Rica, new legislation was passed in 2020 creating deposit insurance coverage, however there was no deposit insurance coverage prior to 2020. In general, local regulations applicable to deposit insurance in each country establish similar coverage conditions and restrictions, however, deposit insurance limits vary among countries. In 2020, the applicable insurance limits in each country we operate were as follows:
| · | Costa Rica: U.S.$9,578 |
| · | El Salvador: U.S.$30,867 |
| · | Guatemala: U.S.$2,587 |
| · | Honduras: U.S.$9,633 |
| · | Nicaragua: U.S.10,000 |
| · | Panamá: Not applicable |
The amount of uninsured deposits is estimated on a product-by-product basis for each client and up to the established limits. The following table presents an estimate of the aggregate amount of uninsured deposits by geography and according to local regulations and limits described above:
| As of December 31 | |||||
| 2020 | 2019 | 2018 | |||
| (in U.S.$ millions) | |||||
| Panamá (1) | 8,547.8 | 5,004.6 | 4,561.5 | ||
| Costa Rica (2) | 3,802.2 | 4,250.9 | 3,866.8 | ||
| Guatemala | 3,267.5 | 2,651.7 | 2,305.0 | ||
| Honduras | 2,209.4 | 1,654.9 | 1,457.4 | ||
| El Salvador | 1,438.7 | 1,310.7 | 1,240.3 | ||
| Nicaragua | 733.0 | 605.1 | 597.3 | ||
| Total uninsured deposits | 19,998.6 | 15,477.9 | 14,028.3 | ||
| (1) | Panama does not have local regulation establishing deposit insurance coverage, thus all deposits in Panama are uninsured. |
| (2) | Prior to 2020, Costa Rica did not have local regulations establishing deposit insurance coverage thus all deposits were considered uninsured deposits in 2019 and 2018. |
The following table presents an estimate of uninsured time deposits by maturity profile as of December 31, 2020:
| As of December 31, 2020 | |||||||||
| Remaining term to contractual maturity | |||||||||
| Within 3 months | 3 to 6 months | 6 to 12 months | Over 12 months | Total | |||||
| (in U.S.$ millions) | |||||||||
| Time deposits in excess of insured limit: | |||||||||
| Panama | - | - | - | - | - | ||||
| Costa Rica | 381.9 | 231.2 | 279.2 | 597.6 | 1,489.9 | ||||
| Guatemala | 289.1 | 376.6 | 470.0 | 140.5 | 1,276.2 | ||||
| Honduras | 521.7 | 149.1 | 89.0 | 1.0 | 760.9 | ||||
| El Salvador | 232.1 | 119.8 | 115.3 | 4.4 | 471.6 | ||||
| Nicaragua | 53.7 | 30.3 | 38.3 | 7.9 | 130.2 | ||||
| Total | 1,478.5 | 907.0 | 991.7 | 751.5 | 4,128.7 | ||||
| Time deposits in uninsured accounts: | |||||||||
| Panama | 810.4 | 637.6 | 1,278.9 | 3,262.1 | 5,989.0 | ||||
| Costa Rica | - | - | - | - | - | ||||
| Guatemala | - | - | - | - | - | ||||
| Honduras | - | - | - | - | - | ||||
| El Salvador | - | - | - | - | - | ||||
| Nicaragua | - | - | - | - | - | ||||
| Total | 810.4 | 637.6 | 1,278.9 | 3,262.1 | 5,989.0 | ||||
| Total uninsured time deposits | 2,288.9 | 1,544.5 | 2,270.6 | 4,013.6 | 10,117.7 | ||||
53
9. MANAGEMENT’S DISCUSSION AND ANALYSIS OF FINANCIAL CONDITION AND RESULTS OF OPERATIONS
The following discussion of our financial condition and results of operations should be read in conjunction with our audited consolidated financial statements for the years ended December 31, 2020 and 2019, our unaudited interim financial statements for the nine-month periods ended September 30, 2021 and 2020, as well as the related notes thereto included in this information statement. The preparation of our audited consolidated financial statements requires the adoption of assumptions and estimates that affect the amounts recorded as assets, liabilities, revenue and expenses in the years and periods addressed and are subject to certain risks and uncertainties. Our future results may vary substantially from those indicated because of various factors that affect our business, including, among others, those identified under Section 4. “Risk Factors”, and other factors discussed in this information statement. Our audited consolidated financial statements at December 31, 2020 and 2019 and for the years ended December 31, 2020 and 2019 included in this information statement have been prepared in accordance with IFRS.
Volume and rate variances have been calculated based on variances in monthly average balances over the period and changes in interest rates on average interest-earning assets and average interest-bearing funding as follows: (a) changes in volume (change in volume times new rate) and (b) changes in rates (change in rate times old volume). Net changes attributable to changes in both volume and interest rate have been allocated to changes in volume. Calculations are done on a line-by-line basis to account for changes in mix when analyzing each group of interest-earning assets (total gross loans and total interest-earning assets) and interest-bearing funding (customer deposits, other funding and total funding). In this section, we refer to “N.A.” as not applicable.
Overview: BAC Holding International Corp.
BHI, through its indirect subsidiary BAC International Bank, Inc., is a full-service Central American financial institution with leading credit card issuance and merchant-acquiring franchises and operations in Costa Rica, El Salvador, Guatemala, Honduras, Nicaragua and Panama, among other countries. Prior to the Spinoff, BAC Holding was a wholly-owned subsidiary of Banco de Bogotá S.A.
BAC Holding’s functional currency is the U.S. dollar, although some of its subsidiaries have functional currencies different from the U.S. dollar. Even though BHI consolidates its financial statements in U.S. dollars, it may also use the Colombian Peso for fiscal and reporting purposes in Colombia, where it is based. BAC Holding’s subsidiaries carry out their ordinary course of business in a mix of local currencies, particularly in Costa Rican Colones, Guatemalan Quetzales, Honduran Lempiras and Nicaraguan Cordobas, and in U.S. dollars in Panama and El Salvador. Accordingly, BAC Holding is exposed to foreign exchange risk.
On May 22, 2020, BAC Holding acquired 99.6% of the equity capital of Multi Financial Group, Inc. (“MFG”), a company organized under Panamanian law, for a final adjusted purchase price of U.S.$432.2 million. On September 30, 2021, in anticipation of the Spinoff, MFG was demerged from BAC Holding by way of escisión and retained by Banco de Bogotá. Accordingly, MFG’s results have been consolidated and recognized in BAC Holding’s audited consolidated financial statements from the date it obtained control over MFG, reflecting seven months of revenues and expenses in 2020 and the full nine-month period ended September 30, 2021, until BAC Holding’s divestiture of MFG on September 30, 2021. In accordance with IFRS, our audited consolidated financial statements for 2020 reflect the results of MFG as a continuing operation, while our unaudited interim financial statements reflect the results of MFG as a discontinued operation, reflecting the demerger of MFG from BAC Holding on September 30, 2021. Where noted, we discuss our results of operations excluding the impact of MFG (refers to MFG’s results of operations, net of purchase price allocation -PPA- and eliminations). For more information on the MFG business combination, please refer to Note 4 of our audited consolidated financial statements for the year ended December 31, 2020, and for information regarding our divestiture of MFG, please refer to Note 25 of our unaudited interim consolidated financial statements for the period ended September 30, 2021.
BAC Holding’s net income for the nine months ended September 30, 2021 was U.S.$334.4 million, increasing 31.6% or U.S.$80.3 million (U.S.$317.1 million, increasing 24.2% or U.S.$61.7 million considering net income from continued operations) compared to the nine months ended September 30, 2020. BAC Holding’s net income for the year ended December 31, 2020, was U.S.$310.9 million from continued operations (including U.S.$5.5 million related to impact of MFG), decreasing 22.7% or U.S.$91.0 million compared to the year ended December 31, 2019. BAC Holding’s net income for the year ended December 31, 2019, was U.S.$402.0 million, increasing 2.8% or U.S.$10.8 million compared to the year ended December 31, 2018.
Principal factors affecting our financial condition and results of operations
International context
In 2020, the global economies experienced the deepest and most synchronized recession in documented history. The COVID-19 pandemic acted as an unprecedented external shock to supply and demand, as it disrupted supply chains, led to strict lockdowns and travel restrictions, reduced household and firm income and changed consumption patterns. According to International Monetary Fund (IMF), global GDP contracted 3.1% in 2020, substantially more than in 2009 when global GDP contracted 0.1%. Economies in Latin America faced the double impact of the pandemic and lower commodity prices, added to a weaker auto and textile industry. For 2020, the IMF estimated a 6.9% contraction for Latin American economies, more than in other emerging regions.
54
However, partly due to global stimulus measures, for 2021 the IMF estimates a sharp recovery of global GDP growth of 5.9%, boosted by emerging markets such as Latin American and the Caribbean, for which the IMF estimates a recovery of 6.8%. Additionally, the vaccination campaigns that took place during 2021 allowed a gradual easing of the strict lockdowns implemented across the world and in Latin America and ultimately led to an economic recovery in most world economies. The strong economic recovery during the first three quarters of 2021 was slightly dampened in the fourth quarter by the new virus variants, persistence in supply chain bottlenecks and higher input and consumer prices. The risks of these issues persisting are expected to remain throughout 2022 and the IMF expects slower growth as compared to 2021. Nevertheless, the growth forecast for Latin America improved as compared to earlier projections; according to the World Bank this is explained by supportive external conditions and rapid application of vaccines during the second half of 2021.
Real GDP Growth – World, USA and Latin America and the Caribbean Selected Regions. (2021, 2022, forecasts)
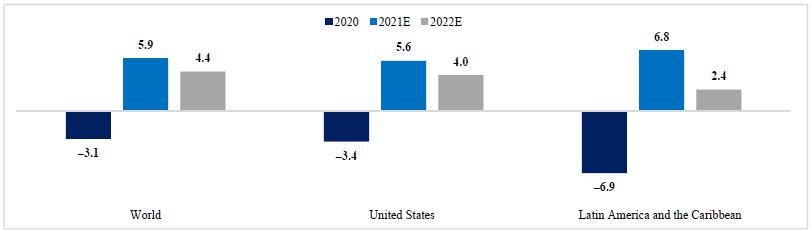
Source: Chart elaborated by BHI using data retrieved from World Economic Outlook Database, IMF, updated January 2022.
Inflation and Interest Rates
In 2021 inflation remained high in the US, well above the Federal Reserve’s target rate of 2.0%. Higher inflation was driven by price increases in all main categories of commodities, including energy, metals and agricultural products, and specific markets that affected by supply chain disruptions, such as vehicles where supply was affected by a global microchip shortage. The Federal Reserve expects 2022 fourth quarter year-on-year inflation in the range of 2.0% to 3.2%, above its target rate but significantly lower than levels seen in 2021.
US Consumer Price Index for All Urban Consumers,
Annual change, %
| Yield on US Treasury, 10-Year Constant Maturity, % | |
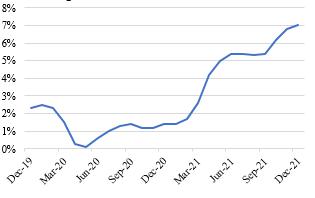 | 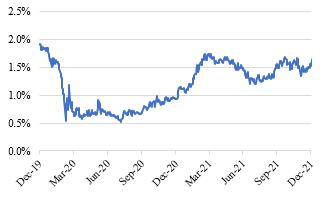 |
Source: Chart elaborated by BHI using data retrieved from Federal Reserve Economic Data (https://fred.stlouisfed.org/).
The US ten-year treasury yield remained low and stable during 2021, fluctuating between 1.0% and 2.0%. In response to inflation remaining persistently above the target rate, the US Federal Reserve has announced it will use it´s available monetary policy tools, starting on December 2021. Measures announced include ending new asset purchases (corporate and sovereign bonds) by March 2022, raising monetary policy rates. Market expectations signal around 4 rate hikes of 25 basis points during 2022, beginning in March 2022. The hikes are expected to continue throughout 2023, subject to the evolution of economic indicators.
55
The path of inflation in Central American countries has been similar to the one seen in the US, as inflation in all countries increased, particularly in the second half of 2021, impacted by international commodity prices and supply chain disruptions. In response to the pandemic, the relevant monetary authorities in each country used the tools at their disposal to provide support to the economies including lowering interest rates, providing liquidity and obtaining external financing to respond to the sanitary emergency. Average lending rates in national currency of Central American countries decreased during 2020 and continued to do so in most countries during 2021 in an effort to stimulate growth. During the second half of 2021, average rates remained stable.
Central American Consumer Price Indexes,
Annual change, %
| Central American Average National Currency Lending Rates, % | |
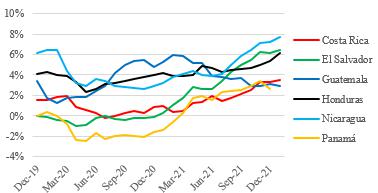 | 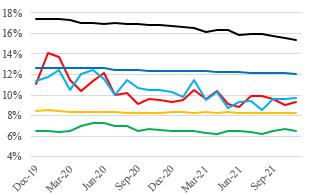 |
Source: Chart elaborated by BHI using data retrieved from Consejo Monetario Centroamericano. Average lending rates in national currency refer to data compiled by the Consejo Monetario Centroamericano (Central American Monetary Council) and estimate average nominal active lending rates offered by financial intermediaries to economic participants in each country.
Central American Economic Conditions
According to the IMF’s October 2021 WEO, Central America is expected to post a combined nominal GDP of U.S.$272.3 billion, making it the sixth largest economy in Latin America after Brazil (U.S.$1,645.8 billion), Mexico (U.S.$1,285.5 billion), Argentina (U.S.$455.2 billion), Chile (U.S.$331.3 billion), and Colombia (U.S.$300.8 billion) in nominal terms. Given that BHI’s business operations are concentrated in Central America, its results are linked to the region’s economic performance.
The COVID-19 pandemic had a marked negative impact on the macroeconomic conditions of the Region, resulting in contractions in production and income levels, and, consequently, consumption and investment expenditures, as well as foreign trade. Conversely, for the countries that make up the Northern Triangle (Guatemala, El Salvador and Honduras); the pandemic resulted in increased remittance flows, with monthly figures at historic levels. In response to the spread of the virus and to safeguard public health, the government authorities of each country adopted measures restricting mobility and partial or total closure of activities, which in turn exacerbated the economic contraction.
During 2021, the economic recovery varied between countries as the gradual lifting of restrictions was dependent on the situation of each country and the criteria of each Government. Likewise, the progress in vaccination rates varied significantly between countries as the supply of vaccines was subject to the individual negotiations carried out by each Government, monetary and fiscal support measures provided to companies and households, and the different pre-existing economic realities in each country.
Costa Rica
As a result of the pandemic, Costa Rica suffered a historic contraction in real GDP of 4.1% in 2020; a contraction not seen since 1982. On the other hand, this was less severe than the aggregate contraction of 6.9% for Latin American and the Caribbean. During 2021, inflation remained low throughout the year and interest rates decreased as a result of higher savings, increases in external finance for the government and lower policy rates. Preliminary estimates published by the central bank indicate that the 2021 GDP growth of 7.6%, well above the previous central bank forecast of 5.4% in October 2021 and above the IMF’s October 2021 WEO forecast of 3.9%. The vaccination process accelerated in the second half of 2021 and by year end 68.2% of the population was vaccinated, helping to reactivate spending and economic growth. In response to the pandemic, local authorities declared loan relief measures and flexible arrangements in the country, which were extended until March 2021. Inflation increased from 0.9% in December 2020 to 3.3% in December 2021, within the central bank’s target range of between 2.0% - 4.0%. Although inflation remains in the target range set by the monetary authority, in December the policy rate was raised from 0.75% to 1.25% as a prospective measure. The foreign exchange rate (CRC/USD) depreciated both in 2020 and 2021 by 7.1% and 4.5%, respectively. The recovery of the tourism industry, one of the main sources of foreign currency, was impacted in 2021 by new variants of Sars-Cov2 and intermittent sanitary restrictions implemented throughout the year. The IMF estimates the fiscal deficit will close at 6.4% in 2021, lower than both in 2020, 8.6%, and 2019, 6.8%. Costa Rica has entered an Extended Funding Facility arrangement with the IMF for 36 months, however challenges remain in the political arena as the approval of laws to which the government committed under the agreement have been delayed in the Legislative Assembly, in the midst of national elections during the first half of 2022.
56
El Salvador
In 2020, El Salvador suffered a contraction of 7.9% as a result of the pandemic as the government implemented stringent policies to control the spread of the virus. In contrast, during 2021 the country had a strong recovery in economic activity and according to the IMF’s Article IV January 2022 forecasts, GDP is expected to grow 10%, above its October 2021 growth forecast of 9.0%. The strong recovery is explained by record high income of remittances, strong external demand and sound management of the pandemic. The vaccination process advanced at a fast pace that allowed easing of sanitary restrictions. By the end of 2021, 63.8% of the population was fully vaccinated. The government extended special lending relief measures and flexible arrangements implemented in 2020 until March 2021. Inflation increased from -0.1% in in December 2020 to 6.1% in December 2021 impacted by global commodity price increases and supply chain issues, which heavily impacted the prices of food and transport categories. Average interest rates in the banking system remained relatively stable during 2021 however, financial risks increased. Moody’s downgraded El Salvador’s credit rating from B3 to Caa1 during 2021, maintaining a negative outlook and citing the country’s high levels of public debt. El Salvador faces two main challenges: implementing a structural fiscal adjustment and finding external financing to meet their obligations, in particular a debt payment of $800 million due January 2023. In addition, the IMF warned that the adoption of bitcoin as legal tender poses risks for financial stability, financial integrity, among others, and urged the government to reduce its scope by removing its legal tender status.
Guatemala
The GDP contraction of 1.5% experienced by Guatemala in 2020 was among the least severe in Latin America during 2020. For 2021, preliminary estimates of Banco de Guatemala, Guatemala’s Central Bank, expect growth of 7.5%, higher than the IMF’s October 2021 forecast of 5.5%. Compared to pre-pandemic levels, Guatemala is expected to register the highest GDP growth of all the Central American economies. The economic recovery of the US resulted in strong external demand for exports, which boosted the manufacturing sector, and a large increase in remittances sent by workers abroad. Like in other countries in the region, local financial authorities agreed to temporarily ease credit regulations in April 2020 to facilitate loan restructuring for borrowers economically affected by the pandemic; these temporary measures were gradually reduced since January 2021 and were completely phased out by May 2021. Additionally, prices of agricultural commodities have risen to historically high levels, improving market conditions for exports. However, vaccination has been slow in Guatemala, the country with the largest population of all the Central American countries. By the end of 2021 only 25.6% of the population is fully vaccinated. Despite being resilient to the economic impact of the pandemic, slow vaccination could result in new setbacks to economic activity for the country. Macroeconomic variables have remained stable. Inflation decreased in 2021 to 3.1%, which is the lower end of the range defined by the central bank of between 3.0% to 5.0%, down from 4.8% at year-end 2020. The Quetzal registered an annual appreciation of 1.0% by the end of 2021, helped by the recovery of the external sector.
Honduras
Honduras suffered a deep GDP contraction of 9.0% during 2020. While starting to recover from the first waves of the pandemic, the country was hit by two hurricanes in November 2020, affecting manufacturing in San Pedro Sula and the agricultural sector near the Caribbean coast. However, in 2021, according to preliminary estimates, the central bank expects a similarly steep economic recovery of 11.5%, compared to the IMF’s October 2021 estimates of 4.9%. The government implemented policies for supervised financial institutions to provide temporary relief for those affected by the pandemic until the end of 2020. The vaccination process accelerated during the second half of 2021, though levels remain relatively low at 42.7% of the population with full vaccination by the end of 2021. Inflation has increased gradually and closed 2021 at 5.3%, slightly above the range set by the central bank of between 3.0% and 5.0%. The increase in prices was impacted mainly by price increases in categories such as food and energy, in part related to the higher prices of commodities. The nominal exchange rate Lempira-US dollar remained stable over the last two years, with an appreciation of 1.9% on 2020 and a depreciation of 1.5% in 2021. Economic growth in 2021 was driven by the external sector due to strong external demand and favorable prices for agricultural commodities like coffee and palm oil as well as strong income flow from remittances. Despite the challenge of attending attend both emergencies, the IMF recognized the government’s efforts and commitment to macroeconomic stability and provided the country with external financing through its Stand-By Credit Facility program. During November 2021, Honduras held presidential elections, supervised by international observers and improved transparency.
Nicaragua
In 2020 Nicaragua’s GDP contracted by 2.0%, representing its third year of negative economic growth following the sociopolitical crisis that impacted growth in 2018 and 2019. The country’s response to the pandemic diverted from the rest of Central America as the government did not enforce stringent measures to mitigate the spread of the virus and the transparency of Covid-19 related data has been questioned as the country reported the least number of cases among Central American countries. The vaccination process started late compared to its Central American peers but gained pace in the last months of 2021, reporting 43.4% of the population fully vaccinated by year end. The superintendence of banks issued temporary regulations allowing financial institutions to negotiate flexible arrangements with borrowers including increasing maturities and moratoriums on payments for up to 6 months. These measures were extended until December 31, 2020. Political tensions have remained and during the presidential elections held in 2021, at least 6 opposition candidates or leaders were arrested and did not participate in the process, which was heavily criticized by international actors. The decline in democracy could lead to further international isolation of Nicaragua, and economic sanctions that would limit its ability to take advantage of the global economic recovery. Nevertheless, the economy is expected to grow 5.0% in 2021, according to the IMF’s October 2021 forecast. The main driver for growth was the global rebound in economic activity, which resulted in strong exports and higher income from remittances. Inflation increased from 2.9% in December 2020 to 7.2% in December 2021, the highest among Central American countries. Prices increases have been higher in the food and transport categories, affected by the global pattern of higher commodity prices. In 2021 interest rates have remained stable and public finances remain resilient, which resulted in a change in Fitch Ratings credit perspective for the country from Negative to Stable. Exchange rate policy continues to be managed according to a crawling peg system targeting 3.0% depreciation per year against the U.S. dollar.
57
Panamá
In 2020 Panama suffered the most severe contraction in GDP among Central American countries, -17.9%, heavily affected by lockdowns during the pandemic and halted international trade which affected the country’s income produced by the Panama Canal. However, the IMF forecasts a recovery in 2021 of 12.0%, although GDP is not expected to return to pre-pandemic levels until 2024. Panama’s recovery has been mainly supported by the external sector, with a strong recovery in demand for transport services, and thus Panama Canal income, and copper exports, that have been favored by rising metal prices. The vaccination process started quicky but reduced its pace later in the year. As of the end of 2021, 56.3% of the population was reported to be fully vaccinated. In response to the pandemic the government implemented relief measures for troubled borrowers including grace periods and flexible loan restructuring arrangements with financial intermediaries. Initially these measures were introduced until December 2020 but were later extended until September 2021. Panamá experienced price deflation during 2020, however this behavior was reversed in 2021 and inflation picked up gradually registering 2.6% annual inflation in December 2021. As part of the stimulus measures, Panama reached an agreement with the IMF to provide a Precautionary and Liquidity Line, as a precautionary measure to withstand external shocks and provide financial stability to the economy. Fitch recently changed Panama’s credit perspective from Negative to Stable, citing improvement in the fiscal position and better than expected economic recovery.
Critical Accounting Policies
Critical accounting policies are those that require us to exercise judgment or involve a higher degree of complexity in the application of the accounting policies that currently affect our financial condition and results of operations. The accounting estimates we make in these contexts require us to calculate variables and make assumptions about matters that are highly uncertain. In each case, if we had made other estimates, or if changes in the estimates occur from period to period, our financial condition and results of operations could be materially affected.
Significant accounting policies, including those affected by critical accounting estimates and judgements, are described in Note 3 of our audited consolidated financial statements. See Note 7 to our audited consolidated financial statements for the year ended December 31, 2020, for a complete list of the critical accounting judgments and estimates. There are many other areas in which we use estimates about uncertain matters, but we believe the reasonably likely effect of changed or different estimates would not be material to our financial statements.
The following are the critical accounting policies that have the most significant effects on the amounts recognized in our audited consolidated financial statements:
| · | Impairment of amortized cost financial assets and financial assets measured at fair value through other comprehensive income (FVOCI): the most significant judgments relate to establishing the criteria for determining whether credit risk on a financial asset has increased significantly since initial recognition, determining the methodology for incorporating forward-looking information into the measurement of ECL and selection and approval of models used to measure ECL. A high degree of uncertainty is involved in making estimations using assumptions that are highly subjective and very sensitive to the risk factors. See Note 5 of our audited consolidated financial statements for the year ended December 31, 2020. |
| · | Recognition of deferred tax assets: the most significant judgments relate to availability of future taxable profit against which carry-forward tax losses can be used. See Note 26 of our audited consolidated financial statements for the year ended December 31, 2020. |
| · | Fair value of financial instruments: a variety of valuation techniques are used, some of which are determined using significant unobservable inputs. See Note 10 of our audited consolidated financial statements for the year ended December 31, 2020. |
| · | Impairment testing for CGUs containing goodwill: a high degree of uncertainty is involved in estimating the recoverable amounts resulting from future cash flows of the cash-generating units (CGU) and discount rates. See Note 13 of our audited consolidated financial statements for the year ended December 31, 2020. |
58
Results of Operations for the Nine Months Ended September 30, 2021 Compared to the Nine Months Ended September 30, 2020
The following discussion describes the main drivers of BHI’s results of operations for the nine months ended September 30, 2021, compared to the nine months ended September 30, 2020, with MFG shown as a discontinued operation.
| BAC Holding International Corp. | |||||||
| For the period ended September 30, | Change 2021 vs 2020 | ||||||
| 2021 | 2020 | U.S.$ | % | ||||
| (in U.S.$ millions, except percentages) | |||||||
| Total interest income | 1,381.4 | 1,468.4 | (86.9) | (5.9) | |||
| Total interest expense | (457.8) | (502.3) | 44.4 | (8.8) | |||
| Interest income, net | 923.6 | 966.1 | (42.5) | (4.4) | |||
| Provision for loan and interest losses | (252.3) | (319.8) | 67.5 | (21.1) | |||
| Credit risk of investments and interest-bearing deposits | (3.6) | (15.3) | 11.8 | (76.8) | |||
| Provision for account receivable losses | (1.9) | (1.8) | (0.1) | 8.0 | |||
| Net impairment loss on financial assets | (257.8) | (336.9) | 79.1 | (23.5) | |||
| Interest income, net after provisions | 665.8 | 629.2 | 36.7 | 5.8 | |||
| Gains on financial instruments, net | 57.2 | 28.7 | 28.5 | 99.0 | |||
| Service charges | 295.8 | 292.4 | 3.4 | 1.2 | |||
| Commissions and other fees, net | 136.8 | 121.8 | 15.0 | 12.3 | |||
| Other income | 141.5 | 162.1 | (20.6) | (12.7) | |||
| Total general and administrative expenses | (884.3) | (874.2) | (10.1) | 1.2 | |||
| Income before income tax expense | 412.8 | 360.0 | 52.8 | 14.7 | |||
| Tax expense | (95.7) | (104.6) | 8.9 | (8.5) | |||
| Net income continued operations | 317.1 | 255.4 | 61.7 | 24.2 | |||
| Gains from discontinued activities, net of income tax | 17.3 | (1.3) | 18.6 | (1,439.9) | |||
| Net income for the year | 334.4 | 254.1 | 80.3 | 31.6 | |||
| Net income for the year attributable to: | |||||||
| Owners of the parent | 334.4 | 254.1 | 80.3 | 31.6 | |||
| Non-controlling interest | 0.0 | 0.0 | 0.0 | 28.8 | |||
Net interest income
Net interest income decreased 4.4% or U.S.$42.5 million to U.S.$923.6 million in the nine months ended September 30, 2021, compared to the same period in 2020. Total interest income decreased by 5.9% or U.S.$86.9 million, driven by a 112 basis point decrease in the average yield of interest-earning assets that was partially offset by a 7.2% or U.S.$1,527.4 million increase in average interest-earning assets. Interest expense decreased 8.8% or U.S.$44.4 million due to a 54 basis point decrease in the average rate paid for interest-bearing funding that was partially offset by 9.6% or U.S.$1,935.6 million increase in the average balance of interest-bearing funding. On an annualized basis, the interest spread between the average yield on gross loans and the average rate paid on interest-bearing deposits decreased by 55 basis points to 7.2% and, in turn, net interest margin contracted by 65 basis points to 5.4%.
| Average balance of interest-earning assets for the period ended September 30, | Change, 2021 vs. 2020 | Net interest margin for the period ended September 30, | Net interest income for the period ended September 30, | Change, 2021 vs. 2020 | ||||||||||||||
| 2021 | 2020 | U.S.$ | % | 2021 | 2020 | 2021 | 2020 | U.S.$ | % | |||||||||
| (in U.S.$ millions, except percentages) | ||||||||||||||||||
| 22,832.4 | 21,305.1 | 1,527.4 | 7.2 | 5.4% | 6.0% | 923.6 | 966.1 | (42.5) | (4.4) | |||||||||
The following tables show: (i) the average balance, average yield and interest income on interest-earning assets with an analysis of impacts derived from changes in the average balance and the average yield, per type of interest-earning asset; interest on deposits and investments in debt securities is shown separate from gross loans due to their characteristics and (ii) the average balance, average rate paid and interest expense on interest-bearing funding with an analysis of impacts derived from changes in the average balance and the average rate, per type of interest-bearing funding. Average balances are calculated based on monthly figures between December 2020 and September 2021 and between December 2019 and September 2020, excluding MFG from all points, and average yields and rates paid are annualized for analytical purposes.
59
| (i) | Average balance for the period ended September 30, | Change 2021 vs 2020 | Average yield for the period ended September 30, | Interest income for the period ended September 30, | Impact on interest income due to changes in | Change 2021 vs 2020 | |||||||||||||||||
| 2021 | 2020 | U.S.$ | % | 2021 | 2020 | 2021 | 2020 | Balance | Yield | Total | % | ||||||||||||
| (in U.S.$ millions, except percentages) | |||||||||||||||||||||||
| Corporate | 7,004.5 | 6,672.4 | 332.1 | 5.0 | 7.1% | 7.6% | 373.1 | 382.8 | 23.6 | (33.3) | (9.7) | (2.5) | |||||||||||
| Small Company | 768.7 | 775.7 | (7.0) | (0.9) | 0.8% | 0.9% | 4.5 | 5.5 | (0.1) | (0.9) | (1.0) | (18.0) | |||||||||||
| Mortgage | 3,475.7 | 3,384.0 | 91.8 | 2.7 | 8.1% | 8.4% | 211.4 | 212.8 | 7.4 | (8.8) | (1.3) | (0.6) | |||||||||||
| Personal | 2,037.9 | 2,041.7 | (3.8) | (0.2) | 10.2% | 10.4% | 156.6 | 158.6 | (0.4) | (1.6) | (2.0) | (1.3) | |||||||||||
| Vehicles | 901.9 | 854.1 | 47.8 | 5.6 | 7.9% | 8.0% | 53.6 | 51.5 | 3.8 | (1.7) | 2.0 | 4.0 | |||||||||||
| Credit Cards | 3,098.8 | 3,056.0 | 42.8 | 1.4 | 19.4% | 23.7% | 450.6 | 542.2 | 8.3 | (99.9) | (91.6) | (16.9) | |||||||||||
| Gross loans | 17,287.5 | 16,783.9 | 503.6 | 3.0 | 9.6% | 10.8% | 1,249.8 | 1,353.4 | 48.5 | (152.1) | (103.6) | (7.7) | |||||||||||
| Deposits in banks | 2,183.7 | 2,256.3 | (72.7) | (3.2) | 0.5% | 1.0% | 7.8 | 16.2 | (0.3) | (8.1) | (8.4) | (52.1) | |||||||||||
| Investments in debt securities | 3,361.3 | 2,264.9 | 1,096.4 | 48.4 | 4.9% | 5.8% | 123.9 | 98.7 | 53.9 | (28.7) | 25.1 | 25.5 | |||||||||||
| Total interest-earning assets | 22,832.4 | 21,305.1 | 1,527.4 | 7.2 | 8.1% | 9.2% | 1,381.4 | 1,468.4 | 123.2 | (210.1) | (86.9) | (5.9) | |||||||||||
| (ii) | Average balance for the period ended September 30, | Change 2021 vs 2020 | Average rate for the period ended September 30, | Interest expense for the period ended September 30, | Impact on interest expense due to changes in | Change 2021 vs 2020 | |||||||||||||||||
| 2021 | 2020 | U.S.$ | % | 2021 | 2020 | 2021 | 2020 | Balance | Yield | Total | % | ||||||||||||
| (in U.S.$ millions, except percentages) | |||||||||||||||||||||||
| Demand deposits | 6,652.8 | 5,401.7 | 1,251.1 | 23.2 | 0.8% | 1.0% | (41.4) | (41.9) | (10.4) | 10.9 | 0.5 | (1.2) | |||||||||||
| Savings deposits | 4,470.2 | 3,645.2 | 825.0 | 22.6 | 1.1% | 1.3% | (37.7) | (36.2) | (9.3) | 7.8 | (1.5) | 4.1 | |||||||||||
| Time deposits | 8,452.3 | 7,984.4 | 467.9 | 5.9 | 4.4% | 5.1% | (279.4) | (305.3) | (20.6) | 46.5 | 25.9 | (8.5) | |||||||||||
| Total interest-bearing deposits | 19,575.3 | 17,031.3 | 2,544.0 | 14.9 | 2.4% | 3.0% | (358.5) | (383.4) | (62.1) | 87.1 | 24.9 | (6.5) | |||||||||||
| Borrowings from banks and other | 1,592.6 | 2,365.0 | (772.4) | (32.7) | 3.6% | 4.3% | (42.5) | (76.8) | 27.5 | 6.8 | 34.3 | (44.6) | |||||||||||
| Bonds issued | 742.4 | 540.5 | 201.9 | 37.3 | 8.9% | 8.1% | (49.4) | (32.7) | (17.9) | 1.2 | (16.7) | 51.0 | |||||||||||
| Securities sold under repurchase agreements | 39.0 | 31.1 | 7.9 | 25.3 | 2.5% | 3.9% | (0.7) | (0.9) | (0.2) | 0.4 | 0.2 | (19.8) | |||||||||||
| Lease liabilities | 177.9 | 223.7 | (45.7) | (20.4) | 5.1% | 5.0% | (6.8) | (8.5) | 2.3 | (0.6) | 1.7 | (20.1) | |||||||||||
| Other funding | 2,551.9 | 3,160.4 | (608.4) | (19.3) | 5.2% | 5.0% | (99.4) | (118.9) | 31.6 | (12.1) | 19.5 | (16.4) | |||||||||||
| Total interest-bearing funding | 22,127.3 | 20,191.7 | 1,935.6 | 9.6 | 2.8% | 3.3% | (457.8) | (502.3) | (53.4) | 97.8 | 44.4 | (8.8) | |||||||||||
BHI’s average balance of gross loans increased 3.0% or U.S.$503.6 million in the nine-month period ended September 30, 2021, (7.1% or U.S.$1,193.2 million at closing balances), compared to a year earlier, with growth across all loan categories except small company loans and personal loans. Corporate, mortgage, vehicles, and credit card loans led average loan growth, while small company and personal loan average balances declined slightly. The average yield of gross loans was 9.6%, 111 basis points lower than in September 2020, as a result of declining average yields across loan categories in connection with the following two drivers. First, a decrease in financing needs through credit cards; although customer consumption in credit cards increased on a year-on-year, our customers also increased their month-end repayments, resulting in a decrease in interest income received due to outstanding credit balances. Additionally, introduction of interest rate caps in Costa Rica reduced the rates charge to customers with outstanding credit card balances. As a result, the average yield of credit cards decreased to 19.4% as of September 2021, 427 basis points lower than in September 2020. Secondly, abundant liquidity in Central America due to accommodative monetary policy which pushed rates down across the other loan categories.
BHI’s average balance of deposits in banks, which includes other short-term instruments such as repos and overnight instruments, decreased 3.2% or U.S.$72.7 million. Meanwhile, our average balance of investments in debt securities increased 48.4% or U.S.$1,096.4 million as a result of the increase in average balances of customer deposits discussed below.
With respect to total interest-bearing funding, BHI’s average balance increased 9.6% or U.S.$1,935.6 million in the nine-month period ended September 30, 2021, compared to a year earlier. This was driven primarily by an increase in the average balance of customer deposits of 14.9% or U.S.$2,544.0 million during the period. This can be explained by market factors as the general economic slowdown caused by the pandemic led customers to save and increase their liquidity deposited with BHI. Additionally, some corporate clients’ liquidity management measures led them to concentrate their excess liquidity at BHI’s subsidiaries. Part of the increase in deposit funding, was used to reduce the average balance of borrowings from banks which decreased by 32.7% or U.S.$772.4 million. The average rate paid on total interest-bearing funding was 2.8%, 56 basis points lower than for the period ended September 2020. This reduction in the average rate paid was a result of (i) the increase in lower cost funding from interest-bearing customer deposits, and (ii) the decrease in other funding sources which pay higher average rates.
60
Net impairment loss on financial assets
| Period ended September 30, | Change, 2021 vs. 2020 | ||||||
| 2021 | 2020 | U.S.$ | % | ||||
| (in U.S.$ millions, except percentages) | |||||||
| Provision for loan and interest losses | (252.3) | (319.8) | 67.5 | (21.1) | |||
| Credit risk of investments and interest-bearing deposits | (3.6) | (15.3) | 11.8 | (76.8) | |||
| Provision for account receivable losses | (1.9) | (1.8) | (0.1) | 8.0 | |||
| Net impairment loss on financial assets | (257.8) | (336.9) | 79.1 | (23.5) | |||
BHI’s net impairment loss on financial assets decreased U.S.$79.1 million or 23.5% to U.S.$257.8 million, driven by a U.S.$67.5 million decrease in impairment loss on loans to U.S.$252.3 million for the nine-month period ended September 30, 2021, compared to U.S.$319.8 million over the same period of 2020. The decrease in impairment loss on loans is mainly explained by a U.S.$52.3 million or 27.5% decrease in impairment loss on credit card loans. Impairment losses on small company, mortgage, and personal loans also decreased by U.S.$17.2 million on aggregate while losses on corporate and vehicle loans increased by U.S.$2.0 million on aggregate. Overall, the improved performance of impairment losses in the nine-month period of 2021 compared to 2020 is partly explained by the recovery of economic conditions in 2021 relative to 2020’s heightened pandemic-related uncertainty.
The following table provides detail by category of impairment loss on loans and cost of risk. The following financial data of BHI and its subsidiaries at September 30, 2021 and 2020 has been derived from our internal unaudited consolidated financial statements. Our historical results are not necessarily indicative of results to be expected for future periods. This financial data should be read in conjunction with our unaudited consolidated financial statements for September 30, 2021.
| Provision for loan and interest losses | Cost of risk for the period ended September 30, | Change, 2021 vs. 2020 | |||||||||||
| Period ended September 30, | Change, 2021 vs. 2020 | ||||||||||||
| 2021 | 2020 | U.S.$ | % | 2021 | 2020 | basis points | |||||||
| (in U.S.$ millions, except percentages and basis points) | |||||||||||||
| Corporate | 41.9 | 41.7 | 0.2 | 0.5 | 0.8% | 0.8% | (1) | ||||||
| Small Company | 11.7 | 14.1 | (2.4) | (17.0) | 2.0% | 2.4% | (39) | ||||||
| Mortgage | 18.2 | 25.9 | (7.8) | (30.0) | 0.7% | 1.0% | (32) | ||||||
| Personal | 29.8 | 36.8 | (7.0) | (19.0) | 2.0% | 2.5% | (44) | ||||||
| Vehicles | 12.7 | 10.9 | 1.8 | 16.3 | 1.7% | 1.6% | 13 | ||||||
| Credit Cards | 138.0 | 190.3 | (52.3) | (27.5) | 5.9% | 8.3% | (237) | ||||||
| Gross loans | 252.3 | 319.8 | (67.5) | (21.1) | 1.9% | 2.5% | (58) | ||||||
Cost of risk of total gross loans decreased by 58 basis points to 1.9% for the nine-month period ended September 30, 2021. This decrease occurred across all loan categories, except vehicles, and was led by credit cards, for which cost of risk decreased by 237 basis points to 5.9% at September 2021 as compared to a year earlier on an annualized basis. This decrease in cost of risk was mainly a result of improved asset quality in Guatemala, Honduras, El Salvador, Nicaragua, and Costa Rica. During 2020 BHI increased the loan loss allowance in all geographies due to COVID-19 relief actions. Loans that required extended relief periods in 2020 were categorized in Stage 2 as a precautionary measure. This transition resulted in a higher cost of risk in 2020. In 2021 only Panama (as instructed by the Panamanian regulators) continued the COVID-19 relief actions. As of September 2021, the administration has decided not to reclassify to Stage 1 the loans that needed extended reliefs, awaiting for the appropriate relief periods to complete.
At September 30, 2021, and compared to the same period in 2020, the composition of loans by Stages showed a transition across all loan categories, except credit cards, to Stage 2 which increased by U.S.$868.6 million to U.S.$2,805.5 million. This increase in Stage 2 loans was driven by increases of U.S.307.5 million in corporate, U.S.$97.6 million in small company, U.S.$325.5 million in mortgage, U.S.$59.3 million in personal and U.S.$106.1 million in vehicle loans and was partially offset by a decrease of U.S.$27.3 million in credit cards. The overall performance was driven by the extended loan reliefs in Panama described above.
For more information on loss allowance calculations and a description of PD risk categories under IFRS 9, please refer to Note 3 of our audited consolidated financial statements. The following tables show BHI’s gross loan classification by Stages in accordance with IFRS 9 at September 30, 2021, compared to September 30, 2020, and December 31, 2020, for analytical purposes.
61
| At September 30, | Change, 2021 vs. 2020 | |||||||||||||||||||||||
| 2021 | 2020 | Gross | ||||||||||||||||||||||
| Stage 1 | Stage 2 | Stage 3 | Gross loans | Stage 1 | Stage 2 | Stage 3 | Gross loans | Stage 1 | Stage 2 | Stage 3 | loans | |||||||||||||
| (in U.S.$ millions) | % | |||||||||||||||||||||||
| Corporate | 6,519.5 | 588.7 | 222.2 | 7,330.4 | 6,288.2 | 281.2 | 195.7 | 6,765.2 | 3.7 | 109.3 | 13.5 | 8.4 | ||||||||||||
| Small Company | 505.7 | 266.7 | 17.5 | 789.8 | 588.2 | 169.1 | 23.6 | 780.9 | (14.0) | 57.7 | (26.0) | 1.1 | ||||||||||||
| Mortgage | 2,546.0 | 893.3 | 159.0 | 3,598.3 | 2,775.1 | 567.8 | 113.3 | 3,456.3 | (8.3) | 57.3 | 40.3 | 4.1 | ||||||||||||
| Personal | 1,628.4 | 299.1 | 76.6 | 2,004.1 | 1,624.4 | 239.9 | 71.5 | 1,935.7 | 0.2 | 24.7 | 7.2 | 3.5 | ||||||||||||
| Vehicles | 785.5 | 222.9 | 15.3 | 1,023.6 | 785.7 | 116.8 | 8.5 | 911.0 | (0.0) | 90.9 | 80.2 | 12.4 | ||||||||||||
| Credit Cards | 2,470.2 | 534.8 | 267.6 | 3,272.6 | 2,153.1 | 562.1 | 261.2 | 2,976.5 | 14.7 | (4.9) | 2.4 | 9.9 | ||||||||||||
| Gross loans | 14,455.2 | 2,805.5 | 758.0 | 18,018.7 | 14,214.8 | 1,936.9 | 673.9 | 16,825.5 | 1.7 | 44.8 | 12.5 | 7.1 | ||||||||||||
| Corporate | 88.9% | 8.0% | 3.0% | 100.0% | 92.9% | 4.2% | 2.9% | 100.0% | ||||||||||||||||
| Small Company | 64.0% | 33.8% | 2.2% | 100.0% | 75.3% | 21.7% | 3.0% | 100.0% | ||||||||||||||||
| Mortgage | 70.8% | 24.8% | 4.4% | 100.0% | 80.3% | 16.4% | 3.3% | 100.0% | ||||||||||||||||
| Personal | 81.3% | 14.9% | 3.8% | 100.0% | 83.9% | 12.4% | 3.7% | 100.0% | ||||||||||||||||
| Vehicles | 76.7% | 21.8% | 1.5% | 100.0% | 86.3% | 12.8% | 0.9% | 100.0% | ||||||||||||||||
| Credit Cards | 75.5% | 16.3% | 8.2% | 100.0% | 72.3% | 18.9% | 8.8% | 100.0% | ||||||||||||||||
| Composition of gross loans per Stage | 80.2% | 15.6% | 4.2% | 100.0% | 84.5% | 11.5% | 4.0% | 100.0% | ||||||||||||||||
| At September 30, 2021 | At December 31, 2020 (1) | Change, 2021 vs. 2020 | ||||||||||||||||||||||
| Gross | ||||||||||||||||||||||||
| Stage 1 | Stage 2 | Stage 3 | Gross loans | Stage 1 | Stage 2 | Stage 3 | Gross loans | Stage 1 | Stage 2 | Stage 3 | loans | |||||||||||||
| (in U.S.$ millions) | % | |||||||||||||||||||||||
| Corporate | 6,519.5 | 588.7 | 222.2 | 7,330.4 | 6,168.3 | 498.3 | 210.3 | 6,877.0 | 5.7 | 18.1 | 5.6 | 6.6 | ||||||||||||
| Small Company | 505.7 | 266.7 | 17.5 | 789.8 | 542.5 | 219.1 | 19.9 | 781.5 | (6.8) | 21.7 | (12.2) | 1.1 | ||||||||||||
| Mortgage | 2,546.0 | 893.3 | 159.0 | 3,598.3 | 2,458.4 | 905.7 | 123.8 | 3,487.9 | 3.6 | (1.4) | 28.4 | 3.2 | ||||||||||||
| Personal | 1,628.4 | 299.1 | 76.6 | 2,004.1 | 1,527.0 | 341.3 | 70.6 | 1,938.9 | 6.6 | (12.4) | 8.5 | 3.4 | ||||||||||||
| Vehicles | 785.5 | 222.9 | 15.3 | 1,023.6 | 732.4 | 249.7 | 8.1 | 990.2 | 7.2 | (10.8) | 88.7 | 3.4 | ||||||||||||
| Credit Cards | 2,470.2 | 534.8 | 267.6 | 3,272.6 | 2,157.7 | 627.9 | 292.7 | 3,078.3 | 14.5 | (14.8) | (8.6) | 6.3 | ||||||||||||
| Gross loans | 14,455.2 | 2,805.5 | 758.0 | 18,018.7 | 13,586.3 | 2,842.0 | 725.4 | 17,153.7 | 6.4 | (1.3) | 4.5 | 5.0 | ||||||||||||
| Corporate | 88.9% | 8.0% | 3.0% | 100.0% | 89.7% | 7.2% | 3.1% | 100.0% | ||||||||||||||||
| Small Company | 64.0% | 33.8% | 2.2% | 100.0% | 69.4% | 28.0% | 2.5% | 100.0% | ||||||||||||||||
| Mortgage | 70.8% | 24.8% | 4.4% | 100.0% | 70.5% | 26.0% | 3.5% | 100.0% | ||||||||||||||||
| Personal | 81.3% | 14.9% | 3.8% | 100.0% | 78.8% | 17.6% | 3.6% | 100.0% | ||||||||||||||||
| Vehicles | 76.7% | 21.8% | 1.5% | 100.0% | 74.0% | 25.2% | 0.8% | 100.0% | ||||||||||||||||
| Credit Cards | 75.5% | 16.3% | 8.2% | 100.0% | 70.1% | 20.4% | 9.5% | 100.0% | ||||||||||||||||
| Composition of gross loans per Stage | 80.2% | 15.6% | 4.2% | 100.0% | 79.2% | 16.6% | 4.2% | 100.0% | ||||||||||||||||
| (1) | Figures at December 31, 2020, exclude MFG for analytical purposes. |
However, as compared to December 30, 2020, and adjusting for MFG, the loan portfolio by stages showed a slight improvement as Stage 2 loans represented 15.6% of gross loans at September 30, 2021, down from 16.6% at December 2020. This is explained by the reclassification of a significant portion of loans to Stage 2 between the third and fourth quarters of 2020, where Stage 2 loans increased by U.S.$905.1 million to U.S.$2,842.0 million at December 31, 2020, as compared to U.S.$1,936.9 million at September 30, 2020.
62
The following table shows the outstanding balances and status of loans that were relieved and under structural payment programs for BHI, as well as their proportion over each category of loans at the dates indicated.
| At September 30, 2021 | |||||||||||||||||||||
| Status of reliefs granted | Status of loans under structural payment programs | ||||||||||||||||||||
| Currently paying | Under payment holidays | Past due between 1 and 30 days | Past due between 31 and 90 days | Past due more than 90 days | Outstanding balances of loans that were relieved | Currently paying | Past due between 1 and 30 days | Past due between 31 and 90 days | Past due more than 90 days | Outstanding balances of loans under structural payment programs | |||||||||||
| (in U.S.$ millions) | |||||||||||||||||||||
| Corporate | 976.7 | 77.7 | 2.8 | 5.7 | 9.4 | 1,072.2 | 887.4 | 2.3 | 2.2 | 1.7 | 893.6 | ||||||||||
| As a % of Corporate | 13.3% | 1.1% | 0.0% | 0.1% | 0.1% | 14.6% | 12.1% | 0.0% | 0.0% | 0.0% | 12.2% | ||||||||||
| Small Company | 243.3 | 1.9 | 1.8 | 2.6 | 5.6 | 255.2 | 136.1 | 1.9 | 2.3 | 3.4 | 143.8 | ||||||||||
| As a % of Small Company | 30.8% | 0.2% | 0.2% | 0.3% | 0.7% | 32.3% | 17.2% | 0.2% | 0.3% | 0.4% | 18.2% | ||||||||||
| Mortgage | 1,280.7 | 129.3 | 26.8 | 23.1 | 44.3 | 1,504.2 | 526.3 | 18.5 | 14.3 | 12.9 | 572.0 | ||||||||||
| As a % of Mortgage | 35.6% | 3.6% | 0.7% | 0.6% | 1.2% | 41.8% | 14.6% | 0.5% | 0.4% | 0.4% | 15.9% | ||||||||||
| Personal | 268.2 | 57.4 | 10.1 | 12.2 | 19.0 | 366.8 | 107.1 | 2.5 | 5.1 | 3.1 | 117.8 | ||||||||||
| As a % of Personal | 13.4% | 2.9% | 0.5% | 0.6% | 0.9% | 18.3% | 5.3% | 0.1% | 0.3% | 0.2% | 5.9% | ||||||||||
| Vehicles | 248.1 | 43.2 | 7.8 | 7.4 | 1.6 | 308.0 | 107.9 | 4.7 | 6.3 | 2.3 | 121.3 | ||||||||||
| As a % of Vehicles | 24.2% | 4.2% | 0.8% | 0.7% | 0.2% | 30.1% | 10.5% | 0.5% | 0.6% | 0.2% | 11.8% | ||||||||||
| Credit Cards | 942.6 | 175.2 | 41.9 | 43.4 | 27.8 | 1,230.9 | 241.7 | 36.8 | 49.1 | 50.1 | 377.7 | ||||||||||
| As a % of Credit Cards | 28.8% | 5.4% | 1.3% | 1.3% | 0.8% | 37.6% | 7.4% | 1.1% | 1.5% | 1.5% | 11.5% | ||||||||||
| Gross loans | 3,959.5 | 484.7 | 91.1 | 94.3 | 107.6 | 4,737.3 | 2,006.4 | 66.8 | 79.3 | 73.6 | 2,226.1 | ||||||||||
| As a % of gross loans | 22.0% | 2.7% | 0.5% | 0.5% | 0.6% | 26.3% | 11.1% | 0.4% | 0.4% | 0.4% | 12.4% | ||||||||||
| At September 30, 2020 | |||||||||||||||||||||
| Status of reliefs granted | Status of loans under structural payment programs | ||||||||||||||||||||
| Currently paying | Under payment holidays | Past due between 1 and 30 days | Past due between 31 and 90 days | Past due more than 90 days | Outstanding balances of loans that were relieved | Currently paying | Past due between 1 and 30 days | Past due between 31 and 90 days | Past due more than 90 days | Outstanding balances of loans under structural payment programs | |||||||||||
| (in U.S.$ millions) | |||||||||||||||||||||
| Corporate | 6.3 | 1,016.3 | 5.7 | 0.1 | 0.3 | 1,028.8 | 1,196.9 | 4.5 | 1.8 | 1.5 | 1,204.8 | ||||||||||
| As a % of Corporate | 0.1% | 15.0% | 0.1% | 0.0% | 0.0% | 15.2% | 17.7% | 0.1% | 0.0% | 0.0% | 17.8% | ||||||||||
| Small Company | 348.8 | 79.2 | 22.8 | 11.0 | 7.7 | 469.5 | 49.3 | 6.2 | 1.5 | 0.6 | 57.6 | ||||||||||
| As a % of Small Company | 44.7% | 10.1% | 2.9% | 1.4% | 1.0% | 60.1% | 6.3% | 0.8% | 0.2% | 0.1% | 7.4% | ||||||||||
| Mortgage | 1,331.6 | 512.0 | 58.3 | 39.6 | 32.5 | 1,973.9 | 152.1 | 18.7 | 3.4 | 2.0 | 176.1 | ||||||||||
| As a % of Mortgage | 38.5% | 14.8% | 1.7% | 1.1% | 0.9% | 57.1% | 4.4% | 0.5% | 0.1% | 0.1% | 5.1% | ||||||||||
| Personal | 416.5 | 84.7 | 24.3 | 26.2 | 18.9 | 570.6 | 82.9 | 3.7 | 1.6 | 1.4 | 89.5 | ||||||||||
| As a % of Personal | 21.5% | 4.4% | 1.3% | 1.4% | 1.0% | 29.5% | 4.3% | 0.2% | 0.1% | 0.1% | 4.6% | ||||||||||
| Vehicles | 282.1 | 151.1 | 18.8 | 10.8 | 5.3 | 468.0 | 51.0 | 4.8 | 1.3 | 0.1 | 57.3 | ||||||||||
| As a % of Vehicles | 31.0% | 16.6% | 2.1% | 1.2% | 0.6% | 51.4% | 5.6% | 0.5% | 0.1% | 0.0% | 6.3% | ||||||||||
| Credit Cards | 1,002.3 | 284.4 | 72.8 | 93.3 | 83.1 | 1,535.9 | 218.9 | 25.3 | 13.2 | 2.9 | 260.4 | ||||||||||
| As a % of Credit Cards | 33.7% | 9.6% | 2.4% | 3.1% | 2.8% | 51.6% | 7.4% | 0.9% | 0.4% | 0.1% | 8.7% | ||||||||||
| Gross loans | 3,387.6 | 2,127.8 | 202.6 | 181.0 | 147.8 | 6,046.8 | 1,751.0 | 63.2 | 22.7 | 8.6 | 1,845.6 | ||||||||||
| As a % of gross loans | 20.1% | 12.6% | 1.2% | 1.1% | 0.9% | 35.9% | 10.4% | 0.4% | 0.1% | 0.1% | 11.0% | ||||||||||
63
The following table shows the balance of loans past due at least 91 days past due, delinquency ratios, charge-offs and charge-offs as a percentage of average gross loans for BHI.
| Loans at least 91 days past due | Delinquency ratio (1) At September, 30 | Change, 2021 vs. 2020 | |||||||||||
| At September, 30 | Change, 2021 vs. 2020 | ||||||||||||
| 2021 | 2020 | U.S.$ | % | 2021 | 2020 | basis points | |||||||
| (in U.S.$ millions, except percentages and basis points) | |||||||||||||
| Corporate | 37.4 | 70.9 | (33.5) | (47.2) | 0.5% | 1.0% | (54) | ||||||
| Small Company | 13.8 | 20.5 | (6.7) | (32.7) | 1.7% | 2.6% | (88) | ||||||
| Mortgage | 75.0 | 82.3 | (7.3) | (8.9) | 2.1% | 2.4% | (30) | ||||||
| Personal | 37.6 | 34.0 | 3.6 | 10.7 | 1.9% | 1.8% | 12 | ||||||
| Vehicles | 9.4 | 7.4 | 2.0 | 27.1 | 0.9% | 0.8% | 11 | ||||||
| Credit Cards | 85.5 | 71.2 | 14.4 | 20.2 | 2.6% | 2.4% | 22 | ||||||
| Gross loans | 258.7 | 286.2 | (27.5) | (9.6) | 1.4% | 1.7% | (27) | ||||||
| Charge-offs | Charge-offs as a percentage of average gross loans | Change, 2021 vs. 2020 | |||||||||||
| At September, 30 | Change, 2021 vs. 2020 | ||||||||||||
| 2021 | 2020 | U.S.$ | % | 2021 | 2020 | basis points | |||||||
| (in U.S.$ millions, except percentages and basis points) | |||||||||||||
| Corporate | 48.2 | 9.2 | 39.0 | 421.3 | 0.7% | 0.1% | 55 | ||||||
| Small Company | 13.0 | 10.5 | 2.6 | 24.4 | 1.7% | 1.4% | 34 | ||||||
| Mortgage | 10.0 | 24.2 | (14.2) | (58.7) | 0.3% | 0.7% | (43) | ||||||
| Personal | 44.3 | 48.6 | (4.3) | (8.8) | 2.2% | 2.4% | (20) | ||||||
| Vehicles | 16.8 | 13.8 | 3.0 | 21.5 | 1.9% | 1.6% | 24 | ||||||
| Credit Cards | 222.6 | 163.7 | 58.8 | 35.9 | 7.2% | 5.4% | 182 | ||||||
| Total charge-offs | 354.9 | 270.0 | 84.9 | 31.4 | 2.1% | 1.6% | 44 | ||||||
| (1) | Calculated as loans past due more than 90 days divided by gross loans |
Delinquency coverage ratio for gross loans, as measured by loss allowance divided by past due gross loans more than 90 days was 248.9% in September 2021 and 212.8% in September 2020.
Service charges and Commissions and other fees, net
| Period ended September 30, | Change, 2021 vs. 2020 | ||||||
| 2021 | 2020 | U.S.$ | % | ||||
| (in U.S.$ millions, except percentages) | |||||||
| Service charges | |||||||
| Consumer and Corporate Banking Services | 275.2 | 275.0 | 0.2 | 0.1 | |||
| Asset Management | 15.5 | 13.1 | 2.5 | 18.9 | |||
| Investment Banking Services | 5.1 | 4.4 | 0.7 | 16.4 | |||
| Total Service charges | 295.8 | 292.4 | 3.4 | 1.2 | |||
| Commissions and other fees, net | |||||||
| Interchange and merchant fees, income | 449.3 | 363.4 | 85.9 | 23.6 | |||
| Credit Card's membership fees | 15.1 | 15.4 | (0.3) | (2.0) | |||
| Income from commissions and fees | 464.4 | 378.8 | 85.6 | 22.6 | |||
| Expenses from commissions and fees | (327.6) | (257.0) | (70.6) | 27.5 | |||
| Commissions and other fees, net | 136.8 | 121.8 | 15.0 | 12.3 | |||
In the normal course of business BHI’s subsidiaries provide a variety of services to its clients including consumer and corporate banking services, asset management, and investment banking services which generate recurring income from service charges. Service charges increased 1.2% or U.S.$3.4 million in the nine-month period ended September 30, 2021, relative to the same period in 2020.
Through its cards business the company generates fee and commission income from credit card membership fees and interchange and merchant fees related to our regional payment and POS network. Income from commissions and fees increased 22.6% or U.S.$85.6 million, mainly driven by a 23.6% or U.S.$85.9 million increase in interchange and merchant fees, which in turn was primarily explained by a 27.4% or U.S.$70.4 million increase in merchant fees and a 20.5% or U.S.$14.1 million increase in interchange credit card income. This performance was largely a result of the gradual recovery in the number of point-of-sale (POS) transactions associated with the waning effects from lockdowns imposed in 2020. This increase in transactions also explains the increase in expenses associated to commissions and fees of 27.5% or U.S.$70.6 million. Overall, commissions and other fees, net, increased 12.3% or U.S.$15.0 million in the nine-month period ended September 30,2021, compared to the same period in 2020.
64
Total income from investment securities
BHI’s securities portfolio is classified in the following categories: (i) equity and fixed income investments at fair value through profit and loss (FVPL), (ii) fixed income investments at fair value through other comprehensive income (FVOCI), and (iii) fixed income investments at amortized cost (AC). Interest income from (ii) and (iii) are included in net interest income as interest income on investments in debt securities while unrealized and realized gains from sales of investments at FVPL and FVOCI are included in net gain (loss) on financial instruments on the income statement. BHI manages its investment portfolio in a comprehensive and integral manner that considers the individual return of each one of these three categories and the total return of the investment securities portfolio.
Total income from investment securities for BHI (comprised of interest income on investments in debt securities and net gain (loss) on financial instruments) increased 42.0%, or U.S.$53.6 million, to U.S.$181.1 million for the nine-month period ended September 30, 2021, compared to the same period in 2020. This was driven by a U.S.$28.5 million increase in net gain (loss) from financial instruments to U.S.$57.2 million and a U.S.$25.1 million increase in interest income on investments in debt securities, discussed above in net interest income, to U.S.$123.9 million in the nine-month period ended September 30, 2021.
Other income
| Period ended September 30, | Change, 2021 vs. 2020 | ||||||
| 2021 | 2020 | U.S.$ | % | ||||
| (in U.S.$ millions, except percentages) | |||||||
| Gain on foreign currency exchange, net | 101.5 | 125.0 | (23.5) | (18.8) | |||
| Other income from associates | 0.9 | 0.8 | 0.1 | 14.6 | |||
| Gain (loss) on the sale of assets held for sale | 6.1 | 2.4 | 3.7 | 149.6 | |||
| Impairment of assets held for sale | (0.2) | (0.1) | (0.2) | 254.3 | |||
| Gain on sale of property, plant and equipment | 0.6 | 0.0 | 0.6 | 1,573.3 | |||
| Services to affiliates | 19.9 | 18.5 | 1.4 | 7.6 | |||
| Commercial recoveries | 3.8 | 4.2 | (0.4) | (9.5) | |||
| Other non-banking commissions | 6.1 | 6.0 | 0.1 | 1.7 | |||
| Rentals | 1.4 | 2.1 | (0.7) | (33.3) | |||
| Visa Stocks | — | — | — | N.A. | |||
| Other | 1.4 | 3.1 | (1.6) | (53.9) | |||
| Other income | 141.5 | 162.1 | (20.6) | (12.7) | |||
Other income decreased 12.7% or U.S.$20.6 million to U.S.$141.5 million through the 9-month period ended September 30, 2021, mainly as a result of a U.S.$23.5 million decrease in gains on foreign currency exchange, net, to U.S.$101.5 million. This decrease was partially offset by a U.S.$3.5 million increase in gains on the sale of non-current assets held for sale, among others.
General and administrative expenses
| Period ended September 30, | Change, 2021 vs. 2020 | ||||||
| 2021 | 2020 | U.S.$ | % | ||||
| (in U.S.$ millions, except percentages) | |||||||
| Salaries and employee benefits | (379.0) | (396.6) | 17.6 | (4.4) | |||
| Depreciation and amortization | (88.0) | (94.8) | 6.8 | (7.2) | |||
| Administrative | (59.0) | (56.6) | (2.4) | 4.3 | |||
| Occupancy and related expenses | (23.0) | (25.8) | 2.8 | (10.8) | |||
| Credit card franchises | (72.3) | (55.4) | (16.9) | 30.5 | |||
| Taxes other than income tax | (62.8) | (52.2) | (10.6) | 20.3 | |||
| Computer software and licenses maintenance | (32.8) | (28.2) | (4.6) | 16.4 | |||
| Advertising and marketing | (23.2) | (17.6) | (5.5) | 31.4 | |||
| Equipment and vehicle maintenance | (19.1) | (17.8) | (1.3) | 7.1 | |||
| Armored services | (14.8) | (14.0) | (0.8) | 5.9 | |||
| Guarantee deposits | (13.4) | (11.0) | (2.4) | 21.5 | |||
| Bank licenses | (12.6) | (10.7) | (1.9) | 17.4 | |||
| Security services | (10.1) | (10.7) | 0.7 | (6.1) | |||
| Dedicated lines | (8.3) | (8.3) | (0.1) | 0.9 | |||
| Telephone service | (8.1) | (9.4) | 1.3 | (13.3) | |||
| Operational losses | (6.0) | (6.8) | 0.8 | (11.3) | |||
| Municipal taxes and patents | (4.8) | (5.0) | 0.3 | (5.4) | |||
| Postage and courier | (2.6) | (2.4) | (0.2) | 6.8 | |||
| Office supplies | (3.6) | (5.3) | 1.7 | (32.2) | |||
| Per diem expenses | (2.9) | (3.2) | 0.3 | (8.9) | |||
| Other | (37.9) | (42.4) | 4.4 | (10.4) | |||
| Total general and administrative expenses | (884.3) | (874.2) | (10.1) | 1.2 | |||
65
Total general and administrative expenses increased 1.2% or U.S.$10.1 million to U.S.$884.3 million, led by a 30.5% or U.S.$16.9 million increase in credit card franchise expense related to the increase in customer transactions and interchange and merchant fees, a 20.3% or U.S.$10.6 million increase in taxes (other than income tax), and a 31.4% or U.S.$5.5 million increase in advertising and marketing expense, partially offset by a 4.4% or U.S.$17.6 million decrease in salaries and employee benefits and a 7.2% or U.S.$6.8 million decrease in depreciation and amortization.
Given that general and administrative expenses increased by 1.2% and total income before net impairment losses on financial assets (defined as the sum of net interest income, net gain (loss) on financial instruments, service charges, net income from commissions and fees, and other income) decreased by 1.0%, the cost to income efficiency ratio increased to 56.9% for the nine-month period ended September 30, 2021, from 55.6% in the same period of 2020. The ratio of general and administrative expenses, on an annualized basis, as a percentage of average assets improved by 24 basis points to 4.2% compared to the same period in 2020.
Tax expense
Income tax expense for BHI decreased by 8.5%, or U.S.$8.9 million, to U.S.$95.7 million in the nine-month period ended September 30, 2021, compared to the same period in 2020. BHI’s effective tax rate, calculated as income tax expense divided by income before income tax expense was 23.2% in the nine-month period ended September 30, 2021, and 29.1% in the same period of 2020. The reduction in the effective tax rate was mainly the result of the growth of the Company reinsurance business which has a lower tax rate.
Net income attributable to non-controlling interest
Net income attributable to non-controlling interest is not significant for BHI.
Net income (loss) from discontinued operations
Net income (loss) from discontinued operations primarily reflects MFG’s net income recognized by BHI, which increased to a U.S.$17.3 million gain for the nine-month period ended September 30, 2021, as compared to a U.S.$1.3 million loss for the same period in 2020. Part of this improvement is explained by the fact that BHI accounted for nine months of net income from MFG for the nine-month period ended September 30, 2021, as compared to only five months in the same period in 2020.
66
Results of Operations for the Year Ended December 31, 2020 Compared to the Year Ended December 31, 2019
The following discussion describes the main drivers of BHI’s results of operations for the year ended December 31, 2020 compared to the year ended December 31, 2019.
| BAC Holding International Corp. | |||||||
| For the year ended December 31, | Change 2020 vs 2019 | ||||||
| 2020 | 2019 | U.S.$ | % | ||||
| (in U.S.$ millions, except percentages) | |||||||
| Total interest income | 2,074.8 | 1,955.5 | 119.3 | 6.1 | |||
| Total interest expense | (739.0) | (657.1) | (81.9) | 12.5 | |||
| Interest income, net | 1,335.7 | 1,298.4 | 37.3 | 2.9 | |||
| Provision for loan and interest losses | (486.4) | (380.1) | (106.3) | 28.0 | |||
| Credit risk of investments and interest-bearing deposits | (18.4) | (2.9) | (15.5) | 535.6 | |||
| Provision for account receivable losses | (2.8) | (1.5) | (1.2) | 79.7 | |||
| Net impairment loss on financial assets | (507.6) | (384.5) | (123.1) | 32.0 | |||
| Interest income, net after provisions | 828.1 | 913.9 | (85.7) | (9.4) | |||
| Gains on financial instruments, net | 48.2 | 16.5 | 31.7 | 192.8 | |||
| Service charges | 404.2 | 474.5 | (70.3) | (14.8) | |||
| Commissions and other fees, net | 178.1 | 213.3 | (35.2) | (16.5) | |||
| Other income | 221.5 | 140.6 | 80.8 | 57.5 | |||
| Total general and administrative expenses | (1,234.4) | (1,211.4) | (23.0) | 1.9 | |||
| Income before income tax expense | 445.7 | 547.4 | (101.7) | (18.6) | |||
| Tax expense | (134.8) | (145.4) | 10.7 | (7.4) | |||
| Net income continued operations | 310.9 | 402.0 | (91.0) | (22.7) | |||
| Gains from discontinued activities, net of income tax | — | — | — | N.A. | |||
| Net income for the year | 310.9 | 402.0 | (91.1) | (22.7) | |||
| Net income for the year attributable to: | |||||||
| Owners of the parent | 310.8 | 402.0 | (91.1) | (22.7) | |||
| Non-controlling interest | 0.1 | 0.0 | 0.0 | 86.0 | |||
Net interest income
Net interest income increased 2.9% or U.S.$37.3 million to U.S.$1,335.7 million in 2020. Total interest income increased 6.1% or U.S.$119.3 million, driven by a 21.7% or U.S.$4,334.0 million increase in average interest-earning assets that was partially offset by a 126 basis points decrease in the average yield of interest-earning assets. Interest expense increased 12.5% or U.S.$81.9 million, resulting from a 23.6% or U.S.$4,369.0 million increase in the average balance of interest-bearing funding that was partially offset by a 32 basis point reduction in the interest rate paid on interest-bearing funding. Yields and rates paid were pressured downwards by a declining benchmark interest rate and high liquidity environment. The interest spread between the average yield on gross loans and the average rate paid on interest-bearing deposits decreased by 73 basis points to 7.2%, in this falling interest rate environment. In turn, net interest margin contracted by 101 basis points to 5.5%.
Average balance of interest-earning assets for the year ended December 31, | Change, 2020 vs. 2019 | Net interest margin for the year ended December 31, | Net interest income for the year ended December 31, | Change, 2020 vs. 2019 | ||||||||||||||
| 2020 | 2019 | USD | % | 2020 | 2019 | 2020 | 2019 | USD | % | |||||||||
| (in U.S.$ millions, except percentages) | ||||||||||||||||||
| 24,264.2 | 19,930.1 | 4,334.0 | 21.7 | 5.5% | 6.5% | 1,335.7 | 1,298.4 | 37.3 | 2.9 | |||||||||
The following tables show: (i) the average balance, average yield and interest income on interest-earning assets with an analysis of impacts derived from changes in the average balance and the average yield, per type of interest-earning asset; interbank and overnight funds are shown separate from gross loans due to their characteristics and short-term nature and (ii) the average balance, average rate paid and interest expense on interest-bearing funding with an analysis of impacts derived from changes in the average balance and the average rate, per type of interest-bearing funding.
67
| (i) | Average balance for the year ended December 31, | Change 2020 vs 2019 | Average yield for the year ended December 31, | Interest income for the year ended December 31, | Impact on interest income due to changes in | Change 2020 vs 2019 | |||||||||||||||||
| 2020 | 2019 | U.S.$ | % | 2020 | 2019 | 2020 | 2019 | Balance | Yield | Total | % | ||||||||||||
| (in U.S.$ millions, except percentages) | |||||||||||||||||||||||
| Corporate | 8,415.7 | 6,823.2 | 1,592.6 | 23.3 | 6.9% | 7.3% | 576.6 | 497.9 | 109.1 | (30.5) | 78.6 | 15.8 | |||||||||||
| Small Company | 95.9 | 109.0 | (13.2) | (12.1) | 7.5% | 8.3% | 7.2 | 9.1 | (1.0) | (0.9) | (1.9) | (20.7) | |||||||||||
| Mortgage | 3,818.0 | 3,291.0 | 527.0 | 16.0 | 7.9% | 9.0% | 300.5 | 295.4 | 41.5 | (36.3) | 5.1 | 1.7 | |||||||||||
| Personal | 2,286.8 | 2,092.5 | 194.3 | 9.3 | 9.9% | 10.9% | 227.5 | 228.1 | 19.3 | (19.9) | (0.6) | (0.2) | |||||||||||
| Vehicles | 1,056.6 | 881.5 | 175.1 | 19.9 | 8.0% | 8.3% | 84.4 | 73.1 | 14.0 | (2.7) | 11.3 | 15.4 | |||||||||||
| Credit Cards | 3,080.7 | 3,025.0 | 55.6 | 1.8 | 23.0% | 23.2% | 709.8 | 702.9 | 12.8 | (6.0) | 6.9 | 1.0 | |||||||||||
| Gross loans | 18,753.7 | 16,222.2 | 2,531.4 | 15.6 | 10.2% | 11.1% | 1,906.0 | 1,806.6 | 257.3 | (157.8) | 99.5 | 5.5 | |||||||||||
| Deposits in banks | 2,422.3 | 1,628.7 | 793.5 | 48.7 | 0.7% | 2.9% | 17.9 | 47.3 | 5.9 | (35.3) | (29.5) | (62.3) | |||||||||||
| Investments in debt securities | 3,088.2 | 2,079.2 | 1,009.1 | 48.5 | 4.9% | 4.9% | 150.9 | 101.6 | 49.3 | (0.0) | 49.3 | 48.5 | |||||||||||
| Total interest-earning assets | 24,264.2 | 19,930.1 | 4,334.0 | 21.7 | 8.6% | 9.8% | 2,074.8 | 1,955.5 | 370.6 | (251.3) | 119.3 | 6.1 | |||||||||||
| (ii) | Average balance for the year ended December 31, | Change 2020 vs 2019 | Average rate for the year ended December 31, | Interest expense for the period ended December 31, | Impact on interest expense due to changes in | Change 2020 vs 2019 | |||||||||||||||||
| 2020 | 2019 | U.S.$ | % | 2020 | 2019 | 2020 | 2019 | Balance | Rate | Total | % | ||||||||||||
| (in U.S.$ millions, except percentages) | |||||||||||||||||||||||
| Demand deposits | 5,712.4 | 4,612.4 | 1,100.0 | 23.8 | 1.0% | 0.9% | (58.5) | (40.9) | (11.3) | (6.3) | (17.6) | 43.0 | |||||||||||
| Savings deposits | 3,985.7 | 3,118.9 | 866.8 | 27.8 | 1.3% | 1.4% | (52.4) | (43.0) | (11.4) | 2.0 | (9.4) | 21.8 | |||||||||||
| Time deposits | 9,361.3 | 7,450.9 | 1,910.4 | 25.6 | 4.8% | 5.3% | (446.0) | (396.9) | (91.0) | 41.9 | (49.1) | 12.4 | |||||||||||
| Total interest-bearing deposits | 19,059.4 | 15,182.3 | 3,877.2 | 25.5 | 2.9% | 3.2% | (556.8) | (480.8) | (113.3) | 37.2 | (76.1) | 15.8 | |||||||||||
| Borrowings from banks and other | 2,661.7 | 2,775.4 | (113.8) | (4.1) | 3.9% | 5.1% | (102.8) | (141.8) | 4.4 | 34.6 | 39.0 | (27.5) | |||||||||||
| Bonds issued | 901.3 | 321.4 | 579.9 | 180.4 | 7.5% | 6.3% | (67.4) | (20.1) | (43.4) | (3.9) | (47.3) | 235.0 | |||||||||||
| Securities sold under repurchase agreements | 51.3 | 43.2 | 8.1 | 18.7 | 0.3% | 5.7% | (0.2) | (2.5) | (0.0) | 2.3 | 2.3 | (93.5) | |||||||||||
| Lease liabilities | 230.2 | 212.6 | 17.6 | 8.3 | 5.1% | 5.6% | (11.8) | (11.9) | (0.9) | 1.0 | 0.1 | (1.0) | |||||||||||
| Other funding | 3,844.5 | 3,352.7 | 491.8 | 14.7 | 4.7% | 5.3% | (182.2) | (176.4) | (23.3) | 17.4 | (5.9) | 3.3 | |||||||||||
| Total interest-bearing funding | 22,903.9 | 18,535.0 | 4,369.0 | 23.6 | 3.2% | 3.5% | (739.0) | (657.1) | (141.0) | 59.0 | (81.9) | 12.5 | |||||||||||
BHI’s average balance of gross loans increased 15.6% or U.S.$2,531.4 million in 2020 with growth across all loan categories except small company loans. The average yield of gross loans was 10.2%, 97 basis points lower than in 2019. MFG’s contribution to BHI’s average balance of gross loans was U.S.$1,947.1 million in 2020 (U.S.$3,200.5 million on closing balances). Organic growth for BHI’s average balance of gross loans was 3.6% or U.S.$584.4 million.
BHI’s commercial strategy over the year focused on shifting the gross loan mix toward less risky products and segments, especially in credit cards, for which the end of period balance decreased 4.0% or U.S.$130.4 million. The main drivers for the decrease in yields and rates paid were (i) regulatory interest rate caps introduced in Costa Rica, (ii) repricing pressed by the reductions in LIBOR rates, (iii) the aforementioned shift in underwriting towards lower credit risk segments and products and increased pricing competition in these segments and products, that resulted in a lower average yield on gross loans, and (iv) the effect of reliefs on interest income using the effective interest rate method. The average 3-month LIBOR contracted by 168 basis points to 0.65% in 2020 from 2.33% in 2019. The end of period 3-month LIBOR contracted by 167 basis points to 0.24% from 1.91%, respectively.
BHI’s average balances of deposits in banks increased 48.7% or U.S.$793.5 million and investments in debt securities increased 48.5% or U.S.$1,009.1 million in 2020. MFG’s contribution to BHI’s average balance of (i) interest-earning deposits was U.S.$89.3 million (U.S.$119.6 million on closing balances), and (ii) investments in debt securities was U.S.$686.8 million (U.S.$1,053.6 million on closing balances). Organic growth for BHI’s average balance of interest-earning deposits and interest-earning investments in debt securities was 43.2% or U.S.$704.3 million and 15.5% or U.S.$322.3 million, respectively.
BHI’s portfolio strategy focused on increasing the exposure to Central American public debt and to some extent in corporate and sovereign global issuers. During the market recovery between May and December 2020, BHI was able to realize a significant portion of gains on fixed income investments at FVOCI (recognized on the income statement as net gain (loss) on financial instruments). The increase in average balances of deposits in banks as compared to 2019 is explained partly by this profit-taking strategy but also by a strategic decision to increase the liquidity position to weather the heightened pandemic-related uncertainty of 2020. Overall, the increase in customer deposits and investments in debt securities is directly related to the increase in customer deposits discussed below.
Finally, with respect to total interest-bearing funding, BHI’s average balance increased 23.6% or U.S.$4,369.0 million in 2020 and the average rate paid was 3.2%, 32 basis points lower than in 2019. MFG’s contribution to BHI’s average balance of total interest-bearing funding was U.S.$2,351.7 million (U.S.$3,709.2 million on closing balances). Organic growth for BHI’s average balance of interest-bearing funding was 10.9% or U.S.$2,017.2 million.
68
The increase in average balance of interest-bearing funding is driven mainly by an increase in interest-bearing customer deposits of 25.5% or U.S.$3,877.2 million (of which MFG contributed U.S.$1,619.1 million). The increase in deposits is explained in part by market factors as the lockdowns caused by the pandemic led customers to save, thus increasing their balance of deposits. Additionally, BHI benefited from a perceived trend of flight to quality as customers concentrated their deposits with our subsidiaries. MFG’s contribution to the average balance of interest-bearing funding mix is higher on time deposits (U.S.$1,323.2 million), borrowings from banks and others (U.S.$386.0 million) and bonds (U.S.$311.6 million), that despite paying higher rates than savings and checking accounts, pay lower rates in Panama as compared to funding in other countries across the region. The increase in the average balance of bonds issued is mainly explained by MFG’s contribution and the issuance of a U.S.$520.0 million additional tier 1 (hybrid) instrument by BAC International Bank Inc., which was purchased in full by Grupo Aval Limited. For more information on this and other transactions with related parties see Section 13. “Certain Relationships and Related Party Transactions”.
Net impairment loss on financial assets
| Year ended December 31, | Change, 2020 vs. 2019 | ||||||
| 2020 | 2019 | U.S.$ | % | ||||
| (in U.S.$ millions, except percentages) | |||||||
| Provision for loan and interest losses | (486.4) | (380.1) | (106.3) | 28.0 | |||
| Credit risk of investments and interest-bearing deposits | (18.4) | (2.9) | (15.5) | 535.6 | |||
| Provision for account receivable losses | (2.8) | (1.5) | (1.2) | 79.7 | |||
| Net impairment loss on financial assets | (507.6) | (384.5) | (123.1) | 32.0 | |||
BHI’s net impairment loss on financial assets increased 32.0% or U.S.$123.1 million, driven by the deterioration of the loan portfolio’s ECL, in line with the outlook of asset quality deterioration resulting from the economic impacts of lockdowns on borrowers’ current and future credit risk. MFG contributed with U.S.$37.4 million to this increase. For more information regarding risk management measures implemented during 2020 in relation to COVID-19 please see Section 10. “Quantitative and Qualitative Disclosures About Risk”.
The U.S.$15.5 million increase in impairment (loss) on investments, of which MFG contributed U.S.$2.8 million, was driven by a deterioration in the credit rating outlook for fixed income investments in public debt of Central American countries, mainly Costa Rica, El Salvador and Panamá.
The following table provides detail by category of impairment loss on gross loans and cost of risk. The following financial data of BHI at December 31, 2020 and 2019 and for the years ended December 31, 2020 and 2019 have been derived from our audited consolidated financial statements prepared in accordance with IFRS, included in this information statement. Our historical results are not necessarily indicative of results to be expected for future periods. This financial data should be read in conjunction with our audited consolidated financial statements.
| Provision for loan and interest losses | Cost of risk for the | Change, | |||||||||||
| Year ended December 31, | Change, 2020 vs. 2019 | year ended December 31, | 2020 vs. 2019 | ||||||||||
| 2020 | 2019 | U.S.$ | % | 2020 | 2019 | basis points | |||||||
| (in U.S.$ millions, except percentages and basis points) | |||||||||||||
| Corporate | 73.6 | 34.0 | 39.6 | 116.4 | 0.9% | 0.5% | 37 | ||||||
| Small Company | 19.5 | 13.5 | 6.0 | 44.3 | 2.4% | 1.8% | 62 | ||||||
| Mortgage | 52.8 | 34.2 | 18.6 | 54.4 | 1.4% | 1.0% | 36 | ||||||
| Personal | 52.0 | 79.0 | (27.0) | (34.2) | 2.4% | 3.9% | (151) | ||||||
| Vehicles | 24.3 | 15.8 | 8.5 | 53.8 | 2.2% | 1.7% | 54 | ||||||
| Credit Cards | 264.1 | 203.5 | 60.6 | 29.8 | 8.6% | 6.7% | 186 | ||||||
| Gross loans | 486.4 | 380.1 | 106.3 | 28.0 | 2.6% | 2.3% | 27 | ||||||
BHI’s cost of risk increased across all categories of loans, except personal loans, driven by the transition of loans to Stage 2 and reclassification to higher risk categories, in general. In 2019 cost of risk in personal loans was atypically high due to a weak performance in non-public and independent-worker segments. At December 31, 2020, the balance of Stage 2 loans had increased over 2.0 times or U.S.$2,311.3 million to U.S.$3,422.9 million from U.S.$1,111.5 million a year earlier, with MFG contributing U.S.$580.9 million of Stage 2 loans.
In the corporate category, Stage 2 loans increased U.S.$343.7 million to U.S.$508.2 million, with MFG contributing U.S.$9.8 million. Small company Stage 2 loans increased U.S.$156.8 million to U.S.$247.0 million with MFG contributing U.S.$9.8 million. The overall performance in these two categories was driven by a deterioration in industries such as hospitality, tourism, entertainment, and to a lesser extent, retail. Personal Stage 2 loans increased U.S.$237.4 million to U.S.$397.9 million, with MFG contributing U.S.$56.6 million. Vehicle Stage 2 loans increased U.S.$293.4 million to U.S.$386.5 million with MFG contributing U.S.$136.7 million. In mortgages, Stage 2 loans increased U.S.$898.9 million to U.S.$1,224.8 million, with MFG contributing U.S.$319.1 million. The overall performance was driven by a deterioration in Panama and Costa Rica. Loans with an active relief during the fourth quarter were classified in Stage 2 across all Central America. Credit Card Stage 2 loans increased U.S.$381.2 million to U.S.$658.5 million, with MFG contributing U.S.$30.6 million. The overall performance was driven by extended reliefs, mainly in Panama. MFG contributed U.S.$2,481.6 million of Stage 1 gross loans, U.S.$580.9 million of Stage 2 loans and U.S.$138.0 million of Stage 3 loans at December 31, 2020.
69
For more information on loss allowance calculations and a description of PD risk categories under IFRS 9, please refer to Note 3 of our audited consolidated financial statements. The following table shows BHI’s gross loan classification by Stages in accordance with IFRS 9 (interbank and overnight funds are not included as they tend to be mostly Stage 1 and with low loss allowance due to their characteristics and short-term nature).
| At December 31, | Change, 2020 vs. 2019 | |||||||||||||||||||||||
| 2020 | 2019 | Gross | ||||||||||||||||||||||
| Stage 1 | Stage 2 | Stage 3 | Gross loans | Stage 1 | Stage 2 | Stage 3 | Gross loans | Stage 1 | Stage 2 | Stage 3 | loans | |||||||||||||
| (in U.S.$ millions) | % | |||||||||||||||||||||||
| Corporate | 7,708.8 | 508.2 | 329.1 | 8,546.1 | 6,160.8 | 164.4 | 148.6 | 6,473.8 | 25.1 | 209.0 | 121.5 | 32.0 | ||||||||||||
| Small Company | 588.3 | 247.0 | 23.3 | 858.5 | 662.5 | 90.3 | 16.7 | 769.5 | (11.2) | 173.7 | 38.9 | 11.6 | ||||||||||||
| Mortgage | 2,832.5 | 1,224.8 | 133.4 | 4,190.7 | 2,949.9 | 326.0 | 108.3 | 3,384.1 | (4.0) | 275.8 | 23.2 | 23.8 | ||||||||||||
| Personal | 1,879.0 | 397.9 | 74.2 | 2,351.1 | 1,799.9 | 160.5 | 44.3 | 2,004.8 | 4.4 | 147.9 | 67.4 | 17.3 | ||||||||||||
| Vehicles | 880.0 | 386.5 | 9.7 | 1,276.2 | 838.4 | 93.1 | 10.1 | 941.5 | 5.0 | 315.2 | (3.5) | 35.5 | ||||||||||||
| Credit Cards | 2,179.2 | 658.5 | 293.8 | 3,131.5 | 2,739.3 | 277.3 | 245.3 | 3,261.9 | (20.4) | 137.5 | 19.8 | (4.0) | ||||||||||||
| Gross loans | 16,067.9 | 3,422.9 | 863.5 | 20,354.2 | 15,150.8 | 1,111.5 | 573.2 | 16,835.6 | 6.1 | 207.9 | 50.6 | 20.9 | ||||||||||||
| Corporate | 90.2% | 5.9% | 3.9% | 100.0% | 95.2% | 2.5% | 2.3% | 100.0% | ||||||||||||||||
| Small Company | 68.5% | 28.8% | 2.7% | 100.0% | 86.1% | 11.7% | 2.2% | 100.0% | ||||||||||||||||
| Mortgage | 67.6% | 29.2% | 3.2% | 100.0% | 87.2% | 9.6% | 3.2% | 100.0% | ||||||||||||||||
| Personal | 79.9% | 16.9% | 3.2% | 100.0% | 89.8% | 8.0% | 2.2% | 100.0% | ||||||||||||||||
| Vehicles | 69.0% | 30.3% | 0.8% | 100.0% | 89.0% | 9.9% | 1.1% | 100.0% | ||||||||||||||||
| Credit Cards | 69.6% | 21.0% | 9.4% | 100.0% | 84.0% | 8.5% | 7.5% | 100.0% | ||||||||||||||||
| Composition of gross loans per Stage | 78.9% | 16.8% | 4.2% | 100.0% | 90.0% | 6.6% | 3.4% | 100.0% | ||||||||||||||||
At December 31, 2020, asset quality measured by loans at least 91 days past due divided by total gross loans deteriorated 19 basis points to 1.7% as compared to a year earlier. Increase in delinquency was milder than the transitions in stages as reliefs were still in place at year-end, particularly due to regulation in Panamá, and included payment holidays and extensions, some of which expired during the first half of 2021. At December 31, 2020, BHI had 9.5% of its gross loans under payment holidays and 7.3% under structural payment programs. Loans past due more than 30 days that had benefited either from payment holidays or were restructured represented 1.8% of gross loans or 6.3% of loans that had active payment schedules. Loans past due more than 90 days that had benefited either from payment holidays or were restructured represented 0.8% of our gross loans or 2.7% of loans that had active payment schedules. The following table shows the outstanding balances and status of loans that were relieved and under structural payment programs for BHI, as well as their proportion over each category of loans at the date indicated.
| At December 31, 2020 | |||||||||||||||||||||
| Status of reliefs granted | Status of loans under structural payment programs | ||||||||||||||||||||
| Currently paying | Under payment holidays | Past due between 1 and 30 days | Past due between 31 and 90 days | Past due more than 90 days | Outstanding balances of loans that were relieved | Currently paying | Past due between 1 and 30 days | Past due between 31 and 90 days | Past due more than 90 days | Outstanding balances of loans under structural payment programs | |||||||||||
| (in U.S.$ millions) | |||||||||||||||||||||
| Corporate | 654.5 | 827.9 | 87.0 | 0.2 | 1.6 | 1,571.2 | 864.3 | 3.2 | 1.3 | 1.1 | 869.8 | ||||||||||
| As a % of Corporate | 7.7% | 9.7% | 1.0% | 0.0% | 0.0% | 18.4% | 10.1% | 0.0% | 0.0% | 0.0% | 10.2% | ||||||||||
| Small Company | 311.0 | 75.0 | 25.4 | 9.3 | 6.4 | 427.1 | 39.8 | 5.0 | 1.2 | 0.5 | 46.5 | ||||||||||
| As a % of Small Company | 36.2% | 8.7% | 3.0% | 1.1% | 0.7% | 49.7% | 4.6% | 0.6% | 0.1% | 0.1% | 5.4% | ||||||||||
| Mortgage | 1,581.3 | 511.3 | 152.9 | 45.3 | 33.8 | 2,324.6 | 151.2 | 18.6 | 3.4 | 2.0 | 175.1 | ||||||||||
| As a % of Mortgage | 37.7% | 12.2% | 3.6% | 1.1% | 0.8% | 55.5% | 3.6% | 0.4% | 0.1% | 0.0% | 4.2% | ||||||||||
| Personal | 404.0 | 73.7 | 31.1 | 24.2 | 16.8 | 549.9 | 71.7 | 3.2 | 1.4 | 1.2 | 77.5 | ||||||||||
| As a % of Personal | 17.2% | 3.1% | 1.3% | 1.0% | 0.7% | 23.4% | 3.1% | 0.1% | 0.1% | 0.1% | 3.3% | ||||||||||
| Vehicles | 425.5 | 152.6 | 44.8 | 13.8 | 6.9 | 643.7 | 51.3 | 4.9 | 1.3 | 0.1 | 57.7 | ||||||||||
| As a % of Vehicles | 33.3% | 12.0% | 3.5% | 1.1% | 0.5% | 50.4% | 4.0% | 0.4% | 0.1% | 0.0% | 4.5% | ||||||||||
| Credit Cards | 1,063.3 | 291.1 | 76.2 | 96.3 | 86.0 | 1,612.8 | 224.4 | 25.9 | 13.5 | 3.0 | 266.8 | ||||||||||
| As a % of Credit Cards | 34.0% | 9.3% | 2.4% | 3.1% | 2.7% | 51.5% | 7.2% | 0.8% | 0.4% | 0.1% | 8.5% | ||||||||||
| Gross loans | 4,439.7 | 1,931.6 | 417.4 | 189.1 | 151.5 | 7,129.2 | 1,402.7 | 60.7 | 22.0 | 7.9 | 1,493.3 | ||||||||||
| As a % of gross loans | 21.8% | 9.5% | 2.1% | 0.9% | 0.7% | 35.0% | 6.9% | 0.3% | 0.1% | 0.0% | 7.3% | ||||||||||
70
The following table shows the balance of loans past due at least 91 days past due, delinquency ratios, charge-offs and charge-offs as a percentage of average gross loans for BHI.
| Loans at least 91 days past due | Delinquency ratio (1) | Change, 2020 | |||||||||||
| At December 31, | Change, 2020 vs. 2019 | at December 31, | vs. 2019 | ||||||||||
| 2020 | 2019 | U.S.$ | % | 2020 | 2019 | basis points | |||||||
| (in U.S.$ millions, except percentages and basis points) | |||||||||||||
| Corporate | 107.5 | 25.7 | 81.8 | 317.7 | 1.3% | 0.4% | 86 | ||||||
| Small Company | 19.1 | 14.8 | 4.3 | 29.4 | 2.2% | 1.9% | 31 | ||||||
| Mortgage | 89.9 | 90.0 | (0.1) | (0.1) | 2.1% | 2.7% | (51) | ||||||
| Personal | 35.5 | 37.3 | (1.8) | (4.9) | 1.5% | 1.9% | (35) | ||||||
| Vehicles | 8.5 | 8.8 | (0.3) | (3.5) | 0.7% | 0.9% | (27) | ||||||
| Credit Cards | 89.5 | 80.7 | 8.8 | 10.9 | 2.9% | 2.5% | 38 | ||||||
| Gross loans | 349.9 | 257.2 | 92.7 | 36.0 | 1.7% | 1.5% | 19 | ||||||
| Charge-offs | Charge-offs as a percentage | Change, 2020 | |||||||||||
| At December 31, | Change, 2020 vs. 2019 | of average gross loans | vs. 2019 | ||||||||||
| 2020 | 2019 | U.S.$ | % | 2020 | 2019 | basis points | |||||||
| (in U.S.$ millions, except percentages and basis points) | |||||||||||||
| Corporate | 15.9 | 24.3 | (8.5) | (34.8) | 0.2% | 0.4% | (19) | ||||||
| Small Company | 18.0 | 17.7 | 0.4 | 2.1 | 2.2% | 2.3% | (11) | ||||||
| Mortgage | 30.4 | 23.6 | 6.8 | 28.6 | 0.8% | 0.7% | 8 | ||||||
| Personal | 67.6 | 98.7 | (31.2) | (31.6) | 3.0% | 4.7% | (176) | ||||||
| Vehicles | 20.7 | 19.6 | 1.1 | 5.6 | 2.0% | 2.2% | (27) | ||||||
| Credit Cards | 232.8 | 281.3 | (48.6) | (17.3) | 7.6% | 9.3% | (174) | ||||||
| Total charge-offs | 385.4 | 465.3 | (80.0) | (17.2) | 1.7% | 2.3% | (56) | ||||||
| (1) | Calculated as loans past due more than 90 days divided by gross loans. |
Delinquency coverage ratio for gross loans, as measured by loss allowance divided by past due gross loans more than 90 days was 195.1% in 2020 and 196.0% in 2019. In 2020, MFG contributed U.S.$55.6 million to the balance of loans at least 91 days past due, which were composed of U.S.$38.5 million of corporate loans, U.S.$10.0 million of mortgages, U.S.$2.8 million of personal loans, U.S.$2.0 million of small company loans, U.S.$1.5 million of vehicle loans and U.S.$0.8 million from credit cards. The delinquency in corporate loans was largely due the Avianca Group exposure, which amounted to U.S.$30.6 million with 64.6% allowance coverage at December 31, 2020. Charge-offs were impacted by the relief programs implemented across the region in 2020 as they temporarily reduced past due loan formation and halted charge-offs that would normally be applied according to thresholds for days past due as set out in BHI subsidiaries’ policies.
Service Charges and Commissions and other fees, net
| Year ended December 31, | Change, 2020 vs. 2019 | ||||||
| 2020 | 2019 | U.S.$ | % | ||||
| (in U.S.$ millions, except percentages) | |||||||
| Service charges | |||||||
| Consumer and Corporate Banking Services | 379.4 | 449.2 | (69.8) | (15.5) | |||
| Asset Management | 18.2 | 18.8 | (0.6) | (3.2) | |||
| Investment Banking Services | 6.5 | 6.5 | 0.0 | 0.4 | |||
| Total Service charges | 404.2 | 474.5 | (70.3) | (14.8) | |||
| Commissions and other fees, net | |||||||
| Interchange and merchant fees, income | 516.8 | 640.2 | (123.4) | (19.3) | |||
| Credit Card's membership fees | 21.8 | 21.4 | 0.4 | 1.7 | |||
| Income from commissions and fees | 538.6 | 661.6 | (123.1) | (18.6) | |||
| Expenses from commissions and fees | (360.4) | (448.3) | 87.8 | (19.6) | |||
| Commissions and other fees, net | 178.1 | 213.3 | (35.2) | (16.5) | |||
Service charges decreased 14.8% or U.S.$70.3 million in 2020 led by consumer and corporate banking services which decreased 15.5% or U.S.$69.8 million. The main drivers for this decrease were (i) lower transaction volumes on our branch network, especially during the second and third quarters of the year, when a large portion of our distribution network remained closed due to strict lockdowns, (ii) lower bancassurance income in 2020 due to a contraction in retail originations and (iii) the implementation of temporary waivers on ATM withdrawals to support our clients.
Similarly, commissions and other fees, net, decreased 16.5% or U.S.$35.2 million, negatively impacted by the effects of lockdowns. Interchange and merchant fees were the main driver of this result, contracting 19.3% or U.S.$123.4 million, impacted by COVID lockdowns, as well as commission caps established by recent legislation for the acquirer business in Costa Rica. These effects were softened progressively as lockdowns were lifted and our borrowers’ demand began to recover. Expenses from commissions and fees decreased 19.6% or U.S.$87.8 million, driven by lower transaction volumes as a result of sanitary restrictions and lockdowns.
71
Total income from investment securities
BHI’s securities portfolio is classified in the following categories: (i) equity and fixed income investments at fair value through profit and loss (FVPL), (ii) fixed income investments at fair value through other comprehensive income (FVOCI), and (iii) fixed income investments at amortized cost (AC). Interest income from (ii) and (iii) are included in net interest income as interest income on investments in debt securities while unrealized and realized gains from sales of investments at FVPL and FVOCI are included in net gain (loss) on financial instruments on the income statement. BHI manages its investment portfolio in a comprehensive and integral manner that considers the individual return of each one of these three categories and the total return of the investment securities portfolio.
Total income from investment securities for BHI (comprised of interest income on investments in debt securities and net gain (loss) on financial instruments) increased 68.6% or U.S.$81.0 million to U.S.$199.1 million in 2020, of which MFG contributed U.S.$20.4 million. Interest income from investments in debt securities increased 48.5% or U.S.$49.3 million (of which MFG contributed U.S.$12.3 million) and was driven by growth in our investment portfolio as a result of customer deposit growth. Net gain (loss) on financial instruments increased 192.8% or U.S.$31.7 (of which MFG contributed U.S.$8.2 million) as BHI was able take advantage of market conditions during 2020 to realize profits on the sale of fixed income investments.
Other income
| Year ended December 31, | Change, 2020 vs. 2019 | ||||||
| 2020 | 2019 | U.S.$ | % | ||||
| (in U.S.$ millions, except percentages) | |||||||
| Gain on foreign currency exchange, net | 167.1 | 81.7 | 85.4 | 104.4 | |||
| Other income from associates | 3.7 | 0.8 | 2.9 | 388.3 | |||
| Gain (loss) on the sale of assets held for sale | 4.3 | 4.6 | (0.3) | (7.3) | |||
| Impairment of assets held for sale | (0.3) | 2.3 | (2.6) | (111.7) | |||
| Gain on sale of property, plant and equipment | 0.1 | 0.1 | (0.0) | (18.2) | |||
| Services to affiliates | 22.3 | 17.8 | 4.5 | 25.3 | |||
| Commercial recoveries | 8.3 | 3.5 | 4.8 | 136.6 | |||
| Other non-banking commissions | 7.7 | 6.6 | 1.1 | 16.9 | |||
| Rentals | 3.5 | 2.5 | 1.0 | 39.3 | |||
| Visa Stocks | — | 5.5 | (5.5) | (100.0) | |||
| Other | 4.9 | 15.2 | (10.4) | (68.1) | |||
| Other income | 221.5 | 140.6 | 80.8 | 57.5 | |||
Other income increased 57.5% or U.S.$80.8 million to U.S.$221.5 million in 2020, mainly as a result of a U.S.$85.4 million increase in gains on foreign currency exchange, net, to U.S.$167.1 million, derived from the depreciation of the Central American currencies (mainly the Costa Rican Colón) against the U.S. dollar. Of the total increase in other income in 2020, MFG contributed U.S.$4.1 million mainly due to dividend income and commercial recoveries. In 2019, the bank realized a one-time gain of U.S.$5.5 million from the sale of equity positions in Visa that were acquired in 2013 through the acquisition of Banco Reformador de Guatemala.
General and administrative expenses
| Year ended December 31, | Change, 2020 vs. 2019 | ||||||
| 2020 | 2019 | U.S.$ | % | ||||
| (in U.S.$ millions, except percentages) | |||||||
| Salaries and employee benefits | (547.9) | (539.9) | (8.0) | 1.5 | |||
| Depreciation and amortization | (135.2) | (125.7) | (9.4) | 7.5 | |||
| Administrative | (85.6) | (79.2) | (6.4) | 8.1 | |||
| Occupancy and related expenses | (36.1) | (34.1) | (2.0) | 5.9 | |||
| Credit card franchises | (75.7) | (86.0) | 10.3 | (12.0) | |||
| Taxes other than income tax | (73.5) | (49.4) | (24.0) | 48.6 | |||
| Computer software and licenses maintenance | (45.6) | (34.7) | (10.9) | 31.5 | |||
| Advertising and marketing | (26.9) | (49.9) | 22.9 | (46.0) | |||
| Equipment and vehicle maintenance | (26.9) | (24.9) | (2.0) | 8.0 | |||
| Armored services | (19.1) | (18.7) | (0.4) | 1.9 | |||
| Guarantee deposits | (14.9) | (13.9) | (1.0) | 7.2 | |||
| Bank licenses | (15.5) | (13.7) | (1.7) | 12.6 | |||
| Security services | (14.6) | (13.4) | (1.2) | 8.6 | |||
| Dedicated lines | (12.3) | (11.3) | (1.0) | 9.3 | |||
| Telephone service | (12.6) | (13.5) | 0.9 | (6.9) | |||
| Operational losses | (11.9) | (9.0) | (2.9) | 32.3 | |||
| Municipal taxes and patents | (7.2) | (6.4) | (0.8) | 12.3 | |||
| Postage and courier | (5.4) | (4.3) | (1.1) | 26.0 | |||
| Office supplies | (6.8) | (7.8) | 1.1 | (13.7) | |||
| Per diem expenses | (4.3) | (9.6) | 5.3 | (55.2) | |||
| Other | (56.6) | (65.9) | 9.3 | (14.1) | |||
| Total general and administrative expenses | (1,234.4) | (1,211.4) | (23.0) | 1.9 | |||
72
Total general and administrative expenses increased 1.9% or U.S.$23.0 million to U.S.$1,234.4 million, led by a 48.6% or U.S.$24.0 increase in taxes other than income tax, a 31.5% or U.S.$10.9 million increase in computer software and licenses, a 7.5% or U.S.$9.4 million increase in depreciation and amortization, a 1.5%, or U.S.$8.0 million increase in salaries and employee benefits and an 8.1% or U.S.$6.4 million increase in administrative expenses. Credit card Franchises fees decrease 12.0% or U.S.$10.3 million and advertising and marketing expenses decreased 46.0% or U.S.$22.9 million. MFG contributed with U.S.$58.6 million to general and administrative expenses, mainly from U.S.$28.3 million in salaries and employee benefits and U.S.$7.6 million in depreciation and amortization expense. Excluding MFG, BHI decreased its total general and administrative expenses by 2.9% or U.S.$35.6 million in response to the pandemic realizing efficiencies in marketing and advertising expense and salaries among other categories.
Given that general and administrative expenses increased by 1.9% and total income before net impairment losses on financial assets (defined as the sum of net interest income, net gain (loss) on financial instruments, service charges, net income from commissions and fees, and other income) increased by 2.1%, the cost to income efficiency ratio decreased to 56.4% in 2020 from 56.5% in 2019. The ratio of general and administrative expenses as a percentage of average assets improved by 78 basis points to 4.2% compared to 2019.
Tax expense
Income tax expense for BHI decreased 7.4% or U.S.$10.7 million (of which MFG contributed U.S.$3.0 million) to U.S.$134.8 million in 2020. BHI’s effective tax rate, calculated as income tax expense divided by income before income tax expense, was 30.2% in 2020 and 26.6% in 2019.
Net income attributable to non-controlling interest
Net income attributable to non-controlling interest is not significant for BAC Holding.
73
Results of Operations for the Year Ended December 31, 2019 Compared to the Year Ended December 31, 2018
The following discussion describes the main drivers of BAC Holding’s results of operations for the year ended December 31, 2019 compared to the year ended December 31, 2018.
| BAC Holding International Corp. | |||||||
| For the year ended December 31, | Change 2019 vs 2018 | ||||||
| 2019 | 2018 | U.S.$ | % | ||||
| (in U.S.$ millions, except percentages) | |||||||
| Total interest income | 1,955.5 | 1,844.1 | 111.4 | 6.0 | |||
| Total interest expense | (657.1) | (626.3) | (30.8) | 4.9 | |||
| Interest income, net | 1,298.4 | 1,217.8 | 80.6 | 6.6 | |||
| Provision for loan and interest losses | (380.1) | (374.2) | (5.9) | 1.6 | |||
| Credit risk of investments and interest-bearing deposits | (2.9) | (2.1) | (0.8) | 35.4 | |||
| Provision for account receivable losses | (1.5) | (0.6) | (0.9) | 146.6 | |||
| Net impairment loss on financial assets | (384.5) | (377.0) | (7.6) | 2.0 | |||
| Interest income, net after provisions | 913.9 | 840.8 | 73.1 | 8.7 | |||
| Gains on financial instruments, net | 16.5 | (0.9) | 17.4 | (1,884.8) | |||
| Service charges | 474.5 | 448.1 | 26.4 | 5.9 | |||
| Commissions and other fees, net | 213.3 | 200.1 | 13.3 | 6.6 | |||
| Other income | 140.6 | 206.7 | (66.1) | (32.0) | |||
| Total general and administrative expenses | (1,211.4) | (1,141.0) | (70.4) | 6.2 | |||
| Income before income tax expense | 547.4 | 553.6 | (6.2) | (1.1) | |||
| Tax expense | (145.4) | (166.4) | 20.9 | (12.6) | |||
| Net income continued operations | 402.0 | 387.2 | 14.7 | 3.8 | |||
| Gains from discontinued activities, net of income tax | — | 3.6 | (3.6) | (100.0) | |||
| Net income for the year | 402.0 | 390.8 | 11.2 | 2.9 | |||
| Net income for the year attributable to: | |||||||
| Owners of the parent | 401.9 | 390.8 | 11.2 | 2.9 | |||
| Non-controlling interest | 0.0 | 0.0 | (0.0) | (4.4) | |||
Net interest income
Net interest income grew by 6.6% or U.S.$80.6 million to U.S.$1,298.4 million in 2019 compared to 2018. Total interest income increased by 6.0% or U.S.$111.4 million driven by a 3.5% or U.S.$682.5 million increase in average interest-earning assets. Interest expense increased 4.9% or U.S.$30.8 million, resulting from a 3.3% or U.S.$587.4 million increase in average interest-bearing funding.
Overall, average yields on interest-earning assets increased by 23 basis points to 6.5% and average rates paid on interest-bearing liabilities remained relatively stable at 3.5%. In turn, net interest margin expanded by 19 basis points to 6.5%.
Average balance of interest-earning assets for the year ended December 31, | Change, 2019 vs. 2018 | Net interest margin for the year ended December 31, | Net interest income for the year ended December 31, | Change, 2019 vs. 2018 | ||||||||||||||
| 2019 | 2018 | USD | % | 2019 | 2018 | 2019 | 2018 | USD | % | |||||||||
| (in U.S.$ millions, except percentages) | ||||||||||||||||||
| 19,930.1 | 19,247.7 | 682.5 | 3.5 | 6.5% | 6.3% | 1,298.4 | 1,217.8 | 80.6 | 6.6 | |||||||||
The following tables show: (i) the average balance, average yield and interest income on interest-earning assets with an analysis of impacts derived from changes in the average balance and the average yield, per type of interest-earning asset; interbank and overnight funds are shown separate from gross loans due to their characteristics and short-term nature and (ii) the average balance, average rate paid and interest expense on interest-bearing funding with an analysis of impacts derived from changes in the average balance and the average rate, per type of interest-bearing funding.
74
| (i) | Average balance for the year ended December 31, | Change 2019 vs 2018 | Average yield for the year ended December 31, | Interest income for the year ended December 31, | Impact on interest income due to changes in | Change 2019 vs 2018 | |||||||||||||||||
| 2019 | 2018 | U.S.$ | % | 2019 | 2018 | 2019 | 2018 | Balance | Yield | Total | % | ||||||||||||
| (in U.S.$ millions, except percentages) | |||||||||||||||||||||||
| Corporate | 6,173.2 | 5,964.9 | 208.3 | 3.5 | 8.1% | 7.9% | 497.9 | 470.3 | 16.8 | 10.8 | 27.6 | 5.9 | |||||||||||
| Small Company | 759.0 | 680.6 | 78.4 | 11.5 | 1.2% | 0.0% | 9.1 | — | 0.9 | 8.1 | 9.1 | N.A. | |||||||||||
| Mortgage | 3,291.0 | 3,196.4 | 94.6 | 3.0 | 9.0% | 8.9% | 295.4 | 284.1 | 8.5 | 2.8 | 11.3 | 4.0 | |||||||||||
| Personal | 2,092.5 | 2,125.2 | (32.7) | (1.5) | 10.9% | 11.7% | 228.1 | 247.6 | (3.6) | (16.0) | (19.6) | (7.9) | |||||||||||
| Vehicles | 881.5 | 921.8 | (40.3) | (4.4) | 8.3% | 8.0% | 73.1 | 74.0 | (3.3) | 2.5 | (0.9) | (1.2) | |||||||||||
| Credit Cards | 3,025.0 | 2,820.9 | 204.1 | 7.2 | 23.2% | 23.4% | 702.9 | 659.6 | 47.4 | (4.1) | 43.3 | 6.6 | |||||||||||
| Gross loans | 16,222.2 | 15,709.9 | 512.3 | 3.3 | 11.1% | 11.0% | 1,806.6 | 1,735.7 | 57.1 | 13.8 | 70.9 | 4.1 | |||||||||||
| Deposits in banks | 1,628.7 | 1,777.7 | (148.9) | (8.4) | 2.9% | 2.2% | 47.3 | 39.4 | (4.3) | 12.2 | 7.9 | 20.1 | |||||||||||
| Investments in debt securities | 2,079.2 | 1,760.1 | 319.1 | 18.1 | 4.9% | 3.9% | 101.6 | 68.9 | 15.6 | 17.1 | 32.7 | 47.4 | |||||||||||
| Total interest-earning assets | 19,930.1 | 19,247.7 | 682.5 | 3.5 | 9.8% | 9.6% | 1,955.5 | 1,844.1 | 67.0 | 44.5 | 111.4 | 6.0 | |||||||||||
| (ii) | Average balance for the year ended December 31, | Change 2019 vs 2018 | Average rate for the year ended December 31, | Interest expense for the year ended December 31, | Impact on interest expense due to changes in | Change 2019 vs 2018 | |||||||||||||||||
| 2019 | 2018 | U.S.$ | % | 2019 | 2018 | 2019 | 2018 | Balance | Rate | Total | % | ||||||||||||
| (in U.S.$ millions, except percentages) | |||||||||||||||||||||||
| Demand deposits | 4,612.4 | 4,371.7 | 240.8 | 5.5 | 0.9% | 0.8% | (40.9) | (36.4) | (2.1) | (2.4) | (4.5) | 12.4 | |||||||||||
| Savings deposits | 3,118.9 | 2,932.4 | 186.5 | 6.4 | 1.4% | 1.4% | (43.0) | (39.7) | (2.6) | (0.8) | (3.3) | 8.4 | |||||||||||
| Time deposits | 7,450.9 | 7,064.8 | 386.1 | 5.5 | 5.3% | 5.2% | (396.9) | (369.7) | (20.6) | (6.6) | (27.2) | 7.3 | |||||||||||
| Total interest-bearing deposits | 15,182.3 | 14,368.9 | 813.3 | 5.7 | 3.2% | 3.1% | (480.8) | (445.8) | (25.8) | (9.2) | (35.0) | 7.9 | |||||||||||
| Borrowings from banks and other | 2,775.4 | 3,202.1 | (426.6) | (13.3) | 5.1% | 4.9% | (141.8) | (158.2) | 21.8 | (5.5) | 16.3 | (10.3) | |||||||||||
| Bonds issued | 321.4 | 310.1 | 11.3 | 3.6 | 6.3% | 6.3% | (20.1) | (19.6) | (0.7) | 0.2 | (0.5) | 2.6 | |||||||||||
| Securities sold under repurchase agreements | 43.2 | 66.4 | (23.2) | (34.9) | 5.7% | 4.2% | (2.5) | (2.8) | 1.3 | (1.0) | 0.3 | (10.4) | |||||||||||
| Lease liabilities | 212.6 | — | 212.6 | N.A. | 5.6% | N.A. | (11.9) | — | (11.9) | — | (11.9) | N.A. | |||||||||||
| Other funding | 3,352.7 | 3,578.6 | (225.9) | (6.3) | 5.3% | 5.0% | (176.4) | (180.6) | 11.9 | (7.7) | 4.2 | (2.3) | |||||||||||
| Total interest-bearing funding | 18,535.0 | 17,947.6 | 587.4 | 3.3 | 3.5% | 3.5% | (657.1) | (626.3) | (20.8) | (10.0) | (30.8) | 4.9 | |||||||||||
BHI’s average balance of gross loans increased 3.3% or U.S.$512.3 million in 2019, compared to a year earlier, with growth in average balances of corporate, small company, mortgage, and credit card loans, while personal and vehicle loans average balances declined. The average yield on gross loans increased 9 basis points to 11.1%. The average balance of investments in debt securities increased 18.1% or U.S.$319.1 million but was partially offset by a decrease in average balance of deposits in banks of 8.4% or U.S.148.9 million. However, average yields of investments in debt securities and deposits in banks increased by 97 basis points and 69 basis points to 4.9% and 2.9%, respectively, contributing to the increase of our net interest margin.
With respect to total interest-bearing funding, BHI’s average balance increased 3.3% or U.S.$587.4 million in 2019 compared to a year earlier. Total interest-bearing deposits increased 5.7% or U.S.$813.3 million in 2019, led by a 5.5% or U.S.$386.1 million increase in time deposits, which drove an increase of 6 basis points in average rate of total interest-bearing deposits to 3.2% in 2019. Other funding decreased 6.3% or U.S.$225.9 million in 2019, primarily due to a 13.3% or U.S.$426.6 million decrease in borrowings from banks and others. Despite an increase in average rate paid on other funding, the decrease in average balances of other funding, which pays higher rates than deposits, permitted the average rate paid on total interest-bearing funding to remain relatively stable at 3.5% in 2019, as rates increased across all interest-bearing funding except for bonds issued.
Net impairment loss on financial assets
| Year ended December 31, | Change, 2019 vs. 2018 | ||||||
| 2019 | 2018 | U.S. $ | % | ||||
| (in U.S.$ millions, except percentages) | |||||||
| Provision for loan and interest losses | (380.1) | (374.2) | (5.9) | 1.6 | |||
| Credit risk of investments and interest-bearing deposits | (2.9) | (2.1) | (0.8) | 35.4 | |||
| Provision for account receivable losses | (1.5) | (0.6) | (0.9) | 146.6 | |||
| Net impairment loss on financial assets | (384.5) | (377.0) | (7.6) | 2.0 | |||
BHI’s net impairment loss on financial assets increased 2.0% or U.S.$7.6 million to U.S.$384.5 million, driven by a U.S.$5.9 million increase in impairment loss on loans to U.S.$380.1 million in 2019 from U.S.$374.2 million in 2018, a U.S.$0.8 million increase in impairment loss on investments, and a U.S.$0.9 million increase in impairment loss on other accounts receivable
The increase in impairment loss on loans is mainly explained driven by increases in impairment losses from mortgage, corporate, and personal loans of 46.3% or U.S.$10.8 million, 14.7% or U.S.$4.4 million, and 3.4% or U.S.$2.6 million, respectively, and partially offset by a decrease in impairment losses from credit cards of U.S.$9.7 million or 4.6%.
The following table provides detail by category of impairment loss on loans and other accounts receivable and cost of risk. The following financial data of BHI at December 31, 2019 and 2018 and for the years ended December 31, 2019 and 2018 have been derived from our audited consolidated financial statements prepared in accordance with IFRS, included in this information statement. Our historical results are not necessarily indicative of results to be expected for future periods. This financial data should be read in conjunction with our audited consolidated financial statements.
75
| Provision for loan and interest losses | Cost of risk for the | Change, | |||||||||||
| Year ended December 31, | Change, 2019 vs. 2018 | year ended December 31, | 2019 vs. 2018 | ||||||||||
| 2019 | 2018 | U.S.$ | % | 2019 | 2018 | basis points | |||||||
| (in U.S. $ millions, except percentages and basis points) | |||||||||||||
| Corporate | 34.0 | 29.7 | 4.4 | 14.7 | 0.5% | 0.5% | 1 | ||||||
| Small Company | 13.5 | 14.4 | (0.9) | (6.0) | 1.8% | 1.9% | (9) | ||||||
| Mortgage | 34.2 | 23.4 | 10.8 | 46.3 | 1.0% | 0.7% | 31 | ||||||
| Personal | 79.0 | 76.4 | 2.6 | 3.4 | 3.9% | 3.7% | 20 | ||||||
| Vehicles | 15.8 | 17.1 | (1.3) | (7.6) | 1.7% | 1.7% | (7) | ||||||
| Credit Cards | 203.5 | 213.2 | (9.7) | (4.6) | 6.7% | 7.6% | (83) | ||||||
| Gross loans | 380.1 | 374.2 | 5.9 | 1.6 | 2.3% | 2.4% | (5) | ||||||
Cost of risk of total gross loans decreased by 5 basis points to 2.3% for the year ended December 31, 2019, driven by an 83 basis point decrease in credit cards’ cost of risk that was partially offset by increases in cost of risk of personal and mortgage loans of 20 basis points and 28 basis points, respectively. The decrease of cost of risk of credit cards was the result of de-risking strategy implemented regionally where the company reviewed key variables like score cutoff points and qualifying income levels, amongst others. Meanwhile, the increases in cost of risk of consumer and mortgage loans were a result of modest performance in non-public segments and LIBOR indexed mortgages.
At December 30, 2019, and compared to a year earlier, the composition of loans by stages showed a transition across all loan categories, to Stage 3 which increased by U.S.$125.5 million. This was driven by underperforming segments is retail banking such as payroll loans to the non-public sector and credit cards and mortgages for self-employed individuals. However, Stage 1 loans increased by 3.4% or U.S.$503.2 million to U.S.$15,150.8 million, led by increases in credit cards, corporate, and mortgage loans. In credit cards, Stage 1 loans increased 13.5%, or U.S.$325.4 million, to U.S.$2,739.3 million. The overall performance was driven by sales finance lines in our credit cards. Corporate Stage 1 loans increased 3.3%, or U.S.$198.0 million, to U.S.$6,160.8 million driven by new volume in industries such as services, industry, and energy. In mortgages, Stage 1 loans increased 3.2%, or U.S.$90.5 million, to U.S.$2,949.9 million, driven by organic portfolio growth. Finally, Stage 1 personal and vehicle loans decreased U.S.$36.0 million to U.S.$1,799.9 million and U.S.$58.4 million to U.S.$838.4 million, respectively, primarily driven by modest performance of non-public segments, where charge-offs and delinquencies increased during the year.
For more information on loss allowance calculations and a description of PD risk categories under IFRS 9, please refer to Note 3 of our audited consolidated financial statements. The following table shows BHI’s gross loan classification by Stages in accordance with IFRS 9 (interbank and overnight funds are not included as they tend to be mostly Stage 1 and with low loss allowance due to their characteristics and short-term nature).
| At December 31, | Change, 2019 vs. 2018 | |||||||||||||||||||||||
| 2019 | 2018 | Gross | ||||||||||||||||||||||
| Stage 1 | Stage 2 | Stage 3 | Gross loans | Stage 1 | Stage 2 | Stage 3 | Gross loans | Stage 1 | Stage 2 | Stage 3 | loans | |||||||||||||
| (in U.S.$ millions) | % | |||||||||||||||||||||||
| Corporate | 6,160.8 | 164.4 | 148.6 | 6,473.8 | 5,962.9 | 161.5 | 100.1 | 6,224.4 | 3.3 | 1.8 | 48.5 | 4.0 | ||||||||||||
| Small Company | 662.5 | 90.3 | 16.7 | 769.5 | 678.8 | 58.9 | 13.7 | 751.3 | (2.4) | 53.3 | 22.3 | 2.4 | ||||||||||||
| Mortgage | 2,949.9 | 326.0 | 108.3 | 3,384.1 | 2,859.4 | 330.5 | 66.6 | 3,256.5 | 3.2 | (1.4) | 62.7 | 3.9 | ||||||||||||
| Personal | 1,799.9 | 160.5 | 44.3 | 2,004.8 | 1,835.9 | 158.6 | 41.5 | 2,036.0 | (2.0) | 1.2 | 6.8 | (1.5) | ||||||||||||
| Vehicles | 838.4 | 93.1 | 10.1 | 941.5 | 896.7 | 78.0 | 7.8 | 982.6 | (6.5) | 19.3 | 28.8 | (4.2) | ||||||||||||
| Credit Cards | 2,739.3 | 277.3 | 245.3 | 3,261.9 | 2,413.9 | 340.8 | 218.1 | 2,972.8 | 13.5 | (18.6) | 12.4 | 9.7 | ||||||||||||
| Gross loans | 15,150.8 | 1,111.5 | 573.2 | 16,835.6 | 14,647.5 | 1,128.4 | 447.7 | 16,223.6 | 3.4 | (1.5) | 28.0 | 3.8 | ||||||||||||
| Corporate | 95.2% | 2.5% | 2.3% | 100.0% | 95.8% | 2.6% | 1.6% | 100.0% | �� | |||||||||||||||
| Small Company | 86.1% | 11.7% | 2.2% | 100.0% | 90.3% | 7.8% | 1.8% | 100.0% | ||||||||||||||||
| Mortgage | 87.2% | 9.6% | 3.2% | 100.0% | 87.8% | 10.2% | 2.0% | 100.0% | ||||||||||||||||
| Personal | 89.8% | 8.0% | 2.2% | 100.0% | 90.2% | 7.8% | 2.0% | 100.0% | ||||||||||||||||
| Vehicles | 89.0% | 9.9% | 1.1% | 100.0% | 91.3% | 7.9% | 0.8% | 100.0% | ||||||||||||||||
| Credit Cards | 84.0% | 8.5% | 7.5% | 100.0% | 81.2% | 11.5% | 7.3% | 100.0% | ||||||||||||||||
| Composition of gross loans per Stage | 90.0% | 6.6% | 3.4% | 100.0% | 90.3% | 7.0% | 2.8% | 100.0% | ||||||||||||||||
76
The following table shows the balance of loans past due at least 91 days past due, delinquency ratios, charge-offs and charge-offs as a percentage of average gross loans for BHI.
| Loans at least 91 days past due | Delinquency ratio (1) | Change, 2019 | |||||||||||
| At December 31, | Change, 2019 vs. 2018 | at December 31, | vs. 2018 | ||||||||||
| 2019 | 2018 | U.S.$ | % | 2019 | 2018 | basis points | |||||||
| (in U.S.$ millions, except percentages and basis points) | |||||||||||||
| Corporate | 25.7 | 36.7 | (11.0) | (29.9) | 0.4% | 0.6% | (19) | ||||||
| Small Company | 14.8 | 12.9 | 1.9 | 14.4 | 1.9% | 1.7% | 20 | ||||||
| Mortgage | 90.0 | 58.2 | 31.7 | 54.5 | 2.7% | 1.8% | 87 | ||||||
| Personal | 37.3 | 34.8 | 2.4 | 7.0 | 1.9% | 1.7% | 15 | ||||||
| Vehicles | 8.8 | 6.1 | 2.7 | 44.2 | 0.9% | 0.6% | 31 | ||||||
| Credit Cards | 80.7 | 67.5 | 13.2 | 19.5 | 2.5% | 2.3% | 20 | ||||||
| Gross loans | 257.2 | 216.3 | 40.9 | 18.9 | 1.5% | 1.3% | 19 | ||||||
| Charge-offs | Charge-offs as a percentage | Change, 2019 | |||||||||||
| At December 31, | Change, 2019 vs. 2018 | of average gross loans | vs. 2018 | ||||||||||
| 2019 | 2018 | U.S.$ | % | 2019 | 2018 | basis points | |||||||
| (in U.S.$ millions, except percentages and basis points) | |||||||||||||
| Corporate | 24.3 | 13.4 | 10.9 | 81.1 | 0.4% | 0.2% | 17 | ||||||
| Small Company | 17.7 | 15.2 | 2.4 | 16.0 | 2.3% | 2.2% | 9 | ||||||
| Mortgage | 23.6 | 17.3 | 6.3 | 36.4 | 0.7% | 0.5% | 18 | ||||||
| Personal | 98.7 | 97.4 | 1.4 | 1.4 | 4.7% | 4.6% | 14 | ||||||
| Vehicles | 19.6 | 14.8 | 4.8 | 32.7 | 2.2% | 1.6% | 62 | ||||||
| Credit Cards | 281.3 | 247.1 | 34.2 | 13.8 | 9.3% | 8.8% | 54 | ||||||
| Total charge-offs | 465.3 | 405.3 | 60.0 | 14.8 | 2.9% | 2.6% | 29 | ||||||
| (1) | Calculated as loans past due more than 90 days divided by gross loans. |
At December 31, 2019, asset quality measured by loans at least 91 days past due divided by gross loans deteriorated 19 basis points to 1.5% as compared to a year earlier as delinquency ratios increased across all loan categories except corporate. The increase in delinquency was led by mortgage loans where delinquency rose by 87 basis points to 2.7%. This increase in delinquency ratios is explained partly by (i) rising LIBOR rates that translated into higher installments in indexed mortgage portfolios, (ii) weaker performance in personal loans to non-public sector in El Salvador and Panamá and (iii) underwriting challenges in the independent-workers segment. Total charge-offs increased 14.8% or U.S.$60.0 million in 2019, led by credit cards which increased 13.8% or U.S.$34.2 million because of the de-risking strategy mentioned previously. Delinquency coverage ratio for gross loans, as measured by loss allowance divided by past due gross loans more than 90 days was 196.0% in 2019 and 222.9% in 2018.
Service charges and Commissions and other fees, net
| Year ended December 31, | Change, 2019 vs. 2018 | ||||||
| 2019 | 2018 | U.S.$ | % | ||||
| (in U.S.$ millions, except percentages) | |||||||
| Service charges | |||||||
| Consumer and Corporate Banking Services | 449.2 | 429.1 | 20.1 | 4.7 | |||
| Asset Management | 18.8 | 14.9 | 3.8 | 25.7 | |||
| Investment Banking Services | 6.5 | 4.0 | 2.5 | 62.0 | |||
| Total Service charges | 474.5 | 448.1 | 26.4 | 5.9 | |||
| Commissions and other fees, net | |||||||
| Interchange and merchant fees, income | 640.2 | 601.3 | 38.9 | 6.5 | |||
| Credit Card's membership fees | 21.4 | 22.2 | (0.8) | (3.4) | |||
| Income from commissions and fees | 661.6 | 623.5 | 38.1 | 6.1 | |||
| Expenses from commissions and fees | (448.3) | (423.5) | (24.8) | 5.9 | |||
| Commissions and other fees, net | 213.3 | 200.1 | 13.3 | 6.6 | |||
Service charges increased 5.9% or U.S.$26.4 million in 2019, mainly due to consumer and corporate banking services which increased 4.7% or U.S.$20.1 million, primarily from electronic toll payment devices, card insurance fees and wire transfers.
Total income from commissions and fees increased 6.1% or U.S.$38.1 million, mainly driven by a U.S.$38.9 million increase in interchange and merchant fees. This was primarily driven by increases in merchant fee income as well as interchange fees on credit and debit cards as a result of increase transactions through our network. Related to the increase in transactions, expenses from commissions and fees increased by 5.9% or U.S.$24.8 million driven by commissions paid and by loyalty program expenses. As a result, commissions and other fees, net, increased 6.6%, or U.S.$13.3 million, to U.S.$213.3 million in 2019.
77
Total income from investment securities
BHI’s securities portfolio is classified in the following categories: (i) equity and fixed income investments at fair value through profit and loss (FVPL), (ii) fixed income investments at fair value through other comprehensive income (FVOCI), and (iii) fixed income investments at amortized cost (AC) (results from (ii) and (iii) are included in net interest income as interest income on investments in debt securities). Interest income from each of these categories is included in net interest income as interest income on investments in debt securities while unrealized and realized gains from sales of investments at FVPL and FVOCI are included in net gain (loss) on financial instruments on the income statement. BHI manages its investment portfolio in a comprehensive and integral manner that considers the individual return of each one of these three categories and the total return of the investment securities portfolio.
Total income from investment securities for BHI (comprised of interest income on investments in debt securities and net gain (loss) on financial instruments) increased 73.6%, or U.S.$50.0 million, to U.S.$118.1 million in 2019. This increase was driven primarily by a U.S.$34.8 million increase in interest income on investments in debt securities as a result of a growth in the customer deposit base and, in turn, the investment portfolio. Additionally, in contrast to 2018 when a net loss of U.S.$0.9 million was realized, in 2019 BHI realized net gains on sales of financial instruments of U.S.$16.5 million.
Other income
| Year ended December 31, | Change, 2019 vs. 2018 | ||||||
| 2019 | 2018 | U.S.$ | % | ||||
| (in U.S.$ millions, except percentages) | |||||||
| Gain on foreign currency exchange, net | 81.7 | 165.7 | (83.9) | (50.7) | |||
| Other income from associates | 0.8 | 1.3 | (0.6) | (43.9) | |||
| Gain (loss) on the sale of assets held for sale | 4.6 | 3.1 | 1.5 | 48.5 | |||
| Impairment of assets held for sale | 2.3 | (7.2) | 9.6 | (132.3) | |||
| Gain on sale of property, plant and equipment | 0.1 | — | 0.1 | N.A. | |||
| Services to affiliates | 17.8 | 16.4 | 1.4 | 8.9 | |||
| Commercial recoveries | 3.5 | 0.9 | 2.6 | 283.3 | |||
| Other non-banking commissions | 6.6 | 11.0 | (4.4) | (40.2) | |||
| Rentals | 2.5 | 0.6 | 1.9 | 337.4 | |||
| Visa Stocks | 5.5 | — | 5.5 | N.A. | |||
| Other | 15.2 | 15.0 | 0.2 | 1.6 | |||
| Other income | 140.6 | 206.7 | (66.1) | (32.0) | |||
Other income decreased 32.0% or U.S.$66.1 million to U.S.$140.6 million in 2019, mainly as a result of a U.S.$83.9 million decrease in gains on foreign currency exchange, net, to U.S.$81.7 million, explained by FX volatility in Costa Rica due to fiscal reform related uncertainty in 2018 and subsequently in 2019, when the country approved a fiscal reform bill. This decrease was partially offset by reversals of impairment provisions as well as gains on the sale of non-current assets held for sale and a one-time U.S.$5.5 million gain on the sale of Visa equity securities, which were acquired in the purchase of Banco Reformador de Guatemala in 2013.
General and administrative expenses
| Year ended December 31, | Change, 2019 vs. 2018 | ||||||
| 2019 | 2018 | U.S.$ | % | ||||
| (in U.S.$ millions, except percentages) | |||||||
| Salaries and employee benefits | (539.9) | (528.5) | (11.4) | 2.2 | |||
| Depreciation and amortization | (125.7) | (92.3) | (33.4) | 36.2 | |||
| Administrative | (79.2) | (66.3) | (12.9) | 19.4 | |||
| Occupancy and related expenses | (34.1) | (68.1) | 34.1 | (50.0) | |||
| Credit card franchises | (86.0) | (74.5) | (11.5) | 15.5 | |||
| Taxes other than income tax | (49.4) | (36.5) | (12.9) | 35.3 | |||
| Computer software and licenses maintenance | (34.7) | (30.0) | (4.7) | 15.8 | |||
| Advertising and marketing | (49.9) | (49.9) | 0.1 | (0.1) | |||
| Equipment and vehicle maintenance | (24.9) | (25.0) | 0.1 | (0.6) | |||
| Armored services | (18.7) | (16.5) | (2.3) | 13.7 | |||
| Guarantee deposits | (13.9) | (12.6) | (1.3) | 10.4 | |||
| Bank licenses | (13.7) | (12.3) | (1.4) | 11.7 | |||
| Security services | (13.4) | (13.1) | (0.4) | 2.7 | |||
| Dedicated lines | (11.3) | (12.0) | 0.7 | (6.2) | |||
| Telephone service | (13.5) | (13.5) | (0.0) | 0.4 | |||
| Operational losses | (9.0) | (5.7) | (3.3) | 58.5 | |||
| Municipal taxes and patents | (6.4) | (7.0) | 0.6 | (8.4) | |||
| Postage and courier | (4.3) | (4.2) | (0.1) | 2.2 | |||
| Office supplies | (7.8) | (7.8) | (0.0) | 0.6 | |||
| Per diem expenses | (9.6) | (9.4) | (0.2) | 2.4 | |||
| Other | (65.9) | (55.9) | (10.0) | 17.9 | |||
| Total general and administrative expenses | (1,211.4) | (1,141.1) | (70.4) | 6.2 | |||
78
Total general and administrative expenses increased 6.2% or U.S.$70.4 million to U.S.$1,211.4 million, led by a 36.2% or U.S.$33.4 million increase in depreciation and amortization, a 19.4% or U.S.$12.9 million increase in administrative expense, and a 35.3% or U.S.$12.9 million increase in taxes other than income tax expense. This increase in expenses was partially offset by a 50.0% or U.S.$34.1 million decrease in occupancy and related expenses.
The adoption of IFRS 16 in 2019 drove i) the increase in depreciation and amortization expense, with U.S.$36.7 million of depreciation of right-of-use assets recognized in 2019, and ii) the decrease in occupancy and related expenses, with a U.S.$38.4 million reversal of rent expense in 2019.
The U.S.$12.9 million increase in administrative expense is mainly due to (i) a U.S.$6.9 million increase in IT services expense, (ii) a U.S.$4.2 million increase in other professional services, and (iii) a U.S.$1.8 million increase in sponsorships.
Given that general and administrative expenses increased by 6.2% and total income before net impairment losses on financial assets (defined as the sum of net interest income, net gain (loss) on financial instruments, service charges, net income from commissions and fees, and other income) increased by 3.5%, the cost to income efficiency ratio increased to 56.5% in 2019 from 55.1% in 2018. The ratio of general and administrative expenses as a percentage of average assets deteriorated by 10 basis points to 5.0% compared to the same period in 2018.
Tax expense
Income tax expense for BHI decreased by 12.6%, or U.S.$20.9 million, to U.S.$145.4 million in 2019. BHI’s effective tax rate, calculated as income tax expense divided by income before income tax expense was 26.6% in 2019 and 30.1% in 2018.
Net income attributable to non-controlling interest
Net income attributable to non-controlling interest is not significant for BHI.
B. Liquidity and capital resources
The following table sets forth our sources of funding at the dates indicated.
| At September 30, | At December 31, | ||||
| 2021 | 2020 | 2019 | |||
| (in U.S.$ millions) | |||||
| Liabilities and equity: | |||||
| Deposits from customers (1) | 21,078.1 | 23,251.9 | 17,234.6 | ||
| Borrowings from banks and other (2) | 2,106.8 | 2,645.1 | 2,339.4 | ||
| Bonds issued | 753.8 | 1,246.4 | 319.4 | ||
| Securities sold under repurchase agreements | 10.0 | 41.9 | 34.7 | ||
| Lease liabilities | 164.5 | 217.4 | 231.6 | ||
| Acceptance outstanding | 1.6 | 197.6 | 2.0 | ||
| Income tax liabilities | 31.7 | 58.4 | 60.3 | ||
| Deferred income tax | 99.7 | 84.0 | 75.7 | ||
| Other liabilities (3) | 624.4 | 640.1 | 549.0 | ||
| Total liabilities | 24,870.6 | 28,382.7 | 20,846.7 | ||
| Equity attributable to owners of the parent | 3,307.8 | 4,252.0 | 4,410.1 | ||
| Non-controlling interest | 0.5 | 10.5 | 0.9 | ||
| Total equity | 3,308.3 | 4,262.5 | 4,411.0 | ||
| Total liabilities and equity | 28,178.9 | 32,645.2 | 25,257.8 | ||
| (1) | Includes non-interest-bearing demand deposits. |
| (2) | Includes financial obligations and in 2021, U.S.$677.9 million of dividends payable registered as Other liabilities in the interim consolidated statement of financial position at September 30, 2021 that were subsequently classified as financial obligations in accordance with IFRS rules. |
| (3) | Other liabilities exclude U.S.$677.9 million of dividends payable to related parties. For more information on this and other transactions with related parties see Section 13. “Certain Relationships and Related Party Transactions”. |
79
Capitalization ratios
The following table presents consolidated capitalization ratios for BHI’s indirect subsidiaries which are subject to capital requirements according to Panamanian regulations. Calculations based on each entity’s respective financial statements for the period indicated under IFRS, Basel III (starting in December 2019) according to Panamanian regulations.
| BAC International, Corp & Subs | |||||
| At September 30, | At December 31 | ||||
| 2021 | 2020 | 2019 | |||
| (in percentages) | |||||
| Tangible equity ratio(1) | 8.7% | 8.1% | 10.7% | ||
| Tier 1 ratio(2) | 12.3% | 11.7% | 11.5% | ||
| Solvency ratio(3) | 13.3% | 12.8% | 12.8% | ||
| BAC International Bank & Subs | |||||
| At September 30, | At December 31 | ||||
| 2021 | 2020 | 2019 | |||
| (in percentages) | |||||
| Tangible equity ratio(1) | 8.6% | 8.1% | 10.7% | ||
| Tier 1 ratio(2) | 11.6% | 11.6% | 11.5% | ||
| Solvency ratio(3) | 12.8% | 12.8% | 12.9% | ||
| (1) | Tangible equity ratio is calculated as total equity minus intangible assets (calculated as goodwill plus other intangible assets) divided by total assets minus intangible assets (calculated as goodwill plus other intangible assets). |
| (2) | Tier 1 ratio is calculated as primary capital and additional primary capital divided by risk-weighted assets according to Panamanian regulations published February 3, 2015, by the Superintendencia de Bancos de Panamá in Acuerdo No. 001-2015. |
| (3) | Solvency ratio is calculated as technical capital divided by risk-weighted assets according to Panamanian regulations published March 22, 2016, by the Superintendencia de Bancos de Panamá in Acuerdo No. 003-2016. |
BAC Holding International Corp. is a financial institution in the Republic of Panama, licensed as a financial leasing company and, therefore, supervised and regulated by the Ministry of Commerce and Industries of the Republic of Panama. However, BHI’s subsidiaries, BAC International Corp. & Subs and BAC International Bank & Subs, as the holding companies of the Group’s financial institutions in the region, are subject to inspection and supervision as financial institutions by the Superintendencia de Bancos de Panamá and are responsible for compliance with capital adequacy requirements, corporate governance standards, risk management and internal control and criteria for identifying, managing and revealing conflicts of interest, applicable to its financial subsidiaries, which are in turn also subject to the regulatory requirements managed by the government agencies of the countries in which they operate or have a license. For more information on our subsidiaries and corporate structure see Section 11. “Business Overview” as well as Note 1 of our audited consolidated financial statements for the year ended December 31, 2020.
Funding
Our banking subsidiaries fund most of their loans with customer deposits. Other sources of funding include interbank borrowings and overnight funds, borrowings from banks and others, and bonds issued. For more information on funding refer to Notes 16 and 17 of our audited financial statements.
The following table summarizes the funding structure of our banks on a consolidated basis at the dates indicated.
| At September 30, | At December 31, | ||||
| 2021 | 2020 | 2019 | |||
| (in U.S.$ millions, except percentages) | |||||
| Deposits from customers (1) | 21,078.1 | 23,251.9 | 17,234.6 | ||
| Borrowings from banks and other | 2,106.8 | 2,645.1 | 2,339.4 | ||
| Bonds issued | 753.8 | 1,246.4 | 319.4 | ||
| Securities sold under repurchase agreements | 10.0 | 41.9 | 34.7 | ||
| Total funding | 23,948.7 | 27,185.3 | 19,928.2 | ||
| As a % of total funding | |||||
| Deposits from customers (1) | 88.0% | 85.5% | 86.5% | ||
| Borrowings from banks and other | 8.8% | 9.7% | 11.7% | ||
| Bonds issued | 3.1% | 4.6% | 1.6% | ||
| Securities sold under repurchase agreements | 0.0% | 0.2% | 0.2% | ||
| Total funding | 100.0% | 100.0% | 100.0% | ||
| (1) | Includes non-interest-bearing demand deposits. |
80
Total Funding
Total funding decreased 11.9% to U.S.$23,948.7 million at September 30, 2021, as compared to U.S.$27,185.3 million at December 31, 2020, due largely to the impact of the spinoff of MFG. At September 30, 2021, total funding was comprised of 88.0% customer deposits, 8.8% borrowings from banks and other, and 3.1% bonds issued, with customer deposits gaining relevance in the funding structure as compared to December, 31, 2020.
Adjusting for the acquisition of MFG, BHI’s total funding grew 3.5% or U.S.$809.2 million at September 30, 2021, from U.S.$23,139.5 million at December 31, 2020, excluding MFG. This organic growth of total funding was driven primarily by customer deposits which increased by U.S.$767.4 million during the same period. However, the funding structure remained relatively stable with customer deposits, borrowings from banks and others, and bonds issued representing 87.8%, 8.9% and 3.2%, respectively, at December 31, 2020, excluding MFG.
Between 2020 and 2019 total funding increased by 36.4% or U.S.$7,257.1 million to U.S.$27,185.3 million at December 31, 2020, with the acquisition of MFG, mainly as a result of an increase in deposits and bonds issued. In terms of funding structure, bonds issued increased 298 basis points to 4.6% in 2020, while customer deposits and borrowing from banks and others decreased by 95 basis points and 201 basis points to 85.5% and 9.7%, respectively.
BHI’s subsidiaries across Central America benefit from ample coverage from rating agencies such as Moody’s, Standard & Poor’s and Fitch Ratings.
The following table presents BHI’s subsidiaries’ international credit ratings as issuers as of December 31, 2021:
| International | Outlook | |||||||||||
| Standard | Fitch | Standard | Fitch | |||||||||
| Moody's | & Poor's | Ratings | Moody’s | & Poor's | Ratings | |||||||
| BAC International Bank Inc. (Panama) | ||||||||||||
| Foreign currency LT | Ba1 | BB+ | BB+ | Stable | Positive | Negative | ||||||
| Foreign currency ST | NP | B | B | Positive | ||||||||
| Local currency LT | Ba1 | BB+ | Stable | Positive | Negative | |||||||
| Local currency ST | NP | B | Positive | |||||||||
| Banco BAC San Jose S.A. (Costa Rica) | ||||||||||||
| Foreign currency LT | B+ | Negative | ||||||||||
| Foreign currency ST | B | |||||||||||
| Local currency LT | BB- | Negative | ||||||||||
| Local currency ST | B | |||||||||||
The following table presents BHI’s subsidiaries’ local credit ratings as issuers:
| Local | Outlook | |||||||
| Fitch | Fitch | |||||||
| Ratings | SCRiesgo | Ratings | SCRiesgo | |||||
| BAC International Bank Inc. (Panama) | ||||||||
| Local currency LT | AA(pan) | Negative | ||||||
| Local currency ST | F1+(pan) | |||||||
| BAC Bank Inc. (Guatemala) | ||||||||
| Local currency LT | AA+(gtm) | Stable | ||||||
| Local currency ST | F1+(gtm) | |||||||
| Banco de América Central S.A. (Guatemala) | ||||||||
| Local currency LT | AA+(gtm) | Stable | ||||||
| Local currency ST | F1+(gtm) | |||||||
| Credomatic de Guatemala S.A. (Guatemala) | ||||||||
| Local currency LT | AA+(gtm) | Stable | ||||||
| Local currency ST | F1+(gtm) | |||||||
| Financiera de Capitales S.A. (Guatemala) | ||||||||
| Local currency LT | AA+(gtm) | Stable | ||||||
| Local currency ST | F1+(gtm) | |||||||
| Banco de América Central El Salvador (El Salvador) | ||||||||
| Local currency LT | EAAA(slv) | Stable | ||||||
| Local currency ST | F1+(slv) | |||||||
| Inversiones Financieras Banco de América Central (El Salvador) | ||||||||
| Local currency LT | EAAA(slv) | Stable | ||||||
| Local currency ST | F1+(slv) | |||||||
| Banco de América Central Honduras S.A. (Honduras) | ||||||||
| Local currency LT | AA+(hnd) | Stable | ||||||
| Local currency ST | F1+(hnd) | |||||||
| Banco de América Central S.A. (Nicaragua) | ||||||||
| Foreign currency LT | scr AA+ (NIC) | Stable | ||||||
| Foreign currency ST | SCR 1 (NIC) | Stable | ||||||
| Local currency LT | scr AA+ (NIC) | Stable | ||||||
| Local currency ST | SCR 1 (NIC) | Stable | ||||||
| Banco BAC San José S.A. (Costa Rica) | ||||||||
| Local currency LT | AAA(cri) | Stable | ||||||
| Local currency ST | F1+(cri) | |||||||
81
Any adverse change in credit ratings may increase the cost of our funding. See Section 4. “Risk Factors —Risks relating to the countries in which we operate—Adverse economic and political conditions in Central American countries in which BAC Credomatic Group operates (Guatemala, Honduras, El Salvador, Honduras, Nicaragua, Costa Rica y Panama), including variations in the exchange rates or downgrades in credit ratings of sovereign debt securities, may have an adverse effect on our results of operations and financial condition.”.
The following table presents our consolidated funding from deposits at the dates indicated:
| At September 30, | At December 31, | ||||
| 2021 | 2020 | 2019 | |||
| (in U.S.$ millions) | |||||
| Interest-bearing customer deposits: | |||||
| Demand deposits | 6,724.2 | 6,673.1 | 5,008.5 | ||
| Savings deposits | 4,655.9 | 4,605.5 | 3,335.2 | ||
| Time deposits | 8,471.1 | 10,531.5 | 7,927.6 | ||
| Total interest-bearing customer deposits | 19,851.2 | 21,810.1 | 16,271.3 | ||
| Non-interest-bearing customer deposits: (1) | |||||
| Demand deposits | 1,226.9 | 1,441.8 | 963.3 | ||
| Total non-interest-bearing customer deposits | 1,226.9 | 1,441.8 | 963.3 | ||
| Total customer deposits | 21,078.1 | 23,251.9 | 17,234.6 | ||
| (1) | Non-interest-bearing demand deposits are demand deposits in transaction accounts for clients that make daily deposits and transactions; these accounts do not bear interest on deposited funds. |
Demand deposits: Our consolidated balance of demand deposits was U.S.$7,951.1 million at September 30, 2021, U.S.$8,114.9 million at December 31, 2020, and U.S.$5,971.8 million at December 31, 2019, representing 33.2%, 29.9%, and 30.0% of total funding, respectively, at those dates.
Savings deposits: Our consolidated balance of savings deposits was U.S.$4,655.9 million at September 30, 2021, U.S.$4,605.5 million at December 31, 2020, and U.S.$3,335.2 million at December 31, 2019, representing 19.4%, 16.9% and 16.7% of total funding, respectively, at those dates.
Time deposits: Our consolidated balance of time deposits was U.S.$8,471.1 million at September 30, 2021, U.S.$10,531.5 million at December 31, 2020, and U.S.$7,927.6 million at December 31, 2019, representing 35.4%, 38.7% and 39.8% of total funding, respectively, at those dates.
The following table presents time deposits held by amount and maturity for deposits at the date indicated:
| At December 31, 2020 | |||||
| U.S.$ denominated | Foreign currency denominated | Total | |||
| (in U.S.$ millions) | |||||
| Domestic | |||||
| Up to 3 months | 774.7 | 3.0 | 777.7 | ||
| From 3 to 6 months | 610.2 | — | 610.2 | ||
| From 6 to 12 months | 1,230.7 | — | 1,230.7 | ||
| More than 12 months | 3,219.6 | — | 3,219.6 | ||
| Time deposits less than U.S.$100,000 | 150.9 | — | 150.9 | ||
| Total domestic | 5,986.0 | 3.0 | 5,989.0 | ||
| Foreign | 2,223.3 | 2,319.3 | 4,542.6 | ||
| Total time deposits | 8,209.3 | 2,322.3 | 10,531.5 | ||
82
Securities sold under repurchase agreements: Our consolidated balance of securities sold under repurchase agreements was U.S.$10.0 million at September 30, 2021, U.S.$41.9 million at December 31, 2020, and U.S.$34.7 million at December 31, 2019, representing less than 0.2% of total funding in each of those years.
The following table presents our short-term borrowings consisting of securities sold under repurchase agreements at and for the period ended September, 30, 2021:
| At and for the year ended December 31, | ||||
| 2020 | ||||
| Nominal weighted | ||||
| Amount | average rate | |||
| (in U.S.$ millions, except percentages) | ||||
| Short-term borrowings | ||||
| Securities sold under repurchase agreements | ||||
| End of period | 41.9 | — | ||
| Average during period | 51.3 | 0.3% | ||
| Maximum amount of borrowing at any month-end | 117.0 | — | ||
| Interest paid during the period | 0.2 | — | ||
As part of their interbank transactions, our banks maintain a portfolio of Government securities and private sector liquid debt instruments that can be used to obtain short-term funds from other financial institutions or investment funds by selling such securities and simultaneously agreeing to repurchase them. Due to the short-term nature of this source of funding, the balance of these transactions is volatile.
Borrowings from banks and others: Our consolidated balance of borrowings from banks and others was U.S.$2,106.8 million at September 30, 2021, U.S.$2,645.1 million at December 31, 2020, and U.S.$2,339.4 million at December 31, 2019, representing 8.8%, 9.7%, and 11.7% of total funding, respectively, at those dates.
Bonds issued: BHI, through its subsidiaries, has placed debt certificates in U.S. dollars and foreign currencies through the stock markets of El Salvador, Panama, and Honduras. Our consolidated balance of bonds issued was U.S.$753.8 million at September 30, 2021, U.S.$1,246.4 at December 31, 2020, and U.S.$319.4 at December 31, 2019, representing 3.1%, 4.6%, and 1.6% of total funding, respectively, at those dates. For more information on bonds issued see Note 17 of our audited consolidated financial statements.
Capital Expenditures
BHI incurred in U.S.$36.7 million of net capital expenditures in tangible assets in the nine-month period ending September 30, 2021, as compared to U.S.$42.2 million in the nine months ended September 30, 2020, excluding MFG (capital expenditures due to MFG impact were U.S.$2.5 million in the nine months ended September 30, 2020).
BHI’s net capital expenditures for the year ended December 31, 2020, was U.S.$63.8 million, as compared to U.S.$69.6 million in 2019.
C. Research and development, patents and licenses, etc.
N/A.
D. Trend Information
During 2020, BHI’s net income, decreased 22.7% or U.S.91.0 million to U.S.310.9 million from U.S.$402.0 million a year earlier. Results for our business in 2020 were negatively impacted by the economic effects of lockdowns designed to mitigate the spread of COVID-19. As of September 30, 2021, net income was U.S.$334.4 million, an increase of 31.6% or U.S.$80.3 million compared to the same period in 2020 (including a net income of U.S.$17.3 million from discontinued operations related to MFG). For information on this acquisition, please refer to Note 4 of our audited consolidated financial statements.
Gross loans grew by 20.9% or U.S.$3,518.7 million year-on-year in 2020, from a combination of organic growth and the business combination of MFG (MFG contributed U.S.$3,200.5 million of this loan growth at year end). Excluding MFG, BHI’s gross loans increased U.S.$318.2 million or 1.9% organically in 2020. Lower growth was related to a general slowdown of loan growth in the countries where we operate in Central America and related to the impact of COVID-19. As of September 30, 2021, gross loans decreased by 11.5% or U.S.$2,335.5 million compared to December 2020, mainly due to the impact of MFG, however, excluding MFG impact, gross loans grew 5.0% or U.S.$865.0 million between December 31, 2020, and September 30, 2021.
83
Net interest margin (NIM) for 2020 decreased by 101 basis points to 5.5% as a result of a narrowing spread between average yields on interest earning assets and average rate paid on interest-bearing funding of approximately 94 basis points. As Central Banks turned towards accommodative monetary policies in the countries where we operate, NIM compressed due to the repricing of variable rate commercial loans and to an increasingly competitive environment in lower risk products and segments. Additionally, the acquisition and incorporation of MFG lowered the NIM of our Central American operations as it increased the share of interest-earning assets in Panama, which has a lower NIM than other countries in the region. As of September 30, 2021, NIM decreased by 65 basis points to 5.4% as compared to the same period in 2020 and excluding MFG as monetary policy continued decreasing average rates.
Cost of risk was 2.6% for 2020, 27 basis points higher than in 2019. BHI’s cost of risk deteriorated driven by the increase in expected credit losses (ECL) resulting from lower economic activity triggered by lockdowns. Asset quality, as measured by gross loans classified as Stage 2 and Stage 3 over gross loans, deteriorated to 21.1% in 2020 from 10.0% in 2019 due to the impact of the pandemic on the loan portfolio. As of September 30, 2021, cost of risk had improved to 1.9% as compared to 2.5% in September 30, 2020, excluding MFG and on an annualized basis. As of September 30, 2021, asset quality, as measured by gross loans classified as Stage 2 and Stage 3 over gross loans, improved slightly to 19.8% as of September 30, 2021, from 21.1% in 2020.
BHI focused part of its efforts on a rigorous control of operating expenses growth in 2020. Total general and administrative expenses grew by 1.9% or U.S.$23.0 million as compared to 2019, impacted by the acquisition of MFG which contributed U.S.$58.6 million in additional expenses, mainly from salaries and employee benefits and depreciation and amortization. BHI’s organic general and administrative expenses (excluding MFG impact in 2020) decreased 2.9% or U.S.$35.6 million driven by decreases in advertising and marketing expense, salaries and employee benefits, and credit card franchise expenses of U.S.$23.7 million, U.S.$20.4 million and U.S.$10.6 million, respectively. Part of these savings were achieved as lockdowns, travel and mobility restrictions and work-from-home policies reduced expenses such as staffing, utilities, travel and transportation, and supplies and stationery, among others, in addition to lower marketing expenses. The continued progress of our digital efforts and cost control initiatives across our subsidiaries also contributed to this improvement. Some initiatives include (i) reformatting and closure of branches, (ii) business process optimizations, (iii) a migration of transactions to digital channels and (iv) an ATM network optimization.
BHI’s future results will be driven by the performance of its banking operations and thus will depend on how credit volumes, net interest margin, cost of risk and overall expenses behave.
E. Off-balance sheet arrangements
In the ordinary course of business, our banking subsidiaries have entered into various types of off-balance sheet arrangements, including credit lines, letters of credit and financial guarantees. Our banking subsidiaries utilize these instruments to meet their customers’ financing needs. The contractual amount of these instruments represents the maximum possible credit risk should the counterparty draw down the entire commitment or our bank fulfill its entire obligation under the guarantees, and the counterparty subsequently fails to perform according to the terms of the contract. Our banking subsidiaries may hold cash or other liquid collateral to support these commitments, and they generally have legal recourse to recover amounts paid but not recovered from customers under these instruments. Most of these commitments and guarantees expire undrawn. As a result, the total contractual amount of these instruments does not represent our banking subsidiaries’ future credit exposure or funding requirements under normal circumstances. In addition, some of these commitments, primarily those related to consumer financing, are cancelable upon notice.
| At September 30, | At December 31, | ||||
| 2021 | 2020 | 2019 | |||
| (in U.S.$ millions) | |||||
| Unused credit card limits | 4,464.0 | 4,113.0 | 4,314.7 | ||
| Stand-by letters of credit | 149.6 | 193.7 | 157.4 | ||
| Commercial letters of credit | 58.1 | 33.5 | 20.9 | ||
| Financial guarantees | 298.7 | 360.3 | 269.8 | ||
| Commitments and guarantees | 65.6 | 130.1 | 60.1 | ||
| Total | 5,036.0 | 4,830.5 | 4,822.9 | ||
F. Other Commitments and Obligations
A U.S.$750 million dividend was approved by an Extraordinary Shareholders Meeting on September 29th, 2021, further amended by Extraordinary Shareholders Meeting on December 17th, 2021; the agreement taken in said meeting, set a 10-year payment plan to complete the agreed amount of the extraordinary dividend. At September 30, 2021, these dividends payable are registered as other liabilities at present value. As of December 31, 2021, U.S.$375 million have been paid with a U.S.$300.0 million loan from Bancolombia and a U.S.$75.0 million loan from Grupo Aval Limited. The remaining amount, U.S.$288.4 million, is registered as other financial obligations in accordance with IFRS rules. For more information on this and other related party transactions see Section 13. “Certain Relationships and Related Party Transactions”.
84
For more information on commitments and obligations related to our financial assets and liabilities in contractual maturity groups please see Note 5b to our audited consolidated financial statements at December 31, 2020.
85
10. QUANTITATIVE AND QUALITATIVE DISCLOSURES ABOUT RISK
Risk Management
BHI and its subsidiaries in the financial sector manage risk pursuant to the applicable regulations in each country where they operate, the best practice frameworks, and according to their internal policies.
Direct risk management at BHI consists of periodic risk surveillance carried out through the following systems of corporate governance: Board of Directors and Audit Committee. However, as the holding company, BHI manages the relevant risks in the region indirectly through its main subsidiaries, which use an Enterprise Risk Management (ERM) framework, in which functions, guidelines and responsibilities are duly defined according to international standards, best practices and adequate corporate governance principles. For the purposes of this section, we will refer simply to BAC Credomatic (“BAC”) or the Group in describing the various risk management processes and practices executed through BHI’s subsidiaries in the region.
Our risk framework requires that strong risk management practices are integrated into key processes across the organization, ensuring risks are appropriately considered, evaluated, and addressed in a timely manner. The Group employs a risk management process that aims to identify, measure, monitor and control, the relevant risks. The following sections outline the key risks that are inherent in the business activities of our subsidiaries, as well as the way in which those risks are managed:
A) Financial risks: The main financial risks managed by our financial subsidiaries are credit risk, market risk, liquidity risk, interest rate risk and capital risk.
B) Non - financial risks: The main non-financial risks managed by BAC are operational risks, reputational risk, supplier risk, business continuity, anti-money laundering, terrorist financing and the proliferation of weapons of mass destruction financing, anti-bribery and anti-corruption and legal risk.
Control Environment
Our risk management model operates under a control environment that allows an adequate control of the relevant risks related to the business of each subsidiary and that provides an integrated view of all risks. Risk management is carried out in all business units and for each type of risk to ensure that the exposures and the general risk profile are within the limitations established by the Board of Directors and the regulators of the markets where our subsidiaries operate. The main elements that ensure effective control of the risks are:
· The assignment of responsibilities in risk-generating functions, coupled with decision-making and due control of their activities.
· Specialized control of each risk factor.
· The supervision of relevant risks.
· The assessment of control mechanisms; and
· An independent assessment by internal audit.
BAC promotes a culture of risk management that reaches all the entities, whether financial or non-financial.
Lines of defense
The three lines of defense seek to improve communication in risk management and control in a simple and effective way by clarifying the related roles and responsibilities.
· First line: Represents the first contact that each entity has with each of the risks it faces, responsible for identifying and reporting any aspect related to the risks to which it is exposed.
· Second line: defense is responsible for recommending the Risk Appetite and risk management policies to the Board of Directors.
· Third line: responsible for independently evaluating the effectiveness of the entity's Risk Appetite Framework.
Risk Culture
Our Enterprise Risk Management (ERM) framework is implemented at the regional and country levels by qualified personnel, with different functions according to roles and responsibilities defined by the organizational structure and aligned with the strategy.
86
At the regional level, the risk management governance is structured as follows:
· Regional Board of Directors: Defines the regional strategy and sets the guidelines and risk appetite accordingly.
· Regional Risk Management Committee: Reports directly to the Board of Directors and is responsible for the implementation of the risk management framework across the enterprise and oversight of the Group’s risk management processes.
· Regional Top Management: Assures that the resources required by the ERM framework are provided and that its decisions consider the risk guidelines and appetite.
· Regional Risk Management Unit: The Regional Risk Management Unit is independent from any commercial or business area and reports directly to the Regional Risk Management Committee. The Regional Risk Management Unit designs and standardizes the general risk management guidelines and participates in the implementation of those guidelines across the countries. Its ultimate goal is to define robust risk management guidelines and standards which apply regionally and are also in accordance with the local legal requirements in each country in which BAC’s subsidiaries operate.
· Regional Risk Owners: For each type of risk such as credit, liquidity, market, operational, and information technology (among others), Risk Owners are designated and held responsible for standardizing, supervising, and overseeing the management of these risks in each country. The Risk Management Unit tracks and oversees risk owners’ implementation of the ERM framework.
At each country level, the structure for risk management reflects its regional counterpart:
· Board of Directors, Risk Management Committee and Top Management in each country, have the same fundamental roles as described above and also take into consideration their own country´s particular characteristics (e.g., local laws, culture, and supervisory requirements).
· Local Risk Management Units: In each of the countries, the Local Risk Management Units are responsible for identifying, measuring, monitoring, controlling and communicating all relevant risks, according to the guidelines given by Regional Risk Management Unit (and by which they are periodically evaluated), while focusing on each country’s local legal requirements. The Local Risk Management Units are independent from the commercial and business areas and report directly to the Local Risk Management Committees, which in turn report to the local Board of Directors.
Additionally, the Code of Integrity and Ethics establishes the general principles that apply to BHI and its subsidiaries and on which our entities’ culture and actions are based.
· Comply with applicable laws and regulations throughout the market where we operate.
· Avoid conflicts of interest.
· Ensure a safe work environment and ensure fair employment practices.
· Ensure transparency in all operations and functions.
Risk Management Systems
Risk management and periodic risk surveillance are carried out through the following systems of corporate governance which are established at a regional corporate level and in each of the countries where our subsidiaries operate:
· Risk Management Committee
· Assets and Liabilities Committee (ALCO)
· Compliance Committee
· Credit Committee
· Investment Committee
· Operational Risk Committee
· Information Security Committee
· Audit Committee
The Boards of Directors, regional or local, appoint the members of each committee, as applicable, which in turn report back to the relevant Board of Directors. Each committee is responsible for standardizing, supervising, and overseeing the Risk Management Units or Risk Owners implementation of their respective risk controls in each country or at the regional level.
Credit Risk
Regarding credit risk management, our subsidiaries have a centralized structure throughout the region, led by a Chief Credit Risk Officer (CCRO), who reports to BAC’s CEO. The Regional Credit Committee, whose members include the CEO and the CCRO of BAC, is responsible for submitting credit policies and procedures at a regional level for approval of the Board of Directors. This committee is responsible for monitoring the loan portfolio’s credit risk. The Regional Credit Committee is also responsible for the final decision on loans exceeding the credit limits delegated to each individual country. While local risk managers report to the local CEO, observance of regional policies and procedures are reported to BAC’s CCRO.
87
The credit risk management process for BAC takes into consideration the requirements of local regulators, BAC’s credit risk management guidelines and the composition of our loan portfolio.
The guiding principles of risk management at BAC are the following:
· Collective decision making for commercial loans of significant amount for each BAC banking operation throughout the region at the board’s credit committee level
· Extensive and in-depth market knowledge, the result of our market leadership and our experienced, stable, and seasoned senior management
· Clear top-down directives in accordance with: (i) know-your-customer policies, and (ii) commercial loan credit structures based on the clear identification of sources of repayment and the cash-flow generating capacity of the borrower
· Use of common credit analysis tools and loan pricing tools
· Diversification of the commercial loan portfolio with respect to industries and economic groups
· Specialization in retail banking product niches
· Extensive use of continuously updated rating and scoring models to ensure the growth of high-credit quality consumer loans
Commercial Lending
As of September 31, 2021, 45% of our total gross loan portfolio is composed of commercial loans to corporate, small and medium sized enterprises.
Commercial lending is managed with sound policies and procedures, following the best-in-class governance standards. BAC has appointed a regional Chief Credit Risk Officer (CCRO) that oversees all the subsidiaries with banking operations. The CCRO is complemented by a robust staff and a Regional Credit Committee.
The Regional Credit Committee meets biweekly to review corporate loan applications above a given threshold and also to discuss general developments in the industry and economy, portfolio delinquency and loan loss allowance, risks and opportunities, and the structure of credit transactions. Additionally, the Regional Credit Committee reviews loan policies and sets the risk appetite that is passed on to all other banking subsidiaries.
Below the Regional Credit Committee, country-level credit committees have the responsibility to approve loan applications below the defined threshold. The CCRO is also an appointed member in each of the country level credit committees, alongside internal and external directors.
When assessing a corporate loan application, the committee resolves according to its policies and credit analysis guidelines. It may make recommendations according to the structure of the loan (such as guarantees, interest rates, commissions, and covenants). The Regional Credit Committee submits a report to the Board of Directors at least twice a year, with a comprehensive review of its decisions.
BACs banking subsidiaries seek to achieve a profitable, high-quality commercial loan portfolio through an efficient procedure for analyzing potential loans. For that purpose, we have established policies and procedures for the analysis and approval of potential commercial credit transactions that seek to focus lending on the following principles:
· Borrowers whose shareholders and management have, in our opinion, the highest integrity (considering not only an analysis of the borrower’s credit profile but also its reputation in the business community, among other factors);
· Clearly identify and quantify primary and secondary sources of repayment, with a bias towards operational cash flow;
· Borrowers that participate in key industries;
· Borrowers that are leaders or strong players in the industries where they participate;
· Transaction structures, including covenants and guarantees which provide adequate protection; and
· Adequate pricing that compensates for the capital invested and the market and credit risks incurred.
88
As part of our commercial banking activity, BAC’s subsidiaries make loans to public sector entities. For purposes of evaluating the extension of credit to public sector entities, we follow two criteria: (i) the loan must be used to finance an investment that has been approved by local authorities; and (ii) a source of repayment, primarily tax revenues, must be clearly identified.
Consumer Lending
Consumer lending represented 35% of the total gross loan portfolio as of September 30, 2021
The consumer lending business includes products such as credit cards (52% of consumer loans), auto financing (16% of consumer loans) and personal loans (32% of consumer loans).
Credit card receivables include the revolving line of credit and installment loans associated with the card. Those installment loans are part of the cross-selling strategies that BAC’s banking subsidiaries regularly implement. Customers that demonstrate an appropriate use of the revolving facility, with superior credit scores, may qualify for preapproved installment loans.
The Regional Credit Committee and CCRO at the regional level define the guidelines and general risk appetite. At a second level, risk management staff and the country-level committees execute the strategy and are responsible for the asset quality.
Mortgage Lending
Mortgage lending represented 20% of our total gross loan portfolio as of September 30, 2021.
BAC’s banking subsidiaries support the housing market in Central America primarily through mortgage loans that are geared towards families purchasing their primary home. Like the commercial lending framework, the Regional Credit Committee and CCRO at the regional level define the guidelines and general risk appetite. At a second level, risk management staff and the country-level committees execute the strategy and are responsible for the asset quality.
COVID-19 Event: Main government measures in Central America
In 2020, different measures were adopted by the governments in Central America to mitigate the effects of the COVID-19 pandemic. Central American Governments (some countries to a lesser degree) adopted measures aimed at mitigating the negative effect of the COVID-19 pandemic on their local economies, including regulation for the extension on tax reporting and payment, temporary deferral of bank loan servicing, and reduction and/or freeze of interest rates, without negative consequences on credit scores or payment records. Panamá, Costa Rica, El Salvador, Honduras and Guatemala implemented further measures such as economic aids to individuals directly affected by the economic crisis resulting from the spread of COVID-19 pandemic in their countries.
Actions adopted by our banking subsidiaries to mitigate the risks associated with the COVID-19 pandemic on credit portfolios included:
· Use of technical methodologies to identify sectors at risk
· Debtors’ monitoring was intensified, especially in sectors at risk
· Definition and expansion of different channels for servicing debtors according to the different portfolio segments
· Review and adjustment of origination strategies
· Enhanced collection strategies for vulnerable customers
· Review of approved debt limits in accordance with individual risk analysis
· Use of guarantees offered by the government for affected sectors and customers
· Adjustments to models through quantitative and qualitative overlays, considering the uncertainty of the information due to the reliefs granted by the banks
See Section 9. “Management’s Discussion and Analysis of Financial Condition and Results of Operations” for additional information on reliefs granted by our banking subsidiaries in 2020 and 2021.
For more information see Note 6 of our audited consolidated financial statements for the year ended December 31, 2020.
89
Credit Classification and Provisioning
We are continually reviewing our policies and procedures to ensure a healthy credit quality. The Regional Risk Management Unit is responsible for loan underwriting parameters, portfolio management strategies, credit classification, provisioning, and collections. We have designed our own scoring and rating models, based on best practices in statistical modeling.
We are required to classify the loan portfolio in accordance with the rules of the banking authorities in each of the geographies where our subsidiaries operate. In addition to that, our internal models standardize loan classification regardless of the country of origin.
Following International Financial Reporting Standards, the loan portfolio is classified in three stages:
· Stage 1 loans, where credit risk has not increased significantly since initial recognition. For financial assets in Stage 1, a 12-month expected credit loss (ECL) and interest income are recognized on a gross basis.
· Stage 2 loans, where credit risk has increased significantly since initial recognition. When a financial asset transitions to Stage 2 a lifetime ECL is recognized, and interest income continues to be recognized on a gross basis.
· Stage 3 loans, where the financial asset is credit impaired. A lifetime ECL is recognized, and interest income is recognized on a net basis.
Furthermore, BAC utilizes a credit risk administration system based on its internal models. For the consumer business, it is based on credit scores, which are used intensively throughout the whole life cycle: underwriting, cross selling, pricing, limit management and collections. In the corporate business, a ratings system is the core of the process. The corporate risk rating (CRR) is used to classify each loan into different categories, based on minimum objective criteria, such as balance sheet strength, profitability, and cash generation capacity. For new originations, the initial classification is made based on these objective criteria. Periodical classification reviews of existing commercial loans incorporate such criteria on an ongoing basis, coupled with delinquency thresholds.
The following chart describes the risk classification system:
Category | Stage | Commercial loan portfolio | Consumer loan portfolio | |||||||
| “A” | Stage 1 | CRR 1 CRR 2 Excellent credit profile CRR 3 Very good credit profile CRR 4 Good credit profile CRR 5 Adequate credit profile | Scores R2 to R4. Typically, excellent to adequate profiles. | |||||||
| “B” | Stage 1 / Stage 2 | CRR 5 stage 2. Stage 2 could be triggered by a significant increase in credit risk or by the +30 days of delinquency backstop. | Scores R5. Could be classified in Stage 1 or Stage 2 depending on the increase in credit risk and +30 days of delinquency backstop. | |||||||
| “C” | Stage 2 | CRR 6. This is the equivalent to a watch category. Significant increase in credit risk profile. | Scores R6. Significant increase in credit risk profile. | |||||||
| “D” | Stage 3 | CRR 7 CRR 8 Typically defaulted loans with +90 days of delinquency. | Scores R7. Default loan, +90 days of delinquency. | |||||||
| “E” | Stage 3 | CRR 9. Lowest credit classification. 100% provision. Delinquency well over 90 days. | Scores R9. 100% provision. Delinquency well over 90 days. | |||||||
For more information see Note 3c of our audited consolidated financial statements for the year ended December 31, 2020.
Loss allowance
BAC regularly reviews its loan portfolio to evaluate its impairment. When determining if an impairment should be charged to the year’s results, management exercises its judgment to determine if there is observable data indicating a decrease in the estimated cash flow of the loan portfolio before the decrease in such flow may be identified for a particular loan of the portfolio.
The provision calculation process includes analysis of specific, historical, and subjective components. The methodologies used by our banking subsidiaries include the following elements:
· A detailed periodic analysis of the loan portfolio;
· A credit classification system by risk levels;
90
· Robust statistical and econometric models;
· Periodic back testing of experienced losses against historical provisions;
· Identification of individually assessed loans due to impairment;
· Consideration of internal factors such as size, organizational structure, loan portfolio structure, loan administration process, analysis of delinquent portfolio and historical losses;
· Consideration of particular risks inherent to different types of loans; and
· Consideration of prospective external factors, including local and regional economic factors and political events.
For credits individually considered as significant and impaired, the amount of the loan loss allowance is calculated using the discounted cash flow method. Management of each banking subsidiary makes assumptions regarding the recoverable amounts for each client and the points in time in which such amounts will be recovered. When calculating allowances for guaranteed loans considered individually as significant and impaired, management performs estimates of the fair value of such guarantees, with the support of independent expert appraisers.
For loans not considered individually significant, or for those credits individually significant but not impaired, loan loss allowances are calculated collectively using an expected loss framework. The models estimated by the Risk Management Unit feature historical loss rates, periodically updated data reflecting current economic conditions, industry performance trends, geographic concentrations of debtors within each portfolio of the segment and any other relevant information that may affect payment behavior. BAC also determines whether the credit risk (i.e., risk of default) of a financial instrument has increased significantly since initial recognition. This process considers reasonable and supportable information that is relevant and available without undue cost or effort, including both quantitative and qualitative information and analysis based on historical experience, expert credit assessment and forward-looking information.
To quantify expected credit losses in its portfolio, BAC has calculation methodologies that consider three fundamental factors:
· Exposure at default – “EAD” is the expected exposure from a counterparty at the time of a possible default.
· Probability of default – “PD” is the probability that the counterpart defaults in its payment obligations of capital and/or interest. The probability of default is associated to the rating/scoring or level of delinquency of the borrower. When a financial instrument’s credit risk has increased significantly since initial recognition, a PD for the remaining life of the credit (lifetime PD) is used. When a financial instrument’s credit risk has not increased significantly a 12 month PD is used.
· Loss given default – “LGD” is the estimated loss in case a payment default occurs, taking into consideration any guarantees and their corresponding appraisal.
Liquidity Risk
Our liquidity management aims to ensure the servicing of deposit withdrawals, repayment of borrowings as they mature, servicing of contractual agreements and meeting demand for new loan and investment funding, as necessary. Our liquidity position at each financial subsidiary is managed autonomously and monitored on a daily basis.
Liquidity risk policies at our financial subsidiaries comply with both the corporate guidelines set out in the Regional Asset and Liability Management Policy (defined by the Assets and Liabilities Committee) and the local regulatory requirements of each of the countries in which our subsidiaries operate. BHI, as a holding company, is not required to maintain minimum liquidity positions. However, the Group’s internal liquidity requirements are more conservative than those of the local regulators. Therefore, the Group regularly maintains liquidity positions in excess of the local regulatory requirements.
BAC’s subsidiaries are subject to different indicators in response to the regulatory requirements of each jurisdiction. These regulatory indicators seek to ensure that the banks maintain sufficient liquid assets to meet their needs in different time horizons. For this reason, our internal liquidity framework establishes liquidity risk measurement indicators designed to ensure compliance with both corporate and regulatory requirements. The internal indicators are replicated in each jurisdiction and seek to ensure that our subsidiaries have sufficient liquidity to fulfill their respective strategic objectives. For example, BAC’s internal liquidity coverage policy requires a minimum coverage ratio of 25% to 30%, depending on the jurisdiction, assuming the total withdrawal of demand deposits and the non-renewal for time deposits and institutional funding maturing within the next 30-day period.
See additional information in Note 5b of our audited consolidated financial statements.
91
Market Risk Management
Market risk management focuses on the probability of changes in the value of the investment portfolios due to fluctuations in prices for financial instruments. BAC’s market risk management framework is primarily controlled and managed by the guidelines set out in the Regional Investment Policy and the Regional Asset and Liability Management Policy. Adherence to the regional policies is mandatory for the subsidiaries and compliance is monitored through procedures that identify, measure, and control the sources of risk.
BHI, as a financial holding company, does not have material market risk but it monitors and oversees market risk at a consolidated level through reports received from its financial subsidiaries, who in turn, are in charge of managing their own market risk. The financial subsidiaries are subject to market risk, primarily as a result of banks’ lending businesses and investment portfolios. The main sources of market risks to which financial subsidiaries are exposed are interest rate risk and foreign exchange rate risk:
· Interest rate risk: as a result of mismatches between interest rate sensitive assets and liabilities and potential investment losses resulting from fluctuations in interest rates.
· Foreign exchange rate risk: as a result of mismatches between assets and liabilities, and off-balance sheet items denominated in foreign currencies.
BHI’s board of directors, through its Regional Assets and Liabilities Committee (Regional ALCO), is responsible for establishing policies, procedures, and limits regarding market risk. Additionally, risk management committees monitor overall performance considering the risks assumed. These policies and procedures describe the control framework used by BAC to identify, measure, and manage market risk exposures inherent to financial activities. The main purpose of these policies and procedures is to standardize management and minimize risk through the definition of risk limits.
All risk managers within BAC must ensure that all business activities are performed in accordance with the established policies and the respective local regulatory standards. Market risks assumed by the subsidiaries are in line with the structure, complexity, size, and nature of each operation. The periodic oversight and management of risk exposure and compliance with policies is conducted through the Risk Management Committee and Assets and Liabilities Committee, established both regionally and at a country-by-country basis.
Market risk management employees at BAC are responsible for:
· Identifying, measuring, managing and controlling market risk exposures inherent to their businesses;
· Analyzing exposures under stress scenarios; and
· Ensuring compliance with risk management policies, reporting violations of such policies, and proposing new ones.
Investment Securities
Our subsidiaries’ investment portfolios are mainly comprised of Central American government bonds, and to a lesser extent, bonds from international and prime local issuers. Investments in Central America are the preferred alternative for our subsidiaries given that the government debt markets are the most developed in the region and because these securities support liquidity management due to their eligibility for repo funding in each jurisdiction. These investments are not only managed under conservative criteria from a credit risk standpoint but are also held to meet the company’s primary objective of maintaining adequate liquidity reserves.
In Central America, governments are the main issuers of debt securities and banks are the main holders. Our subsidiaries investments in Central American sovereign debt securities are primarily used to manage the liquidity position. Although market conditions are monitored in order to identify opportunities to generate returns on these investments, the securities portfolio is not held for the purpose of realizing short-term capital gains. For the most part, the debt securities portfolio is registered and measured at fair value through other comprehensive income (FVOCI). Investments measured at fair value through profit or loss (FVTPL) are not significant within our subsidiaries securities portfolios.
For more information, see Note 3o, Note 5c and Note 10 of our audited consolidated financial statements.
Interest Rate Risk
Our subsidiaries’ investment portfolios are exposed to potential losses resulting from a change in overall interest rates. The risk departments utilize a duration sensitivity approach in order to estimate potential losses in the market value of the portfolios. To estimate the change in value for each instrument in the portfolios, interest sensitivity factors are applied that vary in accordance with the degree of credit risk of each security based on the evaluations of the main international credit rating agencies. Maximum exposure limits measured as a percentage of equity are defined for each of the subsidiaries and at the consolidated level.
92
For more information, see Note 5c of our audited consolidated financial statements
Consolidated Statement of Financial Position
In addition to the securities investment portfolio, BHI’s consolidated statement of financial position consists mainly of loans and deposits where our primary market risk exposures are to interest rate risk and foreign exchange risk. Management, through both local and regional committees, engages actively in the measurement and control of these risks by applying market risk frameworks based on internal regional guidelines and indicators as well as those required by local regulators. These indicators are calculated at the country level and on a consolidated basis.
Interest Rate Risk
Our subsidiaries’ exposure to interest rate risk on their balance sheets primarily arises from the possibility that fluctuations in market interest rates may affect the value of equity and net interest income due to timing differences in the repricing of assets and liabilities.
Interest rate risk on the balance sheet is analyzed based on gap analysis. Assets and liabilities are categorized based on their repricing or maturity intervals, as applicable, in order to determine the maturity gap and as such, their sensitivity to interest rate changes. The analysis estimates the impact that pre-defined parallel shifts in the average rates of return would have on the economic value of equity and net interest income. In addition to the hypothetical shifts in interest rates, the analysis assumes that the composition of our balance sheet remains constant over the period being measured. With respect to impact on changes in interest rates on the economic value of equity, we have defined internal limits for each local operation and on a consolidated basis that are measured as a percentage of equity. The monitoring and compliance with these limits is carried out jointly and constantly by the local Assets and Liabilities Committees and the Regional ALCO.
For more information, see Note 5c of the audited consolidated financial statements which presents a summary of the impact on BHI’s economic value of equity and net interest income.
Foreign Exchange Rate Risk
Our subsidiaries’ balance sheets are exposed to foreign exchange rate risk mainly from loans and deposits denominated in the local Central American currencies from the countries in which it operates. Foreign exchange rate risk is measured by the determination of the percentage of equity that is not dollarized. The internal policy establishes that the difference between U.S. dollar denominated assets and liabilities should be at least equal to equity. In other words, the Group seeks to maintain a long position in U.S. dollars in order to protect equity against local currency fluctuations. Management has defined specific limits for each of the countries where the company operates which consider structural limitations and local regulatory requirements, which in some jurisdictions require that the net monetary position in U.S. dollars must be less than 100% of equity.
For more information, see Note 3b and Note 5c of the audited consolidated financial statements
Non-Financial Risk Review
BAC is committed to the preservation of integrity through compliance with applicable laws, regulations and ethical standards in each of the markets in which our subsidiaries operate. All employees are expected to adhere to these laws, regulations and ethical standards and management of each financial subsidiary is responsible for ensuring such compliance. Compliance is an essential ingredient of good corporate governance.
The compliance function covers all matters relating to regulatory compliance, the prevention of money laundering, terrorist financing and the proliferation of weapons of mass destruction financing and anticorruption, as well as compliance with the standards of the U.S. Sarbanes-Oxley Act of 2002 (Sarbanes-Oxley).
The compliance function is independent of the business lines in all our financial subsidiaries and promotes adherence to the rules, oversight requirements, principles, and values of good conduct through all our companies. Our corporate governance structure establishes standards, policies and best practices that apply to our subsidiaries to enforce the standard requirements that should be followed. The compliance or risk units in each financial subsidiary enforce the application of the corporate and internal policies providing advice and information in the interest of employees, customers, shareholders, and supervisors.
The compliance function is incorporated into the risk areas with access to the Board of Directors and its committees through the Chief Governance and Compliance Officer. In addition, the legal departments of each financial subsidiary, have access to these bodies on a regular basis. This structure is aligned with banking regulatory requirements and supervisory expectations.
93
The compliance unit performs a monitoring and reporting role and assists management at the entity level in identifying and assessing potential compliance issues and provides guidance to staff on compliance laws, rules and standards. However, the legal departments of the financial subsidiaries have the primary responsibility for identifying and interpreting compliance laws, rules and standards, and for aiding in drafting related policies and procedures. The internal audit units review the adequacy of controls established to ensure compliance with policies, plans, procedures, and business objectives, in accordance with the annual internal audit plan and legal requirements, as well as COSO 2013 as internal control framework.
Operational Risk Management
Operational Risk Management at BAC is carried out using the conceptual methodology of Basel II guidelines and the elements of The Committee of Sponsoring Organizations of the Treadway Commission (COSO) as a main reference. A centralized operational risk management unit ensures that policies are in place to establish a standardized treatment of operational risks including methodologies for the timely recognition of principal exposures, the ownership of operational risks by functional units, accountability throughout the organization and effective procedures to collect information on operational losses. The Operational Risk Committee is also responsible for monitoring the effectiveness of the business continuity plan.
BAC defines operational risk as “the risk of incurring losses due to deficiencies, failures or inadequate functioning of our processes, technology, infrastructure or human resources, as well as the occurrence of external events associated with these”. Operational risk is inherent in all products, activities, processes, and systems, and affects all business and support areas, thus, all employees are responsible for managing and controlling the risks arising in their area of activity.
The operational risk policies at our financial subsidiaries aim to comply with the guidelines established by the banking authorities of the countries where our financial subsidiaries operate. These guidelines establish a system of operational risk management that includes identification, measurement, control and monitoring of functions required to ensure adequate risk management.
As part of operational risk management, the most relevant business processes are analyzed to identify risks and implement the necessary controls to comply with obligations to clients, shareholders and other stakeholders. Operational risk management is complemented by the definition, implementation, testing and maintenance of the Business Continuity Plan, which is part of strengthening the operational risk control stage.
To comply with the implementation of operational risk management, each of our financial subsidiaries establishes within its organizational structure an operational risk unit independent of the operational and control areas of each financial subsidiary. These units are responsible for establishing and defining policies, methodologies and procedures for communicating all information related to operational risk within each organization. In addition to the staff of each operational risk unit, the financial subsidiaries have established the role of operational risk leaders, which are employees in key areas who, in addition to their functional responsibilities, are required to report events or situations which may result in eventual operational or IT losses. Additionally, each financial subsidiary has an operational risk management committee which meets on a periodical basis to review operational risk policies and follow up on the execution of action plans.
The Operational Risk Unit (URO) maintains its monitoring process to the risk profile of the entity, reports to Senior Management, and validates that risks levels have not exceeded the adequate and accepted risk levels.
The main heads of operational risks units, members of senior management, and URO participate in an operational risk committee, held every three months to discuss and suggest any management requirements. The main activities of this committee are:
· Coordinate the analysis of regulation and the impact on the Group
· Identify and apply operational risk management and other related risk (business continuity, information security and IT risk) best practices
· Inform the Board of Directors about the exposures against the established limits, in addition to the historical behavior of these risks
· Monitor the Group’s operational risk management performance systems
· Coordinate the standardization of operational risk methodologies
· Identify and implement operational risk management tools; and
· Standardization of criteria in the search for business continuity, information security and IT risk tools.
94
The maturity of our Business Continuity Management system represents our commitment to a strong and resilient culture, providing all stakeholders with contingency solutions that allow them to enhance their confidence in the management of events that disrupt the normal operation of our business. The Business Continuity Testing has been developed to identify strengths and improvement opportunities into entities scheme. As a result, the strategies and preparation of technological equipment and processes have been effective.
In accordance with the minimum capital requirements and in compliance with the Superintendency of Finance of Panama’s regulation (as supervisory entity to the Holding Company of BHI´s subsidiaries), the Group follows the guidelines of the regulation effective since 2020 which defines operational risk capital requirements within the Basel III standards.
Anti-money laundering, terrorist financing and the proliferation of weapons of mass destruction financing
BAC must comply with the guidelines established by local authorities and international standards. These guidelines require that financial entities establish a system for the administration of risks related to anti-money laundering, financing and the proliferation of weapons of mass destruction financing program, that includes the identification, measurement, control and monitoring functions to prevent and mitigate the materialization of these risks.
The control environment and the effectiveness of the controls are evaluated annually, in order to guarantee adequate compliance with the anti-money laundering, financing of terrorism and financing of weapons of mass destruction program. The Group ensures that best practices are adopted by its subsidiaries, regarding knowledge of the client and third parties, identification of unusual operations and due diligence of each operation., status of communications, acquisition, development and maintenance of systems, incident management, business continuity plans, degree of compliance, strategy, government, among others. Compliance Officers of the supervised companies of the Group are required to report periodically the main findings and assessment of the anti-money laundering, terrorist financing and the proliferation of weapons of mass destruction financing risk to the Board of Directors.
Anti-Bribery and Anti-corruption Program
BAC has designed controls to safeguard that its employees act with integrity in all of their dealings and strictly prohibits corruption in any form. Anti-corruption principles are stated in the Corporate Anti-corruption Policy and are summarized below, based on the fundamental principle of zero risk tolerance:
· Employees of BAC must conduct their business fairly, honestly, accountably and transparently; therefore, all forms of corruption, including facilitation payments, are strictly prohibited.
· Employees, members of corporate governance committees and directors of the Board of Directors must report those situations that contain a Conflict of Interest as soon as they are perceived and before making any decision.
· Ethical lines are available to employees and third parties. Any complaints are carefully investigated, ensuring appropriate actions and the whistleblowers anonymity.
· Gifts or entertainment must always be proportionate and reasonable, must have a legitimate purpose and must not create a conflict of interest or the perception thereof.
· Donations and sponsorships are controlled, regulated by principles of transparence and integrity; and
· Questionable behavior and rumors of improper payments or activities should be reported to management or can be reported via the reporting channels.
In accordance with the above, BAC monitors the accounting records of transactions with high exposure to anti-corruption laws to ensure proper accounting and accurate reflection of those transactions in order to comply with applicable regulations preventing bribery as determined in every jurisdiction where BAC subsidiaries operate.
Legal Risk
BAC’s regional legal division and each of its financial subsidiaries’ legal divisions, directly or indirectly, support operational risk management in its particular area of expertise. Specifically, such divisions define and institute the necessary procedures to adequately control the legal risks inherent in financial subsidiaries’ operations, making sure legal risks are well mitigated and that the controls meet legal standards. These divisions also analyze and draft contracts for operations carried out by the different business units.
The Group’s financial subsidiaries assess the relevant claims filed against them, based on the analysis and criteria of the lawyers in charge; this analysis allows them to provision appropriately any respective contingency whenever required.
As of September 30, 2021, according to the best knowledge of the management, BHI is not involved in litigation or any claim that is likely to cause a significant adverse effect on the business, its financial situation, or the results of the operation.
95
11. BUSINESS OVERVIEW
Overview
BHI is a company incorporated under Panamanian laws since 1972. BHI is holding company whose only material tangible assets are its 100% equity ownership stake in BAC Credomatic Inc. and its subsidiaries and its 9.46% direct participation in BAC International Bank Inc. BHI has a single class of ordinary shares outstanding with equal voting and economic rights.
BHI’s main corporate purpose is to act as the "holding" of the shares of BAC Credomatic Inc, the main direct subsidiary of BHI, and its activities include management of its direct or indirect subsidiaries and investments. In the development of the purpose, the company may carry out in its own name all kinds of operations, enter and execute any type of contracts and civil or commercial acts on movable or immovable property that are related to, necessary, or facilitate the development of its activities or the activities of the companies in which it has an interest and that are specific to achieve of its purpose.
In accordance with the provisions of Article 3 of its Articles of Incorporation, BHI has an indefinite or perpetual duration, without prejudice to the fact that it may be dissolved in accordance with the Applicable Laws.
Likewise, in accordance with the provisions of article 44 of its Articles of Incorporation, the company may be dissolved and liquidated for any reason provided for in the Applicable Laws or when so decided by the General Shareholders' Meeting.
History and Development of the Company
The BAC Credomatic group of companies (the “Group”) was founded in 1952 along with the establishment of Banco de América in Nicaragua and the start of operations of Credomatic Nicaragua in 1974. Credomatic Nicaragua began its operations by launching a credit card for local use named "Cred-o-matic".
In 1973, the Group acquired the Master Charge franchise (now MasterCard) and in 1977, it obtained the license to issue Visa credit cards in the Central American region. In the seventies, Credomatic El Salvador, Credomatic Costa Rica, Credomatic Guatemala and Credomatic Honduras began operations issuing credit cards under the MasterCard, Visa, and Diners Club brands.
The Group focused exclusively on the credit card business until 1985, when in conjunction with a group of local partners, it acquired the Banco de América operation in Costa Rica. Since then, it has developed a set of financial and banking services complementary to the credit card operation.
In 1995, BAC Credomatic obtained a banking license in Panama, and began operations in the country in 1996. In that same year the Group obtained an exclusive license to issue American Express credit cards in the Central American region.
In 1997 it obtained banking licenses to start operations in Guatemala with Banco de América Central, in Honduras with Banco Credomatic (currently called Banco de América Central Honduras S.A.) and in El Salvador with Banco Credomatic El Salvador (currently called Banco de América Central El Salvador). Thus, together with the existing banks in Costa Rica, Nicaragua, and Panama, it achieved the strategic goal of having regional presence in each Central American country, except Belize.
In 2001, it obtained an investment grade rating of BBB- from the rating agency Standard & Poor's. As part of the growth and expansion strategy, BAC Credomatic decided to enter the credit card market in Panama in 2001 and in Mexico in 2004.
During 2005, BAC Credomatic Group entered into a strategic alliance with GE, under which its subsidiary, GE Consumer Finance, acquired 49.99% of the capital of BAC Credomatic GECF Inc., a company that indirectly controlled 100% of BAC International Bank Inc.
During 2007, as a complement to organic growth, three acquisitions were made: Banco Mercantil de Honduras (Bamer) with the main objective of consolidating the Group's presence in that country; Corporación Financiera Miravalles: a Costa Rican financial institution focused on consumer credit; and Propemi: a Salvadoran entity focused mainly on loans to small and medium-sized enterprises.
In mid-2009, GE increased its stake to 75%, thus becoming the majority shareholder. In July 2010, Leasing Bogotá S.A. Panamá (currently BHI) a subsidiary of Grupo Aval Acciones y Valores, S. A. (“Grupo Aval”), the largest financial conglomerate in Colombia, through its subsidiary Banco de Bogotá S.A. (“Banco de Bogotá”) signed a share purchase agreement with GE Consumer Finance for the acquisition of 100% of the shares of the BAC Credomatic Group. In December 2010, after obtaining approvals from the respective regulators in each country, the purchase process was successfully completed.
BAC International Bank Inc. is a licensed bank, registered under the laws of Panama. It is, therefore, subject to supervision by the Superintendency of Banks of Panama (SBP), as well as the Superintendency of the Securities Market (SMV) and the Panama Stock Exchange. Banking and securities supervision applicable to BAC International Bank Inc. is carried out on a consolidated basis. In addition, following the purchase by Grupo Aval, BAC Credomatic Group has also been subject to the regulatory standards issued by the Superintendencia Financiera de Colombia (SFC), Colombia’s financial regulator.
96
As part of its strategic development plan in the region, in June 2013, BAC Credomatic Group reached an agreement to acquire Grupo Financiero Reformador de Guatemala, which included Banco Reformador de Guatemala, Financiera de Capitales, Casa de Bolsa and Transcom Bank Limited of Barbados; the transaction was closed in December 2013 following the approval of the relevant regulators.
In July 2013, Grupo Aval, through Leasing Bogotá S.A., Panamá agreed to acquire Banco Bilbao Vizcaya Argentaria de Panamá (BBVA Panama). This transaction was also closed in December 2013 and in December 2014 BAC International Bank, Inc. and Banco BAC de Panamá, S.A. (formerly BBVA Panama) completed a Merger Agreement, through which the former absorbed the latter, and BAC International Bank, Inc remained as the surviving company.
Both acquisitions marked an important step because they allowed BAC to deepen and expand its banking presence in the Central American region, facilitated the implementation of local business strategies, strengthened the competitive position of all operations in Central America and increased the benefits for the Group's customers, who would have access to a significant number of regional products and services.
In May 2020, Grupo Aval, through its indirect subsidiary Leasing Bogotá S.A. Panama, acquired 96.60% of the common shares of Multi Financial Group Inc., the parent company of Multibank Inc., a Panamanian banking institution. In the month of June 2020, an additional 2.97% of the non-controlling interest was acquired, for a total stake of 99.57%. Multi Financial Group Inc., a company incorporated in accordance with the laws of the Republic of Panama, provided through its subsidiaries a wide variety of financial services to individuals and institutions mainly in Panama.
BHI was renamed on September 15, 2021, through a comprehensive amendment to the Articles of Incorporation made by the Board of Directors and registered on September 16, 2021 before the Public Registry of the Republic of Panama. As previously outlined, the prior name of the company was Leasing Bogotá S.A. Panama. No changes were made to the corporate purpose or authorized capital of the company.
In September 2021, BAC International Bank Inc. informed the market that its parent, Leasing Bogotá S.A. Panama (now BHI), owner of BAC Credomatic, Inc. and MultiFinancial Group, Inc., had submitted to the Superintendencia Financiera de Colombia (SFC), the Colombian financial regulator, an application to (i) register its shares with the Registro Nacional de Valores y Emisores (RNVE) for subsequent listing on the Bolsa de Valores de Colombia (BVC), Colombia’s stock exchange, and (ii) spin off Multi Financial Group, Inc. (“MFG”), from BHI in favor of Banco de Bogotá S.A. These transactions are part of the corporate restructurings described in Section 2. “The Spinoff”, that were completed during the first quarter of 2022.
Corporate Structure
The chart below shows a simplified corporate structure of BHI as of September 30, 2021.
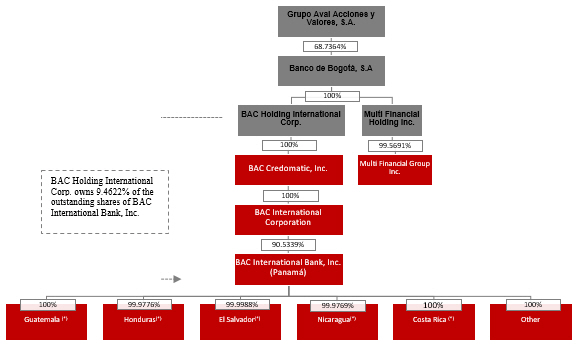
*Titles with an asterisk (*) group the operating entities that are part of the financial group in each country. (b) The "Other" category includes the Shared Services Center, banks in the Cayman Islands and Bahamas, and other subsidiaries referred to in Note 1 of our audited consolidated financial statements.
97
BHI’s direct ownership stake in BAC International Bank, Inc., is a result of BHI’s acquisition of BBVA Panama in 2013 and the subsequent merger of BBVA Panamá with BAC International Bank Inc, with the latter remaining as the surviving company.
As of September 30, 2021, 0.0039% of the outstanding shares of BAC International Bank, Inc. were owned by minority shareholders. For its part, 0.4309% of the outstanding shares of Multi Financial Group Inc. were owned by minority shareholders.
For more information regarding BHI’s subsidiaries please refer to Note 1 of our audited consolidated financial statements.
Business Overview
BHI is a financial institution legally incorporated in Panama and managed from Colombia, whose main corporate purpose is to be a financial holding of shares issued by national or foreign companies that develop financial activities, directly or indirectly.
BAC Credomatic Inc., the main and direct subsidiary of BAC Holding International Corp., is a pure equity holding company that directly and indirectly holds the shares of the remaining regulated and/or operating financial subsidiaries that operate under the BAC Credomatic trademark as a single institution throughout Central America, offering a wide variety of products and services to its clients through a centralized strategy led by a unified group of financial institutions that function as a single entity with a homogeneous marketing strategy, in addition to a solid infrastructure and technological platform, which is operated by local management teams in six countries of the Central American region. This has allowed BAC Credomatic Inc. to share regional best practices efficiently and benefit from economies of scale that result in enhanced services for large Central American companies and multinationals.
BAC Credomatic Inc., through its direct subsidiary BAC International Corp. (“BIC”), the holding company regulated by the Superintendencia de Bancos de Panamá as the “tenedora de acciones” that owns and exercises corporate governance over BAC International Bank, Inc. (“BIB”), a bank organized under the laws of Panama, is a full-service Central American financial conglomerate with leading credit card issuance and merchant-acquiring franchises and operations in Costa Rica, El Salvador, Guatemala, Honduras, Nicaragua and Panama, among other countries. For the purposes of this section we will refer to BAC Credomatic Group (“BAC” the “Group” or the “Company”) in describing the guiding principles of our regional strategy that is executed across Central America by the regulated and operating financial subsidiaries.
Strategic Overview
Since the 1980s, we have developed and perfected a robust business strategy based on two underlying principles: (i) operating a single brand and an integrated technology platform across the Central American region, and (ii) utilizing existing consumer and commercial payment channels and infrastructure (known internally as the “Payment Chain Strategy”) to integrate vertically; resulting in a stable, low cost funding source via merchant deposits and a well-defined low risk consumer and commercial lending franchise. Over the years, this strategy has also been complemented by an integrated digital strategy that is supported by unified and robust online platforms, top talent, and a focus on sustainability and ESG factors.
Regional Strategy
Central America has a GDP of approximately U.S.$272 billion and a population of approximately 51 million (IMF 2021 estimates). Over the last three decades, Central America has experienced an increasing rate of integration (politically and economically). However, the locally owned banking industry in Central America remained largely fragmented until the early 2000s, with the exception of BAC Credomatic Group.
The Group’s underlying focus has been Central America (since the acquisition of the entity that is currently known as Banco BAC San Jose) and our integrated presence and expertise in the Region has been a key competitive advantage for the Company. Our regional perspective allowed us to take advantage of regional economies of scale, when we first built our leading card business (utilizing the Payment Chain Strategy discussed below) which we then gradually leveraged into a leading regional banking franchise. Additionally, this regional focus allowed us to improve our service and offer more competitive regional products to superior local clients, such as larger Central American companies and multinationals operating throughout the Region. The success of our regional strategy has been a result of the following strategic initiatives, which allow the Group to operate as a single institution throughout the Region:
□ We use the same brands and market our products and services similarly throughout the Region. From the start, the concept of BAC Credomatic Network was created to standardize the different channels in the different countries.
□ We utilize the same technological infrastructure and offer our clients an integrated banking and card platform across the Region.
□ We offer a unified and robust online platform and have invested a significant number of resources to become a leader in electronic banking in an effort to reduce costs and facilitate regional transactions for clients.
98
□ We have developed cost-effective alternative payment and banking channels and networks in the Region (in lieu of an over-expansive regional branch network), such as multi-service kiosks, ATMs, call centers, IVRs, online banking, and electronic applications.
□ We have a strong local corporate governance structure in each country that also benefits from a centralized regional management structure, human resources, and risk functions, that promotes standardization, aligns interests and helps control costs. We manage our business utilizing a geographic-product matrix.
In the coming years, the Company will continue to consolidate its leadership in the Central American financial sector by focusing on:
1. Increasing participation in Central America, complementing its presence and leadership in the Personal and Corporate Banking segment by:
i.Capturing the opportunities presented by the growth of the Financial Sector in Central America.
ii.Developing and strengthening its Corporate Banking segment in the region, leveraging the knowledge and skills acquired through its regional presence.
2. Developing and capturing operational synergies through centralized shared services between the different entities that allow savings due to economies of scale (e.g., centralized corporate purchasing and technology).
3. Focusing its attention on self-service needs in digital channels: promoting efforts and strategies throughout the organization, from its culture to technological investments, with the aim of deepening customer relationships by positioning digital products and services that are preferred by customers due to their convenience and efficiency and migrating from traditional channels to digital channels.
4. Inorganic growth: Selectively evaluating strategic investments and inorganic growth opportunities in Central America where the Company believes that it can generate strategic value.
Payment Chain Strategy
At the center of our Payment Chain Strategy lie both the card merchant voucher acquiring and card issuing businesses, which work together in a symbiotic relationship that drives banking business growth and profitability.
In the merchant voucher acquiring business, as the only processor of all card brands in the Region, our strategic goal is to continue to be the main player in the merchant payment system (by volume acquired) to drive lending and deposit growth alongside the processing fee profits that are generated by this business. As part of this process, we seek to integrate vertically around our merchants by establishing relationships (from lending to deposit taking) with their suppliers and employees (including providing payroll services to our merchants). Additionally, by dominating the acquiring business, we ensure that the cards issued under the issuing business are universally accepted and thereby facilitate the payment cycle between our two client bases (merchants and cardholders). Therefore, our sales force focuses on expanding the merchant universe and point-of-sale (“POS”) terminal penetration in Central America.
To further illustrate the acquiring business strategy, it is important to highlight that, as of September 2021, 87% of the volume processed for our merchants was credited to an account at one of our banks and 95% of our merchants have bank accounts with BHI’s subsidiaries. The aggregate balance of these merchant accounts is U.S.$2,721 million (as of September 30, 2021), about 13% of total deposits at that date. As highlighted above, these low-cost deposits are in turn used to efficiently fund commercial lending (including the merchants themselves and their suppliers, deepening the relationship with such merchants) and consumer lending (including merchants’ employees or the issuing side of the business).
In the card issuing business, the strategic goal is to remain the leaders in the consumer payment system (as measured by issuing volume and market penetration) to drive lending and deposit growth, as well as to promote usage and merchant chain growth. Additionally, the card issuing business drives brand recognition, facilitating the expansion of the acquiring business strategy. Therefore, our issuing business sales force focuses on expanding its share of each consumer target market (subject to strict credit risk parameters). As of September 2021, our subsidiaries represented 38% of the credit card billed volume in the Region, based on internal estimates. As of September 30, 2021, we have close to 5.0 million debit and credit card accounts outstanding and a credit card portfolio of approximately U.S.$3,272.6 million which represents approximately 18.2% of our total loan portfolio.
As highlighted above, our positioning in the issuing and acquiring of credit cards, effectively facilitates the payment cycle between our two main client bases (merchants and consumers), enhancing the attraction and retention of low-cost deposits (e.g., funds are debited from a consumer account and credited into a merchant account). This low-cost deposit funding base plays an important role in our overall strategy and is a key competitive advantage. Furthermore, the extension of vertical integration around the Group’s merchants to all payment channels and product divisions within our banking business (including: e-banking, Swift ACH transfers, Americhecks and Ameritransfers (our real time transfer system among the Company's banks), among others) generates fee income and expands upon the synergies between our credit card and banking businesses.
99
Digital Strategy
Reinventing our business and constantly innovating is a strategic priority at BAC Credomatic. For that reason, in 2017 we started the journey towards a more digital and customer centric organization. We continue implementing a strategy focused on customer needs, offering solutions that make the customer experience seamless and straight forward.
Our digital banking platforms are a by-product of that digital transformation. Our robust online and mobile banking platforms allow our customers to carry out virtually any type of transaction, seamlessly and conveniently. Our organization keeps evolving and, as a result, we not only continue improving our mobile and online banking by releasing tools that enable efficient self-service, but we have also taken the digital transformation to our physical assets. In fact, we redesigned our branches to emphasize relational banking and created well-thought spaces for self-servicing. In response to customer needs during the pandemic, we made progress in our customer service channels to ensure our customer interactions are smooth and agile.
Our customers have access to state of the art mobile and online banking options that facilitate their day-to-day financial needs. Some of our mobile banking app functionalities include simple tools such as transfer vouchers that can be shared with contacts via WhatsApp, to more complex features such as payments using the mobile phone through NFC technology or cardless cash withdrawals. In fact, clients are now able to easily withdraw money without the need to physically carry their card. In 2020, we enabled this functionality through our entire commercial network – not only through our branches and ATMs but also through Rapibac, our banking correspondents channel (merchants that act as financial correspondents and process simple transactions like deposits, bill payments, cash withdrawal, etc.)
In 2021, BAC Credomatic focused its innovation efforts on mobile payments and was one of the first financial entities to launch Apple Pay and payments with Gamin and Fitbit devices, using NFC technology. This technology offers several advantages over traditional credit card payments, namely ease of use and security. As of December 2021, BAC had close to 100 thousand registered users and enrolled close to 90 thousand cards and over 55 thousand customers. Today BAC’s mobile wallet shows double digit growth month to month. In fact, the number of customers that have enrolled, registered their cards and made a transaction using the mobile wallet has increased 67% since the launch in April 2021. These solutions are key to winning over Millennial and Centennial customers. In fact, Gen Z customers represent close to 38% of Apple Pay activations vs. 11% when looking at other BAC solutions.
The other growth area that has shown a steep uptick during the pandemic is e-commerce. Compra Click is BAC Credomatic’s e-commerce tool, designed for small and medium businesses, allowing them to sell online through a secure link that can be published on any website or even social media platforms. Compra Click generated $546 million in 2021, which represents 81% growth versus 2020. The other solution is MiPos, a platform that allows any business owner to accept payments online by using their mobile phones or tablets as a payment terminal. In 2021, MiPos reached 17 thousand retailers with close to 20 thousand installed devices and an average ticket size of $118. This represents a 74% growth versus 2020, reaching $528 million in sales.
Regarding our online banking, in 2020, as a response to the sanitary crisis, we added two new sections to our website (automobile and real estate) that allow our customers to easily navigate and explore available properties and fill out a form to apply for financing. This has become a flagship project and customers are now able to participate in virtual expos and fairs, contributing positively to the re-activation of the economy during the pandemic. Through these online features we have been able to exceed pre-pandemic car loan and mortgage volumes in 2021. During the year we organized 8 virtual fairs and several hybrid (online and in-person) events, backed by our online catalogs. These events are a great way of offering relevant information to our customers, to help them in their purchase decision and at the same time, strengthen our relationship with commercial partners. Through these online events we have been able to showcase 319 real estate projects and 64 car dealership companies throughout the region, allowing us to strengthen the bank’s regional platform positioning.
Given the importance of tourism in our region, we made efforts to help reactivate the industry in 2021. With that objective in mind, in June 2021 we re-launched our online booking platform Viajes BAC. The platform allows customers to use credit card points or miles and pay for their vacation in installments with zero interest.
In 2021, over 46% of our customers actively used our online banking platforms. In addition to the self-service digital banking platforms, we have expanded the operation of our digital customer service channels, mainly WhatsApp, webchat and our chatbots. WhatsApp is the channel that gained most relevance during the year and for the first time in 2021 we interacted with our customers via digital channels more than through voice channels.
On the back end, we launched a new platform that allows us to offer a more personalized experience and meet the specific needs of our customers. Over 10 thousand executives in the region now use this cloud-based platform in order to:
- Get a 360 view of the customer
- Access a knowledge base that provides quick and targeted answers so that the executive can interact with the customer seamlessly and rapidly
100
- A smart assistant that guides the executive with step-by-step guides that allow the executive to perform any task
Furthermore, we are also committed to digitizing our corporate banking customers with products that meet their unique needs. Within the corporate segment our focus is on payment traceability and self-service via our online banking. In 2020 we became the first bank in the region to implement SWIFT GPI payments, allowing our corporate banking customers to trace their international payments transparently. We are the region’s leading bank in terms of international transfers, processing close to 850,000 international transfers yearly. In addition, we launched a new functionality tailored to our SME customers, that allows them to process their payroll online through a simple and user-friendly interface. This functionality was deployed gradually in each of the six countries in our region, allowing us to learn and tweak the product throughout the year.
As we adapt to the new reality that we face in each of our six countries, we will continue leveraging our regional scale and promoting the use of digital channels, but always prioritizing the wellbeing of our clients and employees. At BAC Credomatic, we are making every effort to keep our customers at the center of every initiative we undertake. Therefore, we constantly research our markets making sure we understand our customers’ behavior to find solutions that appeal to and resonate with them. Our UX team goes out to the field on a weekly basis to get customers’ input on new products and prototypes. The insights we obtain are very valuable. In 2021, we implemented a new tool that will help us measure customer satisfaction at every touchpoint. We receive feedback from around 40,000 customers regionally every month and use this information to improve our digital experience. Technology is an enabler, but the customer will always dictate the path we will follow.
ESG Strategy
At BAC Credomatic, support and commitment towards sustainability is ongoing and enduring. The journey towards achieving the United Nations’ Sustainability Development Goals (SDGs) is embedded within the organizational culture and cuts across all the business units and core operating processes. We aspire to be an organization that improves the quality of life of the people that we serve and positively impacts the communities in the six countries where we operate. As of February 2021, we joined the UN Environment Program - Finance Initiative (UNEP FI), formalizing our commitment to the Principles of Responsible Banking. This marks a milestone in our history as we publicly pledged to work towards creating a financial sector that positively impacts and serves people and planet.
Given our commitment to the development of Central America as a region, we have developed a series of partnerships designed to support SMEs, and to serve unbanked segments of the population. In the past 10 years, BAC Credomatic has reached over 1 million people through financial literacy programs conducted in-person and online. Our financial literacy programs ensure that more people can access financial services, make informed decisions, and utilize the products and services that we offer, in a responsible and productive manner. We extend the reach of our financial literacy programs in two ways. First, for years we have been operating an online portal called Aprendiendo (Learning). The portal is a repository of educational tools and resources for children, young adults, and SMEs. Second, we have implemented public-private partnerships with the ministries of education of Costa Rica, Guatemala, and Honduras. These partnerships stress the importance of financial education from an early age, by embedding financial literacy in the public schools’ curricula.
In addition, we serve over 300,000 small and medium enterprises (SMEs) regionally and have impacted 120,000 SMEs through our SME development program, which aims to strengthen our SME clients’ businesses by providing training, development and networking opportunities. We work closely with female business owners to assist them with the tools they need to grow their businesses.
Since 2014 we have been running Yo Me Uno (I’m in!), a program that supports NGOs and non-profits by enabling links between private enterprise and the wider society. The Yo Me Uno online platform offers an opportunity for NGOs to showcase the work that they do. Most importantly, Yo Me Uno allows citizens to select their cause of choice and donate their time, money or other benefits in kind, directly through the web portal. Yo Me Uno has raised over $4 million through close to 100 fundraising campaigns in five different countries. In addition, in 2020, we launched an online training program that impacted to over 1,000 NGO leaders and implemented several digital campaigns to raise funds for NGOs in the health industry that supported with the pandemic response. Through the 250 NGOs that are affiliated to the program we have indirectly impacted over 30 million people in Central America.
For years we have been working on an internal program called "Posibilidades BAC Credomatic" (BAC Credomatic Possibilities) with the purpose of eradicating poverty within our workforce, assessed via the Multidimensional Poverty Index (MPI). The program aims to identify and assist all our employees that live under the poverty line, due to over indebtedness or other personal circumstances. In 2020 we started working on regionalizing the program and in 2021 we reached over 700 employees with emotional support and over 2,000 with financial literacy programs, among other support measures. Over half of our employees have completed the initial diagnostic assessment.
Throughout the pandemic we doubled down on our employee wellness program; implementing over 5,000 new measures to assist our employees and their families in response to the COVID-19 crisis. These include virtual medical assistance, enabling work-from-home conditions, financial relief measures, transport options for employees, follow-up for employees that had coronavirus, support for families of deceased employees, communication about hygiene, health and family wellbeing, and employability and entrepreneurship programs to support employees and their family members.
101
As a socially responsible financial entity, it was our duty to support our customers throughout the global health crisis. For this reason, we implemented financial relief measures in all the countries where we operate, benefiting over 870 thousand customers (individuals and enterprises) through our financial relief program. For our individual clients, the measures included delaying payment of instalments for personal and home loans for two months and delaying payment of credit card debt. Additionally, we offered our customers exclusive benefits for essential purchases such as purchases made in supermarkets, pharmacies, and hospitals and clinics. In general, we offered tailored relief measures for our personal and corporate banking customers, based on each clients’ particular situation.
Finally, we support local initiatives in each of the six countries where we operate. Some of the key local milestones of the past years are the following:
- Mapping the corporate portfolio to identify credit operations of over U.S.$780 million with a social or environmental component.
- Over 136 thousand SMEs have participated in our capability building programs with a special emphasis on female entrepreneurs and business owners. In Guatemala and El Salvador specifically, we have a special alliance with BID Invest that includes a fund of over U.S.$160 million to give credit to female business owners.
- We have obtained ISO 14001 certification in 29 of our buildings in Costa Rica, ISO 50001 certification in two more buildings and a carbon neutrality acknowledgement.
- Our new environmental initiative includes the setup of 12 electric vehicle charging stations in Costa Rica and Panama, a carbon responsible acknowledgement in Guatemala and solar panel projects in Honduras.
- We created the Smart Gender Equality Forum, where we have taken important steps towards identifying and closing gender pay gaps and prioritize the wellbeing of our female employees.
- Over 1.2 million people have benefited from our education and financial literacy programs including high school students, through the public-private partnership we have with the Ministry of Education in Guatemala, Honduras, and Costa Rica. Our online content has been played by close to 200 thousand users and has over 334 thousand visits.
Description Of The Main Markets Of Operation
Central American Financial System
With data as of September 30, 2021, the Central American financial system shows dynamism with year-on-year (YoY) growth of the system’s total assets, deposits, and net lending portfolio of 3.5%, 5.5%, and 2.9%, respectively. The regional financial sector showed resilience, as business continuity measures made it easier for the government as well as private clients to obtain emergency resources. The financial system, which adhered to government directives aimed at rescheduling client payments, has continued to provide a full range of services during the health emergency caused by COVID-19.
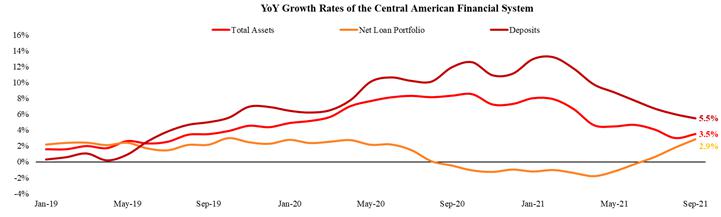
Source: Financial Superintendence of each country. For Guatemala, Financial Groups are considered along with banks that do not belong to any Financial Group. Panama considers only general license banks, total deposits, and the local gross portfolio.
The following table provides an overview of the assets, net loans and deposits of the Central American banking system and each country in which BHI has presence at September 30, 2021, and 2020:
102
| Total Assets | Net Loan Portfolio | Deposits | ||||||||||||||||
| At September 30, | Change 2021 | At September 30, | Change 2021 | At September 30, | Change 2021 | |||||||||||||
| 2021 | 2020 | vs 2020 | 2021 | 2020 | vs 2020 | 2021 | 2020 | vs 2020 | ||||||||||
(in U.S. $ millions) | % | (in U.S.$ millions) | % | (in U.S.$ millions) | % | |||||||||||||
| Panama | 114,397 | 114,333 | 0.1% | 54,727 | 54,141 | 1.1% | 84,447 | 82,355 | 2.5% | |||||||||
| Guatemala | 57,755 | 53,406 | 8.1% | 28,732 | 26,361 | 9.0% | 43,206 | 39,523 | 9.3% | |||||||||
| Costa Rica | 49,457 | 48,407 | 2.2% | 27,388 | 27,961 | -2.0% | 35,845 | 34,612 | 3.6% | |||||||||
| Honduras | 30,199 | 27,125 | 11.3% | 15,064 | 14,075 | 7.0% | 19,091 | 16,608 | 14.9% | |||||||||
| El Salvador | 20,504 | 19,917 | 2.9% | 13,517 | 12,951 | 4.4% | 15,218 | 14,602 | 4.2% | |||||||||
| Nicaragua | 6,969 | 6,624 | 5.2% | 3,319 | 3,274 | 1.4% | 4,815 | 4,369 | 10.2% | |||||||||
| Total | 279,282 | 269,811 | 3.5% | 142,747 | 138,763 | 2.9% | 202,622 | 192,068 | 5.5% | |||||||||
Source: Financial Superintendence of each country and BHI internal data.
Our Operations
The Company serves customers across Central America in the corporate and consumer segments. Our goal is to establish profitable long-term relationships with members of this broad customer base, using segmentation strategies that allow us to offer products and services designed to meet the specific needs of each individual customer and/or customer segment. As part of our regional banking business, we offer a variety of services for the consumer and corporate segments, including demand and term deposits, loans, private banking, leasing, factoring, bank guarantee, pension funds, investment funds, brokerage, local and international transfers, among others.
As stated before in this document, figures for 2020 include MFG, which provides a wide variety of financial services in Panama, mainly commercial, investment, mortgage and consumer banking, insurance, factoring, leasing and training services, as well as real estate. The main subsidiary of MFG is Multibank Inc., which consolidates the banking, insurance and portfolio management operations of the company. BHI realized a spinoff of MFG operations on September 29, 2021, by which it transferred to Multi Financial Holding Inc., a company created simultaneously with that spinoff, the shares it held in Multi Financial Group Inc. at that date. As such, the financial and operating figures shown in the following discussion of operations reflect aggregated figures for BAC and MFG for the year ended 2020 and BAC figures for the period ended September 30, 2021, following the partial spinoff of MFG.
Corporate customers
Through our financial subsidiaries we offer our corporate clients a wide variety of products and services that allow them to carry out their projects and strengthen their businesses. We structure financial solutions adjusted to our corporate customers’ short, medium and long term needs and objectives focused on financing capital goods and working capital through modalities.
The following table presents the number of corporate customers that our subsidiaries across the region served at the dates indicated.
| At September 30, | At December 31, | ||||||
| 2021 | 2020 (1) | 2019 | 2018 | ||||
| (in thousands) | |||||||
| Total corporate customers | 133.5 | 133.7 | 126.7 | 118.2 | |||
| (1) | Includes 5.6 thousand corporate customers of MFG at December 31, 2020. |
Individual customers
Our consumer banking offering is heavily leveraged on our leadership in the regional credit card business, as previously discussed. As part of our consumer banking business, we offer a variety of services for the consumer segment, including demand and time deposits, loans, private banking, leasing, pension funds, investment funds, brokerage, and local and international transfers, among others.
The following table presents the number of individual customers that our subsidiaries across the region served at the dates indicated.
| At September 30, | At December 31, | ||||||
| 2021 | 2020 (1) | 2019 | 2018 | ||||
| (in thousands) | |||||||
| Individual customers | 3,988.3 | 3,736.3 | 3,708.0 | 3,461.6 | |||
| (1) | Includes 99.2 thousand individual customers of MFG at December 31, 2020. |
103
Lending activities
We classify our banks’ loans into commercial, which include corporate and small business loans, and consumer loans, which include personal, mortgage, vehicle, and credit cards. The following table presents our total net loans at the dates indicated:
| At September 30, | At December 31, | ||||||
| 2021 | 2020 (1) | 2019 | 2018 | ||||
| (in U.S.$ millions) | |||||||
| Commercial | 8,120.2 | 9,404.7 | 7,243.3 | 6,975.7 | |||
| Consumer | 9,898.6 | 10,949.5 | 9,592.3 | 9,247.9 | |||
| Total gross loans | 18,018.7 | 20,354.2 | 16,835.6 | 16,223.6 | |||
| Loss allowance | (659.6) | (697.8) | (509.7) | (482.1) | |||
| Total loans, net | 17,359.1 | 19,656.4 | 16,325.9 | 15,741.5 | |||
| (1) | Includes U.S.$1,746.2 million commercial and U.S.$1,454.3 consumer loans from MFG at December 31, 2020. MFG contributed a U.S.$3,172.4 balance of total loans, net at the same date. |
At September 30, 2021, the aggregate outstanding loans to our banks’ twenty largest borrowers represented 7.5% of our consolidated total net loan portfolio.
Commercial loan portfolio: consists of corporate loans, which include general purpose and working capital loans, and small company loans. The following table presents our commercial loan portfolio at the dates indicated:
| At September 30, | At December 31, | ||||||
| 2021 | 2020 (1) | 2019 | 2018 | ||||
| (in U.S.$ millions) | |||||||
| Corporate | 7,330.4 | 8,546.1 | 6,473.8 | 6,224.4 | |||
| Small Company | 789.8 | 858.5 | 769.5 | 751.3 | |||
| Total commercial loans | 8,120.2 | 9,404.7 | 7,243.3 | 6,975.7 | |||
| (1) | Includes U.S.$1,669.2 million and U.S.$77.0 million of corporate loans and small business loans, respectively, from MFG at December 31, 2020. |
Consumer loan portfolio: consists of personal loans, automobile and other vehicle loans, leases, and credit cards. The following table presents our consumer loan portfolio at the dates indicated:
| At September 30, | At December 31, | ||||||
| 2021 | 2020 (1) | 2019 | 2018 | ||||
| (in U.S.$ millions) | |||||||
| Mortgage | 3,598.3 | 4,190.7 | 3,384.1 | 3,256.5 | |||
| Personal | 2,004.1 | 2,351.1 | 2,004.8 | 2,036.0 | |||
| Vehicles | 1,023.6 | 1,276.2 | 941.5 | 982.6 | |||
| Credit Cards | 3,272.6 | 3,131.5 | 3,261.9 | 2,972.8 | |||
| Total consumer loans | 9,898.6 | 10,949.5 | 9,592.3 | 9,247.9 | |||
| (1) | Includes U.S.$702.8 million, U.S.$412.3 million, U.S.$286.0 million and U.S.$53.2 million of mortgage, personal, vehicles, and credit card loans, respectively, from MFG at December 31, 2020. |
As previously described, our card business is of high strategic importance for the Group. While competitors may manage the card business as a complimentary product division, we view the card business as a core competitive advantage and a critical component of our continued success in Central America. We are the only company in Central America that can acquire merchant vouchers and issue cards across all major brands through long-term agreements with Visa and MasterCard and exclusive agreements with American Express, JCB and Diners Club International.
104
The following table presents the total number of activated card accounts of our banks at the dates indicated.
| At September 30, | At December 31, | |||||||
| 2021 | 2020 (1) | 2019 | 2018 | |||||
| (in thousands) | ||||||||
| Total activated card accounts: | ||||||||
| Credit cards | 2,083.1 | 2,121.6 | 2,395.8 | 2,293.6 | ||||
| Debit cards | 2,881.3 | 2,740.3 | 2,704.5 | 2,593.5 | ||||
| Total cards | 4,964.4 | 4,861.9 | 5,100.3 | 4,887.1 | ||||
| (1) | Includes 15.4 thousand credit cards and 18.3 thousand credit cards from MFG in 2020. |
Mortgages portfolio
Under the consumer loan portfolio we offer loans for the purchase of real estate secured by mortgages. We have implemented strict underwriting standards: we do not offer mortgage loans in amounts greater than 80% of the value of the property to be purchased upon origination, and all of our mortgage loans have maturities of up to thirty years. The weighted average maturity of the mortgage loan portfolio at December 31, 2020 was 203 months. Borrowers must also meet certain minimum income levels, and payments may not exceed 30% of the borrower’s monthly income in compliance with local regulations.
Treasury operations
Our banks’ treasury departments are responsible for the optimization of liquidity structures, managing investment portfolios, trading activities, distribution of treasury services and products to customers and wholesale funding activities. Each of our banks’ treasury departments is managed autonomously in adherence with investment and asset liability management policies and local regulatory requirements. In addition, their functions are framed within the corporate guidelines set out in the regional policies. Furthermore, the treasury departments are responsible for ensuring the financial sustainability and overall strategic alignment of their operations. Our banks’ proprietary trading activities primarily include investments in fixed income securities and foreign exchange operations, and to a lesser extent derivatives. We do not have any proprietary trading activities in equities.
Deposits
Our banks offer traditional deposit services and products, including checking accounts, savings accounts, and time deposits. Checking accounts typically bear low or no interest. Checking accounts and savings accounts are payable on demand, although a significant portion of these accounts tend to be stable in amount over time, leveraging our payment chain strategy. Most of our time deposits have maturities below 12 months and commonly earn interest at a fixed rate. The following table presents our deposits by product type at the dates indicated.
| At September 30, | At December 31, | |||||||
| 2021 | 2020 (1) | 2019 | 2018 | |||||
| Customer deposits by type | (in U.S.$ millions) | |||||||
| Demand deposits (2) | 7,951.1 | 8,114.9 | 5,971.8 | 5,578.2 | ||||
| Savings deposits | 4,655.9 | 4,605.5 | 3,335.2 | 2,965.9 | ||||
| Time deposits | 8,471.1 | 10,531.5 | 7,927.6 | 7,224.9 | ||||
| Total customer deposits | 21,078.1 | �� 23,251.9 | 17,234.6 | 15,769.1 | ||||
| (1) | Includes U.S.$383.3 million, U.S.$384.1 million, and U.S.$2,173.7 million of demand, savings, and time deposits, respectively, from MFG at December 31, 2020. |
| (2) | Includes non-interest-bearing demand deposits. |
Distribution channels
We have one of the region’s strongest and most diversified distribution networks, that includes branches, kiosks (non-cash machines which provide online banking capabilities as well as a full keyboard), ATMs, a standardized online banking platform, call centers and mobile banking. Additionally, we have the largest fully integrated ATM network, offering identical products and services across the region. Our distribution network allows customers to make transfers, payments and undertake other basic banking functions in our bank network, through traditional channels and electronic networks, with real-time effect to the account holder’s account.
105
The following table describes the main channels of our distribution network.
| Distribution Channel | Description | |
| Full-service branches | Full-service branches act as part of our sales and advisory network, primarily focused on account opening and credit card sales as well as digital banking onboarding. We also offer services such as check cashing, deposits, withdrawals, loan and credit card payments, transfers and advances. | |
| Other branch formats | Other branch formats include on-site tellers, auto/drive-thru branches, in-store branches, and digital branches where customers can perform monetary transactions. | |
| ATMs and electronic service points | Through our ATMs network, our customers can, among other services, make account withdrawals, consult their balances, perform Salary Advances and pay third party services. Additionally, many of our branch-based ATM´s are enabled to receive envelope free deposits and card payments. Non-customers can use our ATM´s for withdrawals using any MasterCard, Visa, American Express or Discover network card. | |
| Banking correspondents (RapiBACs) | Banking correspondents allow customers to perform cash transaction services in third party establishments such as convenience stores and pharmacies. Services include deposits, card payments, withdrawals and bill payment. | |
| Automated telephone banking, mobile banking and online banking | Through our banks’ websites, mobile banking services and automated telephone banking, customers may pay loan and credit card balances, execute transfers between accounts within BAC, to local banks or internationally, make payments for collection agreements, pay payroll and suppliers among many other services. Customers can also perform self-service transactions, account opening and other high value services. |
During 2021, we continued optimizing our footprint by either closing, relocating, or adapting branches to increase the effectiveness of our distribution network. The following table presents our total full-service branches across the region at the dates indicated.
| At September 30, | At December 31, | |||||||
| 2021 | 2020 | 2019 | 2018 | |||||
| Costa Rica | 40 | 42 | 41 | 44 | ||||
| Guatemala | 97 | 99 | 134 | 134 | ||||
| Honduras | 60 | 61 | 60 | 58 | ||||
| Nicaragua | 40 | 40 | 40 | 40 | ||||
| Panama (1) | 31 | 53 | 37 | 37 | ||||
| El Salvador | 36 | 36 | 39 | 39 | ||||
| Full service branches | 304 | 331 | 351 | 352 | ||||
| Other branch formats | 359 | 375 | 411 | 390 | ||||
| (1) | In 2020, includes 20 new full-service branches resulting from the acquisition of MFG. |
| (2) | Includes on-site tellers, auto/drive branches, in-store branches, and digital branches. |
We also continued optimizing our ATM footprint by either closing, relocating or adapting ATMs to increase the effectiveness of our distribution network. The following table presents our total ATMs in the region at the dates indicated:
| At September 30, | At December 31, | |||||||
| 2021 | 2020 | 2019 | 2018 | |||||
| Costa Rica | 526 | 542 | 555 | 545 | ||||
| Guatemala | 279 | 264 | 270 | 271 | ||||
| Honduras | 474 | 469 | 474 | 435 | ||||
| Nicaragua | 307 | 306 | 299 | 290 | ||||
| Panama(1) | 198 | 302 | 235 | 230 | ||||
| El Salvador | 275 | 296 | 303 | 298 | ||||
| Total ATMs | 2,059 | 2,179 | 2,136 | 2,069 | ||||
| (1) | In 2020, it includes 94 new ATMs resulting from the acquisition of MFG. |
Finally, we also serve our customer through other points of service comprised of self-service kiosks and RapiBACs (banking correspondents). The following table presents our other points of service in the region at the dates indicated.
| At September 30, | At December 31, | |||||||
| 2021 | 2020 | 2019 | 2018 | |||||
| Costa Rica | 2,812 | 2,541 | 2,263 | 2,174 | ||||
| Guatemala | 1,290 | 1,127 | 1,120 | 1,012 | ||||
| Honduras | 1,780 | 1,642 | 1,571 | 1,467 | ||||
| Nicaragua | 2,790 | 2,794 | 2,724 | 2,783 | ||||
| Panama(1) | 346 | 495 | 722 | 829 | ||||
| El Salvador | 270 | 386 | 460 | 381 | ||||
| Other points of service | 9,288 | 8,985 | 8,860 | 8,646 | ||||
| (1) | In 2020, it includes 126 new banking correspondents resulting from the acquisition of MFG. |
106
In addition to these “traditional” banking channels, we have consistently innovated in non-traditional channels, including developing effective strategies to engage Gen Y and Gen X customers while reducing the costs associated with customer service and transaction migration. In 2020 and through September 2021, our transaction mix shifted toward digital channels, following the migration trend towards digital channels seen in recent years and broadened by the effects of the COVID-19 pandemic on our clients’ habits. As lockdowns were put in place in Central America during the COVID-19 pandemic, transactions in our physical channels (mainly branches and ATMs) decreased significantly and favored the usage of alternate channels (mainly online and mobile banking). As such, successful monetary transactions through online and mobile banking channels accounted for 55.6% of total transactions through September 30, 2021, up from 47.9%, 33.0%, and 29.3% in 2020, 2019, and 2018, respectively.
The following tables present volumes for successful monetary transactions processed through our distribution channels and their share of our total transactions in the region at the dates indicated:
| Period ended September 30, | For the year ended December 31, | |||||||
| 2021 | 2020 (1) | 2019 | 2018 | |||||
| (in thousands) | ||||||||
| Branches | 34,218 | 44,459 | 64,446 | 67,432 | ||||
| ATMs | 52,285 | 64,287 | 80,724 | 78,302 | ||||
| Online banking | 45,327 | 54,145 | 49,362 | 42,273 | ||||
| Mobile Banking | 83,378 | 63,564 | 31,080 | 24,209 | ||||
| Banking correspondents and other | 16,139 | 19,236 | 18,348 | 14,940 | ||||
| Total monetary transactions | 231,346 | 245,690 | 243,960 | 227,156 | ||||
| Branches | 14.8% | 18.1% | 26.4% | 29.7% | ||||
| ATMs | 22.6% | 26.2% | 33.1% | 34.5% | ||||
| Online banking | 19.6% | 22.0% | 20.2% | 18.6% | ||||
| Mobile Banking | 36.0% | 25.9% | 12.7% | 10.7% | ||||
| Banking correspondents and other | 7.0% | 7.8% | 7.5% | 6.6% | ||||
| (1) | In 2020, it includes 2,400 thousand transactions from MFG if which 31.7% were transactions from mobile and online banking. |
Competition
At the regional level, as of September 30, 2021, BHI, through its subsidiaries, is the leading financial institution in Central America, measured by assets, net loans, deposits and net income. The following market share estimates comparing us and our banking subsidiaries to our competitors is based on information derived from separate financial information reported to each of the local regulators in the six countries where we operate in the region.
| Period ended September 30, | At December 31, | |||||||
| 2021 | 2020 (1) | 2019 | 2018 | |||||
| Market Share: | (in percentages) | |||||||
| Assets | 10.2 | 12.3 | 9.9 | 9.8 | ||||
| Net Loans | 11.0 | 13.1 | 10.3 | 10.1 | ||||
| Deposits | 10.5 | 12.2 | 9.7 | 9.4 | ||||
| Net Income | 14.8 | 15.1 | 13.4 | 14.0 | ||||
| (1) | Market share in 2020 includes MFG. Adjusting for MFG, BHI’s market shares at December 31, 2020, were 10.7%, 11.3%, 10.9%, and 16.4% in terms of assets, net loans, deposits, and net income, respectively. |
107
Property, plant and equipment
We have listed below the carrying amount of property, plants and equipment for BHI and its subsidiaries at the dates indicated:
| At September 30, | At December 31, | |||||||
| 2021 | 2020 | 2019 | 2018 | |||||
| (in U.S.$ millions) | ||||||||
| Land | 61.6 | 91.2 | 63.6 | 60.3 | ||||
| Premises and leases (right-of-use) | 489.1 | 570.9 | 516.0 | 247.8 | ||||
| Equipment | 451.7 | 454.0 | 445.6 | 343.9 | ||||
| Property, plants and equipment, gross | 1,002.4 | 1,116.2 | 1,025.3 | 652.0 | ||||
| Accumulated depreciation | -491.4 | -454.6 | -410.6 | -320.6 | ||||
| Property, plants and equipment, net | 511.0 | 661.6 | 614.7 | 331.4 | ||||
Human Capital
At September 30, 2021, on a consolidated basis, we employed 21,636 individuals, with 18,947 direct employees, 1,634 staffing service company employees and 1,055 outside contractors.
The following table presents the approximate breakdown of the employees, by direct employees, employees provided by staffing service companies, and outside contractors of BHI and its subsidiaries at the dates indicated.
| At September 30, | At December 31, | |||||||
| 2021 | 2020 | 2019 | 2018 | |||||
| Direct employees | 18,947 | 20,026 | 21,114 | 21,464 | ||||
| Staffing service company employees | 1,634 | 835 | 1,042 | 618 | ||||
| Outside contractors | 1,055 | 2,585 | 2,449 | 1,974 | ||||
| Total employees by type | 21,636 | 23,446 | 24,605 | 24,056 | ||||
| (1) | Includes 1,089 direct employees, 1 staffing service company employee, and 108 outside contractors from MFG at December 31, 2020. |
There is no workers' union at BHI.
Legal Proceedings
BHI and its subsidiaries are party to lawsuits and administrative proceedings incidental to the ordinary course of our business.
BHI and its subsidiaries record contingency provisions when the risk of loss is probable, in which case, we would consider settling. In cases where we litigate a claim, we record a provision for our estimate of the probable loss based on historical data for similar claims.
To the best of management's knowledge, the Company is not involved in any litigation or claim that is likely to cause a significant adverse effect on its business, its consolidated financial position, or its consolidated financial performance.
108
12. MANAGEMENT
Identity of Directors, Senior Management and Advisers
Directors
The Board of Directors is composed of five (5) directors, who are elected by the shareholders in the General Shareholders' Meeting for a period of one (1) year, that may be re-elected indefinitely, subject to the restrictions and incompatibilities provided for in the applicable laws. The Directors’ compensation is defined by the General Shareholders' Meeting. At least twenty-five percent (25%) of the seats on the Board of Directors must be occupied by independent members, in accordance with applicable laws. At any given time, the Board of Directors must have at least two (2) members who meet the criteria of independence in accordance with Paragraph 3 of Article 44 of Law 964 of 2005 of the Republic of Colombia.
To ensure compliance with the requirements of independence, in electing the members of the Board of Directors, the Company will observe the provisions of Law 964 of 2005 of Colombia and Decree 3923 of 2006 of Colombia, as well as any provisions that modify or add to them, and ensure compliance in accordance with the Code of Good Governance.
The Chairman of the Board of Directors shall be elected by the Board. The General Secretary of the Company or, in their absence, an executive of the Company designated by the Board of Directors shall act as Secretary of the Board of Directors. In the absence of the Chairman of the Board of Directors, the Board may appoint one of the other Directors to preside over the meeting as "ad hoc" Chairman. Directors shall have no alternates.
As of the date of this information statement, the Board of Directors of BAC Holding International Corp. is as follows:
1. Rodolfo Tabash: Director and President
2. Daniel Pérez: Director and Secretary
3. José Alberto Santana: Director and Treasurer
4. Rolando Laclé: Independent Director
5. Eloy Alfaro: Independent Director
In connection with the Spinoff, new appointments of Directors are expected in the upcoming weeks.
Below is an overview of the members of the Board of Directors:
Rodolfo Tabash:
Nationality: Costa Rican
Birth Date: February 17th, 1969
Commercial Address: Plaza Roble, Edificio Terrazas B, piso 4, Escazú, San José, Costa Rica
P.O. Box: 2150-1000 San Jose
Email: rtabash@baccredomatic.com
Phone: (506) 2502-8812
Fax: (506) 2502-8834
Education: Master in Business Administration from the Central American Institute of Business Administration INCAE; Bachelor of Business Administration, Universidad de las Américas.
Professional Experience: Country Manager of BAC International Bank, Inc. He has also served as Chief Corporate Banking Officer, in charge of developing the strategy and implementation of the Corporate Banking area in the Central American region. Mr. Tabash also worked as Commercial Banking Manager of Banco de San José in Costa Rica, Financial Manager of BSJ International Bank & Trust Company Ltd and Deputy General Manager of Lachner & Saenz. In July 2016 he took the position of CEO at BAC International Corporation (BIC).
Daniel Pérez:
Nationality: Costa Rican
Birth Date: December 7th, 1980
Business Address: Plaza Roble, Edificio Terrazas B, piso 4 Escazú, San José
P.O. Box: 1586-2050
Email: dperez@baccredomatic.com
Phone: (506) 2502-8817
Fax: (506) 2502-8834
109
Education: Master of Laws (LL.M.) with emphasis in Corporate and Financial Law, Harvard Law School (Boston, MA, USA); Master of Laws (M. Jur.) with emphasis in Comparative Financial Law and International Dispute Resolution, Oxford University (Oxfordshire, U.K.); Executive Program on Legal Aspects of International Business, INCAE/Georgetown; Specialist in Notarial and Registry Law, Universidad Escuela Libre de Derecho; Law Degree (J.D. Equivalent), University of Costa Rica.
Professional Experience: He has served as Chief Legal Officer of the BAC Credomatic Group since 2011; Lawyer/Partner at Gómez y Galindo Law Firm (San José, Costa Rica; 2004-2007, 2009-2011); Professor of Law and Banking at the University of Costa Rica; Professor of Corporate Governance at ULEAD.
José Alberto Santana:
Nationality: Panamanian
Birth Date: July 10th, 1961
Business Address: Calle Aquilino de la Guardia with Calle 49, Edificio Banco de Bogota, Panama City, Republic of Panama.
P.O. Box: 0816-02028 Panama
Email: josealberto.santana@hotmail.com
Phone: (507) 306-1100
Fax: (506) 2502-8834
Education: Business Administrator from the School of Business Administration and Finance Specialist from Universidad de los Andes.
Professional Experience: He served as Financial Vice President of Corficolombiana S.A. from 1998 to 2006 and as General Manager of Banco de Bogotá S.A. (Panama) S.A. from 2006 to 2020. He currently serves as a member of the boards of directors of Banco de Bogotá S.A. (Panamá) S.A., Banco de Bogotá (Nassau) Ltd., and as a member of the board of directors and General Manager of BAC Holding International Corp.
Rolando Laclé:
Nationality: Costa Rican
Birth Date: January 27th, 1968
Business Address: Consortium Legal - Costa Rica, Trejos Montealegre, Escazú. Banco General Building 6th floor San José, San José
P.O. Box: 10203, San Jose
Email: rlacle@consortiumlegal.com
Phone: +506 2289-0750
Education: Master of Laws, Georgetown University, United States (1994). Specialization in Commercial Law, University of Costa Rica, Costa Rica (1993). Law Degree and Notary (cum laude), University of Costa Rica, Costa Rica (1990)
Professional Experience: He is a partner in Consortium Legal – Costa Rica. With 30 years of experience, he specializes in mergers and acquisitions, foreign investment, real estate, civil and commercial litigation. He has participated in multiple local and international transactions related to securitizations, acquisitions of local companies, and sophisticated real estate transactions. He has also acted as legal counsel in major litigation cases primarily in civil and commercial matters.
Eloy Alfaro:
Nationality: Panamanian
Birth Date: September 27th, 1978
Business Address: PH Humboldt Tower, Calle 53 E, Piso 2, Panama City, Republic of Panama
P.O. Box: 0819-09132 Panama
Email: ealfaro@alcogal.com
Phone: (507) 269-2620
Fax: (507) 264-3257
Education: Columbia University in the City of New York (B.A. – Ciencias Políticas) 2001; University of Pennsylvania Law School (Juris Doctor) 2004.
Professional Experience: Partner in Alemán, Cordero, Galindo & Lee with extensive experience in banking and securities regulatory law; bank mergers and acquisitions; cross-border financing; corporate law (2004-present). Director and Vice President of the Chamber of Commerce, Industries & Agriculture of Panama (2016-2021).
110
Executive Officers
BHI Executive Officers
As a holding company, the majority and relevant business decisions in BHI are made by the Board of Directors. However, the Company has appointed a General Manager, and a small team to administrate and manage the day-to-day business activities.
Current BHI General Manager information is disclosed below:
José Alberto Santana Martínez:
Nationality: Panamanian
Birth Date: July 10th, 1961
Business Address: Calle Aquilino de la Guardia with Calle 49, Edificio Banco de Bogotá, Panama City, Republic of Panama.
P.O. Box: PAN-0816-02028 Panama
Email: josealberto.santana@hotmail.com
Phone: (507) 306-1100
Fax: (506) 2502-8834
Education: Business Administrator from the School of Business Administration and Finance Specialist from Universidad de los Andes.
Professional Experience: He served as Financial Vice President of Corficolombiana S.A. from 1998 to 2006 and as General Manager of Banco de Bogotá S.A. (Panama) S.A. from 2006 to 2020. He currently serves as a member of the boards of directors of Banco de Bogotá S.A. (Panamá) S.A., Banco de Bogotá (Nassau) Ltd., and as a member of the board of directors and General Manager of BAC Holding International Corp.
BAC Credomatic Group Executive Officers
Day-to-day management of BAC Credomatic Group is led by the CEO and a senior team of Executive Officers, which report to the CEO, that support and execute the Group’s strategy across the region. This management team is responsible for setting goals, developing strategies, and providing regional strategic and operational leadership to ensure the effective execution of the Group’s business strategy. The management team is comprised of the Chief Executive Officer, eleven regional Chiefs across key competencies and control functions, and 6 Country Managers, one in each country of operation. Certain of the Executive Officers are also members of the boards of directors of BHI subsidiaries.
The names and positions of BAC Credomatic Group Executive Officers are listed below:
Name | Position | |
| Rodolfo Tabash | Chief Executive Officer | |
| Finance and Control Functions | ||
| Alejandro Guardia | Chief Financial Officer | |
| Daniel Bañados | Chief Compliance Officer | |
| Adrián Elizondo | Chief Credit Risk Officer | |
| Daniel Pérez | Chief Legal Officer | |
| Kenneth Rothe | Chief Internal Control Officer | |
| Key Competencies | ||
| Alfonso Salvo | Chief Information Technology & Corporate Banking Officer | |
| Carlos Sevilla | Chief Operating Officer | |
| Gisela Sánchez | Chief Corporate Relations Officer | |
| Jessica Mora | Chief Experience and Talent Officer | |
| José Manuel Paez | Chief Digital Transformation Officer | |
| Jaime Compte | Chief Personal Banking & Payments Officer | |
| Execution | ||
| Ramón Chiari | Country Manager (Panama) | |
| Juan Carlos Sansón | Country Manager (Nicaragua) | |
| Jacobo Atala | Country Manager (Honduras) | |
| Federico Odio | Country Manager (Costa Rica) | |
| Fernando González | Country Manager (El Salvador | |
| Eric Campos | Country Manager (Guatemala) |
Below is an overview of BAC Credomatic’s Executive Officers and management team:
111
Rodolfo Tabash, Chief Executive Officer
Rodolfo Tabash has served as Chief Executive Officer of BAC since July, 2016. He has previous acted in several key management positions in BAC for the past 20 years, including Country Manager for BAC International Bank and its Panamanian subsidiaries, General Manager of BAC International Bank, Regional Chief Operating Officer for BAC Credomatic’s Banking Business and Commercial Banking Manager of Banco BAC San José. He is also a member of the board of directors of several BAC Credomatic subsidiaries. Mr. Tabash Espinach holds a degree in business administration from Universidad Internacional de las Américas and an MBA from INCAE.
Alejandro Guardia, Chief Financial Officer
Alejandro Guardia served as Director of Investment Banking of BAC since April 2021 and as Chief Financial Officer since November 2021. He has over 20 years’ experience in financial services in the Central American region. Mr. Guardia Lachner holds a degree in business administration from The Ohio State University, an MBA from University of Notre Dame and an MSF form The George Washington University.
Daniel Bañados, Chief Compliance Officer
Daniel Bañados has served as Chief of Compliance Officer at BAC since July 2018. Previously, he acted in key management positions in BAC for the past 15 years, including Corporate Compliance Manager for BAC Credomatic in Costa Rica and Honduras, and other Risk Management positions in financial institutions in Peru, as Bank Boston N.A. and Banco Interbank. Mr. Bañados holds a degree as Public Accountant from Universidad Federico Villarreal in Perú and an MBA from Universidad Francisco de Victoria in Spain.
Adrián Elizondo, Chief Credit Risk Officer
Adrián Elizondo has served as Chief Risk Management Officer of BAC since April 2021. He previously served as Commercial Credit Risk Manager and several other positions in Risk Management. He is an appointed member in the Credit Committee of the banking subsidiaries throughout Central America. Mr. Elizondo holds a degree in Economics from Universidad de Costa Rica, an MSc. in Economics from Pompeu Fabra University and an MBA from INCAE Business School. His business address is Centro Corporativo Plaza Roble, Terrazas B, Escazu, San José, Costa Rica.
Daniel Pérez, Chief Legal Officer
Daniel Pérez has served as Chief Legal Officer of the BAC Credomatic Group since 2011. Previously, he worked as a Partner at the law firm Gómez y Galindo (LatamLex) in Costa Rica; he has also been a Professor of Law and Banking at the University of Costa Rica and Professor of Corporate Governance at ULEAD. Mr. Pérez holds an LLM with emphasis in Corporate and Financial Law from Harvard Law School and a Master of Laws (M. Jur.) with emphasis in Comparative Financial Law and International Dispute Resolution from Oxford University.
Kenneth Rothe, Chief Internal Control Officer
Kenneth Rother has served as Chief Internal Control Officer for BAC since March 2017. Previously he held the position of Corporate Controller Regional Manager of BAC since November 2012. Mr. Rothe also has more than 15 years of solid experience in internal and external audit functions in companies such as: KPMG, Philip Morris International, Enel Group and Citibank. He is member of the board of directors of several BAC Credomatic subsidiaries. Mr. Rothe is a Certified Public Accountant and holds an MBA in Business Administration with emphasis in Finance from Universidad Latinoamericana de Ciencia y Tecnología (ULACIT).
Alfonso Salvo, Chief Information Technology and Corporate Banking Officer
Alfonso Salvo has been Chief Information Technology & Corporate Banking Officer since 2010 and is responsible for leading BAC's strategy focused on innovation and product development for business customers. Since joining BAC in 2004 he led the design and implementation of the new online banking platform & the CRM tool deployment throughout all customer touch points and oversaw the strategy definition and execution focused on innovation for retail & business customer servicing and sales channels for Central America. His team developed the first cash deposit ATM network (2008) & the first mobile banking app in Central America (2009). Recently he oversaw the integration of 2 acquired banks to BAC's technological platform in 2014 and increasing business cash collection reach with the creation of a business agent network for banking transactions. He successfully led the development and commercial launch of BAC's Corporate Digital Treasury – a single point payment hub to deliver faster local & cross border payments in Central America using ISO20022 standard formats. Also, he recently implemented the first online banking GPI customer facing interface in Central America providing customers with tracking information of global cross-border payments. Before being involved in the financial industry, he was a structural engineering for a consulting-design firm in Costa Rica, Grupo IECA S.A. Alfonso holds a bachelor’s degree in civil engineering, with an MBA from INCAE Business School.
Carlos Sevilla, Chief Operating Officer
Carlos Sevilla is the Chief Operating Officer and has 19 years of professional experience in different positions in BAC Credomatic. Previously, Carlos implemented and directed the Shared Service Center, worked for 9 years as the Regional Corporate Credit and Collections Manager and was the Service Channels Manager for BAC San José. He participates as Director in different Corporate Governance Committees. Mr. Sevilla graduated with honors from INCAE Business School with an MBA degree in Business Administration. He also has a dual degree in Industrial Engineering from Universidad Latinoamericana de Ciencia y Tecnología (ULACIT), and Chemical Engineering from Universidad de Costa Rica (UCR).
112
Gisela Sánchez, Chief Corporate Relations Officer
Gisela Sánchez has been the Chief of Corporate Affairs at BAC since 2021. Before joining BAC, she worked for FIFCO and before as a consultant for governments, NGOs, and companies in Central America in the areas of competitiveness and corporate social responsibility. Between 2001 and 2003, she worked for the AVINA Foundation in Latin America as Strategic Initiatives Manager and before AVINA as a Researcher and Project Coordinator for the Latin American Center for Competitiveness and Sustainable Development at INCAE. Sánchez is an Industrial Engineer and has an MBA from Kellogg Graduate School of Management at Northwestern University.
Jessica Mora, Chief Experience Officer
Jessica Mora leads all the bank’s channels (branches, contact centers, and digital channels) and oversees the employees' and clients' experience improvement initiatives as well as talent development. She has more than 30 years of professional career experience leading organizational change initiatives, mergers and acquisitions, quality assurance programs and critical negotiations with stakeholders and has occupied other key positions including Regional Quality Manager and Operational Excellence Manager at BAC. Jessica is a publicist and has a master's in Business Administration from the University of Costa Rica/Fundepos, a graduate degree from INCAE Business School, a Senior Strategic Leadership degree from Kellogg Graduate School of Management at Northwestern University and a master’s degree in Customer Experience Strategic Management from the University of Barcelona. She is an active social contributor, and she participates in NGOs´ board of directors and advisory committees in Costa Rica.
Jose Manuel Paez, Chief Digital Transformation Officer
Jose Manuel Paez has been the Chief Digital Transformation Officer for BAC Credomatic since the division was created in 2015. He is responsible for leading the Digital Transformation efforts at the bank, defining the digital strategy around online and mobile banking propositions, digital marketing initiatives, and front-end and process automation optimizations. He holds an MBA degree from the London Business School, a Master's in Management of Information Systems from the London School of Economics and a Bachelor of Commerce degree from McGill University in Montreal, Canada.
Jaime Compte, Chief Personal Banking and Payments Officer
Jaime Compte, age 43, has over 10 years’ experience working with BAC and has occupied multiple senior positions in BAC including Regional Manager for the Merchant Business and Payments and before that the position of Regional Manager of Contact Centers. Between 2004-2009 he occupied management positions in different companies in Costa Rica and Spain including the position of Senior Consultant on Strategy and Supply Chain Management for Accenture (European Office). Jaime is a Chemical Engineer from the Chemical Institute at Sarria. He has a master's in Bioengineering from the Massachusetts Institute of Technology (MIT) and an Executive Master’s Degree from the Polytechnic University of Cataluña in alliance with Cranfield University in England.
Ramón Chiari, Country Manager (Panamá)
Ramón Chiari has served as Country Manager of BAC Credomatic Panama since January 2020. He has more than 30 years in banking industry experience in Panama in different organizations including as General Manager and member of the Board of Directors of Banco de Panama. Mr. Chiari also held positions in Corporate Banking at Banco Continental Panamá as Vice President of Corporate Banking, where he managed the bank’s business strategy in Central America, and in Citibank’s Corporate Banking division before that. Mr. Chiari holds a degree in Accounting from Saint Joseph´s University.
Juan Carlos Sansón, Country Manager (Nicaragua)
Juan Carlos Sansón has served as Country Manager in Nicaragua since March 2011. He previously acted as Vice General Manager (1999) and General Manager (2008) in BAC Nicaragua. Mr. Sanson holds a degree in Industrial Engineering from Universidad Autonoma de Costa Rica and a Master’s in Economics from INCAE Business School.
Jacobo Atala, Country Manager (Honduras)
Jacobo Atala is currently Country Manager in BAC Honduras. He has served in several key management positions in BAC Honduras for the past 25 years and was formerly the President of Banco BAMER which was acquired by BAC Credomatic. He was also Secretary of the Honduran Association of Banking Institutions for seven years and Director of the Industrial and Agricultural Finance (FIA) in Honduras. He has been recognized for supporting different institutions that permanently support the well-being of the Honduran community, mostly in the education sector and has stood out in his role as representative of the bank and the financial sector in the Honduran Association of Banks (AHIBA). Mr. Atala holds a degree in Business Administration from Universidad Autonoma de Honduras.
Federico Odio, Country Manager (Costa Rica)
Federico Odio is the Country Manager of BAC Credomatic Costa Rica, the leading private bank in the country with assets of more than 7 billion dollars and more than 5,000 employees. Previously, he occupied important executive positions within the Group including Executive Vice-president and CFO of BAC responsible for the 6 countries in Central America as well as several Board of Directors positions within the Group. Before joining BAC, he was the General Manager of San José Financial Group and before that Finance Manager at Banex Bank. He holds a Business Administration degree from Collegium Fidelitas University, a graduate degree in Risk Management from UCLA University as well as professional and leadership programs from leading universities.
113
Fernando González, Country Manager (El Salvador)
Fernando González has served as Country Manager for El Salvador since September 2019 and previously work with Credomatic El Salvador for 11 years. Mr. Gonzalez holds an Economic degree from Universidad Dr Jose Matias Delgado and an MBA from INCAE Business School.
Eric Campos, Country Manager (Guatemala)
Eric Campos is currently the Country Manager of BAC CREDOMATIC Guatemala, leading the country growth strategies and day to day operations. He joined the group in 2000, as a Commercial Manager in BAC San Jose, Costa Rica; from 2003 to 2009 he oversaw Corporate and Commercial Banking, overseeing new products and services in the PYMES area and the corporate world. In 2010 he was promoted as Chief of Operations (COO) and later in 2012, as Chief of Innovation. Prior to his banking experience, he worked as a Corporate Financial Manager for the biggest retail store in Costa Rica, with operations in several countries in Central America & the Caribbean. He has an Economics Bachelor's Degree from Universidad de Costa Rica and an MBA from INCAE Business School.
Important employees and advisors
BAC Holding International Corp., its affiliates and subsidiaries must ensure, in the event of any leakage or loss of key talent, that dependence on key personnel does not compromise fulfillment of the promise of service to its customers or the adequate continuation of business operations. For this reason, it has established knowledge management policies to ensure that there is no reliance on key personnel in its operations. Additionally, annual reviews of key talent are carried out with the CEO, to study and develop succession plans and identify potential candidates for these positions.
External Auditors
For the past 3 years, KPMG has been engaged by the Company to exercise the external audit of its consolidated financial statements. The senior partner in charge of the tax review of BHI as of December 31, 2021, was Mr. Ricardo Antonio Carvajal Vargas and the alternate partner in case of absence of the principal partner was Mr. Kuldip Singh Kaur; both are partners of the KPMG office in Panama.
Legal Advisors
BAC Holding International Corp.'s principal external legal advisor in Panama is Rafael Marquínez, partner in Alemán, Cordero & Lee. In Colombia our principal external legal advisor is Camilo Martínez, partner in DLA Piper Martínez Beltrán Abogados S.A.S.
Executive Compensation
Our shareholders must approve the compensation of the members of the Board of Directors at a General Shareholders Meeting held in March of every calendar year. Each Director receives a fee based on attendance at each Board of Directors’ session and for the attendance at the appointed committees. As approved in the Extraordinary Shareholders Meeting held on December 17, 2021, the Board of Directors and Audit Committee session fees were U.S.$2,000 and U.S.$1,000, respectively, per member per session.
We are not required under Panamanian nor Colombian law to publish information regarding the compensation of our individual Executive Officers, and we do not make this information public. The aggregate amount of compensation, inclusive of bonuses, paid BHI and its subsidiaries to Executive Officers of BAC Credomatic Group, was U.S.$13.3 million in 2021. We pay bonuses to our Executive Officers which vary according to each Officer’s performance and the achievement of certain goals, and, therefore, the amounts paid may vary for each Officer and each year.
The Company does not have, and has not had in the past, any share option plans for executive officers or directors.
BHI has not yet established a Compensation Committee as neither Panamanian nor Colombian law have required the creation of such Committee, and BHI’s Board of Directors is also not required by law, or by the Company´s bylaws to adopt a Compensation Committee charter. However, there BAC Credomatic Group has a regional Compensation Committee (“Comité de Puestos y Compensación”) and BAC Latam SSC S.A. and BHI´s financial subsidiaries also have their own Compensation and Nomination Committees to ensure compliance with applicable regional policies, local regulatory requirements and/or best practices for the compensation of Senior Executive Management.
Board Practices
114
Meetings, voting and responsibilities of the Board of Directors
The Board of Directors will meet ordinarily at least one (1) time per quarter, and extraordinarily as many times as necessary. In general, the General Manager, the President of the Board, its Secretary or any Director, may call for a meeting of the Board of Directors through written or electronic notification, with a minimum notice of five (5) calendar days. The General Manager (provided that he/she is not also a Director) and other Executive Officers determined by the Board of Directors, and the Statutory Auditor, may attend and participate in the sessions but will not have a vote.
The Board of Directors may validly session with the presence of the majority of its members. Any decision or act of the Board of Directors must be approved by a majority vote of the members present, and all decisions of the Board of Directors shall be recorded in minutes that must be signed by the President and the Secretary, according to applicable law. These minutes may be kept in physical or digital books.
According with the Articles of Incorporation, the duties of BHI´s Board of Directors are:
| 1. | Approve its own internal regulations. |
| 2. | Establish and close, subject to legal requirements, the subsidiaries, branches, and agencies that it deems convenient. |
| 3. | Attend to all matters related to changes in the titles of shares of the Company and new issues of shares in reserve that correspond to the authorized capital. |
| 4. | When in doubt, clarify the meaning of the Articles of Incorporation, and report to the next General Shareholders' Meeting these clarifications, after consultation with the corresponding competent authorities. |
| 5. | Submit to the General Shareholder Meeting in its ordinary sessions, along with the General Manager of the Company or whoever acts on his behalf, the financial statements, and other reports, documents, details, and accounts required by applicable law. This presentation will be accompanied by the Management Report that will include a report on the progress of business and the general situation of the Company, including the description of the main risks of the Company, the internal control activities as well as the relevant findings. Said report will be available to the shareholders in accordance with the mechanisms established in the Good Governance Code. |
| 6. | In accordance with the applicable laws, propose to the General Shareholders' Meeting the distribution of profits. |
| 7. | If requested by the General Management of the Company, create any positions of branch managers, or any other that imply the legal representation of the Company. |
| 8. | Elect the President of the Board of Directors and the General Secretary of the Company and decide on their resignation from their positions when applicable. |
| 9. | Freely appoint and remove the General Manager of the Company, indicate their remuneration and decide on their resignation and any licenses or dispenses. |
| 10. | Evaluate the General Manager of the Company and other main executives, taking in consideration the Management Report at the end of each fiscal year, and in any other occasion required by legal provision or by requirement of the Board of Directors. |
| 11. | Create consultative or advisory committees deemed necessary, define their functions, appoint the corresponding members and delegate to them the functions deemed convenient. |
| 12. | Appoint or approve the powers of the Alternate General Manager, as well as any other member of the management staff that is submitted for consideration by the General Management of the Company. |
| 13. | Adopt the determinations related to the people who will exercise the legal representation of the Company. |
| 14. | Decide on the matters submitted for consideration by the General Manager of the Company. |
| 15. | Summon the General Shareholders' Meeting to decide on the resignation of the members of the Board of Directors and the Statutory Auditor. |
| 16. | Summon to an Extraordinary Shareholders’ Meeting, when deemed appropriate. |
| 17. | Consider the monthly financial statements; examine the books and documents of the Company and verify the state of its treasury. |
| 18. | Submit to the consideration of the General Shareholders' Meeting the amendment projects of the Articles of Incorporation. |
| 19. | Ensure effective compliance with the requirements established by market regulation authorities. |
| 20. | Adopt specific measures regarding the governance of the Company, its conduct, and its information, in order to ensure the rights of those who invest in the shares or in any other security issued, and the proper administration of its affairs and the public knowledge of its management. |
| 21. | Ensure respect for the rights of all its shareholders and other investors in securities, in accordance with the parameters set by the market regulation authorities. |
| 22. | Approve the Good Governance Code that will contain the rules, policies and mechanisms required by applicable laws, the General Shareholders' Meeting, and the bylaws, and approve its modifications and updates. |
| 23. | Ensure compliance with the Articles of Incorporation, the legal regulations applicable to the Company and the decisions adopted by the Board or the General Shareholders' Meeting. |
115
| 24. | Ensure due compliance with the Company's internal control policies and procedures. |
| 25. | Authorize the issuance of bonds. |
| 26. | Decide on the authorization of specialized audits requested by shareholders representing at least fifteen percent (15%) of the outstanding shares of the Company and/or investors who own at least twenty-five percent (25%) of the total fixed-income securities in circulation issued by the Company, under the terms and conditions established by the Code of Good Governance. |
| 27. | Authorize the donations to be made by the Company, and according with the authorizations granted by the General Shareholders' Meeting. |
| 28. | Analyze and define the principles applicable to the Corporate Governance of the Company. |
| 29. | Exercise the faculties that, according to the Articles of Incorporation, are not assigned to the General Meeting of Shareholders. |
| 30. | Approve the Share Subscription Regulations, which will contain: a) The number of shares offered, which may not be less than those issued; b) The proportion and manner in which they may be subscribed; c) The term of the offer, which will not be less than fifteen (15) days nor will it exceed one (1) year; d) The price at which they are offered, e) The terms for the payment of the shares. |
| 31. | Respond to the proposals to be debated by the General Shareholders' Meeting presented to the Board of Directors by a plural number of shareholders representing, at least, five percent (5%) of the subscribed shares. |
| 32. | The others that correspond to them in accordance with the applicable laws. |
Mechanisms Adopted to Guarantee the Independence of Members of the Board of Directors
To ensure compliance with the independence requirements established in the applicable law, for purposes of the election of the independent members of the Company, it is observed that the candidate in no case is:
| · | Employee or director of the Company or of any of its affiliates, subsidiaries or controlling entities, including those persons who had such capacity during the year immediately prior to the appointment, except in the case of the re-election of an independent person. |
| · | Shareholders who directly or by virtue of an agreement direct, guide or control the majority of the Company´s voting rights or who determine the majority composition of the Company´s administrative, management or control bodies. |
| · | Partner or employee of associations or companies that provide advisory or consultancy services to the Company or to the companies that belong to the same economic group (as defined in the Colombian law) of which it is a part, when the income for said concept represents for them, twenty percent (20%) or more of its operating income. |
| · | Employee or director of a foundation, association or company that receives important donations from the Company. Important donations are those that represent more than twenty percent (20%) of the total donations received by the respective institution. |
| · | Administrator of an entity in whose board of directors a legal representative of the Company participates. |
| · | Person who receives from the Company any compensation other than fees as a member of the Board of Directors, the Audit Committee or any other committee created by the Board of Directors. |
Indemnification Obligations to D&Os / Limitations
BHI has not entered into specific indemnification agreements with its Directors (including Independent Directors) or its Executive Officers (“D&O”), it has acquired D&O Liability Insurance for its D&O and those of its subsidiaries in order to protect them from claims which may arise from the decisions and actions taken within the scope of their regular duties. The main terms on the policy are:
| 1. | The insurance company will indemnify individual Directors or Officers against any losses and/or expenses resulting from negligent acts, provided such losses and/or expenses have not been already indemnified by BHI or its subsidiaries. |
| 2. | If BHI or its subsidiaries have already indemnified any such losses or expenses to the respective D&O, then the insurance company will indemnify BHI (or its applicable subsidiaries) against such economic losses and/or expenses. |
The main limitations of the policy are:
| 1. | Majority Shareholders Exclusion: claims made by shareholders holding a direct or indirect participation of 30% or more (with its respective voting rights) are excluded from coverage. |
| 2. | AML Exclusion: the insurance company will not be responsible to pay or compensate BHI, its subsidiaries, or its D&O´s, against events related, derived or caused by or in connection with a real or alleged money laundering activity. |
| 3. | Claims related to infectious contagious diseases. |
116
Audit Committee
According to BHI by laws, the Company must have an Audit Committee, composed of three Directors and appointed by the Board of Directors; two of the members must be independent and the Chairman of the Committee must be independent. The Statutory Auditor of the Company will also be part of the Committee, who will attend without vote; any other BHI or its subsidiaries employee may be summoned to the meetings of the Committee. The Audit Committee must meet at least every three (3) months and its decisions are recorded in minutes.
BHI´s Audit Committee advises the Board of Directors generally on internal control matters, and it is specifically responsible for:
| a. | Supervision of BHI internal control structure |
| b. | Ensuring the transparency of the financial information |
| c. | Ensuring that the necessary controls are being taken in the Company to avoid any illicit activity |
| d. | Assessing the internal control reports issued by internal and external auditors. |
Currently, the Audit Committee is composed by:
| ● | Rolando Laclé: Chairman |
| ● | Eloy Alfaro |
| ● | José Alberto Santana |
117
13. CERTAIN RELATIONSHIPS AND RELATED PARTY TRANSACTIONS
We currently engage in and expect from time to time in the future to engage in, financial and commercial transactions with “related parties”. Unless otherwise indicated below, such transactions are conducted on an arm’s-length basis in the ordinary course of business, on terms that would apply to transactions with third parties.
Relationship of the Members of the Board of Directors with the Company or its Related Companies
The members of the Company's Board of Directors who are related to BHI are listed below:
· José Alberto Santana Martínez: General Manager of the Company.
The members of the Company's Board of Directors who work in companies related to BHI are listed below:
· Rodolfo Tabash Espinach: CEO of BAC Credomatic Group
· Daniel Pérez Umaña: Regional Chief Legal Officer of BAC Credomatic Group
· Eloy Alfaro Boyd: partner in the firm Alemán, Cordero, Galindo & Lee, external legal counsels of the Company.
· Rolando Laclé Zúñiga: partner in the firm Consortium Costa Rica, external legal counsel of the BHI´s subsidiaries in Costa Rica.
Loans or Deposits Involving Related Parties
In the normal course of business, the Company conducts transactions with related parties, including its main executives and directors and their affiliates and Grupo Aval and its subsidiaries.
The following table presents outstanding amounts of related party transactions involving loans or deposits between BHI and its consolidated subsidiaries, and each of the following individuals and entities.
| Transactions between BHI and its subsidiaries, and | ||||||
| BHI's key management personnel and their affiliates (1) | Other related parties (2) | Grupo Aval and its subsidiaries and their affiliates (3) | ||||
| (in U.S.$ millions) | ||||||
| At September 30, 2021 | ||||||
| Outstanding loans granted by us (4) | 86.6 | 5.0 | 0.1 | |||
| Financial liabilities issued by us (5) | - | - | 520.0 | |||
| Deposits (6) | 54.2 | 3.1 | 126.6 | |||
| At December 31, 2020 | ||||||
| Outstanding loans granted by us (4) | 92.3 | 6.3 | 0.1 | |||
| Financial liabilities issued by us (5) | - | - | 525.0 | |||
| Deposits (6) | 134.0 | 3.0 | 236.1 | |||
| At December 31, 2019 | ||||||
| Outstanding loans granted by us (4) | 87.3 | - | 0.0 | |||
| Financial liabilities issued by us (5) | - | - | 185.0 | |||
| Deposits (6) | 54.6 | - | 125.2 | |||
| (1) | Refers to key personnel and directors who have the authority and responsibility to plan, direct and control the activities of BHI´s subsidiaries, directly or indirectly, including any director or legal representative, whether or not an executive of the Company. Also includes close relatives and related companies in which key personnel maintain beneficial ownership. |
| (2) | “Other related parties” includes mainly the outstanding balance of loans granted by BHI to MFG and any deposits MFG has with BHI and its subsidiaries. |
| (3) | Refers to transactions with Grupo Aval and its subsidiaries, including Banco de Bogotá as the current controlling entity of BHI, and their affiliates. |
| (4) | Figures based on disbursed loans. See “---Loans granted to related parties by our banking subsidiaries”. |
| (5) | Figures based on closing balances. See “---Financial liabilities issued by BHI and its subsidiaries with Grupo Aval and its subsidiaries”. |
| (6) | All deposits, including time deposits and investment portfolios, of all related parties held with us are made in the ordinary course of business, held at market rates and on terms and conditions not materially different from those available to the general public. |
118
For more information on related party transactions in accordance with IFRS disclosure rules, see Note 30 to our audited consolidated financial statements for December 31, 2020.
For the purposes of this section, the concept of “related parties” includes (i) key management personnel of BHI and its subsidiaries, their close family members and related companies in which management personnel maintain beneficial ownership, (ii) outstanding loan balances and deposits from MFG and (iii) enterprises that control, or are under common control with Grupo Aval, associates, individuals owning directly or indirectly an interest in the voting power that gives them significant influence over Grupo Aval, close family members, key management personnel (including directors and senior management) and any enterprises in which a substantial interest in the voting power is owned, directly or indirectly, by any of the persons listed above.
Loans Granted to Related Parties by our banking subsidiaries
Key management of BHI and our subsidiaries, and their respective affiliates and close family members, who meet our credit eligibility requirements may subscribe to loans in the ordinary course of business, on market terms and conditions available to the general public.
All outstanding loans with our related parties are made in the ordinary course of business and on terms and conditions, including interest rates and collateral, not materially different from those available to the general public and did not involve more than the normal risk of collectability or present other unfavorable features.
Financial liabilities issued by BHI and its subsidiaries with Grupo Aval and its subsidiaries
In the past, BHI and its subsidiaries have obtained loans from Grupo Aval and its subsidiaries in the ordinary course of business. Most recently, in 2020, through Resolution No. 208-20 of May 14, 2020 issued by the Superintendency of the Securities Market of the Republic of Panama, BAC International Bank, Inc. issued perpetual subordinated corporate bonds convertible into common shares for a nominal value of $700 million. The bonds are issued in registered form and without coupons, in denominations of $1,000,000 and in integral multiples of $100,000, with no specific expiration or redemption date. The bonds bear an interest rate of 10% and payable quarterly unless the issuer exercises its right not to pay interest. The bonds were acquired by Grupo Aval Limited, a fully owned subsidiary of Grupo Aval, and as of September 30, 2021, the balance of the perpetual bonds is U.S.$520 million.
Other Financial Obligations
A U.S.$750 million dividend was approved by an Extraordinary Shareholders Meeting on September 29th, 2021, further amended by Extraordinary Shareholders Meeting on December 17th, 2021; the agreement taken in said meeting, set a 10-year payment plan to complete the agreed amount of the extraordinary dividend. These dividends were declared from retained earnings generated by BHI’s subsidiaries in previous periods. As of December 31, 2021, U.S.$375 million have been paid with a U.S.$300.0 million loan from Bancolombia and a U.S.$75.0 million loan from Grupo Aval Limited. The remaining amount, U.S.$288.4 million, is registered as financial obligations in accordance with IFRS rules. For more information on this dividend refer to Section 5. “Dividend Policy”.
119
14. BENEFICIAL OWNERSHIP BY CERTAIN SHAREHOLDERS
Shareholding Composition and Information on Main Shareholders
As of December 31st, 2021, our issued and outstanding share capital amounted to U.S.$2,865.4 million corresponding to the subscription of 77,443,101 shares. All of the outstanding shares of our common stock are, and will be, prior to the Spinoff, held by a single shareholder, Banco de Bogotá S.A., and there have been no changes to our shareholding composition in the last three years.
At the same date, Grupo Aval owned approximately 68.7% of Banco de Bogotá´s outstanding share capital, comprised of a single class of ordinary shares with a par value of Colombian Pesos (“Ps.”) 10.00 per share. Banco de Bogotá´s remaining outstanding shares were beneficially owned by Mr. Luis Carlos Sarmiento Angulo (approximately 8.3%) and public minority shareholders (approximately 23.0%). Furthermore, at the same date, Mr. Luis Carlos Sarmiento Angulo was the beneficial owner of approximately 80% of Grupo Aval’s issued and outstanding share capital. Both Banco de Bogotá and Grupo Aval are listed in the Colombian stock exchange.
In connection with the Spinoff, BHI will effect a stock split, after which BHI’s authorized stock will consist of 44,197,377,192 shares and its issued and outstanding share capital will consist of 43,220,189,095 shares, with a nominal value of $0.0662975983446469 per share, reflecting a stock split ratio of approximately 558.09 to 1.
Beneficial ownership
Following the Spinoff, Mr. Luis Carlos Sarmiento Angulo will continue to control BHI as the beneficial owner of approximately 47.5% of our issued and outstanding share capital directly and 15.8% indirectly through his indirect control of Banco de Bogota, which will retain a 25% stake in BHI.
The following table sets forth information, as of the date of this information statement, regarding shares of our common stock and each person or entity known to us that is projected to beneficially own 5% or more of our common shares, based on a stock split ratio of approximately 558.09 to 1, immediately after the Spinoff:
| Shareholder | Number of Common Shares | % of Common Shares | ||
| Luis Carlos Sarmiento Angulo (1) | 20,508,664,958 | 47.5% | ||
| Banco de Bogota S.A. | 10,805,047,274 | 25.0% | ||
| Carlos Arcesio Paz Bautista (2) | 3,802,567,848 | 8.8% | ||
| Other shareholders | 8,103,909,015 | 18.8% | ||
| Total | 43,220,189,095 | 100.0% |
(1) Does not include Mr. Sarmiento Angulo’s approximately 15.8% indirect beneficial ownership stake in BHI, through his direct and indirect ownership stake of Banco de Bogota. Mr. Sarmiento Angulo’s business address is Carrera 13 No. 26A-47, Bogotá, D.C., Colombia.
(2) Does not include Mr. Paz Bautista’s approximately 2.9% indirect beneficial ownership stake in BHI, through his ownership stake in Banco de Bogota. Mr. Paz Bautista’s business address is Carrera 1B #47-12, Cali, Valle del Cauca, Colombia.
The Panamanian legal system does not make an express distinction regarding the class or nature of the rights that shareholders have, not even for the majority shareholders if any, however, among other rights, all shareholders have certain legally provided political, economic, individual, and collective rights. For more information on shareholders rights please see Section 16. “Description of Capital Stock”.
120
15. MATERIAL TAX CONSEQUENCES
The following summary contains a description of certain Colombian, Panamanian and U.S. federal income tax considerations in connection with ownership and disposition of BHI shares, but it does not support to be a comprehensive description of all of the Colombian, Panamanian and United States tax considerations. The summary is based upon our understanding of the tax laws of Colombia or Panama and regulations thereunder and on the tax laws of the United States and regulations thereunder as of date hereof, which are subject to change. A change in such laws and regulations could affect the validity of this summary
Applicable Tax Regime to Shares
The information contained in this chapter is of a general nature and is based on the tax legislation in force at the date of this document. Therefore, this information does not contemplate possible future changes in the legislation, nor should it be considered as legal or tax advice to shareholders or other interested parties. Potential investors should consult their own tax advisers in relation to tax issues that may arise from any of the situations or events set forth in this document.
General Description of the Tax Regime Applicable to Shares that are Traded Through the Colombian Stock Exchange
For Colombian tax purposes, the residence status is triggered depending on the type of individual as follows:
· Aliens: Residence is established by the continuous or discontinuous presence in the country for more than 183 days including entry and exit days, within any period of 365 consecutive calendar days. For this purpose, when the continuous or discontinuous presence in the country takes place in more than one taxable year, the person would be considered as a Colombian resident for the next taxable year.
· Diplomatic employees of the Colombian State and their companions: These persons are totally or partially exempted from income tax or capital gains tax in the country in which they are performing their work, according to the Vienna Conventions on Diplomatic and Consular Relations.
· Colombian Nationals:
Individuals:
An individual can be considered a tax resident under different circumstances, one of them implies the permanence in Colombian territory either continuously or discontinuously - considering entry and leaving days- for 183 days in a given 365-day period. If the 365-day period covers more than one taxable year, the individual will be deemed as a taxpayer for the next year.
However, domestic tax law also deems as a tax residents those individuals who hold the Colombian nationality and fulfill at least one of the following requirements in the corresponding taxable year: (i) the individual’s spouse or permanent companion or dependent children are Colombian tax residents in the corresponding tax year; or, (ii) 50% or more of the income is considered to be Colombian-source income; or, (iii) 50% or more of their assets are managed within Colombia; or, (iv) 50% or more of their assets are deemed to be possessed in Colombia; or, (v) if once required by the Tax Authorities, the Colombian national fails to demonstrate that the tax residence is held abroad or, (vi) have tax residence in a jurisdiction qualified by the Colombian Government as a tax haven or low tax jurisdiction.
Legal entities:
For Colombian tax purposes, a legal entity is considered a tax resident generally when its place of effective management is located in Colombia during the relevant taxable year. In addition, a Legal Entity is also considered a Colombian resident if: i) It is incorporated under the laws of Colombia or ii) Its principal residence place of business is located in Colombia.
Pursuant to the Colombian Tax Code, resident individuals and Colombian entities are subject to tax over their worldwide income, while non-resident individuals and foreign entities are only taxed on their Colombian-source income. Foreign entities with permanent establishments or branches in Colombia are taxed over the worldwide income which is attributable to the branch or permanent establishment.
Colombian Tax Law includes a definition of permanent establishment for foreign entities or individuals that is applicable when the entity or individual trigger the events that are described in Article 20-1 of the Colombian Tax Code. In this case, as stated before, the permanent establishment is considered a Colombian taxpayer in regard to its attributable worldwide income.
Profits from the sale of shares in Colombia
For shareholders who are resident natural persons, companies or other national entities, the difference between the tax cost of the shares and the sale price (in accordance with the rules provided in the Colombian Tax Statute), will be taxable in observance of the corresponding rate of the nature of the investor (natural person or legal person).
121
As a general rule, and notwithstanding to special rules that may apply to certain investors, if the shares have been part of the investor's fixed assets for a period of less than 2 years or can be considered as part of the investor's movable assets, the profit on their sale will be considered ordinary taxable income. In this case, the income tax rate will range from 0% to 39% depending on the amount of taxable income for individuals, and 35% for Entities. On the contrary, if the shares were part of the investors fixed assets for a period of 2 years or more, the profit on their sale will be considered an occasional gain; in this event, the tax rate will be 10% of the difference between the tax cost of the shares and the sale price.
The profit in the sale of shares of a foreign Entity considered Colombian Entity as consequence of its place of effective management is a Colombian income taxed as capital gain or ordinary income as noted above.
For foreign shareholders without residence or domicile in Colombia, the profit for the sale of shares of a foreign company, although it is not considered an income of Colombian source, when it has underlying assets in the country could be subject to the income tax by application of the indirect sales regime indicated in the Tax Statute, except that: (i) the shares of the foreign entity are registered in a Stock Exchange recognized by a government authority, which has an active secondary market and whenever the shares are not concentrated in the same beneficiary by more than 20% or (ii) the underlying assets in Colombia represent less than 20% of the book value and less than 20% of the commercial value of the whole assets owned by the foreign divested company. This regime is not applicable to the foreign companies that are considered national companies as consequence of its place of effective management. That will be the case of BHI.
Additionally, is important to consider that Colombian Tax Statute stipulate that the profits from the sale of shares registered in the Colombian stock exchange, of a same beneficial owner, when said sale does not exceed 10% of the outstanding shares of the respective company, during the same taxable year, does not constitute income or occasional profits.
Finally, pursuant to the article 36-1 of the Colombian Tax Code, does not constitute income or occasional gain, profits from trading derivatives that are securities and whose underlying is represented exclusively in shares registered in a stock exchange, indexes or any holding in funds or collective portfolios that reflects behavior of said shares.
Special income tax on dividends
In Colombia, the dividends distributed by a national company, such as BHI (while BHI is a Panamanian company, due to its place of effective management, it is considered as a “national company” under Colombian tax legislation), are subject to the tax on dividends through a withholding tax as follows: i) When the payment is made in favor of individual tax resident, 10% on the amount of dividends that exceeds 300 UVT; ii) When the payment is made in favor of non-residents, individuals or entities, 10% on the amount of the dividends; and iii) When the payment is made in favor of resident entities, 7.5% on the amount of the dividends.
The tax on dividends is due regardless of whether the BHI has been subject to income tax in Colombia. However, if the profits received by the BHI are exempt, the dividend in favor of the shareholder is taxable with general income tax. In such a case, in order to do the tax assessment, the taxable base is established as the difference between the gross dividends and the general tax income that must be paid on the dividends by the shareholder.
In some cases, the withholding does not apply. For instance, between companies that belong to the same business group, subsequent dividend payments between resident entities or when it is made in favor of a Colombian Holding Company.
General Description of the Tax Regime of the Panamanian Law Applicable to Shares
Panamanian income tax regime is based on the principle of territoriality; it means that any income, from any source, produce within the territory of the Republic of Panama, disregarding the place in which such income will be perceived, is subject to this tax. Hence, the incomes received by natural or legal persons, from non-Panamanian sources would not be subject to income tax.
Profits from the sale of shares in Panama
Gains or losses arising from the sale of the shares are not considered taxable, as long as they are registered with the Superintendencia de Mercado de Valores (SMV) from Panama and that such sale occurs through a stock exchange or other organized market.
If the shares are not registered with the SMV and they are not disposed through a stock exchange or other organized market, in accordance with Panamanian Law Number 18 from June 19, 2006, then:
i.the seller of the shares will be subject to income tax for the capital gains on the sale of said shares, calculated at a fixed rate of 10% on capital gains;
ii.the buyer will have the obligation to withhold from the seller the equivalent to 5% of the total value of the sale of said shares, as an advance on income tax on the profit of capital; and
iii.the buyer will have the obligation to refer to the Treasury the amount withheld, within the 10 days following the date on which the obligation to pay arose. The seller may consider the amount withheld by the buyer as the final income tax to be paid for capital gains.
122
When the advance of the tax withheld is higher than the amount of applying the 10% rate on the capital gain obtained in the sale, the taxpayer may present an affidavit indicated the withholding made and may claim the excess paid. The Treasury could return the cash or apply a tax credit for the payment of taxes administered by the Ministry of Economy and Finance of the Republic of Panama, and such tax credit may be assigned to other taxpayers.
The amount of the gains obtained in the sale of the shares could not be accumulative to the taxpayer's taxable income.
However, if a legal entity is the indirect owner of shares issued by legal entities that earn taxable income in Panama and at the same time is an indirect owner of shares of legal entities that do not obtain taxable income in Panama, the amount that would be subject to income tax for the capital gain of the sale of shares, must be calculated proportionally, applying the tax on the one that is higher between the calculation of the proportion of equity or the calculation of the proportion of assets.
Income Tax on Dividends
Legal entities that require notice of operations to carry out commercial and industrial operations within the territory of the Republic of Panama, or that generate taxable income in the Republic of Panama, are required to withhold dividend tax equivalent to a rate of 10% of the profits distributed to their shareholders when they are from Panamanian source, and 5% when the dividends are originated from exempt incomes, including income from foreign sources and/or exports.
However, legal entities will not be obliged to withhold dividend tax, on the income that proceed from dividends if such entities already have paid the corresponding tax and have withhold the dividend tax.
Hence, the company will not be obliged to withhold dividends tax on the profits to be distributed to its shareholders, if said profits constitute dividends paid by subsidiaries of the company, and that subsidiaries have already made withholding tax on dividends previously.
“Stamp” tax
Shares and values registered in the SMV will not be affected by the tax, as well as any contract, agreement or other documents related in any way with said values: issuance, subscription, sale, payment, transfer, exchange, or trade in general. However, if the shares are not registered in the SMV, any operation will be subject to a US$ 0.10 tax for each US$ 100.00 trade, or a US$ 100.00 fraction of the value expressed in the trading.
Material Tax Consequences to U.S. Persons Resulting from the Spinoff or the Holding of BHI Shares
United States Federal Income Taxation Considerations for U.S. Holders
The following is a description of the material U.S. federal income tax consequences to the U.S. Holders described below of receiving BHI’s common shares in the Spinoff and of owning and disposing of BHI’s common shares, but it does not purport to be a comprehensive description of all tax considerations that may be relevant to a particular person’s receipt, ownership or disposition of BHI’s common shares. This discussion applies only to a U.S. Holder that receives BHI’s common shares in the Spinoff and holds BHI’s common shares as capital assets for U.S. federal income tax purposes. In addition, it does not describe all of the tax consequences that may be relevant in light of the U.S. Holder’s particular circumstances, including alternative minimum tax consequences, the potential application of certain provisions of the Internal Revenue Code of 1986, as amended (the “Code”), known as the Medicare contribution tax, and tax consequences applicable to U.S. Holders subject to special rules, such as:
· certain financial institutions;
· dealers in securities or traders in securities that use a mark-to-market method of tax accounting;
· persons holding common shares as part of a hedging transaction, straddle, wash sale, conversion transaction or integrated transaction or persons entering into a constructive sale with respect to the common shares;
· persons whose functional currency for U.S. federal income tax purposes is not the U.S. dollar;
· entities classified as partnerships for U.S. federal income tax purposes;
· tax-exempt entities, “individual retirement accounts” or “Roth IRAs”;
· persons that own or are deemed to own ten percent or more of the voting power or value of our stock; or
· persons holding BHI’s common shares in connection with a trade or business conducted outside of the United States.
123
If an entity that is classified as a partnership for U.S. federal income tax purposes holds BHI’s common shares, the U.S. federal income tax treatment of a partner will generally depend on the status of the partner and the activities of the partnership. Partnerships holding BHI’s common shares and partners in such partnerships should consult their tax advisers as to the particular U.S. federal income tax consequences of holding and disposing of the common shares applicable to them.
This discussion is based on the Code, administrative pronouncements, judicial decisions, and final, temporary and proposed Treasury regulations, all as of the date hereof, any of which is subject to change, possibly with retroactive effect.
A “U.S. Holder” is a beneficial owner of BHI’s common shares or preferred shares, including preferred shares in the form of Grupo Aval’s ADSs (collectively, the “Grupo Aval Shares”), as applicable, that is for U.S. federal income tax purposes:
· a citizen or individual resident of the United States;
· a corporation, or other entity taxable as a corporation, created or organized in or under the laws of the United States, any state therein or the District of Columbia; or
· an estate or trust the income of which is subject to U.S. federal income taxation regardless of its source.
U.S. Holders should consult their tax advisers concerning the U.S. federal, state, local and non-U.S. tax consequences of owning and disposing of BHI’s common shares in their particular circumstances.
Except as described in “─Passive Foreign Investment Company Rules” below, this discussion assumes that we have not been, and will not become, a passive foreign investment company, or “PFIC”, for any taxable year.
Tax Treatment of the Spinoff
It is not expected that the Spinoff will qualify for tax-free treatment under the relevant sections of the Code. Accordingly, U.S. Holders of Grupo Aval Shares that receive BHI’s common shares in the Spinoff will be treated as receiving a distribution from Grupo Aval equal to the fair market value of the common shares received. This distribution will be taxable as a dividend to the extent of Grupo Aval’s current and accumulated earnings and profits, as determined under U.S. federal income tax principles. Because Grupo Aval does not maintain calculations of its earnings and profits under U.S. federal income tax principles, it is expected that the distribution of common shares to U.S. Holders of Grupo Aval Shares in the Spinoff will be reported to such U.S. Holders as a dividend. Subject to applicable limitations (including a minimum holding period requirement), certain non-corporate U.S. Holders of Grupo Aval Shares receiving BHI’s common shares in the Spinoff will be treated as receiving “qualified dividend income” provided that such Grupo Aval Shares are readily tradable on an established securities market in the United States (such as the NYSE, where Grupo Aval’s ADSs are traded), and provided that Grupo Aval is not treated as a PFIC. It is unclear whether these reduced rates will apply to income recognized by holders of Grupo Aval common shares for which there are not corresponding ADSs and which are not traded on a U.S. stock exchange. The amount of the dividend will generally be treated as foreign-source dividend income to U.S. Holders and will not be eligible for the dividends-received deduction generally available to U.S. corporations under the Code. U.S. Holders should consult their tax advisers concerning the tax consequences of the receipt of BHI’s common shares pursuant to the Spinoff.
Taxation of Dividends
Distributions paid on BHI’s common shares will be treated as dividends to the extent paid out of our current or accumulated earnings and profits (as determined under U.S. federal income tax principles). Because we do not maintain calculations of our earnings and profits under U.S. federal income tax principles, it is expected that distributions generally will be reported to U.S. Holders of BHI’s common shares as dividends. Because BHI’s common shares are not tradable on an established securities market in the United States and there is no income tax treaty between Panama and the United States, we do not expect that any dividends we pay will constitute “qualified dividend income” eligible for reduced rates of taxation.
The amount of a dividend generally will include any amounts withheld by our company in respect of Panamanian or Colombian taxes. The amount of the dividend will generally be treated as foreign-source dividend income to U.S. Holders of BHI’s common shares and will not be eligible for the dividends-received deduction generally available to U.S. corporations under the Code. Dividends will be included in a U.S. Holder’s income on the date actually or constructively received by the U.S. Holder. The amount of any dividend income paid in Colombian pesos will be the U.S. dollar amount calculated by reference to the exchange rate in effect on the applicable date of receipt, regardless of whether the payment is in fact converted into U.S. dollars. If the dividend is converted into U.S. dollars on the applicable date of receipt, a U.S. Holder should not be required to recognize foreign currency gain or loss in respect of the dividend income. A U.S. Holder may have foreign currency gain or loss if the dividend is converted into U.S. dollars after the date of receipt.
124
Subject to applicable limitations (including a minimum holding period requirement), some of which vary depending upon the U.S. Holder’s circumstances, Panamanian or Colombian income taxes withheld from dividends on common shares may be creditable against the U.S. Holder’s U.S. federal income tax liability, although recent regulations addressing foreign tax credits may make the creditability of such taxes uncertain. In lieu of claiming a foreign tax credit, U.S. Holders may, at their election, deduct foreign taxes, including the Panamanian or Colombian tax, in computing their taxable income, subject to generally applicable limitations under U.S. law. An election to deduct foreign taxes instead of claiming foreign tax credits applies to all foreign taxes paid or accrued in the taxable year. The rules governing foreign tax credits are complex. U.S. Holders of BHI’s common shares should consult their tax advisers regarding the creditability of Panamanian or Colombian taxes in their particular circumstances.
Sale or Other Taxable Disposition of Common Shares
Subject to the PFIC rules described below, for U.S. federal income tax purposes, gain or loss realized on the sale or other taxable disposition of BHI’s common shares will be capital gain or loss, and will be long-term capital gain or loss if the U.S. Holder held the common shares for more than one year. The amount of the gain or loss will equal the difference between the U.S. Holder’s tax basis in the common shares disposed of and the amount realized on the disposition, in each case as determined in U.S. dollars. This gain or loss will generally be U.S.-source gain or loss for foreign tax credit purposes.
Passive Foreign Investment Company Rules
Based on proposed Treasury regulations, including those which are proposed to be effective for taxable years beginning after December 31, 1994, we do not expect to be a PFIC for U.S. federal income tax purposes for the current taxable year. However, because the proposed Treasury regulations may not be finalized in their current form, because the application of the proposed regulations is not entirely clear and because the composition of our income and assets will vary over time, there can be no assurance that we will not be a PFIC for any taxable year. The determination of whether we are a PFIC is made annually and is based upon the composition of our income and assets (including the income and assets of, among others, entities in which we hold at least a 25% interest) and the nature of our activities. In general, we will be a PFIC for any taxable year in which at least 75% of our gross income is passive income, or at least 50% of the value (determined on a quarterly basis) of our assets is attributable to assets that produce or are held for the production of passive income.
If we were a PFIC for any taxable year during which a U.S. Holder held BHI’s common shares, any gain recognized by such U.S. Holder on a sale or other disposition of common shares (including certain pledges) would be allocated ratably over the U.S. Holder’s holding period for the common shares. The amounts allocated to the taxable year of the sale or other disposition and to any year before we became a PFIC would be taxed as ordinary income. The amount allocated to each other taxable year within the holding period would be subject to tax at the highest rate in effect for individuals or corporations, as appropriate, for that taxable year, and an interest charge would be imposed on the tax on such amount. Further, any distribution in respect of common shares in excess of 125% of the average of the annual distributions on common shares received by the U.S. Holder during the preceding three years or the U.S. Holder’s holding period, whichever is shorter, would be subject to taxation in the same manner as described immediately above with respect to gains. Certain elections may be available that would result in alternative treatments (such as mark-to-market treatment) of the common shares. U.S. Holders should consult their tax advisers to determine whether any of these elections would be available and, if so, what the consequences of the alternative treatments would be in their particular circumstances.
If we were a PFIC or, with respect to a particular U.S. Holder of BHI’s common shares, were treated as a PFIC, the U.S. Holder will generally be required to file IRS Form 8621 (or any successor form) with their annual U.S. federal income tax returns, subject to certain exceptions.
Information Reporting and Backup Withholding
Payments of dividends and sales proceeds that are made within the United States or through certain U.S.- related financial intermediaries (including distributions of BHI’s common shares pursuant to the Spinoff) generally are subject to information reporting, and may be subject to backup withholding, unless (i) the U.S. Holder is an exempt recipient or (ii) in the case of backup withholding, the U.S. Holder provides a correct taxpayer identification number and certifies that it is not subject to backup withholding. The amount of any backup withholding from a payment to a U.S. Holder will be allowed as a credit against the holder’s U.S. federal income tax liability and may entitle it to a refund, provided that the required information is timely furnished to the Internal Revenue Service.
Certain U.S. Holders who are individuals (and certain specified entities) may be required to report information relating to their ownership of shares of a non-U.S. entity or non-U.S. accounts through which such shares are held. U.S. Holders are urged to consult their tax advisers regarding any reporting obligation with respect to BHI’s common shares.
125
16. DESCRIPTION OF CAPITAL STOCK
Share Capital
Information Related to Equity Accounts
As of September 30, 2021, the equity of BHI amounted to U.S.$3,307.8 million.
| As of September 30, | As of December 31, | ||||||
| 2021 | 2020 | 2019 | 2018 | ||||
| (in U.S.$ millions, except shares) | |||||||
| Equity | 3,307.8 | 4,252.0 | 4,410.1 | 3,900.1 | |||
| Net income | 334.4 | 310.9 | 402.0 | 390.8 | |||
| Declared and paid dividends | 828.2 | 378.3 | — | — | |||
| Shares (millions) | 77.4 | 77.4 | 77.4 | 77.4 | |||
Authorized, Subscribed and Paid Capital of BHI, Number of Shares in Circulation and Reserves
As of September 30, 2021, BHI’s capital stock was comprised of 79,194,053 authorized shares and 77,443,101 issued and outstanding shares with a nominal value of $37 per share. Prior to the Spinoff, there had been no changes in the Company’s capital stock in the past three years.
| As of September 30, | As of December 31, | ||||||
| 2021 | 2020 | 2019 | 2018 | ||||
| (in U.S.$ millions, except number and value of shares) | |||||||
| Authorized shares | 79,194,053 | 79,194,053 | 79,194,053 | 79,194,053 | |||
| Issued and outstanding shares | 77,443,101 | 77,443,101 | 77,443,101 | 77,443,101 | |||
| Authorized capital | 2,930.2 | 2,930.2 | 2,930.2 | 2,930.2 | |||
| Issued and outstanding capital (common stock) | 2,865.4 | 2,865.4 | 2,865.4 | 2,865.4 | |||
| Nominal value per share | 37.0 | 37.0 | 37.0 | 37.0 | |||
In connection with the Spinoff, BHI will effect a stock split, after which BHI’s authorized stock will consist of 44,197,377,192 shares and its issued and outstanding share capital will consist of 43,220,189,095 shares, with a nominal value of $0.0662975983446469 per share, reflecting a stock split ratio of approximately 558.09 to 1.
Convertible Obligations
As of September 30, 2021, BHI had no convertible loans, convertible, exchangeable bonds, or bonds convertible into shares.
However, in 2020, BAC International Bank, Inc., a direct and indirect subsidiary of BHI, issued perpetual subordinated corporate bonds convertible into common shares for a nominal value of $700 million. The bonds are issued in registered form and without coupons, in denominations of $1,000,000 and in integral multiples of $100,000, with no specific expiration or redemption date. The bonds bear an interest rate of 10% and payable quarterly unless the issuer exercises its right not to pay interest. The bonds were acquired by Grupo Aval Limited, a fully owned subsidiary of Grupo Aval, and as of September 30, 2021, the balance of the perpetual bonds is U.S.$520 million. For more information on this and other related party transactions see Section 13. “Certain Relationships and Related Party Transactions”.
Memorandum and Articles of Incorporation
The following is a summary of certain significant provisions of our by-laws, Panamanian corporate law, pertain to our capital, management, periodical, and occasional disclosures, as well as other corporate issues applicable to us. The description below includes the material provisions of our by-laws and Panamanian corporate law. In Panama, by-laws are the principal governing document of a corporation.
Rights granted by the Shares
In accordance with the Panamanian Law 32 of 1927, with respect to the holders of the shares of BHI, the Company is obliged to guarantee to the shareholders (including those who have shares through the Colombian Stock Exchange) the rights provided in the Articles of Incorporation and in the local Law, including, but not limited to, the provisions contained in said Law and the provisions in the Commercial Code of the Republic of Panama.
126
The Panamanian legal system does not make an express distinction regarding the class or nature of the rights that shareholders of public limited companies have, however, among other rights, the political, economic, individual and collective rights of the shareholders are enshrined and dispersed through Panamanian laws, such as the Law 32, the Commercial Code, among other rules and regulations, and mainly in form of rights granted by the Articles of Incorporation, and which may be exercised directly and individually by the shareholders, unless specifically indicated that it must be exercised collectively; these rights are mainly the following:
a) Entitlement to vote. The shares entitle each shareholder of common shares one vote per share at General Shareholders' Meetings. The Shareholders of the Company have the right to appoint a proxy to represent them at the General Shareholders' Meetings.
Proxys can be granted in private documents, and they must include a clear identification of the representative, voting powers and any limitation, if relevant. For certain General Shareholders' Meetings, powers of attorney are required to be authenticated by a notary public and/or, if issued abroad, legalized by apostille, to ensure their authenticity.
b) Right to assign shares. In the event of a capitalization of profits, if so determined by the Board of Directors, each shareholder will have the right to receive shares to be issued in a proportional amount of its participation in the equity of the Company, based on the dividend amount they would have otherwise received and on the value set for said shares to be issued.
c) Right to inspect the Company's records by appointing reviewers approved by the General Shareholders' Meeting. Shareholders have the right to investigate the course of corporate business, examine corporate books, correspondence and other documents relating to the administration of the Company. This right must be exercised collectively.
d) Subscription right. BHI’s Articles of Incorporation provide that, unless otherwise approved by the General Shareholders' Meeting in accordance with the terms provided in the Articles of Incorporation, the shares will entitle each shareholder to retain an equal ownership percentage by granting them a right of first refusal to subscribe preferentially to new share issuances in an amount proportional to the one held on the date in which the share subscription regulations were approved. This right of first refusal also applies to the sale of shares reacquired by the Company if and when the Board of Directors decides to put them back into circulation.
e) Economic rights. Subject to the provisions in the Articles of Incorporation, shareholders have the right to receive dividends, and to receive any excess of assets over liabilities in the event of a liquidation.
f) Acquired rights. The general rule is that the General Shareholders' Meeting constitutes the supreme governing body of the Company, provided that in no case can the majority of the votes deprive shareholders of their acquired rights or impose agreements that are contrary to applicable law or to the Articles of Incorporation.
In addition, the law grants the minority shareholders, the following rights:
a) Right to convene shareholders' meetings. The General Shareholders' Meeting may be convened by shareholders representing at least 5% of the issued and outstanding shares of the Company.
b) Right to appoint reviewers. All the shareholders or group of them may request, at a General Shareholders' Meeting, that auditors or reviewers be appointed to examine the financial position or other historical records regarding the constitution or the management of the Company. If said request is rejected, any shareholder or group of shareholders representing at least 5% of the shares may file a request before the competent judicial authority who, without further ado, shall appoint auditors. According to the Panamanian Commercial Code, in such scenario, the Company shall allow the duly appointed reviewers to examine the books and all the relevant information of the Company required by the shareholders.
c) Right to protest. Each shareholder has the right to protest any resolution approved by the Management of Company, the Board of Directors, or the General Shareholders' Meeting, that is against the Law, and the Articles of Incorporation of the Company; said request for annulment must be filed by the shareholder within the term of 30 days from its adoption before a competent Judge, who may suspend the execution of said resolution. In principle, such 30-day period is an expiration date and not a statute of limitations. The shareholder also has the option to sue in an ordinary trial, in which case the suspension of the execution of the resolution would not proceed.
Obligations of the Shareholders
The main obligations of the shareholders are:
a) Comply with the Articles of Incorporation of the Company.
127
b) Abide by the decisions of the corporate bodies of the Company.
c) Refrain from performing acts that lead, directly or indirectly, to conflicts of interest.
d) Collaborate with the Company in complying with the regulations on the prevention and control of criminal activities through the stock market.
e) Provide the necessary information to disclose its withholding tax situation.
f) The others that emanate from the Articles of Incorporation, from the Prospectus or the law.
In addition, the holders of shares listed on the Colombian Stock Exchange will have the following obligations:
a) The shareholder will be responsible for the information provided to the Company or to Deceval, who will act as administrator of the shares.
b) Promptly notify to Deceval of any transfer, encumbrance, restriction, lien or title limitation that may exist on the shares and that in any way fetters the free and marketable title to the shares.
c) Any new or current shareholder, and in accordance with the Colombian and Panamanian law, must register with the Depósito Centralizado de Valores de Colombia (Deceval) in Colombia or the Central Latinoamericana de Valores, S.A. (Latinclear) in Panama, their address and the address of the legal representatives or proxies (if applicable) to receive communications. If the Company requires to know the information of its shareholders, it must submit a request for indirect holders to Deceval or Latinclear.
Process for changing the shareholder´s rights over their shares
The rights that legally are associated to the shares cannot be ignored by the General Shareholders' Meeting nor by the Board of Directors of BHI. By legal provision and the Articles of Incorporation, the General Shareholders' Meeting will be the only body authorized to modify the rights incorporated by the shares through an amendment to said Articles of Incorporation.
Any amendment or modification to the Articles of Incorporation must be approved by its shareholders at the General Shareholders' Meeting. For this matter to be heard at such meeting, the representation of at least half plus one of the subscribed shares of the Company is required and for its subsequent approval, the vote of the majority of the shares represented at that meeting is required; provided that, if such modification implies an agreement that, pursuant to applicable law, requires a special majority, then the applicable enhanced quorum and/or majority requirements shall apply. After a General Shareholders' Meeting is held, a minute of the meeting containing all the agreements must be drawn up and signed by the President and the Secretary of such General Shareholders' Meeting.
Shares Available for Future Sale Under U.S. Securities Laws
Before the Spinoff, there has been no public market for the BHI Shares. However, in accordance with the terms of Rule 144 under the Securities Act of 1933, as amended, and the SEC Staff’s Legal Bulletin No. 4, all of the BHI Shares after the Spinoff that are held by persons who are not affiliates of BHI will be freely saleable without registration under Rule 144 under the Securities Act of 1933, as amended.
Any sales of BHI Shares owned by BHI’s affiliates would remain subject to Rule 144 under the Securities Act, except for the holding period requirement, and could not be offered or sold in the United States absent registration or another exemption from registration.
Future sales of substantial amounts of BHI Shares in the public market after the Spinoff, or the perception that those sales may occur, could cause the prevailing market price for the BHI Shares to fall or impair our ability to raise capital through sales of our equity securities. There is no guarantee that a public market for the BHI Shares will develop, and therefore your ability to sell your BHI Shares will subject to market risks and conditions, including those described under “Risk Factors.”
128
17. FINANCIAL STATEMENTS OF BHI
INDEX TO CONSOLIDATED FINANCIAL STATEMENTS
129
BAC HOLDING INTERNATIONAL CORP.
AND SUBSIDIARY
(Panama, Republic of Panama)
Condensed Consolidated Interim Financial Statements
September 30, 2021
(With Independent Auditors’ Review Report Thereon)
F-1
Independent Auditors’ Report ON REVIEW OF CONDENSED CONSOLIDATED Interim FINANCIAL STATEMENTS
To the Board of Director and Shareholder
BAC Holding International Corp.
Introduction
We have reviewed the accompanying condensed consolidated interim financial statements of BAC Holding International Corp. and Subsidiary (the "Company") as of September 30, 2021, which comprises:
| · | the condensed consolidated statement of financial position as at September 30, 2021; |
| · | the condensed consolidated statement of income for the three- and nine-month periods ended September 30, 2021; |
| · | the condensed consolidated statement of comprehensive income for the three- and nine-month periods ended September 30, 2021; |
| · | the condensed consolidated statement of changes in equity for the nine-month period ended September 30, 2021; |
| · | the condensed consolidated statement of cash flows for the nine-month period ended September 30, 2021; and |
| · | notes to the condensed consolidated interim financial statements. |
Management is responsible for the preparation and presentation of the condensed consolidated interim financial statements in accordance with International Accounting Standard No.34,"Interim Financial Reporting". Our responsibility is to express a conclusion on the condensed consolidated interim financial statements based on our review.
Scope of Review
We conducted our review in accordance with International Standard on Review Engagements No.2410, "Review of Interim Financial Information Performed by the Independent Auditor of the Entity". A review of interim financial information consists of making inquiries, primarily of persons responsible for financial and accounting matters, and applying analytical and other review procedures. A review is substantially less in scope than an audit conducted in accordance with International Standards on Auditing and consequently does not enable us to obtain assurance that we would become aware of all significant matters that might be identified in an audit. Accordingly, we do not express an audit opinion.
Conclusion
Based on our review, nothing has come to our attention that causes us to believe that the accompanying condensed consolidated interim financial statements of BAC Holding International Corp. and Subsidiary as of September 30, 2021, is not prepared, in all material respects, in accordance with International Accounting Standard No.34,"Interim Financial Reporting".
Panama, Republic of Panama
November 10, 2021
F-2
BAC HOLDING INTERNATIONAL CORP. AND SUBSIDIARY
(Panama, Republic of Panama)
Condensed Consolidated Statement of Financial Position
September 30, 2021
(In U.S. dollars)
| September 30, | December 31, | |||
| Assets | Note | 2021 | 2020 | |
| (Unaudited) | (Audited) | |||
| Cash and cash equivalents | 605,868,262 | 729,239,556 | ||
| Securities purchased under resale agreements | 5, 9 | 13,231,790 | 21,227,306 | |
| Deposits in banks: | ||||
| Demand | 3,648,043,730 | 4,203,096,402 | ||
| Time deposits | 597,630,059 | 1,013,944,630 | ||
| Total deposits in banks | 4,245,673,789 | 5,217,041,032 | ||
| Total cash, cash equivalents and deposits in banks | 8 | 4,864,773,841 | 5,967,507,894 | |
| Investments at fair value | 5, 10 | 3,502,699,427 | 3,948,885,846 | |
| Loans | 5, 11 | 18,018,748,793 | 20,354,233,806 | |
| Allowance for loan losses | 5 | -659,640,868 | -697,819,096 | |
| Loans at amortized cost | 17,359,107,925 | 19,656,414,710 | ||
| Property, furniture, equipment and improvements, net | 511,016,991 | 661,554,049 | ||
| Acceptances outstanding | 1,562,548 | 197,565,833 | ||
| Other accounts receivable | 5 | 198,332,798 | 301,914,302 | |
| Provision for accounts receivable | 5 | -8,312,393 | -6,964,522 | |
| Goodwill and intangible assets | 1,588,425,873 | 1,673,398,033 | ||
| Deferred income tax | 62,196,238 | 92,724,379 | ||
| Other assets | 99,124,080 | 152,197,800 | ||
| Total assets | 28,178,927,328 | 32,645,198,324 |
| Liabilities and Equity | Note | 2021 | 2020 | |
| (Unaudited) | (Audited) | |||
| Liabilities: | ||||
| Deposits from customers: | ||||
| Demand | 7,951,129,865 | 8,114,873,415 | ||
| Savings | 4,655,929,850 | 4,605,502,356 | ||
| Time deposits | 8,471,050,962 | 10,531,530,114 | ||
| Total deposits from customers | 12 | 21,078,110,677 | 23,251,905,885 | |
| Securities sold under repurchase agreements | 10,036,838 | 41,920,772 | ||
| Financial obligations | 13 | 1,428,936,271 | 2,645,123,010 | |
| Other financial obligations | 14 | 753,793,721 | 1,246,357,650 | |
| Lease liabilities | 15 | 164,474,568 | 217,371,346 | |
| Acceptances outstanding | 1,562,548 | 197,565,833 | ||
| Income tax payable | 31,734,370 | 58,376,143 | ||
| Deferred income tax | 99,734,864 | 83,964,688 | ||
| Other liabilities | 1,302,265,107 | 640,139,577 | ||
| Total liabilities | 24,870,648,964 | 28,382,724,904 | ||
| Equity: | ||||
| Common stock | 16 | 2,865,394,737 | 2,865,394,737 | |
| Retained earnings | 712,567,667 | 1,666,257,570 | ||
| Other comprehensive losses | -270,202,122 | -279,663,595 | ||
| Total shareholder equity of the controlling Company | ||||
| 3,307,760,282 | 4,251,988,712 | |||
| Non-controlling interest of the Company | 518,082 | 10,484,708 | ||
| Total equity | 3,308,278,364 | 4,262,473,420 | ||
| Commitments and contingencies | 19 | |||
| Total liabilities and equity | 28,178,927,328 | 32,645,198,324 |
The consolidated statement of financial position must be read in conjunction with the accompanying notes which are an integral part of the condensed consolidated interim financial statements.
F-3
BAC HOLDING INTERNATIONAL CORP. AND SUBSIDIARY
(Panama, Republic of Panama)
Condensed Consolidated Statement of Income
For the nine and three months period ended September 30, 2021
(In U.S. dollars)
| For the nine months period ended | For the three months period ended | |||||||
| September 30, | September 30, | September 30, | September 30, | |||||
| Note | 2021 | 2020 | 2021 | 2020 | ||||
| Continued operations | (Unaudited) | (Unaudited) | (Unaudited) | (Unaudited) | ||||
| Interest income: | ||||||||
| Deposits in banks | 7,778,350 | 16,226,647 | 2,225,921 | 3,867,189 | ||||
| Investments at FVOCI | 123,869,579 | 98,729,759 | 40,766,433 | 34,261,412 | ||||
| Loans | 1,249,801,201 | 1,353,399,399 | 429,254,837 | 437,853,251 | ||||
| Total interest income | 1,381,449,130 | 1,468,355,805 | 472,247,191 | 475,981,852 | ||||
| Interest expense: | ||||||||
| Deposits from customers | 358,474,711 | 383,418,193 | 113,410,742 | 130,216,119 | ||||
| Financial obligations | 42,505,039 | 76,776,353 | 12,681,104 | 21,260,661 | ||||
| Other financial obligations | 49,373,400 | 32,702,858 | 16,619,843 | 17,395,577 | ||||
| Securities sold under repurchase agreements | 724,825 | 903,666 | 340,154 | 50,538 | ||||
| Lease liabilities | 6,762,840 | 8,468,172 | 2,163,253 | 2,738,761 | ||||
| Total interest expense | 457,840,815 | 502,269,242 | 145,215,096 | 171,661,656 | ||||
| Interest income, net | 923,608,315 | 966,086,563 | 327,032,095 | 304,320,196 | ||||
| Provision for loan and interest losses | 5 | 252,272,680 | 319,770,698 | 86,845,170 | 133,858,403 | |||
| Credit risk of investments and interest bearing deposits | 5 | 3,561,086 | 15,343,663 | 1,556,998 | 2,250,468 | |||
| Provision for account receivable losses | 5 | 1,939,803 | 1,795,328 | 215,873 | 903,452 | |||
| Interest income, net after provisions | 665,834,746 | 629,176,874 | 238,414,054 | 167,307,873 | ||||
| Other income (expenses): | ||||||||
| Gains in financial instruments, net | 17 | 57,183,535 | 28,730,325 | 19,006,668 | 15,259,270 | |||
| Service charges | 295,783,791 | 292,412,107 | 99,950,993 | 91,205,253 | ||||
| Commissions and other fees, net | 136,812,495 | 121,804,978 | 48,648,655 | 43,057,967 | ||||
| Gain on foreign currency exchange, net | 101,527,842 | 125,040,736 | 38,991,069 | 53,576,582 | ||||
| Impairment of assets held for sale | -227,374 | -64,177 | -218,815 | 0 | ||||
| Other income | 40,218,828 | 37,119,882 | 8,818,835 | 15,904,097 | ||||
| Total other income, net | 631,299,117 | 605,043,851 | 215,197,405 | 219,003,169 | ||||
| General and administrative expenses: | ||||||||
| Salaries and employee benefits | 379,029,735 | 396,597,178 | 128,818,133 | 130,703,417 | ||||
| Depreciation and amortization | 87,983,630 | 94,824,383 | 28,801,955 | 31,804,241 | ||||
| Administrative | 58,991,213 | 56,561,798 | 21,937,789 | 18,561,464 | ||||
| Occupancy and related expenses | 23,048,515 | 25,846,735 | 7,873,896 | 8,440,308 | ||||
| Other operating expenses | 335,283,909 | 300,418,040 | 118,313,883 | 98,228,082 | ||||
| Total general and administrative expenses | 884,337,002 | 874,248,134 | 305,745,656 | 287,737,512 | ||||
| Income before income tax | 412,796,861 | 359,972,591 | 147,865,803 | 98,573,530 | ||||
| Current income tax | -87,457,918 | -114,733,478 | -40,251,180 | -34,911,372 | ||||
| Deferred income tax | -8,260,788 | 10,152,728 | -3,512,226 | 8,551,448 | ||||
| Net income continued operations | 317,078,155 | 255,391,841 | 104,102,397 | 72,213,606 | ||||
| Gains from discontinued activities, net of income tax | 25 | 17,333,593 | -1,276,931 | 6,453,706 | -1,039,498 | |||
| Net income | 334,411,748 | 254,114,910 | 110,556,103 | 71,174,108 | ||||
| Net income attributable to: | ||||||||
| Controlling interest | 334,375,534 | 254,070,089 | 110,577,144 | 71,152,714 | ||||
| Non-controlling interest | 36,214 | 44,821 | -21,041 | 21,394 | ||||
| 334,411,748 | 254,114,910 | 110,556,103 | 71,174,108 | |||||
The condensed consolidated interim statement of income must be read in conjunction with the notes which are an integral part of the condensed consolidated interim financial statements.
F-4
BAC HOLDING INTERNATIONAL CORP. AND SUBSIDIARY
(Panama, Republic of Panama)
Condensed Consolidated Statement of Income
For the nine and three months period ended September 30, 2021
(In U.S. dollars)
| For the nine months period ended | For the three months period ended | |||||||
| September 30, | September 30, | September 30, | September 30, | |||||
| 2021 | 2020 | 2021 | 2020 | |||||
| (Unaudited) | (Unaudited) | (Unaudited) | (Unaudited) | |||||
| Net income | 334,411,748 | 254,114,910 | 110,556,103 | 71,174,108 | ||||
| Other comprehensive results: | ||||||||
| Items that will not be reclassified to the consolidated income statement | ||||||||
| Employee benefits plan - change in actuarial effect | -817,871 | -32,751 | 15,937 | -7,754 | ||||
| Net change in fair value of common stocks | 11,653 | 0 | 19,703 | -22,196 | ||||
| Items that are or can be reclassified to the consolidated income statement | ||||||||
| Foreign currency translation | -21,774,045 | -74,368,121 | -17,622,134 | -43,238,860 | ||||
| Valuation for investments FVOCI: | ||||||||
| Net amount transferred to income statement | -48,240,060 | -27,576,937 | -16,021,349 | -22,830,908 | ||||
| Net change in fair value | 74,493,765 | 26,264,803 | 156,850 | 47,933,467 | ||||
| Net change in cash flow hedge | -1,158,697 | 690,540 | 0 | 501,075 | ||||
| Net change in swaps fair value | 1,730,325 | 687,139 | 214,227 | 665,197 | ||||
| Other comprehensive results | 4,245,070 | -74,335,327 | -33,450,993 | -17,665,176 | ||||
| Comprehensive income | 338,656,818 | 179,779,583 | 77,105,110 | 53,508,932 | ||||
| Comprehensive income attributable to: | ||||||||
| Controlling interest | 338,702,343 | 179,708,372 | 77,368,958 | 54,127,927 | ||||
| Non-controlling interest | -45,525 | 71,211 | -49,623 | 46,200 | ||||
| 338,656,818 | 179,779,583 | 77,319,335 | 54,174,127 | |||||
The condensed consolidated interim statement of income must be read in conjunction with the notes which are an integral part of the condensed consolidated interim financial statements.
F-5
BAC HOLDING INTERNATIONAL CORP. AND SUBSIDIARY
(Panama, Republic of Panama)
Condensed Consolidated Statement of Changes in Equity
For the nine months period ended September 30, 2021
(In U.S. dollars)
| Attributable to the Company's owners | |||||||||||
| Other | Total | ||||||||||
| Common | Retained | comprehensive | controlling | Non-controlling | |||||||
| stock | earnings | losses | interest | interest | Total | ||||||
| Balance as of January 1, 2020 (Audited) | 2,865,394,737 | 1,736,845,314 | -192,169,805 | 4,410,070,246 | 947,174 | 4,411,017,420 | |||||
| Net income | 0 | 254,070,089 | 0 | 254,070,089 | 44,821 | 254,114,910 | |||||
| Other comprehensive results: | |||||||||||
| Foreign currency translation | 0 | 0 | -74,361,444 | -74,361,444 | -6,677 | -74,368,121 | |||||
| Valuation of FVOCI securities: | |||||||||||
| Net amount transferred to income statement | 0 | 0 | -27,556,640 | -27,556,640 | -20,297 | -27,576,937 | |||||
| Net change in fair value | 0 | 0 | 26,217,267 | 26,217,267 | 47,536 | 26,264,803 | |||||
| Employee benefits plan - change in actuarial effect | 0 | 0 | -32,642 | -32,642 | -109 | -32,751 | |||||
| Net change in cash flow hedge | 0 | 0 | 687,579 | 687,579 | 2,961 | 690,540 | |||||
| Net change in swaps fair value | 0 | 0 | 684,163 | 684,163 | 2,976 | 687,139 | |||||
| Total other comprehensive results | 0 | 0 | -74,361,717 | -74,361,717 | 26,390 | -74,335,327 | |||||
| Total comprehensive results | 0 | 254,070,089 | -74,361,717 | 179,708,372 | 71,211 | 179,779,583 | |||||
| Business combinations | 0 | 0 | 0 | 0 | 125,282,341 | 125,282,341 | |||||
| Transactions with the Company's owners: | |||||||||||
| Changes in the ownership | |||||||||||
| Reorganization of the holding company | 0 | 0 | 0 | 0 | -468,795 | -468,795 | |||||
| Purchase of non-controlling interest | 0 | 0 | 0 | 0 | -13,346,885 | -13,346,885 | |||||
| Adjustment of previous periods - IFRS9 adoption | 0 | -3,174,882 | 3,174,882 | 0 | 0 | 0 | |||||
| Non-controlling interest adjustment | 0 | 0 | 0 | 0 | 4,517 | 4,517 | |||||
| Redemption of preferred shares | 0 | 0 | 0 | 0 | -62,000,000 | -62,000,000 | |||||
| Complementary tax | 0 | 0 | 0 | 0 | -6,846 | -6,846 | |||||
| Contributions and distributions: | |||||||||||
| Dividends paid | 0 | -375,000,000 | 0 | -375,000,000 | -28,352 | -375,028,352 | |||||
| Transfer of preferred dividends | 0 | -3,120,463 | 0 | -3,120,463 | 3,120,463 | 0 | |||||
| Payment of preferred dividends | 0 | 0 | 0 | 0 | -3,120,463 | -3,120,463 | |||||
| Total transactions with the Company's owners | 0 | -381,295,345 | 3,174,882 | -378,120,463 | -75,846,361 | -453,966,824 | |||||
| Balance as of September 30, 2020 (Unaudited) | 2,865,394,737 | 1,609,620,058 | -263,356,640 | 4,211,658,155 | 50,454,365 | 4,262,112,520 | |||||
| Balance as of January 1, 2021 (Audited) | 2,865,394,737 | 1,666,257,570 | -279,663,595 | 4,251,988,712 | 10,484,708 | 4,262,473,420 | |||||
| Net income | 0 | 334,375,534 | 0 | 334,375,534 | 36,214 | 334,411,748 | |||||
| Other comprehensive results: | 0 | ||||||||||
| Foreign currency translation | 0 | 0 | -21,770,632 | -21,770,632 | -3,413 | -21,774,045 | |||||
| Valuation of FVOCI securities: | 0 | ||||||||||
| Net amount transferred to income statement | 0 | 0 | -48,209,461 | -48,209,461 | -30,599 | -48,240,060 | |||||
| Net change in fair value | 0 | 0 | 74,543,884 | 74,543,884 | -50,119 | 74,493,765 | |||||
| Employee benefits plan - change in actuarial effect | 0 | 0 | -817,799 | -817,799 | -72 | -817,871 | |||||
| Net change in fair value of common shares | 0 | 0 | 11,653 | 11,653 | 0 | 11,653 | |||||
| Net change in cash flow hedge | 0 | 0 | -1,153,704 | -1,153,704 | -4,993 | -1,158,697 | |||||
| Net change in swaps fair value | 0 | 0 | 1,722,868 | 1,722,868 | 7,457 | 1,730,325 | |||||
| Total other comprehensive results | 0 | 0 | 4,326,809 | 4,326,809 | -81,739 | 4,245,070 | |||||
| Total comprehensive results | 0 | 334,375,534 | 4,326,809 | 338,702,343 | -45,525 | 338,656,818 | |||||
| Transactions with the Company's owners: | |||||||||||
| Transactions between the Bank and the non-controlling interest | |||||||||||
| Reorganization of the holding company | 0 | 0 | 0 | 0 | -2,514 | -2,514 | |||||
| Spin-off movement | 0 | -459,855,877 | 5,134,664 | -454,721,213 | -9,964,827 | -464,686,040 | |||||
| Variation in profit of non-controlling interest due to spin-off | 0 | 0 | 0 | 0 | 52,916 | 52,916 | |||||
| Complementary tax | 0 | 0 | 0 | 0 | 39 | 39 | |||||
| Contributions and distributions: | |||||||||||
| Declared Dividends | 0 | -677,806,603 | 0 | -677,806,603 | 0 | -677,806,603 | |||||
| Dividends paid | 0 | -150,402,957 | 0 | -150,402,957 | -6,715 | -150,409,672 | |||||
| Total transactions with the Company's owners | 0 | -1,288,065,437 | 5,134,664 | -1,282,930,773 | -9,921,101 | -1,292,851,874 | |||||
| Balance as of September 30, 2021 (Unaudited) | 2,865,394,737 | 712,567,667 | -270,202,122 | 3,307,760,282 | 518,082 | 3,308,278,364 | |||||
The condensed consolidated statement of changes in equity must be read in conjunction with the notes which are an integral part of the condensed consolidated interim financial statements.
F-6
BAC HOLDING INTERNATIONAL CORP. AND SUBSIDIARY
(Panama, Republic of Panama)
Condensed Consolidated Statement of Cash Flows
For the nine months period ended September 30, 2021
(In U.S. dollars)
| September 30, | September 30, | |||
| Nota | 2021 | 2020 | ||
| (Unaudited) | (Unaudited) | |||
| Cash flows from operating activities: | ||||
| Net Income | 334,411,748 | 254,114,910 | ||
| Adjustments to reconcile net income and cash by operating activities: | ||||
| Depreciation and amortization | 64,450,749 | 67,091,336 | ||
| Amortization of the right-of-use assets | 23,532,881 | 27,733,047 | ||
| Provision for loan losses | 5 | 252,272,680 | 319,770,698 | |
| Credit risk of investments and interest bearing deposits | 5 | 3,561,086 | 15,343,663 | |
| Provision for accounts receivable losses | 1,939,803 | 1,795,328 | ||
| Impairment (reversal) of assets held for sale | 227,374 | 64,177 | ||
| Provision (release) for unfunded commitments | 137 | -58,595 | ||
| Interest income, net | -923,608,315 | -966,086,563 | ||
| Gain on financial instruments, net | 17 | -57,183,535 | -28,730,325 | |
| Loss on sale and disposal of property and equipment, net | 830,593 | 204,251 | ||
| Loss on sale and disposal of intangible assets | -6,109,250 | 27,425 | ||
| Net gain on sale of assets held for sale | 596,757 | -2,447,656 | ||
| Dividends on equity securities at FVOCI | -892,659 | -779,228 | ||
| Income tax expense | 95,718,706 | 104,580,750 | ||
| Changes in operating assets and liabilities: | ||||
| Deposits with original maturities of 90 days or more | 43,904,373 | -569,440 | ||
| Investments at fair value | 8,466,602 | 7,315,723 | ||
| Loans | -1,210,084,484 | -375,042,732 | ||
| Securities sold under agreements to repurchase | -14,912,794 | -28,402,821 | ||
| Other accounts receivable | -37,584,162 | 58,930,053 | ||
| Other assets | -14,107,970 | 25,052,888 | ||
| Deposits from costumers | 827,196,687 | 2,001,199,620 | ||
| Other liabilities | 828,819,373 | -92,505,332 | ||
| Discontinued operations | -12,283,573 | 106,781,893 | ||
| Cash generated by operations: | ||||
| Interest received | 1,371,084,647 | 1,317,574,728 | ||
| Interest paid | -461,842,884 | -499,163,695 | ||
| Dividends received | 892,659 | 779,228 | ||
| Income tax paid | -112,229,274 | -109,939,104 | ||
| Net cash provided by operating activities | 1,007,067,955 | 2,204,634,227 | ||
| Cash flows from investment activities: | ||||
| Proceeds from sale of investments at FVOCI | 10 | 962,648,331 | 584,604,565 | |
| Maturities, and prepayments of investments at FVOCI | 1,886,049,802 | 817,034,640 | ||
| Purchase of investments at FVOCI | -3,344,410,381 | -1,878,185,179 | ||
| Purchase of property and equipment | -38,652,685 | -42,764,749 | ||
| Proceeds from sale of property and equipment | 1,961,241 | 585,471 | ||
| Acquisition of intangible assets | -14,678,759 | 17,403,814 | ||
| Proceeds from sale of assets held for sale | 22,568,869 | 6,552,109 | ||
| Discontinued operations | 0 | -18,283,459 | ||
| Discontinued operations, net of cash | 25 | -121,794,441 | 0 | |
| Cash paid in business acquisition, net of cash received | 0 | -433,849,700 | ||
| Net cash used in investment activities | -646,308,023 | -946,902,488 | ||
| Cash flows from financing activities: | ||||
| Proceeds from financial obligations | 715,156,529 | 1,834,245,138 | ||
| Payment of financial obligations | -1,489,383,437 | -1,578,214,821 | ||
| Proceeds from other financial obligations | 158,649,807 | 20,440,379 | ||
| Payment of other financial obligations | -3,484,409 | -71,169,444 | ||
| Payment of lease liabilities | -16,836,872 | -20,936,694 | ||
| Dividends | -828,216,275 | -378,148,815 | ||
| Reorganization of the holding company | -48 | 0 | ||
| Discontinued operations, net of cash | 0 | -2,196,523 | ||
| Acquisition of non-controlling intetrest | 0 | -13,346,885 | ||
| Net cash used in financing activities | -1,464,114,705 | -209,327,665 | ||
| Effect of exchange rate fluctuation on cash held | -24,970,106 | -51,000,159 | ||
| Net (decrease) increase in cash and cash equivalents | -1,128,324,879 | 997,403,915 | ||
| Cash and cash equivalents at beginning of the year | 5,904,018,802 | 4,035,866,449 | ||
| Cash and cash equivalents at the end of the year | 8 | 4,775,693,923 | 5,033,270,364 |
The condensed consolidated statement of cash flows must be read in conjunction with the notes which are an integral part of the condensed consolidated interim financial statements.
F-7
BAC HOLDING INTERNATIONAL CORP. AND SUBSIDIARY
Notes to the Condensed Consolidated Interim Financial Statements
September 30, 2021
(In U.S. dollars)
| (1) | Organization |
BAC Holding International Corp. is incorporated under the Companies Law of the Republic of Panama since 1972. BAC Holding International Corp. and it subsidiary will be jointly referred to as the “Company”. BAC Holding International Corp. is wholly owned by Banco de Bogota S. A., an authorized bank in the Republic of Colombia, which is a subsidiary of Grupo Aval Acciones y Valores, S. A., an entity domiciled in the Republic of Colombia.
BAC Holding International Corp. was renamed on September 15, 2021, through a comprehensive amendment to the Articles of Association made in the Board of Directors, and registered on September 16, 2021, before the Public Registry of the Republic of Panama. The previous name of the company was Leasing Bogota S.A. Panama. No changes were made to the corporate purpose or authorized capital of the company.
The Company owns 100% of the shares of BAC Credomatic, Inc. BAC Credomatic, Inc. provides through its indirect subsidiary BAC International Bank Inc., a Panamanian banking institution, a wide variety of financial services to individuals and institutions, principally in Costa Rica, El Salvador, Guatemala, Honduras, Nicaragua and Panama.
In May 2020, the Company acquired 96.60% of the common shares of Multi Financial Group Inc. (MFG), a Panamanian banking institution. In the month of June 2020, 2.97% of the non-controlling stake was acquired, for a total stake of 99.57%.
The Company carried out a partial spin-off of its operations on September 29, 2021, through which it transferred to Multi Financial Holding Inc., a company created simultaneously with said spin-off, the shares it owned in Multi Financial Group Inc. as of that date. More information on this operation is shown in Note 25.
The Company consolidates directly and indirectly with the following entities:
| Subsidiary | Activity | Location | Total Holdings |
| BAC Credomatic Inc. | Holding company | British Virgin Islands | 100.0000% |
| BAC International Corporation | Holding company | British Virgin Islands | 100.0000% |
| BAC International Bank Inc. | Bank | Panama | 99.9961% |
| BAC International Bank (Grand Cayman) | Bank | Grand Cayman | 100.0000% |
| BAC Bahamas Bank Limited | Bank | Bahamas | 100.0000% |
| BAC Latam SSC S.A. | Services | Costa Rica | 100.0000% |
| BAC Valores Inc. | Stock Exchange | Panama | 100.0000% |
| Premier Assets Management Inc. | Mutual Funds | Panama | 100.0000% |
| Red Land Bridge Reinsurance Ltd. | Reinsurance | Grand Cayman | 100.0000% |
| Corporación Latinoamericana de Finanzas S.A. | Holding Company | Panama | 100.0000% |
| Informaciones S.A. | Holding Company | Guatemala | 100.0000% |
| Banco de América Central S.A | Bank | Guatemala | 100.0000% |
| Financiera de Capitales S.A. | Financial | Guatemala | 99.9996% |
| BAC Valores de Guatemala S.A. | Stock Exchange | Guatemala | 99.9929% |
| BAC Bank Inc. | Bank | Panama | 100.0000% |
| Credomatic de Guatemala S.A. | Card Industry | Guatemala | 100.0000% |
| Banco de América Central Honduras S.A | Bank | Honduras | 99.9776% |
| Credomatic de Honduras S.A. | Card Industry | Honduras | 99.9999% |
| Admin. de Fondos de Pensiones y Cesantías BAC | Mutual Funds | Honduras | 100.0000% |
| Inversiones Financieras Banco de América Central S.A. | Holding Company | El Salvador | 99.9988% |
| Banco de America Central S.A. | Bank | El Salvador | 99.9999% |
| Credomatic de El Salvador S.A. | Card Industry | El Salvador | 99.9997% |
| Sistemas Internacionales S.A. | Holding Company | El Salvador | 99.9949% |
| Viajes Credomatic El Salvador S.A | Travel Agency | El Salvador | 99.9436% |
| Corporacion Tenedora BAC COM S.A. | Holding Company | Nicaragua | 99.9769% |
| Banco de América Central S.A. | Bank | Nicaragua | 100.0000% |
| Almacenes Generales de Deposito BAC S.A. | Tax Deposit | Nicaragua | 99.9995% |
| Credito S.A. | Card Industry | Nicaragua | 99.6631% |
| BAC Valores Nicaragua Puesto de Bolsa S.A. | Stock Exchange | Nicaragua | 99.9946% |
| Corporacion de Inversiones Credomatic S.A. | Holding Company | Costa Rica | 100.0000% |
| Corporacion Tenedora BAC Credomatic S.A. | Holding Company | Costa Rica | 100.0000% |
| Banco BAC San Jose S.A. | Bank | Costa Rica | 100.0000% |
| BAC San Jose Puesto de Bolsa S.A. | Stock Exchange | Costa Rica | 100.0000% |
| BAC San Jose Leasing S.A. | Leasing | Costa Rica | 100.0000% |
| Inmobiliaria Credomatic S.A. | Realty | Costa Rica | 100.0000% |
| BAC San Jose Soc. de Fondos de Inversión S.A. | Mutual Funds | Costa Rica | 100.0000% |
| BAC San Jose Pensiones S.A. | Mutual Funds | Costa Rica | 100.0000% |
| BAC Credomatic Corredora de Seguros S.A. | Insurance | Costa Rica | 100.0000% |
| Credomatic de Costa Rica S.A. | Card Industry | Costa Rica | 100.0000% |
F-8
| (2) | Basis for Preparation of the Condensed Consolidated Interim Financial Statements |
| (a) | Condensed consolidated financial statement |
The Company prepares its condensed consolidated interim financial statements incorporating its controlled entities. The Company controls an entity if and only if it complies with the following elements:
· Power over the entity that gives the Company the right to direct any relevant activity that significantly affects the performance of the entity.
· Exposure or rights to variable returns from their participation in the entity.
· Ability to affect those returns through their power over the entity.
To meet this requirement, the Company conducts an annual reassessment of all its contractual relationships. It is not required to consolidate new entities such as result of this process, including structured entities.
The financial statements of the Company's subsidiaries are included in the condensed consolidated interim financial statements from the date on which the Company acquired control or until the date control is lost.
During the consolidation process, the Company consolidates the assets, liabilities and profits or losses of the entities under control, previously aligning the accounting policies in all its subsidiaries. Such process includes the elimination of balances and transactions within the group and any unrealized and realized income and expenses (except foreign currency conversion gains or losses and taxes that are not subject to disposal) arising from transactions within the group. Unrealized and realized losses are eliminated in the same way as unrealized and realized gains, but only to the extent that there is no evidence of impairment.
| (b) | Compliance with International Financial Reporting Standards (“IFRS”) |
The condensed consolidated interim financial statements have been prepared in accordance with International Accounting Standard (IAS) No. 34, "Interim Financial Reporting", which must be read in conjunction with the latest consolidated financial statements for the period ended December 31, 2020.
IAS No. 34 does not require disclosure in interim financial information of all notes that are included when preparing the annual financial statements as required by IFRS; however, a selection of informative notes have been included to explain the events and transactions that are important for understanding the change and performance of the Company in its financial position since its last annual financial statement.
Consolidated results of operations for interim periods are not necessarily indicative of the results that can be expected for the full year.
The condensed consolidated interim financial statements were authorized by the Company's Board of Directors for issuance on November 10, 2021.
F-9
| (2) | Basis for Preparation of the Condensed Consolidated Interim Financial Statements, continued |
| (c) | Basis of measurement |
The condensed consolidated interim financial statements have been prepared on a historical cost basis, except for the following accounts in the condensed consolidated statement of financial position.
· Investments at fair value; and
· Assets held for sale.
Initially, the Company recognizes financial instruments at fair value on the date they are settled. Investments in securities are recorded when they are traded and loans at amortized cost when they are settled.
| (d) | Functional and presentation currency |
The items included in the accounts of each of the Company's subsidiaries are measured using the currency of the main economic environment where the entity operates ("functional currency").
The Company’s condensed consolidated interim financial statements are presented in U.S.A. dollars, which is also Company's functional currency. Information presented in U.S.A. dollars is expressed in units, unless otherwise stated.
| (e) | Use of estimates and judgments |
Preparation of the condensed consolidated interim financial statements requires the Company’s management to make judgments, estimates and assumptions affecting the application of accounting policies and the reported amounts of assets, liabilities, revenues and expenses. Final results may differ from these estimates. These also require the Company’s management to apply its judgment when applying the Company's accounting policies.
The information on the most significant areas of estimation of uncertainty and critical judgments in applying the accounting policies that have the most important effect on the amounts recognized in the condensed consolidated interim financial statements is disclosed in Note 7.
| (3) | Summary of Significant Accounting Policies |
The Company has applied the policies to the condensed consolidated interim financial statements in a manner consistent with those of the consolidated financial statements as of December 31, 2020, which are detailed below:
| (a) | Basis of consolidation |
Subsidiaries
Subsidiaries are entities controlled by the Company. The Company controls an entity when it is exposed to, or has rights to, variable return from its involvement with the investee and has the ability to affect those returns through its power over the investee.
To determine the control, the potential voting rights that are currently executable or convertible are considered. The subsidiaries’ financial statements are included in the condensed consolidated interim financial statements from the date on which the control begins, and until the control ceases.
Balances and Transactions Eliminated in the Consolidation
Intragroup transactions, balances, revenue and expenses in transactions between subsidiaries are eliminated. Losses and gains that arise from intragroup transactions that are recognized as assets or liabilities are also eliminated.
Changes in the ownership of the subsidiaries that do not result in a change of control
Transactions with non-controlling interest that do not result in a loss of control are accounted for as equity transactions; that is, as transactions with the owners. Any difference between the carrying value of the interest and the amount of the transaction is recorded as an adjustment in retained earnings.
Loss of control
When the Company ceases to have control over a subsidiary, it derecognizes the assets and liabilities of the subsidiary, and any non-controlling interest and other components of equity. Any resulting gain or loss is recognized in the condensed consolidated statement of income. Any retained interest in the former subsidiary is measured at fair value when control is lost.
| (b) | Foreign currencies |
Assets and liabilities maintained in foreign currency are converted to the functional currency at the exchange rate in effect on the reporting date. Gains or losses resulting from the conversion of foreign currency are reflected in other revenues or other expense accounts in the condensed consolidated statement of income.
F-10
| (3) | Summary of Significant Accounting Policies, continued |
Goodwill and adjustments to fair value resulting from the acquisition of a foreign entity are treated as assets and liabilities of the foreign entity and, consequently, are converted at the exchange rates in effect on each period closing date.
Subsidiaries of the Company
The financial position and results of all of the Company's subsidiaries that have a functional currency different from the Company's functional currency are converted into the presentation currency as follows:
| · | Assets and liabilities: at the exchange rate at the period closing date. |
| · | Revenues and expenses: at the average exchange rate. |
| · | Equity accounts: at the historical exchange rate. |
The resulting conversion adjustment is carried directly to a separate account in the “Equity” section, under "other comprehensive loss".
| (c) | Financial assets and liabilities |
Financial assets are classified on the date of initial recognition, based on the nature and purpose of the financial asset's acquisition.
Classification
IFRS 9 contains three principal classification categories for financial assets: measured at amortized cost (AC), fair value through other comprehensive income (FVOCI) and fair value through profit or loss (FVPL). IFRS 9 classification is generally based on the business model in which a financial asset is managed and its contractual cash flows.
At initial recognition, financial assets are classified as measured at: AC, FVOCI or FVPL.
A financial asset is measured at amortized cost and not at FVPL, if it meets both of the following conditions:
| 1. | The asset is kept within a business model to collect contractual cash flows; and |
| 2. | The contractual terms of the financial asset establish specific dates for cash flows that represent solely payments of principal and interest on the outstanding balance. |
A debt instrument is measured at FVOCI only if it meets both of the following conditions and has not been designated as FVPL:
| 1. | The asset is kept within a business model whose objective is achieved by collecting contractual cash flows and selling financial assets and; |
| 2. | The contractual terms of the financial asset establish specific dates for cash flows that represent solely payments of principal and interest on the current outstanding balance. |
During the initial recognition of investments in equity instruments not traded, the Company may elect to irrevocably register subsequent changes in fair value as part of other comprehensive profit and loss in equity. This election is made on an instrument by instrument basis.
All financial assets not classified as measured at AC or FVOCI as described above, are measured at FVPL.
In addition, in the initial recognition, the Company may irrevocably designate a financial asset that meets the measurement requirements at AC or FVOCI to be measured at FVPL, if doing so eliminates or significantly reduces an accounting mismatch that may occur if not done. For now, the Company do not use this option.
A financial asset is classified in one of the referenced categories at the time of its initial recognition.
An embedded derivative where the main contract is a financial contract covered under IFRS 9 is not separated and instead the hybrid financial instrument is jointly assessed for classification.
Business Model Assessment
The Company assess the objectives of the business models that hold the financial assets in a portfolio to better represent how each subsidiary manages the business and how management information is reported. The information considered includes:
F-11
| (3) | Summary of Significant Accounting Policies, continued |
| · | The policies and objectives stated for each portfolio of financial assets and the operation of these policies in practice. These include, whether management’s strategy is to collect income from contractual interest; hold a profile of specific interest performance or coordinate the duration of the financial assets with the liabilities being financed or the expected outgoing cash or through cash flows from the sale of assets; |
| · | How they are evaluated or reported to key management personnel for each Bank subsidiary on portfolio performance. |
| · | The risks that affect the performance of the portfolios (and the financial assets held within) and the way those risks are managed; |
| · | How managers of the business are compensated (for example, whether compensation is based on the fair value of the assets managed or the contractual cash flows collected); and, |
| · | The frequency, value and timing of sales in prior fiscal periods, the reasons for those sales and expectations about future sales activity. However, the information on sales activity cannot be considered in isolation, but rather as part of an assessment of how Bank objectives established for managing financial assets is achieved and how cash flows are realized. |
Financial assets held or managed for trading and where their performance is evaluated on a fair value basis, are measured at FVPL because these are not held to cover contractual cash flows or to obtain contractual cash flows and to sell these financial assets.
Assessment if contractual cash flows are solely payments of principal and interest
For purposes of this assessment, “principal” is defined as the fair value of the financial asset at initial recognition. “Interest” is defined as compensation for the time value of money and credit risk associated with holding the current principal for a period of time and for other basic risk from loan agreements and other associated costs (e.g. liquidity risk and administrative costs), as well as the profit margin.
When evaluating whether contractual cash flows are solely payment of principal and interest, the Company considered the contractual terms of the instrument. This includes an assessment to determine whether the financial asset contains a contractual term that could change the timing or amount of the contractual cash flows in such a way that it does not meet this condition. In making this assessment the Company considers:
| · | Contingent events that will change the amount and timing of cash flows; |
| · | Hedging conditions; |
| · | Prepayment and extension terms; |
| · | Terms that limit the Company in achieving cash flows for specific assets (e.g. unfunded asset agreements); and |
| · | Terms that change the considerations on the value of money over time (e.g. periodic revision of interest rates). |
Interest rates on certain consumer and business loans are based on variable interest rates established at the discretion of the Company. Variable interest rates are generally established in accordance with the practices of each of the countries where the Company operates, plus certain additional discretionary points. In these cases, the Company assess whether the discretionary feature is consistent with the solely principal and interest criteria considering a number of factors that include whether:
| · | Debtors can prepay the loans without significant penalties; |
| · | Competitive market factors insure that interest rates are consistent between banks; and, |
| · | Any regulatory protection standard in favor of customers in the country requiring banks to treat customers reasonably (e.g. regulated rates). |
All fixed rate consumer and corporate loans contain a prepayment condition.
A prepayment feature is consistent with the solely principal and interest criteria, if the prepayment amount substantially represents unpaid amounts of principal and interest on the amount of outstanding principal, which may include fair compensation for early termination of the contract.
F-12
| (3) | Summary of Significant Accounting Policies, continued |
In addition, a prepayment feature is consistent with these criteria, if a financial asset is acquired or originates from a premium or discount to the contractual par amount and the prepayment amount substantially represents the contractual par amount, plus accrued, but unpaid, contractual interest (which may include fair compensation for early termination) and the fair value of the prepayment feature is insignificant in the initial recognition.
Impairment of Financial Assets
The Company assesses the impairment of financial assets with an Expected Credit Losses model (ECL). This model requires the application of considerable judgment regarding how changes in economic factors impact on ECL, which is determined on a weighted average basis.
The impairment model applies to the following financial assets that are not measured at FVPL.
| · | Debt instruments; |
| · | Lease payments receivable; |
| · | Other accounts receivable; |
| · | Loan portfolio; |
| · | Financial guarantee contracts issued; and |
| · | Loans commitments issued. |
The Company recognizes a provision for impairment of financial assets at AC and FVOCI in an amount equal to the expected impairment losses in a period of twelve months after the end date of financial statements or during the remaining life of the loan. Expected losses during the remaining life of the loan are the losses expected from all possible impairment events during the expected life of the financial instrument, while expected losses in a twelve-month period are the portion of expected losses arising from impairment events resulting from impairment events that are possible during the twelve months following on the date of the report.
Reserves for losses are recognized in an amount equal to the ECL during the life of the asset, except in the following cases, in which the amount recognized is equal to ECL for the 12 months following the measurement date:
| · | Investments in debt instruments determined to represent low credit risk to the reporting date; and, |
| · | Other financial assets (other than short term accounts receivable) on which the credit risk has not increased significantly since initial recognition. |
Impairment requirements are complex and require estimated judgments and significant assumptions by management, particularly in the following areas:
| · | Assess whether the credit risk has increased significantly from initial recognition; and, |
| · | Incorporate prospective information in the measurement of expected impairment losses. |
Measuring ECL
Expected credit loss (ECL) is the estimated weighted probability of credit losses measured as follows:
| · | Financial assets with no credit impairment to the reporting date: the present value of all contractual cash payments in arrears (for example: the difference between Bank cash flow debt in accordance with the contract and cash flows that the Company expects to receive); |
| · | Impaired financial assets to the reporting date: the difference between the gross book value and the present value of estimated future cash flows; |
| · | Outstanding loan commitments: the present value of the difference between contractual cash flows owed to the Company in the event it enforces the commitment and cash flows that the Company expects to receive; and |
| · | Financially secured contracts: expected payments to reimburse the holder minus any amount the Company expects to recover. |
Definition of impairment
The Company considers a financial asset to be impaired when:
F-13
| (3) | Summary of Significant Accounting Policies, continued |
| · | It is highly unlikely that the debtor will fully pay its credit obligations to the Company, without recourse for the Company to take such actions as enforcing the guarantees (if any); or |
| · | The debtor is more than 90-days past-due on any material credit obligation. Overdrafts are considered in arrears once the client has exceeded the established limit, or the established limit is less than the outstanding balance. |
| · | For fixed income financial instruments, the following concepts, among others, are included: |
| - | Downgrade on the issuer’s credit risk rating; |
| - | Contractual payments are not made on the due date or in the term period stipulated; |
| - | There is a virtual certainty of default; |
| - | Issuer is likely to go bankrupt or a bankruptcy petition is filed or similar action; |
| - | The financial asset stops trading in an active market given its financial difficulties; |
To assess whether a debtor is impaired, the Company considers indicators such as:
| · | Qualitative, e.g. noncompliance with contractual clauses; |
| · | Quantitative, e.g. arrears or non-payment of another obligation from the same issuer to the Company; and, |
| · | Based on data developed internally and obtained from external sources. |
Inputs used in the assessment of whether financial instruments are in impairment and their importance may vary over time to reflect changes in circumstances.
Significant increase in credit risk
When determining whether the credit risk of a financial assets has increased significantly since initial recognition, the Company considers relevant fair, sustainable information available at no cost or disproportionate effort, including information and quantitative and qualitative analyses based on historical experience and expert assessment of Company credit risk, including information with future projection.
The Company identifies if a significant increase in the credit risk has occurred for each exposure by comparing:
| · | The probability of default (PD) during the remaining life of financial instrument at the closing date, with |
| · | The PD during the remaining life at a point in time, which was estimated at initial recognition of exposure. |
The assessment of whether the credit risk has increased significantly from initial recognition of a financial asset requires identification of the initial recognition date of the instrument. For purposes of revolving credit (credit cards, overdrafts, among others), the date when the credit was first delivered may be a long time ago. Changes in the contractual terms of a financial asset may also impact this assessment, as discussed below.
Grading by credit risk categories
The Company assigns a credit risk grade to each exposure based on a variety of data that is determined to predict the PD and applying the judgment of a credit expert, the Company use these grades to identify significant increases in credit risk. Credit risk grading is defined using qualitative and quantitative factors indicative of the risk of losses. These factors varies depending on the type of exposure and the type of borrower.
Credit risk grading is defined and calibrated so that the risk of losses increases exponentially as the credit risk is impaired and so that, for example, the difference in the risk of losses between grade satisfactory and special mention is less than the difference between the credit risk between grades special mention and sub-standard.
Each exposure is given a credit risk grade upon initial recognition based on information available on the debtor. Exposures are subject to continuous monitoring, that may result in displacement of an exposure to a different credit risk grade.
F-14
| 3) | Summary of Significant Accounting Policies, continued |
Generating the Structure of the PD term
Credit risk grading are the main input to determine the structure of the PD term for the different exposures. The Company obtains performance and loss information on the credit risk exposures analyzed by jurisdiction or region, type of product and debtor, as well as by credit risk grade.
The Company uses statistical models to analyze the data compiled and generate estimates of the probability of impairment during the remaining life of the exposures and how these probabilities of impairment change over time.
These analyses include identification and calibration of relationships between changes in impairment rates and key macroeconomic factors, as well as in-depth analysis of certain impairment risk factors (for example, loans portfolio charge-offs). For the majority of loans, key economic factors includes growth in gross domestic product, changes in interest rates on the market and unemployment.
The approach used by the Company to prepare prospective economic information within its assessment is indicated below.
Determine if the credit risk has increased significantly
The Company has established a general framework that incorporates quantitative information and qualitative to determine if the credit risk of a financial asset has significantly increased since its initial recognition.
The initial framework is aligned with the internal process of the Company for credit risk management.
The criteria to determine whether the credit risk has increased significantly varies by portfolio and includes limits based on noncompliance.
The Company evaluates whether the credit risk of a particular exposure has increased significantly since initial recognition if, based on Bank qualitative modeling, the expected probability of impairment during the remaining life will increase significantly from initial recognition. In determining the credit risk increase, the expected impairment losses in the remaining life is adjusted by changes in expiration.
Under certain circumstances, using the judgment of credit experts, and based on relevant historical information, the Company determines that an exposure has had a significant increase in credit risk, if particular qualitative factors indicate this and those factors may not be completely captured by periodic quantitative analyses. As a limit, the Company assumes that a significant credit risk occurs no later than when the asset is in arrears for more than 30 days.
The Company monitors the effectiveness of the criteria used to identify significant increases in credit risk based on regular reviews to confirm that:
| · | The criteria can identify significant increases in credit risk before an exposure becomes impaired; |
| · | The criteria are inconsistent with the time when the asset is more than 30 days past the due date; |
Modified financial assets
The contractual terms of the loans may be modified for a number of reasons, including changes in market conditions, client retention and other factors unrelated to an actual or potential impairment of the client’s loan.
When the terms of a financial asset are modified and the modification does not result in the removal of the asset from the condensed consolidated statement of financial position, the determination of whether the credit risk has significantly increased reflects comparisons of:
| · | The PD during the remaining life on the date of the balance sheet based on the terms modified with; |
| · | The PD on the estimated remaining life based on the date of initial recognition and the original contractual terms. |
The Company renegotiates loans to customers in financial difficulties to maximize the opportunities to collect and to minimize the risk of noncompliance. Under the Company’s renegotiation policies, customers in financial difficulties are given concessions that generally involve a reduction in interest rate, extension of the payment term, reductions in the balances due or a combination of these.
F-15
| (3) | Summary of Significant Accounting Policies, continued |
For financial assets modified as part of the Company’s renegotiation policies, the estimation of the PD reflects whether the modifications have improved or restored the ability of the Company to collect principal and interest and the prior experience of the Company in similar actions. As part of the process, the Company evaluates the debtor’s payment compliance as compared to the modified terms of the debt and considers several performance indicators for the group of debtors modified.
Generally, restructuring indicators are a relevant factor on increased credit risk. Therefore, a restructured debtor must demonstrate a consistent payment behavior over a period of time before no longer being considered as an impaired loan or that the PI has decreased in such a way that the provision may be reversed and the loan measured for impairment over a term of twelve months after the closing date of the report.
Inputs in Measuring ECL
Key inputs in measuring ECL are usually the structure of terms of the following variables:
| · | Probability of default (PD). |
| · | Losses given default (LGD). |
| · | Exposure at default (EAD). |
The foregoing parameters are derived from internal statistical models and other historical information. These models are adjusted to reflect prospective information as described below.
PDs are estimated on certain cut-off dates. They are calculated using survival models, based on historical default vectors. If a counterparty or exposure migrates between the different ratings then this will cause a change in the estimated PD for that group. The PDs are estimated considering the contractual expiration terms of the exposures and the estimated prepayment rates.
The historical PD is then transformed to a prospective PD, using macroeconomic sensitivity models.
LGD is the magnitude of probable losses in the event of noncompliance. The Company estimates the parameters of the LGD based on historical loss recovery rates against the noncomplying parties. LGD models consider the structure, collateral and the recovery costs of any collateral when there are mortgage guarantees.
For unsecured loans, a cash to value recovery model is used. For loans secured by real property, indices relating to the value of the security as compared to the loan (Loan to value, “LTV”), are parameters used in the determination of the LGD. LGD estimates are calibrated at different economic scenarios and for loans secured by real estate, variations in price indices for these assets. These loans are calculated on the bases of discounted cash flow using the effective interest rate of the loan.
EAD represents expected exposure in the event of noncompliance. The Company derives the EAD from the current exposure of the counterpart and potential changes in the current amount permitted under the terms of the contract, including amortization and prepayments for decreasing and revolving exposures with no commitment to disburse. For loan commitments and financial security, the EAD considers the amount removed, as well as potential future amounts that may be removed or collected under the contract, which are estimated based on historical issues. Finally, for credit cards, due to its relative nature, the Company determines the EAD by modeling a percentage of historical utilization over approved credit limit.
The Company measures the EAD considering the risk of noncompliance during the maximum contractual period (including options to extend the customer’s debt) on which there is an exposure to credit risk, even if, for purposes of risk management, the Company considers a longer period of time. The maximum contractual period is extended to the date on which the Company has the right to require payment of a loan or terminate a loan commitment or security given.
For credit card balances the Company measures EADs over a longer period than the maximum contractual period, if the contractual ability of the Company to demand payments and pay off the commitment no withdraw does not limit the Company’s exposure to credit losses for the contractual period of the contract. These facilities do not have a fixed term or a collection structure and are managed on a collective basis. The Company may cancel them immediately, but this contractual right is forced in the normal management of the Company’s day to day management, rather only when the Company finds that there has been increased credit risk for each loan. This longer period will be estimated taking into account the actions for the management of credit risk that the Company expects to take and that mitigate the EAD.
F-16
| (3) | Summary of Significant Accounting Policies, continued |
These measures include a reduction in limits and cancellation of loan contracts.
Where parameter modeling is performed on a collective basis, the financial instruments are pooled on the basis of shared risk characteristics that include:
| · | Type of instrument. |
| · | Credit risk rating. |
| · | Guarantees. |
| · | Date of initial recognition. |
| · | Remaining expiration term. |
| · | Geographical location of the debtor. |
The above pooling is subject to regular review to ensure that the exposure of a particular Group remains uniform.
Projection of future conditions
Semi-annually, macroeconomic scenarios forecast for twelve months are approved for the six countries where the Company operates, and they are divided into three categories: upside, central and downside. These scenarios are prepared based on the Company's macroeconomic simulation model and are complemented by (i) projections from supranational organizations such as the International Monetary Fund, the World Bank, ECLAC, etc. (ii) the macroeconomic program of the Central American central banks and (iii) economists outside the Company.
| · | Central scenario: According to current expectations. In the current situation, it contemplates stability in the nominal macroeconomic variables, exchange rate, interest rates, and inflation. Forecasts from other organizations that carry out economic research are used as a reference, for example, the International Monetary Fund, the World Bank and the central banks of each country. External references bring fairness to the exercise. |
| · | Upside and downside scenarios: These are the probable macroeconomic scenarios before the realization of some of the main risks associated with each country. They are categorized as upside and downside risks, furthermore, divided between internal and external risks. |
| · | External Risks: The Central American countries, being small and open economies, are exposed to the economic performance of the large economies and main trading partners, mainly the United States and Europe. The economic activity of these countries affects the Central American countries in a generalized way, mainly through income from remittances, exports, tourism, and foreign direct investment. |
| · | Internal Risks: These are risks specific to each country. They include risks associated with the internal social, political, and economic situation. In the current situation, the risks associated with the performance of governments predominate public finance management, natural disasters, health policies, etc. |
The external information includes economic data and publication of projections by government committees, monetary authorities (mainly in the countries where the Company operates), supranational organizations (such as the Organization for Economic Cooperation and Development, the International Monetary Fund and others), academic projections, private sector, and credit risk rating agencies.
The base case represents the most probable. Other scenarios represent a more optimistic or pessimistic outcome. In addition, the Company uses periodic stress testing to calibrate the determination of these other representative scenarios.
Financial liabilities
Financial liabilities are measured at amortized cost using the effective interest method, except when there are financial liabilities measured at FVPL.
Recognition, disposal and measurement
The Company regularly recognizes the purchase or sale of financial instruments on the date of each negotiation, which is the date on which the Company commits to buy or sell a financial instrument. Financial assets and liabilities are initially recognized at fair value.
F-17
| (3) | Summary of Significant Accounting Policies, continued |
Transaction costs are attributed to expenses in the condensed consolidated statement of income when incurred for financial assets and liabilities at fair value with changes in the condensed consolidated statement of income, and they are recorded as part of the initial value of the instrument for assets and liabilities at amortized cost and available for sale securities. Transaction costs are incremental costs incurred to acquire assets or sell financial liabilities. These include fees, commissions and other concepts paid to agents, brokers, advisors and intermediaries, rates established by regulatory agencies and stock markets, as well as taxes and other rights.
Financial assets are derecognized from the condensed consolidated statement of financial position when the payments derived from it were received, the rights to receive cash flows from the investments has expired or have been transferred and the Company has transferred substantially all of the risks and benefits derived from their ownership.
Offsetting of financial instruments
Financial assets and financial liabilities are offset and the net amount is reported in the condensed consolidated statement of financial position if there is a currently enforceable legal right to offset the recognized amounts and there is an intention to settle on a net basis, or to realize the assets and settle the liabilities simultaneously.
Presentation of provision for PCE in the condensed consolidated statement of position financial
The provision for PCE is presented in the condensed consolidated statement of financial position of the following way:
| · | Financial assets measured at amortized cost: as a deduction from gross value in the books of assets; |
| · | Loan commitments and financial guarantee contracts: generally, as a provision; and |
| · | Debt instruments measured at VRCOUI: no provision is recognized for losses in the condensed consolidated statement of financial position because the value. The carrying amount of these assets is their fair value. However, the provision for losses is disclosed and recognized in other comprehensive income. |
| (d) | Loans |
Loans and advances were initially measured at fair value plus incremental direct transaction costs, and subsequently measured at their amortized cost using the effective interest method. Unearned interest and commissions are recognized as income during the life of the loan using the effective interest method.
| (e) | Assets held for sale |
Assets acquired or awarded in the settlement of a loan are held for sale, and are initially recognized at the lower of the balance of the loan and fair value less selling costs as of the award date, establishing a new cost basis. After the award, management conducts periodic assessments and assets are recognized at the lower of carrying value or fair value less costs to sell. Operating revenues and expenses originated and changes in the provision for the valuation of those assets are included in other operating expenses. Costs related to the maintenance of these properties are included as expenses when incurred.
| (f) | Recognition of the most significant income and expenses |
Interest income and expenses
Interest income and expenses are recognized in the condensed consolidated statement of income using the effective interest method. The effective interest rate is the discount rate that equals exactly the estimated cash flows receivable or payable throughout the expected life of the financial instrument or when appropriate (in a shorter period) with the net carrying value of the financial asset or liability. To calculate the effective interest rate, the Company will estimate cash flows considering all of the contractual conditions of the financial instrument, but not considering future credit losses.
The calculation of the effective interest rate includes all commissions and points paid or received that are part of the effective interest rate. Transaction costs include incremental costs that are directly attributable to the acquisition or issue of a financial asset or liability.
Fees and commissions
Fees and commissions that are part of the effective interest rate in a financial asset or liability instrument are included in the measurement of the effective interest rate.
Other revenues from fees and commissions, including services fees, asset management, sales commissions, loan syndication, among others, are recognized when the corresponding services are provided.
F-18
| (3) | Summary of Significant Accounting Policies, continued |
Annual credit card memberships, net of direct card-origination incremental costs, are deferred and amortized by applying the straight-line method during a term of one year. Commissions charged to affiliated commercial establishments are determined based on the amount and type of purchase by the cardholder and are recognized when invoiced.
Other fees and commissions received mainly relating to fees for transactions and services are recognized as income when they are received.
Loyalty programs
The Company offers loyalty programs that allow cardholders to earn points that can be redeemed for a variety of awards, including cash, trips and products at a discount. The points are recognized as a separately identifiable component of the initial transaction of credit card consumption income.
The estimated fair value of loyalty programs and those points redeemed are recognized in the commissions account in the condensed consolidated statement of income. The Company recognizes the points based on the earned points expected to be redeemed and the fair value of the point to be redeemed. The points to be redeemed are estimated based on the history of redemption, card product type, account transaction activity and past performance of the cards.
| (g) | Cash and cash equivalents |
The Company considers all highly liquid time deposits with maturities of 90 days or less as cash equivalents. Cash and cash equivalents consist of cash, demand deposits at banks, certain securities and deposits that generate interests, with original maturities of 90 days or less.
| (h) | Property, furniture, equipment and improvements and depreciation method used |
Property, furniture, equipment and improvements are presented at cost, less accumulated depreciation and amortization.
The cost of renewals and improvements is capitalized when they increase the asset's useful life; while repairs and maintenance that do not extend the useful life or improve the asset are charged to profit or loss during the period in which they are incurred.
Depreciation is calculated on a straight-line basis over the estimated useful lives of the assets. The Company depreciates amounts with a charge to the period's profit or loss with a credit to the accumulated depreciation account. Land is not depreciated. The estimated useful lives of assets are:
| Category | Years/Base |
Buildings | 20 - 50 |
| Furniture and equipment | 5 - 10 |
| Vehicles | 5 |
| Computers | 3 - 5 |
| Leasehold improvements | 3 - 10 |
Leasehold improvements are amortized during the lower of the estimated useful life or the term of the lease contract.
Property and equipment are reviewed for impairment whenever events or changes in circumstances indicate that the carrying amount may not be recoverable. The carrying amount of an asset is immediate reduced to its recoverable value if the carrying amount of the asset is greater than the estimated recoverable value. The recoverable amount is the highest between the fair value of the asset less the cost of selling and its value in use.
| (i) | Leases |
At inception of a contract, the Company assesses whether a contract is, or contains, a lease. A contract is, or contains, a lease if the contract conveys the right to control the use of an identified asset for a period of time in exchange for consideration. To assess whether a contract conveys the right to control the use of an identified asset, the Company assesses whether:
| · | the contract involves the use of an identified asset – this may be specified explicitly or implicitly and should be physically distinct or represent substantially all of the capacity of a physically distinct asset. If the supplier has a substantive substitution right, then the asset is not identified; |
F-19
| (3) | Summary of Significant Accounting Policies, continued |
| · | The Company has the right to obtain substantially all of the economic benefits from use of the asset throughout the period of use; and |
| · | The Company has the right to direct the use of the asset. The Company has this right when it has the decision-making rights that are most relevant to changing how and for what purpose the asset is used. In rare cases where the decision about how and for what purpose the asset is used is predetermined, the Company has the right to direct the use of the asset if either: |
| · | The Company has the right to operate the asset; or |
| · | The Company designed the asset in a way that predetermines how and for what purpose it will be used. |
This policy is applied to contracts entered into, or changed, on or after January 1, 2019.
At inception or on reassessment of a contract that contains a lease component, the Company allocates the consideration in the contract to each lease component on the basis of their relative stand-alone prices. However, for the leases of land and buildings in which it is a lessee, the Company has elected not to separate non-lease components and account for the lease and non-lease components as a single lease component.
| i. | As a lessee |
The Company recognizes a right-of-use asset and a lease liability at the lease commencement date. The right-of-use asset is initially measured at cost, which comprises the initial amount of the lease liability adjusted for any lease payments made at or before the commencement date, plus any initial direct costs incurred and an estimate of costs to dismantle and remove the underlying asset or to restore the underlying asset or the site on which it is located, less any lease incentives received.
The right-of-use asset is subsequently depreciated using the straight-line method from the commencement date to the earlier of the end of the useful life of the right-of-use asset or the end of the lease term. The estimated useful lives of right-of-use assets are determined on the same basis as those of property and equipment. In addition, the right-of-use asset is periodically reduced by impairment losses, if any, and adjusted for certain remeasurements of the lease liability.
The lease liability is initially measured at the present value of the lease payments that are not paid at the commencement date, discounted using the interest rate implicit in the lease or, if that rate cannot be readily determined, the Company’s incremental borrowing rate. The Company uses its incremental borrowing rate as the discount rate.
Lease payments included in the measurement of the lease liability comprise the following:
| · | fixed payments, including in-substance fixed payments; |
| · | variable lease payments that depend on an index or a rate, initially measured using the index or rate as at the commencement date; |
| · | amounts expected to be payable under a residual value guarantee; and |
| · | the exercise price under a purchase option that the Company is reasonably certain to exercise, lease payments in an optional renewal period if the Company is reasonably certain to exercise an extension option, and penalties for early termination of a lease unless the Company is reasonably certain not to terminate early. |
The lease liability is measured at amortized cost using the effective interest method. It is remeasured when there is a change in future lease payments arising from a change in an index or rate, if there is a change in the Company’s estimate of the amount expected to be payable under a residual value guarantee, or if the Company changes its assessment of whether it will exercise a purchase, extension or termination option.
When the lease liability is remeasured in this way, a corresponding adjustment is made to the carrying amount of the right-of-use asset or is recorded in profit or loss if the carrying amount of the right-of-use asset has been reduced to zero.
The Company presents right-of-use assets that do not meet the definition of investment property in “property, furniture, equipment and improvements” and lease liabilities in “lease liabilities” in the condensed consolidated statement of financial position.
F-20
| (3) | Summary of Significant Accounting Policies, continued |
Short-term leases and leases of low-value assets
The Company has elected not to recognize right-of-use assets and lease liabilities for short-term leases of machinery that have a lease term of 12 months or less and leases of low-value assets, including IT equipment. The Company recognizes the lease payments associated with these leases as an expense on a straight-line basis over the lease term.
| ii. | As a lessor |
When the Company acts as a lessor, it determines at lease inception whether each lease is a finance lease or an operating lease.
To classify each lease, the Company makes an overall assessment of whether the lease transfers substantially all of the risks and rewards incidental to ownership of the underlying asset. If this is the case, then the lease is a finance lease; if not, then it is an operating lease. As part of this assessment, the Company considers certain indicators such as whether the lease is for the major part of the economic life of the asset.
If an arrangement contains lease and non-lease components, the Company applies IFRS 15 to allocate the consideration in the contract.
The Company recognizes lease payments received under operating leases as income on a straight-line basis over the lease term as part of “other income”.
| (j) | Business combinations and goodwill |
The Company accounts for business combinations using the acquisition method when control is transferred. The consideration transferred in the acquisition is generally measured at fair value as are the identifiable net assets acquired. Any goodwill is subject to annual impairment tests. Any gain from purchase under very advantageous conditions is immediately recognized in profit or loss. Transaction costs are recorded as an expense when incurred, except if they are related to the issuance of debt or equity instruments.
Any contingent consideration is measured at fair value at the acquisition date. If an obligation to pay the contingent consideration that meets the definition of financial instruments is classified as equity, it should not be measured again, and its subsequent settlement should be accounted for within equity. If not, the other contingent consideration is remeasured at fair value on each reporting date and subsequent changes in the fair value of the contingent consideration are recognized in profit or loss.
Non-controlling interests are recorded for the proportional part of fair value of the identifiable assets and liabilities, unless stated otherwise. When the Company has the corresponding option to settle the purchase of a non-controlling interest through the issue of its own ordinary shares, no financial liability is recorded.
During the measurement period (which is a term of one year from the date of the acquisition), the Company can, retrospectively, adjust the amounts recognized on the date of acquisition to reflect new information obtained on events and circumstances that existed at that date.
For impairment tests purposes, goodwill acquired in a business combination is, on the acquisition date, assigned to each of the cash-generating unit groups (CGUs) expected to benefit from the combination. The CGUs to which goodwill is assigned will be disaggregated so impairment-testing level reflects the lowest level to which the goodwill is controlled for purposes of internal management.
An impairment loss will be recognized if the carrying amount of the CGU plus the goodwill allocated to it is higher than its recoverable amount, in which case the allocated goodwill will be reduced, and any remaining impairment would be applied to other CGUs’ assets.
| (k) | Intangible assets |
Intangible assets represent identifiable non-monetary assets and are acquired separately or through a business combination or are generated internally. The Company's intangible assets are recognized at cost or at fair value and mainly comprised of relations with the depositors, relations with credit card clients, relations with affiliated businesses, technological programs and trade names.
Cash-generating units to which goodwill has been attributed are periodically assessed for impairment. This assessment is carried out at least annually, or whenever there is evidence of impairment.
The amortization expense of intangible assets is presented in the condensed consolidated statement of income as depreciation and amortization expenses.
Trade names are non-amortizable intangible assets.
F-21
| (3) | Summary of Significant Accounting Policies, continued |
| (l) | Income tax |
Tax expense for the year includes current and deferred taxes. Taxes are recognized in profit or loss, except to the extent that they refer to items recognized directly in equity.
The current tax expense is calculated based on the laws enacted on the balance sheet date in the countries where the parent company and its subsidiaries operate, and where they generate positive taxable bases. The Company’s management periodically assesses the positions assumed in tax returns regarding situations in which applicable tax regulation is subject to interpretation, and when necessary, recognizes provisions for the amounts expected to be paid to the tax authorities.
Deferred taxes are recognized for the temporary differences that arise between the tax bases of assets and liabilities and their carrying amounts in the condensed consolidated interim financial statements. However, deferred tax liabilities are not recorded if they arise from the initial recognition of goodwill; deferred taxes are not recognized if they arise from an asset or liability in a transaction, other than a business combination, that at the time of the transaction does not affect the accounting results nor taxable income or loss. Deferred tax is determined using tax rates (and laws) enacted on the balance sheet date and expected to be applicable when the corresponding deferred tax asset is realized, or the liability is settled.
Deferred tax assets are recognized only to the extend that it is probable that future tax benefits will be available with which to offset the temporary differences.
Deferred taxes are recognized over temporary differences that arise from investments in subsidiaries and associates, except for those deferred tax liabilities for which the Company can control the date on which the temporary differences will be reversed, and it is likely that they will not be reversed in the near future. Deferred tax assets are recognized in deductible temporary differences that arise from investments in subsidiaries only to the extent that it is likely that the temporary differences will be reversed in the future, and there is a sufficient future taxable income against which the temporary differences can be used.
Deferred tax assets and deferred tax liabilities are set off only if there is a legally recognized right to offset the current tax assets with the current tax liabilities and when the deferred tax assets and deferred tax liabilities are derived from income tax corresponding to the same tax authority, and the authority allows the Company to pay or received a single amount that settle the existing net balance.
| (m) | Employee benefits |
The Company is subject to the labor laws in each country where it operates. The Company provisioned an employment benefit when such benefit is related to employee services already rendered, the employee has earned the right to receive the benefit, the benefit payment is probable, and the amount of such benefit can be estimated.
| (n) | Trust Contracts and Securities Management |
The assets under trust contracts and securities under custody are not considered part of the Company, and accordingly, such securities and related revenue are not included in these condensed consolidated interim financial statements. It is the obligation of the Company to manage and safeguard the assets under contract and independently of their equity.
The Company charges a fee for the management of trust contracts and custody of securities, which is paid according to agreements between the parties. These fees are recognized as income according to the terms of the contracts either monthly, quarterly or annually on an accrual base.
| (o) | Fair value estimates |
The fair value of a financial asset or liability is the price that would be received to sell an asset or paid to transfer a liability in an orderly transaction between market participants at the measurement date (exit price).
The different hierarchy levels have been defined as follows:
| · | Level 1 - Quoted prices in active markets without adjustments for identical assets or liabilities that the Company can access at the measurement date. |
| · | Level 2 - Inputs other than quoted prices included in Level 1 that are observable, either directly (i.e. as prices) or indirectly (i.e. derived from prices). This category includes instruments valued using quoted prices in active markets for similar instruments, quoted prices for identical or similar instruments in markets that are not active and other valuation techniques where significant data inputs are directly or indirectly observable in the market. |
F-22
(3) Summary of Significant Accounting Policies, continued
| · | Level 3 - Unobservable inputs for the asset or liability. This category includes all instruments where the valuation technique includes unobservable inputs and these have a significant effect on the fair value measurement. This category also includes instruments that are valued based on quoted prices for similar instruments for which we must make significant adjustments using unobservable inputs, assumptions or adjustments in which no observable or subjective data are used when there are differences between the instruments. |
A market is considered active if quoted prices are readily and regularly available from an exchange, financial intermediaries, a sector institution, pricing service or regulatory agency, and those prices reflect actual market transactions with sufficient frequency and volume to provide pricing market information.
| (p) | Transactions between entities under common control |
Transfers of assets between entities under common control, including transactions with intermediate holding companies, are initially recorded at book value of the Company transferring the assets at the date of transfer. If the carrying amount of the assets and liabilities transferred differs from historical cost of the Parent Company of entities under common control, then the Company receiving the assets and liabilities will recognize them at the historical cost of the Parent Company.
The Company enters into transactions with related parties, which according to the internal policies of the Company are carried out at market conditions.
| (q) | New International Financial Reporting Standards (“IFRSs”) not yet adopted. |
A number of new standards and amendments to standards are effective for annual periods beginning January 1, 2021 and early application is permitted; however, the Company has not early adopted the new and modified standards when preparing the condensed consolidated interim financial statements as of September 30, 2021.
These new rules and amended standards are not expected to have a significant impact on the Company's condensed consolidated interim financial statements:
| (r) | Reform of benchmark interest rates |
Any of these developments, and any future initiatives to regulate, reform or change the management of the benchmark, could have adverse consequences for the performance, value and the market of loans, mortgages, securities, derivatives, and other financial instruments whose returns are linked to any benchmark, including those issued, financed or maintained by us or our financial subsidiaries.
Various regulators, industry authorities, and other market participants in the United States and other countries are involved in initiatives to develop, introduce, and encourage the use of alternative rates to replace certain benchmarks. There is no guarantee that these new rates will be accepted or widely used by market participants, or that the characteristics of any of these new rates will be similar or will produce the economic equivalent of the benchmark rates they trying to replace.
The London Interbank Rate (LIBOR) is the most widely referenced interest rate worldwide for derivatives, bonds, loans, and other floating rate instruments; On July 27, 2017, the Executive Director of the Authority UK Financial Conduct Board (the "FCA"), which regulates "LIBOR", announced that the FCA will no longer require banks to submit rates for the calculation of the LIBOR benchmark after 2021. This announcement indicates that the continuation LIBOR on the current basis cannot be guaranteed after this date. Therefore, after 2021 LIBOR may be discontinued. There is a regulator-led push to transition the market from LIBOR and some other benchmark rates to risk-free alternative rates, which are based on overnight transactions. Derivatives, floating rate notes, loans and other financial contracts whose terms extend beyond the relevant discontinuation date and which refer to certain benchmark rates (including LIBOR) as the benchmark rate will be affected. As a result, agencies are moving toward new benchmark rates.
Many unsolved problems remain, such as the timing of the introduction of the new benchmark indices and the transition from a benchmark index to a replacement rate, which could lead to a generalized dislocation in financial markets, generate volatility in the prices of securities, derivatives and other instruments, and repress the activities of the capital markets.
As of September 30, 2021, the Company used the Libor rate as a reference in most of its financial instruments, as well as derivatives with these characteristics. While some of these outstanding LIBOR-based loans and contracts include alternative benchmark rate support provisions, most of our existing LIBOR-based contracts and products do not include adequate support provisions or support mechanisms and will require modifications to their terms.
F-23
| (3) | Summary of Significant Accounting Policies, continued |
Additionally, most of our loans, and outstanding LIBOR-based contracts can be difficult to modify due to the requirement that all affected parties’ consent to the respective modifications. It is currently not possible to determine to what extent these changes will affect us.
Our transition activities are currently under development and by 2021 are focused on converting existing LIBOR-based contracts to other alternative rates through:
| a. | identification of asset and liability operations indexed to the Libor rate in each of our Subsidiaries |
| b. | development of new alternative products linked to a reference rate |
| c. | negotiations with clients and counterparties |
| d. | contract modifications |
| e. | adjustments in information systems |
| f. | modifications of procedures and policies |
| g. | modifications in valuation models |
| h. | the timeline of our work plan depends on a wider acceptance in the market of products that refer to the new alternative reference rates and, on the readiness, and capacity of our clients to adopt the replacement products. We are following the recommended dates for the termination of LIBOR. |
| (s) | Discontinued operations |
A discontinued operation is a component of the Company that has been sold or has been disposed of in another way, or has been classified as held for sale, and, (i) represents a business line or geographic area of &NegativeTh&NegativeThoperation that is significant and that can be considered separate from the rest, or (ii) is part of a single coordinated plan to sell or otherwise dispose of a business line or a geographic area of the transaction that is significant and can be considered separate from the rest.
The classification as a discontinued operation occurs upon disposition of the operation or when it meets the criteria to be classified as held for sale, to happen earlier.
When an operation is classified as discontinued, the comparative consolidated statements of income and comprehensive income are modified as if the operation it would have been discontinued from the beginning of the comparative year.
In accordance with IFRS 5, the presentation of net cash flows attributable to the operations, investment and financing activities of discontinued operations have been presented on a separate line in the condensed consolidated statement of cash flow.
| (4) | Business Combinations |
On May 22, 2020, the Company acquired Multi Financial Group Inc. (MFG), composed mainly of 100% of the issued and outstanding shares of Multibank Inc. and subsidiaries. MFG provides a wide variety of financial services primarily corporate, investment, mortgage and consumer banking, as well as insurance, securities brokerage, factoring, leasing and real estate services. The purchase price was $433.8 million paid in cash on May 22, 2020, thus acquiring 96.6% of the ordinary and outstanding shares, with the option to acquire the remaining 3.4% of the outstanding shares in the short term. During the month of September, the Company received an amount of $1.6 million as an adjustment to the price for reimbursement of items that should not have been included in the transaction. The final adjusted purchase price is $432.2 million. As of December 31, 2020, the non-controlling interest is 0.43%.
The company spin-off the investment from this transaction on September 29, 2021. More detail is included in Note 25. The consolidated financial statements as of December 31, 2020 include the impact of this subsidiary. Below are the details of the business combination as of that date.
The goodwill has been allocated to MFG as a single operating segment. The recognized goodwill is not deductible for tax purposes.
F-24
| (4) | Business Combinations, continued |
The following table summarizes the consideration paid in cash for the acquisition of MFG and the amounts of the assets acquired, and the liabilities assumed, at book value and at fair value, at the acquisition date:
| Fair value | ||
| Fair value of the consideration paid in cash | 432,210,992 | |
| Assets | ||
| Cash and cash equivalents | 74,398,087 | |
| Term deposits | 135,093,910 | |
| Investments | 982,737,646 | |
| Loans | 3,265,534,602 | |
| Property and equipment | 103,860,951 | |
| Acceptances outstanding | 136,254,985 | |
| Intangible assets | 47,407,001 | |
| Other assets | 152,853,264 | |
| Total Assets acquired | 4,898,140,446 | |
| Liabilities | ||
| Deposits | 2,893,749,418 | |
| Financial obligations | 641,817,717 | |
| Other financial obligations | 605,097,557 | |
| Acceptances outstanding | 136,254,985 | |
| Other liabilities | 100,156,618 | |
| Total liabilities assumed | 4,377,076,295 | |
| Non-controlling interest | 125,282,341 | |
| Net Assets acquired | 395,781,810 | |
| Goodwill | 36,429,182 | |
| 432,210,992 |
The Company completed the evaluation and allocation of the purchase price based on the acquisition accounting method. The Company identified that the intangible assets correspond mainly to Relationship with Depositors, Relationship with Clients, and Trademarks and Trade Names.
Fair value of assets acquired and liabilities assumed on the date of purchase:
The fair value of the assets acquired and the liabilities assumed is based on the information available as of May 31, 2020. The Company considers that this information provides an adequate basis for determining fair values. Taking into consideration the existence of a certain degree of uncertainty in the main assumptions used in the valuation methods, they represent the best estimate of the Company at the date of analysis.
The methods used to determine the fair value of the assets acquired and the significant liabilities assumed are described below:
Non-controlling interest
In accordance with IFRS3 “Business Combinations”, a transaction in which the Company obtains control of a business, it is accounted for in the consolidated financial statements under the acquisition method. Following this method, the acquisition price is distributed among the identifiable net assets acquired, including any intangible assets and assumed liabilities, including contingent liabilities, based on their respective fair values, with some exceptions such as deferred tax that is measured at book value. The Company acquired 96.6% of the ordinary shares of MFG, leaving a non-controlling interest, which has been recorded at fair value. The non-controlling interest was calculated under the proportional interest method in the recognized amounts of the identifiable net assets of the acquired entity in accordance with the price paid.
Cash and cash equivalents
Cash and cash equivalents include cash and bank deposits, and interest-bearing deposits. Cash and cash equivalents have a maturity of 90 days or less at the time of purchase. For financial instruments that are short-term or that have frequent pricing and that have little or no risk, they are considered to have a fair value that approximates the book value.
Investments in securities
The securities are predominantly valued at quoted market prices. In case, if a market price is not available, the fair value is estimated using the market price of a similar instrument. In cases where the significant assumptions of the valuation are not directly observable in the market, the instruments are valued using the best information available to estimate the fair value. This information could be developed internally and considers the premiums that a market participant would require.
Loans
As a result of the MFG acquisition, the Company acquired loans (including loans acquired with impairment), which maintain an outstanding principal of $3,326,897,729 and a fair value of $3,265,534,602. According to the analysis carried out, the Company estimated a possibility of non-collection for an amount of $61,122,447, on the estimated total flows.
F-25
| (4) | Business Combinations, continued |
The methods used to estimate fair value are extremely sensitive to the assumptions and estimates used. Although the Company intends to use the assumptions and estimates that best reflect the acquired loan portfolios and current market conditions, a greater degree of subjectivity is inherent in these values than those determined in active markets.
This fair value is based on significant elements or factors that are not observable in the market and represent the Company's best estimate as of May 31, 2020.
Intangible assets
For the valuation study, the Company hired an expert firm in valuations of this type of assets. As of the acquisition date, the amount of the identified intangibles is $31.4 million. The methodology used to value the identified intangible assets is the following:
Relationship with depositors
Clients’ Depository Relationship ("CDI") is a measure of the value of demand, savings and money market depositsthat are acquired in business combinations. The fair value of the CDI is estimated based on the present value of the expected cost savings attributable to financing received from depositors, compared to an alternative source of financing.
Relationship with clients
Relationships with credit cards, business customers and affiliated businesses, measure the value that such relationships have for the Company, given the history of recurring cash flows from current customers and the probability that those customers will continue to generate cash flows in a future period. The fair value of these intangible assets is estimated using the multi-period excess income methodology, the assumption of which establishes that the fair value of a relationship with customers can be estimated based on the present value of the net future flows that will be received on the life of the asset.
Trademarks and trade names
A brand or trade name that is highly recognized in the marketplace has considerable value to an entity. The determination of the fair value of trademarks and trade names considers, among other factors, the comparable industry rates for royalty charges and the total projected future revenues that the banking business will generate.
Assets available for sale
Assets available for sale include real estate acquired in the cancellation of loans. The assets available for sale were recorded at their estimated fair value less costs to sell on the acquisition date based on the Company's evaluations of available appraisals or opinions from real estate brokers. Estimated costs sales are based on experience in disposing of similar real estate and the usual conditions for real estate transactions.
Clients’ deposits
The fair value used for demand and savings deposits is, by definition, equal to the amount payable on demand on the acquisition date. Fair values for time deposits are estimated using a discounted cash flow method that uses the interest rates offered by similar banks in Panama for the different groups of remaining maturities.
Deffered taxes
Deferred income taxes refer to the differences between amounts in the financial statements and the tax bases of the assets acquired and the liabilities assumed in the acquisition.
Debt instruments
The fair value of debt instruments was estimated using discounted cash flows. The contractual interest rates were compared with estimated market interest rates at the valuation date. Those debt instruments whose contractual interest rates are above or below market rates are adjusted to reflect a premium or discount.
Other Assets and other liabilities
Due to the relatively short term of other assets and other liabilities, their book value is considered to be close to their fair value.
| (5) | Risk Management |
Risk management is a fundamental part of the Company. It has an infrastructure to comprehensively manage risks, in order to ensure a responsible and sustainable growth in time, to maintain the confidence of its stakeholders, and to assure with reasonable certainty the fulfillment of its short, medium and long-term goals, through a balance between meeting objectives and taking risks, in line with the corporate strategy.
F-26
| (5) | Risk Management, continued |
Classification of financial assets
See the classification under IFRS 9 in accounting policies in Note 3 (c).
The following table provides a reconciliation between line items in the condensed consolidated statement of financial position and categories of financial instruments.
| September 30, 2021 | Designated FVPL – debt instruments | Designated FVPL - equity instruments | FVOCI - debt instruments | FVOCI - equity instruments | AC | Total | ||||||||||||||||||
| Cash, cash equivalents and deposits in banks | 0 | 0 | 0 | 0 | 4,864,773,841 | 4,864,773,841 | ||||||||||||||||||
| Investments at fair value | 33,976,623 | 10,462,896 | 3,455,200,319 | 3,059,589 | 0 | 3,502,699,427 | ||||||||||||||||||
| Loans at amortized costs | 0 | 0 | 0 | 0 | 17,359,107,925 | 17,359,107,925 | ||||||||||||||||||
| Other accounts receivable | 0 | 0 | 0 | 0 | 190,020,405 | 190,020,405 | ||||||||||||||||||
| Total financial assets | 33,976,623 | 10,462,896 | 3,455,200,319 | 3,059,589 | 22,413,902,171 | 25,916,601,598 | ||||||||||||||||||
| December 31, 2020 | Designated FVPL – debt instruments | Designated FVPL - equity instruments | FVOCI - debt instruments | FVOCI - equity instruments | AC | Total | ||||||||||||||||||
| Cash, cash equivalents and deposits in banks | 0 | 0 | 0 | 0 | 5,967,507,894 | 5,967,507,894 | ||||||||||||||||||
| Investments at fair value | 79,514,054 | 12,425,258 | 3,773,500,429 | 5,061,326 | 78,384,779 | 3,948,885,846 | ||||||||||||||||||
| Loans at amortized costs | 0 | 0 | 0 | 0 | 19,656,414,710 | 19,656,414,710 | ||||||||||||||||||
| Other accounts receivable | 0 | 0 | 0 | 0 | 294,949,780 | 294,949,780 | ||||||||||||||||||
| Total financial assets | 79,514,054 | 12,425,258 | 3,773,500,429 | 5,061,326 | 25,997,257,163 | 29,867,758,230 | ||||||||||||||||||
As of September 30, 2021, and December 31, 2020, all of the financial liabilities held by the Company are classified at amortized cost.
The Company is exposed to the following risks from financial instruments:
· Credit risk,
· Liquidity risk,
· Market risk and
· Operational risk.
For the management of these risk, an organizational framework based on current regulations in the region on risk management has been defined. This framework includes policies, procedures and a human and technical infrastructure to identify, analyze and assess risks, as well as to set adequate limits and controls, monitor risk management and comply with defined limits. These policies and risk management systems are periodically reviewed, updated and reported to the respective committees, to ensure they reflect changes in market conditions, products and services offered.
Through its management procedures and standards, the Company aims to develop a disciplined and constructive control environment where all employees understand their roles and duties.
The periodic oversight and management of risks is conducted through the following corporate governance bodies, established both regionally and in the countries where the Company operates: Committee of Comprehensive Risk Management, Assets and Liabilities Committee (ALICO), Compliance Committee, Credit Committee, and Audit Committee.
| (a) | Credit Risk |
This is the risk of financial loss faced by the Company when a client or counterparty fails to meet their contractual obligations, and is mainly originated from deposits, investments in securities and loans receivable.
To mitigate credit risk, risk management policies establish processes and controls to follow for the approval of loans or credit facilities. The Company structures acceptable credit risk levels by setting limits on the amount of risk that is
assumed in relation to one borrower, or group of borrowers, and geographic segment. These credits are constantly controlled and subject to periodic review.
Exposure to credit risk is managed through a periodic analysis of the borrowers' or potential borrowers' capacity to pay principal and interest. Exposure to credit risk is also mitigated in part through collateral, corporate and personal guarantees.
F-27
| (5) | Risk Management, continued |
Credit is managed through policies that have been clearly defined by the Board of Directors and are reviewed and modified periodically based on changes and expectations in the market where the Company operates, regulations and other factors considered while preparing these policies.
The Company uses a series of credit reports to assess its portfolio's performance, provision requirements and specially to anticipate events that could affect its debtor’s condition in the future.
The Company has a regional guideline on investments that defines the general profile for the investment portfolio and establishes two large maximum levels to control the investments' exposure: a limit on country risk and on issuer risk. The country risk limits are set based on an internal qualification scale and are measured as percentages of the Company's equity or as absolute amounts. The guideline includes approval schemes and attributions for new limits or increases on existing limits.
Compliance with this guideline is monitored on a daily basis through the Investment Portfolio Management and Control Module (MACCI from Spanish), an internal tool to document the entire investment process, including new approvals, limit increases or decreases, purchases and sales, and also to control exposures by issuer and the use of assigned quotas.
The Board of Directors has delegated the responsibility of managing credit risk to the Credit Committee and Assets and Liabilities Committee (ALICO); both periodically monitor the financial condition of the respective debtors and issuers that represent a credit risk for The Company.
Information on the portfolio's quality
Quality of the portfolio of bank deposits and securities under resale agreements
The Company maintains deposits in banks for $4,245,673,789 as of September 30, 2021 (December 31, 2020: $5,217,041,032). Deposits are maintained at central banks and other financial institutions, most of which have A+ to CC risk ratings (December 31,2020, with risk ratings between AA and CCC), based on Standard & Poor’s, Moody's, and/or Fitch Ratings. Of total deposits, excluding deposits in central banks, as of September 30, 2021, approximately $19 million did not have a risk rating (December 31, 2020: $24 million).
Securities under resale agreements are mostly classified based on the ratings assigned by Standard & Poor’s, Moody's, and/or Fitch Ratings.
As of September 30, 2021, all securities under resale agreements and bank deposits are up to date on the payment of principal and interest.
Quality of the investments at fair value
The Company segregates the investment portfolio into investments at FVPL and investments at FVOCI. As of September 30, 2021, investments amounted to $3,502,699,427 (December 31, 2020: $3,948,885,846).
| · | Investments at FVLP |
The credit quality of investments is monitored according to the international risk rating of the issuer provided by Standard & Poor’s, Moody’s, and/or Fitch Ratings
The following table summarizes investments at FVLP categories:
September 30, 2021 | December 31, 2020 | |||||||
| Governments and agencies | ||||||||
| BBB | 0 | 21,043,038 | ||||||
| B | 33,225,613 | 34,950,485 | ||||||
| Total governments and agencies | 33,225,613 | 55,993,523 | ||||||
| Corporates | ||||||||
| Not rated | 0 | 16,100 | ||||||
| Total Corporates | 0 | 16,100 | ||||||
| Total investments at FVPL | 33,225,613 | 56,009,623 | ||||||
F-28
| (5) | Risk Management, continued |
| · | Investments at FVOCI |
The following table summarizes the investments at FVOCI categories:
| September 30, 2021 | December 31, 2020 | |||||||||||||||||||||||
12 months ECL | Lifetime ECL - without impairment | Total investments at FVOCI | 12 months ECL | Lifetime ECL - without impairment | Total investments at FVOCI | |||||||||||||||||||
| Governments and agencies | ||||||||||||||||||||||||
| AAA | 725 | 0 | 725 | 54,881,728 | 0 | 54,881,728 | ||||||||||||||||||
| AA+ | 9,832,516 | 0 | 9,832,516 | 625,283,370 | 0 | 625,283,370 | ||||||||||||||||||
| A+ | 0 | 0 | 0 | 1,041,330 | 0 | 1,041,330 | ||||||||||||||||||
| BBB+ | 1,111,815 | 0 | 1,111,815 | 0 | 0 | 0 | ||||||||||||||||||
| BBB | 227,098,714 | 0 | 227,098,714 | 314,612,782 | 0 | 314,612,782 | ||||||||||||||||||
| BB+ a B- | 2,607,727,766 | 0 | 2,607,727,766 | 2,299,623,202 | 5,041,147 | 2,304,664,349 | ||||||||||||||||||
| Total Governments and Agencies | 2,845,771,536 | 0 | 2,845,771,536 | 3,295,442,412 | 5,041,147 | 3,300,483,559 | ||||||||||||||||||
| Corporates | ||||||||||||||||||||||||
| AA | 2,031,489 | 0 | 2,031,489 | 2,021,110 | 0 | 2,021,110 | ||||||||||||||||||
| A+ | 0 | 0 | 0 | 0 | 0 | 0 | ||||||||||||||||||
| A | 10,626,917 | 0 | 10,626,917 | 0 | 0 | 0 | ||||||||||||||||||
| A- | 113,998,072 | 0 | 113,998,072 | 22,052,740 | 0 | 22,052,740 | ||||||||||||||||||
| BBB+ | 110,946,932 | 0 | 110,946,932 | 31,398,868 | 0 | 31,398,868 | ||||||||||||||||||
| BBB | 16,206,432 | 0 | 16,206,432 | 41,816,505 | 0 | 41,816,505 | ||||||||||||||||||
| BBB- | 58,849,119 | 0 | 58,849,119 | 84,248,082 | 0 | 84,248,082 | ||||||||||||||||||
| BB+ a CCC+ | 296,769,822 | 0 | 296,769,822 | 291,479,565 | 0 | 291,479,565 | ||||||||||||||||||
| Total Corporates | 609,428,783 | 0 | 609,428,783 | 473,016,870 | 0 | 473,016,870 | ||||||||||||||||||
| Total | 3,455,200,319 | 0 | 3,455,200,319 | 3,768,459,282 | 5,041,147 | 3,773,500,429 | ||||||||||||||||||
| Allowance for ECL | 26,790,504 | 0 | 26,790,504 | 24,671,086 | 52,154 | 24,723,240 | ||||||||||||||||||
As of September 30, 2021 and as of December 31, 2020, investments at FVOCI are current and do not reflect impairment
| · | Investments at AC |
The following table summarizes the investments at AC categories:
| September 30, 2021 | December 31, 2020 | |||||||||||||||||||||||
12 months ECL | Lifetime ECL - without impairment | Total investments at FVOCI | 12 months ECL | Lifetime ECL - without impairment | Total investments at FVOCI | |||||||||||||||||||
| Governments and Agencies | ||||||||||||||||||||||||
| BB+ a BB- | 0 | 0 | 0 | 6,697,211 | 0 | 6,697,211 | ||||||||||||||||||
| Total Governments and Agencies | 0 | 0 | 0 | 6,697,211 | 0 | 6,697,211 | ||||||||||||||||||
| Corporates | ||||||||||||||||||||||||
| BBB- | 0 | 0 | 0 | 0 | 0 | 0 | ||||||||||||||||||
| BB+ a BB- | 0 | 0 | 0 | 71,687,568 | 0 | 71,687,568 | ||||||||||||||||||
| Not rated | 0 | 0 | 0 | 0 | 0 | 0 | ||||||||||||||||||
| Total Corporates | 0 | 0 | 0 | 71,687,568 | 0 | 71,687,568 | ||||||||||||||||||
| Total | 0 | 0 | 0 | 78,384,779 | 0 | 78,384,779 | ||||||||||||||||||
| Allowance for ECL | 0 | 0 | 0 | 1,066,713 | 0 | 1,066,713 | ||||||||||||||||||
As of September 30, 2021, investments at AC are current and do not reflect impairment.
F-29
| (5) | Risk Management, continued |
Quality of the loans portfolio
Note 3 (c) contains an explanation of the measurement of the quality of financial instruments, which include the loan portfolio.
The following table presents the loans portfolio according to its risk category, in accordance with the grading used for each stated term:
| Loans | ||||||||||||||||
| September 30, 2021 | 12 months ECL | Lifetime ECL - credit unimpaired | Lifetime ECL - credit impaired | Total | ||||||||||||
Corporate | ||||||||||||||||
| Satisfactory | 6,519,525,148 | 30,637,032 | 0 | 6,550,162,180 | ||||||||||||
| Special mention | 0 | 558,070,048 | 152,385 | 558,222,433 | ||||||||||||
| Sub-standard | 0 | 0 | 164,467,696 | 164,467,696 | ||||||||||||
| Doubtful | 0 | 0 | 12,128,626 | 12,128,626 | ||||||||||||
| Loss | 0 | 0 | 45,412,921 | 45,412,921 | ||||||||||||
| Gross amount | 6,519,525,148 | 588,707,080 | 222,161,628 | 7,330,393,856 | ||||||||||||
| Allowance for ECL | (36,593,783 | ) | (52,106,629 | ) | (55,682,508 | ) | (144,382,920 | ) | ||||||||
| Net amount | 6,482,931,365 | 536,600,451 | 166,479,120 | 7,186,010,936 | ||||||||||||
Small Company | ||||||||||||||||
| Satisfactory | 504,720,923 | 209,420,579 | 0 | 714,141,502 | ||||||||||||
| Special mention | 949,712 | 57,259,998 | 0 | 58,209,710 | ||||||||||||
| Sub-standard | 0 | 0 | 8,747,492 | 8,747,492 | ||||||||||||
| Doubtful | 0 | 0 | 3,132,407 | 3,132,407 | ||||||||||||
| Loss | 0 | 0 | 5,571,392 | 5,571,392 | ||||||||||||
| Gross amount | 505,670,635 | 266,680,577 | 17,451,291 | 789,802,503 | ||||||||||||
| Allowance for ECL | (7,169,323 | ) | (12,232,604 | ) | (4,262,951 | ) | (23,664,878 | ) | ||||||||
| Net amount | 498,501,312 | 254,447,973 | 13,188,340 | 766,137,625 | ||||||||||||
Mortgage | ||||||||||||||||
| Satisfactory | 2,540,930,167 | 521,709,190 | 0 | 3,062,639,357 | ||||||||||||
| Special mention | 5,084,700 | 370,894,630 | 0 | 375,979,330 | ||||||||||||
| Sub-standard | 0 | 686,012 | 94,286,754 | 94,972,766 | ||||||||||||
| Doubtful | 0 | 0 | 16,995,301 | 16,995,301 | ||||||||||||
| Loss | 0 | 0 | 47,702,079 | 47,702,079 | ||||||||||||
| Gross amount | 2,546,014,867 | 893,289,832 | 158,984,134 | 3,598,288,833 | ||||||||||||
| Allowance for ECL | (8,576,519 | ) | (48,359,825 | ) | (29,004,229 | ) | (85,940,573 | ) | ||||||||
| Net amount | 2,537,438,348 | 844,930,007 | 129,979,905 | 3,512,348,260 | ||||||||||||
Personal banking | ||||||||||||||||
| Satisfactory | 1,625,754,862 | 197,272,758 | 988,641 | 1,824,016,261 | ||||||||||||
| Special mention | 2,630,380 | 101,747,084 | 1,748,694 | 106,126,158 | ||||||||||||
| Sub-standard | 0 | 97,860 | 42,953,740 | 43,051,600 | ||||||||||||
| Doubtful | 0 | 0 | 19,660,557 | 19,660,557 | ||||||||||||
| Loss | 0 | 0 | 11,234,441 | 11,234,441 | ||||||||||||
| Gross amount | 1,628,385,242 | 299,117,702 | 76,586,073 | 2,004,089,017 | ||||||||||||
| Allowance for ECL | (21,464,197 | ) | (36,865,508 | ) | (32,639,020 | ) | (90,968,725 | ) | ||||||||
| Net amount | 1,606,921,045 | 262,252,194 | 43,947,053 | 1,913,120,292 | ||||||||||||
Vehicles | ||||||||||||||||
| Satisfactory | 783,174,172 | 152,125,797 | 0 | 935,299,969 | ||||||||||||
| Special mention | 2,286,969 | 70,388,249 | 0 | 72,675,218 | ||||||||||||
| Sub-standard | 0 | 359,714 | 10,492,673 | 10,852,387 | ||||||||||||
| Doubtful | 0 | 0 | 4,765,752 | 4,765,752 | ||||||||||||
| Loss | 0 | 0 | 14,276 | 14,276 | ||||||||||||
| Gross amount | 785,461,141 | 222,873,760 | 15,272,701 | 1,023,607,602 | ||||||||||||
| Allowance for ECL | (5,295,571 | ) | (11,931,550 | ) | (5,454,556 | ) | (22,681,677 | ) | ||||||||
| Net amount | 780,165,570 | 210,942,210 | 9,818,145 | 1,000,925,925 | ||||||||||||
Credit Card | ||||||||||||||||
| Satisfactory | 2,466,000,431 | 344,312,570 | 3,021,964 | 2,813,334,965 | ||||||||||||
| Special mention | 3,923,677 | 150,141,013 | 109,021,383 | 263,086,073 | ||||||||||||
| Sub-standard | 0 | 0 | 10,532,516 | 10,532,516 | ||||||||||||
| Doubtful | 243,724 | 40,357,857 | 14,328,239 | 54,929,820 | ||||||||||||
| Loss | 82 | 0 | 130,683,526 | 130,683,608 | ||||||||||||
| Gross amount | 2,470,167,914 | 534,811,440 | 267,587,628 | 3,272,566,982 | ||||||||||||
| Allowance for ECL | (64,887,054 | ) | (110,086,946 | ) | (117,028,095 | ) | (292,002,095 | ) | ||||||||
| Net amount | 2,405,280,860 | 424,724,494 | 150,559,533 | 2,980,564,887 | ||||||||||||
| Net carrying amount, net of reserve | 14,311,238,500 | 2,533,897,329 | 513,972,096 | 17,359,107,925 | ||||||||||||
F-30
(5) Risk Management, continued
| Loans | ||||||||||||||||||||
| December 31, 2020 | 12 months ECL | Lifetime ECL - credit unimpaired | Lifetime ECL - credit impaired | Portfolio acquired with impairment | Total | |||||||||||||||
Corporate | ||||||||||||||||||||
| Satisfactory | 7,708,834,966 | 38,934,283 | 0 | 0 | 7,747,769,249 | |||||||||||||||
| Special mention | 0 | 469,228,580 | 0 | 0 | 469,228,580 | |||||||||||||||
| Sub-standard | 0 | 0 | 177,915,502 | 40,219,968 | 218,135,470 | |||||||||||||||
| Doubtful | 0 | 0 | 24,160,911 | 20,965,416 | 45,126,327 | |||||||||||||||
| Loss | 0 | 0 | 32,275,861 | 33,604,047 | 65,879,908 | |||||||||||||||
| Gross amount | 7,708,834,966 | 508,162,863 | 234,352,274 | 94,789,431 | 8,546,139,534 | |||||||||||||||
| Allowance for ECL | (38,178,719 | ) | (40,329,411 | ) | (72,003,754 | ) | (1,224,757 | ) | (151,736,641 | ) | ||||||||||
| Net amount | 7,670,656,247 | 467,833,452 | 162,348,520 | 93,564,674 | 8,394,402,893 | |||||||||||||||
Small Company | ||||||||||||||||||||
| Satisfactory | 587,604,431 | 176,087,273 | 0 | 133,729 | 763,825,433 | |||||||||||||||
| Special mention | 645,805 | 70,948,033 | 1,645 | 0 | 71,595,483 | |||||||||||||||
| Sub-standard | 0 | 0 | 10,506,178 | 0 | 10,506,178 | |||||||||||||||
| Doubtful | 0 | 0 | 4,088,796 | 118,752 | 4,207,548 | |||||||||||||||
| Loss | 0 | 0 | 5,854,292 | 2,559,583 | 8,413,875 | |||||||||||||||
| Gross amount | 588,250,236 | 247,035,306 | 20,450,911 | 2,812,064 | 858,548,517 | |||||||||||||||
| Allowance for ECL | (4,107,833 | ) | (10,927,111 | ) | (4,882,658 | ) | (10,010 | ) | (19,927,612 | ) | ||||||||||
| Net amount | 584,142,403 | 236,108,195 | 15,568,253 | 2,802,054 | 838,620,905 | |||||||||||||||
| Mortgage | ||||||||||||||||||||
| Satisfactory | 2,827,952,998 | 973,711,713 | 0 | 0 | 3,801,664,711 | |||||||||||||||
| Special mention | 4,583,931 | 251,103,341 | 0 | 799,169 | 256,486,441 | |||||||||||||||
| Sub-standard | 0 | 0 | 52,218,949 | 152,596 | 52,371,545 | |||||||||||||||
| Doubtful | 0 | 0 | 21,982,885 | 285,651 | 22,268,536 | |||||||||||||||
| Loss | 0 | 0 | 50,215,261 | 7,732,924 | 57,948,185 | |||||||||||||||
| Gross amount | 2,832,536,929 | 1,224,815,054 | 124,417,095 | 8,970,340 | 4,190,739,418 | |||||||||||||||
| Allowance for ECL | (8,921,940 | ) | (49,421,900 | ) | (20,758,099 | ) | (44,295 | ) | (79,146,234 | ) | ||||||||||
| Net amount | 2,823,614,989 | 1,175,393,154 | 103,658,996 | 8,926,045 | 4,111,593,184 | |||||||||||||||
Personal banking | ||||||||||||||||||||
| Satisfactory | 1,875,245,709 | 306,332,835 | 1,866,138 | 36,525 | 2,183,481,207 | |||||||||||||||
| Special mention | 3,787,128 | 91,592,716 | 4,225,642 | 180,313 | 99,785,799 | |||||||||||||||
| Sub-standard | 0 | 0 | 39,591,664 | 65,961 | 39,657,625 | |||||||||||||||
| Doubtful | 0 | 0 | 11,336,685 | 109,645 | 11,446,330 | |||||||||||||||
| Loss | 0 | 0 | 14,379,532 | 2,391,773 | 16,771,305 | |||||||||||||||
| Gross amount | 1,879,032,837 | 397,925,551 | 71,399,661 | 2,784,217 | 2,351,142,266 | |||||||||||||||
| Allowance for ECL | (25,018,966 | ) | (44,849,963 | ) | (23,767,661 | ) | (49,317 | ) | (93,685,907 | ) | ||||||||||
| Net amount | 1,854,013,871 | 353,075,588 | 47,632,000 | 2,734,900 | 2,257,456,359 | |||||||||||||||
Vehicles | ||||||||||||||||||||
| Satisfactory | 879,043,952 | 330,964,075 | 0 | 15,865 | 1,210,023,892 | |||||||||||||||
| Special mention | 955,320 | 55,504,009 | 0 | 88,604 | 56,547,933 | |||||||||||||||
| Sub-standard | 0 | 0 | 4,675,180 | 18,843 | 4,694,023 | |||||||||||||||
| Doubtful | 0 | 0 | 4,446,359 | 12,859 | 4,459,218 | |||||||||||||||
| Loss | 0 | 0 | 401,145 | 58,562 | 459,707 | |||||||||||||||
| Gross amount | 879,999,272 | 386,468,084 | 9,522,684 | 194,733 | 1,276,184,773 | |||||||||||||||
| Allowance for ECL | (4,743,061 | ) | (15,391,812 | ) | (3,897,459 | ) | (10,082 | ) | (24,042,414 | ) | ||||||||||
| Net amount | 875,256,211 | 371,076,272 | 5,625,225 | 184,651 | 1,252,142,359 | |||||||||||||||
Credit Card | ||||||||||||||||||||
| Satisfactory | 2,173,496,914 | 365,640,438 | 3,974,057 | 0 | 2,543,111,409 | |||||||||||||||
| Special mention | 5,612,694 | 238,068,505 | 123,589,891 | 0 | 367,271,090 | |||||||||||||||
| Sub-standard | 0 | 0 | 11,464,026 | 0 | 11,464,026 | |||||||||||||||
| Doubtful | 115,694 | 54,765,462 | 7,779,900 | 0 | 62,661,056 | |||||||||||||||
| Loss | 0 | 0 | 146,971,717 | 0 | 146,971,717 | |||||||||||||||
| Gross amount | 2,179,225,302 | 658,474,405 | 293,779,591 | 0 | 3,131,479,298 | |||||||||||||||
| Allowance for ECL | (56,042,094 | ) | (138,439,212 | ) | (134,798,982 | ) | 0 | (329,280,288 | ) | |||||||||||
| Net amount | 2,123,183,208 | 520,035,193 | 158,980,609 | 0 | 2,802,199,010 | |||||||||||||||
| Net carrying amount, net of reserve | 15,930,866,929 | 3,123,521,854 | 493,813,603 | 108,212,324 | 19,656,414,710 | |||||||||||||||
F-31
(5) Risk Management, continued
The following table presents the debts commitments and guarantee according to its risk category, in accordance with the classification used for each year indicated:
| Debt commitments and guaranties | ||||||||||||||||
| September 30, 2021 | 12 months ECL | Lifetime ECL - credit unimpaired | Lifetime ECL - credit impaired | Total | ||||||||||||
Corporate
| ||||||||||||||||
| Satisfactory | 519,091,934 | 0 | 0 | 519,091,934 | ||||||||||||
| Special mention | 0 | 3,992,608 | 0 | 3,992,608 | ||||||||||||
| Sub-standard | 0 | 0 | 28,689 | 28,689 | ||||||||||||
| Doubtful | 0 | 0 | 212,556 | 212,556 | ||||||||||||
| Loss | 0 | 0 | 3,429 | 3,429 | ||||||||||||
| Gross amount | 519,091,934 | 3,992,608 | 244,674 | 523,329,216 | ||||||||||||
| Allowance for ECL | (278,235 | ) | (36,733 | ) | (4,295 | ) | (319,263 | ) | ||||||||
| Net amount | 518,813,699 | 3,955,875 | 240,379 | 523,009,953 | ||||||||||||
| Small company | ||||||||||||||||
| Satisfactory | 4,091,564 | 0 | 0 | 4,091,564 | ||||||||||||
| Special mention | 0 | 0 | 0 | 0 | ||||||||||||
| Sub-standard | 0 | 0 | 0 | 0 | ||||||||||||
| Doubtful | 0 | 0 | 13,953 | 13,953 | ||||||||||||
| Loss | 0 | 0 | 16,200 | 16,200 | ||||||||||||
| Gross amount | 4,091,564 | 0 | 30,153 | 4,121,717 | ||||||||||||
| Allowance for ECL | (1,155 | ) | 0 | (6 | ) | (1,161 | ) | |||||||||
| Net amount | 4,090,409 | 0 | 30,147 | 4,120,556 | ||||||||||||
| Personal banking | ||||||||||||||||
| Satisfactory | 44,598,616 | 0 | 0 | 44,598,616 | ||||||||||||
| Special mention | 0 | 0 | 0 | 0 | ||||||||||||
| Sub-standard | 0 | 0 | 0 | 0 | ||||||||||||
| Doubtful | 0 | 0 | 0 | 0 | ||||||||||||
| Loss | 0 | 0 | 0 | 0 | ||||||||||||
| Gross amount | 44,598,616 | 0 | 0 | 44,598,616 | ||||||||||||
| Allowance for ECL | (54,104 | ) | 0 | 0 | (54,104 | ) | ||||||||||
| Net amount | 44,544,512 | 0 | 0 | 44,544,512 | ||||||||||||
| Net carrying amount, net of reserve | 567,448,620 | 3,955,875 | 270,526 | 571,675,021 | ||||||||||||
| Debt commitments and guaranties | ||||||||||||||||
| December 31, 2020 | PCE 12 meses | PCE vida esperada – sin deterioro | PCE vida esperada – con deterioro | Total | ||||||||||||
Corporate | ||||||||||||||||
| Satisfactory | 601,686,338 | 0 | 0 | 601,686,338 | ||||||||||||
| Special mention | 0 | 5,756,869 | 0 | 5,756,869 | ||||||||||||
| Sub-standard | 0 | 0 | 254,760 | 254,760 | ||||||||||||
| Doubtful | 0 | 0 | 49,995 | 49,995 | ||||||||||||
| Loss | 0 | 0 | 9,076 | 9,076 | ||||||||||||
| Gross amount | 601,686,338 | 5,756,869 | 313,831 | 607,757,038 | ||||||||||||
| Allowance for ECL | (308,533 | ) | (52,463 | ) | (68,784 | ) | (429,780 | ) | ||||||||
| Net amount | 601,377,805 | 5,704,406 | 245,047 | 607,327,258 | ||||||||||||
| Small company | ||||||||||||||||
| Satisfactory | 4,953,992 | 0 | 0 | 4,953,992 | ||||||||||||
| Special mention | 0 | 3,240 | 0 | 3,240 | ||||||||||||
| Sub-standard | 0 | 0 | 0 | 0 | ||||||||||||
| Doubtful | 0 | 0 | 0 | 0 | ||||||||||||
| Loss | 0 | 0 | 0 | 0 | ||||||||||||
| Gross amount | 4,953,992 | 3,240 | 0 | 4,957,232 | ||||||||||||
| Allowance for ECL | (1,371 | ) | (1 | ) | 0 | (1,372 | ) | |||||||||
| Net amount | 4,952,621 | 3,239 | 0 | 4,955,860 | ||||||||||||
| Personal banking | ||||||||||||||||
| Satisfactory | 104,785,641 | 0 | 0 | 104,785,641 | ||||||||||||
| Special mention | 0 | 0 | 0 | 0 | ||||||||||||
| Sub-standard | 0 | 0 | 0 | 0 | ||||||||||||
| Doubtful | 0 | 0 | 0 | 0 | ||||||||||||
| Loss | 0 | 0 | 0 | 0 | ||||||||||||
| Gross amount | 104,785,641 | 0 | 0 | 104,785,641 | ||||||||||||
| Allowance for ECL | (46,910 | ) | 0 | 0 | (46,910 | ) | ||||||||||
| Net amount | 104,738,731 | 0 | 0 | 104,738,731 | ||||||||||||
| Net carrying amount, net of reserve | 711,069,157 | 5,707,645 | 245,047 | 717,021,849 | ||||||||||||
F-32
(5) Risk Management, continued
Guarantees and other improvements to reduce credit risk and its financial effect
The Company maintains guarantees and other improvements to reduce credit risk to ensure the payment of their financial assets exposed to credit risk. The types of mortgage guarantees include residential and commercial, buildings and land. The types of collateral include private vehicles, commercial use, leasing, machinery and other equipment.
The table below shows the main types of guarantees taken with respect to different types of financial assets.
| September 30, 2021 | ||||||||||||||||||||||||
| Mortgage | Pledge | Certificates of deposit | Investments in securities | Unsecured | Total | |||||||||||||||||||
| Securities under resale agreements | 0 | 0 | 0 | 13,231,790 | 0 | 13,231,790 | ||||||||||||||||||
| Investments in securities | 0 | 0 | 0 | 0 | 3,489,176,942 | 3,489,176,942 | ||||||||||||||||||
| Loans at amortized cost | ||||||||||||||||||||||||
| Corporate | ||||||||||||||||||||||||
| Corporate | 3,441,617,429 | 553,870,634 | 210,016,161 | 0 | 2,973,988,120 | 7,179,492,344 | ||||||||||||||||||
| Corporate leases, net | 0 | 144,627,308 | 6,274,204 | 0 | 0 | 150,901,512 | ||||||||||||||||||
| Total corporate | 3,441,617,429 | 698,497,942 | 216,290,365 | 0 | 2,973,988,120 | 7,330,393,856 | ||||||||||||||||||
| Personal Banking and Small company | ||||||||||||||||||||||||
| Small company | ||||||||||||||||||||||||
| Small company loans | 460,565,466 | 48,713,568 | 22,871,615 | 0 | 174,369,143 | 706,519,792 | ||||||||||||||||||
| Small company leases, net | 0 | 82,822,039 | 460,672 | 0 | 0 | 83,282,711 | ||||||||||||||||||
| Total Small company | 460,565,466 | 131,535,607 | 23,332,287 | 0 | 174,369,143 | 789,802,503 | ||||||||||||||||||
| Personal Banking | ||||||||||||||||||||||||
| Mortgage | 3,598,288,833 | 0 | 0 | 0 | 0 | 3,598,288,833 | ||||||||||||||||||
| Personal | 376,301,561 | 134,170 | 27,293,653 | 0 | 1,600,359,633 | 2,004,089,017 | ||||||||||||||||||
| Vehicles | 0 | 936,973,104 | 0 | 0 | 0 | 936,973,104 | ||||||||||||||||||
| Personal leases, net of interest | 0 | 86,634,498 | 0 | 0 | 0 | 86,634,498 | ||||||||||||||||||
| Credit cards | 0 | 0 | 0 | 0 | 3,272,566,982 | 3,272,566,982 | ||||||||||||||||||
| Total Personal Banking | 3,974,590,394 | 1,023,741,772 | 27,293,653 | 0 | 4,872,926,615 | 9,898,552,434 | ||||||||||||||||||
| Total Personal Banking and Small company | 4,435,155,860 | 1,155,277,379 | 50,625,940 | 0 | 5,047,295,758 | 10,688,354,937 | ||||||||||||||||||
| Allowance for ECL | (207,481,195 | ) | (44,288,028 | ) | (1,418,346 | ) | 0 | (406,453,299 | ) | (659,640,868 | ) | |||||||||||||
| Total loans | 7,669,292,094 | 1,809,487,293 | 265,497,959 | 0 | 7,614,830,579 | 17,359,107,925 | ||||||||||||||||||
| Commitments and guarantees, net | 51,805,607 | 2,613,617 | 15,720,777 | 0 | 501,535,020 | 571,675,021 | ||||||||||||||||||
| December 31, 2020 | ||||||||||||||||||||||||
| Mortgage | Pledge | Certificates of deposit | Investments in securities | Unsecured | Total | |||||||||||||||||||
| Securities under resale agreements | 0 | 0 | 0 | 21,227,306 | 0 | 21,227,306 | ||||||||||||||||||
| Investments in securities | 0 | 0 | 0 | 0 | 3,931,399,262 | 3,931,399,262 | ||||||||||||||||||
| Loans at amortized cost | ||||||||||||||||||||||||
| Corporate | ||||||||||||||||||||||||
| Corporate | 4,377,423,240 | 545,566,443 | 308,211,315 | 0 | 3,165,392,899 | 8,396,593,897 | ||||||||||||||||||
| Corporate leases, net | 0 | 149,545,637 | 0 | 0 | 0 | 149,545,637 | ||||||||||||||||||
| Total corporate | 4,377,423,240 | 695,112,080 | 308,211,315 | 0 | 3,165,392,899 | 8,546,139,534 | ||||||||||||||||||
| Personal Banking and Small company | ||||||||||||||||||||||||
| Small company | ||||||||||||||||||||||||
| Small company loans | 529,833,731 | 2,350,993 | 34,667,362 | 0 | 202,638,939 | 769,491,025 | ||||||||||||||||||
| Small company leases, net | 0 | 89,057,492 | 0 | 0 | 0 | 89,057,492 | ||||||||||||||||||
| Total Small company | 529,833,731 | 91,408,485 | 34,667,362 | 0 | 202,638,939 | 858,548,517 | ||||||||||||||||||
| Personal Banking | ||||||||||||||||||||||||
| Mortgage | 4,190,739,418 | 0 | 0 | 0 | 0 | 4,190,739,418 | ||||||||||||||||||
| Personal | 428,701,266 | 0 | 72,160,592 | 0 | 1,850,280,408 | 2,351,142,266 | ||||||||||||||||||
| Vehicles | 0 | 1,183,895,384 | 0 | 0 | 0 | 1,183,895,384 | ||||||||||||||||||
| Personal leases, net of interest | 0 | 92,289,389 | 0 | 0 | 0 | 92,289,389 | ||||||||||||||||||
| Credit cards | 0 | 0 | 0 | 0 | 3,131,479,298 | 3,131,479,298 | ||||||||||||||||||
| Total Personal Banking | 4,619,440,684 | 1,276,184,773 | 72,160,592 | 0 | 4,981,759,706 | 10,949,545,755 | ||||||||||||||||||
| Total Personal Banking and Small company | 5,149,274,415 | 1,367,593,258 | 106,827,954 | 0 | 5,184,398,645 | 11,808,094,272 | ||||||||||||||||||
| Allowance for ECL | (178,637,982 | ) | (47,804,526 | ) | (904,397 | ) | 0 | (470,472,191 | ) | (697,819,096 | ) | |||||||||||||
| Total loans | 9,348,059,673 | 2,014,900,812 | 414,134,872 | 0 | 7,879,319,353 | 19,656,414,710 | ||||||||||||||||||
| Commitments and guarantees, net | 63,654,961 | 1,929,854 | 21,473,657 | 0 | 629,963,377 | 717,021,849 | ||||||||||||||||||
F-33
| (5) | Risk Management, continued |
The table below shows the portfolio and identifiable value of collateral (primarily commercial properties) backing the loan. For each loan, the corresponding value of its guarantees is capped by the guaranteed nominal amount:
| September 30, 2021 | December 31, 2020 | |||||||||||||||
| Corporates | Loans | Covered amount | Loans | Covered amount | ||||||||||||
| Stage 1 y 2 | 2,726,079,058 | 3,641,695,479 | 3,739,418,183 | 3,739,417,634 | ||||||||||||
| Stage 3 | 91,074,694 | 107,769,331 | 245,043,917 | 244,505,657 | ||||||||||||
| Total | 2,817,153,752 | 3,749,464,810 | 3,984,462,100 | 3,983,923,291 | ||||||||||||
The following are the non-financial assets that the Company seized as collaterals to secure collection during the period.
September 30, 2021 | December 31, 2020 | |||||||
| Property | 9,801,610 | 9,301,419 | ||||||
| Furniture and Equipment | 0 | 465,143 | ||||||
| Total | 9,801,610 | 9,766,562 | ||||||
The Company's policy is to perform the sale of these assets to cover the balances due. Using non-financial assets for its operations is not a Company policy.
Residential mortgage loans
The following table shows the index of loans from the mortgage portfolio to the value of collaterals. LTV is calculated as a percentage of the gross amount of the loan in relation to the value of collaterals. The gross amount of the loan excludes any loss impairment. The value of collaterals for mortgages is based on the original value of the guarantee as of the date of disbursement.
The corresponding values are updated based on requirements from local regulators, new disbursements with the same guarantee, credit restructuring or judicial processes that involve execution.
| September 30, 2021 | December 31, 2020 | |||||||||||||||
| LTV Ratio | Loans | Credit and guarantee commitments | Loans | Credit and guarantee commitments | ||||||||||||
| Less than 50% | 654,047,749 | 2,869,884 | 777,526,687 | 4,275,402 | ||||||||||||
| 51-70% | 1,175,349,615 | 6,657,756 | 1,466,936,337 | 14,047,161 | ||||||||||||
| 71-80% | 1,074,727,893 | 14,670,348 | 1,262,525,558 | 19,250,649 | ||||||||||||
| 81-90% | 307,479,190 | 17,940,287 | 445,425,455 | 36,853,211 | ||||||||||||
| 91-100% | 332,454,148 | 2,460,341 | 223,929,646 | 30,249,113 | ||||||||||||
| More than 100% | 54,230,238 | 0 | 14,395,735 | 110,105 | ||||||||||||
| Total | 3,598,288,833 | 44,598,616 | 4,190,739,418 | 104,785,641 | ||||||||||||
Impaired loans
| LTV Ratio | September 30, 2021 | December 31, 2020 | ||||||
| Less than 50% | 20,514,793 | 8,940,401 | ||||||
| 51-70% | 44,513,516 | 39,366,509 | ||||||
| 71-80% | 51,223,857 | 45,694,008 | ||||||
| 81-90% | 31,226,208 | 23,665,082 | ||||||
| 91-100% | 8,024,821 | 4,778,105 | ||||||
| More than 100% | 3,480,939 | 1,972,990 | ||||||
| Total | 158,984,134 | 124,417,095 | ||||||
ECL allowance
Projection of future conditions
The upside, central and downside scenarios are described below, along with the main risks taken into consideration to define them.
F-34
(5) Risk Management, continued
External sector:
| External risk | Upside | Central | Downside |
Vaccine Application:
It is identified as the distribution and effectiveness of the vaccine and its impact on economic growth.
| 1) Main commercial partners immunize population during the first semester, 2021.
| 1) Main commercial partners immunize population during the first semester, 2021.
| 1) Main commercial partners immunize population during the first semester, 2022.
|
Income from remittances:
Migration policy and income from remittances. Honduras, El Salvador, Guatemala and Nicaragua. | 2) Change in US immigration policy improves the outlook for income from remittances.
| 2) Migration policy is maintained, outlook for the growth of remittances remains stable.
| 3) Migration policy tightens, remittance growth prospect decreases.
|
The scenarios for each country are detailed below
| Scenario | Scenarios synthesis | Upside | Central | Downside |
| Guatemala | 1. Nominal variables are considered stable, with solid macroeconomic fundamentals, relatively low level of debt and high level of International Monetary Reserves.
2. Main differences in scenarios: they respect the recovery of economic growth, associated with the persistence of the pandemic and the effectiveness of the measures to mitigate it. Downside scenario contemplates the possibility of CPI above BanGuat's target range, considering the recent increase in the CPI and the expected increase in food prices during 2021. | Tax policy measures are effective, improve the outlook for economic growth and mitigate impairment in social gaps.
Vaccine is obtained and distributed effectively, approaching immunity during 2021.
| Immunization applies to the most vulnerable populations during 2021.
There is a gradual improvement in economic activity as the health services response is strengthened and the vaccine is distributed.
| Distribution of the ineffective vaccine, deterioration in health indicators, social gaps and political stability.
|
| Honduras | 1. Scenarios remain stable in nominal variables, considering the government's tax discipline in accordance with the IMF agreement and the recovery in the external sector (exports and remittances).
2. Main differences in scenarios: recovery of economic growth, associated with the persistence of the pandemic and damage to productivity caused by natural disasters.
| Fiscal policy measures are more effective than expected in mitigating the deterioration of social gaps and the economic impact of the pandemic and natural disasters. End of 2021 without the 'la Niña' phenomenon and with less probability of natural disasters.
Economic recovery reduces social tensions in the context of the electoral period.
| Immunization applies to the most vulnerable populations during 2021.
There is a gradual improvement in economic activity as the health services response is strengthened and the vaccine is distributed.
Election period generates certain uncertainty that affects economic recovery.
| Distribution of the ineffective vaccine, deterioration in health indicators.
Deterioration in social gaps and increase in political instability.
It contemplates a slight recovery in economic activity compared to 2020.
|
F-35
| (5) | Risk Management, continued |
| Scenario | Scenarios synthesis | Upside | Central | Downside |
| El Salvador | 1. Inflation remains stable and low, considering its recent history of weak domestic demand and the lack of monetary policy tools.
2. Main differences in scenarios: recovery of economic growth and interest rates, associated with the persistence of the pandemic and the level of financial stress of the central government.
| Government obtains financing to maintain expansionary tax policy during 2021.
Obtaining, distribution of vaccine during 2021.
Favorable terms of trade and increases in remittance income are maintained.
| Immunization applies to the most vulnerable populations during 2021.
Financing remains costly for the Government in international financial markets.
| Distribution of the ineffective vaccine, deterioration in health indicators. Increase in risk aversion in international financial markets and increase in spreads.
|
| Nicaragua | 1. Nominal variables: inflation remains stable.
2. Main differences in scenarios: recovery of economic growth and variation in interest rates. Nicaragua will hold presidential elections in November 2021. Before, it had a GDP contraction in 2018 and 2019, the consequence of a socio-political crisis that has not been overcome. A worsening of the socio-political crisis could lead to lower economic growth and less access for the government to external sources of financing.
| The government reestablishes dialogue with the opposition and takes measures to improve investor confidence and the possibility of obtaining external financing.
| Dialogue does not advance; however, the socio-political crisis does not worsen. See 2021 without GDP growth.
| Upsurge of socio-political crisis; a new contraction in economic growth and less access to financing due to international sanctions.
|
| Costa Rica | 1. Inflation remains stable.
2. Main differences in scenarios: recovery of economic growth, exchange rate and interest rates, consequence of the possibility that the deterioration in public finances will continue.
| Approval of reforms that show fiscal commitment and that improve the conditions of the Government to obtain financing, including an agreement with the IMF.
Strength in health services allows the population to be immunized during the 2021.
| Country approaches immunization during 2021.
An agreement is reached with the IMF, however, the commitment only partially restores investor confidence in the face of fiscal challenges. Expansive fiscal policy is limited in 2021.
| Political agreements are not reached to reduce the fiscal deficit, uncertainty generates exchange rate pressures and an increase in the demand for loanable funds from the government puts pressure on interest rates. |
| Panama | 1. Inflation and interest rates remain stable.
2. Main differences in scenarios: Panama has historically been the Central American country with the highest rate of economic growth; however, it has had the greatest impact due to the pandemic. There is uncertainty about the speed of recovery, which remained below its historical average in 2018 and 2019.
| Economic recovery occurs faster than expected, with effective access and distribution of the vaccine and rapid recovery of sectors that remained inactive, such as construction and commerce. Rapid recovery of main commercial partners and international trade | Immunization applies to the most vulnerable populations during 2021.
Panama gradually recovers economic growth, below its historically high level.
| Acquisition and distribution of ineffective vaccine, deterioration in health indicators.
Slow economic recovery due to greater vulnerability of the Companying system before the moratorium law to help those affected by the pandemic. Slow recovery of investment and consumption.
|
The scenario probability weightings applied in measuring ECL in each of the countries where the Company operates, are as follows:
| September 30, 2021 | ||||||
| Scenario probability weighting | Guatemala | Honduras | El Salvador | Nicaragua | Costa Rica | Panama |
Upside | 25% | 20% | 15% | 10% | 15% | 20% |
| Central | 65% | 60% | 65% | 60% | 65% | 60% |
| Downside | 10% | 20% | 20% | 30% | 20% | 20% |
| December 31, 2020 | ||||||
| Scenario probability weighting | Guatemala | Honduras | El Salvador | Nicaragua | Costa Rica | Panama |
Upside | 25% | 20% | 15% | 15% | 5% | 10% |
| Central | 65% | 65% | 65% | 65% | 60% | 60% |
| Downside | 10% | 15% | 20% | 20% | 35% | 30% |
Periodically, the Company carries out stress testing of more extreme shocks to calibrate its determination of the upside and downside representative scenarios. A comprehensive review is performed at least annually on the design of the scenarios, advised by at least one external economist.
F-36
(5) Risk Management, continued
The Company has identified and documented key drivers of credit risk and credit losses for each portfolio of financial instruments and, using an analysis of historical data, has estimated relationships between macro-economic variables and credit risk and credit losses.
The key drivers for credit risk for loans’ portfolios are: Monthly Economic Activity Index, Consumer Price Index, Exchange Rate, Local Currency Interest Rate and Dollars Interest Rate.
The Company estimates each key driver for credit risk over the active forecast period of one year.
The table below lists the macroeconomic assumptions used in the base, upside and downside scenarios over the forecast period.
| September 30, 2021 | |||||||
| Guatemala | Honduras | El Salvador | Nicaragua | Costa Rica | Panama | ||
| % | % | % | % | % | % | ||
| Monthly Economic Activity Index | Upside | 5.05 | 5.41 | 5.02 | 2.48 | 4.49 | 9.78 |
| Central | 4.31 | 4.38 | 3.17 | 0.99 | 3.54 | 8.72 | |
| Downside | 2.53 | 3.16 | 1.33 | (1.91) | 2.14 | 5.42 | |
| Consumer Price Index | Upside | 2.96 | 2.67 | 0.77 | 2.89 | 0.53 | 0.87 |
| Central | 4.40 | 4.09 | 1.58 | 4.40 | 1.77 | 1.81 | |
| Downside | 5.56 | 4.37 | 2.33 | 4.92 | 2.62 | 2.65 | |
| Exchange Rate | Upside | (0.73) | (0.85) | - | (0.39) | 2.47 | - |
| Central | (0.04) | (0.32) | - | 2.59 | 3.49 | - | |
| Downside | 1.47 | 1.25 | - | 4.13 | 4.96 | - | |
| Local Currency Interest Rate | Upside | (0.95) | (1.73) | - | (1.15) | (2.46) | - |
| Central | (0.19) | (0.85) | - | 1.05 | (1.90) | - | |
| Downside | (0.18) | 0.19 | - | 1.95 | 0.12 | - | |
| Dollars Interest Rate | Upside | (0.31) | (0.40) | (0.20) | (0.52) | (2.13) | (0.55) |
| Central | (0.11) | (0.14) | 0.36 | 0.13 | (0.82) | (0.23) | |
| Downside | (0.03) | 0.41 | 0.80 | 1.09 | 0.38 | 0.85 | |
| December 31, 2020 | |||||||
| Guatemala | Honduras | El Salvador | Nicaragua | Costa Rica | Panama | ||
| % | % | % | % | % | % | ||
| Monthly Economic Activity Index | Upside | 5.46 | 4.19 | 4.25 | 2.27 | 3.58 | 5.54 |
| Central | 3.90 | 3.42 | 3.18 | 0.23 | 2.32 | 3.34 | |
| Downside | 1.60 | 1.50 | 1.54 | (2.25) | 0.41 | 1.63 | |
| Consumer Price Index | Upside | 2.53 | 2.85 | (0.28) | 2.39 | 0.65 | (0.58) |
| Central | 3.26 | 3.54 | 0.18 | 2.69 | 0.85 | (0.16) | |
| Downside | 5.24 | 3.39 | 1.18 | 3.60 | 1.85 | 1.21 | |
| Exchange Rate | Upside | (1.54) | (0.74) | - | 2.35 | 2.35 | - |
| Central | (0.12) | 0.51 | - | 2.89 | 3.69 | - | |
| Downside | 1.18 | 1.38 | - | 4.09 | 5.13 | - | |
| Local Currency Interest Rate | Upside | (0.50) | (0.56) | - | (1.43) | (0.21) | - |
| Central | (0.28) | (0.30) | - | 0.03 | 1.29 | - | |
| Downside | 0.03 | 0.08 | - | 0.93 | 1.66 | - | |
| Dollars Interest Rate | Upside | (0.50) | (0.18) | (0.06) | (0.95) | (1.28) | (0.16) |
| Central | (0.15) | (0.09) | 0.44 | (0.18) | 0.28 | (0.02) | |
| Downside | 0.11 | 0.11 | 1.15 | 1.41 | 1.02 | 0.16 | |
Sensitivity of ECL to future economic conditions
The ECL are sensitive to judgements and assumptions made regarding formulation of forward-looking scenarios and how such scenarios are incorporated into the calculations. Management performs a sensitivity analysis on the ECL recognized on material classes of its assets.
F-37
| (5) | Risk Management, continued |
The table below shows the loss allowance on loans assuming each forward-looking scenario (e.g. central, upside and downside) were weighted 100% instead of applying scenario probability weights across the three scenarios. See Note 3 (c).
| September 30, 2021 | Upside | Central | Downside | |||||||||
| Book Value | ||||||||||||
| Corporate | 7,330,393,856 | 7,330,393,856 | 7,330,393,856 | |||||||||
| Small company | 789,802,503 | 789,802,503 | 789,802,503 | |||||||||
| Mortgage | 3,598,288,833 | 3,598,288,833 | 3,598,288,833 | |||||||||
| Personal banking | 2,004,089,017 | 2,004,089,017 | 2,004,089,017 | |||||||||
| Vehicles | 1,023,607,602 | 1,023,607,602 | 1,023,607,602 | |||||||||
| Credit card | 3,272,566,982 | 3,272,566,982 | 3,272,566,982 | |||||||||
| 18,018,748,793 | 18,018,748,793 | 18,018,748,793 | ||||||||||
| ECL Allowance | ||||||||||||
| Corporate | 137,038,326 | 144,408,519 | 150,751,604 | |||||||||
| Small company | 19,954,272 | 23,424,888 | 28,233,223 | |||||||||
| Mortgage | 74,988,271 | 85,345,313 | 96,311,926 | |||||||||
| Personal banking | 83,000,327 | 90,091,834 | 98,406,036 | |||||||||
| Vehicles | 20,136,406 | 22,489,601 | 25,302,528 | |||||||||
| Credit card | 277,802,299 | 294,215,198 | 318,057,762 | |||||||||
| 612,919,901 | 659,975,353 | 717,063,079 | ||||||||||
| Proportion of assets in Stage 2 | ||||||||||||
| Corporate | 7.88 | % | 7.88 | % | 7.88 | % | ||||||
| Small company | 29.91 | % | 33.04 | % | 42.31 | % | ||||||
| Mortgage | 22.97 | % | 23.66 | % | 24.49 | % | ||||||
| Personal banking | 14.07 | % | 14.21 | % | 14.44 | % | ||||||
| Vehicles | 20.11 | % | 20.65 | % | 21.56 | % | ||||||
| Credit card | 16.11 | % | 16.24 | % | 16.39 | % | ||||||
| 14.74 | % | 15.08 | % | 15.76 | % | |||||||
| December 31, 2020 | Upside | Central | Downside | |||||||||
| Book Value | ||||||||||||
| Corporate | 8,546,139,534 | 8,546,139,534 | 8,546,139,534 | |||||||||
| Small company | 858,548,517 | 858,548,517 | 858,548,517 | |||||||||
| Mortgage | 4,190,739,418 | 4,190,739,418 | 4,190,739,418 | |||||||||
| Personal banking | 2,351,142,266 | 2,351,142,266 | 2,351,142,266 | |||||||||
| Vehicles | 1,276,184,773 | 1,276,184,773 | 1,276,184,773 | |||||||||
| Credit card | 3,131,479,298 | 3,131,479,298 | 3,131,479,298 | |||||||||
| 20,354,233,806 | 20,354,233,806 | 20,354,233,806 | ||||||||||
| ECL Allowance | ||||||||||||
| Corporate | 143,813,719 | 149,756,296 | 160,411,700 | |||||||||
| Small company | 17,344,111 | 19,586,001 | 23,101,116 | |||||||||
| Mortgage | 67,566,258 | 76,897,244 | 85,643,910 | |||||||||
| Personal banking | 86,364,778 | 92,631,863 | 100,964,826 | |||||||||
| Vehicles | 21,540,930 | 23,229,781 | 25,580,634 | |||||||||
| Credit card | 311,371,046 | 327,378,756 | 346,113,592 | |||||||||
| 648,000,842 | 689,479,941 | 741,815,778 | ||||||||||
| Proportion of assets in Stage 2 | ||||||||||||
| Corporate | 5.83 | % | 5.83 | % | 5.83 | % | ||||||
| Small company | 27.23 | % | 27.59 | % | 32.03 | % | ||||||
| Mortgage | 27.47 | % | 28.10 | % | 29.09 | % | ||||||
| Personal banking | 16.22 | % | 16.32 | % | 16.78 | % | ||||||
| Vehicles | 28.69 | % | 28.87 | % | 29.66 | % | ||||||
| Credit card | 20.75 | % | 20.86 | % | 20.98 | % | ||||||
| 16.12 | % | 16.30 | % | 16.82 | % | |||||||
F-38
| (5) | Risk Management, continued |
The following table shows a reconciliation of the opening and closing balances of the period as of September 30, 2021, of the financial assets’ ECL allowance.
| September 30, 2021 | December 31, 2020 | |||||||||||||||||||||||||||||||
| Deposits in Banks | 12 months ECL | Lifetime ECL - unimpaired | Lifetime ECL - impaired | Total | 12 months ECL | Lifetime ECL - unimpaired | Lifetime ECL - impaired | Total | ||||||||||||||||||||||||
| Balance at January 1 | 615,351 | 2,131 | 0 | 617,482 | 85,894 | 0 | 0 | 85,894 | ||||||||||||||||||||||||
| Portion reclassified as discontinued operation | (5,817 | ) | (2,131 | ) | 0 | (7,948 | ) | 0 | 0 | 0 | 0 | |||||||||||||||||||||
| Net remeasurement of loss allowance | (488,749 | ) | 0 | 0 | (488,749 | ) | (85,895 | ) | 0 | 0 | (85,895 | ) | ||||||||||||||||||||
| New financial assets originated | 33,867 | 0 | 0 | 33,867 | 616,832 | 2,131 | 0 | 618,963 | ||||||||||||||||||||||||
| Foreign currency translation | (363 | ) | 0 | 0 | (363 | ) | (1,480 | ) | 0 | 0 | (1,480 | ) | ||||||||||||||||||||
| Balance at period end | 154,289 | 0 | 0 | 154,289 | 615,351 | 2,131 | 0 | 617,482 | ||||||||||||||||||||||||
| September 30, 2021 | December 31, 2020 | |||||||||||||||||||||||||||||||
| Investments at FVOCI | 12 months ECL | Lifetime ECL - unimpaired | Lifetime ECL - impaired | Total | 12 months ECL | Lifetime ECL - unimpaired | Lifetime ECL - impaired | Total | ||||||||||||||||||||||||
| Balance at January 1 | 24,671,086 | 52,154 | 0 | 24,723,240 | 8,554,961 | 0 | 0 | 8,554,961 | ||||||||||||||||||||||||
| Transfer from stage 1 to 2 | (11,324 | ) | 11,324 | 0 | 0 | (86,933 | ) | 86,933 | 0 | 0 | ||||||||||||||||||||||
| Portion reclassified as discontinued operation | (1,673,826 | ) | (11,324 | ) | 0 | (1,685,150 | ) | 0 | 0 | 0 | 0 | |||||||||||||||||||||
| Net remeasurement of loss allowance | (14,202,523 | ) | (52,154 | ) | 0 | (14,254,677 | ) | (2,949,367 | ) | (48,656 | ) | 0 | (2,998,023 | ) | ||||||||||||||||||
| New financial assets originated | 18,270,645 | 0 | 0 | 18,270,645 | 19,815,272 | 13,877 | 0 | 19,829,149 | ||||||||||||||||||||||||
| Foreign currency translation | (263,554 | ) | 0 | 0 | (263,554 | ) | (662,847 | ) | 0 | 0 | (662,847 | ) | ||||||||||||||||||||
| Balance at period end | 26,790,504 | 0 | 0 | 26,790,504 | 24,671,086 | 52,154 | 0 | 24,723,240 | ||||||||||||||||||||||||
| September 30, 2021 | December 31, 2020 | |||||||||||||||||||||||||||||||
| Investments at AC | 12 months ECL | Lifetime ECL - unimpaired | Lifetime ECL - impaired | Total | 12 months ECL | Lifetime ECL - unimpaired | Lifetime ECL - impaired | Total | ||||||||||||||||||||||||
| Balance at January 1 | 1,066,713 | 0 | 0 | 1,066,713 | 0 | 0 | 0 | 0 | ||||||||||||||||||||||||
| Portion reclassified as discontinued operation | (1,066,713 | ) | (1,066,713 | ) | 0 | 0 | 0 | 0 | ||||||||||||||||||||||||
| Net remeasurement of loss allowance | 0 | 0 | 0 | 0 | 0 | 0 | 0 | 0 | ||||||||||||||||||||||||
| New financial assets originated | 0 | 0 | 0 | 0 | 1,066,713 | 0 | 0 | 1,066,713 | ||||||||||||||||||||||||
| Foreign currency translation | 0 | 0 | 0 | 0 | 0 | 0 | 0 | 0 | ||||||||||||||||||||||||
| Balance at period end | 0 | 0 | 0 | 0 | 1,066,713 | 0 | 0 | 1,066,713 | ||||||||||||||||||||||||
| September 30, 2021 | December 31, 2020 | |||||||||||||||||||||||||||||||||||||||
| Loans at AC | 12 months ECL | Lifetime ECL – unimpaired | Lifetime ECL - impaired | Acquired impaired | Total | 12 months ECL | Lifetime ECL - unimpaired | Lifetime ECL - impaired | Acquired impaired | Total | ||||||||||||||||||||||||||||||
| Balance at January 1 | 137,012,613 | 299,359,409 | 260,108,613 | 1,338,461 | 697,819,096 | 163,392,092 | 143,782,573 | 202,529,547 | 0 | 509,704,212 | ||||||||||||||||||||||||||||||
| Portion reclassified as discontinued operation | (4,472,173 | ) | (15,275,697 | ) | (6,994,159 | ) | (1,338,461 | ) | (28,080,490 | ) | 0 | 0 | 0 | 0 | 0 | |||||||||||||||||||||||||
| Transfer from stage 1 to 2 | (32,629,917 | ) | 32,629,917 | 0 | 0 | 0 | (102,508,035 | ) | 102,508,035 | 0 | 0 | 0 | ||||||||||||||||||||||||||||
| Transfer from stage 1 to 3 | (180,015 | ) | 0 | 180,015 | 0 | 0 | (205,369 | ) | 0 | 205,369 | 0 | 0 | ||||||||||||||||||||||||||||
| Transfer from stage 2 to 3 | 0 | (142,548,546 | ) | 142,548,546 | 0 | 0 | 0 | (185,854,506 | ) | 185,854,506 | 0 | 0 | ||||||||||||||||||||||||||||
| Transfer from stage 3 to 2 | 0 | 64,590,198 | (64,590,198 | ) | 0 | 0 | 0 | 61,876,431 | (61,876,431 | ) | 0 | 0 | ||||||||||||||||||||||||||||
| Transfer from stage 2 to 1 | 87,110,092 | (87,110,092 | ) | 0 | 0 | 0 | 159,759,607 | (159,759,607 | ) | 0 | 0 | 0 | ||||||||||||||||||||||||||||
| Transfer from stage 3 to 1 | 15,333,137 | 0 | (15,333,137 | ) | 0 | 0 | 23,321,114 | 0 | (23,321,114 | ) | 0 | 0 | ||||||||||||||||||||||||||||
| Net remeasurement of loss allowance | 356,443 | 66,353,920 | 144,029,165 | 0 | 210,739,528 | (799,123 | ) | 181,919,658 | 202,061,069 | 1,328,648 | 384,510,252 | |||||||||||||||||||||||||||||
| New financial assets originated | 113,484,077 | 174,453,210 | 134,838,200 | 0 | 422,775,487 | 157,442,672 | 293,881,435 | 110,849,000 | 93,820 | 562,266,927 | ||||||||||||||||||||||||||||||
| Net derecognition of financial assets | (172,027,810 | ) | (120,869,257 | ) | (88,345,268 | ) | 0 | (381,242,335 | ) | (263,390,345 | ) | (138,994,610 | ) | (57,887,073 | ) | (84,007 | ) | (460,356,035 | ) | |||||||||||||||||||||
| Charge-offs | 0 | 0 | (354,892,896 | ) | 0 | (354,892,896 | ) | 0 | 0 | (385,633,165 | ) | 0 | (385,633,165 | ) | ||||||||||||||||||||||||||
| Recoveries | 0 | 0 | 93,328,662 | 0 | 93,328,662 | 0 | 0 | 96,441,804 | 0 | 96,441,804 | ||||||||||||||||||||||||||||||
| Foreign currency translation | 0 | 0 | (806,184 | ) | 0 | (806,184 | ) | 0 | 0 | (9,114,899 | ) | 0 | (9,114,899 | ) | ||||||||||||||||||||||||||
| Balance at period end | 143,986,447 | 271,583,062 | 244,071,359 | 0 | 659,640,868 | 137,012,613 | 299,359,409 | 260,108,613 | 1,338,461 | 697,819,096 | ||||||||||||||||||||||||||||||
| September 30, 2021 | December 31, 2020 | |||||||||||||||||||||||||||||||
| Commitments and guarantee | 12 months ECL | Lifetime ECL – unimpaired | Lifetime ECL - impaired | Total | 12 months ECL | Lifetime ECL – unimpaired | Lifetime ECL - impaired | Total | ||||||||||||||||||||||||
Balance at January 1 | 356,814 | 52,464 | 68,784 | 478,062 | 554,121 | 10,391 | 199,321 | 763,833 | ||||||||||||||||||||||||
| Portion reclassified as discontinued operation | (125,981 | ) | 0 | (500 | ) | (126,481 | ) | 0 | 0 | 0 | 0 | |||||||||||||||||||||
| Transfer from stage 1 to 2 | (539 | ) | 539 | 0 | 0 | (3,553 | ) | 3,553 | 0 | 0 | ||||||||||||||||||||||
| Transfer from stage 1 to 3 | (54 | ) | 0 | 54 | 0 | (81 | ) | 0 | 81 | 0 | ||||||||||||||||||||||
| Transfer from stage 2 to 3 | 0 | 0 | 0 | 0 | 0 | (330 | ) | 330 | 0 | |||||||||||||||||||||||
| Transfer from stage 3 to 2 | 0 | 0 | 0 | 0 | 0 | 15,599 | (15,599 | ) | 0 | |||||||||||||||||||||||
| Transfer from stage 2 to 1 | 315 | (315 | ) | 0 | 0 | (20 | ) | 20 | 0 | 0 | ||||||||||||||||||||||
| Net remeasurement of loss allowance | (47,708 | ) | 5,543 | (12 | ) | (42,177 | ) | (318,263 | ) | 10,046 | 2,741 | (305,476 | ) | |||||||||||||||||||
| New financial assets originated | 229,503 | 5,983 | 1,976 | 237,462 | 162,508 | 20,605 | 63,461 | 246,574 | ||||||||||||||||||||||||
| Net derecognition of financial assets | (101,666 | ) | (27,481 | ) | (66,001 | ) | (195,148 | ) | (83,735 | ) | (7,420 | ) | (181,551 | ) | (272,706 | ) | ||||||||||||||||
| Foreign currency translation | 22,810 | 0 | 0 | 22,810 | 45,837 | 0 | 0 | 45,837 | ||||||||||||||||||||||||
| Balance at period end | 333,494 | 36,733 | 4,301 | 374,528 | 356,814 | 52,464 | 68,784 | 478,062 | ||||||||||||||||||||||||
| September 30, 2021 | December 31, 2020 | |||||||||||||||||||||||||||||||
| Other accounts receivable | 12 months ECL | Lifetime ECL – unimpaired | Lifetime ECL - impaired | Total | 12 months ECL | Lifetime ECL – unimpaired | Lifetime ECL - impaired | Total | ||||||||||||||||||||||||
Balance at January 1
| 6,964,522 | 0 | 0 | 6,964,522 | 4,931,417 | 0 | 0 | 4,931,417 | ||||||||||||||||||||||||
| Portion reclassified as discontinued operation | 333,967 | 0 | 0 | 333,967 | 0 | 0 | 0 | 0 | ||||||||||||||||||||||||
| Net remeasurement of loss allowance | (1,190,799 | ) | 0 | 0 | (1,190,799 | ) | (1,562,598 | ) | 0 | 0 | (1,562,598 | ) | ||||||||||||||||||||
| New financial assets originated | 3,130,602 | 0 | 0 | 3,130,602 | 4,319,715 | 0 | 0 | 4,319,715 | ||||||||||||||||||||||||
| Charge-offs | (1,246,563 | ) | 0 | 0 | (1,246,563 | ) | (1,314,109 | ) | 0 | 0 | (1,314,109 | ) | ||||||||||||||||||||
| Recoveries | 450,774 | 0 | 0 | 450,774 | 655,439 | 0 | 0 | 655,439 | ||||||||||||||||||||||||
| Foreign currency translation | (130,110 | ) | 0 | 0 | (130,110 | ) | (65,342 | ) | 0 | 0 | (65,342 | ) | ||||||||||||||||||||
| Balance at period end | 8,312,393 | 0 | 0 | 8,312,393 | 6,964,522 | 0 | 0 | 6,964,522 | ||||||||||||||||||||||||
Modified Financial Assets
The following table provides information on individually significant financial assets that were modified while having a provision for losses measured in an amount equal to the ECL for the expected life.
| September 30, 2021 | December 31, 2020 | |||||||
| Amortized cost before modification | 71,445,538 | 28,535,003 | ||||||
| Net loss due modification | 322,916 | 1,139,962 | ||||||
| Total | 71,768,454 | 29,674,965 | ||||||
F-39
| (5) | Risk Management, continued |
Concentration of credit risk
The Company follow-up the concentration of credit risk by sector and geographic location. The geographic location of loans and deposits in banks is based on the location of the debtor. In regards to investments, they are based on the location of the issuer. The analysis of the concentration of credit risks as of the date of the condensed consolidated interim financial statements is as follows:
| September 30, 2021 | ||||||||||||||||||||||||||||
| Loans at amortized cost | Commitments and guarantees | Securities purchased under resale agreements | Deposits in banks | Investments at FVOCI | Investments at FVPL | Investments at AC | ||||||||||||||||||||||
| Concentration by sector | ||||||||||||||||||||||||||||
| Government | 0 | 0 | 13,231,790 | 3,102,557,163 | 2,845,771,536 | 33,225,613 | 0 | |||||||||||||||||||||
| Corporate | ||||||||||||||||||||||||||||
| Trade | 1,816,005,588 | 92,085,478 | 0 | 0 | 0 | 0 | 0 | |||||||||||||||||||||
| Real estate | 983,180,111 | 20,894,390 | 0 | 0 | 65,484,930 | 0 | 0 | |||||||||||||||||||||
| Services | 1,347,154,556 | 103,114,177 | 0 | 0 | 2,133,361 | 0 | 0 | |||||||||||||||||||||
| Food Industry | 976,600,447 | 27,512,047 | 0 | 0 | 8,439,215 | 0 | 0 | |||||||||||||||||||||
| General Industry | 942,793,490 | 58,983,498 | 0 | 0 | 0 | 0 | 0 | |||||||||||||||||||||
| Construction | 765,349,788 | 67,490,995 | 0 | 0 | 9,603,052 | 0 | 0 | |||||||||||||||||||||
| Agriculture | 420,932,079 | 6,693,523 | 0 | 0 | 0 | 0 | 0 | |||||||||||||||||||||
| Hotels y restaurants | 286,660,751 | 1,565,927 | 0 | 0 | 0 | 0 | 0 | |||||||||||||||||||||
| Financial | 231,015,059 | 125,263,705 | 0 | 1,143,116,626 | 393,701,380 | 751,010 | 0 | |||||||||||||||||||||
| Transportation | 136,457,170 | 10,841,839 | 0 | 0 | 3,729,989 | 0 | 0 | |||||||||||||||||||||
| Oil and Derivatives | 0 | 0 | 0 | 0 | 6,473,580 | 0 | 0 | |||||||||||||||||||||
| Public Services | 0 | 0 | 0 | 0 | 3,994,114 | 0 | 0 | |||||||||||||||||||||
| Telecommunication | 214,047,320 | 13,005,354 | 0 | 0 | 1,984,382 | 0 | 0 | |||||||||||||||||||||
| Energy | 0 | 0 | 0 | 0 | 108,405,647 | 0 | 0 | |||||||||||||||||||||
| Personal Banking | 9,898,552,434 | 44,598,616 | 0 | 0 | 5,479,133 | 0 | 0 | |||||||||||||||||||||
| Allowance for ECL | (659,640,868 | ) | (374,528 | ) | 0 | 0 | 0 | 0 | 0 | |||||||||||||||||||
| Net carrying amount | 17,359,107,925 | 571,675,021 | 13,231,790 | 4,245,673,789 | 3,455,200,319 | 33,976,623 | 0 | |||||||||||||||||||||
| Geographic location: | ||||||||||||||||||||||||||||
| Panama | 4,938,645,297 | 189,755,372 | 9,352,473 | 1,033,996,114 | 1,150,606,634 | 33,976,623 | 0 | |||||||||||||||||||||
| Costa Rica | 4,229,450,961 | 203,847,495 | 0 | 165,321,619 | 441,093,820 | 0 | 0 | |||||||||||||||||||||
| Guatemala | 3,528,686,187 | 25,981,219 | 3,879,317 | 488,504,478 | 547,231,154 | 3,879,317 | 0 | |||||||||||||||||||||
| Honduras | 2,359,142,837 | 39,356,230 | 0 | 933,487,666 | 483,607,741 | 0 | 0 | |||||||||||||||||||||
| El Salvador | 2,086,079,355 | 101,583,378 | 0 | 393,143,979 | 190,148,571 | 0 | 0 | |||||||||||||||||||||
| Nicaragua | 876,744,156 | 11,525,855 | 0 | 274,338,636 | 283,467,278 | 0 | 0 | |||||||||||||||||||||
| North America | 0 | 0 | 0 | 937,149,232 | 285,477,884 | 0 | 0 | |||||||||||||||||||||
| Europe | 0 | 0 | 0 | 19,713,324 | 0 | 0 | 0 | |||||||||||||||||||||
| South America | 0 | 0 | 0 | 0 | 71,535,752 | 0 | 0 | |||||||||||||||||||||
| Asia | 0 | 0 | 0 | 0 | 0 | 0 | 0 | |||||||||||||||||||||
| Others | 0 | 0 | 0 | 18,741 | 2,031,485 | 0 | 0 | |||||||||||||||||||||
| Allowance for ECL | (659,640,868 | ) | (374,528 | ) | 0 | 0 | 0 | 0 | 0 | |||||||||||||||||||
| Net carrying amount | 17,359,107,925 | 571,675,021 | 13,231,790 | 4,245,673,789 | 3,455,200,319 | 33,976,623 | 0 | |||||||||||||||||||||
F-40
| (5) | Risk Management, continued |
| December 31, 2020 | ||||||||||||||||||||||||||||
| Loans at amortized cost | Commitments and guarantees | Securities purchased under resale agreements | Deposits in banks | Investments at FVOCI | Investments at FVPL | Investments at AC | ||||||||||||||||||||||
| Concentration by sector | ||||||||||||||||||||||||||||
| Government | 0 | 0 | 21,227,306 | 3,289,910,944 | 3,300,483,559 | 55,993,523 | 6,697,211 | |||||||||||||||||||||
| Corporate | ||||||||||||||||||||||||||||
| Trade | 2,034,290,934 | 99,798,814 | 0 | 0 | 0 | 0 | 0 | |||||||||||||||||||||
| Real estate | 1,594,365,633 | 16,018,764 | 0 | 0 | 26,267,820 | 0 | 62,346,802 | |||||||||||||||||||||
| Services | 1,407,653,175 | 121,060,866 | 0 | 0 | 11,668,188 | 0 | 5,274,349 | |||||||||||||||||||||
| Food Industry | 1,030,703,534 | 23,388,580 | 0 | 0 | 7,676,127 | 0 | 0 | |||||||||||||||||||||
| General Industry | 925,664,702 | 34,538,674 | 0 | 0 | 0 | 0 | 0 | |||||||||||||||||||||
| Construction | 701,693,983 | 53,216,553 | 0 | 0 | 20,451,343 | 0 | 0 | |||||||||||||||||||||
| Agriculture | 691,995,156 | 13,184,690 | 0 | 0 | 0 | 0 | 0 | |||||||||||||||||||||
| Hotels y restaurants | 435,152,548 | 1,341,739 | 0 | 0 | 0 | 0 | 0 | |||||||||||||||||||||
| Financial | 295,600,109 | 231,695,072 | 0 | 1,927,130,088 | 277,758,563 | 0 | 0 | |||||||||||||||||||||
| Transportation | 229,599,854 | 16,945,171 | 0 | 0 | 3,351,600 | 0 | 0 | |||||||||||||||||||||
| Oil and derivatives | 0 | 0 | 0 | 0 | 22,604,938 | 16,100 | 0 | |||||||||||||||||||||
| Public Services | 0 | 0 | 0 | 0 | 2,214,224 | 0 | 0 | |||||||||||||||||||||
| Telecommunication | 57,968,423 | 1,525,347 | 0 | 0 | 2,054,845 | 0 | 0 | |||||||||||||||||||||
| Energy | 0 | 0 | 0 | 0 | 93,358,835 | 0 | 4,066,417 | |||||||||||||||||||||
| Personal banking | 10,949,545,755 | 104,785,641 | 0 | 0 | 5,610,387 | 0 | 0 | |||||||||||||||||||||
| Allowance for ECL | (697,819,096 | ) | (478,062 | ) | 0 | 0 | 0 | 0 | 0 | |||||||||||||||||||
| Net carrying amount | 19,656,414,710 | 717,021,849 | 21,227,306 | 5,217,041,032 | 3,773,500,429 | 56,009,623 | 78,384,779 | |||||||||||||||||||||
| Geographic location | ||||||||||||||||||||||||||||
| Panama | 7,156,860,211 | 369,098,030 | 0 | 109,660,948 | 583,372,870 | 34,950,485 | 71,687,568 | |||||||||||||||||||||
| Costa Rica | 4,742,330,177 | 188,846,026 | 16,708,679 | 992,173,423 | 945,596,568 | 21,043,038 | 6,697,211 | |||||||||||||||||||||
| Guatemala | 3,377,429,731 | 20,379,529 | 4,518,627 | 648,779,426 | 553,389,258 | 0 | 0 | |||||||||||||||||||||
| Honduras | 2,271,944,389 | 34,844,463 | 0 | 920,707,396 | 333,599,726 | 0 | 0 | |||||||||||||||||||||
| El Salvador | 1,950,457,095 | 96,780,217 | 0 | 477,182,782 | 267,796,458 | 0 | 0 | |||||||||||||||||||||
| Nicaragua | 855,212,203 | 7,551,646 | 0 | 239,206,300 | 265,489,324 | 0 | 0 | |||||||||||||||||||||
| North America | 0 | 0 | 0 | 1,674,570,770 | 767,626,441 | 0 | 0 | |||||||||||||||||||||
| Europe | 0 | 0 | 0 | 104,695,105 | 0 | 0 | 0 | |||||||||||||||||||||
| South America | 0 | 0 | 0 | 15,000,054 | 53,567,344 | 16,100 | 0 | |||||||||||||||||||||
| Asia | 0 | 0 | 0 | 20,043,874 | 0 | 0 | 0 | |||||||||||||||||||||
| Others | 0 | 0 | 0 | 15,020,954 | 3,062,440 | 0 | 0 | |||||||||||||||||||||
| Allowance for ECL | (697,819,096 | ) | (478,062 | ) | 0 | 0 | 0 | 0 | 0 | |||||||||||||||||||
| Net carrying amount | 19,656,414,710 | 717,021,849 | 21,227,306 | 5,217,041,032 | 3,773,500,429 | 56,009,623 | 78,384,779 | |||||||||||||||||||||
Since April 2018, the Republic of Nicaragua has been facing a series of socio-political events that have economic implications that are affecting the development of activities in the productive sectors of the country.
The Company has been and will continue to monitor the evolution of the liquidity and the quality of the portfolio of financial instruments placed or acquired in that country, in order to mitigate and manage the impacts of this situation.
| (b) | Liquidity Risk |
Liquidity risk is defined as the contingency of not being able to comply fully, in a timely and efficient manner, the expected and unexpected cash flows, current and future, without affecting the course of daily operations or the financial condition of the entity. This contingency (liquidity risk) is evidenced in the insufficient liquid assets available for this and/or the need to assume unusual funding costs.
The liquidity management conducted by the Company seeks to meet its obligations of (i) withdrawals of deposits by its customers, (ii) repayment of the service of its debts of institutional funding according to maturity and the payment scheme scheduled, and (iii) compliance with the credit demand and investment funds according to the requirements. In this regard, the Company has constant control over its short term liabilities and assets.The liquidity of the Company is carefully managed and adjusted daily based on the estimated liquidity in a contingent and expected scenario.
F-41
(5) Risk Management, continued
The best practices of Company’s liquidity management is in compliance with the policies and guidelines issued by Senior management and/or Regional and Local Board of Directors; the regulators of each country in which it operates and the contractual obligations. These best practices are primarily defensive, in the sense of seeking to maintain appropriate levels of liquidity at all times. In addition, the Company has implemented the internal liquidity requirements that force it to keep excesses on regulatory requirements.
Specifically, the Company’s liquidity risk is managed through the calculation of liquidity coverage indicators in the short term, net of obligations and requirements, and in normal and stressful situations, as well as a stress model of liquidity based on the cash flow, which considers the activity of assets and liabilities in a time horizon of up to one year, under a variety of scenarios, which include both normal market conditions and more severe conditions. In addition, the Company seeks to maintain a term matching, which enables it to meet its financial obligations over time.
As in the market risk, Senior Management engages actively in liquidity risk management through regional and local Assets and Liabilities Committee (ALICO) and Comprehensive Risk Management; thus giving greater support to the strategic decision-making process. The liquidity risk assumed by the Company is in line with the structure, complexity, size and nature of its operation, while always respecting the local regulations, the regional guidelines and the guidelines issued by Senior Management and/or Regional and Local Board of Directors.
At the level of the entire Company is established the obligation of properly documenting the periodic assessment of measurement indicators and compliance with regional guidelines and local regulations is established; as well as ensuring that reports related to liquidity risk to be remitted to the different internal and external instances (including the regulator) are adequate in terms of content, quality of information, generation, transmission and validation according to the requirements set forth in the respective standards.
The following table shows the results of the ratios for high-quality liquidity coverage with respect to the outflow of deposits under normal and stressful conditions, calculated based on internal policies, reported as of the reporting date and during the year:
| % of Liquidity | ||||||||||
| September 30, 2021 | December 31, 2020 | |||||||||
| As of year end | 31.1 | 46.3 | ||||||||
| Maximum | 47.1 | 52.9 | ||||||||
| Average | 38.0 | 47.1 | ||||||||
| Minimum | 32.6 | 37.1 | ||||||||
As of September 30, 2021, and December 31, 2020, the banking operations of the Company comply with the liquidity requirements established by the regulators.
F-42
(5) Risk Management, continued
Quantitative information
The following table details the undiscounted cash flows of financial liabilities and financial assets, and disbursements due to financial derivatives in contractual maturity groups from the remaining period from the date of the condensed consolidated statement of financial report:
| September 30, 2021 | ||||||||||||||||||||||||||||
| Amounts in thousands | Carrying Amount | Total nominal gross amount inflows /(outflows) | Up to 1 month | From 1 to 3 months | From 3 months to 1 year | From 1 to 5 years | More than 5 years | |||||||||||||||||||||
| Liabilities | ||||||||||||||||||||||||||||
| Demand deposits | 7,951,130 | (7,951,130 | ) | (7,951,130 | ) | 0 | 0 | 0 | 0 | |||||||||||||||||||
| Savings deposits | 4,655,930 | (4,655,930 | ) | (4,655,930 | ) | 0 | 0 | 0 | 0 | |||||||||||||||||||
| Time deposits | 8,471,051 | (9,170,410 | ) | (769,864 | ) | (1,259,104 | ) | (3,497,791 | ) | (2,924,098 | ) | (719,553 | ) | |||||||||||||||
| Securities sold under repurchase agreements | 10,037 | (10,036 | ) | (8,333 | ) | (1,703 | ) | 0 | 0 | 0 | ||||||||||||||||||
| Financial obligations | 1,428,936 | (1,558,537 | ) | (189,158 | ) | (212,855 | ) | (399,287 | ) | (571,580 | ) | (185,657 | ) | |||||||||||||||
| Other financial obligations | 753,794 | (872,577 | ) | (35,728 | ) | (30,249 | ) | (84,725 | ) | (721,875 | ) | 0 | ||||||||||||||||
| Lease Liabilities | 164,475 | (193,559 | ) | (3,038 | ) | (15,005 | ) | (17,481 | ) | (111,800 | ) | (46,235 | ) | |||||||||||||||
| Sub-total liabilities | 23,435,353 | (24,412,179 | ) | (13,613,181 | ) | (1,518,916 | ) | (3,999,284 | ) | (4,329,353 | ) | (951,445 | ) | |||||||||||||||
| Commitments and guarantees | 65,579 | (65,579 | ) | (11,719 | ) | (7,746 | ) | (45,926 | ) | (188 | ) | 0 | ||||||||||||||||
| Acceptances outstanding | 1,563 | (1,563 | ) | (229 | ) | (414 | ) | (920 | ) | 0 | 0 | |||||||||||||||||
| Total liabilities | 23,502,495 | (24,479,321 | ) | (13,625,129 | ) | (1,527,076 | ) | (4,046,130 | ) | (4,329,541 | ) | (951,445 | ) | |||||||||||||||
Assets | ||||||||||||||||||||||||||||
| Cash and cash equivalents | 605,868 | 605,868 | 605,868 | 0 | 0 | 0 | 0 | |||||||||||||||||||||
| Securities purchased under resale agreements | 13,232 | 13,231 | 8,856 | 4,375 | 0 | 0 | 0 | |||||||||||||||||||||
| Deposits in banks | 4,245,674 | 4,255,643 | 4,152,756 | 10,707 | 26,648 | 51,774 | 13,758 | |||||||||||||||||||||
| Investments at FVPL (1) | 33,977 | 41,595 | 755 | 21 | 1,749 | 29,817 | 9,253 | |||||||||||||||||||||
| Investments at FVOCI (1) | 3,455,200 | 4,042,866 | 113,932 | 203,636 | 684,111 | 1,641,633 | 1,399,554 | |||||||||||||||||||||
| Investments at AC | 0 | 0 | 0 | 0 | 0 | 0 | 0 | |||||||||||||||||||||
| Other accounts receivables | 190,020 | 190,020 | 123,577 | 25,016 | 20,113 | 21,314 | 0 | |||||||||||||||||||||
| Loans at amortized cost, net | 17,359,108 | 23,466,667 | 2,293,036 | 2,663,230 | 3,185,656 | 6,921,555 | 8,403,190 | |||||||||||||||||||||
| Sub-total assets | 25,903,079 | 32,615,891 | 7,298,780 | 2,906,985 | 3,918,278 | 8,666,093 | 9,825,755 | |||||||||||||||||||||
| Acceptances outstanding | 1,563 | 1,563 | 229 | 414 | 920 | 0 | 0 | |||||||||||||||||||||
| Total assets | 25,904,642 | 32,617,453 | 7,299,009 | 2,907,399 | 3,919,197 | 8,666,093 | 9,825,755 | |||||||||||||||||||||
| 1. | Common stocks are excluded |
| December 31, 2020 | ||||||||||||||||||||||||||||
| Amounts in thousands | Carrying Amount | Total nominal gross amount inflows /(outflows) | Up to 1 month | From 1 to 3 months | From 3 months to 1 year | From 1 to 5 years | More than 5 years | |||||||||||||||||||||
| Liabilities | ||||||||||||||||||||||||||||
| Demand deposits | 8,114,873 | (8,114,873 | ) | (8,114,873 | ) | 0 | 0 | 0 | 0 | |||||||||||||||||||
| Savings deposits | 4,605,502 | (4,605,502 | ) | (4,605,502 | ) | 0 | 0 | 0 | 0 | |||||||||||||||||||
| Time deposits | 10,531,530 | (11,332,908 | ) | (909,551 | ) | (1,665,913 | ) | (4,160,759 | ) | (3,904,695 | ) | (691,990 | ) | |||||||||||||||
| Securities sold under repurchase agreements | 41,921 | (42,100 | ) | (21,193 | ) | (2,951 | ) | (17,956 | ) | 0 | 0 | |||||||||||||||||
| Financial obligations | 2,645,123 | (2,876,243 | ) | (31,993 | ) | (217,822 | ) | (951,397 | ) | (1,257,087 | ) | (417,944 | ) | |||||||||||||||
| Other financial obligations | 1,246,358 | (1,402,685 | ) | (114,816 | ) | (34,232 | ) | (157,802 | ) | (1,095,835 | ) | 0 | ||||||||||||||||
| Lease Liabilities | 217,371 | (258,308 | ) | (3,607 | ) | (6,941 | ) | (30,530 | ) | (140,673 | ) | (76,557 | ) | |||||||||||||||
| Sub-total liabilities | 27,402,678 | (28,632,619 | ) | (13,801,535 | ) | (1,927,859 | ) | (5,318,444 | ) | (6,398,290 | ) | (1,186,491 | ) | |||||||||||||||
| Commitments and guarantees | 130,059 | (130,060 | ) | (10,880 | ) | (22,940 | ) | (55,850 | ) | (40,390 | ) | 0 | ||||||||||||||||
| Acceptances outstanding | 197,566 | (197,566 | ) | (1,101 | ) | (54,212 | ) | (142,253 | ) | 0 | 0 | |||||||||||||||||
| Total liabilities | 27,730,303 | (28,960,245 | ) | (13,813,516 | ) | (2,005,011 | ) | (5,516,547 | ) | (6,438,680 | ) | (1,186,491 | ) | |||||||||||||||
Assets | ||||||||||||||||||||||||||||
| Cash and cash equivalents | 729,240 | 729,240 | 729,240 | 0 | 0 | 0 | 0 | |||||||||||||||||||||
| Securities purchased under resale agreements | 21,227 | 21,228 | 15,335 | 5,893 | 0 | 0 | 0 | |||||||||||||||||||||
| Deposits in banks | 5,217,041 | 5,218,230 | 5,127,500 | 76,840 | 12,851 | 1,039 | 0 | |||||||||||||||||||||
| Investments at FVPL (1) | 79,514 | 86,100 | 1,754 | 395 | 19,016 | 54,758 | 10,177 | |||||||||||||||||||||
| Investments at FVOCI (1) | 3,773,500 | 4,152,567 | 390 | 418,863 | 483,619 | 1,829,240 | 1,420,455 | |||||||||||||||||||||
| Investments at AC | 78,385 | 115,091 | 12 | 651 | 9,379 | 36,447 | 68,602 | |||||||||||||||||||||
| Other accounts receivables | 294,950 | 294,950 | 153,857 | 47,137 | 32,889 | 61,067 | 0 | |||||||||||||||||||||
| Loans at amortized cost, net | 19,656,415 | 25,215,938 | 2,808,351 | 2,610,169 | 3,265,740 | 7,757,251 | 8,774,427 | |||||||||||||||||||||
| Sub-total assets | 29,850,272 | 35,833,344 | 8,836,439 | 3,159,948 | 3,823,494 | 9,739,802 | 10,273,661 | |||||||||||||||||||||
| Acceptances outstanding | 197,566 | 197,566 | 1,101 | 54,212 | 142,253 | 0 | 0 | |||||||||||||||||||||
| Total assets | 30,047,838 | 36,030,910 | 8,837,540 | 3,214,160 | 3,965,747 | 9,739,802 | 10,273,661 | |||||||||||||||||||||
| (1) | Common stocks are excluded |
F-43
| (5) | Risk Management, continued |
The liquidity of the Company is measured and monitored on a daily basis by the Treasury of each country. In addition, the Company maintains appropriate levels of cash in vaults, deposits in banks and short-term deposits which constitutes the Company’s basis of liquidity reserves. The composition of liquidity is shown in the following table:
| September 30, 2021 | December 31, 2020 | |||||||
| Cash and cash equivalents | 605,868,262 | 729,239,556 | ||||||
| Securities bought under resale agreements | 13,231,790 | 21,227,306 | ||||||
| Deposits in central banks | 2,837,449,773 | 2,926,805,725 | ||||||
| Deposits due from banks maturing in less than 90 days | 1,319,144,098 | 2,226,746,215 | ||||||
| Deposits due from banks greater than 90 days | 89,079,918 | 63,489,092 | ||||||
| Total cash, cash equivalents and deposits in banks | 4,864,773,841 | 5,967,507,894 | ||||||
| Not committed sovereign debt instruments | 2,869,856,103 | 3,009,431,408 | ||||||
| Other credit lines available (1) | 2,007,494,410 | 3,017,409,447 | ||||||
| Total liquidity reserve | 9,742,124,354 | 11,994,348,749 | ||||||
| (1) Amounts not disbursed as of the reporting date. |
The available credit lines are for use in normal business scenarios. They may have restricted use in stressful situations.
The following table shows the availability of the Company's financial assets to support the future financing:
| September 30, 2021 | Committed | Uncommitted | ||||||||||||||||||
| As Collateral | Available as Collateral | Legal Reserve (1) | Others (2) | Total | ||||||||||||||||
| Cash and cash equivalents | 0 | 0 | 0 | 605,868,262 | 605,868,262 | |||||||||||||||
| Securities purchased under resale agreements | 0 | 0 | 13,231,790 | 0 | 13,231,790 | |||||||||||||||
| Deposits due from banks | 37,743,907 | 345,506,724 | 2,204,116,851 | 1,658,306,307 | 4,245,673,789 | |||||||||||||||
| Investments at FVOCI | 9,141,045 | 3,122,653,583 | 0 | 370,904,799 | 3,502,699,427 | |||||||||||||||
| Investments at AC | 0 | 0 | 0 | 0 | 0 | |||||||||||||||
| Loans at amortized cost | 312,287,497 | 0 | 0 | 17,046,820,428 | 17,359,107,925 | |||||||||||||||
| Total assets | 359,172,449 | 3,468,160,307 | 2,217,348,641 | 19,681,899,796 | 25,726,581,193 | |||||||||||||||
| (1) | It represents uncommitted assets, but whose use the Company considers use to guarantee financing, for legal or other reasons. Committed deposits in banks comprise the legal reserve required by the different jurisdictions in which the Company operates, and can be used according to the regulation of each country. |
| (2) | It represents assets that are uncommitted for use as collateral. |
| December 31, 2020 | Committed | Uncommitted | ||||||||||||||||||
| As Collateral | Available as Collateral | Legal Reserve (1) | Others | Total | ||||||||||||||||
| Cash and cash equivalents | 0 | 0 | 0 | 729,239,556 | 729,239,556 | |||||||||||||||
| Securities purchased under resale agreements | 0 | 0 | 21,227,306 | 0 | 21,227,306 | |||||||||||||||
| Deposits due from banks | 140,012,863 | 327,787,776 | 2,058,375,857 | 2,690,864,536 | 5,217,041,032 | |||||||||||||||
| Investments at FVOCI | 383,875,413 | 2,980,256,770 | 0 | 506,368,884 | 3,870,501,067 | |||||||||||||||
| Investments at AC | 0 | 0 | 0 | 78,384,779 | 78,384,779 | |||||||||||||||
| Loans at amortized cost | 355,360,261 | 0 | 0 | 19,301,054,449 | 19,656,414,710 | |||||||||||||||
| Total assets | 879,248,537 | 3,308,044,546 | 2,079,603,163 | 23,305,912,204 | 29,572,808,450 | |||||||||||||||
| (1) | It represents uncommitted assets, but whose use the Company considers use to guarantee financing, for legal or other reasons. Committed deposits in banks comprise the legal reserve required by the different jurisdictions in which the Company operates, and can be used according to the regulation of each country. |
| (2) | It represents assets that are uncommitted for use as collateral. |
| (c) | Market risk |
Market risks are those that may result in losses as a result of adverse price movements in the financial markets where positions are maintained. It comprises the following risks:
| - | Interest rate risk: is the possibility of an economic loss due to adverse variations in interest rates. |
| - | Exchange rate risk: is the possibility of an economic loss due to adverse variations in the exchange rate. |
The main objectives of the Company’s corporate governance structure include supervising the performance of the management team in each country, ensuring the proper functioning of the internal control system, monitoring the exposure to risks and managing them effectively. For such purpose, management engages actively in market risk management through the regional and local Assets and Liabilities Committees (ALICO) and the Comprehensive Risk Management Committee; thus giving greater support to the strategic decision-making process.
F-44
| (5) | Risk Management, continued |
Market risks assumed by the Company are in line with the structure, complexity, size and nature of its operation, while always respecting the local regulations, the regional guidelines and the guidelines issued by management and/or regional and local board of directors.
The Company establishes the requirement of properly documenting the periodic assessment of measurement indicators and compliance with regional guidelines and local regulations, as well as ensuring that reports related to market risk to be remitted to the different internal and external instances (including the regulator) are adequate in terms of the content, quality of information, generation, transmission and validation according to the requirements set forth in the respective standards.
For the measurement, control and management of market risk, the Company uses the indicators required by the regulator of each country as well as another set of indicators established in the internal regional guideline, which are calculated by country and in a consolidated manner based on internal sources of information.
Exchange risk is measured through the determination of the equity percentage that is not dollarized (also known as monetary position). The main objective of the policy is to establish that the difference between assets denominated in US dollars and liabilities denominated in US dollars is at least equal to equity, which is equivalent to having a 100% dollarized equity. However, due to regulatory restrictions applicable in each country that limit the position in US dollars, the consolidated monetary position may be below this desirable limit.
Quantitative information
The Company maintains operations in the condensed consolidated statement of financial position, agreed in local currency other than US dollars, which are listed below:
September 30, 2021
Amounts in US millions | Euro | GBP Pound | Canadian dollars | Swiss Francs | Quetzales | Lempiras | Cordobas | Colones | Total | |||||||||||||||||||||||||||
| Cash, cash equivalents and deposits in banks | 37 | 0 | 0 | 0 | 288 | 794 | 128 | 554 | 1,764 | |||||||||||||||||||||||||||
| Investments in securities | 0 | 0 | 0 | 0 | 416 | 439 | 0 | 250 | 1,105 | |||||||||||||||||||||||||||
| Loans, net | 0 | 0 | 0 | 0 | 1,885 | 1,633 | 86 | 1,656 | 5,260 | |||||||||||||||||||||||||||
| Total assets | 37 | 0 | 0 | 0 | 2,589 | 2,866 | 214 | 2,460 | 8,129 | |||||||||||||||||||||||||||
| Deposits | 15 | 0 | 0 | 0 | 2,142 | 2,269 | 301 | 2,103 | 6,815 | |||||||||||||||||||||||||||
| Obligations | 0 | 0 | 0 | 0 | 252 | 196 | 0 | 175 | 623 | |||||||||||||||||||||||||||
| Total liabilities | 15 | 0 | 0 | 0 | 2,394 | 2,465 | 301 | 2,278 | 7,438 | |||||||||||||||||||||||||||
| Contingencies | 0 | 0 | 0 | 0 | 0 | 23 | 0 | 34 | 57 | |||||||||||||||||||||||||||
| Exchange risk exposure | 22 | 0 | 0 | 0 | 195 | 424 | (87 | ) | 216 | 770 | ||||||||||||||||||||||||||
| December 31, 2020 | Euro | GBP Pound | Canadian dollars | Swiss Francs | Quetzales | Lempiras | Cordobas | Colones | Total | |||||||||||||||||||||||||||
| Amounts in US millions | ||||||||||||||||||||||||||||||||||||
| Cash, cash equivalents and deposits in banks | 30 | 4 | 1 | 2 | 502 | 816 | 126 | 587 | 2,068 | |||||||||||||||||||||||||||
| Investments in securities | 0 | 0 | 0 | 0 | 450 | 305 | 0 | 243 | 998 | |||||||||||||||||||||||||||
| Loans, net | 0 | 0 | 0 | 0 | 1,773 | 1,495 | 71 | 1,532 | 4,871 | |||||||||||||||||||||||||||
| Total assets | 30 | 4 | 1 | 2 | 2,725 | 2,616 | 197 | 2,362 | 7,937 | |||||||||||||||||||||||||||
| Deposits | 32 | 4 | 1 | 2 | 2,299 | 2,104 | 283 | 2,165 | 6,890 | |||||||||||||||||||||||||||
| Obligations | 0 | 0 | 0 | 113 | 256 | 193 | 0 | 41 | 603 | |||||||||||||||||||||||||||
| Total liabilities | 32 | 4 | 1 | 115 | 2,555 | 2,297 | 283 | 2,206 | 7,493 | |||||||||||||||||||||||||||
| Contingencies | 0 | 0 | 0 | 0 | 0 | 20 | 0 | 34 | 54 | |||||||||||||||||||||||||||
| Exchange risk exposure | (2 | ) | 0 | 0 | (113 | ) | 170 | 339 | (86 | ) | 190 | 498 | ||||||||||||||||||||||||
F-45
| (5) | Risk Management, continued |
Below, the summary exposure of the Company’s consolidated statement of financial position to interest rate risk. Assets and liabilities are included in the table at their carrying amount, classified by categories of time considering the next rate review date or the maturity date, as applicable:
| September 30, 2021 | Without exposure | Up to 1 year | From 1 to 5 years | More than 5 years | Total | |||||||||||||||
| Cash and cash equivalents | 605,868,262 | 0 | 0 | 0 | 605,868,262 | |||||||||||||||
| Securities purchased under resale agreements | 9,231 | 13,222,559 | 0 | 0 | 13,231,790 | |||||||||||||||
| Deposits due from banks | 2,241,225,364 | 1,946,213,165 | 44,960,260 | 13,275,000 | 4,245,673,789 | |||||||||||||||
| Investments in securities | 623,941,251 | 378,321,424 | 1,315,312,826 | 1,185,123,926 | 3,502,699,427 | |||||||||||||||
| Loans at amortized cost | 204,055,611 | 15,542,422,441 | 1,509,245,282 | 103,384,591 | 17,359,107,925 | |||||||||||||||
| Total assets | 3,675,099,719 | 17,880,179,589 | 2,869,518,368 | 1,301,783,517 | 25,726,581,193 | |||||||||||||||
| Deposits | 1,285,525,128 | 16,687,712,753 | 2,547,992,566 | 556,880,230 | 21,078,110,677 | |||||||||||||||
| Securities sold under resale agreements | 10,730 | 10,026,108 | 0 | 0 | 10,036,838 | |||||||||||||||
| Financial obligations | 7,531,083 | 778,642,777 | 342,416,617 | 300,345,794 | 1,428,936,271 | |||||||||||||||
| Other financial obligations | 3,855,592 | 115,156,984 | 634,781,145 | 0 | 753,793,721 | |||||||||||||||
| Total liabilities | 1,296,922,533 | 17,591,538,622 | 3,525,190,328 | 857,226,024 | 23,270,877,507 | |||||||||||||||
| Exposure to interest rate risk | 2,378,177,186 | 288,640,967 | (655,671,960 | ) | 444,557,493 | 2,455,703,686 | ||||||||||||||
| December 31, 2020 | Without exposure | Up to 1 year | From 1 to 5 years | More than 5 years | Total | |||||||||||||||
| Cash and cash equivalents | 729,239,556 | 0 | 0 | 0 | 729,239,556 | |||||||||||||||
| Securities purchased under resale agreements | 41,248 | 21,186,058 | 0 | 0 | 21,227,306 | |||||||||||||||
| Deposits due from banks | 2,266,786,844 | 2,949,254,188 | 1,000,000 | 0 | 5,217,041,032 | |||||||||||||||
| Investments in securities | 898,103,512 | 444,877,353 | 1,408,452,121 | 1,197,452,860 | 3,948,885,846 | |||||||||||||||
| Loans at amortized cost | 326,481,873 | 17,198,537,311 | 1,272,937,277 | 858,458,249 | 19,656,414,710 | |||||||||||||||
| Total assets | 4,220,653,033 | 20,613,854,910 | 2,682,389,398 | 2,055,911,109 | 29,572,808,450 | |||||||||||||||
| Deposits | 1,552,283,456 | 17,716,146,820 | 3,447,496,370 | 535,979,239 | 23,251,905,885 | |||||||||||||||
| Securities sold under resale agreements | 41,408 | 41,879,364 | 0 | 0 | 41,920,772 | |||||||||||||||
| Financial obligations | 11,372,912 | 1,503,715,397 | 530,234,311 | 599,800,390 | 2,645,123,010 | |||||||||||||||
| Other obligations | 11,269,613 | 251,765,775 | 983,322,262 | 0 | 1,246,357,650 | |||||||||||||||
| Total liabilities | 1,574,967,389 | 19,513,507,356 | 4,961,052,943 | 1,135,779,629 | 27,185,307,317 | |||||||||||||||
| Exposure to interest rate risk | 2,645,685,644 | 1,100,347,554 | (2,278,663,545 | ) | 920,131,480 | 2,387,501,133 | ||||||||||||||
Based on the above, the Company calculates the total exposure of the condensed consolidated statement of financial position to interest rate risk. The Company states that the interest rate risk should be measured for each currency in which assets and liabilities are maintained.
Interest rate risk is analyzed based on the gap analysis, in order to approximate the change in equity of the Company's consolidated statement of financial position and in the net income from interest from eventual changes in market interest rates. The economic value of an instrument involves an assessment of the current value of its expected net cash flows, discounted to reflect market rates. By extension, the economic value of a financial entity can be seen as the present value of expected net cash flows from the entity, defined as expected cash flows from assets less expected cash flows from liabilities. In this sense, the perspective of economic value reflects a view of the sensitivity of the financial entity net value to interest rate fluctuations.
F-46
| (5) | Risk Management, continued |
The estimate of the impact of variations in interest rates is conducted under a scenario of increase or decrease of 100 basis points in assets and liabilities at the different terms (parallel movement of the curve). The following table presents a summary of the impact on the Company's economic value and on the net interest income applying these variations:
| Increase of | Decrease of | |||||||
| 100 bps (1) | 100 bps (1) | |||||||
| Impact on equity to interest rate movements | �� | |||||||
| September 30, 2021 | (14,341,280 | ) | 14,341,280 | |||||
| Average for the year | 2,041,386 | (2,041,386 | ) | |||||
| Maximum for the year | 21,752,386 | (21,752,386 | ) | |||||
| Minimum for the year | (14,341,280 | ) | 14,341,280 | |||||
| December 31, 2020 | (9,714,573 | ) | 9,714,573 | |||||
| Average for the year | 12,254,951 | (12,254,951 | ) | |||||
| Maximum for the year | 63,501,786 | (63,501,786 | ) | |||||
| Minimum for the year | (34,644,684 | ) | 34,644,684 | |||||
| Impact on net income from interests | ||||||||
| September 30, 2021 | 71,956,921 | (71,956,921 | ) | |||||
| Average for the year | 67,950,688 | (67,950,688 | ) | |||||
| Maximum for the year | 69,731,333 | (69,731,333 | ) | |||||
| Minimum for the year | 65,031,173 | (65,031,173 | ) | |||||
| December 31, 2020 | 64,360,713 | (64,360,713 | ) | |||||
| Average for the year | 62,931,008 | (62,931,008 | ) | |||||
| Maximum for the year | 67,625,540 | (67,625,540 | ) | |||||
| Minimum for the year | 59,064,722 | (59,064,722 | ) | |||||
| (1) | According to the nature of the instruments on demand, the sensitivity of annual income and expenses to a decrease or increase in rates for currencies with rates below 1% is measured using a variation of 25 basis points. |
| (d) | Operational risk |
The Company has established a minimum framework for operational risk management within its companies, which is intended to provide general guidelines to ensure the identification, assessment, control, monitoring and reporting of operational risks and materialized events that may affect the organization with the objective of ensuring the proper management, mitigation or reduction of the managed risks and contributing to provide a reasonable assurance with respect to the achievement of organizational objectives.
The operational risk management model considers best practices issued by the Basel Committee on Banking Supervision and by COSO (Committee of Sponsoring Organizations of the Treadway Commission). In addition, it complies with the regulatory requirements of the region, which have been defined by the regulators of the countries where the Company operates.
Based on the above, operational risk is defined as the possibility that the events resulting from personnel, information technologies or inadequate or failed internal processes, or produced by external causes, generate negative impacts that go against the objectives. By its nature, it is present in all of the organization’s activities.
The priority of the Company is, therefore, identifying and managing the major risk factors, regardless of whether they can produce monetary losses. The measurement also contributes to the establishment of priorities in the management of operational risk.
The operational risk management system is properly documented in the Operational Risk Guideline and Manual. It is a continuous process with several stages:
· Measurement of the perspective of control environment
· Identification and assessment of operational risks
· Treatment and mitigation of operational risks
· Risk monitoring and review
· Registration and accounting of losses due to operational risk incidents
Additionally, the Company has policies formally established for the management of information security, business continuity, fraud prevention and code of ethics that support the proper management of operational risks in the organization.
F-47
| (5) | Risk Management, continued |
At the regional level and in all countries where the Company operates, there is an operational risk management unit that monitors, advises and assesses the management conducted by the administration with regard to operational risks. In addition, there is a specialized Operational Risk Committee (OR Committee) composed of senior management. The OR Committee reports to the Comprehensive Risk Management Committee, monitors management and ensures that identified operational risks are kept at accepted levels by the organization.
Compliance with Company standards is supported by a program of periodic reviews undertaken by Internal Audit, which reports the results to the Internal Audit Committee of each entity where the Company operates.
| (6) | COVID – 19 |
Impact of the pandemic of the spread of COVID-19
During the first half of 2020, the Coronavirus (COVID-19) spread all over the world, generating the closure of production and supply chains and interrupting international trade, which is causing a global economic slowdown that is affecting various industries. Global authorities, including those in the countries where the Company operates, have adopted, among other measures, the temporary closure of establishments and the mandatory preventive confinement of persons in various areas, resulting in employees, suppliers, and customers being unable to carry out their activities normally.
During the following periods of 2020, this situation has been monitored on a daily basis by the Company's management to assess the adverse effects that could be generated on the results of operations, the financial situation and the liquidity of the Company, and take all the appropriate measures to minimize the negative impacts that may arise from this situation during the 2020 financial year and subsequent periods. The Company continues to have a reasonable expectation that it has adequate resources to continue as a going concern indefinitely.
As of September 30, 2021, the Company has not defaulted on the principal or interest payments of its financial obligations. As a result of the regulatory responses that Central Banks and Regulatory Entities implemented in most of the countries where the Company operates, in order to mitigate the macroeconomic and financial impacts generated by the COVID-19 pandemic, there are non-compliance with some commitments contractual, mainly associated with specific financial indicators that have been impacted by such implementations.
As of September 30, 2021, the following issues have been evaluated, which in some cases have generated impacts on the Company's financial statements and operations and on which, during the period after the date of these financial statements and until the date of issue, continue to be monitored by the administration to address its effects on the Company's operations and those of its clients.
| a) | Impairment of financial instruments — Portfolio of receivables, other accounts receivable and other |
Financial instruments that are within the scope of the Expected Credit Loss Model (PCE) of IFRS 9 (loans, trade accounts and other accounts receivable, unmeasured debt instruments at fair value through profit or loss, accounts loan receivables, financial guarantees and loan commitments), have been assessed considering the impacts that COVID-19 is having on the PCE by the measures taken by governments in each of the countries and regions where the Company operates.
The impacts that have been generated for the Company's entities in relation to the deterioration of financial instruments are based on the following aspects:
| · | Measurement of the ECL, by changes in the allocation of credit risk of financial instruments, incorporating affectation analysis by COVID and generating an impact on the provision, moving from measurement for 12 months (stage 1) to measurement for the remaining life of the instrument (stages 2 and 3) for those in which it is determined that there was a significant increased credit risk since its initial measurement. |
| · | Credit risk, the behavior of which has changed for institutions according to the economic segments of their loan portfolios, increasing in the case of clients whose business has been negatively affected. |
| · | The amount at risk (default exposure), taking into account the fact that affected debtors of some of the Company's entities have been found to have stopped making payments or are taking more time than normal to pay, mainly within the framework of relief schemes promulgated by different governments. |
| · | The estimated loss for credits that are assessed individually, resulting from lower recovery of flows taking into account the impact caused by COVID-19. |
| · | Macroeconomic aspects considered in the elaboration of scenarios and models for the calculation of the provision, where some of the variables have been weakened in view of the effects of COVID on the economy. |
F-48
| (6) | COVID – 19, continued |
The calculation of expected credit risk losses incorporated from the second quarter of 2020 forward-looking information projections, in line with the effects of the decisions that governments continue to take around COVID-19, and considering the high level of uncertainty in these terms of intensity and duration. The projection information has been based on the best available information obtained, considering the different geographical areas where the Company operates, and taking into account the effects on segments and portfolios of different entities, which are exposed to different risks and situations.
When considering prospective information based on macroeconomic variables, the Company updated the scenarios used and the probabilities assigned to them at the end of September 30, 2021, with the effects shown in the following two tables:
| i. | Macroeconomic variables used in the calculation of ECL |
| September 30, 2021 | |||||||
| Guatemala | Honduras | El Salvador | Nicaragua | Costa Rica | Panama | ||
| % | % | % | % | % | |||
| Monthly Economic Activity Index | Upside | 5.05 | 5.41 | 5.02 | 2.48 | 4.49 | 9.78 |
| Central | 4.31 | 4.38 | 3.17 | 0.99 | 3.54 | 8.72 | |
| Downside | 2.53 | 3.16 | 1.33 | (1.91) | 2.14 | 5.42 | |
| Consumer Price Index | Upside | 2.96 | 2.67 | 0.77 | 2.89 | 0.53 | 0.87 |
| Central | 4.40 | 4.09 | 1.58 | 4.40 | 1.77 | 1.81 | |
| Downside | 5.56 | 4.37 | 2.33 | 4.92 | 2.62 | 2.65 | |
| Exchange Rate | Upside | (0.73) | (0.85) | - | (0.39) | 2.47 | - |
| Central | (0.04) | (0.32) | - | 2.59 | 3.49 | - | |
| Downside | 1.47 | 1.25 | - | 4.13 | 4.96 | - | |
| Local Currency Interest Rate | Upside | (0.95) | (1.73) | - | (1.15) | (2.46) | - |
| Central | (0.19) | (0.85) | - | 1.05 | (1.90) | - | |
| Downside | (0.18) | 0.19 | - | 1.95 | 0.12 | - | |
| Dollars Interest Rate | Upside | (0.31) | (0.40) | (0.20) | (0.52) | (2.13) | (0.55) |
| Central | (0.11) | (0.14) | 0.36 | 0.13 | (0.82) | (0.23) | |
| Downside | (0.03) | 0.41 | 0.80 | 1.09 | 0.38 | 0.85 | |
| December 31, 2020 | |||||||
| Guatemala | Honduras | El Salvador | Nicaragua | Costa Rica | Panama | ||
| % | % | % | % | % | |||
| Monthly Economic Activity Index | Upside | 5.46 | 4.19 | 4.25 | 2.27 | 3.58 | 5.54 |
| Central | 3.90 | 3.42 | 3.18 | 0.23 | 2.32 | 3.34 | |
| Downside | 1.60 | 1.50 | 1.54 | (2.25) | 0.41 | 1.63 | |
| Consumer Price Index | Upside | 2.53 | 2.85 | (0.28) | 2.39 | 0.65 | (0.58) |
| Central | 3.26 | 3.54 | 0.18 | 2.69 | 0.85 | (0.16) | |
| Downside | 5.24 | 3.39 | 1.18 | 3.60 | 1.85 | 1.21 | |
| Exchange Rate | Upside | (1.54) | (0.74) | - | 2.35 | 2.35 | - |
| Central | (0.12) | 0.51 | - | 2.89 | 3.69 | - | |
| Downside | 1.18 | 1.38 | - | 4.09 | 5.13 | - | |
| Local Currency Interest Rate | Upside | (0.50) | (0.56) | - | (1.43) | (0.21) | - |
| Central | (0.28) | (0.30) | - | 0.03 | 1.29 | - | |
| Downside | 0.03 | 0.08 | - | 0.93 | 1.66 | - | |
| Dollars Interest Rate | Upside | (0.50) | (0.18) | (0.06) | (0.95) | (1.28) | (0.16) |
| Central | (0.15) | (0.09) | 0.44 | (0.18) | 0.28 | (0.02) | |
| Downside | 0.11 | 0.11 | 1.15 | 1.41 | 1.02 | 0.16 | |
| ii. | Weighting of probabilities assigned to scenarios before and after COVID-19 |
| September 30, 2021 | ||||||
| Guatemala | Honduras | El Salvador | Nicaragua | Costa Rica | Panama | |
| Upside | 25% | 20% | 15% | 10% | 15% | 20% |
| Central | 65% | 60% | 65% | 60% | 65% | 60% |
| Downside | 10% | 20% | 20% | 30% | 20% | 20% |
| December 31, 2020 | ||||||
| Guatemala | Honduras | El Salvador | Nicaragua | Costa Rica | Panama | |
| Upside | 25% | 20% | 15% | 15% | 5% | 10% |
| Central | 65% | 65% | 65% | 65% | 60% | 60% |
| Downside | 10% | 15% | 20% | 20% | 35% | 30% |
F-49
| (6) | COVID – 19, continued |
The macroeconomic scenarios were adjusted to reflect the impacts of COVID-19 and the weights assigned to each scenario were recalibrated based on the expectations resulting from the information available to date (as well as updating historical information, assumptions related to the severity and duration of the pandemic, speed of recovery of the economy and their respective impact on the market).
The possible impacts considering the different macroeconomic scenarios are presented in Note 5 in the table "Sensitivity of the ECL to future conditions".
The Company continues to monitor continuously information that allows it to identify in a timely manner possible impact to ECL.
| iii. | Impairment allowance balances |
September 30, 2021 | June 30, 2021 | March 31, 2021 | December 31, 2020 | |||||||||||||
| Corporate | (144,382,920 | ) | (163,400,806 | ) | (161,488,382 | ) | (151,736,641 | ) | ||||||||
| Small Company | (23,664,878 | ) | (22,794,014 | ) | (18,780,840 | ) | (19,927,612 | ) | ||||||||
| Mortgage | (85,940,573 | ) | (94,086,444 | ) | (86,745,344 | ) | (79,146,234 | ) | ||||||||
| Personal banking | (90,968,725 | ) | (91,043,725 | ) | (92,153,574 | ) | (93,685,907 | ) | ||||||||
| Vehicles | (22,681,677 | ) | (27,676,610 | ) | (26,346,526 | ) | (24,042,414 | ) | ||||||||
| Credit Card | (292,002,095 | ) | (297,807,087 | ) | (311,340,733 | ) | (329,280,288 | ) | ||||||||
| Total | (659,640,868 | ) | (696,808,686 | ) | (696,855,399 | ) | (697,819,096 | ) | ||||||||
The table above summarizes the total balance of the provision by portfolio for each quarter of 2021. The detail of the movement of the provision, transfers between stages, the impact by refinement of models, among others, is presented in the Note 5.
| iv. | Loan’s Portfolio provision expense |
September 30, 2021 | June 30, 2021 | March 31, 2021 | December 31, 2020 | |||||||||||||
| Corporate | 7,540,137 | 18,825,797 | 15,479,069 | 23,841,780 | ||||||||||||
| Small Company | 5,217,129 | 5,384,260 | 1,077,097 | 4,934,559 | ||||||||||||
| Mortgage | 6,080,804 | 4,672,811 | 7,479,945 | 25,730,151 | ||||||||||||
| Personal banking | 15,291,376 | 5,825,491 | 8,675,416 | 13,068,351 | ||||||||||||
| Vehicles | 5,043,414 | 3,282,211 | 4,366,582 | 10,935,825 | ||||||||||||
| Credit Card | 47,672,310 | 43,375,705 | 46,983,126 | 68,114,112 | ||||||||||||
| Total | 86,845,170 | 81,366,275 | 84,061,235 | 146,624,778 | ||||||||||||
The above table summarizes the impairment provision expense per portfolio for each quarter of 2021.
| b) | Reliefs to customers |
The actions taken or suggested by the governments of the countries in which the Company operates have promoted the generation of reliefs to customers (companies or individuals) between April 2020 and September 2021 in relation to loans or loan agreements in force, which have involved the renegotiation of their terms including, among others, the granting of grace periods, deferment of assessments, extension of deadlines and extension of credit quotas. The following table summarizes the volume of relief granted by portfolio and its effects on the Company´s result:
| Corporate | Small Company | Mortgage | Personal banking | Vehicles | Credit Card | |||||||||||||||||||
September 30, 2021 Amount of credits with relief granted | 2,910 | 6,288 | 21,461 | 53,707 | 32,847 | 302,382 | ||||||||||||||||||
| % of credit with relief / Total credits | 49.11 | % | 58.99 | % | 65.09 | % | 33.62 | % | 60.45 | % | 58.38 | % | ||||||||||||
As of September 30, 2021, the impact recognized in results for COVID-19 relief is $233,030.
To date, the governments of the countries where the Company operates have not decreed direct support to banks.
| c) | Leases from the perspective of the lessee |
Between lessors and lessees, since April 2020, processes have been carried out to renegotiate the terms of their lease agreements, as a result of which the lessors have granted the lessees concessions of some kind in connection with the lease payments.
F-50
| (6) | COVID – 19, continued |
Some entities of the Company that have leased goods have renegotiated the terms of their lease agreements as a result of the crisis triggered by COVID-19. The Company has considered, in its role as lessee, the proper accounting of these concessions analyzing whether or not they correspond to modifications of the contract; this analysis resulted in the recognition of gains and/or losses in the statement of profit or loss and the adjustment of the lease liabilities, with the impacts that are exposed in the following table:
| Relief mode | Number of relief received | % Relief contracts / Total contracts | Recognized effect on results | |||||||||
| Decrease in the fee for a number of months | 145 | 22.27 | % | 332,909 | ||||||||
| (7) | Critical Accounting Estimates and Judgments in the Implementation of Accounting Policies |
The Company's management is responsible for the development, selection, disclosure of policies and critical accounting estimates and their implementation in a manner consistent with the assumptions selected and related to the significant estimate uncertainties.
The significant judgments applied by management in its accounting policies and the key sources related to significant estimation uncertainties are the same as those described in the annual financial statements.
Loan Impairment Losses
The Company reviews its loan portfolio to assess the impairment at least on a quarterly basis. When determining whether an impairment loss should be recorded in the condensed consolidated statement of income, the Company makes decisions as to whether observable information exists indicating that there is a measurable reduction in estimated future cash flows from a loan portfolio before such reduction may be identified with an individual loan in that portfolio. This evidence includes observable information indicating that an adverse change in the payment condition of borrowers in a group, national or local economic conditions that correlate with non-compliance instances in Company’s assets have occurred.
Fair Value of Financial Instruments
Fair value of financial instruments that are not quoted in active markets is determined using valuation techniques. All models are evaluated and adjusted before use, and the models are calibrated to ensure that the results reflect current information and comparative market prices.
To the extent possible, models only use observable information; however, areas such as credit risk (own and by the counterparty), volatilities and correlations require estimates by management. Changes in assumptions about these factors may affect the reported fair value of financial instruments.
Impairment of Investments at FVOCI
In debt instruments the impairment may be appropriate when there is evidence of impairment in the financial health of the issuer, industry or sector performance, changes in technology, and operational and financial cash flows.
Goodwill Impairment
The Company will determine whether goodwill is impaired annually or when there is indication of possible impairment.
This requires an estimate of the value in use of CGUs to which the goodwill value is attributed. The estimate of the value in use requires management to consider the expected cash flows from CGUs and also the selection of an appropriate discount rate to calculate the current value of such cash flows.
Income Tax
The Company uses the asset and liability method to record income tax. Under this method, the deferred tax assets and liabilities are recognized by the estimates of future tax consequences attributable to temporary differences between the amounts of assets and liabilities in the condensed consolidated interim financial statements and their respective tax bases and due to accumulated tax losses. The deferred tax assets and liabilities are valued using the enacted tax rates that are expected to be applied to the tax revenue for the years in which they are expected to be recovered or temporary differences are settled.
The effect on deferred tax assets and liabilities by a change in tax rates is recognized in the operation results in the year in which the change occurs.
Management regularly assesses the realization of deferred tax assets for it recognition. Management evaluates whether it is more likely than not that a portion or all deferred tax assets are not realizable.
F-51
| (8) | Cash, Cash Equivalents and Deposits |
Cash and cash equivalents are listed below for reconciliation purposes with the condensed consolidated statement of cash flow:
September 30, 2021 | December 31, 2020 | |||||||
| Cash and cash equivalents | 605,868,262 | 527,163,972 | ||||||
| Securities purchased under resale agreements | 13,231,790 | 9,269,238 | ||||||
| Deposits in central banks | 2,837,449,773 | 2,579,070,847 | ||||||
| Deposits in banks and deposits due in less than 90 days | 1,319,144,098 | 1,917,766,307 | ||||||
| Cash and cash equivalents in the cash flow statement | 4,775,693,923 | 5,033,270,364 | ||||||
| Deposits in banks greater than 90 days and pledged | 89,079,918 | 62,791,442 | ||||||
| Total cash, cash equivalents and deposits in banks | 4,864,773,841 | 5,096,061,806 | ||||||
| (9) | Securities Purchased Under Resale Agreements |
As of September 30, 2021, securities purchased under resale agreements amounted to $13,231,790 (December 31, 2020: $21,227,306), which had maturity dates in November 2021 (December 31, 2020: February 2021) and an interest rate between 1.5% and 2.9% (December 31, 2020: between 1.9% and 2.8%). These securities were guaranteed with local government bonds and corporate bonds, which amounted to $15,348,109 (December 31, 2020: $26,690,737).
| (10) | Investments at Fair Value |
As of September 30, 2021, investments at fair value amounted to $3,502,699,427 (December 31, 2020: $3,948,885,846) are summarized as follows:
| (a) | Investments at FVPL |
The portfolio of investments in securities at FVPL is detailed as follows:
September 30, 2021 | December 31, 2020 | |||||||
| Government bonds | 33,225,613 | 55,993,523 | ||||||
| Corporate bonds | 0 | 16,100 | ||||||
| Mutual funds | 751,010 | 23,504,431 | ||||||
| Common stocks | 10,462,896 | 12,425,258 | ||||||
| 44,439,519 | 91,939,312 | |||||||
As of September 30, 2021, securities at FVPL with a carrying amount of $5,562,458 (December 31, 2020: $6,163,940) are used as collateral for repurchase agreements.
| (b) | Investments at FVOCI |
The portfolio of investments at FVOCI is detailed as follows:
September 30, 2021 | December 31, 2020 | |||||||
| Governments and Agencies | ||||||||
| United States of America | 9,833,240 | 680,165,101 | ||||||
| Other governments | 2,835,938,296 | 2,620,318,458 | ||||||
| 2,845,771,536 | 3,300,483,559 | |||||||
| Corporate bonds | 609,428,783 | 473,016,870 | ||||||
| Common stocks | 3,059,589 | 5,061,326 | ||||||
| 3,458,259,908 | 3,778,561,755 | |||||||
The Company maintains a portfolio of equity investments issued by the following companies:
| Entity | Country | September 30, 2021 | December 31, 2020 | |||||||||
| Latinex Holdings, Inc. | Panama | 521,682 | 2,035,798 | |||||||||
| Grupo APC, S. A. | Panama | 445,582 | 512,858 | |||||||||
| Transacciones y Transferencia, S. A. | Guatemala | 310,200 | 445,582 | |||||||||
| ACH DE NICARAGUA | Nicaragua | 190,980 | 307,805 | |||||||||
| Others | Others | 1,591,145 | 1,759,283 | |||||||||
| 3,059,589 | 5,061,326 | |||||||||||
As of September 30, 2021, the portfolio of common stocks at FVOCI had a variation in the Company’s Other Comprehensive Results of $11,653 (September 30, 2020: $11,210). As of September 30, 2021, the Company received $892,659 for dividends of common stocks at FVOCI (September 30, 2020: $779,227).
F-52
| (10) | Investments at Fair Value, continued |
| (c) | Investments at AC |
The investment portfolio at AC is detailed as follows:
September 30, 2021 | December 31, 2020 | |||||||
| Government bonds | 0 | 6,697,211 | ||||||
| 0 | 6,697,211 | |||||||
| Corporate bonds | 0 | 71,687,568 | ||||||
| 0 | 78,384,779 | |||||||
| (11) | Loans |
A breakdown of the loan portfolio by type is as follows:
| September 30, 2021 | December 31, 2020 | |||||||||||||||||||||||
| Portfolio | Allowance for ECL | Net portfolio of allowance | Portfolio | Allowance for ECL | Net portfolio of allowance | |||||||||||||||||||
| Loans | ||||||||||||||||||||||||
| Corporate | ||||||||||||||||||||||||
| Corporate loans | 7,179,492,344 | (140,893,076 | ) | 7,038,599,268 | 8,396,593,897 | (148,546,587 | ) | 8,248,047,310 | ||||||||||||||||
| Corporate leases, net (1) | 150,901,512 | (3,489,844 | ) | 147,411,668 | 149,545,637 | (3,190,054 | ) | 146,355,583 | ||||||||||||||||
| Total Corporate | 7,330,393,856 | (144,382,920 | ) | 7,186,010,936 | 8,546,139,534 | (151,736,641 | ) | 8,394,402,893 | ||||||||||||||||
Personal Banking and Small company | ||||||||||||||||||||||||
| Small company | ||||||||||||||||||||||||
| Small company loans | 706,519,792 | (21,640,054 | ) | 684,879,738 | 769,491,025 | (18,326,261 | ) | 751,164,764 | ||||||||||||||||
| Small company leases, net (1) | 83,282,711 | (2,024,824 | ) | 81,257,887 | 89,057,492 | (1,601,351 | ) | 87,456,141 | ||||||||||||||||
| Total Small company | 789,802,503 | (23,664,878 | ) | 766,137,625 | 858,548,517 | (19,927,612 | ) | 838,620,905 | ||||||||||||||||
| Personal Banking | ||||||||||||||||||||||||
| Mortgage loans | 3,598,288,833 | (85,940,573 | ) | 3,512,348,260 | 4,190,739,418 | (79,146,234 | ) | 4,111,593,184 | ||||||||||||||||
| Personals | 2,004,089,017 | (90,968,725 | ) | 1,913,120,292 | 2,351,142,266 | (93,685,907 | ) | 2,257,456,359 | ||||||||||||||||
| Vehicles | 936,973,104 | (19,013,659 | ) | 917,959,445 | 1,183,895,384 | (20,512,499 | ) | 1,163,382,885 | ||||||||||||||||
| Personal leases, net (1) | 86,634,498 | (3,668,018 | ) | 82,966,480 | 92,289,389 | (3,529,915 | ) | 88,759,474 | ||||||||||||||||
| Credit Cards | 3,272,566,982 | (292,002,095 | ) | 2,980,564,887 | 3,131,479,298 | (329,280,288 | ) | 2,802,199,010 | ||||||||||||||||
| Total Personal Banking | 9,898,552,434 | (491,593,070 | ) | 9,406,959,364 | 10,949,545,755 | (526,154,843 | ) | 10,423,390,912 | ||||||||||||||||
| Total Personal Banking and Small company | 10,688,354,937 | (515,257,948 | ) | 10,173,096,989 | 11,808,094,272 | (546,082,455 | ) | 11,262,011,817 | ||||||||||||||||
| Total loans at AC | 18,018,748,793 | (659,640,868 | ) | 17,359,107,925 | 20,354,233,806 | (697,819,096 | ) | 19,656,414,710 | ||||||||||||||||
| (1) Total leases, net of unearned interest | 320,818,721 | (9,182,686 | ) | 311,636,035 | 330,892,518 | (8,321,320 | ) | 322,571,198 | ||||||||||||||||
The net value of the financial leases receivable is presented below:
September 30, 2021 | December 31, 2020 | |||||||
| Minimum lease payments receivable | 340,648,037 | 364,506,926 | ||||||
| Less: unearned interest | 16,134,794 | 30,027,446 | ||||||
| Minimum lease payments receivable, net | 324,513,243 | 334,479,480 | ||||||
| Less: allowance for loss in leases | 9,182,686 | 8,321,320 | ||||||
| Less: net deferred commissions | 3,694,522 | 3,586,962 | ||||||
| Net value of investment in finance leases | 311,636,035 | 322,571,198 | ||||||
The following table summarizes the minimum lease payments receivable as of September 30, 2021:
| Year ended December 31, | ||||||
| 2021 | 23,857,839 | |||||
| 2022 | 72,943,313 | |||||
| 2023 | 66,120,804 | |||||
| 2024 | 60,116,298 | |||||
| 2025 and thereafter | 101,474,989 | |||||
| 324,513,243 | ||||||
F-53
| (12) | Deposits from Customers |
Deposits from customers are detailed below:
September 30, 2021 | December 31, 2020 | |||||||
| Retail customers | ||||||||
| Demand | 1,046,888,767 | 1,161,048,315 | ||||||
| Savings | 2,938,858,420 | 3,022,074,251 | ||||||
| Time deposits | 1,147,387,844 | 1,740,015,270 | ||||||
| Corporate customers | ||||||||
| Demand | 6,904,241,098 | 6,953,825,100 | ||||||
| Savings | 1,717,071,430 | 1,583,428,105 | ||||||
| Time deposits | 7,323,663,118 | 8,791,514,844 | ||||||
| 21,078,110,677 | 23,251,905,885 | |||||||
Based on the merger of Credomatic International Corporation and BAC International Bank, on January 2, 2021, the conversion of the financial obligations of BIB Central American Card Receivables Limited (a SPV) amounting to $ 305,000,000 to a certificate of fixed-term deposit. There are no changes in the original conditions of the financial liability. As of September 30, 2021, the balance of time deposits under the SPV amounted to $ 700,000,000 (December 31, 2020: $ 395,000,000). The pending origination costs amortization of the certificates amounted to $ 16,191,164 as of September 30, 2021 (December 31, 2020: $ 4,225,121). The certificates issued by the vehicle are guaranteed by future cash flows originated from transactions in affiliated businesses in Costa Rica, El Salvador, Guatemala, Honduras, Nicaragua and Panama. Transactions at affiliated merchants are those generated by cardholders of credit cards issued by international financial institutions, under the Visa, MasterCard and American Express credit programs that are processed by the Company. The notes pay quarterly interest in January, April, July and October at a fixed rate of 3.50%. Amortizations to the principal will begin to be paid to the holders, through Citibank N.A., as of October 2023. The notes have an original average duration of 7.00 years. As of September 30, 2021, the weighted average duration of the certificates is 5.61 years.
| (13) | Financial Obligations |
Financial obligations are detailed below:
| September 30, 2021 | ||||||||||||
| Interest rate | Maturities up to | Carrying amount | ||||||||||
| Payable in US dollars: | ||||||||||||
| Fixed rate | 1.30% a 4.50% | 2028 | 338,608,333 | |||||||||
| Floating rate | 0.60% a 10.61% | 2031 | 502,192,763 | |||||||||
| Payable in quetzales (Guatemala): | ||||||||||||
| Fixed rate | 4.25% a 5.25% | 2022 | 252,235,845 | |||||||||
| Floating rate | 8.25 | % | 2021 | 168,833 | ||||||||
| Payable in lempiras (Honduras): | ||||||||||||
| Fixed rate | 15.00 | % | 2046 | 162,969,342 | ||||||||
| Payable in colones (Costa Rica): | ||||||||||||
| Fixed rate | 0.80 | % | 2025 | 158,912,863 | ||||||||
| Floating rate | 3.80% a 5.00% | 2031 | 13,848,292 | |||||||||
| Total financial obligations at amortized cost | 1,428,936,271 | |||||||||||
| December 31, 2020 | ||||||||||||
| Interest rate | Maturities up to | Carrying amount | ||||||||||
| Payable in US dollars: | ||||||||||||
| Fixed rate | 5.92 | % | 2030 | 976,078,582 | ||||||||
| Floating rate | 0.44% a 11.50% | 2031 | 1,236,443,745 | |||||||||
| Payable in quetzales (Guatemala): | ||||||||||||
| Fixed rate | 4.40% a 5.50% | 2022 | 256,113,921 | |||||||||
| Floating rate | 8.51 | % | 2021 | 667,852 | ||||||||
| Payable in lempiras (Honduras): | ||||||||||||
| Fixed rate | 3.00% a 15.00% | 2045 | 159,961,239 | |||||||||
| Payable in colones (Costa Rica): | ||||||||||||
| Floating rate | 3.95% a 8.91% | 2031 | 15,857,671 | |||||||||
| Total financial obligations at amortized cost | 2,645,123,010 | |||||||||||
F-54
As of September 30, 2021, the carrying amount of the principal issued by BAC San Jose DPR Funding Limited, a consolidated special purpose vehicle (hereinafter SPV), amounted to $158,000,000 (December 31, 2020: $ 182,000,000), divided into two programs: 1) Series 2014-2 with a balance of $ 8,000,000 (December 31, 2020: $ 32,000,000) and 2) Series 2020-1 with a balance of $150,000,000. The origination costs pending amortization of the certificates amounted to $ 2,306,624 as of September 30, 2021 (December 31, 2020: $ 2,761,123). The notes issued by the SPV are guaranteed by the current and future Diversified Payment Rights denominated in United States dollars, originated by a subsidiary of the Company and sold to the SPV. The 2014-2 series notes pay interest in February, May, August and November of each year at a fixed interest rate of 4.50%. The notes have an original average duration of 4.60 years. As of September 30, 2021, the weighted average duration of the notes is 0.13 years. Series 2020-1 notes pay interest in February, May, August and November of each year at a fixed interest rate of 3.70%. The notes have an original average duration of 5.58 years. As of September 30, 2021, the weighted average duration of the notes is 4.82 years.
The Company has had no defaults of principal, interest or other contractual clauses concerning its financial obligations.
| (14) | Other Financial Obligations |
The Company has placed, through its subsidiaries and through the stock markets of El Salvador, Panama, and Honduras debt certificates with fixed and variable rates, which are described below:
| September 30, 2021 | December 31, 2020 | |||||||||||
| Payable in: | Interest rate | Carrying amount | Interest rate | Carrying amount | ||||||||
| US dollars | 2.83% a 10.00% | 718,077,727 | 2.00% a 10.00% | 1,210,869,103 | ||||||||
| Lempiras | 7.00% A 9.50% | 35,715,994 | 7.50% a 9.50% | 35,488,547 | ||||||||
| Total of other financial obligations at amortized cost | 753,793,721 | 1,246,357,650 | ||||||||||
The Company has had no defaults of principal, interest or other contractual clauses concerning its other financial obligations.
Through Resolution No. 208-20 of May 14, 2020, issued by the Superintendency of the Securities Market of the Republic of Panama, the Bank is authorized to offer a Public Offering, Perpetual Subordinated Corporate Bonds convertible into common shares for a nominal value of $700 million. The bonds are issued in registered form, registered and without coupons, in denominations of $1,000,000 and in integral multiples of $100,000, with no specific expiration or redemption date. The bonds bear an interest rate of 10% and interest is payable quarterly, unless the issuer exercises its right not to pay interest. As of September 30, 2021, the balance of the perpetual bonds is $520,000,000, and they have been acquired by Grupo AVAL Limited.
| (15) | Lease Liabilities |
Lease liabilities are detailed below:
| September 30, 2021 | ||||||||||||||||
| Interest rate | Maturities up to | Carrying amount | Undiscounted cash flows | |||||||||||||
| Payable in US dollars | 5.22 | % | 2033 | 159,321,100 | 179,236,508 | |||||||||||
| Payable in quetzales (Guatemala) | 3.03% to 5.50% | 2029 | 3,111,764 | 5,568,848 | ||||||||||||
| Payable in lempiras (Honduras) | 5.22% to 7.58% | 2029 | 1,278,110 | 4,863,619 | ||||||||||||
| Payable in colones (Costa Rica) | 3.96% to 8.02% | 2033 | 763,594 | 3,889,884 | ||||||||||||
| Total lease liabilities | 164,474,568 | 193,558,859 | ||||||||||||||
| December 31, 2020 | ||||||||||||||||
| Interest rate | Maturities up to | Carrying amount | Undiscounted cash flows | |||||||||||||
| Payable in US dollars | 5.22 | % | 2033 | 212,057,761 | 250,813,316 | |||||||||||
| Payable in quetzales (Guatemala) | 3.03% to 5.50% | 2029 | 2,954,276 | 4,549,001 | ||||||||||||
| Payable in lempiras (Honduras) | 5.22% to 7.58% | 2029 | 1,340,683 | 1,710,707 | ||||||||||||
| Payable in colones (Costa Rica) | 3.96% to 8.02% | 2033 | 1,018,626 | 1,234,523 | ||||||||||||
| Total lease liabilities | 217,371,346 | 258,307,547 | ||||||||||||||
The following is the detail of the maturity of the undiscounted contractual cash flows, related to lease liabilities:
September 30, 2021 | December 31, 2020 | |||||||
| Less than a year | 35,524,277 | 41,077,493 | ||||||
| One to two years | 33,287,952 | 39,327,085 | ||||||
| Two to three years | 31,145,094 | 37,279,480 | ||||||
| Three to four years | 27,008,413 | 34,321,650 | ||||||
| Four to five years | 20,358,066 | 29,744,473 | ||||||
| More than five years | 46,235,057 | 76,557,366 | ||||||
| 193,558,859 | 258,307,547 | |||||||
F-55
The following are the items recognized in the condensed consolidated statement of income, related to lease liabilities:
| September 30, 2021 | September 30, 2020 | |||||||
| Interest on leases | 6,762,840 | 9,446,095 | ||||||
| Expense for leases with less than 12 months | 2,471,818 | 4,366,019 | ||||||
| Expense for leases of low-value assets | 5,678,473 | 5,086,983 | ||||||
| 14,913,130 | 18,899,097 | |||||||
| (16) | Common Stock |
The Company’s authorized stock comprises 79,194,053 authorized stock and 77,443,101 issued and outstanding stock (December 31, 2020: 79,194,053 authorized stock and 77,443,101 issued and outstanding stock) and with a nominal value of $37 per share.
| (17) | Income from Financial Instruments, Net |
Income from financial instruments, net, included in the condensed consolidated statement of income is summarized below:
| September 30, 2021 | September 30, 2020 | |||||||
| Net income from the sale of investments at FVOCI | 52,181,306 | 27,288,422 | ||||||
| Unrealized net gains from securities at FVPL | 29,827 | 1,100,676 | ||||||
| Net (loss) gain from the sale of securities at FVPL | 4,769,097 | 341,227 | ||||||
| Net gain (loss) fair value on derivative financial instruments | 203,305 | 0 | ||||||
| 57,183,535 | 28,730,325 | |||||||
| (18) | Income Taxes |
As of September 30, 2021, the Company maintains an effective tax rate of 23.19% (September 30, 2020: 29.58%).
The Company's earnings are taxed in various jurisdictions. As of September 30, 2021, the Company had unrecognized tax positions for $6,552,039 (December 31, 2020: $18,972,840). Interest expense and penalties related to income tax liabilities and recognized as part of income tax expenses for the period ended September 30, 2021, amounted to $777,554 (September 30, 2020: $1,751,637). As of September 30, 2021, total interest and penalties expenses included in other liabilities amounted to $3,290,489 (December 31, 2020: $10,028,775). As of September 30, 2021, a contingency reversal was carried out for $19,794,545.
| (19) | Off-Balance Financial Instruments with Risk and Other Commitments |
The Company is a party to financial instruments with off-balance sheet risk in the normal course of business to meet the financing needs of its customers. These financial instruments include, principally, commitments to extend credit, financial guarantees and letters of credit, the balances of which are not reflected in the accompanying consolidated balance sheets.
Letters of credit are conditional commitments issued by the Company to guarantee performance of a customer to a third party. Those letters of credit are primarily used to support trade transactions and borrowing arrangements. Generally, all letters of credit issued have expiration dates within one year. The credit risk involved in issuing letters of credit is essentially the same as that involved in extending loan facilities to customers.
Commitments to extend credit are agreements to lend to a customer as long as there is no violation of any condition established in the contract. Commitments generally have fixed expiration dates or other termination clauses and may require payment of a fee. The commitments may expire without being drawn upon; therefore, the total commitment amounts do not necessarily represent future cash requirements. The amount of collateral obtained, if it is deemed necessary by the Company, is based on management’s credit evaluation of the customer.
As of September 30, 2021, the Company had outstanding revolving available to its credit card customers in each of the various countries of operation that ranged from approximately $369 million to $2,547 million (December 31, 2020: from $72 million to $2,349 million). The unused portion of the total amount available in each country, aggregated approximately from $271 million to $1,911 million (December 31, 2020: from $31 million to $1,757 million). While these amounts represented the available lines of credit to customers per country, the Company has experienced, and does not anticipate, that all of its customers will exercise their entire available lines at any given point in time.
The Company generally has the right to increase, reduce, cancel, alter or amend the terms of these available lines of credit at any time.
Financial guarantees are used in various transactions to enhance the credit standing of the Company’s customers. They represent irrevocable assurances that the Company will make payment in the event that the customer fails to fulfill its obligations to third parties.
F-56
| (19) | Off-Balance Financial Instruments with Risk and Other Commitments, continued |
The Company uses the same credit policies in making commitments and conditional obligations as it does for on-balance sheet instruments. As of September 30, 2021, outstanding letters of credit and financial guarantees are as follows:
| September 30, 2021 | December 31, 2020 | |||||||
| Stand-by letters of credit | 149,602,459 | 193,650,272 | ||||||
| Commercial letters of credit | 58,137,642 | 33,536,676 | ||||||
| Financial guarantees | 298,730.284 | 360,253,706 | ||||||
| Commitments and guarantees (1) | 65,579,164 | 130,059,257 | ||||||
| 572,049.549 | 717,499,911 | |||||||
| (1) | Includes commercial and mortgage payment promise letters |
The nature, terms and maximum potential amount of future payments the Company could be required to make under the standby letters of credit and guarantees as of September 30, 2021, are detailed as follows:
| September 30, 2021 | December 31, 2020 | |||||||
| Up to 1 year | 439,091.036 | 529,976,427 | ||||||
| Over 1 year | 74,820,871 | 153,986,808 | ||||||
| 513,911,907 | 683,963,235 | |||||||
Generally, the Company has resources to recover from clients the amounts paid under these guarantees; additionally, the Company can hold cash or other collateral to cover for these guarantees. As of September 30, 2021, the assets held as collateral, that the Company can obtain and liquidate to recover totally or partially the amounts paid under guarantees amounted to $70,208,001 (December 31, 2020: $87,086,076).
| (20) | Disclosures on the Fair Value of Financial Instruments |
The Company established a process for determining the fair value. The fair value is primarily based on quoted market prices, when available. If market prices or quotes are not available, fair value is determined based on internally developed models that primarily use market information or other information obtained as inputs regardless of market parameters, including but not limited to yield curves, interest rates, debt prices, foreign exchange rates and credit curves. However, in situations where there is little or no market activity for the asset or liability at the measurement date, the fair value measurement reflects the Company's own judgments about assumptions that market participants would use in setting the price of the asset or liability.
The judgments are developed by the Company based on the best information available in the circumstances, including expected cash flows, discount rates adjusted for risks and the availability of observable and unobservable inputs.
The methods described above can generate fair value estimates that may not be indicative of the net realizable value or that do not reflect future values. In addition, while the Company believes its valuation methods are appropriate and consistent with those used by other market participants, the use of different methodologies or assumptions to determine the fair value of certain financial instruments could result in different fair value estimates as of the reporting date.
Financial instruments at fair value
Recurring Fair Value Measurement
The following is a description of the valuation methodologies used to value instruments carried at fair value, including a general classification of such instruments according to the fair value hierarchy.
Securities
When there are market prices in an active market, securities are classified in Level 1 of the fair value hierarchy. Level 1 securities include highly liquid bonds from the government and agencies and investments in highly traded shares.
If market prices are not available for a specific security, the fair value is determined using market prices of securities with similar characteristics or discounted cash flows, and are classified in Level 2. In certain cases where there is limited activity or less transparency in determining the assumptions used in the valuation, securities are classified in Level 3 of the fair value hierarchy.
Therefore, when valuing certain debt obligations, determining fair value may require comparisons with similar instruments or default and collection rate analysis.
F-57
| (20) | Disclosures on the Fair Value of Financial Instruments, continued |
Assets and liabilities recorded at fair value on a recurring basis are summarized below:
| Other significant observable | Significant unobservable | |||||||||||
| Assumptions | Assumptions | September 30, | ||||||||||
| (Level 2) | (Level 3) | 2021 | ||||||||||
| Assets | ||||||||||||
| Investments at FVPL: | ||||||||||||
| Other governments | 33,225,613 | 0 | 33,225,613 | |||||||||
| Corporate bonds | 0 | 0 | 0 | |||||||||
| Mutual funds | 751,010 | 0 | 751,010 | |||||||||
| Common stocks | 0 | 10,462,896 | 10,462,896 | |||||||||
| Total investments at FVPL | 33,976,623 | 10,462,896 | 44,439,519 | |||||||||
| Investments at FVOCI: | ||||||||||||
| Governments and Agencies bonds | ||||||||||||
| United States of America | 9,833,240 | 0 | 9,833,240 | |||||||||
| Other governments | 2,835,938,296 | 0 | 2,835,938,296 | |||||||||
| 2,845,771,536 | 0 | 2,845,771,536 | ||||||||||
| Corporate bonds | 609,428,783 | 0 | 609,428,783 | |||||||||
| Common stocks | 967,264 | 2,092,325 | 3,059,589 | |||||||||
| Total investments at FVOCI | 3,456,167,583 | 2,092,325 | 3,458,259,908 | |||||||||
| Total assets | 3,490,144,206 | 12,555,221 | 3,502,699,427 | |||||||||
| Other significant observable | Significant unobservable | |||||||||||
| assumptions | Assumptions | December 31, | ||||||||||
| (Level 2) | (Level 3) | 2020 | ||||||||||
| Assets | ||||||||||||
| Investments at FVPL: | ||||||||||||
| Other governments | 55,993,523 | 0 | 55,993,523 | |||||||||
| Corporate bonds | 16,100 | 0 | 16,100 | |||||||||
| Mutual funds | 23,504,431 | 0 | 23,504,431 | |||||||||
| Common stocks | 278,881 | 12,146,377 | 12,425,258 | |||||||||
| Total investments at FVPL | 79,792,935 | 12,146,377 | 91,939,312 | |||||||||
| Investments at FVOCI: | ||||||||||||
| Governments and Agencies bonds | ||||||||||||
| United States of America | 680,165,101 | 0 | 680,165,101 | |||||||||
| Other governments | 2,620,318,458 | 0 | 2,620,318,458 | |||||||||
| 3,300,483,559 | 0 | 3,300,483,559 | ||||||||||
| Corporate bonds | 473,016,870 | 0 | 473,016,870 | |||||||||
| Common stocks | 958,439 | 4,102,887 | 5,061,326 | |||||||||
| Total investments at FVOCI | 3,774,458,868 | 4,102,887 | 3,778,561,755 | |||||||||
| Investments at AC | ||||||||||||
| Other governments | 6,697,211 | 0 | 6,697,211 | |||||||||
| Corporate bonds | 71,687,568 | 0 | 71,687,568 | |||||||||
| Total investments a AC | 78,384,779 | 0 | 78,384,779 | |||||||||
| Total assets | 3,932,636,582 | 16,249,264 | 3,948,885,846 | |||||||||
The Company's accounting policies include the recognition of transfers between the levels of the fair value hierarchy on the date of the event or change in the circumstances that caused the transfer.
As of September 30, 2021, there were no transfers between levels.
F-58
| (20) | Disclosures on the Fair Value of Financial Instruments, continued |
The table below includes the movement of the figures in the consolidated balance sheet (including changes in fair value) of the financial instruments classified by the Company within Level 3 of the fair value hierarchy, for the period ended September 30, 2021. When determining whether to classify an instrument in Level 3, the decision is based on the importance of unobservable assumptions within the overall fair value measurement.
| Investments | ||||
| September 30, 2021 | Common stocks | |||
| Assets | ||||
| Fair value at January 01, 2021 | 12,425,258 | |||
| Portion reclassified as discontinued operation | (1,964,608 | ) | ||
| Foreign currency translation | 2,246 | |||
| Fair value at September 30, 2021 | 10,462,896 | |||
| Investments | ||||
| December 31, 2020 | Common stocks | |||
| Assets | ||||
| Fair value at January 01, 2020 | 10,617,681 | |||
| Business combinations | 1,967,349 | |||
| Valuation of investments at FVPL | (194,912 | ) | ||
| Foreign currency translation | 35,140 | |||
| Fair value at December 31, 2020 | 12,425,258 | |||
The table below describes the valuation techniques and input data used in the financial instruments' recurring fair value measurements:
| Financial instrument | Valuation technique and entry data used | Level |
| Corporate bonds and government and agencies bonds | Consensus prices obtained from price providers (Bloomberg). For part of these instruments the Company applies cash flows discounted using a market rate of an instrument with a similar remaining maturity.
Market prices of suppliers or local regulators in markets with lower marketability.
Discounted cash flows are used for various bonds using a market rate of an instrument with a similar remaining maturity. | (2,3) |
| Common stocks | Discounted cash flow using capital cost rate adjusted for size premium. | (3) |
| Common stocks | Market prices provided by local stock exchanges. | (2) |
| Mutual funds and other stocks | Net Asset Value. | (2) |
| Embedded financial derivative instruments | Functional currency cash flows
Foreign currency cash flows | (3) |
Fair Value of Financial Instruments, additional disclosures
A description of the methods and assumptions used to estimate the fair value of the main financial instruments held by the Company is provided below:
Financial instruments with carrying amounts that approach the fair value:
Cash and cash equivalents, deposits that bear interest and clients' obligations for acceptances and acceptances outstanding are measured at book value reported in the consolidated balance sheet, which is considered a reasonable fair value estimate due to the characteristics and maturity of these instruments.
Loans
To determine the fair value of the loan portfolio, the cash flows were discounted at a rate that reflects:
| a. | actual market rate, and |
| b. | future interest rate expectations, for a term that reflects the anticipated payments on the loan portfolio. |
Deposits
To determine the fair value of these instruments, the cash flows were discounted at a rate that reflects:
| a. | actual market rate, and |
| b. | future interest rate expectations, for the remaining term of these instruments. |
F-59
| (20) | Disclosures on the Fair Value of Financial Instruments, continued |
Securities sold under repurchase agreements
There are no market price quotes for these instruments; therefore, their fair value is determined using discounted cash flow techniques. Cash flows are estimated based on the contractual terms, taking into account any incorporated derivative characteristic or other factors. Expected cash flows are discounted using market rates that approach the maturity of the instrument, as well as the nature and amount of the guarantee given or received.
Borrowings
The fair value is estimated based on current interest rates for debt with similar and adjusted maturities to reflect the credit rating of the Company and its guarantees.
Other borrowed funds
Fair value is estimated based on the market price quotes for the same issuance or similar issuances or on the current rates offered by the Company for debts with the same terms, adjusted for credit quality.
Below are described the valuation techniques and significant unobservable input data used in determining the fair value of recurring and nonrecurring assets and liabilities categorized within Level 3 of the fair value hierarchy that are recognized in the consolidated balance sheet:
| September 30, 2021 | Quantitative information of Level 3 fair values | |||
| Fair value | Valuation technique | Unobservable assumptions | Range (weighted average) | |
| Common stocks | 12,555,221 | Discounted cash flows | Increase annual rate | 10% - 15% |
| December 31, 2020 | Quantitative information of Level 3 fair values | |||
| Fair value | Valuation technique | Unobservable assumptions | Range (weighted average) | |
| Common stocks | 16,249,264 | Discounted cash flows | Increase annual rate | 10% - 15% |
The following table sets out the fair values of financial instruments not measured at fair value and analyses them by the level in the fair value hierarchy into which each fair value measurement is categorized:
| September 30, 2021 | Level 2 | Level 3 | Total fair value | Total carrying amount | ||||||||||||
| Financial assets | ||||||||||||||||
| Cash and cash equivalents | 605,868,262 | 0 | 605,868,262 | 605,868,262 | ||||||||||||
| Securities purchased under resale agreements | 0 | 13,231,790 | 13,231,790 | 13,231,790 | ||||||||||||
| Deposits in banks | 0 | 4,245,673,789 | 4,245,673,789 | 4,245,673,789 | ||||||||||||
| Loans, excluding financial leases | 0 | 16,708,386,971 | 16,708,386,971 | 17,047,471,890 | ||||||||||||
| Acceptances outstanding | 0 | 1,562,548 | 1,562,548 | 1,562,548 | ||||||||||||
| Total financial assets | 605,868,262 | 20,968,855,098 | 21,574,723,360 | 21,913,808,279 | ||||||||||||
Financial liabilities | ||||||||||||||||
| Deposits | 12,607,059,715 | 8,780,252,470 | 21,387,312,185 | 21,078,110,677 | ||||||||||||
| Securities sold under repurchase agreements | 0 | 10,036,838 | 10,036,838 | 10,036,838 | ||||||||||||
| Financial obligations | 0 | 1,440,228,235 | 1,440,228,235 | 1,428,936,271 | ||||||||||||
| Other financial obligations | 0 | 744,923,897 | 744,923,897 | 753,793,721 | ||||||||||||
| Acceptances outstanding | 0 | 1,562,548 | 1,562,548 | 1,562,548 | ||||||||||||
| Total financial liabilities | 12,607,059,715 | 10,997,003,988 | 23,584,063,703 | 23,272,440,055 | ||||||||||||
| December 31, 2020 | Level 2 | Level 3 | Total fair value | Total carrying amount | ||||||||||||
| Financial assets | ||||||||||||||||
| Cash and cash equivalents | 729,239,556 | 0 | 729,239,556 | 729,239,556 | ||||||||||||
| Securities purchased under resale agreements | 0 | 21,227,306 | 21,227,306 | 21,227,306 | ||||||||||||
| Deposits in banks | 0 | 5,217,041,032 | 5,217,041,032 | 5,217,041,032 | ||||||||||||
| Loans, excluding financial leases | 0 | 18,856,452,417 | 18,856,452,417 | 19,333,843,512 | ||||||||||||
| Acceptances outstanding | 0 | 197,565,833 | 197,565,833 | 197,565,833 | ||||||||||||
| Total financial assets | 729,239,556 | 24,292,286,588 | 25,021,526,144 | 25,498,917,239 | ||||||||||||
Financial liabilities
| ||||||||||||||||
| Deposits | 12,720,375,771 | 10,841,619,703 | 23,561,995,474 | 23,251,905,885 | ||||||||||||
| Securities sold under repurchase agreements | 0 | 41,920,772 | 41,920,772 | 41,920,772 | ||||||||||||
| Financial obligations | 0 | 2,689,145,888 | 2,689,145,888 | 2,645,123,010 | ||||||||||||
| Other financial obligations | 0 | 1,230,217,418 | 1,230,217,418 | 1,246,357,650 | ||||||||||||
| Acceptances outstanding | 0 | 197,565,833 | 197,565,833 | 197,565,833 | ||||||||||||
| Total financial liabilities | 12,720,375,771 | 15,000,469,614 | 27,720,845,385 | 27,382,873,150 | ||||||||||||
F-60
| (21) | Administration of Trust Contracts and Securities Custody |
As of September 30, 2021, several subsidiaries of the Company manage and keep custody of securities for a total amount of approximately $3,563,680,792 (December 31, 2020: $3,656,751,665).
| (22) | Related Party Transactions |
In the normal course of business, the Company conducts transactions with related parties, including main executives and directors. These transactions, according to the internal policies of the Company, are carried out at market conditions.
The following table shows the balances and transactions with related parties as of September 30, 2021:
| September 30, 2021 | December 31, 2020 | |||||||||||||||||||||||
Key personnel and directors | Related parties | Controlling entities | Key personnel and directors | Related parties | Controlling entities | |||||||||||||||||||
| Assets: | ||||||||||||||||||||||||
| Deposits due from banks | 0 | 17,098,207 | 0 | 0 | 60,999,914 | 6,915,670 | ||||||||||||||||||
| Interest bearing deposits | 0 | 79,630,000 | 0 | 0 | 59,630,000 | 0 | ||||||||||||||||||
| Loans | 12,846,469 | 78,693,387 | 91,162 | 12,477,203 | 86,163,208 | 92,541 | ||||||||||||||||||
| Loans Loss Reserve | (59,008 | ) | (298,417 | ) | 0 | (15,124 | ) | (511,806 | ) | 0 | ||||||||||||||
| Accumulated interest receivable and other accounts receivable | 50,877 | 1,426,184 | 700,253 | 53,164 | 3,121,600 | 718,999 | ||||||||||||||||||
| 12,838,338 | 176,549,361 | 791,464 | 12,515,243 | 209,402,916 | 7,727,210 | |||||||||||||||||||
| Liabilities: | ||||||||||||||||||||||||
| Demand deposits | 6,861,533 | 22,344,692 | 1,317,151 | 11,046,216 | 77,577,709 | 818,273 | ||||||||||||||||||
| Term deposits | 9,693,502 | 18,374,179 | 125,247,495 | 12,305,293 | 36,075,781 | 235,237,695 | ||||||||||||||||||
| Financial obligations | 0 | 0 | 0 | 0 | 0 | 5,000,000 | ||||||||||||||||||
| Other financial obligations | 0 | 0 | 520,000,000 | 0 | 0 | 520,000,000 | ||||||||||||||||||
| Accumulated interest payable and other liabilities | 166,586 | 237,839 | 680,657,775 | 202,483 | 100,885,128 | 4,018,442 | ||||||||||||||||||
| 16,721,621 | 40,956,709 | 1,327,222,421 | 23,553,992 | 214,538,618 | 765,074,410 | |||||||||||||||||||
| September 30, 2021 | September 30, 2020 | |||||||||||||||||||||||
Key personnel and directors | Related parties | Controlling entities | Key personnel and directors | Related parties | Controlling entities | |||||||||||||||||||
| Interest income and other income | 506,911 | 12,688,013 | 479,230 | 556,723 | 9,641,489 | 0 | ||||||||||||||||||
| Interest expense and other operating expenses | 318,346 | 1,684,898 | 43,893,187 | 366,525 | 1,966,901 | 0 | ||||||||||||||||||
| Key management personnel benefit | 10,794,475 | 0 | 0 | 14,492,812 | 0 | 0 | ||||||||||||||||||
| (23) | Litigations |
To the best of management's knowledge, the Company is not involved in any litigation or claim that is likely to cause a significant adverse effect on its business, its consolidated financial position or its consolidated financial performance.
| (24) | Regulatory Aspects |
The Company's banking operations are subject to various regulatory requirements managed by the government agencies of the countries in which it operates or has a license. Failure to comply with these regulatory requirements can lead to certain mandatory actions and possibly additional discretionary actions by the regulators that, if performed, could have a significant effect on The Company's condensed consolidated interim financial statements. Under capital adequacy guidelines and the regulatory framework of prompt corrective actions, the Company's banking operations must comply with specific capital guidelines that provide for the quantitative asset measurements and certain elements out of the consolidated balance sheet, in accordance with the regulatory accounting practices. The amounts of capital of the Company's banking operations and their classification are subject to qualitative judgments by the regulators about their components, risk weightings and other factors.
As of September 30, 2021, the Company´s banking operations meet all capital adequacy minimum requirements to which they are subject, which varies from 8.00% to 12.00% and other regulatory requirements.
Equity reserves
The Company is subject in several countries in which it operates to dynamic reserves on the portfolio of loans receivable. Additionally, it must establish equity reserves on the assets available for sale. Both items appropriate retained earnings.
The credit balance of the dynamic provision is part of the regulatory capital but does not substitute nor does it compensate the requirements at the minimum capital adequacy percentages established.
The provision on assets available for sale is made progressively within a range of 10% from the first year of registration up to 90% in the fifth year of adjudication.
F-61
| (25) | Unusual Transactions |
The Company carried out a partial spin-off of its operations on September 29, 2021, through which it transferred to Multi Financial Holding Inc., a company created simultaneously with said spin-off, the shares it owned in Multi Financial Group Inc. at that date.
For comparative purposes, below are the balances of assets and liabilities that the company recognized from the operations of Multi Financial Group Inc. in its audited consolidated financial statements as of December 31, 2020, and September 30,2021. These figures do not consider the eliminations for items related to other subsidiaries of the Company.
September 30, 2021 | December 31, 2020 | |||||||
| Assets | ||||||||
| Cash and cash equivalents | 20,856,474 | 20,587,457 | ||||||
| Deposits in banks: | ||||||||
| Demand | 59,814,464 | 52,667,232 | ||||||
| Time deposits | 83,733,870 | 129,553,721 | ||||||
| Total deposits in banks | 143,548,334 | 182,220,953 | ||||||
| Total cash, cash equivalents and deposits in banks | 164,404,808 | 202,808,410 | ||||||
| Investments at fair value | 925,933,828 | 1,050,394,712 | ||||||
| Loans | 3,452,657,658 | 3,200,484,956 | ||||||
| Allowance for loan losses | (57,735,396 | ) | (28,080,492 | ) | ||||
| Loans at amortized cost | 3,394,922,262 | 3,172,404,464 | ||||||
| Property, furniture, equipment and improvements, net | 101,768,346 | 102,839,725 | ||||||
| Acceptances outstanding | 92,269,992 | 194,237,832 | ||||||
| Other accounts receivable | 66,632,312 | 59,219,339 | ||||||
| Provision for accounts receivable | (808,550 | ) | 333,967 | |||||
| Goodwill | 36,429,181 | 36,429,182 | ||||||
| Intangible assets | 36,176,126 | 41,496,937 | ||||||
| Deferred income tax | 38,462,699 | 35,964,688 | ||||||
| Other assets | 68,303,155 | 64,789,630 | ||||||
| Total assets | 4,924,494,159 | 4,960,918,886 | ||||||
| Liabilities | ||||||||
| Deposits from customers: | ||||||||
| Demand | 358,711,768 | 444,326,950 | ||||||
| Savings | 398,297,845 | 384,127,215 | ||||||
| Time deposits | 2,215,015,197 | 2,236,861,003 | ||||||
| Total deposits from customers | 2,972,024,810 | 3,065,315,168 | ||||||
| Securities sold under repurchase agreements | 44,640,461 | 16,738,510 | ||||||
| Financial obligations | 834,396,839 | 595,120,187 | ||||||
| Other financial obligations | 394,297,907 | 499,104,353 | ||||||
| Lease liabilities | 16,871,643 | 17,681,588 | ||||||
| Acceptances outstanding | 92,269,992 | 194,237,832 | ||||||
| Income tax payable | 0 | 150,118 | ||||||
| Deferred income tax | 15,391,546 | 15,074,938 | ||||||
| Other liabilities | 84,713,477 | 85,164,220 | ||||||
| Total liabilities | 4,454,606,675 | 4,488,586,914 | ||||||
F-62
(25) Unusual Transactions, continued
The following table shows the results that the Company consolidated for the operations of Multi Financial Group Inc. as of September 30, 2021, and September 30, 2020. In the case of 2020, the results are presented for the period between the date of acquisition and the end of the period as of September 30. These figures do not consider the eliminations for items related to other subsidiaries of the Company.
| As of September 30, 2021 | As of September 30, 2020 | |||||||
| Interest income: | ||||||||
| Deposits in banks | 289,071 | 142,752 | ||||||
| Investments | 14,096,687 | 7,203,441 | ||||||
| Loans | 170,056,135 | 80,925,183 | ||||||
| Total interest income | 184,441,893 | 88,271,376 | ||||||
| Interest expense: | ||||||||
| Deposits | 63,133,648 | 33,472,905 | ||||||
| Financial obligations | 12,031,881 | 6,119,586 | ||||||
| Other financial obligations | 13,332,641 | 7,837,807 | ||||||
| Securities sold under repurchase agreements | (279,368 | ) | 219,329 | |||||
| Lease liabilities | 842,604 | 397,260 | ||||||
| Total interest expense | 89,061,406 | 48,046,887 | ||||||
| Interest income, net | 95,380,487 | 40,224,489 | ||||||
| Provision for loan losses | 42,063,507 | 20,025,667 | ||||||
| Credit risk of investments and time deposits | (114,586 | ) | 2,491,522 | |||||
| Provision for accounts receivable losses | 163,336 | (222,545 | ) | |||||
| Interest income, net after provisions | 53,268,230 | 17,929,845 | ||||||
| Other income: | ||||||||
| Gain on financial instruments, net | 6,939,808 | 3,297,662 | ||||||
| Service charges | 16,436,134 | 7,564,749 | ||||||
| Commissions and other fees, net | 2,159,673 | 1,158,940 | ||||||
| Gain on foreign currency exchange, net | (9,380 | ) | (24,523 | ) | ||||
| Impairment of assets held for sale | (1,404,798 | ) | (151,352 | ) | ||||
| Other income | 8,120,426 | 3,882,167 | ||||||
| Total other income, net | 32,241,863 | 15.727,642 | ||||||
| General and administrative expenses: | ||||||||
| Salaries and employee benefits | 32,625,066 | 16,820,231 | ||||||
| Depreciation and amortization | 9,895,718 | 3,930,053 | ||||||
| Administratives | 3,661,466 | 2,454,875 | ||||||
| Occupancy and related expenses | 1,962,831 | 843,217 | ||||||
| Other expenses | 17,468,020 | 8,708,517 | ||||||
| Total general and administrative expenses | 65,613,101 | 32,756,893 | ||||||
| Income before income tax | 19,896,992 | 900,594 | ||||||
| Less: Income tax | (2,563,399 | ) | (2,177,525 | ) | ||||
| Net income | 17,333,593 | (1.276,931 | ) | |||||
In the opinion of the administration, MFG constitutes a business line, since said group of companies have various financial products for a specific group of clients. Thus, MFG's operation has been independently analyzed by the Company, under its own brand and administration.
The condensed consolidated statement of cash flows includes the total figures of the discontinued operation according to its nature, for each of the periods presented. The spin-off of MFG did not represent cash flows, only the deconsolidation of the accounts of cash and cash equivalents of MFG, which amounted as of September 30, 2021 $63,852,584 (September 30, 2020: $90,138,445). The total effect of the discontinued operation, net of cash is included in the investment activities of the condensed consolidated statement of cash flows in the amount of $121,794,441.
| (26) | Subsequent Events |
The Company has assessed the subsequent events to November 10, 2021 to assess the need for their recognition or disclosure in the accompanying condensed consolidated interim financial statements. Based on this evaluation, we determined that there were no subsequent events which require recognition or disclosure in these condensed consolidated interim financial statements.
F-63
LEASING BOGOTA S.A. PANAMA
AND SUBSIDIARIES
(Panama, Republic of Panama)
Consolidated Financial Statements
December 31, 2020
(With Independent Auditors’ Report Thereon)
F-64
INDEPENDENT AUDITORS’ REPORT
To the Board of Director and Shareholders
Leasing Bogotá S.A. Panamá
Opinion
We have audited the consolidated financial statements of Leasing Bogotá and Subsidiaries (“the Company”), which comprise the consolidated statement of financial position as at December 31, 2020, the consolidated statements of profit or loss and other comprehensive income, changes in equity and cash flows for the year then ended, and notes, comprising significant accounting policies and other explanatory information.
In our opinion, the accompanying consolidated financial statements present fairly, in all material respects, the consolidated financial position of the Company as at December 31, 2020, and its consolidated financial performance and its consolidated cash flows for the year then ended in accordance with International Financial Reporting Standards (IFRS).
Basis for Opinion
We have conducted our audit in accordance with International Standards on Auditing (ISAs). Our responsibilities under those standards are further described in the Auditors’ Responsibilities Related to the Audit of the Consolidated Financial Statements section of our report. We are independent of the Company in accordance with the International Ethics Standards Board for Accountants’ Code of Ethics for Professional Accountants (IESBA Code) together with the ethics requirements that are relevant to our audit of the consolidated financial statements in the Republic of Panama, and we have fulfilled all other ethical responsibilities in accordance with those requirements and with the Code of Ethics of the IESBA. We believe that the audit evidence we have obtained is sufficient and appropriate to provide a basis for our opinion.
Responsibilities of Management and Those Charged with Governance for the Consolidated Financial Statements
Management is responsible for the preparation and fair presentation of the consolidated financial statements in accordance with IFRS, and for such internal control as management determines is necessary to enable the preparation of consolidated financial statements that are free from material misstatement, whether due to fraud or error.
In preparing the consolidated financial statements, management is responsible for assessing the Company’s ability to continue as a going concern, disclosing, as applicable, matters related to going concern and using the going concern basis of accounting unless management either intends to liquidate the Bank or to cease operations, or has no realistic alternative but to do so.
Those charged with governance are responsible for overseeing the Company’s financial reporting process.
Auditors’ Responsibilities for the Audit of the Consolidated Financial Statements
Our objectives are to obtain reasonable assurance about whether the consolidated financial statements as a whole are free from material misstatement, whether due to fraud or error, and to issue an auditors’ report that includes our opinion. Reasonable assurance is a high level of assurance but is not a guarantee that an audit conducted in accordance with ISAs will always detect a material misstatement when it exists. Misstatements can arise from fraud or error and are considered material if, individually or in the aggregate, they could reasonably be expected to influence the economic decisions of users taken on the basis of these consolidated financial statements.
As part of an audit in accordance with ISAs, we exercise professional judgment and maintain professional skepticism throughout the audit. We also:
| · | Identify and assess the risks of material misstatement of the consolidated financial statements, whether due to fraud or error, design and perform audit procedures responsive to those risks, and obtain audit evidence that is sufficient and appropriate to provide a basis for our opinion. The risk of not detecting a material misstatement resulting from fraud is higher than for one resulting from error, as fraud may involve collusion, forgery, intentional omissions, misrepresentations, or the override of internal control. |
| · | Obtain an understanding of internal control relevant to the audit in order to design audit procedures that are appropriate in the circumstances, but not for the purpose of expressing an opinion on the effectiveness of the Bank’s internal control. |
| · | Evaluate the appropriateness of accounting policies used and the reasonableness of accounting estimates and related disclosures made by management. |
F-65
| · | Conclude on the appropriateness of management’s use of the going concern basis of accounting and, based on the audit evidence obtained, whether a material uncertainty exists related to events or conditions that may cast significant doubt on the Company’s ability to continue as a going concern. If we conclude that a material uncertainty exists, we are required to draw attention in our auditors’ report to the related disclosures in the consolidated financial statements or, if such disclosures are inadequate, to modify our opinion. Our conclusions are based on the audit evidence obtained up to the date of our auditors’ report. However, future events or conditions may cause the Company to cease to continue as a going concern. |
| · | Evaluate the overall presentation, structure and content of the consolidated financial statements, including the disclosures, and whether the consolidated financial statements represent the underlying transactions and events in a manner that achieves fair presentation. |
| · | Obtain sufficient appropriate audit evidence regarding the financial information of the entities or business activities within the Company to express an opinion on the consolidated financial statements. We are responsible for the direction, supervision and performance of the group audit. We remain solely responsible for our audit opinion. |
We communicate with those charged with governance regarding, among other matters, the planned scope and timing of the audit and significant audit findings, including any significant deficiencies in internal control that we identify during our audit.
Panama, Republic of Panama
February 19, 2021
F-66
LEASING BOGOTA, S. A. PANAMA AND SUBSIDIARIES
(Panama, Republic of Panama)
Consolidated Statement of Financial Position
December 31,2020
(In U.S. dollars)
| Assets | Note | 2020 | 2019 | ||
| Cash and cash equivalents | 729,239,556 | 727,125,481 | |||
| Securities purchased under resale agreements | 5, 9 | 21,227,306 | 18,149,866 | ||
| Deposits in banks: | |||||
| Demand | 4,203,096,402 | 2,998,327,971 | |||
| Time deposits | 1,013,944,630 | 351,664,054 | |||
| Total deposits in banks | 5,217,041,032 | 3,349,992,025 | |||
| Total cash, cash equivalents and deposits in banks | 8 | 5,967,507,894 | 4,095,267,372 | ||
| Investments at fair value | 5, 10 | 3,948,885,846 | 2,254,767,064 | ||
| Loans | 5, 11 | 20,354,233,806 | 16,835,561,863 | ||
| Allowance for loan losses | 5 | (697,819,096) | (509,704,212) | ||
| Loans at amortized cost | 19,656,414,710 | 16,325,857,651 | |||
| Property, furniture, equipment and improvements, net | 12 | 661,554,049 | 614,695,235 | ||
| Acceptances outstanding | 197,565,833 | 1,968,793 | |||
| Other accounts receivable | 5 | 301,914,302 | 242,688,285 | ||
| Provision for accounts receivable | 5 | (6,964,522) | (4,931,417) | ||
| Goodwill and intangible assets | 13 | 1,673,398,033 | 1,598,385,311 | ||
| Deferred Income tax | 26 | 92,724,379 | 44,636,405 | ||
| Other assets | 14 | 152,197,800 | 84,086,107 | ||
| Total assets | 32,645,198,324 | 25,257,420,806 | |||
Liabilities and Equity | Note | 2020 | 2019 | ||
| Liabilities: | |||||
| Deposits from customers: | |||||
| Demand | 8,114,873,415 | 5,971,831,616 | |||
| Savings | 4,605,502,356 | 3,335,166,545 | |||
| Time deposits | 10,531,530,114 | 7,927,601,870 | |||
| Total deposits from customers | 15 | 23,251,905,885 | 17,234,600,031 | ||
| Securities sold under repurchase agreements | 41,920,772 | 34,740,578 | |||
| Financial obligations | 16 | 2,645,123,010 | 2,339,121,387 | ||
| Other financial obligations | 17 | 1,246,357,650 | 319,415,360 | ||
| Lease liabilities | 18 | 217,371,346 | 231,563,044 | ||
| Acceptances outstanding | 197,565,833 | 1,968,793 | |||
| Income tax payable | 58,376,143 | 60,298,059 | |||
| Deferred income tax | 26 | 83,964,688 | 75,676,104 | ||
| Other liabilities | 19 | 640,139,577 | 549,020,030 | ||
| Total liabilities | 28,382,724,904 | 20,846,403,386 | |||
| Equity: | |||||
| Common stock | 20 | 2,865,394,737 | 2,865,394,737 | ||
| Retained earnings | 1,666,257,570 | 1,736,845,314 | |||
| Other comprehensive losses | 21 | (279,663,595) | (192,169,805) | ||
| Total shareholder equity of the controlling Company | 4,251,988,712 | 4,410,070,246 | |||
| Non-controlling interest of the Company | 10,484,708 | 947,174 | |||
| Total equity | 4,262,473,420 | 4,411,017,420 | |||
| Commitments and contingencies | 27 | ||||
| Total liabilities and equity | 32,645,198,324 | 25,257,420,806 |
The consolidated statement of financial position must be read in conjunction with the notes which are part of the consolidated financial statements.
F-67
LEASING BOGOTA, S. A. PANAMA AND SUBSIDIARIES
(Panama, Republic of Panama)
Consolidated Statement of Income
For the year ended December 31, 2020
(In U.S. dollars)
| Note | 2020 | 2019 | |||
| Interest income: | |||||
| Deposits in banks | 17,863,344 | 46,811,688 | |||
| Investments at fair value | 147,304,547 | 102,121,872 | |||
| Investments at amortized cost | 3,559,539 | 0 | |||
| Loans | 1,906,047,310 | 1,806,573,193 | |||
| Total interest income | 2,074,774,740 | 1,955,506,753 | |||
| Interest expense: | |||||
| Deposits from customers | 556,817,040 | 480,755,680 | |||
| Financial obligations | 102,838,589 | 141,845,145 | |||
| Other financial obligations | 67,424,239 | 20,124,663 | |||
| Securities sold under repurchase agreements | 161,025 | 2,472,472 | |||
| Lease liabilities | 11,797,568 | 11,913,779 | |||
| Total interest expense | 739,038,461 | 657,111,739 | |||
| Interest income, net | 1,335,736,279 | 1,298,395,014 | |||
| Provision for loan and interest losses | 5 | 486,421,144 | 380,099,447 | ||
| Credit risk of investments and interest bearing deposits | 5 | 18,430,907 | 2,899,559 | ||
| Provision for account receivable losses | 5 | 2,757,117 | 1,534,652 | ||
| Interest income, net after provisions | 828,127,111 | 913,861,356 | |||
| Other income (expenses): | |||||
| Gains in financial instruments, net | 22 | 48,207,294 | 16,466,731 | ||
| Service charges | 23 | 404,151,427 | 474,492,879 | ||
| Commissions and other fees, net | 178,127,504 | 213,347,088 | |||
| Gain on foreign currency exchange, net | 167,096,162 | 81,743,805 | |||
| Impairment of assets held for sale | 14 | (272,436) | 2,336,581 | ||
| Other income | 23 | 54,650,095 | 56,559,833 | ||
| Total other income, net | 851,960,046 | 844,946,917 | |||
| General and administrative expenses: | |||||
| Salaries and employee benefits | 24 | 547,871,927 | 539,906,442 | ||
| Depreciation and amortization | 135,155,198 | 125,714,863 | |||
| Administrative | 85,605,249 | 79,213,783 | |||
| Occupancy and related expenses | 36,086,348 | 34,064,529 | |||
| Other operating expenses | 25 | 429,708,455 | 432,508,518 | ||
| Total general and administrative expenses | 1,234,427,177 | 1,211,408,135 | |||
| Income before income tax | 445,659,980 | 547,400,138 | |||
| Current income tax | 26 | 135,062,760 | 139,212,402 | ||
| Deferred income tax | 26 | (310,404) | 6,237,504 | ||
| Net income | 310,907,624 | 401,950,232 | |||
| Net income attributable to: | |||||
| Controlling interest | 310,843,990 | 401,916,026 | |||
| Non-controlling interest | 63,634 | 34,206 | |||
| 310,907,624 | 401,950,232 |
The consolidated statement of income must be read in conjunction with the notes which are part of the consolidated financial statements.
F-68
LEASING BOGOTA, S. A. PANAMA AND SUBSIDIARIES
(Panama, Republic of Panama)
Consolidated Statement of Comprehensive Income
For the year ended December 31, 2020
(In U.S. dollars)
| 2020 | 2019 | ||
| Net income | 310,907,624 | 401,950,232 | |
| Other comprehensive results: | |||
| Items that will not be reclassified to the consolidated income statement | |||
| Employee benefits plan - change in actuarial effect | (1,473,690) | (1,281,256) | |
| Net change in fair value of common stocks | (1,161,309) | 0 | |
| Items that are or can be reclassified to the consolidated income statement | |||
| Foreign currency translation | (88,385,503) | 38,712,077 | |
| Valuation for investments FVOCI: | |||
| Net amount transferred to income statement | (37,753,404) | (9,707,184) | |
| Net change in fair value | 35,527,778 | 80,661,581 | |
| Net change in cash flow hedge | 1,158,696 | 0 | |
| Net change in swaps fair value | 1,463,560 | 0 | |
| Other comprehensive results | (90,623,872) | 108,385,218 | |
| Comprehensive income | 220,283,752 | 510,335,450 | |
| Comprehensive income attributable to: | |||
| Controlling interest | 220,175,317 | 510,297,552 | |
| Non-controlling interest | 108,435 | 37,898 | |
| 220,283,752 | 510,335,450 |
The consolidated statement of comprehensive income must be read in conjunction with the notes which are part of the consolidated financial statements.
F-69
LEASING BOGOTA, S. A. PANAMA AND SUBSIDIARIES
(Panama, Republic of Panama)
Consolidated Statement of Changes in Equity
For the year ended December 31, 2020
(In U.S. dollars)
| Other | Total | ||||||||||
| Common | Retained | comprehensive | controlling | Non-controlling | |||||||
| stock | earnings | losses | interest | interest | Total | ||||||
| Balance as of January 1, 2019 | 2,865,394,737 | 1,334,929,288 | (300,551,331) | 3,899,772,694 | 955,144 | 3,900,727,838 | |||||
| Net income | 0 | 401,916,026 | 0 | 401,916,026 | 34,206 | 401,950,232 | |||||
| Other comprehensive results: | |||||||||||
| Foreign currency translation | 0 | 0 | 38,708,264 | 38,708,264 | 3,813 | 38,712,077 | |||||
| Valuation of FVOCI securities: | |||||||||||
| Net amount transferred to income statement | 0 | 0 | (9,707,184) | (9,707,184) | 0 | (9,707,184) | |||||
| Net change in fair value | 0 | 0 | 80,661,581 | 80,661,581 | 0 | 80,661,581 | |||||
| Employee benefits plan - change in actuarial effect | 0 | 0 | (1,281,135) | (1,281,135) | (121) | (1,281,256) | |||||
| Total other comprehensive results | 0 | 0 | 108,381,526 | 108,381,526 | 3,692 | 108,385,218 | |||||
| Total comprehensive results | 0 | 401,916,026 | 108,381,526 | 510,297,552 | 37,898 | 510,335,450 | |||||
| Transactions with the Company's owners: | |||||||||||
| Changes in the ownership | |||||||||||
| Purchase of non-controlling interest | 0 | 0 | 0 | 0 | (41,580) | (41,580) | |||||
| Contributions and distributions: | |||||||||||
| Dividends paid | 0 | 0 | 0 | 0 | (3,687) | (3,687) | |||||
| Complementary tax | 0 | 0 | 0 | 0 | (601) | (601) | |||||
| Total transactions with the Company's owners | 0 | 0 | 0 | 0 | (45,868) | (45,868) | |||||
| Balance as of December 31, 2019 | 2,865,394,737 | 1,736,845,314 | (192,169,805) | 4,410,070,246 | 947,174 | 4,411,017,420 | |||||
| Balance as of January 1, 2020 | 2,865,394,737 | 1,736,845,314 | (192,169,805) | 4,410,070,246 | 947,174 | 4,411,017,420 | |||||
| Net income | 0 | 310,843,990 | 0 | 310,843,990 | 63,634 | 310,907,624 | |||||
| Other comprehensive results: | |||||||||||
| Foreign currency translation | 0 | 0 | (88,381,167) | (88,381,167) | (4,336) | (88,385,503) | |||||
| Valuation of FVOCI securities: | |||||||||||
| Net amount transferred to income statement | 0 | 0 | (41,751,239) | (41,751,239) | 3,997,835 | (37,753,404) | |||||
| Net change in fair value | 0 | 0 | 39,377,968 | 39,377,968 | (3,850,190) | 35,527,778 | |||||
| Employee benefits plan - change in actuarial effect | 0 | 0 | (1,473,772) | (1,473,772) | 82 | (1,473,690) | |||||
| Net change in foreign currency of common stocks | 0 | 0 | (1,051,419) | (1,051,419) | (109,890) | (1,161,309) | |||||
| Net change in cash flow hedge | 0 | 0 | 1,153,703 | 1,153,703 | 4,993 | 1,158,696 | |||||
| Net change in swaps fair value | 0 | 0 | 1,457,253 | 1,457,253 | 6,307 | 1,463,560 | |||||
| Total other comprehensive results | 0 | 0 | (90,668,673) | (90,668,673) | 44,801 | (90,623,872) | |||||
| Total comprehensive results | 0 | 310,843,990 | (90,668,673) | 220,175,317 | 108,435 | 220,283,752 | |||||
| Business combinations | 0 | 0 | 0 | 0 | 125,282,341 | 125,282,341 | |||||
| Transactions with the Company's owners: | |||||||||||
| Changes in the ownership | |||||||||||
| Contribution from the holding Company | 0 | 0 | 0 | 0 | (465,861) | (465,861) | |||||
| Acquisition of non-controlling interest | 0 | 0 | 0 | 0 | (13,346,885) | (13,346,885) | |||||
| Redemption of preferred shares | 0 | 0 | 0 | 0 | (102,000,000) | (102,000,000) | |||||
| Adjustment of previous years - adoption of IFRS 9 | 0 | (3,174,883) | 3,174,883 | 0 | 0 | 0 | |||||
| Complementary tax | 0 | 0 | 0 | 0 | (8,100) | (8,100) | |||||
| Contributions and distributions: | |||||||||||
| Transfer of preferred dividends | 0 | (3,120,463) | 0 | (3,120,463) | 3,120,463 | 0 | |||||
| Payment of preferred dividends | 0 | 0 | 0 | 0 | (3,120,463) | (3,120,463) | |||||
| Dividends declared | 0 | 0 | 0 | 0 | (4,044) | (4,044) | |||||
| Dividends paid | 0 | (375,136,388) | 0 | (375,136,388) | (28,352) | (375,164,740) | |||||
| Total transactions with the Company's owners | 0 | (381,431,734) | 3,174,883 | (378,256,851) | (115,853,242) | (494,110,093) | |||||
| Balance as of December 31, 2020 | 2,865,394,737 | 1,666,257,570 | (279,663,595) | 4,251,988,712 | 10,484,708 | 4,262,473,420 |
The consolidated statement of changes in equity must be read in conjunction with the notes which are part of the consolidated financial statements.
F-70
LEASING BOGOTA, S. A. PANAMA AND SUBSIDIARIES
(Panama, Republic of Panama)
Consolidated Statement of Cash Flows
For the year ended December 31, 2020
(In U.S. dollars)
| Note | 2020 | 2019 | |||
| Cash flows from operating activities: | |||||
| Net Income | 310,907,624 | 401,950,232 | |||
| Adjustments to reconcile net income and cash by operating activities: | |||||
| Depreciation and amortization | 97,196,689 | 89,063,229 | |||
| Amortization of the right-of-use assets | 37,958,509 | 36,651,634 | |||
| Provision for loan losses | 5 | 486,421,144 | 380,099,447 | ||
| Credit risk of investments and interest bearing deposits | 5 | 18,430,907 | 2,899,559 | ||
| Provision for accounts receivable losses | 2,757,117 | 1,534,652 | |||
| Impairment (reversal) of assets held for sale | 272,436 | (2,336,581) | |||
| Provision (release) for unfunded commitments | (125,713) | (46,688) | |||
| Interest income, net | (1,335,736,279) | (1,298,395,014) | |||
| Gain on financial instruments, net | 22 | (48,207,294) | (16,466,731) | ||
| Loss on sale and disposal of property and equipment, net | 482,671 | 623,876 | |||
| Loss on sale and disposal of intangible assets | 2,125,229 | 443,413 | |||
| Net gain on sale of assets held for sale | (4,273,635) | (4,607,814) | |||
| Dividends on equity securities at FVOCI | (3,523,461) | (1,298,780) | |||
| Income tax expense | 134,752,356 | 145,449,906 | |||
| Changes in operating assets and liabilities: | |||||
| Deposits with original maturities of 90 days or more | (121,825,418) | (36,370,996) | |||
| Investments at fair value | (4,473,231) | (3,459,836) | |||
| Loans | (748,940,532) | (719,815,822) | |||
| Securities sold under agreements to repurchase | (58,056,150) | (78,887,084) | |||
| Other accounts receivable | (8,773,396) | 30,550,794 | |||
| Other assets | 9,895,834 | 1,558,936 | |||
| Deposits from costumers | 3,941,554,752 | 1,282,077,685 | |||
| Other liabilities | (236,383,770) | (105,872,484) | |||
| Cash generated by operations: | |||||
| Interest received | 1,773,208,840 | 1,905,545,230 | |||
| Interest paid | (673,552,894) | (657,557,652) | |||
| Dividends received | 3,523,461 | 1,298,780 | |||
| Income tax paid | (135,554,245) | (143,120,188) | |||
| Net cash provided by operating activities | 3,440,061,551 | 1,211,511,703 | |||
| Cash flows from investment activities: | |||||
| Proceeds from sale of investments at FVOCI | 10 | 1,655,860,675 | 615,631,289 | ||
| Maturities, and prepayments of investments at FVOCI | 1,687,218,902 | 1,406,403,233 | |||
| Purchase of investments at FVOCI | (4,093,010,303) | (2,320,074,469) | |||
| Purchase of property and equipment | (64,475,753) | (70,244,954) | |||
| Proceeds from sale of property and equipment | 657,171 | 632,249 | |||
| Acquisition of intangible assets | (30,513,061) | (28,854,325) | |||
| Cash paid in business acquisition, net of cash received | (233,299,928) | 0 | |||
| Proceeds from sale of assets held for sale | 23,030,076 | 22,574,709 | |||
| Net cash used in investment activities | (1,054,532,221) | (373,932,268) | |||
| Cash flows from financing activities: | |||||
| Proceeds from other financial obligations | 31,462,204 | 135,876,342 | |||
| Payment of other financial obligations | (208,624,376) | (115,311,820) | |||
| Proceeds from financial obligations | 2,591,618,064 | 1,666,309,173 | |||
| Payment of financial obligations | (2,328,762,744) | (2,670,739,365) | |||
| Payment of lease liabilities | (40,669,495) | (39,148,908) | |||
| Dividends | (378,285,203) | (3,687) | |||
| Redemption of preferred shares | (102,000,000) | 0 | |||
| Acquisition of non-controlling intetrest | (13,346,885) | (41,580) | |||
| Net cash used in financing activities | (448,608,435) | (1,023,059,845) | |||
| Effect of exchange rate fluctuation on cash held | (104,360,727) | 80,539,778 | |||
| Net increase (decrease) in cash and cash equivalents | 1,832,560,167 | (104,940,632) | |||
| Cash and cash equivalents at beginning of the year | 4,071,458,635 | 4,176,399,267 | |||
| Cash and cash equivalents at the end of the year | 8 | 5,904,018,802 | 4,071,458,635 |
The consolidated statement of cash flows must be read in conjunction with the notes which are part of the consolidated financial statements.
F-71
LEASING BOGOTA S.A. PANAMA AND SUBSIDIARIES
(Panama, Republic of Panama)
Notes to the Consolidated Financial Statements
December 31, 2020
(In U.S. dollars)
| (1) | Organization |
Leasing Bogota, S. A. Panama is incorporated under the Companies Law of the Republic of Panama since 1972. Until September 30, 2012, it operated as holding company in other entities of the banking sector. Leasing Bogota, S. A. Panamá and its Subsidiaries will be jointly referred to as the “Company”. Leasing Bogota S. A. Panama is wholly owned by Banco de Bogota S. A., an authorized bank in the Republic of Colombia, which is a subsidiary of Grupo Aval Acciones y Valores, S. A., an entity domiciled in the Republic of Colombia.
The Company owns 100% of the shares of BAC Credomatic, Inc. BAC Credomatic, Inc. provides through its indirect subsidiary BAC International Bank Inc., a Panamanian banking institution, a wide variety of financial services to individuals and institutions, principally in Guatemala, Honduras, El Salvador, Nicaragua, Costa Rica and Panama.
In May 2020, the Company acquired 96.60% of the common shares of Multi Financial Group Inc. (MFG), a Panamanian banking institution. Multi Financial Group Inc. provides through its subsidiaries a wide variety of financial services to individuals and institutions mainly in Panama. Further details of the transaction are detailed in Note 4.
After December 31, 2020, the stake in MFG amounted to 99.57%, since 2.97% of the non-controlling interest was acquired in June 2020.
The Company owns 100% of the economic interest on the majority of the capital and the results of its subsidiaries. The Company consolidates directly and indirectly with the following significant entities:
| Subsidiary | Core Business | Location | Total voting rights held by the Company |
| BAC Credomatic Inc. | Holding | British Virgin Islands | 100.0000% |
| BAC International Corporation | Holding | British Virgin Islands | 100.0000% |
| BAC International Bank Inc. | Banking | Panama | 99.9961% |
| BAC International Bank (Grand Cayman) | Banking | Grand Cayman | 100.0000% |
| BAC Bahamas Bank Limited | Banking | Bahamas | 100.0000% |
| BAC Latam SSC S.A. | Services | Costa Rica | 100.0000% |
| BAC Valores Inc. | Securities broker | Panama | 100.0000% |
| Premier Assets Management Inc. | Mutual funds | Panama | 100.0000% |
| Red Land Bridge Reinsurance Ltd. | Reinsurance | Grand Cayman | 100.0000% |
| Corporación Latinoamericana de Finanzas S.A. | Holding | Panama | 100.0000% |
| Informaciones S.A. | Holding | Guatemala | 100.0000% |
| Banco de América Central S.A | Banking | Guatemala | 100.0000% |
| Financiera de Capitales S.A. | Financial | Guatemala | 99.9996% |
| BAC Valores de Guatemala S.A. | Securities broker | Guatemala | 99.9929% |
| BAC Bank Inc. | Banking | Panama | 100.0000% |
| Credomatic de Guatemala S.A. | Card Industry | Guatemala | 100.0000% |
| Banco de América Central Honduras S.A | Banking | Honduras | 99.9776% |
| Ventas Internacionales S.A. | Card Industry | Honduras | 99.9950% |
| Credomatic de Honduras S.A. | Card Industry | Honduras | 99.9950% |
| Admin. de Fondos de Pensiones y Cesantías BAC | Mutual funds | Honduras | 100.0000% |
| Inversiones Financieras Banco de América Central S.A. | Holding | El Salvador | 99.9988% |
| Banco de América Central S.A. | Banking | El Salvador | 99.9999% |
| Credomatic de El Salvador S.A. | Card Industry | El Salvador | 99.9997% |
| Sistemas Internacionales S.A. | Holding | El Salvador | 99.9949% |
| Viajes Credomatic El Salvador S.A | Travel agency | El Salvador | 99.9436% |
| Corporación Tenedora BAC COM S.A. | Holding | Nicaragua | 99.9769% |
| Banco de América Central S.A. | Banking | Nicaragua | 100.0000% |
| Almacenes Generales de Depósito BAC S.A. | Fiscal Warehouse | Nicaragua | 99.9995% |
| Crédito S.A. | Cards Industry | Nicaragua | 99.6631% |
| BAC Valores Nicaragua Puesto de Bolsa S.A. | Securities broker | Nicaragua | 99.9946% |
| Corporación de Inversiones Credomatic S.A. | Holding | Costa Rica | 100.0000% |
| Corporación Tenedora BAC Credomatic S.A. | Holding | Costa Rica | 100.0000% |
| Banco BAC San José S.A. | Banking | Costa Rica | 100.0000% |
| BAC San José Puesto de Bolsa S.A. | Securities broker | Costa Rica | 100.0000% |
| BAC San José Leasing S.A. | Leasing | Costa Rica | 100.0000% |
| Inmobiliaria Credomatic S.A. | Real Estate | Costa Rica | 100.0000% |
| BAC San José Soc. de Fondos de Inversión S.A. | Mutual funds | Costa Rica | 100.0000% |
| BAC San José Pensiones S.A. | Mutual funds | Costa Rica | 100.0000% |
| BAC Credomatic Corredora de Seguros S.A. | Insurance | Costa Rica | 100.0000% |
| Credomatic de Costa Rica S.A. | Card Industry | Costa Rica | 100.0000% |
| Multi Financial Group Inc. | Holding | Panama | 99.5691% |
| Multibank Inc. | Banking | Panama | 100.0000% |
| Multi Securities Inc. | Securities broker | Panama | 100.0000% |
| Multi Trust Inc. | Mutual funds | Panama | 100.0000% |
| Orbis Real Estate Inc. | Real Estate | Panama | 100.0000% |
| Multibank Seguros, S.A. | Insurance | Panama | 100.0000% |
| MB Créditos, S.A. | Financial | Costa Rica | 100.0000% |
| MB Leasing, S.A. | Financial | Costa Rica | 100.0000% |
| Multibank Cayman Inc. | Banking | Grand Cayman | 100.0000% |
| Multi Investments, S.A. | Real Estate | Panama | 100.0000% |
| Multi Real Estate, S.A. | Real Estate | Panama | 100.0000% |
| Instituto De Microfinanzas, S.A. | SME's support | Panama | 100.0000% |
| Promotora Prosperidad, S.A. | Real Estate | Panama | 100.0000% |
F-72
| (2) | Basis of Preparation of the Consolidated Financial Statements |
| (a) | Compliance with International Financial Reporting Standards (“IFRS”) |
The consolidated financial statements have been prepared in conformity with IFRSs issued by the International Accounting Standards Board (“IASB”).
The consolidated financial statements were approved by the Company´s Board of Directors on February 19, 2021.
| (b) | Basis of measurement |
The consolidated financial statements have been prepared on a historical cost basis, except for the following accounts in the consolidated statement of financial position.
| · | Investments at fair value; and |
| · | Assets held for sale. |
Initially, the Company recognizes financial instruments as of the date they are disbursed.
| (c) | Functional and presentation currency |
The items included in the accounts of each of the Company's subsidiaries are measured using the currency of the main economic environment where the entity operates ("functional currency").
The Company’s consolidated financial statements are presented in U.S.A. dollars, which is also Bank's functional currency. Information presented in U.S.A. dollars is expressed in units, unless otherwise stated.
| (d) | Use of estimates and judgments |
Preparation of the consolidated financial statements requires the Company’s management to make judgments, estimates and assumptions affecting the application of accounting policies and the reported amounts of assets, liabilities, revenues and expenses. Final results may differ from these estimates. These also require the Company’s management to apply its judgment when applying the Company's accounting policies.
The information on the most significant areas of estimation of uncertainty and critical judgments in applying the accounting policies that have the most important effect on the amounts recognized in the consolidated financial statements is disclosed in Note 7.
F-73
| (3) | Summary of Significant Accounting Policies |
The Company has applied the policies to the Consolidated financial statements in a manner consistent with those of the Consolidated Financial Statements as of December 31, 2020, which are detailed below:
| (a) | Basis of consolidation |
Subsidiaries
Subsidiaries are entities controlled by the Company. The Company controls an entity when it is exposed to, or has rights to, variable return from its involvement with the investee and has the ability to affect those returns through its power over the investee.
To determine the control, the potential voting rights that are currently executable or convertible are considered. The subsidiaries’ financial statements are included in the consolidated financial statements from the date on which the control begins, and until the control ceases.
Balances and Transactions Eliminated in the Consolidation
Intragroup transactions, balances, revenue and expenses in transactions between subsidiaries are eliminated. Losses and gains that arise from intragroup transactions that are recognized as assets or liabilities are also eliminated.
Changes in the ownership of the subsidiaries that do not result in a change of control
Transactions with non-controlling interest that do not result in a loss of control are accounted for as equity transactions; that is, as transactions with the owners. Any difference between the carrying value of the interest and the amount of the transaction is recorded as an adjustment in retained earnings.
Loss of control
When the Company ceases to have control over a subsidiary, it derecognizes the assets and liabilities of the subsidiary, and any non-controlling interest and other components of equity. Any resulting gain or loss is recognized in the consolidated statement of income. Any retained interest in the former subsidiary is measured at fair value when control is lost.
| (b) | Foreign currencies |
Assets and liabilities maintained in foreign currency are converted to the functional currency at the exchange rate in effect on the reporting date. Gains or losses resulting from the conversion of foreign currency are reflected in other revenues or other expense accounts in the consolidated statement of income.
Goodwill and adjustments to fair value resulting from the acquisition of a foreign entity are treated as assets and liabilities of the foreign entity and, consequently, are converted at the exchange rates in effect on each period closing date.
Subsidiaries of the Company
The financial position and results of all of the Company's subsidiaries that have a functional currency different from the Company's functional currency are converted into the presentation currency as follows:
| · | Assets and liabilities: at the exchange rate at the period closing date. |
| · | Revenues and expenses: at the average exchange rate. |
| · | Equity accounts: at the historical exchange rate. |
The resulting conversion adjustment is carried directly to a separate account in the “Equity” section, under "other comprehensive loss".
| (c) | Financial assets and liabilities |
Financial assets are classified on the date of initial recognition, based on the nature and purpose of the financial asset's acquisition.
F-74
| (3) | Summary of Significant Accounting Policies, continued |
Classification
IFRS 9 contains three principal classification categories for financial assets: measured at amortized cost (AC), fair value through other comprehensive income (FVOCI) and fair value through profit or loss (FVPL). IFRS 9 classification is generally based on the business model in which a financial asset is managed and its contractual cash flows.
At initial recognition, financial assets are classified as measured at: AC, FVOCI or FVPL.
A financial asset is measured at amortized cost and not at FVPL, if it meets both of the following conditions:
| 1. | The asset is kept within a business model to collect contractual cash flows; and |
| 2. | The contractual terms of the financial asset establish specific dates for cash flows that represent solely payments of principal and interest on the outstanding balance. |
A debt instrument is measured at FVOCI only if it meets both of the following conditions and has not been designated as FVPL:
| 1. | The asset is kept within a business model whose objective is achieved by collecting contractual cash flows and selling financial assets and; |
| 2. | The contractual terms of the financial asset establish specific dates for cash flows that represent solely payments of principal and interest on the current outstanding balance. |
During the initial recognition of investments in equity instruments not traded, the Company may elect to irrevocably register subsequent changes in fair value as part of other comprehensive profit and loss in equity. This election is made on an instrument by instrument basis.
All financial assets not classified as measured at AC or FVOCI as described above, are measured at FVPL.
F-75
| (3) | Summary of Significant Accounting Policies, continued |
In addition, in the initial recognition, the Company may irrevocably designate a financial asset that meets the measurement requirements at AC or FVOCI to be measured at FVPL, if doing so eliminates or significantly reduces an accounting mismatch that may occur if not done. For now, the Company do not use this option.
A financial asset is classified in one of the referenced categories at the time of its initial recognition.
An embedded derivative where the main contract is a financial contract covered under IFRS 9 is not separated and instead the hybrid financial instrument is jointly assessed for classification.
Business Model Assessment
The Company assess the objectives of the business models that hold the financial assets in a portfolio to better represent how each subsidiary manages the business and how management information is reported. The information considered includes:
| · | The policies and objectives stated for each portfolio of financial assets and the operation of these policies in practice. These include, whether management’s strategy is to collect income from contractual interest; hold a profile of specific interest performance or coordinate the duration of the financial assets with the liabilities being financed or the expected outgoing cash or through cash flows from the sale of assets; |
| · | How they are evaluated or reported to key management personnel for each Bank subsidiary on portfolio performance. |
| · | The risks that affect the performance of the portfolios (and the financial assets held within) and the way those risks are managed; |
| · | How managers of the business are compensated (for example, whether compensation is based on the fair value of the assets managed or the contractual cash flows collected); and, |
| · | The frequency, value and timing of sales in prior fiscal periods, the reasons for those sales and expectations about future sales activity. However, the information on sales activity cannot be considered in isolation, but rather as part of an assessment of how Bank objectives established for managing financial assets is achieved and how cash flows are realized. |
Financial assets held or managed for trading and where their performance is evaluated on a fair value basis, are measured at FVPL because these are not held to cover contractual cash flows or to obtain contractual cash flows and to sell these financial assets.
F-76
| (3) | Summary of Significant Accounting Policies, continued |
Assessment if contractual cash flows are solely payments of principal and interest
For purposes of this assessment, “principal” is defined as the fair value of the financial asset at initial recognition. “Interest” is defined as compensation for the time value of money and credit risk associated with holding the current principal for a period of time and for other basic risk from loan agreements and other associated costs (e.g. liquidity risk and administrative costs), as well as the profit margin.
When evaluating whether contractual cash flows are solely payment of principal and interest, the Company considered the contractual terms of the instrument. This includes an assessment to determine whether the financial asset contains a contractual term that could change the timing or amount of the contractual cash flows in such a way that it does not meet this condition. In making this assessment the Company considers:
| · | Contingent events that will change the amount and timing of cash flows; |
| · | Hedging conditions; |
| · | Prepayment and extension terms; |
| · | Terms that limit the Company in achieving cash flows for specific assets (e.g. unfunded asset agreements); and |
| · | Terms that change the considerations on the value of money over time (e.g. periodic revision of interest rates). |
Interest rates on certain consumer and business loans are based on variable interest rates established at the discretion of the Company. Variable interest rates are generally established in accordance with the practices of each of the countries where the Company operates, plus certain additional discretionary points. In these cases, the Company assess whether the discretionary feature is consistent with the solely principal and interest criteria considering a number of factors that include whether:
| · | Debtors can prepay the loans without significant penalties; |
| · | Competitive market factors insure that interest rates are consistent between banks; and, |
| · | Any regulatory protection standard in favor of customers in the country requiring banks to treat customers reasonably (e.g. regulated rates). |
All fixed rate consumer and corporate loans contain a prepayment condition.
A prepayment feature is consistent with the solely principal and interest criteria, if the prepayment amount substantially represents unpaid amounts of principal and interest on the amount of outstanding principal, which may include fair compensation for early termination of the contract.
F-77
| (3) | Summary of Significant Accounting Policies, continued |
In addition, a prepayment feature is consistent with these criteria, if a financial asset is acquired or originates from a premium or discount to the contractual par amount and the prepayment amount substantially represents the contractual par amount, plus accrued, but unpaid, contractual interest (which may include fair compensation for early termination) and the fair value of the prepayment feature is insignificant in the initial recognition.
Impairment of Financial Assets
The Company assesses the impairment of financial assets with an Expected Credit Losses model (ECL). This model requires the application of considerable judgment regarding how changes in economic factors impact on ECL, which is determined on a weighted average basis.
The impairment model applies to the following financial assets that are not measured at FVPL.
| · | Debt instruments; |
| · | Lease payments receivable; |
| · | Other accounts receivable; |
| · | Loan portfolio |
| · | Financial guarantee contracts issued; and |
| · | Loans commitments issued. |
The Company recognizes a provision for impairment of financial assets at AC and FVOCI in an amount equal to the expected impairment losses in a period of twelve months after the end date of financial statements or during the remaining life of the loan. Expected losses during the remaining life of the loan are the losses expected from all possible impairment events during the expected life of the financial instrument, while expected losses in a twelve-month period are the portion of expected losses arising from impairment events resulting from impairment events that are possible during the twelve months following on the date of the report.
Reserves for losses are recognized in an amount equal to the ECL during the life of the asset, except in the following cases, in which the amount recognized is equal to ECL for the 12 months following the measurement date:
| · | Investments in debt instruments determined to represent low credit risk to the reporting date; and, |
| · | Other financial assets (other than short term accounts receivable) on which the credit risk has not increased significantly since initial recognition. |
F-78
| (3) | Summary of Significant Accounting Policies, continued |
Impairment requirements are complex and require estimated judgments and significant assumptions by management, particularly in the following areas:
| · | Assess whether the credit risk has increased significantly from initial recognition; and, |
| · | Incorporate prospective information in the measurement of expected impairment losses. |
Measuring ECL
Expected credit loss (ECL) is the estimated weighted probability of credit losses measured as follows:
| · | Financial assets with no credit impairment to the reporting date: the present value of all contractual cash payments in arrears (for example: the difference between Bank cash flow debt in accordance with the contract and cash flows that the Company expects to receive); |
| · | Impaired financial assets to the reporting date: the difference between the gross book value and the present value of estimated future cash flows; |
| · | Outstanding loan commitments: the present value of the difference between contractual cash flows owed to the Company in the event it enforces the commitment and cash flows that the Company expects to receive; and |
| · | Financially secured contracts: expected payments to reimburse the holder minus any amount the Company expects to recover. |
Definition of impairment
The Company considers a financial asset to be impaired when:
| · | It is highly unlikely that the debtor will fully pay its credit obligations to the Company, without recourse for the Company to take such actions as enforcing the guarantees (if any); or |
| · | The debtor is more than 90-days past-due on any material credit obligation. Overdrafts are considered in arrears once the client has exceeded the established limit, or the established limit is less than the outstanding balance. |
| · | For fixed income financial instruments, the following concepts, among others, are included: |
| - | Downgrade on the issuer’s credit risk rating; |
| - | Contractual payments are not made on the due date or in the term period stipulated; |
| - | There is a virtual certainty of default; |
| - | Issuer is likely to go bankrupt or a bankruptcy petition is filed or similar action; |
| - | The financial asset stops trading in an active market given its financial difficulties; |
F-79
| (3) | Summary of Significant Accounting Policies, continued |
To assess whether a debtor is impaired, the Company considers indicators such as:
| · | Qualitative, e.g. noncompliance with contractual clauses; |
| · | Quantitative, e.g. arrears or non-payment of another obligation from the same issuer to the Company; and, |
| · | Based on data developed internally and obtained from external sources. |
Inputs used in the assessment of whether financial instruments are in impairment and their importance may vary over time to reflect changes in circumstances.
Significant increase in credit risk
Under IFRS 9, when determining whether the credit risk of a financial assets has increased significantly since initial recognition, the Company considers relevant fair, sustainable information available at no cost or disproportionate effort, including information and quantitative and qualitative analyses based on historical experience and expert assessment of Company credit risk, including information with future projection.
The Company identifies if a significant increase in the credit risk has occurred for each exposure by comparing:
| · | The probability of default (PD) during the remaining life of financial instrument at the closing date, with |
| · | The PD during the remaining life at a point in time, which was estimated at initial recognition of exposure. |
The assessment of whether the credit risk has increased significantly from initial recognition of a financial asset requires identification of the initial recognition date of the instrument. For purposes of revolving credit (credit cards, overdrafts, among others), the date when the credit was first delivered may be a long time ago. Changes in the contractual terms of a financial asset may also impact this assessment, as discussed below.
Grading by credit risk categories
The Company assigns a credit risk grade to each exposure based on a variety of data that is determined to predict the PD and applying the judgment of a credit expert, the Company use these grades to identify significant increases in credit risk. Credit risk grading is defined using qualitative and quantitative factors indicative of the risk of losses. These factors varies depending on the type of exposure and the type of borrower.
Credit risk grading is defined and calibrated so that the risk of losses increases exponentially as the credit risk is impaired and so that, for example, the difference in the risk of losses between grade satisfactory and special mention is less than the difference between the credit risk between grades special mention and sub-standard.
F-80
| (3) | Summary of Significant Accounting Policies, continued |
Each exposure is given a credit risk grade upon initial recognition based on information available on the debtor. Exposures are subject to continuous monitoring, that may result in displacement of an exposure to a different credit risk grade.
Generating the Structure of the PD term
Credit risk grading are the main input to determine the structure of the PD term for the different exposures. The Company obtains performance and loss information on the credit risk exposures analyzed by jurisdiction or region, type of product and debtor, as well as by credit risk grade.
The Company uses statistical models to analyze the data compiled and generate estimates of the probability of impairment during the remaining life of the exposures and how these probabilities of impairment change over time.
These analyses include identification and calibration of relationships between changes in impairment rates and key macroeconomic factors, as well as in-depth analysis of certain impairment risk factors (for example, loans portfolio charge-offs). For the majority of loans, key economic factors includes growth in gross domestic product, changes in interest rates on the market and unemployment.
The approach used by the Company to prepare prospective economic information within its assessment is indicated below.
Determine if the credit risk has increased significantly
The Company has established a general framework that incorporates quantitative information and qualitative to determine if the credit risk of a financial asset has significantly increased since its initial recognition.
The initial framework is aligned with the internal process of the Company for credit risk management.
The criteria to determine whether the credit risk has increased significantly varies by portfolio and includes limits based on noncompliance.
The Company evaluates whether the credit risk of a particular exposure has increased significantly since initial recognition if, based on Bank qualitative modeling, the expected probability of impairment during the remaining life will increase significantly from initial recognition. In determining the credit risk increase, the expected impairment losses in the remaining life is adjusted by changes in expiration.
F-81
| (3) | Summary of Significant Accounting Policies, continued |
Under certain circumstances, using the judgment of credit experts, and based on relevant historical information, the Company determines that an exposure has had a significant increase in credit risk, if particular qualitative factors indicate this and those factors may not be completely captured by periodic quantitative analyses. As a limit, the Company assumes that a significant credit risk occurs no later than when the asset is in arrears for more than 30 days.
The Company monitors the effectiveness of the criteria used to identify significant increases in credit risk based on regular reviews to confirm that:
| · | The criteria can identify significant increases in credit risk before an exposure becomes impaired; |
| · | The criteria are inconsistent with the time when the asset is more than 30 days past the due date; |
Modified financial assets
The contractual terms of the loans may be modified for a number of reasons, including changes in market conditions, client retention and other factors unrelated to an actual or potential impairment of the client’s loan.
When the terms of a financial asset are modified and the modification does not result in the removal of the asset from the consolidated statement of financial position, the determination of whether the credit risk has significantly increased reflects comparisons of:
| · | The PD during the remaining life on the date of the balance sheet based on the terms modified with; |
| · | The PD on the estimated remaining life based on the date of initial recognition and the original contractual terms. |
The Company renegotiates loans to customers in financial difficulties to maximize the opportunities to collect and to minimize the risk of noncompliance. Under the Company’s renegotiation policies, customers in financial difficulties are given concessions that generally involve a reduction in interest rate, extension of the payment term, reductions in the balances due or a combination of these.
F-82
| (3) | Summary of Significant Accounting Policies, continued |
For financial assets modified as part of the Company’s renegotiation policies, the estimation of the PD reflects whether the modifications have improved or restored the ability of the Company to collect principal and interest and the prior experience of the Company in similar actions. As part of the process, the Company evaluates the debtor’s payment compliance as compared to the modified terms of the debt and considers several performance indicators for the group of debtors modified.
Generally, restructuring indicators are a relevant factor on increased credit risk. Therefore, a restructured debtor must demonstrate a consistent payment behavior over a period of time before no longer being considered as an impaired loan or that the PI has decreased in such a way that the provision may be reversed and the loan measured for impairment over a term of twelve months after the closing date of the report.
Inputs in Measuring ECL
Key inputs in measuring ECL are usually the structure of terms of the following variables:
| · | Probability of default (PD). |
| · | Losses given default (LGD). |
| · | Exposure at default (EAD). |
The foregoing parameters are derived from internal statistical models and other historical information. These models are adjusted to reflect prospective information as described below.
PDs are estimated on certain cut-off dates. They are calculated using survival models,based on historical default vectors. If a counterparty or exposure migrates between the different ratings then this will cause a change in the estimated PD for that group. The PDs are estimated considering the contractual expiration terms of the exposures and the estimated prepayment rates.
The historical PD is then transformed to a prospective PD, using macroeconomic sensitivity models.
LGD is the magnitude of probable losses in the event of noncompliance. The Company estimates the parameters of the LGD based on historical loss recovery rates against the noncomplying parties. LGD models consider the structure, collateral and the recovery costs of any collateral when there are mortgage guarantees.
For unsecured loans, a cash to value recovery model is used. For loans secured by real property, indices relating to the value of the security as compared to the loan (Loan to value, “LTV”), are parameters used in the determination of the LGD. LGD estimates are calibrated at different economic scenarios and for loans secured by real estate, variations in price indices for these assets. These loans are calculated on the bases of discounted cash flow using the effective interest rate of the loan.
F-83
| (3) | Summary of Significant Accounting Policies, continued |
EAD represents expected exposure in the event of noncompliance. The Company derives the EAD from the current exposure of the counterpart and potential changes in the current amount permitted under the terms of the contract, including amortization and prepayments for decreasing and revolving exposures with no commitment to disburse. For loan commitments and financial security, the EAD considers the amount removed, as well as potential future amounts that may be removed or collected under the contract, which are estimated based on historical issues. Finally, for credit cards, due to its relative nature, the Company determines the EAD by modeling a percentage of historical utilization over approved credit limit.
The Company measures the EAD considering the risk of noncompliance during the maximum contractual period (including options to extend the customer’s debt) on which there is an exposure to credit risk, even if, for purposes of risk management, the Company considers a longer period of time. The maximum contractual period is extended to the date on which the Company has the right to require payment of a loan or terminate a loan commitment or security given.
For credit card balances the Company measures EADs over a longer period than the maximum contractual period, if the contractual ability of the Company to demand payments and pay off the commitment no withdraw does not limit the Company’s exposure to credit losses for the contractual period of the contract. These facilities do not have a fixed term or a collection structure and are managed on a collective basis. The Company may cancel them immediately, but this contractual right is forced in the normal management of the Company’s day to day management, rather only when the Company finds that there has been increased credit risk for each loan. This longer period will be estimated taking into account the actions for the management of credit risk that the Company expects to take and that mitigate the EAD. These measures include a reduction in limits and cancellation of loan contracts.
Where parameter modeling is performed on a collective basis, the financial instruments are pooled on the basis of shared risk characteristics that include:
| · | Type of instrument. |
| · | Credit risk rating. |
| · | Guarantees. |
| · | Date of initial recognition. |
| · | Remaining expiration term. |
| · | Geographical location of the debtor. |
The above pooling is subject to regular review to ensure that the exposure of a particular Group remains uniform.
F-84
| (3) | Summary of Significant Accounting Policies, continued |
Projection of future conditions
On a quarterly basis, macroeconomic scenarios forecast for twelve months are approved for the six countries where the Company operates, and they are divided into three categories: upside, central and downside. These scenarios are prepared based on the Company's macroeconomic simulation model and are complemented by (i) projections from supranational organizations such as the International Monetary Fund, the World Bank, ECLAC, etc. (ii) the macroeconomic program of the Central American central banks and (iii) economists outside the Company.
| · | Central scenario: According to current expectations. In the current situation, it contemplates stability in the nominal macroeconomic variables, exchange rate, interest rates, and inflation. Forecasts from other organizations that carry out economic research are used as a reference, for example, the International Monetary Fund, the World Bank and the central banks of each country. External references bring fairness to the exercise. |
| · | Upside and downside scenarios: These are the probable macroeconomic scenarios before the realization of some of the main risks associated with each country. They are categorized as upside and downside risks, furthermore, divided between internal and external risks. |
| · | External Risks: The Central American countries, being small and open economies, are exposed to the economic performance of the large economies and main trading partners, mainly the United States and Europe. The economic activity of these countries affects the Central American countries in a generalized way, mainly through income from remittances, exports, tourism, and foreign direct investment. |
| · | Internal Risks: These are risks specific to each country. They include risks associated with the internal social, political, and economic situation. In the current situation, the risks associated with the performance of governments predominate public finance management, natural disasters, health policies, etc. |
The external information includes economic data and publication of projections by government committees, monetary authorities (mainly in the countries where the Company operates), supranational organizations (such as the Organization for Economic Cooperation and Development, the International Monetary Fund and others), academic projections, private sector, and credit risk rating agencies.
The base case represents the most probable. Other scenarios represent a more optimistic or pessimistic outcome. In addition, the Company uses periodic stress testing to calibrate the determination of these other representative scenarios.
F-85
| (3) | Summary of Significant Accounting Policies, continued |
Financial liabilities
Financial liabilities are measured at amortized cost using the effective interest method, except when there are financial liabilities measured at FVPL.
Recognition, disposal and measurement
The Company regularly recognizes the purchase or sale of financial instruments on the date of each negotiation, which is the date on which the Company commits to buy or sell a financial instrument. Financial assets and liabilities are initially recognized at fair value.
Transaction costs are attributed to expenses in the consolidated statement of income when incurred for financial assets and liabilities at fair value with changes in the consolidated statement of income, and they are recorded as part of the initial value of the instrument for assets and liabilities at amortized cost and available for sale securities.
Transaction costs are incremental costs incurred to acquire assets or sell financial liabilities. These include fees, commissions and other concepts paid to agents, brokers, advisors and intermediaries, rates established by regulatory agencies and stock markets, as well as taxes and other rights.
Financial assets are derecognized from the consolidated statement of financial position when the payments derived from it were received, the rights to receive cash flows from the investments has expired or have been transferred and the Company has transferred substantially all of the risks and benefits derived from their ownership.
After initial recognition, all financial assets and financial liabilities classified at amortized cost are measured based on the amortized cost method. Interest accrued are recorded in the interest income or expense account.
Offsetting of financial instruments
Financial assets and financial liabilities are offset and the net amount is reported in the consolidated statement of financial position if there is a currently enforceable legal right to offset the recognized amounts and there is an intention to settle on a net basis, or to realize the assets and settle the liabilities simultaneously.
Presentation of provision for PCE in the consolidated statement of financial position
The provision for PCE is presented in the consolidated statement of financial position of the following way:
| · | Financial assets measured at amortized cost: as a deduction from gross value in the books of assets; |
| · | Loan commitments and financial guarantee contracts: generally, as a provision; and |
| · | Debt instruments measured at VRCOUI: no provision is recognized for losses in the consolidated statement of financial position because the value. The carrying amount of these assets is their fair value. However, the provision for losses is disclosed and recognized in other comprehensive income. |
F-86
| (3) | Summary of Significant Accounting Policies, continued |
| (d) | Loans |
Loans and advances were initially measured at fair value plus incremental direct transaction costs, and subsequently measured at their amortized cost using the effective interest method. Unearned interest and commissions are recognized as income during the life of the loan using the effective interest method.
| (e) | Assets held for sale |
Assets acquired or awarded in the settlement of a loan are held for sale, and are initially recognized at the lower of the balance of the loan and fair value less selling costs as of the award date, establishing a new cost basis. After the award, management conducts periodic assessments and assets are recognized at the lower of carrying value or fair value less costs to sell. Operating revenues and expenses originated and changes in the provision for the valuation of those assets are included in other operating expenses. Costs related to the maintenance of these properties are included as expenses when incurred.
| (f) | Recognition of the most significant income and expenses |
Interest income and expenses
Interest income and expenses are recognized in the consolidated statement of income using the effective interest method. The effective interest rate is the discount rate that equals exactly the estimated cash flows receivable or payable throughout the expected life of the financial instrument or when appropriate (in a shorter period) with the net carrying value of the financial asset or liability. To calculate the effective interest rate, the Company will estimate cash flows considering all of the contractual conditions of the financial instrument, but not considering future credit losses.
The calculation of the effective interest rate includes all commissions and points paid or received that are part of the effective interest rate. Transaction costs include incremental costs that are directly attributable to the acquisition or issue of a financial asset or liability.
Fees and commissions
Fees and commissions that are part of the effective interest rate in a financial asset or liability instrument are included in the measurement of the effective interest rate.
Other revenues from fees and commissions, including services fees, asset management, sales commissions, loan syndication, among others, are recognized when the corresponding services are provided.
Annual credit card memberships, net of direct card-origination incremental costs, are deferred and amortized by applying the straight-line method during a term of one year. Commissions charged to affiliated commercial establishments are determined based on the amount and type of purchase by the cardholder and are recognized when invoiced.
Other fees and commissions received mainly relating to fees for transactions and services are recognized as income when they are received.
F-87
| (3) | Summary of Significant Accounting Policies, continued |
Loyalty programs
The Company offers loyalty programs that allow cardholders to earn points that can be redeemed for a variety of awards, including cash, trips and products at a discount. The points are recognized as a separately identifiable component of the initial transaction of credit card consumption income.
The estimated fair value of loyalty programs and those points redeemed are recognized in the commissions account in the consolidated statement of income. The Company recognizes the points based on the earned points expected to be redeemed and the fair value of the point to be redeemed. The points to be redeemed are estimated based on the history of redemption, card product type, account transaction activity and past performance of the cards.
| (g) | Cash and cash equivalents |
The Company considers all highly liquid time deposits with maturities of 90 days or less as cash equivalents. Cash and cash equivalents consist of cash, demand deposits at banks, certain securities and deposits that generate interests, with original maturities of 90 days or less.
| (h) | Property, furniture, equipment and improvements and depreciation method used |
Property, furniture, equipment and improvements are presented at cost, less accumulated depreciation and amortization.
The cost of renewals and improvements is capitalized when they increase the asset's useful life; while repairs and maintenance that do not extend the useful life or improve the asset are charged to profit or loss during the period in which they are incurred.
Depreciation is calculated on a straight-line basis over the estimated useful lives of the assets. The Company depreciates amounts with a charge to the period's profit or loss with a credit to the accumulated depreciation account. Land is not depreciated. The estimated useful lives of assets are:
| Category | Years/Base |
| Buildings | 20 - 50 |
| Furniture and equipment | 5 - 10 |
| Vehicles | 5 |
| Computers | 3 - 5 |
| Leasehold improvements | 3 - 10 |
Leasehold improvements are amortized during the lower of the estimated useful life or the term of the lease contract.
Property and equipment are reviewed for impairment whenever events or changes in circumstances indicate that the carrying amount may not be recoverable. The carrying amount of an asset is immediate reduced to its recoverable value if the carrying amount of the asset is greater than the estimated recoverable value. The recoverable amount is the highest between the fair value of the asset less the cost of selling and its value in use.
F-88
| (3) | Summary of Significant Accounting Policies, continued |
| (i) | Leases |
At inception of a contract, the Company assesses whether a contract is, or contains, a lease. A contract is, or contains, a lease if the contract conveys the right to control the use of an identified asset for a period of time in exchange for consideration. To assess whether a contract conveys the right to control the use of an identified asset, the Company assesses whether:
| · | the contract involves the use of an identified asset – this may be specified explicitly or implicitly and should be physically distinct or represent substantially all of the capacity of a physically distinct asset. If the supplier has a substantive substitution right, then the asset is not identified; |
| · | The Company has the right to obtain substantially all of the economic benefits from use of the asset throughout the period of use; and |
| · | The Company has the right to direct the use of the asset. The Company has this right when it has the decision-making rights that are most relevant to changing how and for what purpose the asset is used. In rare cases where the decision about how and for what purpose the asset is used is predetermined, the Company has the right to direct the use of the asset if either: |
| · | The Company has the right to operate the asset; or |
| · | The Company designed the asset in a way that predetermines how and for what purpose it will be used. |
This policy is applied to contracts entered into, or changed, on or after January 1, 2019.
At inception or on reassessment of a contract that contains a lease component, the Company allocates the consideration in the contract to each lease component on the basis of their relative stand-alone prices. However, for the leases of land and buildings in which it is a lessee, the Company has elected not to separate non-lease components and account for the lease and non-lease components as a single lease component.
| i. | As a lessee |
The Company recognizes a right-of-use asset and a lease liability at the lease commencement date. The right-of-use asset is initially measured at cost, which comprises the initial amount of the lease liability adjusted for any lease payments made at or before the commencement date, plus any initial direct costs incurred and an estimate of costs to dismantle and remove the underlying asset or to restore the underlying asset or the site on which it is located, less any lease incentives received.
The right-of-use asset is subsequently depreciated using the straight-line method from the commencement date to the earlier of the end of the useful life of the right-of-use asset or the end of the lease term. The estimated useful lives of right-of-use assets are determined on the same basis as those of property and equipment. In addition, the right-of-use asset is periodically reduced by impairment losses, if any, and adjusted for certain remeasurements of the lease liability.
F-89
(3) Summary of Significant Accounting Policies, continued
The lease liability is initially measured at the present value of the lease payments that are not paid at the commencement date, discounted using the interest rate implicit in the lease or, if that rate cannot be readily determined, the Company’s incremental borrowing rate. The Company uses its incremental borrowing rate as the discount rate.
Lease payments included in the measurement of the lease liability comprise the following:
| · | fixed payments, including in-substance fixed payments; |
| · | variable lease payments that depend on an index or a rate, initially measured using the index or rate as at the commencement date; |
| · | amounts expected to be payable under a residual value guarantee; and |
| · | the exercise price under a purchase option that the Company is reasonably certain to exercise, lease payments in an optional renewal period if the Company is reasonably certain to exercise an extension option, and penalties for early termination of a lease unless the Company is reasonably certain not to terminate early. |
The lease liability is measured at amortized cost using the effective interest method. It is remeasured when there is a change in future lease payments arising from a change in an index or rate, if there is a change in the Company’s estimate of the amount expected to be payable under a residual value guarantee, or if the Company changes its assessment of whether it will exercise a purchase, extension or termination option.
When the lease liability is remeasured in this way, a corresponding adjustment is made to the carrying amount of the right-of-use asset or is recorded in profit or loss if the carrying amount of the right-of-use asset has been reduced to zero.
The Company presents right-of-use assets that do not meet the definition of investment property in “property, furniture, equipment and improvements” and lease liabilities in “lease liabilities” in the consolidated statement of financial position.
Short-term leases and leases of low-value assets
The Company has elected not to recognize right-of-use assets and lease liabilities for short-term leases of machinery that have a lease term of 12 months or less and leases of low-value assets, including IT equipment. The Company recognizes the lease payments associated with these leases as an expense on a straight-line basis over the lease term.
| ii. | As a lessor |
When the Company acts as a lessor, it determines at lease inception whether each lease is a finance lease or an operating lease.
F-90
| (3) | Summary of Significant Accounting Policies, continued |
To classify each lease, the Company makes an overall assessment of whether the lease transfers substantially all of the risks and rewards incidental to ownership of the underlying asset. If this is the case, then the lease is a finance lease; if not, then it is an operating lease. As part of this assessment, the Company considers certain indicators such as whether the lease is for the major part of the economic life of the asset.
If an arrangement contains lease and non-lease components, the Company applies IFRS 15 to allocate the consideration in the contract.
The Company recognizes lease payments received under operating leases as income on a straight-line basis over the lease term as part of “other income”.
| (j) | Business combinations and goodwill |
The Company accounts for business combinations using the acquisition method when control is transferred. The consideration transferred in the acquisition is generally measured at fair value as are the identifiable net assets acquired. Any goodwill is subject to annual impairment tests. Any gain from purchase under very advantageous conditions is immediately recognized in profit or loss. Transaction costs are recorded as an expense when incurred, except if they are related to the issuance of debt or equity instruments.
Any contingent consideration is measured at fair value at the acquisition date. If an obligation to pay the contingent consideration that meets the definition of financial instruments is classified as equity, it should not be measured again, and its subsequent settlement should be accounted for within equity. If not, the other contingent consideration is remeasured at fair value on each reporting date and subsequent changes in the fair value of the contingent consideration are recognized in profit or loss.
Non-controlling interests are recorded for the proportional part of fair value of the identifiable assets and liabilities, unless stated otherwise. When the Company has the corresponding option to settle the purchase of a non-controlling interest through the issue of its own ordinary shares, no financial liability is recorded.
During the measurement period (which is a term of one year from the date of the acquisition), the Company can, retrospectively, adjust the amounts recognized on the date of acquisition to reflect new information obtained on events and circumstances that existed at that date.
For impairment tests purposes, goodwill acquired in a business combination is, on the acquisition date, assigned to each of the cash-generating unit groups (CGUs) expected to benefit from the combination. The CGUs to which goodwill is assigned will be disaggregated so impairment-testing level reflects the lowest level to which the goodwill is controlled for purposes of internal management.
An impairment loss will be recognized if the carrying amount of the CGU plus the goodwill allocated to it is higher than its recoverable amount, in which case the allocated goodwill will be reduced, and any remaining impairment would be applied to other CGUs’ assets.
F-91
| (3) | Summary of Significant Accounting Policies, continued |
| (k) | Intangible assets |
Intangible assets represent identifiable non-monetary assets and are acquired separately or through a business combination or are generated internally. The Company's intangible assets are recognized at cost or at fair value and mainly comprised of relations with the depositors, relations with credit card clients, relations with affiliated businesses, technological programs and trade names.
Cash-generating units to which goodwill has been attributed are periodically assessed for impairment. This assessment is carried out at least annually, or whenever there is evidence of impairment.
The amortization expense of intangible assets is presented in the consolidated statement of income as depreciation and amortization expenses.
Trade names are non-amortizable intangible assets.
| (l) | Income tax |
Tax expense for the year includes current and deferred taxes. Taxes are recognized in profit or loss, except to the extent that they refer to items recognized directly in equity.
The current tax expense is calculated based on the laws enacted on the balance sheet date in the countries where the parent company and its subsidiaries operate, and where they generate positive taxable bases. The Company’s management periodically assesses the positions assumed in tax returns regarding situations in which applicable tax regulation is subject to interpretation, and when necessary, recognizes provisions for the amounts expected to be paid to the tax authorities.
Deferred taxes are recognized for the temporary differences that arise between the tax bases of assets and liabilities and their carrying amounts in the consolidated financial statements. However, deferred tax liabilities are not recorded if they arise from the initial recognition of goodwill; deferred taxes are not recognized if they arise from an asset or liability in a transaction, other than a business combination, that at the time of the transaction does not affect the accounting results nor taxable income or loss. Deferred tax is determined using tax rates (and laws) enacted on the balance sheet date and expected to be applicable when the corresponding deferred tax asset is realized, or the liability is settled.
Deferred tax assets are recognized only to the extend that it is probable that future tax benefits will be available with which to offset the temporary differences.
Deferred taxes are recognized over temporary differences that arise from investments in subsidiaries and associates, except for those deferred tax liabilities for which the Company can control the date on which the temporary differences will be reversed, and it is likely that they will not be reversed in the near future. Deferred tax assets are recognized in deductible temporary differences that arise from investments in subsidiaries only to the extent that it is likely that the temporary differences will be reversed in the future, and there is a sufficient future taxable income against which the temporary differences can be used.
F-92
| (3) | Summary of Significant Accounting Policies, continued |
Deferred tax assets and deferred tax liabilities are set off only if there is a legally recognized right to offset the current tax assets with the current tax liabilities and when the deferred tax assets and deferred tax liabilities are derived from income tax corresponding to the same tax authority, and the authority allows the Company to pay or received a single amount that settle the existing net balance.
| (m) | Employee benefits |
The Company is subject to the labor laws in each country where it operates. The Company provisioned an employment benefit when such benefit is related to employee services already rendered, the employee has earned the right to receive the benefit, the benefit payment is probable, and the amount of such benefit can be estimated.
| (n) | Trust Contracts and Securities Management |
The assets under trust contracts and securities under custody are not considered part of the Company, and accordingly, such securities and related revenue are not included in these consolidated financial statements. It is the obligation of the Company to manage and safeguard the assets under contract and independently of their equity.
The Company charges a fee for the management of trust contracts and custody of securities, which is paid according to agreements between the parties. These fees are recognized as income according to the terms of the contracts either monthly, quarterly or annually on an accrual base.
| (o) | Fair value estimates |
The fair value of a financial asset or liability is the price that would be received to sell an asset or paid to transfer a liability in an orderly transaction between market participants at the measurement date (exit price).
The different hierarchy levels have been defined as follows:
| · | Level 1 - Quoted prices in active markets without adjustments for identical assets or liabilities that the Company can access at the measurement date. |
| · | Level 2 - Inputs other than quoted prices included in Level 1 that are observable, either directly (i.e. as prices) or indirectly (i.e. derived from prices). This category includes instruments valued using quoted prices in active markets for similar instruments, quoted prices for identical or similar instruments in markets that are not active and other valuation techniques where significant data inputs are directly or indirectly observable in the market. |
| · | Level 3 - Unobservable inputs for the asset or liability. This category includes all instruments where the valuation technique includes unobservable inputs and these have a significant effect on the fair value measurement. This category also includes instruments that are valued based on quoted prices for similar instruments for which we must make significant adjustments using unobservable inputs, assumptions or adjustments in which no observable or subjective data are used when there are differences between the instruments. |
A market is considered active if quoted prices are readily and regularly available from an exchange, financial intermediaries, a sector institution, pricing service or regulatory agency, and those prices reflect actual market transactions with sufficient frequency and volume to provide pricing market information.
F-93
| (3) | Summary of Significant Accounting Policies, continued |
| (p) | Transactions between entities under common control |
Transfers of assets between entities under common control, including transactions with intermediate holding companies, are initially recorded at book value of the Company transferring the assets at the date of transfer. If the carrying amount of the assets and liabilities transferred differs from historical cost of the Parent Company of entities under common control, then the Company receiving the assets and liabilities will recognize them at the historical cost of the Parent Company.
The Company enters into transactions with related parties, which according to the internal policies of the Company are carried out at market conditions.
| (q) | New International Financial Reporting Standards (“IFRSs”) not yet adopted. |
A number of new standards and amendments to standards are effective for annual periods beginning January 1, 2020 and early application is permitted; however, the Company has not early adopted the new and modified standards when preparing the consolidated financial statements as of December 31, 2020.
The following new and amended standards are not expected to have a significant impact on the Company's consolidated financial statements:
| · | Onerous contracts – Cost of fulfilling a contract (amendments to IAS 37) |
| · | Property, Plant and Equipment: Proceeds before intended use (amendments to IFRS 3) |
| · | Classification of liabilities as current or non-current (amendments to IAS 1) |
| · | IFRS 17 Insurance Contracts and amendments to IFRS 17 Insurance contracts. |
| (r) | Reform of benchmark interest rates |
Any of these developments, and any future initiatives to regulate, reform or change the management of the benchmark, could have adverse consequences for the performance, value and the market of loans, mortgages, securities, derivatives, and other financial instruments whose returns are linked to any benchmark, including those issued, financed or maintained by us or our financial subsidiaries.
F-94
| (3) | Summary of Significant Accounting Policies, continued |
Various regulators, industry authorities, and other market participants in the United States and other countries are involved in initiatives to develop, introduce, and encourage the use of alternative rates to replace certain benchmarks. There is no guarantee that these new rates will be accepted or widely used by market participants, or that the characteristics of any of these new rates will be similar or will produce the economic equivalent of the benchmark rates they trying to replace.
The London Interbank Rate (LIBOR) is the most widely referenced interest rate worldwide for derivatives, bonds, loans, and other floating rate instruments; On July 27, 2017, the Executive Director of the Authority UK Financial Conduct Board (the "FCA"), which regulates "LIBOR", announced that the FCA will no longer require banks to submit rates for the calculation of the LIBOR benchmark after 2021. This announcement indicates that the continuation LIBOR on the current basis cannot be guaranteed after this date. Therefore, after 2021 LIBOR may be discontinued. There is a regulator-led push to transition the market from LIBOR and some other benchmark rates to risk-free alternative rates, which are based on overnight transactions. Derivatives, floating rate notes, loans and other financial contracts whose terms extend beyond the relevant discontinuation date and which refer to certain benchmark rates (including LIBOR) as the benchmark rate will be affected. As a result, agencies are moving toward new benchmark rates.
Many unsolved problems remain, such as the timing of the introduction of the new benchmark indices and the transition from a benchmark index to a replacement rate, which could lead to a generalized dislocation in financial markets, generate volatility in the prices of securities, derivatives and other instruments, and repress the activities of the capital markets.
As of December 31, 2020, the Company used the Libor rate as a reference in most of its financial instruments, as well as derivatives with these characteristics. While some of these outstanding LIBOR-based loans and contracts include alternative benchmark rate support provisions, most of our existing LIBOR-based contracts and products do not include adequate support provisions or support mechanisms and will require modifications to their terms. Additionally, most of our loans, and outstanding LIBOR-based contracts can be difficult to modify due to the requirement that all affected parties’ consent to the respective modifications. It is currently not possible to determine to what extent these changes will affect us.
Our transition activities are currently under development and by 2021 are focused on converting existing LIBOR-based contracts to other alternative rates through:
| a. | identification of asset and liability operations indexed to the Libor rate in each of our Subsidiaries |
| b. | development of new alternative products linked to a reference rate |
| c. | negotiations with clients and counterparties |
| d. | contract modifications |
| e. | adjustments in information systems |
| f. | modifications of procedures and policies |
| g. | modifications in valuation models |
| h. | the timeline of our work plan depends on a wider acceptance in the market of products that refer to the new alternative reference rates and, on the readiness, and capacity of our clients to adopt the replacement products. We are following the recommended dates for the termination of LIBOR. |
F-95
| (4) | Business combinations |
On May 22, 2020, the Company acquired Multi Financial Group Inc. (MFG), composed mainly of 100% of the issued and outstanding shares of Multibank Inc. and subsidiaries. MFG provides a wide variety of financial services primarily corporate, investment, mortgage and consumer banking, as well as insurance, securities brokerage, factoring, leasing and real estate services. The purchase price was $433.8 million paid in cash on May 22, 2020, thus acquiring 96.6% of the ordinary and outstanding shares, with the option to acquire the remaining 3.4% of the outstanding shares in the short term. During the month of September, the Company received an amount of $1.6 million as an adjustment to the price for reimbursement of items that should not have been included in the transaction. The final adjusted purchase price is $432.2 million. As of December 31, 2020, the non-controlling interest is 0.43%.
The consolidated results of MFG have been recognized in the consolidated financial statements as of May 22, 2020. The acquisition was carried out mainly in order to increase the operation of the Company through MFG's future business potential through international expansion. considering different factors such as geographic proximity, similarity in population size and growth expectation; strengthening the leadership position in Central America, the synergies and economies of scale expected from operations and from MFG, this transaction being complementary to the business lines in which the Company already participates in Panama. The goodwill has been allocated to MFG as a single operating segment. The recognized goodwill is not deductible for tax purposes.
For the period between the acquisition date and December 31, 2020, MFG contributed an income of $172.8 million to the Company's results and net income of $6.7 million to the Company's results. If the acquisition had occurred on January 1, 2020, the Company estimates that consolidated revenues would have been $3,044 million, and consolidated net income for the year ended December 31, 2020 would have been $273.2 million. In determining these amounts, the Company has assumed that the fair value adjustments, determined, that arose on the acquisition date would have been the same if the acquisition had occurred on January 1, 2020.
The Company incurred acquisition-related costs of $778.6 thousand for legal fees, valuation fees and due diligence costs. These costs have been included in “administrative expenses”.
The following table summarizes the consideration paid in cash for the acquisition of MFG and the amounts of the assets acquired, and the liabilities assumed, at fair value, at the acquisition date:
| Fair value | ||||
| Fair value of the consideration paid in cash | 432,210,992 | |||
| Assets | ||||
| Cash and cash equivalents | 74,398,087 | |||
| Term deposits | 135,093,910 | |||
| Investments | 982,737,646 | |||
| Loans | 3,265,534,602 | |||
| Property and equipment | 103,860,951 | |||
| Acceptances outstanding | 136,254,985 | |||
| Intangible assets | 47,407,001 | |||
| Other assets | 152,853,264 | |||
| Total Assets acquired | 4,898,140,446 | |||
| Liabilities | ||||
| Deposits | 2,893,749,418 | |||
| Financial obligations | 641,817,717 | |||
| Other financial obligations | 605,097,557 | |||
| Acceptances outstanding | 136,254,985 | |||
| Other liabilities | 100,156,618 | |||
| Total liabilities assumed | 4,377,076,295 | |||
| Non-controlling interest | 125,282,341 | |||
| Net Assets acquired | 395,781,810 | |||
| Goodwill | 36,429,182 | |||
| 432,210,992 | ||||
The Company has completed the evaluation and allocation of the purchase price based on the acquisition accounting method. The Company identified that the intangible assets correspond mainly to Relationship with Depositors, Relationship with Clients, and Trademarks and Trade Names. The Company has recognized the amortization and depreciation of the fair value adjustments for the seven-month period from May 22 (acquisition date) to December 31, 2020 for a net amount of $0.4MM.
F-96
| (4) | Business combinations, continued |
Fair value of assets acquired and liabilities assumed on the date of purchase:
The fair value of the assets acquired and the liabilities assumed is based on the information available as of May 31, 2020. The Company considers that this information provides an adequate basis for determining fair values. Taking into consideration the existence of a certain degree of uncertainty in the main assumptions used in the valuation methods, they represent the best estimate of the Company at the date of analysis.
The methods used to determine the fair value of the assets acquired and the significant liabilities assumed are described below:
Non-controlling interest
In accordance with IFRS3 “Business Combinations”, a transaction in which the Company obtains control of a business is accounted for in the consolidated financial statements under the acquisition method. Following this method, the acquisition price is distributed among the identifiable net assets acquired, including any intangible assets and assumed liabilities, including contingent liabilities, on the basis of their respective fair values, with some exceptions such as deferred tax that is measured at values. in books. The Company acquired 96.6% of the ordinary shares of MFG, leaving a non-controlling interest, which has been recorded at fair value. The non-controlling interest was calculated under the proportional interest method in the recognized amounts of the identifiable net assets of the acquired entity in accordance with the price paid.
Cash and cash equivalent
Cash and cash equivalents include cash and bank deposits, and interest-bearing deposits. Cash and cash equivalents have a maturity of 90 days or less at the time of purchase. For financial instruments that are short-term or that have frequent pricing and that have little or no risk, they are considered to have a fair value that approximates the book value.
Investments in securities
The securities are predominantly valued at quoted market prices. If a market price is not available, the fair value is estimated using the market price of a similar instrument. In cases where the significant assumptions of the valuation are not directly observable in the market, the instruments are valued using the best information available to estimate the fair value. This information could be developed internally and considers the premiums that a market participant would require.
Loans
As a result of the MFG acquisition, the Company acquired loans (including loans acquired with impairment), which maintain an outstanding principal of $3,326,897,729 and a fair value of $3,265,534,602. According to the analysis carried out, the Company has estimated a possibility of non-collection for an amount of $61,122,447, on the estimated total flows.
The methods used to estimate fair value are extremely sensitive to the assumptions and estimates used. Although the Company intends to use the assumptions and estimates that best reflect the acquired loan portfolios and current market conditions, a greater degree of subjectivity is inherent in these values than those determined in active markets.
This fair value is based on significant elements or factors that are not observable in the market and represent the Company's best estimate as of May 31, 2020.
F-97
| (4) | Business combinations, continued |
Intangible assets
For the valuation study, the Company hired an expert firm in valuations of this type of assets. As of the acquisition date, the amount of the identified intangibles is $31.4 million. The methodology used to value the identified intangible assets is the following:
Relationship with depositors
Clients’ Depository Relationship ("CDI") is a measure of the value of demand, savings and money market deposits that are acquired in business combinations. The fair value of the CDI is estimated based on the present value of the expected cost savings attributable to financing received from depositors, compared to an alternative source of financing.
Relationship with clients
Relationships with credit cards, business customers and affiliated businesses, measure the value that such relationships have for the Company, given the history of recurring cash flows from current customers and the probability that those customers will continue to generate cash flows in a future period. The fair value of these intangible assets is estimated using the multi-period excess income methodology, the assumption of which establishes that the fair value of a relationship with customers can be estimated based on the present value of the net future flows that will be received on the life of the asset.
Trademarks and trade names
A brand or trade name that is highly recognized in the marketplace has considerable value to an entity. The determination of the fair value of trademarks and trade names considers, among other factors, the comparable industry rates for royalty charges and the total projected future revenues that the banking business will generate.
Assets available for sale
Assets available for sale include real estate acquired in the cancellation of loans. The assets available for sale were recorded at their estimated fair value less costs to sell on the acquisition date based on the Company's evaluations of available appraisals or opinions of real estate brokers. Estimated costs to sell are based on experience in disposing of similar real estate and customary conditions for real estate transactions.
Clients’ deposits
The fair value used for demand and savings deposits is, by definition, equal to the amount payable on demand on the acquisition date. Fair values for time deposits are estimated using a discounted cash flow method that uses the interest rates offered by similar banks in Panama for the different groups of remaining maturities.
Deferred taxes
Deferred income taxes refer to the differences between amounts in the financial statements and the tax bases of the assets acquired and the liabilities assumed in the acquisition.
Debt instruments
The fair value of debt instruments was estimated using discounted cash flows. The contractual interest rates were compared with estimated market interest rates at the valuation date. Those debt instruments whose contractual interest rates are above or below market rates are adjusted to reflect a premium or discount.
Other Assets and other liabilities
Due to the relatively short term of other assets and other liabilities, their book value is considered to be close to their fair value.
F-98
| (5) | Risk Management |
Risk management is a fundamental part of the Company. It has an infrastructure to comprehensively manage risks, in order to ensure a responsible and sustainable growth in time, to maintain the confidence of its stakeholders, and to assure with reasonable certainty the fulfillment of its short, medium and long-term goals, through a balance between meeting objectives and taking risks, in line with the corporate strategy.
Classification of financial assets
See the classification under IFRS 9 in accounting policies in Note 3 (c).
The following table provides a reconciliation between line items in the consolidated statement of financial position and categories of financial instruments.
| 2020 | Designated FVPL – debt instruments | Designated FVPL - equity instruments | FVOCI - debt instruments | FVOCI - equity instruments | AC | Total | ||||||||||||||||||
| Cash, cash equivalents and deposits in banks | 0 | 0 | 0 | 0 | 5,967,507,894 | 5,967,507,894 | ||||||||||||||||||
| Investments at fair value | 79,514,054 | 12,425,258 | 3,773,500,429 | 5,061,326 | 78,384,779 | 3,948,885,846 | ||||||||||||||||||
| Loans at amortized costs | 0 | 0 | 0 | 0 | 19,656,414,710 | 19,656,414,710 | ||||||||||||||||||
| Other accounts receivable | 0 | 0 | 0 | 0 | 294,949,780 | 294,949,780 | ||||||||||||||||||
| Total financial assets | 79,514,054 | 12,425,258 | 3,773,500,429 | 5,061,326 | 25,997,257,163 | 29,867,758,230 | ||||||||||||||||||
| 2019 | Designated FVPL – debt instruments | DesignatedFVPL - equity instruments | FVOCI - debt instruments | FVOCI - equity instruments | AC | Total | ||||||||||||||||||
| Cash, cash equivalents and deposits in banks | 0 | 0 | 0 | 0 | 4,095,267,372 | 4,095,267,372 | ||||||||||||||||||
| Investments at fair value | 42,636,461 | 10,617,681 | 2,196,184,021 | 5,328,901 | 0 | 2,254,767,064 | ||||||||||||||||||
| Loans at amortized costs | 0 | 0 | 0 | 0 | 16,325,857,651 | 16,325,857,651 | ||||||||||||||||||
| Other accounts receivable | 0 | 0 | 0 | 0 | 237,756,868 | 237,756,868 | ||||||||||||||||||
| Total financial assets | 42,636,461 | 10,617,681 | 2,196,184,021 | 5,328,901 | 20,658,881,891 | 22,913,648,955 | ||||||||||||||||||
As of December 31, 2020, and 2019, all of the financial liabilities held by the Company are classified at amortized cost.
The Company is exposed to the following risks from financial instruments:
· Credit risk,
· Liquidity risk,
· Market risk and
· Operational risk.
F-99
(5) Risk Management, continued
For the management of these risk, an organizational framework based on current regulations in the region on risk management has been defined. This framework includes policies, procedures and a human and technical infrastructure to identify, analyze and assess risks, as well as to set adequate limits and controls, monitor risk management and comply with defined limits. These policies and risk management systems are periodically reviewed, updated and reported to the respective committees, to ensure they reflect changes in market conditions, products and services offered.
Through its management procedures and standards, the Company aims to develop a disciplined and constructive control environment where all employees understand their roles and duties.
The periodic oversight and management of risks is conducted through the following corporate governance bodies, established both regionally and in the countries where the Company operates: Committee of Comprehensive Risk Management, Assets and Liabilities Committee (ALICO), Compliance Committee, Credit Committee, and Audit Committee.
| (a) | Credit Risk |
This is the risk of financial loss faced by the Company when a client or counterparty fails to meet their contractual obligations, and is mainly originated from deposits, investments in securities and loans receivable.
To mitigate credit risk, risk management policies establish processes and controls to follow for the approval of loans or credit facilities. The Company structures acceptable credit risk levels by setting limits on the amount of risk that is assumed in relation to one borrower, or group of borrowers, and geographic segment. These credits are constantly controlled and subject to periodic review.
Exposure to credit risk is managed through a periodic analysis of the borrowers' or potential borrowers' capacity to pay principal and interest. Exposure to credit risk is also mitigated in part through collateral, corporate and personal guarantees.
Credit is managed through policies that have been clearly defined by the Board of Directors and are reviewed and modified periodically based on changes and expectations in the market where the Company operates, regulations and other factors considered while preparing these policies.
The Company uses a series of credit reports to assess its portfolio's performance, provision requirements and specially to anticipate events that could affect its debtor’s condition in the future.
The Company has a regional guideline on investments that defines the general profile for the investment portfolio and establishes two large maximum levels to control the investments' exposure: a limit on country risk and on issuer risk. The country risk limits are set based on an internal qualification scale and are measured as percentages of the Company's equity or as absolute amounts. The guideline includes approval schemes and attributions for new limits or increases on existing limits.
F-100
(5) Risk Management, continued
Compliance with this guideline is monitored on a daily basis through the Investment Portfolio Management and Control Module (MACCI from Spanish), an internal tool to document the entire investment process, including new approvals, limit increases or decreases, purchases and sales, and also to control exposures by issuer and the use of assigned quotas.
The Board of Directors has delegated the responsibility of managing credit risk to the Credit Committee and Assets and Liabilities Committee (ALICO); both periodically monitor the financial condition of the respective debtors and issuers that represent a credit risk for The Company.
Information on the portfolio's quality
Quality of the portfolio of bank deposits and securities under resale agreements
The Company maintains deposits in banks for $5,217,041,032 as of December 31, 2020 (December 31, 2019: $3,349,992,025). Deposits are maintained at central banks and other financial institutions, most of which have AA to CCC risk ratings, based on Standard & Poor’s, Moody's, and/or Fitch Ratings. Of total deposits, excluding deposits in central banks, as of December 31, 2020, approximately $24 million did not have a risk rating (December 31, 2019: $43 million).
Securities under resale agreements are mostly classified based on the ratings assigned by Standard & Poor’s, Moody's, and/or Fitch Ratings.
As of December 31, 2020, all securities under resale agreements and bank deposits are up to date on the payment of principal and interest.
Quality of the investments at fair value
The Company segregates the investment portfolio into investments at FVPL and investments at FVOCI. As of December 31, 2020, investments amounted to $3,948,885,846 (2019: $2,254,767,064).
| · | Investments at FVLP |
The credit quality of investments is monitored according to the international risk rating of the issuer provided by Standard & Poor’s, Moody’s, and/or Fitch Ratings
The following table summarizes investments at FVLP categories:
| 2020 | 2019 | |||||||
| Governments and agencies | ||||||||
| BBB | 21,043,038 | 0 | ||||||
| B+ | 0 | 41,705,042 | ||||||
| B | 34,950,485 | 0 | ||||||
| Total governments and agencies | 55,993,523 | 41,705,042 | ||||||
| Corporates | ||||||||
| BB- | 0 | 152,534 | ||||||
| Not rated | 23,520,531 | 778,885 | ||||||
| Total corporates | 23,520,531 | 931,419 | ||||||
| Total investments at FVPL | 79,514,054 | 42,636,461 | ||||||
F-101
(5) Risk Management, continued
| · | Investments at FVOCI |
The following table summarizes the investments at FVOCI categories:
| 2020 | 2019 | |||||||||||||||||||||||
| 12 months ECL | Lifetime ECL - without impairment | Total investments at FVOCI | 12 months ECL | Lifetime ECL – without impairment | Total investments at FVOCI | |||||||||||||||||||
| Governments and agencies | ||||||||||||||||||||||||
| AAA | 54,881,728 | 0 | 54,881,728 | 839 | 0 | 839 | ||||||||||||||||||
| AA+ | 625,283,370 | 0 | 625,283,370 | 40,134,123 | 0 | 40,134,123 | ||||||||||||||||||
| A+ | 1,041,330 | 0 | 1,041,330 | 0 | 0 | 0 | ||||||||||||||||||
| BBB+ | 0 | 0 | 0 | 157,338,820 | 0 | 157,338,820 | ||||||||||||||||||
| BBB | 314,612,782 | 0 | 314,612,782 | 0 | 0 | 0 | ||||||||||||||||||
| BB+ to B- | 2,299,623,202 | 5,041,147 | 2,304,664,349 | 1,532,265,685 | 0 | 1,532,265,685 | ||||||||||||||||||
| Total Governments and Agencies | 3,295,442,412 | 5,041,147 | 3,300,483,559 | 1,729,739,467 | 0 | 1,729,739,467 | ||||||||||||||||||
| Corporates | ||||||||||||||||||||||||
| AA | 2,021,110 | 0 | 2,021,110 | 2,026,899 | 0 | 2,026,899 | ||||||||||||||||||
| A- | 22,052,740 | 0 | 22,052,740 | 265,829,815 | 0 | 265,829,815 | ||||||||||||||||||
| BBB+ | 31,398,868 | 0 | 31,398,868 | 126,367,304 | 0 | 126,367,304 | ||||||||||||||||||
| BBB | 41,816,505 | 0 | 41,816,505 | 0 | 0 | 0 | ||||||||||||||||||
| BBB- | 84,248,082 | 0 | 84,248,082 | 0 | 0 | 0 | ||||||||||||||||||
| BB+ to CCC+ | 291,479,565 | 0 | 291,479,565 | 72,220,535 | 0 | 72,220,535 | ||||||||||||||||||
| Total Corporates | 473,016,870 | 0 | 473,016,870 | 466,444,553 | 0 | 466,444,553 | ||||||||||||||||||
| Total | 3,768,459,282 | 5,041,147 | 3,773,500,429 | 2,196,184,020 | 0 | 2,196,184,020 | ||||||||||||||||||
| Allowance for ECL | 24,671,086 | 52,154 | 24,723,240 | 8,554,961 | 0 | 8,554,961 | ||||||||||||||||||
As of December 31, 2020 and as of December 31, 2019, investments at FVOCI are current and do not reflect impairment
| · | Investments at AC |
The following table summarizes the investments at AC categories:
| 2020 | ||||
| Governments and Agencies | ||||
| BB+ to BB- | 6,697,211 | |||
| Total Governments and Agencies | 6,697,211 | |||
| Corporates | ||||
| BB+ to BB- | 71,687,568 | |||
| Total corporates | 71,687,568 | |||
| Total investments at AC | 78,384,779 | |||
| Allowance for ECL | 1,066,713 | |||
As of December 31, 2020, investments at AC are current and do not reflect impairment.
F-102
(5) Risk Management, continued
Quality of the loans portfolio
Note 3c contains an explanation of the measurement of the quality of financial instruments, which include the loan portfolio.
The following table presents the loans portfolio and the debts commitments and guarantee according to its risk category, in accordance with the grading used for each stated term:
| 2020 | 12 months ECL | Lifetime ECL - credit unimpaired | Lifetime ECL - credit impaired | Impaired loans acquired | Total | |||||||||||||||
Corporate | ||||||||||||||||||||
| Satisfactory | 7,708,834,966 | 38,934,283 | 0 | 0 | 7,747,769,249 | |||||||||||||||
| Special mention | 0 | 469,228,580 | 0 | 0 | 469,228,580 | |||||||||||||||
| Sub-standard | 0 | 0 | 177,915,502 | 40,219,968 | 218,135,470 | |||||||||||||||
| Doubtful | 0 | 0 | 24,160,911 | 20,965,416 | 45,126,327 | |||||||||||||||
| Loss | 0 | 0 | 32,275,861 | 33,604,047 | 65,879,908 | |||||||||||||||
| Gross amount | 7,708,834,966 | 508,162,863 | 234,352,274 | 94,789,431 | 8,546,139,534 | |||||||||||||||
| Allowance for ECL | (38,178,719 | ) | (40,329,411 | ) | (72,003,754 | ) | (1,224,757 | ) | (151,736,641 | ) | ||||||||||
| Net amount | 7,670,656,247 | 467,833,452 | 162,348,520 | 93,564,674 | 8,394,402,893 | |||||||||||||||
Small Company | ||||||||||||||||||||
| Satisfactory | 587,604,431 | 176,087,273 | 0 | 133,729 | 763,825,433 | |||||||||||||||
| Special mention | 645,805 | 70,948,033 | 1,645 | 0 | 71,595,483 | |||||||||||||||
| Sub-standard | 0 | 0 | 10,506,178 | 0 | 10,506,178 | |||||||||||||||
| Doubtful | 0 | 0 | 4,088,796 | 118,752 | 4,207,548 | |||||||||||||||
| Loss | 0 | 0 | 5,854,292 | 2,559,583 | 8,413,875 | |||||||||||||||
| Gross amount | 588,250,236 | 247,035,306 | 20,450,911 | 2,812,064 | 858,548,517 | |||||||||||||||
| Allowance for ECL | (4,107,833 | ) | (10,927,111 | ) | (4,882,658 | ) | (10,010 | ) | (19,927,612 | ) | ||||||||||
| Net amount | 584,142,403 | 236,108,195 | 15,568,253 | 2,802,054 | 838,620,905 | |||||||||||||||
Mortgage | ||||||||||||||||||||
| Satisfactory | 2,827,952,998 | 973,711,713 | 0 | 0 | 3,801,664,711 | |||||||||||||||
| Special mention | 4,583,931 | 251,103,341 | 0 | 799,169 | 256,486,441 | |||||||||||||||
| Sub-standard | 0 | 0 | 52,218,949 | 152,596 | 52,371,545 | |||||||||||||||
| Doubtful | 0 | 0 | 21,982,885 | 285,651 | 22,268,536 | |||||||||||||||
| Loss | 0 | 0 | 50,215,261 | 7,732,924 | 57,948,185 | |||||||||||||||
| Gross amount | 2,832,536,929 | 1,224,815,054 | 124,417,095 | 8,970,340 | 4,190,739,418 | |||||||||||||||
| Allowance for ECL | (8,921,940 | ) | (49,421,900 | ) | (20,758,099 | ) | (44,295 | ) | (79,146,234 | ) | ||||||||||
| Net amount | 2,823,614,989 | 1,175,393,154 | 103,658,996 | 8,926,045 | 4,111,593,184 | |||||||||||||||
Personal banking | ||||||||||||||||||||
| Satisfactory | 1,875,245,709 | 306,332,835 | 1,866,138 | 36,525 | 2,183,481,207 | |||||||||||||||
| Special mention | 3,787,128 | 91,592,716 | 4,225,642 | 180,313 | 99,785,799 | |||||||||||||||
| Sub-standard | 0 | 0 | 39,591,664 | 65,961 | 39,657,625 | |||||||||||||||
| Doubtful | 0 | 0 | 11,336,685 | 109,645 | 11,446,330 | |||||||||||||||
| Loss | 0 | 0 | 14,379,532 | 2,391,773 | 16,771,305 | |||||||||||||||
| Gross amount | 1,879,032,837 | 397,925,551 | 71,399,661 | 2,784,217 | 2,351,142,266 | |||||||||||||||
| Allowance for ECL | (25,018,966 | ) | (44,849,963 | ) | (23,767,661 | ) | (49,317 | ) | (93,685,907 | ) | ||||||||||
| Net amount | 1,854,013,871 | 353,075,588 | 47,632,000 | 2,734,900 | 2,257,456,359 | |||||||||||||||
Vehicles | ||||||||||||||||||||
| Satisfactory | 879,043,952 | 330,964,075 | 0 | 15,865 | 1,210,023,892 | |||||||||||||||
| Special mention | 955,320 | 55,504,009 | 0 | 88,604 | 56,547,933 | |||||||||||||||
| Sub-standard | 0 | 0 | 4,675,180 | 18,843 | 4,694,023 | |||||||||||||||
| Doubtful | 0 | 0 | 4,446,359 | 12,859 | 4,459,218 | |||||||||||||||
| Loss | 0 | 0 | 401,145 | 58,562 | 459,707 | |||||||||||||||
| Gross amount | 879,999,272 | 386,468,084 | 9,522,684 | 194,733 | 1,276,184,773 | |||||||||||||||
| Allowance for ECL | (4,743,061 | ) | (15,391,812 | ) | (3,897,459 | ) | (10,082 | ) | (24,042,414 | ) | ||||||||||
| Net amount | 875,256,211 | 371,076,272 | 5,625,225 | 184,651 | 1,252,142,359 | |||||||||||||||
Credit Card | ||||||||||||||||||||
| Satisfactory | 2,173,496,914 | 365,640,438 | 3,974,057 | 0 | 2,543,111,409 | |||||||||||||||
| Special mention | 5,612,694 | 238,068,505 | 123,589,891 | 0 | 367,271,090 | |||||||||||||||
| Sub-standard | 0 | 0 | 11,464,026 | 0 | 11,464,026 | |||||||||||||||
| Doubtful | 115,694 | 54,765,462 | 7,779,900 | 0 | 62,661,056 | |||||||||||||||
| Loss | 0 | 0 | 146,971,717 | 0 | 146,971,717 | |||||||||||||||
| Gross amount | 2,179,225,302 | 658,474,405 | 293,779,591 | 0 | 3,131,479,298 | |||||||||||||||
| Allowance for ECL | (56,042,094 | ) | (138,439,212 | ) | (134,798,982 | ) | 0 | (329,280,288 | ) | |||||||||||
| Net amount | 2,123,183,208 | 520,035,193 | 158,980,609 | 0 | 2,802,199,010 | |||||||||||||||
| Net carrying amount, net of reserve | 15,930,866,929 | 3,123,521,854 | 493,813,603 | 108,212,324 | 19,656,414,710 | |||||||||||||||
F-103
(5) Risk Management, continued
| 2019 | 12 months ECL | Lifetime ECL - credit unimpaired | Lifetime ECL - credit impaired | Total | ||||||||||||
Corporate | ||||||||||||||||
| Satisfactory | 6,160,821,589 | 1,949,132 | 0 | 6,162,770,721 | ||||||||||||
| Special mention | 0 | 162,481,618 | 0 | 162,481,618 | ||||||||||||
| Sub-standard | 0 | 0 | 102,670,782 | 102,670,782 | ||||||||||||
| Doubtful | 0 | 0 | 16,319,303 | 16,319,303 | ||||||||||||
| Loss | 0 | 0 | 29,584,355 | 29,584,355 | ||||||||||||
| Gross amount | 6,160,821,589 | 164,430,750 | 148,574,440 | 6,473,826,779 | ||||||||||||
| Allowance for ECL | (35,618,255 | ) | (17,012,276 | ) | (41,991,855 | ) | (94,622,386 | ) | ||||||||
| Net amount | 6,125,203,334 | 147,418,474 | 106,582,585 | 6,379,204,393 | ||||||||||||
Small Company | ||||||||||||||||
| Satisfactory | 661,905,203 | 51,974,883 | 0 | 713,880,086 | ||||||||||||
| Special mention | 553,850 | 38,196,649 | 0 | 38,750,499 | ||||||||||||
| Sub-standard | 0 | 93,722 | 8,714,486 | 8,808,208 | ||||||||||||
| Doubtful | 0 | 0 | 4,857,194 | 4,857,194 | ||||||||||||
| Loss | 0 | 0 | 3,174,452 | 3,174,452 | ||||||||||||
| Gross amount | 662,459,053 | 90,265,254 | 16,746,132 | 769,470,439 | ||||||||||||
| Allowance for ECL | (4,568,794 | ) | (6,047,401 | ) | (5,217,866 | ) | (15,834,061 | ) | ||||||||
| Net amount | 657,890,259 | 84,217,853 | 11,528,266 | 753,636,378 | ||||||||||||
| Mortgage | ||||||||||||||||
| Satisfactory | 2,942,235,108 | 170,553,924 | 0 | 3,112,789,032 | ||||||||||||
| Special mention | 7,633,982 | 154,721,529 | 0 | 162,355,511 | ||||||||||||
| Sub-standard | 0 | 687,503 | 33,831,760 | 34,519,263 | ||||||||||||
| Doubtful | 0 | 0 | 35,375,995 | 35,375,995 | ||||||||||||
| Loss | 0 | 0 | 39,078,065 | 39,078,065 | ||||||||||||
| Gross amount | 2,949,869,090 | 325,962,956 | 108,285,820 | 3,384,117,866 | ||||||||||||
| Allowance for ECL | (7,502,543 | ) | (16,169,515 | ) | (23,809,469 | ) | (47,481,527 | ) | ||||||||
| Net amount | 2,942,366,547 | 309,793,441 | 84,476,351 | 3,336,636,339 | ||||||||||||
Personal banking | ||||||||||||||||
| Satisfactory | 1,797,553,294 | 70,712,458 | 1,836,813 | 1,870,102,565 | ||||||||||||
| Special mention | 2,389,101 | 89,434,848 | 2,693,609 | 94,517,558 | ||||||||||||
| Sub-standard | 0 | 345,873 | 11,963,044 | 12,308,917 | ||||||||||||
| Doubtful | 0 | 0 | 13,829,038 | 13,829,038 | ||||||||||||
| Loss | 0 | 15,585 | 13,982,479 | 13,998,064 | ||||||||||||
| Gross amount | 1,799,942,395 | 160,508,764 | 44,304,983 | 2,004,756,142 | ||||||||||||
| Allowance for ECL | (36,770,713 | ) | (33,255,645 | ) | (22,741,542 | ) | (92,767,900 | ) | ||||||||
| Net amount | 1,763,171,682 | 127,253,119 | 21,563,441 | 1,911,988,242 | ||||||||||||
Vehicles | ||||||||||||||||
| Satisfactory | 836,413,947 | 53,583,409 | 0 | 889,997,356 | ||||||||||||
| Special mention | 1,944,480 | 39,423,694 | 0 | 41,368,174 | ||||||||||||
| Sub-standard | 0 | 75,801 | 5,419,591 | 5,495,392 | ||||||||||||
| Doubtful | 0 | 0 | 4,651,370 | 4,651,370 | ||||||||||||
| Loss | 0 | 0 | 2,211 | 2,211 | ||||||||||||
| Gross amount | 838,358,427 | 93,082,904 | 10,073,172 | 941,514,503 | ||||||||||||
| Allowance for ECL | (3,458,949 | ) | (6,756,295 | ) | (4,044,239 | ) | (14,259,483 | ) | ||||||||
| Net amount | 834,899,478 | 86,326,609 | 6,028,933 | 927,255,020 | ||||||||||||
Credit Card | ||||||||||||||||
| Satisfactory | 2,727,382,917 | 149,486,781 | 4,162,675 | 2,881,032,373 | ||||||||||||
| Special mention | 11,659,011 | 80,351,072 | 96,898,298 | 188,908,381 | ||||||||||||
| Sub-standard | 0 | 0 | 13,177,012 | 13,177,012 | ||||||||||||
| Doubtful | 295,585 | 47,450,695 | 7,802,819 | 55,549,099 | ||||||||||||
| Loss | 0 | 0 | 123,209,269 | 123,209,269 | ||||||||||||
| Gross amount | 2,739,337,513 | 277,288,548 | 245,250,073 | 3,261,876,134 | ||||||||||||
| Allowance for ECL | (75,472,838 | ) | (64,541,441 | ) | (104,724,576 | ) | (244,738,855 | ) | ||||||||
| Net amount | 2,663,864,675 | 212,747,107 | 140,525,497 | 3,017,137,279 | ||||||||||||
| Net carrying amount, net of reserve | 14,987,395,975 | 967,756,603 | 370,705,073 | 16,325,857,651 | ||||||||||||
F-104
(5) Risk Management, continued
The following table presents the loans portfolio and the debts commitments and guarantee according to its risk category, in accordance with the classification used for each year indicated:
| 2020 | 12 months ECL | Lifetime ECL - credit unimpaired | Lifetime ECL - credit impaired | Total | ||||||||||||
Corporate | ||||||||||||||||
| Satisfactory | 601,686,338 | 0 | 0 | 601,686,338 | ||||||||||||
| Special mention | 0 | 5,756,869 | 0 | 5,756,869 | ||||||||||||
| Sub-standard | 0 | 0 | 254,760 | 254,760 | ||||||||||||
| Doubtful | 0 | 0 | 49,995 | 49,995 | ||||||||||||
| Loss | 0 | 0 | 9,076 | 9,076 | ||||||||||||
| Gross amount | 601,686,338 | 5,756,869 | 313,831 | 607,757,038 | ||||||||||||
| Allowance for ECL | (308,533 | ) | (52,463 | ) | (68,784 | ) | (429,780 | ) | ||||||||
| Net amount | 601,377,805 | 5,704,406 | 245,047 | 607,327,258 | ||||||||||||
| Small company | ||||||||||||||||
| Satisfactory | 4,953,992 | 0 | 0 | 4,953,992 | ||||||||||||
| Special mention | 0 | 3,240 | 0 | 3,240 | ||||||||||||
| Sub-standard | 0 | 0 | 0 | 0 | ||||||||||||
| Doubtful | 0 | 0 | 0 | 0 | ||||||||||||
| Loss | 0 | 0 | 0 | 0 | ||||||||||||
| Gross amount | 4,953,992 | 3,240 | 0 | 4,957,232 | ||||||||||||
| Allowance for ECL | (1,371 | ) | (1 | ) | 0 | (1,372 | ) | |||||||||
| Net amount | 4,952,621 | 3,239 | 0 | 4,955,860 | ||||||||||||
| Personal banking | ||||||||||||||||
| Satisfactory | 104,785,641 | 0 | 0 | 104,785,641 | ||||||||||||
| Special mention | 0 | 0 | 0 | 0 | ||||||||||||
| Sub-standard | 0 | 0 | 0 | 0 | ||||||||||||
| Doubtful | 0 | 0 | 0 | 0 | ||||||||||||
| Loss | 0 | 0 | 0 | 0 | ||||||||||||
| Gross amount | 104,785,641 | 0 | 0 | 104,785,641 | ||||||||||||
| Allowance for ECL | (46,910 | ) | 0 | 0 | (46,910 | ) | ||||||||||
| Net amount | 104,738,731 | 0 | 0 | 104,738,731 | ||||||||||||
| Net carrying amount, net of reserve | 711,069,157 | 5,707,645 | 245,047 | 717,021,849 | ||||||||||||
| 2019 | 12 months ECL | 2020 | 12 months ECL | 2020 | ||||||||||||
Corporate
| ||||||||||||||||
| Satisfactory | 452,671,486 | 0 | 0 | 452,671,486 | ||||||||||||
| Special mention | 0 | 1,571,378 | 0 | 1,571,378 | ||||||||||||
| Sub-standard | 0 | 0 | 44,071 | 44,071 | ||||||||||||
| Doubtful | 0 | 0 | 0 | 0 | ||||||||||||
| Loss | 0 | 0 | 313,981 | 313,981 | ||||||||||||
| Gross amount | 452,671,486 | 1,571,378 | 358,052 | 454,600,916 | ||||||||||||
| Allowance for ECL | (171,065 | ) | (10,391 | ) | (199,319 | ) | (380,775 | ) | ||||||||
| Net amount | 452,500,421 | 1,560,987 | 158,733 | 454,220,141 | ||||||||||||
| Small company | ||||||||||||||||
| Satisfactory | 8,500,840 | 0 | 0 | 8,500,840 | ||||||||||||
| Special mention | 0 | 0 | 0 | 0 | ||||||||||||
| Sub-standard | 0 | 0 | 0 | 0 | ||||||||||||
| Doubtful | 0 | 0 | 1,116 | 1,116 | ||||||||||||
| Loss | 0 | 0 | 0 | 0 | ||||||||||||
| Gross amount | 8,500,840 | 0 | 1,116 | 8,501,956 | ||||||||||||
| Allowance for ECL | (1,545 | ) | 0 | (2 | ) | (1,547 | ) | |||||||||
| Net amount | 8,499,295 | 0 | 1,114 | 8,500,409 | ||||||||||||
| Personal banking | ||||||||||||||||
| Satisfactory | 45,087,813 | 0 | 0 | 45,087,813 | ||||||||||||
| Special mention | 0 | 0 | 0 | 0 | ||||||||||||
| Sub-standard | 0 | 0 | 0 | 0 | ||||||||||||
| Doubtful | 0 | 0 | 0 | 0 | ||||||||||||
| Loss | 0 | 0 | 0 | 0 | ||||||||||||
| Gross amount | 45,087,813 | 0 | 0 | 45,087,813 | ||||||||||||
| Allowance for ECL | (4,509 | ) | 0 | 0 | (4,509 | ) | ||||||||||
| Net amount | 45,083,304 | 0 | 0 | 45,083,304 | ||||||||||||
| Net carrying amount, net of reserve | 506,083,020 | 1,560,987 | 159,847 | 507,803,854 | ||||||||||||
F-105
(5) Risk Management, continued
Guarantees and other improvements to reduce credit risk and its financial effect
The Company maintains guarantees and other improvements to reduce credit risk to ensure the payment of their financial assets exposed to credit risk. The types of mortgage guarantees include residential and commercial, buildings and land. The types of collateral include private vehicles, commercial use, leasing, machinery and other equipment.
The table below shows the main types of guarantees taken with respect to different types of financial assets.
| 2020 | ||||||||||||||||||||||||
| Mortgage | Pledge | Certificates of deposit | Investments in securities | Unsecured | Total | |||||||||||||||||||
| Securities under resale agreements | 0 | 0 | 0 | 21,227,306 | 0 | 21,227,306 | ||||||||||||||||||
| Investments in securities | 0 | 0 | 0 | 0 | 3,863,355,709 | 3,863,355,709 | ||||||||||||||||||
| Loans at amortized cost | ||||||||||||||||||||||||
| Corporate | ||||||||||||||||||||||||
| Corporate loan | 4,377,423,240 | 545,566,443 | 308,211,315 | 0 | 3,165,392,899 | 8,396,593,897 | ||||||||||||||||||
| Corporate leases, net | 0 | 149,545,637 | 0 | 0 | 0 | 149,545,637 | ||||||||||||||||||
| Total corporate | 4,377,423,240 | 695,112,080 | 308,211,315 | 0 | 3,165,392,899 | 8,546,139,534 | ||||||||||||||||||
| Personal Banking and Small company | ||||||||||||||||||||||||
| Small company | ||||||||||||||||||||||||
| Small company | 529,833,731 | 2,350,993 | 34,667,362 | 0 | 202,638,939 | 769,491,025 | ||||||||||||||||||
| Small company leases, net | 0 | 89,057,492 | 0 | 0 | 0 | 89,057,492 | ||||||||||||||||||
| Total Small company | 529,833,731 | 91,408,485 | 34,667,362 | 0 | 202,638,939 | 858,548,517 | ||||||||||||||||||
| Personal Banking | ||||||||||||||||||||||||
| Mortgage | 4,190,739,418 | 0 | 0 | 0 | 0 | 4,190,739,418 | ||||||||||||||||||
| Personal | 428,701,266 | 0 | 72,160,592 | 0 | 1,850,280,408 | 2,351,142,266 | ||||||||||||||||||
| Vehicles | 0 | 1,183,895,384 | 0 | 0 | 0 | 1,183,895,384 | ||||||||||||||||||
| Personal leases, net of interest | 0 | 92,289,389 | 0 | 0 | 0 | 92,289,389 | ||||||||||||||||||
| Credit cards | 0 | 0 | 0 | 0 | 3,131,479,298 | 3,131,479,298 | ||||||||||||||||||
| Total Personal Banking | 4,619,440,684 | 1,276,184,773 | 72,160,592 | 0 | 4,981,759,706 | 10,949,545,755 | ||||||||||||||||||
| Total Personal Banking and Small company | 5,149,274,415 | 1,367,593,258 | 106,827,954 | 0 | 5,184,398,645 | 11,808,094,272 | ||||||||||||||||||
| Allowance for ECL | (178,637,982 | ) | (47,804,526 | ) | (904,397 | ) | 0 | (470,472,191 | ) | (697,819,096 | ) | |||||||||||||
| Total loans | 9,348,059,673 | 2,014,900,812 | 414,134,872 | 0 | 7,879,319,353 | 19,656,414,710 | ||||||||||||||||||
| Commitments and guarantees, net | 63,654,961 | 1,929,854 | 21,473,657 | 0 | 629,963,377 | 717,021,849 | ||||||||||||||||||
| 2019 | ||||||||||||||||||||||||
| Mortgage | Pledge | Certificates of deposit | Investments in securities | Unsecured | Total | |||||||||||||||||||
| Securities under resale agreements | 0 | 0 | 0 | 18,149,866 | 0 | 18,149,866 | ||||||||||||||||||
| Investments in securities | 0 | 0 | 0 | 0 | 2,238,820,481 | 2,238,820,481 | ||||||||||||||||||
| Loans | ||||||||||||||||||||||||
| Corporate | ||||||||||||||||||||||||
| Corporate | 2,921,376,524 | 513,563,338 | 211,673,118 | 0 | 2,710,306,138 | 6,356,919,118 | ||||||||||||||||||
| Corporate leases, net | 0 | 116,907,661 | 0 | 0 | 0 | 116,907,661 | ||||||||||||||||||
| Total corporate | 2,921,376,524 | 630,470,999 | 211,673,118 | 0 | 2,710,306,138 | 6,473,826,779 | ||||||||||||||||||
| Personal Banking and Small company | ||||||||||||||||||||||||
| Small company | ||||||||||||||||||||||||
| Small company | 417,399,110 | 0 | 21,129,863 | 0 | 222,585,730 | 661,114,703 | ||||||||||||||||||
| Small company leases, net | 0 | 108,355,736 | 0 | 0 | 0 | 108,355,736 | ||||||||||||||||||
| Total Small company | 417,399,110 | 108,355,736 | 21,129,863 | 0 | 222,585,730 | 769,470,439 | ||||||||||||||||||
| Personal Banking | ||||||||||||||||||||||||
| Mortgage | 3,384,117,866 | 0 | 0 | 0 | 0 | 3,384,117,866 | ||||||||||||||||||
| Personal | 406,120,368 | 0 | 45,769,904 | 0 | 1,552,865,870 | 2,004,756,142 | ||||||||||||||||||
| Vehicles | 0 | 870,723,040 | 0 | 0 | 0 | 870,723,040 | ||||||||||||||||||
| Personal leases, net of interest | 0 | 70,791,463 | 0 | 0 | 0 | 70,791,463 | ||||||||||||||||||
| Credit cards | 0 | 0 | 0 | 0 | 3,261,876,134 | 3,261,876,134 | ||||||||||||||||||
| Total Personal Banking | 3,790,238,234 | 941,514,503 | 45,769,904 | 0 | 4,814,742,004 | 9,592,264,645 | ||||||||||||||||||
| Total Personal Banking and Small company | 4,207,637,344 | 1,049,870,239 | 66,899,767 | 0 | 5,037,327,734 | 10,361,735,084 | ||||||||||||||||||
| Allowance for ECL | (129,544,875 | ) | (31,483,749 | ) | (56,057 | ) | 0 | (348,619,531 | ) | (509,704,212 | ) | |||||||||||||
| Total loans | 6,999,468,993 | 1,648,857,489 | 278,516,828 | 0 | 7,399,014,341 | 16,325,857,651 | ||||||||||||||||||
| Commitments and guarantees, net | 53,171,462 | 871,219 | 16,954,050 | 0 | 436,807,123 | 507,803,854 | ||||||||||||||||||
F-106
| (5) | Risk Management, continued |
The table below shows the portfolio and identifiable value of collateral (primarily commercial properties) backing the loan. For each loan, the corresponding value of its guarantees is capped by the guaranteed nominal amount:
| 2020 | 2019 | |||||||||||||||
| Loans | Covered amount | Loans | Covered amount | |||||||||||||
| Corporates | ||||||||||||||||
Stage 1 y 2 | 3,739,418,183 | 3,739,417,634 | 2,610,540,417 | 2,610,531,369 | ||||||||||||
| Stage 3 | 245,043,917 | 244,505,657 | 120,807,751 | 120,807,751 | ||||||||||||
| Total | 3,984,462,100 | 3,983,923,291 | 2,731,348,168 | 2,731,339,120 | ||||||||||||
The following are the non-financial assets that the Company seized as collaterals to secure collection during the period.
| 2020 | 2019 | |||||||
| Property | 9,301,419 | 14,769,068 | ||||||
| Furniture and equipment | 465,143 | 0 | ||||||
| Total | 9,766,562 | 14,769,068 | ||||||
The Company's policy is to perform the sale of these assets to cover the balances due. Using non-financial assets for its operations is not a Company policy.
Residential mortgage loans
The following table shows the index of loans from the mortgage portfolio to the value of collaterals. LTV is calculated as a percentage of the gross amount of the loan in relation to the value of collaterals. The gross amount of the loan excludes any loss impairment. The value of collaterals for mortgages is based on the original value of the guarantee as of the date of disbursement.
| 2020 | 2019 | |||||||||||||||
| LTV Ratio | Loans | Credit and guarantee commitments | Loans | Credit and guarantee commitments | ||||||||||||
| Less than 50% | 777,526,687 | 4,275,402 | 683,778,125 | 3,481,789 | ||||||||||||
| 51-70% | 1,466,936,337 | 14,047,161 | 1,241,534,639 | 10,826,492 | ||||||||||||
| 71-80% | 1,262,525,558 | 19,250,649 | 1,161,452,203 | 19,530,267 | ||||||||||||
| 81-90% | 445,425,455 | 36,853,211 | 274,339,033 | 11,142,973 | ||||||||||||
| 91-100% | 223,929,646 | 30,249,113 | 16,072,256 | 106,292 | ||||||||||||
| More than 100% | 14,395,735 | 110,105 | 6,941,610 | 0 | ||||||||||||
| Total | 4,190,739,418 | 104,785,641 | 3,384,117,866 | 45,087,813 | ||||||||||||
Impaired loans
| LTV Ratio | 2020 | 2019 | ||||||
| Less than 50% | 8,940,401 | 10,924,978 | ||||||
| 51-70% | 39,366,509 | 33,928,177 | ||||||
| 71-80% | 45,694,008 | 47,713,454 | ||||||
| 81-90% | 23,665,082 | 12,960,482 | ||||||
| 91-100% | 4,778,105 | 2,243,085 | ||||||
| More than 100% | 1,972,990 | 515,644 | ||||||
| Total | 124,417,095 | 108,285,820 | ||||||
F-107
| (5) | Risk Management, continued |
ECL allowance
Projection of future conditions
The upside, central and downside scenarios are described below, along with the main risks taken into consideration to define them.
External sector:
| External risk | Upside | Central | Downside |
Vaccine Application:
It is identified as the distribution and effectiveness of the vaccine and its impact on economic growth.
| 1) Main commercial partners immunize population during the first semester, 2021.
| 1) Main commercial partners immunize population during the first semester, 2021.
| 1) Main commercial partners immunize population during the first semester, 2022.
|
Income from remittances:
Migration policy and income from remittances. Honduras, El Salvador, Guatemala and Nicaragua.
| 2) Change in US immigration policy improves the outlook for income from remittances.
| 2) Migration policy is maintained, outlook for the growth of remittances remains stable.
| 3) Migration policy tightens, remittance growth prospect decreases.
|
The scenarios for each country are detailed below
| Scenario | Scenarios synthesis | Upside | Central | Downside |
| Guatemala | 3. Nominal variables are considered stable, with solid macroeconomic fundamentals, relatively low level of debt and high level of International Monetary Reserves.
4. Main differences in scenarios: they respect the recovery of economic growth, associated with the persistence of the pandemic and the effectiveness of the measures to mitigate it. Downside scenario contemplates the possibility of CPI above BanGuat's target range, considering the recent increase in the CPI and the expected increase in food prices during 2021.
| Tax policy measures are effective, improve the outlook for economic growth and mitigate impairment in social gaps.
Vaccine is obtained and distributed effectively, approaching immunity during 2021.
| Immunization applies to the most vulnerable populations during 2021.
There is a gradual improvement in economic activity as the health services response is strengthened and the vaccine is distributed.
| Distribution of the ineffective vaccine, deterioration in health indicators, social gaps and political stability.
|
| Honduras | 3. Scenarios remain stable in nominal variables, considering the government's tax discipline in accordance with the IMF agreement and the recovery in the external sector (exports and remittances).
4. Main differences in scenarios: recovery of economic growth, associated with the persistence of the pandemic and damage to productivity caused by natural disasters.
| Fiscal policy measures are more effective than expected in mitigating the deterioration of social gaps and the economic impact of the pandemic and natural disasters. End of 2021 without the 'la Niña' phenomenon and with less probability of natural disasters.
Economic recovery reduces social tensions in the context of the electoral period.
| Immunization applies to the most vulnerable populations during 2021.
There is a gradual improvement in economic activity as the health services response is strengthened and the vaccine is distributed.
Election period generates certain uncertainty that affects economic recovery.
| Distribution of the ineffective vaccine, deterioration in health indicators.
Deterioration in social gaps and increase in political instability.
It contemplates a slight recovery in economic activity compared to 2020.
|
F-108
| (5) | Risk Management, continued |
| Scenario | Scenarios synthesis | Upside | Central | Downside |
| El Salvador | 3. Inflation remains stable and low, considering its recent history of weak domestic demand and the lack of monetary policy tools.
4. Main differences in scenarios: recovery of economic growth and interest rates, associated with the persistence of the pandemic and the level of financial stress of the central government.
| Government obtains financing to maintain expansionary tax policy during 2021.
Obtaining, distribution of vaccine during 2021.
Favorable terms of trade and increases in remittance income are maintained.
| Immunization applies to the most vulnerable populations during 2021.
Financing remains costly for the Government in international financial markets.
| Distribution of the ineffective vaccine, deterioration in health indicators. Increase in risk aversion in international financial markets and increase in spreads.
|
| Nicaragua | 3. Nominal variables: inflation remains stable.
4. Main differences in scenarios: recovery of economic growth and variation in interest rates. Nicaragua will hold presidential elections in November 2021. Before, it had a GDP contraction in 2018 and 2019, the consequence of a socio-political crisis that has not been overcome. A worsening of the socio-political crisis could lead to lower economic growth and less access for the government to external sources of financing.
| The government reestablishes dialogue with the opposition and takes measures to improve investor confidence and the possibility of obtaining external financing.
| Dialogue does not advance; however, the socio-political crisis does not worsen. See 2021 without GDP growth.
| Upsurge of socio-political crisis; a new contraction in economic growth and less access to financing due to international sanctions.
|
| Costa Rica | 3. Inflation remains stable.
4. Main differences in scenarios: recovery of economic growth, exchange rate and interest rates, consequence of the possibility that the deterioration in public finances will continue.
| Approval of reforms that show fiscal commitment and that improve the conditions of the Government to obtain financing, including an agreement with the IMF.
Strength in health services allows the population to be immunized during the first semester of 2021.
| Country approaches immunization during 2021.
An agreement is reached with the IMF, however, the commitment only partially restores investor confidence in the face of fiscal challenges. Expansive fiscal policy is limited in 2021.
| Political agreements are not reached to reduce the fiscal deficit, uncertainty generates exchange rate pressures and an increase in the demand for loanable funds from the government puts pressure on interest rates. |
| Panama | 3. Inflation and interest rates remain stable.
4. Main differences in scenarios: Panama has historically been the Central American country with the highest rate of economic growth; however, it has had the greatest impact due to the pandemic. There is uncertainty about the speed of recovery, which remained below its historical average in 2018 and 2019.
| Economic recovery occurs faster than expected, with effective access and distribution of the vaccine and rapid recovery of sectors that remained inactive, such as construction and commerce. Rapid recovery of main commercial partners and international trade | Immunization applies to the most vulnerable populations during 2021.
Panama gradually recovers economic growth, below its historically high level.
| Acquisition and distribution of ineffective vaccine, deterioration in health indicators.
Slow economic recovery due to greater vulnerability of the Companying system before the moratorium law to help those affected by the pandemic. Slow recovery of investment and consumption.
|
F-109
| (5) | Risk Management, continued |
The scenario probability weightings applied in measuring ECL in each of the countries where the Company operates, are as follows:
| 2020 | ||||||
| Scenario probability weighting | Guatemala | Honduras | El Salvador | Nicaragua | Costa Rica | Panama |
Upside | 25% | 20% | 15% | 15% | 5% | 10% |
| Central | 65% | 65% | 65% | 65% | 60% | 60% |
| Downside | 10% | 15% | 20% | 20% | 35% | 30% |
| 2019 | ||||||
| Scenario probability weighting | Guatemala | Honduras | El Salvador | Nicaragua | Costa Rica | Panama |
Upside | 20% | 25% | 15% | 15% | 20% | 25% |
| Central | 70% | 65% | 70% | 70% | 60% | 60% |
| Downside | 10% | 10% | 15% | 15% | 20% | 15% |
Periodically, the Company carries out stress testing of more extreme shocks to calibrate its determination of the upside and downside representative scenarios. A comprehensive review is performed at least annually on the design of the scenarios, advised by at least one external economist.
The Company has identified and documented key drivers of credit risk and credit losses for each portfolio of financial instruments and, using an analysis of historical data, has estimated relationships between macro-economic variables and credit risk and credit losses.
The key drivers for credit risk for loans’ portfolios are: Monthly Economic Activity Index, Consumer Price Index, Exchange Rate, Local Currency Interest Rate and Dollars Interest Rate.
The Company estimates each key driver for credit risk over the active forecast period of one year.
F-110
| (5) | Risk Management, continued |
The table below lists the macroeconomic assumptions used in the base, upside and downside scenarios over the forecast period.
| 2020 | |||||||
| Guatemala | Honduras | El Salvador | Nicaragua | Costa Rica | Panama | ||
| % | % | % | % | % | % | ||
| Monthly Economic Activity Index | Upside | 5.46 | 4.19 | 4.25 | 2.27 | 3.58 | 5.54 |
| Central | 3.90 | 3.42 | 3.18 | 0.23 | 2.32 | 3.34 | |
| Downside | 1.60 | 1.50 | 1.54 | (2.25) | 0.41 | 1.63 | |
| Consumer Price Index | Upside | 2.53 | 2.85 | (0.28) | 2.39 | 0.65 | (0.58) |
| Central | 3.26 | 3.54 | 0.18 | 2.69 | 0.85 | (0.16) | |
| Downside | 5.24 | 3.39 | 1.18 | 3.60 | 1.85 | 1.21 | |
| Exchange Rate | Upside | (1.54) | (0.74) | - | 2.35 | 2.35 | - |
| Central | (0.12) | 0.51 | - | 2.89 | 3.69 | - | |
| Downside | 1.18 | 1.38 | - | 4.09 | 5.13 | - | |
| Local Currency Interest Rate | Upside | (0.50) | (0.56) | - | (1.43) | (0.21) | - |
| Central | (0.28) | (0.30) | - | 0.03 | 1.29 | - | |
| Downside | 0.03 | 0.08 | - | 0.93 | 1.66 | - | |
| Dollars Interest Rate | Upside | (0.50) | (0.18) | (0.06) | (0.95) | (1.28) | (0.16) |
| Central | (0.15) | (0.09) | 0.44 | (0.18) | 0.28 | (0.02) | |
| Downside | 0.11 | 0.11 | 1.15 | 1.41 | 1.02 | 0.16 | |
| 2019 | |||||||
| Guatemala | Honduras | El Salvador | Nicaragua | Costa Rica | Panama | ||
| % | % | % | % | % | % | ||
| Monthly Economic Activity Index | Upside | 3.71 | 4.04 | 2.80 | (1.26) | 3.03 | 4.89 |
| Central | 3.19 | 2.95 | 2.40 | (3.08) | 2.59 | 3.83 | |
| Downside | 2.15 | 1.98 | 1.84 | (5.61) | 1.76 | 2.97 | |
| Consumer Price Index | Upside | 3.26 | 3.34 | 0.00 | 3.34 | 1.76 | 0.54 |
| Central | 3.53 | 4.61 | 0.97 | 6.58 | 1.91 | 0.77 | |
| Downside | 3.72 | 5.07 | 2.11 | 8.92 | 4.04 | 1.71 | |
| Exchange Rate | Upside | (0.95) | 0.72 | - | 2.72 | (1.07) | - |
| Central | (0.46) | 3.34 | - | 3.01 | 0.22 | - | |
| Downside | 1.54 | 4.50 | - | 3.74 | 3.39 | - | |
| Local Currency Interest Rate | Upside | (0.30) | (3.25) | - | (0.99) | (1.81) | - |
| Central | (0.03) | (1.45) | - | 1.70 | (1.58) | - | |
| Downside | 0.26 | (0.30) | - | 4.93 | (0.99) | - | |
| Dollars Interest Rate | Upside | (0.29) | (0.36) | (0.07) | (0.09) | (1.55) | (0.35) |
| Central | (0.12) | (0.34) | 0.03 | 1.03 | (1.17) | 0.08 | |
| Downside | 0.34 | 0.27 | 0.34 | 3.12 | (0.18) | 0.56 | |
Sensitivity of ECL to future economic conditions
The ECL are sensitive to judgements and assumptions made regarding formulation of forward-looking scenarios and how such scenarios are incorporated into the calculations. Management performs a sensitivity analysis on the ECL recognized on material classes of its assets.
F-111
| (5) | Risk Management, continued |
The table below shows the loss allowance on loans assuming each forward-looking scenario (e.g. central, upside and downside) were weighted 100% instead of applying scenario probability weights across the three scenarios.
| 2020 | Upside | Central | Downside | |||||||||
| Book Value | ||||||||||||
| Corporate | 8,546,519,819 | 8,546,519,819 | 8,546,519,819 | |||||||||
| Small company | 859,240,529 | 859,240,529 | 859,240,529 | |||||||||
| Mortgage | 4,189,667,123 | 4,189,667,123 | 4,189,667,123 | |||||||||
| Personal banking | 2,351,142,265 | 2,351,142,265 | 2,351,142,265 | |||||||||
| Vehicles | 1,276,184,776 | 1,276,184,776 | 1,276,184,776 | |||||||||
| Credit card | 3,131,479,296 | 3,131,479,296 | 3,131,479,296 | |||||||||
| 20,354,233,806 | 20,354,233,806 | 20,354,233,806 | ||||||||||
| ECL Allowance | ||||||||||||
| Corporate | 143,813,719 | 149,756,296 | 160,411,700 | |||||||||
| Small company | 17,344,111 | 19,586,001 | 23,101,116 | |||||||||
| Mortgage | 67,566,258 | 76,897,244 | 85,643,910 | |||||||||
| Personal banking | 86,364,778 | 92,631,863 | 100,964,826 | |||||||||
| Vehicles | 21,540,930 | 23,229,781 | 25,580,634 | |||||||||
| Credit card | 311,371,046 | 327,378,756 | 346,113,592 | |||||||||
| 648,000,842 | 689,479,941 | 741,815,778 | ||||||||||
| Proportion of assets in Stage 2 | ||||||||||||
| Corporate | 5.83 | % | 5.83 | % | 5.83 | % | ||||||
| Small company | 27.23 | % | 27.59 | % | 32.03 | % | ||||||
| Mortgage | 27.47 | % | 28.10 | % | 29.09 | % | ||||||
| Personal banking | 16.22 | % | 16.32 | % | 16.78 | % | ||||||
| Vehicles | 28.69 | % | 28.87 | % | 29.66 | % | ||||||
| Credit card | 20.75 | % | 20.86 | % | 20.98 | % | ||||||
| 16.12 | % | 16.30 | % | 16.82 | % | |||||||
| 2019 | Upside | Central | Downside | |||||||||
| Book Value | ||||||||||||
| Corporate | 6,473,826,779 | 6,473,826,779 | 6,473,826,779 | |||||||||
| Small company | 769,470,439 | 769,470,439 | 769,470,439 | |||||||||
| Mortgage | 3,384,117,866 | 3,384,117,866 | 3,384,117,866 | |||||||||
| Personal banking | 2,004,756,142 | 2,004,756,142 | 2,004,756,142 | |||||||||
| Vehicles | 941,514,503 | 941,514,503 | 941,514,503 | |||||||||
| Credit card | 3,261,876,134 | 3,261,876,134 | 3,261,876,134 | |||||||||
| 16,835,561,863 | 16,835,561,863 | 16,835,561,863 | ||||||||||
| ECL Allowance | ||||||||||||
| Corporate | 86,411,296 | 93,819,741 | 114,742,964 | |||||||||
| Small company | 15,336,408 | 15,780,988 | 16,126,848 | |||||||||
| Mortgage | 47,112,487 | 48,096,227 | 50,611,937 | |||||||||
| Personal banking | 91,095,658 | 93,781,460 | 97,291,172 | |||||||||
| Vehicles | 13,734,832 | 14,351,142 | 15,037,242 | |||||||||
| Credit card | 242,705,884 | 244,012,603 | 247,591,486 | |||||||||
| 496,396,565 | 509,842,161 | 541,401,649 | ||||||||||
| Proportion of assets in Stage 2 | ||||||||||||
| Corporate | 2.54 | % | 2.54 | % | 2.54 | % | ||||||
| Small company | 10.18 | % | 11.73 | % | 12.11 | % | ||||||
| Mortgage | 8.74 | % | 9.61 | % | 10.30 | % | ||||||
| Personal banking | 7.92 | % | 8.07 | % | 8.87 | % | ||||||
| Vehicles | 8.96 | % | 9.96 | % | 10.63 | % | ||||||
| Credit card | 8.48 | % | 8.49 | % | 8.51 | % | ||||||
| 6.29 | % | 6.61 | % | 6.90 | % | |||||||
F-112
| (5) | Risk Management, continued |
The following table shows a reconciliation of the opening and closing balances of the period as of December 31, 2020, of the financial assets’ ECL allowance.
| 2020 | 2019 | |||||||||||||||||||||||||||||||
| Deposits in banks | 12 months ECL | Lifetime ECL - unimpaired | Lifetime ECL - impaired | Total | 12 months ECL | Lifetime ECL - unimpaired | Lifetime ECL – impaired | Total | ||||||||||||||||||||||||
Balance at January 1 | 85,894 | 0 | 0 | 85,894 | 21,201 | 0 | 0 | 21,201 | ||||||||||||||||||||||||
| Net remeasurement of loss allowance | (85,895 | ) | 0 | 0 | (85,895 | ) | (21,201 | ) | 0 | 0 | (21,201 | ) | ||||||||||||||||||||
| New financial assets originated | 616,832 | 2,131 | 0 | 618,963 | 85,223 | 0 | 0 | 85,223 | ||||||||||||||||||||||||
| Foreign currency translation | (1,480 | ) | 0 | 0 | (1,480 | ) | 671 | 0 | 0 | 671 | ||||||||||||||||||||||
| Balance at December 31 | 615,351 | 2,131 | 0 | 617,482 | 85,894 | 0 | 0 | 85,894 | ||||||||||||||||||||||||
| 2020 | 2019 | |||||||||||||||||||||||||||||||
| Investments at FVOCI | 12 months ECL | Lifetime ECL - unimpaired | Lifetime ECL - impaired | Total | 12 months ECL | Lifetime ECL - unimpaired | Lifetime ECL - impaired | Total | ||||||||||||||||||||||||
Balance at January 1 | 8,554,961 | 0 | 0 | 8,554,961 | 5,445,181 | 142,335 | 0 | 5,587,516 | ||||||||||||||||||||||||
| Transfer from stage 1 to 2 | (86,933 | ) | 86,933 | 0 | 0 | 0 | 0 | 0 | 0 | |||||||||||||||||||||||
| Net remeasurement of loss allowance | (2,949,367 | ) | (48,656 | ) | 0 | (2,998,023 | ) | (3,802,214 | ) | (142,335 | ) | 0 | (3,944,549 | ) | ||||||||||||||||||
| New financial assets originated | 19,815,272 | 13,877 | 0 | 19,829,149 | 6,780,086 | 0 | 0 | 6,780,086 | ||||||||||||||||||||||||
| Foreign currency translation | �� | (662,847 | ) | 0 | 0 | (662,847 | ) | 131,908 | 0 | 0 | 131,908 | |||||||||||||||||||||
| Balance at December 31 | 24,671,086 | 52,154 | 0 | 24,723,240 | 8,554,961 | 0 | 0 | 8,554,961 | ||||||||||||||||||||||||
| 2020 | 2019 | |||||||||||||||||||||||||||||||
| Investments at AC | 12 months ECL | Lifetime ECL - unimpaired | Lifetime ECL - impaired | Total | 12 months ECL | Lifetime ECL - unimpaired | Lifetime ECL - impaired | Total | ||||||||||||||||||||||||
Balance at January 1 | 0 | 0 | 0 | 0 | 0 | 0 | 0 | 0 | ||||||||||||||||||||||||
| Net remeasurement of loss allowance | 1,066,713 | 0 | 0 | 1,066,713 | 0 | 0 | 0 | 0 | ||||||||||||||||||||||||
| Foreign currency translation | 0 | 0 | 0 | 0 | 0 | 0 | 0 | 0 | ||||||||||||||||||||||||
| Balance at December 31 | 1,066,713 | 0 | 0 | 1,066,713 | 0 | 0 | 0 | 0 | ||||||||||||||||||||||||
The above investments’ ECL allowance is not recognized within the consolidated statement of financial position, because the book value of the investments at FVOCI is its fair value.
| 2020 | 2019 | |||||||||||||||||||||||||||||||
| Loans at AC | 12 months ECL | Lifetime ECL - unimpaired | Lifetime ECL - impaired | Total | 12 months ECL | Lifetime ECL - unimpaired | Lifetime ECL - impaired | Total | ||||||||||||||||||||||||
Balance at January 1 | 163,392,092 | 143,782,573 | 202,529,547 | 509,704,212 | 175,052,396 | 149,600,183 | 157,423,049 | 482,075,628 | ||||||||||||||||||||||||
| Transfer from stage 1 to 2 | (102,508,035 | ) | 102,508,035 | 0 | 0 | (12,103,051 | ) | 12,103,051 | 0 | 0 | ||||||||||||||||||||||
| Transfer from stage 1 to 3 | (205,369 | ) | 0 | 205,369 | 0 | (3,962,792 | ) | 0 | 3,962,792 | 0 | ||||||||||||||||||||||
| Transfer from stage 2 to 3 | 0 | (185,854,506 | ) | 185,854,506 | 0 | 0 | (15,952,342 | ) | 15,952,342 | 0 | ||||||||||||||||||||||
| Transfer from stage 3 to 2 | 0 | 61,876,431 | (61,876,431 | ) | 0 | 0 | 4,908,385 | (4,908,385 | ) | 0 | ||||||||||||||||||||||
| Transfer from stage 2 to 1 | 159,759,607 | (159,759,607 | ) | 0 | 0 | 25,284,859 | (25,284,859 | ) | 0 | 0 | ||||||||||||||||||||||
| Transfer from stage 3 to 1 | 23,321,114 | 0 | (23,321,114 | ) | 0 | 1,537,467 | 0 | (1,537,467 | ) | 0 | ||||||||||||||||||||||
| Net remeasurement of loss allowance | (799,123 | ) | 181,919,658 | 203,389,717 | 384,510,252 | (29,992,123 | ) | 40,843,940 | 402,860,205 | 413,712,022 | ||||||||||||||||||||||
| New financial assets originated | 157,442,672 | 293,881,435 | 110,942,820 | 562,266,927 | 48,268,855 | 0 | 0 | 48,268,855 | ||||||||||||||||||||||||
| Net derecognition of financial assets | (263,390,345 | ) | (138,994,610 | ) | (57,971,080 | ) | (460,356,035 | ) | (40,693,519 | ) | (22,435,785 | ) | (18,752,126 | ) | (81,881,430 | ) | ||||||||||||||||
| Charge-offs | 0 | 0 | (385,633,165 | ) | (385,633,165 | ) | 0 | 0 | (465,260,357 | ) | (465,260,357 | ) | ||||||||||||||||||||
| Recoveries | 0 | 0 | 96,441,804 | 96,441,804 | 0 | 0 | 109,871,715 | 109,871,715 | ||||||||||||||||||||||||
| Foreign currency translation | 0 | 0 | (9,114,899 | ) | (9,114,899 | ) | 0 | 0 | 2,917,779 | 2,917,779 | ||||||||||||||||||||||
| Balance at December 31 | 137,012,613 | 299,359,409 | 261,447,074 | 697,819,096 | 163,392,092 | 143,782,573 | 202,529,547 | 509,704,212 | ||||||||||||||||||||||||
| 2020 | 2019 | |||||||||||||||||||||||||||||||
| Other accounts receivable | 12 months ECL | Lifetime ECL – unimpaired | Lifetime ECL – impaired | Total | 12 months ECL | Lifetime ECL – unimpaired | Lifetime ECL – impaired | Total | ||||||||||||||||||||||||
Balance at January 1
| 4,931,417 | 0 | 0 | 4,931,417 | 3,965,454 | 0 | 0 | 3,965,454 | ||||||||||||||||||||||||
| Net remeasurement of loss allowance | (1,562,598 | ) | 0 | 0 | (1,562,598 | ) | (1,511,396 | ) | 0 | 0 | (1,511,396 | ) | ||||||||||||||||||||
| New financial assets originated | 4,319,715 | 0 | 0 | 4,319,715 | 3,046,048 | 0 | 0 | 3,046,048 | ||||||||||||||||||||||||
| Charge-offs | (1,314,109 | ) | 0 | 0 | (1,314,109 | ) | (851,590 | ) | 0 | 0 | (851,590 | ) | ||||||||||||||||||||
| Recoveries | 655,439 | 0 | 0 | 655,439 | 448,670 | 0 | 0 | 448,670 | ||||||||||||||||||||||||
| Foreign currency translation | (65,342 | ) | 0 | 0 | (65,342 | ) | (165,769 | ) | 0 | 0 | (165,769 | ) | ||||||||||||||||||||
| Balance at December 31 | 6,964,522 | 0 | 0 | 6,964,522 | 4,931,417 | 0 | 0 | 4,931,417 | ||||||||||||||||||||||||
Modified Financial Assets
The following table provides information on individually significant financial assets that were modified while having a provision for losses measured in an amount equal to the ECL for the expected life.
| 2020 | 2019 | |||||||
| Amortized cost before modification | 28,535,003 | 31,597,006 | ||||||
| Net loss due modification | 1,139,962 | 977,385 | ||||||
| Total | 29,674,965 | 32,574,391 | ||||||
F-113
| (5) | Risk Management, continued |
Concentration of credit risk
The Company follow-up the concentration of credit risk by sector and geographic location. The geographic location of loans and deposits in banks is based on the location of the debtor. In regards to investments, they are based on the location of the issuer. The analysis of the concentration of credit risks as of the date of the consolidated financial statements is as follows:
| 2020 | ||||||||||||||||||||||||||||
| Loans at amortized cost | Commitments and guarantees | Securities purchased under resale agreements | Deposits in banks | Investments at FVOCI | Investments at FVPL | Investments at AC | ||||||||||||||||||||||
| Concentration by sector | ||||||||||||||||||||||||||||
| Government | 0 | 0 | 21,227,306 | 3,289,910,944 | 3,300,483,559 | 55,993,523 | 6,697,211 | |||||||||||||||||||||
| Corporate | ||||||||||||||||||||||||||||
| Trade | 2,034,290,934 | 99,798,814 | 0 | 0 | 0 | 0 | 0 | |||||||||||||||||||||
| Real estate | 1,594,365,633 | 16,018,764 | 0 | 0 | 26,267,820 | 19,471,069 | 62,346,802 | |||||||||||||||||||||
| Services | 1,407,653,175 | 121,060,866 | 0 | 0 | 11,668,188 | 0 | 5,274,349 | |||||||||||||||||||||
| Food industry | 1,030,703,534 | 23,388,580 | 0 | 0 | 7,676,127 | 0 | 0 | |||||||||||||||||||||
| General industry | 925,664,702 | 34,538,674 | 0 | 0 | 0 | 0 | 0 | |||||||||||||||||||||
| Construction | 701,693,983 | 53,216,553 | 0 | 0 | 20,451,343 | 0 | 0 | |||||||||||||||||||||
| Agriculture | 691,995,156 | 13,184,690 | 0 | 0 | 0 | 0 | 0 | |||||||||||||||||||||
| Hotels and restaurants | 435,152,548 | 1,341,739 | 0 | 0 | 0 | 0 | 0 | |||||||||||||||||||||
| Financial | 295,600,109 | 231,695,072 | 0 | 1,927,130,088 | 277,758,563 | 4,033,362 | 0 | |||||||||||||||||||||
| Transportation | 229,599,854 | 16,945,171 | 0 | 0 | 3,351,600 | 0 | 0 | |||||||||||||||||||||
| Oil and derivatives | 0 | 0 | 0 | 0 | 22,604,938 | 16,100 | 0 | |||||||||||||||||||||
| Public services | 0 | 0 | 0 | 0 | 2,214,224 | 0 | 0 | |||||||||||||||||||||
| Telecommunication | 57,968,423 | 1,525,347 | 0 | 0 | 2,054,845 | 0 | 0 | |||||||||||||||||||||
| Energy | 0 | 0 | 0 | 0 | 93,358,835 | 0 | 4,066,417 | |||||||||||||||||||||
| Personal Banking | 10,949,545,755 | 104,785,641 | 0 | 0 | 5,610,387 | 0 | 0 | |||||||||||||||||||||
| Allowance for ECL | (697,819,096 | ) | (478,062 | ) | 0 | 0 | 0 | 0 | 0 | |||||||||||||||||||
| Net carrying amount | 19,656,414,710 | 717,021,849 | 21,227,306 | 5,217,041,032 | 3,773,500,429 | 79,514,054 | 78,384,779 | |||||||||||||||||||||
| Geographic location: | ||||||||||||||||||||||||||||
| Panama | 7,156,860,211 | 369,098,030 | 0 | 109,660,948 | 583,372,870 | 42,838,631 | 71,687,568 | |||||||||||||||||||||
| Costa Rica | 4,742,330,177 | 188,846,026 | 16,708,679 | 992,173,423 | 945,596,568 | 36,659,323 | 6,697,211 | |||||||||||||||||||||
| Guatemala | 3,377,429,731 | 20,379,529 | 4,518,627 | 648,779,426 | 553,389,258 | 0 | 0 | |||||||||||||||||||||
| Honduras | 2,271,944,389 | 34,844,463 | 0 | 920,707,396 | 333,599,726 | 0 | 0 | |||||||||||||||||||||
| El Salvador | 1,950,457,095 | 96,780,217 | 0 | 477,182,782 | 267,796,458 | 0 | 0 | |||||||||||||||||||||
| Nicaragua | 855,212,203 | 7,551,646 | 0 | 239,206,300 | 265,489,324 | 0 | 0 | |||||||||||||||||||||
| North America | 0 | 0 | 0 | 1,674,570,770 | 767,626,441 | 0 | 0 | |||||||||||||||||||||
| Europe | 0 | 0 | 0 | 104,695,105 | 0 | 0 | 0 | |||||||||||||||||||||
| South America | 0 | 0 | 0 | 15,000,054 | 53,567,344 | 16,100 | 0 | |||||||||||||||||||||
| Asia | 0 | 0 | 0 | 20,043,874 | 0 | 0 | 0 | |||||||||||||||||||||
| Others | 0 | 0 | 0 | 15,020,954 | 3,062,440 | 0 | 0 | |||||||||||||||||||||
| Allowance for ECL | (697,819,096 | ) | (478,062 | ) | 0 | 0 | 0 | 0 | 0 | |||||||||||||||||||
| Net carrying amount | 19,656,414,710 | 717,021,849 | 21,227,306 | 5,217,041,032 | 3,773,500,429 | 79,514,054 | 78,384,779 | |||||||||||||||||||||
F-114
(5) Risk Management, continued
| 2019 | ||||||||||||||||||||||||
| Loans at amortized cost | Commitments and guarantees | Securities purchased under resale agreements | Deposits in banks | Investments at FVOCI | Investments at FVPL | |||||||||||||||||||
| Concentration by sector | ||||||||||||||||||||||||
| Government | 0 | 0 | 18,149,866 | 2,520,887,441 | 1,729,739,468 | 41,705,042 | ||||||||||||||||||
| Corporate | 0 | |||||||||||||||||||||||
| Trade | 1,628,348,603 | 72,785,084 | 0 | 0 | 0 | 0 | ||||||||||||||||||
| Real estate | 1,258,683,209 | 16,775,962 | 0 | 0 | 9,677,273 | 0 | ||||||||||||||||||
| Services | 1,222,822,388 | 129,324,038 | 0 | 0 | 0 | 0 | ||||||||||||||||||
| Food industry | 909,930,633 | 18,445,008 | 0 | 0 | 0 | 0 | ||||||||||||||||||
| General industry | 797,028,016 | 28,075,759 | 0 | 0 | 0 | 0 | ||||||||||||||||||
| Agriculture | 524,895,249 | 8,249,552 | 0 | 0 | 0 | 0 | ||||||||||||||||||
| Hotels and restaurants | 317,879,388 | 2,841,393 | 0 | 0 | 0 | 0 | ||||||||||||||||||
| Financial | 234,001,453 | 130,269,469 | 0 | 829,104,983 | 443,182,245 | 931,419 | ||||||||||||||||||
| Transportation | 176,374,973 | 10,892,182 | 0 | 0 | 0 | 0 | ||||||||||||||||||
| Construction | 138,748,943 | 43,668,016 | 0 | 0 | 13,585,035 | 0 | ||||||||||||||||||
| Telecommunication | 34,584,363 | 1,776,409 | 0 | 0 | 0 | 0 | ||||||||||||||||||
| Personal Banking | 9,592,264,645 | 45,087,813 | 0 | 0 | 0 | 0 | ||||||||||||||||||
| Allowance for ECL | (509,704,212 | ) | (386,831 | ) | 0 | 0 | 0 | 0 | ||||||||||||||||
| Net carrying amount | 16,325,857,651 | 507,803,854 | 18,149,866 | 3,349,992,424 | 2,196,184,021 | 42,636,461 | ||||||||||||||||||
| Geographic location: | ||||||||||||||||||||||||
| Costa Rica | 4,769,177,138 | 187,085,520 | 5,159,081 | 847,144,103 | 872,266,220 | 42,434,788 | ||||||||||||||||||
| Panama | 3,969,838,700 | 158,418,723 | 0 | 61,376,790 | 196,423,956 | 0 | ||||||||||||||||||
| Guatemala | 3,277,527,013 | 10,818,107 | 12,990,785 | 450,556,305 | 400,054,213 | 201,673 | ||||||||||||||||||
| Honduras | 2,086,150,903 | 31,835,080 | 0 | 469,083,497 | 189,589,455 | 0 | ||||||||||||||||||
| El Salvador | 1,859,080,609 | 102,737,415 | 0 | 571,610,063 | 79,293,308 | 0 | ||||||||||||||||||
| Nicaragua | 873,787,500 | 17,295,840 | 0 | 250,283,236 | 24,197,890 | 0 | ||||||||||||||||||
| North America | 0 | 0 | 0 | 670,024,951 | 431,297,157 | 0 | ||||||||||||||||||
| Europe | 0 | 0 | 0 | 17,694,882 | 0 | 0 | ||||||||||||||||||
| South America | 0 | 0 | 0 | 0 | 1,034,926 | 0 | ||||||||||||||||||
| Others | 0 | 0 | 0 | 12,218,597 | 2,026,896 | 0 | ||||||||||||||||||
| Allowance for ECL | (509,704,212 | ) | (386,831 | ) | 0 | 0 | 0 | 0 | ||||||||||||||||
| Net carrying amount | 16,325,857,651 | 507,803,854 | 18,149,866 | 3,349,992,424 | 2,196,184,021 | 42,636,461 | ||||||||||||||||||
Since April 2018, the Republic of Nicaragua has been facing a series of socio-political events that have economic implications that are affecting the development of activities in the productive sectors of the country.
The Company has been and will continue to monitor the evolution of the liquidity and the quality of the portfolio of financial instruments placed or acquired in that country, in order to mitigate and manage the impacts of this situation.
| (b) | Liquidity Risk |
Liquidity risk is defined as the contingency of not being able to comply fully, in a timely and efficient manner, the expected and unexpected cash flows, current and future, without affecting the course of daily operations or the financial condition of the entity. This contingency (liquidity risk) is evidenced in the insufficient liquid assets available for this and/or the need to assume unusual funding costs.
The liquidity management conducted by the Company seeks to meet its obligations of (i) withdrawals of deposits by its customers, (ii) repayment of the service of its debts of institutional funding according to maturity and the payment scheme scheduled, and (iii) compliance with the credit demand and investment funds according to the requirements. In this regard, the Company has constant control over its short term liabilities and assets.The liquidity of the Company is carefully managed and adjusted daily based on the estimated liquidity in a contingent and expected scenario.
F-115
(5) Risk Management, continued
The Company’s liquidity management is in compliance with the policies and guidelines issued by Senior management and/or Regional and Local Board of Directors; the regulators of each country in which it operates and the contractual obligations. These best practices are primarily defensive, in the sense of seeking to maintain appropriate levels of liquidity at all times. In addition, the Company has implemented the internal liquidity requirements that force it to keep excesses on regulatory requirements.
Specifically, the Company’s liquidity risk is managed through the calculation of liquidity coverage indicators in the short term, net of obligations and requirements, and in normal and stressful situations, as well as a stress model of liquidity based on the cash flow, which considers the activity of assets and liabilities in a time horizon of up to one year, under a variety of scenarios, which include both normal market conditions and more severe conditions. In addition, the Company seeks to maintain a term matching, which enables it to meet its financial obligations over time.
As in the market risk, Senior Management engages actively in liquidity risk management through regional and local Assets and Liabilities Committee (ALICO) and Comprehensive Risk Management; thus giving greater support to the strategic decision-making process. The liquidity risk assumed by the Company is in line with the structure, complexity, size and nature of its operation, while always respecting the local regulations, the regional guidelines and the guidelines issued by Senior Management and/or Regional and Local Board of Directors.
At the level of the entire Company is established the obligation of properly documenting the periodic assessment of measurement indicators and compliance with regional guidelines and local regulations is established; as well as ensuring that reports related to liquidity risk to be remitted to the different internal and external instances (including the regulator) are adequate in terms of content, quality of information, generation, transmission and validation according to the requirements set forth in the respective standards.
The following table shows the results of the ratios for high-quality liquidity coverage with respect to the outflow of deposits under normal and stressful conditions, calculated based on internal policies, reported as of the reporting date and during the year:
| % of Liquidity | ||||||||||
| 2020 | 2019 | |||||||||
| As of year end | 46.3 | 36.0 | ||||||||
| Maximum | 52.9 | 39.0 | ||||||||
| Average | 47.1 | 36.0 | ||||||||
| Minimum | 37.1 | 33.0 | ||||||||
As of December 31, 2020 and December 31, 2019, the Companying operations of the Company comply with the liquidity requirements established by the regulators.
F-116
| (5) | Risk Management, continued |
Quantitative information
The following table details the undiscounted cash flows of financial liabilities and financial assets, and disbursements due to financial derivatives in contractual maturity groups from the remaining period from the date of the consolidated statement of financial position:
| 2020 | ||||||||||||||||||||||||||||
| Amounts in thousands | Carrying Amount | Total nominal gross amount inflows /(outflows) | Up to 1 month | From 1 to 3 months | From 3 months to 1 year | From 1 to 5 years | More than 5 years | |||||||||||||||||||||
| Liabilities | ||||||||||||||||||||||||||||
| Demand deposits | 8,114,873 | (8,114,873 | ) | (8,114,873 | ) | 0 | 0 | 0 | 0 | |||||||||||||||||||
| Savings deposits | 4,605,502 | (4,605,502 | ) | (4,605,502 | ) | 0 | 0 | 0 | 0 | |||||||||||||||||||
| Time deposits | 10,531,530 | (11,332,908 | ) | (909,551 | ) | (1,665,913 | ) | (4,160,759 | ) | (3,904,695 | ) | (691,990 | ) | |||||||||||||||
| Securities sold under repurchase agreements | 41,921 | (42,100 | ) | (21,193 | ) | (2,951 | ) | (17,956 | ) | 0 | 0 | |||||||||||||||||
| Financial obligations | 2,645,123 | (2,876,243 | ) | (31,993 | ) | (217,822 | ) | (951,397 | ) | (1,257,087 | ) | (417,944 | ) | |||||||||||||||
| Other financial obligations | 1,246,358 | (1,402,685 | ) | (114,816 | ) | (34,232 | ) | (157,802 | ) | (1,095,835 | ) | 0 | ||||||||||||||||
| Lease Liabilities | 217,371 | (258,308 | ) | (3,607 | ) | (6,941 | ) | (30,530 | ) | (140,673 | ) | (76,557 | ) | |||||||||||||||
| Sub-total liabilities | 27,402,678 | (28,632,619 | ) | (13,801,535 | ) | (1,927,859 | ) | (5,318,444 | ) | (6,398,290 | ) | (1,186,491 | ) | |||||||||||||||
| Commitments and guarantees | 130,059 | (130,060 | ) | (10,880 | ) | (22,940 | ) | (55,850 | ) | (40,390 | ) | 0 | ||||||||||||||||
| Acceptances | 197,566 | (197,565 | ) | (1,100 | ) | (54,212 | ) | (142,253 | ) | 0 | 0 | |||||||||||||||||
| Total liabilities | 27,730,303 | (28,960,244 | ) | (13,813,515 | ) | (2,005,011 | ) | (5,516,547 | ) | (6,438,680 | ) | (1,186,491 | ) | |||||||||||||||
| Assets | ||||||||||||||||||||||||||||
| Cash and cash equivalents | 729,240 | 729,240 | 729,240 | 0 | 0 | 0 | 0 | |||||||||||||||||||||
| Securities purchased under resale agreements | 21,227 | 21,228 | 15,335 | 5,893 | 0 | 0 | 0 | |||||||||||||||||||||
| Deposits in banks | 5,217,041 | 5,218,230 | 5,127,500 | 76,840 | 12,851 | 1,039 | 0 | |||||||||||||||||||||
| Investments at FVPL (1) | 79,514 | 86,100 | 1,754 | 395 | 19,016 | 54,758 | 10,177 | |||||||||||||||||||||
| Investments at FVOCI (1) | 3,773,500 | 4,152,567 | 390 | 418,863 | 483,619 | 1,829,240 | 1,420,455 | |||||||||||||||||||||
| Investments at AC | 78,385 | 115,091 | 12 | 651 | 9,379 | 36,447 | 68,602 | |||||||||||||||||||||
| Loans | 19,656,415 | 25,215,938 | 2,808,351 | 2,610,169 | 3,265,740 | 7,757,251 | 8,774,427 | |||||||||||||||||||||
| Sub-total assets | 29,555,322 | 35,538,394 | 8,682,582 | 3,112,811 | 3,790,605 | 9,678,735 | 10,273,661 | |||||||||||||||||||||
| Acceptances outstanding | 197,566 | 197,566 | 1,101 | 54,212 | 142,253 | 0 | 0 | |||||||||||||||||||||
| Total assets | 29,752,888 | 35,735,960 | 8,683,683 | 3,167,023 | 3,932,858 | 9,678,735 | 10,273,661 | |||||||||||||||||||||
(1) Common stocks are excluded
| 2019 | ||||||||||||||||||||||||||||
| Amounts in thousands | Carrying Amount | Total nominal gross amount inflows /(outflows) | Up to 1 month | From 1 to 3 months | From 3 months to 1 year | From 1 to 5 years | More than 5 years | |||||||||||||||||||||
| Liabilities | ||||||||||||||||||||||||||||
| Demand deposits | 5,971,832 | (5,971,869 | ) | (5,971,869 | ) | 0 | 0 | 0 | 0 | |||||||||||||||||||
| Savings deposits | 3,335,166 | (3,335,166 | ) | (3,335,166 | ) | 0 | 0 | 0 | 0 | |||||||||||||||||||
| Time deposits | 7,927,612 | (8,746,495 | ) | (815,520 | ) | (1,299,917 | ) | (3,062,124 | ) | (2,088,131 | ) | (1,480,803 | ) | |||||||||||||||
| Securities sold under repurchase agreements | 34,741 | (34,765 | ) | (34,765 | ) | 0 | 0 | 0 | 0 | |||||||||||||||||||
| Financial obligations | 2,339,111 | (2,565,918 | ) | (120,994 | ) | (263,556 | ) | (846,167 | ) | (859,832 | ) | (475,369 | ) | |||||||||||||||
| Other financial obligations | 319,415 | (339,999 | ) | (1,517 | ) | (33,096 | ) | (103,457 | ) | (201,929 | ) | 0 | ||||||||||||||||
| Lease Liabilities | 231,563 | (264,626 | ) | (3,167 | ) | (3,929 | ) | (28,612 | ) | (133,818 | ) | (95,100 | ) | |||||||||||||||
| Sub-total liabilities | 20,159,440 | (21,258,838 | ) | (10,282,998 | ) | (1,600,498 | ) | (4,040,360 | ) | (3,283,710 | ) | (2,051,272 | ) | |||||||||||||||
| Commitments and guarantees | 0 | (60,116 | ) | (5,199 | ) | (12,577 | ) | (42,340 | ) | 0 | 0 | |||||||||||||||||
| Acceptances | 1,969 | (1,969 | ) | (441 | ) | (445 | ) | (1,083 | ) | 0 | 0 | |||||||||||||||||
| Total liabilities | 20,161,409 | (21,320,923 | ) | (10,288,638 | ) | (1,613,520 | ) | (4,083,783 | ) | (3,283,710 | ) | (2,051,272 | ) | |||||||||||||||
| Assets | ||||||||||||||||||||||||||||
| Cash and cash equivalents | 727,125 | 727,125 | 727,125 | 0 | 0 | 0 | 0 | |||||||||||||||||||||
| Securities purchased under resale agreements | 18,150 | 18,150 | 18,150 | 0 | 0 | 0 | 0 | |||||||||||||||||||||
| Deposits in banks | 3,349,992 | 3,350,845 | 3,310,558 | 22,786 | 17,501 | 0 | 0 | |||||||||||||||||||||
| Investments at FVPL (1) | 42,636 | 60,663 | 784 | 1,414 | 18,256 | 25,906 | 14,303 | |||||||||||||||||||||
| Investments at FVOCI (1) | 2,196,184 | 2,532,524 | 171,036 | 130,617 | 446,682 | 1,256,177 | 528,012 | |||||||||||||||||||||
| Loans | 16,325,562 | 22,874,588 | 2,497,266 | 2,961,135 | 2,942,747 | 6,484,159 | 7,989,281 | |||||||||||||||||||||
| Sub-total assets | 22,659,649 | 29,563,895 | 6,724,919 | 3,115,952 | 3,425,186 | 7,766,242 | 8,531,596 | |||||||||||||||||||||
| Acceptances outstanding | 1,969 | 1,969 | 441 | 445 | 1,083 | 0 | 0 | |||||||||||||||||||||
| Total assets | 22,661,618 | 29,565,864 | 6,725,360 | 3,116,397 | 3,426,269 | 7,766,242 | 8,531,596 | |||||||||||||||||||||
(1) Common stocks are excluded
F-117
| (5) | Risk Management, continued |
The liquidity of the Company is measured and monitored on a daily basis by the Treasury of each country. In addition, the Company maintains appropriate levels of cash in vaults, deposits in banks and short-term deposits which constitutes the Company’s basis of liquidity reserves. The composition of liquidity is shown in the following table:
| 2020 | 2019 | |||||||
| Cash and cash equivalents | 729,239,556 | 727,125,481 | ||||||
| Securities bought under resale agreements | 21,227,306 | 18,149,866 | ||||||
| Deposits in central banks | 2,926,805,725 | 2,383,253,646 | ||||||
| Deposits due from banks maturing in less than 90 days | 2,226,746,215 | 942,929,643 | ||||||
| Deposits due from banks greater than 90 days | 63,489,092 | 23,808,736 | ||||||
| Total cash, cash equivalents and deposits in banks | 5,967,507,894 | 4,095,267,372 | ||||||
| Not committed sovereign debt instruments | 3,009,431,408 | 1,699,930,581 | ||||||
| Other credit lines available (1) | 3,017,409,447 | 1,756,600,146 | ||||||
| Total liquidity reserve | 11,994,348,749 | 7,551,798,099 | ||||||
| (1) Amounts not disbursed as of the reporting date. |
The available credit lines are for use in normal business scenarios. They may have restricted use in stressful situations.
The following table shows the availability of the Company's financial assets to support the future financing:
| 2020 | Committed | Uncommitted | ||||||||||||||||||
| As Collateral | Available as Collateral | Legal Reserve (1) | Other (2) | Total | ||||||||||||||||
| Cash and cash equivalents | 0 | 0 | 0 | 729,239,556 | 729,239,556 | |||||||||||||||
| Securities purchased under resale agreements | 0 | 0 | 21,227,306 | 0 | 21,227,306 | |||||||||||||||
| Deposits due from banks | 140,012,863 | 327,787,776 | 2,058,375,857 | 2,690,864,536 | 5,217,041,032 | |||||||||||||||
| Investments at FVOCI | 383,875,413 | 2,980,256,770 | 0 | 506,368,884 | 3,870,501,067 | |||||||||||||||
| Investments at AC | 0 | 0 | 0 | 78,384,779 | 78,384,779 | |||||||||||||||
| Loans at amortized cost | 355,360,261 | 0 | 0 | 19,301,054,449 | 19,656,414,710 | |||||||||||||||
| Total assets | 879,248,537 | 3,308,044,546 | 2,079,603,163 | 23,305,912,204 | 29,572,808,450 | |||||||||||||||
| (1) | It represents uncommitted assets, but whose use the Company considers use to guarantee financing, for legal or other reasons. Committed deposits in banks comprise the legal reserve required by the different jurisdictions in which the Company operates, and can be used according to the regulation of each country. |
| (2) | It represents assets that are uncommitted for use as collateral. |
| 2019 | Committed | Uncommitted | ||||||||||||||||||
| As Collateral | Available as Collateral | Legal Reserve (1) | Other (2) | Total | ||||||||||||||||
| Cash and cash equivalents | 0 | 0 | 0 | 727,125,481 | 727,125,481 | |||||||||||||||
| Securities purchased under resale agreements | 0 | 0 | 18,149,866 | 0 | 18,149,866 | |||||||||||||||
| Deposits due from banks | 5,621,665 | 205,658,019 | 2,120,070,883 | 1,018,641,458 | 3,349,992,025 | |||||||||||||||
| Investments at FVOCI | 20,247,371 | 2,091,387,340 | 50,971,992 | 92,160,361 | 2,254,767,064 | |||||||||||||||
| Loans at amortized cost | 352,448,636 | 0 | 0 | 15,973,409,015 | 16,325,857,651 | |||||||||||||||
| Total assets | 378,317,672 | 2,297,045,359 | 2,189,192,741 | 17,811,336,315 | 22,675,892,087 | |||||||||||||||
| (1) | It represents uncommitted assets, but whose use the Company considers use to guarantee financing, for legal or other reasons. Committed deposits in banks comprise the legal reserve required by the different jurisdictions in which the Company operates, and can be used according to the regulation of each country. |
| (2) | It represents assets that are uncommitted for use as collateral. |
| (c) | Market risk |
Market risks are those that may result in losses as a result of adverse price movements in the financial markets where positions are maintained. It comprises the following risks:
| - | Interest rate risk: is the possibility of an economic loss due to adverse variations in interest rates. |
F-118
| (5) | Risk Management, continued |
| - | Exchange rate risk: is the possibility of an economic loss due to adverse variations in the exchange rate. |
The main objectives of the Company’s corporate governance structure include supervising the performance of the management team in each country, ensuring the proper functioning of the internal control system, monitoring the exposure to risks and managing them effectively. For such purpose, management engages actively in market risk management through the regional and local Assets and Liabilities Committees (ALICO) and the Comprehensive Risk Management Committee; thus giving greater support to the strategic decision-making process.
Market risks assumed by the Company are in line with the structure, complexity, size and nature of its operation, while always respecting the local regulations, the regional guidelines and the guidelines issued by management and/or regional and local board of directors.
The Company establishes the requirement of properly documenting the periodic assessment of measurement indicators and compliance with regional guidelines and local regulations, as well as ensuring that reports related to market risk to be remitted to the different internal and external instances (including the regulator) are adequate in terms of the content, quality of information, generation, transmission and validation according to the requirements set forth in the respective standards.
For the measurement, control and management of market risk, the Company uses the indicators required by the regulator of each country as well as another set of indicators established in the internal regional guideline, which are calculated by country and in a consolidated manner based on internal sources of information.
Exchange risk is measured through the determination of the equity percentage that is not dollarized (also known as monetary position). The main objective of the policy is to establish that the difference between assets denominated in US dollars and liabilities denominated in US dollars is at least equal to equity, which is equivalent to having a 100% dollarized equity. However, due to regulatory restrictions applicable in each country that limit the position in US dollars, the consolidated monetary position may be below this desirable limit.
F-119
| (5) | Risk Management, continued |
Quantitative information
The Company maintains operations in the consolidated statement of financial position, agreed in local currency other than US dollars, which are listed below:
2020 Amounts in US millions | Euro | GBP Pound | Canadian dollars | Swiss Francs | Quetzales | Lempiras | Cordobas | Colones | Total | |||||||||||||||||||||||||||
| Cash, cash equivalents and deposits in banks | 30 | 4 | 1 | 2 | 502 | 816 | 126 | 587 | 2,068 | |||||||||||||||||||||||||||
| Investments in securities | 0 | 0 | 0 | 0 | 450 | 305 | 0 | 243 | 998 | |||||||||||||||||||||||||||
| Loans, net | 0 | 0 | 0 | 0 | 1,773 | 1,495 | 71 | 1,532 | 4,871 | |||||||||||||||||||||||||||
| Total assets | 30 | 4 | 1 | 2 | 2,725 | 2,616 | 197 | 2,362 | 7,937 | |||||||||||||||||||||||||||
| Deposits | 32 | 4 | 1 | 2 | 2,299 | 2,104 | 283 | 2,165 | 6,890 | |||||||||||||||||||||||||||
| Obligations | 0 | 0 | 0 | 113 | 256 | 193 | 0 | 41 | 603 | |||||||||||||||||||||||||||
| Total liabilities | 32 | 4 | 1 | 115 | 2,555 | 2,297 | 283 | 2,206 | 7,493 | |||||||||||||||||||||||||||
| Contingencies | 0 | 0 | 0 | 0 | 0 | 20 | 0 | 34 | 54 | |||||||||||||||||||||||||||
| Exchange risk exposure | (2 | ) | 0 | 0 | (113 | ) | 170 | 339 | (86 | ) | 190 | 498 | ||||||||||||||||||||||||
| 2019 | Euro | GBP Pound | Canadian dollars | Swiss Francs | Quetzales | Lempiras | Cordobas | Colones | Total | |||||||||||||||||||||||||||
| Amounts in US millions | ||||||||||||||||||||||||||||||||||||
| Cash, cash equivalents and deposits in banks | 0 | 0 | 0 | 0 | 378 | 398 | 127 | 497 | 1,400 | |||||||||||||||||||||||||||
| Investments in securities | 0 | 0 | 0 | 0 | 368 | 182 | 0 | 228 | 778 | |||||||||||||||||||||||||||
| Loans, net | 0 | 0 | 0 | 0 | 1,703 | 1,450 | 56 | 1,595 | 4,804 | |||||||||||||||||||||||||||
| Total assets | 0 | 0 | 0 | 0 | 2,449 | 2,030 | 183 | 2,320 | 6,982 | |||||||||||||||||||||||||||
| Deposits | 0 | 0 | 0 | 0 | 1,939 | 1,532 | 235 | 2,023 | 5,729 | |||||||||||||||||||||||||||
| Obligations | 0 | 0 | 0 | 0 | 284 | 198 | 0 | 41 | 523 | |||||||||||||||||||||||||||
| Total liabilities | 0 | 0 | 0 | 0 | 2,223 | 1,730 | 235 | 2,064 | 6,252 | |||||||||||||||||||||||||||
| Contingencies | 0 | 0 | 0 | 0 | 0 | 20 | 0 | 38 | 58 | |||||||||||||||||||||||||||
| Exchange risk exposure | 0 | 0 | 0 | 0 | 226 | 320 | (52 | ) | 294 | 788 | ||||||||||||||||||||||||||
Below, the summary exposure of the Company’s consolidated statement of financial position to interest rate risk. Assets and liabilities are included in the table at their carrying amount, classified by categories of time considering the next rate review date or the maturity date, as applicable:
| 2020 | Without exposure | Up to 1 year | From 1 to 5 years | More than 5 years | Total | |||||||||||||||
| Cash and cash equivalents | 729,239,556 | 0 | 0 | 0 | 729,239,556 | |||||||||||||||
| Securities purchased under resale agreements | 41,248 | 21,186,058 | 0 | 0 | 21,227,306 | |||||||||||||||
| Deposits due from banks | 2,266,786,844 | 2,949,254,188 | 1,000,000 | 0 | 5,217,041,032 | |||||||||||||||
| Investments in securities | 898,103,512 | 444,877,353 | 1,408,452,121 | 1,197,452,860 | 3,948,885,846 | |||||||||||||||
| Loans at amortized cost | 326,481,873 | 17,198,537,311 | 1,272,937,277 | 858,458,249 | 19,656,414,710 | |||||||||||||||
| Total assets | 4,220,653,033 | 20,613,854,910 | 2,682,389,398 | 2,055,911,109 | 29,572,808,450 | |||||||||||||||
| Deposits | 1,552,283,456 | 17,716,146,820 | 3,447,496,370 | 535,979,239 | 23,251,905,885 | |||||||||||||||
| Securities sold under resale agreements | 41,408 | 41,879,364 | 0 | 0 | 41,920,772 | |||||||||||||||
| Financial obligations | 11,372,912 | 1,503,715,397 | 530,234,311 | 599,800,390 | 2,645,123,010 | |||||||||||||||
| Other financial obligations | 11,269,613 | 251,765,776 | 983,322,262 | 0 | 1,246,357,650 | |||||||||||||||
| Total liabilities | 1,574,967,389 | 19,513,507,356 | 4,961,052,943 | 1,135,779,629 | 27,185,307,317 | |||||||||||||||
| Exposure to interest rate risk | 2,645,685,644 | 1,100,347,554 | (2,278,663,545 | ) | 920,131,480 | 2,387,501,133 | ||||||||||||||
| 2019 | Without exposure | Up to 1 year | From 1 to 5 years | More than 5 years | Total | |||||||||||||||
| Cash and cash equivalents | 727,125,481 | 0 | 0 | 0 | 727,125,481 | |||||||||||||||
| Securities purchased under resale agreements | 0 | 18,149,866 | 0 | 0 | 18,149,866 | |||||||||||||||
| Deposits due from banks | 1,557,397,292 | 1,792,594,733 | 0 | 0 | 3,349,992,025 | |||||||||||||||
| Investments in securities | 349,469,190 | 491,509,922 | 963,701,319 | 450,086,633 | 2,254,767,064 | |||||||||||||||
| Loans at amortized cost | 112,471,917 | 14,911,425,041 | 1,117,800,798 | 184,159,895 | 16,325,857,651 | |||||||||||||||
| Total assets | 2,746,463,880 | 17,213,679,562 | 2,081,502,117 | 634,246,528 | 22,675,892,087 | |||||||||||||||
| Deposits | 1,048,643,261 | 13,302,885,613 | 1,821,675,970 | 1,061,395,187 | 17,234,600,031 | |||||||||||||||
| Securities sold under resale agreements | 57,059 | 34,683,519 | 0 | 0 | 34,740,578 | |||||||||||||||
| Financial obligations | 11,697,743 | 1,632,147,765 | 253,824,381 | 441,451,498 | 2,339,121,387 | |||||||||||||||
| Other obligations | 2,626,299 | 124,696,997 | 192,092,064 | 0 | 319,415,360 | |||||||||||||||
| Total liabilities | 1,063,024,362 | 15,094,413,894 | 2,267,592,415 | 1,502,846,685 | 19,927,877,356 | |||||||||||||||
| Exposure to interest rate risk | 1,683,439,518 | 2,119,265,668 | (186,090,298 | ) | (868,600,157 | ) | 2,748,014,731 | |||||||||||||
F-120
| (5) | Risk Management, continued |
Based on the above, the Company calculates the total exposure of the consolidated statement of financial position to interest rate risk. The Company states that the interest rate risk should be measured for each currency in which assets and liabilities are maintained.
Interest rate risk is analyzed based on the gap analysis, in order to approximate the change in equity of the Company's consolidated statement of financial position and in the net income from interest from eventual changes in market interest rates. The economic value of an instrument involves an assessment of the current value of its expected net cash flows, discounted to reflect market rates. By extension, the economic value of a financial entity can be seen as the present value of expected net cash flows from the entity, defined as expected cash flows from assets less expected cash flows from liabilities. In this sense, the perspective of economic value reflects a view of the sensitivity of the financial entity net value to interest rate fluctuations.
The estimate of the impact of variations in interest rates is conducted under a scenario of increase or decrease of 100 basis points in assets and liabilities at the different terms (parallel movement of the curve). The following table presents a summary of the impact on the Company's economic value and on the net interest income applying these variations:
| Increase of | Decrease of | |||||||
| 100 bps (1) | 100 bps (1) | |||||||
| Impact on equity to interest rate movements | ||||||||
| 2020 | 9,714,573 | (9,714,573 | ) | |||||
| Average for the year | (12,254,951 | ) | 12,254,951 | |||||
| Maximum for the year | 34,644,684 | (34,644,684 | ) | |||||
| Minimum for the year | (63,501,786 | ) | 63,501,786 | |||||
| 2019 | (68,620,770 | ) | 68,620,770 | |||||
| Average for the year | (59,678,878 | ) | 59,678,878 | |||||
| Maximum for the year | (80,284,343 | ) | �� | 80,284,343 | ||||
| Minimum for the year | (41,941,795 | ) | 41,941,795 | |||||
| Impact on net income from interests | ||||||||
| 2020 | 64,360,713 | (64,360,713 | ) | |||||
| Average for the year | 62,931,008 | (62,931,008 | ) | |||||
| Maximum for the year | 67,625,540 | (67,625,540 | ) | |||||
| Minimum for the year | 59,064,722 | (59,064,722 | ) | |||||
| 2019 | 62,457,673 | (62,457,673 | ) | |||||
| Average for the year | 56,725,165 | (56,725,165 | ) | |||||
| Maximum for the year | 62,457,673 | (62,457,673 | ) | |||||
| Minimum for the year | 53,085,233 | (53,085,233 | ) | |||||
| (1) | According to the nature of the instruments on demand, the sensitivity of annual income and expenses to a decrease or increase in rates for currencies with rates below 1% is measured using a variation of 25 basis points. |
F-121
(5) Risk Management, continued
| (d) | Operational risk |
The Company has established a minimum framework for operational risk management within its companies, which is intended to provide general guidelines to ensure the identification, assessment, control, monitoring and reporting of operational risks and materialized events that may affect the organization with the objective of ensuring the proper management, mitigation or reduction of the managed risks and contributing to provide a reasonable assurance with respect to the achievement of organizational objectives.
The operational risk management model considers best practices issued by the Basel Committee on Banking Supervision and by COSO (Committee of Sponsoring Organizations of the Treadway Commission). In addition, it complies with the regulatory requirements of the region, which have been defined by the regulators of the countries where the Company operates.
Based on the above, operational risk is defined as the possibility that the events resulting from personnel, information technologies or inadequate or failed internal processes, or produced by external causes, generate negative impacts that go against the objectives. By its nature, it is present in all of the organization’s activities.
The priority of the Company is, therefore, identifying and managing the major risk factors, regardless of whether they can produce monetary losses. The measurement also contributes to the establishment of priorities in the management of operational risk.
The operational risk management system is properly documented in the Operational Risk Guideline and Manual. It is a continuous process with several stages:
· Measurement of the perspective of control environment
· Identification and assessment of operational risks
· Treatment and mitigation of operational risks
· Risk monitoring and review
· Registration and accounting of losses due to operational risk incidents
Additionally, the Company has policies formally established for the management of information security, business continuity, fraud prevention and code of ethics that support the proper management of operational risks in the organization.
At the regional level and in all countries where the Company operates, there is an operational risk management unit that monitors, advises and assesses the management conducted by the administration with regard to operational risks. In addition, there is a specialized Operational Risk Committee (OR Committee) composed of senior management. The OR Committee reports to the Comprehensive Risk Management Committee, monitors management and ensures that identified operational risks are kept at accepted levels by the organization.
Compliance with Company standards is supported by a program of periodic reviews undertaken by Internal Audit, which reports the results to the Internal Audit Committee of each entity where the Company operates.
| (6) | COVID – 19 |
Impact of the pandemic of the spread of COVID-19
During the first half of 2020, the Coronavirus (COVID-19) spread all over the world, generating the closure of production and supply chains and interrupting international trade, which is causing a global economic slowdown that is affecting various industries. Global authorities, including those in the countries where the Company operates, have adopted, among other measures, the temporary closure of establishments and the mandatory preventive confinement of persons in various areas, resulting in employees, suppliers, and customers being unable to carry out their activities normally.
During the following periods of 2020, this situation has been monitored on a daily basis by the Company's management to assess the adverse effects that could be generated on the results of operations, the financial situation and the liquidity of the Company, and take all the appropriate measures to minimize the negative impacts that may arise from this situation during the 2020 financial year and subsequent periods. The Company continues to have a reasonable expectation that it has adequate resources to continue as a going concern indefinitely.
As of December 31, 2020, the Company has not defaulted on the principal or interest payments of its financial obligations. As a result of the regulatory responses that Central Banks and Regulatory Entities implemented in most of the countries where the Company operates, in order to mitigate the macroeconomic and financial impacts generated by the COVID-19
F-122
| (6) | COVID – 19, continued |
pandemic, there are non-compliance with some commitments contractual, mainly associated with specific financial indicators that have been impacted by such implementations.
As of December 31, 2020, the following issues have been evaluated, which in some cases have generated impacts on the Company's financial statements and operations and on which, during the period after the date of these financial statements and until the date of issue, continue to be monitored by the administration to address its effects on the Company's operations and those of its clients.
| a) | Impairment of financial instruments — Portfolio of receivables, other accounts receivable and other |
Financial instruments that are within the scope of the Expected Credit Loss Model (PCE) of IFRS 9 (loans, trade accounts and other accounts receivable, unmeasured debt instruments at fair value through profit or loss, accounts loan receivables, financial guarantees and loan commitments), have been assessed considering the impacts that COVID-19 is having on the PCE by the measures taken by governments in each of the countries and regions where the Company operates.
The impacts that have been generated for the Company's entities in relation to the deterioration of financial instruments are based on the following aspects:
| a. | Measurement of the ECL, by changes in the allocation of credit risk of financial instruments, incorporating affectation analysis by COVID and generating an impact on the provision, moving from measurement for 12 months (stage 1) to measurement for the remaining life of the instrument (stages 2 and 3) for those in which it is determined that there was a significant increased credit risk since its initial measurement. |
| b. | Credit risk, the behavior of which has changed for institutions according to the economic segments of their loan portfolios, increasing in the case of clients whose business has been negatively affected. |
| c. | The amount at risk (default exposure), taking into account the fact that affected debtors of some of the Company's entities have been found to have stopped making payments or are taking more time than normal to pay, mainly within the framework of relief schemes promulgated by different governments. |
| d. | The estimated loss for credits that are assessed individually, resulting from lower recovery of flows taking into account the impact caused by COVID-19. |
| e. | Macroeconomic aspects considered in the elaboration of scenarios and models for the calculation of the provision, where some of the variables have been weakened in view of the effects of COVID on the economy. |
The calculation of expected credit risk losses incorporated from the second quarter of 2020 forward-looking information projections, in line with the effects of the decisions that governments continue to take around COVID-19, and considering the high level of uncertainty in these terms of intensity and duration. The projection information has been based on the best available information obtained, considering the different geographical areas where the Company operates, and taking into account the effects on segments and portfolios of different entities, which are exposed to different risks and situations.
F-123
| (6) | COVID – 19, continued |
When considering prospective information based on macroeconomic variables, the Company updated the scenarios used and the probabilities assigned to them at the end of December 31, 2020, with the effects shown in the following two tables:
| i. | Macroeconomic variables used in the calculation of ECL |
| 2020 | |||||||
| Guatemala | Honduras | El Salvador | Nicaragua | Costa Rica | Panama | ||
| % | % | % | % | % | |||
| Monthly Economic Activity Index | Upside | 5.46 | 4.19 | 4.25 | 2.27 | 3.58 | 5.54 |
| Central | 3.90 | 3.42 | 3.18 | 0.23 | 2.32 | 3.34 | |
| Downside | 1.60 | 1.50 | 1.54 | (2.25) | 0.41 | 1.63 | |
| Consumer Price Index | Upside | 2.53 | 2.85 | (0.28) | 2.39 | 0.65 | (0.58) |
| Central | 3.26 | 3.54 | 0.18 | 2.69 | 0.85 | (0.16) | |
| Downside | 5.24 | 3.39 | 1.18 | 3.60 | 1.85 | 1.21 | |
| Exchange Rate | Upside | (1.54) | (0.74) | - | 2.35 | 2.35 | - |
| Central | (0.12) | 0.51 | - | 2.89 | 3.69 | - | |
| Downside | 1.18 | 1.38 | - | 4.09 | 5.13 | - | |
| Local Currency Interest Rate | Upside | (0.50) | (0.56) | - | (1.43) | (0.21) | - |
| Central | (0.28) | (0.30) | - | 0.03 | 1.29 | - | |
| Downside | 0.03 | 0.08 | - | 0.93 | 1.66 | - | |
| Dollars Interest Rate | Upside | (0.50) | (0.18) | (0.06) | (0.95) | (1.28) | (0.16) |
| Central | (0.15) | (0.09) | 0.44 | (0.18) | 0.28 | (0.02) | |
| Downside | 0.11 | 0.11 | 1.15 | 1.41 | 1.02 | 0.16 | |
| 2019 | |||||||
| Guatemala | Honduras | El Salvador | Nicaragua | Costa Rica | Panama | ||
| % | % | % | % | % | |||
| Monthly Economic Activity Index | Upside | 3.60 | 3.07 | 2.78 | (2.95) | 2.46 | 4.71 |
| Central | 3.20 | 2.42 | 2.44 | (4.35) | 2.16 | 3.87 | |
| Downside | 2.40 | 1.84 | 1.98 | (6.25) | 1.62 | 3.22 | |
| Consumer Price Index | Upside | 3.22 | 3.60 | 0.26 | 4.13 | 1.97 | 0.38 |
| Central | 3.49 | 4.45 | 1.10 | 6.71 | 2.08 | 0.57 | |
| Downside | 3.67 | 4.76 | 2.09 | 8.47 | 3.63 | 1.31 | |
| Exchange Rate | Upside | (0.93) | 1.24 | - | 3.07 | (0.89) | - |
| Central | (0.45) | 2.88 | - | 3.29 | 0.21 | - | |
| Downside | 1.52 | 3.63 | - | 3.86 | 2.86 | - | |
| Local Currency Interest Rate | Upside | (0.30) | (2.25) | - | (0.34) | (2.19) | - |
| Central | (0.04) | (1.08) | - | 2.24 | (1.98) | - | |
| Downside | 0.24 | (0.31) | - | 5.18 | (1.50) | - | |
| Dollars Interest Rate | Upside | (0.31) | (0.21) | (0.07) | 0.78 | (1.76) | (0.05) |
| Central | (0.15) | (0.19) | 0.02 | 1.70 | (1.45) | 0.37 | |
| Downside | 0.31 | 0.23 | 0.29 | 3.46 | (0.63) | 0.84 | |
| ii. | Weighting of probabilities assigned to scenarios before and after COVID-19 |
| 2020 | ||||||
| Guatemala | Honduras | El Salvador | Nicaragua | Costa Rica | Panama | |
| Upside | 25% | 20% | 15% | 15% | 5% | 10% |
| Central | 65% | 65% | 65% | 65% | 60% | 60% |
| Downside | 10% | 15% | 20% | 20% | 35% | 30% |
| 2019 | ||||||
| Guatemala | Honduras | El Salvador | Nicaragua | Costa Rica | Panama | |
| Upside | 20% | 25% | 15% | 15% | 20% | 25% |
| Central | 70% | 65% | 70% | 70% | 60% | 60% |
| Downside | 10% | 10% | 15% | 15% | 20% | 15% |
The macroeconomic scenarios were adjusted to reflect the impacts of COVID-19 and the weights assigned to each scenario were recalibrated based on the expectations resulting from the information available to date (as well as updating historical information, assumptions related to the severity and duration of the pandemic, speed of recovery of the economy and their respective impact on the market).
The Company continues to monitor continuously information that allows it to identify in a timely manner possible impact to ECL.
F-124
| (6) | COVID – 19, continued |
| iii. | Impairment allowance balances |
December 31, 2020 | September 30, 2020 | June 30, 2020 | March 31, 2020 | December vs September | September vs June | June vs March | ||||||||||||||||||||||
| Corporate | 151,736,641 | 133,642,952 | 127,087,466 | 101,474,597 | 18,093,670 | 6,555,486 | 25,612,869 | |||||||||||||||||||||
| Small Company | 19,927,612 | 21,714,261 | 16,584,323 | 14,518,349 | (1,786,649 | ) | 5,129,938 | 2,065,974 | ||||||||||||||||||||
| Mortgage | 79,146,234 | 58,129,926 | 44,812,324 | 47,701,620 | 21,016,306 | 13,317,602 | (2,889,296 | ) | ||||||||||||||||||||
| Personal banking | 93,685,907 | 95,256,299 | 82,591,129 | 82,040,048 | (1,570,394 | ) | 12,665,170 | 551,081 | ||||||||||||||||||||
| Vehicles | 24,042,414 | 17,876,337 | 11,335,769 | 13,457,726 | 6,166,078 | 6,540,568 | (2,121,957 | ) | ||||||||||||||||||||
| Credit Card | 329,280,288 | 315,207,451 | 241,864,922 | 231,657,852 | 14,072,859 | 73,342,529 | 10,207,070 | |||||||||||||||||||||
| Total | 697,819,096 | 641,827,226 | 524,275,933 | 490,850,192 | 55,991,870 | 117,551,293 | 33,425,741 | |||||||||||||||||||||
The table above summarizes the total balance of the provision by portfolio for each quarter of the period ended December 31, 2020. The detail of the movement of the provision, transfers between stages, the impact by refinement of models, among others, is presented in the Note 5.
| iv. | Loan’s Portfolio provision expense |
December 31, 2020 | September 30, 2020 | June 30, 2020 | March 31, 2020 | December vs September | September vs June | June vs March | ||||||||||||||||||||||
| Corporate | 23,841,780 | 6,696,979 | 30,675,853 | 9,414,427 | 17,144,801 | (23,978,874 | ) | 21,261,426 | ||||||||||||||||||||
| Small Company | 4,934,559 | 6,601,392 | 5,208,985 | 2,889,521 | (1,666,833 | ) | 1,392,407 | 2,319,464 | ||||||||||||||||||||
| Mortgage | 25,730,151 | 18,047,286 | 3,537,142 | 6,824,036 | 7,682,865 | 14,510,144 | (3,286,894 | ) | ||||||||||||||||||||
| Personal banking | 13,068,351 | 20,941,057 | 12,151,634 | 7,092,862 | (7,872,706 | ) | 8,789,423 | 5,058,772 | ||||||||||||||||||||
| Vehicles | 10,935,825 | 7,580,336 | 2,042,249 | 4,095,546 | 3,355,489 | 5,538,087 | (2,053,297 | ) | ||||||||||||||||||||
| Credit Card | 68,114,112 | 90,623,840 | 58,229,203 | 47,144,018 | (22,509,728 | ) | 32,394,637 | 11,085,185 | ||||||||||||||||||||
| Total | 146,624,778 | 150,490,890 | 111,845,066 | 77,460,410 | (3,866,112 | ) | 38,645,824 | 34,384,656 | ||||||||||||||||||||
The above table summarizes the impairment provision expense per portfolio for each quarter of the year ended December 31, 2020.
| b) | Reliefs to customers |
The actions taken or suggested by the governments of the countries in which the Company operates have promoted the generation of reliefs to customers (companies or individuals) between April and December 2020 in relation to loans or loan agreements in force, which have involved the renegotiation of their terms including, among others, the granting of grace periods, deferment of assessments, extension of deadlines and extension of credit quotas. The following table summarizes the volume of relief granted by portfolio:
| Corporate | Small Company | Mortgage | Personal banking | Vehicles | Credit Card | |||||||||||||||||||
| December 31, 2020 | ||||||||||||||||||||||||
Amount of credits with relief | 5,756 | 12,729 | 31,503 | 84,936 | 60,597 | 900,594 | ||||||||||||||||||
| % of credit with relief / Total credits | 25.75 | % | 55.64 | % | 57.33 | % | 24.23 | % | 57.27 | % | 35.18 | % | ||||||||||||
As of December 31, 2020, the impact recognized in results for COVID-19 relief is $12,724,692.
To date, the governments of the countries where the Company operates have not decreed direct support to banks.
F-125
| (6) | COVID – 19, continued |
| c) | Leases from the perspective of the lessee |
Between lessors and lessees, since April 2020, processes have been carried out to renegotiate the terms of their lease agreements, as a result of which the lessors have granted the lessees concessions of some kind in connection with the lease payments.
Some entities of the Company that have leased goods have renegotiated the terms of their lease agreements as a result of the crisis triggered by COVID-19. The Company has considered, in its role as lessee, the proper accounting of these concessions analyzing whether or not they correspond to modifications of the contract; this analysis resulted in the recognition of gains and/or losses in the statement of profit or loss and the adjustment of the lease liabilities, with the impacts that are exposed in the following table:
| Relief mode | Number of relief received | % Relief contracts / Total contracts | Recognized effect on results | |||||||||
| Decrease in the fee for a number of months | 106 | 18.03 | % | 294,073 | ||||||||
| d) | Impairment of assets — Capital gains, property, plant and equipment and intangible assets As of December 31, 2020, no impairment indicators were identified for the Company's businesses, |
F-126
| (7) | Critical Accounting Estimates and Judgments in the Implementation of Accounting Policies |
The Company's management is responsible for the development, selection, disclosure of policies and critical accounting estimates and their implementation in a manner consistent with the assumptions selected and related to the significant estimate uncertainties.
Loan Impairment Losses
The Company reviews its loan portfolio to assess the impairment at least on a quarterly basis. When determining whether an impairment loss should be recorded in the consolidated statement of income, the Company makes decisions as to whether observable information exists indicating that there is a measurable reduction in estimated future cash flows from a loan portfolio before such reduction may be identified with an individual loan in that portfolio. This evidence includes observable information indicating that an adverse change in the payment condition of borrowers in a group, national or local economic conditions that correlate with non-compliance instances in Company’s assets have occurred.
Fair Value of Financial Instruments
Fair value of financial instruments that are not quoted in active markets is determined using valuation techniques. All models are evaluated and adjusted before use, and the models are calibrated to ensure that the results reflect current information and comparative market prices.
To the extent possible, models only use observable information; however, areas such as credit risk (own and by the counterparty), volatilities and correlations require estimates by management. Changes in assumptions about these factors may affect the reported fair value of financial instruments.
Impairment of Investments at FVOCI
In debt instruments the impairment may be appropriate when there is evidence of impairment in the financial health of the issuer, industry or sector performance, changes in technology, and operational and financial cash flows.
Goodwill Impairment
The Company will determine whether goodwill is impaired annually or when there is indication of possible impairment.
This requires an estimate of the value in use of CGUs to which the goodwill value is attributed. The estimate of the value in use requires management to consider the expected cash flows from CGUs and also the selection of an appropriate discount rate to calculate the current value of such cash flows.
Income Tax
The Company uses the asset and liability method to record income tax. Under this method, the deferred tax assets and liabilities are recognized by the estimates of future tax consequences attributable to temporary differences between the amounts of assets and liabilities in the consolidated financial statements and their respective tax bases and due to accumulated tax losses. The deferred tax assets and liabilities are valued using the enacted tax rates that are expected to be applied to the tax revenue for the years in which they are expected to be recovered or temporary differences are settled. The effect on deferred tax assets and liabilities by a change in tax rates is recognized in the operation results in the year in which the change occurs.
Management regularly assesses the realization of deferred tax assets for it recognition. Management evaluates whether it is more likely than not that a portion or all deferred tax assets are not realizable.
| (8) | Cash, Cash Equivalents and Deposits |
Cash and cash equivalents are listed below for reconciliation purposes with the consolidated statement of cash flow:
| 2020 | 2019 | |||||||
| Cash and cash equivalents | 729,239,556 | 727,125,481 | ||||||
| Securities purchased under resale agreements | 21,227,306 | 18,149,866 | ||||||
| Deposits in central banks | 2,926,805,725 | 2,383,253,646 | ||||||
| Deposits in banks and deposits due in less than 90 days | 2,226,746,215 | 942,929,643 | ||||||
| Cash and cash equivalents in the cash flow statement | 5,904,018,802 | 4,071,458,636 | ||||||
| Deposits in banks greater than 90 days and pledged | 63,489,092 | 23,808,736 | ||||||
| Total cash, cash equivalents and deposits in banks | 5,967,507,894 | 4,095,267,372 | ||||||
| (9) | Securities Purchased Under Resale Agreements |
As of December 31, 2020, securities purchased under resale agreements amounted to $21,227,306 (2019: $18,149,866), which had maturity dates in February 2021 (2019: January 2020) and an interest rate between 1.9% and 2.8% (2019: between 2.6% and 4.6%). These securities were guaranteed with local government bonds and corporate bonds, which amounted to $26,690,737 (2019: $20,186,397).
F-127
| (10) | Investments at Fair Value |
As of December 31, 2020, investments at fair value amounted to $3,948,885,846 (2019: $2,254,767,064) are summarized as follows:
| a) | Investments at FVPL |
The portfolio of investments in securities at FVPL is detailed as follows:
| 2020 | 2019 | |||||||
| Government bonds | 55,993,523 | 41,705,042 | ||||||
| Corporate bonds | 16,100 | 152,534 | ||||||
| Mutual funds | 23,504,431 | 778,885 | ||||||
| Common stocks | 12,425,258 | 10,617,681 | ||||||
| 91,939,312 | 53,254,142 | |||||||
As of December 31, 2020, securities at FVPL with a carrying amount of $6,163,940 (2019: $15,781,926) are used as collateral for repurchase agreements.
F-128
| (10) | Investments at Fair Value, continued |
| b) | Investments at FVOCI |
The portfolio of investments at FVOCI is detailed as follows:
| 2020 | 2019 | |||||||
| Governments and Agencies | ||||||||
| United States of America | 680,165,101 | 55,815,496 | ||||||
| Other governments | 2,620,318,458 | 1,673,923,973 | ||||||
| 3,300,483,559 | 1,729,739,469 | |||||||
| Corporate bonds | 473,016,870 | 466,444,552 | ||||||
| Common stocks | 5,061,326 | 5,328,901 | ||||||
| 3,778,561,755 | 2,201,512,922 | |||||||
The Company maintains a portfolio of equity investments issued by the following companies:
| Entity | Country | 2020 | 2019 | |||||||||
| Almacenadora Guatemalteca, S. A. | Guatemala | 2,035,798 | 2,315,547 | |||||||||
| Latinex Holdings, Inc. | Panama | 512,858 | 501,648 | |||||||||
| Grupo APC, S. A. | Panama | 445,582 | 445,582 | |||||||||
| Transacciones y Transferencia, S. A. | Guatemala | 307,805 | 311,603 | |||||||||
| Otros | Otros | 1,759,283 | 1,754,521 | |||||||||
| 5,061,326 | 5,328,901 | |||||||||||
The Company conducts annual reviews to validate that the value of these investments has not suffered a permanent impairment for which the value of the investment must be adjusted. As of December 31, the portfolio of common stocks at FVOCI had a variation in the Company’s Other Comprehensive Results of $1,161,354 (2019: $(568,601)). As of December 31, 2020, the Company received $487,948 for dividends of common stocks at FVOCI (2019: $406,290).
| c) | Investments at AC |
The investment portfolio at AC is detailed as follows:
| 2020 | ||||
| Government bonds | 6,697,211 | |||
| 6,697,211 | ||||
| Corporate bonds | 71,687,568 | |||
| 78,384,779 | ||||
F-129
| (11) | Loans |
A breakdown of the loan portfolio by type is as follows:
| 2020 | 2019 | |||||||||||||||||||||||
| Portfolio | Allowance for ECL | Net portfolio of allowance | Portfolio | Allowance for ECL | Net portfolio of allowance | |||||||||||||||||||
| Loans | ||||||||||||||||||||||||
| Corporate | ||||||||||||||||||||||||
| Corporate loans | 8,396,593,897 | (148,546,587 | ) | 8,248,047,310 | 6,356,919,118 | (93,281,117 | ) | 6,263,638,001 | ||||||||||||||||
| Corporate leases, net (1) | 149,545,637 | (3,190,054 | ) | 146,355,583 | 116,907,661 | (1,341,269 | ) | 115,566,392 | ||||||||||||||||
| Total Corporate | 8,546,139,534 | (151,736,641 | ) | 8,394,402,893 | 6,473,826,779 | (94,622,386 | ) | 6,379,204,393 | ||||||||||||||||
Personal Banking and Small company
| ||||||||||||||||||||||||
| Small company | ||||||||||||||||||||||||
| Small company loans | 769,491,025 | (18,326,261 | ) | 751,164,764 | 661,114,703 | (14,626,589 | ) | 646,488,114 | ||||||||||||||||
| Small company leases, net (1) | 89,057,492 | (1,601,351 | ) | 87,456,141 | 108,355,736 | (1,207,472 | ) | 107,148,264 | ||||||||||||||||
| Total Small company | 858,548,517 | (19,927,612 | ) | 838,620,905 | 769,470,439 | (15,834,061 | ) | 753,636,378 | ||||||||||||||||
| Personal Banking | ||||||||||||||||||||||||
| Mortgage loans | 4,190,739,418 | (79,146,234 | ) | 4,111,593,184 | 3,384,117,866 | (47,481,527 | ) | 3,336,636,339 | ||||||||||||||||
| Personals | 2,351,142,266 | (93,685,907 | ) | 2,257,456,359 | 2,004,756,142 | (92,767,900 | ) | 1,911,988,242 | ||||||||||||||||
| Vehicles | 1,183,895,384 | (20,512,499 | ) | 1,163,382,885 | 870,723,040 | (12,767,973 | ) | 857,955,067 | ||||||||||||||||
| Personal leases, net (1) | 92,289,389 | (3,529,915 | ) | 88,759,474 | 70,791,463 | (1,491,510 | ) | 69,299,953 | ||||||||||||||||
| Credit Cards | 3,131,479,298 | (329,280,288 | ) | 2,802,199,010 | 3,261,876,134 | (244,738,855 | ) | 3,017,137,279 | ||||||||||||||||
| Total Personal Banking | 10,949,545,755 | (526,154,843 | ) | 10,423,390,912 | 9,592,264,645 | (399,247,765 | ) | 9,193,016,880 | ||||||||||||||||
| Total Personal Banking and Small company | 11,808,094,272 | (546,082,455 | ) | 11,262,011,817 | 10,361,735,084 | (415,081,826 | ) | 9,946,653,258 | ||||||||||||||||
| Total loans at AC | 20,354,233,806 | (697,819,096 | ) | 19,656,414,710 | 16,835,561,863 | (509,704,212 | ) | 16,325,857,651 | ||||||||||||||||
| (1) Total leases, net of interest | 330,892,518 | (8,321,320 | ) | 322,571,198 | 296,054,860 | (4,040,251 | ) | 292,014,609 | ||||||||||||||||
The net value of the financial leases receivable is presented below:
| 2020 | 2019 | |||||||
| Minimum lease payments receivable | 364,506,926 | 347,223,635 | ||||||
| Less: unearned interest | 30,027,446 | 47,128,349 | ||||||
| Minimum lease payments receivable, net | 334,479,480 | 300,095,286 | ||||||
| Less: allowance for loss in leases | 8,321,320 | 4,040,251 | ||||||
| Less: net deferred commissions | 3,586,962 | 4,040,426 | ||||||
| Net value of investment in finance leases | 322,571,198 | 292,014,609 | ||||||
The following table summarizes the minimum lease payments receivable as of December 31, 2020:
| Year ended December 31, | ||||||
| 2021 | 84,109,782 | |||||
| 2022 | 70,505,967 | |||||
| 2023 | 59,702,770 | |||||
| 2024 | 52,782,951 | |||||
| 2025 and thereafter | 67,378,010 | |||||
| 334,479,480 | ||||||
F-130
| (12) | Property, Furniture, Equipment and Improvements |
Property, Equipment and Improvements are detailed as follows:
| 2020 | ||||||||||||||||||||||||||||
| Land and building | Right-of-use assets | Construction in progress | Vehicles | Furniture and equipment | Leasehold improvements | Total | ||||||||||||||||||||||
| Cost: | ||||||||||||||||||||||||||||
| Balance at January 1, 2020 | 228,792,388 | 274,077,289 | 6,036,417 | 11,379,287 | 423,431,330 | 84,722,112 | 1,028,438,823 | |||||||||||||||||||||
| Business combinations | 52,376,427 | 24,903,282 | 13,995,670 | 110,555 | 3,552,425 | 8,922,592 | 103,860,951 | |||||||||||||||||||||
| Purchases | 6,391,787 | 11,499,049 | 12,652,710 | 1,215,115 | 42,356,271 | 1,859,870 | 75,974,802 | |||||||||||||||||||||
| Sales and disposals | (2,489,776 | ) | (1,161,958 | ) | (209,124 | ) | (1,344,384 | ) | (23,811,902 | ) | (9,862,319 | ) | (38,879,463 | ) | ||||||||||||||
| Transfers | 320,448 | 0 | (9,666,490 | ) | 0 | 2,611,401 | 7,469,062 | 734,421 | ||||||||||||||||||||
| Foreign currency translation | (5,547,039 | ) | (26,926,952 | ) | (243,830 | ) | (295,567 | ) | (14,859,075 | ) | (2,895,841 | ) | (50,768,304 | ) | ||||||||||||||
| Balance at December 31, 2020 | 279,844,235 | 282,390,710 | 22,565,353 | 11,065,006 | 433,280,450 | 90,215,476 | 1,119,361,230 | |||||||||||||||||||||
Accumulated depreciation:
| ||||||||||||||||||||||||||||
| Balance at January 1, 2020 | 48,821,505 | 36,514,754 | 0 | 5,964,868 | 276,861,526 | 45,580,935 | 413,743,588 | |||||||||||||||||||||
| Depreciation | 4,705,976 | 37,958,509 | 0 | 1,603,194 | 48,423,643 | 9,081,518 | 101,772,840 | |||||||||||||||||||||
| Sales and disposals | (2,489,776 | ) | (1,161,958 | ) | 0 | (1,109,955 | ) | (23,525,326 | ) | (9,807,864 | ) | (38,094,879 | ) | |||||||||||||||
| Activation and assets transfers | 7,390 | 0 | 0 | 0 | 120,474 | (8,762 | ) | 119,102 | ||||||||||||||||||||
| Foreign currency translation | (1,247,828 | ) | (7,307,256 | ) | 0 | (134,021 | ) | (9,408,695 | ) | (1,635,670 | ) | (19,733,470 | ) | |||||||||||||||
| Balance at December 31, 2020 | 49,797,267 | 66,004,049 | 0 | 6,324,086 | 292,471,622 | 43,210,157 | 457,807,181 | |||||||||||||||||||||
| Net balance | 230,046,968 | 216,386,661 | 22,565,353 | 4,740,920 | 140,808,828 | 47,005,319 | 661,554,049 | |||||||||||||||||||||
| 2019 | ||||||||||||||||||||||||||||
| Land and building | Right-of-use assets | Construction in progress | Vehicles | Furniture and equipment | Leasehold improvements | Total | ||||||||||||||||||||||
| Cost: | ||||||||||||||||||||||||||||
| Balance at January 1, 2019 | 224,785,259 | 0 | 3,142,566 | 10,420,644 | 393,221,366 | 81,384,431 | 712,954,266 | |||||||||||||||||||||
| Impact of IFRS 16 Adopted at January 1, 2019 | 0 | 249,103,818 | 0 | 0 | 0 | 0 | 249,103,818 | |||||||||||||||||||||
| Purchases | 1,479,449 | 20,405,137 | 14,318,290 | 1,891,035 | 50,842,993 | 1,713,187 | 90,650,091 | |||||||||||||||||||||
| Sales and disposals | (1,051,308 | ) | (1,828,424 | ) | (183,842 | ) | (1,104,260 | ) | (30,985,660 | ) | (8,628,350 | ) | (43,781,844 | ) | ||||||||||||||
| Activation and assets transfers | 2,150,381 | 0 | (11,579,661 | ) | 0 | 2,055,942 | 8,424,352 | 1,051,014 | ||||||||||||||||||||
| Foreign currency translation | 1,428,607 | 6,396,758 | 339,064 | 171,868 | 8,296,689 | 1,828,492 | 18,461,478 | |||||||||||||||||||||
| Balance at December 31, 2019 | 228,792,388 | 274,077,289 | 6,036,417 | 11,379,287 | 423,431,330 | 84,722,112 | 1,028,438,823 | |||||||||||||||||||||
Accumulated depreciation:
| ||||||||||||||||||||||||||||
| Balance at January 1, 2019 | 45,577,991 | 0 | 0 | 4,912,820 | 254,120,503 | 45,981,324 | 350,592,638 | |||||||||||||||||||||
| Depreciation | 3,867,498 | 36,651,054 | 0 | 1,818,738 | 48,622,956 | 7,029,430 | 97,989,676 | |||||||||||||||||||||
| Sales and disposals | (704,733 | ) | (374,041 | ) | 0 | (803,451 | ) | (30,521,861 | ) | (8,522,379 | ) | (40,926,465 | ) | |||||||||||||||
| Activation and assets transfers | (137,198 | ) | 0 | 0 | 0 | 1,839 | (9,512 | ) | (144,871 | ) | ||||||||||||||||||
| Foreign currency translation | 217,947 | 237,741 | 0 | 36,761 | 4,638,089 | 1,102,072 | 6,232,610 | |||||||||||||||||||||
| Balance at December 31, 2019 | 48,821,505 | 36,514,754 | 0 | 5,964,868 | 276,861,526 | 45,580,935 | 413,743,588 | |||||||||||||||||||||
| Net balance | 179,970,883 | 237,562,535 | 6,036,417 | 5,414,419 | 146,569,804 | 39,141,177 | 614,695,235 | |||||||||||||||||||||
During the year 2020, the Company made a transfer of other assets to assets for an amount of $615,320 corresponding to land.
During the year 2019, the Company made a transfer of assets to other assets for an amount of $906,143 corresponding to artworks.
| (13) | Goodwill and Intangible Assets |
Changes in the carrying value of goodwill are as follows:
| 2020 | 2019 | |||||||
| Goodwill | ||||||||
Balance at January 1, | 1,465,085,969 | 1,465,085,969 | ||||||
| Acquisitions | 36,429,182 | 0 | ||||||
| Foreign currency translation | 655,934 | 0 | ||||||
| Balance at December 31 | 1,502,171,085 | 1,465,085,969 | ||||||
As of December 31, 2020 and 2019 no impairment in the cash-generating units has been recorded. The fair value of the cash-generating units exceeds the carrying amount plus goodwill; therefore, no impairment loss was recorded.
F-131
| (13) | Goodwill and Intangible Assets, continued |
The recoverable amounts of the CGUs of the Company have been calculated based on their value in use.
The value in use of the CGUs is determined by discounting the future cash flows expected to be generated from the continuing use of the each unit.
Calculation of value in use is based on the following basic assumptions:
| 2020 | 2019 | |||||||
| Average discount rate | 12.9 | % | 11.1 | % | ||||
| Growth rate | 3.0 | % | 3.0 | % | ||||
The discount rate after taxes used to discount the dividend flows reflects the specific risks relating to the CGUs and has been estimated taking into account the risk profile of each of the different markets in which the Company operates.
A 10-year projection was carried out, considering that once this period has passed, the maturity of the businesses and the consequent stabilization of the cash flows will be achieved. Macroeconomic and business assumptions were also used for each of the countries where it operates, in order to reflect the reality that each market provides to all CGUs.
When estimating the terminal value, the normalized flow of funds has been projected in perpetuity, adjusted in accordance with the growth expectations. This projection does not exceed the average long-term growth rate for the economy in each of the countries in which the Company operates; for this reason, an average annual long-term growth rate of 3.0% was estimated (2019: 3.0%).
The main assumptions described above may change as economic and market conditions change. The Company estimates that the reasonably possible changes in these assumptions do not affect the recoverable amount of the CGUs or that they decrease below the CGUs carrying values.
The gross balance of the carrying amount and the accumulated amortization for each intangible asset acquired by the Company subject to amortization as of December 31, 2020 is presented below:
| 2020 | Core deposit intangible | Credit card relationships | Merchants’ relationships | Customers’ relationships | Trade name | Insurance contracts | Operation permits | Software | Total | |||||||||||||||||||||||||||
| Cost: | ||||||||||||||||||||||||||||||||||||
| Balance at January 1, 2020 | 85,248,887 | 83,231,373 | 37,963,355 | 12,465,070 | 56,581,714 | 4,387,103 | 0 | 130,873,630 | 410,751,132 | |||||||||||||||||||||||||||
| Business combinations | 7,209,102 | 3,130,857 | 2,691,046 | 3,071,889 | 13,803,000 | 0 | 1,134,569 | 16,366,538 | 47,407,001 | |||||||||||||||||||||||||||
| Purchases | 0 | 0 | 0 | 0 | 0 | 0 | 0 | 30,513,061 | 30,513,061 | |||||||||||||||||||||||||||
| Sales and disposals | 0 | (7,646,403 | ) | 0 | 0 | 0 | 0 | 0 | (9,304,021 | ) | (16,950,424 | ) | ||||||||||||||||||||||||
| Transfers | 0 | 0 | 0 | 0 | 0 | 0 | 0 | (526,686 | ) | (526,686 | ) | |||||||||||||||||||||||||
| Foreign currency translation | 0 | (44,719 | ) | 0 | (35,568 | ) | (82,728 | ) | 0 | 0 | (7,371,764 | ) | (7,534,779 | ) | ||||||||||||||||||||||
| Balance at December 31, 2020 | 92,457,989 | 78,671,108 | 40,654,401 | 15,501,391 | 70,301,986 | 4,387,103 | 1,134,569 | 160,550,758 | 463,659,305 | |||||||||||||||||||||||||||
| Accumulated amortization: | ||||||||||||||||||||||||||||||||||||
| Balance at January 1, 2020 | 74,477,701 | 67,204,713 | 37,963,355 | 5,435,884 | 0 | 4,387,103 | 0 | 87,983,034 | 277,451,790 | |||||||||||||||||||||||||||
| Amortization | 4,539,003 | 4,925,511 | 3,669,260 | 1,538,493 | 0 | 0 | 438,712 | 18,271,379 | 33,382,358 | |||||||||||||||||||||||||||
| Sales and disposals | 0 | (7,646,403 | ) | 0 | 0 | 0 | 0 | 0 | (6,188,517 | ) | (13,834,920 | ) | ||||||||||||||||||||||||
| Foreign currency translation | 0 | (44,719 | ) | 0 | (29,260 | ) | 0 | 0 | 0 | (4,492,892 | ) | (4,566,871 | ) | |||||||||||||||||||||||
| Balance at December 31, 2020 | 79,016,704 | 64,439,102 | 41,632,615 | 6,945,117 | 0 | 4,387,103 | 438,712 | 95,573,004 | 292,432,357 | |||||||||||||||||||||||||||
| Net balance at December 31, 2020 | 13,441,285 | 14,232,006 | (978,214 | ) | 8,556,274 | 70,301,986 | 0 | 695,857 | 64,977,754 | 171,226,948 | ||||||||||||||||||||||||||
F-132
| (13) | Goodwill and Intangible Assets, continued |
| 2019 | Core deposit intangible | Credit card relationships | Merchants’ relationships | Customers’ relationships | Trade name | Insurance contracts | Operation permits | Software | Total | |||||||||||||||||||||||||||
| Cost: | ||||||||||||||||||||||||||||||||||||
| Balance at January 1, 2019 | 85,248,887 | 82,794,891 | 37,963,355 | 12,438,676 | 56,520,325 | 4,387,103 | 0 | 109,917,554 | 389,270,791 | |||||||||||||||||||||||||||
| Purchases | 0 | 0 | 0 | 0 | 0 | 0 | 0 | 28,854,325 | 28,854,325 | |||||||||||||||||||||||||||
| Sales and disposals | 0 | 0 | 0 | 0 | 0 | 0 | 0 | (12,345,588 | ) | (12,345,588 | ) | |||||||||||||||||||||||||
| Foreign currency translation | 0 | 436,482 | 0 | 26,394 | 61,389 | 0 | 0 | 4,447,339 | 4,971,604 | |||||||||||||||||||||||||||
| Balance at December 31, 2019 | 85,248,887 | 83,231,373 | 37,963,355 | 12,465,070 | 56,581,714 | 4,387,103 | 0 | 130,873,630 | 410,751,132 | |||||||||||||||||||||||||||
| Accumulated amortization: | ||||||||||||||||||||||||||||||||||||
| Balance at January 1, 2019 | 69,316,130 | 60,099,396 | 37,631,265 | 4,143,709 | 0 | 4,387,103 | 0 | 79,485,223 | 255,062,826 | |||||||||||||||||||||||||||
| Amortization | 5,161,571 | 6,668,253 | 332,090 | 1,276,032 | 0 | 0 | 0 | 14,286,661 | 27,724,607 | |||||||||||||||||||||||||||
| Disposals | 0 | 0 | 0 | 0 | 0 | 0 | 0 | (8,740,564 | ) | (8,740,564 | ) | |||||||||||||||||||||||||
| Foreign currency translation | 0 | 437,064 | 0 | 16,143 | 0 | 0 | 0 | 2,951,714 | 3,404,921 | |||||||||||||||||||||||||||
| Balance at December 31, 2019 | 74,477,701 | 67,204,713 | 37,963,355 | 5,435,884 | 0 | 4,387,103 | 0 | 87,983,034 | 277,451,790 | |||||||||||||||||||||||||||
| Net balance at December 31, 2019 | 10,771,186 | 16,026,660 | 0 | 7,029,186 | 56,581,714 | 0 | 0 | 42,890,596 | 133,299,342 | |||||||||||||||||||||||||||
None of the intangible assets listed in the table above have residual value.
During the year 2020, the Company carried out a transfer of intangible assets to property, furniture, equipment and improvements for a net amount of $526,686, corresponding to furniture and equipment (see Note 12).
During the years ended December 31, 2020 and 2019, no impairment losses were recognized.
Remaining life of intangible is presented below:
| Remaining life | |
Relationships with depositors | From 5 to 84 months |
| Relationships with credit cards | From 24 to 59 months |
| Relationships with customers | From 5 to 72 months |
| (14) | Other Assets |
The breakdown of other assets is presented in the table below:
| 2020 | 2019 | |||||||
| Assets held for sale, net | 56,527,322 | 26,874,987 | ||||||
| Deferred expenses | 32,257,859 | 18,706,446 | ||||||
| Asset not available for sale | 14,115,100 | 7,889,366 | ||||||
| Security deposits | 11,117,739 | 8,441,430 | ||||||
| Non-embossed credit card plastic | 7,367,039 | 6,589,458 | ||||||
| Uninstalled assets | 8,202,714 | 7,601,229 | ||||||
| Severance fund | 1,326,490 | 2,670,474 | ||||||
| Process of clearing house | 2,825,868 | 2,504,021 | ||||||
| Derivatives instruments | 10,341,226 | 0 | ||||||
| Others | 8,116,443 | 2,808,696 | ||||||
| 152,197,800 | 84,086,107 | |||||||
During the year 2020, the Company made a transfer of other assets to assets for an amount of $88,633 corresponding to land (see note 12).
As of December 31, 2019, the Company transferred from fixed assets to other assets the amount of $906,143 (see note 12).
F-133
| (14) | Other Assets, continued |
Assets held for sale, net of allowance impairment, are detailed below:
| 2020 | 2019 | |||||||
| Vehicles | 1,969,468 | 0 | ||||||
| Real estate – less than a year | 7,293,632 | 13,015,831 | ||||||
| Real estate – more than a year | 48,510,834 | 17,307,156 | ||||||
| Assets held for sale, gross | 57,773,934 | 30,322,987 | ||||||
| Allowance impairment estimate | (1,246,612 | ) | (3,448,000 | ) | ||||
| Assets held for sale, net | 56,527,322 | 26,874,987 | ||||||
The Company made sales of assets held for sale for an amount of $$23,030,076 (2019: $22,574,709), these gains amount to $4,273,635 (2019: $4,607,814).
The movement of the allowance for assets held for sale is shown below:
| 2020 | 2019 | |||||||
| Balance at year beginning, | 3,448,000 | 11,456,839 | ||||||
| Business combinations | 1,181,385 | 0 | ||||||
| Provision (reversal) charged to expenses | 272,436 | (2,336,581 | ) | |||||
| Sales | (3,690,009 | ) | (2,237,371 | ) | ||||
| Withdrawals | 0 | (4,610,634 | ) | |||||
| Transfer to other assets | 39,421 | 1,090,206 | ||||||
| Foreign currency translation | (4,621 | ) | 85,541 | |||||
| Balance at year end | 1,246,612 | 3,448,000 | ||||||
| (15) | Deposits from Customers |
Deposits from customers are detailed below:
| 2020 | 2019 | |||||||
| Retail customers | ||||||||
| Demand | 1,161,048,315 | 1,116,320,740 | ||||||
| Savings | 3,022,074,251 | 2,206,932,400 | ||||||
| Time deposits | 1,740,015,270 | 1,125,808,366 | ||||||
| Corporate customers | ||||||||
| Demand | 6,953,825,100 | 4,855,510,876 | ||||||
| Savings | 1,583,428,105 | 1,128,234,145 | ||||||
| Time deposits | 8,791,514,844 | 6,801,793,504 | ||||||
| 23,251,905,885 | 17,234,600,031 | |||||||
As of December 31, 2020, within the fixed-term deposits, the carrying amount of the principal issued by BIB Merchant Voucher Receivables Limited, a special purpose consolidated vehicle (from now on SPV), amounting to $750,000,000, divided into two programs: 1) Series 2017-1 with a balance of $350,000,000 (2019: $350,000,000) and 2) Series 2018-1 with a balance of $400,000,000 (2019: $400,000,000). The origination costs pending amortization of the certificates amounted to $7,051,518 as of December 31, 2020 (2019: $8,092,195). The certificates issued by the vehicle are guaranteed by future cash flows arising from transactions in affiliated businesses in Panama. The certificates issued by the vehicle are guaranteed by future cash flows arising from transactions in affiliated businesses in Panama. Transactions in affiliated businesses are those generated by credit card holders issued by international financial institutions, under the Visa and MasterCard credit programs that are processed by the Company. The 2017-1 notes pay interest quarterly in January, April, July and October at a fixed rate of 4.08%. Amortization of principal will begin to be paid to the holders, through Citibank N.A., as of January 2021. The notes have an average original duration of 7.0 years. As of December 31, 2020, the weighted average duration of certificates is 3.52 years. The 2018-1 notes pay interest quarterly in January, April, July and October at a fixed rate of 4.18%.
F-134
| (15) | Deposits from Customers, continued |
The principal repayments will begin to be paid to the holders, through Citibank N.A., as of January 2022. The notes have an average original duration of 7.00 years. As of December 31, 2020, the weighted average duration of the certificates is 4.52 years.
As of December 31, 2020, $395,000,000 (2019: $395,000,000) issued by BIB Central American Card Receivables Limited, a special purpose consolidated vehicle (from now on SPV), is included in the fixed term deposits. The origination costs pending amortization of the certificates amounted to $4,225,121 as of December 31, 2020 (2019: $4,979,598). The certificates issued by the vehicle are guaranteed by future cash flows arising from transactions in affiliated businesses in Costa Rica, El Salvador, Guatemala, Honduras, Nicaragua and Panama. Transactions in affiliated merchants are those generated by credit card holders issued by international financial institutions, under the Visa, MasterCard and American Express credit programs that are processed by the Company. The notes pay interest quarterly in January, April, July and October at a fixed rate of 3.50%. The principal repayments will begin to be paid to the holders, through Citibank N.A., as of October 2023. The notes have an average original duration of 7.00 years. As of December 31, 2020, the weighted average duration of the certificates is 6.25 years.
| (16) | Financial Obligations |
Financial obligations are detailed below:
| 2020 | ||||||||||||
| Interest rate | Maturities up to | Carrying amount | ||||||||||
| Payable in US dollars: | ||||||||||||
| Fixed rate | 5.92 | % | 2030 | 976,078,582 | ||||||||
| Floating rate | 0.44% a 11.50% | 2031 | 1,236,443,745 | |||||||||
| Payable in quetzales (Guatemala): | ||||||||||||
| Fixed rate | 4.40% a 5.50% | 2022 | 256,113,921 | |||||||||
| Floating rate | 8.51 | % | 2021 | 667,852 | ||||||||
| Payable in lempiras (Honduras): | ||||||||||||
| Fixed rate | 3.00% a 15.00% | 2045 | 159,961,239 | |||||||||
| Payable in colones (Costa Rica): | ||||||||||||
| Floating rate | 3.95% a 8.91% | 2031 | 15,857,671 | |||||||||
| Total financial obligations at amortized cost | 2,645,123,010 | |||||||||||
| 2019 | ||||||||||||
| Interest rate | Maturities up to | Carrying amount | ||||||||||
| Payable in US dollars: | ||||||||||||
| Fixed rate | 6.75 | % | 2031 | 1,107,076,488 | ||||||||
| Floating rate | 2.17% a 12.53% | 2030 | 798,072,111 | |||||||||
| Payable in quetzales (Guatemala): | ||||||||||||
| Fixed rate | 5.50% a 6.40% | 2020 | 262,533,673 | |||||||||
| Floating rate | 8.99 | % | 2021 | 1,352,628 | ||||||||
| Payable in lempiras (Honduras): | ||||||||||||
| Fixed rate | 1.00% a 15.00% | 2044 | 144,414,521 | |||||||||
| Payable in colones (Costa Rica): | ||||||||||||
| Floating rate | 6.30% a 12.16% | 2031 | 25,671,966 | |||||||||
| Total financial obligations at amortized cost | 2,339,121,387 | |||||||||||
As of December 31, 2020, the outstanding amount of the principal issued by BIB Central American Card Receivables Limited, a special purpose vehicle (from now on SPV), originated $305,000,000 (2019: $305,000,000). The origination costs pending amortization from the certificates amounted to $14,583,678 as of December 31, 2020 (2019: $17,007,484). Certificates issued by this vehicle are secured by future cash flows from merchant vouchers originating in Costa Rica, El Salvador, Guatemala, Honduras, Nicaragua and Panama. The merchant vouchers are those generated by credit cardholders issued by third-party international
F-135
| (16) | Financial Obligations, continued |
financial institutions, under Visa, MasterCard and American Express credit programs, which are processed by the Company. The certificates pay interest in January, April, July and October at a fixed interest rate of 3.50%. Amortizations to principal will begin in October 2023, through Citibank N.A. The certificates have an average original duration of 7.00 years. As of December 31, 2020, the weighted average duration of the certificates is 6.25 years.
As of December 31, 2020, the outstanding amount of the principal issued by BAC San Jose DPR Funding Limited, a consolidated special purpose vehicle (here in after SPV), amounted to $182,000,000 (2019: $64,000,000), divided into two programs: 1) Series 2014-2 with a balance of $32,000,000 (2019: $64,000,000) and 2) Series 2020-1 with a balance of $150,000,000. The origination costs pending amortization from the certificates amounted to $2,761,125 as of December 31, 2020 (2019: $544,035). The notes issued by the SPV are secured by the current and future Diversified Payment Rights denominated in US dollars, originated by a Bank's subsidiary, and sold to the SPV. The 2014-2 notes pay interest quarterly in February, May, August and November at a fixed rate of 4.50%. The notes have an average original duration of 4.60 years. As of December 31, 2020, the weighted average duration of the notes is 0.50 years.The 2020-1 notes pay interest quarterly in February, May, August and November at a fixed rate of 3.70%. The notes have an average original duration of 5.58 years. As of December 31, 2020, the weighted average duration of the notes is 5.58 years.
In December 2013, BAC International Bank. Inc., subscribed a subordinated loan (in right of payment to all other ordinary credits) with Grupo AVAL Limited for US$180 million. This operation was canceled in June 2020. The loan was subscribed with quarterly interest payments as of March 2014 and based on a fixed rate of 6.75%. The amortization of the principal was established with a single payment at maturity (June 20, 2021).
The Company has had no defaults of principal, interest or other contractual clauses concerning its financial obligations.
On December 31, 2020, a legal and operational merger was carried out between Credomatic International Corp. and BAC International Bank Inc., indirect subsidiaries of the Company. Based on this merger, the financial obligations of BIB Central American Card Receivables Limited (an SPV, more information in Note 16) were converted to a fixed-term certificate of deposit that is perfected on January 2, 2021. In the case of this conversion, there are no changes in the original conditions of the financial liability, therefore, it is not required to derecognize and record an original financial liability cancellation and recognize a new one.
| (17) | Other Financial Obligations |
The Company has placed, through its subsidiaries and through the stock markets of El Salvador, Panama, and Honduras debt certificates with fixed and variable rates, which are described below:
| 2020 | 2019 | |||||||||||||||
| Payable in: | Interest rate | Carrying amount | Interest rate | Carrying amount | ||||||||||||
| US dollars | 2.00% a 10.00% | 1,210,869,103 | 4.75% a 5.85% | 264,260,984 | ||||||||||||
| Lempiras | 7.50% a 9.50% | 35,488,547 | 9.13% a 9.50% | 55,154,376 | ||||||||||||
| Total of other financial obligations at amortized cost | 1,246,357,650 | 319,415,360 | ||||||||||||||
The Company has had no defaults of principal, interest or other contractual clauses concerning its other financial obligations.
F-136
| (17) | Other Financial Obligations, continued |
Through Resolution No. 208-20 of May 14, 2020, issued by the Superintendency of the Securities Market of the Republic of Panama, the Bank is authorized to offer a Public Offering, Perpetual Subordinated Corporate Bonds convertible into common shares for a nominal value of $700 million. The bonds are issued in registered form, registered and without coupons, in denominations of $1,000,000 and in integral multiples of $100,000, with no specific expiration or redemption date. The bonds bear an interest rate of 10% and interest is payable quarterly, unless the issuer exercises its right not to pay interest. As of December 31, 2020, the balance of the perpetual bonds is $520,000,000, and they have been acquired by Grupo AVAL Limited.
| (18) | Lease Liabilities |
Lease liabilities are detailed below:
| 2020 | ||||||||||||||||
| Interest rate | Maturities up to | Carrying amount | Undiscounted cash flows | |||||||||||||
| Payable in US dollars | 5.22 | % | 2033 | 212,057,761 | 250,813,316 | |||||||||||
| Payable in quetzales (Guatemala) | 3.03% a 5.50% | 2029 | 2,954,276 | 4,549,001 | ||||||||||||
| Payable in lempiras (Honduras) | 5.22% a 7.58% | 2029 | 1,340,683 | 1,710,707 | ||||||||||||
| Payable in colones (Costa Rica) | 3.96% a 8.02% | 2033 | 1,018,626 | 1,234,523 | ||||||||||||
| Total lease liabilities | 217,371,346 | 258,307,547 | ||||||||||||||
| 2019 | ||||||||||||||||
| Interest rate | Maturities up to | Carrying amount | Undiscounted cash flows | |||||||||||||
| Payable in US dollars | 5.22 | % | 2033 | 224,321,633 | 255,922,409 | |||||||||||
| Payable in quetzales (Guatemala) | 3.03% a 5.55% | 2029 | 4,568,363 | 5,235,722 | ||||||||||||
| Payable in lempiras (Honduras) | 7.56% a 7.58% | 2029 | 1,560,263 | 2,082,349 | ||||||||||||
| Payable in colones (Costa Rica) | 3.96% a 8.02% | 2033 | 1,112,785 | 1,385,233 | ||||||||||||
| Total lease liabilities | 231,563,044 | 264,625,713 | ||||||||||||||
The following is the detail of the maturity of the undiscounted contractual cash flows, related to lease liabilities:
| 2020 | 2019 | |||||||
| Less than a year | 41,077,493 | 35,707,613 | ||||||
| One to two years | 39,327,085 | 37,054,443 | ||||||
| Two to three years | 37,279,480 | 34,454,541 | ||||||
| Three to four years | 34,321,650 | 32,278,530 | ||||||
| Four to five years | 29,744,473 | 30,030,247 | ||||||
| More than five years | 76,557,366 | 95,100,339 | ||||||
| 258,307,547 | 264,625,713 | |||||||
The following are the items recognized in the consolidated statement of income, related to lease liabilities:
| 2020 | 2019 | |||||||
| Interest on leases | 12,327,424 | 11,913,779 | ||||||
| Expense for leases with less than 12 months | 5,630,063 | 0 | ||||||
| Expense for leases of low-value assets | 7,070,298 | 7,180,736 | ||||||
| 25,027,785 | 19,094,515 | |||||||
F-137
| (19) | Other Liabilities |
The breakdown of other liabilities is presented in the table below:
| 2020 | 2019 | |||||||
| Bank draft to be applied | 115,165,502 | 87,222,261 | ||||||
| Checks issued but not cashed | 102,996,506 | 72,269,244 | ||||||
| Employee benefits | 73,332,588 | 68,909,730 | ||||||
| Collections | 57,773,725 | 66,264,776 | ||||||
| Accounts payable to merchants | 49,812,545 | 49,677,487 | ||||||
| Loyalty programs | 45,766,446 | 47,823,849 | ||||||
| Accounts payable to suppliers | 30,980,174 | 33,680,621 | ||||||
| Payments to account receivable to be applied | 24,971,651 | 25,069,498 | ||||||
| Commissions payable | 20,498,665 | 10,277,357 | ||||||
| Legal contributions to state institutions | 11,976,655 | 11,528,971 | ||||||
| Insurance premiums | 11,731,241 | 10,112,376 | ||||||
| Deferred income | 11,580,107 | 9,730,000 | ||||||
| Reinsurance technical reserves | 11,535,103 | 0 | ||||||
| Dismantling provision of leasehold properties | 9,292,023 | 9,927,842 | ||||||
| Withholding tax | 7,017,882 | 4,999,881 | ||||||
| Derivative intruments | 6,275,992 | 0 | ||||||
| Sales tax payable | 6,050,965 | 5,299,231 | ||||||
| Other | 43,381,807 | 36,226,906 | ||||||
| 640,139,577 | 549,020,030 | |||||||
| (20) | Common Stock |
The Company’s authorized stock comprises 79,194,053 authorized stock and 77,443,101 issued and outstanding stock (2019: 79,194,053 authorized stock and 77,443,101 issued and outstanding stock) and with a nominal value of $37 per share.
| (21) | Other Comprehensive Results |
The following table presents the components and changes in other accumulated comprehensive results as of December 31, 2020:
| Conversion of operations in foreign currency | Unrealized income (loss) from securities | ECL for investments | Employee benefits plan | Total Other Accumulated Comprehensive Loss | ||||||||||||||||
Balance at January 01, 2019
| (288,698,259 | ) | (6,224,199 | ) | (3,174,883 | ) | (2,453,990 | ) | (300,551,331 | ) | ||||||||||
| Other (loss) income before reclassifications | 38,708,264 | 80,661,581 | 0 | (1,281,135 | ) | 118,088,710 | ||||||||||||||
| Reclassified amounts from other comprehensive loss | 0 | (9,707,184 | ) | 0 | 0 | (9,707,184 | ) | |||||||||||||
| Other net comprehensive (loss) income for the year | 38,708,264 | 70,954,397 | 0 | (1,281,135 | ) | 108,381,526 | ||||||||||||||
| Balance at December 31, 2019 | (249,989,995 | ) | 64,730,198 | (3,174,883 | ) | (3,735,125 | ) | (192,169,805 | ) | |||||||||||
| Balance at January 01, 2020 | (249,989,995 | ) | 64,730,198 | (3,174,883 | ) | (3,735,125 | ) | (192,169,805 | ) | |||||||||||
| Adjustment of previous years - adoption of IFRS 9 | 0 | (8,038,429 | ) | 10,267,196 | 946,116 | 3,174,883 | ||||||||||||||
| Other (loss) income before reclassifications | (88,381,168 | ) | 17,937,820 | 13,944,601 | (1,473,771 | ) | (57,972,518 | ) | ||||||||||||
| Reclassified amounts from other comprehensive loss | 0 | (32,696,155 | ) | 0 | 0 | (32,696,155 | ) | |||||||||||||
| Other net comprehensive (loss) income for the year | (88,381,168 | ) | (22,796,764 | ) | 24,211,797 | (527,655 | ) | (87,493,790 | ) | |||||||||||
| Balance at December 31, 2020 | (338,371,163 | ) | 41,933,434 | 21,036,914 | (4,262,780 | ) | (279,663,595 | ) | ||||||||||||
The following table presents the breakdown of other comprehensive results reclassified to the consolidated statement of income for the year ended December 31, 2020:
Reclassified balance of Other Comprehensive Losses | Line of the Consolidated Statement of Income Affected | |||||||||
| 2020 | 2019 | |||||||||
| Investments at FVOCI | ||||||||||
| Unrealized net income from securities | 46,708,792 | 10,463,316 | Other income | |||||||
| Income tax | (14,012,637 | ) | (756,132 | ) | Income tax expense | |||||
| Total reclassifications | 32,696,155 | 9,707,184 | ||||||||
F-138
| (22) | Income from Financial Instruments, Net |
Income from financial instruments, net, included in the consolidated statement of income is summarized below:
| 2020 | 2019 | |||||||
| Net income from the sale of investments at FVOCI | 46,708,792 | 10,463,316 | ||||||
| Unrealized net (losses) gains from securities at FVPL | (2,358,165 | ) | 3,774,934 | |||||
| Net (loss) gain from the sale of securities at FVPL | 3,000,030 | 2,676,609 | ||||||
| Net fair value (loss) on derivative financial instruments | 856,637 | (448,128 | ) | |||||
| 48,207,294 | 16,466,731 | |||||||
| (23) | Other income (charge services) |
The charge services segregated according to their nature, are detailed below.
| 2020 | 2019 | |||||||
| Consumer and Corporate Banking Services | 379,448,740 | 449,209,148 | ||||||
| Asset Management | 6,545,837 | 6,522,914 | ||||||
| Investment Banking Services | 18,156,850 | 18,760,817 | ||||||
| 404,151,427 | 474,492,879 | |||||||
Income from fees and commissions from contracts with clients is measured based on the consideration specified in a contract with a client. The Company recognizes revenue when it transfers control over a service to a customer
F-139
| (23) | Other income (services charge), continued |
The following table provides information about the nature and timing of the satisfaction of performance obligations in contracts with customers, including significant payment terms, and the related revenue recognition policies.
Type of service
| Nature and timing of satisfaction of performance obligations, including significant payment terms | Revenue recognition under IFRS 15) |
Personal and
Corporate Banking
| The Company provides banking services to retail and corporate customers, including account management, provision of overdraft facilities, foreign currency transactions, credit card and servicing fees.
Fees for ongoing account management are charged to the customer’s account on a monthly basis. The Company sets the rates separately for retail and corporate banking customers in each jurisdiction on an annual basis.
Transaction-based fees for interchange, foreign currency transactions and overdrafts are charged to the customer’s account when the transaction takes place.
Servicing fees are charged on a monthly basis and are based on fixed rates reviewed annually by the Company.
| Revenue from account service and servicing fees is recognized over time as the services are provided.
Revenue related to transactions is
recognized at the point in time when the transaction takes place.
|
Investment
Banking Service
| The Company’s investment banking segment provides various finance-related services, including loan administration and agency services, administration of a loan syndication, execution of client transactions with exchanges and securities underwriting.
Fees for ongoing services are charged annually at the end of the calendar year to the customer’s account. However, if a customer terminates the contract before 31 December, then on termination it is charged the fee for the services performed to date.
Transaction-based fees for administration of a loan syndication, execution of transactions, and securities underwriting are charged when the transaction takes place.
| Revenue from administrative agency services is recognized over time as the services are provided. The amounts to be collected from customers on 31 December are recognized as trade receivables.
Revenue related to transactions is recognized at the point in time when the transaction takes place.
|
Asset Management
| The Company provides asset management services.
Fees for asset management services are calculated based on a fixed percentage of the value of assets managed and deducted from the customer’s account balance on a monthly basis.
In addition, the Company charges a nonrefundable up-front fee when opening an account.
| Revenue from asset management services is recognized over time as the services are provided.
Non-refundable up-front fees give rise to material rights for future services and are recognized as revenue over the period for which a customer is expected to continue receiving asset management services.
|
F-140
| (23) | Other Income (services charge), continued |
Other income included in the consolidated statement of income is summarized below:
| 2020 | 2019 | |||||||
| Services to affiliates | 22,305,060 | 17,799,701 | ||||||
| Commercial recoveries | 8,303,799 | 3,509,008 | ||||||
| Other non-banking commissions | 7,687,568 | 6,578,592 | ||||||
| Gain on sale of assets held for sale | 4,273,642 | 4,607,814 | ||||||
| Other income of associates | 3,686,341 | 754,926 | ||||||
| Rentals | 3,477,636 | 2,496,172 | ||||||
| Loans appraisals | 191,424 | 283,957 | ||||||
| VISA stocks | 0 | 5,529,340 | ||||||
| Non-bank fees for leases | 0 | 956,434 | ||||||
| Other | 4,724,625 | 14,043,889 | ||||||
| 54,650,095 | 56,559,833 | |||||||
| (24) | Salaries and Other Personnel Expenses |
The breakdown of salaries and other personnel expenses is presented below:
| 2020 | 2019 | |||||||
| Salaries and other remuneration | 367,276,918 | 351,387,454 | ||||||
| Employee benefits | 156,288,921 | 164,979,653 | ||||||
| Compensations | 21,878,128 | 17,524,566 | ||||||
| Other | 2,427,960 | 6,014,769 | ||||||
| 547,871,927 | 539,906,442 | |||||||
| (25) | Other Operating Expenses |
Other expense included in the consolidated statement of income is summarized below:
2020 | 2019 | |||||||
| Credit card franchises | 75,699,411 | 85,982,058 | ||||||
| Taxes other than income tax | 73,454,601 | 49,430,970 | ||||||
| Computer software and licenses maintenance | 45,639,741 | 34,703,590 | ||||||
| Advertising and marketing | 26,944,440 | 49,874,252 | ||||||
| Equipment and vehicle maintenance | 26,862,366 | 24,869,765 | ||||||
| Armored services | 19,067,955 | 18,715,177 | ||||||
| Bank licenses | 15,451,357 | 13,723,386 | ||||||
| Guarantee deposits | 14,917,674 | 13,920,855 | ||||||
| Security services | 14,555,550 | 13,402,171 | ||||||
| Telephone service | 12,607,966 | 13,535,937 | ||||||
| Dedicated lines | 12,321,299 | 11,275,738 | ||||||
| Operational losses | 11,925,635 | 9,012,776 | ||||||
| Municipal taxes and patents | 7,213,897 | 6,426,169 | ||||||
| Office supplies | 6,765,701 | 7,842,235 | ||||||
| Postage and courier | 5,386,281 | 4,273,625 | ||||||
| Per diem expenses | 4,307,418 | 9,606,447 | ||||||
| Other | 56,587,163 | 65,913,367 | ||||||
| 429,708,455 | 432,508,518 | |||||||
| (26) | Income Taxes |
Income tax expense consists of:
| 2020 | 2019 | ||||||||
| Current | 135,062,760 | 139,212,402 | |||||||
| Deferred | (310,404 | ) | 6,237,504 | ||||||
| 134,752,356 | 145,449,906 | ||||||||
F-141
| (26) | Income Taxes, continued |
Income tax expense for the year ended December 31, 2020 was $134,752,356 (2019: $145,449,906), which differed from the amounts computed by applying the current statutory income tax rate to pretax consolidated earnings as a result of the following:
| 2020 | 2019 | |||||||
| Computed "expected" income tax expense | 111,414,995 | 136,837,475 | ||||||
| Increase (decrease) in income taxes resulting from: | ||||||||
| Nondeductible expenses | 82,746,473 | 62,945,061 | ||||||
| Investments in foreign subsidiaries | 35,938,638 | 11,448,237 | ||||||
| Changes in uncertain tax positions | 2,262,478 | (6,084,515 | ) | |||||
| Tax incentives | (469,160 | ) | (1,065,006 | ) | ||||
| Foreign income taxes rate differential | (18,901,988 | ) | 8,631,128 | |||||
| Exempt and foreign source income | (78,239,080 | ) | (67,262,474 | ) | ||||
| Income tax expense | 134,752,356 | 145,449,906 | ||||||
Temporary differences between the consolidated financial statements carrying amounts and the tax basis of assets and liabilities that give rise to the deferred tax assets and liabilities as of December 31, 2020 are as follows:
| 2020 | ||||||||||||||||||||||||||||||||||||
| Balance at beginning of the year | Recognized in results of the year | Recognized in other comprehensive income | Recognized in equity | Transfer | Business combinations | Balance at year end | Deferred tax assets | Deferred tax liabilities | ||||||||||||||||||||||||||||
| Allowance for loan losses | 34,712,811 | 22,972,720 | 0 | 0 | 0 | 1,295,781 | 58,981,312 | 78,269,681 | (19,288,369 | ) | ||||||||||||||||||||||||||
| Accrued expenses | 6,444,882 | (266,054 | ) | 0 | 0 | 0 | 458,016 | 6,636,844 | 7,595,215 | (958,371 | ) | |||||||||||||||||||||||||
| IFRS 16 Adoption | 1,124,368 | 4,988,276 | 0 | 0 | 0 | 334,440 | 6,447,084 | 57,179,359 | (50,732,275 | ) | ||||||||||||||||||||||||||
| Provision for accounts receivable losses | 255,436 | (1,145,249 | ) | 0 | 0 | 0 | 397,462 | (492,351 | ) | 940,868 | (1,433,219 | ) | ||||||||||||||||||||||||
| Unrealized net loss on investments at FVOCI | 35,423 | 0 | 3,328,566 | 0 | 0 | 0 | 3,363,989 | 3,426,035 | (62,046 | ) | ||||||||||||||||||||||||||
| Net loss from the sale of investments at FVPL | 0 | (174,240 | ) | 0 | 0 | 0 | 161,657 | (12,583 | ) | (12,583 | ) | 0 | ||||||||||||||||||||||||
| Investment property valuation | 0 | (26,511 | ) | 0 | 0 | 0 | (26,512 | ) | (53,023 | ) | 0 | (53,023 | ) | |||||||||||||||||||||||
| Foreign currency translation | 0 | (1,813,535 | ) | 1,813,535 | 0 | 0 | 0 | 0 | 0 | 0 | ||||||||||||||||||||||||||
| Net operating loss carry-over | 0 | (2,864,046 | ) | 0 | 0 | 0 | 7,002,411 | 4,138,365 | 4,138,365 | 0 | ||||||||||||||||||||||||||
| Credit Risk in investments and IBD | (19,012 | ) | 2,221,532 | (2,220,418 | ) | 0 | 3,128 | 1,924 | (12,846 | ) | (15,372 | ) | 2,526 | |||||||||||||||||||||||
| Investments in subsidiaries at cost | (51,007 | ) | 16,976 | 0 | 0 | 0 | 0 | (34,031 | ) | 0 | (34,031 | ) | ||||||||||||||||||||||||
| Deferred loan origination fees and costs | (599,328 | ) | 2,423,646 | 0 | 0 | 0 | 979,773 | 2,804,091 | 3,908,732 | (1,104,641 | ) | |||||||||||||||||||||||||
| Net income from the sale of investments at FVPL | (1,181,442 | ) | 380,385 | 0 | 0 | 0 | 0 | (801,057 | ) | 0 | (801,057 | ) | ||||||||||||||||||||||||
| Assets held for sale valuation | (1,588,332 | ) | (286,702 | ) | 0 | 0 | 0 | 0 | (1,875,034 | ) | 1,151,277 | (3,026,311 | ) | |||||||||||||||||||||||
| Leasing | (3,109,814 | ) | (862,303 | ) | 0 | 0 | 0 | 0 | (3,972,117 | ) | 29,846 | (4,001,963 | ) | |||||||||||||||||||||||
| Employee benefits | (3,710,799 | ) | (237,853 | ) | 321,368 | 0 | 0 | 0 | (3,627,284 | ) | 5,127,610 | (8,754,894 | ) | |||||||||||||||||||||||
| Fair value acquisition adjustment | (5,872,636 | ) | (4,359,593 | ) | 0 | 0 | 605,687 | 13,970,564 | 4,344,023 | 24,131,716 | (19,787,694 | ) | ||||||||||||||||||||||||
| Deferred expenses | (6,528,335 | ) | 6,910,222 | 0 | 0 | 0 | 0 | 381,887 | 498,949 | (117,062 | ) | |||||||||||||||||||||||||
| Investments in foreign subsidiaries, for undistributed earnings | (10,726,971 | ) | (26,164,944 | ) | 0 | 6,900,000 | 0 | 0 | (29,991,915 | ) | 0 | (29,991,915 | ) | |||||||||||||||||||||||
| Accrued interest receivable | (11,615,824 | ) | 449,261 | 0 | 0 | 0 | (11,225 | ) | (11,177,788 | ) | 5,617,564 | (16,795,352 | ) | |||||||||||||||||||||||
| Unrealized net gain on investments at FVOCI | (13,996,618 | ) | 0 | 5,192,540 | 0 | 0 | 0 | (8,804,078 | ) | 0 | (8,804,078 | ) | ||||||||||||||||||||||||
| Net premises and equipment depreciation difference | (14,612,501 | ) | (1,851,585 | ) | 0 | (1,060 | ) | 0 | (1,018,651 | ) | (17,483,797 | ) | 309,862 | (17,793,659 | ) | |||||||||||||||||||||
| Net deferred tax assets (liabilities) | (31,039,699 | ) | 310,404 | 8,435,591 | 6,898,940 | 608,815 | 23,545,640 | 8,759,691 | 192,297,124 | (183,537,433 | ) | |||||||||||||||||||||||||
| Tax compensation | (99,572,745 | ) | 99,572,745 | |||||||||||||||||||||||||||||||||
| Total | 92,724,379 | (83,964,688 | ) | |||||||||||||||||||||||||||||||||
F-142
| (26) | Income Taxes, continued |
| 2019 | ||||||||||||||||||||||||||||
| Balance at beginning of the year | Recognized in results of the year | Recognized in other comprehensive income | Recognized in equity | Balance at year end | Deferred tax assets | Deferred tax liabilities | ||||||||||||||||||||||
| Allowance for loan losses | 40,235,283 | (5,522,472 | ) | 0 | 0 | 34,712,811 | 46,688,837 | (11,976,026 | ) | |||||||||||||||||||
| Accrued expenses | 796,740 | 5,648,142 | 0 | 0 | 6,444,882 | 8,937,610 | (2,492,728 | ) | ||||||||||||||||||||
| IFRS 16 Adoption | 0 | 1,124,368 | 0 | 0 | 1,124,368 | 60,820,916 | (59,696,548 | ) | ||||||||||||||||||||
| Provision for accounts receivable losses | 161,957 | 93,479 | 0 | 0 | 255,436 | 326,362 | (70,926 | ) | ||||||||||||||||||||
| Unrealized net loss on investments at FVOCI | 2,114,748 | 0 | (2,079,325 | ) | 0 | 35,423 | 44,537 | (9,114 | ) | |||||||||||||||||||
| Net loss from the sale of investments at FVPL | 267,490 | (267,490 | ) | 0 | 0 | 0 | 0 | 0 | ||||||||||||||||||||
| Foreign currency translation | 0 | 851,677 | (851,677 | ) | 0 | 0 | 0 | 0 | ||||||||||||||||||||
| Credit Risk in investments and IBD | 51,368 | 542,531 | (612,911 | ) | 0 | (19,012 | ) | (19,010 | ) | (2 | ) | |||||||||||||||||
| Investments at cost | (27,556 | ) | (46,651 | ) | 23,200 | 0 | (51,007 | ) | 0 | (51,007 | ) | |||||||||||||||||
| Deferred loan origination fees and costs | (1,771,084 | ) | 1,171,756 | 0 | 0 | (599,328 | ) | 3,447,598 | (4,046,926 | ) | ||||||||||||||||||
| Net income from the sale of investments at FVPL | (389,379 | ) | (792,063 | ) | 0 | 0 | (1,181,442 | ) | 0 | (1,181,442 | ) | |||||||||||||||||
| Assets held for sale valuation | (162,355 | ) | (1,425,977 | ) | 0 | 0 | (1,588,332 | ) | 1,039,369 | (2,627,701 | ) | |||||||||||||||||
| Leasing | (3,305,752 | ) | 185,081 | 0 | 10,857 | (3,109,814 | ) | 166,318 | (3,276,132 | ) | ||||||||||||||||||
| Employee benefits | (1,251,228 | ) | (2,547,971 | ) | 88,400 | 0 | (3,710,799 | ) | 4,408,579 | (8,119,378 | ) | |||||||||||||||||
| Fair value acquisition adjustment | (5,937,596 | ) | 64,960 | 0 | 0 | (5,872,636 | ) | 2,019,209 | (7,891,845 | ) | ||||||||||||||||||
| Deferred expenses | 28,278 | (6,556,613 | ) | 0 | 0 | (6,528,335 | ) | 628,276 | (7,156,611 | ) | ||||||||||||||||||
| Investments in foreign subsidiaries, for undistributed earnings | (13,638,058 | ) | 2,911,087 | 0 | 0 | (10,726,971 | ) | 0 | (10,726,971 | ) | ||||||||||||||||||
| Accrued interest receivable | (10,120,122 | ) | (1,495,702 | ) | 0 | 0 | (11,615,824 | ) | 1,075,464 | (12,691,288 | ) | |||||||||||||||||
| Unrealized net gain on investments at FVOCI | (516,820 | ) | 0 | (13,479,798 | ) | 0 | (13,996,618 | ) | 0 | (13,996,618 | ) | |||||||||||||||||
| Net premises and equipment depreciation difference | (14,444,366 | ) | (175,646 | ) | 0 | 7,511 | (14,612,501 | ) | 257,089 | (14,869,590 | ) | |||||||||||||||||
| Net deferred tax assets (liabilities) | (7,908,452 | ) | (6,237,504 | ) | (16,912,111 | ) | 18,368 | (31,039,699 | ) | 129,841,154 | (160,880,853 | ) | ||||||||||||||||
| Tax compensation | (85,204,749 | ) | 85,204,749 | |||||||||||||||||||||||||
| Total | 44,636,405 | (75,676,104 | ) | |||||||||||||||||||||||||
The Company’s management performed offsetting of the deferred tax assets and liabilities that derive from income tax corresponding to the same tax jurisdiction in the consolidated statement of financial position.
As of December 31, 2020, the Company has incurred in net operating tax loss carry forwards of $27,110,969 (2019: $10,052,648), which are available to offset future taxable income of the applicable subsidiaries. The net operating losses begin to prescribe in 2025 and through 2036.
As of December 31, 2020, the Company has not recognized a deferred income tax liability of approximately $180,631,000 for undistributed earnings from foreign subsidiaries operations, because the Company believes that $1,403,591,000 of these profits will be reinvested for an indefinite period.
The Company's earnings are taxed in various jurisdictions. As of December 31, 2020, the Company had unrecognized tax positions for $18,972,840 (2019: $20,544,008). Interest expense and penalties related to income tax liabilities and recognized as part of income tax expenses for the year ended December 31, 2020 amounted to $2,262,478 (2019: $6,084,515). As of December 31, 2020, total interest and penalties expenses included in other liabilities amounted to $10,028,775 (2019: $8,526,292). As of December 31, 2020, the Company maintains an effective tax rate of 30.2% (2019: 26.0%).
The following are the tax jurisdictions in which the Company and its affiliates operate and the latest tax year subject to examination: United States of America: 2017, Guatemala: 2016, El Salvador: 2017, Honduras: 2015, Nicaragua: 2016, Costa Rica: 2016 and Panama: 2015.
| (27) | Off-Balance Financial Instruments with Risk and Other Commitments |
The Company is a party to financial instruments with off-balance sheet risk in the normal course of business to meet the financing needs of its customers. These financial instruments include, principally, commitments to extend credit, financial guarantees and letters of credit, the balances of which are not reflected in the accompanying consolidated balance sheets.
Letters of credit are conditional commitments issued by the Company to guarantee performance of a customer to a third party. Those letters of credit are primarily used to support trade transactions and borrowing arrangements. Generally, all letters of credit issued have expiration dates within one year. The credit risk involved in issuing letters of credit is essentially the same as that involved in extending loan facilities to customers.
Commitments to extend credit are agreements to lend to a customer as long as there is no violation of any condition established in the contract. Commitments generally have fixed expiration dates or other termination clauses and may require payment of a fee. The commitments may expire without being drawn upon; therefore, the total commitment amounts do not necessarily represent future cash requirements. The amount of collateral obtained, if it is deemed necessary by the Company, is based on management’s credit evaluation of the customer.
As of December 31, 2020, the Company had outstanding revolving available to its credit card customers in each of the various countries of operation that ranged from approximately $72 million to $2,349 million (2019: from $346 million to $2,528 million). The unused portion of the total amount available in each country, aggregated approximately from $31 million to $1,757 million (2019: from $240 million to $1,838 million). While these amounts represented the available lines of credit to customers per country, the Company has experienced, and does not anticipate, that all of its customers will exercise their entire available lines at any given point in time.
The Company generally has the right to increase, reduce, cancel, alter or amend the terms of these available lines of credit at any time.
Financial guarantees are used in various transactions to enhance the credit standing of the Company’s customers. They represent irrevocable assurances that the Company will make payment in the event that the customer fails to fulfill its obligations to third parties.
F-143
| (27) | Off-Balance Financial Instruments with Risk and Other Commitments, continued |
The Company uses the same credit policies in making commitments and conditional obligations as it does for on-balance sheet instruments. As of December 31, 2020, outstanding letters of credit and financial guarantees are as follows:
| 2020 | 2019 | |||||||
| Stand-by letters of credit | 193,650,272 | 157,397,226 | ||||||
| Commercial letters of credit | 33,536,676 | 20,887,930 | ||||||
| Financial guarantees | 360,253,706 | 269,789,544 | ||||||
| Commitments and guarantees (1) | 130,059,257 | 60,115,985 | ||||||
| 717,499,911 | 508,190,685 | |||||||
| (1) | Includes commercial and mortgage payment promise letters |
The nature, terms and maximum potential amount of future payments the Company could be required to make under the standby letters of credit and guarantees as of December 31, 2020, are detailed as follows:
| 2020 | 2019 | |||||||
| Up to 1 year | 529,976,427 | 426,240,440 | ||||||
| Over 1 year | 153,986,808 | 61,062,315 | ||||||
| 683,963,235 | 487,302,755 | |||||||
Generally, the Company has resources to recover from clients the amounts paid under these guarantees; additionally, the Company can hold cash or other collateral to cover for these guarantees. As of December 31, 2020, the assets held as collateral, that the Company can obtain and liquidate to recover totally or partially the amounts paid under guarantees amounted to $87,086,076 (2019: $71,014,482).
F-144
| (28) | Disclosures on the Fair Value of Financial Instruments |
The Company established a process for determining the fair value. The fair value is primarily based on quoted market prices, when available. If market prices or quotes are not available, fair value is determined based on internally developed models that primarily use market information or other information obtained as inputs regardless of market parameters, including but not limited to yield curves, interest rates, debt prices, foreign exchange rates and credit curves. However, in situations where there is little or no market activity for the asset or liability at the measurement date, the fair value measurement reflects the Company's own judgments about assumptions that market participants would use in setting the price of the asset or liability.
The judgments are developed by the Company based on the best information available in the circumstances, including expected cash flows, discount rates adjusted for risks and the availability of observable and unobservable inputs.
The methods described above can generate fair value estimates that may not be indicative of the net realizable value or that do not reflect future values. In addition, while the Company believes its valuation methods are appropriate and consistent with those used by other market participants, the use of different methodologies or assumptions to determine the fair value of certain financial instruments could result in different fair value estimates as of the reporting date.
F-145
| (28) | Disclosures on the Fair Value of Financial Instruments, continued |
Financial instruments at fair value
Recurring Fair Value Measurement
The following is a description of the valuation methodologies used to value instruments carried at fair value, including a general classification of such instruments according to the fair value hierarchy.
Securities
When there are market prices in an active market, securities are classified in Level 1 of the fair value hierarchy. Level 1 securities include highly liquid bonds from the government and agencies and investments in highly traded shares.
If market prices are not available for a specific security, the fair value is determined using market prices of securities with similar characteristics or discounted cash flows, and are classified in Level 2. In certain cases where there is limited activity or less transparency in determining the assumptions used in the valuation, securities are classified in Level 3 of the fair value hierarchy.
Therefore, when valuing certain debt obligations, determining fair value may require comparisons with similar instruments or default and collection rate analysis.
Assets and liabilities recorded at fair value on a recurring basis are summarized below:
| Other significant observable | Significant unobservable | |||||||||||
| Assumptions | Assumptions | |||||||||||
| (Level 2) | (Level 3) | 2020 | ||||||||||
| Assets | ||||||||||||
| Investments at FVPL: | ||||||||||||
| Other governments | 55,993,523 | 0 | 55,993,523 | |||||||||
| Corporate bonds | 16,100 | 0 | 16,100 | |||||||||
| Mutual funds | 23,504,431 | 0 | 23,504,431 | |||||||||
| Common stocks | 278,881 | 12,146,377 | 12,425,258 | |||||||||
| Total investments at FVPL | 79,792,935 | 12,146,377 | 91,939,312 | |||||||||
| Investments at FVOCI: | ||||||||||||
| Governments and Agencies bonds | ||||||||||||
| United States of America | 680,165,101 | 0 | 680,165,101 | |||||||||
| Other governments | 2,620,318,458 | 0 | 2,620,318,458 | |||||||||
| 3,300,483,559 | 0 | 3,300,483,559 | ||||||||||
| Corporate bonds | 473,016,870 | 0 | 473,016,870 | |||||||||
| Common stocks | 958,439 | 4,102,887 | 5,061,326 | |||||||||
| Total investments at FVOCI | 3,774,458,868 | 4,102,887 | 3,778,561,755 | |||||||||
| Investments at AC | ||||||||||||
| Other governments | 6,697,211 | 0 | 6,697,211 | |||||||||
| Corporate bonds | 71,687,568 | 0 | 71,687,568 | |||||||||
| Total inversiones al CA | 78,384,779 | 0 | 78,384,779 | |||||||||
| Total assets | 3,932,636,582 | 16,249,264 | 3,948,885,846 | |||||||||
F-146
| (28) | Disclosures on the Fair Value of Financial Instruments, continued |
| Other significant observable | Significant unobservable | |||||||||||
| assumptions | Assumptions | |||||||||||
| (Level 2) | (Level 3) | 2019 | ||||||||||
| Assets | ||||||||||||
| Investments at FVPL: | ||||||||||||
| Other governments | 41,705,042 | 0 | 41,705,042 | |||||||||
| Corporate bonds | 152,534 | 0 | 152,534 | |||||||||
| Mutual funds | 778,885 | 0 | 778,885 | |||||||||
| Common stocks | 0 | 10,617,681 | 10,617,681 | |||||||||
| Total investments at FVPL | 42,636,461 | 10,617,681 | 53,254,142 | |||||||||
| Investments at FVOCI: | ||||||||||||
| Governments and Agencies bonds | ||||||||||||
| United States of America | 55,815,496 | 0 | 55,815,496 | |||||||||
| Other governments | 1,673,923,971 | 0 | 1,673,923,971 | |||||||||
| 1,729,739,467 | 0 | 1,729,739,467 | ||||||||||
| Corporate bonds | 466,444,554 | 0 | 466,444,554 | |||||||||
| Common stocks | 947,231 | 4,381,670 | 5,328,901 | |||||||||
| Total investments at FVOCI | 2,197,131,252 | 4,381,670 | 2,201,512,922 | |||||||||
| Total assets | 2,239,767,713 | 14,999,351 | 2,254,767,064 | |||||||||
The Company's accounting policies include the recognition of transfers between the levels of the fair value hierarchy on the date of the event or change in the circumstances that caused the transfer.
The table below includes the movement of the figures in the consolidated balance sheet (including changes in fair value) of the financial instruments classified by the Company within Level 3 of the fair value hierarchy, for the period ended December 31, 2020. When determining whether to classify an instrument in Level 3, the decision is based on the importance of unobservable assumptions within the overall fair value measurement.
| Investments | ||||||||
| December 31, 2020 | Common stocks | Total
| ||||||
| Assets | ||||||||
| Fair value at January 01, 2020 | 10,617,681 | 10,617,681 | ||||||
| Business combinations | 1,967,349 | 1,967,349 | ||||||
| Valuation of investments at FVPL | (194,912 | ) | (194,912 | ) | ||||
| Foreign currency translation | 35,140 | 35,140 | ||||||
| Fair value at December 31, 2020 | 12,425,258 | 12,425,258 | ||||||
| Investments | ||||||||||||
| December 31, 2019 | Common stocks | Derivative Financial Instruments | Total | |||||||||
| Assets | ||||||||||||
| Fair value at January 01, 2019 | 10,072,395 | 517,888 | 10,590,283 | |||||||||
| Valuation of embedded financial derivatives | 0 | (517,888 | ) | (517,888 | ) | |||||||
| Valuation of investments at FVPL | 566,104 | 566,104 | ||||||||||
| Foreign currency translation | (20,818 | ) | 0 | (20,818 | ) | |||||||
| Fair value at December 31, 2019 | 10,617,681 | 0 | 10,617,681 | |||||||||
| Liabilities | ||||||||||||
| Fair value at January 01, 2019 | 0 | 1,778,259 | 1,778,259 | |||||||||
| Valuation of embedded financial derivatives | 0 | (1,778,259 | ) | (1,778,259 | ) | |||||||
| Fair value at December 31, 2019 | 0 | 0 | 0 | |||||||||
| Total unrealized losses included in the results for the year | 0 | 0 | 0 | |||||||||
F-147
| (28) | Disclosures on the Fair Value of Financial Instruments, continued |
The table below describes the valuation techniques and input data used in the financial instruments' recurring fair value measurements:
| Financial instrument | Valuation technique and entry data used | Level |
| Corporate bonds and government and agencies bonds | Consensus prices obtained from price providers (Bloomberg). For part of these instruments the Company applies cash flows discounted using a market rate of an instrument with a similar remaining maturity.
Market prices of suppliers or local regulators in markets with lower marketability.
Discounted cash flows are used for various bonds using a market rate of an instrument with a similar remaining maturity.
| (2,3) |
| Common stocks | Discounted cash flow using capital cost rate adjusted for size premium. | (3) |
| Common stocks | Market prices provided by local stock exchanges. | (2) |
| Mutual funds and other stocks | Net Asset Value. | (2) |
| Embedded financial derivative instruments | Functional currency cash flows
Foreign currency cash flows
| (3) |
Fair Value of Financial Instruments, additional disclosures
A description of the methods and assumptions used to estimate the fair value of the main financial instruments held by the Company is provided below:
Financial instruments with carrying amounts that approach the fair value:
Cash and cash equivalents, deposits that bear interest and clients' obligations for acceptances and acceptances outstanding are measured at book value reported in the consolidated balance sheet, which is considered a reasonable fair value estimate due to the characteristics and maturity of these instruments.
Loans
To determine the fair value of the loan portfolio, the cash flows were discounted at a rate that reflects:
| a. | actual market rate, and |
| b. | future interest rate expectations, for a term that reflects the anticipated payments on the loan portfolio. |
Deposits
To determine the fair value of these instruments, the cash flows were discounted at a rate that reflects:
| a. | actual market rate, and |
| b. | future interest rate expectations, for the remaining term of these instruments. |
Securities sold under repurchase agreements
There are no market price quotes for these instruments; therefore, their fair value is determined using discounted cash flow techniques. Cash flows are estimated based on the contractual terms, taking into account any incorporated derivative characteristic or other factors. Expected cash flows are discounted using market rates that approach the maturity of the instrument, as well as the nature and amount of the guarantee given or received.
Borrowings
The fair value is estimated based on current interest rates for debt with similar and adjusted maturities to reflect the credit rating of the Company and its guarantees.
F-148
| (28) | Disclosures on the Fair Value of Financial Instruments, continued |
Other borrowed funds
Fair value is estimated based on the market price quotes for the same issuance or similar issuances or on the current rates offered by the Company for debts with the same terms, adjusted for credit quality.
Below are described the valuation techniques and significant unobservable input data used in determining the fair value of recurring and nonrecurring assets and liabilities categorized within Level 3 of the fair value hierarchy that are recognized in the consolidated balance sheet:
| December 31, 2020 | Quantitative information of Level 3 fair values | |||
| Fair value | Valuation technique | Unobservable assumptions | Range (weighted average) | |
| Common stocks | 16,249,264 | Discounted cash flows | Increase annual rate | 10% - 15% |
| December 31, 2019 | Quantitative information of Level 3 fair values | |||
| Fair value | Valuation technique | Unobservable assumptions | Range (weighted average) | |
| Common stocks | 10,617,681 | Discounted cash flows | Increase annual rate | 10% - 15% |
The following table sets out the fair values of financial instruments not measured at fair value and analyses them by the level in the fair value hierarchy into which each fair value measurement is categorized:
| December 31, 2020 | Level 2 | Level 3 | Total fair value | Total carrying amount | ||||||||||||
| Financial assets | ||||||||||||||||
| Cash and cash equivalents | 729,239,556 | 0 | 729,239,556 | 729,239,556 | ||||||||||||
| Securities purchased under resale agreements | 0 | 21,227,306 | 21,227,306 | 21,227,306 | ||||||||||||
| Deposits in banks | 0 | 5,217,041,032 | 5,217,041,032 | 5,217,041,032 | ||||||||||||
| Loans, excluding financial leases | 0 | 18,856,452,417 | 18,856,452,417 | 19,311,859,783 | ||||||||||||
| Acceptances outstanding | 0 | 197,565,833 | 197,565,833 | 197,565,833 | ||||||||||||
| Total financial assets | 729,239,556 | 24,292,286,588 | 25,021,526,144 | 25,476,933,510 | ||||||||||||
Financial liabilities
| ||||||||||||||||
| Deposits | 12,720,375,770 | 10,841,619,703 | 23,561,995,473 | 23,251,905,885 | ||||||||||||
| Securities sold under repurchase agreements | 0 | 41,920,772 | 41,920,772 | 41,920,772 | ||||||||||||
| Financial obligations | 0 | 2,689,145,888 | 2,689,145,888 | 2,645,123,010 | ||||||||||||
| Other financial obligations | 0 | 1,230,217,418 | 1,230,217,418 | 1,246,357,650 | ||||||||||||
| Acceptances outstanding | 0 | 197,565,833 | 197,565,833 | 197,565,833 | ||||||||||||
| Total financial liabilities | 12,720,375,770 | 15,000,469,614 | 27,720,845,384 | 27,382,873,150 | ||||||||||||
| December 31, 2019 | Level 2 | Level 3 | Total fair value | Total carrying amount | ||||||||||||
| Financial assets | ||||||||||||||||
| Cash and cash equivalents | 727,125,481 | 0 | 727,125,481 | 727,125,481 | ||||||||||||
| Securities purchased under resale agreements | 0 | 18,149,866 | 18,149,866 | 18,149,866 | ||||||||||||
| Deposits in banks | 101221843 | 3,248,770,182 | 3,349,992,025 | 3,349,992,025 | ||||||||||||
| Loans, excluding financial leases | 0 | 15,713,221,127 | 15,713,221,127 | 16,033,843,042 | ||||||||||||
| Acceptances outstanding | 0 | 1,968,793 | 1,968,793 | 1,968,793 | ||||||||||||
| Total financial assets | 828,347,324 | 18,982,109,968 | 19,810,457,292 | 20,131,079,207 | ||||||||||||
Financial liabilities | ||||||||||||||||
| Deposits | 9,306,998,161 | 8,118,268,125 | 17,425,266,286 | 17,234,600,031 | ||||||||||||
| Securities sold under repurchase agreements | 0 | 34,750,509 | 34,750,509 | 34,740,578 | ||||||||||||
| Financial obligations | 0 | 2,374,594,809 | 2,374,594,809 | 2,339,121,387 | ||||||||||||
| Other financial obligations | 0 | 305,089,928 | 305,089,928 | 319,415,360 | ||||||||||||
| Acceptances outstanding | 0 | 1,968,793 | 1,968,793 | 1,968,793 | ||||||||||||
| Total financial liabilities | 9,306,998,161 | 10,834,672,164 | 20,141,670,325 | 19,929,846,149 | ||||||||||||
| (29) | Administration of Trust Contracts and Securities Custody |
As of December 31, 2020, several subsidiaries of the Company manage and keep custody of securities for a total amount of approximately $3,656,751,665 (2019: $2,579,673,310).
F-149
| (30) | Related Party Transactions |
In the normal course of business, the Company conducts transactions with related parties, including main executives and directors. These transactions, according to the internal policies of the Company, are carried out at market conditions.
The following table shows the balances and transactions with related parties as of December 31, 2020:
| 2020 | 2019 | |||||||||||||||||||||||
Key personnel and directors | Related parties | Controlling entities | Key personnel and directors | Related parties | Controlling entities | |||||||||||||||||||
| Assets: | ||||||||||||||||||||||||
| Deposits due from banks | 0 | 60,999,914 | 6,915,670 | 0 | 0 | 101,115,824 | ||||||||||||||||||
| Interest bearing deposits | 0 | 59,630,000 | 0 | 0 | 0 | 0 | ||||||||||||||||||
| Loans | 12,477,203 | 86,163,208 | 92,541 | 10,600,355 | 76,660,119 | 7,926 | ||||||||||||||||||
| Loans Loss Reserve | (15,124 | ) | (511,806 | ) | 0 | 0 | (527,838 | ) | 0 | |||||||||||||||
| Accumulated interest receivable and other accounts receivable | 53,164 | 3,121,600 | 718,999 | 41,970 | 436,094 | 1,605 | ||||||||||||||||||
| 12,515,243 | 209,402,916 | 7,727,210 | 10,642,325 | 76,568,375 | 101,125,355 | |||||||||||||||||||
| Liabilities: | ||||||||||||||||||||||||
| Demand deposits | 11,046,216 | 77,577,709 | 818,273 | 6,535,493 | 17,486,130 | 60,628 | ||||||||||||||||||
| Term deposits | 12,305,293 | 36,075,781 | 235,237,695 | 14,157,887 | 16,416,399 | 125,100,000 | ||||||||||||||||||
| Financial obligations | 0 | 0 | 5,000,000 | 0 | 0 | 185,000,000 | ||||||||||||||||||
| Other financial obligations | 0 | 0 | 520,000,000 | 0 | 0 | 0 | ||||||||||||||||||
| Accumulated interest payable and other liabilities | 202,483 | 100,885,128 | 4,018,442 | 272,038 | 712,976 | 20,858,910 | ||||||||||||||||||
| 23,553,992 | 214,538,618 | 765,074,410 | 20,965,418 | 34,615,505 | 331,019,538 | |||||||||||||||||||
| 2020 | 2019 | |||||||||||||||||||||||
Key personnel and directors | Related parties | Controlling entities | Key personnel and directors | Related parties | Controlling entities | |||||||||||||||||||
| Interest income and other income | 679,247 | 16,328,067 | 42,998 | 824,579 | 12,728,410 | 7,088,092 | ||||||||||||||||||
| Interest expense and other operating expenses | 504,569 | 2,913,548 | 46,080,432 | 691,035 | 3,140,417 | 47,020,435 | ||||||||||||||||||
| Key management personnel benefit | 17,649,043 | 0 | 0 | 19,535,360 | 0 | 0 | ||||||||||||||||||
| (31) | Litigations |
To the best of management's knowledge, the Company is not involved in any litigation or claim that is likely to cause a significant adverse effect on its business, its consolidated financial position or its consolidated financial performance.
F-150
| (32) | Regulatory Aspects |
The Company's banking operations are subject to various regulatory requirements managed by the government agencies of the countries in which it operates or has a license. Failure to comply with these regulatory requirements can lead to certain mandatory actions and possibly additional discretionary actions by the regulators that, if performed, could have a significant effect on The Company's consolidated financial statements. Under capital adequacy guidelines and the regulatory framework of prompt corrective actions, the Company's banking operations must comply with specific capital guidelines that provide for the quantitative asset measurements and certain elements out of the consolidated balance sheet, in accordance with the regulatory accounting practices. The amounts of capital of the Company's banking operations and their classification are subject to qualitative judgments by the regulators about their components, risk weightings and other factors.
Management believes that as of December 31, 2020, the Companying operations of the Company meet all capital adequacy minimum requirements to which they are subject, which varies from 8.00% to 12.00% and other regulatory requirements.
Equity reserves
The Company is subject in several countries in which it operates to dynamic reserves on the portfolio of loans receivable. Additionally, it must establish equity reserves on the assets available for sale. Both items appropriate retained earnings.
The credit balance of the dynamic provision is part of the regulatory capital but does not replace or compensate the requirements at the minimum capital adequacy percentages established.
The provision on assets available for sale is made progressively within a range of 10% from the first year of registration up to 90% in the fifth year of adjudication.
| (33) | Subsequent Events |
The Company has assessed the subsequent events to February 19, 2021 to assess the need for their recognition or disclosure in the accompanying financial statements. Based on this evaluation, we determined that there were no subsequent events which require recognition or disclosure in these consolidated financial statements.
F-151
LEASING BOGOTA S.A. PANAMA
AND SUBSIDIARIES
(Panama, Republic of Panama)
Consolidated Financial Statements
December 31, 2019
(With Independent Auditors’ Report Thereon)
F-152
Independent Auditors’ Report
To the Board of Director and Shareholders
Leasing Bogotá S.A. Panamá
Opinion
We have audited the consolidated financial statements of Leasing Bogotá and Subsidiaries (“the Company”), which comprise the consolidated statement of financial position as at December 31, 2019, the consolidated statements of profit or loss and other comprehensive income, changes in equity and cash flows for the year then ended, and notes, comprising significant accounting policies and other explanatory information.
In our opinion, the accompanying consolidated financial statements present fairly, in all material respects, the consolidated financial position of the Company as at December 31, 2019, and its consolidated financial performance and its consolidated cash flows for the year then ended in accordance with International Financial Reporting Standards (IFRS).
Basis for Opinion
We have conducted our audit in accordance with International Standards on Auditing (ISAs). Our responsibilities under those standards are further described in the Auditors’ Responsibilities Related to the Audit of the Consolidated Financial Statements section of our report. We are independent of the Company in accordance with the International Ethics Standards Board for Accountants’ Code of Ethics for Professional Accountants (IESBA Code) together with the ethics requirements that are relevant to our audit of the consolidated financial statements in the Republic of Panama and we have fulfilled all other ethical responsibilities in accordance with those requirements and with the Code of Ethics of the IESBA. We believe that the audit evidence we have obtained is sufficient and appropriate to provide a basis for our opinion.
Responsibilities of Management and Those Charged with Governance for the Consolidated Financial Statements
Management is responsible for the preparation and fair presentation of the consolidated financial statements in accordance with IFRS, and for such internal control as management determines is necessary to enable the preparation of consolidated financial statements that are free from material misstatement, whether due to fraud or error.
In preparing the consolidated financial statements, management is responsible for assessing the Company’s ability to continue as a going concern, disclosing, as applicable, matters related to going concern and using the going concern basis of accounting unless management either intends to liquidate the Bank or to cease operations, or has no realistic alternative but to do so.
Those charged with governance are responsible for overseeing the Company’s financial reporting process.
Auditors’ Responsibilities for the Audit of the Consolidated Financial Statements
Our objectives are to obtain reasonable assurance about whether the consolidated financial statements as a whole are free from material misstatement, whether due to fraud or error, and to issue an auditors’ report that includes our opinion. Reasonable assurance is a high level of assurance but is not a guarantee that an audit conducted in accordance with ISAs will always detect a material misstatement when it exists. Misstatements can arise from fraud or error and are considered material if, individually or in the aggregate, they could reasonably be expected to influence the economic decisions of users taken on the basis of these consolidated financial statements.
As part of an audit in accordance with ISAs, we exercise professional judgment and maintain professional skepticism throughout the audit. We also:
| · | Identify and assess the risks of material misstatement of the consolidated financial statements, whether due to fraud or error, design and perform audit procedures responsive to those risks, and obtain audit evidence that is sufficient and appropriate to provide a basis for our opinion. The risk of not detecting a material misstatement resulting from fraud is higher than for one resulting from error, as fraud may involve collusion, forgery, intentional omissions, misrepresentations, or the override of internal control. |
| · | Obtain an understanding of internal control relevant to the audit in order to design audit procedures that are appropriate in the circumstances, but not for the purpose of expressing an opinion on the effectiveness of the Bank’s internal control. |
F-153
| · | Evaluate the appropriateness of accounting policies used and the reasonableness of accounting estimates and related disclosures made by management. |
| · | Conclude on the appropriateness of management’s use of the going concern basis of accounting and, based on the audit evidence obtained, whether a material uncertainty exists related to events or conditions that may cast significant doubt on the Company’s ability to continue as a going concern. If we conclude that a material uncertainty exists, we are required to draw attention in our auditors’ report to the related disclosures in the consolidated financial statements or, if such disclosures are inadequate, to modify our opinion. Our conclusions are based on the audit evidence obtained up to the date of our auditors’ report. However, future events or conditions may cause the Company to cease to continue as a going concern. |
| · | Evaluate the overall presentation, structure and content of the consolidated financial statements, including the disclosures, and whether the consolidated financial statements represent the underlying transactions and events in a manner that achieves fair presentation. |
| · | Obtain sufficient appropriate audit evidence regarding the financial information of the entities or business activities within the Company to express an opinion on the consolidated financial statements. We are responsible for the direction, supervision and performance of the group audit. We remain solely responsible for our audit opinion. |
We communicate with those charged with governance regarding, among other matters, the planned scope and timing of the audit and significant audit findings, including any significant deficiencies in internal control that we identify during our audit.
Panama, Republic of Panama
February 20, 2020
F-154
LEASING BOGOTA, S. A. PANAMA AND SUBSIDIARIES
(Panama, Republic of Panama)
Consolidated Statement of Financial Position
December 31, 2019
(In U.S. dollars)
| Assets | Note | 2019 | 2018 | ||||||||
| Cash and cash equivalents | 727,125,481 | 704,153,739 | |||||||||
| Securities purchased under resale agreements | 5, 8 | 18,130,054 | 20,911,045 | ||||||||
| Deposits in banks: | |||||||||||
| Demand | 2,994,105,432 | 2,982,988,833 | |||||||||
| Time deposits | 351,163,541 | 483,935,748 | |||||||||
| Total deposits in banks | 3,345,268,973 | 3,466,924,581 | |||||||||
| Accrued interest receivable of securities purchased under resale agreements and deposits in banks | 5, 7 | 4,742,864 | 4,649,605 | ||||||||
| Total cash, cash equivalents and deposits in banks | 7 | 4,095,267,372 | 4,196,638,970 | ||||||||
| Investments and other assets at fair value | 5, 9 | 2,224,029,419 | 1,817,223,698 | ||||||||
| Accrued interest receivable of investments and other assets at fair value | 5, 9 | 30,737,645 | 21,993,280 | ||||||||
| Loans | 5, 10 | 16,762,559,681 | 16,164,090,318 | ||||||||
| Accrued interest receivable of loans | 5, 10 | 118,156,902 | 104,379,906 | ||||||||
| Allowance for loan losses | 5 | (509,704,212 | ) | (482,075,627 | ) | ||||||
| Unearned interest | 5 | (3,906,631 | ) | (3,072,806 | ) | ||||||
| Net unearned commissions | 5 | (41,248,089 | ) | (41,786,802 | ) | ||||||
| Loans at amortized cost | 16,325,857,651 | 15,741,534,989 | |||||||||
| Property, furniture, equipment and improvements, net | 11 | 614,695,235 | 362,361,628 | ||||||||
| Acceptances outstanding | 1,968,793 | 1,526,352 | |||||||||
| Other accounts receivable | 237,756,868 | 261,585,478 | |||||||||
| Goodwill and intangible assets | 12 | 1,598,385,311 | 1,599,293,934 | ||||||||
| Deferred Income tax | 25 | 44,636,405 | 37,142,471 | ||||||||
| Other assets | 13 | 84,086,107 | 85,491,058 | ||||||||
| Total assets | 25,257,420,806 | 24,124,791,858 | |||||||||
| Liabilities and Equity | Note | 2019 | 2018 | ||||||||
| Liabilities: | |||||||||||
| Deposits from customers: | |||||||||||
| Demand | 5,971,831,616 | 5,578,225,923 | |||||||||
| Savings | 3,334,869,080 | 2,965,229,445 | |||||||||
| Time deposits | 7,842,500,039 | 7,143,421,811 | |||||||||
| Accrued interest payable of deposits from customers | 85,399,296 | 81,705,890 | |||||||||
| Total deposits from customers | 14 | 17,234,600,031 | 15,768,583,069 | ||||||||
| Securities sold under repurchase agreements | 34,683,519 | 110,737,028 | |||||||||
| Financial obligations | 15 | 2,327,423,644 | 3,298,442,616 | ||||||||
| Other financial obligations | 16 | 316,789,061 | 296,603,582 | ||||||||
| Accrued interest payable of financial obligations and other obligations | 15, 16 | 14,381,101 | 19,450,466 | ||||||||
| Lease liabilities | 17 | 231,563,044 | 0 | ||||||||
| Acceptances outstanding | 1,968,793 | 1,526,352 | |||||||||
| Income tax payable | 60,298,059 | 71,189,646 | |||||||||
| Deferred income tax | 25 | 75,676,104 | 45,050,921 | ||||||||
| Other liabilities | 18 | 549,020,030 | 612,480,340 | ||||||||
| Total liabilities | 20,846,403,386 | 20,224,064,020 | |||||||||
| Equity: | |||||||||||
| Common stock | 19 | 2,865,394,737 | 2,865,394,737 | ||||||||
| Retained earnings | 1,736,845,314 | 1,334,929,289 | |||||||||
| Other comprehensive losses | 20 | (192,169,805 | ) | (300,551,331 | ) | ||||||
| Total shareholder equity of the controlling Company | 4,410,070,246 | 3,899,772,695 | |||||||||
| Non-controlling interest of the Company | 947,174 | 955,143 | |||||||||
| Total equity | 4,411,017,420 | 3,900,727,838 | |||||||||
| Commitments and contingencies | 26 | ||||||||||
| Total liabilities and equity | 25,257,420,806 | 24,124,791,858 | |||||||||
The consolidated statement of financial position must be read in conjunction with the notes which are part of the consolidated financial statements.
F-155
LEASING BOGOTA, S. A. PANAMA AND SUBSIDIARIES
(Panama, Republic of Panama)
Consolidated Statement of Income
For the year ended December 31, 2019
(In U.S. dollars)
| Note | 2019 | 2018 | |||||||||
| Interest income: | |||||||||||
| Deposits in banks | 46,811,688 | 39,423,314 | |||||||||
| Investments | 102,121,872 | 68,941,974 | |||||||||
| Loans | 1,806,573,193 | 1,735,704,051 | |||||||||
| Total interest income | 1,955,506,753 | 1,844,069,339 | |||||||||
| Interest expense: | |||||||||||
| Deposits from customers | 480,755,680 | 445,761,037 | |||||||||
| Financial obligations | 141,845,145 | 158,185,892 | |||||||||
| Other financial obligations | 20,124,663 | 19,605,131 | |||||||||
| Securities sold under repurchase agreements | 2,472,472 | 2,760,307 | |||||||||
| Lease libilities | 11,913,779 | 0 | |||||||||
| Total interest expense | 657,111,739 | 626,312,367 | |||||||||
| Interest income, net | 1,298,395,014 | 1,217,756,972 | |||||||||
| Provision for loan and interest losses | 5 | 380,099,447 | 374,209,677 | ||||||||
| Credit risk of investments and interest bearing deposits | 5 | 2,899,559 | 2,142,147 | ||||||||
| Provision for account receivable losses | 5 | 1,534,652 | 622,343 | ||||||||
| Interest income, net after provisions | 913,861,356 | 840,782,805 | |||||||||
| Other income (expenses): | |||||||||||
| Gains (loss) in financial instruments, net | 21 | 16,466,731 | (922,625 | ) | |||||||
| Service charges | 474,492,879 | 448,053,016 | |||||||||
| Commissions and other fees, net | 213,347,088 | 200,053,011 | |||||||||
| Gain on foreign currency exchange, net | 81,743,805 | 165,684,098 | |||||||||
| Reversal (impairment) of assets held for sale | 13 | 2,336,581 | (7,242,021 | ) | |||||||
| Other income | 23 | 56,559,833 | 48,261,269 | ||||||||
| Total other income, net | 844,946,917 | 853,886,748 | |||||||||
| General and administrative expenses: | |||||||||||
| Salaries and employee benefits | 23 | 539,906,442 | 528,511,493 | ||||||||
| Depreciation and amortization | 125,714,863 | 92,309,364 | |||||||||
| Administrative | 79,213,783 | 66,318,811 | |||||||||
| Occupancy and related expenses | 34,064,529 | 68,129,800 | |||||||||
| Other operating expenses | 24 | 432,508,518 | 385,782,239 | ||||||||
| Total general and administrative expenses | 1,211,408,135 | 1,141,051,707 | |||||||||
| Income before income tax and discontinued operations | 547,400,138 | 553,617,846 | |||||||||
| Less: income tax | 25 | 145,449,906 | 166,388,300 | ||||||||
| Net Income from continued operations | 401,950,232 | 387,229,546 | |||||||||
| Discontinued operations | |||||||||||
| Gains from discontinued operations, net of income taxes | 29 | 0 | 3,567,278 | ||||||||
| Net Income | 401,950,232 | 390,796,824 | |||||||||
| Net income attributable to: | |||||||||||
| Controlling interest | 401,916,026 | 390,761,031 | |||||||||
| Non-controlling interest | 34,206 | 35,793 | |||||||||
| 401,950,232 | 390,796,824 | ||||||||||
The consolidated statement of income must be read in conjunction with the notes which are part of the consolidated financial statements.
F-156
LEASING BOGOTA, S. A. PANAMA AND SUBSIDIARIES
(Panama, Republic of Panama)
Consolidated Statement of Comprehensive Income
For the year ended December 31, 2019
(In U.S. dollars)
| 2019 | 2018 | |||||||
| Net income | 401,950,232 | 390,796,824 | ||||||
| Other comprehensive results: | ||||||||
| Items that will not be reclassified to the consolidated income statement | ||||||||
| Employee benefits plan - change in actuarial effect | (1,281,257 | ) | (1,488,187 | ) | ||||
| Items that are or can be reclassified to the consolidated income statement | ||||||||
| Foreign currency translation | 38,712,078 | (107,242,923 | ) | |||||
| Valuation for investments FVOCI: | ||||||||
| Net change in fair value | 80,661,581 | (1,037,928 | ) | |||||
| Net amount transferred to income statement | (9,707,184 | ) | (96,023 | ) | ||||
| Other comprehensive results | 108,385,218 | (109,865,061 | ) | |||||
| Comprehensive income | 510,335,450 | 280,931,763 | ||||||
| Comprehensive income attributable to: | ||||||||
| Controlling interest | 510,297,551 | 280,922,809 | ||||||
| Non-controlling interest | 37,898 | 8,954 | ||||||
| 510,335,450 | 280,931,763 | |||||||
The consolidated statement of comprehensive income must be read in conjunction with the notes which are part of the consolidated financial statements.
F-157
LEASING BOGOTA, S. A. PANAMA AND SUBSIDIARIES
(Panama, Republic of Panama)
Consolidated Statement of Changes in Equity
For the year ended December 31, 2019
(In U.S. dollars)
| Other | Total | |||||||||||||||||||||||
| Common | Retained | comprehensive | controlling | Non-controlling | ||||||||||||||||||||
| stock | earnings | losses | interest | interest | Total | |||||||||||||||||||
| Balance al 31 de diciembre de 2017 | 2,865,394,737 | 1,093,074,300 | -187,538,226 | 3,770,930,811 | 997,937 | 3,771,928,748 | ||||||||||||||||||
| Impact of adoption of IFRS 9 as of January 1, 2018 (Note 4) | 0 | -148,906,042 | -3,174,883 | -152,080,925 | 0 | -152,080,925 | ||||||||||||||||||
| Restated balance at 1 January, 2018 | 2,865,394,737 | 944,168,258 | (190,713,109 | ) | 3,618,849,886 | 997,937 | 3,619,847,823 | |||||||||||||||||
| Net income | 0 | 390,761,031 | 0 | 390,761,031 | 35,793 | 390,796,824 | ||||||||||||||||||
| Other comprehensive results: | ||||||||||||||||||||||||
| Foreign currency translation | 0 | 0 | (107,216,732 | ) | (107,216,732 | ) | (26,191 | ) | (107,242,923 | ) | ||||||||||||||
| Valuation of FVOCI securities: | ||||||||||||||||||||||||
| Net amount transferred to income statement | 0 | 0 | (96,023 | ) | (96,023 | ) | 0 | (96,023 | ) | |||||||||||||||
| Net change in fair value | 0 | 0 | (1,037,389 | ) | (1,037,389 | ) | (539 | ) | (1,037,928 | ) | ||||||||||||||
| Employee benefits plan - change in actuarial effect | 0 | 0 | (1,488,078 | ) | (1,488,078 | ) | (109 | ) | (1,488,187 | ) | ||||||||||||||
| Total other comprehensive results | 0 | 0 | (109,838,222 | ) | (109,838,222 | ) | (26,839 | ) | (109,865,061 | ) | ||||||||||||||
| Total comprehensive results | 0 | 390,761,031 | (109,838,222 | ) | 280,922,809 | 8,954 | 280,931,763 | |||||||||||||||||
| Transactions with the Company's owners: | ||||||||||||||||||||||||
| Purchase of non-controlling interest | 0 | 0 | 0 | 0 | (47,149 | ) | (47,149 | ) | ||||||||||||||||
| Complementary tax of non-controlling interest | 0 | 0 | 0 | 0 | 31 | 31 | ||||||||||||||||||
| Contributions and distributions: | 0 | 0 | 0 | 0 | 0 | 0 | ||||||||||||||||||
| Dividends | 0 | 0 | 0 | 0 | (4,630 | ) | (4,630 | ) | ||||||||||||||||
| Total Contributions and distributions | 0 | 0 | 0 | 0 | (51,748 | ) | (51,748 | ) | ||||||||||||||||
| Balance as of December 31, 2018 | 2,865,394,737 | 1,334,929,289 | (300,551,331 | ) | 3,899,772,695 | 955,143 | 3,900,727,838 | |||||||||||||||||
| Net income | 0 | 401,916,026 | 401,916,026 | 34,206 | 401,950,232 | |||||||||||||||||||
| Other comprehensive results: | 0 | 0 | ||||||||||||||||||||||
| Foreign currency translation | 0 | 0 | 38,708,264 | 38,708,264 | 3,813 | 38,712,078 | ||||||||||||||||||
| Valuation of FVOCI securities: | 0 | 0 | ||||||||||||||||||||||
| Net amount transferred to income statement | 0 | 0 | (9,707,184 | ) | (9,707,184 | ) | 0 | (9,707,184 | ) | |||||||||||||||
| Net change in fair value | 0 | 0 | 80,661,581 | 80,661,581 | 0 | 80,661,581 | ||||||||||||||||||
| Employee benefits plan - change in actuarial effect | 0 | 0 | (1,281,135 | ) | (1,281,135 | ) | (121 | ) | (1,281,257 | ) | ||||||||||||||
| Total other comprehensive results | 0 | 0 | 108,381,526 | 108,381,526 | 3,692 | 108,385,218 | ||||||||||||||||||
| Total comprehensive results | 0 | 401,916,026 | 108,381,526 | 510,297,552 | 37,898 | 510,335,450 | ||||||||||||||||||
| Transactions with the Company's owners: | ||||||||||||||||||||||||
| Purchase of non-controlling interest | 0 | 0 | 0 | 0 | (41,580 | ) | (41,580 | ) | ||||||||||||||||
| Contributions and distributions: | ||||||||||||||||||||||||
| Complementary tax of non-controlling interest | 0 | 0 | 0 | 0 | (601 | ) | (601 | ) | ||||||||||||||||
| Dividends | 0 | 0 | 0 | 0 | (3,687 | ) | (3,687 | ) | ||||||||||||||||
| Total Contributions and distributions | 0 | 0 | 0 | 0 | (45,868 | ) | (45,868 | ) | ||||||||||||||||
| Balance as of December 31, 2019 | 2,865,394,737 | 1,736,845,314 | (192,169,805 | ) | 4,410,070,246 | 947,174 | 4,411,017,420 | |||||||||||||||||
The consolidated statement of changes in equity must be read in conjunction with the notes which are part of the consolidated financial statements.
F-158
LEASING BOGOTA, S. A. PANAMA AND SUBSIDIARIES
(Panama, Republic of Panama)
Consolidated Statement of Cash Flows
For the year ended December 31, 2019
(In U.S. dollars)
| Note | 2019 | 2018 | |||||||||
| Cash flows from operating activities: | |||||||||||
| Net Income | 401,950,232 | 390,796,824 | |||||||||
| Adjustments to reconcile net income and cash by operating activities: | |||||||||||
| Depreciation and amortization | 89,063,229 | 92,309,364 | |||||||||
| Amortization of the right-of-use assets | 36,651,634 | 0 | |||||||||
| Provision for loan losses | 5 | 380,099,447 | 374,209,677 | ||||||||
| Provision for credit risk of investments and time deposits | 5 | 2,899,559 | 2,142,147 | ||||||||
| Provision for accounts receivable losses | 1,534,652 | 622,343 | |||||||||
| Impairment of assets held for sale | (2,336,581 | ) | 7,242,021 | ||||||||
| (Release) Provision for unfunded commitments | (46,688 | ) | 557,037 | ||||||||
| Interest income, net | (1,298,395,014 | ) | (1,217,756,972 | ) | |||||||
| Gain on financial instruments, net | 21 | (16,466,731 | ) | 922,625 | |||||||
| Loss on sale and disposal of property and equipment, net | 623,876 | 717,018 | |||||||||
| Disposal of intangible assets | 3,605,023 | 0 | |||||||||
| Net gain on sale of assets held for sale | (4,607,814 | ) | (3,102,382 | ) | |||||||
| Dividends on equity securities | (1,298,780 | ) | (1,264,025 | ) | |||||||
| Income tax expense | 145,449,906 | 166,388,300 | |||||||||
| Changes in operating assets and liabilities: | |||||||||||
| Deposits with original maturities of 90 days or more | (36,370,996 | ) | 29,294,719 | ||||||||
| Investments and other assets at fair value | (3,459,836 | ) | 3,666,406 | ||||||||
| Loans | (719,815,822 | ) | (1,553,258,753 | ) | |||||||
| Other accounts receivable | 30,550,794 | 36,038,663 | |||||||||
| Other assets | (1,602,674 | ) | (32,539,168 | ) | |||||||
| Deposits from costumers | 1,282,077,685 | 1,249,815,568 | |||||||||
| Securities purchased under agreements to repurchase | (78,887,084 | ) | 54,424,535 | ||||||||
| Other liabilities | (105,872,484 | ) | 21,688,282 | ||||||||
| Discontinued operations | 0 | 3,147,510 | |||||||||
| Cash generated by operations: | |||||||||||
| Interest received | 1,905,545,230 | 1,811,791,201 | |||||||||
| Interest paid | (657,557,652 | ) | (616,575,696 | ) | |||||||
| Dividends received | 1,298,780 | 1,264,025 | |||||||||
| Income tax paid | (143,120,188 | ) | (132,502,210 | ) | |||||||
| Net cash provided by operating activities | 1,211,511,703 | 690,039,059 | |||||||||
| Cash flows from investment activities: | |||||||||||
| Proceeds from sale of investments at FVOCI | 9 | 615,631,289 | 117,784,282 | ||||||||
| Maturities, and prepayments of investments at FVOCI | 1,406,403,233 | 1,764,361,701 | |||||||||
| Purchase of investments at FVOCI | (2,320,074,469 | ) | (1,902,025,250 | ) | |||||||
| Purchase of property and equipment | (70,244,954 | ) | (49,671,320 | ) | |||||||
| Proceeds from sale of property and equipment | 632,249 | 673,175 | |||||||||
| Acquisition of intangible assets | (28,854,325 | ) | (11,949,124 | ) | |||||||
| Proceeds from sale of assets held for sale | 22,574,709 | 14,589,322 | |||||||||
| Discontinued operations, net of cash received | 0 | 5,005,802 | |||||||||
| Net cash used in investment activities | (373,932,268 | ) | (61,231,412 | ) | |||||||
| Cash flows from financing activities: | |||||||||||
| Proceeds from other financial obligations | 1,666,309,173 | 2,300,976,248 | |||||||||
| Payment of obligations | (2,670,739,365 | ) | (2,440,620,798 | ) | |||||||
| Proceeds from other obligations | 135,876,342 | 68,723,325 | |||||||||
| Payment other obligations | (115,311,820 | ) | (160,037,995 | ) | |||||||
| Payment of lease liabilities | (39,148,908 | ) | 0 | ||||||||
| Dividends paid | (3,687 | ) | (4,630 | ) | |||||||
| Acquisition of non-controlling intetrest | (41,580 | ) | (47,149 | ) | |||||||
| Net cash used in financing activities | (1,023,059,845 | ) | (231,010,999 | ) | |||||||
| Effect of exchange rate fluctuation on cash held | 80,539,778 | (146,239,092 | ) | ||||||||
| Effect of exchange rate fluctuation on discontinued operations | 0 | 187,379 | |||||||||
| Net (decrease) increase in cash and cash equivalents | (104,940,632 | ) | 251,744,935 | ||||||||
| Cash and cash equivalents at beginning of the year | 4,176,399,267 | 3,924,654,332 | |||||||||
| Cash and cash equivalents at the end of the year | 7 | 4,071,458,635 | 4,176,399,267 | ||||||||
The consolidated statement of cash flows must be read in conjunction with the notes which are part of the consolidated financial statements.
F-159
LEASING BOGOTA S.A. PANAMA AND SUBSIDIARIES
(Panama, Republic of Panama)
Notes to the Consolidated Financial Statements
December 31, 2019
(In U.S. dollars)
| (1) | Organization |
Leasing Bogota, S. A. Panama is incorporated under the Companies Law of the Republic of Panama since 1972. Until September 30, 2012, it operated as holding company in other entities of the banking sector. Leasing Bogota, S. A. Panamá and its Subsidiaries will be jointly referred to as the “Company”. Leasing Bogota S. A. Panama is wholly owned by Banco de Bogota S. A., an authorized bank in the Republic of Colombia, which is a subsidiary of Grupo Aval Acciones y Valores, S. A.
The Company owns 100% of the shares of BAC Credomatic, Inc. BAC Credomatic, Inc. provides through its indirect subsidiary BAC International Bank Inc., a Panamanian banking institution, a wide variety of financial services to individuals and institutions, principally in Guatemala, Honduras, El Salvador, Nicaragua, Costa Rica and Panama.
| (2) | Basis of Preparation of the Consolidated Financial Statements |
| (a) | Compliance with International Financial Reporting Standards (“IFRS”) |
The consolidated financial statements have been prepared in conformity with IFRSs issued by the International Accounting Standards Board (“IASB”).
The consolidated financial statements were approved by the Company´s Board of Directors on February 20, 2020.
| (b) | Basis of measurement |
The consolidated financial statements have been prepared on a historical cost basis, except for the following accounts in the consolidated statement of financial position.
· Investments at fair value; and
· Assets held for sale.
Initially, the Company recognizes financial instruments as of the date they are disbursed.
| (c) | Functional and presentation currency |
The items included in the accounts of each of the Company's subsidiaries are measured using the currency of the main economic environment where the entity operates ("functional currency").
The Company’s consolidated financial statements are presented in U.S.A. dollars, which is also Bank's functional currency. Information presented in U.S.A. dollars is expressed in units, unless otherwise stated.
| (d) | Use of estimates and judgments |
Preparation of the consolidated financial statements requires the Company’s management to make judgments, estimates and assumptions affecting the application of accounting policies and the reported amounts of assets, liabilities, revenues and expenses. Final results may differ from these estimates. These also require the Company’s management to apply its judgment when applying the Company's accounting policies.
The information on the most significant areas of estimation of uncertainty and critical judgments in applying the accounting policies that have the most important effect on the amounts recognized in the consolidated financial statements is disclosed in Note 5.
| (3) | Changes in Accounting Policies |
Except for the changes below, the Company has consistently applied the accounting policies as set out in Note 4 to all periods presented in these consolidated financial statements.
Policies applicable from January 1, 2019
| a) | IFRS 16 Leases |
The Company applied IFRS 16 with a date of initial application of January 1, 2019. As a result, the Company has changed its accounting policy for lease contracts as detailed below:
F-160
| (3) | Changes in Accounting Policies, continued |
The Company applied IFRS 16 using the modified retrospective approach, under which the cumulative effect of initial application is recognized in retained earnings as of January 1, 2019. The details of the changes in accounting policies are disclosed below:
| A. | Definition of a lease |
Previously, the Company determined at contract inception whether an arrangement is or contains a lease under IFRIC 4. Under IFRS 16, the Company assesses whether a contract is or contains a lease based on the definition of a lease, as explained in Note 4 (j).
On transition to IFRS 16, the Company elected to apply the practical expedient to grandfather the assessment of which transactions are leases. It applied IFRS 16 only to contracts that were previously identified as leases. Contracts that were not identified as leases under IAS 17 and IFRIC 4 were not reassessed for whether there is a lease. Therefore, the definition of a lease under IFRS 16 was applied only to contracts entered into or changed on or after January 1, 2019.
| B. | As a lessee |
As a lessee, the Company previously classified leases as operating or finance leases based on its assessment of whether the lease transferred significantly all of the risks and rewards incidental to ownership of the underlying asset to the Company. Under IFRS 16, the Company recognizes right-of-use assets and lease liabilities for most leases – i.e. these leases are on-balance sheet.
The Company decided to apply recognition exemptions to short-term leases (see Note 4 (j)). For leases of other assets, which were classified as operating under IAS 17, the Company recognized right-of-use assets and lease liabilities.
F-161
| (3) | Changes in Accounting Policies, continued, continued |
| i. | Leases classified as operating leases under IAS 17 |
At transition, lease liabilities were measured at the present value of the remaining lease payments, discounted at the Company’s incremental borrowing rate as of January 1, 2019. Right-of-use assets are measured at an amount equal to the lease liability, adjusted by the amount of any prepaid or accrued lease payments.
The Company used the following practical expedients when applying IFRS 16 to leases previously classified as operating leases under IAS 17.
| · | Applied the exemption not to recognize right-of-use assets and liabilities for leases with less than 12 months of lease term. |
| · | Excluded initial direct costs from measuring the right-of-use asset at the date of initial application. |
| ii. | Leases previously classified as finance leases |
For leases that were classified as finance leases under IAS 17, the carrying amount of the right-of-use asset and the lease liability at January 1, 2019 are determined at the carrying amount of the lease asset and lease liability under IAS 17 immediately before that date.
| C. | Impacts on financial statements |
On transition to IFRS 16, the Company recognized $249 million of right-of-use assets and $240 million of lease liabilities. At December 31, 2018 right-of-use assets net amounted to $238 million that are registered within the property, furniture, equipment and improvements, and lease liabilities to $232 million.
When measuring lease liabilities, the Company discounted lease payments using its incremental borrowing rate as of January 1, 2019. The weighted-average rate applied is 5.24%.
January 1, 2019 | ||||
| Operating lease commitment at December 31, 2018 | 296,957,017 | |||
| Discounted using the incremental borrowing rate as of January 1, 2019 | 247,827,529 | |||
| - Recognition exemptions for: | ||||
| Low-value assets | (8,305,812 | ) | ||
| Lease liabilities recognized at January 1, 2019 | 239,521,717 | |||
F-162
| (4) | Summary of Significant Accounting Policies |
The Company has applied the policies to the Consolidated financial statements in a manner consistent with those of the Consolidated Financial Statements As of December 31, 2019, which are detailed below:
| (a) | Basis of consolidation |
Subsidiaries
Subsidiaries are entities controlled by the Company. The Company controls an entity when it is exposed to, or has rights to, variable return from its involvement with the investee and has the ability to affect those returns through its power over the investee.
To determine the control, the potential voting rights that are currently executable or convertible are considered. The subsidiaries’ financial statements are included in the consolidated financial statements from the date on which the control begins, and until the control ceases.
Balances and Transactions Eliminated in the Consolidation
Intragroup transactions, balances, revenue and expenses in transactions between subsidiaries are eliminated. Losses and gains that arise from intragroup transactions that are recognized as assets or liabilities are also eliminated.
Changes in the ownership of the subsidiaries that do not result in a change of control
Transactions with non-controlling interest that do not result in a loss of control are accounted for as equity transactions; that is, as transactions with the owners. Any difference between the carrying value of the interest and the amount of the transaction is recorded as an adjustment in retained earnings.
Disposal of subsidiaries
When the Company ceases to have control over a subsidiary, it derecognizes the assets and liabilities of the subsidiary, and any non-controlling interest and other components of equity. Any resulting gain or loss is recognized in the consolidated statement of income. Any retained interest in the former subsidiary is measured at fair value when control is lost.
(b) Transactions and balances in foreign currencies
Assets and liabilities maintained in foreign currency are converted to the functional currency at the exchange rate in effect on the reporting date. Gains or losses resulting from the conversion of foreign currency are reflected in other revenues or other expense accounts in the consolidated statement of income.
Goodwill and adjustments to fair value resulting from the acquisition of a foreign entity are treated as assets and liabilities of the foreign entity and, consequently, are converted at the exchange rates in effect on each period closing date.
Subsidiaries of the Company
The financial position and results of all of the Company's subsidiaries that have a functional currency different from the Company's functional currency are converted into the presentation currency as follows:
· Assets and liabilities: at the exchange rate at the period closing date.
· Revenues and expenses: at the average exchange rate.
· Equity accounts: at the historical exchange rate.
The resulting conversion adjustment is carried directly to a separate account in the “Equity” section, under "other comprehensive loss".
F-163
| (4) | Summary of Significant Accounting Policies, continued |
| (c) | Financial assets and liabilities |
The Company has adopted IFRS 9 Financial Instruments issued in July 2014 with date of initial implementation of January 1, 2018. The requirements of IFRS 9 represent a significant change from IAS 39 Financial Instruments: Recognition and Measurement. The new standard requires fundamental changes to the accounting for financial assets and to certain aspects of the accounting for financial liabilities.
The following table summarizes the impact, net of taxes, of the transition to IFRS 9 on the initial balance of retained earnings.
Impact of adoption of IFRS 9 as of January 1, 2018 | ||||
| Attributable to controlling interest of the Bank | ||||
| Retained earnings | ||||
| Recognition of ECL under IFRS 9 - AC | 205,135.,513 | |||
| Financial assets’ reclassification | (202,485 | ) | ||
| Related deferred tax - AC | (56,026,986 | ) | ||
| 148,906,042 | ||||
| Other comprehensive losses | ||||
| Recognition of ECL under IFRS 9 - FVOCI | 3,599,444 | |||
| Related deferred tax – FVOCI | (424,561 | ) | ||
| 3,174,883 | ||||
| Total | 152,080,925 | |||
Financial assets are classified on the date of initial recognition, based on the nature and purpose of the financial asset's acquisition.
Classification
IFRS 9 contains three principal classification categories for financial assets: measured at amortized cost (AC), fair value through other comprehensive income (FVOCI) and fair value through profit or loss (FVPL). IFRS 9 classification is generally based on the business model in which a financial asset is managed and its contractual cash flows.
At initial recognition, financial assets are classified as measured at: AC, FVOCI or FVPL.
A financial asset is measured at amortized cost and not at FVPL, if it meets both of the following conditions:
| 1. | The asset is kept within a business model to collect contractual cash flows; and |
| 2. | The contractual terms of the financial asset establish specific dates for cash flows that represent solely payments of principal and interest on the outstanding balance. |
A debt instrument is measured at FVOCI only if it meets both of the following conditions and has not been designated as FVPL:
| 1. | The asset is kept within a business model whose objective is achieved by collecting contractual cash flows and selling financial assets and; |
| 2. | The contractual terms of the financial asset establish specific dates for cash flows that represent solely payments of principal and interest on the current outstanding balance. |
During the initial recognition of investments in equity instruments not traded, the Company may elect to irrevocably register subsequent changes in fair value as part of other comprehensive profit and loss in equity. This election is made on an instrument by instrument basis.
All financial assets not classified as measured at AC or FVOCI as described above, are measured at FVPL.
In addition, in the initial recognition, the Company may irrevocably designate a financial asset that meets the measurement requirements at AC or FVOCI to be measured at FVPL, if doing so eliminates or significantly reduces an accounting mismatch that may occur if not done. For now, the Company do not use this option.
A financial asset is classified in one of the referenced categories at the time of its initial recognition.
An embedded derivative where the main contract is a financial contract covered under IFRS 9 is not separated and instead the hybrid financial instrument is jointly assessed for classification.
F-164
| (4) | Summary of Significant Accounting Policies, continued |
Business Model Assessment
The Company assess the objectives of the business models that hold the financial assets in a portfolio to better represent how each subsidiary manages the business and how management information is reported. The information considered includes:
| · | The policies and objectives stated for each portfolio of financial assets and the operation of these policies in practice. These include, whether management’s strategy is to collect income from contractual interest; hold a profile of specific interest performance or coordinate the duration of the financial assets with the liabilities being financed or the expected outgoing cash or through cash flows from the sale of assets; |
| · | How they are evaluated or reported to key management personnel for each Bank subsidiary on portfolio performance. |
| · | The risks that affect the performance of the portfolios (and the financial assets held within) and the way those risks are managed; |
| · | How managers of the business are compensated (for example, whether compensation is based on the fair value of the assets managed or the contractual cash flows collected); and, |
| · | The frequency, value and timing of sales in prior fiscal periods, the reasons for those sales and expectations about future sales activity. However, the information on sales activity cannot be considered in isolation, but rather as part of an assessment of how Bank objectives established for managing financial assets is achieved and how cash flows are realized. |
Financial assets held or managed for trading and where their performance is evaluated on a fair value basis, are measured at FVPL because these are not held to cover contractual cash flows or to obtain contractual cash flows and to sell these financial assets.
Assessment if contractual cash flows are solely payments of principal and interest
For purposes of this assessment, “principal” is defined as the fair value of the financial asset at initial recognition. “Interest” is defined as compensation for the time value of money and credit risk associated with holding the current principal for a period of time and for other basic risk from loan agreements and other associated costs (e.g. liquidity risk and administrative costs), as well as the profit margin.
F-165
| (4) | Summary of Significant Accounting Policies, continued |
When evaluating whether contractual cash flows are solely payment of principal and interest, the Company considered the contractual terms of the instrument. This includes an assessment to determine whether the financial asset contains a contractual term that could change the timing or amount of the contractual cash flows in such a way that it does not meet this condition. In making this assessment the Company considers:
| · | Contingent events that will change the amount and timing of cash flows; |
| · | Hedging conditions; |
| · | Prepayment and extension terms; |
| · | Terms that limit the Company in achieving cash flows for specific assets (e.g. unfunded asset agreements); and |
| · | Terms that change the considerations on the value of money over time (e.g. periodic revision of interest rates). |
Interest rates on certain consumer and business loans are based on variable interest rates established at the discretion of the Company. Variable interest rates are generally established in accordance with the practices of each of the countries where the Company operates, plus certain additional discretionary points. In these cases, the Company assess whether the discretionary feature is consistent with the solely principal and interest criteria considering a number of factors that include whether:
| · | Debtors can prepay the loans without significant penalties; |
| · | Competitive market factors insure that interest rates are consistent between banks; and, |
| · | Any regulatory protection standard in favor of customers in the country requiring banks to treat customers reasonably (e.g. regulated rates). |
All fixed rate consumer and corporate loans contain a prepayment condition.
A prepayment feature is consistent with the solely principal and interest criteria, if the prepayment amount substantially represents unpaid amounts of principal and interest on the amount of outstanding principal, which may include fair compensation for early termination of the contract.
In addition, a prepayment feature is consistent with these criteria, if a financial asset is acquired or originates from a premium or discount to the contractual par amount and the prepayment amount substantially represents the contractual par amount, plus accrued, but unpaid, contractual interest (which may include fair compensation for early termination) and the fair value of the prepayment feature is insignificant in the initial recognition.
F-166
| (4) | Summary of Significant Accounting Policies, continued |
Impairment of Financial Assets
The Company assesses the impairment of financial assets with an Expected Credit Losses model (ECL). This model requires the application of considerable judgment regarding how changes in economic factors impact on ECL, which is determined on a weighted average basis.
The impairment model applies to the following financial assets that are not measured at FVPL.
| · | Debt instruments; |
| · | Lease payments receivable; |
| · | Other accounts receivable; |
| · | Loan portfolio; |
| · | Financial guarantee contracts issued; and |
| · | Loans commitments issued. |
The Company recognizes a provision for impairment of financial assets at AC and FVOCI in an amount equal to the expected impairment losses in a period of twelve months after the end date of financial statements or during the remaining life of the loan. Expected losses during the remaining life of the loan are the losses expected from all possible impairment events during the expected life of the financial instrument, while expected losses in a twelve-month period are the portion of expected losses arising from impairment events resulting from impairment events that are possible during the twelve months following on the date of the report.
Reserves for losses are recognized in an amount equal to the ECL during the life of the asset, except in the following cases, in which the amount recognized is equal to ECL for the 12 months following the measurement date:
| · | Investments in debt instruments determined to represent low credit risk to the reporting date; and, |
| · | Other financial assets (other than short term accounts receivable) on which the credit risk has not increased significantly since initial recognition. |
Impairment requirements are complex and require estimated judgments and significant assumptions by management, particularly in the following areas:
| · | Assess whether the credit risk has increased significantly from initial recognition; and, |
| · | Incorporate prospective information in the measurement of expected impairment losses. |
F-167
| (4) | Summary of Significant Accounting Policies, continued |
Measuring ECL
Expected credit loss (ECL) is the estimated weighted probability of credit losses measured as follows:
| · | Financial assets with no credit impairment to the reporting date: the present value of all contractual cash payments in arrears (for example: the difference between Bank cash flow debt in accordance with the contract and cash flows that the Company expects to receive); |
| · | Impaired financial assets to the reporting date: the difference between the gross book value and the present value of estimated future cash flows; |
| · | Outstanding loan commitments: the present value of the difference between contractual cash flows owed to the Company in the event it enforces the commitment and cash flows that the Company expects to receive; and |
| · | Financially secured contracts: expected payments to reimburse the holder minus any amount the Company expects to recover. |
Definition of impairment
The Company considers a financial asset to be impaired when:
| · | It is highly unlikely that the debtor will fully pay its credit obligations to the Company, without recourse for the Company to take such actions as enforcing the guarantees (if any); or |
| · | The debtor is more than 90-days past-due on any material credit obligation. Overdrafts are considered in arrears once the client has exceeded the established limit, or the established limit is less than the outstanding balance. |
| · | For fixed income financial instruments, the following concepts, among others, are included: |
| - | Downgrade on the issuer’s credit risk rating; |
| - | Contractual payments are not made on the due date or in the term period stipulated; |
| - | There is a virtual certainty of default; |
| - | Issuer is likely to go bankrupt or a bankruptcy petition is filed or similar action; |
| - | The financial asset stops trading in an active market given its financial difficulties; |
F-168
| (4) | Summary of Significant Accounting Policies, continued |
To assess whether a debtor is impaired, the Company considers indicators such as:
| · | Qualitative, e.g. noncompliance with contractual clauses; |
| · | Quantitative, e.g. arrears or non-payment of another obligation from the same issuer to the Company; and, |
| · | Based on data developed internally and obtained from external sources. |
Inputs used in the assessment of whether financial instruments are in impairment and their importance may vary over time to reflect changes in circumstances.
Significant increase in credit risk
When determining whether the credit risk of a financial assets has increased significantly since initial recognition, the Company considers relevant fair, sustainable information available at no cost or disproportionate effort, including information and quantitative and qualitative analyses based on historical experience and expert assessment of Bank credit risk, including information with future projection.
The Company identifies if a significant increase in the credit risk has occurred for each exposure by comparing:
| · | The probability of default (PD) during the remaining life of financial instrument at the closing date, with |
| · | The PD during the remaining life at a point in time, which was estimated at initial recognition of exposure. |
The assessment of whether the credit risk has increased significantly from initial recognition of a financial asset requires identification of the initial recognition date of the instrument. For purposes of revolving credit (credit cards, overdrafts, among others), the date when the credit was first delivered may be a long time ago. Changes in the contractual terms of a financial asset may also impact this assessment, as discussed below.
Grading by credit risk categories
The Company assigns a credit risk grade to each exposure based on a variety of data that is determined to predict the PD and applying the judgment of a credit expert, the Company use these grades to identify significant increases in credit risk. Credit risk grading is defined using qualitative and quantitative factors indicative of the risk of losses. These factors varies depending on the type of exposure and the type of borrower.
Credit risk grading is defined and calibrated so that the risk of losses increases exponentially as the credit risk is impaired and so that, for example, the difference in the risk of losses between grade satisfactory and special mention is less than the difference between the credit risk between grades special mention and sub-standard.
F-169
| (4) | Summary of Significant Accounting Policies, continued |
Each exposure is given a credit risk grade upon initial recognition based on information available on the debtor. Exposures are subject to continuous monitoring, that may result in displacement of an exposure to a different credit risk grade.
Generating the Structure of the PD term
Credit risk grading are the main input to determine the structure of the PD term for the different exposures. The Company obtains performance and loss information on the credit risk exposures analyzed by jurisdiction or region, type of product and debtor, as well as by credit risk grade. For some portfolios, information purchased from external credit reference agencies could be used.
The Company uses statistical models to analyze the data compiled and generate estimates of the probability of impairment during the remaining life of the exposures and how these probabilities of impairment change over time.
These analyses include identification and calibration of relationships between changes in impairment rates and key macroeconomic factors, as well as in-depth analysis of certain impairment risk factors (for example, loans portfolio charge-offs). For the majority of loans, key economic factors includes growth in gross domestic product, changes in interest rates on the market and unemployment.
For exposures in specific industries and/or regions, the analysis may extend to products regarding real estate prices.
The approach used by the Company to prepare prospective economic information within its assessment is indicated below.
Determine if the credit risk has increased significantly
The Company has established a general framework that incorporates quantitative information and qualitative to determine if the credit risk of a financial asset has significantly increased since its initial recognition.
The initial framework is aligned with the internal process of the Company for credit risk management.
The criteria to determine whether the credit risk has increased significantly varies by portfolio and includes limits based on noncompliance.
The Company evaluates whether the credit risk of a particular exposure has increased significantly since initial recognition if, based on Bank qualitative modeling, the expected probability of impairment during the remaining life will increase significantly from initial recognition. In determining the credit risk increase, the expected impairment losses in the remaining life is adjusted by changes in expiration.
Under certain circumstances, using the judgment of credit experts, and based on relevant historical information, the Company determines that an exposure has had a significant increase in credit risk, if particular qualitative factors indicate this and those factors may not be completely captured by periodic quantitative analyses. As a limit, the Company assumes that a significant credit risk occurs no later than when the asset is in arrears for more than 30 days.
F-170
| (4) | Summary of Significant Accounting Policies, continued |
The Company monitors the effectiveness of the criteria used to identify significant increases in credit risk based on regular reviews to confirm that:
| · | The criteria can identify significant increases in credit risk before an exposure becomes impaired; |
| · | The criteria are inconsistent with the time when the asset is more than 30 days past the due date; |
| · | The average time to identify a significant increase in credit risk and noncompliance appear to be reasonable; |
| · | Exposures are not generally transferred directly to the Company on the probability of expected impairment in the twelve months following the impairment of the group of loans; |
| · | There is no unjustified volatility in the provision for impairment of transfers between groups with the probability of expected losses in the twelve months following and the probability of expected losses in the remaining life of the loans. |
F-171
| (4) | Summary of Significant Accounting Policies, continued |
Modified financial assets
The contractual terms of the loans may be modified for a number of reasons, including changes in market conditions, client retention and other factors unrelated to an actual or potential impairment of the client’s loan.
When the terms of a financial asset are modified and the modification does not result in the removal of the asset from the consolidated statement of financial position, the determination of whether the credit risk has significantly increased reflects comparisons of:
| · | The PD during the remaining life on the date of the balance sheet based on the terms modified with; |
| · | The PD on the estimated remaining life based on the date of initial recognition and the original contractual terms. |
The Company renegotiates loans to customers in financial difficulties to maximize the opportunities to collect and to minimize the risk of noncompliance. Under the Company’s renegotiation policies, customers in financial difficulties are given concessions that generally involve a reduction in interest rate, extension of the payment term, reductions in the balances due or a combination of these.
For financial assets modified as part of the Company’s renegotiation policies, the estimation of the PD reflects whether the modifications have improved or restored the ability of the Company to collect principal and interest and the prior experience of the Company in similar actions. As part of the process, the Company evaluates the debtor’s payment compliance as compared to the modified terms of the debt and considers several performance indicators for the group of debtors modified.
Generally, restructuring indicators are a relevant factor on increased credit risk. Therefore, a restructured debtor must demonstrate a consistent payment behavior over a period of time before no longer being considered as an impaired loan or that the PI has decreased in such a way that the provision may be reversed and the loan measured for impairment over a term of twelve months after the closing date of the report.
F-172
| (4) | Summary of Significant Accounting Policies, continued |
Inputs in Measuring ECL
Key inputs in measuring ECL are usually the structure of terms of the following variables:
| · | Probability of default (PD). |
| · | Losses given default (LGD). |
| · | Exposure at default (EAD). |
The foregoing parameters are derived from internal statistical models and other historical information. These models are adjusted to reflect prospective information as described below.
Estimated PDs at a certain date, which is calculated based on statistical classification and assessment models using grading tools adjusted to the different counterpart categories and exposures. These statistical models are based on data compiled internally comprising both qualitative and quantitative factors. If a counterpart or exposure migrates between different grades, then this will result in a change in the estimated PD. PDs are estimated considering contractual terms on expiration of exposures and estimated prepayment rates.
LGD is the magnitude of probable losses in the event of noncompliance. The Company estimates the parameters of the LGD based on historical loss recovery rates against the noncomplying parties. LGD models consider the structure, collateral and the priority of the lost debt, the industry of the counterpart and the recovery costs of any collateral integrated into the financial asset. For loans secured by real property, indices relating to the value of the security as compared to the loan (Loan to value, “LTV”), are parameters used in the determination of the LGD. LGD estimates are calibrated at different economic scenarios and for loans secured by real estate, variations in price indices for these assets. These loans are calculated on the bases of discounted cash flows using the effective interest rate of the loan.
EAD represents expected exposure in the event of noncompliance. The Company derives the EAD from the current exposure of the counterpart and potential changes in the current amount permitted under the terms of the contract, including amortization and prepayments. The EAD of a financial asset is the gross value at the time of noncompliance. For loan commitments and financial security, the EAD considers the amount removed, as well as potential future amounts that may be removed or collected under the contract, which are estimated based on historical issues and projected prospective information. For some financial assets, the Bank determines the EAD by modeling a range of possible results of exposures as several points over time using scenarios and statistical techniques.
F-173
| (4) | Summary of Significant Accounting Policies, continued |
As described above and subject to using a maximum PD of twelve months for which credit risk has increased significantly, the Company measures the EAD considering the risk of noncompliance during the maximum contractual period (including options to extend the customer's debt) on which there is an exposure to credit risk, even if, for purposes of risk management, the Company considers a longer period of time. The maximum contractual period is extended to the date on which the Company has the right to require payment of a loan or terminate a loan commitment or security given.
For consumer overdrafts, credit card balances and certain corporate revolving credit that includes both a loan and a component of the customer’s commission not to withdraw the loan, the Company measures EADs over a longer period than the maximum contractual period, if the contractual ability of the Company to demand payments and pay off the commitment not withdrawn does not limit the Company’s exposure to credit losses for the contractual period of the contract. These facilities do not have a fixed term or a collection structure and are managed on a collective basis. The Company may cancel them immediately, but this contractual right is forced in the normal management of the Bank’s day to day management, rather only when the Company finds that there has been increased credit risk for each loan. This longer period of time will be estimated taking into account the actions for the management of credit risk that the Company expects to take and that mitigate the EAD. These measures include a reduction in limits and cancellation of loan contracts.
Where parameter modeling is performed on a collective basis, the financial instruments are pooled on the basis of shared risk characteristics that include:
| · | Type of instrument. |
| · | Credit risk rating. |
| · | Guarantees. |
| · | Date of initial recognition. |
| · | Remaining expiration term. |
| · | Industry. |
| · | Geographical location of the debtor. |
The above pooling is subject to regular review to ensure that the exposure of a particular group remains uniform.
Projection of future conditions
The Company incorporates information with projection of future conditions in both, the assessment of whether the credit risk of an instrument has increased significantly from initial recognition and a measurement of ECL, based on the recommendations of the Company’s Credit Risk Committee, use of economic experts and consideration of a variety of current and projected external information. The Company formulates a base case for the projection of relevant economic variables as well as a range representative of other possible projected scenarios. This process involves the development of two more additional economic scenarios and considers the relative probabilities of each outcome.
F-174
| (4) | Summary of Significant Accounting Policies, continued |
The external information includes economic data and publication of projections by government committees, monetary authorities (mainly in the countries where the Company operates), supranational organizations (such as the Organization for Economic Cooperation and Development, the International Monetary Fund and others), academic projections, private sector, and credit risk rating agencies.
The base case represents the most probable outcome consistent with the information used by the Company for other purposes and strategical planning and the budget. Other scenarios represents a more optimistic or pessimistic outcome. In addition, the Company uses periodic stress testing to calibrate the determination of these other representative scenarios
Financial liabilities
Financial liabilities are measured at amortized cost using the effective interest method, except when there are financial liabilities measured at fair value through profit or loss.
Recognition, disposal and measurement
The purchase or sale of financial instruments are recognizes on the date of each negotiation, which is the date on which the Company commits to buy or sell a financial instrument. Financial assets and liabilities are initially recognized at fair value.
Transaction costs are attributed to expenses in the consolidated statement of income when incurred for financial assets and liabilities at fair value with changes in the consolidated statement of income, and they are recorded as part of the initial value of the instrument for assets and liabilities at amortized cost and available for sale securities. Transaction costs are incremental costs incurred to acquire assets or sell financial liabilities. These include fees, commissions and other concepts paid to agents, brokers, advisors and intermediaries, rates established by regulatory agencies and stock markets, as well as taxes and other rights.
Financial assets are derecognized from the consolidated statement of financial position when the payments derived from it were received, the rights to receive cash flows from the investments has expired or have been transferred and the Company has transferred substantially all of the risks and benefits derived from their ownership.
F-175
| (4) | Summary of Significant Accounting Policies, continued |
After initial recognition, all financial assets and financial liabilities classified at amortized cost are measured based on the amortized cost method. Interest accrued are recorded in the interest income or expense account.
Offsetting of financial instruments
Financial assets and financial liabilities are offset and the net amount is reported in the consolidated statement of financial position if there is a currently enforceable legal right to offset the recognized amounts and there is an intention to settle on a net basis, or to realize the assets and settle the liabilities simultaneously.
Presentation of provision for PCE in the consolidated statement of position
financial
The provision for PCE is presented in the consolidated statement of financial position of the following way:
| · | Financial assets measured at amortized cost: as a deduction from gross value in the books of assets; |
| · | Loan commitments and financial guarantee contracts: generally, as a provision; and |
| · | Debt instruments measured at FVOCI: no provision is recognized for losses in the consolidated statement of financial position because the value. The carrying amount of these assets is their fair value. However, the provision for losses is disclosed and recognized in other comprehensive income. |
| (d) | Loans |
Loans receivable are non-derivative financial assets with fixed or determinable payments that are not quoted in active markets and are originated when funds are provided to a debtor in the form of a loan. Loans and advances were initially measured at fair value plus incremental direct transaction costs, and subsequently measured at their amortized cost using the effective interest method. Unearned interest and commissions are recognized as income during the life of the loan using the effective interest method.
For purposes of the establishment of an impairment allowance, products are classified into: corporate, small company, vehicles, credit card, personal, mortgage, leases or debt and guarantee commitments, as defined below.
Corporate and Small Company
Corporate clients and small company are defined, in general terms, as entities registered (for example corporations, limited liability companies, limited stock companies) and sole proprietors or self-employed partiers using credit lines for business purposes. Corporate and small company clients should be segmented into two separate categories, as detailed below. Client segmentation in these categories is based on sales and credit exposure of the client with the Bank. The total consolidated credit exposure with the client will only appear in one category.
| · | Small company - legal entities or other entities that employ commercial products or financing assets for commercial use where the credit exposure is less than or equal to $350,000 and annual sales are below $1 million. |
| · | Corporate - legal entities or other entities that employ commercial products or financing assets for commercial use where the credit exposure is higher than $350,000 and annual sales are higher than or equal to $1 million. |
The portfolio should be classified based on the original amount approved.
F-176
Vehicles
There is an agreed amortization calendar to pay for the entire original loan; there are no more disbursements without additional contract and the main objective is to grant financing for the purchase of vehicles, whether new or used.
Credit card
There is a credit limit up to which the customer may disburse without the need for additional contracts, and the balance owed at the end of the cycle is used to assess a minimum payment.
Personal
There is an agreed amortization calendar to pay for the entire original loan; there are no more disbursements without an additional contract and the main objective is to grant financing to individuals for a variety of purposes.
Mortgage
Mortgage product for the purpose of providing financing for the purchase of real estate (family homes) secured through a mortgage on residential property provided by the borrower. There is an agreed amortization calendar to pay for the entire original loan; there are no more disbursements without an additional contract.
| (4) | Summary of Significant Accounting Policies, continued |
Leases
Financing mechanism for the acquisition of assets through a contract. The lessor agrees to temporarily transfer the use of an asset to the other party, called a lessee. The lessee is under the obligation to make a payment for the use of the asset. This definition covers both financial leases and operating leases.
Debt commitments and guarantees
It is composed of letters of credit, financial guarantees and contractual commitments to disburse loans. The off balance sheet commitments are subject to individual reviews and are analyzed and segregated by risk according to the client's internal risk rating.
| (e) | Assets held for sale |
Assets acquired or awarded in the settlement of a loan are held for sale, and are initially recognized at the lower of the balance of the loan and fair value less selling costs as of the award date, establishing a new cost basis. After the award, management conducts periodic assessments and assets are recognized at the lower of carrying value or fair value less costs to sell. Operating revenues and expenses originated and changes in the provision for the valuation of those assets are included in other operating expenses. Costs related to the maintenance of these properties are included as expenses when incurred.
| (f) | Derivative financial instruments and hedge accounting |
Derivatives are initially recognized at fair value on the date in which the derivatives contract is signed. After initial recognition, they are measured again at fair value; attributable transaction costs are recognized in income when incurred.
F-177
| (4) | Summary of Significant Accounting Policies, continued |
When the Company conducts a hedge accounting, it documents the existing relationship between hedging instruments and the hedged items, as well as its risk management objectives and the strategy to execute the hedge transaction. The Company also documents its assessment, both at inception and on an ongoing basis, of whether the derivatives used in the hedging transactions are highly effective in offsetting the changes in fair value or in the cash flows of the hedged items.
After initial recognition, derivative financial instruments are measured at fair value, and changes are recorded according to the type of hedge used, as described below:
Cash flow hedges
When a derivative instrument is designated as a cash flow hedge, the effective portion of the changes in fair value is recognized in other comprehensive income, and presented in the hedge reserve. Any ineffective portion of the changes in the fair value of the derivative is recognized in the consolidated statement of income.
The amount accumulated in equity is maintained in other comprehensive income and is reclassified to the consolidated statement of income in the same period that the hedged item affects income.
If the hedged instrument no longer meets the criteria for hedge accounting, expires or is sold, or is terminated or exercised, or the designation is revoked, this hedge is prospectively discontinued. If the expected transaction is no longer expected to occur, the balance recorded in equity is immediately reclassified to the consolidated statement of income.
Derivatives not designated for hedge accounting
Derivative instruments that are not linked to a hedge strategy are classified as assets or liabilities at fair value and recorded in the consolidated statement of financial position at fair value. Changes in the valuation of these derivative instruments are recorded in the consolidated statement of income.
Embedded derivatives
Derivatives may be embedded in another contractual arrangement (a host contract). The Company accounts for an embedded derivative separately from the host contract when:
| · | the host contract is not an asset in the scope of IFRS 9; |
| · | the host contract is not itself carried at FVTPL; |
| · | the terms of the embedded derivative would meet the definition of a derivative if they were contained in a separate contract; and |
| · | the economic characteristics and risks of the embedded derivative are not closely related to the economic characteristics and risks of the host contract. |
F-178
| (4) | Summary of Significant Accounting Policies, continued |
Separated embedded derivatives are measured at fair value, with all changes in fair value recognized in profit or loss unless they form part of a qualifying cash flow or net investment hedging relationship. Separated embedded derivatives are presented in the statement of financial position together with the host contract.
(g) Recognition of the most significant income and expenses
Interest income and expenses
Interest income and expenses are recognized in the consolidated statement of income using the effective interest method. The effective interest rate is the discount rate that equals exactly the estimated cash flows receivable or payable throughout the expected life of the financial instrument or when appropriate (in a shorter period) with the net carrying value of the financial asset or liability. To calculate the effective interest rate, the Company will estimate cash flows considering all of the contractual conditions of the financial instrument, but not considering future credit losses.
The calculation of the effective interest rate includes all commissions and points paid or received that are part of the effective interest rate. Transaction costs include incremental costs that are directly attributable to the acquisition or issue of a financial asset or liability.
Fees and commissions
Fees and commissions that are part of the effective interest rate in a financial asset or liability instrument are included in the measurement of the effective interest rate.
Other revenues from fees and commissions, including services fees, asset management, sales commissions, loan syndication, among others, are recognized when the corresponding services are provided. When a loan commitment is not expected to be disbursed in the short term, the corresponding fees for this commitment are recognized on a straight-line basis over the commitment's term.
Annual credit card memberships, net of direct card-origination incremental costs, are deferred and amortized by applying the straight-line method during a term of one year. Commissions charged to affiliated commercial establishments are determined based on the amount and type of purchase by the cardholder and are recognized when invoiced.
Other fees and commissions received mainly relating to fees for transactions and services are recognized as income when they are received.
Loyalty programs
The Company offers loyalty programs that allow cardholders to earn points that can be redeemed for a variety of awards, including cash, trips and products at a discount. The points are recognized as a separately identifiable component of the initial transaction of credit card consumption income.
The estimated fair value of loyalty programs and those points redeemed are recognized in the commissions account in the consolidated statement of income. The Company recognizes the points based on the earned points expected to be redeemed and the fair value of the point to be redeemed. The points to be redeemed are estimated based on the history of redemption, card product type, account transaction activity and past performance of the cards.
F-179
| (4) | Summary of Significant Accounting Policies, continued |
(h) Cash and cash equivalents
The Company considers all highly liquid time deposits with maturities of 90 days or less as cash equivalents. Cash and cash equivalents consist of cash, demand deposits at banks, certain securities and deposits that generate interests, with original maturities of 90 days or less.
(i) Property, furniture, equipment and improvements and depreciation method used
Property, furniture, equipment and improvements are presented at cost, less accumulated depreciation and amortization.
The cost of renewals and improvements is capitalized when they increase the asset's useful life; while repairs and maintenance that do not extend the useful life or improve the asset are charged to profit or loss during the period in which they are incurred.
Depreciation is calculated on a straight-line basis over the estimated useful lives of the assets. The Company depreciates amounts with a charge to the period's profit or loss with a credit to the accumulated depreciation account. Land is not depreciated. The estimated useful lives of assets are:
| Category | Years/Base |
Buildings | 20 - 50 |
| Furniture and equipment | 5 - 10 |
| Vehicles | 5 |
| Computers | 3 - 5 |
| Leasehold improvements | 3 - 10 |
Leasehold improvements are amortized during the lower of the estimated useful life or the term of the lease contract.
Property and equipment are reviewed for impairment whenever events or changes in circumstances indicate that the carrying amount may not be recoverable. The carrying amount of an asset is immediate reduced to its recoverable value if the carrying amount of the asset is greater than the estimated recoverable value. The recoverable amount is the highest between the fair value of the asset less the cost of selling and its value in use.
| (j) | Leases |
Policy applicable as of January 1, 2019
The Company has applied IFRS 16 using the modified retrospective approach and therefore the comparative information has not been restated and continues to be reported under IAS 17 and IFRIC 4. The details of accounting policies under IAS 17 and IFRIC 4 are disclosed separately if they are different from those under IFRS 16 and the impact of changes is disclosed in Note 3.
At inception of a contract, the Company assesses whether a contract is, or contains, a lease. A contract is, or contains, a lease if the contract conveys the right to control the use of an identified asset for a period of time in exchange for consideration. To assess whether a contract conveys the right to control the use of an identified asset, the Company assesses whether:
| · | the contract involves the use of an identified asset – this may be specified explicitly or implicitly and should be physically distinct or represent substantially all of the capacity of a physically distinct asset. If the supplier has a substantive substitution right, then the asset is not identified; |
F-180
| (4) | Summary of Significant Accounting Policies, continued |
| · | the Company has the right to obtain substantially all of the economic benefits from use of the asset throughout the period of use; and |
| · | the Company has the right to direct the use of the asset. The Company has this right when it has the decision-making rights that are most relevant to changing how and for what purpose the asset is used. In rare cases where the decision about how and for what purpose the asset is used is predetermined, the Company has the right to direct the use of the asset if either: |
| · | the Company has the right to operate the asset; or |
| · | the Company designed the asset in a way that predetermines how and for what purpose it will be used. |
This policy is applied to contracts entered into, or changed, on or after January 1, 2019.
At inception or on reassessment of a contract that contains a lease component, the Company allocates the consideration in the contract to each lease component on the basis of their relative stand-alone prices. However, for the leases of land and buildings in which it is a lessee, the Company has elected not to separate non-lease components and account for the lease and non-lease components as a single lease component.
| i. | As a lessee |
The Company recognizes a right-of-use asset and a lease liability at the lease commencement date. The right-of-use asset is initially measured at cost, which comprises the initial amount of the lease liability adjusted for any lease payments made at or before the commencement date, plus any initial direct costs incurred and an estimate of costs to dismantle and remove the underlying asset or to restore the underlying asset or the site on which it is located, less any lease incentives received.
The right-of-use asset is subsequently depreciated using the straight-line method from the commencement date to the earlier of the end of the useful life of the right-of-use asset or the end of the lease term. The estimated useful lives of right-of-use assets are determined on the same basis as those of property and equipment. In addition, the right-of-use asset is periodically reduced by impairment losses, if any, and adjusted for certain remeasurements of the lease liability.
The lease liability is initially measured at the present value of the lease payments that are not paid at the commencement date, discounted using the interest rate implicit in the lease or, if that rate cannot be readily determined, the Company’s incremental borrowing rate. The Company uses its incremental borrowing rate as the discount rate.
F-181
| (4) | Summary of Significant Accounting Policies, continued |
Lease payments included in the measurement of the lease liability comprise the following:
| · | fixed payments, including in-substance fixed payments; |
| · | variable lease payments that depend on an index or a rate, initially measured using the index or rate as at the commencement date; |
| · | amounts expected to be payable under a residual value guarantee; and |
| · | the exercise price under a purchase option that the Company is reasonably certain to exercise, lease payments in an optional renewal period if the Company is reasonably certain to exercise an extension option, and penalties for early termination of a lease unless the Company is reasonably certain not to terminate early. |
The lease liability is measured at amortized cost using the effective interest method. It is remeasured when there is a change in future lease payments arising from a change in an index or rate, if there is a change in the Company’s estimate of the amount expected to be payable under a residual value guarantee, or if the Company changes its assessment of whether it will exercise a purchase, extension or termination option.
When the lease liability is remeasured in this way, a corresponding adjustment is made to the carrying amount of the right-of-use asset or is recorded in profit or loss if the carrying amount of the right-of-use asset has been reduced to zero.
The Company presents right-of-use assets that do not meet the definition of investment property in “property, furniture, equipment and improvements” and lease liabilities in “lease liabilities” in the consolidated statement of financial position.
Short-term leases and leases of low-value assets
The Company has elected not to recognize right-of-use assets and lease liabilities for short-term leases of machinery that have a lease term of 12 months or less and leases of low-value assets, including IT equipment. The Company recognizes the lease payments associated with these leases as an expense on a straight-line basis over the lease term.
| ii. | As a lessor |
When the Company acts as a lessor, it determines at lease inception whether each lease is a finance lease or an operating lease.
To classify each lease, the Company makes an overall assessment of whether the lease transfers substantially all of the risks and rewards incidental to ownership of the underlying asset. If this is the case, then the lease is a finance lease; if not, then it is an operating lease. As part of this assessment, the Company considers certain indicators such as whether the lease is for the major part of the economic life of the asset.
If an arrangement contains lease and non-lease components, the Company applies IFRS 15 to allocate the consideration in the contract.
F-182
| (4) | Summary of Significant Accounting Policies, continued |
The Company recognizes lease payments received under operating leases as income on a straight-line basis over the lease term as part of “other income”.
The accounting policies applicable to the Bank as a lessor in the comparative period were not different from IFRS 16.
Under IAS 17
In the comparative period, as a lessee the Company classified leases that transfer substantially all of the risks and rewards of ownership as finance leases. When this was the case, the leased assets were measured initially at an amount equal to the lower of their fair value and the present value of the minimum lease payments. Minimum lease payments were the payments over the lease term that the lessee was required to make, excluding any contingent rent.
Subsequently, the assets were accounted for in accordance with the accounting policy applicable to that asset.
Assets held under other leases were classified as operating leases and were not recognized in the Company’s statement of financial position. Payments made under operating leases were recognized in profit or loss on a straight-line basis over the term of the lease. Lease incentives received were recognized as an integral part of the total lease expense, over the term of the lease.
Policy applicable before January 1, 2019
For contracts entered into before January 1, 2019, the Company determined whether the arrangement was or contained a lease based on the assessment of whether:
| · | fulfilment of the arrangement was dependent on the use of a specific asset or assets; and |
| · | the arrangement had conveyed a right to use the asset. An arrangement conveyed the right to use the asset if one of the following was met: |
| · | the purchaser had the ability or right to operate the asset while obtaining or controlling more than an insignificant amount of the output; |
| · | the purchaser had the ability or right to control physical access to the asset while obtaining or controlling more than an insignificant amount of the output; or |
| · | facts and circumstances indicated that it was remote that other parties would take more than an insignificant amount of the output, and the price per unit was neither fixed per unit of output nor equal to the current market price per unit of output. |
F-183
| (4) | Summary of Significant Accounting Policies, continued |
| (k) | Business combinations and goodwill |
The Company follows the acquisition method to account for the acquisition of subsidiaries. The Company considers that the acquisition date is the date on which control is obtained and it legally transfers the consideration for assets acquired and liabilities assumed. The cost of an acquisition is measured through the fair value of the consideration paid. The fair value of the consideration transferred by the Company in a business combination is calculated as the sum of the fair value on the acquisition date of the assets transferred to the Company, deferred considerations and contingent considerations, including options, issued by the Company.The Company recognizes fair values on the date of acquisition of any preexisting investment in the subsidiary and the contingent consideration as part of the consideration transferred in exchange for the acquisition.
In general, all identifiable assets acquired (including intangible assets) and liabilities assumed (including contingent liabilities) are measured at fair value on the acquisition date. The Company records identifiable intangible assets regardless of whether the assets have been already recognized by the acquirer prior to the business combination. Non-controlling interests are recorded for the proportional part of fair value of the identifiable assets and liabilities, unless stated otherwise. When the Company has the corresponding option to settle the purchase of a non-controlling interest through the issue of its own ordinary shares, no financial liability is recorded.
Any excess in the cost of acquisition over the interest in net fair value of the identifiable assets acquired and the liabilities assumed by the Company is recorded as goodwill. If the cost of the acquisition is lower than the fair value of the interest in the identifiable assets acquired and liabilities assumed by the Company, the resulting gain is recognized immediately in other revenue, in the consolidated statement of income. During the measurement period (which is a term of one year from the date of the acquisition), the Company can, retrospectively, adjust the amounts recognized on the date of acquisition to reflect new information obtained on events and circumstances that existed at that date.
F-184
| (4) | Summary of Significant Accounting Policies, continued |
After initial recognition of goodwill in a business combination, goodwill is measured at cost less accumulated impairment losses. Goodwill is not amortized, but impairment tests are conducted each year, and when circumstances indicate that carrying amounts may be impaired.
For impairment tests purposes, goodwill acquired in a business combination is, on the acquisition date, assigned to each of the cash-generating unit groups (CGUs) expected to benefit from the combination. The CGUs to which goodwill is assigned will be disaggregated so impairment-testing level reflects the lowest level to which the goodwill is controlled for purposes of internal management.
An impairment loss will be recognized if the carrying amount of the CGU plus the goodwill allocated to it is higher than its recoverable amount, in which case the allocated goodwill will be reduced, and any remaining impairment would be applied to other CGUs’ assets.
| (l) | Intangible assets |
Intangible assets represent identifiable non-monetary assets and are acquired separately or through a business combination or are generated internally. The Company's intangible assets are recognized at cost or at fair value and mainly comprised of relations with the depositors, relations with credit card clients, relations with affiliated businesses, technological programs and trade names.
Cash-generating units to which goodwill has been attributed are periodically assessed for impairment. This assessment is carried out at least annually, or whenever there is evidence of impairment.
The amortization expense of intangible assets is presented in the consolidated statement of income as depreciation and amortization expenses.
Trade names are non-amortizable intangible assets.
| (m) | Income tax |
Tax expense for the year includes current and deferred taxes. Taxes are recognized in profit or loss, except to the extent that they refer to items recognized directly in equity.
The current tax expense is calculated based on the laws enacted on the balance sheet date in the countries where the parent company and its subsidiaries operate, and where they generate positive taxable bases. The Company’s management periodically assesses the positions assumed in tax returns regarding situations in which applicable tax regulation is subject to interpretation, and when necessary, recognizes provisions for the amounts expected to be paid to the tax authorities.
Deferred taxes are recognized for the temporary differences that arise between the tax bases of assets and liabilities and their carrying amounts in the consolidated financial statements. However, deferred tax liabilities are not recorded if they arise from the initial recognition of goodwill; deferred taxes are not recognized if they arise from an asset or liability in a transaction, other than a business combination, that at the time of the transaction does not affect the accounting results nor taxable income or loss. Deferred tax is determined using tax rates (and laws) enacted on the balance sheet date and expected to be applicable when the corresponding deferred tax asset is realized, or the liability is settled.
Deferred tax assets are recognized only to the extend that it is probable that future tax benefits will be available with which to offset the temporary differences.
Deferred taxes are recognized over temporary differences that arise from investments in subsidiaries and associates, except for those deferred tax liabilities for which the Company can control the date on which the temporary differences will be reversed, and it is likely that they will not be reversed in the near future. Deferred tax assets are recognized in deductible temporary differences that arise from investments in subsidiaries only to the extent that it is likely that the temporary differences will be reversed in the future, and there is a sufficient future taxable income against which the temporary differences can be used.
Deferred tax assets and deferred tax liabilities are set off only if there is a legally recognized right to offset the current tax assets with the current tax liabilities and when the deferred tax assets and deferred tax liabilities are derived from income tax corresponding to the same tax authority, and the authority allows the Company to pay or received a single amount that settle the existing net balance.
F-185
| (4) | Summary of Significant Accounting Policies, continued |
| (n) | Employee benefits |
The Company is subject to the labor laws in each country where it operates. The Company provisioned an employment benefit when such benefit is related to employee services already rendered, the employee has earned the right to receive the benefit, the benefit payment is probable, and the amount of such benefit can be estimated.
| (o) | Trust contracts and securities management |
The assets under trust contracts and securities under custody are not considered part of the Company, and accordingly, such securities and related revenue are not included in these consolidated financial statements. It is the obligation of the Company to manage and safeguard the assets under contract and independently of their equity.
The Company charges a fee for the management of trust contracts and custody of securities, which is paid according to agreements between the parties. These fees are recognized as income according to the terms of the contracts either monthly, quarterly or annually on an accrual base.
| (p) | Fair value option |
The Company may choose to measure some of its financial instruments at fair value, if they meet the criteria to eliminate or significantly reduce the volatility introduced in profit or loss as a result of different measurements related financial instruments (accounting mismatch). Under these criteria, the Company’s management adopted the policy of designating a portion of the mortgage portfolio at fair value; covering the risk exposure generated by the growing trend of rates by acquiring derivative financial instruments.
| (q) | Fair value estimates |
The fair value of a financial asset or liability is the price that would be received to sell an asset or paid to transfer a liability in an orderly transaction between market participants at the measurement date (exit price).
The different hierarchy levels have been defined as follows:
| · | Level 1 - Quoted prices in active markets without adjustments for identical assets or liabilities that the Company can access at the measurement date. |
| · | Level 2 - Inputs other than quoted prices included in Level 1 that are observable, either directly (i.e. as prices) or indirectly (i.e. derived from prices). This category includes instruments valued using quoted prices in active markets for similar instruments, quoted prices for identical or similar instruments in markets that are not active and other valuation techniques where significant data inputs are directly or indirectly observable in the market. |
F-186
| (4) | Summary of Significant Accounting Policies, continued |
| · | Level 3 - Unobservable inputs for the asset or liability. This category includes all instruments where the valuation technique includes unobservable inputs and these have a significant effect on the fair value measurement. This category also includes instruments that are valued based on quoted prices for similar instruments for which we must make significant adjustments using unobservable inputs, assumptions or adjustments in which no observable or subjective data are used when there are differences between the instruments. |
A market is considered active if quoted prices are readily and regularly available from an exchange, financial intermediaries, a sector institution, pricing service or regulatory agency, and those prices reflect actual market transactions with sufficient frequency and volume to provide pricing market information.
| (r) | Transactions between entities under common control |
Transfers of assets between entities under common control, including transactions with intermediate holding companies, are initially recorded at book value of the Company transferring the assets at the date of transfer. If the carrying amount of the assets and liabilities transferred differs from historical cost of the Parent Company of entities under common control, then the Company receiving the assets and liabilities will recognize them at the historical cost.
The Company enters into transactions with related parties, which according to the internal policies of the Company are carried out at market conditions.
| (s) | Assets and liabilities classified as held for sale |
The disposal group of assets and liabilities, expected to be recovered through sale rather than continued operation, are classified as held for sale. Immediately before the initial classification as held for sale, the carrying amounts of the assets and liabilities or disposal group of assets or liabilities are measured at fair value. Subsequent to this measurement, assets held for sale are recognized at the lower of the book value, and fair value less costs to sell. An impairment loss will be recognized by initial or subsequent reductions in the group of assets and liabilities. Impairment losses in the initial and subsequent classification of assets and liabilities held for sale are recognized in the consolidated statement of income.
F-187
| (4) | Summary of Significant Accounting Policies, continued |
| (t) | Discontinued operations |
A discontinued operation is a component of the Company that has been sold or otherwise disposed of, or has been classified as held for sale, and (i) represents a significant and independent line of business or a geographical area of operation, or (ii) is part of a single coordinated plan to sell or dispose of a significant and independent line of business or a geographical area of operation. Classification as a discontinued operation occurs when the operation is sold or when it meets the criteria to be classified as held for sale, if it occurs earlier. When an operation is classified as discontinued, the consolidated statement of income and comprehensive income are modified as if the operation had been discontinued since the beginning of the comparative year.
| (u) | Uniformity in the presentation of the Consolidated Financial Statements |
Certain amounts in the consolidated financial statements of 2018 have been reclassified to conform their presentation to the 2018, as a result of the discontinued operations, see Note 29.
| (v) | New International Financial Reporting Standards (“IFRSs”) not yet adopted. |
As of the date of the consolidated financial statements, there were IFRS that were still not applied when preparing them:
| · | IFRS 17 “Insurance Contracts” |
IFRS 17 establishes the principles for the recognition, measurement, presentation and disclosure of insurance contracts within the scope of the standard. The objective of IFRS 17 is to ensure that an entity provides relevant information that faithfully represents those contracts. This information gives a basis for users of financial statements to assess the effect that insurance contracts have on the entity's financial position, financial performance and cash flows.
IFRS 17 was issued in May 2017 and applies to annual reporting periods beginning on or after January 1, 2021.
The Company considers that IFRS 17 will not have a significant impact on the consolidated financial statements.
F-188
| (5) | Risk Management |
Risk management is a fundamental part of the Company. It has an infrastructure to comprehensively manage risks, in order to ensure a responsible and sustainable growth in time, to maintain the confidence of its stakeholders, and to assure with reasonable certainty the fulfillment of its short, medium and long-term goals, through a balance between meeting objectives and taking risks, in line with the corporate strategy.
Classification of financial assets
See the classification under IFRS 9 in accounting policies in Note 4 (c).
The following table provides a reconciliation between line items in the consolidated statement of financial position and categories of financial instruments.
| 2019 | Designated FVPL – debt instruments | Designated FVPL - equity instruments | FVOCI - debt instruments | FVOCI - equity instruments | AC | Total | ||||||||||||||||||
| Cash, cash flow and bank deposits | 0 | 0 | 0 | 0 | 4,090,524,508 | 4,090,524,508 | ||||||||||||||||||
| Interest receivable from cash and bank deposits | 0 | 0 | 0 | 0 | 4,742,864 | 4,742,864 | ||||||||||||||||||
| Investments and other assets at fair value | 42,636,461 | 10,617,681 | 2,165,446,376 | 5,328,901 | 0 | 2,224,029,419 | ||||||||||||||||||
| Interest receivable from investments at fair value | 0 | 0 | 30,737,645 | 0 | 0 | 30,737,645 | ||||||||||||||||||
| Loans at amortized cost | 0 | 0 | 0 | 0 | 16,325,857,651 | 16,325,857,651 | ||||||||||||||||||
| Other accounts receivable | 0 | 0 | 0 | 0 | 237,756,868 | 237,756,868 | ||||||||||||||||||
| Total financial assets | 42,636,461 | 10,617,681 | 2,196,184,021 | 5,328,901 | 20,658,881,891 | 22,913,648,955 | ||||||||||||||||||
| 2018 | Designated FVPL – debt instruments | Designated FVPL - equity instruments | FVOCI - debt instruments | FVOCI - equity instruments | AC | Total | ||||||||||||||||||
| Cash, cash flow and bank deposits | 0 | 0 | 0 | 0 | 4,191,989,365 | 4,191,989,365 | ||||||||||||||||||
| Interest receivable from cash and bank deposits | 0 | 0 | 0 | 0 | 4,649,605 | 4,649,605 | ||||||||||||||||||
| Investments and other assets at fair value | 36,741,359 | 10,072,395 | 1,765,606,585 | 4,803,359 | 0 | 1,817,223,698 | ||||||||||||||||||
| Interest receivable from investments at fair value | 0 | 0 | 21,993,280 | 0 | 0 | 21,993,280 | ||||||||||||||||||
| Loans at amortized cost | 0 | 0 | 0 | 0 | 15,741,534,989 | 15,741,534,989 | ||||||||||||||||||
| Other accounts receivable | 0 | 0 | 0 | 0 | 261,585,478 | 261,585,478 | ||||||||||||||||||
| Total financial assets | 36,741,359 | 10,072,395 | 1,787,599,865 | 4,803,359 | 20,199,759,437 | 22,038,976,415 | ||||||||||||||||||
As of December 31, 2019, and as of December 31, 2018, all of the financial liabilities held by the Company are classified at amortized cost.
The Company is exposed to the following risks from financial instruments:
| · | Credit risk, |
| · | Liquidity risk, |
| · | Market risk and |
| · | Operational risk. |
For the management of these risk, an organizational framework based on current regulations in the region on risk management has been defined. This framework includes policies, procedures and a human and technical infrastructure to identify, analyze and assess risks, as well as to set adequate limits and controls, monitor risk management and comply with defined limits. These policies and risk management systems are periodically reviewed, updated and reported to the respective committees, to ensure they reflect changes in market conditions, products and services offered.
Through its management procedures and standards, the Company aims to develop a disciplined and constructive control environment where all employees understand their roles and duties.
| (5) | Risk Management, continued |
The periodic oversight and management of risks is conducted through the following corporate governance bodies, established both regionally and in the countries where the Company operates: Committee of Comprehensive Risk Management, Assets and Liabilities Committee (ALICO), Compliance Committee, Credit Committee, and Audit Committee.
| (a) | Credit Risk |
This is the risk of financial loss faced by the Company when a client or counterparty fails to meet their contractual obligations, and is mainly originated from deposits, investments in securities and loans receivable.
To mitigate credit risk, risk management policies establish processes and controls to follow for the approval of loans or credit facilities. The Company structures acceptable credit risk levels by setting limits on the amount of risk that is assumed in relation to one borrower, or group of borrowers, and geographic segment. These credits are constantly controlled and subject to periodic review.
Exposure to credit risk is managed through a periodic analysis of the borrowers' or potential borrowers' capacity to pay principal and interest. Exposure to credit risk is also mitigated in part through collateral, corporate and personal guarantees.
Credit is managed through policies that have been clearly defined by the Board of Directors and are reviewed and modified periodically based on changes and expectations in the market where the Company operates, regulations and other factors considered while preparing these policies.
The Company uses a series of credit reports to assess its portfolio's performance, provision requirements and specially to anticipate events that could affect its debtor’s condition in the future.
The Company has a regional guideline on investments that defines the general profile for the investment portfolio and establishes two large maximum levels to control the investments' exposure: a limit on country risk and on issuer risk. The country risk limits are set based on an internal qualification scale and are measured as percentages of the Company's equity or as absolute amounts. The guideline includes approval schemes and attributions for new limits or increases on existing limits.
Compliance with this guideline is monitored on a daily basis through the Investment Portfolio Management and Control Module (MACCI from Spanish), an internal tool to document the entire investment process, including new approvals, limit increases or decreases, purchases and sales, and also to control exposures by issuer and the use of assigned quotas.
The Board of Directors has delegated the responsibility of managing credit risk to the Credit Committee and Assets and Liabilities Committee (ALICO); both periodically monitor the financial condition of the respective debtors and issuers that represent a credit risk for The Company.
F-189
| (5) | Risk Management, continued |
Information on the portfolio's quality
Quality of the portfolio of bank deposits and securities under resale agreements
The Company maintains deposits in banks for $3,345,268,973 as of December 31, 2019 (2018: $3,466,924,581). Deposits are maintained at central banks and other financial institutions, most of which have AA to CCC risk ratings, based on Standard & Poor’s, Moody's, and/or Fitch Ratings. Of total deposits, excluding deposits in central banks, As of December 31, 2019, approximately $43 million did not have a risk rating (2018: $84 million).
Securities under resale agreements are mostly classified based on the ratings assigned by Standard & Poor’s, Moody's, and/or Fitch Ratings.
As of December 31, 2019, all securities under resale agreements and bank deposits are up to date on the payment of principal and interest.
F-190
| (5) | Risk Management, continued |
Quality of the investments and other assets at fair value
The Company segregates the investment portfolio and other assets into investments at FVPL and investments at FVOCI. As of December 31, 2019, investments amounted to $2,224,029,419 (2018: $1,817,223,698). Interest receivable amounts to $30,737,645 (2018: $21,993,280).
| · | Investments and other assets at FVPL |
As of December 31, 2019, investments at FVPL included in this risk analysis amounted to $42,636,461 (2018: $36,741,359).
As of December 31, 2019, the Company does not held derivative financial instruments (2018: $1,405,988). For further discussion on derivative financial instruments, see Note 27.
As of December 31, 2019, the other assets at FVPL includes investments in common stocks for $10,617,681 (2018: $10,072,395) which are excluded from the following risk analyzes. As of December 31, 2019, there are mutual funds for $778,885 (2018: $1,157,801). Further details of the investments at FVPL can be found in Note 9.
The credit quality of investments is monitored according to the international risk rating of the issuer provided by Standard & Poor’s, Moody’s, and/or Fitch Ratings
The following table summarizes investments at FVLP categories:
| 2019 | 2018 | |||||||
| Governments and Agencies | ||||||||
| BB+ to BB- | 41,705,042 | 34,177,569 | ||||||
| Total Governments and Agencies | 41,705,042 | 34,177,569 | ||||||
| Corporates | ||||||||
| BB- or less | 152,534 | 0 | ||||||
| Not rated | 778,885 | 2,563,790 | ||||||
| Total Corporates | 931,419 | 2,563,790 | ||||||
| Total investments at FVPL | 42,636,461 | 36,741,359 | ||||||
As of December 31, 2019, investments at FVPL are current and do not reflect impairment (2018: current and do not reflect impairment).
The following table shows the analysis of counterparty credit exposures resulting from operations with derivative financial instruments as of December 31, 2018. The Company's derivative operations are generally guaranteed by cash. All of the Company's derivative financial instruments are traded on over-the-counter markets. For a further discussion of derivative financial instruments, see Note 27.
| 2018 | ||||||||||
Notional value | Fair value | |||||||||
| Assets | 66,250,000 | 888,101 | ||||||||
| Liabilities | 87,860,000 | 189,072 | ||||||||
F-191
| (5) | Risk Management, continued |
| · | Investments at FVOCI |
As of December 31, 2019, the investments at FVOCI included in this risk analysis total $2,165,446,376 (2018: $1,765,606,585). Interest receivable amounts to $30,737,645 (2018: $21,993,280).
As of December 31, 2019, the other assets at FVOCI include investments in common shares for $5,328,901 (2018: $4,803,359) which are excluded from the following risk analyzes. More detail of the investments at FVOCI can be found in Note 9.
As of December 31, 2019, investments in securities and other assets measured at fair value included in this risk analysis total $2,208,082,837 (2018: $1,801,459,844). Interest receivable amounts to $30,737,645 (2018: $21,993,280).
The following table summarizes the ratings of the investment portfolio at FVOCI:
| 2019 | 2018 | |||||||||||||||||||||||
| 12 months ECL | Lifetime ECL - without impairment | Total investments at FVOCI | 12 months ECL | Lifetime ECL - without impairment | Total investments at FVOCI | |||||||||||||||||||
| Governments and Agencies | ||||||||||||||||||||||||
| AAA | 839 | 0 | 839 | 970 | 0 | 970 | ||||||||||||||||||
| AA+ | 40,023,370 | 0 | 40,023,370 | 89,673,364 | 0 | 89,673,364 | ||||||||||||||||||
| BBB+ | 154,395,736 | 0 | 154,395,736 | 134,696,438 | 0 | 134,696,438 | ||||||||||||||||||
| BB+ or less | 1,509,957,869 | 0 | 1,509,957,869 | 947,308,411 | 19,976,400 | 967,284,811 | ||||||||||||||||||
| Total Governments and Agencies | 1,704,377,814 | 0 | 1,704,377,814 | 1,171,679,183 | 19,976,400 | 1,191,655,583 | ||||||||||||||||||
| Corporates | ||||||||||||||||||||||||
| AA | 2,020,000 | 0 | 2,020,000 | 0 | 0 | 0 | ||||||||||||||||||
| A- | 262,364,590 | 0 | 262,364,590 | 269,374,733 | 0 | 269,374,733 | ||||||||||||||||||
| BBB+ | 124,886,782 | 0 | 124,886,782 | 171,782,254 | 0 | 171,782,254 | ||||||||||||||||||
| BB+ or less | 71,797,190 | 0 | 71,797,190 | 132,794,015 | 0 | 132,794,015 | ||||||||||||||||||
| Total Corporates | 461,068,562 | 0 | 461,068,562 | 573,951,002 | 0 | 573,951,002 | ||||||||||||||||||
| Interest receivable from investments at FVOCI | 30,737,645 | 0 | 30,737,645 | 21,993,280 | 0 | 21,993,280 | ||||||||||||||||||
| Total | 2,196,184,021 | 0 | 2,196,184,021 | 1,767,623,465 | 19,976,400 | 1,787,599,865 | ||||||||||||||||||
| Allowance for ECL | 8,554,961 | 0 | 8,554,961 | 5,445,181 | 142,335 | 5,587,516 | ||||||||||||||||||
As of December 31, 2019 and as of December 31, 2018, investments at FVOCI are current and do not reflect impairment (2018: current and do not reflect impairment).
F-192
| (5) | Risk Management, continued |
Quality of the loans portfolio
Note 4 (c) contains an explanation of the measurement of the quality of financial instruments, which include the loan portfolio.
The following table presents the loans portfolio and the debts commitments and guarantee according to its risk category, in accordance with the grading used for each stated term:
| Loans | Debt commitments and guarantees | |||||||||
| 2019 | 12 months ECL | Lifetime ECL - credit unimpaired | Lifetime ECL - credit impaired | Total | Total | |||||
| Corporate | ||||||||||
| Satisfactory | 6,143,363,775 | 1,929,922 | 0 | 6,145,293,697 | 452,459,196 | |||||
| Special mention | 0 | 161,783,509 | 0 | 161,783,509 | 1,571,378 | |||||
| Sub-standard | 0 | 0 | 97,730,636 | 97,730,636 | 44,071 | |||||
| Doubtful | 0 | 0 | 15,719,902 | 15,719,902 | 0 | |||||
| Loss | 0 | 0 | 27,599,829 | 27,599,829 | 313,981 | |||||
| Gross amount | 6,143,363,775 | 163,713,431 | 141,050,367 | 6,448,127,573 | 454,388,626 | |||||
| Allowance for ECL | 35,618,255 | 17,012,276 | 41,991,855 | 94,622,386 | 380,751 | |||||
| Net amount | 6,107,745,520 | 146,701,155 | 99,058,512 | 6,353,505,187 | 454,007,875 | |||||
| Small Company | ||||||||||
| Satisfactory | 660,981,729 | 51,711,635 | 0 | 712,693,364 | 8,713,130 | |||||
| Special mention | 550,267 | 37,719,588 | 0 | 38,269,855 | 0 | |||||
| Sub-standard | 0 | 93,538 | 8,374,118 | 8,467,656 | 0 | |||||
| Doubtful | 0 | 0 | 4,571,559 | 4,571,559 | 1,116 | |||||
| Loss | 0 | 0 | 2,739,913 | 2,739,913 | 0 | |||||
| Gross amount | 661,531,996 | 89,524,761 | 15,685,590 | 766,742,347 | 8,714,246 | |||||
| Allowance for ECL | 4,568,794 | 6,047,401 | 5,217,866 | 15,834,061 | 1,571 | |||||
| Net amount | 656,963,202 | 83,477,360 | 10,467,724 | 750,908,286 | 8,712,675 | |||||
| Mortgage | ||||||||||
| Satisfactory | 2,934,458,154 | 168,943,334 | 0 | 3,103,401,488 | 45,087,813 | |||||
| Special mention | 7,588,423 | 152,377,405 | 0 | 159,965,828 | 0 | |||||
| Sub-standard | 0 | 683,383 | 32,707,345 | 33,390,728 | 0 | |||||
| Doubtful | 0 | 0 | 33,743,412 | 33,743,412 | 0 | |||||
| Loss | 0 | 0 | 34,390,549 | 34,390,549 | 0 | |||||
| Gross amount | 2,942,046,577 | 322,004,122 | 100,841,306 | 3,364,892,005 | 45,087,813 | |||||
| Allowance for ECL | 7,502,543 | 16,169,515 | 23,809,469 | 47,481,527 | 4,509 | |||||
| Net amount | 2,934,544,034 | 305,834,607 | 77,031,837 | 3,317,410,478 | 45,083,304 | |||||
| Personal banking | ||||||||||
| Satisfactory | 1,802,670,615 | 71,676,846 | 1,834,180 | 1,876,181,641 | 0 | |||||
| Special mention | 2,394,413 | 88,910,600 | 2,693,672 | 93,998,685 | 0 | |||||
| Sub-standard | 0 | 332,610 | 11,529,447 | 11,862,057 | 0 | |||||
| Doubtful | 0 | 0 | 13,281,015 | 13,281,015 | 0 | |||||
| Loss | 0 | 15,776 | 13,285,025 | 13,300,801 | 0 | |||||
| Gross amount | 1,805,065,028 | 160,935,832 | 42,623,339 | 2,008,624,199 | 0 | |||||
| Allowance for ECL | 36,770,713 | 33,255,645 | 22,741,542 | 92,767,900 | 0 | |||||
| Net amount | 1,768,294,315 | 127,680,187 | 19,881,797 | 1,915,856,299 | 0 | |||||
| Vehicles | ||||||||||
| Satisfactory | 838,491,135 | 53,429,196 | 0 | 891,920,331 | 0 | |||||
| Special mention | 1,939,880 | 39,057,759 | 0 | 40,997,639 | 0 | |||||
| Sub-standard | 0 | 74,827 | 5,318,846 | 5,393,673 | 0 | |||||
| Doubtful | 0 | 0 | 4,545,350 | 4,545,350 | 0 | |||||
| Loss | 0 | 0 | 6,643 | 6,643 | 0 | |||||
| Gross amount | 840,431,015 | 92,561,782 | 9,870,839 | 942,863,636 | 0 | |||||
| Allowance for ECL | 3,458,949 | 6,756,295 | 4,044,239 | 14,259,483 | 0 | |||||
| Net amount | 836,972,066 | 85,805,487 | 5,826,600 | 928,604,153 | 0 | |||||
| Credit Card | ||||||||||
| Satisfactory | 2,703,442,683 | 148,314,434 | 4,158,772 | 2,855,915,889 | 0 | |||||
| Special mention | 11,578,316 | 79,685,751 | 95,431,506 | 186,695,573 | 0 | |||||
| Sub-standard | 0 | 0 | 12,828,692 | 12,828,692 | 0 | |||||
| Doubtful | 291,578 | 47,007,376 | 7,106,256 | 54,405,210 | 0 | |||||
| Loss | 0 | 0 | 121,464,557 | 121,464,557 | 0 | |||||
| Gross amount | 2,715,312,577 | 275,007,561 | 240,989,783 | 3,231,309,921 | 0 | |||||
| Allowance for ECL | 75,472,838 | 64,541,441 | 104,724,576 | 244,738,855 | 0 | |||||
| Net amount | 2,639,839,739 | 210,466,120 | 136,265,207 | 2,986,571,066 | 0 | |||||
| Interest receivable on loans | 82,395,854 | 11,941,861 | 23,819,187 | 118,156,902 | 0 | |||||
| Unearned interest | (3,657,665) | (166,670) | (82,296) | (3,906,631) | 0 | |||||
| Net unearned commissions | (35,701,090) | (3,983,504) | (1,563,495) | (41,248,089) | 0 | |||||
| Net carrying amount, net of reserve | 14,987,395,975 | 967,756,603 | 370,705,073 | 16,325,857,651 | 507,803,854 | |||||
F-193
(5) Risk Management, continued
| Loans | Debt commitments and guarantees | |||||||||||
| 2018 | 12 months ECL | Lifetime ECL - credit unimpaired | Lifetime ECL - credit impaired | Acquired impaired | Total | Total | ||||||
| Corporate | ||||||||||||
| Satisfactory | 5,944,258,555 | 3,113,802 | 82 | 0 | 5,947,372,439 | 454,393,382 | ||||||
| Special mention | 0 | 156,659,456 | 0 | 0 | 156,659,456 | 0 | ||||||
| Sub-standard | 0 | 0 | 66,529,011 | 1,788,790 | 68,317,801 | 0 | ||||||
| Doubtful | 0 | 0 | 22,757,737 | 0 | 22,757,737 | 0 | ||||||
| Loss | 0 | 225,957 | 7,689,166 | 0 | 7,915,123 | 0 | ||||||
| Gross amount | 5,944,258,555 | 159,999,215 | 96,975,996 | 1,788,790 | 6,203,022,556 | 454,393,382 | ||||||
| Allowance for ECL | 42,526,178 | 18,587,825 | 21,607,134 | 840,731 | 83,561,868 | 458,441 | ||||||
| Net amount | 5,901,732,377 | 141,411,390 | 75,368,862 | 948,059 | 6,119,460,688 | 453,934,941 | ||||||
| Small Company | ||||||||||||
| Satisfactory | 673,501,604 | 31,118,540 | 562,260 | 0 | 705,182,404 | 8,306,334 | ||||||
| Special mention | 2,888,715 | 27,139,544 | 97,163 | 0 | 30,125,422 | 0 | ||||||
| Sub-standard | 0 | 0 | 6,986,915 | 0 | 6,986,915 | 0 | ||||||
| Doubtful | 0 | 0 | 3,923,210 | 0 | 3,923,210 | 0 | ||||||
| Loss | 266,272 | 107,991 | 1,989,750 | 0 | 2,364,013 | 0 | ||||||
| Gross amount | 676,656,591 | 58,366,075 | 13,559,298 | 0 | 748,581,964 | 8,306,334 | ||||||
| Allowance for ECL | 4,839,482 | 4,918,336 | 5,422,541 | 0 | 15,180,359 | 6,811 | ||||||
| Net amount | 671,817,109 | 53,447,739 | 8,136,757 | 0 | 733,401,605 | 8,299,523 | ||||||
| Mortgage | ||||||||||||
| Satisfactory | 2,845,873,756 | 200,150,796 | 7,113,093 | 0 | 3,053,137,645 | 41,874,498 | ||||||
| Special mention | 4,105,123 | 125,820,741 | 389,547 | 0 | 130,315,411 | 0 | ||||||
| Sub-standard | 0 | 0 | 18,019,256 | 0 | 18,019,256 | 0 | ||||||
| Doubtful | 0 | 0 | 22,404,546 | 0 | 22,404,546 | 0 | ||||||
| Loss | 516,125 | 1,502,214 | 17,798,888 | 0 | 19,817,227 | 0 | ||||||
| Gross amount | 2,850,495,004 | 327,473,751 | 65,725,330 | 0 | 3,243,694,085 | 41,874,498 | ||||||
| Allowance for ECL | 5,339,426 | 15,482,092 | 13,401,438 | 0 | 34,222,956 | 12,562 | ||||||
| Net amount | 2,845,155,578 | 311,991,659 | 52,323,892 | 0 | 3,209,471,129 | 41,861,936 | ||||||
| Personal banking | ||||||||||||
| Satisfactory | 1,828,088,042 | 91,780,300 | 4,089,168 | 0 | 1,923,957,510 | 0 | ||||||
| Special mention | 2,101,300 | 63,244,227 | 240,357 | 0 | 65,585,884 | 0 | ||||||
| Sub-standard | 0 | 0 | 8,620,424 | 0 | 8,620,424 | 0 | ||||||
| Doubtful | 0 | 0 | 11,652,797 | 0 | 11,652,797 | 0 | ||||||
| Loss | 120,859 | 2,321,517 | 16,586,077 | 0 | 19,028,453 | 0 | ||||||
| Gross amount | 1,830,310,201 | 157,346,044 | 41,188,823 | 0 | 2,028,845,068 | 0 | ||||||
| Allowance for ECL | 40,769,314 | 31,163,766 | 22,364,725 | 0 | 94,297,805 | 0 | ||||||
| Net amount | 1,789,540,887 | 126,182,278 | 18,824,098 | 0 | 1,934,547,263 | 0 | ||||||
| Vehicles | ||||||||||||
| Satisfactory | 890,657,600 | 49,692,609 | 1,468,629 | 0 | 941,818,838 | 0 | ||||||
| Special mention | 3,299,432 | 27,603,159 | 167,803 | 0 | 31,070,394 | 0 | ||||||
| Sub-standard | 0 | 0 | 2,754,346 | 0 | 2,754,346 | 0 | ||||||
| Doubtful | 0 | 0 | 3,350,152 | 0 | 3,350,152 | 0 | ||||||
| Loss | 315 | 200 | 0 | 0 | 515 | 0 | ||||||
| Gross amount | 893,957,347 | 77,295,968 | 7,740,930 | 0 | 978,994,245 | 0 | ||||||
| Allowance for ECL | 3,295,069 | 6,502,589 | 2,693,073 | 0 | 12,490,731 | 0 | ||||||
| Net amount | 890,662,278 | 70,793,379 | 5,047,857 | 0 | 966,503,514 | 0 | ||||||
| Credit Card | ||||||||||||
| Satisfactory | 2,399,262,706 | 194,352,841 | 2,383,459 | 0 | 2,595,999,006 | 0 | ||||||
| Special mention | 7,055,373 | 91,959,394 | 100,656,707 | 0 | 199,671,474 | 0 | ||||||
| Sub-standard | 0 | 0 | 12,729,535 | 0 | 12,729,535 | 0 | ||||||
| Doubtful | 287,930 | 43,587,567 | 7,381,132 | 0 | 51,256,629 | 0 | ||||||
| Loss | 13,697 | 8,330,673 | 92,951,386 | 0 | 101,295,756 | 0 | ||||||
| Gross amount | 2,406,619,706 | 338,230,475 | 216,102,219 | 0 | 2,960,952,400 | 0 | ||||||
| Allowance for ECL | 78,282,925 | 72,945,575 | 91,093,408 | 0 | 242,321,908 | 0 | ||||||
| Net amount | 2,328,336,781 | 265,284,900 | 125,008,811 | 0 | 2,718,630,492 | 0 | ||||||
| Interest receivable on loans | 85,264,285 | 13,616,347 | 5,490,887 | 8,387 | 104,379,906 | 0 | ||||||
| Unearned interest | (3,015,548) | (38,395) | (18,863) | 0 | (3,072,806) | 0 | ||||||
| Net unearned commissions | (37,003,260) | (3,936,283) | (847,259) | 0 | (41,786,802) | 0 | ||||||
| Net carrying amount, net of reserve | 14,472,490,487 | 978,753,014 | 289,335,042 | 956,446 | 15,741,534,989 | 504,096,400 | ||||||
Guarantees and other improvements to reduce credit risk and its financial effect
The Company maintains guarantees and other improvements to reduce credit risk to ensure the payment of their financial assets exposed to credit risk.
F-194
(5) Risk Management, continued
The table below shows the main types of guarantees taken with respect to different types of financial assets.
| 2019 | ||||||||||||
| Mortgage | Pledge | Certificates of deposit | Investments in securities | Unsecured | Total | |||||||
| Securities under resale agreements | 0 | 0 | 0 | 18,130,054 | 0 | 18,130,054 | ||||||
| Accrued interest on securities under resale agreements | 0 | 0 | 0 | 19,812 | 0 | 19,812 | ||||||
| Investments in securities at fair value | 0 | 0 | 0 | 0 | 2,208,082,837 | 2,208,082,837 | ||||||
| Accrued interest on investments in securities at fair value | 0 | 0 | 0 | 0 | 30,737,645 | 30,737,645 | ||||||
| Loans at amortized cost | ||||||||||||
| Corporates | ||||||||||||
| Corporate loans | 2,907,548,553 | 509,829,329 | 211,071,075 | 0 | 2,702,549,210 | 6,330,998,167 | ||||||
| Corporate leases, net | 0 | 117,129,406 | 0 | 0 | 0 | 117,129,406 | ||||||
| Total Corporates | 2,907,548,553 | 626,958,735 | 211,071,075 | 0 | 2,702,549,210 | 6,448,127,573 | ||||||
| Personal Banking and Small company | ||||||||||||
| Small company | ||||||||||||
| Small company | 414,340,524 | 0 | 21,090,455 | 0 | 221,641,280 | 657,072,259 | ||||||
| Small company leases, net | 0 | 109,670,088 | 0 | 0 | 0 | 109,670,088 | ||||||
| Total Small company | 414,340,524 | 109,670,088 | 21,090,455 | 0 | 221,641,280 | 766,742,347 | ||||||
| Vehicles | 0 | 871,071,317 | 0 | 0 | 0 | 871,071,317 | ||||||
| Credit cards | 0 | 0 | 0 | 0 | 3,231,309,921 | 3,231,309,921 | ||||||
| Personal | 403,347,582 | 0 | 45,513,232 | 0 | 1,559,763,385 | 2,008,624,199 | ||||||
| Mortgages | 3,364,892,005 | 0 | 0 | 0 | 0 | 3,364,892,005 | ||||||
| Personal leases, net | 0 | 71,792,319 | 0 | 0 | 0 | 71,792,319 | ||||||
| Total Personal Banking and Small company | 4,182,580,111 | 1,052,533,724 | 66,603,687 | 0 | 5,012,714,586 | 10,314,432,108 | ||||||
| Interest receivable on loans | 54,279,222 | 11,021,120 | 1,128,538 | 0 | 51,728,022 | 118,156,902 | ||||||
| Allowance for ECL | (129,544,875) | (31,483,749) | (56,057) | 0 | (348,619,531) | (509,704,212) | ||||||
| Unearned interest | (898,822) | (154,796) | (71,098) | 0 | (2,781,915) | (3,906,631) | ||||||
| Net unearned commissions | (14,495,196) | (10,017,545) | (159,317) | 0 | (16,576,031) | (41,248,089) | ||||||
| Total loans | 6,999,468,993 | 1,648,857,489 | 278,516,828 | 0 | 7,399,014,341 | 16,325,857,651 | ||||||
| Commitments and guarantees | 53,186,729 | 873,559 | 16,954,194 | 0 | 437,176,203 | 508,190,685 | ||||||
| 2018 | ||||||||||||
| Mortgage | Pledge | Certificates of deposit | Investments in securities | Unsecured | Total | |||||||
| Securities under resale agreements | 0 | 0 | 0 | 20,911,045 | 0 | 20,911,045 | ||||||
| Accrued interest on securities under resale agreements | 0 | 0 | 0 | 40,643 | 0 | 40,643 | ||||||
| Investments in securities at fair value | 0 | 0 | 888,101 | 0 | 1,801,459,843 | 1,802,347,944 | ||||||
| Accrued interest on investments in securities at fair value | 0 | 0 | 0 | 0 | 21,993,280 | 21,993,280 | ||||||
| Loans at amortized cost | ||||||||||||
| Corporates | ||||||||||||
| Corporate loans | 2,951,741,458 | 434,187,673 | 220,131,599 | 0 | 2,466,148,936 | 6,072,209,666 | ||||||
| Corporate leases, net | 0 | 130,812,890 | 0 | 0 | 0 | 130,812,890 | ||||||
| Total Corporates | 2,951,741,458 | 565,000,563 | 220,131,599 | 0 | 2,466,148,936 | 6,203,022,556 | ||||||
| Personal Banking and Small company | ||||||||||||
| Small company | ||||||||||||
| Small company | 396,189,969 | 0 | 19,031,660 | 0 | 236,750,317 | 651,971,946 | ||||||
| Small company leases, net | 0 | 96,610,018 | 0 | 0 | 0 | 96,610,018 | ||||||
| Total Small company | 396,189,969 | 96,610,018 | 19,031,660 | 0 | 236,750,317 | 748,581,964 | ||||||
| Vehicles | 0 | 908,177,699 | 0 | 0 | 0 | 908,177,699 | ||||||
| Credit cards | 0 | 0 | 0 | 0 | 2,960,952,400 | 2,960,952,400 | ||||||
| Personal | 402,150,490 | 0 | 45,062,289 | 0 | 1,581,632,289 | 2,028,845,068 | ||||||
| Mortgages | 3,243,694,082 | 0 | 0 | 0 | 0 | 3,243,694,082 | ||||||
| Personal leases, net | 0 | 70,816,546 | 0 | 0 | 0 | 70,816,546 | ||||||
| Total Personal Banking and Small company | 4,042,034,543 | 1,075,604,263 | 64,093,949 | 0 | 4,779,335,007 | 9,961,067,762 | ||||||
| Interest receivable on loans | 42,161,566 | 9,620,798 | 1,268,253 | 0 | 51,329,289 | 104,379,906 | ||||||
| Allowance for ECL | (96,578,174) | (25,006,861) | (80,101) | 0 | (360,410,491) | (482,075,627) | ||||||
| Unearned interest | (828,621) | (120,215) | (66,391) | 0 | (2,057,579) | (3,072,806) | ||||||
| Net unearned commissions | (15,233,154) | (5,414,760) | (130,386) | 0 | (21,008,502) | (41,786,802) | ||||||
| Total loans | 6,923,297,618 | 1,619,683,788 | 285,216,923 | 0 | 6,913,336,660 | 15,741,534,989 | ||||||
| Commitments and guarantees | 46,722,362 | 3,254,623 | 17,150,419 | 0 | 437,446,810 | 504,574,214 | ||||||
F-195
| (5) | Risk Management, continued |
The following are the non-financial assets that the Company seized as collaterals to secure collection during the period.
| 2019 | 2018 | |||
| Property | 14,769,068 | 13,365,053 | ||
| Others | 0 | 153,242 | ||
| Total | 14,769,068 | 13,518,295 |
The Company's policy is to perform the sale of these assets to cover the balances due. Using non-financial assets for its operations is not a Bank policy.
Residential mortgage loans
The following table shows the index of loans from the mortgage portfolio to the value of collaterals. LTV is calculated as a percentage of the gross amount of the loan in relation to the value of collaterals. The gross amount of the loan excludes any loss impairment. The value of collaterals for mortgages is based on the original value of the guarantee as of the date of disbursement.
| 2019 | 2018 | |||||||
| LTV Ratio | Loans | Credit and guarantee commitments | Loans | Credit and guarantee commitments | ||||
| Less than 50% | 680,576,315 | 3,481,789 | 640,969,312 | 3,567,348 | ||||
| 51-70% | 1,234,471,836 | 10,826,492 | 1,208,942,570 | 10,245,628 | ||||
| 71-80% | 1,154,696,226 | 19,530,266 | 1,083,266,655 | 16,149,237 | ||||
| 81-90% | 272,490,666 | 11,142,973 | 284,402,593 | 10,899,928 | ||||
| 91-100% | 15,840,405 | 106,292 | 19,182,962 | 697,856 | ||||
| More than 100% | 6,816,557 | 0 | 6,929,993 | 314,501 | ||||
| Total | 3,364,892,005 | 45,087,812 | 3,243,694,085 | 41,874,498 | ||||
Impaired loans
| LTV Ratio | 2019 | 2018 | ||
| Less than 50% | 10,890,641 | 7,717,065 | ||
| 51-70% | 31,715,674 | 20,451,733 | ||
| 71-80% | 43,868,716 | 26,410,635 | ||
| 81-90% | 11,835,871 | 9,304,500 | ||
| 91-100% | 2,065,495 | 1,580,624 | ||
| More than 100% | 464,909 | 260,773 | ||
| Total | 100,841,306 | 65,725,330 |
F-196
| (5) | Risk Management, continued |
ECL allowance
For further detail of the PCE calculation model, see Note 4 (c).
The Company incorporates information with projections of future conditions both in its evaluation of whether the credit risk of an instrument has increased significantly since its initial recognition and in its PCE measurement. For further details, see Note 4 (c).
The scenario probability weightings applied in measuring ECL in each of the countries where the Company operates, are as follows:
| 2019 | ||||||
| Scenario probability weighting | Guatemala | Honduras | El Salvador | Nicaragua | Costa Rica | Panama |
Upside
| 20% | 25% | 15% | 15% | 20% | 25% |
| Central | 70% | 65% | 70% | 70% | 60% | 60% |
| Downside | 10% | 10% | 15% | 15% | 20% | 15% |
| 2018 | ||||||
| Scenario probability weighting | Guatemala | Honduras | El Salvador | Nicaragua | Costa Rica | Panama |
Upside
| 40% | 15% | 50% | 15% | 5% | 15% |
| Central | 50% | 70% | 10% | 45% | 55% | 40% |
| Downside | 10% | 15% | 40% | 40% | 40% | 45% |
Periodically, the Company carries out stress testing of more extreme shocks to calibrate its determination of the upside and downside representative scenarios. A comprehensive review is performed at least annually on the design of the scenarios, advised by at least one external economist.
The Company has identified and documented key drivers of credit risk and credit losses for each portfolio of financial instruments and, using an analysis of historical data, has estimated relationships between macro-economic variables and credit risk and credit losses.
The key drivers for credit risk for loans’ portfolios are: Monthly Economic Activity Index, Consumer Price Index, Exchange Rate, Local Currency Interest Rate and Dollars Interest Rate.
The Company estimates each key driver for credit risk over the active forecast period of one year.
F-197
| (5) | Risk Management, continued |
The table below lists the macroeconomic assumptions used in the base, upside and downside scenarios over the forecast period.
| 2019 | |||||||
| Guatemala | Honduras | El Salvador | Nicaragua | Costa Rica | Panama | ||
| % | % | % | % | % | % | ||
| Monthly Economic Activity Index | Upside | 3.71 | 4.04 | 2.80 | (1.26) | 3.03 | 4.89 |
| Central | 3.19 | 2.95 | 2.40 | (3.08) | 2.59 | 3.83 | |
| Downside | 2.15 | 1.98 | 1.84 | (5.61) | 1.76 | 2.97 | |
| Consumer Price Index | Upside | 3.26 | 3.34 | 0.00 | 3.34 | 1.76 | 0.54 |
| Central | 3.53 | 4.61 | 0.97 | 6.58 | 1.91 | 0.77 | |
| Downside | 3.72 | 5.07 | 2.11 | 8.92 | 4.04 | 1.71 | |
| Exchange Rate | Upside | (0.95) | 0.72 | - | 2.72 | (1.07) | - |
| Central | (0.46) | 3.34 | - | 3.01 | 0.22 | - | |
| Downside | 1.54 | 4.50 | - | 3.74 | 3.39 | - | |
| Local Currency Interest Rate | Upside | (0.30) | (3.25) | - | (0.99) | (1.81) | - |
| Central | (0.03) | (1.45) | - | 1.70 | (1.58) | - | |
| Downside | 0.26 | (0.30) | - | 4.93 | (0.99) | - | |
| Dollars Interest Rate | Upside | (0.29) | (0.36) | (0.07) | (0.09) | (1.55) | (0.35) |
| Central | (0.12) | (0.34) | 0.03 | 1.03 | (1.17) | 0.08 | |
| Downside | 0.34 | 0.27 | 0.34 | 3.12 | (0.18) | 0.56 | |
| 2018 | |||||||
| Guatemala | Honduras | El Salvador | Nicaragua | Costa Rica | Panama | ||
| % | % | % | % | % | % | ||
| Monthly Economic Activity Index | Upside | 3.54 | 4.41 | 4.64 | 1.32 | 4.60 | 4.85 |
| Central | 2.76 | 3.46 | 2.50 | (3.64) | 2.11 | 4.60 | |
| Downside | 2.33 | 3.17 | 1.34 | (6.78) | (0.95) | 2.16 | |
| Consumer Price Index | Upside | 5.16 | 4.22 | 5.94 | 2.68 | 4.69 | 3.68 |
| Central | 3.23 | 4.69 | 1.40 | 6.62 | 3.62 | 2.00 | |
| Downside | 6.67 | 5.02 | 1.40 | 9.08 | 11.41 | 1.79 | |
| Exchange Rate | Upside | 0.32 | 3.92 | 0 | 5.68 | (1.56) | 0 |
| Central | 1.12 | 4.15 | 0 | 7.00 | 6.43 | 0 | |
| Downside | 1.43 | 4.35 | 0 | 6.26 | 18.35 | 0 | |
| Local Currency Interest Rate | Upside | (0.15) | (1.49) | 0 | 0.63 | (1.90) | 0 |
| Central | 0.30 | 0.30 | 0 | 1.69 | 7.72 | 0 | |
| Downside | 0.47 | 0.20 | 0 | 1.04 | 9.63 | 0 | |
| Dollars Interest Rate | Upside | (0.45) | (0.19) | 0.21 | 0.71 | (0.56) | 0.45 |
| Central | 0.11 | 0.11 | 0.11 | 1.74 | 0.36 | 0.11 | |
| Downside | 0.66 | 0.08 | 0.24 | 2.15 | 2.29 | 0.44 | |
Sensitivity of ECL to future economic conditions
The ECL are sensitive to judgements and assumptions made regarding formulation of forward-looking scenarios and how such scenarios are incorporated into the calculations. Management performs a sensitivity analysis on the ECL recognized on material classes of its assets.
F-198
| (5) | Risk Management, continued |
The table below shows the loss allowance on loans assuming each forward-looking scenario (e.g. central, upside and downside) were weighted 100% instead of applying scenario probability weights across the three scenarios.
| 2019 | Upside | Central | Downside | |||
| Book Value | ||||||
| Corporate | 6,448,127,573 | 6,448,127,573 | 6,448,127,573 | |||
| Small company | 766,742,347 | 766,742,347 | 766,742,347 | |||
| Mortgage | 3,364,892,005 | 3,364,892,005 | 3,364,892,005 | |||
| Personal banking | 2,008,624,199 | 2,008,624,199 | 2,008,624,199 | |||
| Vehicles | 942,863,636 | 942,863,636 | 942,863,636 | |||
| Credit card | 3,231,309,921 | 3,231,309,921 | 3,231,309,921 | |||
| 16,762,559,681 | 16,762,559,681 | 16,762,559,681 | ||||
| ECL Allowance | ||||||
| Corporate | 86,411,296 | 93,819,741 | 114,742,964 | |||
| Small company | 15,336,408 | 15,780,988 | 16,126,848 | |||
| Mortgage | 47,112,487 | 48,096,227 | 50,611,937 | |||
| Personal banking | 91,095,658 | 93,781,460 | 97,291,172 | |||
| Vehicles | 13,734,832 | 14,351,142 | 15,037,242 | |||
| Credit card | 242,705,884 | 244,012,603 | 247,591,486 | |||
| 496,396,565 | 509,842,161 | 541,401,649 | ||||
| Proportion of assets in Stage 2 | ||||||
| Corporate | 2.5% | 2.5% | 2.5% | |||
| Small company | 10.2% | 11.7% | 12.1% | |||
| Mortgage | 8.7% | 9.6% | 10.3% | |||
| Personal banking | 7.9% | 8.1% | 8.9% | |||
| Vehicles | 9.0% | 10.0% | 10.6% | |||
| Credit card | 8.5% | 8.5% | 8.5% | |||
| 6.3% | 6.6% | 6.9% |
| 2018 | Upside | Central | Downside | |||
| Book Value | ||||||
| Corporate | 6,203,022,556 | 6,203,022,556 | 6,203,022,556 | |||
| Small company | 748,581,964 | 748,581,964 | 748,581,964 | |||
| Mortgage | 3,243,694,085 | 3,243,694,085 | 3,243,694,085 | |||
| Personal banking | 2,028,845,068 | 2,028,845,068 | 2,028,845,068 | |||
| Vehicles | 978,994,245 | 978,994,245 | 978,994,245 | |||
| Credit card | 2,960,952,400 | 2,960,952,400 | 2,960,952,400 | |||
| 16,164,090,318 | 16,164,090,318 | 16,164,090,318 | ||||
| ECL Allowance | ||||||
| Corporate | 70,578,549 | 78,669,661 | 100,153,146 | |||
| Small company | 13,055,160 | 14,753,950 | 16,393,640 | |||
| Mortgage | 30,433,940 | 33,767,880 | 38,660,770 | |||
| Personal banking | 90,452,782 | 94,377,129 | 100,596,497 | |||
| Vehicles | 10,447,800 | 12,019,710 | 13,905,380 | |||
| Credit card | 228,745,274 | 239,391,691 | 254,481,220 | |||
| 443,713,505 | 472,980,021 | 524,190,653 | ||||
| Proportion of assets in Stage 2 | ||||||
| Corporate | 2.6% | 2.6% | 2.6% | |||
| Small company | 7.4% | 7.8% | 8.2% | |||
| Mortgage | 9.2% | 10.1% | 11.0% | |||
| Personal banking | 7.3% | 7.8% | 9.2% | |||
| Vehicles | 5.9% | 8.6% | 9.4% | |||
| Credit card | 11.2% | 11.3% | 12.2% | |||
| 6.5% | 6.9% | 7.5% |
F-199
| (5) | Risk Management, continued |
The following table shows a reconciliation of the opening and closing balances of the period As of December 31, 2019, of the financial assets’ ECL allowance.
| 2019 | 2018 | |||||||||||||||
| Deposits in banks | 12 months ECL | Lifetime ECL - unimpaired | Lifetime ECL - impaired | Total | 12 months ECL | Lifetime ECL - unimpaired | Lifetime ECL – impaired | Total | ||||||||
Balance at beginning of year | 21,201 | 0 | 0 | 21,201 | 0 | 0 | 0 | 0 | ||||||||
| Impact of adoption of IFRS 9 as of January 1, 2018 | 0 | 0 | 0 | 0 | 37,762 | 0 | 0 | 37,762 | ||||||||
| Restated balance at beginning of year | 21,201 | 0 | 0 | 21,201 | 37,762 | 0 | 0 | 37,762 | ||||||||
| Net remeasurement of loss allowance | (21,201) | 0 | 0 | (21,201) | (37,101) | 0 | 0 | (37,101) | ||||||||
| New financial assets originated | 85,223 | 0 | 0 | 85,223 | 24,375 | 0 | 0 | 24,375 | ||||||||
| Foreign currency translation | 671 | 0 | 0 | 671 | (3,835) | 0 | 0 | (3,835) | ||||||||
| Balance at year end | 85,894 | 0 | 0 | 85,894 | 21,201 | 0 | 0 | 21,201 | ||||||||
| 2019 | 2018 | |||||||||||||||
| Investments at FVOCI | 12 months ECL | Lifetime ECL - unimpaired | Lifetime ECL - impaired | Total | 12 months ECL | Lifetime ECL - unimpaired | Lifetime ECL - impaired | Total | ||||||||
Balance at beginning of year | 5,445,181 | 142,335 | 0 | 5,587,516 | 0 | 0 | 0 | 0 | ||||||||
| Impact of adoption of IFRS 9 as of January 1, 2018 | 0 | 0 | 0 | 0 | 3,440,711 | 121,284 | 0 | 3,561,995 | ||||||||
| Restated balance at beginning of year | 5,445,181 | 142,335 | 0 | 5,587,516 | 3,440,711 | 121,284 | 0 | 3,561,995 | ||||||||
| Net remeasurement of loss allowance | (3,802,214) | (142,335) | 0 | (3,944,549) | (2,132,567) | 7,063 | 0 | (2,125,504) | ||||||||
| New financial assets originated | 6,780,086 | 0 | 0 | 6,780,086 | 4,266,389 | 13,988 | 0 | 4,280,377 | ||||||||
| Foreign currency translation | 131,908 | 0 | 0 | 131,908 | (129,352) | 0 | 0 | (129,352) | ||||||||
| Balance at year end | 8,554,961 | 0 | 0 | 8,554,961 | 5,445,181 | 142,335 | 0 | 5,587,516 | ||||||||
The above investments’ ECL allowance is not recognized within the consolidated statement of financial position, because the book value of the investments at FVOCI is its fair value.
| 2019 | 2018 | |||||||||||||||
| Loans at AC | 12 months ECL | Lifetime ECL - unimpaired | Lifetime ECL - impaired | Total | 12 months ECL | Lifetime ECL - unimpaired | Lifetime ECL - impaired | Total | ||||||||
Balance at beginning of year | 174,771,033 | 149,600,183 | 157,704,411 | 482,075,627 | 52,093,113 | 53,859,532 | 126,997,176 | 232,949,821 | ||||||||
| Impact of adoption of IFRS 9 as of January 1, 2018 | 0 | 0 | 0 | 0 | 109,081,324 | 77,728,733 | 16,326,591 | 203,136,648 | ||||||||
| Restated balance at beginning of year | 174,771,033 | 149,600,183 | 157,704,411 | 482,075,627 | 161,174,437 | 131,588,265 | 143,323,767 | 436,086,469 | ||||||||
| Transfer from stage 1 to 2 | (12,103,051) | 12,103,051 | 0 | 0 | (13,457,146) | 13,457,146 | 0 | 0 | ||||||||
| Transfer from stage 1 to 3 | (3,962,792) | 0 | 3,962,792 | 0 | (3,920,057) | 0 | 3,920,057 | 0 | ||||||||
| Transfer from stage 2 to 3 | 0 | (15,952,342) | 15,952,342 | 0 | 0 | (11,702,498) | 11,702,498 | 0 | ||||||||
| Transfer from stage 3 to 2 | 0 | 4,908,385 | (4,908,385) | 0 | 0 | 5,481,777 | (5,481,777) | 0 | ||||||||
| Transfer from stage 2 to 1 | 25,284,859 | (25,284,859) | 0 | 0 | 25,768,484 | (25,768,484) | 0 | 0 | ||||||||
| Transfer from stage 3 to 1 | 1,537,465 | 0 | (1,537,465) | 0 | 1,561,437 | 0 | (1,561,437) | 0 | ||||||||
| Net remeasurement of loss allowance | (29,710,758) | 40,843,940 | 402,578,841 | 413,712,023 | (14,884,885) | 54,139,087 | 353,452,288 | 392,706,490 | ||||||||
| New financial assets originated | 48,268,855 | 0 | 0 | 48,268,855 | 59,064,657 | 0 | 0 | 59,064,657 | ||||||||
| Net derecognition of financial assets | (40,693,519) | (22,435,785) | (18,752,127) | (81,881,431) | (40,535,894) | (17,595,110) | (19,430,466) | (77,561,470) | ||||||||
| Charge-offs | 14,163 | 0 | (465,260,357) | (465,260,357) | 0 | 0 | (405,288,309) | (405,288,309) | ||||||||
| Recoveries | 0 | 0 | 109,871,713 | 109,871,713 | 0 | 0 | 95,718,529 | 95,718,529 | ||||||||
| Foreign currency translation | 0 | 0 | 2,917,782 | 2,917,782 | 0 | 0 | (18,650,739) | (18,650,739) | ||||||||
| Balance at year end | 163,392,092 | 143,782,573 | 202,529,547 | 509,704,212 | 174,771,033 | 149,600,183 | 157,704,411 | 482,075,627 | ||||||||
| 2019 | 2018 | |||||||||||||||
| Other accounts receivable | 12 months ECL | Lifetime ECL – unimpaired | Lifetime ECL – impaired | Total | 12 months ECL | Lifetime ECL – unimpaired | Lifetime ECL – impaired | Total | ||||||||
Balance at beginning of year | 4,317,644 | 0 | 0 | 4,317,644 | 2,621,251 | 0 | 0 | 2,621,251 | ||||||||
| Impact of adoption of IFRS 9 as of January 1, 2018 | 0 | 0 | 0 | 0 | 1,796,792 | 0 | 0 | 1,796,792 | ||||||||
| Restated balance at beginning of year | 4,317,644 | 0 | 0 | 4,317,644 | 4,418,043 | 0 | 0 | 4,418,043 | ||||||||
| Net remeasurement of loss allowance | (1,511,396) | 0 | 0 | (1,511,396) | (743,663) | 0 | 0 | (743,663) | ||||||||
| New financial assets originated | 3,046,048 | 0 | 0 | 3,046,048 | 1,366,006 | 0 | 0 | 1,366,006 | ||||||||
| Discontinued operations | 0 | 0 | 0 | 0 | 14,639 | 0 | 0 | 14,639 | ||||||||
| Charge-offs | (851,690) | 0 | 0 | (851,690) | (843,648) | 0 | 0 | (843,648) | ||||||||
| Recoveries | 448,670 | 0 | 0 | 448,670 | 220,435 | 0 | 0 | 220,435 | ||||||||
| Foreign currency translation | (107,958) | 0 | 0 | (107,958) | (114,168) | 0 | 0 | (114,168) | ||||||||
| Balance at year end | 5,341,318 | 0 | 0 | 5,341,318 | 4,317,644 | 0 | 0 | 4,317,644 | ||||||||
Modified Financial Assets
The following table provides information on individually significant financial assets that were modified while having a provision for losses measured in an amount equal to the ECL for the expected life.
| 2019 | 2018 | |||
| Amortized cost before modification | 31,597,006 | 634,847 | ||
| Net loss due modification | 977,385 | 0 | ||
| Total | 32,574,391 | 634,847 |
F-200
| (5) | Risk Management, continued |
Concentration of credit risk
The Company follow-up the concentration of credit risk by sector and geographic location. The geographic location of loans and deposits in banks is based on the location of the debtor. In regards to investments, they are based on the location of the issuer. The analysis of the concentration of credit risks as of the date of the consolidated financial statements is as follows:
| 2019 | ||||||||||||
| Loans at amortized cost | Commitments and guarantees | Securities purchased under resale agreements | Deposits in banks | Investments at FVOCI | Investments at FVPL | |||||||
| Concentration by sector | ||||||||||||
| Government | 0 | 0 | 18,130,054 | 2,516,601,838 | 1,704,377,814 | 41,705,042 | ||||||
| Corporate | ||||||||||||
| Trade | 1,622,914,692 | 72,785,084 | 0 | 0 | 0 | 0 | ||||||
| Real estate | 1,255,633,856 | 16,775,962 | 0 | 0 | 9,648,017 | 0 | ||||||
| Services | 1,218,843,150 | 129,324,038 | 0 | 0 | 0 | 0 | ||||||
| Food industry | 906,537,978 | 18,445,008 | 0 | 0 | 0 | 0 | ||||||
| General industry | 795,394,658 | 28,075,759 | 0 | 0 | 0 | 0 | ||||||
| Agriculture | 517,566,146 | 8,249,552 | 0 | 0 | 0 | 0 | ||||||
| Hotels and restaurants | 316,554,680 | 2,841,393 | 0 | 0 | 0 | 0 | ||||||
| Financial | 233,547,292 | 130,269,469 | 0 | 828,667,135 | 437,874,019 | 931,419 | ||||||
| Transportation | 175,681,911 | 10,892,182 | 0 | 0 | 0 | 0 | ||||||
| Construction | 138,405,206 | 43,668,016 | 0 | 0 | 13,546,526 | 0 | ||||||
| Telecommunication | 34,442,438 | 1,776,409 | 0 | 0 | 0 | 0 | ||||||
| Personal Banking | 9,547,037,674 | 45,087,813 | 0 | 0 | 0 | 0 | ||||||
| Interest receivable on loans | 118,156,902 | 0 | 19,812 | 4,723,052 | 30,737,645 | 0 | ||||||
| Allowance for ECL | (509,704,212) | 0 | 0 | 0 | 0 | 0 | ||||||
| Unearned interest | (3,906,631) | 0 | 0 | 0 | 0 | 0 | ||||||
| Net unearned commissions | (41,248,089) | 0 | 0 | 0 | 0 | 0 | ||||||
| Net carrying amount | 16,325,857,651 | 508,190,685 | 18,149,866 | 3,349,992,025 | 2,196,184,021 | 42,636,461 | ||||||
| Geographic location: | ||||||||||||
| Costa Rica | 4,748,518,505 | 187,085,520 | 5,141,084 | 847,046,148 | 855,595,241 | 42,434,788 | ||||||
| Panama | 3,960,754,784 | 158,418,723 | 0 | 61,375,638 | 193,396,442 | 0 | ||||||
| Guatemala | 3,256,142,251 | 10,818,107 | 12,988,970 | 450,512,049 | 397,267,521 | 201,673 | ||||||
| Honduras | 2,075,554,902 | 31,835,080 | 0 | 468,675,367 | 187,014,662 | 0 | ||||||
| El Salvador | 1,854,034,976 | 102,737,415 | 0 | 567,805,037 | 78,974,929 | 0 | ||||||
| Nicaragua | 867,554,263 | 17,295,840 | 0 | 250,216,191 | 23,901,999 | 0 | ||||||
| North America | 0 | 0 | 0 | 670,012,455 | 426,247,225 | 0 | ||||||
| Europe | 0 | 0 | 0 | 17,694,882 | 0 | 0 | ||||||
| South America | 0 | 0 | 0 | 0 | 1,028,357 | 0 | ||||||
| Others | 0 | 0 | 0 | 11,931,205 | 2,020,000 | 0 | ||||||
| Interest receivable on loans | 118,156,902 | 0 | 19,812 | 4,723,052 | 30,737,645 | 0 | ||||||
| Allowance for ECL | (509,704,212) | 0 | 0 | 0 | 0 | 0 | ||||||
| Unearned interest | (3,906,631) | 0 | 0 | 0 | 0 | 0 | ||||||
| Net unearned commissions | (41,248,089) | 0 | 0 | 0 | 0 | 0 | ||||||
| Total Concentration by sector | 16,325,857,651 | 508,190,685 | 18,149,866 | 3,349,992,024 | 2,196,184,021 | 42,636,461 | ||||||
F-201
| (5) | Risk Management, continued |
| 2018 | ||||||||||||
| Loans at amortized cost | Commitments and guarantees | Securities purchased under resale agreements | Deposits in banks | Investments at FVOCI | Investments at FVPL | |||||||
| Concentration by sector | ||||||||||||
| Government | 0 | 0 | 14,448,550 | 2,382,933,308 | 1,190,392,412 | 34,177,569 | ||||||
| Corporate | ||||||||||||
| Trade | 1,683,188,465 | 129,392,984 | 0 | 0 | 0 | 0 | ||||||
| Services | 1,244,317,765 | 110,528,473 | 0 | 0 | 0 | 0 | ||||||
| Real estate | 1,036,469,527 | 13,103,589 | 0 | 0 | 0 | 0 | ||||||
| Food industry | 934,214,212 | 12,900,102 | 0 | 0 | 7,766,419 | 0 | ||||||
| General industry | 716,493,372 | 49,808,133 | 0 | 0 | 0 | 0 | ||||||
| Agriculture | 468,988,888 | 23,225,137 | 0 | 0 | 0 | 0 | ||||||
| Hotels and restaurants | 271,143,154 | 6,671,982 | 0 | 0 | 0 | 0 | ||||||
| Financial | 231,998,951 | 63,822,539 | 6,462,495 | 1,083,991,273 | 495,959,697 | 2,563,790 | ||||||
| Transportation | 166,825,911 | 8,591,407 | 0 | 0 | 0 | 0 | ||||||
| Construction | 154,774,346 | 43,628,571 | 0 | 0 | 8,746,896 | 0 | ||||||
| Telecommunication | 44,191,209 | 1,026,800 | 0 | 0 | 7,825,922 | 0 | ||||||
| Mining | 0 | 0 | 0 | 0 | 51,269,749 | 0 | ||||||
| Other industries | 0 | 0 | 0 | 0 | 3,645,490 | 0 | ||||||
| Personal Banking | 9,211,484,518 | 41,874,497 | 0 | 0 | 0 | 0 | ||||||
| Interest receivable on loans | 104,379,906 | 0 | 40,643 | 4,608,962 | 21,993,280 | 0 | ||||||
| Allowance for ECL | (482,075,627) | 0 | 0 | 0 | 0 | 0 | ||||||
| Unearned interest | (3,072,806) | 0 | 0 | 0 | 0 | 0 | ||||||
| Net unearned commissions | (41,786,802) | 0 | 0 | 0 | 0 | 0 | ||||||
| Net carrying amount | 15,741,534,989 | 504,574,214 | 20,951,688 | 3,471,533,543 | 1,787,599,865 | 36,741,359 | ||||||
| Geographic location: | ||||||||||||
| Costa Rica | 4,491,394,882 | 173,599,182 | 14,448,550 | 927,432,568 | 474,558,111 | 35,336,431 | ||||||
| Panama | 3,999,866,740 | 160,362,657 | 0 | 48,814,598 | 143,443,334 | 0 | ||||||
| Guatemala | 2,975,143,800 | 21,932,696 | 6,462,495 | 399,166,965 | 291,187,606 | 10,357 | ||||||
| Honduras | 1,872,752,321 | 33,185,739 | 0 | 367,927,597 | 177,386,705 | 506,470 | ||||||
| El Salvador | 1,737,459,997 | 85,125,200 | 0 | 569,330,490 | 12,582,555 | 0 | ||||||
| Nicaragua | 1,087,472,578 | 30,368,740 | 0 | 197,015,758 | 19,976,400 | 0 | ||||||
| North America | 0 | 0 | 0 | 916,820,269 | 529,796,516 | 0 | ||||||
| South America | 0 | 0 | 0 | 0 | 116,675,358 | 0 | ||||||
| Europe | 0 | 0 | 0 | 30,396,712 | 0 | 0 | ||||||
| Others | 0 | 0 | 0 | 10,019,624 | 0 | 888,101 | ||||||
| Interest receivable on loans | 104,379,906 | 0 | 40,643 | 4,608,962 | 21,993,280 | 0 | ||||||
| Allowance for ECL | (482,075,627) | 0 | 0 | 0 | 0 | 0 | ||||||
| Unearned interest | (3,072,806) | 0 | 0 | 0 | 0 | 0 | ||||||
| Net unearned commissions | (41,786,802) | 0 | 0 | 0 | 0 | 0 | ||||||
| Total Concentration by sector | 15,741,534,989 | 504,574,214 | 20,951,688 | 3,471,533,543 | 1,787,599,865 | 36,741,359 | ||||||
Since April 2018, the Republic of Nicaragua has been facing a series of socio-political events that have economic implications that are affecting the development of activities in the productive sectors of the country.
The Company has been and will continue to monitor the evolution of the liquidity and the quality of the portfolio of financial instruments placed or acquired in that country, in order to mitigate and manage the impacts of this situation.
| (b) | Liquidity Risk |
Liquidity risk is defined as the contingency of not being able to comply fully, in a timely and efficient manner, the expected and unexpected cash flows, current and future, without affecting the course of daily operations or the financial condition of the entity. This contingency (liquidity risk) is evidenced in the insufficient liquid assets available for this and/or the need to assume unusual funding costs.
F-202
(5) Risk Management, continued
The liquidity management conducted by the Company seeks to meet its obligations of (i) withdrawals of deposits by its customers, (ii) repayment of the service of its debts of institutional funding according to maturity and the payment scheme scheduled, and (iii) compliance with the credit demand and investment funds according to the requirements. In this regard, the Company has constant control over its short term liabilities and assets. The liquidity of the Company is carefully managed and adjusted daily based on the estimated liquidity in a contingent and expected scenario.
The Company’s liquidity management is in compliance with the policies and guidelines issued by Senior management and/or Regional and Local Board of Directors; the regulators of each country in which it operates and the contractual obligations. These best practices are primarily defensive, in the sense of seeking to maintain appropriate levels of liquidity at all times. In addition, the Company has implemented the internal liquidity requirements that force it to keep excesses on regulatory requirements.
Specifically, the Company’s liquidity risk is managed through the calculation of liquidity coverage indicators in the short term, net of obligations and requirements, and in normal and stressful situations, as well as a stress model of liquidity based on the cash flow, which considers the activity of assets and liabilities in a time horizon of up to one year, under a variety of scenarios, which include both normal market conditions and more severe conditions. In addition, the Company seeks to maintain a term matching, which enables it to meet its financial obligations over time.
As in the market risk, Senior Management engages actively in liquidity risk management through regional and local Assets and Liabilities Committee (ALICO) and Comprehensive Risk Management; thus giving greater support to the strategic decision-making process. The liquidity risk assumed by the Company is in line with the structure, complexity, size and nature of its operation, while always respecting the local regulations, the regional guidelines and the guidelines issued by Senior Management and/or Regional and Local Board of Directors.
At the level of the entire Company is established the obligation of properly documenting the periodic assessment of measurement indicators and compliance with regional guidelines and local regulations is established; as well as ensuring that reports related to liquidity risk to be remitted to the different internal and external instances (including the regulator) are adequate in terms of content, quality of information, generation, transmission and validation according to the requirements set forth in the respective standards.
The following table shows the results of the ratios for high-quality liquidity coverage with respect to the outflow of deposits under normal and stressful conditions, calculated based on internal policies, reported as of the reporting date and during the year:
| % of Liquidity | ||||
| 2019 | 2018 | |||
| As of year end | 36.0 | 36.0 | ||
| Maximum | 39.0 | 41.0 | ||
| Average | 36.0 | 34.4 | ||
| Minimum | 33.0 | 31.0 | ||
F-203
(5) Risk Management, continued
As of December 31, 2019 and as of December 31, 2018, the Banking operations of the Company comply with the liquidity requirements established by the regulators.
Quantitative information
The following table details the undiscounted cash flows of financial liabilities and financial assets, and disbursements due to financial derivatives in contractual maturity groups from the remaining period from the date of the consolidated statement of financial position:
| 2019 | ||||||||||||||
| Amounts in thousands | Carrying Amount (1) | Total nominal gross amount inflows /(outflows) | Up to 1 month | From 1 to 3 months | From 3 months to 1 year | From 1 to 5 years | More than 5 years | |||||||
| Liabilities | ||||||||||||||
| Demand deposits | 5,971,832 | (5,971,832) | (5,971,832) | 0 | 0 | 0 | 0 | |||||||
| Savings deposits | 3,335,166 | (3,335,166) | (3,335,166) | 0 | 0 | 0 | 0 | |||||||
| Time deposits | 7,927,603 | (8,746,495) | (815,520) | (1,299,917) | (3,062,124) | (2,088,131) | (1,480,803) | |||||||
| Securities sold under repurchase agreements | 34,740 | (34,765) | (34,765) | 0 | 0 | 0 | 0 | |||||||
| Financial obligations | 2,339,121 | (2,572,018) | (120,994) | (263,556) | (846,167) | (865,932) | (475,369) | |||||||
| Other financial obligations | 319,415 | (339,999) | (1,517) | (33,096) | (103,457) | (201,929) | 0 | |||||||
| Sub-total liabilities | 19,927,877 | (21,000,275) | (10,279,794) | (1,596,569) | (4,011,748) | (3,155,992) | (1,956,172) | |||||||
| Commitments and guarantees | 0 | (60,116) | (5,199) | (12,577) | (42,340) | 0 | 0 | |||||||
| Acceptances outstantding | 1,969 | (1,969) | (441) | (445) | (1,083) | 0 | 0 | |||||||
| Total liabilities | 19,929,846 | (21,062,360) | (10,285,434) | (1,609,591) | (4,055,171) | (3,155,992) | (1,956,172) | |||||||
| Assets | ||||||||||||||
| Cash and cash equivalents | 727,125 | 727,125 | 727,125 | 0 | 0 | 0 | 0 | |||||||
| Securities purchased under resale agreements | 18,150 | 18,150 | 18,150 | 0 | 0 | 0 | 0 | |||||||
| Deposits in banks | 3,349,992 | 3,350,845 | 3,310,558 | 22,786 | 17,501 | 0 | 0 | |||||||
| Investments at FVPL (2) | 42,636 | 60,663 | 784 | 1,414 | 18,256 | 25,906 | 14,303 | |||||||
| Investments at FVOCI (2) | 2,196,184 | 2,532,524 | 171,036 | 130,617 | 446,682 | 1,256,177 | 528,012 | |||||||
| Loans | 16,325,858 | 22,874,588 | 2,497,266 | 2,961,135 | 2,942,747 | 6,484,159 | 7,989,281 | |||||||
| Sub-total assets | 22,659,945 | 29,563,895 | 6,724,919 | 3,115,952 | 3,425,186 | 7,766,242 | 8,531,596 | |||||||
| Acceptances outstanding | 1,969 | 1,969 | 441 | 445 | 1,083 | 0 | 0 | |||||||
| Total assets | 22,661,914 | 23,565,864 | 6,725,360 | 3,116,397 | 3,426,269 | 7,766,242 | 8,531,596 | |||||||
| (1) Includes interest receivable / payable on financial assets / liabilities |
| (2) Common stocks are excluded |
F-204
(5) Risk Management, continued
| 2018 | ||||||||||||||
| Amounts in thousands | Carrying Amount (1) | Total nominal gross amount inflows /(outflows) | Up to 1 month | From 1 to 3 months | From 3 months to 1 year | From 1 to 5 years | More than 5 years | |||||||
| Liabilities | ||||||||||||||
| Demand deposits | 5,578,226 | (5,578,226) | (5,578,226) | 0 | 0 | 0 | 0 | |||||||
| Savings deposits | 2,965,495 | (2,965,495) | (2,965,495) | 0 | 0 | 0 | 0 | |||||||
| Time deposits | 7,224,862 | (7,878,424) | (672,428) | (1,272,931) | (3,072,072) | (1,794,062) | (1,066,931) | |||||||
| Securities sold under repurchase agreements | 110,873 | (110,895) | (110,895) | 0 | 0 | 0 | 0 | |||||||
| Financial obligations | 3,315,076 | (3,568,519) | (193,391) | (503,967) | (1,475,487) | (1,123,464) | (272,210) | |||||||
| Other financial obligations | 299,285 | (315,902) | (3,007) | (6,919) | (87,910) | (218,066) | 0 | |||||||
| Sub-total liabilities | 19,493,817 | (20,417,461) | (9,523,442) | (1,783,817) | (4,635,469) | (3,135,592) | (1,339,141) | |||||||
| Commitments and guarantees | 0 | (66,221) | (6,079) | (15,797) | (44,345) | 0 | 0 | |||||||
| Acceptances outstanding | 1,526 | (1,526) | (342) | (646) | (538) | 0 | 0 | |||||||
| Total liabilities | 19,495,343 | (20,485,208) | (9,529,863) | (1,800,260) | (4,680,352) | (3,135,592) | (1,339,141) | |||||||
| Derivative instruments, liabilities | ||||||||||||||
| Fair value hedge contract | (189) | (189) | (189) | 0 | 0 | 0 | 0 | |||||||
| (189) | (189) | (189) | 0 | 0 | 0 | 0 | ||||||||
| Assets | ||||||||||||||
| Cash and cash equivalents | 704,154 | 704,154 | 704,154 | 0 | 0 | 0 | 0 | |||||||
| Securities purchased under resale agreements | 20,952 | 20,952 | 18,668 | 2,284 | 0 | 0 | 0 | |||||||
| Deposits in banks | 3,471,533 | 3,471,677 | 3,459,375 | 6,536 | 5,766 | 0 | 0 | |||||||
| Investments at FVPL (2) | 35,335 | 39,588 | 1 | 290 | 8,004 | 31,293 | 0 | |||||||
| Investments at FVOCI (3) | 1,787,600 | 1,969,623 | 42,277 | 153,067 | 389,593 | 1,347,450 | 37,236 | |||||||
| Loans | 16,268,470 | 21,231,639 | 2,289,689 | 2,762,613 | 2,838,254 | 6,048,234 | 7,292,849 | |||||||
| Sub-total assets | 22,288,044 | 27,437,606 | 6,514,164 | 2,924,790 | 3,241,617 | 7,426,977 | 7,330,085 | |||||||
| Acceptances outstanding | 1,526 | 1,526 | 342 | 646 | 538 | 0 | 0 | |||||||
| Total assets | 22,289,570 | 27,439,159 | 6,514,506 | 2,925,436 | 3,242,155 | 7,426,977 | 7,330,085 | |||||||
| Derivative instruments, assets | 888 | 888 | 888 | 0 | 0 | 0 | 0 | |||||||
| Fair value hedge contract | 888 | 888 | 888 | 0 | 0 | 0 | 0 | |||||||
| (1) Includes interest receivable / payable on financial assets / liabilities |
| (2) Common stocks and implicit derivatives are excluded |
| (3) Common stocks are excluded |
The liquidity of the Company is measured and monitored on a daily basis by the Treasury of each country. In addition, the Company maintains appropriate levels of cash in vaults, deposits in banks and short-term deposits which constitutes the Company’s basis of liquidity reserves. The composition of liquidity is shown in the following table:
| 2019 | 2018 | |||
| Cash and cash equivalents | 727,125,481 | 704,153,739 | ||
| Securities bought under resale agreements | 18,130,054 | 20,911,045 | ||
| Deposits in central banks | 2,383,147,625 | 2,282,847,029 | ||
| Deposits due from banks maturing in less than 90 days | 938,707,104 | 1,164,111,908 | ||
| Deposits due from banks greater than 90 days | 23,414,243 | 19,965,644 | ||
| Cash, cash equivalent and deposit in banks | 4,090,524,507 | 4,191,989,365 | ||
| Accrued interests of securities bought under resale agreements and deposits due from banks | 4,742,864 | 4,649,605 | ||
| Total cash, cash equivalent and deposit in banks | 4,095,267,371 | 4,196,638,970 | ||
| Not committed sovereign debt instruments | 1,674,926,042 | 1,076,975,599 | ||
| Other credit lines available (1) | 1,756,600,146 | 1,730,992,419 | ||
| Total liquidity reserve | 7,526,793,559 | 7,004,606,988 |
| (1) Amounts not disbursed as of the reporting date. |
The available credit lines are for use in normal business scenarios. They may have restricted use in stressful situations.
F-205
| (5) | Risk Management, continued |
The following table shows the availability of the Company's financial assets to support the future financing:
| 2019 | Committed | |||||||||
| As Collateral | Available as Collateral | Uncommitted Legal Reserve (1) | Other (2) | Total | ||||||
| Cash and cash equivalents | 0 | 0 | 0 | 727,125,481 | 727,125,481 | |||||
| Securities purchased under resale agreements | 0 | 18,130,054 | 0 | 0 | 18,130,054 | |||||
| Deposits due from banks | 5,529,203 | 2,115,848,345 | 205,252,355 | 1,018,639,069 | 3,345,268,973 | |||||
| Accrued interests of securities bought under resale agreements and deposits due from banks | 0 | 0 | 0 | 4,742,864 | 4,742,864 | |||||
| Investments in securities and other assets at fair value | 20,247,371 | 50,614,876 | 2,061,443,623 | 91,723,549 | 2,224,029,419 | |||||
| Accrued interests of investments at fair value | 0 | 0 | 0 | 30,737,645 | 30,737,645 | |||||
| Loans at amortized cost | 352,448,636 | 0 | 0 | 15,973,409,015 | 16,325,857,651 | |||||
| Total assets | 378,225,210 | 2,184,593,275 | 2,266,695,978 | 17,846,377,623 | 22,675,892,087 | |||||
| (1) | It represents uncommitted assets, but whose use the Company considers use to guarantee financing, for legal or other reasons. Committed deposits in banks comprise the legal reserve required by the different jurisdictions in which the Company operates, and can be used according to the regulation of each country. |
| (2) | It represents assets that are uncommitted for use as collateral. |
| 2018 | Committed | |||||||||
| As Collateral | Available as Collateral | Uncommitted Legal Reserve (1) | Other (2) | Total | ||||||
| Cash and cash equivalents | 0 | 0 | 0 | 704,153,739 | 704,153,739 | |||||
| Securities purchased under resale agreements | 0 | 20,911,045 | 0 | 0 | 20,911,045 | |||||
| Deposits due from banks | 0 | 1,973,243,895 | 185,610,603 | 1,308,070,083 | 3,466,924,581 | |||||
| Accrued interests of securities bought under resale agreements and deposits due from banks | 0 | 0 | 0 | 4,649,605 | 4,649,605 | |||||
| Investments in securities and other assets at fair value | 80,831,650 | 52,119,097 | 1,649,193,405 | 35,079,546 | 1,817,223,698 | |||||
| Accrued interests of investments at fair value | 0 | 0 | 0 | 21,993,280 | 21,993,280 | |||||
| Loans at amortized cost | 386,318,397 | 0 | 0 | 15,355,216,592 | 15,741,534,989 | |||||
| Total assets | 467,150,047 | 2,046,274,037 | 1,834,804,008 | 17,429,162,845 | 21,777,390,937 | |||||
| (1) | It represents uncommitted assets, but whose use the Company considers use to guarantee financing, for legal or other reasons. Committed deposits in banks comprise the legal reserve required by the different jurisdictions in which the Company operates, and can be used according to the regulation of each country. |
| (2) | It represents assets that are uncommitted for use as collateral. |
| (c) | Market risk |
Market risks are those that may result in losses as a result of adverse price movements in the financial markets where positions are maintained. It comprises the following risks:
- Interest rate risk: is the possibility of an economic loss due to adverse variations in interest rates.
- Exchange rate risk: is the possibility of an economic loss due to adverse variations in the exchange rate.
The main objectives of the Company’s corporate governance structure include supervising the performance of the management team in each country, ensuring the proper functioning of the internal control system, monitoring the exposure to risks and managing them effectively. For such purpose, management engages actively in market risk management through the regional and local Assets and Liabilities Committees (ALICO) and the Comprehensive Risk Management Committee; thus giving greater support to the strategic decision-making process.
F-206
| (5) | Risk Management, continued |
Market risks assumed by the Company are in line with the structure, complexity, size and nature of its operation, while always respecting the local regulations, the regional guidelines and the guidelines issued by management and/or regional and local board of directors.
The Company establishes the requirement of properly documenting the periodic assessment of measurement indicators and compliance with regional guidelines and local regulations, as well as ensuring that reports related to market risk to be remitted to the different internal and external instances (including the regulator) are adequate in terms of the content, quality of information, generation, transmission and validation according to the requirements set forth in the respective standards.
For the measurement, control and management of market risk, the Company uses the indicators required by the regulator of each country as well as another set of indicators established in the internal regional guideline, which are calculated by country and in a consolidated manner based on internal sources of information.
Exchange risk is measured through the determination of the equity percentage that is not dollarized (also known as monetary position). The main objective of the policy is to establish that the difference between assets denominated in US dollars and liabilities denominated in US dollars is at least equal to equity, which is equivalent to having a 100% dollarized equity. However, due to regulatory restrictions applicable in each country that limit the position in US dollars, the consolidated monetary position may be below this desirable limit.
Quantitative information
The Company maintains operations in the consolidated statement of financial position, agreed in local currency other than US dollars, which are listed below:
2019 Amounts in US millions | Quetzales | Lempiras | Cordobas | Colones | Total | |||||
| Cash, cash equivalents and deposits in banks | 378 | 398 | 127 | 497 | 1,400 | |||||
| Investments in securities | 368 | 182 | 0 | 228 | 778 | |||||
| Loans, net | 1,703 | 1,450 | 56 | 1,595 | 4,804 | |||||
| Total assets | 2,449 | 2,030 | 183 | 2,320 | 6,982 | |||||
| Deposits | 1,939 | 1,532 | 235 | 2,023 | 5,729 | |||||
| Obligations | 284 | 198 | 0 | 41 | 523 | |||||
| Total liabilities | 2,223 | 1,730 | 235 | 2,064 | 6,252 | |||||
| Contingencies | 0 | 20 | 0 | 38 | 58 | |||||
| Exchange risk exposure | 226 | 320 | (52) | 294 | 788 | |||||
| 2018 | Quetzales | Lempiras | Cordobas | Colones | Total | |||||
| Amounts in US millions | ||||||||||
| Cash, cash equivalents and deposits in banks | 316 | 291 | 99 | 562 | 1,268 | |||||
| Investments in securities | 248 | 167 | 20 | 194 | 629 | |||||
| Loans, net | 1,565 | 1,297 | 68 | 1,499 | 4.429 | |||||
| Total assets | 2,129 | 1,755 | 187 | 2,255 | 6,326 | |||||
| Deposits | 1,634 | 1,339 | 207 | 1,931 | 5,111 | |||||
| Obligations | 263 | 161 | 10 | 123 | 557 | |||||
| Total liabilities | 1,897 | 1,500 | 217 | 2,054 | 5,668 | |||||
| Contingencies | 0 | 20 | 0 | 45 | 65 | |||||
| Exchange risk exposure | 232 | 275 | (30) | 246 | 723 |
F-207
| (5) | Risk Management, continued |
Below, the summary exposure of the Company’s consolidated statement of financial position to interest rate risk. Assets and liabilities are included in the table at their carrying amount, classified by categories of time considering the next rate review date or the maturity date, as applicable:
| 2019 | Without exposure | Up to 1 year | From 1 to 5 years | More than 5 years | Total | |||||
| Cash and cash equivalents | 727,125,481 | 0 | 0 | 0 | 727,125,481 | |||||
| Securities purchased under resale agreements | 0 | 18,130,054 | 0 | 0 | 18,130,054 | |||||
| Deposits due from banks | 1,552,674,241 | 1,792,594,733 | 0 | 0 | 3,345,268,973 | |||||
| Accrued interests of securities bought under resale agreements and deposits due from banks | 4,742,864 | 0 | 0 | 0 | 4,742,864 | |||||
| Investments in securities and other assets at fair value | 318,731,545 | 491,509,922 | 963,701,319 | 450,086,633 | 2,224,029,419 | |||||
| Accrued interests of investments at fair value | 30,737,645 | 0 | 0 | 0 | 30,737,645 | |||||
| Loans at amortized cost | 0 | 15,418,441,943 | 1,167,020,390 | 177,097,348 | 16,762,559,681 | |||||
| Accrued interests of loans at amortized cost, net | 118,156,902 | 0 | 0 | 0 | 118,156,902 | |||||
| Total assets | 2,752,168,678 | 17,720,676,652 | 2,130,721,709 | 627,183,981 | 23,230,751,020 | |||||
| Deposits | 963,243,964 | 13,302,885,613 | 1,821,675,970 | 1,061,395,187 | 17,149,200,735 | |||||
| Accrued interest payable of deposits | 85,399,295 | 0 | 0 | 0 | 85,399,295 | |||||
| Institutional funding | 0 | 1,791,528,281 | 445,916,445 | 411,767,979 | 2,644,212,705 | |||||
| Accrued interest payable of securities sold under repurchase agreements, obligations and other financial obligations | 15,350,303 | 9,931 | 0 | 0 | 15,360,234 | |||||
| Total liabilities | 1,063,993,562 | 15,094,423,825 | 2,267,592,415 | 1,473,163,166 | 19,894,172,969 | |||||
| Exposure to interest rate risk | 1,688,175,116 | 2,626,252,827 | (136,870,706) | (845,979,185) | 3,336,578,051 |
| 2018 | Without exposure | Up to 1 year | From 1 to 5 years | More than 5 years | Total | |||||
| Cash and cash equivalents | 704,153,739 | 0 | 0 | 0 | 704,153,739 | |||||
| Securities purchased under resale agreements | 0 | 20,911,045 | 0 | 0 | 20,911,045 | |||||
| Deposits due from banks | 1,829,034,197 | 1,637,890,384 | 0 | 0 | 3,466,924, 581 | |||||
| Accrued interests of securities bought under resale agreements and deposits due from banks | 4,649,605 | 0 | 0 | 0 | 4,649,605 | |||||
| Investments in securities and other assets at fair value | 15,733,482 | 551,510,766 | 1,239,889,421 | 10,090,030 | 1,817,223,698 | |||||
| Accrued interests of investments at fair value | 19,499,824 | 2,493,456 | 0 | 0 | 21,993,280 | |||||
| Loans at amortized cost | 0 | 14,917,031,223 | 1.079.207.517 | 167,851,578 | 16,164,090,318 | |||||
| Accrued interests of loans at amortized cost | 104,379,906 | 0 | 0 | 0 | 104,379,906 | |||||
| Total assets | 2,677,450,753 | 17,129,836,874 | 2,319,096,937 | 177,941,608 | 22,304,326,173 | |||||
| Deposits | 935,690,680 | 12,408,379,620 | 1,590,819,086 | 751,987,793 | 15,686,877,179 | |||||
| Accrued interest payable of deposits | 81,705,890 | 0 | 0 | 0 | 81,705,890 | |||||
| Institutional funding | 0 | 2.646.094.763 | 835.663.044 | 113,288,391 | 3,595,046,198 | |||||
| Accrued interest payable of securities sold under repurchase agreements, obligations and other financial obligations | 18,956,819 | 0 | 0 | 0 | 18,956,819 | |||||
| Total liabilities | 1,036,353,389 | 15,054,474,383 | 2,426,482,130 | 865,276,184 | 19,382,586,086 | |||||
| Exposure to interest rate risk | 1.641.097.364 | 2,075,362,492 | (107.385.193) | (687,334,576) | 2,921,740,087 |
F-208
| (5) | Risk Management, continued |
Based on the above, the Company calculates the total exposure of the consolidated statement of financial position to interest rate risk. The Company states that the interest rate risk should be measured for each currency in which assets and liabilities are maintained.
Interest rate risk is analyzed based on the gap analysis, in order to approximate the change in equity of the Company's consolidated statement of financial position and in the net income from interest from eventual changes in market interest rates. The economic value of an instrument involves an assessment of the current value of its expected net cash flows, discounted to reflect market rates. By extension, the economic value of a financial entity can be seen as the present value of expected net cash flows from the entity, defined as expected cash flows from assets less expected cash flows from liabilities. In this sense, the perspective of economic value reflects a view of the sensitivity of the financial entity net value to interest rate fluctuations.
The estimate of the impact of variations in interest rates is conducted under a scenario of increase or decrease of 100 basis points in assets and liabilities at the different terms (parallel movement of the curve). The following table presents a summary of the impact on the Company's economic value and on the net interest income applying these variations:
| Increase of | Decrease of | |||
| 100 bps (1) | 100 bps (1) | |||
| Impact on equity to interest rate movements | ||||
| 2019 | (68,620,770) | 68,620,770 | ||
| Average for the year | (59,678,878) | 59,678,878 | ||
| Maximum for the year | (80,284,343) | 80,284,343 | ||
| Minimum for the year | (41,941,795) | 41,941,795 | ||
| 2018 | (78,514,563) | 78,514,563 | ||
| Average for the year | (82,988,274) | 82,988,274 | ||
| Maximum for the year | (95,111,272) | 95,111,272 | ||
| Minimum for the year | (60,288,586) | 60,288,586 | ||
| Impact on net income from interests | ||||
| 2019 | 62,457,673 | (62,457,673) | ||
| Average for the year | 56,725,165 | (56,725,165) | ||
| Maximum for the year | 62,457,673 | (62,457,673) | ||
| Minimum for the year | 53,085,233 | (53,085,233) | ||
| 2018 | 53,867,583 | (53,867,583) | ||
| Average for the year | 52,456,079 | (52,456,079) | ||
| Maximum for the year | 54,196,121 | (54,196,121) | ||
| Minimum for the year | 49,265,048 | (49,265,048) |
| (1) | According to the nature of the instruments on demand, the sensitivity of annual income and expenses to a decrease or increase in rates for currencies with rates below 1% is measured using a variation of 25 basis points. |
F-209
| (5) | Risk Management, continued |
| (d) | Operational risk |
The Company has established a minimum framework for operational risk management within its companies, which is intended to provide general guidelines to ensure the identification, assessment, control, monitoring and reporting of operational risks and materialized events that may affect the organization with the objective of ensuring the proper management, mitigation or reduction of the managed risks and contributing to provide a reasonable assurance with respect to the achievement of organizational objectives.
The operational risk management model considers best practices issued by the Basel Committee on Banking Supervision and by COSO (Committee of Sponsoring Organizations of the Treadway Commission). In addition, it complies with the regulatory requirements of the region, which have been defined by the regulators of the countries where the Company operates.
Based on the above, operational risk is defined as the possibility that the events resulting from personnel, information technologies or inadequate or failed internal processes, or produced by external causes, generate negative impacts that go against the objectives. By its nature, it is present in all of the organization’s activities.
The priority of the Company is, therefore, identifying and managing the major risk factors, regardless of whether they can produce monetary losses. The measurement also contributes to the establishment of priorities in the management of operational risk.
The operational risk management system is properly documented in the Operational Risk Guideline and Manual. It is a continuous process with several stages:
| · | Measurement of the perspective of control environment |
| · | Identification and assessment of operational risks |
| · | Treatment and mitigation of operational risks |
| · | Risk monitoring and review |
| · | Registration and accounting of losses due to operational risk incidents |
Additionally, the Company has policies formally established for the management of information security, business continuity, fraud prevention and code of ethics that support the proper management of operational risks in the organization.
At the regional level and in all countries where the Company operates, there is an operational risk management unit that monitors, advises and assesses the management conducted by the administration with regard to operational risks. In addition, there is a specialized Operational Risk Committee (OR Committee) composed of senior management. The OR Committee reports to the Comprehensive Risk Management Committee, monitors management and ensures that identified operational risks are kept at accepted levels by the organization.
Compliance with Bank standards is supported by a program of periodic reviews undertaken by Internal Audit, which reports the results to the Internal Audit Committee of each entity where the Company operates.
| (6) | Critical Accounting Estimates and Judgments in the Implementation of Accounting Policies |
The Company's management is responsible for the development, selection, disclosure of policies and critical accounting estimates and their implementation in a manner consistent with the assumptions selected and related to the significant estimate uncertainties.
Loan Impairment Losses
The Company reviews its loan portfolio to assess the impairment at least on a quarterly basis. When determining whether an impairment loss should be recorded in the consolidated statement of income, the Company makes decisions as to whether observable information exists indicating that there is a measurable reduction in estimated future cash flows from a loan portfolio before such reduction may be identified with an individual loan in that portfolio. This evidence includes observable information indicating that an adverse change in the payment condition of borrowers in a group, national or local economic conditions that correlate with non-compliance instances in Company’s assets have occurred.
Management determines estimates based on the experience of historical loss by assets with credit risk similar characteristics and objective evidence of impairment.
F-210
| (6) | Critical Accounting Estimates and Judgments in the Implementation of Accounting Policies, continued |
Fair Value of Financial Instruments
Fair value of financial instruments that are not quoted in active markets is determined using valuation techniques. All models are evaluated and adjusted before use, and the models are calibrated to ensure that the results reflect current information and comparative market prices.
To the extent possible, models only use observable information; however, areas such as credit risk (own and by the counterparty), volatilities and correlations require estimates by management. Changes in assumptions about these factors may affect the reported fair value of financial instruments.
Impairment of Investments at FVOCI
In debt instruments the impairment may be appropriate when there is evidence of impairment in the financial health of the issuer, industry or sector performance, changes in technology, and operational and financial cash flows.
Goodwill Impairment
The Company will determine whether goodwill is impaired annually or when there is indication of possible impairment.
This requires an estimate of the value in use of CGUs to which the goodwill value is attributed. The estimate of the value in use requires management to consider the expected cash flows from CGUs and also the selection of an appropriate discount rate to calculate the current value of such cash flows.
Income Tax
The Company uses the asset and liability method to record income tax. Under this method, the deferred tax assets and liabilities are recognized by the estimates of future tax consequences attributable to temporary differences between the amounts of assets and liabilities in the consolidated financial statements and their respective tax bases and due to accumulated tax losses. The deferred tax assets and liabilities are valued using the enacted tax rates that are expected to be applied to the tax revenue for the years in which they are expected to be recovered or temporary differences are settled. The effect on deferred tax assets and
liabilities by a change in tax rates is recognized in the operation results in the year in which the change occurs.
Management regularly assesses the realization of deferred tax assets for it recognition. Management evaluates whether it is more likely than not that a portion or all deferred tax assets are not realizable.
| (7) | Cash, Cash Equivalents and Deposits |
Cash and cash equivalents are listed below for reconciliation purposes with the consolidated statement of cash flow:
| 2019 | 2018 | |||
| Cash and cash equivalents | 727,125,481 | 704,153,739 | ||
| Securities purchased under resale agreements | 18,130,054 | 20,911,045 | ||
| Deposits in central banks | 2,383,147,625 | 2,282,847,029 | ||
| Deposits in banks and deposits due in less than 90 days | 938,707,106 | 1,164,111,908 | ||
| Accrued interests of securities bought under resale agreements and deposits due from banks | 4,348,371 | 4,375,546 | ||
| Cash and cash equivalents in the cash flow statement | 4,071,458,635 | 4,176,399,267 | ||
| Deposits in banks greater than 90 days and pledged | 23,414,243 | 19,965,644 | ||
| Accrued interests of deposits in banks greater than 90 days and pledged | 394,493 | 274,059 | ||
| Total cash, cash equivalents and deposits in banks | 4,095,267,371 | 4,196,638,970 | ||
| (8) | Securities Purchased Under Resale Agreements |
As of December 31, 2019, securities purchased under resale agreements amounted to $18,130,054 (2018: $20,911,045), which had maturity dates in January 2020 (2018: January and February 2019) and an interest rate between 2.6% and 4.6% (2018: between 3.0% and 5.8%). These securities were guaranteed with local government bonds and corporate bonds, which amounted to $20,186,397 (2018: $25,257,630).
F-211
| (9) | Investments at Fair Value |
As of December 31, 2019, investments at fair value amounted to $2,254,767,064 (2018: $1,839,216,978) are summarized as follows:
| (a) | Investments and other assets at FVPL |
The portfolio of investments in securities and other assets at FVPL is detailed as follows:
| 2019 | 2018 | |||
| Government bonds | 41,705,042 | 34,177,569 | ||
| Corporate bonds | 152,534 | 0 | ||
| Derivative instruments | 0 | 1.405.989 | ||
| Mutual funds | 778,885 | 1,157,801 | ||
| Common stocks | 10,617,681 | 10,072,395 | ||
| 53,254,142 | 46.813.754 |
The Company made sales of the FVPL portfolio for a total of $23,001,471 (2018: $5,138,230). The net gain in securities at the FVPL in the consolidated income statement amounted to $6,451,543 (2018: $896,959), which includes unrealized gains in securities at the FVPL for $6,195,588 (2018: $886,011). Realized earnings amount to $255,955 (2018: $10,948).
As of December 31, 2019, securities at FVPL with a carrying amount of $15,781,926 (2018: $16,311,372) are used as collateral for repurchase agreements.
| (b) | Investments at FVOCI |
The portfolio of investments at FVOCI is detailed as follows:
| 2019 | 2018 | |||
| Governments and Agencies bonds | ||||
| United States of America | 55,496,709 | 89,674,333 | ||
| Other governments | 1,648,881,105 | 1,101,981,250 | ||
| 1,704,377,814 | 1,191,655,583 | |||
| Corporate bonds | 461,068,562 | 573,951,002 | ||
| Accrued interest of investments at FVOCI | 30,737,645 | 21,993,280 | ||
| Common stocks | 5,328,901 | 4,803,359 | ||
| 2,201,512,922 | 1.792.403.224 |
As of December 31, 2019, the Company made sales of the investment portfolio to the FVOCI for $615,631,289 (2018: $117,784,282), these sales generated a net profit of $10,463,316 (2018: $433,068).
The Company had redemptions, maturities and prepayments of investments to the FVOCI for $1,406,403,233 (2018: $1,764,361,701).
As of December 31, 2019, the Company holds capital shares in the amount of $5,328,901 (2018: $4,803,359). As of December 31, 2019, the Company did not sell common stocks (2018: it did not sell common stocks).
During 2019, the portfolio of common stocks of the FVOCI had a variation in the Other Comprehensive Results of the Company of $568,600 (2018: $1,261,301). As of December 31, 2019, the Company received $399,284 for dividends from common stocks to the FVOUI (2018: $483,162).
The Company maintains a portfolio of equity investments issued by the following companies:
| Entity | Country | 2019 | 2018 | |||
| Almacenadora Guatemalteca, S. A. | Guatemala | 2,315,547 | 1,749,854 | |||
| Latinex Holdings, Inc. | Panama | 501,648 | 571,150 | |||
| Grupo APC, S. A. | Panama | 445,582 | 365,842 | |||
| Transacciones y Transferencia, S. A. | Guatemala | 311,603 | 310,068 | |||
| Otros | Otros | 1,754,521 | 1,806,445 | |||
| 5,328,901 | 4,803,359 |
Investments in equity measured at FVOCI are not held for trading.
F-212
| (10) | Loans |
A breakdown of the loan portfolio by type is as follows:
| 2019 | 2018 | |||||||||||
| Portfolio | Allowance for ECL | Net carrying amount | Portfolio | Allowance for ECL | Net carrying amount | |||||||
| Loans | ||||||||||||
| Corporates | ||||||||||||
| Corporate loans | 6,330,998,167 | 93,281,117 | 6,237,717,050 | 6,072,209,666 | 81,692,296 | 5,990,517,370 | ||||||
| Corporate leases, net (1) | 117,129,406 | 1,341,269 | 115,788,137 | 130,812,890 | 1,869,573 | 128,943,317 | ||||||
| Total Corporate | 6,448,127,573 | 94,622,386 | 6,353,505,187 | 6,203,022,556 | 83,561,869 | 6,119,460,687 | ||||||
| Personal Banking and Small company | ||||||||||||
| Small company | ||||||||||||
| Small company | 657,072,259 | 14,626,589 | 642,445,670 | 651,971,946 | 13,736,300 | 638,235,646 | ||||||
| Small company leases, net (1) | 109,670,088 | 1,207,472 | 108,462,616 | 96,610,018 | 1,444,059 | 95,165,959 | ||||||
| Total Small company loans | 766,742,347 | 15,834,061 | 750,908,286 | 748,581,964 | 15,180,359 | 733,401,605 | ||||||
| Vehicles | 871,071,317 | 12,767,973 | 858,303,344 | 908,177,699 | 11,601,249 | 896,576,450 | ||||||
| Credit Cards | 3,231,309,921 | 244,738,855 | 2,986,571,066 | 2,960,952,400 | 242,321,907 | 2,718,630,493 | ||||||
| Personals | 2,008,624,199 | 92,767,900 | 1,915,856,299 | 2,028,845,068 | 94,297,804 | 1,934,547,264 | ||||||
| Mortgage | 3,364,892,005 | 47,481,527 | 3,317,410,478 | 3,243,694,085 | 34,222,957 | 3,209,471,128 | ||||||
| Personal leases, net (1) | 71,792,319 | 1,491,510 | 70,300,809 | 70,816,546 | 889,482 | 69,927,064 | ||||||
| Total Personal Banking and Small company | 10,314,432,108 | 415,081,826 | 9,899,350,282 | 9,961,067,762 | 398,513,758 | 9,562,554,006 | ||||||
| Interest receivable on loans, net | 118,156,902 | 0 | 118,156,902 | 104,379,906 | 0 | 104,379,906 | ||||||
| Unearned interest | (3,906,631) | 0 | (3,906,631) | (3,072,806) | 0 | (3,072,806) | ||||||
| Net unearned commissions | (41,248,089) | 0 | (41,248,089) | (41,786,802) | 0 | (41,786,802) | ||||||
| Total loans at AC | 16,835,561,863 | 509,704,212 | 16,325,857,651 | 16,223,610,616 | 482,075,627 | 15,741,534,989 | ||||||
| (1) Total leases, net of interest | 298,591,813 | 4,040,251 | 294,551,562 | 298,239,454 | 4,203,114 | 294,036,340 | ||||||
The net value of the financial leases receivable is presented below:
| 2019 | 2018 | |||
| Minimum lease payments receivable | 345,720,162 | 348,186,924 | ||
| Less: unearned interest | 47,128,349 | 49,947,470 | ||
| Minimum lease payments receivable, net | 298,591,813 | 298,239,454 | ||
| Less: allowance for loss in leases | 4,040,251 | 4,203,114 | ||
| Less: net deferred commissions | 4,040,429 | 4,342,421 | ||
| Net value of investment in finance leases | 290,511,133 | 289,693,919 |
The following table summarizes the minimum lease payments receivable as of December 31, 2019:
| Year ended December 31, | ||
| 2020 | 79,430,417 | |
| 2021 | 69,834,836 | |
| 2022 | 54,135,562 | |
| 2023 | 41,805,085 | |
| 2024 and thereafter | 53,385,913 | |
| 298,591,813 |
F-213
| (11) | Property, Furniture, Equipment and Improvements |
Property, Equipment and Improvements as of December 31, 2019 and 2018 are detailed as follows:
| 2019 | ||||||||||||||
| Land and building | Construction in progress | Right-of-use assets | Vehicles | Furniture and equipment | Leasehold improvements | Total | ||||||||
| Cost: | ||||||||||||||
| Balance at January 1, 2019 | 224,785,259 | 3,142,566 | 0 | 10,420,644 | 393,221,366 | 81,384,431 | 712,954,266 | |||||||
| Impact of IFRS 16 adoption on January 1st, 2019 | 0 | 0 | 249,103,818 | 0 | 0 | 0 | 249,103,818 | |||||||
| Purchases | 1,479,449 | 14,318,290 | 20,405,137 | 1,891,035 | 50,842,993 | 1,713,187 | 90,650,091 | |||||||
| Sales and disposals | (1,051,308) | (183,842) | (1,828,424) | (1,104,260) | (30,985,660) | (8,628,350) | (43,781,844) | |||||||
| Transfers | 2,150,381 | (11,579,661) | 0 | 0 | 2,055,942 | 8,424,352 | 1,051,014 | |||||||
| Foreign currency translation | 1,428,607 | 339,064 | 6,396,758 | 171,868 | 8,296,689 | 1,828,492 | 18,461,478 | |||||||
| Balance at December 31, 2019 | 228,792,388 | 6,036,417 | 274,077,289 | 11,379,287 | 423,431,330 | 84,722,112 | 1,028,438,823 | |||||||
Accumulated depreciation:
| ||||||||||||||
| Balance at January 1, 2019 | 45,577,991 | 0 | 0 | 4,912,820 | 254,120,503 | 45,981,324 | 350,592,638 | |||||||
| Depreciation | 3,867,498 | 0 | 36,651,054 | 1,818,738 | 48,622,956 | 7,029,430 | 97,989,676 | |||||||
| Sales and disposals | (704,733) | 0 | (374,041) | (803,451) | (30,521,861) | (8,522,379) | (40,926,465) | |||||||
| Transfers | (137,198) | 0 | 0 | 0 | 1,839 | (9,512) | (144,871) | |||||||
| Foreign currency translation | 217,947 | 0 | 237,741 | 36,761 | 4,638,089 | 1,102,072 | 6,232,610 | |||||||
| Balance at December 31, 2018 | 45,577,991 | 0 | 36,514,755 | 5,964,868 | 276,861,526 | 45,580,935 | 413,743,588 | |||||||
| Net balance | 179,970,883 | 6,036,417 | 237,562,534 | 5,414,419 | 146,569,804 | 39,141,177 | 614,695,235 | |||||||
| 2018 | ||||||||||||
| Land and building | Construction in progress | Vehicles | Furniture and equipment | Leasehold improvements | Total | |||||||
| Cost: | ||||||||||||
| Balance at January 1, 2018 | 227,234,267 | 2,569,751 | 10,077,622 | 381,960,323 | 81,400,786 | 703,242,749 | ||||||
| Purchases | 4,174,875 | 7,042,991 | 3,168,824 | 48,891,170 | 1,731,722 | 65,009,582 | ||||||
| Sales and disposals | (943,249) | (91,441) | (2,373,253) | (21,438,415) | (1,710,771) | (26,557,129) | ||||||
| Transfers | 2,526,913 | (6,173,746) | 0 | (523,827) | 3,065,471 | (1,105,189) | ||||||
| Foreign currency translation | (8,207,547) | (204,989) | (452,549) | (15,667,885) | (3,102,777) | (27,635,747) | ||||||
| Balance at December 31, 2018 | 224,785,259 | 3,142,566 | 10,420,644 | 393,221,366 | 81,384,431 | 712,954,266 | ||||||
Accumulated depreciation:
| ||||||||||||
| Balance at January 1, 2018 | 44,109,280 | 0 | 5,194,830 | 237,008,699 | 42,649,959 | 328,962,768 | ||||||
| Depreciation | 3,738,190 | 0 | 1,763,047 | 47,337,718 | 6,862,590 | 59,701,545 | ||||||
| Depreciation of discontinued operations | 0 | 0 | 3,979 | 35,505 | 0 | 39,484 | ||||||
| sales and disposals | (891,945) | 0 | (1,856,570) | (20,362,973) | (1,688,354) | (24,799,842) | ||||||
| Transfers | 1,970 | 0 | 0 | 1,402 | (3,372) | 0 | ||||||
| Foreign currency translation | (1,379,504) | 0 | (192,466) | (9,899,848) | (1,839,499) | (13,311,317) | ||||||
| Balance at December 31, 2018 | 45,577,991 | 0 | 4,912,820 | 254,120,503 | 45,981,324 | 350,592,638 | ||||||
| Net balance | 179,207,268 | 3,142,566 | 5,507,824 | 139,100,863 | 35,403,107 | 362,361,628 | ||||||
During the year 2019, the Bank made a transfer of other assets to property, furniture, equipment and improvements for an amount of $1,051,014 corresponding to land.
During the year 2018, the Bank made a transfer of property, furniture, equipment and improvements to other assets for an amount of $1,105,189 corresponding to artworks.
| (12) | Goodwill and Intangible Assets |
Changes in the carrying value of goodwill are as follows:
| 2019 | 2018 | |||
Goodwill Balance at year beginning, | 1,465,085,969 | 1,465,085,969 | ||
| Balance at year end | 1,465,085,969 | 1,465,085,969 |
As of December 31, 2019 and 2018 no impairment in the cash-generating units has been recorded. The fair value of the cash-generating units exceeds the carrying amount plus goodwill; therefore, no impairment loss was recorded.
F-214
| (12) | Goodwill and Intangible Assets, continued |
The recoverable amounts of the CGUs of the Company have been calculated based on their value in use.
The value in use of the CGUs is determined by discounting the future cash flows expected to be generated from the continuing use of the each unit.
Calculation of value in use is based on the following basic assumptions:
| 2019 | 2018 | |||
| Discount rate | 11.1% | 11.4% | ||
| Terminal value (growth rate) | 3.0% | 3.0% |
The discount rate after taxes used to discount the dividend flows reflects the specific risks relating to the CGUs and has been estimated taking into account the risk profile of each of the different markets in which the Company operates.
A 10-year projection was carried out, considering that once this period has passed, the maturity of the businesses and the consequent stabilization of the cash flows will be achieved. Macroeconomic and business assumptions were also used for each of the countries where it operates, in order to reflect the reality that each market provides to all CGUs.
When estimating the terminal value, the normalized flow of funds has been projected in perpetuity, adjusted in accordance with the growth expectations. This projection does not exceed the average long-term growth rate for the economy in each of the countries in which the Company operates; for this reason, an average annual long-term growth rate of 3.0% was estimated (2018: 3.0%).
The main assumptions described above may change as economic and market conditions change. The Company estimates that the reasonably possible changes in these assumptions do not affect the recoverable amount of the CGUs or that they decrease below the CGUs carrying values.
The gross balance of the carrying amount and the accumulated amortization for each intangible asset acquired by the Company subject to amortization as of December 31, 2018 is presented below:
| 2019 | Core deposit intangible | Credit card relationships | Merchants’ relationships | Customers’ relationships | Trade name | Insurance contracts | Software | Total | ||||||||
| Cost: | ||||||||||||||||
| Balance at January 1, 2019 | 85,248,887 | 82,794,891 | 37,963,355 | 12,438,676 | 56,520,325 | 4,387,103 | 109,917,554 | 389.270.791 | ||||||||
| Purchases | 0 | 0 | 0 | 0 | 0 | 0 | 28,854,325 | 28,854,325 | ||||||||
| Sales and disposals | 0 | 0 | 0 | 0 | 0 | 0 | (12,345,588) | (12,345,588) | ||||||||
| Foreign currency translation | 0 | 436,482 | 0 | 26,394 | 61,389 | 0 | 4,447,339 | 4,971,604 | ||||||||
| Balance at December 31, 2019 | 85,248,887 | 83.231.373 | 37,963,355 | 12,465,070 | 56,581,714 | 4,387,103 | 130,873,630 | 410,751,132 | ||||||||
| Accumulated amortization: | ||||||||||||||||
| Balance at January 1, 2019 | 69,316,130 | 60,099,396 | 37,631,265 | 4,143,709 | 0 | 4,387,103 | 79,485,223 | 255,062,826 | ||||||||
| Amortization | 5,161,571 | 6,668,253 | 332,090 | 1,276,032 | 0 | 0 | 14,286,661 | 27,724,607 | ||||||||
| Sales and disposals | 0 | 0 | 0 | 0 | 0 | 0 | (8,740,564) | (8,740,564) | ||||||||
| Foreign currency translation | 0 | 437,064 | 0 | 16,143 | 0 | 0 | 2,951,714 | 3,404,921 | ||||||||
| Balance at December 31, 2019 | 74,477,701 | 67,204,713 | 37,963,355 | 5,435,884 | 0 | 4,387,103 | 87,983,034 | 277,451,790 | ||||||||
| Net balance at December 31, 2019 | 10,771,186 | 16,026,660 | 0 | 7,029,186 | 56.581.714 | 0 | 42,890,596 | 133,299,342 |
| 2018 | Core deposit intangible | Credit card relationships | Merchants’ relationships | Customers’ relationships | Trade name | Software | Total | |||||||
| Cost: | ||||||||||||||
| Balance at January 1, 2018 | 85,248,887 | 83,281,206 | 37,872,567 | 12,468,083 | 56,588,722 | 101,616,285 | 381,462,853 | |||||||
| Purchases | 0 | 0 | 0 | 0 | 0 | 20,138,597 | 20,138,597 | |||||||
| Sales and disposals | 0 | 0 | 90,788 | 0 | 0 | (7,220,637) | (7,129,849) | |||||||
| Foreign currency translation | 0 | (486,315) | 0 | (29,407) | (68,397) | (4,616,691) | (5,200,810) | |||||||
| Balance at December 31, 2018 | 85,248,887 | 82,794,891 | 37,963,355 | 12,438,676 | 56,520,325 | 109,917,554 | 389,270,791 | |||||||
| Accumulated amortization: | ||||||||||||||
| Balance at January 1, 2018 | 62,987,011 | 61,748,414 | 27,197,562 | 2,882,032 | 0 | 74,068,985 | 233,271,107 | |||||||
| Amortization | 6,329,199 | 5,399,410 | 3,660,000 | 1,276,898 | 0 | 14,845,451 | 31,510,882 | |||||||
| Discontinued operations | 0 | 1,400,000 | 7,192,914 | 0 | 0 | 284,734 | 8,877,648 | |||||||
| Sales and disposals | 0 | (1,400,000) | (7,102,126) | 0 | 0 | (6,020,786) | (14,522,912) | |||||||
| Foreign currency translation | 0 | (7,048,428) | 6,682,915 | (15,221) | 0 | (3,693,162) | (4,073,899) | |||||||
| Balance at December 31, 2018 | 69,316,130 | 60,099,396 | 37,631,265 | 4,143,709 | 0 | 79,485,223 | 255,062,826 | |||||||
| Net balance at December 31, 2018 | 15,932,757 | 22,695,495 | 332,090 | 8,294,967 | 56,520,325 | 30,432,331 | 134,207,965 |
None of the intangible assets listed in the table above have residual value.
During the years ended December 31, 2019 and 2018, no impairment losses were recognized.
F-215
| (13) | Other Assets |
The breakdown of other assets is presented in the table below:
| 2019 | 2018 | |||
| Assets held for sale, net | 26,874,987 | 17,809,175 | ||
| Deferred expenses | 18,706,446 | 14,682,994 | ||
| Security deposits | 8,441,430 | 8,259,996 | ||
| Non-embossed credit card plastic | 6,589,458 | 8,381,393 | ||
| Advances of contracts and suppliers | 407,584 | 2,661,678 | ||
| Others | 23,066,202 | 33,695,822 | ||
| 84,086,107 | 85,491,058 |
During the year 2019, the Company made a transfer of other assets to fixed assets for an amount of $1,051,041 corresponding to land (see note 11).
During the year 2018, the Company made a transfer from fixed assets to other assets for an amount of $1,105,189 (see note 11).
Assets held for sale, net of allowance for impairment, are detailed below:
| 2019 | 2018 | |||
| Vehicles | 0 | 11,761 | ||
| Real estate – less than a year | 13,015,831 | 11,800,853 | ||
| Real estate – more than a year | 17,307,156 | 17,453,400 | ||
| Assets held for sale, gross | 30,322,987 | 29,266,014 | ||
| Allowance for impairment | (3,448,000) | (11,456,839) | ||
| Assets held for sale, net | 26,874,987 | 17,809,175 |
The Company made sales of assets held for sale for an amount of $22,574,709 (2018: $14,589,322), these gains amount to $4,607,814 (2018: $3,102,382).
The movement of the allowance for assets held for sale is shown below:
| 2019 | 2018 | |||
| Balance at beginning, | 11,456,839 | 8,478,159 | ||
| Provision (reversal) charged to expenses | (2,336,581) | 7,242,021 | ||
| Sales | (2,237,371) | (3,083,811) | ||
| Withdrawals | (4,610,634) | (772,152) | ||
| Transfer to other assets | 1,090,206 | 1,323,542 | ||
| Foreign currency translation | 85,541 | (1,730,920) | ||
| Balance at year end | 3,448,000 | 11,456,839 |
F-216
| (14) | Deposits from Customers |
Deposits from customers are detailed below:
| 2019 | 2018 | |||
| Retail customers | ||||
| Demand | 1,116,320,740 | 1,022,382,255 | ||
| Savings | 2,206,634,935 | 1,958,696,196 | ||
| Time deposits | 1,040,706,535 | 1,085,362,217 | ||
| Corporate customers | ||||
| Demand | 4,855,510,876 | 4,555,843,668 | ||
| Savings | 1,128,234,145 | 1,006,533,249 | ||
| Time deposits | 6,801,793,504 | 6,058,059,594 | ||
| Accrued interest of deposits from customers | 85,399,296 | 81,705,890 | ||
| 17,234,600,031 | 15,768,583,069 |
As of December 31, 2019, within the fixed-term deposits, the carrying amount of the principal issued by BIB Merchant Voucher Receivables Limited, a special purpose consolidated vehicle (from now on SPV), amounting to $750,000,000, divided into two programs: 1) Series 2017-1 with a balance of $350,000,000 (2018: $350,000,000) and 2) Series 2018-1 with a balance of $400,000,000 (2018: $400,000,000). The origination costs pending amortization of the certificates amounted to $8,092,195 as of December 31, 2018 (2018: $8,092,195). The certificates issued by the vehicle are guaranteed by future cash flows arising from transactions in affiliated businesses in Panama. Transactions in affiliated businesses are those generated by credit card holders issued by international financial institutions, under the Visa and MasterCard credit programs that are processed by the Company. The 2017-1 notes pay interest quarterly in January, April, July and October at a fixed rate of 4.08%. Amortization of principal will begin to be paid to the holders, through Citibank N.A., as of January 2021. The notes have an average original duration of 7.0 years. As of December 31, 2019, the weighted average duration of certificates is 4.52 years. The 2018-1 notes pay interest quarterly in January, April, July and October at a fixed rate of 4.18%. The principal repayments will begin to be paid to the holders, through Citibank N.A., as of January 2022. The notes have an average original duration of 7.00 years. As of December 31, 2019, the weighted average duration of the certificates is 5.52 years.
As of December 31, 2019, $395,000,000 issued by BIB Central American Card Receivables Limited, a special purpose consolidated vehicle (from now on SPV), is included in the fixed term deposits. The origination costs pending amortization of the certificates amounted to $ 4,979,598 as of December 31, 2019. The certificates issued by the vehicle are guaranteed by future cash flows arising from transactions in affiliated businesses in Costa Rica, El Salvador, Guatemala, Honduras, Nicaragua and Panama. Transactions in affiliated merchants are those generated by credit card holders issued by international financial institutions, under the Visa, MasterCard and American Express credit programs that are processed by the Bank. The notes pay interest quarterly in January, April, July and October at a fixed rate of 3.50%. The principal repayments will begin to be paid to the holders, through Citibank N.A., as of October 2023. The notes have an average original duration of 7.00 years. As of December 31, 2019, the weighted average duration of the certificates is 7.00 years.
F-217
| (15) | Financial Obligations |
Financial obligations are detailed below:
| 2019 | ||||||
| Interest rate | Maturities up to | Carrying amount | ||||
| Payable in US dollars: | ||||||
| Fixed rate | 6.75% | 2031 | 1,099,205,910 | |||
| Floating rate | 2.17% to 12.53% | 2030 | 794,752,483 | |||
| Payable in quetzales (Guatemala): | ||||||
| Fixed rate | 5.50% to 6.40% | 2020 | 262,376,880 | |||
| Floating rate | 8.99% | 2021 | 1,325,954 | |||
| Payable in lempiras (Honduras): | ||||||
| Fixed rate | 1.00% to 15.00% | 2044 | 144,231,871 | |||
| Payable in colones (Costa Rica): | ||||||
| Floating rate | 6.30% to 12.16% | 2031 | 25,530,546 | |||
| Sub-total financial obligations | 2,327,423,644 | |||||
| Accrued interest from financial obligations | 11,697,743 | |||||
| Total financial obligations at amortized cost | 2.339.121.387 | |||||
| 2018 | ||||||
| Interest rate | Maturities up to | Carrying amount | ||||
| Payable in US dollars: | ||||||
| Fixed rate | 2.83% to 7.88% | 2028 | 1,483,371,844 | |||
| Floating rate | 2.29% to 13.16% | 2031 | 1,418,522,468 | |||
| Payable in quetzales (Guatemala): | ||||||
| Fixed rate | 6.00% to 6.50% | 2019 | 230,097,805 | |||
| Floating rate | 5.78% to 9.13% | 2021 | 3,146,813 | |||
| Payable in lempiras (Honduras): | ||||||
| Fixed rate | 1.00% to 15.00% | 2038 | 126,228,569 | |||
| Payable in colones (Costa Rica): | ||||||
| Floating rate | 6.30% to 12.79% | 2031 | 37,075,117 | |||
| Sub-total financial obligations | 3.298,442,616 | |||||
| Accrued interest from financial obligations | 16,633,946 | |||||
| Total financial obligations at amortized cost | 3,315,076,562 | |||||
As of December 31, 2019, the outstanding amount of the principal issued by BIB Central American Card Receivables Limited, a special purpose vehicle (from now on SPV), originated $305,000,000 The origination costs pending amortization from the certificates amounted to $17,007,484 as of December 31, 2018. Certificates issued by this vehicle are secured by future cash flows from merchant vouchers originating in Costa Rica, El Salvador, Guatemala, Honduras, Nicaragua and Panama. The merchant vouchers are those generated by credit cardholders issued by third-party international financial institutions, under Visa, MasterCard and American Express credit programs, which are processed by the Company. The certificates pay interest in January, April, July and October at a fixed interest rate of 3.50%. Amortizations to principal will begin in October 2023, through Citibank N.A. The certificates have an average original duration of 7.00 years. As of December 31, 2019, the weighted average duration of the certificates is 7.00 years.
F-218
| (15) | Financial Obligations, continued |
During the month of November 2019, the Company made a debt swap of the certificates issued under the special purpose vehicles CIC Receivables Master Trust (a.k.a. Cinco Tierras Holding) and CIC Central American Card Receivables Limited. The vehicles had a balance of $202,443,682 and $210,656,140, respectively, as of December 31, 2018.
On December 2013, the Bank signed a subordinated loan (in right of payment to all other ordinary loans) Aval Group Limited for US $180 million, which has an expiration date of March 20, 2021, for a total period of 8 years. The principal of this loan must be paid in a single payment of principal at maturity, and interest must be paid quarterly starting in March 2014, based on a fixed rate of 7.71%.
As of December 31, 2019, the outstanding amount of the principal issued by BAC San Jose DPR Funding Limited, a consolidated special purpose vehicle (here in after SPV), amounted to $64,000,000 (2018: $112,666,664), divided into two programs: 1) Series 2014-1 with a balance of $16,666,664, and 2) Series 2014-2 with a balance of $96,000,000. Origination costs pending amortization from the certificates amounted to $544,035 as of December 31, 2019 (2018: $903,206). The notes issued by the SPV are secured by the current and future Diversified Payment Rights denominated in US dollars, originated by a Bank's subsidiary and sold to the SPV. The notes pay interest in February, May, August and November at a fixed interest rate of 4.50%.The Series 2014-2 notes have an original average term of 4.60 years. As of December 31, 2019, the weighted average duration of the notes is 1.01 years.
The Company has had no defaults of principal, interest or other contractual clauses concerning its financial obligations.
| (16) | Other Financial Obligations |
The Company has placed, through its subsidiaries and through the stock markets of El Salvador, Guatemala, and Honduras debt certificates with fixed and variable rates, which are described below:
| 2019 | 2018 | |||||||
| Payable in: | Interest rate | Carrying amount | Interest rate | Carrying amount | ||||
| US dollars | 4,75% to 5,85% | 262,366,840 | 4.75% to 5.85% | 257,385,965 | ||||
| Quetzales | 0% | 0 | 4.25% to 7.50% | 4,160,851 | ||||
| Lempiras | 9.13% to 9.50% | 54,422,221 | 8.88% to 9.26% | 35,056,766 | ||||
| Sub-total of other financial obligations | 316,789,061 | 296,603,582 | ||||||
| Accrued interest from other financial obligations | 2,626,299 | 2,680,573 | ||||||
| Total of other financial obligations | 319,415,360 | 299,284,155 | ||||||
The Company has had no defaults of principal, interest or other contractual clauses concerning its other financial obligations.
F-219
| (17) | Lease Liabilities |
Lease liabilities are detailed below:
| 2019 | ||||||||
| Interest rate | Maturities up to | Carrying amount | Undiscounted cash flows | |||||
| Payable in US dollars | 5.22% | 2033 | 224,321,633 | 255,922,409 | ||||
| Payable in quetzales (Guatemala) | 3.03% to 5.55% | 2029 | 4,568,363 | 5,235,722 | ||||
| Payable in lempiras (Honduras) | 7.56% to 7.58% | 2029 | 1,560,263 | 2,082,349 | ||||
| Payable in colones (Costa Rica) | 3.96% to 8.02% | 2033 | 1,112,785 | 1,385,233 | ||||
| Total lease liabilities | 231,563,044 | 264,625,713 | ||||||
The following is the detail of the maturity of the undiscounted contractual cash flows, related to lease liabilities:
| 2019 | ||
| Less than a year | 35,707,613 | |
| One to two years | 37,054,443 | |
| Two to three years | 34,454,541 | |
| Three to four years | 32,278,530 | |
| Four to five years | 30,030,247 | |
| More than five years | 95,100,339 | |
| 264,625,713 |
Based on the applicable regulations (IAS 17), the minimum operating lease payments for each of the five years as of December 31, 2018, are presented below:
| 2018 | ||
| Less than a year | 47,475,791 | |
| One to two years | 36,055,114 | |
| Two to three years | 35,255,291 | |
| Three to four years | 32,768,993 | |
| Four to five years | 30,057,750 | |
| More than five years | 115,344,078 | |
| 296,957,017 |
The following are the items recognized in the consolidated statement of income, related to lease liabilities:
| 2018 | ||
| Interest on leases | 11,913,779 | |
| Variable lease payments not included in lease liabilities | 0 | |
| Expense for leases with less than 12 months | 0 | |
| Expense for leases of low-value assets | 7,180,736 | |
| 19,094,515 |
| (18) | Other Liabilities |
The breakdown of other liabilities is presented in the table below:
| 2019 | 2018 | |||
| Checks issued but not cashed | 68,998,365 | 66,905,568 | ||
| Employee benefits | 68,537,192 | 70,743,954 | ||
| Collections | 65,628,657 | 79,811,968 | ||
| Accounts payable to merchants | 49,670,694 | 81,775,794 | ||
| Bank draft to be applied | 49,314,943 | 72,275,649 | ||
| Loyalty programs | 47,814,541 | 40,959,603 | ||
| Accounts payable to suppliers | 33,133,357 | 36,339,397 | ||
| Payments to account receivable to be applied | 13,736,912 | 23,581,169 | ||
| Other accounts payable | 18,027,174 | 15,293,259 | ||
| Dismantling provision of leasehold properties | 9,927,842 | 0 | ||
| Commissions payable | 8,180,669 | 12,282,155 | ||
| Legal contributions to state institutions | 8,105,576 | 8,801,696 | ||
| Insurance premiums | 6,365,741 | 4,586,225 | ||
| Sales tax payable | 5,299,231 | 1,947,577 | ||
| Withholding tax | 2,229,466 | 6,306,412 | ||
| Other | 94,049,671 | 90,869,914 | ||
| 549,020,030 | 612,480,340 |
F-220
| (19) | Common Stock |
As of December 31, 2019, the Company’s authorized stock comprises 79,194,053 authorized stock and 77,443,101 issued and outstanding stock (December 31, 2017: 79,194,053 authorized stock and 77,443,101 issued and outstanding stock) and with a nominal value of $37 per share.
| (20) | Other Comprehensive Results |
The following table presents the components and changes in other accumulated comprehensive results as of December 31, 2019 of controlling interest:
| Conversion of operations in foreign currency | Unrealized (loss) income from securities | ECL for investments at FVOCI | Employee benefits plan – change in actuarial effect | Total Other Accumulated Comprehensive Loss | ||||||
Balance at January 01, 2017
| (181,481,527) | (5,090,787) | 0 | (965,912) | (187,538,226) | |||||
| Impact of adoption of IFRS 9 as of January 1, 2018 | 0 | 0 | (3,174,883) | 0 | 2,847,314 | |||||
| Restated balance at January 1, 2018 | (181,481,527) | (5,090,787) | (3,174,883) | (965,912) | (190,713,109) | |||||
| Other (loss) income before reclassifications | (107,216,732) | (1,037,389) | 0 | 0 | (108,254,121) | |||||
| Reclassified amounts from other comprehensive loss | 0 | (96,023) | 0 | 0 | (96,023) | |||||
| Employee benefits | 0 | 0 | 0 | (1,488,078) | (1,488,078) | |||||
| Other net comprehensive (loss) income for the year | (107,216,732) | (1,133,412) | 0 | (1,488,078) | (109,838,222) | |||||
| Balance at December 31, 2018 | (288,698,259) | (6,224,199) | (3,174,883) | (2,453,990) | (300,551,331) | |||||
| Other (loss) income before reclassifications | 38,708,264 | 80,661,581 | 0 | 0 | 119,369,845 | |||||
| Reclassified amounts from other comprehensive loss | 0 | (9,707,184) | 0 | 0 | (9,707,184) | |||||
| Employee benefits | 0 | 0 | 0 | (1,281,135) | (1,281,135) | |||||
| Other net comprehensive (loss) income for the year | 38,708,264 | 70,954,397 | 0 | (1,281,135) | 108,381,526 | |||||
| Balance at December 31, 2019 | (249,989,995) | 64,730,198 | (3,174,883) | (3,735,125) | (192,169,805) |
The following table presents the breakdown of other comprehensive results reclassified to the consolidated statement of income for the year ended December 31, 2019:
Reclassified balance of Other Comprehensive Losses | Line of the Consolidated Statement of Income Affected | |||||
| Investments at FVOCI | 2019 | 2018 | ||||
| Available for sale investments | ||||||
| Unrealized net income from securities | 10,463,316 | (137,176) | Other income | |||
| Income tax | (756,132) | 41,153 | Income tax expense | |||
| Total reclassifications | 9,707,184 | (96,023) | ||||
F-221
| (21) | Income from Financial Instruments, Net |
Income from financial instruments, net, included in the consolidated statement of income is summarized below:
| 2019 | 2018 | |||
| Net income from the sale of investments at FVOCI | 10,463,316 | 433,068 | ||
| Unrealized net (losses) gains from securities at FVPL | 6,195,588 | 886,011 | ||
| Net gain from the sale of securities at FVPL | 255,955 | 10,948 | ||
| Net fair value (loss) on derivative financial instruments | (455,640) | (2,252,652) | ||
| 16,466,731 | (922,625) |
| (22) | Other income |
The charge services segregated according to their nature, are detailed below.
| 2019 | 2018 | |||
| Merchant service | 17,799,701 | 16,350,065 | ||
| Other non-bank fees | 6,578,592 | 10,996,966 | ||
| VISA Stocks | 5,529,340 | 0 | ||
| Gain on sale of repossessed assets | 4,607,814 | 3,102,382 | ||
| Commercial recoveries | 3,509,008 | 915,572 | ||
| Rentals | 2,496,172 | 570,675 | ||
| Non-bank fees for leases | 956,434 | 1,242,529 | ||
| Other income of associates | 754,926 | 1,346,131 | ||
| Appraisals for loans | 283,957 | 130,201 | ||
| Others | 14,043,889 | 13,606,748 | ||
| 56,559,833 | 48,261,269 |
Income from fees and commissions from contracts with clients is measured based on the consideration specified in a contract with a client. The Company recognizes revenue when it transfers control over a service to a customer.
F-222
| (22) | Other income (services charge), continued |
The following table provides information about the nature and timing of the satisfaction of performance obligations in contracts with customers, including significant payment terms, and the related revenue recognition policies.
Type of service
| Nature and timing of satisfaction of performance obligations, including significant payment terms | Revenue recognition under IFRS 15 (applicable from 1 January 2018) |
Personal and Corporate Banking | The Company provides banking services to retail and corporate customers, including account management, provision of overdraft facilities, foreign currency transactions, credit card and servicing fees.
Fees for ongoing account management are charged to the customer’s account on a monthly basis. The Company sets the rates separately for retail and corporate banking customers in each jurisdiction on an annual basis.
Transaction-based fees for interchange, foreign currency transactions and overdrafts are charged to the customer’s account when the transaction takes place.
Servicing fees are charged on a monthly basis and are based on fixed rates reviewed annually by the Company. | Revenue from account service and servicing fees is recognized over time as the services are provided.
Revenue related to transactions is
recognized at the point in time when the transaction takes place.
|
Investment Banking Service | The Company’s investment banking segment provides various finance-related services, including loan administration and agency services, administration of a loan syndication, execution of client transactions with exchanges and securities underwriting.
Fees for ongoing services are charged annually at the end of the calendar year to the customer’s account. However, if a customer terminates the contract before 31 December, then on termination it is charged the fee for the services performed to date.
Transaction-based fees for administration of a loan syndication, execution of transactions, and securities underwriting are charged when the transaction takes place. | Revenue from administrative agency services is recognized over time as the services are provided. The amounts to be collected from customers on 31 December are recognized as trade receivables.
Revenue related to transactions is recognized at the point in time when the transaction takes place.
|
Asset Management
| The Company provides asset management services.
Fees for asset management services are calculated based on a fixed percentage of the value of assets managed and deducted from the customer’s account balance on a monthly basis.
In addition, the Company charges a nonrefundable up-front fee when opening an account.
| Revenue from asset management services is recognized over time as the services are provided.
Non-refundable up-front fees give rise to material rights for future services and are recognized as revenue over the period for which a customer is expected to continue receiving asset management services.
|
F-223
| (23) | Salaries and Other Personnel Expenses |
The breakdown of salaries and other personnel expenses is presented below:
| 2019 | 2018 | |||
| Salaries and other remuneration | 351,387,454 | 340,255,605 | ||
| Employee benefits | 164,979,653 | 166,092,913 | ||
| Compensations | 17,524,566 | 17,071,050 | ||
| Other | 6,014,769 | 5,091,925 | ||
| 539,906,442 | 528,511,493 |
| (24) | Other Operating Expenses |
Other expense included in the consolidated statement of income is summarized below:
2019 | 2018 | |||
| Credit card franchises | 85,982,058 | 74,475,339 | ||
| Advertising and marketing | 49,874,252 | 49,936,780 | ||
| Taxes other than income tax | 49,430,970 | 36,538,570 | ||
| Computer software and licenses maintenance | 34.703.590 | 29,960,916 | ||
| Equipment and vehicle maintenance | 24,869,765 | 25,008,389 | ||
| Armored services | 18,715,177 | 16,455,185 | ||
| Guarantee deposits | 13,920,855 | 12,606,418 | ||
| Bank licenses | 13,723,386 | 12,288,779 | ||
| Telephone service | 13,535,937 | 13,488,487 | ||
| Security services | 13,402,171 | 13,050,534 | ||
| Dedicated lines | 11,275,738 | 12,020,693 | ||
| Per diem expenses | 9,606,447 | 9,378,915 | ||
| Operational losses | 9,012,776 | 5,687,638 | ||
| Office supplies | 7,842,235 | 7,798,609 | ||
| Municipal taxes and patents | 6,426,169 | 7,015,930 | ||
| Postage and courier | 4,273,625 | 4,179,811 | ||
| Other | 65,913,367 | 55,891,246 | ||
| 432,508,518 | 385,782,239 |
| (25) | Income Taxes |
Income tax expense consists of:
| 2019 | 2018 | |||
| Current | 139,212,402 | 167,644,694 | ||
| Deferred | 6,237,504 | (1,259,394) | ||
| 145,449,906 | 166,388,300 |
Income tax expense for the year ended December 31, 2019 was $145,449,906 (2018: $166,388,300), which differed from the amounts computed by applying the current statutory income tax rate to pretax consolidated earnings as a result of the following:
| 2019 | 2018 | |||
| Computed "expected" income tax expense | 136,837,475 | 138,262,621 | ||
| Increase (decrease) in income taxes resulting from: | ||||
| Nondeductible expenses | 62,945,061 | 39,074,958 | ||
| Investments in foreign subsidiaries | 11,448,237 | 17,458,113 | ||
| Changes in uncertain tax positions | 8,631,128 | 8,562,707 | ||
| Tax incentives | (1,065,006) | (974,901) | ||
| Foreign income taxes rate differential | (6,084,515) | 7,819,715 | ||
| Exempt and foreign source income | (67,262,474) | (43,814,813) | ||
| Income tax | 145,449,906 | 166,388,400 |
F-224
| (25) | Income Taxes, continued |
Temporary differences between the consolidated financial statements carrying amounts and the tax basis of assets and liabilities that give rise to the deferred tax assets and liabilities as of December 31, 2019 are as follows:
| 2019 | ||||||||||||||
| Balance at beginning of the year | Recognized in results of the year | Recognized in other comprehensive income | Recognized in equity | Balance at year end | Deferred tax assets | Deferred tax liabilities | ||||||||
Allowance for loan losses
| 40,235,283 | (5,522,472) | 0 | 0 | 34,712,811 | 46,688,837 | (11,976,026) | |||||||
| Fair value acquisition adjustment | (5.937.596) | 64.960 | 0 | 0 | (5.872.636) | 2.019.209 | (7.891.845) | |||||||
| Unrealized net loss on investments at FVOCI | 2,114,748 | 0 | (2.079.325) | 0 | 35,423 | 44,537 | (9,114) | |||||||
| Accrued expenses | 796,740 | 5,648,142 | 0 | 0 | 6,444,882 | 8,937,610 | (2,492,728) | |||||||
| Net loss from the sale of investments at FVPL | 267,490 | (267,490) | 0 | 0 | 0 | 0 | 0 | |||||||
| Provision for accounts receivable losses | 161,957 | 93,479 | 0 | 0 | 255,436 | 326,362 | (70,926) | |||||||
| Credit Risk in investments and IBD | 51,368 | 542,531 | (612,911) | 0 | (19,012) | (19,010) | (2) | |||||||
| Deferred expenses | 28,278 | (6,556,613) | 0 | 0 | (6,528,335) | 628,276 | (7,156,611) | |||||||
| IFRS 16 Adoption | 0 | 1,124,368 | 0 | 0 | 1,124,368 | 60,820,916 | (59,696,548) | |||||||
| Foreign currency translation | 0 | 851,677 | (851,677) | 0 | 0 | 0 | 0 | |||||||
| Investments in subsidiaries at cost | (27,556) | (46,651) | 23,200 | 0 | (51,007) | 0 | (51,007) | |||||||
| Net income from the sale of investments at FVPL | (389,379) | (792,063) | 0 | 0 | (1,181,442) | 0 | (1,181,442) | |||||||
| Unrealized net gain on investments at FVOCI | (516,820) | 0 | (13,479,798) | 0 | (13,996,618) | 0 | (13,996,618) | |||||||
| Assets held for sale valuation | (162.355) | (1,425,977) | 0 | 0 | (1.588.331) | 1.039.369 | (2.627.700) | |||||||
| Employee benefits | (1,251,228) | (2,547,971) | 88,400 | 0 | (3,710,799) | 4,408,579 | (8,119,378) | |||||||
| Deferred loan origination fees and costs | (1.771.084) | 1.171.756 | 0 | 0 | (599.328) | 3.447.598 | (4,046,926) | |||||||
| Leasing | (3.305.752) | 185,081 | 0 | 10,857 | (3,109,814) | 166,318 | (3,276,132) | |||||||
| Accrued interest receivable | (10,120,122) | (1,495,702) | 0 | 0 | (11,615,824) | 1,075,464 | (12,691,288) | |||||||
| Investments in foreign subsidiaries, for undistributed earnings | (13,638,058) | 2,911,087 | 0 | 0 | (10,726,971) | 0 | (10,726,971) | |||||||
| Net premises and equipment depreciation difference | (14,444,366) | (175,648) | 0 | 7,512 | (14,612,502) | 257,089 | (14,869,591) | |||||||
| Net deferred tax assets (liabilities) | (7.908.453) | (6.237.504) | (16.912.111) | 18,369 | (31.039.699) | 129.841.154 | (160.880.853) | |||||||
| Tax compensation | (85,204,748) | 85,204,748 | ||||||||||||
| Total | 44.636.405 | (75.676.105) | ||||||||||||
| 2018 | ||||||||||||||
| Balance at beginning of the year | Recognized in results of the year | Recognized in other comprehensive income | Recognized in equity | Balance at year end | Deferred tax assets | Deferred tax liabilities | ||||||||
Fair value acquisition adjustment
| (6,357,022) | 419,426 | 0 | 0 | (5,937,596) | 4,387,131 | (10,324,727) | |||||||
| Accrued expenses | 2,393,227 | (1,596,485) | 0 | 0 | 796,742 | 2,801,429 | (2,004,687) | |||||||
| Unrealized net loss on investments at FVOCI | 1,494,458 | 0 | 620,291 | 0 | 2,114,749 | 2,114,749 | 0 | |||||||
| Assets held for sale valuation | 935,585 | (1,097,940) | 0 | 0 | (162,355) | 1,373,871 | (1,536,226) | |||||||
| Deferred expenses | 366,857 | (338,579) | 0 | 0 | 28,278 | 409,604 | (381,326) | |||||||
| Net operating loss carry-over | 236,748 | (236,748) | 0 | 0 | 0 | 0 | 0 | |||||||
| Mortgages portfolio at fair value | 84,071 | 0 | 0 | (84,071) | 0 | 0 | 0 | |||||||
| Net loss from the sale of investments at FVPL | 62,314 | 205,175 | 0 | 0 | 267,489 | 267,489 | 0 | |||||||
| Investments in subsidiaries at cost | 16,098 | (43,654) | 0 | 0 | (27,556) | 0 | (27,555) | |||||||
| Foreign currency translation | 0 | (1,005,162) | 1,005,162 | 0 | 0 | 0 | 0 | |||||||
| Credit Risk in investments and IBD | 0 | 469,423 | (842,653) | 424,598 | 51,368 | 51,368 | 0 | |||||||
| Provision for accounts receivable losses | 0 | (37,140) | 0 | 199,097 | 161,957 | 166,625 | (4,668) | |||||||
| Net income from the sale of investments at FVPL | (370,882) | (18,498) | 0 | 0 | (389,380) | 0 | (389,380) | |||||||
| Unrealized net gain on investments at FVOCI | (547,204) | 0 | 30,384 | 0 | (516,820) | 73,401 | (590,221) | |||||||
| Employee benefits | (1,267,565) | (232,256) | 248,594 | 0 | (1,251,227) | 5,626,019 | (6,877,246) | |||||||
| Deferred loan origination fees and costs | (1,186,829) | (607,580) | 0 | 23,320 | (1,771,089) | 2,302,635 | (4,073,724) | |||||||
| Leasing | (3,080,474) | (225,276) | 0 | 0 | (3,305,750) | 648,525 | (3,954,275) | |||||||
| Accrued interest receivable | (9,652,765) | (467,357) | 0 | 0 | (10,120,122) | 178,765 | (10,298,887) | |||||||
| Net premises and equipment depreciation difference | (14,598,605) | 154,240 | 0 | 0 | (14,444,365) | 213,789 | (14,658,154) | |||||||
| Investments in foreign subsidiaries, for undistributed earnings | (16,488,884) | 2,850,824 | 0 | 0 | (13,638,060) | 0 | (13,638,060) | |||||||
| Allowance for loan losses | (18,720,301) | 3,066,981 | 0 | 55,888,603 | 40,235,283 | 41,361,908 | (1,126,625) | |||||||
| Net deferred tax assets (liabilities) | (66,681,173) | 1,259,394 | 1,061,778 | 56,451,547 | (7,908,454) | 61,977,311 | (69,885,761) | |||||||
| Tax compensation | (24,834,840) | 24,834,840 | ||||||||||||
| Total | 37,142,471 | (45,050,921) | ||||||||||||
The Company’s management performed offsetting of the deferred tax assets and liabilities that derive from income tax corresponding to the same tax jurisdiction in the consolidated statement of financial position.
As of December 31, 2019, the Company has incurred in net operating tax loss carry forwards of $10,052,648 (2018: $11,463,052), which are available to offset future taxable income of the applicable subsidiaries. The net operating losses begin to prescribe in 2030 and through 2036.
As of December 31, 2019, the Company has not recognized deferred tax assets in the consolidated statement of financial position for such operating losses.
F-225
| (25) | Income Taxes, continued |
As of December 31, 2019, the Bank has not recognized a deferred income tax liability of approximately $155,826,000 for undistributed earnings from foreign subsidiaries operations, because the Bank believes that $1,189,069,000 of these profits will be reinvested for an indefinite period.
The Company's earnings are taxed in various jurisdictions. As of December 31, 2019, the Company had unrecognized tax positions for $20,544,008 (2018: $24,648,914). Interest expense and penalties related to income tax liabilities and recognized as part of income tax expenses for the year ended December 31, 2018 amounted to $6,084,515 (2018: $4,986,850). As of December 31, 2019, total interest and penalties expenses included in other liabilities amounted to $8,526,292 (2018: $8,374,128).
As of December 31, 2019, the Company maintains an effective tax rate of 26.6% (2018: 29.4%).
The following are the tax jurisdictions in which the Company and its affiliates operate and the latest tax year subject to examination: United States of America: 2016, Guatemala: 2015, El Salvador: 2016, Honduras: 2015, Nicaragua: 2015, Costa Rica: 2014 and Panama: 2017.
| (26) | Off-Balance Financial Instruments with Risk and Other Commitments |
The Company is a party to financial instruments with off-balance sheet risk in the normal course of business to meet the financing needs of its customers. These financial instruments include, principally, commitments to extend credit, financial guarantees and letters of credit, the balances of which are not reflected in the accompanying consolidated balance sheets.
Letters of credit are conditional commitments issued by the Company to guarantee performance of a customer to a third party. Those letters of credit are primarily used to support trade transactions and borrowing arrangements. Generally, all letters of credit issued have expiration dates within one year. The credit risk involved in issuing letters of credit is essentially the same as that involved in extending loan facilities to customers.
Commitments to extend credit are agreements to lend to a customer as long as there is no violation of any condition established in the contract. Commitments generally have fixed expiration dates or other termination clauses and may require payment of a fee. The commitments may expire without being drawn upon; therefore, the total commitment amounts do not necessarily represent future cash requirements. The amount of collateral obtained, if it is deemed necessary by the Company, is based on management’s credit evaluation of the customer.
As of December 31, 2019, the Company had outstanding revolving available to its credit card customers in each of the various countries of operation that ranged from approximately $346 million to $2,528 million (2018: from $385 million to $2,511). The unused portion of the total amount available in each country, aggregated approximately from $240 million to $1,838 million (2018: from $250 million to $1,715 million). While these amounts represented the available lines of credit to customers per country, the Company has experienced, and does not anticipate, that all of its customers will exercise their entire available lines at any given point in time.
The Company generally has the right to increase, reduce, cancel, alter or amend the terms of these available lines of credit at any time.
Financial guarantees are used in various transactions to enhance the credit standing of the Company’s customers. They represent irrevocable assurances that the Company will make payment in the event that the customer fails to fulfill its obligations to third parties.
F-226
| (26) | Off-Balance Financial Instruments with Risk and Other Commitments, continued |
The Company uses the same credit policies in making commitments and conditional obligations as it does for on-balance sheet instruments. As of December 31, 2019, outstanding letters of credit and financial guarantees are as follows:
| 2019 | 2018 | |||
| Stand-by letters of credit | 157,397,226 | 145,476,197 | ||
| Commercial letters of credit | 20,887,930 | 49,837,601 | ||
| Financial guarantees | 269,789,544 | 243,038,944 | ||
| Commitments and guarantees (1) | 60,115,985 | 66,221,472 | ||
| 508,190,685 | 504,574,214 |
| (1) | Includes commercial and mortgage payment promise letters |
The nature, terms and maximum potential amount of future payments the Company could be required to make under the standby letters of credit and guarantees As of December 31, 2019 and as of December 31, 2018, are detailed as follows:
| 2019 | 2018 | |||
| Up to 1 year | 426,240,440 | 403,532,420 | ||
| Over 1 year | 61,062,315 | 51,204,193 | ||
| 487,302,755 | 454,736,613 |
Generally, the Company has resources to recover from clients the amounts paid under these guarantees; additionally, the Company can hold cash or other collateral to cover for these guarantees. As of December 31, 2019, the assets held as collateral, that the Company can obtain and liquidate to recover totally or partially the amounts paid under guarantees amounted to $71,014,482 (2018: $67,127,404).
| (27) | Derivative Financial Instruments |
In the normal course of business, the Company uses derivative financial instruments of interest rates and exchange rates mainly for economic and accounting hedging purposes in its activities of administration of the consolidated statement of financial position. The Company does not use derivative instruments for speculation.
The fair value of derivative instruments is included in other assets and other liabilities in the consolidated statement of financial position. The net change in derivative instruments designated as cash flow hedges is reflected in the consolidated statement of comprehensive income. The net change in derivative instruments not designated for hedging is reflected in other income for the period.
The Company uses interest rate swaps, “caps”, and “floors” to mitigate interest rate exposure. In addition, the Company uses exchange rate derivative instruments, which are executed over the counter. These contracts are executed between two counterparties who negotiate specific terms in the agreement, among which are the notional amount, the exercise price and the expiration and settlement date.
As of December 31, 2019, the Company does not have derivative instruments.
As of December 31, 2018, the derivative instruments contracts are guaranteed with time deposits for $68,740,753 placed in a related entity of the Company.
F-227
| (27) | Derivative Financial Instruments, continued |
For derivative instruments that are designated as fair value risk hedges, the gain or loss of the derivative instruments as well as the gain or loss of the investments subject to hedging are offset and presented in the separate income statement. The following table presents the gains or losses of the hedging instruments in force and the hedged items in force as of December 31, 2018.
As of December 31, 2018, the hedging derivative financial instruments were settled as a result of the sale of the hedged item.
| Notional | Book value | Account on financial position | Changes in fair value | |||||||
| amount | Assets | Liability | statement | (1) | ||||||
| 2018 | ||||||||||
| Fair value risk | ||||||||||
| Sale of securities, forward contract(2) | 154,110,000 | 888,101 | (189,072) | Other assets at fair value through profit or loss / other liabilities | 699,029 | |||||
(1) Corresponds to the change in fair value used to calculate hedge ineffectiveness
(2) The remaining maturity of the notional value of these contracts is less than 3 months.
| Book value | Account on financial position | Changes in fair value | ||||||
| Assets | Liability | statement | (1) | |||||
| 2018 | ||||||||
| Fair value risk | ||||||||
| Government and corporate bonds | 132,095,621 | 0 | Investments at FVOCI | (729,402) | ||||
(1) Corresponds to the change in fair value used to calculate hedge ineffectiveness
As of December 31, 2018, the hedging instruments present a cumulative result of $9,245,547. The results of the hedged items, as of December 31, 2018 are $10,301,405.
In accordance with the provisions of forward contracts, signed as of July 1, 2015, each time the “Valuation Date” is reached, the cancellation mechanism originated from the result between the hedged portfolio and the derivative contract portfolio is activated. FWD. As of December 31, 2019, the company received for this concept $29,185,721, it does not have accumulated accounts receivable (as of December 31, 2018, accumulated accounts receivable were: $38,890,492).
As of December 31, 2019, the Company does not have embedded currency derivatives. As of December 31, 2018, the Company have embedded currency derivatives, recognized in operating lease agreements that are agreed in currencies other than the functional currency of the countries in which it operates. The following table summarizes the embedded currency derivatives:
| 2019 | 2018 | |||
| Assets | 0 | 517,888 | ||
| Liabilities | 0 | 1,778,259 |
F-228
| (28) | Disclosures on the Fair Value of Financial Instruments |
The Company established a process for determining the fair value. The fair value is primarily based on quoted market prices, when available. If market prices or quotes are not available, fair value is determined based on internally developed models that primarily use market information or other information obtained as inputs regardless of market parameters, including but not limited to yield curves, interest rates, debt prices, foreign exchange rates and credit curves. However, in situations where there is little or no market activity for the asset or liability at the measurement date, the fair value measurement reflects the Company’s own judgments about assumptions that market participants would use in setting the price of the asset or liability.
The judgments are developed by the Company based on the best information available in the circumstances, including expected cash flows, discount rates adjusted for risks and the availability of observable and unobservable inputs.
The methods described above can generate fair value estimates that may not be indicative of the net realizable value or that do not reflect future values. In addition, while the Company believes its valuation methods are appropriate and consistent with those used by other market participants, the use of different methodologies or assumptions to determine the fair value of certain financial instruments could result in different fair value estimates as of the reporting date.
Financial instruments at fair value
Recurring Fair Value Measurement
The following is a description of the valuation methodologies used to value instruments carried at fair value, including a general classification of such instruments according to the fair value hierarchy.
Securities
When there are market prices in an active market, securities are classified in Level 1 of the fair value hierarchy. Level 1 securities include highly liquid bonds from the government and agencies and investments in highly traded shares.
If market prices are not available for a specific security, the fair value is determined using market prices of securities with similar characteristics or discounted cash flows, and are classified in Level 2. In certain cases where there is limited activity or less transparency in determining the assumptions used in the valuation, securities are classified in Level 3 of the fair value hierarchy.
Therefore, when valuing certain debt obligations, determining fair value may require comparisons with similar instruments or default and collection rate analysis.
Derivatives
Derivatives used by the Bank are embedded currency derivatives, and therefore valued using valuation techniques since there are no market prices available for such instruments.
These instruments are generally categorized in Level 3 of the fair value hierarchy.
Assets and liabilities recorded at fair value on a recurring basis are summarized below:
| Other significant observable | Significant unobservable | |||||
| Assumptions | Assumptions | |||||
| (Level 2) | (Level 3) | 2019 | ||||
| Assets | ||||||
| Investments and other assets at FVPL: | ||||||
| Other governments | 41,705,042 | 0 | 41,705,042 | |||
| Corporate bonds | 152,534 | 0 | 152,534 | |||
| Mutual funds | 778,885 | 0 | 778,885 | |||
| Common stocks | 0 | 10,617,681 | 10,617,681 | |||
| Total investments and other assets at FVPL | 42,636,461 | 10,617,681 | 53,254,142 | |||
| Investments at FVOCI: | ||||||
| Governments and Agencies bonds | ||||||
| United States of America | 55,496,709 | 0 | 55,496,709 | |||
| Other governments | 1,648,881,105 | 0 | 1,648,881,105 | |||
| 1,704,377,814 | 0 | 1,704,377,814 | ||||
| Corporate bonds | 461,068,562 | 0 | 461,068,562 | |||
| Total investments at FVOCI | 2,165,446,376 | 0 | 2,165,446,376 | |||
| Total assets | 2.208.082.837 | 10,617,681 | 2,218,700,518 |
| Other significant observable | Significant unobservable | |||||
| assumptions | Assumptions | |||||
| (Level 2) | (Level 3) | 2018 | ||||
| Assets | ||||||
| Investments and other assets at FVPL: | ||||||
| Other governments | 34,177,569 | 0 | 34,177,569 | |||
| Derivative financial instruments | 0 | 517,888 | 517,888 | |||
| Mutual funds | 1,157,801 | 0 | 1,157,801 | |||
| Common stocks | 0 | 10,072,395 | 10,072,395 | |||
| Sale of securities, forward contract (hedge) | 888,101 | 0 | 888,101 | |||
| Total investments at FVPL | 36,223,471 | 10,590,283 | 46,813,754 | |||
| Investments at FVOCI: | ||||||
| Governments and agencies bonds | ||||||
| United States of America | 89,674,333 | 0 | 89,674,333 | |||
| Other governments | 1,101,981,250 | 0 | 1,101,981,250 | |||
| 1,191,655,583 | 0 | 1,191,655,583 | ||||
| Corporate bonds | 573,951,003 | 0 | 573,951,003 | |||
| Total investments at FVOCI | 1.765.606.586 | 3,866,367 | 1.769.472.953 | |||
| Total assets | 1.801.830.057 | 14,456,650 | 1.816.286.707 | |||
| Liabilities | ||||||
| Sale of securities, forward contract (hedge) | 189,072 | 0 | 189,072 | |||
| Derivative financial instruments | 0 | 1,778,259 | 1,778,259 | |||
| Total Liabilities | 189,072 | 1,778,259 | 1,967,331 |
The Company’s accounting policies include the recognition of transfers between the levels of the fair value hierarchy on the date of the event or change in the circumstances that caused the transfer.
F-229
| (28) | Disclosures on the Fair Value of Financial Instruments, continued |
The table below includes the movement of the figures in the consolidated balance sheet (including changes in fair value) of the financial instruments classified by the Company within Level 3 of the fair value hierarchy, for the period ended December 31, 2019. When determining whether to classify an instrument in Level 3, the decision is based on the importance of unobservable assumptions within the overall fair value measurement.
| Investments | ||||||
2019 | Common stocks | Derivative Financial Instruments | Total | |||
| Assets | ||||||
| Fair value at January 01, 2019 | 10,072,395 | 517,888 | 10,590,283 | |||
| Valuation of embedded financial derivatives | 0 | (517,888) | (517,888) | |||
| Valuation of investments at FVPL | 566,104 | 566,104 | ||||
| Foreign currency translation | (20,818) | 0 | (20,818) | |||
| Fair value at December 31, 2018 | 10,617,681 | 0 | 10,617,681 | |||
| Liabilities | ||||||
| Fair value at January 01, 2019 | 0 | 1,778,259 | 1,778,259 | |||
| Valuation of embedded financial derivatives | 0 | (1,778,259) | (1,778,259) | |||
| Foreign currency translation | 0 | 0 | ||||
| Fair value at December 31, 2019 | 0 | 0 | 0 | |||
| Total unrealized losses included in the results for the year | 0 | 0 | 0 | |||
| Investments | Loans | |||||||||
2019 | Common stocks | Derivative Financial Instruments | Common stocks | Derivative Financial Instruments | Total | |||||
| Assets | ||||||||||
| Fair value at January 01, 2018 | 8,492,282 | 525,443 | 12,518,391 | 386,587 | 21,922,703 | |||||
| Valuation of investments at FVPL | 1,627,865 | 0 | 0 | 0 | 1,627,865 | |||||
| Valuation of embedded financial derivatives | 0 | 22,565 | 0 | 0 | 22,565 | |||||
| Foreign currency translation | (47,752) | (30,120) | 0 | 0 | (77,872) | |||||
| IFRS 9 Adoption at January 1, 2018 | 0 | 0 | 12,518,391) | (386,587) | 12,904,978) | |||||
| Fair value at December 31, 2018 | 10,072,395 | 517,888 | 0 | 0 | 10,590,283 | |||||
| Liabilities | ||||||||||
| Fair value at January 01, 2018 | 0 | 604,078 | 0 | 0 | 604,078 | |||||
| Valuation of embedded financial derivatives | 0 | 1,219,359 | 0 | 0 | 1,219,359 | |||||
| Foreign currency translation | 0 | (45,178) | 0 | 0 | (45,178) | |||||
| Fair value at December 31, 2018 | 0 | 1,778,259 | 0 | 0 | 1,778,259 | |||||
| Total unrealized losses included in the results for the year | 1,627,865 | 0 | 0 | 0 | 0 | |||||
The table below describes the valuation techniques and input data used in the financial instruments’ recurring fair value measurements:
| Financial instrument | Valuation technique and entry data used | Level |
| Corporate bonds and bonds issued by the government and agencies | Consensus prices obtained from price providers (Bloomberg). For part of these instruments the Company applies cash flows discounted using a market rate of an instrument with a similar remaining maturity. Market prices of suppliers or local regulators in markets with lower marketability.
Discounted cash flows are used for various bonds using a rate of market for an instrument with a similar remaining maturity. | (2,3) |
| Common stocks | Discounted cash flow using capital cost rate adjusted for size premium. | (3) |
| Common stocks | Market prices provided by local stock exchanges. | (2) |
| Mutual funds and other stocks | Net Asset Value. | (2) |
| Embedded financial derivative instruments | Functional currency cash flows Foreign currency cash flows Profitability rates Currency exchange rates | (3) |
F-230
| (28) | Disclosures on the Fair Value of Financial Instruments, continued |
A description of the methods and assumptions used to estimate the fair value of the main financial instruments held by the Company is provided below:
Financial instruments with carrying amounts that approach the fair value:
Cash and cash equivalents, deposits that bear interest and clients’ obligations for acceptances and acceptances outstanding are measured at book value reported in the consolidated balance sheet, which is considered a reasonable fair value estimate due to the characteristics and maturity of these instruments.
Loans
Most of the Company’s loans are not recurrently recognized at fair value and are not actively traded. Fair values are estimated for certain groups of similar loans based on the type of loan and maturity. The fair value of these loans was determined by discounting estimated cash flows using rates approaching the current rates of market participants for new loans and adjusted to reflect the inherent credit risk. This fair value does not represent a current indicator of an exit price. Fair values for consumer loans (including auto and real estate financing), for which market rates for comparable loans are available, are based on the discount on cash flows adjusted for prepaid. Discount rates for consumer loans are based on current credit-adjusted market rates and other risks that apply to a particular class of assets. The fair value of credit cards is based on the discount on expected cash flows. The discount rate for credit cards incorporates only the effects of interest rate changes as cash flows incorporate a credit risk adjustment.
For loans where there is a doubt about the chargeability, cash flows are discounted using a rate that considers recovery time and a premium for the uncertainty of flows.
The value of the guarantees is also considered. Historical loan prepayment rates are used to adjust cash flows. The assumptions used are expected to approach those that a market participant would use to assess these loans.
Deposits
No maturity defined as are sight deposits, “NOW”/”Money Market” and savings accounts have a fair value that is equal to the amount payable to the demand at the reporting date, that is, their book values. The fair value of term deposits is estimated using a calculation of discounted cash flows that applies the interest rates in force to all scheduled maturities, The assumptions used to perform the analysis of discounted cash flows are expected to approach those that market participants would use to assess these deposits
Securities sold under repurchase agreements
There are no market price quotes for these instruments; therefore, their fair value is determined using discounted cash flow techniques. Cash flows are estimated based on the contractual terms, taking into account any incorporated derivative characteristic or other factors. Expected cash flows are discounted using market rates that approach the maturity of the instrument, as well as the nature and amount of the guarantee given or received.
Borrowings
The fair value is estimated based on current interest rates for debt with similar and adjusted maturities to reflect the credit rating of the Company and its guarantees.
Other borrowed funds
Fair value is estimated based on the market price quotes for the same issuance or similar issuances or on the current rates offered by the Company for debts with the same terms, adjusted for credit quality.
F-231
| (28) | Disclosures on the Fair Value of Financial Instruments, continued |
Below are described the valuation techniques and significant unobservable input data used in determining the fair value of recurring and nonrecurring assets and liabilities categorized within Level 3 of the fair value hierarchy that are recognized in the consolidated balance sheet:
| 2019 | Quantitative information of Level 3 fair values | |||
| Fair value | Valuation technique | Unobservable assumptions | Range (weighted average) | |
| Common stocks | 10,617,681 | Discounted cash flows | Increase annual rate | 10% - 15% |
| 2018 | Quantitative information of Level 3 fair values | |||
| Fair value | Valuation technique | Unobservable assumptions | Range (weighted average) | |
| Common stocks | 10,072,395 | Discounted cash flows | Increase annual rate | 10% - 15% |
| Derivative financial instruments | Assets: 517,888 Liabilities: 1,778,259
| Discounted cash flows | Implicit exchange rate | Dependent on each contract |
| Assets held-for-sale | 8,907,763 | Valuations adjusted for age range and cost of sales | Aging | Movable property: from 0 to 29 months, 20% from 30 to 47 months, 30% -80% after 47 months, 100%
Immovable property from 0 to 5 months, 20% from 6 to 11 months, 40% from 12 to 23 months, 60% after 23 months, 100% |
The following table sets out the fair values of financial instruments not measured at fair value and analyses them by the level in the fair value hierarchy into which each fair value measurement is categorized:
| 2019 | Level 2 | Level 3 | Total fair value | Total carrying amount | ||||
| Financial assets | ||||||||
| Cash and cash equivalents | 727,125,481 | 0 | 727,125,481 | 727,125,481 | ||||
| Securities purchased under resale agreements | 0 | 18,130,054 | 18,130,054 | 18,130,054 | ||||
| Deposits in banks | 101,115,823 | 3,244,153,150 | 3,345,268,973 | 3,345,268,973 | ||||
| Accrued interests of securities bought under resale agreements and deposits due from banks | 106,020 | 4,636,844 | 4,742,864 | 4,742,864 | ||||
| Loans, excluding financial leases | 0 | 15,713,221,127 | 15,713,221,127 | 15,922,830,353 | ||||
| Acceptances outstanding | 0 | 1,968,793 | 1,968,793 | 1,968,793 | ||||
| Total financial assets | 828.347.324 | 18,982,109,968 | 19,810,457,292 | 20,020,066,518 | ||||
Financial liabilities
| ||||||||
| Deposits | 9,306,700,695 | 8,033,166,294 | 17,339,866,989 | 17,149,200,735 | ||||
| Accrued interest from clients | 297,465 | 85,101,831 | 85,399,296 | 85,399,296 | ||||
| Securities sold under repurchase agreements | 0 | 34,683,519 | 34,683,519 | 34,683,519 | ||||
| Financial obligations | 0 | 2,360,213,708 | 2,360,213,708 | 2.327.423.644 | ||||
| Other financial obligations | 0 | 305,089,928 | 305,089,928 | 316,789,061 | ||||
| Accrued interests of financial liabilities | 0 | 14,381,101 | 14,381,101 | 14,381,101 | ||||
| Acceptances outstanding | 0 | 1,968,793 | 1,968,793 | 1,968,793 | ||||
| Total financial liabilities | 9.306.998.160 | 10.834.605.174 | 20.141.603,334 | 19.929.846,149 |
| 2018 | Level 2 | Level 3 | Total fair value | Total carrying amount | ||||
| Financial assets | ||||||||
| Cash and cash equivalents | 704,153,739 | 0 | 704,153,739 | 704,153,739 | ||||
| Securities purchased under resale agreements | 0 | 20,911,045 | 20,911,045 | 20,911,045 | ||||
| Deposits in banks | 770,319 | 3,466,154,262 | 3,466,924,581 | 3,466,924,581 | ||||
| Accrued interests of securities bought under resale agreements and deposits due from banks | 70,962 | 4,578,643 | 4,649,605 | 4,649,605 | ||||
| Loans, excluding financial leases | 0 | 15,169,602,311 | 15,169,602,311 | 15,347,461,165 | ||||
| Acceptances outstanding | 0 | 1,526,352 | 1,526,352 | 1,526,352 | ||||
| Total financial assets | 704,995,020 | 18,662,772,613 | 19,367,767,633 | 19,545,626,487 | ||||
Financial liabilities
| ||||||||
| Deposits | 8,543,455,368 | 7,203,917,819 | 15,747,373,187 | 15,686,877,179 | ||||
| Accrued interest from clients | 265,724 | 81,440,166 | 81,705,890 | 81,705,890 | ||||
| Securities sold under repurchase agreements | 0 | 110,737,028 | 110,737,028 | 110,737,028 | ||||
| Financial obligations | 0 | 3,318,895,727 | 3,318,895,727 | 3,298,442,616 | ||||
| Other financial obligations | 0 | 286,250,724 | 286,250,724 | 296,603,582 | ||||
| Accrued interests of financial liabilities | 0 | 19,450,466 | 19,450,466 | 19,450,466 | ||||
| Acceptances outstanding | 0 | 1,526,352 | 1,526,352 | 1,526,352 | ||||
| Total financial liabilities | 8,543,721,092 | 11,022,218,282 | 19,565,939,374 | 19,495,343,113 |
F-232
| (29) | Assets and Liabilities Classified as Held for Sale |
On December 16, 2016, Credomatic de México S.A de C.V., an indirect subsidiary of the Company, entered into an "Asset Purchase Agreement" with Banco Invex, S.A., a company domiciled in Mexico, for the entirety of its loan portfolio. On June 23, 2017, the Company sold the loan portfolio according to the “Asset Purchase Agreement”. Additionally, the subsidiary Credomatic de México S.A. of C.V., was sold in its entirety on April 11, 2018 to Banco Invex, S.A..
On June 7, 2018, the Board of Directors of COINCA Corporation, an indirect subsidiary of the Company, agreed to sell its subsidiary COINCA Comunicaciones Inalámbricas de Centroamerica S. A.. The transaction was completed on September 6, 2018.
Results of discontinued operations:
| 2018 | ||
| Total interest expense | 0 | |
| Interest income, net | 0 | |
| Release provision for account receivable losses | (10,167) | |
| Interest income, net after provisions | (10,167) | |
| Other income (expenses): | ||
| Gains in financial instruments, net | (68,957) | |
| Service charges | 3,097,357 | |
| Commissions and other fees, net | 0 | |
| Other income | 5,774,951 | |
| Total other income (expenses), net | 8,803,351 | |
| General and administrative expenses: | ||
| Salaries and employee benefits | 1,942,109 | |
| Depreciation and amortization | 324,216 | |
| Administrative | 265,427 | |
| Occupancy and related | 185,803 | |
| Other operating expenses | 2,528,740 | |
| Total general and administrative expenses | 5,246,295 | |
| Income (loss) before income tax | 3,567,223 | |
| Less: Income tax | (55) | |
| Net income (loss) of discontinued operations | 3,567,278 |
| (30) | Administration of Trust Contracts and Securities Custody |
As of December 31, 2019, several subsidiaries of the Company manage and keep custody of securities for a total amount of approximately $2,579,673,310 (2018: $2,660,565,767).
| (31) | Related Party Transactions |
In the normal course of business, the Company conducts transactions with related parties, including main executives and directors. These transactions, according to the internal policies of the Company, are carried out at market conditions.
The following table shows the balances and transactions with related parties as of December 31, 2019:
| 2019 | 2018 | |||||||
Key personnel and directors | Related parties | Key personnel and directors | Related parties | |||||
| Activos: | ||||||||
| Deposits due from banks | 0 | 101,115,824 | 0 | 770,319 | ||||
| Loans | 10,600,355 | 76,668,045 | 10,347,907 | 66,318,677 | ||||
| Loans Loss Reserve | 0 | (527,838) | 0 | (527,838) | ||||
| Accumulated interest receivable and other accounts receivable | 41,970 | 437,699 | 41,745 | 39,837,549 | ||||
| Other assets (derivatives fair value) | 0 | 0 | 0 | 888,101 | ||||
| 10,642,325 | 177,693.730 | 10,389,652 | 107.286.808 | |||||
| Liabilities: | ||||||||
| Demand deposits | 6,535,493 | 17,546,758 | 6,184,955 | 12,698,048 | ||||
| Term deposits | 14,157,887 | 141,516,399 | 13,977,965 | 140,909,062 | ||||
| Financial obligations | 0 | 185,000,000 | 0 | 203,329,656 | ||||
| Accumulated interest payable and other liabilities | 272,038 | 21,571,886 | 214,815 | 1,336,541 | ||||
| Other liabilities (derivatives fair value) | 0 | 0 | 0 | 189,072 | ||||
| 20,965,418 | 365,635,043 | 20,377,735 | 358,462,379 | |||||
| Hedge derivatives (notional value) | 0 | 0 | 0 | 154,110,000 | ||||
| 2019 | 2018 | |||||||
Key personnel and directors | Related parties | Key personnel and directors | Related parties | |||||
| Interest income and other income | 824,579 | 19.816.502 | 629,128 | 41.479.997 | ||||
| Interest expense and other operating expenses | 691,035 | 50.160.852 | 518,230 | 43.582.634 | ||||
| Key management personnel benefit | 19,535,360 | 0 | 19,006,597 | 0 | ||||
| (32) | Litigations |
To the best of management's knowledge, the Company is not involved in any litigation or claim that is likely to cause a significant adverse effect on its business, its consolidated financial position or its consolidated financial performance.
| (33) | Regulatory Aspects |
The Company's banking operations are subject to various regulatory requirements managed by the government agencies of the countries in which it operates or has a license. Failure to comply with these regulatory requirements can lead to certain mandatory actions and possibly additional discretionary actions by the regulators that, if performed, could have a significant effect on The Company's consolidated financial statements. Under capital adequacy guidelines and the regulatory framework of prompt corrective actions, the Company's banking operations must comply with specific capital guidelines that provide for the quantitative asset measurements and certain elements out of the consolidated balance sheet, in accordance with the regulatory accounting practices. The amounts of capital of the Company's banking operations and their classification are subject to qualitative judgments by the regulators about their components, risk weightings and other factors.
Management believes that as of December 31, 2019, the Banking operations of the Company meet all capital adequacy minimum requirements to which they are subject, which varies from 8.00% to 12.00% and other regulatory requirements.
Equity reserves
The Company is subject in several countries in which it operates to dynamic reserves on the portfolio of loans receivable. Additionally, it must establish equity reserves on the assets available for sale. Both items appropriate retained earnings.
The credit balance of the dynamic provision is part of the regulatory capital but does not replace or compensate the requirements at the minimum capital adequacy percentages established.
The provision on assets available for sale is made progressively within a range of 10% from the first year of registration up to 90% in the fifth year of adjudication.
As of December 31, 2019, the total regulatory equity reserves of the Company's subsidiary amount to $224,714,394 (2019: $208,788,982), of which $222,305,472 correspond to dynamic reserves (2018: $208,013,810).
| (34) | Subsequent Events |
The Company has assessed the subsequent events to February 20, 2020 to assess the need for their recognition or disclosure in the accompanying financial statements. Based on this evaluation, we determined that there were no subsequent events which require recognition or disclosure in these consolidated financial statements.
F-233
 |  |
Exhibit A
Form of DR Market Announcement with ADS Holder Election Instructions
March 18, 2022
JPMorgan Chase Bank, N.A. (the “Depositary”)
500 Stanton Christiana Rd.
Newark, DE 19713-2107
Phone: (800) 990-1135
Fax: (302) 220-4591
The New York Stock Exchange
11 Wall Street, 15th Floor,
New York, NY, 10005
Security Name: GRUPO AVAL ACCIONES Y VALORES S.A. (AVAL) - ADR - Spin Off Announcement - CUSIP: 40053W101
Grupo Aval Acciones y Valores S.A. (the "Company") has announced the distribution to its shareholders (the "Spin-Off") of shares of BAC Holding International Corp (“BHI”), a corporation organized under the laws of the Republic of Panama and a wholly-owned subsidiary of the Company.
In connection with the Spin-Off, the Company will, inter alia, distribute common shares of BHI (“BHI Shares”) to record date holders of its common and preferred shares (the “Shares”) in the ratio of one (1) BHI Share for each Share held. In connection with the Spin-Off, the Company has instructed that the Depositary allow holders, including beneficial owners (“Holders”) of American depositary shares (the “ADSs”), each representing 20 of the Company’s preferred shares (the “Preferred Shares”) , to elect to take delivery in Colombia of the BHI Shares distributed in respect of the Preferred Shares represented by Holders’ ADSs. The Depositary will sell the BHI Shares for which proper and timely elections were not made and will deliver the net proceeds from such sale, less any fees and expenses provided for under the terms of the ADSs, to the Holders entitled thereto.
The Company has instructed the Depositary to inform the market that (i) the Company and BHI will make available an information statement relating to the Spin-Off (the “Information Statement”) and will inform DTC participants of its availability, (ii) if you are a broker, a dealer, a trustee or a depositary for securities who holds or will hold ADSs for the account of others as a nominee holder, you should notify the respective beneficial owners of those ADSs of this notice and, once available, the availability of the Information Statement, as soon as possible to inform the beneficial owners of their rights in connection with the Spin-Off and make available to them the Share Delivery Instruction Form noted below, (iii) if a Holder does not have a Colombian brokerage account, such Holder must establish an account with a bank or broker in Colombia (or make arrangements with its current broker for establishing a correspondent account) prior to completing and submitting the Share Delivery Instruction Form and (iv) each Holder is responsible for establishing an account with a bank or broker in Colombia, and neither the Company nor the Depositary shall have any responsibility therefor.
Prior to 8pm (New York City time) on April 8, 2022, any Holders wishing to elect to receive the BHI Shares to which they are entitled in Colombia, will be required to have The Depository Trust Company (“DTC”) participant ultimately holding the ADSs on their behalf (i) make the above described election via the Elective Dividends System ("EDS") function of their Participant Terminal System and (ii) properly complete and submit a Share Delivery Instruction Form (which can be found at https://adr.com/drprofile/40053W101) to the Depositary at EQSS-VoluntaryEvents@equiniti.com. The Share Delivery Instruction Form submitted to the Depositary should accompany any such EDS instruction. The Depositary assumes no responsibility whatsoever to contact any Holder or any bank, broker, custodian or nominee holding ADSs on a Holder’s behalf, in order to remedy any improper or incomplete Share Delivery Instruction Forms.
To the extent BHI Shares cannot be delivered due to incomplete or erroneous instructions or to the extent the delivery of the BHI Shares is rejected by the bank, broker, custodian or intermediary to whom the Depositary is instructed to deliver such BHI Shares, the election submitted by or on behalf of such Holder through the DTC’s EDS function will be null and void and, along with all of the BHI Shares otherwise being sold by the Depositary, the Depositary will sell the BHI Shares that the Holder would have otherwise been entitled to receive and such Holder will, in lieu thereof, be entitled to receive the net cash proceeds from the sale thereof in the manner set forth in the deposit agreement governing the ADSs.
A-1
| | |
In order to be considered, the EDS instruction and properly completed Share Delivery Instruction Forms must be actually received by the Depositary on or prior to Noon (12:00 p.m.) (New York City time) on April 11, 2022.
The first day of trading of the BHI Shares in Colombia is expected to be on or about March 30, 2022. The anticipated delivery date for the BHI Shares to be received by those properly electing to receive the BHI Shares in Colombia will be on or about April 12, 2022. A payment date will be established following the sale of the BHI Shares for the benefit of non-electing Holders and Holders who failed to properly and timely submit an election to receive BHI Shares.
The corresponding ADR Dates are as follows:
Record Date: Close of business (New York City time) on March 28, 2022
Payment Date: To be determined
Election Period: March 29, 2022 through 8 p.m. (New York City time) on April 8, 2022
The Depositary’s books for Issuances and Cancellations will be closed from the close of business (New York City time) on March 18, 2022 through the close of business (New York City time) on March 29, 2022.
¹Investor Disclosures
JPMorgan Chase Bank, N.A. or an affiliate, in its capacity as depositary bank (the “Depositary”) collects fees from holders of depositary receipts. The Depositary may (i) reimburse the issuer for certain expenses incurred by the issuer in connection with the depositary receipts program and/or (ii) share with the issuer revenue derived by or anticipated to be derived by the Depositary from the program. The Depositary may use brokers, dealers or other service providers that are affiliates or other business units of JPMorgan Chase Bank, N.A. (the “Bank”) and, in doing so, each may earn or share fees and commissions.
In addition, to facilitate the administration of various depositary receipt transactions, including disbursement of dividends or other cash distributions and other corporate actions, the Depositary may engage the foreign exchange desk within the Bank and/or its affiliates in order to enter into spot foreign exchange transactions to convert foreign currency into U.S. dollars (“FX Transactions”).
For further details relating to the applicable foreign exchange rate, any applicable spread and the execution of FX Transactions, see the “Disclosure” page (or successor page) of www.adr.com (as updated by the Depositary from time to time).
Execution Disclosure
J.P. Morgan acting as depositary for depositary receipt (“DR”) programs may facilitate the sale and purchase of securities in accordance with the applicable deposit agreement or the terms and condition of an unsponsored depositary receipts program. J.P. Morgan also acts as registrar and dividend disbursing agent for certain New York Registered Share (“NYRS”) programs of issuers incorporated in the Netherlands. The procedures set forth below apply to any sales/purchases required under sponsored or unsponsored DR programs or a NYRS appointment to the extent such sales/purchases are contemplated in the terms of such appointment. Sales or purchases may be executed in the jurisdiction of incorporation of a DR issuer or in the market where the DRs or NYRSs are listed and/or traded. Examples include but are not limited to:
| o | a sale in the local market of rights to subscribe to underlying equity shares of an Issuer, where such rights are not registered in the US (or other jurisdiction if registration is required); |
| o | a sale of shares issued as a result of the acquisition of a DR issuer; |
| o | a sale of corporate action-related entitlements that are not distributed to DR holders; |
| o | the purchase of local shares with a foreign currency cash remittance that cannot be converted to US dollars; and |
| o | a sale of securities underlying DRs that remain outstanding subsequent to the termination of a DR program. Any exceptions to these procedures will be made in accordance with J.P. Morgan’s policies. |
Execution of sale or purchase of securities
If J.P. Morgan is required to endeavor to sell or purchase securities for the benefit of DR or NYRS holders, it may instruct the J.P. Morgan Equity Trading Desk (“JPM trading desk”) acting as principal or agent to execute the transaction. JPM trading desk may charge a commission of up to 5 basis points (unless otherwise disclosed) calculated on the execution price (subject to rounding). If the JPM trading desk does not have the capability to buy or sell securities in the relevant market or is unable to perform the trade for any reason, J.P. Morgan may instruct its appointed local market custodian or a local broker to execute the sale or purchase, as the case may be. Any such local market custodian or local broker may charge a commission in relation to the execution of any such sale or purchase transaction. Sales or purchases executed through agents other than a JPM trading desk or J.P. Morgan’s local market custodian will only be made in accordance with the policies of J.P. Morgan.
A-2
| | |
Execution Period
J.P. Morgan will endeavor to execute the full sale/purchase during the applicable trading period and in the applicable markets of the security to the best of its ability. Sales transactions will only commence subsequent to confirmation by J.P. Morgan of receipt of the security to be sold.
Absent a specific trading period, J.P. Morgan will instruct the JPM trading desk, the local custodian or the local broker, as the case may be to execute a sale or purchase as soon as reasonably practicable as market conditions will permit, endeavoring to complete such sale or purchase within five (5) business days. The execution price for the securities bought or sold will depend on market conditions, including but not limited to:
| a. | volume of securities subject to the trade; |
| b. | influence of the trade on market value of securities; |
| c. | historic trading volumes of the securities; and |
| d. | number of counterparties interested in the trade. |
J.P. Morgan does not guarantee that the securities will be purchased or sold or at any particular price.
Final Price
J.P. Morgan will base the final price (“Final Price”) on the actual execution price for the sale or purchase as adjusted for costs and commissions as described below.
The Final Price for executions of trades over a trading period of more than one day will be determined based on the weighted average of the final prices of all the sales/purchases of securities carried out on behalf of J.P. Morgan and on its instructions that occurred over each day of the trading period taking into account the highest and lowest price traded on all days of the trading period during normal trading hours of the exchange or market where the security trades. Any conversion of foreign currency into US dollars that may be required will be undertaken in accordance with the foreign exchange policies of J.P. Morgan in place at that time. Please consult the additional disclosure for more information: [Depositary Receipts FX Disclosure]
The Final Price will be determined net of certain incurred costs or commissions, including but not limited to: (i) commission paid to a JPM trading desk, local custodian, local broker or other agent; (ii) stock exchange fees; (iii) applicable taxes and governmental charges; and (iv) any sale coordination fee of J.P. Morgan of up to 20 basis points calculated on the execution price (subject to rounding), with such fee to be assessed only in accordance with the terms and conditions of the applicable program and to the extent it would not cause the Final Price to fall outside of the range of prices for the security on that day during normal trading hours of the exchange or market where the security trades.
Disclaimer:
Each of the Depositary, the Bank and/or its affiliates reserves the right to change any of the above execution policies at any time in its discretion. This document is provided solely for informational purposes and provides a summary of the information contained herein. It is not a complete description of the transactions, processes and procedures referred to herein. Processes and procedures described in, and any other content of, this document are subject to change without notice. Neither the Depositary, the Bank nor any of their affiliates accept any obligation to update this document, whether or not such processes and/or procedures have changed
.
© 2022 JPMorgan Chase & Co. All rights reserved
A-3
Exhibit B
Form of Share Delivery Instruction Form
GRUPO AVAL ACCIONES Y VALORES S.A.
Spin-Off Share Delivery Instruction Form (the “Instruction Form”)
| ADSrecorddate: | March 28, 2022 |
| Terms: | Grupo Aval Acciones y Valores S.A. (the "Company") has announced the distribution to its shareholders (the "Spin-Off") of BAC Holding International Corp. ("BHI"), a corporation organized under the laws of the Republic of Panama and a wholly-owned subsidiary of the Company. In connection with the Spin-Off, the Company will, inter alia, distribute common shares of BHI (the “BHI Shares”) to the holders of the Company’s preferred shares (the "Company Shares") in the ratio of one (1) BHI Share for each Company Share held. In connection with the Spin-Off, the Company has decided to allow holders of American depositary shares (“ADSs”), each represented 20 Company Shares, to elect to take delivery in Colombia of the BHI Shares distributed in respect of the Company Shares represented by such holders ADSs. |
ADS Election Period Begins: March 29, 2022
ADS Election Deadline through DTC EDS Function: April 8, 2022 (8:00 PM E.T.)
ADS Election Instruction Form Submission Deadline: April 11, 2022 (12:00 PM E.T.)
CUSIP:40053W101
Ticker: AVAL
DTC participants must submit elections on behalf of holders of ADSs via the EDS function of their Participant Terminal System by 8:00 PM (E.T.) on April 8, 2022. Additionally, the attached Instruction Form must be properly completed and received by JPMorgan Chase Bank, N.A., as depositary (the “Depositary”) on or before 12:00 PM (E.T.) on April 11, 2022. It is strongly suggested that attached Instruction Form be sent simultaneous with any such EDS instruction in order for the ADS holder to be eligible to receive BHI Shares in the local market. The Depositary assumes no responsibility whatsoever to contact any such participant(s) or ADS holder(s) to remedy any improper or incomplete delivery instructions. To the extent BHI Shares cannot be delivered due to incomplete or erroneous instructions or to the extent the delivery of the BHI Shares is rejected by the broker, custodian or intermediary to whom the Depositary is instructed to deliver such BHI Shares, the election submitted for such ADS holder through the EDS function will be null and void and, along with all of the BHI Shares otherwise being sold by the Depositary, the Depositary will sell the BHI Shares to which the ADS holder would have otherwise been entitled to receive and such ADS holder will, in lieu thereof, be entitled to receive their pro-rata portion of the net cash proceeds from the sale thereof, all in the manner set forth in the terms governing the ADSs. In order to be considered, a properly completed Instruction Form must be actually be received by the Depositary at the email address set forth thereon on or before 12 p.m. (New York City time) on April 11, 2022.
B-1
Grupo Aval Acciones y Valores S.A. – Instruction Form for Delivery of BHI Shares in the Colombian Local Market
INSTRUCTIONS:
| 1. | Submit a completed participant instruction on DTC’s Elective Dividend System (“EDS”) via the participant’s PTS terminal |
| 2. | Complete all relevant sections on this Instruction Form, sign and send via email to the Depositary at EQSS-VoluntaryEvents@equiniti.com |
(The Equiniti Team will endeavor to confirm receipt of form by return email)
JPMorgan Chase Bank, N.A., as depositary (the “Depositary”), is not responsible in any way for any Instruction Form that is not received in time or which includes incomplete or incorrect information.
Delivery Information
Number of BHI Shares:_____________________ (number of ADSs multiplied by 20)
The Beneficial owner(s) for which we are acting is/are record date holder(s) of ________________ ADSs held by the undersigned on their behalf and for which we have made an EDS election to request local BHI Shares be delivered. We understand that all deliveries of BHI Shares will be made free of payment and that any and all delivery fees, costs and expenses, stamp duties and stamp duty reserve taxes owing shall be the responsibility of the undersigned DTC participant. You are requested to deliver all the BHI Shares to which this Instruction Form relates to the below coordinates:
Receiving Agent (REAG//) Bic code: ___________________________________
Agent SafeKeeping Account: _________________________________________
Buyer (BUYR//) Bic code: ____________________________________________
Safekeeping Account: ________________________________________________
If a registration is unacceptable for any reason, it will be deemed that no election was made.
DTC Participant Information
DTC Participant Name:__________________________________________
DTC Participant Number:________________________________________
Contact Name at DTC Participant:________________________________
Contact Number at DTC Participant:__________________________________________
Contact Email at DTC Participant:____________________________________________
We acknowledge that if a registration is unacceptable for any reason, if the delivery instructions set forth above are incomplete or inaccurate or any such delivery is rejected, it will be deemed that no election was made.
Date: ___________________________________
| Signature: | By: _____________________________________ |
Name:
Title:
Each Instruction Form must be properly completed and duly signed. JPMorgan is not responsible in any way for any Instruction Forms that are not received in time or which contain incomplete or incorrect information.
B-2
Item 2

Important Notice Regarding the Availability of Information Statement Concerning the Spinoff of BAC Holding International Corp.
Grupo Aval Acciones y Valores S.A.
You are receiving this communication because you have been identified as a resident of the United States or other U.S. person (as defined under U.S. securities laws) that holds common or preferred shares, including preferred shares represented by American Depositary Shares (“ADSs”), of Grupo Aval Acciones y Valores S.A. (“Grupo Aval”). Grupo Aval has released an information statement (the “Information Statement”) regarding its upcoming distribution, through a series of transactions, of an approximately 51.5% equity stake in its subsidiary, BAC Holding International Corp. (“BHI”). The transactions are collectively referred to as the “Spinoff.” The Information Statement is now available for your review.
Grupo Aval is not soliciting a proxy or consent authority in connection with the Spinoff. The Spinoff has been approved by Grupo Aval’s common shareholders and has received all requisite regulatory approvals.
This communication presents only instructions on how to access the Information Statement, which contains important information about the Spinoff and is available on the Internet, by e-mail or by mail. You are encouraged to access and read the Information Statement in full.
The Information Statement that Grupo Aval has prepared in connection with the Spinoff, and any supplements thereto that Grupo Aval may prepare, may be viewed online at https://www.grupoaval.com/investor-relations/shares, under the caption “Foreign Markets,” where you will see a link titled “U.S. Information Statement Regarding Spinoff of BHI.”
You may also easily request a paper or e-mail copy of the Information Statement, at no charge, by following the instructions on the reverse side of this communication.
See the reverse side for instructions on how to access the Information Statement.
[Reverse side of Important Notice]
How to Access the Materials
Materials Available to VIEW or RECEIVE:
How to View Online:
Visit: https://www.grupoaval.com/investor-relations/shares. On the webpage, you will see a caption titled “Foreign Markets,” under which you will see a link titled “U.S. Information Statement Regarding Spinoff of BHI.” Please click on that link to access the Information Statement.
How to Request and Receive a PAPER or E-MAIL Copy:
If you want to receive a paper or e-mail copy of these materials, you must request one. There is NO charge for requesting a copy. Please choose one of the following methods to make your request:
1) BY INTERNET: https://www.grupoaval.com/investor-relations/contact
2) BY TELEPHONE: +57 1 7433222
3) BY E-MAIL*: investorrelations@grupoaval.com
* If requesting materials by e-mail, please send a blank e-mail and the phrase “Information Statement” in the subject line. No other requests should be included within the e-mail. Requests, instructions and other inquiries sent to this e-mail address will NOT be forwarded to your investment advisor.
Please make your request for a paper copy by March 23, 2022 to facilitate timely delivery prior to the completion of the Spinoff, which is expected to occur on or about March 29, 2022.
THIS NOTICE INCLUDES INSTRUCTIONS ON HOW TO ACCESS MATERIALS FOR INFORMATIONAL PURPOSES ONLY
SIGNATURE
Pursuant to the requirements of the Securities Exchange Act of 1934, the registrant has duly caused this report to be signed on its behalf by the undersigned, thereunto duly authorized.
Date: March 22, 2022
| GRUPO AVAL ACCIONES Y VALORES S.A. | |||||
| By: | /s/ Jorge Adrián Rincón Plata | ||||
| Name: | Jorge Adrián Rincón Plata | ||||
| Title: | Chief Legal Counsel | ||||