


MainGate MLP Fund
Class A (AMLPX)
Class C (MLCPX)
Class I (IMLPX)
6075 Poplar Avenue, Suite 720 | Memphis, TN 38119 | 855.MLP.FUND (855.657.3863) | www.maingatefunds.com
SEMI-ANNUAL REPORT
May 31, 2021
SEMI-ANNUAL REPORT 2021 • 3
Table of Contents
MainGate mlp fund
Dear Shareholder,
The MainGate MLP Fund had the following performance as of May 31, 2021 compared to the S&P 500 Index and the Alerian MLP Total Return Index.
| | | CUMULATIVE RETURNS | | AVERAGE ANNUAL RETURNS |
| | | Inception | | Fiscal | | Since | | 1 | | 5 | | 10 | | Since |
| | | Date | | YTD | | Inception | | Year | | Year | | Year | | Inception |
| MainGate MLP Fund – Class A without load | | 2/17/11 | | 40.51% | | 6.83% | | 39.62% | | -2.73% | | 0.67% | | 0.65% |
| MainGate MLP Fund – Class A with 5.75% maximum front-end load | | 2/17/11 | | 32.39% | | 0.69% | | 31.70% | | -3.88% | | 0.08% | | 0.07% |
| MainGate MLP Fund – Class I | | 2/17/11 | | 40.75% | | 9.74% | | 40.21% | | -2.50% | | 0.93% | | 0.91% |
| S&P 500 Index | | 2/17/11 | | 16.95% | | 286.77% | | 40.32% | | 17.16% | | 14.38% | | 14.06% |
| Alerian MLP Total Return Index | | 2/17/11 | | 44.09% | | 5.61% | | 43.63% | | -1.06% | | 0.67% | | 0.53% |
| MainGate MLP Fund – Class C without load | | 3/31/14 | | 39.62% | | -33.06% | | 38.68% | | -3.48% | | — | | -5.45% |
| MainGate MLP Fund – Class C with 1.00% Contingent Deferred Sales Charge | | 3/31/14 | | 38.62% | | -33.06% | | 37.68% | | -3.48% | | — | | -5.45% |
| S&P 500 Index | | 3/31/14 | | 16.95% | | 158.89% | | 40.32% | | 17.16% | | — | | 14.19% |
| Alerian MLP Total Return Index | | 3/31/14 | | 44.09% | | -28.25% | | 43.63% | | -1.06% | | — | | -4.53% |
Expense Ratios (Gross/Net): A Shares = 1.73%/1.73% | C Shares = 2.47%/2.47% | I Shares = 1.47%/1.47%. Net expense ratios represent the percentages paid by investors and reflect a 0.00% deferred income tax expense which represents the performance impact of accrued deferred tax liabilities across the Fund, not individual share classes, for the fiscal year ended November 30, 2020 (the Fund did not have a current tax expense or benefit due to a valuation allowance). The Fund’s adviser has contractually agreed to cap the Fund’s total annual operating expenses (excluding brokerage fees and commissions; Class A 12b-1 fees; borrowing costs; taxes, such as Deferred Income Tax Expense; and extraordinary expenses) at 1.50% through March 31, 2022. The performance data shown For Class C with load reflects the Class C maximum deferred sales charge of 1.00%. Deferred income tax expense/(benefit) represents an estimate of the Fund’s potential tax expense/(benefit) if it were to recognize the unrealized gains/(losses) in the portfolio. An estimate of deferred income tax expense/(benefit) depends upon the Fund’s net investment income/(loss) and realized and unrealized gains/(losses) on its portfolio, which may vary greatly on a daily, monthly and annual basis depending on the nature of the Fund’s investments and their performance. An estimate of deferred income tax expenses/(benefit) cannot be reliably predicted from year to year.
The performance data quoted represents past performance. Past performance is no guarantee of future results. The investment return and the principal value of an investment will fluctuate and shares, when redeemed, may be worth more or less than their original cost. Current performance may be lower or higher than the information quoted. To obtain performance information current to the most recent month-end please call 855.MLP.FUND (855.657.3863). Performance data shown for Class A shares with load reflects the maximum sales charge of 5.75%. Performance data shown for Class C shares with load reflects the maximum deferred sales charge of 1.00%. Performance data shown for Class I shares does not reflect the deduction of a sales load or fee. Performance data shown “Without Load” does not reflect the deduction of the sales load or fee. If reflected, the load or fee would reduce the performance quoted.
SEMI-ANNUAL REPORT 2021 • 5
The Story is Only Beginning.
It always feels easier to write from a position of strength, and with the Alerian MLP Total Return Index (AMZX)1 registering a +21.2% return during the second quarter, boy was it a strong one. However, we believe this quarter marked a new paradigm—we’re aware of the gravity of using this description—for Midstream securities. The quarterly results showed consistently improving fundamentals, as well as an aid to profits from Winter Storm Uri, which accelerated corporate plans for deleveraging goals, if they were not already achieved. Investors took notice of our often-used line, “what else are they going to do with the excess cash flow2?”.
Also, as we alluded to in last quarter’s newsletter, we felt corporate guidance and estimates were too conservative going into the earnings reporting period, and we suspect the same is true for the remainder of the year, as well as for 2022. Highlights include:
| • | The MainGate MLP Fund’s holdings beat consensus estimated earnings before interest, taxes, depreciation and amortization (EBITDA)3 by 17.6% on a weighted average4 basis. |
| • | The 2021 weighted average growth rate for distributable cash flow (DCF)5 per unit for the MainGate MLP Fund increased to +5.2% from -3.0% at 3/31/21—yes, an 820-basis point (bps) swing6. |
| • | 2022 DCF/unit (DCF/u) is now forecasted to grow +2.6% on a weighted average basis for the MainGate MLP Fund. |
| • | Debt/EBITDA7 leverage across the portfolio companies decreased from 3.9x to 3.7x quarter over quarter. |
The inevitable question that naturally occurs after a +21.2% quarter, and we know what many readers may be questioning, is: “did I miss the rally?” Simply put, “we do not believe so”.
While the total return performance was strong, we believe it only partially reflects the fundamental improvement. First, if we rely on our long-standing Alerian MLP Index (AMZ) Price to DCF/u8 chart (see following page), the ratio only increased 11.8% to 6.0x vs. the 18.4% increase for the price-only AMZ. Hence, DCF/u estimate increases have grown so strongly that valuation9 improvement has been less than implied by the price return. And, with the rolling forward 12-month method for DCF/u increasing as it picks up more months of higher estimates this year and next, the index still has room to keep up and potentially catch up to the historical averages of 9.7x since 2008 and 7.3x since the beginning of 2016.
Second, generalist investors are increasingly focused on Free Cash Flow (FCF)10 yields for Midstream and many other sectors within energy. As the chart on the following page illustrates, we estimate the FCF yield on the AMZ to be 13.8% for 2021; however, that estimate is higher in 2022 at 15.0% due to higher expected cash flow and lower growth capital expenditure expectations. Both of these FCF yields remain markedly higher than the S&P 500 Index11 at 3.7%. It is very important to point out this sector has not been FCF positive for most of its public existence, hence the paradigm shift. The newfound financial flexibility should lead to continued balance sheet health, and a dynamic approach to returning capital to investors. We expect to see accelerated unit/share buyback activity and modest distribution increases (~5% or less).
(1) Alerian MLP Index: A capitalization-weighted index of the most prominent energy Master Limited Partnerships. Visit http://www.alerian.com/indices/amz-index for more information, including performance. You cannot invest directly in an index. (2) Cash Flow: A measurement of the cash generating capability of a company by adding non-cash charges (e.g. depreciation) and interest expense to pretax income. (3) Earnings Before Interest, Taxes, Depreciation and Amortization (EBITDA): Essentially net income with interest, taxes, depreciation, and amortization added back to it; can be used to analyze and compare profitability between companies and industries because it eliminates the effects of financing and accounting decisions. (4) Weighted Average: A calculation in which each quantity to be averaged is assigned a weight that represents its relative importance. (5) Distributable Cash Flow: Measured as earnings before interest, taxes, depreciation and amortization (EBITDA) available to pay unitholders after reserving for maintenance capital expenditures and payment of interest expense. (6) Distributable Cash Flow (DCF) data is CCM-calculated consensus of Wall Street estimates for the year indicated. DCF growth rate for the portfolio’s holdings does not guarantee a corresponding increase in the market value of the holding or the portfolio. This is not a forecast of the portfolio’s future performance. (7) Debt to EBITDA: A measurement of leverage, calculated as a company’s interest-bearing liabilities minus cash or cash equivalents, divided by its Earnings Before Interest, Taxes, Depreciation and Amortization (EBITDA). (8) Price to Distributable Cash Flow (P/DCF): Market cap of the MLP divided by a full year of distributable cash flow, which is measured as earnings before interest, taxes, depreciation and amortization (EBITDA) available to pay unitholders after reserving for maintenance capital expenditures and payment of interest expense. (9) Valuation: The process of determining the current worth of an asset or a company. (10) Free Cash Flow: A measure of financial performance calculated as operating cash flow minus capital expenditures. (11) S&P 500: A free-float capitalization-weighted index published since 1957 of the prices of 500 large-cap common stocks actively traded in the United States.
6 | MainGate mlp fund
Alerian Weighted Price/DCF

Source: Blomberg LP, CCM
Estimated Free Cash Flow Yield
Source: Bloomberg LP at 6/30/21, using Bloomberg definition of Free Cash Flow to Equity of cash flow from operations (CFFO) less capex.
BP Midstream Partners LP (BPMP) has no consensus estimate; therefore, we use CCM’s estimate.
SEMI-ANNUAL REPORT 2021 • 7
Future Midstream Capital Spending & the Sector’s Role in the Energy Evolution
We expect Midstream companies to remain disciplined in their growth capital spending plans for the next several years. Where capacity is sparser, companies have indicated they believe they can accommodate customer needs through “light” capital spending plans, such as adding compression, extending laterals, or just being more commercially efficient.
Regarding companies’ plans for the energy transition, it’s apparent from management communications throughout the quarter that they do not intend to be left behind. Nearly all companies either already had defined Energy Transition expenditure plans in place, or designated a new group to focus on this category of investment by the end of the quarter.
Midstream companies are already handling green or clean fuels such as renewable natural gas, responsibly sourced natural gas, renewable diesel and biodiesel through existing assets. While these are currently a small percentage of overall industry volumes, they should be more meaningful by the end of the decade when we expect greater progress on other sustainable fuels such as aviation fuels. There’s also the ever present discussion of hydrogen, which is increasingly discussed as a clean fuel solution. We’ll save most of that discussion for another time, but suffice it to say, barring a groundbreaking technological innovation or a massive government subsidy to make hydrogen power cost competitive, it appears hydrogen will be later this decade at the soonest before hydrogen’s substitution effect is scalable. Even if we get the timing wrong, we expect it to move through existing or repurposed Midstream assets.
Increasingly, as we enter the middle part of the decade, we expect to see increased spending around Carbon Capture Utilization and Storage (CCUS)12 assets in particular. Capturing carbon (CO2), transporting and storage has been a Midstream service offering for 30+ years. The technology is not terribly complicated, particularly the closer to the source the required infrastructure is (i.e. it’s a lot easier to capture carbon at the wellhead or plant level versus direct air capture); but, some of the commercialization questions remaining range from “where do we store the carbon” to “who owns the liability” to, probably the most important, “who’s going to pay for it?”
The current 45Q credit within the IRS tax code allows for companies to receive a tax credit for capturing carbon in the amount of $50/ton (for CO2 that is sequestered) or $35/ton13 (for CO2 used in enhanced oil recovery (EOR) or other industry applications). However, many companies believe the 45Q credits need to be higher than the current aforementioned levels and/or be offered with a direct pay option in order for CCUS to meet their return hurdles. Midstream companies are currently keeping plans very close to the vest when it comes to their de-carbonization investment options, but the majority of the companies we’ve discussed this topic with indicate it is high on their radar.
Let’s put a framework around what this opportunity could be. Press reports in April indicated Exxon Mobil Corp (XOM, $61.23) has proposed a $100 billion hub to capture emissions along the Texas Gulf Coast14. Citi Research believes there is nearly $60 billion per year of capture, storage and transportation investment needed by 203015. Exxon also indicated they believe this could ultimately be a $2 trillion market by 2040 at the $50/ton credit16. For perspective, the market capitalization of the energy companies in the S&P 500 is less than $750 billion as of 6/30/21.
Given their expertise in transportation and storage, Midstream companies should have a significant role to play in this scenario. Putting a finer tooth comb on the analysis to address what we know is on our readers’ minds, based on 2019 U.S. Environmental Protection Agency (EPA)17 emissions data, we conservatively estimate the total addressable market opportunity from CCUS for Midstream companies is approximately $21 billion of EBITDA per annum or roughly 25% of the current EBITDA of the space18. This could go a long way towards addressing terminal value concerns (see section below).
(12) Carbon capture, utilisation and storage, or CCUS, is an important emissions reduction technology that can be applied across the energy system. (13) National Law Review, “Treasury Releases Final Regulations on 45Q Carbon Capture Credits”, 1/28/21. (14) Bloomberg, “Exxon Floats $100 Billion Federally Backed Carbon Capture Hub”, 4/19/21. (15) Citi Research, “Financing CCUS—Financial Markets Obstacles are Eroding…Slowly”, 6/16/21. (16) Wall Street Journal, “Exxon, Once a Skeptic, Sees Profit in Capturing Carbon Emissions”, 3/3/21. (17) Environmental Protection Agency (EPA): An agency of the U.S. federal government which was created for the purpose of protecting human health and the environment by writing and enforcing regulations based on laws passed by Congress. (18) CCM estimates total public company Midstream EBITDA to be ~$80 billion.
8 | MainGate mlp fund
In fact, our Midstream friends north of the border made a significant announcement this quarter regarding such an initiative. On June 17th, Pembina Pipeline Corporation (PBA, $32.07) and TC Energy Corporation (TRP, $50.23) shared their plans for the Alberta Carbon Grid (ACG) where they plan to develop a world class transportation and sequestration system capable of transporting 20 million tons of CO2 annually with assets being phased into service between 2025-2027. This will be an open access system, and they indicated their willingness to take on additional partners to grow the ACG as a meaningful step to help Canada meet its 2030 climate targets including reducing greenhouse gas (GHG) emissions by 40-45% below 2005 levels.
From a national climate policy standpoint, we believe the potential CCUS opportunity is some of the lowest hanging fruit available for decarbonization goals, given it would utilize more existing assets, would require a lower land footprint than other generation sources such as wind and solar, and would allow inexpensive power from fossil fuels to continue their societal and economic benefits. It’s our sense that there is a logjam of questions and implementation strategies being worked behind the scenes between companies and customers. As greater clarity emerges, cash flow from existing or new investments will be easier to forecast.
Quieting Midstream Terminal Value Concerns
Our readers may remember we addressed terminal value for Midstream companies in last quarter’s newsletter as a remaining block in the “wall of worry”. It has been amazing to see the sentiment turnaround on this topic in just 3 months with several factors behind this shift.
Certainly, the increased communication and discussion from companies about participation in decarbonization and renewables investing hasn’t hurt. As mentioned above, the majority of discussion is around utilization of existing assets and announcements of energy transition teams. It’s logical to assume as more concrete details emerge it could bring even more attention to this opportunity, which is quite different from the narrative 12 months ago that these companies were going to just decline to oblivion.
Also, as discussion and action regarding increased equity repurchase activity has picked up, other investors are beginning to understand, as we also alluded to, if you can generate large amounts of excess free cash flow with either fewer or more efficient investment opportunities, repurchasing significant amounts of one’s equity can act as a counterbalance to terminal value concerns. During the quarter there was $185 million of equity repurchased with MPLX LP (MPLX, $29.86) accounting for $155 million. While we would have liked to see a more active repurchase quarter, we believe the current, nascent repurchase activity is set to increase through the rest of the year and into 2022 now that company leverage targets have been achieved or there is good visibility of reaching their targets. Currently 69% of the MainGate MLP Fund’s weightings are to companies with active repurchase agreements. That figure increases to 83.5% if you include the indications from Energy Transfer LP (ET, $10.59) and Williams Cos Inc (WMB, $26.70) for potential authorizations in 2022. Even if we assumed a flip of a clean switch by 2030, which would hinder existing assets further than forecast, we estimate 13 or 68% of the companies in our portfolio could reduce their equity capital19 base >50% by the end of 203020 (see chart on following page).
Lastly, the pendulum of the national conversation on traditional energy has started to swing back to something closer to normal. First, legal support for pipelines continues to be affirmed at various court levels.
On 5/21/21, a federal judge ruled in favor of ET’s Dakota Access Pipeline (DAPL)21 in holding that DAPL could remain in operation while the Army Corps of Engineers completes an environmental impact statement (EIS). Then, on 6/29/21, the Supreme Court ruled in favor of the owners of the PennEast pipeline asserting, as a Federal Energy Regulatory Commission (FERC) approved pipeline, the private owners have the power to condemn necessary rights of way for purposes of constructing their pipeline, whether owned by private parties or states. This overturned a lower court ruling which had previously sided with the state of New Jersey.
(19) Equity Capital: Invested money that represents the owners’ risk through the purchase of a company’s common stock and is not repaid to investors in the normal course of business. (20) Analysis assumes excess free cash flow over the next 10 years is applied to equity repurchase at current prices. The analysis also gives preference to debt holders by keeping each company’s leverage capped at 3.5x debt/EBITDA. Actual share/unit repurchases and the prices at which repurchases occur may vary significantly. (21) Dakota Access Pipeline or Bakken Pipeline: A 1,172-mile-long (1,886 km) underground oil pipeline project in the United States.
SEMI-ANNUAL REPORT 2021 • 9
Estimated Equity Capital Base Reduction by Portfolio Companies

Source: Bloomberg, LP, CCM
Second, when President Biden took office in January, he announced a series of climate-based initiatives such as a moratorium on new oil and gas leases on federal land, which, in hindsight, appear to be an appeasement to the more liberal wing of his base. These announcements opened up a series of questions and analyses, all of which appear for now to be moot, after a June 15th ruling by a federal judge in Louisiana blocked the administration’s plans for suspension. The ruling applies to onshore and offshore leasing nationwide. Even before this ruling, the President has shown a higher degree of pragmatism on energy projects in an appeal to moderates within his party, as evidenced by the Administration’s support or indifference for various production, mining and Midstream projects that have previously had a prolonged stay in the media22. In fact, a new narrative is gaining traction in the media where there is increased concern that even though customers say they want greener energy, they still say “not in my backyard” (NIMBY) regardless of the source of generation the asset is creating23.
The transition to cleaner emissions will take time, which leaves a long intervening period for companies to assess opportunity and risk within their business models. Adding investments that capitalize on new long-term trends in generation sources, spending capital more efficiently on existing assets, and reducing outstanding equity capital to return capital to investors while right sizing companies for the future are all part of the recipe.
Odds & Ends
Cybersecurity
After the reported ransomware attack on the Colonial Pipeline Company on May 6th, interest in cyber-security for other Midstream assets came to the forefront. This event happened after predominately all the earnings calls had occurred, but we were able to catch up with many companies in the weeks following. By and large, they remain assured in the cyber protection of their assets, operations and data centers—this threat is not a new thing—but the event has provided a test case for them to recheck security and policies. We expect to hear more granularity on this topic during the Q2:21 reporting season. Also, we should note our belief that this incident highlighted the mission-critical nature of Midstream assets, and the market seemed to agree, with the AMZ rising 2.4% in the week following the news of the ransomware attack24.
(22) Wall Street Journal, “Biden Administration Supports Oil, Mining Projects Backed by Trump”, 6/1/21. (23) Wall Street Journal, “Solar Power’s Land Grab Hits a Snag: Environmentalists”, 6/4/21. (24) Alerian LP, 5/10/21 through 5/14/21.
10 | MainGate mlp fund
Inflation
With the consumer price index (CPI)25 and producer price index (PPI) coming in stronger than forecast the past several monthly readings, market participants are bracing for elevated inflation whether it’s considered transitory or more permanent. We won’t dive into that debate, but we’ll highlight a few of the ways Midstream is positioned for higher inflation however it may materialize.
Fundamentally, it’s a good reminder to readers the majority of Midstream contracts have inflation escalators present in them generally tied to either PPI or CPI (or the FERC index as described below). We estimate over 90% of cash flows of our holdings are fee-based and contracted, and therefore would have some aspect of inflation protection in them. Additionally, the non-fee-based component may have commodity or volume sensitivity and would benefit from inflation in hydrocarbon prices and/or locational differences.
Using regulated pipelines as a specific example, this inflation feature is built into regulated FERC return on equity (ROEs) rates for gas pipelines. FERC regulated refined products (gasoline, diesel, jet fuel) pipelines have an annual reset tied to PPI plus a regulatory adder. For instance, when rates reset July 2022, it will be based on the 2021 PPI finished goods (FG) rate plus 0.78%. If we take the year-to-date CPI and carry May 2021’s PPI FG index level of 218 forward for the remainder of the year, we arrive at a 6.5% estimate for 2021, and, thus, these pipelines would see a 7.2% year over year increase. Additionally, non-FERC regulated pipes, often referred to as market-based pipelines, typically see similar increases or higher.
As it relates to Midstream securities, they should benefit from dollars seeking inflation hedging characteristics. Certainly, the structural benefit of the cash flows should be appealing, as should be the hard asset characteristic.
Commodity Prices
The second quarter was strong across all commodities. WTI26 crude oil rose +24.1%, Henry Hub natural gas rose +39.8%, and the weighted average composite NGL price rose +29.5%27. We believe this reflects our often-written view that lack of regional, national and international development during 2020 is creating supply & demand mismatches, particularly as the re-opening takes greater hold, creating higher, potentially more stable, prices. If this price view continues to hold, the stability of prices could reduce volatility while creating higher floors for related commodities. Our hope is this would allow new capital to separate the AMZ’s recent, higher volatility from the stability of the cash flows, and therefore focus on the high free cash flow yields and historically low valuation.
Closing Comments
Thank you to our investors. It’s been terrific to review many of the preliminary highlights we’ve discussed in this letter, as we believe tailwinds are increasingly at the sector’s back. We remain at your service and look forward to continuing to share our research and opinions.
| Sincerely, | | |
| | | |
 | |  |
| Geoffrey P. Mavar, Chairman | | Matthew G. Mead, CEO |
(25) Consumer Price Index (CPI): A measure that examines the weighted average of prices of a basket of consumer goods and services, such as transportation, food and medical care. (26) West Texas Intermediate (WTI): A grade of crude oil used as a benchmark in oil pricing; also known as Texas light sweet. (27) Bloomberg, LP; Chickasaw.
Past performance is not a guarantee of future results.
Opinions expressed are those of Chickasaw Capital Management, LLC and are subject to change, are not guaranteed, and should not be considered investment advice.
The information contained in this report is authorized for use when preceded or accompanied by a prospectus.
SEMI-ANNUAL REPORT 2021 • 11
Mutual fund investing involves risk. Principal loss is possible. The Fund is nondiversified, meaning it may concentrate its assets in fewer individual holdings than a diversified fund. Therefore, the Fund is more exposed to individual security price volatility than a diversified fund. The Fund invests in Master Limited Partnerships (MLPs) which concentrate investments in the energy sector and are subject to the risks of energy prices and demand and the volatility of commodity investments. Damage to facilities and infrastructure of MLPs may significantly affect the value of an investment and may incur environmental costs and liabilities due to the nature of their business. MLPs are subject to significant regulation and may be adversely affected by changes in the regulatory environment. Investments in smaller companies involve additional risks, such as limited liquidity and greater volatility. Investments in foreign securities involve greater volatility and political, economic and currency risks and differences in accounting methods. MLPs are subject to certain risks inherent in the structure of MLPs, including complex tax structure risks, limited ability for election or removal of management, limited voting rights, potential dependence on parent companies or sponsors for revenues to satisfy obligations, and potential conflicts of interest between partners, members and affiliates.
References to market or composite indices, benchmarks or other measures of relative market performance over a specified period of time (each, an “index”) are provided for your information only. Reference to this index does not imply that the portfolio will achieve returns, volatility or other results similar to the index. The composition of the index may not reflect the manner in which a portfolio is constructed in relation to expected or achieved returns, portfolio guidelines, restrictions, sectors, correlations, concentrations, volatility or tracking error targets, all of which are subject to change over time. Indices are unmanaged. The figures for the indices do not reflect the deduction of any fees or expenses which would reduce returns. Investors cannot invest directly in indices.
The Alerian MLP Index is a composite of the most prominent energy Master Limited Partnerships that provides investors with an unbiased, comprehensive benchmark for this emerging asset class. The index, which is calculated using a float-adjusted, capitalization-weighted methodology, is disseminated real-time on a price-return basis (NYSE: AMZ), and the corresponding total-return index is disseminated daily (NYSE: AMZX). Relevant data points such as dividend yield are also published daily. For index values, constituents, and announcements regarding constituent changes, please visit www.alerian.com.
“Alerian MLP Index”, “Alerian MLP Total Return Index”, “AMZ” and “AMZX” are servicemarks of GKD Index Partners, LLC d/b/a Alerian (“Alerian”) and their use is granted under a license from Alerian. Alerian does not guarantee the accuracy and/or completeness of the Alerian MLP Index or any data included therein and Alerian shall have no liability for any errors, omissions, interruptions or defects therein. Alerian makes no warranty, express or implied, representations or promises, as to results to be obtained by Licensee, or any other person or entity from the use of the Alerian MLP Index or any data included therein. Alerian makes no express or implied warranties, representations or promises, regarding the originality, merchantability, suitability, non-infringement, or fitness for a particular purpose or use with respect to the Alerian MLP Index or any data included therein. Without limiting any of the foregoing, in no event shall Alerian have any liability for any indirect, special, incidental, or consequential damages (including lost profits), arising out of the Alerian MLP Index or any data included therein, even if notified of the possibility of such damages.
The Energy MLP Classification Standard (“EMCS”) was developed by and is the exclusive property (and a service mark) of GKD Index Partners, LLC d/b/a Alerian (“Alerian”) and its use is granted under a license from Alerian. Alerian makes no warranties, express or implied, or representations with respect to such standard or classification (or the results to be obtained by the use thereof), and hereby expressly disclaims all warranties of originality, accuracy, completeness, merchantability, suitability, non-infringement, or fitness for a particular purpose with respect to any such standard or classification. No warranty is given that the standard or classification will conform to any description thereof or be free of omissions, errors, interruptions, or defects. Without limiting any of the foregoing, in no event shall Alerian have any liability for any indirect, special, incidental, or consequential damages (including lost profits), arising out of any such standard or classification, even if notified of the possibility of such damages.
DJIA Total Return Index: Tracks the total return of The Dow Jones Industrial Average, a price-weighted average of 30 significant stocks traded on the New York Stock Exchange and the Nasdaq. Dividends are reinvested. The DJIA was invented by Charles Dow back in 1896.
NYSE FANG+ Index: The NYSE FANG+ Index is an equal- dollar weighted index designed to represent a segment of the technology and consumer discretionary sectors consisting of highly-traded growth stocks of technology and tech-enabled companies such as Facebook, Apple, Amazon, Netflix, and Alphabet’s Google.
NASDAQ: A market- capitalization weighted index of the more than 3,000 common equities listed on the Nasdaq stock exchange. The types of securities in the index include American depositary receipts, common stocks, real estate investment trusts (REITs) and tracking stocks. The index includes all Nasdaq listed stocks that are not derivatives, preferred shares, funds, exchange-traded funds (ETFs) or debentures.
S&P 500 Total Return Index: A market capitalization-weighted index of 500 leading companies in the U.S. The index captures approximately 80% coverage of available market capitalization.
S&P 500 Industrials Index: The S&P 500® Industrials Index comprises those companies included in the S&P 500 that are classified as members of the GICS® industrials sector.
S&P 500 Materials Index: The S&P 500® Materials Index comprises those companies included in the S&P 500 that are classified as members of the GICS® materials sector.
S&P 500 Real Estate Index: The S&P 500® Real Estate Index comprises those companies included in the S&P 500 that are classified as members of the GICS® real estate sector.
S&P 500 Utilities Index: The S&P 500® Utilities Index comprises those companies included in the S&P 500 that are classified as members of the GICS® utilities sector.
S&P 500 Information Technology Index: The S&P 500® Information Technology Index comprises those companies included in the S&P 500 that are classified as members of the GICS® information technology sector.
Consumer Price Index (CPI) is a measure that examines the weighted average of prices of a basket of consumer goods and services, such as transportation, food, and medical care. It is calculated by taking price changes for each item in the predetermined basket of goods and averaging them. Changes in the CPI are used to assess price changes associated with the cost of living.
Distributable Cash Flow (DCF) is calculated as net income plus depreciation and other noncash items, less maintenance capital expenditure requirements. Distributable cash flow (DCF) data is CCM calculated consensus of Wall Street estimates. The estimated consensus weighted average distributable cash flow (DCF) per unit growth rate for the AMZ and our MainGate MLP Fund incorporates market expectations by using the average annual growth rate using rolling-forward 24 -month data. DCF growth rate is not a forecast of the portfolio’s future performance. DCF growth rate for the portfolio’s holdings does not guarantee a corresponding increase in the market value of the holding or the portfolio.
Distribution Coverage Ratio is calculated as cash available to limited partners divided by cash distributed to limited partners. It gives an indication of an MLP’s ability to make dividend payments to limited partner investors from operating cash flows. MLPs with a coverage ratio of in excess of 1.0 times are able to meet their dividend payments without external financing.
Distributions are quarterly payments, similar to dividends, made to Limited Partner (LP) and General Partner (GP) investors. These amounts are set by the GP and are supported by an MLP’s operating cash flows.
EBITDA is earnings before interest rates taxes depreciation and amortization.
Free Cash Flow to Equity (FCFE) represents the amount of cash a company can pay to equity shareholders after all expenses, reinvestments, and debt payments.
Growth CapEx or Growth Capital Expenditures refers to the aggregate of all capital expenditures undertaken to further growth prospects and/or expand operations and excludes any maintenance and regulatory capital expenditures.
Leverage is net debt divided by EBITDA.
Producer Price Index (PPI), published by the Bureau of Labor Statistics (BLS), is a group of indexes that calculates and represents the average movement in selling prices from domestic production over time.
Terminal Value is the value of an asset, business or project in perpetuity beyond a set forecast period for which future cash flows are estimated.
West Texas Intermediate (WTI), also known as Texas light sweet, is a grade of crude oil used as a benchmark in oil pricing. This grade is described as light because of its relatively low density, and sweet because of its low sulfur content. It is the underlying commodity of Chicago Mercantile Exchange’s oil futures contracts.
Yield refers to the cash dividend or distribution divided by the share or unit price at a particular point in time.
This material is provided for informational and educational purposes only and should not be construed as investment advice or an offer or solicitation to buy or sell any security, product or service.
Fund holdings and sector allocations are subject to change at any time and should not be considered a recommendation to buy or sell any security. Please refer to the schedule of investments for a complete listing of Fund holdings.
The Fund does not receive the same tax benefits of a direct investment in an MLP.
The Fund is subject to U.S. federal income tax on its taxable income at rates applicable to corporations (currently at a rate of 21%) as well as state and local income taxes.
The Fund accrues deferred income taxes for future tax liabilities associated with the portion of MLP distributions considered to be a tax-deferred return of capital and for any net operating gains as well as capital appreciation of its investments. This deferred tax liability is reflected in the daily NAV and as a result the Fund’s after-tax performance could differ significantly from the underlying assets even if the pre-tax performance is closely tracked.
The potential tax benefits from investing in MLPs depend on MLPs being treated as partnerships for federal income tax purposes.
If the MLP is deemed to be a corporation then its income would be subject to federal taxation, reducing the amount of cash available for distribution to the Fund which could result in a reduction of the Fund’s value.
The MainGate MLP Fund is distributed by Quasar Distributors, LLC.
12 | MainGate mlp fund
Hypothetical Growth of a $10,000 Investment | unaudited
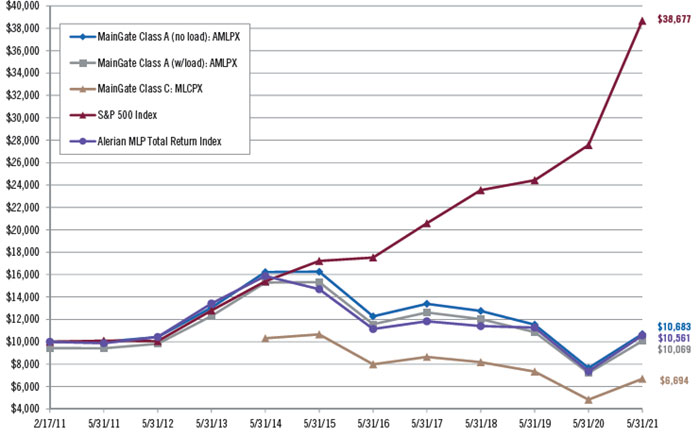
This chart illustrates the performance of a hypothetical $10,000 investment made in each share class as of its inception date (2/17/11 for Class A and 3/31/14 for Class C). Assumes reinvestment of dividends and capital gains. This chart does not imply any future performance.
Hypothetical Growth of a $1,000,000 Investment | unaudited
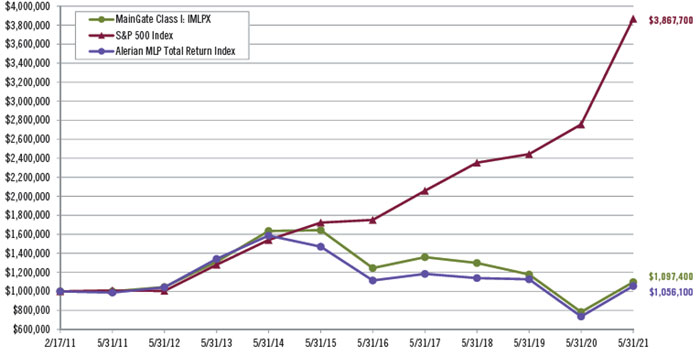
This chart illustrates the performance of a hypothetical $1,000,000 investment made in Class I shares as of their inception date (2/17/11). Assumes reinvestment of dividends and capital gains. This chart does not imply any future performance.
SEMI-ANNUAL REPORT 2021 • 13
Average Annual Returns | May 31, 2021 | unaudited
| | | 1 Year | | | 5 Year | | | Since Inception | | | Inception Date |
| Class A (without sales load) | | | 39.62 | % | | | -2.73 | % | | | 0.65 | % | | 2/17/11 |
| Class A (with sales load) | | | 31.70 | % | | | -3.88 | % | | | 0.07 | % | | 2/17/11 |
| Class C | | | 38.68 | % | | | -3.48 | % | | | -5.45 | % | | 3/31/14 |
| Class C (with CDSC) | | | 37.68 | % | | | -3.48 | % | | | -5.45 | % | | 3/31/14 |
| Class I | | | 40.21 | % | | | -2.50 | % | | | 0.91 | % | | 2/17/11 |
| S&P 500 Index | | | 40.32 | % | | | 17.16 | % | | | 14.06 | % | | 2/17/11 |
| S&P 500 Index | | | 40.32 | % | | | 17.16 | % | | | 14.19 | % | | 3/31/14 |
| Alerian MLP Total Return Index | | | 43.63 | % | | | -1.06 | % | | | 0.53 | % | | 2/17/11 |
| Alerian MLP Total Return Index | | | 43.63 | % | | | -1.06 | % | | | -4.53 | % | | 3/31/14 |
Performance data quoted represents past performance; past performance does not guarantee future results. The investment return and principal value of an investment will fluctuate so that an investor’s shares, when redeemed, may be worth more or less than their original cost. Current performance of the Fund may be lower or higher than the performance quoted. Performance data current to the most recent month end may be obtained by calling 855.MLP.FUND (855.657.3863) or by visiting www.maingatefunds.com.
Class A (with sales load) performance reflects the maximum sales charge of 5.75%. Class C (with CDSC) performance reflects the 1.00% contingent deferred sales charge. Class I is not subject to a sales charge or CDSC.
The S&P 500 Index is a broad based unmanaged index of 500 stocks, which is widely recognized as representative of the equity market in general.
You cannot invest directly in an index.
The graph and table do not reflect the deduction of taxes that a shareholder would pay on Fund distributions or the redemption of the Fund shares.
14 | MainGate mlp fund
Expense Example | unaudited
As a shareholder of the Fund, you incur two types of costs: (1) transaction costs, including sales charges (loads) on purchase payments, reinvested dividends, or other distributions; and exchange fees; and (2) ongoing costs, including management fees; distribution and/ or service (12b-1) fees; and other Fund expenses. This example is intended to help you understand your ongoing costs (in dollars) of investing in the Fund and to compare these costs with the ongoing costs of investing in other mutual funds. The example is based on an investment of $1,000 invested at the beginning of the period and held for the six-month period from December 1, 2020 to May 31, 2021.
Actual Expenses
For each class, the first line of the table below provides information about actual account values and actual expenses. You may use the information in this line, together with the amount you invested, to estimate the expenses that you paid over the period. Simply divide your account value by $1,000 (for example, an $8,600 account value divided by $1,000 = 8.6), then multiply the result by the number in the first line under the heading entitled “Expenses Paid During Period” to estimate the expenses you paid on your account during this period.
Hypothetical Example for
Comparison Purposes
For each class, the second line of the table below provides information about hypothetical account values and hypothetical expenses based on the Fund’s actual expense ratio and an assumed rate of return of 5% per year before expenses, which is not the Fund’s actual return. The hypothetical account values and expenses may not be used to estimate the actual ending account balance or expense you paid for the period. You may use this information to compare the ongoing costs of investing in the Fund and other funds. To do so, compare this 5% hypothetical example with the 5% hypothetical examples that appear in the shareholder reports of the other funds.
Please note that the expenses shown in the table are meant to highlight your ongoing costs only and do not reflect any transactional costs, such as sales charges (loads) or exchange fees. Therefore, the second line of the table for each class is useful in comparing ongoing costs only, and will not help you determine the relative total costs of owning different funds. In addition, if transaction costs were included, your costs would have been higher.
| | | Beginning
Account Value
(12/01/20) | | | Ending
Account Value
(05/31/21) | | | Expenses Paid
During Period(1)
(12/01/20 – 05/31/21) | | | Net Annualized
Expense Ratio(2) | |
| Class A Actual | | $ | 1,000.00 | | | $ | 1,396.57 | | | $ | 10.22 | | | | 1.71 | % |
| Class A Hypothetical | | $ | 1,000.00 | | | $ | 1,016.40 | | | $ | 8.60 | | | | 1.71 | % |
| (5% return before expenses) | | | | | | | | | | | | | | | | |
| Class C Actual | | $ | 1,000.00 | | | $ | 1,383.93 | | | $ | 14.62 | | | | 2.46 | % |
| Class C Hypothetical | | $ | 1,000.00 | | | $ | 1,012.67 | | | $ | 12.34 | | | | 2.46 | % |
| (5% return before expenses) | | | | | | | | | | | | | | | | |
| Class I Actual | | $ | 1,000.00 | | | $ | 1,400.22 | | | $ | 8.74 | | | | 1.46 | % |
| Class I Hypothetical | | $ | 1,000.00 | | | $ | 1,017.65 | | | $ | 7.34 | | | | 1.46 | % |
| (5% return before expenses) | | | | | | | | | | | | | | | | |
| (1) | Expenses are equal to the Fund’s annualized expense ratio multiplied by the average account value over the period, multiplied by 182 days (the number of days in the most recent period)/365 days (to reflect the period), for Class A, Class C and Class I. |
| (2) | Annualized expense ratio excludes current and deferred income and franchise tax expense. |
SEMI-ANNUAL REPORT 2021 • 15
Allocation of Portfolio Assets
May 31, 2021 | unaudited
(expressed as a percentage of total investments)
| ■ Crude/Refined Products Pipelines and Storage* | | | 41.0 | % |
| ■ Natural Gas Gathering/Processing* | | | 33.9 | % |
| ■ Natural Gas/Natural Gas Liquid Pipelines and Storage* | | | 25.1 | % |

*Master Limited Partnerships and Related Companies
Schedule of Investments | May 31, 2021 | unaudited
| Master Limited Partnerships and Related Companies - 98.8%(1) | | Shares | | | Fair Value | |
| Crude/Refined Products Pipelines and Storage - 40.5%(1) | | | | | | | | |
| Canada - 0.5%(1) | | | | | | | | |
| Enbridge, Inc. | | | 103,000 | | | $ | 3,963,440 | |
| United States - 40.0%(1) | | | | | | | | |
| BP Midstream Partners, L.P. | | | 606,000 | | | | 8,568,840 | |
| Genesis Energy, L.P. | | | 2,025,000 | | | | 18,913,500 | |
| Magellan Midstream Partners, L.P. | | | 1,350,000 | | | | 66,541,500 | |
| MPLX, L.P. | | | 3,549,000 | | | | 101,607,870 | |
| Phillips 66 Partners, L.P. | | | 766,000 | | | | 30,701,280 | |
| Plains All American Pipeline, L.P. | | | 4,152,000 | | | | 43,720,560 | |
| Plains GP Holdings, L.P. | | | 4,517,000 | | | | 49,280,470 | |
| Shell Midstream Partners, L.P. | | | 1,695,000 | | | | 24,475,800 | |
| | | | | | | | 343,809,820 | |
| Total Crude/Refined Products Pipelines and Storage | | | | | | | 347,773,260 | |
| | | | | | | | | |
| Natural Gas/Natural Gas Liquid Pipelines and Storage - 24.8%(1) | | | | | | | | |
| Canada - 0.5%(1) | | | | | | | | |
| TC Energy Corporation | | | 81,000 | | | | 4,135,860 | |
| United States - 24.3%(1) | | | | | | | | |
| Energy Transfer, L.P. | | | 11,000,000 | | | | 108,900,000 | |
| Enterprise Products Partners, L.P. | | | 3,000,000 | | | | 70,830,000 | |
| Kinder Morgan, Inc. | | | 457,000 | | | | 8,381,380 | |
| Williams Companies, Inc. | | | 787,000 | | | | 20,729,580 | |
| | | | | | | | 208,840,960 | |
| Total Natural Gas/Natural Gas Liquid Pipelines and Storage | | | | | | | 212,976,820 | |
| | | | | | | | | |
| Natural Gas Gathering/Processing - 33.5%(1) | | | | | | | | |
| United States - 33.5%(1) | | | | | | | | |
| Antero Midstream Corporation | | | 851,000 | | | | 8,169,600 | |
| Crestwood Equity Partners, L.P. | | | 1,566,636 | | | | 44,899,788 | |
| DCP Midstream, L.P. | | | 1,201,000 | | | | 30,229,170 | |
| Enlink Midstream, LLC | | | 8,528,000 | | | | 41,616,640 | |
| Targa Resources Corporation | | | 2,025,000 | | | | 78,691,500 | |
| Western Midstream Partners, L.P. | | | 4,200,000 | | | | 83,916,000 | |
| Total Natural Gas Gathering/Processing | | | | | | | 287,522,698 | |
| | | | | | | | | |
| Total Master Limited Partnerships and Related Companies (Cost $588,564,646) | | | | | | | 848,272,778 | |
| Total Investments - 98.8% (Cost $588,564,646)(1) | | | | | | | 848,272,778 | |
| Other Assets in Excess of Liabilities - 1.2%(1) | | | | | | | 10,583,291 | |
| Net Assets - 100.0%(1) | | | | | | $ | 858,856,069 | |
(1) Calculated as a percentage of net assets.
16 | MainGate mlp fund
Statement of Assets and Liabilities
May 31, 2021 | unaudited
| Assets | | | |
| Investments at fair value (cost $588,564,646) | | $ | 848,272,778 | |
| Cash(1) | | | 11,449,189 | |
| Receivable for Fund shares sold | | | 633,707 | |
| Dividends receivable | | | 165,983 | |
| Prepaid expenses | | | 250,934 | |
| Total assets | | | 860,772,591 | |
| Liabilities | | | | |
| Payable to Adviser | | | 904,636 | |
| Payable for Fund shares redeemed | | | 461,088 | |
| Payable for 12b-1 distribution fee | | | 43,421 | |
| Payable to Trustees | | | 22,481 | |
| Payable to Custodian | | | 11,714 | |
| Accrued expenses and other liabilities | | | 473,182 | |
| Total liabilities | | | 1,916,522 | |
| | | | | |
| Net assets | | $ | 858,856,069 | |
| | | | | |
| Net Assets Consist of | | | | |
| Additional paid-in capital | | $ | 1,338,278,606 | |
| Total distributable earnings, net of deferred taxes | | | (479,422,537 | ) |
| Net assets | | $ | 858,856,069 | |
| (1) | The Fund maintains cash in bank accounts which, at times, may exceed United States Federally insured limits. |
| Unlimited shares authorized, no par value | | Class A | | | Class C | | | Class I | |
| Net assets | | $ | 33,595,820 | | | $ | 19,354,928 | | | $ | 805,905,321 | |
| Shares issued and outstanding | | | 6,384,720 | | | | 3,901,392 | | | | 147,141,126 | |
| Net asset value, redemption price and minimum offering price per share | | $ | 5.26 | | | $ | 4.96 | | | $ | 5.48 | |
| Maximum offering price per share ($5.26/0.9425) | | $ | 5.58 | | | | NA | | | | NA | |
Statement of Operations
For the Six Months Ended May 31, 2021 | unaudited
| Investment Income | | | |
| Distributions received from master limited partnerships | | $ | 26,815,088 | |
| Less: return of capital on distributions from master limited partnerships | | | (26,815,088 | ) |
| Distribution income received in excess of return of capital from master limited partnerships | | | — | |
| Dividends from common stock(2,3) | | | 1,779,950 | |
| Total Investment Income | | | 1,779,950 | |
| (2) | The return of capital amount from C-Corporations was $4,959,268. (See Note 2) |
| (3) | Net of foreign withholding tax of $56,355. |
| Expenses | | | |
| Advisory fees | | | 5,101,839 | |
| Administrator fees | | | 275,402 | |
| Transfer agent expense | | | 180,892 | |
| Reports to shareholders | | | 87,403 | |
| Insurance expense | | | 70,223 | |
| Franchise tax expense | | | 69,570 | |
| Registration fees | | | 64,306 | |
| Professional fees | | | 63,279 | |
| Trustees’ fees | | | 46,482 | |
| Compliance fees | | | 32,653 | |
| Custodian fees and expenses | | | 29,366 | |
| Fund accounting fees | | | 491 | |
| 12b-1 distribution fee - Class A | | | 38,282 | |
| 12b-1 distribution fee - Class C | | | 88,009 | |
| Other expenses | | | 438 | |
| Total Expenses | | | 6,148,635 | |
| Net Investment Loss, before taxes | | | (4,368,685 | ) |
| Current and deferred tax benefit/(expense)(4) | | | — | |
| Net Investment Loss, net of taxes | | | (4,368,685 | ) |
| | | | | |
| Realized and Unrealized Loss on Investments | | | | |
| Net realized loss on investments, before taxes | | | (43,073,695 | ) |
| Current and deferred tax benefit/(expense)(3) | | | — | |
| Net realized loss on investments, net of taxes | | | (43,073,695 | ) |
| Net change in unrealized appreciation/depreciation on investments, before taxes | | | 321,093,516 | |
| Deferred tax benefit/(expense)(3) | | | — | |
| Net change in unrealized appreciation/depreciation on investments, net of taxes | | | 321,093,516 | |
| Net Realized and Unrealized Gain on Investments | | | 278,019,821 | |
| Increase in Net Assets Resulting from Operations | | $ | 273,651,136 | |
(3) Any tax benefit/(expense) was fully offset by a valuation allowance recorded as of May 31, 2021.
| The accompanying notes are an integral part of the financial statements. | SEMI-ANNUAL REPORT 2021 • 17
|
Statements of Changes in Net Assets
| Operations | | For the Six Months
Ended May 31, 2021 | unaudited | | | Year Ended
November 30, 2020 | |
| Net investment loss, net of deferred tax benefit | | $ | (4,368,685 | ) | | $ | (9,454,024 | ) |
| Net realized loss on investments, net of deferred tax benefit/(expense) | | | (43,073,695 | ) | | | (177,024,312 | ) |
Net change in unrealized appreciation/depreciation on investments, net of deferred tax
benefit/(expense) | | | 321,093,516 | | | | (38,350,092 | ) |
| Increase/(Decrease) in net assets applicable to shareholders resulting from operations | | | 273,651,136 | | | | (224,828,428 | ) |
| | | | | | | | | |
| Dividends and Distributions to Class A Shareholders | | | | | | | | |
| Return of capital | | | (1,324,178 | ) | | | (3,885,742 | ) |
| Dividends and Distributions to Class C Shareholders | | | | | | | | |
| Return of capital | | | (809,306 | ) | | | (2,331,384 | ) |
| Dividends and Distributions to Class I Shareholders | | | | | | | | |
| Return of capital | | | (32,425,697 | ) | | | (83,310,078 | ) |
| Total dividends and distributions to Fund shareholders | | | (34,559,181 | ) | | | (89,527,204 | ) |
| | | | | | | | | |
| Capital Share Transactions (Note 8) | | | | | | | | |
| Proceeds from shareholder subscriptions | | | 81,542,044 | | | | 687,002,918 | |
| Dividend reinvestments | | | 28,411,859 | | | | 75,024,609 | |
| Payments for redemptions | | | (282,719,271 | ) | | | (717,093,632 | ) |
| Increase/(Decrease) in net assets from capital share transactions | | | (172,765,368 | ) | | | 44,933,895 | |
| Total increase/(decrease) in net assets | | | 66,326,587 | | | | (269,421,737 | ) |
| | | | | | | | | |
| Net Assets | | | | | | | | |
| Beginning of Period | | | 792,529,482 | | | | 1,061,951,219 | |
| End of Period | | $ | 858,856,069 | | | $ | 792,529,482 | |
| 18 | MainGate mlp fund | The accompanying notes are an integral part of the financial statements. | |
Financial Highlights: Class A Shares
| Per Share Data(1) | | Six Months
Ended May 31,
2021 | unaudited | | | Year Ended
November 30,
2020 | | | Year Ended
November 30,
2019 | | | Year Ended
November 30,
2018 | | | Year Ended
November 30,
2017 | | | Year Ended
November 30,
2016 | |
| Net Asset Value, beginning of period | | $ | 3.91 | | | $ | 5.65 | | | $ | 7.17 | | | $ | 8.25 | | | $ | 9.89 | | | $ | 9.38 | |
| | | | | | | | | | | | | | | | | | | | | | | | | |
| Income from Investment Operations | | | | | | | | | | | | | | | | | | | | | | | | |
| Net investment loss(2) | | | (0.03 | ) | | | (0.06 | ) | | | (0.05 | ) | | | (0.09 | ) | | | (0.11 | ) | | | (0.06 | ) |
| Net realized and unrealized gain (loss) on investments | | | 1.58 | | | | (1.22 | ) | | | (0.84 | ) | | | (0.36 | ) | | | (0.90 | ) | | | 1.20 | |
| Total increase (decrease) from investment operations | | | 1.55 | | | | (1.28 | ) | | | (0.89 | ) | | | (0.45 | ) | | | (1.01 | ) | | | 1.14 | |
| Less Distributions to Shareholders | | | | | | | | | | | | | | | | | | | | | | | | |
| Return of capital | | | (0.20 | ) | | | (0.46 | ) | | | (0.63 | ) | | | (0.63 | ) | | | (0.63 | ) | | | (0.63 | ) |
| Total distributions to shareholders | | | (0.20 | ) | | | (0.46 | ) | | | (0.63 | ) | | | (0.63 | ) | | | (0.63 | ) | | | (0.63 | ) |
| Net Asset Value, end of period | | $ | 5.26 | | | $ | 3.91 | | | $ | 5.65 | | | $ | 7.17 | | | $ | 8.25 | | | $ | 9.89 | |
| Total Investment Return | | | 40.51 | %(3) | | | (22.61 | )% | | | (13.71 | )% | | | (6.24 | )% | | | (10.86 | )% | | | 13.32 | % |
| | | | | | | | | | | | | | | | | | | | | | | | | |
| Supplemental Data and Ratios | | | | | | | | | | | | | | | | | | | | | | | | |
| Net assets, end of period | | $ | 33,595,820 | | | $ | 28,693,359 | | | $ | 60,839,754 | | | $ | 93,423,336 | | | $ | 140,857,758 | | | $ | 209,297,676 | |
| Ratio of Expenses to Average Net Assets(4,5,6) | | | | | | | | | | | | | | | | | | | | | | | | |
| Net deferred income and franchise tax (benefit) expense | | | 0.02 | % | | | 0.01 | % | | | 0.01 | % | | | 0.00 | %‡ | | | 0.01 | % | | | 0.00 | %‡ |
| Expenses (excluding net deferred income and franchise tax (benefit) expense) before (waiver) recoupment | | | 1.71 | % | | | 1.72 | % | | | 1.69 | % | | | 1.66 | % | | | 1.65 | % | | | 1.67 | % |
| Expenses (excluding net deferred income and franchise tax (benefit) expense) after (waiver) recoupment | | | 1.71 | % | | | 1.72 | % | | | 1.69 | % | | | 1.66 | % | | | 1.65 | % | | | 1.67 | % |
| Expenses (including net deferred income and franchise tax (benefit) expense) before (waiver) recoupment | | | 1.73 | % | | | 1.73 | % | | | 1.70 | % | | | 1.66 | % | | | 1.66 | % | | | 1.67 | % |
| Net Fund Expenses(4,5,6) | | | 1.73 | % | | | 1.73 | % | | | 1.70 | % | | | 1.66 | % | | | 1.66 | % | | | 1.67 | % |
| Ratio of Net Investment Income (Loss) to Average Net Assets(4,5,6) | | | | | | | | | | | | | | | | | | | | | | | | |
| Net investment income (loss) (excluding net deferred tax benefit and franchise tax benefit (expense)) before waiver (recoupment) | | | (1.27 | )% | | | (1.32 | )% | | | (0.71 | )% | | | (1.05 | )% | | | (1.11 | )% | | | (0.67 | )% |
| Net investment income (loss) (excluding net deferred tax benefit and franchise tax benefit (expense)) after waiver (recoupment) | | | (1.27 | )% | | | (1.32 | )% | | | (0.71 | )% | | | (1.05 | )% | | | (1.11 | )% | | | (0.67 | )% |
| Net investment income (loss) (including net deferred tax benefit and franchise tax benefit (expense)) before waiver (recoupment) | | | (1.29 | )% | | | (1.33 | )% | | | (0.72 | )% | | | (1.05 | )% | | | (1.12 | )% | | | (0.68 | )% |
| Net Investment Income (Loss)(4,5,6) | | | (1.29 | )% | | | (1.33 | )% | | | (0.72 | )% | | | (1.05 | )% | | | (1.12 | )% | | | (0.68 | )% |
| Portfolio turnover rate(7) | | | 20.87 | %(3) | | | 36.65 | % | | | 66.39 | % | | | 44.57 | % | | | 19.35 | % | | | 24.63 | % |
‡ Less than 0.01%.
(1) Information presented relates to a share of Class A for the entire period. (2) Calculated using average shares outstanding method. (3) Not annualized. (4) For periods less than one full year all income and expenses are annualized. (5) For the period from December 1, 2020 to May 31, 2021, the Fund accrued $69,570 in franchise tax expense, of which $2,610 is attributable to Class A. For the year ended November 30, 2020, the Fund accrued $87,319 in franchise tax expense, of which $3,733 is attributable to Class A. For the year ended November 30, 2019, the Fund accrued $85,100 in franchise tax expense, of which $5,253 is attributable to Class A. For the year ended November 30, 2018, the Fund accrued $26,903 in franchise tax expense, of which $1,982 is attributable to Class A. For the year ended November 30, 2017, the Fund accrued $148,000 in franchise tax expense, of which $14,756 is attributable to Class A. For the year ended November 30, 2016, the Fund accrued $55,653 in franchise tax expense, of which $7,370 is attributable to Class A. (6) The Fund did not accrue a deferred tax expense or benefit. (7) Portfolio turnover is calculated on the basis of the Fund as a whole without distinguishing between the classes of shares issued.
| The accompanying notes are an integral part of the financial statements. | SEMI-ANNUAL REPORT 2021 • 19
|
Financial Highlights: Class C Shares
| Per Share Data(1) | | Six Months
Ended May 31,
2021 | unaudited | | | Year Ended
November 30,
2020 | | | Year Ended
November 30,
2019 | | | Year Ended
November 30, 2018 | | | Year Ended
November 30,
2017 | | | Year Ended
November 30,
2016 | |
| Net Asset Value, beginning of period | | $ | 3.72 | | | $ | 5.43 | | | $ | 6.97 | | | $ | 8.09 | | | $ | 9.78 | | | $ | 9.35 | |
| | | | | | | | | | | | | | | | | | | | | | | | | |
| Income from Investment Operations | | | | | | | | | | | | | | | | | | | | | | | | |
| Net investment loss(2) | | | (0.04 | ) | | | (0.08 | ) | | | (0.10 | ) | | | (0.14 | ) | | | (0.17 | ) | | | (0.13 | ) |
| Net realized and unrealized gain (loss) on investments | | | 1.48 | | | | (1.17 | ) | | | (0.81 | ) | | | (0.35 | ) | | | (0.89 | ) | | | 1.19 | |
| Total increase (decrease) from investment operations | | | 1.44 | | | | (1.25 | ) | | | (0.91 | ) | | | (0.49 | ) | | | (1.06 | ) | | | 1.06 | |
| Less Distributions to Shareholders | | | | | | | | | | | | | | | | | | | | | | | | |
| Return of capital | | | (0.20 | ) | | | (0.46 | ) | | | (0.63 | ) | | | (0.63 | ) | | | (0.63 | ) | | | (0.63 | ) |
| Total distributions to shareholders | | | (0.20 | ) | | | (0.46 | ) | | | (0.63 | ) | | | (0.63 | ) | | | (0.63 | ) | | | (0.63 | ) |
| Net Asset Value, end of period | | $ | 4.96 | | | $ | 3.72 | | | $ | 5.43 | | | $ | 6.97 | | | $ | 8.09 | | | $ | 9.78 | |
| Total Investment Return | | | 39.62 | %(3) | | | (22.99 | )% | | | (14.42 | )% | | | (6.88 | )% | | | (11.51 | )% | | | 12.47 | % |
| | | | | | | | | | | | | | | | | | | | | | | | | |
| Supplemental Data and Ratios | | | | | | | | | | | | | | | | | | | | | | | | |
| Net assets, end of period | | $ | 19,354,928 | | | $ | 16,108,024 | | | $ | 33,310,916 | | | $ | 52,049,211 | | | $ | 62,803,141 | | | $ | 66,956,773 | |
| Ratio of Expenses to Average Net Assets(4,5,6) | | | | | | | | | | | | | | | | | | | | | | | | |
| Net deferred income and franchise tax (benefit) expense | | | 0.02 | % | | | 0.01 | % | | | 0.01 | % | | | 0.00 | %‡ | | | 0.01 | % | | | 0.00 | %‡ |
| Expenses (excluding net deferred income and franchise tax (benefit) expense) before (waiver) recoupment | | | 2.46 | % | | | 2.46 | % | | | 2.44 | % | | | 2.41 | % | | | 2.40 | % | | | 2.42 | % |
| Expenses (excluding net deferred income and franchise tax (benefit) expense) after (waiver) recoupment | | | 2.46 | % | | | 2.46 | % | | | 2.44 | % | | | 2.41 | % | | | 2.40 | % | | | 2.42 | % |
| Expenses (including net deferred income and franchise tax (benefit) expense) before (waiver) recoupment | | | 2.48 | % | | | 2.47 | % | | | 2.45 | % | | | 2.41 | % | | | 2.41 | % | | | 2.42 | % |
| Net Fund Expenses(4,5,6) | | | 2.48 | % | | | 2.47 | % | | | 2.45 | % | | | 2.41 | % | | | 2.41 | % | | | 2.42 | % |
| Ratio of Net Investment Income (Loss) to Average Net Assets(4,5,6) | | | | | | | | | | | | | | | | | | | | | | | | |
| Net investment income (loss) (excluding net deferred tax benefit and franchise tax benefit (expense)) before waiver (recoupment) | | | (2.02 | )% | | | (2.06 | )% | | | (1.46 | )% | | | (1.80 | )% | | | (1.86 | )% | | | (1.42 | )% |
| Net investment income (loss) (excluding net deferred tax benefit and franchise tax benefit (expense)) after waiver (recoupment) | | | (2.02 | )% | | | (2.06 | )% | | | (1.46 | )% | | | (1.80 | )% | | | (1.86 | )% | | | (1.42 | )% |
| Net investment income (loss) (including net deferred tax benefit and franchise tax benefit (expense)) before waiver (recoupment) | | | (2.04 | )% | | | (2.07 | )% | | | (1.47 | )% | | | (1.80 | )% | | | (1.87 | )% | | | (1.43 | )% |
| Net Investment Income (Loss)(4,5,6) | | | (2.04 | )% | | | (2.07 | )% | | | (1.47 | )% | | | (1.80 | )% | | | (1.87 | )% | | | (1.43 | )% |
| Portfolio turnover rate(7) | | | 20.87 | %(3) | | | 36.65 | % | | | 66.39 | % | | | 44.57 | % | | | 19.35 | % | | | 24.63 | % |
‡ Less than 0.01%.
(1) Information presented relates to a share of Class C for the entire period. (2) Calculated using average shares outstanding method. (3) Not annualized. (4) For periods less than one full year all income and expenses are annualized. (5) For the period from December 1, 2020 to May 31, 2021, the Fund accrued $69,570 in franchise tax expense, of which $1,500 is attributable to Class C. For the year ended November 30, 2020, the Fund accrued $87,319 in franchise tax expense, of which $2,149 is attributable to Class C. For the year ended November 30, 2019, the Fund accrued $85,100 in franchise tax expense, of which $2,996 is attributable to Class C. For the year ended November 30, 2018, the Fund accrued $26,903 in franchise tax expense, of which $1,007 is attributable to Class C. For the year ended November 30, 2017, the Fund accrued $148,000 in franchise tax expense, of which $5,467 is attributable to Class C. For the year ended November 30, 2016, the Fund accrued $55,653 in franchise tax expense, of which $2,149 is attributable to Class C. (6) The Fund did not accrue a deferred tax expense or benefit. (7) Portfolio turnover is calculated on the basis of the Fund as a whole without distinguishing between the classes of shares issued.
| 20 | MainGate mlp fund | The accompanying notes are an integral part of the financial statements. | |
Financial Highlights: Class I Shares
| Per Share Data(1) | | Six Months
Ended May 31,
2021 | unaudited | | | Year Ended
November 30,
2020 | | | Year Ended
November 30,
2019 | | | Year Ended
November 30,
2018 | | | Year Ended
November 30,
2017 | | | Year Ended
November 30, 2016 | |
| Net Asset Value, beginning of period | | $ | 4.06 | | | $ | 5.83 | | | $ | 7.36 | | | $ | 8.43 | | | $ | 10.07 | | | $ | 9.52 | |
| | | | | | | | | | | | | | | | | | | | | | | | | |
| Income from Investment Operations | | | | | | | | | | | | | | | | | | | | | | | | |
| Net investment loss(2) | | | (0.02 | ) | | | (0.05 | ) | | | (0.03 | ) | | | (0.07 | ) | | | (0.08 | ) | | | (0.04 | ) |
| Net realized and unrealized gain (loss) on investments | | | 1.64 | | | | (1.26 | ) | | | (0.87 | ) | | | (0.37 | ) | | | (0.93 | ) | | | 1.22 | |
| Total increase (decrease) from investment operations | | | 1.62 | | | | (1.31 | ) | | | (0.90 | ) | | | (0.44 | ) | | | (1.01 | ) | | | 1.18 | |
| Less Distributions to Shareholders | | | | | | | | | | | | | | | | | | | | | | | | |
| Return of capital | | | (0.20 | ) | | | (0.46 | ) | | | (0.63 | ) | | | (0.63 | ) | | | (0.63 | ) | | | (0.63 | ) |
| Total distributions to shareholders | | | (0.20 | ) | | | (0.46 | ) | | | (0.63 | ) | | | (0.63 | ) | | | (0.63 | ) | | | (0.63 | ) |
| Net Asset Value, end of period | | $ | 5.48 | | | $ | 4.06 | | | $ | 5.83 | | | $ | 7.36 | | | $ | 8.43 | | | $ | 10.07 | |
| Total Investment Return | | | 40.75 | %(3) | | | (22.42 | )% | | | (13.48 | )% | | | (5.98 | )% | | | (10.66 | )% | | | 13.55 | % |
| | | | | | | | | | | | | | | | | | | | | | | | | |
| Supplemental Data and Ratios | | | | | | | | | | | | | | | | | | | | | | | | |
| Net assets, end of period | | $ | 805,905,321 | | | $ | 747,728,099 | | | $ | 967,800,549 | | | $ | 1,220,133,792 | | | $ | 1,403,597,144 | | | $ | 1,542,427,608 | |
| Ratio of Expenses to Average Net Assets (4,5,6) | | | | | | | | | | | | | | | | | | | | | | | | |
| Net deferred income and franchise tax (benefit) expense | | | 0.02 | % | | | 0.01 | % | | | 0.01 | % | | | 0.00 | %‡ | | | 0.01 | % | | | 0.00 | %‡ |
| Expenses (excluding net deferred income and franchise tax (benefit) expense) before (waiver) recoupment | | | 1.46 | % | | | 1.46 | % | | | 1.44 | % | | | 1.41 | % | | | 1.40 | % | | | 1.42 | % |
| Expenses (excluding net deferred income and franchise tax (benefit) expense) after (waiver) recoupment | | | 1.46 | % | | | 1.46 | % | | | 1.44 | % | | | 1.41 | % | | | 1.40 | % | | | 1.42 | % |
| Expenses (including net deferred income and franchise tax (benefit) expense) before (waiver) recoupment | | | 1.48 | % | | | 1.47 | % | | | 1.45 | % | | | 1.41 | % | | | 1.41 | % | | | 1.42 | % |
| Net Fund Expenses(4,5,6) | | | 1.48 | % | | | 1.47 | % | | | 1.45 | % | | | 1.41 | % | | | 1.41 | % | | | 1.42 | % |
| Ratio of Net Investment Income (Loss) to Average Net Assets(4,5,6) | | | | | | | | | | | | | | | | | | | | | | | | |
| Net investment income (loss) (excluding net deferred tax benefit and franchise tax benefit (expense)) before waiver (recoupment) | | | (1.02 | )% | | | (1.07 | )% | | | (0.46 | )% | | | (0.80 | )% | | | (0.86 | )% | | | (0.42 | )% |
| Net investment income (loss) (excluding net deferred tax benefit and franchise tax benefit (expense)) after waiver (recoupment) | | | (1.02 | )% | | | (1.07 | )% | | | (0.46 | )% | | | (0.80 | )% | | | (0.86 | )% | | | (0.42 | )% |
| Net investment income (loss) (including net deferred tax benefit and franchise tax benefit (expense)) before waiver (recoupment) | | | (1.04 | )% | | | (1.08 | )% | | | (0.47 | )% | | | (0.80 | )% | | | (0.87 | )% | | | (0.43 | )% |
| Net Investment Income (Loss)(4,5,6) | | | (1.04 | )% | | | (1.08 | )% | | | (0.47 | )% | | | (0.80 | )% | | | (0.87 | )% | | | (0.43 | )% |
| Portfolio turnover rate(7) | | | 20.87 | %(3) | | | 36.65 | % | | | 66.39 | % | | | 44.57 | % | | | 19.35 | % | | | 24.63 | % |
‡ Less than 0.01%.
(1) Information presented relates to a share of Class I for the entire period. (2) Calculated using average shares outstanding method. (3) Not annualized. (4) For periods less than one full year all income and expenses are annualized. (5) For the period ended December 1, 2020 to May 31, 2021, the Fund accrued $69,570 in franchise tax expense, of which $65,460 is attributable to Class I. For the year ended November 30, 2020, the Fund accrued $87,319 in franchise tax expense, of which $81,437 is attributable to Class I. For the year ended November 30, 2019, the Fund accrued $85,100 in franchise tax expense, of which $76,851 is attributable to Class I. For the year ended November 30, 2018, the Fund accrued $26,903 in franchise tax expense, of which $23,914 is attributable to Class I. For the year ended November 30, 2017, the Fund accrued $148,000 in franchise tax expense, of which $127,777 is attributable to Class I. For the year ended November 30, 2016, the Fund accrued $55,653 in franchise tax expense, of which $46,134 is attributable to Class I. (6) The Fund did not accrue a deferred tax expense or benefit. (7) Portfolio turnover is calculated on the basis of the Fund as a whole without distinguishing between the classes of shares issued.
| The accompanying notes are an integral part of the financial statements. | SEMI-ANNUAL REPORT 2021 • 21
|
Notes to Financial Statements
May 31, 2021 | unaudited
1. Organization
MainGate MLP Fund (the “Fund”), a series of MainGate Trust (the “Trust”), is registered under the Investment Company Act of 1940 as an open-end, non-diversified investment company. The Trust was established under the laws of Delaware by an Agreement and Declaration of Trust dated November 3, 2010. The Fund’s investment objective is total return. Class A and Class I commenced operations on February 17, 2011. Class C commenced operations on March 31, 2014.
The Fund offers three classes of shares, Class A, Class C and Class I. Depending on the size of the initial purchase, Class A shares are subject to a maximum 5.75% front-end sales charge or a 1.00% contingent deferred sales charge if shares are redeemed within 18 months. Class C shares have no front-end sales charge, but are subject to a 1.00% contingent deferred sales charge within 12 months of redemption. Class I shares have no sales charge. Class A shareholders pay Rule 12b-1 fees at the annual rate of 0.25% of average daily net assets. Class C shareholders pay Rule 12b-1 fees at the annual rate of 1.00% of average daily net assets. For the period ended May 31, 2021, contingent deferred sales charges of $– and $1,078 were incurred by Class A and Class C shareholders, respectively.
The Fund is an investment company and accordingly follows the investment company accounting and reporting guidance of the Financial Accounting Standards Board (FASB) Accounting Standards Board Codification Topic 946 Financial Services—Investment Companies.
2. Significant Accounting Policies
A. Use of Estimates. The preparation of financial statements in conformity with accounting principles generally accepted in the United States of America requires management to make estimates and assumptions that affect the reported amount of assets and liabilities and disclosure of contingent assets and liabilities at the date of the financial statements and the recognition of distribution income and the reported amounts of increases and decreases in net assets from operations during the reporting period. Actual results could differ from those estimates.
B. Investment Valuation. The Fund uses the following valuation methods to determine fair value as either current market value for investments for which market quotations are available, or if not available, a fair value, as determined in good faith pursuant to such policies and procedures as may be approved by the Trust’s Board of Trustees (“Board of Trustees”) from time to time. The valuation of the portfolio securities of the Fund currently includes the following processes:
| • | Equity Securities: Securities listed on a securities exchange or an automated quotation system for which quotations are readily available, including securities traded over the counter, will be valued at the last quoted sale price on the principal exchange on which they are traded on the valuation date (or at approximately 4:00 p.m. Eastern Time if a security’s principal exchange is normally open at that time), or, if there is no such reported sale on the valuation date, at the most recent quoted bid price. |
| • | Fixed Income Securities: Debt and fixed income securities will be priced by independent, third-party pricing agents approved by the Board of Trustees. These third-party pricing agents will employ methodologies that they believe are appropriate, including actual market transactions, broker-dealer supplied valuations, matrix pricing, or other electronic data processing techniques. These techniques generally consider such factors as security prices, yields, maturities, call features, ratings and developments relating to specific securities in arriving at valuations. Debt obligations with remaining maturities of sixty days or less will be valued at their amortized cost, which approximates fair market value. |
| • | Foreign Securities: Foreign securities are often principally traded on markets that close at different hours than U.S. markets. Such securities will be valued at their most recent closing prices on the relevant principal exchange even if the close of that exchange is earlier than the time of the Fund’s net asset value (“NAV”) calculation. However, securities traded in foreign markets which remain open as of the time of the NAV calculation will be valued at the most recent sales price as of the time of the NAV calculation. In addition, prices for certain foreign securities may be obtained from the Fund’s approved pricing sources. The Adviser also monitors for the occurrence of significant events that may cast doubts on the reliability of previously obtained market prices for foreign securities held by the Fund. The prices for foreign securities will be reported in local currency and converted to U.S. dollars using currency exchange rates. Exchange rates will be provided daily by recognized independent pricing agents. The exchange rates used for the conversion will be captured as of the London close each day. |
C. Security Transactions, Investment Income and Expenses. Security transactions are accounted for on the date the securities are purchased or sold (trade date). Realized gains and losses are reported on a specific identified cost basis. Interest income is recognized on the accrual basis, including amortization of premiums and accretion of discounts. Distributions are recorded on the ex-dividend date. Distributions received from the Fund’s investments in master limited partnerships (“MLPs”), including MLP general partnership interests, generally are comprised of ordinary income and return of capital. Withholding taxes on foreign dividends have been provided for in accordance with the Fund’s understanding of the applicable country’s tax rules and regulations.
| 22 | MainGate mlp fund | The accompanying notes are an integral part of the financial statements. | |
For financial statement purposes, the Fund uses return of capital and income estimates to allocate the distribution income received. Such estimates are based on historical information available from each MLP and other industry sources. These estimates may subsequently be revised based on information received from MLPs after their tax reporting periods are concluded, as the actual character of these distributions is not known until after the fiscal year end of the Fund.
The Fund estimates the allocation of investment income and return of capital for the distributions received from MLPs within the Statement of Operations. For the period ended May 31, 2021, the Fund has estimated approximately 100% of the distributions from MLPs taxed as partnerships to be return of capital. Distributions from common stock may also include income and return of capital. The Fund records the character of distributions received during the year based on estimates available. The characterization of distributions received by the Fund may be subsequently revised based on the information received from the MLPs and common stock after their tax reporting periods conclude.
Expenses are recorded on the accrual basis.
D. Dividends and Distributions to Shareholders. The Fund intends to make quarterly distributions from net income, which include the amount received as cash distributions from MLPs and common stock dividends. These activities will be reported in the Statements of Changes in Net Assets.
Dividends and distributions to shareholders are recorded on the ex-dividend date. The character of dividends and distributions to shareholders made during the period may differ from their ultimate characterization for federal income tax purposes. For the period ended May 31, 2021, the Fund’s dividends and distributions were expected to be comprised of 100% return of capital. The tax character of distributions paid for the period ended May 31, 2021, will be determined in early 2022.
E. Federal Income Taxation. The Fund, taxed as a corporation, is obligated to pay federal and state income tax on its taxable income. Currently, the federal income tax rate for a corporation is 21%.
The Fund invests its assets primarily in MLPs, which generally are treated as partnerships for federal income tax purposes. As a limited partner in the MLPs, the Fund reports its allocable share of the MLP’s taxable income in computing its own taxable income. The Fund’s tax expense or benefit is included in the Statement of Operations based on the component of income or gains (losses) to which such expense or benefit relates. Deferred income taxes reflect the net tax effects of temporary differences between the carrying amounts of assets and liabilities for financial reporting purposes and the amounts used for income tax purposes. A valuation allowance is recognized if, based on the weight of available evidence, it is more likely than not that some portion or all of the deferred income tax asset will not be realized.
The Fund’s policy is to classify interest and penalties associated with underpayment of federal and state income taxes as an income tax expense on the Statement of Operations. For the period ended May 31, 2021, the Fund did not have interest or penalties associated with underpayment of income taxes.
F. Indemnifications. Under the Fund’s organizational documents, its officers and trustees are indemnified against certain liabilities arising out of the performance of their duties to the Fund. In addition, in the normal course of business, the Fund may enter into contracts that provide general indemnification to other parties. The Fund’s maximum exposure under these arrangements is unknown, as this would involve future claims that may be made against the Fund that have not yet occurred, and may not occur. However, the Fund has not had prior claims or losses pursuant to these contracts.
3. Fair Value Measurements
Various inputs that are used in determining the fair value of the Fund’s investments are summarized in the three broad levels listed below:
| • | Level 1: quoted prices in active markets for identical securities that the Fund has the ability to access |
| • | Level 2: other significant observable inputs (including quoted prices for similar securities, interest rates, prepayment speeds, credit risk, etc.) |
| • | Level 3: significant unobservable inputs (including the Fund’s own assumptions in determining the fair value of investments) |
The inputs or methodology used for valuing securities are not necessarily an indication of the risk associated with investing in those securities.
These inputs are summarized in the three broad levels that follow.
SEMI-ANNUAL REPORT 2021 • 23
| | | | | | Fair Value Measurements at Reporting Date Using: | |
| Description | | Fair Value at
May 31, 2021 | | | Quoted Prices in Active Markets for Identical Assets (Level 1) | | | Significant Other Observable Inputs (Level 2) | | | Significant Unobservable Inputs (Level 3) | |
| Equity Securities | | | | | | | | | | | | |
| Master Limited Partnerships and and Related Companies(1) | | $ | 848,272,778 | | | $ | 848,272,778 | | | $ | — | | | $ | — | |
| Total | | $ | 848,272,778 | | | $ | 848,272,778 | | | $ | — | | | $ | — | |
(1) All other industry classifications are identified in the Schedule of Investments.
4. Concentration Risk
The Fund seeks to achieve its investment objective by investing, under normal market conditions, at least 80% of its net assets (plus any borrowings for investment purposes) in MLP interests under normal circumstances as determined in the prospectus.
5. Agreements and Related Party Transactions
The Trust has entered into an Investment Advisory Agreement (the “Agreement”) with Chickasaw Capital Management, LLC (the “Adviser”). Under the terms of the Agreement, the Fund pays the Adviser a fee, payable at the end of each calendar month, at an annual rate equal to 1.25% of the average daily net assets of the Fund.
The Adviser has agreed to waive its advisory fee and/or reimburse certain operating expenses of the Fund, until at least March 31, 2022, but only to the extent necessary so that the Fund’s total annual expenses, excluding brokerage fees and commissions; borrowing costs (such as (a) interest and (b) dividend expenses on securities sold short); taxes, including deferred income tax expense/(benefit) and franchise taxes; any indirect expenses, such as acquired fund fees and expenses; Class A 12b-1 fees, Class C 12b-1 fees, and extraordinary expenses, do not exceed 1.50% of the average daily net assets of each class of the Fund. Any payment by the Adviser of the Fund’s operating, organizational and offering expenses are subject to repayment by the Fund in the three fiscal years following the fiscal year in which the payment was made; provided that the Fund is able to make the repayment without exceeding the 1.50% expense limitation.
Waived fees and reimbursed Fund expenses, including prior year expenses, are subject to potential recoupment by year of expiration. During the period ended May 31, 2021, the Fund did not waive or recoup expenses. At May 31, 2021, there were no prior year amounts subject to potential recoupment.
Certain Trustees and Officers of the Trust/Fund are also Officers of the Adviser or Vigilant Compliance, LLC (“Vigilant”).
The Fund has engaged Vigilant to provide compliance services including the appointment of the Fund’s Chief Compliance Officer. Effective October 1, 2015, the Fund pays Vigilant a monthly fee of $4,728 for net assets up to $1.7 billion, $5,228 for net assets between $1.7 billion and $2.0 billion, $5,728 for net assets between $2.0 billion and $2.5 billion, and $6,000 for net assets above $2.5 billion with each rate subject to a 2% annual increase.
Quasar Distributors, LLC (“Quasar”), a wholly owned broker-dealer subsidiary of Foreside Financial Group, LLC (“Foreside”), serves as the Fund’s distributor. The Fund has adopted a plan of distribution under Rule 12b-1 of the 1940 Act applicable to Class A and Class C shares. Class A shareholders pay Rule 12b-1 fees at the annual rate of 0.25% of average daily net assets. Class C shareholders pay Rule 12b-1 fees at the annual rate of 1.00% of average daily net assets. For the period ended May 31, 2021, 12b-1 distribution expenses of $38,282 and $88,009 were accrued by Class A and Class C shares, respectively.
The Fund reimbursed the Advisor for fees paid to financial intermediaries such as banks, broker-dealers, financial advisors or other financial institutions for sub-transfer agency, sub-administration and other services that the financial intermediaries provided to their clients. The financial intermediaries are the record owners of the Fund on the Fund’s records through omnibus accounts, other group accounts, retirement plans or accounts traded through registered securities clearing agents. These fees are fees that the Fund is obligated to pay to such intermediaries, and the fees may vary based on, for example, the nature of services provided. The fees paid to such intermediaries by the Fund is only a portion of the full fee that is paid to the intermediaries, and the Advisor is obligated to pay the remaining amount. These amounts are included within 12b-1 distribution fees on the Statement of Operations.
24 | MainGate mlp fund
The Fund has engaged U.S. Bancorp Fund Services, LLC d/b/a U.S. Bank Global Fund Services (“Fund Services”) to provide administration and accounting services to the Fund. The Fund pays Fund Services a monthly fee computed at an annual rate of 0.10% of the first $75,000,000 of the Fund’s average daily net assets, 0.08% on the next $250,000,000 of average daily net assets and 0.05% on the balance of the Fund’s average daily net assets, with a minimum annual fee of $64,000 plus $12,000 per share class fee, imposed upon the Fund reaching certain asset levels.
Fund Services serves as the Fund’s transfer agent, dividend paying agent, and agent for the automatic dividend reinvestment plan. The Fund pays the transfer agent a $45,000 flat fee, imposed upon the Fund reaching certain asset levels, plus transaction and other out-of-pocket charges.
U.S. Bank, N.A. serves as the Fund’s custodian. The Fund pays the custodian a monthly fee computed at an annual rate of 0.0075% of the first $250 million of market value and 0.0050% of the balance, with a minimum annual fee of $4,800, imposed upon Fund reaching certain asset levels, plus transaction and other out-of-pocket charges.
6. Income Taxes
Deferred income taxes reflect the net tax effects of temporary differences between the carrying amounts of assets and liabilities for financial reporting purposes and the amounts used for income tax purposes. Such temporary differences are principally: (i) taxes on unrealized gains/(losses), which are attributable to the temporary difference between fair market value and tax basis, (ii) the net tax effects of temporary differences between the carrying amounts of assets and liabilities for financial reporting and income tax purposes and (iii) the net tax benefit of accumulated net operating losses and capital loss carryforwards. Deferred tax assets and liabilities are measured using effective tax rates expected to apply to taxable income in the years such temporary differences are realized or otherwise settled. To the extent the Fund has a deferred tax asset, consideration is given to whether or not a valuation allowance is required. A valuation allowance is required if, based on the evaluation criterion provided by ASC 740, Income Taxes (ASC 740), it is more likely-than-not some portion or all of the deferred tax asset will not be realized. Among the factors considered in assessing the Fund’s valuation allowance are: the nature, frequency and severity of current and cumulative losses, forecasts of future profitability, the duration of the statutory carryforward periods, significant redemptions, and the associated risks that operating and capital loss carryforwards may expire unused.
At May 31, 2021, the Fund determined a valuation allowance was required.
Changes to the factors considered in assessing the Fund’s valuation allowance may result in the Fund revising its position as to the recoverability of its deferred tax assets which may result in a change to the valuation allowance at a later date and could have a material impact on the Fund’s net asset value and results of operations in the period it is recorded.
Components of the Fund’s deferred tax assets and liabilities as of May 31, 2021, are as follows:
Deferred tax assets:
| Net operating loss carryforward (tax basis) | | $ | 52,626,985 | |
| Capital loss carryforward (tax basis) | | | 83,879,700 | |
| Other | | | 856 | |
| Total deferred tax asset | | | 136,507,541 | |
| Valuation allowance | | | (81,527,010 | ) |
| Less: Deferred tax liabilities: | | | | |
| Unrealized gains on investment securities (tax basis) – net | | | (54,980,531 | ) |
| Net deferred tax asset | | $ | — | |
The net operating loss carryforward is available to offset future taxable income. The Fund has the following net operating loss and capital loss carryforward amounts:
| Fiscal Period Ended Net Operating Loss | | Amount | | | Expiration | |
| November 30, 2015 | | $ | 10,794,764 | | | | November 30, 2035 | |
| November 30, 2016 | | | 62,681,569 | | | | November 30, 2036 | |
| November 30, 2017 | | | 77,956,625 | | | | November 30, 2037 | |
| November 30, 2018 | | | 46,816,412 | | | | November 30, 2038 | |
| November 30, 2020 | | | 23,244,346 | | | | Indefinite | |
| November 30, 2021 | | | 10,218,789 | | | | Indefinite | |
| Total Fiscal Period Ended Net Operating Loss | | $ | 231,712,505 | | | | | |
| Fiscal Period Ended Net Capital Loss | | Amount | | | Expiration | |
| November 30, 2017 | | $ | 18,645,662 | | | | November 30, 2022 | |
| November 30, 2018 | | | 13,056,608 | | | | November 30, 2023 | |
| November 30, 2019 | | | 146,554,196 | | | | November 30, 2024 | |
| November 30, 2020 | | | 160,284,519 | | | | November 30, 2025 | |
| November 30, 2021 | | | 30,854,364 | | | | November 30, 2026 | |
| Total Fiscal Period Ended Net Capital Loss | | $ | 369,395,349 | | | | | |
SEMI-ANNUAL REPORT 2021 • 25
For corporations, capital losses can only be used to offset capital gains and cannot be used to offset ordinary income. The capital loss may be carried forward for 5 years and, accordingly, would begin to expire as of November 30, 2021. The net operating loss prior to the Tax Cuts and Jobs Act (“TCJA”) can be carried forward for 20 years and, accordingly, would begin to expire as of November 30, 2035. Any NOLs arising in tax years beginning after December 31, 2017 will have an indefinite carry forward period. The TCJA also established a limitation for any NOLs generated in tax years beginning after December 31, 2017 to the lesser of the aggregate of available NOLs or 80% of taxable income before any NOL utilization. On March 27, 2020 the Coronavirus Aid, Relief, and Economic Stability Act (CARES Act) was signed into law. The CARES Act delays the application of the 80% net operating loss limitation to tax years ending November 30, 2022 and beyond.
Total income tax expense (current and deferred) differs from the amount computed by applying the federal statutory income tax rate of 21% to net investment income (loss) and realized and unrealized gains (losses) on investments before taxes for the period ended May 31, 2021, as follows:
| Total Tax Expense (Benefit) | | Amount | | | Rate | |
| Tax Expense (Benefit) at Statutory Rates | | $ | 57,466,739 | | | | 21.00 | % |
| State Income Tax Expense (Benefit) (Net of Federal Benefit) | | | 4,672,038 | | | | 1.71 | % |
| Tax Expense (Benefit) on Permanent Items(1) | | | (46,276 | ) | | | (0.02 | )% |
| Provision to Return Adjustment | | | 271,015 | | | | 0.10 | % |
| Change in State Rate | | | 496,583 | | | | 0.18 | % |
| Change in Valuation Allowance | | | (62,860,099 | ) | | | (22.97 | )% |
| Total Tax Expense (Benefit) | | | — | | | | 0.00 | % |
(1) Permanent Items are made up of dividends received deductions, non-deductible expenses from K-1s, and tax exempt income from K-1s.
At May 31, 2021, the Fund did not have a current tax expense or benefit due to the use of a valuation allowance.
At May 31, 2021, the tax cost basis of investments was $606,148,631 and gross unrealized appreciation and depreciation of investments for federal income tax purposes were as follows:
| Gross unrealized appreciation | | $ | 276,888,418 | |
| Gross unrealized depreciation | | | (34,764,271 | ) |
| Net unrealized appreciation | | $ | 242,124,147 | |
The differences between book-basis and tax-basis unrealized appreciation (depreciation) are primarily due to timing differences of income recognition from the Fund’s MLP investments and wash sales on security transactions.
The Fund recognizes the tax benefits of uncertain tax positions only where the position is “more likely than not” to be sustained assuming examination by tax authorities. Management has analyzed the Fund’s tax positions, and has concluded that no liability for unrecognized tax benefits should be recorded related to uncertain tax positions taken on U.S. tax returns and state tax returns filed or expected to be filed since inception of the Fund. No income tax returns are currently under examination. The tax years since 2017 remain subject to examination by the tax authorities in the United States. Due to the nature of the Fund’s investments, the Fund may be required to file income tax returns in several states. The Fund is not aware of any tax positions for which it is reasonably possible that the total amounts of unrecognized tax benefits will change materially in the next 12 months.
7. Investment Transactions
For the period ended May 31, 2021, the Fund purchased (at cost) and sold securities (proceeds) in the amount of $163,078,144 and $345,236,618 (excluding short-term securities), respectively.
26 | MainGate mlp fund
8. Share Transactions
Transactions of shares of the Fund were as follows:
| | | For the Six Months Ended May 31, 2021 | | | Year Ended November 30, 2020 | |
| Class A Shares | | Amount | | | Shares | | | Amount | |
| Shares | |
| Sold | | $ | 1,762,816 | | | | 383,564 | | | $ | 10,233,488 | | | | 2,591,548 | |
| Dividends Reinvested | | | 1,118,354 | | | | 246,246 | | | | 3,132,301 | | | | 765,526 | |
| Redeemed | | | (7,068,378 | ) | | | (1,577,153 | ) | | | (29,822,750 | ) | | | (6,795,337 | ) |
| Net Decrease | | $ | (4,187,208 | ) | | | (947,343 | ) | | $ | (16,456,961 | ) | | | (3,438,263 | ) |
| | | | | | | | | | | | | | | | | |
| | For the Six Months Ended May 31, 2021 | | | | Year Ended November 30, 2020 | |
| Class C Shares | | Amount | | | Shares | | | Amount | | | Shares | |
| Sold | | $ | 571,934 | | | | 141,962 | | | $ | 1,876,508 | | | | 403,978 | |
| Dividends Reinvested | | | 668,293 | | | | 155,744 | | | | 1,961,446 | | | | 499,151 | |
| Redeemed | | | (3,086,301 | ) | | | (732,043 | ) | | | (11,102,286 | ) | | | (2,699,961 | ) |
| Net Decrease | | $ | (1,846,074 | ) | | | (434,337 | ) | | $ | (7,264,332 | ) | | | (1,796,832 | ) |
| | | | | | | | | | | | | | | | | |
| | | | For the Six Months Ended May 31, 2021 | | | Year Ended November 30, 2020 | |
| Class I Shares | | Amount | | | Shares | | | Amount | | | Shares | |
| Sold | | $ | 79,207,294 | | | | 16,756,818 | | | $ | 674,892,922 | | | | 158,647,941 | |
| Dividends Reinvested | | | 26,625,212 | | | | 5,649,178 | | | | 69,930,862 | | | | 17,091,869 | |
| Redeemed | | | (272,564,592 | ) | | | (59,302,104 | ) | | | (676,168,596 | ) | | | (157,742,884 | ) |
| Net Increase/(Decrease) | | $ | (166,732,086 | ) | | | (36,896,108 | ) | | $ | 68,655,188 | | | | 17,996,926 | |
9. Risk Factors
The global outbreak of COVID-19 has disrupted economic markets and the prolonged economic impact is uncertain. The operational and financial performance of the issuers of securities in which the Fund invests depends on future developments, including the duration and spread of the outbreak, and such uncertainty may in turn impact the value of the Fund’s investments. COVID-19 has had a material adverse effect on global, national and local economies, which could impact MLPs and midstream companies in which the Fund invests as a result of lower energy prices and an uncertain outlook, which could limit production growth and drive increased credit risk for MLP counterparties.
10. Subsequent Events
The Fund has adopted standards which establish general standards of accounting for disclosure of events that occur after the Statement of Assets and Liabilities date, but before the financial statements are issued. The Fund has performed an evaluation of subsequent events through the date the financial statements were issued.
On July 7, 2021, Foreside, the parent company of Quasar, announced that it had entered into a definitive purchase and sale agreement with Genstar Capital (“Genstar”) such that Genstar would acquire a majority stake in Foreside. The transaction is expected to close at the end of the third quarter of 2021. Quasar will remain the Fund’s distributor at the close of the transaction, which was approved by the Board at a meeting on July 19, 2021.
On July 20, 2021 the Fund declared a distribution payable of $0.100 per share, to Class A shareholders, Class C shareholders, and Class I shareholders of record on July 19, 2021, and payable on July 21, 2021.
SEMI-ANNUAL REPORT 2021 • 27
Additional Information | unaudited
May 31, 2021
Trustee and Officer Compensation
The Fund does not compensate any of its trustees who are interested persons nor any of its officers. For the period ended May 31, 2021, the aggregate compensation paid by the Fund to the independent trustees was $48,000. The Fund did not pay any special compensation to any of its trustees or officers. The Fund’s Statement of Additional Information includes additional information about the trustees and is available on the Fund’s Web site at www.maingatefunds.com or the SEC’s Web site at www.sec.gov.
Cautionary Note Regarding Forward-Looking Statements
This report contains “forward-looking statements” as defined under the U.S. federal securities laws. Generally, the words “believe,” “expect,” “intend,” “estimate,” “anticipate,” “project,” “will” and similar expressions identify forward-looking statements, which generally are not historical in nature. Forward-looking statements are subject to certain risks and uncertainties that could cause actual results to materially differ from the Fund’s historical experience and its present expectations or projections indicated in any forward-looking statements. These risks include, but are not limited to, changes in economic and political conditions; regulatory and legal changes; MLP industry risk; concentration risk; energy sector risk; commodities risk; MLP and other tax risks, such as deferred tax assets and liabilities risk; and other risks discussed in the Fund’s filings with the SEC. You should not place undue reliance on forward-looking statements, which speak only as of the date they are made. The Fund undertakes no obligation to update or revise any forward-looking statements made herein. There is no assurance that the Fund’s investment objectives will be attained.
Proxy Voting Policies
A description of the policies and procedures that the Fund uses to determine how to vote proxies relating to portfolio securities owned by the Fund and information regarding how the Fund voted proxies relating to the portfolio of securities during the most recent 12-month period ended June 30 is available to shareholders without charge by visiting the SEC’s Web site at www.sec.gov.
Portfolio Holdings Disclosure
The Fund files its complete schedule of portfolio holdings for the first and third quarters of each fiscal year with the SEC on Part F of Form N-PORT. The Fund’s Part F of Form N-PORT and statement of additional information are available without charge by visiting the SEC’s Web site at www.sec.gov. In addition, you may review and copy the Fund’s Part F of Form N-PORT at the SEC’s Public Reference Room in Washington D.C. You may obtain information on the operation of the Public Reference Room by calling (800) SEC-0330.
Householding
In an effort to decrease costs, the Fund intends to reduce the number of duplicate prospectuses, annual and semi-annual reports, proxy statements and other similar documents you receive by sending only one copy of each to those addresses shared by two or more accounts and to shareholders that the Transfer Agent reasonably believes are from the same family or household. Once implemented, if you would like to discontinue householding for your accounts, please call toll-free at 855.MLP.FUND (855.657.3863) to request individual copies of these documents. Once the Transfer Agent receives notice to stop householding, the Transfer Agent will begin sending individual copies thirty days after receiving your request. This policy does not apply to account statements.
Liquidity Risk Management Program
In accordance with Rule 22e-4 under the Investment Company Act of 1940, as amended, the Fund has adopted a written liquidity risk management program (the “Program”) designed to assess and manage the Fund’s liquidity risk, which is the risk that the Fund could not meet shareholder redemption requests without significant dilution of remaining Fund shareholders. The Board of Trustees has approved the appointment of the Adviser to administer the Program. The Adviser uses certain market and liquidity classification data provided by a third party in fulfilling its responsibilities as the administrator of the Program.
Rule 22e-4 and the Program further require the Board of Trustees to review, no less frequently than annually, a written report prepared by the Adviser that addresses the operation of the Program and assesses its adequacy and effectiveness of implementation, including, if applicable, any material changes to the Program. The Adviser presented an annual report on the Program to the Board of Trustees at a meeting of the Board of Trustees held in April 2021. The report covered the period of April 1, 2020 to March 31, 2021 and addressed the assessment, management and review of the Fund’s liquidity risk by the Adviser as administrator of the Program, as well as the Adviser’s classification of the liquidity of the Fund’s portfolio investments. The Adviser recommended in the report that the Fund continue to determine that it primarily holds assets that are highly liquid investments, and thus not adopt a highly liquid investment minimum. The Adviser concluded in the report that the Program is reasonably designed to assess and manage the Fund’s liquidity risk, and has operated adequately and effectively to manage the Fund’s liquidity risk during the period covered by the report. In addition, the Adviser concluded in the report that there were no liquidity events during the period covered by the report that materially adversely impacted the Fund’s ability to timely meet redemptions without dilution to existing shareholders, and that no material changes were made to the Program since its full implementation.
28 | MainGate mlp fund
Management Agreement Renewal | unaudited
The Board of Trustees (the “Board”) of MainGate MLP Fund (the “Fund”) oversees the management of the Fund and, as required by law, determines annually whether to approve the continuation of the Fund’s management agreement (the “Advisory Agreement”) with its investment advisor, Chickasaw Capital Management LLC (the “Advisor”). The Board requests and evaluates all information that it deems reasonably necessary under the circumstances in connection with this annual review.
At the Board’s meeting held on January 25, 2021, the Trustees, including all of the Trustees who are not “interested persons” (as that term is defined in the Investment Company Act of 1940) of the Fund or of the Advisor (the “Independent Trustees”), approved the continuation of the Fund’s Advisory Agreement for an additional year. In considering the renewal of the Advisory Agreement, the Trustees reviewed a variety of materials related to the Fund and the Advisor, including: (i) information about the advisory fees paid by, and the expense ratio of, the Fund compared to peer group funds; (ii) information about the Fund’s performance versus its peers and benchmark index, and composite performance information for other accounts managed by the Advisor; (iii) the Advisor’s Form ADV Parts 1A and 2A; (iv) the Advisor’s Balance Sheet as of November 30, 2020, Profit & Loss Statement for the period from January 1 through November 30, 2020, and the Advisor’s profitability analysis with respect to the Advisor’s relationship with the Fund for the period from January 1 through November 30, 2020; (v) a copy of the Fund’s Advisory Agreement; and (vi) an executed copy of the Advisor’s agreement to continue capping certain Fund operating expenses through March 31, 2022. The Independent Trustees also received a memorandum from Fund legal counsel discussing the legal standards for their consideration of the proposed continuation of the Advisory Agreement.
The Independent Trustees considered the Advisory Agreement in Executive Session with the Fund’s legal counsel and Chief Compliance Officer, as well as in the presence of the full Board. The Board also met with executives of the Advisor, and asked questions and discussed with the Advisor its services and personnel, as well as the Fund’s fees, performance, and peer group comparisons. The Board was assisted by the Fund’s legal counsel and Chief Compliance Officer throughout the process.
Some of the factors that figured particularly in the Trustees’ deliberations and how the Trustees considered these factors are described below, although individual Trustees may have evaluated these matters differently, attributing different weights to different factors. The Trustees did not identify any single matter as all important or controlling in arriving at a decision, and the following summary does not detail all of the matters considered. It is also important to recognize that the Trustees’ evaluation of the Advisor and of the Advisory Agreement is an ongoing process, with the Trustees meeting annually to consider the continuation of the Advisory Agreement and quarterly to discuss and consider, among other things, the Advisor’s services to the Fund. Accordingly, the Trustees’ determinations may be based, in part, on their consideration of these matters at previous meetings.
A. Nature, Extent, and Quality of Services: The Trustees examined the Advisor’s ability to provide high quality investment management services to the Fund. The Trustees considered that the Advisor’s services to the Fund include providing a continuous investment program for the Fund, adhering to the Fund’s investment restrictions, complying with applicable Fund policies and regulatory obligations, serving as administrator of the Fund’s Liquidity Risk Management Program, and voting proxies on behalf of the Fund. The Trustees considered the qualifications and experience of the Advisor’s portfolio managers who are responsible for the day-to-day management of the Fund’s portfolio. The Trustees also considered the experience of the research team of the Advisor, and that the Advisor has added a number of new research analysts and other staff since the Fund’s inception.
The Trustees considered the Advisor’s investment philosophy and research and decision making processes, the Advisor’s ability to attract and retain capable research and advisory personnel, the capability of the Advisor’s senior management and staff, and the level of skill required to manage the Fund’s portfolio. The Trustees also considered the Advisor’s representations regarding its risk management process, including its role as administrator of the Fund’s Liquidity Risk Management Program, and its response to the COVID-19 pandemic.
Based on the foregoing, the Trustees concluded that the Advisor’s investment process, research capabilities, and philosophy remain well suited to the Fund given the Fund’s investment objectives and policies.
B. Fund Performance. The Trustees reviewed and discussed information regarding the Fund’s performance over various periods, as measured by the Fund’s Class I shares. Among other things, the Trustees reviewed comparisons of the Fund’s performance to the performance of the following for periods ended December 31, 2020: (i) four peer MLP registered mutual funds; (ii) a composite of the Advisor’s separately managed accounts that invest in MLP interests on a discretionary basis (the “SMA Composite”); (iii) the S&P 500 Index and the Alerian MLP Index; and (iv) for a private MLP fund managed by the Advisor, a representative account statement showing the performance of an investor’s capital account since inception of the fund (January 1, 2018) through December 31, 2020.
The Trustees noted that the Fund had performed better than several of its peers for the one-year period, and had strong long-term relative performance, outperforming three peer group funds since the Fund’s first full month of operations (March 2011). The Trustees also considered that the Fund, along with the MLP peer group funds, had underperformed the S&P 500 Index over the one , three-, and five-year periods, and since March 2011. The Trustees considered the Advisor’s representation that much of the Fund’s underperformance relative to the S&P 500 Index is the result of the downturn in MLP and energy markets compared to the equity markets tracked by the S&P 500 Index. The Trustees noted that the Fund had outperformed the Alerian MLP Index since inception of the Fund.
SEMI-ANNUAL REPORT 2021 • 29
The Trustees reviewed information about the performance of the Advisor’s SMA Composite and private MLP fund. The Trustees considered the Advisor’s representation that any variations in performance were primarily due to the timing of cash flows and tax differences. The Trustees also considered information provided by the Advisor regarding its investment allocation procedures for managing the Fund alongside other client accounts that invest in MLPs.
C. Fee Rate and Profitability. The Trustees considered the advisory fee paid by the Fund under the Advisory Agreement and compared information concerning the Fund’s advisory fee to the advisory fees of certain peer group funds. The Trustees observed that the Fund’s advisory fee is higher than the advisory fees paid by other peer group funds. The Trustees considered the Fund’s advisory fee in light of the services provided by the Advisor to the Fund and the Fund’s strong long-term performance relative to its peers. The Trustees also noted that the Advisor has agreed to continue to waive its advisory fee and/or reimburse expenses of the Fund to the extent that the Fund’s total annual operating expenses (excluding certain items, such as deferred tax and extraordinary expenses) exceed 1.50% through March 31, 2022. The Trustees observed that the Fund’s total annual operating expenses are currently below this level.
The Trustees also considered information regarding advisory fees charged by the Advisor to its other clients that invest in MLPs, including separately managed accounts and the private MLP fund managed by the Advisor. The Trustees observed that, in comparison to the Fund’s advisory fee, the Advisor earns both lower and higher advisory fees from certain separate accounts and a lower advisory fee from sub-advisory/wrap fee program accounts, while it charges the same advisory fee to the Fund and to the private MLP fund. The Trustees discussed with the Advisor the differences between the services it provides to its separate and wrap fee or sub-advisory accounts, and the services that it provides to the Fund, including those attributable to permitted daily shareholder redemptions of Fund shares and the more burdensome administrative, regulatory and legal obligations applicable to the Fund. The Trustees took into consideration that, relative to the Fund, the Advisor’s administrative, management and reporting responsibilities with respect to its wrap fee, sub-advisory and separately managed accounts are less extensive.
The Trustees considered a profitability analysis prepared by the Advisor with respect to its management of the Fund, which showed that, whether or not marketing expenses are taken into consideration, the Advisor is earning a profit as a result of managing the Fund. The Trustees determined that the profit percentage was not excessive compared to profit percentages reported for other large advisory firms. The Trustees also evaluated the other direct and indirect benefits of the advisory relationship to the Advisor, including any “fallout benefits,” such as reputational value derived from serving as investment advisor to the Fund. The Trustees considered the Advisor’s representation that it does not have, and does not currently expect to enter into, any soft dollar arrangements with respect to the Fund. The Trustees also noted the Advisor’s representation that any 12b-1 fees received by the Advisor are used for eligible marketing expenses, including but not limited to payments to selling brokers and mutual fund distribution platforms, that are expected to benefit the Fund.
Based on these factors, the Trustees concluded that the Fund’s current advisory fee represents reasonable compensation to the Advisor in light of the nature and quality of services provided to the Fund, the fees paid by comparable funds, and the profitability of the Advisor with respect to the Fund.
D. Economies of Scale. In determining the reasonableness of the Fund’s advisory fee and the Advisor’s profitability, the Trustees also considered the extent to which economies of scale might be realized by the Advisor if the assets of the Fund were to grow, and the extent to which this is reflected in the Fund’s advisory fee. The Trustees considered the Advisor’s representation that, in light of the size of the Fund, the profitability of the Fund to the Advisor, and the Fund’s advisory fee, the Advisor was not realizing benefits from economies of scale in managing the Fund to such an extent that the Fund’s advisory fee should be reduced or that advisory fee breakpoints should be introduced at this time.
30 | MainGate mlp fund
Privacy Policy
The following is a description of the Fund’s policies regarding disclosure of nonpublic personal information that you provide to the Fund or that the Fund collects from other sources. In the event that you hold shares of the Fund through a broker-dealer or other financial intermediary, the privacy policy of your financial intermediary would govern how your nonpublic personal information would be shared with nonaffiliated third parties.
Categories of Information the Fund Collects. The Fund collects the following nonpublic personal information about you:
| • | Information the Fund receives from you on applications or other forms, correspondence, or conversations (such as your name, address, phone number, social security number, and date of birth); and |
| • | Information about your transactions with the Fund, its affiliates, or others (such as your account number and balance, payment history, cost basis information, and other financial information). |
Categories of Information the Fund Discloses. The Fund does not disclose any nonpublic personal information about its current or former shareholders to unaffiliated third parties, except as required or permitted by law. The Fund is permitted by law to disclose all of the information it collects, as described above, to service providers (such as the Fund’s custodian, administrator, transfer agent, accountant and legal counsel) to process your transactions and otherwise provide services to you.
Confidentiality and Security. The Fund restricts access to your nonpublic personal information to those persons who require such information to provide products or services to you. The Fund maintains physical, electronic, and procedural safeguards that comply with federal standards to guard your nonpublic personal information.
Disposal of Information. The Fund, through its transfer agent, has taken steps to reasonably ensure that the privacy of your nonpublic personal information is maintained at all times, including in connection with the disposal of information that is no longer required to be maintained by the Fund. Such steps shall include, whenever possible, shredding paper documents and records prior to disposal, requiring off-site storage vendors to shred documents maintained in such locations prior to disposal, and erasing and/or obliterating any data contained on electronic media in such a manner that the information can no longer be read or reconstructed.
SEMI-ANNUAL REPORT 2021 • 31
Fund Service Providers
May 31, 2021
Board of Trustees
Geoffrey P. Mavar*, Chairman of the Board
Robert A. Reed, Lead Independent Trustee
David C. Burns, Independent Trustee
Moss W. Davis, Independent Trustee
Marshall K. Gramm, Independent Trustee
Matthew G. Mead*, Interested Trustee
Barry A. Samuels, Independent Trustee
Darrison N. Wharton, Independent Trustee
Officers
Matthew G. Mead*, President and Chief Executive Officer
Geoffrey P. Mavar*, Treasurer and Chief Financial Officer
Gerard Scarpati, Chief Compliance Officer
Andrew E. Garrett*, Secretary
Investment Adviser
Chickasaw Capital Management, LLC
6075 Poplar Avenue, Suite 720, Memphis, TN 38119
Distributor
Quasar Distributors, LLC
111 East Kilbourn Avenue, Suite 2200, Milwaukee, WI 53202
Custodian
U.S. Bank, N.A.
1555 North River Center Drive, Suite 302, Milwaukee, WI 53212
Transfer Agent
U.S. Bancorp Fund Services, LLC
615 East Michigan Street, 3rd Floor, Milwaukee, WI 53202
Administrator
U.S. Bancorp Fund Services, LLC
d/b/a U.S. Bank Global Fund Services
811 East Wisconsin Avenue, 8th Floor, Milwaukee, WI 53202
Legal Counsel
Bryan Cave Leighton Paisner LLP
One Metropolitan Square, St. Louis, MO 63102
Independent Registered Public Accounting Firm
Cohen & Company, Ltd.
342 North Water Street, Suite 830, Milwaukee, WI 53202
*Employed by Chickasaw Capital Management, LLC.
32 | MainGate mlp fund
Notes
SEMI-ANNUAL REPORT 2021 • 33
Notes
34 | MainGate mlp fund
Notes
SEMI-ANNUAL REPORT 2021 • 35

Not applicable for semi-annual reports.
Not applicable for semi-annual reports.
Not applicable for semi-annual reports.
Not applicable to registrants who are not listed issuers (as defined in Rule 10A-3 under the Securities Exchange Act of 1934).
Not applicable to open-end investment companies.
Not applicable to open-end investment companies.
Not applicable to open-end investment companies.
Not Applicable.
Pursuant to the requirements of the Securities Exchange Act of 1934 and the Investment Company Act of 1940, the registrant has duly caused this report to be signed on its behalf by the undersigned, thereunto duly authorized.
Matthew G. Mead, President & Chief Executive Officer
Pursuant to the requirements of the Securities Exchange Act of 1934 and the Investment Company Act of 1940, this report has been signed below by the following persons on behalf of the registrant and in the capacities and on the dates indicated.
Matthew G. Mead, President & Chief Executive Officer
Geoffrey P. Mavar, Treasurer & Chief Financial Officer