UNITED STATES
SECURITIES AND EXCHANGE COMMISSION
Washington, D.C. 20549
FORM N-CSR
CERTIFIED SHAREHOLDER REPORT OF REGISTERED
MANAGEMENT INVESTMENT COMPANIES
Investment Company Act file number: 811-22497
STRATEGY SHARES
(Exact name of registrant as specified in charter)
36 North New York Avenue, Huntington, NY 11743
(Address of principal executive offices) (Zip code)
CITI FUND SERVICES OHIO, INC., 4400 Easton Commons, Suite 200, COLUMBUS, OH 43219
(Name and address of agent for service)
Registrant’s telephone number, including area code: 855-477-3837
Date of fiscal year end: April 30
Date of reporting period: April 30, 2018
Item 1. Reports to Stockholders.
strategyshares
Annual Shareholder Report
US Market Rotation Strategy ETF (HUSE)
EcoLogical Strategy ETF (HECO)
Strategy Shares Nasdaq 7 Handl Index ETF (HNDL)
A P R I L 3 0 , 2 0 1 8
PRIVACY NOTICE
Strategy Shares
Rev. July 2017
| FACTS | WHAT DOES STRATEGY SHARES DO WITH YOUR PERSONAL INFORMATION? |
| Why? | Financial companies choose how they share your personal information. Federal law gives consumers the right to limit some, but not all sharing. Federal law also requires us to tell you how we collect, share, and protect your personal information. Please read this notice carefully to understand what we do. |
| What? | The types of personal information we collect and share depends on the product or service that you have with us. This information can include:
● Social Security number and income
● Account balances and transaction history
● Information about your investment goals and risk tolerances
When you are no longer our customer, we continue to share your information as described in this notice. |
| How? | All financial companies need to share customers’ personal information to run their everyday business. In the section below, we list the reasons financial companies can share their customers’ personal information; the reasons Strategy Shares chooses to share; and whether you can limit this sharing. |
| Reasons we can share your personal information: | Does Strategy Shares share information? | Can you limit this sharing? |
| For our everyday business purposes - such as to process your transactions, maintain your account(s), respond to court orders and legal investigations, or report to credit bureaus. | YES | NO |
| For our marketing purposes - to offer our products and services to you. | NO | We don’t share |
| For joint marketing with other financial companies. | NO | We don’t share |
| For our affiliates’ everyday business purposes - information about your transactions and records. | NO | We don’t share |
| For our affiliates’ everyday business purposes - information about your credit worthiness. | NO | We don’t share |
| For our affiliates to market to you | NO | We don’t share |
| For non-affiliates to market to you | NO | We don’t share |
| QUESTIONS? | Call 1-855-477-3837 |
PRIVACY NOTICE
Strategy Shares
| What we do: | |
How does Strategy Shares protect my personal information? | To protect your personal information from unauthorized access and use, we use security measures that comply with federal law. These measures include computer safeguards and secured files and buildings.
Our service providers are held accountable for adhering to strict policies and procedures to prevent any misuse of your nonpublic personal information. |
How does Strategy Shares collect my personal information? | We collect your personal information, for example, when you: ● open an account or deposit money
● direct us to buy securities or direct us to sell your securities
● seek advice about your investments
We also collect your personal information from others, such as credit bureaus, affiliates, or other companies. |
Why can’t I limit all sharing? | Federal law gives you the right to limit only: ● sharing for affiliates’ everyday business purposes – information about your creditworthiness.
● affiliates from using your information to market to you.
● sharing for non-affiliates to market to you.
State laws and individual companies may give you additional rights to limit sharing. |
| Definitions | |
| Affiliates | Companies related by common ownership or control. They can be financial and non-financial companies.
● Strategy Shares has no affiliates. |
| Non-affiliates | Companies not related by common ownership or control. They can be financial and non-financial companies.
● Strategy Shares doesn’t share with non-affiliates so they can market to you. |
| Joint marketing | A formal agreement between nonaffiliated financial companies that together market financial products or services to you.
● Strategy Shares doesn’t jointly market. |
strategyshares
| TABLE OF CONTENTS | Page | |||
| Management’s Discussion of Fund Performance | ||||
| US Market Rotation Strategy ETF (HUSE) | 1 | |||
| EcoLogical Strategy ETF (HECO) | 3 | |||
| Expense Examples | 5 | |||
| Portfolios of Investments | ||||
| US Market Rotation Strategy ETF (HUSE) | 6 | |||
| EcoLogical Strategy ETF (HECO) | 8 | |||
| Strategy Shares Nasdaq 7 Handl Index ETF (HNDL) | 9 | |||
| Statements of Assets and Liabilities | 10 | |||
| Statements of Operations | 11 | |||
| Statements of Changes in Net Assets | 12 | |||
| Financial Highlights | 14 | |||
| Notes to Financial Statements | 16 | |||
| Report of Independent Registered Public Accounting Firm | 22 | |||
| Additional Information | 23 | |||
| Board of Trustees and Trust Officers | 29 | |||
| US Market Rotation Strategy ETF (Unaudited) | April 30, 2018 |
Management’s Discussion of Fund Performance
Dear Shareholder:
The US Market Rotation Strategy ETF (HUSE) seeks capital appreciation by implementing a quantitative sector rotation investment strategy. The Fund generally invests in S&P Composite 1500 Index constituents, including small-, mid -, and large-cap U.S. companies. The goal of the investment strategy is to outperform its benchmark by overweighting sectors that our models indicate are likely to perform well in the given market environment and underweight or avoid exposure to the sectors that our models indicate are likely to underperform.
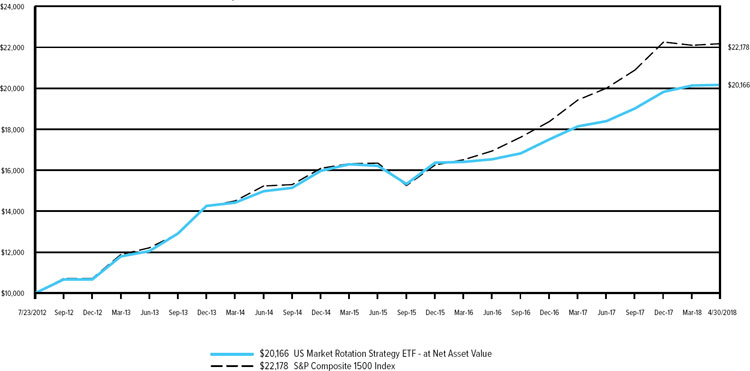
For the fiscal year ended April 30, 2018, HUSE generated a positive return of 9.93% at net asset value and 9.98% at market value. During this same period, the S&P Composite 1500 Index returned 13.00%.
The Fund underperformed the strong return of the benchmark. A primary driver of this underperformance was a tactical allocation to cash. Our quantitative models examine a number of factors, including momentum, counter trends growth, quality, intangibles, value, profitability, trading and smart money activity. Our models will typically begin to increase cash positions in strong uptrends, and this caused the Fund to underperform the benchmark toward the end of 2017 and into the beginning of 2018. The fund handily outperformed the benchmark during the market decline in February and March of 2018.
We are pleased with the long-term performance of the Fund and our quantitative models. The models performed as expected, and we believe that our disciplined approach will allow the Fund to outperform over the long-term. We appreciate your confidence and continued interest in the Fund.
Sincerely,

Matthew Tuttle
Portfolio Manager
US Market Rotation Strategy ETF
| The S&P Composite 1500 Index is a broad equity index based on the S&P 500, S&P MidCap 400, and S&P SmallCap 600 indices. Thus, the S&P Composite 1500 Index includes the top large cap, mid cap and small cap stocks, representing about 85% of the entire U.S. equity market. An investor cannot invest directly in an index. |
ETF Risk. The Fund is an actively-managed ETF and the Fund’s NAV will fluctuate based on changes in the prices of the securities it owns. The market price of Fund shares will fluctuate based on changes in the Fund’s NAV as well as changes in the supply and demand of its shares in the secondary market. It is also possible that an active secondary market for Fund shares may not develop and market trading in the Fund shares may be halted under certain circumstances.
You should consider an investment in the Fund as a long-term investment. The Fund’s returns will fluctuate over long and short periods.
This material represents the manager’s assessment of the Fund and market environment as of April 30, 2018 and should not be relied upon by the reader as research, tax or investment advice, is subject to change at any time based upon economic, market, or other conditions and the Advisor undertakes no obligation to update the views expressed herein. Any discussions of specific securities should not be considered a recommendation to buy or sell those securities. The views expressed above (including any forward-looking statement) may not be relied upon as investment advice or as an indication of the Fund’s trading intent.
The performance of any index mentioned in this commentary has not been adjusted for ongoing management, distribution and operating expenses, and sales charges applicable to exchange traded fund investments. In addition, the Fund’s returns do not reflect brokerage fees that an investor in the Fund may pay. If these commissions were reflected, performance would have been lower.
Annual Shareholder Report | 1
US Market Rotation Strategy ETF (Unaudited) (Continued)
Investment Objective
US Market Rotation Strategy ETF seeks to achieve capital appreciation.
Fund Performance (As of 4/30/18)
| Average Annual Total Returns | Expense Ratios(a) | |||||||||
| One Year | Five Year | Inception(b) | Gross | Net | ||||||
| US Market Rotation Strategy ETF (HUSE) - Total Return (at Net Asset Value)(c) | 9.93% | 11.10% | 12.93% | 2.88% | 0.95% | |||||
| US Market Rotation Strategy ETF (HUSE) - Total Return (at Market Value)(d) | 9.98% | 11.16% | 12.97% | N/A | N/A | |||||
| S&P Composite 1500 Index(e) | 13.00% | 12.90% | 14.81% | N/A | N/A | |||||
Hypothetical Growth of a $10,000 Investment (*)
Past performance does not guarantee future results. Return calculations assume the reinvestment of distributions and do not reflect taxes that a shareholder would pay on Fund distributions or on the redemption of Fund shares. The performance data quoted represent past performance and current returns may be lower or higher. The investment return and principal value will fluctuate so that an investor’s shares, when redeemed may be worth more or less than the original cost. The performance above reflects any fee reductions during the applicable periods. If such fee reductions had not occurred, the quoted performance would be lower. To obtain performance information current to the most recent month-end, please call 855-477-3837 or visit http://strategysharesetfs.com/
| * | The chart represents historical performance of a hypothetical investment of $10,000 in US Market Rotation Strategy ETF and represents the reinvestment of dividends and capital gains in the Fund. |
| (a) | The gross expense ratios reflect the expense ratios as reported in the Fund’s Prospectus dated September 1, 2017. However, the Advisor has agreed to contractual waivers in effect through August 31, 2018 and has agreed to limit total annual fund operating expenses to the net expense ratios shown. Please see the Fund’s most recent prospectus for details. Additional information pertaining to the Fund’s expense ratio as of April 30, 2018 can be found in the Financial Highlights. |
| (b) | Commencement of operations July 23, 2012. |
| (c) | Net asset value total return is calculated assuming an initial investment made at the net asset value at the beginning of the period, reinvestment of all dividends and distributions at net asset value during the period, if any, and redemption on the last day of the period at net asset value. This percentage is not an indication of the performance of a shareholder’s investment in the Fund based on market value due to differences between the market price of the shares and the net asset value per share of the Fund. |
| (d) | Market value total return is calculated assuming an initial investment made at the market value at the beginning of the period, reinvestment of all dividends and distributions at net asset value during the period, if any, and redemption on the last day of the period at market value. Market value is determined by the composite closing price. Composite closing security price is defined as the last reported sale price from any primary listing market (e.g., NYSE Arca) or participating regional exchanges or markets. The composite closing price is the last reported sale price from any of the eligible sources, regardless of volume and not an average price and may have occurred on a date prior to the close of the reporting period. Market value may be greater or less than net asset value, depending on the Fund’s closing price on the listing market. |
| (e) | The S&P Composite 1500 Index is a broad equity index based on the S&P 500, S&P MidCap 400, and S&P SmallCap 600 indices. Thus, the S&P Composite 1500 Index includes the top large cap, mid cap and small cap stocks, representing about 85% of the entire U.S. equity market. An investor cannot invest directly in an index. |
2 | Annual Shareholder Report
| EcoLogical Strategy ETF (Unaudited) | April 30, 2018 |
Management’s Discussion of Fund Performance
Dear Shareholder:
The EcoLogical Strategy ETF (HECO) seeks capital appreciation by investing in ecologically-focused companies. The portfolio management team applies ecologically-focused criteria to identify U.S. and foreign companies that have positioned their business to respond to increased environment legislation, cultural shifts towards environmentally conscious consumption and capital investments in environmentally-oriented projects. The Fund may invest in all companies that are components of recognized environmentally-focused indices.
As of April 30, 2018, we held a portfolio of some of the “greenest” companies in the world, including those ranked most highly by Newsweek Green Rankings in partnership with Corporate Knights, HIP Investor Inc. and leading sustainability minds from nongovernmental organizations and the academic and accounting communities. The Fund’s portfolio is allocated approximately 20% to international stocks and 80% to U.S. stocks.
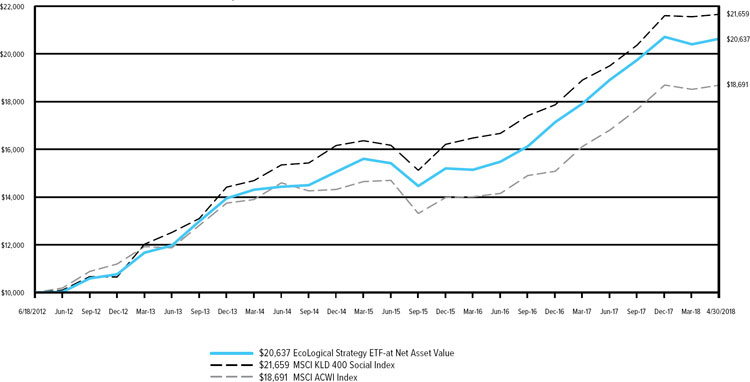
For the fiscal year ended April 30, 2018, HECO generated a return of 14.22% at net asset value and 14.18%. at market value, outperforming the MSCI KLD 400 Social Index return of 12.93% and the MSCI ACWI Index return of 14.16%.
The Fund’s allocations to Information Technology, Consumer Discretionary and Financials sector stocks contributed the most to outperformance. The top five contributing holdings were NVIDIA (Ticker: NVDA), Best Buy (Ticker: BBY), UnitedHealth Group (Ticker: UNH), Texas Instruments (Ticker: TXN) and Baxter International (Ticker: BAX). The bottom five contributing holdings were Rockwell Automation (Ticker: ROK), Hershey (Ticker: HSY), Procter & Gamble (Ticker: PG), Siemens AG (Ticker: SIEGY) and Hasbro (Ticker: HAS).
Sustainability and environmental stewardship continue to grow in importance across the globe. We believe that the companies in the portfolio are well positioned with regard to these growing themes. We are pleased with the long-term performance of the Fund and our quantitative models. The models performed as expected, and we believe that our disciplined approach will allow the Fund to outperform over the long-term.
Sincerely,

David Miller
Chief Investment Officer
Rational Advisors, Inc.
| The MSCI KLD 400 Social Index is based on the MSCI USA Investable Market Index (IMI), its parent index, which includes large-, mid- and small-cap constituents in the U.S. The index includes companies in the parent index with high Environmental, Social and Governance (ESG) ratings, while excluding companies involved in alcohol, tobacco, gambling, firearms, nuclear power and military weapons production. An investor cannot invest directly in an index. |
| The MSCI ACWI Index is a market capitalization weighted index designed to provide a broad measure of equity-market performance throughout the world. The MSCI ACWI is maintained by Morgan Stanley Capital International, and is comprised of stocks from both developed and emerging markets. |
Ecological Investment Risk. The Fund’s ecological investment criteria limit the types of investments the Fund may make. This could cause the Fund to underperform other funds that do not have an ecological focus.
ETF Risk. The Fund is an actively-managed ETF and the Fund’s NAV will fluctuate based on changes in the prices of the securities it owns. The market price of Fund shares will fluctuate based on changes in the Fund’s NAV as well as changes in the supply and demand of its shares in the secondary market. It is also possible that an active secondary market for Fund shares may not develop and market trading in the Fund shares may be halted under certain circumstances.
You should consider an investment in the Fund as a long-term investment. The Fund’s returns will fluctuate over long and short periods.
This material represents the manager’s assessment of the Fund and market environment as of April 30, 2018 and should not be relied upon by the reader as research, tax or investment advice, is subject to change at any time based upon economic, market, or other conditions and the Advisor undertakes no obligation to update the views expressed herein. Any discussions of specific securities should not be considered a recommendation to buy or sell those securities. The views expressed above (including any forward-looking statement) may not be relied upon as investment advice or as an indication of the Fund’s trading intent. Information about the Fund’s holdings, asset allocation or country diversification is historical and is not an indication of future Fund composition, which may vary.
The performance of any index mentioned in this commentary has not been adjusted for ongoing management, distribution and operating expenses, and sales charges applicable to exchange traded fund investments. In addition, the Fund’s returns do not reflect brokerage fees that an investor in the Fund may pay. If these commissions were reflected, performance would have been lower.
Annual Shareholder Report | 3
| EcoLogical Strategy ETF (Unaudited) (Continued) |
| Investment Objective |
| EcoLogical Strategy ETF seeks to achieve capital appreciation. |
| Fund Performance (As of 4/30/18) |
| Average Annual Total Returns | Expense Ratios(a) | |||||||||
| One Year | Five Year | Inception(b) | Gross | Net | ||||||
| EcoLogical Strategy ETF (HECO) - Total Return (at Net Asset Value)(c) | 14.22% | 11.78% | 13.15% | 2.87% | 0.95% | |||||
| EcoLogical Strategy ETF (HECO) - Total Return (at Market Value)(d) | 14.18% | 11.88% | 13.33% | N/A | N/A | |||||
| MSCI KLD 400 Social Index(e) | 12.93% | 12.04% | 14.09% | N/A | N/A | |||||
| MSCI ACWI Index(f) | 14.16% | 8.80% | 11.25% | N/A | N/A | |||||
Hypothetical Growth of a $10,000 Investment (*)
Past performance does not guarantee future results. Return calculations assume the reinvestment of distributions and do not reflect taxes that a shareholder would pay on Fund distributions or on the redemption of Fund shares. The performance data quoted represent past performance and current returns may be lower or higher. The investment return and principal value will fluctuate so that an investor’s shares, when redeemed may be worth more or less than the original cost. The performance above reflects any fee reductions during the applicable periods. If such fee reductions had not occurred, the quoted performance would be lower. To obtain performance information current to the most recent month-end, please call 855-477-3837 or visit http://strategysharesetfs.com/
| * | The chart represents historical performance of a hypothetical investment of $10,000 in EcoLogical Strategy ETF and represents the reinvestment of dividends and capital gains in the Fund. |
| (a) | The gross expense ratios reflect the expense ratios as reported in the Fund’s Prospectus dated September 1, 2017. However, the Advisor has agreed to contractual waivers in effect through August 31, 2018 and has agreed to limit total annual fund operating expenses to the net expense ratios shown. Please see the Fund’s most recent prospectus for details. Additional information pertaining to the Fund’s expense ratio as of April 30, 2018 can be found in the Financial Highlights. |
| (b) | Commencement of operations June 18, 2012. |
| (c) | Net asset value total return is calculated assuming an initial investment made at the net asset value at the beginning of the period, reinvestment of all dividends and distributions at net asset value during the period, if any, and redemption on the last day of the period at net asset value. This percentage is not an indication of the performance of a shareholder’s investment in the Fund based on market value due to differences between the market price of the shares and the net asset value per share of the Fund. |
| (d) | Market value total return is calculated assuming an initial investment made at the market value at the beginning of the period, reinvestment of all dividends and distributions at net asset value during the period, if any, and redemption on the last day of the period at market value. Market value is determined by the composite closing price. Composite closing security price is defined as the last reported sale price from any primary listing market (e.g., NYSE Arca) or participating regional exchanges or markets. The composite closing price is the last reported sale price from any of the eligible sources, regardless of volume and not an average price and may have occurred on a date prior to the close of the reporting period. Market value may be greater or less than net asset value, depending on the Fund’s closing price on the listing market. |
| (e) | The MSCI KLD 400 Social Index is based on the MSCI USA Investable Market Index (IMI), its parent index, which includes large-, mid- and small-cap constituents in the U.S. The index includes companies in the parent index with high Environmental, Social and Governance (ESG) ratings, while excluding companies involved in alcohol, tobacco, gambling, firearms, nuclear power and military weapons production. An investor cannot invest directly in an index. |
| (f) | The MSCI ACWI Index is a market capitalization weighted index designed to provide a broad measure of equity-market performance throughout the world. The MSCI ACWI is maintained by Morgan Stanley Capital International, and is comprised of stocks from both developed and emerging markets. An investor cannot invest directly in an index. |
4 | Annual Shareholder Report
| Expense Examples (Unaudited) | April 30, 2018 |
As a Fund shareholder, you may incur two types of costs: (1) transaction costs, including commissions on trading, as applicable; and (2) ongoing costs, including advisory fees and other Fund expenses. These examples are intended to help you understand your ongoing costs (in dollars) of investing in a Fund and to compare these costs with the ongoing costs of investing in other mutual funds.
The expense examples below are based on an investment of $1,000 invested at November 1, 2017 and held through the period ended April 30, 2018.
The Actual Expense figures in the table below provide information about actual account values and actual expenses. You may use this information, together with the amount you invested, to estimate the expenses that you paid over the period. Simply divide your account value by $1,000 (for example, an $8,600 account value divided by $1,000 = 8.6), then multiply the result by the number in the table under the heading entitled “Actual Expenses Paid During the Period” to estimate the expenses you paid on your account during this period.
The Hypothetical Expense figures in the table below provide information about hypothetical account values and hypothetical expenses based on each Fund’s actual expense ratio and an assumed rate of return of 5% per year before expenses, which is not each Fund’s actual return. The hypothetical account values and expenses may not be used to estimate the actual ending account balance or expenses you paid for the period. You may use this information to compare the ongoing costs of investing in your Fund and other funds. To do so, compare this 5% hypothetical example with the 5% hypothetical examples that appear in the shareholder reports of the other funds.
Please note that the expenses shown in the table are meant to highlight your ongoing costs only and do not reflect any transactional costs. Therefore, the examples are useful in comparing ongoing costs only and will not help you determine the relative total cost of owning different funds. In addition, if these transactional costs were included, your costs would have been higher.
| Beginning | Actual Ending | Hypothetical | Actual | Hypothetical | Annualized | |||||||||
| Account | Account | Ending | Expenses | Total | Expenses | Net Expense | ||||||||
| Value | Value | Account Value | Paid During | Return | Paid During | Ratio During | ||||||||
| Fund | 11/1/17 | 4/30/18 | 4/30/18 | the Period(1) | at NAV | the Period(2)(3) | the Period | |||||||
| US Market Rotation Strategy ETF (HUSE) | $1,000.00 | $1,039.10 | $1,020.08 | $4.80 | 3.91% | $4.76 | 0.95% | |||||||
| EcoLogical Strategy ETF (HECO) | 1,000.00 | 1,030.60 | 1,020.08 | 4.78 | 3.06% | 4.76 | 0.95% | |||||||
| Strategy Shares Nasdaq 7 Handl Index ETF (HNDL) | 1,000.00 | 970.40(4) | 1,020.08 | 2.69(4) | (2.96)%(4) | 4.76 | 0.95% |
| (1) | Expenses are equal to the Fund’s annualized expense ratio multiplied by the average account value over the period multiplied by 181/365 (to reflect the one-half year period). |
| (2) | Expenses are equal to the average hypothetical account value over the period multiplied by the Fund’s annualized expense ratio, multiplied by the number of days in the most recent fiscal half-year divided by the number of days in the fiscal year (to reflect the one-half year period). |
| (3) | Represents the hypothetical 5% annual return before taxes. |
| (4) | Information shown reflects values for the period January 16, 2018 (commencement of operations) to April 30, 2018 and has been calculated using expense ratios and rates of return of the same period. |
Annual Shareholder Report | 5
| US Market Rotation Strategy ETF (HUSE) | April 30, 2018 |
Portfolio of Investments Summary Table
| Percentage of Fair Value | ||
| Consumer Discretionary | 10.6% | |
| Consumer Staples | 10.5% | |
| Energy | 2.4% | |
| Financials | 9.7% | |
| Health Care | 3.4% | |
| Industrials | 8.5% | |
| Information Technology | 33.7% | |
| Materials | 1 7% | |
| Real Estate | 5.6% | |
| Exchange-Traded Funds | 12.3% | |
| Exchange-Traded Note | 1 6% | |
| Total | 100.0% | |
Portfolio holdings and allocations are subject to change. As of April 30, 2018, percentages in the table above are based on total investments. Such total investments may differ from the percentages set forth in the following Portfolio of Investments which are computed using the Fund’s total net assets.
Portfolio of Investments
| Shares | Fair Value | |||||||
| Common Stocks — 74.4% | ||||||||
| Consumer Discretionary — 9.2% | ||||||||
| 33,490 | Aramark | $ | 1,252,191 | |||||
| 7,235 | CarMax, Inc. † | 452,188 | ||||||
| 9,092 | Dollar Tree, Inc. † | 871,832 | ||||||
| 8,768 | Liberty Broadband Corp. † | 621,564 | ||||||
| 14,156 | Liberty Global PLC † | 411,940 | ||||||
| 10,773 | Liberty Siriusxm Group, Class C † | 448,803 | ||||||
| 5,723 | Netflix, Inc. † | 1,788,209 | ||||||
| 3,659 | O’Reilly Automotive, Inc. † | 936,960 | ||||||
| 36,819 | Twenty-First Century Fox, Inc. | 1,328,061 | ||||||
| 8,111,748 | ||||||||
| Consumer Staples — 9.1% | ||||||||
| 41,468 | Coca-Cola Co. | 1,791,832 | ||||||
| 5,830 | Constellation Brands, Inc., Class A | 1,359,148 | ||||||
| 12,075 | PepsiCo, Inc. | 1,218,851 | ||||||
| 16,755 | Procter & Gamble Co. | 1,212,057 | ||||||
| 21,408 | Sysco Corp. | 1,338,856 | ||||||
| 16,950 | Walgreens Boots Alliance, Inc. | 1,126,328 | ||||||
| 8,047,072 | ||||||||
| Energy — 2.1% | ||||||||
| 22,840 | Cheniere Energy, Inc. † | 1,328,374 | ||||||
| 40,153 | EnCana Corp. | 501,109 | ||||||
| 1,829,483 | ||||||||
| Financials — 8.4% | ||||||||
| 2,624 | Credit Acceptance Corp. † | 868,124 | ||||||
| 6,108 | Interactive Brokers Group, Inc. | 453,214 | ||||||
| 43,458 | KKR & Co., LP | 910,011 | ||||||
| 1,158 | Markel Corp. † | 1,308,586 | ||||||
| 8,163 | Moody’s Corp. | 1,324,038 | ||||||
| 24,855 | Morgan Stanley | 1,283,015 | ||||||
| 25,267 | U.S. Bancorp | 1,274,720 | ||||||
| 7,421,708 | ||||||||
| Health Care — 2.9% | ||||||||
| 5,523 | Anthem, Inc. | 1,303,373 | ||||||
| 10,110 | Johnson & Johnson | 1,278,814 | ||||||
| 2,582,187 | ||||||||
| Shares | Fair Value | |||||||
| Common Stocks — (Continued) | ||||||||
| Industrials — 7.3% | ||||||||
| 5,203 | AMERCO, Inc. | $ | 1,756,117 | |||||
| 16,086 | Armstrong World Industries, Inc. † | 900,816 | ||||||
| 6,290 | Roper Industries, Inc. | 1,661,755 | ||||||
| 14,208 | Trinity Industries, Inc. | 452,809 | ||||||
| 14,410 | United Technologies Corp. | 1,731,362 | ||||||
| 6,502,859 | ||||||||
| Information Technology — 29.1% | ||||||||
| 24,574 | Activision Blizzard, Inc. | 1,630,485 | ||||||
| 4,926 | Alibaba Group Holding, Ltd. ADR † | 879,488 | ||||||
| 6,347 | Alliance Data Systems Corp. | 1,288,758 | ||||||
| 1,705 | Alphabet, Inc., Class A † | 1,736,679 | ||||||
| 7,621 | Apple Computer, Inc. | 1,259,446 | ||||||
| 7,488 | Broadcom, Inc. | 1,717,897 | ||||||
| 20,106 | Cisco Systems, Inc. | 890,495 | ||||||
| 31,566 | eBay, Inc. † | 1,195,720 | ||||||
| 5,158 | Facebook, Inc. † | 887,176 | ||||||
| 10,681 | MasterCard, Inc., Class A | 1,904,102 | ||||||
| 11,322 | Microsoft Corp. | 1,058,833 | ||||||
| 7,766 | NVIDIA Corp. | 1,746,573 | ||||||
| 38,039 | Oracle Corp | 1,737,241 | ||||||
| 22,365 | Seagate Technology PLC | 1,294,710 | ||||||
| 12,886 | Shopify, Inc., Class A † | 1,721,957 | ||||||
| 64,674 | Symantec Corp. | 1,797,290 | ||||||
| 27,830 | Twitter, Inc. † | 843,527 | ||||||
| 3,535 | Visa, Inc., Class A | 448,521 | ||||||
| 36,335 | Zillow Group, Inc., Class A † | 1,757,523 | ||||||
| 25,796,421 | ||||||||
| Materials — 1.5% | ||||||||
| 43,439 | Olin Corp. | 1,311,423 | ||||||
| Real Estate — 4.8% | ||||||||
| 12,245 | American Tower Corp. | 1,669,728 | ||||||
| 20,339 | CBRE Group, Inc., Class A † | 921,560 | ||||||
| 10,442 | SBA Communications Corp. † | 1,673,122 | ||||||
| 4,264,410 | ||||||||
| Total Common Stocks (Cost $65,948,695) | $ | 65,867,311 | ||||||
(See notes which are an integral part of the Financial Statements)
6 | Annual Shareholder Report
| US Market Rotation Strategy ETF (HUSE) (Continued) | April 30, 2018 |
Portfolio of Investments
| Shares | Fair Value | |||||||
| Exchange-Traded Funds — 10.6% | ||||||||
| 60,893 | iShares Short Treasury Bond ETF | $ | 6,720,152 | |||||
| 5,545 | PowerShares QQQ Trust ETF | 892,412 | ||||||
| 6,638 | SPDR S&P 500 ETF Trust | 1,755,817 | ||||||
| Total Exchange-Traded Funds (Cost $9,354,939) | $ | 9,368,381 | ||||||
| Exchange-Traded Note — 1.4% | ||||||||
| 29,154 | iPATH S&P 500 VIX Short-Term ETN | 1,211,932 | ||||||
| Total Exchange-Traded Note (Cost $1,208,199) | $ | 1,211,932 | ||||||
| Total Investments — 86.4% (Cost $76,511,833) | $ | 76,447,624 | ||||||
| Other Assets less Liabilities — 13.6% | 12,058,346 | |||||||
| Net Assets — 100.0% | $ | 88,505,970 | ||||||
| † | Non-income producing security |
ADR — American Depositary Receipt
ETF — Exchange-Traded Fund
ETN — Exchange-Traded Note
LP — Limited Partnership
PLC — Public Liability Company
S&P — Standard and Poor’s
SPDR — Standard and Poor’s Depositary Receipts
(See notes which are an integral part of the Financial Statements)
Annual Shareholder Report | 7
| EcoLogical Strategy ETF (HECO) | April 30, 2018 |
Portfolio of Investments Summary Table
| Percentage of Fair Value | ||
| Consumer Discretionary | 14.0% | |
| Consumer Staples | 10.4% | |
| Financials | 22.8% | |
| Health Care | 13.2% | |
| Industrials | 12.3% | |
| Information Technology | 19.9% | |
| Materials | 2.7% | |
| Telecommunication Services | 4.7% | |
| Total | 100.0% | |
Portfolio holdings and allocations are subject to change. As of April 30, 2018, percentages in the table above are based on total investments. Such total investments may differ from the percentages set forth in the following Portfolio of Investments which are computed using the Fund’s total net assets.
Portfolio of Investments
| Shares | Fair Value | |||||||
| Common Stocks — 99.4% | ||||||||
| Consumer Discretionary — 13.9% | ||||||||
| 4,800 | Best Buy Co., Inc. | $ | 367,344 | |||||
| 2,285 | Hasbro, Inc. | 201,286 | ||||||
| 1,508 | McDonald’s Corp. | 252,500 | ||||||
| 2,572 | NIKE, Inc., Class B | 175,899 | ||||||
| 2,094 | Target Corp. | 152,024 | ||||||
| 1,149,053 | ||||||||
| Consumer Staples — 10.3% | ||||||||
| 2,708 | Colgate-Palmolive Co. | 176,642 | ||||||
| 1,820 | CVS Caremark Corp. | 127,091 | ||||||
| �� | 1,817 | Hershey Co. | 167,055 | |||||
| 1,793 | Procter & Gamble Co. | 129,706 | ||||||
| 4,400 | Unilever NV NYS | 251,328 | ||||||
| 851,822 | ||||||||
| Financials — 22.7% | ||||||||
| 5,058 | AFLAC, Inc. | 230,492 | ||||||
| 3,770 | Bank of New York Mellon Corp. | 205,503 | ||||||
| 2,579 | Marsh & McLennan Cos., Inc. | 210,189 | ||||||
| 3,325 | MetLife, Inc. | 158,503 | ||||||
| 2,708 | Royal Bank of Canada | 205,943 | ||||||
| 1,300 | S&P Global, Inc. | 245,180 | ||||||
| 4,538 | Sun Life Financial, Inc. | 187,329 | ||||||
| 3,778 | Toronto-Dominion Bank | 212,135 | ||||||
| 4,490 | Unum Group | 217,226 | ||||||
| 1,872,500 | ||||||||
| Health Care — 13.2% | ||||||||
| 3,405 | Baxter International, Inc. | 236,648 | ||||||
| 593 | Biogen Idec, Inc. † | 162,245 | ||||||
| 1,554 | Johnson & Johnson | 196,565 | ||||||
| 2,600 | Medtronic PLC | 208,338 | ||||||
| 1,201 | UnitedHealth Group, Inc. | 283,916 | ||||||
| 1,087,712 | ||||||||
| Industrials — 12.2% | ||||||||
| 1,049 | 3M Co. | 203,915 | ||||||
| 1,100 | Rockwell Automation, Inc. | 180,983 | ||||||
| 3,656 | Siemens AG ADR | 231,937 | ||||||
| 1,554 | United Parcel Service, Inc., Class B | 176,379 | ||||||
| 2,688 | Waste Management, Inc. | 218,508 | ||||||
| 1,011,722 | ||||||||
| Shares | Fair Value | |||||||
| Common Stocks — (Continued) | ||||||||
| Information Technology — 19.8% | ||||||||
| 1,400 | Accenture PLC, Class A | $ | 211,680 | |||||
| 1,250 | Apple Computer, Inc. | 206,575 | ||||||
| 5,700 | Cisco Systems, Inc. | 252,453 | ||||||
| 2,500 | Microsoft Corp. | 233,800 | ||||||
| 2,100 | NVIDIA Corp. | 472,289 | ||||||
| 2,550 | Texas Instruments, Inc. | 258,647 | ||||||
| 1,635,444 | ||||||||
| Materials — 2.7% | ||||||||
| 1,554 | Ecolab, Inc. | 224,973 | ||||||
| Telecommunication Services — 4.6% | ||||||||
| 7,977 | BT Group PLC ADR | 137,603 | ||||||
| 24,434 | Telecom Italia SpA ADR † | 244,584 | ||||||
| 382,187 | ||||||||
| Total Common Stocks (Cost $6,362,388) | $ | 8,215,413 | ||||||
| Total Investments — 99.4% (Cost $6,362,388) | $ | 8,215,413 | ||||||
| Other Assets less Liabilities — 0.6% | 49,046 | |||||||
| Net Assets — 100.0% | $ | 8,264,459 | ||||||
| † | Non-income producing security |
ADR — American Depositary Receipt
AG — Aktiengesellschaft (German Stock Company)
NV — Naamloze Vennootschap (Dutch Stock Company)
NYS — New York Shares
PLC — Public Liability Company
S&P — Standard and Poor’s
SpA — Societa per Azioni (Italian Joint Stock Company)
(See notes which are an integral part of the Financial Statements)
8 | Annual Shareholder Report
| Strategy Shares Nasdaq 7 Handl Index ETF (HNDL) | April 30, 2018 |
Portfolio of Investments Summary Table
| Percentage of Fair Value | ||
| Exchange-Traded Funds | 100.0% | |
| Total | 100.0% | |
Portfolio holdings and allocations are subject to change. As of April 30, 2018, percentages in the table above are based on total investments. Such total investments may differ from the percentages set forth in the following Portfolio of Investments which are computed using the Fund’s total net assets.
Portfolio of Investments
| Shares | Fair Value | |||||||
| Exchange-Traded Funds — 81.9% | ||||||||
| 2,106 | Fidelity MSCI Utilities Index ETF | $ | 71,225 | |||||
| 2,202 | Global X MLP ETF | 19,972 | ||||||
| 7,614 | Horizons NASDAQ-100 Covered Call ETF | 182,431 | ||||||
| 3,624 | iShares Core Growth Allocation ETF | 160,724 | ||||||
| 276 | iShares Core S&P 500 ETF | 73,502 | ||||||
| 3,204 | iShares Core U.S. Aggregate Bond ETF | 339,624 | ||||||
| 6,540 | iShares US Preferred Stock ETF | 242,830 | ||||||
| 1,380 | PowerShares QQQ Trust ETF | 222,097 | ||||||
| 7,830 | PowerShares Taxable Municipal Portfolio ETF | 232,238 | ||||||
| 6,744 | Schwab U.S. Aggregate Bond ETF | 340,842 | ||||||
| 318 | Schwab U.S. REIT ETF | 12,342 | ||||||
| 1,164 | Schwab U.S. Large-Cap ETF | 73,658 | ||||||
| 1,968 | SPDR Doubleline Total Return Tactical ETF | 93,480 | ||||||
| 12,222 | SPDR Portfolio Aggregate Bond ETF | 340,383 | ||||||
| 570 | Vanguard Dividend Appreciation ETF | 57,063 | ||||||
| 918 | Vanguard Intermediate-Term Corporate Bond ETF | 76,809 | ||||||
| 1,404 | Vanguard Mortgage-Backed Securities ETF | 71,913 | ||||||
| 300 | Vanguard S&P 500 ETF | 72,876 | ||||||
| 4,962 | Xtrackers USD High Yield Corporate Bond ETF | 245,718 | ||||||
| Total Exchange-Traded Funds (Cost $3,000,959) | $ | 2,929,727 | ||||||
| Total Investments — 81.9% (Cost $3,000,959) | $ | 2,929,727 | ||||||
| Other Assets less Liabilities — 18.1% | 646,193 | |||||||
| Net Assets — 100.0% | $ | 3,575,920 | ||||||
ETF — Exchange-Traded Fund
MLP — Master Limited Partnership
MSCI — Morgan Stanley Capital International
REIT — Real Estate Investment Trust
S&P — Standard and Poor’s
SPDR — Standard and Poor’s Depositary Receipts
USD — United States Dollar
Total Return Swap Agreement
| Unrealized | ||||||||||||||||||
| Pay/ | Financing | Payment | Expiration | Notional | Appreciation/ | |||||||||||||
| Receive | Rate | Description | Counterparty | Frequency | Date | Amount | (Depreciation) | |||||||||||
| Pay | 1-Month USD-LIBOR + 80 bps | NASDAQ 7 Handl Index | BNP Paribas SA | Monthly | 1/7/19 | $ | 1,714,440 | $ | 56 | |||||||||
SA — Societe Anonyme (French Investment Bank)
The derivative instruments outstanding as of April 30, 2018 as disclosed in the Portfolio of Investments and the amounts of realized and changes in unrealized gains and losses on swaps during the period as disclosed in the Statements of Operations serve as indicators of the volume of derivative activity for the Fund.
(See notes which are an integral part of the Financial Statements)
Annual Shareholder Report | 9
| Statements of Assets and Liabilities | April 30, 2018 |
| US Market Rotation | EcoLogical | Strategy Shares | ||||||||||
| Strategy ETF | Strategy ETF | Nasdaq 7 Handl | ||||||||||
| (HUSE) | (HECO) | Index ETF (HNDL) | ||||||||||
| Assets: | ||||||||||||
| Investments, at value (Cost $76,511,833, $6,362,388 and $3,000,959) | $ | 76,447,624 | $ | 8,215,413 | $ | 2,929,727 | ||||||
| Cash and Cash Equivalents | 7,791,066 | 53,782 | 643,980 | |||||||||
| Dividends and interest receivable | 30,980 | 11,047 | 1,846 | |||||||||
| Receivable for investments sold | 15,164,086 | — | — | |||||||||
| Unrealized gain on swap agreements | — | — | 56 | |||||||||
| Receivable from Advisor | — | 8,055 | 18,787 | |||||||||
| Prepaid expenses | 8,963 | 2,828 | 5,833 | |||||||||
| Total Assets | 99,442,719 | 8,291,125 | 3,600,229 | |||||||||
| Liabilities: | ||||||||||||
| Payable for investments purchased | 10,853,829 | — | — | |||||||||
| Accrued expenses: | ||||||||||||
| Advisory | 41,102 | — | — | |||||||||
| Administration | 4,284 | 4,284 | 4,284 | |||||||||
| Administrative support | 2,500 | 2,500 | 2,500 | |||||||||
| Custodian | 1,376 | 96 | 243 | |||||||||
| Fund accounting | 96 | 83 | 38 | |||||||||
| Other | 33,562 | 19,703 | 17,244 | |||||||||
| Total Liabilities | 10,936,749 | 26,666 | 24,309 | |||||||||
| Net Assets | $ | 88,505,970 | $ | 8,264,459 | $ | 3,575,920 | ||||||
| Net Assets consist of: | ||||||||||||
| Paid in Capital | $ | 86,993,025 | $ | 6,087,460 | $ | 3,666,533 | ||||||
| Accumulated undistributed net investment income (loss) | — | 29,519 | (56 | ) | ||||||||
| Accumulated net realized gains (losses) from investment and swap transactions | 1,577,154 | 294,455 | (19,381 | ) | ||||||||
| Net unrealized appreciation (depreciation) on investments and swaps | (64,209 | ) | 1,853,025 | (71,176 | ) | |||||||
| Net Assets | $ | 88,505,970 | $ | 8,264,459 | $ | 3,575,920 | ||||||
| Net Assets: | $ | 88,505,970 | $ | 8,264,459 | $ | 3,575,920 | ||||||
| Shares of Beneficial Interest Outstanding (unlimited number of shares authorized, no par value): | 2,275,000 | 200,000 | 150,000 | |||||||||
| Net Asset Value (offering and redemption price per share): | $ | 38.90 | $ | 41.32 | $ | 23.84 | ||||||
(See notes which are an integral part of the Financial Statements)
10 | Annual Shareholder Report
| Statements of Operations | For the year or period ended April 30, 2018 |
| US Market Rotation | EcoLogical | Strategy Shares | ||||||||||
| Strategy ETF | Strategy ETF | Nasdaq 7 Handl | ||||||||||
| (HUSE) | (HECO) | Index ETF (HNDL)(a) | ||||||||||
| Investment Income: | ||||||||||||
| Dividend income (Net of foreign tax withholding of $3,298, $5,830 and $—) | $ | 523,486 | $ | 173,588 | $ | 30,461 | ||||||
| Total Investment Income | 523,486 | 173,588 | 30,461 | |||||||||
| Expenses: | ||||||||||||
| Advisory | 342,251 | 49,831 | 6,187 | |||||||||
| Administration | 51,469 | 51,469 | 14,851 | |||||||||
| Administrative support | 30,000 | 30,000 | 8,710 | |||||||||
| Fund accounting | 1,177 | 1,132 | 153 | |||||||||
| Custodian | 12,465 | 365 | 526 | |||||||||
| Trustee | 6,901 | 6,752 | 617 | |||||||||
| Compliance services | 17,315 | 11,330 | 2,698 | |||||||||
| Legal and audit | 17,636 | 17,766 | 16,999 | |||||||||
| Printing | 13,228 | 1,989 | 1,469 | |||||||||
| Other fees | 40,082 | 24,493 | 13,096 | |||||||||
| Total Expenses before fee reductions | 532,524 | 195,127 | 65,306 | |||||||||
| Expenses contractually waived or reimbursed by the Advisor | — | (116,210 | ) | (55,481 | ) | |||||||
| Total Net Expenses | 532,524 | 78,917 | 9,825 | |||||||||
| Net Investment Income (Loss) | (9,038 | ) | 94,671 | 20,636 | ||||||||
| Realized and Unrealized Gains (Losses) from Investment and Swap Transactions: | ||||||||||||
| Net realized gains (losses) from investment transactions | 5,413,461 | 289,317 | (19,380 | ) | ||||||||
| Net realized gains on in-kind transactions | — | — | 837 | |||||||||
| Net realized losses on swap agreements | — | — | (44,952 | ) | ||||||||
| Change in unrealized appreciation/depreciation on investments | (100,586 | ) | 710,919 | (71,232 | ) | |||||||
| Change in unrealized appreciation on swaps | — | — | 56 | |||||||||
| Net Realized and Unrealized Gains (Losses) from Investment and Swap Transactions | 5,312,875 | 1,000,236 | (134,671 | ) | ||||||||
| Change in Net Assets Resulting From Operations | $ | 5,303,837 | $ | 1,094,907 | $ | (114,035 | ) | |||||
| (a) | For the period from the commencement of operations on January 16, 2018 through April 30, 2018. |
(See notes which are an integral part of the Financial Statements)
Annual Shareholder Report | 11
Statements of Changes in Net Assets
| US Market Rotation Strategy ETF | EcoLogical Strategy ETF | |||||||||||||||
| (HUSE) | (HECO) | |||||||||||||||
| Year Ended | Year Ended | Year Ended | Year Ended | |||||||||||||
| April 30, 2018 | April 30, 2017 | April 30, 2018 | April 30, 2017 | |||||||||||||
| From Investment Activities: | ||||||||||||||||
| Operations: | ||||||||||||||||
| Net investment income (loss) | $ | (9,038 | ) | $ | 42,198 | $ | 94,671 | $ | 79,732 | |||||||
| Net realized gains from investment transactions and in-kind redemptions | 5,413,461 | 1,282,577 | 289,317 | 613,492 | ||||||||||||
| Change in unrealized appreciation/depreciation on investments | (100,586 | ) | (173,913 | ) | 710,919 | 553,861 | ||||||||||
| Change in net assets resulting from operations | 5,303,837 | 1,150,862 | 1,094,907 | 1,247,085 | ||||||||||||
| Distributions to Shareholders From: | ||||||||||||||||
| Net investment income | (14,593 | ) | (49,840 | ) | (89,918 | ) | (63,460 | ) | ||||||||
| Net realized gains from investment transactions | (4,753,678 | ) | (919,153 | ) | (401,834 | ) | (578,807 | ) | ||||||||
| Change in net assets from distributions | (4,768,271 | ) | (968,993 | ) | (491,752 | ) | (642,267 | ) | ||||||||
| Capital Transactions: | ||||||||||||||||
| Proceeds from shares issued | 73,786,722 | 9,355,628 | — | 912,834 | ||||||||||||
| Change in net assets from capital transactions | 73,786,722 | 9,355,628 | — | 912,834 | ||||||||||||
| Change in net assets | 74,322,288 | 9,537,497 | 603,155 | 1,517,652 | ||||||||||||
| Net Assets: | ||||||||||||||||
| Beginning of period | 14,183,682 | 4,646,185 | 7,661,304 | 6,143,652 | ||||||||||||
| End of period | $ | 88,505,970 | $ | 14,183,682 | $ | 8,264,459 | $ | 7,661,304 | ||||||||
| Accumulated undistributed net investment income (loss) | $ | — | $ | 4,982 | $ | 29,519 | $ | 29,934 | ||||||||
| Share Transactions: | ||||||||||||||||
| Issued | 1,900,000 | 250,000 | — | 25,000 | ||||||||||||
| Change in shares | 1,900,000 | 250,000 | — | 25,000 | ||||||||||||
(See notes which are an integral part of the Financial Statements)
12 | Annual Shareholder Report
Statement of Changes in Net Assets (Continued)
| Strategy Shares Nasdaq 7 | ||||
| Handl Index ETF (HNDL) | ||||
| January 16, 2018(a) | ||||
| through April 30, 2018 | ||||
| From Investment Activities: | ||||
| Operations: | ||||
| Net investment income | $ | 20,636 | ||
| Net realized losses from investment and swap transactions | (63,495 | ) | ||
| Change in unrealized appreciation/depreciation on investments and swaps | (71,176 | ) | ||
| Change in net assets resulting from operations | (114,035 | ) | ||
| Distributions to Shareholders From: | ||||
| Return of capital | (63,691 | ) | ||
| Change in net assets from distributions | (63,691 | ) | ||
| Capital Transactions: | ||||
| Proceeds from shares issued | 4,376,999 | |||
| Cost of shares redeemed | (623,353 | ) | ||
| Change in net assets from capital transactions | 3,753,646 | |||
| Change in net assets | 3,575,920 | |||
| Net Assets: | ||||
| Beginning of period | — | |||
| End of period | $ | 3,575,920 | ||
| Accumulated undistributed net investment loss | $ | (56 | ) | |
| Share Transactions: | ||||
| Issued | 175,000 | |||
| Redeemed | (25,000 | ) | ||
| Change in shares | 150,000 | |||
| (a) | Commencement of operations. |
(See notes which are an integral part of the Financial Statements)
Annual Shareholder Report | 13
| Financial Highlights | Strategy Shares |
| Net realized | Distributions | |||||||||||||
| and unrealized | Distributions | from net realized | ||||||||||||
| Net Asset Value, | Net | gains (losses) | Total from | from net | Distributions | gains from | ||||||||
| beginning | investment | from investments | investment | investment | from Return | investment and | ||||||||
| of period | income (loss) | and swaps | activities | income | of Capital | swap transactions | ||||||||
| US Market Rotation Strategy ETF (HUSE) | ||||||||||||||
| Year Ended April 30, 2018 | $37.82 | (0.01) | 3.74 | 3.73 | (0.01) | — | (2.64) | |||||||
| Year Ended April 30, 2017 | $37.17 | 0.11 | 4.42 | 4.53 | (0.20) | — | (3.68) | |||||||
| Year Ended April 30, 2016 | $37.96 | 0.29 | (0.09)(f) | 0.20 | (0.42) | — | (0.57) | |||||||
| Year Ended April 30, 2015 | $35.16 | 0.25 | 4.41 | 4.66 | (0.24) | — | (1.62) | |||||||
| Year Ended April 30, 2014 | $29.63 | 0.18 | 5.80 | 5.98 | (0.19) | — | (0.26) | |||||||
| EcoLogical Strategy ETF (HECO) | ||||||||||||||
| Year Ended April 30, 2018 | $38.31 | 0.47 | 5.00 | 5.47 | (0.45) | — | (2.01) | |||||||
| Year Ended April 30, 2017 | $35.11 | 0.43 | 6.44 | 6.87 | (0.36) | — | (3.31) | |||||||
| Year Ended April 30, 2016 | $37.15 | 0.09 | (0.62) | (0.53) | (0.04) | — | (1.47) | |||||||
| Year Ended April 30, 2015 | $34.75 | 0.10 | 2.77 | 2.87 | (0.08) | — | (0.39) | |||||||
| Year Ended April 30, 2014 | $29.42 | 0.06 | 5.62 | 5.68 | (0.07) | — | (0.28) | |||||||
| Strategy Shares Nasdaq 7 Handl Index ETF (HNDL) | ||||||||||||||
| January 16, 2018(h) through April 30, 2018 | $25.00 | 0.13 | (0.87) | (0.74) | — | (0.42) | — |
| (a) | Not annualized for periods less than one year. |
| (b) | Net asset value total return is calculated assuming an initial investment made at the net asset value at the beginning of the period, reinvestment of all dividends and distributions at net asset value during the period, if any, and redemption on the last day of the period at net asset value. This percentage is not an indication of the performance of a shareholder’s investment in the Fund based on market value due to differences between the market price of the shares and the net asset value per share of the Fund. |
| (c) | Market value total return is calculated assuming an initial investment made at the market value at the beginning of the period, reinvestment of all dividends and distributions at net asset value during the period, if any, and redemption on the last day of the period at market value. Market value is determined by the composite closing price. Composite closing security price is defined as the last reported sale price from any primary listing market (e.g., NYSE Arca) or participating regional exchanges or markets. The composite closing price is the last reported sale price from any of the eligible sources, regardless of volume and not an average price and may have occurred on a date prior to the close of the reporting period. Market value may be greater or less than net asset value, depending on the Fund’s closing price on the listing market. |
| (d) | Annualized for periods less than one year. |
| (e) | If applicable, certain fees were waived and/or reimbursed. If such waivers/reimbursements had not occurred, the ratios would have been as indicated. |
| (f) | The amount shown for a share outstanding throughout the period does not accord with the change in aggregate gains and losses in the portfolio of securities during the period because of the timing of sales and purchases of fund shares in relation to fluctuating market values during the period. |
| (g) | Effective June 1, 2016, Tuttle Tactical Management, LLC became the investment Subadvisor to the US Market Rotation Strategy ETF (HUSE). The ETF is actively managed to rotate among stocks and sectors, therefore portfolio turnover will be higher than previous years. |
| (h) | Commencement of operations. |
(See notes which are an integral part of the Financial Statements)
14 | Annual Shareholder Report
| Ratio of | ||||||||||||||||
| Ratio of | Ratio of | Net Investment | ||||||||||||||
| Net Expenses | Gross Expenses | Income (Loss) to | Net Assets at | |||||||||||||
| Total | Net Asset Value, | Total return | Total return | to Average | to Average | Average | end of period | Portfolio | ||||||||
| distributions | end of period | at NAV(a)(b) | at market(a)(c) | Net Assets(d) | Net Assets(d)(e) | Net Assets(d) | (000’s) | turnover(a) | ||||||||
| (2.65) | $38.90 | 9.93% | 9.98% | 0.95% | 0.95% | (0.02)% | $88,506 | 1,989% | ||||||||
| (3.88) | $37.82 | 12.61% | 11.45% | 0.95% | 2.61% | 0.51% | $14,184 | 2,875%(g) | ||||||||
| (0.99) | $37.17 | 0.47% | 0.76% | 0.95% | 3.83% | 0.80% | $4,646 | 85% | ||||||||
| (1.86) | $37.96 | 13.26% | 14.68% | 0.95% | 2.86% | 0.51% | $5,693 | 16% | ||||||||
| (0.45) | $35.16 | 20.19% | 18.79% | 0.95% | 2.26% | 0.53% | $12,307 | 39% | ||||||||
| (2.46) | $41.32 | 14.22% | 14.18% | 0.95% | 2.35% | 1.14% | $8,264 | 16% | ||||||||
| (3.67) | $38.31 | 20.12% | 21.04% | 0.95% | 2.87% | 1.18% | $7,661 | 70% | ||||||||
| (1.51) | $35.11 | (1.55)% | (3.17)% | 0.95% | 3.57% | 0.22% | $6,144 | 107% | ||||||||
| (0.47) | $37.15 | 8.26% | 10.19% | 0.95% | 2.79% | 0.19% | $8,358 | 54% | ||||||||
| (0.35) | $34.75 | 19.31% | 17.61% | 0.95% | 2.08% | 0.21% | $17,512 | 10% | ||||||||
| (0.42) | $23.84 | (2.96)% | (2.76)% | 0.95% | 6.33% | 2.00% | $3,576 | 18% |
(See notes which are an integral part of the Financial Statements)
Annual Shareholder Report | 15
| Notes to Financial Statements | April 30, 2018 |
| (1) | Organization |
Strategy Shares (the “Trust”) was organized on September 7, 2010 as a Delaware statutory trust. The Trust is registered under the Investment Company Act of 1940 (the “1940 Act”), as an open-end management investment company and thus is determined to be an investment company for accounting purposes. The Declaration of Trust permits the Trust to issue an unlimited number of shares of beneficial interest (“Shares”) in one or more series representing interests in separate portfolios of securities. Currently, the Trust offers its Shares in four separate series; these financial statements are those of the following funds: US Market Rotation Strategy ETF (HUSE), EcoLogical Strategy ETF (HECO), and Strategy Shares Nasdaq 7 Handl Index ETF (HNDL) (“Nasdaq 7 Handl Index ETF”) (individually referred to as a “Fund”, or collectively as the “Funds”). The US Market Rotation Strategy ETF (HUSE) and EcoLogical Strategy ETF (HECO), are each an actively-managed exchange-traded fund. The investment objective of both the US Market Rotation Strategy ETF (HUSE) and EcoLogical Strategy ETF (HECO) is capital appreciation. The Nasdaq 7 Handl Index ETF (HNDL) is a passively-managed exchange-traded fund. The investment objective of the Nasdaq 7 Handl Index ETF (HNDL) is to seek investment results that correlate to the price and yield performance of the NASDAQ 7 Handl Index. The Funds’ prospectuses provide a description of each Fund’s investment objectives, policies, and strategies. The assets of each Fund are segregated and a shareholder’s interest is limited to the Fund in which shares are held.
Shares of the US Market Rotation Strategy ETF (HUSE) and EcoLogical Strategy ETF (HECO) are listed and traded on the NYSE Arca, Inc. Shares of the Nasdaq 7 Handl Index ETF (HNDL) are listed and traded on the NASDAQ. Market prices for the Shares may be different from their net asset value (“NAV”). Each Fund issues and redeems Shares on a continuous basis at NAV only in large blocks of Shares, currently 25,000 Shares, called “Creation Units.” Creation Units are issued and redeemed principally in-kind for securities included in a specified universe. Once created, Shares generally trade in the secondary market at market prices that change throughout the day in amounts less than a Creation Unit.
Under the Trust’s organizational documents, its officers and Board of Trustees (“the Board”) are indemnified against certain liabilities arising out of the performance of their duties to the Funds. In addition, in the normal course of business, the Trust may enter into contracts with vendors and others that provide for general indemnifications. The Trust’s maximum exposure under these arrangements is unknown, as this would involve future claims that may be made against the Trust. However, based on experience, the Trust expects that risk of loss to be remote.
| (2) | Significant Accounting Policies |
The following is a summary of significant accounting policies consistently followed by each Fund in the preparation of its financial statements. These policies are in conformity with generally accepted accounting principles in the United States of America (“GAAP”). Each Fund is an investment company and accordingly follows the investment company accounting and reporting guidance of the Financial Accounting Standards Board (“FASB”) Accounting Standard Codification Topic 946 Financial Services - Investment Companies, including FASB Accounting Standard Update ASU 2013-08. The preparation of financial statements in conformity with GAAP requires management to make estimates and assumptions that affect the amounts of assets, liabilities and disclosure of contingent assets and liabilities at the date of the financial statements and the reported amounts of income and expenses for the period. Actual results could differ from those estimates.
| A. | Investment Valuations |
The Funds hold investments at fair value. Fair value is defined as the price that would be expected to be received to sell an asset or paid to transfer a liability in an orderly transaction between market participants at the measurement date. The valuation techniques used to determine fair value are further described below.
Security values are ordinarily obtained through the use of independent pricing services, in accordance with procedures adopted by the Trust’s Board. Pursuant to these procedures, the Funds may use a pricing service, bank, or broker-dealer experienced in such matters to value the Funds’ securities. When reliable market quotations are not readily available for any security, the fair value of that security will be determined by a committee established by the Board in accordance with procedures adopted by the Board. The fair valuation process is designed to value the subject security at the price the Funds would reasonably expect to receive upon its current sale. Additional consideration is given to securities that have experienced a decrease in the volume or level of activity or to circumstances that indicate that a transaction is not orderly.
The Trust has a three-tier fair value hierarchy that is dependent upon the various “inputs” used to determine the value of the Fund’s investments. The valuation techniques described below maximize the use of observable inputs and minimize the use of unobservable inputs in determining fair value. These inputs are summarized in the three broad levels listed below:
| ● | Level 1 – Quoted prices in active markets for identical assets. |
| ● | Level 2 – Other observable pricing inputs at the measurement date (including quoted prices for similar securities, interest rates, prepayment speeds, credit risk, etc.). |
| ● | Level 3 – Significant unobservable pricing inputs at the measurement date (including the Fund’s own assumptions in determining the fair value of investments). |
The inputs or methodology used for valuing investments are not necessarily an indication of the risk associated with investing in those investments.
Equity securities (including foreign equity securities) traded on a securities exchange are valued at the last reported sales price on the principal exchange. Equity securities quoted by NASDAQ are valued at the NASDAQ official closing price. If there is no reported sale on the principal exchange, and in the case of over-the-counter securities, equity securities are valued at a bid price estimated by the security pricing service. In each of these situations, valuations are typically categorized as Level 1 in the fair value hierarchy.
Debt securities traded on a national securities exchange or in the over-the-counter market are valued at the last reported sales price on the principal exchange. If there is no reported sale on the principal exchange, and for all other debt securities, debt securities are valued at a bid price estimated by a security pricing service. In each of these situations, valuations are typically categorized as Level 2 in the fair value hierarchy.
Swaps are priced daily based on the underlying index and are typically categorized as Level 2 in the fair value hierarchy.
16 | Annual Shareholder Report
Notes to Financial Statements (Continued)
The following table provides the fair value measurement as of April 30, 2018, while the breakdown, by category, of common stocks is disclosed in the Portfolio of Investments for each Fund.
| Total | ||||||||||||
| Level 1 | Level 2 | Investments | ||||||||||
| US Market Rotation Strategy ETF (HUSE) | ||||||||||||
| Common Stocks(1) | $ | 65,867,311 | $ | — | $ | 65,867,311 | ||||||
| Exchange-Traded Note | 1,211,932 | — | 1,211,932 | |||||||||
| Exchange-Traded Funds | 9,368,381 | — | 9,368,381 | |||||||||
| Total Investments | $ | 76,447,624 | $ | — | $ | 76,447,624 | ||||||
| EcoLogical Strategy ETF (HECO) | ||||||||||||
| Common Stocks(1) | $ | 8,215,413 | $ | — | $ | 8,215,413 | ||||||
| Total Investments | $ | 8,215,413 | $ | — | $ | 8,215,413 | ||||||
| Strategy Shares Nasdaq 7 Handl Index ETF (HNDL) | ||||||||||||
| Exchange-Traded Funds | $ | 2,929,727 | $ | — | $ | 2,929,727 | ||||||
| Other Financial Instruments(2) | ||||||||||||
| Total Return | ||||||||||||
| Swap Agreement | $ | — | $ | 56 | $ | 56 | ||||||
| Total Investments | $ | 2,929,727 | $ | 56 | $ | 2,929,783 | ||||||
| (1) | Please see the Portfolios of Investments for industry classifications. |
| (2) | Other Financial Instruments are derivative instruments not reflected in the total investments, such as swap agreements, which are valued at fair value. |
The Trust’s policy is to disclose transfers between fair value hierarchy levels based on valuations at the end of the reporting period. There were no transfers between Levels 1, 2, or 3 for the year or period ended April 30, 2018. As of April 30, 2018, no securities were categorized as Level 3.
| B. | Security Transactions and Related Income |
Investment transactions are accounted for no later than the first calculation of the net asset value (“NAV”) on the business day following the trade date. For financial reporting purposes, however, security transactions are accounted for on the trade date on the last business day of the reporting period. Discounts and premiums on securities purchased are amortized over the lives of the respective securities using the effective interest method. Securities gains and losses are calculated on the identified cost basis. Interest income and expenses are accrued daily. Dividends, less foreign tax withholding, if any, are recorded on the ex-dividend date. Investment income from non-U.S. sources received by a Fund is generally subject to non-U.S. withholding taxes at rates ranging up to 30%. Such withholding taxes may be reduced or eliminated under the terms of applicable U.S. income tax treaties. The Funds may be subject to foreign taxes on gains in investments or currency repatriation. The Funds accrue such taxes, as applicable, based on their current interpretation of tax rules in the foreign markets in which they invest.
| C. | Cash and Cash Equivalents |
Idle cash may be swept into various overnight demand deposits and is classified as cash and cash equivalents on the Statements of Assets and Liabilities. The Funds maintain cash in bank deposit accounts which, at times, may exceed United States federally insured limits. Amounts swept overnight are available on the next business day.
| D. | Derivative Instruments |
Swap Agreements: The US Market Rotation Strategy ETF (HUSE) and Strategy Shares Nasdaq 7 Handl ETF (HNDL) may enter into swap agreements (“swaps”) in an attempt to obtain a particular desired return at a lower cost to the Fund than if it had been invested directly in an instrument that yielded that desired return. Swap agreements are two-party contracts entered into primarily by institutional investors for periods ranging from a few weeks to more than one year. In a standard swap transaction, two parties agree to exchange the returns (or differentials in rates of returns) earned or realized on particular predetermined investments or instruments. The gross returns to be exchanged or “swapped” between the parties are calculated with respect to a “notional amount,” i. e., the return on or increase in value of a particular dollar amount invested in a “basket” of securities representing a particular index. The “notional amount” of the swap agreement is only a fictive basis on which to calculate the obligations the parties to a swap agreement have agreed to exchange. The Fund’s obligations (or rights) under a swap agreement will generally be equal only to the amount to be paid or received under the agreement based on the relative values of the positions held by each party to the agreement (the “net amount”).
Total Return Swaps: The US Market Rotation Strategy ETF (HUSE) and Strategy Shares Nasdaq 7 Handl ETF (HNDL) may enter into total return swaps to gain or mitigate exposure to the underlying securities or indices. In “long” total return swaps, the counterparty will generally agree to pay the Fund the amount, if any, by which the notional amount of the swaps would have increased in value had it been invested in the particular instruments, plus an amount equal to any dividends or interest that would have been received on those instruments. The Fund will agree to pay to the counterparty an amount equal to a fixed or floating rate of interest on the notional amount of the swaps plus the amount, if any, by which the notional amount would have decreased in value had it been invested in such instruments plus, in certain instances, commissions or trading spreads on the notional amount. Total return swaps do not involve the delivery of securities or other underlying instruments. Until a total return swap is settled in cash, the gain or loss on the notional amount plus dividends or interest on the instruments less the interest paid by the Fund on the notional amount is recorded as “unrealized appreciation or depreciation on swap agreements” and, when cash is exchanged, the gain or loss realized is recorded as “realized gains or losses on swap transactions.” A Fund may enter into total return swaps that provide the opposite return of its benchmark index or security (“short” the index or security). Its operations are similar to those swaps disclosed above except that the counterparty pays interest to the Fund on the notional amount outstanding and that dividends or interest on the underlying instruments reduce the value of the swaps plus, in certain instances, the Fund will agree to pay to the counterparty commissions or trading spreads on the notional amount. These amounts are netted against any unrealized appreciation or depreciation to determine the value of the swaps.
The primary risks associated with the use of swaps are an imperfect correlation between the prices of financial instruments and movements in the prices of the underlying investments and the inability of counterparties to perform under the agreement. The counterparty to any swap agreement will typically be a bank, investment banking firm or broker-dealer. The Fund will bear the counterparty risk, i.e., the risk of loss of the net amount, if any, expected to be received under a swap in the event of the default or bankruptcy of the swap counterparty. The unrealized gain or loss at April 30, 2018 is disclosed in the swap tables included in the Portfolios of Investments.
Annual Shareholder Report | 17
Notes to Financial Statements (Continued)
Summary of Derivative Instruments
The following table summarizes the fair values of derivative instruments on the Strategy Shares Nasdaq 7 Handl Index ETF’s (HNDL) Statement of Assets and Liabilities, categorized by risk exposure, as of April 30, 2018.
| Assets | Liabilities | ||
| Unrealized Gain on | Unrealized Loss on | ||
| Fund | Swap Agreements | Swap Agreements | |
| Equity Risk Exposure: | |||
| Strategy Shares Nasdaq 7 Handl Index ETF (HNDL) | $56 | $0 |
The following table presents the effect of derivative instruments on the Strategy Shares Nasdaq 7 Handl Index ETF’s (HNDL) Statement of Operations, categorized by risk exposure, for the period ended April 30, 2018.
| Change in Net Unrealized | |||
| Net Realized Gain (Loss) | Appreciation/ | ||
| on Swap Agreements | Depreciation on Swap | ||
| Recognized as a Result | Agreements Recognized | ||
| Fund | from Operations | from Operations | |
| Equity Risk Exposure: | |||
| Strategy Shares Nasdaq 7 Handl Index ETF (HNDL) | $(44,952) | $56 |
| E. | Dividends and Distributions to Shareholders |
Dividends to shareholders are recorded on the ex-dividend date. For the US Market Rotation ETF (HUSE) and EcoLogical Strategy ETF (HECO), dividends from net investment income, if any, are declared and paid annually. Net realized capital gains, if any, are distributed at least annually. For the Strategy Shares Nasdaq 7 Handl Index ETF (HNDL), dividends from net investment income, if any are declared and paid monthly. Net realized capital gains, if any, are distributed at least annually.
The amount of dividends from net investment income and net realized gains are determined in accordance with federal income tax regulations, which may differ from GAAP. These “book/tax” differences are considered either temporary or permanent in nature. To the extent these differences are permanent in nature (e. g., distributions and income received from pass-through investments), such amounts are reclassified within the capital accounts based on their nature for federal income tax purposes; temporary differences do not require reclassification. Temporary differences are primarily due to return of capital from investments.
The Funds may own shares of real estate investments trusts (“REITs”) which report information on the source of their distributions annually. Distributions received from investments in REITs in excess of income from underlying investments are recorded as realized gain and/or as a reduction to the cost of the individual REIT.
| F. | Allocation of Expenses |
Expenses directly attributable to a Fund are charged to that Fund. Expenses not directly attributable to a Fund are allocated proportionally among all Funds within the Trust in relation to the net assets of each Fund or on another reasonable basis. The Trust may share expenses with The Mutual Fund & Variable Insurance Trust, another open-end management investment company managed by Rational Advisors, Inc. (the “Advisor”). Those expenses that are shared are allocated proportionally among each of the Trusts or on another reasonable basis.
| (3) | Investment Advisory and Other Contractual Services |
| A. | Investment Advisory Fees |
The Advisor, a wholly-owned subsidiary of Rational Capital LLC, serves as the Funds’ investment advisor. The Advisor is under common control with Catalyst Capital Advisors LLC and AlphaCentric Advisors LLC, the investment advisors of other funds in the same group of investment companies also known as a “fund complex”. The US Market Rotation Strategy ETF (HUSE), EcoLogical Strategy ETF (HECO), and Strategy Shares Nasdaq 7 Handl Index ETF (HNDL) each pay 0.60% of each Fund’s average daily net assets, computed daily and paid monthly, for the advisory services each receives from the Advisor. For the US Market Rotation Strategy ETF (HUSE), the Advisor then pays the Sub-Advisor 65% of the net management fees it receives from the Fund. The Sub-Advisor to the US Market Rotation Strategy ETF (HUSE) is Tuttle Tactical Management, LLC.
The Advisor has contractually agreed to reduce its fees and/or reimburse the expenses for US Market Rotation Strategy ETF (HUSE), EcoLogical Strategy ETF (HECO), and Strategy Shares Nasdaq 7 Handl Index ETF (HNDL) (excluding interest, taxes and dividends, brokerage commissions, acquired fund fees and expenses, and extraordinary expenses) in order to limit total annual fund operating expenses after fee waivers and expense reimbursement to 0.95% of each Fund’s average annual daily net assets (“Expense Cap”). For the US Market Rotation Strategy ETF (HUSE), EcoLogical Strategy ETF (HECO), and Strategy Shares Nasdaq 7 Handl Index ETF (HNDL), the Expense Cap will remain in effect until at least August 31, 2018. The Expense Cap may be terminated earlier only upon the approval of the Board. The Advisor may recoup fees reduced or expenses reimbursed at any time within three years from the date such expenses were incurred, so long as the repayment does not cause the Expense Cap in place at the time of waiver or reimbursement, or in place at the time of recoupment to be exceeded.
As of April 30, 2018, the Advisor may recoup amounts from the Funds as follows:
| Expires | Expires | Expires | ||||||||||||||
| 4/30/19 | 4/30/20 | �� | 4/30/21 | Total | ||||||||||||
| US Market Rotation Strategy ETF (HUSE) | $ | 156,693 | $ | 138,423 | $ | — | $ | 295,116 | ||||||||
| EcoLogical Strategy ETF (HECO) | 186,178 | 129,844 | 116,210 | 432,232 | ||||||||||||
| Strategy Shares Nasdaq 7 Handl Index ETF (HNDL) | — | — | 55,481 | 55,481 | ||||||||||||
| B. | Administration, Transfer Agent and Accounting Fees |
Citi Fund Services Ohio, Inc. (“Citi”) provides financial administration, transfer agency and portfolio accounting services to the Trust. Citi performs certain services on behalf of the Trust including but not limited to: (1) preparing and filing the Trust’s periodic financial reports on forms prescribed by the Securities and Exchange Commission (“SEC”); (2) calculating Fund expenses and making required disbursements; (3) calculating Fund performance data; and (4) providing certain compliance support services. As transfer agent, Citi issues shares of a Fund in Creation Units to fill purchase orders for Fund shares, maintains records of the issuance and redemption of each Fund’s shares, and acts as each Fund’s dividend disbursing agent. As portfolio accountant, Citi maintains certain financial records of the Trust and provides accounting services to each Fund which include the daily calculation of each Fund’s NAV. Citi also performs certain other services on behalf of the Trust including providing financial information for the Trust’s federal and state tax returns and financial reports required to be filed with the SEC.
18 | Annual Shareholder Report
Notes to Financial Statements (Continued)
For these services, each Fund pays Citi a fee accrued daily and paid monthly based on a percentage of each Fund’s average net assets, subject to a minimum annual fee. The fees are as follows:
| - | 0.040% of the first $500 million in aggregate net assets of the Funds; |
| - | 0.035% of the aggregate net assets of the next $500 million; and |
| - | 0.020% of the aggregate net assets in excess of $1 billion |
The asset-based fees are subject to an annual minimum, allocated among the Funds, equal to the number of Funds multiplied by $52,122. Effective January 1, 2018, this fee increased from $51,150.
MFund Services LLC (“MFund”), an affiliate of the Advisor, provides the Funds with various management and legal administrative services. For these services, each Fund pays MFund a fee accrued daily and paid monthly based on a percentage of each Fund’s average net assets, subject to a minimum annual fee. The fees are as follows:
| - | 0.030% of the aggregate net assets from $0 to $1,000,000,000; and |
| - | 0.020% of the aggregate net assets from $1,000,000,000 and above |
The asset-based fees are subject to an annual minimum of $30,000 per Fund. In addition, the Funds reimburse MFund for any reasonable out-of-pocket expenses incurred in the performance of its duties.
| C. | Distribution and Shareholder Services Fees |
Foreside Fund Services, LLC (the “Distributor”) is the principal underwriter and distributor of each Fund’s Shares. The Distributor is compensated by the Advisor in accordance with a Distribution Services Agreement between the Advisor and the Distributor. The Trust has adopted but has yet to implement a Rule 12b-1 Distribution Plan (the “Plan”). The Plan is designed to compensate or reimburse financial intermediaries (including the Distributor, the Advisor, and their affiliates) for activities principally intended to result in the sale of Fund shares, such as advertising and marketing of shares (including printing and disseminating prospectuses and sales literature to prospective shareholders and financial intermediaries) and providing incentives to financial intermediaries to sell shares. The Plan is also designed to cover the cost of administrative services performed in conjunction with the sale of shares, including, but not limited to, shareholder services, recordkeeping services and educational services, as well as the costs of implementing and operating the Plan. In accordance with the Plan, the Distributor may enter into agreements with financial intermediaries and dealers relating to distribution and/or marketing services with respect to the Funds. Pursuant to the Plan, the Funds may pay a 12b-1 fee not to exceed 0.25% per year of each Fund’s average daily net assets. No 12b-1 fee is currently paid by the Funds and the Board has not approved any payments under the Plan.
| D. | Custodian Fees |
Citibank, N.A. (the “Custodian”), an affiliate of Citi, serves as custodian for each Fund and safeguards and holds each Fund’s cash and securities, settles each Fund’s securities transactions and collects income on Fund investments. The Custodian receives fees based on the level of each Fund’s average daily net assets for the period plus out-of-pocket expenses.
| E. | Compliance Services |
Pursuant to a Compliance Services Agreement, MFund provides chief compliance officer services to the Funds. The Funds pay MFund a monthly fee plus an asset-based fee. In addition, the Funds reimburse MFund for any reasonable out-of-pocket expenses incurred in the performance of its duties under the Compliance Services Agreement.
| F. | General |
Certain officers of the Trust are officers, directors and/or trustees of the above companies.
During the period ended April 30, 2018, the EcoLogical Strategy ETF (HECO) paid $469 to Citi Global Markets, Inc., which is considered a broker/dealer affiliate due to its status as an Authorized Participant for the Funds, on the execution of purchases and sales of the Funds’ portfolio investments.
For the Strategy Shares Nasdaq 7 Handl Index ETF (HNDL), the Advisor paid all organizational and offering costs for the Fund.
| (4) | Investment Transactions |
Purchases and sales of investments, excluding in-kind transactions and short-term investments, for the fiscal year or period ended April 30, 2018 were as follows:
| Purchases | Sales | |||||||
| US Market Rotation Strategy ETF (HUSE) | $ | 1,008,111,763 | $ | 1,016,157,037 | ||||
| EcoLogical Strategy ETF (HECO) | 1,334,386 | 1,706,821 | ||||||
| Strategy Shares Nasdaq 7 Handl Index ETF (HNDL) | 511,676 | 870,654 | ||||||
Purchases and sales of in-kind transactions for the fiscal year or period ended April 30, 2018 were as follows:
| Purchases | Sales | |||||||
| US Market Rotation Strategy ETF (HUSE) | $ | 66,447,176 | $ | — | ||||
| EcoLogical Strategy ETF (HECO) | — | — | ||||||
| Strategy Shares Nasdaq 7 Handl Index ETF (HNDL) | 3,939,897 | 561,418 | ||||||
| (5) | Capital Share Transactions |
Shares are issued and redeemed by each Fund only in aggregations of a specified number of shares or multiples thereof (“Creation Units”) at net asset value. Except when aggregated in Creation Units, shares of each Fund are not redeemable. Transactions in shares for each Fund are disclosed in detail on the Statements of Changes in Net Assets.
The consideration for the purchase of Creation Units of a Fund generally consists of the in-kind deposit of a designated basket of securities, which constitutes an optimized representation of the securities of that Fund’s specified universe, and an amount of cash. Investors purchasing and redeeming Creation Units may be charged a transaction fee to cover the transfer and other transactional costs it incurs to issue or redeem Creation Units. The standard charge and maximum transaction fee for each Fund are $250 and $1,000, respectively.
From time to time, settlement of securities related to subscriptions-in-kind or redemptions-in-kind may be delayed. In such cases, securities related to in-kind contributions are reflected as “Due from custodian” and securities related to in-kind redemptions are reflected as “Securities payable related to in-kind transactions” on the Statements of Assets and Liabilities.
During the fiscal year or period ended April 30, 2018, the Funds received securities in exchange for subscriptions of capital shares (subscriptions-in-kind) as follows:
| Fair Value | ||||
| US Market Rotation Strategy ETF (HUSE) | $ | 66,447,176 | ||
| EcoLogical Strategy ETF (HECO) | — | |||
| Strategy Shares Nasdaq 7 Handl Index ETF (HNDL) | 3,939,897 | |||
Annual Shareholder Report | 19
Notes to Financial Statements (Continued)
| (6) | Federal Income Taxes |
It is the policy of each Fund to qualify or continue to qualify as a regulated investment company by complying with the provisions available to certain investment companies, as defined in applicable sections of the Internal Revenue Code, and to make distributions of net investment income and net realized capital gains sufficient to relieve it from all, or substantially all, federal income taxes.
The Trust has evaluated tax positions taken or expected to be taken in the course of preparing each Fund’s tax returns to determine whether it is more likely than not (i.e., greater than 50-percent chance) that each tax position will be sustained upon examination by a taxing authority based on the technical merits of the position. A tax position that meets
the more likely than not recognition threshold is measured to determine the amount of benefit to recognize in the financial statements. Differences between tax positions taken in a tax return and amounts recognized in the financial statements will generally result in an increase in a liability for taxes payable (or a reduction of a tax refund receivable), including the recognition of any related interest and penalties as an operating expense. Tax positions taken in tax years remain subject to examination by tax authorities (generally three years plus the interim tax period since then for federal income tax purposes). The determination has been made that there are not any uncertain tax positions that would require the Funds to record a tax liability and, therefore, there is no impact to the Funds’ financial statements.
As of April 30, 2018, the tax cost of securities and the breakdown of unrealized appreciation (depreciation) for each Fund were as follows:
| Net Unrealized | ||||||||||||||||
| Tax Cost of | Unrealized | Unrealized | Appreciation/ | |||||||||||||
| Securities | Appreciation | Depreciation | (Depreciation) | |||||||||||||
| US Market Rotation Strategy ETF (HUSE) | $ | 81,032,005 | $ | 1,287,851 | $ | (5,872,232 | ) | $ | (4,584,381 | ) | ||||||
| EcoLogical Strategy ETF (HECO) | 6,361,806 | 1,981,606 | (127,999 | ) | 1,853,607 | |||||||||||
| Strategy Shares Nasdaq 7 Handl Index ETF (HNDL) | 3,009,311 | 2,477 | (82,061 | ) | (79,584 | ) | ||||||||||
The differences between book-basis and tax-basis unrealized appreciation/depreciation is attributable primarily to basis adjustments for investments in partnerships, wash sales, capital loss carryforward, swap mark-to-market, and return of capital basis adjustments.
The tax character of distributions paid during the fiscal year or period ended April 30, 2018 was as follows:
| Distributions paid from | ||||||||||||||||||||
| Ordinary | Net Long Term | Total Taxable | Return | Total | ||||||||||||||||
| Income | Capital Gains | Distributions | of Capital | Distributions Paid | ||||||||||||||||
| US Market Rotation Strategy ETF (HUSE) | $ | 4,768,271 | $ | — | $ | 4,768,271 | — | $ | 4,768,271 | |||||||||||
| EcoLogical Strategy ETF (HECO) | 477,859 | 13,893 | 491,752 | — | 491,752 | |||||||||||||||
| Strategy Shares Nasdaq 7 Handl Index ETF (HNDL) | — | — | — | 63,691 | 63,691 | |||||||||||||||
The tax character of distributions paid during the fiscal year ended April 30, 2017 was as follows:
| Distributions paid from | ||||||||||||||||
| Ordinary | Net Long Term | Total Taxable | Total | |||||||||||||
| Income | Capital Gains | Distributions | Distributions Paid | |||||||||||||
| US Market Rotation Strategy ETF (HUSE) | $ | 287,699 | $ | 681,294 | $ | 968,993 | $ | 968,993 | ||||||||
| EcoLogical Strategy ETF (HECO) | 63,460 | 578,807 | 642,267 | 642,267 | ||||||||||||
Strategy Shares Nasdaq 7 Handl Index ETF (HNDL) did not have any distributions during the period ended April 30, 2017, as the Fund had not commenced operations.
As of April 30, 2018, the components of accumulated earnings/(deficit) on a tax basis were as follows:
| Undistributed | Undistributed | Accumulated | Unrealized | Total | ||||||||||||||||||||
| Ordinary | Long Term | Accumulated | Capital and | Appreciation | Accumulated | |||||||||||||||||||
| Income | Capital Gains | Earnings | Other Losses | (Depreciation) | Earnings (Deficit) | |||||||||||||||||||
| US Market Rotation Strategy ETF (HUSE) | $ | 6,097,326 | $ | — | $ | 6,097,326 | $ | — | $ | (4,584,381 | ) | $ | 1,512,945 | |||||||||||
| EcoLogical Strategy ETF (HECO) | 90,935 | 232,457 | 323,392 | — | 1,853,607 | 2,176,999 | ||||||||||||||||||
| Strategy Shares Nasdaq 7 Handl Index ETF (HNDL) | — | — | — | (11,029 | ) | (79,584 | ) | (90,613 | ) | |||||||||||||||
Permanent Tax Differences:
As of April 30, 2018, the following reclassifications relating primarily to net operating loss, distribution re-designations, partnership basis, capital gains from REITs, ordinary loss netting to reduce short-term capital gain, organizational cost, redemptions in-kind, and total return swap reclassifications have been made to increase (decrease) such accounts with offsetting adjustments as indicated.
| Accumulated Undistributed | Accumulated Net Realized | Paid in | ||||||||||
| Net Investment Income (Loss) | Gains (Losses) On Investments | Capital | ||||||||||
| US Market Rotation Strategy ETF (HUSE) | $ | 18,649 | $ | (18,650 | ) | $ | 1 | |||||
| EcoLogical Strategy ETF (HECO) | (5,168 | ) | 5,168 | — | ||||||||
| Strategy Shares Nasdaq 7 Handl Index ETF (HNDL) | (20,692 | ) | 44,114 | (23,422 | ) | |||||||
20 | Annual Shareholder Report
Notes to Financial Statements (Continued)
As of the period ended April 30, 2018, the following Fund has a net capital loss carryforward (“CLCF”) as summarized in the table below. This CLCF is not subject to expiration:
| Short-Term Amount | Total | |
| Strategy Shares Nasdaq 7 Handl Index ETF (HNDL) | $11,029 | $11,029 |
| (7) | Investment Risks |
ETF Risk
The NAV of a Fund can fluctuate up or down, and you could lose money investing in a Fund if the prices of the securities owned by the Fund decline. In addition, a Fund may be subject to the following risks: (1) the market price of a Fund’s shares may trade above or below their NAV; (2) an active trading market for a Fund’s shares may not develop or be maintained; or (3) trading of a Fund’s shares may be halted if the listing exchange’s officials deem such action appropriate, the shares are delisted from the exchange, or the activation of market-wide “circuit breakers” (which are tied to large decreases in stock prices) halts stock trading generally.
EcoLogical Investment Risk
The EcoLogical Strategy ETF’s (HECO) ecological investment criteria could cause it to underperform funds that do not maintain ecological investment criteria. In order to comply with its ecological investment criteria, the EcoLogical Strategy ETF (HECO) may be required to forego advantageous investment opportunities or sell investments at inappropriate times. The EcoLogical Strategy ETF’s (HECO) ecological investment criteria may result in the EcoLogical Strategy ETF (HECO) investing in industry sectors that are not performing as well as others.
| (8) | Subsequent Events |
Management of the Funds has evaluated the need for disclosures and/ or adjustments resulting from subsequent events through the date these financial statements were issued. Based upon this evaluation, no additional disclosures or adjustments were required to the financial statements as of April 30, 2018.
On or about July 1, 2018, Tuttle Tactical Management will become Subadvisor to the EcoLogical Strategy ETF (HECO).
Annual Shareholder Report | 21

REPORT OF INDEPENDENT REGISTERED PUBLIC ACCOUNTING FIRM
To the Shareholders of US Market Rotation Strategy ETF, EcoLogical Strategy ETF, and Strategy Shares NASDAQ
7HANDL™ Index ETF and Board of Trustees of
Strategy Shares
Opinion on the Financial Statements
We have audited the accompanying statements of assets and liabilities, including the portfolios of investments, of US Market Rotation Strategy ETF, EcoLogical Strategy ETF, and Strategy Shares NASDAQ 7HANDL™ Index ETF (the “Funds”), each a series of Strategy Shares, as of April 30, 2018, and the related statements of operations for the year then ended, the statements of changes in net assets for each of the two years in the period then ended, including the related notes, and the financial highlights for each of the three years in the period then ended, for US Market Rotation Strategy ETF and EcoLogical Strategy ETF, and the related statements of operations and changes in net assets, including the related notes, and the financial highlights (collectively referred to as the “financial statements”) for the period January 16, 2018 (commencement of operations) to April 30, 2018, for Strategy Shares NASDAQ 7HANDL™ Index ETF. In our opinion, the financial statements present fairly, in all material respects, the financial position of each of the Funds as of April 30, 2018, the results of their operations, the changes in their net assets, and the financial highlights for each of the periods indicated above, in conformity with accounting principles generally accepted in the United States of America.
US Market Rotation Strategy ETF and EcoLogical Strategy ETF’s financial highlights for the years ended 2015 and prior, were audited by other auditors whose report dated June 26, 2015, expressed an unqualified opinion on those financial statements and financial highlights.
Basis for Opinion
These financial statements are the responsibility of the Funds’ management. Our responsibility is to express an opinion on the Funds’ financial statements based on our audits. We are a public accounting firm registered with the Public Company Accounting Oversight Board (United States) (“PCAOB”) and are required to be independent with respect to the Funds in accordance with the U.S. federal securities laws and the applicable rules and regulations of the Securities and Exchange Commission and the PCAOB.
We conducted our audits in accordance with the standards of the PCAOB. Those standards require that we plan and perform the audit to obtain reasonable assurance about whether the financial statements are free of material misstatement, whether due to error or fraud.
Our audits include performing procedures to assess the risks of material misstatement of the financial statements, whether due to error or fraud, and performing procedures that respond to those risks. Such procedures include examining, on a test basis, evidence regarding the amounts and disclosures in the financial statements and confirmation of securities owned as of April 30, 2018, by correspondence with the custodian and brokers or by other appropriate auditing procedures where replies from brokers were not received. Our audits also included evaluating the accounting principles used and significant estimates made by management, as well as evaluating the overall presentation of the financial statements. We believe that our audits provide a reasonable basis for our opinion.
We have served as the auditor of one or more investment companies with a related advisor since 2015.

COHEN & COMPANY, LTD.
Cleveland, Ohio
June 29, 2018
C O H E N & C O M P A N Y , L T D.
800.229.1099 | 866.818.4538 fax | cohencpa.com
Registered with the Public Company Accounting Oversight Board
| 22 | Annual Shareholder Report |
Additional Information
Additional Federal Income Tax Information (Unaudited)
For the fiscal year ended April 30, 2018, the following percentages of the total ordinary income distributions paid by the Funds qualify for the distributions received deduction available to corporate shareholders.
| Distributions Received Deduction | ||
| US Market Rotation Strategy ETF (HUSE) | 1.95% | |
| EcoLogical Strategy ETF (HECO) | 33.93% | |
| Strategy Shares Nasdaq 7 Handl Index ETF (HNDL) | —% |
For the fiscal year ended April 30, 2018, distributions paid by the Funds may be subject to a maximum tax rate of 15%, as provided by the Jobs and Growth Tax Relief Reconciliation Act of 2003. The Funds intend to designate the maximum amount allowable as taxed at a maximum rate of 15%. Complete information will be reported in conjunction with your 2018 Form 1099-DIV.
For the taxable year ended April 30, 2018, the percentages of Qualified Dividend Income are as follows:
| Qualified Dividend Income | ||
| US Market Rotation Strategy ETF (HUSE) | 0.65% | |
| EcoLogical Strategy ETF (HECO) | 38.04% | |
| Strategy Shares Nasdaq 7 Handl Index ETF (HNDL) | —% | |
| The Funds declared long-term distributions of realized gains as follows: | ||
| Long-Term Capital Gains | ||
| US Market Rotation Strategy ETF (HUSE) | $— | |
| EcoLogical Strategy ETF (HECO) | $13,893 | |
| Strategy Shares Nasdaq 7 Handl Index ETF (HNDL) | $— | |
| The Funds declared short-term distributions of realized gains as follows: | ||
| Short-Term Capital Gains | ||
| US Market Rotation Strategy ETF (HUSE) | $4,763,289 | |
| EcoLogical Strategy ETF (HECO) | $387,941 | |
| Strategy Shares Nasdaq 7 Handl Index ETF (HNDL) | $— |
| Annual Shareholder Report | 23 |
Additional Information (Continued)
Premium/Discount Information (Unaudited)
The charts below present information about differences between the per share net asset value (“NAV”) of each Fund and the market trading price of shares of each Fund. For these purposes, the “market price” is the composite close for Fund shares as of the close of trading on all exchanges where Fund shares are listed. The term “premium” is sometimes used to describe a market price in excess of NAV and the term “discount” is sometimes used to describe a market price below NAV. The charts present information about the size and frequency of premiums or discounts. As with other exchange-traded funds, the market price of Fund shares is typically slightly higher or lower than a Fund’s per share NAV. Factors that contribute to the differences between market price and NAV include the supply and demand for Fund shares and investors’ assessments of the underlying value of a Fund’s portfolio securities.
Differences between the closing times of U.S. and non-U.S. markets may contribute to differences between the NAV and market price of Fund shares. Many non-U.S. markets close prior to the close of the U.S. securities exchanges. Developments after the close of such markets as a result of ongoing price discovery may be reflected in a Fund’s market price but not in its NAV (or vice versa).
| US Market Rotation Strategy ETF (HUSE) | ||||||||
| Calendar Year ended December 31, 2017 | First Calendar Quarter ended March 31, 2018 | |||||||
| Premium/Discount Range | Number of Days | Percentage of Total Days | Number of Days | Percentage of Total Days | ||||
| Greater than 2.0% | 1 | 0.40 | — | — | ||||
| Greater than 1.5% and Less than 2.0% | — | — | — | — | ||||
| Greater than 1.0% and Less than 1.5% | — | — | — | — | ||||
| Greater than 0.5% and Less than 1.0% | 1 | 0.40 | — | — | ||||
| Between 0.5% and -0 5%. | 249 | 99.20 | 61 | 100 | ||||
| Less than -0.5% and Greater than -1.0% | — | — | — | — | ||||
| Less than -1.0% and Greater than -1.5% | — | — | — | — | ||||
| Less than -1.5% and Greater than -2.0% | — | — | — | — | ||||
| Less than -2.0% | — | — | — | — | ||||
| 251 | 100.00% | 61 | 100.00% | |||||
| EcoLogical Strategy ETF (HECO) | ||||||||
| Calendar Year ended December 31, 2017 | First Calendar Quarter ended March 31, 2018 | |||||||
| Premium/Discount Range | Number of Days | Percentage of Total Days | Number of Days | Percentage of Total Days | ||||
| Greater than 2.0% | — | — | 1 | 1.64 | ||||
| Greater than 1.5% and Less than 2.0% | — | — | 1 | 1.64 | ||||
| Greater than 1.0% and Less than 1.5% | 2 | 0.80 | 7 | 11.48 | ||||
| Greater than 0.5% and Less than 1.0% | 12 | 4.78 | 7 | 11.48 | ||||
| Between 0.5% and —0 5%. | 205 | 81.67 | 38 | 62.28 | ||||
| Less than —0.5% and Greater than —1.0% | 24 | 9.56 | 4 | 6.56 | ||||
| Less than —1.0% and Greater than —1.5% | 8 | 3.19 | 1 | 1.64 | ||||
| Less than —1.5% and Greater than —2.0% | — | — | — | — | ||||
| Less than —2.0% | — | — | 2 | 3.28 | ||||
| 251 | 100.00% | 61 | 100.00% | |||||
| Strategy Shares Nasdaq 7 Handl Index ETF (HNDL) | ||||
| First Calendar Quarter(a) | ended March 31, 2018 | |||
| Premium/Discount Range | Number of Days | Percentage of Total Days | ||
| Greater than 2.0% | — | — | ||
| Greater than 1.5% and Less than 2.0% | — | — | ||
| Greater than 1.0% and Less than 1.5% | 1 | 1.96 | ||
| Greater than 0.5% and Less than 1.0% | 6 | 11.76 | ||
| Between 0.5% and —0 5%. | 44 | 86.28 | ||
| Less than —0.5% and Greater than —1.0% | — | — | ||
| Less than —1.0% and Greater than —1.5% | — | — | ||
| Less than —1.5% and Greater than —2.0% | — | — | ||
| Less than —2.0% | — | — | ||
| 51 | 100.00% |
| (a) | For the period from the commencement of operations on January 16th, 2018. |
| 24 | Annual Shareholder Report |
Additional Information (Continued)
Renewal of Management Agreement with Rational Advisors, Inc. with respect to US Market Rotation Strategy ETF and EcoLogical Strategy ETF (Unaudited)
In connection with a regular meeting held on December 15, 2017, the Board of Trustees (the “Board” or the “Trustees”) of Strategy Shares (the “Trust”), including a majority of the Trustees who are not “interested persons” as that term is defined in the Investment Company Act of 1940, as amended, discussed the approval of the management agreement between the Trust and Rational Advisors, Inc. (the “Advisor” or “Rational”) (the “Advisory Agreement”), with respect to the US Market Rotation Strategy ETF and EcoLogical Strategy ETF.
The Trustees were assisted by legal counsel throughout the review process. The Trustees relied upon the advice of legal counsel and their own business judgment in determining the material factors to be considered in evaluating the Advisory Agreement and the weight to be given to each factor considered. The conclusions reached by the Trustees were based on a comprehensive evaluation of all of the information provided and were not the result of any one factor. Moreover, each Trustee may have afforded different weight to the various factors in reaching his conclusions with respect to the approval of the Advisory Agreement. In connection with their deliberations regarding the approval of the Advisory Agreement, the Trustees reviewed materials prepared by the Advisor. The Trustees reviewed Rational’s responses to a series of questions regarding, among other things, Rational’s services to be provided to the US Market Rotation Strategy ETF and EcoLogical Strategy ETF, comparative fee and expense information and Rational’s profitability from managing the US Market Rotation Strategy ETF and EcoLogical Strategy ETF (“Rational 15(c) Response”).
Nature, Extent, and Quality of Services. The Trustees reviewed Rational’s 15(c) Response, which provided an overview of the services provided by Rational, as well as information on the firm’s personnel and its compliance and regulatory record. The Trustees discussed the experience of Rational’s personnel and their satisfaction with Rational’s chief compliance officer. The Trustees noted their familiarity with Rational and its history of performance as advisor to Funds in the Trust. The Trustees discussed the nature of Rational’s operations and strength of its management team. After further discussion, the Trustees concluded that it was reasonable to expect that Rational will continue to provide a level of service consistent with the Board’s expectations.
Performance. The Trustees reviewed the performance of US Market Rotation Strategy ETF and EcoLogical Strategy ETF relative to a peer group and its respective Morningstar category for the one year, five year and since inception periods.
US Market Rotation Strategy ETF. The Board noted that the Fund had outperformed the Morningstar Tactical Allocation category but had underperformed the S&P 1500 Composite Index for each period reported. They further noted that the Fund underperformed the peer group for the one and since inception periods. The Board recalled its discussions with a representative of the Rational earlier in the Meeting regarding the performance of the Fund’s tactical strategy under recent market conditions and, after further discussion, concluded that the Fund’s performance was not unacceptable.
EcoLogical Strategy ETF. The Trustees acknowledged that the Fund outperformed its respective benchmarks and peer groups for each of the reporting periods except the Fund slightly underperformed the MSCI KLD 400 Social Index for the five-year and since inception periods. After discussion, the Trustees concluded that they were satisfied with the Fund’s performance.
Fees and Expenses
US Market Rotation Strategy ETF. The Trustees reviewed the advisory fees for the Fund, and the fees payable by the funds within the peer group and the Large Blend and Tactical Allocation Morningstar categories. The Board noted that the Fund’s advisory fee was below the average fees payable by funds in the peer group and Morningstar Tactical Allocation category and higher than the average fee of the funds within the Morningstar Large Blend category but within the high/low range of fees within the category. They also noted net expenses were within the high/low range of net expenses of the peer group and categories groups. After discussion, the Board determined that the Fund’s advisory fee was not unreasonable. The Trustees discussed the allocation of fees between Rational and the sub-advisor with respect to US Equity Rotation Strategy ETF relative to their duties and other factors, and agreed that the allocation of fees between the Advisor and the sub-advisor was appropriate. In considering the strategy, and noting the range in fees in each category, the size of the Funds, and in recognition of the unique strategies offered by many of the Funds, the Board determined that each advisory fee was not unreasonable.
EcoLogical Strategy ETF. The Trustees then reviewed the Fund’s advisory fee relative to the fees payable by the funds in the peer group and the Morningstar Miscellaneous Sector category. The Trustees considered that the Fund’s advisory fee was slightly higher than the averages of the peer group and Morningstar category and in the center of the high/low range of fees of each benchmark. They also noted net expenses were within the high/low range of net expenses of the peer group and category group.
| Annual Shareholder Report | 25 |
Additional Information (Continued)
Renewal of Management Agreement with Rational Advisors, Inc. with respect to US Market Rotation Strategy ETF and EcoLogical Strategy ETF (Unaudited) (Continued)
Profitability. The Trustees reviewed a profitability analysis for US Market Rotation Strategy ETF and EcoLogical Strategy ETF. They noted the advisor realized a loss in connection with its relationship with the Funds. The Trustees concluded that excessive profitability was not a concern at this time and that Rational’s access to additional capital provided a satisfactory financial cushion in spite of losses.
Economies of Scale. As to economies of scale, the Trustees noted that the Advisory Agreement did not contain breakpoints that reduce the fee rate on assets above specified levels but that the expense cap was benefitting shareholders. The Trustees agreed that breakpoints may be an appropriate way for Rational to share its economies of scale with the Funds and the shareholders if a Fund experiences a substantial growth in assets. However, the Trustees recognized that the US Market Rotation Strategy ETF and EcoLogical Strategy ETF had not yet reached asset levels where Rational could realize significant economies of scale and that the Board would revisit the matter of breakpoints at the next renewal of the Advisory Agreement.
Conclusion. Having requested and received such information from Rational as the Trustees believed to be reasonably necessary to evaluate the terms of the management agreement, and as assisted by the advice of counsel, the Trustees concluded that renewal of the Advisory Agreement was in the best interests of the US Market Rotation Strategy ETF and EcoLogical Strategy ETF and their shareholders.
| 26 | Annual Shareholder Report |
Additional Information (Continued)
Consideration and Approval of Management Agreement – Strategy Shares NASDAQ 7 HANDL™ Index ETF (Unaudited)
Management Agreement
In connection with a regular meeting held on August 25, 2017, the Board of Trustees (the “Board” or the “Trustees”) of Strategy Shares (the “Trust”), including a majority of the Trustees who are not “interested persons” as that term is defined in the Investment Company Act of 1940, as amended, discussed the approval of an advisory agreement between the Trust and Rational Advisors, Inc. (the “Advisor” or “Rational”) (the “Advisory Agreement” or “Management Agreement”), with respect to the Strategy Shares NASDAQ 7 HANDL™ Index ETF (the “7 HANDL™ Index ETF”).
The Trustees were assisted by legal counsel throughout the review process. The Trustees relied upon the advice of legal counsel and their own business judgment in determining the material factors to be considered in evaluating the Advisory Agreement and the weight to be given to each factor considered. The conclusions reached by the Trustees were based on a comprehensive evaluation of all of the information provided and were not the result of any one factor. Moreover, each Trustee may have afforded different weight to the various factors in reaching his conclusions with respect to the approval of the Advisory Agreement. In connection with their deliberations regarding the approval of the Advisory Agreement, the Trustees reviewed materials prepared by the Advisor. The Trustees reviewed Rational’s responses to a series of questions regarding, among other things, Rational’s services to be provided to the 7 HANDL™ Index ETF, comparative fee and expense information and Rational’s projected profitability from managing the 7 HANDL™ Index ETF (“Rational 15(c) Response”).
Nature, Extent and Quality of Services. The Trustees reviewed the Rational 15(c) Response, which provided an overview of the services provided by Rational, as well as information on the firm’s personnel and its compliance and litigation record. The Trustees discussed the background and experience of Rational’s key personnel expected to service the Fund. The Trustees then discussed the nature of Rational’s operations and the quality of its compliance infrastructure. After further discussion and review of the Rational 15(c) Response, the Trustees concluded that Rational could be reasonably expected to provide an acceptable level of service.
Performance. The Trustees could not consider the performance of the New Fund as it had not yet commenced operations. The Board then discussed the performance of other Funds advised by Rational and their experience with the adviser as an adviser to the other Funds in the Trust, and the Trustees concluded that there is a reasonable basis to believe that Rational will achieve positive returns for shareholders of the 7 HANDL™ Index ETF based on the qualifications of Rational’s management team.
Fees and Expenses. The Trustees compared the 7 HANDL™ Index ETF proposed management fee of 0.60% of daily net assets, to the average fees and expenses for funds in the peer group and Morningstar Allocation category. The Trustees noted that the proposed management fee for the 7 HANDL™ Index ETF is lower than the average management fee for the funds in the peer group and the Morningstar category. The Board also discussed that, while the peer group included both active (which typically have higher advisory fees than passive ETFs) and passive ETFs, the proposed management fee for the 7 HANDL™ Index ETF was still lower than all but one of the passive funds in the peer group. The Board further noted that the net expenses of the 7 HANDL™ Index ETF’s shares (after waivers/ reimbursements) was in-line with the average net expenses of the peer group funds and lower than the average net expenses of the funds in the Morningstar category. After further discussion, the Trustees concluded that the advisory fee is not unreasonable.
Profitability. The Trustees reviewed the profitability analysis provided by the Advisor and noted that Rational anticipates accruing a net loss in connection with its relationship with the 7 HANDL™ Index ETF during the initial 24-months of the Management Agreement. After discussion, based on estimated projections for the foreseeable future, the Trustees agreed that excessive profitability was not a concern at this time.
Economies of Scale. The Trustees noted that the Management Agreement does not contain breakpoints that reduce the fee rate on assets above specific levels. The Independent Trustees agreed that breakpoints may be an appropriate way for Rational to share its economies of scale with the 7 HANDL™ Index ETF and its shareholders if the 7 HANDL™ Index ETF experienced a substantial growth in assets. The Board discussed Rational’s expectations for growth of the 7 HANDL™ Index ETF and concluded that any material economies of scale would not be achieved in the near term.
Conclusion. Having requested and received such information from the Advisor as the Trustees believed to be reasonably necessary to evaluate the terms of the Management Agreement, and as assisted by the advice of legal counsel, the Trustees concluded that the approval of the Management Agreement is in the best interests of the shareholders of the 7 HANDL™ Index ETF.
| Annual Shareholder Report | 27 |
Additional Information (Continued)
Renewal of Sub-Advisory Agreement between Rational Advisors, Inc. (the “Advisor”) and Tuttle Tactical Management, LLC (the “Sub-Advisor”) with respect to US Market Rotation Strategy ETF (Unaudited)
In connection with a regular meeting held on February 26, 2018, the Board of the Trust, including a majority of the Trustees who are not “interested persons” as that term is defined in the Investment Company Act of 1940, as amended, discussed the approval of a sub-advisory agreement between the Advisor and Sub-Advisor (the “Sub-Advisory Agreement”), with respect to the US Market Rotation Strategy ETF.
The Trustees were assisted by legal counsel throughout the review process. The Trustees relied upon the advice of legal counsel and their own business judgment in determining the material factors to be considered in evaluating the Sub-Advisory Agreement and the weight to be given to each factor considered. The conclusions reached by the Trustees were based on a comprehensive evaluation of all of the information provided and were not the result of any one factor. Moreover, each Trustee may have afforded different weight to the various factors in reaching his conclusions with respect to the approval of the Sub-Advisory Agreement. In connection with their deliberations regarding renewal of the Sub-Advisory Agreement, the Trustees reviewed materials prepared by the Sub-Adviser (“TTM’s 15c Response”).
Nature, Extent and Quality of Services. The Trustees reviewed TTM’s 15c Response, and considered the firm’s commitment to risk mitigation. The Trust’s CCO confirmed there were no material compliance issues related to the Fund. The Trustees considered the working relationship between the Advisor and Sub-Advisor, and the quality of the portfolio management resources. After discussion, the Trustees concluded that the Sub-Advisor had sufficient quality and depth of personnel, resources, investment methods and compliance policies and procedures essential to performing its duties under the Sub-Advisory Agreement and that the nature, overall quality and extent of the management services provided by the Sub-Advisor were satisfactory.
Performance. The Trustees noted that for the one year and since inception periods ended December 31, 2017, the Fund underperformed its benchmark, the S&P Composite 1500 Index, but outperformed Morningstar’s Tactical Category. The Board discussed the tactical component of the Fund’s investment strategy. They noted that the Fund’s performance should be compared to the performance of other tactical funds that are not always fully invested and agreed that that the Morningstar Tactical Category is a more appropriate benchmark by which to judge the Fund’s performance. The Trustees concluded that the Fund’s overall performance was acceptable.
Fees and Expenses. The Trustees noted the Sub-Advisor receives 65% of the net management fee (with a maximum fee of 0.39%) in connection with its relationship with the Fund, noting that this fee is less than the fees charges by the Sub-Advisor to its other clients. After further discussion, the Trustees concluded that the sub-advisory fee was not unreasonable. The Trustees discussed the allocation of fees between the Advisor and the Sub-Advisor relative to its respective duties and other factors, and agreed that the allocation of fees between the Advisor and the Sub-Advisor was appropriate.
Profitability. The Trustees reviewed a profitability analysis provided by the Sub-Advisor and considered whether the level of profit was excessive. They noted that the Sub-Advisor realized a net loss in connection with its relationship with the Fund, and agreed that excessive profitability was not a concern at this time.
Economies of Scale. The Trustees considered whether the Sub-Advisor had realized economies of scale with respect to the management of the Fund. The Trustees agreed that this was primarily an advisor level issue and should be considered with respect to the overall advisory contract, taking into consideration the impact of the sub-advisory expense.
Conclusion. Having requested and received such information from the Sub-Advisor as the Trustees believed to be reasonably necessary to evaluate the terms of the Sub-Advisory Agreement, and as assisted by the advice of legal counsel, the Trustees concluded that the renewal of the Sub-Advisory Agreement was in the best interests of the shareholders of the Fund.
| 28 | Annual Shareholder Report |
Board of Trustees and Trust Officers (Unaudited)
The following tables provide information about Board of Trustees and the senior officers of the Trust. Each of the Trustees is deemed to be an Independent Trustee of the Trust. Each Trustee oversees all portfolios of the Trust and serves for an indefinite term (subject to mandatory retirement provisions). Information about each Trustee is provided below and includes each person’s: name, address, year of birth, present position(s) held with the Trust, and principal occupations for the past five years. Unless otherwise noted, each officer is elected annually by the Board. Each Trustee and officer also serves in the same capacity for Mutual Fund and Variable Insurance Trust, another open-end investment company whose series are managed by the Advisor. Collectively, the Trust, Mutual Fund and Variable Insurance Trust, Mutual Fund Series Trust, Variable Insurance Trust and the TCG Financial Series Trusts I-X comprise the “Fund Complex” as of April 30, 2018.
Independent Trustees Background
| Name, Address and Year of Birth | Position with the Trust | Term of Office and Length of Time Served* | Principal Occupation(s) During Past 5 Years | Number of Portfolios in Fund Complex** Overseen by Trustee | Other Directorships Held by Trustee |
| Tobias Caldwell 36 N. New York Avenue Huntington, NY 11743 Year of Birth: 1968 | Chairman of the Board and Trustee | Since 1/2016 | Managing member, Bear Properties, LLC (2006 – present) (real estate firm); Managing member, PTL Real Estate, LLC (2000 – present) (real estate/investment firm); Managing member, Genovese Family Enterprises, LLC (1999 – present) (real estate firm). | 51 | Chairman of the Board of Trustees, Mutual Fund and Variable Insurance Trust (1/2016 – present); Lead Independent Trustee and Chairman of Audit Committee, Mutual Fund Series Trust (2006 – present), Trustee, M3Sixty Funds Trust (2016 – present). |
| Stephen P. Lachenauer 36 N. New York Avenue Huntington, NY 11743 Year of Birth: 1968 | Trustee and Audit Committee Chairman | Since 1/2016 | Attorney, private practice (2006 – present). | 14 | Chair of the Audit Committee and Board Member, Mutual Fund and Variable Insurance Trust (1/2016 – present); Chairman of the Board, TCG Financial Series Trusts I-X (2015 – present). |
| Donald McIntosh 36 N. New York Avenue Huntington, NY 11743 Year of Birth: 1969 | Trustee | Since 1/2016 | Credit risk review analyst, Santander Holdings USA (May 2015 – present); Governance analyst, Santander Bank (2011 – April 2015). | 14 | Board Member, Mutual Fund and Variable Insurance Trust (January 2016 – present); Trustee, TCG Financial Series Trusts I-X (2015 – present). |
| * | The term of office of each Trustee is indefinite. |
| ** | The “Fund Complex” includes the Trust, Mutual Fund and Variable Insurance Trust, Mutual Fund Series Trust and the TCG Financial Services Trusts I-X, each a registered open-end investment company. |
Officers*
| Name, Address and Year of Birth | Position with the Trust | Term of Office and Length of Time Served | Principal Occupation(s) During Past 5 Years |
| Jerry Szilagyi 36 N. New York Avenue Huntington, NY 11743 Year of Birth: 1962 | President and Chief Executive Officer | Since 3/2016 | President, Rational Advisors, Inc., (1/2016 – present); Chief Executive Officer, Catalyst Capital Advisors LLC, (1/2006 – present); Member, AlphaCentric Advisors LLC, (2/2014 – present); Chief Executive Officer, Alt Fund Distributors LLC, (12/2014 – present); Managing Member, MFund Distributors LLC, (10/2012 – present); Managing Member, MFund Services LLC, (1/2012 – present); President, Abbington Capital Group LLC, (1998 – present); President, Cross Sound Capital LLC, (6/2011 – 10/2013); President, USA Mutuals, Inc., (3/2011 – 7/2016). |
| James Szilagyi 36 N. New York Avenue Huntington, NY 11743 Year of Birth: 1963 | Treasurer | Since 3/2016 | Product Manager, Catalyst Capital Advisors LLC, (9/2015 – present); Senior Business Consultant, Fidelity Information Services, (2011 – 9/2015). |
| Frederick J. Schmidt 36 N. New York Avenue Huntington, NY 11743 Year of Birth: 1959 | Chief Compliance Officer | Since 3/2016 | Director, MFund Services LLC (since 5/2015); Director & Chief Compliance Officer, Citi Fund Services, (2010 – 2015); Senior Vice-President & Chief Compliance Officer, Citi Fund Services, (2004 – 2010). |
| Jennifer A. Bailey 36 N. New York Avenue Huntington, NY 11743 Year of Birth: 1968 | Secretary | Since 3/2016 | Director of Legal Services, MFund Services LLC, (2/2012 – present) |
| * | Officers do not receive any compensation from the Trust |
The Funds’ Statement of Additional Information (“SAI”) includes additional information about the trustees and is available without charge, upon request. You may call toll-free at 855-477-3837 to request a copy of the SAI or to make shareholder inquiries.
| Annual Shareholder Report | 29 |
[THIS PAGE INTENTIONALLY LEFT BLANK]
strategyshares
VOTING PROXIES ON FUND PORTFOLIO SECURITIES
A copy of the policies and procedures that the Funds use to determine how to vote proxies relating to securities held in the Funds’ portfolios, as well as a record of how the Funds voted any such proxies during the most recent 12-month period ended June 30, is available without charge and upon request by calling 1-855-HSS-ETFS or 1-855-477-3837 or at www.strategysharesetfs.com. This information is also available from the EDGAR database on the SEC’s website at www.sec.gov.
QUARTERLY PORTFOLIO SCHEDULE
The Funds file with the SEC a complete schedule of their portfolio holdings, as of the close of the first and third quarters of their fiscal year, on Form N-Q. These filings are available on the SEC’s website at www. sec.gov and may be reviewed and copied at the SEC’s Public Reference Room in Washington, DC. (call 1-202-551-8090 for information on the operation of the Public Reference Room.) You may also access this information at www.strategysharesetfs.com by selecting “Form N-Q”.
Rational Advisors, Inc. is the Investment Advisor of Strategy Shares. Rational Advisors, Inc. maintains corporate records of the Funds. Foreside Fund Services, LLC is the principal underwriter and distributor of each Fund’s shares.
Exchange-traded funds are not bank deposits or obligations, are not guaranteed by any bank, and are not insured or guaranteed by the U.S. government, the Federal Deposit Insurance Corporation, the Federal Reserve Board, or any other government agency. Investment in exchange-traded funds involves investment risk, including the possible loss of principal.
This report is authorized for distribution to prospective investors only when preceded or accompanied by a prospectus which contains facts concerning the Funds’ objectives and policies, management fees, expenses and other information.
| Cusip 86280R100 | Cusip 86280R209 | Cusip 86280R506 |
Strategy Shares Shareholder Services: 1-855-477-3837
strategyshares
Annual Shareholder Report
Active Alts Contrarian ETF (SQZZ)
A P R I L 3 0 , 2 0 1 8
PRIVACY NOTICE
Strategy Shares
Rev. July 2017
| FACTS | WHAT DOES STRATEGY SHARES DO WITH YOUR PERSONAL INFORMATION? |
| Why? | Financial companies choose how they share your personal information. Federal law gives consumers the right to limit some, but not all sharing. Federal law also requires us to tell you how we collect, share, and protect your personal information. Please read this notice carefully to understand what we do. |
| What? | The types of personal information we collect and share depends on the product or service that you have with us. This information can include:
● Social Security number and income
● Account balances and transaction history
● Information about your investment goals and risk tolerances
When you are no longer our customer, we continue to share your information as described in this notice. |
| How? | All financial companies need to share customers’ personal information to run their everyday business. In the section below, we list the reasons financial companies can share their customers’ personal information; the reasons Strategy Shares chooses to share; and whether you can limit this sharing. |
| Reasons we can share your personal information: | Does Strategy Shares share information? | Can you limit this sharing? |
| For our everyday business purposes - such as to process your transactions, maintain your account(s), respond to court orders and legal investigations, or report to credit bureaus. | YES | NO |
| For our marketing purposes - to offer our products and services to you. | NO | We don’t share |
| For joint marketing with other financial companies. | NO | We don’t share |
| For our affiliates’ everyday business purposes - information about your transactions and records. | NO | We don’t share |
| For our affiliates’ everyday business purposes - information about your credit worthiness. | NO | We don’t share |
| For our affiliates to market to you | NO | We don’t share |
| For non-affiliates to market to you | NO | We don’t share |
| QUESTIONS? | Call 1-855-477-3837 |
PRIVACY NOTICE
Strategy Shares
| What we do: | |
How does Strategy Shares protect my personal information? | To protect your personal information from unauthorized access and use, we use security measures that comply with federal law. These measures include computer safeguards and secured files and buildings.
Our service providers are held accountable for adhering to strict policies and procedures to prevent any misuse of your nonpublic personal information. |
How does Strategy Shares collect my personal information? | We collect your personal information, for example, when you: ● open an account or deposit money
● direct us to buy securities or direct us to sell your securities
● seek advice about your investments
We also collect your personal information from others, such as credit bureaus, affiliates, or other companies. |
Why can’t I limit all sharing? | Federal law gives you the right to limit only: ● sharing for affiliates’ everyday business purposes – information about your creditworthiness.
● affiliates from using your information to market to you.
● sharing for non-affiliates to market to you.
State laws and individual companies may give you additional rights to limit sharing. |
| Definitions | |
| Affiliates | Companies related by common ownership or control. They can be financial and non-financial companies.
● Strategy Shares has no affiliates. |
| Non-affiliates | Companies not related by common ownership or control. They can be financial and non-financial companies.
● Strategy Shares doesn’t share with non-affiliates so they can market to you. |
| Joint marketing | A formal agreement between nonaffiliated financial companies that together market financial products or services to you. �� ● Strategy Shares doesn’t jointly market. |
strategyshares
| TABLE OF CONTENTS | Page |
| Management’s Discussion of Fund Performance | 1 |
| Expense Examples | 3 |
| Portfolio of Investments | 4 |
| Statement of Assets and Liabilities | 5 |
| Statement of Operations | 6 |
| Statements of Changes in Net Assets | 7 |
| Financial Highlights | 8 |
| Notes to Financial Statements | 10 |
| Report of Independent Registered Public Accounting Firm | 14 |
| Additional Information | 15 |
| Board of Trustees and Trust Officers | 16 |
[THIS PAGE INTENTIONALLY LEFT BLANK]
| Active Alts Contrarian ETF (SQZZ) (Unaudited) | April 30, 2018 |
Management’s Discussion of Fund Performance
Dear Shareholder:
The Active Alts Contrarian ETF (SQZZ) seeks current income and capital appreciation by implementing a proprietary investment process to identify equities that the Sub-Adviser believes have a higher potential for capital appreciation as a result of a short squeeze. The process for identifying short squeeze opportunities involves analysis of both fundamental factors and technical factors.
In general, the Fund will acquire positions that the Sub-Adviser believes, based on its analysis of markets, companies and sectors, offer substantial potential for capital appreciation or the opportunity for income. To the extent the Sub-Adviser has not identified equities suitable for investment, the Fund will be invested in cash or cash equivalents, such as money market funds, and at times the Fund’s investment in such investments may be significant. The Fund’s equity securities allocation and cash and cash equivalents allocations may range from 0% to 100% of the Fund’s portfolio, depending on the Sub-Adviser’s current assessment of market value and risk.
For the fiscal year ended April 30, 2018, SQZZ generated a positive return of 1.52% at net asset value and 1.60% at market value. During this same period, the Russell 2000 Index returned 11.54%.
The Fund underperformed the strong return of the benchmark. The primary driver of this underperformance was due to the Sub-Adviser’s bearish macro outlook for the general markets. As a result, the Fund’s portfolio was positioned heavily in cash and cash equivalents, and the Fund’s performance trailed the equity benchmark because of this allocation. Lower securities lending utilization also contributed to the underperformance.
Sincerely,

Brad Lamensdorf
Portfolio Manager
Active Alts Contrarian ETF
| The Russell 2000 Index is a small-cap stock market index measuring the performance of the bottom 2,000 stocks in the Russell 3000 Index, and represents approximately 8 percent of the total Russell 3000 market capitalization. The index is maintained by FTSE Russell, a subsidiary of the London Stock Exchange Group. An investor cannot invest directly in an index. |
ETF Risk. The Fund is an actively-managed ETF and the Fund’s NAV will fluctuate based on changes in the prices of the securities it owns. The market price of Fund shares will fluctuate based on changes in the Fund’s NAV as well as changes in the supply and demand of its shares in the secondary market. It is also possible that an active secondary market for Fund shares may not develop and market trading in the Fund shares may be halted under certain circumstances.
You should consider an investment in the Fund as a long-term investment. The Fund’s returns will fluctuate over long and short periods.
This material represents the manager’s assessment of the Fund and market environment as of April 30, 2018 and should not be relied upon by the reader as research, tax or investment advice, is subject to change at any time based upon economic, market, or other conditions and the Advisor undertakes no obligation to update the views expressed herein. Any discussions of specific securities should not be considered a recommendation to buy or sell those securities. The views expressed above (including any forward-looking statement) may not be relied upon as investment advice or as an indication of the Fund’s trading intent.
The performance of any index mentioned in this commentary has not been adjusted for ongoing management, distribution and operating expenses, and sales charges applicable to exchange traded fund investments. In addition, the Fund’s returns do not reflect brokerage fees that an investor in the Fund may pay. If these commissions were reflected, performance would have been lower.
Annual Shareholder Report | 1
Active Alts Contrarian ETF (SQZZ) (Unaudited) (Continued)
Investment Objective
Active Alts Contrarian ETF seeks to achieve current income and capital appreciation.
Fund Performance (As of 4/30/18)
| Average Annual Total Returns | Expense Ratios(a) | |||||||
| One Year | Inception(b) | Gross | Net | |||||
| Active Alts Contrarian ETF (SQZZ) - Total Return (at Net Asset Value)(c) | 1.52% | 1.55% | 3.11% | 1.95% | ||||
| Active Alts Contrarian ETF (SQZZ) - Total Return (at Market Value)(d) | 1.60% | 1.69% | N/A | N/A | ||||
| Russell 2000 Index(e) | 11.54% | 14.46% | N/A | N/A | ||||
Hypothetical Growth of a $10,000 Investment (*)
Past performance does not guarantee future results. Return calculations assume the reinvestment of distributions and do not reflect taxes that a shareholder would pay on Fund distributions or on the redemption of Fund shares. The performance data quoted represent past performance and current returns may be lower or higher. The investment return and principal value will fluctuate so that an investor’s shares, when redeemed may be worth more or less than the original cost. The performance above reflects any fee reductions during the applicable periods. If such fee reductions had not occurred, the quoted performance would be lower. To obtain performance information current to the most recent month-end, please call 855-477-3837 or visit http://strategysharesetfs ..com/
| * | The chart represents historical performance of a hypothetical investment of $10,000 in Active Alts Contrarian ETF and represents the reinvestment of dividends and capital gains in the Fund. |
| (a) | The gross expense ratios reflect the expense ratios as reported in the Fund’s Prospectus dated September 21, 2016, as amended July 5, 2017. However, the Advisor has agreed to contractual waivers in effect through August 31, 2018 and has agreed to limit total annual fund operating expenses to the net expense ratios shown. Please see the Fund’s most recent prospectus for details. Additional information pertaining to the Fund’s expense ratio as of April 30, 2018 can be found in the Financial Highlights. |
| (b) | Commencement of operations March 20, 2017 |
| (c) | Net asset value total return is calculated assuming an initial investment made at the net asset value at the beginning of the period, reinvestment of all dividends and distributions at net asset value during the period, if any, and redemption on the last day of the period at net asset value. This percentage is not an indication of the performance of a shareholder’s investment in the Fund based on market value due to differences between the market price of the shares and the net asset value per share of the Fund. |
| (d) | Market value total return is calculated assuming an initial investment made at the market value at the beginning of the period, reinvestment of all dividends and distributions at net asset value during the period, if any, and redemption on the last day of the period at market value. Market value is determined by the composite closing price. Composite closing security price is defined as the last reported sale price from any primary listing market (e.g., NYSE Arca) or participating regional exchanges or markets. The composite closing price is the last reported sale price from any of the eligible sources, regardless of volume and not an average price and may have occurred on a date prior to the close of the reporting period. Market value may be greater or less than net asset value, depending on the Fund’s closing price on the listing market. |
| (e) | The Russell 2000 Index is a small-cap stock market index measuring the performance of the bottom 2,000 stocks in the Russell 3000 Index, and represents approximately 8 percent of the total Russell 3000 market capitalization. The index is maintained by FTSE Russell, a subsidiary of the London Stock Exchange Group. An investor cannot invest directly in an index. |
2 | Annual Shareholder Report
| Expense Examples (Unaudited) | April 30, 2018 |
As a Fund shareholder, you may incur two types of costs: (1) transaction costs, including commissions on trading, as applicable; and (2) ongoing costs, including advisory fees and other Fund expenses. These examples are intended to help you understand your ongoing costs (in dollars) of investing in a Fund and to compare these costs with the ongoing costs of investing in other mutual funds.
The expense examples below are based on an investment of $1,000 invested at November 1, 2017 and held through the period ended April 30, 2018.
The Actual Expense figures in the table below provide information about actual account values and actual expenses. You may use this information, together with the amount you invested, to estimate the expenses that you paid over the period. Simply divide your account value by $1,000 (for example, an $8,600 account value divided by $1,000 = 8.6), then multiply the result by the number in the table under the heading entitled “Actual Expenses Paid During the Period” to estimate the expenses you paid on your account during this period.
The Hypothetical Expense figures in the table below provide information about hypothetical account values and hypothetical expenses based on the Fund’s actual expense ratio and an assumed rate of return of 5% per year before expenses, which is not the Fund’s actual return. The hypothetical account values and expenses may not be used to estimate the actual ending account balance or expenses you paid for the period. You may use this information to compare the ongoing costs of investing in your Fund and other funds. To do so, compare this 5% hypothetical example with the 5% hypothetical examples that appear in the shareholder reports of the other funds.
Please note that the expenses shown in the table are meant to highlight your ongoing costs only and do not reflect any transactional costs. Therefore, the examples are useful in comparing ongoing costs only and will not help you determine the relative total cost of owning different funds. In addition, if these transactional costs were included, your costs would have been higher.
| Beginning | Actual Ending | Hypothetical | Actual | Hypothetical | Annualized | ||
| Account | Account | Ending | Expenses | Total | Expenses | Net Expense | |
| Value | Value | Account Value | Paid During | Return | Paid During | Ratio During | |
| Fund | 11/1/17 | 4/30/18 | 4/30/18 | the Period(1) | at NAV | the Period(2)(3) | the Period |
| Active Alts Contrarian ETF (SQZZ) | $1,000.00 | $1,015.60 | $1,015.12 | $9.75 | 1.56% | $9.74 | 1.95% |
| (1) | Expenses are equal to the Fund’s annualized expense ratio multiplied by the average account value over the period multiplied by 181/365 (to reflect the one-half year period). |
| (2) | Expenses are equal to the average hypothetical account value over the period multiplied by the Fund’s annualized expense ratio, multiplied by the number of days in the most recent fiscal half-year divided by the number of days in the fiscal year (to reflect the one-half year period). |
| (3) | Represents the hypothetical 5% annual return before taxes. |
Annual Shareholder Report | 3
| Active Alts Contrarian ETF (SQZZ) | April 30, 2018 |
| Portfolio of Investments Summary Table |
| Percentage of Fair Value | |
| Consumer Discretionary | 42.9% |
| Consumer Staples | 2.7% |
| Energy | 15.1% |
| Financials | 14.7% |
| Information Technology | 21.1% |
| Materials | 3.5% |
| Total | 100.0% |
Portfolio holdings and allocations are subject to change. As of April 30, 2018, percentages in the table above are based on total investments. Such total investments may differ from the percentages set forth in the following Portfolio of Investments which are computed using the Fund’s total net assets.
Portfolio of Investments
| Shares | Fair Value | |||||||
| Common Stocks — 66.1% | ||||||||
| Consumer Discretionary — 28.4% | ||||||||
| 1,500 | Container Store Group, Inc. † | $ | 9,345 | |||||
| 400 | Garmin, Ltd. | 23,468 | ||||||
| 150 | Overstock.com, Inc. † | 5,715 | ||||||
| 800 | Party City Holdco, Inc. † | 12,600 | ||||||
| 150 | Restoration Hardware, Inc. † | 14,318 | ||||||
| 5,000 | Sirius XM Holdings, Inc. | 31,650 | ||||||
| 1,000 | The Wendy’s Co. | 16,740 | ||||||
| 2,100 | Under Armour, Inc., Class C † | 32,235 | ||||||
| 490 | Weight Watchers International, Inc. † | 34,325 | ||||||
| 180,396 | ||||||||
| Consumer Staples — 1.8% | ||||||||
| 500 | Revlon, Inc., Class A † | 11,400 | ||||||
| Energy — 9.9% | ||||||||
| 800 | CARBO Ceramics, Inc. † | 7,072 | ||||||
| 1,200 | Diamond Offshore Drilling, Inc. † | 22,068 | ||||||
| 1,000 | Keane Group, Inc. † | 15,550 | ||||||
| 1,500 | Transocean, Ltd. † | 18,555 | ||||||
| 63,245 | ||||||||
| Financials — 9.7% | ||||||||
| 600 | B. Riley Financial, Inc. | 12,390 | ||||||
| 1,100 | Health Insurance Innovation, Inc. † | 31,350 | ||||||
| 1,700 | Wisdomtree Investments, Inc. | 17,969 | ||||||
| 61,709 | ||||||||
| Information Technology — 14.0% | ||||||||
| 500 | ACI Worldwide, Inc. † | 11,625 | ||||||
| 2,000 | ANGI Homeservices, Inc., Class A † | 26,719 | ||||||
| 2,500 | Blackberry, Ltd. † | 26,175 | ||||||
| 800 | Twitter, Inc. † | 24,248 | ||||||
| 88,767 | ||||||||
| Materials — 2.3% | ||||||||
| 7,000 | McEwen Mining, Inc. | 14,560 | ||||||
| Total Common Stocks (Cost $397,824) | $ | 420,077 | ||||||
| Total Investments — 66.1% | ||||||||
| (Cost $397,824) | $ | 420,077 | ||||||
| Other Assets less Liabilities — 33.9% | 215,659 | |||||||
| Net Assets — 100.0% | $ | 635,736 | ||||||
| † | Non-income producing security |
(See notes which are an integral part of the Financial Statements)
4 | Annual Shareholder Report
| Statement of Assets and Liabilities | April 30, 2018 |
| Active Alts | ||||
| Contrarian ETF | ||||
| (SQZZ) | ||||
| Assets: | ||||
| Investments, at value (Cost $397,824) | $ | 420,077 | ||
| Cash and Cash Equivalents | 162,207 | |||
| Dividends and interest receivable | 14 | |||
| Receivable for investments sold | 55,948 | |||
| Receivable from Sub-Advisor | 14,160 | |||
| Prepaid expenses | 2,764 | |||
| Total Assets | 655,170 | |||
| Liabilities: | ||||
| Accrued expenses: | ||||
| Advisory | 51 | |||
| Administration | 4,284 | |||
| Administrative support | 2,500 | |||
| Custodian | 239 | |||
| Fund accounting | 76 | |||
| Other | 12,284 | |||
| Total Liabilities | 19,434 | |||
| Net Assets | $ | 635,736 | ||
| Net Assets consist of: | ||||
| Paid in Capital | $ | 624,545 | ||
| Accumulated undistributed net investment loss | (3,525 | ) | ||
| Accumulated net realized losses from investment transactions | (7,537 | ) | ||
| Net unrealized appreciation on investments | 22,253 | |||
| Net Assets | $ | 635,736 | ||
| Net Assets: | $ | 635,736 | ||
| Shares of Beneficial Interest Outstanding | ||||
| (unlimited number of shares authorized, no par value): | 25,000 | |||
| Net Asset Value (offering and redemption price per share): | $ | 25.43 | ||
(See notes which are an integral part of the Financial Statements)
Annual Shareholder Report | 5
| Statement of Operations | For the year ended April 30, 2018 |
| Active Alts | ||||
| Contrarian ETF | ||||
| (SQZZ) | ||||
| Investment Income: | ||||
| Dividend income | $ | 2,110 | ||
| Securities lending income | 1,401 | |||
| Total Investment Income | 3,511 | |||
| Expenses: | ||||
| Advisory | 9,010 | |||
| Sub-Advisor | 7,916 | |||
| Administration | 51,469 | |||
| Administrative support | 30,000 | |||
| Fund accounting | 442 | |||
| Custodian | 2,516 | |||
| Trustee | 6,731 | |||
| Compliance services | 21,225 | |||
| Legal and audit | 21,874 | |||
| Printing | 2,400 | |||
| Other fees | 25,269 | |||
| Total Expenses before fee reductions | 178,852 | |||
| Expenses contractually waived or reimbursed by the Sub-Advisor | (156,360 | ) | ||
| Waivers by the Administrator | (9,779 | ) | ||
| Total Net Expenses | 12,713 | |||
| Net Investment Loss | (9,202 | ) | ||
| Realized and Unrealized Gains from Investment Transactions: | ||||
| Net realized gains from investment transactions | 10,409 | |||
| Change in unrealized appreciation on investments | 10,256 | |||
| Net Realized and Unrealized Gains from Investment Transactions | 20,665 | |||
| Change in Net Assets Resulting From Operations | $ | 11,463 | ||
(See notes which are an integral part of the Financial Statements)
6 | Annual Shareholder Report
Statements of Changes in Net Assets
| Active Alts Contrarian ETF | ||||||||
| (SQZZ) | ||||||||
| March 20, 2017(a) | ||||||||
| Year Ended | through | |||||||
| April 30, 2018 | April 30, 2017 | |||||||
| From Investment Activities: | ||||||||
| Operations: | ||||||||
| Net investment loss | $ | (9,202 | ) | $ | (4,595 | ) | ||
| Net realized gains (losses) from investment transactions and in-kind redemptions | 10,409 | (8,473 | ) | |||||
| Change in unrealized appreciation/depreciation on investments | 10,256 | 11,997 | ||||||
| Change in net assets resulting from operations | 11,463 | (1,071 | ) | |||||
| Capital Transactions: | ||||||||
| Proceeds from shares issued | — | 2,500,000 | ||||||
| Cost of shares redeemed | (628,212 | ) | (1,246,444 | ) | ||||
| Change in net assets from capital transactions | (628,212 | ) | 1,253,556 | |||||
| Change in net assets | (616,749 | ) | 1,252,485 | |||||
| Net Assets: | ||||||||
| Beginning of period | 1,252,485 | — | ||||||
| End of period | $ | 635,736 | $ | 1,252,485 | ||||
| Accumulated undistributed net investment loss | $ | (3,525 | ) | $ | (4,595 | ) | ||
| Share Transactions: | ||||||||
| Issued | — | 100,000 | ||||||
| Redeemed | (25,000 | ) | (50,000 | ) | ||||
| Change in shares | (25,000 | ) | 50,000 | |||||
| (a) | Commencement of operations. |
(See notes which are an integral part of the Financial Statements)
Annual Shareholder Report | 7
| Financial Highlights | Strategy Shares |
| Net realized and | Total from | ||||
| Net Asset Value, | Net | unrealized gains | investment | Net Asset Value, | |
| beginning of period | investment loss | from investments | activities | end of period | |
| Active Alts Contrarian ETF (SQZZ) | |||||
| Year Ended April 30, 2018 | $25.05 | (0.46) | 0.84 | 0.38 | $25.43 |
| March 20, 2017(f) through April 30, 2017 | $25.00 | (0.09) | 0.14 | 0.05 | $25.05 |
| (a) | Not annualized for periods less than one year. |
| (b) | Net asset value total return is calculated assuming an initial investment made at the net asset value at the beginning of the period, reinvestment of all dividends and distributions at net asset value during the period, if any, and redemption on the last day of the period at net asset value. This percentage is not an indication of the performance of a shareholder’s investment in the Fund based on market value due to differences between the market price of the shares and the net asset value per share of the Fund. |
| (c) | Market value total return is calculated assuming an initial investment made at the market value at the beginning of the period, reinvestment of all dividends and distributions at net asset value during the period, if any, and redemption on the last day of the period at market value. Market value is determined by the composite closing price. Composite closing security price is defined as the last reported sale price from any primary listing market (e.g., NYSE Arca) or participating regional exchanges or markets. The composite closing price is the last reported sale price from any of the eligible sources, regardless of volume and not an average price and may have occurred on a date prior to the close of the reporting period. Market value may be greater or less than net asset value, depending on the Fund’s closing price on the listing market. |
| (d) | Annualized for periods less than one year. |
| (e) | If applicable, certain fees were waived and/or reimbursed. If such waivers/reimbursements had not occurred, the ratios would have been as indicated. |
| (f) | Commencement of operations. |
(See notes which are an integral part of the Financial Statements)
8 | Annual Shareholder Report
| Ratio of | Ratio of | Ratio of Net | Net Assets | |||
| Total return | Total return | Net Expenses to | Gross Expenses to | Investment Loss to | at end of period | Portfolio |
| at NAV(a)(b) | at market(a)(c) | Average Net Assets(d) | Average Net Assets(d)(e) | Average Net Assets(d) | (000’s) | turnover(a) |
| 1.52% | 1.60% | 1.95% | 27.43% | (1.41)% | $636 | 623% |
| 0.20% | 0.28% | 1.95% | 13.68% | (1.89)% | $1,252 | 82% |
(See notes which are an integral part of the Financial Statements)
Annual Shareholder Report | 9
| Notes to Financial Statements | April 30, 2018 |
| (1) | Organization |
Strategy Shares (the “Trust”) was organized on September 7, 2010 as a Delaware statutory trust. The Trust is registered under the Investment Company Act of 1940 (the “1940 Act”), as an open-end management investment company and thus is determined to be an investment company for accounting purposes. The Declaration of Trust permits the Trust to issue an unlimited number of shares of beneficial interest (“Shares”) in one or more series representing interests in separate portfolios of securities. Currently, the Trust offers its Shares in four separate series. The accompanying financial statements are those of the Active Alts Contrarian ETF (SQZZ) (referred to as the “Fund”). This Fund is an actively-managed exchange-traded fund. The investment objective of the Fund is current income and capital appreciation. The Fund does not seek to replicate a specific index. The Fund’s prospectus provides a description of the Fund’s investment objective, policies, and strategies. The assets of the Fund are segregated and a shareholder’s interest is limited to the Fund in which shares are held.
Shares of the Fund are listed and traded on the NASDAQ. Market prices for the Shares may be different from their net asset value (“NAV”). The Fund issues and redeems Shares on a continuous basis at NAV only in large blocks of Shares, currently 25,000 Shares, called “Creation Units.” Creation Units are issued and redeemed principally in-kind for securities included in a specified universe. Once created, Shares generally trade in the secondary market at market prices that change throughout the day in amounts less than a Creation Unit.
Under the Trust’s organizational documents, its officers and Board of Trustees (“the Board”) are indemnified against certain liabilities arising out of the performance of their duties to the Fund. In addition, in the normal course of business, the Trust may enter into contracts with vendors and others that provide for general indemnifications. The Trust’s maximum exposure under these arrangements is unknown, as this would involve future claims that may be made against the Trust. However, based on experience, the Trust expects that risk of loss to be remote.
| (2) | Significant Accounting Policies |
The following is a summary of significant accounting policies consistently followed by the Fund in the preparation of its financial statements. These policies are in conformity with generally accepted accounting principles in the United States of America (“GAAP”). The Fund is an investment company and accordingly follows the investment company accounting and reporting guidance of the Financial Accounting Standards Board (“FASB”) Accounting Standard Codification Topic 946 Financial Services - Investment Companies, including FASB Accounting Standard Update ASU 2013-08. The preparation of financial statements in conformity with GAAP requires management to make estimates and assumptions that affect the amounts of assets, liabilities and disclosure of contingent assets and liabilities at the date of the financial statements and the reported amounts of income and expenses for the period. Actual results could differ from those estimates.
| A. | Investment Valuations |
The Fund holds investments at fair value. Fair value is defined as the price that would be expected to be received to sell an asset or paid to transfer a liability in an orderly transaction between market participants at the measurement date. The valuation techniques used to determine fair value are further described below.
Security values are ordinarily obtained through the use of independent pricing services, in accordance with procedures adopted by the Board. Pursuant to these procedures, the Fund may use a pricing service, bank, or broker-dealer experienced in such matters to value the Fund’s securities. When reliable market quotations are not readily available for any security, the fair value of that security will be determined by a committee established by the Board in accordance with procedures adopted by the Board. The fair valuation process is designed to value the subject security at the price the Fund would reasonably expect to receive upon its current sale. Additional consideration is given to securities that have experienced a decrease in the volume or level of activity or to circumstances that indicate that a transaction is not orderly.
The Trust has a three-tier fair value hierarchy that is dependent upon the various “inputs” used to determine the value of the Fund’s investments. The valuation techniques described below maximize the use of observable inputs and minimize the use of unobservable inputs in determining fair value. These inputs are summarized in the three broad levels listed below:
| • | Level 1 – Quoted prices in active markets for identical assets. |
| • | Level 2 – Other observable pricing inputs at the measurement date (including quoted prices for similar securities, interest rates, prepayment speeds, credit risk, etc.). |
| • | Level 3 – Significant unobservable pricing inputs at the measurement date (including the Fund’s own assumptions in determining the fair value of investments). |
The inputs or methodology used for valuing investments are not necessarily an indication of the risk associated with investing in those investments.
Equity securities (including foreign equity securities) traded on a securities exchange are valued at the last reported sales price on the principal exchange. Equity securities quoted by NASDAQ are valued at the NASDAQ official closing price. If there is no reported sale on the principal exchange, and in the case of over-the-counter securities, equity securities are valued at a bid price estimated by the security pricing service. In each of these situations, valuations are typically categorized as Level 1 in the fair value hierarchy.
Debt securities traded on a national securities exchange or in the over-the-counter market are valued at the last reported sales price on the principal exchange. If there is no reported sale on the principal exchange, and for all other debt securities, debt securities are valued at a bid price estimated by a security pricing service. In each of these situations, valuations are typically categorized as Level 2 in the fair value hierarchy.
The following table provides the fair value measurement as of April 30, 2018, while the breakdown, by category, of common stocks is disclosed in the Portfolio of Investments for the Fund.
| Total | ||||||||
| Level 1 | Investments | |||||||
| Active Alts Contrarian ETF (SQZZ) | ||||||||
| Common Stocks(1) | $ | 420,077 | $ | 420,077 | ||||
| Total Investments | $ | 420,077 | $ | 420,077 | ||||
| (1) | Please see the Portfolio of Investments for industry classifications. |
The Trust’s policy is to disclose transfers between fair value hierarchy levels based on valuations at the end of the reporting period. There were no transfers between Levels 1, 2, or 3 for the period ended April 30, 2018. As of April 30, 2018, no securities were categorized as Level 2 or Level 3.
| 10 | Annual Shareholder Report |
Notes to Financial Statements (Continued)
| B. | Security Transactions and Related Income |
Investment transactions are accounted for no later than the first calculation of the net asset value (“NAV”) on the business day following the trade date. For financial reporting purposes, however, security transactions are accounted for on the trade date on the last business day of the reporting period. Discounts and premiums on securities purchased are amortized over the lives of the respective securities using the effective interest method. Securities gains and losses are calculated on the identified cost basis. Interest income and expenses are accrued daily. Dividends, less foreign tax withholding, if any, are recorded on the ex-dividend date. Investment income from non-U.S. sources received by the Fund is generally subject to non-U.S. withholding taxes at rates ranging up to 30%. Such withholding taxes may be reduced or eliminated under the terms of applicable U.S. income tax treaties. The Fund may be subject to foreign taxes on gains in investments or currency repatriation. The Fund accrues such taxes, as applicable, based on its current interpretation of tax rules in the foreign markets in which they invest.
| C. | Cash and Cash Equivalents |
Idle cash may be swept into various overnight demand deposits and is classified as cash and cash equivalents on the Statement of Assets and Liabilities. The Fund maintains cash in bank deposit accounts which, at times, may exceed United States federally insured limits. Amounts swept overnight are available on the next business day.
| D. | Securities Lending |
The Trust has entered into a Master Securities Lending Agreement (“MSLA”) with Morgan Stanley (the “Agent”). Under the terms of the MSLA, the Fund may lend securities to certain broker-dealers and banks in exchange for collateral in the amount of at least 102% of the value of U.S. securities loaned or at least 105% of the value of non-U.S. securities loaned, marked to market daily. The collateral can be received in the form of cash collateral and/or noncash collateral. Non-cash collateral can include U.S. Government Securities, letters of credit and certificates of deposit. The Trust does not have effective control of the non-cash collateral and therefore it is not disclosed on the Fund’s Portfolio of Investments. The Fund continues to benefit from interest or dividends on the securities loaned and may also earn a return from the collateral. The Fund pays various fees in connection with the investment of cash collateral. The Fund pays the Agent fees based on the investment income received from securities lending activities. Securities lending income is disclosed on the Statement of Operations. Although risk is mitigated by the collateral, the Fund could experience a delay in recovering its securities and possible loss of income or value if the borrower fails to return them. Securities lending transactions are entered into by a Fund under the MSLA, which permits the Fund, under certain circumstances such as an event of default, to offset amounts payable by the Fund to the same counterparty against amounts receivable from the counterparty to create a net payment due to or from the Fund. Securities lending was terminated in September, 2017.
| E. | Dividends and Distributions to Shareholders |
Dividends to shareholders are recorded on the ex-dividend date. Dividends from net investment income, if any, are declared and paid quarterly. Net realized capital gains, if any, are distributed at least annually.
The amount of dividends from net investment income and net realized gains are determined in accordance with federal income tax regulations, which may differ from GAAP. These “book/tax” differences are considered either temporary or permanent in nature. To the extent these differences are permanent in nature (e.g., distributions and income received from pass-through investments), such amounts are reclassified within the capital accounts based on their nature for federal income tax purposes; temporary differences do not require reclassification. Temporary differences are primarily due to return of capital from investments.
The Fund may own shares of real estate investments trusts (“REITs”) which report information on the source of their distributions annually. Distributions received from investments in REITs in excess of income from underlying investments are recorded as realized gain and/or as a reduction to the cost of the individual REIT.
| F. | Allocation of Expenses |
Expenses directly attributable to the Fund are charged to the Fund. Expenses not directly attributable to the Fund are allocated proportionally among all Funds within the Trust in relation to the net assets of each Fund or on another reasonable basis. The Trust may share expenses with the Mutual Fund and Variable Insurance Trust, another open-end management investment company managed by Rational Advisors, Inc. (the “Advisor”). Those expenses that are shared are allocated proportionally among each of the Trusts or on another reasonable basis.
| (3) | Investment Advisory and Other Contractual Services |
| A. | Investment Advisory Fees |
The Advisor, a wholly-owned subsidiary of Rational Capital LLC, serves as the Fund’s investment advisor. The Advisor is under common control with Catalyst Capital Advisors LLC and AlphaCentric Advisors LLC, the investment advisors of other funds in the same group of investment companies also known as a “fund complex”. Effective June 23, 2017, the Advisor and Sub-Advisor received a fee for its services computed daily and paid monthly, of 1.25% of the Fund’s Average daily net assets; of this, 0.10% is paid to the Advisor, and 1.15% is paid to the Sub-Advisor. Prior to that date, the Advisor and Sub-Advisor received 0.10% and 1.45% respectively. The Sub-Advisor is Active Alts, Inc.
The Sub-Advisor has contractually agreed to reduce its fees and/or reimburse the Fund’s expenses (excluding interest, taxes and dividends, brokerage commissions, acquired fund fees and expenses, and extraordinary expenses) in order to limit total annual fund operating expenses after fee waivers and expense reimbursement to 1.95% of the Fund’s average annual daily net assets. The Expense Cap will remain in effect until at least August 31, 2018. The Expense Cap may be terminated earlier only upon the approval of the Board. The Sub-Advisor may recoup fees reduced or expenses reimbursed at any time within three years from the year such expenses were incurred, so long as the repayment does not cause the Expense Cap to be exceeded. As of April 30, 2018, the Sub-Advisor may recoup amounts from the Fund as follows:
| Expires | Expires | ||
| 4/30/20 | 4/30/21 | Total | |
| Active Alts Contrarian ETF (SQZZ) | $28,619 | $156,360 | $184,979 |
Annual Shareholder Report | 11
Notes to Financial Statements (Continued)
| B. | Administration, Transfer Agent and Accounting Fees |
Citi Fund Services Ohio, Inc. (“Citi”) provides financial administration, transfer agency and portfolio accounting services to the Trust. Citi performs certain services on behalf of the Trust including but not limited to: (1) preparing and filing the Trust’s periodic financial reports on forms prescribed by the Securities and Exchange Commission (“SEC”); (2) calculating Fund expenses and making required disbursements; (3) calculating Fund performance data; and (4) providing certain compliance support services. As transfer agent, Citi issues shares of the Fund in Creation Units to fill purchase orders for Fund shares, maintains records of the issuance and redemption of the Fund’s shares, and acts as the Fund’s dividend disbursing agent. As portfolio accountant, Citi maintains certain financial records of the Trust and provides accounting services to the Fund which include the daily calculation of the Fund’s NAV. Citi also performs certain other services on behalf of the Trust including providing financial information for the Trust’s federal and state tax returns and financial reports required to be filed with the SEC. For these services, the Fund pays Citi a fee accrued daily and paid monthly based on a percentage of the Trust’s average net assets, subject to a minimum annual fee. The fees are as follows:
- 0.040% of the first $500 million in aggregate net assets of the Trust;
- 0.035% of the aggregate net assets of the next $500 million; and
- 0.020% of the aggregate net assets in excess of $1 billion
The asset-based fees are subject to an annual minimum, allocated among the Trust, equal to the number of Funds multiplied by $52,122. Effective January 1, 2018, this fee increased from $51,150.
MFund Services LLC (“MFund”), an affiliate of the Advisor, provides the Fund with various management and legal administrative services. For these services, the Fund pays MFund a fee accrued daily and paid monthly based on a percentage of the Fund’s average net assets, subject to a minimum annual fee. The fees are as follows:
- 0.030% of the aggregate net assets from $0 to $1,000,000,000; and
- 0.020% of the aggregate net assets from $1,000,000,000 and above
The asset-based fees are subject to an annual minimum of $30,000 per Fund. In addition, the Fund reimburses MFund for any reasonable out-of-pocket expenses incurred in the performance of its duties.
| C. | Distribution and Shareholder Services Fees |
Foreside Fund Services, LLC (the “Distributor”) is the principal underwriter and distributor of the Fund’s Shares. The Distributor is compensated by the Advisor in accordance with a Distribution Services Agreement between the Advisor and the Distributor. The Trust has adopted but has yet to implement a Rule 12b-1 Distribution Plan (the “Plan”). The Plan is designed to compensate or reimburse financial intermediaries (including the Distributor, the Advisor, and their affiliates) for activities principally intended to result in the sale of Fund shares, such as advertising and marketing of shares (including printing and disseminating prospectuses and sales literature to prospective shareholders and financial intermediaries) and providing incentives to financial intermediaries to sell shares. The Plan is also designed to cover the cost of administrative services performed in conjunction with the sale of shares, including, but not limited to, shareholder services, recordkeeping services and educational services, as well as the costs of implementing and operating the Plan. In accordance with the Plan, the Distributor may enter into agreements with financial intermediaries
and dealers relating to distribution and/or marketing services with respect to the Fund. Pursuant to the Plan, the Fund may pay a 12b-1 fee not to exceed 0.25% per year of the Fund’s average daily net assets. No 12b-1 fee is currently paid by the Fund and the Board has not approved any payments under the Plan.
| D. | Custodian Fees |
Citibank, N.A. (the “Custodian”), an affiliate of Citi, serves as custodian for the Fund and safeguards and holds the Fund’s cash and securities, settles the Fund’s securities transactions and collects income on Fund investments. The Custodian receives fees based on the level of the Fund’s average daily net assets for the period plus out-of-pocket expenses.
| E. | Compliance Services |
Pursuant to a Compliance Services Agreement, MFund provides chief compliance officer services to the Fund. The Fund pays MFund a monthly fee plus an asset-based fee. In addition, the Fund reimburses MFund for any reasonable out-of-pocket expenses incurred in the performance of its duties under the Compliance Services Agreement.
| F. | General |
Certain officers of the Trust are officers, directors and/or trustees of the above companies.
| (4) | Investment Transactions |
Purchases and sales of investments, excluding in-kind transactions and short-term investments, for the fiscal year ended April 30, 2018 were as follows:
| Purchases | Sales | |
| Active Alts Contrarian ETF (SQZZ) | $2,516,580 | $2,864,947 |
There were no purchases or sales of in-kind transactions for the fiscal year ended April 30, 2018.
| (5) | Capital Share Transactions |
Shares are issued and redeemed by the Fund only in aggregations of a specified number of shares or multiples thereof (“Creation Units”) at net asset value. Except when aggregated in Creation Units, shares of the Fund are not redeemable. Transactions in shares for the Fund are disclosed in detail on the Statements of Changes in Net Assets.
The consideration for the purchase of Creation Units of the Fund generally consists of the in-kind deposit of a designated basket of securities, which constitutes an optimized representation of the securities of the Fund’s specified universe, and an amount of cash. Investors purchasing and redeeming Creation Units may be charged a transaction fee to cover the transfer and other transactional costs it incurs to issue or redeem Creation Units. The standard charge and maximum transaction fee for the Fund are $250 and $1,000, respectively.
From time to time, settlement of securities related to subscriptions-in-kind or redemptions-in-kind may be delayed. In such cases, securities related to in-kind contributions are reflected as “Due from custodian” and securities related to in-kind redemptions are reflected as “Securities payable related to in-kind transactions” on the Statement of Assets and Liabilities.
During the fiscal year ended April 30, 2018, the Fund did not receive securities in exchange for subscriptions of capital shares (subscriptions-in-kind).
| 12 | Annual Shareholder Report |
Notes to Financial Statements (Continued)
| (6) | Federal Income Taxes |
It is the policy of the Fund to qualify or continue to qualify as a regulated investment company by complying with the provisions available to certain investment companies, as defined in applicable sections of the Internal Revenue Code, and to make distributions of net investment income and net realized capital gains sufficient to relieve it from all, or substantially all, federal income taxes.
The Fund has evaluated tax positions taken or expected to be taken in the course of preparing the Fund’s tax returns to determine whether it is more likely than not (i.e., greater than 50-percent chance) that each tax position will be sustained upon examination by a taxing authority based on the technical merits of the position. A tax position that meets
the more likely than not recognition threshold is measured to determine the amount of benefit to recognize in the financial statements. Differences between tax positions taken in a tax return and amounts recognized in the financial statements will generally result in an increase in a liability for taxes payable (or a reduction of a tax refund receivable), including the recognition of any related interest and penalties as an operating expense. Tax positions taken in tax years remain subject to examination by tax authorities (generally three years plus the interim tax period since then for federal income tax purposes). The determination has been made that there are not any uncertain tax positions that would require the Fund to record a tax liability and, therefore, there is no impact to the Fund’s financial statements.
As of April 30, 2018, the tax cost of securities and the breakdown of unrealized appreciation (depreciation) for the Fund were as follows:
| Tax Cost | Unrealized | Unrealized | Net Unrealized |
| of Securities | Appreciation | Depreciation | Appreciation/(Depreciation) |
| $405,361 | $32,139 | $(17,423) | $14,716 |
The differences between book-basis and tax-basis unrealized appreciation/depreciation is attributable primarily to basis adjustments for wash sales and late-year loss deferral.
As of April 30, 2018, the components of accumulated earnings/(deficit) on a tax basis were as follows:
| Undistributed | Undistributed Long Term | Accumulated | Accumulated Capital | Unrealized Appreciation | Total Accumulated |
| Ordinary Income | Capital Gains | Earnings | and Other Losses | (Depreciation) | Earnings (Deficit) |
| $0 | $0 | $0 | $(3,525) | $14,716 | $11,191 |
Qualified late-year ordinary loss deferral amount: $3,525.
Permanent Tax Differences:
As of April 30, 2018, the following reclassifications relating to ordinary losses netting to reduce short-term capital gains and net operating loss:
| Accumulated Undistributed | Accumulated Net Realized | Paid in |
| Net Investment Income (Loss) | Gains (Losses) On Investments | Capital |
| $10,272 | $(9,473) | $(799) |
| (7) | Investment Risks |
ETF Risk
| The NAV of the Fund can fluctuate up or down, and you could lose money investing in the Fund if the prices of the securities owned by the Fund decline. In addition, the Fund may be subject to the following risks: (1) the market price of the Fund’s shares may trade above or below their NAV; (2) an active trading market for the Fund’s shares may not develop or be maintained; or (3) trading of the Fund’s shares may be halted if the listing exchange’s officials deem such action appropriate, the shares are delisted from the exchange, or the activation of market-wide “circuit breakers” (which are tied to large decreases in stock prices) halts stock trading generally. |
| (8) | Subsequent Events |
| On May 11, 2018, the Board of Trustees approved the closing and liquidation of the Fund. The Fund will liquidate on May 30, 2018. No additional disclosures or adjustments were required to the financial statements as of April 30, 2018. |
| Annual Shareholder Report | 13 |

REPORT OF INDEPENDENT REGISTERED PUBLIC ACCOUNTING FIRM
To the Shareholders of Active Alts Contrarian ETF and Board of Trustees of
Strategy Shares
Opinion on the Financial Statements
We have audited the accompanying statement of assets and liabilities, including the portfolio of investments, of Active Alts Contrarian ETF, a series of Strategy Shares, (the “Fund”) as of April 30, 2018, and the related statement of operations for the year then ended, and the statements of changes in net assets and the financial highlights for each of the two periods in the period then ended, including the related notes (collectively referred to as the “financial statements”). In our opinion, the financial statements present fairly, in all material respects, the financial position of the Fund as of April 30, 2018, the results of its operations for the year then ended, and the changes in its net assets and the financial highlights for each of the two periods in the period then ended, in conformity with accounting principles generally accepted in the United States of America.
Basis for Opinion
These financial statements are the responsibility of the Fund’s management. Our responsibility is to express an opinion on the Fund’s financial statements based on our audits. We are a public accounting firm registered with the Public Company Accounting Oversight Board (United States) (“PCAOB”) and are required to be independent with respect to the Fund in accordance with the U.S. federal securities laws and the applicable rules and regulations of the Securities and Exchange Commission and the PCAOB.
We conducted our audits in accordance with the standards of the PCAOB. Those standards require that we plan and perform the audit to obtain reasonable assurance about whether the financial statements are free of material misstatement, whether due to error or fraud.
Our audits include performing procedures to assess the risks of material misstatement of the financial statements, whether due to error or fraud, and performing procedures that respond to those risks. Such procedures include examining, on a test basis, evidence regarding the amounts and disclosures in the financial statements and confirmation of securities owned as of April 30, 2018, by correspondence with the custodian and brokers. Our audits also included evaluating the accounting principles used and significant estimates made by management, as well as evaluating the overall presentation of the financial statements. We believe that our audits provide a reasonable basis for our opinion.
We have served as the auditor of one or more investment companies with a related advisor since 2015.
As described in Note 8 to the financial statements, the Board of Trustees approved the closing and liquidation of the Fund on May 11, 2018, which indicates the Fund is not a going concern. The financial statements do not include any adjustments that might be necessary upon liquidation.

COHEN & COMPANY, LTD.
Cleveland, Ohio
June 29, 2018
C O H E N & C O M P A N Y , L T D.
800.229.1099 | 866.818.4538 fax | cohencpa.com
Registered with the Public Company Accounting Oversight Board
14 | Annual Shareholder Report
Additional Information
Premium/Discount Information (Unaudited)
The charts below present information about differences between the per share net asset value (“NAV”) of the Fund and the market trading price of shares of the Fund. For these purposes, the “market price” is the composite close for Fund shares as of the close of trading on all exchanges where Fund shares are listed. The term “premium” is sometimes used to describe a market price in excess of NAV and the term “discount” is sometimes used to describe a market price below NAV. The chart presents information about the size and frequency of premiums or discounts. As with other exchange-traded funds, the market price of Fund shares is typically slightly higher or lower than a Fund’s per share NAV. Factors that contribute to the differences between market price and NAV include the supply and demand for Fund shares and investors’ assessments of the underlying value of a Fund’s portfolio securities.
Differences between the closing times of U.S. and non-U.S. markets may contribute to differences between the NAV and market price of Fund shares. Many non-U.S. markets close prior to the close of the U.S. securities exchanges. Developments after the close of such markets as a result of ongoing price discovery may be reflected in the Fund’s market price but not in its NAV (or vice versa).
| Calendar Year(a) ended December 31, 2017 | First Calendar Quarter ended March 31, 2018 | |||
| Premium/Discount Range | Number of Days | Percentage of Total Days | Number of Days | Percentage of Total Days |
| Greater than 2.0% | 11 | 5.58 | 9 | 14.75 |
| Greater than 1.5% and Less than 2.0% | 12 | 6.09 | 3 | 4.92 |
| Greater than 1.0% and Less than 1.5% | 17 | 8.63 | 2 | 3.28 |
| Greater than 0.5% and Less than 1.0% | 20 | 10.15 | 7 | 11.48 |
| Between 0.5% and -0.5% | 109 | 55.34 | 23 | 37.70 |
| Less than -0.5% and Greater than -1.0% | 12 | 6.09 | 8 | 13.11 |
| Less than -1.0% and Greater than -1.5% | 7 | 3.55 | 4 | 6.56 |
| Less than -1.5% and Greater than -2.0% | 7 | 3.55 | 1 | 1.64 |
| Less than -2.0% | 2 | 1.02 | 4 | 6.56 |
| 197 | 100.00% | 61 | 100.00% | |
| (a) | Commencement of operations for fund launch effective March 20, 2017. |
Annual Shareholder Report | 15
Board of Trustees and Trust Officers (Unaudited)
The following tables provide information about Board of Trustees and the senior officers of the Trust. Each of the Trustees is deemed to be an Independent Trustee of the Trust. Each Trustee oversees all portfolios of the Trust and serves for an indefinite term (subject to mandatory retirement provisions). Information about each Trustee is provided below and includes each person’s: name, address, year of birth, present position(s) held with the Trust, and principal occupations for the past five years. Unless otherwise noted, each officer is elected annually by the Board. Each Trustee and officer also serves in the same capacity for Mutual Fund and Variable Insurance Trust, another open-end investment company whose series are managed by the Advisor. Collectively, the Trust, Mutual Fund and Variable Insurance Trust, Mutual Fund Series Trust, Variable Insurance Trust and the TCG Financial Series Trusts I-X comprise the “Fund Complex” as of April 30, 2018.
Independent Trustees Background
| Name, Address and Year of Birth | Position with the Trust | Term of Office and Length of Time Served* | Principal Occupation(s) During Past 5 Years | Number of Portfolios in Fund Complex** Overseen by Trustee | Other Directorships Held by Trustee |
| Tobias Caldwell 36 N. New York Avenue Huntington, NY 11743 Year of Birth: 1968 | Chairman of the Board and Trustee | Since 1/2016 | Managing member, Bear Properties, LLC (2006 – present) (real estate firm); Managing member, PTL Real Estate, LLC (2000 – present) (real estate/investment firm); Managing member, Genovese Family Enterprises, LLC (1999 – present) (real estate firm). | 51 | Chairman of the Board of Trustees, Mutual Fund and Variable Insurance Trust (1/2016 – present); Lead Independent Trustee and Chairman of Audit Committee, Mutual Fund Series Trust (2006 – present), Trustee, M3Sixty Funds Trust (2016 – present). |
| Stephen P. Lachenauer 36 N. New York Avenue Huntington, NY 11743 Year of Birth: 1968 | Trustee and Audit Committee Chairman | Since 1/2016 | Attorney, private practice (2006 – present). | 14 | Chair of the Audit Committee and Board Member, Mutual Fund and Variable Insurance Trust (1/2016 – present); Chairman of the Board, TCG Financial Series Trusts I-X (2015 – present). |
| Donald McIntosh 36 N. New York Avenue Huntington, NY 11743 Year of Birth: 1969 | Trustee | Since 1/2016 | Credit risk review analyst, Santander Holdings USA (May 2015 – present); Governance analyst, Santander Bank (2011 – April 2015). | 14 | Board Member, Mutual Fund and Variable Insurance Trust (January 2016 – present); Trustee, TCG Financial Series Trusts I-X (2015 – present). |
| * | The term of office of each Trustee is indefinite. |
| ** | The “Fund Complex” includes the Trust, Mutual Fund and Variable Insurance Trust, Mutual Fund Series Trust and the TCG Financial Services Trusts I-X, each a registered open-end investment company. |
Officers*
| Name, Address and Year of Birth | Position with the Trust | Term of Office and Length of Time Served | Principal Occupation(s) During Past 5 Years |
| Jerry Szilagyi 36 N. New York Avenue Huntington, NY 11743 Year of Birth: 1962 | President and Chief Executive Officer | Since 3/2016 | President, Rational Advisors, Inc., (1/2016 – present); Chief Executive Officer, Catalyst Capital Advisors LLC, (1/2006 – present); Member, AlphaCentric Advisors LLC, (2/2014 – present); Chief Executive Officer, Alt Fund Distributors LLC, (12/2014 – present); Managing Member, MFund Distributors LLC, (10/2012 – present); Managing Member, MFund Services LLC, (1/2012 – present); President, Abbington Capital Group LLC, (1998 – present); President, Cross Sound Capital LLC, (6/2011 – 10/2013); President, USA Mutuals, Inc., (3/2011 – 7/2016). |
| James Szilagyi 36 N. New York Avenue Huntington, NY 11743 Year of Birth: 1963 | Treasurer | Since 3/2016 | Product Manager, Catalyst Capital Advisors LLC, (9/2015 – present); Senior Business Consultant, Fidelity Information Services, (2011 – 9/2015). |
| Frederick J. Schmidt 36 N. New York Avenue Huntington, NY 11743 Year of Birth: 1959 | Chief Compliance Officer | Since 3/2016 | Director, MFund Services LLC (since 5/2015); Director & Chief Compliance Officer, Citi Fund Services, (2010 – 2015); Senior Vice-President & Chief Compliance Officer, Citi Fund Services, (2004 – 2010). |
| Jennifer A. Bailey 36 N. New York Avenue Huntington, NY 11743 Year of Birth: 1968 | Secretary | Since 3/2016 | Director of Legal Services, MFund Services LLC, (2/2012 – present) |
| * | Officers do not receive any compensation from the Trust |
The Funds’ Statement of Additional Information (“SAI”) includes additional information about the trustees and is available without charge, upon request. You may call toll-free at 855-477-3837 to request a copy of the SAI or to make shareholder inquiries.
16 | Annual Shareholder Report
strategyshares
VOTING PROXIES ON FUND PORTFOLIO SECURITIES
A copy of the policies and procedures that the Fund uses to determine how to vote proxies relating to securities held in the Fund’s portfolio, as well as a record of how the Fund voted any such proxies during the most recent 12-month period ended June 30, is available without charge and upon request by calling 1-855-HSS-ETFS or 1-855-477-3837 or at www.strategysharesetfs. com. This information is also available from the EDGAR database on the SEC’s website at www.sec.gov.
QUARTERLY PORTFOLIO SCHEDULE
The Fund files with the SEC a complete schedule of its portfolio holdings, as of the close of the first and third quarters of their fiscal year, on Form N-Q. These filings are available on the SEC’s website at www.sec.gov and may be reviewed and copied at the SEC’s Public Reference Room in Washington, DC. (call 1-202-551-8090 for information on the operation of the Public Reference Room.) You may also access this information at www.strategysharesetfs.com by selecting “Form N-Q”.
Rational Advisors, Inc. is the Investment Advisor of Strategy Shares. Rational Advisors, Inc. maintains corporate records of the Funds. Foreside Fund Services, LLC is the principal underwriter and distributor of the Fund’s shares.
Exchange-traded funds are not bank deposits or obligations, are not guaranteed by any bank, and are not insured or guaranteed by the U.S . government, the Federal Deposit Insurance Corporation, the Federal Reserve Board, or any other government agency. Investment in exchange-traded funds involves investment risk, including the possible loss of principal.
This report is authorized for distribution to prospective investors only when preceded or accompanied by a prospectus which contains facts concerning the Fund’s objectives and policies, management fees, expenses and other information.
Cusip 86280R308
Strategy Shares Shareholder Services: 1-855-477-3837
Item 2. Code of Ethics.
(a) As of the end of the period covered by the report, the registrant has adopted a code of ethics that applies to the registrant’s Principal Executive Officer and Principal Financial Officer.
(b) Not applicable.
(c) During the period covered by the report, with respect to the registrant’s code of ethics that applies to its Principal Executive Officer and Principal Financial Officer: there have been no amendments to a provision that relates to any element of the code of ethics definition enumerated in paragraph (b) of this Item 2.
(d) During the period covered by the report, with respect to the registrant’s code of ethics that applies to its Principal Executive Officer and Principal Financial Officer: there have been no waivers granted from a provision that relates to any element of the code of ethics definition enumerated in paragraph (b) of this Item 2.
(e) Not applicable.
Item 3. Audit Committee Financial Expert.
3(a)(1) The registrant’s Board of Trustees has determined that the registrant has at least one audit committee financial expert serving on its audit committee.
3(a)(2) The audit committee financial expert is Stephen P. Lachenauer, who is “independent” for purposes of this Item 3 of Form N-CSR.
Item 4. Principal Accountant Fees and Services.
(a) Audit Fees billed to the registrant by its principal accountants for the two most recent fiscal years:
Fiscal year ended 2018: $39,250
Fiscal year ended 2017: $30,750
(b) Audit-Related Fees billed to the registrant by its principal accountants for the two most recent fiscal years:
Fiscal year ended 2018: $ -
Fiscal year ended 2017: $ -
(c) Tax Fees billed to the registrant by its principal accountants for the two most recent fiscal years:
Fiscal year ended 2018: $8,000
Fiscal year ended 2017: $4,000
Fees for 2017 related to the review of the registrant’s tax returns. Amount requiring approval of the registrant’s audit committee pursuant to paragraph (c)(7)(ii) of Rule 2-01 of Regulation S-X, $0.
(d) All other fees billed to the registrant by its principal accountants for the two most recent fiscal years:
Fiscal year ended 2018: $ -
Fiscal year ended 2017: $ -
Amount requiring approval of the registrant’s audit committee pursuant to paragraph (c)(7)(ii) of Rule 2-01 of Regulation S-X, $0 and $0 respectively.
(e)(1) Audit and Non-Audit Services Pre-Approval Policies and Procedures
I. Purpose
Under the Sarbanes-Oxley Act of 2002 (the “Act”), the Audit Committee of the Board of Trustees of The Huntington Strategy Shares (the “Trust”) is responsible for the appointment, compensation and oversight of the work of the Trust’s independent auditor. As part of this responsibility, the Audit Committee is required to grant approval for audit and non-audit services performed by the independent auditor for the Trust in order assure that they do not impair the auditor’s independence from the Trust. In addition, the Audit Committee also must pre-approve its independent auditor’s engagement for non-audit services with the Trust’s investment adviser (not including a sub-adviser whose role is primarily portfolio management and is sub-contracted or overseen by another investment adviser) and any entity controlling, controlled by, or under common control with the investment adviser that provides ongoing services to the Trust, if the engagement relates directly to the operations and/or financial reporting of the Trust.
To implement these provisions of the Act, the Securities and Exchange Commission (the “SEC”) has issued rules specifying the types of services that the Trust’s independent auditor may not provide to the Trust, as well as the Audit Committee’s administration of the engagement of the independent auditor. Under these rules, the SEC has provided that a permissible approval of audit and non-audit services can take the form of either (i) a general pre-approval, or (ii) a specific pre-approval (where a specific type of service is authorized, generally subject to a fee maximum). General pre-approvals are authorized by SEC rules only subject to detailed policies and procedures. Unless a type of service has received general pre-approval, it will require specific pre-approval by the Audit Committee if it is to be provided by the independent auditor. Accordingly, the Audit Committee has adopted these Audit and Non-Audit Services Pre-Approval Policies and Procedures, which set forth the procedures and the conditions pursuant to which services for the Trust may be performed by the independent auditor under pre-approvals.
II. General Pre-Approval Policies
It is the policy of the Audit Committee that audit and non-audit services to be performed by the Trust’s independent auditor be pre-approved only when in the best interests of the Trust’s shareholders and fully consistent with applicable law and, particularly, the maintenance of the auditor’s independence. In granting any pre-approval, consideration shall be given to:
| 1. | the qualifications of the auditor to perform the services involved; |
| 2. | the proposed costs (which may be presented as an estimate or based on professional time charges subject to a ceiling) of the services and the reasonableness thereof; |
| 3. | the permissibility of the services under applicable rules and guidance of the SEC; |
| 4. | the effect, if any, of the performance of the proposed services on the auditor’s independence; |
| 5. | the effect of the compensation for the proposed services on the auditor’s independence; and |
| 6. | the effect, if any, of the proposed services on the Trust’s ability to manage or control risk or to improve audit quality. |
In accordance with SEC rules, non-audit services performed by the Trust’s independent auditor may not include the following:
| 1. | Bookkeeping or other services related to the accounting records or financial statements of the audit client; |
| 2. | Financial information systems design and implementation; |
| 3. | Appraisal or valuation services, fairness opinions or contribution-in-kind reports; |
| 4. | Actuarial services; |
| 5. | Internal audit outsourcing services; |
| 6. | Management functions or human resources; |
| 7. | Broker-dealer, investment adviser or investment banking services; and |
| 8. | Legal services and expert services unrelated to the audit. |
III. Procedures for Pre-Approval by the Audit Committee
| 1. | Requests for pre-approval shall be in writing and may be made by either the independent auditors or by management of the Trust. |
| 2. | All requests for pre-approval shall be made to the full Audit Committee at regularly scheduled meetings thereof (or at a special meeting of the Audit Committee set to coincide with regular meetings of the Trust’s Board of Trustees) whenever practicable. |
| 3. | Under normal circumstances, requests for pre-approval should be presented at least 7 days prior (and in no event later than 48 hours prior) to the proposed commencement of the engagement. |
| 4. | If consideration of a request for pre-approval on the dates identified in Section III (2) would not be timely, the requesting party shall notify the Chairman of the Audit Committee. The Chairman of the Audit Committee shall then determine whether to schedule a special meeting of the Audit Committee (which may be conducted telephonically) on an alternative date or whether the request may appropriately be presented to a delegate of the Audit Committee under procedures set forth in Section IV below. |
| 5. | Requests for pre-approval may include, but are not limited to, the following services: |
a. audit engagement, particularly for interim periods;
b. tax compliance, tax planning, and tax advice;
| c. | review and consents with respect to use of reports in post-effective amendments to the registration statements of the Trust; |
d. review of IRS shareholder materials;
| e. | review and validation of Trust procedures (e.g., valuation, interTrust lending, etc.), and |
f. market research and strategic insights.
| 6. | Requests for pre-approval should identify the nature of the services to be provided in a manner sufficiently specific to allow evaluation of the considerations identified above in Section II. |
| 7. | In accordance with PCAOB Rule 3524, requests for pre-approval of permissible tax services by the independent auditor must have the following items described in writing for the audit committee: |
a. the scope of the proposed tax service,
b. the fee structure for the engagement,
| c. | any side letters, amendments to the engagement letter or any other agreements, whether oral, written, or otherwise, relating to the service between the audit firm and the Trusts, and |
| d. | any compensation arrangements or other agreements between the audit firm and any third party with respect to promoting, marketing, or recommending a transaction covered by the proposed tax service. |
The audit firm should discuss with the Audit Committee the potential effect of the proposed tax service(s) on the audit firm’s independence.
| 8. | Requests for pre-approval must include an assessment by the independent auditor of its independence should the request be granted and the proposed services rendered. |
| 9. | The Audit Committee’s action on a request for pre-approval shall be recorded in the Audit Committee’s minutes. |
| 10. | The Audit Committee’s action on a request for pre-approval shall be communicated in writing to the independent auditor and, under normal circumstances, a copy of this communication shall be provided to the Trust’s management. |
| 11. | The Audit Committee’s action on a request for pre-approval shall be reported to the full Board of Trustees. |
12. Pre-approvals will be granted for a period of no more than one year.
IV. Procedures for Pre-Approval by a Delegate of the Audit Committee
| 1. | Where it has been determined by the Chairman of the Audit Committee that consideration of a request for pre-approval by the full Audit Committee would not be timely, the Chairman may determine that the request be presented to a member(s) of the Audit Committee appointed by the Audit Committee as its delegate (the “Delegate”) for this purpose. (As of the date of the adoption of these guidelines and procedures, the Chairman of the Audit Committee has been so appointed, and such appointment may be revoked or modified by the Audit Committee at any time.) |
| 2. | Requests for pre-approval shall be in writing and may be made by either the independent auditors or by management of the Trust. |
| 3. | Under normal circumstances, requests for pre-approval should be presented at least 7 days prior (and in no event later than 48 hours prior) to the proposed commencement of the engagement. |
| 4. | Requests for pre-approval may include, but are not limited to, the following services: |
a. audit engagement, particularly for interim periods;
b. tax compliance, tax planning, and tax advice;
| c. | review and consents with respect to use of reports in post-effective amendments to the registration statements of the Trust; |
d. review of IRS shareholder materials;
| e. | review and validation of Trust procedures (e.g., valuation, interfund lending, etc.); and |
f. market research and strategic insights.
| 5. | Requests for pre-approval should identify the nature of the services to be provided in a manner sufficiently specific to allow evaluation of the considerations identified above in Section II. |
| 6. | Requests for pre-approval must include an assessment by the independent auditor of its independence should the request be granted and the proposed services rendered. |
| 7. | The Delegate’s action on a request for pre-approval shall be communicated in writing to the independent auditor, with a copy to each other member of the Audit Committee and, under normal circumstances, to the Trust’s management. |
| 8. | Pre-approvals by the Delegate shall be reviewed by the Audit Committee at a meeting held no later than the next scheduled meeting of the Board of Trustees or the Audit Committee, whichever occurs sooner. An earlier review shall be conducted upon the written request of one or more Audit Committee members addressed to the Chairman of the Audit Committee. |
| 9. | Pre-approvals by the Delegate may be modified or revoked by the Audit Committee, but will not absolve the Trust of its responsibility to compensate the independent auditor for services rendered prior to such modification or revocation. |
| 10. | The results of the Audit Committee’s review of the Delegate’s action on a request for pre-approval shall be recorded in the Audit Committee’s minutes and reported to the full Board of Trustees. |
| 11. | Pre-approvals will be granted by the Delegate for a period of no more than one year. |
V. Procedures for Monitoring Engagements Authorized Under Pre-Approval Procedures
The independent auditor shall inform the Audit Committee in writing upon the commencement of services rendered under a pre-approval. The independent auditor shall thereafter provide the Audit Committee with written quarterly progress reports within one month of the close of each calendar quarter detailing the work done and fees and other charges incurred during said calendar quarter. Should fees and expenses exceed those specified in a pre-approval (or appear likely to do so prior to completion of the work), the independent auditor or management shall so apprise the Audit Committee and an additional express approval or pre-approval must be obtained.
VI. Amendment
These Policies and Procedures may be amended or revoked at any time by the Audit Committee and shall be reviewed at least annually in conjunction with review of the Audit Committee Charter.
Adopted February 14, 2013
(e)(2) Percentage of services described in each of paragraphs (b) through (d) of this Item that were approved by the audit committee pursuant to paragraph (C)(7)(i)(C) of Rule 2-01 of Regulation S-X.
Fiscal year ended 2017 - 100%
Percentage of services provided to the registrant’s investment adviser and any entity controlling, controlled by, or under common control with the investment adviser that provides ongoing services to the registrant that were approved by the registrant’s audit committee pursuant to paragraph (C)(7)(i)(C) of Rule 2-01 of Regulation S-X, 0%.
(f) Not applicable.
(g) Not applicable.
(h) The registrant’s Audit Committee has considered whether the provision of non audit services that were rendered to registrant’s investment adviser (not including any sub adviser whose role is primarily portfolio management and is subcontracted with or overseen by another investment adviser), and any entity controlling, controlled by, or under common control with the investment adviser that provide ongoing services to the registrant that were not pre-approved pursuant to paragraph (c)(7)(ii) of Rule 2-01 of Regulation S-X is compatible with maintaining the principal account’s independence.
| Item 5. | Audit Committee of Listed Registrants. |
The Registrant is a listed issuer as defined in Rule 10A-3 under the Exchange Act and has a separately-designated standing audit committee established in accordance with Section 3(a)(58)(A) of the Exchange Act. The Registrant’s audit committee members are Stephen P. Lachenauer(Chairman), Tobias Caldwell and Donald McIntosh.
| Item 6. | Investments. |
(a) The schedules of investments are included as part of the report to shareholders filed under Item 1of this form.
(b) Not applicable.
Item 7. Disclosure of Proxy Voting Policies and Procedures for Closed-End Management Investment Companies.
Not applicable.
Item 8. Portfolio Managers of Closed-End Management Investment Companies.
Not applicable.
Item 9. Purchases of Equity Securities by Closed-End Management Investment Company and Affiliated Purchasers.
Not applicable.
Item 10. Submission of Matters to a Vote of Security Holders.
Not applicable.
Item 11. Controls and Procedures.
(a) The registrant’s Principal Executive Officer and Principal Financial Officer have concluded that the registrant’s disclosure controls and procedures (as defined in Rule 30a-3(c) under the Act) are effective in design and operation and are sufficient to form the basis of the certifications required by Rule 30a-2 under the Act, based on their evaluation of these disclosure controls and procedures within 90 days of the filing of this report on Form N-CSR.
(b)There were no changes in the registrant’s internal control over financial reporting (as defined in Rule 30a-3(d) under the Act (17 CFR 270.30a-3(d)) that occurred during the second fiscal quarter of the period covered by this report that have materially affected or are reasonably likely to materially affect, the registrant’s internal control over financial reporting.
Item 12. Exhibits.
(a)(1) The code of ethics that is the subject of the disclosure required by Item 2 is attached hereto.
(a)(2) Certifications pursuant to Rule 30a-2(a) are attached hereto.
(a)(3) Not applicable.
(b) Certifications pursuant to Rule 30a-2(b) are furnished herewith.
SIGNATURES
Pursuant to the requirements of the Securities Exchange Act of 1934 and the Investment Company Act of 1940, the registrant
has duly caused this report to be signed on its behalf by the undersigned, thereunto duly authorized.
(Registrant) Strategy Shares
By (Signature and Title) _/s/ Jerry Szilagyi_
Jerry Szilagyi, Chief Executive Officer
Date __7/6/2018
Pursuant to the requirements of the Securities Exchange Act of 1934 and the Investment Company Act of 1940, this report has been signed below by the following persons on behalf of the registrant and in the capacities and on the dates indicated.
By (Signature and Title) ___/s/ Jerry Szilagyi
Jerry Szilagyi, Chief Executive Officer
Date __7/6/2018_
By (Signature and Title) _/s/ James Szilagyi
James Szilagyi, Treasurer
Date __7/6/2018