Table of Contents
UNITED STATES
SECURITIES AND EXCHANGE COMMISSION
Washington, D.C. 20549
FORM N-CSR
CERTIFIED SHAREHOLDER REPORT OF REGISTERED
MANAGEMENT INVESTMENT COMPANIES
Investment Company Act file number: 811-22497
HUNTINGTON STRATEGY SHARES
(Exact name of registrant as specified in charter)
2960 NORTH MERIDIAN STREET, SUITE 300, INDIANAPOLIS, IN 46208
(Address of principal executive offices) (Zip code)
CITI FUND SERVICES OHIO, INC., 3435 STELZER ROAD, COLUMBUS, OH 43219
(Name and address of agent for service)
Registrant’s telephone number, including area code: 855-477-3837
Date of fiscal year end: April 30
Date of reporting period: April 30, 2015
Table of Contents
| Item 1. | Reports to Stockholders. |
Table of Contents

Annual Shareholder Report
APRIL 30, 2015
Table of Contents

Rev. June 2015
| FACTS | WHAT DO THE HUNTINGTON STRATEGY SHARES DO WITH YOUR PERSONAL INFORMATION?
|
| Why? | Financial companies choose how they share your personal information. Federal law gives consumers the right to limit some but not all sharing. Federal law also requires us to tell you how we collect, share, and protect your personal information. Please read this notice carefully to understand what we do. |
| What? | The types of personal information we collect and share depend on the product or service you have with us. This information can include: ¡ Social Security number and income ¡ Account balances and transaction history ¡ Information about your investment goals and risk tolerances |
| How? | All financial companies need to share customers’ personal information to run their everyday business. In the section below, we list the reasons financial companies can share their customers’ personal information; the reasons the Huntington Strategy Shares choose to share; and whether you can limit this sharing. |
| Reasons we can share your personal information | Do the Huntington Strategy Shares share?
| Can you limit this sharing? | ||
For our everyday business purposes— such as to process your transactions, maintain your account(s), respond to court orders and legal investigations, or report to credit bureaus | Yes | No | ||
For our marketing purposes— to offer our products and services to you | Yes | No | ||
For joint marketing with other financial companies | No | We don’t share | ||
For our affiliates’ everyday business purposes— information about your transactions and experiences | Yes | No | ||
For our affiliates’ everyday business purposes— information about your creditworthiness | Yes | Yes | ||
For our affiliates to market to you | Yes | Yes | ||
For nonaffiliates to market to you | No | We don’t share |
To limit our sharing |
¡ Call toll-free 1-855-477-3837
Please note:
If you are a new customer, we can begin sharing your information 30 days from the date we sent this notice. When you are no longer our customer, we continue to share your information as described in this notice.
However, you can contact us at any time to limit our sharing. |
| Questions? | Calltoll-free 1-855-477-3837 |
State Disclosures - In addition to your rights described below and in this notice, you may have other rights under state laws. We will comply with applicable state laws with respect to our information practices.
California and Vermont Customers have other protections under state law. If your primary mailing address is in California or Vermont, we will not share your financial information that we collect except as permitted by law, including, for example, with your consent or to service your account. We will also not use your information for joint marketing purposes. We do not share customer information with third parties except as permitted by law. | ||
Table of Contents
Page 2 |
Who we are | ||
Who is providing this notice? | Huntington Strategy Shares, a family of exchange-traded funds advised by Huntington Asset Advisors, Inc. | |
What we do | ||
| How do the Huntington Strategy Shares protect my personal information? | We maintain, and require all Fund service providers to maintain policies designed to assure only appropriate access to, and use of information about, our customers. We rely on the Huntington Strategy Shares’ transfer agent to appropriately dispose of our customers’ nonpublic personal information and to protect against its unauthorized access or use when we are no longer required to maintain this information. | |
| How do the Huntington Strategy Shares collect my personal information? | We collect your personal information, for example, when you
¡ Complete an account application or other forms with us ¡ Make a transaction in the Funds ¡ Correspond with us or our service providers—in written form, via telephone or through the Funds’ website | |
| Why can’t I limit all sharing? | Federal law gives you the right to limit only
¡ Sharing for affiliates’ everyday business purposes—information about your creditworthiness ¡ Affiliates from using your information to market to you ¡ Sharing for nonaffiliates to market to you
State laws and individual companies may give you additional rights to limit sharing. | |
| What happens when I limit sharing for an account I hold jointly with someone else? | For joint accounts, any one of the joint account holders has the right to exercise the option described above. If you are a joint account holder, your decision will also apply to others with whom you jointly hold accounts. If you have more than one consumer account with us, you need only respond once. | |
Definitions | ||
| Affiliates | Companies related by common ownership or control. They can be financial and nonfinancial companies.
¡ Our affiliates include companies with a Huntington name and financial companies, including Huntington Asset Advisors, Huntington Investment Company and Huntington Asset Services. | |
| Nonaffiliates | Companies not related by common ownership or control. They can be financial and nonfinancial companies.
¡ Nonaffiliates we share with can include banks, securities broker-dealers, insurance companies, data processors, software companies, marketing service providers, and state and federal government agencies. | |
| Joint marketing | A formal agreement between nonaffiliated financial companies that together market financial products or services to you.
¡ The Huntington Strategy Shares currently do not have any joint marketing arrangements. | |
Table of Contents
| Page | ||||
| 1 | ||||
| 5 | ||||
| 6 | ||||
| 10 | ||||
| 12 | ||||
| 13 | ||||
| 14 | ||||
| 16 | ||||
| 18 | ||||
| 23 | ||||
| 24 | ||||
| 26 | ||||
Table of Contents
Message from the Chief Investment Officer
Dear Shareholder:
Both Huntington Strategy Shares offerings provided positive returns for their shareholders during the fiscal year ended April 30, 2015. The Huntington U.S. Equity Rotation Strategy ETF’s total return at net asset value was 13.26% over the twelve-month period, outperforming the 12.80% return of the unmanaged Standard & Poor’s Composite 1500 (S&P 1500)1, the Fund’s benchmark, for the same period. The Fund’s outperformance of almost one-half percent was achieved by the Fund’s management strategy to match the S&P 1500 with 70% of the portfolio’s holdings, and overweight the remaining 30% in sectors we believe have the best opportunity to outperform the index. During the period, the Fund was overweight in the Health Care, Industrial and Information Technology sectors.
The Huntington EcoLogical Strategy ETF’s total return at net asset value was 8.26% over the twelve-month period, underperforming the 11.30% return of the MSCI KLD 400 Social Index2. The Fund’s performance was negatively impacted by its holdings in two companies, which were evaluated and sold during the period. In the coming year, the Fund manager will focus on opportunities to enhance performance by expanding exposure to the international markets.
During the past year, a number of events occurred that will likely change the course of upcoming investment markets. Most notably was the cessation of the programmed quantitative easing monetary policy by the Federal Reserve Bank (Fed). While the official Fed policy indicated that it would continue with an ‘easy’ money approach, the ending of crowding out in the bond marketplace, and the speculation of when the Fed might start tightening, has (and will likely continue) to impact the bond markets. The provision of liquidity to the fixed income markets has benefitted stock shareholders domestically, and the European Central Bank recently initiated its own version of a bond purchasing program. There is some speculation that a similar stimulus to the international equity markets may occur with the prospect of stock appreciation.
Another transition in the political and economic markets was the recent change in the makeup of Congress. With both houses of Congress now within Republican control, there will likely be policies that influence taxes and regulations, and the potential for roll-backs on several significant pieces of recently enacted legislation. This Congressional alteration is of particular importance due to the increasingly bellicose behavior of Russia. Having moved toward the West in recent decades, in 2014 there was a departure from this policy as Russia seemingly sought a more aggressive posture in its international dealings. These two factors, the change in Congress and the Russian attitude, will likely lead to more U.S. defense spending and, thus, investment opportunities.
The strength of the U.S. dollar is another factor that will carry a longer term market impact. Typically, a strong domestic currency will have the positive implication of a lower level of inflation. International goods and services that are bought domestically will be purchased at lower prices and, therefore, similar items produced domestically will have to compete by restraining prices. This presents a second reason for the international stock market to potentially perform well in the months to come. On the other hand, a strong dollar should serve to dampen top-line growth for those U.S. companies that sell overseas; however, it should aid those domestic companies that derive a benefit from purchasing intermediate goods from overseas with their inflated dollars (think Walmart).
Finally, one avenue Huntington Asset Advisors, Inc. believes emerged during the year is in the field of robotics. While robots have been in the manufacturing sector for years, 2014 marked the first year the general population seemed to become aware of the possibilities for their use in mainstream life. With Amazon exploring the prospect of drone delivery systems, surgical procedures being conducted with robotic precision, Google producing self-driving automobiles, and IRobot providing a host of commercial and military robotic functions, the potential for robotic expansion is enormous. We believe this phenomenon could supersede the investment excitement of the ‘dot-com’ era as new applications for non-human intervention in consumer lives take hold.
As advisor to the Huntington Strategy Shares we will continually evaluate the above transitory events and trends as we make investment selections within the Funds on your behalf. We encourage you to read the following Management’s Discussion of Fund Performance for further insights from the Funds’ manager.
Message from the Chief Investment Officer
Table of Contents
Message from the Chief Investment Officer (Continued)
As always, we appreciate your confidence and continued interest in the Funds, and we will manage them with the utmost ethical behavior and attention to provide you with beneficial investment tools.
Sincerely,

B. Randolph Bateman, CFA
President & Chief Investment Officer
Huntington Asset Advisors, Inc.
This material represents the manager’s assessment of the Funds and market environment at a specific time and should not be relied upon by the reader as research, tax or investment advice.
In addition to the normal risks associated with investing, international investments may involve risk of capital loss from unfavorable fluctuation in currency values, from differences in generally accepted accounting principles or from social, economic or political instability in other nations. Products of technology companies may be subject to severe competition and rapid obsolescence.
| (1) | The S&P Composite 1500 Index is a broad equity index based on the S&P 500, S&P MidCap 400, and S&P SmallCap 600 indices. Thus, the S&P Composite 1500 Index includes the top large cap, mid cap and small cap stocks, representing about 85% of the entire U.S. equity market. An investor cannot invest directly in an index. |
| (2) | The MSCI KLD 400 Social Index is based on the MSCI USA Investable Market Index (IMI), its parent index, which includes large-, mid- and small-cap constituents in the U.S. The index includes companies in the parent index with high Environmental, Social and Governance (ESG) ratings, while excluding companies involved in alcohol, tobacco, gambling, firearms, nuclear power and military weapons production. An investor cannot invest directly in an index. |
Message from the Chief Investment Officer
Table of Contents
| Huntington US Equity Rotation Strategy ETF | April 30, 2015 |
Management’s Discussion of Fund Performance
ETF Manager: Martina Cheung, CFA and CMT
Senior Vice President and Fund Manager
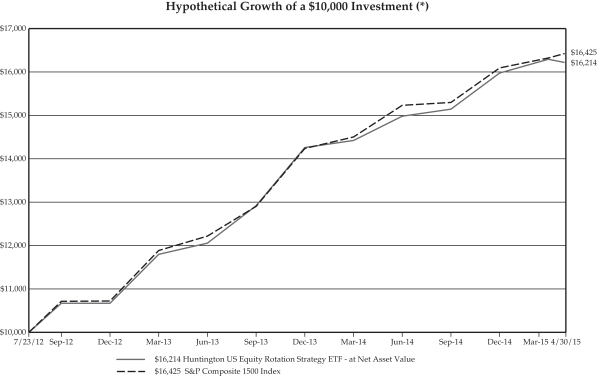
For the fiscal year ended April 30, 2015, the US Equity Rotation Strategy ETF (HUSE) generated a positive return of 13.26% at net asset value. This compared to a return of 12.80% for the Standard & Poor’s Composite 1500 Index (S&P 1500)1, the Fund’s benchmark, for the same period.
The strategy employed by HUSE is to benchmark 70% of the portfolio to the S&P 1500 Index, and invest the remaining 30% in the stocks of the three sectors of the S&P 1500 Index that we believe have the best chance of outperforming the S&P 1500. HUSE seeks to take advantage of the significant volatility that exists between the different sectors of the index to potentially produce alpha2. Over the past twelve-month period ended April 30, 2015, the stock market, as measured by the Standard & Poor’s 500 Index3, had a return of 12.98%. This exceeded its record high achieved in 2000. This was accomplished with a great deal of volatility among sectors.
As an actively managed ETF, HUSE seeks to benefit from this volatility which also occurred in the S&P 1500. The three sectors we chose to overweight during this period were Health Care, Industrials and Information Technology. Industrials and Information Technology were overweighted in an attempt to take advantage of the volatility, while the more defensive Health Care sector was chosen to potentially protect the portfolio from downside risk.
Health Care and Information Technology were among the top performing sectors over the last twelve-month period, up 25.70% and 20.34% respectively. The overweight of these sectors attributed most to the outperformance of HUSE, relative to its benchmark. HUSE also benefited from stock selections and Merger & Acquisition activities within the overweighted sectors. Holdings such as Salix Pharmaceuticals, Ltd., Humana, Inc., Edwards Lifesciences Corp., Measurement Specialties, Inc., and UnitedHealth Group were among the top contributors to the Fund’s return. We believe the strategy employed by HUSE is sound and has the potential to result in outperformance over an extended period of time.
| (1) | The S&P Composite 1500 Index is a broad equity index based on the S&P 500, S&P MidCap 400, and S&P SmallCap 600 indices. Thus, the S&P Composite 1500 Index includes the top large cap, mid cap and small cap stocks, representing about 85% of the entire U.S. equity market. An investor cannot invest directly in an index. |
| (2) | Alpha is a measure of performance on a risk-adjusted basis. Alpha takes the volatility (price risk) of a mutual fund and compares its risk adjusted performance to a benchmark index. The excess return of the fund relative to the return of the benchmark index is a fund’s alpha. |
| (3) | The S&P 500 Index is an unmanaged index generally representing the performance of the broad domestic economy through changes in the aggregate market value of 500 stocks representing all major industries. An investor cannot invest directly in an index. |
ETF Risk. The Fund is an actively-managed ETF and the Fund’s NAV will fluctuate based on changes in the prices of the securities it owns. The market price of Fund shares will fluctuate based on changes in the Fund’s NAV as well as changes in the supply and demand of its shares in the secondary market. It is also possible that an active secondary market for Fund shares may not develop and market trading in the Fund shares may be halted under certain circumstances.
You should consider an investment in the Fund as a long-term investment. The Fund’s returns will fluctuate over long and short periods.
This material represents the manager’s assessment of the Fund and market environment as of April 30, 2015 and should not be relied upon by the reader as research, tax or investment advice, is subject to change at any time based upon economic, market, or other conditions and the Advisor undertakes no obligation to update the views expressed herein. Any discussions of specific securities should not be considered a recommendation to buy or sell those securities. The views expressed above (including any forward-looking statement) may not be relied upon as investment advice or as an indication of the Fund’s trading intent.
The performance of any index mentioned in this commentary has not been adjusted for ongoing management, distribution and operating expenses, and sales charges applicable to exchange traded fund investments. In addition, the Fund’s returns do not reflect brokerage fees that an investor in the Fund may pay. If these commissions were reflected, performance would have been lower.
Annual Shareholder Report
1
Table of Contents
Huntington US Equity Rotation Strategy ETF (Continued)
INVESTMENT OBJECTIVE
The Huntington US Equity Rotation Strategy ETF seeks to achieve capital appreciation.
FUND PERFORMANCE (AS OF 4/30/15)
| Average Annual Total Returns | Expense Ratios (a) | |||||||||||||||
| One Year | Inception (b) | Gross | Net | |||||||||||||
US Equity Rotation Strategy ETF (HUSE) — Total Return (at Net Asset Value) (c) | 13.26 | % | 19.06 | % | 2.26 | % | 0.95 | % | ||||||||
US Equity Rotation Strategy ETF (HUSE) — Total Return (at Market Value) (d) | 14.68 | % | 19.45 | % | N/A | N/A | ||||||||||
S&P Composite 1500 Index (e) | 12.80 | % | 19.64 | % | N/A | N/A | ||||||||||
Past performance does not guarantee future results. Return calculations assume the reinvestment of distributions and do not reflect taxes that a shareholder would pay on Fund distributions or on the redemption of Fund shares. The performance data quoted represents past performance and current returns may be lower or higher. The investment return and principal value will fluctuate so that an investor’s shares, when redeemed may be worth more or less than the original cost. The performance above reflects any fee reductions during the applicable periods. If such fee reductions had not occurred, the quoted performance would be lower. To obtain performance information current to the most recent month-end, please call 855-477-3837 or visit http://www.huntingtonstrategyshares.com
| * | The chart represents historical performance of a hypothetical investment of $10,000 in the Huntington US Equity Rotation Strategy ETF and represents the reinvestment of dividends and capital gains in the Fund. |
| (a) | The gross expense ratios reflect the expense ratios as reported in the Fund’s Prospectus dated August 28, 2014. However, the Advisor has agreed to contractual waivers in effect through August 31, 2015 and has agreed to limit total annual fund operating expenses to the net expense ratios shown. Please see the Fund’s most recent prospectus for details. Additional information pertaining to the Fund’s expense ratio as of April 30, 2015 can be found in the Financial Highlights. |
| (b) | Commencement of operations July 23, 2012. |
| (c) | Net asset value total return is calculated assuming an initial investment made at the net asset value at the beginning of the period, reinvestment of all dividends and distributions at net asset value during the period, if any, and redemption on the last day of the period at net asset value. This percentage is not an indication of the performance of a shareholder’s investment in the Fund based on market value due to differences between the market price of the shares and the net asset value per share of the Fund. |
| (d) | Market value total return is calculated assuming an initial investment made at the market value at the beginning of the period, reinvestment of all dividends and distributions at net asset value during the period, if any, and redemption on the last day of the period at market value. Market value is determined by the composite closing price. Composite closing security price is defined as the last reported sale price from any primary listing market (e.g., NYSE Arca) or participating regional exchanges or markets. The composite closing price is the last reported sale price from any of the eligible sources, regardless of volume and not an average price and may have occurred on a date prior to the close of the reporting period. Market value may be greater or less than net asset value, depending on the Fund’s closing price on the listing market. |
| (e) | The S&P Composite 1500 Index is a broad equity index based on the S&P 500, S&P MidCap 400, and S&P SmallCap 600 indices. Thus, the S&P Composite 1500 Index includes the top large cap, mid cap and small cap stocks, representing about 85% of the entire U.S. equity market. An investor cannot invest directly in an index. |
Annual Shareholder Report
2
Table of Contents
| Huntington EcoLogical Strategy ETF | April 30, 2015 |
Management’s Discussion of Fund Performance
ETF Manager: Martina Cheung, CFA and CMT
Senior Vice President and Fund Manager
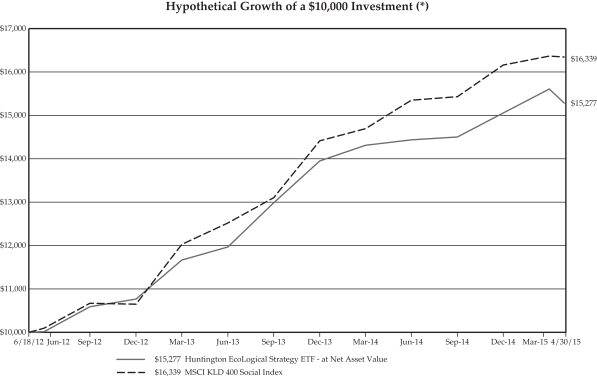
For the fiscal year ended April 30, 2015, the Huntington EcoLogical Strategy ETF (HECO) generated a positive return of 8.26% at net asset value. This compared to a return of 11.30% for the MSCI KLD 400 Social Index1, the Fund’s benchmark, for the same period.
Over the last twelve-month period the stock market, as measured by the Standard & Poor’s 500 Index2, had a return of 12.98%. The Fund’s performance benefitted from the strong overall market. During the period, top contributors were Apple, Inc. and Jones Lang LaSalle Inc. Continued innovations drive investors’ interest in Apple, which was one of the first computer companies to phase out the use of toxic chemicals in its production process, and emphasizes the use of environmentally conscious materials. Additionally, Apple encourages recycling through its Reuse and Recycling Program. Jones Lang LaSalle is a professional services company specializing in providing commercial real estate strategy, services and support to organizations around the globe. Their mission is to offer the broadest and deepest energy and sustainability expertise to property owners and tenants.
Top detractors to the Fund’s performance were Whole Foods Markets and MasTec . As a leading retailer in natural/organic products, Whole Foods will likely be a key beneficiary of increasing interest in natural/organic products, but increased competition in this arena will likely put pressure on its gross margin in the near term. MasTec’s engineers build and maintain gas pipelines, electricity grid transmission lines, and telecom networks. Slowing capital spending on its major clients creates uncertainty in the near term. These holdings were sold during the period.
Sustainability and environmental stewardship continue to grow in importance across the globe. We feel that the companies in the portfolio are well positioned with regard to these growing themes. The portfolio maintains a high quality growth bias. We tend to invest in companies that are better stewards of the environment and better stewards of capital. We believe that these policies will be rewarded over time, and may lead to higher profits and higher market share. This belief guides our investment process.
| (1) | The MSCI KLD 400 Social Index is based on the MSCI USA Investable Market Index (IMI), its parent index, which includes large-, mid- and small-cap constituents in the U.S. The index includes companies in the parent index with high Environmental, Social and Governance (ESG) ratings, while excluding companies involved in alcohol, tobacco, gambling, firearms, nuclear power and military weapons production. An investor cannot invest directly in an index. |
| (2) | The S&P 500 Index is an unmanaged index generally representing the performance of the broad domestic economy through changes in the aggregate market value of 500 stocks representing all major industries. An investor cannot invest directly in an index. |
Ecological Investment Risk. The Fund’s ecological investment criteria limit the types of investments the Fund may make. This could cause the Fund to underperform other funds that do not have an ecological focus.
ETF Risk. The Fund is an actively-managed ETF and the Fund’s NAV will fluctuate based on changes in the prices of the securities it owns. The market price of Fund shares will fluctuate based on changes in the Fund’s NAV as well as changes in the supply and demand of its shares in the secondary market. It is also possible that an active secondary market for Fund shares may not develop and market trading in the Fund shares may be halted under certain circumstances.
You should consider an investment in the Fund as a long-term investment. The Fund’s returns will fluctuate over long and short periods.
This material represents the manager’s assessment of the Fund and market environment as of April 30, 2015 and should not be relied upon by the reader as research, tax or investment advice, is subject to change at any time based upon economic, market, or other conditions and the Advisor undertakes no obligation to update the views expressed herein. Any discussions of specific securities should not be considered a recommendation to buy or sell those securities. The views expressed above (including any forward-looking statement) may not be relied upon as investment advice or as an indication of the Fund’s trading intent. Information about the Fund’s holdings, asset allocation or country diversification is historical and is not an indication of future Fund composition, which may vary.
The performance of any index mentioned in this commentary has not been adjusted for ongoing management, distribution and operating expenses, and sales charges applicable to exchange traded fund investments. In addition, the Fund’s returns do not reflect brokerage fees that an investor in the Fund may pay. If these commissions were reflected, performance would have been lower.
Annual Shareholder Report
3
Table of Contents
Huntington EcoLogical Strategy ETF (Continued)
INVESTMENT OBJECTIVE
The Huntington EcoLogical Strategy ETF seeks to achieve capital appreciation.
FUND PERFORMANCE (AS OF 4/30/15)
| Average Annual Total Returns | Expense Ratios (a) | |||||||||||||||
| One Year | Inception (b) | Gross | Net | |||||||||||||
EcoLogical Strategy ETF (HECO) — Total Return (at Net Asset Value) (c) | 8.26 | % | 15.94 | % | 2.08 | % | 0.95 | % | ||||||||
EcoLogical Strategy ETF (HECO) — Total Return (at Market Value) (d) | 10.19 | % | 16.69 | % | N/A | N/A | ||||||||||
MSCI KLD 400 Social Index (e) | 11.30 | % | 18.70 | % | N/A | N/A | ||||||||||
Past performance does not guarantee future results. Return calculations assume the reinvestment of distributions and do not reflect taxes that a shareholder would pay on Fund distributions or on the redemption of Fund shares. The performance data quoted represents past performance and current returns may be lower or higher. The investment return and principal value will fluctuate so that an investor’s shares, when redeemed may be worth more or less than the original cost. The performance above reflects any fee reductions during the applicable periods. If such fee reductions had not occurred, the quoted performance would be lower. To obtain performance information current to the most recent month-end, please call 855-477-3837 or visit http://www.huntingtonstrategyshares.com
| * | The chart represents historical performance of a hypothetical investment of $10,000 in the Huntington EcoLogical Strategy ETF and represents the reinvestment of dividends and capital gains in the Fund. |
| (a) | The gross expense ratios reflect the expense ratios as reported in the Fund’s Prospectus dated August 28, 2014. However, the Advisor has agreed to contractual waivers in effect through August 31, 2015 and has agreed to limit total annual fund operating expenses to the net expense ratios shown. Please see the Fund’s most recent prospectus for details. Additional information pertaining to the Fund’s expense ratio as of April 30, 2015 can be found in the Financial Highlights. |
| (b) | Commencement of operations June 18, 2012. |
| (c) | Net asset value total return is calculated assuming an initial investment made at the net asset value at the beginning of the period, reinvestment of all dividends and distributions at net asset value during the period, if any, and redemption on the last day of the period at net asset value. This percentage is not an indication of the performance of a shareholder’s investment in the Fund based on market value due to differences between the market price of the shares and the net asset value per share of the Fund. |
| (d) | Market value total return is calculated assuming an initial investment made at the market value at the beginning of the period, reinvestment of all dividends and distributions at net asset value during the period, if any, and redemption on the last day of the period at market value. Market value is determined by the composite closing price. Composite closing security price is defined as the last reported sale price from any primary listing market (e.g., NYSE Arca) or participating regional exchanges or markets. The composite closing price is the last reported sale price from any of the eligible sources, regardless of volume and not an average price and may have occurred on a date prior to the close of the reporting period. Market value may be greater or less than net asset value, depending on the Fund’s closing price on the listing market. |
| (e) | The MSCI KLD 400 Social Index is based on the MSCI USA Investable Market Index (IMI), its parent index, which includes large-, mid- and small-cap constituents in the U.S. The index includes companies in the parent index with high Environmental, Social and Governance (ESG) ratings, while excluding companies involved in alcohol, tobacco, gambling, firearms, nuclear power and military weapons production. An investor cannot invest directly in an index. |
Annual Shareholder Report
4
Table of Contents
| Expense Examples (Unaudited) | April 30, 2015 |
As a Fund shareholder, you may incur two types of costs: (1) transaction costs, including commissions on trading, as applicable; and (2) ongoing costs, including advisory fees and other Fund expenses. These examples are intended to help you understand your ongoing costs (in dollars) of investing in a Fund and to compare these costs with the ongoing costs of investing in other mutual funds.
The expense examples below are based on an investment of $1,000 invested at November 1, 2014 and held through the period ended April 30, 2015.
The Actual Expense figures in the table below provide information about actual account values and actual expenses. You may use this information, together with the amount you invested, to estimate the expenses that you paid over the period. Simply divide your account value by $1,000 (for example, an $8,600 account value divided by $1,000 = 8.6), then multiply the result by the number in the table under the heading entitled “Actual Expenses Paid During the Period” to estimate the expenses you paid on your account during this period.
The Hypothetical Expense figures in the table below provide information about hypothetical account values and hypothetical expenses based on each Fund’s actual expense ratio and an assumed rate of return of 5% per year before expenses, which is not each Fund’s actual return. The hypothetical account values and expenses may not be used to estimate the actual ending account balance or expenses you paid for the period. You may use this information to compare the ongoing costs of investing in your Fund and other funds. To do so, compare this 5% hypothetical example with the 5% hypothetical examples that appear in the shareholder reports of the other funds.
Please note that the expenses shown in the table are meant to highlight your ongoing costs only and do not reflect any transactional costs. Therefore, the examples are useful in comparing ongoing costs only and will not help you determine the relative total cost of owning different funds. In addition, if these transactional costs were included, your costs would have been higher.
| Fund | Beginning 11/1/14 | Actual Ending Account Value 4/30/15 | Hypothetical 4/30/15 | Actual Expenses Paid During the Period (1)(2) | Total Return | Hypothetical Expenses Paid During the Period (2)(3) | Annualized Net Expense Ratio During the Period | |||||||||||||||||||
Huntington US Equity Rotation Strategy ETF | $1,000.00 | $ | 1,037.80 | $ | 1,020.08 | $ | 4.80 | 3.78 | % | $ | 4.76 | 0.95 | % | |||||||||||||
Huntington EcoLogical Strategy ETF | 1,000.00 | 1,024.00 | 1,020.08 | 4.77 | 2.40 | % | 4.76 | 0.95 | % | |||||||||||||||||
| (1) | Expenses are equal to the Fund’s annualized expense ratio multiplied by the average account value over the period multiplied by 181/365 (to reflect the one-half year period). |
| (2) | Expenses are equal to the average hypothetical account value over the period multiplied by the Fund’s annualized expense ratio, multiplied by the number of days in the most recent fiscal half-year divided by the number of days in the fiscal year (to reflect the one-half year period). |
| (3) | Represents the hypothetical 5% annual return before taxes. |
Annual Shareholder Report
5
Table of Contents
| Huntington US Equity Rotation Strategy ETF | April 30, 2015 |
| Portfolio of Investments Summary Table | (unaudited) |
| Percentage of Market Value | ||||
Consumer Discretionary | 8.9% | |||
Consumer Staples | 6.1% | |||
Energy | 5.1% | |||
Financials | 11.7% | |||
Health Care | 23.4% | |||
Industrials | 11.9% | |||
Information Technology | 24.7% | |||
Materials | 2.1% | |||
Telecommunication Services | 0.9% | |||
Utilities | 2.1% | |||
Exchange-Traded Fund | 3.1% | |||
Total | 100.0% | |||
Portfolio holdings and allocations are subject to change. As of April 30, 2015, percentages in the table above are based on total investments. Such total investments may differ from the percentages set forth in the following Portfolio of Investments which are computed using the Fund’s total net assets.
| Shares | Market Value | |||||||||
| Common Stocks — 94.5% | |||||||||
| Consumer Discretionary — 8.7% | |||||||||
| 36 | Advance Auto Parts, Inc. | $ | 5,148 | |||||||
| 66 | Amazon.com, Inc. † | 27,837 | ||||||||
| 132 | Ann, Inc. † | 4,998 | ||||||||
| 60 | Bed Bath & Beyond, Inc. † | 4,228 | ||||||||
| 90 | Best Buy Co., Inc. | 3,119 | ||||||||
| 120 | Cato Corp., Class A | 4,721 | ||||||||
| 156 | CBS Corp., Class B | 9,692 | ||||||||
| 6 | Chipotle Mexican Grill, Inc. † | 3,728 | ||||||||
| 504 | Comcast Corp., Class A | 29,111 | ||||||||
| 18 | CST Brands, Inc. | 751 | ||||||||
| 156 | DIRECTV † | 14,150 | ||||||||
| 72 | Discovery Communications, Inc. † | 2,177 | ||||||||
| 72 | Discovery Communications, Inc., Class A † | 2,330 | ||||||||
| 48 | Dollar Tree, Inc. † | 3,668 | ||||||||
| 36 | Expedia, Inc. | 3,392 | ||||||||
| 42 | Family Dollar Stores, Inc. | 3,282 | ||||||||
| 54 | Foot Locker, Inc. | 3,210 | ||||||||
| 870 | Ford Motor Co. | 13,746 | ||||||||
| 90 | Gap, Inc. | 3,568 | ||||||||
| 192 | Goodyear Tire & Rubber Co. | 5,446 | ||||||||
| 210 | H & R Block, Inc. | 6,350 | ||||||||
| 78 | Harley-Davidson, Inc. | 4,384 | ||||||||
| 300 | Home Depot, Inc. | 32,093 | ||||||||
| 162 | Interpublic Group of Cos., Inc. | 3,376 | ||||||||
| 114 | Johnson Controls, Inc. | 5,743 | ||||||||
| 66 | L Brands, Inc. | 5,898 | ||||||||
| 60 | Lennar Corp., Class A | 2,748 | ||||||||
| 258 | Lowe’s Cos., Inc. | 17,765 | ||||||||
| 102 | Macy’s, Inc. | 6,592 | ||||||||
| Shares | Market Value | |||||||||
| Common Stocks — (Continued) | |||||||||
| Consumer Discretionary — (Continued) | |||||||||
| 84 | Marriott International, Inc., Class A | $ | 6,724 | |||||||
| 174 | McDonald’s Corp. | 16,800 | ||||||||
| 840 | Monarch Casino & Resort, Inc. † | 15,372 | ||||||||
| 18 | Murphy USA, Inc. † | 1,176 | ||||||||
| 12 | Netflix, Inc. † | 6,678 | ||||||||
| 114 | News Corp., Class A † | 1,799 | ||||||||
| 144 | NIKE, Inc., Class B | 14,233 | ||||||||
| 744 | Office Depot, Inc. † | 6,860 | ||||||||
| 30 | O’Reilly Automotive, Inc. † | 6,535 | ||||||||
| 12 | Priceline.com, Inc. † | 14,854 | ||||||||
| 54 | Ross Stores, Inc. | 5,340 | ||||||||
| 288 | Starbucks Corp. | 14,279 | ||||||||
| 60 | Starwood Hotels & Resorts Worldwide, Inc. | 5,157 | ||||||||
| 144 | Target Corp. | 11,351 | ||||||||
| 66 | Tempur-Pedic International, Inc. † | 4,020 | ||||||||
| 78 | Time Warner Cable, Inc. | 12,131 | ||||||||
| 204 | Time Warner, Inc. | 17,220 | ||||||||
| 27 | Time, Inc. | 616 | ||||||||
| 144 | TJX Cos., Inc. | 9,293 | ||||||||
| 36 | Tractor Supply Co. | 3,098 | ||||||||
| 487 | Twenty-First Century Fox, Inc., Class A | 16,597 | ||||||||
| 72 | V.F. Corp. | 5,215 | ||||||||
| 126 | Viacom, Inc., Class B | 8,751 | ||||||||
| 366 | Walt Disney Co. | 39,791 | ||||||||
| 36 | Whirlpool Corp. | 6,322 | ||||||||
| 48 | Wyndham Worldwide Corp. | 4,099 | ||||||||
| 84 | Yum! Brands, Inc. | 7,221 | ||||||||
| 494,783 | ||||||||||
(See notes which are an integral part of the Financial Statements) Annual Shareholder Report
(See notes which are an integral part of the Financial Statements)
Annual Shareholder Report
6
Table of Contents
| Huntington US Equity Rotation Strategy ETF | (Continued) |
| Shares | Market Value | |||||||||
| Common Stocks — (Continued) | |||||||||
| Consumer Staples — 5.9% | |||||||||
| 438 | Altria Group, Inc. | $ | 21,922 | |||||||
| 180 | Archer-Daniels-Midland Co. | 8,798 | ||||||||
| 90 | Clorox Co. | 9,549 | ||||||||
| 876 | Coca-Cola Co. | 35,531 | ||||||||
| 192 | Colgate-Palmolive Co. | 12,918 | ||||||||
| 96 | Costco Wholesale Corp. | 13,733 | ||||||||
| 270 | CVS Caremark Corp. | 26,808 | ||||||||
| 426 | Hormel Foods Corp. | 23,152 | ||||||||
| 126 | J & J Snack Foods Corp. | 13,146 | ||||||||
| 54 | Keurig Green Mountain, Inc. | 6,284 | ||||||||
| 90 | Kimberly-Clark Corp. | 9,872 | ||||||||
| 129 | Kraft Foods Group, Inc. | 10,933 | ||||||||
| 60 | Lancaster Colony Corp. | 5,380 | ||||||||
| 90 | Lorillard, Inc. | 6,287 | ||||||||
| 384 | Mondelez International, Inc. | 14,734 | ||||||||
| 42 | Monster Beverage Corp. † | 5,759 | ||||||||
| 312 | PepsiCo, Inc. | 29,677 | ||||||||
| 438 | Procter & Gamble Co. | 34,825 | ||||||||
| 54 | The Estee Lauder Cos., Inc., Class A | 4,390 | ||||||||
| 168 | Walgreens Boots Alliance, Inc. | 13,932 | ||||||||
| 324 | Wal-Mart Stores, Inc. | 25,288 | ||||||||
| 84 | Whole Foods Market, Inc. | 4,012 | ||||||||
| 336,930 | ||||||||||
| Energy — 5.0% | |||||||||
| 146 | Anadarko Petroleum Corp. | 13,739 | ||||||||
| 170 | Baker Hughes, Inc. | 11,638 | ||||||||
| 252 | Cabot Oil & Gas Corp. | 8,523 | ||||||||
| 428 | California Resources Corp. | 3,980 | ||||||||
| 744 | ConocoPhillips | 50,532 | ||||||||
| 474 | Devon Energy Corp. | 32,332 | ||||||||
| 24 | Energy Transfer Partners | 1,387 | ||||||||
| 120 | EOG Resources, Inc. | 11,874 | ||||||||
| 356 | Helmerich & Payne, Inc. | 27,757 | ||||||||
| 468 | Hess Corp. | 35,989 | ||||||||
| 268 | HollyFrontier Corp. | 10,393 | ||||||||
| 120 | Kinder Morgan, Inc. | 5,154 | ||||||||
| 102 | Marathon Petroleum Corp. | 10,054 | ||||||||
| 104 | Pioneer Natural Resources Co. | 17,969 | ||||||||
| 304 | Schlumberger, Ltd. | 28,762 | ||||||||
| 13 | Seventy Seven Energy, Inc. † | 66 | ||||||||
| 144 | The Williams Cos., Inc. | 7,371 | ||||||||
| 138 | Valero Energy Corp. | 7,852 | ||||||||
| 285,372 | ||||||||||
| Financials — 11.4% | |||||||||
| 96 | ACE, Ltd. | 10,271 | ||||||||
| 120 | AFLAC, Inc. | 7,565 | ||||||||
| 132 | Allstate Corp. | 9,195 | ||||||||
| 240 | American Express Co. | 18,588 | ||||||||
| 168 | American International Group, Inc. | 9,457 | ||||||||
| 90 | American Tower Corp. | 8,508 | ||||||||
| 78 | Ameriprise Financial, Inc. | 9,772 | ||||||||
| 324 | Apartment Investment and Management Co., Class A | 12,224 | ||||||||
| Shares | Market Value | |||||||||
| Common Stocks — (Continued) | |||||||||
| Financials — (Continued) | |||||||||
| 2,166 | Bank of America Corp. | $ | 34,504 | |||||||
| 276 | Bank of New York Mellon Corp. | 11,686 | ||||||||
| 174 | BB&T Corp. | 6,662 | ||||||||
| 348 | Berkshire Hathaway, Inc., Class B † | 49,141 | ||||||||
| 36 | BlackRock, Inc. | 13,102 | ||||||||
| 138 | Capital One Financial Corp. | 11,157 | ||||||||
| 144 | CBOE Holdings, Inc. | 8,103 | ||||||||
| 126 | CBRE Group, Inc., Class A † | 4,831 | ||||||||
| 294 | Charles Schwab Corp. | 8,967 | ||||||||
| 84 | Chubb Corp. | 8,261 | ||||||||
| 570 | Citigroup, Inc. | 30,392 | ||||||||
| 138 | Discover Financial Services | 8,000 | ||||||||
| 294 | Fifth Third Bancorp | 5,880 | ||||||||
| 126 | Franklin Resources, Inc. | 6,497 | ||||||||
| 114 | Goldman Sachs Group, Inc. | 22,391 | ||||||||
| 162 | Hartford Financial Services Group, Inc. | 6,605 | ||||||||
| 228 | Host Hotels & Resorts, Inc. | 4,592 | ||||||||
| 138 | Invesco, Ltd. | 5,716 | ||||||||
| 732 | J.P. Morgan Chase & Co. | 46,307 | ||||||||
| 24 | Jones Lang LaSalle, Inc. | 3,985 | ||||||||
| 408 | KeyCorp | 5,896 | ||||||||
| 102 | Lincoln National Corp. | 5,762 | ||||||||
| 186 | Marsh & McLennan Cos., Inc. | 10,446 | ||||||||
| 96 | McGraw-Hill Cos., Inc. | 10,013 | ||||||||
| 228 | MetLife, Inc. | 11,694 | ||||||||
| 90 | Moody’s Corp. | 9,677 | ||||||||
| 354 | Morgan Stanley | 13,207 | ||||||||
| 90 | Northern Trust Corp. | 6,584 | ||||||||
| 114 | PNC Financial Services Group | 10,457 | ||||||||
| 132 | Prologis, Inc. | 5,306 | ||||||||
| 138 | Prudential Financial, Inc. | 11,261 | ||||||||
| 36 | Public Storage, Inc. | 6,765 | ||||||||
| 354 | Regions Financial Corp. | 3,480 | ||||||||
| 222 | Safety Insurance Group, Inc. | 12,909 | ||||||||
| 66 | Simon Property Group, Inc. | 11,978 | ||||||||
| 48 | SL Green Realty Corp. | 5,873 | ||||||||
| 138 | State Street Corp. | 10,643 | ||||||||
| 144 | SunTrust Banks, Inc. | 5,976 | ||||||||
| 84 | T. Rowe Price Group, Inc. | 6,819 | ||||||||
| 102 | Travelers Cos., Inc. | 10,313 | ||||||||
| 360 | U.S. Bancorp | 15,433 | ||||||||
| 36 | Urban Edge Properties | 815 | ||||||||
| 378 | Urstadt Biddle Properties, Class A | 7,844 | ||||||||
| 72 | Vornado Realty Trust | 7,451 | ||||||||
| 984 | Wells Fargo & Co. | 54,219 | ||||||||
| 180 | Weyerhaeuser Co. | 5,672 | ||||||||
| 37 | WP GLIMCHER, Inc. | 555 | ||||||||
| 649,407 | ||||||||||
| Health Care — 22.9% | |||||||||
| 311 | Abbott Laboratories | 14,437 | ||||||||
| 311 | AbbVie, Inc. | 20,109 | ||||||||
| 34 | Actavis PLC † | 9,617 | ||||||||
| 102 | Aetna, Inc. | 10,901 | ||||||||
| 102 | Agilent Technologies, Inc. | 4,220 | ||||||||
(See notes which are an integral part of the Financial Statements)
Annual Shareholder Report
7
Table of Contents
| Huntington US Equity Rotation Strategy ETF | (Continued) |
| Shares | Market Value | |||||||||
| Common Stocks — (Continued) | |||||||||
| Health Care — (Continued) | |||||||||
| 414 | Alexion Pharmaceuticals, Inc. † | $ | 70,061 | |||||||
| 150 | Amgen, Inc. | 23,687 | ||||||||
| 78 | Anthem, Inc. | 11,773 | ||||||||
| 128 | Baxter International, Inc. | 8,799 | ||||||||
| 204 | Becton, Dickinson & Co. | 28,737 | ||||||||
| 194 | Biogen Idec, Inc. † | 72,542 | ||||||||
| 345 | Bristol-Myers Squibb Co. | 21,987 | ||||||||
| 174 | Celgene Corp. † | 18,802 | ||||||||
| 636 | Cerner Corp. † | 45,671 | ||||||||
| 190 | Cooper Cos., Inc. | 33,833 | ||||||||
| 798 | CryoLife, Inc. | 8,140 | ||||||||
| 60 | DaVita, Inc. † | 4,866 | ||||||||
| 529 | Edwards Lifesciences Corp. † | 66,997 | ||||||||
| 246 | Eli Lilly & Co. | 17,680 | ||||||||
| 162 | Express Scripts Holding Co. † | 13,997 | ||||||||
| 186 | Gilead Sciences, Inc. † | 18,695 | ||||||||
| 12 | Halyard Health, Inc. † | 582 | ||||||||
| 312 | Henry Schein, Inc. † | 42,775 | ||||||||
| 180 | Hologic, Inc. † | 6,073 | ||||||||
| 54 | Hospira, Inc. † | 4,714 | ||||||||
| 417 | Humana, Inc. | 69,055 | ||||||||
| 474 | IDEXX Laboratories, Inc. † | 59,425 | ||||||||
| 120 | Intuitive Surgical, Inc. † | 59,518 | ||||||||
| 582 | Johnson & Johnson | 57,735 | ||||||||
| 20 | Laboratory Corp. of America Holdings † | 2,391 | ||||||||
| 18 | Mallinckrodt PLC † | 2,037 | ||||||||
| 330 | McKesson Corp. | 73,722 | ||||||||
| 343 | Medtronic PLC | 25,536 | ||||||||
| 547 | Merck & Co., Inc. | 32,579 | ||||||||
| 208 | Mettler-Toledo International, Inc. † | 65,938 | ||||||||
| 144 | Mylan NV † | 10,405 | ||||||||
| 330 | Perrigo Co. PLC | 60,483 | ||||||||
| 1,227 | Pfizer, Inc. | 41,632 | ||||||||
| 25 | Regeneron Pharmaceuticals, Inc. † | 11,437 | ||||||||
| 90 | St. Jude Medical, Inc. | 6,305 | ||||||||
| 90 | Stryker Corp. | 8,302 | ||||||||
| 403 | Thermo Fisher Scientific, Inc. | 50,649 | ||||||||
| 696 | UnitedHealth Group, Inc. | 77,534 | ||||||||
| 54 | Vertex Pharmaceuticals, Inc. † | 6,657 | ||||||||
| 1,301,035 | ||||||||||
| Industrials — 11.6% | |||||||||
| 138 | 3M Co. | 21,582 | ||||||||
| 760 | A.O. Smith Corp. | 48,564 | ||||||||
| 60 | ADT Corp. | 2,256 | ||||||||
| 24 | Allegiant Travel Co. | 3,690 | ||||||||
| 30 | Allegion PLC | 1,835 | ||||||||
| 79 | Ametek, Inc. | 4,141 | ||||||||
| 144 | Boeing Co. | 20,641 | ||||||||
| 60 | C.H. Robinson Worldwide, Inc. | 3,863 | ||||||||
| 264 | CSX Corp. | 9,528 | ||||||||
| 60 | Cummins, Inc. | 8,296 | ||||||||
| 144 | Danaher Corp. | 11,791 | ||||||||
| 108 | Deere & Co. | 9,776 | ||||||||
| 156 | Eaton Corp. PLC | 10,722 | ||||||||
| Shares | Market Value | |||||||||
| Common Stocks — (Continued) | |||||||||
| Industrials — (Continued) | |||||||||
| 66 | FedEx Corp. | $ | 11,192 | |||||||
| 402 | Flowserve Corp. | 23,529 | ||||||||
| 72 | General Dynamics Corp. | 9,887 | ||||||||
| 2,052 | General Electric Co. | 55,568 | ||||||||
| 168 | Honeywell International, Inc. | 16,955 | ||||||||
| 120 | Illinois Tool Works, Inc. | 11,230 | ||||||||
| 90 | Ingersoll-Rand PLC | 5,925 | ||||||||
| 90 | ITT Corp. | 3,569 | ||||||||
| 586 | J.B. Hunt Transport Services, Inc. | 51,099 | ||||||||
| 36 | Kansas City Southern Industries, Inc. | 3,690 | ||||||||
| 48 | Lincoln Electric Holdings, Inc. | 3,209 | ||||||||
| 66 | Lockheed Martin Corp. | 12,316 | ||||||||
| 144 | Masco Corp. | 3,815 | ||||||||
| 77 | Norfolk Southern Corp. | 7,765 | ||||||||
| 60 | Northrop Grumman Corp. | 9,242 | ||||||||
| 24 | Now, Inc. † | 574 | ||||||||
| 575 | Old Dominion Freight Line † | 40,900 | ||||||||
| 30 | Oshkosh Truck Corp. | 1,615 | ||||||||
| 114 | PACCAR, Inc. | 7,450 | ||||||||
| 60 | Parker Hannifin Corp. | 7,162 | ||||||||
| 31 | Pentair PLC | 1,927 | ||||||||
| 84 | Raytheon Co. | 8,736 | ||||||||
| 42 | Rockwell Automation, Inc. | 4,981 | ||||||||
| 180 | Rollins, Inc. | 4,464 | ||||||||
| 36 | Roper Industries, Inc. | 6,054 | ||||||||
| 252 | Southwest Airlines Co. | 10,221 | ||||||||
| 54 | Stanley Black & Decker, Inc. | 5,330 | ||||||||
| 90 | Textron, Inc. | 3,958 | ||||||||
| 490 | The Corporate Executive Board Co. | 41,077 | ||||||||
| 120 | Tyco International PLC | 4,726 | ||||||||
| 161 | Union Pacific Corp. | 17,103 | ||||||||
| 192 | United Parcel Service, Inc., Class B | 19,302 | ||||||||
| 210 | United Rentals, Inc. † | 20,281 | ||||||||
| 168 | United Technologies Corp. | 19,110 | ||||||||
| 4 | Veritiv Corp. † | 159 | ||||||||
| 420 | Wabtec Corp. | 39,500 | ||||||||
| 156 | Waste Management, Inc. | 7,727 | ||||||||
| 658,033 | ||||||||||
| Information Technology — 24.1% | |||||||||
| 138 | Adobe Systems, Inc. † | 10,496 | ||||||||
| 66 | Akamai Technologies, Inc. † | 4,869 | ||||||||
| 120 | Altera Corp. | 5,002 | ||||||||
| 624 | Amphenol Corp., Class A | 34,551 | ||||||||
| 2,070 | Apple Computer, Inc. | 259,060 | ||||||||
| 84 | Autodesk, Inc. † | 4,774 | ||||||||
| 126 | Automatic Data Processing, Inc. | 10,652 | ||||||||
| 102 | Cardtronics, Inc. † | 3,848 | ||||||||
| 42 | CDK Global, Inc. | 2,013 | ||||||||
| 1,026 | Cisco Systems, Inc. | 29,579 | ||||||||
| 42 | Citrix Systems, Inc. † | 2,821 | ||||||||
| 156 | Cognizant Technology Solutions Corp. † | 9,132 | ||||||||
| 360 | Corning, Inc. | 7,535 | ||||||||
| 204 | eBay, Inc. † | 11,885 | ||||||||
| 144 | Electronic Arts, Inc. † | 8,365 | ||||||||
(See notes which are an integral part of the Financial Statements)
Annual Shareholder Report
8
Table of Contents
| Huntington US Equity Rotation Strategy ETF | (Continued) |
| Shares | Market Value | |||||||||
| Common Stocks — (Continued) | |||||||||
| Information Technology — (Continued) | |||||||||
| 390 | EMC Corp. | $ | 10,495 | |||||||
| 19 | Equinix, Inc. | 4,863 | ||||||||
| 28 | F5 Networks, Inc. † | 3,417 | ||||||||
| 896 | Facebook, Inc. † | 70,578 | ||||||||
| 900 | Fiserv, Inc. † | 69,841 | ||||||||
| 732 | Gartner Group, Inc. † | 60,742 | ||||||||
| 174 | Google, Inc., Class A † | 95,486 | ||||||||
| 42 | Google, Inc., Class C † | 22,629 | ||||||||
| 396 | Hewlett-Packard Co. | 13,056 | ||||||||
| 468 | Ingram Micro, Inc., Class A † | 11,775 | ||||||||
| 942 | Intel Corp. | 30,662 | ||||||||
| 66 | Intuit, Inc. | 6,622 | ||||||||
| 726 | Jack Henry & Associates, Inc. | 48,286 | ||||||||
| 138 | Juniper Networks, Inc. | 3,647 | ||||||||
| 53 | Keysight Technologies, Inc. † | 1,773 | ||||||||
| 192 | Lam Research Corp. | 14,511 | ||||||||
| 492 | MasterCard, Inc., Class A | 44,383 | ||||||||
| 318 | Micron Technology, Inc. † | 8,945 | ||||||||
| 1,362 | Microsoft Corp. | 66,247 | ||||||||
| 96 | NetApp, Inc. | 3,480 | ||||||||
| 216 | NVIDIA Corp. | 4,794 | ||||||||
| 690 | Oracle Corp. | 30,098 | ||||||||
| 24 | OSI Systems, Inc. † | 1,613 | ||||||||
| 180 | Paychex, Inc. | 8,710 | ||||||||
| 1,344 | PC-Tel, Inc. | 10,618 | ||||||||
| 306 | Qualcomm, Inc. | 20,808 | ||||||||
| 636 | Rackspace Hosting, Inc. † | 34,280 | ||||||||
| 606 | Red Hat, Inc. † | 45,608 | ||||||||
| 102 | Rovi Corp. † | 1,888 | ||||||||
| 648 | Salesforce.com, Inc. † | 47,187 | ||||||||
| 73 | SanDisk Corp. | 4,887 | ||||||||
| 78 | Seagate Technology PLC | 4,580 | ||||||||
| 270 | Texas Instruments, Inc. | 14,637 | ||||||||
| 360 | The Ultimate Software Group, Inc. † | 59,839 | ||||||||
| 108 | Trimble Navigation, Ltd. † | 2,746 | ||||||||
| 384 | Visa, Inc., Class A | 25,363 | ||||||||
| 78 | Western Digital Corp. | 7,624 | ||||||||
| 252 | Wex, Inc. † | 28,403 | ||||||||
| 450 | Xerox Corp. | 5,175 | ||||||||
| 276 | XO Group, Inc. † | 4,488 | ||||||||
| 318 | Yahoo!, Inc. † | 13,536 | ||||||||
| 1,372,902 | ||||||||||
| Materials — 2.0% | |||||||||
| 300 | Alcoa, Inc. | 4,026 | ||||||||
| 24 | CF Industries Holdings, Inc. | 6,899 | ||||||||
| 132 | Clearwater Paper Corp. † | 8,444 | ||||||||
| 60 | Cytec Industries, Inc. | 3,317 | ||||||||
| 246 | Dow Chemical Co. | 12,546 | ||||||||
| 198 | E.I. Du Pont de Nemours & Co. | 14,494 | ||||||||
| 84 | Ecolab, Inc. | 9,406 | ||||||||
| 66 | Hawkins, Inc. | 2,604 | ||||||||
| 90 | International Paper Co. | 4,835 | ||||||||
| 102 | Monsanto Co. | 11,624 | ||||||||
| 102 | Nucor Corp. | 4,984 | ||||||||
| Shares | Market Value | |||||||||
| Common Stocks — (Continued) | |||||||||
| Materials — (Continued) | |||||||||
| 30 | PPG Industries, Inc. | $ | 6,647 | |||||||
| 60 | Praxair, Inc. | 7,316 | ||||||||
| 60 | Rock-Tenn Co., Class A | 3,779 | ||||||||
| 18 | Royal Gold, Inc. | 1,162 | ||||||||
| 102 | Sealed Air Corp. | 4,651 | ||||||||
| 24 | Sherwin-Williams Co. | 6,672 | ||||||||
| 72 | United States Steel Corp. | 1,729 | ||||||||
| 115,135 | ||||||||||
| Telecommunication Services — 0.9% | |||||||||
| 776 | Sprint Corp. † | 3,981 | ||||||||
| 942 | Verizon Communications, Inc. | 47,514 | ||||||||
| 51,495 | ||||||||||
| Utilities — 2.0% | |||||||||
| 672 | American States Water Co. | 25,798 | ||||||||
| 186 | Edison International | 11,335 | ||||||||
| 462 | El Paso Electric Co. | 17,191 | ||||||||
| 288 | Exelon Corp. | 9,798 | ||||||||
| 420 | New Jersey Resources Corp. | 12,814 | ||||||||
| 125 | NextEra Energy, Inc. | 12,616 | ||||||||
| 144 | NRG Energy, Inc. | 3,635 | ||||||||
| 78 | Sempra Energy | 8,281 | ||||||||
| 318 | Southern Co. | 14,087 | ||||||||
| 115,555 | ||||||||||
| Total Common Stocks (Cost $4,298,912) | $ | 5,380,647 | |||||||
| Exchange-Traded Fund — 3.0% | |||||||||
| 815 | SPDR S&P 500 ETF Trust | 169,944 | ||||||||
| Total Exchange-Traded Fund | $ | 169,944 | |||||||
| Total Investments — 97.5% | $ | 5,550,591 | |||||||
| Other Assets less Liabilities — 2.5% | 142,794 | ||||||||
| Net Assets — 100.0% | $ | 5,693,385 | |||||||
| † | Non-income producing security |
ETF — Exchange-Traded Fund
SPDR — Standard & Poor’s Depository Receipts
(See notes which are an integral part of the Financial Statements)
Annual Shareholder Report
9
Table of Contents
| Huntington EcoLogical Strategy ETF | April 30, 2015 |
| Portfolio of Investments Summary Table | (unaudited) |
| Percentage of Market Value | ||||
Consumer Discretionary | 16.4% | |||
Consumer Staples | 10.8% | |||
Energy | 0.5% | |||
Financials | 10.0% | |||
Health Care | 18.1% | |||
Industrials | 11.8% | |||
Information Technology | 26.1% | |||
Materials | 2.4% | |||
Utilities | 3.9% | |||
Total | 100.0% | |||
Portfolio holdings and allocations are subject to change. As of April 30, 2015, percentages in the table above are based on total investments. Such total investments may differ from the percentages set forth in the following Portfolio of Investments which are computed using the Fund’s total net assets.
Portfolio of Investments
| Shares | Market Value | |||||||||
| Common Stocks — 95.0% | |||||||||
| Consumer Discretionary — 15.6% | |||||||||
| 4,069 | BorgWarner, Inc. | $ | 240,885 | |||||||
| 324 | Chipotle Mexican Grill, Inc. † | 201,314 | ||||||||
| 1,030 | Deckers Outdoor Corp. † | 76,220 | ||||||||
| 1,040 | Expedia, Inc. | 97,999 | ||||||||
| 3,200 | Lennar Corp., Class A | 146,560 | ||||||||
| 688 | LKQ Corp. † | 18,624 | ||||||||
| 2,310 | NIKE, Inc., Class B | 228,321 | ||||||||
| 3,644 | Starbucks Corp. | 180,670 | ||||||||
| 1,512 | V.F. Corp. | 109,514 | ||||||||
| 1,300,107 | ||||||||||
| Consumer Staples — 10.3% | |||||||||
| 1,008 | Costco Wholesale Corp. | 144,194 | ||||||||
| 1,134 | CVS Caremark Corp. | 112,595 | ||||||||
| 1,838 | Hain Celestial Group, Inc. † | 110,721 | ||||||||
| 695 | Keurig Green Mountain, Inc. | 80,877 | ||||||||
| 747 | McCormick & Co., Inc. | 56,249 | ||||||||
| 990 | Mead Johnson Nutrition Co. | 94,961 | ||||||||
| 1,350 | United Natural Foods, Inc. † | 91,071 | ||||||||
| 3,784 | Whitewave Foods Co. † | 166,383 | ||||||||
| 857,051 | ||||||||||
| Energy — 0.5% | |||||||||
| 1,146 | Spectra Energy Corp. | 42,689 | ||||||||
| Financials — 9.5% | |||||||||
| 504 | BlackRock, Inc. | 183,426 | ||||||||
| 2,871 | CBRE Group, Inc., Class A † | 110,074 | ||||||||
| 852 | Discover Financial Services | 49,390 | ||||||||
| 1,317 | Jones Lang LaSalle, Inc. | 218,701 | ||||||||
| 1,800 | Marsh & McLennan Cos., Inc. | 101,088 | ||||||||
| 1,170 | State Street Corp. | 90,230 | ||||||||
| 517 | T. Rowe Price Group, Inc. | 41,970 | ||||||||
| 794,879 | ||||||||||
| Shares | Market Value | |||||||||
| Common Stocks — (Continued) | |||||||||
| Health Care — 17.2% | |||||||||
| 2,565 | Abbott Laboratories | $ | 119,067 | |||||||
| 419 | Alexion Pharmaceuticals, Inc. † | 70,907 | �� | |||||||
| 626 | Becton, Dickinson & Co. | 88,185 | ||||||||
| 270 | Biogen Idec, Inc. † | 100,961 | ||||||||
| 1,710 | Cerner Corp. † | 122,795 | ||||||||
| 990 | Edwards Lifesciences Corp. † | 125,384 | ||||||||
| 851 | Gilead Sciences, Inc. † | 85,534 | ||||||||
| 619 | HCA Holdings, Inc. † | 45,812 | ||||||||
| 630 | Henry Schein, Inc. † | 86,373 | ||||||||
| 940 | Humana, Inc. | 155,664 | ||||||||
| 164 | Intuitive Surgical, Inc. † | 81,341 | ||||||||
| 498 | Johnson & Johnson | 49,402 | ||||||||
| 900 | UnitedHealth Group, Inc. | 100,260 | ||||||||
| 855 | Varian Medical Systems, Inc. † | 75,967 | ||||||||
| 2,380 | West Pharmaceutical Services, Inc. | 126,805 | ||||||||
| 1,434,457 | ||||||||||
| Industrials — 11.2% | |||||||||
| 1,800 | A.O. Smith Corp. | 115,020 | ||||||||
| 5,031 | Air Lease Corp. | 194,348 | ||||||||
| 621 | Cummins, Inc. | 85,859 | ||||||||
| 2,251 | Illinois Tool Works, Inc. | 210,649 | ||||||||
| 900 | J.B. Hunt Transport Services, Inc. | 78,480 | ||||||||
| 1,350 | Middleby Corp. † | 136,809 | ||||||||
| 401 | Norfolk Southern Corp. | 40,441 | ||||||||
| 1,148 | Tennant Co. | 73,805 | ||||||||
| 935,411 | ||||||||||
| Information Technology — 24.8% | |||||||||
| 661 | Accenture PLC, Class A | 61,242 | ||||||||
| 2,295 | Amphenol Corp., Class A | 127,074 | ||||||||
| 3,248 | Apple Computer, Inc. | 406,487 | ||||||||
| 900 | ASML Holding NV NYS | 96,336 | ||||||||
| 2,630 | eBay, Inc. † | 153,224 | ||||||||
(See notes which are an integral part of the Financial Statements)
Annual Shareholder Report
10
Table of Contents
| Huntington EcoLogical Strategy ETF | (Continued) |
| Shares | Market Value | |||||||||
| Common Stocks — (Continued) | |||||||||
| Information Technology — (Continued) | |||||||||
| 253 | F5 Networks, Inc. † | $ | 30,871 | |||||||
| 1,536 | Facebook, Inc. † | 120,991 | ||||||||
| 495 | Google, Inc., Class A † | 271,640 | ||||||||
| 1,701 | Jack Henry & Associates, Inc. | 113,134 | ||||||||
| 1,125 | MasterCard, Inc., Class A | 101,486 | ||||||||
| 652 | Qualcomm, Inc. | 44,336 | ||||||||
| 2,300 | Rackspace Hosting, Inc. † | 123,970 | ||||||||
| 1,730 | Red Hat, Inc. † | 130,200 | ||||||||
| 360 | Stratasys, Ltd. † | 13,482 | ||||||||
| 3,238 | Texas Instruments, Inc. | 175,532 | ||||||||
| 927 | Wex, Inc. † | 104,482 | ||||||||
| 2,074,487 | ||||||||||
| Materials — 2.3% | |||||||||
| 1,392 | Ball Corp. | 102,187 | ||||||||
| 783 | Ecolab, Inc. | 87,680 | ||||||||
| 189,867 | ||||||||||
| Utilities — 3.7% | |||||||||
| 2,331 | NextEra Energy, Inc. | 235,268 | ||||||||
| 724 | Sempra Energy | 76,867 | ||||||||
| 312,135 | ||||||||||
| Total Common Stocks (Cost $6,467,609) | $ | 7,941,083 | |||||||
| Total Investments — 95.0% | $ | 7,941,083 | |||||||
| Other Assets less Liabilities — 5.0% | 417,077 | ||||||||
| Net Assets — 100.0% | $ | 8,358,160 | |||||||
| † | Non-income producing security |
NYS — New York Shares
(See notes which are an integral part of the Financial Statements)
Annual Shareholder Report
11
Table of Contents
| Statements of Assets and Liabilities | April 30, 2015 |
Huntington US Equity Rotation | Huntington Strategy ETF | |||||||
| Assets: | ||||||||
Investments, at value (Cost $4,457,087 and $6,467,609) | $ | 5,550,591 | $ | 7,941,083 | ||||
Cash | 150,318 | 427,722 | ||||||
Dividends receivable | 2,903 | 5,195 | ||||||
Receivable from Advisor | 11,337 | 14,021 | ||||||
Prepaid expenses | 1,870 | 1,914 | ||||||
Total Assets | 5,717,019 | 8,389,935 | ||||||
| Liabilities: | ||||||||
Accrued expenses: | ||||||||
Administration | 6,875 | 9,024 | ||||||
Administrative support fees | 2,430 | 3,607 | ||||||
Compliance services | 244 | 288 | ||||||
Fund accounting | 14 | — | ||||||
Legal and audit fees | 9,264 | 13,349 | ||||||
Printing | 3,599 | 4,780 | ||||||
Other | 1,208 | 727 | ||||||
Total Liabilities | 23,634 | 31,775 | ||||||
Net Assets | $ | 5,693,385 | $ | 8,358,160 | ||||
| Net Assets consist of: | ||||||||
Capital | $ | 4,543,272 | $ | 6,682,710 | ||||
Accumulated net investment income | 18,056 | 6,114 | ||||||
Accumulated net realized gains on investments | 38,553 | 195,862 | ||||||
Net unrealized appreciation (depreciation) on investments | 1,093,504 | 1,473,474 | ||||||
Net Assets | $ | 5,693,385 | $ | 8,358,160 | ||||
Net Assets: | $ | 5,693,385 | $ | 8,358,160 | ||||
Shares of Beneficial Interest Outstanding (unlimited number of shares authorized, no par value): | 150,000 | 225,000 | ||||||
Net Asset Value (offering and redemption price per share): | $ | 37.96 | $ | 37.15 | ||||
(See notes which are an integral part of the Financial Statements)
Annual Shareholder Report
12
Table of Contents
| Statements of Operations | For the year ended April 30, 2015 |
Huntington US Equity Rotation | Huntington Strategy ETF | |||||||
| Investment Income: | ||||||||
Dividend income | $ | 154,797 | $ | 125,008 | ||||
Total Investment Income | 154,797 | 125,008 | ||||||
| Expenses: | ||||||||
Advisory fees | 63,847 | 66,173 | ||||||
Administration fees | 94,440 | 100,764 | ||||||
Administrative support fees | 37,143 | 38,874 | ||||||
Fund accounting fees | 8,569 | 1,432 | ||||||
Custodian fees | 13,664 | 3,332 | ||||||
Trustee fees | 2,319 | 2,181 | ||||||
Compliance services fees | 1,009 | 1,056 | ||||||
Legal and audit fees | 33,980 | 40,371 | ||||||
Printing fees | 14,463 | 17,190 | ||||||
Other fees | 34,201 | 35,534 | ||||||
Total Expenses before fee reductions | 303,635 | 306,907 | ||||||
Expenses contractually waived or reimbursed by the Advisor | (202,715 | ) | (202,369 | ) | ||||
Total Net Expenses | 100,920 | 104,538 | ||||||
Net Investment Income | 53,877 | 20,470 | ||||||
| Realized and Unrealized Gains (Losses) on Investments: | ||||||||
Net realized gains on investments | 48,870 | 195,862 | ||||||
Net realized gains on in-kind redemptions of investments | 2,438,988 | 2,569,935 | ||||||
Change in unrealized appreciation/depreciation on investments | (999,601 | ) | (1,859,757 | ) | ||||
Net Realized and Unrealized Gains on Investments | 1,488,257 | 906,040 | ||||||
Change in Net Assets Resulting From Operations | $ | 1,542,134 | $ | 926,510 | ||||
(See notes which are an integral part of the Financial Statements)
Annual Shareholder Report
13
Table of Contents
| Statements of Changes in Net Assets |
| Huntington US Equity Rotation Strategy ETF | Huntington EcoLogical Strategy ETF | |||||||||||||||
| Year Ended April 30, 2015 | Year Ended April 30, 2014 | Year Ended April 30, 2015 | Year Ended April 30, 2014 | |||||||||||||
| From Investment Activities: | ||||||||||||||||
| Operations: | ||||||||||||||||
Net investment income | $ | 53,877 | $ | 68,267 | $ | 20,470 | $ | 33,063 | ||||||||
Net realized gains on investments and in-kind redemptions | 2,487,858 | 1,337,736 | 2,765,797 | 653,908 | ||||||||||||
Change in unrealized appreciation/depreciation on investments | (999,601 | ) | 816,287 | (1,859,757 | ) | 2,030,051 | ||||||||||
Change in net assets resulting from operations | 1,542,134 | 2,222,290 | 926,510 | 2,717,022 | ||||||||||||
| Distributions to Shareholders From: | ||||||||||||||||
Net investment income | (59,668 | ) | (71,442 | ) | (19,733 | ) | (33,136 | ) | ||||||||
Net realized gains on investments | (405,799 | ) | (96,570 | ) | (98,077 | ) | (132,285 | ) | ||||||||
Change in net assets from distributions | (465,467 | ) | (168,012 | ) | (117,810 | ) | (165,421 | ) | ||||||||
| Capital Transactions: | ||||||||||||||||
Proceeds from shares issued | 880,173 | 2,416,485 | — | 6,939,790 | ||||||||||||
Cost of shares redeemed | (8,570,446 | ) | (3,276,607 | ) | (9,962,873 | ) | (1,657,988 | ) | ||||||||
Change in net assets from capital transactions | (7,690,273 | ) | (860,122 | ) | (9,962,873 | ) | 5,281,802 | |||||||||
Change in net assets | (6,613,606 | ) | 1,194,156 | (9,154,173 | ) | 7,833,403 | ||||||||||
| Net Assets: | ||||||||||||||||
Beginning of period | 12,306,991 | 11,112,835 | 17,512,333 | 9,678,930 | ||||||||||||
End of period | $ | 5,693,385 | $ | 12,306,991 | $ | 8,358,160 | $ | 17,512,333 | ||||||||
Accumulated net investment income | $ | 18,056 | $ | 13,792 | $ | 6,114 | $ | 5,377 | ||||||||
| Share Transactions: | ||||||||||||||||
Issued | 25,000 | 75,000 | — | 225,000 | ||||||||||||
Redeemed | (225,001 | ) | (100,000 | ) | (278,999 | ) | (50,000 | ) | ||||||||
Change in shares | (200,001 | ) | (25,000 | ) | (278,999 | ) | 175,000 | |||||||||
(See notes which are an integral part of the Financial Statements)
Annual Shareholder Report
14
Table of Contents
[THIS PAGE INTENTIONALLY LEFT BLANK]
Table of Contents
| Financial Highlights | Huntington Strategy Shares |
| Net Asset Value, beginning of period | Net investment income (loss) | Net realized and unrealized gains (losses) on investments | Total from investment activities | Distributions from net investment income | Distributions from net realized gains from investment transactions | Total distributions | Net Asset Value, end of period | |||||||||||||||||||||||||
| Huntington US Equity Rotation Strategy ETF | ||||||||||||||||||||||||||||||||
Year Ended April 30, 2015 | $ | 35.16 | 0.25 | 4.41 | 4.66 | (0.24 | ) | (1.62 | ) | (1.86 | ) | $ | 37.96 | |||||||||||||||||||
Year Ended April 30, 2014 | $ | 29.63 | 0.18 | 5.80 | 5.98 | (0.19 | ) | (0.26 | ) | (0.45 | ) | $ | 35.16 | |||||||||||||||||||
July 23, 2012(f) through April 30, 2013 | $ | 25.00 | 0.17 | 4.59 | 4.76 | (0.13 | ) | — | (0.13 | ) | $ | 29.63 | ||||||||||||||||||||
| Huntington EcoLogical Strategy ETF | ||||||||||||||||||||||||||||||||
Year Ended April 30, 2015 | $ | 34.75 | 0.10 | 2.77 | 2.87 | (0.08 | ) | (0.39 | ) | (0.47 | ) | $ | 37.15 | |||||||||||||||||||
Year Ended April 30, 2014 | $ | 29.42 | 0.06 | 5.62 | 5.68 | (0.07 | ) | (0.28 | ) | (0.35 | ) | $ | 34.75 | |||||||||||||||||||
June 18, 2012(f) through April 30, 2013 | $ | 25.00 | 0.13 | 4.42 | 4.55 | (0.13 | ) | — | (0.13 | ) | $ | 29.42 | ||||||||||||||||||||
| (a) | Not annualized for periods less than one year. |
| (b) | Net asset value total return is calculated assuming an initial investment made at the net asset value at the beginning of the period, reinvestment of all dividends and distributions at net asset value during the period, if any, and redemption on the last day of the period at net asset value. This percentage is not an indication of the performance of a shareholder’s investment in the Fund based on market value due to differences between the market price of the shares and the net asset value per share of the Fund. |
| (c) | Market value total return is calculated assuming an initial investment made at the market value at the beginning of the period, reinvestment of all dividends and distributions at net asset value during the period, if any, and redemption on the last day of the period at market value. Market value is determined by the composite closing price. Composite closing security price is defined as the last reported sale price from any primary listing market (e.g., NYSE Arca) or participating regional exchanges or markets. The composite closing price is the last reported sale price from any of the eligible sources, regardless of volume and not an average price and may have occurred on a date prior to the close of the reporting period. Market value may be greater or less than net asset value, depending on the Fund’s closing price on the listing market. |
| (d) | Annualized for periods less than one year. |
| (e) | If applicable, certain fees were waived and/or reimbursed. If such waivers/reimbursements had not occurred, the ratios would have been as indicated. |
| (f) | Commencement of operations. |
(See notes which are an integral part of the Financial Statements)
Annual Shareholder Report
16
Table of Contents
| Total return(a)(b) | Total return at market(a)(c) | Ratio of Net Expenses to Average Net Assets(d) | Ratio of Gross Expenses to Average Net Assets(d) | Ratio of Net Investment Income to Average Net Assets(d)(e) | Net Assets at end of period (000’s) | Portfolio turnover(a) | ||||||||||||||||||||
| 13.26 | % | 14.68 | % | 0.95 | % | 2.86 | % | 0.51 | % | $ | 5,693 | 16 | % | |||||||||||||
| 20.19 | % | 18.79 | % | 0.95 | % | 2.26 | % | 0.53 | % | $ | 12,307 | 39 | % | |||||||||||||
| 19.11 | % | 19.19 | % | 0.95 | % | 4.42 | % | 0.82 | % | $ | 11,113 | 13 | % | |||||||||||||
| 8.26 | % | 10.19 | % | 0.95 | % | 2.79 | % | 0.19 | % | $ | 8,358 | 54 | % | |||||||||||||
| 19.31 | % | 17.61 | % | 0.95 | % | 2.08 | % | 0.21 | % | $ | 17,512 | 10 | % | |||||||||||||
| 18.27 | % | 18.47 | % | 0.95 | % | 4.21 | % | 0.63 | % | $ | 9,679 | 16 | % | |||||||||||||
(See notes which are an integral part of the Financial Statements)
Annual Shareholder Report
17
Table of Contents
April 30, 2015
| (1) | Organization |
Huntington Strategy Shares (the “Trust”) was organized on September 1, 2010 as a Delaware statutory trust. The Trust is registered under the Investment Company Act of 1940 (the “1940 Act”), as an open-end management investment company and thus, is determined to be an investment company for accounting purposes. The Declaration of Trust permits the Trust to issue an unlimited number of shares of beneficial interest (“Shares”) in one or more series representing interests in separate portfolios of securities. Currently, the Trust offers its Shares in two separate series: Huntington US Equity Rotation Strategy ETF (the “US Equity Rotation Strategy ETF”) and Huntington EcoLogical Strategy ETF (the “EcoLogical Strategy ETF”) (individually referred to as a “Fund”, or collectively as the “Funds.”). Each Fund is an actively-managed exchange-traded fund. The investment objective of each Fund is to seek capital appreciation, and the Funds do not seek to replicate a specified index. The Funds’ prospectus provides a description of each Fund’s investment objectives, policies, and strategies. The assets of each Fund are segregated and a shareholder’s interest is limited to the Fund in which shares are held.
Shares of each of the Funds are listed and traded on the NYSE Arca, Inc. Market prices for the Shares may be different from their net asset value (“NAV”). Each Fund issues and redeems Shares on a continuous basis at NAV only in large blocks of Shares, currently 25,000 Shares, called “Creation Units.” Creation Units are issued and redeemed principally in-kind for securities included in a specified universe. Once created, Shares generally trade in the secondary market at market prices that change throughout the day in amounts less than a Creation Unit.
Under the Trust’s organizational documents, its officers and Board of Trustees (“the Board”) are indemnified against certain liabilities arising out of the performance of their duties to the Funds. In addition, in the normal course of business, the Trust may enter into contracts with vendors and others that provide for general indemnifications. The Trust’s maximum exposure under these arrangements is unknown, as this would involve future claims that may be made against the Trust. However, based on experience, the Trust expects that risk of loss to be remote.
| (2) | Significant Accounting Policies |
The following is a summary of significant accounting policies consistently followed by each Fund in the preparation of its financial statements. These policies are in conformity with generally accepted accounting principles in the United States of America (“GAAP”). The preparation of financial statements in conformity with GAAP requires management to make estimates and assumptions that affect the amounts of assets, liabilities and disclosure of contingent assets and liabilities at the
date of the financial statements and the reported amounts of income and expenses for the period. Actual results could differ from those estimates.
| A. | Investment Valuations |
The Funds hold investments at fair value. Fair value is defined as the price that would be expected to be received to sell an asset or paid to transfer a liability in an orderly transaction between market participants at the measurement date. The valuation techniques used to determine fair value are further described below.
Security values are ordinarily obtained through the use of independent pricing services, in accordance with procedures adopted by the Trust’s Board. Pursuant to these procedures, the Funds may use a pricing service, bank, or broker-dealer experienced in such matters to value the Funds’ securities. When reliable market quotations are not readily available for any security, the fair value of that security will be determined by a committee established by the Board in accordance with procedures adopted by the Board. The fair valuation process is designed to value the subject security at the price the Funds would reasonably expect to receive upon its current sale. Additional consideration is given to securities that have experienced a decrease in the volume or level of activity or to circumstances that indicate that a transaction is not orderly.
The Trust has a three-tier fair value hierarchy that is dependent upon the various “inputs” used to determine the value of the Funds’ investments. The valuation techniques described below maximize the use of observable inputs and minimize the use of unobservable inputs in determining fair value. These inputs are summarized in the three broad levels listed below:
| • | Level 1—Quoted prices in active markets for identical assets. |
| • | Level 2—Other observable pricing inputs at the measurement date (including quoted prices for similar securities, interest rates, prepayment speeds, credit risk, etc.). |
| • | Level 3—Significant unobservable pricing inputs at the measurement date (including the Funds’ own assumptions in determining the fair value of investments). |
The inputs or methodology used for valuing investments are not necessarily an indication of the risk associated with investing in those investments.
Equity securities (including foreign equity securities) traded on a securities exchange are valued at the last reported sales price on the principal exchange. Equity securities quoted by NASDAQ are valued at the NASDAQ official closing price. If there is no reported sale on the principal exchange, and in the case of over-the-counter securities, equity securities are valued at a bid price
Annual Shareholder Report
18
Table of Contents
Notes to Financial Statements (Continued)
estimated by the security pricing service. In each of these situations, valuations are typically categorized as Level 1 in the fair value hierarchy.
Debt securities traded on a national securities exchange or in the over-the-counter market are valued at the last reported sales price on the principal exchange. If there is no reported sale on the principal exchange, and for all other debt securities, debt securities are valued at a bid
price estimated by a security pricing service. In each of these situations, valuations are typically categorized as Level 2 in the fair value hierarchy.
The following table provides the fair value measurement as of April 30, 2015, while the breakdown, by category, of common stocks is disclosed in the Portfolio of Investments for each Fund.
| Level 1 | Total Investments | |||||||
US Equity Rotation Strategy ETF | ||||||||
Common Stocks(1) | $ | 5,380,647 | $ | 5,380,647 | ||||
Exchange-Traded Fund | 169,944 | 169,944 | ||||||
|
|
|
| |||||
Total Investments | $ | 5,550,591 | $ | 5,550,591 | ||||
|
|
|
| |||||
EcoLogical Strategy ETF | ||||||||
Common Stocks(1) | $ | 7,941,083 | $ | 7,941,083 | ||||
|
|
|
| |||||
Total Investments | $ | 7,941,083 | $ | 7,941,083 | ||||
|
|
|
| |||||
| (1) | Please see the Portfolio of Investments for industry classifications. |
The Trust’s policy is to disclose transfers between fair value hierarchy levels based on valuations at the end of the reporting period. There were no transfers between Levels 1, 2, or 3 for the year ended April 30, 2015. As of April 30, 2015, no securities were categorized as Level 2 or Level 3.
| B. | Security Transactions and Related Income |
Investment transactions are accounted for no later than the first calculation of the NAV on the business day following the trade date. For financial reporting purposes, however, security transactions are accounted for on the trade date on the last business day of the reporting period. Discounts and premiums on securities purchased are amortized over the lives of the respective securities. Securities gains and losses are calculated on the identified cost basis. Interest income and expenses are accrued daily. Dividends, less foreign tax withholding (if any), are recorded on the ex-dividend date.
| C. | Dividends and Distributions to Shareholders |
Dividends from net investment income, if any, are declared and paid annually. Net realized capital gains, if any, are distributed at least annually.
The amount of dividends from net investment income and net realized gains are determined in accordance with the federal income tax regulations, which may differ from GAAP. These “book/tax” differences are either considered temporary or permanent in nature. To the extent these differences are permanent in nature (e.g., distributions and income received from pass-through investments), such amounts are reclassified within the capital accounts based on their nature for federal income tax purposes; temporary differences do not require reclassification. Temporary differences are primarily due to return of capital from investments.
The Funds may own shares of real estate investment trusts (“REITs”) which report information on the source of their distributions annually. Distributions received from investments in REITs in excess of income from underlying investments are recorded as realized gain and/or as a reduction to the cost of the individual REIT.
| D. | Allocation of Expenses |
Expenses directly attributable to a Fund are charged to that Fund. Expenses not directly attributable to a Fund are allocated proportionally among both Funds within the Trust in relation to the net assets of each Fund or on another reasonable basis. The Trust may share expenses with The Huntington Funds, another open-end management investment company managed by the Advisor. Those expenses that are shared are allocated proportionally among each of the Trusts or on another reasonable basis.
| (3) | Investment Advisory and Other Contractual Services |
| A. | Investment Advisory Fees |
Huntington Asset Advisors, Inc. (the “Advisor”), a wholly-owned subsidiary of The Huntington National Bank (“Huntington”), serves as the Funds’ investment advisor. Huntington is a direct wholly-owned subsidiary of Huntington Bancshares Incorporated. The Advisor receives a fee for its services, computed daily and paid monthly, of 0.60% of each Fund’s average daily net assets.
The Advisor has contractually agreed to reduce its fees and/or reimburse each Fund’s expenses (excluding interest, taxes, brokerage commissions, acquired fund fees and expenses, and extraordinary expenses) in order to limit total annual fund operating expenses after fee
Annual Shareholder Report
19
Table of Contents
Notes to Financial Statements (Continued)
waivers and expense reimbursement to 0.95% of each Fund’s average annual daily net assets (“Expense Cap”). The Expense Cap will remain in effect until at least August 31, 2015. The Expense Cap may be terminated earlier only upon the approval of the Board. The Advisor may recoup fees reduced or expenses reimbursed at any time within three years from the year such expenses were incurred, so long as the repayment does not cause the Expense Cap to be exceeded.
As of April 30, 2015, the Advisor may recoup amounts from the Funds as follows:
| Expires 4/30/16 | Expires 4/30/17 | Expires 4/30/18 | Total | |||||||||||||
US Equity Rotation Strategy ETF | $ | 202,689 | $ | 154,843 | $ | 202,715 | $ | 560,247 | ||||||||
EcoLogical Strategy ETF | 219,439 | 171,029 | 202,369 | 592,837 | ||||||||||||
| B. | Administration, Transfer Agent and Accounting Fees |
Citi Fund Services Ohio, Inc. (“Citi”) provides financial administration, transfer agency and portfolio accounting services to the Trust. Citi performs certain services on behalf of the Trust including but not limited to: (1) preparing and filing the Trust’s periodic financial reports on forms prescribed by the Securities and Exchange Commission (“SEC”); (2) calculating Fund expenses and making required disbursements; (3) calculating Fund performance data; and (4) providing certain compliance support services. As portfolio accountant, Citi maintains certain financial records of the Trust and provides accounting services to each Fund which includes the daily calculation of each Fund’s NAV. Citi also performs certain other services on behalf of the Trust including providing financial information for the Trust’s federal and state tax returns and financial reports required to be filed with the SEC. For these services, each Fund pays Citi a fee accrued daily and paid monthly based on a percentage of each Fund’s average net assets, subject to a minimum annual fee. The fees are as follows:
—0.04% of the first $500 million in aggregate net assets of the Funds;
—0.035% of the aggregate net assets of the next $500 million; and
—0.02% of the aggregate net assets in excess of $1 billion
The asset based fees are subject to an annual minimum, allocated among the Funds, equal to the number of Funds multiplied by $100,000 with the period commencing with the Effective Date through the end of the Initial Term.
Pursuant to an Exchange-Traded Fund Services Agreement with the Trust, Huntington Asset Services, Inc.
(“HASI”) maintains the corporate records of the Trust, including minutes of meetings of the Board, and provides administrative support services in connection with updates to the Trust’s registration statement. HASI is a wholly-owned subsidiary of Huntington Bancshares Incorporated. Under the agreement, The Trust will pay HASI a fee of $70,000, allocated among the Funds, for services provided.
| C. | Distribution and Shareholder Services Fees |
SEI Investments Distribution Co. (the “Distributor”) is the principal underwriter and distributor of each Fund’s Shares. The Distributor is compensated by the Advisor in accordance with a Distribution Services Agreement between the Advisor and the Distributor. The Trust has adopted but has yet to implement a Rule 12b-1 Distribution Plan (the “Plan”). The Plan is designed to compensate or reimburse financial intermediaries (including the Distributor, the Advisor, and their affiliates) for activities principally intended to result in the sale of Fund shares, such as advertising and marketing of shares (including printing and disseminating prospectuses and sales literature to prospective shareholders and financial intermediaries) and providing incentives to financial intermediaries to sell shares. The Plan is also designed to cover the cost of administrative services performed in conjunction with the sale of shares, including, but not limited to, shareholder services, recordkeeping services and educational services, as well as the costs of implementing and operating the Plan. In accordance with the Plan, the Distributor may enter into agreements with financial intermediaries and dealers relating to distribution and/or marketing services with respect to the Funds. Pursuant to the Plan, the Funds may pay a 12b-1 fee not to exceed 0.25% per year of each Fund’s average daily net assets. No 12b-1 fee is currently paid by the Funds and the Board has not approved any payments under the Plan.
| D. | Custodian Fees |
Citibank, N.A (the “Custodian”), an affiliate of Citi, serves as custodian for each Fund and safeguards and holds the Fund’s cash and securities, settles each Fund’s securities transactions and collects income on Fund investments. The Custodian receives fees based on the level of each Fund’s average daily net assets for the period, plus out-of-pocket expenses.
| E. | Compliance Services |
The Trust has contracted with HASI to provide a Chief Compliance Officer to the Trust, for which it pays an annual fee of $2,000, allocated among the Funds.
| F. | General |
Certain officers of the Trust are officers, directors and/or trustees of the above companies.
Annual Shareholder Report
20
Table of Contents
Notes to Financial Statements (Continued)
| (4) | Investment Transactions |
Purchases and sales of investments, excluding in-kind transactions and short-term investments, for the year ended April 30, 2015 were as follows:
| Purchases | Sales | |||||||
US Equity Rotation Strategy ETF | $ | 1,595,776 | $ | 1,949,840 | ||||
EcoLogical Strategy ETF | 5,695,742 | 6,019,124 | ||||||
Purchases and sales of in-kind transactions for the year ended April 30, 2015 were as follows:
| Purchases | Sales | |||||||
US Equity Rotation Strategy ETF | $ | 840,724 | $ | 8,261,296 | ||||
EcoLogical Strategy ETF | — | 9,202,759 | ||||||
| (5) | Capital Share Transactions |
Shares are issued and redeemed by each Fund only in aggregations of a specified number of shares or multiples thereof (“Creation Units”) at net asset value. Except when aggregated in Creation Units, shares of each Fund are not redeemable. Transactions in shares for each Fund are disclosed in detail on the Statements of Changes in Net Assets.
The consideration for the purchase of Creation Units of a Fund generally consists of the in-kind deposit of a designated basket of securities, which constitutes an optimized representation of the securities of that Fund’s specified universe, and an amount of cash. Investors purchasing and redeeming Creation Units may be charged a transaction fee to cover the transfer and other transactional costs it incurs to issue or redeem Creation Units. The standard charge and maximum transaction fee for the US Equity Rotation Strategy ETF and EcoLogical Strategy ETF are $250 and $1,000, respectively.
From time to time, settlement of securities related to subscriptions-in-kind or redemptions-in-kind may be delayed. In such cases, securities related to in-kind contributions are reflected as “Due from custodian” and securities related to in-kind redemptions are reflected as “Securities payable related to in-kind transactions” on the Statements of Assets and Liabilities.
During the year ended April 30, 2015, the Funds delivered securities in exchange for the redemption of capital shares (redemptions-in-kind). Securities and cash were transferred in exchange for capital share redemptions at fair value. For financial reporting purposes, the Funds recorded net realized gains and losses in connection with each redemption-in-kind transaction.
For the year ended April 30, 2015, the fair value of securities transferred for redemptions-in-kind and the net realized gains and losses recorded in connection with the transactions were as follows:
| Fair Value | Net Realized Gains/(Losses) | |||||||
US Equity Rotation Strategy ETF | $ | 8,261,296 | $ | 2,438,988 | ||||
EcoLogical Strategy ETF | 9,202,759 | 2,569,935 | ||||||
In addition, during the year ended April 30, 2015, the Funds received securities in exchange for subscriptions of capital shares (subscriptions-in-kind) as follows:
| Fair Value | ||||
US Equity Rotation Strategy ETF | $ | 840,724 | ||
EcoLogical Strategy ETF | — | |||
| (6) | Federal Income Taxes |
It is the policy of each Fund to qualify or continue to qualify as a regulated investment company by complying with the provisions available to certain investment companies, as defined in applicable sections of the Internal Revenue Code, and to make distributions of net investment income and net realized capital gains sufficient to relieve it from all, or substantially all, federal income taxes.
The Trust has evaluated tax positions taken or expected to be taken in the course of preparing each Fund’s tax returns to determine whether it is more-likely-than not (i.e., greater than 50-percent chance) that each tax position will be sustained upon examination by a taxing authority based on the technical merits of the position. A tax position that meets the more-likely-than-not recognition threshold is measured to determine the amount of benefit to recognize in the financial statements. Differences between tax positions taken in a tax return and amounts recognized in the financial statements will generally result in an increase in a liability for taxes payable (or a reduction of a tax refund receivable), including the recognition of any related interest and penalties as an operating expense. Tax positions taken in tax years remain subject to examination by tax authorities (generally three years plus the interim tax period since then for federal income tax purposes). The determination has been made that there are not any uncertain tax positions that would require the Funds to record a tax liability and, therefore, there is no impact to the Funds’ financial statements.
Annual Shareholder Report
21
Table of Contents
Notes to Financial Statements (Continued)
As of April 30, 2015, the tax cost of securities and the breakdown of unrealized appreciation (depreciation) for each Fund was as follows:
Tax Cost of Securities | Unrealized Appreciation | Unrealized Depreciation | Net Unrealized (Depreciation) | |||||||||||||
US Equity Rotation Strategy ETF | $ | 4,471,799 | $ | 1,116,423 | $ | (37,631 | ) | $ | 1,078,792 | |||||||
EcoLogical Strategy ETF | 6,467,609 | 1,569,073 | (95,599 | ) | 1,473,474 | |||||||||||
The differences between book-basis and tax-basis unrealized appreciation/depreciation are attributable primarily to non-taxable distributions and mergers of underlying investments.
The tax character of distributions paid during the fiscal year ended April 30, 2015 was as follows:
| Distributions paid from | ||||||||||||||||
| Ordinary Income | Net Long Term Capital Gains | Total Taxable Distributions | Total Distributions Paid | |||||||||||||
US Equity Rotation Strategy ETF | $ | 277,901 | $ | 187,566 | $ | 465,467 | $ | 465,467 | ||||||||
EcoLogical Strategy ETF | 67,417 | 50,393 | 117,810 | 117,810 | ||||||||||||
As of April 30, 2015, the components of accumulated earnings/(deficit) on a tax basis were as follows:
Undistributed Ordinary Income | Undistributed Long Term Capital Gains | Accumulated Earnings | Accumulated Capital and Other Losses | Unrealized Appreciation/ (Depreciation) | Total Accumulated Earnings (Deficit) | |||||||||||||||||||
US Equity Rotation Strategy ETF | $ | 32,767 | $ | 50,513 | $ | 83,280 | $ | (11,960 | ) | $ | 1,078,792 | $ | 1,150,112 | |||||||||||
EcoLogical Strategy ETF | 6,114 | 195,862 | 201,976 | — | 1,473,474 | 1,675,450 | ||||||||||||||||||
As of April 30, 2014, the components of accumulated earnings/(deficit) on a tax basis were as follows:
Undistributed Ordinary Income | Undistributed Long Term Capital Gains | Accumulated Earnings | Accumulated Capital and Other Losses | Unrealized Appreciation/ (Depreciation) | Total Accumulated Earnings (Deficit) | |||||||||||||||||||
US Equity Rotation Strategy ETF | $ | 231,657 | $ | 187,566 | $ | 419,223 | $ | — | $ | 2,093,472 | $ | 2,512,695 | ||||||||||||
EcoLogical Strategy ETF | 53,061 | 50,393 | 103,454 | — | 3,333,231 | 3,436,685 | ||||||||||||||||||
Under current tax law, capital losses realized after October 31 and ordinary losses realized after December 31 of the Funds’ fiscal period may be deferred and treated as occurring on the first business day of the following fiscal year for tax purposes. The following Fund had deferred post-October capital losses, which will be treated as arising on the first business day of the fiscal year ending April 30, 2016.
| Post-October Loss | ||
US Equity Rotation Strategy ETF | $11,960 |
| (7) | Investment Risks |
| ETF | Risk |
The NAV of a Fund can fluctuate up or down, and you could lose money investing in a Fund if the prices of the securities owned by the Fund decline. In addition, a Fund may be subject to the following additional risks: (1) the market price of a Fund’s shares may trade above or below their NAV; (2) an active trading market for a Fund’s shares may not develop or be maintained; or (3) trading of a Fund’s shares may be halted if the listing exchange’s officials deem such action appropriate, the shares are delisted from the exchange, or the activation of market-wide “circuit breakers” (which are tied to large decreases in stock prices) halts stock trading generally.
| Ecological | Investment Risk |
The EcoLogical Strategy ETF’s ecological investment criteria could cause it to underperform funds that do not
maintain ecological investment criteria. In order to comply with its ecological investment criteria, the EcoLogical Strategy ETF may be required to forego advantageous investment opportunities or sell investments at inappropriate times. The EcoLogical Strategy ETF’s ecological investment criteria may result in the EcoLogical Strategy ETF investing in industry sectors that are not performing as well as others.
| (8) | Subsequent Events |
Management of the Funds has evaluated the need for disclosures and/or adjustments resulting from subsequent events through the date these financial statements were issued. Based upon this evaluation, no additional disclosures or adjustments were required to the financial statements as of April 30, 2015.
Annual Shareholder Report
22
Table of Contents
Report of Independent Registered Public Accounting Firm
The Board of Trustees and Shareholders of Huntington Strategy Shares:
We have audited the accompanying statements of assets and liabilities, including the schedules of portfolio investments, of Huntington Strategy Shares (the “Funds”) comprised of Huntington US Equity Rotation Strategy ETF and Huntington EcoLogical Strategy ETF as of April 30, 2015, and the related statements of operations for the year then ended, and the statements of changes in net assets and the financial highlights for the periods indicated therein. These financial statements and financial highlights are the responsibility of the Funds’ management. Our responsibility is to express an opinion on these financial statements and financial highlights based on our audits.
We conducted our audits in accordance with the standards of the Public Company Accounting Oversight Board (United States). Those standards require that we plan and perform the audit to obtain reasonable assurance about whether the financial statements and financial highlights are free of material misstatement. We were not engaged to perform an audit of the Funds’ internal control over financial reporting. Our audits included consideration of internal control over financial reporting as a basis for designing audit procedures that are appropriate in the circumstances, but not for the purpose of expressing an opinion on the effectiveness of the Funds’ internal control over financial reporting. Accordingly, we express no such opinion. An audit also includes examining, on a test basis, evidence supporting the amounts and disclosures in the financial statements and financial highlights, assessing the accounting principles used and significant estimates made by management, and evaluating the overall financial statement presentation. Our procedures included confirmation of securities owned as of April 30, 2015, by correspondence with the custodian. We believe that our audits provide a reasonable basis for our opinion.
In our opinion, the financial statements and financial highlights referred to above present fairly, in all material respects, the financial position of each of the respective funds constituting Huntington Strategy Shares at April 30, 2015, the results of their operations for the year then ended, and the changes in their net assets and financial highlights for the periods indicated thereon in conformity with U.S. generally accepted accounting principles.

Columbus, Ohio
June 26, 2015
Annual Shareholder Report
23
Table of Contents
| Additional Information | April 30, 2015 |
Additional Federal Income Tax Information (unaudited)
For the fiscal year ended April 30, 2015, the following percentage of the total ordinary income distributions paid by the Funds qualify for the distributions received deduction available to corporate shareholders.
| Distributions Received Deduction | ||||
US Equity Rotation Strategy ETF | 55.73 | % | ||
EcoLogical Strategy ETF | 100.00 | % | ||
For the fiscal year ended April 30, 2015, distributions paid by the Funds may be subject to a maximum tax rate of 15%, as provided by the Jobs and Growth Tax Relief Reconciliation Act of 2003. The Funds intend to designate the maximum amount allowable as taxed at a maximum rate of 15%. Complete information will be reported in conjunction with your 2015 Form 1099-DIV.
For the taxable year ended April 30, 2015, the percentages of Qualified Dividend Income are as follows:
Qualified Dividend Income | ||||
US Equity Rotation Strategy ETF | 58.68 | % | ||
EcoLogical Strategy ETF | 100.00 | % | ||
The Funds declared long term distributions of realized gains as follows:
Long Term Capital Gains | ||||
US Equity Rotation Strategy ETF | $ | 187,566 | ||
EcoLogical Strategy ETF | 50,393 | |||
The Funds declared short term distributions of realized gains as follows:
Short Term Capital Gains | ||||
US Equity Rotation Strategy ETF | $ | 218,233 | ||
EcoLogical Strategy ETF | 47,684 | |||
Annual Shareholder Report
24
Table of Contents
| Additional Information (Continued) |
Premium/Discount Information
The charts below present information about differences between the per share net asset value (“NAV”) of each Fund and the market trading price of shares of each Fund. For these purposes, the “market price” is the composite close for Fund shares as of the close of trading on all exchanges where Fund shares are listed. The term “premium” is sometimes used to describe a market price in excess of NAV and the term “discount” is sometimes used to describe a market price below NAV. The charts present information about the size and frequency of premiums or discounts. As with other exchange-traded funds, the market price of Fund shares is typically slightly higher or lower than a Fund’s per share NAV. Factors that contribute to the differences between market price and NAV include the supply and demand for Fund shares and investors’ assessments of the underlying value of a Fund’s portfolio securities.
Differences between the closing times of U.S. and non-U.S. markets may contribute to differences between the NAV and market price of Fund shares. Many non-U.S. markets close prior to the close of the U.S. securities exchanges. Developments after the close of such markets as a result of ongoing price discovery may be reflected in a Fund’s market price but not in its NAV (or vice versa).
US Equity Rotation Strategy ETF
Year ended April 30, 2015
| Premium/Discount Range | Number of Days | Percentage of Total Days | ||||||
Greater than 2.0% | — | — | % | |||||
Greater than 1.5% and Less than 2.0% | 2 | 0.79 | ||||||
Greater than 1.0% and Less than 1.5% | 5 | 1.98 | ||||||
Greater than 0.5% and Less than 1.0% | 15 | 5.93 | ||||||
Between 0.5% and -0.5% | 212 | 83.79 | ||||||
Less than -0.5% and Greater than -1.0% | 11 | 4.35 | ||||||
Less than -1.0% and Greater than -1.5% | 6 | 2.37 | ||||||
Less than -1.5% and Greater than -2.0% | 2 | 0.79 | ||||||
Less than -2.0% | — | — | ||||||
|
|
|
| |||||
| 253 | 100.00 | % | ||||||
|
|
|
| |||||
EcoLogical Strategy ETF
Year ended April 30, 2015
| Premium/Discount Range | Number of Days | Percentage of Total Days | ||||||
Greater than 2.0% | 1 | 0.40 | % | |||||
Greater than 1.5% and Less than 2.0% | 1 | 0.40 | ||||||
Greater than 1.0% and Less than 1.5% | 3 | 1.18 | ||||||
Greater than 0.5% and Less than 1.0% | 12 | 4.74 | ||||||
Between 0.5% and -0.5% | 217 | 85.77 | ||||||
Less than -0.5% and Greater than -1.0% | 14 | 5.53 | ||||||
Less than -1.0% and Greater than -1.5% | 4 | 1.58 | ||||||
Less than -1.5% and Greater than -2.0% | 1 | 0.40 | ||||||
Less than -2.0% | — | — | ||||||
|
|
|
| |||||
| 253 | 100.00 | % | ||||||
|
|
|
| |||||
Annual Shareholder Report
25
Table of Contents
Board of Trustees and Trust Officers (Unaudited)
The following tables provide information about Independent Trustees and the senior officers of the Trust. Each Trustee oversees all portfolios of the Trust and serves for an indefinite term (subject to mandatory retirement provisions). Information about each Trustee and executive officer is provided below and includes each person’s name, address, age, present position(s) held with the Trust and principal occupations for the past five years. Unless otherwise noted, each officer is elected annually by the Board. Each Trustee and officer also serves in the same capacity for The Huntington Funds, another open-end investment company whose series are managed by the Advisor. Collectively, Huntington Strategy Shares and The Huntington Funds comprise the “Huntington Complex” which is comprised of 11 separate series as of April 30, 2015.
Interested Trustee Background
Name Age Positions Held with Trust Date Service Began with Huntington Complex | Principal Occupation(s) During Past Five Years, Previous Position(s) and Other Directorships Held | |
Joseph L. Rezabek Age: 46 TRUSTEE Began serving: April 2015 | Principal Occupation(s): President, Leader Promotions
Previous Position(s): Executive Vice President, Huntington National Bank (President, Huntington Asset Services, Inc., Huntington Asset Advisors, Inc., Huntington Investment Company, Inc. (March 2012 to April 2015); President, The Huntington Funds and Huntington Strategy Shares (February 2013 to April 2015); Managing Director and Head of Fund Services, Citi (2006 to 2012); Chief Operating Officer (Milan, Italy), State Street Corporation (1999 to 2006).
Other Directorships Held: Board Member, The Huntington Funds. |
Independent Trustees Background
Name Age Positions Held with Trust Date Service Began with Huntington Complex | Principal Occupation(s) During Past Five Years, Previous Position(s) and Other Directorships Held | |
Thomas J. Westerfield* Age: 60 CHAIRMAN OF THE BOARD and TRUSTEE Began serving: January 2001 | Principal Occupation(s): Chairman of the Board and Of Counsel, Dinsmore & Shohl LLP (law firm) (August 2005 to present).
Previous Position(s): Of Counsel, Cors & Bassett LLC (law firm) (1993-2005).
Other Directorships Held: Board Member, The Huntington Funds. | |
Mark D. Shary Age: 55 TRUSTEE Began serving: June 2006 | Principal Occupation(s): Managing Director, ET Partner (consulting) (2008 to present); Private investor (2007 to present).
Previous Position(s): Chief Executive Officer and President, BestTransport.com, Inc. (2003 to 2007); President, Bostech Corporation (2000 to 2002).
Other Directorships Held: Board Member, The Huntington Funds; Director, SafeWhite, hc1.com, Updox, MBA Focus, InnerApps, and Vantage Point Logistics (all private companies); Trustee, TechColumbus (non-profit); Director, Healthcare.com (1998-2000) (public company). | |
William H. Zimmer, III Age: 61 TRUSTEE Began serving: December 2006 | Principal Occupation(s): Chief Executive Officer, Cintel Federal Credit Union, (January 2011 to present); Independent Consultant, WHZIII, LLC (January 2014 to present).
Previous Position(s): Consultant, WHZIII, LLC (March 2009 to January 2011); Assistant Treasurer, Dana Holding Corp. (September 2006 to February 2009) (manufacturing); Vice President and Manager, Global Treasury Management, National City Bank (January 2004 to March 2006); Vice President, Treasury Management Operations, Provident Bank (June 2003 to January 2004); Financial Consultant (April 2001 to June 2003).
Other Directorships Held: Board Member, The Huntington Funds. |
| * | Thomas J. Westerfield became Chairman of the Trust on February 14, 2013. |
Annual Shareholder Report
26
Table of Contents
Officers1
Name Age Positions Held with Trust Address Date Service Began with Huntington Complex | Principal Occupation(s) and Previous Position(s) | |
Daniel Brewer Age: 46 PRESIDENT and CHIEF EXECUTIVE OFFICER 37 West Broad Street Columbus, OH 43215 Began Serving: April 2015 | Principal Occupation(s): Senior Vice President, Huntington Asset Services, Inc. (“HASI”) (March 2014 to present); President, The Huntington Funds (April 2015 to present).
Previous Position(s): Senior Vice President, Operations, Citi (formerly, BISYS Fund Services), (October 2002 to March 2014); Kemper Fund Services (February 1991 to September 2002). | |
Martin R. Dean Age: 51 ANTI-MONEY LAUNDERING OFFICER and CHIEF COMPLIANCE OFFICER 37 West Broad Street Columbus, OH 43215 Began Serving: July 2013 | Principal Occupation(s): Senior Vice President and Compliance Group Manager, HASI (July 2013 to present); Anti-Money Laundering Officer and Chief Compliance Officer, The Huntington Funds (July 2013 to present).
Previous Position(s): Director and Fund Accounting and Fund Administration Product Manager, Citi (2008 to June 2013); Senior Vice President/Vice President, Fund Administration, Citi (formerly, BISYS Fund Services) (May 1994 to 2008). | |
Bryan W. Ashmus Age: 42 TREASURER 37 West Broad Street Columbus, OH 43215 Began Serving: November 2013 | Principal Occupation(s): Vice President, Fund Administration, HASI (September 2013 to present); Chief Financial Officer and Treasurer, Valued Advisors Trust (December 2013 to present); Treasurer, The Huntington Funds (November 2013 to present).
Previous Position(s): Vice President, Fund Adminstration, Citi Fund Services Ohio, Inc., (May 2005 to September 2013). | |
Jay S. Fitton Age: 45 SECRETARY 3805 Edwards Road Cincinnati, OH 45209 Began Serving: February 2012 | Principal Occupation(s): Vice President of Legal Administration, HASI (November 2011 to present); Secretary, The Huntington Funds (October 2012 to present); Secretary, Capitol Series Trust (September 2013 to present).
Previous Position(s): Vice President and Senior Counsel, J.P. Morgan Chase (April 2007 to November 2011). |
| 1 | Officers do not receive any compensation from the Trust. |
The Funds’ Statement of Additional Information (“SAI”) includes additional information about the trustees and is available without charge, upon request. You may call toll-free at 800-253-0412 to request a copy of the SAI or to make shareholder inquiries.
Annual Shareholder Report
27
Table of Contents
VOTING PROXIES ON FUND PORTFOLIO SECURITIES
A copy of the policies and procedures that the Funds use to determine how to vote proxies relating to securities held in the Funds’ portfolios, as well as a record of how the Funds voted any such proxies during the most recent 12-month period ended June 30, is available without charge and upon request by calling 1-855-HSS-ETFS or 1-855-477-3837 or at www.huntingtonstrategyshares.com. This information is also available from the EDGAR database on the SEC’s website at www.sec.gov.
QUARTERLY PORTFOLIO SCHEDULE
The Funds file with the SEC a complete schedule of their portfolio holdings, as of the close of the first and third quarters of their fiscal year, on Form N-Q. These filings are available on the SEC’s website at www.sec.gov and may be reviewed and copied at the SEC’s Public Reference Room in Washington, DC. (call 1-202-551-8090 for information on the operation of the Public Reference Room.) You may also access this information at www.huntingtonstrategyshares.com by selecting “Form N-Q”.
Huntington Asset Advisors, Inc., a wholly-owned subsidiary of The Huntington National Bank, is the Investment Advisor of Huntington Strategy Shares. Huntington Asset Services, Inc. maintains corporate records of the Funds, and is affiliated with Huntington Bancshares Incorporated. SEI Investments Distribution Company is the principal underwriter and distributor of each Fund’s shares.
Exchange-traded funds are not bank deposits or obligations, are not guaranteed by any bank, and are not insured or guaranteed by the U.S. government, the Federal Deposit Insurance Corporation, the Federal Reserve Board, or any other government agency. Investment in exchange-traded funds involves investment risk, including the possible loss of principal.
This report is authorized for distribution to prospective investors only when preceded or accompanied by a prospectus which contains facts concerning the Funds’ objectives and policies, management fees, expenses and other information.
Cusip 446698102 | Cusip 446698201 |
| Huntington Strategy Shares Shareholder Services: 1-855-477-3837 |
Table of Contents
| Item 2. | Code of Ethics. |
(a) As of the end of the period covered by the report, the registrant has adopted a code of ethics that applies to the registrant’s Principal Executive Officer and Principal Financial Officer.
(b) Not applicable.
(c) During the period covered by the report, with respect to the registrant’s code of ethics that applies to its Principal Executive Officer and Principal Financial Officer: there have been no amendments to a provision that relates to any element of the code of ethics definition enumerated in paragraph (b) of this Item 2.
(d) During the period covered by the report, with respect to the registrant’s code of ethics that applies to its Principal Executive Officer and Principal Financial Officer: there have been no waivers granted from a provision that relates to any element of the code of ethics definition enumerated in paragraph (b) of this Item 2.
(e) Not applicable.
| Item 3. | Audit Committee Financial Expert. |
3(a)(1) The registrant’s Board of Trustees has determined that the registrant has at least one audit committee financial expert serving on its audit committee.
3(a)(2) The audit committee financial expert is Mark D. Shary, who is “independent” for purposes of this Item 3 of Form N-CSR.
| Item 4. | Principal Accountant Fees and Services. |
(a) Audit Fees billed to the registrant by its principal accountants for the two most recent fiscal years:
Fiscal year ended 2015: $32,696
Fiscal year ended 2014: $24,828
(b) Audit-Related Fees billed to the registrant by its principal accountants for the two most recent fiscal years:
Fiscal year ended 2015: $ -
Fiscal year ended 2014: $ -
(c) Tax Fees billed to the registrant by its principal accountants for the two most recent fiscal years:
Fiscal year ended 2015: $8,050
Fiscal year ended 2014: $8,050
Fees for 2015 related to the review of the registrant’s tax returns. Amount requiring approval of the registrant’s audit committee pursuant to paragraph (c)(7)(ii) of Rule 2-01 of Regulation S-X, $0.
(d) All other fees billed to the registrant by its principal accountants for the two most recent fiscal years:
Fiscal year ended 2015: $ -
Fiscal year ended 2014: $ -
Amount requiring approval of the registrant’s audit committee pursuant to paragraph (c)(7)(ii) of Rule 2-01 of Regulation S-X, $0 and $0 respectively.
(e)(1) Audit and Non-Audit Services Pre-Approval Policies and Procedures
| I. | Purpose |
Under the Sarbanes-Oxley Act of 2002 (the “Act”), the Audit Committee of the Board of Trustees of The Huntington Strategy Shares (the “Trust”) is responsible for the appointment, compensation and oversight of the work of the Trust’s independent auditor. As part of this responsibility, the Audit Committee is required to grant approval for audit and non-audit services performed by the independent auditor for the Trust in order assure that they do not impair the auditor’s independence from the Trust. In addition, the Audit Committee also must pre-approve its independent auditor’s engagement for non-audit services with the Trust’s investment adviser (not including a sub-adviser whose role is primarily portfolio management and is sub-contracted or overseen by another investment adviser) and any entity controlling, controlled by, or under common control with the investment adviser that provides ongoing services to the Trust, if the engagement relates directly to the operations and/or financial reporting of the Trust.
Table of Contents
To implement these provisions of the Act, the Securities and Exchange Commission (the “SEC”) has issued rules specifying the types of services that the Trust’s independent auditor may not provide to the Trust, as well as the Audit Committee’s administration of the engagement of the independent auditor. Under these rules, the SEC has provided that a permissible approval of audit and non-audit services can take the form of either (i) a general pre-approval, or (ii) a specific pre-approval (where a specific type of service is authorized, generally subject to a fee maximum). General pre-approvals are authorized by SEC rules only subject to detailed policies and procedures. Unless a type of service has received general pre-approval, it will require specific pre-approval by the Audit Committee if it is to be provided by the independent auditor. Accordingly, the Audit Committee has adopted these Audit and Non-Audit Services Pre-Approval Policies and Procedures, which set forth the procedures and the conditions pursuant to which services for the Trust may be performed by the independent auditor under pre-approvals.
| II. | General Pre-Approval Policies |
It is the policy of the Audit Committee that audit and non-audit services to be performed by the Trust’s independent auditor be pre-approved only when in the best interests of the Trust’s shareholders and fully consistent with applicable law and, particularly, the maintenance of the auditor’s independence. In granting any pre-approval, consideration shall be given to:
| 1. | the qualifications of the auditor to perform the services involved; |
| 2. | the proposed costs (which may be presented as an estimate or based on professional time charges subject to a ceiling) of the services and the reasonableness thereof; |
| 3. | the permissibility of the services under applicable rules and guidance of the SEC; |
| 4. | the effect, if any, of the performance of the proposed services on the auditor’s independence; |
| 5. | the effect of the compensation for the proposed services on the auditor’s independence; and |
| 6. | the effect, if any, of the proposed services on the Trust’s ability to manage or control risk or to improve audit quality. |
In accordance with SEC rules, non-audit services performed by the Trust’s independent auditor may not include the following:
| 1. | Bookkeeping or other services related to the accounting records or financial statements of the audit client; |
| 2. | Financial information systems design and implementation; |
| 3. | Appraisal or valuation services, fairness opinions or contribution-in-kind reports; |
| 4. | Actuarial services; |
| 5. | Internal audit outsourcing services; |
| 6. | Management functions or human resources; |
| 7. | Broker-dealer, investment adviser or investment banking services; and |
| 8. | Legal services and expert services unrelated to the audit. |
| III. | Procedures for Pre-Approval by the Audit Committee |
| 1. | Requests for pre-approval shall be in writing and may be made by either the independent auditors or by management of the Trust. |
Table of Contents
| 2. | All requests for pre-approval shall be made to the full Audit Committee at regularly scheduled meetings thereof (or at a special meeting of the Audit Committee set to coincide with regular meetings of the Trust’s Board of Trustees) whenever practicable. |
| 3. | Under normal circumstances, requests for pre-approval should be presented at least 7 days prior (and in no event later than 48 hours prior) to the proposed commencement of the engagement. |
| 4. | If consideration of a request for pre-approval on the dates identified in Section III (2) would not be timely, the requesting party shall notify the Chairman of the Audit Committee. The Chairman of the Audit Committee shall then determine whether to schedule a special meeting of the Audit Committee (which may be conducted telephonically) on an alternative date or whether the request may appropriately be presented to a delegate of the Audit Committee under procedures set forth in Section IV below. |
| 5. | Requests for pre-approval may include, but are not limited to, the following services: |
| a. | audit engagement, particularly for interim periods; |
| b. | tax compliance, tax planning, and tax advice; |
| c. | review and consents with respect to use of reports in post-effective amendments to the registration statements of the Trust; |
| d. | review of IRS shareholder materials; |
| e. | review and validation of Trust procedures (e.g., valuation, interTrust lending, etc.), and |
| f. | market research and strategic insights. |
| 6. | Requests for pre-approval should identify the nature of the services to be provided in a manner sufficiently specific to allow evaluation of the considerations identified above in Section II. |
| 7. | In accordance with PCAOB Rule 3524, requests for pre-approval of permissible tax services by the independent auditor must have the following items described in writing for the audit committee: |
| a. | the scope of the proposed tax service, |
| b. | the fee structure for the engagement, |
| c. | any side letters, amendments to the engagement letter or any other agreements, whether oral, written, or otherwise, relating to the service between the audit firm and the Trusts, and |
| d. | any compensation arrangements or other agreements between the audit firm and any third party with respect to promoting, marketing, or recommending a transaction covered by the proposed tax service. |
The audit firm should discuss with the Audit Committee the potential effect of the proposed tax service(s) on the audit firm’s independence.
| 8. | Requests for pre-approval must include an assessment by the independent auditor of its independence should the request be granted and the proposed services rendered. |
| 9. | The Audit Committee’s action on a request for pre-approval shall be recorded in the Audit Committee’s minutes. |
| 10. | The Audit Committee’s action on a request for pre-approval shall be communicated in writing to the independent auditor and, under normal circumstances, a copy of this communication shall be provided to the Trust’s management. |
Table of Contents
| 11. | The Audit Committee’s action on a request for pre-approval shall be reported to the full Board of Trustees. |
| 12. | Pre-approvals will be granted for a period of no more than one year. |
| IV. | Procedures for Pre-Approval by a Delegate of the Audit Committee |
| 1. | Where it has been determined by the Chairman of the Audit Committee that consideration of a request for pre-approval by the full Audit Committee would not be timely, the Chairman may determine that the request be presented to a member(s) of the Audit Committee appointed by the Audit Committee as its delegate (the “Delegate”) for this purpose. (As of the date of the adoption of these guidelines and procedures, the Chairman of the Audit Committee has been so appointed, and such appointment may be revoked or modified by the Audit Committee at any time.) |
| 2. | Requests for pre-approval shall be in writing and may be made by either the independent auditors or by management of the Trust. |
| 3. | Under normal circumstances, requests for pre-approval should be presented at least 7 days prior (and in no event later than 48 hours prior) to the proposed commencement of the engagement. |
| 4. | Requests for pre-approval may include, but are not limited to, the following services: |
| a. | audit engagement, particularly for interim periods; |
| b. | tax compliance, tax planning, and tax advice; |
| c. | review and consents with respect to use of reports in post-effective amendments to the registration statements of the Trust; |
| d. | review of IRS shareholder materials; |
| e. | review and validation of Trust procedures (e.g., valuation, interfund lending, etc.); and |
| f. | market research and strategic insights. |
| 5. | Requests for pre-approval should identify the nature of the services to be provided in a manner sufficiently specific to allow evaluation of the considerations identified above in Section II. |
| 6. | Requests for pre-approval must include an assessment by the independent auditor of its independence should the request be granted and the proposed services rendered. |
| 7. | The Delegate’s action on a request for pre-approval shall be communicated in writing to the independent auditor, with a copy to each other member of the Audit Committee and, under normal circumstances, to the Trust’s management. |
| 8. | Pre-approvals by the Delegate shall be reviewed by the Audit Committee at a meeting held no later than the next scheduled meeting of the Board of Trustees or the Audit Committee, whichever occurs sooner. An earlier review shall be conducted upon the written request of one or more Audit Committee members addressed to the Chairman of the Audit Committee. |
| 9. | Pre-approvals by the Delegate may be modified or revoked by the Audit Committee, but will not absolve the Trust of its responsibility to compensate the independent auditor for services rendered prior to such modification or revocation. |
Table of Contents
| 10. | The results of the Audit Committee’s review of the Delegate’s action on a request for pre-approval shall be recorded in the Audit Committee’s minutes and reported to the full Board of Trustees. |
| 11. | Pre-approvals will be granted by the Delegate for a period of no more than one year. |
| V. | Procedures for Monitoring Engagements Authorized Under Pre-Approval Procedures |
The independent auditor shall inform the Audit Committee in writing upon the commencement of services rendered under a pre-approval. The independent auditor shall thereafter provide the Audit Committee with written quarterly progress reports within one month of the close of each calendar quarter detailing the work done and fees and other charges incurred during said calendar quarter. Should fees and expenses exceed those specified in a pre-approval (or appear likely to do so prior to completion of the work), the independent auditor or management shall so apprise the Audit Committee and an additional express approval or pre-approval must be obtained.
| VI. | Amendment |
These Policies and Procedures may be amended or revoked at any time by the Audit Committee and shall be reviewed at least annually in conjunction with review of the Audit Committee Charter.
Adopted February 14, 2013
(e)(2) Percentage of services described in each of paragraphs (b) through (d) of this Item that were approved by the audit committee pursuant to paragraph (C)(7)(i)(C) of Rule 2-01 of Regulation S-X.
Fiscal year ended 2015 - 100%
Percentage of services provided to the registrant’s investment adviser and any entity controlling, controlled by, or under common control with the investment adviser that provides ongoing services to the registrant that were approved by the registrant’s audit committee pursuant to paragraph (C)(7)(i)(C) of Rule 2-01 of Regulation S-X, 0%.
(f) Not applicable.
(g) The aggregate non-audit fees billed by Ernst and Young LLP for the Funds and certain entities (including the adviser (excluding sub-adviser) and any entity controlling, controlled by or under common control with the advisor that provides ongoing services to the registrant (Funds)), totaled $256,410 in 2015.
(h) The registrant’s Audit Committee has considered whether the provision of non audit services that were rendered to registrant’s investment adviser (not including any sub adviser whose role is primarily portfolio management and is subcontracted with or overseen by another investment adviser), and any entity controlling, controlled by, or under common control with the investment adviser that provide ongoing services to the registrant that were not pre-approved pursuant to paragraph (c)(7)(ii) of Rule 2-01 of Regulation S-X is compatible with maintaining the principal account’s independence.
| Item 5. | Audit Committee of Listed Registrants. |
The Registrant is a listed issuer as defined in Rule 10A-3 under the Exchange Act and has a separately-designated standing audit committee established in accordance with Section 3(a)(58)(A) of the Exchange Act. The Registrant’s audit committee members are Mark D. Shary (Chairman), Thomas J. Westerfield and William H. Zimmer, III.
| Item 6. | Investments. |
(a) The schedules of investments are included as part of the report to shareholders filed under Item 1 of this form.
(b) Not applicable.
| Item 7. | Disclosure of Proxy Voting Policies and Procedures for Closed-End Management Investment Companies. |
Not applicable.
Table of Contents
| Item 8. | Portfolio Managers of Closed-End Management Investment Companies. |
Not applicable.
| Item 9. | Purchases of Equity Securities by Closed-End Management Investment Company and Affiliated Purchasers. |
Not applicable.
| Item 10. | Submission of Matters to a Vote of Security Holders. |
Not applicable.
| Item 11. | Controls and Procedures. |
(a) The registrant’s Principal Executive Officer and Principal Financial Officer have concluded that the registrant’s disclosure controls and procedures (as defined in Rule 30a-3(c) under the Act) are effective in design and operation and are sufficient to form the basis of the certifications required by Rule 30a-2 under the Act, based on their evaluation of these disclosure controls and procedures within 90 days of the filing of this report on Form N-CSR.
(b)There were no changes in the registrant’s internal control over financial reporting (as defined in Rule 30a-3(d) under the Act (17 CFR 270.30a-3(d)) that occurred during the second fiscal quarter of the period covered by this report that have materially affected or are reasonably likely to materially affect, the registrant’s internal control over financial reporting.
| Item 12. | Exhibits. |
(a)(1) The code of ethics that is the subject of the disclosure required by Item 2 is attached hereto.
(a)(2) Certifications pursuant to Rule 30a-2(a) are attached hereto.
(a)(3) Not applicable.
(b) Certifications pursuant to Rule 30a-2(b) are furnished herewith.
Table of Contents
SIGNATURES
Pursuant to the requirements of the Securities Exchange Act of 1934 and the Investment Company Act of 1940, the registrant has duly caused this report to be signed on its behalf by the undersigned, thereunto duly authorized.
(Registrant) Huntington Strategy Shares
| By (Signature and Title) | /s/ Daniel Brewer | |||
| Daniel Brewer, Chief Executive Officer |
Date June 29, 2015
Pursuant to the requirements of the Securities Exchange Act of 1934 and the Investment Company Act of 1940, this report has been signed below by the following persons on behalf of the registrant and in the capacities and on the dates indicated.
| By (Signature and Title) | /s/ Daniel Brewer | |||
| Daniel Brewer, Chief Executive Officer |
Date June 29, 2015
| By (Signature and Title) | /s/ Bryan W. Ashmus | |||
| Bryan W. Ashmus, Treasurer |
Date June 29, 2015