LoCorr Investment Trust
c/o U.S. Bancorp Global Fund Services
615 East Michigan Street
Milwaukee, WI 53202
February 22, 2019
VIA EDGAR TRANSMISSION
Ms. Samantha Brutlag
United States Securities and Exchange Commission
Division of Investment Management
100 F Street N.E.
Washington D.C. 20549
| Re: | LoCorr Investment Trust (the “Trust”) |
File Nos. 333-171360 and 811-22509
Dear Ms. Brutlag:
We are responding to comments provided to Alia Vasquez of U.S. Bancorp Global Fund Services the Trust’s Administrator, by the U.S. Securities and Exchange Commission (the “SEC”) Division of Investment Management staff (the “Staff”) on February 8, 2019, regarding the Trust’s Post-Effective Amendment (“PEA”) No. 44 to its registration statement on Form N-1A. PEA No. 44 was filed on December 31, 2018 pursuant to Rule 485(a) under the Securities Act of 1933, as amended (the “Securities Act”) for the purpose of adding disclosures relating to First Quadrant LP, the new sub-advisor for the LoCorr Dynamic Equity Fund, including prior performance of First Quadrant LP. The Staff’s comments, along with the Trust’s responses, are set forth below.
For your convenience, the Staff’s comments have been reproduced in bold typeface immediately followed by the Trust’s responses.
| 1. | Staff Comment: In your response, please provide the completed fee tables for each Fund in the Trust. |
Response: The completed fee tables for each Fund will be provided via e-mail prior to filing the Trust’s next post-effective amendment pursuant to Rule 485(b) under the Securities Act.
| 2. | Staff Comment: In your response, please provide the performance chart and table for the Dynamic Equity Fund. |
Response: The completed performance chart and table for the LoCorr Dynamic Equity Fund is included as an attachment to this response letter.
| 3. | Staff Comment: For the Spectrum Income Fund, please explain the deletion of disclosure in the summary section of the Fund’s prospectus. |
Response: For the past two years the Spectrum Income Fund has not utilized the “Loan Investment” Strategy as a principal part of its investment strategy; however, the Fund may employ this strategy in the future. As such, the disclosure related to the Loan Investment Strategy was deleted from the summary section of the Fund’s Prospectus, and was relocated to the statutory section of the Prospectus, under a new sub-heading “Non-Principal Investment Strategy”. Furthermore, additional deletions will be made to the Fund’s summary section to remove remaining references to the “Loan Investment Strategy” that were inadvertently left in the summary section’s disclosure.
1
In addition, the Fund has previously disclosed that, as a non-principal strategy, it may employ hedging strategies. The Fund will begin using these as a principal strategy. Therefore, the Fund will add the following strategy and risk disclosure to the principal strategy and risk section:
“To reduce overall portfolio market risk or security specific risk, the Adviser may employ hedging strategies. These strategies attempt to mitigate potential losses in value in certain Fund holdings. The Adviser attempts to hedge risks by investing long and/or short in exchange-traded futures, ETFs and exchange-traded and over-the-counter options, selling securities short and entering into swap contracts. The Adviser takes short positions in equity or interest rate futures contracts to protect against declines in the equity market and debt market, respectively. The Adviser may also invest in inverse ETFs (those that are designed to have price changes that move in the opposite direction of a market index) to protect against declines in the equity market and debt market. The Adviser may invest in protective put options that give the Fund the right to sell a security at a specific price regardless of the decline in the market price. The Adviser may also combine long and short (written) put and call options in "spread" transactions that are designed to protect the Fund over a range of price changes. Short selling is also used to hedge against overall market or sector price declines. Similarly, swaps contracts (agreements to exchange payments based on price changes in an index or specific security) are used to hedge against overall market, sector or security-specific price declines.”
“Hedging Strategies Risk: There is no assurance that the Fund will succeed in hedging the underlying portfolio holdings because the value of the hedging vehicle may not correlate perfectly with the underlying portfolio asset. The Adviser is not aware of any security or combination of securities that would provide a perfect hedge to the Fund's holdings. Each of the hedging strategies has inherent leverage risk that may tend to magnify the Fund's losses. Derivative contracts, such as futures, have leverage inherent in their terms because of low margin deposits normally required. Consequently, a relatively small price movement in the futures contract reference index may result in an immediate and substantial loss to the Fund. Over-the-counter instruments, such as swaps and certain purchased options, are subject to counterparty default risk and liquidity risk. Swap agreements also involve fees, commissions or other costs that may reduce the Fund's gains from a swap agreement or may cause the Fund to lose money. The Fund will incur a loss as a result of a short position if the price of the short position instrument increases in value between the date of the short position sale and the date on which an offsetting position is purchased. Short positions may be considered speculative transactions and involve special risks, including greater reliance on the Adviser's ability to accurately anticipate the future value of a security or instrument. The Fund's losses are potentially unlimited in a short position transaction. The Adviser covers hedging positions (buys back, sells or closes out positions) when it believes market price trends are no longer unfavorable or security-specific risks are acceptable or when a different hedging vehicle is more attractive.”
| 4. | Staff Comment: In the section entitled, “Additional Information about Principal Investment Objectives, Strategies and Related Risks,” “BDC Risk” is disclosed as principal risk of the Spectrum Income Fund. Please confirm that any fees from BDCs (business development companies) has been included in the acquired fund fees and expenses (“AFFE”) line item in the Spectrum Income Fund’s fee table. |
2
Response: The Trust confirms that any expenses from the Spectrum Income Fund’s investments in BDC’s has been included in the AFFE expenses shown in the Fund’s fee table.
| 5. | Staff Comment: Please confirm supplementally to the Staff that the Trust has the records and documents required to support the calculation of the prior performance of First Quadrant LP, as required by Rule 204-2(a)(16) of the Investment Adviser’s Act. |
Response: Records related to the performance of a sub-adviser are maintained by the Adviser or Sub-Adviser. The Trust confirms that the Adviser or Sub-Adviser has represented to it that the Adviser or Sub-Adviser has the records and documents required to support the calculation of the prior performance shown for First Quadrant LP.
| 6. | SEC Comment: In the fourth paragraph on page 59, with respect to the Prior Performance of First Quadrant LP, the Trust states, “The fees and expenses associated with an investment in the FQ SMA are different from the fees and expenses (after taking into account the expense limitation agreement) associated with an investment in the Dynamic Equity Fund, so that if the results of the FQ SMA were adjusted for expenses of the Dynamic Fund, returns would have been higher.” Is this statement true for all classes of the Fund, both before and after waivers? If not, please revised. |
Response: The FQ SMA is currently comprised entirely of the Adviser’s proprietary funds and the account has not been charged, and has not paid, any fees. The disclosure in the Fund’s prospectus has therefore been revised as follows:
“The fees and expenses associated with an investment in the FQ SMA are different from the fees and expenses (after taking into account the expense limitation agreement) associated with an investment in the Dynamic Equity Fund, so that if the results of the FQ SMA were adjusted for expenses of the Dynamic Fund, returns would have been higherlower.”
| 7. | Staff Comment: In your response, please provide completed prior performance charts for all prior performance presented in the Prospectus. |
Response: All completed prior performance charts are included as an attachment to this response letter.
I trust that the above responses and revisions adequately address the Staff’s comments. If you have any additional questions or require further information, please contact Alia Vasquez of U.S. Bancorp Global Fund Services at (414) 765-6620.
Very truly yours,
/s/ Jon C. Essen
Trustee, Treasurer and Principal Financial Officer
LoCorr Investment Trust
cc: JoAnn M. Strasser, Thompson Hine LLP
3
LoCorr Investment Trust
SEC Response Letter
February 22, 2019
ATTACHMENT – Supplements to Responses
Supplement to Response 2: Dynamic Equity Fund Performance Chart and Table
Performance:
The following bar chart and table provide some indication of the risks of investing in the Fund by showing changes in the performance of the Fund’s Class I shares from year to year and by showing how the one-year and since inception average annual total returns for the Fund’s Class I shares compare with that of a broad-based securities index and a secondary index. The returns in the bar chart and best/worst quarter are for Class I shares which do not have sales charges. The performance of Class A and Class C Shares would be lower due to differing expense structures and sales charges. The returns in the table reflect the maximum applicable sales load of 5.75% on Class A shares, and the maximum deferred sales load of 1.00% on Class C shares for the one-year period. The Fund’s past performance, before and after taxes, is not necessarily an indication of how the Fund will perform in the future and does not guarantee future results. Updated performance information is available on the Fund’s website at www.LoCorrFunds.com. Net asset value (“NAV”) per share information may be obtained by visiting www.LoCorrFunds.com/performance.html.
Calendar Year Total Return
LoCorr Dynamic Equity Fund – Class I
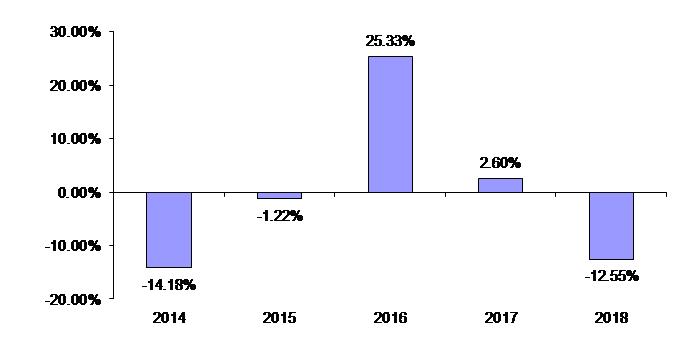
| Highest Quarterly Return: | Q3 2016 | 12.09% |
| Lowest Quarterly Return: | Q3 2015 | -13.03% |
| Average Annual Total Return as of December 31, 2018 | |||
| 1 Year | 5 Years | Since Inception (5/10/2013) | |
LoCorr Dynamic Equity Fund (Class I Shares) | |||
| Return Before Taxes | -12.55% | -0.95% | 1.64% |
4
| Return After Taxes on Distributions | -13.38% | -1.36% | 1.27% |
| Return After Taxes on Distributions and Sale of Fund Shares | -6.93% | -0.72% | 1.27% |
| (Class A Shares) | |||
| Return Before Taxes | -17.87% | -2.37% | 0.32% |
| (Class C Shares) | |||
| Return Before Taxes | -14.28% | -1.94% | 0.62% |
S&P 500 Total Return Index (reflects no deduction for fees, expenses or taxes) | -4.38% | 8.49% | 10.13% |
Morningstar Long/Short Equity Fund Index (reflects no deduction for fees, expenses or taxes) | -6.61% | 1.17% | 2.32% |
After-tax returns are calculated using the historical highest individual federal marginal income tax rates and does not reflect the impact of state and local taxes. Actual after-tax returns depend on the individual investor’s situation and may differ from those shown. Furthermore, the after-tax returns shown are not relevant to investors who hold their shares through tax-deferred arrangements such as 401(k) plans or Individual Retirement Accounts (“IRAs”). After-tax returns are shown for Class I shares only and will vary for Class A and Class C shares.
Supplement to Response 7: Prior Performance Presentations
Prior Performance of Billings Capital Management LLC
Billings manages a private investment fund, the BCM Weston, L.P. (“BCM Weston”), with substantially similar objectives and strategies as it will use to manage the portion of the Dynamic Equity Fund's assets allocated to it. You should not consider the past performance of BCM Weston as indicative of the future performance of the Dynamic Equity Fund.
The following tables set forth performance data relating to the historical performance of BCM Weston, which represents all of the accounts and funds managed by Billings for the periods indicated that have investment objectives, policies, strategies and risks substantially similar to those employed by the sub-adviser in the management of its allocated portion of the Dynamic Equity Fund. The data, which has been provided by the sub-adviser, is provided to illustrate the past performance of the sub-adviser in managing a fund with substantially similar investment strategies, as measured against the Morningstar Global Long/Short Equity Index and the S&P 500® Total Return Index and does not represent the performance of the Dynamic Equity Fund.
BCM Weston is not subject to the same types of expenses to which the Dynamic Equity Fund is subject nor to the diversification requirements, specific tax restrictions and investment limitations imposed on the Fund by the 1940 Act, or Subchapter M of the Code. Consequently, the performance results for BCM Weston could have been adversely affected if BCM Weston had been regulated as an investment company under the federal securities laws. The method used to calculate BCM Weston’s performance was the Modified Dietz (MD) method. For periods where no large cash flows occur, the MD method involves calculating performance through a measure of the historical performance of an investment portfolio in the presence of external cash flows, which divides the gain or loss in value, net of external cash flows, by the average capital over the period of measurement. For periods when a large cash flow occurs, a valuation point is created at the mid-month point and a MD method is used for the two sub periods. These are true Time Weighted Returns. This method differs from the Securities and Exchange Commission's standardized method of calculating performance, and may produce different results.
5
The fees and expenses associated with an investment in BCM Weston are different from the fees and expenses (after taking into account the expense limitation agreement) associated with an investment in the Dynamic Equity Fund, so that if the results of BCM Weston were adjusted for expenses of the Dynamic Fund, returns would have been higher.
The performance presented below for the similarly managed fund is shown on a net basis. The net performance results are net of standard management and performance fees for BCM Weston. Results include the reinvestment of dividends and capital gains. Returns from cash and cash equivalents in BCM Weston are included in the performance calculations, and the cash and cash equivalents are included in the total assets on which the performance is calculated. BCM Weston was valued on a monthly basis, which differs from the SEC return calculation method that employs daily valuation.
The chart below shows the net annual returns for BCM Weston for the calendar years shown. BCM Weston receives a 1.5% management fee and 20% incentive compensation.
| Name | 2009 | 2010 | 2011 | 2012 | 2013 | 2014 | 2015 | 2016 | 2017 | 2018 |
BCM Weston(1) | 19.10% | 20.64% | -8.95% | 15.20% | 50.35% | 3.42% | 4.37% | 33.69% | 5.81% | -21.82% |
(1) Performance results reflect audited returns for the fund from inception beginning in February 2008, and ended December 31, 2018. The Fund charged no management fee or performance fees in 2008. Post 2008 until December 31, 2013, BCM Weston’s returns are net of the 1.5% management fee and 20% incentive compensation. In December 2014, BCM Weston implemented a 6% cumulative hard hurdle rate for the incentive compensation that was applied retroactively for the full year 2014.
The chart below shows the annualized historical performance of BCM Weston, net of fees.
For the Periods Ended 12/31/18 | BCM Weston | Morningstar Global Long/Short Equity Index(1) | S&P 500 Total Return Index(2) |
| 1 Year | -21.82% | -6.72% | -4.38% |
| 5 Years | 3.60% | 1.17% | 8.49% |
| 10 Years | 10.46% | 3.32% | 13.12% |
Since Inception (3) | 9.78% | 1.54% | 7.92% |
| (1) | The Morningstar Global Long/Short Equity Index consists of funds with exposure to long and short positions in global equities or derivatives and is equally weighted. |
| (2) | The S&P 500 Total Return Index consists of 500 stocks chosen for their market size, liquidity and industry group representation. It is a market value-weighted index and one of the most widely-used benchmarks for U.S. stock performance. Investors cannot invest directly in an index, and index figures do not reflect any deduction for fees, expenses or taxes. |
| (3) | The inception date for BCM Weston was February 14, 2008. |
The chart below shows the gross annual returns for BCM Weston for the calendar years shown.
| Name | 2009 | 2010 | 2011 | 2012 | 2013 | 2014 | 2015 | 2016 | 2017 | 2018 |
BCM Weston(1) | 25.71% | 27.67% | -7.56% | 18.28% | 65.30% | 4.98% | 5.94% | 41.57% | 7.41% | -20.62% |
(1) Performance results reflect audited returns for the fund from inception beginning in February 2008, and ended December 31, 2017.
The chart below shows the annualized historical performance of BCM Weston, gross of fees.
6
For the Periods Ended 12/31/18 | BCM Weston | Morningstar Global Long/Short Equity Index(1) | S&P 500 Total Return Index(2) |
| 1 Year | -20.62% | -6.72% | -4.38% |
| 5 Years | 6.07% | 1.17% | 8.49% |
| 10 Years | 14.56% | 3.32% | 13.12% |
Since Inception (3) | 13.50% | 1.54% | 7.92% |
| (1) | The Morningstar Global Long/Short Equity Index consists of funds with exposure to long and short positions in global equities or derivatives and is equally weighted. |
| (2) | The S&P 500 Total Return Index consists of 500 stocks chosen for their market size, liquidity and industry group representation. It is a market value-weighted index and one of the most widely-used benchmarks for U.S. stock performance. Investors cannot invest directly in an index, and index figures do not reflect any deduction for fees, expenses or taxes. |
| (3) | The inception date for BCM Weston was February 14, 2008. |
Prior Performance of First Quadrant LP
First Quadrant LP began offering investment services in 1988. First Quadrant manages one other account (the “FQ SMA”) with substantially similar objectives and strategies as those it uses to manage the portion of the Dynamic Fund's assets allocated to it. You should not consider the past performance of First Quadrant as indicative of the future performance of the Fund.
The following tables set forth performance data relating to the historical performance of the FQ SMA, which represents all accounts and funds managed by First Quadrant for the periods indicated that have investment objectives, policies, strategies and risks substantially similar to those employed by the sub-adviser in the management of its allocated portion of the Dynamic Equity Fund. The data, which has been provided by the sub-adviser, is provided to illustrate the past performance of the sub-adviser in managing accounts with substantially similar investment strategies, as measured against the Morningstar Global Long/Short Equity Index and the S&P 500® Total Return Index and does not represent the performance of the Dynamic Equity Fund.
The FQ SMA is not subject to the same types of expenses to which the Dynamic Equity Fund is subject nor to the diversification requirements, specific tax restrictions and investment limitations imposed on the Fund by the 1940 Act, or Subchapter M of the Code. Consequently, the performance results for the FQ SMA could have been adversely affected if it had been regulated as an investment company under the federal securities laws. The method used to calculate the FQ SMA’s performance differs from the Securities and Exchange Commission’s standardized method of calculating performance because the FQ SMA has not been priced daily and may produce different results. This method differs from the Securities and Exchange Commission's standardized method of calculating performance, and may produce different results.
The fees and expenses associated with an investment in the FQ SMA are different from the fees and expenses (after taking into account the expense limitation agreement) associated with an investment in the Dynamic Equity Fund, so that if the results of the FQ SMA were adjusted for expenses of the Dynamic Equity Fund, returns would have been lower. Currently, the FQ SMA is not being charged any fees.
The performance presented below for the FQ SMA is shown on a net basis. The net performance results are net of standard management and performance fees that may be applicable to the FQ SMA. Results include the reinvestment of dividends and capital gains. Returns from cash and cash equivalents in the FQ SMA are included in the performance calculations, and the cash and cash equivalents are included in the total assets on which the performance is calculated.
The chart below shows the net annual returns for the FQ SMA for the calendar years shown.
7
| Year | 2016 | 2017 | 2018 |
| Return | 11.21% | 22.68% | 5.62% |
The chart below shows the annualized historical performance of the FQ SMA, net of any fees.
For the Periods Ended 12/31/17 | FQ SMA | Morningstar Global Long/Short Equity Index(1) | S&P 500 Total Return Index(2) |
| 1 Year | 5.62% | -6.72% | -4.38% |
Since Inception (3) | 12.95% | 1.78% | 9.26% |
| (1) | The Morningstar Global Long/Short Equity Index consists of funds with exposure to long and short positions in global equities or derivatives and is equally weighted. |
| (2) | The S&P 500 Total Return Index consists of 500 stocks chosen for their market size, liquidity and industry group representation. It is a market value-weighted index and one of the most widely-used benchmarks for U.S. stock performance. Investors cannot invest directly in an index, and index figures do not reflect any deduction for fees, expenses or taxes. |
| (3) | The inception date for the FQ SMA was January 1, 2016. |
Prior Performance of GCM
GCM manages the Graham Tactical Trend Strategy ("Tactical Trend"), an investment strategy with substantially similar objectives and strategies to those it uses to manage the portion of the Fund's assets allocated to it.
The following tables set forth performance data relating to the historical performance of Tactical Trend, which represents the performance of various accounts managed by GCM with investment objectives, policies, strategies and risks substantially similar to those employed by the sub-adviser in the management of its allocated portion of the Fund. These accounts include a proprietary account of GCM, which is the longest running account included in the performance data shown below, and other client accounts. The data, which has been provided by the sub-adviser, is provided to illustrate the past performance of the sub-adviser in managing an investment strategy with substantially similar investment strategies measured against the Barclay CTA Index and the Bank of America Merrill Lynch 3-Month Treasury Bill Index and does not represent the performance of the Fund. The performance data of Tactical Trend is presented on a pro-forma basis to reflect the fees and expenses applicable to Class I Shares of the Fund, subject to the Fee Waiver and/or Reimbursement but exclusive of the Acquired Fund Fees and Expenses, rather than those applicable to the strategy. Tactical Trend is not subject to the diversification requirements, specific tax restrictions and investment limitations imposed on the Fund by the 1940 Act, or Subchapter M of the Internal Revenue Code. In particular, in order to comply with asset segregation rules under the 1940 Act, the Fund will be subject to limitations on the amount of exposure it may maintain in respect of certain futures, primarily commodity based and fixed income futures, which limitation does not apply to the trading of Tactical Trend in the chart. Consequently, the performance results for Tactical Trend could have been adversely affected if the strategy had been operated as a registered investment company. Tactical Trend was valued on a monthly basis, which differs from the Securities and Exchange Commission's standardized method of calculating performance that employs daily valuation and may produce different results. You should not consider the past performance of Tactical Trend as indicative of future performance of the Fund.
The fees and expenses associated with an investment in Tactical Trend are different from the fees and expenses associated with an investment in the Fund; accordingly, the performance of Tactical Trend shown here has been adjusted to reflect the estimated fees and expenses of Class I shares of the Fund, as detailed in the preceding paragraph. If returns had been calculated based on the estimated fees and expenses of Class A or Class C shares of the Fund, returns would have been lower.
8
The performance presented below for the similarly managed accounts is shown on a net basis. Results include the reinvestment of dividends and capital gains. For those Tactical Trend accounts that are traded on a notionally-funded basis, unlike the Fund which is fully funded, the performance for such accounts is adjusted to include interest income earned on cash and cash equivalents calculated for each month in the reporting period by multiplying the then applicable Treasury Bill rate by a factor of 0.90, which represents the average rate of free cash for the portfolio.
The chart below shows the net annual returns for the Tactical Trend accounts for the calendar years shown, adjusted to reflect the fees, expenses and interest income as described above. Rates of return are asset-weighted and are calculated as the change in total capital, as adjusted for subscriptions and redemptions during the period.
| Name | 2009 | 2010 | 2011 | 2012 | 2013(1) | 2014 | 2015 | 2016 | 2017 | 2018 |
| Tactical Trend | 4.50% | 3.32% | -1.30% | 3.23% | 7.51% | 21.80% | 4.74% | -11.57% | 3.67% | -14.08% |
| (1) | The first client account commenced trading on 11/1/2013. |
The chart below shows the average annual historical performance of Tactical Trend.
For the Periods Ended 12/31/18 | Graham Tactical Trend Strategy | Bank of America Merrill Lynch 3-Month Treasury Bill Index(1) | Barclay CTA Index(2) |
| 1 Year | -14.08% | 1.94% | -3.05% |
| 5 Years | 0.10% | 0.64% | 0.48% |
| 10 Years | 1.74% | 0.39% | 0.28% |
Since Inception(3) | 5.19% | 0.99% | 2.17% |
| (1) | Bank of America Merrill Lynch 3-Month Treasury Bill Index tracks the performance of the U.S. dollar denominated U.S. Treasury Bills publicly issued in the U.S. domestic market with a remaining term to final maturity of less than 3 months. |
| (2) | The Barclay CTA Index is a leading industry benchmark of representative performance of investment vehicles of commodity trading advisors. |
| (3) | The inception date for Tactical Trend was 10/1/2006 for the proprietary account and the first client account commenced trading on 11/1/2013. |
Prior Performance of Kettle Hill Capital Management, LLC
KHCM manages a private investment fund, the Kettle Hill Partners, LP (“LP”), with substantially similar objectives and strategies as it will use to manage the portion of the Fund's assets allocated to it. You should not consider the past performance of the LP as indicative of the future performance of the Fund.
The following tables set forth performance data relating to the historical performance of the LP, which represents all of the accounts and funds managed by KHCM for the periods indicated that have investment objectives, policies, strategies and risks substantially similar to those employed by the sub-adviser in the management of its allocated portion of the Fund. The data, which has been provided by the sub-adviser, is provided to illustrate the past performance of the sub-adviser in managing a fund with substantially similar investment strategies, as measured against the Morningstar Global Long/Short Equity Index and the S&P 500® Total Return Index and does not represent the performance of the Fund.
The LP is not subject to the same types of expenses to which the Fund is subject, nor to the diversification requirements, specific tax restrictions and investment limitations imposed on the Fund by the 1940 Act, or Subchapter M of the Internal Revenue Code. Consequently, the performance results for the LP could have been adversely affected if the LP had been regulated as an investment company under the federal securities laws. The method used to calculate the LP’s performance differs from the Securities and Exchange Commission’s standardized method of calculating performance because the LP has not been priced daily and may produce different results.
9
The fees and expenses associated with an investment in the LP are different from the fees and expenses (after taking into account the expense limitation agreement) associated with an investment in the Dynamic Equity Fund, so that if the results of the LP were adjusted for expenses of the Dynamic Equity Fund, net returns would have been higher.
The performance presented below for the LP is shown on a net basis. The net performance results are net of standard management and performance fees for the LP. Results include the reinvestment of dividends and capital gains. Returns from cash and cash equivalents in the LP are included in the performance calculations, and the cash and cash equivalents are included in the total assets on which the performance is calculated. The LP was valued on a monthly basis, which differs from the SEC return calculation method that employs daily valuation.
The chart below shows the net annual returns for the LP for the prior ten calendar years. The LP receives a 1.5% management fee and 20% incentive compensation.
| Name | 2009 | 2010 | 2011 | 2012 | 2013 | 2014 | 2015 | 2016 | 2017 | 2018 |
Kettle Hill Partners, L.P. | 39.76% | 13.32% | 1.93% | 7.95% | 7.81% | 6.40% | 8.04% | 9.74% | 2.91% | -2.07% |
The chart below shows the annualized historical performance of the LP, net of fees.
For the Periods Ended 12/31/18 | Kettle Hill Partners, LP | Morningstar Global Long/Short Equity Index (1) | S&P 500 Total Return Index (2) |
| 1 Year | -2.07% | -6.72% | -4.38% |
| 5 Years | 4.92% | 1.17% | 8.49% |
| 10 Years | 9.10% | 3.32% | 13.12% |
Since Inception (3) | 8.47% | 2.54% | 8.53% |
| (1) | The Morningstar Global Long/Short Equity Index consists of funds with exposure to long and short positions in global equities or derivatives and is equally weighted. |
| (2) | The S&P 500 Total Return Index consists of 500 stocks chosen for their market size, liquidity and industry group representation. It is a market value-weighted index and one of the most widely-used benchmarks for U.S. stock performance. Investors cannot invest directly in an index, and index figures do not reflect any deduction for fees, expenses or taxes. |
| (3) | The inception date for Kettle Hill Partners, LP was June 1, 2003. |
The chart below shows the gross annual returns for the LP for the prior ten calendar years.
| Name | 2009 | 2010 | 2011 | 2012 | 2013 | 2014 | 2015 | 2016 | 2017 | 2018 |
Kettle Hill Partners, LP | 48.25% | 18.89% | 4.41% | 11.67% | 12.14% | 10.48% | 12.28% | 14.83% | 5.10% | -1.03% |
The chart below shows the annualized historical performance of the LP, gross of fees.
10
For the Periods Ended 12/31/17 | Kettle Hill Partners, LP | Morningstar Global Long/Short Equity Index (1) | S&P 500 Total Return Index (2 |
| 1 Year | -1.03% | -6.72% | -4.38% |
| 5 Years | 8.18% | 1.17% | 8.49% |
| 10 Years | 13.07% | 3.32% | 13.12% |
Since Inception (3) | 11.94% | 2.54% | 8.53% |
| (1) | The Morningstar Global Long/Short Equity Index consists of funds with exposure to long and short positions in global equities or derivatives and is equally weighted. |
| (2) | The S&P 500 Total Return Index consists of 500 stocks chosen for their market size, liquidity and industry group representation. It is a market value-weighted index and one of the most widely-used benchmarks for U.S. stock performance. Investors cannot invest directly in an index, and index figures do not reflect any deduction for fees, expenses or taxes. |
| (3) | The inception date for Kettle Hill Partners, LP was June 1, 2003. |
Prior Performance of Millburn
Millburn manages the Millburn Diversified Program ("MDP"), an investment strategy with substantially similar objectives and strategies to those it uses to manage the portion of the Fund's assets allocated to it.
The following tables set forth performance data relating to the historical performance of MDP, which represents the performance of various accounts managed by Millburn with investment objectives, policies, strategies and risks substantially similar to those employed by the sub-adviser in the management of its allocated portion of the Fund. The data, which has been provided by the sub-adviser, is provided to illustrate the past performance of the sub-adviser in managing an investment strategy with substantially similar investment strategies measured against the Barclay CTA Index and the Bank of America Merrill Lynch 3-Month Treasury Bill Index and does not represent the performance of the Fund. The performance data of MDP is presented on a proforma basis to reflect the fees and expenses applicable to a Millburn offering which provides for an annual management fee of 2.0% plus a performance-based fee or allocation of 20%. MDP is not subject to the diversification requirements, specific tax restrictions and investment limitations imposed on the Fund by the 1940 Act, or Subchapter M of the Code. Consequently, the performance results for MDP could have been adversely affected if the strategy had been operated as a registered investment company. MDP was valued on a monthly basis, which differs from the Securities and Exchange Commission's standardized method of calculating performance that employs daily valuation and may produce different results. You should not consider the past performance of MDP as indicative of future performance of the Fund.
The fees and expenses associated with an investment in MDP are different from the fees and expenses associated with an investment in the Fund; the performance of MDP shown here has been adjusted as described in the preceding paragraph.
The chart below shows the net annual returns for the MDP accounts for the past 10 calendar years, adjusted to reflect the fees, expenses and interest income as described above.
| Name | 2009 | 2010 | 2011 | 2012 | 2013(1) | 2014 | 2015 | 2016 | 2017 | 2018 |
| MDP | -10.63% | 9.59% | -9.23% | -8.23% | -7.17% | 15.44% | 4.72% | 10.88% | 5.17% | 0.54% |
11
The chart below shows the average annual historical performance of MDP.
For the Periods Ended 12/31/18 | MDP | Bank of America Merrill Lynch 3-Month Treasury Bill Index | Barclay CTA Index |
| 1 Year | 0.54%% | 1.94% | -3.05% |
| 5 Years | 7.23% | 0.64% | 0.48% |
| 10 Years | 0.71% | 0.39% | 0.28% |
| Since Inception* | 10.94% | 1.63% | 9.04% |
| (1) | Bank of America Merrill Lynch 3-Month Treasury Bill Index tracks the performance of the U.S. dollar denominated U.S. Treasury Bills publicly issued in the U.S. domestic market with a remaining term to final maturity of less than 3 months. |
| (2) | The Barclay CTA Index is a leading industry benchmark of representative performance of investment vehicles of commodity trading advisors. |
| (3) | The inception date for MDP was 2/1/1977, 7/1/2000 for Bank of America Merrill Lynch 3-Month Treasury Bill Index, and 1/1/1980 for Barclay CTA Index. |
Prior Performance of Revolution
Revolution manages their Alpha program ("Alpha"), an investment strategy with substantially similar objectives and strategies to those it uses to manage the portion of the Fund's assets allocated to it.
The following tables set forth performance data relating to the historical performance of Alpha, which represents the performance of a limited partnership managed by Revolution with investment objectives, policies, strategies and risks substantially similar to those employed by the sub-adviser in the management of its allocated portion of the Fund. The data, which has been provided by the sub-adviser, is provided to illustrate the past performance of the sub-adviser in managing an investment strategy with substantially similar investment strategies measured against the Barclay CTA Index and does not represent the performance of the Fund. The performance data of Alpha is presented on a basis to reflect the fees and expenses applicable for the fees charged by the limited partnership which were 0% annual management fee plus 25% incentive fee (during the period from inception to December 2013) and an annual management fee of 2% plus 20% incentive fee thereafter. Alpha is not subject to the diversification requirements, specific tax restrictions and investment limitations imposed on the Fund by the 1940 Act, or Subchapter M of the Code. Consequently, the performance results for Alpha could have been adversely affected if the strategy had been operated as a registered investment company. Alpha was valued on a monthly basis, which differs from the Securities and Exchange Commission's standardized method of calculating performance that employs daily valuation and may produce different results. You should not consider the past performance of Alpha as indicative of future performance of the Fund.
The fees and expenses associated with an investment in Alpha are different from the fees and expenses associated with an investment in the Fund; accordingly, the performance of Alpha shown here has been adjusted as detailed in the preceding paragraph.
The chart below shows the net annual returns for the Alpha accounts for the calendar years shown, adjusted to reflect the fees, expenses and interest income as described above.
| Name | 2009 | 2010 | 2011 | 2012 | 2013 | 2014 | 2015 | 2016 | 2017 | 2018 |
| Alpha | -8.64% | 22.83% | -7.10% | 15.64% | 10.51% | 1.99% | 2.06% | 9.74% | -6.15% | -10.53% |
12
The chart below shows the average annual historical performance of Alpha.
For the Periods Ended 12/31/17 | Revolution Alpha | Bank of America Merrill Lynch 3-Month Treasury Bill Index | Barclay CTA Index |
| 1 Year | -10.53% | 1.94% | 1.94% |
| 5 Years | -0.83% | 0.64% | 0.64% |
| 10 Years | 2.48% | 0.39% | 0.28% |
| Since Inception* | 5.17% | 0.76% | 0.76% |
| (1) | Bank of America Merrill Lynch 3-Month Treasury Bill Index tracks the performance of the U.S. dollar denominated U.S. Treasury Bills publicly issued in the U.S. domestic market with a remaining term to final maturity of less than 3 months. |
| (2) | The Barclay CTA Index is a leading industry benchmark of representative performance of investment vehicles of commodity trading advisors. |
| (3) | The inception date for Alpha was 6/1/2007. |
Prior Performance of Trust and Fiduciary Income Partners LLC
Trust and Fiduciary Income Partners LLC formed in 2016 from a merger of Bramshill Investments and Trust and Fiduciary Management Services, Inc. (“TFMS”). Prior to the merger, TFMS operated as a sub-adviser to the Spectrum Income Fund. TFIP has previously managed similarly managed accounts and other accounts, including a registered investment company, with substantially similar objectives and strategies as those it uses to manage the Income Strategy portion of the Spectrum Income Fund’s assets allocated to it. The Income Strategy portion of each Fund only represents one of the strategies utilized by the Adviser in pursuing the Fund’s investment objective. You should not consider the past performance of these accounts as indicative of the future performance of the Fund.
The following tables set forth performance data relating to the historical performance of the composite of each similarly managed account which represents all such client assets managed by TFIP for the periods indicated that have investment objectives, policies, strategies and risks substantially similar to those employed by TFIP in the management of its Income Strategy allocated portion of the respective Fund’s assets. The data, which has been provided by TFIP, is provided to illustrate the past performance of the Sub-Adviser in managing accounts with substantially similar investment strategies, as measured against the Bloomberg Barclays Aggregate Bond Index and the Morningstar Allocation – 70% to 85% Equity, and does not represent the performance of the Funds.
TFIP’s similarly managed accounts are not subject to the same types of expenses to which the Funds are subject nor to the diversification requirements, specific tax restrictions and investment limitations imposed on the Funds by the 1940 Act, or Subchapter M of the Code. Consequently, the performance results for certain similarly managed accounts could have been adversely affected if they had been regulated as investment companies under the federal securities laws. The method used to calculate each account's performance differs from the Securities and Exchange Commission's standardized method of calculating performance, because they are not priced daily, and may produce different results. TFIP’s similarly managed accounts were subject to expenses that are most similar to the expenses of the Funds’ Class I shares.
The chart below shows the net annual returns of the similarly managed accounts for the prior ten calendar years shown.
| Year | 2009 | 2010 | 2011 | 2012 | 2013 | 2014 | 2015 | 2016 | 2017 | 2018 |
| Return | 72.93% | 25.28% | -0.96% | 10.76% | 10.18% | -4.69% | -7.73% | 6.97% | 3.47% | -7.69% |
13
The chart below shows the average annual performance (net of fees) of the similarly managed accounts through 12/31/2018 (inception date of 7/1/01).
For the Periods Ended 12/31/18 | TFIP | Bloomberg Barclays U.S. Aggregate Bond Index(1) | Morningstar Allocation – 70% to 85% Equity |
| 1 Year | -7.69% | 0.01% | -7.82% |
| 5 Years | -2.12% | 2.52% | 3.47% |
| 10 Years | 8.93% | 3.48% | 8.70% |
Since inception (7/1/01) | 3.70% | 4.39% | 4.67% |
| (1) | The Bloomberg Barclays U.S. Aggregate Bond Index is an unmanaged index which represents the U.S. investment-grade fixed-rate bond market (including government and corporate securities, mortgage pass-through securities and asset-backed securities). |
| (2) | The Morningstar Allocation – 70% to 85% Equity portfolios seek to provide both income and capital appreciation by investing in multiple asset classes, including stocks, bonds and cash. These portfolios are dominated by domestic holdings and have equity expenses between 70% and 85%. |
The chart below shows the gross annual returns of the similarly managed accounts for the prior ten calendar years shown.
| Year | 2009 | 2010 | 2011 | 2012 | 2013 | 2014 | 2015 | 2016 | 2017 | 2018 |
| Return | 75.01% | 27.14% | 0.54% | 12.42% | 11.83% | -3.24% | -6.33% | 8.57% | 4.79% | -6.52% |
The chart below shows the average annual performance (gross of fees) of the similarly managed accounts through 12/31/2018 (inception date of 7/1/01):
For the Periods Ended 12/31/18 | TFIP | Bloomberg Barclays U.S. Aggregate Bond Index(1) | Morningstar Allocation – 70% to 85% Equity(2) |
| 1 Year | -6.52% | 0.01% | -7.82% |
| 5 Years | -0.73% | 2.52% | 3.47% |
| 10 Years | 10.49% | 3.48% | 8.70% |
Since inception (7/1/01) | 5.08% | 4.39% | 4.67% |
| (1) | The Bloomberg Barclays U.S. Aggregate Bond Index is an unmanaged index which represents the U.S. investment-grade fixed-rate bond market (including government and corporate securities, mortgage pass-through securities and asset-backed securities). |
| (2) | The Morningstar Allocation – 70% to 85% Equity portfolios seek to provide both income and capital appreciation by investing in multiple asset classes, including stocks, bonds and cash. These portfolios are dominated by domestic holdings and have equity expenses between 70% and 85%. |
14