UNITED STATES
SECURITIES AND EXCHANGE COMMISSION
Washington, D.C. 20549
FORM N-CSR
CERTIFIED SHAREHOLDER REPORT OF REGISTERED MANAGEMENT
INVESTMENT COMPANIES
Investment Company Act file number 811-22517
Corbin Multi-Strategy Fund, LLC
(Exact name of registrant as specified in charter)
c/o UMB Fund Services, Inc.
235 West Galena Street
Milwaukee, WI 53212
(Address of principal executive offices) (Zip code)
Ann Maurer
235 West Galena Street
Milwaukee, WI 53212
(Name and address of agent for service)
registrant's telephone number, including area code: (414) 299-2270
Date of fiscal year end: March 31
Date of reporting period: March 31, 2023
Form N-CSR is to be used by management investment companies to file reports with the Commission not later than 10 days after the transmission to stockholders of any report that is required to be transmitted to stockholders under Rule 30e-1 under the Investment Company Act of 1940 (17 CFR 270.30e-1). The Commission may use the information provided on Form N-CSR in its regulatory, disclosure review, inspection, and policymaking roles.
A registrant is required to disclose the information specified by Form N-CSR, and the Commission will make this information public. A registrant is not required to respond to the collection of information contained in Form N-CSR unless the Form displays a currently valid Office of Management and Budget (“OMB”) control number. Please direct comments concerning the accuracy of the information collection burden estimate and any suggestions for reducing the burden to Secretary, Securities and Exchange Commission, 100 F Street, NE, Washington, DC 20549-1090. The OMB has reviewed this collection of information under the clearance requirements of 44 U.S.C. § 3507.
ITEM 1.(a) REPORTS TO STOCKHOLDERS.
The Report to Shareholders is attached herewith.
Corbin Multi-Strategy Fund, LLC
Financial Statements
For the Year Ended March 31, 2023
With Report of Independent Registered Public Accounting Firm
Corbin Multi-Strategy Fund, LLC
Table of Contents
For the Year Ended March 31, 2023
| | |
Management’s Discussion of Fund Performance | 2-3 |
Report of Independent Registered Public Accounting Firm | 4 |
Fund Performance | 5-6 |
Schedule of Investments | 7 |
Statement of Assets and Liabilities | 8 |
Statement of Operations | 9 |
Statements of Changes in Net Assets | 10-11 |
Statement of Cash Flows | 12 |
Financial Highlights | 13-14 |
Notes to Financial Statements | 15-27 |
Supplemental Information | 28 |
This report has been prepared for shareholders and may be distributed to others only if preceded or accompanied by the Fund’s private placement memorandum. Please read it carefully before investing.
1
Corbin Multi-Strategy Fund, LLC
Management’s Discussion of Fund Performance (Unaudited)
March 31, 2023
Corbin Multi-Strategy Fund, LLC’s (the “Fund”) Class I shares returned -12.58% net of fees and expenses in fiscal year ended March 31, 2023.
Market Overview for the Fiscal Year Ended March 31, 2023 (the “Fiscal Year”)
After a painful 2022, with nearly all risk assets finishing the year in the red, markets rebounded modestly in Q1 2023, but were still overall negative for the Fiscal Year. During the Fiscal Year, global markets battled several headwinds including surging inflation, the Russia-Ukraine war, lockdowns in China, hawkish central banks, and growing recession fears, resulting in significant volatility and weak performance.
In the United States, the S&P 500 Total Return Index fell -5.93% during the Fiscal Year; the energy sector fared the best during the Fiscal Year (+15.32%) whereas the real estate sector fared the worst (-19.98%). We also saw a reversal in the long-term trend of investors favoring growth stocks; the S&P 500 Value Index (-7.35%) outperformed the S&P 500 Growth Index (-30.09%) by more than 20% in calendar year 2022, though the trend reversed again during Q1 2023 with growth stocks (+9.24%) once again outperforming value stocks (+4.62%). European equities were up +12.65% (Euro Stoxx 50) at Fiscal Year-end, including a +9.75% return in January 2023 on the back of waning energy concerns, falling inflation, and improved investor sentiment. In the United Kingdom, equity returns were more muted, with the FTSE 100 up +2.06% for the Fiscal Year. Chinese equities were impacted by COVID shutdowns and possible sanctions connected to the war in Ukraine and the CSI 300 ended the Fiscal Year down -2.56%.
Fixed income markets experienced significant movement, with the US treasury curve rising across the board. The Federal Reserve hiked the Federal Funds Rate seven times during 2022: 25 basis points (March), 50 basis points (May), 75 basis points (June, July, September, November), and 50 basis points (December). Rate hikes continued in 2023 with 25 basis point increases in both February and March. Notably, June 2022 marked the first 75 basis points rate hike since 1994. The considerable rise in rates caused investment grade bonds to suffer; the ICE BofA US Corporate Index fell -5.19% in the Fiscal Year. US credit markets struggled on duration and decreased risk appetite in 2022 and bounced a bit in Q1 2023 amidst broader risk-on sentiment. High yield bonds fell -2.93% in the Fiscal Year (ICE BofA US High Yield Index), while riskier credits fared worse; the ICE BofA CCC & Lower US High Yield Index dropped -8.88% during the Fiscal Year. Leveraged loans benefitted from their floating rate nature; the Morningstar LSTA US Leveraged Loan Total Return Index ended up for the Fiscal Year, returning +2.71%.
Portfolio Overview
In Q2 2022, the Fund’s portfolio remained focused on investing across strategies but the Fund went into liquidation mode starting in Q3 2022 and therefore was managed to raise liquidity as expeditiously as possible.
Fiscal Year Performance Review by Strategy (as of March 31, 2023)
Fund Strategy | | Avg. Allocation
(Fiscal Year) | | | Gross
Return | | | HFRI Strategy
Index Return | | | Gross
Contribution | |
Long/Short Equity | | | 18.06 | % | | | -15.28 | % | | | -3.70 | % | | | -2.74 | % |
Equity Special Situations | | | 9.23 | % | | | 58.67 | % | | | -0.27 | % | | | -0.99 | % |
Event-Driven/Distressed Credit | | | 20.84 | % | | | -14.03 | % | | | -4.62 | % | | | -0.22 | % |
Asset-Backed Securities | | | 6.69 | % | | | -74.88 | % | | | 0.37 | % | | | -7.67 | % |
Relative Value | | | 4.87 | % | | | 5.66 | % | | | -0.03 | % | | | 1.08 | % |
Global Macro | | | 3.05 | % | | | 5.36 | % | | | -0.35 | % | | | 0.64 | % |
Portfolio Hedge | | | — | | | | — | | | | | | | | 0.30 | % |
Fund - Class I Total (Net) Return | | | 100 | % | | | — | | | | — | | | | -12.58 | % |
Return and contribution figures shown above by strategy for the Fund’s – Class I shares are estimated and unaudited as of March 31, 2023. Figures include the reinvestment of dividends, gains and other earnings and may include slight rounding error. Return figures for the various strategies are gross of the Fund’s fees and expenses but are net of the underlying manager fees and expenses. Contribution figures for the various strategies are net of all fees and expenses. Sector classifications and investment allocations are at the sole discretion of Corbin Capital Partners, L.P. (“Corbin”) and subject to change at any time. It should not be assumed that investments identified herein or in the future will be profitable or will equal performance
2
Corbin Multi-Strategy Fund, LLC
Management’s Discussion of Fund Performance (Unaudited)
March 31, 2023 (continued)
above. Allocations above are expressed as a percentage of the market value of total investments which may be greater than the net asset value of the Fund as a result of leverage. As of 3/31/2023, the market value of total investments represented 31% of the Fund’s net asset value (excluding month end investor activity). HFRI indices used for comparison to the Fund’s strategies are the following: Long/Short Equity (HFRI Equity Hedge (Total) Index); Equity Special Situations (HFRI ED: Special Situations Index); Event-Driven/Distressed Credit (HFRI ED: Distressed/Restructuring Index); Asset-Backed Securities (HFRI RV: Fixed Income-Asset Backed Index); Relative Value (HFRI Relative Value (Total) Index); Global Macro (HFRI Macro (Total) Index). Past performance is not indicative of future results.
Q2 2022 was a challenging period for the Fund as volatility in markets continued. Most strategies were negative, with equities detracting nearly -400 bps from the Fund’s performance during Q2; the Pelham and SRS investments were the more significant detractors, detracting -140 bps and -107 bps, respectively. Credit managers were also negative overall, with Redwood suffering significant mark-to market losses, particularly in June 2022, detracting -173 bps from the Fund’s performance for the Fiscal Year on the back of its weak performance and its notable position size in the Fund. DE Shaw Composite and DE Shaw Oculus performed very well, contributing +108 bps and +64 bps for the Fiscal Year, respectively, but not nearly enough to offset losses in other positions within the Fund’s portfolio.
Corbin began to implement a plan of liquidation in Q2 2022, and substantially all assets were liquidated between 6/30/22 and 3/31/23. As such, during the period 6/30/22-3/31/23, Corbin raised liquidity in underlying funds as it became available, and in select cases through secondary market sales of less liquid assets to accelerate the unwinding of the Fund. These transactions required some discounts to be taken, but on relatively small absolute dollar amounts.
After distributing roughly 50% of Fund assets at the end of Q2 2022, the Fund started Q3 2022 at about $33 million. In Q3 2022, manager-level performance was mixed but overall negative, with equity and credit strategies becoming overweight in the portfolio due to the termination of manager allocations to DE Shaw Composite and DE Shaw Oculus. The largest detractor from the Fund’s performance was the Fund’s position in Pelham, which detracted -72 bps from performance during Q3 2022, with Pelham Small Cap suffering on the back of continued weakness in the European small- and mid-cap universe. East Lodge was the lone bright spot in the credit book, adding +18 bps to performance during Q3 2022.
In Q4 2022, manager-level performance was generally strong, though that was partially offset by the cost of liquidation of select longer-dated positions. Due to the Fund’s significantly reduced size, portfolio concentration increased notably, and as of the beginning of Q4 2022, three positions represented over 40% of the Fund. Redwood had a strong fourth quarter, and in combination with its increased weighting in the Fund, added +237 bps to Fund performance. However, noting the aim of liquidating the portfolio, Corbin had to take discounts selectively to raise liquidity, and the cost of accessing liquidity detracted approximately -156 bps from Fund performance in the quarter.
The Fund distributed close to 60% of the Fund’s balance at the end of Q4 2022 and started Q1 2023 with $8 million, with the vast majority of the remaining portfolio in just a few remaining investments. During the Q1 2023, investment performance was positive on the back of solid non-US gains from Pelham and TAL China. However, that performance was offset by liquidation costs, thereby resulting in a -6.12% quarter performance on the small remaining asset base.
Fund performance and contribution figures shown above are presented as of March 31, 2023, fiscal year performance reflects the period of April 1, 2022 through March 31, 2023, Q2 2022 reflects the period of April 1, 2022 through June 30, 2022, Q3 2022 reflects the period of July 1, 2022 through September 30, 2022; Q4 2022 reflects the period of October 1 through December 31, 2022, and Q1 2023 reflects the period January 1, 2023 through March 31, 2023, are estimated and unaudited, and include the reinvestment of dividends, gains and other earnings. Figures as presented may be rounded. Fund performance and contribution figures for the various sectors are gross of the Fund’s fees and expenses but are net of the underlying manager fees and expenses. Sector classifications and investment allocations are at the sole discretion of the Fund’s investment manager and subject to change at any time. It should not be assumed that investments identified herein or in the future will be profitable or will equal performance shown above. Past performance is not necessarily indicative of future results.
3
Corbin Multi-Strategy Fund, LLC
Report of Independent Registered Public Accounting Firm
March 31, 2023
To the Shareholders and Board of Managers of
Corbin Multi-Strategy Fund, LLC
Opinion on the Financial Statements
We have audited the accompanying statement of assets and liabilities, including the schedule of investments, of Corbin Multi-Strategy Fund, LLC (the “Fund”) as of March 31, 2023, the related statements of operations and cash flows for the year then ended, the statements of changes in net assets for each of the two years in the period then ended, the related notes, and the financial highlights for each of the four years in the period then ended (collectively referred to as the “financial statements”). In our opinion, the financial statements present fairly, in all material respects, the financial position of the Fund as of March 31, 2023, the results of its operations and its cash flows for the year then ended, the changes in net assets for each of the two years in the period then ended, and the financial highlights for each of the four years in the period then ended, in conformity with accounting principles generally accepted in the United States of America.
The Fund’s financial highlights for the year ended March 31, 2019, were audited by other auditors whose report dated May 28, 2019, expressed an unqualified opinion on those financial highlights.
Basis for Opinion
These financial statements are the responsibility of the Fund’s management. Our responsibility is to express an opinion on the Fund’s financial statements based on our audits. We are a public accounting firm registered with the Public Company Accounting Oversight Board (United States) (“PCAOB”) and are required to be independent with respect to the Fund in accordance with the U.S. federal securities laws and the applicable rules and regulations of the Securities and Exchange Commission and the PCAOB.
We conducted our audits in accordance with the standards of the PCAOB. Those standards require that we plan and perform the audit to obtain reasonable assurance about whether the financial statements are free of material misstatement whether due to error or fraud.
Our audits included performing procedures to assess the risks of material misstatement of the financial statements, whether due to error or fraud, and performing procedures that respond to those risks. Such procedures included examining, on a test basis, evidence regarding the amounts and disclosures in the financial statements. Our procedures included confirmation of securities owned as of March 31, 2023, by correspondence with the custodian, brokers, and underlying fund managers; when replies were not received, we performed other auditing procedures. Our audits also included evaluating the accounting principles used and significant estimates made by management, as well as evaluating the overall presentation of the financial statements. We believe that our audits provide a reasonable basis for our opinion.
We have served as the Fund’s auditor since 2019.

COHEN & COMPANY, LTD.
Milwaukee, Wisconsin
May 30, 2023
4
Corbin Multi-Strategy Fund, LLC
Fund Performance (Unaudited)
March 31, 2023
Performance of a $25,000 Investment
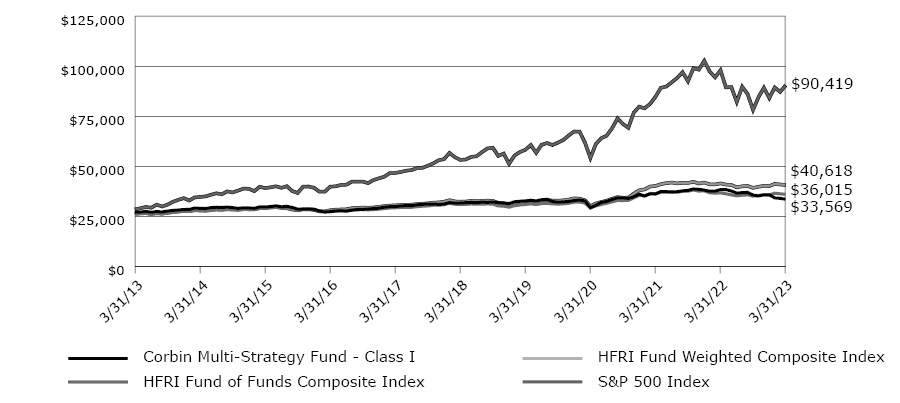
This graph compares a hypothetical $25,000 investment in the Fund’s Class I Shares with a similar investment in the HFRI Fund of Funds Composite Index, the HFRI Fund Weighted Composite Index and the S&P 500 Index. These indices do not serve as benchmarks for the Fund and are shown for illustrative purposes only. The Fund does not have a designated performance benchmark. Results include the reinvestment of all dividends and capital gains. The indices do not reflect expenses, fees, or sales charges, which would lower performance. Please note that the performance of the Fund’s other share class, Class A, will differ based on the differences in sales load and fees paid by shareholders investing in the Fund’s Class A Shares.
HFRI Fund of Funds Composite Index
The HRFI Fund of Funds Composite Index is an equal weighted index that consists of over 800 constituent hedge funds that report to the HFR Database, including both domestic and offshore funds. Fund of funds invest with multiple managers through funds or managed accounts. The index is unmanaged and, unlike the Fund, is not affected by cash flows. The HFRI Fund of Funds Composite Index is not included in the HFRI Fund Weighted Composite Index. It is not possible to invest directly in an index.
HFRI Fund Weighted Composite Index
The HFRI Fund Weighted Composite Index is a global, equal-weighted index of single-manager funds that report to HFR Database. Constituent funds report monthly net of all fees performance in US Dollar and have a minimum of (a) $50 Million under management, or (b) $10 Million under management and a twelve (12) month track record of active performance. The HFRI Fund Weighted Composite Index does not include funds of hedge funds. It is not possible to invest directly in an index.
S&P 500 Index
The S&P 500 Index includes a representative sample of 500 leading companies in leading industries of the U.S. economy and assumes any dividends are reinvested back into the index. It is not possible to invest directly in an index.
5
Corbin Multi-Strategy Fund, LLC
Fund Performance (Unaudited)
March 31, 2023 (continued)
Average Annual Total Returns as of March 31, 2023 | 1 Year | 5 Years | 10 Years |
Corbin Multi-Strategy Fund - Class I | -12.58% | 1.17% | 2.19% |
Corbin Multi-Strategy Fund - Class A | -13.19% | 0.47% | 1.53% |
HFRI Fund of Funds Composite Index | -1.94% | 3.10% | 3.24% |
HFRI Fund Weighted Composite Index | -2.05% | 4.69% | 4.44% |
S&P 500 Index | -7.73% | 11.19% | 12.24% |
The performance data quoted here represents past performance and past performance is not a guarantee of future results. Investment return and principal value will fluctuate so that an investor’s shares, when redeemed, may be worth more or less than their original cost. Current performance may be lower or higher than the performance information quoted. The most recent quarter end performance may be obtained by calling 1 (844) 626-7246.
Performance results may include the effect of expense reduction arrangements for some or all of the periods shown. If those arrangements had not been in place, the performance results for those periods would have been lower.
For the Fund’s current expense ratios, please refer to the Financial Highlights Section of this report.
Returns reflect the reinvestment of distributions made by the Fund, if any. The graph and the performance table above do not reflect the deduction of taxes that a shareholder would pay on Fund distributions or the redemption of Fund shares.
6
Corbin Multi-Strategy Fund, LLC
Schedule of Investments
March 31, 2023
Strategy | Investments | | Original
Acquisition
Date | | | Shares | | | Cost | | | Fair Value | |
Investments in Investment Funds — 0% |
Equity Special Situations — 0% |
| | SGOF Liquidating Feeder, Ltd. | | | 7/1/2020 | | | | 30 | | | $ | 29,599 | | | $ | 72,112 | |
Total Investments in Investment Funds | | | | | 29,599 | | | | 72,112 | |
| | | | | | | | | | | | | | | | | | |
Total Investments (Cost $29,599) — 0% | | | | | | 72,112 | |
Liabilities in excess of other assets — (0%) | | | | | | | | | | | | | | | (72,112 | ) |
Net Assets — 0% | | | | | | | | | | | | | | $ | — | |
Investments by Strategy (as a percentage of total investments) | | | |
Investment Funds | | | | |
Equity Special Situations | | | 100 | % |
Total Investment Funds | | | 100 | % |
See accompanying Notes to Financial Statements.
7
Corbin Multi-Strategy Fund, LLC
Statement of Assets and Liabilities
March 31, 2023
Assets | | | | |
Investments, at fair value (cost $29,599) | | $ | 72,112 | |
Cash | | | 7,785,947 | |
Receivable for investments sold | | | 4,307,599 | |
Due from broker for swap contracts and written options contracts | | | 86,331 | |
Interest receivable | | | 63 | |
Total Assets | | | 12,252,052 | |
| | | | | |
Liabilities | | | | |
Distributions payable | | | 12,008,792 | |
Advance contribution from Advisor | | | 70,642 | |
Transfer agent fees payable | | | 13,578 | |
Board of Managers’ fees payable | | | 19,500 | |
Accounting and administration fees payable | | | 27,688 | |
CCO Fees Payable | | | 8,867 | |
Custody fees payable | | | 5,684 | |
Management Fee payable | | | 5,618 | |
Investor Distribution and Servicing Fees payable (Class A) | | | 809 | |
Professional fees and other accrued expenses | | | 90,874 | |
Total Liabilities | | | 12,252,052 | |
Net Assets | | $ | — | |
| | | | | |
Composition of Net Assets: | | | | |
Paid-in capital | | | 37,005,589 | |
Total accumulated deficit | | | (37,005,589 | ) |
Net Assets | | $ | — | |
| | | | | |
Net Assets Attributable to: | | | | |
Class A Shares | | $ | — | |
Class I Shares | | | — | |
| | | $ | — | |
| | | | | |
Shares of Limited Liability Company Interest Outstanding (Unlimited Number of Shares Authorized): | | | | |
Class A Shares | | | — | |
Class I Shares | | | — | |
| | | | | |
Net Asset Value per Share: | | | | |
Class A Shares | | $ | — | |
Class I Shares | | $ | — | |
See accompanying Notes to Financial Statements.
8
Corbin Multi-Strategy Fund, LLC
Statement of Operations
For the Year Ended March 31, 2023
Investment Income | | | | |
Interest income | | $ | 137,883 | |
Total Income | | | 137,883 | |
| | | | | |
Fund Expenses | | | | |
Management Fee | | | 267,206 | |
Professional fees | | | 195,202 | |
Accounting and administration fees | | | 160,242 | |
Board of Managers’ fees and expenses | | | 82,776 | |
Transfer Agency fees | | | 80,486 | |
Other operating expenses | | | 51,574 | |
Commitment fees | | | 44,274 | |
CCO Fees | | | 29,083 | |
Custodian fees | | | 20,355 | |
Investor Distribution and Servicing Fee (Class A) | | | 13,029 | |
Interest expense | | | 4,732 | |
Total Fund Expenses | | | 948,959 | |
Fund Management Fee waiver (Note 3) | | | (39,032 | ) |
Total Fund Expenses | | | 909,927 | |
| | | | | |
Net Investment Loss | | | (772,044 | ) |
| | | | | |
Net Realized Gain/(Loss) and Change in Unrealized Appreciation/Depreciation on Investments | | | | |
Capital gain distributions from Investment Funds | | | 4,164 | |
Net realized gain on investments | | | 16,269,305 | |
Net realized loss on written options | | | (188,081 | ) |
Net realized loss on credit default swaps | | | (117,811 | ) |
Net change in unrealized appreciation/depreciation on investments | | | (19,997,095 | ) |
Net change in unrealized appreciation/depreciation on written options | | | (15,920 | ) |
Net change in unrealized appreciation/depreciation on credit default swaps | | | 113,918 | |
Net Realized Gain and Change in Unrealized Appreciation/Depreciation on Investments | | | (3,931,520 | ) |
| | | | | |
Net Decrease in Net Assets Resulting from Operations | | $ | (4,703,564 | ) |
See accompanying Notes to Financial Statements.
9
Corbin Multi-Strategy Fund, LLC
Statements of Changes in Net Assets
| | | For the
Year Ended
March 31, 2023 | | | For the
Year Ended
March 31, 2022 | |
Changes in Net Assets Resulting from Operations | | | | | | | | |
Net investment loss | | $ | (772,044 | ) | | $ | (704,694 | ) |
Net realized gain on investments | | | 15,967,577 | | | | 10,366,533 | |
Net change in unrealized appreciation/depreciation on investments | | | (19,899,097 | ) | | | (4,697,012 | ) |
Net Change in Net Assets Resulting from Operations | | | (4,703,564 | ) | | | 4,964,827 | |
| | | | | | | | | |
Distributions to Investors | | | | | | | | |
Distributions | | | | | | | | |
Class A | | | — | | | | (506,436 | ) |
Class I | | | — | | | | (8,076,607 | ) |
From return of capital | | | | | | | | |
Class A | | | (3,598,804 | ) | | | — | |
Class I | | | (59,409,990 | ) | | | — | |
Net Change in Net Assets from Distributions to Investors | | | (63,008,794 | ) | | | (8,583,043 | ) |
| | | | | | | | | |
Change in Net Assets Resulting from Capital Transactions | | | | | | | | |
Class A | | | | | | | | |
Reinvested distributions | | | — | | | | 306,699 | |
Shares tendered | | | — | | | | (600,445 | ) |
Total Class A Transactions | | | — | | | | (293,746 | ) |
| | | | | | | | | |
Class I | | | | | | | | |
Issuance of shares | | | — | | | | 575,000 | |
Reinvested distributions | | | — | | | | 1,992,077 | |
Shares tendered | | | — | | | | (20,369,631 | ) |
Total Class I Transactions | | | — | | | | (17,802,554 | ) |
| | | | | | | | | |
Net Change in Net Assets Resulting from Capital Transactions | | | — | | | | (18,096,300 | ) |
| | | | | | | | | |
Total Net Increase/(Decrease) in Net Assets | | | (67,712,358 | ) | | | (21,714,516 | ) |
| | | | | | | | | |
Net Assets | | | | | | | | |
Beginning of year | | | 67,712,358 | | | | 89,426,874 | |
End of year | | $ | — | | | $ | 67,712,358 | |
| | | | | | | | | |
See accompanying Notes to Financial Statements.
10
Corbin Multi-Strategy Fund, LLC
Statements of Changes in Net Assets (continued)
| | | For the
Year Ended
March 31, 2023 | | | For the
Year Ended
March 31, 2022 | |
Shareholder Activity | | | | | | | | |
Class A Shares | | | | | | | | |
Reinvested distributions | | | — | | | | 3,820 | |
Shares tendered | | | — | | | | (7,346 | ) |
Shares liquidated (Note 4) | | | (47,805 | ) | | | — | |
Net Change in Class A Shares Outstanding | | | (47,805 | ) | | | (3,526 | ) |
| | | | | | | | | |
Class I Shares | | | | | | | | |
Issuance of shares | | | — | | | | 5,794 | |
Reinvested distributions | | | — | | | | 22,471 | |
Shares tendered | | | — | | | | (213,890 | ) |
Shares liquidated (Note 4) | | | (715,257 | ) | | | — | |
Net Change in Class I Shares Outstanding | | | (715,257 | ) | | | (185,625 | ) |
| | | | | | | | | |
See accompanying Notes to Financial Statements.
11
Corbin Multi-Strategy Fund, LLC
Statement of Cash Flows
For the Year Ended March 31, 2023
Cash Flows From Operating Activities | | | | |
Net decrease in net assets from operations | | $ | (4,703,564 | ) |
Adjustments to reconcile net decrease in net assets resulting from operations to net cash provided by operating activities: | | | | |
Purchases of investments | | | (65,368 | ) |
Written options covered | | | (306,612 | ) |
Proceeds from sales of investments | | | 55,324,897 | |
Proceeds from written options | | | 66,579 | |
Proceeds from credit default swaps | | | (29,540 | ) |
Net realized (gain) loss on investments | | | (16,269,295 | ) |
Net realized loss on written options | | | 188,081 | |
Net realized loss on credit default swaps | | | 117,811 | |
Net change in unrealized appreciation/depreciation on investments | | | 19,997,095 | |
Net change in unrealized appreciation/depreciation on written options | | | 15,920 | |
Net change in unrealized appreciation/depreciation on credit default swaps | | | (115,597 | ) |
(Increase)/Decrease in Assets: | | | | |
Decrease in receivable for investments sold | | | 6,018,888 | |
Decrease in Interest receivable | | | 15,416 | |
Decrease in prepaid expenses and other assets | | | 26,626 | |
Increase/(Decrease) in Liabilities: | | | | |
Decrease in Management Fee payable | | | (79,376 | ) |
Increase in accounting and administration fees payable | | | 15,896 | |
Increase in CCO Fees Payable | | | 8,867 | |
Increase in custody fees payable | | | 2,465 | |
Increase in transfer agent fees payable | | | 959 | |
Decrease in Investor Distribution and Servicing Fees payable | | | (5,761 | ) |
Increase in Board of Managers’ fees | | | 18,117 | |
Increase in other accrued expenses | | | 11,629 | |
Net Cash Provided by Operating Activities | | | 60,254,133 | |
| | | | | |
Cash Flows from Financing Activities | | | | |
Payments on loan facility | | | (3,000,000 | ) |
Proceeds from issuance of shares, net of increase in subscriptions received in advance | | | 70,642 | |
Distributions to investors, net of increase in distributions payable | | | (51,000,002 | ) |
Payments for shares tendered, net of decrease in payable for tenders | | | (1,881,901 | ) |
Net Cash Used in Financing Activities | | | (55,811,261 | ) |
| | | | | |
Net change in Cash and Restricted Cash | | | 4,442,872 | |
Cash and Restricted Cash - Beginning of Year | | | 3,429,406 | |
Cash and Restricted Cash - End of Year* | | $ | 7,872,278 | |
| | | | | |
Supplemental disclosure of non-cash activities and financiang activities | | | | |
Cash paid for loan interest | | $ | 4,489 | |
Reinvested dividends | | $ | — | |
| | | | | |
* | Cash and restricted cash include cash, cash held in escrow, and deposits held at broker, as outlined further on the Statement of Assets and Liabilities. |
See accompanying Notes to Financial Statements.
12
Corbin Multi-Strategy Fund, LLC
Financial Highlights
Class A Shares
Per Share Data and Ratios for a Share of Limited Liability Company Interest Outstanding Throughout each year. |
| |
| | | Class A Shares | |
| | | For the Year
Ended
March 31,
2023 | | | For the Year
Ended
March 31,
2022 | | | For the Year
Ended
March 31,
2021 | | | For the Year
Ended
March 31,
2020 | | | For the Year
Ended
March 31,
2019 | |
Per Share Operating Performance: | | | | | | | | | | | | | | | | | | | | |
Net Asset Value per share, beginning of year | | $ | 80.71 | | | $ | 86.25 | | | $ | 73.76 | | | $ | 91.98 | | | $ | 93.79 | |
Activity from investment operations:(1) | | | | | | | | | | | | | | | | | | | | |
Net investment loss | | | (1.25 | ) | | | (1.36 | ) | | | (1.64 | ) | | | (1.81 | ) | | | (1.87 | ) |
Net realized and unrealized gain/(loss) on investments | | | (4.18 | ) | | | 5.95 | | | | 18.42 | | | | (7.12 | ) | | | 3.82 | |
Total from investment operations | | | (5.43 | ) | | | 4.59 | | | | 16.78 | | | | (8.93 | ) | | | 1.95 | |
| | | | | | | | | | | | | | | | | | | | | |
Distributions to investors | | | | | | | | | | | | | | | | | | | | |
From net investment income | | | — | | | | (10.13 | ) | | | (4.29 | ) | | | (9.29 | ) | | | (3.76 | ) |
From return of capital | | | (75.28 | ) | | | — | | | | — | | | | — | | | | — | |
From net realized gains | | | — | | | | — | | | | — | | | | — | | | | — | |
Total distributions to investors | | | (75.28 | ) | | | (10.13 | ) | | | (4.29 | ) | | | (9.29 | ) | | | (3.76 | ) |
| | | | | | | | | | | | | | | | | | | | | |
Net Asset Value per share, end of year | | $ | — | | | $ | 80.71 | | | $ | 86.25 | | | $ | 73.76 | | | $ | 91.98 | |
| | | | | | | | | | | | | | | | | | | | | |
Net Assets, end of year (in thousands) | | $ | — | | | $ | 3,858 | | | $ | 4,427 | | | $ | 4,921 | | | $ | 7,046 | |
| | | | | | | | | | | | | | | | | | | | | |
Ratios/Supplemental Data:(2) | | | | | | | | | | | | | | | | | | | | |
Net investment loss | | | (3.19 | )% | | | (1.58 | )% | | | (1.98 | )% | | | (2.05 | )% | | | (2.04 | )% |
| | | | | | | | | | | | | | | | | | | | | |
Gross Expenses(3) | | | 3.69 | % | | | 2.35 | % | | | 2.47 | % | | | 2.42 | % | | | 2.51 | % |
Fund Management Fee waiver | | | (0.11 | )% | | | 0.00 | % | | | (0.04 | )% | | | — | | | | — | |
Net Expenses(4) | | | 3.58 | % | | | 2.35 | % | | | 2.43 | % | | | 2.42 | % | | | 2.51 | % |
| | | | | | | | | | | | | | | | | | | | | |
Portfolio Turnover Rate(5) | | | 0 | % | | | 6.98 | % | | | 16.89 | % | | | 32.73 | % | | | 9.89 | % |
Total Return(6) | | | (13.19 | )% | | | 5.38 | % | | | 22.76 | % | | | (10.79 | )% | | | 2.24 | % |
| | | | | | | | | | | | | | | | | | | | | |
Senior Securities | | | | | | | | | | | | | | | | | | | | |
Total borrowings (000’s omitted) | | $ | — | | | $ | 3,000 | | | $ | 7,000 | | | $ | 23,000 | | | $ | — | (8) |
Asset coverage per $1,000 unit of senior indebtedness(7) | | $ | — | | | $ | 23,571 | | | $ | 13,775 | | | $ | 4,886 | | | $ | — | (8) |
(1) | Based on average Shares outstanding throughout the year. |
(2) | The expenses and net investment loss ratios do not include income or expenses of the Investment Funds in which the Fund invests. |
(3) | Represents the ratio of expenses to average net assets absent Management Fee waivers, expense reimbursements and/or expense recoupment by the Adviser. |
(4) | Through June 30, 2020, net expenses excluding non-reimbursable expenses are capped at 2.75% for Class A. Effective July 1, 2020 net expenses excluding non-reimbursable expenses are no longer capped for Class A. For the period from July 1, 2020 to December 31, 2020 the Adviser voluntarily agreed to implement a fee reduction of 10% on the Management Fee. |
(5) | Calculated for the Fund as a whole. |
(6) | Total return based on per Share net asset value reflects the change in net asset value based on the effects of the performance of the Fund during the year and assumes distributions, if any, were reinvested. Total returns shown exclude the effect of applicable placement fee and early withdrawal fees. |
(7) | Calculated by subtracting the Fund’s total liabilities (not including borrowings) from the Fund’s total assets and dividing this by the total number of senior indebtedness units, where one unit equals $1,000 of senior indebtedness. |
See accompanying Notes to Financial Statements.
13
Corbin Multi-Strategy Fund, LLC
Financial Highlights
Class I Shares
Per Share Data and Ratios for a Share of Limited Liability Company Interest Outstanding Throughout each year. |
| |
| | | Class I Shares | |
| | | For the Year
Ended
March 31,
2023 | | | For the Year
Ended
March 31,
2022 | | | For the Year
Ended
March 31,
2021 | | | For the Year
Ended
March 31,
2020 | | | For the Year
Ended
March 31,
2019 | |
Per Share Operating Performance: | | | | | | | | | | | | | | | | | | | | |
Net Asset Value per share, beginning of year | | $ | 89.27 | | | $ | 94.35 | | | $ | 80.33 | | | $ | 99.40 | | | $ | 100.37 | |
Activity from investment operations:(1) | | | | | | | | | | | | | | | | | | | | |
Net investment loss | | | (0.99 | ) | | | (0.81 | ) | | | (1.15 | ) | | | (1.31 | ) | | | (1.34 | ) |
Net realized and unrealized gain/(loss) on investments | | | (5.22 | ) | | | 6.52 | | | | 20.11 | | | | (7.77 | ) | | | 4.13 | |
Total from investment operations | | | (6.21 | ) | | | 5.71 | | | | 18.96 | | | | (9.08 | ) | | | 2.79 | |
| | | | | | | | | | | | | | | | | | | | | |
Distributions to investors | | | | | | | | | | | | | | | | | | | | |
From net investment income | | | — | | | | (10.79 | ) | | | (4.94 | ) | | | (9.99 | ) | | | (3.76 | ) |
From return of capital | | | (83.06 | ) | | | — | | | | — | | | | — | | | | — | |
From net realized gains | | | — | | | | — | | | | — | | | | — | | | | — | |
Total distributions to investors | | | (83.06 | ) | | | (10.79 | ) | | | (4.94 | ) | | | (9.99 | ) | | | (3.76 | ) |
| | | | | | | | | | | | | | | | | | | | | |
Net Asset Value per share, end of year | | $ | — | | | $ | 89.27 | | | $ | 94.35 | | | $ | 80.33 | | | $ | 99.40 | |
| | | | | | | | | | | | | | | | | | | | | |
Net Assets, end of year (in thousands) | | $ | — | | | $ | 63,854 | | | $ | 85,000 | | | $ | 84,466 | | | $ | 125,156 | |
| | | | | | | | | | | | | | | | | | | | | |
Ratios/Supplemental Data:(2) | | | | | | | | | | | | | | | | | | | | |
Net investment income/(loss) | | | (2.11 | )% | | | (0.85 | )% | | | (1.26 | )% | | | (1.37 | )% | | | (1.36 | )% |
| | | | | | | | | | | | | | | | | | | | | |
Gross Expenses(3) | | | 2.61 | % | | | 1.62 | % | | | 1.75 | % | | | 1.74 | % | | | 1.84 | % |
Fund management fee waiver | | | (0.11 | )% | | | 0.00 | % | | | (0.04 | )% | | | — | | | | — | |
Net Expenses(4) | | | 2.50 | % | | | 1.62 | % | | | 1.71 | % | | | 1.74 | % | | | 1.84 | % |
| | | | | | | | | | | | | | | | | | | | | |
Portfolio Turnover Rate(5) | | | 0 | % | | | 6.98 | % | | | 16.89 | % | | | 32.73 | % | | | 9.89 | % |
Total Return(6) | | | (12.58 | )% | | | 6.14 | % | | | 23.62 | % | | | (10.19 | )% | | | 2.93 | % |
| | | | | | | | | | | | | | | | | | | | | |
Senior Securities | | | | | | | | | | | | | | | | | | | | |
Total borrowings (000’s omitted) | | $ | — | | | $ | 3,000 | | | $ | 7,000 | | | $ | 23,000 | | | $ | — | (8) |
Asset coverage per $1,000 unit of senior indebtedness(7) | | $ | — | | | $ | 23,571 | | | $ | 13,775 | | | $ | 4,886 | | | $ | — | (8) |
(1) | Based on average Shares outstanding throughout the year. |
(2) | The expenses and net investment loss ratios do not include income or expenses of the Investment Funds in which the Fund invests. |
(3) | Represents the ratio of expenses to average net assets absent Management Fee waivers, expense reimbursements and/or expense recoupment by the Adviser. |
(4) | Through June 30, 2020, net expenses excluding non-reimbursable expenses are capped at 2.00% for Class I. Effective July 1, 2020 net expenses excluding non-reimbursable expenses are no longer capped for Class I. For the period from July 1, 2020 to December 31, 2020 the Adviser voluntarily agreed to implement a fee reduction of 10% on the Management Fee. |
(5) | Calculated for the Fund as a whole. |
(6) | Total return based on per Share net asset value reflects the change in net asset value based on the effects of the performance of the Fund during the year and assumes distributions, if any, were reinvested. Total returns shown exclude the effect of early withdrawal fees. |
(7) | Calculated by subtracting the Fund’s total liabilities (not including borrowings) from the Fund’s total assets and dividing this by the total number of senior indebtedness units, where one unit equals $1,000 of senior indebtedness. |
See accompanying Notes to Financial Statements.
14
Corbin Multi-Strategy Fund, LLC
Notes to Financial Statements
March 31, 2023
Note 1 – Organization
Corbin Multi-Strategy Fund, LLC (the “Fund”), is a Delaware limited liability company, registered under the Investment Company Act of 1940, as amended (the “1940 Act”) as a closed-end management investment company. Corbin Capital Partners, L.P. (the “Adviser”), a Delaware limited partnership, serves as the investment adviser to the Fund. Prior to July 1, 2019 the Fund was known as the GAI Corbin Multi-Strategy Fund, LLC and Wells Fargo Investment Institute, Inc. (the “Former Adviser”) served as the investment adviser to the Fund and the Adviser served as the sub-adviser to the Fund. The Fund has two separate classes of shares of limited liability company interest outstanding, Class A Shares and Class I Shares (“Shares”).
The Fund’s Board of Managers (the “Board”) provides broad oversight over the operations and affairs of the Fund, and has overall responsibility to manage and control the business affairs of the Fund, including the complete and exclusive authority to establish policies regarding the management, conduct, and operation of the Fund’s business. The Board exercises the same powers, authority and responsibilities on behalf of the Fund as are customarily exercised by the board of directors of a registered investment company organized as a corporation.
The Shares of each class represent an interest in the same portfolio of investments of the Fund and have equal rights as to voting, redemptions, dividends and liquidation, subject to the approval of the Board. Income, expenses (other than expenses attributable to a specific class) and realized and unrealized gains and losses on investments are allocated to each class of shares in proportion to their relative net assets. Members of a class that bears distribution and service expenses under the terms of the distribution plan have exclusive voting rights to that plan.
Plan of Liquidation
At a meeting held on March 8, 2022 and March 9, 2022, the Board approved a Plan of Liquidation (the “Plan”) for the Fund and determined to close and liquidate the Fund, as soon as practicable. This decision was made after careful consideration of the Fund’s current and future prospects. Following such approval by the Board, April 1, 2022 was established as the Plan’s effective date (the “Effective Date”). The Plan provides for the liquidation of the Fund and the pro rata distribution of available cash and cash equivalents of the Fund to its investors (“Members”). Accordingly, effective March 10, 2022, the Fund discontinued accepting orders for the purchase of Shares and ceased making tender offers for the repurchase of Shares. The Plan also provides that, subject to continued compliance with applicable rules and regulations, including Subchapter M of the Internal Revenue Code, the Fund shall from time to time make distributions to Members of its available cash resulting from the liquidation of the Fund’s portfolio securities.
As soon as possible after all of the Fund’s investments in portfolio securities are converted to cash, the Fund shall make to each Member of record on the Effective Date a final liquidating distribution equal to the Member’s proportionate net assets of the Fund and shall make available to each such Member information concerning the sources of the liquidating distribution. All outstanding Shares will be cancelled following the final liquidating distribution. Please see Note 2 Accounting Policies (j) Distributions to see additional details about the final liquidating distribution. Prior to that time, the net proceeds from the liquidation of portfolio securities will be invested in cash equivalent securities or held in cash and shall be distributed to Members, as described above. During this time, the Fund may hold more cash or cash equivalents than normal, which may prevent the Fund from meeting its stated investment objective. The Fund has converted substantially all its portfolio securities to cash and currently awaits receipt of payment from one underlying investment fund in which the Fund held an interest. The Fund expects to make the final liquidating distribution in June 2023.
Note 2 – Accounting Policies
The following is a summary of significant accounting policies followed by the Fund and are in conformity with accounting principles generally accepted in the United States (“GAAP”). The accompanying financial statements of the Fund are stated in U.S. dollars. The Fund is considered to be an investment company in accordance with Financial Accounting Standards Board (“FASB”) Accounting Standards Codification (“ASC”) Topic 946, Financial Services – Investment Companies (“FASB ASC 946”), and is following the accounting and reporting guidance found within FASB ASC 946.
(a) Valuation of Investments
In December 2020, the U.S. Securities and Exchange Commission (“SEC”) adopted a new rule providing a framework for fund valuation practices (“Rule 2a-5”). Rule 2a-5 establishes requirements for determining fair value in good faith for purposes of the 1940 Act. Rule 2a-5 permits fund boards to designate certain parties to perform fair value determinations, subject to board oversight and certain other conditions. Rule 2a-5 also defines when market quotations are “readily available” for purposes of the 1940 Act and the threshold for determining whether a fund must fair value a security. In connection with
15
Corbin Multi-Strategy Fund, LLC
Notes to Financial Statements
March 31, 2023 (continued)
Note 2 – Accounting Policies (continued)
Rule 2a-5, the SEC also adopted related recordkeeping requirements and is rescinding previously issued guidance, including with respect to the role of a board in determining fair value and the accounting and auditing of fund investments. Effective September 8, 2022, and pursuant to the requirements of Rule 2a-5, the Board designated the Adviser as Fund’s valuation designee (in this capacity, the “Valuation Designee”) to perform fair value determinations and approved new valuation policies and procedures for the Fund (the “Valuation Procedures”).
Under the Valuation Procedures, the Board has delegated day-to-day responsibility for fair value determinations and pricing to the Valuation Designee, subject to the oversight of the Board. The Valuation Designee oversees the valuation of the Fund’s investments on behalf of the Fund. The fair values of equity securities are determined using last traded or closing prices as reported on the primary exchange where securities are traded and are generally categorized within Level 1 of the Fund’s fair value hierarchy. If no sales of such equity securities are reported on a particular day, the securities are generally valued based upon their closing bid prices. In any case where the Valuation Designee believes that (i) the agreed upon valuation methodology is not appropriate or (ii) market quotations for a security are unavailable, unreliable, or not reflective of the security’s fair value, the Valuation Designee reviews the valuation of the security. The Valuation Designee shall determine the fair value of the security by taking into account such factors deemed relevant.
The Fund values its investments in Investment Funds at fair value in accordance with procedures established in good faith by the Board using net asset value per share (“NAV”). The fair value of an Investment Fund ordinarily will be the NAV of that Investment Fund determined and reported by the Investment Fund in accordance with the valuation policies established by the Investment Fund and/or its Investment Manager, absent information indicating that such value does not represent the fair value of the interest. The Fund could reasonably expect to receive the NAV of its interests amount from the Investment Fund if the Fund’s interest were redeemed at the time of valuation, based on information reasonably available at the time the valuation is made and that the Fund believes to be reliable. In particular, FASB Topic 820, Fair Value Measurements (“FASB ASC 820”) permits a reporting entity to measure the fair value of an investment fund that does not have a readily determinable fair value based on the NAV per share, or its equivalent, of the investment fund as a practical expedient, without further adjustment, unless it is probable that the investment would be sold at a value significantly different than the NAV. If the practical expedient NAV is not as of the reporting entity’s measurement date, then the NAV should be adjusted to reflect any significant events that may change the valuation. In using the NAV as a practical expedient, certain attributes of the investment that may impact its fair value are not considered in measuring fair value. Attributes of those investments include the investment strategies of the investment and may also include, but are not limited to, restrictions on the investor’s ability to redeem its investments at the measurement date and any unfunded commitments. The Fund is permitted to invest in alternative investments that do not have a readily determinable fair value, and as such, has elected to use the NAV as calculated on the reporting entity’s measurement date as the fair value of the investment. A listing of each investment by the Fund by strategy can be found in the Schedule of Investments.
Due to the nature of the investments held by the Investment Funds, changes in market conditions and the economic environment may significantly impact the value of the Investment Funds and the fair value of the Fund’s interests in the Investment Funds. Under some circumstances, the Fund or the Valuation Designee may determine, based on other information available to the Fund or the Valuation Designee, that an Investment Fund’s reported valuation does not represent fair value. If it is determined that the Investment Fund’s reported valuation does not represent fair value, the Valuation Designee may choose to make adjustments to reflect the fair value. During the year ended March 31, 2023, no such adjustments were deemed necessary by the Valuation Designee. In addition, the Fund may not have an Investment Fund’s reported valuation as of a particular fiscal period end. In such cases, the Fund would determine the fair value of such an Investment Fund based on any relevant information available at the time. The Board has established procedures for the valuation of investment securities other than securities of Investment Funds, if any, held directly by the Fund.
(b) Federal Income Taxes
The Fund elects to be treated as, and qualifies as, a regulated investment company (“RIC”) under Subchapter M of the Internal Revenue Code of 1986, as amended (the “Code”) by distributing substantially all of its investment company taxable income and any net realized capital gains (after reduction for capital loss carryforwards) sufficient to relieve it from all, or substantially all, federal income taxes. Accordingly, no provision for federal income taxes was required for the Fund.
16
Corbin Multi-Strategy Fund, LLC
Notes to Financial Statements
March 31, 2023 (continued)
Note 2 – Accounting Policies (continued)
In accounting for income taxes, the Fund follows the guidance in FASB ASC 740, Accounting for Uncertainty in Income Taxes. FASB ASC 740 prescribes the minimum recognition threshold a tax position must meet in connection with accounting for uncertainties in income tax positions taken or expected to be taken by an entity before being measured and recognized in the financial statements. There were no material uncertain tax positions requiring recognition in the Fund’s financial statements as of March 31, 2023.
Management has analyzed the Fund’s tax positions for all open tax years, which include the years ended October 31, 2019 through October 31, 2022, and has concluded that as of March 31, 2023, no provision for income taxes is required in the financial statements. Therefore, no additional tax expense, including any interest and penalties, was recorded in the current year and no adjustments were made to prior periods. To the extent the Fund recognizes interest and penalties, they are included in interest expense and other expenses, respectively, in the Statement of Operations.
The Fund utilizes a tax-year end of October 31 and the Fund’s income and federal excise tax returns and all financial records supporting the 2020, 2021 and 2022 returns are subject to examination by the federal and Delaware revenue authorities.
(c) Security Transactions and Investment Income
The Fund’s transactions are accounted for on a trade-date basis. Realized gains and losses on the Fund’s transactions are determined on a specific identification basis. Interest income is recognized on the accrual basis. Dividend income is recognized on the ex-dividend date. The Fund accounts for capital gain distributions from Investment Funds based on the nature of such distributions as determined by each underlying Investment Fund. Capital gain distributions received are recorded as capital gains as soon as this information is available to the Fund and its service providers.
The Fund will indirectly bear a portion of the Investment Funds’ income and expenses, including management fees and incentive fees charged by the Investment Funds. That income and those expenses are recorded in the Fund’s financial statements as change in unrealized appreciation/depreciation and not as income or expense on the Statement of Operations.
(d) Cash
The Fund maintains cash and cash held in escrow for shares tendered in an interest-bearing bank account, which, at times, may exceed federally insured limits. The Fund has not experienced any losses in such account and does not believe it is exposed to any significant credit risk on such bank deposits. All interest income earned will be paid to the Fund.
(e) Options purchased
When an option is purchased, an amount equal to the premium paid is recorded as an investment and is subsequently adjusted to the current fair value of the option purchased. Premiums paid for the purchase of options which expire unexercised are treated by the Fund on the expiration date as realized losses. If a purchased put option is exercised, the premium is subtracted from the proceeds of the sale of the underlying security or foreign currency in determining whether the Fund has realized a gain or loss. If a purchased call option is exercised, the premium increases the cost basis of the security or foreign currency purchased by the Fund. Options purchased on an exchange are standardized while options purchased over-the-counter (“OTC”) have counterparty risk associated with them.
(f) Options written
When an option is written, an amount equal to the premium received by the Fund is recorded as a liability and is subsequently adjusted to the current fair value of the option written. Premiums received from written options which expire unexercised are treated by the Fund as realized gains on the expiration date. If a written call option is exercised, the premium is added to the proceeds from the sale of the underlying security or foreign currency in determining whether the Fund has realized a gain or loss. If a written put option is exercised, the premium reduces the cost basis of the security or foreign currency purchased by the Fund.
(g) Credit default swaps
The Fund may enter into credit default swaps to manage its exposure to the market or certain sectors of the market, to reduce its risk exposure to defaults of corporate and/or sovereign issuers or to create exposure to corporate and/or sovereign issuers to which it is not otherwise exposed (credit risk). The Fund enters into credit default swaps to provide a measure of protection against the default of an issuer (as buyer of protection) and/or gain credit exposure to an issuer to which it is
17
Corbin Multi-Strategy Fund, LLC
Notes to Financial Statements
March 31, 2023 (continued)
Note 2 – Accounting Policies (continued)
not otherwise exposed (as seller of protection). The Fund may either buy or sell (write) credit default swaps on single-name issuers (corporate or sovereign) or traded indices. Credit default swaps on single-name issuers are agreements in which the buyer pays fixed periodic payments to the seller in consideration for a guarantee from the seller to make a specific payment should a negative credit event take place (e.g., bankruptcy, failure to pay, obligation accelerators, repudiation, moratorium or restructuring). Credit default swaps on traded indices are agreements in which the buyer pays fixed periodic payments to the seller in consideration for a guarantee from the seller to make a specific payment should a write-down, principal or interest shortfall or default of all or individual underlying securities included in the index occur. As a buyer, if an underlying credit event occurs, the Fund will either receive from the seller an amount equal to the notional amount of the swap and deliver the referenced security or underlying securities comprising of an index or receive a net settlement of cash equal to the notional amount of the swap less the recovery value of the security or underlying securities comprising of an index. As a seller (writer), if an underlying credit event occurs, the Fund will either pay the buyer an amount equal to the notional amount of the swap and take delivery of the referenced security or underlying securities comprising of an index or pay a net settlement of cash equal to the notional amount of the swap less the recovery value of the security or underlying securities comprising of an index. The Fund may also enter into collateral agreements with certain counterparties to further mitigate counterparty risk on OTC derivative and forward foreign currency contracts. Subject to established minimum levels, collateral is generally determined based on the net aggregate unrealized gain or loss on contracts with a certain counterparty. Collateral pledged to or from the Fund is held in a segregated account by a third-party agent and can be in the form of cash or debt securities issued by the U.S. government or related agencies.
(h) Valuation of derivatives
The fair value of purchased and written options can be determined using unadjusted quoted prices and are generally categorized within Level 1 of the Fund’s fair value hierarchy. Except as noted below, if no sales of such securities are reported on a particular day, securities are generally valued based upon their closing bid prices for purchased options, or their ask prices for written options. The fair value of written and purchased OTC currency options and credit default swaps can be determined by an independent pricing vendor deemed reliable by management using a pricing model. The pricing model does not entail material subjectivity because the methodologies employed do not necessitate significant judgment, and the pricing inputs are observed from actively quoted markets and/or dealer quotes. The Fund generally categorizes these derivatives within Level 2 of the fair value hierarchy. In instances where significant inputs are unobservable, they would be categorized as Level 3 in the fair value hierarchy.
(i) Collateralized loan obligations
The Fund may invest in collateralized loan obligations (“CLOs”), which are a type of asset-backed security. The cash flows of the CLO can be split into multiple segments, called “tranches”, which will vary in risk profile and yield. The Fund values CLOs at the “bid” quotes provided by external pricing sources deemed reputable by management and therefore generally categorizes CLOs within Level 2 of the fair value hierarchy. In instances where significant inputs are unobservable, they would be categorized as Level 3 in the fair value hierarchy.
(j) Distributions
The Fund is currently operating pursuant to the Plan, as described in Note 1 above. The Plan provides for the liquidation of the Fund and the pro rata distribution of available cash and cash equivalents of the Fund to its Members. As soon as possible after all of the Fund’s investments in portfolio securities are converted to cash, the Fund shall make to each Member of record on the Effective Date a final liquidating distribution equal to the Member’s proportionate net assets of the Fund and shall make available to each such Member information concerning the sources of the liquidating distribution. All outstanding Shares will be canceled following the final liquidating distribution. It is possible that it will take the Fund more than two years from the Effective Date to convert all of its portfolio securities to cash, which could result in certain Fund distributions being taxable to both the Fund and its Members for Federal income tax purposes. The Fund declared a liquidating distribution that was paid on August 12, 2022, to Members of record as of the Effective Date in the amount of $41.57 per Class A share and $41.96 per Class I shares. The Fund declared a liquidating distribution that was paid on February 13, 2023, to Members of record as of the Effective Date in the amount of $24.79 per Class A share and $24.91 per Class I shares. The Fund declared a liquidating distribution to Members of record as of the March 31, 2023 in the amount of $8.92 per Class A share and $16.19 per Class I shares. The Fund’s final liquidating distribution total can be found on the Statement of Assets and Liabilities reflected as Dividend Payable. The Fund’s liquidating distribution totals can be found on the Statements of Changes in Net Assets.
18
Corbin Multi-Strategy Fund, LLC
Notes to Financial Statements
March 31, 2023 (continued)
Note 2 – Accounting Policies (continued)
Distributions to Members from net investment income and net realized gains, if any, are recorded on the ex-dividend date. Such distributions are determined in conformity with income tax regulations, which may differ from GAAP. The timing and character of distributions made during the year from net investment income or net realized gains may differ from their ultimate characterization for federal income tax purposes. To the extent that these differences are permanent in nature, such amounts are reclassified within the capital accounts based on their federal tax-basis treatment. Temporary differences do not require reclassifications.
(k) Use of Estimates
The preparation of the financial statements in conformity with GAAP requires management to make estimates and assumptions that affect the reported amounts of assets and liabilities, and disclosure of contingent assets and liabilities at the date reported in the financial statements and the reported amounts of increases and decreases in net assets from operations during the period. Actual results could differ from those estimates and the differences could be material.
(l) Fund Expenses
The Fund bears all expenses incurred in its business and operations and records them on an accrual basis. Expenses include, but are not limited to, administrative and extraordinary expenses and legal, tax, audit, escrow, fund accounting and printing expenses. Operating expenses also include: (1) certain investment related expenses, (2) interest and commitment expense on any borrowings, if any; and (3) all costs, and expenses associated with the registration of the Fund and/or its securities under, and in compliance with, any applicable federal and state laws.
(m) Due from broker
Due from broker includes cash balances held with the broker and receivables from initial margin related to the Fund’s derivatives trades. Interest may be earned on balances held by the brokers and interest may be charged on debit balances. At March 31, 2023, cash due from the broker totaled $86,331.
Note 3 – Investment Advisory and Other Agreements
Pursuant to the advisory agreement between the Fund and the Adviser, the Fund pays the Adviser each month a management fee (the “Management Fee”) equal to one-twelfth of 0.75% of the aggregate NAV of outstanding Shares (borne by Class A and Class I Shares on a pro rata basis) determined as of the last business day of that month (before any repurchases of Shares). For the period from July 1, 2020 to December 31, 2020 the Adviser voluntarily agreed to implement a fee reduction of 10% on the Management Fee. Beginning September 1, 2022, the Adviser voluntarily waived the portion of the Management Fee that is payable by the Fund with respect to the Fund’s net assets held in cash. The voluntarily waived Management Fees are not subject to recoupment by the Adviser.
Effective June 30, 2020, the Fund’s expense limitation agreement with the Adviser that limited the Fund’s annualized ordinary fund-wide operating expenses to 2.00% expired by its terms. Prior to July 1, 2020, the Fund was party to an expense limitation agreement with the Adviser dated as of July 1, 2019 that limited the Fund’s annualized ordinary fund-wide operating expenses to 2.00% through June 30, 2020 (the “Expense Limitation Agreement”). Class I Shares have no class-specific expenses. Members holding Class A Shares will pay (in addition to ordinary fund-wide operating expenses) an additional annualized amount of up to 0.75% (the “Investor Distribution and Servicing Fee”). Ordinary fund-wide operating expenses exclude the Fund’s borrowing and other investment-related costs, Investment Fund and Investment Manager fees and expenses, taxes, litigation and indemnification expenses, judgments, other extraordinary expenses not incurred in the ordinary course of the Fund’s business, and the Investor Distribution and Servicing Fee charged to Class A Members. Ordinary fund-wide operating expenses include, for the avoidance of doubt, the Management Fee and the Fund’s start-up, offering and organizational expenses. In addition, prior to July 1, 2020, the Adviser was permitted to recover from the Fund expenses it had borne (whether through reduction of its management fee or otherwise) in later periods to the extent that the Fund’s ordinary fund-wide operating expenses (exclusive of the Investor Distribution and Servicing Fee charged to Class A Members) fell below the annualized rate of 2.00% per year. The Fund, however, was not obligated to pay any such amount more than three years after the Adviser deferred a fee or reimbursed an expense. Any such recovery by the Adviser would not cause the Fund to exceed the annual limitation rate set forth above. As of March 31, 2023, there was no amount subject to recoupment within three years after the end of the fiscal year in which the Adviser reimbursed the expenses. As of March 31, 2023, there were no expenses reimbursable to the Adviser.
19
Corbin Multi-Strategy Fund, LLC
Notes to Financial Statements
March 31, 2023 (continued)
Note 3 – Investment Advisory and Other Agreements (continued)
Effective July 1, 2019, under the terms of the wholesaling and placement agent agreement between the Fund and UMB Distribution Services, LLC (the “Placement Agent”) (the “Wholesaling and Placement Agent Agreement”), the Placement Agent is authorized to retain brokers, dealers and certain financial advisors for distribution services and to provide ongoing investor services and account maintenance services to Members purchasing Shares that are their customers (“Investor Service Providers”). These services include, but are not limited to, handling Member inquiries regarding the Fund (e.g. responding to questions concerning investments in the Fund, capital account balances, and reports and tax information provided by the Fund); assisting in the enhancement of relations and communications between Members and the Fund; assisting in the establishment and maintenance of Member accounts with the Fund; assisting in the maintenance of Fund records containing Member information; and providing such other information and Member liaison services as the Fund or the Placement Agent may reasonably request.
Under the Wholesaling and Placement Agent Agreement, the Fund will pay a quarterly Investor and Distribution Servicing Fee out of Class A Share net assets at the annual rate of 0.75% of the aggregate NAV of Class A Shares that have been outstanding for more than twelve (12) months, determined and accrued as of the last day of each calendar month (before any repurchases of Class A Shares) and paid quarterly. The Investor Distribution and Servicing Fee is charged on an aggregate class-wide basis, and investors in Class A Shares will be subject to the Investor Distribution and Servicing Fee regardless of how long they have held their Class A Shares. The Investor Distribution and Servicing Fee is paid to the Placement Agent to reimburse it for payments made to Investor Service Providers and for the Placement Agent’s ongoing investor servicing. The Placement Agent may pay all or a portion of the Investor Distribution and Servicing Fee it receives to other Investor Service Providers, acting as sub-placement agents, which may include affiliates of the Adviser. Each Investor Service Provider is paid based on the aggregate NAV of outstanding Class A Shares held by Members that receive services from such Investor Service Provider that have been outstanding for more than twelve (12) months. Pursuant to the conditions of an exemptive order issued by the SEC, the Investor Distribution and Servicing Fee is paid pursuant to a plan adopted by the Fund in compliance with Rule 12b-1 under the 1940 Act with respect to Class A Shares.
Class I Shares are not subject to the Investor Distribution and Servicing Fee.
Under the terms of the Wholesaling and Placement Agent Agreement, the Placement Agent’s sub-agents are entitled to receive a placement fee based on the net amount of Class A Shares purchased by a Member (the “Class A Share Placement Fee”). In determining the applicable Class A Share Placement Fee at the time of investment in Class A Shares, the amount of a Member’s investment in Class A Shares (whether initial or additional) will be aggregated with the value of (i) the Member’s investments in shares subject to a placement fee of any collective investment vehicle advised by the Adviser, including the Fund and (ii) investments in shares subject to a placement fee of any collective investment vehicle advised by the Adviser, including the Fund, held by the Member’s “Immediate Family Members” (as defined in the Fund’s subscription agreement). The Member must indicate in the subscription agreement who such “Immediate Family Members” are and the amounts of their investments.
The Class A Share Placement Fee shall be deducted from the initial or additional subscriptions provided by the Member and, subject to certain exceptions and waivers listed in the Fund’s Private Placement Memorandum, is as follows:
Current Value of Class A Shares | | Placement Fee | |
Less than $500,000 | | | 2.00 | % |
$500,000 to less than $1,000,000 | | | 1.00 | % |
$1,000,000 or more | | | 0.50 | % |
For the year ended March 31, 2023, Class A Share Placement Fees paid to sub-agents of the Placement Agent by Members upon subscription into the Fund were $0.
In addition, the Placement Agent (or one of its affiliates) may, from its own resources, make payments to brokers, dealers and Investor Service Providers for the provision of sales training, product education and access to sales staff, the support and conduct of due diligence, balance maintenance, the provision of information and support services to clients, inclusion on preferred provider lists and the provision of other services with respect to Shares.
20
Corbin Multi-Strategy Fund, LLC
Notes to Financial Statements
March 31, 2023 (continued)
Note 3 – Investment Advisory and Other Agreements (continued)
UMB Fund Services, Inc. (“UMBFS”) serves as the Fund’s fund accountant, transfer agent and administrator; UMB Bank, n.a., an affiliate of UMBFS, serves as the Fund’s custodian. The Fund’s allocated fees incurred for administrative and custodian services for the year ended March 31, 2023, are reported on the Statement of Operations.
A Manager and officer of the Fund are employees of UMBFS. The Fund does not compensate Managers and officers affiliated with the Fund’s administrator. For the year ended March 31, 2023, the Fund’s allocated fees incurred for Managers who are not affiliated with the Fund’s administrator are reported on the Statement of Operations.
Vigilant Compliance, LLC provides Chief Compliance Officer (“CCO”) services to the Fund. The Fund’s allocated fees incurred for CCO services for the year ended March 31, 2023 are reported on the Statement of Operations.
Note 4 – Capital Stock
The Fund has two separate classes of Shares outstanding, Class A Shares and Class I Shares.
Effective March 10, 2022, the Fund discontinued accepting initial and additional subscriptions of Shares. Prior to March 10, 2022, the Fund accepted initial and additional subscriptions for Shares on subscription dates, which occurred only once each month, effective as of the beginning of the first calendar day of the month at the relevant NAV per Share of the Fund as of the end of the last calendar day of the prior month. All Class A Share subscriptions accepted into the Fund were received net of Class A Share Placement Fees. The Fund’s subscription dollar and Share amounts for the fiscal years ended March 31, 2022 and 2023, are reported on the Statement of Changes in Net Assets. Corbin Capital Partners, L.P. contributed capital to the Fund in the amount $70,642 and is reflected on the Statement of Assets and Liabilities as advance contribution from Adviser.
Effective March 10, 2022, the Fund ceased making tender offers for the repurchase of Shares. Prior to March 10, 2022, the Fund, from time to time, offered to repurchase Shares pursuant to written tenders by Members, in order to provide a limited degree of liquidity to Members. Repurchases were made at such times, in such amounts and on such terms as determined by the Board, in its sole discretion. In determining whether the Fund should offer to repurchase Shares, the Board considered a variety of operational, business and economic factors. Prior to March 10, 2022, the Adviser recommended that the Board authorize the Fund to offer to repurchase Shares from Members quarterly, with March 31, June 30, September 30 and December 31 valuation dates (each, a “Valuation Date”) (or, if any such date is not a business day, on the last business day of such calendar quarter).
If the interval between the date of purchase of Shares and the Valuation Date with respect to the repurchase of such Shares was less than 180 days, then such repurchase was subject to a 2% early withdrawal fee payable to the Fund. In determining whether the repurchase of Shares was subject to an early withdrawal fee, the Fund repurchased those Shares held the longest first. For Members from whom the Fund accepted for repurchase all of their Shares, the Fund sought to pay 95% of the estimated unaudited net asset value of the Shares repurchased determined as of the applicable Valuation Date, less any early withdrawal charge relating to such Shares. Initial payments in connection with tenders generally were made as of the later of (1) the 45th day after the Valuation Date, or (2) in the sole discretion of the Adviser, if the Fund had requested withdrawals of its investment from any Investment Funds in order to fund the repurchase of Shares, within ten business days after the Fund had received at least 95% of the aggregate amount so requested to be withdrawn by the Fund from any Investment Funds. The Fund is permitted to establish an escrow to hold funds or otherwise earmark funds (including investments) reasonably determined by the Board to be needed to make both the initial payment and, if the initial payment was less than 100% of the estimated unaudited NAV, the balance of the repurchase price. The Fund paid the balance, if any, of the repurchase price based on the audited financial statements of the Fund for the fiscal year in which such repurchase was effective. This amount was subject to adjustment upon completion of the annual audit of the Fund’s financial statements for the fiscal year in which the repurchase was effected. Final adjustments of payments in connection with the repurchased Shares generally were made within approximately 45 days after the completion of the annual audit of the Fund.
21
Corbin Multi-Strategy Fund, LLC
Notes to Financial Statements
March 31, 2023 (continued)
Note 5 – Federal Income Taxes
At March 31, 2023, gross unrealized appreciation and depreciation of investments, based on cost for federal income tax purposes were as follows:
Cost of investments | | $ | 29,599 | |
Gross unrealized appreciation | | | 42,513 | |
Gross unrealized depreciation | | | — | |
Net unrealized appreciation on investments | | $ | 42,513 | |
The difference between cost amounts for financial statement and federal income tax purposes is due primarily to timing differences in recognizing certain gains and losses in security transactions.
Additionally, U.S. GAAP requires certain components of net assets relating to permanent differences be reclassified between financial and tax reporting. Permanent differences between book and tax basis are attributable to certain investments in due to net operating loss. These reclassifications have no effect on shareholders’ capital or net asset value per share. For the tax year ended October 31, 2022, the following amounts were reclassified:
| | Increase (Decrease) |
Paid-in capital | $(1,624,372) |
Total distributable earnings | 1,624,372 |
The tax basis of distributable earnings as of October 31, 2022, the Fund’s last tax year end, are as follows:
Undistributed ordinary income | | $ | — | |
Undistributed long-term gains | | | — | |
Tax accumulated earnings | | | — | |
Accumulated capital and other losses | | | (16,486,710 | ) |
Unrealized appreciation on investments | | | (3,247,182 | ) |
Total accumulated deficit | | $ | (19,733,892 | ) |
The character of distributions made during the fiscal year from net investment income or net realized gain may differ from the characterization for federal income tax purposes due to differences in the recognition of income, expense and gain/(loss) items for financial statement and tax purposes. Where appropriate, reclassifications between net asset accounts are made for such differences that are permanent in nature.
The tax character of distributions paid during the tax years ended October 31, 2022 and October 31, 2021 were as follows:
Distribution paid from: | | 2022 | | | 2021 | |
Ordinary income | | $ | 8,486,924 | | | $ | 5,179,629 | |
Return of Capital | | | 32,096,119 | | | | — | |
Net long-term capital gains | | | — | | | | — | |
Total distributions | | $ | 40,583,043 | | | $ | 5,179,629 | |
As of the tax year ended October 31, 2022, the Fund has non-expiring accumulated capital loss carryforwards as follows:
Short-Term | Long-Term | Total |
$6,861,588 | $9,625,116 | $16,486,704 |
During the tax year ended October 31, 2022, the fund utilized $2,059,747 of its capital loss carryover.
22
Corbin Multi-Strategy Fund, LLC
Notes to Financial Statements
March 31, 2023 (continued)
To the extent that a fund may realize future net capital gains, those gains will be offset by any of its unused capital loss carryforward. Future capital loss carryover utilization in any given year may be subject to Internal Revenue Code limitations.
Note 6 – Investment Transactions
For the year ended March 31, 2023, purchases and sales of investments, excluding short-term investments, written and purchased options, and credit default swaps were $131 and $54,836,215, respectively.
Note 7 – Investments in Investment Funds
The Adviser monitors the performance of Investment Funds. Such monitoring procedures include, but are not limited to, monitoring market movements and the Investment Funds’ portfolio investments, comparing performance to industry benchmarks, in depth conference calls and site visits with Investment Managers.
Complete information about the underlying investments held by certain of the Investment Funds is not readily available, so it is unknown whether the Fund, through its aggregate investment in Investment Funds, holds any single investment whereby the Fund’s proportionate share exceeds 5% of the Fund’s net assets as of March 31, 2023.
The following table summarizes the Fund’s investments in the Investment Funds during the year ended March 31, 2023, none of which were related parties. The Fund indirectly bears fees and expenses as an investor in the Investment Funds. Each investor of each Investment Fund will pay the Investment Manager of the Investment Fund a management fee. The fee rate varies and ranges from 0.0% to 2.50% per annum of the NAV of that Investment Fund. Additionally, the Investment Manager of each Investment Fund will generally receive an incentive fee/allocation from each investor ranging from 0% to 25% of any net new appreciation of that Investment Fund as of the end of each performance period for which an incentive fee/allocation is calculated.
Investments in Investment Funds | | % of Fund’s
Total
Investment
Funds’ Fair
Value | | | Fair Value | | | Net Change
in Unrealized
Appreciation/
Depreciation | | | Realized Gain/
Loss | | Redemptions
Permitted* | | Primary
Geographic
Location |
SGOF Liquidating Feeder Ltd | | | 100.00% | | | $ | 72,112 | | | $ | 17,991 | | | $ | 14,092 | | In Liquidation | | Cayman Islands |
Redwood Domestic Fund, L.P. | | | 0.00% | | | | — | | | | (1,675,291 | ) | | | 1,368,360 | | Biennial | | Cayman Islands |
Antara Capital Offshore Fund Ltd | | | 0.00% | | | | — | | | | 247,953 | | | | (812,123 | ) | Quarterly | | Cayman Islands |
TAL China Focus US Fund | | | 0.00% | | | | — | | | | 299,693 | | | | (318,300 | ) | Quarterly | | Cayman Islands |
Redwood Offshore Fund, Ltd | | | 0.00% | | | | — | | | | (1,641,720 | ) | | | 1,395,328 | | Biennial | | Cayman Islands |
Serengeti Lycaon Overseas, Ltd | | | 0.00% | | | | — | | | | (480,154 | ) | | | (100,421 | ) | Not Permitted | | Cayman Islands |
Pelham Long/Short Small Cap Fund, Ltd | | | 0.00% | | | | — | | | | (80,885 | ) | | | (775,238 | ) | Quarterly | | Bermuda |
Perella Weinberg Partners Asset Based Value Offshore Fund, LP | | | 0.00% | | | | — | | | | 29,314 | | | | (549,669 | ) | In Liquidation | | Cayman Islands |
East Lodge Capital Credit Opportunities Fund, Ltd | | | 0.00% | | | | — | | | | (36,602 | ) | | | (113,351 | ) | Not Permitted | | Cayman Islands |
East Lodge Capital Credit Opportunities Fund L.P. | | | 0.00% | | | | — | | | | 116,223 | | | | (416,922 | ) | Not Permitted | | United States |
VPC Offshore Unleveraged Private Debt Fund Feeder, LP | | | 0.00% | | | | — | | | | (65,257 | ) | | | (2,289 | ) | Not Permitted | | Cayman Islands |
Centerbridge Credit Partners Offshore, Ltd | | | 0.00% | | | | — | | | | (4,946 | ) | | | (7,938 | ) | Initial 2-3 yr lock-up, then quarterly | | Cayman Islands |
23
Corbin Multi-Strategy Fund, LLC
Notes to Financial Statements
March 31, 2023 (continued)
Note 7 – Investments in Investment Funds (continued)
Investments in Investment Funds | | % of Fund’s
Total
Investment
Funds’ Fair
Value | | | Fair Value | | | Net Change
in Unrealized
Appreciation/
Depreciation | | | Realized Gain/
Loss | | Redemptions
Permitted* | | Primary
Geographic
Location | |
Luxor Capital Partners Offshore Liquidating SPV, Ltd. | | | 0.00% | | | $ | — | | | $ | 24,091 | | | $ | (34,421 | ) | In Liquidation | Cayman Islands |
Cadian Offshore Fund Ltd. | | | 0.00% | | | | — | | | | (1,359,133 | ) | | | 1,172,104 | | Quarterly | Cayman Islands |
D.E. Shaw Composite International Fund | | | 0.00% | | | | — | | | | (8,712,485 | ) | | | 9,440,616 | | Quarterly | Cayman Islands |
D.E. Shaw Oculus International Fund | | | 0.00% | | | | — | | | | (4,636,900 | ) | | | 5,069,274 | | Quarterly | Cayman Islands |
Pelham Long/Short Fund LP | | | 0.00% | | | | — | | | | 235,392 | | | | (554,363 | ) | Monthly | United States |
SRS Partners, Ltd | | | 0.00% | | | | — | | | | (1,592,844 | ) | | | 870,838 | | Quarterly | United states |
Steamboat Capital Partners Offshore Fund, Ltd | | | 0.00% | | | | — | | | | (67,239 | ) | | | (33,745 | ) | Quarterly | Cayman Islands |
Tal China Focus Fund | | | 0.00% | | | | — | | | | (458,245 | ) | | | 397,155 | | Quarterly | Cayman Islands |
Total Investment in Investment Funds | | | 100.0% | | | $ | 72,112 | | | $ | (19,841,044 | ) | | $ | 16,008,987 | | | | | | |
* | Subject to the terms of the offering memorandums of the Investment Funds. Different tranches may have different liquidity terms and may be subject to investor level gates. Redemption notice periods for the Investment Funds range from 14 to 90 days. |
While redemptions are permitted per the terms of the offering memorandums of the Investment Funds, such redemptions may be deferred or suspended at any time upon the election of the Investment Manager of such Investment Fund. Moreover, certain Investment Funds may amend their liquidity provisions or otherwise further restrict the Fund’s ability to make withdrawals from those Investment Funds. No such amendments were put in place during the year ended March 31, 2023. The Fund had unfunded capital commitments of $0 as of March 31, 2023.
The following is a summary of the investment strategies of the Investment Funds held in the Fund as of March 31, 2023:
Equity Special Situations strategies generally employ an investment process primarily focused on opportunities in equity and equity related instruments of companies which are currently engaged in a corporate transaction, security issuance/repurchase, asset sales, division spin-off or other catalyst-oriented situation. These involve both announced transactions as well as situations which pre-, post-date or situations in which no formal announcement is expected to occur. Strategies employ an investment process focusing broadly on a wide spectrum of corporate life cycle investing, including but not limited to distressed, bankruptcy and post-bankruptcy security issuance, announced acquisitions and corporate division spin-offs, asset sales and other security issuance impacting an individual capital structure focusing primarily on situations identified via fundamental research which are likely to result in a corporate transaction or other realization of shareholder value through the occurrence of some identifiable catalyst. Strategies effectively employ primarily equity but also corporate debt exposure, and in general tend to focus more broadly on post-bankruptcy equity exposure and exit of restructuring proceedings.
24
Corbin Multi-Strategy Fund, LLC
Notes to Financial Statements
March 31, 2023 (continued)
Note 8 – Fair Value Measurements and Disclosure
The Fund measures fair value as the price that would be received to sell an asset or paid to transfer a liability in an orderly transaction between market participants at the measurement date. The three levels of the fair value hierarchy are:
| | ● | Level 1 – Unadjusted quoted prices for identical securities in an active market. Since valuations are based on quoted prices that are readily-accessible at the measurement date, valuation of these securities does not entail a significant degree of judgment. |
| | ● | Level 2 – Quoted prices in non-active markets for which all significant inputs are observable either directly or indirectly. Level 2 inputs may also include pricing models whose inputs are observable or derived principally from or corroborated by observable market data. |
| | ● | Level 3 – Prices or valuation techniques that require inputs that are both significant to the fair value and unobservable. Little if any market activity exists for Level 3 securities. |
Investments in mutual funds and ETFs, and investments in equity securities are included in Level 1 of the fair value hierarchy if an unadjusted price can be obtained from a reputable, independent third-party pricing source as of the measurement date.
The inputs or methodology used for valuing securities are not necessarily an indication of the risk associated with investing in those securities. A summary of the inputs used to value the Fund’s investments and other financial instruments as of March 31, 2023 is as follows:
Description | | Total Fair Value
at 3/31/2023 | | | Level 1
Quoted Prices | | | Level 2
Other
Significant
Observable
Inputs | | | Level 3
Significant
Unobservable
Inputs | |
Assets | | | | | | | | | | | | | | | | |
Investment Funds (1) | | $ | 72,112 | | | $ | — | | | $ | — | | | $ | — | |
Total Assets | | $ | 72,112 | | | $ | — | | | $ | — | | | $ | — | |
(1) | Investment Funds that are measured at fair value using NAV per share (or its equivalent) as a practical expedient have not been categorized in the fair value hierarchy, based on the guidance in FASB ASC 820. The fair value amounts presented in this table are intended to permit reconciliation of the fair value hierarchy to the amounts presented in the Statement of Assets and Liabilities. |
There were no Level 3 securities held during the year nor any transfers into or out of Level 3 of the fair value hierarchy.
Note 9 – Derivative and Hedging Disclosure
The Fund has adopted the disclosure provisions of FASB ASC 815, Derivatives and Hedging. Derivatives and Hedging requires enhanced disclosures about the Fund’s derivative and hedging activities, including how such activities are accounted for and their effects on the Fund’s financial position, performance and cash flows. The Fund invested in options contracts and credit default swaps and used written options during the year ended March 31, 2023.
The effects of derivative instruments on the Statement of Operations for the fiscal year ended March 31, 2023 are as follows:
Amount of Realized Gain or (Loss) on Derivatives Recognized in Income |
Derivatives not designated as hedging instruments | | | Purchased Options Contracts | | | | Written Options Contracts | | | | Futures Contracts | | | | Swap Contracts | | | | Total | |
Equity price risk | | $ | 369,502 | | | $ | (188,081 | ) | | $ | — | | | $ | — | | | $ | 181,421 | |
Credit risk | | | — | | | | — | | | | — | | | | (117,811 | ) | | | (117,811 | ) |
Total | | $ | 369,502 | | | $ | (188,081 | ) | | $ | — | | | $ | (117,811 | ) | | $ | 63,610 | |
25
Corbin Multi-Strategy Fund, LLC
Notes to Financial Statements
March 31, 2023 (continued)
Note 9 – Derivative and Hedging Disclosure (continued)
Change in Unrealized Appreciation/Depreciation on Derivatives Recognized in Income |
Derivatives not designated as hedging instruments | | | Purchased Options Contracts | | | | Written Options Contracts | | | | Futures Contracts | | | | Swap Contracts | | | | Total | |
Equity price risk | | $ | 39,384 | | | $ | (15,920 | ) | | $ | — | | | $ | — | | | $ | 23,464 | |
Credit Risk | | | — | | | | — | | | | — | | | | 113,918 | | | | 113,918 | |
Total | | $ | 39,384 | | | $ | (15,920 | ) | | $ | — | | | $ | 113,918 | | | $ | 137,382 | |
The number of contracts is included on the Schedule of Investments. The quarterly average notional value of derivative instruments as of March 31, 2023 are as follows:
Derivative | | Quarterly Average | | | Amount | |
Options Contracts - Purchased | Average Notional Value | | $ | 672,000 | |
Options Contracts - Written | Average Notional Value | | | (1,392,000 | ) |
Swap Contracts - Long | Average Notional Value | | | 562,980 | |
Note 10 – Indemnifications
In the normal course of business, the Fund enters into contracts that contain a variety of representations and warranties and which provide general indemnifications. The Fund’s maximum exposure under these arrangements is unknown, as any such exposure would result from future claims that may be, but have not yet been, made against the Fund based on events which have not yet occurred. However, based on the Adviser’s experience, the Fund believes the risk of loss from these arrangements to be remote.
Note 11 – Risk Factors
An investment in the Fund involves various risks. The Fund allocates assets to Investment Funds that invest in and actively trade securities and other financial instruments using a variety of strategies and investment techniques with significant risk characteristics, including the risks arising from the volatility of the equity, fixed income, commodity and currency markets, the risks of borrowings and short sales, the risks arising from leverage associated with trading in the equities, currencies and over-the-counter derivatives markets, the illiquidity of derivative instruments and the risk of loss from counterparty defaults.
The Fund may invest in CLOs that directly or indirectly represent a participation in, or are secured by and payable from asset pools. The collateralized loan obligation held by the Fund is an interest in pools of corporate loans. This security provides a monthly payment which consists of both interest and principal payments. Interest payments may be determined by fixed or adjustable rates. Credit risk on the CLOs reflects the risk that the borrowers on the underlying loans may not be able to make timely payments on the loans or may even default on the loans. The Fund is also exposed to the risk that the debt issuers may fail to fulfill their obligations to the Fund with respect to the CLOs. No such losses have been incurred.
No guarantee or representation is made that the investment program will be successful. The Fund is currently operating pursuant to the Plan, as described in Note 1 above. During the period from the Effective Date until the date on which the Fund makes its final liquidating distribution, the Fund may hold more cash or cash equivalents than normal, which may prevent the Fund from meeting its stated investment objective.
The global outbreak of coronavirus (COVID-19) has disrupted economic markets and the prolonged economic impact of the disease is uncertain. Although vaccines for COVID-19 are available, it is unknown how long circumstances related to the pandemic will persist, whether they will reoccur in the future, whether efforts to support the economy and financial markets will be successful, and what additional implications may follow from the pandemic. The impact of these events and other epidemics or pandemics in the future could adversely affect Fund performance. In February 2022, Russia commenced a military attack on Ukraine. The outbreak of hostilities between the two countries and the threat of wider-spread hostilities could have a severe adverse effect on the region and global economies, including significant negative impacts on the markets
26
Corbin Multi-Strategy Fund, LLC
Notes to Financial Statements
March 31, 2023 (continued)
Note 11 – Risk Factors (continued)
for certain securities and commodities, such as oil and natural gas. In addition, sanctions imposed on Russia by the United States and other countries, and any sanctions imposed in the future, could have a significant adverse impact on the Russian economy and related markets. The price and liquidity of investments may fluctuate widely as a result of the conflict and related events. How long the armed conflict and related events will last cannot be predicted. These tensions and any related events could have a significant impact on Fund performance and the value of Fund investments.
Note 12 – Line of Credit Arrangement
The Fund maintained a committed, secured line of credit (the “Facility”) with Royal Bank of Canada (“RBC”). The Facility had the following terms: (a) interest rate of applicable LIBOR rate plus 1.40% per annum, (b) a commitment fee of 0.80% per annum, (c) a commitment amount of $5,000,000 and (d) termination date of December 7, 2022. As of June 15, 2022, the commitment amount of $15,000,000 changed to $5,000,000. As of December 7, 2022, the Fund terminated the Facility. The average interest rate, average daily loan balance, maximum outstanding and amount recorded as interest expense for the year ended March 31, 2023 were 1.86%, $283,356, $3,000,000 and $4,489, respectively. The Fund had outstanding borrowings for 29 days during the year.
For the year ended March 31, 2023, commitment fees of $44,274 were expensed and are included in the accompanying Statement of Operations.
The Fund is required to meet certain financial covenants, such as limiting the amount of debt to the lesser of (a) the committed amount and (b) an amount equal to the product of 35% multiplied by the value of the collateral as defined in the line of credit agreement. The Fund met all financial covenants as of and during the year ended March 31, 2023.
Note 13 – Recent Accounting Pronouncements
In March 2020, the FASB issued ASU No. 2020-04, “Reference Rate Reform (Topic 848),” which provides optional expedients and exceptions for applying GAAP to contracts, hedging relationships, and other transactions affected by reference rate reform if certain criteria are met. The amendments apply only to contracts, hedging relationships, and other transactions that reference LIBOR or another reference rate expected to be discontinued because of reference rate reform. ASU 2020-04 is effective for all entities as of March 12, 2020 through December 31, 2022. The expedients and exceptions provided by the amendments do not apply to contract modifications and hedging relationships entered into or evaluated after December 31, 2022, except for hedging transactions as of December 31, 2022, that an entity has elected certain optional expedients for and that are retained through the end of the hedging relationship. The Fund is currently evaluating the impact of adopting ASU 2020-04 within its financial statements.
Note 14 – Subsequent Events
The Fund has adopted financial reporting rules regarding subsequent events, which require an entity to recognize in the financial statements the effects of all subsequent events that provide additional evidence about conditions that existed at the date of the balance sheet. Management has evaluated the Fund’s related events and transactions that occurred through the date of issuance of the Fund’s financial statements.
The final liquidating distribution was processed in two transactions. The first transaction was processed as a 95% pro rata across shareholder base and wires went out on May 8, 2023. The remaining 5% of shares are being held in shareholder accounts as holdback pending the settlement of underlying custody trades.
There were no additional events or transactions that occurred during this period that materially impacted the amounts or disclosures in the Fund’s financial statements.
27
Corbin Multi-Strategy Fund, LLC
Supplemental Information (Unaudited)
March 31, 2023
The Board of Managers of the Fund
The identity of the Managers and officers of the Fund and brief biographical information regarding each such person during the past five years is set forth below. Each Manager who is deemed to be an “interested person” of the Fund, as defined in the 1940 Act (an “Interested Manager”), is indicated by an asterisk. The business address of each person listed below is c/o UMB Fund Services, Inc. 235 W. Galena St. Milwaukee, WI 53212. The Fund’s Statement of Additional Information includes additional information about the membership of the Board.
INDEPENDENT MANAGERS
Name and Age | Position(s)
With the Fund | Length
of Time
Served(1) | Principal Occupation(s)
During Past Five Years | Number of
Portfolios
In Fund
Complex(2)
Overseen by
Manager | Other
Directorships
Held by
Managers During
the Last 5 Years |
David G. Lee
(Born 1952) | Chairman and Manager | Since 2019 | Retired (since 2012); President and Director, Client Opinions, Inc. (2003-2012); Chief Operating Officer, Brandywine Global Investment Management (1998-2002). | 17 | None. |
Robert Seyferth
(Born 1952) | Manager | Since 2019 | Retired (since 2009); Chief Procurement Officer/Senior Managing Director, Bear Stearns/JP Morgan Chase (1993-2009). | 17 | None. |
Gary E. Shugrue
(Born 1954) | Manager | Since 2019 | Managing Director, Veritable LP(investment advisory firm) (2016 – Present); Founder/President, Ascendant Capital Partners, LP (private equity firm) (2001 – 2015). | 15 | Trustee, Quaker Investment Trust (5 portfolios) (registered investment company). |
(1) | Each Manager serves until death, retirement, resignation or removal from the Board. Any Manager may be removed, with or without cause, at any meeting of the Members by a vote of Members holding a majority of the total number of Shares present at such meeting or, if by written consent, a vote of Members holding at least two-thirds of the total outstanding Shares. |
(2) | As of March 31, 2023, the term “Fund Complex” refers to the Fund The fund complex consists of the Fund, AFA Multi-Manager Credit Fund, Agility Multi-Asset Income Fund, Aspiriant Risk-Managed Capital Appreciation Fund, Aspiriant Risk-Managed Real Assets Fund, Destiny Alternative Fund LLC, Destiny Alternative Fund (TEI) LLC, First Trust Alternative Opportunities Fund, First Trust Private Assets Fund, First Trust Private Credit Fund, First Trust Real Assets Fund, Infinity Core Alternative Fund, Keystone Private Income Fund, Optima Dynamic Alternatives Fund, Variant Alternative Income Fund, Variant Impact Fund and Pender Real Estate Fund. The Adviser is not an affiliate of any fund in the Fund Complex other than the Fund. |
28
Corbin Multi-Strategy Fund, LLC
Supplemental Information (Unaudited)
March 31, 2023 (continued)
INTERESTED MANAGER AND OFFICERS
Name, Address
and Year of Birth | Position(s)
Held with
the Fund | Length
of Time
Served(1) | Principal Occupation(s)
During Past 5 Years | Number of
Portfolios
in Fund
Complex(2)
Overseen | Other
Directorships
Held by Trustees |
Terrance P. Gallagher(3)
Year of Birth: 1958 | Trustee | Since 2019 | Executive Vice President and Director of Fund Accounting, Administration and Tax, UMB Fund Services, Inc. (2007 – present); President, Investment Managers Series Trust II (registered investment company) (2013 – Present); Treasurer, American Independence Funds Trust (registered investment company) (2016 – 2018); Treasurer, Commonwealth International Series Trust (registered investment company) (2010 – 2015). | 17 | Trustee, Investment Managers Series Trust II (51 portfolios) (registered investment company). |
Tracy McHale Stuart
Year of Birth: 1961 | President | Since 2019 | Chief Executive Officer, Corbin Capital Partners, L.P. | N/A | N/A |
Daniel Friedman
Year of Birth: 1975 | Vice President | Since 2019 | General Counsel, Corbin Capital Partners, L.P. | N/A | N/A |
Steve Carlino
Year of Birth: 1964 | Treasurer | Since 2019 | Chief Financial Officer, Corbin Capital Partners, L.P. | N/A | N/A |
29
Corbin Multi-Strategy Fund, LLC
Supplemental Information (Unaudited)
March 31, 2023 (continued)
INTERESTED MANAGER AND OFFICERS (continued)
Name, Address
and Year of Birth | Position(s)
Held with
the Fund | Length
of Time
Served(1) | Principal Occupation(s)
During Past 5 Years | Number of
Portfolios
in Fund
Complex(2)
Overseen | Other
Directorships
Held by Trustees |
Bernadette Murphy
Year of Birth: 1964 | Chief Compliance Officer | Since 2021 | Director, Vigilant Compliance, LLC (investment management solutions firm) (2018 – Present); Director of Compliance and operations, B. Riley Capital Management, LLC (investment advisory firm) (2017 – 2018); Chief Compliance Officer, Dialectic Capital Management, LP (investment advisory firm) (2008 – 2018). | N/A | N/A |
Ann Maurer
Year of Birth: 1972 | Secretary | Since 2019 | Senior Vice President, Client Services (2017 – Present); Vice President, Senior Client Service Manager (2013 – 2017); Assistant Vice President, Client Relations Manager (2002 – 2013), each with UMB Fund Services, Inc. | N/A | N/A |
(1) | Each officer of the Fund serves for an indefinite term until the date his or her successor is elected and qualified, or until he or she sooner dies, retires, is removed or becomes disqualified. |
(2) | The fund complex consists of the Fund, AFA Multi-Manager Credit Fund, Agility Multi-Asset Income Fund, Aspiriant Risk-Managed Capital Appreciation Fund, Aspiriant Risk-Managed Real Assets Fund, Destiny Alternative Fund LLC, Destiny Alternative Fund (TEI) LLC, First Trust Alternative Opportunities Fund, First Trust Private Assets Fund, First Trust Private Credit Fund, First Trust Real Assets Fund, Infinity Core Alternative Fund, Keystone Private Income Fund, Optima Dynamic Alternatives Fund, Variant Alternative Income Fund, Variant Impact Fund and Pender Real Estate Fund. |
(3) | Mr. Gallagher is deemed an Interested Manager because of his affiliation with the Fund’s Administrator. |
30
Corbin Multi-Strategy Fund, LLC
Supplemental Information (Unaudited)
March 31, 2023 (continued)
Proxy Voting Policies and Procedures
A description of the Fund’s proxy voting policies and procedures related to portfolio securities is available without charge, upon request, by calling the Fund at (844) 626-7246 or on the U.S. Securities and Exchange Commission’s (“SEC”) website at www.sec.gov.
Proxy Voting Record
Information regarding how the Fund voted proxies for portfolio securities, if applicable, during the most recent 12-month period ended June 30, is also available, without charge and upon request by calling the Fund (844) 626-7246 or by accessing the Fund’s Form N-PX on the SEC’s website at www.sec.gov.
Availability of Quarterly Portfolio Schedules
The Fund files its complete schedule of portfolio holdings with the SEC for the first and third quarters of each fiscal year on Form N-PORT. The Fund’s Form N-PORTs are available on the SEC’s website at www.sec.gov or by calling the Fund at 1 (888) 449-4909.
Tax Information
For the fiscal year ended October 31, 2022, 0.00% of the dividends paid from net investment income, including short-term capital gains (if any), for the Fund, is designated as qualified dividend income.
For the fiscal year ended October 31, 2022, 0.00% of the dividends paid from net investment income, including short-term capital gains (if any), for the Fund, qualifies for the dividends received deduction available to corporate shareholders.
31
Corbin Multi-Strategy Fund, LLC
Supplemental Information (Unaudited)
March 31, 2023 (continued)
Privacy Policy
FACTS | WHAT DOES THE FUND DO WITH YOUR PERSONAL INFORMATION? |
Why? | Financial companies choose how they share your personal information. Federal law gives consumers the right to limit some but not all sharing. Federal law also requires us to tell you how we collect, share, and protect your personal information. Please read this notice carefully to understand what we do. |
What? | The types of personal information we collect and share depend on the product or service you have with us. This information can include: ● Social Security number ● Account balances ● Account transactions ● Transaction history ● Wire transfer instructions ● Checking account information When you are no longer our customer, we continue to share your information as described in this notice. |
How? | All financial companies need to share customers’ personal information to run their everyday business. In the section below, we list the reasons financial companies can share their customers ‘ personal information; the reasons funds choose to share; and whether you can limit this sharing. |
Reasons we can share your personal information | Does the Fund share? | Can you limit this sharing? |
For our everyday business purposes –
such as to process your transactions, maintain your account(s), respond to court orders and legal investigations, or report to credit bureaus | Yes | No |
For our marketing purposes –
to offer our products and services to you | No | We don’t share |
For joint marketing with other financial companies | No | We don’t share |
For our affiliates’ everyday business purposes –
information about your transactions and experiences | Yes | No |
For our affiliates’ everyday business purposes –
information about your creditworthiness | No | We don’t share |
For our affiliates to market to you | No | We don’t share |
For nonaffiliates to market to you | No | We don’t share |
Questions? | Call 1-877-779-1999 |
32
Corbin Multi-Strategy Fund, LLC
Supplemental Information (Unaudited)
March 31, 2023 (continued)
What we do |
How does the Fund protect my personal information? | To protect your personal information from unauthorized access and use, we use security measures that comply with federal law. These measures include computer safeguards and secured files and buildings. |
How does the Fund collect my personal information? | We collect your personal information, for example, when you ● Open an account ● Provide account information ● Give us your contact information ● Make a wire transfer ● Tell us where to send the money We also collect your information from others, such as credit bureaus, affiliates, or other companies. |
Why can’t I limit all sharing? | Federal law gives you the right to limit only ● Sharing for affiliates’ everyday business purposes – information about your creditworthiness ● Affiliates from using your information to market to you ● Sharing for nonaffiliates to market to you State laws and individual companies may give you additional rights to limit sharing. |
Definitions |
Affiliates | Companies related by common ownership or control. They can be financial and nonfinancial companies. Our affiliates include companies such as Corbin Capital Partners, LP. |
Nonaffiliates | Companies not related by common ownership or control. They can be financial and nonfinancial companies. The Fund doesn’t share with nonaffiliates so they can market to you. |
Joint marketing | A formal agreement between nonaffiliated financial companies that together market financial products or services to you. The Fund doesn’t jointly market. |
33
UMB Distribution Services, LLC, Distributor
P.O. Box 2175
Milwaukee, WI 53201-1811
1-844-626-7246
ITEM 1.(b) Not Applicable.
ITEM 2. CODE OF ETHICS.
(a) The registrant, as of the end of the period covered by this report, has adopted a code of ethics that applies to the registrant's principal executive officer, principal financial officer, principal accounting officer or controller, or persons performing similar functions, regardless of whether these individuals are employed by the registrant or a third party.
(b) Not applicable.
(c) There have been no amendments, during the period covered by this report, to a provision of the code of ethics that applies to the registrant's principal executive officer, principal financial officer, principal accounting officer or controller, or persons performing similar functions, regardless of whether these individuals are employed by the registrant or a third party, and that relates to any element of the code of ethics description.
(d) The registrant has not granted any waivers, during the period covered by this report, including an implicit waiver, from a provision of the code of ethics that applies to the registrant's principal executive officer, principal financial officer, principal accounting officer or controller, or persons performing similar functions, regardless of whether these individuals are employed by the registrant or a third party, that relates to one or more of the items set forth in paragraph (b) of this item's instructions.
(e) Not applicable.
(f) The registrant's Code of Ethics is attached as Exhibit (a)(1) to this Form N-CSR.
ITEM 3. AUDIT COMMITTEE FINANCIAL EXPERT.
As of the end of the period covered by the report, the registrant's board of trustees has determined that Mr. David G. Lee and Mr. Robert Seyferth are qualified to serve as the audit committee financial experts serving on its audit committee and that they are "independent," as defined by Item 3 of Form N-CSR.
ITEM 4. PRINCIPAL ACCOUNTANT FEES AND SERVICES.
Audit Fees
(a) The aggregate fees billed for each of the last two fiscal years for professional services rendered by the principal accountant for the audit of the registrant's annual financial statements or services that are normally provided by the accountant in connection with statutory and regulatory filings or engagements for those fiscal years are $54,000 for 2022 and $40,000 for 2023.
Audit-Related Fees
(b) The aggregate fees billed for each of the last two fiscal years for assurance and related services by the principal accountant that are reasonably related to the performance of the audit of the registrant's financial statements and are not reported under paragraph (a) of this Item are $0 for 2022 and $0 for 2023.
Tax Fees
(c) The aggregate fees billed for each of the last two fiscal years for professional services rendered by the principal accountant for tax compliance, tax advice, and tax planning are $8,000 for 2022 and $8,000 for 2023.
All Other Fees
(d) The aggregate fees billed for each of the last two fiscal years for products and services provided by the principal accountant, other than the services reported in paragraphs (a) through (c) of this Item are $0 for 2022 and $0 for 2023.
(e)(1) Disclose the audit committee's pre-approval policies and procedures described in paragraph (c)(7) of Rule 2-01 of Regulation S-X.
The Registrant's Audit Committee must pre-approve the audit and non-audit services of the Auditors prior to the Auditor's engagement.
(e)(2) The percentage of services described in each of paragraphs (b) through (d) of this Item that were approved by the audit committee pursuant to paragraph (c)(7)(i)(C) of Rule 2-01 of Regulation S-X are as follows:
(b) 0%
(c) 0%
(d) 0%
(f) The percentage of hours expended on the principal accountant's engagement to audit the registrant's financial statements for the most recent fiscal year that were attributed to work performed by persons other than the principal accountant's full-time, permanent employees was less than fifty percent.
(g) The aggregate non-audit fees billed by the registrant's accountant for services rendered to the registrant, and rendered to the registrant's investment adviser (not including any sub-adviser whose role is primarily portfolio management and is subcontracted with or overseen by another investment adviser), and any entity controlling, controlled by, or under common control with the adviser that provides ongoing services to the registrant for each of the last two fiscal years of the registrant was $0 for 2022 and $0 for 2023.
(h) The registrant's audit committee of the board of trustees has considered whether the provision of non-audit services that were rendered to the registrant's investment adviser (not including any sub-adviser whose role is primarily portfolio management and is subcontracted with or overseen by another investment adviser), and any entity controlling, controlled by, or under common control with the investment adviser that provides ongoing services to the registrant that were not pre-approved pursuant to paragraph (c)(7)(ii) of Rule 2-01 of Regulation S-X is compatible with maintaining the principal accountant's independence.
(i) Not Applicable.
(j) Not Applicable.
ITEM 5. AUDIT COMMITTEE OF LISTED REGISTRANTS.
Not applicable.
ITEM 6. SCHEDULE OF INVESTMENTS.
| (a) | Schedule of Investments in securities of unaffiliated issuers as of the close of the reporting period is included as part of the report to shareholders filed under Item 1(a) of this form. |
ITEM 7. DISCLOSURE OF PROXY VOTING POLICIES AND PROCEDURES FOR CLOSED-END MANAGEMENT INVESTMENT COMPANIES.
Exhibit H
Corbin Capital Partners, LP
PROXY POLICY AND PROCEDURE
Effective July 1, 2019
INTRODUCTION
Corbin Capital Partners, LP (“Corbin”) acts as the advisor to the Corbin Multi-Strategy Fund, Inc. (“the Fund”). Rule 206(4)-6 under the Advisers Act requires a registered investment adviser with voting authority over client proxies to adopt proxy voting policies and procedures, including procedures to address material conflicts of interest, and to disclose such procedures and its specific voting history to clients.1 The Rule does not apply to advisers whose clients retain voting authority, smaller investment advisers who are registered with state securities authorities, or investment advisers who are not required to register under the Advisers Act.
An adviser subject to the Rule is required to:
| · | adopt and implement written policies and procedures that are reasonably designed to ensure that the adviser votes proxies in the best interests of its clients; |
| · | describe such procedures to clients and, upon request, provide a summary of the procedures to clients; |
| · | disclose to clients how they may obtain information on how the adviser voted their proxies; and |
| · | retain certain written records about its proxy voting. (See Section XIX. – “Recordkeeping Requirements” below for a more complete description.) |
The Rule applies to all advisers that have explicit or implicit proxy voting authority over client securities. The SEC has clarified that an overall delegation of discretionary authority to an adviser constitutes implicit proxy voting authority, even though an advisory contract may be silent on this point. The Rule does not apply to advisers who do not have authority to vote the proxies themselves but provide advice to clients about voting proxies.
| 1 | The SEC issued a Staff Legal Bulletin recently providing guidance on investment advisers’ proxy voting responsibilities and use of outside proxy advisory firms. The bulletin noted that when considering the retention (or continuation of an existing retention) of a proxy advisory firm to provide voting recommendations, an adviser should assess such firm’s ability to competently and adequately analyze proxy issues. The bulletin also highlighted the importance of policies and procedures designed to ensure (a) adequate oversight of an outside proxy advisory firm; (b) that the investment adviser is apprised of any applicable changes to the proxy firm’s business or any new potential conflicts of interest; and (c) that proxies are being voted in the best interest of clients (see Proxy Voting: Proxy Voting Responsibilities of Investment Advisers and Availability of Exemptions from the Proxy Rules for Proxy Advisory Firms, June 30, 2014). |
The SEC did not mandate specific proxy voting policies and procedures. However, the SEC encouraged the design of policies and procedures that address:
| · | how an adviser votes its proxies on behalf of its clients; and |
| · | the particular factors that an adviser takes into consideration when voting on particular matters. |
The Rule also specifically requires that the procedures address material conflicts that may arise between an adviser or its affiliates and its clients (such as when the adviser has business or personal relationships with participants in proxy contests, corporate directors or candidates for directorship). The SEC noted that a policy of disclosing conflicts to a client and obtaining direction from the client on how to vote would satisfy the requirement of the Rule (although certain additional consideration should be given to this alternative in the case of employee benefit plan clients). Otherwise, the adviser must be able to demonstrate that its vote was based on the client’s best interest and not on the interests of the adviser.
The SEC staff has also issued guidance on an investment adviser’s responsibilities in retaining proxy advisory firms. The guidance suggests that advisers have an ongoing duty to monitor proxy advisory firms to ensure that the firms have the capacity and competency to adequately analyze proxy issues. The SEC staff has indicated that an adviser should take reasonable steps to verify that a proxy advisory firm is independent and can make proxy voting recommendations in an impartial manner and in the best interests of the adviser’s clients.
ITEM 8. PORTFOLIO MANAGERS OF CLOSED-END MANAGEMENT INVESTMENT COMPANIES.
(a)(1) Identification of Portfolio Manager(s) or Management Team Members and Description of Role of Portfolio Manager(s) or Management Team Members Biographies of certain of the Adviser investment professionals having day-to-day portfolio management responsibility to the Fund (the “Portfolio Managers”) are below:
Craig Bergstrom, CFA
Managing Partner, Chief Investment Officer
Mr. Bergstrom is the Chief Investment Officer of the Adviser, and leads the Adviser’s investment team. He works on all aspects of the investment process with a special focus on implementation capabilities, co-investments and direct investing efforts, as well as new initiatives. Prior to joining the Adviser in January 2002, Mr. Bergstrom was Risk Manager at Grantham Mayo Van Otterloo & Co. LLC (“GMO”), a then $20+ billion institutional investment management firm, where he had responsibilities for market risk management, hedge fund product development and derivatives strategy. Prior to joining GMO, he was a Vice President in the Equity Derivatives group at Salomon Smith Barney, and previously worked in the Equity Structured Products group at Morgan Stanley. Mr. Bergstrom graduated from Dartmouth College with a B.A. in Government and was awarded the CFA charter in 1997.
Robert Zellner
Senior Partner, Deputy Chief Investment Officer
Mr. Zellner is the Deputy Chief Investment Officer of the Adviser and leads the portfolio construction process for commingled fund-of-funds products. He is also responsible for research on global macro strategies, and covers corporate and asset-backed credit strategies. Prior to joining the Adviser in April 2005, Mr. Zellner worked with Optima Fund Management in New York as a Vice President of Research focusing on manager research and due diligence for Optima’s fund-of-funds products. Previously, Mr. Zellner spent six years at BlackRock Financial Management (“BlackRock”), most recently as a Vice President in the Fixed Income Portfolio Analytics Group, where he advised on many of BlackRock’s top mortgage banking relationships. Mr. Zellner graduated from Princeton University, where he received an A.B. in Economics with a Certificate in Political Economy.
(a)(2) Other Accounts Managed by Portfolio Manager(s) or Management Team Member and Potential Conflicts of Interest
Other Accounts Managed by the Portfolio Manager(s)
(As of March 31, 2023)
Name of Portfolio Manager or Team Member | Type of Accounts | Total No. of Accounts Managed | Total Assets*** | No. of Accounts where Advisory Fee is Based on Performance | Total Assets in Accounts where Advisory Fee is Based on Performance |
| Craig Bergstrom | Registered Investment Companies*: | 0 | $0 | 0 | $0 |
| | Other Pooled Investment Vehicles**: | 7 | $5,340,395,762 | 7 | $5,340,395,762 |
| | Other Accounts: | 13 | $3,592,554,926 | 12 | $2,349,886,813 |
| ** | Pooled vehicles that are part of the same master-feeder structure are reflected as one account. |
| *** | Double counts certain assets due to certain Adviser-managed vehicles or accounts investing in other Adviser-managed vehicles or accounts |
Real, potential or apparent conflicts of interest may arise because the Adviser has day-to-day portfolio management responsibilities with respect to more than one fund. The Adviser manages other pooled investment vehicles with investment strategies that may be similar to certain investment strategies utilized by the Fund. Fees earned by the Adviser may vary among these accounts, and the Portfolio Managers may personally invest in these accounts. These factors could create conflicts of interest because the Portfolio Managers may have incentives to favor certain accounts over others, resulting in other accounts outperforming the Fund. A conflict may also exist if the Portfolio Managers identify a limited investment opportunity that may be appropriate for more than one account, but the Fund is not able to take full advantage of that opportunity due to the need to allocate that opportunity among multiple accounts. To the extent the Adviser purchases interests in the same Investment Fund for the Fund and other accounts, the Fund, subject to applicable law, may be restricted from purchasing additional interests in such Investment Fund. In addition, the Portfolio Managers may execute transactions for another account that may adversely impact the value of securities held by the Fund. However, the Adviser believes that these risks are mitigated by the fact that accounts with like investment strategies managed by the Portfolio Managers, where possible and appropriate, are generally managed in a similar fashion and the Adviser has a policy that seeks to allocate opportunities in a fair and equitable basis over time, consistent with the Adviser allocation policy in effect from time to time.
The Adviser manages certain private investment funds that have a specific investment focus or criteria (the “Specialty Funds”). A Specialty Fund will be allocated its desired portion of investment opportunities that fall within its mandate before other Adviser clients (that are not Specialty Funds) receive allocations of such investment opportunities. Specialty Funds with overlapping mandates may compete for the same investment opportunities and as a result a Specialty Fund may receive less than its desired allocation of a specific opportunity. Capacity not utilized by Specialty Funds will be available for other Adviser clients, such as the Fund.
(a)(3) Compensation Structure of Portfolio Manager
All professionals of the Adviser are compensated with a base salary and annual bonus, based on individual performance and overall profitability of the Adviser, aligning compensation with performance. Generally, after two years of employment, a 401(a) profit sharing plan, which is part of the base salary and annual bonus, is mandatory for all professionals provided that they have satisfied the minimum criteria. The Portfolio Managers are partners of the Adviser and as such participate in the profitability of the business based on their ownership percentage. The Adviser also offers select non-partners a deferred compensation program pursuant to which deferred amounts are pegged to the performance of selected funds managed by the Adviser and vest over pre-determined time periods. Compensation is generally determined by senior management of the Adviser. The Portfolio Managers may also participate in a 401(k) plan that enables them to direct a percentage of their pre-tax salary into a tax-qualified retirement plan.
(a)(4) Disclosure of Securities Ownership
None of the Portfolio Managers or officers currently owns any Shares of the registrant as of March 31, 2023.
(b) Not applicable.
ITEM 9. PURCHASES OF EQUITY SECURITIES BY CLOSED-END MANAGEMENT INVESTMENT COMPANY AND AFFILIATED PURCHASERS.
Not applicable.
ITEM 10. SUBMISSION OF MATTERS TO A VOTE OF SECURITY HOLDERS.
There have been no material changes to the procedures by which the shareholders may recommend nominees to the registrant's board of managers, where those changes were implemented after the registrant last provided disclosure in response to the requirements of Item 407(c)(2)(iv) of Regulation S-K (17 CFR 229.407), or this Item.
ITEM 11. CONTROLS AND PROCEDURES.
(a) The registrant's principal executive and principal financial officers, or persons performing similar functions, have concluded that the registrant's disclosure controls and procedures (as defined in Rule 30a-3(c) under the Investment Company Act of 1940, as amended (the "1940 Act") (17 CFR 270.30a-3(c))) are effective, as of a date within 90 days of the filing date of the report that includes the disclosure required by this paragraph, based on their evaluation of these controls and procedures required by Rule 30a-3(b) under the 1940 Act (17 CFR 270.30a-3(b)) and Rules 13a-15(b) or 15d-15(b) under the Securities Exchange Act of 1934, as amended (17 CFR 240.13a-15(b) or 240.15d-15(b)).
(b) There were no changes in the registrant's internal control over financial reporting (as defined in Rule 30a-3(d) under the 1940 Act (17 CFR 270.30a-3(d)) that occurred during the period covered by this report that has materially affected, or is reasonably likely to materially affect, the registrant's internal control over financial reporting.
ITEM 12. DISCLOSURE OF THE SECURITIES LENDING ACTIVITIES FOR CLOSED-END MANAGEMENT COMPANIES.
(a) Not applicable.
(b) Not applicable.
ITEM 13. EXHIBITS.
(a)(1) Code of ethics or any amendments thereto, that is subject to disclosure required by item 2 is attached hereto.
(a)(2) Certifications pursuant to Rule 30a-2(a) under the 1940 Act and Section 302 of the Sarbanes-Oxley Act of 2002 are attached hereto.
(a)(3) Not applicable.
(a)(4) Not applicable.
(b) Not applicable.
SIGNATURES
Pursuant to the requirements of the Securities Exchange Act of 1934 and the Investment Company Act of 1940, the registrant has duly caused this report to be signed on its behalf by the undersigned, thereunto duly authorized.
| (registrant) | Corbin Multi-Strategy Fund, LLC | |
| | | |
| By (Signature and Title)* | /s/ Daniel Friedman | |
| | Daniel Friedman, Vice President | |
| | | |
| Date | June 8, 2023 | |
Pursuant to the requirements of the Securities Exchange Act of 1934 and the Investment Company Act of 1940, this report has been signed below by the following persons on behalf of the registrant and in the capacities and on the dates indicated.
| By (Signature and Title)* | /s/ Daniel Friedman | |
| | Daniel Friedman, Vice President | |
| | | |
| Date | June 8, 2023 | |
| By (Signature and Title)* | /s/ Steve Carlino | |
| | Steve Carlino, Treasurer | |
| | (Principal Financial Officer) | |
| | | |
| Date | June 8, 2023 | |
| * | Print the name and title of each signing officer under his or her signature. |